namibia systematic country diagnostic - world bank document
TRANSCRIPT
Namibia Systematic Country Diagnostic 1
SYSTEMATIC COUNTRY DIAGNOSTICNAMIBIA
Pub
lic D
iscl
osur
e A
utho
rized
Pub
lic D
iscl
osur
e A
utho
rized
Pub
lic D
iscl
osur
e A
utho
rized
Pub
lic D
iscl
osur
e A
utho
rized

SYSTEMATIC COUNTRY DIAGNOSTIC
July 2021
NAMIBIA

Namibia Systematic Country Diagnostic 5
2021 The World Bank Group 1818 H Street NW, Washington, DC 20433
Telephone: 202-473-1000; Internet: www.worldbankgroup.org
Some rights reserved
1 2 3 4 21 20 19 18
This work is a product of the staff of The World Bank Group with external contributions. The findings, interpretations, and conclusions expressed in this work do not necessarily reflect the views of the World Bank Group, its Board of Executive Directors, or the governments they represent. The World Bank Group does not guarantee the accuracy of the data included in this work. The boundaries, colors, denominations, and other information shown on any map in this work do not imply any judgment on the part of The World Bank concerning the legal status of any territory or the endorsement or acceptance of such boundaries.
Nothing herein shall constitute or be considered to be a limitation upon or waiver of the privileges and immunities of the World Bank Group, all of which are specifically reserved.
RIGHTS AND PERMISSIONS
This work is available under the Creative Commons Attribution 3.0 IGO license (CC BY 3.0 IGO) http://creativecommons. org/licenses/by/3.0/igo. Under the Creative Commons Attribution license, you are free to copy, distribute, transmit, and adapt this work, including for commercial purposes, under the following conditions:
Attribution - Please cite the work as follows: World Bank Group 2021. Namibia Systematic Country Diagnostic Washington, DC: World Bank. License: Creative Commons Attribution CC BY 3.0 IGO.
Translations - If you create a translation of this work, please add the following disclaimer along with the attribution: This translation was not created by the World Bank Group and should not be considered an official World Bank Group translation. The World Bank Group shall not be liable for any content or error in this translation.
Adaptations - If you create an adaptation of this work, please add the following disclaimer along with the attribution: This is an adaptation of an original work by the World Bank Group. Views and opinions expressed in the adaptation are the sole responsibility of the author or authors of the adaptation and are not endorsed by the World Bank Group.
Third-party content - The World Bank Group does not necessarily own each component of the content contained within the work. The World Bank Group therefore does not warrant that the use of any third-party-owned individual component or part contained in the work will not infringe on the rights of those third parties. The risk of claims resulting from such infringement rests solely with you. If you wish to reuse a component of the work, it is your responsibility to determine whether permission is needed for that reuse and to obtain permission from the copyright owner. Examples of components can include, but are not limited to, tables, figures, or images.
All queries on rights and licenses should be addressed to World Bank Publications, The World Bank Group, 1818 H Street NW, Washington, DC 20433, USA; e-mail: [email protected].
Namibia Systematic Country Diagnostic6
AfDB African Development BankAgribank Agricultural Bank of NamibiaAIDS Acquired Immune Deficiency SyndromeBAU Business as Usual BIPA Business and Intellectual Authority CBNRM Community-Based Natural Resources ManagementCPB Central Procurement BoardCSA Climate-Smart AgricultureCSP Concentrated Solar PowerDAI Digital Adoption IndexDPSM Department of Public Service Management ECB Electricity Control BoardECDE Early Childhood Development and EducationEFTA European Free Trade AreaEIG Emergency Income GrantES Enterprise SurveyEU European UnionFDI Foreign Direct InvestmentFMD Foot-and-Mouth DiseaseFSAP Financial Sector Assessment ProgramFY Fiscal YearGBV Gender-Based ViolenceGDP Gross Domestic ProductGER Gross Enrolment RateGFCF Gross Fixed Capital FormationGNI Gross National IncomeHCI Human Capital IndexHDI Human Development Index HIV Human Immunodeficiency Virus HRMIS Human Resources Management Information SystemICT Information and Communication TechnologyIIP Infant Industry ProtectionILO International Labor OrganizationINDC Intended Nationally Determined ContributionsIPP Independent Power ProducerISC Industry Skills CommitteeLFP Labor Force Participation M&E Monitoring and EvaluationMDAs Ministries, Departments, and Agencies MERCOSUR Mercado Común del Sur; Southern Common MarketMoEAC Ministry of Education, Arts and Culture
ABBREVIATIONS AND ACRONYMS
Namibia Systematic Country Diagnostic 7
MoHSS Ministry of Health and Social ServicesMPE Ministry of Public EnterprisesMSME Micro, Small, and Medium EnterpriseNaCC Namibian Competition CommissionNCA Northern Communal AreaNCD Noncommunicable DiseaseNCP National Competition PolicyNDC Nationally Determined ContributionNDP National Development PlanNDP5 Fifth National Development PlanNFIS Namibia Financial Inclusion SurveyNHIES Namibia Household Income and Expenditure SurveyNIRP National Integrated Resource PlanNSFAF Namibia Students Financial Assistance FundNRSC National Road Safety CouncilNTA Namibia Training AuthorityNUST Namibia University of Science and TechnologyOAG Old Age GrantOECD Organization for Economic Co-operation and DevelopmentPER Public Expenditure ReviewPMR Product Market RegulationPPP Public-Private PartnershipPSEMAS Public Service Employee Medical Aid SchemePV PhotovoltaicRRA Risk and Resilience AssessmentR&D Research and DevelopmentRCC Roads Contractor CompanyREFIT Renewal Energy Feed-In TariffRFA Road Fund AgencySACU Southern African Customs UnionSADC Southern African Development CommunitySAM Social Accounting MatrixSAPP Southern African Power PoolSASA Southern Africa Solar/Renewables AcceleratorSAT Standardized Achievement TestSCD Systematic Country DiagnosticSME Small and Medium EnterpriseSOE State-Owned EnterpriseSSA Sub-Saharan AfricaSWAPO South West Africa People’s OrganizationSTR Student-Teacher RatioTEIs Tertiary Education InstitutionsTFP Total Factor ProductivityTHE Total Health ExpendituresTVET Technical and Vocational Education and TrainingUNAIDS Joint United Nations Programme on HIV/AIDS UNAM University of NamibiaVTC Vocational Training CenterWBG World Bank GroupWHO World Health Organization
Namibia Systematic Country Diagnostic8
TABLE OF CONTENTS
Table on Contents 8
Figures / Tables / Boxes 10
Acknowledgments 12
Executive Summary 15A. Sources of Growth and Poverty Reduction 18B. Binding Constraints to Wealth Creation and Sustainable Economic Development 21C. Pathways to Overcome Growth and Inclusiveness Challenges 22D. Establishing an Environment for Private Sector-led, Job-creating Activities 23E. Building Human Capital and Increasing the Productive Potential of the Labor Force 25F. Reducing Inequalities through better Services Delivery 26G. Reducing Vulnerabilities to Climate Change and Environmental Shocks 28H. Prioritization of Constraints and Interventions 29
CHAPTER 1: Introduction and Analytical Framework 33
1. Introduction 34
2. The Historical Context and the Legacy of Apartheid as a Defining Feature 35
3. Framework for the SCD Analysis: “Changing Wealth of Nations” 36
CHAPTER 2: Achievements Since Independence and the Main Challenges 39
1. Namibia’s Success Story and Achievements since Independence 40A. National Wealth Has Increased 40B. Political Stability and Investment in Produced Capital Led to Rapid Economic Development 41C. Investment in Human Capital Led to Strong Economic Performance, Fast Poverty Reduction and Better Access to Services 45
2. Low Human Capital Levels and Low Growth Potential Remain Challenges 47A. Wealth Remains Relatively Low Compared with Other Countries 47B. The Middle-Income Trap: Myth or Reality for Namibia? 48
CHAPTER 3: Challenges of Maintaining Sustainable Economic Growth and Wealth Accumulation 51
1. Low TFP, Deterioration of Fiscal Liquidity, and High Macro Volatility 52A. High Investment in Mining and Infrastructure but Weak Productivity and Inefficient Inter-sectoral Allocations 52B. Deterioration of Fiscal Situation and Liquidity Challenges 58C. Country Dependence on the Global and Regional Context and Price Volatility 61
2. Barriers to Input Markets and Technology Limit Growth Potential 66A. High Unemployment, Limited Jobs Opportunities, and Polarized Labor Market 66B. Poor Competition and Low Entrepreneurship 69C. Poor Access to Financing 75D. Skewed Access to Land and Low Affordability in the Housing Market 76E. Low Use of Digital Technology 78F. Challenges of Low Productivity in Agriculture 81
Namibia Systematic Country Diagnostic 9
3. Incomplete Structural Transformation and Infrastructure Gaps 83A. Growing Imbalances between Sectors 83B. Declining Trade Fitness and Low Export Complexity 85C. Fast Urbanization and Poor Urban Infrastructure 87D. Economic Transformation Is Held Back by Remaining Infrastructure Gaps 88
CHAPTER 4: Challenges of Inclusiveness and Services Delivery 93
1. Relative High Poverty and Low Human Capital 94
2. Namibia Is the Second Most Unequal Country in the World 100
3. Low Efficiency of the Social Protection System 102
4. High Spending on Education and Health Care Produces Poor Outcomes 105A. High Spending but Low Outcomes of the Educational System 106B. High Spending on the Health System but Outcomes Could Be Improved 112
5. Institutional Gaps and Challenges of Services Delivery 114A. Socioeconomic Inequalities Have Not Been Substantially Reduced 114B. The Mixed Picture of Institutional and Governance Progress 115C. Significant Spatial Inequality in Services Delivery 118
CHAPTER 5: Climate Change and Environmental Vulnerabilities 121
1. Climate Change and Its Economic Impact 122A. Renewable Natural Resources Are of Critical Importance 122B. A Perennial Quest for Sustained Water Availability 123C. Agriculture Challenges 125D. Natural Resources Degradation Is an Eminent Threat to Rural Communities 126E. The Tourism Sector Depends on the Climate Change 128F. The Fisheries Sector Is Vulnerable to Oceanographic Conditions 128
2. Adverse Impact of Environmental Shocks 129G. Natural Resources Degradation Is an Eminent Threat to Rural Communities 129
CHAPTER 6: Priority Interventions to Ensure Strong, Inclusive, and Sustainable Development 133
1. Binding Constraints to Wealth Creation and Sustainable Economic Development 134
2. Pathways to Lifting Binding Constraints 136A. Establishing an environment for private sector-led, job-creating growth 137B. Building Human Capital and Increasing the Productive Potential 139C. Reducing inequalities through better services delivery 140D. Reducing vulnerabilities to climate change and environmental shocks 143
3. Prioritization Criteria and Summary of the Proposed Reforms 144
4. New-Knowledge Gaps 146
Annexes 149
Annex 1. Summary of Policy Proposals 150A. Reforms for Establishing an Environment for Private Sector-led, Job-creating Growth 150B. Building Human Capital and Increasing Productive Potential 153C. Reduce Inequalities through Better Services Delivery, Improving Targeting Efficiency, and Better Governance 154D. Reducing Vulnerabilities to Climate Change and Environmental Shocks 157
Annex 2. Ranking of Policy Proposals 158
References 160
Namibia Systematic Country Diagnostic10
FIGURESFigure 1: Namibia’s wealth components per capita, 1995 and 2014 40Figure 2: Factor of production average contribution to GDP growth, 1992–2017 42Figure 3: Sector contribution to GDP growth, 1992–2017 42Figure 4: Wealth components, comparison 47Figure 5: Composition of total wealth 47Figure 6: Namibia’s wealth per capita components, in constant 2014 US$ per capita, 1995–2014 48Figure 7: Namibia’s natural capital components, in constant 2014 US$ per capita, 1995–2014 48Figure 8: Impact per US$1 million of additional revenue 54Figure 9: Average contribution of each production factor to GDP growth, 1992–2017 (percent) 55Figure 10: Contribution of economic sectors to value-added growth, 1992–2017 (percent) 55Figure 11: Growth Scenarios: Baseline, Boost TFP, and Increase in Investments 56Figure 12: General Government Taxes on Income, Profits, and Capital Gains 59Figure 13: Effectiveness of the revenue administration 59Figure 14: Namibia’s exports and uranium price volatility 61Figure 15: Net Official Development Assistance (ODA) received 61Figure 16: Change in commodity price index (minerals and metals excl. iron ore) and real GDP, 1990–2018 65Figure 17: Change in commodity price index (minerals and metals excl. iron ore) and total government spending, 1990–2018 65Figure 18: Factors constraining competitiveness—Enterprise Survey, 2014 69Figure 19: Bertelsmann Stiftung Transformation Index market economy indicators 69Figure 20: Global Competitiveness Index: domestic competition indicators 69Figure 21: Number of sectors with at least one SOE 72Figure 22: Digital Adoption Index (DAI), 2016 79Figure 23: Namibia’s Economic Complexity Index, 2000–16 85Figure 24: Fitness has declined despite rising incomes 86Figure 25: Investment in removable energy will reduce dependence on imports 90Figure 26: Trends in Namibia’s Human Development Index component indices, 1990–2017 95Figure 27: Human Development Index country ranking, 2017 95Figure 28: Human Capital Index rankings 96Figure 29: Upper-bound national poverty line, 1993–2015 97Figure 30: Overall changes in US$1.90/day international poverty rates, 2014/15 97Figure 31: Distribution of the poor, urban-rural, 2003/04 to 2015/16 98Figure 32: Distribution of poverty by regions, 2015/16 98Figure 33: Access to basic services and the prevalence of stunting 99Figure 34: Gini coefficients, 1993/94–2015/16 101Figure 35: Gini coefficients—international comparison 101Figure 36: Social assistance expenditures as a share of GDP (%) 102Figure 37: Distribution of Social Assistance Beneficiaries by Age 103Figure 38: Share of Government Education Expenditure 106Figure 39: Tertiary education enrolment 111Figure 40: Tertiary gross enrolment rate 111Figure 41: Life expectancy is lower than in countries with similar levels of health spending 113Figure 42: Human Capital Index versus GDP per capita 113Figure 43: Selection of governance indicators: Namibia scores ABOVE income-group average 117Figure 44: Selection of governance indicators: Namibia scores BELOW income-group average 117Figure 45: Services delivery: challenges of the territorial coverage 117Figure 46: Challenges across services delivery sectors 117Figure 47: Estimated income loss by region 130Figure 48: Social assistance prevalence 131
Namibia Systematic Country Diagnostic 11
TABLES
BOXES
Table 1: Prioritization the Proposed Interventions 30Table 2: Labor Force Participation and Unemployment Rates 66Table 3: Impact of Programs on Poverty and Inequality Measures 104Table 4: Prioritization of the Proposed Interventions 145
Box 1: Overcoming the Middle-Income Trap 20Box 2: Explaining the ‘Changing Wealth of Nations’ 37Box 3: Where to Invest to Generate more Jobs and Achieve Inclusive Growth 54Box 4: Economic and social impacts of the COVID-19 crisis - Lessons from abroad 62Box 5: Economic and Social Impacts of the COVID-19 Crisis 64Box 6: Namibia’s Informal Economy—a case study report by the Ministry of Labor 67Box 7: Progress in Eliminating Barriers to Entrepreneurship, Trade, and Investment in Key Sectors 71Box 8: Key Findings and Recommendations of the Financial Sector Assessment Program 76Box 9: Key Challenges of Housing 77Box 10: Developing policy priorities based on World Development Reports 2009 and 2019 83Box 11: Toward Cleaner, Less Expensive Solar Energy 90Box 12: Brief Background on the Evolution of Education Policy 107Box 13: Israel - Achieving Agricultural Transformation in a Desert 127Box 14: Estimating Distributional Impact of the Climate Shocks in Namibia 130
Namibia Systematic Country Diagnostic12
ACKNOWLEDGMENTS
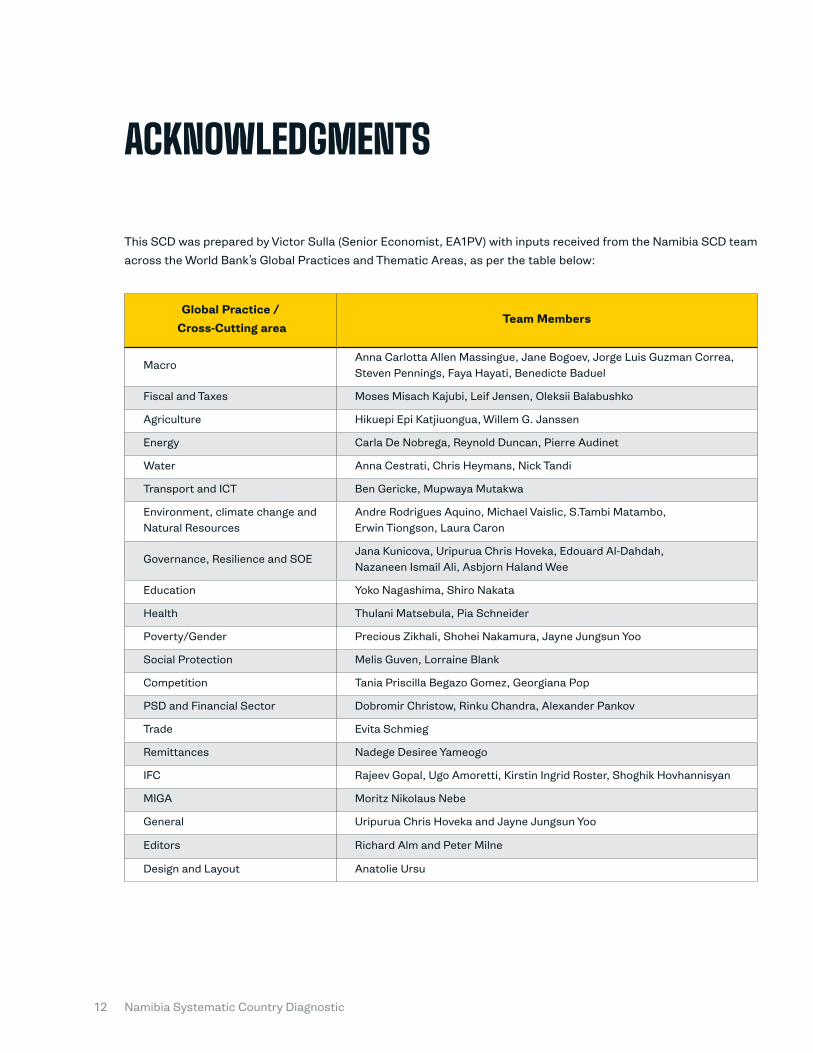
This SCD was prepared by Victor Sulla (Senior Economist, EA1PV) with inputs received from the Namibia SCD team
across the World Bank’s Global Practices and Thematic Areas, as per the table below:
Global Practice / Cross-Cutting area
Team Members
MacroAnna Carlotta Allen Massingue, Jane Bogoev, Jorge Luis Guzman Correa, Steven Pennings, Faya Hayati, Benedicte Baduel
Fiscal and Taxes Moses Misach Kajubi, Leif Jensen, Oleksii Balabushko
Agriculture Hikuepi Epi Katjiuongua, Willem G. Janssen
Energy Carla De Nobrega, Reynold Duncan, Pierre Audinet
Water Anna Cestrati, Chris Heymans, Nick Tandi
Transport and ICT Ben Gericke, Mupwaya Mutakwa
Environment, climate change and Natural Resources
Andre Rodrigues Aquino, Michael Vaislic, S.Tambi Matambo, Erwin Tiongson, Laura Caron
Governance, Resilience and SOEJana Kunicova, Uripurua Chris Hoveka, Edouard Al-Dahdah, Nazaneen Ismail Ali, Asbjorn Haland Wee
Education Yoko Nagashima, Shiro Nakata
Health Thulani Matsebula, Pia Schneider
Poverty/Gender Precious Zikhali, Shohei Nakamura, Jayne Jungsun Yoo
Social Protection Melis Guven, Lorraine Blank
Competition Tania Priscilla Begazo Gomez, Georgiana Pop
PSD and Financial Sector Dobromir Christow, Rinku Chandra, Alexander Pankov
Trade Evita Schmieg
Remittances Nadege Desiree Yameogo
IFC Rajeev Gopal, Ugo Amoretti, Kirstin Ingrid Roster, Shoghik Hovhannisyan
MIGA Moritz Nikolaus Nebe
General Uripurua Chris Hoveka and Jayne Jungsun Yoo
Editors Richard Alm and Peter Milne
Design and Layout Anatolie Ursu
Namibia Systematic Country Diagnostic 13
The SCD was prepared in close consultation with IFC, whose input was coordinated by Rajeev Gopal (Johannesburg)
and Ugo Amoretti (Washington, DC).
Specific background notes for this SCD Fwere prepared by: Yoko Nagashima, Shiro Nakata (education); Uripurua
Chris Hoveka (SOEs); Anna Cestrati (water); Carla De Nobrega (solar energy); Evita Schmieg (trade), Tania Priscilla
Begazo Gomez and Georgiana Pop (competition), Jana Kunicova (institutional assessment), Asbjorn Haland Wee
(risk and resilience assessment); Melis Guven and Lorraine Blank (Social Protection), Jorge Luis Guzman Correa and
Steven Pennings (long-term macro model) and Sebastien Dessus.
The report was undertaken under the guidance and leadership from Marie Francoise Marie-Nelly (Country Director,
AFCS1), Edouard Al-Dahdah (Senior Public Sector Specialist and acting Program Leader), Emmanuel Noubissie
Ngankam (Country Program Coordinator), Aleksandra Posarac (Program Leader), Erwin De Nys (Program Leader),
Wolfgang Fengler (Program Leader), and Pierella Paci (Practice Manager, EA1PV).
Vice President: Hafez Ghanem
Country Director: Marie Francoise Marie-Nelly
Regional Director: Asad Alam
Global Director Carolina Sanchez-Paramo
Practice Manager: Pierella Paci
Task Team Leader: Victor Sulla

EXECUTIVE SUMMARY
Namibia Systematic Country Diagnostic16
Since gaining independence in 1990, Namibia has undertaken an economic transformation and experienced strong economic growth. Fast economic growth has been associated with
structural transformation, a growing share of
services, rapid internal migration, and urbanization.
The economy remains resource-rich, although
dependence on the mining sector has started to
decrease recently. The country has become Africa’s
leader on many governance indicators and has
benefited from significant investments, including
foreign direct investment (FDI) in the extractive
industry. Namibia has made great strides in
fighting the human immunodeficiency virus (HIV)
and improving its educational system. Investment
in infrastructure—roads and ports, information,
and telecommunications—has been accompanied
by the rapid development of the financial system,
and modernization of the legal and regulatory
framework. There has also been steady progress in
improving access to clean drinking water, electricity,
and public health services. As a result, the country
has made significant progress in reducing poverty
and reaching upper middle-income status.
Despite decades marked by progress, deep underlying challenges remain in Namibia, undermining the prospects for further advancement. The pre-1990 history of systematic
exclusion of the black majority from full participation
in economic activities continues to shape society and
the economy, constraining the country’s economic
and social progress to this day. The key legacies of
colonial rule and racial segregation are persisting
territorial segregation and resource misallocation,
and a lack of access to basic services for a large
portion of the population. Economic advantage
remains in the hands of a relatively small segment of
the population, and significant inequalities persist.
This lack of inclusiveness and vast disparities have
led to a dual economy—a highly developed modern
1.
2.
sector co-existing with an informal subsistence-
oriented one—and are manifested in three main
socioeconomic challenges that define the economy
today:
� Namibia ranks as one of the world’s most unequal countries. Its developmental success
masks deep inequalities in the distribution of
resources, opportunities, and incomes. Namibia’s
Gini coefficient of 57.6 in 2015 was second only to
South Africa in terms of inequality. Geographical
disparities in both economic opportunities and
access to services are large and widening. Areas
with low population density, where the cost of
public services delivery is disproportionally high,
are systematically left behind. Land ownership
remains highly unequal, a legacy of the lopsided
distribution of arable land during colonialism.
High levels of inequality result in starkly different
poverty rates across different groups, including
by age and gender.
� Relatively high poverty, lagging human capital, and poor access to basic services are interrelated problems. Namibia’s poverty rapidly
declined from 1993/94 to 2015/16, but it remains
high for the country’s level of development.
Despite recent progress, Namibia ranked 117th
among 157 countries on the Human Capital
Index. Similarly, it remains well behind other
upper middle-income countries in indicators of
health, education, demographics, and access to
basic services. Only about half of the population
is connected to the electricity grid, a figure that
drops to about one-third for the rural population.
Close to 40 percent of the population does not
have access to standard sanitation. About
one-quarter of children under 5 years old are
stunted—four times more than the average of
upper middle-income counties. Namibia has
one of the world’s highest HIV prevalence rates.
Namibia Systematic Country Diagnostic 17
3.
4.
The poor are deprived on multiple fronts, and
poverty’s multidimensional nature poses critical
development challenges.
� The duality of the labor market, combined with slow job creation and low primary-sector productivity, results in very high unemployment. The labor market consists of a
highly sophisticated formal sector and a large,
relatively unproductive subsistence agriculture
sector. Since independence, demand for the
primary sector’s output has declined, and
the tertiary market has expanded. Many new
branches of the services sector have flourished—
for example, the telecommunications sector,
banking and financial institutions, and real
estate services have expanded considerably. In
terms of growth rates, the services sector has
exceeded industry, while agriculture production
has stagnated. Slow growth in the primary
sector has led to rapid rural-to-urban migration.
However, job creation in the tertiary sector has
not been rapid enough to compensate for lost
agricultural jobs, leading to an unemployment
rate of 33.4 percent in 2018, according to the
national definition. Unemployment among the
youth reaches 69.6 percent (age 15 to 19) and
57.0 percent (age 20 to 24). Women are more
likely to be unemployed than men (34.3 percent
compared with 32.5 percent) and tend to cluster
in lower-paying jobs despite surpassing men in
educational attainment. The low productivity
of the informal sector, which employs about 41
percent of the population, contributes to higher
income insecurity and vulnerability.
Namibia has been in recession since 2016 and public finances have continued to deteriorate. Real
economic activity stalled in 2016 as the drivers of
growth (construction, mining) slowed down, and the
economy was affected by South Africa’s slowdown
and worsening terms of trade. Gross domestic
product (GDP) growth contracted by 0.5 percent
annually over the period 2017–19. An expansion in
government spending during the 2010–15 period
of high growth associated with rising public debt
resulted in a severe deterioration of the fiscal
situation despite fiscal adjustments as economic
growth contracted. Government debt, including
guarantees, increased from 25 percent in 2010 to
over 50 percent of GDP in 2017. With the COVID-19
crisis, it is now expected to reach 76 percent of GDP
in 2020 and debt service is expected to reach 4.9
percent of GDP, raising challenges for fiscal policy.
Lackluster growth, debt sustainability concerns,
and vulnerability to external shocks pose significant
challenges for Namibia to achieve inclusive,
sustainable, and equitable economic growth.
The global COVID-19 crisis is expected to have a substantial adverse economic and social impact. The global slowdown caused by the COVID-19
pandemic and country lockdown is expected to result
in an estimated contraction of 7.1 percent of GDP in
2020. The fiscal outlook is fragile as negative growth
and slowing trade constrain revenue collection
and pose a challenge for the fiscal adjustment
program. The lockdown resulting from the COVID-19
pandemic is expected to increase the upper-bound
poverty rate by 2.5 percentage points. The increase
in poverty is equivalent to an 8.6 percent fall in
consumption. The COVID-19 crisis is threatening to
widen gaps and increase the already extremely high
level of inequality. Younger workers, those with only
primary education and those in larger households,
will experience more significant poverty increases.
However, social protection programs can effectively
offset the poverty impact of the pandemic. The
proposed mitigation measures are expected to
cushion some of the impacts of poverty.
Namibia Systematic Country Diagnostic18
A. Large private capital investments in mining and public investments in infrastructure have been the main drivers of capital accumulation and growth over the past 25 years, but productivity growth has been low. A credible exchange rate
peg and relatively prudent fiscal policies have
supported growth, and the stable political and legal
environment has provided conducive conditions for
investment. The economy is heavily dependent on
minerals for export. Mining accounted for on average
9 percent of GDP between 2015 and 2019, but
provided more than 50 percent of foreign exchange
earnings. Large private mining investments and
public infrastructure investments—the main drivers
of capital accumulation—contributed an average of
62 percent to GDP growth in the 1992–2017 period.
The remaining 38 percent of growth was primarily
contributed by labor, although private investment in
labor-intensive production sectors remained muted.
Throughout the period, the average contribution to
growth by total factor productivity (TFP) was mostly
negative.
Reliance on revenues from mineral exports has enabled the expansion of the tertiary sector but is also exposing the country to external shocks. Activity in the tertiary sector has played a key role
in spurring growth, particularly after 2004. Since
independence, the tertiary sector has typically
accounted for more than 50 percent of annual
output, with services on average contributing
more than 72.4 percent of total growth. However,
the economy has historically relied on the primary
sector for export earnings, particularly diamonds,
uranium, gold, meat, fish, and grapes. Product
complexity is low because the level of value added
in most of these goods is limited. This has made the
country extremely vulnerable to external shocks. FDI
and private investment have been mainly channeled
into the mining sector. The economy remains highly
dependent on exports of primary products with little
value added and a capital-intensive mining sector
that employs only 2 percent of the population.
5.
6.
8.
9.
7. The main source for wealth accumulation and fast economic development has been human capital, while natural resource capital has been significantly used. Namibia has been
highly successful in promoting long-term growth
through human capital investment. Human capital
increased by 67 percent between 1995 and 2014.
This was achieved at the expense of disinvestment
in renewable natural capital, which declined from
32.4 percent of the wealth in 1995 to 20.1 percent
in 2014. In the 1995–2014 period, per capita value
decreased by 34 percent for forests and 41 percent
for pastureland.
Economic growth and expansion of the education sector have been the main drivers of poverty reduction, while extending the social protection system has contributed to some reduction in inequality. Namibia has seen one of the fastest
reductions in poverty in Sub-Saharan Africa—
from 37.5 percent in 2004 to 28.8 percent in 2010
and 17.4 percent in 2016. Between 2009/10 and
2015/16, consumption growth largely drove overall
poverty reduction, while distributional change
slowed poverty. Poverty decomposition suggests
that improvements in education have played the
largest role in reducing poverty. Social protection
programs have also played a role, but less so than
the expansion of education and growth of earnings
in agriculture and self-employment. The social
protection system has been more instrumental in
reducing inequality, probably because of imperfect
targeting.
Namibia needs to raise productivity to achieve sustained growth. The period of strong growth over
2010–15 was associated with declining productivity
as the economy relied on mining and low-productivity
sectors with low complexity of exports. The country’s
economic growth is mainly dependent on the global
and regional contexts, underscoring its exposure
and vulnerability to fluctuations in commodity
prices and financial shocks. To achieve higher and
Sources of Growth and Poverty Reduction
Namibia Systematic Country Diagnostic 19
more sustainable growth rates, Namibia will need to
implement structural reforms to raise TFP growth
over the medium term.
Labor productivity is low. Productivity is almost
40 percent below the trend line established by peer
countries. Low labor productivity in relation to the
country’s level of GDP is particularly challenging
in sectors where informality is high, including
agriculture, hunting and forestry, wholesale and
retail trade, hotels and restaurants, and other
community, social, and personal activities. The
informal sector represents about 41 percent of
employment, contributing to income insecurity and
vulnerability.
There is growing concern that Namibia may be stuck in the so-called “middle-income trap,” with slow productivity growth making it unlikely that the country can catch up with the more advanced economies in the near future. The current
macroeconomic framework suggests that growth
potential has peaked and, without significant boosts
in productivity and job creation, economic progress
will be very gradual in the medium to longer term.
There is a clear consensus among stakeholders that
transitioning Namibia to high-income status will not
be easy and will require a strong growth strategy. A
challenge remains in developing a business-friendly
environment to promote productive job creation.
Boosting labor demand through investment in
labor-intensive activities would create jobs, deliver
needed productivity gains, and reduce inequality.
Private investment will generate different impacts
depending on the sector. Both the agriculture
and service sectors are among those with the
highest GDP multipliers, driven by large direct
effects despite weak backward linkages with
other sectors. Emphasis on labor demand should
spur more significant employment increases;
thus, policymakers should consider interventions
that encourage more labor-intensive production.
Encouraging private investment and targeting labor-
intensive sectors would represent a double win.
Increasing the number and quality of formal and
informal sector jobs is an important goal. On the
supply side, improving skills should further increase
productivity and boost the economy. We have
identified four main binding constraints that impede
this objective (Box 1).
All the factors mentioned in Box 1 could boost growth and wealth accumulation but might not increase shared prosperity. It is imperative to
reduce income inequality by investing in human
capital among the poor, enhancing social protection
and service delivery, using targeted special
interventions, and developing and supporting the
middle class. Ultimately, each country’s growth
story is unique and requires strong evidence-based
backing of the proposed policy priorities.
10.
11.
12.
Namibia Systematic Country Diagnostic20
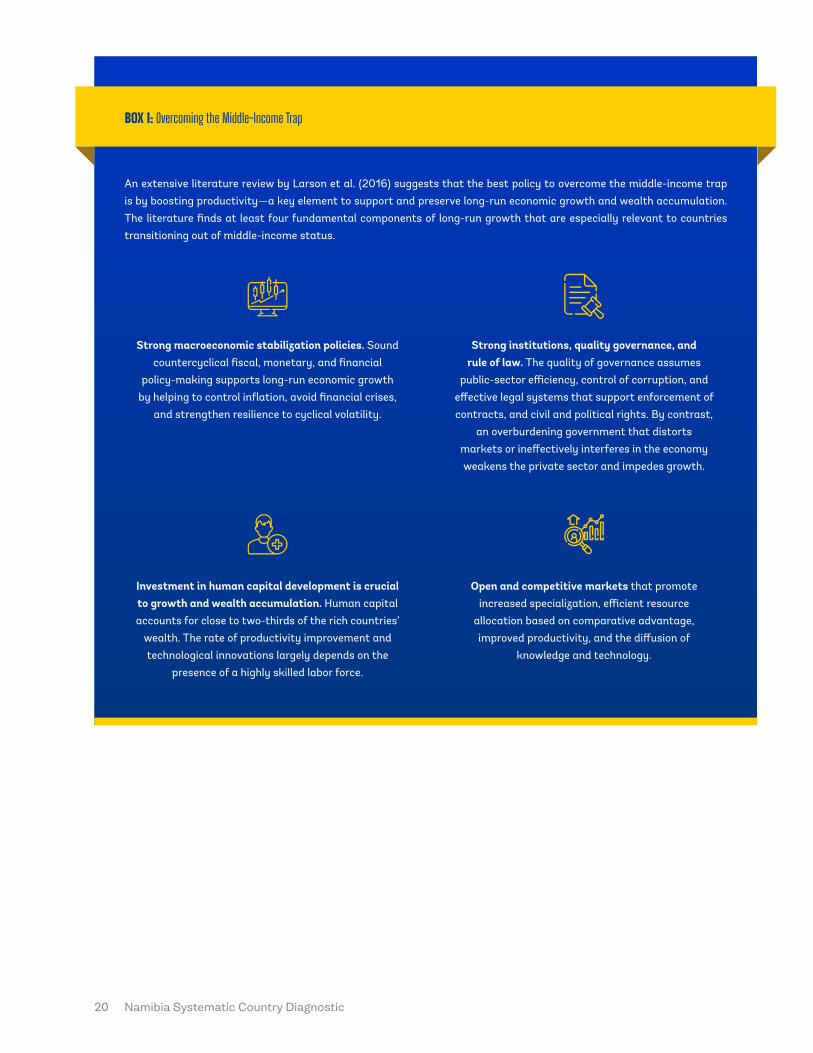
Open and competitive markets that promote increased specialization, efficient resource
allocation based on comparative advantage, improved productivity, and the diffusion of
knowledge and technology.
BOX 1: Overcoming the Middle-Income Trap
An extensive literature review by Larson et al. (2016) suggests that the best policy to overcome the middle-income trap is by boosting productivity—a key element to support and preserve long-run economic growth and wealth accumulation. The literature finds at least four fundamental components of long-run growth that are especially relevant to countries transitioning out of middle-income status.
Strong macroeconomic stabilization policies. Sound countercyclical fiscal, monetary, and financial
policy-making supports long-run economic growth by helping to control inflation, avoid financial crises,
and strengthen resilience to cyclical volatility.
Strong institutions, quality governance, and rule of law. The quality of governance assumes
public-sector efficiency, control of corruption, and effective legal systems that support enforcement of contracts, and civil and political rights. By contrast,
an overburdening government that distorts markets or ineffectively interferes in the economy weakens the private sector and impedes growth.
Investment in human capital development is crucial to growth and wealth accumulation. Human capital accounts for close to two-thirds of the rich countries’
wealth. The rate of productivity improvement and technological innovations largely depends on the
presence of a highly skilled labor force.
Namibia Systematic Country Diagnostic 21
B. This SCD identifies four binding constraints for inclusive economic growth:
� Highly segmented input and output markets, and dependency on low-productivity sectors. A severe segmentation of the labor market is
characterized by a significant gap between
those in high-productivity, high-paying jobs,
and those in low-productivity, low-paying jobs.
Similarly, high levels of inequality in access to
land, finance, and product markets significantly
hamper average productivity. Both supply and
demand factors explain this inequality. State
intervention and monopolistic practices are
relatively common. State-owned enterprises
(SOEs) remain dominant, and their inefficiency
hurts competitiveness. This situation is
exacerbated by low rates of entrepreneurship
and relatively low competition. The financial
sector, dominated by South African banks, also
caters to large formal companies.
� Poor-quality educational and health systems. Lack of skills is an important binding constraint
for economic development. High spending
on inefficient, low quality education has
resulted in widespread skills mismatches. The
educational system is often characterized by
over-aged enrolment, weak learning outcomes,
high repetition and early dropout rates, and
inadequate provision of educational services in
remote rural areas. There is an excess supply of
low-skilled laborers but a lack of demand. The
returns on postsecondary education are high.
Shortages of skilled labor limit the capacity to
apply knowledge and innovation in many sectors.
Technology constraints slow productivity growth,
reduce profitability and investment returns, and
diminish international competitiveness. Despite
rising health spending, poor health outcomes are
evident, particularly for low-income groups. Poor
children’s health outcomes are a critical barrier
to inclusion over time.
� Highly skewed distribution of productive assets and land. Property rights are weak, and
a small segment of the population still holds
most of the wealth and land. Weak titling—
13. especially in poorer, more informal areas—limits
the value of the property. Such inequality strains
socially acceptable standards of fairness. It is
a major source of policy uncertainty, especially
in agriculture. At the same time, the legacy of
apartheid is reflected in limited or expensive
connectivity, and underserved historically
disadvantaged settlements and northern parts of
the country. Although many Namibians continue
to live far away from job opportunities, migration
has been significant from rural areas in pursuit
of jobs in cities. This migration can help reduce
poverty, but it also can put pressure on the
sustainability of existing public services. Access
to electricity, water and sanitation, flush toilets,
and good public clinics and schools remains
much weaker in historically disadvantaged
communities.
� Extreme vulnerabilities to climate change and vulnerabilities arising from markets and technology. Renewable natural resources are
critically important, not only to the economy
but also to the population, especially the poor.
The country is exposed to prolonged droughts
and intensifying water insecurities, and
urbanization and economic growth continue
to increase demand for water. Namibia is the
driest Sub-Sahara African country and one of
the most vulnerable to climate change. The most
impoverished population and indigenous people
are particularly vulnerable to climate change
and weather shocks. Structural water deficits
are acutely felt in the agriculture, tourism, and
fisheries sectors. Households face significant
environmental and economic shocks, and
targeted assistance and mitigation strategies
should be adjusted to meet the challenges of
different drought events. The adverse effects
of price shocks distress revenue streams and
impact efficient resource exploitation. Namibia is
also highly dependent on South Africa’s product
markets, which have high barriers to entry, and
firms miss out on opportunities to tap into high
value-added global markets and growth through
technology transfers.
Binding Constraints to Wealth Creation and Sustainable Economic Development
Namibia Systematic Country Diagnostic22
C. These development pathways can address Namibia’s binding constraints:
I. Establishing an environment for private sector-led, job-creating growth by creating an
environment conducive to long-term growth
through better economic management,
enhanced competition, and development of a
better entrepreneurship ecosystem.
II. Building human capital and increasing the productive potential of the labor force by
improving the quality and relevance of the
educational system, generating needed skills,
and improving health outcomes.
14. III. Reducing inequalities through better services delivery by improving governance and the
quality of services, especially for marginalized
communities and remote areas where population
density is low and the cost of delivering services
is high.
IV. Reducing vulnerabilities to climate change and environmental shocks through investments that
can mitigate adverse consequences.
These developmental pathways will work together
to lift the binding constraints and move Namibia
toward boosting economic growth and becoming a
more inclusive economy.
Pathways to Overcome Growth and Inclusiveness Challenges
Namibia Systematic Country Diagnostic 23
D. Job creation has not been rapid enough to absorb Namibians who have lost agricultural jobs, leading to increased unemployment. Unemployment is 15
percent higher in rural areas than in urban areas,
women are 6 percent more likely to be unemployed
than men, and unemployment is especially high
among young people, reaching 46.1 percent.
Structural factors result in mismatches between the
skills demanded by employers and those supplied
by job seekers. These factors combine to result
in Namibia having the world’s seventh-highest
unemployment rate.
Given the high unemployment rate, the priority is to boost competition and develop a vibrant private sector. The analysis highlights areas related to
increasing competition, improving entrepreneurship,
and reducing the antitrust and business regulations
that are obstacles to both domestic and foreign
investment. Youth unemployment is unquestionably
a problem. Programs targeting youth unemployment
can take various forms, such as a matching process
to shrink the informational gap between employers
with unfilled vacancies and potential workers with
the appropriate skills for those jobs. It would reduce
frictional unemployment by connecting employers
with employees. Depending on its structure, the
process may also reduce structural unemployment
based on differences in skills and needs across
various locations in the country.
The goal of fostering competition could be advanced through improving the legal framework, reducing regulation, and reforming SOEs. Lack of
competition among Namibian companies is a serious
issue for private sector development, as it reduces
the contestability of markets. The strict regulatory
environment and substantial bureaucracy are
barriers to both domestic and foreign investment.
They also impact business startups, permitting,
and access to key infrastructure. This contributes
not only to lower domestic investment but also
to the low levels of non-mineral FDI. The market
structure is mostly monopolistic, where several big
players dominate markets and use their position to
restrict entry by new competitors, especially small
and medium enterprises (SMEs). Furthermore, a
15.
16.
17.
18.
19.
large government sector and its presence in the
private sector economic space through SOEs and
parastatals, increases market inefficiencies and
crowds out the private sector. The SCD highlights the
importance of: (i) streamlining newly implemented
legal frameworks, processes, and institutions,
including the Public Procurement Framework,
operationalizing its implementing body and reducing
turnaround time for business registrations and the
application process for backhaul transportation; (ii)
introducing reforms to SOEs as a key component
in addressing the challenges facing Namibia’s
competitiveness; and (iii) achieving a double win
by boosting public-private partnerships (PPPs) and
private investment in targeting jobs in the industry
and services sectors.
A broad set of actions will improve the entrepreneurial ecosystem and access to SME financing. The low level of entrepreneurship is an
obstacle for SME development and the creation
of productive jobs. There is a need to engage
the Government, the private sector, and tertiary
institutions to foster a conducive environment for
boosting entrepreneurship. This SCD focuses on:
(i) fostering entrepreneurship by upgrading skills,
networks, and hubs for startups; (ii) making it a core
priority to boost entrepreneurship and support the
development of digital incubators, accelerators, and
early-stage funding programs; (iii) expanding access
to financing and promoting financial inclusion, and
an improved regulatory framework for microfinance
institutions; and (iv) facilitating financial access for
micro, small, and medium enterprises (MSMEs) via
an improved credit information system for MSMEs,
a secure transaction framework for movable assets,
and a modernized insolvency regime.
Investing in the digital economy will help foster productivity. Namibia is one of the information
and communications technology (ICT) development
frontrunners in Africa. However, the country has
a highly concentrated market, with the Mobile
Telecommunication Company and Telecom Namibia
controlling 91 percent of the assets and 88 percent
of the revenues. Despite the progress in expanding
access to internet and broadband services, the
Establishing an Environment for Private Sector-led, Job-creating Activities
Namibia Systematic Country Diagnostic24
cost remains high. The mobile money penetration
level stands at 45 percent, signaling further room
for growth. Domestic technical skills are not
high enough to drive the digital transformation
initiatives that the country aspires to roll out.
Adopting new technologies and focusing on the
digital economy will increase productivity. Investing
in the digital economy could be an integral part of
entrepreneurship development, supporting the
development of digital incubators, accelerators, and
early-stage funding programs.
Creating more and better jobs requires an economic transformation that focuses on developing rural productivity while also supporting internal migration and agglomeration. Creating
more and better jobs rests on a broad economic
transformation, as well as moving workers from
lower- to higher-productivity activities, and from
rural to urban areas. Higher agricultural productivity
and climate-smart agriculture are critical in
catalyzing growth and economic transformation.
Most rural workers have limited educations and
tend to do informal work, so usable technologies
designed to help them learn more and earn more
have substantial potential to make them more
productive. At the same time, digital technologies
have the potential to help people with low educational
levels and limited opportunities to build their skills,
boost their productivity, and create better jobs in all
enterprises, including informal ones.
Value chains and trade are important. Although
overseas sales have grown, the diversity and
complexity of Namibia’s exports have fallen in
the past decade, compromising future growth
potential. The small size of the domestic market
and its specialization on low-productivity goods
increases the importance of refocusing the
export strategy. The SCD focuses on: (i) resolving
weaknesses in the trade-enabling environment
and lowering regional integration barriers to cross-
border business; (ii) continuing to diversify exports
into medium and higher technology products and
building product groups with higher technological
content; (iii) developing the regional corridors to
their full potential through additional investments
and services development; and (iv) exploiting better
preferences under its free trade agreements.
In the medium term, continuing fiscal consolidation will be crucial but very challenging. Namibia’s
revenue streams are vulnerable because of the
fiscal pressure of the ongoing COVID-19 crisis, the
volatility of commodity prices, and uncertainty over
Southern African Customs Union (SACU) receipts.
The country’s economy is heavily dependent on
earnings generated from commodity exports of
livestock, fish, and minerals, especially diamonds. It
is integrated with South Africa, which supplies the
bulk of Namibia’s imports. Exposure to commodity
prices variations is also amplified by dependence
on volatile Angolan demand for Namibian services
(transport, housing, and education). The fiscal
outlook is expected to remain weak in fiscal years
2021/22 and 2022/23. While the authorities are
committed to recalibrating expenditures from the
temporary COVID-19 stimulus, the deficit is expected
to remain large, averaging about 11 percent of GDP
over fiscal years 2021/22 to 2022/23, as SACU
transfers are set to decline sharply as a result of the
COVID-19 pandemic. Public debt is expected to peak
at 76.2 percent in 2020 and to gradually decrease
thereafter, declining to below 70 percent by 2022.
20.
21.
22.
Namibia Systematic Country Diagnostic 25
E. Investing in education and health is a key priority. The focus on overcoming the challenges of developing
early childhood development and education (ECDE)
programs and improving basic education at all levels
should continue. Opportunities to develop skills
need to be substantially broadened to generate
human capital for economic modernization, while
also making investments to enhance the quality,
relevance, and efficiency of skills training.
ECDE and basic education programs should be redesigned to cater for the poorest sections of society. The SCD focuses on: (i) implementing
curriculum reform, including the incorporation
of technical education; (ii) improving classroom
and standardized student assessment, enhancing
teacher training programs, both pre-service and
in-service, and improving the teacher management
system and policies for recruitment, deployment,
performance incentives, and continuous
professional development; (iii) addressing the
shortage of teacher housing; (iv) developing
teaching and learning materials; and (iv) broadening
and improving ECDE.
Reforms should be adopted in technical and vocational education and training (TVET) and the higher education system. The SCD focuses
on: (i) encouraging long-term investments needed
23.
24.
25.
26.
to improve the quality of higher education, and
keep up with increasing student enrolments; and
(ii) strengthening faculty development for pedagogy
and research skills, accelerating the upgrading of
faculty qualifications, improving the curriculum’s job-
market relevance to enhance graduate employability
through industry partnership, boosting industry
collaboration for research and innovation, and
improving research grants through competitive
grant schemes.
Further reforms are required in the health system. The SCD focuses on: (i) establishing a single-payer
reform that includes a health financing strategy with
operational plans, the necessary legal framework
and governance system, and national dialogue
with all stakeholders; (ii) conducting analysis and
continuing to monitor and evaluate health sector
performance in the public and private sectors; (iii)
increasing domestic resources and strengthening
public sector management; (iv) improving the
regulatory framework for health services delivery
in the private and public sectors; (v) ensuring
operational excellence in health services; and (vi)
revisiting the organization and structure of the
health workforce.
Building Human Capital and Increasing the Productive Potential of the Labor Force
Namibia Systematic Country Diagnostic26
F.
High and persistent inequality constrains the ability to generate sustainable and equitable growth. Poor services delivery, especially in remote
areas, and ineffectual policy implementation and
coordination, diminish the Government’s ability to
reduce inequality and spur equitable growth.
Large-scale development of solar and wind industries can create jobs, boost growth in remote areas, and reduce inequality. Namibia imports 73
percent of its electricity. Access to electric power
remains inadequate, especially in rural areas (45.4
percent of households connected). Poor access
poses a key constraint on reducing rural poverty,
improving economic opportunities, and accessing
social services, including health and education.
Namibia’s potential for low-cost, renewable energy
is substantial, given cost reductions in renewable
energy, the country’s high solar-irradiation
environment, and recent improvements in battery-
storage technologies. Renewable energy conserves
the nation’s natural resources, provides reliable
power supplies, enhances energy security, and
reduces the need for energy and fuels imports.
The development of the renewable energy sector
27.
28.
29.
presents an opportunity to stimulate private
investment across the value chain. Moreover,
solar power could also facilitate energy access to
sparse populations through off-grid electrification.
Investments in renewable energy should also
promote a structural shift of the energy sector
from centralized and monopolistic models toward
distributed systems. PPPs can unlock the benefits
of private sector financing to support renewable
energy development.
Reforms to the machinery of government should improve the quality of services delivery and boost implementation capacity. Good governance
represents a fundamental pillar of Namibia’s
development progress. However, the governance
story is more complex than a cursory look at
the indicators might imply. The low indicators of
regulatory governance point to poor private sector
development policies. The implementation of
the long- and medium-term plans is a persistent
challenge, and the monitoring and evaluation (M&E)
function of national development planning is still in
its infancy. Institutional capacity for either policy
coordination or interagency coordination is limited.
Reducing Inequalities through better Services Delivery
Namibia Systematic Country Diagnostic 27
30.
31.
Improved governance and coordination are required
in several domains. The SCD focuses on: (i) upgrading,
as a first precondition for success, the capacity
to plan service delivery solutions across agencies,
and to monitor and evaluate the implementation of
such plans; (ii) coordinating interagency activities
both horizontally (across ministries, departments,
and agencies) and vertically (among national and
subnational levels of government); (iii) ensuring the
availability of key services delivery inputs for an
efficient public procurement system; and (iv) better
management, training, and deployment of public
employees.
Sizable resources are allocated to Namibia’s social protection system, but its targeting and efficiency should be improved to further reduce inequality. Social protection makes important contributions to
inclusive growth and poverty reduction. However,
the SCD analysis points out that sizable shares
of the benefits leak to the non-poor, diluting the
poverty-fighting impact. The social protection
system is also fragmented, leading to inefficiencies.
A priority should be improving the social protection
system’s targeting efficiency. The SCD focuses on: (i)
modernizing social protection to improve efficiency
and policy coordination through the development of
a unified social registry; (ii) improving the targeting
efficiency of means-tested programs; and (iii)
redirecting resources toward children.
Overcoming the legacy of apartheid requires strong land-tenure security and a capacity for land reform. The highly unequal distribution of arable
agricultural land has historical origins. Back in the
apartheid period, most arable and productive land in
the southern and central parts of Namibia was taken
from black Namibians and allocated exclusively to
white European settlers and their descendants.
As a result, currently, 70 percent of Namibia’s 39.7
million hectares of commercial farmland is owned
by Namibians of European descent. Farmers on
communal land do not have land titles, which makes
it difficult to secure financing from commercial
banks. Resolving land-ownership inequality is a key
priority area. The SCD focuses on: (i) streamlining
the process for applicants to plots allocated by local
authorities, and enlarging communal lands to create
more space for grazing and agricultural production;
and (ii) developing a legal provision for group land
tenure in communal areas to increase the ability of
communities to manage their land sustainably.
Namibia Systematic Country Diagnostic28
G.
Namibia is the driest country in Sub-Saharan Africa and one of the most vulnerable to climate change. The water and agriculture sectors are
particularly vulnerable to climate change, and the
poor are affected most by water shortages and
pollution. At the same time, forests, fisheries, and
tourism play an important role in offsetting losses in
agricultural income.
Promoting territorial development is an important area of further investment. Namibia has seen one
of the world’s most rapid urbanizations. In the early
1990s, only about one-quarter of Namibians lived
in cities. Today, close to half do. Urban population
growth gives rise to both opportunities and
challenges. Cities are attracting human capital,
talent, and investment. Urban areas are becoming
major growth engines, generating larger shares of
GDP and helping many people rise out of poverty.
However, the speed and scale of urbanization can
leave cities struggling to keep up with their fast-
growing populations. Housing crises and widening
income gaps are increasing in the cities. A rapidly
growing urban population puts pressure on land
availability, employment opportunities, and the
delivery of basic services, including security. This
is especially true if local governments do not have
the capacity and know-how to cater to the growing
population. Namibia should prepare for massive
urban population growth and ensure that it occurs
in efficient and sustainable ways. Moreover,
given Namibia’s large territory and low population
density, the way in which it develops its cities
and how they are connected to each other and to
regional/ international markets will have significant
implications for infrastructure needs and their
climate impacts.
Urbanization can contribute to sustainable growth if managed well. Building cities that are inclusive,
safe, resilient, and sustainable requires policy
coordination and investment choices.1 National and
local governments have an important role to play in
creating opportunities for urbanization.
32.
33.
34.
35.
36.
Investment in climate smart agriculture (CSA) should increase resilience and boost productivity. The adverse effects of climate change, including
recurring and increasingly prolonged droughts, are
expected to increase and intensify. The SCD focuses
on: (i) building resilience through the adoption of CSA
technologies and practices; (ii) restoring degraded
land, disseminating innovative CSA technologies,
including drought- and heat-resistant seed varieties,
and rotational grazing, and building knowledge and
local capacity; and (iii) stimulating both private and
public investment to build capacity to clear invasive
bush species in an environmentally sustainable
manner.
Effectively manage water production and improve sanitation. Namibia is severely water-stressed and
highly vulnerable to the impacts of water scarcity on
agriculture, human capital, and economic growth.
The most arid country in Sub-Saharan Africa,
Namibia, is marked by low and varied precipitation.
Water scarcity acts as a brake on economic growth,
and such water challenges require systematic
mitigation. Namibia’s structural water deficit is felt
most acutely in the agriculture sector. This reinforces
the idea that the CSA strategy will be fundamental to
maintaining Namibia’s productivity. Water scarcity
also increases stunting and threatens tourism. The
perennial drought conditions demand attention
to such issues as integrated water monitoring,
innovative water production, re-use, desalinization,
aquifer recharging and water transfers, as well as
other demand management options such as through
improved efficiency and regulation. Improved,
sustainable water production is critical in both
rural and urban contexts. The SCD focuses on: (i)
improving information and data management for
water security; (ii) investment in water conservation,
saving, and utilization; (iii) enhancing fair water
pricing; (iv) converting food production into CSA;
(v) fostering more water cooperation with regional
neighbors; and (vi) developing sound systems to
collect and manage hydro data.
Reducing Vulnerabilities to Climate Change and Environmental Shocks
Urban development following the concept of sustainable, livable, green and compact cities provides a strong foundation for climate smart, more efficient and resilient urban forms.
1.

Namibia Systematic Country Diagnostic 29
38.
37.
39.
Namibia is also in a favorable position—because of its leading knowledge—to work on enhancing water production using renewable energy and reusing water. Namibia has a uniquely large potential for
renewable energy (solar,2 wind and biomass) and has
access to good quality seawater that can be used
for desalination using renewable energy sources.
Namibia’s globally acknowledged water reclamation
achievements, especially in Windhoek, demonstrate
a commitment to, and know-how in, diversifying
water sources. Within Southern Africa, and even
more widely in the continent, Namibia is a leader,
and its being ahead of the curve could be used to
great effect to benefit the entire African region.
Smallholder access to the market offers a way to boost tourism, and support forest conservation and forest restoration. Renewable natural resources
are of critical importance not only to the economy
but also to the population, especially the poor.
Forests, fisheries, and tourism play an important
role in offsetting losses in agricultural income.
Critical areas for forest and land restoration need
to be identified, and community forest management
should be promoted along with opportunities for the
development of the tourism sector.
The targeting of drought-relief assistance should be modified because the mechanisms used in the past may not work in reaching victims of future droughts. Social protection policies are
one way that governments can help households
manage risks. A sustainable approach requires
efficient infrastructure networks, institutional and
financial incentives, communications that guide
demand management, financial sustainability, and
institutional role assignment and coherence.
H. The reform agenda is large and complex. Recent
developments have highlighted the importance of
diversified sources of growth and improved resilience
in key productive sectors. The authorities’ ability
to move away from a state-centric growth model
and create conditions for further private sector
contributions to growth will dictate the pace of this
diversification agenda. The areas of intervention
can be grouped by their development pathways
40. and ranked according to their potential impact in
lifting the identified binding constraints: (1) boosting
growth, (2) reducing poverty, (3) sustainability of
the intervention, (4) time horizon of impacts, and
(5) complementarities for achieving the twin goals.
Reforms include interventions to support PPPs and
private sector investments to promote growth and
generate job opportunities. Table 1 summarizes the
key policy interventions proposed in the SCD.
Prioritization of Constraints and Interventions
With approximately 300 sunny days and over 3,000 sun hours per year, the annual solar irradiation for Namibia reaches values of 2,200 to 2,400 kWh/m². Due to the constantly high irradiation, PV systems in Namibia generate twice as much electricity as comparable systems in Germany on an annual average (source: https://www.giz.de/en/downloads/GBN_Sector%20Brief_Namibia_RenewableEnergy_E_WEB.pdf).
2.
Namibia Systematic Country Diagnostic30
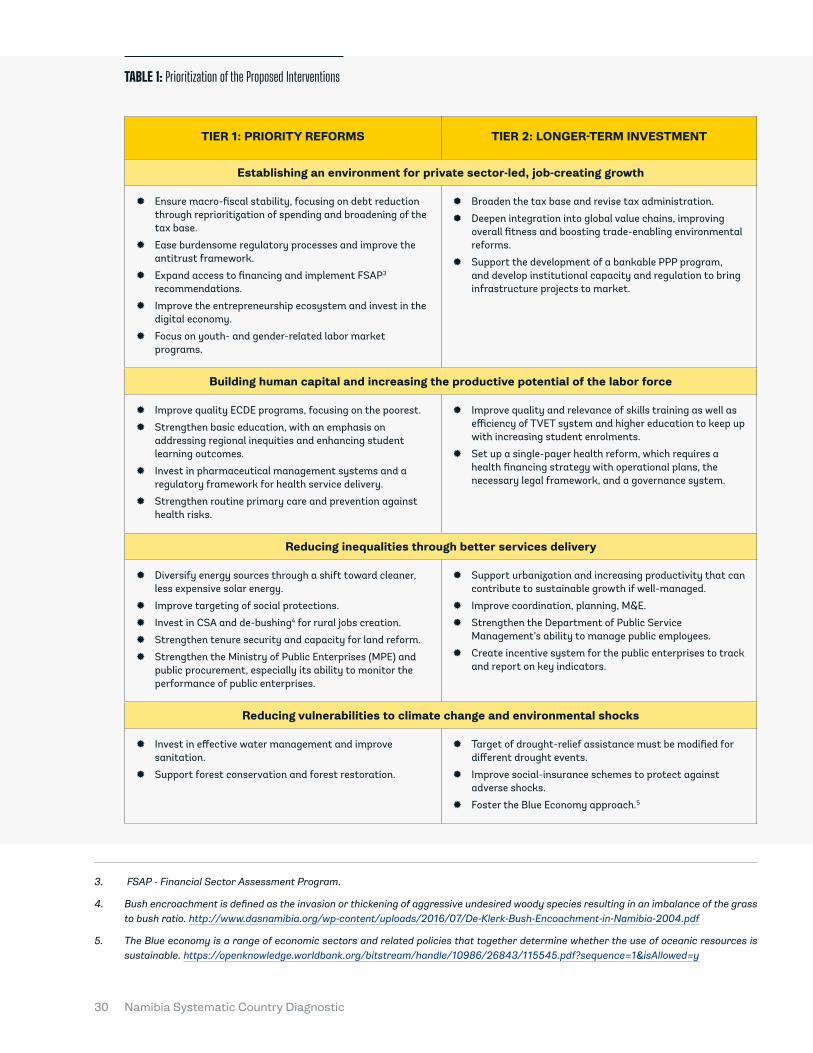
TIER 1: PRIORITY REFORMS TIER 2: LONGER-TERM INVESTMENT
Establishing an environment for private sector-led, job-creating growth
� Ensure macro-fiscal stability, focusing on debt reduction through reprioritization of spending and broadening of the tax base.
� Ease burdensome regulatory processes and improve the antitrust framework.
� Expand access to financing and implement FSAP3 recommendations.
� Improve the entrepreneurship ecosystem and invest in the digital economy.
� Focus on youth- and gender-related labor market programs.
� Broaden the tax base and revise tax administration.
� Deepen integration into global value chains, improving overall fitness and boosting trade-enabling environmental reforms.
� Support the development of a bankable PPP program, and develop institutional capacity and regulation to bring infrastructure projects to market.
Building human capital and increasing the productive potential of the labor force
� Improve quality ECDE programs, focusing on the poorest.
� Strengthen basic education, with an emphasis on addressing regional inequities and enhancing student learning outcomes.
� Invest in pharmaceutical management systems and a regulatory framework for health service delivery.
� Strengthen routine primary care and prevention against health risks.
� Improve quality and relevance of skills training as well as efficiency of TVET system and higher education to keep up with increasing student enrolments.
� Set up a single-payer health reform, which requires a health financing strategy with operational plans, the necessary legal framework, and a governance system.
Reducing inequalities through better services delivery
� Diversify energy sources through a shift toward cleaner, less expensive solar energy.
� Improve targeting of social protections.
� Invest in CSA and de-bushing4 for rural jobs creation.
� Strengthen tenure security and capacity for land reform.
� Strengthen the Ministry of Public Enterprises (MPE) and public procurement, especially its ability to monitor the performance of public enterprises.
� Support urbanization and increasing productivity that can contribute to sustainable growth if well-managed.
� Improve coordination, planning, M&E.
� Strengthen the Department of Public Service Management’s ability to manage public employees.
� Create incentive system for the public enterprises to track and report on key indicators.
Reducing vulnerabilities to climate change and environmental shocks
� Invest in effective water management and improve sanitation.
� Support forest conservation and forest restoration.
� Target of drought-relief assistance must be modified for different drought events.
� Improve social-insurance schemes to protect against adverse shocks.
� Foster the Blue Economy approach.5
TABLE 1: Prioritization of the Proposed Interventions
FSAP - Financial Sector Assessment Program.
Bush encroachment is defined as the invasion or thickening of aggressive undesired woody species resulting in an imbalance of the grass to bush ratio. http://www.dasnamibia.org/wp-content/uploads/2016/07/De-Klerk-Bush-Encoachment-in-Namibia-2004.pdf
The Blue economy is a range of economic sectors and related policies that together determine whether the use of oceanic resources is sustainable. https://openknowledge.worldbank.org/bitstream/handle/10986/26843/115545.pdf?sequence=1&isAllowed=y
3.
4.
5.
Namibia Systematic Country Diagnostic 31


INTRODUCTION AND ANALYTICAL FRAMEWORK

Namibia Systematic Country Diagnostic34
1.Namibia consists largely of desert and has a long coastline on the South Atlantic. It borders South
Africa, Botswana, and Angola. The country has a
population of 2.5 million. Due to the large, arid Namib
desert, the country is one of the world’s least densely
populated. The largest population cluster is found in
the extreme north-central area along the border with
Angola. The population has diverse origins, including
at least 11 ethnic groups. As a former settler colony,
the population includes an economically prosperous
minority of European descent. The population is
rapidly becoming urbanized. In 1991, close to 28
percent of the population lived in urban areas, but
as of 2016, this figure had risen to about 48 percent.
After independence, gross national income (GNI) per capita grew quickly, and the success has been attributed to effective governance. The
country used earnings from its natural resources to
modernize physical capital, build human capital, and
develop and strengthen institutions. The Government
devoted money to changing the economic structure
by investing in education, health, and infrastructure.
As a result, the country made significant progress in
reducing poverty and achieved upper middle-income
status. Namibia has made considerable gains on
universal primary education, literacy, access to
water and sanitation, gender equality, and various
health indicators.
Despite the progress, Namibia has not taken full advantage of its opportunities, and growth has not been fully inclusive. The country continues to
grapple with the triple challenges of poverty, high
inequality, and high unemployment. The economy’s
steady growth has not generated enough jobs, which
has resulted in a sluggish reduction in inequality.
The unemployment rate has remained extremely
high, and the country is burdened with one of the
41.
42.
43.
44.
45.
Introductionworld’s highest levels of income inequality, with a
Gini coefficient of 57.6 in 2015. The spread of the
human immunodeficiency virus (HIV) and acquired
immune deficiency syndrome (AIDS) has caused a
deterioration in several Millennium Development
Goal indicators.
Structural transformation of the economy is required to achieve broad-based and sustainable economic growth and poverty eradication. Stable
economic growth halted recently. The National
Development Plan (NDP) recognizes the need to
transform the economy, taking advantage of a
favorable geographical location, natural resources,
and improvements in intellectual and skills profiles.
Located next to South Africa, which has the
continent’s second-largest and most sophisticated
economy, Namibia still wrestles with weak
productivity growth, low wages among unskilled
workers, limited skills, and high transportation
costs. The Government’s current plans include the
Fifth National Development Plan (NDP5: 2017/18 to
2021/22), and the Harambe Prosperity Plan. Both
aim to achieve “prosperity for all” with the following
goals: poverty eradication, a more equitable
distribution of income, rapid and sustainable
economic growth and diversification, human capital
development, and good governance.
The challenge, however, is to look deeply into Namibian history, culture, and institutions to find the drivers of economic transformation. This
requires strong leadership and a national consensus
supporting determined efforts to turn challenges
into opportunities. A favorable investment climate,
a labor force with the necessary technical skills, and
institutions that can meet the challenges of global
competitiveness will support the effort.
Namibia Systematic Country Diagnostic 35
2.
The legacy of apartheid is the defining element of South African and Namibian history. The long
period of colonial rule and racial segregation created
stark divides in poverty levels and a lack of access
to basic services for most of the population, giving
rise to the country’s high levels of unemployment,
poverty, and income inequality.6 Formerly known
as South West Africa, Namibia gained political
independence in 1990 after more than a century
of colonial rule, first by Germany from 1884, and
then by South Africa from 1915. Pre-1990 history
continues to shape the country and casts a shadow
that constrains progress to this day. It is the story
of an incomplete transition in which progress on the
political front has not been matched by progress on
the social and economic fronts. Distortions from the
historical legacy hold back further social progress,
including reducing poverty and inequality.
The foundation of apartheid was the belief in racial differences. When the National Party was
unexpectedly voted into power in 1948, racial
segregation intensified with the implementation
of apartheid policy. Because Africans were
disenfranchised, the interest of the poor whites
trumped those of blacks, and apartheid became a
tool to create a dual economy. A white-dominated
modern industrial economy, with a European-style
class system that included a proletariat, stood beside
a traditional black economy. The black economy was
largely detached from the white one, except when
it came to jobs eschewed by whites, often because
they involved severe hazards. This division between
an affluent economy and a weak economy, separated
along racial lines, casts a shadow.
46. 48.
49.47.
The Historical Context and the Legacy of Apartheid as a Defining Feature
The consequences of apartheid were wide-ranging. Access to services, including education, was uneven,
and the impact on skills still exists as a barrier to
entering the labor market. Pre-1990 governments
underinvested in the education of black Namibians,
most notably under the 1953 Bantu Education
Act designed to limit blacks to only minimum
schooling. The consequences of a dual educational
system persist to this day, with stark differences in
educational outcomes across ethnic groups and
schools. Education is key to obtaining jobs and
earning good wages, and the unequal educational
system contributes to the current high levels of
income inequality. Black marginalization extended
beyond education to such areas as health and housing
(further discussed below). These exclusions serve as
barriers that continue to disproportionately affect
Namibia’s historically disadvantaged population.
Although the legal structure of apartheid has fallen, the spatial legacy continues to disproportionately affect historically disadvantaged groups and serves as a barrier to entry into the labor market, especially for the poor. After the Land Act of
1913, blacks were often moved off their properties,
forfeiting their assets, breaking up families and
social structures, and worsening and entrenching
black poverty. The black settlement was designed
to maximize returns for the white-dominated
modern economy. Townships were located near
areas where production required black workers—but
sufficiently far from white settlements. This created
the considerable spatial misallocations observed
today, where townships are often far away from
major places of production, especially cities. As
This historical legacy led to the divergence of economic and social development between the country’s less-developed north and more-developed south, a region with much better infrastructure due to its proximity to South Africa.
6.
Namibia Systematic Country Diagnostic36
a result, workers face long commutes, which are
exacerbated by relatively high transportation costs
that raise reservation wages (a job needs to pay
more than it costs to get to it). Affirmative action
policies are designed to break the entrenched
structures of exclusion, including those in labor
markets (employment equity) and capital markets.
The bitterness engendered by colonialism and apartheid’s racist practices also posed real threats to the creation of a peaceful postcolonial society. Recognizing the potential threats, the new
government adopted a policy of national reconciliation
as the basis for building a new nation, and as the
bedrock for policies to address the economic and
social injustices of the past. The constitution adopted
after independence was drafted with a strong
sense of positive socioeconomic rights, including
access to education, health care, water, electricity,
and housing. Consistent with the aspirations of
the new constitution, policies implemented after
independence focused on promoting economic
growth and addressing social challenges.
3.This SCD applies a wealth framework (Lange et al. 2018) to identify priorities for inclusive growth in Namibia. A nation’s prosperity is determined
by wealth, as well as income. GDP measures the
value added of the goods and services that a
country produces, but it fails to measure changes
in the underlying asset base. Although GDP is
the widely used indicator concerning the health
of national economies, it can provide misleading
signals because it ignores wealth accumulation
and asset depreciation. Wealth is determined by
a country’s total assets minus its vulnerabilities.
The “Changing Wealth of Nations” framework
is preferable to just focusing on GDP growth
and its inclusiveness because it considers the
annual flow of national revenue (Box 2). The
proper management of a country’s endowments
is a necessary condition for sustained long-term
economic growth. Using wealth accounting helps
determine which binding constraints are impeding
the sustainable management of natural capital,
long-term investments in produced capital, and the
development of intangible assets that will generate
favorable conditions for future growth.
The emphasis of this SCD is on identifying priority interventions to accelerate progress toward the goals of ending extreme poverty and promoting shared prosperity in a sustainable manner over the next five to 10 years. The SCD draws from
an extensive set of reports, papers, and studies
produced by the World Bank, the Government of
50.
51.
52.
Framework for the SCD Analysis: “Changing Wealth of Nations”Namibia, development partners, and academics
and research institutions. A full list of these reports
is provided in the report’s references section.
In addition, the SCD benefited from extensive
consultations with key stakeholders, including
government, parastatals, and agencies, the business
community, civil society organizations, development
partners, academics, and research institutes. The
remainder of this SCD is structured as follows:
� Chapter 2 presents the success story and poses
the main questions.
� Chapter 3 identifies the challenges to sustainable
economic growth, focusing on the recent
economic slowdown and analysis of constraints
in competition and trade.
� Chapter 4 looks at the challenges of inclusion.
It assesses the degree to which individuals can
build and leverage assets to contribute to, and
benefit from, growth; this includes analysis of
inclusiveness and the challenges of education,
health, and other key assets.
� Chapter 5 focuses on the challenges of
sustainability in the face of the issues that
Namibia faces in managing natural resources,
mitigating shocks, and dealing with fiscal
vulnerabilities.
� Chapter 6 summarizes the main binding
constraints and identifies key short- and medium-
term priorities for meeting the aims of inclusive
growth and poverty eradication.
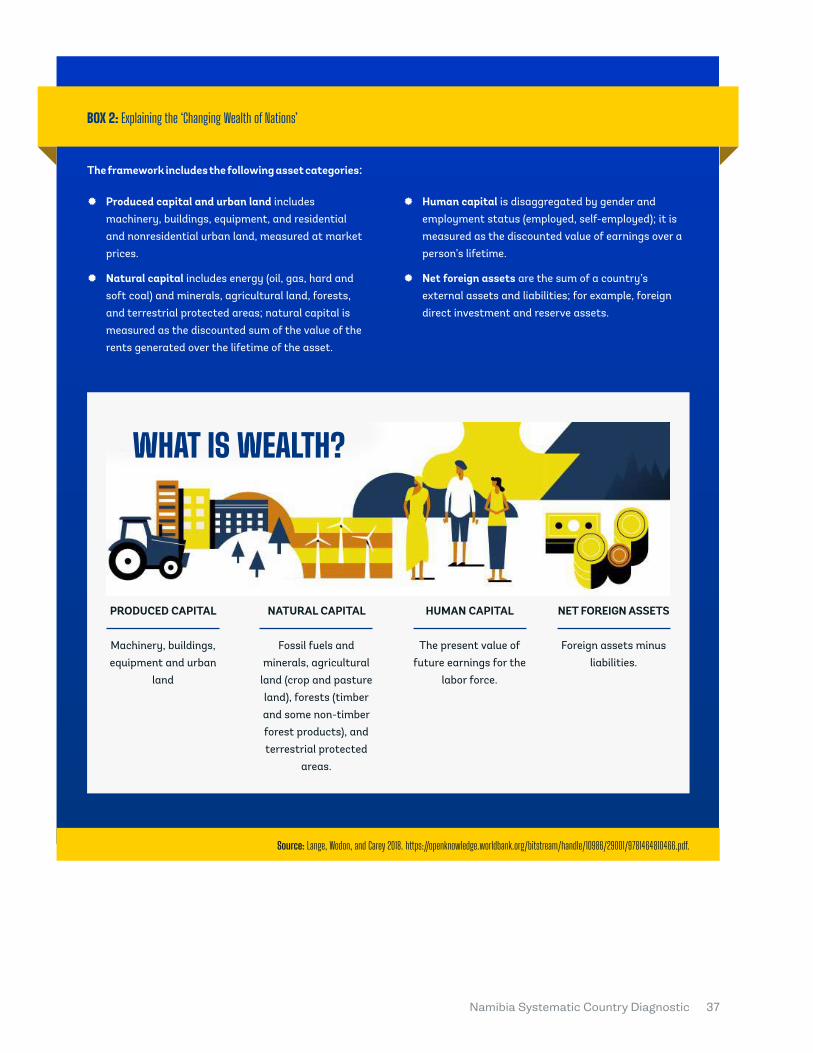
Namibia Systematic Country Diagnostic 37
� Produced capital and urban land includes machinery, buildings, equipment, and residential and nonresidential urban land, measured at market prices.
� Natural capital includes energy (oil, gas, hard and soft coal) and minerals, agricultural land, forests, and terrestrial protected areas; natural capital is measured as the discounted sum of the value of the rents generated over the lifetime of the asset.
� Human capital is disaggregated by gender and employment status (employed, self-employed); it is measured as the discounted value of earnings over a person’s lifetime.
� Net foreign assets are the sum of a country’s external assets and liabilities; for example, foreign direct investment and reserve assets.
BOX 2: Explaining the ‘Changing Wealth of Nations’
Source: Lange, Wodon, and Carey 2018. https://openknowledge.worldbank.org/bitstream/handle/10986/29001/9781464810466.pdf.
The framework includes the following asset categories:
WHAT IS WEALTH?
Machinery, buildings, equipment and urban
land
PRODUCED CAPITAL NATURAL CAPITAL HUMAN CAPITAL NET FOREIGN ASSETS
Fossil fuels and minerals, agricultural
land (crop and pasture land), forests (timber and some non-timber forest products), and terrestrial protected
areas.
The present value of future earnings for the
labor force.
Foreign assets minus liabilities.

ACHIEVEMENTS SINCE INDEPENDENCE AND THE MAIN CHALLENGES
The Republic of Namibia is a young, upper middle-income country with an impressive track record of economic development since gaining its independence in 1990. In the post-independence decades, the country was highly successful in boosting wealth accumulation, promoting long-term growth through human capital and capital investments. It built good institutions, recorded rapid poverty reduction, raised access to services, developed a modern financial system, and built high-quality infrastructure, especially roads, ports, and information and telecommunications technology. Namibia has also become a global leader in terms of environmental protection. Despite these advances, however, Namibia remains significantly below its upper middle-income counterparts in wealth accumulation. There is growing concern that the economy may be stuck in the “middle-income trap,” with slow productivity growth making it unlikely that the country will catch up with the top global economies in the near future.

Namibia Systematic Country Diagnostic40
A. National Wealth Has Increased
1.
Namibia effectively leveraged its natural capital to increase its wealth from 1995 to 2014. During
this period, Namibia disinvested in its natural
capital, which dropped by 10.2 percent. However, it
effectively used its resources to invest in other forms
of capital. The result was a 36 percent increase in
total wealth over 19 years (Figure 1).
In this document, wealth is defined as the sum of the following four asset categories: natural capital, produced capital and urban land, human capital, and net foreign assets. Natural capital comprises nonrenewable resources (14 types of minerals and fossil fuels) and renewable resources, including cropland, pastureland, forest timber, forest services (an estimate of non-timber forest products), watershed services, recreation values, and protected areas (value estimated as the opportunity cost of converting to agriculture). Produced capital and urban land comprise infrastructure, machinery, buildings, equipment, and urban land. (For the sake of brevity, we use the abbreviated term produced capital to include both). Human capital is measured as the total discounted value of lifetime earnings in a country. Net foreign assets are the sum of a country’s external assets and liabilities.
7.
For all countries, national income and well-being are supported by assets or wealth, measured comprehensively to
include produced capital, natural capital, human capital, and net foreign assets.7 Viewed through the lens of wealth,
development is a process of building and managing a broad portfolio of assets.
54. 55.
53.
The share of human and physical produced capital has increased significantly in Namibia. Human
capital, the largest component, increased by 67
percent between 1995 and 2014, and produced
capital rose by 35 percent. These gains were
achieved at the cost of a decline in the share of total
wealth accounted for by renewable natural capital,
which declined from 32.4 percent in 1995 to 20.1
percent in 2014. By contrast, nonrenewable natural
capital endowments made up only 1.8 percent of
total wealth in 2014.
Namibia’s Success Story and Achievements since Independence
Figure 1: Namibia’s wealth components per capita, 1995 and 2014
Wea
lth
com
pone
nts
in p
er c
apit
a te
rms
90,000
80,000
70,000
60,000
50,000
40,000
30,000
20,000
10,000
0
Namibia 1995 Namibia 2014Sub-Saharan Africa 1995
Sub-Saharan Africa 2014
9,591
31,701
9,3974,354 4,017
12,69612,680
9,225
52,458
18,501
- 1,028 -360
13,680
20,601
106
744
Produced Capital
Natural Capital
Net Foreign Assets
Human Capital
Source: Calculated from the database from Lange, Wodon, and Carey 2018. Note: In constant 2014 US$ per capita
Namibia Systematic Country Diagnostic 41
B.
Since independence, a remarkable political stability was built around a strong social contract. Policies implemented after independence were
designed to promote economic growth and address
social challenges by allocating a bigger share of the
budget to the social sectors, especially education
and health.
I. Prudent governance and capital accumulation in broad sectors provided the enabling environment for strong economic growth
The social compact was constructed around SWAPO—the South West Africa People’s Organization.8 Namibians prefer consensus
building, which was illustrated following
independence through early efforts to forge a sense
of national unity under the ruling party’s umbrella.
SWAPO inherited a functioning civil service and
bulk infrastructure. The SWAPO Government chose
an incremental approach to the policy changes
required to address the legacy of apartheid.
Although sometimes criticized for moving too
slowly, particularly in relation to land reform, this
incremental approach paid off in investor confidence
and contributed to economic stability.
A credible exchange rate peg, prudent fiscal and monetary policies, and the stable legal environment provided conditions for private sector development. GDP growth was fueled by
the expansion of the services sector and private
consumption. The adoption of new marine mining
technologies in 2004 led to a significant increase in
diamond production, helping the economy achieve
Officially known as the SWAPO Party of Namibia, this is a political party and former liberation movement. SWAPO has held a majority in parliament since independence in 1990. Since November 2017, Namibian President Hage Geingob has served as SWAPO president after being elected to the position at the party’s congress.
This average masks the high contribution to growth from TFP between 2000 and 2008 due to the adoption of new offshore diamond-mining technologies.
8.
9.
56.
57.
59.
58.
60.
historically high growth of 12.3 percent. This robust
growth performance continued until 2008, when the
global financial crisis hit the economy. A commodity
price super-cycle reversal turned the previous period
of strong economic performance into a contraction,
as external demand for minerals fell, pushing the
output gap into negative territory. In 2009 and 2010,
mining activity fell almost one-third below its 2008
level, with negative spillovers on the fiscal balance
and external sector.
The country has attracted significant amounts of FDI. As a proportion of GDP, FDI averaged 5.8
percent in 1995–99, 11.6 percent in 2001–05, and
9.0 percent in 2011–15. Mining has been the main
attraction for FDI, followed by the financial sector.
The main factors facilitating inward FDI have been
political stability, a favorable macroeconomic
environment, an independent judicial system, the
protection of property and contractual rights, and
good quality infrastructure.
Capital accumulation has been the main driver of growth over the past 25 years, followed by labor. Significant private investments in the mining sector
and public investments in infrastructure have been
the main drivers of capital accumulation, which
contributed an average of 62 percent to GDP growth
in the 1992–2017 period (Figure 2). Labor largely
accounted for the remaining 38 percent, although
private investment in labor-intensive production
sectors has remained muted. Throughout the
period, the average contribution to growth by total
factor productivity (TFP) was mostly negative9, and
human capital per labor was negligible.
Political Stability and Investment in Produced Capital Led to Rapid Economic Development
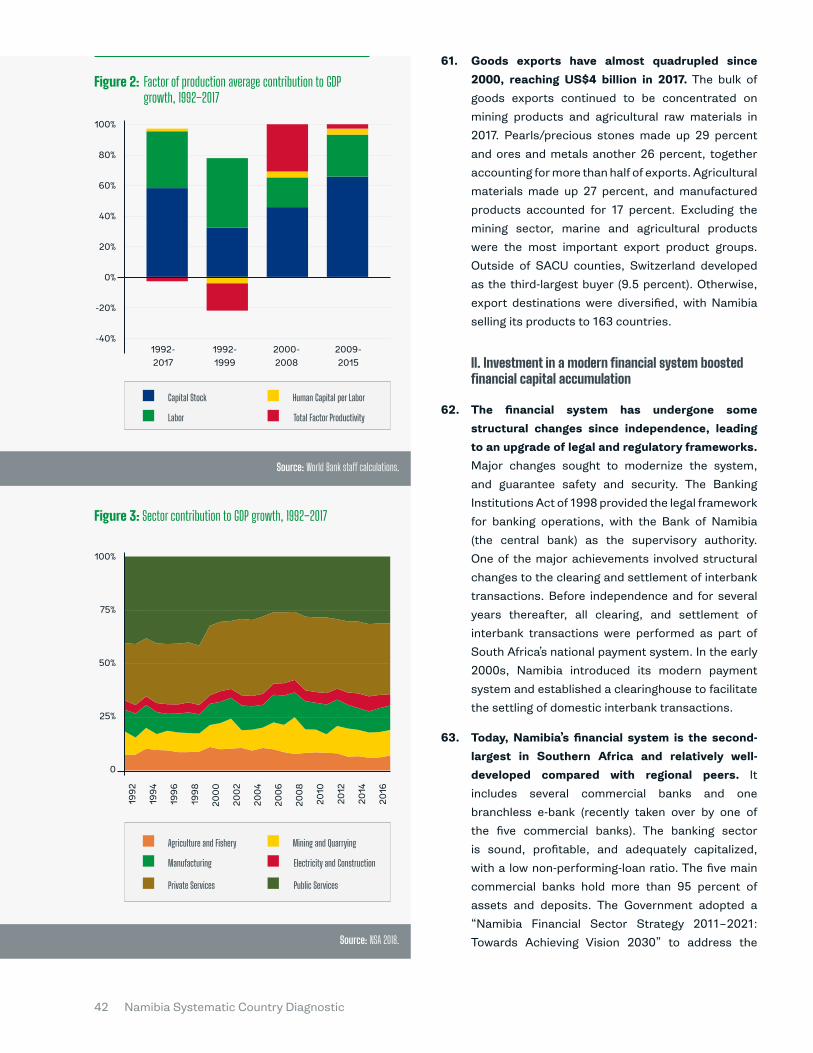
Namibia Systematic Country Diagnostic42
Goods exports have almost quadrupled since 2000, reaching US$4 billion in 2017. The bulk of
goods exports continued to be concentrated on
mining products and agricultural raw materials in
2017. Pearls/precious stones made up 29 percent
and ores and metals another 26 percent, together
accounting for more than half of exports. Agricultural
materials made up 27 percent, and manufactured
products accounted for 17 percent. Excluding the
mining sector, marine and agricultural products
were the most important export product groups.
Outside of SACU counties, Switzerland developed
as the third-largest buyer (9.5 percent). Otherwise,
export destinations were diversified, with Namibia
selling its products to 163 countries.
II. Investment in a modern financial system boosted financial capital accumulation
The financial system has undergone some structural changes since independence, leading to an upgrade of legal and regulatory frameworks. Major changes sought to modernize the system,
and guarantee safety and security. The Banking
Institutions Act of 1998 provided the legal framework
for banking operations, with the Bank of Namibia
(the central bank) as the supervisory authority.
One of the major achievements involved structural
changes to the clearing and settlement of interbank
transactions. Before independence and for several
years thereafter, all clearing, and settlement of
interbank transactions were performed as part of
South Africa’s national payment system. In the early
2000s, Namibia introduced its modern payment
system and established a clearinghouse to facilitate
the settling of domestic interbank transactions.
Today, Namibia’s financial system is the second-largest in Southern Africa and relatively well-developed compared with regional peers. It
includes several commercial banks and one
branchless e-bank (recently taken over by one of
the five commercial banks). The banking sector
is sound, profitable, and adequately capitalized,
with a low non-performing-loan ratio. The five main
commercial banks hold more than 95 percent of
assets and deposits. The Government adopted a
“Namibia Financial Sector Strategy 2011–2021:
Towards Achieving Vision 2030” to address the
61.
62.
63.
Agriculture and Fishery Mining and Quarrying
Electricity and Construction
Public Services
Manufacturing
Private Services
Source: World Bank staff calculations.
Source: NSA 2018.
Figure 3: Sector contribution to GDP growth, 1992–2017
100%
75%
50%
25%
0
1992
1994
1996
1998
200
0
200
2
200
4
200
6
200
8
2010
2012
2014
2016
Figure 2: Factor of production average contribution to GDP growth, 1992–2017
Capital Stock Human Capital per Labor
Total Factor ProductivityLabor
1992- 2017
1992- 1999
2000-2008
2009-2015
100%
80%
60%
40%
20%
0%
-20%
-40%
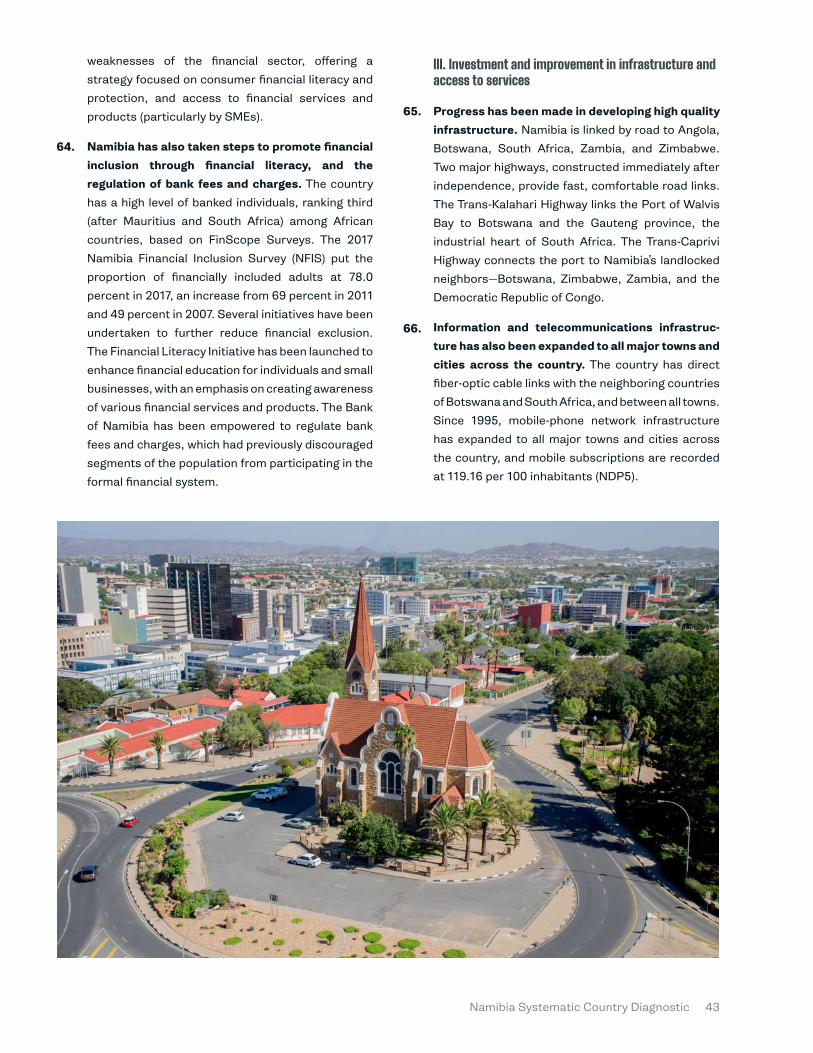
Namibia Systematic Country Diagnostic 43
64.
65.
66.
weaknesses of the financial sector, offering a
strategy focused on consumer financial literacy and
protection, and access to financial services and
products (particularly by SMEs).
Namibia has also taken steps to promote financial inclusion through financial literacy, and the regulation of bank fees and charges. The country
has a high level of banked individuals, ranking third
(after Mauritius and South Africa) among African
countries, based on FinScope Surveys. The 2017
Namibia Financial Inclusion Survey (NFIS) put the
proportion of financially included adults at 78.0
percent in 2017, an increase from 69 percent in 2011
and 49 percent in 2007. Several initiatives have been
undertaken to further reduce financial exclusion.
The Financial Literacy Initiative has been launched to
enhance financial education for individuals and small
businesses, with an emphasis on creating awareness
of various financial services and products. The Bank
of Namibia has been empowered to regulate bank
fees and charges, which had previously discouraged
segments of the population from participating in the
formal financial system.
III. Investment and improvement in infrastructure and access to services
Progress has been made in developing high quality infrastructure. Namibia is linked by road to Angola,
Botswana, South Africa, Zambia, and Zimbabwe.
Two major highways, constructed immediately after
independence, provide fast, comfortable road links.
The Trans-Kalahari Highway links the Port of Walvis
Bay to Botswana and the Gauteng province, the
industrial heart of South Africa. The Trans-Caprivi
Highway connects the port to Namibia’s landlocked
neighbors—Botswana, Zimbabwe, Zambia, and the
Democratic Republic of Congo.
Information and telecommunications infrastruc-ture has also been expanded to all major towns and cities across the country. The country has direct
fiber-optic cable links with the neighboring countries
of Botswana and South Africa, and between all towns.
Since 1995, mobile-phone network infrastructure
has expanded to all major towns and cities across
the country, and mobile subscriptions are recorded
at 119.16 per 100 inhabitants (NDP5).
Namibia Systematic Country Diagnostic44
Domestic energy production has increased due to the independent power producers (IPP), which generated additional capacity through the Renewal Energy Feed-In Tariffs (REFIT) program. According
to the National Planning Commission’s Economic
Development Report (NPC 2018a), domestic energy-
generation capacity increased from a baseline of
484 megawatts (MW) in 2016 to 517 MW in 2017. The
additional capacity is attributed to IPPs that jointly
generated about 33 MW through the REFIT program.
There has been steady progress in improving access to clean drinking water. According to the
Namibia Household Income and Expenditure Survey
(NHIES) report of 2016, about 91.9 percent of the
population had access to clean drinking water, up
from 75.6 percent in 2010 and 64 percent in 1990.10
In urban areas, 98 percent of households had access
to clean drinking water, compared with 69 percent in
rural areas. Greater disparity emerges when access
is separated by income. The NHIES data indicate
that access to clean drinking water and sanitation
is positively correlated with income—97 percent
of high-income households have access to clean
drinking water in their homes, compared with 41
percent of low-income households.
The availability of modern toilet facilities has improved only modestly over the past few years. For households, toilet type is an important indicator
of sanitation. The NHIES 2016 survey reported
that 45 percent of households used flush toilets,
10 percent used pit latrines, less than 1 percent
67.
68.
69.
70.
71.
According to the survey, most households in Namibia (66 percent) reported that they have access to drinking water in their yards. Among urban households, more than three-quarters have access to drinking water in their yards, compared with 53.5 percent of rural households. In rural areas, 4.5 percent of households travel more than 60 minutes to and from their drinking water sources.
10.
used bucket toilets, and 45 percent used the bush/
no toilet. Use of flush toilets was higher in urban
households (70 percent) than in rural households (15
percent).
Steady progress has been made in increasing access to electricity. Before independence, most
of Namibia’s population did not have access to
electricity, even in cities. In the ensuing decades,
Namibia has made steady progress. In 2017, 52.5
percent of the population had access to electricity,
up from 26.4 percent in 1992 (World Bank, WDI
Database). Providing access to everyone, however, is
complicated by the size of the country, the dispersion
of the population, and the cost of infrastructure.
Despite the large investments devoted to rural
electrification since the mid-1990s, access in rural
areas remains a challenge.
Increasing access to electricity requires increasing domestic generation capacity. To increase access
to energy, the Government realizes that the country
needs to reduce its reliance on imported electricity.
It has, therefore, engaged private investors to help
develop Namibia’s energy infrastructure, especially
in the renewable sector. To this end, a national
renewable energy policy, which clearly signals
the Government’s commitment to developing a
sustainable energy sector, has been developed. The
Government has also committed to increasing the
rural electrification rate from 34 percent in 2017 to
50 percent by 2020.

Namibia Systematic Country Diagnostic 45
C.
The Government has invested in people and
developing their human capital, boosting
productivity by enabling more people to realize
their potential. This human capital investment has
required investing in people through nutrition, health
care, quality education, jobs, and skills.
IV. Investment in human capital has transformed the economy and led to poverty reduction
Access to education has improved greatly. Before
independence, the educational system was based on
apartheid-era policies of institutional racism. Since
becoming independent in 1990, Namibia has made
great strides in addressing the educational system’s
disparities and improving access to, and the quality
of, education for all children. Free primary and
secondary education was introduced on a phased
basis; by 2018, the country had made primary and
secondary education free and compulsory by law.
Enrolment in primary schools increased from 60
percent in 1990 to 95 percent in 2000; the teaching
workforce increased by 30 percent, and 3,000 new
classrooms were built. According to a joint report
by the Government of Namibia and the United
Nations on the implementation of the Sustainable
Development Goals, the country managed to
attain the targets for universal access to primary
education, literacy rates, and gender parity in
terms of enrolment at all school levels. The report
further shows that Namibia’s tertiary-education
gross enrolment rate (GER) of 16.2 percent in 2016
was above the Sub-Saharan Africa standard of 8.2
percent (NPC 2018b).
Improvements in the educational system have made the largest contribution to poverty reduction, both from endowment and returns-to-endowment perspectives. The overall change in education has
lowered poverty rates by 5.53 percentage points
in endowment accumulation and 4.5 percentage
points in endowment returns. Both account for
72.
73.
74.
75.
76.
77.
more than 90 percent of the reduction. In addition,
improvements in employment characteristics have
had an important role in poverty reduction, and have
translated through increased returns.
Gradual progress has been made in the overall Human Development Index (HDI) ranking. According to the United Nations Development
Program, Namibia’s HDI value for 2017 was 0.647,
ranking the country 129th among 189 nations and
territories, and putting it in the medium human
development category. (Namibia’s score is above the
average of 0.645 for countries in the medium human
development group and above the average of 0.537
for countries in Sub-Saharan Africa.) Between 1990
and 2017, the HDI value increased from 0.579 to
0.647, an increase of 11.7 percent. Over the period,
life expectancy at birth increased by 3.4 years;
mean years of schooling increased by 1.2 years; and
expected years of schooling increased by 1.2 years.
Since independence, access to public health services has greatly increased, with more than 70 percent of the population now living within six miles of a health facility. Immunization programs
for children are widely available across the country,
and some diseases, such as measles, neonatal
tetanus, and polio, have been nearly eradicated.
Rates of malnutrition and diarrhea have declined,
reflecting better education, nutrition, water supply,
and sanitation. Access to health facilities is higher
in urban areas. Over 90 percent of households have
access to a hospital or clinic within six miles, in rural
areas, where the comparable figure is 56 percent of
rural households. In addition, significant progress
has been reported toward reducing preventable
mortalities.
Great strides have also been made in the fight against HIV. The National Health Policy Framework
2010–2020 indicates that HIV/AIDS is “a major
public health problem and the highest national
Investment in Human Capital Led to Strong Economic Performance, Fast Poverty Reduction and Better Access to Services
Namibia Systematic Country Diagnostic46
public health priority.” The HIV prevalence rate rose
from 4.2 percent in 1992 to 22 percent in 2002,
but it ebbed to 18.2 percent in 2012. The Namibia
Population-Based HIV Impact Assessment, released
at the 2018 International AIDS Conference, indicates
that the HIV prevalence rate declined further to
12.6 percent in 2017. The results also show that
77 percent of all HIV-positive adults have achieved
viral-load suppression—meaning an HIV-positive
person cannot pass the virus on to someone else.
Namibia has already surpassed the Joint United
Nations Program on HIV/AIDS (UNAIDS) target of 73
percent by 2020. Compared with the 2012 UNAIDS
estimates, the country has reduced its adult HIV
incidence rate by 50 percent in the past five years
(Namibia Population-Based HIV Impact Assessment
2018). This achievement is attributed to political
commitment, useful data, and community-centered
HIV programs. However, the disease continues to
affect women disproportionally.
Namibia has seen one of the fastest poverty reductions in Sub-Saharan Africa due to strong economic growth and robust social protection programs. The proportion of the population living
below the poverty line declined from 69 percent in
1994 to 28.8 percent in 2010, and then to 17.4 percent
in 2016 (NSA 2016). This achievement was partly the
result of strong and stable economic growth, rising
from an average rate of 2.5 percent in 1990–94,
3.6 percent in 1995–99, and 5.7 percent in 2010–15
(Bank of Namibia Annual Reports 1992, 2010, 2018).
While a poverty decomposition analysis suggests
that education and income growth in agriculture and
self-employment jobs are the main drivers of poverty
reduction, the Government’s social protection
system has also proved to be an effective instrument
in lifting people out of poverty.11 The Old Age Grant
(OAG) was introduced before independence, but the
monthly allowance paid to beneficiaries was based
on race. This was changed after independence,
and all beneficiaries now receive the same amount.
The social safety net was substantially expanded
after independence to include monthly transfers to
orphan children and people with disabilities, further
contributing to the decline in poverty. Much progress
has also been made in reducing income inequality.
In the early 1990s, income inequality, as measured
by the Gini coefficient, was estimated at around 70.
Progress in reducing income disparities has been
steady since then, with the Gini coefficient gradually
declining to 60.0 in 2004 and to 57.6 in 2015.
78.
Based on the results of the analysis of decomposing poverty changes by income sources and by endowment accumulation and returns to endowments. In the former, the change in the poverty rates between 2009/10 and 2015/16 was decomposed into consumption/income ratio, household size, work income (wage and agriculture/business) and social protection. The largest contribution to poverty reduction came from income in agriculture/business (8.5 percentage points), while social protection made a 3.7-percentage-point contribution. In the poverty decomposition analysis by endowments and its returns, improvements in educational attainment and returns to education contributed the most to poverty reduction (5.3 percentage points and 4.5 percentage points, respectively).
11.
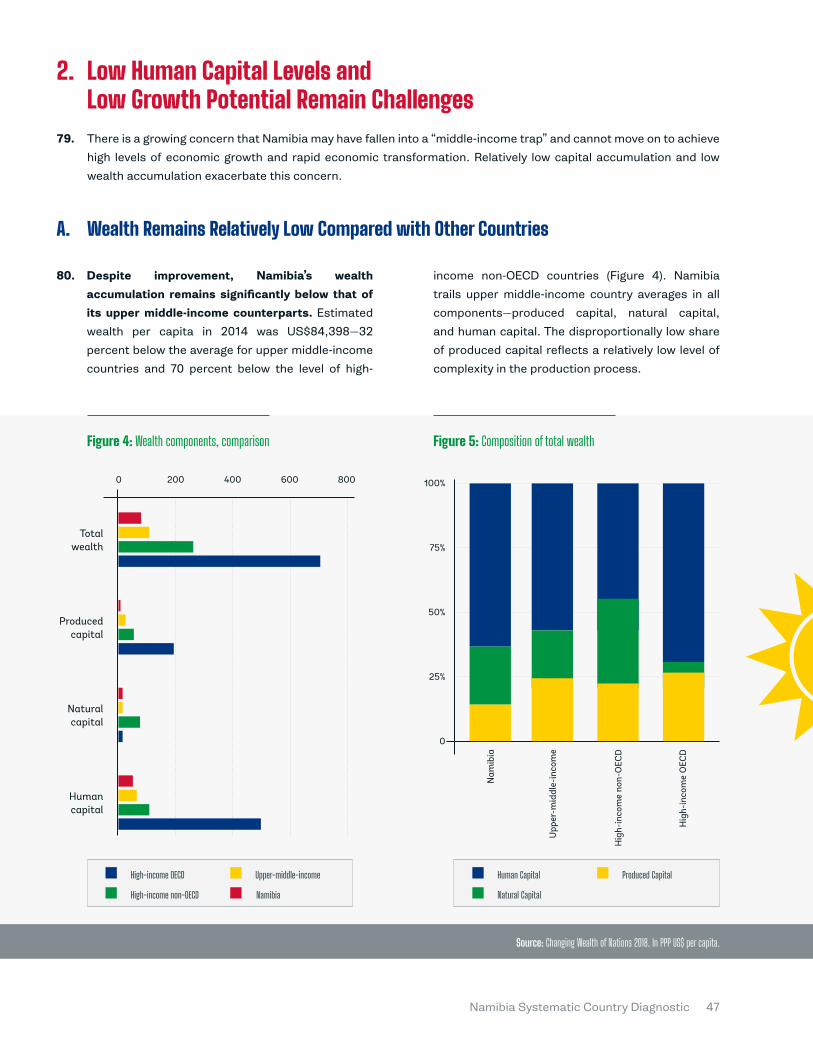
Namibia Systematic Country Diagnostic 47
Low Human Capital Levels and Low Growth Potential Remain ChallengesThere is a growing concern that Namibia may have fallen into a “middle-income trap” and cannot move on to achieve
high levels of economic growth and rapid economic transformation. Relatively low capital accumulation and low
wealth accumulation exacerbate this concern.
79.
2.
A.
Despite improvement, Namibia’s wealth accumulation remains significantly below that of its upper middle-income counterparts. Estimated
wealth per capita in 2014 was US$84,398—32
percent below the average for upper middle-income
countries and 70 percent below the level of high-
80.
Wealth Remains Relatively Low Compared with Other Countries
income non-OECD countries (Figure 4). Namibia
trails upper middle-income country averages in all
components—produced capital, natural capital,
and human capital. The disproportionally low share
of produced capital reflects a relatively low level of
complexity in the production process.
100%
75%
50%
25%
0
0 200 400 600 800
Total wealth
Natural capital
Human capital
Produced capital
High-income OECD Upper-middle-income
NamibiaHigh-income non-OECD
Human Capital
Hig
h-in
com
e O
ECD
Produced Capital
Upp
er-m
iddl
e-in
com
e
Nam
ibia
Natural Capital
Hig
h-in
com
e no
n-O
ECD
Figure 4: Wealth components, comparison Figure 5: Composition of total wealth
Source: Changing Wealth of Nations 2018. In PPP US$ per capita.

Namibia Systematic Country Diagnostic48
81 Nonrenewable natural capital endowments accounted only for 1.8 percent of wealth in 2014
(Figure 6). Over the 1995–2014 period, per capita
value decreased by 34 percent for forests and 41
percent for pasturelands (Figure 7). Conversely,
average values surged by 69 percent for protected
areas and 188 percent for cropland. The contribution
of protected areas is linked to nature-based tourism,
which has become increasing significantly.
B.
82.
The Middle-Income Trap: Myth or Reality for Namibia?
The negative economic growth recorded since 2016 has prompted a discussion about whether the country might be in a middle-income trap. GDP growth rates had been on an upward trajectory
since independence, averaging 3.5 percent annually
between 1990 and 1999, then rising to 4.3 percent
between 2000 and 2009, and accelerating to 5.7
percent from 2010 to 2015. The factors behind
the acceleration were mainly mining investments
and expansionary fiscal policy. However, real GDP
started to contract in 2016, reaching -1.1 percent in
2019. Could this slow growth be due to structural
challenges, or is the country in a middle-income
trap?
Figure 6: Figure 7: Namibia’s wealth per capita components, in constant 2014 US$ per capita, 1995–2014
Namibia’s natural capital components, in constant 2014 US$ per capita, 1995–2014
1995 2000 2005 2010 2014
Source: Calculated from the database from Lange et al. 2018. Changing Wealth of Nations 2018.
Produced Capital Human Capital
Net foreign assetsNatural Capital - Renewable
Natural capital - Nonrenewable
Forests Pastureland
MineralsProtected areas
Cropland Fossil fuel energy
90,000
80,000
70,000
60,000
50,000
40,000
30,000
20,000
10,000
01995 2000 2005 2010 2014
25,000
20,000
15,000
10,000
5,000
0
Namibia Systematic Country Diagnostic 49
85.
84.
The middle-income trap (MIT) refers to the difficulty some low-income countries that have grown fast and made significant progress in reducing extreme poverty face in making the next step from middle-income to high-income status. Only 13 of the 101 countries deemed middle-income
in 1960 achieved high-income levels by 2011. As
presented in several World Bank studies, GDP growth
rates often slow down, and countries can struggle
to build and maintain international competitiveness.
Among the often discussed factors associated
with MIT are rising labor costs, failure to invest in
human capital and adopt technological changes, an
inability to generate private sector-led innovations,
institutional failures, problems in maintaining
macroeconomic stability, and political economy
issues. MIT is an important notion widely discussed
among international and local policymakers,
academics, media, and relevant stakeholders. The
Bank of Namibia (BoN) annual symposium in 2019
was held under the theme “Escaping the Middle-
Income Trap: A Perspective from Namibia,” a title
that encapsulates the country’s concern.
MIT definitions differ and do not provide conclusive results. A recently published MIT analysis that
presents alternative absolute definitions of the
upper-income threshold were inconclusive in terms
of the situation in Namibia (Zaaruka and Tjeriko
2019). According to the relative definition by Im and
Rosenblatt (2013), at the current GDP per capita
growth rate it will take Namibia 54 years to catch up
with the US economy.
There is a clear consensus among stakeholders that transitioning Namibia to high-income status will not be easy and will require strong growth strategies. An extensive review provided by Larson
et al. (2016) suggests that boosting productivity—a
key element to support and preserve a long-term
economic growth and wealth accumulation—is the
best policy to overcome the middle-income trap.
Researchers point to at least four fundamental
components of long-term growth, which are
especially relevant to any country transitioning out
of middle-income status.
� Strong macroeconomic stabilization policies. Sound countercyclical fiscal, monetary, and
financial policy-making supports long-term
economic growth by helping to control inflation,
avoid financial crises, and strengthen resilience
to cyclical volatility.
� Strong institutions, quality governance, and rule of law. The quality of governance assumes
public sector efficiency, control of corruption,
and effective legal systems that support
the enforcement of contracts, and civil and
political rights. By contrast, an overburdening
government that distorts markets or ineffectively
interferes in the economy weakens the private
sector and impedes growth.
� Investment in human capital development. Human capital makes up close to two-thirds
of the rich countries’ wealth, indicating its
importance for growth and wealth creation.
The rates of productivity improvement and
technological innovations largely depend on the
presence of a highly skilled labor force.
� Open and competitive markets. They promote
increased specialization, efficient resource
allocation based on comparative advantage,
improved productivity, and the diffusion of
knowledge and technology.
All the above-mentioned factors could boost growth
and wealth accumulation but might not increase
shared prosperity. It is imperative to reduce income
inequality by investing in human capital among the
poor, enhancing social protection and services
delivery, using targeted special interventions,
and developing and supporting the middle class.
Ultimately, each country’s growth story is unique
and requires strong evidence-based backing of the
proposed policies priorities. The main objective
of subsequent chapters is to answer two related
questions: What are the most critical binding
constraints and opportunities in accelerating
Namibia’s progress toward the goals of ending
extreme poverty, promoting shared prosperity in a
sustainable manner, and overcoming the middle-
income trap? What policy measures will be most
effective in addressing these issues?
83.

CHALLENGES OF MAINTAINING SUSTAINABLE ECONOMIC GROWTH AND WEALTH ACCUMULATION
Capital accumulation has been driven by large private investments in the mining sector and public investments in infrastructure that did not lead to increases in TFP. The economy remains highly dependent on exports of primary products with little value added. Relatively high budget deficits and the rapid accumulation of public debt have resulted in a draining of domestic market liquidity. A narrow-base tax system and the fiscal deficit are obstacles to economic growth. The duality of the labor market and the lack of productive jobs have led to extremely high unemployment. Those who find employment, especially in the informal sector, have limited earnings despite working long hours. Productivity varies significantly across sectors, with agriculture being the lowest. Lack of competitiveness, poor access to financing, low integration in global value chains, and generally low levels of entrepreneurship are among the core challenges facing the private sector. Reforms in antitrust policy and the management of SOEs are pending. Energy dependency is an obstacle for economic growth and the status of the domestic energy supply remains a major infrastructure challenge.

Namibia Systematic Country Diagnostic52
High Investment in Mining and Infrastructure but Weak Productivity and Inefficient Inter-sectoral Allocations
1.
The Namibian economy grew at a solid average annual 4 percent during 1992–2018, in line with the Sub-Saharan Africa average. This performance
has been around the midpoint among middle-income
countries. Income per capita has significantly
increased since independence, allowing Namibia to
be reclassified to an upper middle-income country
in 2009.
Economic growth came to a halt in 2016 after a period of strong growth but rising macro imbalances. After years of robust growth during
2010–15, growth in Namibia’s economy halted in
2016 and contracted by 0.5 percent annually over
2017–19, driven by a correction in activities in the
construction and mining sectors, as well as weak
growth in neighboring countries that had additional
adverse effects on demand for Namibia’s exports.
The rebalancing of the economy was accompanied
by fiscal consolidation as the growth boom was
Sustainable economic growth is the most important factor influencing the speed of poverty reduction. Establishing
conditions that facilitate private sector investment is a key objective for accelerating a country’s growth and
poverty reduction. Prudent macroeconomic and fiscal policies are cornerstones of private sector development,
economic growth, and capital accumulation. This section explores the main challenges of macroeconomic and fiscal
management in Namibia.
87.
88.
89.
90.
86.
Low TFP, Deterioration of Fiscal Liquidity, and High Macro Volatility
A.
marked by rising public spending and public debt,
contributing to the depressed economic activity.
Structural transformation was evident, but not enough to significantly boost productivity. The
structure of Namibia’s economy has remained stable
over the past three decades, dominated by the
services sector, both public and private. Overall, it
accounted for around 63 percent of output in 2017;
the industrial sector, including mining, contributed
around 27 percent, and agriculture and fishing made
up another 8 percent (NSA). Tourism and transport
services were significant foreign-exchange earners,
generating receipts of US$260 million in 2017, and
contributing 8.4 percent to Namibia’s GDP.
Namibia’s manufacturing base lacks diversifi-cation. Since independence, Namibia has had
limited industrial development and continues to
import most manufactured goods from South Africa.
Manufacturing makes up a low share of national
Namibia Systematic Country Diagnostic 53
92.
91.
93.
94.
output (11 percent), employment (7.3 percent), and
exports (35 percent). The Government is committed
to supporting broader-based industrialization.
However, the challenge is to make Namibia—a small
country adjacent to a large neighbor—an attractive
destination for investors integrated into global and
regional value chains in order to foster productivity
and economic growth. The World Bank suggests that
it can be achieved through: (i) institutional reforms
that facilitate intraregional trade and factor mobility;
and (ii) investment in infrastructure that links the
region to major world markets (World Development
Report 2009).
Agriculture retains its dualistic structure. There
are two distinct farming systems in Namibia—a
large-scale commercial sector that dominates
output and a small-scale communal farming sector
largely subsistence in nature. About 70 percent of
the population relies on agricultural activities for its
livelihood. The agriculture sector is dominated by
livestock farming—cattle, sheep, goats, and pigs—
although the share of livestock farming in the sector
declined from 67 percent in 2007 to 57 percent in
2017. Meat contributed 90 percent of agricultural
export earnings and 6 percent of total export
earnings in 2017.
The economy relies heavily on the extraction and processing of minerals. Namibia is well endowed
with nonrenewable natural resources, including
gem-quality diamonds, uranium, copper, lead, zinc,
arsenic, cadmium, antimony, pyrite, silver, gold,
and semiprecious stones. Diamonds are the most
important product in the mining sector, accounting
for about 68 percent of mineral output and more
than 45 percent of foreign-exchange earnings. The
mining sector in Namibia, however, has not been
a major contributor to employment and poverty
reduction. The most recent Labor Force Survey
for 2018 shows that mining employed 1.7 percent
of the labor force, down from 2.2 percent in 2016
(Namibia Statistics Agency 2018). In more general
terms, a World Bank Group study (World Bank Group
and Agence Française de Developement 2017)
indicates that harnessing the returns from natural
resources wealth and channeling them productively
could contribute substantially to eradicating
extreme poverty and enhancing shared prosperity.
Success will depend on good decisions and sound
implementation.
Capital accumulation has been driven by large private investments in the mining sector and public investments in infrastructure. Mining received
close to one-third of the country’s investment. Not
much private investment has been directed to other
productive sectors. Government investment has
focused mostly on infrastructure projects, raising
the issue of how to stimulate private investment
activity that would raise productivity in other sectors.
These investments could become the major growth
engine because no new big projects are expected in
the mining sector, and government sources for large
capital projects are already exhausted.
Since 1990, little investment has taken place in labor-intensive production. Several factors explain
investment sluggishness. First, the proximity of the
more advanced South African market represents a
key disincentive for investment in Namibia. Second,
market incumbents can block new entrants—for
instance, Namibia Breweries did this for decades
(stories are similar in other industries). Third, a range
of government policies and regulations discourage
new firms from starting production.12 In addition to
the Doing Business-measured regulations, many
trade-related policies introduce an anti-export bias,
immigration policies prevent the use of skilled foreign
labor, and labor policies generally raise the cost of
hiring new workers. Although some private sector
services industries have expanded since 1990, the
structures of production, trade, and employment
look very much like they did at independence.
Boosting private investment in labor-intensive areas
could result in job creation and have a lasting impact
of growth (Box 3).
In 2018, Namibia ranked 107th among 190 economies in Ease of Doing Business, according to the latest World Bank report. The country’s rank slipped from 106th in 2017. From 2008 until 2018, Namibia’s average ranking was 90th, reaching an all-time low of 108 in 2016 and a record high of 54 in 2008 (Doing Business 2019).
12.
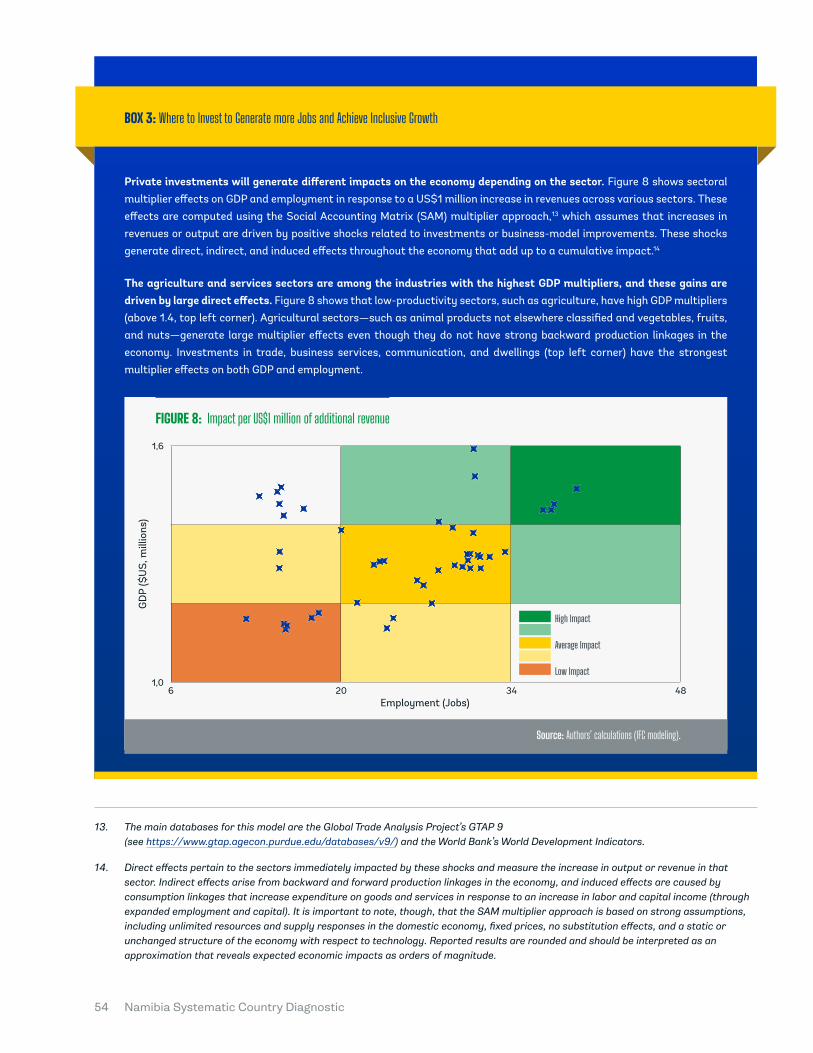
Namibia Systematic Country Diagnostic54
The main databases for this model are the Global Trade Analysis Project’s GTAP 9 (see https://www.gtap.agecon.purdue.edu/databases/v9/) and the World Bank’s World Development Indicators.
Direct effects pertain to the sectors immediately impacted by these shocks and measure the increase in output or revenue in that sector. Indirect effects arise from backward and forward production linkages in the economy, and induced effects are caused by consumption linkages that increase expenditure on goods and services in response to an increase in labor and capital income (through expanded employment and capital). It is important to note, though, that the SAM multiplier approach is based on strong assumptions, including unlimited resources and supply responses in the domestic economy, fixed prices, no substitution effects, and a static or unchanged structure of the economy with respect to technology. Reported results are rounded and should be interpreted as an approximation that reveals expected economic impacts as orders of magnitude.
13.
14.
Private investments will generate different impacts on the economy depending on the sector. Figure 8 shows sectoral multiplier effects on GDP and employment in response to a US$1 million increase in revenues across various sectors. These effects are computed using the Social Accounting Matrix (SAM) multiplier approach,13 which assumes that increases in revenues or output are driven by positive shocks related to investments or business-model improvements. These shocks generate direct, indirect, and induced effects throughout the economy that add up to a cumulative impact.14
The agriculture and services sectors are among the industries with the highest GDP multipliers, and these gains are driven by large direct effects. Figure 8 shows that low-productivity sectors, such as agriculture, have high GDP multipliers (above 1.4, top left corner). Agricultural sectors—such as animal products not elsewhere classified and vegetables, fruits, and nuts—generate large multiplier effects even though they do not have strong backward production linkages in the economy. Investments in trade, business services, communication, and dwellings (top left corner) have the strongest multiplier effects on both GDP and employment.
BOX 3: Where to Invest to Generate more Jobs and Achieve Inclusive Growth
FIGURE 8: Impact per US$1 million of additional revenue
1,6
1,06 20 34 48
GD
P ($
US,
mill
ions
)
Employment (Jobs)
Source: Authors’ calculations (IFC modeling).
High Impact
Average Impact
Low Impact
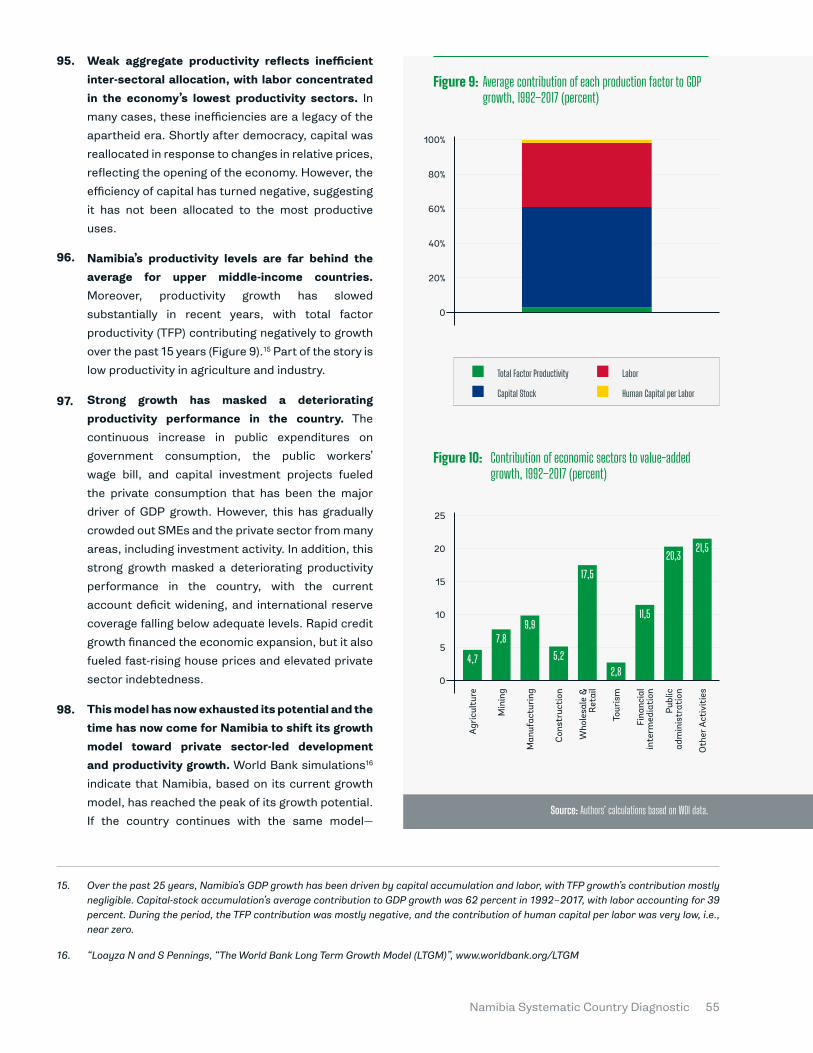
Namibia Systematic Country Diagnostic 55
Weak aggregate productivity reflects inefficient inter-sectoral allocation, with labor concentrated in the economy’s lowest productivity sectors. In
many cases, these inefficiencies are a legacy of the
apartheid era. Shortly after democracy, capital was
reallocated in response to changes in relative prices,
reflecting the opening of the economy. However, the
efficiency of capital has turned negative, suggesting
it has not been allocated to the most productive
uses.
Namibia’s productivity levels are far behind the average for upper middle-income countries. Moreover, productivity growth has slowed
substantially in recent years, with total factor
productivity (TFP) contributing negatively to growth
over the past 15 years (Figure 9).15 Part of the story is
low productivity in agriculture and industry.
Strong growth has masked a deteriorating productivity performance in the country. The
continuous increase in public expenditures on
government consumption, the public workers’
wage bill, and capital investment projects fueled
the private consumption that has been the major
driver of GDP growth. However, this has gradually
crowded out SMEs and the private sector from many
areas, including investment activity. In addition, this
strong growth masked a deteriorating productivity
performance in the country, with the current
account deficit widening, and international reserve
coverage falling below adequate levels. Rapid credit
growth financed the economic expansion, but it also
fueled fast-rising house prices and elevated private
sector indebtedness.
This model has now exhausted its potential and the time has now come for Namibia to shift its growth model toward private sector-led development and productivity growth. World Bank simulations16
indicate that Namibia, based on its current growth
model, has reached the peak of its growth potential.
If the country continues with the same model—
Over the past 25 years, Namibia’s GDP growth has been driven by capital accumulation and labor, with TFP growth’s contribution mostly negligible. Capital-stock accumulation’s average contribution to GDP growth was 62 percent in 1992–2017, with labor accounting for 39 percent. During the period, the TFP contribution was mostly negative, and the contribution of human capital per labor was very low, i.e., near zero.
“Loayza N and S Pennings, “The World Bank Long Term Growth Model (LTGM)”, www.worldbank.org/LTGM
15.
16.
Figure 10: Contribution of economic sectors to value-added growth, 1992–2017 (percent)
Figure 9: Average contribution of each production factor to GDP growth, 1992–2017 (percent)
25
20
15
10
5
0
Total Factor Productivity Labor
Capital Stock Human Capital per Labor
Tour
ism
Fina
ncia
l in
term
edia
tion
Publ
ic
adm
inis
trat
ion
Oth
er A
ctiv
itie
s
Agr
icul
ture
Min
ing
Man
ufac
turi
ng
Con
stru
ctio
n
Who
lesa
le &
Ret
ail
4,7
7,89,9
5,2
17,5
2,8
11,5
20,321,5
Source: Authors’ calculations based on WDI data.
100%
80%
60%
40%
20%
0
96.
97.
98.
95.
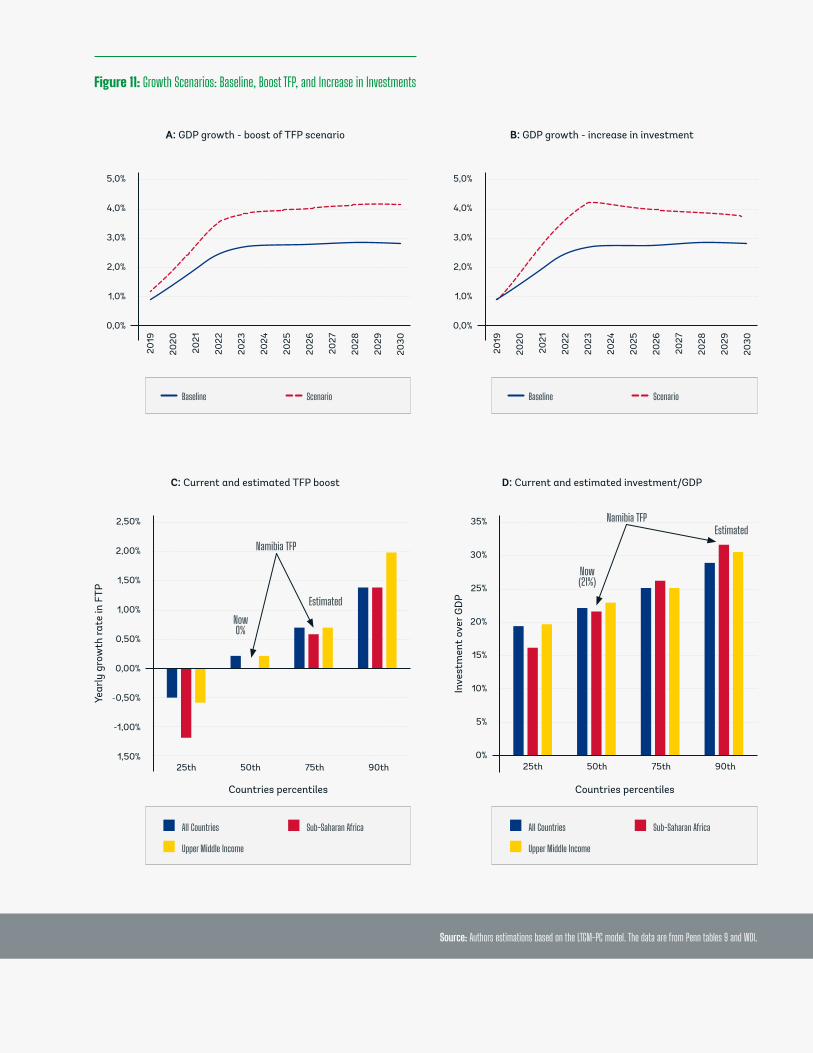
Namibia Systematic Country Diagnostic56
Figure 11: Growth Scenarios: Baseline, Boost TFP, and Increase in Investments
A: GDP growth - boost of TFP scenario
C: Current and estimated TFP boost D: Current and estimated investment/GDP
B: GDP growth - increase in investment
Baseline
Namibia TFP
NowEstimated
0%
BaselineScenario Scenario
5,0%
4,0%
3,0%
2,0%
1,0%
0,0%
5,0%
4,0%
3,0%
2,0%
1,0%
0,0%
Countries percentiles
Year
ly g
row
th ra
te in
FTP
Inve
stm
ent
over
GD
P
25th 50th 75th 90th
2,50%
2,00%
1,50%
1,00%
0,50%
0,00%
-0,50%
-1,00%
1,50%25th 50th 75th 90th
Countries percentiles
35%
30%
25%
20%
15%
10%
5%
0%
All Countries All CountriesSub-Saharan Africa Sub-Saharan Africa
Upper Middle Income Upper Middle Income
Namibia TFP
Now
Estimated
(21%)
Source: Authors estimations based on the LTGM-PC model. The data are from Penn tables 9 and WDI.
2019
2020
2021
2022
2023
2024
2025
2026
2027
2028
2029
2030
2019
2020
2021
2022
2023
2024
2025
2026
2027
2028
2029
2030

Namibia Systematic Country Diagnostic 57
without a significant boost in productivity growth,
private sector development, or introduction of new
production technology and know-how—the potential
growth rate will increase only very gradually in the
medium to longer run.
The World Bank estimates indicate potential growth of only 1.0 to 3.7 percent over the next five years as the economy recovers from a recession and low investment levels. Potential growth will not
exceed 3.5 percent thereafter, based on the gradual
decline in the investment-to-GDP ratio, very small
TFP gains, and a projected decline in population
growth after 2023. GDP per capita will also grow
at a low annual rate of around 1.5 percent in the
medium to longer run. Shifting the model toward
private sector-led development, inclusion, and
boosting productivity will need to become the core
government priority to improve growth prospects.
For this strategy to succeed, the Government must
increase the returns on its investments in education
and health, improve the business environment, and
promote good governance. Investment in technology
to reap digital dividends in the form of faster growth,
more jobs, and better services will also be critical.
To regain a 4 percent growth rate, Namibia needs to either boost productivity or increase investment. We estimated the effect of increasing
TFP growth to 1 percent in the medium to long
term (by 2022), rather than the zero percent in
the baseline scenario. The model suggests that
a 1-percentage-point higher TFP growth rate
achieves 4 percent growth over the period 2022–
30. Alternatively, Namibia could try boosting
growth through higher investment. Specifically,
this scenario looks at increasing private investment
from 10 percent of GDP in 2017 to 23.5 percent by
2022, with constant public investment as a share
of GDP. This means that total investment increases
from 16 percent of GDP to 29.5 percent of GDP (vs.
21 percent in the baseline). Figure 11 presents the
resulting GDP growth associated with both the TFP
and investment scenarios. As foreshadowed by the
analytical results, the increase in growth from an
expansion of private investment is very similar to
(but marginally larger than) the increase in growth
from an expansion of public investment. As such,
policymakers need not be concerned that public
investment is unable to expand due to budgetary
pressures, if private investment is able to take its
place.
Although increases in average growth are the same with the higher TFP and investment simulations, the dynamics are quite different. With the increasing investment, the highest growth
rates are at the start (4.2 percent in 2023) and
then growth falls off—by 2030, growth is only 3.8
percent. The reason is diminishing marginal returns
to capital—that is, keeping other factors fixed, each
new building or machine adds less to output than
the previous one (as private capital becomes less
scarce). Although both simulations lead to the same
growth rates over 2023–30, higher productivity
growth is the preferred path because it is both
more feasible and more sustainable. The proposed
1 percent TFP growth target is between the 75th
and 90th percentile across countries (Figure 11C),
so it is achievable. In contrast, investment rates
of around 30 percent of GDP are close to the 90th
percentile across countries over a 20-year horizon,
and so should be regarded as more ambitious
(Figure 11D). In the Namibian context, recent high
rates of investment are due to the construction of
new mines. Once those mines have been completed,
the prospect for rates of investment approaching 30
percent is limited.
TFP growth can be driven by increased efficiency of individual firms, the reallocation of factors of production to more efficient firms/industries, a more efficient allocation of credit, or better infrastructure. Improvements in the competitive
environment usually encourage both higher
efficiency of individual firms and allow factors of
production to move from less-efficient to more-
efficient firms and industries. Lower distortions—for
example, those identified in the World Bank’s Doing
Business indicators—have a similar effect.
99.
101.
100.
102.
Namibia Systematic Country Diagnostic58
Deterioration of Fiscal Situation and Liquidity ChallengesThe role of fiscal policy will continue to be key in guiding Namibia’s growth trajectory. As a
member of the Common Monetary Area, and with
a currency pegged at par to the South African
rand, inflation and interest rate developments have
remained closely linked to those in South Africa
because of the common framework for monetary
and exchange-rate policies. As a result, fiscal policy
is, and will continue to be, the main tool used for
macroeconomic stabilization. To this end, a shift
toward a countercyclical fiscal policy with more
predictable government spending patterns will be
essential for sustaining macroeconomic stability
and providing a more encouraging environment for
private investment.
Namibia’s public debt levels and the associated debt service are a cause for concern. Namibia’s
public and publicly guaranteed debt is expected
to reach 76 percent of GDP in 2020 and interest
payments 4.9 percent of GDP. These levels are
expected to remain elevated in the near future,
creating challenges for fiscal consolidation. Although
the larger share of debt is in domestic currency, the
country faces foreign-currency exposure through
two Eurobonds, amounting to US$1.3 billion with
amortizations due over the next two years. Almost
one-quarter of outstanding debt has a short-term
maturity. In this context, the Government’s gross
borrowing requirements will remain high in the
coming years, placing additional liquidity pressures
on public finances.
103. 105.
104.
106.
B. The taxation system is not broad enough and may burden the private sector. Total government
tax revenues as a share of GDP are the largest
among the comparable countries (structural and
aspirational peers) and the upper middle-income
countries. The collections are mostly from direct
taxes rather than indirect ones. Especially high are
direct taxes on income, profits, and capital gains of
the business sector and individuals. This imposes
a high burden on the business sector and impedes
private sector development.
The erratic and narrow tax base is particularly worrisome in the context of the large debt stock and high fiscal deficits, which leads to concerns over rising debt-service costs and the unsustainability of public finances. Although increasing revenues
are usually not considered a pro-growth measure in
fiscal consolidation, structuring the reform around
broadening the tax base and reducing the informal
economy could be both pro-growth and pro-poor.
Namibia may not need to focus on collecting more
revenues as a share of GDP, but it may find that
broadening the tax base could reduce some of the
higher statutory rates than those of most regional
peers (Figure 12). The corporate tax rate in Namibia
of 32 percent is higher than regional averages of
around 27 to 28 percent. Improvements in tax
administration would also be key to bringing about
the needed change.
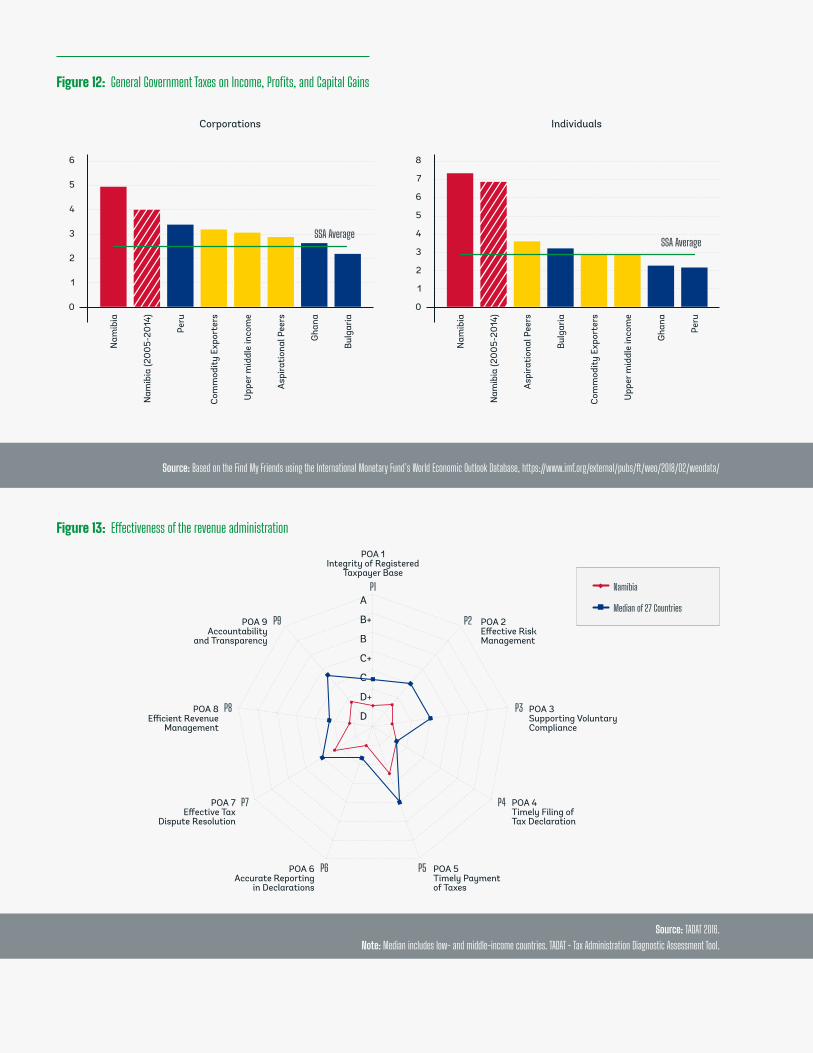
Namibia Systematic Country Diagnostic 59
Figure 12: General Government Taxes on Income, Profits, and Capital Gains
Figure 13: Effectiveness of the revenue administration
P1
P2P9
P3
P4
P5P6
P7
P8
Source: Based on the Find My Friends using the International Monetary Fund’s World Economic Outlook Database, https://www.imf.org/external/pubs/ft/weo/2018/02/weodata/
Source: TADAT 2016.Note: Median includes low- and middle-income countries. TADAT - Tax Administration Diagnostic Assessment Tool.
Corporations
6
5
4
3
2
1
0
Nam
ibia
Upp
er m
iddl
e in
com
e
Upp
er m
iddl
e in
com
e
Peru
Peru
Gha
na
Nam
ibia
(20
05-
2014
)
Asp
irati
onal
Pee
rs
Asp
irati
onal
Pee
rs
Com
mod
ity
Expo
rter
s
Com
mod
ity
Expo
rter
s
Bul
gari
a
Bul
gari
a
SSA Average
Individuals
8
7
6
5
4
3
2
1
0
Nam
ibia
Gha
na
Nam
ibia
(20
05-
2014
)
SSA Average
A
POA 1Integrity of Registered
Taxpayer Base
POA 2Effective Risk Management
POA 3Supporting Voluntary Compliance
POA 4Timely Filing of Tax Declaration
POA 5Timely Payment of Taxes
POA 6Accurate Reporting
in Declarations
POA 7Effective Tax
Dispute Resolution
POA 8Efficient Revenue
Management
POA 9Accountability
and Transparency
B+
B
C+
C
D+
D
Namibia
Median of 27 Countries
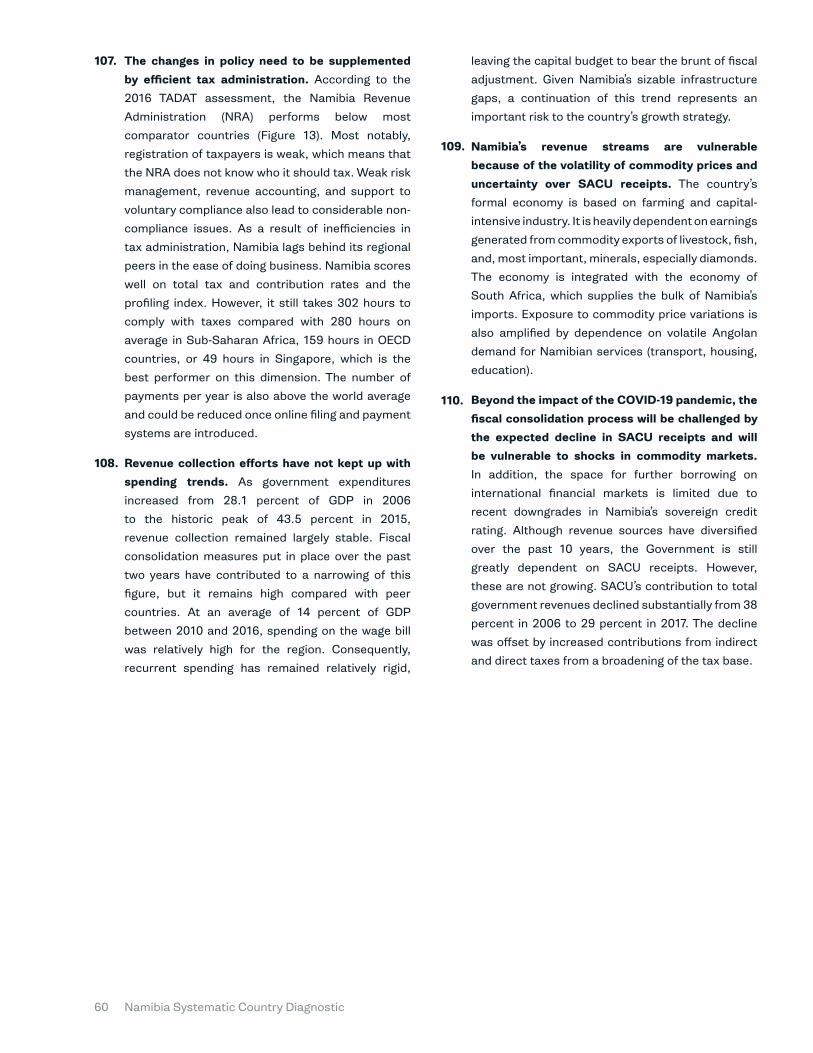
Namibia Systematic Country Diagnostic60
The changes in policy need to be supplemented by efficient tax administration. According to the
2016 TADAT assessment, the Namibia Revenue
Administration (NRA) performs below most
comparator countries (Figure 13). Most notably,
registration of taxpayers is weak, which means that
the NRA does not know who it should tax. Weak risk
management, revenue accounting, and support to
voluntary compliance also lead to considerable non-
compliance issues. As a result of inefficiencies in
tax administration, Namibia lags behind its regional
peers in the ease of doing business. Namibia scores
well on total tax and contribution rates and the
profiling index. However, it still takes 302 hours to
comply with taxes compared with 280 hours on
average in Sub-Saharan Africa, 159 hours in OECD
countries, or 49 hours in Singapore, which is the
best performer on this dimension. The number of
payments per year is also above the world average
and could be reduced once online filing and payment
systems are introduced.
Revenue collection efforts have not kept up with spending trends. As government expenditures
increased from 28.1 percent of GDP in 2006
to the historic peak of 43.5 percent in 2015,
revenue collection remained largely stable. Fiscal
consolidation measures put in place over the past
two years have contributed to a narrowing of this
figure, but it remains high compared with peer
countries. At an average of 14 percent of GDP
between 2010 and 2016, spending on the wage bill
was relatively high for the region. Consequently,
recurrent spending has remained relatively rigid,
leaving the capital budget to bear the brunt of fiscal
adjustment. Given Namibia’s sizable infrastructure
gaps, a continuation of this trend represents an
important risk to the country’s growth strategy.
Namibia’s revenue streams are vulnerable because of the volatility of commodity prices and uncertainty over SACU receipts. The country’s
formal economy is based on farming and capital-
intensive industry. It is heavily dependent on earnings
generated from commodity exports of livestock, fish,
and, most important, minerals, especially diamonds.
The economy is integrated with the economy of
South Africa, which supplies the bulk of Namibia’s
imports. Exposure to commodity price variations is
also amplified by dependence on volatile Angolan
demand for Namibian services (transport, housing,
education).
Beyond the impact of the COVID-19 pandemic, the fiscal consolidation process will be challenged by the expected decline in SACU receipts and will be vulnerable to shocks in commodity markets. In addition, the space for further borrowing on
international financial markets is limited due to
recent downgrades in Namibia’s sovereign credit
rating. Although revenue sources have diversified
over the past 10 years, the Government is still
greatly dependent on SACU receipts. However,
these are not growing. SACU’s contribution to total
government revenues declined substantially from 38
percent in 2006 to 29 percent in 2017. The decline
was offset by increased contributions from indirect
and direct taxes from a broadening of the tax base.
107.
108.
109.
110.

Namibia Systematic Country Diagnostic 61
Country Dependence on the Global and Regional Context and Price VolatilityNamibia’s economy remains highly dependent on international trade, with an average ratio of goods and services’ exports and imports to GDP of over 80 percent. South Africa supplies the majority of
imports. Export destinations, however, are more
diversified than they were in the first 15 years
after independence. In 2016, for example, the top
merchandise export destinations were Switzerland
(with a share of 18.8 percent), South Africa (16
percent), and Botswana (14.1 percent).
Namibia is heavily dependent on the global and regional contexts more broadly. Its location and
regional interdependence mean that the country
is heavily susceptible to, and influenced by, its
neighbors to trade, cooperation, and regional
stability. Similarly, the profitability and investment
outlook for extractive industries is closely tied to
international commodity prices (Figure 14). Falling
prices risk undercutting mining operations. On the
back of low global uranium prices, Rössing Uranium
failed to turn a profit for several years after 2010,
resulting in cost cuts and job shedding (World
Nuclear Association 2019), and the Langer Heinrich
Uranium Mine suspended operations in 2018 (Kaira
2018).
Channels for potential vulnerabilities from regional developments are many. As a member of
the SACU area, fiscal revenues are closely related
to South Africa’s import levels. These levels are
typically procyclical, exposing Namibia to South
Africa’s business cycles. A negative shock to the
South African economy would have an adverse
impact on flows to Namibia’s budget—and this has
already occurred with the COVID-19 pandemic.
Trade linkages with South Africa, the SACU area,
and the broader Southern African Development
Community (SADC) area are also a source of
spillovers through exports and imports. South
Africa and Botswana—both partners in the SACU
region—are Namibia’s most important individual
export markets, with export shares of 21.8 and 12.2
percent, respectively. The SADC, which includes
SACU, has replaced the EU as Namibia’s most
C.
Figure 14: Namibia’s exports and uranium price volatility
Figure 15: Net Official Development Assistance (ODA) received
Exports of goods and services (% of GDP)
Net ODA received (% of central government expense)
Uranium global prices
120
100
80
60
40
20
0
25
20
15
10
5
0
1990
1992
1994
1996
1998
200
0
200
2
200
4
200
6
200
8
2010
2012
2014
2016
2018
1997
1999
200
1
200
3
200
5
200
7
200
9
2011
2013
2015
2017
% of
cen
tral
gov
ernm
ent
expe
nse
Source: Authors’ calculations based on World Development Indicators and the International Monetary Fund.
111.
112.
113.
Namibia Systematic Country Diagnostic62
important export partner during the past decade. Its
share in exports rose to 40 percent in 2017, up from
36.5 percent in 2010. Moreover, almost two-thirds of
Namibia’s imports originate in the SACU region, the
largest part in South Africa (59 percent). Electricity
is an example of a key intermediate goods imported
from South Africa. Given electricity’s importance for
domestic economic activity, any disruption in supply
or shortage is likely to have a negative impact on
production.
Insulating the budget against instability in mineral prices and production is a key objective. Botswana set up its Pula Fund (PF) in 1994 to shield the budget and foreign reserves from falling mineral prices. Similarly, the Economic and Social Stabilization Fund (ESSF) in Chile was set up to stabilize fiscal spending across economic cycles with low copper prices and production. The ESSF’s assets may also be used to finance payments on public debt, freeing up revenue to finance productive expenditure. The main objective of Norway’s Government Pension Fund-Global (GPFG)—the world’s largest sovereign wealth fund—has been to create long-term savings and a stream of revenues for future generations. The approach has been to gradually phase petroleum revenues back into the local economy when oil reserves become depleted. Norges Bank, the central bank of Norway, is responsible for managing the fund’s resources by investing in international financial markets, with the objective of maximizing returns. Similarly, the Central Bank of Mongolia is responsible for managing the fund’s assets and for investing efficiently in international markets. Contrastingly, in Chile the minister of finance is responsible for managing his country’s fund and its investments (asset eligibility, portfolio allocation, benchmarks for investment limits, and performance
Source: Developed based on Note on stabilization/wealth funds: a case study analysis, World Bank (2018).17.
Changing international relations and the reclassification of Namibia as an upper middle-income country in 2009 have resulted in lower ODA (NPC 2012, ix). Figure 17 shows the
three-decade trend in the country’s ODA. The
reclassification has also contributed to a withdrawal
of development partner support for civil society
organizations, undermining the ability of alternative
service providers to fill gaps in government services
(USAID 2018, 155–57). Some organizations, such
evaluation), although an external advisory board composed of independent experts has been set up to advise the minister on the fund’s long-term investment policy. Botswana takes a joint-management approach, where the Bank of Botswana is responsible for managing reserve accumulation, while the Ministry of Finance manages fiscal transfers.
Withdrawals typically follow the inverse of the deposit rules. If reserve levels in Botswana fall below the reserve’s adequacy target, for example, then withdrawals from the PF are authorized. Often, countries place added restrictions on withdrawals to ensure that funds are used appropriately. In Botswana, where a more qualitative approach is taken toward withdrawals to support the fiscal balance, the authorities are not allowed to use the PF to finance quasi-fiscal or off-budget operations. For Norway’s GPFG, government withdrawal is based on the annual real return on the fund’s invested assets, capped to a maximum of 4 percent of the GPFG’s overall asset value. Capping withdrawals has the two-fold effect of reigning in government expenditures while ensuring that existing buffers remain at prudent levels.
Several resource-rich countries have established funds in response to the challenges and complications that resources revenues pose to fiscal policy and asset management. In some of these countries, the fund is part of a fiscal framework that includes a fiscal rule or guideline. This box looks at stabilization mechanisms set up in the following resource-rich countries: Botswana, Chile, and Norway. A summary of the objectives, governance and ownership structure, sources of funding, and rules for withdrawal is provided below:
BOX 4: Economic and social impacts of the COVID-19 crisis - Lessons from abroad17
114.
Namibia Systematic Country Diagnostic 63
SACU receipts are determined at the beginning of each fiscal year for each member country and are disbursed on a quarterly basis. For the five member countries, SACU receipts are determined by a revenue-sharing formula. According to the formula, the collected pool of excises and import duties is distributed by considering the relative share of intra-SACU trade, GDP, and GDP per capita. For more details, see Honda et al. 2017.
18.
as the Global Fund, which helps to combat HIV/
AIDS, tuberculosis, and malaria, have had to shift
assistance to countries categorized as being in
greater need of financial assistance (Menges 2018).
Because it is pegged to the South African rand, Namibia’s currency has been depreciating steeply relative to the US dollar in recent years. To a
considerable extent, this is due to the end of the
commodity super-cycle, worsening the terms of
trade for commodity exporters such as South Africa
and Namibia. The phasing out of quantitative easing
in the United States has also weakened the Namibian
dollar relative to the US dollar. This may offer some
openings for more manufacturing exports, as well as
improved exports in other areas.
The COVID-19 pandemic is confronting every level of the Namibian economy with an unprecedented challenge. The global slowdown caused by the
COVID-19 outbreak and closure of economies is
expected to result in a growth contraction of 7.1
percent in 2020. Growing spending pressures
and rising debt levels have worsened the fiscal
outlook, particularly as the decline in output and
slowing trade constrain revenue collection. Regional
developments, including the sharp decline in South
Africa’s economic activity, will further constrain the
growth outlook and pose a threat to Namibia’s SACU
receipts. The poor and middle class are expected to
bear the brunt of the crisis. The lockdown due to the
pandemic is expected to increase the upper bound
poverty rate by between 2.5 and 6.6 percentage
points, depending on the length of the crisis. Box 5
summarizes the adverse socioeconomic impacts of
the COVID-19 crisis.
I. Vulnerability to price volatility
The Government’s revenue streams are vulnerable because of the volatility of commodity prices and uncertainty over SACU receipts.18 The country’s
formal economy is based on farming and capital-
intensive industries. It is heavily dependent on
earnings generated from exports of livestock, fish,
and minerals, especially diamonds. The economy is
integrated with South Africa, which supplies the bulk
of Namibia’s imports. Exposure to commodity-price
variations is also amplified by dependence on volatile
Angolan demand for Namibian services (transport,
housing, education, and retail, among others).
Vulnerability to commodity-price shocks is reinforced by the resource-intensive economic model. Despite efforts to diversify exports, the
country’s export structure has remained broadly
unchanged, and exports remain dominated by
mineral products (around 60 percent of total
exports), including diamonds, uranium, and gold,
as well as processed metals such as copper blisters
and refined zinc. Over the 1992–2017 period,
minerals accounted for 11.4 percent of GDP and
44 percent of exports. The real impact of minerals
goes even deeper because of the importance of
government employment and spending in driving
consumption—the second engine of the economy.
Continued reliance on the mining sector means
that the economy remains exposed to commodity-
price shocks and trends in global demand. Low
uranium prices will continue to adversely impact
the prospects for expected uranium production
in the country, and the weakening global demand
for diamonds could lead to larger-than-anticipated
reductions in diamond production. Moreover,
mineral production is now well past its peak.
Although new finds and improvements in extraction
technology suggest that output is likely to continue
beyond previously predicted estimates of 2030, the
reality is that diamonds are a dwindling resource.
Heavy dependence on resources also implies that both export receipts and tax revenues are subject to fluctuations in international commodity prices. This dominance of mineral products has
come at the expense of progress toward developing
sophisticated export goods, thus affecting the
country’s competitiveness. In its most recent Article
IV staff report (2019), the IMF reports that the ongoing
government strategy to add value to raw materials
115.
116.
118.
119.
117.

Namibia Systematic Country Diagnostic64
has so far had limited impact on developing general
capabilities and more sophisticated industries.
SACU revenues have proven volatile and largely
pro-cyclical, raising further concerns over fiscal
vulnerability. More important, the future of SACU
revenues is highly uncertain because changes to the
revenue-sharing formula appear imminent.
The global slowdown caused by the COVID-19 outbreak is expected to result in a growth contraction of the Namibian economy by 7.1 percent in 2020. Downside risks to the outlook predominate, with both domestic and external factors weighing in. With trade largely concentrated to a few countries and commodities, real export growth is expected to narrow by 12 percent this year as demand falters in key export markets, including China, South Africa, Botswana and Spain. Demand for luxury commodities such as diamonds will likely come under further pressure, along with uranium. Gross domestic expenditure will also narrow as investment remains muted and the contraction in private consumption witnessed since the growth slowdown began in 2016 continues. On the production side, apart from the blow to mining activity, the demand slump is set to have adverse effects on tourism, retailers and service sectors, which could result in significant rising unemployment levels.
The poverty impact of the COVID-19 pandemic is significant. The lockdown due to the COVID-19 pandemic is expected to increase the upper bound poverty rate between 2.5 and 6.6 percentage points, depending on the length of the crisis. The poverty increase is equivalent to an 8.6 percent fall in consumption in the less severe scenario.
The poverty impact is not equally distributed. Male, younger workers, those with only primary education and those in larger households will experience larger poverty increases. Urban households will be affected more than rural households and the impact is unequally distributed across regions.
The crisis has hit everybody, but the middle class and the better off are affected the most. Those in higher expenditure percentiles have experienced larger decreases in consumption: in fact, 27 percent of those in affected households are in Q5.
However, the proposed mitigation measures are expected to cushion some of the impact on poverty. The Minister of Finance announced on April 1, 2020, the Economic Stimulus and Relief Package to mitigate the impact of the COVID-19 pandemic. The relief package amounting to N$8.1 billion includes N$5.9 billion in direct support to businesses and households and cashflow acceleration payments for services rendered to government; and N$2.3 billion as loans guaranteed by government to further support loan uptake on preferential terms by business and individuals. Added expenditure pressures linked to strengthening the health system and increased social transfers could push the fiscal deficit to over 13 percent of GDP this year. Consequently, public debt levels are expected to increase to 76.2 percent of GDP in 2020 as the authorities resort to additional domestic borrowing to cover the budget financing gap.
Social protection programs can effectively offset the poverty impact of the pandemic. The emergency income grant (EIG) and employment protection schemes reduce poverty by between 3.85 and 5.72 percentage points depending on the length of the crisis. The EIG has stronger poverty mitigation impact.
BOX 5: Economic and Social Impacts of the COVID-19 Crisis
The current limited fiscal space suggests the impact of commodity-market volatility could be heightened even more. Expansionary fiscal policies
in the aftermath of the commodity-price super-
cycle reversal of 2009, which resulted in an output
contraction due to the fall in external demand for
minerals, played a key role in spurring economic
120.
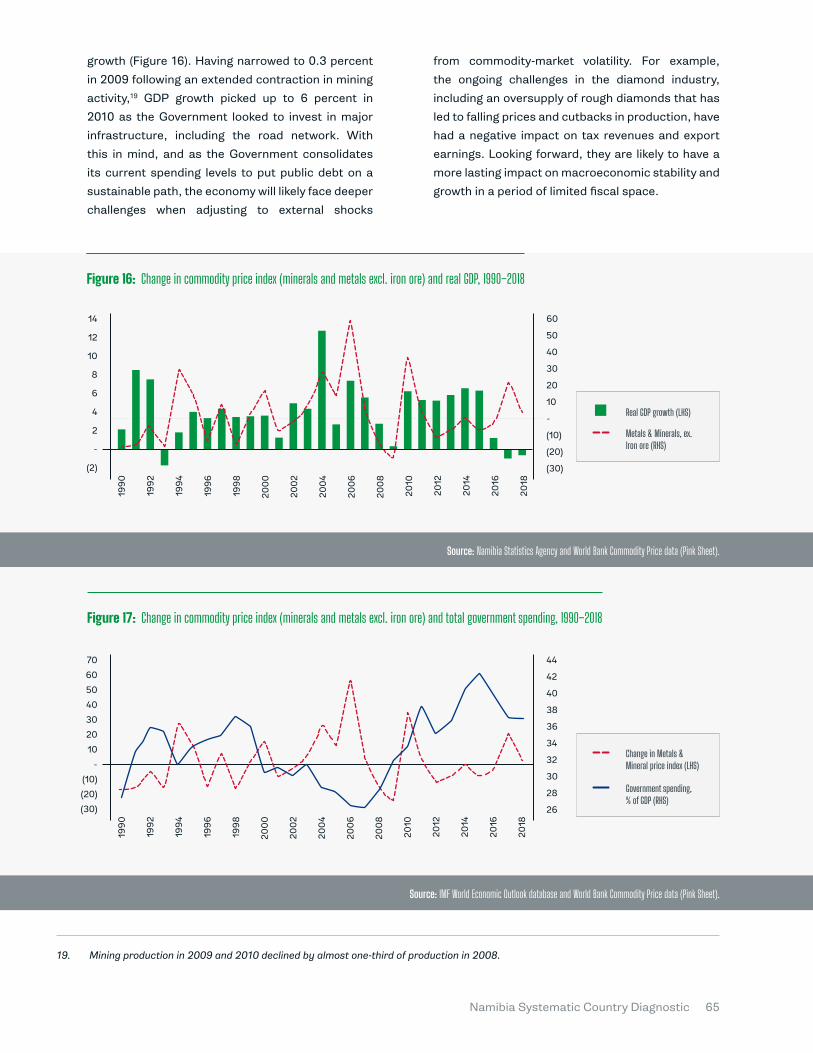
Namibia Systematic Country Diagnostic 65
Mining production in 2009 and 2010 declined by almost one-third of production in 2008.19.
growth (Figure 16). Having narrowed to 0.3 percent
in 2009 following an extended contraction in mining
activity,19 GDP growth picked up to 6 percent in
2010 as the Government looked to invest in major
infrastructure, including the road network. With
this in mind, and as the Government consolidates
its current spending levels to put public debt on a
sustainable path, the economy will likely face deeper
challenges when adjusting to external shocks
from commodity-market volatility. For example,
the ongoing challenges in the diamond industry,
including an oversupply of rough diamonds that has
led to falling prices and cutbacks in production, have
had a negative impact on tax revenues and export
earnings. Looking forward, they are likely to have a
more lasting impact on macroeconomic stability and
growth in a period of limited fiscal space.
Figure 17: Change in commodity price index (minerals and metals excl. iron ore) and total government spending, 1990–2018
44
42
40
38
36
34
32
30
28
26
70
60
50
40
30
20
10
-
(10)
(20)
(30)
1990
1992
1994
1996
1998
200
0
200
2
200
4
200
6
200
8
2010
2012
2014
2016
2018
Source: IMF World Economic Outlook database and World Bank Commodity Price data (Pink Sheet).
Change in Metals & Mineral price index (LHS)
Government spending, % of GDP (RHS)
14
12
10
8
6
4
2
-
(2)
60
50
40
30
20
10
-
(10)
(20)
(30)
1990
1992
1994
1996
1998
200
0
200
2
200
4
200
6
200
8
2010
2012
2014
2016
2018
Source: Namibia Statistics Agency and World Bank Commodity Price data (Pink Sheet).
Real GDP growth (LHS)
Metals & Minerals, ex. Iron ore (RHS)
Figure 16: Change in commodity price index (minerals and metals excl. iron ore) and real GDP, 1990–2018

Namibia Systematic Country Diagnostic66
High Unemployment, Limited Jobs Opportunities, and Polarized Labor Market
2.
Unemployment is high and a substantial percentage of the population remains idle. Looking at the broad
measure of unemployment, Table 2 shows jobless
rates of 27.5 to 33.4 percent between 2012 and
2018. Less than 50 percent of the adult population
A healthy economy can create jobs and reallocate workers to jobs needed to sustain growth. Barriers to entry are
the obstacles or hindrances that make it difficult for new companies to enter a given market. These may include
technology challenges, government regulations, patents, startup costs, or education and licensing requirements.
Because of the lack of competition, monopolies tend to earn significant economic profits.
122.
121.
Barriers to Input Markets and Technology Limit Growth Potential
A. has found work, even though roughly 70 percent of
Namibians would like to be working. For those ages
25 to 59, roughly 60 percent of the population is
employed, even though 80 percent would like to be
working.
2012 2014 2016 2018
Labor force participation rate 41.8 56.1 69.4 71.2
Labor force absorption rate E/PWA 30.3 40.3 45.8 47.4
Unemployment rate UE/LF 27.5 28.1 34.0 33.4
Male unemployment rate 23.0 24.4 29.8 32.5
Female unemployment rate 31.9 31.8 38.3 34.3
Youth unemployment rate 50.2 53.6 58.5 60.0
TABLE 2: Labor Force Participation and Unemployment Rates
Source: Authors’ calculations based on the Namibian Labor Force Survey, 2012, 2014, 2016, 2018. E = employment, PWA = population in working age, UE = unemployed plus employed population, LF = labor force. Note: Unemployment is measured based on the broad definition.
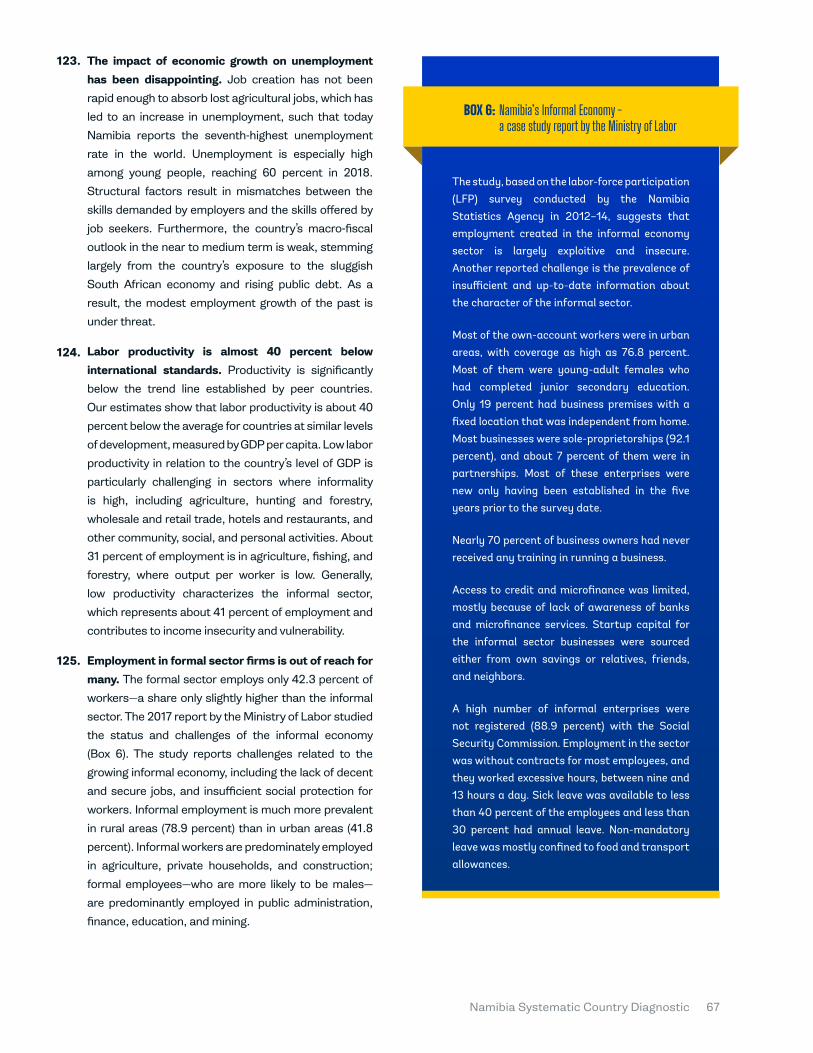
Namibia Systematic Country Diagnostic 67
123.
124.
125.
The impact of economic growth on unemployment has been disappointing. Job creation has not been
rapid enough to absorb lost agricultural jobs, which has
led to an increase in unemployment, such that today
Namibia reports the seventh-highest unemployment
rate in the world. Unemployment is especially high
among young people, reaching 60 percent in 2018.
Structural factors result in mismatches between the
skills demanded by employers and the skills offered by
job seekers. Furthermore, the country’s macro-fiscal
outlook in the near to medium term is weak, stemming
largely from the country’s exposure to the sluggish
South African economy and rising public debt. As a
result, the modest employment growth of the past is
under threat.
Labor productivity is almost 40 percent below international standards. Productivity is significantly
below the trend line established by peer countries.
Our estimates show that labor productivity is about 40
percent below the average for countries at similar levels
of development, measured by GDP per capita. Low labor
productivity in relation to the country’s level of GDP is
particularly challenging in sectors where informality
is high, including agriculture, hunting and forestry,
wholesale and retail trade, hotels and restaurants, and
other community, social, and personal activities. About
31 percent of employment is in agriculture, fishing, and
forestry, where output per worker is low. Generally,
low productivity characterizes the informal sector,
which represents about 41 percent of employment and
contributes to income insecurity and vulnerability.
Employment in formal sector firms is out of reach for many. The formal sector employs only 42.3 percent of
workers—a share only slightly higher than the informal
sector. The 2017 report by the Ministry of Labor studied
the status and challenges of the informal economy
(Box 6). The study reports challenges related to the
growing informal economy, including the lack of decent
and secure jobs, and insufficient social protection for
workers. Informal employment is much more prevalent
in rural areas (78.9 percent) than in urban areas (41.8
percent). Informal workers are predominately employed
in agriculture, private households, and construction;
formal employees—who are more likely to be males—
are predominantly employed in public administration,
finance, education, and mining.
BOX 6:
The study, based on the labor-force participation (LFP) survey conducted by the Namibia Statistics Agency in 2012–14, suggests that employment created in the informal economy sector is largely exploitive and insecure. Another reported challenge is the prevalence of insufficient and up-to-date information about the character of the informal sector.
Most of the own-account workers were in urban areas, with coverage as high as 76.8 percent. Most of them were young-adult females who had completed junior secondary education. Only 19 percent had business premises with a fixed location that was independent from home. Most businesses were sole-proprietorships (92.1 percent), and about 7 percent of them were in partnerships. Most of these enterprises were new only having been established in the five years prior to the survey date.
Nearly 70 percent of business owners had never received any training in running a business.
Access to credit and microfinance was limited, mostly because of lack of awareness of banks and microfinance services. Startup capital for the informal sector businesses were sourced either from own savings or relatives, friends, and neighbors.
A high number of informal enterprises were not registered (88.9 percent) with the Social Security Commission. Employment in the sector was without contracts for most employees, and they worked excessive hours, between nine and 13 hours a day. Sick leave was available to less than 40 percent of the employees and less than 30 percent had annual leave. Non-mandatory leave was mostly confined to food and transport allowances.
Namibia’s Informal Economy - a case study report by the Ministry of Labor

Namibia Systematic Country Diagnostic68
Wage employees in the formal sector have higher pay than similar workers in the informal sector. Even after controlling for location, gender, education,
and other variables, formal-sector wages were about
double those in the informal sector. Individuals with
tertiary education earned more than double (143
percent) the pay of those who had some senior
secondary education. Compared with similar
individuals with no education, those with some
primary education averaged just 4 percent higher
pay, those with junior secondary education earned
36 percent more, and those with senior secondary
education earned a massive 139 percent more.
Women, people with disabilities, and sexual and gender minorities face difficulties in accessing and maintaining employment (OutRight Namibia 2013, 17). The unemployment rate is higher for females
than for males, and the gap has been widening (it was
8.5 percent in 2016). Unemployment levels for young
people are exacerbated by a mismatch between
their existing skills sets and the skills required for the
opportunities at hand. Formal education has largely
failed to deliver employment for this demographic
group, and the types of practical and vocational skills
that are in short supply and could offer a source of
income are often stigmatized as being low-grade and
lacking in prestige.
Women are excluded from industrial jobs, including mining and manufacturing. Industry employs nearly
one in four men and one in 20 women. Women are
disproportionately employed in services work.
Agricultural employment represents a relatively
similar amount of employment for both men and
women. Most workers are wage and salary workers,
particularly in urban areas. Differences across gender
clearly exist, with females less likely to be wage and
salary workers, and more likely to be own-account
operators. In addition, males are rarely unpaid family
workers.
Domestic workers, who are predominately women, earned substantially less than other employees across most age groups. In 2014, 41 percent of
the economically active population was in informal
employment, with rates of 38 percent for females
and 44 percent for males. Between 2006 and 2013,
about 33 percent of SMEs had female participation
in ownership. An enterprise survey conducted
in 2014/15 indicated that 41 percent of business
enterprises had female participation in ownership,
with majority female ownership at 26 percent.
Moreover, 27 percent of firms had a female top
manager, compared with 16 percent in Sub-Saharan
Africa.
126.
127.
128.
129.
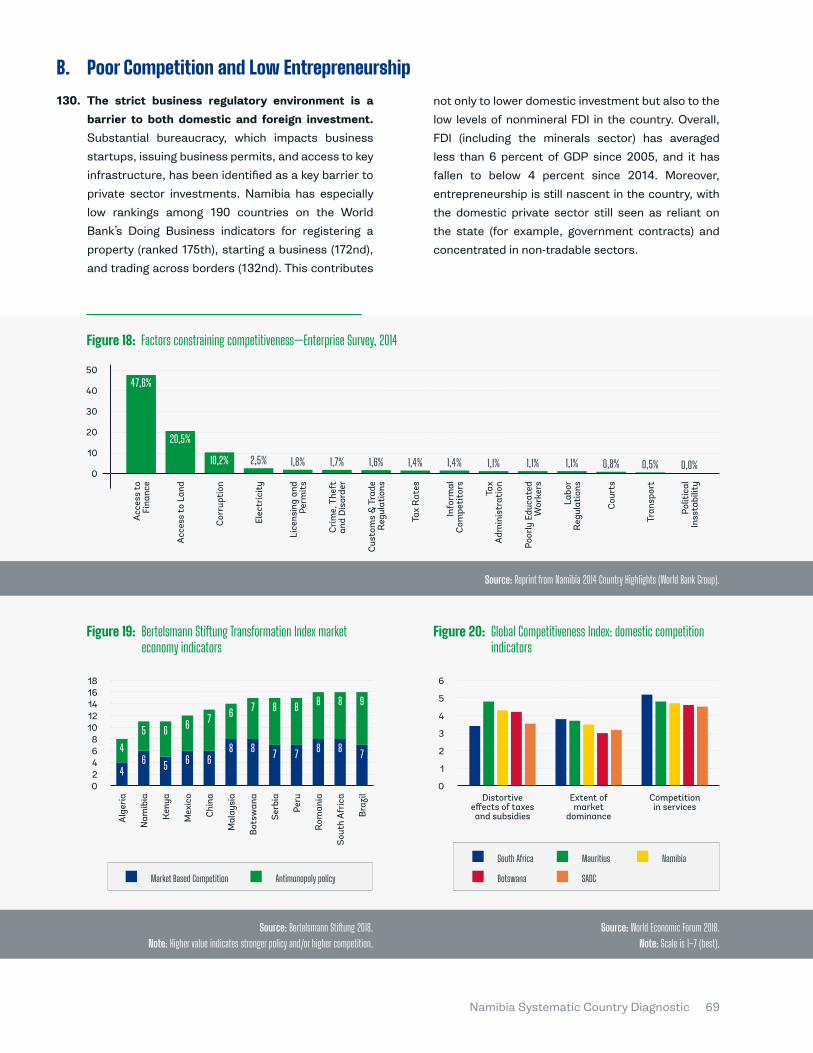
Namibia Systematic Country Diagnostic 69
Poor Competition and Low EntrepreneurshipThe strict business regulatory environment is a barrier to both domestic and foreign investment. Substantial bureaucracy, which impacts business
startups, issuing business permits, and access to key
infrastructure, has been identified as a key barrier to
private sector investments. Namibia has especially
low rankings among 190 countries on the World
Bank’s Doing Business indicators for registering a
property (ranked 175th), starting a business (172nd),
and trading across borders (132nd). This contributes
130.
B. not only to lower domestic investment but also to the
low levels of nonmineral FDI in the country. Overall,
FDI (including the minerals sector) has averaged
less than 6 percent of GDP since 2005, and it has
fallen to below 4 percent since 2014. Moreover,
entrepreneurship is still nascent in the country, with
the domestic private sector still seen as reliant on
the state (for example, government contracts) and
concentrated in non-tradable sectors.
Figure 18: Factors constraining competitiveness—Enterprise Survey, 2014
Source: Reprint from Namibia 2014 Country Highlights (World Bank Group).
Acc
ess
to F
inan
ce
Elec
tric
ity
Info
rmal
C
ompe
tito
rs
Labo
r R
egul
atio
ns
Tran
spor
t
Acc
ess
to L
and
Cus
tom
s &
Tra
de
Reg
ulat
ions
Lice
nsin
g an
d Pe
rmit
s
Tax
Adm
inis
trat
ion
Cou
rts
Polit
ical
In
ssta
bilit
y
Cor
rupt
ion
Tax
Rat
es
Poor
ly E
duca
ted
Wor
kers
Cri
me,
The
ft
and
Dis
orde
r
50
40
30
20
10
0
47,6%
20,5%
10,2% 2,5% 1,8% 1,7% 1,6% 1,4% 1,4% 1,1% 1,1% 1,1% 0,8% 0,5% 0,0%
Source: Bertelsmann Stiftung 2018. Note: Higher value indicates stronger policy and/or higher competition.
Source: World Economic Forum 2018. Note: Scale is 1–7 (best).
Figure 19:
Alg
eria
Chi
na
Peru
Ken
ya
Bot
swan
a
Sout
h A
fric
a
Nam
ibia
Mal
aysi
a
Rom
ania
Mex
ico
Serb
ia
Bra
zil
181614121086420
Bertelsmann Stiftung Transformation Index market economy indicators
46 5 6 6
8 8 7 7 8 8 745 6 6 7 6 7 8 8 8 8 9
Market Based Competition Antimonopoly policy
Figure 20:
Distortive effects of taxes and subsidies
Extent of market
dominance
Competition in services
6
5
4
3
2
1
0
Global Competitiveness Index: domestic competition indicators
South Africa Mauritius Namibia
Botswana SADC
Namibia Systematic Country Diagnostic70
Lack of competition and competitiveness among companies is a serious issue for private sector development in Namibia. The market structure is
mostly monopolistic, whereby several big players
dominate and use their position to restrict market
entry by new competitors, especially small- and
medium-sized firms. For example, the big and well-
established companies impose contracts that
exclude competitors and inhibit private sector
development. Furthermore, a large government
sector, and its presence in the private sector
space through state-owned enterprises (SOEs) and
parastatals, increases market inefficiencies and
crowds out the private sector. In areas where SOEs
are present, this ultimately leads to less competition
and lower competitiveness for the private sector.
Further impeding the low competition of the market—
and thus low competitiveness—are the high costs of
production, including energy prices, taxes, and land.
� Namibia ranks low on competitiveness, and several factors play an important role. The
Global Competitiveness Report and the Enterprise
Survey (ES) identify the main constraints facing
firms. According to the Global Competitiveness
Report 2017–2018, Namibia is ranked 100th
out of 140 countries, and its ranking has not
improved over time. The 2014 ES provides
valuable information on formal-sector firms and
what they regard as the impediments in the local
economy, in particular access to finance (Figure
18).20 In general, Namibia falls behind comparable
countries with regard to overall market economy
indicators, scoring lower on the perception of
the existence of market-based competition and
the effectiveness of the antimonopoly policy.
Furthermore, the country ranks 63rd out of 140
in the Global Competitiveness Index domestic
competition-perception indicators, which can
be attributed to the extent of market dominance
and the distortive effects of taxes and subsidies
(Figure 20). This is corroborated by the Product
Market Regulation (PMR)21 indicators, which
show that the restrictiveness of product
markets is brought about by state involvement
in business operations through SOEs, controls
on certain prices that may increase costs for
final consumers, barriers to entry, trade, and
investment, and the ineffective enforcement
of the antimonopoly policy. These studies and
surveys show that enhancing market competition
is essential to increasing investment and
productivity in Namibia, and meeting the NDP5
(NPC 2017) goal of raising the country’s overall
competitiveness by 2022.
� The entrepreneurship ecosystem is still nascent
despite a relatively good level of entrepreneurship
compared with other African countries.
Namibia ranked 61st among 137 countries on
the Global Entrepreneurship Index 2018—the
third-best country in Africa after Botswana and
South Africa. Despite being a relatively better-
positioned country in terms of entrepreneurship,
Namibia scores low in startup skills, technology
absorption, and risk of capital. Institutional
factors play an adverse role in entrepreneurship.
Barriers to entrepreneurship, trade, and investment inhibit businesses entry and expansion in Namibia. Company registration
remains lengthy and cumbersome, with the average
number of days stagnating at 66 since 2010 (Brandt
2018).22 The lack of progress is disappointing given
the establishment of the Business and Intellectual
Property Authority (BIPA), designed to reduce
The data come from firms randomly selected from nonagricultural firms registered with local municipalities in a country’s three most active economic regions. The hope is that learning more from direct responses from firms can identify ways to increase firm profitability and spur hiring (i.e., increase labor demand). In Namibia, highly sophisticated enterprises with world-class expertise exist side by side with informal activities. Statistical averages (for example, findings from the ES, Doing Business, etc.) need to be treated carefully.
The Organisation for Economic Co-operation and Development’s PMR indicators focus on key sectors regarding SOE presence, price controls, international standards and certification, and national treatment principles. They include nonmanufacturing sectors, such as network sectors (telecoms, electricity, gas, post, rail, air-passenger transport, and road freight) and retail and professional services (accounting, legal, engineering, and architectural services) in more detail.
Data in this section are taken from “Starting a Business in Namibia” in the Doing Business (database), World Bank, Washington, DC (accessed October 27, 2019), http://www.doingbusiness.org/en/data/exploreeconomies/namibia#DB_sb
20.
21.
22.
131.
132.

Namibia Systematic Country Diagnostic 71
The report also indicated that liberalization of the Namibian air passenger market would result in a 25 percent reduction in average fares, a total savings of US$28.1 million for existing users, and an increase of US$85.9 million in consumer surplus.
BIPA was established after passage of the BIPA Act in 2016 (Act No. 8 of 2016), but its effectiveness has been limited because the number of days for business registrations has not changed. Namibia has even declined in the overall Ease of Doing Business Index from 106th to 107th out of 190 countries; it ranked 172nd in the starting a business indicator.
Current regulations restrict the sale of more than 50 percent of shares of NamibRE, an SOE in the reinsurance sector.
23.
24.
25.
turnaround times by serving as a one-stop shop for
business and intellectual property registrations.24
Restrictions in certain markets also limit entry and
expansion. Bilateral agreements on the provision of
air transport services restrict entry into the markets
for passengers and cargo. In road transport, the
application process for backhaul is onerous, limiting
the full development of a regional transport market.
Restrictions on the sale of government shares in the
reinsurance sector also restrict entry.25 Nonetheless,
some progress has been made in remedying the
restrictive regulations (Box 7).
I. Monopolization and state control through SOEs are significant
Namibian SOEs operate in a wide range of markets. The potential for anticompetitive effects may be
substantial due to the SOEs’ various advantages, and
sometimes monopolistic and privileged positions. As
a result, SOEs may negatively affect competition; to
prevent this outcome, it is important to ensure that
they are subject to competition disciplines similar to
private companies.
BOX 7: Progress in Eliminating Barriers to Entrepreneurship, Trade, and Investment in Key Sectors
An International Air Transport Association report revealed that liberalization of the South Africa-
Namibia route would lead to a 55 percent increase in passenger
traffic, the highest among the routes reviews in the report
(InterVISTAS 2014).23 Subsequently, the bilateral air service agreement between Namibia and South Africa
was reviewed, allowing some South African airlines to operate unlimited flights for passengers
and overnight express cargo (Department of Transport 2016).
The cabinet revised the single-buyer model for electricity,
allowing entry of independent power producers (IPPs). They were
expected to invest over N$1.6 billion in the sector (Brandt 2019). However, some restrictions that still exist might limit expansion because IPPs still need to sell to
NamPower, which dictates prices, and the Electricity Control Board,
which generates tariffs, is involved in negotiating the power purchase
agreements.
Competition in the telecommunication market has been enhanced through the entry of a new player in the provision of LTE services
(Paratus Telecom), the licensing of the mobile virtual network
operators Demshi Investments and MTN (BuddeComm. n.d.), and the development of the
spectrum assignment strategy by the Communications Regulatory Authority.
CIVIL AVIATION ELECTRICITY TELECOMMUNICATION
133.
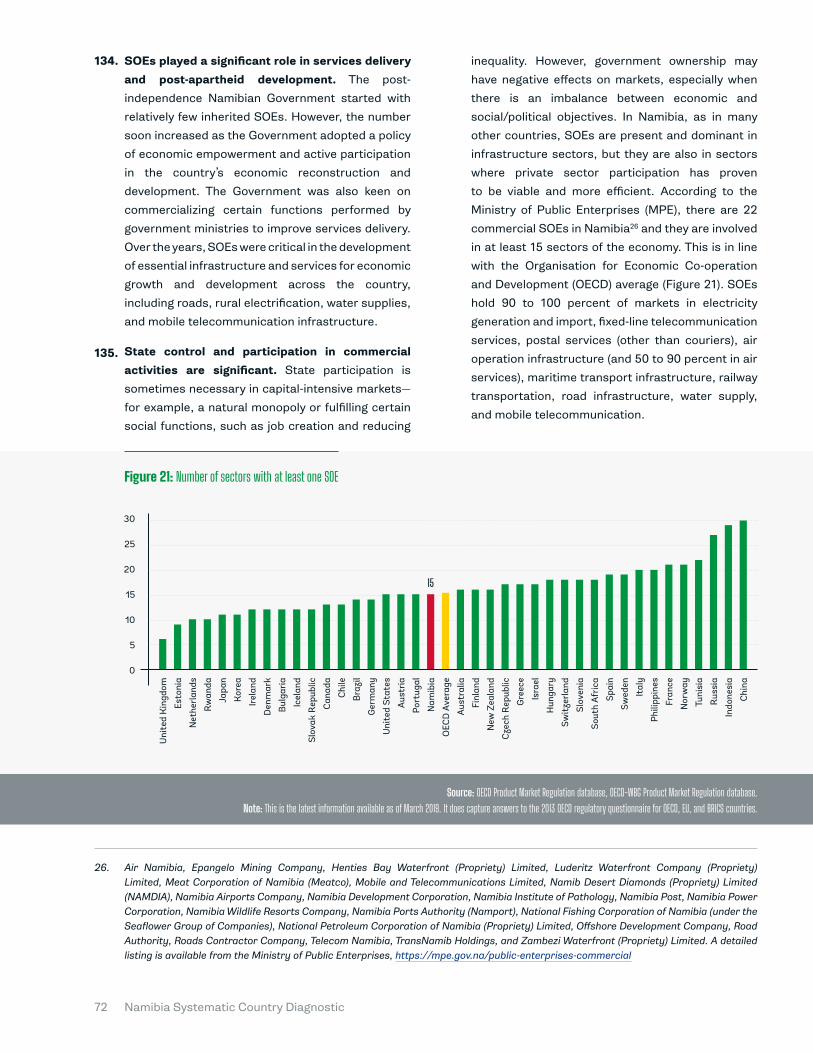
Namibia Systematic Country Diagnostic72
SOEs played a significant role in services delivery and post-apartheid development. The post-
independence Namibian Government started with
relatively few inherited SOEs. However, the number
soon increased as the Government adopted a policy
of economic empowerment and active participation
in the country’s economic reconstruction and
development. The Government was also keen on
commercializing certain functions performed by
government ministries to improve services delivery.
Over the years, SOEs were critical in the development
of essential infrastructure and services for economic
growth and development across the country,
including roads, rural electrification, water supplies,
and mobile telecommunication infrastructure.
State control and participation in commercial activities are significant. State participation is
sometimes necessary in capital-intensive markets—
for example, a natural monopoly or fulfilling certain
social functions, such as job creation and reducing
inequality. However, government ownership may
have negative effects on markets, especially when
there is an imbalance between economic and
social/political objectives. In Namibia, as in many
other countries, SOEs are present and dominant in
infrastructure sectors, but they are also in sectors
where private sector participation has proven
to be viable and more efficient. According to the
Ministry of Public Enterprises (MPE), there are 22
commercial SOEs in Namibia26 and they are involved
in at least 15 sectors of the economy. This is in line
with the Organisation for Economic Co-operation
and Development (OECD) average (Figure 21). SOEs
hold 90 to 100 percent of markets in electricity
generation and import, fixed-line telecommunication
services, postal services (other than couriers), air
operation infrastructure (and 50 to 90 percent in air
services), maritime transport infrastructure, railway
transportation, road infrastructure, water supply,
and mobile telecommunication.
Air Namibia, Epangelo Mining Company, Henties Bay Waterfront (Propriety) Limited, Luderitz Waterfront Company (Propriety) Limited, Meat Corporation of Namibia (Meatco), Mobile and Telecommunications Limited, Namib Desert Diamonds (Propriety) Limited (NAMDIA), Namibia Airports Company, Namibia Development Corporation, Namibia Institute of Pathology, Namibia Post, Namibia Power Corporation, Namibia Wildlife Resorts Company, Namibia Ports Authority (Namport), National Fishing Corporation of Namibia (under the Seaflower Group of Companies), National Petroleum Corporation of Namibia (Propriety) Limited, Offshore Development Company, Road Authority, Roads Contractor Company, Telecom Namibia, TransNamib Holdings, and Zambezi Waterfront (Propriety) Limited. A detailed listing is available from the Ministry of Public Enterprises, https://mpe.gov.na/public-enterprises-commercial
26.
Figure 21: Number of sectors with at least one SOE
Source: OECD Product Market Regulation database, OECD-WBG Product Market Regulation database. Note: This is the latest information available as of March 2019. It does capture answers to the 2013 OECD regulatory questionnaire for OECD, EU, and BRICS countries.
Uni
ted
Kin
gdom
Bul
gari
a
Aus
tria
Gre
ece
Ital
y
Japa
n
Chi
le
Aus
tral
ia
Slov
enia
Tuni
sia
Net
herl
ands
Slov
ak R
epub
lic
Nam
ibia
Hun
gary
Fran
ce
Irel
and
Ger
man
y
New
Zea
land
Spai
n
Indo
nesi
a
Esto
nia
Icel
and
Port
ugal
Isra
el
Phili
ppin
es
Kor
ea
Bra
zil
Finl
and
Sout
h A
fric
a
Rus
sia
Rw
anda
Can
ada
OEC
D A
vera
ge
Swit
zerl
and
Nor
way
Den
mar
k
Uni
ted
Stat
es
Cze
ch R
epub
lic
Swed
en
Chi
na
30
25
20
15
10
5
0
15
134.
135.
Namibia Systematic Country Diagnostic 73
SOEs receive government support for their activities that goes beyond normal equity financing. The Government funds SOE operations
through various instruments, with subsidies and
grants constituting almost 80 percent of the main
funding sources. The share of donor funding is just
over 30 percent. Some SOEs combine operating and
regulatory functions, which may create an uneven
playing field for the private sector. In the tourism
sector, the regulatory framework limits private
sector access to certain areas of Namibia, which
are assigned through a concession to the Namibia
Wildlife Resort.27 Private sector operators are put in
a disadvantaged competitive position.
Undue competitive advantages for SOEs and a lack of competitive neutrality principles have contributed to the crowding out of efficient private sector investments in key sectors. The presence of
SOEs that enjoy privileges and immunities not applied
across the board to the private sector leads to market
distortions that restrict entry or the ability of the
private sector to participate and compete. The key
drivers of this inequality include: (i) a lack of separation
between operating and regulatory functions, which
often provides incumbents with incentives to preclude
potential competitors by raising barriers to entry; (ii)
the unstructured granting of state support measures,28
which can have significant negative impacts on
markets and needs to be granted systematically with
clear objectives and monitoring (whether promoting
commercial activities or social policy objectives),
avoiding preferential treatment of firms; and (iii)
decision-making processes that limit transparency, which
combine government-owned incumbents dealing with
new entrants and line ministries heavily involved in final
decision-making. These factors have contributed to
competition obstacles in several key sectors:
The Namibia Wildlife Resort is an SOE established in 1998; it has extensive tourism facilities across Namibia.
State support measures include subsidies, debt write-offs or takeover of losses, exemptions, reductions or deferrals of fee and tax payments, guarantees, and preferential granting of loans. The Namibian government has granted state support to attract foreign investment, promote small and medium enterprises and exports, and encourage agriculture development.
According to Namport’s Group Annual Report 2017/18, “Namport, through the channel of the Ministry of Finance, has approached the World Bank to investigate the feasibility of appointing a private sector operator to maximize the utilization of the new container terminal, simultaneously boosting the country’s economy” (Namport 2017, 21). This should be further facilitated by the Public-Private Partnerships Act, which once implemented will promote strategic alliances and improve public enterprises’ efficiency.
The Namibia Airports Company will not renew the ground-handling agreement with Air Namibia for Hosea Kutako International Airport.
For example, the Roads Authority of Namibia aims to assist the RCC in landing new government contracts as part of the entity’s reform process after significant losses (NBC 2014).
27.
28.
29.
30.
31.
� Maritime transport. Namport is both the operator and regulator of ports infrastructure and maritime services, including the setting of port tariffs. As more countries open their port operations and infrastructure markets to private players through longer-term operation contracts (landlord model), Namport has begun to experience the effects of its closed port operations. Enabling private sector participation in port infrastructure would enhance efficiency and increase the attractiveness of Namibia as a preferred port of call (Namport 2017). This has prompted Namport to consider the viability of a PPP with a private operator for the new container terminal.29 However, line-ministry involvement in Namport’s decision-making processes may limit transparency and create uncertainty for potential investors.
� Civil aviation. Air Namibia is one of the beneficiaries of recurrent state support despite constant losses and poor efficiency. Although it is one of the largest recipients of government subsidies (Kahiurika and Shikongo 2019), the airline has failed to produce the expected results, even with restrictive entry regulations limiting competition. Air Namibia’s continued poor financial performance has a significant impact on the financial viability of the Namibia Airports Company, which derives about 40 percent of its total revenue from passenger and landing charges from Air Namibia (ALG Group 2018), as well as ground handling operations30 at the Hosea Kutako International Airport. The cabinet is mulling the liquidation of the national carrier.
� Road rehabilitation and construction. Entry into the construction and road maintenance industry has been limited due to preferential access given to the Roads Contractor Company (RCC) to government-financed infrastructure projects.31 The RCC has, since its establishment in 1998, gradually lost its market share in road maintenance to small- and medium-sized private
136.
137.
Namibia Systematic Country Diagnostic74
sector companies through competition. The preferential access to infrastructure projects led the RCC to subcontract significant amounts of work to private sector contractors, thereby further reducing its capacity.
� Electricity. Despite the Electricity Control Board (ECB) being the overall regulator of the electricity sector, the line ministry has the power to direct long-term strategies for the sector, as well as overturn the ECB’s decisions, bringing into question its independence.
II. Lack of effectiveness of the antitrust framework
The current Namibian Competition Act was adopted in 2003 to facilitate efficient markets following the 2002 SACU agreement. In line with
international best practices, the act prohibits
cartels, proscribes abuses of dominance,
establishes a suspensory merger control system,
grants independent status to Namibian Competition
Commission (NaCC), and deals with concurrent
jurisdictional issues between the NaCC and other
sector regulators with competition powers. In
fulfilling its mandate, the NaCC has handled more
than 400 mergers since 2009, and it has conducted
numerous investigations into restricted business
practices, including handing out the first cartel fine
in 2016. In addition, the NaCC has signed several
memoranda of understanding with sector regulators
and government agencies, such as the Bank of
Namibia, the Anticorruption Agency, the ECB, the
Communications Regulatory Authority, and the
Namibia Statistics Agency. It is currently exploring
collaboration with the newly established public
procurement body. In the international sphere, the
NaCC collaborates with other competition agencies
through the Africa Competition Forum,32 and it has
signed a memorandum of understanding with the
Competition Commission of South Africa.
The dynamic nature of markets has limited the ability of the current competition framework to effectively regulate the market and prevent anticompetitive practices. The NaCC has
addressed some of these concerns by: (i) drafting
a new competition bill;33 (ii) developing internal
manuals covering the merger review process
and restrictive business practices; (iii) publishing
guidelines for mergers, enforcement exemptions,
and cartels for external stakeholders, including
some clarification of its methodology for fines;34
(v) reviewing merger thresholds in line with the
current market conditions; and (v) developing a
National Competition Policy.
Several loopholes that still exist threaten to undermine the effectiveness of the antitrust framework. The general power granted to the
Minister of Industrialization, Trade, and SME
Development—in concurrence with the NaCC—to
exempt any good or service from application of
the Competition Act affects legal certainty for the
private sector and potentially increases the cost
of doing business. A broad legal basis to exempt
anticompetitive conduct may also undermine
the application of the Competition Act. Although
the draft bill differentiates between horizontal
agreements as per se violations (hard-core cartels
are considered the most harmful violation of
competition law) and other types of agreements
(which may be efficient under some circumstances).
Furthermore, the determination of dominance still
relies heavily on structural measures, namely market
shares. Unnecessary exemptions from the merger
review process to specific industries or categories
of undertakings are also maintained.
NaCC has collaborated with the Africa Competition Forum in conducting a study in the construction market in Namibia.
The commission is in the process of incorporating comments into the draft bill.
The commission has developed a model for calculating pecuniary penalties that takes the following into consideration: (i) maximum of 10 percent of global turnover, (ii) 10 percent of affected turnover, and (iii) duration of the contravening conduct. However, it has received pushback on the use of global turnover during settlement proceedings, especially given that fines should have a local nexus to the Namibian economy.
32.
33.
34.
138.
139.
140.
Namibia Systematic Country Diagnostic 75
Poor Access to FinancingAccess to finance was unquestionably the main hindrance to firms’ growth and market entry, with 48 percent of responding firms citing it as their main obstacle. More than half of small firms (one to
19 employees) and just over 30 percent of medium-
sized firms (20 to 99 employees) identified access
to finance as their leading constraint. For large firms
(100 employees or more), finance was not among their
top three obstacles. The percentage of firms with
checking or savings accounts was on a par with, or
better than, the average across upper middle-income
countries. However, the share with bank loans or
lines of credit (20 percent of firms) was roughly half
the average for upper middle-income countries.
Despite Namibia’s large and sophisticated financial system, a significant share of the low-income and rural population is excluded from formal financial services (IMF 2018a). A highly concentrated banking
sector has resulted in reduced competition and
innovation because banks have little incentive to
invest in new ways to extend services. The Financial
Sector Assessment Program (FSAP) has proposed
promoting financial inclusion through digitization of
social transfers, with appropriate safeguards, and
an improved regulatory framework for microfinance
institutions. An improved credit information system
for micro, small, and medium enterprises (MSMEs),
a secured transactions framework for movable
assets, and a modernized insolvency regime would
facilitate financial access for MSMEs. The mandates
of state-sponsored financial institutions need to
be reassessed, and some restructuring is needed,
especially in housing and agriculture, two areas with
poor performance and difficult financial situations.
Box 8 summarizes FSAP’s recommendations.
141. 143.
142.
C. Moreover, many Namibians have limited access to bank credit, and quality banking and insurance services. The 2017 Namibia Financial Inclusion
Survey (NFIS) put the proportion of financially
included adults at 78.0 percent in 2017, an increase
from 69 percent in 2011 and 49 percent in 2007. Of
this financially included population, 72.6 percent were
formally served—67.7 percent by commercial banks
and 52.8 percent by non-bank formal institutions.
Another 23.9 percent made use of informal financial
mechanisms. The portion of adults who borrowed
money stood at 42.1 percent, an increase of 10
percentage points from 32 percent in 2011. However,
more than half of the eligible population reported not
borrowing money (57.8 percent), with a vast majority
(95.1 percent) citing their fear of debt. The use of
debt councilors was almost nonexistent, at only 0.4
percent. The uptake of insurance was low, reported
at 30.1 percent across all insurance forms—30.0
percent in the formal market and only 0.1 percent
using informal means. Among adults, 69.9 percent
did not have any insurance products or services,
with the majority stating that this was a matter of
affordability. Bank branches were still concentrated
in urban areas, where 90 percent of people needed
an hour or less to reach a bank. By contrast, more
than 40 percent of people needed an hour or more
to reach banks in rural areas. Mobile banking was
a promising option given the high level of access to
mobile phones.
Namibia Systematic Country Diagnostic76
Skewed Access to Land and Low Affordability in the Housing MarketAccess to land was identified as their main obstacle by roughly 20 percent of firms.35 This constraint was
the second-leading obstacle for firms of all sizes—
small, medium, and large. However, the percentage
naming it as their top constraint was highest among
medium-sized firms (almost 30 percent). Land
scarcity, inadequate financial resources, and the
political sensitivity of land acquisition presents
challenges for the Government in achieving a more
144.
D. equitable distribution of landownership. The current
system to acquire land is cumbersome, requiring
several approval processes by local authorities and
the central government. Besides prohibitive prices,
given the slow rate of new supply of serviced land it
often takes ages for applicants to be allocated plots
by local authorities. This problem is compounded by
bureaucratic inefficiency.
Landownership in Namibia is highly unequal and land redistribution has been slow. The unequal distribution of agricultural land has historical origins. Most arable and productive land in the country’s southern and central parts was taken from black Namibians and allocated exclusively to white European settlers and their descendants. As a result, 70 percent of Namibia’s 39.7 million hectares of commercial farmland are still owned by Namibians of European descent. Only 16 percent of commercial farmland is owned by black Namibians, and the Government owns 14 percent. The state essentially owns all agricultural land, creating obstacles to farmers investing in the land. Unequal distribution of landownership reduces small farmers’ access to land, raising their costs of production and ultimately impeding the sector’s development.
35.
The development of MSME financing and easing MSMEs’ financial constraints remain key government priorities under the National Financial Sector Strategy. The FSAP, update in 2018, highlighted numerous initiatives to support MSME development but acknowledged that these companies still face significant barriers to financing because of the following:
High collateral requirements and the inability of MSMEs to collateralize their movable assets, given the lack of secured transactions and collateral registry regime;
� Limited coverage of MSMEs by credit bureaus, resulting in information asymmetries;
� Outdated insolvency regime creates uncertainty for debtors due to the lack of an exit mechanism in cases of default; and
� Uncertainty over the Government’s role in MSME financing following the failure of the SME Bank of Namibia in 2017.
BOX 8: Key Findings and Recommendations of the Financial Sector Assessment Program
Key FSAP recommendations to improve MSME access to finance:
� Provide the Development Bank of Namibia with a specific and clear mandate on MSME financing as part of the bank’s expanded role in implementing the partial credit guarantee scheme and venture capital fund;
� Enact comprehensive modernized insolvency legislation with cross-border treatment in line with the United Nations Commission on International Trade Law;
� Establish a credit information system for MSMEs to reduce information asymmetries; and
� Pursue secured transactions reform and establish an online movable registry.
Namibia Systematic Country Diagnostic 77
145. 146.
Dietrich Remmert and Pauline Ndhlovu, 2018. Housing in Namibia Rights, Challenges and Opportunities. IPPR.36.
Recent Institute for Public Policy Research (IPPR) studies (2018) analyzed the housing sector in depth, addressing the progress and challenges of the housing market.36
The country has made a progress in terms of addressing the many challenges around housing and land provision: (i) the Mass Housing Initiative focuses on providing affordably priced housing units in selected towns and the servicing of municipal land for residential purposes; (ii) local authorities have improved control over the expansion of informal settlements by various means, including the relaxation of specific building codes, making allowances for higher density zoning/planning/building; (iii) unserviced land has been demarcated and allocated prior to the legal formalization of townships; and (iv) the Government has introduced a new Urban and Rural Planning Bill, which offers the opportunity to improve spatial planning and establish a more enabling regulatory framework for urban planning.
Among the main challenges of the housing market were: slow delivery of housing units, limited availability of serviced land, gaps in housing supply, limited use of alternative and local materials, slow adoption of innovative technologies within the construction industry,
BOX 9: Key Challenges of Housing
lack of integrative housing projects, insufficient use of private sector expertise and resources, lack of clear data on key programs, and lack of information on access to banking and mortgages.
Key IPPR recommendations to improve the housing market:
� Ensure that the timely development of the national spatial planning framework under the Urban and Rural Planning Bill.
� Allocate more funding to the housing sector and urban-land development, focusing on low-income groups.
� Actively improve communication among industry, agencies and the public.
� Ensure that urban building standards and town planning regulations enable and incentivize integrated, flexible, cost-effective, and sustainable housing developments.
� Provide local authorities with more tangible resources and practical support regarding land surveying and servicing, town planning, and housing initiatives.
Affordable housing for the working class is another problem related to land. Namibia has
a significant shortage of accommodation for
working-class families, especially in urban areas.
This is due to a combination of rapid urbanization,
changes in family size, and unequal access to land
and financing. Between 1990 and 2018, the urban
share of the population grew from 25 percent to
almost 50 percent. Average household size shrank
from 5.7 persons in 1995 to 4.4 persons in 2016, so
the overall number of households rose significantly
during the period. The key challenges of the housing
market are presented in Box 9.
Many Namibians cannot buy or rent decent houses. This is because the housing shortage has
made the existing stock too expensive and barriers in
access to mortgage finance has raised the demand
for cheaper houses. House prices have risen sharply
in recent years, and low incomes make it impossible
for many families to afford decent accommodations.
Moreover, over 90 percent of households would
not qualify for a mortgage from any commercial
bank for an average-priced house (Chiripanhura
2018). Commercial banks’ lending policies are
openly discriminatory, generally targeting formally
employed persons and making mortgage finance
available mainly to high-income groups.
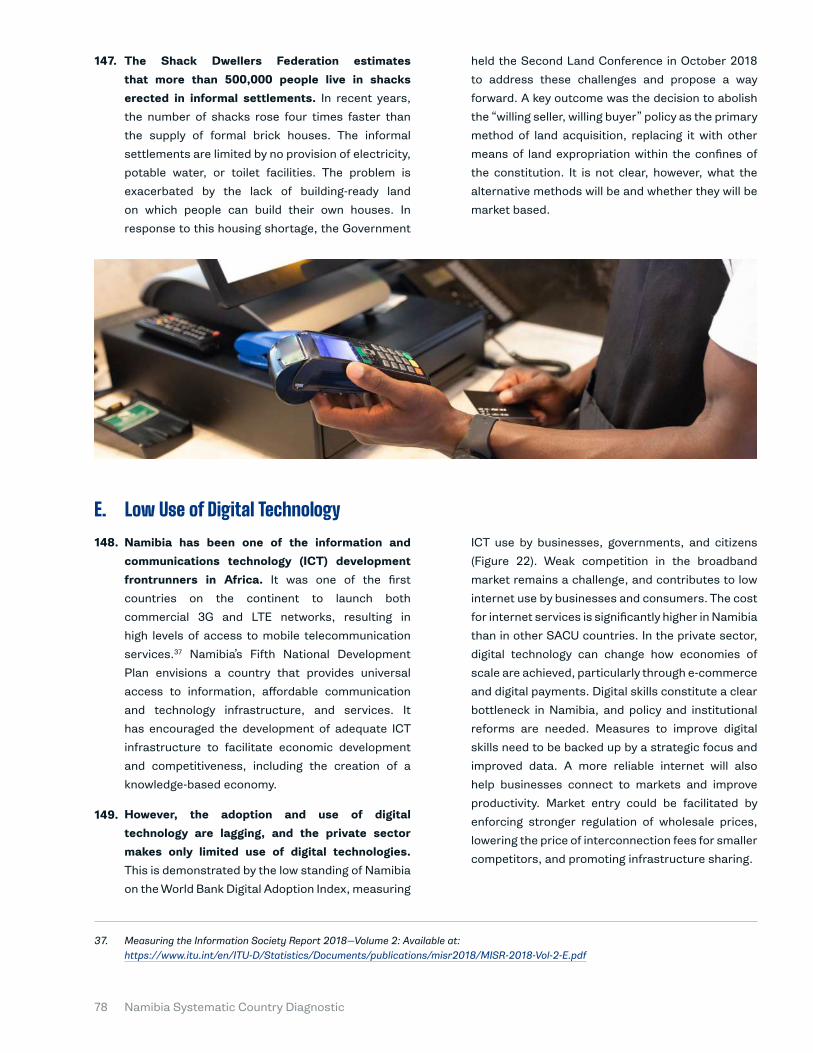
Namibia Systematic Country Diagnostic78
The Shack Dwellers Federation estimates that more than 500,000 people live in shacks erected in informal settlements. In recent years,
the number of shacks rose four times faster than
the supply of formal brick houses. The informal
settlements are limited by no provision of electricity,
potable water, or toilet facilities. The problem is
exacerbated by the lack of building-ready land
on which people can build their own houses. In
response to this housing shortage, the Government
held the Second Land Conference in October 2018
to address these challenges and propose a way
forward. A key outcome was the decision to abolish
the “willing seller, willing buyer” policy as the primary
method of land acquisition, replacing it with other
means of land expropriation within the confines of
the constitution. It is not clear, however, what the
alternative methods will be and whether they will be
market based.
Low Use of Digital TechnologyNamibia has been one of the information and communications technology (ICT) development frontrunners in Africa. It was one of the first
countries on the continent to launch both
commercial 3G and LTE networks, resulting in
high levels of access to mobile telecommunication
services.37 Namibia’s Fifth National Development
Plan envisions a country that provides universal
access to information, affordable communication
and technology infrastructure, and services. It
has encouraged the development of adequate ICT
infrastructure to facilitate economic development
and competitiveness, including the creation of a
knowledge-based economy.
However, the adoption and use of digital technology are lagging, and the private sector makes only limited use of digital technologies. This is demonstrated by the low standing of Namibia
on the World Bank Digital Adoption Index, measuring
E. ICT use by businesses, governments, and citizens
(Figure 22). Weak competition in the broadband
market remains a challenge, and contributes to low
internet use by businesses and consumers. The cost
for internet services is significantly higher in Namibia
than in other SACU countries. In the private sector,
digital technology can change how economies of
scale are achieved, particularly through e-commerce
and digital payments. Digital skills constitute a clear
bottleneck in Namibia, and policy and institutional
reforms are needed. Measures to improve digital
skills need to be backed up by a strategic focus and
improved data. A more reliable internet will also
help businesses connect to markets and improve
productivity. Market entry could be facilitated by
enforcing stronger regulation of wholesale prices,
lowering the price of interconnection fees for smaller
competitors, and promoting infrastructure sharing.
Measuring the Information Society Report 2018—Volume 2: Available at: https://www.itu.int/en/ITU-D/Statistics/Documents/publications/misr2018/MISR-2018-Vol-2-E.pdf
37.
147.
148.
149.
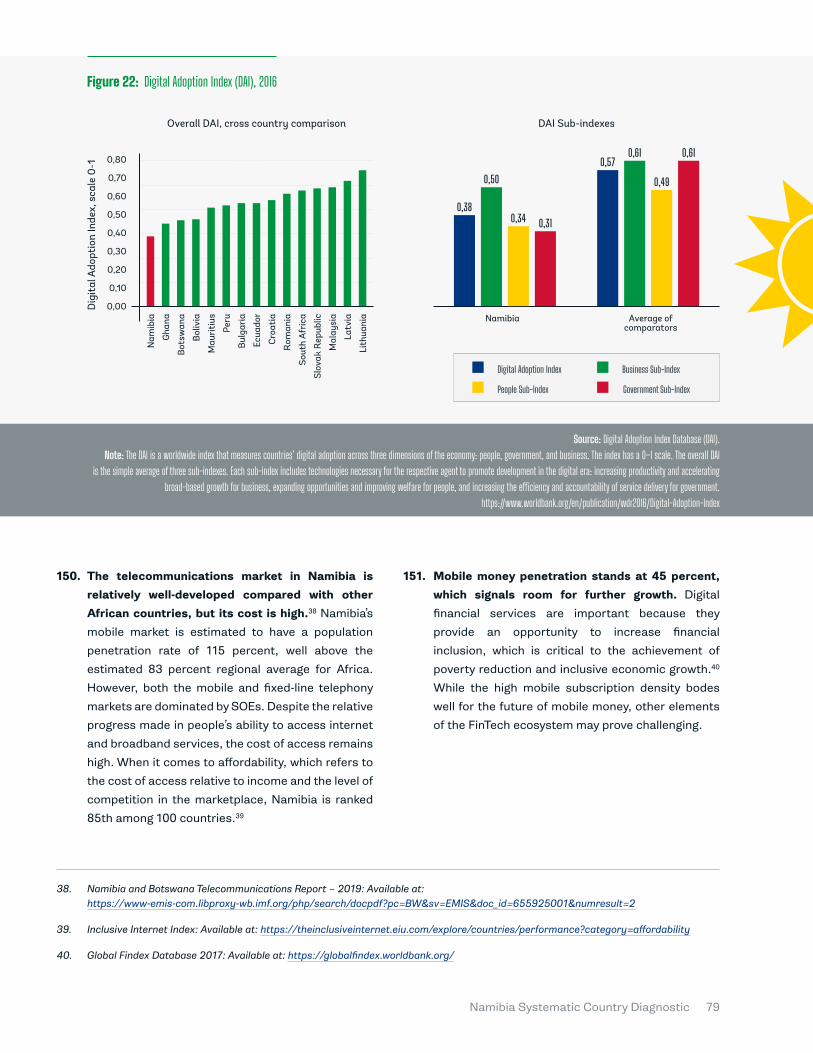
Namibia Systematic Country Diagnostic 79
The telecommunications market in Namibia is relatively well-developed compared with other African countries, but its cost is high.38 Namibia’s
mobile market is estimated to have a population
penetration rate of 115 percent, well above the
estimated 83 percent regional average for Africa.
However, both the mobile and fixed-line telephony
markets are dominated by SOEs. Despite the relative
progress made in people’s ability to access internet
and broadband services, the cost of access remains
high. When it comes to affordability, which refers to
the cost of access relative to income and the level of
competition in the marketplace, Namibia is ranked
85th among 100 countries.39
Mobile money penetration stands at 45 percent, which signals room for further growth. Digital
financial services are important because they
provide an opportunity to increase financial
inclusion, which is critical to the achievement of
poverty reduction and inclusive economic growth.40
While the high mobile subscription density bodes
well for the future of mobile money, other elements
of the FinTech ecosystem may prove challenging.
Namibia and Botswana Telecommunications Report – 2019: Available at: https://www-emis-com.libproxy-wb.imf.org/php/search/docpdf?pc=BW&sv=EMIS&doc_id=655925001&numresult=2
Inclusive Internet Index: Available at: https://theinclusiveinternet.eiu.com/explore/countries/performance?category=affordability
Global Findex Database 2017: Available at: https://globalfindex.worldbank.org/
38.
39.
40.
Figure 22: Digital Adoption Index (DAI), 2016
Source: Digital Adoption Index Database (DAI). Note: The DAI is a worldwide index that measures countries’ digital adoption across three dimensions of the economy: people, government, and business. The index has a 0–1 scale. The overall DAI
is the simple average of three sub-indexes. Each sub-index includes technologies necessary for the respective agent to promote development in the digital era: increasing productivity and accelerating broad-based growth for business, expanding opportunities and improving welfare for people, and increasing the efficiency and accountability of service delivery for government.
https://www.worldbank.org/en/publication/wdr2016/Digital-Adoption-Index
Overall DAI, cross country comparison
0,80
0,70
0,60
0,50
0,40
0,30
0,20
0,10
0,00
Nam
ibia
Mau
riti
us
Cro
atia
Mal
aysi
a
Bot
swan
a
Bul
gari
a
Sout
h A
fric
a
Lith
uani
a
Gha
na
Peru
Rom
ania
Latv
ia
Bol
ivia
Ecua
dor
Slov
ak R
epub
lic
Dig
ital
Ado
ptio
n In
dex,
sca
le 0
-1
DAI Sub-indexes
Namibia Average of comparators
Digital Adoption Index Business Sub-Index
Government Sub-IndexPeople Sub-Index
0,38
0,50
0,34 0,31
0,570,61
0,49
0,61
150. 151.
Namibia Systematic Country Diagnostic80
Namibia faces an urgent need to overcome policy inconsistencies, unevenly distributed access to internet services, content that is not relevant, and capability deficits to realize the outcomes and associated benefits of its e-government strategy.The e-Government Readiness Model was used to
measure how ready various levels of government,
businesses, and communities are for participation
in e-government. The model focuses on five main
categories of readiness for e-government, and
Namibia was classified as having an “average” level
of e-government readiness.41 Concerted efforts
to modernize began in 2014 with the launch of the
e-Government Strategic Action Plan for the Public
Service of Namibia (2014–18).
Entrepreneurship in the digital ecosystem also needs to be improved. According to the Global
Entrepreneurship Index Study, efforts to improve the
entrepreneurship ecosystem should be distributed
as follows: 44 percent to developing startup skills
(those necessary to start a business based on their
own perceptions and the availability of tertiary
education); 19 percent to technology absorption
(enlarging the technology sector and enabling
businesses to rapidly absorb new technology); 19
percent to process innovation (ensuring businesses
use new technology and that they are they able
access high quality human capital in STEM fields);
and 17 percent to risk capital (ensuring capital is
available from both individual and institutional
investors).
However, Namibia’s technical skills are not high enough to drive the digital transformation initiatives that the country aspires to roll out. A
country with adequate technical skills, particularly
where the youth are concerned, is a precondition for
becoming an industrialized nation and creating the
E-Government Strategic Action Plan for the Public Service of Namibia: Available at: https://www.gov.na/documents/10181/18040/e-Gov+Strategic+Plan+for+the+Public+Service+2014+to+2018/cce8facc-309d-43cd-ab3d-e5ce714eaf69
70% of Government Schools without Internet: Available at: https://neweralive.na/posts/70-of-govt-schools-without-internet
Namibia’s 5th National Development Plan: Available at: https://www.gov.na/documents/10181/14226/NDP+5/5a0620ab-4f8f-4606-a449-ea0c810898cc?version=1.0
41.
42.
43.
necessary demand to grow a vibrant digital economy.
Namibia has a large pool of young workers who could
contribute to the economic transformation agenda.
The challenge is that many of them are unskilled.
Given the importance of technical and vocational
education and training (TVET) in addressing this
challenge, the current TVET enrolment represents
half of the enrolment of Namibia’s three universities.
Furthermore, almost 70 percent of government
schools—590 out of 1,897—are still not connected to
the internet.42
Likewise, access to university educational opportunities continues to be low, especially among poor, rural students from marginalized and special-needs groups. Public and private
sector employers have expressed concern over the
quality and relevance of Namibia’s universities. Post-
graduate education continues to be underdeveloped,
and its contribution to research and innovation
remains small. The Government has an ambitious
plan to increase the ICT literacy and skills of its
population as part of its vision to create a knowledge-
based society. Investments in quality technical skills
development is one of five game-changers that
the Fifth National Development Plan identifies as
key to building a high-performing economy.43 Fair
competition facilitates ICT-driven economic growth
and job creation, marked by broadband access and
use extending geographically in terms of quality and
applications. Speed and quality of service of end-
user connectivity are key product differentiators,
both national and internationally. New efforts from
policymakers and legislators are required to attract
the private investment that drives social inclusion
and economic growth.
152.
153.
154.
155.
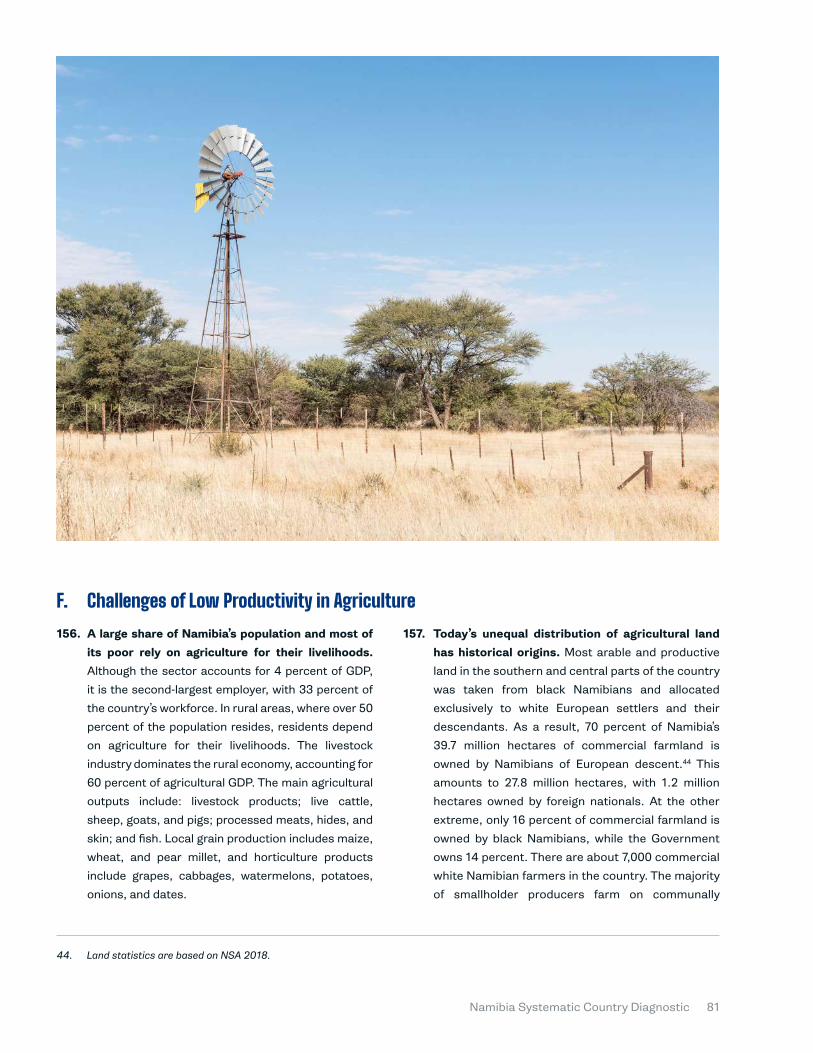
Namibia Systematic Country Diagnostic 81
Challenges of Low Productivity in AgricultureA large share of Namibia’s population and most of its poor rely on agriculture for their livelihoods. Although the sector accounts for 4 percent of GDP,
it is the second-largest employer, with 33 percent of
the country’s workforce. In rural areas, where over 50
percent of the population resides, residents depend
on agriculture for their livelihoods. The livestock
industry dominates the rural economy, accounting for
60 percent of agricultural GDP. The main agricultural
outputs include: livestock products; live cattle,
sheep, goats, and pigs; processed meats, hides, and
skin; and fish. Local grain production includes maize,
wheat, and pear millet, and horticulture products
include grapes, cabbages, watermelons, potatoes,
onions, and dates.
F. Today’s unequal distribution of agricultural land has historical origins. Most arable and productive
land in the southern and central parts of the country
was taken from black Namibians and allocated
exclusively to white European settlers and their
descendants. As a result, 70 percent of Namibia’s
39.7 million hectares of commercial farmland is
owned by Namibians of European descent.44 This
amounts to 27.8 million hectares, with 1.2 million
hectares owned by foreign nationals. At the other
extreme, only 16 percent of commercial farmland is
owned by black Namibians, while the Government
owns 14 percent. There are about 7,000 commercial
white Namibian farmers in the country. The majority
of smallholder producers farm on communally
Land statistics are based on NSA 2018. 44.
156. 157.
Namibia Systematic Country Diagnostic82
owned land, which is highly degraded, overgrazed,
and exposed to bush encroachment. Farmers on
communal land do not have land titles, which makes
it difficult to access finance from commercial banks.
Gender gaps are also evident in land and housing ownership. The 2013 Demographic and Health
Survey analyzed women’s ownership of houses
and land. Ownership was sub-categorized by sole
ownership, joint ownership, and both sole and joint
ownership. Overall, only about 31 percent of women
owned a house and just 21 percent owned land at
the time of the survey. House ownership by women
was slightly higher in urban areas (32 percent) than
in rural areas (29 percent), while land ownership was
higher in rural areas (24 percent) than in urban areas
(19 percent). As was the case with women, men were
more likely to own property with increasing age, with
male house ownership being higher in urban areas
and male land ownership being higher in rural areas.
To address the historical issue of unequal land distribution, the Government implemented a land reform policy in 1991. The policy is based
in the “willing seller, willing buyer” market-based
approach. Over the past 26 years, the Government
has acquired 496 farms (totaling about 3 million
hectares at a cost of about N$1.9 billion) and
resettled 5,352 beneficiaries.
Lack of access to credit and innovative financial products limits value addition in the agriculture sector. A key binding constraint to many value-chain
actors—a common thread to the above-mentioned
challenges—is the lack of access to credit. This is an
especially serious constraint for small-to-medium
communal and emerging producers. It hinders
the ability of producers and other actors to: add
value to their enterprises; meet other household
demands, such as buying feed, supplements, and
veterinary drugs and services; and invest in needed
infrastructure.
Most commercial banks are reluctant to lend to smallholder communal farmers due to the lack of landownership, infrastructure, and other assets. The requirement for collateral is a major problem
for the many producers who farm on communal
lands because they lack land titles. Emerging
livestock farmers on commercial land or those who
have been resettled and hold land titles also face
major constraints when it comes to borrowing from
commercial banks. Taken together, the communal
and emerging commercial farmers hold the largest
share of the national livestock herd. Agribank is the
only bank that offers loans to all farmers, including
communal and emerging farmers. Overall, there
is unmet demand for finance and access to credit
by smallholder and emerging producers, partly
because there are insufficient innovative financial
lending products targeting the diverse needs of
value-chain actors.
Creating more and better jobs requires economic transformation or moving workers from lower to higher productivity activities. A two-pronged
focus involves developing rural productivity while
supporting internal migration and agglomeration.
It also means a spatial transformation while pulling
people from rural to urban areas. This shift will need
to be led by the private sector, the main engine of
job growth. Beyond these traditionally important
sectors, it is essential to harness the technological
innovation and entrepreneurship that the digital
age has unleashed. However, it is clear that a large
proportion of the poor will remain in rural areas due
to the rural population’s high fertility rates.
Technology adoption is relatively low and raising agricultural productivity is critical in catalyzing growth and economic transformation. The WDR
2009 and the recent WDR 2019 on “The Future
of Work in Africa” support the notion of fast
agglomeration and adoption of productivity changes
associated with technology (Box 10). Namibia has
a small manufacturing base, so automation is not
likely to displace many workers in the coming years.
Most rural workers have limited education and tend
to do informal work, so usable technologies designed
to meet their productive needs have the potential
to help them learn more and earn more. Digital
technologies have the potential to help build skills for
those with low education and limited opportunities—
and to boost productivity and create better jobs in all
enterprises, including informal ones.
158.
159.
160.
161.
162.
163.
Namibia Systematic Country Diagnostic 83
The World Development Report 2009 sets policy priorities for special development in rapidly urbanizing economies. The main principles are universal:
� In places rapidly urbanizing, governments with good institutions in place can focus on connective infrastructure, so that the benefits of rising economic density are more widely shared. A good example is Chongqing, China.
� Where institutions and infrastructure are in place, targeted interventions may still be necessary to deal with slums/townships. These interventions will not work unless institutions for land and basic services are reasonably effective and transport infrastructure is in place. A good example is Bogotá, Colombia.
� In some countries, lagging areas are sparsely populated. It does not make much sense to spread expensive infrastructure into these places, or to give firms incentives to move to them. What makes much more sense is to provide basic services everywhere, even if it costs more to reach distant areas. Encouraging mobility of people is the priority, and institutions that make land markets work better and provide security, schools, streets, and sanitation should be the mainstay of integration policy.
BOX 10: Developing policy priorities based on World Development Reports 2009 and 2019
According to the recent flagship World Bank report “The Future of Work in Africa,” digital technology adoption has the potential, if harnessed effectively, to transform the nature of work for all Africans. The policy priorities could be emphasized in three E’s.
� First, enable entrepreneurship: let good ideas flourish no matter where they come from, so that African entrepreneurs build apps that enable Africa’s workers to build their skills as they work.
� Second, enhance the productivity of the informal sector: create a business environment that helps boost the productivity of informal businesses and workers, rather than focusing on trying to formalize them.
� Third, extend social protection coverage: improve revenue collection, rebalance government spending, and more effectively coordinate development assistance. The future of work in Africa could be bright.
Growing Imbalances between Sectors
3.
The share of GDP from agriculture and mining has decreased over time, while the share from services has increased. Data from the Bank of Namibia (Bank
of Namibia Annual Reports 1992, 2010, 2017) show
agriculture’s share of gross value added declined from
9.8 percent in 1990 to 5.1 percent in 2012 and to 4.5
percent in 2017. This was mainly due to unfavorable
climatic conditions but also reflected the rapid
expansion of other sectors, such as manufacturing
and services. The contribution of the manufacturing
164.
Incomplete Structural Transformation and Infrastructure GapsA.
sector to GDP increased from 4.5 percent in 1990
to 9.7 percent in 2015 and 10.8 percent in 2017,
primarily because of the rapid expansion of fish and
meat processing, and some mineral operations—
the two areas that currently constitute the bulk of
manufacturing activities. Services also expanded
from 48 percent of the economy in 1990 to 59
percent in 2015. This increase can be attributed
to the expansion of government services after
independence, particularly education and health. By
Namibia Systematic Country Diagnostic84
contrast, mining decreased from a high of 20 percent
of the economy at independence to 16.1 percent in
2008 and to 11.3 percent in 2012.
Activity in the tertiary sector has played a key role in spurring growth, particularly after 2004. Since independence, the tertiary sector (services)
has typically accounted for more than 50 percent of
annual output with services, on average, contributing
to more than 72.4 percent to total growth (Figure
3). Within the tertiary sector, public administration
contributed the most to services’ value-added growth
with 20.3 percent, driven by the continuous increase
in government expenditures; it was followed by trade
(17.5 percent) and financial intermediation services
(11.5 percent). The contribution of the secondary
sector (manufacturing, construction, and utilities)
was an average of 15.7 percent during 1992–2017, with
manufacturing and construction having the largest
contributions. The mining sector’s contribution to
growth was less than 10 percent during this period.
Its contribution has increased gradually since 2004,
with the start of offshore diamond extraction, and it
further intensified in 2017, driven by the opening of
the Husab mine operation. Given its capital-intensive
nature, the mining sector has done very little for job
creation.
However, there is an evident, and growing, imbalance between the sectors’ labor-force shares and contributions to growth, which largely reflects investment patterns. A large share of the population
lives off subsistence agricultural activities, and
one-third are employed in the agriculture sector.
Despite this, the sector only accounts for 10 percent
of national output. This imbalance in the share of
employment and output implies the absence of
productivity growth in the sector. A similar imbalance
is found in mining: the sector employs less than 2
percent of the population despite accounting for
more than 10 percent of output. Investment patterns
to date, which have focused on a largely capital-
intensive mining sector, have been a key driver of this
trend. During 2007–17, gross fixed capital formation
(GFCF) in agriculture accounted for a mere 5 percent
of the overall level.45
Agriculture’s prominence in the economy has faltered, despite its relative importance. The
agriculture sector’s average contribution to growth
has been a marginal 4.1 percent, despite employing
a large proportion of the labor force. Growth in
agricultural output has averaged a mere 2 percent,
and its share in output has narrowed from its peak
of 13 percent in 1993 to 7 percent in 2018. The
sector is also characterized by low wages: average
wages for 1995–2016 are almost 120 times higher
in mining, 50 times higher in services, and 23 times
higher in manufacturing.46 The authorities have taken
strides to improve agricultural production through
the implementation of the Green Scheme47 but,
due to increasing vulnerability to climate change,
Namibia has seen a reversal in the gains made in
the agriculture sector. The persistent occurrence of
droughts and floods in recent years has reduced food
production in the country, increasing food scarcity.48
During 2007–17, average GFCF was highest in private services (30 percent) and mining and quarrying (28 percent), followed by public services (17 percent).
Figure based on average wage per sector expressed in 2010 constant prices.
A Ministry of Agriculture, Water and Forestry initiative to encourage the development of irrigation-based production with the aim of increasing agriculture’s contribution to GDP while providing opportunities for community and skills development.
For example, provisional crop harvest estimates for 2018/19 indicate that the whole country is expecting a reduction of at least 53 percent below last season’s harvest and more than 42 percent below 20-year average production.
45.
46.
47.
48.
165.
166.
167.
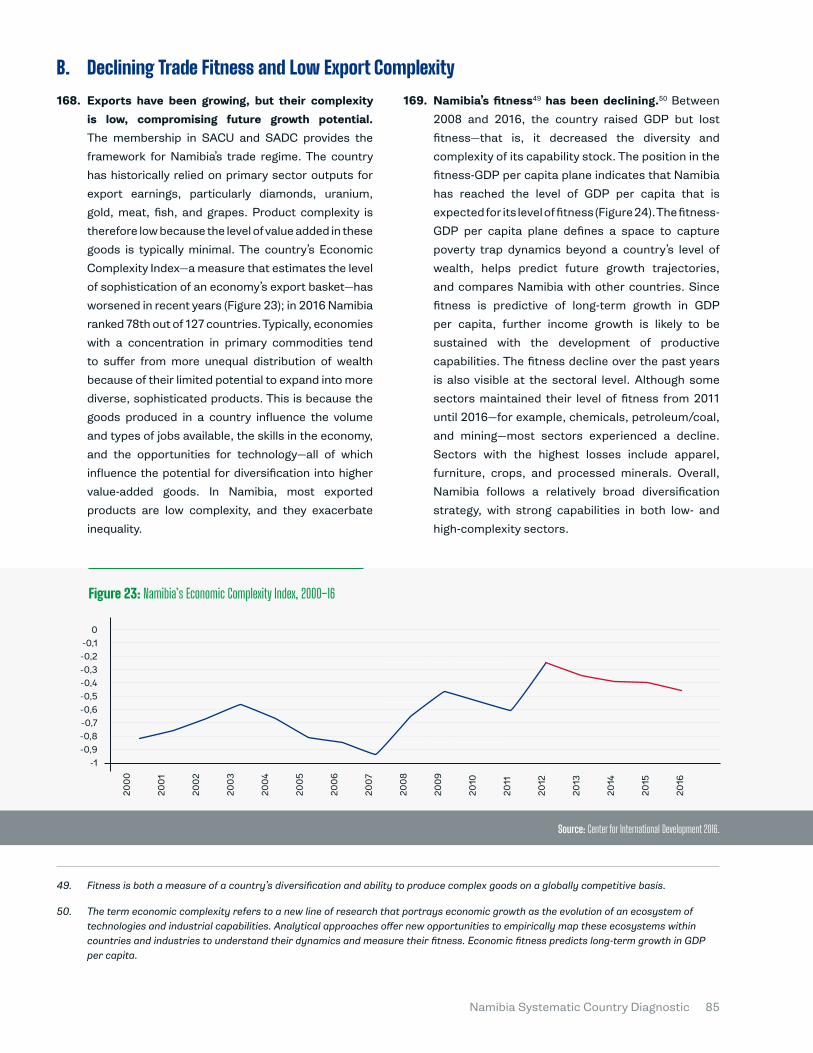
Namibia Systematic Country Diagnostic 85
Declining Trade Fitness and Low Export ComplexityExports have been growing, but their complexity is low, compromising future growth potential. The membership in SACU and SADC provides the
framework for Namibia’s trade regime. The country
has historically relied on primary sector outputs for
export earnings, particularly diamonds, uranium,
gold, meat, fish, and grapes. Product complexity is
therefore low because the level of value added in these
goods is typically minimal. The country’s Economic
Complexity Index—a measure that estimates the level
of sophistication of an economy’s export basket—has
worsened in recent years (Figure 23); in 2016 Namibia
ranked 78th out of 127 countries. Typically, economies
with a concentration in primary commodities tend
to suffer from more unequal distribution of wealth
because of their limited potential to expand into more
diverse, sophisticated products. This is because the
goods produced in a country influence the volume
and types of jobs available, the skills in the economy,
and the opportunities for technology—all of which
influence the potential for diversification into higher
value-added goods. In Namibia, most exported
products are low complexity, and they exacerbate
inequality.
168. 169.
B. Namibia’s fitness49 has been declining.50 Between
2008 and 2016, the country raised GDP but lost
fitness—that is, it decreased the diversity and
complexity of its capability stock. The position in the
fitness-GDP per capita plane indicates that Namibia
has reached the level of GDP per capita that is
expected for its level of fitness (Figure 24). The fitness-
GDP per capita plane defines a space to capture
poverty trap dynamics beyond a country’s level of
wealth, helps predict future growth trajectories,
and compares Namibia with other countries. Since
fitness is predictive of long-term growth in GDP
per capita, further income growth is likely to be
sustained with the development of productive
capabilities. The fitness decline over the past years
is also visible at the sectoral level. Although some
sectors maintained their level of fitness from 2011
until 2016—for example, chemicals, petroleum/coal,
and mining—most sectors experienced a decline.
Sectors with the highest losses include apparel,
furniture, crops, and processed minerals. Overall,
Namibia follows a relatively broad diversification
strategy, with strong capabilities in both low- and
high-complexity sectors.
Fitness is both a measure of a country’s diversification and ability to produce complex goods on a globally competitive basis.
The term economic complexity refers to a new line of research that portrays economic growth as the evolution of an ecosystem of technologies and industrial capabilities. Analytical approaches offer new opportunities to empirically map these ecosystems within countries and industries to understand their dynamics and measure their fitness. Economic fitness predicts long-term growth in GDP per capita.
49.
50.
Figure 23: Namibia’s Economic Complexity Index, 2000–16
Source: Center for International Development 2016.
0-0,1-0,2-0,3-0,4-0,5-0,6-0,7-0,8-0,9
-1
200
0
200
1
200
2
200
3
200
4
200
5
200
6
200
7
200
8
200
9
2010
2011
2012
2013
2014
2015
2016
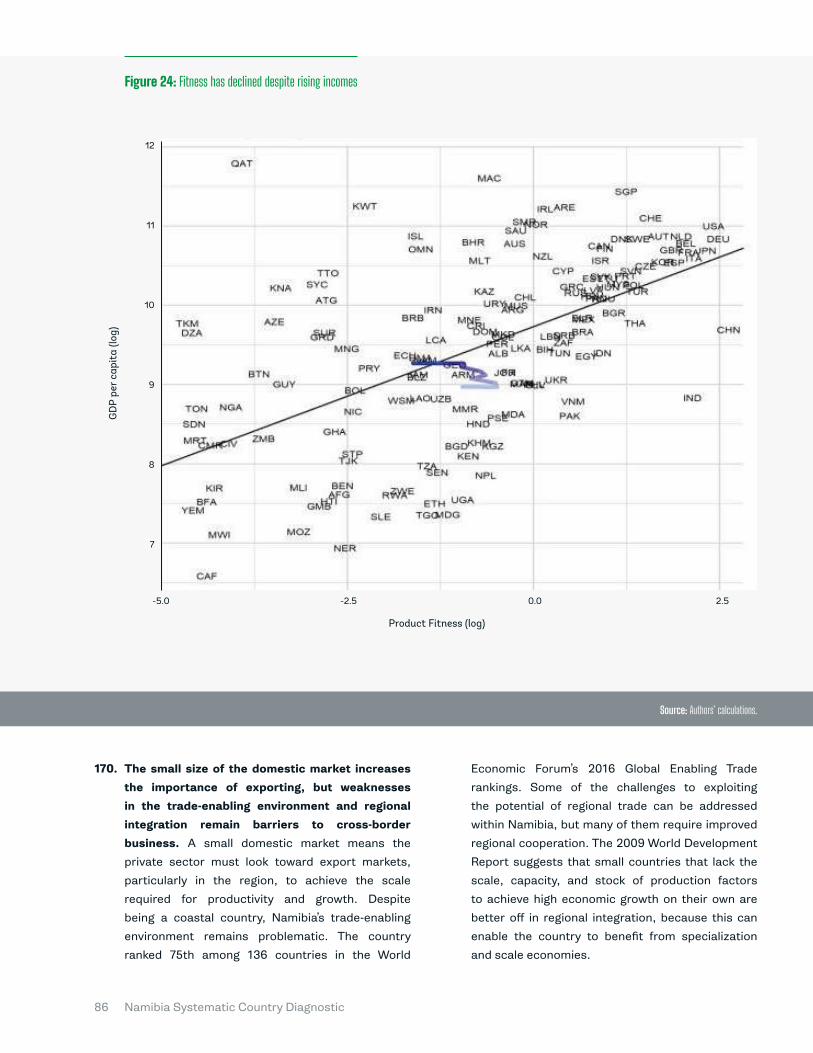
Namibia Systematic Country Diagnostic86
The small size of the domestic market increases the importance of exporting, but weaknesses in the trade-enabling environment and regional integration remain barriers to cross-border business. A small domestic market means the
private sector must look toward export markets,
particularly in the region, to achieve the scale
required for productivity and growth. Despite
being a coastal country, Namibia’s trade-enabling
environment remains problematic. The country
ranked 75th among 136 countries in the World
Figure 24: Fitness has declined despite rising incomes
Economic Forum’s 2016 Global Enabling Trade
rankings. Some of the challenges to exploiting
the potential of regional trade can be addressed
within Namibia, but many of them require improved
regional cooperation. The 2009 World Development
Report suggests that small countries that lack the
scale, capacity, and stock of production factors
to achieve high economic growth on their own are
better off in regional integration, because this can
enable the country to benefit from specialization
and scale economies.
170.
Source: Authors’ calculations.
12
11
10
9
8
7
-5.0 -2.5 0.0 2.5
GD
P pe
r cap
ita
(log)
Product Fitness (log)
Namibia Systematic Country Diagnostic 87
Fast Urbanization and Poor Urban InfrastructureNamibia has one of the world’s fastest urbanization rates. Back in the early 1990s, only about one-
quarter of Namibians lived in cities. Today, close
to half of the population is urbanized. Based on UN
population projections, this trend will continue and
almost three-quarters of Namibians will be living
in cities within next 30 years. Cities are attracting
human capital, talent, and investment. Urban areas
are becoming major growth engines, generating
larger shares of GDP and helping many people rise
out of poverty. However, the speed and scale of
urbanization also brings challenges. Housing crises
and widening income gaps are defining Namibian
cities, which are struggling to keep up with their fast-
growing populations.
As cities grow, so does their exposure and vulnerability to natural disasters. Natural hazards
are becoming more frequent, intense, and severe due
to climate change. It is important to build resilience
to climate change and disaster risks, connecting
investors with bankable projects and keeping
millions of people safer. Urban resilience goes hand-
in-hand with environmental sustainability. The World
Bank’s Global Platform for Sustainable Cities works
with mayors in developing countries to transform
cities into inclusive and resilient hubs of growth.
Urban population growth gives rise to both opportunities and challenges. As the urbanization
process unfolds, Namibia will soon face
unprecedented growth in the number of people
residing in Windhoek and other cities. Because
agglomeration in cities stimulates trade and
C. productivity gains, this major demographic shift has
the potential to boost the economy toward faster
growth and economic development. Namibia should
prepare for massive urban population growth and
ensure that it occurs in efficient and sustainable
ways. This will entail: (i) mobilizing lessons from
urban economics and economic geography; and (ii)
assessing the feasibility and efficiency of policies
designed to reap the benefits of agglomeration,
with an emphasis on land, services delivery, and
transport issues.
Unmanaged urbanization is a growing concern and, as in other unequal countries, this could pose a risk for urban violence and crime. This so-called
“urban dilemma” connotes the paradoxical challenge
of urbanization as an engine of development,
as well as an accelerator of the risk of violence,
especially for the urban poor. A rapidly growing
urban population puts pressure on land availability,
employment opportunities, and the delivery of
basic services, including security. These issues are
especially troubling if local governments do not have
the capacity and the know-how to cater to their
growing populations.
Promoting territorial development is an important area of further investment. Promoting territorial
development, developing a new urban agenda, and
supporting urban resilience to climate change and
disaster risks should be core government priorities
in the years to come. There is urgent need to support
sustainable economic growth in urban spaces.51
This section is based on the World Bank’s publication “Three Big Ideas to Achieve Sustainable Cities and Communities” (World Bank 2018c). The World Bank Group provides support as a knowledge partner to the Urban 20 initiative, which encourages cities to share their experiences and develop collective messages to enrich the G20 debates on the global issues of climate action, sustainable development, and their socioeconomic ramifications. The World Bank’s “East Asia and Pacific Cities: Expanding Opportunities for the Urban Poor” report encourages cities in the region to ensure inclusive, equitable urban growth through a multidimensional approach to planning. The report “Africa’s Cities: Opening Doors to the World” encourages improving conditions for people and businesses in African cities by aggressively investing in infrastructure and reforming land markets to accelerate economic growth, add jobs, and improve city competitiveness. The World Bank is launching the North and Northeastern Development Initiative, a multisectoral program consisting of projects in transport, water, energy, agriculture, livelihoods, and social protection to connect the region to national and global markets. These efforts focus on strengthening institutions for land management and territorial planning, as well as improving subnational financial management and investment prioritization.
51.
171.
172.
174.
175.
173.2.5
Namibia Systematic Country Diagnostic88
Economic Transformation Is Held Back by Remaining Infrastructure GapsOutside of diamonds, several sectors identified as having the best potential to accelerate growth remain undeveloped due in part to gaps in critical infrastructure. Namibia also has several renewable
energy resources it could develop to increase
the domestic power supply. The country’s solar
irradiation is the best in Africa, yet minimal solar-
based power generation has been developed.52
Developing this resource deserves serious
consideration because of its potential to bridge
demand/supply gaps, as well as increase exports.
The country could move from being a net power
importer to a major exporter in the Southern African
Power Pool (SAPP). Solar power could also facilitate
energy access to sparse populations through off-
grid electrification. Similarly, the vision to develop
as a logistics hub requires significant efforts to
develop the three regional corridors into multimodal
corridors that can both compete with other regional
corridors and support the development of growth
opportunities along them. These gaps exist in the
rail, civil aviation, and road subsectors.
Namibia promulgated a PPP law in 2017, but it has yet to unlock the benefits of private sector financing to support infrastructure development. The country has to date used public financing to
fund the delivery of government programs. Given
the country’s relative political stability and well-
established rule of law, the 2017 PPP Law provides
the regulatory basis to supplement public financing
D. with private sector funds for necessary infrastructure
developments. These include additional generation
capacity through solar power (both on- and off-grid),
expansion of the international airport’s capacity, and
improving safe, reliable, and efficient operations in
the port, rail, and road subsectors.
I. The energy sector is a major infrastructure challenge
The status of the domestic energy supply remains a major infrastructure challenge. Domestic
generation capacity is inadequate to meet domestic
demand. Namibia currently imports 73 percent of its
electricity; about half of these imports come from
South Africa, with one-third being purchased from
the SAPP market. At peak times, imports can rise
to as much as 90 percent. This creates a high level
of dependence on the availability and reliability of
foreign generators, also placing a burden on the
balance of payments and budget. Recent events in
the energy sector in South Africa, as well as pressure
on domestic hydro resources due to prolonged
drought, could potentially undermine the security
of supply. In its National Integrated Resource Plan
(NIRP), the Government has prioritized security of
supply, access to appropriate, affordable energy,
and sustainability as the underlying objectives of its
energy policy framework (Namibia Electricity Supply
Industry 2016).
Namibia’s 2016 Integrated Resource Plan (IRP) prioritized coal-based generation, some concentrating solar power and biomass. Over the past decade, the cost of solar technologies has fallen rapidly as technologies matured, and the trend has continued since the IRP was completed in 2016.
52.
176.
177.
178.
Namibia Systematic Country Diagnostic 89
Based on World Development Indicators data, less than half of Namibia’s population has access to electricity. Namibia has an overall access rate of
45.4 percent. This figure is considerably higher in
urban areas (83 percent) than in the inadequately
served rural areas (21 percent). Access is mostly
grid connected, leaving roughly 200,000 households
without access in rural areas and about 50,000
households without it in urban areas. This poses a
key constraint to reducing rural poverty, improving
economic opportunities, and accessing social
services, including health and education.53
Namibia needs to address many energy-sector challenges and obstacles. These include
centricity infrastructure (the electricity grid and
the connectedness of remote areas), power
generation gaps, and energy prices. A stable and
accessible electricity supply is one of the foremost
preconditions for starting and operating a business.
According to the 2018 Ease of Doing Business
Index, Namibia has gaps in electricity production
and is dependent on imports from South Africa
(around 50 percent of electricity consumption).
Domestic electricity production depends mostly
on the Ruacana Hydropower Station, where annual
electricity production is vulnerable to climate
conditions.
On a positive note, Namibia has one of the highest solar irradiation regimes in the world, but it has yet to benefit from utility-scale renewables to the extent made possible by cost trends in recent years. The potential for low-cost, renewable energy
is substantial given advances in renewable energy
and battery storage technologies in the past five
years.54 In meeting its renewable energy goals under
its NIRP, the Government has committed to bringing
online 170 megawatts (MW) of renewable (solar and
wind) power projects.55 Given the high-quality solar
and wind resources in the country and dramatic cost
declines of renewable technologies in recent years,
the country could benefit greatly from its excellent
renewable resources. The challenges posed by small
power systems, however, have led to the suboptimal
development of a few small renewable energy
projects. This market imperfection prevents the
country from developing its gigawatts of potential
solar and wind projects (Box 11).
Investment in renewable energy could eliminate Namibia’s energy dependency. The Nationally
Determined Contributions (NDC) and national
climate strategies place a high priority on
adaptation to climate change.56 Based on the NDC,
implementation of this INDC57 represents a challenge
to the Government. Multiple shortcomings and
constraints will have to be overcome while fulfilling
the needs for systemic, individual, and institutional
capacity-building, as well as access to the latest
environmentally friendly and clean production
technologies. As a signatory to the 2015 Paris
Agreement on Climate Change, Namibia is expected
to submit an updated NDC in 2020. It is intended
to be more ambitious in terms of increasing both
adaptation and mitigation measures in line with
the Paris Agreement’s goal of reaching net-zero
emissions and climate resilience by 2050.
The Government has launched a technical assistance program funded by the Energy Sector Management Assistance Program, with support from the World Bank, to prepare a nationwide geospatial least-cost grid expansion and off-grid complement plan. The results are meant to aid the revision of the Rural Electrification Distribution Master Plan and promote efficient scale-up of electricity access.
The cost of solar photovoltaic has declined by 80 percent, concentrated solar power by 70 percent, and battery storage by 60 percent.
This objective and commitment under NIRP have largely been met with 150 MW of solar already connected to the national grid and with another 100 MW of priority projects (solar, wind, and biomass) being sequentially deployed by NamPower.
Namibia’s NDC: https://www4.unfccc.int/sites/ndcstaging/PublishedDocuments/Namibia%20First/INDC%20of%20Namibia%20Final%20pdf.pdf Namibia Climate Change Strategy and Action Plan (NCCSAP): http://www.met.gov.na/files/files/National%20Climate%20Change%20Strategy%20&%20Action%20Plan%202013%20-%202020.pdf National Policy on Climate Change for Namibia 2011: http://www.met.gov.na/files/files/National%20Policy%20on%20Climate%20Change%20for%20Namibia%202011(1).pdf
INDC Intended Nationally Determined Contributions of The Republic of Namibia to the United Nations Framework Convention on Climate Change. https://www4.unfccc.int/sites/ndcstaging/PublishedDocuments/Namibia%20First/INDC%20of%20Namibia%20Final%20pdf.pdf
53.
54.
55.
56
57.
179.
180.
181.
182.
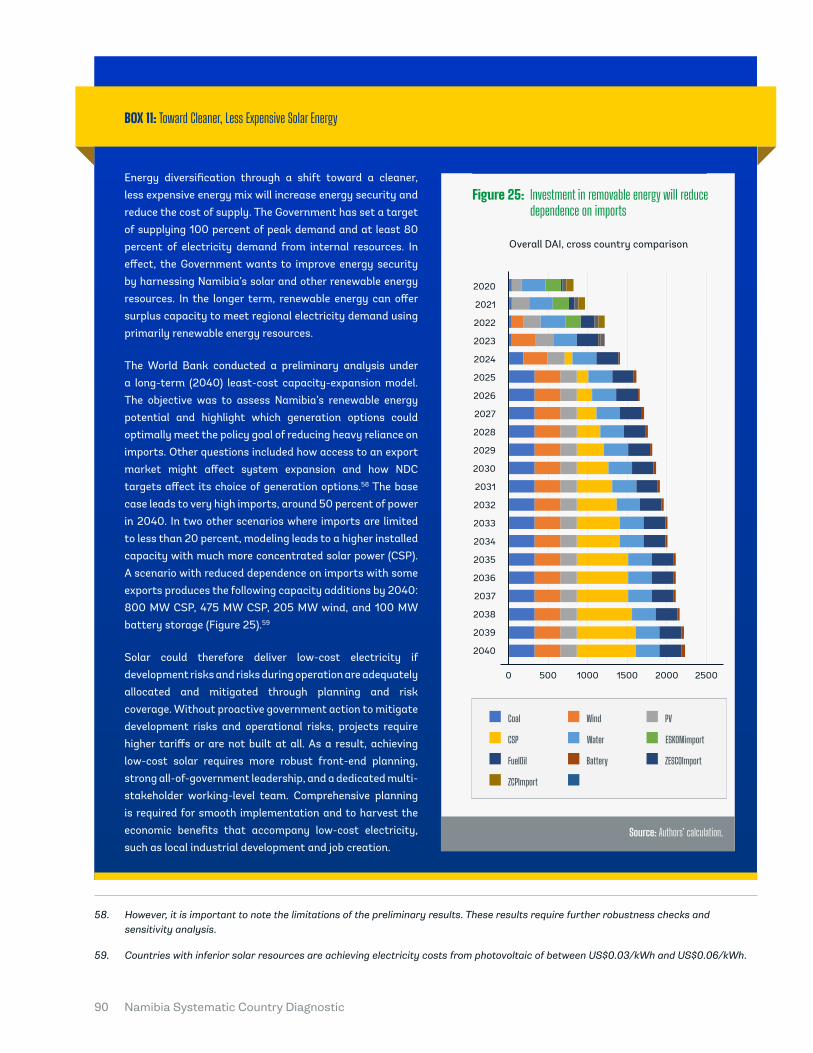
Namibia Systematic Country Diagnostic90
However, it is important to note the limitations of the preliminary results. These results require further robustness checks and sensitivity analysis.
Countries with inferior solar resources are achieving electricity costs from photovoltaic of between US$0.03/kWh and US$0.06/kWh.
58.
59.
Energy diversification through a shift toward a cleaner, less expensive energy mix will increase energy security and reduce the cost of supply. The Government has set a target of supplying 100 percent of peak demand and at least 80 percent of electricity demand from internal resources. In effect, the Government wants to improve energy security by harnessing Namibia’s solar and other renewable energy resources. In the longer term, renewable energy can offer surplus capacity to meet regional electricity demand using primarily renewable energy resources.
The World Bank conducted a preliminary analysis under a long-term (2040) least-cost capacity-expansion model. The objective was to assess Namibia’s renewable energy potential and highlight which generation options could optimally meet the policy goal of reducing heavy reliance on imports. Other questions included how access to an export market might affect system expansion and how NDC targets affect its choice of generation options.58 The base case leads to very high imports, around 50 percent of power in 2040. In two other scenarios where imports are limited to less than 20 percent, modeling leads to a higher installed capacity with much more concentrated solar power (CSP). A scenario with reduced dependence on imports with some exports produces the following capacity additions by 2040: 800 MW CSP, 475 MW CSP, 205 MW wind, and 100 MW battery storage (Figure 25).59
Solar could therefore deliver low-cost electricity if development risks and risks during operation are adequately allocated and mitigated through planning and risk coverage. Without proactive government action to mitigate development risks and operational risks, projects require higher tariffs or are not built at all. As a result, achieving low-cost solar requires more robust front-end planning, strong all-of-government leadership, and a dedicated multi-stakeholder working-level team. Comprehensive planning is required for smooth implementation and to harvest the economic benefits that accompany low-cost electricity, such as local industrial development and job creation.
BOX 11: Toward Cleaner, Less Expensive Solar Energy
Source: Authors’ calculation.
Coal Wind PV
Water ESKOMimportCSP
FuelOil
ZCPImport
Battery ZESCOImport
Figure 25: Investment in removable energy will reduce dependence on imports
2020
2021
2022
2023
2024
2025
2026
2027
2028
2029
2030
2031
2032
2033
2034
2035
2036
2037
2038
2039
2040
0 500 1000 1500 2000 2500
Overall DAI, cross country comparison
Namibia Systematic Country Diagnostic 91
II. Challenges of the transport sector
Recent government funding constraints have negatively impacted the execution of road works. The quality of road infrastructure is ranked 21st by the Global Competitiveness Report 2019. Nevertheless, several infrastructure projects
have been delayed, increasing costs. The road
reform of 1998 resulted in the establishment of the
Road Fund Administration (RFA), responsible for
providing financing for a safe and efficient national
road network, the Roads Authority, responsible
for managing the national road network, and the
Roads Contractor Company (RCC), responsible for
maintaining the road network, for a limited time,
under contract. The respective pieces of enabling
legislation intended that the RFA would generate
enough funds for both the provision and maintenance
of the road network. However, currency depreciation,
inflation, and increasing demand for road upgrading
resulted in lower revenue collections (Runji 2003).
In later years, the Government has contributed
significant financing for these investments.
Road safety is a growing concern. The road-injury
fatality rate has been reported to be considerably
higher than the African average by more than four
fatalities per 100,000 (NRSC 2015).60 The costs
extend far beyond the families and communities
of those directly affected and are ultimately borne
by the wider society and government. Hundreds of
millions of Namibian dollars are spent each year
in the aftermath of road accidents, and the total
figure has been estimated at a staggering 3 percent
of annual GDP. This huge financial burden places
avoidable strain on important public services,
reducing the capacity of emergency, health, and
welfare providers. The private sector is also affected,
and employers can suffer a considerable loss of
productivity and insurance companies are burdened
with high payouts in compensation for the lives lost
(LAC 2016).
The rail network provides an ideal opportunity to establish safe, reliable multimodal transport options along the three regional corridors. Currently, the rail links between Windhoek and South
Africa, and between Keetmanshoop and Gobabis
carry very little traffic, and the focus of Transnamib
Holdings, the rail operator, is to establish improved
services on the Walvis Bay–Windhoek, as well as the
Walvis Bay–Tsumeb, links. A viable railway system
could potentially connect coastal areas (ports)
with target destinations. Reliable, safe rail services
connecting ports with inland markets could both
boost internal freight and provide multimodal options
along regional corridors, linking Angola, Botswana,
and Zambia. The Government is currently investing
in track infrastructure rehabilitation (with the
assistance of a loan from the African Development
Bank, or AfDB) along the section between Walvis Bay
and Karibib. Parallel improvements in operations will
require further support.
According to the National Road Safety Council (NRSC), Namibia’s road injury fatality rate exceeds the African continental average of 26.6 per 100 000 at 31 per 100 000. Also, Statistics from the Motor Vehicle Accident Fund (MVA) of Namibia show that in 2018 Namibia ranked on of the first in Africa in road accidents with more than 19,000 accidents occurring every year.
60.
183.
184.
185.

CHALLENGES OF INCLUSIVENESS AND SERVICES DELIVERY
Namibia’s robust economic growth, democratic progress, and political stability mask deep inequalities in the distribution of resources, opportunities, income, and access to services that trace back to the colonial era. Despite rapid development, growth has not been inclusive. Economic advantage has remained in the hands of a relatively small elite group. This lack of inclusiveness and vast disparities are manifested in three main socioeconomic challenges that define the economy today: extremely high inequality in all income and social dimensions; low levels of human capital, especially among the poor; and a lack of productive jobs, resulting in extremely high levels of unemployment. Exclusion and lack of opportunities are evident for large segments of the population. High spending on social protection, health, and education has produced meager outcomes, especially for the poor.

Namibia Systematic Country Diagnostic94
1.Namibia’s human capital wealth is growing rapidly, but it is still behind other upper middle-income countries. According to the “Changing Wealth of
Nations” 2018 report, human capital is the largest
component of global wealth, accounting for two-
thirds of the total.61 This points to the need to invest
in people for wealth creation and future income
generation. For Namibia, human capital wealth
was close to 60 percent, a relatively high share in
comparison to other upper middle-income countries
(Figure 5). However, this relatively high share is
attributed to small production capital, and in absolute
terms the country is behind its upper middle-income
counterparts (Figure 4).
Relative High Poverty and Low Human CapitalBoth monetary and non-monetary indicators show significant progress over time. Between 1990 and
2017, Namibia’s life expectancy at birth increased by
3.4 years, mean years of schooling increased by 1.2
years, and expected years of schooling increased by
1.2 year (Figure 26). In 2017, the Human Development
Index (HDI)62 ranked Namibia 129th among 189
countries and territories, placing the country in the
medium human-development category. Namibia’s HDI
of 0.647 is above the average of 0.645 for countries in
the medium human-development group63 and above
the average of 0.537 for countries in Sub-Saharan
Africa (see country ranking, Figure 27).
The “Changing Wealth of Nations” report defines human capital wealth as the present value of the labor force’s future earnings. The estimates suggest human capital accounts for the largest share of a country’s wealth and typically a higher share in upper middle-income and high-income countries than in poorer countries.
The HDI is a summary measure for assessing long-term progress in three basic dimensions of human development: a long and healthy life, access to knowledge, and a decent standard of living. A long and healthy life is measured by life expectancy. Knowledge level is measured by mean years of education among the adult population (the average number of years of education received in a life-time by people aged 25 years and older); and access to learning and knowledge by expected years of schooling for children of school-entry age (the total number of years of schooling a child of school-entry age can expect to receive if prevailing patterns of age-specific enrolment rates stay the same throughout the child’s life). Standard of living is measured by gross national income (GNI) per capita expressed in constant 2011 international US dollars converted using purchasing power parity (PPP) rates (from UNDP publication).
Countries fall into four broad human development categories: Very High Human Development, High Human Development, Medium Human Development and Low Human Development. Medium Human Development includes countries ranked between 113 and 132: the Philippines, Egypt, Indonesia, Vietnam, Bolivia, Palestine, Iraq, El Salvador, Kyrgyzstan, Morocco, Nicaragua, Cape Verde, Guyana, Guatemala, Tajikistan, Namibia, India, Micronesia and Timor Leste.
61.
62.
63.
186. 187.
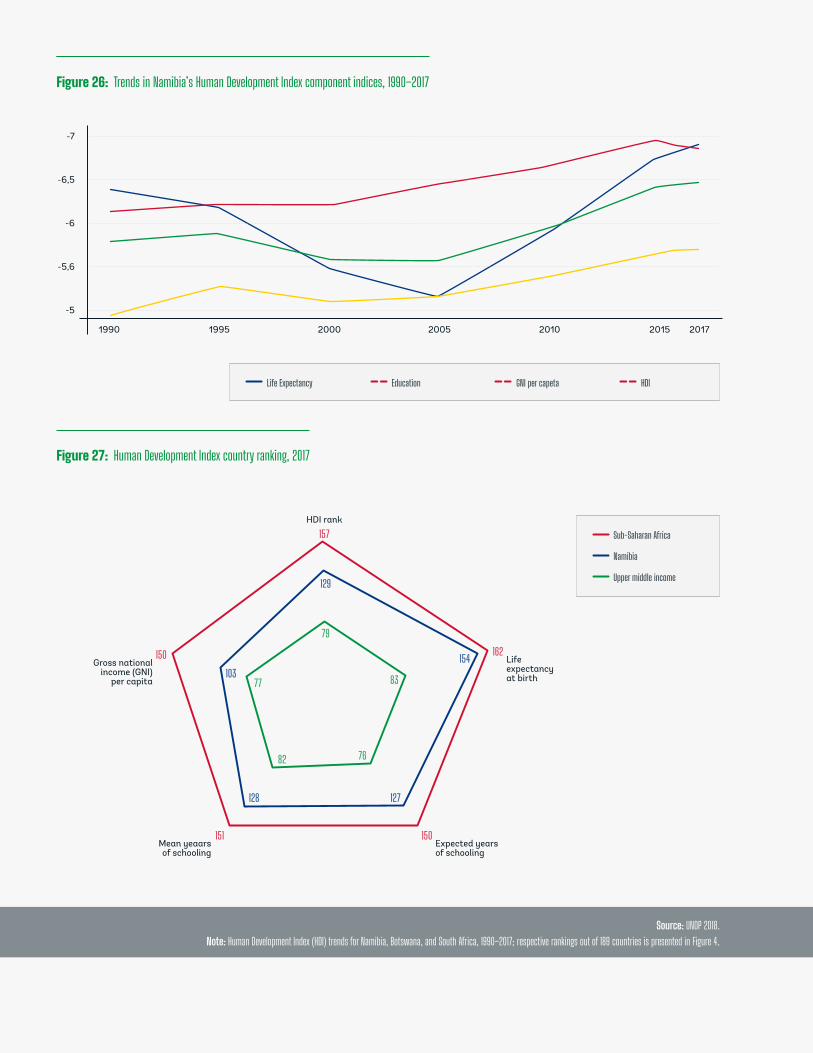
Namibia Systematic Country Diagnostic 95
Figure 26: Trends in Namibia’s Human Development Index component indices, 1990–2017
Figure 27: Human Development Index country ranking, 2017
Sub-Saharan Africa
Namibia
Upper middle income
Life Expectancy Education GNI per capeta HDI
-7
-6,5
-6
-5,6
-5
1990 1995 2000 2005 2010 2015 2017
Source: UNDP 2018. Note: Human Development Index (HDI) trends for Namibia, Botswana, and South Africa, 1990–2017; respective rankings out of 189 countries is presented in Figure 4.
157
129
10377
79
83
7682
128 127
154 162150
151 150Expected years of schooling
Life expectancy at birth
Gross national income (GNI)
per capita
Mean yeaars of schooling
HDI rank

Namibia Systematic Country Diagnostic96
Namibia ranks behind other upper middle-income countries on most human capital indicators. The
country ranked 117th among 157 countries on the
World Bank’s Human Capital Index (HCI).64 Children
born in Namibia today will be only 43 percent as
productive when they grow up as they could be if they
enjoyed complete education and full health. Namibia
ranks below other upper middle-income countries on
HCI components, and it fares only slightly better than
the average HCI for countries in Sub-Saharan Africa
(Figure 28). Namibian children who start school at
age 4 can expect to complete 8.9 years of school by
their 18th birthdays, a figure significantly lower than
the comparable countries. Only 71 percent of 15-year-
olds will survive to age 60. Twenty-three out of 100
children are stunted and at risk for cognitive and
physical limitations that can last a lifetime. Students
have poor learning outcomes: on harmonized tests,
they score only 407 on a scale where 625 represents
advanced learning attainment and 300 represents
minimum attainment. Factoring in what children
learn, expected years of school is only 5.8, indicating
a learning gap of 3.1 years.
The HCI measures the amount of human capital that a child born today can expect to attain by age 18. It conveys the productivity of the next generation of workers, measured against a benchmark of complete education and full health. It is made up of five indicators: the probability of survival to age 5, a child’s expected years of schooling, harmonized test scores as a measure of learning quality, adult survival rate (fraction of 15-year-olds who will survive to age 60), and the proportion of children who are not stunted.
64.
Figure 28 Figure 28 Human Capital Index rankings
Sub-Saharan Africa
Namibia
Upper middle income
131
76
56
131
133143
74
74 76
126
72
113
117
32
11590
78
130Human
Capital Index
Adult Survival Rate
Harmonized Test Scores
Expected Years of School
Probability of Survival to
Age 5
Fraction of Kids Under 5 Not
Stunted
Source: Human Capital Index 2017. Note: Respective rankings out of 157 countries is presented in the chart. The stunting ranking (fraction of children under age 5 who are not stunted) is out of 109 countries with available data.
188.
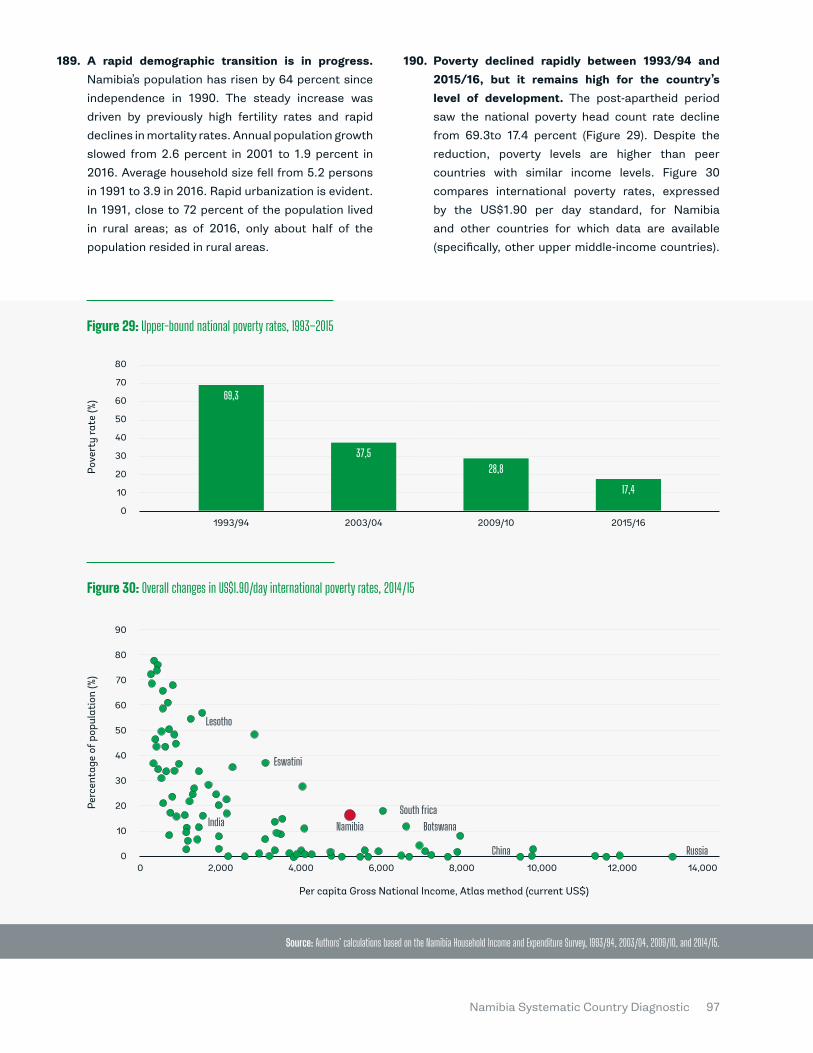
Namibia Systematic Country Diagnostic 97
A rapid demographic transition is in progress. Namibia’s population has risen by 64 percent since
independence in 1990. The steady increase was
driven by previously high fertility rates and rapid
declines in mortality rates. Annual population growth
slowed from 2.6 percent in 2001 to 1.9 percent in
2016. Average household size fell from 5.2 persons
in 1991 to 3.9 in 2016. Rapid urbanization is evident.
In 1991, close to 72 percent of the population lived
in rural areas; as of 2016, only about half of the
population resided in rural areas.
Poverty declined rapidly between 1993/94 and 2015/16, but it remains high for the country’s level of development. The post-apartheid period
saw the national poverty head count rate decline
from 69.3to 17.4 percent (Figure 29). Despite the
reduction, poverty levels are higher than peer
countries with similar income levels. Figure 30
compares international poverty rates, expressed
by the US$1.90 per day standard, for Namibia
and other countries for which data are available
(specifically, other upper middle-income countries).
Figure 29: Upper-bound national poverty rates, 1993–2015
Figure 30: Overall changes in US$1.90/day international poverty rates, 2014/15
Source: Authors’ calculations based on the Namibia Household Income and Expenditure Survey, 1993/94, 2003/04, 2009/10, and 2014/15.
80
70
60
50
40
30
20
10
0
Pove
rty
rate
(%)
2015/162009/102003/041993/94
69,3
37,528,8
17,4
2,0000 4,000 6,000 8,000 10,000 12,000 14,000
90
80
70
60
50
40
30
20
10
0
Per capita Gross National Income, Atlas method (current US$)
Lesotho
Eswatini
IndiaSouth frica
Namibia Botswana
China Russia
Perc
enta
ge o
f pop
ulat
ion
(%)
189. 190.
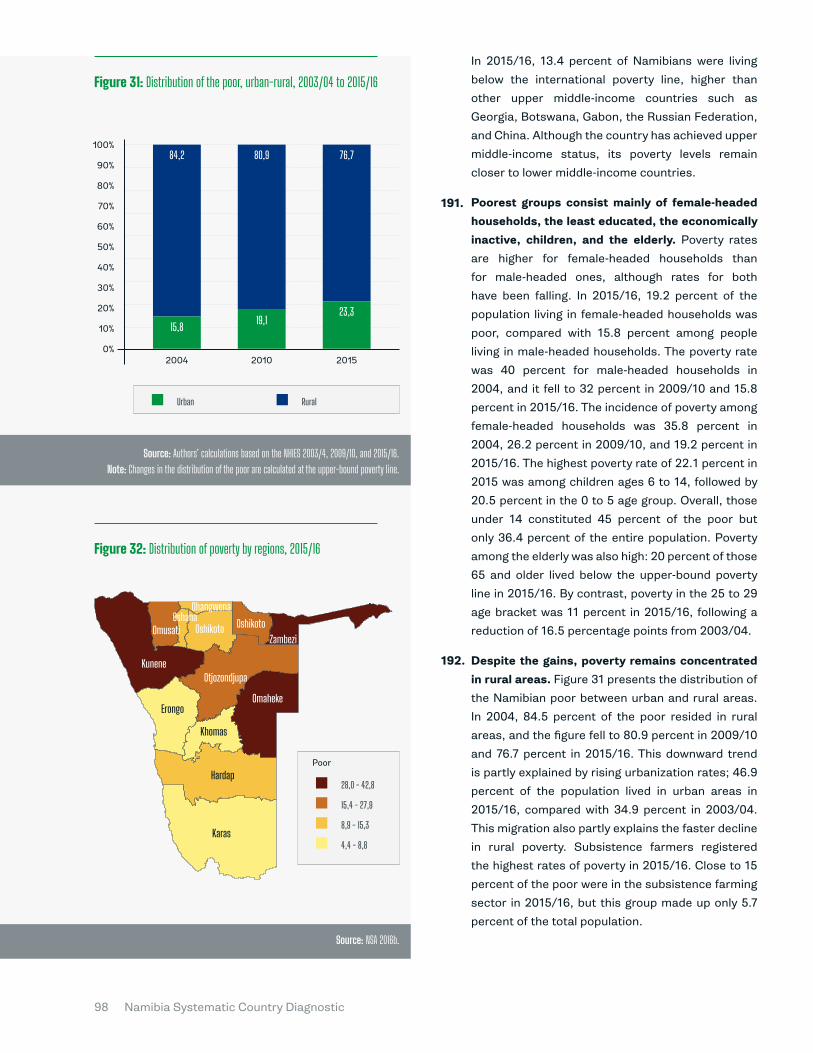
Namibia Systematic Country Diagnostic98
In 2015/16, 13.4 percent of Namibians were living
below the international poverty line, higher than
other upper middle-income countries such as
Georgia, Botswana, Gabon, the Russian Federation,
and China. Although the country has achieved upper
middle-income status, its poverty levels remain
closer to lower middle-income countries.
Poorest groups consist mainly of female-headed households, the least educated, the economically inactive, children, and the elderly. Poverty rates
are higher for female-headed households than
for male-headed ones, although rates for both
have been falling. In 2015/16, 19.2 percent of the
population living in female-headed households was
poor, compared with 15.8 percent among people
living in male-headed households. The poverty rate
was 40 percent for male-headed households in
2004, and it fell to 32 percent in 2009/10 and 15.8
percent in 2015/16. The incidence of poverty among
female-headed households was 35.8 percent in
2004, 26.2 percent in 2009/10, and 19.2 percent in
2015/16. The highest poverty rate of 22.1 percent in
2015 was among children ages 6 to 14, followed by
20.5 percent in the 0 to 5 age group. Overall, those
under 14 constituted 45 percent of the poor but
only 36.4 percent of the entire population. Poverty
among the elderly was also high: 20 percent of those
65 and older lived below the upper-bound poverty
line in 2015/16. By contrast, poverty in the 25 to 29
age bracket was 11 percent in 2015/16, following a
reduction of 16.5 percentage points from 2003/04.
Despite the gains, poverty remains concentrated in rural areas. Figure 31 presents the distribution of
the Namibian poor between urban and rural areas.
In 2004, 84.5 percent of the poor resided in rural
areas, and the figure fell to 80.9 percent in 2009/10
and 76.7 percent in 2015/16. This downward trend
is partly explained by rising urbanization rates; 46.9
percent of the population lived in urban areas in
2015/16, compared with 34.9 percent in 2003/04.
This migration also partly explains the faster decline
in rural poverty. Subsistence farmers registered
the highest rates of poverty in 2015/16. Close to 15
percent of the poor were in the subsistence farming
sector in 2015/16, but this group made up only 5.7
percent of the total population.
Figure 31: Distribution of the poor, urban-rural, 2003/04 to 2015/16
Source: Authors’ calculations based on the NHIES 2003/4, 2009/10, and 2015/16. Note: Changes in the distribution of the poor are calculated at the upper-bound poverty line.
Urban Rural
2004 2010 2015
100%
90%
80%
70%
60%
50%
40%
30%
20%
10%
0%
76,7
23,3
80,9
19,1
84,2
15,8
191.
192.
Figure 32: Distribution of poverty by regions, 2015/16
Source: NSA 2016b.
28,0 - 42,8
Poor
8,9 - 15,3
4,4 - 8,8
15,4 - 27,9
Kunene
OmusatiOshana
Ohangwena
Oshikoto OshikotoZambezi
Otjozondjupa
Erongo
Khomas
Omaheke
Hardap
Karas
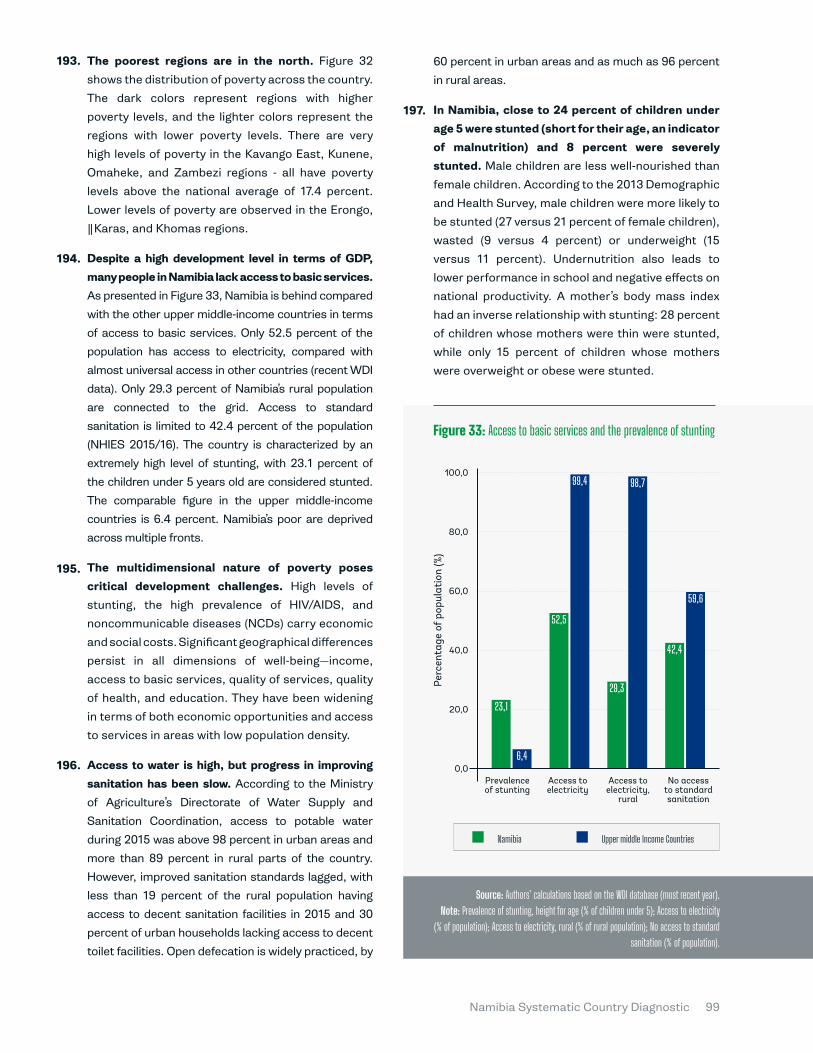
Namibia Systematic Country Diagnostic 99
The poorest regions are in the north. Figure 32
shows the distribution of poverty across the country.
The dark colors represent regions with higher
poverty levels, and the lighter colors represent the
regions with lower poverty levels. There are very
high levels of poverty in the Kavango East, Kunene,
Omaheke, and Zambezi regions - all have poverty
levels above the national average of 17.4 percent.
Lower levels of poverty are observed in the Erongo,
| | Karas, and Khomas regions.
Despite a high development level in terms of GDP, many people in Namibia lack access to basic services. As presented in Figure 33, Namibia is behind compared
with the other upper middle-income countries in terms
of access to basic services. Only 52.5 percent of the
population has access to electricity, compared with
almost universal access in other countries (recent WDI
data). Only 29.3 percent of Namibia’s rural population
are connected to the grid. Access to standard
sanitation is limited to 42.4 percent of the population
(NHIES 2015/16). The country is characterized by an
extremely high level of stunting, with 23.1 percent of
the children under 5 years old are considered stunted.
The comparable figure in the upper middle-income
countries is 6.4 percent. Namibia’s poor are deprived
across multiple fronts.
The multidimensional nature of poverty poses critical development challenges. High levels of
stunting, the high prevalence of HIV/AIDS, and
noncommunicable diseases (NCDs) carry economic
and social costs. Significant geographical differences
persist in all dimensions of well-being—income,
access to basic services, quality of services, quality
of health, and education. They have been widening
in terms of both economic opportunities and access
to services in areas with low population density.
Access to water is high, but progress in improving sanitation has been slow. According to the Ministry
of Agriculture’s Directorate of Water Supply and
Sanitation Coordination, access to potable water
during 2015 was above 98 percent in urban areas and
more than 89 percent in rural parts of the country.
However, improved sanitation standards lagged, with
less than 19 percent of the rural population having
access to decent sanitation facilities in 2015 and 30
percent of urban households lacking access to decent
toilet facilities. Open defecation is widely practiced, by
60 percent in urban areas and as much as 96 percent
in rural areas.
In Namibia, close to 24 percent of children under age 5 were stunted (short for their age, an indicator of malnutrition) and 8 percent were severely stunted. Male children are less well-nourished than
female children. According to the 2013 Demographic
and Health Survey, male children were more likely to
be stunted (27 versus 21 percent of female children),
wasted (9 versus 4 percent) or underweight (15
versus 11 percent). Undernutrition also leads to
lower performance in school and negative effects on
national productivity. A mother’s body mass index
had an inverse relationship with stunting: 28 percent
of children whose mothers were thin were stunted,
while only 15 percent of children whose mothers
were overweight or obese were stunted.
Figure 33: Access to basic services and the prevalence of stunting
Source: Authors’ calculations based on the WDI database (most recent year). Note: Prevalence of stunting, height for age (% of children under 5); Access to electricity
(% of population); Access to electricity, rural (% of rural population); No access to standard sanitation (% of population).
Namibia Upper middle Income Countries
100,0
80,0
60,0
40,0
20,0
0,0Prevalence of stunting
Access to electricity
No access to standard sanitation
Access to electricity,
rural
98,7
59,6
42,4
29,3
99,4
52,5
6,4
23,1
Perc
enta
ge o
f pop
ulat
ion
(%)
193.
194.
195.
196.
197.

Namibia Systematic Country Diagnostic100
2.Regardless of the measure of economic inequality used, Namibia ranks as one of the most unequal countries in the world. Namibia recorded a Gini
coefficient of 57.6 in 2015, following declines from
64.6 in 1993/94, 60.0 in 2004, and 59.7 in 2010 (Figure
34). The post-independence perpetuation of previous
inequalities, as well as the creation of new ones, has
resulted in Namibia being ranked as the second-
most-unequal country in the world after South Africa
(Figure 35). The country is one of the most lucrative
and better places to live for the top end of the income
distribution, but high levels of extreme poverty define
life for a large proportion of the population. Rates of
access to basic services are among the lowest of any
upper middle-income country.
The inequalities of income and wealth are staggering, and striking disparities affect all aspects of well-being and economic development. Net wealth inequality is even higher than consumption
inequality and has been growing over time. The
household balance sheet data required for direct
calculation of wealth inequality is not available, but
estimations based on a regression analysis resulted
in a Namibian wealth Gini of 0.847—the highest in
the world.65 There is a strong correlation between
levels of inequality in consumption and wealth, with
wealth remaining an important source of long-run
inequality. Landownership is an example of the high
concentration of wealth. During the colonial era,
much of the arable, productive land was allocated
exclusively to white European settlers and their
descendants. As a result, 70 percent of Namibia’s 39.7
million hectares of commercial farmland is owned by
Namibians of European descent, with only 16 percent
of commercial farmland owned by Namibians of
Namibia Is the Second Most Unequal Country in the WorldAfrican descent. There have been growing calls for
ancestral lands to be returned to Namibia’s tribes, and
the Government faces significant pressure to reduce
the vast inequalities in the country’s landownership.
Despite the general improvement in welfare, structural inequalities have not been addressed. As a result, growth has not been shared equally, a
fact made evident by the consumption expenditure
growth between 2004 and 2015. Nationally, evidence
suggests that the poor did not benefit overall from
consumption growth. Nor did growth translate into
commensurate employment opportunities, leaving
unemployment rates high and increasing inequality.
High levels of inequality of opportunity and low intergenerational mobility are linked to the extremely high inequality in the distribution of productive assets. Inequality of opportunity is
measured by the influence of race, parents’ education,
parents’ occupation, place of birth, and gender—it is
high in Namibia. The inequality is further compounded
by low intergenerational mobility, indicating an
enduring link between life outcomes for a today’s
generation and those of previous generations.
High inequality of opportunity results in labor market polarization, splitting it into two extreme job types. At one extreme are the few people in high-
skilled, high-productivity, and high-paid jobs, mostly
in formal sectors and larger enterprises; at the other
extreme is the rest of the population, working in low-
skilled, low-productivity, and low-paid jobs that are
often informal. This duality has in part resulted in
high wage inequality that has been steadily rising,
reflecting a highly polarized labor market.
https://www.nber.org/papers/w15508.pdf Daviel J., Sandström S, Shorrocks A, Wolff E. “The level and distribution of global household wealth.” NBER Working Paper 2009.
65.
198.
199.
200.
201.
202.
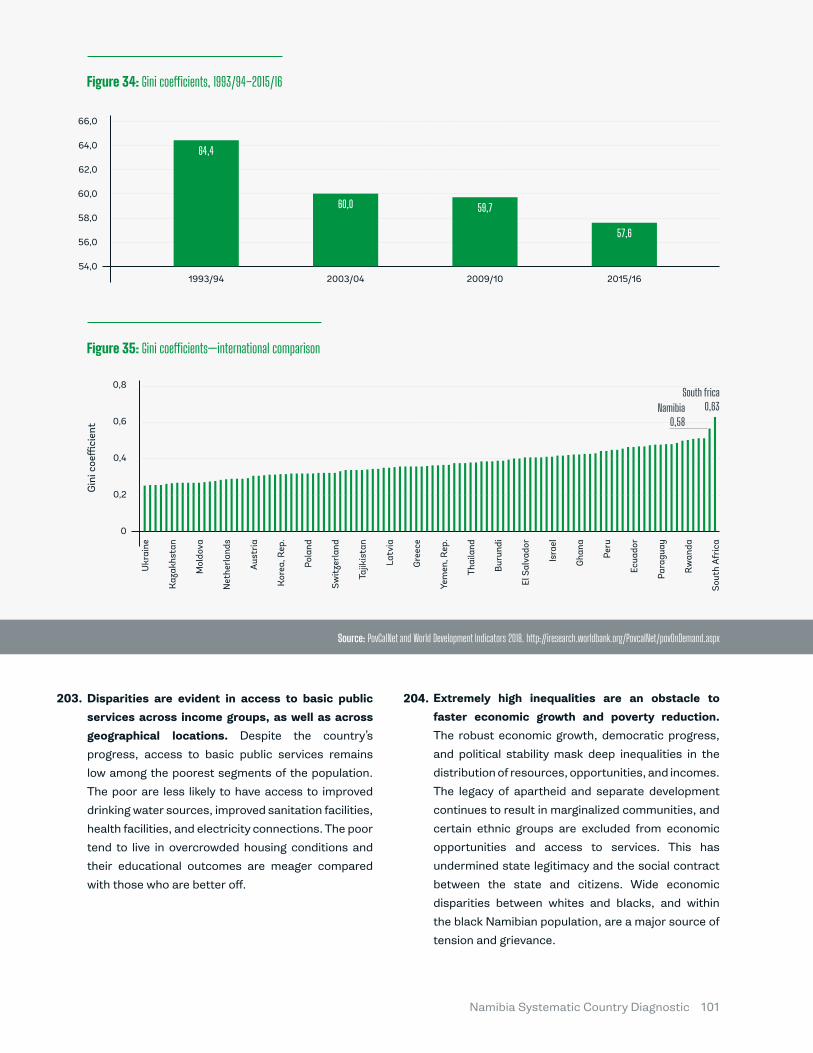
Namibia Systematic Country Diagnostic 101
Disparities are evident in access to basic public services across income groups, as well as across geographical locations. Despite the country’s
progress, access to basic public services remains
low among the poorest segments of the population.
The poor are less likely to have access to improved
drinking water sources, improved sanitation facilities,
health facilities, and electricity connections. The poor
tend to live in overcrowded housing conditions and
their educational outcomes are meager compared
with those who are better off.
Extremely high inequalities are an obstacle to faster economic growth and poverty reduction. The robust economic growth, democratic progress,
and political stability mask deep inequalities in the
distribution of resources, opportunities, and incomes.
The legacy of apartheid and separate development
continues to result in marginalized communities, and
certain ethnic groups are excluded from economic
opportunities and access to services. This has
undermined state legitimacy and the social contract
between the state and citizens. Wide economic
disparities between whites and blacks, and within
the black Namibian population, are a major source of
tension and grievance.
Figure 34: Gini coefficients, 1993/94–2015/16
2015/162009/102003/041993/94
66,0
64,0
62,0
60,0
58,0
56,0
54,0
64,4
60,0 59,7
57,6
203. 204.
Source: PovCalNet and World Development Indicators 2018. http://iresearch.worldbank.org/PovcalNet/povOnDemand.aspx
Figure 35: Gini coefficients—international comparison
0,8
0,6
0,4
0,2
0
Gin
i coe
ffici
ent
Ukr
aine
Gha
na
Tajik
ista
n
Aus
tria
Rw
anda
Thai
land
Mol
dova
Ecua
dor
Gre
ece
Pola
nd
El S
alva
dor
Kaz
akhs
tan
Peru
Latv
ia
Kor
ea, R
ep.
Sout
h A
fric
a
Bur
undi
Net
herl
ands
Para
guay
Yem
en, R
ep.
Swit
zerl
and
Isra
el
South frica0,63Namibia
0,58
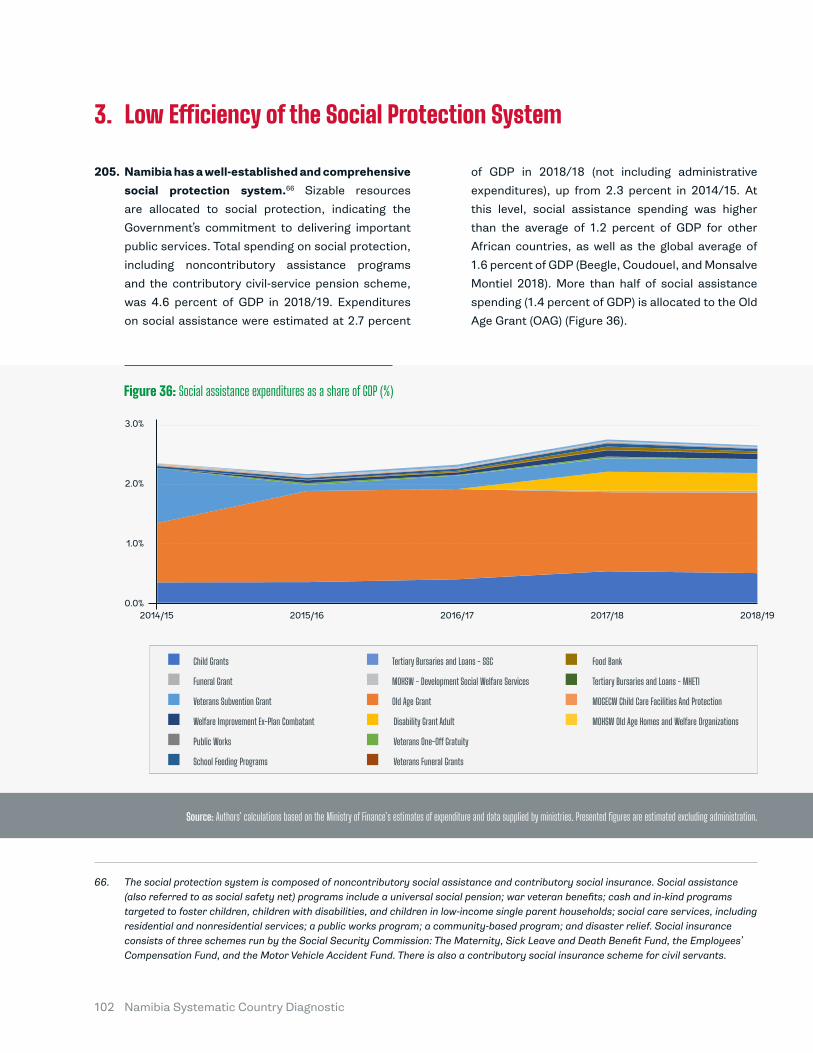
Namibia Systematic Country Diagnostic102
3.
Namibia has a well-established and comprehensive social protection system.66 Sizable resources
are allocated to social protection, indicating the
Government’s commitment to delivering important
public services. Total spending on social protection,
including noncontributory assistance programs
and the contributory civil-service pension scheme,
was 4.6 percent of GDP in 2018/19. Expenditures
on social assistance were estimated at 2.7 percent
Low Efficiency of the Social Protection System
The social protection system is composed of noncontributory social assistance and contributory social insurance. Social assistance (also referred to as social safety net) programs include a universal social pension; war veteran benefits; cash and in-kind programs targeted to foster children, children with disabilities, and children in low-income single parent households; social care services, including residential and nonresidential services; a public works program; a community-based program; and disaster relief. Social insurance consists of three schemes run by the Social Security Commission: The Maternity, Sick Leave and Death Benefit Fund, the Employees’ Compensation Fund, and the Motor Vehicle Accident Fund. There is also a contributory social insurance scheme for civil servants.
66.
of GDP in 2018/18 (not including administrative
expenditures), up from 2.3 percent in 2014/15. At
this level, social assistance spending was higher
than the average of 1.2 percent of GDP for other
African countries, as well as the global average of
1.6 percent of GDP (Beegle, Coudouel, and Monsalve
Montiel 2018). More than half of social assistance
spending (1.4 percent of GDP) is allocated to the Old
Age Grant (OAG) (Figure 36).
205.
Source: Authors’ calculations based on the Ministry of Finance’s estimates of expenditure and data supplied by ministries. Presented figures are estimated excluding administration.
Child Grants
Old Age Grant
Disability Grant Adult
Veterans Funeral Grants
Veterans One-Off Gratuity
MOGECW Child Care Facilities And Protection
Tertiary Bursaries and Loans - MHETI
Food Bank
MOHSW Old Age Homes and Welfare Organizations
Funeral Grant
Welfare Improvement Ex-Plan Combatant
Tertiary Bursaries and Loans - SSC
Veterans Subvention Grant
School Feeding Programs
Public Works
MOHSW - Development Social Welfare Services
Figure 36: Social assistance expenditures as a share of GDP (%)
3.0%
2.0%
1.0%
0.0%2014/15 2015/16 2016/17 2017/18 2018/19
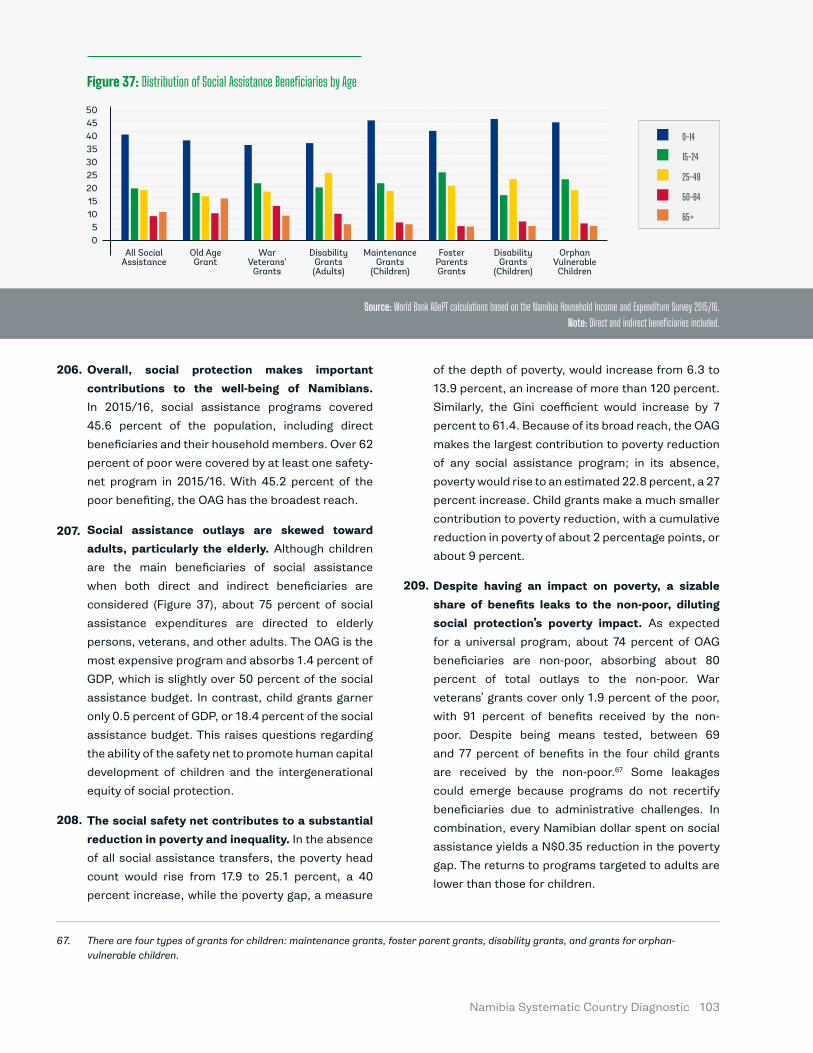
Namibia Systematic Country Diagnostic 103
Overall, social protection makes important contributions to the well-being of Namibians. In 2015/16, social assistance programs covered
45.6 percent of the population, including direct
beneficiaries and their household members. Over 62
percent of poor were covered by at least one safety-
net program in 2015/16. With 45.2 percent of the
poor benefiting, the OAG has the broadest reach.
Social assistance outlays are skewed toward adults, particularly the elderly. Although children
are the main beneficiaries of social assistance
when both direct and indirect beneficiaries are
considered (Figure 37), about 75 percent of social
assistance expenditures are directed to elderly
persons, veterans, and other adults. The OAG is the
most expensive program and absorbs 1.4 percent of
GDP, which is slightly over 50 percent of the social
assistance budget. In contrast, child grants garner
only 0.5 percent of GDP, or 18.4 percent of the social
assistance budget. This raises questions regarding
the ability of the safety net to promote human capital
development of children and the intergenerational
equity of social protection.
The social safety net contributes to a substantial reduction in poverty and inequality. In the absence
of all social assistance transfers, the poverty head
count would rise from 17.9 to 25.1 percent, a 40
percent increase, while the poverty gap, a measure
There are four types of grants for children: maintenance grants, foster parent grants, disability grants, and grants for orphan-vulnerable children.
67.
of the depth of poverty, would increase from 6.3 to
13.9 percent, an increase of more than 120 percent.
Similarly, the Gini coefficient would increase by 7
percent to 61.4. Because of its broad reach, the OAG
makes the largest contribution to poverty reduction
of any social assistance program; in its absence,
poverty would rise to an estimated 22.8 percent, a 27
percent increase. Child grants make a much smaller
contribution to poverty reduction, with a cumulative
reduction in poverty of about 2 percentage points, or
about 9 percent.
Despite having an impact on poverty, a sizable share of benefits leaks to the non-poor, diluting social protection’s poverty impact. As expected
for a universal program, about 74 percent of OAG
beneficiaries are non-poor, absorbing about 80
percent of total outlays to the non-poor. War
veterans’ grants cover only 1.9 percent of the poor,
with 91 percent of benefits received by the non-
poor. Despite being means tested, between 69
and 77 percent of benefits in the four child grants
are received by the non-poor.67 Some leakages
could emerge because programs do not recertify
beneficiaries due to administrative challenges. In
combination, every Namibian dollar spent on social
assistance yields a N$0.35 reduction in the poverty
gap. The returns to programs targeted to adults are
lower than those for children.
Figure 37: Distribution of Social Assistance Beneficiaries by Age
Source: World Bank ADePT calculations based on the Namibia Household Income and Expenditure Survey 2015/16. Note: Direct and indirect beneficiaries included.
504540353025201510
50
All Social Assistance
Old Age Grant
War Veterans’
Grants
Disability Grants (Adults)
Maintenance Grants
(Children)
Foster Parents Grants
Disability Grants
(Children)
Orphan Vulnerable
Children
0-14
15-24
50-64
25-49
65+
206.
207.
208.
209.
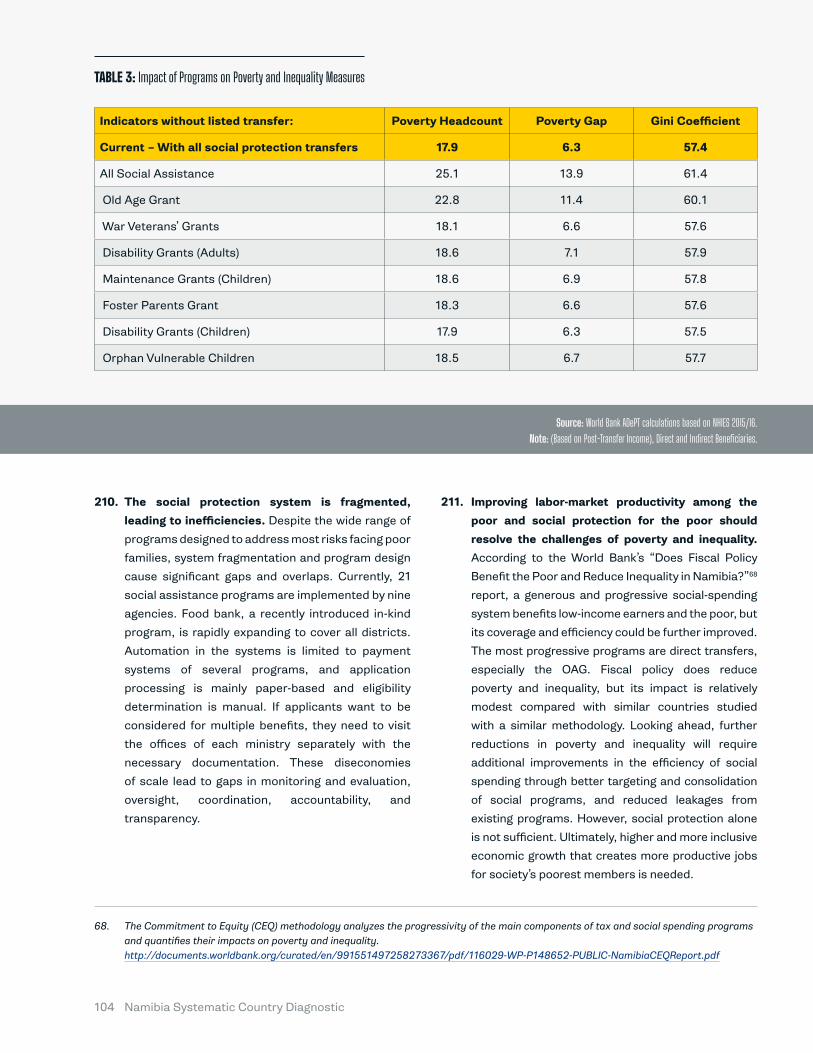
Namibia Systematic Country Diagnostic104
The social protection system is fragmented, leading to inefficiencies. Despite the wide range of
programs designed to address most risks facing poor
families, system fragmentation and program design
cause significant gaps and overlaps. Currently, 21
social assistance programs are implemented by nine
agencies. Food bank, a recently introduced in-kind
program, is rapidly expanding to cover all districts.
Automation in the systems is limited to payment
systems of several programs, and application
processing is mainly paper-based and eligibility
determination is manual. If applicants want to be
considered for multiple benefits, they need to visit
the offices of each ministry separately with the
necessary documentation. These diseconomies
of scale lead to gaps in monitoring and evaluation,
oversight, coordination, accountability, and
transparency.
Improving labor-market productivity among the poor and social protection for the poor should resolve the challenges of poverty and inequality. According to the World Bank’s “Does Fiscal Policy
Benefit the Poor and Reduce Inequality in Namibia?”68
report, a generous and progressive social-spending
system benefits low-income earners and the poor, but
its coverage and efficiency could be further improved.
The most progressive programs are direct transfers,
especially the OAG. Fiscal policy does reduce
poverty and inequality, but its impact is relatively
modest compared with similar countries studied
with a similar methodology. Looking ahead, further
reductions in poverty and inequality will require
additional improvements in the efficiency of social
spending through better targeting and consolidation
of social programs, and reduced leakages from
existing programs. However, social protection alone
is not sufficient. Ultimately, higher and more inclusive
economic growth that creates more productive jobs
for society’s poorest members is needed.
The Commitment to Equity (CEQ) methodology analyzes the progressivity of the main components of tax and social spending programs and quantifies their impacts on poverty and inequality. http://documents.worldbank.org/curated/en/991551497258273367/pdf/116029-WP-P148652-PUBLIC-NamibiaCEQReport.pdf
68.
210. 211.
Indicators without listed transfer: Poverty Headcount Poverty Gap Gini Coefficient
Current – With all social protection transfers 17.9 6.3 57.4
All Social Assistance 25.1 13.9 61.4
Old Age Grant 22.8 11.4 60.1
War Veterans’ Grants 18.1 6.6 57.6
Disability Grants (Adults) 18.6 7.1 57.9
Maintenance Grants (Children) 18.6 6.9 57.8
Foster Parents Grant 18.3 6.6 57.6
Disability Grants (Children) 17.9 6.3 57.5
Orphan Vulnerable Children 18.5 6.7 57.7
TABLE 3: Impact of Programs on Poverty and Inequality Measures
Source: World Bank ADePT calculations based on NHIES 2015/16.Note: (Based on Post-Transfer Income), Direct and Indirect Beneficiaries.
Namibia Systematic Country Diagnostic 105
https://www.unicef.org/namibia/na.Budget_Brief_SocAss.pdf69.
4.
Since independence, Namibia has placed a high priority on using public resources to address poverty, inequality, and other social policy objectives. More than half of government spending routinely goes to education, health,
social security, housing, and other social programs. Despite external shocks caused by global economic forces since
the 1990s, Namibia has sharply increased social spending as a share of GDP, bringing it to record levels (UNICEF
Social Protection Study 2016). A progressive income tax schedule and VAT exemptions for goods the poor consume
complement public spending on poverty reduction.
Access to education and health care has been critical in reducing inequalities, but the disparities that remain in educational outcomes continue to impact labor markets. The educational system has come a long way.
The increased investments in education, including universal primary and high school, have doubled the rates of
secondary enrolment and virtually eliminated illiteracy among the working-age population (PER on Education, UNDP
2017).69 In doing so, Namibia has long led among African nations in ensuring equal access to education for girls and
women. Even so, gender disparities remain. Despite equal access to education, females have a 25-percentage-point
lower employment rate than males. Significant disparities in educational outcomes are also apparent based on
socioeconomic status.
High Spending on Education and Health Care Produces Poor Outcomes
212.
213.
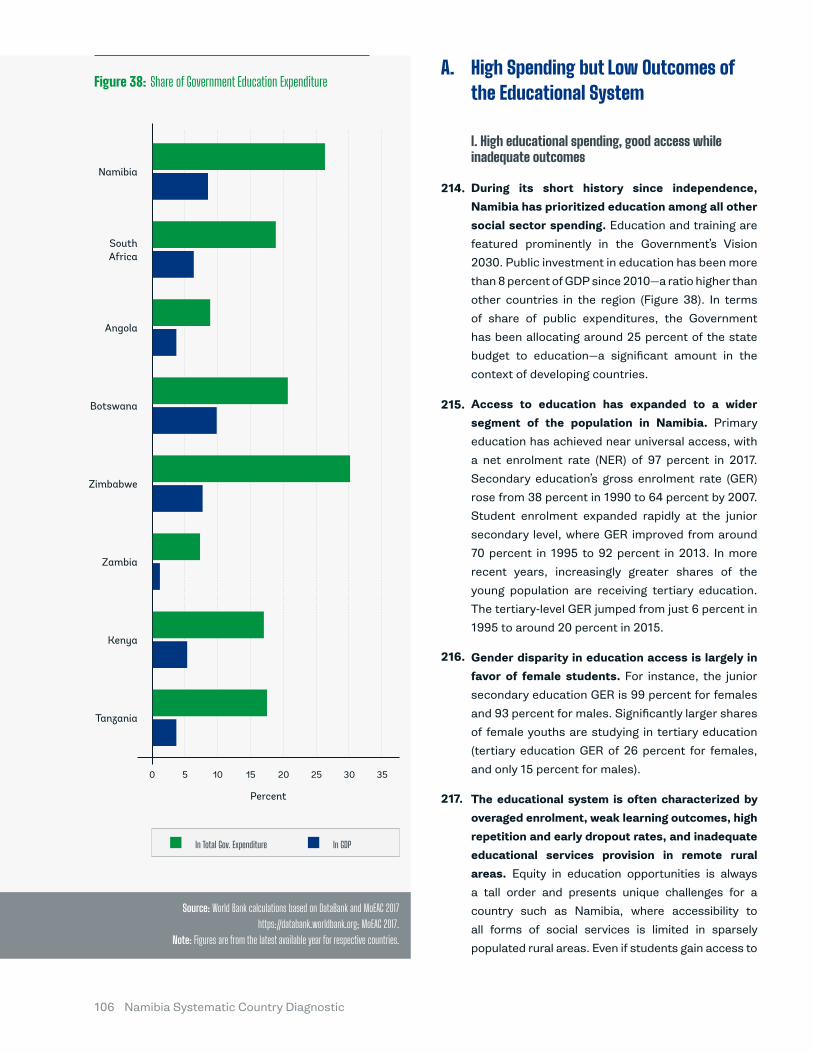
Namibia Systematic Country Diagnostic106
High Spending but Low Outcomes of the Educational System
I. High educational spending, good access while inadequate outcomes
During its short history since independence, Namibia has prioritized education among all other social sector spending. Education and training are
featured prominently in the Government’s Vision
2030. Public investment in education has been more
than 8 percent of GDP since 2010—a ratio higher than
other countries in the region (Figure 38). In terms
of share of public expenditures, the Government
has been allocating around 25 percent of the state
budget to education—a significant amount in the
context of developing countries.
Access to education has expanded to a wider segment of the population in Namibia. Primary
education has achieved near universal access, with
a net enrolment rate (NER) of 97 percent in 2017.
Secondary education’s gross enrolment rate (GER)
rose from 38 percent in 1990 to 64 percent by 2007.
Student enrolment expanded rapidly at the junior
secondary level, where GER improved from around
70 percent in 1995 to 92 percent in 2013. In more
recent years, increasingly greater shares of the
young population are receiving tertiary education.
The tertiary-level GER jumped from just 6 percent in
1995 to around 20 percent in 2015.
Gender disparity in education access is largely in favor of female students. For instance, the junior
secondary education GER is 99 percent for females
and 93 percent for males. Significantly larger shares
of female youths are studying in tertiary education
(tertiary education GER of 26 percent for females,
and only 15 percent for males).
The educational system is often characterized by overaged enrolment, weak learning outcomes, high repetition and early dropout rates, and inadequate educational services provision in remote rural areas. Equity in education opportunities is always
a tall order and presents unique challenges for a
country such as Namibia, where accessibility to
all forms of social services is limited in sparsely
populated rural areas. Even if students gain access to
A. Figure 38: Share of Government Education Expenditure
In Total Gov. Expenditure In GDP
0 5 10 15 20 25 30 35
Namibia
Angola
Zimbabwe
Zambia
Botswana
Kenya
Tanzania
South Africa
Percent
Source: World Bank calculations based on DataBank and MoEAC 2017 https://databank.worldbank.org; MoEAC 2017.
Note: Figures are from the latest available year for respective countries.
214.
215.
216.
217.
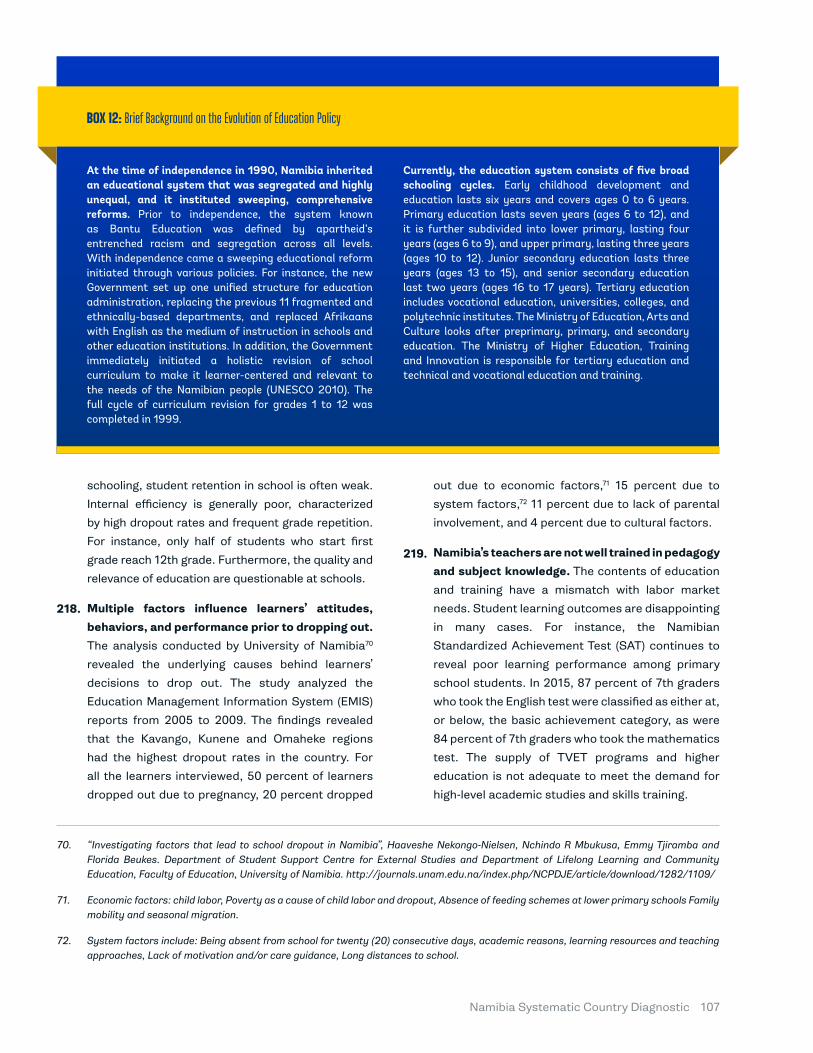
Namibia Systematic Country Diagnostic 107
At the time of independence in 1990, Namibia inherited an educational system that was segregated and highly unequal, and it instituted sweeping, comprehensive reforms. Prior to independence, the system known as Bantu Education was defined by apartheid’s entrenched racism and segregation across all levels. With independence came a sweeping educational reform initiated through various policies. For instance, the new Government set up one unified structure for education administration, replacing the previous 11 fragmented and ethnically-based departments, and replaced Afrikaans with English as the medium of instruction in schools and other education institutions. In addition, the Government immediately initiated a holistic revision of school curriculum to make it learner-centered and relevant to the needs of the Namibian people (UNESCO 2010). The full cycle of curriculum revision for grades 1 to 12 was completed in 1999.
BOX 12: Brief Background on the Evolution of Education Policy
Currently, the education system consists of five broad schooling cycles. Early childhood development and education lasts six years and covers ages 0 to 6 years. Primary education lasts seven years (ages 6 to 12), and it is further subdivided into lower primary, lasting four years (ages 6 to 9), and upper primary, lasting three years (ages 10 to 12). Junior secondary education lasts three years (ages 13 to 15), and senior secondary education last two years (ages 16 to 17 years). Tertiary education includes vocational education, universities, colleges, and polytechnic institutes. The Ministry of Education, Arts and Culture looks after preprimary, primary, and secondary education. The Ministry of Higher Education, Training and Innovation is responsible for tertiary education and technical and vocational education and training.
schooling, student retention in school is often weak.
Internal efficiency is generally poor, characterized
by high dropout rates and frequent grade repetition.
For instance, only half of students who start first
grade reach 12th grade. Furthermore, the quality and
relevance of education are questionable at schools.
Multiple factors influence learners’ attitudes, behaviors, and performance prior to dropping out. The analysis conducted by University of Namibia70
revealed the underlying causes behind learners’
decisions to drop out. The study analyzed the
Education Management Information System (EMIS)
reports from 2005 to 2009. The findings revealed
that the Kavango, Kunene and Omaheke regions
had the highest dropout rates in the country. For
all the learners interviewed, 50 percent of learners
dropped out due to pregnancy, 20 percent dropped
out due to economic factors,71 15 percent due to
system factors,72 11 percent due to lack of parental
involvement, and 4 percent due to cultural factors.
Namibia’s teachers are not well trained in pedagogy and subject knowledge. The contents of education
and training have a mismatch with labor market
needs. Student learning outcomes are disappointing
in many cases. For instance, the Namibian
Standardized Achievement Test (SAT) continues to
reveal poor learning performance among primary
school students. In 2015, 87 percent of 7th graders
who took the English test were classified as either at,
or below, the basic achievement category, as were
84 percent of 7th graders who took the mathematics
test. The supply of TVET programs and higher
education is not adequate to meet the demand for
high-level academic studies and skills training.
“Investigating factors that lead to school dropout in Namibia”, Haaveshe Nekongo-Nielsen, Nchindo R Mbukusa, Emmy Tjiramba and Florida Beukes. Department of Student Support Centre for External Studies and Department of Lifelong Learning and Community Education, Faculty of Education, University of Namibia. http://journals.unam.edu.na/index.php/NCPDJE/article/download/1282/1109/
Economic factors: child labor, Poverty as a cause of child labor and dropout, Absence of feeding schemes at lower primary schools Family mobility and seasonal migration.
System factors include: Being absent from school for twenty (20) consecutive days, academic reasons, learning resources and teaching approaches, Lack of motivation and/or care guidance, Long distances to school.
70.
71.
72.
218.
219.
Namibia Systematic Country Diagnostic108
The provision and affordability of quality education for young Namibians are still inadequate in many parts of the country, specifically for the poor segments of society. Early childhood development
and education (ECDE) is increasingly recognized as
a crucial first stage for cognitive and socioemotional
development for children, and it has significantly
expanded in recent years. Preprimary enrolment
has been increasing sharply, a clear indication of the
strong demand for ECDE programs. It is important
that more resources be allocated to ECDE to keep up
with demand from communities. At the same time,
it is critical that measures are put in place to ensure
the provision of quality ECDE programs in the face of
the supply surge.
Overall, students in basic education demonstrate poor learning outcomes. On average, Namibian
children can expect to complete 8.9 years of
schooling by their 18th birthdays. However, once
student learning performance is factored in (i.e.,
learning adjusted years of schooling), it goes down
to only 5.8 years (Human Capital Index 2018). In
other words, students lose an average of three
years’ worth of learning, compared with an optimal
learning system, due to a range of obstacles in
teaching and learning. In fact, the learning outcomes
have been well documented. Namibia participated
in four rounds of the Southern and Eastern Africa
Consortium for Monitoring Education Quality survey.
Students perform far below the regional average for
mathematics and below average in reading (UNESCO
2016).
School facilities are not yet up to the mark in many regions. Key school facilities—such as access
to electricity, teacher housing, computer rooms,
and laboratories—are inadequate, especially in
some disadvantaged regions. Nationally, electricity
is available at more than 80 percent of schools;
however, electrification of schools is lagging far
behind in regions such as Kavango and Oshikoto.
Teacher housing is unavailable in most schools;
nationally, it is available at only 37 percent of schools.
The scarcity is significantly worse in the northern
II. Provision of early childhood development and basic education is inadequate in rural areas and among the poor
regions. Other essential teaching and learning
facilities, such as laboratories and computer rooms,
are only sporadically available at schools, especially
so in the northern part of the country.
Gaps in learning outcomes are a serious concern. There are significant socioeconomic and spatial
disparities in learning outcomes among the
population. In the national student assessments,
primary school students in the central regions,
especially Khomas and Erongo, consistently
demonstrate higher learning achievements in all
subjects. Poorer northern regions, on the contrary,
perform far less well. For instance, around 62
percent of 7th graders in the Kavango and Kunene
regions were lower performers in science in the 2015
national SAT assessment; by contrast, the Khomas
and Erongo regions had only around 32 percent of
their students falling into that category. Looking
back, there were some noteworthy improvements
in student learning over time, although the gaps are
persistent.
Internal efficiency is low due to high repetition and dropout rates. Despite the remarkable achievement
in broadening access to education, basic education
still suffers from significant inefficiencies. Many
students leave school or have to repeat grades due
to poor performance. Frequent repetition leads to
over-aged enrolment and subsequently to dropping
out. According to annual education statistics for
2016, an average of about 15 percent of students
repeated a grade, and 8 percent of students left
school. Repetition seems most frequent during
the first years of the schooling cycles for upper
primary and junior secondary, namely 5th grade
and 8th grade. Dropouts are most frequent during
secondary education, and they spike in 10th grade,
the last year of junior secondary. Poor internal
efficiency in basic education points to the low
quality of education provision and the poor learning
attainment of students. Huge education resources
are being wasted as students take more years than
they should to finish school, or leave school without
attaining basic skills.
220.
221.
222.
224.
223.

Namibia Systematic Country Diagnostic 109
III. TVET achievements are mixed
A diverse mix of public and private providers comprises Namibia’s TVET system. The main
public training providers are seven vocational
training centers (VTCs) that operate under the
Namibia Training Authority (NTA). These VTCs
provide courses at levels one through three of the
National Qualification Framework for a range of
trades. Some other line ministries have their own
centers that offer training for work in their respective
sectors. The Namibian College of Open Learning
offers technical training in four trades to out-of-
school youths and unemployed adults. Higher levels
of technical education are being offered at Namibia
University of Science and Technology (NUST) as part
of the higher education program. Private providers
are much more diverse, including for-profit, non-
profit, and community-based institutions, and
they often focus on the human resources needs of
specific industries.
A training levy was introduced to finance skills training provision and encourage employer participation in workplace-based training. All
employers operating with an annual payroll of
N$1 million or more are required to pay a training
levy equivalent to 1 percent of their total payroll.
The NTA is mandated to handle the training levy
and manage the program operation. Funds from
the levy are used to finance public TVET provision
by the NTA, but companies can reclaim some of
the money. Employers can receive a training grant
of up to 50 percent of their paid-in levy based on
submission of evidence of training provided in their
workplaces. According to the NTA, however, take-up
of the company training grant has been slow, with
only around 20 percent of employers claiming the
grant. A lack of awareness and complex application
requirements seem to discourage employers from
making a claim.
There is inadequate access to skills-development opportunities, especially in rural areas and for the less-educated population. Compared with human
resource needs, the capacity of the TVET system
remains insufficient. As of 2016, roughly 25,000
students were enrolled with public and private
training providers. The NTA plans to increase the
capacity up to 89,000 by 2032, mostly by expanding
public TVET education. Interviews at VTCs also
point to a highly competitive selection process
for entrance to VTCs due to high demand and low
supply. This raises concerns about the lack of
access for young people who have not completed
secondary education. (Most formal training centers
require completion of 10th or 12th grade as a
minimum requirement.) This requirement and the
competitive screening process make it extremely
difficult for less-educated youth to gain substantive
skills training. Moreover, formal training centers are
mostly concentrated in Windhoek and other urban
areas, and they are far scarcer in rural parts of the
country, where a majority of the poor population
resides. Many VTC trainees also benefit from
government loans through the Namibia Students
Financial Assistance Fund (NSFAF).
The capacity for providing quality and relevant skills training is weak at the system level and in training institutions. Namibia faces a myriad of
challenges related to TVET quality and relevance.
First, quality assurance is not fully enforced because
not all training providers are officially certified by the
NTA, the accrediting agency for TVET institutions.
Second, the teaching and learning environment,
including instructors’ skills, are outdated and
need significant revamping. VTCs struggle with
teacher shortages, and professional development
opportunities for teachers are limited.
The curriculum and teaching methods need to be updated in close consultation with potential employers in industries. Trades at VTCs may
need to be more diversified to meet industry
needs. To improve post-graduation employability,
graduate tracer studies should be regularly
conducted centrally and by institutions as feedback
mechanisms from the labor market. Enterprise-
based training and apprenticeship programs need
to be strengthened in partnership with potential
employers to offer informal practical skills-training
opportunities. Labor market information needs to
be established and updated regularly with support
226.
227.
229.
225.
228.
Namibia Systematic Country Diagnostic110
from Industry Skills Committees (ISCs). In the
current economic context, entrepreneurship skills
are greatly needed for technical graduates; however,
provision of entrepreneurship training has been
largely ineffective.
Governance, financing, and coordination of the TVET system need further strengthening. A key
systemic issue is integration of TVET with general
education and higher education. In terms of its
linkages with basic education, the current secondary
education system offers little scope for technical
education. As a result, technology-oriented students
who enroll in VTCs and other TVET institutions are
deprived of exposure to technical skills during basic
education. More problematic is the absence of a
pathway to higher education. Once enrolled in the
TVET track under the current framework, students
are unable to progress to higher education due to
the qualifications gap between TVET and tertiary
schools. Coordination and mutual recognition across
TVET institutions are poor. There is no entity tasked
with oversight of the entire TVET system. Some of the
trades offered by public and private institutions are
overlapping, without proper coordination or mutual
recognition. Coherent performance-management
systems and performance accountability are
lacking, and financing mechanisms for rewarding
performance are missing. Monitoring of TVET
delivery and utilization are fragmented.
IV. Higher education is highly unequal and lacks a systematic mechanism to address employability of students
The higher education system is very young, with universities established only after 1990. Currently,
the country is home two public universities and
a private one: the University of Namibia (UNAM)
was formally established in 1992; the Polytechnic
of Namibia was converted into NUST in 2015; and
the International University of Management, the
sole private university, was formally accredited as
a university in 2002. According to the 2017 Public
Expenditure Review (PER), around 16 percent of
education expenditures in FY2014/15 went toward
higher education and the NSFAF. Four colleges of
education and three colleges of agriculture also
offer tertiary-level education and training. People
are increasingly entering the labor force with higher
education degrees. As of 2016, the labor force survey
estimates that around 15 percent of the employed
population held some postsecondary education
qualification (diploma, bachelor’s, master’s, or PhD).
Enrolment in tertiary education has increased sharply over the past decade, reaching the same level as South Africa. In 2012, a total of
41,200 students were enrolled in tertiary education
institutions (TEIs). Enrolment continued to expand
and, by 2016, the number of students in universities
and other TEIs had reached 53,600 (Figure 39), a
significant increase of 30 percent over five years.
Females consistently account for more than 60
percent of students in tertiary education. The share
of the youth population studying in TEIs also rose
explosively. GER for tertiary education was only 7
percent in 2006. By 2016, tertiary GER rose to 21
percent, a level equivalent to that of South Africa
(Figure 40).
Many university students come from modest socioeconomic backgrounds and achieve upward social mobility. According to the national tracer
study on graduates from the 2012–13 cohort,
commissioned by National Council for Higher
Education, only 23 percent of mothers and fathers
of university graduates had higher education
qualifications themselves. Many parents are far
less well educated. Around 28 percent of fathers
had no education, and 49 percent had only primary
or secondary certificates. It is evident that many of
today’s university students are the first generation
of university goers in their families. In addition, the
UNAM and NUST operate bridging programs—the
Science Foundation Program at UNAM; the STEM
program at NUST—where students who may not
qualify for acceptance into undergraduate courses
are given a chance to take short courses to upgrade
their academic skills. Regional campuses and
bridging programs have been playing an important
role in accepting more students from rural parts of
the country.
Geographically, around 40 percent of graduates completed secondary education in rural areas. Although urban bias is clearly apparent, it should
be highlighted that universities are receiving a
substantial number of students from poor rural
communities. To finance higher education, many
230.
231.
232.
233.
234.
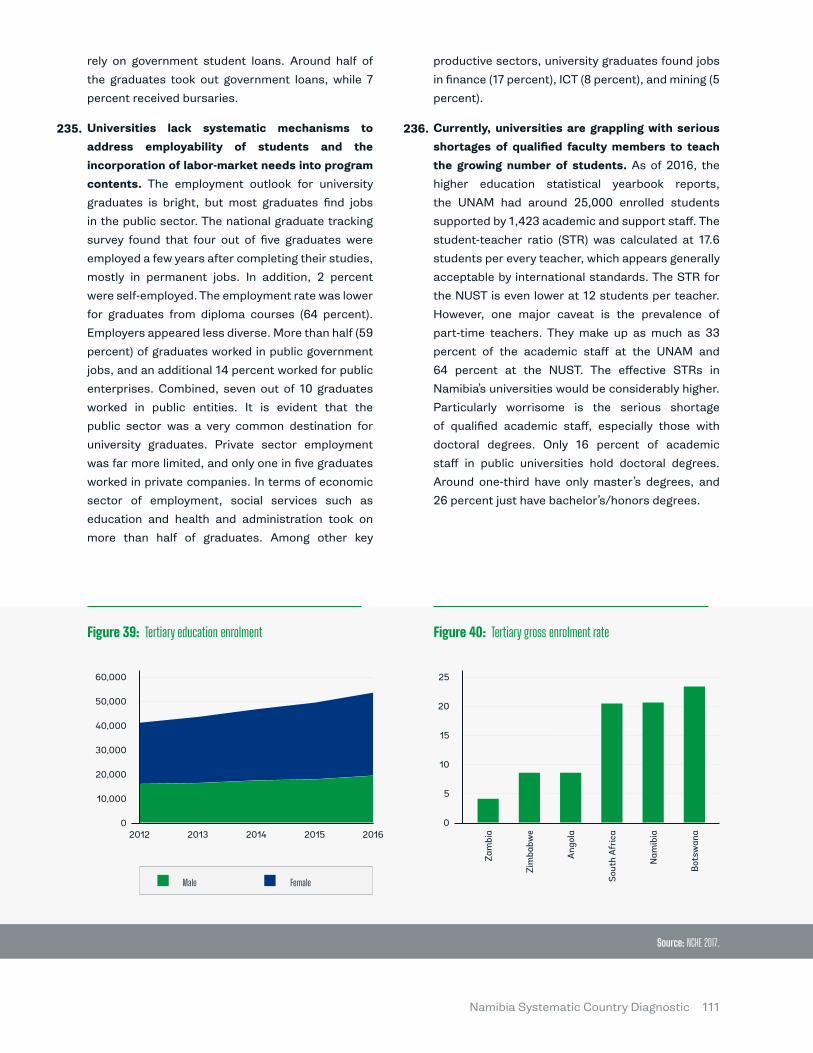
Namibia Systematic Country Diagnostic 111
rely on government student loans. Around half of
the graduates took out government loans, while 7
percent received bursaries.
Universities lack systematic mechanisms to address employability of students and the incorporation of labor-market needs into program contents. The employment outlook for university
graduates is bright, but most graduates find jobs
in the public sector. The national graduate tracking
survey found that four out of five graduates were
employed a few years after completing their studies,
mostly in permanent jobs. In addition, 2 percent
were self-employed. The employment rate was lower
for graduates from diploma courses (64 percent).
Employers appeared less diverse. More than half (59
percent) of graduates worked in public government
jobs, and an additional 14 percent worked for public
enterprises. Combined, seven out of 10 graduates
worked in public entities. It is evident that the
public sector was a very common destination for
university graduates. Private sector employment
was far more limited, and only one in five graduates
worked in private companies. In terms of economic
sector of employment, social services such as
education and health and administration took on
more than half of graduates. Among other key
productive sectors, university graduates found jobs
in finance (17 percent), ICT (8 percent), and mining (5
percent).
Currently, universities are grappling with serious shortages of qualified faculty members to teach the growing number of students. As of 2016, the
higher education statistical yearbook reports,
the UNAM had around 25,000 enrolled students
supported by 1,423 academic and support staff. The
student-teacher ratio (STR) was calculated at 17.6
students per every teacher, which appears generally
acceptable by international standards. The STR for
the NUST is even lower at 12 students per teacher.
However, one major caveat is the prevalence of
part-time teachers. They make up as much as 33
percent of the academic staff at the UNAM and
64 percent at the NUST. The effective STRs in
Namibia’s universities would be considerably higher.
Particularly worrisome is the serious shortage
of qualified academic staff, especially those with
doctoral degrees. Only 16 percent of academic
staff in public universities hold doctoral degrees.
Around one-third have only master’s degrees, and
26 percent just have bachelor’s/honors degrees.
Source: NCHE 2017.
Figure 39: Tertiary education enrolment Figure 40: Tertiary gross enrolment rate
60,000
50,000
40,000
30,000
20,000
10,000
0
FemaleMale
2012 2016201520142013
25
20
15
10
5
0
Sout
h A
fric
a
Zim
babw
e
Bot
swan
a
Nam
ibia
Zam
bia
Ang
ola
235. 236.

Namibia Systematic Country Diagnostic112
Financial assistance and bridging programs have been key policy tools to promote more equitable and accessible higher education. The NSFAF
provides eligible university and TVET students with
government-supported loans to pay their education
costs. The NSFAF extends its support to a large
share of tertiary-education students. According to
the NSFAF annual report, it awarded loans to 15,317
students in academic year 2017—3,248 TVET, 10,888
undergraduates, and 1,181 postgraduates. A worrying
trend is declining expected repayment and potentially
weak sustainability. Out of more than 25,000 debtors,
only 587 are currently repaying their loans. The rest
are not honoring their loan repayment obligations.
High Spending on the Health System but Outcomes Could Be Improved
Total health spending is high compared with other countries.73 In 2015, the Government
allocated almost 13 percent of general government
expenditures to health, or 5.6 percent of GDP. The
Government accounts for about 64 percent of total
health expenditures (THE). Employers contribute
another 20 percent of THE, with development
partners at 6 percent and households at 10 percent.74
Development partner funding mainly finances HIV/
AIDS care. Household out-of-pocket expenditures
are below the WHO threshold of 20 percent; however,
low household spending can also be a sign of people
not seeking care, pointing to an access problem.
About 80 percent of the population seeks care in
the government-funded public health sector; the
remaining 20 percent has access to private sector
care through the Public Service Employee Medical
Aid Scheme (PSEMAS) or private medical-aid funds.
Despite rising health spending, poor health outcomes are evident, particularly for low-income groups. Life expectancy is lower in Namibia than in
countries with similar levels of health spending (Figure
41). At the same time, Namibia performs poorly on
health outcomes compared with the average for
upper middle-income countries (Figure 42). Namibia
is experiencing a major demographic transition; by
2050, about 65 percent of the population is expected
B.
to be working age. Non-communicable diseases
(NCDs) will become more prevalent as the population
ages. At the same time, the stunting rate among
children, maternal mortality, and adolescent fertility
are still much higher than the average for upper
middle-income countries. The HIV prevalence of 14
percent is extremely high, and even higher among
women. HIV/AIDS, diarrhea, respiratory infections,
tuberculosis, and road injuries are the main reasons
for premature death. The key risk factors that drive
most deaths include unsafe sex, malnutrition, and
alcohol and drug use (IHME, n.d.).
These risks are higher for the poor but also preventable. Increased support to maternal health
care and the prevention of risk factors will enable
low-income children and adults to enjoy better health,
perform better in school, and participate more fully
in the economy. Investing in the health system to
improve prevention and early detection of NCDs will
contribute to a healthy workforce. Moreover, there is
need to strengthen the system of accountability for
health outcomes. This means greater investment in
M&E mechanisms that capture disparities in health.
Experience from Latin America, Asia, and several
countries in West Africa shows that health services
can improve outcomes for even the poorest groups—
if those services are well delivered (World Bank 2003).
This chapter is based on World Bank 2018: Health Public Expenditure Review.
World Bank 2018: Health Public Expenditure Review.
73.
74.
Research and innovation capacity are weak. Namibian universities possess only limited research
capacity and resources. Shortages of PhD holders
place a serious damper on the ability of universities
to conduct research and train researchers. Access to
research funding is severely limited. For instance, the
UNAM’s Center for Research and Publication awarded
research funding to only seven projects in 2016. As in
other African countries, much of output from Namibian
researchers is produced with external funding from
international research collaborations. In 2017, around
80 percent of citable publications by Namibian
researchers were published under international
collaboration, according to Scimago data.
237.
239.
240.
241.
238.
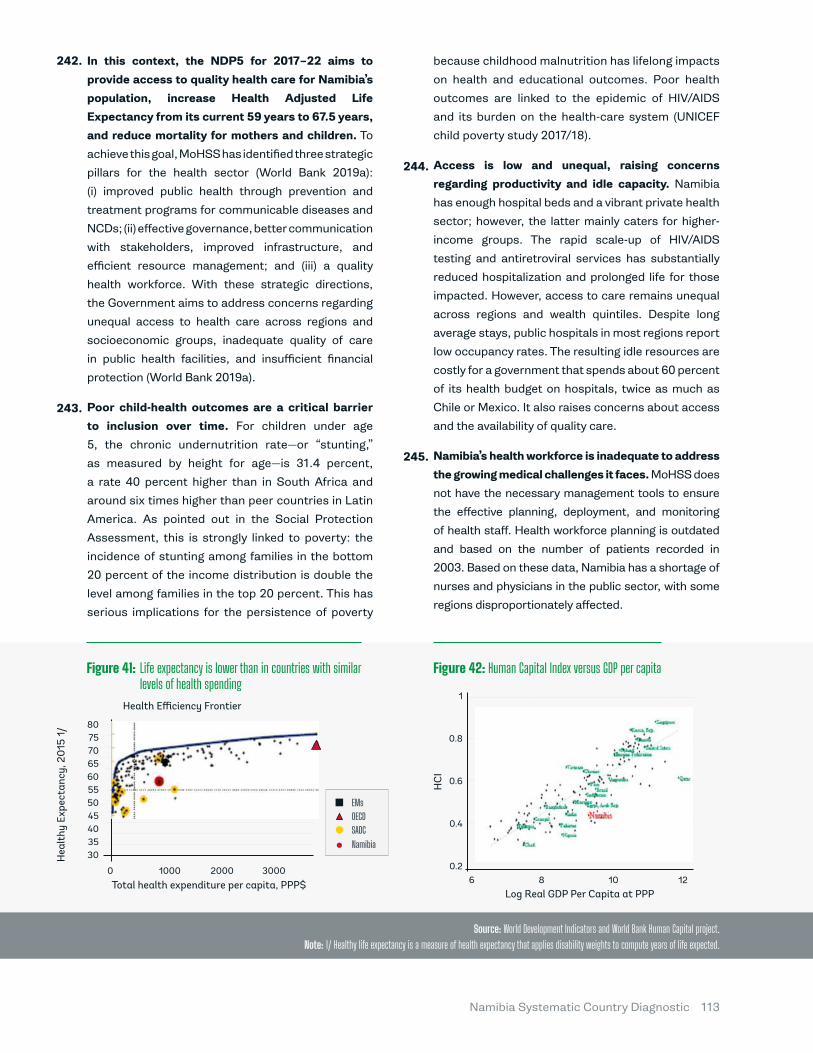
Namibia Systematic Country Diagnostic 113
In this context, the NDP5 for 2017–22 aims to provide access to quality health care for Namibia’s population, increase Health Adjusted Life Expectancy from its current 59 years to 67.5 years, and reduce mortality for mothers and children. To
achieve this goal, MoHSS has identified three strategic
pillars for the health sector (World Bank 2019a):
(i) improved public health through prevention and
treatment programs for communicable diseases and
NCDs; (ii) effective governance, better communication
with stakeholders, improved infrastructure, and
efficient resource management; and (iii) a quality
health workforce. With these strategic directions,
the Government aims to address concerns regarding
unequal access to health care across regions and
socioeconomic groups, inadequate quality of care
in public health facilities, and insufficient financial
protection (World Bank 2019a).
Poor child-health outcomes are a critical barrier to inclusion over time. For children under age
5, the chronic undernutrition rate—or “stunting,”
as measured by height for age—is 31.4 percent,
a rate 40 percent higher than in South Africa and
around six times higher than peer countries in Latin
America. As pointed out in the Social Protection
Assessment, this is strongly linked to poverty: the
incidence of stunting among families in the bottom
20 percent of the income distribution is double the
level among families in the top 20 percent. This has
serious implications for the persistence of poverty
because childhood malnutrition has lifelong impacts
on health and educational outcomes. Poor health
outcomes are linked to the epidemic of HIV/AIDS
and its burden on the health-care system (UNICEF
child poverty study 2017/18).
Access is low and unequal, raising concerns regarding productivity and idle capacity. Namibia
has enough hospital beds and a vibrant private health
sector; however, the latter mainly caters for higher-
income groups. The rapid scale-up of HIV/AIDS
testing and antiretroviral services has substantially
reduced hospitalization and prolonged life for those
impacted. However, access to care remains unequal
across regions and wealth quintiles. Despite long
average stays, public hospitals in most regions report
low occupancy rates. The resulting idle resources are
costly for a government that spends about 60 percent
of its health budget on hospitals, twice as much as
Chile or Mexico. It also raises concerns about access
and the availability of quality care.
Namibia’s health workforce is inadequate to address the growing medical challenges it faces. MoHSS does
not have the necessary management tools to ensure
the effective planning, deployment, and monitoring
of health staff. Health workforce planning is outdated
and based on the number of patients recorded in
2003. Based on these data, Namibia has a shortage of
nurses and physicians in the public sector, with some
regions disproportionately affected.
Figure 41: Figure 42: Human Capital Index versus GDP per capita
242.
243.
244.
245.
Life expectancy is lower than in countries with similar levels of health spending
Source: World Development Indicators and World Bank Human Capital project.Note: 1/ Healthy life expectancy is a measure of health expectancy that applies disability weights to compute years of life expected.
1
0.8
0.6
0.4
0.26 8 10 12
HC
I
Log Real GDP Per Capita at PPP
8075706560555045403530H
ealt
hy E
xpec
tanc
y, 2
015
1/
Health Efficiency Frontier
Total health expenditure per capita, PPP$0 1000 2000 3000
EMs
SADCNamibia
OECD
Namibia Systematic Country Diagnostic114
5. Institutional Gaps and Challenges of Services Delivery
Socioeconomic Inequalities Have Not Been Substantially ReducedThe socioeconomic discrepancies that continue to exclude large segments of the population from opportunities are linked to very high and persistent inequality and slow progress in addressing the legacy of apartheid. Based on the World Bank’s Risk
and Resilience Assessment (RRA),75 the Government
has been advancing structural transformation
since independence to tackle the challenges of
exclusion. It is promoting policies of inclusion and
an economic growth model in its National Vision
2030 and the Harambee Prosperity Plan. However,
implementation of these reforms has been slow and
has not met expectations for rapid improvements
to livelihoods and income-generating opportunities.
The economy is now contracting, and Namibia
exhibits stark inequality as it relates to income
generation, as well as access to quality social
services and meaningful job opportunities.
Gender inequalities are acute. Women have limited
voice in the political sphere and are more likely to be
negatively impacted by socioeconomic and political
issues, as well as by environmental shocks. They are
underrepresented in senior government positions.76
Women have in recent years comprised about one-
fifth to one-quarter of all cabinet positions. Female
representation in senior government positions
below the level of minister and deputy minister
ranges from one-quarter to one-third (SAD Gender
and Development Monitor 2016). Despite these
numbers, Namibia ranks well globally and regionally
in terms of women’s representation.77 Women’s
access to land has been a tremendously contentious
issue in the debate over redefining land tenure
because it raises issues that impact their ability to
A. participate in commercial agriculture and the export
economy. Although representation of women is
comparable to men at a regional level, women use
their political voices and access less than their male
peers to raise critical questions or contribute to
government oversight.
A raft of social ills, such as gender-based violence (GBV), are becoming more common, many of them linked to factors such as poverty, changing social norms, and the perceived emasculation of men. Despite efforts to counter GBV, incidents appear to
be on the rise. The 2014 DHS survey found that 32
percent of all women aged 15 to 49 had experienced
physical violence since age 15, and that 14 percent
had experienced physical violence in the 12 months
prior to the survey. Looking at sexual violence
specifically, 7 percent of women aged 15 to 49 had
experienced sexual violence since age 15, and 4
percent had experienced such violence in the 12
months prior to the survey. About 6 percent of the
women surveyed reported experiencing physical
violence during a pregnancy, and 15 percent of
women who had experienced violence never sought
help or told anyone about it. The Afrobarometer
survey found that about 14 percent of women and
8 percent of men said they or their family members
were victims of GBV in the past year, with 7 percent
of women and 2 percent of men saying that it
occurred two or more times. In addition, 48 percent
of women and 37 percent of men reported feeling
unsafe walking in their neighborhoods during the
past year, while 34 percent of women and 27 percent
of men reported that they feared crime in their home
during the past year.
This section is based on the Namibia Risk and Resilience Assessment (RRA); Wee Asbjorn 2019.
A total of 43 women and 61 men were elected to the National Assembly (41.3 percent women overall), while there were 10 women compared to 32 men in the National Council (23.8 percent).
Women are represented relatively well in government and in politics. As of 2017, Namibia was ranked 11th in the world on female representation in the larger house of Parliament. It is now the fourth best in Africa on this score behind Rwanda, Senegal, and South Africa.
75.
76.
77.
246.
247.
248.
Namibia Systematic Country Diagnostic 115
The Mixed Picture of Institutional and Governance ProgressSince its independence in 1990, Namibia has staked out its place on the African continent as an example of good governance, political rights, and civil liberties. These characteristics represent
a fundamental pillar of the country’s development
progress. Namibia consistently stands above most
African countries with respect to key dimensions of
governance (Figure 43). The country outperforms its
income-group average on several other governance
indicators, including the rule of law (Global Integrity
2007; Mo Ibrahim Foundation 2018), democratic
stability and commitment (Bertelsmann Stiftung
2018; Freedom House 2018), and anticorruption
(Bertelsmann Stiftung 2018).
However, the governance story is more complex than a cursory look at the indicators might imply. Namibia has enjoyed free and fair elections
at the national and local levels. Similar to many
other postcolonial countries in Africa and Asia,
B. however, democratic transitions of government
have never been tested because the same party
has been in power since independence. According
to Afrobarometer (2018), citizens seem to have high
trust in the president (64 percent), but declining
trust in local politicians (44 percent), and low trust
in the opposition party (32 percent). This affects
the environment for open political debate and
democratic competition, even while political stability
remains high. In that sense, political stability is a
mixed blessing: although providing continuity, the
elites become entrenched, which leads to growing
discontent among the population.
Although most aggregate indicators suggest that Namibia is relatively free of corruption, citizens perceive the problem to be on the rise. Citizens
also believe that the Government is not doing
enough to combat it. Afrobarometer (2018) reports
that 78 percent of Namibians believe corruption
Mendelsohn 2008.
It is estimated that over 80 percent of San live more than 80 kilometers away from any type of health facility. San children experience some of the worst education indicators: 62 percent of San-speaking children are enrolled in lower primary school, 23 percent in upper primary school, 7 percent in junior secondary school, and less than 1 percent in senior secondary school.
78.
79.
Land ownership is highly unequal, with a mismatch between the availability of, and demand for, commercial arable land. The distribution of arable
agricultural land that favored white European
settlers and their descendants during colonialism
has skewed ownership rights, and the Government
faces significant pressure to reduce this vast
inequality. The efforts have not kept pace with high
expectations for land reform and the delivery of
productive land to previously disadvantaged citizens.
The Government aims to transfer 52 percent, or 15
million hectares, of the country’s arable commercial
agricultural land to previously disadvantaged
citizens. Traditional authorities hold nominal control
over land allocation. However, these powers are
increasingly being challenged by institutions set up
by government entities to provide services such as
registering land rights, managing water points, or
administering peri-urban areas.78
Marginalized communities are particularly land insecure, which exacerbates their socioeconomic vulnerabilities and reinforces inequality. Remoteness and discrimination against
the San and Himba groups often aggravate their
vulnerabilities with regard to education and health
care, and extreme poverty makes it difficult for San
children in particular to attend and stay in school.79
Indigenous communities also face systemic and
structural barriers to political representation and
participation and responsive governance. They are
also largely excluded from decision-making and/or
from benefiting from activities that take place on or
near their lands—for instance, mining, hydroelectric
dams, and resource development.
249. 250.
251.
252.253.
Namibia Systematic Country Diagnostic116
in the country has increased, and that corruption
exists at all levels of government. About 65 percent
believe that the Government is mishandling the
anticorruption fight. The “BTI 2018: Namibia Country
Report” (Bertelsmann Stiftung 2018) describes
financial scandals involving high-level officials and
government tenders, the auditor general’s office
being underfunded and understaffed, and various
anticorruption initiatives that remain poorly enforced.
The machinery of government is relatively weak. The low indicators of regulatory governance (WBG,
n.d.) point to poor private sector development
policies. Decreasing indicators related to policy and
interagency coordination (Bertelsmann Stiftung
2018) and policy evaluations (Institutional Profiles
Database 2016) suggest fundamental weaknesses
in how the Government is organized, undermining
its ability to stimulate equitable growth (Figure
44). This is compounded by structural constraints
(Bertelsmann Stiftung 2018): large territory, small
population, arid or semi-arid climate, the legacy of
colonial rule (including an export economy), and low
educational attainment of most of the population at
the time of independence.
The relationship between the Government and civil society also appears to be deteriorating. According to the IPD (2016), population participation
at both local and national levels was below the
income-group average, along with political and
social expression. Civil society organizations have
become weak, scarce, and generally ineffective. The
inability of civil society interest groups to organize
open debates around government shortcomings
is an important constraint. This is related to the
relative opaqueness of the Government. As the
Afrobarometer (2018) survey shows, citizens lack
access to information about the basic workings of
the Government and do not believe they would obtain
it if they were to inquire with the relevant authorities.
In the survey, the shares of people who thought they
were not very likely or unlikely to receive information
were 62 percent on how to register a business,
70 percent on landownership, and 72 percent on
the school budget. There is also a concern about
government surveillance of citizens, leading to
fears of expressing their opinions freely. On the
positive side, the country has traditionally enjoyed
a relatively free press. In 2019, Reporters without
Borders ranked Namibia 23rd out of 180 countries,
the highest ranking of any country in Africa. This is
due to a vibrant print media landscape and some
quality investigative journalism; however, the state
broadcaster rarely challenges the point of view of
the Government (Bertelsmann Stiftung 2018).
Namibia has a tradition of national development planning, although the implementation of the long- and medium-term plans is a persistent challenge. The Government drafted its Vision 2030, a long-term
aspirational plan, in 1998 under its first president,
Samuel Nujoma. The medium-term planning is
governed by a series of five-year NDPs; Namibia
is currently implementing its fifth NDP (NDP5,
2017–22). In addition, the Harambee Prosperity
Plan (2016–20) envisions the goal of “prosperity
for all.” Despite the existence of, and high-level
support for, these well-formulated documents,
implementation has been uneven, and the goals
remain largely on paper. Generally, the stakeholders
report an overreliance on international consultants
to draft these plans; this outside assistance
often circumvents or replaces a labor-intensive
iterative process of bottom-up submissions from
ministries, departments, and agencies (MDAs) and
prioritization by the center of government and the
National Planning Commission (NPC). As a result,
the MDAs do not own the NDP, which is also not
properly underpinned by the budget.
Implementation capacity is weak, and the M&E function of the national development planning is at its infancy. To implement the NDP, a proper results
framework with key performance indicators (KPIs)
and targets should be developed along with the
implementing MDAs, who must develop capacity and
be incentivized to track the indicators and regularly
report on them. However, the NPC has only recently
established an M&E Department. There is limited or
no institutionalized interface between the MDAs and
the NPC (that is, no ministerial-level M&E units, very
few staff trained in M&E, let alone any dedicated
M&E specialists), resulting in low capacity to collect,
track, and report the data. In addition, there are
few institutional incentives from MDAs to report
on the KPIs in a timely manner because the KPIs of
the NDP are not part of performance agreements Source: Governance databases such as: Bertelsmann Stiftung Transformation Index, Freedom House, Global Integrity index, Intuitional Profiled Database, AfroBarometer.
254.
255.
256.
257.

Namibia Systematic Country Diagnostic 117
Figure 43: Figure 44:
Figure 45: Figure 46:
Selection of governance indicators: Namibia scores ABOVE income-group average
Selection of governance indicators: Namibia scores BELOW income-group average
Services delivery: challenges of the territorial coverage Challenges across services delivery sectors
Source: Governance databases such as: Bertelsmann Stiftung Transformation Index, Freedom House, Global Integrity index, Intuitional Profiled Database, AfroBarometer.
9
8
7
6
5
4
3
2
1
0
Ant
icor
rupt
ion
polic
y
Com
mit
men
t to
de
moc
racy
Stab
ility
of
dem
ocra
cy
Elec
tora
l de
moc
raci
es
Rul
e of
law
Gov
erna
nce
indi
cato
rs
4,45
5,4 5,2
0,6 0,8
87,5
1 0,8
Comparators Namibia
3
2,5
2
1,5
1
0,5
0
Hea
lth
care
co
vera
ge
(ter
rito
riat
)
Dri
nkin
g w
ater
an
d sa
nita
tion
Elec
tric
ity
grid
Mai
nten
ance
and
so
lid w
aste
Publ
ic s
choo
ls
Gov
erna
nce
indi
cato
rs t
erit
oria
l
2,6
2 2,1
2,7
1,6
2,8
2 2 2 2
Comparators Namibia
6
5
4
3
2
1
0
Polit
ical
ac
coun
tabi
lity
Publ
ic p
olic
ies
Popu
lati
on
part
icip
atio
n (lo
cal)
Popu
lati
on
part
icip
atio
n (n
atio
nal)
Polic
y co
ordi
nati
on
Gov
erna
nce
indi
cato
rs
3,7
2 2,11,8 1,7
5,6
2
1 1
5
Comparators Namibia
6
5
4
3
2
1
0Education
and policy R&DHigh
educationTransport
Infrastructure
Gov
erna
nce
indi
cato
rs
5,4
4
2,52,22 2
Comparators Namibia
Namibia Systematic Country Diagnostic118
of ministers or high-level civil servants. There are
some initial steps in the right direction. President
Geingob has introduced some initial delivery targets
for ministers; however, the critics report that the
results remain disappointing. Targets are often weak
and poorly resourced, decisions are personalized,
and urgent “firefighting” often replaces the focus
on medium-term goals without any consequences
(Bertelsmann Stiftung 2018).
Overall, coordination at the center of government is ineffectual. There is limited institutional capacity
for either policy coordination (such as the formulation
of high-level strategy horizontally across MDAs, and
vertically through levels of national and subnational
government) or interagency coordination (such as
coordinating the implementation of such strategic
decisions). There are no designated organs in the
prime minister’s office specifically mandated to
carry out such high-level tasks. As a result, most
coordination is ad hoc or a by-product of other
processes, such as the planning process or budget
process. Consequently, bodies such as the NPC and
the Ministry of Finance play a key role in coordination
efforts; however, they are not always empowered to
do so. Horizontal coordination is rendered difficult
by inter-ministerial rivalries and the inability of
agencies such as the NPC to meaningfully enforce
their decisions or incentivize the MDAs. Vertical
policy and interagency coordination are particularly
challenging, given the gap between the de jure
and de facto decentralization efforts. Overall, the
coordination capacity seems to be declining over
time: the BTI Policy Coordination score dropped
from 7 out of 10 (2007) to 5 out of 10 (2016).
Significant Spatial Inequality in Services DeliveryNamibia’s sheer size and low population density make targeted services delivery extremely challenging but critically important for achieving the twin goals. The population living in remote
and isolated regions is also the poorest, most
marginalized, and most excluded. Yet the provision
of basic services in a sparsely populated country
with large desert and semidesert areas is also more
difficult and expensive for the Government. This is
reflected in the IPD (2016) indicators of territorial
coverage of public services, where scores are
significantly lower than the income-group average
on the territorial coverage of public schools,
basic health-care services, water, sanitation, and
electricity. Only the solid waste disposal score is
higher than its income-group average.
As described in earlier chapters, the services delivery challenges have their roots in the structural legacy of apartheid. Before 1990,
Namibia was divided into “homelands.” Homeland
government systems were segregated along racial
lines, resulting in inequitable services provision. In
the areas occupied by non-whites, basic services
and infrastructure were minimal or nonexistent
C. (Totemeyer 2010). After independence, the new
country inherited the spatial inequities in services
delivery and infrastructure, exacerbated by
population growth. Du Pisani (2010) identifies the
regions with indigenous populations that were
affected most: the Owambo, Herero, Damara, Nama,
Kavango, and Zambezi. In particular, the northern
regions of Kavango, Oshikoto, Zambezi, Kunene, and
Ohangwena are the poorest in the country, with one-
third of the population living below the poverty line.
The rural population in these areas had minimal or
no access to electricity, drinking water, sanitation,
health care, or education. Since independence,
the Government has been struggling to address
these structural inequities through decentralization
policies and targeted services delivery.
Poor coverage, limited access, low quality, and insufficient public resources are among the additional services delivery challenges. Territorial
coverage is only one of the issues reflected in the
indicators. Access to, and coverage of, public
services for Namibians are uniformly lower than
the income-group average across most available
indicators; the same holds for the quality of health
258.
259.
260. 261.
Namibia Systematic Country Diagnostic 119
care and education. (The only exceptions are the
quality of transport infrastructure, including ports,
airports, and public transport, where the country
scores above its income-group average.) Related
to the deteriorating government effectiveness,
Namibia scores lower than its income-group
average on the ability to reform services in health
care and education (IPD 2016) and policy research
and development (Bertelsmann Stiftung 2018).
The proportion of public spending on most public
services also seems to be below the standard for
upper middle-income countries (IPD 2016).
Although the Government has made progress since independence, the current state of services delivery requires a careful strategic policy approach, as well as more efficient spending to reduce the existing inequities. Spatial inequities
are obvious in access to water, sanitation, and
electricity: 78 percent of urban residents live in
electrified areas, compared with only 14 percent
of rural residents (Helao and Naidoo 2016). Access
to health facilities is also more difficult in the rural
areas. The education sector faces similar challenges.
In 2016, Namibians had one year less of education
on average than residents of other upper middle-
income countries, and 19 percent of Namibian
students had to repeat a grade (EMIS 2017).
Many service delivery bottlenecks may be related to delayed, inefficient, or leaky public procurement systems. Although evidence of
this issue is not available, one can speculate on a
number of possible bottlenecks in the system. For
example, funds may not be released on time by
the responsible ministry or they may be diverted;
contracts may not be awarded based on competitive
practices, leading to higher prices; the procurement
process can be long and cumbersome due to new
frameworks or restructuring; or the responsible
staff may lack knowledge and experience in quality-
assurance measures. Procurement obstacles may
result in school supplies not reaching classrooms
or medicines not arriving in the clinics on time or in
the quantity required. Worse still, public funds may
be squandered or outright misappropriated in the
process.
Public procurement reform is underway. The
new Public Procurement Law passed two years
ago, addresses several grievances and the loss of
legitimacy of the previous decentralized and opaque
procurement system. The law has been hailed as
a major policy improvement by centralizing large
procurements under the Central Procurement
Board (CPB). However, the implementation has been
difficult due to capacity constraints. This applies
both to the newly established CPB and to the public
entities that lack an understanding of the new law.
Paradoxically, even though the law has been a policy
improvement over the previous procurement regime,
its implementation has been difficult and has led to
temporary but dramatic increases in procurement
times for large contracts. These now take up to 12
months (as opposed to three to four months in the
past); there are also reported shortages of medical
supplies and other items critical to delivering
services.
The digital economy offers potential for enhanced services delivery in the public sector, but the Government’s efforts in this field appear fragmented and slow moving. Namibia’s consumers
have been rapid adopters of new technology in
the form of mobile phones and mobile payments.
However, limited digital skills hold back the adoption
and use of digital products and services, restricting
digital businesses’ growth potential. Improved
digital infrastructure can only achieve the desired
transformational impact if combined with a capable
public sector, investments in digital skills and literacy,
increased access to digital financial services, and a
ramp-up of support for digital startups and existing
businesses.
262.
263.
264.
265.

CLIMATE CHANGE ANDENVIRONMENTAL VULNERABILITIES
Namibia’s wealth relies heavily on renewable natural capital. Namibia is the driest Sub-Sahara African country and the most vulnerable to climate change. The water and agriculture sectors are particularly vulnerable to climate change, and the poor are the most affected by water shortages or pollution. Forests, fisheries, and tourism play important roles in offsetting losses in agricultural income. Namibia’s globally acknowledged water reclamation achievements, especially in Windhoek, demonstrate the commitment and know-how needed for diversifying water sources. Improved, sustainable water production is critical for several sectors in both rural and urban contexts.
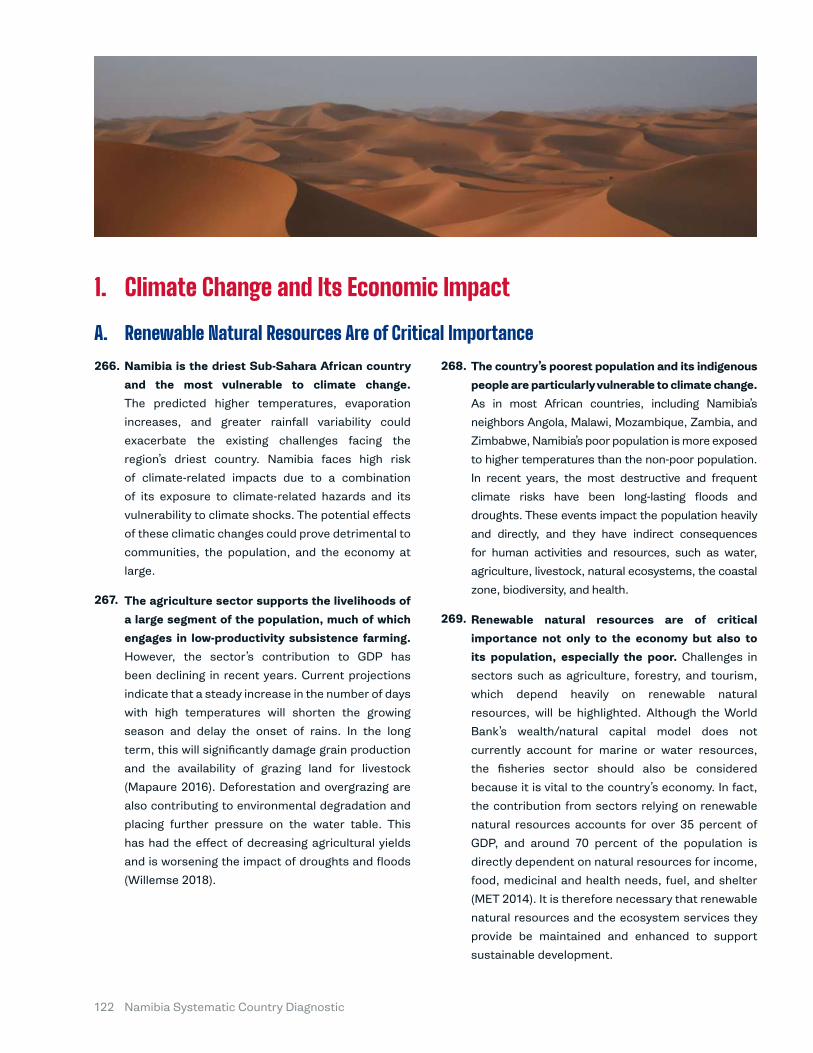
Namibia Systematic Country Diagnostic122
Renewable Natural Resources Are of Critical Importance
1.
Namibia is the driest Sub-Sahara African country and the most vulnerable to climate change. The predicted higher temperatures, evaporation
increases, and greater rainfall variability could
exacerbate the existing challenges facing the
region’s driest country. Namibia faces high risk
of climate-related impacts due to a combination
of its exposure to climate-related hazards and its
vulnerability to climate shocks. The potential effects
of these climatic changes could prove detrimental to
communities, the population, and the economy at
large.
The agriculture sector supports the livelihoods of a large segment of the population, much of which engages in low-productivity subsistence farming. However, the sector’s contribution to GDP has
been declining in recent years. Current projections
indicate that a steady increase in the number of days
with high temperatures will shorten the growing
season and delay the onset of rains. In the long
term, this will significantly damage grain production
and the availability of grazing land for livestock
(Mapaure 2016). Deforestation and overgrazing are
also contributing to environmental degradation and
placing further pressure on the water table. This
has had the effect of decreasing agricultural yields
and is worsening the impact of droughts and floods
(Willemse 2018).
Climate Change and Its Economic ImpactA.
The country’s poorest population and its indigenous people are particularly vulnerable to climate change. As in most African countries, including Namibia’s
neighbors Angola, Malawi, Mozambique, Zambia, and
Zimbabwe, Namibia’s poor population is more exposed
to higher temperatures than the non-poor population.
In recent years, the most destructive and frequent
climate risks have been long-lasting floods and
droughts. These events impact the population heavily
and directly, and they have indirect consequences
for human activities and resources, such as water,
agriculture, livestock, natural ecosystems, the coastal
zone, biodiversity, and health.
Renewable natural resources are of critical importance not only to the economy but also to its population, especially the poor. Challenges in
sectors such as agriculture, forestry, and tourism,
which depend heavily on renewable natural
resources, will be highlighted. Although the World
Bank’s wealth/natural capital model does not
currently account for marine or water resources,
the fisheries sector should also be considered
because it is vital to the country’s economy. In fact,
the contribution from sectors relying on renewable
natural resources accounts for over 35 percent of
GDP, and around 70 percent of the population is
directly dependent on natural resources for income,
food, medicinal and health needs, fuel, and shelter
(MET 2014). It is therefore necessary that renewable
natural resources and the ecosystem services they
provide be maintained and enhanced to support
sustainable development.
266.
267.
268.
269.
Namibia Systematic Country Diagnostic 123
A Perennial Quest for Sustained Water Availability
The water sector is particularly vulnerable to climate change, and the poor are the most affected by water shortages or pollution. The
three areas of Namibia that are the most water
stressed and vulnerable to climate change and rising
water demand are the central area, the Walvis Bay–
Swakopmund coastal area, and the Cuvelai area
with its high density of rural people in north-central
Namibia. The northern regions (especially Kavango
East and West, Ohangwena, Omusati, and Zambezi)
have the highest shares of people lacking access to
safe water and adequate sanitation.
Droughts pose substantial risks for the agriculture sector, the mainstay of the vulnerable, rural population. Large parts of the country are
extremely arid, with scarce, unpredictable rainfall.
Although substantial water resources exist in the
country’s north, Namibia is, for the most part, poorly
endowed with water. In this context, the country is
clearly vulnerable to volatile rainfall patterns, with
recurrent droughts having a significant impact on
poverty. Given the strong link between poverty and
rural households reliant on agriculture, vulnerability
to water shortfalls represents a substantial risk.
Water runs through the narrative of putting Namibia on a sustainable growth and development path. The most arid country in Sub-Saharan Africa,
Namibia is marked by highly variable and low
precipitation rates: from a maximum rainfall of
about 650 millimeters a year in the northeast to
less than 50 millimeters a year along the coast. The
mean annual rainfall is less than 100 millimeters.
About 70 percent of Namibia’s land surface is
arid and semi-arid, and 22 percent is desert. It is
estimated that only 2 percent of the rainfall ends up
as surface runoff, and a mere 1 percent becomes
available to recharge groundwater.80 The balance of
97 percent is lost through evaporation (83 percent)
and evapotranspiration (14 percent). There is also a
shortage of natural water resources. Groundwater
B.
270.
271.
272.
273.
274.
is the largest natural source of water and provides
about 40 percent of freshwater. The Ministry of
Agriculture, Water and Forestry reported an extreme
drought prevailing in the country in 2018/19 as
Namibia received less than 50 percent of its average
seasonal rainfall.
Global modeling has shown that water scarcity often acts as a brake on economic growth, so the economic ramifications of such water challenges require systematic mitigation. The World Bank’s
2016 report “High and Dry: Climate Change, Water
and the Economy,” showed that the effects of water
scarcity on GDP and well-being can vary across
regions. In Sub-Saharan Africa, these losses might
amount to 0.2 percent by 2050, close to the global
average. Since Namibia is more water stressed than
most other parts of Sub-Saharan Africa, the impacts
will be considerably higher; therefore, the country
will likely experience even more stress, which will
be exacerbated by rising demand combined with
increasing variability of rainfall and runoff.
A lack of water and sanitation causes stunting. About 23 out of 100 children are stunted in Namibia,
and therefore at risk of cognitive and physical
limitations that can last a lifetime. Access to
adequate water and sanitation services is known to
play a role in reducing stunting. JMP81 data from 2015
showed that access to safe drinking water among
the poorest varies from urban areas (86.46 percent)
to rural areas (47.66 percent). Open defecation is
widely practiced: 60 percent in urban areas and as
high as 96 percent in rural areas. In addition to poor
access to water and sanitation services, rainfall
shocks can also impact the health of children and
their later-life productivity. Because human growth
and development occurs nonlinearly, a “shock” or
deprivation experienced by a young child may have
devastating short- and long-term impacts. This is
particularly true when water shocks cause nutritional
deficiencies or health impacts in young children or
Data from this section are from the Water Global Practice (database), World Bank, Washington, DC (accessed October 28, 2019), https://www.globalwaters.org/resources/assets/world-bank-water-global-practice
Joint Monitoring Programme for Water Supply, Sanitation and Hygiene (JMP)
80.
81.
Namibia Systematic Country Diagnostic124
when income shocks prevent families from investing
in their children. Early childhood is a critical time for
determining whether children will grow up stunted.
Using Demographic and Health Survey data along
with detailed weather data shows that children
younger than age 5 who are exposed to more dry
rainfall shocks since birth have significantly lower
height-for-age scores. Evidence from the 2018 World
Bank report Uncharted Waters extends these results
to adult women in Sub-Saharan Africa, finding that
women born during periods of below-average rainfall
grow up to be significantly shorter, less educated,
and less wealthy.
Namibia is severely water stressed and is highly vulnerable to the impacts of water scarcity on agriculture, human capital, and overall economic growth. A drought state of emergency was declared
in 2018. This introduced drought contingency
measures but also underscored that addressing
water availability is critical for long-term sustainable
development. Water scarcity is an underlying
constraint across the main economic sectors,
impacting industrial production, employment
generation, and the significant agribusiness sector.
In October 2019, the Government reported spending
N$131 million (about US$14 million) on drought-relief
efforts in the past year and called for an extension
of at least six months of the drought state of
emergency.
Namibia’s globally acknowledged water-reclamation achievements, especially in Windhoek, demonstrate the commitment and know-how needed for diversifying water sources. The Government has made efforts to draw
together stakeholders to strengthen the existing—
but weakened—Namibia Water Partnership to
collaborate on a strategy for water management.
Despite its high capacity, especially when compared
with the rest of Sub-Saharan Africa, challenges of
this scale require a concerted effort to overhaul
an aged bulk water and distribution infrastructure,
increase financial and human resources to effectively
manage water supply and sanitation facilities and
services, and develop coherent policies to deal with
growing scarcity and uncertainty. There have been
many calls for new approaches to managing water
resources, especially for integrated water resources
management. The challenge is to access the best
knowledge and adapt it to the Namibian context
while securing political momentum for sweeping
policies—all at a time when drought and water
scarcity conditions continue to intensify due to
climate change.
To sustain development, Namibia is striving to preserve and augment its water resources. While
dire drought conditions persist, the country is
seeking to scale up its globally recognized innovative
solutions to manage demand and maximize reuse
of water. Perhaps the best-known innovation has
been in Windhoek, one of a few cities in the world
where wastewater recycling for direct potable water
supply has been implemented. The city’s managed
aquifer scheme has also enabled significant
artificial recharge of its water table, augmenting
its water resources by up to 40 percent, according
to its estimates. The water department has also
adopted a diligent metering strategy, including
prepaid meters. Moving forward, Namibia requires
investments in water conservation and storage,
groundwater preservation, and the development
of new water resources, as well as cost-reflective
pricing to encourage conservation and reallocation
to more productive sectors. The balance between
supply and demand needs to be improved and
water tariffs adjusted; however, this comes at the
risk of additional costs to firms that may make
them less competitive—especially given the high
costs of innovations such as desalination—so that
it is important that careful pricing policies and
pricing formulas are developed. In Swakopmund
on the Atlantic coast, for example, a relatively new,
highly automated, and energy efficient desalination
plant has a capacity of 57 million liters per day. The
water is mostly used to supply uranium mines in the
desert, but there is potential to expand the scale and
client base of desalination as part of a national, as
well as regional, augmentation strategy.
275.
276.
277.
Namibia Systematic Country Diagnostic 125
Agriculture Challenges
Food insecurity is a critical challenge for Namibia. Recurrent and prolonged droughts in recent years,
worsening an already water-stressed production
system, have resulted in a declining yields and
productivity. An estimated 16 percent of the
population were food insecure and in urgent need
of food support, and 578,480 people were affected
by food shortages and experienced a significant
reduction in food and water availability due to the
2014/15 drought (IFRC 2018). Namibia is a net food
importer and has run an agriculture trade deficit for
the past five years.
Structural water deficits are felt most acutely in the agriculture sector. About 70 percent of
Namibia’s people rely on agriculture for their
livelihoods. The agriculture sector is dominated by
livestock farming—cattle, sheep, goats, and pigs—
but its share of GDP declined from 67 percent in
2007 to 57 percent in 2017. Meat, a water-intensive
product, contributed 90 percent to agricultural
export earnings and 6 percent of total export
earnings in 2017. Statistical evidence shows that
the impact of dry rainfall episodes on agricultural
productivity is stark. As measured by net primary
productivity, a satellite-based metric, agricultural
yields decrease by 6 to 7 percent for the full Sub-
Saharan Africa sample and a staggering 41 to 58
percent for Namibia, an order of magnitude higher
than the rest of the region and at the high end of
global results, too. This suggests that climate smart
agriculture (CSA) strategies will be fundamental to
maintaining productivity in Namibia. Ultimately, the
limits of agriculture will need to be recognized with a
stronger focus on diversification of basic livelihoods
for the poor and keeping people out of poverty.
Hydrological monitoring and planning are also going
to be very important for addressing water scarcity
for agriculture productivity. Good hydrological
and meteorological (hydromet) services will be of
great help when preparing for extreme weather
conditions. This becomes even more important
when considering the impacts of climate change.
C.
The negative impacts of climate change are worsening an already low agricultural productivity capacity. Droughts are more frequent, intense, and
prolonged, with severe impacts. For example, the
recent consecutive droughts (2013/14, 2015/16,
2018/19) resulted in losses of thousands of livestock
animals, water and food shortages for households,
and a reduction in domestic grain production by
more than 50 percent.
Drought is particularly burdensome for women. Large number of the subsistence farmers are women,
and this source of livelihood is particularly vulnerable
to the increasing frequency of drought. During the
droughts, women tend to remain responsible for
households’ food production and management, while
men tend to leave to seek work in other industries or
in urban areas. Drought conditions also force women
to travel longer distances to seek water.
Land degradation has deteriorated grazing conditions for livestock. A lack of feed limits
agricultural productivity and the raising of large
and small ruminants (primarily local and mixed
breeds) for many smallholder livestock producers
on communal lands. Poor grazing results in inferior
animals, resulting in livestock that fetch lower
prices. As a result, many smallholder producers
in communal areas prefer to sell weaners82 and
older cows to minimize losing cattle due to wasting
and reduce the costs related to cattle feed and
supplements, especially during prolonged droughts.
Overgrazing and poor land management practices
diminish the quantity and quality of grass. Securing
land management and planning of settlements
(urban and rural) will help Namibia improve living
conditions for the poor.
Bush encroachment is a critical challenge. The
invasion and thickening of aggressive woody species
results in an imbalance in the bush-to-grass ratio and
reduces agricultural productivity by decreasing the
land’s carrying capacity. Bush encroachment also
decreases underground water supplies because of
In Namibia, the term weaner producer refers to a cattle farmer who predominantly produces and markets young calves (aged 6 to 10 months), which are called weaners
82.
278.
279.
280.
281.
282.
283.
Namibia Systematic Country Diagnostic126
high extraction of groundwater. In addition, a large
amount of water is intercepted and transpired back
into the atmosphere without producing fodder. The
results are economic losses that reduce livelihoods
in many rural areas. Bush encroachment is estimated
to affect up to 45 million hectares of Namibian
land (Namibia Economist 2015). Bush control was
declared a priority in the country’s NDP5.
Meeting animal health and welfare standards is necessary to penetrate international and regional markets for livestock and livestock products. Controlling animal disease outbreaks is a challenge,
particularly because transboundary diseases,
including foot-and-mouth disease and contagious
bovine pleuropneumonia, are present. Although
Namibia has a control strategy for goat plague
(pestes de petits ruminants), the disease is present
in the SADC region, and the Northern Communal
Area remains at risk due to porous borders with
Angola, Zambia, and Zimbabwe.
The delivery of agricultural extension services is challenging. There are few extension-service
workers; it is estimated that one extension worker
serves more than 2,500 farmers and must travel
long distances between farms, making services
delivery difficult. In addition, there are few resources
available to extension workers. There is a need for
innovative solutions to enhance effective extension
services delivery and reach more farmers (Box 13).
Natural Resources Degradation Is an Eminent Threat to Rural CommunitiesDeforestation poses a serious threat to the habitats of rural communities, reducing the capacity for carbon sequestration, as well as hydrological and nutrient-cycling functions. Originally, about 20
percent of Namibia’s surface area (16 million hectares)
was covered by dryland forests and woodlands (MET
2014); today, an estimated 8.4 percent remains
under forest cover.83 The annual deforestation rate
averaged an estimated 0.84 percent from 2000
to 2010. In parallel, land-productivity dynamics
showed the summer vegetation productivity
potential on 44,816 km²—6 percent of total national
surface area—decreased between 1998 and 2013.84
Deforestation is most prevalent in the north and
north-central regions—particularly in the Kavango,
Ohangwena, and Zambezi regions—and is due largely
to small-scale agriculture, fuelwood collection, and
unsuitable fire management. Forests also suffer from
illegal harvesting for firewood and timber (including
harvesting of the valuable slow-growing miombo
species). All else being equal, it may be estimated
that deforestation over the 1995–2014 period
D. represented a loss of 2.2 percent of the country’s
wealth, or US$1,872 per capita. 85
Forests play an important role in offsetting losses in agricultural income due to weather shocks or changes in commodity prices. According to
the Poverty and Environment Network findings,86
an estimated 9 percent of the rural population is
lifted above the extreme poverty line because of
income from forest resources. The wooded areas
represent an important safety net for rural people in
times of economic distress, with many households
responding to an income shock by seeking additional
resources from forests (Noack et al. 2015).
Namibia has significant room to improve on adequately monitoring its forests, and understanding the basic dynamics related to its forests. The scarcity of available data and
limited understanding of the situation combine to
alert Namibia about the need to develop improved
monitoring systems, tapping into earth-observation
technologies and techniques.
Forest area (as a percentage of land area) in Namibia was last measured at 8.4 percent in 2015, according to the World Bank. Forest area is land under natural or planted stands of trees of at least five meters in situ. See “Forest area (% of Land Area)” in the World Bank database, http://data.worldbank.org/indicator/AG.LND.FRST.ZS
Joint Research Centre of the European Union (JRC-EU), 2011.
Calculated from the database from Lange, Wodon, and Carey (2018), assuming that no forest depletion would have occurred from 1995 to 2014.
The Poverty and Environment Network survey covers about 8,000 households in 24 countries across Sub-Saharan Africa, South and East Asia, and Latin America and represents smallholder-dominated communities living close to forests (with access to forest resources).
83.
84.
85.
86.
284.
285.
286.
287.
288.

Namibia Systematic Country Diagnostic 127
BOX 13: Israel - Achieving Agricultural Transformation in a Desert
Similar to Namibia, Israel is one of the most water-scarce countries in the world. A significant part of the country (66 percent) is semi-arid with poor soil quality. Yet Israel has a flourishing agriculture sector in desert conditions. It records high productivity rates in several crops, including citrus fruits and tomatoes. Its citrus yield is 262 tons per hectare (compared with 243 tons per hectare in North America), and its tomato yield is 300 tons per hectare (versus the world average of 50 tons per hectare). Below are the key ingredients of Israel’s agricultural success.
� Five huge seawater desalination plants supply 95 percent of household and industry water consumption (four via public-private partnership investments).
� Effluent wastewater recycling—86 percent of sewage water is reused for agriculture.
� Efficient low-volume irrigation technologies: drip, mini-sprinklers, moisture-sensitive automated drips, etc.
� Government made extension a priority with sufficient funding.
� One extension worker serves 50 to 80 farmers versus an average of 2,500 in Namibia.
� Extension workers are strongly connected to research.
� One consultant crop specialist serves every 110 farmers.
� Close relationship/accessibility between researchers, extension agents, and farmers.
� Regional R&D centers adapt solutions to local conditions.
� Innovative technologies: drought-resistant seeds, stem water sensors, heat-stress-resistant tomato varieties, greenhouses, precision agriculture, and other low-tech, low-cost solutions.
� High government investment in agricultural research—a US$37 million per year budget in addition to some private sector funding.
� Robust and well-managed farmer cooperatives increase economies of scale, bargaining power, and market linkages for Israeli farmers.
� Various cooperative models allow effective aggregation for different farmers.
� Clear policies/programs—especially on enabling infrastructure—to support farmers.
� Policy consistency and continuity to support a clear agricultural vision.
� Effective prioritization, planning, and coordination.
INNOVATIVE AND EFFECTIVE WATER MANAGEMENT
EXTENSION SERVICES ARE PRIORITIZED
EFFECTIVE PROBLEM SOLVING AND WELL-FUNDED AGRICULTURAL R&D
STRONG FARMER COOPERATIVES
GOVERNMENT COMMITMENT AND LEADERSHIP
Source: Abraham et al. 2019.
Namibia Systematic Country Diagnostic128
The Tourism Sector Depends on the Climate Change
The Fisheries Sector Is Vulnerable to Oceanographic Conditions
Growing tourism demand is highly beneficial because it creates direct and indirect income and employment effects to host regions that tend to emphasize community involvement and community-based tourism initiatives. Growth of the biodiversity
economy through the encouragement of the
Community-Based Natural Resources Management
(CBNRM) program is essential for the development of
the tourism sector and rural communities, renewable
natural resources conservation, and income
generation. The CBNRM program devolves rights
and responsibilities over natural resources to local
communities, leading over the past two decades to
the formation of 83 communal conservancies (38 are
directly involved in tourism activities), 32 community
forests, and a community association living within a
national park’s boundaries. Together, these endeavors
cover almost 20 percent of the land and empower 10
percent of the population as conservation stewards.
Nevertheless, the tourism sector faces environmental challenges. Due to the rise in
wildlife population numbers, human-wildlife conflict
has increased, including encounters with lions,
Namibia has one of the most productive fishing grounds in the world—primarily because of the Benguela Current—and the fisheries sector is the third-largest income earner after mining and tourism, contributing to job creation, remittances, and about 15 percent of total exports. The annual
catches of about 550,000 tons are valued at an
average of N$7 billion (about US$800 million) and
constitute about 4.5 percent of GDP. About 14,000
people are directly employed in the fisheries sector,
and about three times as many are indirectly
employed in supporting industries, such as
stevedoring services, fishery-related supplies, and
logistics. Many fishing-industry employees come
from the northern parts of the country, but the
sector’s economic importance reaches far beyond
the Erongo and | | Karas regions, as workers send
resources to their families residing in home regions,
E.
F.
leopards, elephants, and hippos. Between 2011 and
2016, Namibia faced an average of 100 incidents
per conservancy caused by the increase in wildlife
populations and the different migration patterns of
humans and wildlife in response to drought. In the
Zambezi region, human-wildlife conflict resulted
in a loss of US$770,000 to the national economy
(WWF 2008). In addition, more frequent episodes of
drought have forced people to move into conservancy
areas previously reserved for wildlife. Another issue
that needs combating is the rising threats from
commercial poaching and trafficking, which has
dramatically increased in southern Africa. Moreover,
irresponsible tourism may result in severe economic
consequences. For instance, off-road driving in dunes
may destroy key desert habitats, further affecting
the rural poor. Pollution and waste generated by the
development of tourism facilities, transportation,
and tourist activities themselves are also major
causes of environmental impacts. As these impacts
accumulate, they destroy the very foundation on
which tourism thrives and may impede growth.
especially the Ohangwena, Okavango, Omusati,
Oshana, Oshikoto, and Zambezi regions.
The fisheries sector is facing many challenges, particularly from competition for the use of ocean resources by different sectors. Mining activities
such as seismic exploration and diamond mining in
the south are likely to have negative impacts on the
catches of highly migratory tuna and rock lobsters.
What is more, a lack of zoned land and access to
water for mariculture projects along the coast
hamper the expansion of mariculture production.
The oceanographic conditions, such as the recurrent
hydrogen sulfide eruptions along the coast and the
unprotected high energy coastline, are additional
limiting factors to marine aquaculture production
(FAO 2013).
289.
290.
291.
292.
Namibia Systematic Country Diagnostic 129
Natural Resources Degradation Is an Eminent Threat to Rural CommunitiesHouseholds were significantly harmed by the 2015/16 drought, with the most severely hit households losing up to 28 percent of their consumption. In the basic simulation model, areas
affected by the 2015/16 drought were predicted
to experience an average decrease of N$12,500 in
per capita income, amounting to an average 3.5
percent decrease and, among the worst hit, a 28.8
percent decrease. In a simulation that also included
the floods, households affected by the drought were
predicted to experience a 4.1 percent average income
loss, and those in flooded areas were predicted to
experience substantial losses.
G.
2.Namibia has been hit by several severe environmental shocks in recent years. A devastating
drought in 2013 left 35 percent of the population food
insecure (Willemse 2018). In 2009, flooding in the
north and northeastern parts of Namibia affected
about 700,000 people and resulted in damage and
losses estimated at 1 percent of GDP. Meteorological
data and community reports indicate an increase in
the frequency of droughts and floods in recent times
(Mapaure 2016). The two most recent droughts, the
2015/16 El Niño drought and the 2018/19 drought,
have had particularly strong impacts. The 2015/16 El
Niño episode peaked between December 2016 and
March 2017, and has been called the region’s worst
drought in 35 years (UNICEF 2017). As a result, the
Government declared a state of emergency in June
2016, which ended in March 2017, and it offered
drought-relief food assistance between May and July
2016 (FAO 2016). This drought was also followed by
floods that peaked in April 2017. The 2015/16 El Niño
drought largely affected the south and east of the
country, while the 2018/19 drought that followed
hit more heavily in the north. Both droughts caused
severe damage to agricultural productivity. The
Adverse Impact of Environmental Shocks2018/19 drought, for example, resulted in the deaths
of more than 30,000 cattle between October 2018
and April 2019, according to SADC reports. These
droughts crippled farming and livestock livelihoods in
the country, hampered socioeconomic development,
and put pressure on the national disaster risk
response budgets.
Research has shown that climate change is likely to exacerbate the intensity and frequency of extreme weather events in Namibia (Reid et al. 2008). Droughts may be expected to worsen with
climate change. In a recent Afrobarometer survey,
34 percent of Namibians felt that climate change
had worsened their agricultural conditions over the
past 10 years, and 38 percent believed that droughts
had become more severe over the past 10 years.
Meanwhile, 63 percent stated that climate change
was making life worse or much worse for them.
However, only 16 percent are what Afrobarometer
calls “climate change literate,” meaning they had
heard of climate change, believe it is caused in part
by human activity, and associate it with negative
changes (Selormey et al. 2019).
Households affected by the 2018/19 drought appear quite different from those households unaffected by the drought, and quite different from those households that were affected by the 2015/16 drought. Drought-affected households
were 14 percentage points more likely than non-
drought-affected households to be headed by a
female. On average, they had one more household
member and about 60 percent of the average per
capita income. They were 12.4 percentage points
more likely to be food insecure. They were also more
likely to depend on agriculture: nearly 40 percent had
grown crops in the past year (compared with 11.2
percent for non-drought-affected households), and
they were 10 percentage points more likely to earn
their main income from agriculture, 21 percentage
points more likely to use subsistence farming, and
17.7 percentage points more likely to keep livestock.
293.
294.
295. 296.
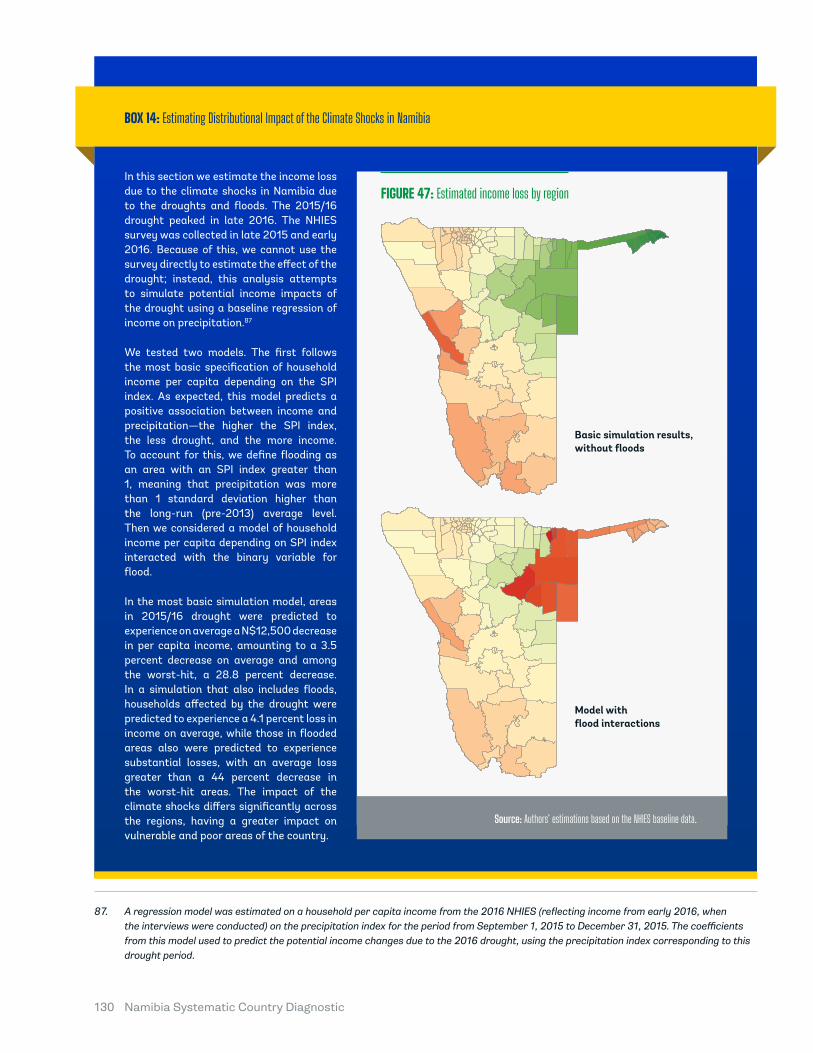
Namibia Systematic Country Diagnostic130
BOX 14: Estimating Distributional Impact of the Climate Shocks in Namibia
In this section we estimate the income loss due to the climate shocks in Namibia due to the droughts and floods. The 2015/16 drought peaked in late 2016. The NHIES survey was collected in late 2015 and early 2016. Because of this, we cannot use the survey directly to estimate the effect of the drought; instead, this analysis attempts to simulate potential income impacts of the drought using a baseline regression of income on precipitation.87
We tested two models. The first follows the most basic specification of household income per capita depending on the SPI index. As expected, this model predicts a positive association between income and precipitation—the higher the SPI index, the less drought, and the more income. To account for this, we define flooding as an area with an SPI index greater than 1, meaning that precipitation was more than 1 standard deviation higher than the long-run (pre-2013) average level. Then we considered a model of household income per capita depending on SPI index interacted with the binary variable for flood.
In the most basic simulation model, areas in 2015/16 drought were predicted to experience on average a N$12,500 decrease in per capita income, amounting to a 3.5 percent decrease on average and among the worst-hit, a 28.8 percent decrease. In a simulation that also includes floods, households affected by the drought were predicted to experience a 4.1 percent loss in income on average, while those in flooded areas also were predicted to experience substantial losses, with an average loss greater than a 44 percent decrease in the worst-hit areas. The impact of the climate shocks differs significantly across the regions, having a greater impact on vulnerable and poor areas of the country.
FIGURE 47: Estimated income loss by region
Basic simulation results, without floods
Source: Authors’ estimations based on the NHIES baseline data.
Model with flood interactions
A regression model was estimated on a household per capita income from the 2016 NHIES (reflecting income from early 2016, when the interviews were conducted) on the precipitation index for the period from September 1, 2015 to December 31, 2015. The coefficients from this model used to predict the potential income changes due to the 2016 drought, using the precipitation index corresponding to this drought period.
87.
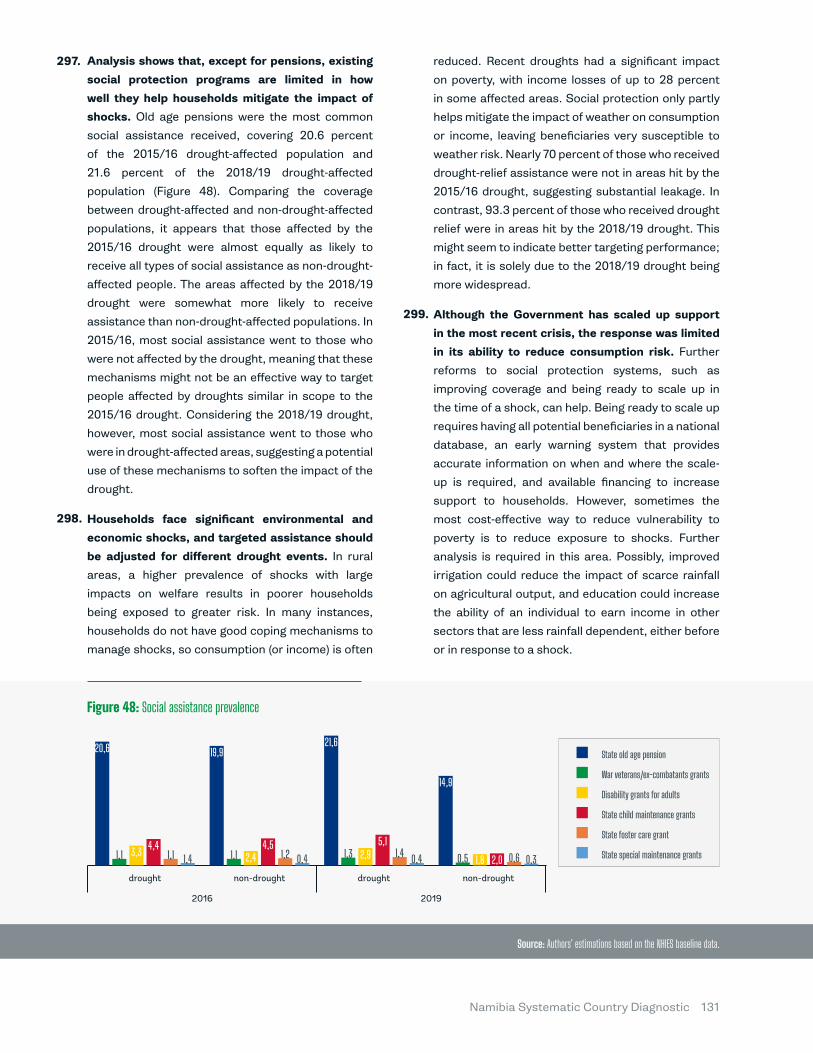
Namibia Systematic Country Diagnostic 131
Analysis shows that, except for pensions, existing social protection programs are limited in how well they help households mitigate the impact of shocks. Old age pensions were the most common
social assistance received, covering 20.6 percent
of the 2015/16 drought-affected population and
21.6 percent of the 2018/19 drought-affected
population (Figure 48). Comparing the coverage
between drought-affected and non-drought-affected
populations, it appears that those affected by the
2015/16 drought were almost equally as likely to
receive all types of social assistance as non-drought-
affected people. The areas affected by the 2018/19
drought were somewhat more likely to receive
assistance than non-drought-affected populations. In
2015/16, most social assistance went to those who
were not affected by the drought, meaning that these
mechanisms might not be an effective way to target
people affected by droughts similar in scope to the
2015/16 drought. Considering the 2018/19 drought,
however, most social assistance went to those who
were in drought-affected areas, suggesting a potential
use of these mechanisms to soften the impact of the
drought.
Households face significant environmental and economic shocks, and targeted assistance should be adjusted for different drought events. In rural
areas, a higher prevalence of shocks with large
impacts on welfare results in poorer households
being exposed to greater risk. In many instances,
households do not have good coping mechanisms to
manage shocks, so consumption (or income) is often
reduced. Recent droughts had a significant impact
on poverty, with income losses of up to 28 percent
in some affected areas. Social protection only partly
helps mitigate the impact of weather on consumption
or income, leaving beneficiaries very susceptible to
weather risk. Nearly 70 percent of those who received
drought-relief assistance were not in areas hit by the
2015/16 drought, suggesting substantial leakage. In
contrast, 93.3 percent of those who received drought
relief were in areas hit by the 2018/19 drought. This
might seem to indicate better targeting performance;
in fact, it is solely due to the 2018/19 drought being
more widespread.
Although the Government has scaled up support in the most recent crisis, the response was limited in its ability to reduce consumption risk. Further
reforms to social protection systems, such as
improving coverage and being ready to scale up in
the time of a shock, can help. Being ready to scale up
requires having all potential beneficiaries in a national
database, an early warning system that provides
accurate information on when and where the scale-
up is required, and available financing to increase
support to households. However, sometimes the
most cost-effective way to reduce vulnerability to
poverty is to reduce exposure to shocks. Further
analysis is required in this area. Possibly, improved
irrigation could reduce the impact of scarce rainfall
on agricultural output, and education could increase
the ability of an individual to earn income in other
sectors that are less rainfall dependent, either before
or in response to a shock.
Figure 48: Social assistance prevalence
drought non-drought
2016 2019
drought non-drought
State old age pension
Disability grants for adults
War veterans/ex-combatants grants
State foster care grant
State child maintenance grants
State special maintenance grants
Source: Authors’ estimations based on the NHIES baseline data.
20,6 19,921,6
14,9
1,1 1,1 1,3 0,53,3 2,4 2,9 1,84,4 4,5 5,1
2,01,1 1,2 1,4 0,61,4 0,4 0,4 0,3
297.
298.
299.

PRIORITY INTERVENTIONS TO ENSURE STRONG, INCLUSIVE, AND SUSTAINABLE DEVELOPMENT
Namibia Systematic Country Diagnostic134
1.
The analysis presented in previous chapters identified a wide range of development constraints. The aim of this SCD is to identify key
binding constrains for inclusive economic growth and
broad policy priorities. The overarching conclusion
of the analysis is that private sector-led economic
growth is critical for achieving Namibia’s sustainable
development, improving human capital, and raising
people’s living standards. The analysis builds on four
key binding constraints summarized as follows:
� Highly segmented input and output markets and dependency on low-productivity sectors. The
labor market is characterized by a significant gap
between those in high-productivity, high-paying
jobs and those in low-productivity, low-paying
jobs. Similarly, high levels of inequality in land,
financial, and product markets play an important
role in markets’ segmentation, hampering
productivity. Both supply and demand factors
explain this inequality. State intervention and
monopolistic practices are relatively common.
SOEs remain dominant, and their inefficiency
hurts the economy’s competitiveness. This
situation is exacerbated by low entrepreneurship
rates and relatively thin competition. The
financial sector, dominated by South African
banks, caters to large formal companies.
Namibia’s economic growth is largely dependent
on the global and regional context, underscoring
its vulnerability to commodity prices and
financial shocks. Economic dependence on low-
productivity sectors and a low complexity of
exports strain TFP. The adverse effects of price
shocks distress revenue streams and impact
efficient resource exploitation. Namibia is highly
dependent on South Africa’s product markets,
which have high barriers to entry, and firms miss
out on opportunities to tap into high-value-added
global markets and grow through technology
transfers. The country is extremely vulnerable to
climate change and environmental shocks.
Binding Constraints to Wealth Creation and Sustainable Economic Development
� Poor-quality educational and health systems. Lack of skills is an important binding constraint
on economic development. High spending on
inefficient, poor quality education has resulted in
widespread skills mismatches. The educational
system is often characterized by overaged
enrolment, weak learning outcomes, high
repetition and early dropout rates, and inadequate
educational services in remote rural areas. There is
an excess supply of low-skilled laborers but a lack
of demand for them. The returns on postsecondary
education are very high. Shortages of skilled
labor limit the capacity to apply knowledge and
technology, constrain productivity growth, lower
profitability and investment returns, and reduce
international competitiveness. Despite rising
spending, poor health outcomes are evident,
particularly among low-income groups. Poor
children’s health outcomes present a critical
barrier to inclusion over time.
� Highly skewed distribution of productive assets and land. Property rights are weak, and wealth
and land are still held by very few Namibians.
Such inequality strains socially acceptable
standards of fairness. As in neighboring South
Africa, weak titling—especially in poorer, more
informal areas—limits the value of property.
It is a major source of policy uncertainty,
especially in agriculture. At the same time, the
legacy of apartheid is reflected in limited or
expensive connectivity, underserved historically
disadvantaged settlements, and development
of the northern parts of the country. Although
many Namibians continue to live far away from
job opportunities, migration has been significant
from rural areas in pursuit of jobs in cities. This
migration can help reduce poverty, but it also
can put pressure on the sustainability of existing
public services. Access to electricity, water and
sanitation, flush toilets, and good public clinics
and schools remains much weaker in historically
disadvantaged communities.
300.
Namibia Systematic Country Diagnostic 135
� Extreme vulnerabilities to climate change and vulnerabilities arising from markets and technology. The country is exposed to
prolonged droughts and intensifying water
insecurities, and urbanization and economic
growth continue to increase demand for water.
Namibia is the driest Sub-Sahara African country
and the most vulnerable to climate change. The
country’s poorest population and its indigenous
people are particularly vulnerable to climate
change and weather shocks. Renewable natural
resources are of critical importance not only to
the economy but also to Namibia’s population,
especially the poor. Structural water deficits
are felt acutely in the agriculture, tourism, and
fisheries sectors. Households face significant
environmental and economic shocks, and
targeted assistance and mitigation strategies
should be adjusted to meet the challenges of
different types of drought events. Namibia is
also highly dependent on South Africa’s product
markets, which have high barriers to entry, and
firms miss out on opportunities to tap into high-
value-added global markets and growth through
technology transfers.

Namibia Systematic Country Diagnostic136
2.This report’s “Changing Wealth of Nations” approach suggests that the level of economic development is strongly related to the composition of national wealth. In Namibia, the main source
for wealth accumulation and rapid economic
development has been human capital, while natural
resources capital has been depleted. The country
effectively leveraged its natural capital to increase
its national wealth from 1995 to 2014, and the value
and share of human- and physical-produced capital
increased significantly. Despite improvements,
wealth accumulation remains significantly below
that of Namibia’s upper middle-income counterparts.
The development of a country’s wealth is a holistic
approach combining several key elements. Human
capital is one of them. Renewable resources—
agricultural land and forests and protected areas—
can also produce benefits if managed sustainably.
Despite investment in human and physical capital, economic growth that Namibia achieved in the post-independence period has not been enough to overcome structural challenges. The
recent deterioration in the macro-fiscal framework
indicates that the country’s vulnerabilities and
imbalances have been accumulating over time. The
growth model has not been inclusive enough; it has
been unable to address stark levels of inequality and
has failed to create enough new jobs. Going forward,
Pathways to Lifting Binding Constraints Namibia needs a greater emphasis on broadening
the sources of growth and increasing TFP.
Addressing the above-identified binding constraints requires making progress along four key development pathways. They involve:
(i) establishing an environment for private sector-
led, job-creating growth through better economic
management, enhanced competition, and a better
entrepreneurship ecosystem; (ii) building human
capital and increasing the productive potential of
the labor force by improving quality and relevance
of education, workers’ skills and health outcomes;
(iii) reducing inequalities through better services
delivery brought about by improved governance
and upgraded quality, especially for marginalized
communities and those living in remote areas where
population density is low and the cost of delivering
services high; and (iv) reducing vulnerabilities
to climate change and environmental shocks
through investments that can mitigate adverse
consequences. These development pathways will
work together to lift the binding constraints and
move Namibia toward boosting economic growth
and becoming a more inclusive economy. Given the
aim of this SCD to identify broad policy priorities,
more specific interventions will be highlighted by the
follow-up sectoral work.
301.
302.
303.
Namibia Systematic Country Diagnostic 137
Establishing an environment for private sector-led, job-creating growthStrengthening fiscal buffers is key to shielding Namibia from commodity market volatility and declining SACU receipts. The instability of
commodity prices and SACU receipts contributes
to widening fiscal deficits and growing debt levels.
Automatic stabilizers should be introduced to
mitigate the adverse impacts. Wealth funds, for
example, would provide cushioning for erratic
mineral prices. In the short term, they would reduce
the impact of volatile revenues on the economy
and provide a funding source for countercyclical
spending. In the long term, the funds provide an
intergenerational impact as they spread the financial
benefits of resources more evenly over time. Fiscal
consolidation should continue through FY2021/22,
when further cuts in government spending are
projected but the fiscal outlook will remain weak
as SACU revenues are expected to decline, leading
the budget deficit staying above 10 percent of GDP.
Public debt should peak in 2020 and return to below
70 percent of GDP by 2022. Beyond increased
domestic borrowing and use of the Contingency
Fund savings, Namibia has auctioned fishing quotas
to obtain much-needed forex to reduce the financing
gap. The authorities have also approached the IMF
for support through a Rapid Financing Instrument.
The Doing Business indicators suggest that regulatory processes may be overly burdensome and could be made more efficient for firms. The
business regulatory environment is a barrier to
both domestic and foreign investment. The Doing
Business areas highlighted in the analysis include
starting a legal business, registering property,
trading across borders, and resolving insolvency.
Company registration in Namibia is a lengthy,
cumbersome process, taking an average of 66
days to complete. Price controls and restrictive
regulations for professional services facilitate
coordinated behavior and increase overall costs,
limiting consumer welfare. FDI barriers also impede
entry and investment in key infrastructure sectors by
restricting foreign ownership in telecommunication
services, the operation of water and airport
infrastructure, and water collection, treatment and
supply.
A. A broad set of actions would improve the entrepreneurship ecosystem. This SCD calls for
accelerating entrepreneurship by upgrading skills,
networks, and hubs for startups. Policy efforts need
to provide a path for innovative ventures to scale up
regionally, creating opportunities for entrepreneurs
to develop experience and knowledge of how to tap
into global networks and markets. The Government
should strengthen coordination among multiple
stakeholders to support the entrepreneurship
ecosystem, expanding connectivity and coordination
of private and public action.
Investing in the digital economy would foster productivity. Adopting these new technologies
could be an integral part of entrepreneurship,
supporting the development of digital incubators,
accelerators, and early-stage funding programs.
Expanding access to financing would boost SME entrepreneurship. The country can promote
financial inclusion through the digitization of social
transfers, with appropriate safeguards, and an
improved regulatory framework for microfinance
institutions. A better credit-information system,
a secured transactions framework for movable
assets, and a modernized insolvency regime would
facilitate financial access for MSMEs.
Addressing the weaknesses of the trade-enabling environment and regional integration should help foster cross-border business. While maintaining its
traditional export sectors, Namibia should continue
to diversify its foreign sales, focusing on products
with higher technological content. Developing the
regional corridors to their full potential will require
additional investments and an expansion of services.
Namibia’s manufacturing base is one of Africa’s least
diversified, and its composition has remained largely
unchanged since independence. Services deserve
political attention because of their solid potential for
increasing export revenues and strengthening the
productivity of other sectors. The country needs to
better exploit the preferences under its free trade
agreements. Sales to the SADC region (including
SACU), the EU, and the EFTA countries account for
three-quarters of total exports.
304. 306.
307.
308.
309.
305.
Namibia Systematic Country Diagnostic138
Improving the antitrust framework would boost competition. This SCD proposes to facilitate
competitive neutrality in markets by reducing
support measures that may cause market distortions
and inefficiencies. Specific measures include
streamlining newly implemented legal frameworks,
processes, and institutions, including the Public
Procurement Framework, and operationalizing
its implementing body. Other measures include
shortening the turnaround time for business
registrations and the application process for
backhaul transportation. The SCE recommends
a review of statutory restrictions, including those
that limit FDI competition in professional services,
as well as investments in certain sectors, such
as tourism and reinsurance. The country should
separate regulatory and operations functions and
limit line ministry involvement in making decisions.
It is important to boost reforms of SOEs. The
institutional arrangement governing SOEs in the
post-independence period took an important step
forward in 2006 with the enactment of the State-
Owned Enterprises Governance Act. Strengthening
the role and performance of SOEs is a key component
in addressing the challenges facing Namibia,
including infrastructure delivery.
Boosting private investment, even in the informal sector, creates jobs. Increasing the number and
quality of jobs is an important goal. Informal sector
firms—despite their lower incomes for employees
and owners alike—should be encouraged rather
than discouraged. Informal sector workers, even the
owner-operators, tend to be disproportionately in
the lowest income brackets. Any increased earnings
in these households can reduce rates of poverty and
inequality. Those currently unemployed also tend to
come from households that are disproportionately
poor. Expanding employment among members of
these households—even through in low-paying jobs—
would also improve poverty and inequality outcomes.
The goal becomes finding ways to expand the overall
number of such firms—that is, increasing the number
of individuals that choose self-employment over
unemployment—and to increase profits for those
engaged in such self-employment.
An enhanced PPP framework would support the development of a bankable PPP program. The framework should include the identification,
preparation, structuring, and execution of
competitive tenders and the implementation of PPP
projects. It would also encompass legal, regulatory,
institutional, policy and procedural issues. Namibia
should develop institutional capacity and regulations
to bring infrastructure projects to market—for
example, by having clear project data requirements
and more competitive tenders. This could include a
centralized resource center or dedicated PPP unit
to promote global best practices, efficient decision-
making and planning, process integrity, pipeline
development, and downstream support.
Given high unemployment rates, the priority is to increase the number of quality private sector jobs, especially among Namibia’s youth. The SCD
offers some avenues to explore—some first steps in
both mindset and action— to create an environment
in which more jobs can develop. Programs targeting
youth unemployment can take various forms. One
common version focuses on the matching process.
It assumes an informational problem between
the employers who have unmet vacancies and
the potential workers with the appropriate skills
to fill those jobs. The goal is to reduce frictional
unemployment by helping to match employers with
employees. Depending on how it is structured, the
program may also reduce structural unemployment
based on differences in skills and needs across
various locations in the country.
310.
311.
312.
313.
314.
Namibia Systematic Country Diagnostic 139
Building Human Capital and Increasing the Productive PotentialThe challenges of limited provision and affordability of quality ECDE programs should be resolved. The key interventions would include:
(i) provision of strategically located ECDE centers
catering to the poorest segments of society; (ii)
increased provision of ECDE teacher training and
support; and (iii) strengthening the ministerial
capacity to implement and support ECDE centers.
It is imperative to improve the quality and relevance of basic education, addressing regional inequities to enhance student learning outcomes. Possible priority solutions would include: (i)
implementing curriculum reform, including a greater
emphasis on technical education; (ii) improving
classroom and standardized student assessments;
(iii) enriching teacher training programs, both pre-
service and in-service; (iv) enhancing the teacher
management system and policy for recruitment,
deployment, performance incentives, and
continuous professional development; (v) addressing
the shortage of teacher housing; (vi) developing
teaching and learning materials in local languages;
and (vii) broadening and improving ECDE.
Opportunities for skills development need to be broadened substantially to generate human capital for economic modernization while making investments to beef up TVET quality, relevance, and efficiency. Possible solutions would include: (i)
modernizing facilities and equipment at VTCs and
other training providers; (ii) upgrading teachers’
technical and pedagogical skills with national and
international partners; (iii) deepening links with
industries for job market-driven training and job
placement; (iv) improving coordination within the
TVET system; (v) promoting workplace-based
training and apprenticeship; (vi) strengthening ISCs;
and (vii) expanding TVET in rural areas.
B. Long-term investment is needed to improve the quality of higher education provision to keep up with increases in student enrolments. The country
has only two public universities, and the shortage of
well-qualified academic staff is a crippling challenge
that severely impacts both the quality of education
and the capacity for research and innovation.
Possible solutions would include: (i) strengthening
faculty development for pedagogy and research skills;
(ii) accelerating the upgrading of faculty-member
qualifications; (iii) improving the curriculum’s job-
market relevance to enhance graduate employability
through industry partnerships; (iv) boosting industry
collaboration for research and innovation; and (v)
enhancing research grants through a competitive
grant scheme.
A single-payer system would help address affordability and quality issues in health care. Despite high spending in Namibia, poor health
outcomes are a critical barrier to inclusion over
time. Setting up a single-payer reform requires a
health financing strategy with operational plans, the
necessary legal framework and governance system,
and a national dialogue with all stakeholders.
Establishing a successful program would entail: (i)
increasing domestic resources and strengthening
public sector management; (ii) ensuring the
regulatory framework is in place for health services
delivery in the private and public sectors; (iii)
striving for operational excellence in health; and
(iv) revisiting the organization and structure of the
health workforce. Additional steps would include
conducting analysis and continuing to M&E efforts
for health-sector performance in the public and
private sectors.
315.
316.
317.
319.
318.
Namibia Systematic Country Diagnostic140
Reducing inequalities through better services delivery The Government should improve the quality of services, especially for marginalized communities and the remote areas where population density is low and the cost of delivering services high. A
large share of government spending routinely goes
to social programs. Despite this, Namibia performs
poorly in the provision of social services, including
education and health care. Delivering services in
areas of low population density can pose significant
challenges, yet failure to do so can have especially
dire consequences for marginalized and vulnerable
population groups and rural communities. Several
innovative approaches have been tested successfully
in other countries with similar population densities.
Development of an integrated social registry, improved program coordination, and better targeting would upgrade the social protection system’s efficiency. The system has extensive
coverage and has substantively reduced poverty,
but fragmentation and gaps in targeting have diluted
its impact. Namibia’s social protection needs to
be modernized to enhance efficiency and policy
coordination, improve the targeting efficiency of
means-tested programs, and redirect resources to
children. Social protection programs can help build
human capital by connecting children from poor
households with ECDE services.
The priority for Namibia is to modernize its social protection system and improve policy coordination among different ministries. To achieve this, Namibia
can build a social registry to facilitate all steps related
to the management of social protection programs to
create a standardization in end-to-end processes,
support eligibility and eligibility functions, calculating
benefit levels, validating information collected using
different methods and sources, assessing potential
demand for interventions, planning and costing
of interventions deepening on projected coverage
rates, monitoring and evaluation and other analytics
purposes thereby supporting coordination across all
social protection programs, as well as supporting
accountability and transparency in service delivery.
All of these would also serve as key ingredients to
serve the basis for policy coordination which is
very much needed in Namibia given the multiple
C. institutions and ministries involved in the social
protection sector. There is consensus in Namibia
on the need for a social registry and initial steps
are being taken to develop one. As a first step, it is
important for Namibia to ensure that these initial
steps taken are compatible with the vision for an
integrated social registry.
It is also critical for Namibia to improve the targeting of its programs to ensure that benefits reach the intended beneficiaries. The fact that a
significant share of benefits goes to the non-poor
indicates challenges to the means test used to
identify beneficiaries. This could be related to the
gaps in the means test itself or to implementation
capacity of institutions. In order to better understand
these challenges, there is a need to review the means
test for child grants and war veterans’ programs, as
well as the gaps in implementation capacity. Moving
forward, the means test for the newly introduced
food bank should also be monitored. A social registry
with its automated databases and improved service
delivery should be able to address some of the
implementation challenges. An improved targeting
mechanism with support of a social registry would
improve targeting outcomes toward the more
effective use of resources.
Pension testing of the OAG could be considered to enhance the overall impact of the social safety net. There are about 42,000 pensioners in receipt
of a contributory civil service pension while at the
same time receiving the OAG. This means that they
receive two pensions from the Government—their
civil service pension and their OAG social pension.
Under a pension tested scheme, beneficiaries
of the contributory civil service pension scheme
would not receive an OAG. Pension testing would
provide a relatively easy way to target the OAG. The
OAG contributes little to the welfare of Namibia’s
wealthiest elderly (6.8 percent of consumption
of households in the wealthiest quintile) which
suggests that eliminating the OAP for those in
receipt of a civil service pension (who are likely to
be among the wealthiest) would not place an undue
burden on these households. Restricting pensioners
to one government pension, i.e., pension testing,
320.
321.
322.324.
323.
Namibia Systematic Country Diagnostic 141
could free resources for spending on children in
need. Eliminating the OAG for those in receipt of
a civil service pension) would free about N$630
million per year in current Namibian dollars, or about
23 percent of 2018/19 OAG expenditures and 11
percent of total safety net expenditures.
Poverty and inequality could be reduced in a budget neutral way by allocating a greater share of safety net resources to children. Current benefits to
children (N$250/month) are 20 percent of the value
of the OAG benefit (N$1,250) and 11 percent of the
Veterans Monthly Subvention (N$2,200). Increasing
coverage and increasing the value of child benefits
could be achieved with resources saved by pension
testing of the OAG and these resources would have
greater impact on poverty. As the returns from
programs targeted to children are higher than those
to adults, this re-directing of resources would bring
benefits. However, targeting supported by social
registry would need to improve for cost effectiveness
to increase. Therefore, concomitant improvements
in means-testing procedures would also be required
along with re-allocation of resources within the
safety net. Regular increases in the child grant to
maintain the value of the benefit in real terms would
be required to maintain these gains.
Namibia could strengthen the links between social protection and human capital development. Social
protection can help build human capital by helping
to link children from poor households to early
childhood development services. Namibia invests
in child grants and in early childhood development
(ECD) services, both implemented by the MGECW
but could go one step further by developing greater
synergies between these critical investments,
particularly by improving parents’ ability to provide
stimulation and quality interactions by linking parents
and caregivers to parenting information, including
nutrition education and cognitive stimulation.
The country should create emergency programs focusing on those most affected by social exclusion. Visible programs should be implemented
where the population is feeling increasingly
marginalized, as well as in urban centers’ lagging
regions and peripheral areas, where the Government
is struggling to provide services and its presence
is scarce. In addition, it would be important to put
in place a legal framework to regulate the use of
urban and peri-urban land to address the specific
vulnerabilities of rural-urban migrants and broaden
access to opportunities, income, and services for
populations living in these contexts.
For better services delivery, it is important to conduct planning, coordination, and M&E across agencies. Efficient and timely public procurement
systems can ensure the availability of key services
delivery inputs—for example, medicines, school
supplies, water pumps, and electricity meters. At the
same time, improving the training and management
of public employees and building the institutional
capacity of various government bodies should further
optimize services delivery. These recommendations
include: (i) strengthening the capacity of the prime
minister’s office to help align planning, budget, and
M&E processes; (ii) investing in the institutional
capacity of existing bodies, such as the NPC; (iii)
building implementation capacity and incentives
within the MDAs; (iv) strengthening the MPE,
especially its ability to monitor the performance of
public enterprises; (v) building capacity within the
CPB and the Procurement Policy Unit at the Ministry
of Finance to implement the new procurement law
and roll out the e-GP system; and (vi) strengthening
the DPSM’s ability to manage public employees,
including developing a new HRMIS.
Tenure security and the capacity for land reform need to be strengthened. This can be accomplished
by: (i) streamlining the application process for
plots allocated by local authorities; (ii) enlarging
communal lands to create more space for grazing
and agricultural production; (iii) developing legal
provisions for group land tenure in communal areas;
(iv) increasing the ability of communities to manage
their land sustainably; and (v) abolishing the willing
seller, willing buyer policy as the primary method
of land acquisition, while developing an alternative
system.
Supporting urbanization that increases productivity can contribute to sustainable growth if well-managed. Building cities that are inclusive,
safe, resilient, and sustainable requires policy
coordination and investment choices. National and
325.
326.
327.330.
329.
328.
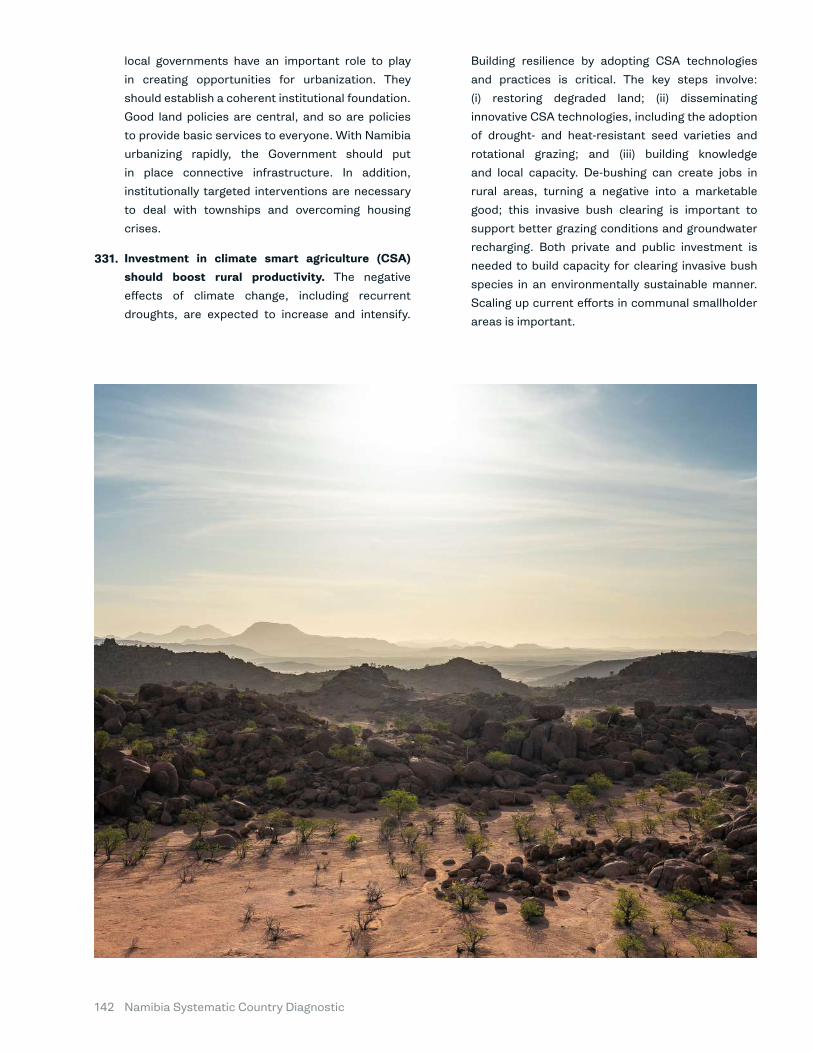
Namibia Systematic Country Diagnostic142
local governments have an important role to play
in creating opportunities for urbanization. They
should establish a coherent institutional foundation.
Good land policies are central, and so are policies
to provide basic services to everyone. With Namibia
urbanizing rapidly, the Government should put
in place connective infrastructure. In addition,
institutionally targeted interventions are necessary
to deal with townships and overcoming housing
crises.
Investment in climate smart agriculture (CSA) should boost rural productivity. The negative
effects of climate change, including recurrent
droughts, are expected to increase and intensify.
Building resilience by adopting CSA technologies
and practices is critical. The key steps involve:
(i) restoring degraded land; (ii) disseminating
innovative CSA technologies, including the adoption
of drought- and heat-resistant seed varieties and
rotational grazing; and (iii) building knowledge
and local capacity. De-bushing can create jobs in
rural areas, turning a negative into a marketable
good; this invasive bush clearing is important to
support better grazing conditions and groundwater
recharging. Both private and public investment is
needed to build capacity for clearing invasive bush
species in an environmentally sustainable manner.
Scaling up current efforts in communal smallholder
areas is important.
331.
Namibia Systematic Country Diagnostic 143
Reducing vulnerabilities to climate change and environmental shocksInvestments in effective water management are key. Water stress and scarcity remain fundamental
challenges for agricultural production. Improved,
sustainable water production is critical for several
sectors in both rural and urban contexts. Investment
is required in: (i) improving information and data
management for water security; (ii) promoting
water conservation, saving, and utilization; (iii)
enhancing adequate water pricing; (iv) converting
food production to CSA; (v) fostering more water
cooperation with regional neighbors; and (vi)
developing sound system to collect and manage
hydro data.
Namibia is in a favorable position to work on enhancing water production through renewable energy and reusing water. Within Southern Africa,
and even more widely on the continent, Namibia
is acknowledged as a leader in diversifying water
sources, and its being ahead of the curve could
be used to great effect to the benefit of the entire
African region.
Smallholder access to the market would support forest conservation and restoration, as well as boost tourism.88 Critical areas for forest and land
restoration need to be identified, and community
forest management should be promoted along with
development opportunities in the tourism sector.
Once established, a CBNRM fund should raise and
manage money to support essential long-term
D. services to local communities and promote joint
ventures between communities and the private
sector. As part of the five-nation Kavango-Zambesi
Transfrontier Conservation Area, Namibia may fully
seize the potential of cross-border tourism, linking
some of the world’s premier tourism destinations,
including Victoria Falls in Zimbabwe and the
Okavango Delta in Botswana.
Energy diversification through a shift to cleaner, less-expensive power sources will increase energy security and reduce costs. Investment in renewable
energy will eliminate the country’s dependency on
fossil fuels. Solar could deliver low-cost electricity if
developmental and operational risks are adequately
allocated and mitigated through planning and risk
coverage.
Drought-relief assistance targeting should be adjusted for different types of episodes. Mechanisms used in the past may not work without
modification to reach the victims of future droughts.
Social protection policies are one means by which
governments can help households manage these
risks. A sustainable approach requires efficient
infrastructure networks, and institutional and
financial incentives, as well as communications to
guide the demand-management program, financial
sustainability, and an institutional role assignment
and coherence.
Most of Namibia’s excluded communities were dispossessed of their traditional lands either by private parties for the creation of farms or by colonial and apartheid governments, sometimes for the purpose of creating national parks or other protected areas (Special Rapporteur on the right of indigenous peoples, 2013). In this regard, the development of the tourism industry and private sector initiatives need to be accomplished in a way that does not further disenfranchise already marginalized groups.
88.
332.
333.
334.
335.
336.

Namibia Systematic Country Diagnostic144
3.This SCD was developed and refined in workshops with the Ministry of Finance, the NPC, the Bank of Namibia, and policymakers. The workshops
were organized around the main issues discussed
in the analysis. Hypotheses developed for this
SCD focus on the key constraints to achieving
the twin goals, and on areas that can generate
jobs and improve people’s well-being. Potential
areas of policy intervention have been identified
and ranked for each pathway according to their
potential impacts. The systematic diagnostic of the
identified binding constraints revealed 33 potential
areas of intervention that could be considered by
policymakers and other national and international
stakeholders. The areas of intervention can be
grouped by the development pathways and ranked
according to the potential impacts they could have
in lifting the identified binding constraints.
In prioritizing constraints, the following criteria were used:
� Magnitude of direct impacts for achieving the twin goals. Under this criterion, we estimated
the likely magnitudes of the proposed actions on
(i) boosting growth, (ii) reducing poverty, and (iii)
the sustainability of the intervention.
Prioritization Criteria and Summary of the Proposed Reforms � Time horizon of impacts (4). This criterion
looked at the expected time frame to realize the
impacts, seeking to balance short- and longer-
term considerations.
� Complementarities for achieving the twin goals (5). Not only direct impacts but also
indirect impacts were considered. This criterion
asked whether addressing a constraint would
cut across different domains (growth, inequality,
sustainability) and/or magnify the positive
impact of addressing other constraints.
The prioritization process attempts to balance medium- and long-term objectives. All the
interventions were divided into Tier 1 and Tier 2
categories. The proposed ranking assessed the
impact of each of these on binding constraints on
growth, inclusion, sustainability, time horizon, and
complementarity. A map was then used to illustrate
the relative importance of each of the binding
constraints. The detailed results of the analysis are
presented in the Annex 2. The ratings were converted
into scores to prioritize the constraints. The results
of the prioritization are presented in Table 4.
337.
338.
339.
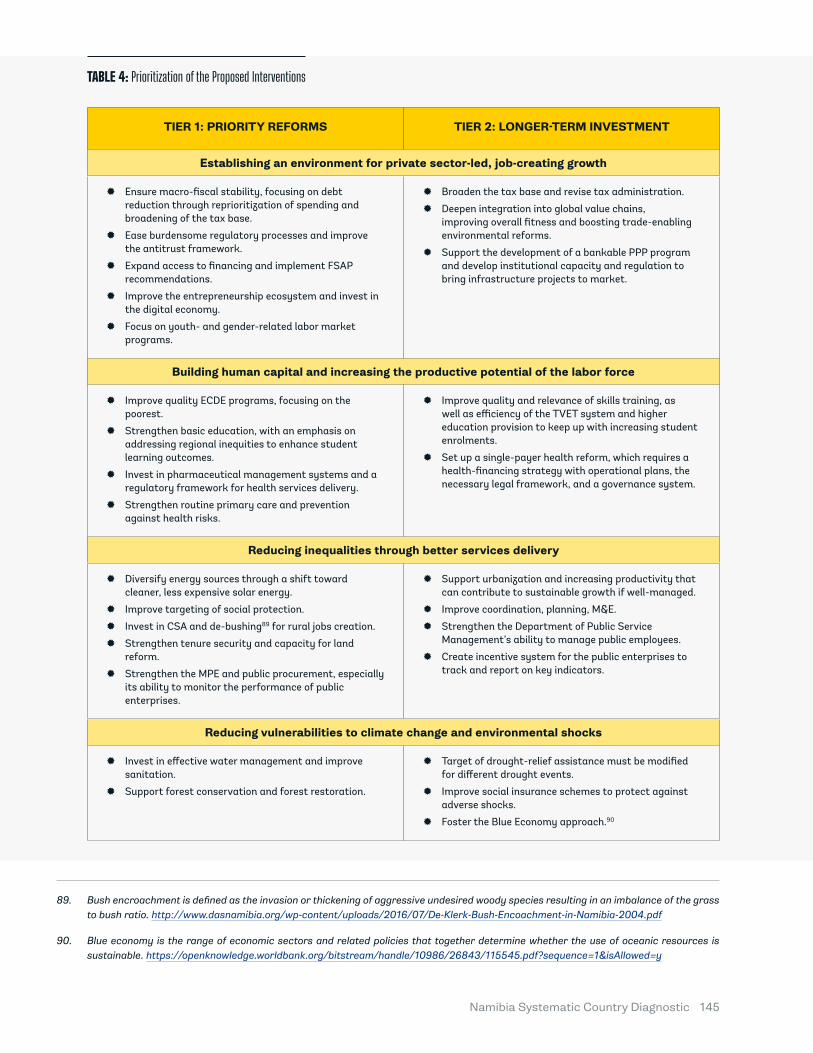
Namibia Systematic Country Diagnostic 145
TIER 1: PRIORITY REFORMS TIER 2: LONGER-TERM INVESTMENT
Establishing an environment for private sector-led, job-creating growth
� Ensure macro-fiscal stability, focusing on debt reduction through reprioritization of spending and broadening of the tax base.
� Ease burdensome regulatory processes and improve the antitrust framework.
� Expand access to financing and implement FSAP recommendations.
� Improve the entrepreneurship ecosystem and invest in the digital economy.
� Focus on youth- and gender-related labor market programs.
� Broaden the tax base and revise tax administration.
� Deepen integration into global value chains, improving overall fitness and boosting trade-enabling environmental reforms.
� Support the development of a bankable PPP program and develop institutional capacity and regulation to bring infrastructure projects to market.
Building human capital and increasing the productive potential of the labor force
� Improve quality ECDE programs, focusing on the poorest.
� Strengthen basic education, with an emphasis on addressing regional inequities to enhance student learning outcomes.
� Invest in pharmaceutical management systems and a regulatory framework for health services delivery.
� Strengthen routine primary care and prevention against health risks.
� Improve quality and relevance of skills training, as well as efficiency of the TVET system and higher education provision to keep up with increasing student enrolments.
� Set up a single-payer health reform, which requires a health-financing strategy with operational plans, the necessary legal framework, and a governance system.
Reducing inequalities through better services delivery
� Diversify energy sources through a shift toward cleaner, less expensive solar energy.
� Improve targeting of social protection.
� Invest in CSA and de-bushing89 for rural jobs creation.
� Strengthen tenure security and capacity for land reform.
� Strengthen the MPE and public procurement, especially its ability to monitor the performance of public enterprises.
� Support urbanization and increasing productivity that can contribute to sustainable growth if well-managed.
� Improve coordination, planning, M&E.
� Strengthen the Department of Public Service Management’s ability to manage public employees.
� Create incentive system for the public enterprises to track and report on key indicators.
Reducing vulnerabilities to climate change and environmental shocks
� Invest in effective water management and improve sanitation.
� Support forest conservation and forest restoration.
� Target of drought-relief assistance must be modified for different drought events.
� Improve social insurance schemes to protect against adverse shocks.
� Foster the Blue Economy approach.90
TABLE 4: Prioritization of the Proposed Interventions
Bush encroachment is defined as the invasion or thickening of aggressive undesired woody species resulting in an imbalance of the grass to bush ratio. http://www.dasnamibia.org/wp-content/uploads/2016/07/De-Klerk-Bush-Encoachment-in-Namibia-2004.pdf
Blue economy is the range of economic sectors and related policies that together determine whether the use of oceanic resources is sustainable. https://openknowledge.worldbank.org/bitstream/handle/10986/26843/115545.pdf?sequence=1&isAllowed=y
89.
90.
Namibia Systematic Country Diagnostic146
4.Throughout this report, key knowledge gaps have been identified. These are topics critical to
understanding the challenges facing Namibia; in
some cases, however, we have limited evidence to
establish a clear position on how well a required
intervention addresses a particular challenge. It
can be viewed as a set of research priorities for
government, development partners, academics, and
research institutions over the next few years.
Labor Market, Private Sector, Gender and Human Capital Development:
� Skills premium and mismatches. A better
measure of skill shortage is the skills premium
that employers are willing to offer in specific
industries. To do such analysis should combine a
strong labor-force survey on labor demand with
government data.
� Analysis of the informal economy. There is very
little information on the informal sector of the
economy outside subsistence agriculture. Labor
market data come infrequently and only provide
a broad snapshot of this part of the economy. It
will be important to analyze key issues in more
detail.
� Analysis of the private sector’s development challenges. Systematic research of the
incentives to boost employment in the private
sector will require a much deeper analysis. How
big is it? How is it structured (firm size, sectors,
formal/informal)? How much is it dependent
on government contracts? This analysis will
help identify specific opportunities that may be
available based on location and endowments.
� Digital assessment. There is demand for a
comprehensive assessment of digital government
reforms. The World Bank has been designing
several approaches and methodologies that
could provide a broad summary about the status
and perspectives of support for the Government
in digital transformation.
New-Knowledge Gaps � Childhood malnutrition. Despite several
government interventions, childhood
malnutrition lingers as an important issue. Given
its potential impacts on long-term outcomes,
further research is needed.
� Gender assessment. The SCD finds gender-
related gaps in earning and in labor market
outcomes. A further analysis is required to shed
light on the origins of the differences.
Agriculture and Rural Development and Shocks
� Agriculture sector and irrigation. It would be
particularly useful to have gender-disaggregated
data on smallholders’ access to inputs (land,
labor, fertilizer, etc.) and their resulting
agricultural yields. This would allow an analysis of
specific constraints to agricultural productivity.
� Focus on climate smart agriculture. The
agriculture sector’s inability to make a strong
contribution to poverty reduction is due to
many factors, including low uptake of modern
production technologies (embodied in inputs),
low labor productivity, low irrigation use, and
land degradation. But what is lacking is good
analysis on what conditions and policies underlie
these factors and clear recommendations on
how they could be addressed.
� Agriculture public expenditure review. One tool
for helping to fill this gap would be an agriculture
public expenditure review to identify whether
current spending patterns correspond to the
major problems. While most of these problems
will ultimately need to be addressed by on-farm
private investment, smart public spending is
needed to create an enabling environment. This
gap could be filled by a good analytical study of
domestic resource production costs for various
products.
340.
341.
342.
Namibia Systematic Country Diagnostic 147
� Economic impact of the climate change and shocks. Understanding of how climate change
impacts an economy and its effects on vulnerable
rural communities is limited, along with the
implications for migration and urbanization.
� Resilience to the effects of climate change in the transport sector. The solutions available to
building resilience in new road construction and
improvements should be analyzed.
� Droughts and electricity supply. To what
extent could increasingly severe and prolonged
droughts affect future for hydropower expansion
and consequently the national electricity
supply? Overcoming the knowledge gap may add
further support the call for opportunities in the
expansion of other renewable energy sources.
Social Development
� Energy sector needs assessment. Namibia
has a good understanding of its power needs
but relatively limited information now on how
to address them. Currently, a feasibility study is
being conducted on solar power. However, there
is a clear need for extending the study to include
solar generation plants.
� Public expenditure review in water sector. Namibia has conducted extensive reviews of the
health (World Bank 2019) and education sectors
(UNICEF). A public expenditure review for water
and sanitation could analyze the efficiency and
effectiveness of government outlays in a range
of areas, including water services, household
water and sanitation, household sewerage and
wastewater treatment, irrigation, catchment
management, environmental protection and
water quality, and pollution control. To review
the impact of spending on budgetary outcomes,
economic growth, poverty reduction, and asset
maintenance, additional issues might include
the level and composition of public expenditures,
structures of governance, and the functioning of
public institutions.
343.


ANNEXES
Namibia Systematic Country Diagnostic150
A. Reforms for Establishing an Environment for Private Sector-led, Job-creating Growth
Annex 1. Summary of Policy Proposals
I. Overcoming the challenges of lack of competition and low entrepreneurship
Improve the entrepreneurship ecosystem. This SCD calls for accelerating entrepreneurship by upgrading skills,
networks, and hubs for startups. Developing startup skills also should be a priority. Policy efforts need to provide
a path for innovative ventures to scale up regionally, creating opportunities for entrepreneurs to develop their
experiences and knowledge of how to tap into global networks and markets. The Government should strengthen
coordination among multiple stakeholders to support the ecosystem of entrepreneurship, and expand the
connectivity and coordination of private and public action.
� Foster productivity by investing in the digital economy. Adopting new technologies and focusing on the digital
economy will increase productivity. Investing in the digital economy could be an integral part of development
entrepreneurship, supporting the development of digital incubators, accelerators, and early-stage funding
programs.
� Expand access to financing. Promote financial inclusion through digitization of social transfers, with appropriate
safeguards, and an improved regulatory framework for microfinance institutions. An improved credit-information
system for MSMEs, a secured transactions framework for movable assets, and a modernized insolvency regime
would facilitate financial access for MSMEs.
� Implement key FSAP recommendations. Provide a specific and clear mandate for the Development Bank of
Namibia with respect to MSME financing, given the bank’s expanded role in implementing the partial credit
guarantee scheme and venture capital fund. Enact comprehensive modernized insolvency legislation with cross-
border treatment in line with the United Nations Commission on International Trade Law. Establish a credit
information system for MSMEs to reduce information asymmetries. Pursue secured transactions reform and
establish an online movable registry.
� Reform land administration and resolve the housing crisis. Streamline the process for applicants to be allocated
plots by local authorities. Enlarge communal lands to create more space for grazing and agricultural production.
Develop a legal provision for group land tenure in communal areas, increasing the ability of communities to
manage their land sustainably.
� Solve the urban housing question. This is an issue important to a growing number of citizens and central
to addressing the overall problem of poverty. Low- and middle-income groups are hardest hit by the housing
shortage. In addition, shack fires are a daily occurrence, and countless shack dwellers have tragically lost their
lives in recent years, and the quality of life for the majority has been decimated by the dire conditions in the
shantytowns.
� Enhance the PPP framework to support the development of a bankable PPP program. Such a framework
should include the identification, preparation, structuring, and execution of competitive tenders and the
implementation of PPP projects. The country should develop institutional capacity and regulations to bring
infrastructure projects to market.
Namibia Systematic Country Diagnostic 151
II. Resolving the challenges of trade and low export complexity
Deepen integration into global value chains, improving overall fitness and boosting trade-enabling environmental reforms. External trade is crucial for development and should form part of any development strategy.
� To improve its overall fitness, Namibia can continue this broad diversification pattern or focus its capability
development in strategic sectors.
� The country should build on the positive development in some product groups with higher technological content.
� Including services in trade negotiations should be used as an instrument to strengthen value added and knowledge creation. Services deserve special attention because they bear a high potential for increasing export
revenues and strengthening the productivity of other sectors.
� Namibia needs to better exploit the preferences under its free trade agreements.
� The country should use the possibilities of trade policy and negotiations to further increase value added and
technological content in exports.
III. Overcoming the challenges and restrictiveness of PMR
� Fast track the enacting into law of the draft national competition policy and the draft competition bill. This
will facilitate competitive neutrality in markets, control support measures that may cause market distortions,
and promote efficient markets.
� Streamline newly implemented legal frameworks, processes, and institutions. This includes the Public
Procurement Framework and operationalizing its implementing body, as well as the BIPA, reducing turnaround
time for business registration and the application process for backhaul transportation.
� Review statutory restrictions to competition, including those that limit FDI, competition in professional
services, and investment in certain sectors, such as tourism and reinsurance.
� Separate regulatory and operational functions and limit line-ministry involvement in decision-making. The
separation of Namport’s regulatory responsibilities from its development and operations functions should be
considered to increase efficiency. Limiting line-ministry involvement in decision-making in electricity, maritime
transport, and implementation of the competition framework would promote independence and transparency.
� Increase the transparency of the analysis motivating NaCC decisions to enhance predictability and ensure
compliance; implement a training program targeting the needs of NaCC, as well as the judiciary.
� Further improvements to the competition law framework and its implementation include the following: ▶ Exemptions. Define and implement exemption provisions by developing guidelines to offer objective and
transparent criteria; limit the ability of the Minister of Industrialization, Trade and SME Development to grant
general exclusions to the application of the act; exclude hard-core cartels from the general exemptions of the
Competition Act; and prohibit granting general exemptions from the merger review to specific industries or
categories of undertakings.
▶ Dominance. Avoid relying heavily on market shares to establish market dominance
▶ Fines. Publish fining guidelines, including a clear methodology for the quantification of fines, to enhance
predictability and deterrence.
Namibia Systematic Country Diagnostic152
IV. Overcoming the challenges of fiscal and macroeconomic management
� Ensure macro-fiscal stability by focusing on debt reduction.
� Broaden the tax base to help reduce some statutory rates, which are higher than most regional peers.
▶ Realign the tax system to ensure a broad tax base and simple tax instruments’ structure;
▶ Reduce risks of tax-base erosion from international taxation;
▶ Comprehensively modernize the tax administration to generate both efficiency gains and improve compliance; and
▶ Supplement the changes in policy with efficient tax administration.
V. Mitigating the macro-fiscal vulnerabilities
� In the medium term, the fiscal consolidation’s continuation will be crucial but very challenging for further public
debt reduction. Fiscal consolidation should continue over the medium term but will be challenged by projected
low SACU revenues from the COVID-19 shock. As a result, the budget deficit is projected to remain high in
2021/22 and 2022/23 at 12.6 and 9.7 percent of GDP, respectively, despite further cuts in government spending.
� Strengthening fiscal buffers (stabilization fund) and domestic revenue mobilization is key to shielding the country
from commodity market volatility and declining SACU receipts.
� Public debt is expected to peak at 76.2 percent of GDP in 2020 and to gradually decrease in the next years,
returning below 70 percent of GDP by 2022. The domestic capital market is expected to remain the main source
financing, complemented by cash reserve and development financial institutions’ financing (AfDB, IMF). The
increase of the public debt should be undertaken mostly through domestic borrowing.
� The World Bank and the IMF welcomed the fiscal adjustment efforts and emphasized that additional adjustment
and possible consolidation is needed to ensure debt sustainability.
VI. Investment in urban development and improving agricultural productivity
Supporting urbanization that focuses on job creation, infrastructure development, and reducing vulnerabilities is
key for territorial development.
CSA to increase resilience and productivity and overcome the negative effects of climate change, including
recurrent droughts.
� Building resilience through the adoption of CSA technologies and practices is critical.
� Restoring degraded land, disseminating innovative CSA technologies, including the adoption of drought- and
heat-resistant seed varieties and rotational grazing, and building knowledge and local capacity are important.
� De-bushing can create jobs in rural areas and turn a negative into a marketable good; invasive-bush clearing is
important to improve grazing conditions and groundwater recharge.
� Both private and public investment are needed to build capacity for clearing invasive bush species in an
environmentally sustainable manner. Scaling up current efforts in communal smallholder areas is important.
� Effective water management for agriculture production remains a fundamental challenge due to water stress
and scarcity.
Namibia Systematic Country Diagnostic 153
B. Building Human Capital and Increasing Productive Potential VII. Overcoming the challenges of the education system
ECDE. To build a strong foundation of cognitive and socioemotional development for children, it is critical that the
Government overcome the challenges of limited provision and affordability of quality ECDE programs, especially for
the poorest sections of society. The key interventions include:
� Provision of strategically located ECDE centers catering to the poorest sections of society;
� Increased provision of ECDE teacher training and support; and
� Strengthening the ministerial capacity to implement and support ECDE centers.
Basic education. It is imperative for the country to improve the quality and relevance of basic education, addressing
regional inequities to enhance student learning outcomes. Priority solutions include:
� Implementing curriculum reform, including incorporating technical education;
� Improving classroom and standardized student assessment;
� Enhancing teacher training programs both pre-service and in-service;
� Improving the teacher management system and policy for recruitment, deployment, performance incentives,
and continuous professional development;
� Addressing the shortage of teacher housing;
� Developing teaching and learning materials in local languages; and
� Broadening and improving early childhood education.
TVET. Skills development opportunities need to be broadened substantially to generate human capital for economic
modernization, and make investments in the quality and relevance of skills training, as well as the efficiency of the
TVET system. Possible solutions include:
� Modernizing facilities and equipment at VTCs and other training providers;
� Upgrading teachers’ technical and pedagogical skills with national and international partners, deepening links
with industries for job market–driven trainings and job placement, and better coordination within the TVET
system;
� Promoting workplace-based training and apprenticeship; and
� Strengthening ISCs and expanding TVET in rural areas.
Higher education. Long-term investment is needed to improve the quality of higher education to keep up with
student increases. Although the country has only two public universities, the shortage of well-qualified academic
staff is a crippling challenge that severely impacts both the quality of education and the capacity of research and
innovation. Possible solutions include:
� Strengthening faculty development for pedagogy and research skills;
� Accelerating the upgrading of faculty member qualifications;
� Improving the job market relevance of the curriculum to enhance graduate employability through industry
partnership; and
� Boosting industry collaboration for research and innovation and enhancing research grants through a competitive
scheme.
Namibia Systematic Country Diagnostic154
VIII. Overcoming the challenges of the health system
Long-term goal:
� Setting up a single-payer reform requires a health financing strategy with operational plans, the necessary legal
framework and governance system, and a national dialogue with all stakeholders.
Medium-term goals:
� Conduct analysis and continue to monitor and evaluate health-sector performance in the public and private
sectors;
� Support efforts to strengthen routine primary care and prevention against health risks;
� Ensure regulatory framework for health services delivery in the private and public sectors;
� Invest in pharmaceutical management systems; and
� Revisit the organization and structure of the health workforce.
C. Reduce Inequalities through Better Services Delivery, Improving Targeting Efficiency, and Better GovernanceIX. Investment in energy and transport to boost economic growth
Invest in PPPs to unlock the benefits of private sector financing to support infrastructure development.
� Investment in renewable energy will help eliminate country dependency. Solar power could deliver low-cost
electricity if development and operational risks are adequately allocated and mitigated through planning and risk
coverage.
� Improving terminals’ efficiency by targeting key facilities. Expand the capacity of Hosea Kutako International
Airport including a new passenger terminal. Improve operational efficiency of the new container terminal at the
Port of Walvis Bay.
� Road safety should be improved.
� The rail network provides an ideal opportunity to establish safe, reliable multimodal transport options along the
three regional corridors.
▶ Improved regional trade facilitation and freight logistics for imports and exports would fully utilize the capacity
of the new container terminal at the Port of Walvis Bay.
X. Improving social protection
The social protection system provides reasonable coverage and has significantly reduced poverty and inequality,
but fragmentation and gaps in the targeting of programs have diluted its impact.
� At the policy level, to reprioritizing allocations where they can be most effective in reducing poverty:
▶ The OAG makes a significant contribution to poverty reduction, but pension testing of the OAG would enhance
the overall impact of the social safety net.
▶ Namibia could reduce poverty and inequality in a budget neutral way by allocating a greater share of safety net
resources to children.
Namibia Systematic Country Diagnostic 155
� At the administrative level, to improve basic business processes, including means testing and beneficiary
selection, payment, information management, and the organization of services:
▶ Modernize Information Management. Ministries have their own independent information systems, with most
data coming from paper forms that are generated in district offices. This results in slow processing of data,
difficulties in verifying information, difficulties in updating data, and data duplication. Developing an integrated
service delivery platform for social assistance programs would improve the efficiency and effectiveness of
these programs.
▶ Build a Social Registry. A social registry is an archive of structured and systematized information about
beneficiaries and potential beneficiaries of different social protection programs. It provides information about
household socioeconomic status that provides a mechanism for targeting social benefits and deciding who
is not eligible under the eligibility rules. A social registry also provides information on the services and social
benefits that individuals and households receive.
▶ Establish a single harmonized application process for all social grants that includes a single means-testing system for all means-tested programs. Social assistance programs each have their own application and
eligibility criteria, although they are often directed to the same households and collect the same information.
This absorbs considerable staff resources and imposes an undue burden on the poor who must apply at
different offices. A single application process for all social assistance programs would increase the efficiency,
effectiveness and transparency of the safety net. It would streamline the application process and would apply
objective criteria, screening instruments and procedures to all programs.
▶ Establish one-s top shops. Namibia has vast distances and low population density, and this speaks to the
need for administrative efficiency in the delivery of the social safety net. Applicants and beneficiaries travel
long distances to apply, make enquiries, or update personal information and may need to do this at multiple
offices. One-stop shops would help to reduce fragmentation of service delivery and lower the burden on
applicants. The objectives would be to: provide citizen friendly access to a range of safety net services in a
single location; improve coverage of services by linking a variety of services to individual needs and eligibility;
and strengthen the capacity of the Government to provide safety net services in a coordinated manner. One-
stop shops could work in tandem with the single social registry by serving as the local face to the registry. One-
stop shop would have multiple functions including: provision of information, case management, assessment,
registration and enrolment, updating of beneficiary records, service transaction, referral services, registration,
and reregistering grievances.
▶ Introduce more efficient payment systems. Payment mechanisms are fragmented. The OAG, the Disability
Grant, and Child Grants rely on multiple payment mechanism, including direct deposit to banks and NamPost
and cash payment at designated pay points. All veterans benefits are paid via direct deposit to banks. Despite
long waits at cash pay points, beneficiaries seem to prefer collecting there because of fees incurred at banks
and NamPost. However, it would be possible to negotiate contracts with banks and NamPost to waive fees and
minimum balances for social grant recipients. This would likely encourage more beneficiaries to move to direct
deposit of benefits.
� At the program level, to exploit synergies between programs and fill gaps in programing. Social protection
programs can help build human capital by connecting children from poor households with ECDE services.
▶ Strengthen the links between social protection and human capital development. Social protection can help
build human capital by helping to link children from poor households to early childhood development (ECD)
services.
▶ Develop a graduation strategy for child grant beneficiaries, including the child and their parents.
▶ Plan social care services for an aging population.
▶ Position the social protection system to address climate change.

Namibia Systematic Country Diagnostic156
XI. Improving services delivery by strengthening governance efficiency
� Public enterprises.
▶ Strengthen MPE, especially the ability to monitor the performance of public enterprises.
▶ Ensure that the indicators in the centralized monitoring database are well designed to track both the enterprises’
financial health and potential issues with services delivery.
▶ Strengthen the institutional capacity of the MPE, as well as the capacity of its staff.
▶ Create the right incentive system for the public enterprises to track and report on these indicators with
sufficient frequency.
� Public procurement.
▶ Build capacity within the CPB, as well as the Procurement Policy Unit at the Ministry of Finance, for the
implementation of the law.
▶ Roll out the electronic procurement (e-GP) system.
▶ Systematically build capacity within the MDAs and public enterprises to apply the new procurement framework.
� Coordination, planning, and M&E.
▶ Strengthen the capacity of the Prime Minister’s department to help align the planning, budget, and M&E
processes (consider establishing a dedicated policy coordination unit at the center of government).
▶ Invest in the institutional capacity of the existing bodies, such as the NPC, to:
• Provide them with the authority relative to the MDAs; and
• Create and sustain enough technical and M&E capacity within these structures.
▶ Build the implementation capacity and incentives within the implementing MDAs to:
• Create delivery incentives (for example, performance contracts for ministers and high-level civil servants
that include KPIs); and
• Establish an institutional interface for the NPC within MDAs (for example, a small implementation unit that
would also track the KPIs and report on them).
� Public employment management. Strengthen the DPSM’s ability to manage public employees and:
▶ Develop a modern HRMIS;
▶ Perform an evidence-based analysis of the wage bill;
▶ Perform a rigorous analysis of services delivery assignments; and
▶ Strengthen and track performance management.
Namibia Systematic Country Diagnostic 157
D. Reducing Vulnerabilities to Climate Change and Environmental ShocksXII. Supporting investment in forestry, tourism, and fisheries
� Forestry. Enhance conservation and restoration by:
▶ Supporting SMEs and smallholders;
▶ Identifying critical areas for forest and land restoration using earth-observation data and participatory
methodologies;
▶ Promoting community forest management; and
▶ Promoting the training of forest management professionals.
� Tourism. Opportunities in the development of the tourism sector include:
▶ Establishing a CBNRM fund to raise and manage funds to support essential long-term services to local
communities and promote joint ventures between communities and the private sector;
▶ Promoting sustainable value chains that would also support the deepening of the CBNRM implementation,
while conservancies could add value to various local crafts and nontimber forest products; and
▶ Establishing partnerships with private entities to operate campsites, eco-lodges, and wildlife activities such as
game drives or trails.
� Fisheries. Opportunities in the development of the fisheries sector include:
▶ Fostering the Blue Economy approach and preparing for Marine Spatial Planning will mainstream marine
resources sustainability; and
▶ Promoting market diversification and value addition of fisheries products via, for instance, eco-labeling and a
microgeneration certification scheme, should improve the industry.
XIII. Mitigating environmental shocks and their economic impact
� The targeting of drought-relief assistance must be adjusted for different drought events, and mechanisms that
were used in the past may not work without modification for reaching the victims of future droughts.
� Social protection policies are one way in which governments can help households manage these risks.
� Drought needs to be acknowledged as a high risk for which clear protocols are needed for different responses,
prepared through consensus-building on using and costing different sources clearly and through mechanisms for
the reallocation of resources among various users in the basins, cities, and other locations.
� A sustainable approach requires efficient infrastructure networks, institutional and financial incentives, and
communication to guide demand management, financial sustainability, and institutions’ role assignment and
coherence.
XIV. Improving and sustainable water production
Improved and sustainable water production is critical for several sectors in both rural and urban contexts.
Investments are required to:
� Improve information and data management for water security, particularly the effective monitoring of surface
and groundwater resources, and the development of hydrological modeling for surface water and groundwater;
� Help with water conservation, saving, and utilization, especially to improve livestock management to decrease
its vulnerability to rainfall shortages and to offer crop and livestock insurance; and
� Enhance adequate water pricing and elimination subsidies.
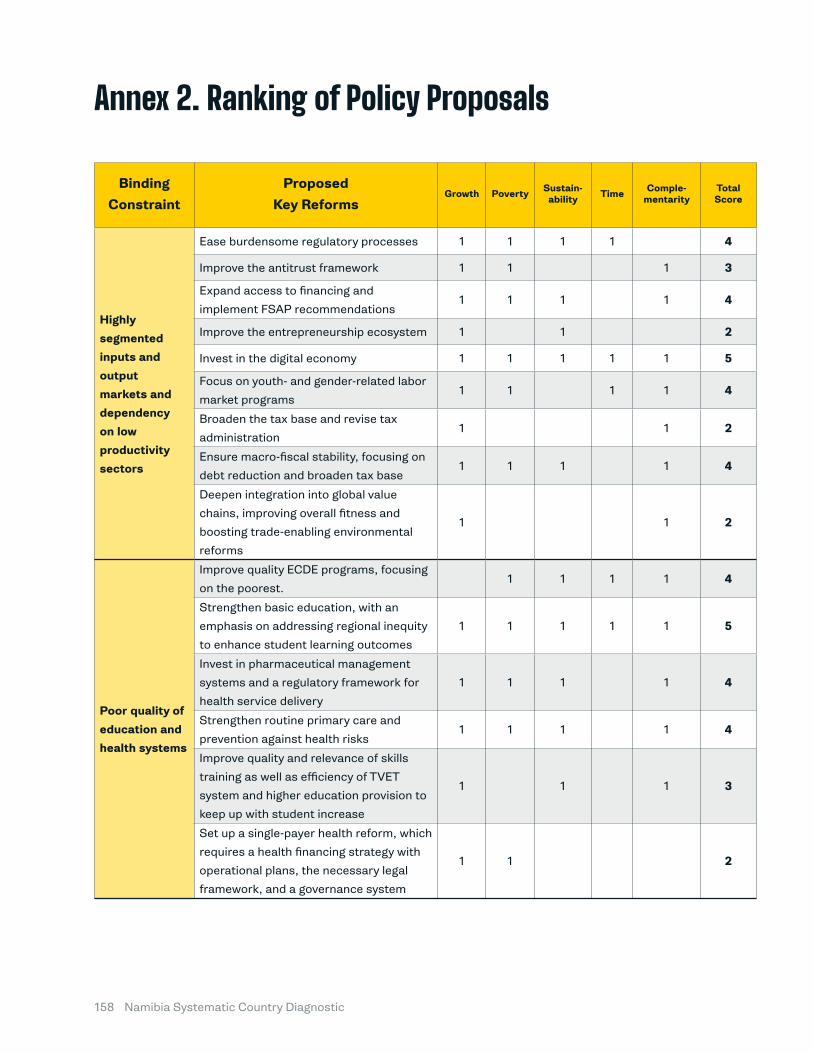
Namibia Systematic Country Diagnostic158
Annex 2. Ranking of Policy Proposals
Binding Constraint
Proposed Key Reforms
Growth Poverty Sustain-ability Time Comple-
mentarityTotal Score
Highly segmented inputs and output markets and dependency on low productivity sectors
Ease burdensome regulatory processes 1 1 1 1 4
Improve the antitrust framework 1 1 1 3
Expand access to financing and
implement FSAP recommendations 1 1 1 1 4
Improve the entrepreneurship ecosystem 1 1 2
Invest in the digital economy 1 1 1 1 1 5
Focus on youth- and gender-related labor
market programs1 1 1 1 4
Broaden the tax base and revise tax
administration1 1 2
Ensure macro-fiscal stability, focusing on
debt reduction and broaden tax base1 1 1 1 4
Deepen integration into global value
chains, improving overall fitness and
boosting trade-enabling environmental
reforms
1 1 2
Poor quality of education and health systems
Improve quality ECDE programs, focusing
on the poorest.1 1 1 1 4
Strengthen basic education, with an
emphasis on addressing regional inequity
to enhance student learning outcomes
1 1 1 1 1 5
Invest in pharmaceutical management
systems and a regulatory framework for
health service delivery
1 1 1 1 4
Strengthen routine primary care and
prevention against health risks1 1 1 1 4
Improve quality and relevance of skills
training as well as efficiency of TVET
system and higher education provision to
keep up with student increase
1 1 1 3
Set up a single-payer health reform, which
requires a health financing strategy with
operational plans, the necessary legal
framework, and a governance system
1 1 2
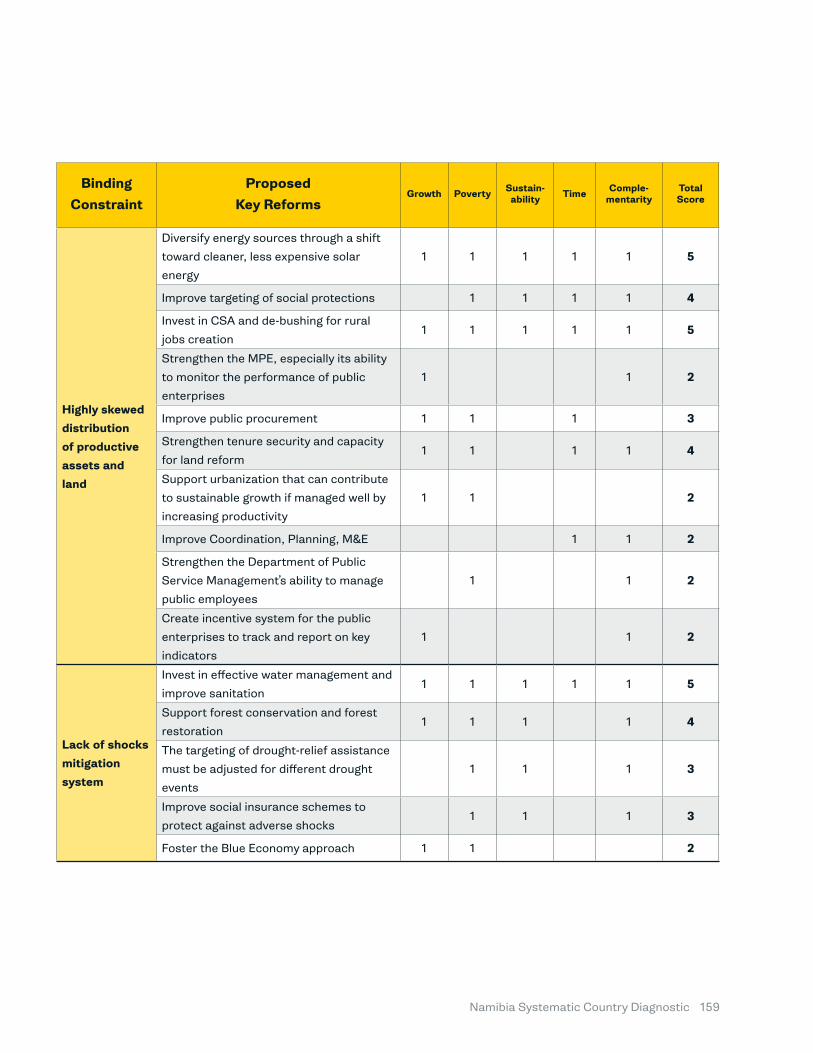
Namibia Systematic Country Diagnostic 159
Binding Constraint
Proposed Key Reforms
Growth Poverty Sustain-ability Time Comple-
mentarityTotal Score
Highly skewed distribution of productive assets and land
Diversify energy sources through a shift
toward cleaner, less expensive solar
energy
1 1 1 1 1 5
Improve targeting of social protections 1 1 1 1 4
Invest in CSA and de-bushing for rural
jobs creation1 1 1 1 1 5
Strengthen the MPE, especially its ability
to monitor the performance of public
enterprises
1 1 2
Improve public procurement 1 1 1 3
Strengthen tenure security and capacity
for land reform1 1 1 1 4
Support urbanization that can contribute
to sustainable growth if managed well by
increasing productivity
1 1 2
Improve Coordination, Planning, M&E 1 1 2
Strengthen the Department of Public
Service Management’s ability to manage
public employees
1 1 2
Create incentive system for the public
enterprises to track and report on key
indicators
1 1 2
Lack of shocks mitigation system
Invest in effective water management and
improve sanitation1 1 1 1 1 5
Support forest conservation and forest
restoration1 1 1 1 4
The targeting of drought-relief assistance
must be adjusted for different drought
events
1 1 1 3
Improve social insurance schemes to
protect against adverse shocks1 1 1 3
Foster the Blue Economy approach 1 1 2
Namibia Systematic Country Diagnostic160
REFERENCES
Abraham, D., T. Ngoga, J. Said, and M. Yachin. 2019. How Israel Became a World Leader in Agriculture and Water: Insights for Today’s Developing Countries. London: Tony Blair Institute for Global Change. https://institute.global/sites/default/files/inline-files/Israel%20Case%20Study%20Web%20reduced.pdf
Ács, Z.J., L. Szerb, and A. Lloyd. 2017. Global Entrepreneurship Index 2018. Washington, DC: Global Entrepreneurship and Development Institute. https://thegedi.org/wp-content/uploads/dlm_uploads/2017/11/GEI-2018-1.pdf
AfDB (African Development Bank). 2014. Namibia: Country Strategy Paper 2014–2018. Abidjan, Côte d’Ivoire: AfDB. https://www.afdb.org/en/documents/document/2014-2018-namibia-country-strategy-paper-46431
AfDB, Empowering African Women: An Agenda for Action, Africa Gender Equality Index 2015, and accompanying “Gender Equality Index Technical Note”
AfDB. 2015. The Africa Gender Equality Index.
Afrobarometer. 2018. “Namibia.” https://www.afrobarometer.org/countries/namibia-0
Agénor, Pierre-Richard and Octaviano Canuto (2015). “Middle-Income Growth Traps.” Research in Economics 69(4): 641–660.
Agribusdev. 2017. Annual Report 2017. Namibia. http://www.agribusdev.org.na/images/Docs/Annual_reports/Agribusev_Annual_Report_Final_2017.pdf
Aiyar, Shekhar, Romain Duval, Damien Puy D, Yiqun Wu and Longmei Zhang (2013). “Growth Slowdowns and the Middle Income Trap.” IMF Working Paper 13/71. International Monetary Fund, Washington DC
ALG Group. 2018. Assessment of Potential Financing and Investment Options to Implement the Envisaged Expansion of the
Alweendo, Ndapwa, Rakkel Andreas, and Deanna Rafla-Yuan. 2018. “Landscaping Gender-Based Violence in Namibia.” Special Briefing Report No. 25, Institute for Public Policy Research, Windhoek, Namibia. https://ippr.org.na/wp-content/uploads/2018/11/GBV_WEB.pdf
Anaya, James. 2013. Report of the Special Rapporteur on the Rights of Indigenous Peoples, Addendum: The Situation of Indigenous Peoples in Namibia. Geneva: United Nations Human Rights Council. https://www.refworld.org/docid/522db4014.html
HKIA. Final report. Windhoek: ALG Group
Almeida Santos, A. 2018. 2018 Economic Outlook Country Note: Namibia. Abidjan, Côte d’Ivoire: African Development Bank. https://www.afdb.org/fileadmin/uploads/afdb/Documents/Generic-Documents/country_notes/Namibia_country_note.pdf
Ammon, V. 2018. “Using Indigenous Knowledge to Adapt to Climate Change.” Namibian Association of CBNRM Support Organisations, August 20. http://www.nacso.org.na/news/2018/08/using-indigenous-knowledge-to-adapt-to-climate-change
Beegle, K.G., A. Coudouel, and E.M. Monsalve Montiel. 2018. Realizing the Full Potential of Social Safety Nets in Africa. Washington, DC: World Bank Group. http://documents.worldbank.org/curated/en/657581531930611436/Realizing-the-Full-Potential-of-Social-Safety-Nets-in-Africa
Belete-Tekie, S. 2015. “Taking the Namibian Road Management System to the Next Level.” Paper prepared for the Ninth International Conference on Managing Pavement Assets, Washington, DC, May 18–21.
Namibia Systematic Country Diagnostic 161
Bertelsmann Stiftung. 2018. “BTI 2018: Namibia Country Report.” Bertelsmann Stiftung Transformation Index (database). Gütersloh, Germany: Bertelsmann Stiftung. https://www.bti-project.org/en/reports/country-reports/detail/itc/nam/ity/2018/itr/esa/
Blimpo, M.P. and M. Cosgove-Davies. 2019. Electricity Access in Sub-Saharan Africa: Uptake, Reliability, and Complementary Factors for Economic Impact. Washington, DC: World Bank Group. http://documents.worldbank.org/curated/en/837061552325989473/Electricity-Access-in-Sub-Saharan-Africa-Uptake-Reliability-and-Complementary-Factors-for-Economic-Impact
BLUE ECONOMY Increasing Long-term Benefits of the Sustainable Use of Marine Resources for Small Island Developing States and Coastal Least Developed Countries. The World Bank. https://openknowledge.worldbank.org/bitstream/handle/10986/26843/115545.pdf?sequence=1&isAllowed=y
Brandt, E. 2017. “Namibia: Consumers Question Benefits of Poultry Industry Protection.” AllAfrica, July 24. https://allafrica.com/stories/201707260769.html
———. 2018. “Southern Africa: Namibia Down One Place to 107 in WB’s Doing Business Report.” AllAfrica, November 5. https://allafrica.com/stories/201811050431.html.
———. 2019. “IPPs to Invest N$1.6 Billion into Electricity Sector.” New Era Live, March 7. https://neweralive.na/posts/ipps-to-invest-n16-billion-into-electricity-sector
Bank of Namibia Annual Reports, 1992- 2018. https://www.bon.com.na/Economic-information/Annual-Reports.aspx
Bertelsmann Stiftung. 2014. BTI 2014: Namibia Country Report. Gütersloh, Germany: Bertelsmann Stiftung. https://www.bti-project.org/fileadmin/files/BTI/Downloads/Reports/2014/pdf/BTI_2014_Namibia.pdf
Brown, R. 2017. “The National Budget 2017–18: Prioritising Personnel.” In Democracy Report. Special Briefing 19. Windhoek: Institute for Public Policy Research. https://ippr.org.na/wp-content/uploads/2017/05/19_DB_Budget_WEB.pdf
———. 2016. The Namibian Balance of Payments, Foreign Exchange Reserves and the Currency Peg. Windhoek, Namibia: Economic Association of Namibia. https://www.ean.org.na/wp-content/uploads/2017/03/Balance-of-Payments-final.pdf
BuddeComm. n.d. “Namibia—Telecoms, Mobile and Broadband—Statistics and Analyses.” https://www.budde.com.au/Research/Namibia-Telecoms-Mobile-and-Broadband-Statistics-and-Analyses
Center for International Development. n.d. Atlas of Economic Complexity (database). Harvard University, Cambridge, MA. http://atlas.cid.harvard.edu/
Cervigni, R., R. Liden, Rikard, J.E. Neumann, and K.M. Strzepek. 2015. Enhancing the Climate Resilience of Africa’s Infrastructure: The Power and Water Sectors. Washington, DC: World Bank. https://openknowledge.worldbank.org/handle/10986/21875
Chiripanhura, B.M. 2018. “Housing in Namibia: The Challenges and Prospects for Adequate Future Provision.” Working Paper 7, Integrated Land Management Institute, Namibia University of Science and Technology, Windhoek. http://ir.nust.na/bitstream/handle/10628/607/WP7-CHIRIPANHURA-Housing-in-Namibia-WEB.pdf?sequence=1&isAllowed=y
Choi, Jieun; Dutz, Mark; Usman, Zainab. 2019. The Future of Work in Africa: Harnessing the Potential of Digital Technologies for All. Washington, DC: World Bank. https://openknowledge.worldbank.org/handle/10986/32124
Christiaensen, L., L. Demery, B. Dillon, C.B. Barrett, K.W. Deininger, S. Savastano, F. Xia, et al. 2018. Agriculture in Africa: Telling Myths from Facts. Washington, DC: World Bank Group. http://documents.worldbank.org/curated/en/681121528784639307/Agriculture-in-Africa-telling-myths-from-facts
Daviel J., Sandström S, Shorrocks A, Wolff E. “The level and distribution of global household wealth”. NBER Working Paper 2009. https://www.nber.org/papers/w15508.pdf
De la Brière, B., D.P. Filmer, D. Ringold, D.P. Rohner, K.A.Y. Samuda, and A. Denisova. 2017. From Mines and Wells to Well-Built Minds, Turning Sub-Saharan Africa’s Natural Resource Wealth into Human Capital. Washington, DC: World Bank Group. http://documents.worldbank.org/curated/en/687681493880957794/From-mines-and-wells-to-well-built-minds-turning-Sub-Saharan-Africas-natural-resource-wealth-into-human-capital

Namibia Systematic Country Diagnostic162
Delegation of the European Union to Namibia. 2017. Namibia Gender Analysis 2017. Windhoek, Namibia: Delegation of the European Union to Namibia. http://www.lac.org.na/projects/grap/Pdf/Namibia_Gender_Analysis_2017.pdf
Department of Transport. 2016. “South Africa Signs the Bilateral Air Service Agreement (BASA) with Namibia.” Traffic Information, October 14. https://www.trafficinformation.co.za/2016/10/south-africa-signs-the-bilateral-air-service-agreement-basa-with-the-namibia/
Donnenfeld, Zachary. 2017. “How Namibia Can Realise Its Vast Development Potential.” ISS Today (blog), Institute for Security Studies, October 30. https://issafrica.org/iss-today/how-namibia-can-realise-its-vast-development-potential
Du Pisani, A. 2010. “State and Society under South African Rule.” In State, Society, and Democracy: A Reader in Namibian Politics, edited by C. Keulder, 49–74. Windhoek: Macmillan Education Namibia.
Education Management Information System. 2018. Education Statistics 2017. Namibia: Ministry of Education, Arts and Culture & UNICEF. https://www.moe.gov.na/files/downloads/d15_EMIS%20Education%20Statistics%202017%20-%20web%20quality.pdf
EIU (Economist Intelligence Unit). 2019. Namibia Country Report. London: EIU.
EMIS (Education Management Information System). 2016. EMIS Education Statistics 2016. Windhoek: Ministry of Education, Arts and Culture, Republic of Namibia. https://www.moe.gov.na/files/downloads/412_EMIS.Education.Statistics.2016.pdf
———. 2017. EMIS Education Statistics 2017. Windhoek: Ministry of Education, Arts and Culture, Government of the Republic of Namibia. https://www.moe.gov.na/files/downloads/d15_EMIS%20Education%20Statistics%202017%20-%20web%20quality.pdf
———. 2018. Namibia Fifteenth School Day Report 2018. Windhoek: Ministry of Education, Arts and Culture, Government of the Republic of Namibia.
Eichengreen, Barry, Donghyun Park and Kwanho Shin (2014). “Growth slowdowns redux.” Japan and the World Economy 32(November 2014): 65-84.
Enterprise Surveys, Namibia, 2014. World Bank Group
EU (European Union). 2015. Dealing with Climate Change in the N≠a Jaqna and Nyae Conservancy and Community Forest. Brussels: EU.
———. 2016. “Economic Partnership Agreement between the European Union and Its Member States, of the One Part, and the SADC EPA States of the Other Part.” Official Journal of the European Union, September 16. http://trade.ec.europa.eu/doclib/docs/2015/october/tradoc_153915.pdf
European Commission. 2016. Economic Partnership Agreement between the European Union and the Southern African Development Community (SADC) EPA Group: Key Advantages. Brussels: European Commission. http://trade.ec.europa.eu/doclib/docs/2014/october/tradoc_152818.pdf
FAO (Food and Agriculture Organization. 2016. Assessment of Impacts and Recovery Needs of Communities Affected by El Niño-Induced Drought in Kunene, Erongo and Omusati Regions of Namibia: FAO in Emergencies. Rome: FAO. http://www.fao.org/3/a-i6604e.pdf
———. 2013. Fishery and Aquaculture Country Profiles: Namibia. Rome: Fisheries and Aquaculture Department, FAO. http://www.fao.org/fishery/facp/NAM/en
Freedom House. 2018. “Namibia.” https://freedomhouse.org/country/namibia
Funk, C.C., P.J. Peterson, M.F. Landsfeld, D.H. Pedreros, J.P. Verdin, J.D. Rowland, B.E. Romero, G.J. Husak, J.C. Michaelsen, and A.P. Verdin. 2014. “A Quasi-global Precipitation Time Series for Drought Monitoring.” US Geological Survey Data Series 832 (4): 1–12. https://dx.doi.org/10.3133/ds832
Gill, Indermit and Homi Kharas (2007). An East Asian Renaissance: Ideas for Economic Growth. World Bank, Washington DC.
Global Integrity. 2007. Global Integrity Report 2007—Corruption Notebook—Namibia. Washington, DC: Global Integrity. https://www.globalintegrity.org/resource/gir2007-namibia/
Namibia Systematic Country Diagnostic 163
Goodwin, T., and M.D. Pierola Castro. 2015. Export Competitiveness: Why Domestic Market Competition Matters. Viewpoint 348. Washington, DC: World Bank Group. http://documents.worldbank.org/curated/en/432141468189538318/Export-competitiveness-Why-Domestic-Market-Competition-Matters
Government Gazette of the Republic of Namibia, no. 6255, March 1, 2017. https://www.greengazette.co.na/notices/commencement-of-public-procurement-act-2015_20170301-GGN-06255-00046
Government Gazette of the Republic of Namibia, no. 6776 of November 26, 2018. https://www.greengazette.co.na/notices/communications-regulatory-authority-of-namibia-spectrum-assignment-strategy_20181126-GGN-06776-00673.pdf
Government of Namibia. 2004. Namibia Vision 2030: Policy Framework for Long-Term National Development. Windhoek: Office of the President, Government of Namibia.
———. 2010. Integrated Water Resources Management Plan.
———. 2012. National Human Resources Plan, 2010–2025. Windhoek: Office of the President, National Planning Commission. http://www.npc.gov.na/?wpfb_dl=203
———. 2015. Namibia Third National Communication to the United Nations Framework Convention on Climate Change. Windhoek: Government of Namibia. https://unfccc.int/sites/default/files/resource/namnc3.pdf
———. 2016. Harambee Prosperity Plan 2016/17–2019/20. Windhoek: Office of the President, Government of Namibia. https://www.gov.na/documents/10181/264466/HPP+page+70-71.pdf/bc958f46-8f06-4c48-9307-773f242c9338
———. 2018. The State of Land Reform since the 1991 National Conference on Land Reform and the Land Question.
Goyal, A., and J. Nash. World Bank Group and Agence Françoise de Developpement, 2017. Reaping Richer Returns: Public Spending Priorities for African Agriculture Productivity Growth. Washington, DC: World Bank and Agence Francaise de Developpement. https://openknowledge.worldbank.org/handle/10986/25996
Greg Larson, Norman Loayza, Michael Woolcock The Middle-Income Trap: Myth or Reality? 2016 http://documents.worldbank.org/curated/en/965511468194956837/pdf/104230-BRI-Policy-1.pdf
Hallegatte, Stephane; Rentschler, Jun; Rozenberg, Julie. 2019. Lifelines: The Resilient Infrastructure Opportunity. Sustainable Infrastructure. Washington, DC: World Bank. http://hdl.handle.net/10986/31805
Frankel, J., Vegh. C., and Vuletin, G. 2013. On graduation from fiscal procyclicality. Journal of Development Economics 100 (2013) 32–47. https://pdfs.semanticscholar.org/8b9c/ca21c164dd43320069d4be17070dce54754a.pdf
Hansen, K., and J. Stevens. 2019. “Drought Harms Corn Crops in Southern Africa.” NASA Earth Observatory (blog), March 20. https://earthobservatory.nasa.gov/images/144704/drought-harms-corn-crops-in-southern-africa
Helao, T., and G. Naidoo. 2016. “A Perspective on Service Delivery in the Oshana Region of Namibia: Lessons for Governance.” Journal of Public Administration 51 (2): 246–64.
Hoffmann, J. 2012. “The Role of Cross-Border Trade in Achieving Food Security.”
Honda, J., M. Nose, C. Sosa Padilla, J.L. Torres, M. Morgan, F.G Im, and N.A Koliadina. 2017. “Fiscal Rules: Coping with Revenue Volatility in Lesotho and Swaziland.” Departmental Paper 17/05. Washington, DC: IMF.
IFRC (International Federation of Red Cross and Red Crescent Societies). 2018. Emergency Plan of Action Final Report—Namibia: Food Insecurity. Geneva: IFRC.
IHME (Institute for Health Metrics and Evaluation). n.d. “Namibia.” http://www.healthdata.org/Namibia
ILO (International Labour Organization). 2014. Namibia Social Protection Floor Assessment. Geneva: ILO. https://www.social-protection.org/gimi/gess/RessourcePDF.action?ressource.ressourceId=47837
IMF (International Monetary Fund). 1993. Namibia: Staff Report for the 1993 Article IV Consultation. Washington, DC: IMF.
———. 1995. Namibia: Staff Report for the 1995 Article IV Consultation. Washington, DC: IMF.
———. 2000. Namibia: Staff Report for the 2000 Article IV Consultation. Washington, DC: IMF.
Namibia Systematic Country Diagnostic164
———. 2003. Namibia: Staff Report for the 2002 Article IV Consultation. Washington, DC: IMF.
———. 2005. Namibia: Staff Report for the 2004 Article IV Consultation. Country Report 05/97. Washington, DC: IMF.
———. 2011. Namibia: Staff Report for the 2010 Article IV Consultation. Country Report 10/269. Washington, DC: IMF.
———. 2012. Namibia: Staff Report for the 2011 Article IV Consultation. Country Report 12/41. Washington, DC: IMF.
———. 2016. Namibia: Staff Report for the 2016 Article IV Consultation. Country Report 16/373. Washington, DC: IMF.
———. 2018a. Namibia: Financial System Stability Assessment. Country Report 18/77. Washington, DC: IMF.
———. 2018b. Namibia: Staff Report for the 2017 Article IV Consultation. Country Report 18/56. Washington, DC: IMF.
———. 2018c. Namibia: Staff Report for the 2018. Article IV Consultation. Washington, DC: IMF.
———. 2019. Regional Economic Outlook: Sub-Sahara Africa—Recovery Amid Elevated Uncertainty. Washington, DC: IMF.
Institutional Profiles Database. 2016. http://www.cepii.fr/institutions/EN/ipd.asp
Im, Fernando Gabriel and David Rosenblatt (2014). “Middle-Income Traps: A Conceptual and Empirical Survey.” Policy Research Working Paper No. 6594, World Bank, Washington DC.
InterVISTAS. 2014. Transforming Intra-African Air Connectivity: The Economic Benefits of Implementing the Yamoussoukro Decision. Montreal: International Air Transport Association. https://www.iata.org/whatwedo/Documents/economics/InterVISTAS_AfricaLiberalisation_FinalReport_July2014.pdf
IRENA (International Renewable Energy Agency). 2017. Rethinking Energy 2017: Accelerating the Global Energy Transformation. Abu Dhabi: IRENA. https://www.irena.org/documentdownloads/publications/irena_rethinking_energy_2017.pdf
JICA (Japan International Cooperation Agency). 2011. Namibia: Country Review Study for Economic Development Assistance. Tokyo: JICA.
Kahiurika, N., and A. Shikongo. 2019. “Air Namibia in Steep Descent.” Namibian, June 12. https://www.namibian.com.na/79473/read/Air-Namibia-in-steep-descent
Kaira, C. 2018. “Langer Heinrich Closure to Hit Suppliers Hard.” Windhoek Observer, June 1. https://www.observer.com.na/index.php/business/item/9868-langer-heinrich-closure-to-hit-suppliers-hard
Kitzmuller, M., and M. Martinez Licetti. 2013. Competition Policy: Encouraging Thriving Markets for Development. Viewpoint 331. Washington, DC: World Bank Group. http://documents.worldbank.org/curated/en/778181468328582034/Competition-policy-encouraging-thriving-markets-for-development
Knoema. n.d. “Namibia—Contribution of Tourism and Travel to GDP as a Share of GDP.” https://knoema.com/atlas/Namibia/topics/Tourism/Travel-and-Tourism-Total-Contribution-to-GDP/Contribution-of-travel-and-tourism-to-GDP-percent-of-GDP
KPMG. 2017. Namibia Economic Snapshot H2, 2017. Amstelveen, Netherlands: KPMG. https://home.kpmg/content/dam/kpmg/za/pdf/2017/12/KPMG_Namibia_2017_V2.pdf
Kruger, B. 2014. Study on Informal Trade Beef/Cattle in the Northern Communal Areas. Washington, DC: Millennium Challenge Account Namibia.
LAC (Legal Assistance Centre). 2016. Proposals for Enhancing Road Safety in Namibia. Windhoek: LAC. http://www.lac.org.na/projects/grap/Pdf/roadsafetyproposals.pdf
———. 2017. Namibia Gender Analysis 2017. Windhoek: Delegation of the European Union to Namibia. https://eeas.europa.eu/sites/eeas/files/namibia_gender_analysis_2017.pdf
Lange, G.-M., Q. Wodon, and K. Carey. 2018. The Changing Wealth of Nations 2018: Building a Sustainable Future. Washington, DC: World Bank. https://openknowledge.worldbank.org/handle/10986/29001
Legal Assistance Centre for the Delegation of the European Union to Namibia.“

Namibia Systematic Country Diagnostic 165
Namibia Gender Analysis”, 2017 https://www.lac.org.na/projects/grap/Pdf/Namibia_Gender_Analysis_2017.pdf
Namibia Demographic and Health Survey 2013, Windhoek: Ministry of Health and Social Services and ICF International, 2014
Levine, S., S. van der Berg, and D. Yu. 2011. “The Impact of Cash Transfers on Household Welfare in Namibia.” Development Southern Africa 28 (1): 39–59. https://doi.org/10.1080/0376835X.2011.545169
Marope, M.T. 2005. “Namibia Human Capital and Knowledge Development for Economic Growth with Equity.” Working Paper 84, World Bank, Washington, DC. http://documents.worldbank.org/curated/en/956301468279287500/Namibia-human-capital-and-knowledge-development-for-economic-growth-with-equity
Mapaure, I. 2016. “Review of the Climate Change Situation in Namibia: Projected Trends, Vulnerability and Effects.” In Environmental law and Policy in Namibia, edited by O.C. Ruppel and K. Ruppel-Schlichting, 339–58. Windhoek: Hanns Seidel Foundation and Solitary Press.
Melber, Henning. 2015. “The Power of Liberation Movements. Development + Cooperation.” https://www.dandc.eu/en/article/namibian-government-has-good-international-reputation-not-driving-forward-socio-economic
———. 2018. “The Political Economy of Namibia.” UNICEF Esaro Country Paper, Rift Valley Institute.
MAWF (Ministry of Agriculture, Water and Forestry). 2011. Namibian Agriculture, Marketing and Trade Policy and Strategy. Windhoek: MAWF, Government of Namibia. http://www.mawf.gov.na/documents/37726/205215/Final+AgriMrkng+and+Trade+Policy+and+Strategy+%282%29.pdf/83339713-0dba-4bb6-8bcc-e5e681a17fc6
Menges, W. 2018. “Namibia: Global Fund Cuts Deepen Namibia’s Woes.” Namibian, Feburary 12. https://allafrica.com/stories/201802120152.html
Mendelsohn, John, Louise Shixwameni, and Uda Nakamhela. n.d. An Overview of Communal Land Tenure in Namibia: Unlocking Its Economic Potential. Windhoek, Namibia: Research & Information Services of Namibia. 2008.
MERCOSUR (Mercado Común del Sur; Southern Common Market) and SACU (Southern African Customs Union. 2016. Preferential Trade Agreement between the Common Market of the South (MERCOSUR) and the Southern African Customs Union (SACU). http://www.sacu.int/docs/agreements/2016/mercosur-and-sacu-trade-agreement.pdf
MET (Ministry of Environment and Tourism). 2014. Namibia’s Second National Biodiversity Strategy and Action Plan 2013–2022. Windhoek: MET, Government of the Republic of Namibia. http://www.met.gov.na/files/files/Namibia%E2%80%99s%20Second%20National%20Biodiversity%20Strategy%20and%20Action%20Plan%20(NBSAP%202)%20%202013%20-%202022.pdf
———. 2012. Namibia Climate Change Strategy and Action Plan (NCCSAP). http://www.met.gov.na/files/files/National%20Climate%20Change%20Strategy%20&%20Action%20Plan%202013%20-%202020.pdf
———. 2011 National Policy on Climate Change for Namibia 2011. http://www.met.gov.na/files/files/National%20Policy%20on%20Climate%20Change%20for%20Namibia%202011(1).pdf
Ministry of Health, ICAP, CDC. Namibia population-based HIV impact assessment (NAMPHIA) 2015-18.
Ministry of Land Reform. 2018. Resolutions of the Second National Conference, 1st–5th October 2018. Windhoek: Office of the Prime Minister, Government of Namibia.
Ministry of Labour, Industrial Relations and Employment Creation. Namibia Informal Economy Case Study Report. 2016/17. https://mol.gov.na/documents/53329/69995/Informal+Case+Study+Report.pdf/3669c455-1fce-2276-70b6-10ad07df1d6b
Ministry of Trade and Industry and UNDP (United Nations Development Programme). 2011. Integrating Globally: Namibia’s Aid for Trade Framework and Strategy. Windhoek: Ministry of Trade and Industry; UNDP. https://www.undp.org/content/dam/namibia/docs/povred/undp_na_povred_namaidfortradeframstrat_2011.pdf
MoEAC (Ministry of Education, Arts and Culture). 2016. The National Standardised Achievement Test (SAT) Results, 2015 for Grades 5 and 7. Windhoek: MoEAC, Government of the Republic of Namibia.
———. 2017. A Public Expenditure Review of the Basic Education Sector in Namibia. Windhoek: Directorate of Planning and Development, MoEAC, Government of the Republic of Namibia. https://www.moe.gov.na/files/downloads/047_NamibiaEducationPublicExpenditureReport.pdf
Namibia Systematic Country Diagnostic166
Mo Ibrahim Foundation. 2018. 2018 Ibrahim Index of African Governance: Index Report. http://s.mo.ibrahim.foundation/u/2018/11/27173840/2018-Index-Report.pdf?_ga=2.91277018.1989544098.1548941645-1329949972.1548941645
MTBS (Maritime & Transport Business Solutions). n.d. “PPP Options Analysis for the Port of Walvis Bay.” September 2017 to November 2017.” https://www.mtbs.nl/projects/ppp-options-analysis-for-the-port-of-walvis-bay
NAB (Namibian Agronomic Board). 2017
Namibia Daily News. 2018. “Jooste Tables Public Enterprises Governance Bill,” October 11. https://namibiadailynews.info/jooste-tables-public-enterprises-governance-bill/
Namibia Economist. 2015. “Bush Encroachment Must Be Curbed,” October 23. https://economist.com.na/13437/environment/bush-encroachment-must-be-curbed/
Namibia Electricity Supply Industry. 2016. National Integrated Resource Plan Review and Update—Final Report. Windhoek: Ministry of Mines and Energy, Government of the Republic of Namibia. http://www.mme.gov.na/files/publications/f74_29a_ELECTRICITY%20SECTOR%20NATIONAL%20INTEGRATED%20RESOURCE%20PLAN%20(NIRP)%202016%20FINAL%20REPORT.pdf
NAMPA (Namibia Press Agency). 2015. “Infant Industry Protection Is Flawed: NCT.” Namibia News Digest, August 20. https://www.namibianewsdigest.com/infant-industry-protection-is-flawed-nct-the-namibia-press-agency/
Namport (Namibian Ports Authority). 2017. Group Annual Report 2017/18: Connecting Southern Africa to the World and the World to Southern Africa. Walvis Bay, Namibia: Namport. https://www.namport.com.na/files/documents/dee_Annual%20Report%2012%20months%20ended%2031%20March%202018.pdf
———. n.d. “Welcome to the Port of Walvis Bay.” https://www.namport.com.na/ports/39/. Accessed May 19, 2019.
National Treasury and SARS (South African Revenue Service). 2014. 2014 Tax Statistics. Pretoria: National Treasury; SARS. http://www.treasury.gov.za/publications/tax%20statistics/2014/TStats%202014%20WEB.pdf
———. 2015. 2015 Tax Statistics. Pretoria: National Treasury; SARS. http://www.treasury.gov.za/publications/tax%20statistics/2015/TStats%202015%20Inside%20WEB.pdf
———. 2016. 2016 Tax Statistics. Pretoria: National Treasury; SARS. https://www.sars.gov.za/AllDocs/Documents/Tax%20Stats/Tax%20Stats%202016/Tax%20Stats%202016%20Full%20document%20web.pdf
———. 2017. 2017 Tax Statistics. Pretoria: National Treasury; SARS. https://www.sars.gov.za/AllDocs/Documents/Tax%20Stats/Tax%20Stats%202017/Tax%20Stats%202017%20Publication.pdf
Naumann, E. 2018. “AGOA and Namibia: The African Growth and Opportunity Act.” Western Cape, South Africa: Trade Law Centre. https://agoa.info/images/documents/15555/namibiacountrybrochureagoafinal.pdf
NBC (Namibian Broadcasting Corporation). 2018. “RCC Aims to Capture New Road Maintenance and Construction Projects.” January 8. https://www.nbc.na/news/rcc-aims-capture-new-road-maintenance-and-construction-projects.15791
NCHE (National Council for Higher Education). 2016. 2015 Namibia Higher Education Statistical Yearbook (NHESY). Windhoek: NCHE. http://www.nche.org.na/sites/default/files/documents/nhesy_2015.pdf
———. 2017. 2016 Namibia Higher Education Statistical Yearbook (NHESY). Windhoek: NCHE. http://www.nche.org.na/sites/default/files/documents/nhesy_2016.pdf
———. 2018a. Annual Plan 2018/19. Windhoek: NCHE. http://www.nche.org.na/sites/default/files/documents/nche_2018-19_annual_plan_-_final.pdf
———. 2018b. National Graduate Survey. Windhoek: NCHE. http://www.nche.org.na/sites/default/files/documents/2017_national_graduate_survey.pdf
———. 2018c. Strategic Plan 2017/18–2021/22. Windhoek: NCHE. http://www.nche.org.na/sites/default/files/documents/nche_strategic_plan_2017-18_to_2021-22_final.pdf
NDC Partnership. 2018. “Namibia’s Rapid Situational Assessment.” Draft. Washington, DC: World Resources Institute; Bonn, Germany: United Nations Climate Change.

Namibia Systematic Country Diagnostic 167
Noack et al. 2015. Environmental Income, Rural Poverty, and Adaptation to Climate Variability: A Cross-Sectional Analysis.
NPC (National Planning Commission). 2012. Namibia’s Fourth National Development Plan: NDP4— 2012/13 to 2016/17. Windhoek: NPC, Government of Namibia. https://www.npc.gov.na/?wpfb_dl=37
———. 2017. Namibia’s Fifth National Development Plan (NDP5): Working Together Towards Prosperity, 2017/18–2021/22. Windhoek: NPC, Government of Namibia. http://www.gov.na/documents/10181/14226/NDP+5/
———. 2018a. Economic Development Report. Windhoek: NPC, Government of Namibia.
———. 2018b. Implementation of Sustainable Development Goals: Voluntary National Review 2018. Windhoek: NPC, Government of the Republic of Namibia. https://sustainabledevelopment.un.org/content/documents/19880New_Version_Full_Voluntary_National_Review_2018_single_1_Report.pdf
NRSC (National Road Safety Council). 2015. “National Road Safety Council Media Briefing on Road Safety Issues.” Press release. Windhoek: NRSC. http://www.nrsc.org.na/files/downloads/4dc_Media%20Briefing%20on%20Road%20Safety%20Issues%20(01%20December%202015).pdf
NSA (Namibia Statistics Agency). 2011. Namibia 2011: Population and Housing Census Main Report. Windhoek: NSA, Government of the Republic of Namibia.
———. 2012a. Child Poverty in Namibia. Windhoek: NSA, Government of the Republic of Namibia.
———. 2012b. Namibia Household Income and Expenditure Survey Summary—June 2012. Windhoek: NSA, Government of the Republic of Namibia.
———. 2012c. Poverty Dynamics in Namibia: A Comparative Study Using the 1993/94, 2003/04 and the 2009/10 NHIES Surveys. Windhoek: NSA, Government of the Republic of Namibia.
———. 2015. Annual National Accounts 2015. Windhoek: NSA, Government of the Republic of Namibia. https://d3rp5jatom3eyn.cloudfront.net/cms/assets/documents/National_Accounts_2015_-_11_August_2016.pdf
———. 2016a. Annual National Accounts 2016. Windhoek: NSA, Government of the Republic of Namibia. https://d3rp5jatom3eyn.cloudfront.net/cms/assets/documents/Annual_National_Accounts_2016.pdf
———. 2016b. Namibia Household Income and Expenditure Survey (NHIES) 2015/2016 Report. Windhoek: NSA, Government of the Republic of Namibia. https://d3rp5jatom3eyn.cloudfront.net/cms/assets/documents/NHIES_2015-16.pdf
———. 2017a. Annual National Accounts 2017. Windhoek: NSA, Government of the Republic of Namibia. https://d3rp5jatom3eyn.cloudfront.net/cms/assets/documents/Annual_National_Accounts_2017.pdf
———. 2017b. The Namibia Labour Force Survey 2016 Report. Windhoek: NSA, Government of the Republic of Namibia.
———. 2018. Namibia Land Statistics Booklet 2018. Windhoek: NSA, Government of the Republic of Namibia. http://196.216.167.74/landconference/submissions_2018/NamibiaLandStatistics2018.pdf
NAMPA. 2019. “Geingob Says NEEEF to Undergo Internal Review.” Lela. https://www.lelamobile.com/content/79798/Geingob-says-NEEEF-to-undergo-internal-review
Nanghonga, Indileni, and Naufiku Hamunime. 2019. “The Budget 2019–20: Adapting to Fiscal Constraints.” Special Briefing Report No. 26, Institute for Public Policy Research, Windhoek, Namibia. https://ippr.org.na/wp-content/uploads/2019/06/BudgetReview19_WEB.pdf
Nekongo-Nielsen, Mbukusa, Tjiramba , Florida Beukes “Investigating factors that lead to school dropout in Namibia”, Department of Student Support Centre for External Studies and Department of Lifelong Learning and Community Education, Faculty of Education4 , University of Namibia. http://journals.unam.edu.na/index.php/NCPDJE/article/download/1282/1109/
Ngatjiheue, Charmaine. 2018. “Informal Sector Detached from Economy—Jauch.” Namibian, July 30, 2018. https://www.namibian.com.na/179989/archive-read/Informal-sector-detached-from-economy-%E2%80%93-Jauch
NSFAF (Namibia Students Financial Assistance Fund). 2018. Annual Report 2017/2018. Windhoek: NSFAF. https://www.nsfaf.na/wp-content/uploads/2019/02/NSFAF-Annual-Report-2016-2018.pdf

Namibia Systematic Country Diagnostic168
NTA (Namibia Training Authority). 2016. Transformation and Expansion Strategy for Technical and Vocational Education and Training (TVET): Building a Skilled Nation. Windhoek: NTA.
———. 2018a. Namibia Training Authority: Annual Report 2017/18. Windhoek: NTA. http://www.nta.com.na/wp-content/uploads/2013/07/NTA-Annual-Report-2017-18.pdf
———. 2018b. Namibia Training Authority: Strategic Plan 2019/20–2022/23. Windhoek: NTA. http://www.nta.com.na/wp-content/uploads/2013/07/Namibia-Training-Authority-Strategic-Plan-2019-20-2022-23-June-2018.pdf
Nunuhe, M. 2018. “Emotions Running High in Namibia’s Cement Industry,” Southern Times, March 19. https://southerntimesafrica.com/site/news/emotions-running-high-in-namibias-cement-industry
Tshabalala, Sibusiso. 2015. “These Charts Show Why Namibia Doesn’t Want to Be Called an Upper Middle-Income Country.” Quartz Africa. https://qz.com/africa/454505/these-charts-show-why-namibia-doesnt-want-to-be-called-an-upper-middle-income-country
OECD (Organisation for Economic Co-operation and Development). 1999. Competition in Professional Services. Paris: OECD. http://www.oecd.org/regreform/sectors/1920231.pdf
OutRight Namibia. 2013. LGBTI Human Right Report on Lesbian, Gay, Bisexual, Transgender and Intersex People in Namibia. Windhoek, Namibia: OutRight Namibia.
Productivity Commission. 2005. Review of National Competition Policy. Report 33. Canberra: Commonwealth of Australia. https://www.pc.gov.au/inquiries/completed/national-competition-policy/report/ncp.pdf
Reid, H., L. Sahlén, J. Stage, and J. Macgregor. 2008. “Climate Change Impacts on Namibia’s Natural Resources and Economy.” Climate Policy 8 (5): 452–66. https://doi.org/10.3763/cpol.2008.0521
Remmert D. and Ndhlovu P., 2018. Housing in Namibia Rights, Challenges and Opportunities. IPPR
Republic of Namibia. 2006. “State-Owned Enterprises Governance Act 2006.”
https://ippr.org.na/wp-content/uploads/2018/03/IPPR_HousingBook_PRINT.pdf
Runji, J. 2003. “Road Sector Reform in Namibia.” Paper presented at the Senior Road Executive Seminar, Pretoria, South Africa. http://siteresources.worldbank.org/INTROADSHIGHWAYS/Resources/338993-1115316483571/21-namibia_reform.pdf
SACMEQ (Southern and Eastern Africa Consortium for Monitoring Educational Quality). 2011. The SACMEQIII Project in Namibia: A Study of the Conditions of Schooling and the Quality of Education. Gaborone, Botswana: SACMEQ. http://www.sacmeq.org/sites/default/files/sacmeq/reports/sacmeq-iii/national-reports/s3_namibia_final.pdf
———. 2015. The SACMEQ IV Project in Namibia: A Study of the Conditions of Schooling and the Quality of Primary Education in Namibia. Policy Research Report 4. Windhoek: Ministry of Education, Arts and Culture. http://www.sacmeq.org/sites/default/files/sacmeq/publications/final_sacmeq_iv_report_namibia-compressed-compressed.pdf
SACU (Southern African Customs Union). 2008. Cooperative Agreement between the United States of America and the Southern African Customs Union to Foster Trade, Investment and Development. http://www.sacu.int/docs/tidca/agreement.pdf
SADC (Southern African Development Community). 2019. Synthesis Report on the State of Food and Nutrition Security and Vulnerability in Southern Africa. Windhoek: SADC. https://www.sadc.int/files/7315/6284/6868/SADC_2019_Synthesis_Report_on_the_State_of_Food_and_Nutrition_Security_and_Vulnerability_in_Southern_Africa.pdf
Salmi, J. 2018. Daring to Soar Higher: Unleashing the Potential of Namibia University of Science and Technology. Windhoek.
Selormey, E., M.Z. Dome, L. Osse, and C. Logan. 2019. “Change Ahead: Experience and Awareness of Climate Change in Africa.” Policy Paper 60. Accra, Ghana: Afrobarometer. https://afrobarometer.org/sites/default/files/publications/Policy%20papers/ab_r7_policypaperno60_experience_and_awareness_of_climate_change_in_africa.pdf
Slany, A. 2017. The Role of Trade Policies in Building Regional Value Chains—Some Preliminary Evidence from Africa. Research Paper 11. Geneva: United Nations Conference on Trade and Development. https://unctad.org/en/PublicationsLibrary/ser-rp-2017d11_en.pdf
Namibia Systematic Country Diagnostic 169
Sulla, V., P. Zikhali, P.M. Schuler, and J.R. Jellema. 2017. Does Namibia’s Fiscal Policy Benefit the Poor and Reduce Inequality? Washington, DC: World Bank Group. http://documents.worldbank.org/curated/en/991551497258273367/Does-fiscal-policy-benefit-the-poor-and-reduce-inequality-in-Namibia
Totemeyer, G. 2010. “Decentralization and State Building at Local Level.” In State, Society, and Democracy: A Reader in Namibian Politics, edited by C. Keulder, 108–45. Windhoek: Macmillan Education Namibia.
UNAM (University of Namibia). 2016. Annual Report 2016. Windhoek: UNAM. http://www.unam.edu.na/sites/default/files/newsletter/unam_annual_report2016_web_0.pdf
UNCTAD (United Nations Conference on Trade and Development). 2016. Trade Policy Framework: Namibia. https://unctad.org/en/PublicationsLibrary/ditctncd2016d2_en.pdf Geneva: UNCTAD
UNDP, Africa Human Development Report 2016: Accelerating Gender Equality and Women’s Empowerment in Africa, 2016.
———.2017. “Human Development Index Trends, 1990–2017.” http://hdr.undp.org/en/composite/trends.
———. 2018. Briefing Note for Countries on the 2018 Statistical Update: Namibia. New York: UNDP. http://hdr.undp.org/sites/all/themes/hdr_theme/country-notes/NAM.pdf
UNESCO (United Nations Educational, Scientific and Cultural Organization). 2010. World Data on Education: Namibia. Paris: UNESCO.
———. 2016. TVET, Higher Education and Innovation: Policy Review—Namibia. Paris: UNESCO. https://unesdoc.unesco.org/ark:/48223/pf0000245818
UNICEF (United Nations Children’s Fund). 2013. Regional Education Analysis for Namibia. New York: UNICEF. https://www.unicef.org/namibia/MoE-UNICEF_2013_Regional_education_analysis_Namibia_combined1.pdf
———. 2016. UNICEF Annual Report 2016: Namibia. New York: UNICEF. https://www.unicef.org/about/annualreport/files/Namibia_2016_COAR.pdf
———. 2017. “Southern Africa El Niño/La Niña Situation Overview (31 July 2017).” New York: UNICEF.
———. 2018. Children and the Namibian budget: Social Assistance and Welfare – 2017/2018. UNICEF
———. 2019. Drought Emergency Declared in Namibia. Situation Report 1. New York: UNICEF. https://www.unicef.org/appeals/files/UNICEF_Namibia_Humanitarian_SitRep_Drought_Emergency_9_May_2019.pdf
UNFCCC Namibia’s NDC. https://www4.unfccc.int/sites/ndcstaging/PublishedDocuments/Namibia%20First/INDC%20of%20Namibia%20Final%20pdf.pdf
USAID (US Agency for International Development). n.d. “Country Profile: Property Rights and Resource Governance—Namibia.” https://pdf.usaid.gov/pdf_docs/pa00j7tv.pdf
———. 2018. 2017 Civil Society Organization Sustainability Index. 9th ed. Washington, DC: USAID. https://www.usaid.gov/sites/default/files/documents/1866/2017-CSO-Sustainability-Index-for-Sub-Saharan-Africa.pdf
Wee Asbjorn, Namibia Risk and Resilience Assessment (RRA). 2019. The World Bank.
Weyland, Maximilian. 2018. “Views of Namibia’s Economy Darken Sharply; Youth More Likely to Consider Emigration.” Dispatch No. 202, Afrobarometer. http://afrobarometer.org/sites/default/files/publications/Dispatches/ab_r7_dispatchno202_namibia_economy.pdf
World Bank. 2013. Enhancing the climate resilience of Africa’s Infrastructure: the roads and bridges sector. http://documents.worldbank.org/curated/en/270671478809724744/Enhancing-the-climate-resilience-of-Africa-s-Infrastructure-the-roads-and-bridges-sector
Zaaruka B, Tjeriko C. Is Namibia in a middle – income trap? A comparative analysis, 2018 https://www.bon.com.na/CMSTemplates/Bon/Files/bon.com.na/2b/2b640b4d-98c6-4bde-8205-e674bb3a5357.pdf


