a dynamic model of photoadaptation in phytoplankton
TRANSCRIPT

LIMNOLOGY AND January 1996
Volume 4 1
Number 1 OCEANOGRAPHY
Limnol. Oceanogr., 41(l), 1996, 1 -15 0 1996, by the American Society of Limnology and Oceanography, Inc.
A dynamic model of photoadaptation in phytoplankton
Richard J. Geider’ and Hugh L. MacIntyre Graduate College of Marine Studies, University of Delaware, Lewes 1995% 1298
Todd M. Kana Horn Point Environmental Laboratories, University of Maryland, Cambridge 2 16 13-0775
Abstract We present a new dynamic model that uses a small number of prescribed parameters to predict the
chlorophyll a:carbon ratio and growth rate of phytoplankton in both constant and varying irradiance. The model provides a self-contained description of energy and mass fluxes and regulation of partitioning of photosynthate during phytoplankton adaptation to irradiance. The kinetics and steady-state outcomes of photoadaptation are described in terms of changes in the rates of synthesis of three intracellular carbon pools. These pools account for the distribution of cell material between light-harvesting components, the biosynthetic apparatus, and energy storage compounds. Regulation of the flow of recent photosynthate to these pools is controlled by the ratio of realized to potential photosynthetic electron flow at a given instant. The responses of growth rate and Chl a:C to static and dynamic irradiance regimes can be adequately described by specifying four parameters: the initial slope of the photosynthesis-irradiance curve, the maximum growth rate, the maximum Chl a:C observed under light limitation, and the maintenance metabolic rate. The model predic- tions compared favorably with observations of the diatoms Thalassiosira pseudonana and Phaedactylum tricornutum.
Photoadaptation, involving the down-regulation of pig- ment synthesis at high irradiance, is well documented in procaryotic and eucaryotic phytoplankton (Falkowski and La Roche 199 1). The chlorophyll a : carbon ratio (0) and the chlorophyll a-specific light-saturated photosynthesis rate (P”“‘,) are two of the most widely used indices of the photoadaptive state of phytoplankton (Geider 1993). 6’ provides a link between phytoplankton growth rate (p) and the commonly measured chlorophyll a-specific pho- tosynthesis rate pChl (i.e. p = pChl 0) (Eppley 1972). Since
l To whom correspondence should be addressed. Present ad- dress: Marine Biological Association of the U.K., The Labo- ratory, Citadel Hill, Plymouth PLl 2PB, England.
Acknowledgments We acknowledge support from NSF grants OCE 93-01768
(R.J.G.) and OCE 93-05896 (T.M.K.) and DOE DE-FG02- 93ER6 195 (R.J.G.).
We thank John Cullen for a thought-provoking review and Paul Falkowski for providing preprints of works in press. We also thank Peggy Conlon for assistance in preparing the manu- script.
Contribution 2663 from the Center for Environmental and Estuaries Studies of the University of Maryland System.
chlorophyll a is the most widespread index of phyto- plankton abundance (Cullen 1982) photoadaptation of 0 and pChl has significant implications for our understand- ing of phytoplankton ecology and biooptical modeling of primary productivity. Variability in 8 can lead to consid- erable uncertainty in both the biomass and specific growth rate of phytoplankton. Finally, our understanding of par- ticle dynamics in the upper ocean rests on our ability to describe and predict 8 and pChl.
Oceanographers and limnologists have made signifi- cant progress in modeling balanced phytoplankton growth quantitatively. The models have a common basis in de- picting phytoplankton growth in terms of mass and energy fluxes (Geider 1993; Cullen et al. 1993) that describe light absorption and carbon assimilation for a cell with a spec- ified light-harvesting composition (i.e. 0). Despite the suc- cess of these models in providing an internally consistent description of phytoplankton growth, photosynthesis, and pigment content (Sakshaug et al. 1989), they are little more than accounting procedures because they cannot be used to simultaneously predict the light dependencies of both 0 and p. Specifically, the prediction of the light de- pendence of p requires specification of the light depen- dence of 0. Alternatively, prediction of the light depen- dence of 8 requires specification of the light dependence

2 Geider et al.
of I-L. This circularity reduces the predictive power of these models of balanced growth. In this paper, we relax this constraint by imposing biological regulatory rules that govern changes in the photosynthetic apparatus and dis- tribution of cell materials in response to irradiance. This approach provides a method for describing both steady- state (i.e. constant irradiance) and dynamic (i.e. fluctu- ating irradiance) responses in a unified conceptual frame- work and can thus be used in the context of real-world effects on phytoplankton exposed to changing light fields. Additionally, the formulation and testing of the regula- tory rules can provide insight into the regulation of pho- tosynthesis in diverse taxa.
Photoadaptive responses have been observed in stably stratified water columns (Harrison and Platt 1986) and following manipulations of samples taken from the sur- face mixed layer (Lewis et al. 1984b). Investigations of bio-optical properties of particulate matter (Mitchell and Kiefer 1988) and single cell pigment content that use flow cytometery (Li et al. 1993) have demonstrated adaptation of pigment content in natural phytoplankton populations. However, the significance of photoadaptation in regulat- ing the rate of primary productivity in the sea has been difficult to evaluate because irradiance fluctuates over a wide range of time scales that cannot be adequately mim- icked by conventional experimental techniques. Although vertical mixing has been shown to modulate primary pro-’ ductivity (Marra 1978; Gallegoes and Platt 198 5), eval- uating the quantitative significance of vertical mixing in nature requires explicit models incorporating a descrip- tion of physical mixing and physiological responses (Ka- mykowski et al. 1994). Many of these models have fo- cused on photosynthetic responses that occur on the rel- atively short time scales of minutes to hours. Photoad- aptation of pigment content on the longer time scales of hours to days is associated with cell growth and division and is also likely to be important. It is this latter scale of response that is the subject of our dynamic model of photoadaptation.
Photoadaptation kinetics are typically modeled with empirically determined first-order rate constants, al- though expressions other than first-order rate equations may be more appropriate (Cullen and Lewis 1988). Gei- der and Platt (1986) provided a mechanistic basis for establishing the first-order rate constants for photoad- aptation from mass budgets for cell carbon and Chl a. They showed that the first-order description was a special case of a more general behavior. Cullen and Lewis (1988) have compared various formulations of the kinetics of photoadaptation. In this paper, we describe a dynamic model of phytoplankton growth and photoadaptation un- der nutrient-replete conditions that extends the analysis of Geider and Platt (1986). The key feature of the model is an explicit description of the regulation of the biosyn- thesis of light-harvesting pigments by the ratio of pho- tosynthesis to light harvesting. One can think of this ratio as a measure of the oxidation-reduction status of the pho- tosynthetic electron transfer chain. The model shows how photoadaptation can arise out of the dynamics of parti- tioning of carbon among intracellular pools and specifies
both balanced growth and transient responses to changes of irradiance. The model is unique in that the same pa- rameters that determine p and 0 in balanced growth also predict the transients that occur following changes of ir- radiance.
Theory: A dynamic model of phytoplankton growth and photoadaptation
For simplicity, we assume that cellular macromolecules fall into one of three categories: pigments and proteins whose abundances are light regulated, macromolecules whose abundances are not light regulated, and energy reserve carbohydrates and lipids. To the best of our knowledge, l;here is no single data set that allows the light dependencies of all three of these classes of cell compo- nents to be illustrated for an alga. However, it is possible to provide examples of the different light dependencies of these thrlee classes of macromolecules by combining data from several sources (Fig. I). The down-regulation of light-harvesting components as irradiance increases is illustrated by the light dependence of several components of the thylakoid membranes in Dunaliella tertiolecta (Fig. 1B). Under low light conditions, the sum of pigments, light-harvesting complex 2, and electron transport chain proteins and associated lipids can equal 30% of cell car- bon in D. tertiolecta. Examples of catalysts whose abun- dances are not light regulated are provided by RNA in Thalassiosira weisflogii (Fig. 1 C), the Calvin cycle enzyme Rubisco (ribulose 1,5-bisphosphate carboxylase-oxygen- ase) in D. telrtiolecta (Fig. 1 B), and residual carbohydrates in Thalassiosira pseudonana (Fig. 1A). Finally, an ex- ample of the dependence of energy reserve polymers on growth irradiance is provided by the increase of hot-wa- ter-extracta’ble carbohydrates with increasing irradiance in T. pseudonana (Fig. 1A).
Like the models of Shuter (1979) and Lancelot et al. (199 l), our model considers the phytoplankton cell to consist of a number of functional, structural, and storage pools. Our .model is based on the flow of carbon to three intracellular pools (Fig. 2). It combines the treatment of energy and :mass fluxes (i.e. photon absorption and chang- ing pool sizes) with the description of regulation (i.e. sig- nal transduction and regulation of biosynthesis). Signif- icantly, the model is formulated in such a way that pho- toadaptation is regulated by the energy and mass fluxes. Thus, the model is self-contained, with energy-mass flux- es providing the information that regulates the synthesis of the components that catalyze these fluxes.
Intracellular carbon is distributed among the light-har- vesting apparatus (designated L), the biosynthetic appa- ratus (designated E), and an energy storage reserve (des- ignated R). Although abstractions, these pools can be as- sociated with fundamental aspects of energy transduction and storage (Fig. 1). L consists of the photosynthetic pig- ment-prote:in complexes and supporting membranes, to- gether with the reaction centers and electron transfer chain. In the jargon of photosynthetic units, we assume constant photosynthetic unit composition and stoichiometry (i.e.

Photoadaptation dynamics
4 0.5
; 0.4
5 0.3
g 0.2
.E 0.1 e g 0.0
k
I I I
IO 100
Irradiance (mol photons m-2 d-1) Fig. 1. Variation of biochemical composition with growth irradiance in microalgae illus-
trating light-regulated components, light-independent components, and storage components. A. Proportion of cell C accounted for by total (0) and residual (0) carbohydrates in Thalas- siosira pseudonana (Geider 1984). The difference between total and residual carbohydrates is attributable to hot-water-extractable energy reserve polymers. Carbohydrates are assumed to be 40% C by weight. B. Cumulative proportion of cell C in Rubisco and thylakoid membrane components of Dunaliella tertiolecta. Rubisco (0) plus pigments (0) plus light-harvesting complex 2 proteins m plus photosynthetic electron transfer chain components (0) plus thy- lakoid lipids (A). The sum of these components (A) underestimates the total C in thylakoid membranes because it does not include contributions from light-harvesting complex 1 com- ponents, the ATP synthase complex, and mobile electron carriers. Cellular concentrations of Rubisco, photosynthetic pigments, and light-harvesting complex 2 proteins were obtained from Sukenik et al. (1987). Rubisco is assumed to have a molecular weight of 560 kDa (Miziorko and Lorimer 1983), 50% of which is attributed to C. Photosynthetic electron transfer system components were calculated from photosystem 1, photosystem 2, and cytochrome b,/f concentrations reported by Sukenik et al. (1987) and the following molecular weights for the thylakoid membrane complexes: 280 kDa for the photosystem 2 complex (Erickson and Rouchaix 1992), 98 kDa for the cytochrome b6/f complex (Hope 1993), and 280 kDa for the PS 1 complex (Ikeuchi 1992). Protein is assumed to be 50% C by weight. Thylakoid membrane lipid is assumed to equal 19% of protein in the integral membrane complexes (Raven 1984), and lipid is 74% C by weight. D. tertiolecta is assumed to have a cell C content of 29 pg cell-l, independent of irradiance (Falkowski and Owens 1980). C. Proportion of cell C in RNA of Thalassiosira weisflogii. RNA : C ratios for T. weisflogii (mean of 0.15 gRNA g-l C) were obtained from Laws et al. (1983). The amount of cell C associated with RNA was calculated as 59% of the RNA : C ratio based on the assumptions that RNA is 35% C by weight, that ribosomes account for 90% of cellular RNA, and that ribosomes are 35% protein and 65% RNA by weight (Whittmann 1982).
a constant ratio of pigments to reaction centers 1 and 2 and photosynthetic electron transfer chain components). We do not consider possible changes of pigment-protein composition and photosynthetic unit size (Falkowski and La Roche 1991) that may be observed in phytoplankton. E can be considered to consist of the enzymes involved in carbon fixation and in the elaboration of fixed carbon into new cells. E thus includes the machinery of biosyn- thesis and cell replication. It also includes the Calvin cycle enzyme, Rubisco, which does not seem to be light reg- ulated in chlorophytes (Sukenik et al. 1987; Fisher et al. 1989; but see Orellana and Perry 1992 for an example of light regulation of Rubisco content in a diatom). R is considered to consist of those polysaccharides and lipids that serve as energy storage reserves.
The present model of photoadaptation is strictly ap-
plicable to photoadaptation only under nutrient-sufficient conditions. In addition, we limit our description of model behavior to changes of Chl a and particulate organic C because these are the variables for which data are most readily available. It will be possible to evaluate more elaborate models with increased availability of quanti- tative data on the concentrations of photosynthetic pro- teins (including Rubisco, light-harvesting complex pro- teins, and electron transfer chain proteins) and other mac- romolecules or macromolecular assemblages, such as ri- bosomal RNA. For the present, we must be content with the more limited description of changes in Chl a and C that the available database can support. However, even this primitive description of phytoplankton photosyn- thesis provides insights into photoadaptation, phyto- plankton growth, and productivity.

4 Geider et al.
/ ’ Light- ’
harvesting apparatus
L ’ Energy
storage reserves
Biosynthetic apparatus
E
, R , \
\ \ \ \ \ \ \ \ HIGH IRRADIANCE
\ \ \ \ \ \ \ \ \ \ \ \ \ \ \ LOW IRRADIANCE \ \ \ \ \ ‘4 ‘\ ‘4 ‘4
Fig. 2. Diagrammatic representation of the dynamic model of phytoplankton growth and photoadaptation. The three intra- cellular pools are identified in the top panel. The solid arrows and circle in the upper panel illustrate the flux of excitation energy into a control point and of photosynthate out of the control point. The middle panel illustrates the small size of L and the large size of R in high light-adapted cells. The solid arrows illustrate the high flux of excitation energy into the con- trol noint and allocation of photosynthate among the intracel-
The link between photon flux and mass flux is provided by the photosynthesis-irradiance (PI) curve (Eq. 1). Note that the rate of photosynthesis is expressed relative to the C content of the biosynthetic pool and is designated PE, where the superscript E refers to the biosynthetic appa- ratus. (A list of notation is provided.)
PE=PEm[l -exp(s)].
I is irradiance, E the C content of the biosynthetic ap- paratus, L the C content of the light-harvesting apparatus, PE the rate of C fixation normalized to the size of the biosynthetic apparatus, PE, the maximum value of PE, and g the ftmctional cross-section of the light-harvesting apparatus. (7 can also be considered the L-specific initial slope of the PI curve, operationally defined as the product of the Chl a-specific light absorption coefficient (desig- nated a* ohI), the maximum quantum efficiency for pho- tosynthesis (designated $,), and the ratio of Chl a to C in L (Chl a : L). We make the simplifying assumption that (7, PEnl 7 and Chl a : L are independent of growth irradiance, which is broadly consistent with observations (Geider 1993). As formulated here, the model applies only to constant temperature. However, temperature dependence can be readily incorporated into the model (Geider et al. in prep.) through specification of the temperature depen- dence of Plzm, assuming also that a*ch, and &., are inde- pendent of temperature (but see Raven and Geider 1988).
Note that the rate of C fixation (Eq. 1) is determined by size of both the biosynthetic (E) and light-harvesting (L) pools. The relative importance of each pool in con- trolling the rate of C fixation depends on irradiance. Light- limited photosynthesis is controlled by L, but light-sat- urated photosynthesis is controlled by E. Both pools are important jn the transition from light limitation to light saturation. The L : E ratio varies as a consequence of pho- toadaptation (Fig. 2), and thus the photoadaptive state of the phytoplankton is explicit in Eq. 1.
We assume that recent photosynthate can have three fates (Fig. l!). It can be used in the synthesis of new L, E, or R. The net rate of synthesis of L, E, or R is determined by the difference between production and degradation as follows:
dL - = pLPEE - r,,.,L, dt
dE - = pEPEE - rmE, dt
(2)
lular pools. The bottom panel illustrates the large size of L and small size of’R in low light-adapted cells. The flux of excitation energy into the control point is markedly reduced relative to high light-adapted cells. The proportion of photosynthate al- located to synthesis of L is greater in low light-adapted cells, although the: absolute amount may actually be smaller because of light limitation of photosynthesis.
Photoadaptation dynamics 5
Notation
E L R
0” Chl : L
KL
KE
kL
Fey
PL PE
PR
ML
ME
MR
MT
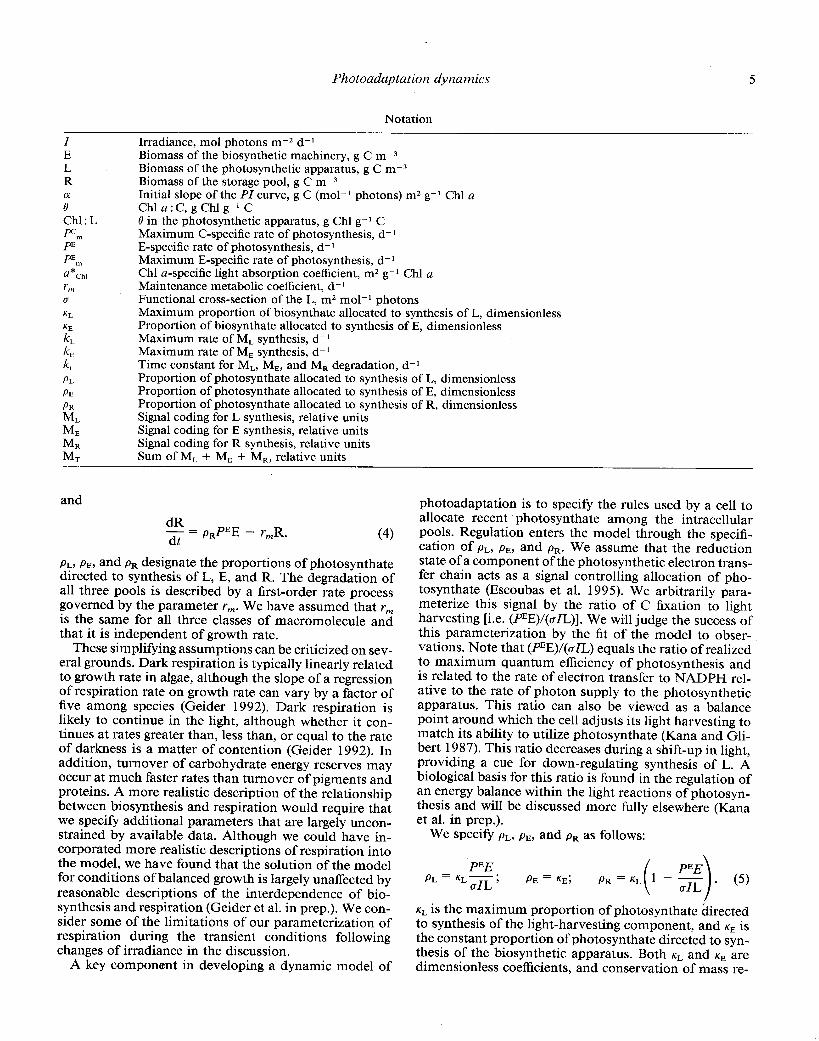
Irradiance, mol photons m-2 d-l Biomass of the biosynthetic machinery, g C m-3 Biomass of the photosynthetic apparatus, g C m-3 Biomass of the storage pool, g C m-3 Initial slope of the PI curve, g C (mol-’ photons) m2 g-l Chl a Chl a : C, g Chl g-l C 13 in the photosynthetic apparatus, g Chl g-l C Maximum C-specific rate of photosynthesis, d-l E-specific rate of photosynthesis, d-l Maximum E-specific rate of photosynthesis, d-l Chl a-specific light absorption coefficient, m2 g-l Chl a Maintenance metabolic coefficient, d-l Functional cross-section of the L, m2 mol-I photons Maximum proportion of biosynthate allocated to synthesis of L, dimensionless Proportion of biosynthate allocated to synthesis of E, dimensionless Maximum rate of M, synthesis, d-l Maximum rate of ME synthesis, d-l Time constant for ML, M,, and MR degradation, d-l Proportion of photosynthate allocated to synthesis of L, dimensionless Proportion of photosynthate allocated to synthesis of E, dimensionless Proportion of photosynthate allocated to synthesis of R, dimensionless Signal coding for L synthesis, relative units Signal coding for E synthesis, relative units Signal coding for R synthesis, relative units Sum of ML + M, + MR, relative units
and
dR -ii-
= pRPEE - r,R.
pL, PE, and PR designate the PrOpOrtiOnS of photosynthate directed to synthesis of L, E, and R. The degradation of all three pools is described by a first-order rate process governed by the parameter r,. We have assumed that r, is the same for all three classes of macromolecule and that it is independent of growth rate.
These simplifying assumptions can be criticized on sev- eral grounds. Dark respiration is typically linearly related to growth rate in algae, although the slope of a regression of respiration rate on growth rate can vary by a factor of five among species (Geider 1992). Dark respiration is likely to continue in the light, although whether it con- tinues at rates greater than, less than, or equal to the rate of darkness is a matter of contention (Geider 1992). In addition, turnover of carbohydrate energy reserves may occur at much faster rates than turnover of pigments and proteins. A more realistic description of the relationship between biosynthesis and respiration would require that we specify additional parameters that are largely uncon- strained by available data. Although we could have in- corporated more realistic descriptions of respiration into the model, we have found that the solution of the model for conditions of balanced growth is largely unaffected by reasonable descriptions of the interdependence of bio- synthesis and respiration (Geider et al. in prep.). We con- sider some of the limitations of our parameterization of respiration during the transient conditions following changes of irradiance in the discussion.
A key component in developing a dynamic model of
photoadaptation is to specify the rules used by a cell to allocate recent photosynthate among the intracellular pools. Regulation enters the model through the specifi- cation of PL, PE, and PR. We assume that the reduction state of a component of the photosynthetic electron trans- fer chain acts as a signal controlling allocation of pho- tosynthate (Escoubas et al. 1995). We arbitrarily para- meterize this signal by the ratio of C fixation to light harvesting [i.e. (PEE)/(aIL)]. We will judge the success of this parameterization by the fit of the model to obser- vations. Note that (PEE)/(cn) equals the ratio of realized to maximum quantum efficiency of photosynthesis and is related to the rate of electron transfer to NADPH rel- ative to the rate of photon supply to the photosynthetic apparatus. This ratio can also be viewed as a balance point around which the cell adjusts its light harvesting to match its ability to utilize photosynthate (Kana and Gli- bert 1987). This ratio decreases during a shift-up in light, providing a cue for down-regulating synthesis of L. A biological basis for this ratio is found in the regulation of an energy balance within the light reactions of photosyn- thesis and will be discussed more fully elsewhere (Kana et al. in prep.).
We specify PL, PE, and PR as follows:
PEE PL=KL~; PE=KE;
~~ is the maximum proportion of photosynthate directed to synthesis of the light-harvesting component, and KE is the constant proportion of photosynthate directed to syn- thesis of the biosynthetic apparatus. Both ICY and KE are dimensionless coefficients, and conservation of mass re-

6 Geider et al.
quires that xL + KE = 1 .O. The rate of change of the total phytoplankton carbon pool is given by the sum of the rates of change of the three intracellular pools in Eq. 6:
dC dL + dE -=- dt dt dt+
dR - PEE dt
- r,C. (6)
Equations 2 and 5 set the rate of synthesis of L equal to the product of three terms: the maximum proportion of photsynthate devoted to synthesis of L at limiting ir- radiance (designated KL), the rate of photosynthesis (given by PEE), and the regulatory parameter (PEE)IaK). Since the ratio (PEE) : (CT=) decreases as irradiance is raised, the model requires down-regulation of the synthesis of L rel- ative to synthesis of E at high light. Equations 3 and 5 set the rate of flow of recent photosynthate to E to a constant proportion (KE) of the instantaneous rate of pho- tosynthesis. Thus, the proportion of photosynthate allo- cated to synthesis of E is independent of irradiance (i.e. E is not light regulated), although the absolute rate of synthesis of E depends on irradiance through the PI curve (Eq. 1). Equations 4 and 5 specify that R increases in size only when photosynthate is diverted away from synthesis Of L (thus, pL + PR = K~). In other words, photosynthate is increasingly directed to storage as the instantaneous rate of photosynthesis approaches light saturation (Fig. 2), consistent with observations (Morris 198 1; Li and Platt 1982). Photoadaptation occurs through variations in ratio L : E, with synthesis of L down-regulated relative to synthesis of E as irradiance increases. Inspection of Eq. 2 and 5 shows that the maximum size of L is obtained as irradiance approaches zero and is given by L/C = K~.
The upper limit on the size of R is achieved as irradiance becomes very large and approaches the limit R/C = KL.
The storage pool should be capable of supporting con- tinued flow of carbon to both E and L in the event that photosynthesis declines due to a reduction of irradiance. Accumulation of carbohydrates during the day and mo- bilization at night have been reported for several algae and cyanobacteria (Foy and Smith 1980; Cuhel et al. 1984; Lancelot and Mathot 1985). In addition, carbo- hydrates may be preferentially respired during the day (Li and Harrison 1982; Lancelot and Mathot 1985). In contrast to these observations, we have assumed that the energy reserve pool is not preferentially mobilized in or- der to avoid making ad hoc assumptions regarding the parameterization of mobilization of energy reserve prod- ucts. Despite this limitation, the model provides a robust description of photoadaptation, indicating that the reg- ulatory term (PEE)I(alL) captures an essential feature of phytoplankton photophysiology.
The model (Eq. 2-4) requires that we specify four pa- rameters Q, PE,, KL, and rm. CT is the light absorption cross- section for L, PE, is the maximum rate of photosynthesis normalized to the size of the biosynthetic pool; ~~ gives the maximum proportion of photosynthate that can be directed to synthesis of L; rm is the maintenance metabolic rate. Note that the proportion of photosynthate directed toward synthesis of E is given by KE = 1 - K~. Given values for the four parameters, the model predicts the
time-dependent evolution of the sizes of L, E, and R. The allocation of photosynthate among these pools is regu- lated by the ratio (PEE) : (aZL), which determines the re- alized and potential fluxes of photons, electrons, and car- bon through the cell. We now turn to an evaluation of the numerical values of these four parameters and then to the application of the model to balanced growth in the diatoms Phaeodactylum tricornutum and T. pseudonana.
Selection of parameter values
The light absorption cross-section--a is related to the Chl a-specijic initial slope of the PI curve through Eq. 7:
CT = a Chl : L = a*ch, (6, Chl : L. (7)
cy is the initial slope of the PI curve and Chl : L is the ratio of Chl a to C in the photosynthetic machinery. We have chosen a value for cy of 10. The value is consistent with a typical maximum quantum efficiency for photo- synthesis of 4, = 0.083 mol C mol-l photons and typical in vivo light absorption coefficient of a*ch, = 10 m2 g-’ Chl a (Langdon 1988; Geider 1993). It remains to esti- mate the Chl a : C ratio of the photosynthetic apparatus (Chl : L). There is conflicting evidence on this ratio. Raven (1984) calculated a Chl a : C ratio for the thylakoid mem- branes of 0.33. In contrast, Friedman and Alberte (1984) and Owens and Wold (1986) present data that suggests a much 1owe:r ratio of 0.10-O. 15 for the thylakoid mem- branes of P. tricornutum. However, it is difficult to rec- oncile these lower ratios with the observed maximum Chl a : C ratio (Omax) of 0.08 for whole cells (Geider et al. 1986; Cullen and Lewis 1988). We have chosen a value of Chl : L = 0.2, although we recognize that this value is subject to considerable uncertainty and is deserving of further measurements. Given cx = 10 g C (mol-’ photons) m2 (g-l Chl a) and Chl : L = 0.2, we calculate that g = a Chl : L = 2.0 rn:? mol-1 photons.
Proportion of photosynthate directed to synthesis of L - In the limit as irradiance approaches zero, Chl a : C ap- proaches a maximum value (e,,,) (Geider 1987). In this limit, the ratio of L to C is given by the dimensionless constant, K~,. Using a value of emax = 0.08 obtained under extreme light limitation in P. tricornutum (Geider et al. 1986) and T. pseudonana (Cullen and Lewis 1988) and a Chl : L ratio for L of 0.2, we calculate ~~ = &,-,,,/Chl : L = 0.4.
Maintenance metabolic rate constant - rm can be esti- mated by extrapolation of respiration rate to p = 0. This exercise typically yields values for rm of <O. 1 d-l (Geider 1992), consistent with the low rate of protein turnover observed in nutrient replete Chlorella fusca (Richards and Thurston 1980)-the only microalgae for which reliable data are avrailable. A low value for rm is also consistent with low rates of pigment turnover obtained from 14C- labeling ex.periments (Goericke and Welschmeyer 1992). We have chosen a value of 0.05 d- l. For diatoms, which

Photoadaptation dynamics 7
typically have high light-saturated growth rates, the res- piration term in our model becomes significant only at extremely low n-radiances under conditions of balanced growth. Thus, the choice of rm values is not critical. The value chosen for r, may be more critical for modeling slowly growing phytoplankters. Parameterization of res- piration as a constant -independent of previous envi- ronmental conditions- may affect the fidelity of the mod- el during transients following a shift-down of irradiance. This point is addressed in the discussion.
The maximum rate of photosynthesis-The value of PE, is intrinsically linked to the resource-saturated max- imum growth rate. At maximum growth rate, Eq. 6 be- comes
1 dC E pm = cdt = PEmc - rm.
Rearranging, we obtain
(8)
PE, = (pm + rm)z = (pm + rm)e KE
In words, PEm can be determined from the maximum growth rate, the maintenance metabolic rate, and the ratio of C : E. the model requires that C : E = ~/KE under all conditions, as inspection of Eq. 2-5 will verify. Since we have already determined that ~~ = 0.4 and thus that KE =
(1 - K~) = 0.6, it follows that PEm = 1.66 (pm + rm). The parameter values used. in a simulation must be
tailored to the species under consideration. However, it is important to recognize that the parameters are not strictly independent. Changing the value of the relative maximum size of L (K~) has implications for the derived value of PEm if pm is constant. Similarly, changing the value of ~~ will affect the value of the functional cross- section (a) if Chl : L and 8,,, are constant. Laboratory observations have demonstrated that a*chl can vary by a factor of three within and between species (Falkowski et al. 1985) and that pm can vary from ~0.5 to >3 d-l among species and with temperature (Eppley 1972). Clearly, the assumption of constant g is inconsistent with variability of a* Chl unless there are compensating changes of (b,, as is commonly observed (Geider 1993). Variations in the measured variables a*chl and y, can arise from differences in the allocation of resources to L and E among species (i.e. from a change in ~~ and K~) at fixed u and PEm, from variations in the catalytic efficiencies c and PEm (at fixed KL), or from some combination of effects. Ob- servations of growth rate and Chl a : protein ratios in diatoms and dinoflagellates are consistent with compen- satory changes in resource allocation and catalytic effi- ciencies (Chan 19 7 8).
Balanced growth: Comparison of predictions with ob- servations-The model can be solved analytically for bal- anced growth (Geider et al. in prep.) to yield the following expressions for the light dependence of 8 and I.C:
Table 1. Parameter values used to model steady-state, nu- trient-saturated growth of Thalassiosira pseudonana and Phaeo- dactylum tricornutum.
T. P. tricor- Parameter pseudonana nutum Dimensions
CT 2.0 1.0 m2 mol-l photons KL 0.4 0.4 Dimensionless KE 0.6 0.6 Dimensionless Chl: L 0.2 0.2 gChlag-‘C PE 111 5.55 2.4 d-’ rm 0.05 0.05 d-’
e = omax [
1
l + (“maxaO~(2pcm) 1 (10)
p = PC,[l - exp( -aZB/PCm)] - rm. (11) PC, is the C-specific light-saturated photosynthesis rate, PC, = (PEm E)/C = pm + rm, and a is the Chl a-specific initial slope of the PI curve. Note that the irradiance dependence of 8 can be predicted by specifying the values of three parameters. The value of 0 calculated from Eq. 10 can be inserted into Eq. 11 to calculate the growth rate, provided that the respiration rate is also known. For completeness, we have presented the analytical solutions (Eq. 10 and 11) without derivation. The derivation and further discussion of the application of these equations is provided by Geider et al. (in prep.).
The model predictions were compared with observa- tions for the diatoms P. tricornutum (Geider et al. 1985, 1986) and T. pseudonana (Cullen and Lewis 1988). Using the parameter values given in Table 1, we obtained good agreement between predicted and observed growth rate (II) and pigment content (0). The balanced growth rate is a saturating function of irradiance (Fig. 3A, B). To ac- I count for the differences in growth rate between P. tri- cornutum,and T. pseudonana, we needed to specify dif- ferent values of c and PEm for the two species. Although the difference in pm is real, it remains to be determined whether the variation in (T between these diatoms is due to interspecific differences in light absorption and energy conversion or to the differences in light sources and op- tical geometries used by Geider et al. ( 198 5, 1986) and Cullen and Lewis ( 1988). Maximum values of 8 are ob- served at low light-limiting n-radiances, with a sigmoidal decrease of 8 as log(l) increases (Fig. 3C, D). Both species appear to be characterized by similar values of em,,.
Recent observations of regulation of photoadaptation in the chlorophyte D. tertiolecta bear on our parameter- ization of regulation by the term (PEE)/(aZL). Escoubas et al. (1995) demonstrated that the redox state of the plastoquinone pool provides the signal regulating pho- toadaptation in D. tertiolecta. Following a shift from low- to high-light conditions, the plastoquinone pool is highly reduced, the synthesis of mRNA encoding the light-har- vesting complex proteins (cab mRNA) declines, and D. tertiolecta adapts by reducing the rate of synthesis of light- harvesting complex proteins. In contrast, following a shift

Geider et al.
1.5 1 I I I 1 I I 0.10
A C C - 0.08 0.08
1.0 - 5 0 0.06 - 0
#, \-
0.06
0.5 - - 0.04 0.04
.o a a
0.02 - 0.02 : :
k 0 -L 0 ?
3 - A 4 I I I I I I I I I v-1 0.10 (0" 1 I I . t.10 (g
B D D # #
- 3. 3- - 0.08 6 \* 0.08 6
- 0.06 2.
- 0.04
1 . - 0.02 0.02
0 I
I \- - - 0.06 0.04
‘-0 , 0 0.01 0.01 0.1 1 10 0.1 1 10 100 10000.01 0.1 1 10 100 10000.01 0.1 1 10 100 1000 100 1000
Irradiance (mol photons m-2 d-l) Irradiance (mol photons m-2 d-l)
Fig. 3. Fig. 3. Observed (0) and predicted (-) dependencies of growth rate (EL) and the Chl a : Observed (0) and predicted (-) dependencies of growth rate (EL) and the Chl a : C ratio (e) on irradiance of fully acclimated Phaeodactylurrl tricornutum (A and C) and C ratio (e) on irradiance of fully acclimated Phaeodactylurrl tricornutum (A and C) and Thalassiosira pseudonana (B and D). Observations are from ‘Geider et al. (1985, 1986) and Thalassiosira pseudonana (B and D). Observations are from ‘Geider et al. (1985, 1986) and Cullen and Lewis (1988). Values for the model parameters used 1.0 obtain the predicted relations Cullen and Lewis (1988). Values for the model parameters used 1.0 obtain the predicted relations are given in Table 1.
from high- to low-light conditions, the plastoquinone pool is highly oxidized, cab mRNA synthesis is enhanced, and the rate of synthesis of light-harvesting complex protein is also enhanced following a lag during which cab mRNA accumulates (Escoubas et al. 1995). One of the assump- tions of our model is that the variation of 8 with irradiance provides an index of the down-regulation of the rate of synthesis of L. Under conditions of balanced growth, our model requires that 0 = 8, (PEE)I(aK). We anticipate that in the steady state, the oxidation-reduction status of the plastoquinone pool should parallel changes of 0. Specif- ically, the plastoquinone pool should be more reduced at high irradiance, and 0 should decline in parallel with the proportion of plastoquinone that is in the reduced form, although the relationship need not be linear. Using the recently developed fast-repetition-rate fluorescence tech- nique to assess the redox state of plastoquinone pool (Prasil et al. in prep.) will allow this assumption to be tested.
Dynamics of photoadaptation: Comparison of pre- diction with observation
The agreement of predicted and observed values of p and 8 in nutrient-saturated cultures maintained in bal- anced growth at a range of n-radiances (Fig. 3) shows that the model captures essential features of photoadaptation. A more rigorous test of the dynamic model is the ability to predict changes of pigment and carbon content of cul- tures following changes of irradiance. Observations of
particulate C and Chl a for T. pseudonana during recip- rocal step shifts in growth irradiance (Cullen and Lewis 1988) allow this comparison to be made. The parameter values given in Table 1 were used in Eq. 2-5 to predict changes of r3 and the concentrations of carbon [C] and chlorophyll a [Chl a] for cultures of T. pseudonana sub- jected to irradiance shifts between 8.6 and 190 mol pho- tons m-2 d-l (100 and 2,200 pmol photons m-2 s-l). The dynamic model predicts the general shape of the responses of 0 during the transients following reciprocal shifts of irradiance (Fig. 4A). However, examination of the predicted and observed variations of [Chl a] and [C] show a divergence of prediction from observation (Fig. 4B and C). The divergence is greater for the step-down (Fig. 4C) than the step-up (Fig. 4B) in irradiance. Spe- cifically, predicted Chl a and C accumulation rates are much greater than observed rates following the shift-down of irradiance.
A possible explanation for the divergence between pre- dictions and observations is that phytoplankton possess photoprotective mechanisms that are not included in the model. These mechanisms could serve to modify (r by affecting $,, thus altering the ratio (PEE) : (aK) in ways not accounted for by our model. Reversible changes in the functional cross-section of photosystem 2 associated with xanthc’phyll cycle activity (Olaizola et al. 1994) will modify the regulatory term (PEE)I(arP) and the photo- synthesis rate. In addition, accumulation of photoinhi- bitory damage could account for a decrease in the rate of C fixation in cells shifted to very high irradiance but not predicted by the model. These explanations are not ap-

Photoadaptation dynamics 9
Time (d) Fig. 4. Observed and predicted changes of 0 and of [Chl a] and [C] in Thalassiosira
pseudonana during light shift experiments (observations of Cullen and Lewis 1988). A. Changes of 0 during reciprocal shifts bctwecn irradiances of 8.6 and 190 mol photons m-2 d-l contin- uous illumination. The predicted changes arc based on Eq. 2-5 using the parameter values given in Table 1. Shift-up (0,-) and shift-down (O,- - -) are indicated. B. Relative changes of [Chl a] (0, - - -) and [C] (0,) during a shift-up of irradiance from 8.6 to 190 mol photons m-” s-l. Predictions are based on Eq. 2-5. Data are expressed relative to the initial values. C. Relative changes of [Chl a] and [C] during the shift-down from 190 to 8.6 mol photons m-” s-l (symbols as in panel B). Predictions are based on Eq. 2-5. Note that the predicted increase of Chl a is much more rapid than the observed increase. D. Changes of 8 during reciprocal shifts of irradiance (symbols as in panel A). The observations are as in panel A, and the predictions are based on the time-lagged model (Eq. 2-4 and 10-l 3). E. Relative changes of Chl a and C during a shift-up (symbols as in panel B). The observations are as a panel B, and the predictions are based on the time-lagged model. F. Relative changes of Chl a and C during a shift-down in irradiance. The observations are as in panel C, and the predictions are based on the time-lagged model.
plicable to the observations presented in Fig. 4 for T. pseudonana (see Lewis et al. 1984a), so we need to look elsewhere for an explanation of the divergence between prediction and observation.
Coupling of information to material fluxes
The dynamic model assumes that the allocation of pho- tosynthate to L and R responds instantaneously to changes of irradiance through a change in the ratio of photosyn-
thesis to light absorption [i.e. (PEE)I(alL)]. This assump- tion does not affect the solution of the model under con- ditions of balanced growth. However, an explanation for the deviation of observed and predicted behavior illus- trated in Fig. 4A, B, and C could arise from a limitation imposed on the dynamic model by this assumption. It is likely that signal transduction, resulting in a decline of pigment synthesis in high light or enhanced pigment syn- thesis in low light, operates with an intrinsic lag. One can hypothesize that the lag is associated with changes in the level of molecule signaling synthesis of light-harvesting

10 Geider et al.
harvesting apparatus
Fig. 5. Diagrammatic illustration of the coupling of signal transduction to biosynthesis during photoadaptation. Flows of energy and fixed C are illustrated by solid arrows; signal transduction is illustrated by dashed arrows. The signal mediating photoadaptation is deter- mined by the ratio of the rate of C fixation to the rate of photon absorption as parameterized by (PEE)/(oIL). (See text for details.) Panel A illustrates the instantaneous response, in which the redox state of a component of the photosynthetic electron transfer directly regulates the allocation of fixed C between synthesis of new L (AL), new E (AE), or R (AR). Panel B illustrates the role of signal pools (ME, M,, and MR) in mediating signal transduction. The allocation of photosynthate among AL, AE, and AR is assumed to be proportional to the abundances of ML, ME, and M, as described in the text. Thus, a time lag is introduced into the response.
complex proteins. This molecule could be mRNA for light-harvesting complex proteins. La Roche et al. (199 1) and Escoubas et al. (1995) have shown that mRNA en- coding the light-harvesting complex proteins of D. teri- olecta increases following a shift from high to low irra- diance.
To examine the consequences of this hypothesis, we formulated a model of information flow to drive the al- location of photosynthate in the dynamic model. We as- sume that the rate of synthesis of each of the three com- ponents of the model phytoplankter (L, E, and R) is de- termined by a strict competition among signals coding for these components. To avoid unwarranted precision, we prefer to frame the model in terms of somewhat ill- defined “signals” rather than precisely defined mRNAs; however, we assume that the signals of our model are in many respects analogous to mRNA levels. We recognize that this assumption of strict regulation of relative rates of protein synthesis by mRNA pool sizes is not generally applicable. For example, chloroplast-encoded proteins show high degrees of translational control (Harris et al. 1994). However, the translational control of chloroplast- encoded protein synthesis is exerted, at least in part, by nuclear-encoded proteins that must be synthesized and degraded-sequestered in order to regulate protein syn-
thesis. Thus, the signals may be pools of regulatory pro- teins rather than pools of mRNA.
Designating the signal levels for L, E, and R as ML, ME, and MR, we require that
PL = ML/M-r-; /IE = ME/M-r; PR = MR/“T(12)
where MT =: ML + ME + MR. We assume that the relative rates of ML and MR synthesis are determined by the reg- ulatory term (PEE)/alL) as depicted in Eq. 13-15. We recognize that this treatment is grossly oversimplified. However, it is a convenient approach for introducing a time lag into information flow and cellular responses.
Conceptual diagrams depicting the models of instan- taneous and lagged responses in allocation of photosyn- thate among intracellular pools (i.e. changes of pL and &) are illustrated in Fig. 5. There are two control points in these diagra.ms. A signal is generated by comparing fluxes around the first control point. This signal is the imbalance between photon absorption and carbon fixation specified as (PEE)I(alL). The allocation of resources between L, E, and R occurs at a second control point. For the instan- taneous response, synthesis rates of L, E, and R respond directly to jmbalances in the ratio of light absorption to C fixation (Fig. 5A). A lag is introduced when the signal operates by modifying the relative concentrations of three

Photoadaptation dynamics 11
signal pools (Fig. 5B) which in turn influence the relative rates of synthesis of L, E, and R.
The problem now becomes one of specifying the dy- namics controlling the signal levels ML, ME, and MR. We start with the requirement that Eq. 12 giving the values Of pL, PE, and PR be identical to Eq. 5 for steady-state (i.e. balanced) growth. This limits the possible choices of the dynamic equations describing change of ML, ME, and MR and ensures that the regulatory term (PEE)/(aZL) appears in the equations describing changes of ML and MR. The changes in ML, ME, and MR can result from changes in the rates of synthesis and degradation of signal (Fig. 6). There is strong evidence for light regulation of the rate of transcription of mRNAs coding for light harvesting complex in higher plants and microalgae (La Roche et al. 199 1; Escoubas et al. 1995). An increase in the rate of transcription (synthesis of ML) can adequately account for the delay in net Chl a synthesis during a shift from high to low irradiance. In our formulation of signal trans- duction, the nearly immediate cessation of net Chl a ac- cumulation upon a transfer from low to high irradiance requires that the stability of ML decrease in high light. It is possible, however, that other mechanisms can account for a change in net pigment accumulation. These include down-regulation of pigment synthesis (Thompson and White 199 1) or enhanced pigment turnover (Riper et al. 1979). Chlorophyll synthesis has been shown to be es- sential for accumulation of pigment protein complexes in D. tertiolecta (Mortain-Bertrand et al. 1990). We have assumed that the down-regulation of synthesis of light- harvesting complex proteins (and associated pigments) occurring in response to increased irradiance is mediated by changing sizes of signal pools. We recognize that ex- perimental work is required to establish the relative im- portance of decreased signal stability, increased pigment turnover, and regulation of pigment synthesis (as related to regulation of light-harvesting protein synthesis) during adaptation to high light.
We attempted a number of different formulations of the regulation of ML synthesis and degradation and settled on a formulation in which both down-regulation of syn- thesis of ML and increased degradation of ML occur in response to increased irradiance. We chose this formu- lation because assigning all of the regulation to control of ML and MR synthesis resulted in a significant overes- timate of Chl a concentrations from the observation dur- ing the shift-up. The regulatory term (PEE)I(aZL) is thus split between effects on synthesis and degradation of ML. The sizes of the signal pools are assumed to change with variations in the rates of signal synthesis and turnover as follows:
dML k&L - = k,[(PE E)‘(azL)l 1’2 - [(p”E),(aZL)] ,,2 9 dt ( ’ 3,
dMR - = kL[ 1 -’ [(PEE)I(aZL)]1’2 dt
k&k -- 1 - [(PEE)I(aZL)] 1’2 ’
and dM, - = kE - k,M,.
dt kL is the maximum rate of ML or MR synthesis, kE is the maximum rate of ME synthesis, and kt is the signal deg- radation time constant. We assume that kL = kt ~~ and kE = kt KE. In Eq. 13, [(PEE)/(aZL)]1/2 is multiplied by kL to account for the down-regulation of synthesis of ML, and kt ML is divided by [(PEE)I(cZL)]1/2 to account for an increased degradation rate at high irradiance.
Solving Eq. 13-l 5 for steady-state signal levels [i.e. (11 M)(dMldt) = 01, we obtain the values of pL, PE, and PR given in Eq. 5. Thus, the steady-state solution of a model specifying signal levels by Eq. 12-l 5 is identical to the solution of the original dynamic model (Eq. 2-5). How- ever, the predicted transient behavior changes signifi- cantly. We assumed arbitrarily that kt = 5 d- l, consistent with complex light-harvesting proteins of D. tertiolecta (Escoubas et al. 1995). Substituting the values obtained from Eq. 12 to 15 into the dynamic model (Eq. 2-4) yields predictions of the transient behavior following step changes of irradiance illustrated in Fig. 4D, E, F. Changes of [Chl a], [CJ, and 0 during the high to low shift occur more slowly when a time lag for information flow is in- corporated into the dynamic model, and the predictions agree more closely to observations (Fig. 4D, E, F). Pig- ment synthesis continues for a short time following the shift from low to high light, although the model slightly overestimates this effect (Fig. 4E). Inspection of all of the data provided by Cullen and Lewis (1988) suggests that Chl a synthesis stops abruptly following the low- to high- light shift.
The effect of varying the signal synthesis and turnover rate constants on the proportion of photosynthate di- rected to biosynthesis of L (i.e. pL = ML/MT) is illustrated in Fig. 7. The decline of pL following a shift-up in irra- diance is rapid, approaching a step change. However, there is a small undershoot in pL relative to the new steady- state value (Fig. 7A). In contrast, the rate of increase of pL following a step-down in irradiance is much slower (Fig. 7B) and cannot be readily accommodated by the simpler model that assumes instantaneous up-regulation of synthesis of L upon a shift from high to low irradiance. Equations 13-15 predict an overshoot in pL that is con- sistent with observations of mRNA levels for light-har- vesting complex proteins in D. tertiolecta following a shift- down in irradiance (La Roche et al. 199 1). The predicted asymmetry in the response of pL to increased and de- creased irradiance may have significant implications for phytoplankton growth and photoadaptation in the surface mixed layer. Specifically, the model predicts that adap- tation to high light will be much more rapid than adap- tation to low light. In addition, brief exposures to high irradiance will outweight much longer exposures to low irradiance in determining the photoadaptive state of the phytoplankton. This prediction of the model is consistent with observations that phytoplankton seem to be adapted to the highest n-radiances experienced as they cycle through the mixed layer rather than to the average irradiance with- in the mixed layer (Vincent et al. 1994). In contrast, Cul-

12 Geider et al.
I: mRNA
‘i
3: Protein A synthesis
DNA - synthesis ML - 0 5: Growth
L-
2: mRNA degrada Zion
1
4: Protein degradation
Steady-state low irradiance
DNA +?+vB
Shift-up in irradiance / \ C
DNA ) L + c
t Steady-state high irradiance D DNA - M
i”
4-4D+
1
Shift-down in irradiance E DNA II)) M b L -
P P
Fig. 6. Diagrams indicating coupling of information flow to protein synthesis and growth. A. Arrows indicate rate constants, and arrow thickness represents the magnitudes of the rate con- stants. The size of the signal pool for ML, as a proportion of total signal, varied in response to changes in the rates of signal synthesis and degradation. The proportion of cell C in L changes as a result of protein synthesis and degradation. B. The steady- state low light condition in which a high rate constant for M, synthesis and low constant for ML degradation results in a large pool of ML- This in turn stimulates allocation of a large pro- portion of photosynthate to synthesis of L. Growth is low, how- ever, because irradiance limits photosynthesis. C. A decrease in tQe rate constant for M, synthesis and increase in the rate con- stant for ML degradation occur immediately after an increase of irradiance. However, synthesis of L continues at a high rate until the M, pool is drained. The decline of M, can bc quite
len and Lewis (1988) concluded that adaptation to low light was more rapid than adaptation to high light.
Mobilization of the energy reserve pool, respiration, and the cost of biosynthesis
Our model focuses on regulation of pigment synthesis during photoadaptation. Respiration is simply treated as a constant and small maintenance metabolic rate. How- ever, it is likely that variations in the respiration rate associated with pigment and protein turnover and with mobilization of energy storage reserves will be a signifi- cant component of the response to a change in environ- mental conditions. In fact, examination of Fig. 4C and F shows zero net organic C accumulation in the culture shifted from high to low light, indicating that gross pho- tosynthesis is balanced by respiration in this experiment. Thus, one of the major limitations of the dynamic model as formulated in Eq. 2-4 is failure to include mobilization of the energy reserve pool. An increase in respiration not accommoda.ted by our model accounts for at least part of the divergence of observed [C] from predictions in the irradiance step-down experiment (Fig. 3C, F). Energy re- serves are known to be mobilized in darkness to support continued synthesis of macromolecules (Foy and Smith 1980; Cuhel et al. 1984; Lancelot and Mathot 1985). However, the respiration of organic carbon to CO2 will be substantially less than the rate of mobilization of car- bohydrate. Despite mobilization of carbohydrates and lipids during darkness, Falkowski and La Roche ( 199 1) concluded that phytoplankton do not acclimate to shade at night, indicating that the signal regulating photoad- aptation is preserved during the dark period.
Variations in the rate of turnover of macromolecules may play a role in photoadaptation following changes in environmental conditions. Protein turnover is difficult to detect in exponentially growing microalgae (Richards and Thurston 1980), consistent with the low maintenance metabolic rate of microalgae (Geider 1992). There are conflicting reports on the magnitude of chlorophyll a turnover in microalgae (Riper et al. 1979; Goericke and Welschmeyer 1992). Even if low rates of pigment turn- over under conditions of balanced growth are the rule (Goericke and Welschmeyer 1992), pigment degradation may be accelerated during transients following increases in irradiance or decreases in nutrient supply. Protein turn- over also increases to a rate as high as 0.7 d-l during unbalanced growth when Chlorella sp. enters stationary
t rapid (see Fig. 7A). D. The steady-state high light condition in which M, is maintained at a low level by a low rate constant for synthesis and high rate constant for degradation. The rate constant for growth is high, however, because photosynthesis is light saturated. E. The rate constant for M, synthesis increases and the constant for M, degradation decreases immediately after a shift-down Iaf irradiance. However, a delay arises before syn- thesis of L reaches the new steady-state level because of the need for M, to increase (Fig. 7B).

Photoadaptation dynamics 13
j$ 0.30 a, 5 .- 0.25 v, ‘i E 0.20 g
r 0.15
-3 0.10 2
0.2 0.4 0.6 0.8 0.6 0.8
Time (d)
Fig. 7. Predicted changes in M L : M, = pL during (A) the shift-up from 8.6 to 190 mol photons m-2 s-l and (b) the reciprocal shift-down. Solid curves show changes of pL corre- sponding to the stimulation illustrated in Fig. 3D, E, and F in which kL = 2 d-l, kE = 3 d-l, and k, = 5 d-l. Dotted curves indicate the changes of pL for 2-fold greater values of K,, kE, and k,; dashed curves indicate the changes of pL for 2-fold lower changes of kL, kE, and k,.
phase (Richards and Thurston 1980). The constancy of chlorophyll a concentration in T. pseudonana following a shift-up in irradiance observed by Cullen and Lewis ( 1988) (Fig. 4C) could arise from a balance between syn- thesis and degradation of chlorophyll a or from a rapid decline in the gross rate of pigment synthesis following the shift-up in irradiance.
Conclusions and future research
A simple dynamic model of photoadaptation incor- porating material fluxes and an explicit description of regulation of pigment synthesis (Eq. 2-5) can describe essential features of phytoplankton growth and photoad- aptation in constant and fluctuating light. Consideration of time lags in information transduction (Eq. 12-l 5) in the dynamic model improves prediction of photoadap- tation of pigment content following step changes of ir- radiance. One consequence of our formulation of pho- tosynthesis (Eq. 1) and resource allocation (Eq. 2-5) is an ability to account for lagged responses (i.e. the “memory” of past environmental conditions, such as described by Jones 1978). In addition, explicit consideration of regu- lation may allow incorporation of other signals, such as circadian rhythms (Ernst et al. 1990), by specifying their effects on modulating rates of pigment and protein syn- thesis. The model provides a formal strategy for quan- titatively relating the molecular mechanisms of photoad- aptation to the ecophysiological responses. Although ca- pable of accounting for observed photoadaptation of pig- ment content and growth rate, the model has not been rigorously tested and remains largely heuristic. Rigorous testing is feasible because the model specifies that pho- toadaptation results from changes in the rates of mac- romolecule synthesis and degradation, with synthesis reg- ulated by resource availability (i.e. light and information flow, see Fig. 6). The regulatory component is based on changing signal levels.
There are many limitations in our dynamic model that can only be redressed by focused experimental research.
Among the areas that need to be addressed are the rules governing the mobilization of energy reserve polymers, the importance of photoinhibition in high light adapta- tion, nutrient uptake and limitation, the role of turnover (i.e. controlled degradation) of key macromolecules, the signal transduction pathways modulating the synthesis of key macromolecules, and the modulation of catalytic ef- ficiencies that occur independently of net pigment and protein synthesis. Bespite these limitations, the model provides insights into the basic mechanism of photoad- aptation and a link between molecular, physiological, and ecological aspects of phytoplankton biology.
Photoadaptation is a universal feature of algal physi- ology. Although there are many descriptions of photoad- aptation in laboratory and natural phytoplankton popu- lations, there have been few attempts to calculate the change in fitness that accompanies photoadaptation. Ul- timately, the success of a phytoplankton population in nature depends on achieving a positive balance between cell division and death. Photoadaptation presumably en- hances cell division; as such, it should contribute to the positive side of this balance. We anticipate that explicit consideration of physiological adaptation within the con- text of ecosystem models of planktonic food webs will allow us to address the relative importance of physiolog- ical responses vs. predation and physical transport on phytoplankton population dynamics and productivity.
References
CHAN, A. T. 1978. Comparative physiological study of marine diatoms and dinoflagellates in relation to irradiance and cell size. 1. Growth under continuous light. J. Phycol. 14: 396-402.
CUHEL, R. L., P. B. ORTNER, AND D. R. S. LEAN. 1984. Night synthesis of protein by algae. Limnol. Oceanogr. 29: 73 l- 744.
CULLEN, J. J. 1982. The deep chlorophyll maximum layer: Comparing vertical profiles of chlorophyll a. Can. J. Fish. Aquat. Sci. 39: 791-803.
- AND OTHERS. 1993. Toward a general model of phy- ,
14 Geider et al.
toplankton growth for biogeochemical models, p. 153-l 76. In G. T. Evans and M. J. R. Fasham [eds.], Towards a model of ocean biogeochemical processes. Springer.
AND M. R. LEWIS. 1988. The kinetics of algal pho- toadaptation in the context of vertical mixing. J. Plankton Res. 10: 1039-1063.
over in the marine diatom Thalassiosira weissflogii. 1. The 14COz-labeling kinetics of chlorophyll a. J. Phycol. 28: 498- 507.
HARRIS, E. El., J. E. BOYNTON, AND N. W. GILHAM. 1994. Chloroplast ribosomes and protein synthesis. Microbial. Rev. 58: 700-754.
EPPLEY, R. W. 1972. Temperature and phytoplankton growth in the sea. Fish. Bull. 70: 1063-1085.
ERICKSON, J. M., AND J.-D. ROUCHAIX. 1992. The molecular biology of photosystem 2, p. 101-l 78. In J. Barber [ed.], The photosystems: Structure, function and molecular bi- ology. Elsevier.
ERNST, D., A. APFELB~CK, A. BERGMANN, AND C. WEYRAUCH. 1990. Rhythmic regulation of the light-harvesting chlo- rophyll a/b protein and the small subunit of ribulose- 1,5- bisphosphate carboxylase mRNA in rye seedlings. Photo- them. Photobiol. 52: 29-33.
HARRISON, W. G., AND T. PLATT. 1986. Photosynthesis-irra- diance relationships in polar and temperate phytoplankton populations. Polar Biol. 5: 15 3-l 64.
HOPE, A. B. 1993. The chloroplast bf complex: A critical focus on function. Biochim. Biophys. Acta 1143: l-22.
IKEUCHI, M. 1992. Subunit protein of photosystem 1. Plant Cell Physiol. 3: 669-676.
JONES, R. I. 1978. Adaptations to fluctuating irradiance by natural phytoplankton communities. Limnol. Oceanogr. 23: 920-926.
ESCOUBAS, J.-M., M. LOMAS, J. LAROCHE, AND P. G. FALKOWSKI. 1995. Light intensity regulation of calogene transcription is signaled by the redox state of the plastoguinone pool. Proc. Natl. Acad. Sci. 92: 10,237-10,241.
FALKOWSKI, P. G., Z. DUBINSKY, AND K. WYMAN. 1985. Growth-irradiance relationships in phytoplankton. Limnol. Oceanogr. 30: 3 1 l-32 1.
KAMYKOWSKI, D., H. YAM-, AND G. S. JANOWITZ. 1994. A Lagrangian model of phytoplankton photosynthetic re- sponse in the upper mixed layer. J. Plankton Res. 16: 1059- 1069.
KANA, T. M., AND P. M. GLIBERT. 1987. Effect of n-radiances up to 2000 PE m-2 s-l on marine Synechococcus WH7803. 2. Photosynthetic responses and mechanisms. Deep-Sea Res. 34: 497-5 16.
-, AND J. LA ROCHE. 199 1. Acclimation to spectral ir- radiance in algae. J. Phycol. 27: 8-14.
AND T. G. OWENS. 1980. Light-shade adaptation: Two stiategies in marine phytoplankton. Plant Physiol. 66: 592- 595.
LANCELOT, C., AND S. MATHOT. 1985. Biochemical fraction- ation of primary production by phytoplankton in Belgian coastal waters during short- and long-term incubations with 14C-bicarbonate. 1. Mixed diatom population. Mar. Biol. 86: 2 19-226.
FISHER, T., R. SHURTZ~WIRSKI, S. GEPSTEIN, AND Z. DUBINSKY. 1989. Changes in the levels of ribolose-1,5-bisphosphate carboxylase/oxygenase (Rubisco) in Tetraedron minimum (Chlorophyta) during light and shade adaptation. Plant Cell Physiol. 30: 22 l-228.
FOY, R. H., AND R. V. SMITH. 1980. The role of carbohydrate accumulation in the growth of planktonic Oscillatoria spe- cies. Br. Phycol. J. 15: 139-150.
FRIEDMAN, A. L., AND R. S. ALBERTE. 1984. A diatom light- harvesting pigment-protein complex: Purification and char- acterization. Plant Physiol. 76: 483-489.
GALLEGOES, C. L., AND T. PLATT. 1985. Vertical advection of phytoplankton and productivity estimates: A dimensional analysis. Mar. Ecol. Prog. Ser. 26: 125-134.
GEIDER, R. J. 1984. Light and nutrient effects on algal phys- iology. Ph.D. thesis, Dalhousie Univ. 187 p.
- C. VETH, AND S. MATHOT. 1991. Modelling ice-edge ph&opla.nkton bloom in the Scotia-Weddel Sea sector of the Southern Ocean during Spring 1988. J. Mar. Syst. 2: 333-346.
LANGDON, C. 1988. On the causes of interspecific differences in the growth-irradiance relationship for phytoplankton. 2. A general review. J. Plankton Res. 10: 129 l-l 3 12.
LA ROCHE, J., A. MORTAIN-BERTRAND, AND P. G. FALKOWSKI. 199 1. Light intensity-induced changes in cab mRNA and light harvesting complex 2 apoprotein levels in the unicel- lular chlorophyte Dunaliella tertiolecta. Plant Physiol. 97: 147-153.
LAWS, E. A., D. G. REDALJE, D. M. KARL, AND M. S. CHALUP. 1983. A theoretical and experimental examination of the predictions of two recent models of phytoplankton growth. J. Theor. Biol. 105: 469-491.
. 1987. Light and temperature dependence of the car- LEWIS, M. R., J. J. CULLEN, AND T. PLAIT. 1984a. Relation- bon : chlorophyll a ratio in microalgae and cyanobacteria: ships between vertical mixing and photoadaptation of phy- Implications for physiology and growth of phytoplankton. toplankton: Similarity criteria. Mar. Ecol. Prog. Ser. 15: New Phytol. 106: l-34. 141-149.
- 1992. Respiration: Taxation without representation, . p. 333-360. In P. G. Falkowski [ed.], Primary productivity and geochemical cycles in the sea. Plenum.
-. 1993. Quantitative phytoplankton ecophysiology: Im- plications for primary production and phytoplankton growth. ICES Mar. Sci. Symp. 197, p. 52-62.
-, B. A. OSBORNE, AND J. A. RAVEN. 1985. Light depen- dence of growth and photosynthesis in Phaeodactylum tri- cornutum (Bacillariophyceae). J. Phycol. 21: 609-6 19.
- - AND - 1986. Growth, photosynthesis . and maintenance metabolic cost in the diatom Phaeodac- tylum tricornutum at very low light levels. J. Phycol. 22: 39-48.
-, E. P. W. HORNE, J. J. CULLEN, N. S. OAKEY, m T. PLAT. .1984b. Turbulent motions may control phyto- plankton photosynthesis in the upper ocean. Nature 311: 49-50.
LI, W. K. W., AND W. G. HARRISON. 1982. Carbon flow into the end-products of photosynthesis in short and long in- cubatiocs of a natural phytoplankton population. Mar. Biol. 72: 175-l 82.
-, AND T. PLATT. 1986. A mechanistic model of pho- toadaptation in microalgae. Mar. Ecol. Prog. Ser. 30: 85- 92.
-, AND T. PLATT. 1982. Distribution of carbon among photosynthetic end-products in phytoplankton of the east- ern Canadian Arctic. J. Phycol. 18: 466-47 1.
-, T. ZOHARY, Y. Z. YACOBI, AND A. M. WOOD. 1993. Ultraplankton in the eastern Mediterranean Sea: Towards deriving phytoplankton biomass from flow cytometric mea- surements of abundance, fluorescence and light scatter. Mar. Ecol. Prog. Ser. 102: 79-87.
GOERICKE, R., AND N. A. WELSCHMEYER. 1992. Pigment turn- MARRA, J. 1978. Phytoplankton photosynthetic response to

Photoadaptation dynamics 15
vertical movement in a mixed layer. Mar. Biol. 46: 203- 208.
MITCHELL, B. G., AND D. A. KIEFER. 1988. Variability in pig- ment specific particulate fluorescence and absorption spec- tra in the northeastern Pacific Ocean. Deep-Sea Res. 35: 665-689.
MIZIORKO, H. M., AND G. H. LCNMER. 1983. Ribulose-1,5- bisphosphate carboxylase-oxygenase. Annu. Rev. Bio- them. 52: 507-535.
MORRIS, I. 198 1. Photosynthesis products, physiological state, and phytoplankton growth p. 83-l 02. In Physiological bas- es of phytoplankton ecology. Can. Bull. Fish. Aquat. Sci. 210.
MORTAIN-BERTRAND, A., J. BENNETT, AND P. G. FALKOWSKI. 1990. Photoregulation of the light-harvesting chlorophyll protein complex associated with photosystem 2 in Duna- ZieZZa tertiolecta. Plant Physiol. 94: 304-3 11.
OLAIZOLA, M., J. LA ROCHE, Z. KOLBER, AND P. G. FALKOWSKI. 1994. Non-photochemical fluorescence quenching and the diadinoxanthin cycle in a marine diatom. Photosyn. Res. 41: 357-370.
ORELLANA, M. V., AND M. J. PERRY. 1992. An immunoprobe to measure Rubisco concentrations and maximal photo- synthetic rates of individual phytoplankton cells. Limnol. Oceanogr. 37: 978-990.
OWENS, T. G., AND E. R. WOLD. 1986. Light-harvesting func- tion in the diatom Phaeodactylum tricornutum. 1. Isolation and characterization of pigment-protein complexes. Plant Physiol. 80: 732-738.
RAVEN, J. A. 1984. A cost-benefit analysis of photo absorption by photosynthetic unicells. New Phytol. 98: 593-625.
-, AND R. J. GEIDER. 1988. Temperature and algal growth. New Phytol. 110: 441-461.
RICHARDS, L., AND C. F. THURSTON. 1980. Protein turnover in Chlorella fusca var. vacuolata: Measurement of the over- all rate of intracellular protein degradation using isotope exchange with water. J. Gen. Microbial. 121: 49-61.
RIPER, P. M., T. G. OWENS, AND P. G FALKOWSKI. 1979. Chlo- rophyll turnover in Skeletonema costatum, a marine dia- tom. Plant Physiol. 64: 49-54.
SAKNAUG, E., K. ANDERSEN, AND D. A. KIEFER. 1989. A steady state description of growth and light absorption in the marine planktonic diatom Skeletonema costatum. Lim- nol. Oceanogr. 34: 198-205.
SHUTER, B. 1979. A model of physiological adaptation in uni- cellular algae. J. Theor. Biol. 78: 519-552.
SUKENIK, A., J. BENNETT, AND P. FALKOWSKI. 1987. Light- saturated photosynthesis-limitation by electron transport or carbon fixation? Biochim. Biophys. Acta 891: 205-2 15.
THOMPSON, W. F., AND M. J. WHITE. 199 1. Physiological and molecular studies of light-regulated nuclear genes in higher plants. Annu. Rev. Plant Physiol. Plant Mol. Biol. 42: 423- 466.
VINCENT, W. F., N. BERTRAND, AND J.-F. FRENETTE. 1994. Photoadaptation in intermittent light across the St. Law- rence estuary freshwater-saltwater transition zone. Mar. Ecol. Prog. Ser. 110: 283-292.
WHITTMANN, H. G. 1982. Components of bacterial ribosomes. Annu. Rev. Biochem. 51: 155-l 83.
Submitted: 14 November I994 Accepted: 7 June 1995 Amended: 6 July 1995