dynamic model development for lead acid storage battery
TRANSCRIPT
Indonesian Journal of Electrical Engineering and Computer Science
Vol. 15, No. 2, August 2019, pp. 609~619
ISSN: 2502-4752, DOI: 10.11591/ijeecs.v15.i2.pp609-619 609
Journal homepage: http://iaescore.com/journals/index.php/ijeecs
Dynamic model development for lead acid storage battery
B V Rajanna, Malligunta Kiran Kumar
Department of Electrical and Electronics Engineering, Koneru Lakshmaiah Education Foundation, India
Article Info ABSTRACT
Article history:
Received Oct 9, 2018
Revised Feb 10, 2019
Accepted Mar 24, 2019
It is widely accepted that electrochemical batteries ensure superior energy
storage and reliability of power supply. This paper proposes to discuss the dynamic performance of the Lead Acid Storage battery and to develop an Electrical Equivalent circuit and study its response to sudden changes in the output. A detailed explanation of the discharging process for lead-acid storage batteries and the factors affecting the rate of chemical reactions is provided. The objective of the study is to find the reduction in terminal voltage due to the change in reaction rate and to evolve a simple dynamic model for discharge of the battery.
Keywords:
Discharging process model
Lead acid storage battery
Matlab/simulink
Copyright © 2019 Institute of Advanced Engineering and Science. All rights reserved.
Corresponding Author:
B V Rajanna,
Department of Electrical and Electronics Engineering,
Koneru Lakshmaiah Education Foundation,
Green Fields, Vaddeswaram, Guntur-522502, Andhra Pradesh, India.
Email: [email protected]
1. INTRODUCTION There are numerous energy storage systems in use now. The electrochemical storage systems are
preferred both in power installations and electric mass transportation as they are both convenient and
economical [1].
Ever since the lead acid storage battery was introduced in the middle of the 19th century there has
been ongoing research on this commercially viable product. It has numerous and extensive utility in starting,
lighting and ignition in electric vehicle applications. In an age of power supplies with frequent interruptions,
the lead acid storage battery proved to be a dependable standby resource. Further, it is also used as a method
for control and storage of energy generated from renewable resources. Though solar applications through the
lithium ion batteries are replacing lead acid batteries in some areas, the latter still enjoy a larger market share
due to their cost-effectiveness [2-3].
A Lead Acid electrical model is proposed [4]. This model has a voltage source, self-discharge
resistance and RC network with three time constants. It can be used only for very low frequency operations. However the electrical and chemical parameters are not properly mapped in this model. Hence it does not
include data regarding rate of chemical reactions varying with state of charge, depth of discharge, depth of
charge, state of health, battery storage capacity, internal resistance, physical temperature and shelf life.
Research has been done to obtain improved mathematical models for the Lead acid storage battery
and Lead acid storage battery mathematical model is proposed in [5]. This model has non-linear components
and takes into account such parameters like self-discharge, battery storage capacity, internal resistance,
overvoltage and environmental temperature. The performance of the lead-acid storage battery with
temperature compensation is tracked accurately. However, this model does not take into account the rate of
chemical reactions varying with state of charge, depth of charge and discharge time constant and state
of health.
ISSN: 2502-4752
Indonesian J Elec Eng & Comp Sci, Vol. 15, No. 2, August 2019 : 609 - 619
610
In [6], describes a model for evaluating the lead acid battery ampere hour capacity. The affect of
ampere hour capacity at different rates of charge and discharge, at different end voltages and at different
temperatures can be explained and simulated by this electrical model. The verification of this electrical model
is done by obtaining parameters from the model simulation and then comparing with experimental results.
This model does not include rate of chemical reactions varying with state of charge, depth of charge and
discharge, state of health and time constant of battery.
A charge and discharge modelling was presented in [7] which includes rate of chemical reactions
varying with rate of charge/discharge cycles, battery float measurements, voltage and current variation with charge and discharge time. The current source in this model represents gassing current of electrolysis, which
causes a major part of the energy losses in lead batteries. The effect of impedance on diffusion, double layer
and electrolyte components is shown in this model. The voltage on capacitor in this model represents the
degree of conversion of the active electrode material. This model does not include rate of chemical reactions
varying with state of charge, state of health, depth of charge and discharge, environmental temperature,
time constant and age/shelf life of battery.
A new dynamical model for the battery is described in [8]. This model takes into account battery
thermal capacitance, electrolyte temperature, thermal resistance between the battery and its environment,
environmental temperature and source thermal power, i.e., the heat that is generated internally in the battery.
This model can give estimation of state of charge of battery and rate of charge and discharge process of
battery for various applications. This model does not supply detailed information on how to identify the
several parameters of the proposed models, and it defines a whole family of models, but does not discuss which model of the family is adequate for a given purpose.
An accurate modelling of lead-acid batteries still remains a difficult task. The above issues are
solved in a new model presented in [9]. A battery-charging model to study AC transient dynamics of battery
at high frequency is presented in [10]. This model takes into account state of charge, rate of charge and
discharge. This model does not include temperature effect, depth of charge, depth of discharge and
self-discharge resistance. In [11-23], deal with various developments in the dynamic modelling of lead acid
batteries. Notwithstanding that the accurate battery parametric identification under dynamic conditions still
remains a problem.
The lead acid batteries for grid based photovoltaic systems need an accurate, intuitive,
and comprehensive electrical battery model which can sense the battery response under dynamic conditions.
Simple electric models for this battery using a voltage source in series with a resistance have been used to develop energy management systems in distribution with renewable energy integration. But this model does
not reflect the response of the battery to sudden change in output both during charging and discharging.
Detailed behaviour of the lead acid battery under such conditions requires a dynamic model which is
different from the steady state model. That dynamic electrical model should give the battery response relating
to the battery voltage and current with the rate of change of chemical reactions taking place inside the battery
due to sudden change in load. This paper explains the basic chemical reactions that take place inside the
battery during charging and discharging and how the rate of change of these reactions affects its dynamic
response. Development of an electrical equivalent circuit which will simulate the dynamic characteristics of
the battery based on chemical reactions is also explained.
2. DISCHARGING PROCESS BY CONNECTING A ELECTRICAL LOAD EXTERNALLY
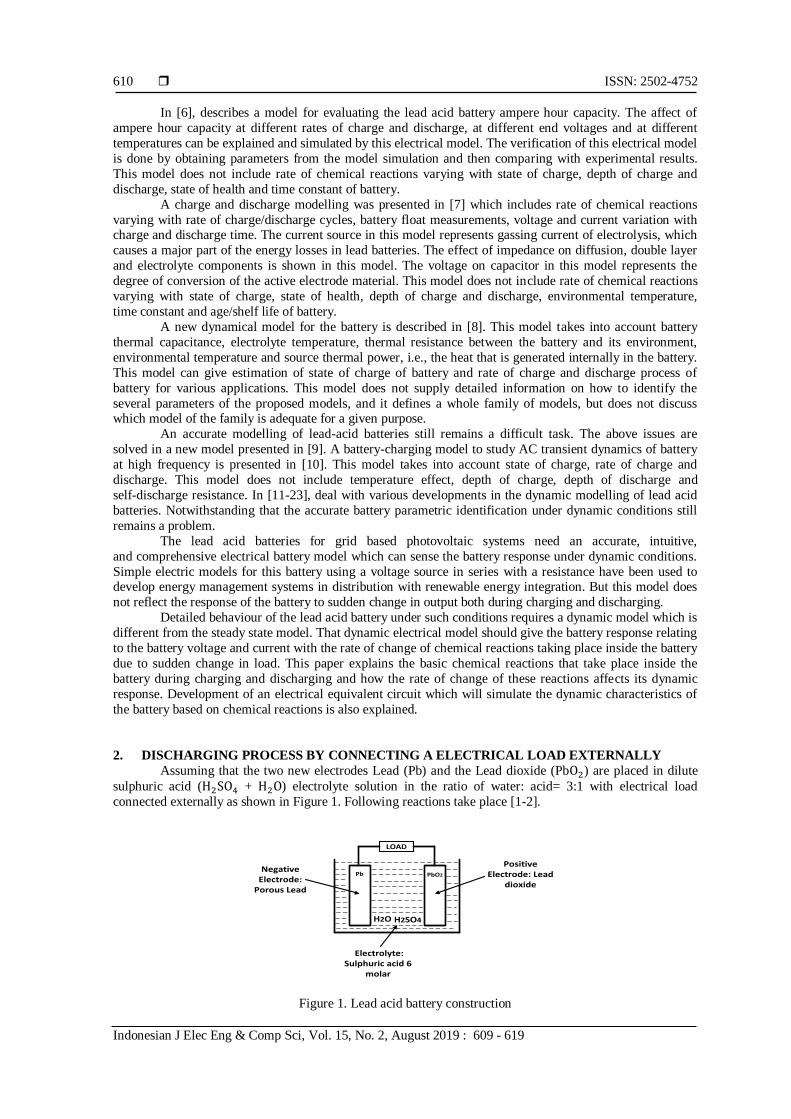
Assuming that the two new electrodes Lead (Pb) and the Lead dioxide (PbO2) are placed in dilute
sulphuric acid (H2SO4 + H2O) electrolyte solution in the ratio of water: acid= 3:1 with electrical load
connected externally as shown in Figure 1. Following reactions take place [1-2].
Negative Electrode:
Porous Lead
Positive Electrode: Lead
dioxide
Electrolyte: Sulphuric acid 6
molar
H2O H2SO4
Pb PbO2
LOAD
Figure 1. Lead acid battery construction
Indonesian J Elec Eng & Comp Sci ISSN: 2502-4752
Dynamic model development for lead acid storage battery (B V Rajanna)
611
During discharge process, the chemical energy stored is converted into electrical energy. Due to the
flow of current through the load, the following chemical reactions take place [1-2].
A. At negative electrode plate (Pb) (Anode-Oxidation process)
Pb→ Pb+2 + 2e−
Pb+2 + SO4−2 → PbSO4
---------------------------------
Pb + SO4−2 → PbSO4 + 2e−
---------------------------------
The energy released from the above reaction
E0 > -0.356eV or E0 < 0.356eV.
Ered0 (Anode) < 0.356 V or Ered
0 > -0.356 V
Ered0 is the standard reduction electrode potential at Pb electrode.
B. At positive electrode plate (PbO2) (Cathode-Reduction process)
PbO2 + 4H+ + 2𝑒− → Pb+2 + 2H2O
Pb+2 + SO4−2 → PbSO4
--------------------------------------------------------
PbO2 + 4H+ + SO4−2 + 2e− → PbSO4 + 2H2O
--------------------------------------------------------
The energy released from the above reaction E0 < 1.685 eV.
Ered0 (Cathode) < 1.685 V.
Ered0 is the standard reduction electrode potential at PbO2 electrode.
C. Overall reaction
Pb + SO4−2 → PbSO4 + 2e−
PbO2 + 4H+ + SO4−2 + 2𝑒− → PbSO4 + 2H2O
---------------------------------------------------
Pb + PbO2 + 2H2SO4 → 2PbSO4 + 2H2O
----------------------------------------------------
The net amount of energy released in the above reaction will be lesser than 2.041eV i.e. E0< 2.041eV and the
potential difference between the plates decreases i.e. Vbatt < 2.041 V.
D. During discharging process of a Lead acid storage battery
1) Both plates (Pb & PbO2) are coated or covered with PbSO4 (lead sulphate).
2) Due to the formation of PbSO4 layer on the electrodes, the active area of electrode plates decreases. As a
result, the reaction rate falls which implies the potential difference between the plates decreases i.e. Vbatt
< 2.041 V.
3) Also due to the formation of water at the cathode plate during the chemical reaction, specific gravity of
sulphuric acid solution falls and this makes the acid weaker. The pH of the acid increases and the
concentration of H+ ions decrease.
4) These two factors namely sulphation at electrodes and formation of water at cathode plate affect the ionic
production in the electrolyte solution and the rate of chemical reactions.
5) Further the ions inside the electrolyte solution face resistance during movement causing energy loss
which results in rising the temperature of electrolyte. This affects the rate of chemical reactions.
6) When equilibrium is reached, the electron balance takes place between positive and negative electrodes.
The terminal voltage will be lesser than the open circuit voltage i.e. Vbatt < 2.041 V due to the internal
resistive drop.
7) Further due to the reduction of active surface area of electrodes and the dilution of electrolyte solution,
the rate of chemical reaction decreases and finally comes to an equilibrium state. Accordingly the
terminal voltage also decreases.
8) Active electrode surface area for Pb and PbO2 plates where the electron exchange takes place goes on
reducing due to the formation of PbSO4 layers on the surface of the electrodes. This reduces the reaction
rate causing decrease of the potential difference between the two electrode plates. The rate of decrease of
the reaction rate is nonlinear being governed by the exponential law. This decides the state of charge and depth of charge in the battery.
ISSN: 2502-4752
Indonesian J Elec Eng & Comp Sci, Vol. 15, No. 2, August 2019 : 609 - 619
612
3. FACTORS AFFECTING RATE OF CHEMICAL REACTION
The rate of chemical reaction [1-3] varies with the following conditions:
1. Temperature
2. Molar Concentration of reactants
3. Active Surface area of electrode plates
4. Capacity of the battery
5. SOC (State of Charge)
6. Open circuit voltage of the battery 7. Time Constant
In chemical kinetics, a reaction rate constant or reaction rate coefficient K quantifies the rate of
chemical reaction. For a relation between reactants A and B to form product C i.e. aA + bB → cC, we have
reaction rate [2-3].
‘r’=K[T][A]𝑚[B]𝑛 (1)
Where:
‘a’ and ‘b’ are called stoichiometric coefficients.
‘K[T]’ is the rate constant which is a function of temperature. [A] and [B] are the molar concentrations of reactants A and B in moles per unit volume of the solution.
‘m’ and ‘n’ are called the partial orders of the Reaction reactants [A] and [B] which can be determined
experimentally based on the reaction mechanism in a chemical reaction and are not generally equal to the
stoichiometric coefficients.
From (1) it can be concluded that Reaction rate ‘r’ is directly proportional to the product of
concentration of active reactants A and B i.e. r ∝ [A]𝑚[B]𝑛. So during discharging process of a lead acid
storage battery, the reaction rate r falls slowly and thus the concentration of reactants decreases slowly.
Since the electrode plates lose active molar mass and surface area.
By Modified Arrhenius equation, the rate constant [2-3]
K[T]=DT𝑛𝑒−Ea/RT (2)
For n→ -1< n < 1
Where:
‘D’ is the frequency factor or pre-exponential factor which gives collision frequency of molecules in a
chemical reaction.
‘Ea’ is the activation energy, which is the minimum energy at which the chemical reaction occurs.
‘R’ is the universal gas constant = 8.3144598 JK−1mol−1
‘T’ is the temperature in Kelvin.
Substituting (2) in (1) the reaction rate
‘r’=DT𝑛𝑒−Ea/RT[A]𝑚[B]𝑛 (3)
So, from (2) and (3) it can be concluded that reaction rate ‘r’ is directly proportional to rate constant
K[T] and in turn depend upon temperature i.e. r ∝ K[T]. So, during discharging process of a battery,
the reaction rate r falls slowly with decrease in rate constant K[T] and temperature T. By thumb rule it can be
concluded that at constant room temperature (25), for every 10 raise in temperature, the reaction rate r
doubles in any chemical reaction.
The cell potential can be determined by using the Nernst equation.
𝐸𝐶𝑒𝑙𝑙=𝐸𝑐𝑒𝑙𝑙0 +
0.05916 𝑉
𝑍log10
[𝐶𝑎𝑡ℎ𝑜𝑙𝑦𝑡𝑒]
[𝐴𝑛𝑜𝑙𝑦𝑡𝑒] (4)
Where:
‘𝐸𝐶𝑒𝑙𝑙’ is the cell potential in V.
‘𝐸𝑐𝑒𝑙𝑙0 ’ is the standard cell potential in V.
‘Z’ number of moles of electrons transferred in the cell reaction or half-reaction.
From (4) it can be concluded that cell potential falls with decrease in concentration of ions in
solution. So during discharging process of a battery, the reaction rate ‘r’ falls and the state of charge goes
down along with the decrease in concentration of ions which imply that the potential difference between the
plates decrease. Indirectly it also means that the internal voltage ‘E’ is also a function of the state of charge.
Indonesian J Elec Eng & Comp Sci ISSN: 2502-4752
Dynamic model development for lead acid storage battery (B V Rajanna)
613
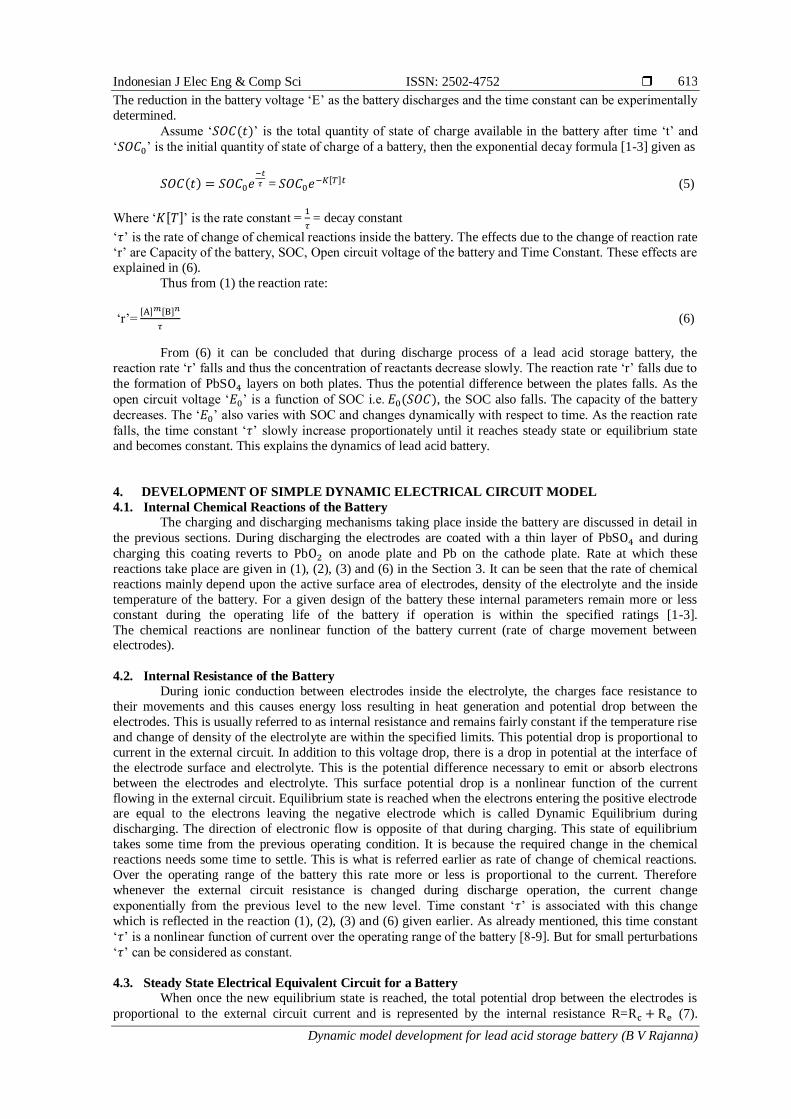
The reduction in the battery voltage ‘E’ as the battery discharges and the time constant can be experimentally
determined.
Assume ‘𝑆𝑂𝐶(𝑡)’ is the total quantity of state of charge available in the battery after time ‘t’ and
‘𝑆𝑂𝐶0’ is the initial quantity of state of charge of a battery, then the exponential decay formula [1-3] given as
𝑆𝑂𝐶(𝑡) = 𝑆𝑂𝐶0𝑒−𝑡
𝜏 = 𝑆𝑂𝐶0𝑒−𝐾[𝑇]𝑡 (5)
Where ‘𝐾[𝑇]’ is the rate constant = 1
𝜏 = decay constant
‘𝜏’ is the rate of change of chemical reactions inside the battery. The effects due to the change of reaction rate
‘r’ are Capacity of the battery, SOC, Open circuit voltage of the battery and Time Constant. These effects are
explained in (6).
Thus from (1) the reaction rate:
‘r’= [A]𝑚[B]𝑛
𝜏 (6)
From (6) it can be concluded that during discharge process of a lead acid storage battery, the
reaction rate ‘r’ falls and thus the concentration of reactants decrease slowly. The reaction rate ‘r’ falls due to
the formation of PbSO4 layers on both plates. Thus the potential difference between the plates falls. As the
open circuit voltage ‘𝐸0’ is a function of SOC i.e. 𝐸0(𝑆𝑂𝐶), the SOC also falls. The capacity of the battery
decreases. The ‘𝐸0’ also varies with SOC and changes dynamically with respect to time. As the reaction rate
falls, the time constant ‘𝜏’ slowly increase proportionately until it reaches steady state or equilibrium state
and becomes constant. This explains the dynamics of lead acid battery.
4. DEVELOPMENT OF SIMPLE DYNAMIC ELECTRICAL CIRCUIT MODEL
4.1. Internal Chemical Reactions of the Battery
The charging and discharging mechanisms taking place inside the battery are discussed in detail in
the previous sections. During discharging the electrodes are coated with a thin layer of PbSO4 and during
charging this coating reverts to PbO2 on anode plate and Pb on the cathode plate. Rate at which these
reactions take place are given in (1), (2), (3) and (6) in the Section 3. It can be seen that the rate of chemical
reactions mainly depend upon the active surface area of electrodes, density of the electrolyte and the inside
temperature of the battery. For a given design of the battery these internal parameters remain more or less
constant during the operating life of the battery if operation is within the specified ratings [1-3].
The chemical reactions are nonlinear function of the battery current (rate of charge movement between electrodes).
4.2. Internal Resistance of the Battery
During ionic conduction between electrodes inside the electrolyte, the charges face resistance to
their movements and this causes energy loss resulting in heat generation and potential drop between the
electrodes. This is usually referred to as internal resistance and remains fairly constant if the temperature rise
and change of density of the electrolyte are within the specified limits. This potential drop is proportional to
current in the external circuit. In addition to this voltage drop, there is a drop in potential at the interface of
the electrode surface and electrolyte. This is the potential difference necessary to emit or absorb electrons
between the electrodes and electrolyte. This surface potential drop is a nonlinear function of the current
flowing in the external circuit. Equilibrium state is reached when the electrons entering the positive electrode are equal to the electrons leaving the negative electrode which is called Dynamic Equilibrium during
discharging. The direction of electronic flow is opposite of that during charging. This state of equilibrium
takes some time from the previous operating condition. It is because the required change in the chemical
reactions needs some time to settle. This is what is referred earlier as rate of change of chemical reactions.
Over the operating range of the battery this rate more or less is proportional to the current. Therefore
whenever the external circuit resistance is changed during discharge operation, the current change
exponentially from the previous level to the new level. Time constant ‘𝜏’ is associated with this change
which is reflected in the reaction (1), (2), (3) and (6) given earlier. As already mentioned, this time constant
‘𝜏’ is a nonlinear function of current over the operating range of the battery [8-9]. But for small perturbations
‘𝜏’ can be considered as constant.
4.3. Steady State Electrical Equivalent Circuit for a Battery
When once the new equilibrium state is reached, the total potential drop between the electrodes is
proportional to the external circuit current and is represented by the internal resistance R=Rc + Re (7).
ISSN: 2502-4752
Indonesian J Elec Eng & Comp Sci, Vol. 15, No. 2, August 2019 : 609 - 619
614
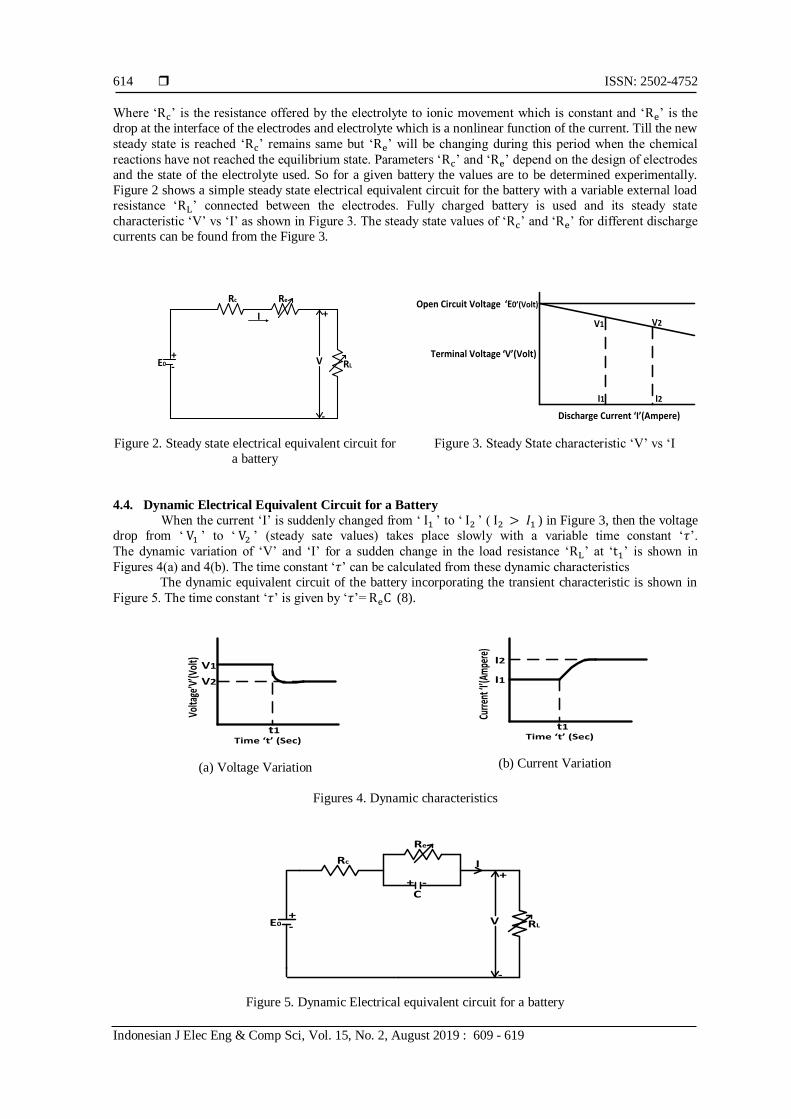
Where ‘Rc’ is the resistance offered by the electrolyte to ionic movement which is constant and ‘Re’ is the
drop at the interface of the electrodes and electrolyte which is a nonlinear function of the current. Till the new
steady state is reached ‘Rc’ remains same but ‘Re’ will be changing during this period when the chemical
reactions have not reached the equilibrium state. Parameters ‘Rc’ and ‘Re’ depend on the design of electrodes
and the state of the electrolyte used. So for a given battery the values are to be determined experimentally.
Figure 2 shows a simple steady state electrical equivalent circuit for the battery with a variable external load
resistance ‘RL’ connected between the electrodes. Fully charged battery is used and its steady state
characteristic ‘V’ vs ‘I’ as shown in Figure 3. The steady state values of ‘Rc’ and ‘Re’ for different discharge
currents can be found from the Figure 3.
V
Rc Re
RL
+
-
I
E0+-
Figure 2. Steady state electrical equivalent circuit for
a battery
‘E0’(Volt)Open Circuit Voltage
‘V’(Volt)Terminal Voltage
Discharge Current ‘I’(Ampere)
V1 V2
I1 I2
Figure 3. Steady State characteristic ‘V’ vs ‘I
4.4. Dynamic Electrical Equivalent Circuit for a Battery
When the current ‘I’ is suddenly changed from ‘ I1 ’ to ‘ I2 ’ ( I2 > 𝐼1 ) in Figure 3, then the voltage
drop from ‘ V1 ’ to ‘ V2 ’ (steady sate values) takes place slowly with a variable time constant ‘𝜏’.
The dynamic variation of ‘V’ and ‘I’ for a sudden change in the load resistance ‘RL’ at ‘t1’ is shown in
Figures 4(a) and 4(b). The time constant ‘𝜏’ can be calculated from these dynamic characteristics
The dynamic equivalent circuit of the battery incorporating the transient characteristic is shown in
Figure 5. The time constant ‘𝜏’ is given by ‘𝜏’= ReC (8).
V1
V2
t1Time ‘t’ (Sec)
Volta
ge’V
’(Vol
t)
(a) Voltage Variation
I2
I1
t1Time ‘t’ (Sec)
Curre
nt ‘I
’(Am
pere
)
(b) Current Variation
Figures 4. Dynamic characteristics
V
Rc
Re
RL
+
-
I
E0+-
C+ -
Figure 5. Dynamic Electrical equivalent circuit for a battery
Indonesian J Elec Eng & Comp Sci ISSN: 2502-4752
Dynamic model development for lead acid storage battery (B V Rajanna)
615
‘E0’ is the internal open circuit voltage, ‘Rc’ is the internal resistance representing the resistance
offered by the electrolyte to ionic movement and ‘Re’ is the steady state resistance representing the interfacial
potential drop at the electrodes, ‘C’ is the capacitance, ‘V’ is the battery terminal voltage, ‘RL’ is the variable
load resistance.
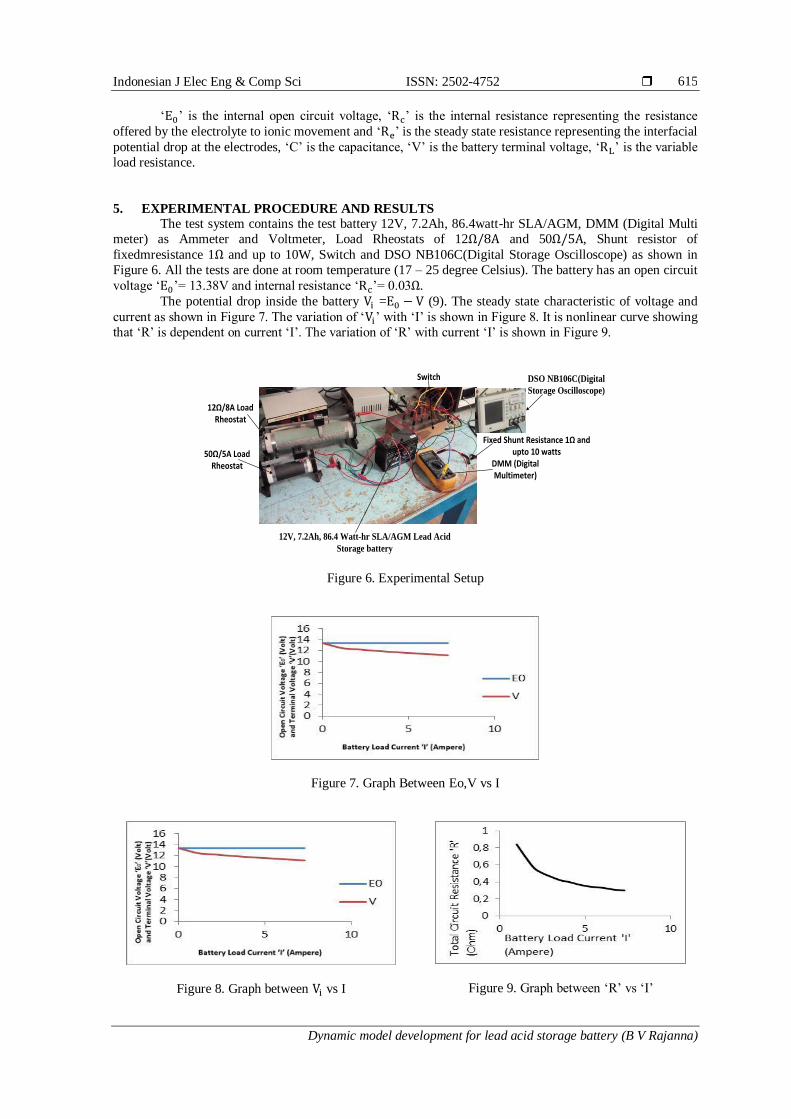
5. EXPERIMENTAL PROCEDURE AND RESULTS
The test system contains the test battery 12V, 7.2Ah, 86.4watt-hr SLA/AGM, DMM (Digital Multi
meter) as Ammeter and Voltmeter, Load Rheostats of 12Ω/8A and 50Ω/5A, Shunt resistor of
fixedmresistance 1Ω and up to 10W, Switch and DSO NB106C(Digital Storage Oscilloscope) as shown in
Figure 6. All the tests are done at room temperature (17 – 25 degree Celsius). The battery has an open circuit
voltage ‘E0’= 13.38V and internal resistance ‘Rc’= 0.03Ω.
The potential drop inside the battery Vi =E0 − V (9). The steady state characteristic of voltage and
current as shown in Figure 7. The variation of ‘Vi’ with ‘I’ is shown in Figure 8. It is nonlinear curve showing
that ‘R’ is dependent on current ‘I’. The variation of ‘R’ with current ‘I’ is shown in Figure 9.
12Ω/8A Load Rheostat
50Ω/5A Load Rheostat DMM (Digital
Multimeter)
12V, 7.2Ah, 86.4 Watt-hr SLA/AGM Lead Acid
Storage battery
Fixed Shunt Resistance 1Ω and upto 10 watts
Switch DSO NB106C(Digital
Storage Oscilloscope)
Figure 6. Experimental Setup
Figure 7. Graph Between Eo,V vs I
Figure 8. Graph between Vi vs I
Figure 9. Graph between ‘R’ vs ‘I’
ISSN: 2502-4752
Indonesian J Elec Eng & Comp Sci, Vol. 15, No. 2, August 2019 : 609 - 619
616
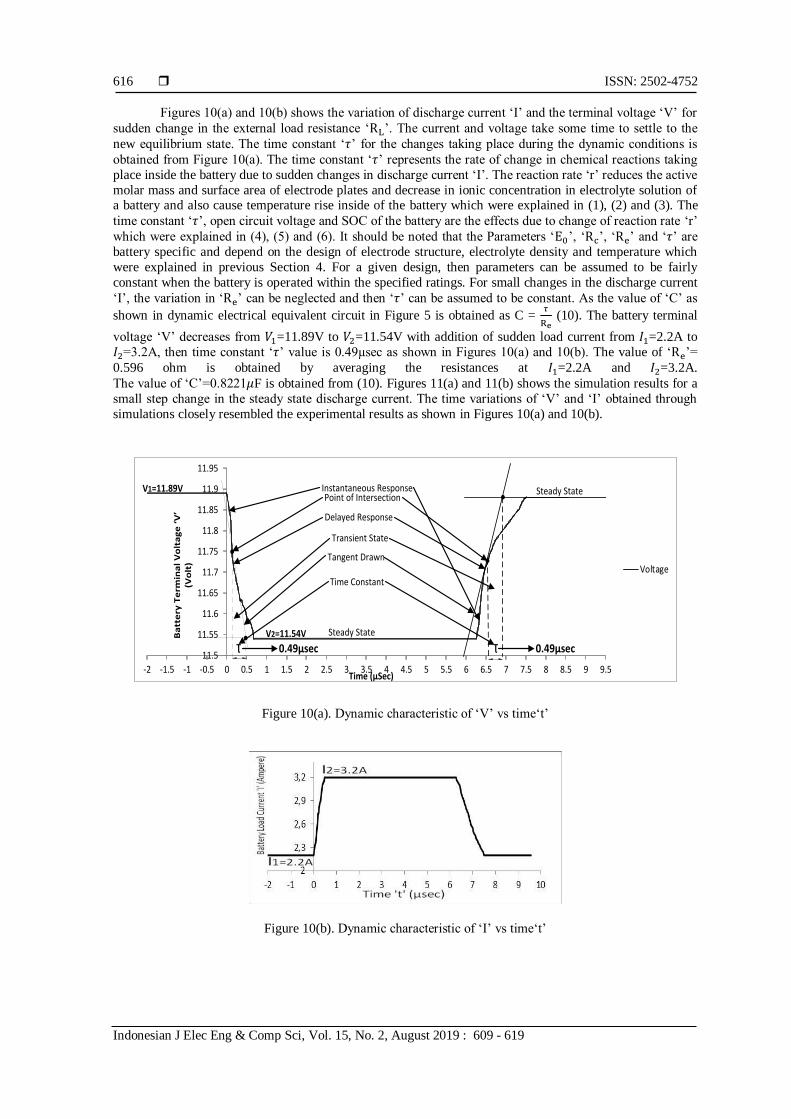
Figures 10(a) and 10(b) shows the variation of discharge current ‘I’ and the terminal voltage ‘V’ for
sudden change in the external load resistance ‘RL’. The current and voltage take some time to settle to the
new equilibrium state. The time constant ‘𝜏’ for the changes taking place during the dynamic conditions is
obtained from Figure 10(a). The time constant ‘𝜏’ represents the rate of change in chemical reactions taking
place inside the battery due to sudden changes in discharge current ‘I’. The reaction rate ‘r’ reduces the active
molar mass and surface area of electrode plates and decrease in ionic concentration in electrolyte solution of a battery and also cause temperature rise inside of the battery which were explained in (1), (2) and (3). The
time constant ‘𝜏’, open circuit voltage and SOC of the battery are the effects due to change of reaction rate ‘r’
which were explained in (4), (5) and (6). It should be noted that the Parameters ‘E0’, ‘Rc’, ‘Re’ and ‘𝜏’ are
battery specific and depend on the design of electrode structure, electrolyte density and temperature which
were explained in previous Section 4. For a given design, then parameters can be assumed to be fairly
constant when the battery is operated within the specified ratings. For small changes in the discharge current
‘I’, the variation in ‘Re’ can be neglected and then ‘𝜏’ can be assumed to be constant. As the value of ‘C’ as
shown in dynamic electrical equivalent circuit in Figure 5 is obtained as C = 𝜏
Re (10). The battery terminal
voltage ‘V’ decreases from 𝑉1=11.89V to 𝑉2=11.54V with addition of sudden load current from 𝐼1=2.2A to
𝐼2=3.2A, then time constant ‘𝜏’ value is 0.49µsec as shown in Figures 10(a) and 10(b). The value of ‘Re’=
0.596 ohm is obtained by averaging the resistances at 𝐼1=2.2A and 𝐼2=3.2A.
The value of ‘C’=0.8221𝜇F is obtained from (10). Figures 11(a) and 11(b) shows the simulation results for a
small step change in the steady state discharge current. The time variations of ‘V’ and ‘I’ obtained through
simulations closely resembled the experimental results as shown in Figures 10(a) and 10(b).
11.5
11.55
11.6
11.65
11.7
11.75
11.8
11.85
11.9
11.95
-2 -1.5 -1 -0.5 0 0.5 1 1.5 2 2.5 3 3.5 4 4.5 5 5.5 6 6.5 7 7.5 8 8.5 9 9.5
Voltage
Ʈ
Time (µSec)
Ʈ 0.49µsec 0.49µsec
Tangent Drawn
Point of Intersection
Time Constant
Transient State
Steady State
Steady StateV1=11.89V
V2=11.54V
Instantaneous Response
Delayed Response
Ba
tte
ry T
erm
ina
l V
olt
ag
e ‘
V’
(Vo
lt)
Figure 10(a). Dynamic characteristic of ‘V’ vs time‘t’
Figure 10(b). Dynamic characteristic of ‘I’ vs time‘t’
Indonesian J Elec Eng & Comp Sci ISSN: 2502-4752
Dynamic model development for lead acid storage battery (B V Rajanna)
617
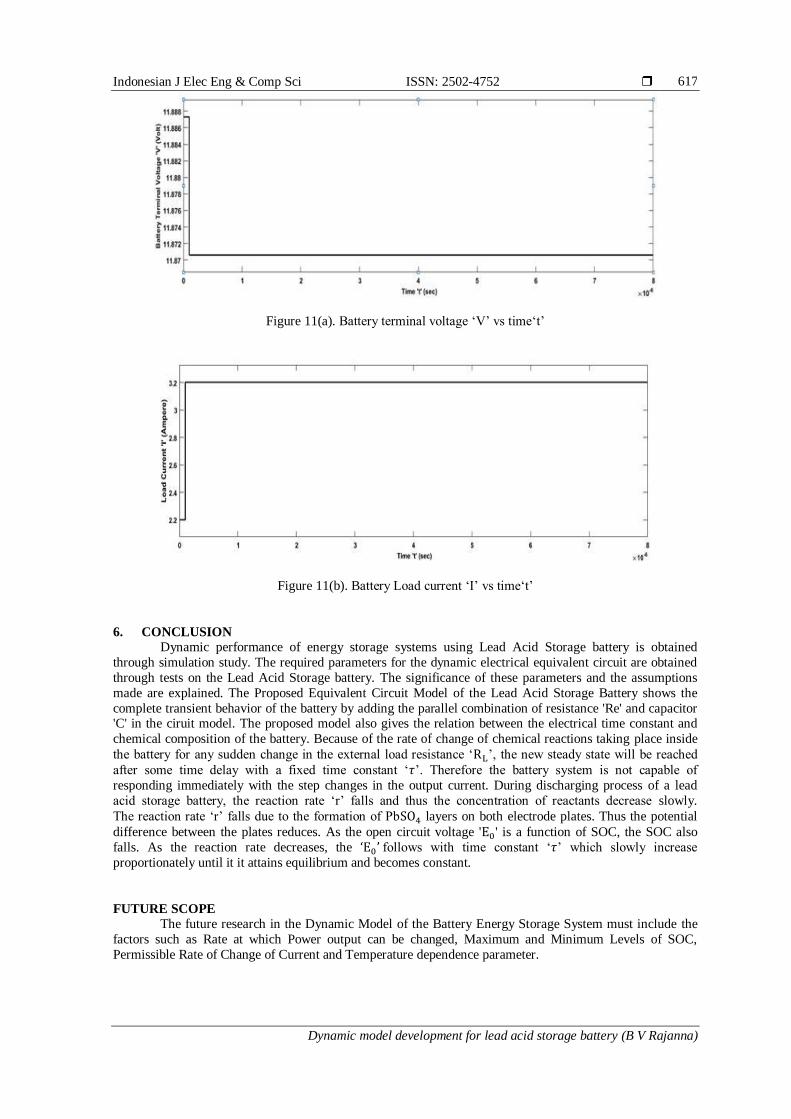
Figure 11(a). Battery terminal voltage ‘V’ vs time‘t’
Figure 11(b). Battery Load current ‘I’ vs time‘t’
6. CONCLUSION
Dynamic performance of energy storage systems using Lead Acid Storage battery is obtained
through simulation study. The required parameters for the dynamic electrical equivalent circuit are obtained
through tests on the Lead Acid Storage battery. The significance of these parameters and the assumptions
made are explained. The Proposed Equivalent Circuit Model of the Lead Acid Storage Battery shows the
complete transient behavior of the battery by adding the parallel combination of resistance 'Re' and capacitor 'C' in the ciruit model. The proposed model also gives the relation between the electrical time constant and
chemical composition of the battery. Because of the rate of change of chemical reactions taking place inside
the battery for any sudden change in the external load resistance ‘RL’, the new steady state will be reached
after some time delay with a fixed time constant ‘𝜏’. Therefore the battery system is not capable of
responding immediately with the step changes in the output current. During discharging process of a lead
acid storage battery, the reaction rate ‘r’ falls and thus the concentration of reactants decrease slowly.
The reaction rate ‘r’ falls due to the formation of PbSO4 layers on both electrode plates. Thus the potential
difference between the plates reduces. As the open circuit voltage 'E0' is a function of SOC, the SOC also
falls. As the reaction rate decreases, the ‘E0’ follows with time constant ‘𝜏’ which slowly increase
proportionately until it it attains equilibrium and becomes constant.
FUTURE SCOPE
The future research in the Dynamic Model of the Battery Energy Storage System must include the
factors such as Rate at which Power output can be changed, Maximum and Minimum Levels of SOC,
Permissible Rate of Change of Current and Temperature dependence parameter.

ISSN: 2502-4752
Indonesian J Elec Eng & Comp Sci, Vol. 15, No. 2, August 2019 : 609 - 619
618
ACKNOWLEDGEMENTS
I express my thanks to the support given by management in completing my project. I also express
my sincere gratitude & deep sense of respect to Dr. Malligunta Kiran Kumar for making us available all the
required assistance & for his support & inspiration to carry out this project in the Institute. I would like to
thank Dr. Malligunta Kiran Kumar, Professor who has been an inspiring guide and committed faculty who
gave relief moral support in every situation of engineering career. The encouragement and support by him,
especially in carrying out this project motivated me to complete this project. I am thankful to the teaching
and non-teaching staff of EEE department for their direct as well as indirect help in my project. I am elated to avail my selves to this opportunity to express my deep sense of gratitude to my parents.
REFERENCES [1] D. Linden, T. B. Reddy, “Lead Acid Batteries” in Handbook of Batteries, 3rd ed. New York, NY: McGraw-
Hill,2002. [2] Chemical Kinetics (3rd Edition) 3rd Edition by Keith J. Laidler (Author) Pearson India; 2003. [3] Chemical Kinetics and Reaction Dynamics by Paul L. Houston, Dover Publications, November 17, 2006.
[4] J. Appelbaum and R. Weiss, “An Electrical Model of the Lead-Acid Battery“, pp. 304-307, 1982. [5] Z. Salameh, M. Casacca, and W. A. Lynch, “A mathematical model for Lead-acid batteries”, IEEE Transactions on
Energy Conversion, vol. 7, pp. 93-98, Mar 1992. [6] M. Casacca and Z. Salameh, “Determination of lead-acid battery capacity via mathematical modeling techniques,”
IEEE Transactions on Energy Conversion, vol. 7, pp. 442-446, Sep 1992. [7] R. Rynkiewicz, “Discharge and charge modeling of lead acid batteries,” in Applied Power Electronics Conference
and Exposition, 1999. APEC'99. Fourteenth Annual, vol. 2, pp. 707-710, IEEE, 1999. [8] Ceraolo, “New Dynamical Models of Lead-Acid Batteries,” IEEE Transactions on Power Systems. Vol. 15, No. 4,
IEEE, November 2000. [9] S. Barsali and M. Ceraolo, “Dynamical models of lead-acid batteries: implementation issues”, IEEE Transactions
on Energy Conversion, vol. 17, pp. 16-23, Mar 2002. [10] Cai Chenghui, Du Dong, Ge Jingtian, Liu Zhiyu and Zhang Hua, "Battery-charging model to study transient
dynamics of battery at high frequency," TENCON '02. Proceedings. IEEE Region 10 Conference on Computers,Communications,Control and Power Engineering, vol.3, pp.1843-1846, 2002.
[11] H. Khafagy and A. Makki, “Mathematical modeling and simulation of lead acid battery,” in Information and Communication Technologies: From Theory to Applications, 2004. Proceedings. 2004 International Conference on,
pp. 137, April 2004. [12] A. Jossen, “Fundamentals of battery dynamics,” J. Power Sources, vol. 154, no. 2, pp. 530–538, 2006. [13] M. Chen and G. A. Rincon-Mora, “Accurate electrical battery model capable of predicting runtime and I-V
performance,” IEEE Transactions on Energy Conversion, vol. 21, no. 2, pp. 504-511, 2006. [14] Jackey, R., “A Simple, Effective Lead-Acid Battery Modeling Process for Electrical System Component
Selection,” SAE Technical Paper 2007-01-0778, 2007. [15] Olivier Tremblay, Louis-A. Dessaint, ‘’Experimental Validation of a Battery Dynamic Model for EV
Applications”, EVS24 Stavanger, Norway, May 13 - 16, 2009.
[16] Peng, Wenxin, "Accurate circuit model for predicting the performance of lead-acid AGM batteries", UNLV Theses, 2011.Dissertations, Professional Papers, and Capstones. Paper 1244.
[17] R. Carter, A. Cruden, P. J. Hall and A. S. Zaher, "An Improved Lead–Acid Battery Pack Model for Use in Power Simulations of Electric Vehicles," in IEEE Transactions on Energy Conversion, vol. 27, no. 1, pp.21-28, March2012.
[18] B. Schweighofer, M. Recheis, T. Gallien, and H.Wegleiter, “Fast and accurate battery model including temperature dependency,” in Industrial Electronics Society, IECON 2013 - 39th Annual Conference of the IEEE, pp. 6740-6745, Nov 2013.
[19] L. C. Stevanatto, V. J. Brusamarello and S. Tairov, "Parameter Identification and Analysis of Uncertainties in
Measurements of Lead–Acid Batteries," in IEEE Transactions on Instrumentation and Measurement, vol. 63, no. 4, pp. 761-768, April 2014.
[20] N. Kularatna, "Dynamics and Modeling of Rechargeable Batteries: What electrochemists? Work tells the electronic engineers," in IEEE Power Electronics Magazine, vol. 1, no. 4, pp. 23-33, Dec. 2014.
[21] M. Greenleaf, O. Dalchand, H. Li and J. P. Zheng, "A Temperature- Dependent Study of Sealed Lead-Acid Batteries Using Physical Equivalent Circuit Modeling With Impedance Spectra Derived High Current/Power Correction," in IEEE Transactions on Sustainable Energy,vol.6,no.2,pp.380387,Apr. 2015.
[22] C. R. Lashway and O. A. Mohammed, "Adaptive Battery Management and Parameter Estimation Through Physics-
Based Modeling and Experimental Verification," in IEEE Transactions on Transportation Electrification, vol. 2, no. 4, pp.454-464,Dec.2016.doi: 10.1109/TTE.2016.2558843.
[23] BV Rajanna, SVNL Lalitha, Ganta Joga Rao, SK Shrivastava,"Solar Photovoltaic Generators with MPPT and Battery Storage in Microgrids", in International Journal of Power Electronics and Drive Systems (IJPEDS), vol. 7, no. 3, pp. 701-712, Sep.2016.

Indonesian J Elec Eng & Comp Sci ISSN: 2502-4752
Dynamic model development for lead acid storage battery (B V Rajanna)
619
BIOGRAPHIES OF AUTHORS
B V Rajanna received B.Tech degree in Electrical and Electronics Engineering from Chirala Engineering College, JNTU, Kakinada, India, in 2010, M.Tech degree in Power Electronics and Drives from Koneru Lakshmaiah Education Foundation, Guntur, India, in 2015 and pursuing full
time Ph.D in Electrical and Electronics Engineering at Koneru Lakshmaiah Education Foundation. His Current Research includes, Dynamic Modeling of Batteries for Renewable Energy Storage, Electric vehicles and Portable Electronics Applications, Renewable Energy Sources Integration with Battery Energy Storage Systems (BESS), Smart Metering and Smart Grids, Micro-Grids, AMR(Automatic Meter Reading) devices, GSM/GPRS and PLC (Power Line Carrier) Communication and Various modulation techniques such as QPSK, BPSK, ASK, FSK, OOK and GMSK.
M. Kiran Kumar received B.Tech Degree in Electrical and Electronics Engineering from Gokula Krishna College of Engineering and Technology, JNTU, Hyderabad, India, in 2007, M.E.
Degree in Power Electronics and Drives from Sree Sastha Institute of Engineering and Technology, Anna University, Chennai, India, in 2010 and Ph.D in Electrical Engineering at Koneru Lakshmaiah Education Foundation, Guntur, India, in 2016. His research interest includes Switched Reluctance Machines, Power Electronics and Control Systems.