untitled - au-ir
TRANSCRIPT

THE ASSUMPTION UNIVERSITYLIORARY
APPLICATION TECHNIQUE OF TAKT TIME AND TIME AND MOTION IN THE OPERATION OF A PRODUCTION LINE: A
CASE STUDY OF A PLASTIC SPOON MANUFACTURER
By
THANYALUCK DEEVONGKIJ
A Final Report of the Six-Credit Course SCM 2202 Graduate Project
Submitted in Partial Fulfillment of the Requirements for the Degree of
MASTER OF SCIENCE IN SUPPLY CHAIN MANAGEMENT
Martin de Tours School of Management Assumption University
Bangkok, Thailand
October, 2010

Application technique of Takt time and time and motion in the operation of a production line: A case study of a plastic spoon manufacturer
By
Thanyaluck Deevongkij
Submitted in Partial Fulfillment of the Requirements for the Degree of Master of Science in Supply Chain Management
Assumption University
Examination Committee:
1. Asst. Prof. Dr. Nucharee Supatn (Chair)
2. A. Piyawan Puttibarncharoensri (Member)
3. Assoc. Prof. Dr. Sompong Sirisoponsilp (Advisor)
Approved for Graduation on: October 2, 2010
Martin de Tours School of Management Assumption University
Bangkok, Thailand
October, 2010
Assumption University
Martin de Tours School of Management
Master of Science in Supply Chain Management
Form signed by Proofreader of the Graduate Project
1, Asst. Prof. Brian Lawrence , have proofread this Graduate Project entitled
Application Technique of Takt Time and Time and Motion in the Operation
of a Production Line: A Case Study of a Plastic Spoon Manufacturer
Ms. Thanyaluck Deevongkij
and hereby certify that the verbiage, spelling and format is commensurate with the quality of
internationally acceptable writing standards for a master degree in supply chain management.
Signed ,
-
( Asst. Prof Brian Lawrence
Contact Number / Email address [email protected]
Date:
t 0

Assumption University Martin de Tours School of Management
Maste-- of Science in Supply Chain Management
Declaration of Authorship Form
I, Ms. Thanyaluck Deevongkij
declare that this thesis/project and the work presented in it are my own and has been generated by me as the result of my own original research.
APPLICATION TECHNIQUE OF TAKT TIME AND TIME AND MOTION IN THE OPERATION OF A PRODUCTION LINE: A CASE STUDY OF A PLASTIC SPOON MANUFACTURER
I confirm that:
I. This work was done wholly or mainly while in candidature for the M. Sc. degree at this University;
2. Where any part of this dissertation has previously been submitted for a degree or any other qualification at this University or any other institution, this has been clearly stated;
3. Where I have consulted the published work of others, this is always clearly attributed;
4. Where I have quoted from the work of others, the source is always given. With the exception of such quotations, this dissertation is entirely my own work;
5. I have acknowledged all main sources of help;
6. Where the thesis/project is based on work done by myself jointly with others, I have made clear exactly what was done by others and what I have contributed myself;
7. Either none of this work has been published before submission, or parts of this work have been published as: [please list references in separate page]:
SignedinUm P "pit' u
Date: October 2, 2010

Assumption University Martin de Tours School of Management
Master of Science in Supply Chain Management
Student Name: Ms. Thanyaluck Deevongkij
ID: 491-9622
ADVISOR'S STATEMENT
I confirm that this thesis/project has been carried out under my supervision and it represents the original work of the candidate.
Signed:
(Assoc.ifiro Advisor
Date
Sompong Sirisoponsilp)
October 2, 2010
ABSTRACT
Productivity improvement is very important for every industry because it is able to
increase capacity and reduce cost. This study aims to improve the efficiency of the
production of plastic products by a Plastic Spoon Manufacturer. The study employs
Takt time and time and motion technique.
From an investigation of the production process and interviews with supervisors, it
was found that the production line did not flow smoothly, and the labor used more or
less time than the production time schedule. Most production was at a slow rate,
whose effect was to increase working time and labor cost. As the layout of the
production line did not allow workers to move easily, workers soon felt tired, causing
them to work more slowly. As a consequence of this, production could not meet
customer demand. Hence, some potential customers decided to order the products
from other companies.
To improve the operation of the production line, the researcher uses Takt time to
balance the production line in the packing section. The Operator Balance Chart is
employed to show the improvement channel by visually showing the Takt time and
cycle time of each operation. Takt time and cycle time in each operation are
compared, and the target manpower is specified. The elimination of waste is used to
achieve line balancing. The researcher uses time and motion technique to improve
production efficiency by applying a wage incentive scheme. Performance and labor
cost are compared before and after the improvement to find the solution to the
problem.
ii
ACKNOWLEDGEMENTS
I would particularly like to express my deepest gratitude to Assoc. Prof. Dr. Sompong
Sirisoponsilp, my supervisor, for his valuable suggestions, constructive comments,
support, encouragement and kindness throughout the period of this dissertation.
I would sincerely like to thank all the interviewees for their suggestions, and for data
concerning the Plastic Spoon Manufacturer.
The concerns, warm friendship and cheerful encouragement of my friends and
colleagues are deeply appreciated and will always be remembered.
Last but not least, my special and sincere thanks to my parents for their assistance,
support and spiritual encouragement throughout the entire dissertation process.
Any mistakes in this study are my responsibility.
Ms. Thanyaluck Deevongkij
Assumption University
October, 2010
iii
MASSMPTION ITISTMRSITY LIBRARY
TABLE OF CONTENTS
Page
Committee's Approval Sheet ............................................................................
ABSTRACT ...........ii
ACKNOWLEDGEMENTS .............................................................................. iii
TABLE OF CONTENTS ..........iv
LIST OF TABLES ..........vi
LIST OF FIGURES ........ vii
CHAPTER I: GENERALITIES OF THE STUDY
1.1 Background of the Study ...........1
1.2 Statement of the Problem ...........4
1.3 Research Objectives ...........6
1.4 Scope of Research ...........6
CHAPTER II: REVIEW OF RELATED LITERATURE AND RESEARCH
FRAMEWORKS
2.1 Takt Time ...........7
2.2 Operator Balance Chart .........11
2.3 Time and Motion Study .........12
CHAPTER III: RESEARCH METHODOLOGY
3.1 Perform Takt Time and Line Balancing .........27
3.2 Improve Production Efficiency .........29
3.3 Improve Production Performance .........30
CHAPTER IV: PRESENTATION AND CRITICAL DISCUSSION OF
RESULTS
4.1 Data Set and Data Collection .........31
4.2 Draw current state Line Balance by using Operator Balance Chart 36
iv
4.3 Perform Line Balancing .........43
4.4 Improve Production Efficiency by using
Time and Motion Technique ......... 52
4.5 Improve Production Performance by applying
Wage Incentive Scheme ..........57
CHAPTER V: SUMMARY FINDINGS, CONCLUSIONS AND
RECOMMENDATIONS
5.1 Conclusions .........63
5.2 Limitations .........66
5.3 Recommendations .........66
BIBLIOGRAPHY ......................................................................................... 67
APPENDICES ................................................................................................. 70
Appendix A: Description of Packing Section
(before and after reallocation) .........70
Appendix B: Packing Section layout
(before improvement and reallocation) ............................................ 72
Appendix C: The description of Packing Section
(before improvement and reallocation ....................73
Appendix D: Packing Section layout
(after improvement and reallocation .............74
Appendix E: The description of Packing Section
(after improvement and reallocation) .............75
Appendix F: Labor motion of Packing Section ........... 76
Appendix G: Normal time in Process of Insert Plastic Spoon into
Packaging Bag ...........77
LIST OF TABLES
TABLE Page
2.1 Determining Operator Rating ........................................................... 20
4.1 Plastic Spoon demand (box) (year 2006-2008) ................................ 31
4.2 The labor cost of Packing Section (baht) (year 2008) ...................... 32
4.3 Takt Time (year 2008) ..................................................................... 38
4.4 The time and manpower of Packing Section (calculated from available
working regular time and overtime) ................................................ 40
4.5 The time and manpower of Packing Section (calculated from available
working regular time) ....................................................................... 41
4.6 The time and target manpower of Packing Section .......................... 42
4.7 The time and target manpower of Packing Section (after rebalance) 49
4.8 The time (before improvement) (per 24 units) ................................. 54
4.9 Work hours (calculated from normal time) ...................................... 55
4.10 Labor cost (baht) (after reallocate and rebalance) ............................ 56
4.11 Work hours (before and after improvement) ................................... 58
4.12 The labor cost (before and after improvement) .............................. 60
4.13 Customer demand, Work hours, Labor cost (normal and new method) 62
vi
LIST OF FIGURES
FIGURES Page
1.1 Business Process of the Plastic Spoon Manufacturer ...................... 2
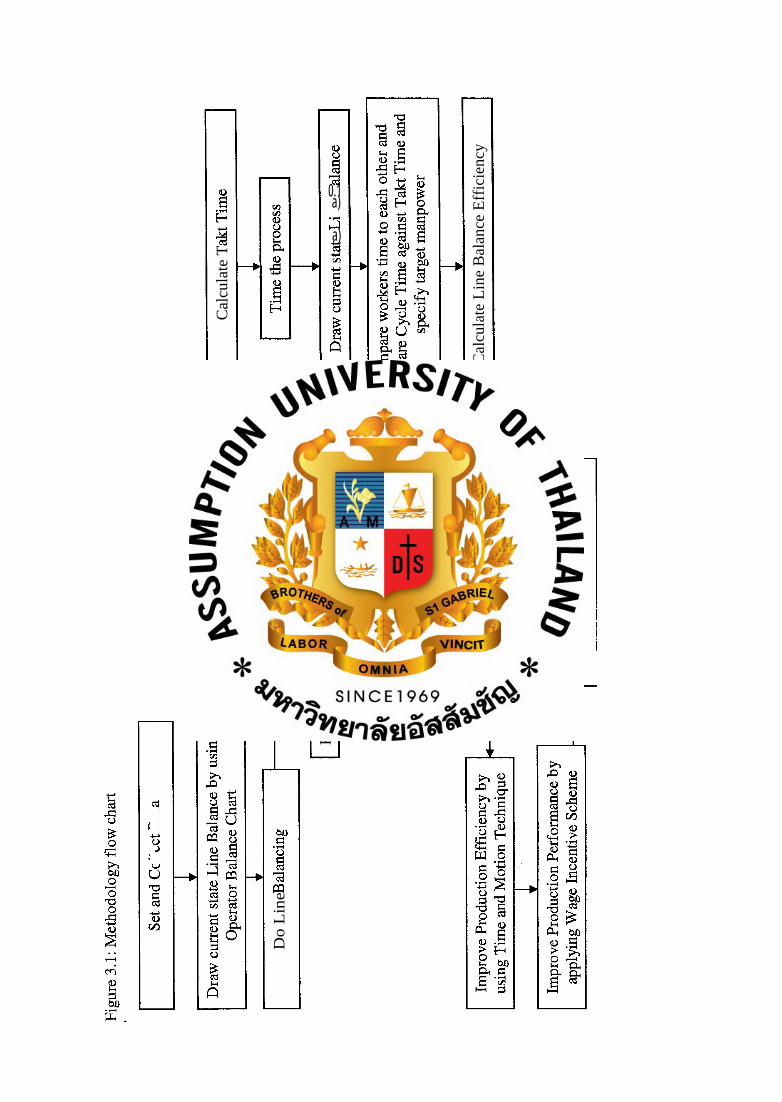
3.1 Methodology flow chart ................................................................... 26
4.1 Production process of Plastic Spoon Manufacturer ......................... 33
4.2 Illustration of the defined cycle time ............................................... 35
4.3 Packing Section process ................................................................... 38
4.4 Operator balance chart — Current state ............................................. 39
4.5 Standard work layout ....................................................................... 50
4.6 Operator balance chart (reallocate and rebalance) ........................... 51
vii

CHAPTER I
GENERALITIES OF THE STUDY
Nowadays, many producers are suffering from market change and high competition,
which needs responses to the high variety and rapidity of changes in customers.
Manufacturing industries find it necessary to plan new production abilities to be able
to respond to the customers' needs. A company must try to develop its
competitiveness in many facts, including cost, innovation, quality, and production
technique (Dangayach & Deshmukh, 2003; Laosirihongthong & Dangayach, 2005).
For many years, companies have been creating and using tools to identify and
eliminate waste during each process, and motivating operator's to improve quality
production time, performance, and productivity.
1.1 Background of the Study
The subject of this research is a Plastic Spoon Manufacturer which produces Ice-
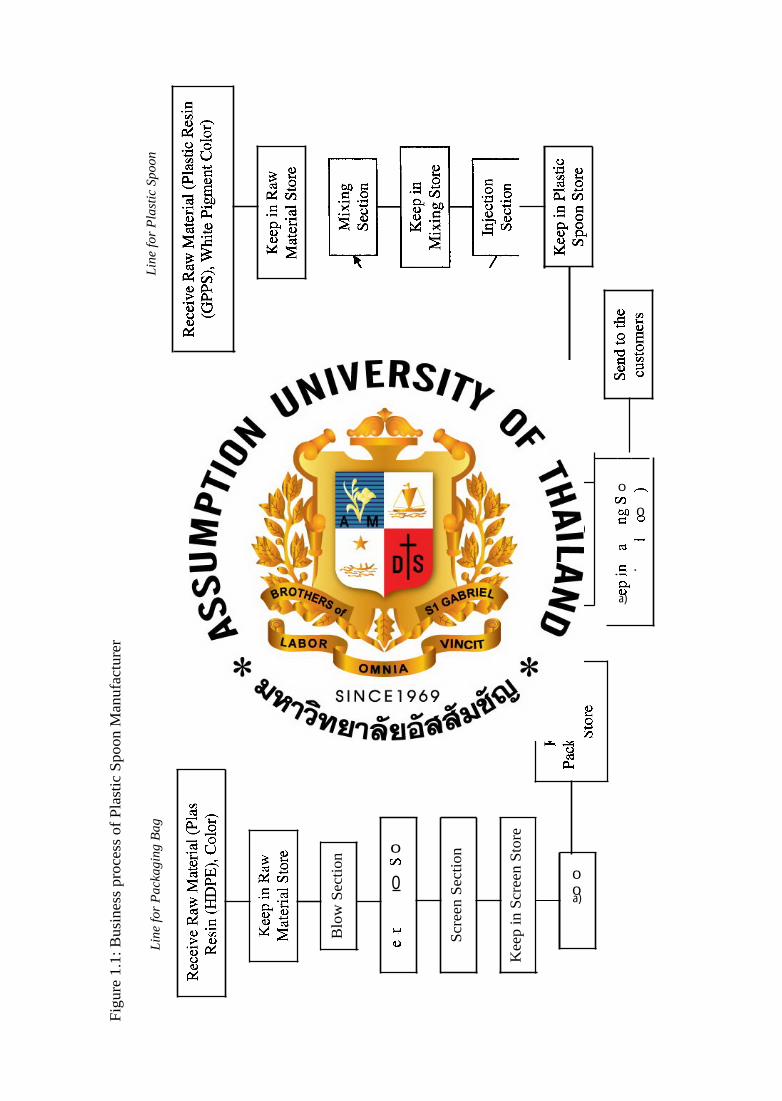
cream plastic spoons and Yoghurt plastic spoons. Figure 1.1 shows the business
process of this manufacturer, separated into two production lines.
1
Lin
e fo
r P
last
ic S
poon
•
ci) O e•—•,
at) 0 0 0
r ort
c)
0 • ••••4
1:14 cu a)
tab c)
c.) cd ci)
0
Lin
e fo
r P
acka
ging
Bag
0 a)
Scr
een
Sec
tion
0 fD
0
1.)(1) Blo
w S
ecti
on
Kee
p in
Scr
een
Sto
re
Fig
ure
1.1:
Bus
ines
s pr
oces
s of
Pla
stic
Spo
on M
anuf
actu
rer
ASSUMPTION UNIVERSITY LIBRARY
This company procures raw material (Plastic Resin) from the supplier in the country.
The company uses two types of plastic resin. The company's manufacturing line is
separated into two production lines.
In the first line (Line for Plastic Spoon), general purpose polystyrene (GPPS) and
white pigment color are used to produce the plastic spoon. When the company
receives raw material (GPPS, Color), the Raw Material Store Department checks the
raw material and then, the material will be kept in the Raw Material Store and sent to
the Mixing Section in accordance with the planning order. After the Mixing Section
has finished the process, the material will be kept in the Mixing Store and sent to the
Injection Section in accordance with the planning order. In the Injection Section, the
material will be injected to become a plastic spoon and then it will be kept in the
Plastic Spoon Store. As for the stem of plastic spoon, that will be taken for recycling
in the Milling room. The stem will be milled to be Recycled Plastic Resin. Recycled
Plastic Resin is part of the raw material which will be taken to the Mixing Section in
a suitable ratio.
In the second line (Line for Packaging Bag), High Density Polyethylene (HDPE) and
Color (according to the screen packaging bag) will be used to produce the packaging
bag in which to pack the plastic spoon. When the company receives raw material
(HDPE and Color), the Raw Material Store Department checks the raw material and
then the material will be kept in the Raw Material Store and sent to the Blow Section
in accordance with the planning order. After the Blow Section has finished, the
material will be kept in the Blow Store and sent to the Screen Section, kept in the
Screen Store, and sent to the Cut Section and kept in the Packaging Bag Store, in
accordance with the planning order.
Then, the Packing Section takes the plastic spoon and packaging bag from the Plastic
Spoon Store and the Packaging Bag Store to pack and patch, to make them finished
goods. Finally, they are kept in the Packing Store and sent to customers.
3
The customers demand changes all the time. Their ordering schedule is about one
month in advance. Then, the company can plan the production schedule. Each
section knows the weekly production plan. The company employs about 126 people
in the manufacturing line. In the first line, the Mixing Section has four people, two
people for Mix and two people for Mill. The Injection Section has 30 people. In the
second line, the Blow Section, Screen Section and Cut Sections have one person each.
There is only one supervisor in control of the Blow, Screen, and Cut Sections. The
Packing Section has 88 people.
1.2 Statement of Problem
The economic situation in Thailand has problems and uncertainty, which affects the
customers. Furthermore, it affects fluctuations in customer demand. From the
financial report for 2008, costs consist of the production cost, and sales and
administrative expenses. The production cost is about 95.64% and sale and
administrative expense is only about 4.36%. The production cost comprises of Raw
material (67.28%), Labor cost (17.86%), Utilities expense (5.98%), Packaging
(2.62%), Depreciation expense (4.18%), and other expense (2.08%). The profit
margin is about 3.37%. Although the raw material (Plastic Resin and Color) is the
main cost, the company finds it hard to control this cost because the Plastic Resin
price is changeable depending on the market. The second main cost is the Labor
Cost, with most of this cost coming from the Packing Section. Packing is done
manually by the operators. The Mixing, Injection, Blow, Screen, and Cut Sections
also operate manually, by operators using machines.
Labor costs fluctuate widely because the overtime cost has been rising. From data
checking of the production plan for 2006 to 2008, the plastic spoon demand in 2008
was the highest for these three years. In the case of production cost, the company
tries to use regular time efficiently because the regular time cost is cheaper than the
overtime cost. The production plan has been rising because the company tries to
respond to customers need. But the production capacity limitation in each production
line causes an increase in working time and that causes an increase in the labor cost.
4
The total labor cost for 2008 inlcuded the Packing section (73.01%) (Regular time
42.97% and Overtime 30.04%); Injection section (23.04%) (Regular time 14.74% and
Overtime 8.30%); Mix, Blow, Screen, and Cut sections (3.95%). The main labor cost
comes from the Packing section.
Takt time can be applied to do line balancing in the Packing Section. Takt time is
about standardizing the production cycle times. Takt time is the rate of production
which the company must produce in accordance with the customers demand.
Producing to takt time is about making the production rate according to the selling
rate.
The company has production time planning, and measures the cycle time in each
section. But the company does not use takt time to balance the production line (Line
Balancing) in each section. Job distribution is still not good, especially in thePacking
Section. Sometimes, the Packing Section production line does not flow well and the
labor uses more or less time than allowed for in the production time schedule. This
section has more overtime. Sometimes, there are defects and late deliveries. The
Packing store has safety stock to counter uncertainties in supply and demand. Safety
stock is defined as extra units of inventory carried as protection against possible
stock-outs (shortfall in raw material or packaging). That can create much waste in the
company. However, the company still does not know the real cause of the several
wastes. Therefore, the company management is looking for improvement
opportunities to reduce the cycle time down to the takt time level in this step of the
production process as well as some of the other production steps. Possible
improvement areas are identified, such as reducing the steps in some processes and
balancing the production line in problem sections. And the normal, allowance, and
working times are calculated to identify the standard time. The company tries to
improve the quality of the production time, increase the performance, and increase
productivity.
5
To deal with the customer demand fluctuation, the company is going to need to
eliminate waste during the process and motivate the operators to improve the quality
of production time, performance and productivity, in order to survive in this industry.
1.3 Research Objective
1. To investigate the current operation and performance of the production
line in the Packing Section
2. To apply the technique of "Takt Time" and "Time and Motion" to
analyze and improve the operation of the production line
3. To provide recommendations that the company can adopt to enhance
the efficiency and productivity of the production line
1.4 Scope of Research
This project starts with a study of the main product, its functions, components and
structure. The data for 2008 will be analysed because that year has the highest
demand of the three years 2006-2008. The researcher assumes a full capacity
situation. This research focuses on the use of concepts and tools of "Takt time and
Line balancing" seeking the improvement of the production line operation,
productivity and quality in the Packing Section in this plastic spoon manufacturer.
The researcher uses the technique of motion and time study because that deals mainly
with labor costs. This technique will be used to find the standard time and a financial
incentive scheme in seeking the improvement of performance, the quality of
production time, and productivity.
6
CHAPTER II
LITERATURE REVIEW
This chapter describes the meaning and details of Takt time, the operator balance
chart, and time and motion study.
2.1 Takt Time
Takt time was developed as a manufacturing flow tool in the 1930s. It was
thoroughly developed by Toyota internally as a manufacturing management tool in
the 1950s. By the late 1960s it was in widespread use throughout the Toyota supply
base and became a well-known concept by the mid-1980s, well before the term "lean"
was introduced (Rother & Shook, 1998).
Takt time is a fundamental part of the design of production systems. There are many
definitions of Takt time, all appropriate in concept but quite commonly
misunderstood. This results in bad designs being specified and also in some general
confusion about the term. Takt time relates customer demand to available production
time, with the purpose of determining capacity during the planning stage and of
pacing production during the operation stage. Takt time, then, impacts both the
design and the operation of a manufacturing system. Takt time considers that
capacity planning should be the fastest possible operational Takt time. In operation,
Takt time can be understood as the pace at which products should be produced, or the
average volume of sales over a specific time period, or the time available to produce
one part (Shingo, 1989).
The most significant source of Muda (waste) is overproduction, i.e. producing more,
sooner or faster than is required by the next process downstream (Rother & Shook,
1998). Over-production leads to buffer inventories which require resources that are
not directly devoted to production. Buffer inventories are often costly to store and
handle, hinder movement from one product design to another, and hide production
errors. Hence, by avoiding overproduction, Takt is fundamental to Lean production.
7

The term "Takt" was first introduced in the German aircraft industry in the1930s, and
was subsequently taken to Japan by the German engineers training Japanese aircraft
producers pre-Second World War, and became an integral element of lean production
(Wada, 1995). Implementation of a "Takt system" was one of the first attempts
towards world class manufacturing in Japan, Germany and the USA (Wada, 1995;
Ohno, 1988; Kidder, 1995; Hounshell, 1984).
2.1.1 Calculation of Takt Time
Takt time is calculated by dividing the customer demand into available working time
per shift. The calculation for takt time is as follow:
Takt time = Available working time during the period
Customer demand during the period
(Production time available is total production time minus breaks, downtime, etc. It
includes changeover time, sometimes regarded as operational availability. Customer
demand is the average customer demand over a certain period.)
2.1.2 Implications of producing to Takt Time
The simplicity of the Takt time concept belies its astonishing effects. Here are some
main features of a Takt system.
2.1.2.1 Stabilized production flow. In lean production, work-in-progress
continuously flows through the processing steps. The production flow can have a
constant or a variable rate. For example, a production line with variable flow rate
may run between 0.75 and 1.25 units per minute on different occasions within any
particular hour; but average 60 per hour. By contrast, a constant rate line runs at 1
unit per minute throughout the hour. Operating to a takt time means all workstations
operate a constant rate synchronized to the customer demand. Takt system describes
a constant rate of flow. By eliminating variability at each step, Takt time prevents
8
build-ups of inventory between workstations and the stops and starts that occur at a
variable flow rate.
Flow production dates back to 1913, when Ford Motor Company sets up the first flow
assembly line for the Magneto assembly process (Hounshell, 1984). This was a major
breakthrough in the static mode of assembly and was later transformed by Toyota into
the Toyota Production System and eventually lean production (Womack et al., 1990;
Shiomi & Wada, 1995). However, a problem soon occurred in this method of
production: the rate of the work flow is not constant. Before long, Ford engineers
found that by moving magnetos at a set rate with a motorized chain, they could set the
pace of work. This resulted in a four-fold increase of productivity: five man-minutes
compared to the original 20 (Hounshell, 1984). Clearly, the Takt concept evolved
alongside the concept of "flow". It has been understood that smoothness and
harmony in flows are fundamental to productivity and efficiency (also see the case of
aircraft industry Kidder, 1995; Wada, 1995).
2.1.2.2 Work balance. Work balance refers to a situation where all the
operators along the production line require the same length of time to perform their
tasks. Operating a line to Takt time is a prerequisite to effective work balance. In an
ideal production line, the work content is distributed evenly between workstations in a
way to meet the Takt time (Tapping & Fabrizio, 2000). If any operation exceeds the
Takt time, the line cannot produce at the necessary rate, unless inventory buffers are
introduced, as in Picture (a).
Picture (a) is an illustration of a motorized process (i.e. stabilized flow) where the
pace of the process is set to the Takt time. As illustrated, Cycle times vary
significantly from one processing step to another (Cycle time for a machine or work
station is the time required from completion of one unit to completion of the next
operators. So, the line is unbalanced and operator 4 is tempted to cut corners in order
to finish his/her job within the Takt time, while operators 1, 6 and 7 drag their heels.
On the other hand, if the production line is not motorized (i.e. variable flow rate)
varying cycle times will lead to build-ups of inventory between the workstations. So,
9
line imbalance impairs quality, leads to underutilized machinery and people, builds up
inventory levels, causes individual frustration, and triggers team dissension. Picture
(b) illustrates improved balance of the line. In Picture (b) the work content is
balanced in a way that the cycle times are just below the Takt time. Ohno (1988)
refers to work balancing as the skill of passing the baton in a track relay. Ohno
explains that the more capable workers should make up for the less skilled, just as the
faster track runner carriers the baton for slower team-mates. So, in a balanced line,
workload is split according to individual skills and duration of specific tasks.
Line balance creates a situation where individual and team performance can be
monitored. Also, it increases morale since everyone works equally hard.
(a) (b)
Source: Strategos (2004)
2.1.2.3 Enhanced awareness on performance. Takt time is displayed on the
shop floor, sometimes using electronic devices (Andon board) which count back from
the Takt time to zero in every cycle. So, the production team tracks time and
"everyone can see where production stands at each moment" (Womack & Jones,
1996). This provides frequent and cyclic feedback on productivity, machine
reliability and quality problems, which increases the level of awareness in both
workers and management. Such heightened awareness is a great motivator, which
leads to higher productivity and better quality.
The objective of each processing step is to do the work within the span of Takt time.
The production team needs to provide rapid response (within Takt time) to any
problem that might cause delay. The root cause of problems should be eliminated so
10
THSASSUIVIPTION UNIVERS= LIBRARY
3531c-1
that they never disrupt the process again. Also, changeover times should be
minimized to enable the operator to change tools — if needed and to produce — within
the Takt slot (Miltenberg, 2001; Rother & Shook, 1998).
2.2 Operator Balance Chart
Normally, some operations may use more time than other operations, then the free
time may happen whilst awaiting the next work piece, or some operations may
necessitate using more than one operator. Line Balancing is distributing the work
elements equally, according to Takt time. Line Balancing helps to allocate the work
suitably to each operator. Customer demand fluctuates and can affect Takt time, and
then line balancing is necessary. Line Balancing must start from a current state
analysis. The best tool is the Operator Balance Chart. This chart can show the
improvement channel by visually showing the Takt time and cycle time of each
operation. The operator balance chart is "a graphic tool that assists the creation of
continuous flow in a multi-step, multi-operator process by distributing operator work
elements in relation to Takt time" (Lei, 2003). An operation balance chart uses
vertical bars to represent the total amount of work each operator must do compared to
Takt time. Creating an operation balance chart helps the critical task of redistributing
work elements among operators. This is essential for minimizing the number of
operators needed by making the amount of work for each operator nearly equal to, but
slightly less than, Takt time (Lei, 2003). Rother and Harris (2002) give examples of
practical use of this tool to improve work design.
Simons and Zokaei (2005) analyze five cutting rooms - by means of activity sampling
and observation - and categorize them as traditional and advanced, with significant
differences in productivity. The traditional cutting rooms have no concept of Takt
time or standardized work. These lines were run at a fast pace exhibiting the waste of
"over-production" (Ohno, 1988) resulting in variable flow, non-standard work and
intermittent operator activity. The advanced lines all run at a pace that operators can
apply standard operations and cut to the correct quality and were also paced to a Takt
time. The paper tentatively (due to the activity sampling method) concludes on
11
operator activity, that traditional lines run at 60 percent and advanced lines run at 80
percent; and therefore advanced lines can operate with 25 percent less labor cost due
to improved line balance.
2.3 Time and Motion Study
Time study was first used by Frederick W. Taylor while he is working at the Midvale
Steel Company in the 1890's. At about the same time, Frank B. Gilbreth applied
motion study to bricklaying as a means of improving his contracting business.
Motion and time study affects the way a man works and how much he gets for his
work. These things are vital to him. He finds it difficult to accept any change without
understanding the reason for it. In most cases, motion and time study is not fully
understood by those not actually trained to work with the technique. Often the lack of
understanding and the misapplication of motion and time study are responsible for
much of the controversy.
2.3.1 Why have motion and time study?
Management of manufacturing concerns feel that economy of effort and cost are
extremely important factors in the operation of a plant. In many cases they use
motion and time study as one of the techniques to achieve this economy. In addition,
they give serious consideration to the effect of production economy on the buying
public. They try to set the selling price of a product at a level the customer is willing
and able to pay. Frequently, if the product is a good one, well known, and sells at a
reasonable price, a manufacturer may gain a leading position in the field. Thus he is
able to maintain good profits and security.
In order to price a product, most manufacturers try to determine and lower three major
cost factors — material, overhead, and labor. Motion and time study has dealt mainly
with labor costs. Yet it is affected by many complex variables such as the
understanding of the whole field of motivation. It is this technical treatment of the
12
subject, without due regard for the human being, which has caused many motion and
time study systems to get into untenable positions in industry (Barbara, 1952).
Motion and Time study can reduce and control costs, improve working conditions and
environment, and motivate people. The basic purpose is to improve the work and to
reduce waste. Motion studies are performed to eliminate waste. Before any
improvement in quality or quantity of output, any study of operations time, any
scheduling of work or balancing of workload or any calculation of standard time, a
study of the current and proposed method is required. Studies of overall factory flow
or process, called macromotion studies, and then additional studies of detail or
operations, called micromotion studies, should be completed for a project. Motion
study seeks to minimize and simplify manual efforts.
2.3.1.1 Macromotion Study
Any process can be studied by dividing it into process activities. Although each
activity is different, depending on the product, there are five classes of activities that
are included in all process. Savings may be found in the process by reorganizing
activities. These activities found in every sequence of processes are
Operations Changes in the properties of the product
Transportations Changes in the location of the product
Inspection Confirmation that change fits the specification
Delay Wait for start of operation, transportation, or inspection
Storage Wait until needed
When the process is first studied, each activity is recorded and arranged into one of
the five classes. All observed activities are recorded, and activities not done are not
recorded. The purpose of each activity should be studied.
13
2.3.1.2 Micromotion Study
Considerable wasted motion and idle time can occur within an operation. This time
cannot be found with macromotion studies because is usually within one process
operation. The improvement is gained from reducing the operation cycle time. The
definition of a time standard is "the time required to produce a product at a work
station with the following three conditions":
1. a qualified, well-trained operator,
2. working at a normal pace,
3. doing a specific task
These three conditions are essential to the understanding of time study. The time
standard is one of the most important pieces of information produced in the
manufacturing department. It is used to develop answers for the following problems:
- Determining the number of machine tools to buy
- Determining the number of production people to employ
- Determining manufacturing costs and selling prices
Scheduling the machines, operations, and people to do the job and deliver on
time
Determining the assembly line balance, determining the conveyor belt speed,
loading the work cells with the correct amount of work, and balancing the
work cells
- Determining individual worker performance and identifying operations that
are having problems so the problems can be corrected
- Paying incentive wages for outstanding team or individual performance
- Evaluating cost reduction ideas and picking the most economical method
based on cost analysis, not opinion
- Evaluating new equipment purchases to justify their expense
- Developing operation personnel budgets to measure management performance
14
2.3.2 Motion and Time Study in the Wage Structure
In the technical sense, motion and time study can be placed between the job
evaluation system and the specific wage incentive plan used in the company. The
motion and time study program establishes the minimum expected rate of production
on each job to which it is applied for the base money rate being paid for that job.
(The base money rate for the job may change from time to time due to changing
economic conditions and social outlooks, but the time standard should remain the
same as long as the method of doing the job is not changed.)
Furthermore, motion and time study programs set the basis for wage incentive
systems. Through the use of motion and time study, the unit base of measure for extra
pay for extra production above the acceptable minimum is established.
2.3.2.1 Motion Study
To achieve rational and reasonable results it is essential to use motion and time study
together to determine a production standard. It is particularly important that
reasonable effort be applied in motion study to insure equitable results when time
study is used.
Basically, motion study is the foundation for time study. The time study determines
the time to do the job according to a certain method and is valid only so long as
method is continued. Once a new way to do the job is developed, the time study must
be changed to agree with the new method. Otherwise the time allowed for the job
would be too great, and a loose standard would result. This, in turn, would mean
inconsistent standards or unequal opportunity for all persons on incentive work to
earn essentially equal bonuses.
Motion study can be used successfully without time study — but time study cannot be
used without motion study. Since motion study is the foundation for time study and
should be done before a time study is made.
15
The purpose of motion study should be to find the greatest economy of effort with due
regard for safety and the human aspect. The total cost for human expenditure of effort
can be reduced at the same time that the unit cost for human effort is increased. The
same amount of work can be accomplished in less time with more efficient
application of human effort which will justify higher hourly wage rates.
Stated simply, motion study means —
1. Find out how a job is being done now.
2. Thoroughly question the reason for each step as it is being done now on
the job.
3. Remove the steps on the job which cannot be fully justified.
4. Install and standardize the new procedure for doing the job. The job study
may be simple or elaborate — depending on the desires of those making the
study and the people on the job. The amount of time and money to be
spent may limit the scope of the study.
The usual and tested procedures in motion study involve the use of —
1. Process Charts. The study of a series of steps in making an article or the
series of events a person goes through in completing a job assignment.
2. Flow Charts. A supporting route of travel that an article or person may
take in completing a series of steps in a job assignment. This chart is
usually used to supplement the process chart.
3. Operation Charts. A detailed analysis of just what an employee does in a
specific step or task.
4. Micromotion (simo) Charts. An elaborate breakdown of an operation chart
into very fine motion patterns, showing what the employee does in a
specific step or task.
16
2.3.2.2 Time Study
Once the method of doing the work is determined by motion study, it is often
desirable to find out how much time is used to do the work. Many industries adopt
some sort of a time study system to record the time on a job.
The name time study implies that some sort of a time-measuring device must be used.
In most case, it is a stopwatch. This particular area is more familiar to the employee
because he is able to observe at least the physical aspects of a time study man with his
stopwatch and board.
Before taking a time study, it is necessary to understand just what a time study
attempts to do. A time study attempts to find out the amount of work that a qualified
operator, properly trained, can do in a given time. The operator must do the work
according to a certain method, under certain conditions, and at a certain pace which
will produce a certain physical reaction. Certain allowances for personal and other
delays are provided.
In this explanation, "certain" is used several times. It is the problem of each
individual plant to determine the exact specifications for the "certain" method,
"certain" conditions, "certain" pace, "certain" physical reaction, and "certain"
allowances. Just how the specifications are determined - unilaterally by management
or bilaterally by management and the employees or union — is decided in each case by
the person or persons involved. But it must be remembered that the employees'
acceptance of the final answer — the production-standard-time to be allowed — is one
of the criteria for the success of time study.
From the technical aspect, this first step of the time study is not too important.
However, from the psychological point of view, it is perhaps the one which
determines whether the idea of time study is accepted or rejected. In most cases, the
employee's first contact with time study comes when he sees the time study man with
his board and stopwatch.
17
a) Recording the actual time value
The selection of a method depends upon the time study department's preference and
the acceptance of the selected method by the working force. The two methods of
recording as below:
1. Continuous Stopwatch Reading and Recording
The stopwatch is started at the beginning of the first element of the job description
and runs continuously until the study is completed. At the end of each element, in
turn, the particular reading of the watch is recorded for the corresponding element.
2. Snapback or Repetitive Stopwatch Reading and Recording
The stopwatch is started at the beginning of each element. At the end of each
element, the watch is read and the hand is snapped back to zero.
b) Determining the average time to do the job by a certain operator
To avoid the misuse of the idea of abnormal time valued, consideration of this policy
is suggested:
All time values for an element are to be included in determining the average time for
an operator studied, unless a specific rate is made in each case of a discarded time
value that the job method is not followed.
This means that if all the work calls for in the element of the job is not done, the time
value (which probably will be low) will be discarded. If the operator unnecessarily
does more work than the element of the job calls for, the time value (which probably
will be too high) also will be discarded.
18
TIMASSUMPTION UNIVERSTrY LIBRARY
c) Determining the Base Time for the Job by Rating or Leveling
The process of comparing a worker's rate of performance with the performance
expected of a person working at the selected speed for the area, industry, or plant is
called rating or leveling.
The rating process is a systematic attempt to relate the observed performance to the
performance expects from a certain type of individual who has certain skill
qualifications, who follows a certain method, and who works under certain conditions
and at a certain pace.
The Westinghouse System of Rating was created by the Westinghouse Company in
1927. This system of rating consists of four factors, which are:
1. Skill — The operator can work according to the assigned method rapidly.
2. Effort — The operator desires to work efficiency.
3. Consistency — The operator can operate work consistently.
4. Conditions — Something that affects the operator and non-operator.
Determining the operator rating gives a mark to these four factors, as in Table 2.1.
19
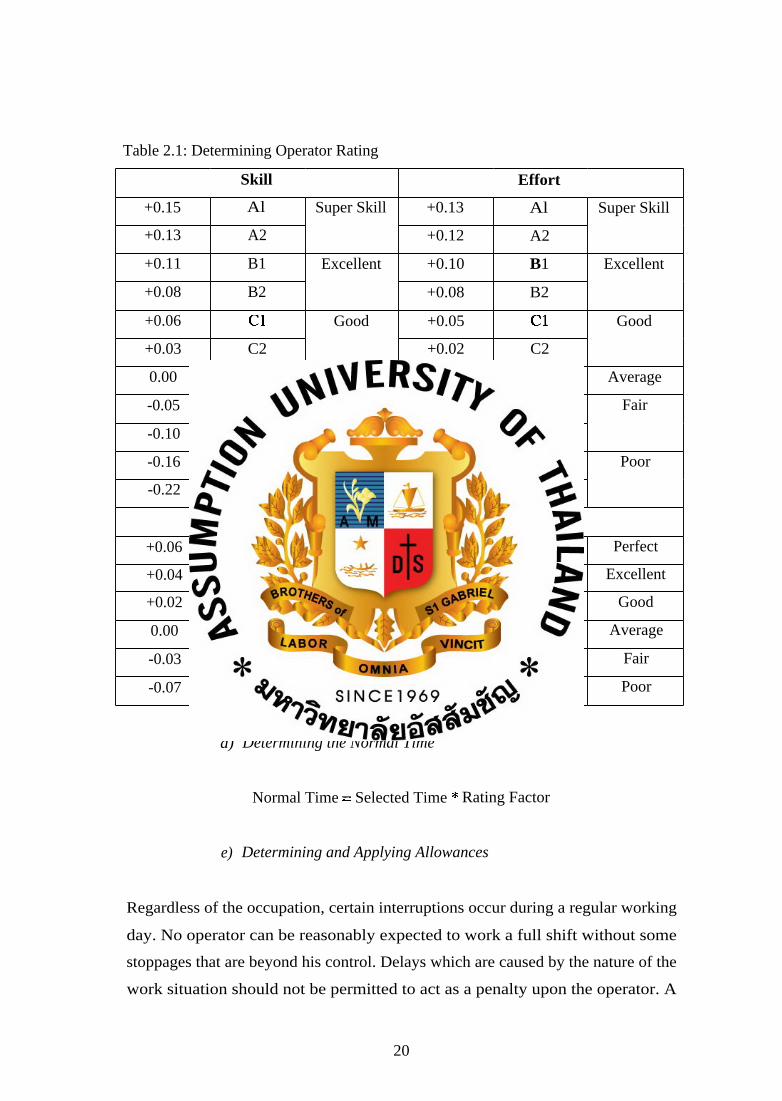
Table 2.1: Determining Operator Rating
Skill Effort
+0.15 Al Super Skill +0.13 Al Super Skill
+0.13 A2 +0.12 A2
+0.11 B1 Excellent +0.10 B 1 Excellent
+0.08 B2 +0.08 B2
+0.06 Cl Good +0.05 Cl Good
+0.03 C2 +0.02 C2
0.00 D Average 0.00 D Average
-0.05 El Fair -0.04 El Fair
-0.10 E2 -0.08 E2
-0.16 Fl Poor -0.12 Fl Poor
-0.22 F2 -0.17 F2
Conditions Consistency
+0.06 A Ideal +0.04 A Perfect
+0.04 B Excellent +0.03 B Excellent
+0.02 C Good +0.01 C Good
0.00 D Average 0.00 D Average
-0.03 E Fair -0.02 E Fair
-0.07 F Poor -0.04 F Poor
d) Determining the Normal Time
Normal Time = Selected Time * Rating Factor
e) Determining and Applying Allowances
Regardless of the occupation, certain interruptions occur during a regular working
day. No operator can be reasonably expected to work a full shift without some
stoppages that are beyond his control. Delays which are caused by the nature of the
work situation should not be permitted to act as a penalty upon the operator. A
20
definite policy should establish which type and duration of delays are to be covered in
the delay allowances in time study and which are to be covered by the time card.
Allowances for personal needs, such as food, drink, and toilet, and rest allowances
can be determined by study and agreement between management and labor. The
formula is
Percent allowance for delay = Delay time * 100
Net production time
Then,
Production-standard-time-allowed = base time * (1.00 + percent allowance for delay)
(Barbara, 1952).
In a group of approximately 15 factories productivity is as low as a 30 rating before
the introduction of work study. After work study is applied, new layouts introduced,
job methods revised, and preventive maintenance brought into use - the rating
increases to 55. this is still below the normal rating of 60. At this stage, incentives
are introduced, and the operators' performance steadily increases until an 80 rating is
achieved. Work study achieves an increase from 30 to 55, representing a gain of
83%. By applying incentives the performance increases from 55 to 80, a gain of a
further 83% (Gordon, 1958).
One paper studied organizational changes at 0. M. Scott after a leveraged buyout.
For fifteen years before the buyout, Scott was a subsidiary of ITT Corporation. The
company's principal controls and incentives were imposed by the corporate parent.
After the buyout was completed in 1986, Clayton and Dubilier, a private firm
specializing in leveraged buyouts, worked with management to come up with new
incentives. The major changes introduced after the buyout swere substantial increases
in salary and even greater increases in bonuses that managers can earn by meeting,
corporate performance targets. More managers participate in the program, and factors
that determine bonuses now include corporate performance, divisional performance,
and individual goals and performance. The plan is designed so that the payoff is
extremely sensitive to change in performance. Average bonuses as a percentage of
21
salary for the top ten managers increases from 10% and 17% in the two years before
the buyout to 66% and 39% in the two years after, during which period operating
income increases by 42%. Personal objectives are set by managers and their
superiors, and achievement against those objectives is monitored by superiors (Bruns,
1992).
Normally, if the incentive scheme is used to motivate the operator, the working level
of operator will increase about 25-35%. This increment rate is called "Average
Incentive Pace".
Manufacturing management and engineering students are being prepared to design
work stations, develop efficient and effective work methods, establish time standards,
balance assembly lines, estimate labor costs, develop effective tooling, select proper
equipment, and layout manufacturing facilities. However, the most important thing is
to learn how to train production workers in these skills and techniques so they can
become motion and time conscious. Motion study offers a great potential for savings
in any area of human effort. We can reduce the cost by combining elements of one
task with elements of another. Motion study uses the principles of motion economy
to develop work stations that are friendly to the human body and efficient in their
operation. Motion study must consider the operator's safety. Time study can reduce
cost significantly well. Time standards are goals to strive for. In organizations that
operate without time standards, 60% performance is typical. When time standards are
set, performance improves to an average of 85%. This is a 42% increase in
performance. Incentive systems can improve performance even further. Incentive
system performances are 120%: that is another 42% increase in performance.
Manufacturing plants with no standards average 60% performance, with time
standards average 85% performance, and with incentive systems average 120%
performance. If additional production output is required, do not buy more machinery,
do not add a second shift, and do not build a new plant. Just establish a motion and
time study program.
22
BMR Case Studies on Wage Based Incentive Schemes
1. A furniture manufacturing business with a turnover of $11.5 million dollars per
year employing 62 employees improved their bottom line profit by $485,835
within 10 months of commencing the program. Employee levels reduced by 10%
in the first four months with increased overall production levels resulting in
reduced wage costs offsetting the cost of the program.
2. By introducing a wages based incentive scheme into the business, a manufacturing
company increased production by 23% within 12 months while reducing their
work force. Increased production due to motivation and natural attrition achieved
savings of $405,000 per year.
3. A joinery business employing 30 staff with an annual turnover of $4.5 million
incurred an annual loss of $346,000. On commencing the program the company
started to see significant gains after 9 months and went on to record a net profit of
$155,000 within 18 months.
4. A small manufacturing company with eight employees with an annual turnover of
$2.1 million dollars per year increased production by 20% over four months
increasing the net profit by $25,200 per month allowing an increase in sales of
approximately $32,000 per month by introducing a Wage Based Incentive Scheme
based on a Piece Rate.
It is established practice in the plantation sector in Tamil Nadu for triennial industry-
wide wage agreements to be negotiated between the authorized representatives of
management and workers, and for the understanding arrives at to be recognized as a
formal settlement by the Labor Department of the state government. Until the 1980s,
tea pluckers were paid a fixed daily wage plus a cost-of-living allowance (revised
every quarter, based on published index numbers). In return, they had to harvest a
minimum quantity of green leaf per day. For any excess quantity harvested above the
norm, they were paid a plucking incentive. This is a constant amount per kilogram of
leaf but, in due course, the system was refined by having two incentive slabs
(categories). The general feeling among management was that the incentive scheme
was defective in that the minimum quantity was the same in both the high and lean
cropping months, and that the rate of incentive was not attractive to the worker. A
23

scheme was formulated in 1985 by the association of planters and taken up for
internal consideration among its members. The initial response from the practicing
planters is that they were not ready for such a scheme and that it was premature to
place it before the trade unions as part of the negotiating package. Over the next three
years, the scheme was discussed by management with a view to reaching agreement.
In the light of comments and suggestions, the minimum quantity of leaf to be plucked
as well as the incentive slabs and rates were modified, and a compromise reached
within the management camp, it being evident from the calculations that all
managements would stand to gain from the proposed incentive system. An evaluation
of the scheme indicated that it was implemented with fairness and transparency and,
in the process, it gained credibility in the eyes of the trade unions. The existence of a
grievance redress process was added to the successful working of the scheme. Both
management and workers gained, albeit to a different extent. According to one
estimate -- and this comes from a highly productive and well-managed group -- a
combination of programmed plucking based on leaf expansion time (LET), selective
use of shear harvesters and the adoption of the new incentive system has led to a 36
percent improvement in the plucking average over the past five years, since the
scheme has been in operation. It is also reported by the same group that, as a
consequence, 10 percent of the total leaf harvested during 1994 came from pluckers in
the 50 kg plus slab. In terms of incentive earnings, the benefit to pluckers during the
five-year period goes up by 25 percent (Sivaram, 2000).
24
CHAPTER III
METHODOLOGY
The research objective is the operation production line, productivity, quality in
production time, and performance improvement by using Takt Time, Time and
Motion, and a Wage Incentive Scheme. The aim is waste reduction or elimination,
production process and cycle time reduction, and motivation of the operator to work
with more productive effort. These techniques will be used as the operation guideline
in the production line in this plastic spoon manufacturer. The researcher separates the
techniques into three groups. The first group is "Takt Time and Do Line Balancing"
which comprises data set and data collection, draw a current state line balance by
using an operator balance chart, and do line balancing. The second group is "Improve
Production Efficiency". The third group is "Improve Production Performance". To
demonstrate this, the methodology processes are shown in Figure 3.1.
25
e-ba
lanc
e w
Cal
cula
te T
Cal
cula
te L
ine
Bal
ance
Eff
icie
ncy
0.1 a) .1.71 a) cl)
cd
'F);O
—00
Red
uce
Non
Val
ue A
dded
and
e
—10
bO
Do
Lin
e Bal
3.1 Perform Takt Time and Line Balancing
3.1.1 Data Set and Data Collection
The researcher collects the data of the Plastic Spoon Manufacturer such as customer
demand, regular and overtime costs, production processes, work time, etc., by
choosing the highest customer demand year, and the highest labor cost section. After
the year and section are specified, the qualifications of the Packing section are
collected (such as cycle time, available production time, number of operators, in-
process inventory, on time delivery, and defects, etc).
3.1.2 Draw current state Line Balance by using the Operator Balance Chart
After finishing the data set and data collection, Takt time will be calculated. The best
way is to achieve target Takt time at fluctuation of demand. Takt time is a better
measure over cycle time and lead time. The customer has the demand of a daily rate
of supply, therefore Takt time is chosen as a reference number. This number gives a
sense for the rate at which a process should be producing. It helps to see how one is
doing and what needs to be improved. Takt time is the rate at which a company must
produce a product to satisfy customer demand. A comparison of station cycle time
against Takt time guides the improvement areas. Then, the operation processes and
the cycle time in each operation will be specified.
The current state line balance will be drawn by using the operator balance chart which
can help to see the situation clearly, and a bar chart shows the current state of balance
outside line and non-equilibrium point. This chart shows the cycle time, the number
of operators, and Takt time.
The researcher shows the worker time comparisons with each other, compares cycle
time against Takt time, and specifies target manpower which is separate into two
calculation methods (calculated from available working regular time and overtime,
and calculated from available working regular time). These calculations show the
27
difference between the manpower available and the target manpower in each
operation.
The line balance efficiency of current state will be calculated. The objective of line
balance efficiency calculation is to check the waiting time in the production system
when compared with the bottleneck (longest operation).
3.1.3 Do Line Balancing
The number of operators and the description in each operation will be specified
(before and after reallocation), and then the number of operators and process in each
operation will be reallocated.
Waste will be identified, with an explanation of the seven wastes (Overproduction,
Inventory, Conveyance, Defect Waste, Processing Waste, Operation Waste, and Idle
time).
After finishing in waste identification, the waste will be eliminated in product
movement and human motion. For waste elimination in product movement, retention
and conveyance are the main sources of waste. These wastes are about the type of
"conveyance". Then, the retention and conveyance points will be eliminated. If the
retention and conveyance points are reduced or eliminated, more than half of all
wastes will be eliminated. The packing section layout before improvement and
reallocation will be shown at the retention and conveyance point, work in process, and
the checking point. And for the waste elimination in human motion, the labor motion
and the type of waste in each operation (before and after improvement) will be
specified. The packing section layout after improvement and reallocation will be
shown at the retention and conveyance point, work in process, and the checking point
again.
When the operations are reallocated and the wastes are eliminated from the human
motion and product movement, the production will be more efficient. Then, these
operations will be rebalanced. The new cycle time, target manpower and manpower
28
available after being rebalanced, will be specified. Then, the reallocated work and
rebalance will be shown in the standard work layout and operator balance chart again.
The future state of line balance efficiency will be calculated again which shows how
much these operations are better.
3.2 Improve Production Efficiency
3.2.1 Time study of production process
For average time study, the researcher studies only the highest cycle time and labor
cost because this process has more problems and affects other operations especially
labor. The researcher calculates the time of the operators' work, for about 30 persons
(10 times per each person).
Standard time calculation starts from normal time calculation, rating factor, and
selected time. The rating factor comprises skill (considered as the skill of operator's
work), effort (considered as the operator's working effort to succeed in work),
condition (considered from the operator's working condition that affects the speed of
working or not), consistency (considered as the operator's working consistency
between reckoned time). The assessment the rating factor of operators in this process
is specified by the head worker and the production manager. After the normal time is
calculated, the next process is standard time calculation by using allowance time. The
allowance time in this research is specified by the head worker and production
manager.
The researcher takes the normal time to calculate the number of hours that the
operators must work to support the demand fluctuation in each month. And then, the
researcher takes these work hours per day in each month to calculates the regular time
cost and the overtime cost.
After finishing the calculation of average work hours, standard time, and allowance
time, the production performance will be calculated. The researcher calculates the
pay performance which gives us as the number of standard minutes per hour for
29
which the department is paid. And true performance will be calculated, which gives
us the number for production of good work.
3.3 Improve Production Performance
After the researcher acquires knowledge of the performance, the researcher applies an
incentive scheme to motivate the operator towards more productive effort, and this
scheme creates the average incentive pace.
Nowadays, the wage system of this operation is the hourly wage. For the incentive
scheme application, the wage will be paid in accordance with the productivity (wage
per box). The wage rate per box is specified by the production manager and the head
worker. Then, the labor cost and the work time will be changed. The researcher
expects that the work time will be reduced from the normal time by about 10 percent
approximately.
From the new average work hours, standard time, and allowance time, the production
performance in pay and true performance are calculated again. The researcher
calculates and compares between the normal method (hourly wage) and the new
method (wage per box) of labor cost calculations, if the customer demand increases
by about 10 percent.
30
►ASSUMPTION UNTI/ERSITY LIBRARY
CHAPTER IV
PRESENTATION AND CRITICAL DISCUSSION OF RESULTS
This chapter shows the details and figures of all parts of the methodology processes.
4.1 Collect and Set Data
4.1.1 Set Data
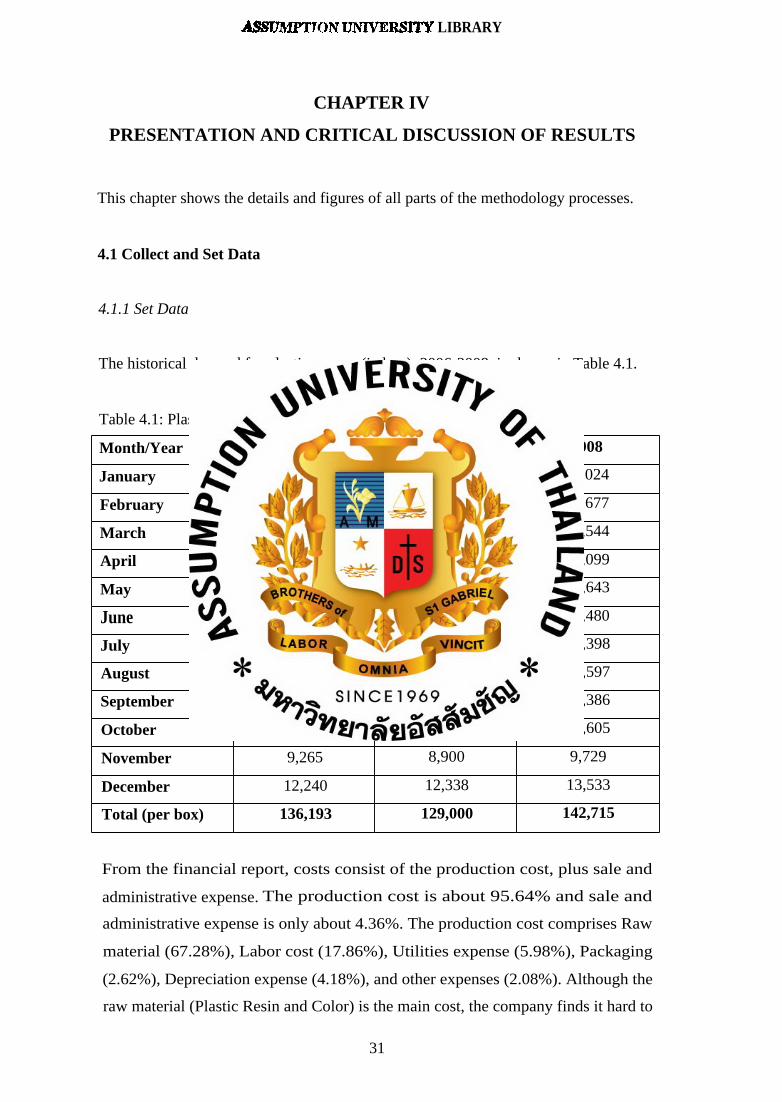
The historical demand for plastic spoons (in box), 2006-2008, is shown in Table 4.1.
Table 4.1: Plastic spoon demand (box) (2006-2008)
Month/Year 2006 2007 2008
January 11,489 10,492 12,024
February 10,940 10,864 11,677
March 10,796 9,391 10,544
April 12,153 11,131 12,099
May 12,052 11,392 12,643
June 11,056 10,152 11,480
July 13,107 11,570 13,398
August 11,648 11,920 12,597
September 11,446 11,096 12,386
October 10,001 9,754 10,605
November 9,265 8,900 9,729
December 12,240 12,338 13,533
Total (per box) 136,193 129,000 142,715
From the financial report, costs consist of the production cost, plus sale and
administrative expense. The production cost is about 95.64% and sale and
administrative expense is only about 4.36%. The production cost comprises Raw
material (67.28%), Labor cost (17.86%), Utilities expense (5.98%), Packaging
(2.62%), Depreciation expense (4.18%), and other expenses (2.08%). Although the
raw material (Plastic Resin and Color) is the main cost, the company finds it hard to
31
control this cost because the Plastic Resin price is changeable, depending on the
market price. The second main cost for the company is the Labor cost.
Out of all the labor costs in 2008, the labor cost comprises the Packing section
(73.01%) (Regular time 42.97% and Overtime 30.04%);; Injection section (23.04%)
(Regular time 14.74% and Overtime 8.30%); and Mix, Blow, Screen, and Cut sections
(3.95%). The main labor cost is from the Packing section.
Within the labor cost of the Packing section, the labor cost of regular time (8.00-
17.00) is 56.82% and Overtime is 43.18%.
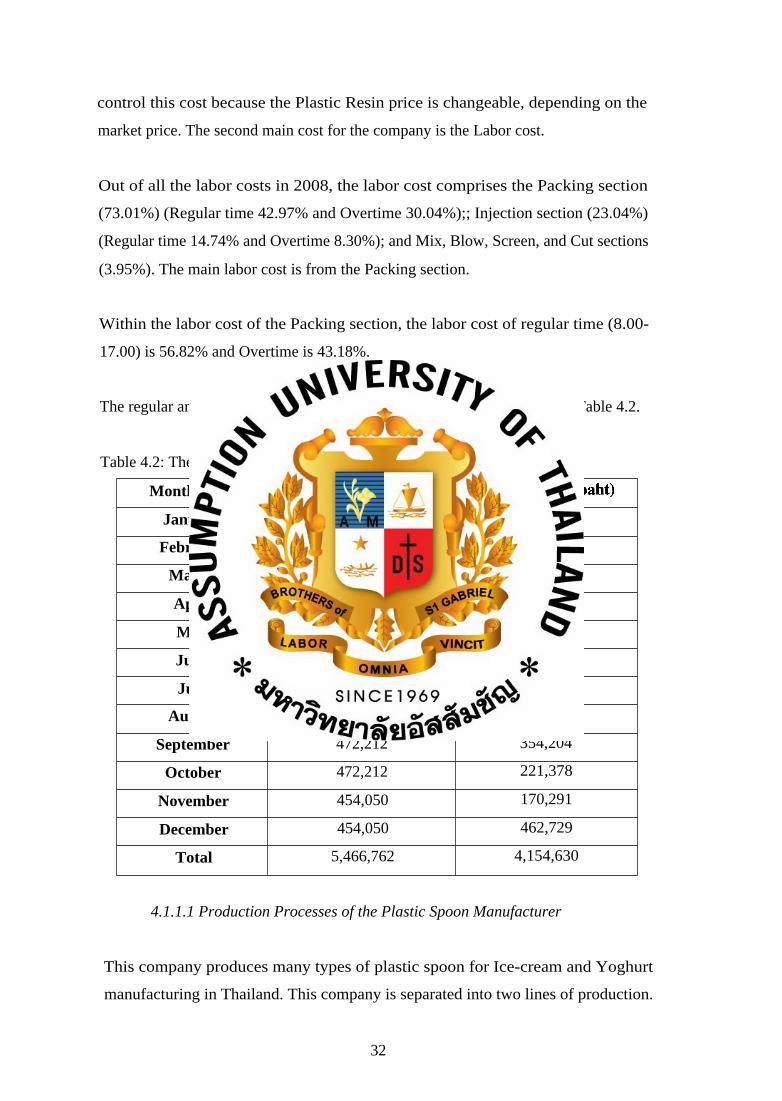
The regular and overtime cost of the Packing Section for 2008 is shown in Table 4.2.
Table 4.2: The labor cost of Packing Section (baht) (2008)
Month/Year Regular time cost (baht) Overtime cost (baht)
January 472,212 309,929
February 435,888 367,828
March 472,212 221,378
April 417,726 430,836
May 435,888 449,567
June 454,050 298,009
July 472,212 442,755
August 454,050 425,726
September 472,212 354,204
October 472,212 221,378
November 454,050 170,291
December 454,050 462,729
Total 5,466,762 4,154,630
4.1.1.1 Production Processes of the Plastic Spoon Manufacturer
This company produces many types of plastic spoon for Ice-cream and Yoghurt
manufacturing in Thailand. This company is separated into two lines of production.
32
/ Cut section
Packing section
Injection section
Mixing section
Blow section
--*
Screen section
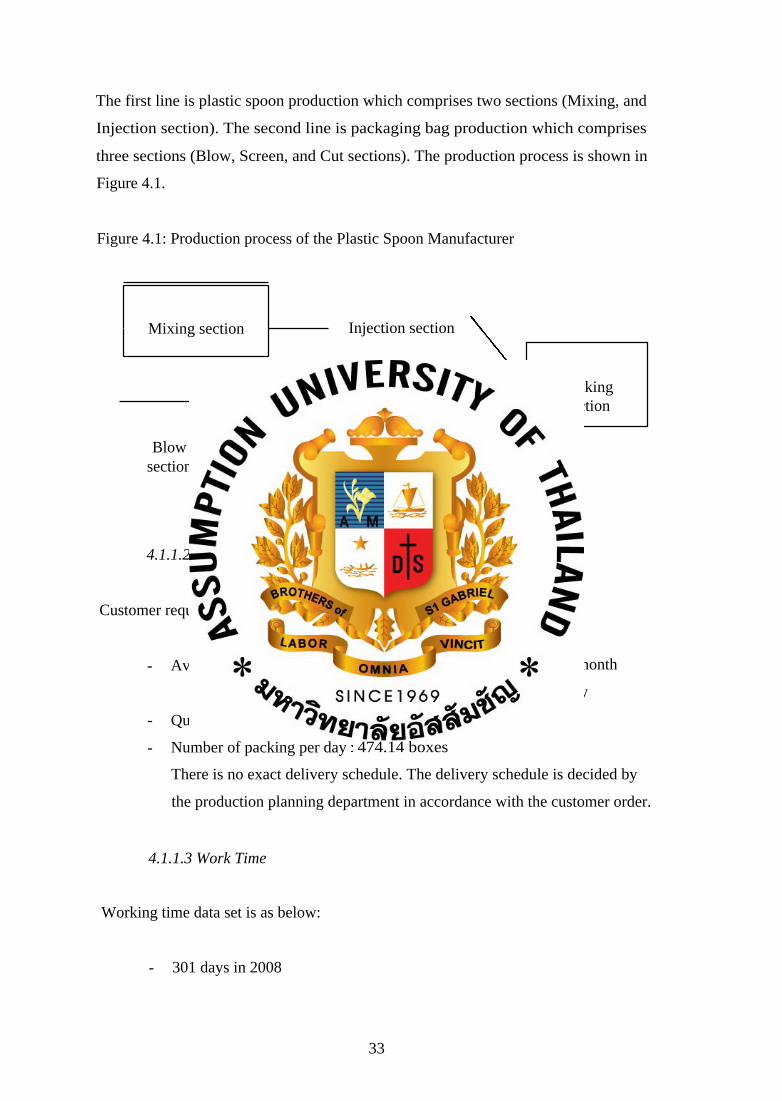
The first line is plastic spoon production which comprises two sections (Mixing, and
Injection section). The second line is packaging bag production which comprises
three sections (Blow, Screen, and Cut sections). The production process is shown in
Figure 4.1.
Figure 4.1: Production process of the Plastic Spoon Manufacturer
4.1.1.2 Customer Requirements
Customer requirements data set out below:
- Average customer demand : 142,715/12 = 11,892.92 boxes per month
142,715/301 = 474.14 boxes per day
- Quantity per packing : 3,000 units (1 box)
- Number of packing per day : 474.14 boxes
There is no exact delivery schedule. The delivery schedule is decided by
the production planning department in accordance with the customer order.
4.1.1.3 Work Time
Working time data set is as below:
- 301 days in 2008
33
- One shift production in all production departments except the Injection
department
- Company holiday is Sunday
- For one shift : Between 8:00 and 17:00
(60 minutes for unpaid lunch break) (12:00-13:00)
: Overtime between 17:00 and 20:00
(One x 15 minutes break during Overtime) (17:00-17:15)
4.1.1.4 Plastic Spoon Manufacturer Production Control Department
Data for the information and material flow from and to the production control
department is as below:
- The company communicates with the customers and the suppliers by
electronic device.
- Customer services department receives one month prior forecast from the
customer.
- Production control department receives the customer forecasts, validates
them, and converts the validated forecasts into company work orders.
Work order status is updated and issued weekly. Each work order contains
six active sections. Weekly work orders (targets) are hung up on the
production board in order to provide information to the group leaders
- Shipping schedule is decided by the logistics department of the Plastic
Spoon Manufacturer
- Production control department enters the material requirements into the
company data, and the purchasing of necessary parts is done by the
procurement department. Weekly meetings are held in order to discuss
critical procurement issues
4.1.2 Collect Data
Some processes on the production shop floor are done manually by the operators.
And some processes are done manually by both the operators and the machine. The
start time of each process is considered to be the time when the operator picks up the
34
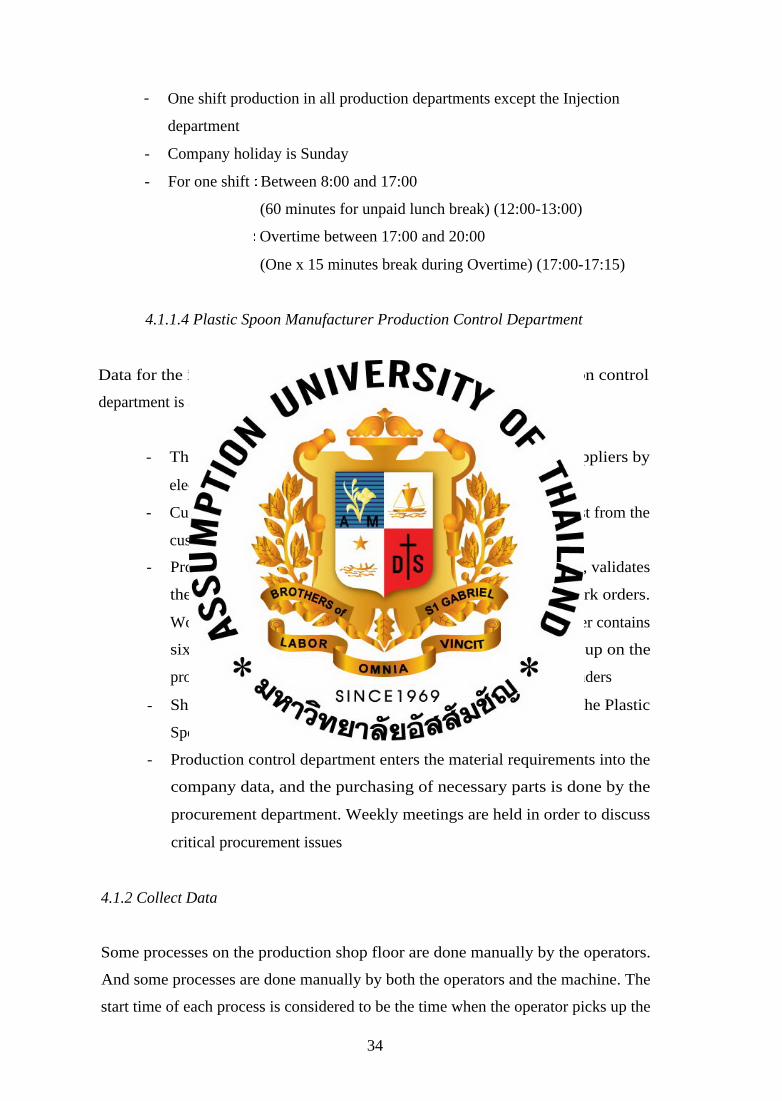
product from the incoming buffer of each section. The finish time of each process is
considered to be the time when the operator delivers the product to the outgoing
buffer of each section (Figure 4.2).
Figure 4.2: Illustration of the defined cycle time
i
Process
Incoming Buffer
Outgoing Buffer
Buffer Cycle Time Buffer
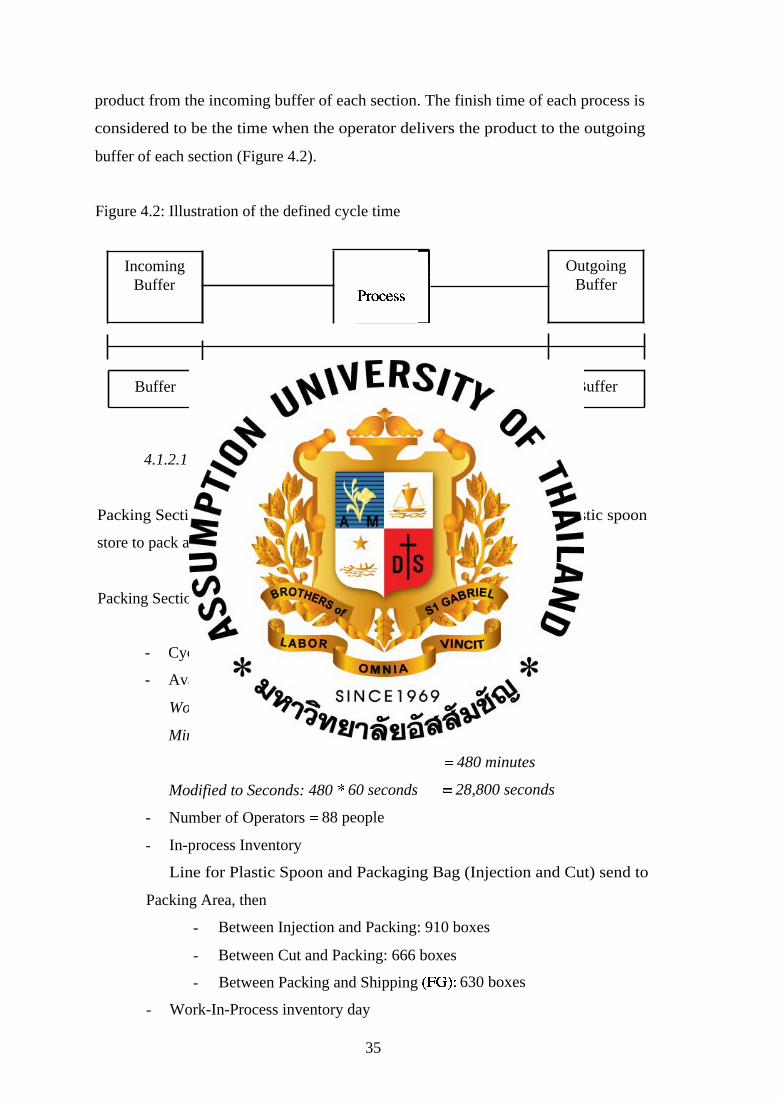
4.1.2.1 The qualifications of the Plastic Spoon Manufacturer process
Packing Section takes the raw materials from the packaging bag and plastic spoon
store to pack and patch so as to become manufactured products.
Packing Section:
- Cycle Time = 7,865.64 seconds per box
- Available Production Time = 28,800 seconds
Work Time per day: 9 hours * 60 minutes = 540 minutes
Minus Downtime: Lunch break = 60 minutes
= 480 minutes
Modified to Seconds: 480 * 60 seconds = 28,800 seconds
- Number of Operators = 88 people
- In-process Inventory
Line for Plastic Spoon and Packaging Bag (Injection and Cut) send to
Packing Area, then
- Between Injection and Packing: 910 boxes
- Between Cut and Packing: 666 boxes
- Between Packing and Shipping (FG): 630 boxes
- Work-In-Process inventory day
35
The work-in-process inventory day calculation is In-process inventory
divided by the customer demand per day. Customers demand data shown in
the previous part in the topic of the customer requirements data set Line for
Plastic Spoon and Packaging Bag (Injection and Cut) are sent to the Packing
Area, then.
- Between Injection and Packing : 910 boxes (910 boxes/474.14
boxes per day) = 1.92 days
- Between Cut and Packing : 666 boxes (666 boxes/474.14 boxes
per day ) = 1.41 days
- Between Packing and Shipping (FG) : 630 boxes (630
boxes/474.14 boxes per day) = 1.33 days
On time Delivery
On time Delivery of Plastic Spoon Manufacturer is 97% (about 138,433.55
boxes per year) which is the source of the problem:
- Job allocation for workers in the packing section still has problems.
Sometimes, the customers may be quick in ordering, in which it
can be seen that the job allocation is still not good enough.
Whenever quick ordering is required, it may affect normal ordering
if the company cannot allocate the job to the worker suitably. This
could result in late delivery to the customers.
- Production Schedule is changed all the time.
- Defects (per one million units)
The defective rate is shown in Parts per Million (ppm) that equals
5,000 units (1.67 boxes). And most defects result from the packing station.
These defects must be re-checked and corrected.
After finishing the Packing process, it is taken to the Packing Section Store (Finished
Products) (3,000 pieces per box).
4.2 Draw current state Line Balance by using the Operator Balance Chart
36
4.2.1 Calculate Takt time
The best way out is to achieve target Takt time at fluctuation of demand. Takt time is
a better measure over cycle time and lead time. The customer has the demand at a
daily rate supply, therefore Takt time was chosen as a reference number. This number
gives a sense for the rate at which a process should be producing. It helps to see how
one is doing and what needs to be improved. Takt time is the rate at which a company
must produce a product to satisfy customer demand. A comparison of station cycle
time against Takt time guides the improvement areas.
Takt time = Available working time during the period
Customer demand during the period
Average Takt Time (2008) of the Packing Section:
Average Customer Demand = 474.14 boxes/day
Total Time Available = 28,800 seconds
Average Takt Time = 28,800 seconds
474.14 boxes / day
= 60.74 seconds / box
The Takt time of the Packing Section in each month is shown in Table 4.3.
37
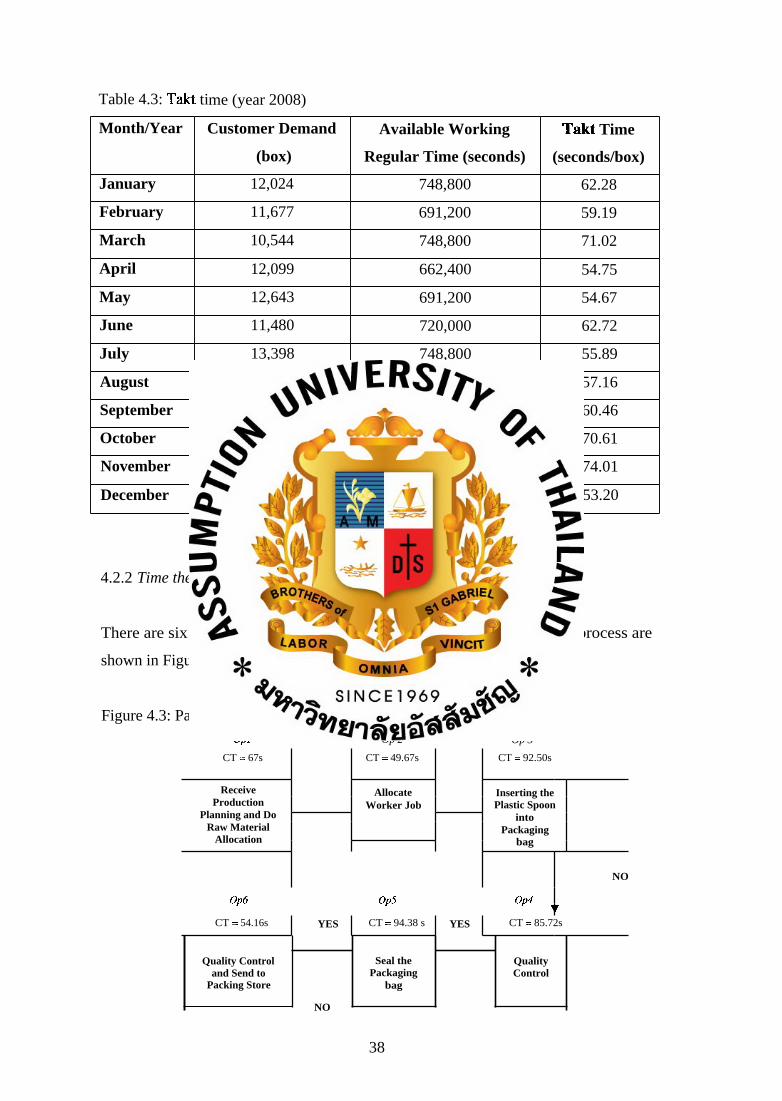
Table 4.3: Takt time (year 2008)
Month/Year Customer Demand
(box)
Available Working
Regular Time (seconds)
Takt Time
(seconds/box)
January 12,024 748,800 62.28
February 11,677 691,200 59.19
March 10,544 748,800 71.02
April 12,099 662,400 54.75
May 12,643 691,200 54.67
June 11,480 720,000 62.72
July 13,398 748,800 55.89
August 12,597 720,000 57.16
September 12,386 748,800 60.46
October 10,605 748,800 70.61
November 9,729 720,000 74.01
December 13,533 720,000 53.20
4.2.2 Time the Process
There are six operations in the Packing process. The cycle time and the process are
shown in Figure 4.3.
Figure 4.3: Packing Section processes
Opl Op 2 Op 3
CT = 67s CT = 49.67s CT = 92.50s
Receive Allocate Inserting the Production
Planning and Do Worker Job Plastic Spoon
into Raw Material
Allocation Packaging
bag
NO
Op6 Op5 Op4 •
CT = 54.16s YES CT = 94.38 s YES CT = 85.72s
Quality Control Seal the Quality and Send to Packaging Control
Packing Store bag
NO
38
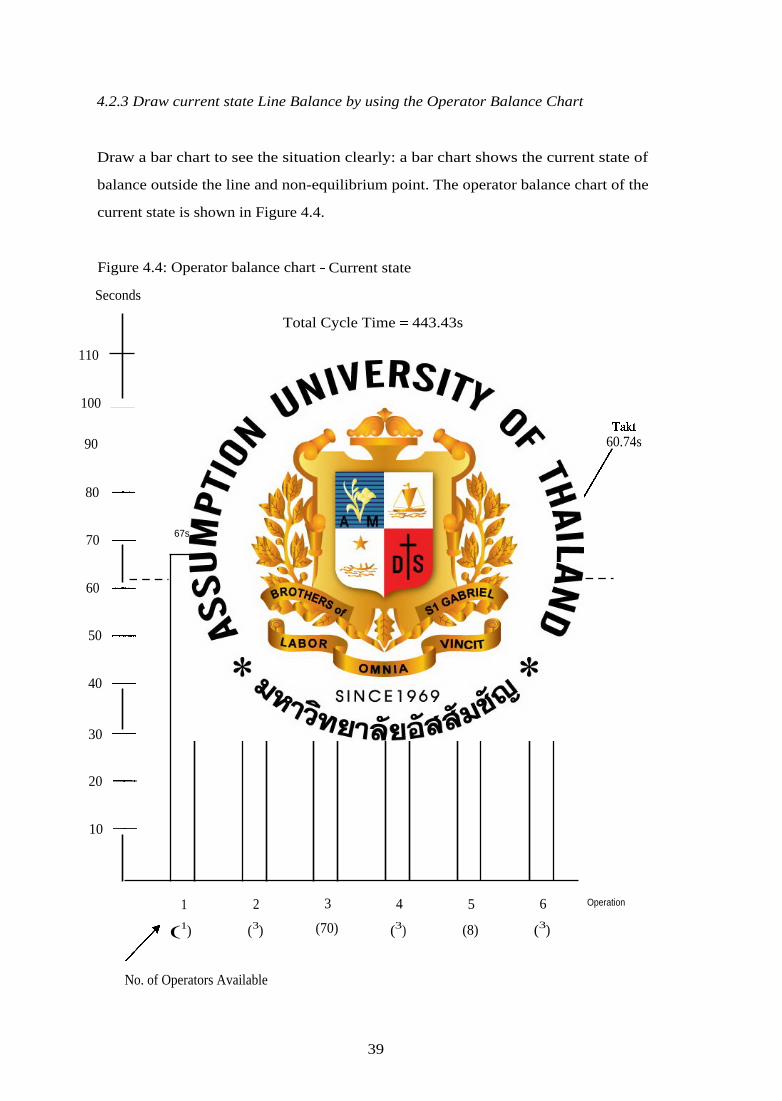
4.2.3 Draw current state Line Balance by using the Operator Balance Chart
Draw a bar chart to see the situation clearly: a bar chart shows the current state of
balance outside the line and non-equilibrium point. The operator balance chart of the
current state is shown in Figure 4.4.
Figure 4.4: Operator balance chart - Current state
Seconds
Total Cycle Time = 443.43s
92.50s
85.72s
49.67s
110
100
90
80 —
70 — 67s
60 —
50 —
40 —
94.38s
Takt 60.74s
54.16s
30 —
20 —
10 —
1 2 3 4 5 6 Operation
/ (1) (3) (70) (3) (8) (3)
No. of Operators Available
39
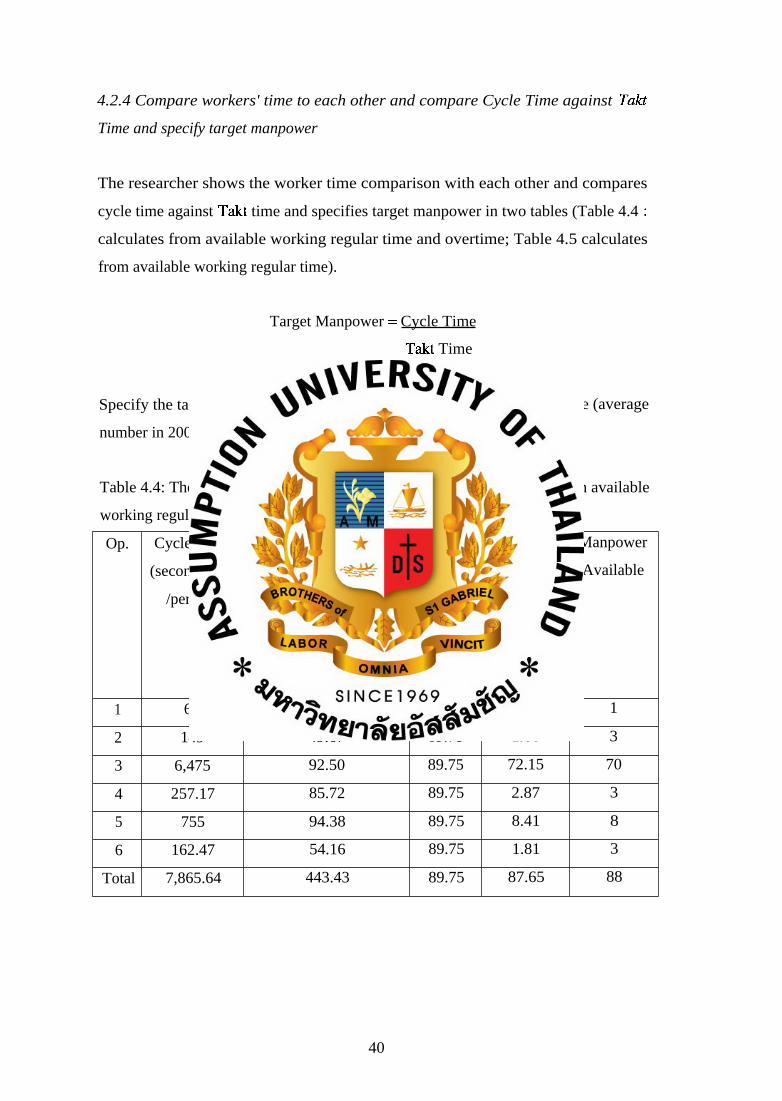
4.2.4 Compare workers' time to each other and compare Cycle Time against Takt
Time and specify target manpower
The researcher shows the worker time comparison with each other and compares
cycle time against Takt time and specifies target manpower in two tables (Table 4.4 :
calculates from available working regular time and overtime; Table 4.5 calculates
from available working regular time).
Target Manpower = Cycle Time
Takt Time
Specify the target manpower by taking the cycle time divided by Takt time (average
number in 2008), as below:
Table 4.4: The time and manpower of the Packing Section (calculated from available
working regular time and overtime)
Op. Cycle Time
(seconds/box
/person)
Cycle Time at stations
when using multiple
operators
(CT/Manpower
Available)
(seconds/box)
Takt
Time
(seconds
/box)
Target
Manpower
Manpower
Available
1 67 67 89.75 0.75 1
2 149 49.67 89.75 1.66 3
3 6,475 92.50 89.75 72.15 70
4 257.17 85.72 89.75 2.87 3
5 755 94.38 89.75 8.41 8
6 162.47 54.16 89.75 1.81 3
Total 7,865.64 443.43 89.75 87.65 88
40
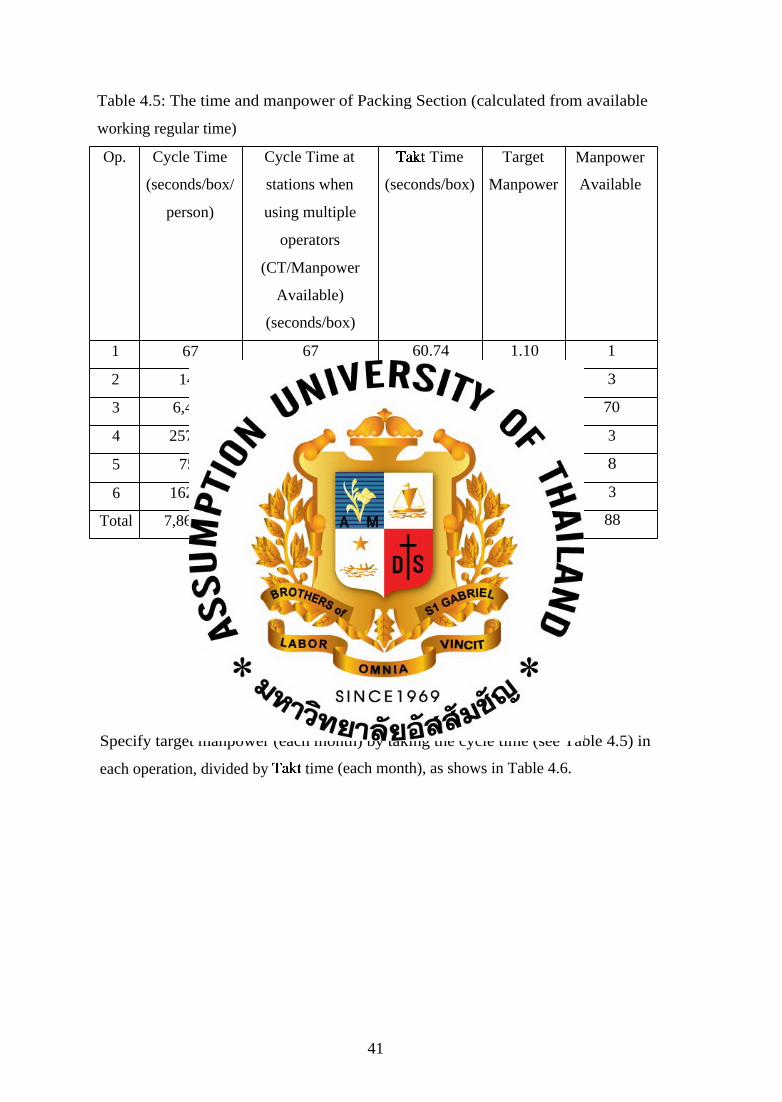
Table 4.5: The time and manpower of Packing Section (calculated from available
working regular time)
Op. Cycle Time
(seconds/box/
person)
Cycle Time at
stations when
using multiple
operators
(CT/Manpower
Available)
(seconds/box)
Takt Time
(seconds/box)
Target
Manpower
Manpower
Available
1 67 67 60.74 1.10 1
2 149 49.67 60.74 2.45 3
3 6,475 92.50 60.74 106.60 70
4 257.17 85.72 60.74 4.23 3
5 755 94.38 60.74 12.43 8
6 162.47 54.16 60.74 2.68 3
Total 7,865.64 443.43 60.74 129.50 88
Target Manpower = Total Cycle Time
Takt Time
= 7,865.64
60.74
= 129.50
Specify target manpower (each month) by taking the cycle time (see Table 4.5) in
each operation, divided by Takt time (each month), as shows in Table 4.6.
41
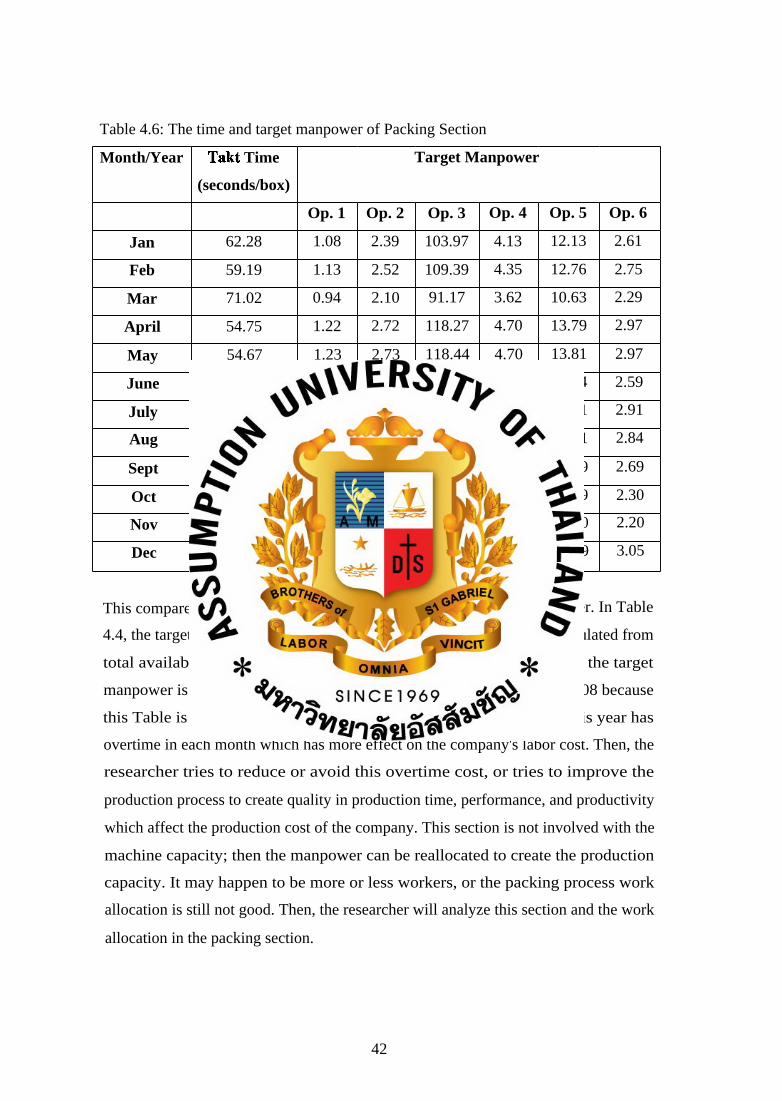
Table 4.6: The time and target manpower of Packing Section
Month/Year Takt Time
(seconds/box)
Target Manpower
Op. 1 Op. 2 Op. 3 Op. 4 Op. 5 Op. 6
Jan 62.28 1.08 2.39 103.97 4.13 12.13 2.61
Feb 59.19 1.13 2.52 109.39 4.35 12.76 2.75
Mar 71.02 0.94 2.10 91.17 3.62 10.63 2.29
April 54.75 1.22 2.72 118.27 4.70 13.79 2.97
May 54.67 1.23 2.73 118.44 4.70 13.81 2.97
June 62.72 1.07 2.38 103.24 4.10 12.04 2.59
July 55.89 1.20 2.67 115.85 4.60 13.51 2.91
Aug 57.16 1.17 2.61 113.28 4.50 13.21 2.84
Sept 60.46 1.11 2.46 107.10 4.25 12.49 2.69
Oct 70.61 0.95 2.11 91.70 3.64 10.69 2.30
Nov 74.01 0.91 2.01 87.49 3.48 10.20 2.20
Dec 53.20 1.26 2.80 121.71 4.83 14.19 3.05
This compares cycle time against Takt time and specified target manpower. In Table
4.4, the target and available manpower are equal because this table is calculated from
total available working regular time and overtime. But for Table 4.5, the target
manpower is more than the available manpower in every operation of 2008 because
this Table is calculated from available working regular time. Then, this year has
overtime in each month which has more effect on the company's labor cost. Then, the
researcher tries to reduce or avoid this overtime cost, or tries to improve the
production process to create quality in production time, performance, and productivity
which affect the production cost of the company. This section is not involved with the
machine capacity; then the manpower can be reallocated to create the production
capacity. It may happen to be more or less workers, or the packing process work
allocation is still not good. Then, the researcher will analyze this section and the work
allocation in the packing section.
42
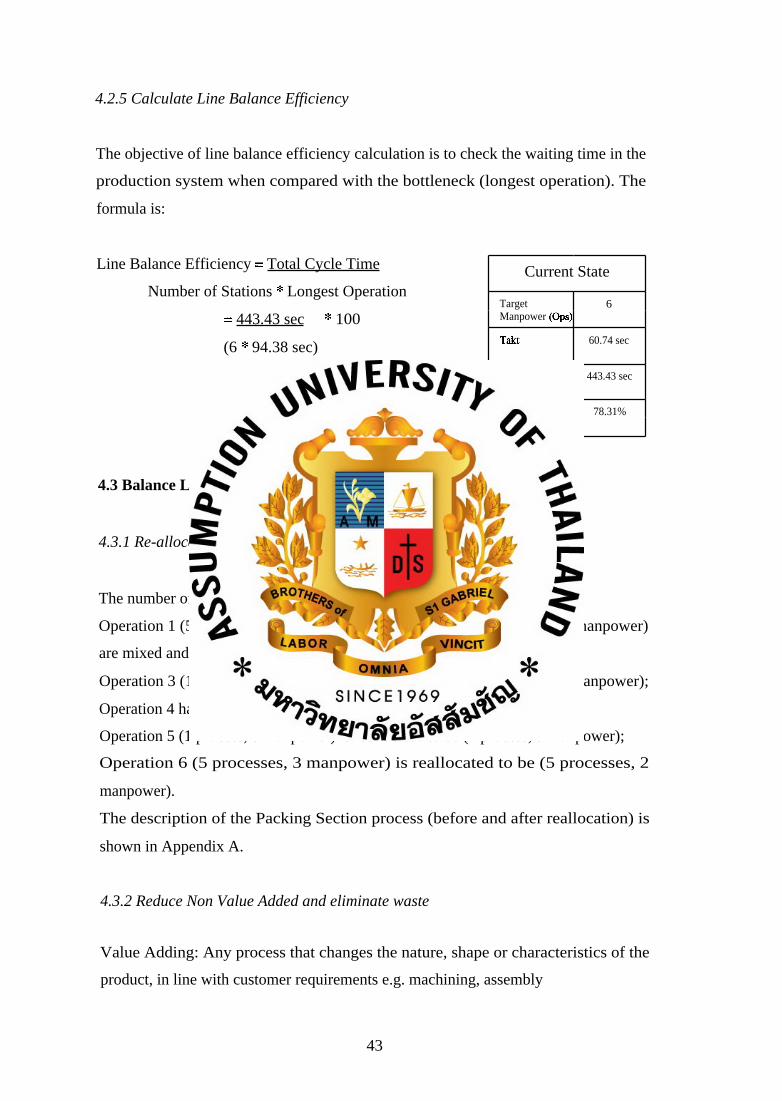
4.2.5 Calculate Line Balance Efficiency
The objective of line balance efficiency calculation is to check the waiting time in the
production system when compared with the bottleneck (longest operation). The
formula is:
Line Balance Efficiency = Total Cycle Time
Number of Stations * Longest Operation
= 443.43 sec * 100
(6 * 94.38 sec)
=78.31 %
Current State
Target 6 Manpower (Ops)
Takt 60.74 sec
Cycle Time 443.43 sec
Line Balance 78.31% Efficiency
4.3 Balance Line Balancing
4.3.1 Re-allocate work
The number of operators and process in each operation will be re-allocated:
Operation 1 (5 processes, 1 manpower) and Operation 2 (11 processes, 3 manpower)
are mixed and reallocated to be one operation (9 processes, 2 manpower);
Operation 3 (1 process, 70 manpower) is reallocated to be (1 process, 72 manpower);
Operation 4 has the same number of process and manpower;
Operation 5 (1 process, 8 manpower) is reallocated to be (1 process, 9 manpower);
Operation 6 (5 processes, 3 manpower) is reallocated to be (5 processes, 2
manpower).
The description of the Packing Section process (before and after reallocation) is
shown in Appendix A.
4.3.2 Reduce Non Value Added and eliminate waste
Value Adding: Any process that changes the nature, shape or characteristics of the
product, in line with customer requirements e.g. machining, assembly
43
Non-Value Adding, but unavoidable with current technology or methods: Any work
carried out which does not increase product value. Often, there are forms of waste
that are necessary for the current state of a process. In TPS this is called incidental or
auxiliary waste. e.g. inspection, part movement, tool changing, maintenance, walk
time or conveyance that cannot currently be eliminated or reduced further. They add
no value but are stuck as part of the current process.
Waste (Pure Waste): All other meaningless, non-essential activities that do not add
value to the product can be eliminated immediately e.g. looking for tools, waiting
time.
Waste is defined as an actions that increases cost more than necessary, lowers quality,
damages tools and equipment, does not meet objectives, etc.
4.3.2.1 Waste Identification of the seven wastes
1. Overproduction happens because
The production schedule planning is not balanced and the production is not in
accordance with the production schedule. The product is produced before the
customer demand (supply>demand). The production does still have defects, so the
safety products must be stocked instead of defective parts. Parts and equipment are
lost and damaged, and if the production in each process is not balanced, then some
processes have more manpower and equipment than they require.
2. Inventory happens because
The products are produced before the customer demand (supply>demand). Safety
products must be stocked instead of the defective parts. And some processes are
produced more rapidly than the next processes; thus, the production line is not
balanced. There are also a lot of inventories on the shelf and the floor where this
storage has more space and blocks the way, and the inventory between each process is
piled up against the operators and the processes.
44
3. Conveyance happens because
The parts are piled in sets between transporting, and there is a change of trolley during
the conveyance, and the conveyance distance is too far. Thus, the layout is still not
practical and some manpower does not have the skill needed for the operation.
4. Defect Waste happens because
The downstream checking (quality checking) is attended which sometimes the quality
checking still does not meet the standard. Sometimes there are some complaints
about the previous process and there are defects in the processes and mistakes from
human working in which the operator is not interested. The operation is neglected,
does not have mistake protection, and does not have activities to improve and manage
the defects.
5. Processing Waste happens because
Many processes, operations, and equipments are not learnt sufficiently and the
operator still does not meet the standard. There are unnecessary processes in the
operation and there are some parts of the operation which can possibly be eliminated,
which does not affect the product's quality.
6. Operation Waste happens because
The operation does not flow and does not meet the standard. Some operators do not
have the morale and are not well-trained in working. The workers' skills are not
developed; some of them are walking, turning around, leaning to one side, bending,
and making unnecessary wrist movements. The arm movement is too wide. The left
or right hand is not used in an operation. And the workers and working hours increase
while most break time is not properly used. Sometimes, the installation or parts
movement are useless.
45
7. Idle Time happens because
The production line does not flow. Sometimes the upstream operation has some
problems because the previous process is slow and some parts are lost. The
production capacity is not balanced because of the imbalance of the working process
and an ineffective plan. The operation does not meet the standard. Some operators
take time off, and there is more manpower than necessary.
4.3.2.2 Waste Elimination
Waste will be eliminated in product movement (conveyance) and human motion
(operation waste). The basic analysis research is that these two types of wastes are
the main sources of the problem.
a) Waste Elimination in Product Movement
Retention and conveyance are the main sources of the waste. These sources are
involved with the waste of "conveyance". Then, the retention and conveyance point
must be eliminated.
Retention and Conveyance:
If the retention and conveyance point are reduced or eliminated, more than half of all
wastes will be eliminated. Firstly, the packing section layout before improvement and
reallocation will be shown at the retention and conveyance point, work in process, and
the checking point (see Appendix B).
Appendix B shows the packing section layout before improvement and reallocation.
The Packing section has one floor, six operations (two operations for value added
activities), 29 points in retention, 3 points in conveyance, and 2 points in checking.
There are six operations and 88 operators, and the description of each operation will
be shown in Appendix C.
46

nar ASSUMPTION IJINTI'VERSITY LIBRARY
In the first improvement process, the retention and conveyance point will be
eliminated and reduced to discover wastes easily. And then, some wastes will be
easily eliminated too. The retention and conveyance point elimination can help to
reduce the waste from conveyance. Then, the retention point of operation 2 and 3 will
be eliminated. The packing layout will be allocated to help in easy retention and
conveyance elimination.
For Operation 2, the conveyance point will be located between the Packaging Bag
Store and the Injection Store. When the operator takes the raw materials from two
stores, the operator will not take them to the Head Worker at the retention point, but
the operator and the head worker walk together to take the raw materials to each
worker and assign work to each worker.
For Operation 3, the operator takes the raw materials (plastic spoon and packaging
bag) to each worker. The plastic spoons will be poured on the table. They will not be
piled in sets at the retention point, for the packaging bag is beside on each worker,
only one box. When these raw materials are almost used up, the operator takes them
to each worker.
For operation 5, the retention point increases because the operators increase from 8 to
9 operators.
The packing section layout after improvement and reallocation will be shown in
Appendix D.
Appendix D shows the packing section layout after improvement and reallocation.
The Packing section has one floor, five operations (two operations for value added
activities), 11 points in retention, 3 points in conveyance, and 2 points in checking.
There are five operations and 88 operators; a description of each operation will be
shown in Appendix E.
47
b) Waste elimination from the human motion
This waste includes all labor motions (such as bending over, stretching out one's
hand, raising it, etc). This labor motion is involved with operation waste which will
be identified and eliminated.
From checking and analyzing the human motion of work elements in each operation
before work reallocation, the waste from human motion in six operations is shown
below:
Operation 1: There is no standardization in laying down tools and equipment (such
as Computer, Telephone, Printer, etc). Then, the worker must use more movement in
working.
Operation 2: There are more torso and leg movements than necessary to take the
equipment to the workers.
Operation 3: The working method causes workers to work more slowly. Workers
felt tired because the body and arm movements are not balanced. There are more arm
and body movement because the worker must stretch out the hand to pick up the raw
materials. And the chair does is not standard, causing them to feel tired. The
retention point is not suitable causing them to use more eye and neck movements.
The raw materials are taken to the retention point more than is necessary. This
process must use more specialized and experienced workers who work quicker and
make less mistakes in working. For a new worker or less experienced, or an elderly
worker, there are more mistake, they work slowly, and create waiting time. The
workers have differences in being diligent, cautious, and intent in working: these
things have a large effect on the production efficiency of each worker.
Operation 4: There are more leg and torso movement then necessary to lift the
finished rack to QC and lift to the next process.
Operation 5: There are more in arm and body movement because the worker must
stretch out the hand to pick up the raw materials. And the chair is not the standard,
causing them to feel tired. The retention point is not suitable causing them to make
48
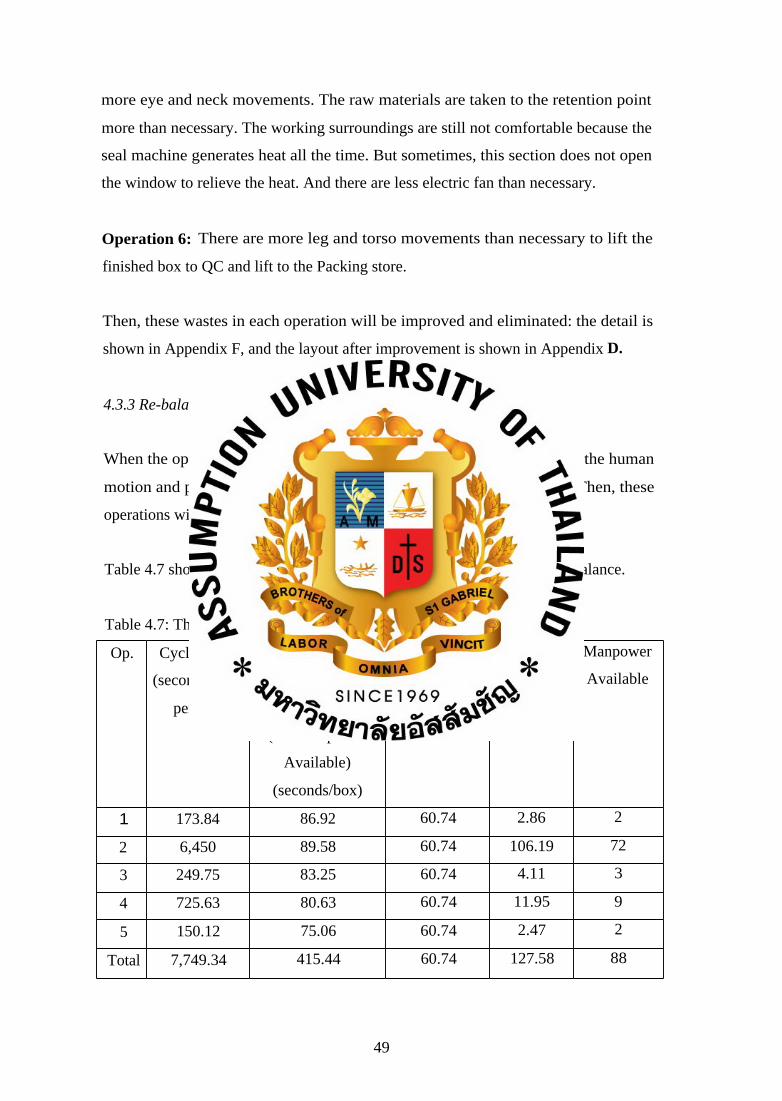
more eye and neck movements. The raw materials are taken to the retention point
more than necessary. The working surroundings are still not comfortable because the
seal machine generates heat all the time. But sometimes, this section does not open
the window to relieve the heat. And there are less electric fan than necessary.
Operation 6: There are more leg and torso movements than necessary to lift the
finished box to QC and lift to the Packing store.
Then, these wastes in each operation will be improved and eliminated: the detail is
shown in Appendix F, and the layout after improvement is shown in Appendix D.
4.3.3 Re-balanced
When the operations are reallocated and the wastes are eliminated from the human
motion and product movement, the production will be more efficient. Then, these
operations will be rebalanced.
Table 4.7 showing the time and manpower of the Packing Section after rebalance.
Table 4.7: The time and manpower of Packing Section (after rebalance)
Op. Cycle Time
(seconds/box/
person)
New CT at stations
when using
multiple operators
(CT/Manpower
Available)
(seconds/box)
Takt Time
(seconds/box)
Target
Manpower
Manpower
Available
1 173.84 86.92 60.74 2.86 2
2 6,450 89.58 60.74 106.19 72
3 249.75 83.25 60.74 4.11 3
4 725.63 80.63 60.74 11.95 9
5 150.12 75.06 60.74 2.47 2
Total 7,749.34 415.44 60.74 127.58 88
49
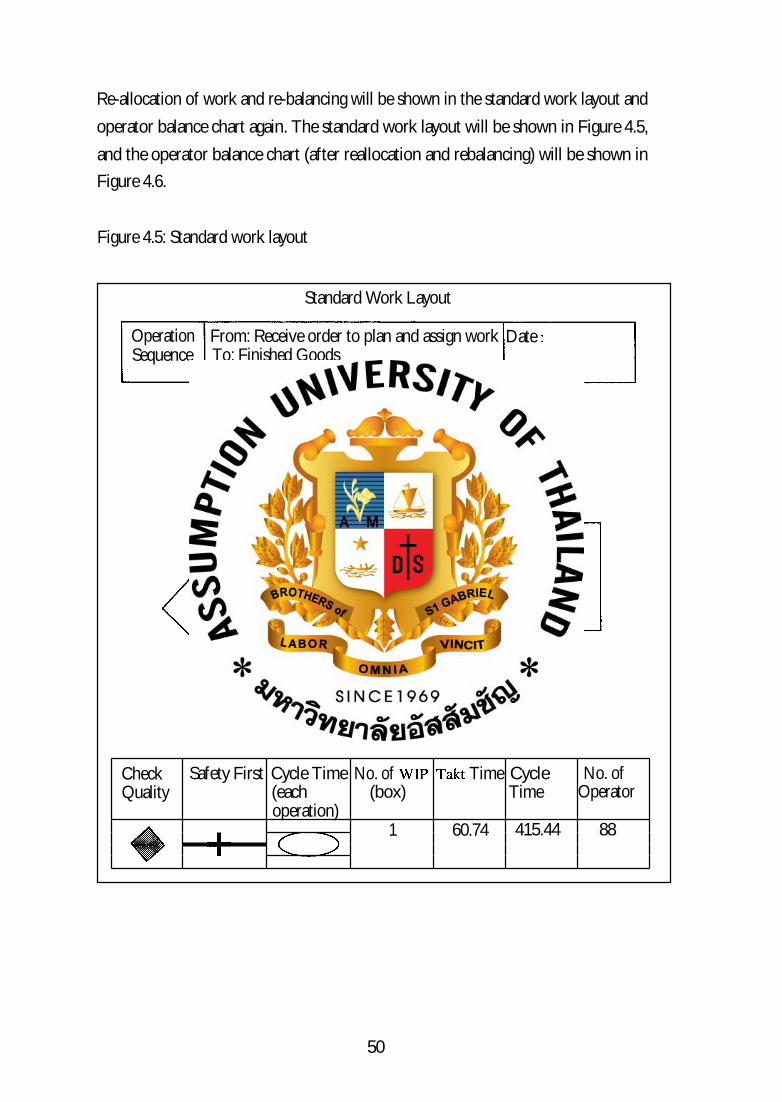
Date : Operation Sequence
From: Receive order to plan and assign work To: Finished Goods
Seal Packaging Bag
CO.63s)
Insert Plastic Spoon into Packaging Bag
89.58s
Re-allocation of work and re-balancing will be shown in the standard work layout and
operator balance chart again. The standard work layout will be shown in Figure 4.5,
and the operator balance chart (after reallocation and rebalancing) will be shown in Figure 4.6.
Figure 4.5: Standard work layout
Standard Work Layout
Check Quality
Safety First Cycle Time (each operation)
No. of WIP (box)
Takt Time Cycle Time
No. of Operator
• 1 60.74 415.44 88
(1) +
50
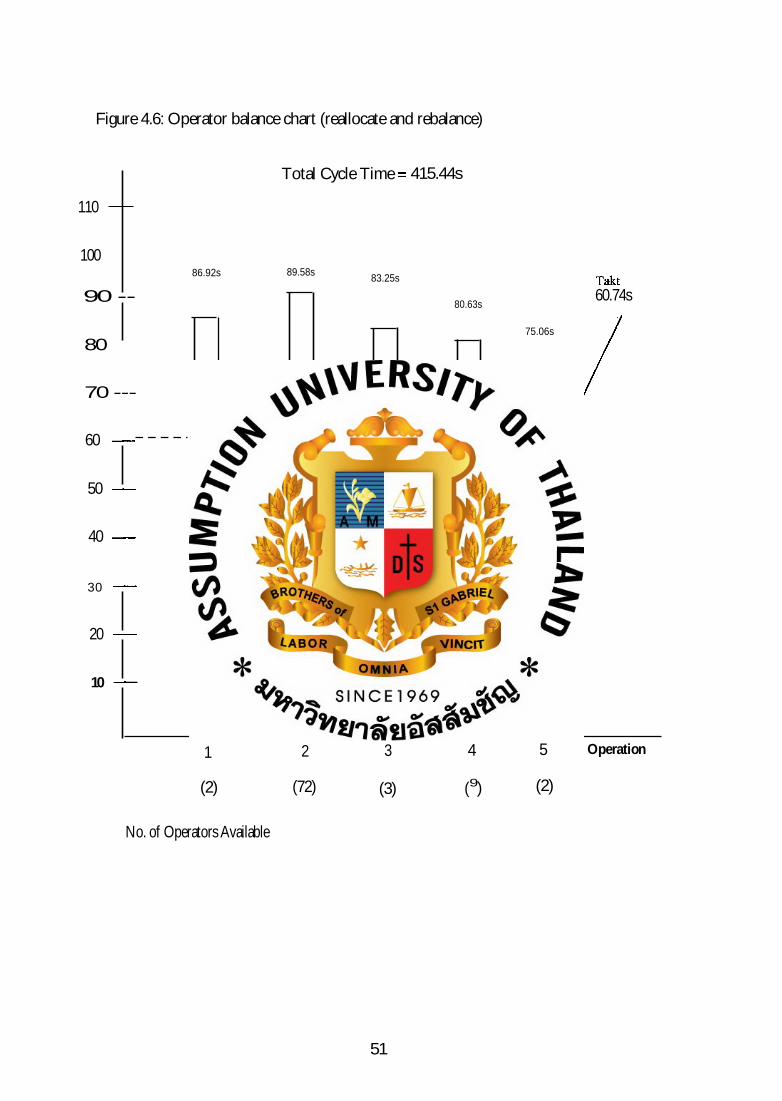
Figure 4.6: Operator balance chart (reallocate and rebalance)
Total Cycle Time = 415.44s
110
100
90 --
86.92s 89.58s 83.25s
80.63s
Takt 60.74s
75.06s 80 —
70 ---
60 —
50 —
40 —
30 —
20 —
10 —
1 2 3 4 5 Operation
(2) (72) (3) (9) (2)
No. of Operators Available
51
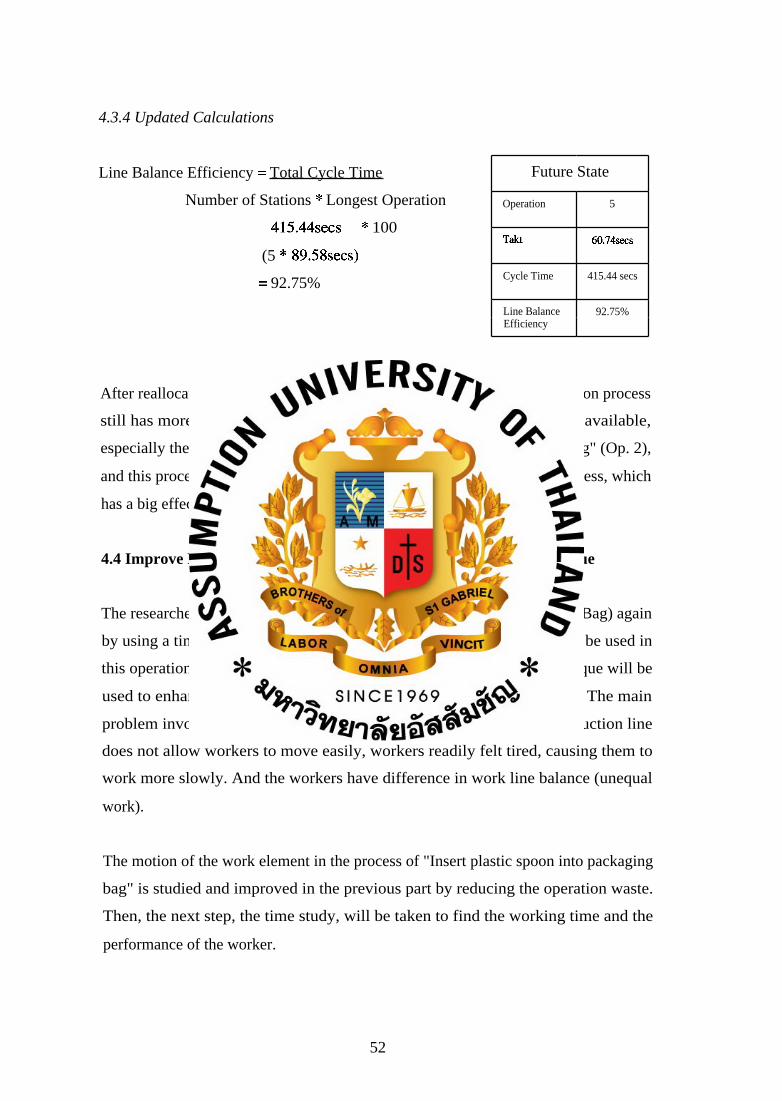
4.3.4 Updated Calculations
Line Balance Efficiency = Total Cycle Time
Number of Stations * Longest Operation
415.44secs * 100
(5 * 89.58secs)
= 92.75%
Future State
Operation 5
Takt 60.74secs
Cycle Time 415.44 secs
Line Balance 92.75% Efficiency
After reallocating work and rebalancing, the researcher sees that the operation process
still has more difference between the target manpower and manpower available,
especially the operation process of "Insert plastic spoon into packaging bag" (Op. 2),
and this process uses more cycle time. Most of the workers are in this process, which
has a big effect on the labor cost.
4.4 Improve Production Efficiency by using Time and Motion Technique
The researcher improves operation 2 (Insert Plastic Spoon into Packaging Bag) again
by using a time and motion technique. A time and motion technique will be used in
this operation to help to reduce cycle time and work process. This technique will be
used to enhance the efficiency and productivity of the production line. The main
problem involves the slow rate of production. As the layout of the production line
does not allow workers to move easily, workers readily felt tired, causing them to
work more slowly. And the workers have difference in work line balance (unequal
work).
The motion of the work element in the process of "Insert plastic spoon into packaging
bag" is studied and improved in the previous part by reducing the operation waste.
Then, the next step, the time study, will be taken to find the working time and the
performance of the worker.
52
4.4.1 Time study of production process
For average time study, the researcher studies only the process of `Insert plastic spoon
into packaging bag" because this process has more problems and effect than other
operations, especially concerning labor. The researcher reckons the time of the
operators working, about 30 persons (10 times per each person). The average time of
operators is shown in Appendix G.
4.4.1.1 Standard, Normal, and Allowance time calculation
Standard time calculation starts from normal time calculation, rating factor, and
selected time. The rating factor comprises skill (considered from the skill of the
operator working), effort (considered from the operator's working effort to success),
condition (considered from the operator's working condition that affects the speed of
working or not), consistency (considered from the operator's working consistency
between reckoned time).
The assessment of the rating factor of operators in this process is specified by the head
worker and the production manager. Normal time calculation of the process of "Insert
plastic spoon into packaging bag" and the assessment the rating factor of operator in
this process are given a mark as below:
Skill: Good = C2 +0.03
Effort: Average = D 0.00
Conditions: Fair = E -0.03
Consistency: Average = D 0.00
Total = 0.00
The rate of 0.00 will be taken to unite with 1 because the rating is calculated from the
base 100, thus the working efficiency is 100 or 1%.
Then,
Normal Time = 51.60 * 1.00 = 51.60 second (per 24 units)
53
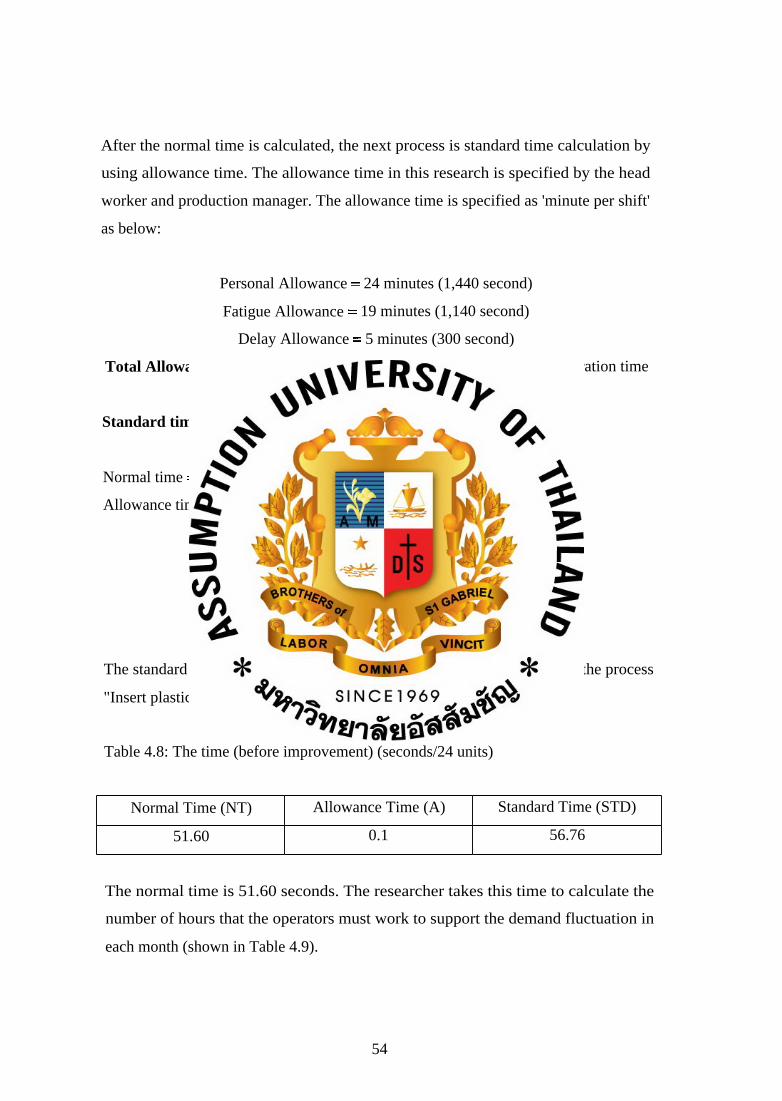
After the normal time is calculated, the next process is standard time calculation by
using allowance time. The allowance time in this research is specified by the head
worker and production manager. The allowance time is specified as 'minute per shift'
as below:
Personal Allowance = 24 minutes (1,440 second)
Fatigue Allowance = 19 minutes (1,140 second)
Delay Allowance = 5 minutes (300 second)
Total Allowances = 48 minutes (2,880 seconds) per day or 10% of all operation time
Standard time calculation
Normal time = 51.60 seconds (per 24 units)
Allowance time 10 %
Standard Time = Normal Time + A* (NT)
=NT*(1 +A)
= 51.60 * (1 + 0.1)
= 56.76 seconds (per 24 units)
The standard time, normal time, and allowance time of all 30 operators in the process
"Insert plastic spoon into packaging bag", is shown in Table 4.8.
Table 4.8: The time (before improvement) (seconds/24 units)
Normal Time (NT) Allowance Time (A) Standard Time (STD)
51.60 0.1 56.76
The normal time is 51.60 seconds. The researcher takes this time to calculate the
number of hours that the operators must work to support the demand fluctuation in
each month (shown in Table 4.9).
54
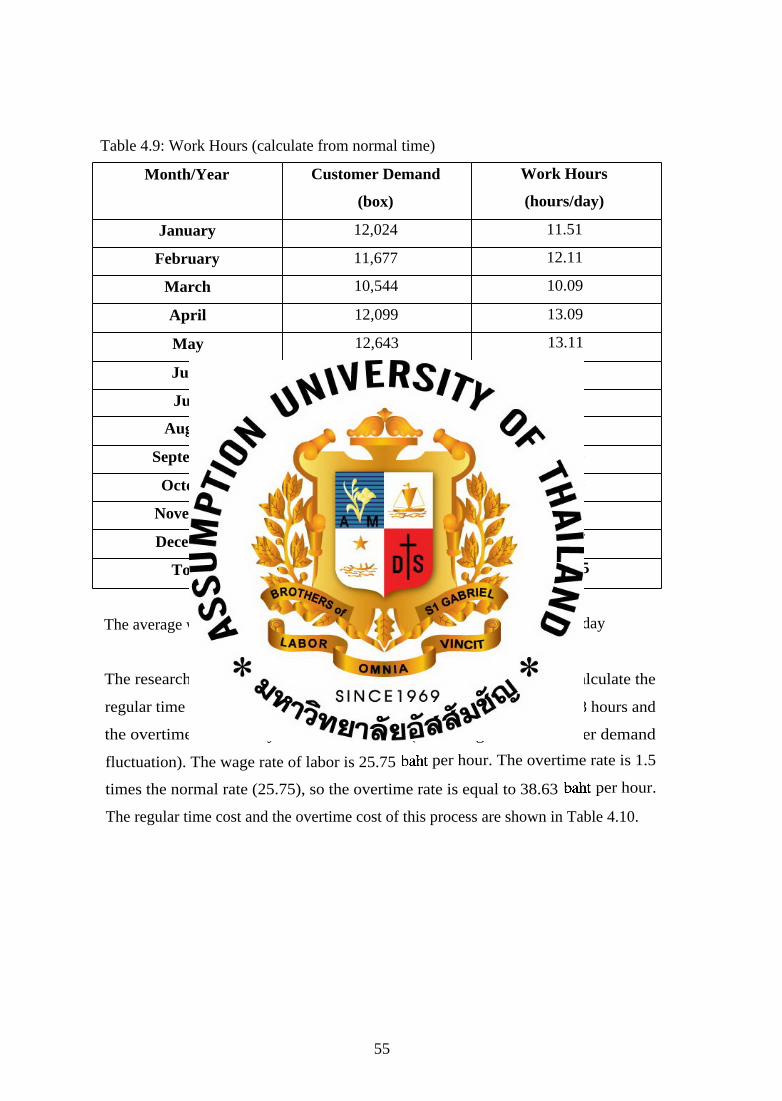
Table 4.9: Work Hours (calculate from normal time)
Month/Year Customer Demand
(box)
Work Hours
(hours/day)
January 12,024 11.51
February 11,677 12.11
March 10,544 10.09
April 12,099 13.09
May 12,643 13.11
June 11,480 11.43
July 13,398 12.82
August 12,597 12.54
September 12,386 11.85
October 10,605 10.15
November 9,729 9.68
December 13,533 13.47
Total 142,715 141.85
The average work hours is 141.85 / 12 = 11.82 hours (42,552 seconds) per day
The researcher then takes these work hours per day in each month to calculate the
regular time cost and the overtime cost. The regular time in each day is 8 hours and
the overtime in each day is about 2-5 hours (according to the customer demand
fluctuation). The wage rate of labor is 25.75 baht per hour. The overtime rate is 1.5
times the normal rate (25.75), so the overtime rate is equal to 38.63 baht per hour.
The regular time cost and the overtime cost of this process are shown in Table 4.10.
55
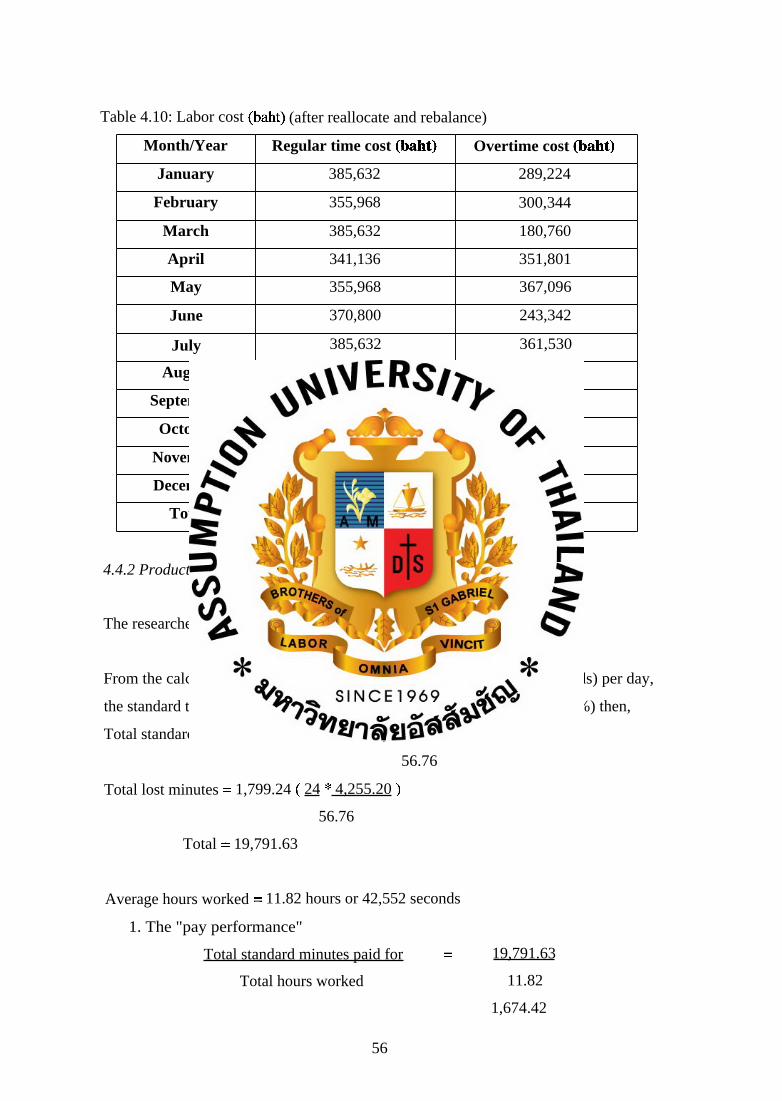
Table 4.10: Labor cost (baht) (after reallocate and rebalance)
Month/Year Regular time cost (baht) Overtime cost (baht)
January 385,632 289,224
February 355,968 300,344
March 385,632 180,760
April 341,136 351,801
May 355,968 367,096
June 370,800 243,342
July 385,632 361,530
August 370,800 347,625
September 385,632 289,224
October 385,632 180,760
November 370,800 139,050
December 370,800 382,392
Total 4,464,432 3,433,148
4.4.2 Production Performance Calculation
The researcher calculates the production performance, as shown below:
From the calculation of average work hours (11.82 hours or 42,552 seconds) per day,
the standard time (56.76 seconds per 24 units), and the allowance time (10%) then,
Total standard minutes earned = 17,992.39 ( 24 * 42,552 )
56.76
Total lost minutes = 1,799.24 ( 24 * 4,255.20 )
56.76
Total = 19,791.63
Average hours worked = 11.82 hours or 42,552 seconds
1. The "pay performance"
Total standard minutes paid for = 19,791.63
Total hours worked 11.82
1,674.42
56
This figure gives us the number of standard minutes per hour for which the
department is paid.
2. The true performance
Total number of standard minutes produced on good work
Total number of hours worked
= 17,992.39 = 1,522.20
11.82
Let us examine these figures for a moment. The department is paid at the rate of
1,674.42 units per hour and produces only 1,522.20 units per hour of good work.
There are 152.22 minutes per hour of time available, which if it could be put to
productive effort instead of being lost for one reason or another, would represent an
available increase in productivity of 152.22 *100 = 10% approximately.
1,522.20
4.5 Improve Production Performance by applying a Wage Incentive Scheme
The researcher applies an incentive scheme to motivate the operator towards more
productive effort, and this scheme creates the average incentive pace.
Nowadays, the wage system of this operation is an hourly wage which is separated
into two rates (Regular rate 25.75 baht per hour, Overtime rate 1.5 times the regular
rate (38.63 baht per hour)). The overtime hours in each month are about 2-5 hours
which depends on the customer demand fluctuation. The regular and overtime cost in
each month are shown in Table 4.10 in the previous page. For the incentive scheme
application, the wage will be paid in accordance with the productivity (wage per box).
The wage rate per box is equal to 56 baht per box. Then, the labor cost and the work
time will be changed. The researcher expects that the work time will be reduced from
the normal time by about 10 percent approximately.
The normal time of 51.60 seconds per 24 units will be reduced to 46.44 seconds per
24 units (or 5,805 seconds per 3000 units (per box)). When, the work time is about
5,805 seconds per 3,000 units (per box), the work hours in each month is in
accordance with customer demand fluctuation, and will be changed as below:
57
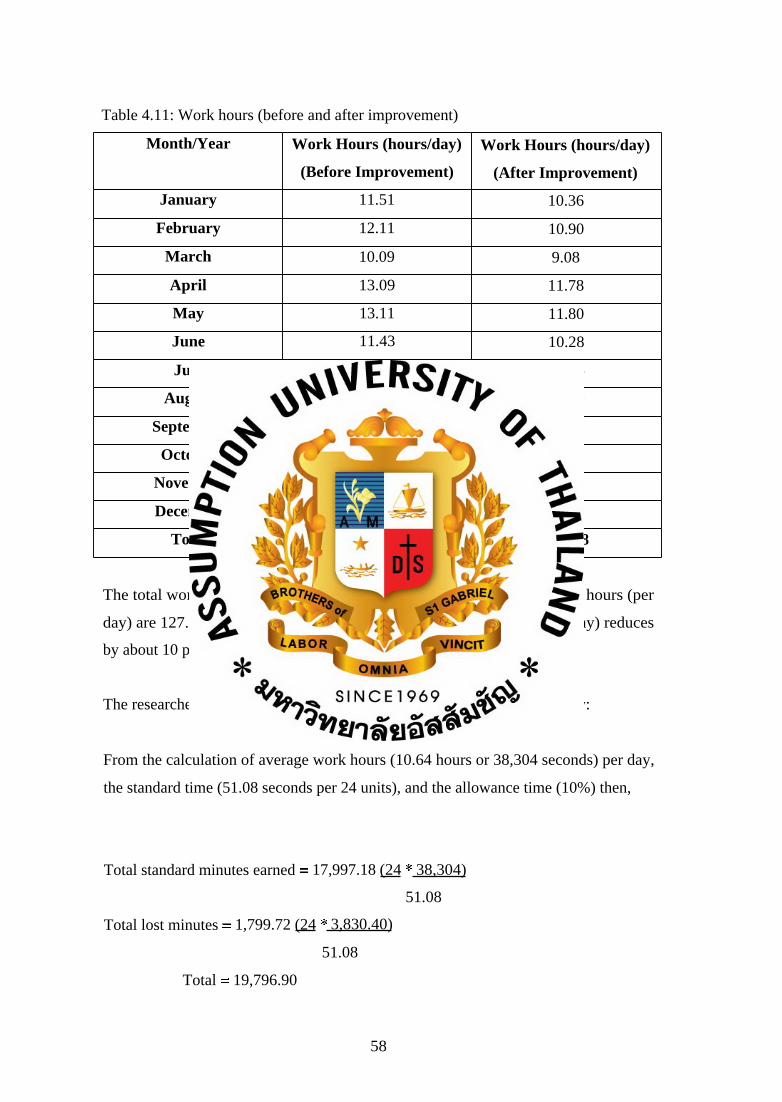
Table 4.11: Work hours (before and after improvement)
Month/Year Work Hours (hours/day)
(Before Improvement)
Work Hours (hours/day)
(After Improvement)
January 11.51 10.36
February 12.11 10.90
March 10.09 9.08
April 13.09 11.78
May 13.11 11.80
June 11.43 10.28
July 12.82 11.54
August 12.54 11.29
September 11.85 10.67
October 10.15 9.14
November 9.68 8.72
December 13.47 12.12
Total 141.85 127.68
The total work hours (after improvement) are 127.68. The average work hours (per
day) are 127.68/12 =10.64 hours per day. The average work hours (per day) reduces
by about 10 percent.
The researcher calculates the production performance to be as shown below:
From the calculation of average work hours (10.64 hours or 38,304 seconds) per day,
the standard time (51.08 seconds per 24 units), and the allowance time (10%) then,
Total standard minutes earned = 17,997.18 (24 * 38,304)
51.08
Total lost minutes = 1,799.72 (24 * 3,830.40)
51.08
Total = 19,796.90
58
Average hours worked = 10.64 hours or 38,304 seconds
1. The "pay performance"
Total standard minutes paid for = 19,796.90
Total hours worked 10.64
= 1,860.61
This figure gives us the number of standard minutes per hour for which the
department is paid.
2. The true performance
Total number of standard minutes produced on good work
Total number of hours worked
= 19,796.90 = 1,860.61
10.64
Let us examine these figures for a moment. The department is paid at the rate of
1,860.61 units per hour and produces 1,860.61 units per hour of good work. When
the productive effort could be put to good use instead of being lost for one reason or
another, the pay performance will equal to the true performance.
The researcher calculates the wage rate per box from the labor cost calculation of
normal method (before and after improvement). The wage rate per box (before
improvement) is 55.50 baht and the wage rate per box (after improvement) is 48.50
baht. The researcher interviewed the production manager and the head worker of the
Packing Section about the new wage rate (wage per box). The new wage rate is
specified by the head worker and production manager as 1 percent of the wage rate
calculation of the normal method (hourly wage) (before improvement). Therefore, the
new wage is 56 baht per box.
From the new wage rate of 56 baht per box then, the new labor cost (before and after
improvement of the normal method) (hourly wage) and the new labor cost (after
improvement of the new method) (wage per box) in each month is in accordance with
the customer demand, as shown in Table 4.12.
59
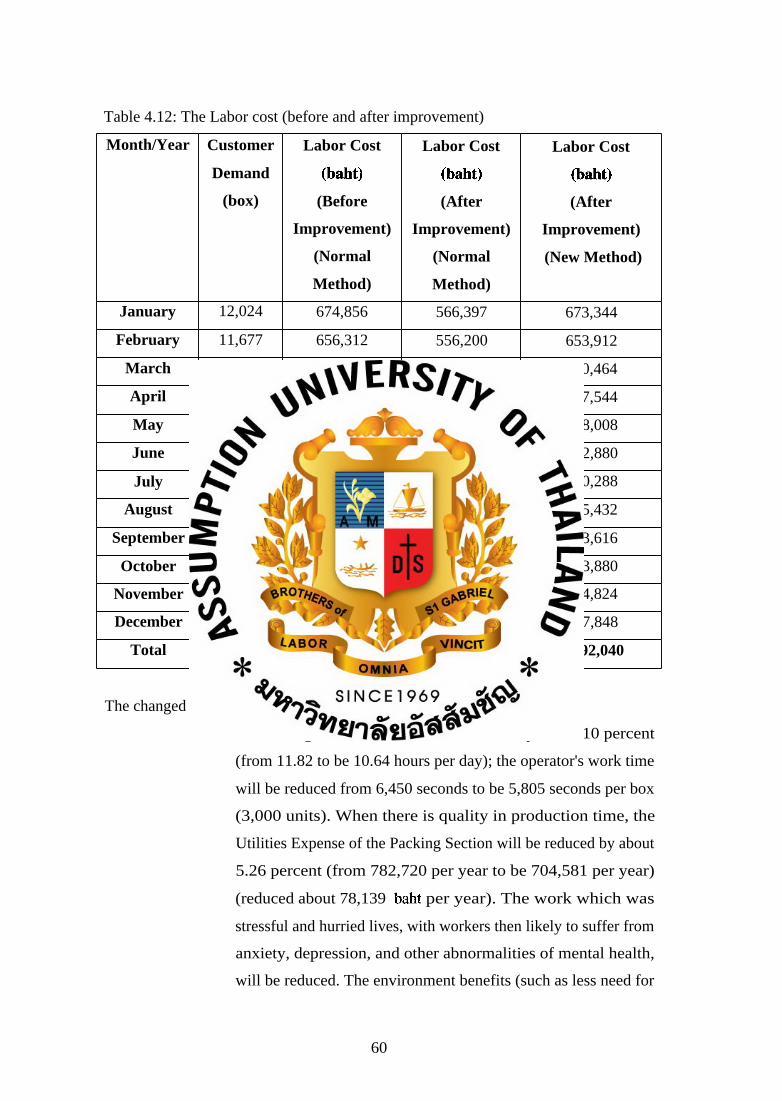
Table 4.12: The Labor cost (before and after improvement)
Month/Year Customer
Demand
(box)
Labor Cost
(baht)
(Before
Improvement)
(Normal
Method)
Labor Cost
(baht)
(After
Improvement)
(Normal
Method)
Labor Cost
(baht)
(After
Improvement)
(New Method)
January 12,024 674,856 566,397 673,344
February 11,677 656,312 556,200 653,912
March 10,544 566,392 494,091 590,464
April 12,099 692,937 596,988 677,544
May 12,643 723,064 622,944 708,008
June 11,480 614,142 544,613 642,880
July 13,398 747,162 674,856 750,288
August 12,597 718,425 614,138 705,432
September 12,386 674,856 602,550 693,616
October 10,605 566,392 494,091 593,880
November 9,729 509,850 440,325 544,824
December 13,533 753,192 683,663 757,848
Total 142,715 7,897,580 6,890,856 7,992,040
The changed result after applying the wage incentive scheme is:
The average work hours will be reduced by about 10 percent
(from 11.82 to be 10.64 hours per day); the operator's work time
will be reduced from 6,450 seconds to be 5,805 seconds per box
(3,000 units). When there is quality in production time, the
Utilities Expense of the Packing Section will be reduced by about
5.26 percent (from 782,720 per year to be 704,581 per year)
(reduced about 78,139 baht per year). The work which was
stressful and hurried lives, with workers then likely to suffer from
anxiety, depression, and other abnormalities of mental health,
will be reduced. The environment benefits (such as less need for
60
convenience products (e.g.. fast food), time to make other
behavioral choices, etc.) will be increased.
- The pay performance will be equal to the true performance (The
department will be paid at the rate of 1,860.61 units per hour and
produces 1,860.61 units per hour of good work.).
- When the work hours reduce by about 10 percent, the total labor
cost (normal method calculation) will be reduced by about 12.75
percent (from 7,897,580 to be 6,890,856). But the company must
use the new calculation method (wage per box) because this
method is used to motivate the operator's work and effort to be
more productive. Thus, the total labor cost (new method) (wage
per box) will be increased by only 1.20 percent (from 7,897,580
to be 7,992,040 baht) (an increase of 94,460 baht per year).
Although the total labor cost (after improvement) will be increased by about 1.20
percent, it is worthwhile because of the quality in production time and performance
improvement of the operator.
The researcher calculates and compares the normal (hourly wage) and the new
method (wage per box) of labor cost calculation, if the customer demand increases by
10 percent. The calculation is shown in Table 4.13.
61
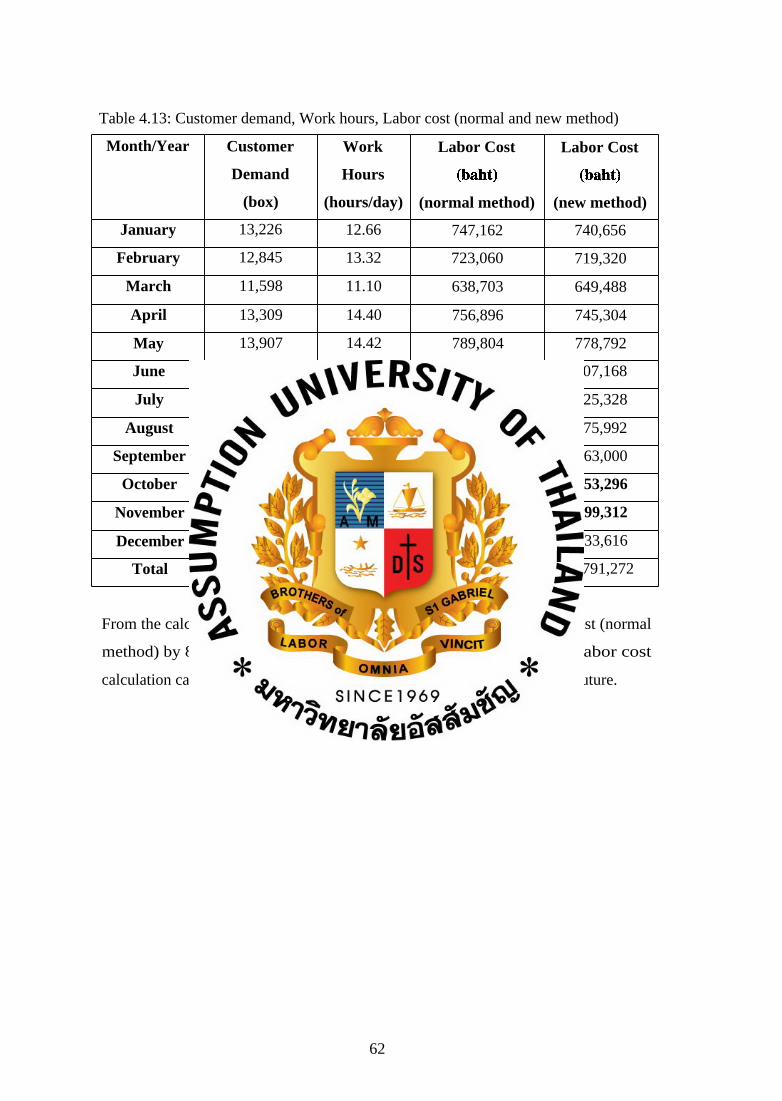
Table 4.13: Customer demand, Work hours, Labor cost (normal and new method)
Month/Year Customer
Demand
(box)
Work
Hours
(hours/day)
Labor Cost
(baht)
(normal method)
Labor Cost
(baht)
(new method)
January 13,226 12.66 747,162 740,656
February 12,845 13.32 723,060 719,320
March 11,598 11.10 638,703 649,488
April 13,309 14.40 756,896 745,304
May 13,907 14.42 789,804 778,792
June 12,628 12.57 718,425 707,168
July 14,738 14.11 855,621 825,328
August 13,857 13.79 787,950 775,992
September 13,625 13.04 783,315 763,000
October 11,666 11.17 638,703 653,296
November 10,702 10.65 579,375 599,312
December 14,886 14.82 857,475 833,616
Total 164,125 156.05 8,876,489 8,791,272
From the calculation, the labor cost (new method) is less than the labor cost (normal
method) by 85,217 baht (0.96 percent). Thus, the new method of labor cost
calculation can help to reduce the labor cost if the business expands in the future.
62
CHAPTER V
SUMMARY FINDINGS, CONCLUSIONS AND
RECOMMENDATIONS
5.1 Conclusions
Nowadays, there is high competition and rapidly changing customer demand, which
affects the plastic spoon industry. Therefore the company tries to develop its
competition potentiality. The company faces many problems (such as high
production cost (Raw Material and Labor Cost), production line imbalance, labor
which uses more or less time than production time schedules, overtime, defects, late
delivery, and safety stock). Most of problems happen in the packing section because
this section is labor intensive. These problems create many wastes. Therefore, the
company is looking for improvement opportunities to balance the production line, so
as to improve production efficiency and performance.
Takt Time can be applied to do line balancing in the packing Section. This technique
is about standardizing the production cycle times. Producing to Takt time is about
making the production rate accord with the selling rate. This paper applies the Takt
time technique to identify the rate of production which the company must produce so
as to be in accordance with customer demand. To improve the operation of the
production line is the objective of the packing Section, therefore the company wants
to balance the production line to enhance its efficiency and productivity.
From the comparison between cycle time against Takt time and specifying target
manpower, in Table 4.4, the target and available manpower is equal because this
Table is calculated from total available working regular time and overtime. But For
Table 4.5, the target manpower is more than the manpower available in every month
in 2008 because this Table is calculated from available working regular time. This
year had overtime in each month which has a big effect on the company's labor cost
The researcher tried to reduce or avoid this overtime cost, and tried to improve the
63
production process to create quality in production time, performance, and productivity
which affects the company's production cost.
After the production line was rebalanced and reallocated, the researcher saw that the
operation process still had more difference between the target manpower and
manpower available, especially the operation process of 'insert plastic spoon into
packaging bag' (Op. 2). This process also uses more cycle time. Most of the labor is
involved in this process which therefore has a big effect on the labor cost. The
researcher improved this operation again by using the time and motion technique
The time and motion technique was used in the process of "Insert Plastic Spoon into
Packaging Bag" to help to reduce cycle time and work process. And this technique
was used to enhance the efficiency and productivity of the production line. The main
problems were involved with the slow rate of production. As the layout of the
production line does not allow workers to move easily, workers readily felt tired,
causing them to work more slowly. Also, the workers had differences in work line
balance (work is unequal).
The motion of work elements in this operation process (Insert plastic spoon into
packaging bag) was studied and improved in the process of eliminating waste by
reducing the operation waste of the packing section. The next step, the time study,
was taken to find the working time and performance of the worker.
From the calculation of average work hours (11.82 hours or 42,552 seconds) per day,
the standard time (56.76 seconds per 24 units), and the allowance time (10%) then,
the department is paid at the rate of 1,674.42 units per hour and produces only
1,522.20 units per hour of good work. There are 152.22 minutes per hour of time
available, which if it could be put to productive effort, instead of being lost for one
reason or another, would represent an available increase in productivity of
152.22 *100 = 10% approximately.
1,522.20
64
The researcher applied an incentive scheme to motivate the operator towards more
productive effort, and this scheme creates the average incentive pace. In the incentive
scheme application, the wage will be paid in accordance with the productivity (wage
per box). The wage rate per box is equal to 56 baht per box. Then, the labor cost and
the work time will be changed. The researcher expects that the work time will be
reduced from the normal time by about 10% approximately.
Although the total labor cost (after improvement) increases by about 1.2%, it is
worthwhile because of the quality in production time which reduces the Utilities
Expense of the packing section by about 5.26 percent, and reduces the stressful labor
and hurried lives, and creates environment benefits, along with performance
improvement of the operator.
The researcher calculated and compared the normal and new methodd of labor cost
calculation, if the customer demand increases by 10 percent. The result is that the
labor cost decreases by about 85,217 or 0.96 percent (from 8,876,489 to be 8,791,272
baht). Thus, the new method of labor cost calculation can help to reduce the labor
cost if the business expands in the future.
It was proposed that Takt time and line balancing would improve the productivity and
quality of the packing production line. Reallocation and traditional cases were studied
and it was illustrated that the results from the reallocation case are superior. It is
concluded that these systems generally improve the quality and productivity in the
packing section of this manufacturer of plastic spoons. In this paper, the causal links
between these systems (Takt time and line balancing) and improved performance, are
explained. Also, this research studies the time and motion technique which can
reduce and control costs, improve working conditions and the environment, and
motivate people. Motion study seeks to minimize and simplify manual efforts. A
time study attempts to find out the amount of work that a qualified operator, properly
trained, can do in a given time. The operator must do the work in accordance with a
certain method, under certain conditions, and at a certain pace, and a certain physical
reaction will be produced. A wage incentive can motivate the operator's working
efforts, which can then improve the quality of the production time and production
65
performance. Also, this wage incentive can help to reduce the labor cost if the
business expands in the future.
5.2 Limitations
The result of this study is greater effectiveness for a plastic spoon manufacturer which
had a problem of line balance and operation performance. However, there are some
limitations to this research:
- This study only concerns the packing section of plastic spoon
manufacturer. There may be other considerations and factors in
other sections which would affect the operation of the production
line.
- This case study used historical data from 2008 only. Therefore,
the simulation result could change from the example in this
paper, and could affect the production time, performance, and
productivity.
5.3 Recommendations
5.3.1 The operators working capacity data should be kept and added to the database
for other work.
5.3.2 In the production line of the packing section, there are more variables because
this section involves manpower capacity. The line balance controlling and checking
should receive attention to improve and balance the production line.
5.3.3 The working time should always be checked and compared with the standard
time. If there are problems, these problems should be considered and corrected.
In conclusion, it is necessary to develop the company to be more efficient in
manufacturing in order to reduce cost and expand its market, and it may be interested
to test the proposed method.
66
BIBLIOGRAPHY
Barbara D. Dennis (1952, September). Job evaluation, Motion and time study, and
gage incentives, Motion and Time Study (Vol. 6, No. 1, pp. 9-39). University of
Illinois Bulletin: I.L.I.R Publications.
BMR Business Service. (n.d.). BMR Case Studies on Wage Based Incentive Schemes.
Retrieved from http://www.bmrbiz.com.au/wage-based-incentive-schemes.html
Bruns, W. J., Jr. (1992). Performance measurement, Evaluation, and Incentives.
Boston, Mass.: Harvard Business School Press.
Chane, G. W. (1942). Motion and time study,. Harper & Brothers, New York.
Dangayach, G. S., & Deshmukh, S. G. (2003). Evidence of manufacturing strategies
in Indian industry : a survey. International Journal of Production Economics 83
(3), 279-298.
Garbett, Gordon H. G. (1955, August). Time and motion study (Vol. 4, No. 8, pp. 15-
17).
Garbett, Gordon H.G. (1958, August). Time and Motion Study (Vol. 7, No. 8, pp. 12-
13).
Hayes, Human Factors and Work Analysis, Line Balancing (PowerPoint Slides)
(n.d.). Retrieved February 16, 2009, from website: http://www.me.umn.edu
Holmes, W. G. (1938). Applied Time and Motion Study. Ronald Press, Inc., New
York.
Hounshell, D. A. (1984). From the American system to mass production, 1800-1932:
The development of manufacturing technology in the United States. John Hopkins
University Press, London.
Hunyala J. (2009). "Production Efficiency Improvement of Garment Factory Using
Motion and Time Study Technique", Master of Science (Industrial Management).
Kanjanapanyakom R. & Tinganchalee N. (1995). Motion and time study. Physics
Center Bangkok.
Kidder, W. B. (1995). Willow Run: Colossus of American Industry, KLF, Berlin.
Laosirihongthong, T., & Dangayach, G. S. (2005). New manufacturing technology
implementation: A study of the Thai Automotive Industry. Production Planning
and Control 16 (3), 263-272.
67
Lean lexicon: A graphical glossary for lean thinkers. (2003). Lean Enterprise Institute
Inc., Massachusetts, USA.
Line Balance: Training Pack (PowerPoint Slides) (n.d.) Retrieved July 30, 2009, from
website: http://www.beyondleaninfopresLineBalance059.ppt#256,1,Line Balance
Miltenberg, J. (2001). One-piece flow manufacturing on u-shape production lines:
tutorial, IIE Transactions (Vol. 33, No. 1, pp. 303-321).
Motion and Time Study (PowerPoint Slides) (n.d.). Retrieved March 28, 2010, from
website: http://www.scribd.com/dod.../Chapter4Motion-and-Time-Study
Mundel, M. E. (1950). Motion and time study, Prentice-Hall, Inc. New York.
Ohno, T. (1988). Just-in-time for today and tomorrow. Taiichi Ohno with Setsuo
Mito; translated by Joseph P. Schmelzeis, Productivity Press.
Ohno, T. (1988). Toyota production system: Beyond large-scale production.
Productivity Press, Portland, OR.
Rother, M., & Harris, R. (2002). Creating continuous flow (p. 104). Brookline, MA,
USA.
Rother, M., & Shook, J. (1998). Learning to see. The Lean Enterprise Institute, Inc.,
Brookline, MA.
Rother, M. & Shook, J. (1998). Learning to see: Value stream mapping to create
value and eliminate Muda. The Lean Enterprise Institute, Brookline, MA.
Shingo, S. (1989). A study of the Toyota production system. Productivity Press,
Portland, OR.
Shiomi, H. & Wada, K. (1995). Fordism transformed: The development of production
methods in the Automobile Industry. Oxford University Press, Oxford.
Simons D. W. & A. K. Zokaei. (2005). Application of Lean paradigm in the Red Meat
Industry. British Food Journal, 107 (4), 192.
Sivaram, B. (2000, September 28). Productivity improvement and labor relations in
the Tea Industry in South Asia. Retrieved October 13, 2010, from International
Labor Organization's Reviews website:
http://www.ilo.org/public/english/dialogue/sector/papers/proschem/proasia4.htm
Standard Time and Line Balancing (PowerPoint Slides) (n.d.). Retrieved March 28,
2010, from Intro to Agro Industrial Plant Design NSM website:
http://www.pe.kmutnb.ac.th/nsm/files/st_lb.pdf
68

Strategos (2004), All about Takt Time. Retrieved from website:
http://www.strategosinc.com/takt_time.htm
Tapping, D. & Fabrizio, T. (2000). Value stream management: Eight steps to
planning, mapping and sustaining lean improvements. Productivity Press,
Portland, OR.
Uhrbrock, R. S. (1935). A psychologist looks at wage incentive methods. American
Management Association, Institute of Management Series, No. 15.
United Electrical, Radio and Machine Workers of America (1943). U. E. Guide to
wage payment, time study and job evaluation. The Union, New York.
Viboonlert C. (2006). "A Study of Productivity Improvement by using Time and
Motion Study Technique A Study Case of Wirebonding Process of Integrated
Circuits in Electronic Industry", unpublished Master of Education Degree in
Industrial Education, Srinakharinwirot University.
Wada, K. (1995), "The emergence of the flow production method in Japan", in
Shiomi, H. & Wada, K. (Eds), Fordism transformed the development of
production methods in the Automobile Industry. Oxford University Press,
Oxford.
Womack, J. P. & Jones, D. T. (1996). Lean thinking: Banish waste and create wealth
in your corporation. Simon & Schuster, NY.
Womack, J. P., Jones, D. T., & Ross, D. (1990). The machine that changed the world.
Rawson Associates, NY.
69
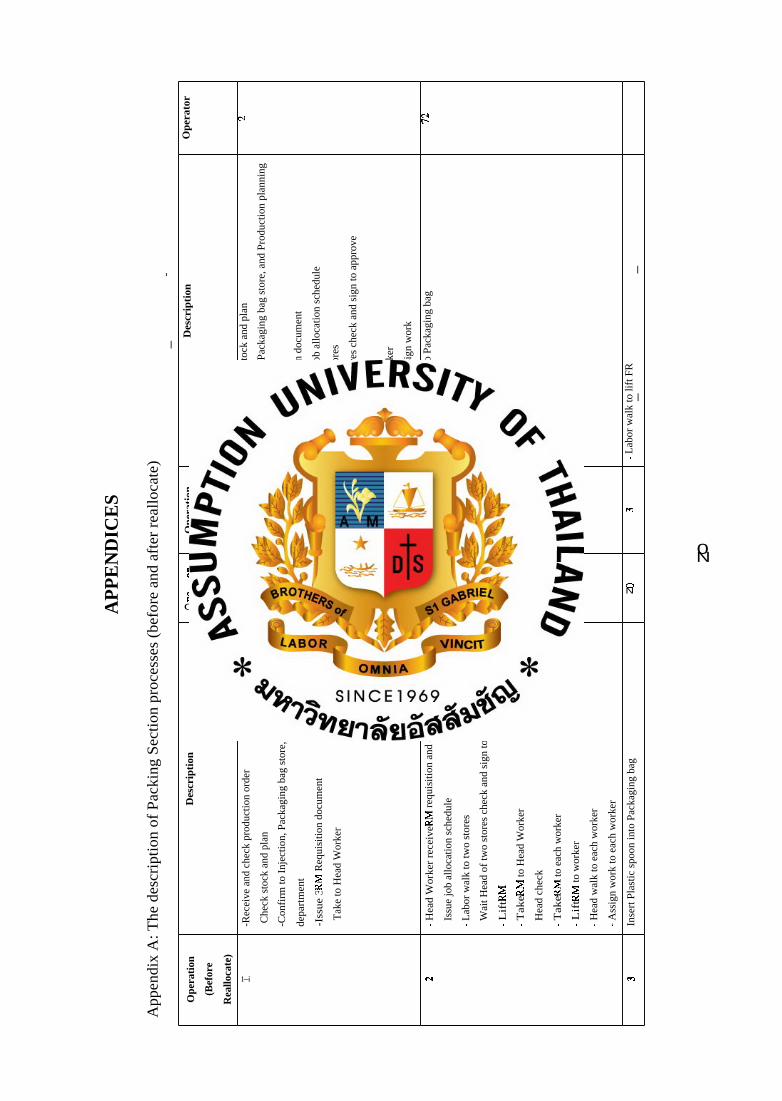
AP
PE
ND
ICE
S
App
endi
x A
: The
des
crip
tion
of
Pac
king
Sec
tion
pro
cess
es (
befo
re a
nd a
fter
rea
lloc
ate)
Ope
rato
r
NI CI N.
Des
crip
tion
- Hea
d re
ceiv
e, c
heck
sto
ck a
nd p
lan
-
Con
firm
to I
njec
tion
, Pac
kagi
ng b
ag s
tore
, and
Pro
duct
ion
plan
ning
depa
rtm
ent
- Iss
ue
3 R
M r
equi
siti
on d
ocum
ent
- Hea
d pl
an a
nd is
sue
job
allo
cati
on s
ched
ule
- Lab
or w
alk
to tw
o st
ores
- Wai
t Hea
d of
two
stor
es c
heck
and
sig
n to
app
rove
- L
ift R
M
-
Tak
e RM
to e
ach
wor
ker
- L
ift R
M a
nd H
ead
assi
gn w
ork
Inse
rt P
last
ic s
poon
into
Pac
kagi
ng b
ag
- Lab
or w
alk
to li
ft F
R
Ope
rati
on
(Aft
er
Rea
lloca
te)
,—+ csl cn
;.. ©
cu O., 0
—, M c:p N
Des
crip
tion
-Rec
eive
and
che
ck p
rodu
ctio
n or
der
-
Che
ck s
tock
and
pla
n
-Con
firm
to I
njec
tion,
Pac
kagi
ng b
ag s
tore
, and
pro
duct
ion
plan
ning
depa
rtm
ent
-Iss
ue 3
RM
Req
uisi
tion
docu
men
t
-
Tak
e to
Hea
d W
orke
r
- Hea
d W
orke
r re
ceiv
e RM
req
uisi
tion
and
chec
k do
cum
ent
- Iss
ue jo
b al
loca
tion
sche
dule
- Lab
or w
alk
to tw
o st
ores
- Wai
t Hea
d of
two
stor
es c
heck
and
sig
n to
app
rove
- L
ift R
M
- T
ake R
M to
Hea
d W
orke
r
- Hea
d ch
eck
- Tak
e RM
to e
ach
wor
ker
- L
ift R
M to
wor
ker
- Hea
d w
alk
to e
ach
wor
ker
- Ass
ign
wor
k to
eac
h w
orke
r
Inse
rt P
last
ic s
poon
into
Pac
kagi
ng b
ag
Ope
rati
on
(Bef
ore
Rea
lloca
te)
1—i C•1 en
0 N

- Lif
t FR
to Q
C
-
QC
che
ck q
ualit
y an
d is
sue
qual
ity a
ppro
val d
ocum
ent
-
Lab
or w
alk
to li
ft F
R to
nex
t pro
cess
-
Lif
t FR
ON (N1
Seal
Pac
kagi
ng B
ag
- Lab
or w
alk
to li
ft FG
- Lif
t FG
to Q
C
- QC
che
ck q
ualit
y an
d is
sue
qual
ity a
ppro
val d
ocum
ent
- Lab
or w
alk
to ta
ke FG
to P
acki
ng S
ectio
n St
ore
- Lif
t FG
Tr 1/1
00 00
o - L
abor
wal
k to
lift
Fin
ishe
d go
ods (
FG)
3 - L
ift F
G to
rete
ntio
n po
int
- QC
che
ck q
ualit
y an
d is
sue
qual
ity a
ppro
val d
ocum
ent
- Lab
or w
alk
to ta
ke FG
to P
acki
ng S
ectio
n St
ore
- Lif
t FG
. .
. r - L
abor
wal
k to
lift
Fin
ishe
d R
ack
(FR
)
- Lab
or li
ft F
R to
rete
ntio
n po
int
- QC
che
ck q
ualit
y an
d is
sue
qual
ity a
ppro
val d
ocum
ent
- Lab
or w
alk
to ta
ke F
R to
nex
t pro
cess
- Lif
t FR
_
_ Se
al P
acka
ging
Bag
_ _
et kr, s.
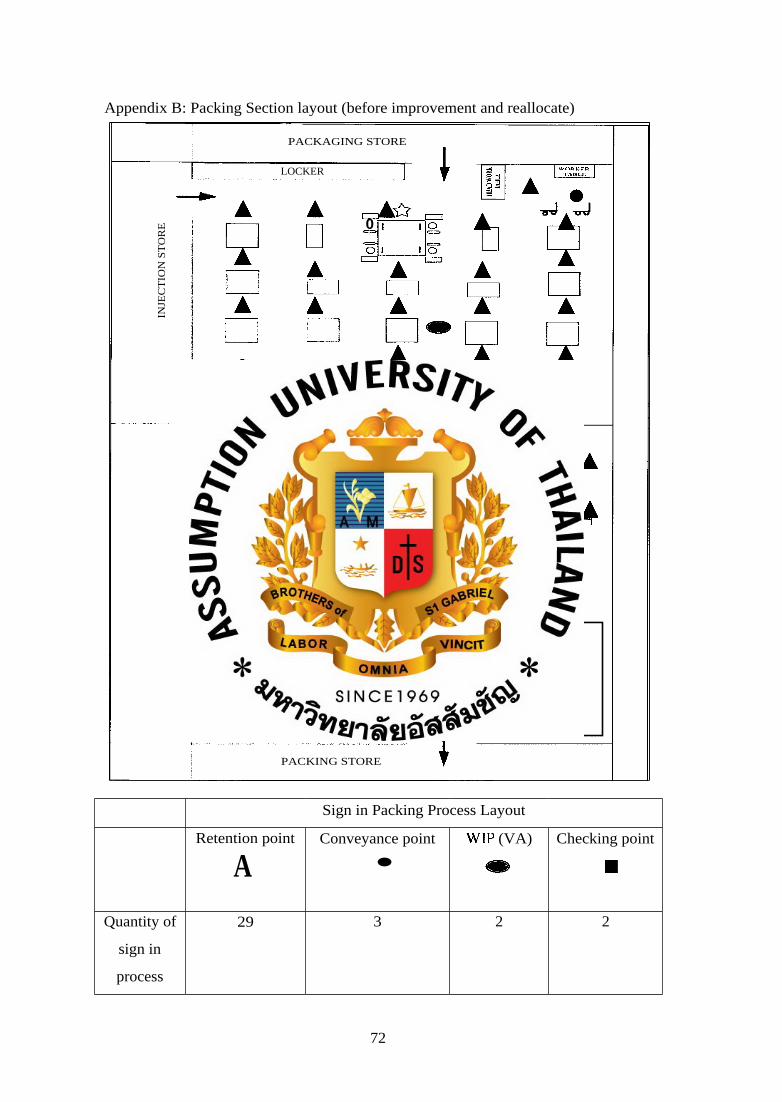
410 ED nirm H
El A E,„_Lo * 1.HA0
•
BOX
INJE
CT
ION
ST
OR
E
PACKAGING STORE
LOCKER
• • A FINISH
AREA •
I QC I •
• • 0
•
PACKING STORE
Appendix B: Packing Section layout (before improvement and reallocate)
Sign in Packing Process Layout
Retention point
A Conveyance point
• WIP (VA)
MO ■ Checking point
Quantity of
sign in
process
29 3 2 2
72
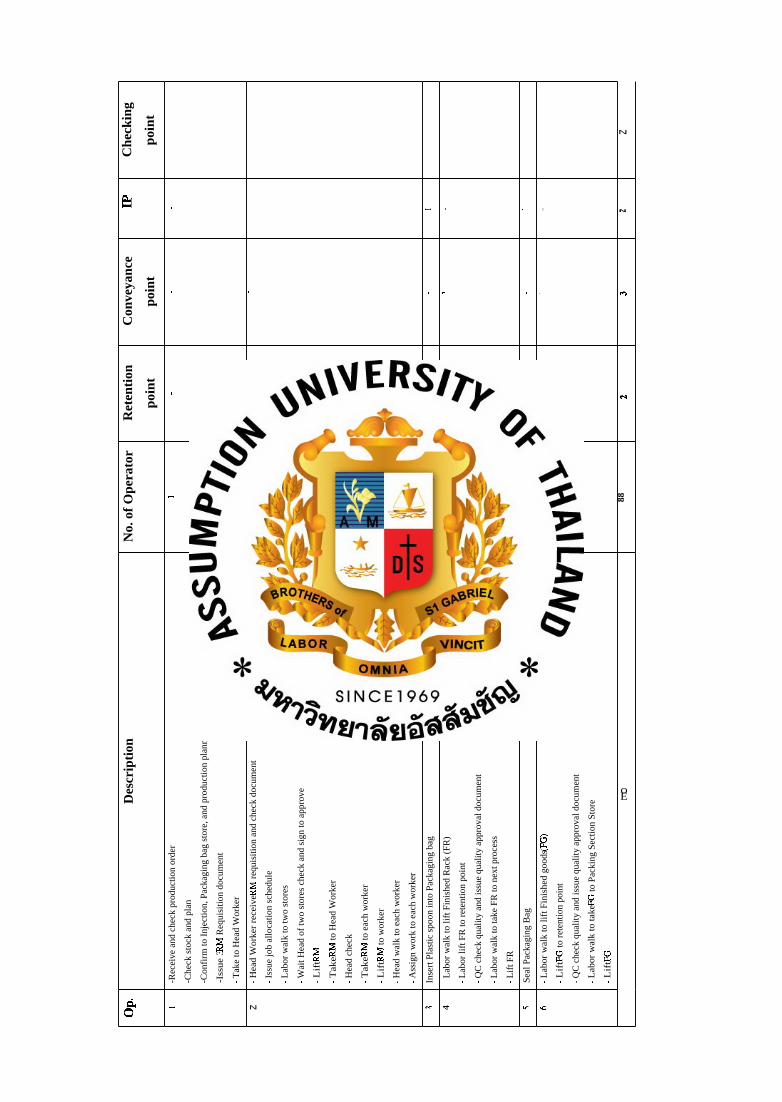
Che
ckin
g
poin
t N
Fl 1 1 e-e I . I N
Con
veya
nce
poin
t
I I I I I. I 1 en
Ret
enti
on
poin
t
I t, 00 r4
No.
of
Ope
rato
r
,-, cn Os m 00 On 88
Des
crip
tion
-Rec
eive
and
che
ck p
rodu
ctio
n or
der
-Che
ck s
tock
and
pla
n
-Con
firm
to I
njec
tion,
Pac
kagi
ng b
ag s
tore
, and
pro
duct
ion
plan
ning
dep
artm
ent
-Iss
ue 3
RM
Req
uisi
tion
doc
umen
t
- Tak
e to
Hea
d W
orke
r
- Hea
d W
orke
r re
ceiv
e RM
req
uisi
tion
and
chec
k do
cum
ent
- Iss
ue jo
b al
loca
tion
sche
dule
- Lab
or w
alk
to tw
o st
ores
- Wai
t Hea
d of
two
stor
es c
heck
and
sig
n to
app
rove
- L
ift R
M
- Tak
e RM
to H
ead
Wor
ker
- Hea
d ch
eck
- Tak
e RM
to e
ach
wor
ker
- Lif
t RM
to w
orke
r
- Hea
d w
alk
to e
ach
wor
ker
- Ass
ign
wor
k to
eac
h w
orke
r
Inse
rt P
last
ic s
poon
into
Pac
kagi
ng b
ag
- Lab
or w
alk
to li
ft F
inis
hed
Rac
k (F
R)
- Lab
or li
ft F
R to
ret
entio
n po
int
- QC
che
ck q
ualit
y an
d is
sue
qual
ity a
ppro
val d
ocum
ent
- Lab
or w
alk
to ta
ke F
R to
nex
t pro
cess
- Lif
t FR
Sea
l Pac
kagi
ng B
ag
- Lab
or w
alk
to li
ft F
inis
hed
good
s (FG
)
- L
ift F
G to
ret
entio
n po
int
- QC
che
ck q
ualit
y an
d is
sue
qual
ity a
ppro
val d
ocum
ent
- Lab
or w
alk
to ta
ke FG
to P
acki
ng S
ectio
n St
ore
- L
ift F
G
0 E
4 0 - N to 7 ., ,0
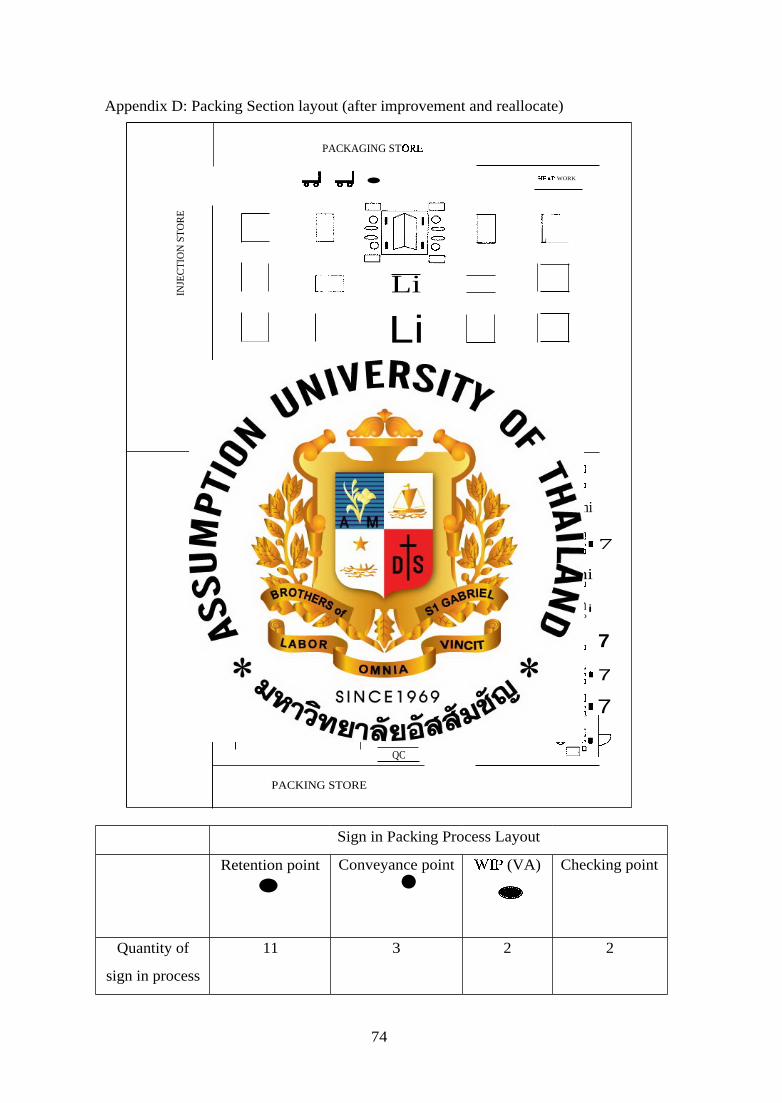
INJE
CT
ION
ST
OR
E
PACKAGING ST ORL
Tral TTel • HFAD WORK
• Trei /sal
AEJ El°
AD hi
ci;,§ El°
A® hi =0
h i n o
A FINISHED AREA
L11
•
L 1 -
r i
BOX
A FINISHED AREA
QC
7
PACKING STORE
Li
Li
n. 7
7
7
Appendix D: Packing Section layout (after improvement and reallocate)
Sign in Packing Process Layout
Retention point
• Conveyance point • WIP (VA)
MO
Checking point
Quantity of
sign in process
11 3 2 2
74
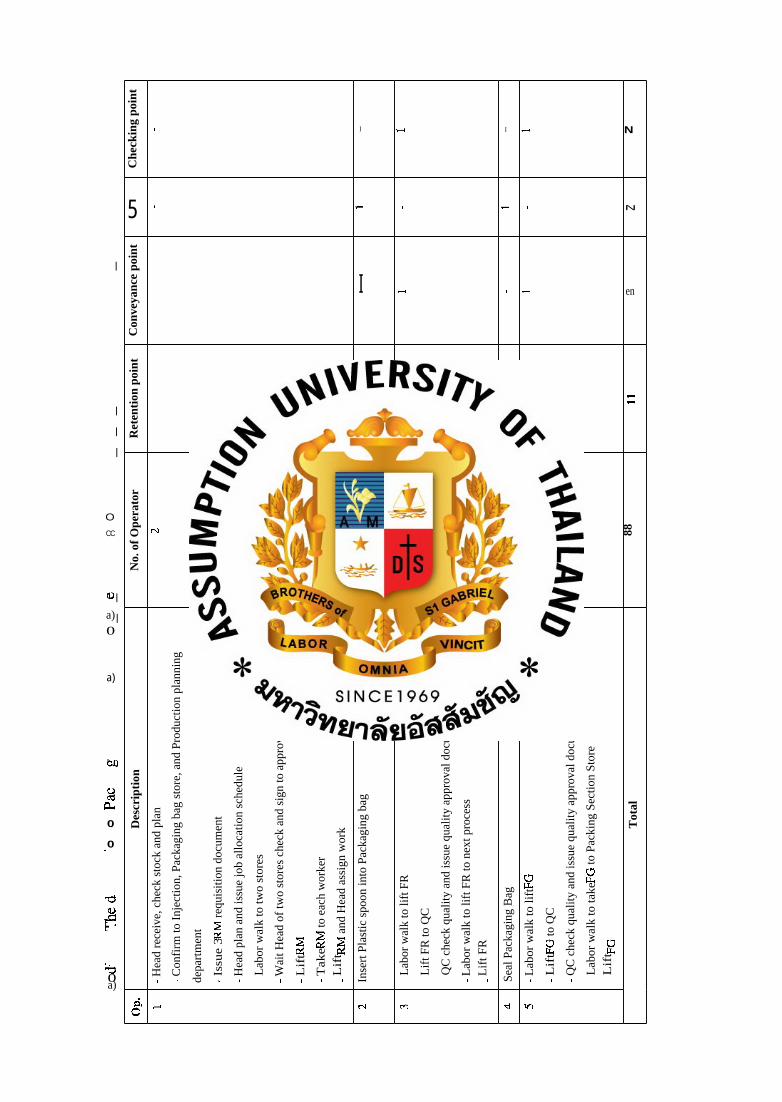
O CC
N
a) 0
a)
b.()
U czt
f3-4
0
0 •
rcs cu
eZ E.1
• 7:3 0 a)
Che
ckin
g po
int
1 I v--I I T-4 N
5 ' - , _ . N
Con
veya
nce
poin
t
I ._, . ,.. en
Ret
enti
on p
oint
,—i (-1
No.
of
Ope
rato
r
(-4 (-4 1--- Cn ON Cl 88
Des
crip
tion
- Hea
d re
ceiv
e, c
heck
sto
ck a
nd p
lan
- Con
firm
to I
njec
tion,
Pac
kagi
ng b
ag s
tore
, and
Pro
duct
ion
plan
ning
depa
rtm
ent
- Iss
ue
3 R
M r
equi
sitio
n do
cum
ent
- Hea
d pl
an a
nd is
sue
job
allo
catio
n sc
hedu
le
-
Lab
or w
alk
to tw
o st
ores
- Wai
t Hea
d of
two
stor
es c
heck
and
sig
n to
app
rove
- L
ift R
M
- Tak
e RM
to e
ach
wor
ker
- Lif
t RM
and
Hea
d as
sign
wor
k
Inse
rt P
last
ic s
poon
into
Pac
kagi
ng b
ag
-
Lab
or w
alk
to li
ft F
R
-
Lif
t FR
to Q
C
-
QC
che
ck q
ualit
y an
d is
sue
qual
ity a
ppro
val d
ocum
ent
- Lab
or w
alk
to li
ft F
R to
nex
t pro
cess
- Lif
t FR
Seal
Pac
kagi
ng B
ag
- Lab
or w
alk
to li
ft FG
- L
ift F
G to
QC
- QC
che
ck q
ualit
y an
d is
sue
qual
ity a
ppro
val d
ocum
ent
-
Lab
or w
alk
to ta
ke F
G to
Pac
king
Sec
tion
Sto
re
-
Lif
t FG
Tot
al
11. V
,-, CNII Cn 71- If)
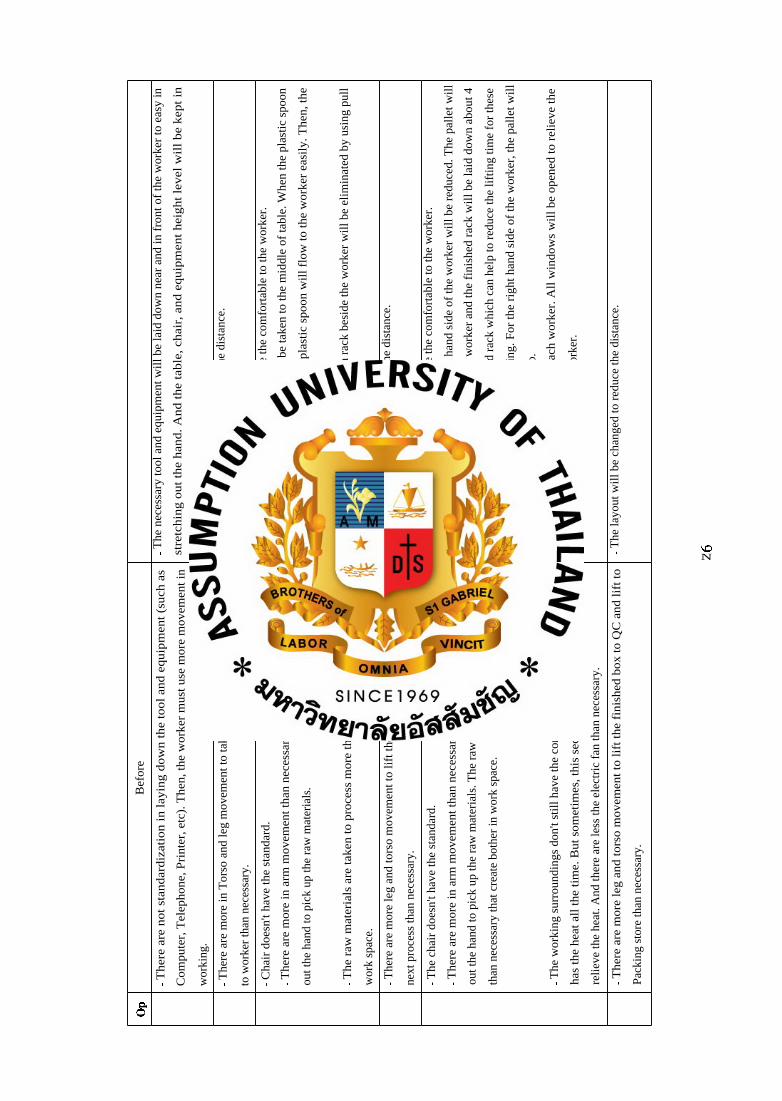
- The
nec
essa
ry to
ol a
nd e
quip
men
t wil
l be
laid
dow
n ne
ar a
nd in
fro
nt o
f th
e w
orke
r to
eas
y in
stre
tchin
g o
ut
the
han
d. A
nd t
he
table
, ch
air,
and e
quip
men
t hei
ght
level
wil
l be
kep
t in
acco
rdan
ce w
ith th
e w
orke
r he
ight
.
- The
layo
ut w
ill b
e ch
ange
d to
red
uce
the
dist
ance
.
- The
cus
hion
sea
t wil
l be
take
n to
cre
ate
the
com
fort
able
to th
e w
orke
r.
- The
sta
inle
ss w
ill b
e sl
oped
and
it w
ill b
e ta
ken
to th
e m
iddl
e of
tabl
e. W
hen
the
plas
tic
spoo
n
is p
oure
d of
f to
the
stai
nles
s sl
ope,
the
plas
tic
spoo
n w
ill f
low
to th
e w
orke
r ea
sily
. The
n, th
e
arm
mov
emen
t will
be
redu
ced.
- The
ret
enti
on p
oint
of
the
plas
tic
spoo
n ra
ck b
esid
e th
e w
orke
r w
ill b
e el
imin
ated
by
usin
g pu
ll
prod
uctio
n.
- The
layo
ut w
ill b
e ch
ange
d to
red
uce
the
dist
ance
.
- The
cus
hion
sea
t wil
l be
take
n to
cre
ate
the
com
fort
able
to th
e w
orke
r.
- The
am
ount
of
fini
shed
rac
k in
the
left
han
d si
de o
f th
e w
orke
r w
ill b
e re
duce
d. T
he p
alle
t wil
l
be la
id d
own
in th
e le
ft h
and
side
of
the
wor
ker
and
the
fini
shed
rac
k w
ill b
e la
id d
own
abou
t 4
rack
s to
red
uce
the
over
lie
of th
e fi
nish
ed r
ack
whi
ch c
an h
elp
to r
educ
e th
e li
ftin
g ti
me
for
thes
e
rack
s. T
he p
alle
t can
hel
p to
trea
t cle
anin
g. F
or th
e ri
ght h
and
side
of
the
wor
ker,
the
pall
et w
ill
be ta
ken
to la
y do
wn
the
fini
shed
box
too.
- The
ele
ctri
c fa
n w
ill b
e in
stal
led
for
each
wor
ker.
All
win
dow
s w
ill b
e op
ened
to r
elie
ve th
e
heat
and
cre
ate
the
com
fort
able
to th
e w
orke
r.
- The
layo
ut w
ill b
e ch
ange
d to
red
uce
the
dist
ance
.
Bef
ore
- The
re a
re n
ot s
tand
ardi
zati
on i
n la
ying
dow
n th
e to
ol a
nd e
quip
men
t (s
uch
as
Com
pute
r, T
elep
hone
, Pri
nter
, etc
). T
hen,
the
wor
ker
mus
t us
e m
ore
mov
emen
t in
wor
king
.
- The
re a
re m
ore
in T
orso
and
leg
mov
emen
t to
take
the
raw
mat
eria
ls a
nd e
quip
men
t
to w
orke
r th
an n
eces
sary
.
- Cha
ir d
oesn
't ha
ve th
e st
anda
rd.
- The
re a
re m
ore
in a
rm m
ovem
ent t
han
nece
ssar
y be
caus
e th
e w
orke
r m
ust s
tret
ch
out t
he h
and
to p
ick
up th
e ra
w m
ater
ials
.
- The
raw
mat
eria
ls a
re t
aken
to
proc
ess
mor
e th
an n
eces
sary
tha
t cr
eate
bot
her
in
wor
k sp
ace.
- The
re a
re m
ore
leg
and
tors
o m
ovem
ent t
o li
ft th
e fi
nish
ed r
ack
to Q
C a
nd li
ft to
the
next
pro
cess
than
nec
essa
ry.
- The
cha
ir d
oesn
't ha
ve th
e st
anda
rd.
- The
re a
re m
ore
in a
rm m
ovem
ent t
han
nece
ssar
y be
caus
e th
e w
orke
r m
ust s
tret
ch
out t
he h
and
to p
ick
up th
e ra
w m
ater
ials
. The
raw
mat
eria
ls a
re ta
ken
to p
roce
ss m
ore
than
nec
essa
ry th
at c
reat
e bo
ther
in w
ork
spac
e.
- The
wor
king
sur
roun
ding
s do
n't s
till
hav
e th
e co
mfo
rtab
le b
ecau
se th
e se
al m
achi
ne
has
the
heat
all
the
tim
e. B
ut s
omet
imes
, thi
s se
ctio
n do
es n
ot o
pen
the
win
dow
to
reli
eve
the
heat
. And
ther
e ar
e le
ss th
e el
ectr
ic f
an th
an n
eces
sary
.
- The
re a
re m
ore
leg
and
tors
o m
ovem
ent
to l
ift
the
fini
shed
box
to
QC
and
lif
t to
Pack
ing
stor
e th
an n
eces
sary
.
CL, - 0
VO N
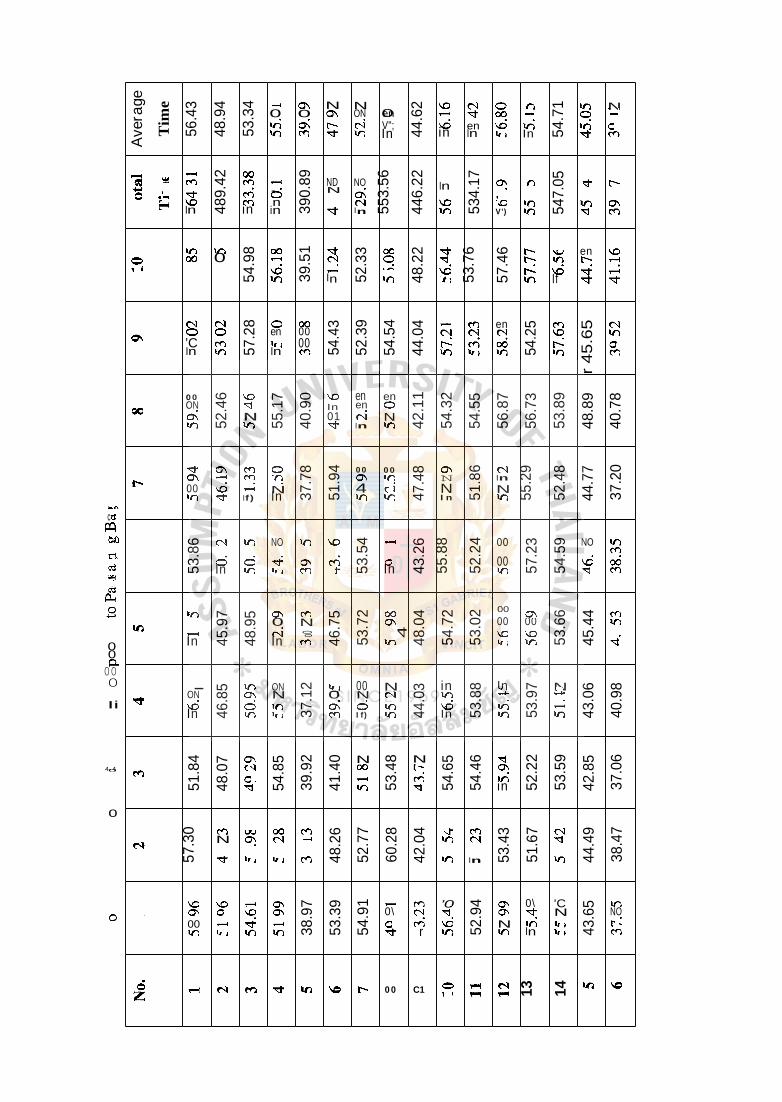
c z1b4 P:1 bA
Idbj)
celc) 0-0 2,
0 0 00
C14
0
Ii
4-40
0
0
Ave
rage
Tim
e
56.4
3
48.9
4
53.3
4 ,--1 0 Ir; in
ON 0 01 cn
N ON N 7t
N ON CV in
0 en V"; In 44
.62 C
NC; in
I f) CI 71- en In
0 00 NO In
,--1 If) In 54
.71 V')
0 In 71-
N ,---1 .c: cn
. cio) Ig 0 •,-1 E.0
.
71- NC In
M cn
489.
42
re; en in
— c:5 'n in 39
0.89
ND N
7t•
NO
cv In 55
3.56
oo
446.
22
In VD In
Ci
534.
17
C rN . ,C) V')
) In V') 54
7.05
•71- V') 71-
t-- ON Cr)
= 1 1
In oo In 0 54
.98 oo ,-,
<5 ICI 39
.51 71-
cl In 52
.33
..-i <5 oo o
Iko
n 1 / 1
48.2
2 ..7t 71-
53.7
6
57.4
6 s r".. S kr)
VI VI <3 If
en ts"- 4 71- 41
.16
csi 0 'C In
t0.£g 57
.28 0
en In In
oo 00 00 54
.43
cn
M I n 52.3
9
54.5
4
44.0
4 - CNI
cn CV In
r•-: M00 S en CI
In 54.2
5 cn NO
In
r 45
.65 CV
V") c:1 Cr)
00 00 ON
In 52.4
6 VD 71- N In
OR
55.1
7
40.9
0 VD In 01 `71'
en en CNi In
en 0 N In 42
.11
54.3
2
54.5
5
56.8
7
56.7
3
53.8
9
48.8
9
40.7
8
r . 71' O1 1,--1 00 In
CON
v:3 71'
Cr) Cr) .--( If)
0 11) . N In 37
.78
51.9
4 00 ON 4 If)
00 In c,i If) 47
.48 a\
N N In 51
.86 r•1
In N If) 55
.29
52.4
8
44.7
7
37.2
0
53.8
6 CI In
6 In 6 ,in
NO
71: In
In
01 cr)
1/0
cri , i- 53.5
4 —
cri In 43.2
6 55
.88
52.2
4 00
00 in 57.2
3
54.5
9 NO
<5 71- 38
.35
if) In
,-, In 45
.97
48.9
5 0 czh
c4 In
cn N
cn o0 4
46.7
5
53.7
2
00\ 00
in 48.0
4
54.7
2
53.0
2 0000 "0 '0 In
00 ON
In 53.6
6
45.4
4
InCr)
71-
.er . ON v3 In 46
.85 If)
ON
in c:5 In cA ON N
In 37.1
2 In 0
cn
00 N 6 If)
N CA In In 44
.03 in
If) <5 In 53
.88 In
71: If) VI 53
.97 N
"1: ,--I In 43
.06
40.9
8
M
51.8
4
48.0
7 ON (-1 ,:: 71- 54
.85
39.9
2
41.4
0 N 00 r-i V) 53
.48 N
t---- cli 71- 54
.65
54.4
6 71- ON If; in 52
.22
53.5
9
42.8
5
37.0
6
CN1
57.3
0 cn N
71- ON ON
In
oo CA
In
cn ,--1
cf) 48.2
6
52.7
7
60.2
8
42.0
4 71- Ir)
In
cn CV
In 53.4
3
51.6
7 CV 71-
In 44.4
9
38.4
7
VD CIN 00 If)
VD C:3 .-I In
7-0 V:::) 4 in
ON 01 -, in 38
.97
53.3
9
1-1
e- :
54.9
1 ,--! 0\ c:i 7r.
cn Cl M r
'0 71- <5 in 52
.94 CS\
ON N In
0\ 7r: In In
'C N In In 43
.65 If)
NO
cn
ei, 4
,I--1 csei ( en .1- or) 1G r--• 00 C1 , c: 4 k.-.1 ro el 13
ri
14
kre NO
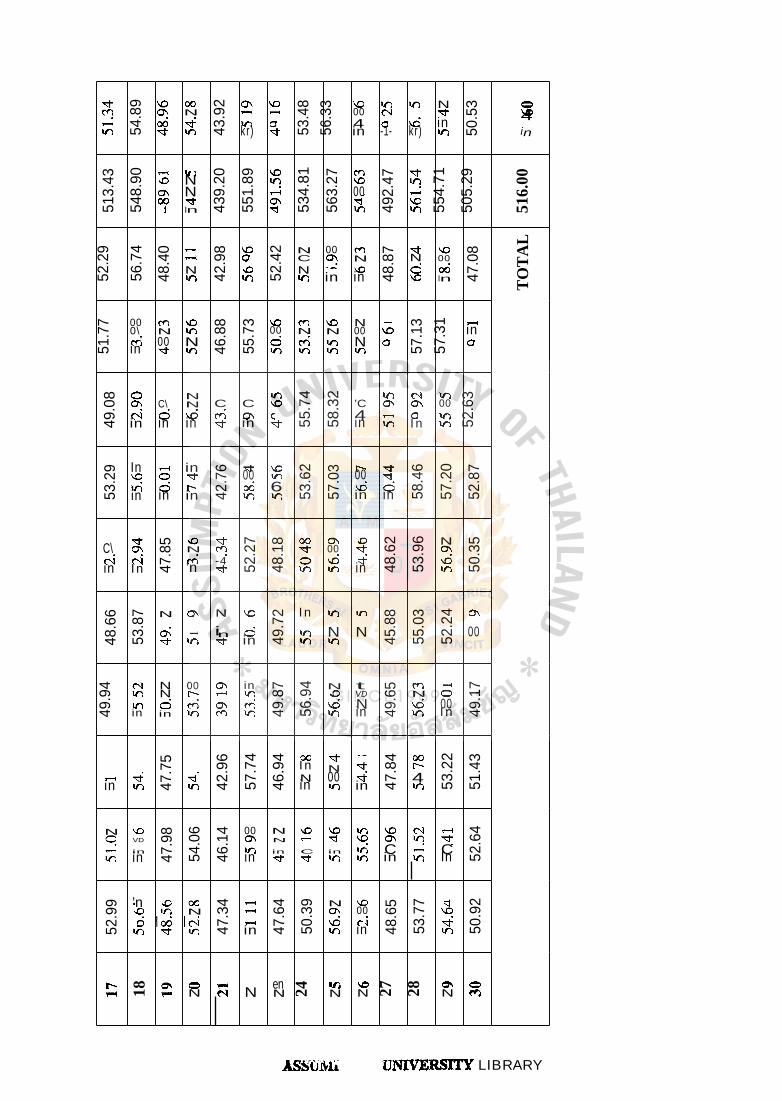
MCn ,-, in 54
.89
ON ON00 71-
00 N 7t: kr) 43
.92 0\ 1••••4
in kr)
VD ,..I e:s -1- 53
.48
56.3
3 \C 00 4 in
In (NI c:: -1-
tr)
q:;, kr)
N 'Tr in kr) 50
.53 =
VD 4 in
513.
43
548.
90 -
c) O\ oo - 1-
in N N .1- In 43
9.20
551.
89
v;) wl ,--, cs. 71- 53
4.81
563.
27 cn ‘.o
00 kn 71- 49
2.47
1-in ,-, .0 In 55
4.71
505.
29
516.
00
52.2
9
56.7
4
48.4
0 ,--, ,--( N kr) 42
.98 VD
C:7 1/ 4.0 In 52.4
2 N C N in
00 ON in in
Cr) N VD in 48
.87 't
N 6 VD
\C 00 (xi In 47
.08
TO
TA
L
51.7
7 00 0\ cci in
Cn N 00 -;t•
VD in N in 46
.88
55.7
3 \O 00 6 in
Cn N en in
`O N In in
N 00 N in
,-1 ‘‘) C 57
.13
57.3
1 ,--1 in c:s
49.0
8 0 ON (Ni in
C\ 6 in
N N ‘.6. in
C cn .1-
C C1 in
VD VD e:: 1- 55
.74
58.3
2
'C 4 in
C - in
N CT \ c:i In
in 00 In in 52
.63
53.2
9 In \c) kri in
- o 6 in
in -7t- t.-- in 42
.76 -1- 00
oci in
\C In 6 in 53
.62
57.0
3 t--. 00 v3 in
-I- -71 6 in 58
.46
57.2
0
52.8
7
C\ ("Ni in
71- ON Ci In 47
.85 ,..0
N Cri 'n
71- cn -4 71- 52
.27
48.1
8 oo 71" 0 in
C1 00 v:3 kr)
..0 7t: ,1- in 48
.62
53.9
6 N ON v3 in 50
.35
48.6
6
53.8
7 N
CT Cr \
in
N
in -I-
VD
6 in
, -1
49.7
2
71-
In in in
kr) N kr)
kr)
N 45.8
8
55.0
3
52.2
4 cr‘ 00
49.9
4 N If) in in
N N 6 in
00 r--- cn In
C\ . c).\ cn
in In cci in 49
.87
56.9
4 N ..tj v3 in
t VD N in 49
.65 Cl N vzi in
,-.4 0 00 In 49
.17
,---4 in
4 In 47
.75
71- in 42.9
6
57.7
4
46.9
4 In oo N in
- N I- 00 in
'oo
I' 4 in 47
.84
S oo 4 in 53
.22
51.4
3
N CD.
,-+ in
VD VD
in in 47.9
8
54.0
6
46.1
4 00 ON in in
N N
in .1-
VD ,-,
C -71-
VD 71-
in in
in VD
IA kr)
v:D r C'N
C in
ZS' JS
1-1
71. C In 52.6
4
52.9
9 'n ,c)
in COON4
,.o in 71-
oo N
in 47.3
4 ,-, 1-4
. in 47
.64
50.3
9 N CA
v:i in
`O 00 c,i in 48
.65
53.7
7 .71-\O 4 in 50
.92
t--- 1..1 18
a, 1mi
c:::, N
IZ
N en N 24
it) N
vz) N 27
28
01 N
0 en
ASSOIVIi 'UNIVERSITY LIBRARY