mokoena_td.pdf - nwu-ir home
TRANSCRIPT
A CRITICAL ANALYSIS OF COMMUNITY-DRIVEN
DEVELOPMENT PROJECTS AIMED AT POVERTY
ALLEVIATION IN EVATON WEST
TEMEKI DANIEL MOKOENA
Submitted in accordance with the requirements for the
degree of
PHILOSOPHIAE DOCTOR
in Economics at the
NORTH-WEST UNIVERSITY
Promoter: Prof. T.J.C. Slabbert
Vanderbijlpark
2004

ACKNOWLEDGEMENTS
This thesis is dedicated to the people of Evaton West, the Evaton Wes it Community
Development Forum, C O L ~ A P ~ A ~ , the Eindhoven municipality and SOLID (a
Canadian NGO). I also wish to acknowledge the willingness of all these people and
bodies to share information and data and their assistance throughout.
I wish to thank my promoter, Professor TJC Slabbert, for his constant guidance
and encouragement, without whom this work would not have reached fruition.
Thanks to Dr Jerry Berlin (from the DBSA) for editorial (including language editing)
and other advice on the thesis. I also wish to acknowledge the support of family
and friends. The assistance of Mrs Manini Kganakga and Ms Nicola McAntagart
with the typing of this thesis is also acknowledged.
Finally, I thank the Vaal University of Technology for providing funding for this
research. Above all, I thank God for strength to endure.
TD Mokoena
2004
Community-Driven Development projects towards poverty alleviation 1
DECLARATION
I declare that
A CRITICAL ANALYSIS OF COMMUNITY-DRIVEN DEVELOPMENT
PROJECTS AIMED AT POVERTY ALLEVIATION IN EVATON WEST
is my own work, that all the sources used or quoted have been duly
acknowledged by means of complete references, and that I have not previously
submitted the thesis for a degree at another university.
Terneki Daniel Mokoena
. . CDD Projects towards poverty eradication 11
A CRITICAL ANALYSIS OF COMMUNITY-DRIVEN DEVELOPMENT
PROJECTS AIMED AT POVERTY ALLEVIATION IN EVATON WEST
by
Temeki Daniel Mokoena
Degree: Philosophiae Doctor (PhD)
Department: Economics
Promoter: Professor T.J.C. Slabbert
SUMMARY
This thesis studies the effects of specific community- driven developmer
programmes run in Evaton West over the past three years (200011 to 200314) on
poverty in the area. These programmes were targeted at poverty reduction and
community development in Evaton West, driven by the Eindhoven municipality
and COL~AP~A'@.
The relationship between the Eindhoven Municipality and the Ernfuleni
Municipality started as a result of the twinning of Tilburg and Eindhoven cities in
the Netherlands with the erstwhile LekoaNaal Local Metropolitan Council.
Evaton West was chosen as a pilot site for Eindhoven to run practical IDP
programmes at, as an example of what can be achieved from properly run
community-based programmes. COL~AP~A' was introduced to Evaton West by
the Vaal University of Technology's Community Service department. Its
programmes were aimed at poverty alleviation through small-scale business
initiatives coupled with leadership training in the area.
The approach in the thesis is to define poverty, measure it and determine the
profile of the poor. This is done firstly employing household-level indicators and
secondly employing community-level indicators. At household level, some of the
following tools are used: the poverty line (HSL), headcount index, the poverty
gap, dependency ratio, the Lorenz curve and the Gini coefficient. Unemployment
... Community-Driven Development projects towards poverty alleviation 111
is also used to determine poverty levels. At community level, the thesis employs
tools such as community characteristics, community assets, principal services,
education, health and environmental issues. The thesis ends with specific
recommendations. In particular, formation of co-operatives and the introduction
of the basic income grant (BIG) are proposed.
The thesis shows that compared to Bophelong, which is approximately similar to
Evaton West in terms of age and composition of residents (especially based on
age analysis), Evaton West is worse-off judging by poverty and welfare at
household level. It proposes that one of the problems is Evaton West's
geographical displacement.
The thesis also shows that compared to three years ago, Evaton West is
marginally better-off judging from the community indicators applied. It ascribed
such improvement to the application of the above-stated community-driven
development projects in Evaton West.
Finally, the thesis suggests that one of the major solutions in dealing with poverty
is to consider small-scale, home-based industries that allow for easy entry. Such
projects can only succeed if they are approached in an integrated manner in
which local authorities are fully involved. Labour absorption capacity of large
industries is declining. This forces policy-making to be redirected to alternative
sources of employment. The thesis contributes ways in which community-driven
development programmes may be assessed at household and community levels.
Key terms
Poverty, Community-Driven Development (CDD), Evaton West, Bophelong,
unemployment, poverty measurement, poverty definition, headcount index,
poverty gap, profiles of the poor, Lorenz curve, Gini coefficient, poverty indices,
Eindhoven Municipality, COL~AP~A@ (Centres of Learning to Alleviate Poverty in
Africa), SOLID (Saltspring Organization for Life Improvement and Development).
Community-Driven Development projects towards poverty alleviation iv
'N KRITIESE ANALISE VAN 'N GEMEENSKAPSGEDREWE
ONTWIKKELINGSPROGRAM WAT OP ARMOEDEVERLIGTING IN EVATON-
WES GEMIK IS
deur
Temeki Daniel Mokoena
Graad: Philosophiae Doctor (PhD)
Departement: Ekonomie
Studieleier: Professor T.J.C. Slabbert
OPSOMMING
Hierdie tesis bestudeer die effek van spesifieke gerneenskapsgedrewe
ontwikkelingsprogramme wat gedurende die afgelope drie jaar (200011 tot
200314) op arrnoede in die Evaton-Wes gebied gerig is. Die
ontwikkelingsprogramme is deur die Eindhoven Munisipaliteit en COL~AP~A@
bestuur.
Die verhouding tussen die Eindhoven en Emfuleni Munisipaliteite het hul
ontstaan te danke aan die samevoeging van die stede Tilburg en Eindhoven met
die eertydse LekoaNaal Plaaslike Metropolitaanse Raad. Evaton-Wes was
aangewys as 'n proefterrein vir Eindhoven wat praktiese IDP programme wou
loods. Hierdie programme moes as voorbeeld dien vir ander gebiede in die
Vaaldriehoek ten opsigte van dit wat bereik kan word indien
ontwikkelingsprogramme effektief bestuur word. Coltapia is deur die Vaal
Universiteit van Tegnologie se Departement Gemeenskapsdiens aan Evaton-
Wes voorgestel. Die programme wat geloods sou word was op
armoedeverligting gemik. Dit geskied deur middel van kleinskaalse inisiatiewe
wat met leiersopleiding in die area gekoppel is.
Die benadering wat in hierdie studie gevolg is, soek eers na 'n definisie en 'n
meting van armoede waawolgens 'n armoedeprofiel gevorm word.
Laasgenoemde is gedoen deur die gebruik van huishoudelikevlak indikators en
die gebruik van gemeenskapsvlak indikators. Op huishoudelike vlak is sommige
van die volgende instrumente gebruik: die armoede lyn (HSL), "headcount"
Community-Driven Development projects towards poverty alleviation v
indeks, die arrnoede gaping, afhanklikheidsratio, die Lorenz kurwe en die Gini
koeffisient. Werkloosheid word ook gebruik om arrnoedevlakke vas te stel. Op
gemeenskapsvlak is die volgende instrumente gebruik:
gemeenskapskaraktertrekke, gemeenskapsbates, die vernaamste dienste,
opvoeding, gesondheid en omgewingsake. Die studie sluit met spesifieke
aanbevelings af. In besonder word die samestelling van kooperatiewes en die
bekendstelling van die basiese inkomste voorsiening ("grant") voorgestel.
Die studie dui daarop dat, in vergelyking met Bophelong, wat omtrent dieselfde
as Evaton-Wes is in terrne van ouderdom en samestelling van inwoners
(spesifiek ouderdomsanalise), Evaton-Wes in werklikheid slegter daaraan toe is
ten opsigte van arrnoede en welvaart op huishoudelike vlak. Die studie stel voor
dat een van die problerne Evaton-Wes se geografiese verskuiwing is.
Die studie dui ook daarop dat in vergelyking met drie jaar gelede, Evaton-Wes
marginaal beter daaraan toe is wat betref die gerneenskapsindikators wat
toegepas is. Die studie skryf hierdie verbetering aan die aanwending van
bogenoemde gerneenskapsgedrewe ontwikkelingsprojeke in Evaton-Wes toe.
Ten slotte stel die studie voor dat een van die hoofoplossings vir armoede die
oorweging van kleinskaalse, tuisbasis industriee is wat rnaklike toegang tot
gevolg het. Hierdie projekte kan slegs suksesvol wees as hulle in 'n
gei'ntegreerde rnanier benader word waar plaaslike owerhede ten volle betrokke
is. Arbeidsabsorpsie kapasiteit van groot industriee toon 'n afname. Dit dwing
beleidrnaking om alternatiewe bronne van werksverskaffing te benut.
Sleutelterme
Armoede, Gemeenskapsgedrewe Ontwikkeling (GGO), Evaton-Wes, Bophelong,
werkloosheid, armoede maatstawe, armoede definisie, 'headcount' indeks,
arrnoedegaping, profiel van die arrne, Lorenz kurwe, Gini koemsient, arrnoede
indekse, Eindhoven Munisipaliteit, Coltapia, SOLID (Saltspring Organization for
Life Improvement and Development)
Community-Driven Development projects towards poverty alleviation vi
A CRITICAL ANALYSIS OF COMMUNITY-DRIVEN DEVELOPMENT
PROJECTS AIMED AT POVERTY ALLEVIATION IN EVATON WEST
TABLE OF CONTENTS
CONTENTS
Acknowledgements
Declaration
Summary
Opsomming
Table of contents
List of Abbreviations
List of diagrams, figures and maps
List of tables
Chapter 1 -The problem and its setting
Introduction
Research problem
Purpose and objective of the study
Motivation for the study
Hypothesis
Research methodology
Outline of the study
Explanation of terms
Summary
PAGE #
i
ii
iii
v
vii
xiii
xvi
xxi
Community-Driven Development projects towards poverty alleviation vii
Chapter 2 - Definitions and explanations of underlying concepts (poverty,
inequality, community-driven development and unemployment)
Introduction
The rationale for poverty alleviation
Definition of poverty
Subsistence, inequality or externality
Social exclusion
Human Scale Development
Objective and subjective approaches
Urban poverty1Rural poverty
Vulnerability
Poverty issues - a recap
Measurements of poverty and inequality
Measuring poverty
Poverty lines
Minimum income question (MIQ)
Poverty indices
The headcount index
The poverty gap and the squared poverty gap indices
Examples of other poverty indices
2.3.1.6.1 Sen's index
2.3.1.6.2 Foster, Greer and Thorbecke (FGT) (1984) poverty index
2.3.1.6.3 Costa's index of deprivation
2.3.1.6.4 Sen-Shorrocks-Thon (SST) index
2.3.1.6.5 Watts index
2.3.1.6.6 Atkinson class of indices
2.3.2 Measures of inequality
2.3.2.1 The Lorenz curve and the Gini coefficient
2.3.2.2 Other generalized entropy measures
2.3.2.3 Stochastic dominance
. . . Community-Driven Development projects towards poverty alleviation VIII
2.3.2.3.1 First order stochastic dominance (FSD)
2.3.2.3.2 Second order stochastic dominance
Poverty profiles
Demographic characteristics
Economic characteristics
Social characteristics
Access to services
Poverty in Africa
Poverty and inequality in South Africa
Community-driven development
Concept of Community Driven Development
Problems arising from Community Driven Development
Process of CDD
Employment and unemployment
Summary
Chapter 3 - Background of Evaton West and the community development
initiatives in the area
3.1 Introduction 70
3.2 Background to Evaton West 7 1
3.2.1 Location of Evaton West 71
3.2.2 Profile of Evaton West from Census 2001 data 77
3.3 Community-driven development initiatives 88
3.3.1 COLMP~A@ 89
3.3.1 .I Project outline 89
3.3.1 .I .I Poverty alleviation training 90
3.3.1.1.2 Leadership development within the context of poverty alleviation91
3.3.1.2 The process of community development as outlined by
COLNP~A@ 9 1
3.3.1.3 Focus areas of the project 92
Community-Driven Development projects towards poverty alleviation ix
3.3.1.3.1 The roles of the various partners
3.3.1.4 Evaluation of the project by the focus group
3.3.2 Eindhoven Municipality
3.3.2.1 Evaluation of the project by the focus group
3.4 Summary
Chapter 4 - Analysis of household indicators in Evaton West compared to
Bophelong
4.1 Introduction
4.2 Demographic and employment profiling
4.2.1 Demographic profile
4.2.2 Labour force
4.2.3 The employed and the unemployed
4.3 Poverty and inequality
4.3.1 Inequality
4.3.2 Profile of the poor
4.3.2.1 Age analysis
4.3.2.2 Education levels
4.3.2.3 Employed poor
4.3.2.4 Unemployed poor
4.3.2.4.1 Age
4.4 Income and expenditure
4.5 Environmental issues
4.5.1 Littering
4.5.2 Air and noise pollution
4.5.3 Social cost of pollution
4.5.4 Heating and cooking technologies
4.6 Crime
4.7 Narrower focus on Evaton West
4.8 Quality of life
- ~
Cornrnunity-Driven Development projects towards poverty alleviation x
4.8.1 Satisfaction survey
4.8.2 Asset ownership
4.8.3 Indebtedness
4.8.4 Housing adequacy
4.9 Snapshot of indicators
4.10 Summary
Chapter 5 - Analysis of community indicators in Evaton West in 200314
compared to 200011
Introduction
Community characteristics
Population
Employment activities
Roads
Income
Public transport
Housing adequacy
Quality of life
Trust and conflict in the community
Principal sewices
Electricity
Public lighting
Drinking water
Home telephone service
Communication service
Public telephone services
Postallmail service
Internet service
Sewage
Refuse collection
Community-Driven Development projects towards poverty alleviation xi
Recreation
Safety and security
Labour migration
Education
Preschool
Primary school
Secondary school
Adult education
Health
Environmental issues
Small, micro and medium enterprises (SMME's)
Community support
Snapshot of indicators in this chapter
Summary
Chapter 6 - Summary, conclusions and recommendations
6.1 Introduction
6.2 Summary of thesis
6.3 Conclusions
6.4 Recommendations
Chapter 6 -Addendum: The basic income grant (BIG) and its effect on
poverty in Evaton West
6A. 1 Introduction
6A.2 The proposed BIG
6A.3 BIG in Evaton West
6A.4 BIG summary
Bibliography 213
Community-Driven Development projects towards poverty alleviation xii
Annexure 1 - Survey design and application
Annexure 2 - Household questionnaire
Annexure 3 - Community questionnaire
Annexure 4 - Respondents to the community questionnaire
Annexure 5 - Methodologies
Annexure 6 - Transcript of the focus group interview (FGI)
. . . Community-Driven Development projects towards poverty alleviation XIII
LIST OF ABREVIATIONS
AIDS
ANC
CEAS
COL~AP~A@
CPF
CPS
CROP
DoA
DOE
DoL
DTI
ELM
EPWP
ERU
EWCDF
FA0
FBT
FG I
FGT
FSD
FWT
GDP
GTZ
HDI
HEL
HlPC
HIV
HSD
HSL
ICT
I DC
Acquired Immune-Deficiency Syndrome
African National Congress
Central Economic Advisory Service
Centres of Learning to Alleviate Poverty in Africa
Community Policing Forum
Current Population Survey
Comparative Research Programme on Poverty
Department of Agriculture
Department of Education
Department of Labour
Department of Trade and Industry
Emfuleni Local Municipality
Expanded Public Works Programme
Employment Research Unit
Evaton West Community Development Forum
Food and Agriculture Organization
Former Black Townships
Focus Group Interview
Forster-Greer-Thorbecke
First Order Stochastic Dominance
Former White Towns
Gross Domestic Product
The Deutsche Gesellschaft fur Technische Zusammenarbeit
Human Development Index
Household Effective Level
Heavily Indebted Poor Country
Human Immune-Deficiency Virus
Human Scale Development
Household Subsistence Level
Information and Communications Technology
Industrial Development Corporation
Community-Driven Development projects towards poverty alleviation xiv
lDGs
IDP
IDT
ILO
IMF
IRDC
LDC
LED
LLM
LM
MDG
MHSL
MLL
MLM
MPCC
MSL
NGO
OECD
PDL
PHP
PUA
PUMF
PWV
RDP
RSA (also SA)
SALDRU
SBDC
S DA
SDM
SMME
SOLID@
SST
STATSSA
U A
lnternational Development Goals
Integrated Development Plan
Independent Development Trust
lnternational Labour Office
lnternational Monetary Fund
lnternational Development Research Centre
Less Developed Country
Local Economic Development
Lesedi Local Municipalty
Local Municipalities
Millennium Development Goals
Minimum Humane Standard of Living
Minimum Living Level
Midvaal Local Municipality
Multi-Purpose Community Centre
Minimum Standard of Living
Non-Governmental Organization
Organisation for Economic Co-operation and Development
Poverty Datum Line
People's Housing Programme
Peri-Urban Agriculture
Peri-Urban Mini Farm
Pretoria-Witwatersrand-Vereeniging
Reconstruction and Development Programme
Republic of South Africa
Southern Africa Labour and Development Research Unit
Small Business Development Corporation
Skills Development Act
Sedibeng District Municipality
Small, Medium and Micro Enterprises
Saltspring Organization for Life Improvement and Development
Sen-Shorocks-Thorn
Statistics South Africa
Urban Agriculture
Community-Driven Development projects towards poverty alleviation xv
U AC
UN
UNDP
VCCl
VTA
VTT
VUT
VUTCS
Urban Agricultural Co-operatives
United Nations
United Nations Development Programme
Vaal Chamber of Commerce and Industries
Vaal Triangle Area
Vaal Triangle Technikon
Vaal University of Technology
Vaal University of Tehcnology Community Service
Community-Driven Development projects towards poverty alleviation xvi
LIST OF DIAGRAMS, FIGURES & MAPS
CHAPTER 7
DIAGRAM 1 .I: STUDY PLAN
DIAGRAM 1.2: PLAN OF THE STUDY
PAGE #
5
8
CHAPTER 2
BOX 2.1:
FIGURE 2.1:
MAP 2.1:
MAP 2.2:
FIGURE 2.2:
FIGURE 2.3:
FIGURE 2.4:
FIGURE 2.5:
FIGURE 2.6:
FIGURE 2.7:
MAP 2.3:
FIGURE 2.8:
FIGURE 2.9:
BOX 2.2:
CHAPTER 3
MAP 3.1:
FIGURE 3.0:
MAP 3.2:
CHARACTERISTICS OF THE URBAN POOR 23
DIMENSIONS OF RISK 25
POPULATION BELOW THE POVERTY LlNE (%): LESS THAN
US$? A DAY 29
POPULATION BELOW THE POVERTY LlNE (%):
LESS THAN US$2 A DAY 30
SUBJECTIVE MlNlMlM INCOME AND ACTUAL INCOME 33
EFFECTS OF THE VALUES OF a 38
THE LOREN2 CURVE 4 1
FIRST ORDER STOCHASTIC DOMINANCE 45
SHARE OF PEOPLE LIVING ON LESS THAN US$?
AND US$2 PER DAY 53
CONTINUOUS DISTRIBUTION FUNCTIONS OF PER CAPITA
REAL INCOMES 58
POVERTY DISTRIBUTION BASED ON MONTHLY
EXPENDITURE, BY MAGISTERIAL DISTRICT 59
PHASES OF THE COMMUNITY DEVELOPMENT PROCESS 65
OUTCOMES OF POPULAR PARTICIPATION AND STATE
PROVISION 66
OFFICIAL AND EXPANDED UNEMPLOYMENT RATES 67
REPUBLIC OF SOUTH AFRICA 72
POPULATION DISTRIBUTION -1 999 74
EVATON WEST WITH NEIGHBOURING TOWNS 75
Community-Driven Development projects towards poverty alleviation xvii
MAP 3.3:
FIGURE 3.1:
FIGURE 3.2:
FIGURE 3.3:
FIGURE 3.4:
FIGURE 3.5:
FIGURE 3.6:
FIGURE 3.7:
FIGURE 3.8:
FIGURE 3.9:
FIGURE 3.10:
FIGURE 3.1 1 :
FIGURE 3.12:
FIGURE 3.13:
FIGURE 3.14:
FIGURE 3.1 5:
FIGURE 3.16:
FIGURE 3.17:
FIGURE 3.18:
FIGURE 3.19:
FIGURE 3.20:
FIGURE 3.21 :
CHAPTER 4
FIGURE 4.1:
FIGURE 4.2:
FIGURE 4.3:
FIGURE 4.4:
FIGURE 4.5:
FIGURE 4.6:
FIGURE 4.7:
EVATON WEST
POPULATION GROUP OF EVATON WEST
GENDER BY AGE
AGE DISTRIBUTION
HIGHEST EDUCATION LEVELS ATTAINED BY OVER
20 YEAR OLDS
LABOUR FORCE
INDUSTRY AND SECTOR OF EMPLOYMENT
OCCUPATION
INDIVIDUAL MONTHLY INCOME
LANGUAGE DISTRIBUTION
DISABILITY
MODE OF TRAVEL TO WORK OR SCHOOL
DWELLING TYPE
HOUSEHOLD SIZE
NUMBER OF ROOMS
SOURCE OF ENERGY FOR LIGHTING
REFUSE
SANITATION
TELEPHONE
WATER
ANNUAL HOUSEHOLD INCOME
MARITAL STATUS
GENDER DISTRIBUTION OF THE EVATON WEST
POPULATION IN 2003
TOTAL POPULATION: PERCENTAGE
IN AGE CATEGORIES - 2003
QUALIFICATIONS: POPULATION OUT OF SCHOOL - 2003 102
REASONS FOR MOVING TO THE VAAL - 2003 103
LABOUR FORCE - 2003 104
UNEMPLOYMENT RATE BY PROVINCE - 2003 104
SECTORS OF EMPLOYMENT FOR THE EMPLOYED - 2003 106
Community-Driven Development projects towards poverty alleviation xviii
FIGURE 4.8:
FIGURE 4.9:
FIGURE 4.10:
FIGURE 4.1 1:
FIGURE 4.12:
FIGURE 4.13:
FIGURE 4.14:
FIGURE 4.15:
FIGURE 4.16:
FIGURE 4.17:
FIGURE 4.18:
FIGURE 4.19:
FIGURE 4.20:
FIGURE 4.21:
FIGURE 4.22:
FIGURE 4.23:
FIGURE 4.24:
FIGURE 4.25:
FIGURE 4.26:
EMPLOYMENT BY SECTOR IN GAUTENG 107
DURATION OF UNEMPLOYMENT: EVATON WEST- 2003 107
PERCENTAGE OF UNEMPLOYED IN DIFFERENT AGE
CATEGORIES - 2003 108
EDUCATIONAL LEVELS OF THE UNEMPLOYED - 2003 109
POVERTY MAP OF GAUTENG - 2003 11 1
HOUSEHOLDS AND THEIR HSL RATIOS - 2003 112
LORENZ CURVES: 2001 & 2003 - EVATON WEST 113
AGE CATEGORIES - POOR POPULATION - 2003 115
QUALIFICATIONS OF THE POOR NOT IN SCHOOL - 2003 116
THE COMPOSITION OF THE POOR LABOUR FORCE - 2003 11 7
SECTOR OF EMPLOYMENT FOR EMPLOYED POOR - 2003 118
CATEGORIES OF THE UNEMPLOYED POOR POPULATION
IN EVATON WEST - 2003 119
POOR UNEMPLOYED: DURATION OF
UNEMPLOYMENT - 2003 120
QUALIFICATION OF POOR UNEMPLOYED - 2003 121
AVERAGE HOUSEHOLD INCOME:
% CONTRIBUTION OF DIFFERENT SOURCES - 2003 122
PLACE WHERE HOUSEHOLD PRODUCTS ARE BOUGHT 123
HOUSEHOLD EXPENDITURE - 2003 124
OPINIONS ABOUT THE ENVIRONMENT - LITTERING - 2003 125
INITIATIVE AND RESPONSIBILITY FOR DEALING WITH
LITTER - 2003 126
FIGURE 4.26a: OPINIONS ON POLLUTION: NOISE AND AIR
POLLUTION - 2003
FIGURE 4.27: HOUSEHOLDS AFFECTED BY AIR POLLUTION - 2003
FIGURE 4.28: NOISE POLLUTION - HOUSEHOLDS AFFECTED - 2003
FIGURE 4.29: OPINIONS: RESPONSIBILITY TO CONTROL NOISE
POLLUTION - 2003
FIGURE 4.30: ANNUAL SOCIAL COST OF POLLUTION - 2003
FIGURE 4.31: COOKING AND HEATING TECHNOLOGIES - 2003
FIGURE 4.32: INTEREST IN COOKING AND HEATING
TECHNOLOGIES - 2003
Community-Driven Development projects towards poverty alleviation
FIGURE 4.33:
FIGURE 4.34:
FIGURE 4.35:
FIGURE 4.36:
FIGURE 4.37:
FIGURE 4.38:
FIGURE 4.39:
FIGURE 4.40:
FIGURE 4.41 :
CHAPTER 5
FIGURE 5.1:
FIGURE 5.2:
FIGURE 5.3:
FIGURE 5.4:
FIGURE 5.5:
FIGURE 5.6:
FIGURE 5.7
FIGURE 5.8:
FIGURE 5.9:
FIGURE 5.10:
FIGURE 5.1 1:
FIGURE 5.12:
FIGURE 5.13:
HOUSEHOLDS AFFECTED BY CRIME IN THE PAST 12
MONTHS - 2003
TYPES OF CRIME: HOUSEHOLDS AFFECTED - 2003
PHYSICAL SAFETY - 2003
SATISFACTION WITH WAY HOUSEHOLD LIVES - 2003
SITUATION COMPARED TO THAT OF PARENTS - 2003
ITEMS GOVERNMENT SHOULD FOCUS ON TO IMPROVE
LIVING STANDARDS - 2003
SATISFACTION WITH SERVICES OFFERED BY LOCAL
MUNICIPALITY - 2003
AVERAGE NUMBER OF ITEMS OWNED PER
HOUSEHOLD - 2003
PERCENTAGE AMOUNTS OWED - PER HOUSEHOLD
AND PER BORROWER - 2003
PERCEPTIONS REGARDING ROADS AND STORMWATER
DRAINAGE - 2001
INDIVIDUAL INCOMES - 2001 & 2003
PERCEPTIONS REGARDING TRANSPORT-2001
PERCEPTIONS REGARDING HOUSING-2001
PERCEPTIONS OF COMMUNITY CONFLICT
PERCEPTIONS REGARDING ELECTRICITY
PROVISION - 2001
PERCEPTIONS REGARDING WATER DELIVERY - 2001
PERCEPTIONS REGARDING REFUSE REMOVAL - 2001
PERCEPTIONS REGARDING SPORT AND
RECREATION - 2001
PERCEPTIONS REGARDING SAFETY AND
SECURITY - 2001
PERCEPTIONS REGARDING EDUCATON - 2001
PERCEPTIONS REGARDING PUBLIC HEALTH - 2001
UNEMPLOYED'S PREFERRED SECTORS TO GET SKILLS
TRAINING IN
Cornmunay-Driven Development projects towards poverty alleviation xx
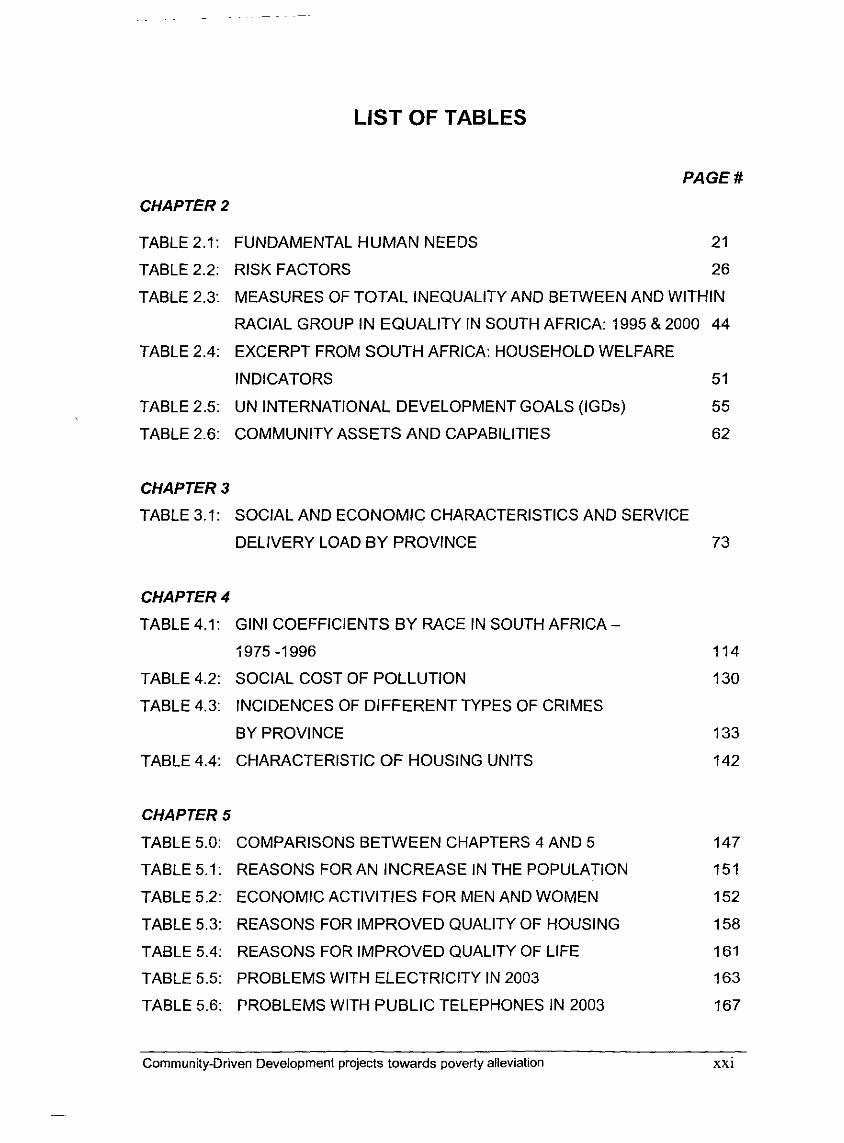
LIST OF TABLES
PAGE #
CHAPTER 2
TABLE 2.1: FUNDAMENTAL HUMAN NEEDS 2 1
TABLE 2.2: RISK FACTORS 26
TABLE 2.3: MEASURES OF TOTAL INEQUALITY AND BETWEEN AND WITHIN
RACIAL GROUP IN EQUALITY IN SOUTH AFRICA: 1995 & 2000 44
TABLE 2.4: EXCERPT FROM SOUTH AFRICA: HOUSEHOLD WELFARE
INDICATORS 5 1
TABLE 2.5: UN INTERNATIONAL DEVELOPMENT GOALS (IGDs) 55
TABLE 2.6: COMMUNITY ASSETS AND CAPABILITIES 62
CHAPTER 3
TABLE 3.1: SOCIAL AND ECONOMIC CHARACTERISTICS AND SERVICE
DELIVERY LOAD BY PROVINCE 73
CHAPTER 4
TABLE 4.1: GIN1 COEFFICIENTS BY RACE IN SOUTH AFRICA -
i 975 -1 996 114
TABLE 4.2: SOCIAL COST OF POLLUTION 130
TABLE 4.3: INCIDENCES OF DIFFERENT TYPES OF CRIMES
BY PROVINCE 133
TABLE 4.4: CHARACTERISTIC OF HOUSING UNITS 142
CHAPTER 5
TABLE 5.0: COMPARISONS BETWEEN CHAPTERS 4 AND 5 147
TABLE 5.1: REASONS FOR AN INCREASE IN THE POPULATION 151
TABLE 5.2: ECONOMIC ACTIVITIES FOR MEN AND WOMEN 152
TABLE 5.3: REASONS FOR IMPROVED QUALITY OF HOUSING 158
TABLE 5.4: REASONS FOR IMPROVED QUALITY OF LIFE 161
TABLE 5.5: PROBLEMS WITH ELECTRICITY IN 2003 163
TABLE 5.6: PROBLEMS WITH PUBLIC TELEPHONES IN 2003 167
Community-Driven Development projects towards poverty alleviation xxi
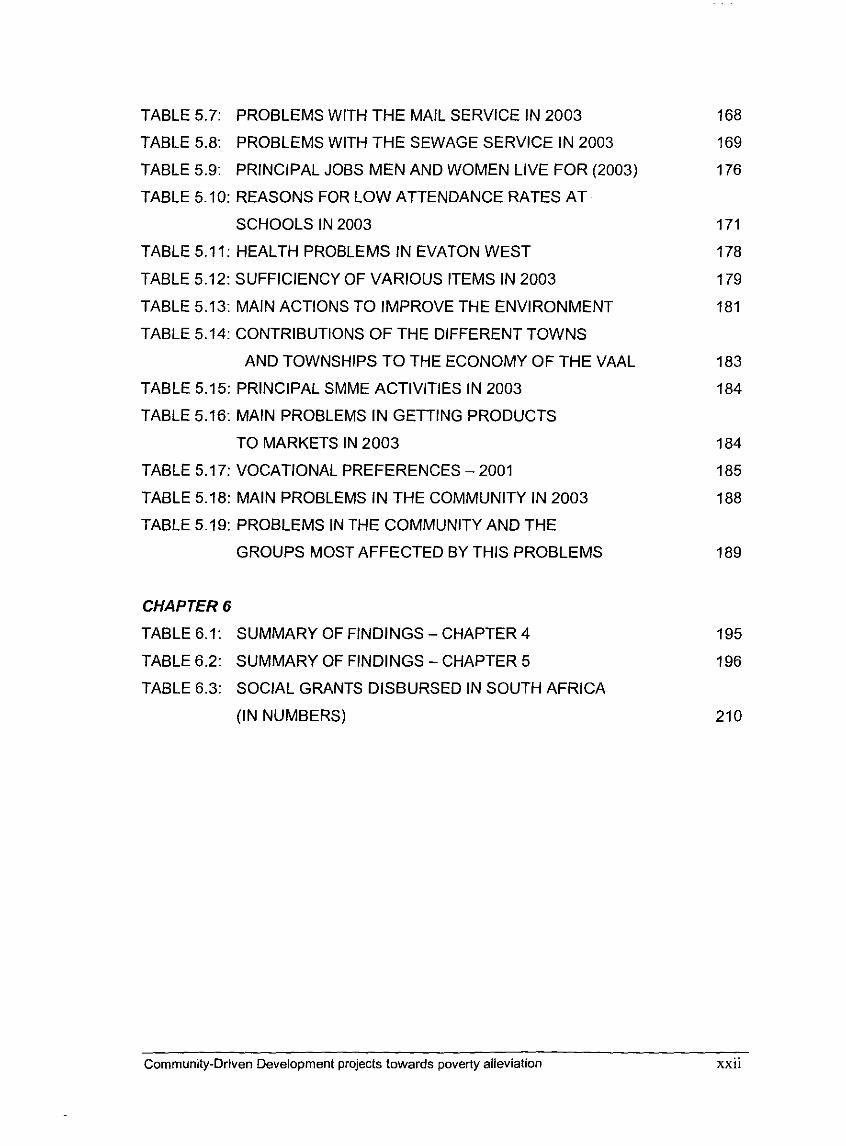
TABLE 5.7: PROBLEMS WlTH THE MAIL SERVICE IN 2003
TABLE 5.8: PROBLEMS WlTH THE SEWAGE SERVICE IN 2003
TABLE 5.9: PRINCIPAL JOBS MEN AND WOMEN LIVE FOR (2003)
TABLE 5.10: REASONS FOR LOW ATTENDANCE RATES AT
SCHOOLS IN 2003
TABLE 5.1 1: HEALTH PROBLEMS IN EVATON WEST
TABLE 5.12: SUFFICIENCY OF VARIOUS ITEMS IN 2003
TABLE 5.13: MAlN ACTIONS TO IMPROVE THE ENVIRONMENT
TABLE 5.14: CONTRIBUTIONS OF THE DIFFERENT TOWNS
AND TOWNSHIPS TO THE ECONOMY OF THE VAAL
TABLE 5.15: PRINCIPAL SMME ACTIVITIES IN 2003
TABLE 5.16: MAlN PROBLEMS IN GETTING PRODUCTS
TO MARKETS IN 2003
TABLE 5.1 7: VOCATIONAL PREFERENCES - 2001
TABLE 5.18: MAlN PROBLEMS IN THE COMMUNITY IN 2003
TABLE 5.19: PROBLEMS IN THE COMMUNITY AND THE
GROUPS MOST AFFECTED BY THIS PROBLEMS
CHAPTER 6
TABLE 6.1: SUMMARY OF FINDINGS -CHAPTER 4
TABLE 6.2: SUMMARY OF FINDINGS - CHAPTER 5
TABLE 6.3: SOCIAL GRANTS DISBURSED IN SOUTH AFRICA
(IN NUMBERS)
Community-Driven Development projects towards poverty alleviation xxii
Chapter 1
The problem and its setting
1.1 Introduction
The World Bank and many institutions measuring poverty and proposing
measures to deal with it measure poverty at macro-levels
(i.e. country-wide levels). Measurements such as the US$1 and US$2 per day
methods based on the purchasing power parities among countries are calculated
on countrywide data. Even the participatory poverty assessment measures
conducted by the World Bank under the banner of "Voices of the Poor" (World
Bank, 2000) looked at macro-level issues. Not much research has concentrated
on micro-level (such as community-level) assessment and solutions and South
Africa is no exception. This thesis concentrates on micro-level (specifically
community-level), local indicators of poverty within the Vaal Triangle Area (VTA)
in the Gauteng province of South Africa.
Burkey (1996: xvi-xvii) points out that the numbers of the poor in the Third World
are increasing and poverty is deepening in spite of all the projects targeted at
poverty alleviation. The problem seems to lie in the top-down approach followed
in these programmes. Those who have the means dictate what programmes and
projects should be followed.
The Vaal Triangle Area VTA itself experiences high levels of poverty, the highest
in the Gauteng. This is confirmed by research conducted over time by Slabbert
(1997) and Mokoena (2001). Statistics South Africa (StatsSA) (2000) has also
found high levels of poverty and inequality in Gauteng and especially in the VTA.
This research also suggests high unemployment levels. A number of projects
targeted at poverty alleviation in the area have been undertaken.
This thesis describes the notion of participatory, self-help, local initiatives rather
than the macro-level countrywide programmes targeted by development
agencies and governments. The former seem to prove more successful than the
latter (Burkey, 1996: xvii) as the success of community projects lies in their long-
Community-Driven Development projects towards poverty alleviation 1
term sustainability. Projects started, run and maintained by the affected
individuals seem to have longer life spans ("staying power") than 'imposed'
projects. There is, therefore, a move towards participatory approaches in aid and
development by for example the World Bank (1999). This study looks at the
success of this type of approach at a micro-level (i.e. employing community-level
indicators) within one community.
1.2 Research problem
How a researcher defines poverty will influence how poverty will be measured,
this, in turn, will influence policy options recommended in fighting poverty
(Mokoena, 1994: 11). Much research on poverty in the Vaal area has used the
indicators of consumption and income, based mainly on household surveys, to
measure it (cf. Slabbert, 1997 & StatsSA, 2000). Well-meaning policy
recommendations have, in the past, not been based on participatory methods.
These are fairly recent (cf. Chambers, 1999). Not much seems to have been
done in understanding poverty from the perspective of the poor through
participatory methods. Participatory poverty assessments as proposed by the
World Bank (Robb, 1999: xii) have primarily been used in countrywide surveys to
propose macro socio-economic solutions. Coupled to this lack of research in
micro-level participatory methods is the initiation and support of poverty
alleviation programmes in which poor people have fully participated in their
envisioning, development and implementation. This raises the following major
research question:
What is the impact of a community-driven development approach in
alleviating poverty?
This question further points to the following sub-questions:
i. What is participatory community development or community-
driven development (CDD)?
ii. Is community-driven development effective in alleviating
poverty or increasing the well-being of a community?
iii. How is poverty defined and measured?
Community-Driven Development projects towards poverty alleviation 2
iv. How can the impact of poverty alleviation projects in a
community be measured?
The thesis is aimed at answering these research questions with relation to the
community of Evaton West and the poverty alleviation projects applied in the
community.
1.3 Purpose and objective of the study
The objective of this study is to assess the impact of typical participatory projects
within a given community (Evaton West). The envisaged outcome of the study is
to showcase the success or failure of these projects and to recommend further
projects. In order to achieve this, the following aspects will, inter alia, receive
attention in measuring the impact of the projects:
A. Household indicators such as:
Labour force, employment and unemployment
Poverty and inequality,
Income and consumption,
Quality of life, crime, asset ownership and housing,
Environmental issues.
B. Community indicators such as:
Community characteristics: population, employment, income,
housing, public roads, quality of life and trust and conflict in the
community,
Principal services (electricity, communication services, sewage,
drinking water, public lighting),
Recreation, safety and security, labour migration,
Education,
Health,
Environmental issues,
SMME's,
Community support.
Community-Driven Development projects towards poverty alleviation 3
1.4 Motivation for the study
Involvement in poverty research in the VTA both for academic studies and as
part of the Vaal Research Group (VRG) has made the researcher aware of an
overt need to include the poor in defining their own existence and being pro-
active in bringing themselves out of the state of poverty. Sustainability of projects
depends on their inclusivity of the people affected by poverty in planning,
execution and evaluation (Wates, 2000: 2-3). Being part of a poor community
helps one understand the reality of poverty much better. Chambers (1997: 13-23)
points out the pre-conceived biases of 'outsiders' to poor communities in
attempting to define, measure and propose strategies against poverty. 'Insiders'
better understand, though not in a formatted or formalised way, what needs to be
done. The poor can better articulate their condition and can positively influence
policies directed at poverty reduction if they are carefully questioned, led and
assisted by those with the means and the articulation, expertise and
commitment.
1.5 Hypothesis
This study aims to test the hypothesis that community-driven development
projects are effective in reducing levels of poverty in a given community. In this
study, the COLWP~A~ project and the Eindhoven Municipality projects will be
evaluated as applied in Evaton West. The hypothesis will be tested against
criteria to be developed this thesis. The hypothesis can be phrased formally as
follows:
Ho: Poverty levels in Evaton West are the same or higher after the
C O L ~ A P ~ A ~ and the Eindhoven Municipality projects were applied
than they were before these projects.
HA: Poverty levels in Evaton West are lower after the COLWP~A@ and
Eindhoven municipality projects were applied than they were before
these projects.
The null hypothesis will be rejected if only one of the following indicators shows
improvement, without the others being worse off: that is, if it can be proven that
Community-Driven Development projects towards poverty alleviation 4
on aggregate the level of well-being (welfare) has increased or alternatively that
the level of ill-being has been reduced. The indicators to be used are:
Household indicators and
Community indicators as listed under 1.3 above.
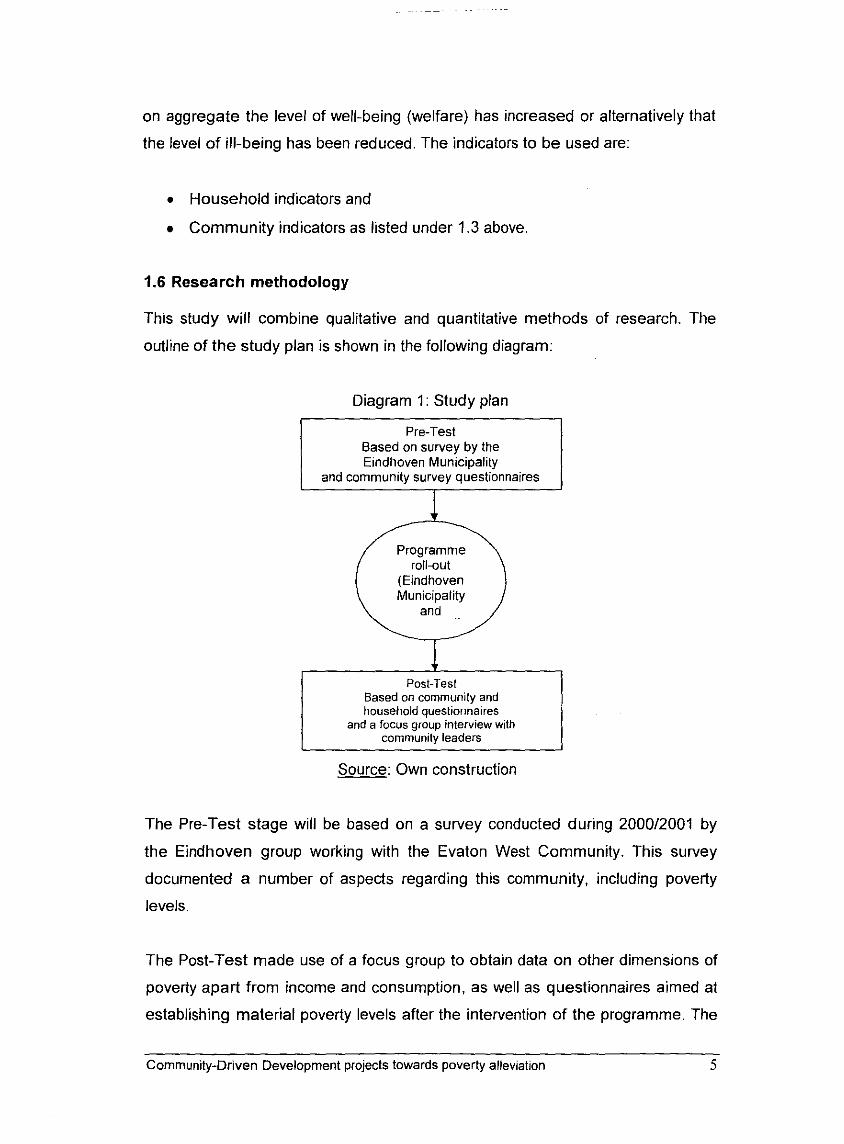
1.6 Research methodology
This study will combine qualitative and quantitative methods of research. The
outline of the study plan is shown in the following diagram:
Diagram 1 : Study plan
Pre-Test Based on survey by the Eindhoven Municipality
Programme roll-out
(Eindhoven Municipality
Based on community and household questionnaires
and a focus group interview with community leaders
Source: Own construction
The Pre-Test stage will be based on a survey conducted during 2000/2001 by
the Eindhoven group working with the Evaton West Community. This survey
documented a number of aspects regarding this community, including poverty
levels.
The Post-Test made use of a focus group to obtain data on other dimensions of
poverty apart from income and consumption, as well as questionnaires aimed at
establishing material poverty levels after the intervention of the programme. The
Community-Driven Development projects towards poverty alleviation 5
programme where the effects are assessed was from the C O L ~ A P ~ A ~ (Centres of
Learning to Alleviate Poverty in Africa) programme run jointly by COL~AP~A@ and
the Emfuleni Municipality, the Vaal University of Technology (formerly the Vaal
Triangle Technikon) and CoLtAPiA in combination with projects initiated by the
Eindhoven Municipality.
The study employed three broad strategies:
. Define and measure poverty - this will be done quantitatively (employing
income and consumption) and qualitatively (employing social indicators
and subjective methods) in Evaton West.
. Describe the Programmes (Community-driven development or
participatory community development) as employed in Evaton West.
. Evaluate the outcomes of these programmes and propose
recommendations with regards to these programmes in Evaton West.
1.7 Outline of the study
In Chapter I : The problem and its setting, the background study focusing on
justification of the study and the hypothesis being tested are described. The
chapter uses the research proposal as a base.
Chapter 2: Concepts and explanations deals with the background theory on
poverty and the community-driven development 1 participatory approach to
poverty assessment and definitions. It also deals with the theoretical
underpinnings of the study. A literature review of concepts such as poverty
definitions and measurement, community development and
employment/unemployment form part of this chapter.
In Chapter 3: Background of Evaton West and the community-driven
development initiatives in the area, the outline of the two main intervention
programmes run in Evaton West in the past three years, namely COL~AP~A@ and
the Eindhoven-driven programmes are discussed, both from the initiators' as well
as from the recipients' perspective of the programmes. The aims, purpose and
Community-Driven Development projects towards poverty alleviation 6
intended benefits, as well as perceived actual outcomes, are discussed. The
chapter also offers a brief profile of Evaton West.
Chapter 4: Analysis of household indicators in Evaton West (compared to
Bophelong) outlines a cross-sectional comparative evaluation of key household
indicators. The chapter compares the results of the current survey conducted in
Evaton West with the results of similar surveys conducted in both Bophelong (a
similar township) and the greater Emfuleni area. The purpose of the study was to
determine whether Evaton West, by receiving aid from the stated programmes,
was better off than similar communities in the Vaal, or worse off.
In Chapter 5: Analysis of community indicators in Evaton West in 200314
compared to 2000/1, a longitudinal comparison of Evaton West indicators is
described. The chapter presents the results of the survey assessing the social
capital of the Evaton West community. The determination of whether or not the
social capital of the community had increased over the three year period was
made.
Chapter 6: Conclusions and recommendations, presents a summary of findings
of the study and evaluates the hypothesis against the findings. Conclusions have
been drawn from these outcomes. The chapter contains recommendations of
appropriate approaches and projects with regard sustainable community
development especially in Evaton West. Policy imperatives, the Integrated
Development Plan (IDP) processes and self-help initiatives also form part of the
recommendations in this chapter.
A comprehensive plan of the study is presented in Diagram 2. The diagram
shows that chapters 2 and 3 deal with that background theory underpinning the
rest of the thesis. Chapters 4 and 5 presents the various indicators used in the
study as they apply to Evaton West; with Chapter 4 focusing on household
indicators and Chapter 5 on community-level indicators. Chapter 6 gives a
summary of the thesis as well as conclusions and recommendations.
Community-Driven Development projects towards poverty alleviation 7
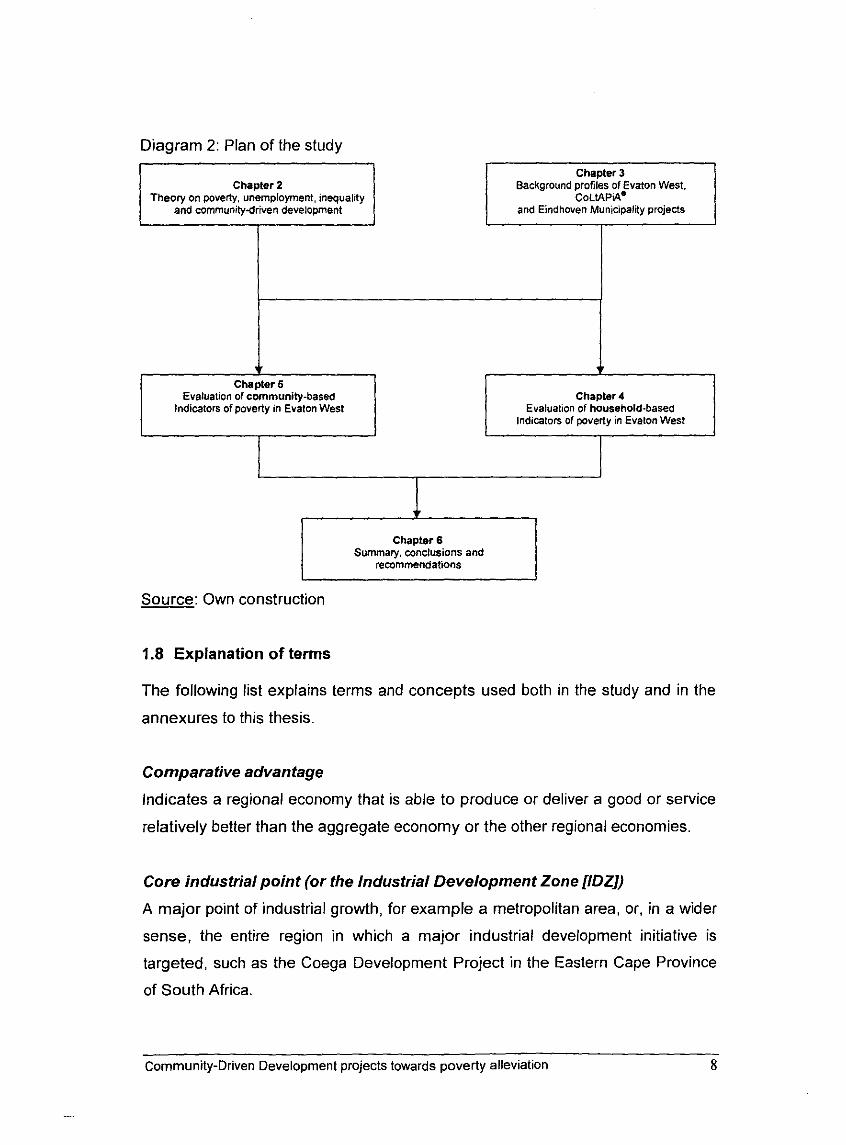
Diagram 2: Plan of the study
Chapter 2 Theory on poveq, unemployment, inequality
Chapter 3 Background protiles of Evaton West,
C0~ tAP l4~ and Eindhoven Muntclpalny projects
Evaluation of community-based lndicalon of poveity in Evalon West
Chapter 4 Evaluation of household-based
Ind~cators of poverty in Evalon Wesl
Chapter 6 Summary, conclusions and
recommendations
Source: Own construction
1.8 Explanation of terms
The following list explains terms and concepts used both in the study and in the
annexures to this thesis.
Comparative advantage
Indicates a regional economy that is able to produce or deliver a good or service
relatively better than the aggregate economy or the other regional economies.
Core industrial point (or the Industrial Development Zone [IDZ])
A major point of industrial growth, for example a metropolitan area, or, in a wider
sense, the entire region in which a major industrial development initiative is
targeted, such as the Coega Development Project in the Eastern Cape Province
of South Africa.
Community-Driven Development projects towards poverty alleviation 8
Density (population)
The number of people in a given area divided by the geographical size of the
region.
Dependency burden
Specifically refers to the financial implications of the dependency ratio.
Dependency ratio
The number of people supported by a single employed person, excluding him- or
herself.
Deprivation
Refers to lacking what is needed for well-being. Its dimensions are physical,
social, economic, political and psychologicallspiritual. It includes forms of
disadvantage such as physical weakness, isolation, poverty, vulnerability and
powerlessness.
Economically active population
All workers in an area, whether employers, employees, self employed or
unemployed, including trans-frontier commuters and resting migrant workers,
present in their area of origin at the time of a survey.
Income-poor and income-poverty
Refers to low per capita income.
Labour supply
The economically active population of a region, excluding migrant workers
Literacy rate
The percentage of the population with reading, writing and arithmetic skills. In the
study it is taken as the percentage of the population with standard 4 or more of
formal education.
Community-Driven Development projects towards poverty alleviation 9
~- ~ -- ~~
Livelihood
Refers to the means of gaining a living, including income capabilities, tangible
assets and intangible assets. Employment can provide a livelihood, but most
livelihoods of the poor are based on multiple activities and sources of food,
income and security.
Me fropole
The metropolitan areas, namely Tshwane and the Greater Johannesburg, the
greater DurbanlPinetown area, the Cape Peninsula and the greater Port
Elizabethluitenhage area.
Micro-level
Pertaining to economic units and entities the analysis of which are performed on
a small (micro) scale rather than at a larger (macro) scale. Examples include a
single community (e.g. Evaton West) as opposed to multiple, geographically
spread communities (e.g. Gauteng or South Africa).
Non-poor households /individuals
A non-poor household is defined as a household of which the combined income
of all its members is more than the Household Subsistence Level (HSL)
calculated for the specific household. Persons belonging to such households are
referred to as "the non-poor."
Participation rate
The percentage of people actually available to the labour market, that is, the
economically active population as a percentage of the potential economically
active population.
Poor
Goes beyond being the adjective for poverty, referring to lack of physical
necessities, assets and income, to include the broader sense of being deprived,
in a bad condition and lacking basic needs.
Community-Driven Development projects towards poverty alleviation 10
Poor households / individuals
A poor household is defined as a household of which the cornbined income of all
its members is less than the Household Subsistence Level (HSL) calculated for
the specific household. Persons belonging to such households are referred to as
"the poor."
Potential labour force
The number of persons in the age range of 15 to 64 years.
Poverty
Refers to lack of physical necessities, assets and income. It includes, but is
more than, being income-poor. Poverty can be distinguished from other
dimensions of deprivation such as physical weakness, isolation, vulnerability and
powerlessness with which it interacts.
Poverty gap (household)
The poverty gap for a household is defined as the difference between the income
of a poor household and the HSL for that specific household.
Poverty gap (population)
The sum of the poverty gaps for individual households. That is the total amount
needed to lift all the households below the poverty line to a level equal to their
poverty lines.
Poverty rate
Number of poor households expressed as a percentage of the total number of
households
Social development
Means enhanced individual and community well-being and autonomy, within an
integrated, equitable and just society.
Structural poverty
A state of long-term poverty due to the personal or social circumstances of
Community-Drwen Development projects towards poverty allev~at~on
- -- -
individuals. Individuals are, for example, poor because they lack access to land,
to employment, or to employment at sufficient level for basic subsistence.
Sustainable livelihood
Refers to a living which is adequate for the satisfaction of basic needs, and
secure against anticipated shocks and stresses.
Unemployed persons
People who are available for and willing to work, who are actively looking for
jobs, but are not in any type of paid employment in the formal sector.
Urbanisation level
Physical concentration of people and activity in towns and cities and the social
dimensions of being urbanised.
Vulnerability
Means not lack or want, but exposure and defenselessness. It has two sides: the
external side of exposure to shocks, stress and risk; and the internal side of
defenselessness, meaning a lack of means to cope without damaging loss.
Well-being
It is the experience of good quality of life.
1.9 Summary
This chapter presented and justified the writing of the thesis and provided the
methodology employed in the thesis. The chapter outlined the research project,
the motivation for this project and how the research was undertaken. The
hypothesis was presented as well as the chapter outline of the thesis.
The purpose of the study was presented as an assessment of the success of the
community-driven development projects as applied in Evaton West. The thesis
focuses on the two main programmes applied in Evaton West, namely, the
COL~AP~A@ Programme and the Eindhoven Municipality Programme.
Community-Driven Development projects towards poverty alleviation 12
Chapter 2
Definitions and explanations of underlying concepts
(poverty, inequality, community-driven development and
unemployment)
2.1 Introduction
This chapter provides the theoretical framework and the literature review on
concepts that form the underpinnings of this thesis. It begins with a review of the
understanding of poverty, its definitions and measurements. This study focuses
on material urban poverty at township-level. Poverty will be reviewed first in a
broad macro-economic perspective and then the discussion will be narrowed to a
micro-level (localized) view of poverty, the same as township-level.
A review of community-driven development will be given before attention is
focused on micro-level development projects driven mainly by the community
and for the community. The chapter will provide material for a broad and generic
understanding of these concepts without going into any specific detail.
It is important to note right at the outset that there is a large and intensive a body
of knowledge that deals with the concepts discussed in this chapter. It is not the
aim of this thesis to provide an in-depth review of these concepts and so it is
mentioned and discussed only as it relates to and form the basis of this thesis.
Furthermore, more attention will be paid to poverty than to other issues, firstly
because it forms the key to the entire research premise and, secondly, due to the
convoluted nature of the concept.
Community-Driven Development projects towards poverty alleviation
~~- ~- -~ -
2.2 The rationale for poverty alleviation
Throughout the ages, mankind has had to deal with poverty, even in Biblical
times. In Deuteronomy 28:48 (Bible, 1970: 147), for example, The Bible even
makes reference to the concept of dire poverty. The twentieth century saw a
great deal of attention paid to the profiling of poverty, especially at city-level. The
work of researchers like Charles Booth at the turn of the 20" century in London
(Scott, 1994: 19-32, and Fisher, 1997), Seebohm Rowntree in York (Scott, 1994:
33-38, and Fisher, 1997) and Mollie Orshansky (Orshansky, 1965) all bear
testimony to this. Throughout the ages, such fundamental aspects as the
definition of poverty engaged many researchers and policy-makers. Bell (2002:
507) states: "in the final decades of the twentieth century, the analysis of poverty
in the countries of the South became a priority of many major institutions located
in the North". This seeming obsession with poverty stems from the need to
eradicate poverty.
Streeten (1998: 2-3) gives the following reasons for the desire to eliminate
poverty from society: Firstly, the elimination of poverty leads to increased
productivity. Increases in health, skills, education and mental alertness (which
the poor are normally deprived of) make for a healthy workforce. Secondly, the
elimination of poverty would lead to desirably lower family sizes. Thirdly, poverty
reduction leads to a healthier environment. Lastly, reduced poverty contributes
to a healthy civil society, democracy and greater social stability. For these and
other reasons, it is desirable that poverty is eradicated or at least alleviated.
This section is aimed at providing a general background on the study of poverty
focusing on issues like the definitions of poverty, subsistence, inequality or
externality, social exclusion, Human Scale Development, urban poverty,
vulnerability and poverty measurement issues.
2.2.1 Definition of poverty
Defining poverty is not an easy task. Scott (1994: 17) points out that poverty is a
highly contested term. Many works on the subject become so technical that it is
very difficult to draw conclusions from them or to employ them in policy-making
Community-Driven Development projects towards poverty alleviation 14
endeavours. The important factor with definitions of poverty is that definitions
drive policies. How poverty is defined and measured tends to determine the
types and direction of policies aimed at reducing it. Alcock (1997: 1-2) concurs
that underlying the discussions on poverty is the assumption that identifying the
problem provides a basis for action upon which all will agree.
Many definitions of poverty are based on income or material-based poverty [cf.
Atkinson and Bourguignon (1999: 1, 5-7)]. This then militates in favour of income-
based policies in poverty reduction. There are other dimensions to poverty,
though, as pointed out by Max-Neef, Elizalde and Hopenhayn (1989). A few
illustrative definitions of poverty proposed in some of the prominent works on the
subject appear below.
Kanbur and Squire (1999:l) stated that: "Any reasonable definition of poverty
implies that significant numbers of people are living in intolerable circumstances
where starvation is a constant threat, sickness is a familiar companion, and
oppression is a fact of life." This approach raises some very fundamental issues
with regard to poverty, namely lack of command over resources, vulnerability,
insecurity, social exclusion and lack of participation. Most definitions of poverty
contain these issues.
The World Bank (2001: 1-2) defined poverty as being a lack of command over
commodities in general deemed essential to constitute a reasonable standard of
living in a society, or lack of ability to function in a society. This definition also
emphasises command over resources as well as the lack of participation or
"voice" in governance and civil matters.
May (1998: 3) defined poverty as the inability to attain a minimal standard of
living, measured in terms of basic consumption needs or the income required to
satisfy them. This definition runs in tandem with the measurement of poverty
employing the Minimum Living Level (MLL) as the accepted poverty datum line in
South Africa.
Community-Dr~ven Development projects towards poverty allev~ation
-- - - -
The examples of definitions given above show that poverty may be defined either
based on income or on non-income dimensions. Schiller (1984: 5-10) makes the
point that although non-economic aspects are understood, they are not easily
quantifiable. It is therefore much more convenient to employ income-based
measures for ease of measurement. It has nevertheless become imperative and
equally important to attempt the measuring of non-income indicators as well. The
World Bank (World Bank 2000) has specifically developed the HDI (Human
Development Index) for this purpose.
The following sections outline some of the main issues regarding poverty
definitions. Although not all of these issues will not be used in evaluating poverty
in Evaton West, they are essential for a complete discussion on poverty as they
develop the contextual understanding thereof. Many of these issues are also
currently debated issues with regard to poverty and demand reference in a
research work such as this thesis.
2.2.2 Subsistence, inequality and externality
Subsistence, inequality and externality are concepts linked to poverty definition
by Rein (1 971: 46-52). Subsistence has to do with the basic necessities required
to provide adequate health and working capacity. This concept correlates with
Scott (1994: 54) and others' 'absolute poverty' concept, which has to do with the
basic physiological needs of a household. The problem with this approach lies in
the definition of basic needs or necessities as well as the determination of the
basket of necessities required to enable a family to cross the poverty line to a
non-poor state.
Holman (1978: 2) refers to this poverty as subsistence poverty, implying that
those who are classified as such live below subsistence level and also refers to
the poor (with bare minimal income) and the very poor (who for some reason fall
below this standard). George and Lawson (1980: 1) state that this type of poverty
does not change much over time or across nations. Brady (2003: 721) says that
absolute measures involve a cross-nationally and historically-constant and fixed
threshold, which distinguishes poor from non-poor.
Community-Driven Development projects towards poverty alleviation 16
At the heart of this type of poverty is the notion of people with less than adequate
nutritional provision or access. The immediate and obvious problem with this
approach is to define what constitutes 'adequate nutrition'. Furthermore, as
pointed out by Sen (1981: 12), it is necessary to determine how are such
nutritional requirements translated into food requirements. Schiller (1984: 4-5)
points out that there is another problem with regard to the absolute definition,
namely the issue of who defines what basic needs are. Is it the poor themselves,
policy-makers or researchers who are to determine what constitute basic needs?
What criteria should be used? People will tend to define basic needs based on
their current socio-economic situations. For these and other problems, it does not
seem prudent to define poverty purely in absolute terms.
Inequality refers to stratification of society along wealth, means and income lines
or, as Rein (1971: 46) put it, the relative position of income groups to each other.
Scott (1994: 54-55) refers to relative poverty: the essence of this approach lies in
the fact that the poor are poor in relation to the community to which they belong.
Holman (1978: 14-20) stated that the relative approach includes four main
elements: Firstly, comparison with other people, secondly, the contemporary
environment, thirdly, inequality, and fourthly, value judgement referring to the
standard of living society dictates as normal. Desai and Shah (1988: 508)
characterised this type of poverty by stating that there is a community to which
those who are deprived, and those who are not, belong. The non-deprived set
the living pattern, custom and activities which, if practiced, constitute "belonging
to the community".
Brady (2003: 721) points out that relative measures generate specific poverty
thresholds for each society in each time period from patterns in the income
distribution. They reflect the difference in living conditions between the poor and
the majority of society, rather than some abstract standard. This approach has
also been criticised. Hazlitt (1973:33) pointed out that, if based on the definition
that poverty means being worse off than somebody else, then all but one of us
are poor. On the question of value judgement and standards which also form part
of this approach, Sen'(1981: 16-17) contended that the question "what are the
Community-Driven Development projects towards poverty alleviation 17
contemporary standards" rather than "what should contemporary standards be"
needs to be asked. In other words, descriptive rather than prescriptive research
needs to be pursued to ensure objectivity rather than subjectivity in judging value
and standards and in setting ill-being and well-being standards.
Razafindrakoto and Roubaud (2003: 4) state that in practice, there is a tendency
to favour relative measures in the developed countries, whereas in the
developing countries, where many basic needs are not met, the preference goes
to measures of absolute poverty. This is nevertheless not conclusive nor really
scientific (applies compared with apples) as poverty also has a strong regional
dimension, that is, what Alcock and Graig (2000: 58) refer to as the spatial
dimensions of the poverty problem. Atkinson and Bourguignon (1999: 30)
propose that a relative threshold takes account of the social standing of the
individual, and that an absolute threshold makes it possible to rank priorities.
There is therefore a strong tendency to combine the two approaches into a
complementary whole. Sen (1981: 16-17) pointed out that "the approach of
relative deprivation ... cannot really be the only basis for the concept of poverty.
There is an irreducible core of absolute deprivation in our idea of poverty.. .Thus
the approach of relative deprivation supplements rather than supplants the
analysis of poverty in terms of the absolute dispossession".
Externality, as an adjunct, refers to the social consequences of poverty for the
rest of society (Rein, 1971: 46-47). This has more to do with how the rest of
society experiences the presence of the poverty problem rather than the effects
to the poor themselves. Recent works on the subject see social exclusion,
whether based on subjective feeling or objective considerations as the real issue
(Razafindrakoto & Roubaud, 2003: 8).
2.2.3 Social Exclusion
A relatively new concept in poverty analysis is the idea of social exclusion. The
Poverty Group (2001: 20) led by Martin Ravallion at the World Bank stated that
social exclusion refers to social arrangements or structures within a society that
systematically exclude disadvantaged groups from economic opportunities for
reasons other than their potential productivity. The group further asserts that
Community-Driven Development projects towards poverty alleviation 18
social exclusion appears to be an important but under-researched impediment to
pro-poor growth, implying that left unattended and excluded from policy
imperatives, social exclusion has the potential of emasculating the effect of such
policies.
Brady (2003: 723) adjoins that social exclusion is polysemic, having multiple
meanings in different contexts and for different purposes. Social exclusion is the
antithesis of the concept of solidarity and connotes marginalisation and
irrelevance. Within the context of poverty alleviation therefore, social exclusion
refers to marginalisation of certain groups in a community from political, social
and economic participation. A further evidence of exclusion relates to top-down
policy interventions as opposed to participative pro-poor developmental
ideologies.
Siddiqui (2003: 7-9) and Saith (2001: 6-10) point out the following issues
regarding social exclusion in relation to developing country social policies:
Inherent within the concept of exclusion is the idea of systemic isolation.
Such isolation may not apply in developing countries as it is applied in
developed countries for a number of reasons.
Developing countries do not have as advanced social security and safety
nets as developed countries. This is due to a number of factors, not least
of which is the socio-economic structures in these countries. . Exclusion from promotive social security. Promotive social security refers
to measures concerned with the promotion and enhancing of normal living
conditions. In developing countries, many people are excluded from these,
that is, people who do not achieve certain minimal standards of
functioning related to health, nutrition and education.
Exclusion as defined in relation to employment: while it is relatively easy to
classify the unemployed in developed countries as socially excluded, it is
not so straightforward in developing countries. What may be considered
as unemployment in developed countries may be the norm in developing
countries, questioning the assertion of social exclusion.
Community-Driven Development projects towards poverty alleviation 19
. Concepts paralleling 'social exclusion' - these include exclusion from
basic services (e.g. water and electricity), exclusion from employment,
human rights and income.
From the issues listed above, it follows that social exclusion is a prominent
feature in developing countries' social policies and structures.
2.2.4 Human Scale Development
The works of Max-Neef (in for example, Max-Neef, Elizalde and Hopenhayn
1989) have led to what is now known as Human Scale Development (HSD)
where poverty is seen as being multi-dimensional (i.e. different poverties). HSD
thus also refers to the satisfaction of basic human needs. The Sorefeelings
website (http://www.sorefeelings.com) refers to HSD as "focused and based on
the satisfaction of fundamental human needs, on the generation of growing levels
of self-reliance, and on the construction of organic articulations of people with
nature and technology, of global processes with local activity, of the personal
with the social, of planning with autonomy, and of civil society with the state."
Human scale development is focused and based on the satisfaction of
fundamental human needs, on the generation of growing levels of self-reliance,
and on the construction of organic articulations of people with nature and
technology, of global processes with local activity, of the personal with the social,
of planning with autonomy, and of civil society with the state (cf. Max-Neef,
Elizalde and Hopenhayn 1989). The following table lists the Fundamental Human
Needs, their qualities, and their explanations.
This approach identifies human needs and their satisfiers. Human needs are
seen as few, finite and classifiable and are constant through many human
cultures and across historical time periods. What changes over time and between
cultures is the way these needs are satisfied. As an example from the Table 2.1,
the need for participation includes aspects such as receptiveness and dedication.
The satisfiers for this need include having rights and obligations which can be
achieved by co-operation and openly expressing views and opinions. An
enabling framework and institutions for the achievement of such satisfiers include
Community-Driven Development projects towards poverty alleviation 20
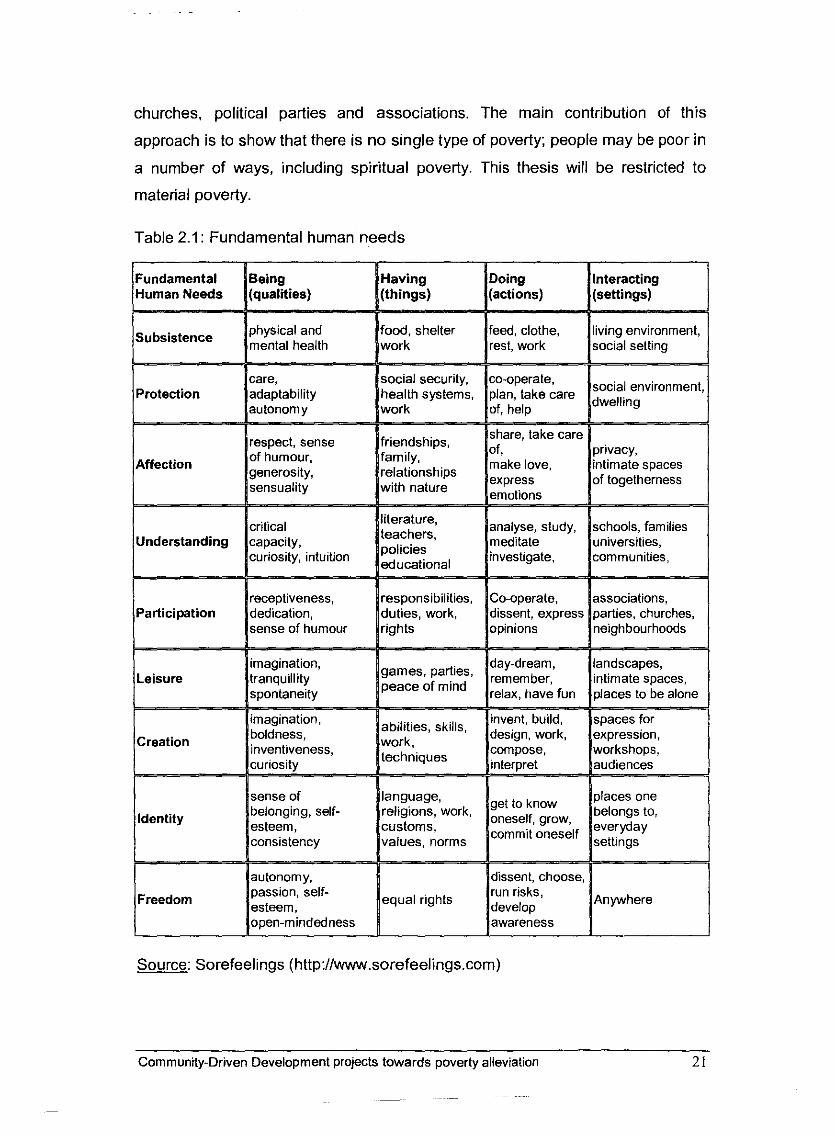
churches, political parties and associations. The main contribution of this
approach is to show that there is no single type of poverty; people may be poor in
a number of ways, including spiritual poverty. This thesis will be restricted to
material poverty.
Table 2.1: Fundamental human needs
share, take care
Source: Sorefeelings (http://www.sorefeelings.corn)
Community-Driven Development projects towards poverty alleviation 21
2.2.5 Objective and subjective approaches
The definition and measurement of poverty can be seen in two ways: objectively
(by the researcher or policymaker), and subjectively (by those directly affected by
poverty). Hagenaars (1986: 13-15) referred to two criteria for identifying the poor,
firstly, based on the objective aspects of someone's situation or, secondly,
subjectively based on the opinion and feeling of the person concerned. Saunders
(1997: 15) suggests similar notions, referring to a definitional sense which
focuses on what poverty means to those who study it, as well as an outcome-
oriented perspective which explores what poverty means to those who
experience it. Although it is tempting to go with the former for ease of
quantification, there is more substance in the qualitative nature of the latter. The
World Bank (Narayan, Pate!, Schafft, Rademacher & Koch-Schulte, 1999) with
its "Voices of the Poor" drive sought to qualitatively quantify the experiences of
the poor. Since then, participative approaches to poverty assessment have
gained popularity. Wilson and Ramphele (1991: 14) emphasize the importance of
poverty as defined by those who experience it, who know what it means (to be
poor).
2.2.6 Urban poverty I Rural poverty
Urban poverty differs from rural poverty in a number of ways (see for example:
Pradhan & Ravallion, 1998; Datt, Jolliffe & Sharma, 2001 and Devereux, 2002).
One of these ways is the fact that the poverty line and consumption patterns of
rural poor differ markedly from those of the urban poor in most developing
countries. A single poverty line for both urban and rural poverty may therefore
underestimate poverty in urban areas. In this thesis, urban poverty is specifically
considered due to the nature of the area being studied. Jegasothy (1999: 1034)
states in respect of urban poverty that the physical manifestations thereof are
evident in all cities of developing countries in the form of slums and squatters. In
this respect, South Africa is no different, and the same applies to the object area
of this study.
The following Box 2.1 represents characteristics of the urban poor suggested by
Global Urban Observatory (GUO) (2001 : 4-5):
Community-Driven Development projects towards poverty alleviation 22
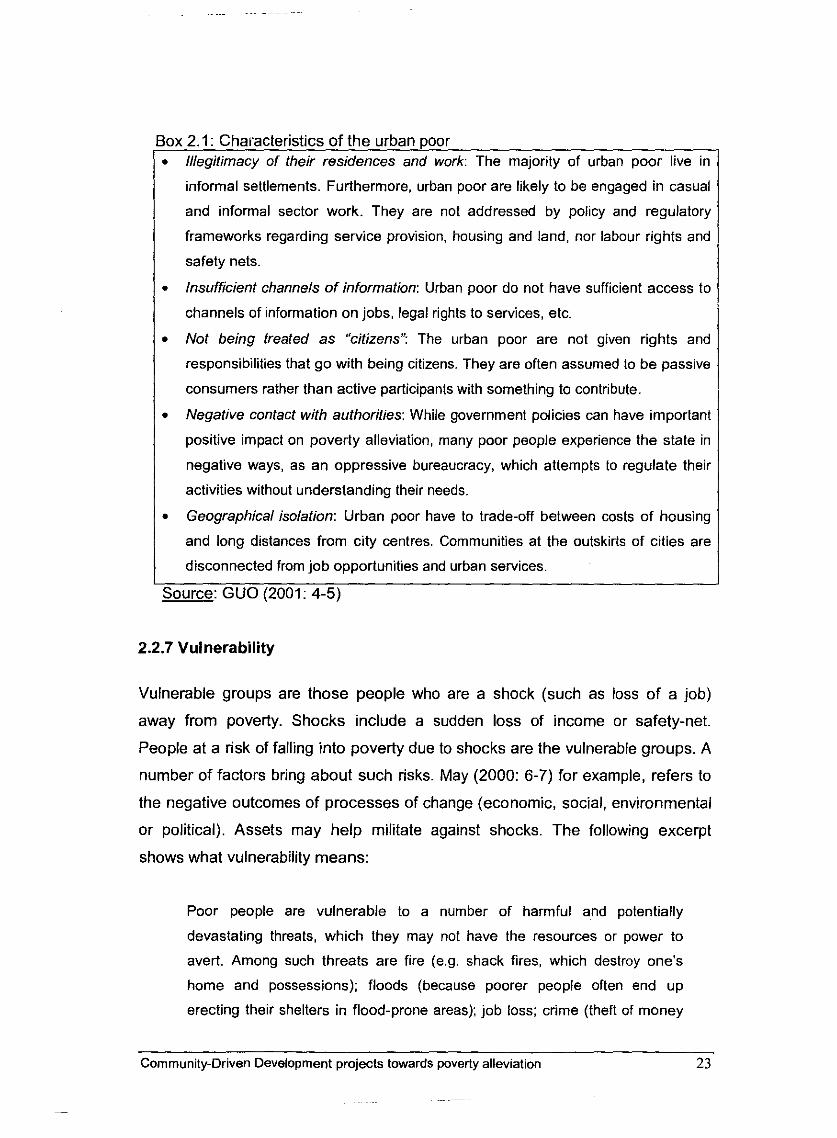
3ox 2.1: Characteristics of the urban poor Illegitimacy of their residences and work: The majority of urban poor live in
informal settlements. Furthermore, urban poor are likely to be engaged in casual
and informal sector work. They are not addressed by policy and regulatory
frameworks regarding service provision, housing and land, nor labour rights and
safety nets.
Insufficient channels of information: Urban poor do not have sufficient access to
channels of information on jobs, legal rights to services, etc.
Not being treated as "citizens": The urban poor are not given rights and
responsibilities that go with being citizens. They are often assumed to be passive
consumers rather than active participants with something to contribute.
Negative contact with authorities: While government policies can have important
positive impact on poverty alleviation, many poor people experience the state in
negative ways, as an oppressive bureaucracy, which attempts to regulate their
activities without understanding their needs.
Geographical isolation: Urban poor have to trade-off between costs of housing
and long distances from city centres. Communities at the outskirts of cities are
disconnected from job opportunities and urban services.
Source: GUO (2001 : 4-5)
2.2.7 Vulnerability
Vulnerable groups are those people who are a shock (such as loss o f a job)
away from poverty. Shocks include a sudden loss of income or safety-net.
People at a risk of falling into poverty due to shocks are the vulnerable groups. A
number of factors bring about such risks. May (2000: 6-7) for example, refers to
the negative outcomes of processes of change (economic, social, environmental
or political). Assets may help militate against shocks. The following excerpt
shows what vulnerability means:
Poor people are vulnerable to a number of harmful and potentially
devastating threats, which they may not have the resources or power to
avert. Among such threats are fire (e.g. shack fires, which destroy one's
home and possessions); floods (because poorer people often end up
erecting their shelters in flood-prone areas); job loss; crime (theft of money
Community-Drwen Development projects towards poverty allev~ation 23
-
and possessions, and bodily harm); poor agricultural conditions (e.g. for
those who rely in part on food production for sustenance); and illness and
death in the family (often with no resources to seek medical care) (Aliber
2001 : 23).
In urban areas especially, there is a greater dependence on cash income for
survival. This renders urban dwellers susceptible to income risks (people are
almost always a salarylwage away from poverty). Certain assets may be used to
mitigate against shocks (May, 2000: 6). Mostly savings and investments are used
as such. GUO (2001: 5) also state that in cities people have to rely on market
exchanges to buy basic goods and services such as food, water, electricity and
transport.
The ability to earn cash income thus becomes an important determinant of food
security and other aspects of human well being. Food expenditures, for example,
could form as much as 60 to 80 percent of total income among low-income urban
households; transportation, water and sanitation have also been reported to
absorb far higher shares of household income than planners have predicted.
There is therefore a high reliance on money income as security against risk, yet
the high liquidity of cash becomes a risk on its own.
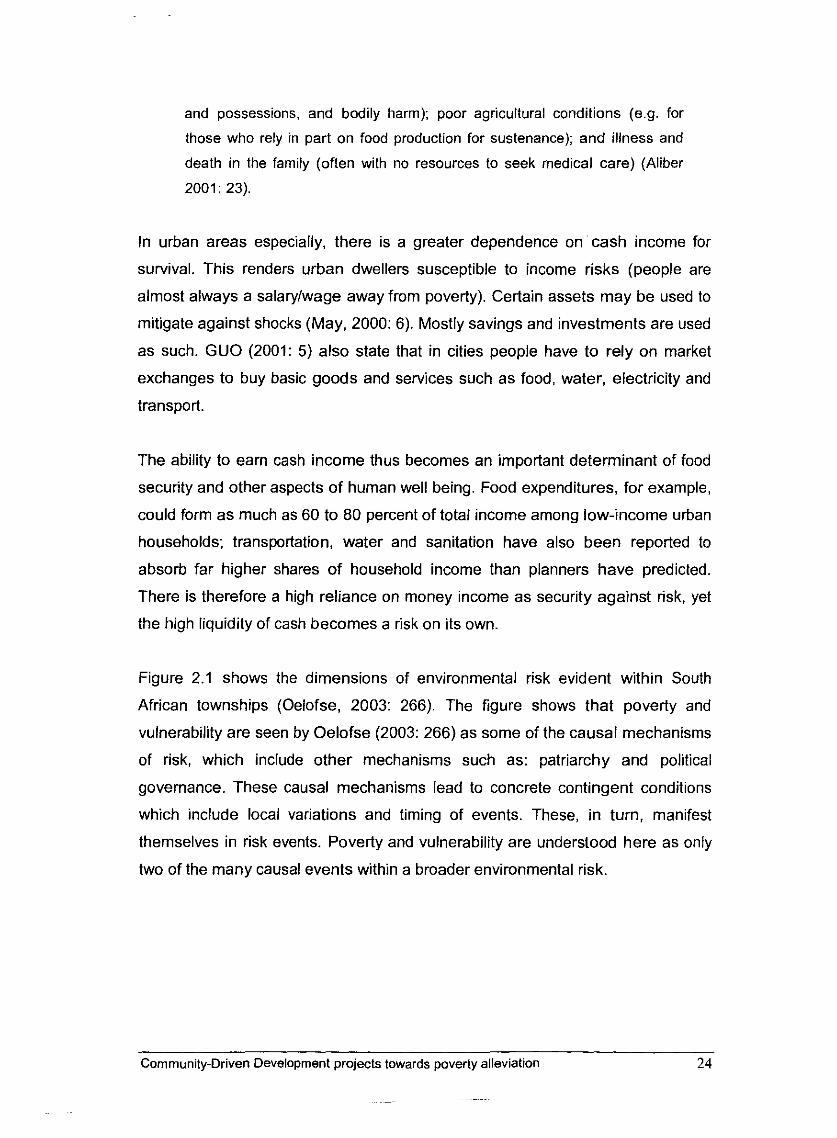
Figure 2.1 shows the dimensions of environmental risk evident within South
African townships (Oelofse, 2003: 266). The figure shows that poverty and
vulnerability are seen by Oelofse (2003: 266) as some of the causal mechanisms
of risk, which include other mechanisms such as: patriarchy and political
governance. These causal mechanisms lead to concrete contingent conditions
which include local variations and timing of events. These, in turn, manifest
themselves in risk events. Poverty and vulnerability are understood here as only
two of the many causal events within a broader environmental risk.
Community-Driven Development projects towards poverty alleviation 24
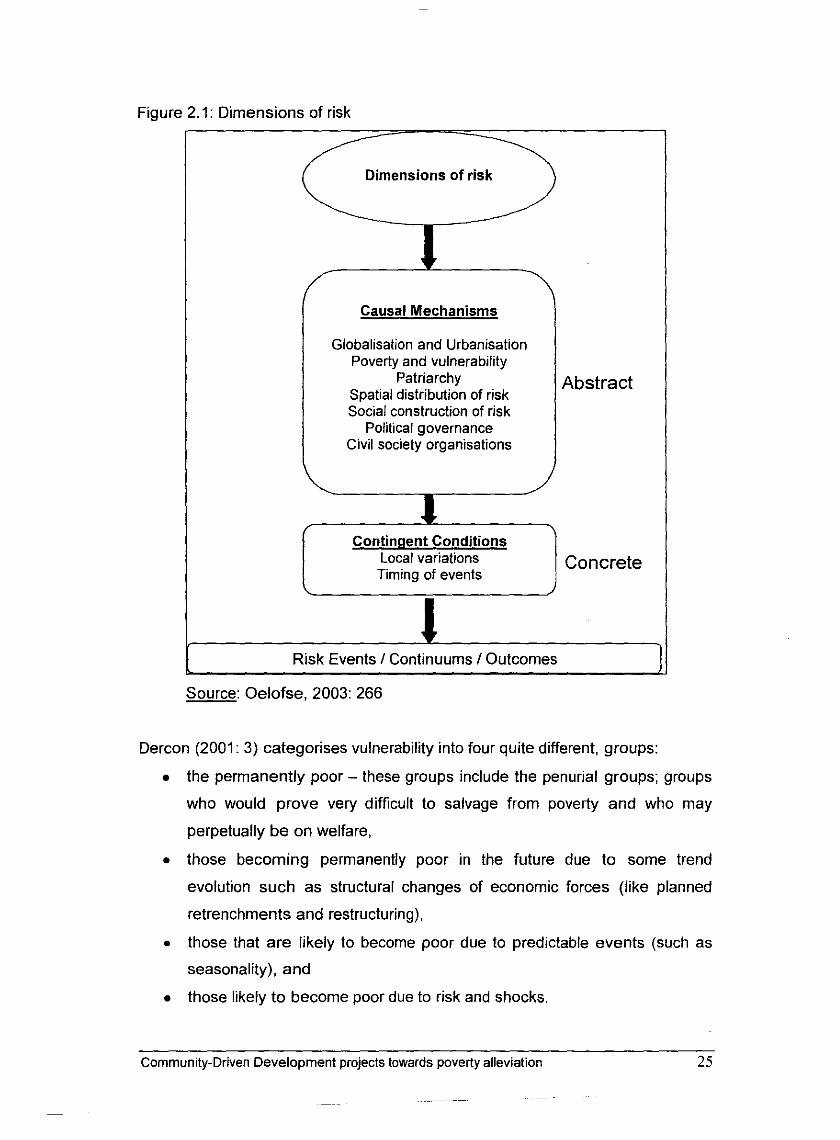
Figure 2.1: Dimensions of risk
Source: Oelofse, 2003: 266
Dercon (2001 : 3) categorises vulnerability into four quite different, groups:
Dimensions of risk
the permanently poor - these groups include the penurial groups; groups
who would prove very difficult to salvage from poverty and who may
perpetually be on welfare,
those becoming permanently poor in the future due to some trend
evolution such as structural changes of economic forces (like planned
retrenchments and restructuring),
those that are likely to become poor due to predictable events (such as
seasonality), and
those likely to become poor due to risk and shocks.
Causal Mechanisms
Globalisation and Urbanisation Poverty and vulnerability
Patriarchy Spatial distribution of risk Social construction of risk
Political governance Civil society organisations
Community-Driven Development projects towards poverty alleviation 25
Abstract
1 Contingent Conditions
Local variations Concrete
t Timing of events
I Risk Events 1 Continuums I Outcomes
While the focus is mostly on the last group, the other groups, including those
facing seasonality, should not be excluded (Dercon, 2001: 3)
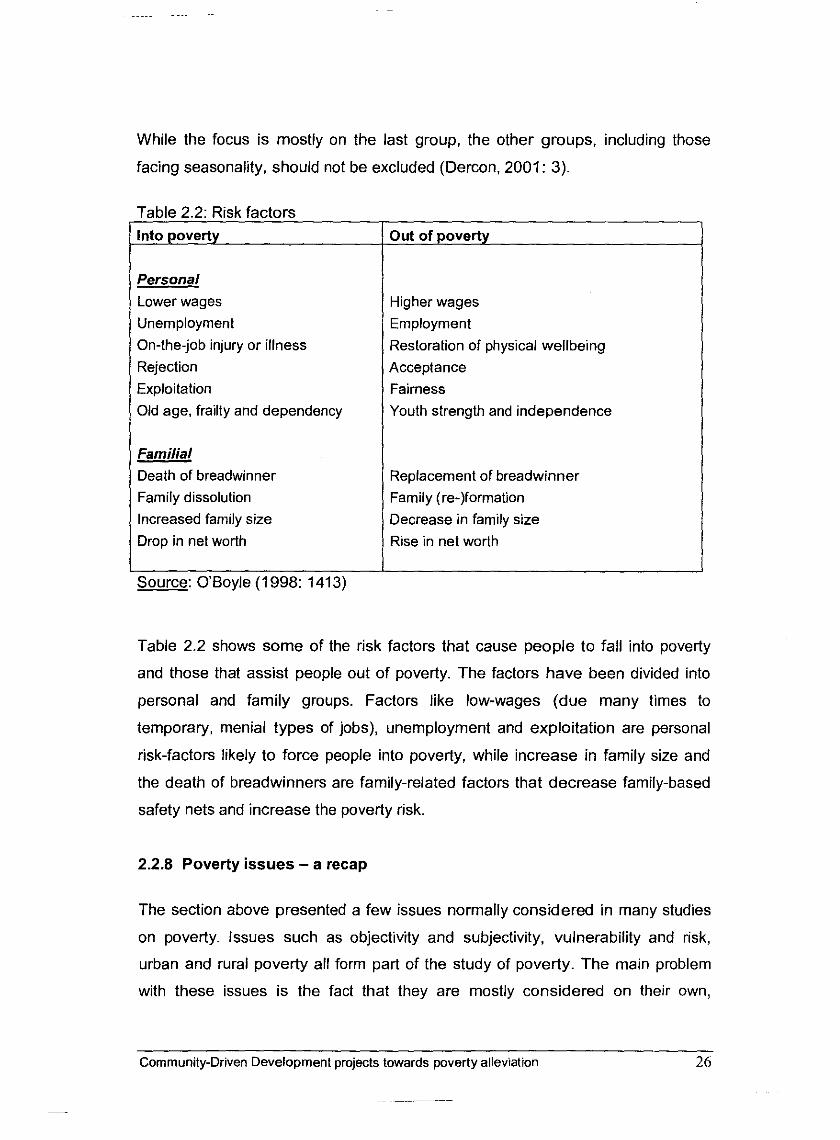
Table 2.2: Risk factors
i!
I Source: O'Boyle (1998: 1413)
Into poverty
Personal
Lower wages Unemployment On-the-job injury or illness Rejection Exploitation Old age, frailty and dependency
Familial
Death of breadwinner Family dissolution Increased family size Drop in net worth
Table 2.2 shows some of the risk factors that cause people to fall into poverty
and those that assist people out of poverty. The factors have been divided into
personal and family groups. Factors like low-wages (due many times to
temporary, menial types of jobs), unemployment and exploitation are personal
risk-factors likely to force people into poverty, while increase in family size and
the death of breadwinners are family-related factors that decrease family-based
safety nets and increase the poverty risk.
Out of poverty
Higher wages Employment Restoration of physical wellbeing Acceptance Fairness Youth strength and independence
Replacement of breadwinner Family (re-)formation Decrease in family size Rise in net worth
2.2.8 Poverty issues - a recap
The section above presented a few issues normally considered in many studies
on poverty. Issues such as objectivity and subjectivity, vulnerability and risk,
urban and rural poverty all form part of the study of poverty. The main problem
with these issues is the fact that they are mostly considered on their own,
Community-Driven Development projects towards poverty alleviation 26
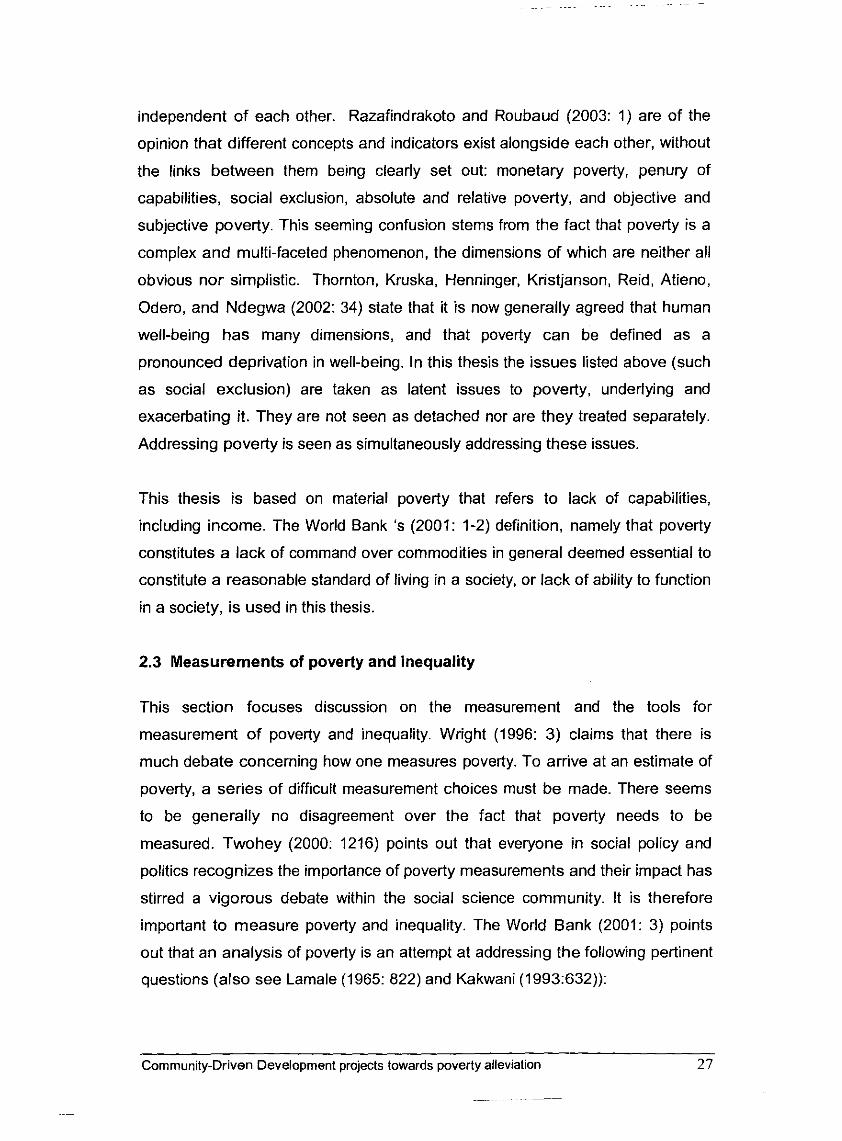
independent of each other. Razafindrakoto and Roubaud (2003: 1) are of the
opinion that different concepts and indicators exist alongside each other, without
the links between them being clearly set out: monetary poverty, penury of
capabilities, social exclusion, absolute and relative poverty, and objective and
subjective poverty. This seeming confusion stems from the fact that poverty is a
complex and multi-faceted phenomenon, the dimensions of which are neither all
obvious nor simplistic. Thornton, Kruska, Henninger, Kristjanson, Reid, Atieno,
Odero, and Ndegwa (2002: 34) state that it is now generally agreed that human
well-being has many dimensions, and that poverty can be defined as a
pronounced deprivation in well-being. In this thesis the issues listed above (such
as social exclusion) are taken as latent issues to poverty, underlying and
exacerbating it. They are not seen as detached nor are they treated separately.
Addressing poverty is seen as simultaneously addressing these issues.
This thesis is based on material poverty that refers to lack of capabilities,
including income. The World Bank 's (2001: 1-2) definition, namely that poverty
constitutes a lack of command over commodities in general deemed essential to
constitute a reasonable standard of living in a society, or lack of ability to function
in a society, is used in this thesis.
2.3 Measurements of poverty and inequality
This section focuses discussion on the measurement and the tools for
measurement of poverty and inequality. Wright (1996: 3) claims that there is
much debate concerning how one measures poverty. To arrive at an estimate of
poverty, a series of difficult measurement choices must be made. There seems
to be generally no disagreement over the fact that poverty needs to be
measured. Twohey (2000: 1216) points out that everyone in social policy and
politics recognizes the importance of poverty measurements and their impact has
stirred a vigorous debate within the social science community. It is therefore
important to measure poverty and inequality. The World Bank (2001: 3) points
out that an analysis of poverty is an attempt at addressing the following pertinent
questions (also see Lamale (1965: 822) and Kakwani (1993:632)):
Community-Driven Development projects towards poverty alleviation 27
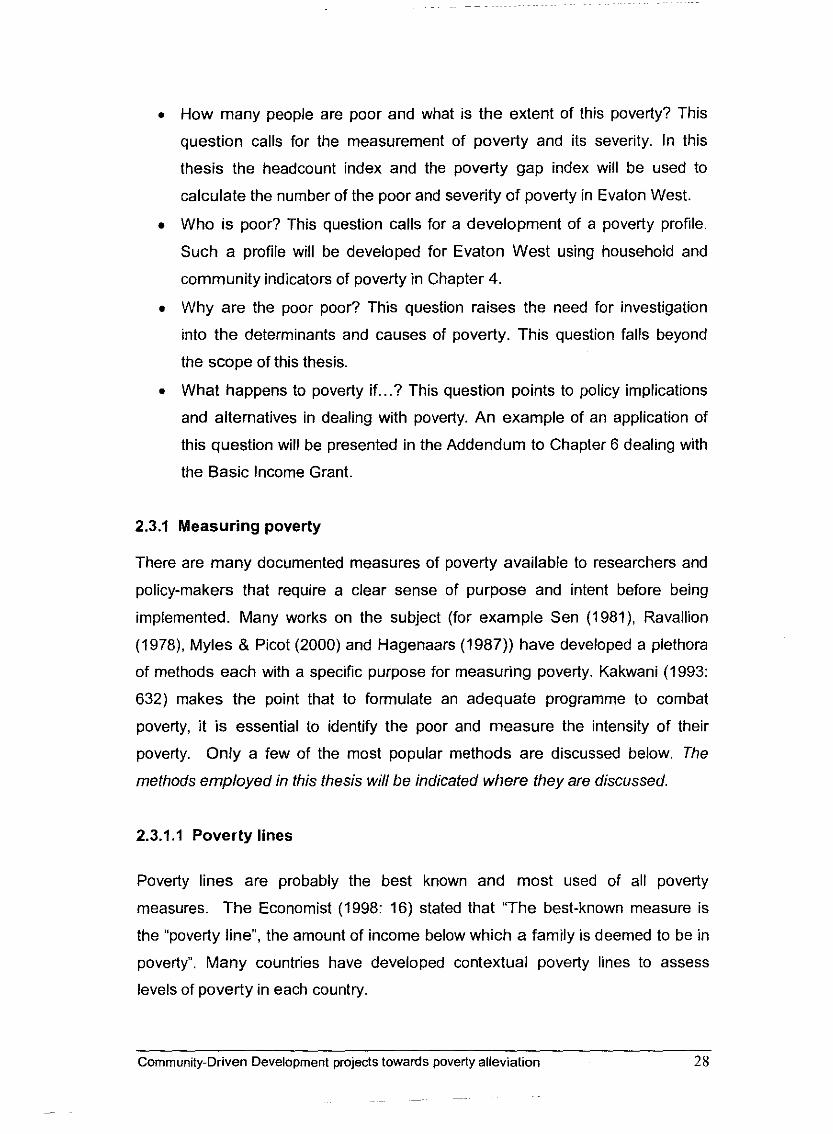
0 How many people are poor and what is the extent of this poverty? This
question calls for the measurement of poverty and its severity. In this
thesis the headcount index and the poverty gap index will be used to
calculate the number of the poor and severity of poverty in Evaton West.
Who is poor? This question calls for a development of a poverty profile.
Such a profile will be developed for Evaton West using household and
community indicators of poverty in Chapter 4.
Why are the poor poor? This question raises the need for investigation
into the determinants and causes of poverty. This question falls beyond
the scope of this thesis.
0 What happens to poverty if ... ? This question points to policy implications
and alternatives in dealing with poverty. An example of an application of
this question will be presented in the Addendum to Chapter 6 dealing with
the Basic Income Grant.
2.3.1 Measuring poverty
There are many documented measures of poverty available to researchers and
policy-makers that require a clear sense of purpose and intent before being
implemented. Many works on the subject (for example Sen (1981), Ravallion
(1978), Myles & Picot (2000) and Hagenaars (1987)) have developed a plethora
of methods each with a specific purpose for measuring poverty. Kakwani (1993:
632) makes the point that to formulate an adequate programme to combat
poverty, it is essential to identify the poor and measure the intensity of their
poverty. Only a few of the most popular methods are discussed below. The
methods employed in this thesis will be indicated where they are discussed.
2.3.1.1 Poverty lines
Poverty lines are probably the best known and most used of all poverty
measures. The Economist (1998: 16) stated that "The best-known measure is
the "poverty line", the amount of income below which a family is deemed to be in
poverty". Many countries have developed contextual poverty lines to assess
levels of poverty in each country.
Community-Driven Development projects towards poverty alleviation 28
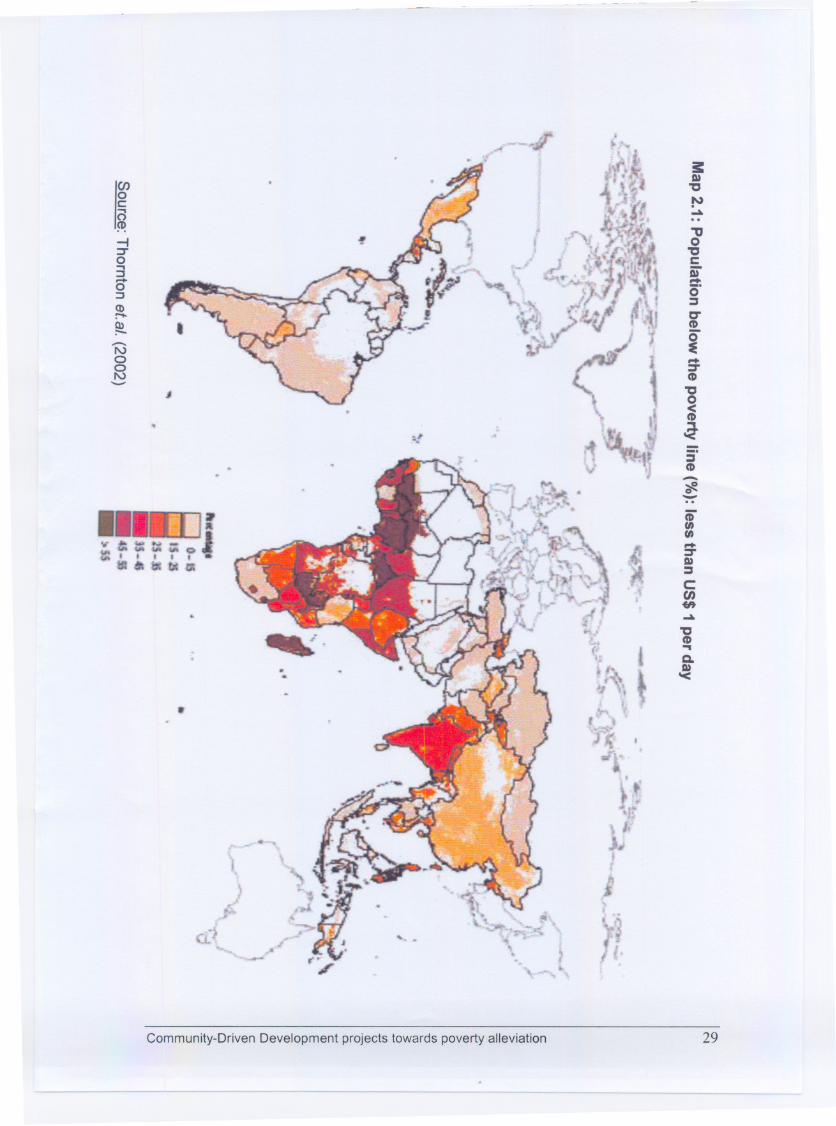
.
..
29Community-DrivenDevelopment projects towards povertyalleviation
3:en ,
?}Do)"
0c:0 -
"U
-I 0::r . "0
'I;"
c3 m- -0 0':J rQ)
=:"'0- f 0"Q) -="" CD:- i- ..I\)a -2 =-- CD
l "0<CD
:.: i-3'CD--..CD00-=-Do)=c:tn..-"CD..Q.I»'<
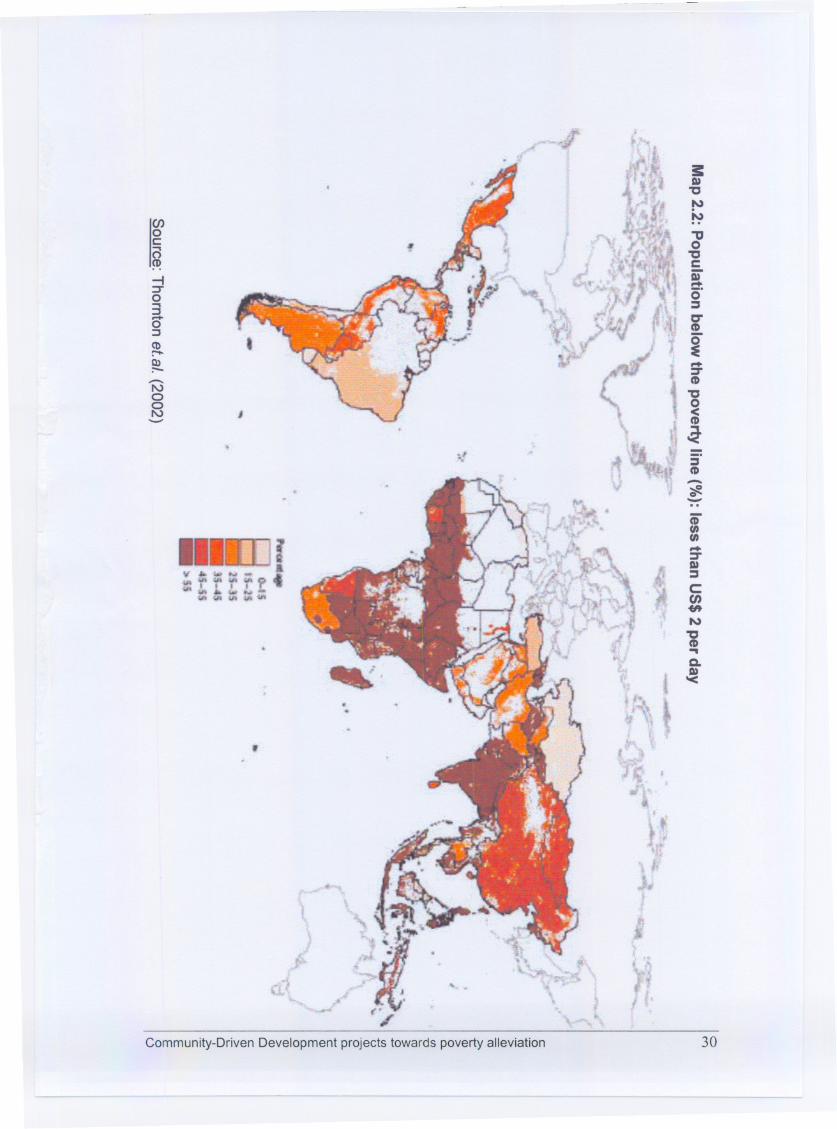
enoc:o~-I=ro3o:::::J
Q)~Q)=-
..
"Uo"gcAi'-cr=C"CD
~-::rCD"go~i
'i\)ooI\,)-
-s'CD-~-
,
Community-Driven Development projects towards poverty alleviation 30
Perhaps the best known poverty lines are the US$1 per day and the US$2 per
day lines used by the World Bank to compare poverty among different countries.
Curtain (2002: 6) states that "the original definition of US$1 a day came from the
[I991 work of Martin Ravallion and others] who used "perceptions of poverty" in
the poorest countries to place the poverty line at US$31 per month". The US$? a
day line has since been adopted by the World Bank as the "official" definition of
'absolute poverty'. The lines are based on the purchasing power parities (PPPs)
between countries.
The previous two pages contain the poverty maps of the world depicting the
ratios of the population living below the two poverty lines (US$1 and US$2 per
day lines). Map 2.1 shows the global distribution of the population living below
US$1 per day and Map 2.2 shows the distribution of the world population living
below US$2 per day. The maps (sourced from Thornton et al. (2002)) show that
Sub-Saharan Africa and India are the poorest regions using these two measures.
Apart from the concept of an absolute poverty line, there are also several
attempts at relative poverty lines.
This thesis will employ a poverty line for household-level measurement o f
poverty. The methodology used in the thesis is outlined in Annexure 5.
2.3.1.2 Minimum Income Question (MIQ)
The so-called Minimum Income Question (MIQ) refers to the question normally
posed to the poor, requiring them to estimate the income level at which they
would consider themselves non-poor. This question has been refined several
times to attempt to receive as accurate information as possible from
respondents. The information received is then used to construct a subjective
poverty line. Pradhan and Ravallion (1998: 4-6) stated that past empirical work
had found that the expected value of the answer to the MIQ conditional on
income tends to be an increasing function of income. The MIQ gives a
relationship such as that depicted in Figure 2.2, which gives a stylized
representation of the regression function on income for answers to the MIQ
(Pradhan and Ravallion 1998: 4-6). The point r i n the figure represents a poverty
Community-Driven Development projects towards poverty alleviation 3 1
line; people with income above z.tend to feel that their income is adequate, while
those below z. tend to feel that it is not. z. is then the "subjective poverty line".
Pradhan and Ravallion (1998: 4-6) state:
While the MIQ has been applied in a number of OECD countries, we know of
no attempts to apply it in a developing country. There are a number of
potential pitfalls in doing so. "Income" is not a well-defined concept in most
developing countries, particularly (but not only) in rural areas. It is not at all
clear whether or not one could get sensible answers to the MIQ. The
qualitative idea of the "adequacy" of consumption is a more promising one in
a developing country setting.
Razafindrakoto and Roubaud (2003: 6) submit that a subjective poverty line can
be calculated on the basis of the minimum income that households regard as
necessary to "make ends meet" (Minimum Income Question - MIQ). Normally,
the replies to this question are an increasing function of actual income. They give
the following equation for such a line:
In (Yrnin) = k+ a ln(Y) +bZ + grn + ds + e
Where Ymin is the household's reply to the MIQ, Z are the characteristics of the
household (size, age, number of children) rn and s are the mean and standard
deviation of the log incomes in a population used as reference and k,a,g,d and e
are constant co-efficients of the variables.
Cornrnun~ty-Drnen Development projects towards poverty allevlat~on 32
-
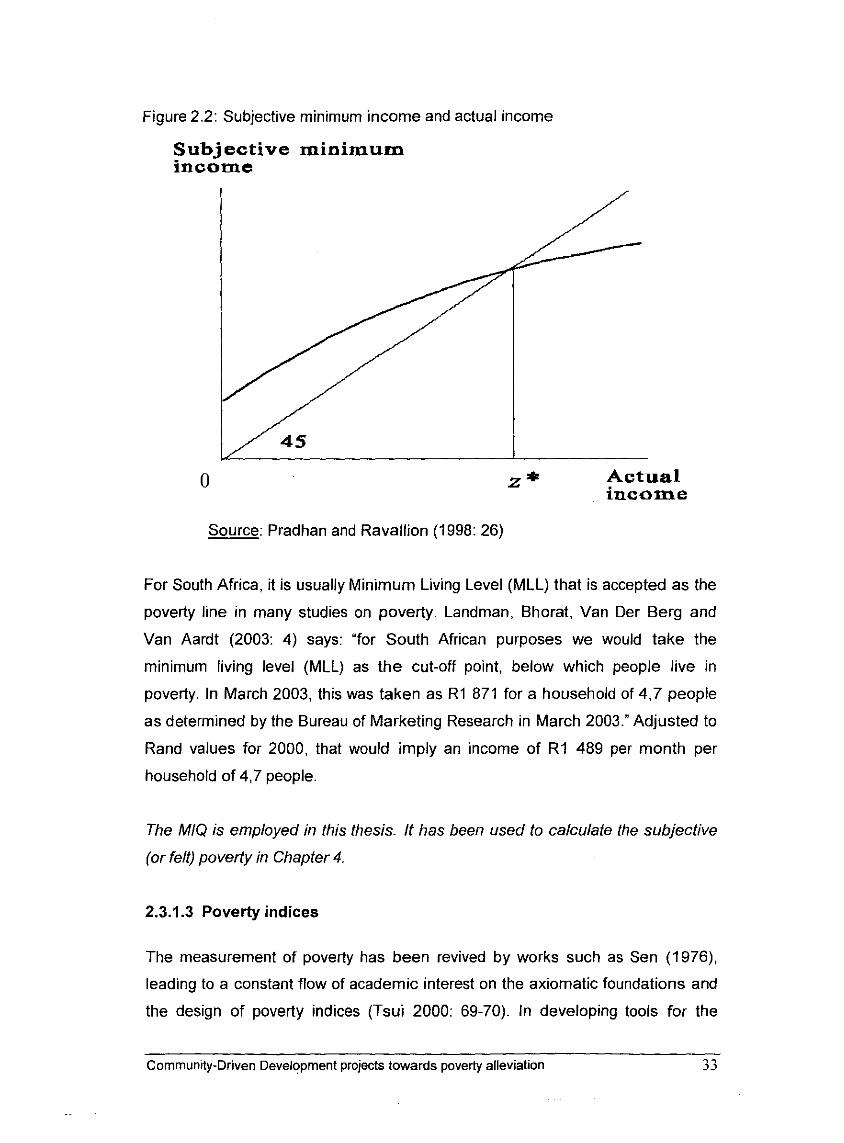
Figure 2.2: Subjective minimum income and actual income
Subjective minimum income
0 z* Actual income
Source: Pradhan and Ravallion (1998: 26)
For South Africa, it is usually Minimum Living Level (MLL) that is accepted as the
poverty line in many studies on poverty. Landman, Bhorat, Van Der Berg and
Van Aardt (2003: 4) says: "for South African purposes we would take the
minimum living level (MLL) as the cut-off point, below which people live in
poverty. In March 2003, this was taken as R1 871 for a household of 4,7 people
as determined by the Bureau of Marketing Research in March 2003." Adjusted to
Rand values for 2000, that would imply an income of R1 489 per month per
household of 4,7 people.
The MIQ is employed in this thesis. It has been used to calculate the subjective
(or felt) poverty in Chapter 4.
2.3.1.3 Poverty indices
The measurement of poverty has been revived by works such as Sen (1976),
leading to a constant flow of academic interest on the axiomatic foundations and
the design of poverty indices (Tsui 2000: 69-70). In developing tools for the
Community-Driven Development projects towards poverty alleviation 33
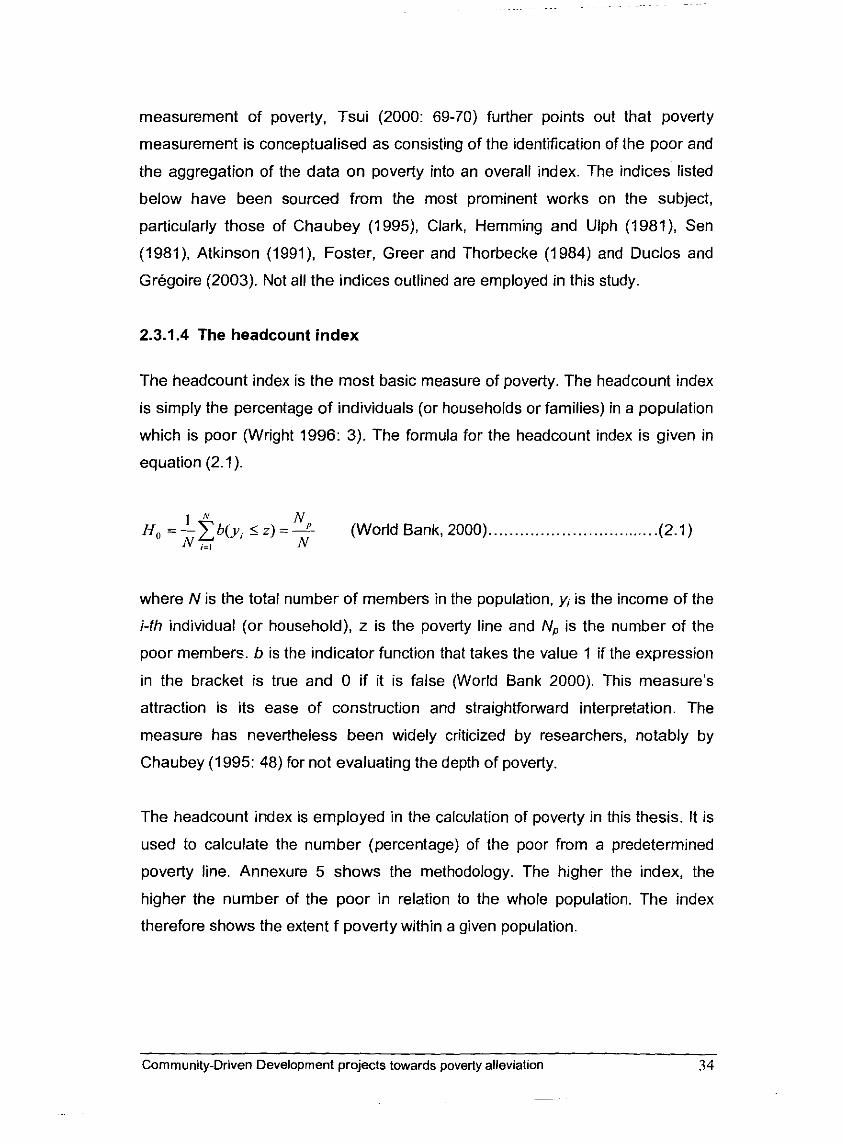
measurement of poverty, Tsui (2000: 69-70) further points out that poverty
measurement is conceptualised as consisting of the identification of the poor and
the aggregation of the data on poverty into an overall index. The indices listed
below have been sourced from the most prominent works on the subject,
particularly those of Chaubey (1995), Clark, Hemming and Ulph (1981), Sen
(1981), Atkinson (1991), Foster, Greer and Thorbecke (1984) and Duclos and
Gregoire (2003). Not all the indices outlined are employed in this study.
2.3.1.4 The headcount index
The headcount index is the most basic measure of poverty. The headcount index
is simply the percentage of individuals (or households or families) in a population
which is poor (Wright 1996: 3). The formula for the headcount index is given in
equation (2.1).
I N No = - x b ( y , I Z ) = ~ (World Bank, 2000). . . . . . . . .. . . . . .. . . . . .. . .. . ..... . .(2.1)
N i= , N
where N is the total number of members in the population, y, is the income of the
i-fh individual (or household), z is the poverty line and N, is the number of the
poor members. b is the indicator function that takes the value I if the expression
in the bracket is true and 0 if it is false (World Bank 2000). This measure's
attraction is its ease of construction and straightforward interpretation. The
measure has nevertheless been widely criticized by researchers, notably by
Chaubey (1995: 48) for not evaluating the depth of poverty.
The headcount index is employed in the calculation of poverty in this thesis. It is
used to calculate the number (percentage) of the poor from a predetermined
poverty line. Annexure 5 shows the methodology. The higher the index, the
higher the number of the poor in relation to the whole population. The index
therefore shows the extent f poverty within a given population.
Community-Driven Development projects towards poverty alleviation 34
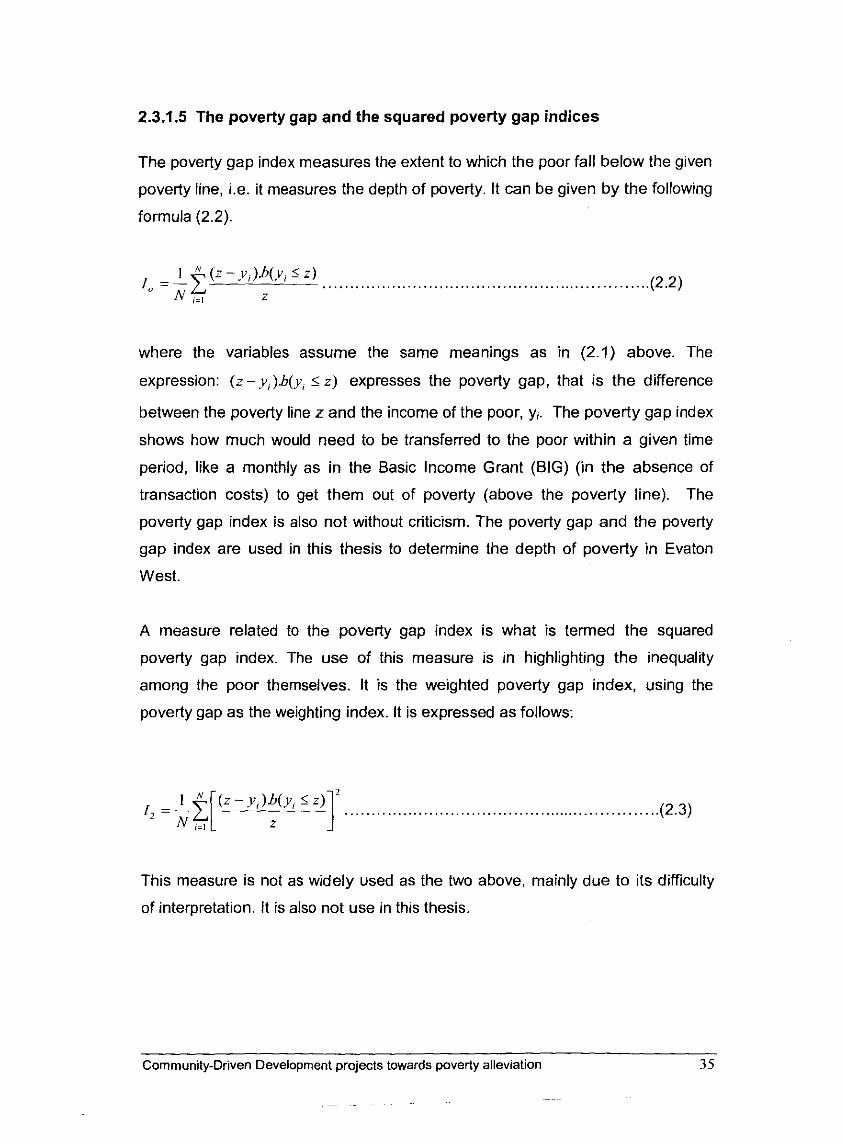
2.3.1.5 The poverty gap and the squared poverty gap indices
The poverty gap index measures the extent to which the poor fall below the given
poverty line, i.e. it measures the depth of poverty. It can be given by the following
formula (2.2).
where the variables assume the same meanings as in (2.1) above. The
expression: ( Z - y , )b(y , s Z ) expresses the poverty gap, that is the difference
between the poverty line z and the income of the poor, y,. The poverty gap index
shows how much would need to be transferred to the poor within a given time
period, like a monthly as in the Basic Income Grant (BIG) (in the absence of
transaction costs) to get them out of poverty (above the poverty line). The
poverty gap index is also not without criticism. The poverty gap and the poverty
gap index are used in this thesis to determine the depth of poverty in Evaton
West.
A measure related to the poverty gap index is what is termed the squared
poverty gap index. The use of this measure is in highlighting the inequality
among the poor themselves. It is the weighted poverty gap index, using the
poverty gap as the weighting index. It is expressed as follows:
This measure is not as widely used as the two above, mainly due to its difficulty
of interpretation. It is also not use in this thesis.
Cornrnun~ty-Dr~ven Development projects towards poverty alleviation 35
-
2.3.1.6 Examples of other poverty indices
Poverty and welfare indices have received much attention, especially with the
advent of the work by Sen (1976). This led to Duclos and Makdissi (1999: 2)
commenting that the last decades had seen considerable developments of the
methods that could be used to make comparisons of welfare distributions more
robust to the choice of ethical indices. Earlier works focused on inequality
measurement and social welfare, but the more recent literature has also pointed
out that similar robustness is desirable for poverty measurement. Only a few of
the most prominent indices are discussed in this section.
Sen (in Wright, 1996: 4) described three properties that a good summary index of
poverty should possess and be sensitive to, namely, it must be sensitive to:
(1) the relative number of poor, capturing the incidence of poverty;
(2) the average level of income of the poor, indicating their average
deprivation;
(3) the distribution of income among the poor, indicating their degree of
relative deprivation.
The following indices aimed at achieving these 'ideals'
2.3.1.6.1 Sen's index
Xu and Osberg (2002: 2) point out that the Sen indices are based on a set of
well-justified and commonly-agreed axioms. However, although from a policy
point of view it is also desirable to understand the meaning of the Sen indices in
terms of social welfare evaluation, the social evaluation function that the Sen
indices jointly share has not yet been explicitly summarised in the literature. The
Sen index takes the following form:
Community-Driven Development projects towards poverty alleviation 36
Where Po represents the headcount index, 4 is the mean income of the poor, z
is the poverty line and GP is the Gini co-efficient of inequality of income among
the poor. There are other indices within this class which are variations of this
basic index. Since this indicex has desirable ethical properties and is
multiplicatively decomposable, it and its decomposed components can be readily
used to measure the multi-dimensional impacts of anti-poverty policy actions (Xu
& Osberg, 2002: 2). The Sen indices do not lend themselves readily to
interpretation and are therefore primarily academic. These are not used in the
thesis.
2.3.1.6.2 Foster, Greer and Thorbecke (FGT) poverty index
Foster, Greer and Thorbecke (FGT) (1984) present a class of poverty indices
which is both practically useful and theoretically appealing (DeFina, 2000: 1). The
general FGT class of indices can take the forms as represented by (2.5) (Jha &
Sharma, 2003: 3) for a continuous distribution or (2.6) (Wright, 1996: 5) for a
discrete distribution of the population income subgroups.
and
where a is a measure of sensitivity of the index to poverty. The most common
values of a are 0, 1 and 2. The effect of the different values of a can be shown
graphically as in Figure 2.3. The figure depicts the P, measure in relation to
income for one individual. For Po, the relation with income is constant. The
measure accords the same weight to the richest of the poor as it does to the
poorest of the poor. Thus, the sum of each individual's Po is simply the
headcount ratio. The second measure, P,, has a linear and decreasing relation
with income. Since the income gap grows larger, more importance is given to the
poorest and less to the richest in the poverty measure. The last measure
quantifies the aversion of the society towards poverty; from the figure, P2 is
Community-Driven Development projects towards poverty alleviation 37
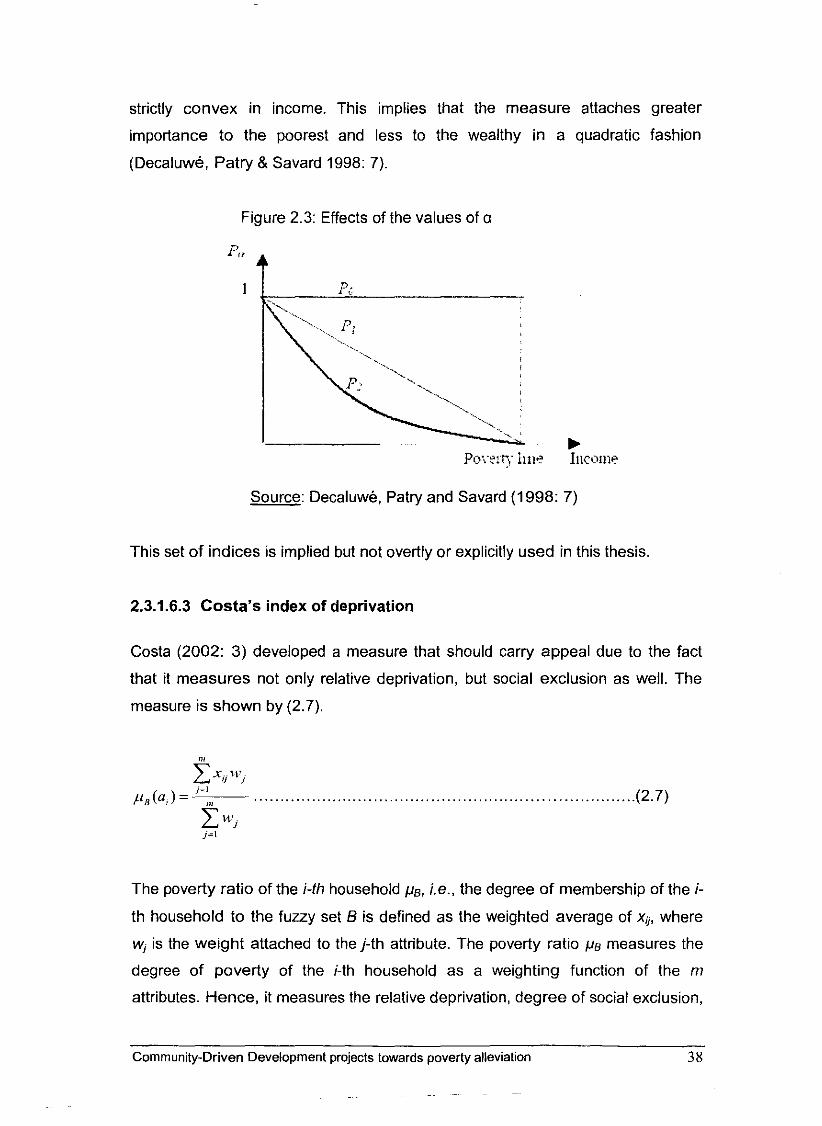
strictly convex in income. This implies that the measure attaches greater
importance to the poorest and less to the wealthy in a quadratic fashion
(Decaluwe, Patry & Savard 1998: 7).
Figure 2.3: Effects of the values of a
Source: Decaluwe, Patry and Savard (1998: 7)
This set of indices is implied but not overtly or explicitly used in this thesis.
2.3.1.6.3 Costa's index of deprivation
Costa (2002: 3) developed a measure that should carry appeal due to the fact
that it measures not only relative deprivation, but social exclusion as well. The
measure is shown by (2.7).
The poverty ratio of the i-th household p ~ , i.e., the degree of membership of the i-
th household to the fuzzy set B is defined as the weighted average of xv, where
w, is the weight attached to the j-th attribute. The poverty ratio p~ measures the
degree of poverty of the i-th household as a weighting function of the rn
attributes. Hence, it measures the relative deprivation, degree of social exclusion,
Community-Driven Development projects towards poverty alleviation 3 8

and insufficient capability of the i-th household to reach a living standard of the
society to which it belongs. (Costa, 2002: 3). This index is not used in the thesis.
2.3.1.6.4 Sen-Shorrocks-Thon (SST) index
The Sen-Shorrocks-Thon (SST) index is a modification of the Sen index. It is the
product of the headcount index, the poverty gap index of the poor and a term
with the Gini co-efficient of the poverty gap index. It can be shown as in (2.8).
The index is useful for cross-country and provincial comparisons as applied by
authors like Xu and Osberg (1999). This index is not employed in this study.
2.3.1.6.5 Watts index
The Watts index is an additive poverty measure that is distribution sensitive and
takes the form of (2.9).
The Watts index is not employed in the study.
2.3.1.6.6 Atkinson class of indices
The general class of additive measures encompassing the Watts index, the FGT
and other measures can be expressed generally as follows:
where p(z,yi) is zero for the non-poor (i.e. where y,2 z) and some positive number
for the poor, the value of which is a function of both the poverty line and the
individual living standard, non-decreasing in the former and non-increasing in the
Community-Driven Development projects towards poverty alleviation 39
latter (World Bank, 2000). This class is implied but not explicitly used in the
study.
2.3.2 Measures of inequality
Measuring income inequality is an important aspect of the evaluation of welfare.
The reason is that income or 'equivalent income' is taken as a proxy for welfare
and it follows that income inequality is seen as synonymous to welfare inequality,
a performance index of society (Ferrer-i-Carbonell & Van Praag, 2001: 2).
According to Litchfield (1999: 2), Chaubey (1995: 58-69) and Hagenaars (1987:
584-586), a good inequality index (measure) will contain most of the following
axioms:
. The Pigou-Dalton Transfer Principle. This axiom requires the inequality
measure to rise (or at least not fall) in response to a mean-preserving spread;
an income transfer from a poorer person to a richer person should register as
a rise (or at least not as a fall) in inequality and an income transfer from a
richer to a poorer person should register as a fall (or at least not as an
increase) in equality. What it points to is that a redistribution of wealth or
income from the 'haves' to the 'have-nots' should not leave both poorer,
inequality should be reduced and at least one person should be better-off
than before.
. Income Scale Independence. This requires the inequality measure to be
invariant to uniform proportional changes: if each individual's income
changes by the same proportion (as happens when changing currency unit)
then inequality should not change.
. Principle of Population. The population principle requires inequality measures
to be invariant to replications of the population: merging two identical
distributions should not alter inequality.
. Anonymity. The axiom - sometimes also referred to as "Symmetry", requires
that the inequality measure be independent of any characteristics of
individuals other than their income (or the welfare indicator whose distribution
is being measured).
Community-Driven Development projects towards poverty alleviation 40
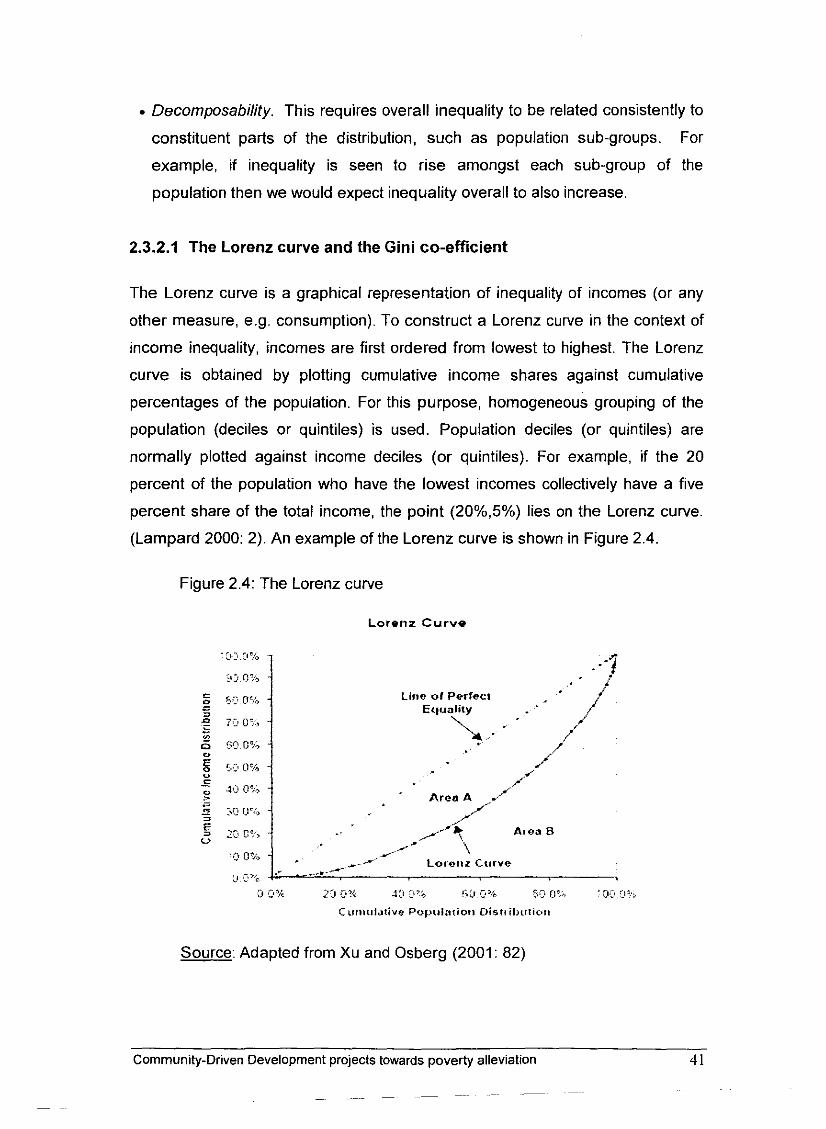
Decomposability. This requires overall inequality to be related consistently to
constituent parts of the distribution, such as population sub-groups. For
example, if inequality is seen to rise amongst each sub-group of the
population then we would expect inequality overall to also increase.
2.3.2.1 The Lorenz curve and the Gini co-efficient
The Lorenz curve is a graphical representation of inequality of incomes (or any
other measure, e.g. consumption). To construct a Lorenz curve in the context of
income inequality, incomes are first ordered from lowest to highest. The Lorenz
curve is obtained by plotting cumulative income shares against cumulative
percentages of the population. For this purpose, homogeneous grouping of the
population (deciles or quintiles) is used. Population deciles (or quintiles) are
normally plotted against income deciles (or quintiles). For example, if the 20
percent of the population who have the lowest incomes collectively have a five
percent share of the total income, the point (20%,5%) lies on the Lorenz curve.
(Lampard 2000: 2). An example of the Lorenz curve is shown in Figure 2.4.
Figure 2.4: The Lorenz curve
Lorcnz Curve
. :,.>, [, 5,
.. . :< 3 0 5 ,
C 2 5,3 7.0% - = 0 7G05, 6 - 2 0 590% " g 5 0 0 % " C - W 0 % > - -. " r.oI.lv, - 3
S zt, c:,> U
J C'b
Source: Adapted from Xu and Osberg (2001: 82)
Community-Driven Development projects towards poverty alleviation 41
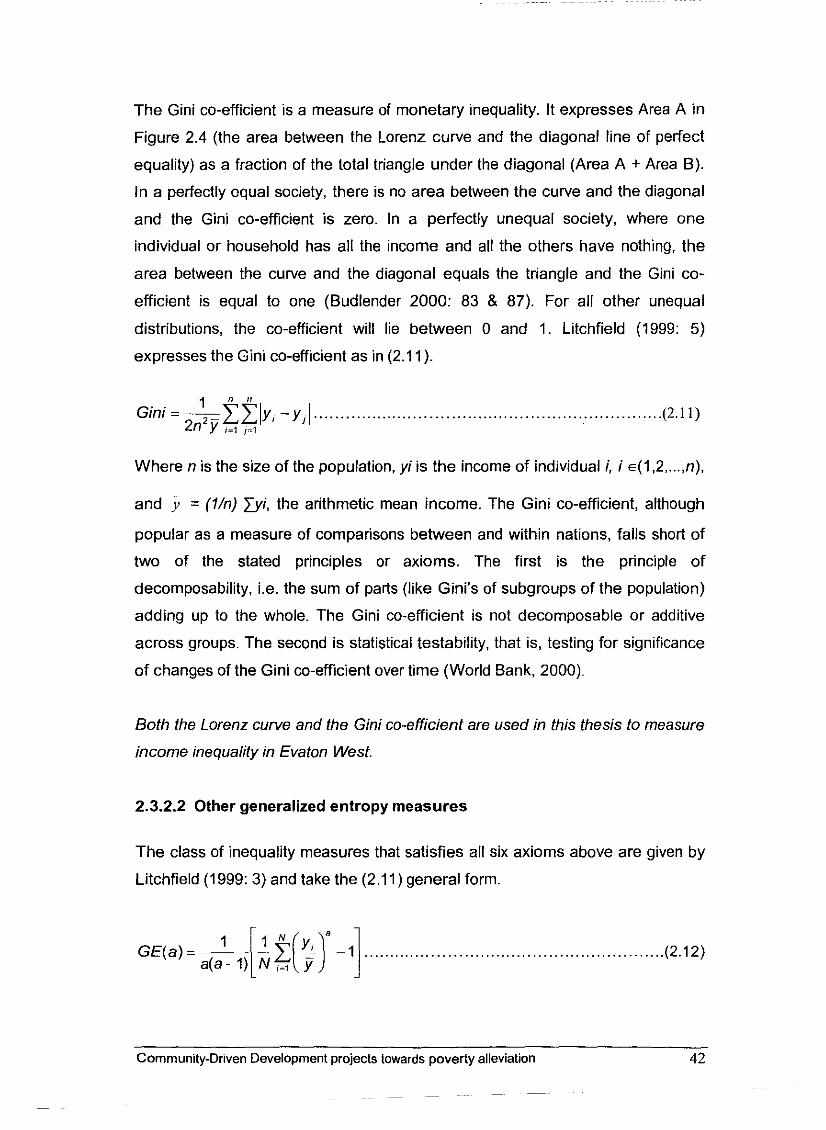
The Gini co-efficient is a measure of monetary inequality. It expresses Area A in
Figure 2.4 (the area between the Lorenz curve and the diagonal line of perfect
equality) as a fraction of the total triangle under the diagonal (Area A + Area B).
In a perfectly equal society, there is no area between the curve and the diagonal
and the Gini co-efficient is zero. In a perfectly unequal society, where one
individual or household has all the income and all the others have nothing, the
area between the curve and the diagonal equals the triangle and the Gini co-
efficient is equal to one (Budlender 2000: 83 & 87). For all other unequal
distributions, the co-efficient will lie between 0 and 1. Litchfield (1999: 5)
expresses the Gini co-efficient as in (2.1 1).
..... Where n is the size of the population, y i is the income of individual i, i ~ ( 1 , 2 n),
and y = (l/n) ty i , the arithmetic mean income. The Gini co-efficient, although
popular as a measure of comparisons between and within nations, falls short of
two of the stated principles or axioms. The first is the principle of
decomposability, i.e. the sum of parts (like Gini's of subgroups of the population)
adding up to the whole. The Gini co-efficient is not decomposable or additive
across groups. The second is statistical testability, that is, testing for significance
of changes of the Gini co-efficient over time (World Bank, 2000).
Both the Lorenz curve and the Gini co-efficient are used in this thesis to measure
income inequality in Evaton West.
2.3.2.2 Other generalized entropy measures
The class of inequality measures that satisfies all six axioms above are given by
Litchfield (1999: 3) and take the (2.11) general form.
-- -
Community-Driven Development projects towards poverty alleviation 42
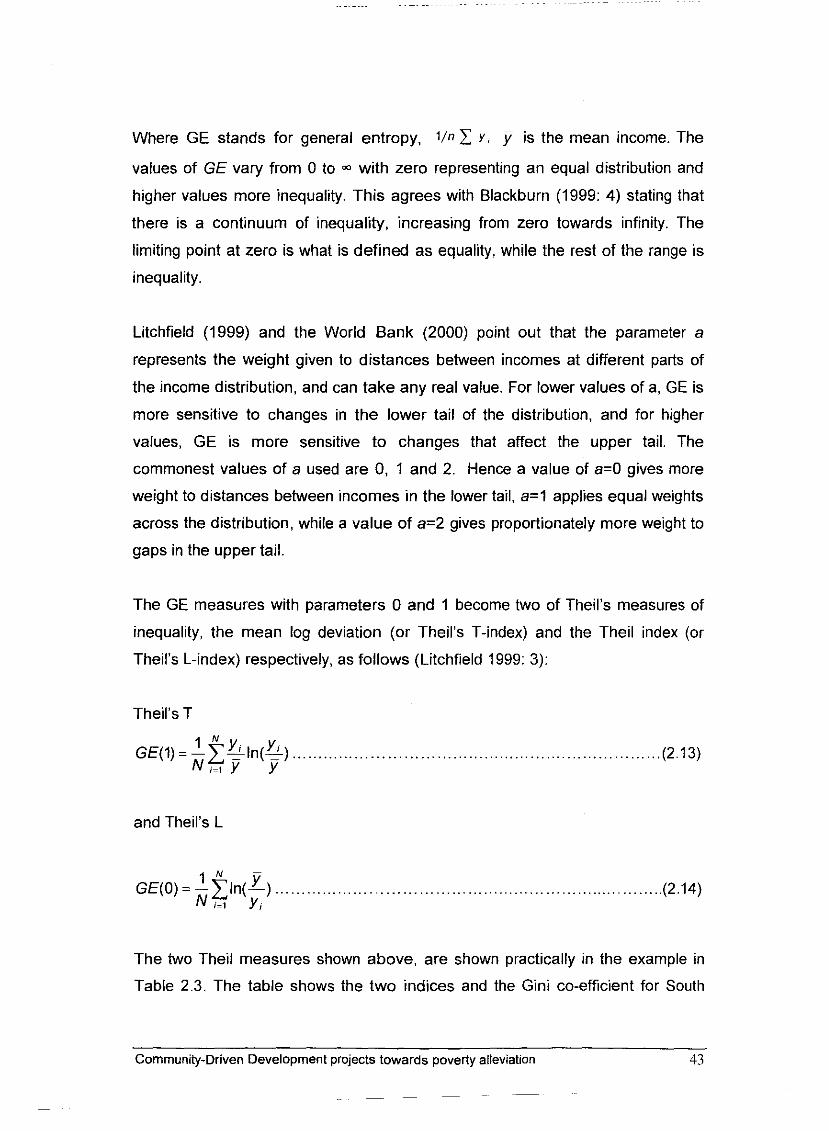
Where GE stands for general entropy, l l n C Y , y is the mean income. The
values of GE vary from 0 to - with zero representing an equal distribution and
higher values more inequality. This agrees with Blackburn (1999: 4) stating that
there is a continuum of inequality, increasing from zero towards infinity. The
limiting point at zero is what is defined as equality, while the rest of the range is
inequality.
Litchfield (1999) and the World Bank (2000) point out that the parameter a
represents the weight given to distances between incomes at different parts of
the income distribution, and can take any real value. For lower values of a, GE is
more sensitive to changes in the lower tail of the distribution, and for higher
values, GE is more sensitive to changes that affect the upper tail. The
commonest values of a used are 0, 1 and 2. Hence a value of a=O gives more
weight to distances between incomes in the lower tail, a= l applies equal weights
across the distribution, while a value of a=2 gives proportionately more weight to
gaps in the upper tail.
The GE measures with parameters 0 and 1 become two of Theil's measures of
inequality, the mean log deviation (or Theil's T-index) and the Theil index (or
Theil's L-index) respectively, as follows (Litchfield 1999: 3):
Theil's T
and Theil's L
The two Theil measures shown above, are shown practically in the example in
Table 2.3. The table shows the two indices and the Gini co-efficient for South
Community-Driven Development projects towards poverty alleviation 43
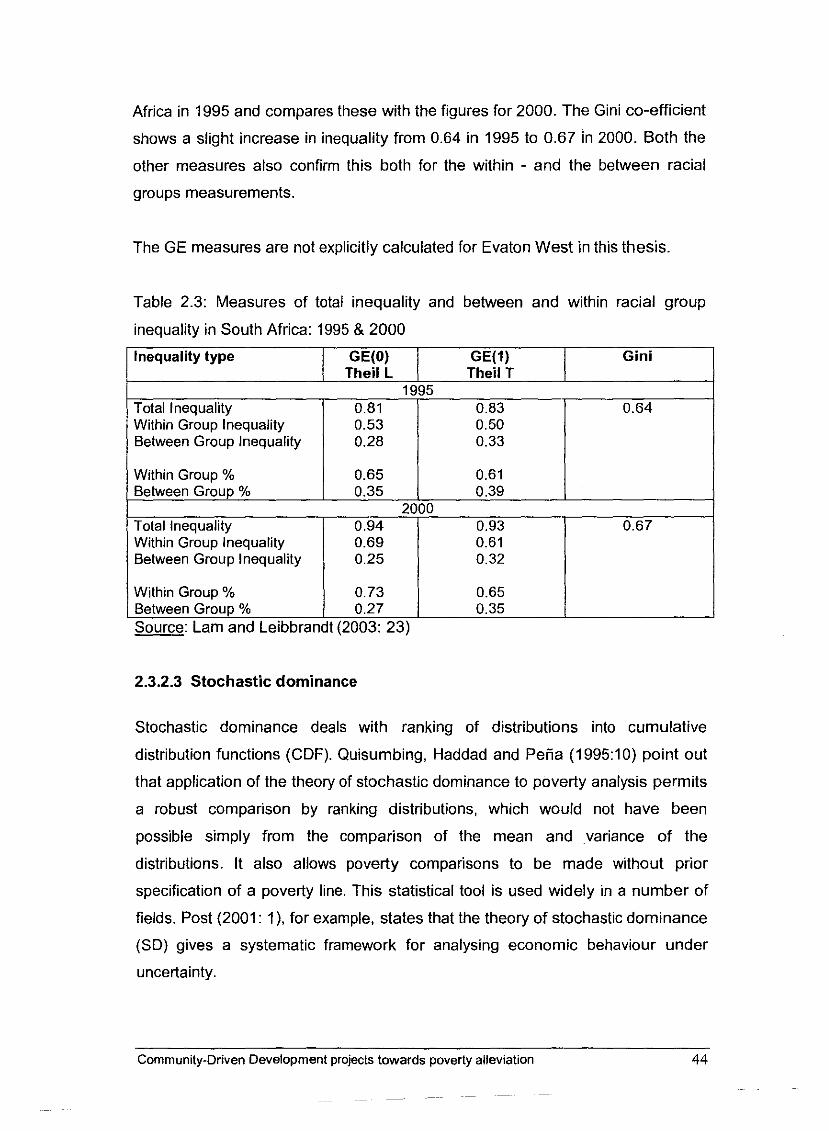
Africa in 1995 and compares these with the figures for 2000. The Gini co-efficient
shows a slight increase in inequality from 0.64 in 1995 to 0.67 in 2000. Both the
other measures also confirm this both for the within - and the between racial
groups measurements.
The GE measures are not explicitly calculated for Evaton West in this thesis.
Table 2.3: Measures of total inequality and between and within racial group
inequality in South Africa: 1995 & 2000
2.3.2.3 Stochastic dominance
Inequality type
Within Group % Between Group %
Stochastic dominance deals with ranking of distributions into cumulative
distribution functions (CDF). Quisumbing, Haddad and Peiia (1995:lO) point out
that application of the theory of stochastic dominance to poverty analysis permits
a robust comparison by ranking distributions, which would not have been
possible simply from the comparison of the mean and variance of the
distributions. It also allows poverty comparisons to be made without prior
specification of a poverty line. This statistical tool is used widely in a number of
fields. Post (2001: I ) , for example, states that the theory of stochastic dominance
(SD) gives a systematic framework for analysing economic behaviour under
uncertainty.
Community-Driven Development projects towards poverty alleviation 44
- - - - --- - -
G W ) Theil L
Source: Lam and Leibbrandt (2003: 23)
0.73 0.27
1995
0.65 0.35
GE(V Theil T
Gini
Total Inequality Within Group Inequality Between Group Inequality
Within Group % Between Group %
Total Inequality Within Group Inequality Between Group Inequality
0.83 0.50 0.33
0.61 0.39
2000 0.93 0.61 0.32
0.81 0.53 0.28
0.65 0.35
0.94 0.69 0.25
0.64
0.67
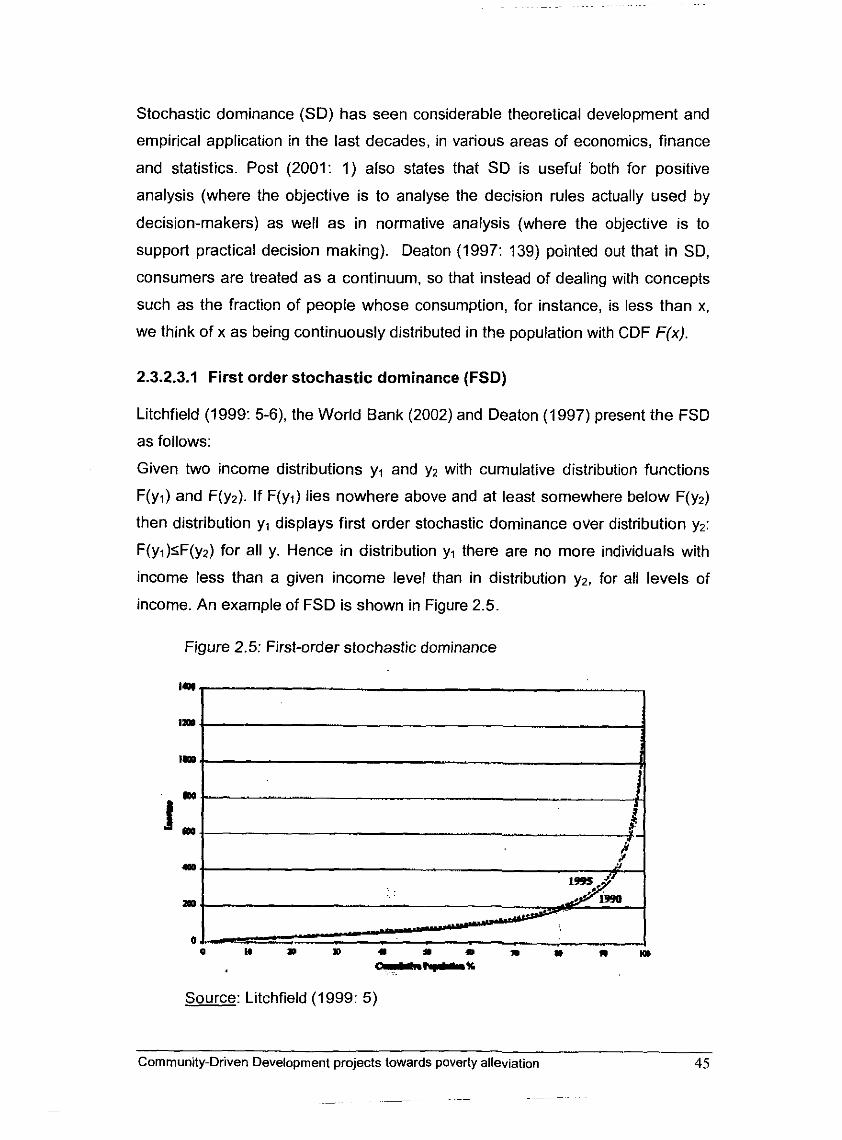
Stochastic dominance (SD) has seen considerable theoretical development and
empirical application in the last decades, in various areas of economics, finance
and statistics. Post (2001: 1) also states that SD is useful both for positive
analysis (where the objective is to analyse the decision rules actually used by
decision-makers) as well as in normative analysis (where the objective is to
support practical decision making). Deaton (1997: 139) pointed out that in SD,
consumers are treated as a continuum, so that instead of dealing with concepts
such as the fraction of people whose consumption, for instance, is less than x,
we think of x as being continuously distributed in the population with CDF F(x).
2.3.2.3.1 First order stochastic dominance (FSD)
Litchfield (1999: 5-6), the World Bank (2002) and Deaton (1997) present the FSD
as follows:
Given two income distributions yl and y2 with cumulative distribution functions
F(yr) and F(y2). If F(y1) lies nowhere above and at least somewhere below F(y2)
then distribution yl displays first order stochastic dominance over distribution y2:
F(yl)rF(y2) for all y. Hence in distribution yl there are no more individuals with
income less than a given income level than in distribution y2, for all levels of
income. An example of FSD is shown in Figure 2.5.
Figure 2.5: First-order stochastic dominance
h C I * . X . ..
Source: Litchfield (1999: 5)
Community-Driven Development projects towards poverty alleviation 45
2.3.2.3.2 Second order stochastic dominance
The deficit functions (the integral of the CDF) of distributions y l and y2 are now
considered: If the deficit function of distribution y l lies nowhere above and
somewhere below that of distribution y2, then distribution yl displays second
order stochastic dominance over distribution y2: G(yl,k) 5 G(y2,k) for all yk. The
dual of the deficit curve is the Generalized Lorenz curve defined as:
2.15 plots the cumulative income shares scaled by the mean of the distribution
against cumulative population, where the height of the curve at p is given by the
mean of the distribution below p. Second order dominance of distribution yl over
distribution y2 implies that any social welfare function that is increasing and
concave in income will record higher levels of welfare in yl than in y2 It should
now be apparent that second order stochastic dominance is therefore implied by
first order stochastic dominance, although the reverse is not true. (Litchfield,
1999; World Bank, 2002; Deaton, 1997).
Stochastic dominance is not employed in this study,
2.3.3 Poverty profiles
The methods employed above have centred analysis on incomes I consumption.
There are other tools of analysis that focus on non-income measurements.
Measuring and ameliorating other dimensions of poverty, such as health,
nutrition, housing and educational attainment, warrant equal attention (Sahn,
1999: 1). One tool that is used to account for such non-income measures, is the
development of profiles of poverty based on countries, regions and households.
A poverty profile is a standard methodology to describe the nature and extent of
poverty in a country or a region. As Datt, Jolliffe and Sharma (2001: 203) state, a
poverty profile assesses the magnitude of poverty and its distribution across
Community-Driven Development projects towards poverty alleviation 46
geographic and socio-economic domains, provides information on the
characteristics of the poor, illustrates the heterogeneity among the poor and
helps identify the empirical correlates of poverty. Household surveys as well as
community surveys are utilised to solicit information used on poverty profiles.
A word of caution need to be mentioned, namely that poverty profiles on their
own may not be sufficient for an effective anti-poverty policy framework. There
will always be a need to supplement them with other poverty measures. Tarp,
Simler, Matusse, Heltberg and Dava (2002: 77) also pointed out that poverty
measures and poverty profiles are used increasingly as guides in targeting
resources for poverty reduction, but an allocation that is efficient according to one
methodology may prove to be ineffectual under another. In order to supplement
this, in the following sections some of the factors normally included in a typical
poverty profile are discussed to bring balance to the discussion.
The following indicators are all employed in this thesis to develop a profile for
Evaton West.
2.3.3.1 Demographic characteristics
A number of characteristics may be included under demographic characteristics.
The following are a few examples.
Household characteristics
Household characteristics such as household size and composition (e.g. gender)
are profiled in this section. It is important not to be quick to draw conclusions
regarding causality between poverty and any characteristic within the profile,
including household characteristics. White and Masset (2003: 106) also warn that
misleading results linking household size and poverty thus do indeed affect other
aspects of the poverty profile. This only serves to distort results.
There are, nevertheless, research-proven links between household
characteristics and poverty, especially with regard to gender. Razavi (1999: 474)
Cornrnun~ty-Driven Development projects towards poverty alleviation
- --
agrees by stating: "... the links between gender and poverty have also been
captured through the gender aggregation of well-being outcomes such as child
mortality and nutrition, which has served to highlight significant female
disadvantage".
Dependency ratios
Dependency ratios refer to the burden of the unemployed carried by the
employed population. A dependency ratio is calculated as a ratio of the number
of household members not employed to the number of those members who are
employed (Wcrld Bank 2000). Higher ratios may be expected in poor than in non-
poor households.
Household head
Works like those of Kossoudji and Mueller (1983) and Quisumbing, Haddad and
Peiia (1995) show that female-headed households experience more poverty than
male-headed households, especially in Sub-Saharan Africa (Kossoudji and
Mueller's (1983) research was, in fact, conducted in Botswana). Pressman
(2003: 353) also states that it is well-known that women are much more likely to
be poor than men in most developed nations, even though the causes of this
phenomenon remains a matter of dispute.
2.3.3.2 Economic Characteristics
Garfinkel and Haveman (1976) have shown a link between economic
characteristics such as earning capacity and economic status and poverty. It is
normally accepted that there is a link between employment status and poverty.
These characteristics form an important part of most poverty profiles.
Employment and unemployment
Even though it is true that unemployment is normally taken as an important
contributor to poverty, DeFina (2002) questions the link between unemployment
and poverty and cautions against over-reliance on the lower unemployment
Community-Driven Development projects towards poverty alleviation 48
phenomenon as an anti-poverty strategy. The link between unemployment and
poverty should not be assumed in any profiling process, but it should be tested.
Income and expenditure
lncome is the singular most-used indicator of poverty. Gatfinkel and Haveman
(1 976: 49) stated that whether or not a household is counted as poor depends on
its annual money income. Most poverty lines are income-based. The link
between income and poverty is therefore normally accepted. This link is also
acknowledged in this thesis.
2.3.3.4 Social Characteristics
Social characteristics include such indicators as education, housing and health.
Such indicators are also frequently used in poverty profiles.
Education
Education is one of the indicators of poverty that is almost always included in
poverty profiles. De Gregorio and Lee (2002) have developed a measure of the
effects of education on income inequality and therefore subsequently on poverty.
They state that income distribution is related to the population's average
schooling and its dispersion. lncome inequality increases with education
inequality. The Asian Development Bank (ADB) (2003) states: "The relationship
between education and poverty reduction is clear. Education [leads to:] pro-poor
sustainable economic growth, social development, and good governance".
Health
Health and poverty are linked. Health is an important indicator of poverty.
Graham, Fitzmaurice, Bell and Cairns (2004: 24) point out that recognition of the
synergy between health and poverty is now apparent in the development
strategies of many low-income countries. The relationship between income
inequality, health and poverty has been comprehensively studied and
documented by Judge and Paterson (2001), stating (for example) that poverty
Community-Driven Development projects towards poverty alleviation 49
reinforces health-damaging behaviours. It has become evident that successful
poverty reduction must include measures that specifically address health needs
of the poor, such as through primary health care (Bloom & Lucas 2000: 3). It will
therefore be expected that health feature prominently in most poverty profiles.
Housing
Housinglshelter is also accepted as an important indicator of poverty. In many
developing countries, development strategies include housing as an important
anti-poverty strategy. A previous Minister of Housing in South Africa, Minister
Sankie Mthembu-Mahanyele, addressing the Round-Table on Sustainable
African Cities as part of the World Summit on Sustainable Development in 2002,
pointed out the importance of housing in development: Housing not only satisfies
a basic need for shelter but also plays a critical role in economic development
(South Africa, 2002: 7). This has led to the development of strategies like the
People's Housing Programme (PHP) in South Africa.
2.3.3.5 Access to services
Access to social and engineering services has become very important in
assessing levels of poverty. Electricity supply, water and reticulation services,
communication services and roads are examples of services that have received
attention as development indicators. Anas (2003) points out, for example, that
poor, inefficient and unreliable states of infrastructure services pose a threat to
fulfil targets laid down in the Interim-Poverty Reduction Strategy Paper (I-PRSP)
and the Millennium Development Goals (MDG).
Table 2.4 is an example of an excerpt from a profile developed by the World
Bank (1994) showing household amenities and services.
Cornrnun~ty-Driven Development projects towards poverty alleviation
-- - - ---
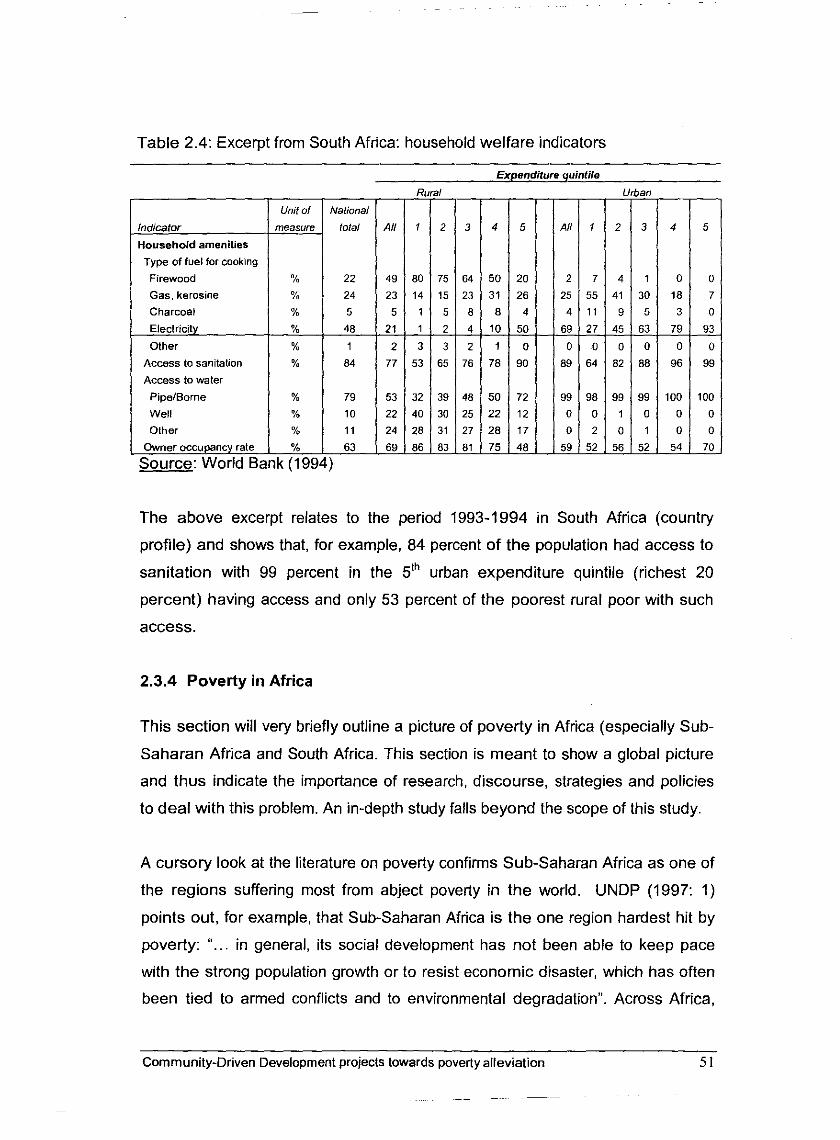
Table 2.4: Excerpt from South Africa: household welfare indicators
Type of fuel for cooking
Firewood
Gas, kerosine
Charcoal
Other
Access to sanitation
Access lo water
PipeIBorne
Well %
Other %
63
Source: World Bank (1994)
All
49
23
5
21 - 2
77
53
22 24
69 -
The above excerpt relates to the period 1993-1994 in South Africa (country
profile) and shows that, for example, 84 percent of the population had access to
sanitation with 99 percent in the 5'h urban expenditure quintile (richest 20
percent) having access and only 53 percent of the poorest rural poor with such
access.
2.3.4 Poverty in Africa
This section will very briefly outline a picture of poverty in Africa (especially Sub-
Saharan Africa and South Africa. This section is meant to show a global picture
and thus indicate the importance of research, discourse, strategies and policies
to deal with this problem. An in-depth study falls beyond the scope of this study.
A cursory look at the literature on poverty confirms Sub-Saharan Africa as one of
the regions suffering most from abject poverty in the world. UNDP (1997: 1)
points out, for example, that Sub-Saharan Africa is the one region hardest hit by
poverty: "... in general, its social development has not been able to keep pace
with the strong population growth or to resist economic disaster, which has often
been tied to armed conflicts and to environmental degradation". Across Africa,
Community-Driven Development projects towards poverty alleviation
- -- --
millions of people are fighting their own war against poverty every day (Oxfam,
2003: 2).
The following brief facts highlight the problem (Oxfam, 2003: 2):
More than half of sub-Saharan Africa's 600 million people still live on less
than US$1 a day.
More than 28 million Africans are living with HIVIAIDS.
Forty per cent of children never go to school in Africa -the only region in
the world where the numbers of children out of school are rising.
A comparative analysis of poverty across the different regions in the world is
shown in Figure 2.6. The figure shows Sub-Saharan Africa as the region
suffering most from severe levels of poverty. It also shows that poverty in Sub-
Saharan Africa barely decreased between the years 1990 and 1999. The target
for 201 5 is to reduce poverty to 24 percent, which would still be higher than in all
the other regions. Many writers on the subject have offered several explanations
for this state of affairs; some of these are presented after Figure 2.6 as an
illustration of perceptions related to the problem.
Shah (2001) sees the following as being some of the reasons for Africa's
persistent poverty:
Food dumping: The dumping of the surplus production for free or nearly
no cost to poorer nations means that the farmers from such countries
cannot compete and are driven out of jobs. The net effect of such policies
on the poor is not clear-cut.
Hunger: meaningful long-term alleviation of hunger is rooted in the
alleviation of poverty, as poverty leads to hunger.
Structural Adjustment: Many developing nations are in debt and poverty
partly due to the policies of international institutions such as the
International Monetary Fund (IMF) and the World Bank. Their programme
have been heavily criticised for many years for resulting in poverty. This is
despite the IMF and World Bank's claim that they will reduce poverty. This
Community-Driven Development projects towards poverty alleviation 52
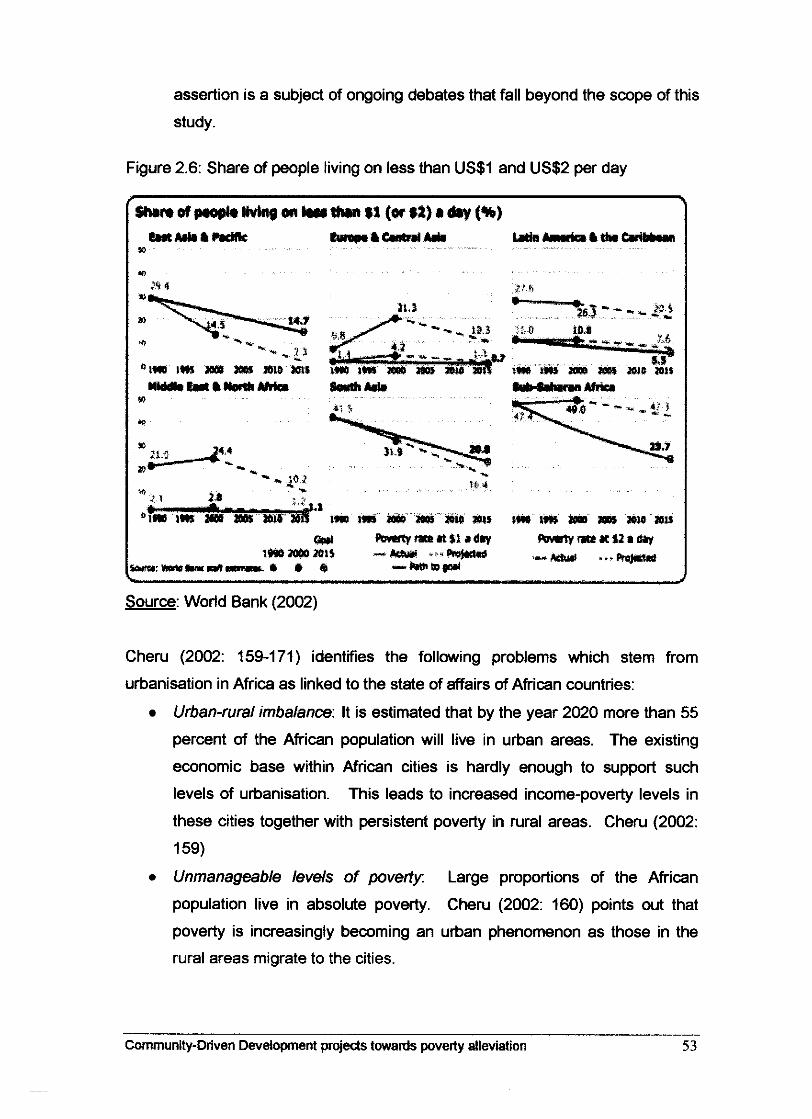
~ ~ ~- ~
assertion is a subject of ongoing debates that fall beyond the scope of this
study.
Figure 2.6: Share of people living on less than US$1 and US$2 per day
Source: World Bank (2002)
Cheru (2002: 159-171) identies the following problems which stem from
urbanisation in Africa as linked to the state of affairs of African countries:
Urban-rural imbalance: It is estimated that by the year 2020 more than 55
percent of the African population will live in urban areas. The existing
economic base within African cities is hardly enough to support such
levels of urbanisation. This leads to increased income-poverty levels in
these cities together with persistent poverty in rural areas. Cheru (2002:
159)
Unmanageable levels of poverty Large proportions of the African
population live in absolute poverty. Cheru (2002: 160) points out that
poverty is increasingly becoming an urban phenomenon as those in the
rural areas migrate to the cities.
Community-Driven Development projects towards poverty alleviation 53
An inappropriate regulatory framework The absence of an enabling
macro-economic environment at national level and the persistence of
inappropriate and outdated regulatory frameworks at local government
level are problems plaguing African countries.
Weak municipal institutions and poor revenue base: Cheru (2002: 162)
argues that across Africa central government interventions have paid little
attention to the critical responsibilities of local institutions such as the
operation and maintenance of infrastructure. With narrow revenue bases
and limited technical capacities, municipalities have been unwilling or
unable to maintain infrastructure which they have not designed.
The United Nations developed the Millennium Development Goals (MDG) that
are summarised in Table 2.5 (Panos, 2002:lO). These are development goals
set for developing countries and aimed to be achieved by the year 2015. The
African Development Bank (2002: 1) pessimistically (gloomily) stated that few
African countries are likely to meet most of these goals. The African
Development Bank further asserts that African countries will need to act in the
following three main areas if these goals are to be achieved:
Deepening macroeconomic reforms, and enhancing domestic
competitiveness and efficiency, as foundations for a favorable investment
climate and pro-poor growth.
Strengthening democratic institutions and systems of public budget and
financial management to ensure that governments are accountable to their
people, especially for the effective use of public resources.
Investing adequate resources in human development.
Other possible solutions to the 'war on poverty' in Africa are provided by Oxfam
(2003: 2-3). The key battlefields in the war on poverty are:
"Trade: the enormous harm being done by the subsidies rich
Western countries pay their farm sectors to produce a glut of cheap
food which is dumped on world markets, undercutting African
farmers and robbing millions of their livelihoods.
Community-Driven Development projects towards poverty alleviation 54
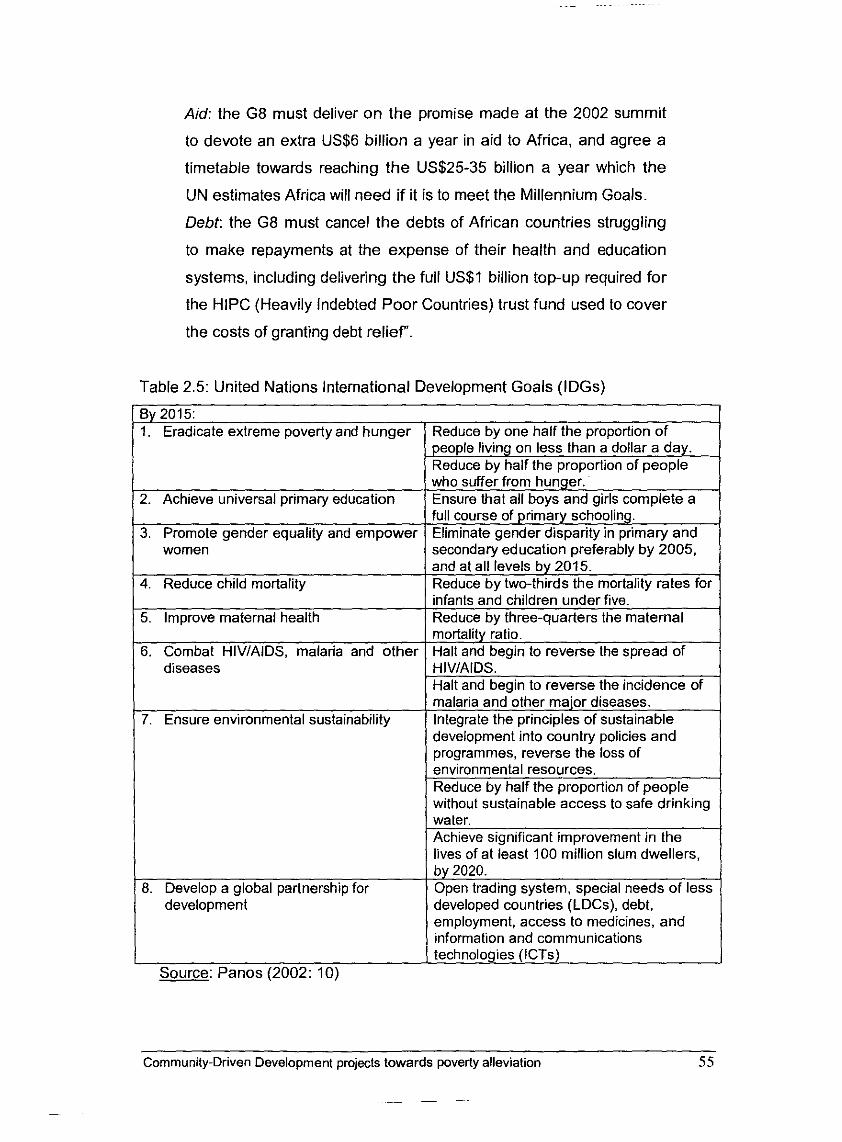
Aid: the G8 must deliver o n the promise made at the 2002 summit
to devote an extra US$6 billion a year in aid to Africa, and agree a
timetable towards reaching the US$25-35 billion a year which the
UN estimates Africa will need if it is to meet the Millennium Goals.
Debt: the G8 must cancel the debts of African countries struggling
to make repayments at the expense of their health and education
systems, including delivering the full US$1 billion top-up required for
the HlPC (Heavily Indebted Poor Countries) trust fund used to cover
the costs of granting debt relief'.
Table 2.5: United Nations International Development Goals (IDGs)
I. Achieve universal primary education
I. Promote gender equality and empower women
I. Reduce child mortality
i. Improve maternal health
i. Combat HIVIAIDS, malaria and other diseases
-
'. Ensure environmental sustainability
3. Develop a global partnership for development
Source: Panos (2002: 10)
Reduce by one half the proportion of people living on less than a dollar a day. Reduce by half the proportion of people who suffer from hunger. Ensure that all bovs and ails com~lete a full course of prim& schLoling.
'
Eliminate aender dis~aritv in ~r imarv and secondaieducation preferably by 2005. and at all levels by 2015. Reduce bv two-thirds the mortalitv rates for infants and children under five. Reduce bv three-auarlers the maternal mortality ratio. Halt and begin to reverse the spread of
development into country policies and programmes, reverse the loss of
ly 2015: . Eradicate extreme poverty and hunger
.
environmental resources. Reduce by half the proportion of people
I
-
-
-
-
-
-
-
-
-
-
&
without sustainable access to safe drinking water. Achieve significant improvement in the lives of at least 100 million slum dwellers, by 2020. Open trading system, special needs of less developed countries (LDCs), debt, employment, access to medicines, and information and communications technologies (ICTs) -
Community-Driven Development projects towards poverty alleviation 55
-
Though Africa is hardest hit by escalating global poverty levels, much is being
done in attempting to deal with this problem.
2.3.5 Poverty and inequality in South Africa
South Africa celebrates its ten years of freedom and democracy in 2004. A great
deal of development has taken place over the period. Nevertheless, poverty and
inequality seem to have persisted over this period. Gibson (2001: 373) states:
"Six years after the end of apartheid, why has so little changed in South Africa?
How were the dreams of freedom and social and economic equality so quickly
dashed?"
Much of this situation is seen as politically motivated. Southall (2003: 48), for
example, states that:
"The ANC may now (at times) claim to have embraced social democracy,
yet if it has, then it is a Blairite version which prioritises wealth-creation
over welfare, and opportunity over equity. 'Black empowerment' is thus
readily transformed into a black middle-class-enhancing construct which
celebrates the non-racialisation of, rather than the abolition of, poverty
and inequity. (The distribution of income in South Africa remains one of
the [most unequal] in the world. Even though the proporlion of the highest
income group which is black has increased markedly over the last three
decades, the proportion of households in the poorest four income groups
that are African has also increased)."
StatsSA (2000: 1) states that the reduction of poverty and inequality has been a
central concern of South Africa's government since 1994 (referring to the
Reconstruction and Development Programme of the ANC (African National
Congress 1994)). Yet quantitative description and analysis in this field have been
slow to emerge. The main reason is that evidence had to be built up (mainly by
Statistics South Africa) from a very limited historical base. A further problem with
the measurement of poverty in South Africa was pointed out by Godsell and Buys
(1992: 636) namely, the fact that no national definition of poverty exists in South
Africa. Much research into poverty in South Africa has used various, mostly
Community-Driven Development projects towards poverty alleviation 56
international measurements of poverty with little effort at national
contextualisation. Estimates of the levels of poverty in the country therefore vary
considerably.
This has been pointed out by Cheru (2001: 506) writing that: "Estimates of the
incidence and depth of poverty in South Africa vary. Figures have ranged from
over 56 percent of the population to just over 36 percent living in poverty." Based
on consumption expenditure levels consistent with the minimum level of food
intake, which usually defines the 'absolute poverty' level, it is estimated that
about 40 percent of the South African population may be considered poor. Global
Poverty Network (GPN) (2000: 6) concurs by stating that despite South Africa
being an upper-middle-income country, its rate of poverty (a measure of the
extent of absolute poverty) is 45 percent. This translates into 3,126,000
households or more than 18 million citizens.
The United Nations Development Programme (UNDP) (2000: 52) also agrees
that South Africa's rate of poverty (a measurement of the extent of absolute
poverty) is 45 percent. Klasen (2000), StatsSA (2000), May (2000) and other
researchers have all attempted to measure poverty in SA with slightly varying
results.
Insofar as inequality of income is concerned, Binns and Nel (2002: 10) state that
"after decades of apartheid policies, the 'new' South Africa, which emerged under
the leadership of Nelson Mandela after the first democratic elections in April
1994, remains one of the most unequal societies in the world. Both social and
spatial inequalities are features of everyday life in South Africa". This assertion
has been confirmed by a number of other research works on the subject (for
example Gelb, 2003). Figure 2.7 shows the cumulative distribution functions
(CDF) of incomes in South Africa for 1995 and 2000. The figure shows that
income inequality has worsened over the period.
Community-Driven Development projects towards poverty alleviation
~
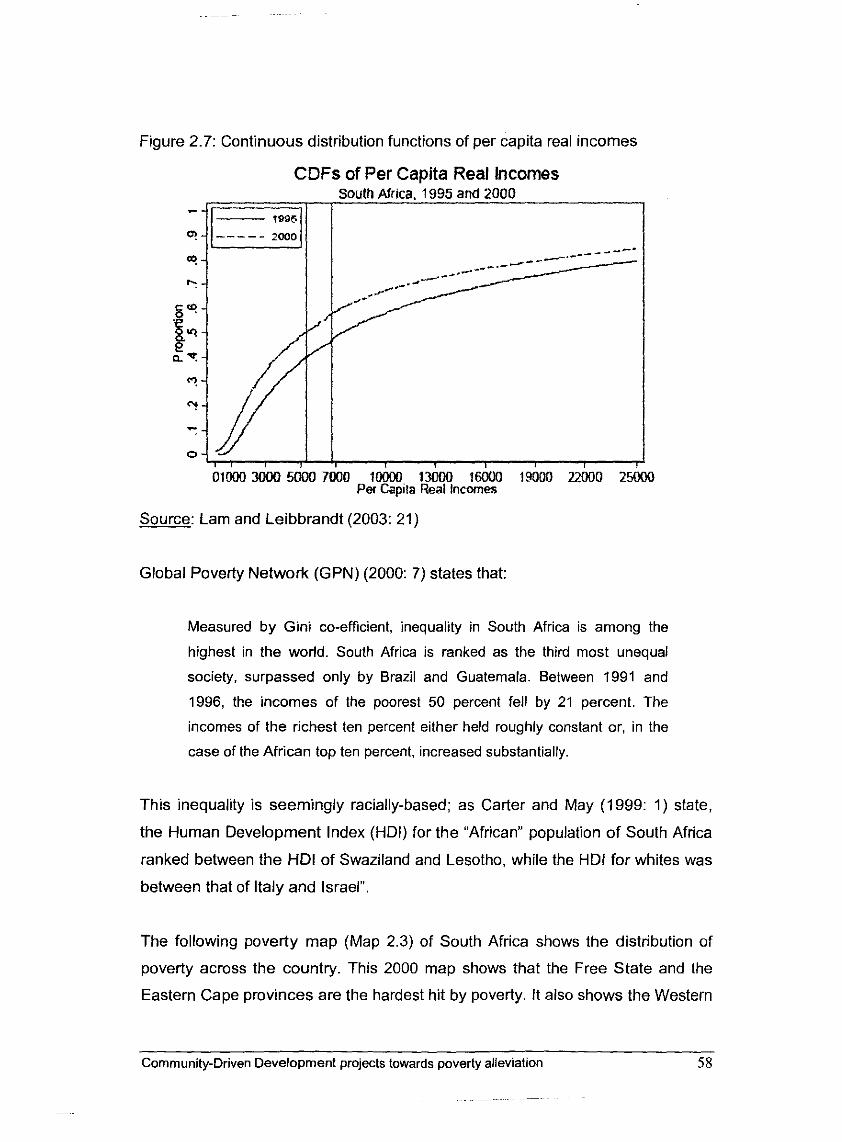
Figure 2.7: Continuous distribution functions of per capita real incomes
CDFs of Per Capita Real Incomes South Africa. 1995 and 2000
1895
q ----- ,,I OD - P- -
C? -
0
OlDOD3WO5WO7000 lOMXl 13WO 16000 19000 22000 W Per Capcta Real Incomes
Source: Lam and Leibbrandt (2003: 21)
Global Poverty Network (GPN) (2000: 7) states that:
Measured by Gini co-efficient, inequality in South Africa is among the
highest in the world. South Africa is ranked as the third most unequal
society, surpassed only by Brazil and Guatemala. Between 1991 and
1996, the incomes of the poorest 50 percent fell by 21 percent. The
incomes of the richest ten percent either held roughly constant or, in the
case of the African top ten percent, increased substantially.
This inequality is seemingly racially-based; as Carter and May (1999: I ) state,
the Human Development Index (HDI) for the "African" population of South Africa
ranked between the HDI of Swaziland and Lesotho, while the HDI for whites was
between that of Italy and Israel".
The following poverty map (Map 2.3) of South Africa shows the distribution of
poverty across the country. This 2000 map shows that the Free State and the
Eastern Cape provinces are the hardest hit by poverty. It also shows the Western
Community-Driven Development projects towards poverty alleviation 58
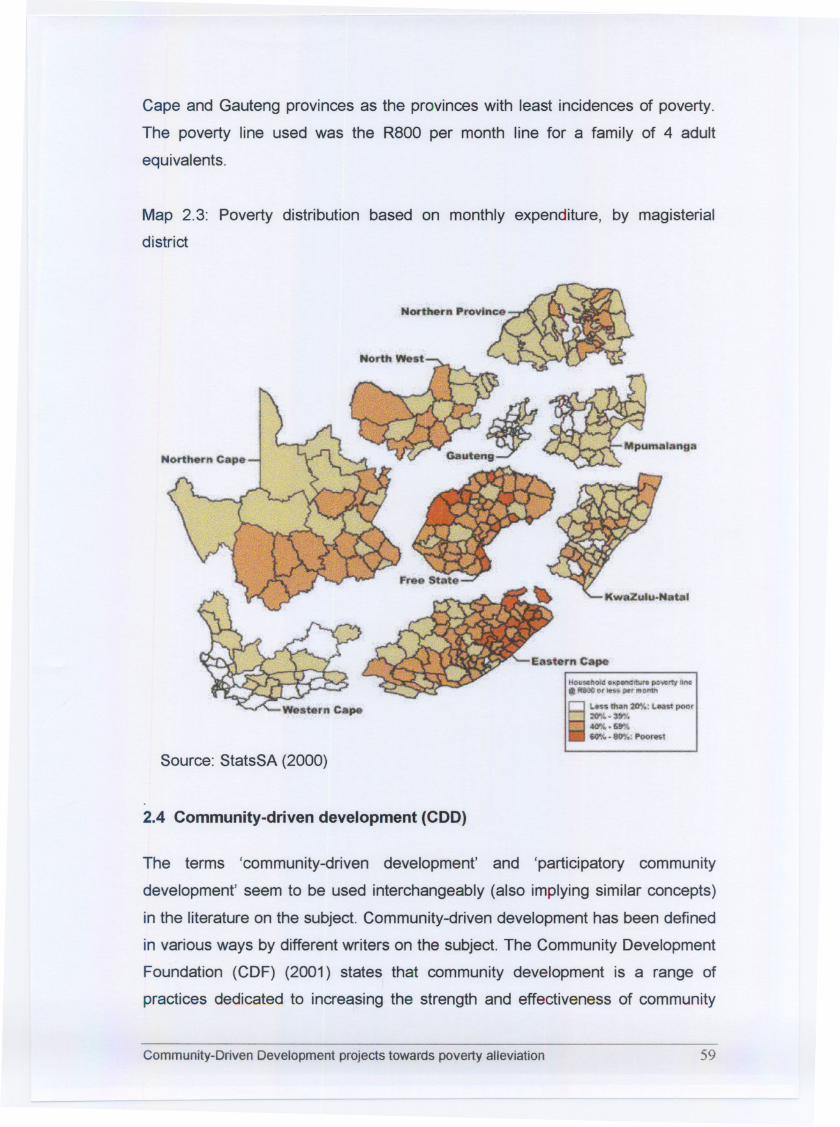
Cape and Gauteng provincesas the provinceswith least incidences of poverty.
The poverty line used was the R800 per month line for a family of 4 adult
equivalents.
Map 2.3: Poverty distribution based on monthly expenditure, by magisterial
district
KW8IZulu.Natlll
Source: StatsSA (2000)
2.4 Community-driven development (CDD)
The terms 'community-driven development' and 'participatory community
development' seem to be used interchangeably (also implyingsimilar concepts)
in the literature on the subject. Community-drivendevelopment has been defined
in various ways by different writers on the subject. The Community Development
Foundation (CDF) (2001) states that community development is a range of
practices dedicated to increasing the strength and effectiveness of community
Community-Driven Development projects towards poverty alleviation 59
life, improving local conditions, especially for people in disadvantaged situations,
and enabling people to participate in public decision-making and to achieve
greater long-term control over their circumstances. This definition is premised on
the idea that community development should be participatory and empowering to
the beneficiary communities.
This approach is supported by Frank and Smith (1999: 6) who point out that
community development is the planned evolution of all aspects of community
well-being (economic, social, environmental and cultural). It is a process whereby
community members come together to take collective action and generate
solutions to common problems.
This approach differs markedly from the traditional approach to community
development which viewed it as a top-down, authority-initiated process. As Das
Gupta, Grandvoinnet and Roman (2001: 1) point out: "With growing awareness
of the limitations of traditional "top-down" approaches for development and
poverty reduction, interest has shifted to the potentially powerful role of the
participation of communities in the planning and management of public sector
service delivery at the local level." Sillitoe (2002: I) calls this shift from emphasis
on "top-down" interventions to a "grassroots" participatory perspective a
revolution in pursuit of ethnography. This approach revolutionizes the way
community development has been conceptualized and applied in the past.
Within the framework of CDD, community work can be seen as the process of
assisting people improve their own communities by undertaking collective action
(Twelvetrees, 2002: 1). This implies that community workers are seen as
facilitators within this approach, they don't own the process of development. It
also shows that community development start with individuals. There has to be
individual involvement for collective action to succeed.
2.4.1 Concept of Community-Driven Development
This section briefly introduces the concept of community development especially
community-driven development in general terms. Perhaps the most revealing
Community-Driven Development projects towards poverty alleviation 60
definition and ideological characterisation of participatory community
development was coined by Siddiqui (2003: I ) who wrote that the main principle
of participatory approaches is the belief that every individual, poor or rich, man or
woman has the capacity to analyse hislher own reality and take action based on
this analysis, given the opportunity. "For too many years now in the field of
development we have approached our projects from a welfare and charity-based
perspective, where we go with the notion that "we" (development workers) know
best and have something to offer to "them" (beneficiaries)" (Siddiqui 2003: 1).
This approach accepts that within each community there are individuals with
knowledge, skills and innate potential to define their conditions and contribute
tremendously to the upliftment of that community, given the chance. This
approach is also an indictment of the erstwhile approach that believed, almost
presumptuously, that community workers knew best what the community needed
and how this should be provided.
The participatory community development approach accepts that the community
has a primary role to play in development. It also accepts the inevitable role of
the local government in such development. The participation of local government
is essential, especially in funding initiatives the community identifies. This is
confirmed by Binswanger. and Aiyar (2003: 5) who state that community driven
development is not a project. It is an approach that aims to empower
communities and local governments with resources and the authority to use
these flexibly, thus taking control of their development: This means that
empowerment means the expansion of assets and capabilities of poor people to
participate in, negotiate with and hold accountable institutions that affect their
lives. It also means giving people access to voice and information, greater social
inclusion and participation, greater accountability, and organisational strength.
The role of local government is also emphasized by the World Bank (2000) which
pointed out that past experience suggests that decentralisation will not work
without vibrant, participatory communities and that enhanced participation will, at
some point, need a local government structure for sustainability: the two can
evolve together dynamically, strengthening one another.
Community-Driven Development projects towards poverty alleviation 6 1
~ ~ -~ ~ ~~ - ~~
~- -
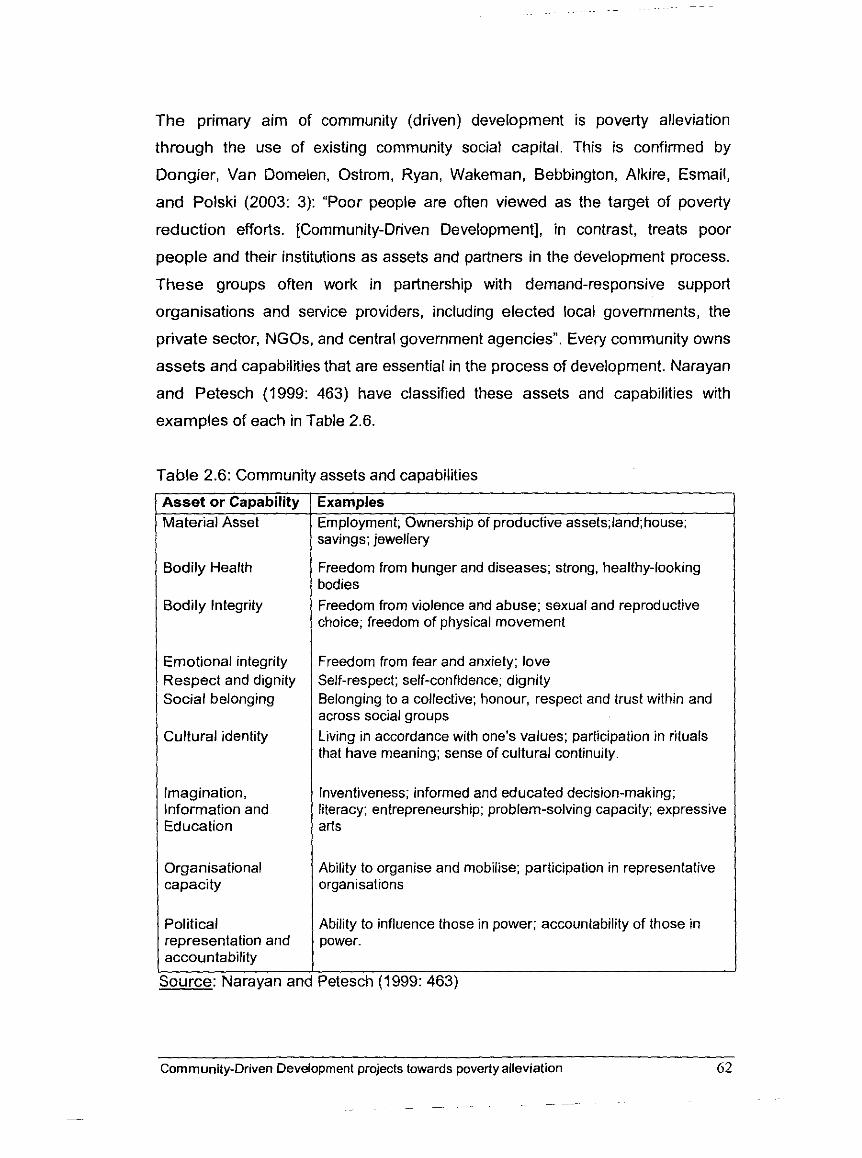
The primary aim of community (driven) development is poverty alleviation
through the use of existing community social capital. This is confirmed by
Dongier, Van Domelen, Ostrom, Ryan, Wakeman, Bebbington, Alkire, Esmail,
and Polski (2003: 3): "Poor people are often viewed as the target of poverty
reduction efforts. [Community-Driven Development], in contrast, treats poor
people and their institutions as assets and partners in the development process.
These groups often work in partnership with demand-responsive support
organisations and service providers, including elected local governments, the
private sector, NGOs, and central government agencies". Every community owns
assets and capabilities that are essential in the process of development. Narayan
and Petesch (1999: 463) have classified these assets and capabilities with
examples of each in Table 2.6.
Table 2.6: Community assets and capabilities
Rsset or Capability Material Asset
Bodily Health
Bodily Integrity
Emotional integrity Respect and dignity Social belonging
Cultural identity
Imagination, Information and Education
Organisational capacity
Political representation and accountability
iource: Narayan anc
Examples Employment; Ownership of productive assets;land;house; savings; jewellery
Freedom from hunger and diseases; strong, healthy-looking bodies Freedom from violence and abuse; sexual and reproductive choice; freedom of physical movement
Freedom from fear and anxiety; love Self-respect; self-confidence; dignity Belonging to a collective; honour, respect and trust within and across social groups Living in accordance with one's values; participation in rituals that have meaning; sense of cultural continuity.
Inventiveness; informed and educated decision-making; literacy; entrepreneurship; problem-solving capacity; expressive arts
Ability to organise and mobilise; participation in representative organisations
Ability to influence those in power; accountability of those in power.
Petesch (1999: 463)
Community-Drwen Development projects towards poverty alleviation 62
- - - - - -
Any attempt at community development should ideally begin with an investigation
into such assets and capabilities as described above. Community development
is never a smooth process: it is fraught with conflicts, controversies,
disagreements and often suspicions. It depends on how the community handles
and manages these whether their efforts at development will succeed. Lyons
and Smuts (1998: 2153) pointed out: "Some writers on community agency and
participation assume, indeed find, cohesive communities. These writers focus
heavily on inter-agency conflicts of interest in service delivery. A small, but
growing, body of opinion, however, suggests that conflict within communities may
be at least as important, and that many people remain confused about the
purpose of community involvement, while others are entering the participation
process with quite different, and possibly conflicting, motivations and objectives."
The World Bank (2000) lists the powers, rights and obligations of the community
in participatory development as follows:
The right to be treated as people with capabilities, not objects of pity.
The power to plan, implement and maintain projects to serve their felt
needs.
The right to hold politicians and officials accountable.
The power to command local bureaucrats instead of being supplicants.
The power to hire, pay and discipline all who provide them with frontline
local services like education, health, municipal and agricultural services.
The right to a share of central government revenue.
The power to levy user charges and local taxes.
The obligation to enable women, ethnic minorities, the poorest, and other
long excluded groups to participate fully in economic development.
The obligation to be accountable to local people, not just central
governments or donors.
Community-Driven Development projects towards poverty alleviation 63
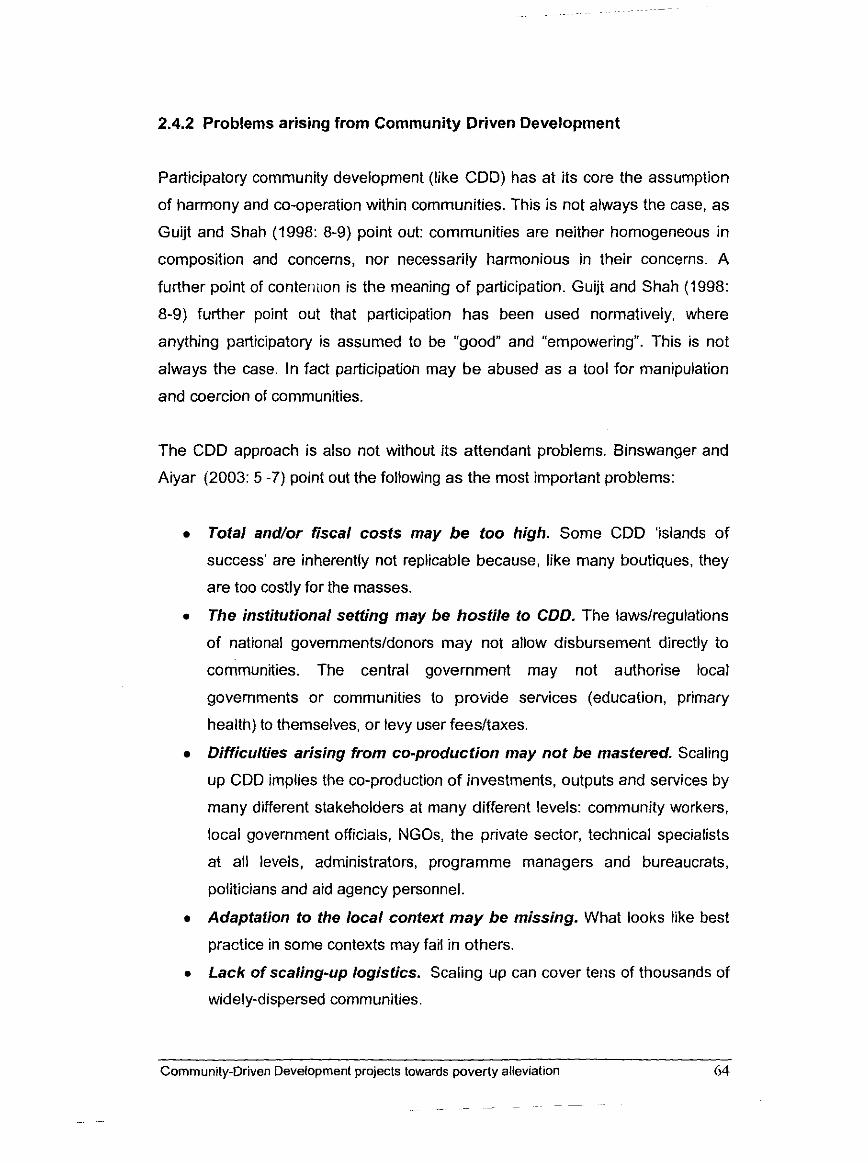
2.4.2 Problems arising from Community Driven Development
Participatory community development (like CDD) has at its core the assumption
of harmony and co-operation within communities. This is not always the case, as
Guijt and Shah (1998: 8-9) point out: communities are neither homogeneous in
composition and concerns, nor necessarily harmonious in their concerns. A
further point of conteni~on is the meaning of participation. Guijt and Shah (1998:
8-9) further point out that participation has been used normatively, where
anything participatory is assumed to be "good" and "empowering". This is not
always the case. In fact participation may be abused as a tool for manipulation
and coercion of communities.
The CDD approach is also not without its attendant problems. Binswanger and
Aiyar (2003: 5 -7) point out the following as the most important problems:
Totat and/or fiscal costs may be too high. Some CDD 'islands of
success' are inherently not replicable because, like many boutiques, they
are too costly for the masses.
The institutional setting may be hostile to CDD. The lawslregulations
of national governmentsldonors may not allow disbursement directly to
communities. The central government may not authorise local
governments or communities to provide services (education, primary
health) to themselves, or levy user feesltaxes.
Difficulties arising from co-production may not be mastered. Scaling
up CDD implies the co-production of investments, outputs and services by
many different stakeholders at many different levels: community workers,
local government officials, NGOs, the private sector, technical specialists
at all levels, administrators, programme managers and bureaucrats,
politicians and aid agency personnel.
Adaptation to the local context may be missing. What looks like best
practice in some contexts may fail in others.
Lack of scaling-up logistics. Scaling up can cover tens of thousands of
widely-dispersed communities.
Community-Driven Development projects towards poverty alleviation 64
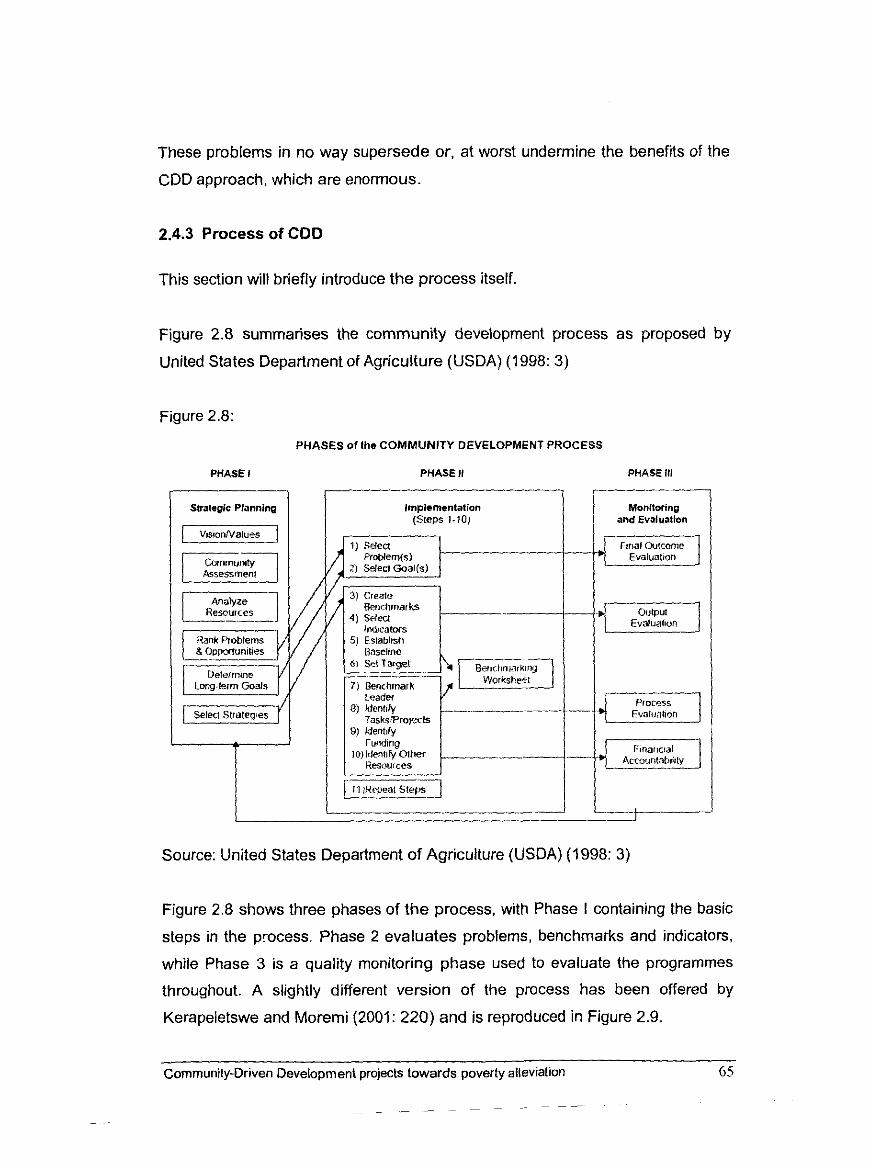
These problems in no way supersede or, at worst undermine the benefits of the
CDD approach, which are enormous.
2.4.3 Process of CDD
This section will briefly introduce the process itself.
Figure 2.8 summarises the community development process as proposed by
United States Department of Agriculture (USDA) (1998: 3)
Figure 2.8:
PHASES of llle COMMUNITY DEVELOPMENT PROCESS
PHASE I PHASE I1 PHASE Ill
Strategic PlanninQ
Coriunulnty Assessment
Resources LT
Implemenlation (Sleps 1-10)
Monlloring and Evaluation
Source: United States Department of Agriculture (USDA) (1998: 3)
Figure 2.8 shows three phases of the process, with Phase I containing the basic
steps in the process. Phase 2 evaluates problems, benchmarks and indicators,
while Phase 3 is a quality monitoring phase used to evaluate the programmes
throughout. A slightly different version of the process has been offered by
Kerapeletswe and Moremi (2001: 220) and is reproduced in Figure 2.9.
Community-Driven Development projects towards poverty alleviation 65
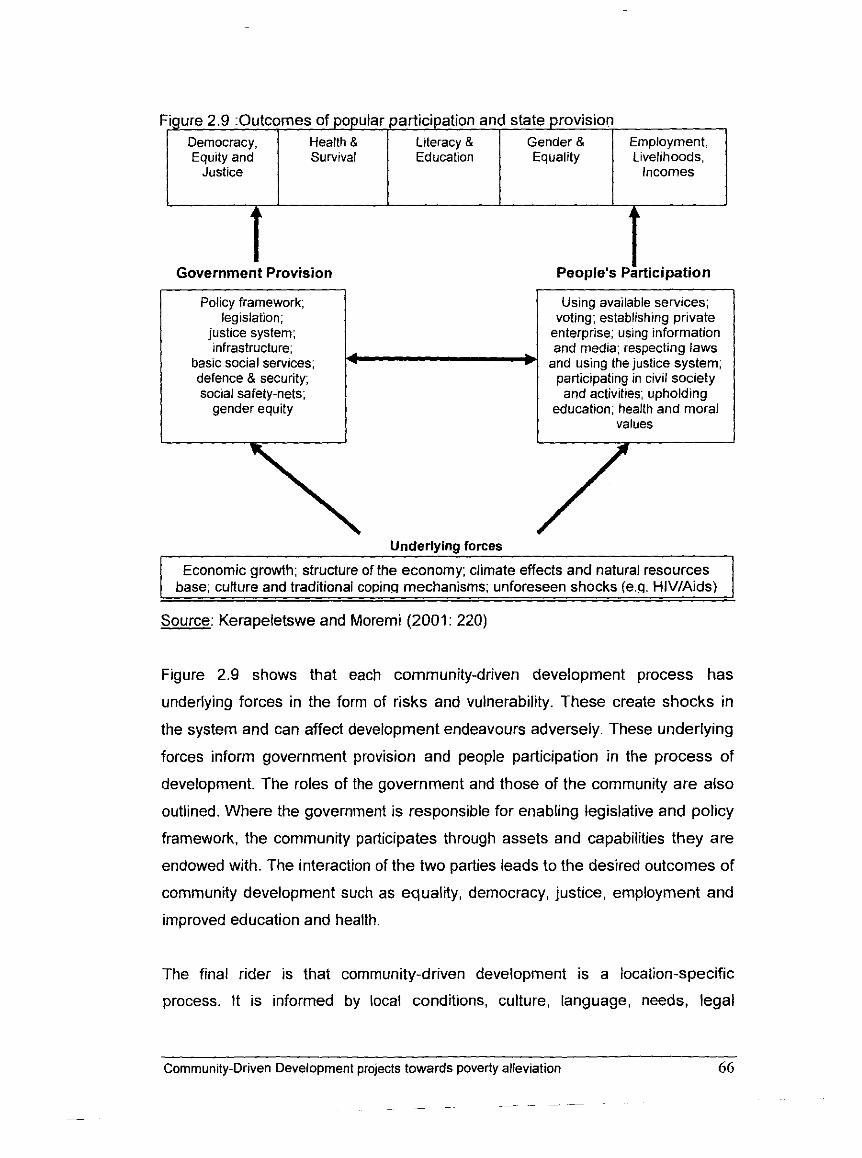
Figure - 2.9 :Outcomes of popular participation and state provision
Underlying forces
Economic growth; structure of the economy; climate effects and natural resources base; culture and traditional coping mechanisms; unforeseen shocks (e.q. HIVIAids)
Policy framework; legislation;
justice system; infrastructure; * basic social services;
defence & security; social safety-nets;
gender equity
Source: Kerapeletswe and Moremi (2001: 220)
Employment, Livelihoods.
Incomes
-
Democracy, Equity and
Justice
L
Using available services; voting; establishing private
enterprise; using information and media; respecting laws
and using the justice system; participating in civil society and activities; upholding
education; health and moral values
Figure 2.9 shows that each community-driven development process has
underlying forces in the form of risks and vulnerability. These create shocks in
the system and can affect development endeavours adversely. These underlying
forces inform government provision and people participation in the process of
A
Government Provision People's Participation
development. The roles of the government and those of the community are also
outlined. Where the government is responsible for enabling legislative and policy
framework, the community participates through assets and capabilities they are
endowed with. The interaction of the two parties leads to the desired outcomes of
community development such as equality, democracy, justice, employment and
improved education and health.
Health & Survival
The final rider is that community-driven development is a location-specific
process. It is informed by local conditions, culture, language, needs, legal
Community-Driven Development projects towards poverty alleviation 66
Literacy & Education
Gender 8 Equality
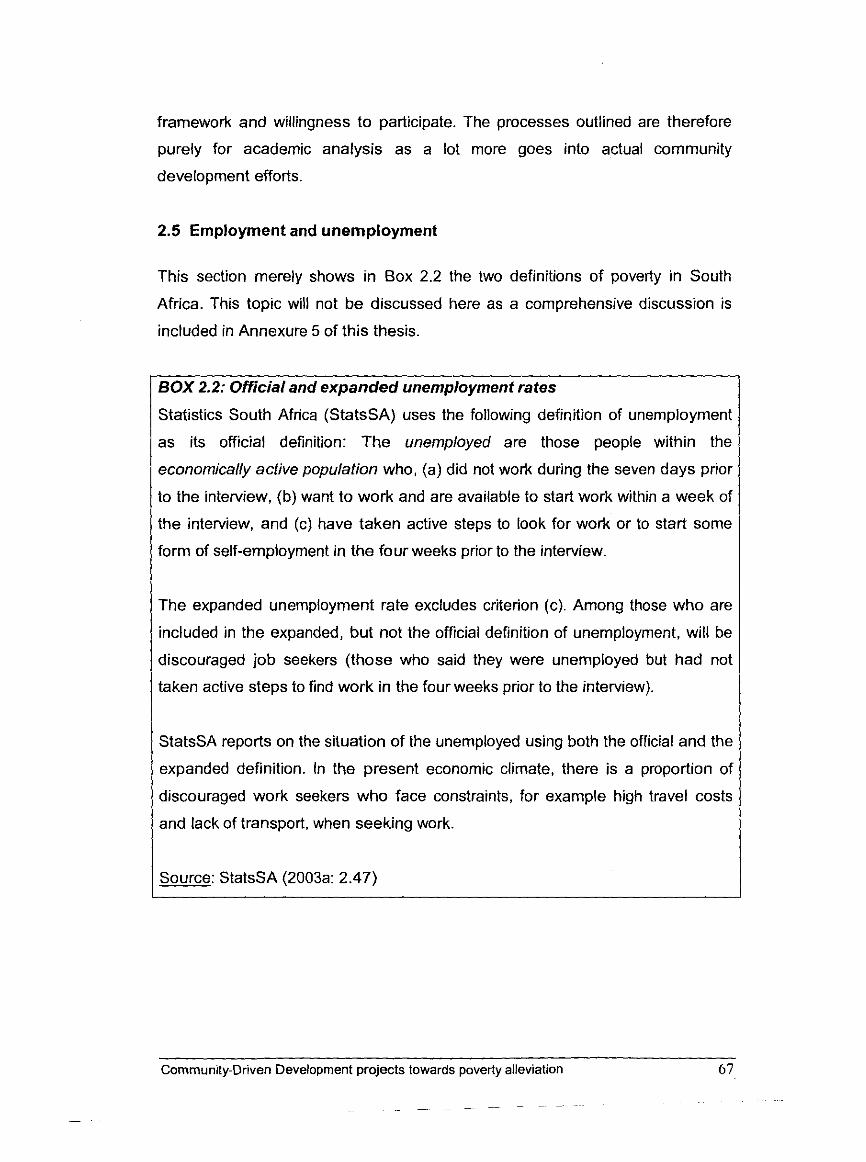
framework and willingness to participate. The processes outlined are therefore
purely for academic analysis as a lot more goes into actual community
development efforts.
2.5 Employment and unemployment
This section merely shows in Box 2.2 the two definitions of poverty in South
Africa. This topic will not be discussed here as a comprehensive discussion is
included in Annexure 5 of this thesis.
BOX 2.2: Official and expanded unemployment rates
Statistics South Africa (StatsSA) uses the following definition of unemployment
as its official definition: The unemployed are those people within the
economically active population who, (a) did not work during the seven days prior
to the interview, (b) want to work and are available to start work within a week of
the interview, and (c) have taken active steps to look for work or to start some
form of self-employment in the four weeks prior to the interview.
The expanded unemployment rate excludes criterion (c). Among those who are
included in the expanded, but not the official definition of unemployment, will be
discouraged job seekers (those who said they were unemployed but had not
taken active steps to find work in the four weeks prior to the interview).
StatsSA reports on the situation of the unemployed using both the official and the
expanded definition. In the present economic climate, there is a proportion 01
discouraged work seekers who face constraints, for example high travel costs
and lack of transport, when seeking work.
Source: StatsSA (2003a: 2.47)
Community-Driven Development projects towards poverty alleviation
-~ - - - -- - -~ -
2.6 Summary
The theoretical underpinnings of this thesis were presented in this chapter. To
achieve this, a literature survey was carried out, aimed at developing a
framework for the rest of the study.
Poverty was defined in various ways. The entire thesis focuses on impact of
community-driven development on poverty. It was therefore imperative that this
chapter provided a study of poverty that included definitions of poverty and
approaches in the measurements of poverty. The proliferation of concepts and
indicators usually employed in the different definitions and measurements
poverty included discussions of the following concepts:
Income or consumption poverty
Human development index
Social exclusion
(Lack of) capability and functioning
Vulnerability and risk
Lack of basic needs
Relative deprivation
Some poverty indicators were also discussed. Different models of poverty imply
using different indicators. Income-based models require information on income or
consumption; while vulnerability models use indicators of wealth and exposure to
risk, as well as income: Models concerned with capability and functioning present
indicators of life expectancy or educational achievement; while models of well-
being or social exclusion will include measures like the degree of social support.
Some indicators are inherently more quantifiable than others, and more
decomposable, in the sense that they can be subjected to statistical
manipulation. Thus, income and consumption poverty are conventionally
measured using the co-called FGT (Foster, Greer and Thorbecke) measures.
These FGT measures enable a calculation to be made both of the headcount, i.e.
Community-Drtven Development projects towards poverty allevlat~on
- - -
the number of people below the poverty line, and the poverty gap, or shortfall of
the poor below the poverty line.
A discussion of community-driven development (CDD) and unemployment.
Community driven development is not a project. CDD was referred to as an
approach that aims to empower communities and local governments with
resources and the authority to use these flexibly, thus taking control of their
development.
Unemployment was defined in the South African context to round off the
discussion in this chapter because it forms such an important part of the ensuing
discussions on Evaton West.
Community-Driven Development projects towards poverty alleviation 69
- -
Chapter 3
Background of Evaton West and the community
development initiatives in the area
Chapter 2 was a presentation of the underpinning theory to this thesis and
discussed the major indicators employed in the study. Indicators such as poverty,
employrnenffunemployment and community-driven development and their
practical application in this thesis were discussed. This was a prelude to the
current chapter narrows the discussion down to the essentials of this thesis,
presenting a broad overview of Evaton West which is the settlement under study.
Evaton West was formed in the late 1990's as an RDP (Reconstruction and
Development Programme) housing initiative. This makes Evaton West one of the
youngest communities in the Vaal (Evaton itself is 100 years old). Even though it
is a relatively young community, it is an organised community where issues
affecting it are dealt with in a methodical way through the Evaton West
Community Development Forum (EWCDF). This is evidenced in the vision of the
community which is given by the EWCDF as: "to become a well-managed and
sustainable residential community, based on a sound infrastructure offering an
acceptable living environment to its inhabitants" (Frankel, 2001: 9).
Community cohesion has helped to draw development initiatives into the area. It
has become the pilot community for initiatives such as those run by the
Eindhoven Municipality (Holland) in conjunction with the Emfuleni Municipality,
the Vaal University of Technology (VUT), COL~AP~A' (Centres of Learning to
Alleviate Poverty in Africa) and SOLID" (Saltspring Organization for Life
Improvement and Development - a Canadian-based organization).
The chapter will discuss the two main initiatives at work in Evaton West, namely
those of the Eindhoven Mmunicipality and COL~AP~A". The main sources used in
this chapter will be the focus group interview (FGI) output, StatsSA (2001), the
Community-Driven Development projects towards poverty alleviation 70
work of Frankel (2001) and data drawn from the Evaton West community survey
of 2003.
3.2 Background to Evaton West
This section gives a background to Evaton West and establishes a profile of the
area. Evaton West is a residential area flanked by Evaton to the East, Beverfy
Hills to the South and Palm Springs and Orange Farms to the North and North-
East. The working people in Evaton West work mainly in Johannesburg and in
the Vaal (the south-most part of the Gauteng Province, so-called because it lies
along the Vaal River). The population of Evaton (30 079) also includes an
immigrant population (legal and illegal) (Frankel 2001: 14). Most of the
inhabitants came from nearby townships, especially the "old" Evaton. Many are
young people who left their parents' homes to set up their own homes, taking
advantage of the government's criteria for issuing these houses (mainly that
people had to have dependents to qualify for a house). Most homes in the area
are still single-parent households. This has led to a relatively young community of
primarily young people who are neither in school, university nor employed.
3.2.1 Location of Evaton West
Evaton West is a recent extension to the "old Evaton" which turned 100 years old
in 2004. The Figures, Tables and Maps in the next few pages serve to locate
Evaton West within its geographical, demographic and econmic context. Map 3.1
shows that Evaton West lies on the southern-most end of the Gauteng Province,
just north of the Free State Province. It forms part of what used to be called (and
is popularly known as) the Vaal Triangle. This area is currently known as the
Sedibeng District Municipality. The District itself is made up of three
municipalities, namely Emfuleni, Lesedi and Midvaal.
Commun~ty-Driven Development projects towards poverty alleviat~on
- - - -
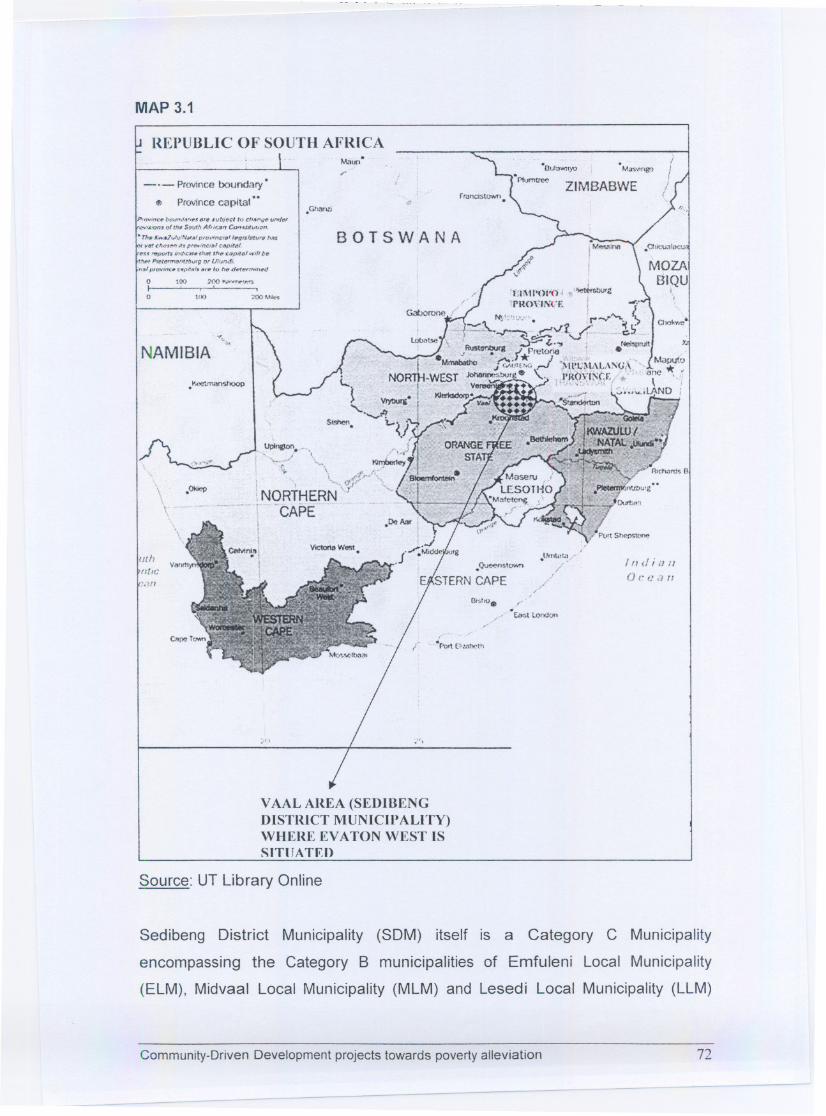
MAP 3.1
REPUBLIC OF SOUTH AFRICA
\
Mnun.r
-.- Province boundary'
e Provincecapita'"ZIMBABWE
.GNIndPrnvfnCtt boUfflJ""'l!s "'" .vtJieCt to CIU''''l,/tI urnJ",'.:N1.vn$ 01 1M SC)tJth Aftlf:." C4"..'111f#'~,
.. Th. Kw.rulvW_.I pnJ~.'lrgts/pf~. foAS
yef ~hIn"" A' 1"~it'Jc;.' c"lJittJI.
Sf "fIpf)ff~ indoeM. ,hm ,,,,, C4'lpdlll.Yl/1 b.
,,.,,, Plftlttrmll,,,rbtlfg or U:vndi.
."., ptUtfrm:. e""ff,,'. .,. 10 hf1 dcoffl'T?"nl/d
BOTSWANA
o 100 '00 tt./II'WnI'~~
I '.' .o ilt() :;-OO"WM
NAMIBIA
.O;.icp
\JpIn&Ion. ",- ,,\-." ., .....
'10- '- If- /~ ". (j";"""
;NORTHERN \ r'-CAPE
uthtltlC
.Unttl'''!..-.Qt~"t""'" /
Indiill1
OC/J<7n/
/
BrShO. . r"Eaoot lond"..
0''' .".
VAAL AREA (SEDIIJENGDISTRICT MUNICIPALITY)WHERE EVATON WEST ISSITIJATF.n
Source: UT Library Online
Sedibeng District Municipality (SDM) itself is a Category C Municipality
encompassing the Category B municipalities of Emfuleni Local Municipality
(ELM), Midvaal Local Municipality (MLM) and Lesedi Local Municipality (LLM)
Community-Driven Development projects towards povertyalleviation 72
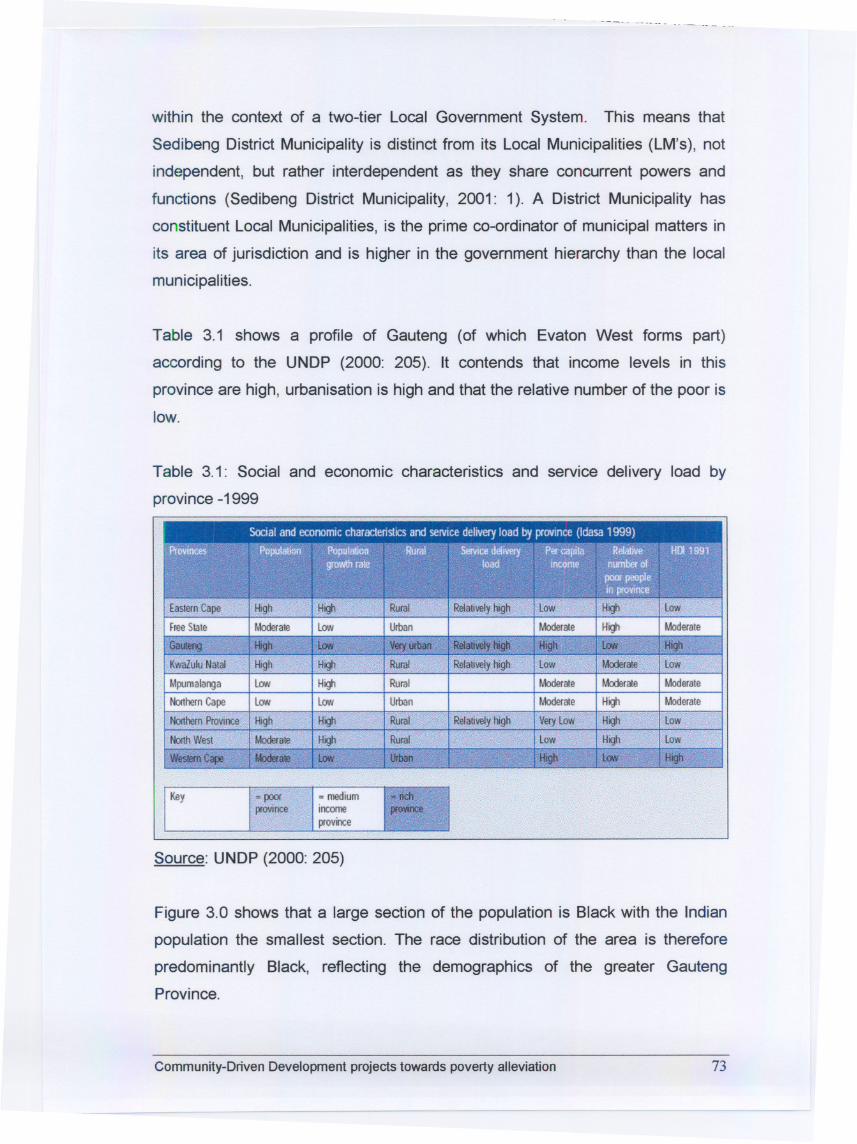
- - - _.-- _..
within the context of a two-tier Local Government System. This means that
Sedibeng District Municipality is distinct from its Local Municipalities (LM's), not
independent, but rather interdependent as they share concurrent powers and
functions (Sedibeng District Municipality,2001: 1). A District Municipality has
constituent Local Municipalities, is the prime co-ordinator of municipal matters in
its area of jurisdiction and is higher in the government hierarchy than the local
municipalities.
Table 3.1 shows a profile of Gauteng (of which Evaton West forms part)
according to the UNDP (2000: 205). It contends that income levels in this
province are high, urbanisation is high and that the relative number of the poor is
low.
Table 3.1: Social and economic characteristics and service delivery load by
province -1999
EasternCape
FreeStale
~.i KwaZuluNatal
Mj:lJmalanga
NorthernCape
f NorthernProvince
NoIIhWest
WesternCape
High
Moderale-~~.I.aN
I.aN~
High
Moderale
'~ate"'
HighI.aN~
Low~
High
Highlow-High
HighLc:'
'Rer$ivelh!,..if. .
ReI~tive!yhigh
Rural
Ulban---RUial
Rural"'""""ii:',UIban
Reladvelyhigh
Key t = ~ .j. ~medium Ii,
..ii~.province ,lIIcome I'PfOYInce,
" provi1ce
Source: UNDP (2000: 205)
Figure 3.0 shows that a large section of the population is Black with the Indian
population the smallest section. The race distribution of the area is therefore
predominantly Black, reflecting the demographics of the greater Gauteng
Province.
73Community-Driven Development projects towards poverty alleviation
low
Moderate-:.41wHigh Hc.""....
low Moderate low
Moderate Moderate Moderate
Moderare H91 Moderate
Verylow High low
low High low
High lcrN High
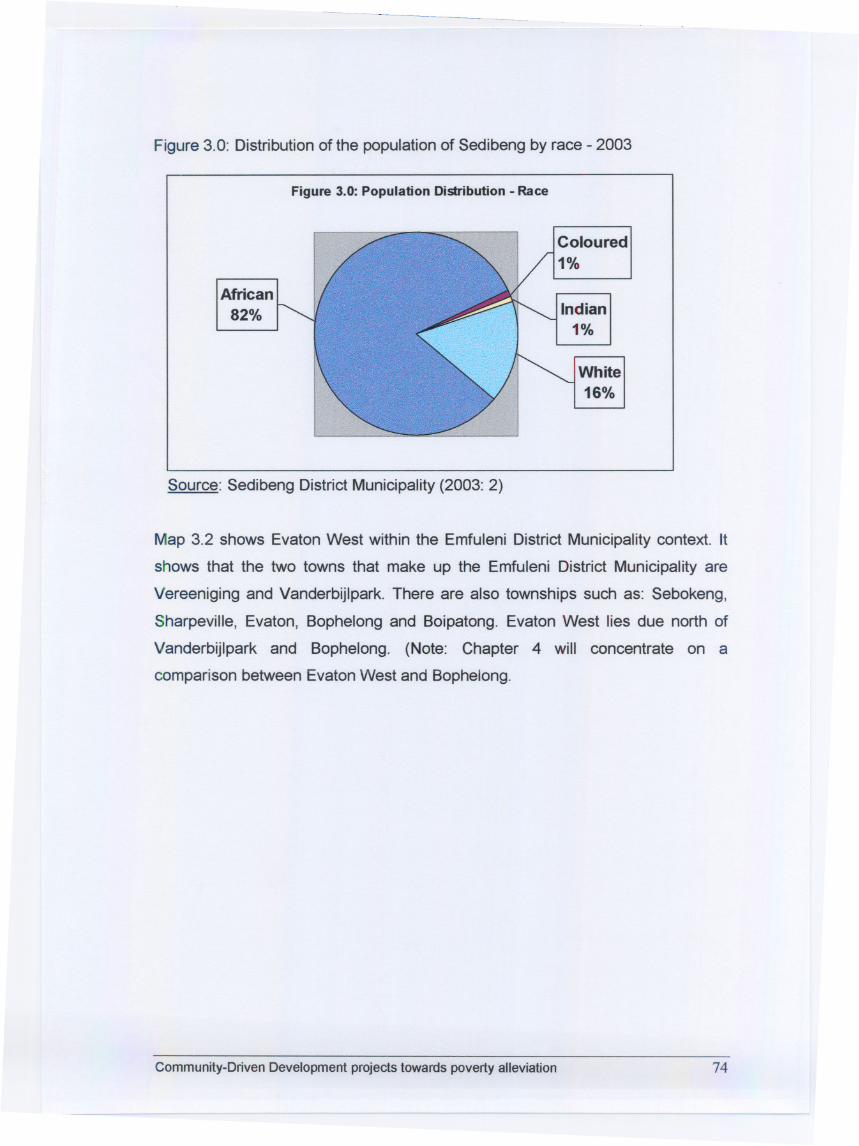
---
Figure 3.0: Distribution of the population of Sedibeng by race -2003
Figure 3.0: Population Distribution -Race
African82%
Source: Sedibeng District Municipality (2003: 2)
Map 3.2 shows Evaton West within the Emfuleni District Municipality context. It
shows that the two towns that make up the Emfuleni District Municipality are
Vereeniging and Vanderbijlpark. There are also townships such as: Sebokeng,
Sharpeville, Evaton, Bophelong and Boipatong. Evaton West lies due north of
Vanderbijlpark and Bophelong. (Note: Chapter 4 will concentrate on a
comparison between Evaton West and Bophelong.
Community-Driven Development projects towards poverty alleviation 74
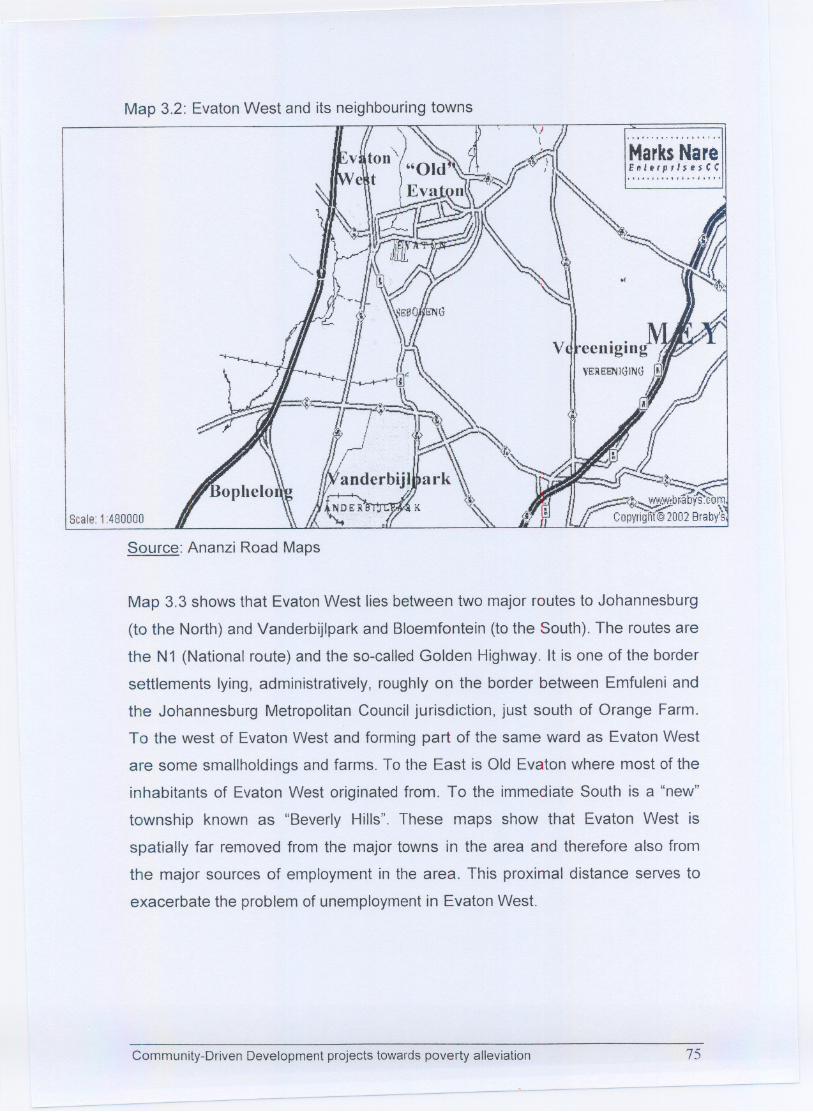
Map 3.2: EvatonWest and its neighbouring towns
Scale:1:480000
. . . ~. . I . . ~....I . I I . I .
MarksNar~E"'erp,/pnCC""""".,""""
Source: Ananzi Road Maps
Map 3.3 shows that EvatonWest lies between two major routes to Johannesburg
(to the North) and Vanderbijlpark and Bloemfontein (to the South). The routes are
the N1 (National route) and the so-called Golden Highway. It is one of the border
settlements lying, administratively, roughly on the border between Emfuleni and
the Johannesburg Metropolitan Council jurisdiction, just south of Orange Farm.
To the west of Evaton West and forming part of the same ward as Evaton West
are some smallholdings and farms. To the East is Old Evaton where most of the
inhabitants of Evaton West originated from. To the immediate South is a "new"
township known as "Beverly Hills". These maps show that Evaton West is
spatially far removed from the major towns in the area and therefore also from
the major sources of employment in the area. This proximal distance serves to
exacerbate the problem of unemploymentin Evaton West.
Community-Driven Development projects towardspoverty alleviation 75
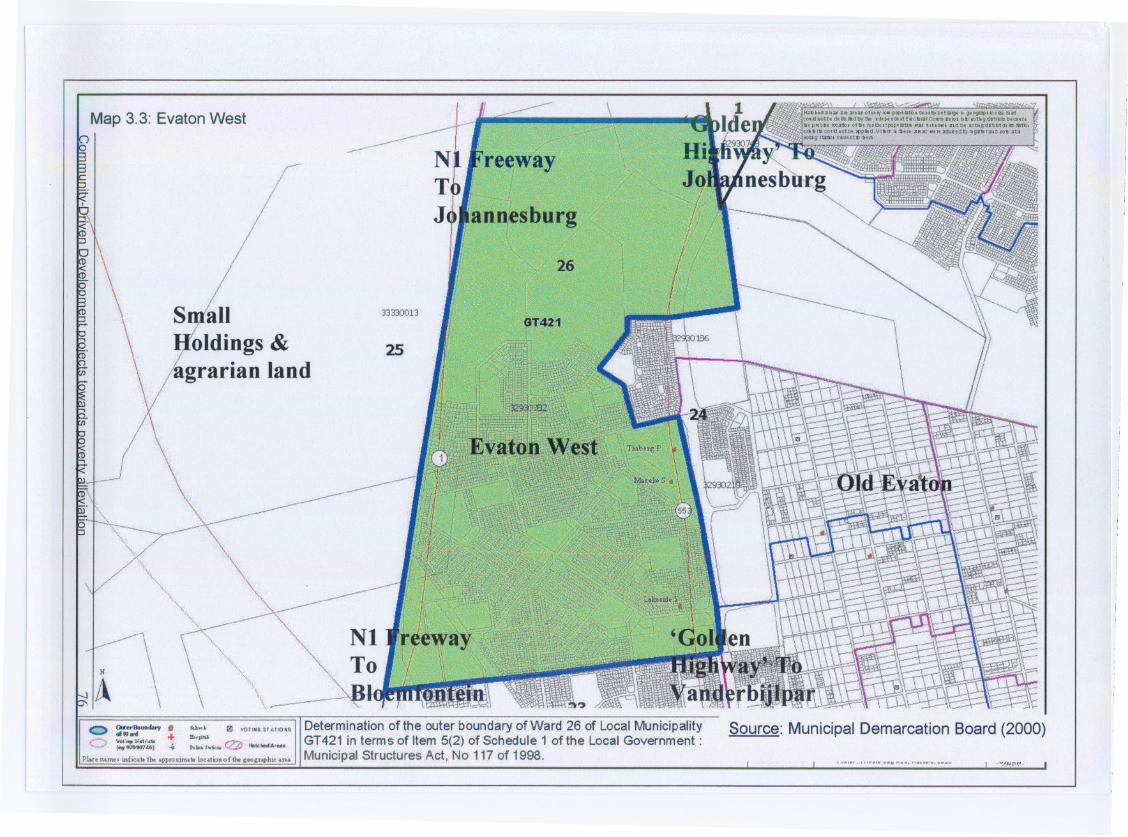
Map 3.3: Evaton West
---
r. annesburg
1/.i
iI;i
26
S~alloldings &
agrarian land
33330013 ri,
I25
....."".
\:
\.
\ ~\ ,\~~~ '-l~
l~h'4ii.ai"..,.':i"ai 011M,,"" "H.tbl O4I.; D Ii"~opp.tI'b hattI.olk cJt" .dtl¥tk '8dtptldll:ttI!ItCtlmIC088I1kn IItllI01Jag48nrWkQ,,.pttCIk bGlIl)l 011)t ",ldtltpop..tbll III., 1."0.' .UI1l, ~t"'gdlnll:)ta.M.tlOt1tfll COIII:I,otbt~ltd. VO"II h.." n:IlII4IJII:aGUlndJ>Itg..'lIa lOt au f:<
,..g nasa Okln.ltlh.
.f
_ 010I , .- II +~ .'-" ) .." B VOTING" ATIO.,
........h... , ,~' tIIk"'''rMil
Determinationof the outer boundary of Ward 26 of Local MunicipalityGT421 in terms of Item 5(2) of Schedule 1 of the Local Government:Municipal Structures Act, No 117of 1998.
Source: Municipal Demarcation Board (2000)
PlIIC'enamtJ iDdic... tht &PPIOKimd. loc~. oftbe c~~rchx "R" . ,., , ..." ........
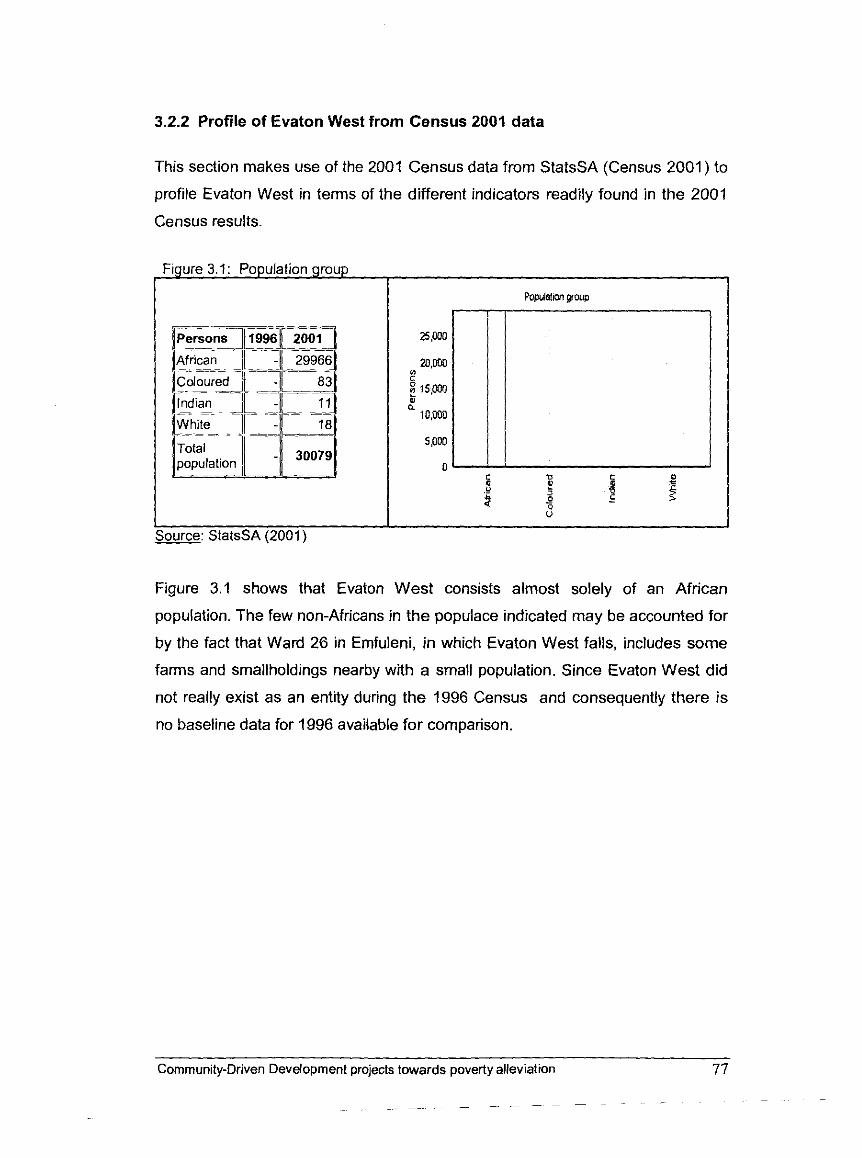
3.2.2 Profile of Evaton West from Census 2001 data
This section makes use of the 2001 Census data from StatsSA (Census 2001) to
profile Evaton West in terms of the different indicators readily found in the 2001
Census results.
Figure 3.1: Population group
m: StatsSA (2001)
Figure 3.1 shows that Evaton West consists almost solely of an African
population. The few non-Africans in the populace indicated may be accounted for
by the fact that Ward 26 in Emfuleni, in which Evaton West falls, includes some
farms and smallholdings nearby with a small population. Since Evaton West did
not really exist as an entity during the 1996 Census and consequently there is
no baseline data for 1996 available for comparison.
Community-Driven Development projects towards poverty alleviation 77
- -
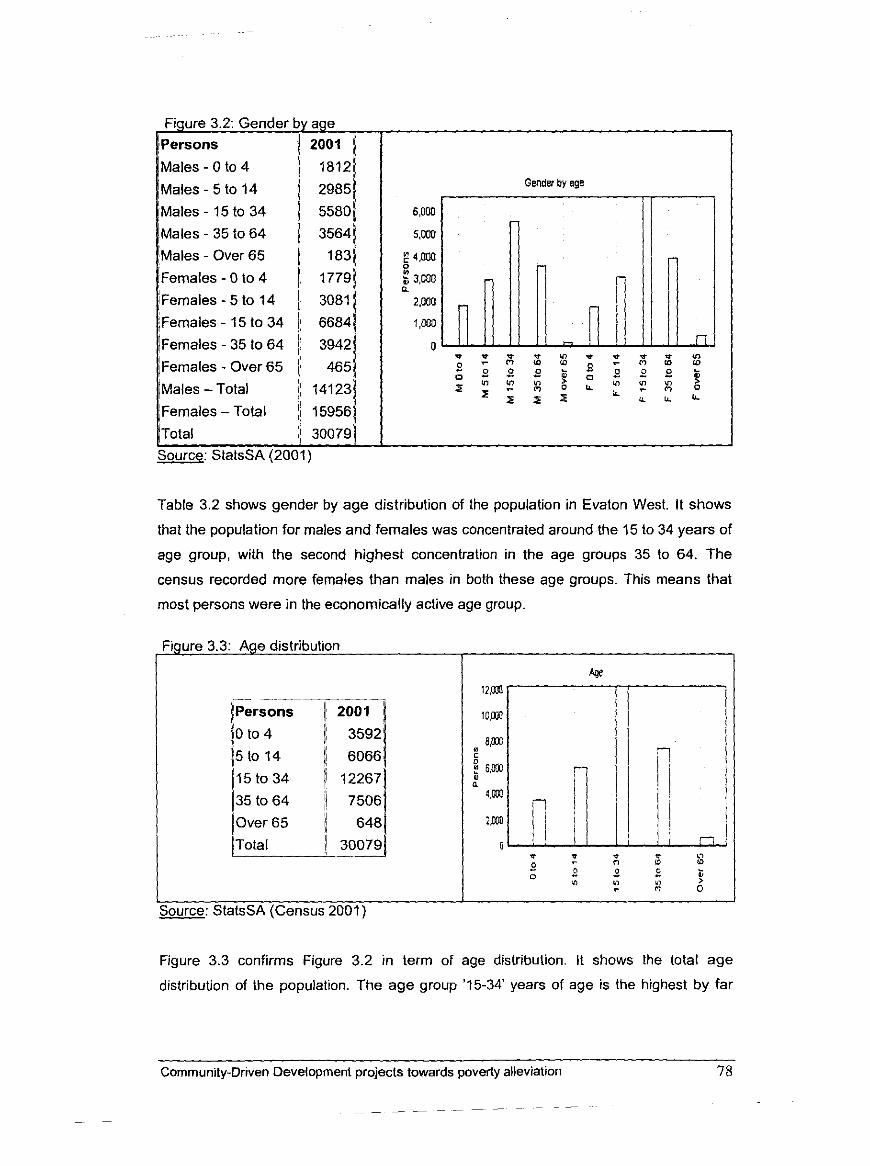
Figure 3.2: Gender by age l~ersons 2001 1 Males - 0 to 4 1 I 18121 )Males - 5 to 14 j/ 29851
i ~ a l e s - 15 to 34 (1 5580
ales - 35 to 64 1 3564
I ~ a l e s - Over 65 1 1831 I !Females - 0 to 4 17791
i~emales - 5 to 14 11 3081 1 l~emales I - 15 to 34 jj 66841
l~emales - 35 to 64 // 3942 I ,Females - Over 65 1 465
JMales -Total I/ 14123
;Females -Total 11 15956
j~o ta l 30079)
m: StatsSA (2001)
Gender by age
?r
Table 3.2 shows gender by age distribution of the population in Evaton West. It shows
that the population for males and females was concentrated around the 15 to 34 years of
age group, with the second highest concentration in the age groups 35 to 64. The
census recorded more females than males in both these age groups. This means that
most persons were in the economically active age group.
su re 3.3: Age distribution
Figure 3.3 confirms Figure 3.2 in term of age distribution. It shows the total age
distribution of the population. The age group '15-34' years of age is the highest by far
Community-Dr~ven Development projects towards poverty alleviation 78
- - - _ -
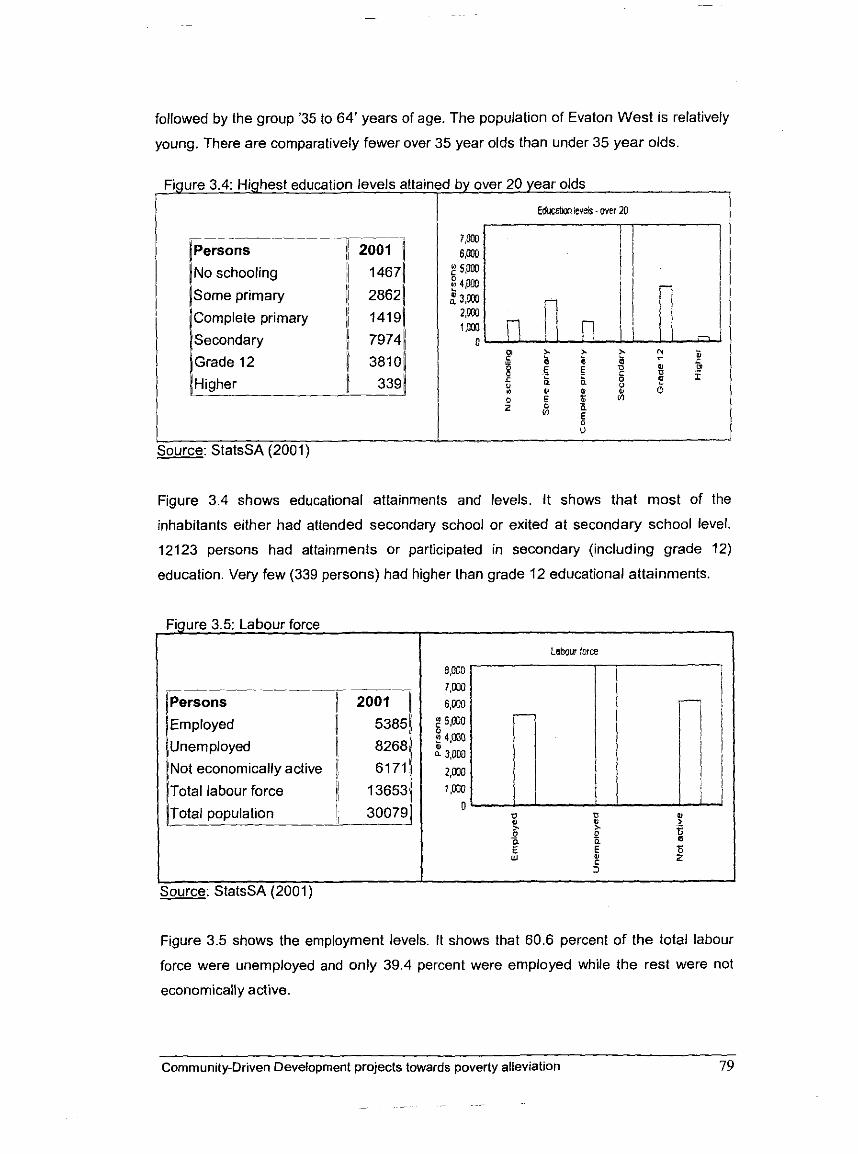
followed by the group '35 to 64' years of age. The population of Evaton West is relatively
young. There are comparatively fewer over 35 year olds than under 35 year olds.
Figure 3.4 shows educational attainments and levels. It shows that most of the
inhabitants either had attended secondary school or exited at secondary school level.
12123 persons had attainments or participated in secondary (including grade 12)
Qure 3.4: Highest education levels attained by over 20 year olds
education. Very few (339 persons) had higher than grade 12 educational attainments.
rp=rio-T~ ----- 11 2001 j/ J/NO schooling I/ 14671
\some primary 11 28621
/1~omplete primary 11 1419
Secondary " i Grade 12
Higher 339
Figure 3.5: Labour force I
Edicrtan !eveis - wer 20
:s,m
). " N, . P $ .. a -
8 E E = D .-
h h 2 I c U n u ; z 0
: , + j z E
u
l~ersons 1 2001 1 I~rnployed 1 53851
(unemployed 1 82681
l ~ o t economically active i! 61711
I ~ o t a l labour force ii 136531
Total population 1, 300791
Source: StatsSA (2001)
r force
I jource: StatsSA (2001)
Figure 3.5 shows the employment levels. It shows that 60.6 percent of the total labour
force were unemployed and only 39.4 percent were employed while the rest were not
economically active.
Community-Driven Development projects towards poverty alleviation 79
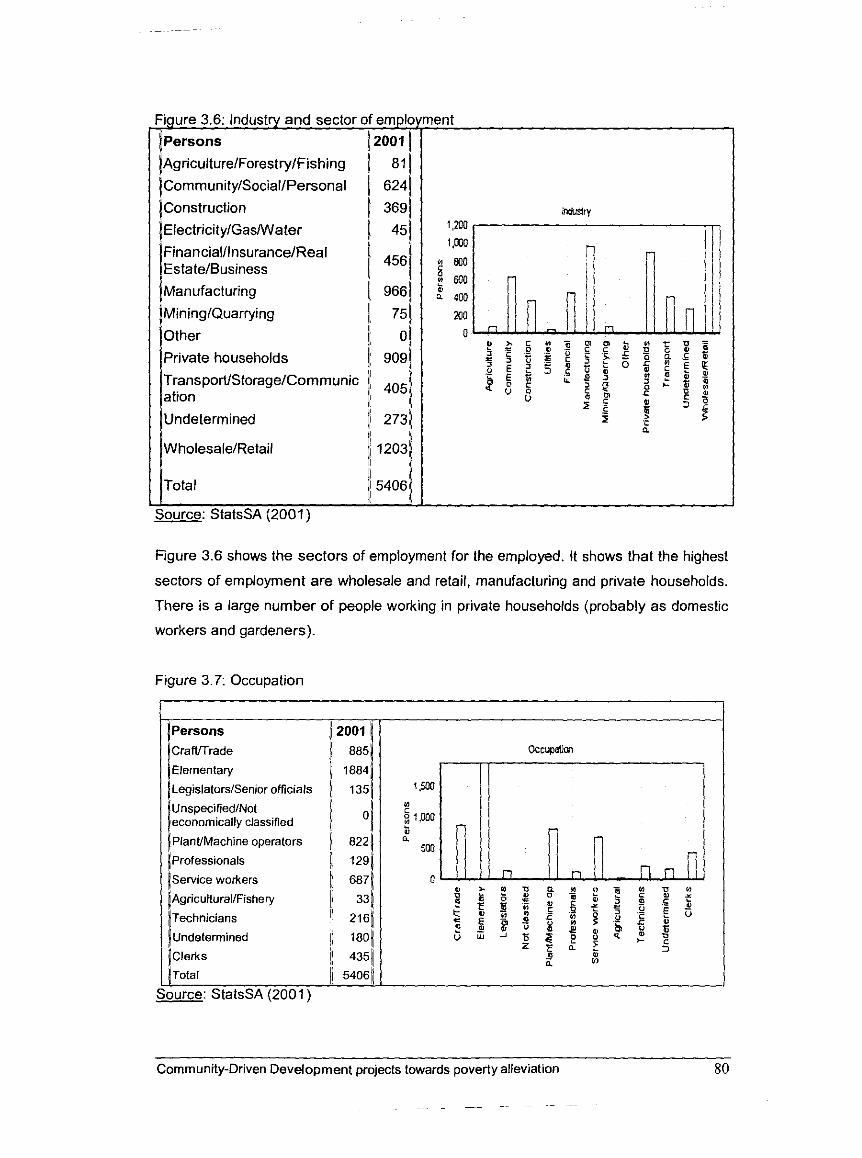
'igure 3.6: Industry and sector (
]persons
~~griculturel~orestryl~ishing
)~ommunity/Social/~ersonal
Construction
ElectricitylGasANater
Financial/lnsurance/ReaI EstatelBusiness
Manufacturing
) ~ i n i n g / ~ u a r r y i n ~
[other
l~ r i va te households
I TransporVStoragelCommunic ation
l~ndetermined
J a: StatsSA (2001)
Figure 3.6 shows the sectors of employment for the employed. It shows that the highest
sectors of employment are wholesale and retail, manufacturing and private households.
There is a large number of people working in private households (probably as domestic
workers and gardeners).
Figure 3.7: Occupation
l~ersons 11 2001 Icramrade 11 885
)Elementary I
11 18841 ~~e~islatorsl~enioroff ic ials 11 1351
I UnspeciliedlNot economically classifled I 01
I~lantl~achine operators // 822)
lprofessiona~s 11 l 29 /
I Service workers 1 6871
AgriculturallFishery Technicians
11 331
I " 2161
Undetermined 11 1801
1~1erks II 435%
Total 11 540611
m: StatsSA (2001)
Community-Driven Development projects towards poverty alleviation 80
-- -- -- - --
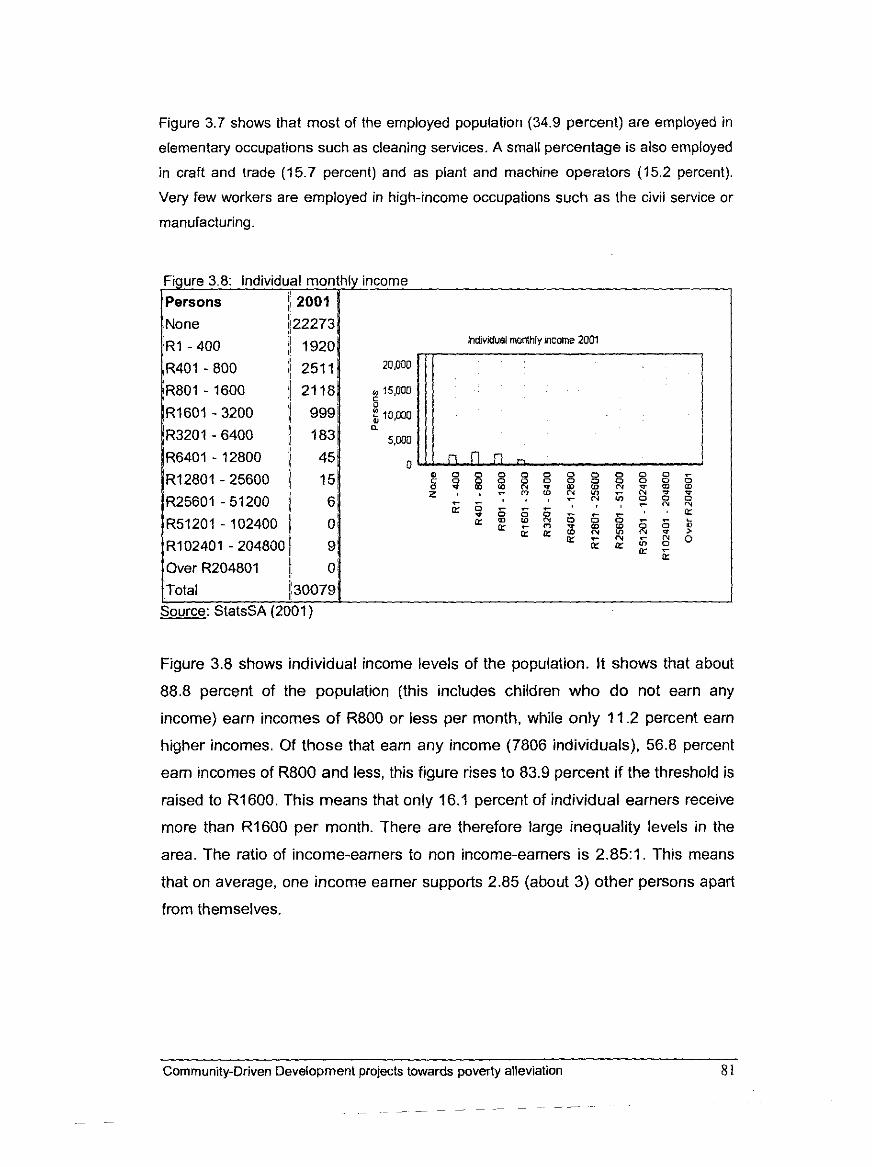
Figure 3.7 shows that most of the employed population (34.9 percent) are employed in
elementary occupations such as cleaning services. A small percentage is also employed
in craft and trade (15.7 percent) and as plant and machine operators (15.2 percent).
Very few workers are employed in high-income occupations such as the civil service or
manufacturing
R6401 - 12800
R12801 - 25600
R25601 - 51200
R51201 - 102400
R102401 - 20480C
Over R204801
Source: StatsSA (2
I monthly income 2001
Figure 3.8 shows individual income levels of the population. It shows that about
88.8 percent of the population (this includes children who do not earn any
income) earn incomes of R800 or less per month, while only 11.2 percent earn
higher incomes. Of those that earn any income (7806 individuals), 56.8 percent
earn incomes of R800 and less, this figure rises to 83.9 percent if the threshold is
raised to R1600. This means that only 16.1 percent of individual earners receive
more than R1600 per month. There are therefore large inequality levels in the
area. The ratio of income-earners to non income-earners is 2.85:l. This means
that on average, one income earner supports 2.85 (about 3) other persons apart
from themselves.
Community-Driven Development projects towards poverty alleviation 8 1
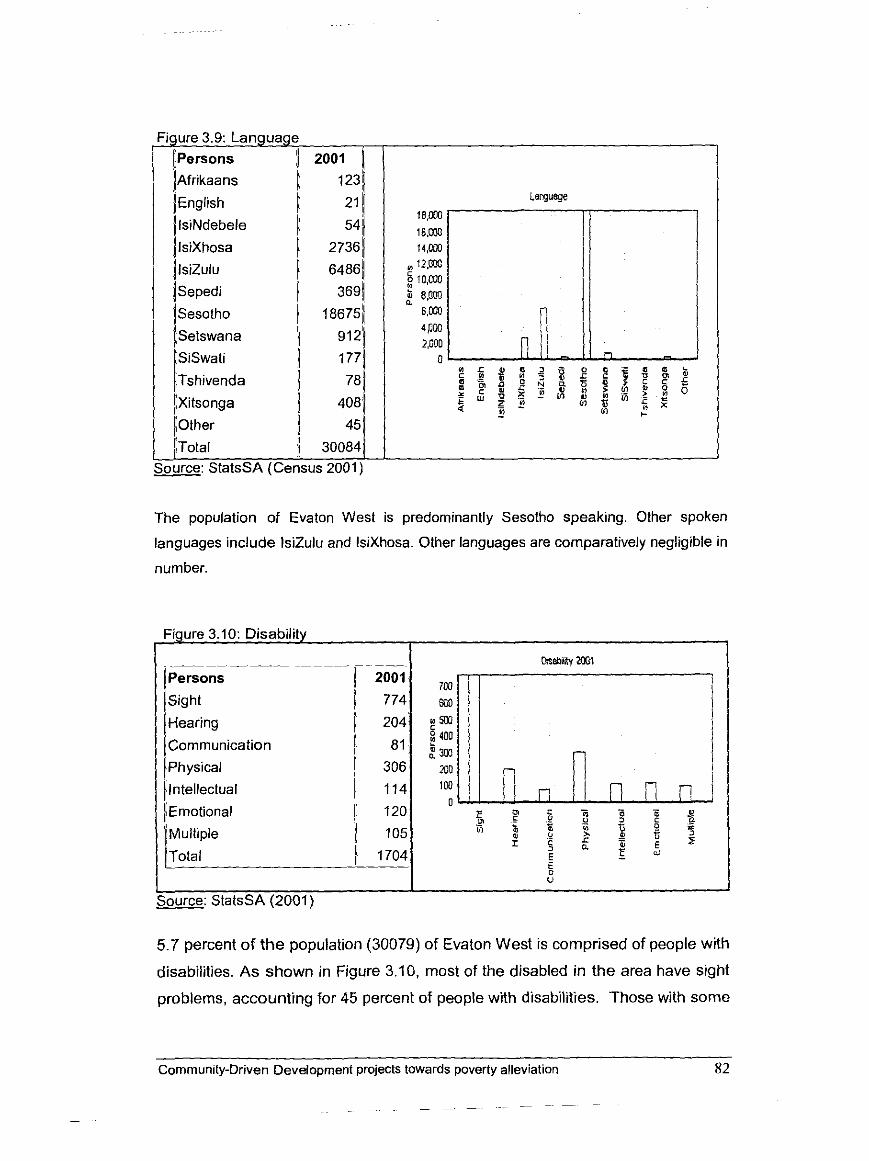
'igure 3.9: Language h~ersons 1 2001 1 I~frikaans 1 1231 Il~nglish
l lsi~debele w 211
/Ilsi~hosa 1 541 1 27361
tsizulu K 64861 Sepedi 11 3691
Sesotho # 1867511
j~etswana
SiSwati n 9121
C 11 1771 Tshivenda 11 781
lxitsonga I! 4081
lother 1 451
l ~ o t a l 11 300841 w: StatsSA (Census 2001)
The population of Evaton West is predominantly Sesotho speaking. Other spoken
languages include IsiZulu and IsiXhosa. Other languages are comparatively negligible in
number.
Figure 3.10: Disability
~ ~~ ~- -- o iswy rml
Persons
'sight
Hearing
Communication
)Physical
h~ntel~ectua~ 1 114' TOO
(1 120 l~rnotional
i~u l t ip le 1 105
I/_Total I/ 1704 E u E, ti
. Source: StatsSA (2001)
5.7 percent o f the population (30079) of Evaton West is comprised of people with
disabilities. A s shown in Figure 3.10, most of the disabled in the area have sight
problems, accounting for 45 percent of people with disabilities. Those with some
Cornrnun~ty-Driven Development projects towards poverty alleviat~on 82
- - - - -
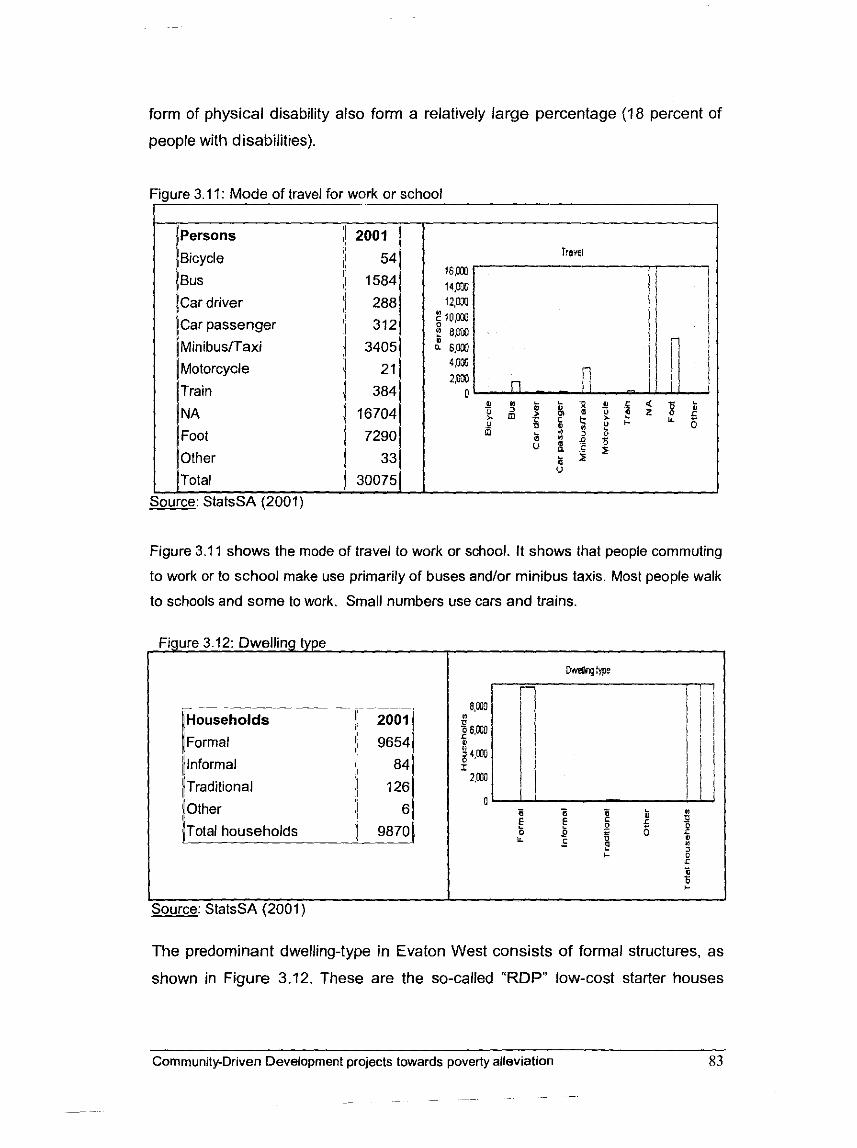
form of physical disability also form a relatively large percentage (18 percent of
people with disabilities).
Jure 3.1 1: Mode of travel for work or school
l~ersons 11 2001 1 i ~ i c ~ c ~ e II 541
BUS [car driver
/car passenger
I~inibusiTaxi
l~otorcycle 1 21
l ~ r a i n 1 384
INA 1 16704
l ~ o o t 1 7290
lot her I/ 33
Total 11 300751 L I I m: StatsSA (2001)
Figure 3.1 1 shows the mode of travel to work or school. It shows that people commuting
to work or to school make use primarily of buses and/or minibus taxis. Most people walk
to schools and some to work. Small numbers use cars and trains.
1 I Source: StatsSA (2001)
The predominant dwelling-type in Evaton West consists of formal structures, as
shown in Figure 3.12. These are the so-called "RDP" low-cost starter houses
Cornrnunlty-Drwen Development projects towards poverty allev~ation
- - - -- -
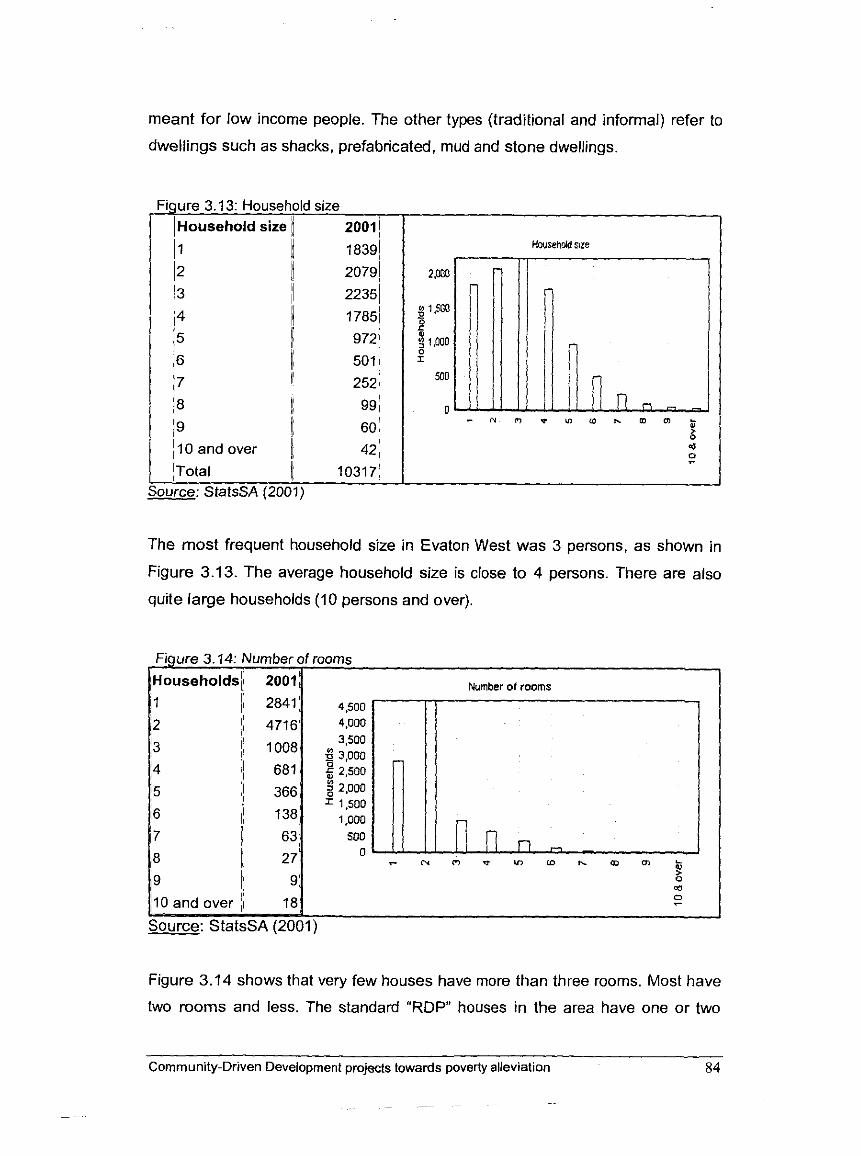
meant for low income people. The other types (traditional and informal) refer to
dwellings such as shacks, prefabricated, mud and stone dwellings.
3gure 3.13: Houset j~ousehold size
11 !2 13
I4
15 is
d size 2001 / 18391
20791 22351
17851 9721 501 1
L ' Source: StatsSA (2001)
Household sze I
The most frequent household size in Evaton West was 3 persons, as shown in
Figure 3.13. The average household size is close to 4 persons. There are also
quite large households (10 persons and over).
Number of rwms
Source: StatsSA (2001)
Figure 3.14 shows that very few houses have more than three rooms. Most have
two rooms and less. The standard "RDP" houses in the area have one or two
Community-Driven Development projects towards poverty alleviation 84
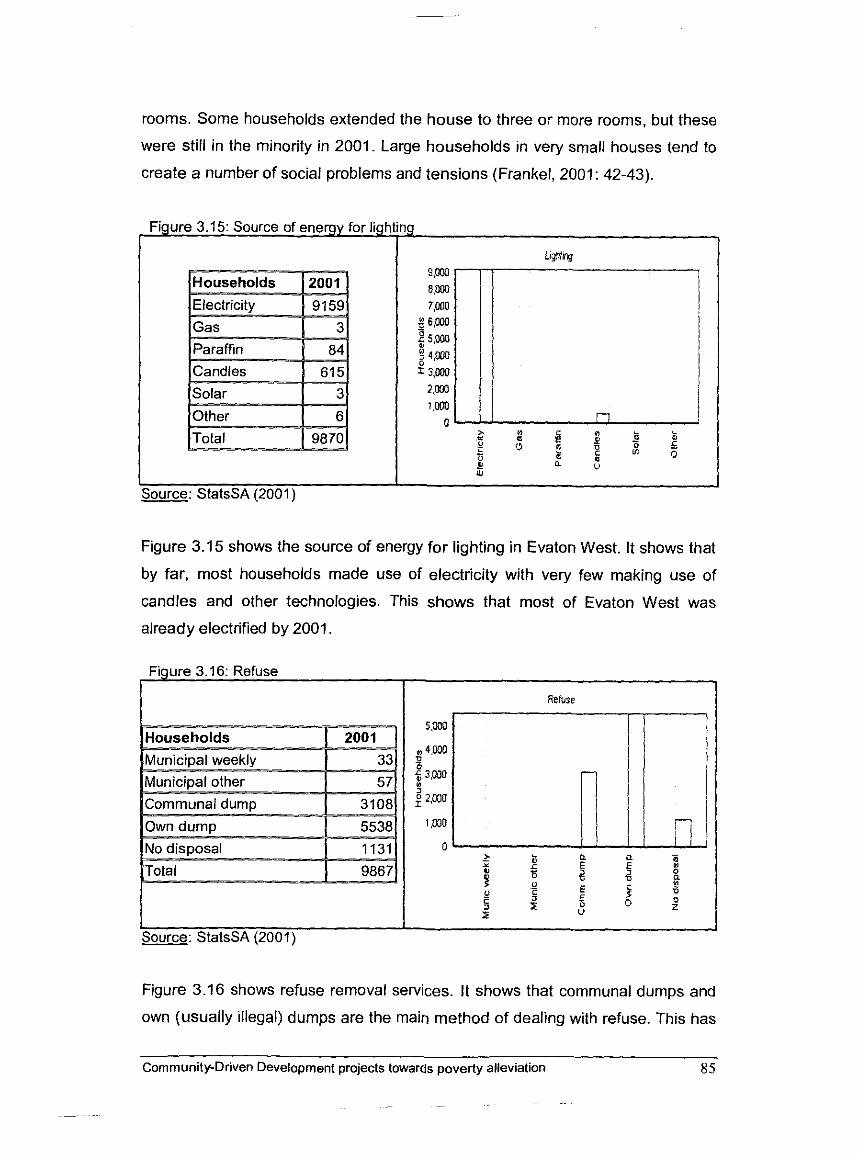
rooms. Some households extended the house to three o: more rooms, but these
were still in the minority in 2001. Large households in very small houses tend to
create a number of social problems and tensions (Frankel, 2001 : 42-43).
Figure 3.15: Source of energy for lighting
I L m n g
Figure 3.15 shows the source of energy for lighting in Evaton West. It shows that
by far, most households made use of electricity with very few making use of
candles and other technologies. This shows that most of Evaton West was
already electrified by 2001
Figure 3.16: Refuse
Reluse
Figure 3.16 shows refuse removal services. It shows that communal dumps and
own (usually illegal) dumps are the main method of dealing with refuse. This has
Community-Driven Development projects towards poverty alleviation 85
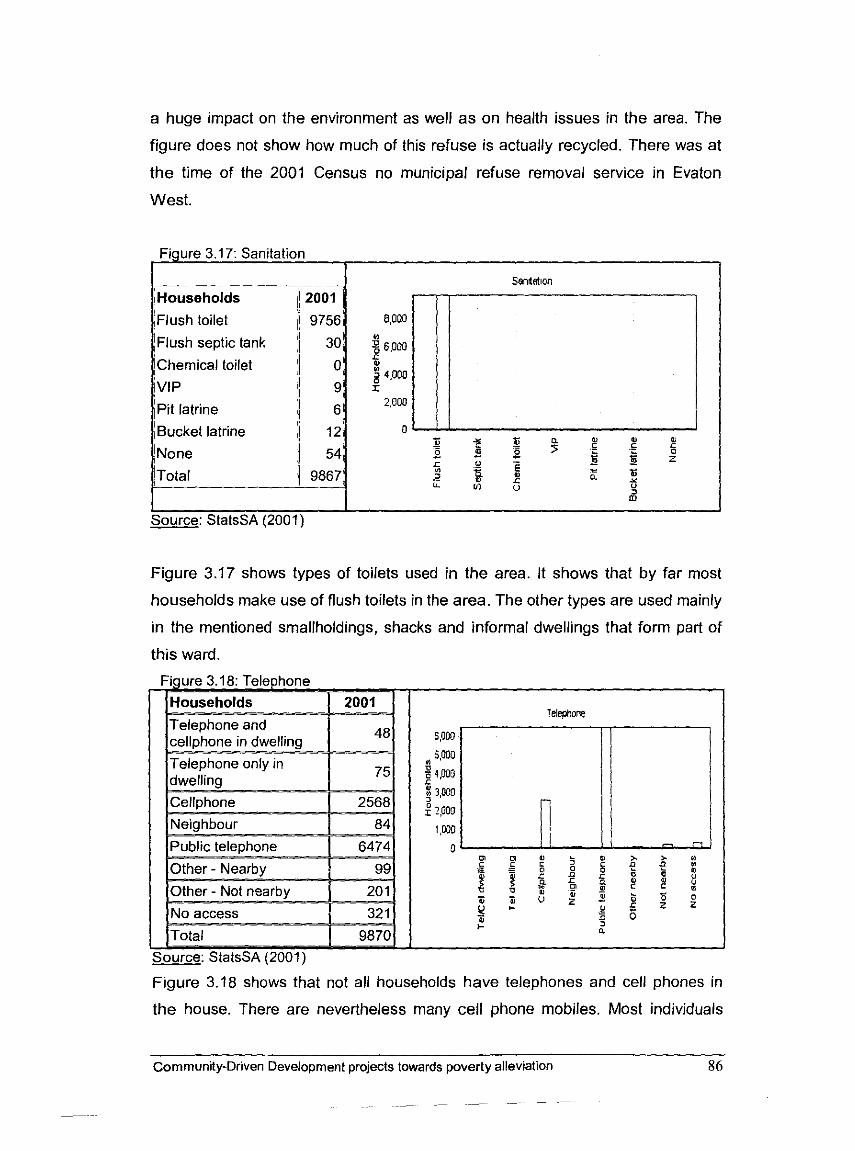
a huge impact on the environment as well as on health issues in the area. The
figure does not show how much of this refuse is actually recycled. There was at
the time of the 2001 Census no municipal refuse removal service in Evaton
West.
1
Chemical toilet
Bucket latrine
I Source: StatsSA (2001)
Figure 3.17 shows types of toilets used in the area. It shows that by far most
households make use of flush toilets in the area. The other types are used mainly
in the mentioned smallholdings, shacks and informal dwellings that form part of
this ward.
Source: StatsSA (2001)
Figure 3.18 shows that not all households have telephones and cell phones in
the house. There are nevertheless many cell phone mobiles. Most individuals
Community-Driven Development projects towards poverty alleviation
~ ~ ~- -p -
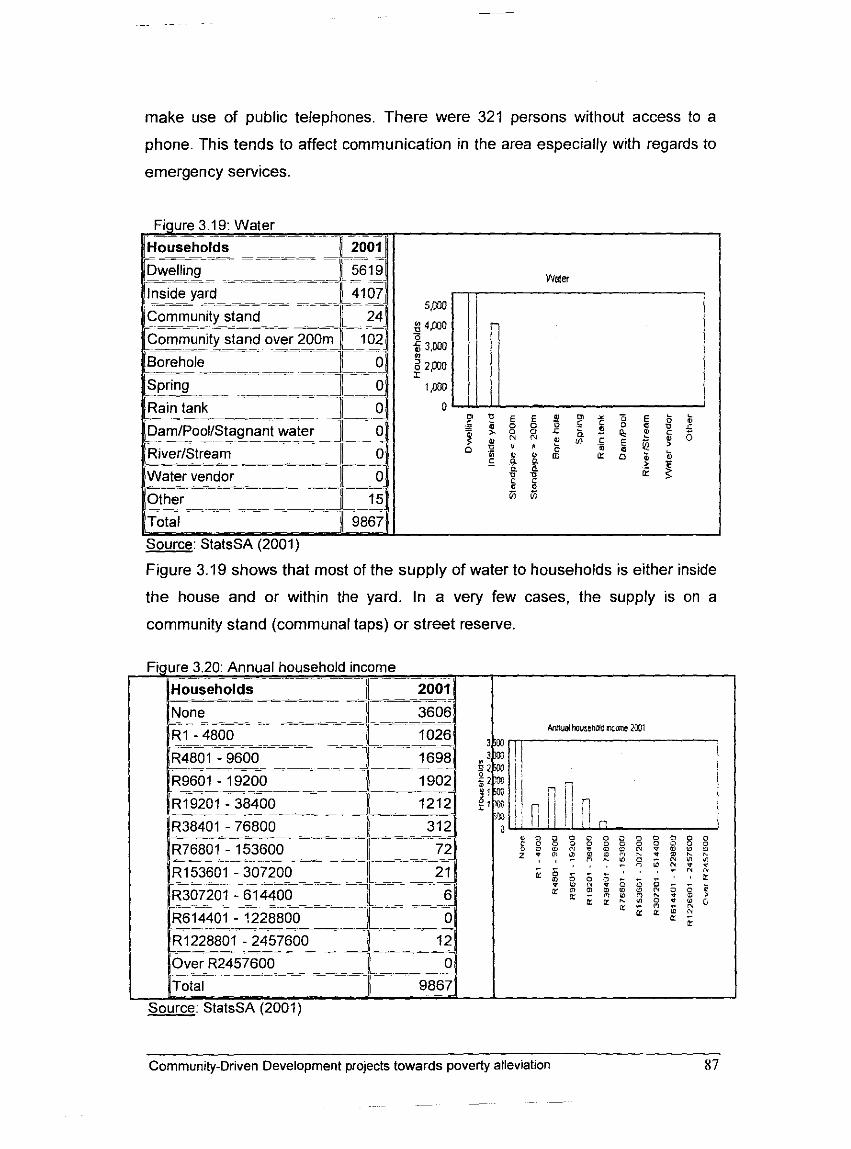
make use of public telephones. There were 321 persons without access to a
phone. This tends to affect communication in the area especially with regards to
emergency services.
Figure 3.19 shows that most of the supply of water to households is either inside
the house and or within the yard. In a very few cases, the supply is on a
community stand (communal taps) or street reserve.
3601 - 307200 307201-614400
401 - ?228800 228801 - 2457600
Over R2457600 -- -- -~ - - ~ - - - - - -
Community-Driven Development projects towards poverty alleviation 87
~~~~ - ~- - ~~
-

Figure 3.20 shows that using the MLL of R800, about 64.2 percent of the
households earn incomes of R800 or less per month (or R9600 or less per
annum). The households without any income amount to 36.6 percent,
At the time of the 2001 Census most of the Evaton West community consisted of
people who were never married (including children). Only a few are in civil and
traditional marriages. This may also be accounted for by the relatively youthful
(1 5-34 years of age) population of the area as indicated above.
3.3 Community development initiatives
Evaton West is a relatively young community consisting mainly of young people
(15 to 35 years of age) and a large number of children. Most of these young
people are unemployed and live in poverty as was shown in the sections above
and also will be in the next two chapters. Because it is a young community, it
apparently does not have deep set and shared community ways of thinking. This
makes it susceptible to change and presents a conducive condition for positive
influence. Partly because of this, it has attracted a number of organised initiatives
aimed at developing the community and reducing poverty. Two of these major
initiatives are discussed hereafter.
Community-Driven Development projects towards poverty alleviation
-~ - ~-
COLMP~A@, which stands for Centres of Learning to Alleviate Poverty in Africa,
with assistance from the then Vaal University of Technology (VUT) and the
Emfuleni Municipality, started to work in Evaton West in 2001 on a poverty
alleviation programme. COL~AP~A@ is a Pretoria, South Africa, based NGO
working among communities in South Africa and the rest of Africa. This NGO
organises the community leaders into formulating a vision for their particular
community, developing (in conjunction with the community members) particular
strategies to achieve such a vision, prioritises such strategies and helps to elicit
funding for such priorities. Parallel to this process, the NGO offers a leadership
training course for the selected leaders. The role of local government in these
processes is essential. The outcomes of a typical COL~AP~A@ project are a range
of small, normally inter-dependent, businesses and projects (such as sewing
groups, bread-baking and fence-making businesses) run by, managed and
controlled by the involved community-members.
In an interview with the Director of coLtA~iA@, it was revealed that after
observing its successes with the community of Mautseng in the Free State,
where small but successful poverty alleviation programmes were initiated through
COLMP~A@ , the Vaal University of Technology approached the NGO to replicate
this in Evaton West. The University financed the original (first year) part of the
project. The Emfuleni Local Municipality was requested to be a partner in the
project.
The aim of the project was community-driven development focussed on poverty
alleviation that included leadership training. Twenty five representatives were
selected to be part of the programme (representing the Evaton West Community
Development Forum, Vaal Triangle Technikon and the Emfuleni Municipality). All
of the selected persons are active community workers.
3.3.1.1 Project outline
Not much has been written about co~tAPiA@ and references are mainly from
interviews (FGI, with EWCDF and with Dr. Brenda Olivier, COL~AP~A@'S director),
Community-Driven Development projects towards poverty alleviation 89
presentations notes (from the poverty alleviation training) and short notes
(handouts) given out during the course of the project.
The Evaton West project started with the identification of the pilot community
(Evaton West) in which all aspects of the project were focussed. It was intended
to run over twelve months and to entail the following:
3.3.1.1 .I Poverty alleviation training
This step comprised the training of 25 community development workers,
including 15 key leaders, in the Evaton West community in the following aspects:
Introduction to poverty and self-help
Organising a community self-survey
Identify, prioritise and analyse needs
Envisioning workshop
Identifying markets and viability
Writing project plans
Writing project proposals
Fundraising
Community co-ordination
Legal issues
Budgeting and financial management
Entrepreneurial development
The approach to this training included contact sessions as well as mentoring
during implementation. Other services offered by C O L ~ A P ~ A ~ included:
Group Sessions
Report back on projects
Mentoring of projects
Networking with donors, specialists and industrialists
Conflict resolution
Community-Driven Development projects towards poverty alleviation 90
Link with people who can provide technical training (such as the
Department of Agriculture)
Facilitating community meetings
Telephone support.
The outcomes of this stage included:
Envisioning and prioritisation of needs by the community
Projects identified and run with the community forthe community
Poverty alleviation
3.3.1.1.2 Leadership development within the context of poverty alleviation
In addition to the activities outlined above, the following phase was also
undertaken. Good community leadership is seen by COL~AP~A@ as essential to
poverty alleviation. The phase was built into the project to develop such skills in
the community leaders participating in the project. This phase included training of
the identified leaders and community developers in the following aspects:
Evaluation of present level of leadership development
Design of a personalised development programme (PDP)
a Mentoring of leadership development for twelve months.
3.3.1.2 The Process of community development as outlined by COL~AP~A@'
The processes outlined to the participants in the project included the following
phases (COL~AP~A~, 2001):
Phase 1: Getting acquainted - During this phase, the community
workers make themselves known to the community and also let people
interact to know each other. It is meant to establish rapport and create a
trusting environment and engagement. This step is about community self-
survey.
Community-Driven Development projects towards poverty alleviation
~ ~~ -- - -- -- -~
Phase 2: Needs identification - This phase is meant to allow the
community to identify and prioritise the needs of their particular
community. Once the profile of the community has been developed, needs
can then be identified. The nature, causes and extent of these needs are
also determined.
Phase 3: Envisioning - During this step, the community is assisted to
develop a community vision. The step answers the question: what would
you have liked to achieve in the community if you had limitless resources?
Phase 4: Planning - The outcome of this step is a well-written project
proposal to sponsors. Short-term objectives, barriers, resources, co-
ordination and networks are all analysed during this step.
Phase 5: Implementation - This step is about people empowerment and
self-help. Some of the steps in this phase include skills transfer (technical,
managerial, inter-personal and entrepreneurial), finding sponsors and
seed capital, finding appropriate technologies and reporting progress to
the sponsors.
Phase 6: Evaluation - Ongoing evaluation of progress and
implementation is essential for success and ensures discipline. A
summative evaluation at the end of the project will indicate whether the
vision has been achieved.
Phase 7: Expanding the vision - Following the success of the previous
vision, the community builds on it to formulate further and broader visions.
3.3.1.3 Focus areas of the project
The project's focus areas in Evaton West were identified as follows:
Poverty Alleviation through:
0 Income Generation - reducing unemployment, lack of skills, lack of
financial support by creating small business, offering effective training
programmes and sourcing funding from private and public sector sources.
HIV-Aids targeting - offering home-based care to sufferers and training
volunteers.
Community-Driven Development projects towards poverty alleviation 92
Health - since there is no clinic, there are only poor emergency services
and widespread malnutrition, it was necessary for these issues to receive
attention.
Education and Liferacy - problems identified included overcrowding and
poor management of schools and no further education and training (FET)
or adult basic education and training (ABET) centres. These issues were
also to be addressed.
Welfare and Youth - lack of recreational facilities, lack of skills training,
lack of information and career guidance, loitering and crime.
3.3.1.3.1 The roles of the various partners
The roles of the various partners in the project were designated as follows:
- Vaal University of Technology - Centre for Community Service:
The part played by this Centre included:
Organising beneficiaries
Assisting in drawing up project constitutions and business plans
Training in entrepreneurship and sustainable development
strategies to participants.
Overseeing the project over the agreed period.
- The Local Council and Industry:
The Local Council and industry should assist in identifying and providing
land for use in these projects, and other resources as and when required.
The Council should be the main driving force behind these developments.
3.3.1.4 Evaluation of the project by the focus group
The participants (both community leaders and beneficiaries) in the focus group
interview (FGI) stated that they found the COL~AP~A@ methodology to be very
helpful in assisting the community to be involved in its own development, in
empowering individuals and in assisting the community to seek solutions
themselves rather than have outside people do this for them. They also pointed
Community-Driven Development projects towards poverty alleviation
-
out that the leadership training they received was instrumental in assisting
especially the community leaders to discover themselves and to lead effectively.
The main criticisms of the project were as follows:
Time factor - Not enough time was given to the project. The project was
terminated abruptly due to lack of funding. Its results could not be
evaluated due to the fact that the project had not been brought to its
logical conclusion. It was brought to a close before the good initiatives it
kicked off could take ground.
Lack of written materials: No written notes or materials were given for
reference by the participants. This may also be linked to funding. This led
to people not reviewing or consolidating what they were learning. As a
result many soon forgot what they had learned.
Business focus: The project was seen as too business-oriented in favour
of those who ran it: this was seen almost as a race issue. This issue may
be linked to the two above in that when funding dried up, the project
stopped.
Lack of close monitorinq by the Vaal University of Technology (VUT) that
sponsored the programme was also seen as a contributing factor to its
demise. This may just be an incorrect perception as monitoring was done
by the Community Service Department of the VUT.
3.3.2 Eindhoven Municipality
The intervention of the Eindhoven Municipality in Evaton West arose as a result
of the twinning of the then LekoaIVaal municipality and the City of Eindhoven in
Holland (Record 1999). In 2001, the Emfuleni Local Municipality requested
Eindhoven to provide support in getting working experience with the newly-
introduced Integrated Development Plans (IDPs) process, not only from a
theoretical perspective, but also through practical experiences (Blankwater,
2002). Evaton West was then identified as a pilot site for the programme. A two
year programme was outlined together with the Evaton West Development
Forum. The main thrust of the programme was the Objective-Oriented Project
Community-Driven Development projects towards poverty alleviation 94
Planning (OOPP) methodology which may be summarized as follows
(Blankwater, 2002: 7):
Defining realistic and unique objectives,
Stimulating communication between those in charge of the project as well
as between the project and its donors,
Clarifying responsibilities of those in charge of the project and others
interested in or affected by the proposed activities, and
a Providing indicators for both project monitoring and evaluation.
The councillors and community members were trained in this methodology. As a
result of this programme, three main groups were formed out of representatives
from the Evaton West Community Development Forum, members of the
community, Local Council representatives and specialists/technocrats (from the
various professions and professional bodies, e.g. medical doctors and lawyers).
All the groups were trained locally and abroad (in Eindhoven, Holland). The
following were three different groups (Blankwater 2002 and Blankwater 2003):
Local Economic Development (LED) pilot project group
This LED pilot project was aimed at stimulating economic development in the
area. The group found out that the biggest economic problem in the area was its
weak economic performance which then spiral let into a vicious circle affecting
health, crime and family problems. They further found that:
a Services were not paid for, leading to services being suspended or not
being supplied as required.
a No new products or economic activities were developed.
a The area was therefore unattractive to investors.
a Businesses could not survive and would soon collapse.
The LED group proposed that the development of a local business centre should
assist businesses survive by offering a number of services to them.
Community-Driven Development projects towards poverty alleviation 95
Health pilot project group
This group had over sixty health volunteers meant to assist the community in
various ways from health awareness campaigns to home-based care for the
terminally-ill. The group found that Evaton West experienced an increase in the
number of sick people, a condition on which poverty thrives. The lack of a proper
health service in the area exacerbated the situation. They found that the most
prominent health problems in the area were HIVIAids and general health
problems (these included nutritional deficiencies, lack of proper hygiene, as well
as alcohol and substance abuse). A number of programmes were initiated by the
group to try to improve the situation, focussing primarily on health education.
Waste pilot project group
This group was formed to deal with solid waste management and to develop
strategies to earn income through waste. This group also focused on
environmental management programmes. The group found that there are two
major problems regarding waste in Evaton West, normally a lack of refuse
collection service and a lack of environmental education and awareness. This
group identified the following activities:
Development of environmental education programmes for schools,
Organisation of workshops to educate parents on environmental issues,
Organisation of environmental competitions,
Organisation of awareness campaigns regarding green environments,
Organisation of cleaning campaigns,
Organisation of tree planting activities,
Stimulation of vegetable gardening projects, and
Use of the media to spread the 'green message'.
3.3.2.1 Evaluation of the project by the focus group
The focus group interview (FGI) participants saw the involvement of the
Eindhoven Municipality as an empowering undertaking, assisting the community
of Evaton West in a number of ways. The continued involvement of the
Comrnun~ty-Driven Development projects towards poverty alleviatton
-- - - - -
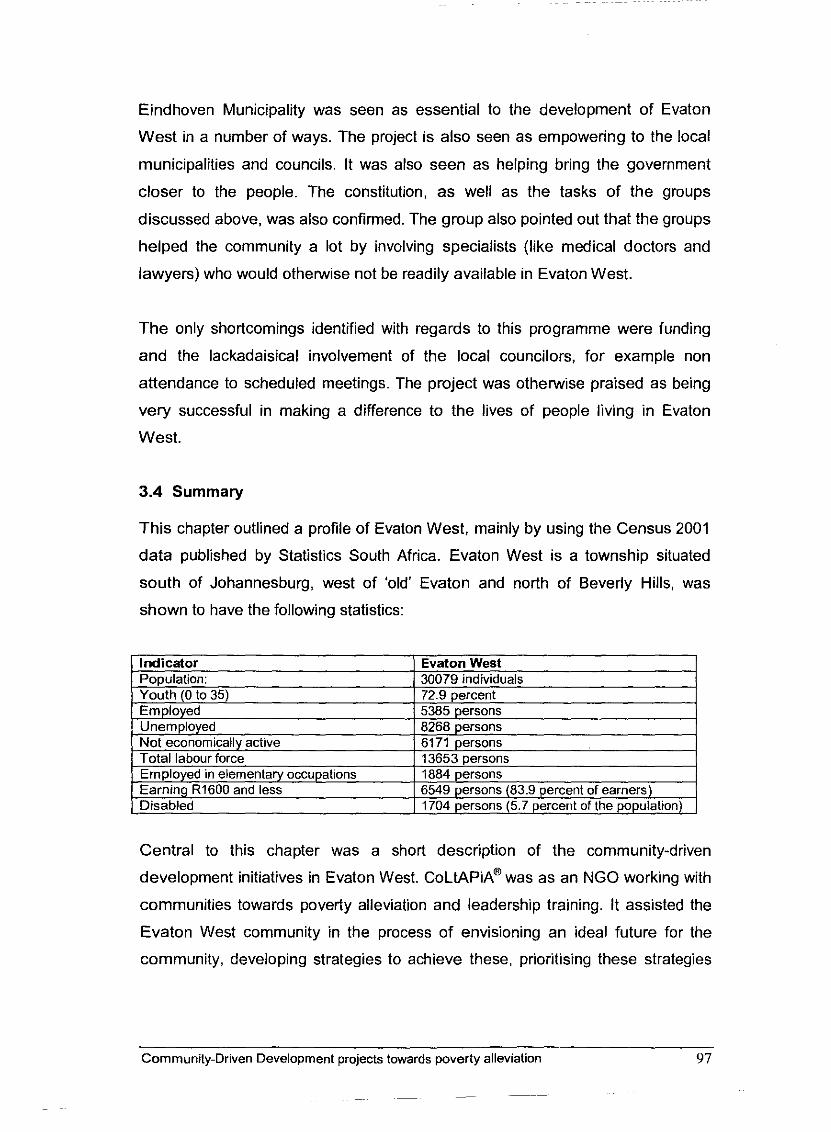
Eindhoven Municipality was seen as essential to the development of Evaton
West in a number of ways. The project is also seen as empowering to the local
municipalities and councils. It was also seen as helping bring the government
closer to the people. The constitution, as well as the tasks of the groups
discussed above, was also confirmed. The group also pointed out that the groups
helped the community a lot by involving specialists (like medical doctors and
lawyers) who would otherwise not be readily available in Evaton West.
The only shortcomings identified with regards to this programme were funding
and the lackadaisical involvement of the local councilors, for example non
attendance to scheduled meetings. The project was otherwise praised as being
very successful in making a difference to the lives of people living in Evaton
West.
3.4 Summary
This chapter outlined a profile of Evaton West, mainly by using the Census 2001
data published by Statistics South Africa. Evaton West is a township situated
south of Johannesburg, west of 'old' Evaton and north of Beverly Hills, was
shown to have the following statistics:
Indicator 1 Evaton West Population: 1 30079 individuals
Employed in elementary occupations 1 1884 persons Earning R1600 and less ( 6549 persons (83.9 percent of earners) Disabled ] 1704 persons (5.7 percent of the population)
- - - - -
Youth (0 to 35) Employed Unemployed Not econom~cally actwe Total labour force
Central to this chapter was a short description of the community-driven
development initiatives in Evaton West. COL~AP~A' was as an NGO working with
communities towards poverty alleviation and leadership training. It assisted the
Evaton West community in the process of envisioning an ideal future for the
community, developing strategies to achieve these, prioritising these strategies
729 percent 5385 persons 8268 persons 61 71 persons 13653 persons
Community-Driven Development projects towards poverty alleviation 97
and sourcing funding for priority strategies. The projects were run in conjunction
with the local government in Emfuleni.
The Eindhoven Municipality's involvement came about as a result of the twinning
of cities in the Netherlands and in the Vaal Triangle in South Africa. Three
effective local community groups have already resulted from their co-operation
with Evaton West. These are the Health Group, the Local Economic
Development group and the Environmental Group.
Chapter 4 and Chapter 5 will study Evaton West in detail using predetermined
indicator with a view to assessing poverty levels and unemployment as well as
community level indicators.
CommunityDriven Development projects towards poverty alleviation 98
Chapter 4
Analysis of household indicators
in Evaton West compared to Bophelong
4.1 Introduction
In the previous chapter, an outline of the two major initiatives in Evaton West was
presented, as was a general outline of Evaton West. This chapter will make use
of this information to assess levels o f specific indicators in relation to poverty
alleviation. The discussion will encompass the different indicators of poverty and
welfare in Evaton West and compare Evaton West with Muvhango (Bophelong)
in respect of these indicators. The comparison is to establish whether Evaton
West, having received the attention it has in terms of the various initiatives at
poverty alleviation, is better off currently than Bophelong.
The rationale behind the choice of Muvhango (Bophelong) lies in the fact that the
two townships are both relatively "new" areas as both are the result of the
government's RDP (reconstruction and development) housing projects.
Muvhango (Bophelong) has also recently been similarly profiled (by Slabbert,
2003) and both are relatively equal in size (household count) (StatsSA, 2001).
The difference between the two lies in the fact that whereas Evaton West has
received a great deal of attention from a number of development initiatives,
Muvhango (henceforth simply referred to as Bophelong), has comparatively not.
The information for Evaton West was analyzed from household questionnaires
administered in the area during October/November 2003 (henceforth refered to
as Mokoena (2003)). The information for Bophelong is based on a study
conducted by Slabbert (2003). A fuller discussion on the survey design and
methodology is contained in Annexure 1 of this study.
Community-Driven Development projects towards poverty alleviation
-- - - -
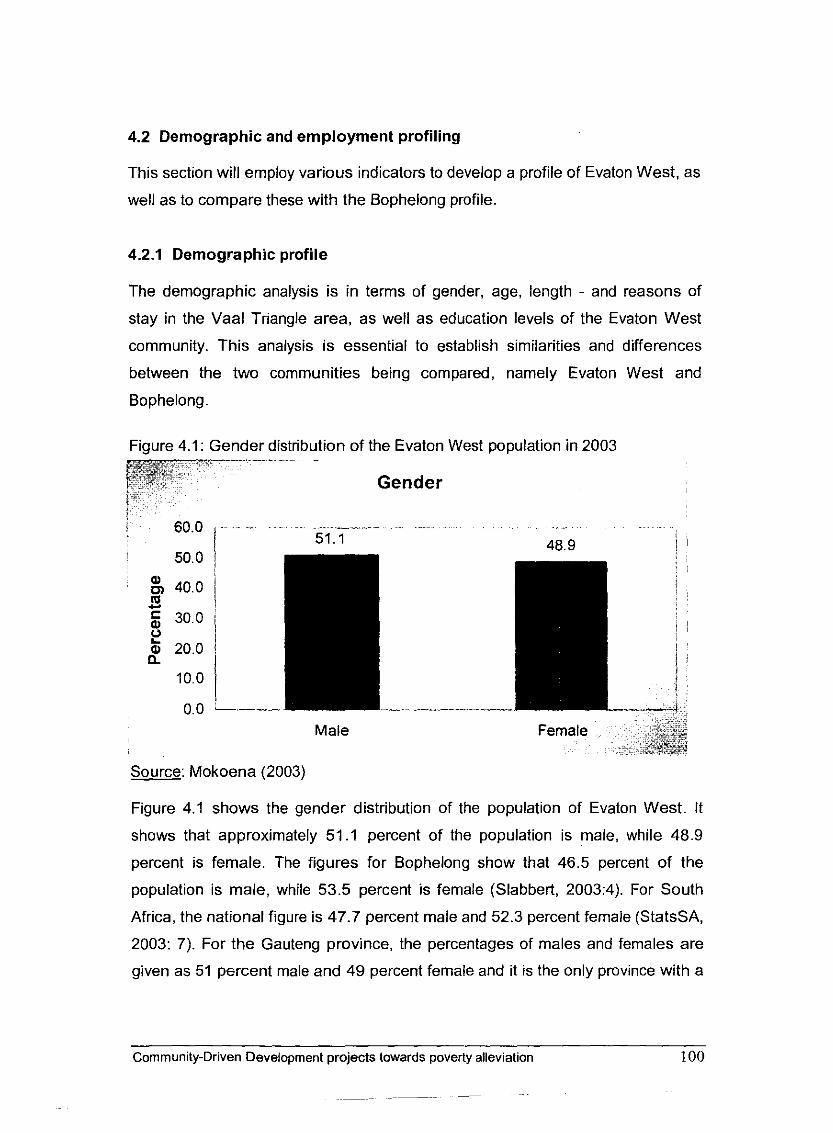
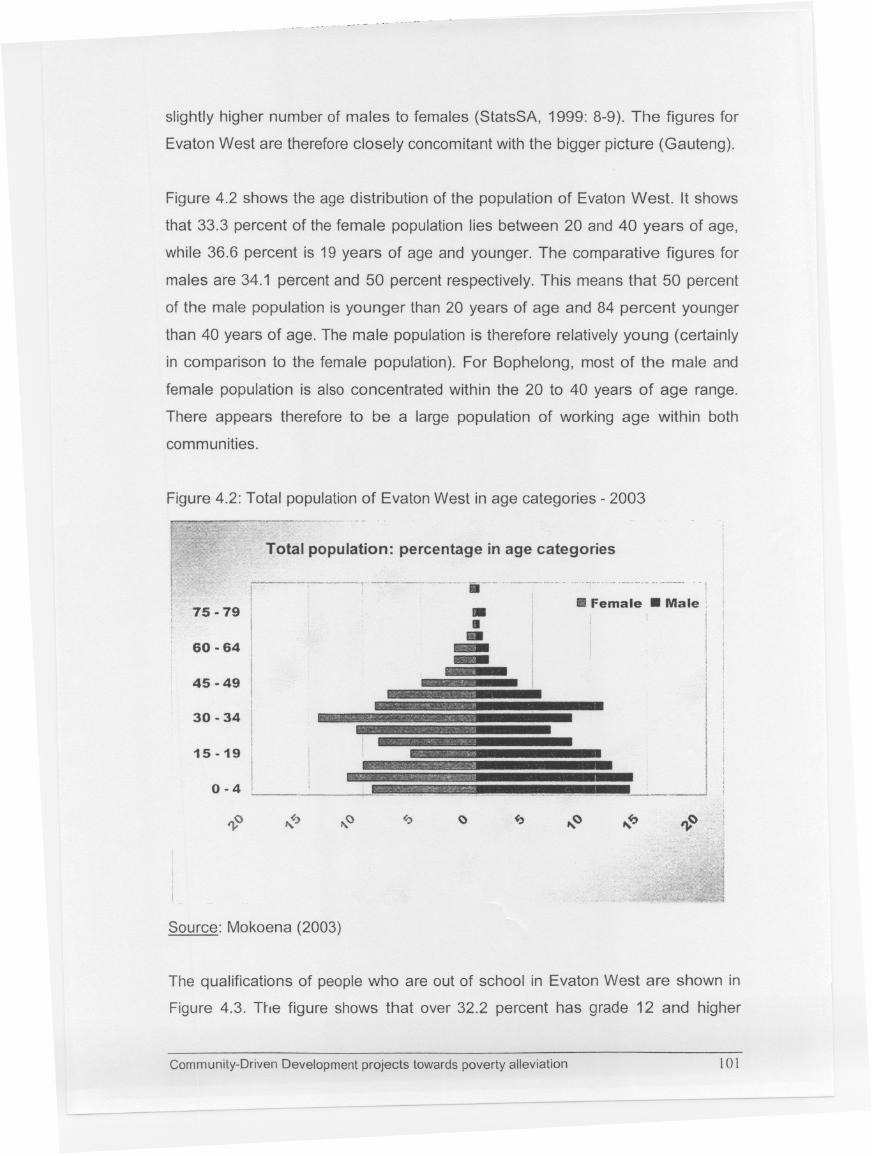
..- _.- - _.- . .---
slightly higher number of males to females (StatsSA, 1999: 8-9). The figures for
Evaton West are therefore closely concomitant with the bigger picture (Gauteng).
Figure 4.2 shows the age distribution of the population of Evaton West. It shows
that 33.3 percent of the female population lies between 20 and 40 years of age,
while 36.6 percent is 19 years of age and younger. The comparative figures for
males are 34.1 percent and 50 percent respectively. This means that 50 percent
of the male population is younger than 20 years of age and 84 percent younger
than 40 years of age. The male population is therefore relatively young (certainly
in comparison to the female population). For Bophelong, most of the male and
female population is also concentrated within the 20 to 40 years of age range.
There appears therefore to be a large population of working age within both
communities.
Figure 4.2: Total populationof Evaton West in age categories - 2003
Total population: percentage in age categories
-_. -_. '0' ..., .- - -. - 1...-I!iBII- IIFemale . MaleI i
-
I
J-- -....
o
Source: Mokoena (2003)
The qualifications of people who are out of school in Evaton West are shown in
Figure 4.3. The figure shows that over 32.2 percent has grade 12 and higher
Community-Driven Development projects towards poverty alleviation 101
r ---.
t
. >
75 .79
60 -64
45 - 49
30 - 34
15-19
0-4
q,,0
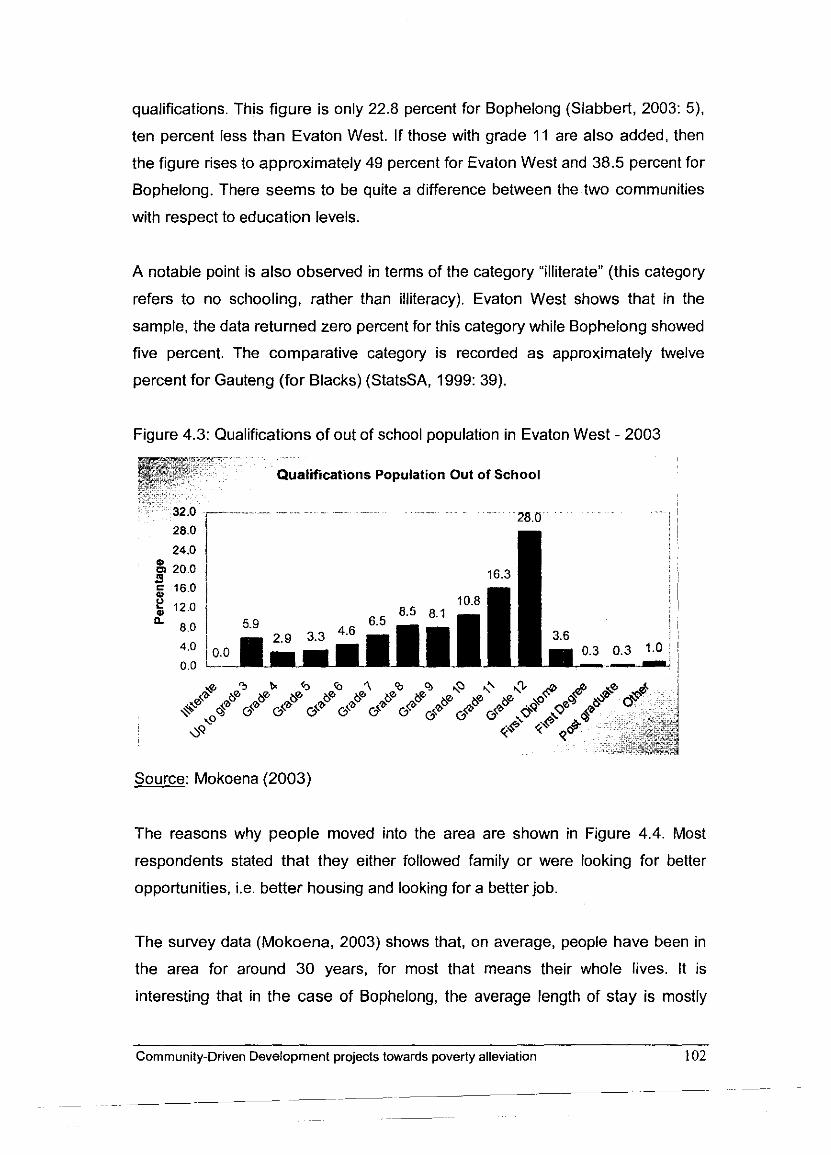
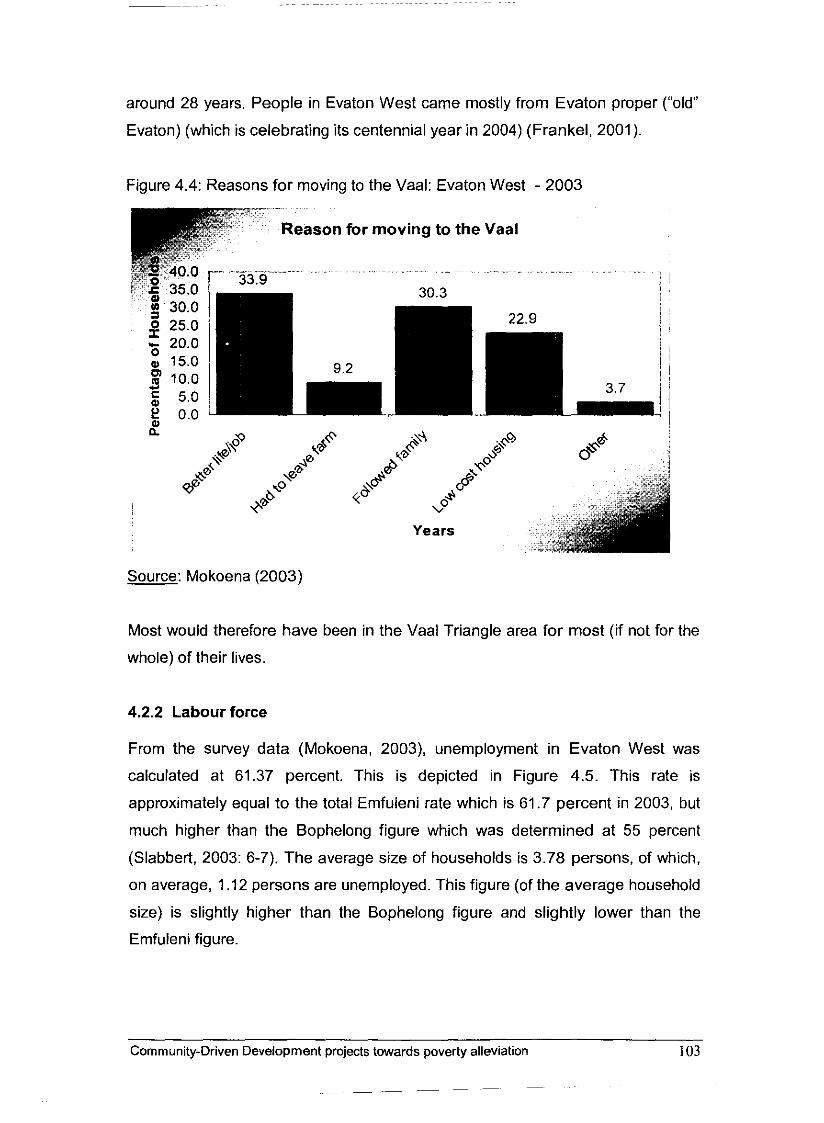
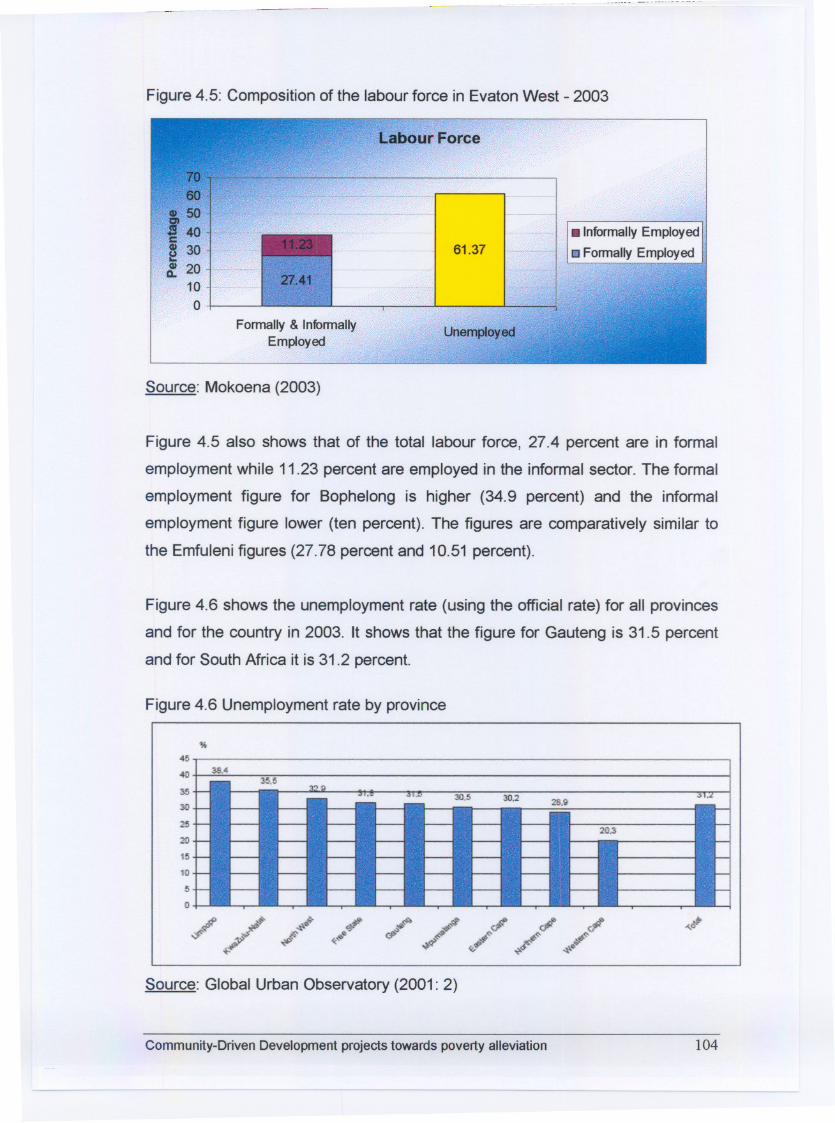
---.
Figure 4.5: Composition of the labour force in Evaton West - 2003
Labour Force
, 60~ 50en
:940c
~ 30~ 20G.
10
o
61.37.Informally Employed
rJFormally Employed
Formally & InformallyEmployed
Unemployed
"
2Z:41../ i.:>
Source: Mokoena (2003)
Figure 4.5 also shows that of the total labour force, 27.4 percent are in formal
employment while 11.23 percent are employed in the informal sector. The formal
employment figure for Bophelong is higher (34.9 percent) and the informal
employment figure lower (ten percent). The figures are comparatively similar to
the Emfuleni figures (27.78 percent and 10.51 percent).
Figure 4.6 shows the unemployment rate (using the official rate) for all provinces
and for the country in 2003. It shows that the figure for Gauteng is 31.5 percent
and for South Africa it is 31.2 percent.
Figure 4.6 Unemployment rate by province
Source: Global Urban Observatory (2001: 2)
Community-Driven Development projects towards poverty alleviation 104
,.45
<40
3530
2!
201!1
10
!I
0
Jf' f"".; .
.;p ; / f(of:
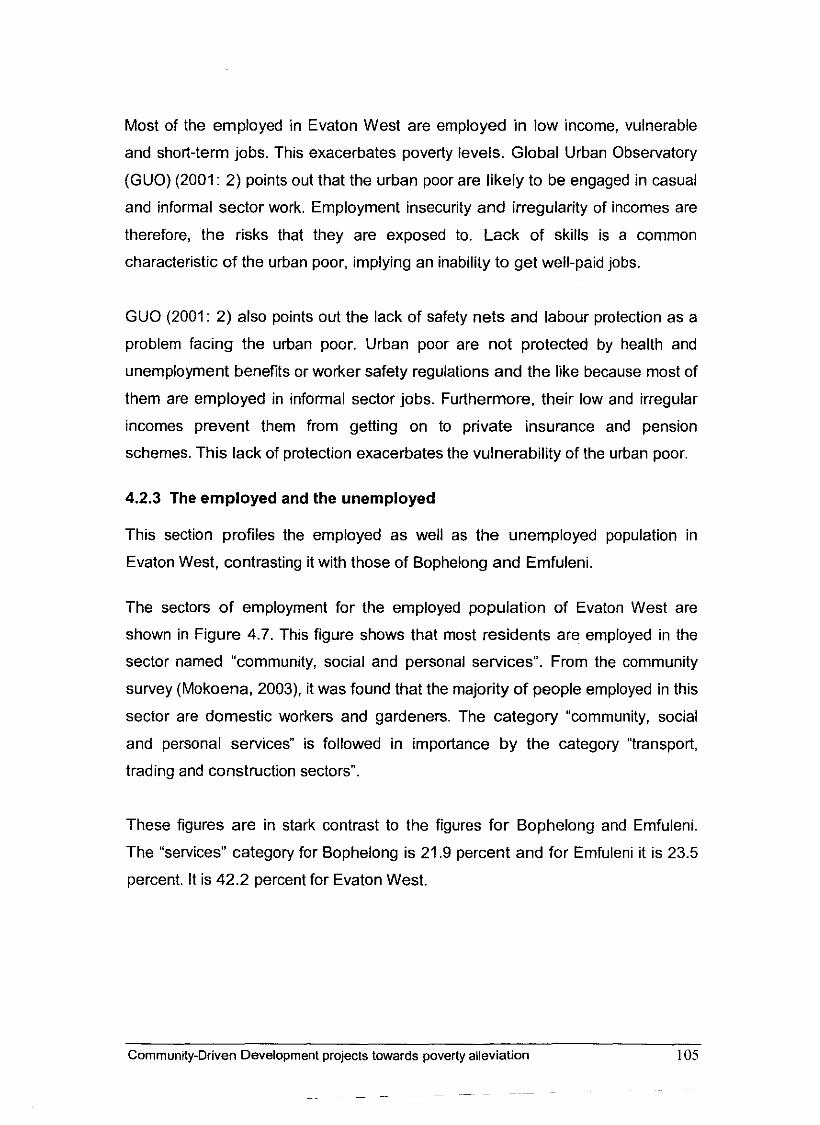
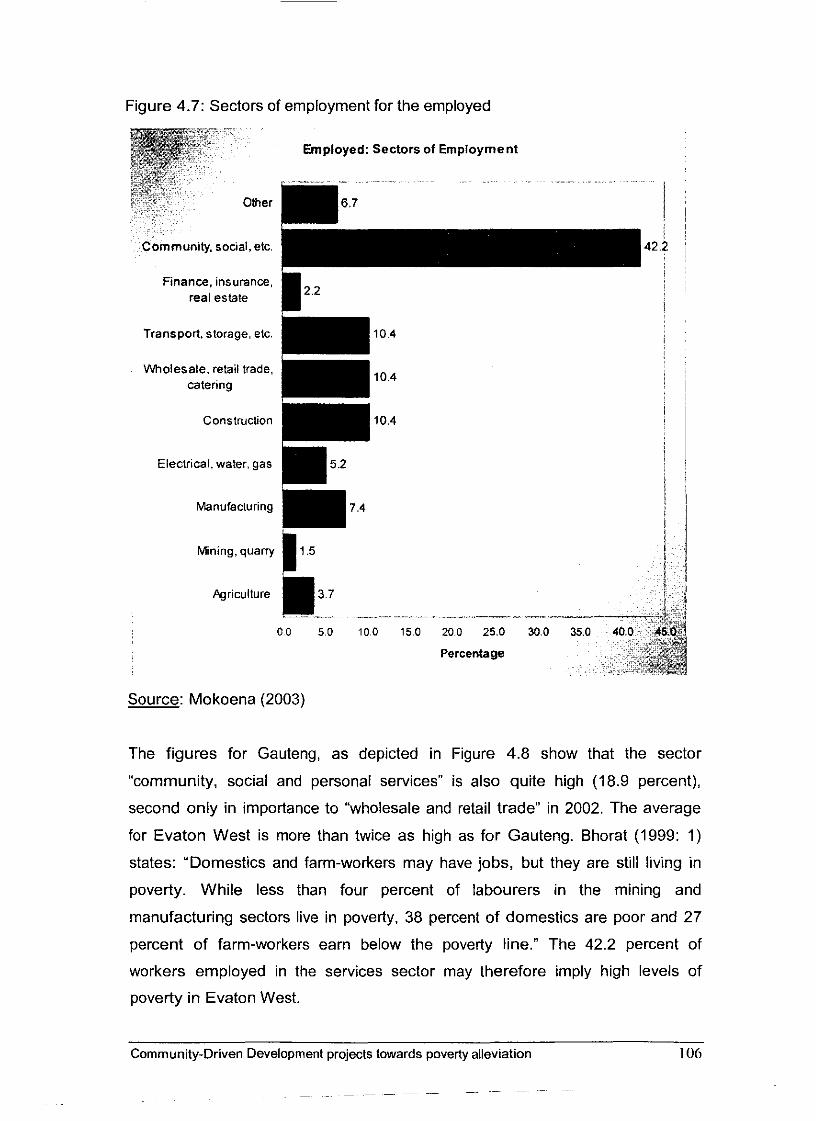
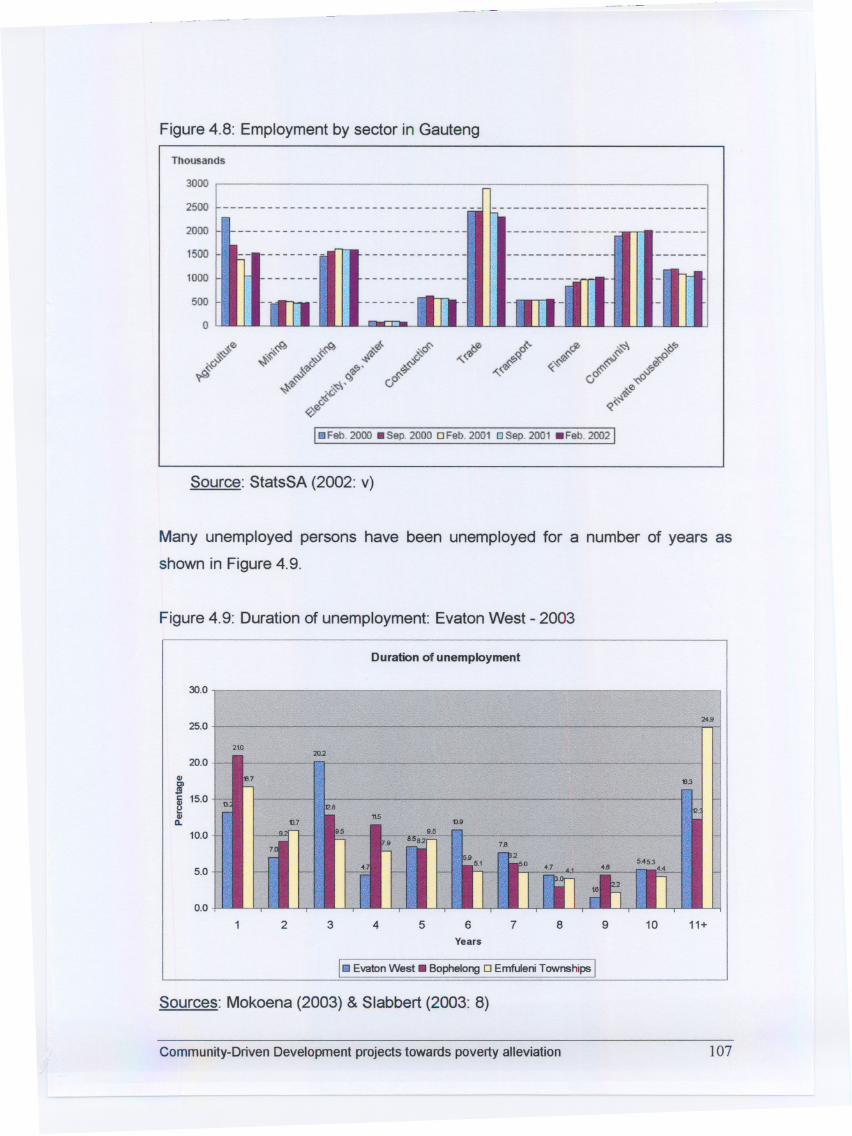
Figure 4.8: Employment by sector in Gauteng
Thousands
3000
2500
2000
1500
---------------------------------- ----------------------------------------------------------- --------------- -------
------- ------------- ~ -------1000 ------- ------------- ----------500
o
Source: StatsSA (2002: v)
Many unemployed persons have been unemployed for a number of years as
shown in Figure 4.9.
Figure 4.9: Duration of unemployment: Evaton West - 2003
Duration of unemployment
30.0
25.0 . 24,9
2tO202
20.0
GI, I 88.7
8 15.0ii I11D.
10.0
11.3
5.0
115119
0.0
2 3 4 5 6 7 8 9 10 11+Years
I_ EvatDn West - Bophelong 0 Emfuleni Townships ISources: Mokoena (2003) & Siabbert (2003: 8)
Community-Driven Development projects towards poverty alleviation 107
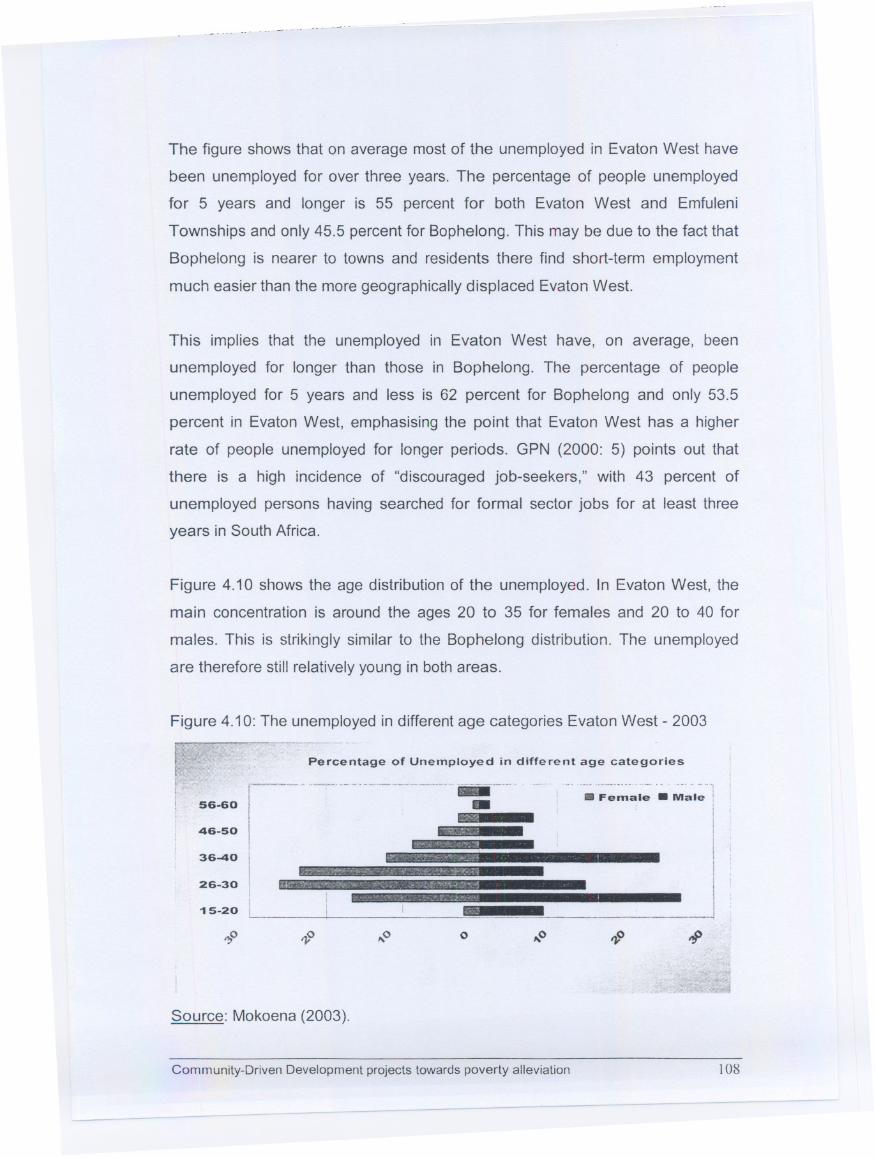
The figure shows that on average most of the unemployed in Evaton West have
been unemployed for over three years. The percentage of people unemployed
for 5 years and longer is 55 percent for both Evaton West and Emfuleni
Townships and only 45.5 percent for Bophelong. This may be due to the fact that
Bophelong is nearer to towns and residents there find short-term employment
much easier than the more geographicallydisplaced Evaton West.
This implies that the unemployed in Evaton West have, on average, been
unemployed for longer than those in Bophelong. The percentage of people
unemployed for 5 years and less is 62 percent for Bophelong and only 53.5
percent in Evaton West, emphasising the point that Evaton West has a higher
rate of people unemployed for longer periods. GPN (2000: 5) points out that
there is a high incidence of "discouraged job-seekers," with 43 percent of
unemployed persons having searched for formal sector jobs for at least three
years in South Africa.
Figure 4.10 shows the age distribution of the unemployed. In Evaton West, the
main concentration is around the ages 20 to 35 for females and 20 to 40 for
males. This is strikingly similar to the Bophelong distribution. The unemployed
are therefore still relatively young in both areas.
Figure 4.10: The unemployed in different age categories Evaton West - 2003
r~iI 56-60
Percentage of Unemployed in different age categories
.__ _ .. ._ _4.¥ _ ._,~ ___¥.,<O:~':' ':::1
,~
~~".
!r-'v .,'~."' '~"',-
~l'--;c.-~:t:..~'::'~:'-':'''''';'/:''''..l,;d
~;r#~,~~;,;",,~,.-:';::.fJ.trcf.P:;::~:>-~~k'+A;;::"\.
~.~~~<~~~,,~:~}'t .'~<{'Jtqi:;J!'~Z1.'~,-..f.~.:;<:"
'/..:r_~,1.-::.,...~.:i: 1'...l'
IIIFemale . Male ;
46-50
36-40
26-30
1 5-20
,..0 o
Source: Mokoena (2003).
Community-Driven Development projects towards poverty alleviation 108
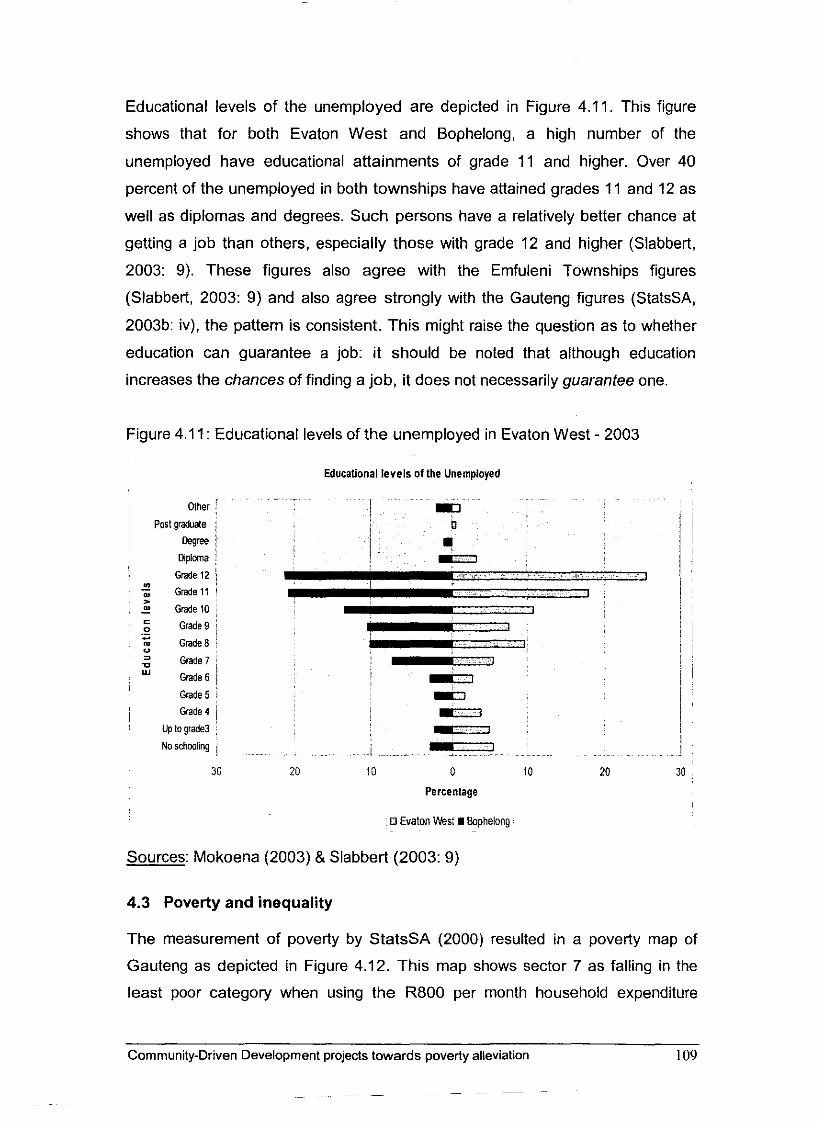
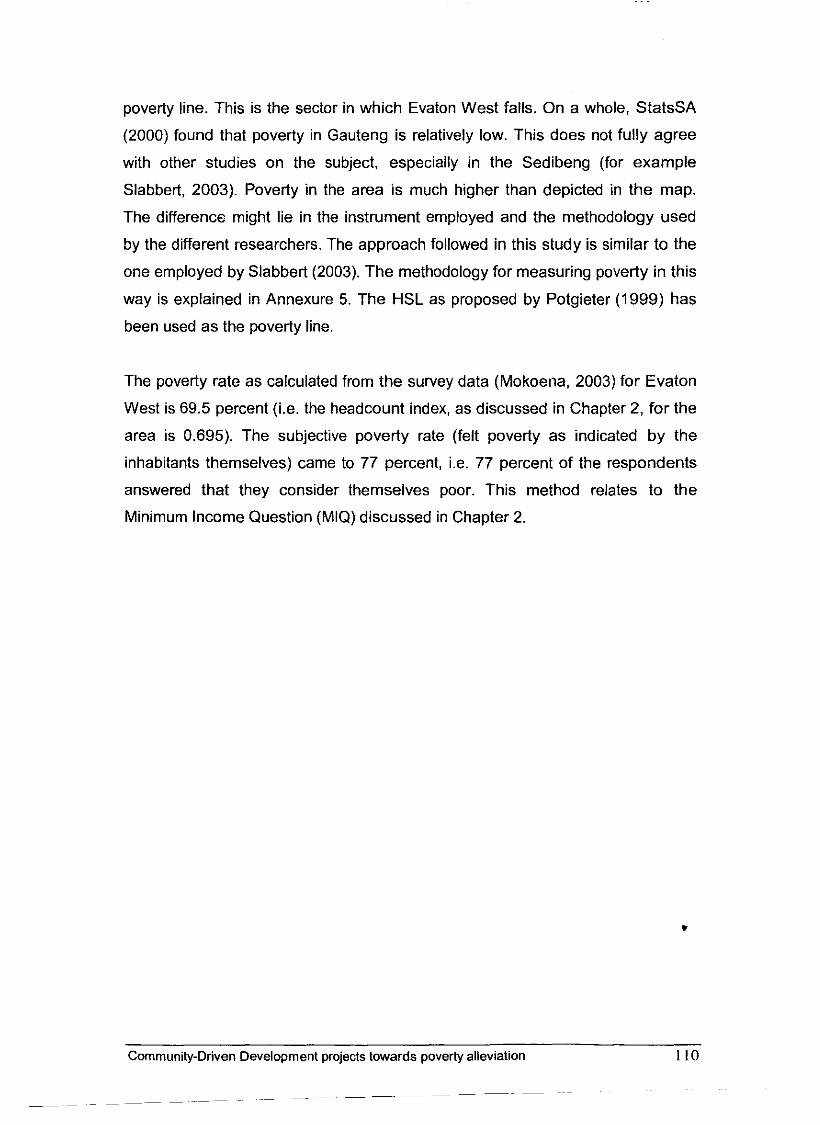
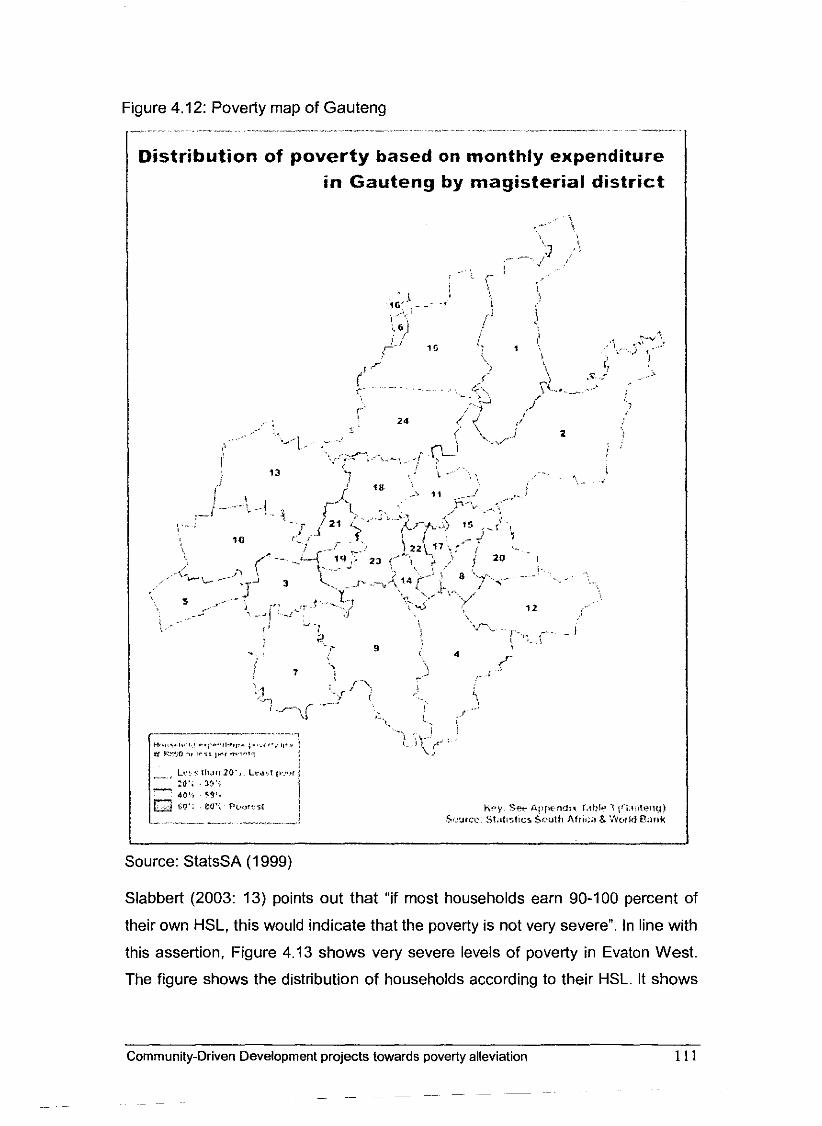

4.3.1 Inequality
Figure 4.14: The Lorenz curves of Evaton West in 2001 and 2003
Lorenz Cuwes: 2001 & 2003 - Evaton West
Household deciles
,- 2003 - - - .- - 45 degree line - - - - 2001
Source: StatsSA (Census 2001) and Mokoena (2003)
Figure 4.14 depicts the non-normalized Lorenz curves for the income distribution
in Evaton West as calculated from the survey data (Mokoena 2003) and the 2001
Census data (StatsSA 2001). This Lorenz curve shows an uneven distribution of
income. The 2003 line shows that 50 percent of households earn just above ten
percent of the incomes. The top 20 percent earn about 60 percent of all incomes.
The highest income earned by a household in the study area was R9000 per
month, while the bottom fourteen percent earned no income at all. The 2001 line
shows that 65 percent of the bottom income earners earned only about ten
percent of incomes, while the top ten percent of households earned 50 percent
the of incomes. The top 20 percent of households earn about 75 percent of the
incomes. This is a highly unequal distribution.
This pattern of inequality is reinforced by the Gini co-efficients for the area. From
the survey data (Mokoena 2003), the Gini co-efficient is calculated at 0.53 for
2003, while from StatsSA (2001) data it was 0.75 for 2001. These are relatively
Community-Driven Development projects towards poverty alleviation 113
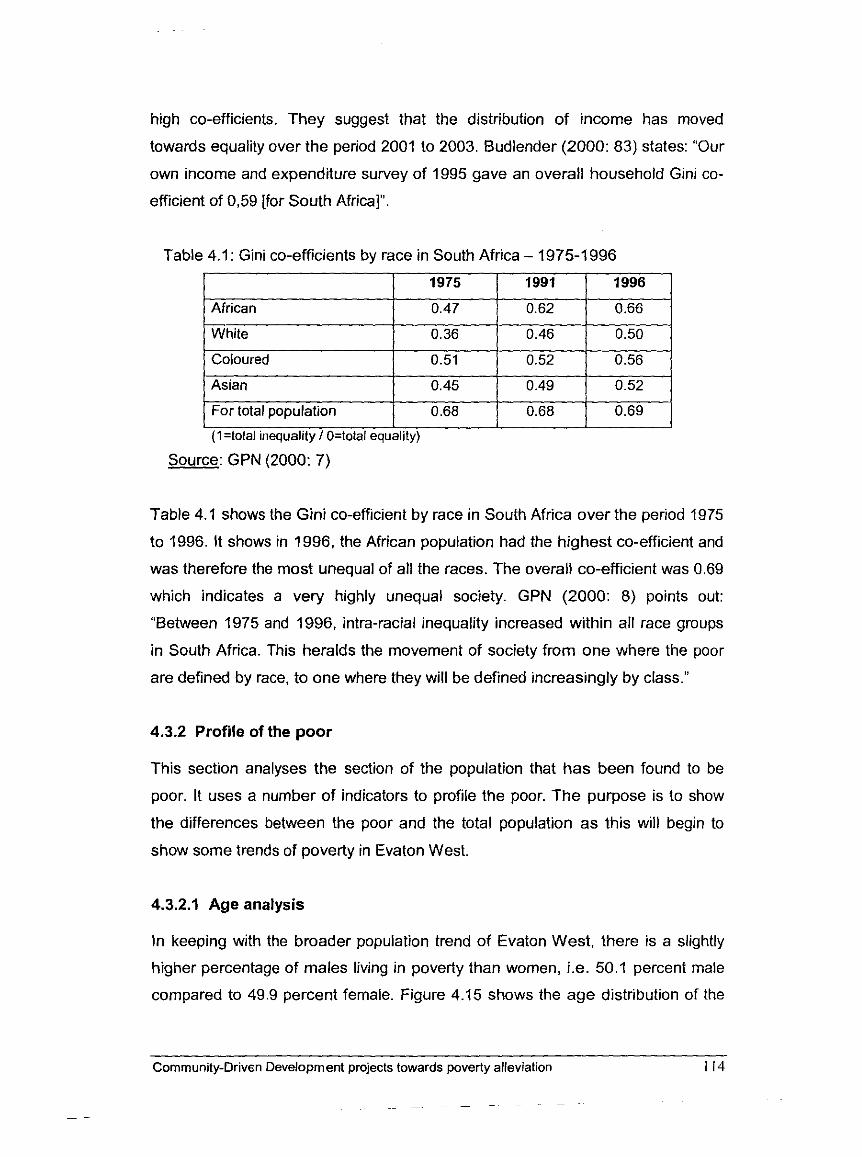
high co-efficients. They suggest that the distribution of income has moved
towards equality over the period 2001 to 2003. Budlender (2000: 83) states: "Our
own income and expenditure survey of 1995 gave an overall household Gini co-
efficient of 0,59 [for South Africa]".
Table 4.1: Gini co-efficients by race in South Africa - 1975-1996
(I=total inequality 1 O=total equality)
Source: GPN (2000: 7)
Table 4.1 shows the Gini co-efficient by race in South Africa over the period 1975
to 1996. It shows in 1996, the African population had the highest co-efficient and
was therefore the most unequal of all the races. The overall co-efficient was 0.69
which indicates a very highly unequal society. GPN (2000: 8) points out:
"Between 1975 and 1996, intra-racial inequality increased within all race groups
in South Africa. This heralds the movement of society from one where the poor
are defined by race, to one where they will be defined increasingly by class."
4.3.2 Profile of the poor
This section analyses the section of the population that has been found to be
poor. It uses a number of indicators to profile the poor. The purpose is to show
the differences between the poor and the total population as this will begin to
show some trends of poverty in Evaton West.
4.3.2.1 Age analysis
In keeping with the broader population trend of Evaton West, there is a slightly
higher percentage of males living in poverty than women, i.e. 50.1 percent male
compared to 49.9 percent female. Figure 4.15 shows the age distribution of the
Community-Driven Development projects towards poverty alleviation 114

. - .-'
poor population. It shows that 52.6 percent of the male population and 37.6
percent of the female population lies within the age bracket 0-19 years. This
means that over half of the poor males are children and teenagers. The
breakdown for the age group 20-39 is 40.2 percent female and 32.6 percent
male. This shows that while the concentration for the male poor population is in
the children and youth bracket, it is more evenly spread in the. case of females.
The poor population under 40 years of age accounts for 85.2 percent in males
and 78.2 percent in females.
Figure 4.15: Poor population in age categories in EvatonWest - 2003
f;'" ,--~~ -'Age Categories -Poor PopulationEiI .. ..-
80-84
70 - 74 r--!
I
I
I
!i
I
IL.
- -' -" ~
~ 60-641:050-54CJIQ)c; 40-44oQ) 30 - 34CJI
« 20 -24
10 -14
0-4
...-.-----
--...-,.
II1!!IiJI-
II Female. Male Percentage
Source: Mokoena (2003)
4.3.2.2 Education levels
Education levels of the poor population of Evaton West that are out of school is
shown in Figure 4.16. It shows that about 25.2 percent of the poor post-school
population has attained Grade 12 and higher educational levels compared to
Community-Driven Development projectstowards poverty alleviation 115
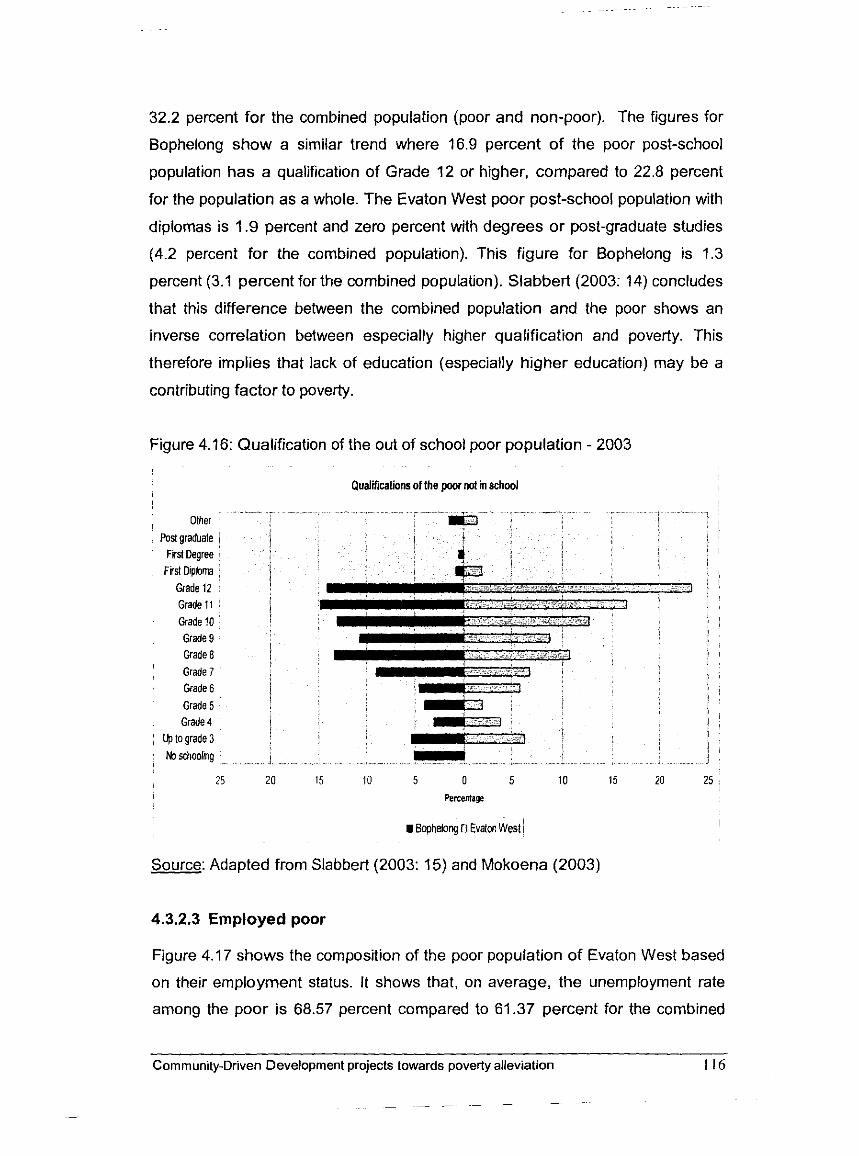
32.2 percent for the combined population (poor and non-poor). The figures for
Bophelong show a similar trend where 16.9 percent of the poor post-school
population has a qualification of Grade 12 or higher, compared to 22.8 percent
for the population as a whole. The Evaton West poor post-school population with
diplomas is 1.9 percent and zero percent with degrees or post-graduate studies
(4.2 percent for the combined population). This figure for Bophelong is 1.3
percent (3.1 percent for the combined population). Slabbert (2003: 14) concludes
that this difference between the combined population and the poor shows an
inverse correlation between especially higher qualification and poverty. This
therefore implies that lack of education (especially higher education) may be a
contributing factor to poverty.
Figure 4.16: Qualification of the out of school poor population - 2003
Qualifications ofthe poor not in school
. . .. ; Other
Posl graduale 1 Firsl Degree
First Dipbim Grade 12
1 Grade 11 I I Grade 10
Grade9 : Grade 8
Grade 7 Grade 6 Grade 5 Grade 4
; Ilpto grade 3 MI SChool'mg . . . ....... . . . -
25 20 15 10 5 0 5 10 15 20 25 Percentage
Bophelong 0 Evaton West i I
Source: Adapted from Slabbert(2003: 15) and Mokoena (2003)
4.3.2.3 Employed poor
Figure 4.17 shows the composition of the poor population of Evaton West based
on their employment status. It shows that, on average, the unemployment rate
among the poor is 68.57 percent compared to 61.37 percent for the combined
Community-Driven Development projects towards poverty alleviation 1 16
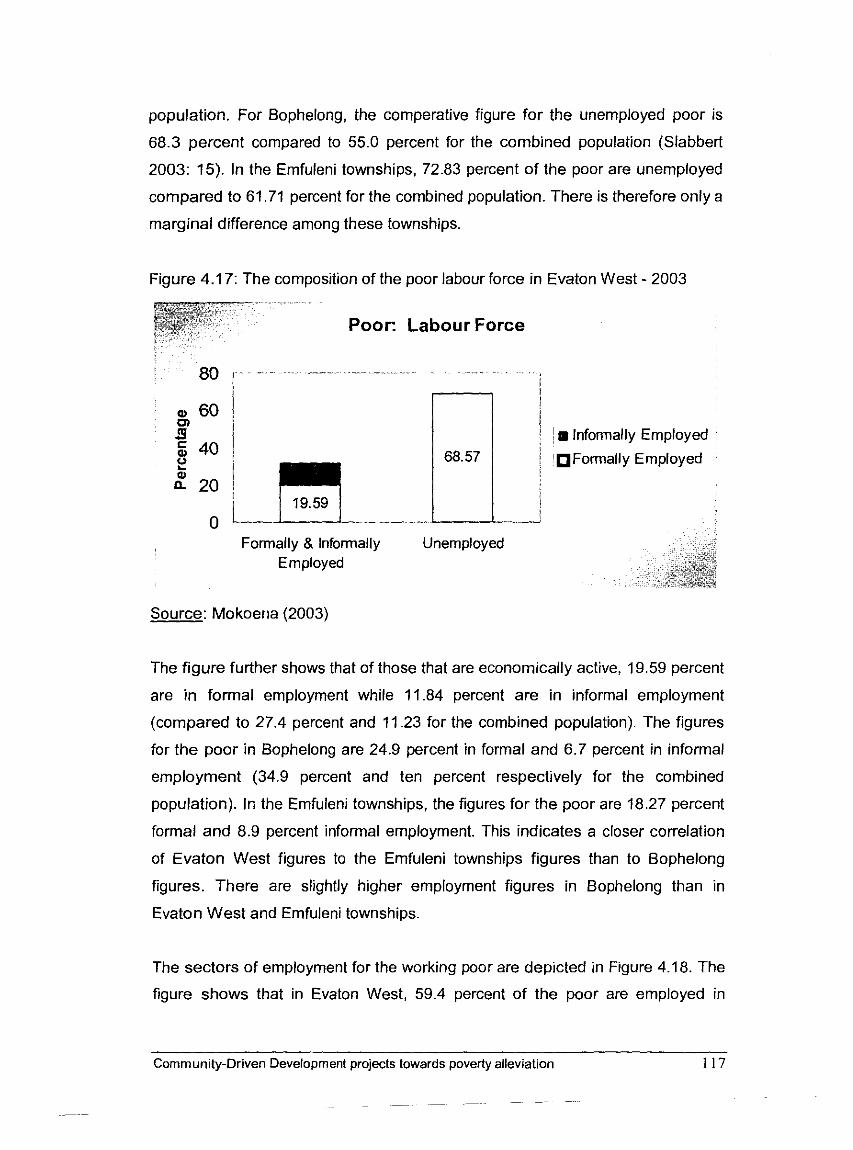
population. For Bophelong, the comperative figure for the unemployed poor is
68.3 percent compared to 55.0 percent for the combined population (Slabbert
2003: 15). In the Emfuleni townships, 72.83 percent of the poor are unemployed
compared to 61.71 percent for the combined population. There is therefore only a
marginal difference among these townships.
Figure 4.17: The composition of the poor labour force in Evaton West - 2003
Poor: Labour Force
i I
1 CD 60 a" i 1 ID Informally Employed ~ E 40 68.57 ? Formally Employed
"0 I 19.59 !
0 . -
Formally & Infom~ally Unemployed Employed
Source: Mokoerla (2003)
The figure further shows that of those that are economically active, 19.59 percent
are in formal employment while 11.84 percent are in informal employment
(compared to 27.4 percent and 11.23 for the combined population). The figures
for the poor in Bophelong are 24.9 percent in formal and 6.7 percent in informal
employment (34.9 percent and ten percent respectively for the combined
population). In the Emfuleni townships, the figures for the poor are 18.27 percent
formal and 8.9 percent informal employment. This indicates a closer correlation
of Evaton West figures to the Emfuleni townships figures than to Bophelong
figures. There are slightly higher employment figures in Bophelong than in
Evaton West and Emfuleni townships.
The sectors of employment for the working poor are depicted in Figure 4.18. The
figure shows that in Evaton West, 59.4 percent of the poor are employed in
Community-Driven Development projects towards poverty alleviation 117
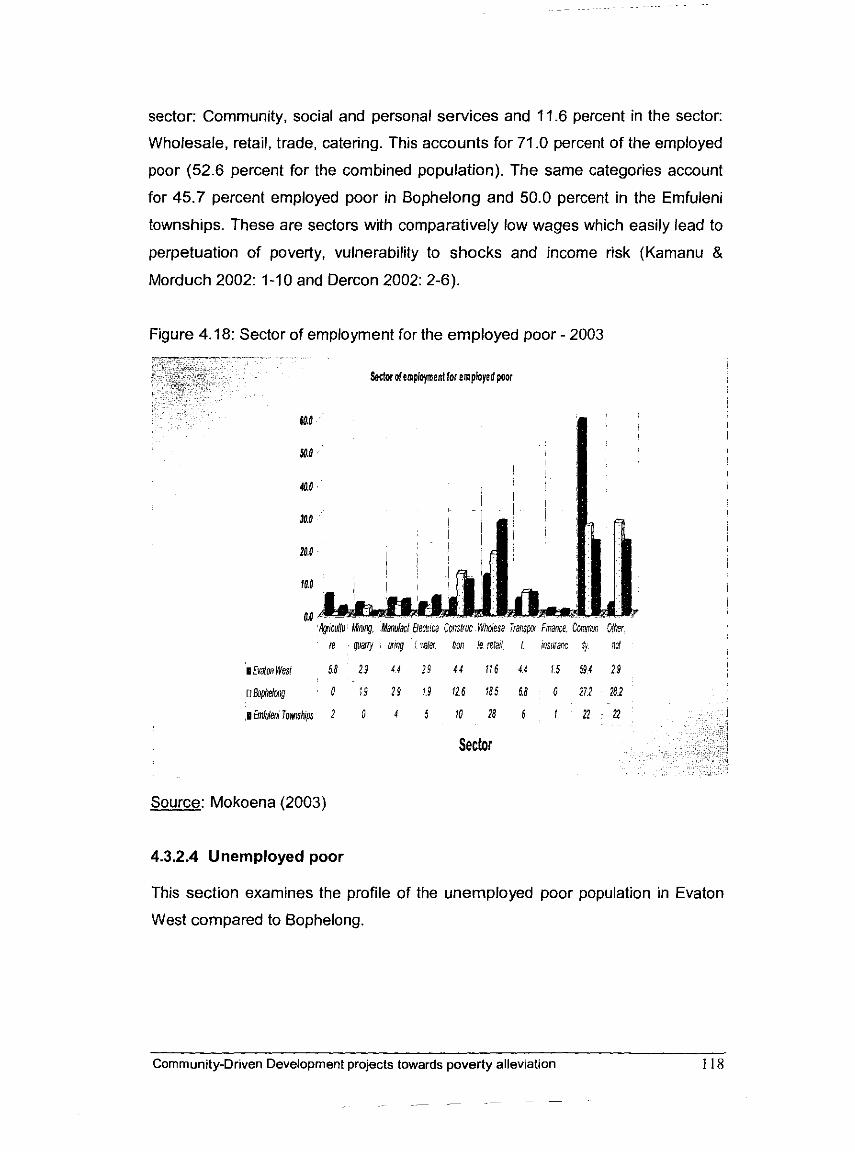
sector: Community, social and personal services and 11.6 percent in the sector:
Wholesale, retail, trade, catering. This accounts for 71.0 percent of the employed
poor (52.6 percent for the combined population). The same categories account
for 45.7 percent employed poor in Bophelong and 50.0 percent in the Emfuleni
townships. These are sectors with comparatively low wages which easily lead to
perpetuation of poverty, vulnerability to shocks and income risk (Kamanu &
Morduch 2002: 1-10 and Dercon 2002: 2-6).
Figure 4.18: Sector of employment for the employed poor - 2003
hdord~mplO~enlforemployed poor
Source: Mokoena (2003)
4.3.2.4 Unemployed poor
This section examines the profile of the unemployed poor population in Evaton
West compared to Bophelong.
Community-Driven Development projects towards poverty alleviation 1 18
~~ ~ ~- - -
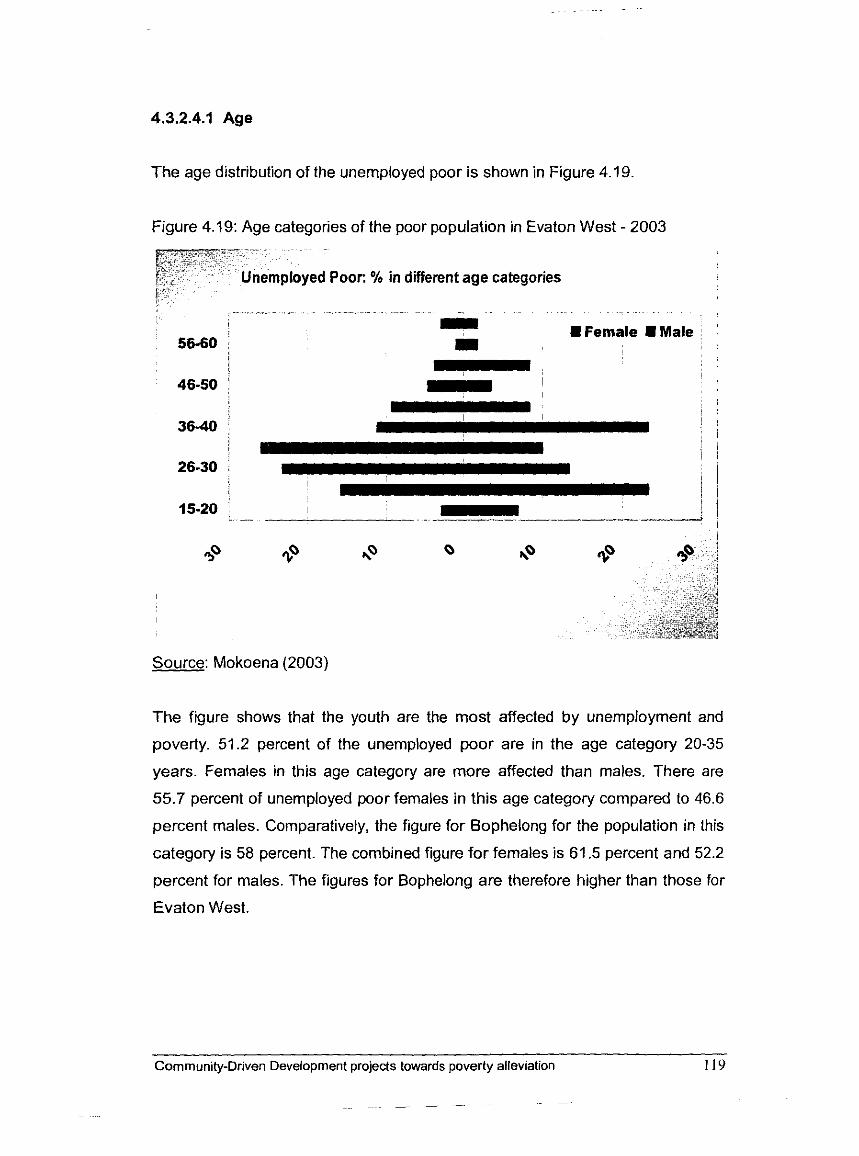
4.3.2.4.1 Age
The age distribution of the unemployed poor is shown in Figure 4.19
Figure 4.19: Age categories of the poor population in Evaton West - 2003 . .
ployed Poor: % in different age categories
" - ,..,... . .. . , .. . ... .. . .
I ' ' F e m a l e .Male : ' i
Source: Mokoena (2003)
The figure shows that the youth are the most affected by unemployment and
poverty. 51.2 percent of the unemployed poor are in the age category 20-35
years. Females in this age category are more affected than males. There are
55.7 percent of unemployed poor females in this age category compared to 46.6
percent males. Comparatively, the figure for Bophelong for the population in this
category is 58 percent. The combined figure for females is 61.5 percent and 52.2
percent for males. The figures for Bophelong are therefore higher than those for
Evaton West.
Commun~ty-Driven Development projects towards poverty allev~ation 119
- - - - - -
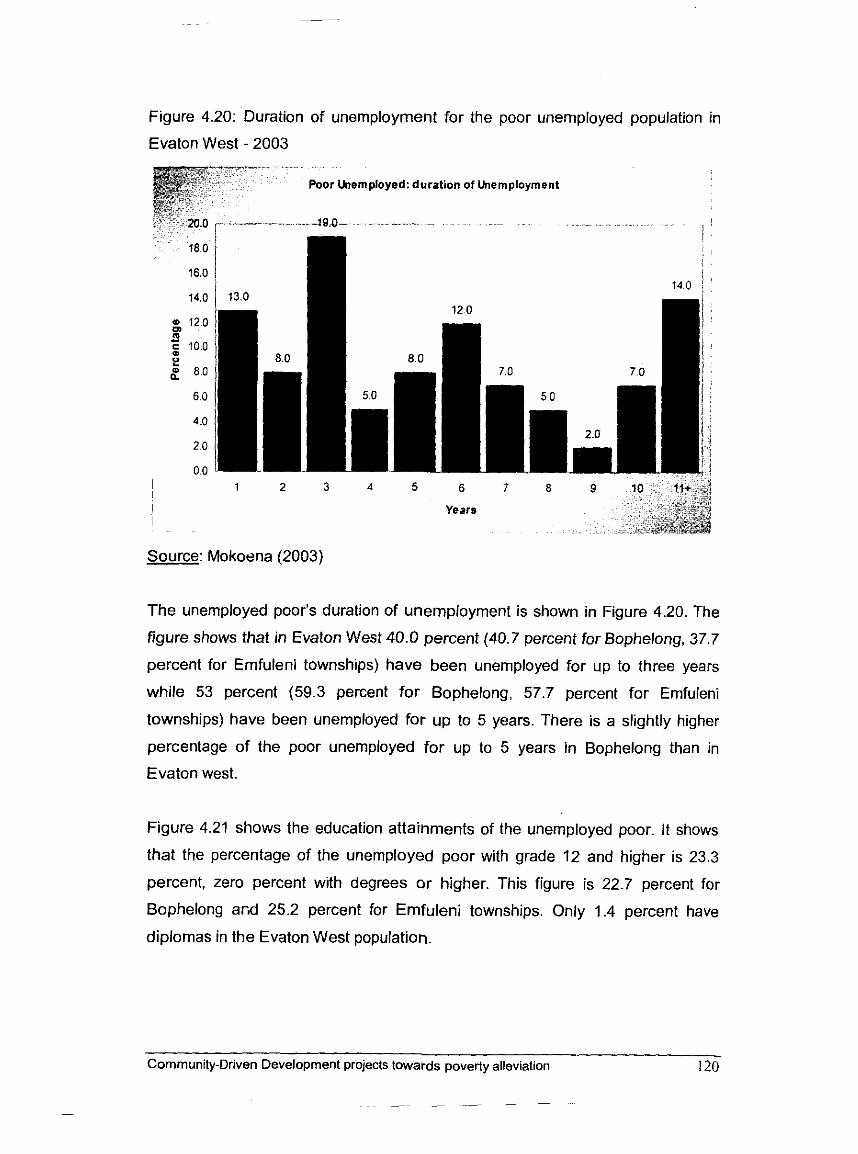
Figure 4.20: Duration of unemployment for the poor unemployed population in
Evaton West - 2003
Poor Ulemployed: duration of Unemployment
. .. . . .. . .. .. .
5 6
Years
Source: Mokoena (2003)
The unemployed poor's duration of unemployment is shown in Figure 4.20. The
figure shows that in Evaton West 40.0 percent (40.7 percent for Bophelong, 37.7
percent for Ernfuleni townships) have been unemployed for up to three years
while 53 percent (59.3 percent for Bophelong, 57.7 percent for Emfuleni
townships) have been unemployed for up to 5 years. There is a slightly higher
percentage of the poor unemployed for up to 5 years in Bophelong than in
Evaton west.
Figure 4.21 shows the education attainments of the unemployed poor. It shows
that the percentage of the unemployed poor with grade 12 and higher is 23.3
percent, zero percent with degrees or higher. This figure is 22.7 percent for
Bophelong ar,d 25.2 percent for Ernfuleni townships. Only 1.4 percent have
diplomas in the Evaton West population.
Community-Driven Development projects towards poverty alleviation 120
~~ -- - - ~-
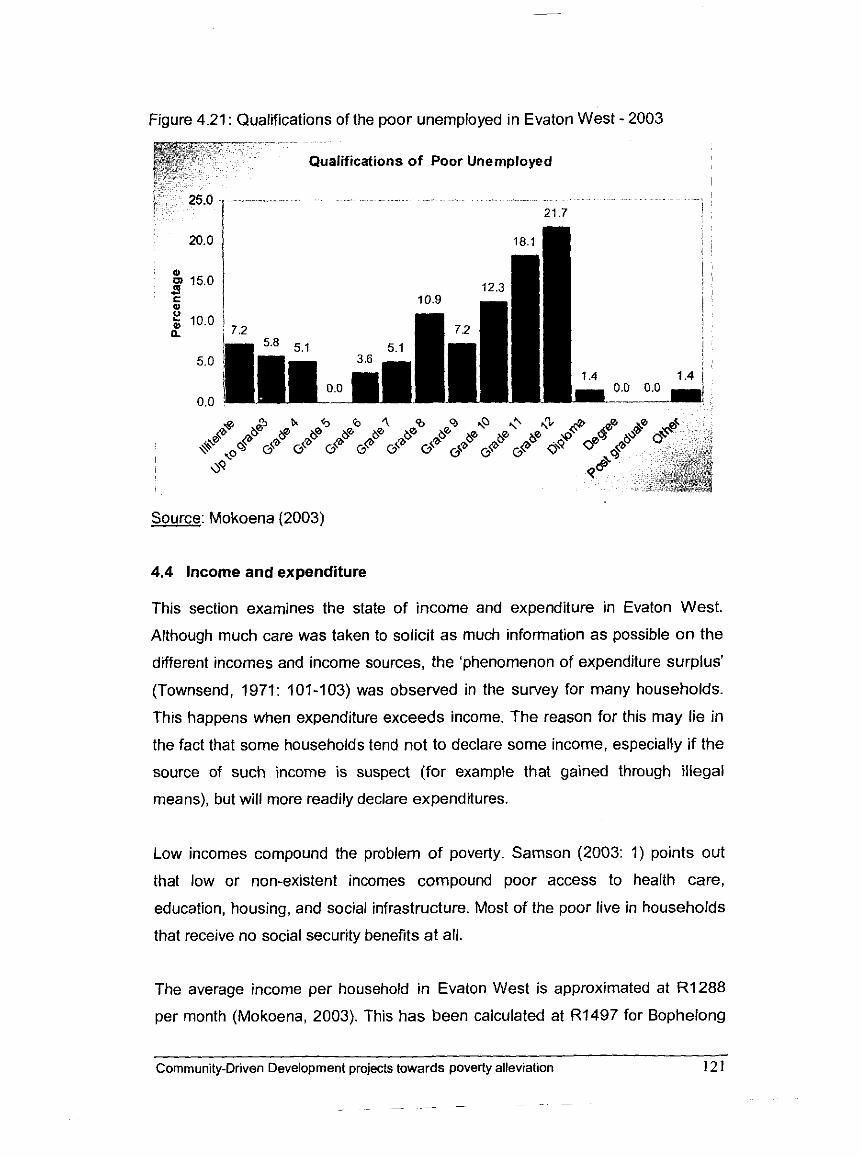
Figure 4.21: Qualifications of the poor unemployed in Evaton West - 2003
Source: Mokoena (2003)
4.4 Income and expenditure
This section examines the state of income and expenditure in Evaton West.
Although much care was taken to solicit as much information as possible on the
different incomes and income sources, the 'phenomenon of expenditure surplus'
(Townsend, 1971: 101-103) was observed in the survey for many households.
This happens when expenditure exceeds income. The reason for this may lie in
the fact that some households tend not to declare some income, especially if the
source of such income is suspect (for example that gained through illegal
means), but will more readily declare expenditures.
Low incomes compound the problem of poverty. Samson (2003: 1) points out
that low or non-existent incomes compound poor access to health care,
education, housing, and social infrastructure. Most of the poor live in households
that receive no social security benefits at all.
The average income per household in Evaton West is approximated at R1288
per month (Mokoena, 2003). This has been calculated at R1497 for Bophelong
Community-Driven Development projects towards poverty alleviation 121
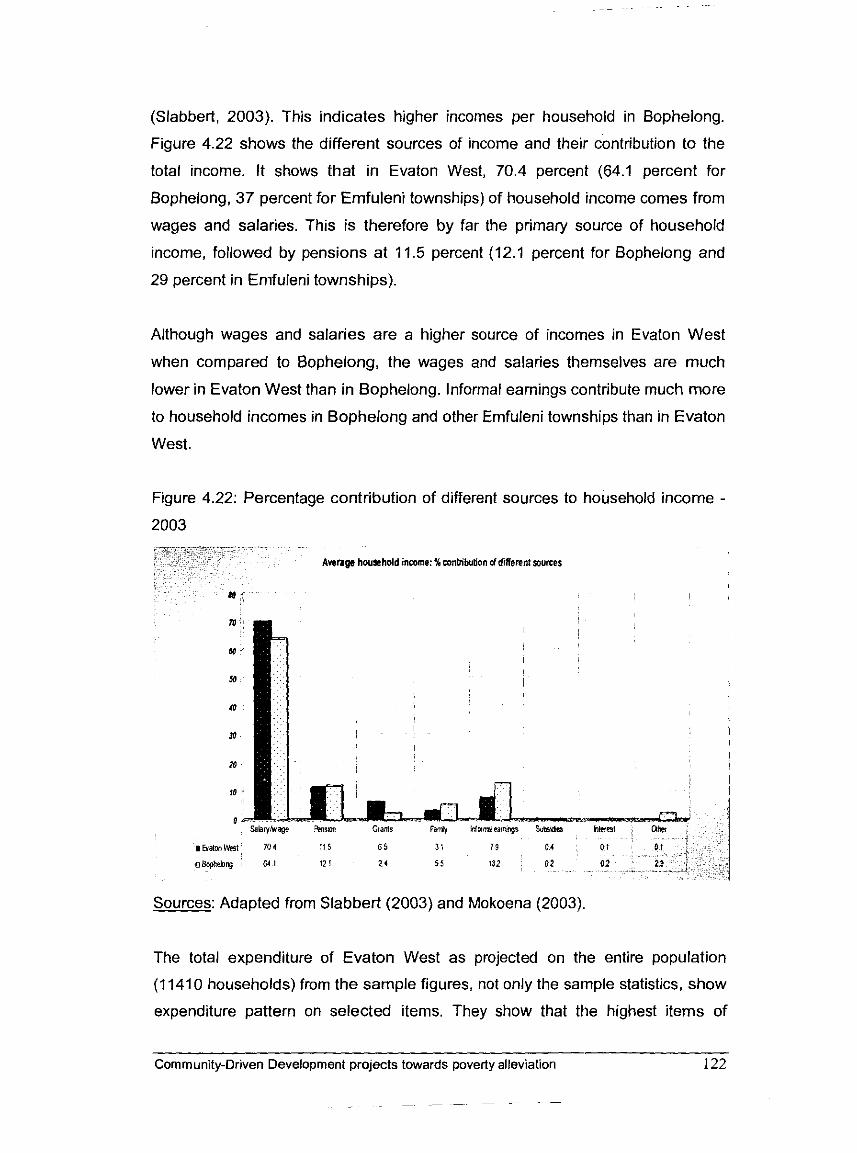
(Slabbed, 2003). This indicates higher incomes per household in Bophelong.
Figure 4.22 shows the different sources of income and their contribution to the
total income. It shows that in Evaton West, 70.4 percent (64.1 percent for
Bophelong, 37 percent for Ernfuleni townships) of household income comes from
wages and salaries. This is therefore by far the primary source of household
income, followed by pensions at 11.5 percent (12.1 percent for Bophelong and
29 percent in Enifuleni townships).
Although wages and salaries are a higher source of incomes in Evaton West
when compared to Bophelong, the wages and salaries themselves are much
lower in Evaton West than in Bophelong. Informal earnings contribute much more
to household incomes in Bophelong and other Emfuleni townships than in Evaton
West.
Figure 4.22: Percentage contribution of different sources to household income -
2003
Amrags houahold income: % wnbibulion oldifrerent aurcer
I
I I I
I
I balm Wt 701
Sources: Adapted from Slabbed (2003) and Mokoena (2003).
The total expenditure of Evaton West as projected on the entire population
(11410 households) from the sample figures, not only the sample statistics, show
expenditure pattern on selected items. They show that the highest items of
Community-Driven Development projects towards poverty alleviation 122
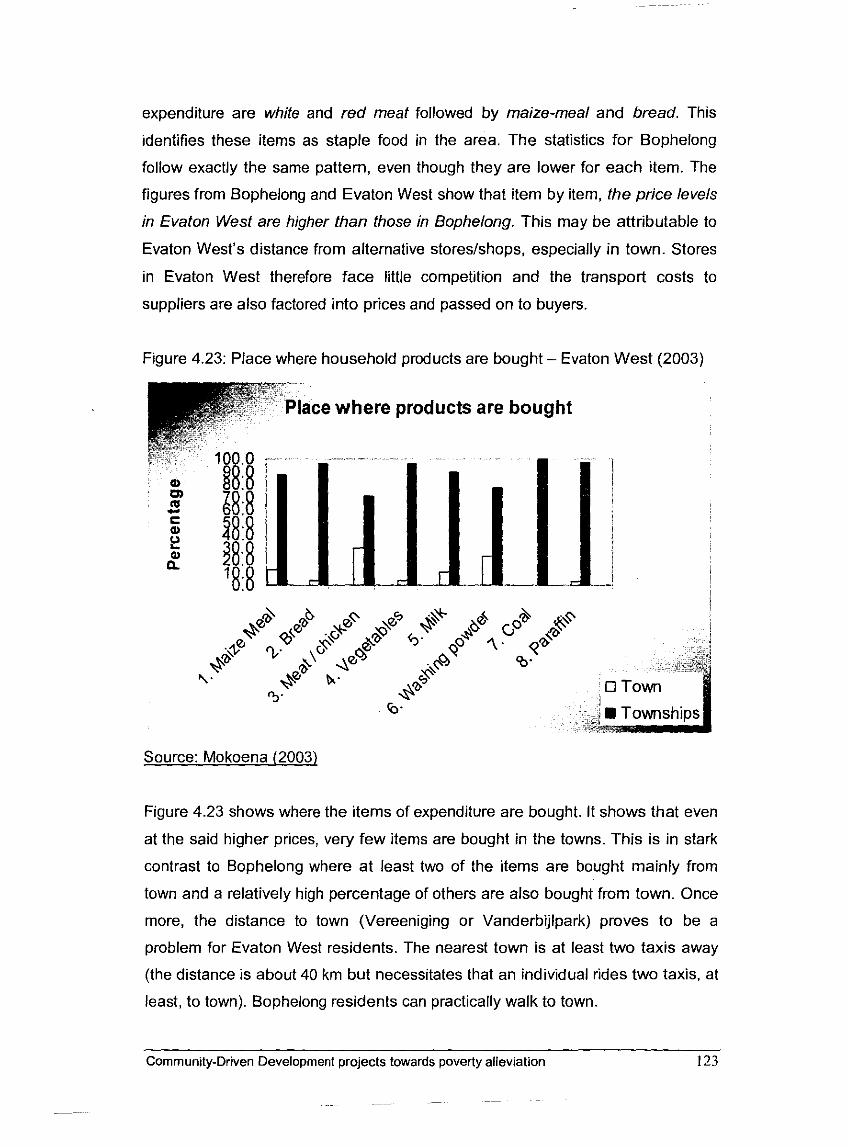
expenditure are white and red meat followed by maize-meal and bread. This
identifies these items as staple food in the area. The statistics for Bophelong
follow exactly the same pattern, even though they are lower for each item. The
figures from Bophelong and Evaton West show that item by item, the price levels
in Evaton West are higher than those in Bophelong. This may be attributable to
Evaton West's distance from alternative stores/shops, especially in town. Stores
in Evaton West therefore face little competition and the transport costs to
suppliers are also factored into prices and passed on to buyers.
Figure 4.23: Place where household products are bought - Evaton West (2003)
Source: Mokoena (2003)
Figure 4.23 shows where the items of expenditure are bought. It shows that even
at the said higher prices, very few items are bought in the towns. This is in stark
contrast to Bophelong where at least two of the items are bought mainly from
town and a relatively high percentage of others are also bought from town. Once
more, the distance to town (Vereeniging or Vanderbijlpark) proves to be a
problem for Evaton West residents. The nearest town is at least two taxis away
(the distance is about 40 km but necessitates that an individual rides two taxis, at
least, to town). Bophelong residents can practically walk to town.
Community-Driven Development projects towards poverty alleviation
- -- --
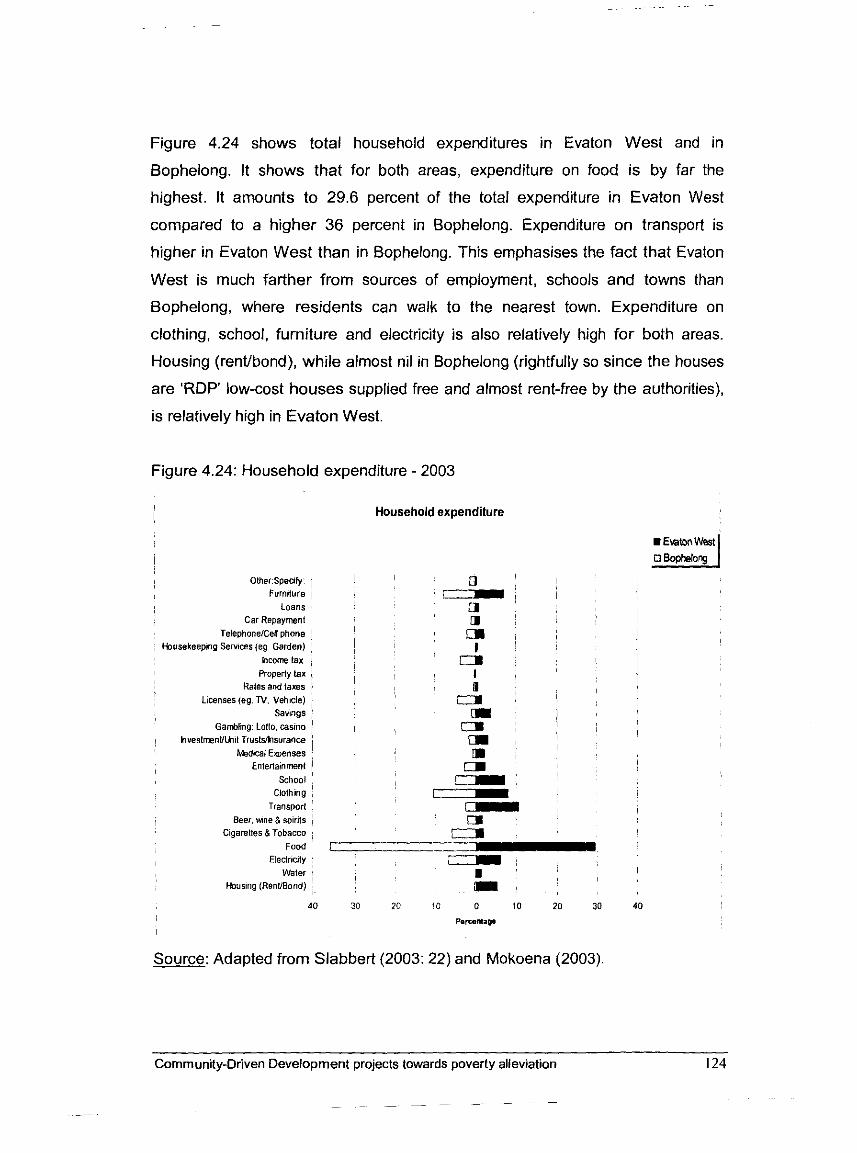
Figure 4.24 shows total household expenditures in Evaton West and in
Bophelong. It shows that for both areas, expenditure on food is by far the
highest. It amounts to 29.6 percent of the total expenditure in Evaton West
compared to a higher 36 percent in Bophelong. Expenditure on transport is
higher in Evaton West than in Bophelong. This emphasises the fact that Evaton
West is much farther from sources of employment, schools and towns than
Bophelong, where residents can walk to the nearest town. Expenditure on
clothing, school, furniture and electricity is also relatively high for both areas.
Housing (rentlbond), while almost nil in Bophelong (rightfully so since the houses
are 'RDP' low-cost houses supplied free and almost rent-free by the authorities),
is relatively high in Evaton West.
Figure 4.24: Household expenditure - 2003
Household expenditure
Other Speafy , Furntture I
Loans Car Repayment
TebphonelCell phone tbusekeepmg Servfces (eg Garden)
hcom lax Property lax
Rates and taxes Ldcenses (eg TV Vehole)
Savings Gambhg Lollo casm
hveslmenUUmt Trurtslhsurance Medm1 Evenses
Entertammen1 School
Clothmg Tran~porl
Beer w e 8 splnts Clgareltes 8 Tobacco
Food Eledrtaty
Water tbusmg (RenUBand)
Source: Adapted from Slabbert (2003: 22) and Mokoena (2003).
Community-Driven Development projects towards poverty alleviation 124
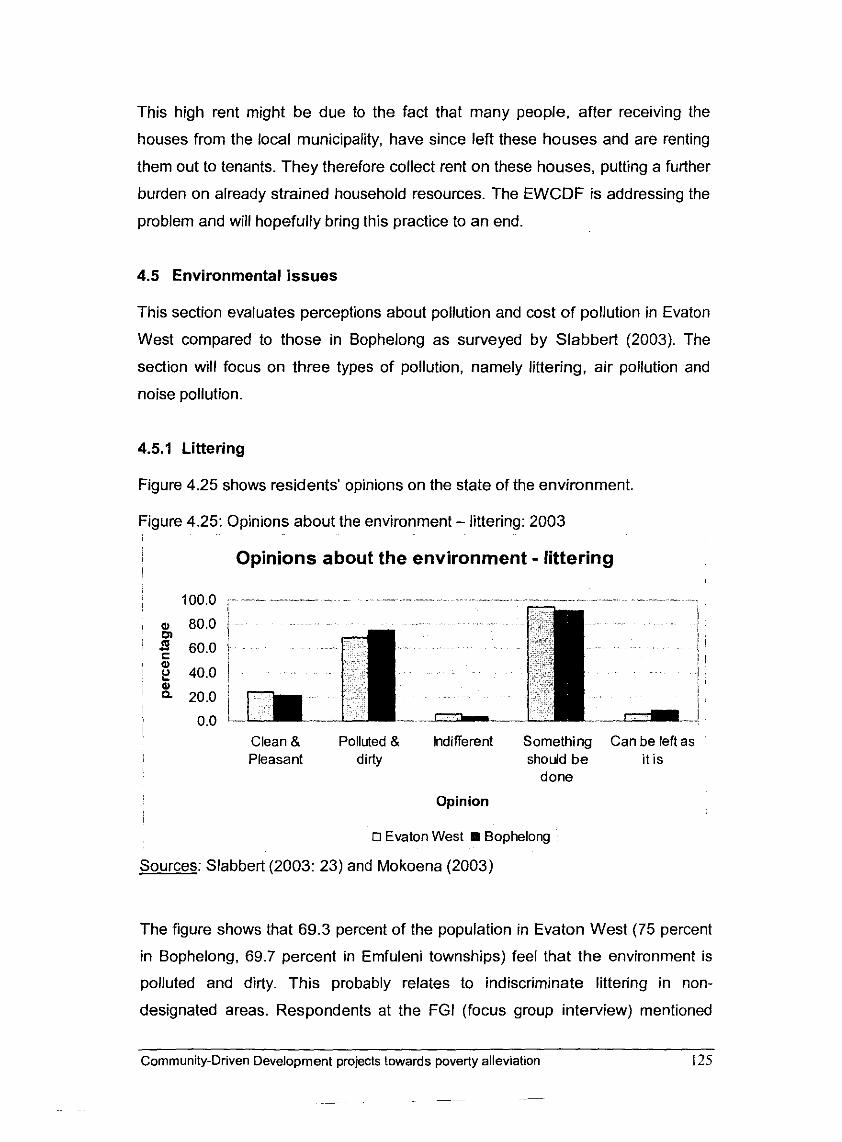
This high rent might be due to the fact that many people, after receiving the
houses from the local municipality, have since left these houses and are renting
them out to tenants. They therefore collect rent on these houses, putting a further
burden on already strained household resources. The EWCDF is addressing the
problem and will hopefully bring this practice to an end.
4.5 Environmental issues
This section evaluates perceptions about pollution and cost of pollution in Evaton
West compared to those in Bophelong as surveyed by Slabbert (2003). The
section will focus on three types of pollution, namely littering, air pollution and
noise pollution.
4.5.1 Littering
Figure 4.25 shows residents' opinions on the state of the environment.
Figure 4.25: Opinions about the environment - littering: 2003
Opinions about the environment - littering
Clean 8 Polluted 8 indifferent Something Can be left as Pleasant dirty should b e it is
done
Opinion
O Evaton West . Bophelong
Sources: Slabbert (2003: 23) and Mokoena (2003)
The figure shows that 69.3 percent of the population in Evaton West (75 percent
in Bophelong, 69.7 percent in Emfuleni townships) feel that the environment is
polluted and dirty. This probably relates to indiscriminate littering in non-
designated areas. Respondents at the FGI (focus group interview) mentioned
Community-Driven Development projects towards poverty alleviation 125
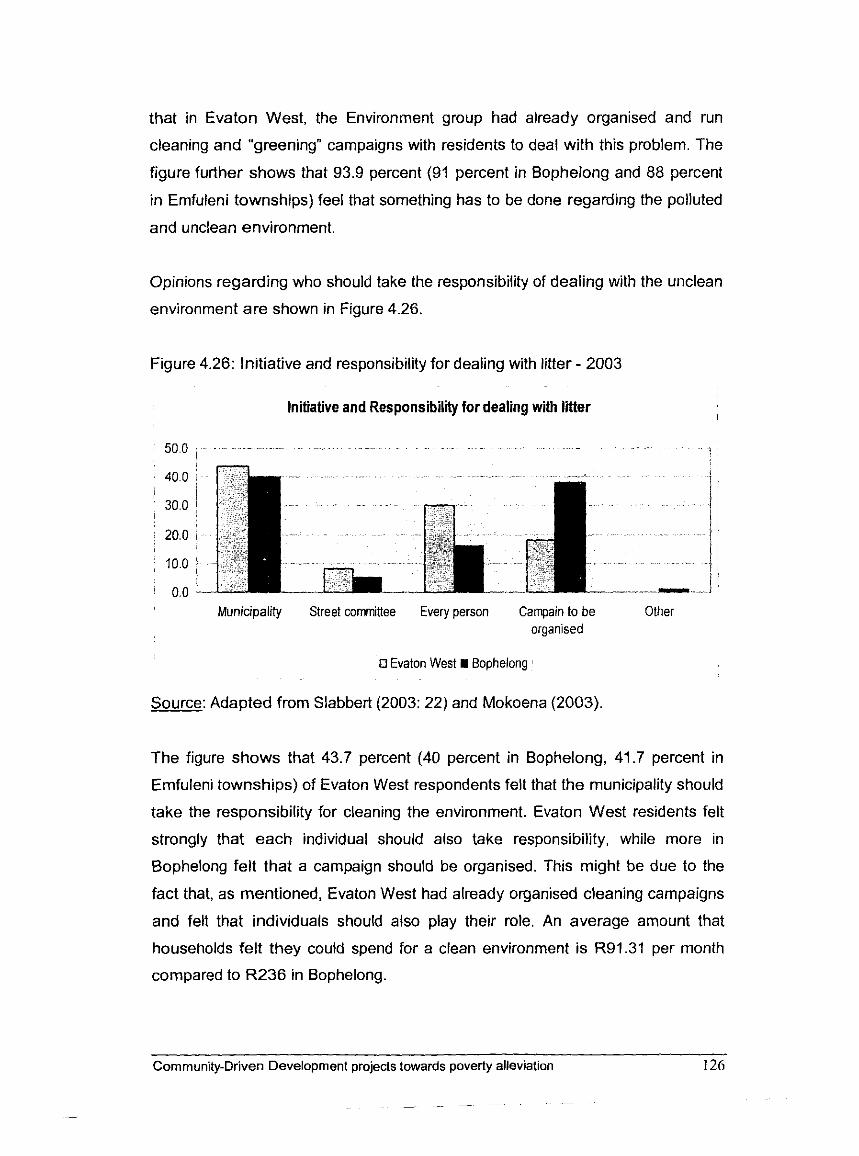
that in Evaton West, the Environment group had already organised and run
cleaning and "greening" campaigns with residents to deal with this problem. The
figure further shows that 93.9 percent (91 percent in Bophelong and 88 percent
in Emfuleni townships) feel that something has to be done regarding the polluted
and unclean environment.
Opinions regarding who should take the responsibility of dealing with the unclean
environment are shown in Figure 4.26.
Figure 4.26: Initiative and responsibility for dealing with litter - 2003
Initiative and Responsibili for dealing with l i e r
Municipality Street committee Every person Campain to be Other organised
a Evaton West I Bophelong '
Source: Adapted from Slabbert (2003: 22) and Mokoena (2003).
The figure shows that 43.7 percent (40 percent in Bophelong, 41.7 percent in
Emfuleni townships) of Evaton West respondents felt that the municipality should
take the responsibility for cleaning the environment. Evaton West residents felt
strongly that each individual should also take responsibility, while more in
Bophelong felt that a campaign should be organised. This might be due to the
fact that, as mentioned, Evaton West had already organised cleaning campaigns
and felt that individuals should also play their role. An average amount that
households felt they could spend for a clean environment is R91.31 per month
compared to R236 in Bophelong.
Community-Driven Development projects towards poverty alleviation
-
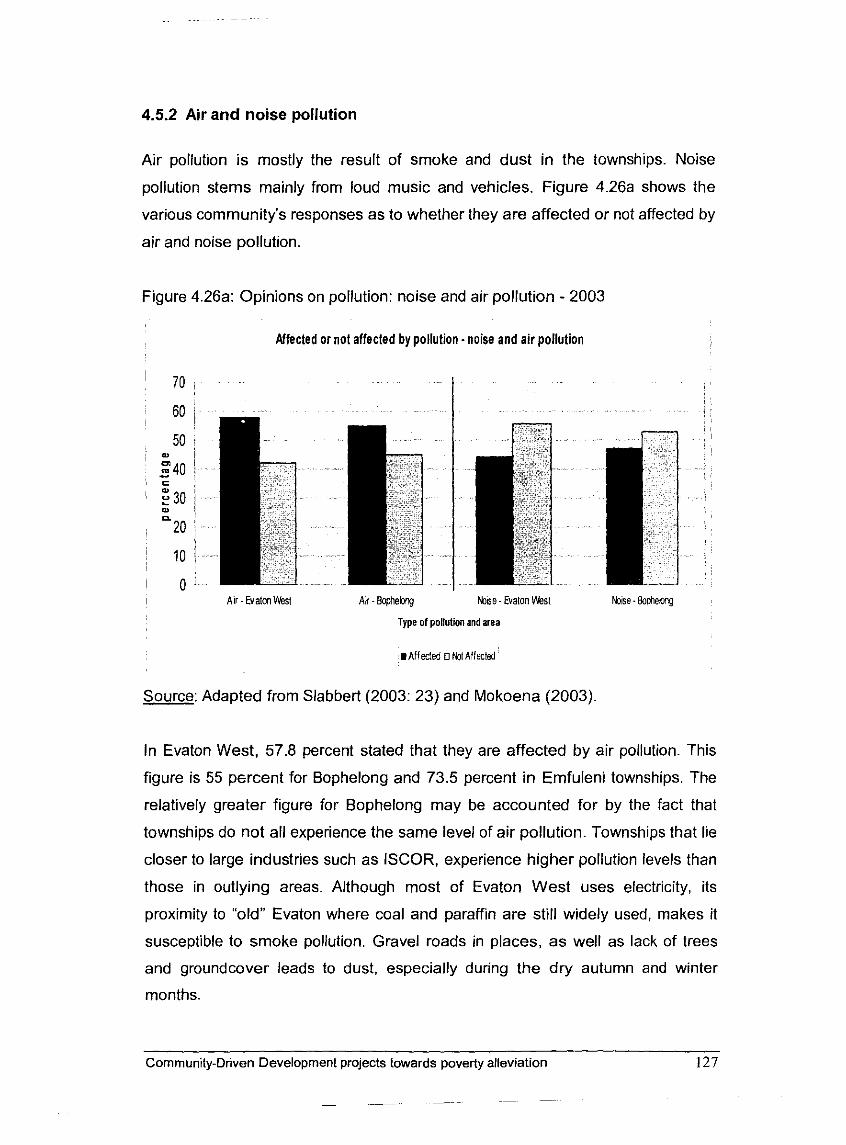
4.5.2 Air and noise pollution
Air pollution is mostly the result of smoke and dust in the townships. Noise
pollution stems mainly from loud music and vehicles. Figure 4.26a shows the
various community's responses as to whether they are affected or not affected by
air and noise pollution.
Figure 4.26a: Opinions on pollution: noise and alr pollution - 2003
Affected or not affected by pollution - noise and air pollution
I A r - Evaton West An - Baphebng b e - Evaton YUest k s e - Bophebrq
Type of pollution and area
.Affected o b I Affected
Source: Adapted from Slabbert (2003: 23) and Mokoena (2003).
In Evaton West, 57.8 percent stated that they are affected by air pollution. This
figure is 55 percent for Bophelong and 73.5 percent in Emfuleni townships. The
relatively greater figure for Bophelong may be accounted for by the fact that
townships do not all experience the same level of air pollution. Townships that lie
closer to large industries such as ISCOR, experience higher pollution levels than
those in outlying areas. Although most of Evaton West uses electricity, its
proximity to "old" Evaton where coal and paraffin are still widely used, makes it
susceptible to smoke pollution. Gravel roads in places, as well as lack of trees
and groundcover leads to dust, especially during the dry autumn and winter
months.
Community-Driven Development projects towards poverty alleviation
-- -- -~ -p~ - -
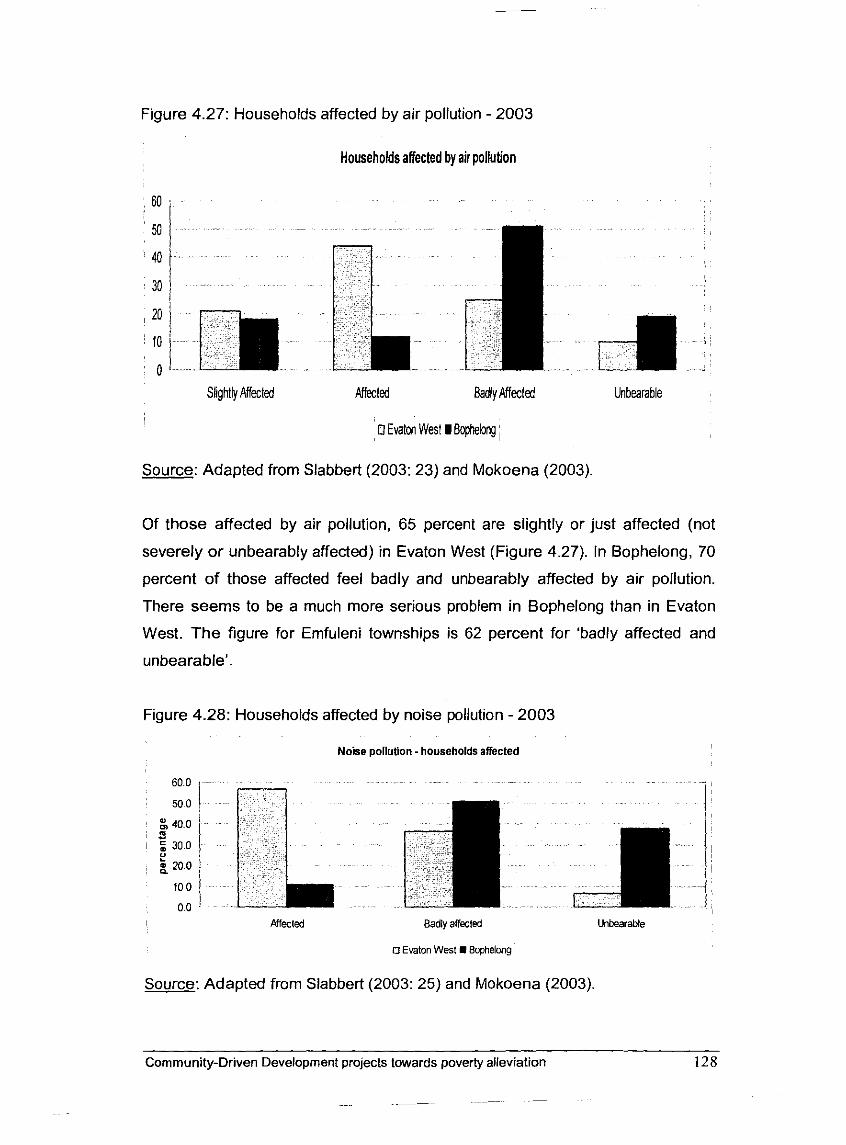
Figure 4.27: Households affected by air pollution - 2003
Households affected by air pollution
Slighlly Affected Affecled Badly Affected Unbearable
0 Evaton West 8 Bophelong,
Source: Adapted from Slabbert (2003: 23) and Mokoena (2003).
Of those affected by air pollution, 65 percent are slightly or just affected (not
severely or unbearably affected) in Evaton West (Figure 4.27). In Bophelong, 70
percent of those affected feel badly and unbearably affected by air pollution.
There seems to be a much more serious problem in Bophelong than in Evaton
West. The figure for Emfuleni townships is 62 percent for 'badly affected and
unbearable'.
Figure 4.28: Households affected by noise pollution - 2003
Noise pollution - households affected
Affected Badly affected Unbearable
D Evaton West rn Bophelong
Source: Adapted from Slabbert (2003: 25) and Mokoena (2003).
Community-Driven Development projects towards poverty alleviation
~
~-
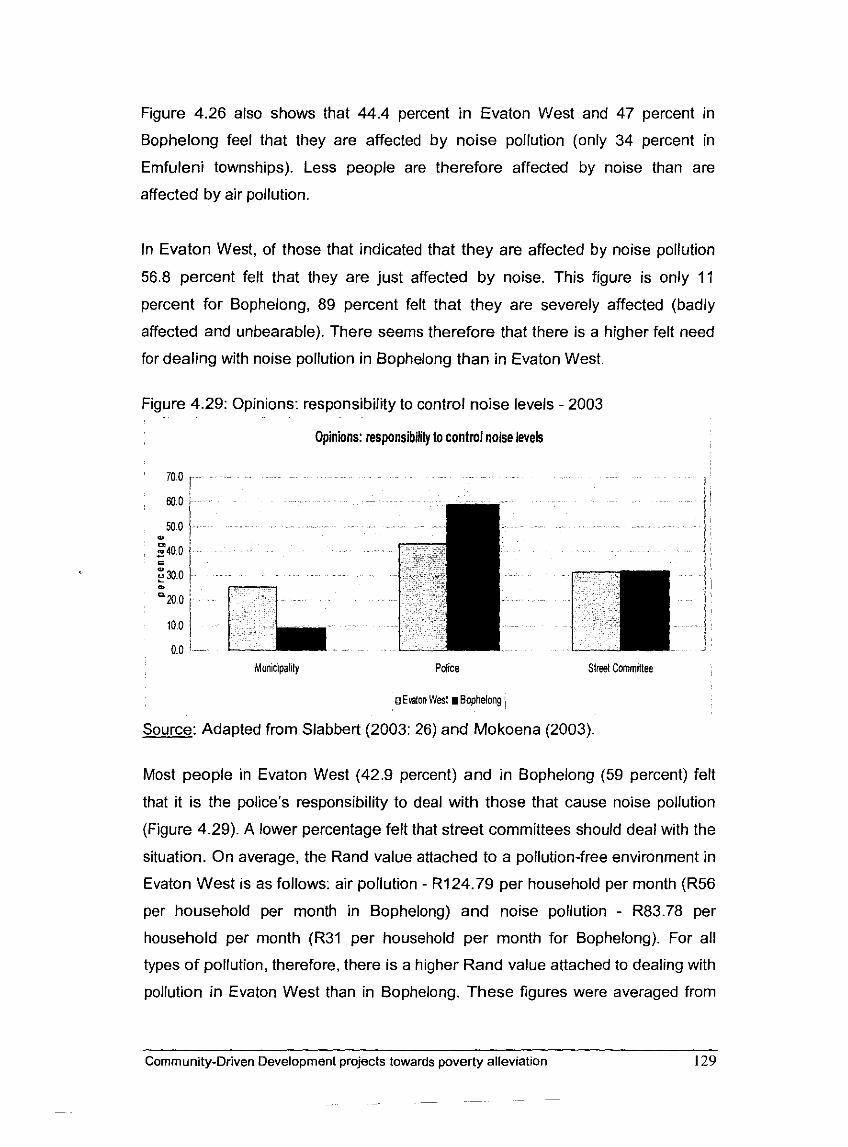
Figure 4.26 also shows that 44.4 percent in Evaton West and 47 percent in
Bophelong feel that they are affected by noise pollution (only 34 percent in
Emfuleni townships). Less people are therefore affected by noise than are
affected by air pollution.
In Evaton West, of those that indicated that they are affected by noise pollution
56.8 percent felt that they are just affected by noise. This figure is only 11
percent for Bophelong, 89 percent felt that they are severely affected (badly
affected and unbearable). There seems therefore that there is a higher felt need
for dealing with noise pollution in Bophelong than in Evaton West.
Figure 4.29: Opinions: responsibility to control noise levels - 2003
Opinions: responsibilily to control noise levels
o Evdlon W e : I Bophelong , Source: Adapted from Slabbert (2003: 26) and Mokoena (2003).
Most people in Evaton West (42.9 percent) and in Bophelong (59 percent) felt
that it is the police's responsibility to deal with those that cause noise pollution
(Figure 4.29). A lower percentage felt that street committees should deal with the
situation. On average, the Rand value attached to a pollution-free environment in
Evaton West is as follows: air pollution - R124.79 per household per month (R56
per household per month in Bophelong) and noise pollution - R83.78 per
household per month (R31 per household per month for Bophelong). For all
types of pollution, therefore, there is a higher Rand value attached to dealing with
pollution in Evaton West than in Bophelong. These figures were averaged from
Community-Driven Development projects towards poverty allevlatlon
- - -
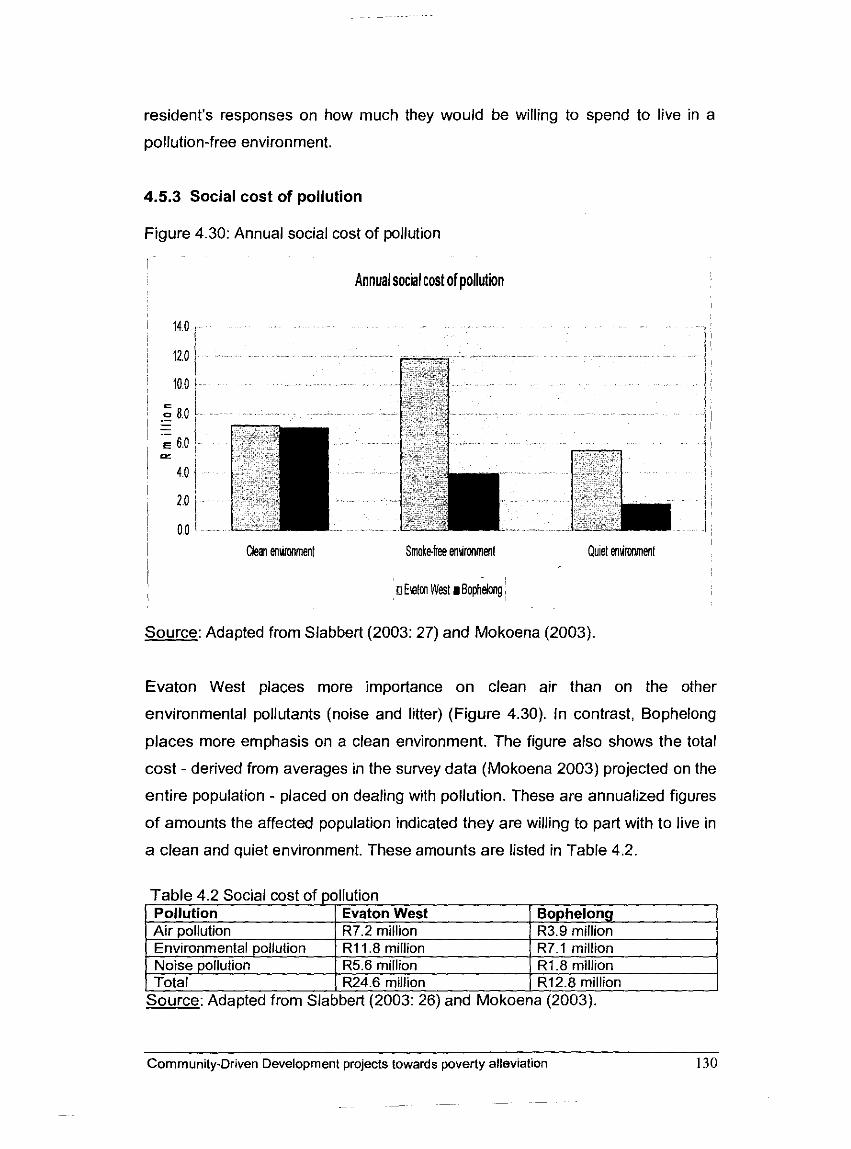
resident's responses on how much they would be willing to spend to live in a
pollution-free environment.
4.5.3 Social cost of pollution
Figure 4.30: Annual social cost of pollution
Annual social cost of pollution
Clean enumment Smoke-hee enummenl Quiel enimoment
o Ewlon West I Bophelong
Source: Adapted from Slabbert (2003: 27) and Mokoena (2003).
Evaton West places more importance on clean air than on the other
environmental pollutants (noise and litter) (Figure 4.30). In contrast, Bophelong
places more emphasis on a clean environment. The figure also shows the total
cost - derived from averages in the survey data (Mokoena 2003) projected on the
entire population - placed on dealing with pollution. These are annualized figures
of amounts the affected population indicated they are willing to part with to live in
a clean and quiet environment. These amounts are listed in Table 4.2.
. . - . - - - . . -. . - . . . . - . - . . . . . . . - . . . . . . - . . . . . . . - . . Total 1 R24.6 million I R12.8 million
Table 4.2 Social cost of pollution
Source: Adapted from Slabbert (2003: 26) and Mokoena (2003).
Pollution Air pollution Environmental pollution Noise nnllutinn
~- - - -~ - - -~
Community-Driven Development projects towards poverty alleviation 130
Evaton West -- R7.2 million R1 1.8 million R5 6 millinn
R3.9 million R7.1 million R1 8 million
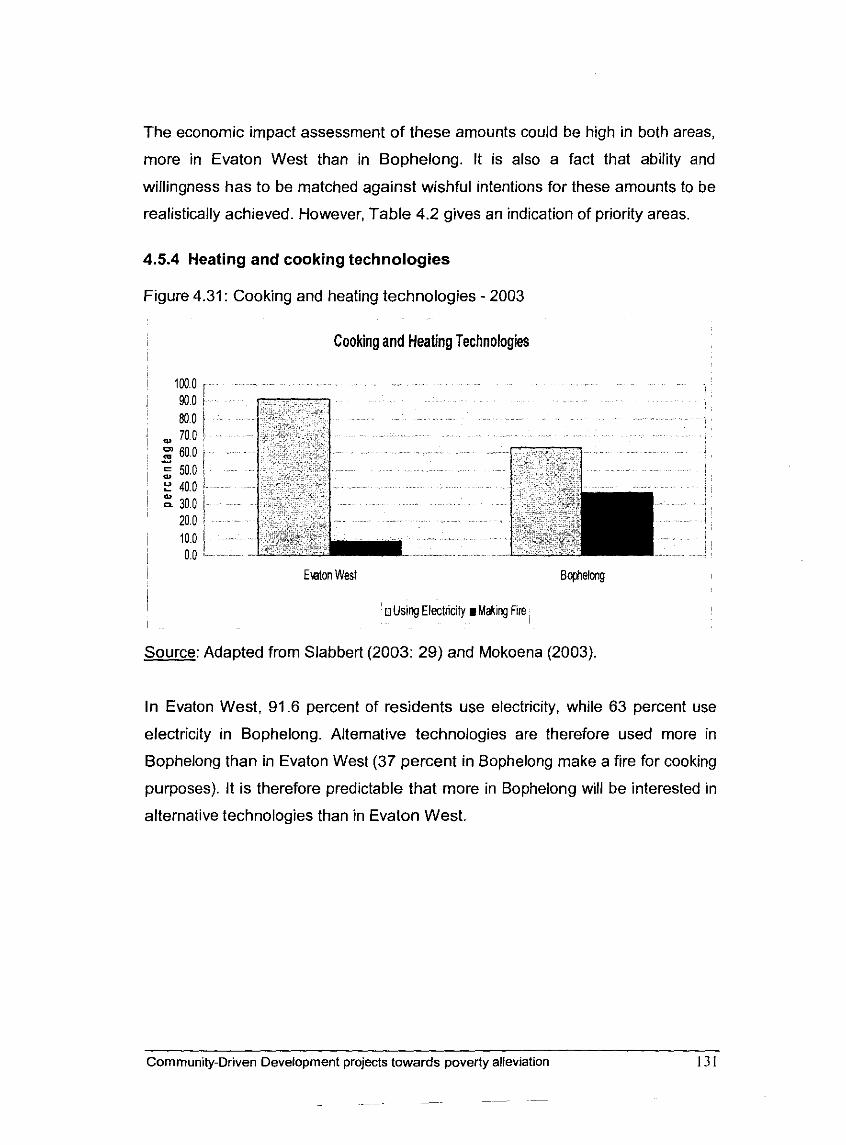
The economic impact assessment of these amounts could be high in both areas,
more in Evaton West than in Bophelong. It is also a fact that ability and
willingness has to be matched against wishful intentions for these amounts to be
realistically achieved. However, Table 4.2 gives an indication of priority areas.
4.5.4 Heating and cooking technologies
Figure 4.31: Cooking and heating technologies - 2003
Cooking and Heating Technologies
Emton West Bophelong
Source: Adapted from Slabbert (2003: 29) and Mokoena (2003).
In Evaton West, 91.6 percent of residents use electricity, while 63 percent use
electricity in Bophelong. Alternative technologies are therefore used more in
Bophelong than in Evaton West (37 percent in Bophelong make a fire for cooking
purposes). It is therefore predictable that more in Bophelong will be interested in
alternative technologies than in Evaton West.
Community-Driven Development projects towards poverty alleviation
~ p p ~ -~ p~p -
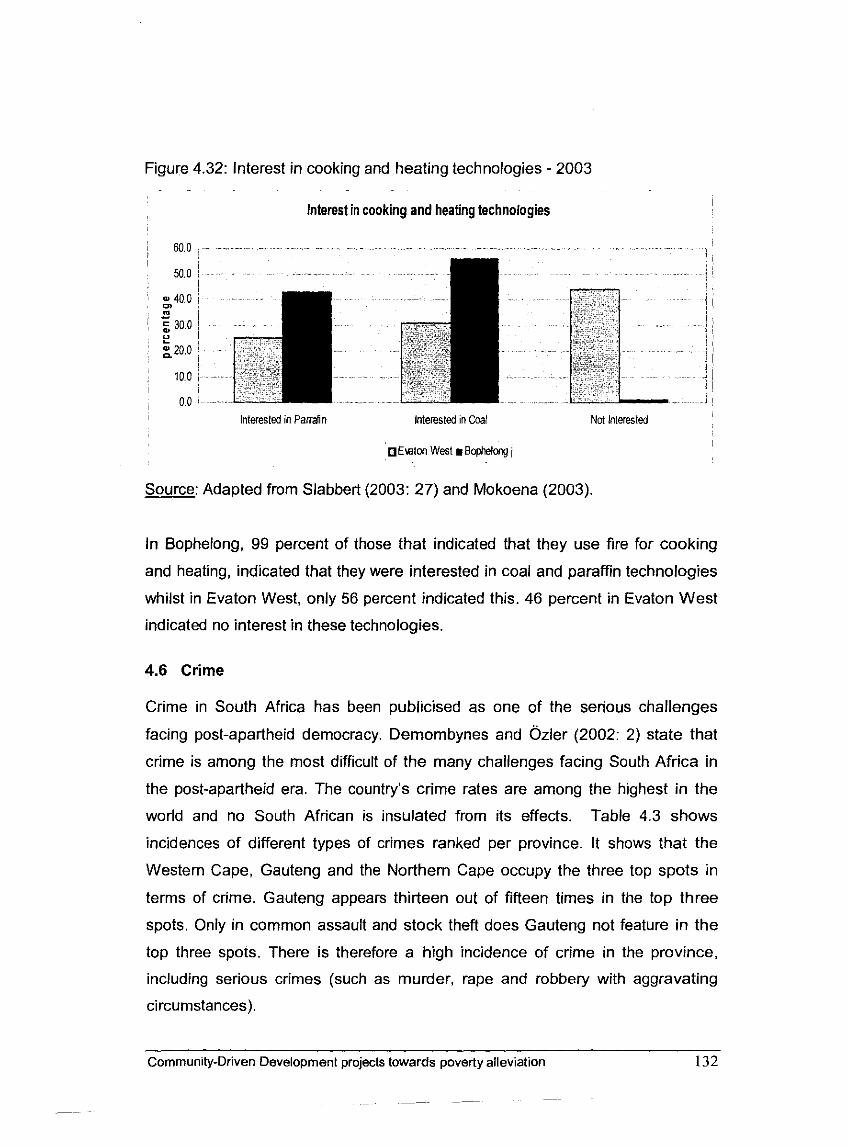
Figure 4.32: lnterest in cooking and heating technologies - 2003 -
Interest in cooking and heating technologies
Interested in P a d n Interested in Coal Nd Interested
OElaton West boph he long I
Source: Adapted from Slabbert (2003: 27) and Mokoena (2003).
In Bophelong, 99 percent of those that indicated that they use fire for cooking
and heating, indicated that they were interested in coal and paraffin technologies
whilst in Evaton West, only 56 percent indicated this. 46 percent in Evaton West
indicated no interest in these technologies.
4.6 Crime
Crime in South Africa has been publicised as one of the serious challenges
facing post-apartheid democracy. Demombynes and 0zler (2002: 2) state that
crime is among the most difficult of the many challenges facing South Africa in
the post-apartheid era. The country's crime rates are among the highest in the
world and no South African is insulated from its effects. Table 4.3 shows
incidences of different types of crimes ranked per province. It shows that the
Western Cape, Gauteng and the Northern Cape occupy the three top spots in
terms of crime. Gauteng appears thirteen out of fifteen times in the top three
spots. Only in common assault and stock theft does Gauteng not feature in the
top three spots. There is therefore a high incidence of crime in the province,
including serious crimes (such as murder, rape and robbery with aggravating
circumstances).
Community-Driven Development projects towards poverty alleviation 132
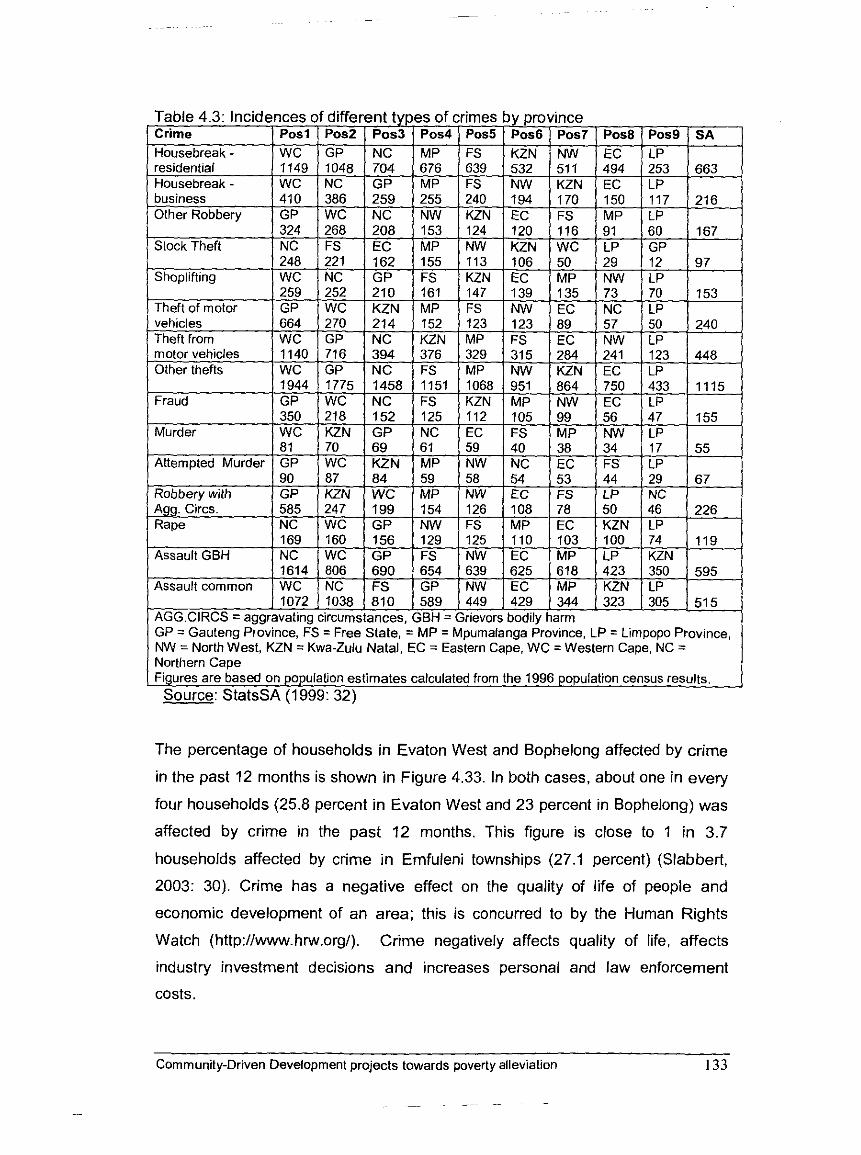
Table 4.3: Incidences of different tu Crime Posl Pos2 P O S ~
Housebreak - WC GP NC residential 1149 1048 704 Housebreak - WC NC GP business 410 386 259 Other Robbery GP WC NC
324 268 208 Stock Theft NC FS EC
248 221 162 Shoplifting WC NC GP
.259 . 252 210 Theft of motor GP WC KZN vehicles 664 270 214 Theft from WC GP NC motor veh~cles
Fraud
Murder
A . Circs. Rape WC
169 160 156 Assault GBH WC GP
1614 806 690 Assault common WC
1072 1038 810 AGG.CIRCS = amravatina circumstances,
h e s by province
58 54 53 44 29 67 NW EC FS LP NC 126 108 78 50 46 226 FS MP EC KZN LP 125 110 103 100 74 119
NW EC MP KZN LP 449 429 344 323 305 515 irievors bodilv harm I G
GP = Gauteng province, k = Free State, = MP = Mpurnalanga Province, LP = Lirnpopo Province, NW = North West, KZN = Kwa-Zulu Natal, EC = Eastern Cape, WC =Western Cape, NC = Northern Cape Figures are based on population estimates calculated from the 1996 population census results. Source: StatsSA (1999: 32)
The percentage of households in Evaton West and Bophelong affected by crime
in the past 12 months is shown in Figure 4.33. In both cases, about one in every
four households (25.8 percent in Evaton West and 23 percent in Bophelong) was
affected by crime in the past 12 months. This figure is close to 1 in 3.7
households affected by crime in Emfuleni townships (27.1 percent) (Slabbert,
2003: 30). Crime has a negative effect on the quality of life of people and
economic development of an area; this is concurred to by the Human Rights
Watch (http://www.hrw.org/). Crime negatively affects quality of life, affects
industry investment decisions and increases personal and law enforcement
costs.
Community-Driven Development projects towards poverty alleviation 133
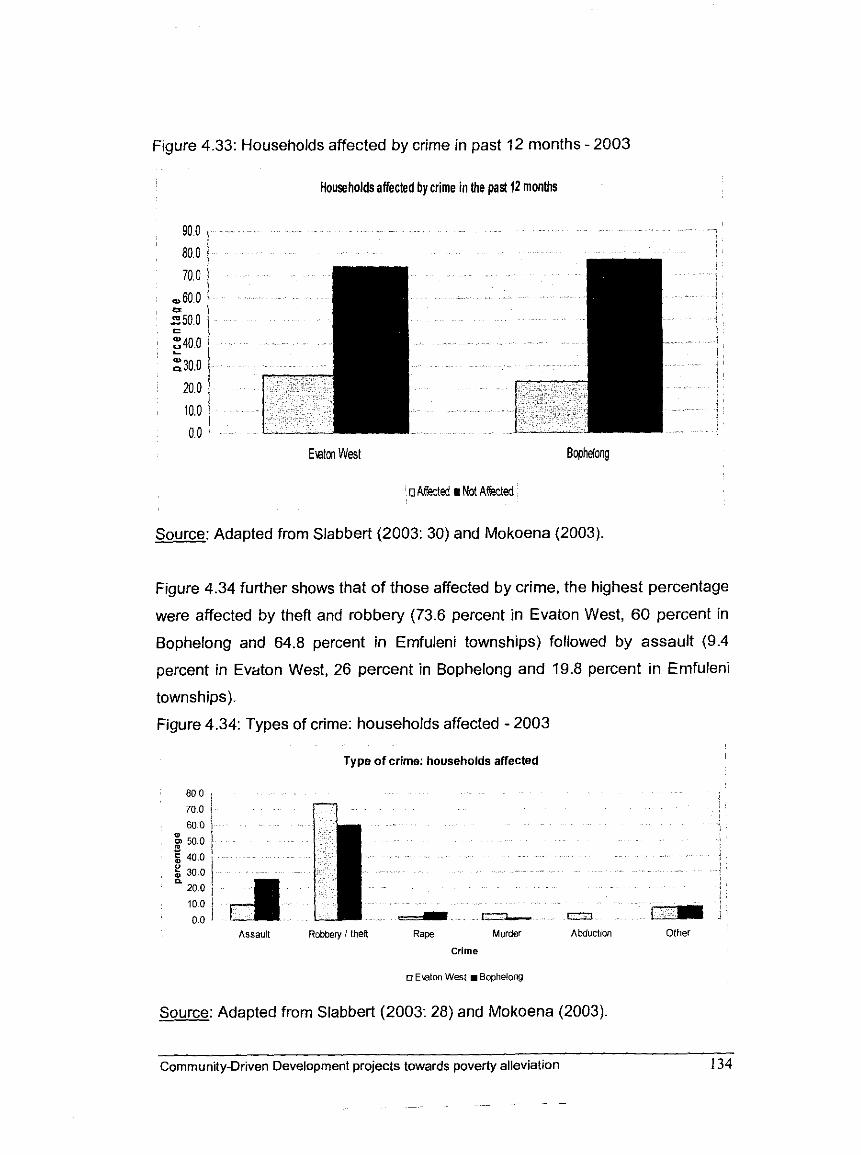
Figure 4.33: Households affected by crime in past 12 months - 2003
Householdsaffected by crime in the past 12 months
E\alon Wesl Bophelong
o A k k d m Not AWed
Source: Adapted from Slabbert (2003: 30) and Mokoena (2003).
Figure 4.34 further shows that of those affected by crime, the highest percentage
were affected by theR and robbery (73.6 percent in Evaton West, 60 percent in
Bophelong and 64.8 percent in Emfuleni townships) followed by assault (9.4
percent in Evaton West, 26 percent in Bophelong and 19.8 percent in Emfuleni
townships).
Figure 4.34: Types of crime: households affected - 2003
Type of crime: households affected I
Assault Robbery i then Rape Murder AWuctlon Other
Crime
o Emton West mBophdong
Source: Adapted from Slabbert (2003: 28) and Mokoena (2003).
Community-Driven Development projects towards poverty alleviation 134
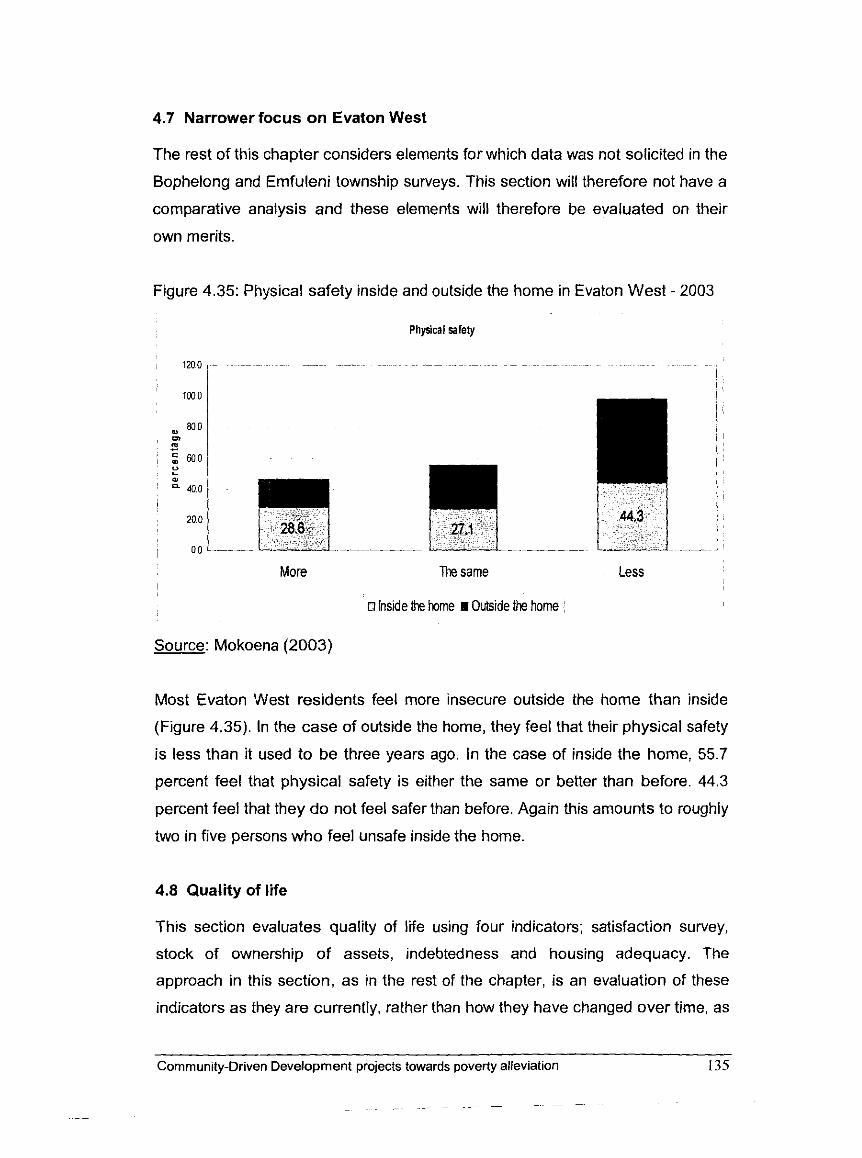
4.7 Narrower focus on Evaton West
The rest of this chapter considers elements for which data was not solicited in the
Bophelong and Emfuleni township surveys. This section will therefore not have a
comparative analysis and these elements will therefore be evaluated on their
own merits.
Figure 4.35: Physical safety inside and outside the home in Evaton West - 2003
Physical safely
More The same Less I
o hs~de the tome m Outsrde the home
Source: Mokoena (2003)
Most Evaton West residents feel more insecure outside the home than inside
(Figure 4.35). In the case of outside the home, they feel that their physical safety
is less than it used to be three years ago. In the case of inside the home, 55.7
percent feel that physical safety is either the same or better than before. 44.3
percent feel that they do not feel safer than before. Again this amounts to roughly
two in five persons who feel unsafe inside the home.
4.8 Quality of life
This section evaluates quality of life using four indicators; satisfaction survey,
stock of ownership of assets, indebtedness and housing adequacy. The
approach in this section, as in the rest of the chapter, is an evaluation of these
indicators as they are currently, rather than how they have changed over time, as
Communtty-Driven Development projects towards poverty alleviation
-
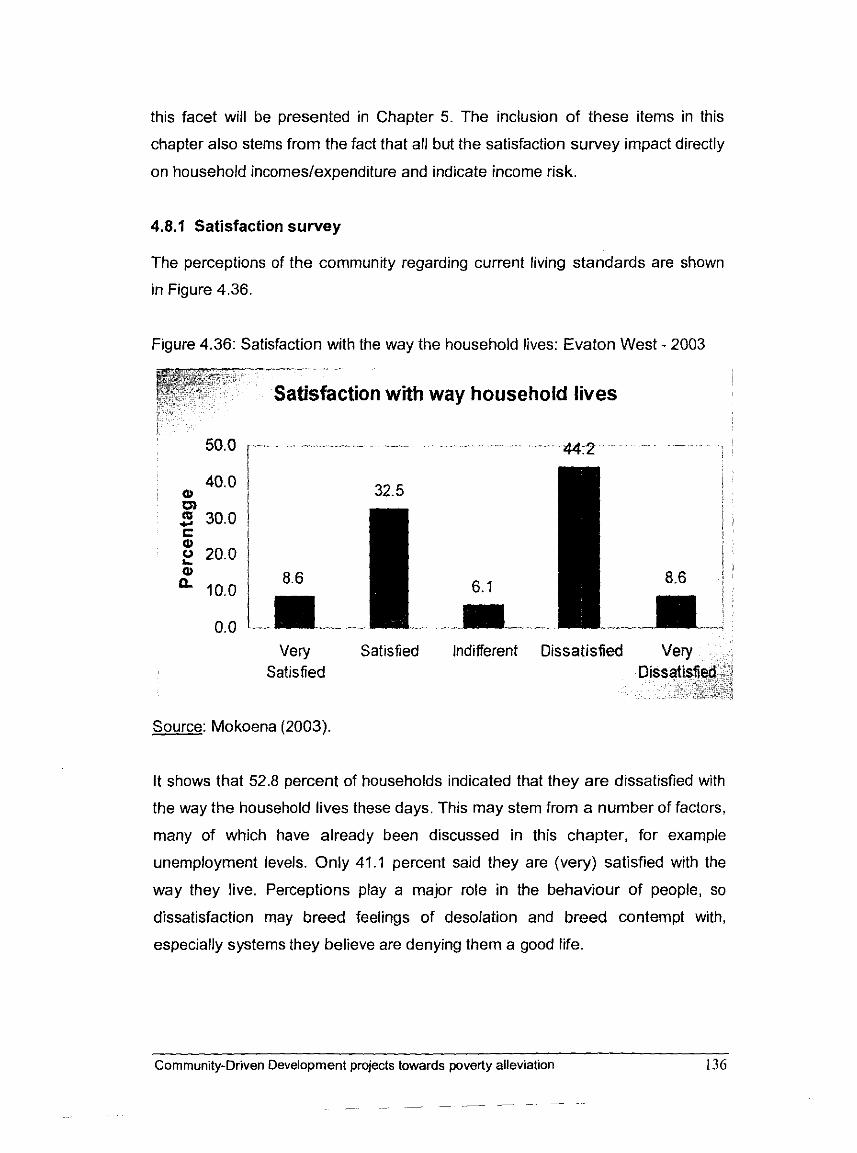
this facet will be presented in Chapter 5. The inclusion of these items in this
chapter also stems from the fact that all but the satisfaction survey impact directly
on household incomes/expenditure and indicate income risk.
4.8.1 Satisfaction survey
The perceptions of the community regarding current living standards are shown
in Figure 4.36.
Figure 4.36: Satisfaction with the way the household lives: Evaton West - 2003 - -. -. . .
Satisfaction with way household lives
Very Satisfied Satisfied
Indifferent Dissatisfied Very
Source: Mokoena (2003).
It shows that 52.8 percent of households indicated that they are dissatisfied with
the way the household lives these days. This may stem from a number of factors,
many of which have already been discussed in this chapter, for example
unemployment levels. Only 41.1 percent said they are (very) satisfied with the
way they live. Perceptions play a major role in the behaviour of people, so
dissatisfaction may breed feelings of desolation and breed contempt with,
especially systems they believe are denying them a good life.
Community-Driven Development projects towards poverty allev~ation 136
-
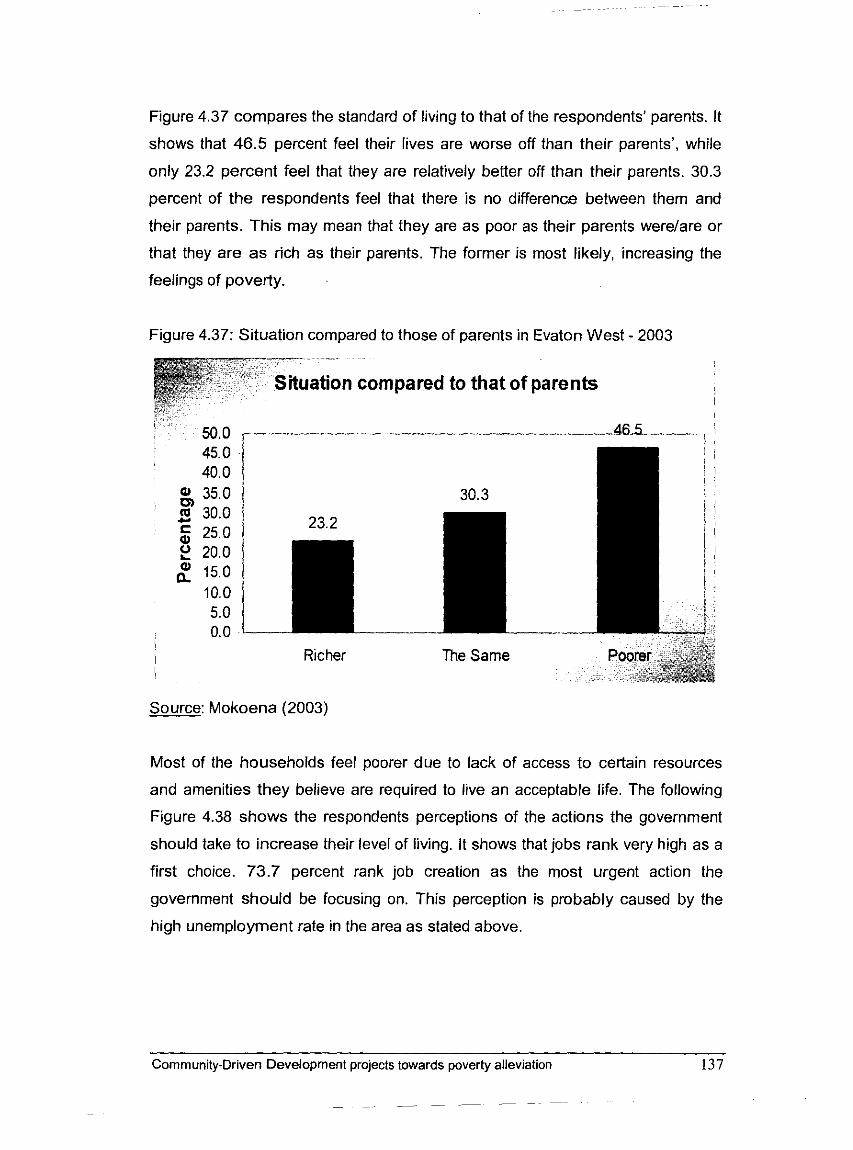
Figure 4.37 compares the standard of living to that of the respondents' parents. It
shows that 46.5 percent feel their lives are worse off than their parents', while
only 23.2 percent feel that they are relatively better off than their parents. 30.3
percent of the respondents feel that there is no difference between them and
their parents. This may mean that they are as poor as their parents werelare or
that they are as rich as their parents. The former is most likely, increasing the
feelings of poverty.
Figure 4.37: Situation compared to those of parents in Evaton West - 2003 . .
ituation compared to that of parents I I
Richer The Same
Source: Mokoena (2003)
Most of the households feel poorer due to lack of access to certain resources
and amenities they believe are required to live an acceptable life. The following
Figure 4.38 shows the respondents perceptions of the actions the government
should take to increase their level of living. It shows that jobs rank very high as a
first choice. 73.7 percent rank job creation as the most urgent action the
government should be focusing on. This perception is probably caused by the
high unemployment rate in the area as stated above.
Community-Driven Development projects towards poverty alleviation 137
- - / - -- - - -
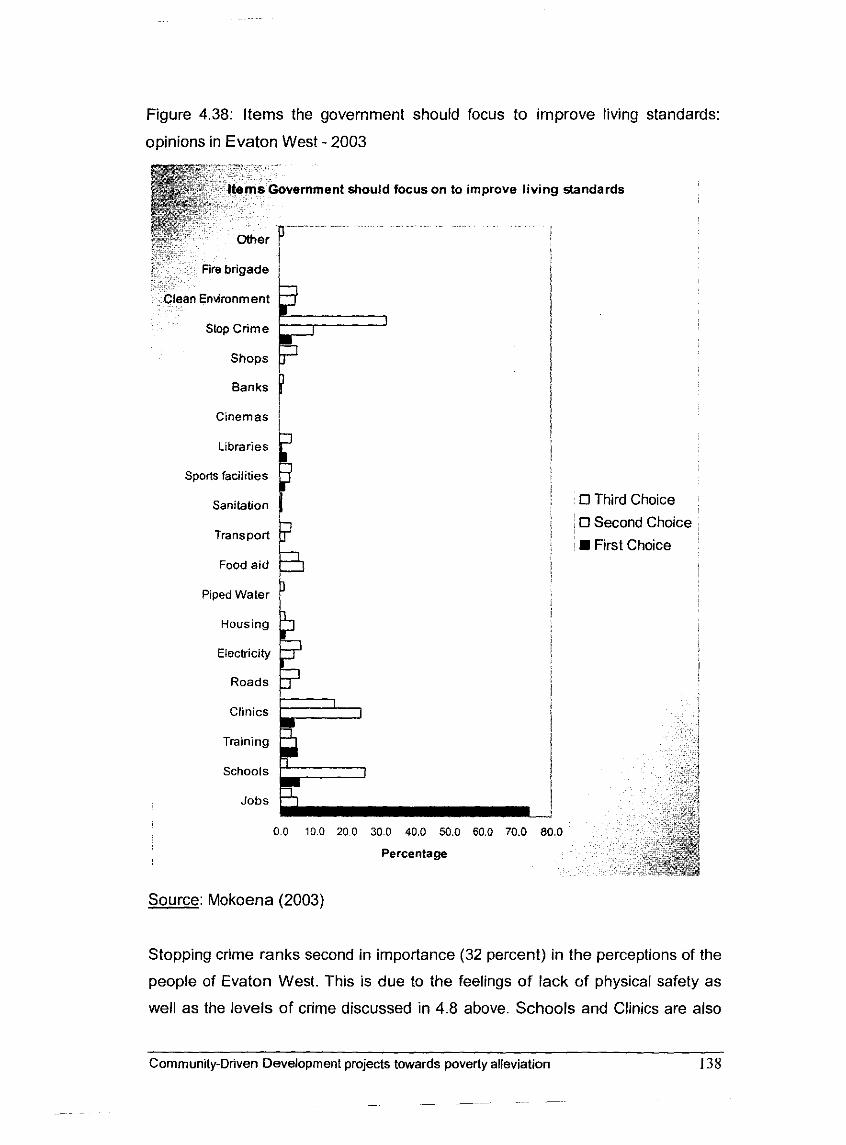
Figure 4.38: Items the government should focus to improve living standards:
opinions in Evaton West - 2003
p c r i m eJ Shops
Banks ? i
Cinemas ;
Libraries
Sports facilities
Sanitation I Transport
Piped Water
Housing
Electricity
Roads
focus on to
-
improve living standards
0 Third Choice
10 Second Choice , 8 First Choice
Clinics P Training B
I
0 0 100 20.0 30.0 40.0 50.0 60.0 70.0 80.0
! Percentage
Source: Mokoena (2003)
Stopping crime ranks second in importance (32 percent) in the perceptions of the
people of Evaton West. This is due to the feelings of lack of physical safety as
well as the levels of crime discussed in 4.8 above. Schools and Clinics are also
Community-Driven Development projects towards poverty alleviation 138
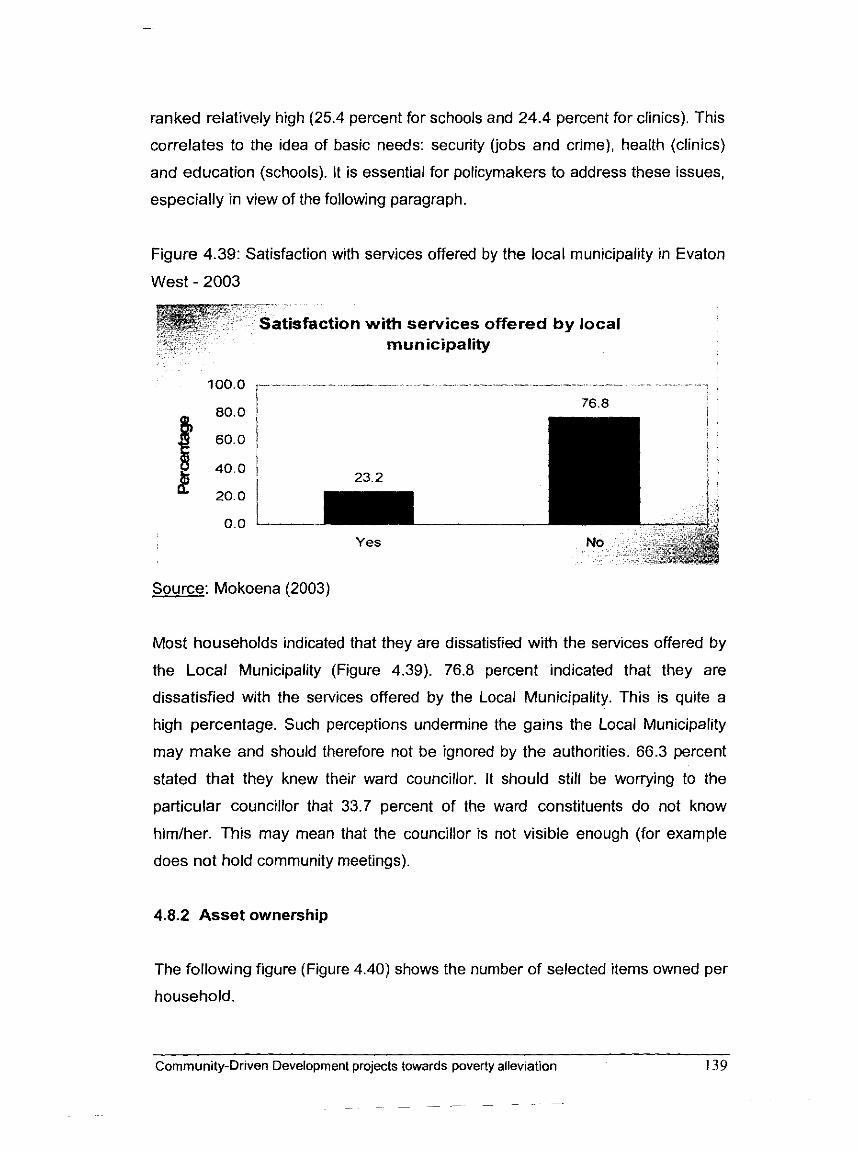
ranked relatively high (25.4 percent for schools and 24.4 percent for clinics). This
correlates to the idea of basic needs: security (jobs and crime), health (clinics)
and education (schools). It is essential for policymakers to address these issues,
especially in view of the following paragraph.
Figure 4.39: Satisfaction with services offered by the local municipality in Evaton
West - 2003
isfaction with services offered by local municipality
Source: Mokoena (2003)
Most households indicated that they are dissatisfied with the services offered by
the Local Municipality (Figure 4.39). 76.8 percent indicated that they are
dissatisfied with the services offered by the Local Municipality. This is quite a
high percentage. Such perceptions undermine the gains the Local Municipality
may make and should therefore not be ignored by the authorities. 66.3 percent
stated that they knew their ward councillor. It should still be worrying to the
particular councillor that 33.7 percent of the ward constituents do not know
himlher. This may mean that the councillor is not visible enough (for example
does not hold community meetings).
4.8.2 Asset ownership
The following figure (Figure 4.40) shows the number of selected items owned per
household.
Community-Driven Development projects towards poverty alleviation
~ -~ - - - - ~~~ -
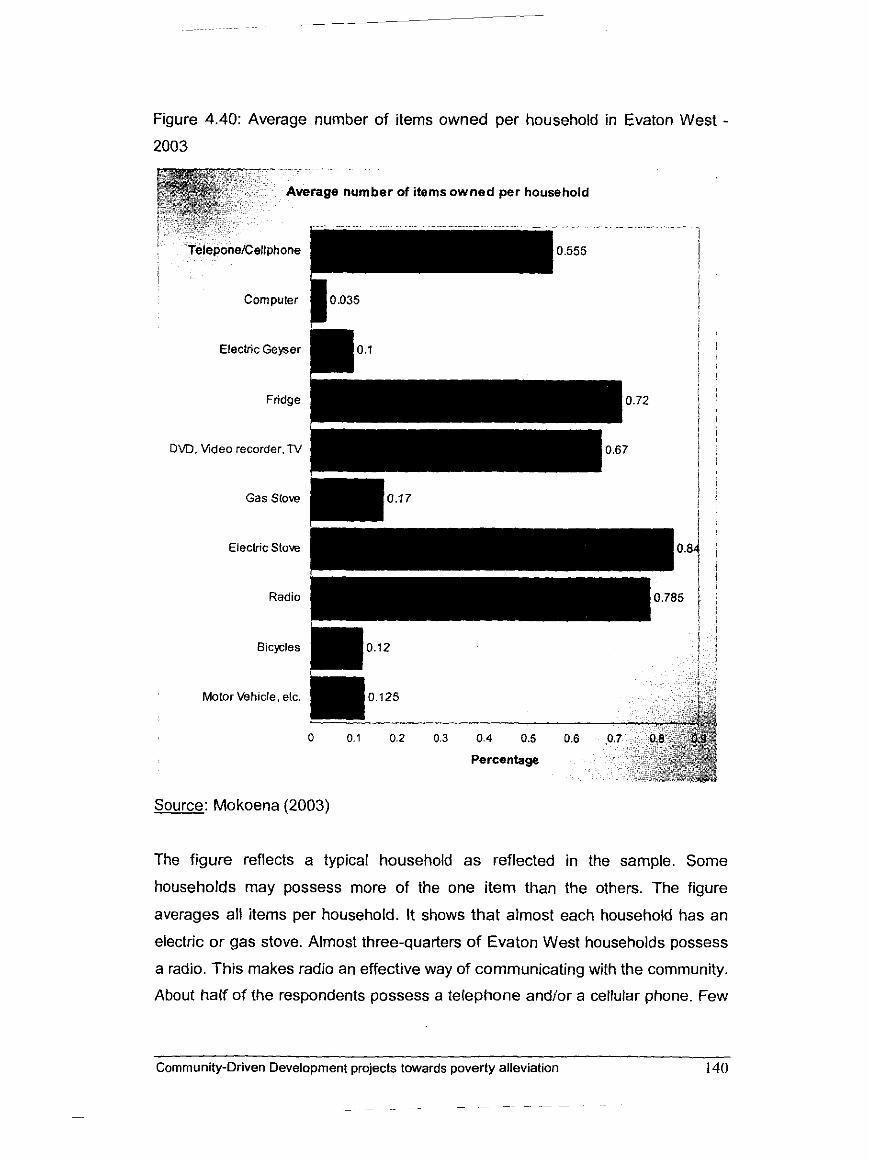
Figure 4.40: Average number of items owned per household in Evaton West -
verage number of items owned per household
.
0.555
Electric Geyser
Fridge
DVD, Video recorder. N
Gas Slow
Eleclr~c Stove
Radlo
B~cycles
Motor Vehlcle, elc
Source: Mokoena (2003)
The figure reflects a typical household as reflected in the sample. Some
households may possess more of the one item than the others. The figure
averages all items per household. It shows that almost each household has an
electric or gas stove. Almost three-quarters of Evaton West households possess
a radio. This makes radio an effective way of communicating with the community.
About haif of the respondents possess a telephone and/or a cellular phone. Few
Community-Driven Development projects towards poverty alleviation 140
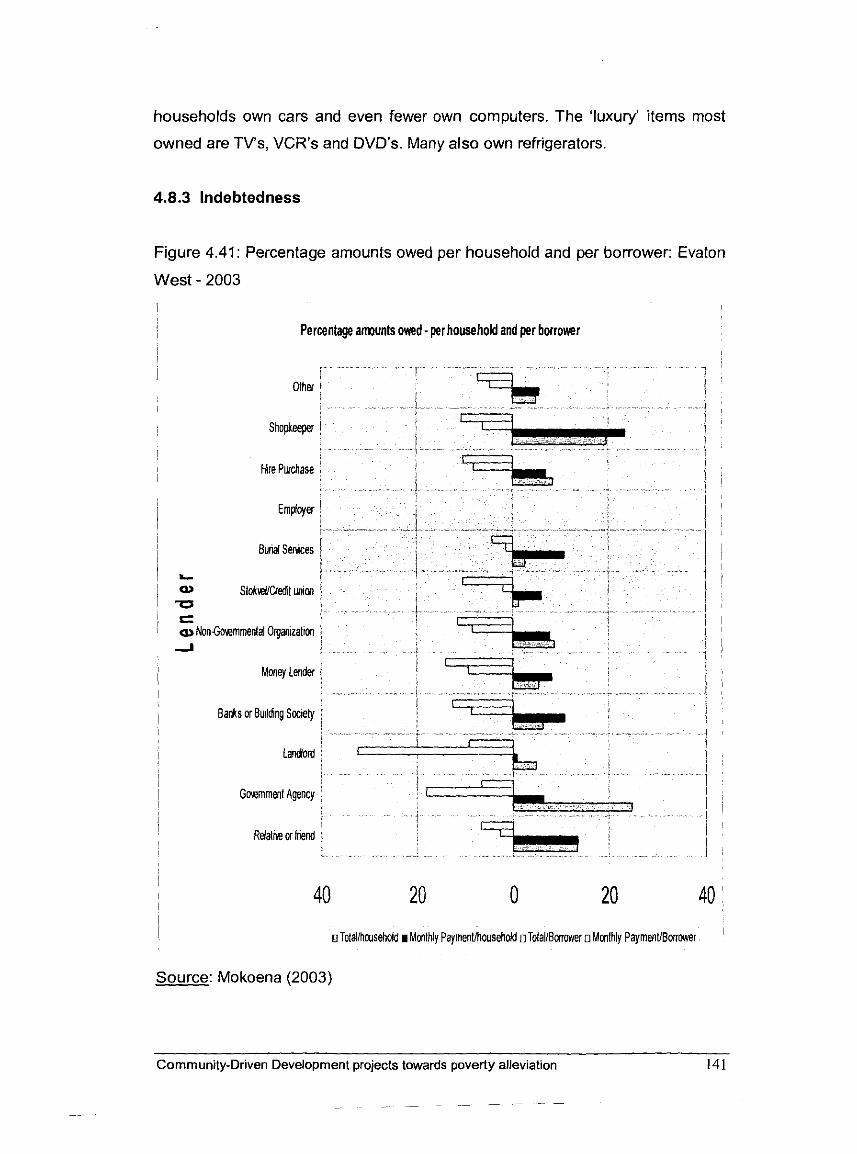
households own cars and even fewer own computers. The 'luxuw items most
owned are TV's, VCR's and DVD's. Many also own refrigerators.
4.8.3 Indebtedness
Figure 4.41: Percentage amounts owed per household and per borrower: Evaton
West - 2003
Percentage anaunts owed - per household and per bor row
I ~Tolalihwsehold I Monthly Paymenl/household o TolaliBmwer o Monlhly Payment iBomr I
Source: Mokoena (2003)
Cornmun~ty-Driven Development projects towards poverty allev~at~on
- - -
Figure 4.41 shows the level of indebtedness in the community. It shows
percentage indebtedness averaged per household and percentage averages per
borrower. The figure shows that the relative contribution to total debts of some
government agency, of friends and relatives and of shopkeepers is the highest in
the case of borrowers. In terms of monthly repayments, borrowers pay back
relatively low amounts to the government agencies even though their total debts
to them are the highest. Repayments to shopkeepers are the highest. The
contribution of banks is relatively low, raising questions regarding access and
trust of the community to banks, small business finance and loans. There may
also be aversion to the level of interest rates and the subsequent regular
payments associated with bank loans.
Analysis of contributions per household show that indebtedness to landlords is
the highest per household, followed by indebtedness to some government
agency. Monthly repayments are relatively low compared to repayments to
money lenders and banks. An insignificant number owes money to employers.
The survey data (Mokoena, 2003) showed that on average, each household
owes R1013.91 at a monthly repayment rate of R114.31. It also shows that on
average, each borrower owes R30964 at a monthly repayment rate of R2265.
4.8.4 Housing adequacy
Cheru (2002: 168) points that the housing problem in urban Africa has assumed
massive proportions involving a maze of complex policy issues that defy clear
strategic responses; these include income and employment, land tenure, access
to credit and legal reform. Cheru (2002: 168) further states that increased
squatting is an indicator of the housing mayhem, were an inappropriate
government response denies squatter citizens their full rights subjecting them
instead to sporadic forced evictions. Many of these problems have found their
way into the South African arena as well.
Table 4.3 shows the characteristics of housing units in Evaton West. It shows
that the main housing units are brick houses and only half a percent are shacks.
This is to be expected since these are standard RDP low-cost houses built by the
Community-Driven Development projects towards poverty alleviation 142
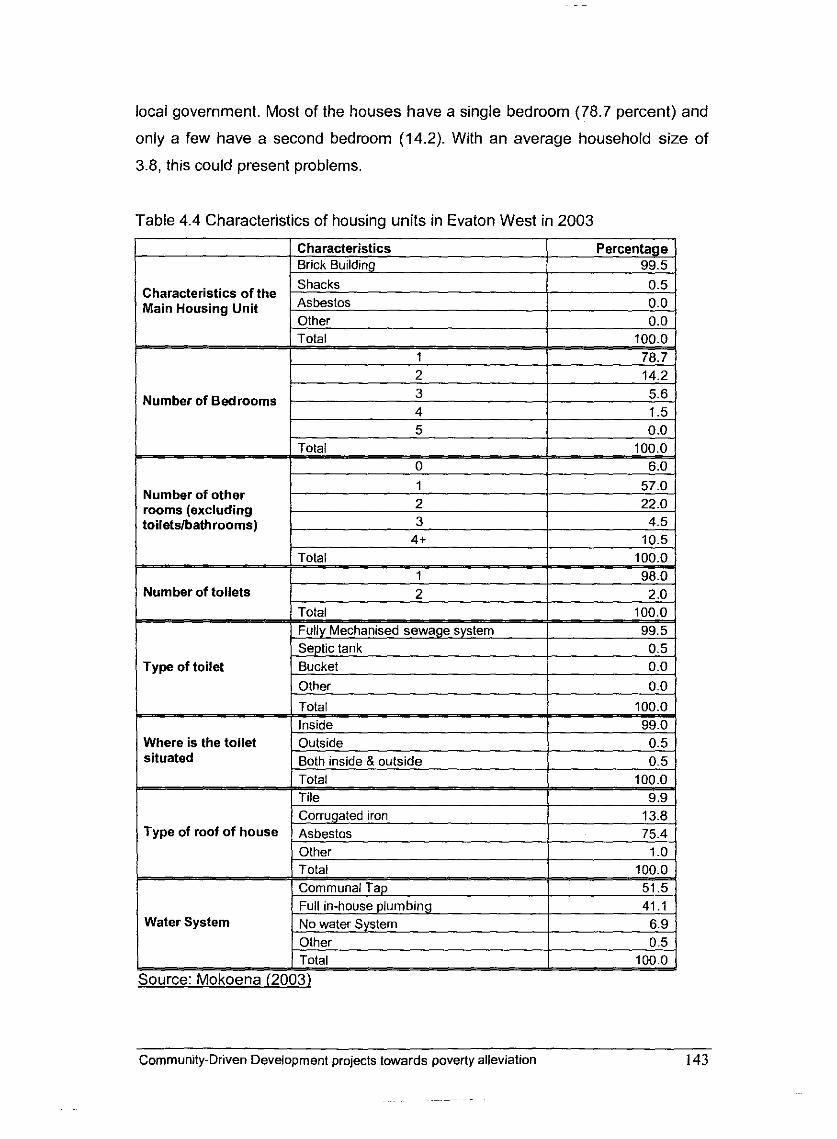
local government. Most of the houses have a single bedroom (78.7 percent) and
only a few have a second bedroom (14.2). With an average household size of
3.8, this could present problems,
Table 4.4 Characteristics of housing units in Evaton West in 2003
Characteristics of the Main Housing Unit
I Characteristics
Number of Bedrooms
Percentage I Brick Building 1 99.5
Number of toilets
Number of other rooms (excluding toiletslbathrooms)
Type of toilet
1 2 3
4+
57.0 22.0 4.5
10.5
Bucket
Type of roof of house
0.0
Where is the toilet situated
Source: Mokoena (2003)
Community-Driven Development projects towards poverty alleviation 143
Other
Outside
0.0
0.5 Both inside 8 outside 0.5
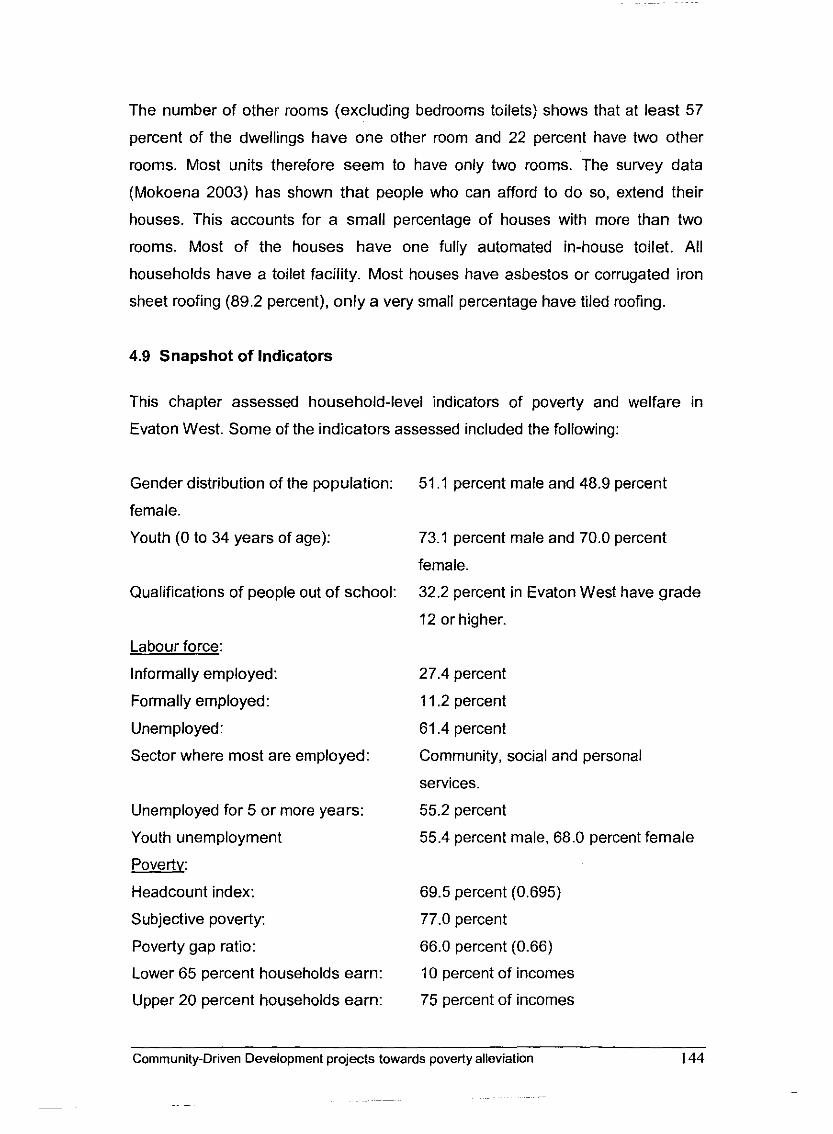
The number of other rooms (excluding bedrooms toilets) shows that at least 57
percent of the dwellings have one other room and 22 percent have two other
rooms. Most units therefore seem to have only two rooms. The survey data
(Mokoena 2003) has shown that people who can afford to do so, extend their
houses. This accounts for a small percentage of houses with more than two
rooms. Most of the houses have one fully automated in-house toilet. All
households have a toilet facility. Most houses have asbestos or corrugated iron
sheet roofing (89.2 percent), only a very small percentage have tiled roofing.
4.9 Snapshot of Indicators
This chapter assessed household-level indicators of poverty and welfare in
Evaton West. Some of the indicators assessed included the following:
Gender distribution of the population:
female.
Youth (0 to 34 years of age):
Qualifications of people out of school:
Labour force:
Informally employed:
Formally employed:
Unemployed:
Sector where most are employed:
Unemployed for 5 or more years:
Youth unemployment
Poverty:
Headcount index:
Subjective poverty:
Poverty gap ratio:
Lower 65 percent households earn:
Upper 20 percent households earn:
51 .I percent male and 48.9 percent
73.1 percent male and 70.0 percent
female.
32.2 percent in Evaton West have grade
12 or higher.
27.4 percent
11.2 percent
61.4 percent
Community, social and personal
services.
55.2 percent
55.4 percent male, 68.0 percent female
69.5 percent (0.695)
77.0 percent
66.0 percent (0.66)
10 percent of incomes
75 percent of incomes
Community-Drwen Development projects towards poverty alleviation
--
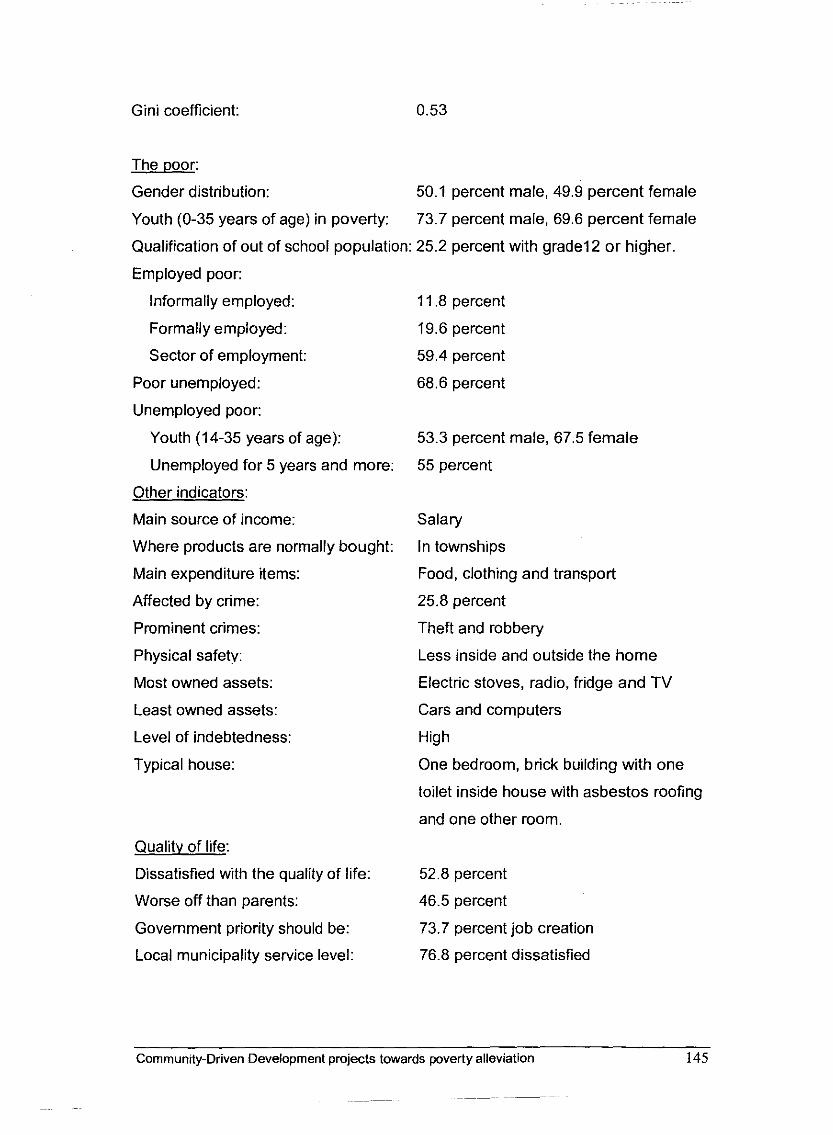
Gini coefficient:
The poor:
Gender distribution: 50.1 percent male, 49.9 percent female
Youth (0-35 years of age) in poverty: 73.7 percent male, 69.6 percent female
Qualification of out of school population: 25.2 percent with grade12 or higher.
Employed poor:
Informally employed:
Formally employed:
Sector of employment:
Poor unemployed:
Unemployed poor:
Youth (14-35 years of age):
Unemployed for 5 years and more:
Other indicators:
Main source of income:
Where products are normally bought:
Main expenditure items:
Affected by crime:
Prominent crimes:
Physical safetv:
Most owned assets:
Least owned assets:
Level of indebtedness:
Typical house:
Quality of life:
Dissatisfied with the quality of life:
Worse off than parents:
Government priority should be:
Local municipality service level:
11.8 percent
19.6 percent
59.4 percent
68.6 percent
53.3 percent male, 67.5 female
55 percent
Salary
In townships
Food, clothing and transport
25.8 percent
Theft and robbery
Less inside and outside the home
Electric stoves, radio, fridge and TV
Cars and computers
High
One bedroom, brick building with one
toilet inside house with asbestos roofing
and one other room.
52.8 percent
46.5 percent
73.7 percent job creation
76.8 percent dissatisfied
-- -
Commun~ty-Driven Development projects towards poverty alleviation
-- -- - -- -- -- -
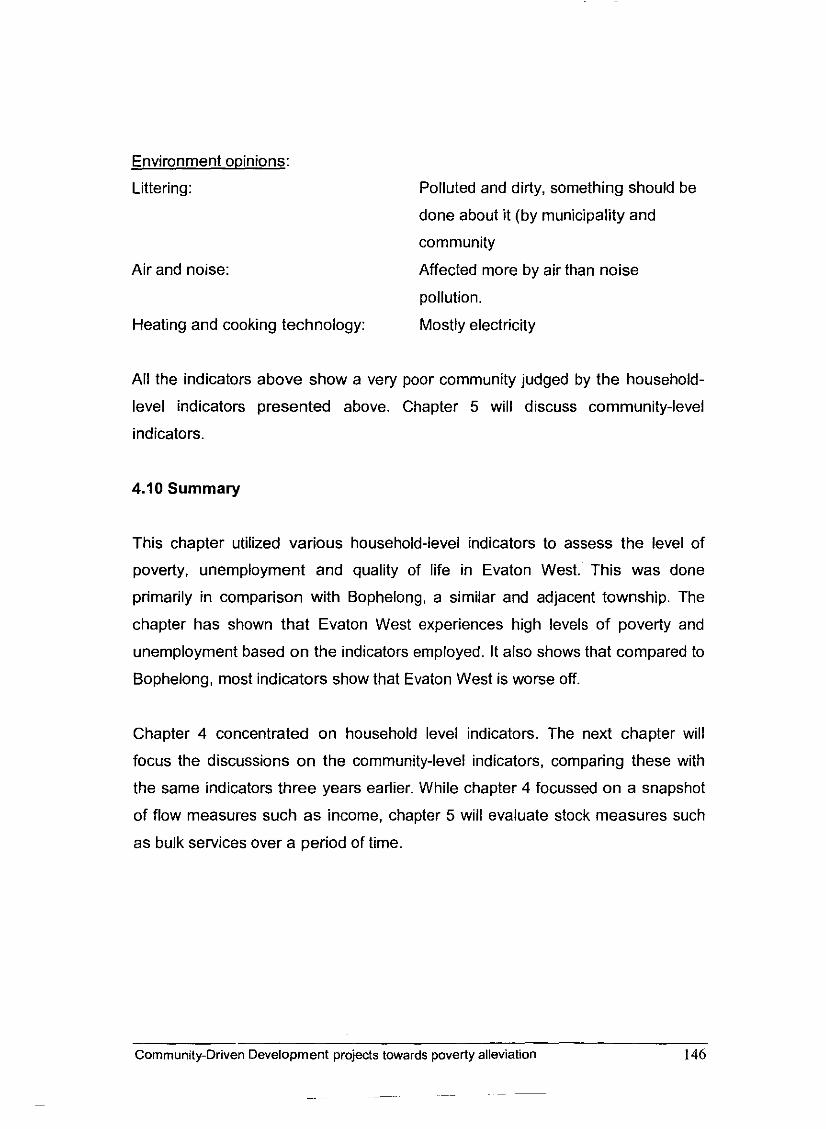
Environment opinions:
Littering: Polluted and dirty, something should be
done about it (by municipality and
community
Air and noise: Affected more by air than noise
pollution.
Heating and cooking technology: Mostly electricity
All the indicators above show a very poor community judged by the household-
level indicators presented above. Chapter 5 will discuss community-level
indicators.
4.10 Summary
This chapter utilized various household-level indicators to assess the level of
poverty, unemployment and quality of life in Evaton West. This was done
primarily in comparison with Bophelong, a similar and adjacent township. The
chapter has shown that Evaton West experiences high levels of poverty and
unemployment based on the indicators employed. It also shows that compared to
Bophelong, most indicators show that Evaton West is worse off.
Chapter 4 concentrated on household level indicators. The next chapter will
focus the discussions on the community-level indicators, comparing these with
the same indicators three years earlier. While chapter 4 focussed on a snapshot
of flow measures such as income, chapter 5 will evaluate stock measures such
as bulk services over a period of time.
Cornrnun~ty-Driven Development projects towards poverty alleviation 146
- - -- -- - -
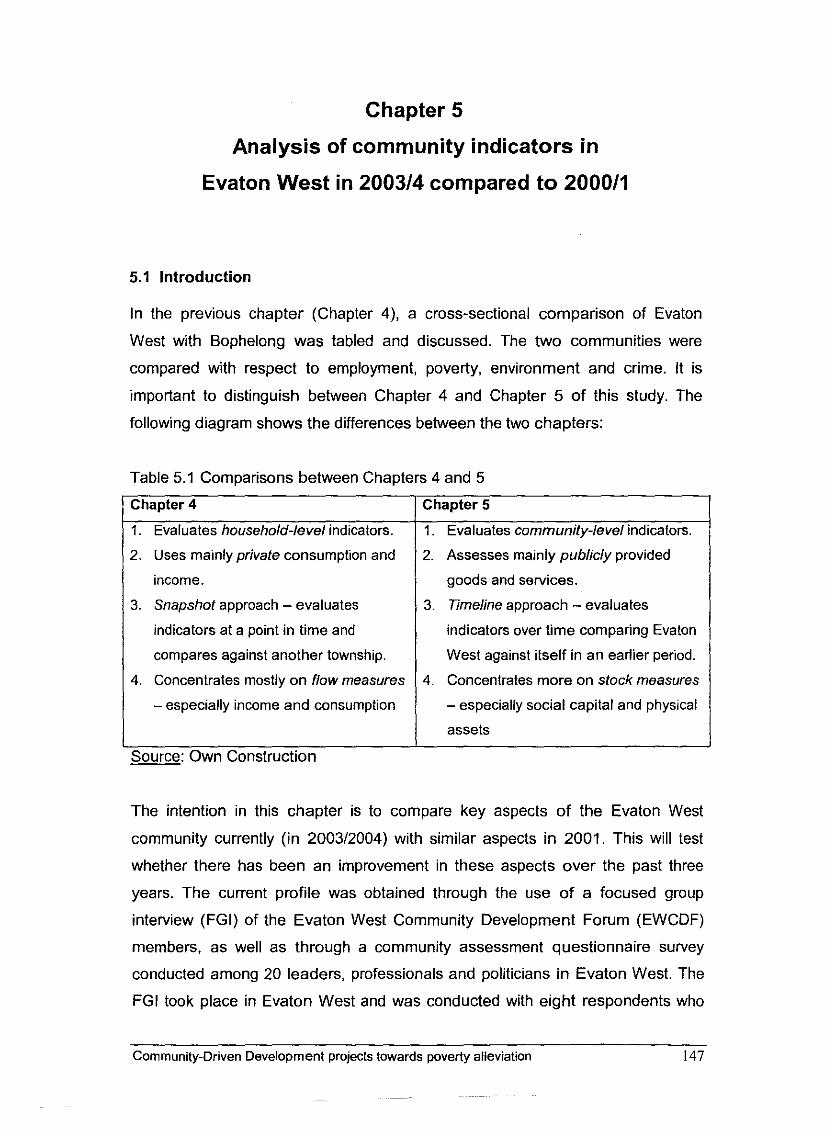
Chapter 5
Analysis of community indicators in
Evaton West in 200314 compared to 200011
5.1 Introduction
In the previous chapter (Chapter 4), a cross-sectional comparison of Evaton
West with Bophelong was tabled and discussed. The two communities were
compared with respect to employment, poverty, environment and crime. It is
important to distinguish between Chapter 4 and Chapter 5 of this study. The
following diagram shows the differences between the two chapters:
Table 5.1 Comparisons between Chapters 4 and 5
Chapter 4
1. Evaluates household-level indicators.
2. Uses mainly private consumption and
income.
3. Snapshot approach - evaluates
indicators at a point in time and
compares against another township.
4. Concentrates mostly on flow measures
- especially income and consumption
Source: Own Construction
Chapter 5
1. Evaluates community-level indicators.
2. Assesses mainly publicly provided
goods and services.
3. Timeline approach - evaluates
indicators over time comparing Evaton
West against itself in an earlier period.
4. Concentrates more on stock measures
- especially social capital and physical
assets
The intention in this chapter is to compare key aspects of the Evaton West
community currently (in 200312004) with similar aspects in 2001. This will test
whether there has been an improvement in these aspects over the past three
years. The current profile was obtained through the use of a focused group
interview (FGI) of the Evaton West Community Development Forum (EWCDF)
members, as well as through a community assessment questionnaire survey
conducted among 20 leaders, professionals and politicians in Evaton West. The
FGI took place in Evaton West and was conducted with eight respondents who
Community-Driven Development projects towards poverty alleviation 147
~-~ p~~
are members of the EWCDF. The respondents were chosen on the basis of their
participation in both the COL~AP~A@ project and the Eindhoven Municipality
projects. The focus group interview was aimed at soliciting information and views
on the two programmes and the state of Evaton West in relation to the indicators
discussed in this chapter.
The community questionnaire survey was conducted with 20 "influential" people
in Evaton West who knew the area and its dynamics. The 2001 data was
sourced from the work of Dr. Philip Frankel on Evaton West commissioned by the
Eindhoven Municipality (Frankel, 2001). The information sources used by Frankel
(2001) included the following:
Initial focus groups conducted around general issues of community
development like the delivery of bulk services with key stakeholders in the
area (e.g. women and the youth).
0 Strategic interviews conducted with key community leaders across the
political spectrum.
0 Random interviews conducted with members of the general public of
Evaton West. (Frankel 2001: 3-4)
Oelofse (2003: 268-269) provided a good premise upon which this chapter could
be based when stating: "The definition of urban poverty needs to be widened
beyond conventional income-based or consumption-based definitions to include
the health, social and environmental aspects of deprivation."
Oelofse (2003: 268-269) further stated that absolute poverty consists of five
interrelated deprivations:
inadequate and unstable income;
inadequate or risky asset base (of both material and nonmaterial
resources);
Community-Driven Development projects towards poverty alleviation 148
0 lack of or poor quality basic public services and housing;
0 limited or no rights to make demands within the political or legal system;
and
0 discrimination, particularly against women.
These forms of poverty contribute to levels of risk experienced by individuals
and communities in urban areas.
5.2 Community characteristics
In Chapter 2, various theoretical aspects of poverty and inequality were
discussed. One of these aspects was social exclusion. This primarily refers to
poverty as measured by how much people have access to various civil society
benefits. Lack of access to items like bulk services, political participation, law and
order and clean environments is indicative of a poor society. Poverty cannot
continue to be defined merely in consumption/income terms; vulnerability and
lack of access to social capital have to be taken into account in any reasonable
definition of poverty.
Prowse (2003: 18-19) stated that: "Vulnerability ... has also been associated with
the concept of social capital. .. define[d] as being a form of mutual assistance [or]
... the 'asset' in "social relationships [which] facilitate access to information,
finance, state services, equipment, food and goods that raise the capacity of
households to survive and prosper". The following excerpt from Sen (2000: 1)
emphasises these points:
"Those who like to keep issues straight and narrow tend to resist
broadening the definition of poverty. Why not just look at incomes and ask
a question like "How many people live on less than, say, $1 or $2 a day?"
This narrow analysis then takes the uncomplicated form of predicting
trends and counting the poor. It is a cheap way of telling "the future of the
poor." But human lives can be impoverished in many different ways.
Politically unfree citizens - whether rich or poor - are deprived of a basic
constituent of good living. The same applies to such social deprivations
Community-Driven Development projects towards poverty alleviation 149
as illiteracy, lack of health care, unequal attention to the elementary
interests of women and of young girls and so on."
Oelofse (2003: 269) also maintained that environmental problems in cities can be
reduced by altering the condition of poverty in its broadest sense. These forms of
deprivation lie within the ambit of tasks that local authorities are responsible for.
Quality of life can be improved by improving access to an asset base, or
providing basic services and infrastructure, rather than just dealing with the
problem of income.
This chapter therefore approaches the evaluation of poverty in Evaton West from
the perspective of social inclusivity. It tests community access to various civil
liberties and services expected to be available in any normal community. The
community of Evaton West will be judged as poor or non-poor depending, not
only on household affordability as discussed in Chapter 4, but also on whether
the essential community (social) capital exists in the area. This section
characterises the community in terms of population movement, employment
activities, roads, public transport, housing adequacy, quality of life and trust in the
community.
5.2.1 Population
The population of Evaton West has increased in the last three years, according
to 79 percent of the respondents to the community questionnaire. Of those who
said that the population has increased, most indicated that availability of more
houses, increased birth rate and hope for further developments in the area are
the major reasons for such increase (Table 5.1).
Frankel (2001: 18-19) states that in 2001, there was a markedly higher female
population than male population. This, Frankel maintained, led to many women
surviving as sex workers due to high unemployment in the area. In addition,
many women drifted to part-time or occasional prostitution as a survival mode. It
was postulated that many "outsiders" also manipulate women into transitory
relationships with the object of extracting sexual favours from them. This was
Community-Driven Development projects towards poverty alleviation 150
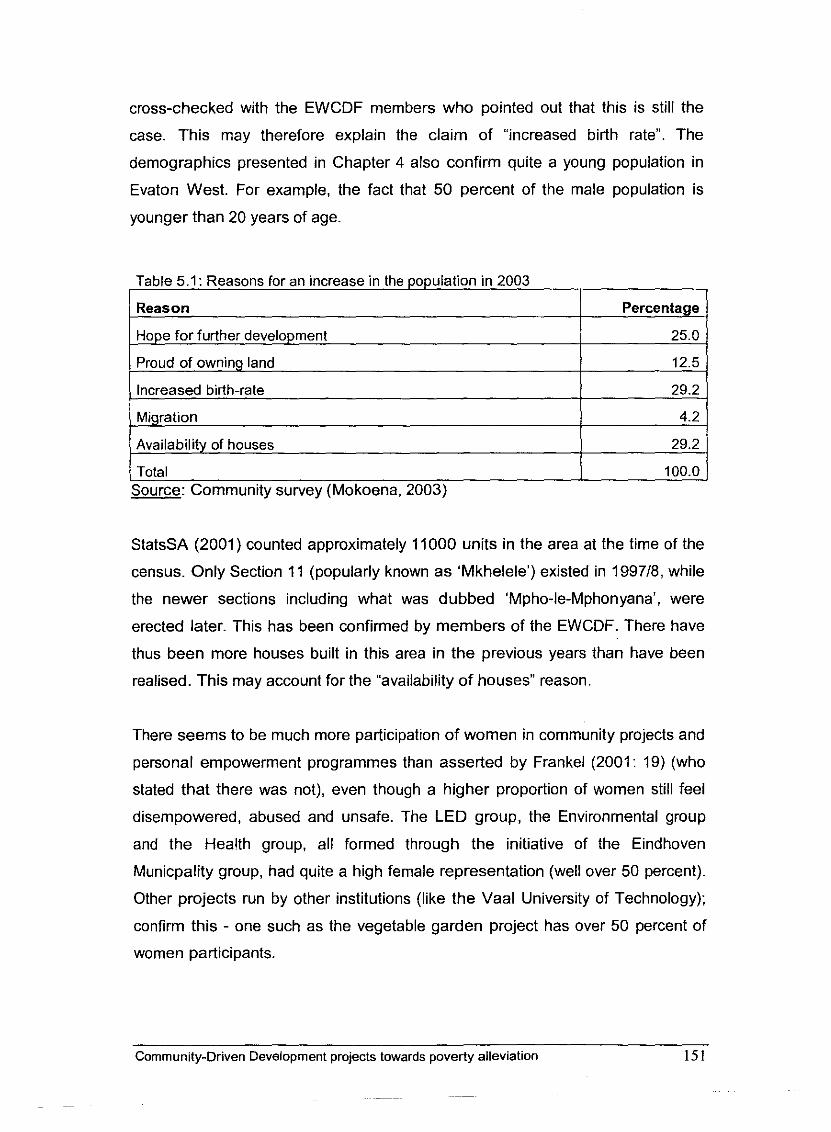
cross-checked with the EWCDF members who pointed out that this is still the
case. This may therefore explain the claim of "increased birth rate". The
demographics presented in Chapter 4 also confirm quite a young population in
Evaton West. For example, the fact that 50 percent of the male population is
younger than 20 years of age.
, Total 100.0 1 Source: Community survey (Mokoena, 2003)
Table 5.1: Reasons for an increase in the population in 2003
StatsSA (2001) counted approximately 11000 units in the area at the time of the
census. Only Section 11 (popularly known as 'Mkhelele') existed in 199718, while
Reason
Hope for further development
Proud of owning land
, Increased birth-rate
Migration
Availability of houses
the newer sections including what was dubbed 'Mpho-le-Mphonyana', were
erected later. This has been confirmed by members of the EWCDF. There have
thus been more houses built in this area in the previous years than have been
realised. This may account for the "availability of houses" reason.
Percentage
25.0
12.5
29.2
4.2
29.2
There seems to be much more participation of women in community projects and
personal empowerment programmes than asserted by Frankel (2001: 19) (who
stated that there was not), even though a higher proportion of women still feel
disempowered, abused and unsafe. The LED group, the Environmental group
and the Health group, all formed through the initiative of the Eindhoven
Municpality group, had quite a high female representation (well over 50 percent).
Other projects run by other institutions (like the Vaal University of Technology);
confirm this - one such as the vegetable garden project has over 50 percent of
women participants.
Community-Driven Development projects towards poverty alleviation 151
--
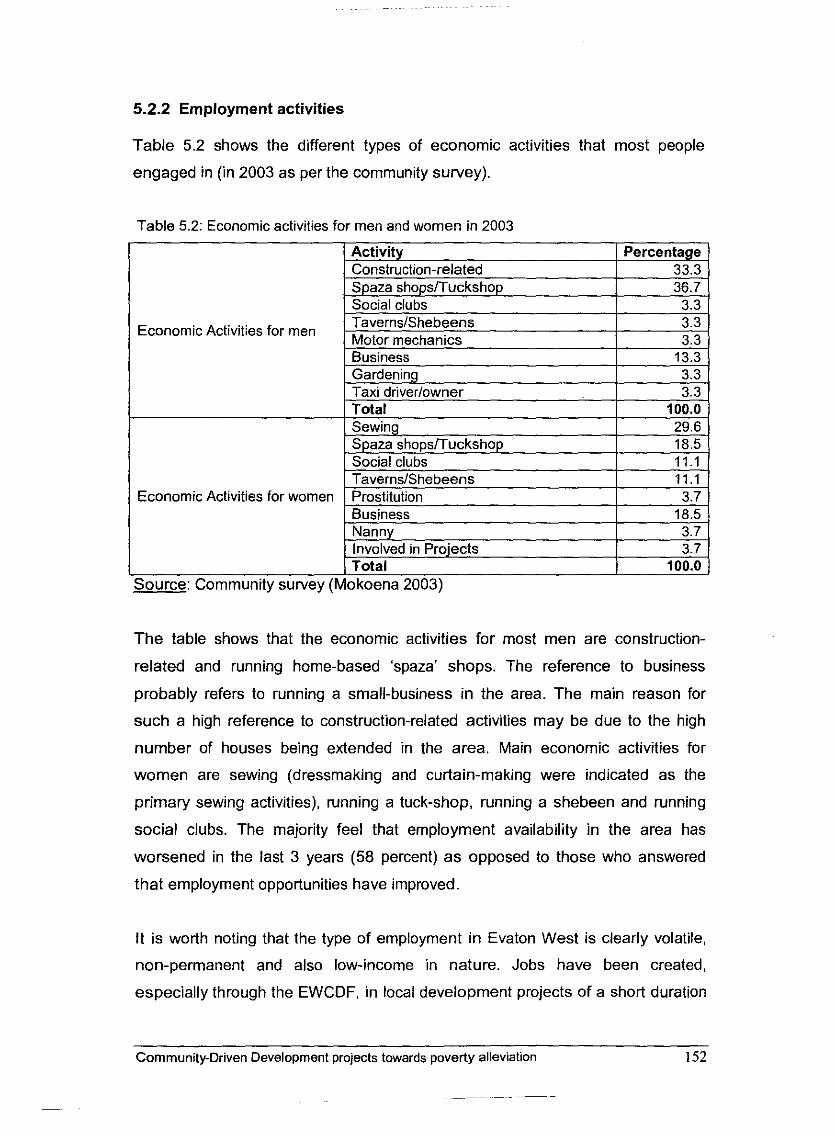
5.2.2 Employment activities
Table 5.2 shows the different types of economic activities that most people
engaged in (in 2003 as per the community survey).
Table 5.2: Economic activities for men and women in 2003
Economic Activities for men
Economic Activities for women
iardening i'axi driverlowner Total
I ^ .
Activity Construction-related Spaza shopsiTuckshop Social clubs TavernsIShebeens Motor mechanics Business
3.3 3.3
100.0 -- -
The table shows that the economic activities for most men are construction-
related and running home-based 'spaza' shops. The reference to business
probably refers to running a small-business in the area. The main reason for
such a high reference to construction-related activities may be due to the high
number of houses being extended in the area. Main economic activities for
women are sewing (dressmaking and curtain-making were indicated as the
primary sewing activities), running a tuck-shop, running a shebeen and running
social clubs. The majority feel that employment availability in the area has
worsened in the last 3 years (58 percent) as opposed to those who answered
that employment opportunities have improved.
Percentage 33.3 36.7 3.3 3.3 3.3
13.3
Business 10.3
It is worth noting that the type of employment in Evaton West is clearly volatile,
non-permanent and also low-income in nature. Jobs have been created,
especially through the EWCDF, in local development projects of a short duration
c - -
Nanny Involved in Projects Total
Community-Driven Development projects towards poverty alleviation 152
3.7 3.7
100.0 Source: Community survey (Mokoena 2003)
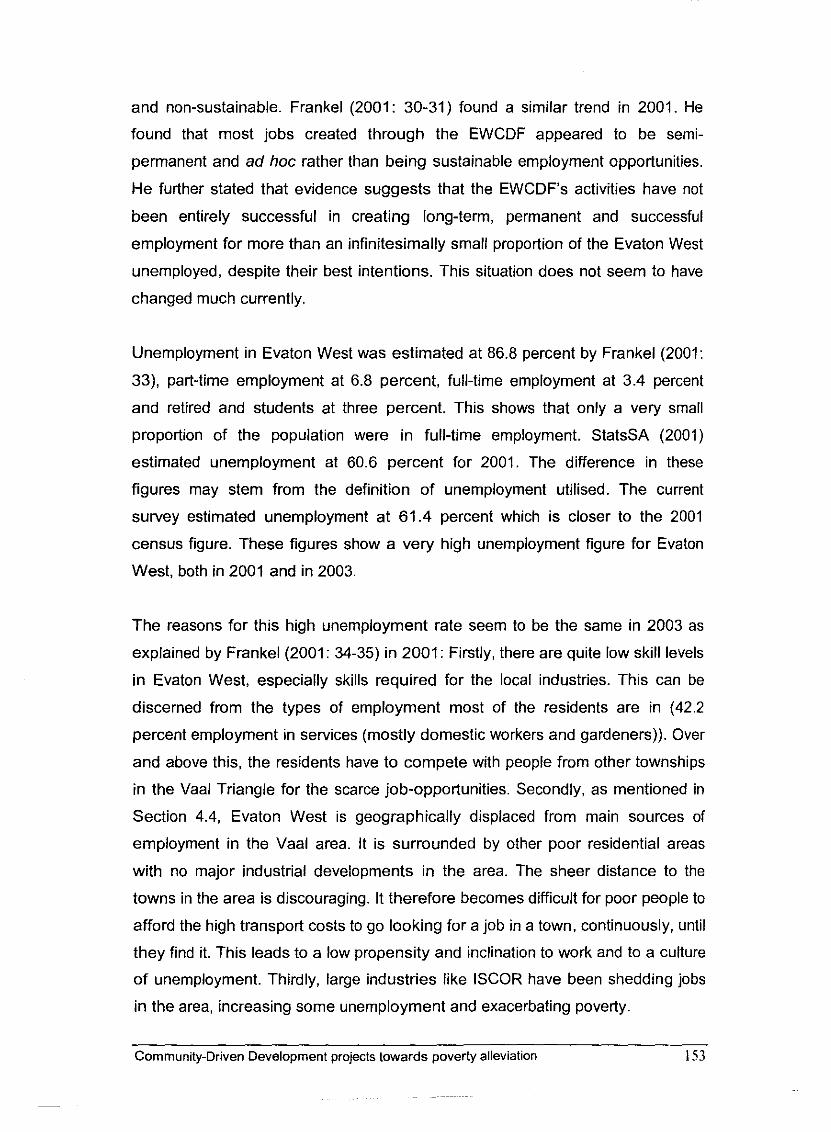
and non-sustainable. Frankel (2001: 30-31) found a similar trend in 2001. He
found that most jobs created through the EWCDF appeared to be semi-
permanent and ad hoc rather than being sustainable employment opportunities.
He further stated that evidence suggests that the EWCDF's activities have not
been entirely successful in creating long-term, permanent and successful
employment for more than an infinitesimally small proportion of the Evaton West
unemployed, despite their best intentions. This situation does not seem to have
changed much currently.
Unemployment in Evaton West was estimated at 86.8 percent by Frankel (2001:
33), part-time employment at 6.8 percent, full-time employment at 3.4 percent
and retired and students at three percent. This shows that only a very small
proportion of the population were in full-time employment. StatsSA (2001)
estimated unemployment at 60.6 percent for 2001. The difference in these
figures may stem from the definition of unemployment utilised. The current
survey estimated unemployment at 61.4 percent which is closer to the 2001
census figure. These figures show a very high unemployment figure for Evaton
West. both in 2001 and in 2003.
The reasons for this high unemployment rate seem to be the same in 2003 as
explained by Frankel (2001: 34-35) in 2001: Firstly, there are quite low skill levels
in Evaton West, especially skills required for the local industries. This can be
discerned from the types of employment most of the residents are in (42.2
percent employment in services (mostly domestic workers and gardeners)). Over
and above this, the residents have to compete with people from other townships
in the Vaal Triangle for the scarce job-opportunities. Secondly, as mentioned in
Section 4.4, Evaton West is geographically displaced from main sources of
employment in the Vaal area. It is surrounded by other poor residential areas
with no major industrial developments in the area. The sheer distance to the
towns in the area is discouraging. It therefore becomes difficult for poor people to
afford the high transport costs to go looking for a job in a town, continuously, until
they find it. This leads to a low propensity and inclination to work and to a culture
of unemployment. Thirdly, large industries like ISCOR have been shedding jobs
in the area, increasing some unemployment and exacerbating poverty.
Community-Driven Development projects towards poverty alleviation 153
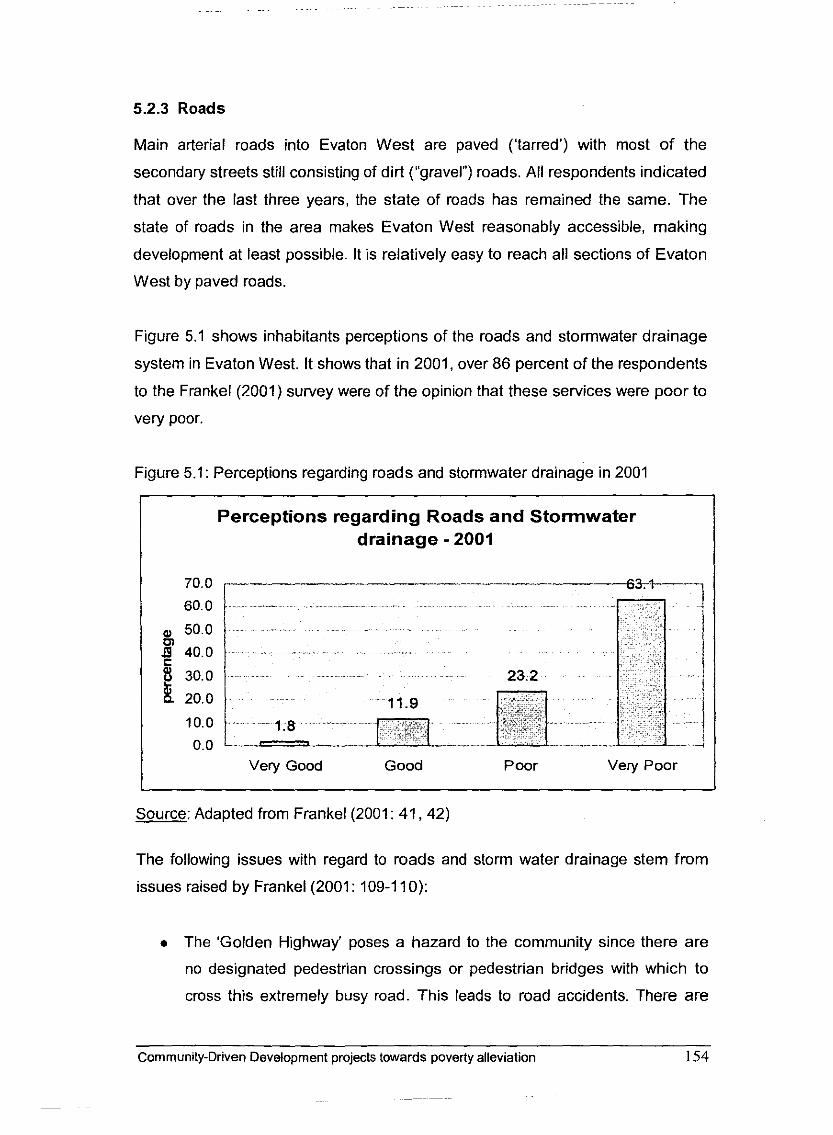
5.2.3 Roads
Main arterial roads into Evaton West are paved ('tarred') with most of the
secondary streets still consisting of dirt ("gravel") roads. All respondents indicated
that over the last three years, the state of roads has remained the same. The
state of roads in the area makes Evaton West reasonably accessible, making
development at least possible. It is relatively easy to reach all sections of Evaton
West by paved roads.
Figure 5.1 shows inhabitants perceptions of the roads and stormwater drainage
system in Evaton West. It shows that in 2001, over 86 percent of the respondents
to the Frankel (2001) survey were of the opinion that these services were poor to
very poor.
Figure 5.1: Perceptions regarding roads and stormwater drainage in 2001
Perceptions regarding Roads and Stormwater drainage - 2001
I Very Good Good Poor Very Poor
Source: Adapted from Frankel (2001: 41,42)
The following issues with regard to roads and storm water drainage stem from
issues raised by Frankel (2001 : 109-1 10):
0 The 'Golden Highway' poses a hazard to the community since there are
no designated pedestrian crossings or pedestrian bridges with which to
cross this extremely busy road. This leads to road accidents. There are
Cornmun~ty-Driven Development projects towards poverty alleviation 154
-
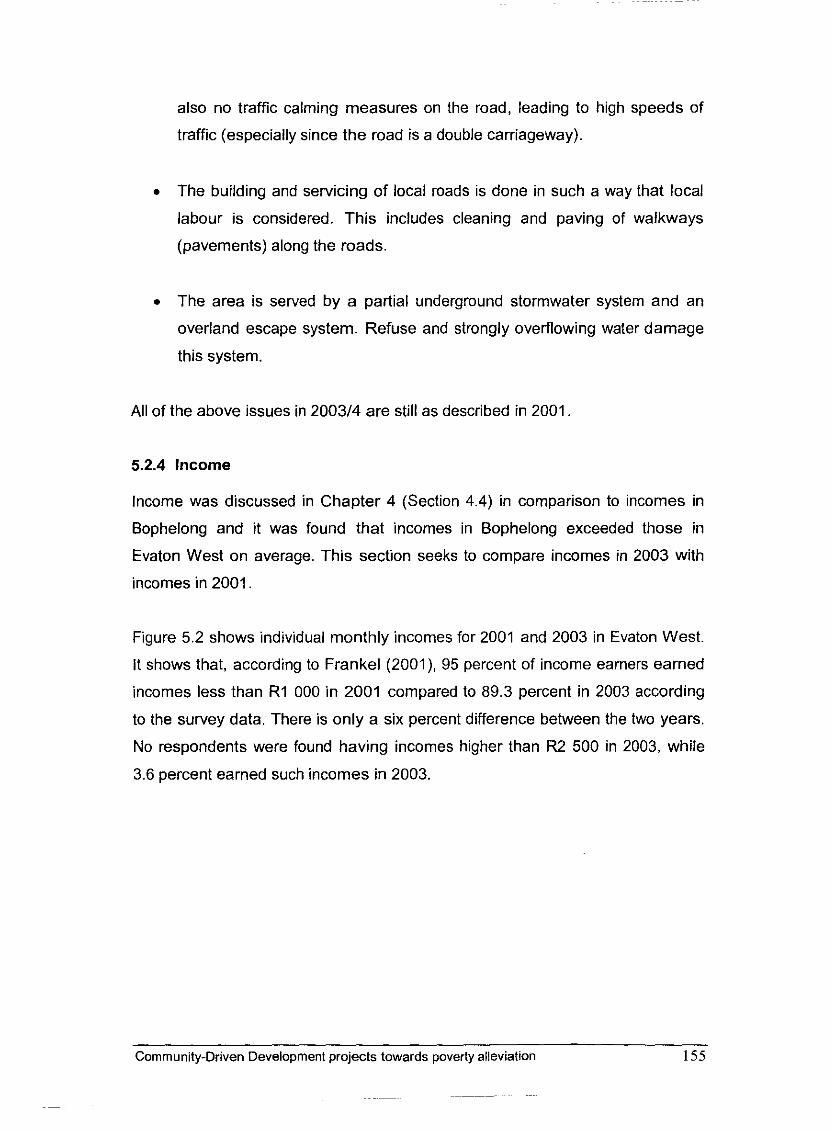
also no traffic calming measures on the road, leading to high speeds of
traffic (especially since the road is a double carriageway),
w The building and servicing of local roads is done in such a way that local
labour is considered. This includes cleaning and paving of walkways
(pavements) along the roads.
The area is served by a partial underground stormwater system and an
overland escape system. Refuse and strongly overflowing water damage
this system.
All of the above issues in 200314 are still as described in 2001.
5.2.4 Income
Income was discussed in Chapter 4 (Section 4.4) in comparison to incomes in
Bophelong and it was found that incomes in Bophelong exceeded those in
Evaton West on average. This section seeks to compare incomes in 2003 with
incomes in 2001.
Figure 5.2 shows individual monthly incomes for 2001 and 2003 in Evaton West.
It shows that, according to Frankel (2001), 95 percent of income earners earned
incomes less than R1 000 in 2001 compared to 89.3 percent in 2003 according
to the survey data. There is only a six percent difference between the two years.
No respondents were found having incomes higher than R2 500 in 2003, while
3.6 percent earned such incomes in 2003.
Community-Driven Development projects towards poverty alleviation 155
~ ~~~ ~-~
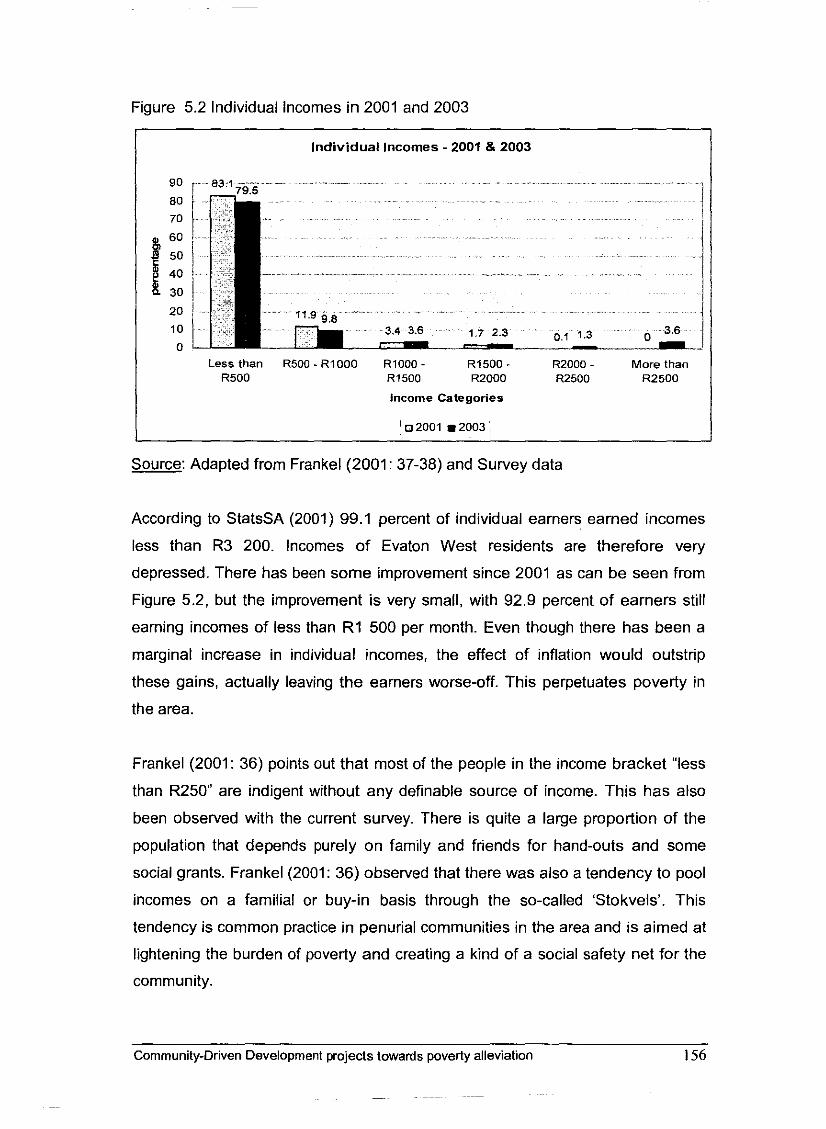
Figure 5.2 Individual lncomes in 2001 and 2003
I lndividual Incomes - 2001 8 2003
................ - ... - .... - ... -. ..... -- - ... .-
...... ... -. - ---,- .. -. .
Less than R500 - R1000 RlOOO - R1500 - R2000 - More than R500 R150O R2000 R2500 R2500
Income Categories
Source: Adapted from Frankel (2001: 37-38) and Survey data
According to StatsSA (2001) 99.1 percent of individual earners earned incomes
less than R3 200. lncomes of Evaton West residents are therefore very
depressed. There has been some improvement since 2001 as can be seen from
Figure 5.2, but the improvement is very small, with 92.9 percent of earners still
eaming incomes of less than R1 500 per month. Even though there has been a
marginal increase in individual incomes, the effect of inflation would outstrip
these gains, actually leaving the earners worse-off. This perpetuates poverty in
the area.
Frankel (2001: 36) points out that most of the people in the income bracket "less
than R250 are indigent without any definable source of income. This has also
been observed with the current survey. There is quite a large proportion of the
population that depends purely on family and friends for hand-outs and some
social grants. Frankel (2001: 36) observed that there was also a tendency to pool
incomes on a familial or buy-in basis through the so-called 'Stokvels'. This
tendency is common practice in penurial communities in the area and is aimed at
lightening the burden of poverty and creating a kind of a social safety net for the
community.
Community-Drwen Development projects towards poverty alleviation
- -- - --
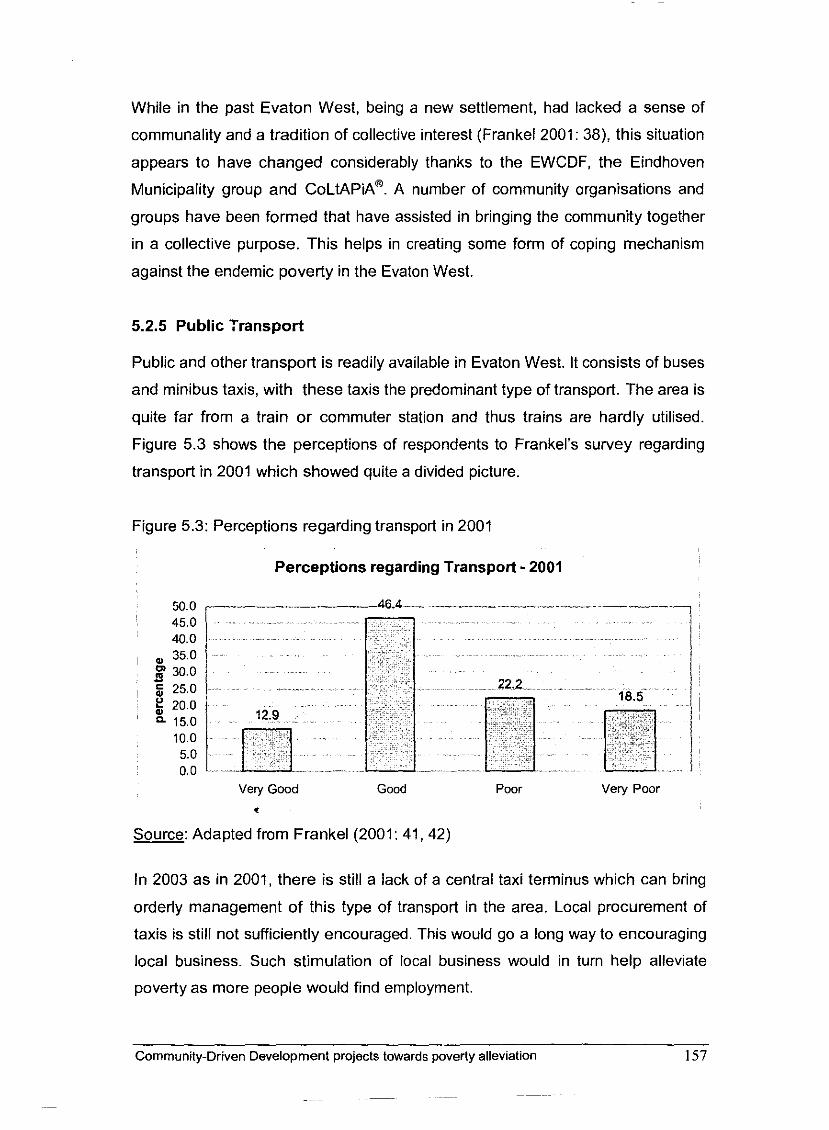
While in the past Evaton West, being a new settlement, had lacked a sense of
communality and a tradition of collective interest (Frankel 2001: 38), this situation
appears to have changed considerably thanks to the EWCDF, the Eindhoven
Municipality group and COL~AP~A@. A number of community organisations and
groups have been formed that have assisted in bringing the community together
in a collective purpose. This helps in creating some form of coping mechanism
against the endemic poverty in the Evaton West.
5.2.5 Public Transport
Public and other transport is readily available in Evaton West. It consists of buses
and minibus taxis, with these taxis the predominant type of transport. The area is
quite far from a train or commuter station and thus trains are hardly utilised.
Figure 5.3 shows the perceptions of respondents to Frankel's survey regarding
transport in 2001 which showed quite a divided picture.
Figure 5.3: Perceptions regarding transport in 2001
Perceptions regarding Transport - 2001
Very Good Good Poor Very Poor
t
Source: Adapted from Frankel (2001: 41,42)
In 2003 as in 2001, there is still a lack of a central taxi terminus which can bring
orderly management of this type of transport in the area. Local procurement of
taxis is still not sufficiently encouraged. This would go a long way to encouraging
local business. Such stimulation of local business would in turn help alleviate
poverty as more people would find employment.
Community-Driven Development projects towards poverty alleviation 157
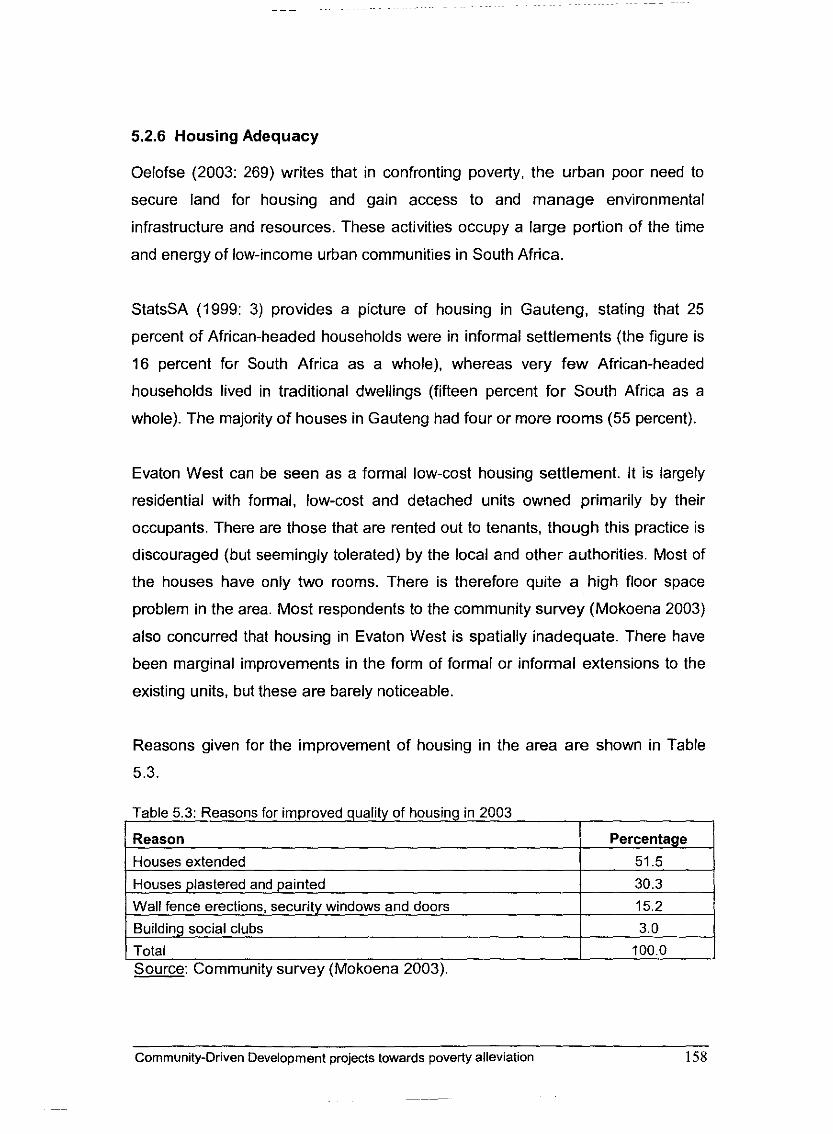
5.2.6 Housing Adequacy
Oelofse (2003: 269) writes that in confronting poverty, the urban poor need to
secure land for housing and gain access to and manage environmental
infrastructure and resources. These activities occupy a large portion of the time
and energy of low-income urban communities in South Africa.
StatsSA (1999: 3) provides a picture of housing in Gauteng, stating that 25
percent of African-headed households were in informal settlements (the figure is
16 percent f ~ r South Africa as a whole), whereas very few African-headed
households lived in traditional dwellings (fifteen percent for South Africa as a
whole). The majority of houses in Gauteng had four or more rooms (55 percent).
Evaton West can be seen as a formal low-cost housing settlement. It is largely
residential with formal, low-cost and detached units owned primarily by their
occupants. There are those that are rented out to tenants, though this practice is
discouraged (but seemingly tolerated) by the local and other authorities. Most of
the houses have only two rooms. There is therefore quite a high floor space
problem in the area. Most respondents to the community survey (Mokoena 2003)
also concurred that housing in Evaton West is spatially inadequate. There have
been marginal improvements in the form of formal or informal extensions to the
existing units, but these are barely noticeable.
Reasons given for the improvement of housing in the area are shown in Table
5.3.
Community-Driven Development projects towards poverty alleviation 158
Table 5.3: Reasons for improved quality of housing in 2003
Reason Houses extended Houses plastered and painted Wall fence erections, security windows and doors Building social clubs
I Total
Percentage
51.5
30.3
15.2
3.0
100.0 Source: Community survey (Mokoena 2003).
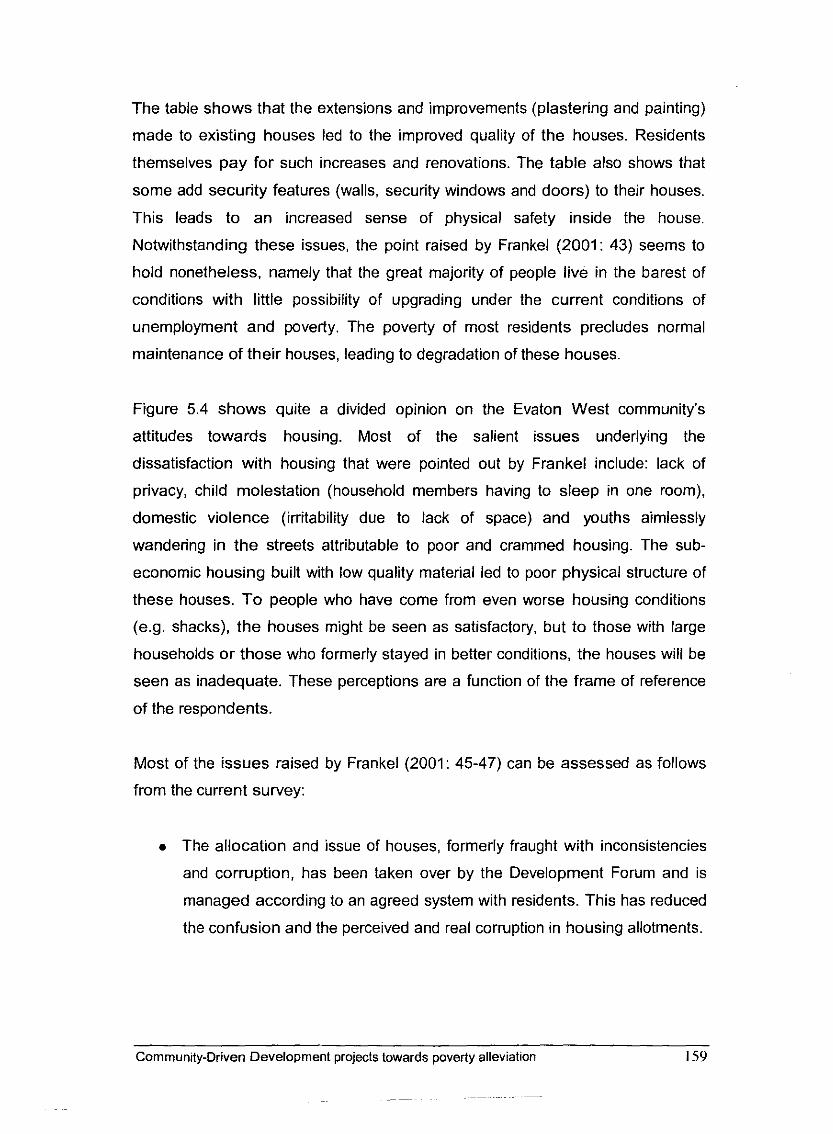
The table shows that the extensions and improvements (plastering and painting)
made to existing houses led to the improved quality of the houses. Residents
themselves pay for such increases and renovations. The table also shows that
some add security features (walls, security windows and doors) to their houses.
This leads to an increased sense of physical safety inside the house.
Notwithstanding these issues, the point raised by Frankel (2001: 43) seems to
hold nonetheless, namely that the great majority of people live in the barest of
conditions with little possibility of upgrading under the current conditions of
unemployment and poverty. The poverty of most residents precludes normal
maintenance of their houses, leading to degradation of these houses.
Figure 5.4 shows quite a divided opinion on the Evaton West community's
attitudes towards housing. Most of the salient issues underlying the
dissatisfaction with housing that were pointed out by Frankel include: lack of
privacy, child molestation (household members having to sleep in one room),
domestic violence (irritability due to lack of space) and youths aimlessly
wandering in the streets attributable to poor and crammed housing. The sub-
economic housing built with low quality material led to poor physical structure of
these houses. To people who have come from even worse housing conditions
(e.g. shacks), the houses might be seen as satisfactory, but to those with large
households or those who formerly stayed in better conditions, the houses will be
seen as inadequate. These perceptions are a function of the frame of reference
of the respondents.
Most of the issues raised by Frankel (2001: 45-47) can be assessed as follows
from the current survey:
0 The allocation and issue of houses, formerly fraught with inconsistencies
and corruption, has been taken over by the Development Forum and is
managed according to an agreed system with residents. This has reduced
the confusion and the perceived and real corruption in housing allotments.
Community-Driven Development projects towards poverty alleviation 159
~~~
~- p~ -p~ ~~~~ ~~ ~-
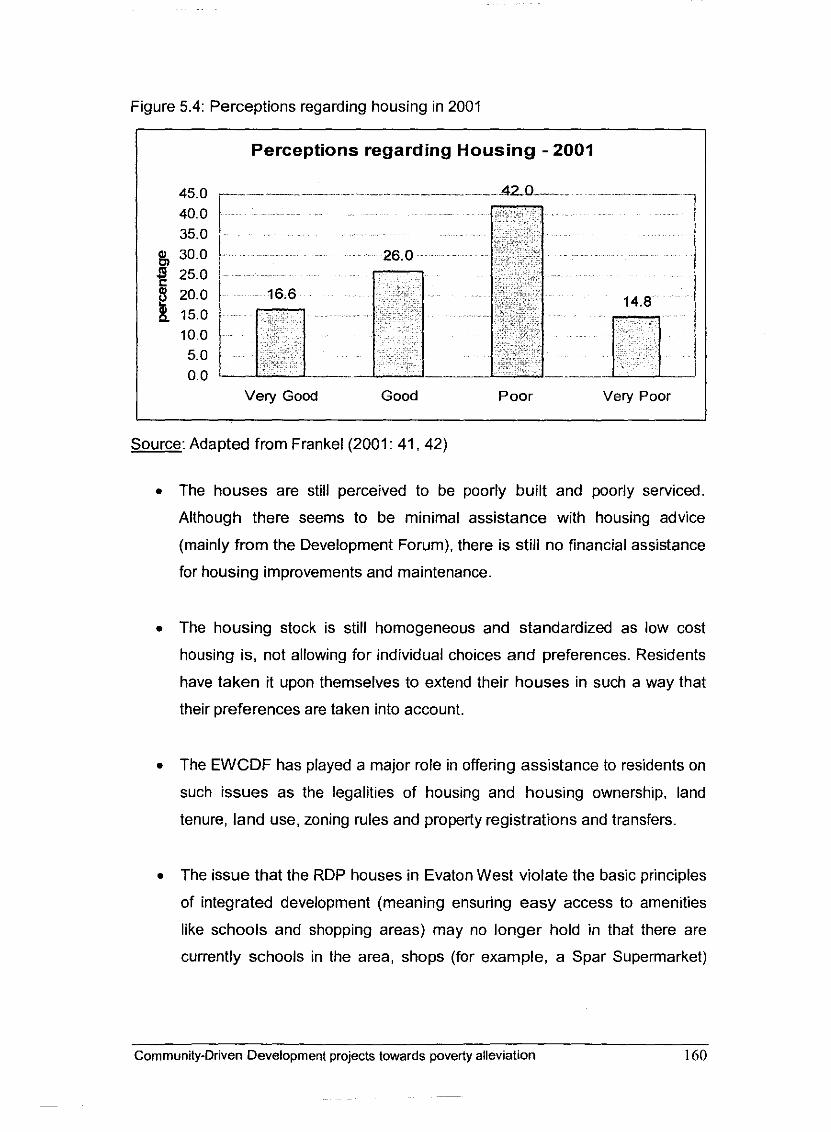
Figure 5.4: Perceptions regarding housing in 2001
Perceptions regarding Housing - 2001
... . .
Very Good Good Poor Very Poor
Source: Adapted from Frankel (2001: 41,42)
The houses are still perceived to be poorly built and poorly serviced.
Although there seems to be minimal assistance with housing advice
(mainly from the Development Forum), there is still no financial assistance
for housing improvements and maintenance.
The housing stock is still homogeneous and standardized as low cost
housing is, not allowing for individual choices and preferences. Residents
have taken it upon themselves to extend their houses in such a way that
their preferences are taken into account.
The EWCDF has played a major role in offering assistance to residents on
such issues as the legalities of housing and housing ownership, land
tenure, land use, zoning rules and property registrations and transfers.
The issue that the RDP houses in Evaton West violate the basic principles
of integrated development (meaning ensuring easy access to amenities
like schools and shopping areas) may no longer hold in that there are
currently schools in the area, shops (for example, a Spar Supermarket)
Community-Driven Development projects towards poverty alleviation 160
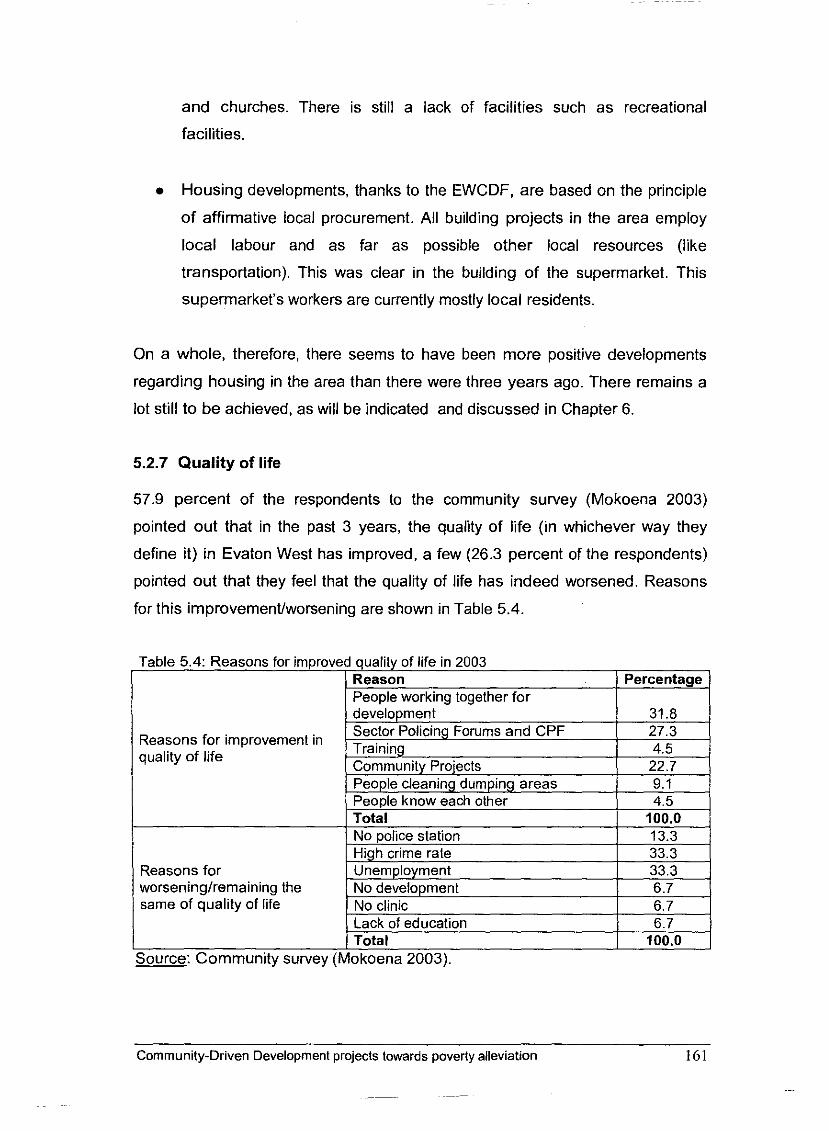
and churches. There is still a lack of facilities such as recreational
facilities.
Housing developments, thanks to the EWCDF, are based on the principle
of affirmative local procurement. All building projects in the area employ
local labour and as far as possible other local resources (like
transportation). This was clear in the building of the supermarket. This
supemlarket's workers are currently mostly local residents.
On a whole, therefore, there seems to have been more positive developments
regarding housing in the area than there were three years ago. There remains a
lot still to be achieved, as will be indicated and discussed in Chapter 6.
5.2.7 Quality of life
57.9 percent of the respondents to the community survey (Mokoena 2003)
pointed out that in the past 3 years, the quality of life (in whichever way they
define it) in Evaton West has improved, a few (26.3 percent of the respondents)
pointed out that they feel that the quality of life has indeed worsened. Reasons
for this improvement/worsening are shown in Table 5.4.
worseninglrernaining the same of quality of life
Source: Community survey (Mokoena 2003).
Reasons for improvement in quality of life
Community-Driven Development projects towards poverty alleviation I61
development Sector Policing Forums and CPF Training Community Projects
31.8 27.3 4.5 - 22.7
Table 5.4 shows that people working together for development, increased
policing and various community projects have assisted in increasing the quality of
life in the area, especially the fact that people are working together to develop the
area. On the other hand, the high crime rate, unemployment and lack of a police
station in the area militate against an improvement in the quality of life.
In term of levels of living, 57.9 percent of respondents characterised the level of
living of the community as poor to very poor in 2003, while 36.8 percent felt that
the level of living is average. "Average" implies that the level of living is no
different than in surrounding communities, which means that if they are poor, so
is Evaton West.
5.2.8 Trust and conflict in the community
An almost equal number of respondents of the community survey (Mokoena
2003) felt that trust in the community in lendinglborrowing matters is either there
or not there. Almost 50 percent felt that people in the community do not generally
trust one another in such matters, while the other half felt that people do trust one
another. 47 percent indicated that in the last 3 years, the level of trust in the
community has improved, while only 15 percent said it has worsened. Most also
indicated that, compared to other communities, trust in Evaton West is either
better or the same as in those other communities. People in Evaton West look
out for the welfare of their own families and they are concerned with community
welfare.
Frankel (2001: 152) points out that the local developmental culture in South
African communities is dominated by notions of "the struggle", inherited from the
recent resistance to apartheid and the continued difficulties of the historically
disadvantaged to eke out a basic existence. Conflict becomes the prism through
which they view social existence. The perceptions in the current survey
(Mokoena 2003) indicated a low propensity for conflict in the area. There is a
much higher sense of mutuality and co-operation in the community. This was
enforced by the various campaigns where people had to work together on issues
of mutual interest.
Community-Driven Development projects towards poverty alleviation 162
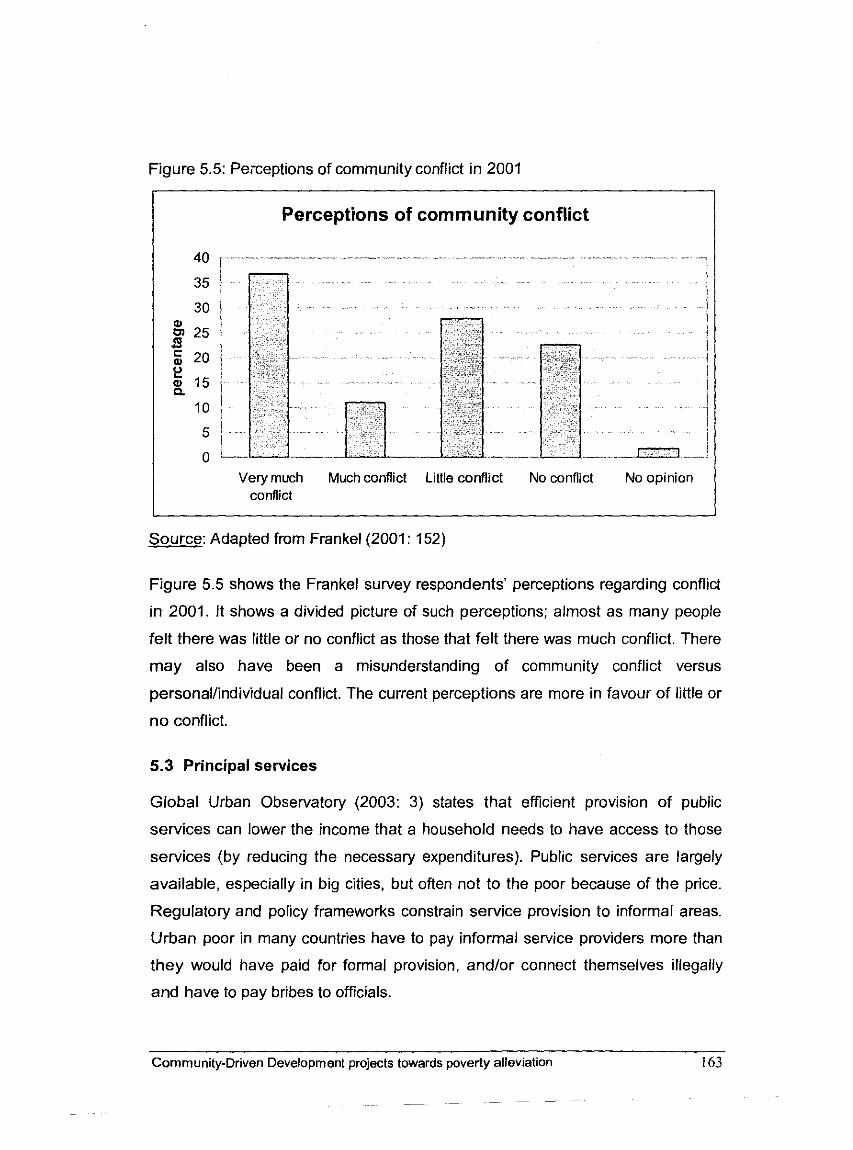
Figure 5.5: Peiceptions of community conflict in 2001
Perceptions of community conflict
... .... ............- ................ ........ -- ............................... '-
I Very much Much conflict Little conflict No conflict No opinion conflict
Source: Adapted from Frankel (2001: 152)
Figure 5.5 shows the Frankel survey respondents' perceptions regarding conflict
in 2001. It shows a divided picture of such perceptions; almost as many people
felt there was little or no conflict as those that felt there was much conflict. There
may also have been a misunderstanding of community conflict versus
personal/individual conflict. The current perceptions are more in favour of little or
no conflict.
5.3 Principal services
Global Urban Observatory (2003: 3) states that efficient provision of public
services can lower the income that a household needs to have access to those
services (by reducing the necessary expenditures). Public services are largely
available, especially in big cities, but often not to the poor because of the price.
Regulatory and policy frameworks constrain service provision to informal areas.
Urban poor in many countries have to pay informal service providers more than
they would have paid for formal provision, and/or connect themselves illegally
and have to pay bribes to officials.
Community-Driven Development projects towards poverty alleviation 163
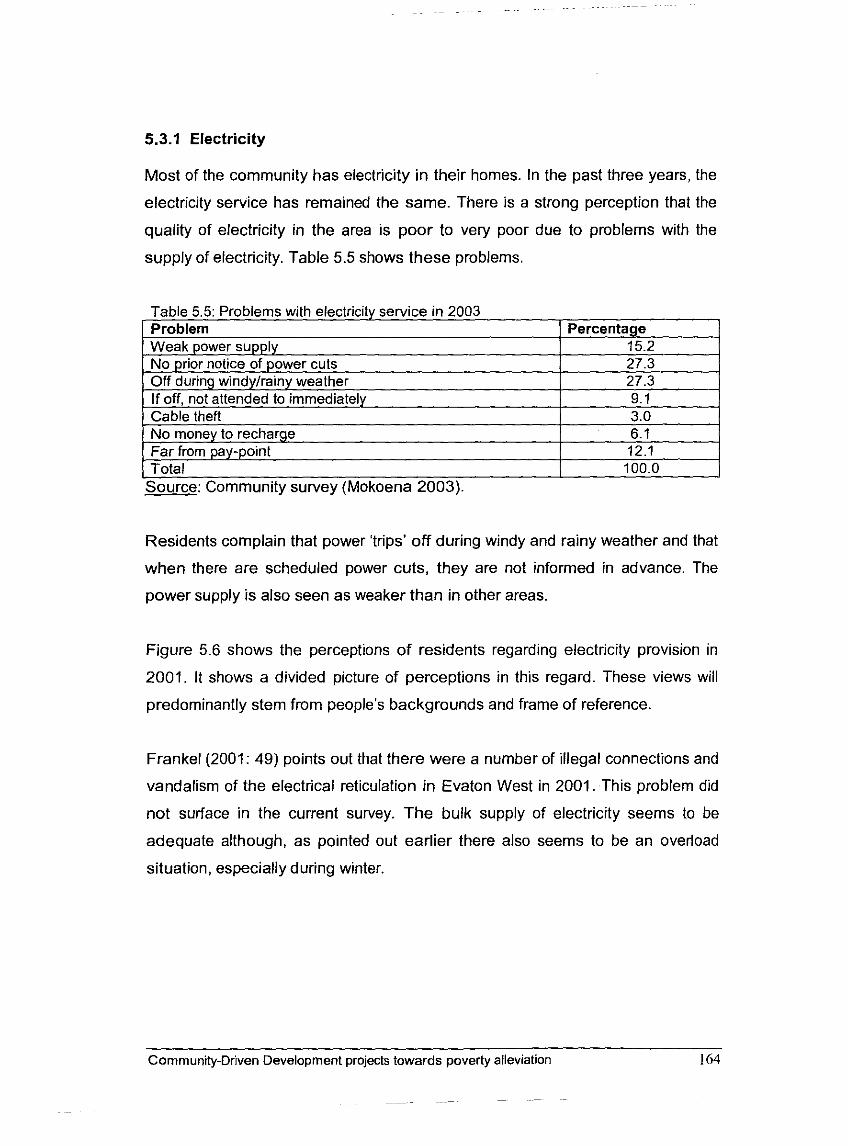
5.3.1 Electricity
Most of the community has electricity in their homes. In the past three years, the
electricity service has remained the same. There is a strong perception that the
quality of electricity in the area is poor to very poor due to problems with the
supply of electricity. Table 5.5 shows these problems.
Source: Community survey (Mokoena 2003).
Residents complain that power 'trips' off during windy and rainy weather and that
when there are scheduled power cuts, they are not informed in advance. The
power supply is also seen as weaker than in other areas.
Figure 5.6 shows the perceptions of residents regarding electricity provision in
2001. It shows a divided picture of perceptions in this regard. These views will
predominantly stem from people's backgrounds and frame of reference.
Frankel (2001: 49) points out that there were a number of illegal connections and
vandalism of the electrical reticulation in Evaton West in 2001. This problem did
not surface in the current survey. The bulk supply of electricity seems to be
adequate although, as pointed out earlier there also seems to be an overload
situation, especially during winter.
Community-Driven Development projects towards poverty alleviation 164
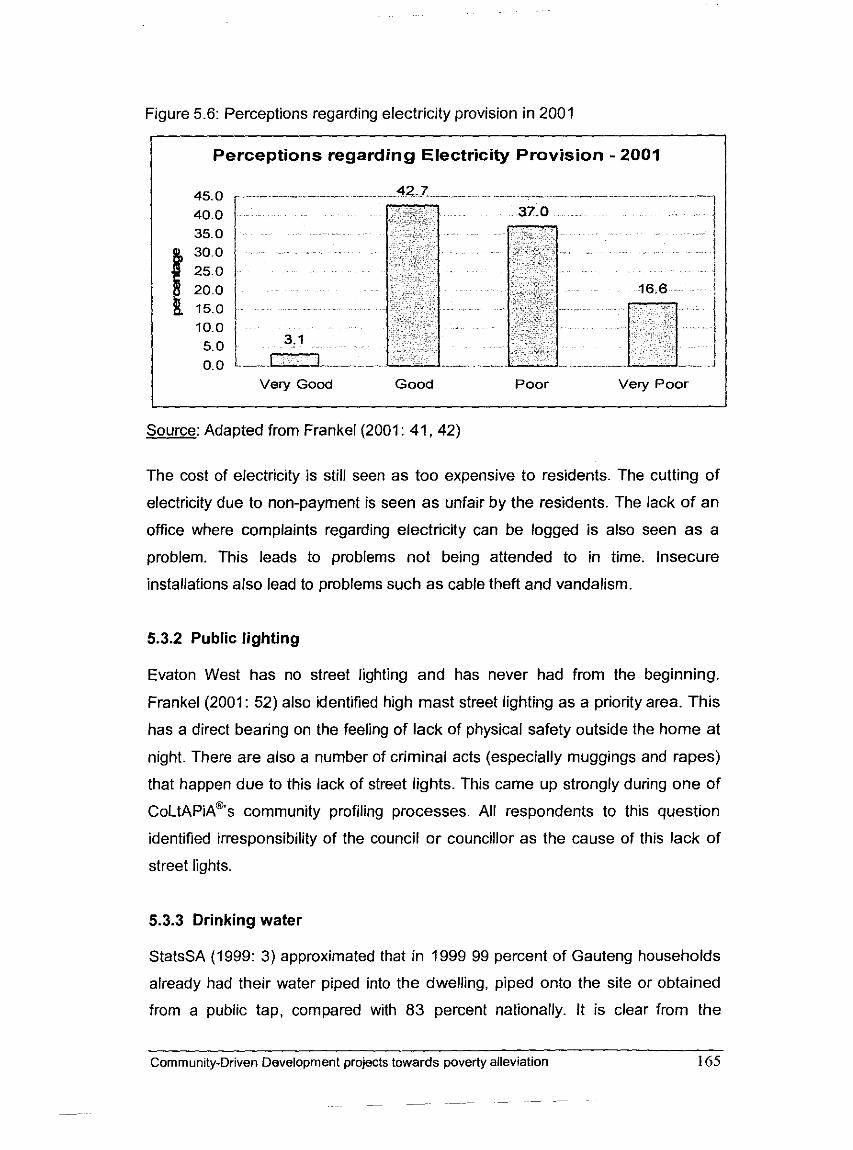
Figure 5.6: Perceptions regarding electricity provision in 2001
Perceptions regarding Electricity Provision - 2001 1
Very Good Good P o o r Very Poor
Source: Adapted from Frankel (2001 : 41,42)
The cost of electricity is still seen as too expensive to residents. The cutting of
electricity due to non-payment is seen as unfair by the residents. The lack of an
office where complaints regarding electricity can be logged is also seen as a
problem. This leads to problems not being attended to in time. Insecure
installations also lead to problems such as cable theft and vandalism.
5.3.2 Public lighting
Evaton West has no street lighting and has never had from the beginning.
Frankel (2001: 52) also identified high mast street lighting as a priority area. This
has a direct bearing on the feeling of lack of physical safety outside the home at
night. There are also a number of criminal acts (especially muggings and rapes)
that happen due to this lack of street lights. This came up strongly during one of
COL~AP~A@'S community profiling processes. All respondents to this question
identified irresponsibility of the council or councillor as the cause of this lack of
street lights.
5.3.3 Drinking water
StatsSA (1999: 3) approximated that in 1999 99 percent of Gauteng households
already had their water piped into the dwelling, piped onto the site or obtained
from a public tap, compared with 83 percent nationally. It is clear from the
Community-Driven Development projects towards poverty alleviation 165
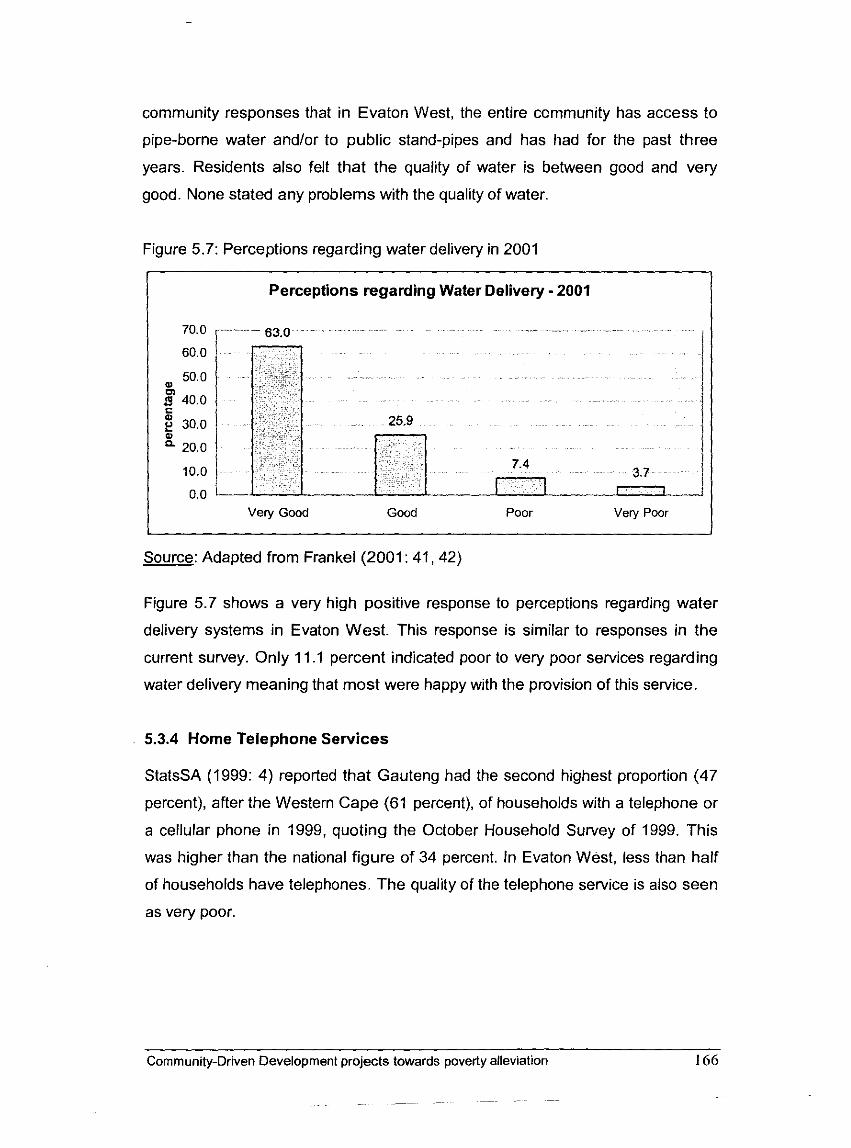
community responses that in Evaton West, the entire community has access to
pipe-borne water and/or to public stand-pipes and has had for the past three
years. Residents also felt that the quality of water is between good and very
good. None stated any problems with the quality of water.
Figure 5.7: Perceptions regarding water delivery in 2001
Perceptions regarding Water Delivery - 2001
70.0 (-.-.-. 63 .- . . .. . . . - .. . . . . . ... . . . . .-.- . . . . . . ...
Very Good Good Poor Very Poor
Source: Adapted from Frankel (2001 : 41,42)
Figure 5.7 shows a very high positive response to perceptions regarding water
delivery systems in Evaton West. This response is similar to responses in the
current survey. Only 1 1 .I percent indicated poor to very poor services regarding
water delivery meaning that most were happy with the provision of this service.
5.3.4 Home Telephone Services
StatsSA (1999: 4) reported that Gauteng had the second highest proportion (47
percent), after the Western Cape (61 percent), of households with a telephone or
a cellular phone in 1999, quoting the October Household Survey of 1999. This
was higher than the national figure of 34 percent. In Evaton West, less than half
of households have telephones. The quality of the telephone service is also seen
as very poor.
Community-Driven Development projects towards poverty alleviation 166
-~ ~ - - -- ~ ~
~~~
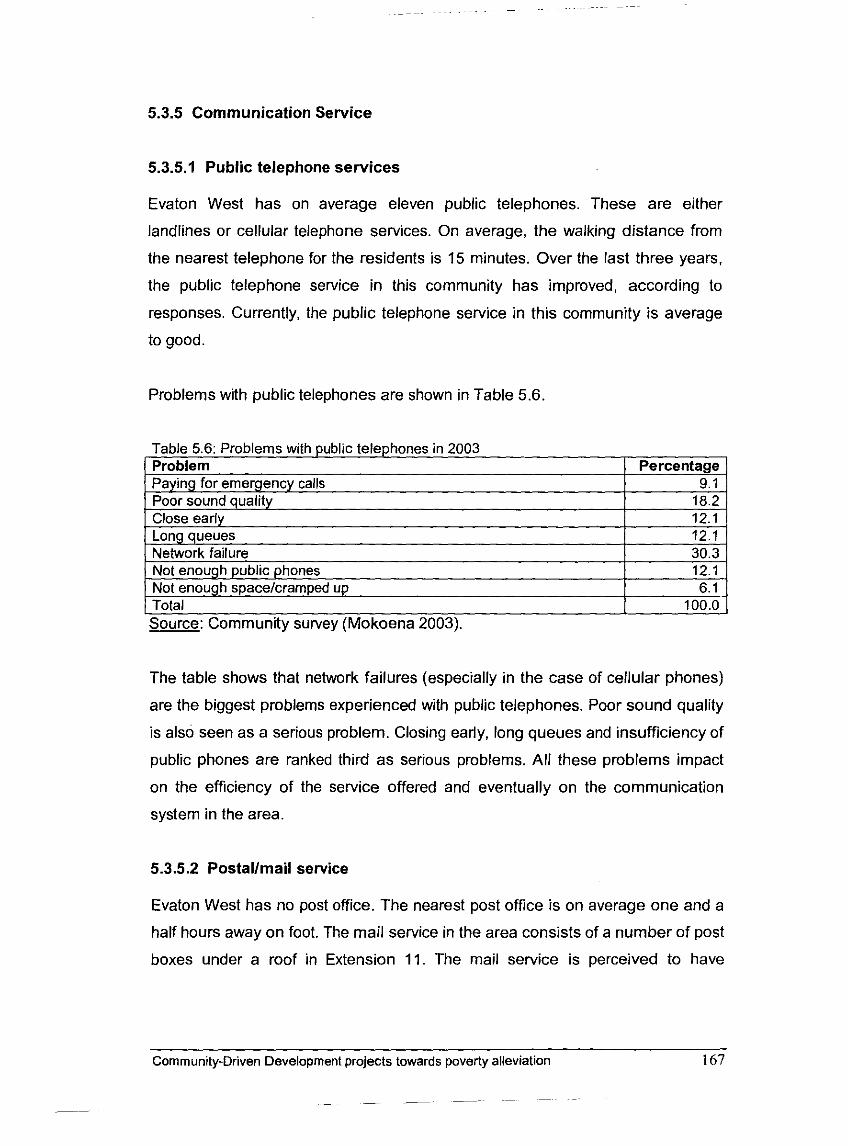
5.3.5 Communication Service
5.3.5.1 Public telephone services
Evaton West has on average eleven public telephones. These are either
landlines or cellular telephone services. On average, the walking distance from
the nearest telephone for the residents is 15 minutes. Over the last three years,
the public telephone service in this community has improved, according to
responses. Currently, the public telephone service in this community is average
to good,
Problems with public telephones are shown in Table 5.6.
Table 5.6: Problems with public telephones in 2003 Problem ( Percentage Paying for emergency calls 1 9.1 Poor sound quality Close early Long queues
18.2 12.1 12.1
Network failure I 30.3
The table shows that network failures (especially in the case of cellular phones)
are the biggest problems experienced with public telephones. Poor sound quality
is also seen as a serious problem. Closing early, long queues and insufficiency of
public phones are ranked third as serious problems. All these problems impact
on the efficiency of the service offered and eventually on the communication
system in the area.
Not enough public phones Not enough spacelcramped up I 6.1
5.3.5.2 Postallmail service
12.1
Total
Evaton West has no post office. The nearest post office is on average one and a
half hours away on foot. The mail service in the area consists of a number of post
boxes under a roof in Extension 11. The mail service is perceived to have
100.0
Community-Driven Development projects towards poverty alleviation 167
Source: Community survey (Mokoena 2003).
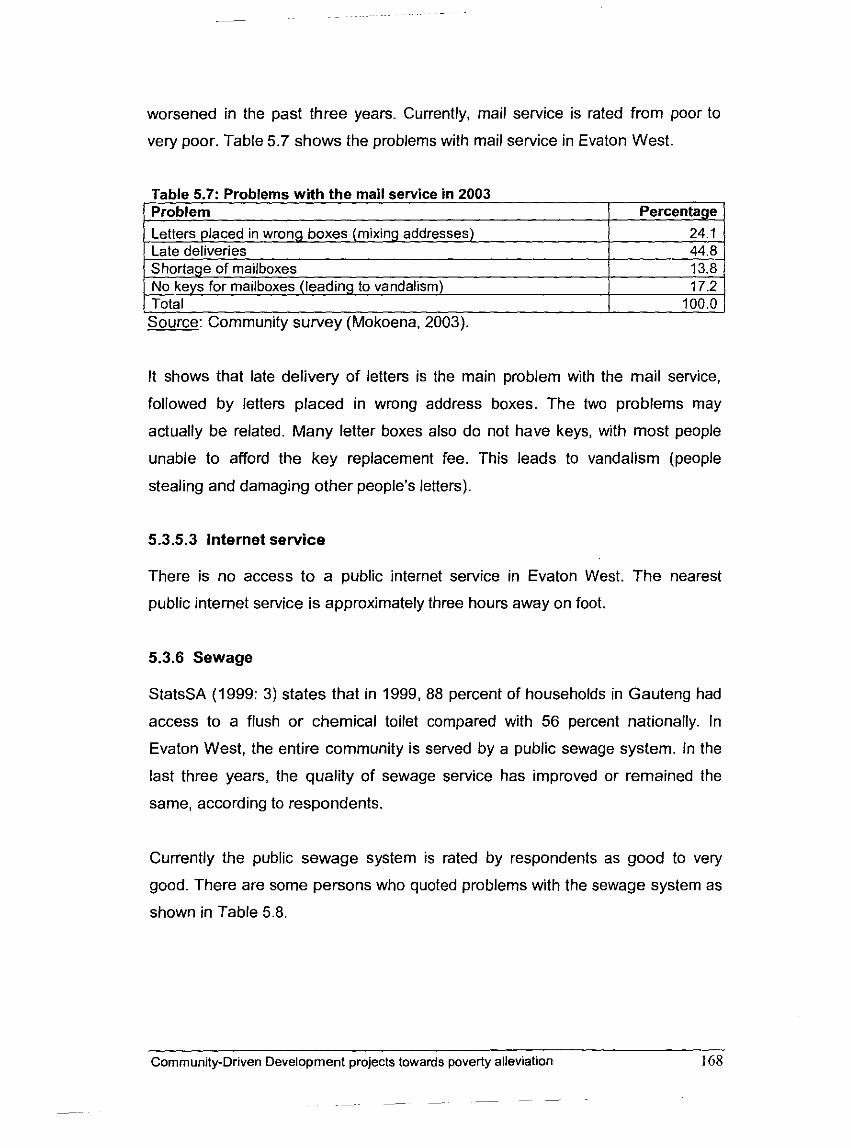
worsened in the past three years. Currently, mail service is rated from poor to
very poor. Table 5.7 shows the problems with mail service in Evaton West.
Table 5.7: Problems with the mail service in 2003 I Problem Percentage
It shows that late delivery of letters is the main problem with the mail service,
Letters placed in wrong boxes (mixing addresses) Late deliveries Shortage of mailboxes No keys for mailboxes (leading to vandalism) Total
followed by letters placed in wrong address boxes. The two problems may
actually be related. Many letter boxes also do not have keys, with most people
unable to afford the key replacement fee. This leads to vandalism (people
stealing and damaging other people's letters).
24.1 44.8 13.8 17.2
100.0
5.3.5.3 Internet service
Source: Community survey (Mokoena, 2003).
There is no access to a public internet service in Evaton West. The nearest
public internet sewice is approximately three hours away on foot.
5.3.6 Sewage
StatsSA (1999: 3) states that in 1999, 88 percent of households in Gauteng had
access to a flush or chemical toilet compared with 56 percent nationally. In
Evaton West, the entire community is sewed by a public sewage system. In the
last three years, the quality of sewage service has improved or remained the
same, according to respondents.
Currently the public sewage system is rated by respondents as good to very
good. There are some persons who quoted problems with the sewage system as
shown in Table 5.8.
Community-Driven Development projects towards poverty alleviation
- -- - - -
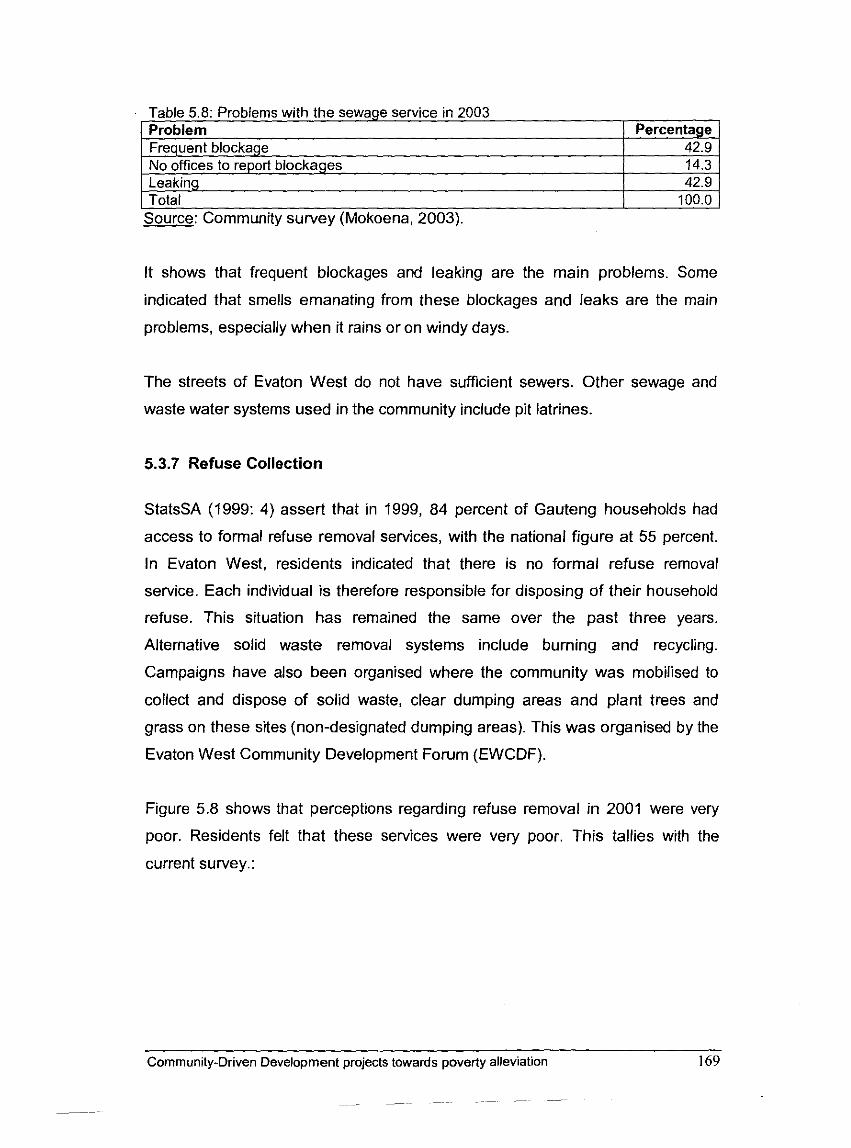
It shows that frequent blockages and leaking are the main problems. Some
indicated that smells emanating from these blockages and leaks are the main
problems, especially when it rains or on windy days.
Table 5.8: Problems with the sewage service in 2003 -
The streets of Evaton West do not have sufficient sewers. Other sewage and
waste water systems used in the community include pit latrines.
Problem Frequent blockage No offices to report blockages Leaking Total
5.3.7 Refuse Collection
Percentage 42.9 14.3 42.9
100.0
StatsSA (1999: 4) assert that in 1999, 84 percent of Gauteng households had
access to formal refuse removal services, with the national figure at 55 percent.
In Evaton West, residents indicated that there is no formal refuse removal
service. Each individual is therefore responsible for disposing of their household
refuse. This situation has remained the same over the past three years.
Alternative solid waste removal systems include burning and recycling.
Campaigns have also been organised where the community was mobilised to
collect and dispose of solid waste, clear dumping areas and plant trees and
grass on these sites (non-designated dumping areas). This was organised by the
Evaton West Community Development Forum (EWCDF).
Source: Community survey (Mokoena, 2003).
Figure 5.8 shows that perceptions regarding refuse removal in 2001 were very
poor. Residents felt that these services were very poor. This tallies with the
current survey.:
Commun~ty-Drwen Development projects towards poverty allevlatlon
- -- - - -
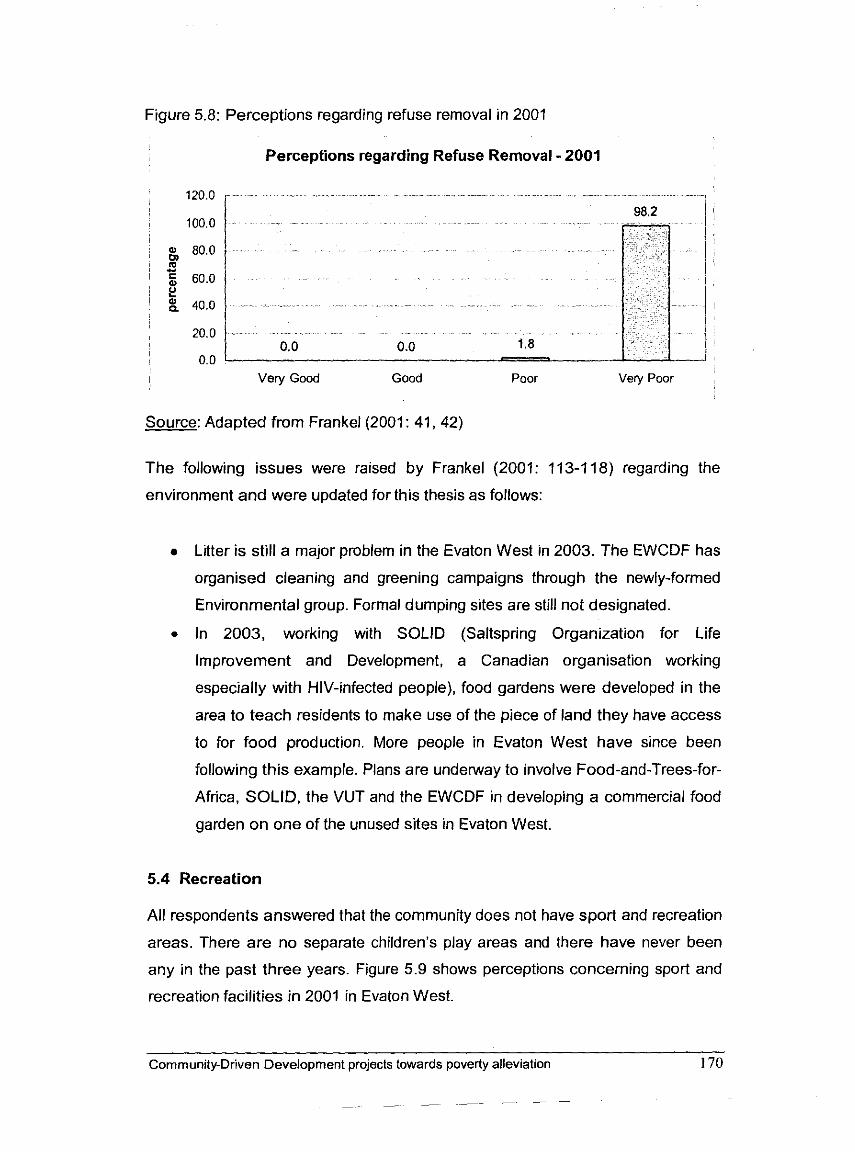
Figure 5.8: Perceptions regarding refuse removal in 2001
Perceptions regarding Refuse Removal - 2001
120.0 . . '---I
I Vely Good Good Poor Very Poor
Source: Adapted from Frankel (2001: 41,42)
The following issues were raised by Frankel (2001: 113-118) regarding the
environment and were updated for this thesis as follows:
0 Litter is still a major problem in the Evaton West in 2003. The EWCDF has
organised cleaning and greening campaigns through the newly-formed
Environmental group. Formal dumping sites are still not designated.
0 In 2003, working with SOLID (Saltspring Organization for Life
Improvement and Development, a Canadian organisation working
especially with HIV-infected people), food gardens were developed in the
area to teach residents to make use of the piece of land they have access
to for food production. More people in Evaton West have since been
following this example. Plans are underway to involve Food-and-Trees-for-
Africa, SOLID, the VUT and the EWCDF in developing a commercial food
garden on one of the unused sites in Evaton West.
5.4 Recreation
All respondents answered that the community does not have sport and recreation
areas. There are no separate children's play areas and there have never been
any in the past three years. Figure 5.9 shows perceptions concerning sport and
recreation facilities in 2001 in Evaton West.
Community-Driven Development projects towards poverty alleviation 170
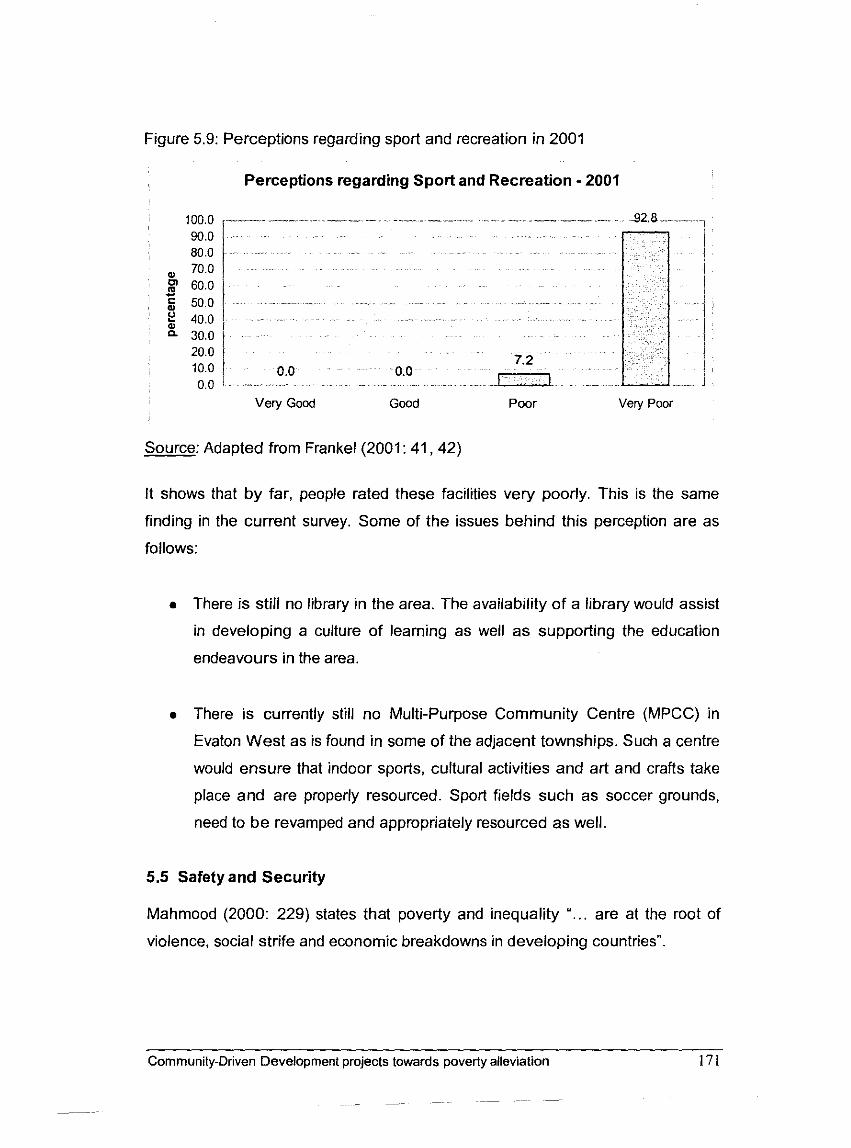
Figure 5.9: Perceptions regarding sport and recreation in 2001
Perceptions regarding Sport and Recreation - 2001
32.8 . . . - . . . . . . . . . . .
. . . . . . . . . . .
. . . . . . . . .
. . . ......
. .
i . . . 0.0 0.0
.. - - .... .-.. -. .T-I=l . . . . - . . .
Very Good Good Poor Very Poor
i
Source: Adapted from Frankel (2001: 41,42)
It shows that by far, people rated these facilities very poorly. This is the same
finding in the current survey. Some of the issues behind this perception are as
follows:
There is still no library in the area. The availability of a library would assist
in developing a culture of learning as well as supporting the education
endeavours in the area.
There is currently still no Multi-Purpose Community Centre (MPCC) in
Evaton West as is found in some of the adjacent townships. Such a centre
would ensure that indoor sports, cultural activities and art and crafts take
place and are properly resourced. Sport fields such as soccer grounds,
need to be revamped and appropriately resourced as well.
5.5 Safety and Security
Mahmood (2000: 229) states that poverty and inequality "... are at the root of
violence, social strife and economic breakdowns in developing countries".
Community-Drwen Development projects towards poverty allev~ation
- -- - - - -
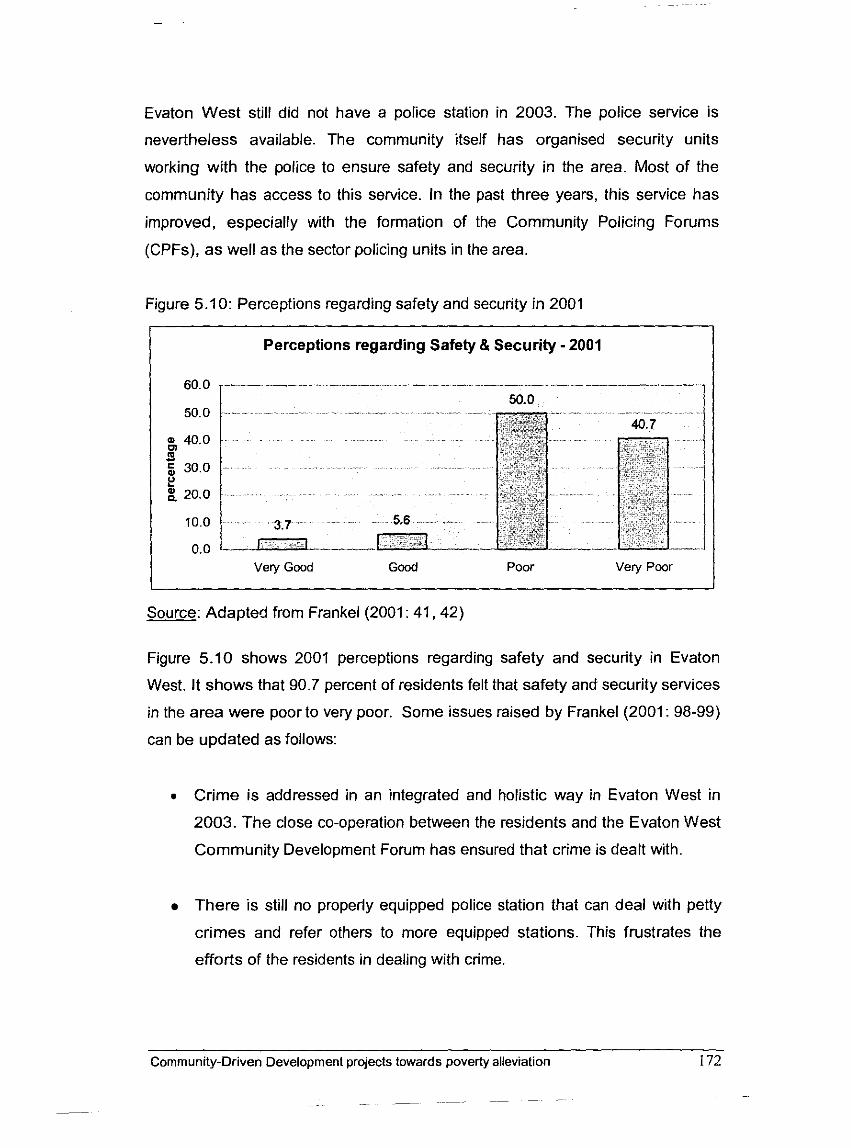
Evaton West still did not have a police station in 2003. The police service is
nevertheless available. The community itself has organised security units
working with the police to ensure safety and security in the area. Most of the
community has access to this service. In the past three years, this service has
improved, especially with the formation of the Community Policing Forums
(CPFs), as well as the sector policing units in the area.
Figure 5.10: Perceptions regarding safety and security in 2001
Perceptions regarding Safety & Security - 2001
Very Good Good Poor Very Poor
Source: Adapted from Frankel (2001 : 41,42)
Figure 5.10 shows 2001 perceptions regarding safety and security in Evaton
West. It shows that 90.7 percent of residents felt that safety and security services
in the area were poor to very poor. Some issues raised by Frankel (2001: 98-99)
can be updated as follows:
Crime is addressed in an integrated and holistic way in Evaton West in
2003. The close co-operation between the residents and the Evaton West
Community Development Forum has ensured that crime is dealt with.
There is still no properly equipped police station that can deal with petty
crimes and refer others to more equipped stations. This frustrates the
efforts of the residents in dealing with crime.
Community-Driven Development projects towards poverty alleviation 172
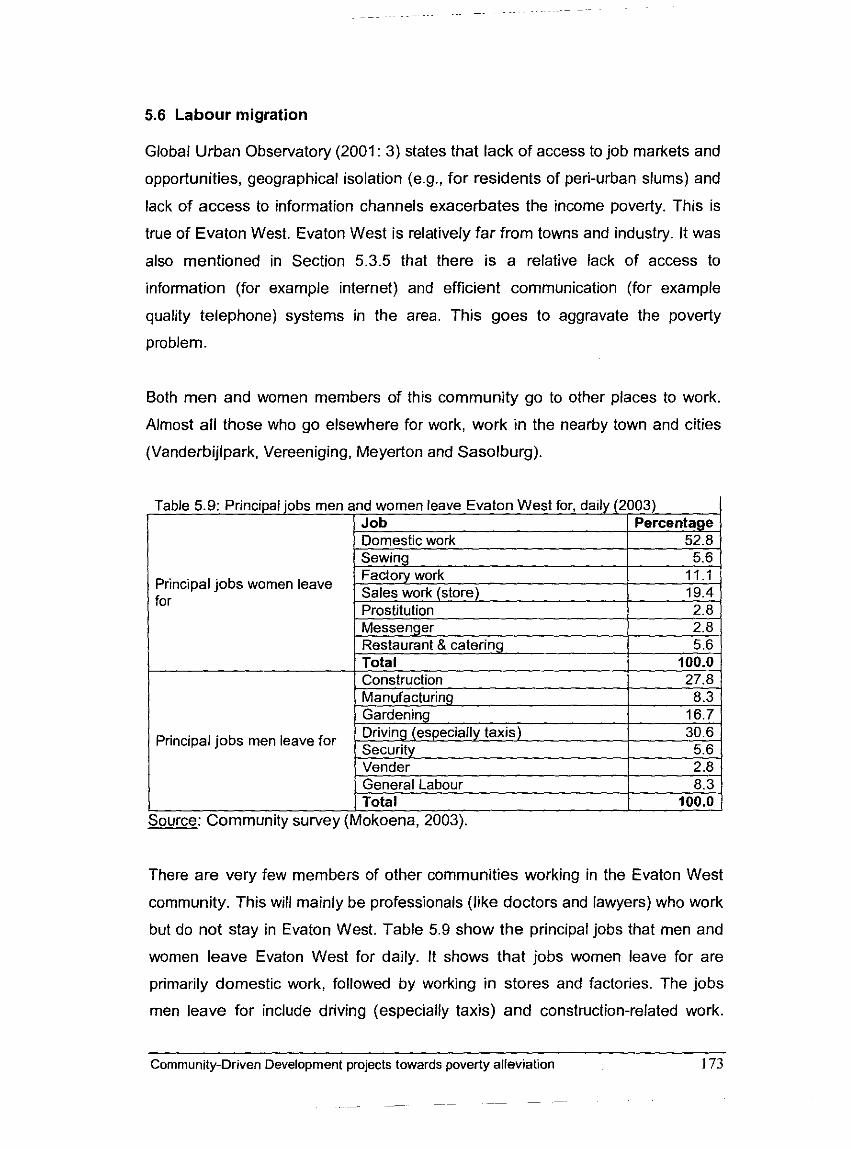
5.6 Labour migration
Global Urban Observatory (2001: 3) states that lack of access to job markets and
opportunities, geographical isolation (e.g., for residents of peri-urban slums) and
lack of access to information channels exacerbates the income poverty. This is
true of Evaton West. Evaton West is relatively far from towns and industry. It was
also mentioned in Section 5.3.5 that there is a relative lack of access to
information (for example internet) and efficient communication (for example
quality telephone) systems in the area. This goes to aggravate the poverty
problem.
Both men and women members of this community go to other places to work.
Almost all those who go elsewhere for work, work in the nearby town and cities
(Vanderbijlpark, Vereeniging, Meyerton and Sasolburg).
Principal jobs women leave
Principal jobs men leave for
Source: Community survey (Mokoena, 2003).
There are very few members of other communities working in the Evaton West
community. This will mainly be professionals (like doctors and lawyers) who work
but do not stay in Evaton West. Table 5.9 show the principal jobs that men and
women leave Evaton West for daily. It shows that jobs women leave for are
primarily domestic work, followed by working in stores and factories. The jobs
men leave for include driving (especially taxis) and construction-related work.
Community-Driven Development projects towards poverty alleviation 173
Working in gardens is also seen as a large category of employment. These are
some of the low-wage jobs perpetuating poverty in Evaton West.
5.7 Education
GUO (2003: 4) states that crime and violence, insufficient school places and
inability to afford school expenses are generally the main problems keeping
children from attending school. Castro-Leal (1999: ii) found that "...school
expenses are the most important reason that keep parents from sending children
to school. Most families have to spend a significant amount for school fees,
uniforms, transport, meals and books and stationary: Poor families pay more
than 40 percent of per capita non-food household expenditures per child in
primary school compared to only six percent for non-poor families." These
problems are also evident in Evaton West as indicated by the respondents to the
community questionnaire.
5.7.1 Preschool
There is no public pre-school in Evaton West, resulting in those parents wanting
to take their children to a pre-school sending them to other areas where there is
one or sending them to private pre-schools. The distance to the nearest pre-
school is, 45 minutes on foot. The number of pre-schools as well as the number
of teachers running them, is not sufficient to service the whole community. The
physical condition of those that are available in the area is seen as average, that
is no different from others in nearby communities. It appears that about half or
less of young children attend pre-schools. The problems 'attached to low
attendance rate at pre-schools are shown in Table 5.10. It shows that lack of
affordability of fees, the sheer distance to pre-schools and lack of confidence in
teachers are the main problems preventing parents from sending their children to
pre-schools in Evaton West.
5.7.2 Primary school
There is a public primary school in Evaton West. The distance to the school from
various points in Evaton West is on average 40 minutes on foot. The school is
not large enough for the entire school-going population of Evaton West. The ratio
Community-Driven Development projects towards poverty alleviation 174
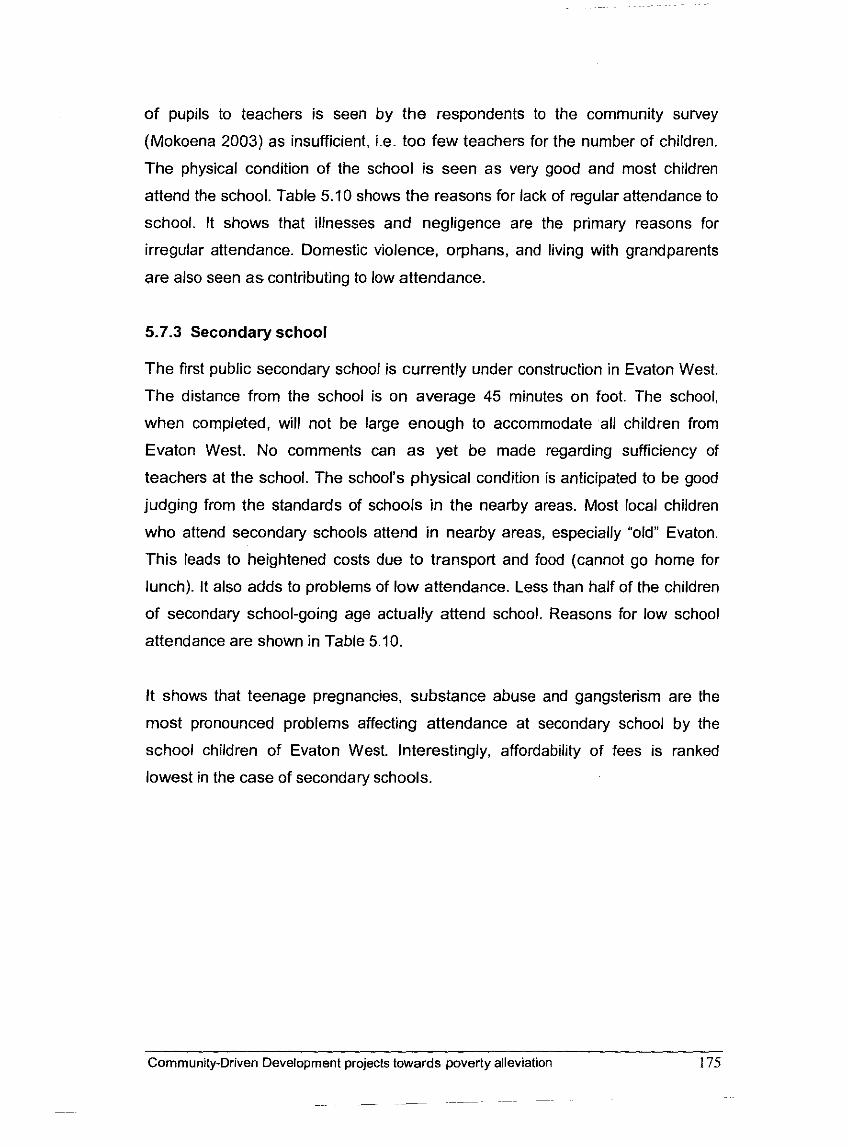
of pupils to teachers is seen by the respondents to the community survey
(Mokoena 2003) as insufficient, i.e. too few teachers for the number of children.
The physical condition of the school is seen as very good and most children
attend the school. Table 5.10 shows the reasons for lack of regular attendance to
school. It shows that illnesses and negligence are the primary reasons for
irregular attendance. Domestic violence, orphans, and living with grandparents
are also seen as contributing to low attendance.
5.7.3 Secondary school
The first public secondary school is currently under construction in Evaton West.
The distance from the school is on average 45 minutes on foot. The school,
when completed, will not be large enough to accommodate all children from
Evaton West. No comments can as yet be made regarding sufficiency of
teachers at the school. The school's physical condition is anticipated to be good
judging from the standards of schools in the nearby areas. Most local children
who attend secondary schools attend in nearby areas, especially "old" Evaton.
This leads to heightened costs due to transport and food (cannot go home for
lunch). It also adds to problems of low attendance. Less than half of the children
of secondary school-going age actually attend school. Reasons for low school
attendance are shown in Table 5.10.
It shows that teenage pregnancies, substance abuse and gangsterism are the
most pronounced problems affecting attendance at secondary school by the
school children of Evaton West. Interestingly, affordability of fees is ranked
lowest in the case of secondary schools.
Community-Driven Development projects towards poverty allev~ation 175
- - - - -
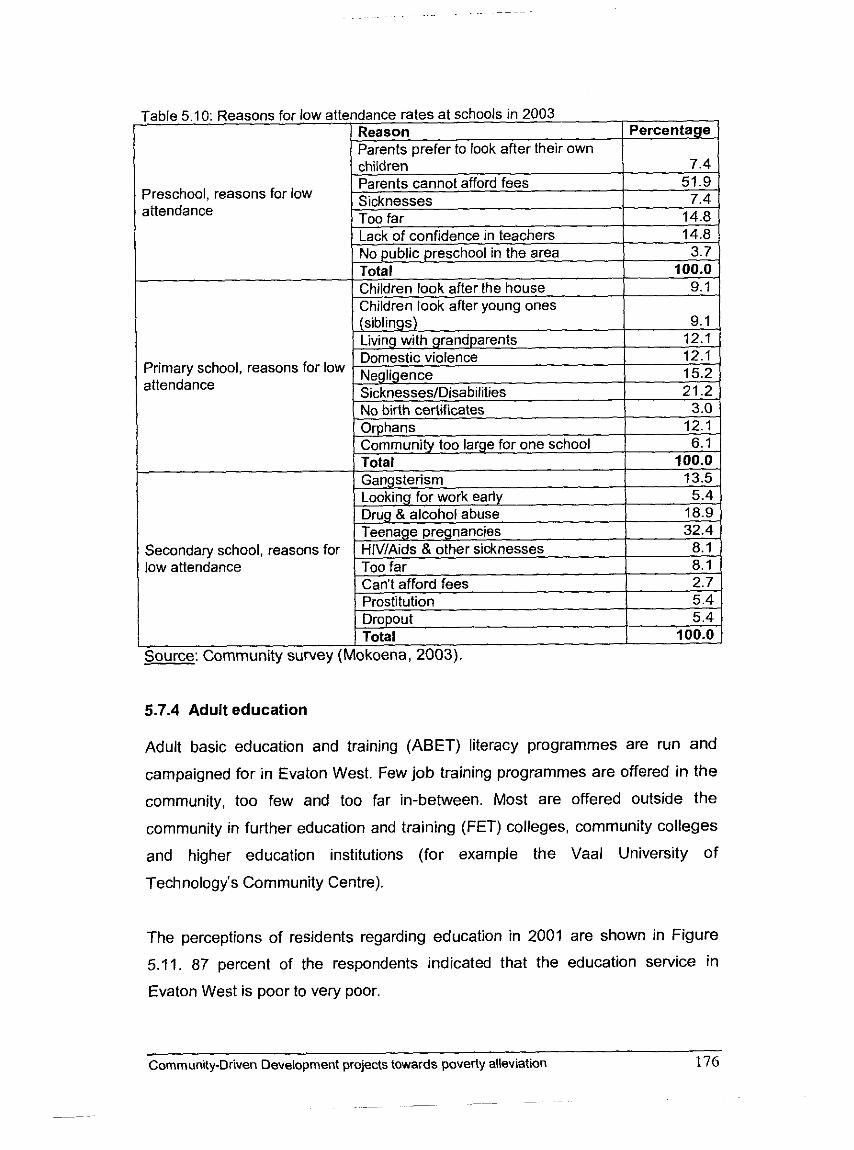
Preschool, reasons for low
Primary school, reasons for low
Secondary school, reasons for low attendance
Source: Community survey (Mokoena, 2003).
5.7.4 Adult education
Adult basic education and training (ABET) literacy programmes are run and
campaigned for in Evaton West. Few job training programmes are offered in the
community, too few and too far in-between. Most are offered outside the
community in further education and training (FET) colleges, community colleges
and higher education institutions (for example the Vaal University of
Technology's Community Centre).
The perceptions of residents regarding education in 2001 are shown in Figure
5.11. 87 percent of the respondents indicated that the education service in
Evaton West is poor to very poor.
Community-Driven Development projects towards poverty alleviation 176
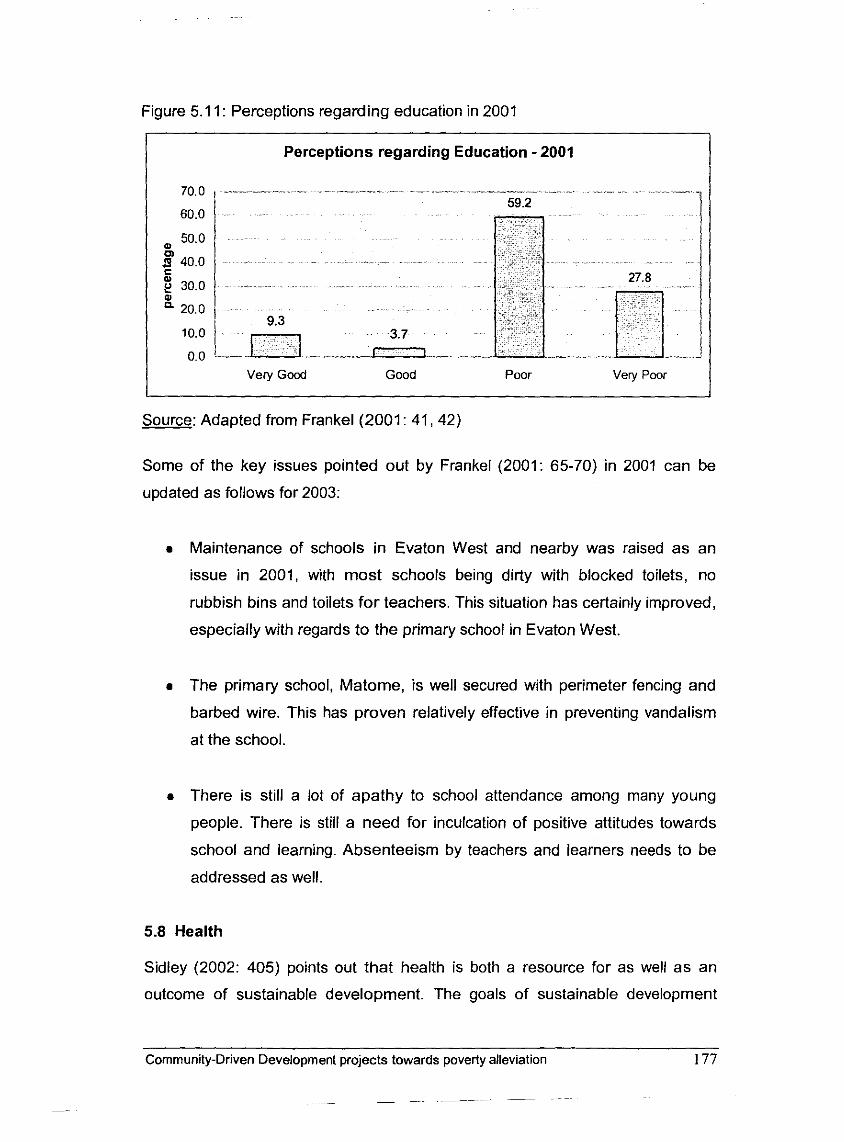
Figure 5.1 1: Perceptions regarding education in 2001
Perceptions regarding Education - 2001
Very Good Good Poor Very Poor
Source: Adapted from Frankel (2001 : 41,42)
Some of the key issues pointed out by Frankel (2001: 65-70) in 2001 can be
updated as follows for 2003:
a Maintenance of schools in Evaton West and nearby was raised as an
issue in 2001, with most schools being dirty with blocked toilets, no
rubbish bins and toilets for teachers. This situation has certainly improved,
especially with regards to the primary school in Evaton West.
a The primary school, Matome, is well secured with perimeter fencing and
barbed wire. This has proven relatively effective in preventing vandalism
at the school.
There is still a lot of apathy to school attendance among many young
people. There is still a need for inculcation of positive attitudes towards
school and learning. Absenteeism by teachers and learners needs to be
addressed as well.
5.8 Health
Sidley (2002: 405) points out that health is both a resource for as well as an
outcome of sustainable development. The goals of sustainable development
Community-Driven Development projects towards poverty alleviation 177
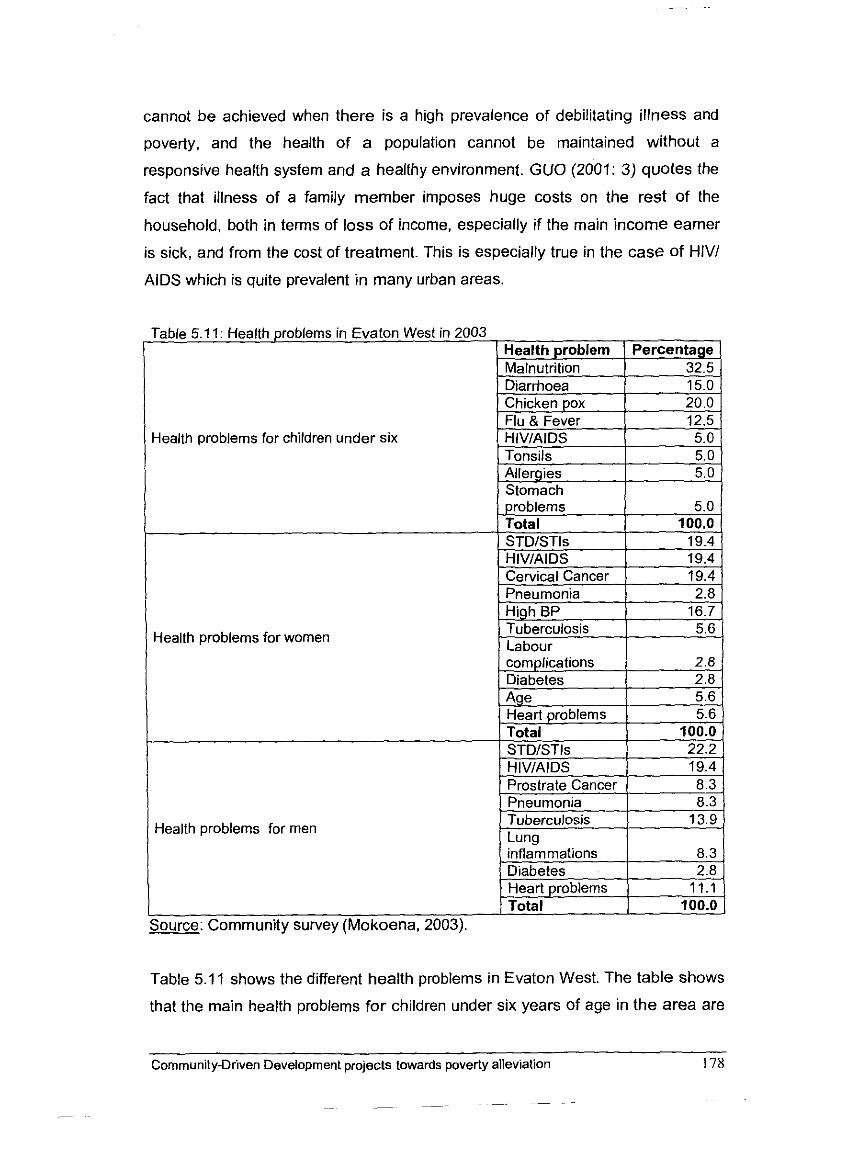
cannot be achieved when there is a high prevalence of debilitating illness and
poverty, and the health of a population cannot be maintained without a
responsive health system and a healthy environment. GUO (20b7: 3) quotes the
fact that illness of a family member imposes huge costs on the rest of the
household, both in terms of loss of income, especially if the main income earner
is sick, and from the cost of treatment. This is especially true in the case of HIVI
AIDS which is quite prevalent in many urban areas.
Health problems for children under six
Health problems for women
Health problems for men
Source: Community survey (Mokoena, 2003).
Table 5.1 1 shows the different health problems in Evaton West. The table shows
that the main health problems for children under six years of age in the area are
Community-Driven Development projects towards poverty alleviation 178
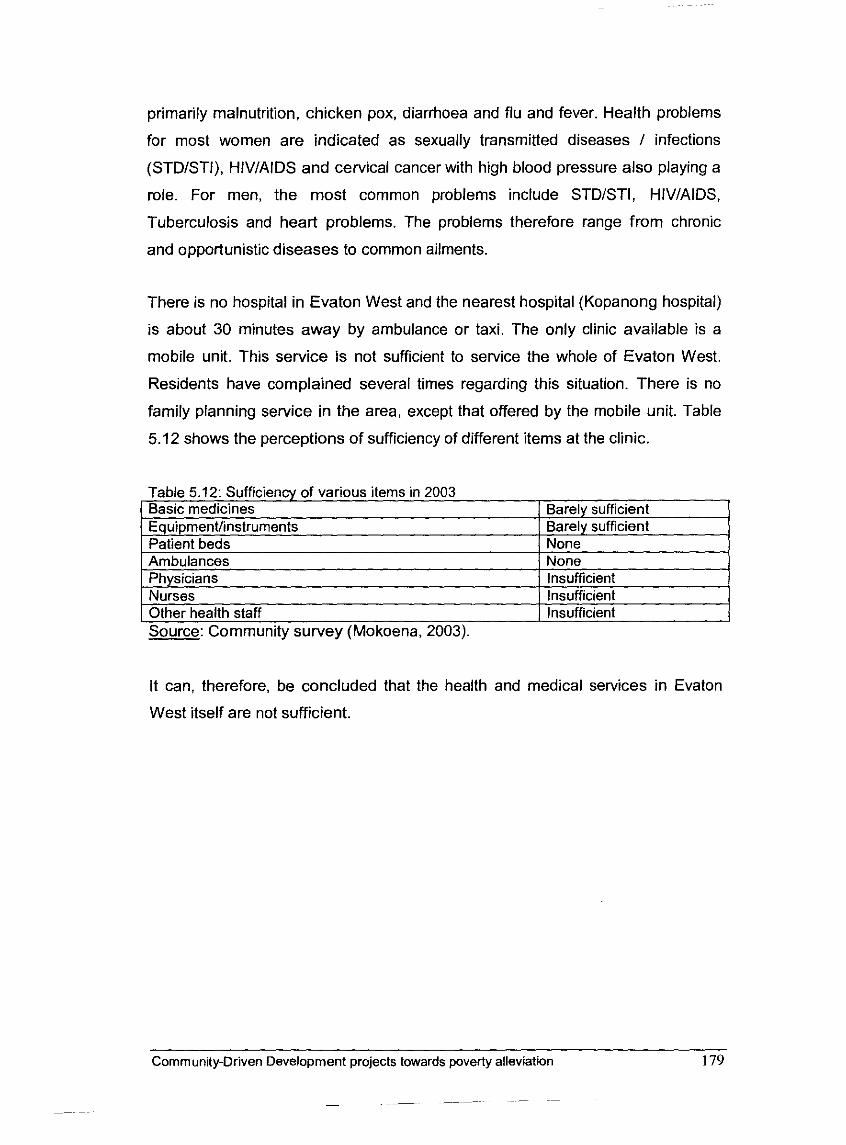
primarily malnutrition, chicken pox, diarrhoea and flu and fever. Health problems
for most women are indicated as sexually transmitted diseases / infections
(STDISTI), HIV/AIDS and cervical cancer with high blood pressure also playing a
role. For men, the most common problems include STDISTI, HIVIAIDS,
Tuberculosis and heart problems. The problems therefore range from chronic
and opportunistic diseases to common ailments.
There is no hospital in Evaton West and the nearest hospital (Kopanong hospital)
is about 30 minutes away by ambulance or taxi. The only clinic available is a
mobile unit. This service is not sufficient to service the whole of Evaton West.
Residents have complained several times regarding this situation. There is no
family planning service in the area, except that offered by the mobile unit. Table
5.12 shows the perceptions of sufficiency of different items at the clinic.
Table 5.12: Sufficiency of various items in 2003 Basic medicines I Barely sufficient Equipmentlinstruments I Barely sufficient 1 Patient beds ( None Ambulances I None
It can, therefore, be concluded that the health and medical services in Evaton
West itself are not sufficient.
Physicians Nurses Other health staff
CommunityDriven Development projects towards poverty alleviation 179
-- -- ---- -- -
Insufficient Insufficient Insufficient
Source: Community survey (Mokoena, 2003).
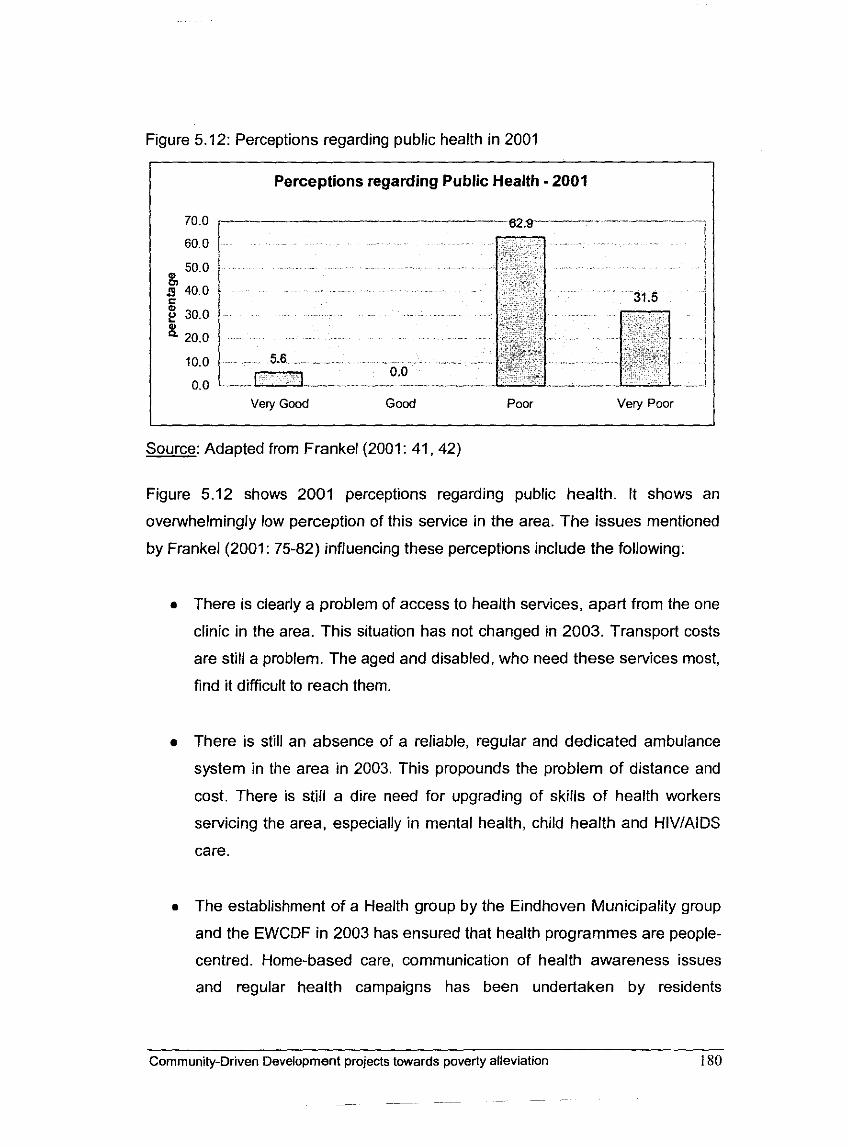
Figure 5.12: Perceptions regarding public health in 2001
Perceptions regarding Public Health - 2001
Very Good Good Poor Very Poor
Source: Adapted from Frankel (2001: 41,42)
Figure 5.12 shows 2001 perceptions regarding public health. It shows an
overwhelmingly low perception of this service in the area. The issues mentioned
by Frankel (2001 : 75-82) influencing these perceptions include the following:
a There is clearly a problem of access to health services, apart from the one
clinic in the area. This situation has not changed in 2003. Transport costs
are still a problem. The aged and disabled, who need these services most,
find it difficult to reach them.
There is still an absence of a reliable, regular and dedicated ambulance
system in the area in 2003. This propounds the problem of distance and
cost. There is still a dire need for upgrading of skills of health workers
servicing the area, especially in mental health, child health and HIVIAIDS
care.
a The establishment of a Health group by the Eindhoven Municipality group
and the EWCDF in 2003 has ensured that health programmes are people-
centred. Home-based care, communication of health awareness issues
and regular health campaigns has been undertaken by residents
Community-Driven Development projects towards poverty alleviation 180
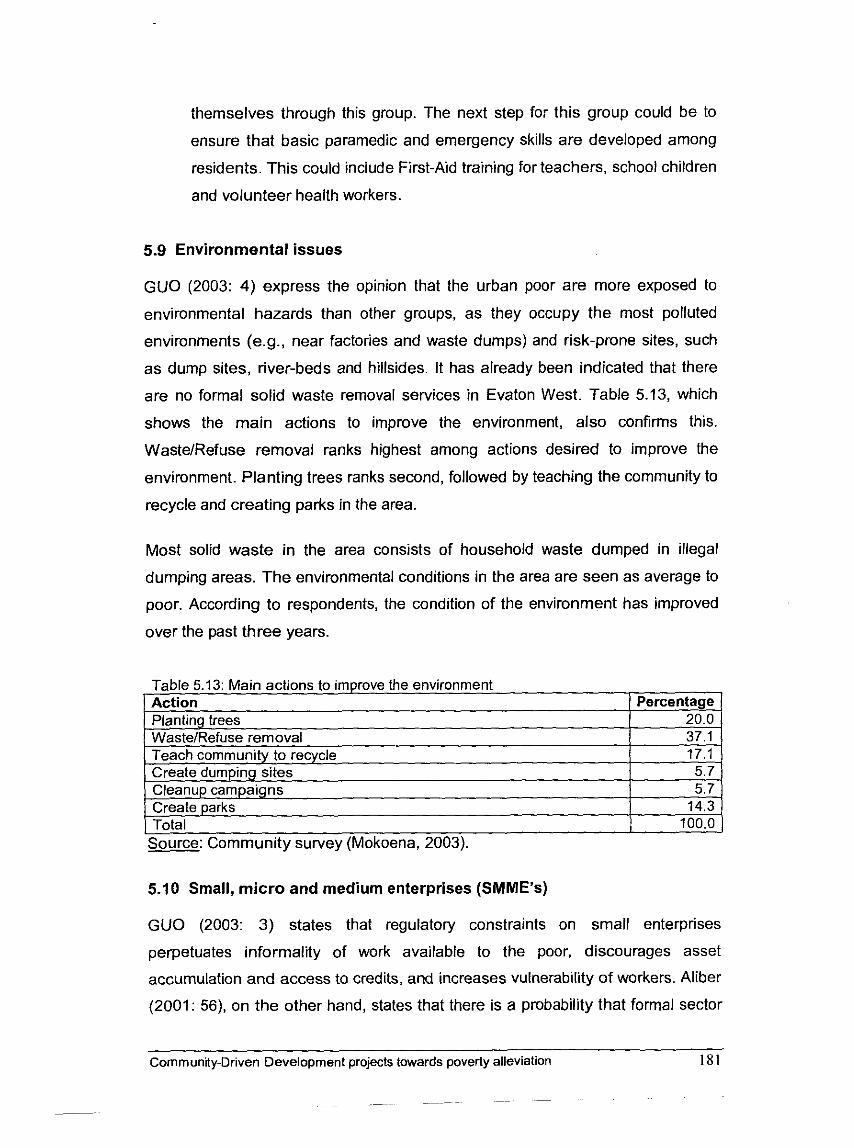
themselves through this group. The next step for this group could be to
ensure that basic paramedic and emergency skills are developed among
residents. This could include First-Aid training for teachers, school children
and volunteer health workers.
5.9 Environmental issues
GUO (2003: 4) express the opinion that the urban poor are more exposed to
environmental hazards than other groups, as they occupy the most polluted
environments (e.g., near factories and waste dumps) and risk-prone sites, such
as dump sites, river-beds and hillsides. It has already been indicated that there
are no formal solid waste removal services in Evaton West. Table 5.13, which
shows the main actions to improve the environment, also confirms this.
WasteIRefuse removal ranks highest among actions desired to improve the
environment. Planting trees ranks second, followed by teaching the community to
recycle and creating parks in the area.
Most solid waste in the area consists of household waste dumped in illegal
dumping areas. The environmental conditions in the area are seen as average to
poor. According to respondents, the condition of the environment has improved
over the past three years.
Table 5.13: Main actions to improve the environment A-timn 1 D m r ~ m n t a n t a I n,,..",.
Planting trees WasteIRefuse removal Teach community to recycle
nping sites ) campaigns
5.10 Small, micro and medium enterprises (SMME's)
. 20.0 37.1 17.1 5.7 5.7
Create parks 1 14.3
GUO (2003: 3) states that regulatory constraints on small enterprises
perpetuates informality of work available to the poor, discourages asset
accumulation and access to credits, and increases vulnerability of workers. Aliber
(2001: 56), on the other hand, states that there is a probability that formal sector
Total
Community-Driven Development projects towards poverty alleviation
- ~
--
100.0 Source: Community survey (Mokoena, 2003).
employment will fail to expand dramatically in the near future. Prospects are
especially bleak for unskilled work. This implies that if chronic poverty is to be
reduced, then the SMME sector will have to pick up the slack. This calls for more
support (through enabling regulatory framework) for SMMEs. Aliber (2001: 56)'s
assertion states:
"A ... challenge to addressing chronic poverty is the probability that formal
sector employment will fail to expand dramatically in the near future.
Prospects are especially bleak for unskilled work. This implies that if
chronic poverty is to be reduced then the SMME sector will have to pick
up the slack. The fact that the SMME sector is only partially able to do so
now (among Africans and coloureds, there are more than 5 times as
many unemployed people as there are employed or self-employed in the
informal sector, excluding domestic workers), suggests as a necessary
condition that government and civil society will have to step up their
efforts considerably from what they are presently. Whether this will be a
sufficient condition, however, is doubtful. A key question is whether
markets for the goods and services that SMMEs provide are sufficiently
large. Another key question is whether an increasing number of SMMEs
can move beyond the 'survivalist' mode and thereby provide actual
escapes from poverty."
There are a number of reasons that many SMME stay in the survivalist mode
referred to by Aliber (2001: 56) above, including the fact that
Small business owners are normally people skilled in the particular areas
(like building and painting), and are not really skilled in the entire business
management field.
It is also true that whilst these people move about soliciting customers, a
lot of time that could have been spent on production is wasted.
Pricing of products is also done arbitrarily and not consistently. All these
and other problems may be addressed through a co-operative approach.
The economic base of Evaton West is very small compared to other more
established areas. Table 5.14 shows the contribution of the different areas
Community-Driven Development projects towards poverty alleviation 182
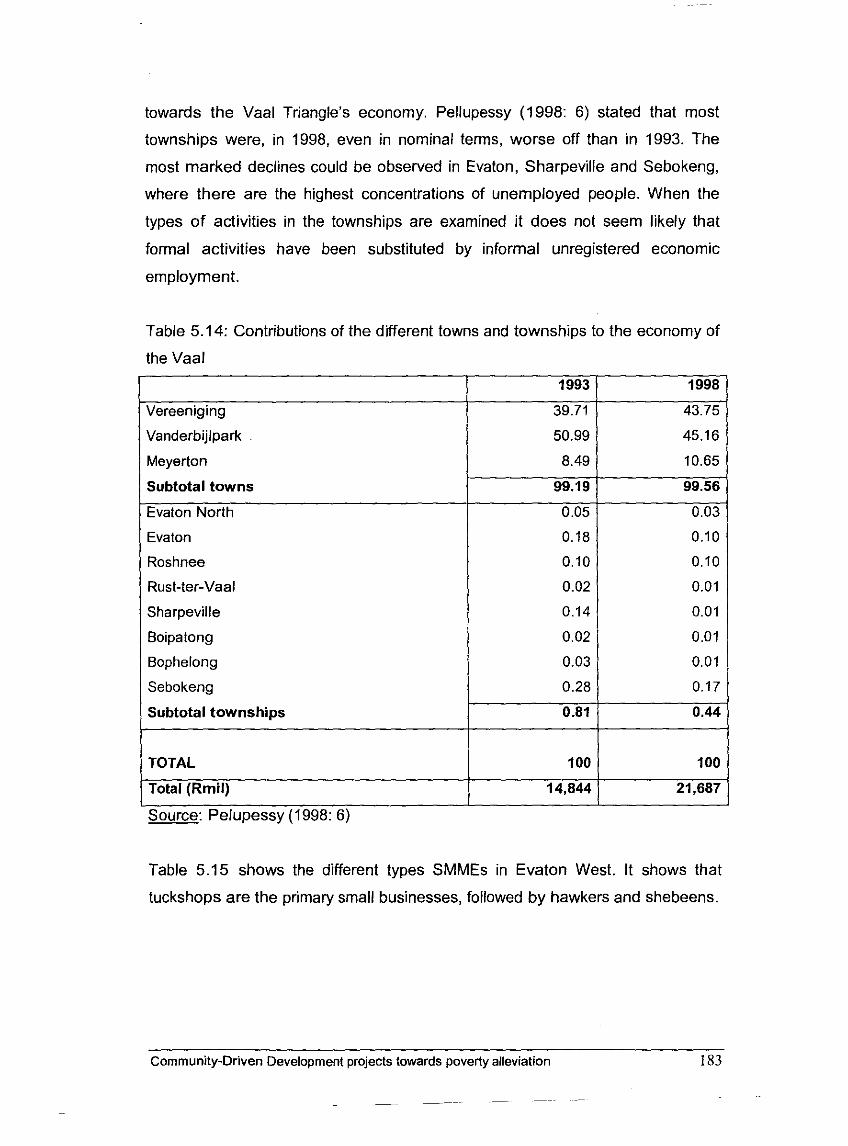
towards the Vaal Triangle's economy. Pellupessy (1998: 6) stated that most
townships were, in 1998, even in nominal terms, worse off than in 1993. The
most marked declines could be observed in Evaton, Sharpeville and Sebokeng,
where there are the highest concentrations of unemployed people. When the
types of activities in the townships are examined it does not seem likely that
formal activities have been substituted by informal unregistered economic
employment.
Table 5.14: Contributions of the different towns and townships to the economy of
Table 5.15 shows the different types SMMEs in Evaton West. It shows that
the Vaal
tuckshops are the primary small businesses, followed by hawkers and shebeens.
Vereeniging
Vanderbijlpark
Meyerton
Subtotal towns
Evaton North
Evaton
Roshnee
Rust-ter-Vaal
Sharpeville
Boipatong
Bophelong
Sebokeng
Subtotal townships
TOTAL
Total (Rmil)
Source: Pelupessy (1998: 6 )
Community-Driven Development projects towards poverty alleviation 183
- -- -- -- - --
1993
39.71
50.99
8.49
99.19
0.05
0.18
0.10
0.02
0.14
0.02
0.03
0.28
0.81
100
14,844
1998
43.75
45.16
10.65
99.56
0.03
0.10
0.10
0.01
0.01
0.01
0.01
0.17
0.44
100
21,687
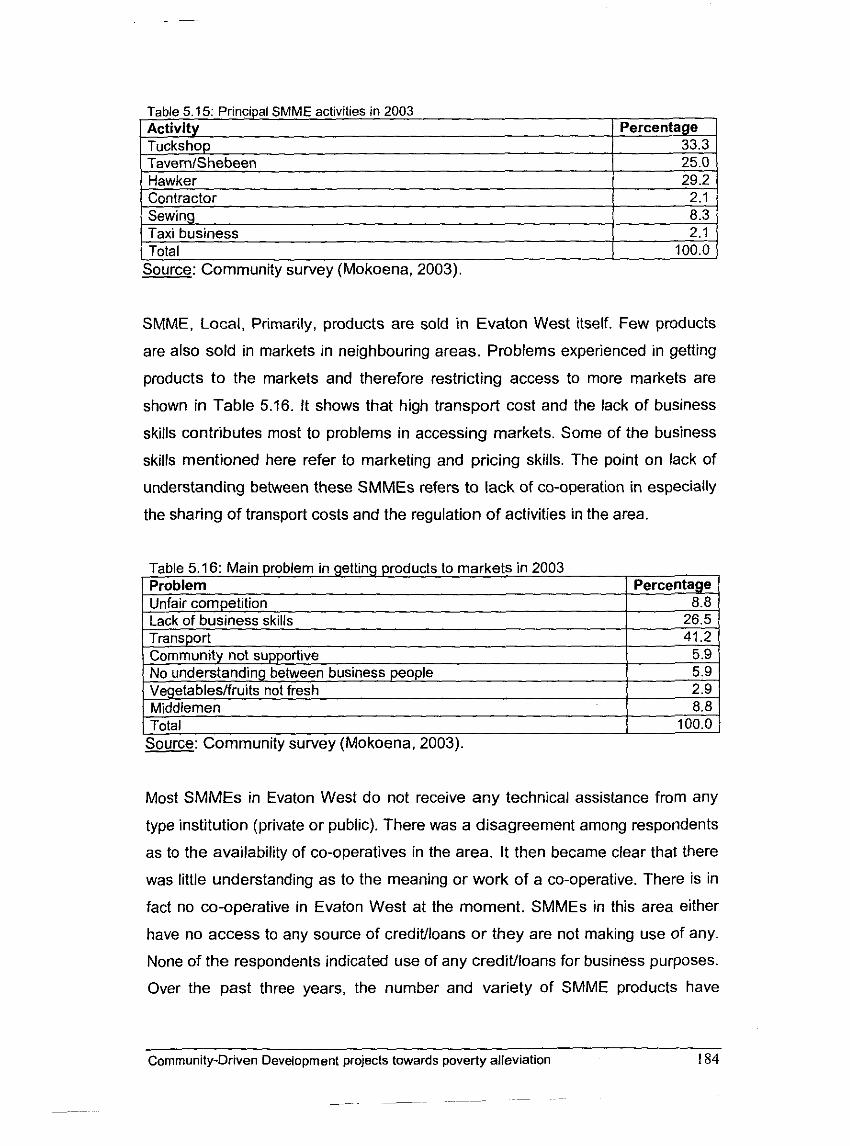
SMME, Local, Primarily, products are sold in Evaton West itself. Few products
are also sold in markets in neighbouring areas. Problems experienced in getting
products to the markets and therefore restricting access to more markets are
shown in Table 5.16. It shows that high transport cost and the lack of business
skills contributes most to problems in accessing markets. Some of the business
skills mentioned here refer to marketing and pricing skills. The point on lack of
understanding between these SMMEs refers to lack of co-operation in especially
the sharing of transport costs and the regulation of activities in the area.
Contractor Sewing Taxi business Total
2.1 8.3 2.1
100.0 Source: Community survey (Mokoena, 2003).
Table 5.16: Main problem in getting products to markets in 2003 Problem Unfair competition Lack of business skills Transport Community not supportive No understanding between business people Vegetableslfruits not fresh
I I ",_I I .--.- Source: Community survey (Mokoena, 2003).
Percentage 8.8
26.5 41.2
5.9 5.9 2.9
~iddlemen
Most SMMEs in Evaton West do not receive any technical assistance from any
type institution (private or public). There was a disagreement among respondents
as to the availability of co-operatives in the area. It then became clear that there
was little understanding as to the meaning or work of a co-operative. There is in
fact no co-operative in Evaton West at the moment. SMMEs in this area either
have no access to any source of creditlloans or they are not making use of any.
None of the respondents indicated use of any creditlloans for business purposes.
Over the past three years, the number and variety of SMME products have
8.8
Community-Driven Development projects towards poverty alleviation 184
T-I-I I inn n
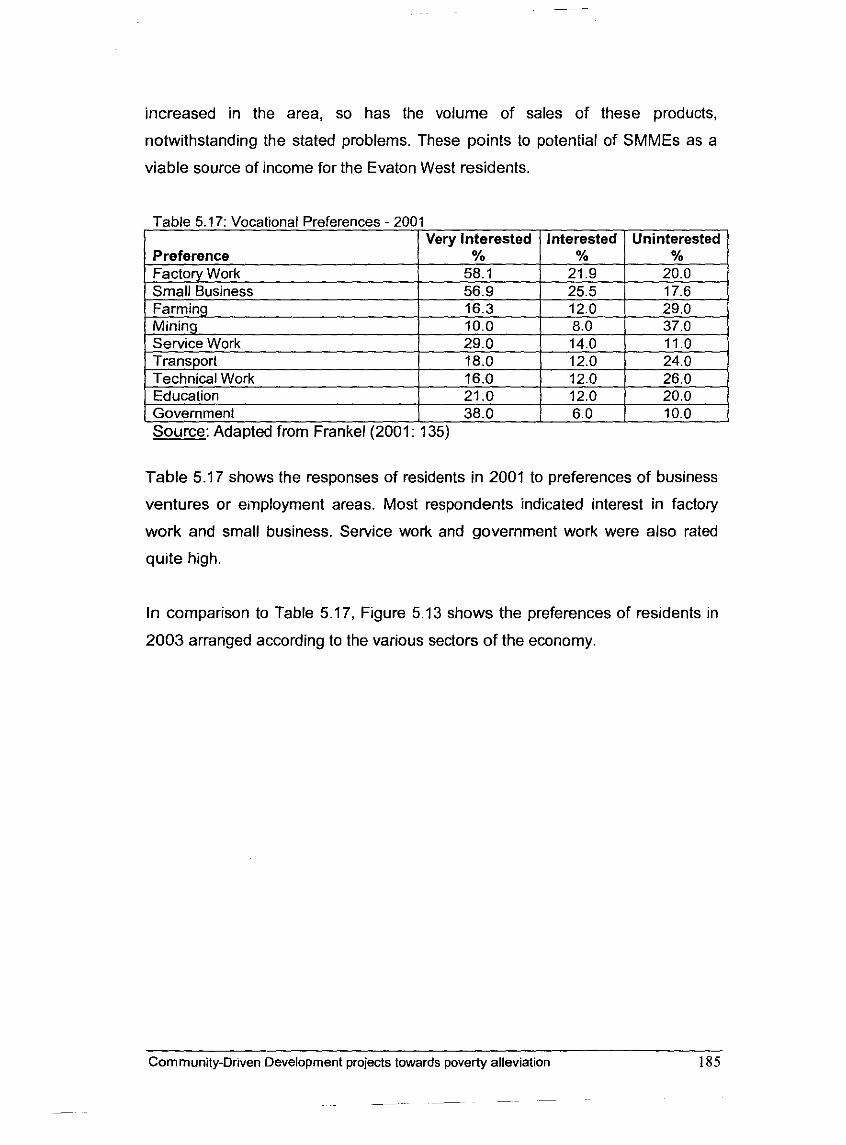
increased in the area, so has the volume of sales of these products,
notwithstanding the stated problems. These points to potential of SMMEs as a
viable source of income for the Evaton West residents.
Table 5.17: Vocational Preferences - 2001
Source: Adapted from Frankel (2001: 135)
Table 5.17 shows the responses of residents in 2001 to preferences of business
ventures or employment areas. Most respondents indicated interest in factory
work and small business. Service work and government work were also rated
quite high.
In comparison to Table 5.17, Figure 5.13 shows the preferences of residents in
2003 arranged according to the various sectors of the economy.
Community-Dr~ven Development projects towards poverty allev~at~on
- -- -- -
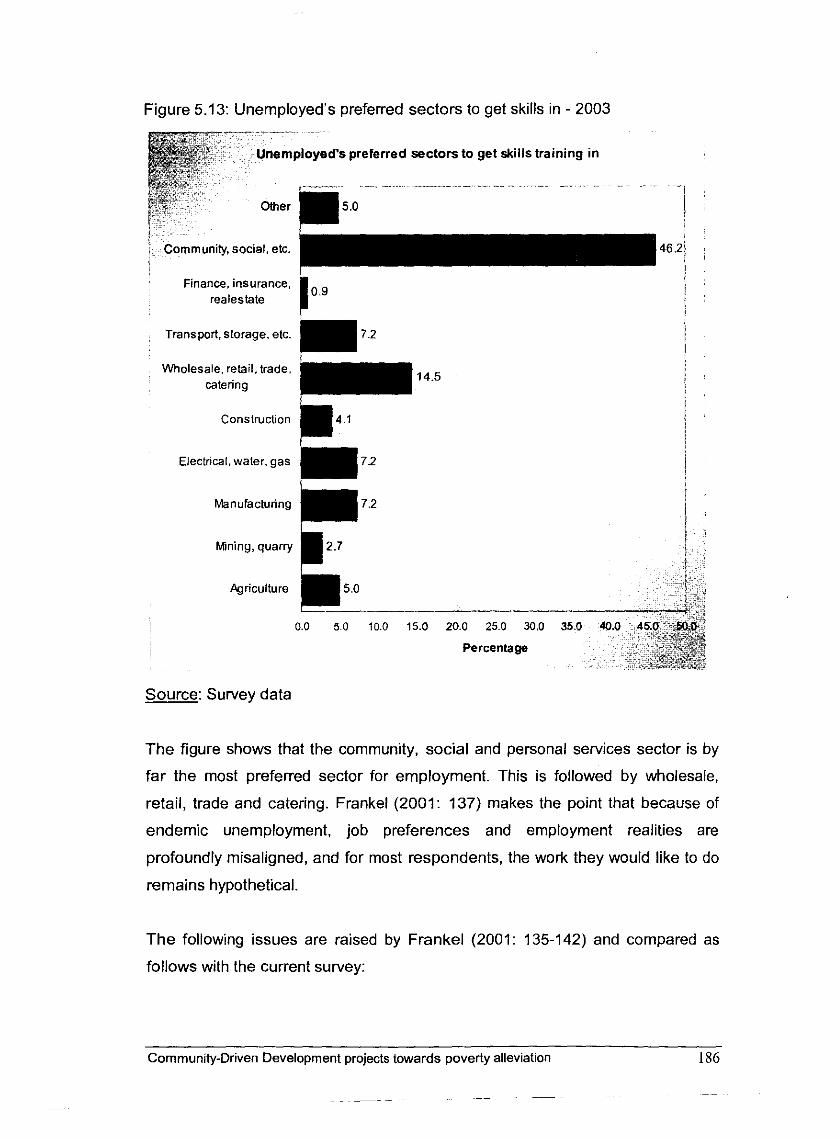
Figure 5.13: Unemployed's preferred sectors to get skills in - 2003
mployed's preferred sectors to get skills training in
~ -.. . ~ . .~ ... . - i
I !
Finance, insurance, I
realestate I 1 I
i
Transport, storage, etc. ! I
Wholesale, relail, trade. I
catering I ', , '
I : Construction i
i i
Electrical, water, gas 1 :
Mning, quarry
Agriculture
0.0 5.0 10.0 15.0 20.0 25.0 30.0 3
Percentage
Source: Survey data
The figure shows that the community, social and personal services sector is by
far the most preferred sector for employment. This is followed by wholesale,
retail, trade and catering. Frankel (2001: 137) makes the point that because of
endemic unemployment, job preferences and employment realities are
profoundly misaligned, and for most respondents, the work they would like to do
remains hypothetical.
The following issues are raised by Frankel (2001: 135-142) and compared as
follows with the current survey:
Community-Driven Development projects towards poverty alleviation 186
The possibilities of tourism in the area, although seemingly a promising
prospect, have not been investigated. All produce sold in the area is
meant almost entirely for local consumption. The prospects of tourism
stem from the ideal location of Evaton West; it lies along two major routes
for tourists travelling either south to places like Vanderbijlpark, the Free
State Province, The Eastern Cape and the Western Cape, and to the
north (greater Gauteng and Limpopo).
Affirmative local procurement involving people and services in Evaton
West for local projects is encouraged.
Key problems of lack of business skills and access to finance are still
present in the community. This stifles initiatives in the area.
5.1 1 Community support
The following community organisations or groups existed in Evaton West in
2003:
a. Community development committee - The Evaton West Community
Development Forum.
b. LED Group (Local Economic Development)
c. Parent-teacher association (PTA)
d. Health committee
e. Youth group
f. Sports group
g. Cultural group
h. Civic group
All these groups consist primarily of residents. In some cases (like in the LED
group), representatives of the local council are also included. These groups are
supported by the following institutions primarily:
Commun~ty-Drwen Development projects towards poverty alleviation
-
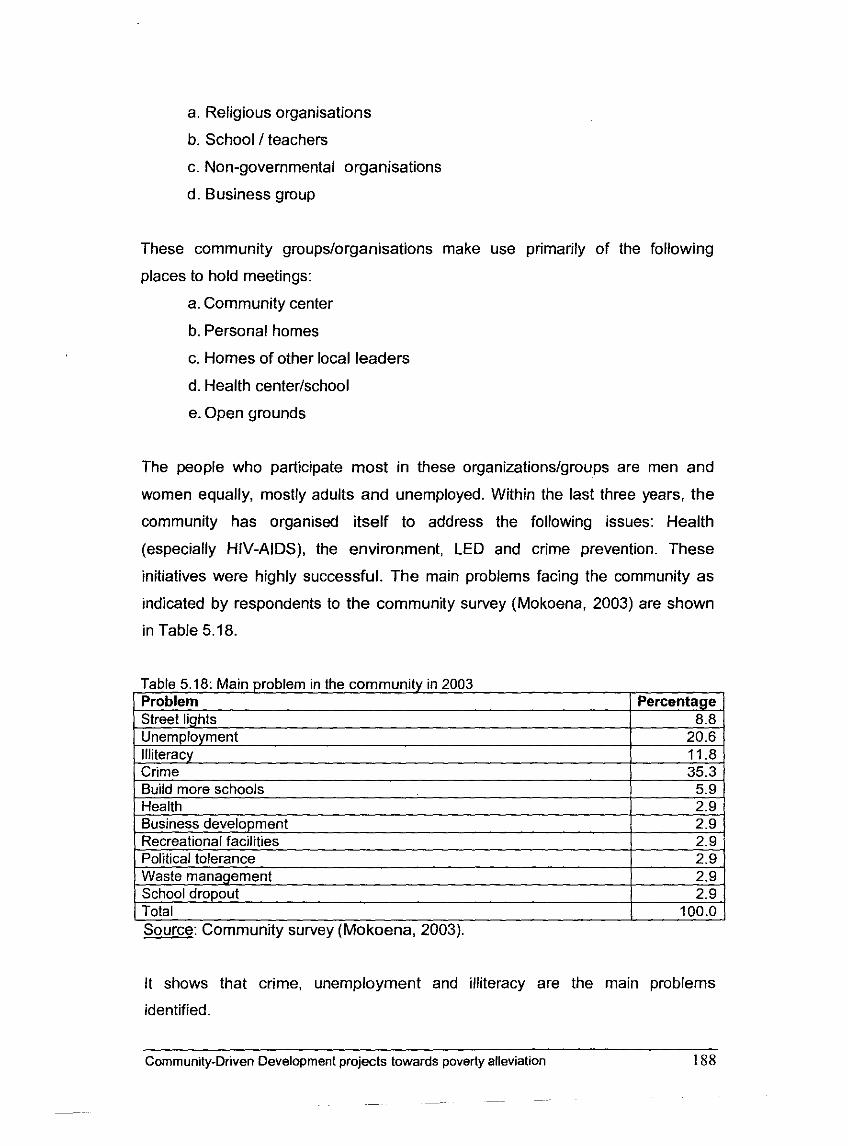
a. Religious organisations
b. School I teachers
c. Non-governmental organisations
d. Business group
These community groupslorganisations make use primarily of the following
places to hold meetings:
a. Community center
b. Personal homes
c. Homes of other local leaders
d. Health centerlschool
e. Open grounds
The people who participate most in these organizations/groups are men and
women equally, mostly adults and unemployed. Within the last three years, the
community has organised itself to address the following issues: Health
(especially HIV-AIDS), the environment, LED and crime prevention. These
initiatives were highly successful. The main problems facing the community as
indicated by respondents to the community survey (Mokoena, 2003) are shown
in Table 5.18.
Source: Community survey (Mokoena, 2003).
It shows that crime, unemployment and illiteracy are the main problems
identified.
Commun~ty-Drwen Development projects towards poverty alleviation 188
- - - - -
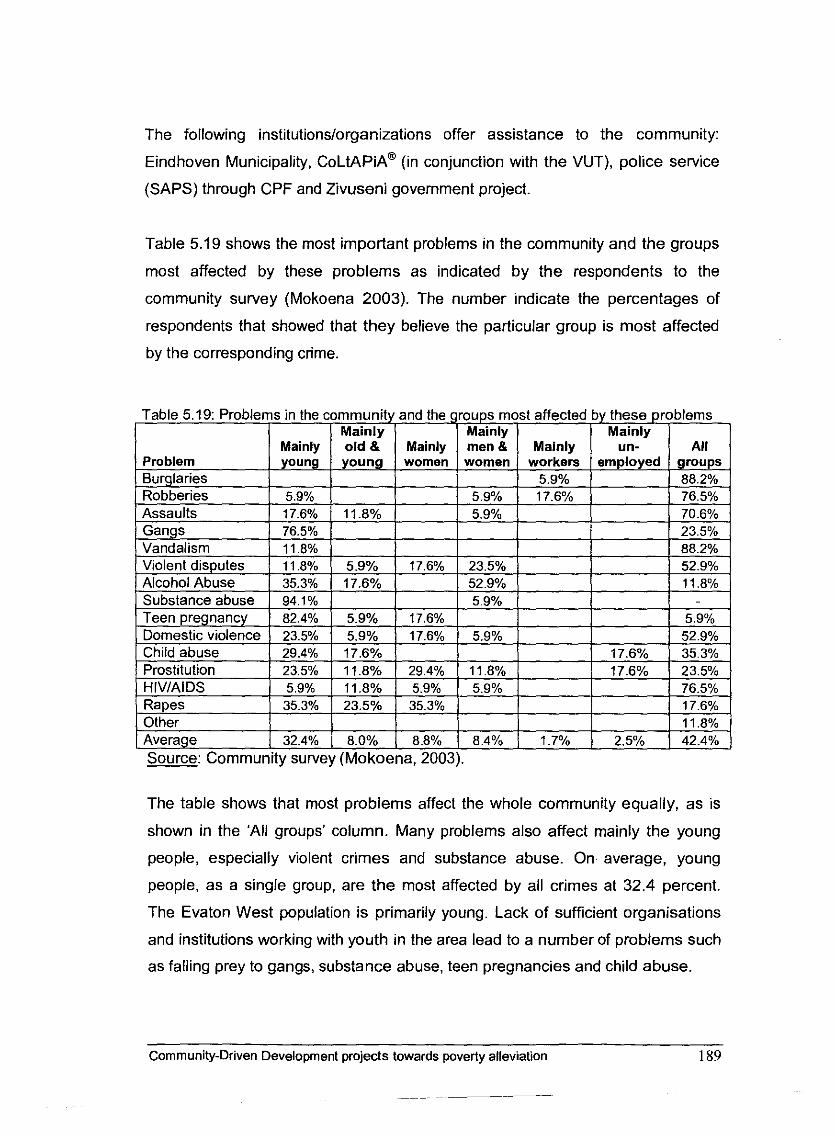
The following institutions/organizations offer assistance to the community:
Eindhoven Municipality, COL~AP~A@ (in conjunction with the VUT), police service
(SAPS) through CPF and Zivuseni government project.
Table 5.19 shows the most important problems in the community and the groups
most affected by these problems as indicated by the respondents to the
community survey (Mokoena 2003). The number indicate the percentages of
respondents that showed that they believe the particular group is most affected
by the corresponding crime.
Source: Community survey (Mokoena, 2003).
The table shows that most problems affect the whole community equally, as is
shown in the 'All groups' column. Many problems also affect mainly the young
people, especially violent crimes and substance abuse. On average, young
people, as a single group, are the most affected by all crimes at 32.4 percent.
The Evaton West population is primarily young. Lack of sufficient organisations
and institutions working with youth in the area lead to a number of problems such
as falling prey to gangs, substance abuse, teen pregnancies and child abuse.
Community-Driven Development projects towards poverty alleviation 189
Lack of employment and opportunities for women ensures that they stay poor
and this makes them susceptible to abuse and illegal ways of earning incomes.
Frankel (2001: 95) states that relative to other township areas in the Vaal area,
the level of reported crime did not appear to be particularly high in the Evaton
West. The situation has remained like this, primarily due to the sector policing
initiatives and the community police forum established in the area with the help of
the EWCDF.
5.12 Snapshot of indicators in this chapter
This chapter discussed community level indicators to establish if the community
is better-off currently than it was in 200011. Some of the indicators used include
the following:
Community Characteristics:
Main employment activities:
For men: Construction-related and spaza shopsltuckshops
For women: Sewing and spaza shops/tuckshops
Roads: Not enough storm water drainage system
Individual incomes: 79.5 percent earn less than R500 per month
Public Transport: Available, no central terminus for buses or taxis
Housing adequacy: Houses too small and inadequate for most
households
Quality of life: I. 57.9 percent say it improved; people are working
together for development.
2. Crime is still too high and so is unemployment
Trust and conflict: 47.0 percent say there is trust in the community
Principal services:
Electricity: Most houses have electricity although they feel the
quality thereof is poor
Drinking water: Community has access to pipe-borne water
Home telephone service: Less than half of households have home telephones
Public telephone service: Not enough public telephones
Postallmail service: Poor service
- - - --
Community-Driven Development projects towards poverty alleviation 190
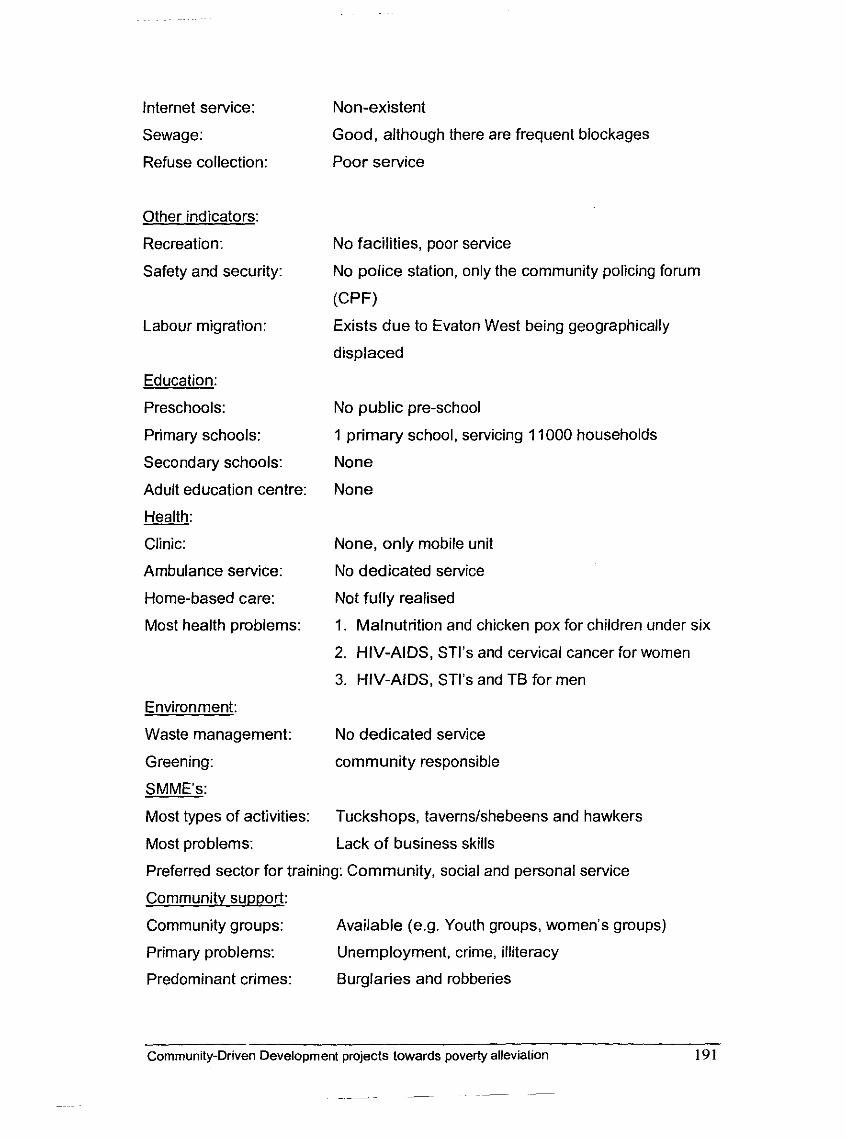
Internet service:
Sewage:
Refuse collection:
Other indicators:
Recreation:
Safety and security:
Labour migration:
Education:
Preschools:
Primary schools:
Secondary schools:
Adult education centre:
Health: Clinic:
Ambulance service:
Home-based care:
Most health problems:
Environment:
Waste management:
Greening:
SMME's:
Most types of activities:
Most problems:
Non-existent
Good, although there are frequent blockages
Poor service
No facilities, poor service
No police station, only the community policing forum
P F )
Exists due to Evaton West being geographically
displaced
No public pre-school
1 primary school, servicing 11000 households
None
None
None, only mobile unit
No dedicated service
Not fully realised
1. Malnutrition and chicken pox for children under six
2. HIV-AIDS, STl's and cervical cancer for women
3. HIV-AIDS, STl's and TB for men
No dedicated service
community responsible
Tuckshops, tavernslshebeens and hawkers
Lack of business skills
Preferred sector for training: Community, social and personal service
Communitv support:
Community groups: Available (e.g. Youth groups, women's groups)
Primary problems: Unemployment, crime, illiteracy
Predominant crimes: Burglaries and robberies
Community-Driven Development projects towards poverty alleviation 191
The above indicators show that even though the community has access to a
number of services, there is still a lot to be done before the community as a
whole can be seen as a non-poor community.
5.13 Summary
Chapter 5 discussed several community-based indicators as they apply in Evaton
West. These were then compared to results of a study undertaken in 2001. The
aim was to establish whether Evaton West has improved with regards to these
indicators over time. The indicators considered included bulk services, education,
health and the environment.
Chapter 4 and 5 assessed Evaton West on the basis of household and
community characteristics. This was done with the aim of assessing whether
Evaton West is better-off based on these characteristics or worse-off. Such
conclusions will be drawn in Chapter 6.
Community-Driven Development projects towards poverty alleviation 192
Chapter 6
Summary, conclusions and recommendations
6.1 Introduction
The previous chapters of this thesis gave a profile of the study area, namely
Evaton West (which is in the Emfuleni district of Gauteng Province) and based
this profile on a number of well-researched indicators. This chapter provides a
summary of the main points of this thesis and draws pertinent conclusions from
the findings in the other chapters. It also focuses attention on some
recommendations stemming from the conclusions presented.
The chapter contains a brief evaluation of the various indicators and compares
these findings to either those of Bophelong (a similar township) or their levels in
Evaton West as determined three years before. This assisted the reader and the
researcher in evaluating the hypothesis set at the beginning of this thesis.
Chapter 6 will conclude with some recommendations based on these indicators
and the practical results of the survey work done in Evaton West.
6.2 Summary of thesis
Chapter 1 of this thesis dealt with the problem and its setting, explaining the
motivation for this study, outlining the research problem and setting the
hypothesis. This then provided a solid basis for the ensuing chapters.
In Chapter 2, there was a short discussion on the major issues underlying this
thesis, as well as a review of the theory and literature upon which the thesis is
based. It was shown that poverty should not be simply about the level of income
obtained by households or individuals, nor that it is only about lack of access to
social services. Factors such as the inability to participate in society are also
important, and that economical, social, cultural and political factors also play a
part. Poverty is indeed all this and more: it will always be dependent on whoever
is studying poverty and why they are studying it.
Community-Driven Development projects towards poverty alleviation 193
Poverty calculations are usually based on representative sample data of income
or consumption gathered from the target area, and related to a poverty line. This,
in turn, is established with reference to minimum consumption as in the case of
absolute poverty. Defining minimum consumption is not easy. Other measures
of poverty are more qualitative and/or more location-specific, and cannot so
easily be aggregated. When poverty is multi-dimensional, problems arise with the
weighting of different components (cf. Maxwell, 1999). These apparent
contradictions are dealt with in the text.
Community-driven development (CDD), which refers to the participation of the
community in their own developments efforts also received attention, as did
unemployment, with reference to both the official and the unofficial
unemployment rates.
Chapter 3 built on the theoretical discussion started in Chapter 2. It provided the
expanded profile of Evaton West using data from Census 2001 as well as giving
a brief background sketch as to the two prominent poverty alleviation initiatives in
the area, namely the C O L ~ A P ~ A ~ and the Eindhoven Municipality programmes.
C O L ~ A P ~ A ~ W ~ ~ described as an NGO working with communities towards poverty
alleviation and leadership training. The Eindhoven Municipality's involvement
came as a result of the twinning of cities in the Netherlands and in the Vaal
Triangle in South Africa. Three local community groups have already resulted
from this co-operation with Evaton West, namely the Health group, the Local
Economic Development (LED) group and the Environmental group. A significant
finding of this chapter showed that of the total population of 30079 in 2001, 72.9
percent of the population could be classified as 'youth' (i.e. between the ages of
0 and 35). It also showed that the total labour force in 2001 was 13653
individuals with 8268 unemployed.
Community-Driven Development projects towards poverty alleviation 194
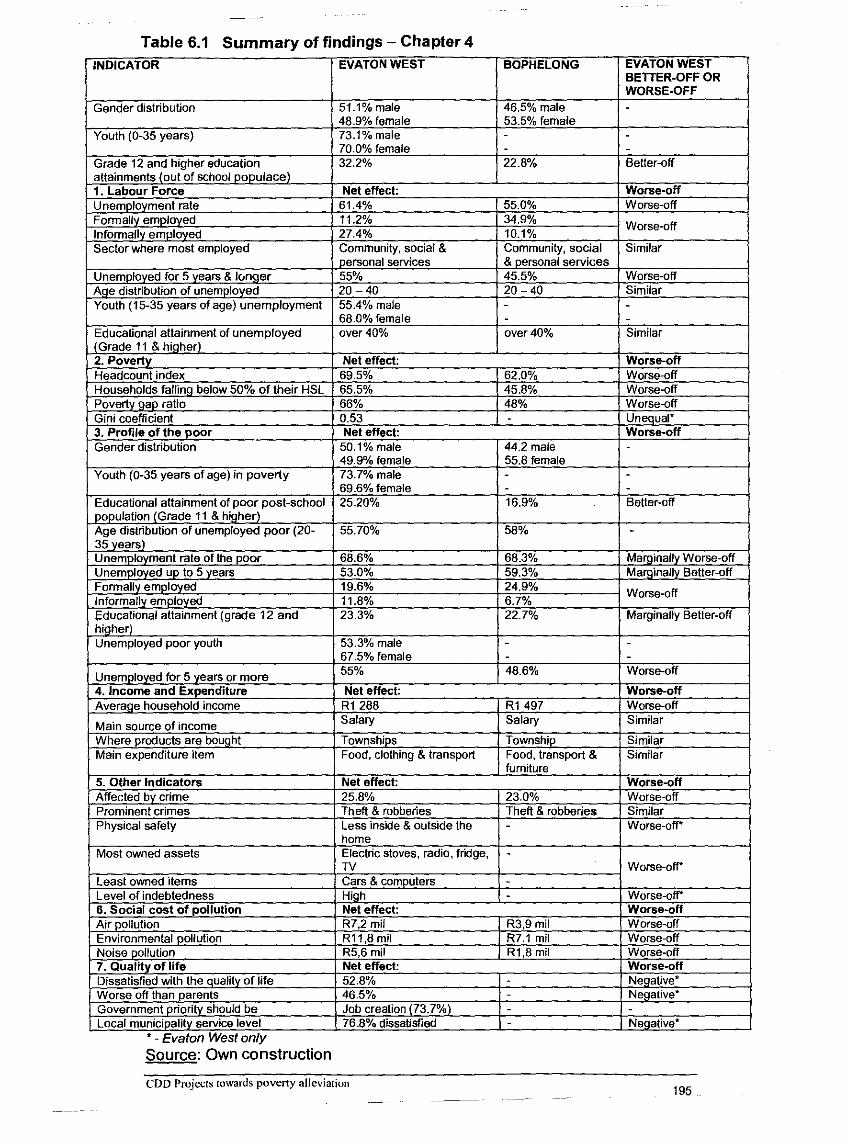
~~~~~ ~~ ~~~
~ ~~~
~ ~~ ~~~ - ~~ ~ ~
Table 6.1 Summary of findings - Chapter 4
BETTER-OFF OR
Gender distribution
* - Evaton West only Source: Own construction
CDD Projsfs towards poveny alleviation ~
~~~p~
195
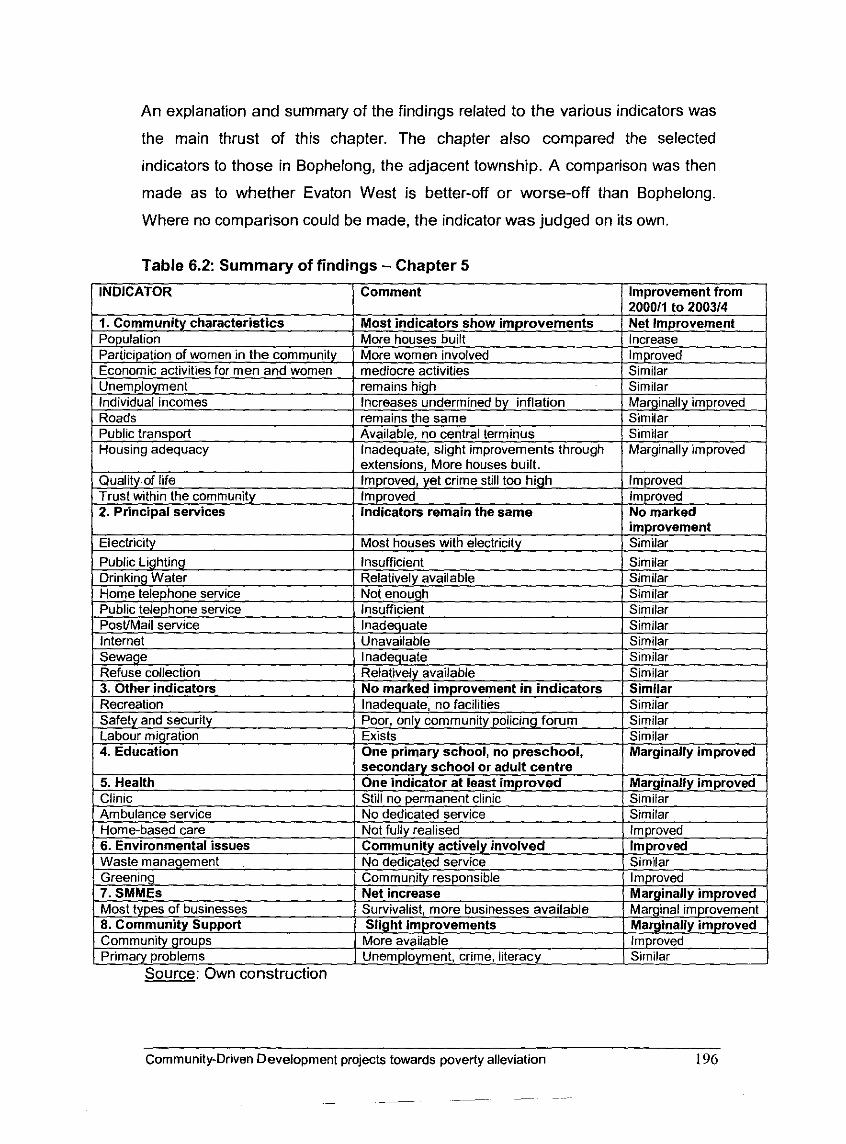
An explanation and summary of the findings related to the various indicators was
the main thrust of this chapter. The chapter also compared the selected
indicators to those in Bophelong, the adjacent township. A comparison was then
made as to whether Evaton West is better-off or worse-off than Bophelong.
Where no comparison could be made, the indicator was judged on its own.
Table 6.2: Summary of findings - Chapter 5
Source: Own construction
Community-Driven Development projects towards poverty alleviation 196
-- ~
-~
Chapter 5 dealt with an array of data and provided an analysis of community
indicators in 200314 and compared these to similar indicators from 200011. The
tables provided summarise results and also assess whether there has been an
improvement of conditions measured by the various indicators. These tables also
have importance in relation to the Conclusions reached and the
Recommendations made in this chapter and this thesis.
From the tables it can be concluded at a glance that Bophelong, on a
comparative basis, is better-off than Evaton West when judged through most
indicators. It may also be concluded that compared to three years back, Evaton
West has improved, albeit marginally. Recommendation will be made on how to
improve the situation in the short, medium and long-term.
6.3 Conclusions
The study conducted for the purposes of this thesis has shown that on a whole,
Evaton West is better-off after the participatory programmes described in the text
were run there than before. Although the improvement is marginal, Evaton West
still appears to be worse-off than Bophelong, which was not subjected to the
same poverty alleviation programmes. The null hypothesis is therefore rejected.
The study found, especially from the Focus Group Interview (FGI), that the
initiatives need a great deal of refining, yet the positive aspects stemming out of
these initiatives far outstrip any required refinement thereof. The projects are
worth pursuing and this will receive attention in the Recommendations section of
this chapter.
More specifically, the C O L ~ A P ~ A ~ project does not seem to have been fully
completed in Evaton West. This project was aimed at poverty alleviation through
proper leadership and community involvement through community-driven
development programmes. The fact that the project has not yet been brought to
its logical conclusion seems to still affect the levels of poverty. It has therefore
not been very effective in achieving its objective. The Eindhoven Municipality
project, on the other hand, has gone a long way in establishing projects
organised around health, local economic development and the environment.
Community-Driven Development projects towards poverty alleviation
~ -- ~ -~ ~
These projects have the potential to go a long way in assisting the community to
alleviate the poverty situation in Evaton West. The only real drawback is the fact
that these projects are still in their infancy and therefore their effects are not yet
fully realised. It is believed (and fervently hoped) that their long-term effects may
show a different picture altogether and that the results of the investigation given
in this thesis will provide significant base data on which to report progress over
time.
Poverty is still high in Evaton West, even in the face of these initiatives aimed at
alleviating it. This thesis is, nevertheless, not an indictment of these initiatives, as
with time and maybe a little restructuring, much may be gained towards positive
poverty alleviation and, perhaps one day, the eradication of poverty altogether.
6.4 Recommendations
More research needs to be undertaken after the application of these initiatives to
comprehensively evaluate, the further effects and successes of such
programmes and to develop even more specific recommendations over time. The
Recommendaiions outlined hereafter will be restricted to specific developmental
issues and aspects. These recommendations are divided into:
A. General Recommendations and
B. Specific Recommendations.
They are all equally important and deserve attention of policy makers and the
Evaton West community.
A. GENERAL RECOMMENDATIONS
The following General Recommendations are made with specific reference to the
various developmental aspects in Evaton West.
Recommendation 1: Skills Development
It is recommended that: Broad-based skills development initiatives need to be
undertaken in Evaton West.
Community-Driven Development projects towards poverty alleviation 198
Residents are mostly unskilled and they have to compete with other
unskilled workers from other areas for very few jobs in a volatile
employment situation. Being skilled in areas most needed for the local
economy will make people more employable. This may be achieved
through the government's Expanded Public Works Programmes (EPWP)
or the Department of Labour's Learnership programmes. Such training
can also be run by the Eindhoven Municipality, the Vaal University of
Technology and SOLID.
Recommendation 2: Communication
It is recommended that: An information and communication technology centre
(ICT centre) or a telecentre within a Multi-Purpose Community Centre (MPCC)
b e created for Evaton West.
The benefits of such a centre include:
Support for the ability of local enterprises to succeed,
Improves civic life,
Provides open access to information and resources,
Internet access for the community and
Training in information technology and other technologies.
Recommendation 3: Safety 8 security
It is recommended that: A police station is provided for the community o f Evaton
West.
The community has already done a great deal with regards to dealing with
crime in the area, including the establishment of a community policing
forum. The assessment of the area shows that a police station or at least
a satellite police station is urgently needed.
Community-Driven Development projects towards poverty alleviation 199
p~
- -~
Recommendation 4: Land and housing
It is recommended that: A programme to suppod residents with funds and
services to extend their existing houses is developed.
The housing units in Evaton West are generally two-roomed units
(the rooms are themselves very small). Such services may include:
o Financial assistance for housing extensions
o Access to housing plans and building services
It is recommended that: The existing stock of houses should be increased
to accommodate more residents.
This may be done using the Department of Housing's People's
Housing Programme (PHP) which is aimed at people being
assisted to build their own houses.
It is recommended that: As much as possible local procurement of labour
and material should be actively encouraged for all future housing projects
in Evaton West.
This will lead to employment of local labour and assist in skills
development of the community.
Recommendation 5: Electricity
It is recommended that: There needs to be an office available for residents
to report faults, pay bills, buy top-up prepaid supply and general queries.
The absence of such an office leads to frustrations and a good
solution would be to house such a facility within a Multi-Purpose
Community Centre (MPCC).
It is recommended that: Installations need to be better secured to prevent
illegal connections and vandalism.
Community-Driven Development projects towards poverty alleviation
- -- -- ---
This will reduce electrical faults and down-times. Illegal connections
are also dangerous to the community as electrocution of people
may result from such connections.
It is recomrnended that: Irregular and erratic service provision needs to be
investigated and appropriate action taken to regularise supply.
Facilities may require upgrading such that a higher load of electrical
requirements may be carried.
Recommendation 6: Water and sanitation
It is recomrnended that: Fire hydrants need to be supplied at strategic
places in Evaton West.
In the absence of a fire and other emergency services the risk of
fire destruction is very high. The use of paraftin, gas and other such
highly flammable materials exacerbates this risk.
It is recomrnended that: A water and sanitation education programme
needs to be offered to residents.
This will teach them the importance of saving water and increased
health due to proper sanitation.
It is recommended that: Water reticulation systems need to be attended to
in order to minimize wastage.
Such actions should include storm water drainage system being
erected and properly and regularly serviced.
Community-Driven Development projects towards poverty alleviation 201
Recommendation 7: Environment
0 It is recommended that: Greening of open spaces through planting of trees
and shrubs should be actively encouraged.
This will lead not only to beautification and increase in the aesthetic
appearance of Evaton West but also to a healthier environment.
Evaton West also hosts a number of visitors from Canada, Holland
and other areas in South Africa. Greening the environment can
attract even more visitorsltourists.
It is recommended that: An effective waste management system needs to
be developed in the area and the provision of refuse bins should also be
considered.
The community can be assisted to handle waste themselves. This
should include money-generating recycling initiatives for the
community through, for example, collect-a-can@ and other
initiatives.
It is recommended that: The development of a dumping site at a
convenient point for all residents and linked to the recycling initiatives
should be considered.
There is currently no central dumping site. This leads to residents
dumping refuse at any open space. Such refuse is then never
collected or dealt with, leading to health hazards.
It is recommended that: A culture of small-scale urban agriculture should
be inculcated in residents.
This will ensure that as many yards as possible in the area are
used for vegetable growing. This will assist residents with food
harvested from their own backyards.
Community-Driven Development projects towards poverty alleviation 202
Recommendation 8: Health
It is recommended that: Proper home-based care for people needing such
help (especially HIV/AIDS sufferers) needs to be intensified.
This can be achieved through training of health volunteers as
identified by the Evaton West Community Development Forum
(EWCDF). Willing partners like SOLID should then be brought in to
assist in such training.
It is recommended that: A dedicated clinic needs to be erected for Evaton
West with proper facilities.
This needs to be combined with an improved referral facility and an
accessible and reliable ambulance service.
It is recommended that: Awareness campaigns, counseling facilities and
prevention strategies need to be implemented on such health issues as
HIV/AIDS and TB.
This should include the identification and training of sex workers in
the area as they form the group most at risk of infections and
infecting others.
It is recommended that: Assistance for HIV-Aids orphans, child-headed
households and HIVinfected children needs to be intensified.
Although the Evaton West Community Development Forum is
already doing something regarding this problem through the Health
Group, it is essential that Local Government and other authorities
assist in dealing with this problem.
Community-Driven Development projects towards poverty alleviation 203
-
Recommendation 9: Sport and Recreation
It is recommended that: A Multi-Purpose Community Centre (MPCC) needs to be
built in Evaton West.
Such a facility may be used for a number of recreational activities
such as indoor sports, arts, culture and various skill-based training
efforts. A library facility could also be housed in the MPCC and
even a mobile library should also be considered.
B. SPECIFIC RECOMMENDATIONS
The following are specific recommendations aimed at poverty alleviation in
Evaton West. This section considers some practical recommendations in dealing
with the problems of Evaton West. Most of the discussions on poverty in this
study have focused on income-poverty. This section also concentrates mostly on
income generating activities.
Recommendation 10: Small business development
I t is recommended that: The development of sustainable new ventures in Evaton
West receive urgent attention as a way to develop the economy of the area and
adjacent areas and to ensure longer circulation of money in the area.
Chapter 4 (especially 4.4) and Chapter 5 (5.10) showed that there is a
relatively high dependence on small businesses in Evaton West, for
example due to its distance from towns and big businesses. Residents
spend most of their incomes locally. There appears therefore, to be a
need to assist such small businesses in the area (and indeed to stimulate
and create them), both as a job-creation mechanism and as a way of
bringing markets closer to residents.
Recommendation 10.1: Co-operative approach to SMME development
I t is recommended that: The creation of co-operatives or similar structures is
actively pursued with a view to implementation.
Community-Driven Development projects towards poverty alleviation 204
The Evaton West Community Development Forum (EWCDF) can help in
identifying specific gaps and niches the Evaton West economy can fill, and
promote a diversified range of specialised industry clusters drawing on
local advantages to serve local, national and global markets. Such co-
operatives would take the burden off the shoulders of the small
businesses in the following ways, for example:
Sales and marketing
Financing and Accounting
Procurement and contracting - bulk buying
Since many residents spend most of their income on mainly food items in
the area, there is a strong case to support such businesses. One way of
doing this is by backward integration. This means that production of these
items that are bought in Evaton West can also take place locally; many
more jobs can be created and supported by the local economy in this way.
Further recommendations are listed below and have been supported
mostly from the work of Cole, Kelly, Corbett and Sprowls (2001).
It i s recommended that: An overt policy o f inward industrialisation and
local focus needs to be pursued in Evaton West and its periphery.
Because each community's most valuable assets are the ones they
already have, and existing businesses are already contributing to
their home communities, economic development efforts should give
first priority to supporting existing enterprises as the best source of
business expansion and local job growth. Luring businesses away
from neighbouring communities is a zero-sum game that doesn't
create new wealth in the regional economy. Community economic
development should focus instead on promoting local
entrepreneurship to build locally-based industries and businesses
that can succeed among national and international competitors.
Community-Driven Development projects towards poverty alleviation 205
It is recommended that: A local procurement policy needs to be pursued.
There needs to be a strong policy promoting local procurement
especially with regards Extended Public Works and other
programmes (especially housing projects) taking place in the
Evaton West area. This policy will lead to the stimulation of the
local economy, promotion of local products and the creation of jobs
for local people. It will also lead to increased circulation of money in
the area which will lead to the improvement of Evaton West
economy.
It is recommended that: Skills development needs to be applied for small
business entrepreneurs.
Continuous development of skills in various areas of interest is
imperative if enterprise development is to be a success. Primary
skills (actual production-based skills like building and fence-
making), as well as secondary skills (such as business and
marketing skills) need to be given particular attention. This would
need the active involvement of the training institutions in the region
and support by local, provincial and national government.
I t is recommended that: Information and Communication Technology
Centres (ICT's) and telecentres to assist new ventures need to be
developed.
Access to information, international markets and business
opportunities and trends as well as training and guidance can be
made possible through the establishment of ICT's and/or
telecentres. Such facilities and centres will make telephones, faxes,
photocopy machines, computers and access to the internet
available to the Evaton West community and contribute to poverty
Community-Driven Development projects towards poverty alleviation 206
alleviation. The EWCF would be well-advised to solicit funding to
invest in technology that supports the ability of local enterprises to
succeed, improves civic life, and provides open access to
information and resources. The postal service would also need to
be improved.
It is recommended that: An Integrated approach to new venture
development needs to be applied.
Government, business, education, and the local Evaton West
community should work together to create a vibrant local economy.
This can be done through a long-term investment strategy that
encourages local enterprise, serves the needs of local residents,
workers and businesses, promotes stable employment and
revenues by building on local competitive advantages, protects the
natural environment, increases social equity, is capable of
succeeding in the global marketplace.
It is recommended that: Regional collaboration should be considered.
Regional industries, transportation, land uses, natural resources
and other key elements of a healthy economy need government,
communities and the private sector co-operate in creating regional
structures to promote a coherent metropolitan whole that respects
local character and identity.
Recommendation 11: Social grants - the basic income grant (BIG)
It is recommended that a basic income grant (BIG) be considered for all South
African citizens above the age of 14 years.
Though there have been a number of debates and disagreements
with regards such a grant, the impact of such a grant on poverty
alleviation is highly positive. The addendum to Chapter 6 shows in
Community-Driven Development projects towards poverty alleviation 207
detail how such a grant would assist in alleviating poverty in Evaton
West. Due to the number of the poor that have no access to any of
the existing social grants, BIG is seen as an essential
complementary grant that will reach all South Africans and
therefore bring relief to the poverty-stricken.
Community-Driven Development projects towards poverty alleviation 208
Chapter 6 - Addendum
The basic income grant (BIG) and its effect on poverty in
Evaton West
6A.1 Introduction
The issue of grants almost always leads to disagreements. On the one hand,
there is a system of social grants emanating from the Department of Social
Development that aims to prevent certain people from slipping into total
destitution. On the other hand, there is an avowed intention by Social
Development, as well as by other departments, to deliberately move away from
"welfarism" and towards "development", by which people will be empowered to
lift themselves out of poverty. There is always a fear that social grants may
promote a dependency syndrome even though there is general agreement that
there needs to be a social system of grants aimed at the poor and destitute (see
Samson 2003: 1). Samson (2003: 1) states that clearly argued and well-
researched debate is needed on how best to structure grants to avoid
dependency and welfare traps as found in some countries. Extensive research
clearly documents that comprehensive social security reform can effectively
reduce poverty while potentially contributing to social development and economic
growth (Samson, 2003: 1). Following on this, South Africa has developed a
proliferation of social grants aimed at poverty alleviation and welfare
improvement. Table 6.3 shows the social grants that have been disbursed in
South Africa from April 2000 to February 2003.
The table shows that the Child Support Grant accounts for the greatest increase
in the number of beneficiaries. The number of children in payment has increased
from 348,532 in April 2000 ago to over 2.5 million in February 2003. This grant
has increased by more than 2.1 million between April 2000 and February 2003.
(DoSD, 2003: 2).
Cornrnunrty-Driven Development projects towards poverty allevlatlon 209
- - -- --
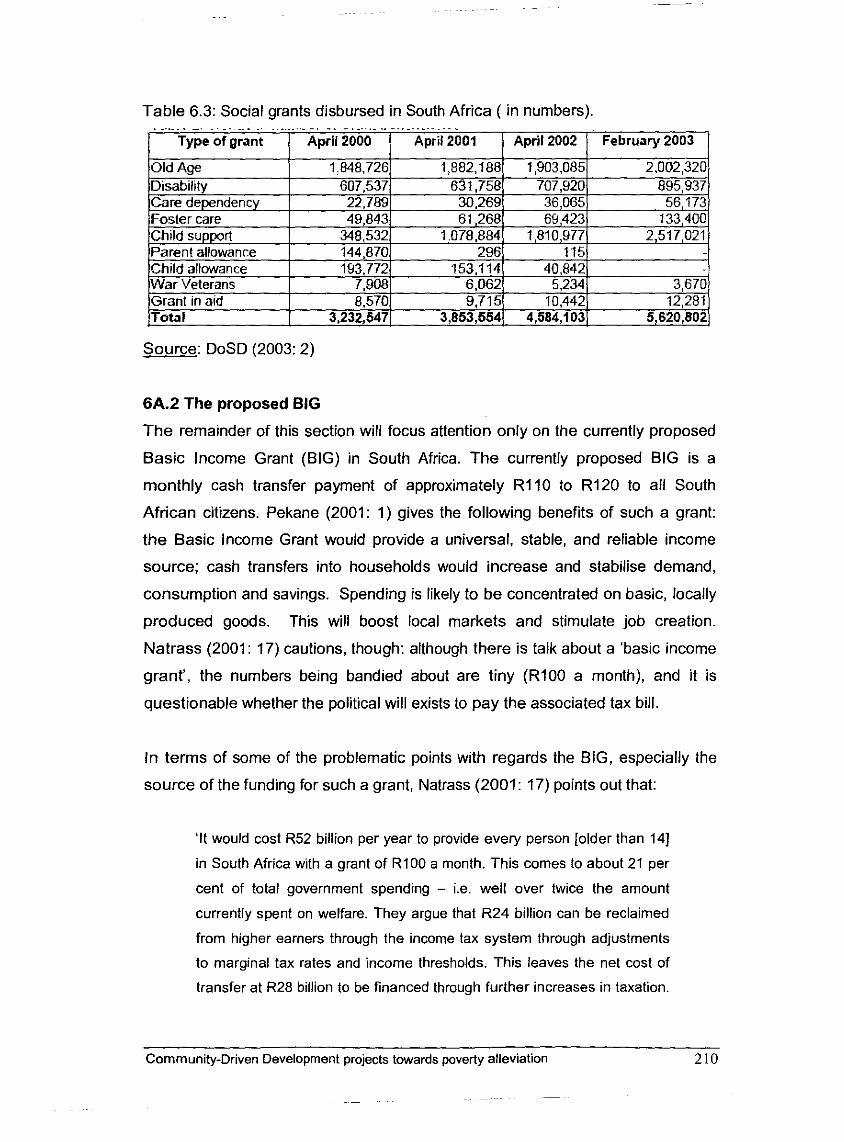
Table 6.3: Social grants disbursed in South Africa ( in numbers). . . . .. . - - . . . . . - - . . . . .. . . . - - . - . - . . . . . . .. - . . . . . - . . .. . - -
1 Type of grant ( April 2000 1 April 2001 1 April 2002 I February 2003 /
Source: DoSD (2003: 2)
6A.2 The proposed BIG
The remainder of this section will focus attention only on the currently proposed
Basic Income Grant (BIG) in South Africa. The currently proposed BIG is a
monthly cash transfer payment of approximately R l l O to R120 to all South
African citizens. Pekane (2001: 1) gives the following benefits of such a grant:
the Basic Income Grant would provide a universal, stable, and reliable income
source; cash transfers into households would increase and stabilise demand,
consumption and savings. Spending is likely to be concentrated on basic, locally
produced goods. This will boost local markets and stimulate job creation.
Natrass (2001: 17) cautions, though: although there is talk about a 'basic income
grant', the numbers being bandied about are tiny (R100 a month), and it is
questionable whether the political will exists to pay the associated tax bill.
In terms of some of the problematic points with regards the BIG, especially the
source of the funding for such a grant, Natrass (2001: 17) points out that:
'It would cost R52 billion per year to provide every person [older than 141
in South Africa with a grant of RlOO a month. This comes to about 21 per
cent of total government spending - i.e. well over twice the amount
currently spent on welfare. They argue that R24 billion can be reclaimed
from higher earners through the income tax system through adjustments
to marginal tax rates and income thresholds. This leaves the net cost of
transfer at R28 billion to be financed through further increases in taxation.
Community-Driven Development projects towards poverty alleviation 210
Given that South Africa's top income earners are already highly
burdened, it is thus likely that significant and sustainable increases in tax
revenues could only come about through either adding to the income tax
burden of households in, especially, the seventh and eighth income
deciles (i.e. the labour movement's chief constituency) or increasing
value-added tax. If the burden falls mainly on value-added tax, then the
redistributive impact of the basic income grant will be reduced, as the
poor will be paying for part of it every time they spend it on goods and
services. At present both the trade union movement and the Democratic
Party (representing most of the rich) profess support for a basic income
grant, but both seem to anticipate that their constituencies will not
shoulder the financial burden.'
6A.3 BIG in Evaton West
The possible effect of BIG on poverty in Evaton West is now considered. If the
BIG is set at R120 per citizen above the age of 14 as proposed, and it is
accepted that there are about 11000 households in Evaton West with on average
2.5 persons over 14 years of age per household (according to the survey data
(Mokoena 2003)), then there is a monthly injection of approximately R3.3 million
(or R39.6 million per annum) into Evaton West, giving the following effects on
poverty levels.
The effect of an injection of R120 per person into households, ceteris paribus, is
that the headcount index which is currently 69.5 percent reduces to 64.5 percent,
a reduction of five percent in the poverty rate of the area.
The impact on the poverty gap would be a reduction of R246,76 (from R957,99 to
R711.23) which is a decrease of 0.17 in the poverty gap ratio (from 0.66 to 0.49).
There appears, therefore, to be a more significant reduction in the poverty gap
ratio than in the headcount index. This means that although the number of the
poor might be reduced by an insignificant number, most of the poor will not be
destitute (they would move closer to the poverty line).
Community-Driven Development projects towards poverty alleviation 211
-p-p-~
-
If the amount of BIG is increased to R300 per month, then there would be a
significant impact overall on poverty. The headcount index would be about 44.5
percent (from 69.5 percent - a change of 25 percent) and the poverty gap ratio
would be 0.33 (from 0.66).
6A.4 BIG Summary
Due to the number of the poor that have no access to any of the existing social
grants, BIG is seen as an essential complementary grant that will reach all South
Africans and therefore bring relieve to the poverty-stricken.
In addition to the BIG suggested above, there have been suggestions of the
establishment of an unemployment grant targeted at the economically active
population currently unemployed. In Evaton West, the impact of such a grant on
poverty levels would also be significant. If such a grant is pitched at R120 (same
level as BIG), the impact on the headcount index would be a reduction of two
percent (from 69.5 percent to 67.5 percent) and the poverty gap ratio would
decrease from 0.66 to 0.57. At a level of R300, the headcount index would
decrease from 69.5 percent to 62 percent (seven percent difference) and the
poverty gap ratio would decrease from 0.66 to 0.47 (0.19 difference). These
grants (BIG and unemployment grant) were considered separately above. It
stands to reason that if both are introduced, the impact on poverty would be even
more distinct.
Community-Driven Development projects towards poverty alleviation 212
Bibliography
ADEYA, C.N. 2003. lCTs and poverty. A literature review. ACACIA. Ottawa:
International Development Research Centre.
AFRICAN DEVELOPMENT BANK. 2002. Achieving the Millennium Development
Goals in Africa: Progress, prospects, and policy implications. Global Poverty
Report, 2002. ADB &The World Bank. Jun.1-32.
AFRICAN NATIONAL CONGRESS. 1994. The Reconstruction and Development
Programme (RDP). Johannesburg: ANC.
ALCOCK, P. 1997. Understanding poverty. znd ed. London: MacMillan Press.
ALCOCK, P. & CRAIG, G. 2000. Local poverty profiles and local anti-poverty
work (In: Bradshaw, J. & Sainsbury, R. (eds.). 2000. Experiencing poverty.
Aldershot: Ashgate Publishing Ltd).
ALIBER, M. 2001. Study of the incidence and nature of chronic poverty and
development policy in South Africa: An overview. Background Paper 3. London:
Chronic Poverty Research Centre. 1-67.
ANANZI ROAD MAPS. web:] http://www.brabys.com/ananzimapping.asp [Date
of access: 12 Mar. 20041.
ANAS, A.Z.M. 2003. Poor infrastructure services threaten I-PRSP targets: WB.
The Independent, Jun. 17. Bangladesh.
ASIAN DEVELOPMENT BANK (ADB). 2003. Policy on education. web:]
http://www.adb.org/Docurnents/Policies/Education [Date of access: 13 Mar.
20041.
CDD Projects towards poverty alleviation 213
ATKINSON A.B. AND BOURGUIGNON F. 1999. Poverty and inclusion from a
world perspective. ABCDE Europe Conference. 1-30.
ATKINSON, A.B. 1991. Measuring poverty and differences in family composition.
Economica. Feb. 59: 1-16.
BADAWI, A. A. 2003. Abdullah: Education the way out of poverty. New Straits
Times - Management Times (Malaysia). WorldSources, Inc. Jul.
BELL, M. 2002. Inquiring minds and post-colonial devices: examining poverty at
a distance. Annals o f the Association of American Geographers. 92(3): 507-523.
Blackwell Publishing.
BHORAT, H. 1999. Why poverty's more than sums. Mail & Guardian.
Johannesburg. May 28 -Jun. 3.
BIBLE. 1970. The Holy Bible: Authorized (King James) version. Tulsa: Oral
Roberts University.
BINNS, T. & NEL, E. 2002. Supporting local economic development in post-
apartheid South Africa. Local Economy. Routledge Publishing. 17(1): 8-24.
BINSWANGER, H.P. & Aiyar S.S. 2003. Scaling up community-driven
development: Theoretical underpinnings and program design implications. World
Bank Policy Research Working Paper 3039, May.
BLACKBURN, R.M.1999. Understanding social inequality. 19 (9/10/11): 1-22.
BLANKWATER, Y. 2002. IDP pilot project Evaton West - Annual Report 2002. 1 - 30.
BLANKWATER, Y. 2003. IDP pilot project Evaton West - Annual Report 2003. 1-
39.
CDD Projects towards poverty alleviation 214
BLOOM, G. & LUCAS, H. 2000. Health and poverty in Sub-Saharan Africa. IDS
Working Paper. Institute of Development Studies. (103):l-42.
BRADY, D. 2003. Rethinking the sociological measurement of poverty. Social
Forces. The University of North Carolina Press. 81(3): 715-752. Mar.
BUDLENDER, D. 2000. Earnings and inequality in South Africa, 1995-1998. (In:
StatsSA. 2000. Measuring poverty in South Africa. Pretoria: Statistics South
Africa).
CARTER, M. R. & MAY, J. 1999. One kind of freedom: Poverty dynamics in post-
apartheid South Africa. University of Wisconsin. Madison: Land Tenure Centre.
1-39.
CASTRO-LEAL, F. 1999. Poverty and inequality in the distribution of public
education spending in South Africa. Informal discussion paper series.
Washington DC: The World Bank.
CHAMBERS, R. 1998. Whose reality counts? Putting the first last. London: ITDG
Publishing.
CHAMBERS, R. 1999. Notes for the session on participatory methods of poverty
measurement. Values, norms and poverty. A consultation on WDR 200011:
Poverty and Development. Johannesburg. Jan. 1-7.
CHAUBEY, P.K. 1995. Poverty measurement - Issues, approaches and indices.
New Delhi: New Age International (P) Limited.
CHERU, F. 2002. African renaissance: Roadmaps to the challenge of
globalization. London: ZED Books.
CHERU. F. 2001. Overcoming apartheid's legacy: the ascendancy of
neoliberalism in South Africa's anti-poverty strategy. Third World Quarterly.
London: Carfax Publishers. 22(4): 505-527.
CDD Projects towards poverty alleviation 215
CLARK, S., HEMMING, R. & ULPH, D. 1981. On indices for the measurement of
poverty. The Economic Journal. Jun. 91: 515-526.
COLE, R., KELLY, T., CORBETT, J. & SPROWLS, S. 2001. Ahwahnee
Principles for Smart Economic Development: An Implementation Guidebook.
Sacramento: Local Government Commission.
CoLtAPiAm. 2001. Project methodology. (Notes issued as part of the poverty
alleviation training course at the Vaal University of Technology in 2001.)
Vanderbijlpark. (Unpublished.)
COMMUNITY DEVELOPMENT FOUNDATION (CDF). 2001. What is community
development? [Web:] http://www.cdf.org.uk/html/whatis.html [Date of access: 17
Jul. 20031.
COSTA, M. 2002. A multidimensional approach to the measurement of poverty.
IRES Working Paper Series. (2002-05). Luxembourg: CEPSIINSTEAD,
Differdange, G.-D.
CURTAIN, R. 2002. Youth in extreme poverty: Dimensions and country
responses. Sep. Draft paper. (Unpublished).
DAS GUPTA, M., GRANDVOINNET, H. & ROMAN, M. 2001. State-community
synergies in development: Laying the basis for collective action. Development
Research Group, World Bank.
DATT, G., JOLLIFFE, D. & SHARMA, M. 2001. A profile of poverty in Egypt.
African Development Bank. Blackwell Publishers. 202-237.
DE GREGORIO, J. & LEE, J. 2002. Education and income inequality: new
evidence from cross-country data. Review of Income and Wealth. Sep. 48(3):
395-41 6.
CDD Projects towards poverty alleviation 216
DEATON, A. 1997. The analysis of household surveys - A microeconometric
approach to development policy. Baltimore and London: The Johns Hopkins
University Press for the World Bank.
DECALUWE, B., PATRY, A. SAVARD, L. 1998. Income distribution, poverty
measures and trade shocks: A computable general equilibrium model of a
archetype developing country. Research paper 9812. CREFA.
DEFINA, R.H. 2000. Changing population weights in a decomposable poverty
index. Journal o f Economic and Social Measurement. IOS Press. 26 (2000): 1-
10.
DEFINA, R.H. 2002. Does lower unemployment reduce poverty? Business
Review. Q3: 34-41.
DEMOMBYNES, G. & OZLER, B. Crime and local inequality in South Africa.
World Bank Policy Research Working Paper 2925. Washington: The World Bank.
Nov.
DEPARTMENT of Social Development see SOUTH AFRICA. Department of
Social Development.
DERCON, S. 2001. Vulnerability to poverty: A framework for policy analysis.
DflD. [Web:]
www.economics.ox.ac.uk/members/stefan.derconl [Date of access: 17 Nov.
20031.
DERCON, S. 2002. Income risk, coping strategies and safety nets. Discussion
paper no. 2002122. New York: UNUNVIDER.
DESAI, M. & SHAH, A. 1988. An econometric approach to the measurement of
poverty. Oxford Economic Papers. 40: 505-522.
- -
CDD Projects towards poverty alleviation 217
DEVEREUX, S. 2002. Can social safety nets reduce chronic poverty?
Development Policy Review. Overseas Development Institute. Blackwell
Publishers. 20(5): 657-675.
DONGIER, P. VAN DOMELEN, J., OSTROM, E., RYAN, A. WAKEMAN, W.,
BEBBINGTON, A., ALKIRE, S. ESMAIL, T. & POLSKI, M. 2003. Community-
driven development. Chapter 9. Vol 1 - Core Techniques and Cross-Cutting
Issues. Washington, D.C.: World Bank.
DUCLOS, J. & GREGOIRE, P. 2003. Absolute and relative deprivation and the
measurement of poverty. Working Paper 03-02. CIRPEE.
DUCLOS, J. & MAKDISSI, P. 1999. Sequential stochastic dominance and the
robustness of poverty orderings.
[Web:] http://www.ecn.ulavaI.ca/w3/recherche/cahiers/l999/9905.pdf [Date of
access: 21 Jul. 20021.
ECONOMIST, THE. 1998. The war over poverty. The Economist. Apr 25.
346(8065): 16.
FERRER-I-CARBONELL, A. & VAN PRAAG, B.M.S. 2001. Income satisfaction
inequality and its causes. Tinbergen Institute Discussion Paper. Amsterdam:
Tinbergen Institute.
FISHER, G.M. 1997. From Hunter to Orshansky: An Overview of (unofficial)
poverty lines in the United States - from 1904 to 1965. Poverty measurement
working papers. Washington: US Census Bureau.
FOSTER, J., GREER, J. AND THORBECKE, E. 1984. A Class of decomposable
poverty measures. Econometrics, 52: 761-767.
FRANK, F. & SMITH, A. 1999. The community development handbook - A tool to
build community capacity. (Web:] http://www.hrdc-drhc.gc.ca/community [Date of
access: 13 Jun. 20031.
CDD Projects towards poverty alleviation 218

FRANKEL, P. 2001. Evaton West forensic community analysis for integrated
development planning. Report prepared for the Bureau lnternationale Coordinatie
of the Eindhoven Municipality (the Netherlands). (Unpublished report).
GARFINKEL, I & HAVEMAN, R. 1976. Earnings capacity, economic status, and
poverty. Journal o f Human Resources. XII(1): 49-70.
GELB, S. 2003. lnequality in South Africa: Nature, causes and responses. DflD
Policy Initiative on Addressing lnequality in Middle-income Countries.
Johannesburg: The EDGE (Economic Development: Growth & Equity) Institute.
GEORGE, V. & LAWSON, R. 1980. Poverty and inequality in common market
countries. London: Routledge & Kegan Paul.
GIBSON, N. 2001. The pitfalls of South Africa's "Liberation". New Political
Science. 23(3): 371-387.
GLOBAL URBAN OBSERVATORY (GUO). 2001. Urban poverty technical notes.
Nairobi: UNCHS (Habitat).
GODSELL, B. S BUYS, P. 1992. Growth and poverty - towards some shared
goals. (In: Shrire, R. (ed.) Wealth or poverty? Critical choices for South Africa.
Cape Town: Oxford University Press).
GPN (GLOBAL POVERTY NETWORK). 2000. Highlights of current labor market
conditions in South Africa. Johannesburg: NALEDI (National Labour & Economic
Development Institute). [Web:] www.GlobalPolicyNetwork.org [Date of access: 17
Jun. 20031.
GRAHAM, W.J., FITZMAURICE., A. E., BELL J. S. & CAIRNS, J. A. 2004. The
familial technique for linking maternal death with poverty. The Lancet. Jan.
363:23- 27.
CDD Projects towards poverty alleviation 219
HAGENAARS, A. 1987. A class of poverty indices. International Economic
Review. Oct. 28(3): 583-607.
HAGENAARS, A.J.M. 1986. The perception of poverty. Amsterdam: Elsevier
Science Publishers B.V.
HAZLITT, H. 1973. The conquest of poverty. New York: Arlington House.
HOLMAN, R. 1978. Poverty: Explanation of social deprivation. London:
Robertson.
JEGASOTHY, K. 1999. Population and rural-urban environmental interactions in
developing countries. lnternational Journal of Social Economics. MCB University
Press. 26(7/8/9): 1027-1 041.
JHA, R. & SHARMA, A. 2003. Spatial distribution of rural poverty in the last three
quinquennial rounds of NSS. WP. 20031002.
JUDGE, K. & PATERSON, 1. 2001. Poverty, income inequality and health.
Treasury Working paper 01129. New Zealand Treasury.
KAKWANI, N. 1993. Statistical inference in the measurement of poverty. The
Review of Economics and Statistics. 632-639.
KAMANU, G & MORDUCH, J. 2002. Measuring vulnerability to poverty.
Discussion paper no. 2002158. New York: UNUANIDER.
KANBUR, R & SQUIRE, L. 1999. The evolution of thinking about poverty:
Exploring the interactions. Washington DC: The World Bank.
KERAPELETSWE, C.K. & MOREMI, T. 2001. Poverty and democratization: the
case of Botswana. (In Wilson, F., Kanji, N. & Braathen, E. (eds) Poverty
CDD Projects towards poverty alleviation 220
reduction - what role for the state in today's globalized economy? Cape Town:
CROP lnternational Studies on Poverty).
KLASEN, S. 2000. Measuring poverty and deprivation in South Africa. Review of
Income and Wealth. Mar. 46(1): 33-58.
KOSSOUDJI, S. & MUELLER, E. 1983. The economic and demographic status
of female-headed households in rural Botswana. Economic Development and
Cultural Change. The University of Chicago. 831-859.
LAM, D. & LEIBBRANDT, M. 2003. What's happened to inequality in South
Africa since the end of Apartheid?
web: ] http://www.wdi.bus.urnich.edu/events/ceds.htm [Date of access: 14 Mar.
20041.
LAMALE, H. H. 1965. Poverty: The word and the reality. Monthly Labor Review.
Jul. 822-827.
LAMPARD, R. 2000. Measuring inequality in a cross-tabulation with ordered
categories: from the Gini coefficient to the Tog coefficient. lnternational Journal of
Social Research Methodology. Taylor & Francis Ltd. 3(1): 1-14.
LANDMAN, J. P., BHORAT, H., VAN DER BERG, S. VAN AARDT, C. 2003.
Poverty and inequality in South Africa 2004 - 2014: Current trends, issues and
future policy options. Stellenbosch: EFSA. 17.
LITCHFIELD, J.A. 1999. Inequality: Methods and tools. Text for World Bank's
Web Site on Inequality, Poverty, and Socio-economic Performance. [Web:]
http://www.worldbank.org/povertylinequal/index.htm [Date of access: 20 Feb.
20041.
LOK-DESSALLIEN, R. 1998. Poverty profiles: Interpreting the data. Poverty
Elimination Programme, UNDP. 1-5.
CDD Projects towards poverty alleviation 221
[Web:] http://www.undp.org/poverty/publications/pov~red/PovertyyProfiles.pdf
[Date of access: 13 Jun. 20031.
LYONS, M. & SMUTS, C. 1998. Community agency in the new South Africa: A
comparative approach. Urban Studies. 36(12): 2151-2167. Nov.
MAHMOOD, A. 2000. a review of CHOUSSODOSKY, M. 1997. The
Globalisation of Poverty: Impacts of IMF and World Bank Reforms. Journal of
Economic Studies. MCB University Press. 27(3): 222-229.
MAX-NEEF, M., ELIZALDE, M. & HOPENHAYN, M. 1989. Human scale
development. Development dialogue. (1): 1-81.
MAY, J. 2000. Growth, development, poverty and inequality. (In May, J (ed).
Poverty and inequality in South Africa: meeting the challenge. Cape Town: David
Philip Publishers).
MAXWELL, S. 1999. The meaning and measurement of poverty. Overseas
Development Institute (001). (3): Feb. web:] http://w.odi.org.uk [Date of
access: 15 May 20041.
MINISTRY OF HOUSING (SA). see SOUTH AFRICA. Ministry of Housing.
MOKOENA, T.D. 1994. Poverty: A look at the position of the Vaal Triangle
townships. Unpublished research essay. Vanderbijlpark: Vista University.
MOKOENA, T.D. 2003. Results of a survey conducted in Evaton West in 2003,
comprising household questionnaire, a community questionnaire and a focus
group interview.
MUNICIPAL DEMARCATION BOARD. 2000. Determination of the outer
boundary of Ward 26 of the Local Municipality GT421 in terms of item 5(2) of
Schedule 1 of the Local Government: Municipal Structures Act , No. 17 of 1998.
CDD Projccts towards poverty alleviation 222
[Web:] http://www.demarcation.org.za/info~lndex.aspx [Date of access: 17 Oct.
20031.
MYLES, J. & PICOT, G. 2000. Poverty indices and policy analysis. Review of
Income and Wealth. Jun. 46(2): 161-179.
NARAYAN, D. & PETESCH, P. 1999. An empowering approach to poverty
reduction. (In: Narayan, D. Patel, R., Schafft, K., Rademacher, R. & Koch-
Schulte, S. 1999. Can anyone hear us? Voices from 47 countries. Voices of the
poor : From Many Lands.1. Washington: The World Bank Group).
NARAYAN, D. PATEL, R., SCHAFFT, K., RADEMACHER, R. & KOCH-
SCHULTE, S. 1999. Can anyone hear us? Voices from 47 countries. Voices of
the poor. (1). Washington: The World Bank Group.
NATRASS, N. 2001. High productivity now: a critical review of South Africa's
growth strategy. Transformation. 45: 1-24.
O'BOYLE, E.J. 1998. Transitions into and out of poverty. International Journal of
Social Economics. MCB University Press. 25(9): 1411-1424.
OELOFSE, C. 2003. A critical realist perspective on urban environmental risk: a
case study of an informal settlement in South Africa. Local Environment. Catfax
Publishing. Jun. 8(3): 261-275.
ORSHANSKY, M. 1965. Counting the poor: another look at the poverty profile.
Social Security Bulletin. 28(1): 3-29
OSBERG, L. & XU, K. 1999. Poverty intensity: How well do Canadian provinces
compare? Canadian Public Policy. XXV: 179-198.
OXFAM. 2003. Evian G8: Time to declare a war on poverty in Africa. Oxfam
Briefing Paper No. 47. May. Oxfarn International.
CDD Projects towards poverty alleviation 223
PANOS. 2002. Reducing Poverty: Is the World Bank strategy working? London:
The Panos Institute.
PEKANE, J. 2001. The economic effects of a Basic Income Grant and its
financial sustainability. Cape Town: Cosatu. [Web:]
http://www.cosatu.org.za/press12001 /South-Africans-for-a-Basic-Income-Grant
--729.html [Date of access: 23 Mar. 20041.
PELUPESSY, W. 2001. Industrial restructuring and employment in the South
African townships of Emfuleni. Published article. Tilburg: Development Research
lnstitute (IVO).
POST, T. 2001. Testing for stochastic dominance with diversification possibilities.
ERlM Report Series: Research In Management. Erasmus Research lnstitute of
Management. Nov. 1-32.
POTGIETER, J. F. 1999. The Household Subsistence Level in the major urban
centres of the Republic of South Africa: September 1999. Port Elizabeth: lnstitute
for Planning and Research.
POVERTY GROUP, THE. 2001. Looking Beyond Averages: A Research
Program on Poverty and Inequality. Washington: DECRG
PRADHAN, M. & RAVALLION, M.1998. Measuring poverty using qualitative
perceptions of Welfare. Washington: The World Bank.
PRESSMAN, S. 2003. Feminist explanations for the feminization of poverty.
Journal of Economic Issues. Jun. 37(2): 353-362.
PROWSE, M. 2003. Towards a clearer understanding of 'vulnerability' in relation
to chronic poverty. CPRC Working Paper No 24. Chronic Poverty Research
Centre.
CDD Projects towards poverty alleviation 224
- - - - -
QUISUMBING, A.R., HADDAD, L. & PENA, C. 1995. Gender and poverty: New
evidence from 10 developing countries. Food Consumption and Nutrition Division
Discussion Paper No. 9. Washington: International Food Policy Research
Institute.
RAVALLION, M. 1998. Poverty lines in theory and practice. Living Standards
Measurement Study Working Paper no. 133. Washington: The World Bank.
RAZAFINDRAKOTO, M & ROUBAUD, F. 2003. The multiple facets of poverty:
the case of urban Africa. Paris: IRD
RAZAVI, S. 1999. Seeing poverty through a gender lens. ISSJ. 162: 473-482.
UNESCO. Blackwell Publishers.
RECORD, B. 1999. Report on visit of Mr Brent Record to Eindhoven,
Netherlands, 24 May to 5 June 1999. Vanderbijlpark. 1-20. (Unpublished).
REIN, M.1971. Problems in the definition and measurement of poverty. (In:
Townsend, P.(ed.). 1971. The concept of poverty. London: Heinemann).
SAHN, D.E. 1999. None-income dimensions of poverty - A note of research
findings and issues. WDR on Poverty and Development 2000/01. Stiglitz
Summer Research Workshop on Poverty, Washington DC: The World Bank.
SAITH, R. 2001. Social exclusion: the concept and application to developing
countries. Working Paper Number 72. QEH Working Paper Series.
SAMSON, M. 2003. Breaking the poverty trap. web:]
http://www.drc.crg.za/docslBIG%20-20Breaking%20the%20Poverty%20Trap.doc
[Date of access: 20 Mar. 20041.
SAUNDERS, P. 1997. Toward a better poverty measure. Focus. 19(2). Institute
for Research on Poverty: University of Wisconsin-Madison.
CDD Projects towards poverty alleviation 225
SCHILLER, B. R. 1984. The economics of poverty and discrimination. New
Jersey: Prentice-Hall.
SCOTT, J. 1994. Poverty and wealth: Citizenship, deprivation and privilege. New
York: Longman Publishing.
SEDIBENG DISTRICT MUNICIPALITY. 2003. Mid-term report. December 2000
to June 2003. Vanderbijlpark. 1-36.
SEN, A. 2000. Will there be any hope for the poor? Visions of the 21'' Century.
[Web:] www.time.com [Date of access: 22 Jan. 20041.
SEN, A. 1981. Poverty and famines - an essay on entitlements and deprivation.
New York: Oxford University Press.
SEN, A.K. 1976. Poverty: an ordinal approach to measurement. Econornetrica,
44: 219-31.
SHAH, A. 2001. Causes of poverty.
[Web:] http://www.globalissues.org/TradeRelatedlPoverty [Date of access: 17
Sept. 20031.
SIDDIQUI, S. 2003. Reach out and practice participation. Aid Workers Exchange.
Jun. 25. [Web:] www.aidworkers.net [Date of access: 24 Mar. 20041.
SIDLEY, P. 2002. Health, poverty and sanitation to feature highly in world
summit. BMJ. Aug. 24. 325.
SILLITOE, P. 2002. Participant observation to participatory development -
making anthropology work. (In: Sillitoe, P., Bicker, A. & Pottier, J. (eds.). 2002.
Participating in development - Approaches to indigenous knowledge. London:
Routledge).
CDD Projects towards poverty alleviation 226
SLABBERT, T.J.C. 1997. Poverty among Black households in the Vaal Triangle
Metropolitan Area: a micro analysis. Doctoral Thesis. Vanderbijlpark: Vista
University.
SLABBERT, T.J.C. 2003. Bophelong: a socio-economic & environmental
analysis. Research report no.12. Vanderbijlpark: Vaal Research Group.
SOREFEELINGS. Human Scale Development.
web:] http://www.sorefeelings.com [Date of access: 3 Mar. 20041.
SOUTHALL, R. 2003. Democracy in Africa: Moving beyond a difficult legacy.
Democracy and Governance Research Programme, Occasional Paper 2.
Pretoria: Human Sciences Research Council.
SOUTH AFRICA. Department of Social Development. 2002. Transforming the
present, protecting the future - Consolidated Report. Report of the committee of
inquiry into a comprehensive system of social security for South Africa. Pretoria:
Government Printer.
SOUTH AFRICA. Department of Social Development. 2003. Fact Sheet: Social
grants beneficiaries. [Web:] http://www.welfare.gov.za [Date o f access: 20 Feb.
20041.
SOUTH AFRICA. Ministry of Housing. 2002. Keynote address by the Minister of
Housing, Sankie Mthembi-Mahanyele to the Round-Table on Sustainable African
Cities. WSSD. 27 Aug. 2002.
STATSSA see Statistics South Africa.
STATISTICS SOUTH AFRICA.1999. Provincial profile 1999 - Gauteng. Pretoria:
Statistics South Africa.
STATISTICS SOUTH AFRICA. 2000. Measuring poverty in South Africa.
Pretoria: Statistics South Africa.
CDD Projects towards poverty alleviation 227
STATISTICS SOUTH AFRICA. 2001. Census 2001. Pretoria: Statistics South
Africa.
STATISTICS SOUTH AFRICA. 2003a. Bulletin of statistics. 37(4). Pretoria:
Statistics South Africa.
STATISTICS SOUTH AFRICA. 2003b. Labour force survey. Pretoria: Statistics
South Africa.
STREETEN, P. 1998. Beyond the six veils: conceptualizing and measuring
poverty. Journal of lnternational Affairs. New York: The Trustees of Colombia
University. 52 (1).
TARP, F., SIMLER, K., MATUSSE, C., HELTBERG, R. & DAVA G. 2002. The
robustness of poverty profiles reconsidered. The University of Chicago. 2002: 77-
108.
THIOUNE, R.M (ed). 2003. Information and communication technologies for
development in Africa. Vol.1: Opportunities and challenges for community
development. Ottawa: lnternational Development Research Centre & Dakar:
CODESRIA
THORNTON, P.K., KRUSKA, R.L., HENNINGER, N., KRISTJANSON, P.M.,
REID, R.S., ATIENO, F., ODERO, A.N. AND NDEGWA, T. 2002. Mapping
poverty and livestock in the developing world. Nairobi: lnternational Livestock
Research Institute.
TSUI, K. 2000. Multidimensional poverty indices. Social Choice and Welfare.
Springer-Verlag. 2002(19): 69-93.
TWELVETREES, A. 2002. Community work. 3'* ed. New York: Palgrave.
CDD Projects towards poverty alleviation 22 8
- - - - - - - -
TWOHEY, M. 2000. Poverty on the line. National Journal. National Journal
Group, Inc. Apr. 32(16): 1216-1218.
GUlJT AND SHAH (eds.). 1998. The myth of community - gender issues in
participatory development. London: Intermediate Technology Publications, Ltd.
UNDP. 1997. The Dimensions of poverty: From the Summit to the grassroots.
Social Watch. web:] http://ww.undp.org/ [Date of access: 17 Jul. 20031.
UNDP: 2000. South Africa human development report: 2000. Washington: UN.
UNITED NATIONS. 2001. The Millennium Development Goals: How are we
doing? Implementing the millennium declaration.
web:] http://www.un.org/millenniumgoals [Date of access: 14 Feb. 20041.
UNITED STATES DEPARTMENT OF AGRICULTURE (USDA). 1998. A Guide to
implementation and benchmarking for rural communities. USDA Rural
Development. Apr. 1-20.
UT LIBRARY ONLINE. South African Provinces Map.
web:] http://ww.lib.utexas.edulmaps/africalsafricaprovinces95.jpg [Date of
access: 4 Feb. 20041.
WHITE, H. & MASSET, E. 2003. The importance of household size and
composition in constructing poverty profiles: An illustration from Vietnam.
Development and Change. Institute of Social Studies. Blackwell Publishing Ltd.
34(1): 105-126.
WILSON, F. & RAMPHELE, M. 1991. Uprooting poverty - the South African
Challenge. Cape Town: Philip.
WORLD BANK. 1994. South Africa, 1993-1994. 1993 LSDS. Africa Household
Survey Databank: Standardized Welfare Indicators. World Bank: Africa Region
Poverty Reduction & Social Development - Poverty Monitoring Unit.
CDD Projects towards poverty alleviation 229
WORLD BANK. 1999. Can the poor influence policy? The World Bank. [Web:]
http/lwww.worldbank.org/participation/methods2.htm [Date of access: 16 Jul.
20021.
WORLD BANK. 2000. The community driven development approach in the Africa
region: A vision of poverty reduction through empowerment. Dec. Africa Region,
The World Bank. [Web:]
http:/llnwebl8.worldbank.orglESSD/sdvext.nsf/O9ByDocName/AFR~vision~en
[Date of access: 17 Jul. 20031.
WORLD BANK. 2001. Poverty manual. Washington: The World Bank Group
WORLD BANK. 2002. Millenium Development Goals: Eradicating extreme
poverty. Progress towards the poverty goal and projections to 2015. web:]
http://www.developmentgoals.orglPoverty.htm [Date of access: 12 May 20041.
WRIGHT, R.E. 1996. Standardized poverty measurement. Journal o f Economic
Studies. MCB University Press. 23 (4): 3-1 7.
XU, K. & OSBERG, L. 2001. How to decompose Sen-Shorrocks-Thon Poverty
Index: A Practitioner's Guide. Journal of Income Distribution. Feb. lO(1-2) 77-94.
XU, K. & OSBERG, L. 2002. The social welfare implications, decomposability,
and geometry of the Sen family of poverty indices. Canadian Journal of
Economics. Canadian Economics Association. Feb. 35(1) 138-152.
ZHENG, 6. 1997. Aggregate poverty measures. Journal of Economic Surveys.
Blackwell Publishers. l l (2): 123-162.
CDD Projects towards poverty alleviation 230
Annexure I
Survey design and application
Questionnaires
Two questionnaires were employed in soliciting data from households and the
community in Evaton West: the Household Survey Questionnaire and the
Community Survey Questionnaire. Both were carefully constructed to utilise
specific indicators. They were compiled from a number of other questionnaires
used in the field such as by Slabbert (2003) and the World Bank (2003). In total,
250 household questionnaires and 20 community questionnaires were employed.
Maps of Evaton West were obtained from the Emfuleni City Council and
Trynamics cc. These were used to stratify the area and to allocate questionnaires
evenly throughout. Household Questionnaires were completed on site. Details
with regard to the site were listed, but no names were recorded with regard to the
head of the household or other persons living at the site. This was done to
ensure anonymity, thereby encouraging honest and reliable information.
Community Questionnaires were left with the respondents identiiied and
collected later at an agreed time. Samples of both questionnaires are annexed as
well as the names of the respondents to the community questionnaire.
Fieldworkers
Ten research fieldworkers were used for the household survey. They were
initially trained in a group and subsequently some of them received further
individual coaching. All had the opportunity of calling on the researcher if they
encountered problems. The questionnaires were completed during late 2003. On
receipt of questionnaires, spot checks were made on a random basis by the
researcher. These checks were aimed at judging the degree of accuracy with
which the questionnaires were completed. Where errors were found, further
CDD Projects towards poverty alleviation 23 1
cross-checking was done. Only a few questionnaires were rejected based on
these checks.
Reliability of results
It should be kept in mind that a properly conducted sample survey might yield
useful estimates. Although every precaution was taken to minimize errors and to
make sure that questions were well understood in order to obtain quality
answers, they still might not give exact unquestionable values. Although every
possible measure was also taken to limit possible errors, the following could have
affected the reliability of the results of this survey Sampling errors, because only
a fraction of the population was interviewed; survey errors, stemming from
memory errors and misunderstanding of questions; and processing errors of
calculation in the processing of data.
Focus Group Interview (FGI)
In addition to the above questionnaires, a focus group interview was held with 8
members of the Evaton West Community Development Forum to further elicit
more information on the community and the community development initiatives in
the area. The following is an outline of this process.
Purpose of the Interview
To solicit information from Community leaders regarding the two main
initiatives applied in the community towards poverty alleviation and
community development.
Resources used
The focus group interview was held on the 20 '~ November 2003 at the
Commenity Centre in Evaton West. 8 participants were interviewed. A
voice recorder and a video camera was used during the interview. A list of
12 questions was compiled and used for the interview.
CDD Projects towards poverty alleviation 232
Selection of the interview team
A team consisting of a facilitator (researcher) and a scribe (rapporteur)
was used in the interview. Both persons are skilled and experienced in
these tasks.
Selection of participants
A group of six participants was selected to be interviewed. These are
people who participated in the COL~AP~A@ project and who have been
involved in the Eindhoven-driven initiatives. They are also all Community
leaders in Evaton West engaged in programmes like Local Economic
Development (LED), Health and Environmental Awareness.
Timing and location
The interview took place at the Community Centre in Evaton West. This
provided a natural setting for the participants and provided a relaxed
atmosphere. It took place at 16h00 in the afternoon when all participants
were available and had no pressing engagements. The interview took
approximately 2 hours.
The discussion guide
A guide containing 12 questions was prepared for the interview. It was
arranged in such a way that comments and follow-up question space was
left out between the questions to make it easy to conduct the interview
without unnecessary breaks.
CDD Projects towards poverty alleviation 233
- - - - - - - - -
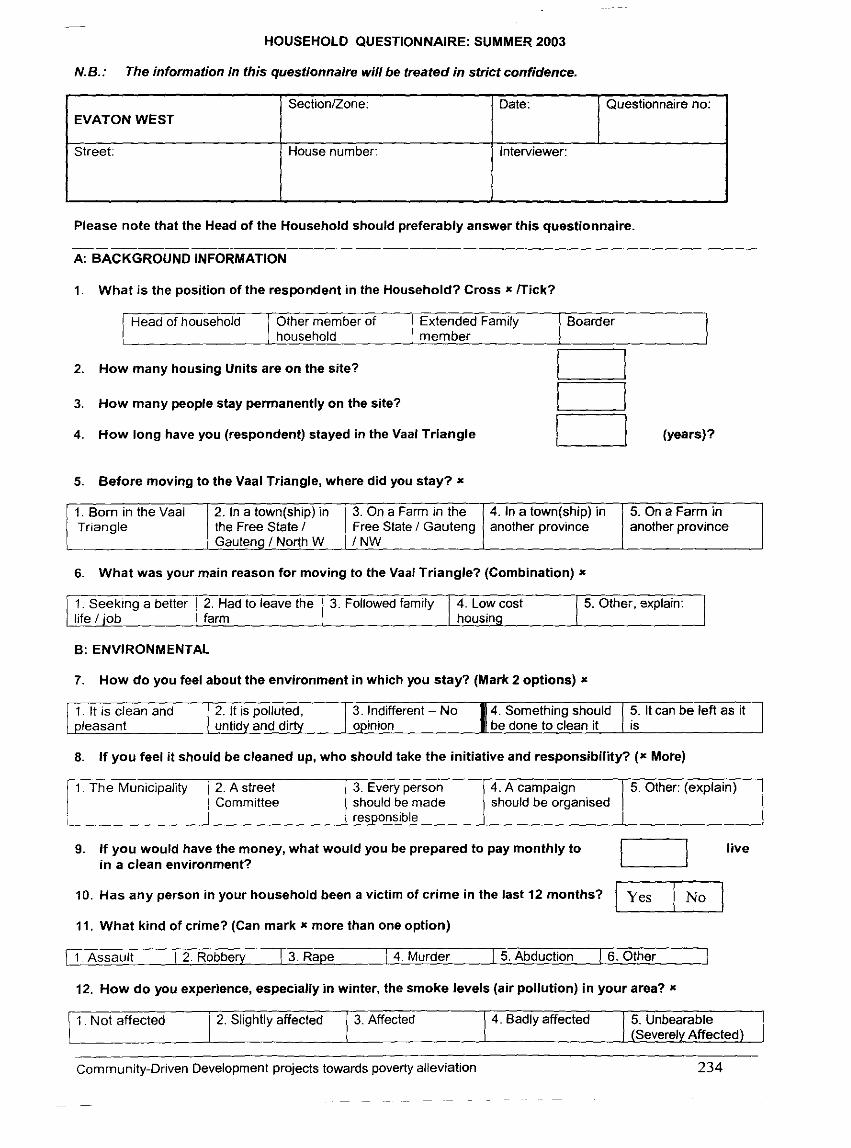
HOUSEHOLD QUESTIONNAIRE: SUMMER 2003
N.B.: The information in this questionnaire will be treated in strict confidence.
I I I J
Please note that the Head of the Household should preferably answer this questionnaire.
A: BACKGROUND INFORMATION
EVATON WEST
Street:
4. How long have you (respondent) stayed in the Vaal Triangle I I (years)?
SectionIZone:
House number:
1. What is the position of the respondent in the Household? Cross x f l ick?
5. Before moving to the Vaal Triangle, where did you stay? x
Date:
Head of household
6. What was your main reason for moving to the Vaal Triangle? (Combination) x
Questionnaire no:
Other member of Extended Family
[1 Born in the Vaal Triangle
5. Other, explain:
Interviewer:
I
Boarder
B: ENVIRONMENTAL
household 1 member
2. In a town(ship) in the Free State I Gauteng 1 North W
7. How do you feel about the environment in which you stay? (Mark 2 options) x
2. How many housing Units are on the site?
3. How many people stay permanently on the site?
El C I r----7
3. On a Farm in the Free State I Gauteng I NW
8. If you feel i t should be cleaned up, who should take the initiative and responsibility? (x More)
1. It is clean and pleasant
4. In a town(ship) in another province
9. If you would have the money, what would you be prepared to pay monthly to live in a clean environment?
5 On a Farm in another province
2. It is polluted, untidy and dirty
10. Has any person in your household been a victim of crime in the last 12 months? yes I N~ / 11. What kind of crime? (Can mark x more than one option)
1 . The Municipality
L-
[ 1. Assault 1 2. Robbery 1 3. Rape 4. Murder 1 5. Abduction 1 6. Other
3. Indifferent - No 4. Something should opinion be done to clean it
3. Every person should be made responsible
2. A street Committee
12. How do you experience, especially in winter, the smoke levels (air pollution) in your area? x
5. It can be left as it is
4. A campaign should be organised
5. Other: (explain)
( 1. Not affected 1
Community-Driven Development projects towards poverty alleviation 234
2. Slightly affected 3. Affected 4. Badly affected 5. Unbearable (Severely Affected)

13. If you are making fire for cooking & heating purposes, would you like to be introduced to technologies that will reduce the smoke levels at your house? x
14. If you would have the money, what would you be prepared to pay monthly to live i n a smoke-free environment?
15. It i s known that the burning of plastics & tyres had serious toxic & polluting effects. In order to restrict such pollution, do you think people who do that should be given a fine? x
1. Not mak~ng fire: using electricity for cooking 8 heating
16. Especially in the spring & summer some people are using amplifiers to make loud music. How are you affected by this in your area? *
2. Making coal I wood fire: but Not interested
3. Making coal I wood fire: And Interested
17. If you feel that something should be done i n your area to reduce the noise levels, who should be responsible and what should be done? (Mark x more than one option)
4. Using paraffin: Not interested
i 1 Not affected (quiet I in the area) 1
5. Using paraffin: i t ~ierested
18. If you would have the money, what would you be prepared to pay monthly to live in a quiet environment?
2. 1 hear it but I don't care (accepting it)
C: CONSUMPTION
r 1 The Municipality 1 should control 8
restrict people to play loud music
19. How much of the following items do you buy per week &about how much do you spend on these items per week?
3. 1 hear it and it is affecting me (don't like it)
3. A street committee should control & restrict people to play loud music
2. The police should control 8 restrict people to play loud music
I Kilograms I litres per week / Rand per week / Town 4 1 Township 4 1. Maize Meal
2. Bread
3. Meat 1 chicken
4. Vegetables
5. Milk
6. Washing powder
7. Coal
8. Paraffin
4. 1 hear it and I am badly affected
4. People who disturb the neighbourhood with noise should be fined /punished
CDD Projects towards poverty alleviation
- - -
5. 1 hear it and it is unbearable (severely affected)
5. The instruments of those who disturb the neighbourhood should be confiscated
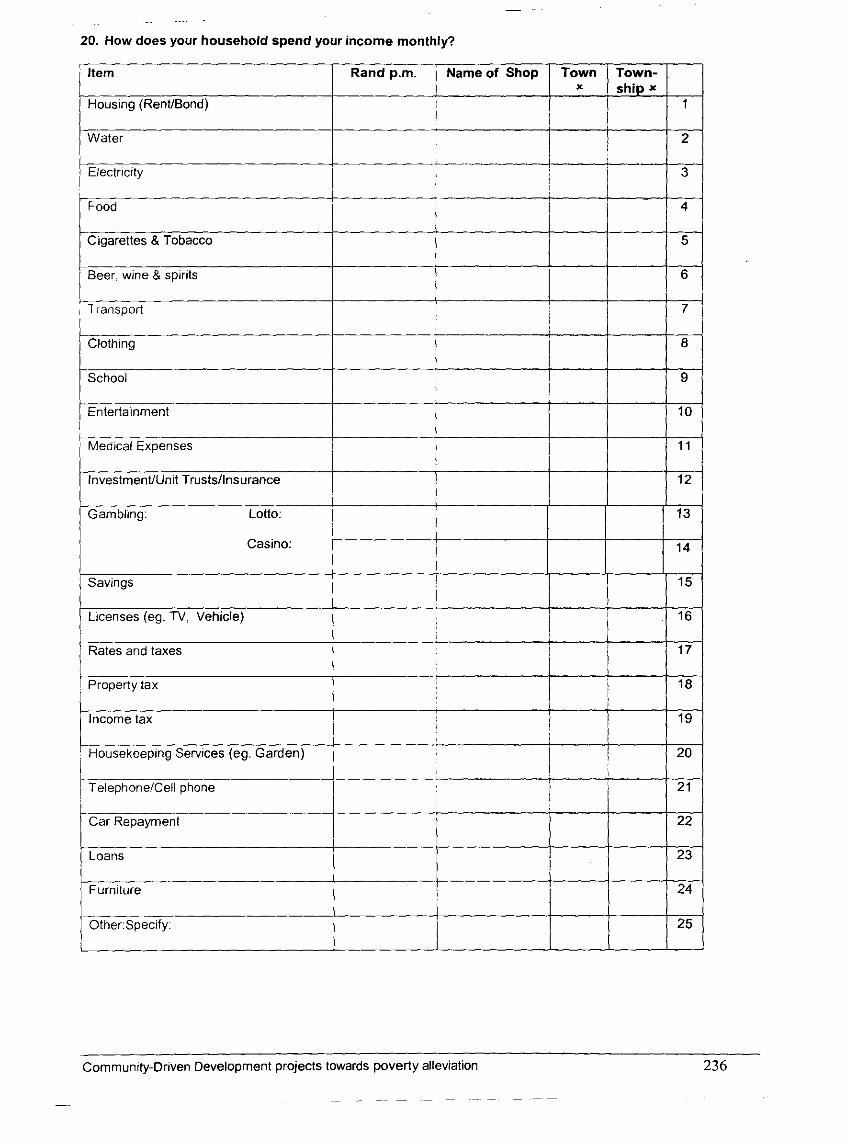
Clothtng
School
- ~ -~
20. How does your household spend your income monthly?
Gambling: Lotto:
Town X
Item
Casino:
Savtngs
Ltcenses (eg TV, Vehicle)
I-
Property tax
Income tax
Rand p.m.
Housing (RenUBond)
Water
, Electrictty I -* I
I I
I Housekeeping Sewtces (eg Garden) I
I I i
Name o f Shop
Food
Rates and taxes
I TelephonelCell phone
_____i___ I
I
i
Loans
Furniture
rOther.Specify:
Cigarettes & Tobacco
I
Town- q
Beer. wine & spirits
, Transport I
Car Repayment I
Community-Driven Development projects towards poverty alleviation 236
I
I I
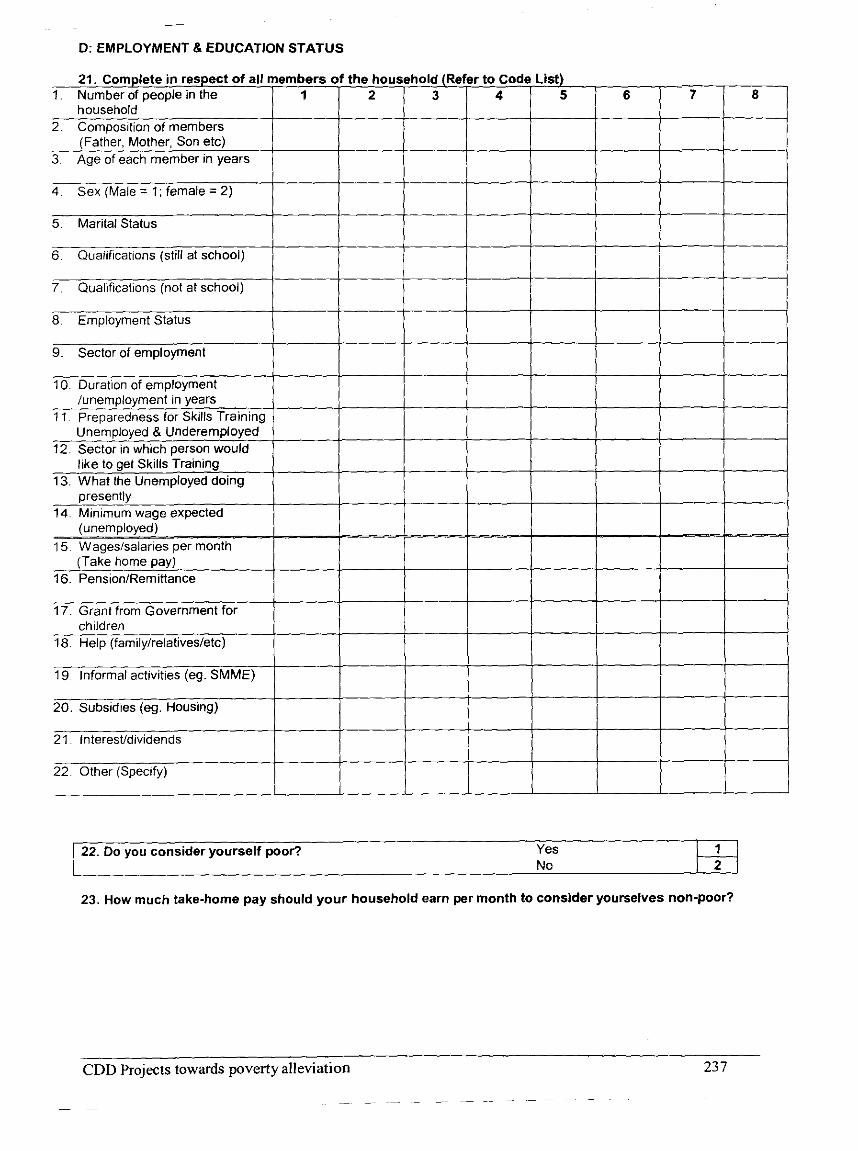
- D: EMPLOYMENT 8 EDUCATION STATUS
21. Complete in respect of all members of the household (Refer to Code List) 1. Number of people in the 1 2 3 4 5 6 7 8
household 2. Composition of members
(Father. Mother, Son etc) 3. Age of each member in years
4. Sex (Male = 1; female = 2)
- 5. Marital Status
19 Informal activities (eg. SMME)
20. Subsidies (eg. Housing)
21. lnterestldividends
22. Other (Specify)
- -
22. Do you consider yourself poor? Yes No
23. How much take-home pay should your household earn per month to consider yourselves non-poor?
CDD Pro~ects towards poverty alleviation 23 7
- - - - - - - - -
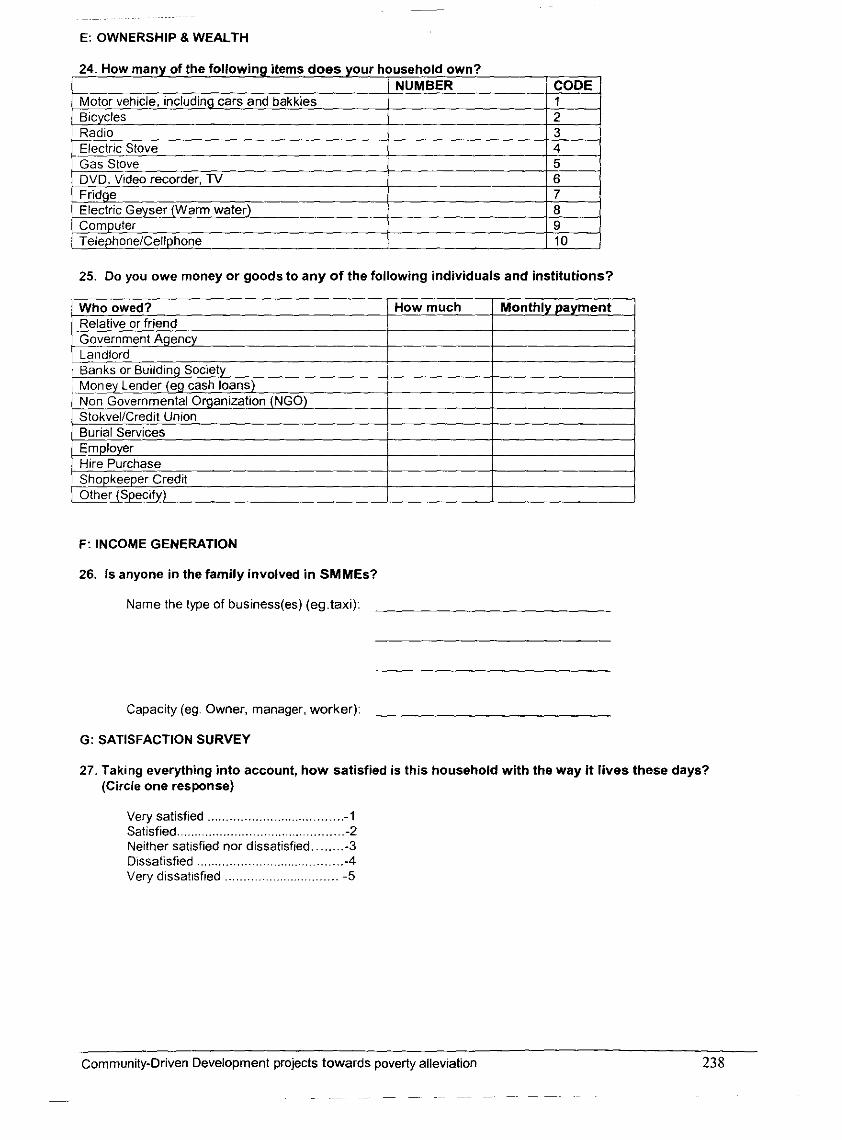
- - -
E: OWNERSHIP 8 WEALTH
25. Do you owe money or goods to any of the following individuals and institutions?
/ How much I Monthly payment Relative or friend 1 1 Government Agency
Employer Hire Purchase Shopkeeper Credit
I Other (Specify)
,--- - ~o%~er ide r (eg cash loans on Governmental Organiratibn (NGO) StokvelICredit Union Burial Services
F: INCOME GENERATION
~ -
Is anyone in the family involved in SMMEs?
Name the type of business(es) (eg.taxi):
1
Capacity (eg. Owner, manager, worker):
G: SATISFACTION SURVEY
27. Taking everything into account, h o w satisfied is this household wi th the way it l ives these days? (~ircl; one & m k e )
Very satisfied ..................................... -1 Satisfied .............................................. -2 Neither satisfied nor dissatisfied.. ...... -3
...................................... Dissatisfied -4 Very dissatisfied .............................. -5
Community-Driven Development projects towards poverty alleviation 238
~~~~ - ~- p~~ - - ~ -- -- -~ - ~-
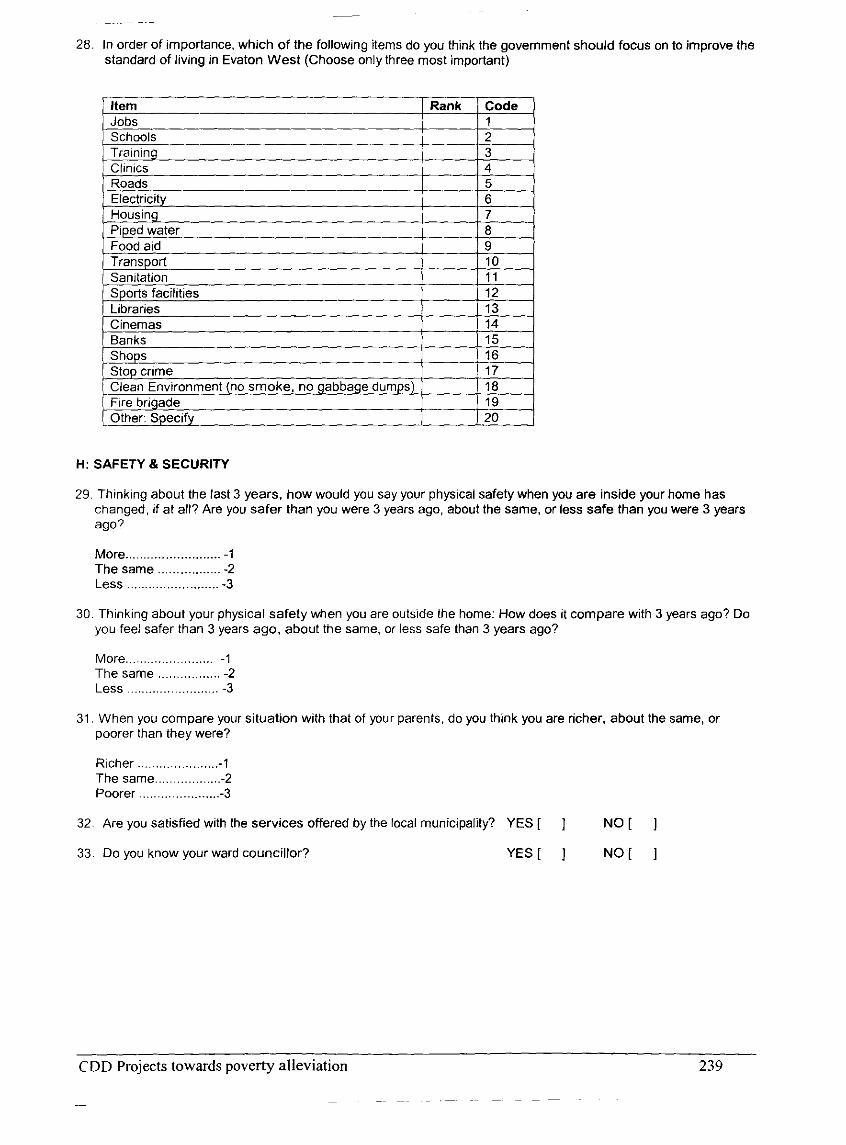
28. In order of importance, which of the following items do you think the government should focus on to improve the standard of living in Evaton West (Choose only three most important)
I Item 1 Rank / Code 1
H: SAFETY B SECURITY
29. Thinking about the last 3 years, how would you say your physical safety when you are inside your home has changed, if at all? Are you safer than you were 3 years ago, about the same, or less safe than you were 3 years ago?
More .......................... -1 The same ................. -2 Less ......................... -3
30. Thinking about your physical safety when you are outside the home: How does it compare with 3 years ago? Do you feel safer than 3 years ago, about the same, or less safe than 3 years ago?
More ........................ -1 The same ................. -2 Less ......................... -3
When you compare your situation with that of your parents, do you think you are richer, about the same, or poorer than they were?
Richer ...................... -1 The same .................. -2 Poorer ..................... .-3
32. Are you satisfied with the services offered by the local municipality? YES [ ] NO[ 1
33. Do you know your ward councillor? YES [ 1 NO[ 1
CDD Projects towards poverty alleviation 239
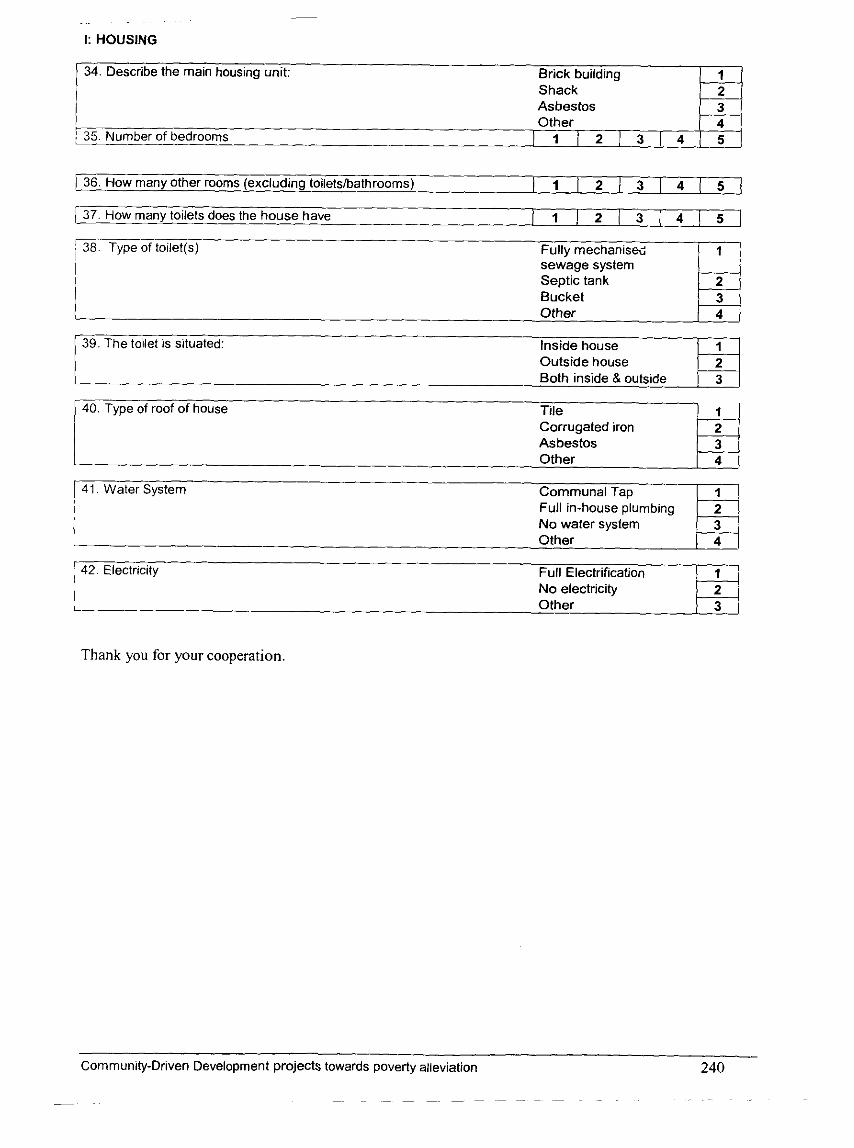
I: HOUSING
34. Describe the main housing unit: Brick building Shack Asbestos
1 2 3
38. Type of toilet(s) Fully mechanisei sewage system Septic tank Bucket Other
Thank you for your cooperation,
1
2 3 4
39. The toilet is situated: Inside house Outside house Both inside &outside
Community-Driven Development projects towards poverty alleviation 240
p~ ~- p~ - ~- -~ - ~ ~- ~
1 2 3
- 40. Type of roof of house Tile
Corrugated iron Asbestos Other -
1 41. Water System Communal Tap I Full in-house plumbing
No water system Other
42. Electricity Full Electrification No electricity Other
1 2 3 4
1 2 3
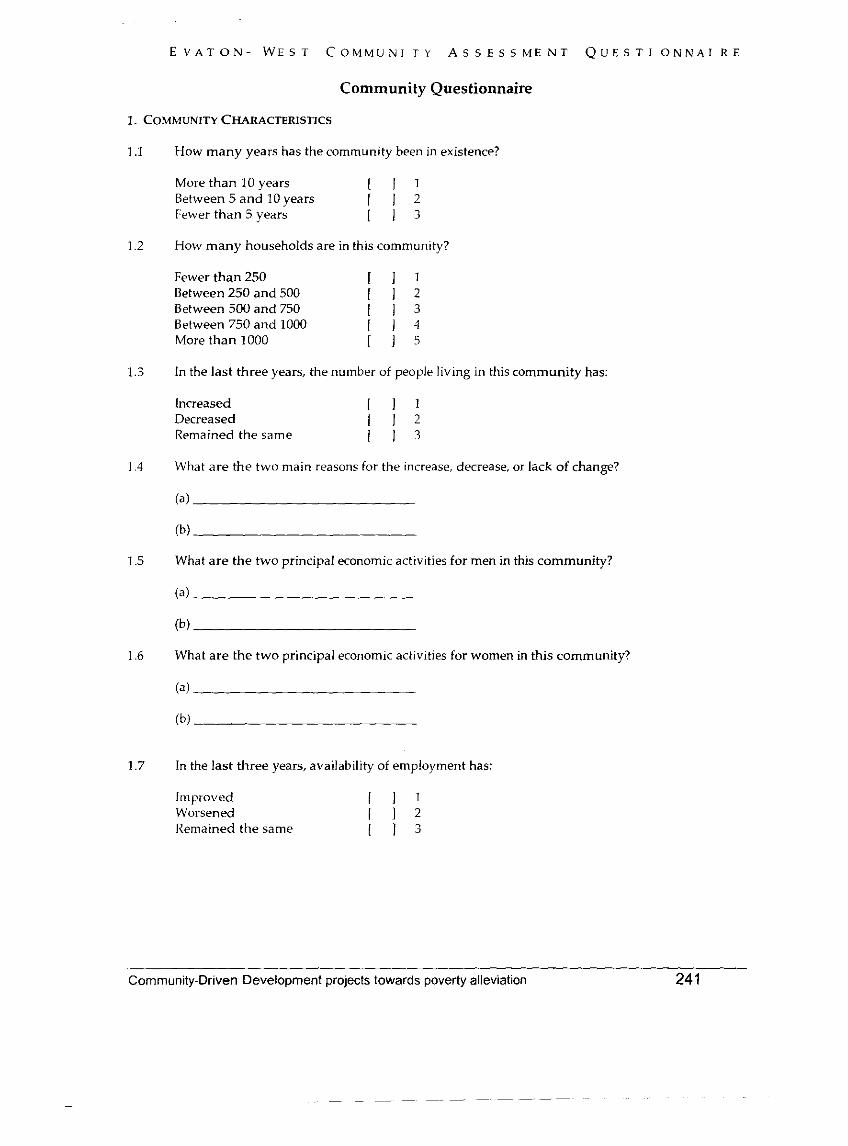
E V A T O N - W E S T C O M M U N I T Y A S S E S S M E N T Q U E S T 1 O N N A I R E
Community Questionnaire
1. COMMUNITY CHARACTERISTICS
How many years has the community been in existence?
More than 10 years 1 1 1
Between 5 and 10 years 1 1 2 Fewer than 5 years 1 1 3
How many households are in this community?
Fewer than 250 Between 250 and 500 Between 500 and 750 Between 750 and 1000 More than 1000
In the last three years, the number of people living in this community has:
Increased 1 1 1 Decreased 1 1 2 Remained the same 1 1 3
What a re the two main reasons for the increase, decrease, or l x k of change?
What a re the two principal economic activities for men in this community?
What are the two principal economic activities for women in this community?
In the last three years, availability of employment has:
Improved 1 1 1 Worsened 1 1 2 Remained the same 1 1 3
Community-Driven Development projects towards poverty alleviation 24 1
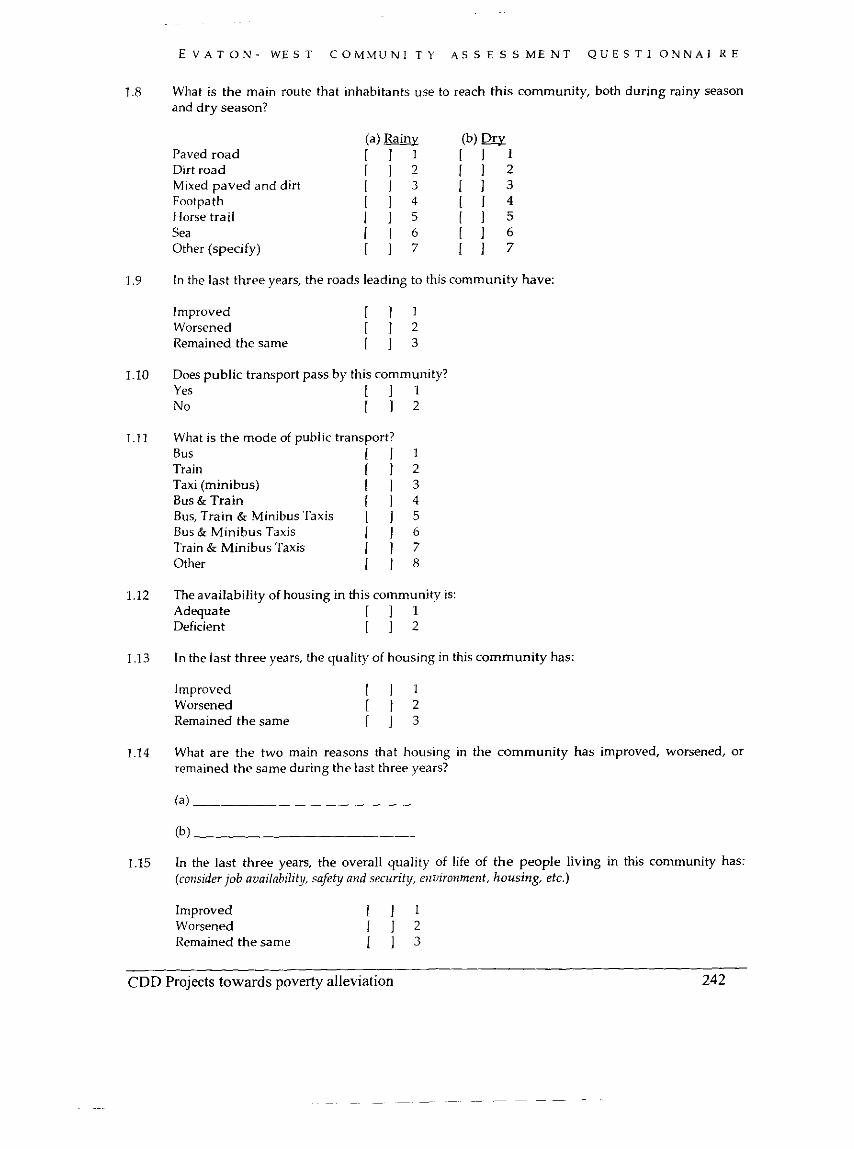
E V A T O N - W E S T C O M M U N I T Y A S S E S S M E N T Q U E S T 1 O N N A I R E
1.8 What is the main route that inhabitants use to reach this community, both during rainy season and dry season?
(a) Rainv Paved road 1 1 1 Dirt road 1 1 2 Mixed paved and dirt 1 1 3 Footpath 1 1 4 Horse trail 1 1 5 Sea 1 1 6 Other (specify) 1 1 7
1.9 In the last three years, the roads leading to this community have:
Improved 1 1 1 Worsened 1 1 2 Remained the same 1 1 3
1.10 Does public transport pass by this community? Yes 1 1 1 No 1 1 2
I . I 1 What is the mode of public transport? Bus I I Train 1 1 Taxi (minibus) I 1 Bus & Train 1 1 Bus, Train & Minibus Taxis [ 1 Bus & Minibus Taxis 1 I Train & Minibus Taxis 1 1 Other 1 1
1.12 The availability of housing in this community is: Adequate 1 1 1 Deficient [ I 2
1 . I3 In the last three years, the quality of housing in this community has:
Inlproved 1 1 1 Worsened 1 1 2 Remained the same 1 1 3
1.14 What are the two main reasons that housing in the community has improved, worsened, or remained the same during the last three years?
1.15 In the last three years, the overall quality of life of t he people living in this community has: (consider job availability, safety and security, environment, housing, etc.)
Improved 1 1 1 Worsened 1 1 2 Remained the same [ I 3
CDD Projects towards poverty alleviation 242
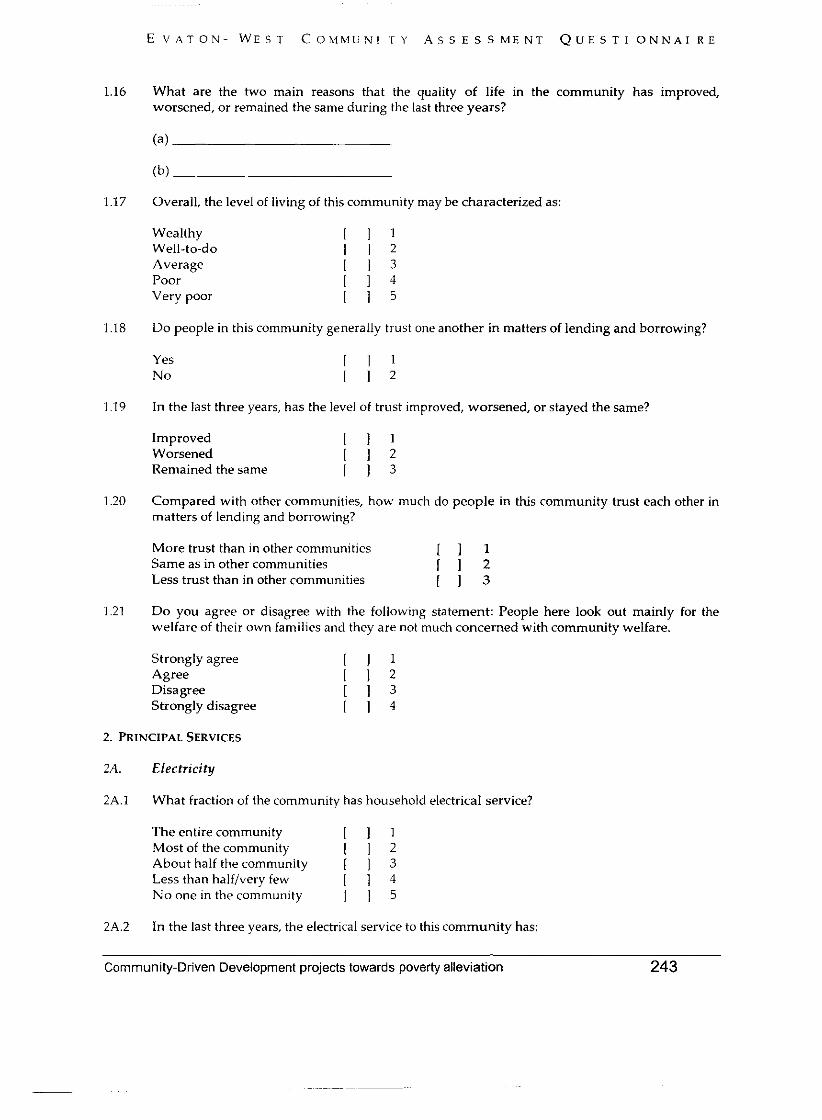
E V A T O N - W E S T C O M M U N I .l Y A S S E S S M E N T Q U E S T 1 O N N A I R E
What are the two main reasons that the quality of life in the community has improved, worsened, or remained the same during the last three years?
Overall, the level of living of this community may be characterized as:
Wealthy Well-to-do Average Poor Very poor
Do people in this community generally trust one another in matters of lending and borrowing?
Yes No
In the last three years, has the level of trust improved, worsened, or stayed the same?
Improved [ 1 1 Worsened [ 1 2 Remained the same 1 1 3
Compared with other communities, how much do people in this community trust each other in matters of lending and borrowing?
More trust than in other communities 1 1 1 Same as in other communities [ I 2 Less trust than in other communities [ I 3
Do you agree or disagree with the following statement: People here look out mainly for the welfare of their own families and they are not much concerned with community welfare.
Strongly agree Agree Disagree Strongly disagree
?A. Electricity
2A.1 What fraction of the community has household electrical service?
The entire community [ ] I Most of the community 1 1 2 About half the community 1 3 Less than halflvery few 1 1 4 No one in the community 1 1 5
2A.2 In the last three years, the electrical service to this community has:
Community-Driven Development projects towards poverty alleviation 243
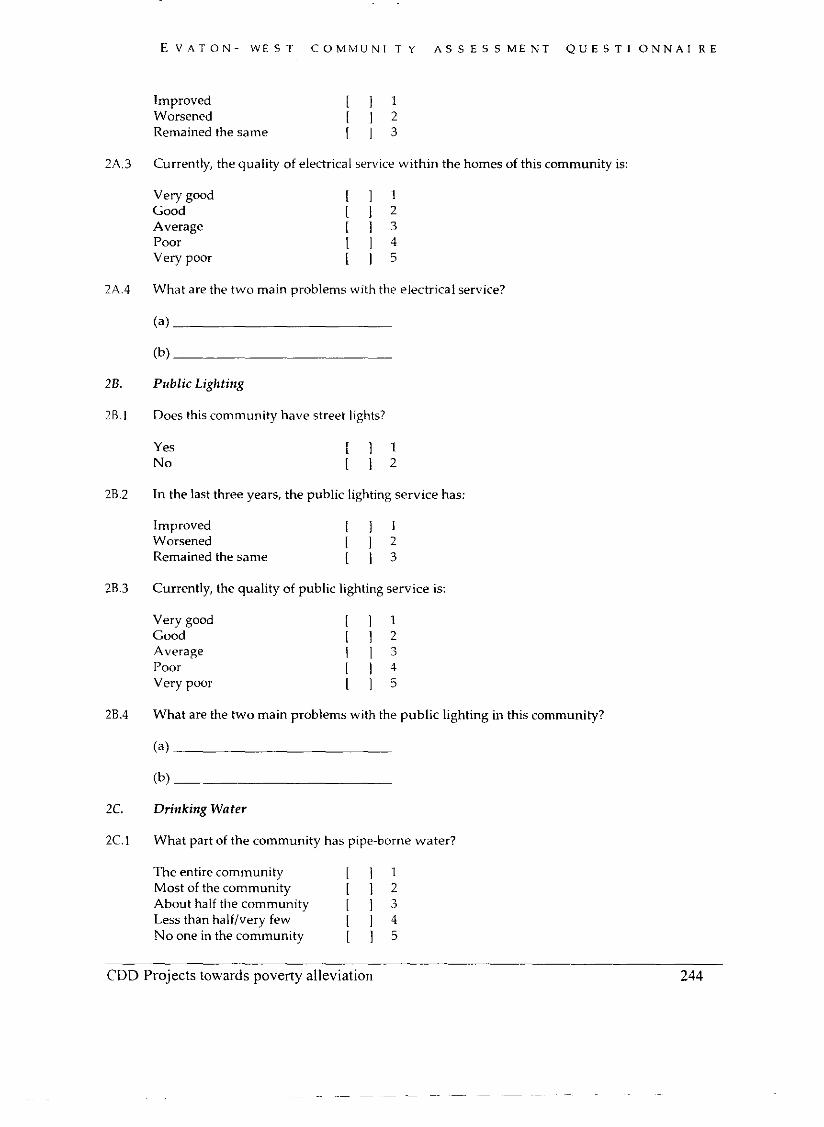
E V A T O N - W E S T C O M M U N I T Y A S S E S S M E N T Q U E S T 1 O N N A I R E
Improved 1 1 1 Worsened 1 1 2 Remained the same 1 1 3
Currently, the quality of electrical service within the homes of this community is:
Very good Good Average Poor Very poor
What are the two main problems with the electrical service?
Public Lighting
Does this community have street lights?
Yes No
In the last three years, the public lighting service has:
Improved [ ] I Worsened 1 1 2 Remained the same ( 1 3
Currently, the quality of public lighting service is:
Very good Good Average Poor Very poor
What are the two main problems with the public lighting in this community?
Drinking Water
What part of the community has pipe-borne water?
The entire community 1 1 1 Most of the community 1 1 2 About half the community [ I 3 Less than halfivery few 1 1 4 No one in the community [ I 5
CDD Projects towards poverty alleviation 244
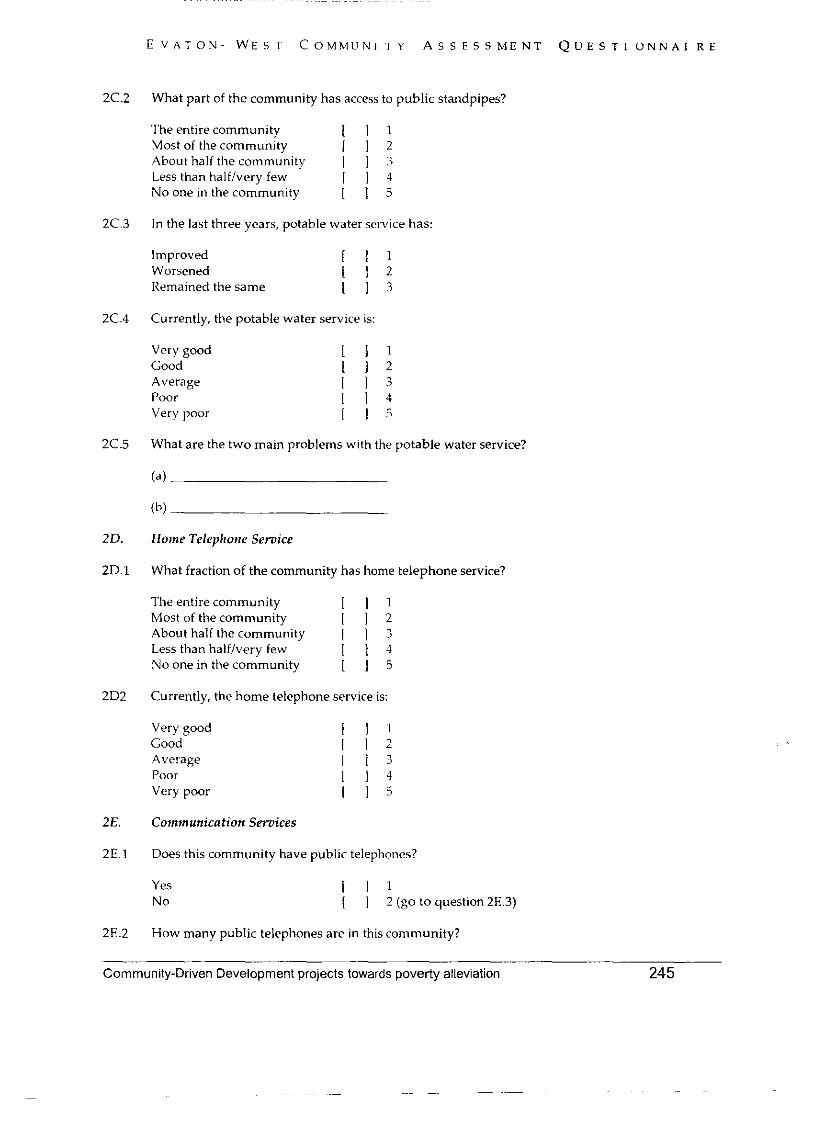
What part of the community has access to public standpipes?
The entire community 1 1 1 Most of the community 1 1 2 About half the community 1 1 3 Less than halflvery few I 1 4 No one in the community [ l j
In the last three years, potable water service has:
Improved 1 1 1 Worsened 1 1 2 Remained the same [ I 3
Currently, the potable water service is:
Very good Good Average Poor Very poor
What are the two main problems with the potable water service?
Home Telephone Service
What fraction of the community has home telephone service?
The entire community 1 1 1 Most of the community 1 1 2 About half the community 1 1 3 Less than halflvery few 1 1 4 No one in the community 1 1 5
Currently, the home telephone service is:
Very good Good Average Poor Very poor
Communication Semices
Does this community have public telephones?
Yes No
1 1 1 [ 1 2 (go to question 2E.3)
How many public telephones are in this community?
- Community-Driven Development projects towards poverty alleviation
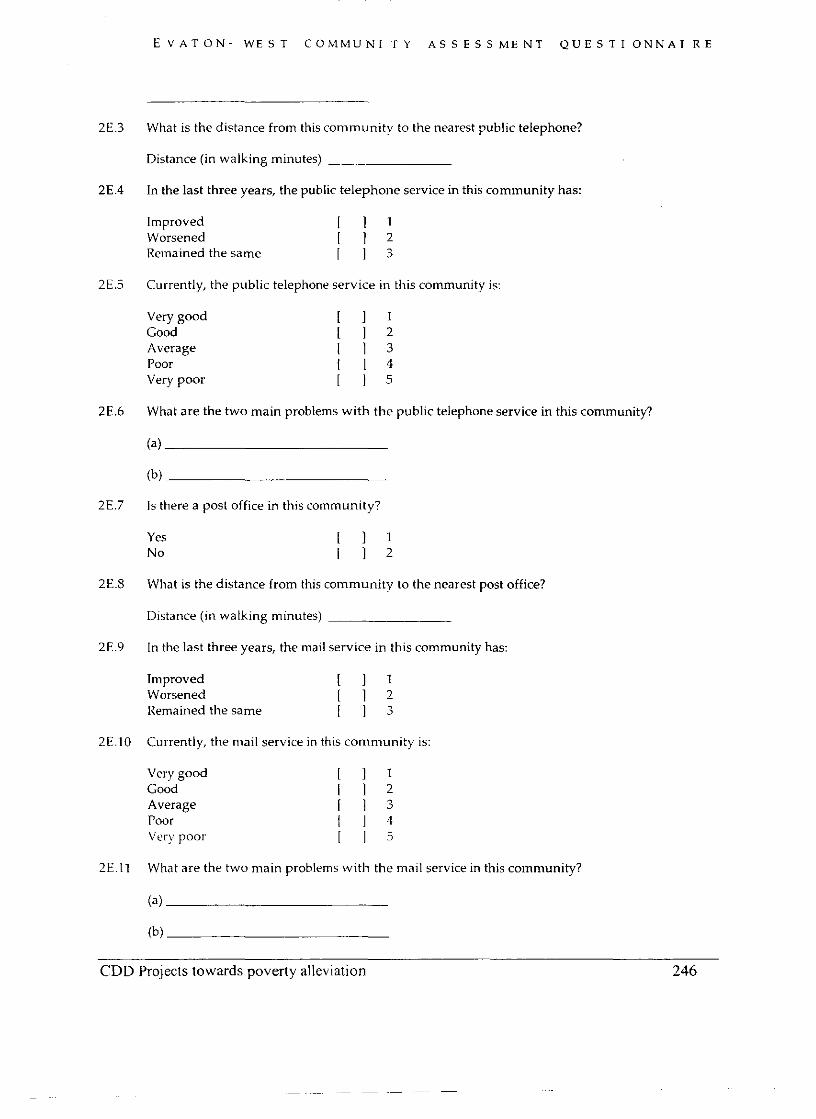
E V A T O N - W E S T COMMUNI T Y A S S E S S M E N T Q U E S T 1 O N N A I R E
What is the distance from this community to the nearest public telephone?
Distance (in walking minutes)
In the last three years, the public telephone service in this community has:
Improved 1 1 1 Worsened 1 1 2 Remained the same 1 1 ;
Currently, the public telephone service in this community is:
Very good Good Average Poor Very poor
What are the two main problems with the public telephone service in this community?
Is there a post office in this community?
Yes I 1 1 No 1 1 2
What is the distance from this community to the nearest post office?
Distance (in walking minutes)
In the last three years, the mail service in this community has:
Improved 1 1 1 Worsened [ I 2 Remained the same I 1 3
Currently, the mail service in this community is:
Very good 1 1 1 Good 1 1 2 Average 1 1 3 Poor 1 1 4 Very poor 1 1 ;
What are the two main problems with the mail service in this comn~unity?
CDD Projects towards poverty alleviation 246
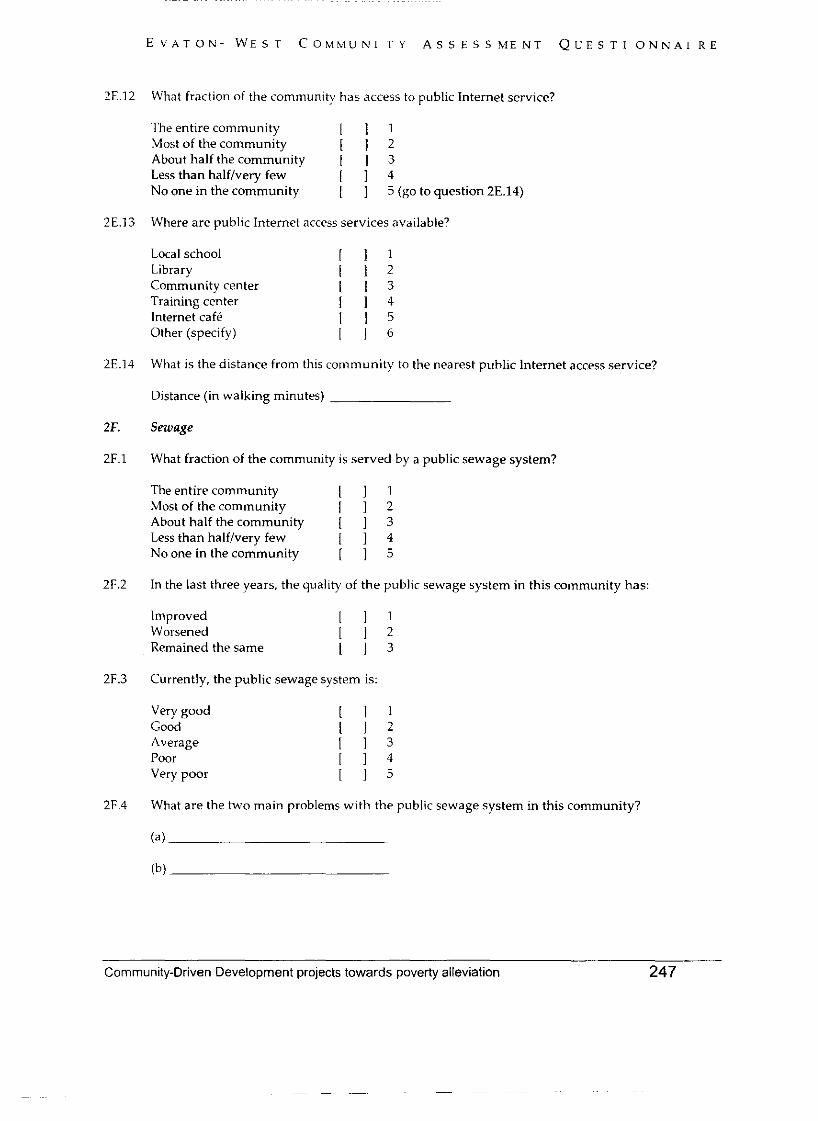
~ ~~~~ ~ ~~~~~~ ~~~~~~ ~~ ~~~ ~~~~
E V A T O N - W E S T C O M M U N I T Y A S S E S S M E N T Q U E S T 1 O N N A I R E
What fraction of the community has access to public Internet service?
The entire community I Most of the community [ About half the community [ Less than halflvery few I No one in the community 1
1 2 3 4 5 (go to question 2E.14)
Where are public Internet access services available?
Local school I Library 1 Community center 1 Training center I Internet cafP 1 Other (specify) I
What is the distance from this community to the nearest puhlic lnternet access service?
Distance (in walking minutes)
Sewage
What fraction of the community is served by a public sewage system?
The entire community 1 Most of the community I About half the community [ Less than halflvery few 1 No one in the community [
In the last three years, the quality of the public sewage system in this community has:
Improved 1 1 1 Worsened 1 1 2 Remained the same [ I 3
Currently, the public sewage system is:
Very good Good Average Poor Very poor
What are the two main problems with the public sewage system in this community?
Community-Driven Development projects towards poverty alleviation 247
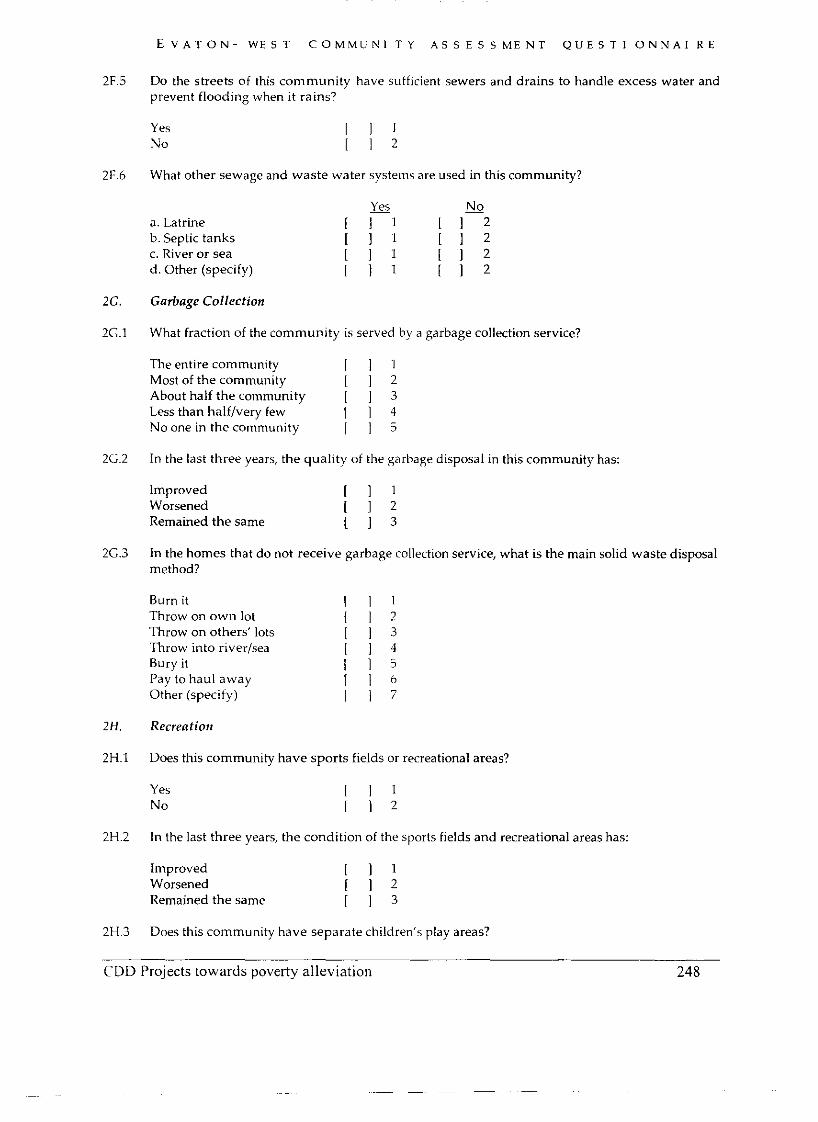
E V A T O N - W E S T C O M M U N I T Y A S S E S S M E N T Q U E S T 1 O N N A l R E
2F.5 Do the streets of this community have sufficient sewers and drains to handle excess water and prevent flooding when it rains?
2F.6 What other sewage and waste water systems are used in this community?
a. Latrine b. Septic tanks c. River or sea d. Other (specify)
2G. Garbage Collection
2G.1 What fraction of the community is served by a garbage collection service?
The entire community 1 1 1 Most of the community [ I 2 About half the community 1 1 3 Less than halflvery few 1 1 4 No one in the community 1 1 5
2G.2 In the last three years, the quality of the garbage disposal in this community has:
Improved I 1 1 Worsened [ I 2 Remained the same [ I 3
2G.3 In the homes that do not receive garbage collection service, what is the main solid waste disposal method?
Burn it 1 1 1 Throw on own lot 1 1 2 Throw on others' lots [ I ; Throw into riverlsea 1 1 4 Bury it I l j Pay to haul away 1 1 6 Other (specify) 1 1 7
2H. Recreation
2H.l Does this community have sports fields or recreational areas?
Yes No
2H.2 In the last three years, the condition of the sports fields and recreational areas has:
Improved 1 1 1 Worsened 1 1 2 Remained the same [ I 3
2H.3 Does this community have separate children's play areas?
CDD Projects towards poverty alleviation 248
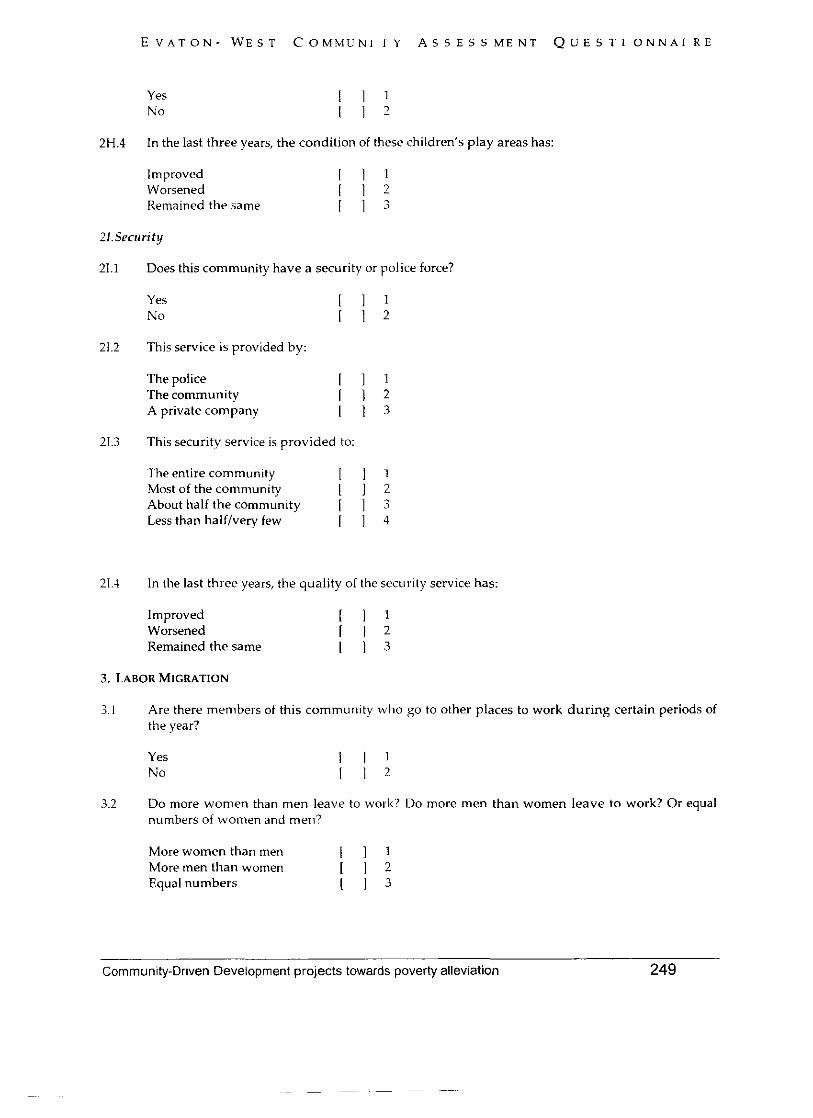
Yes No
2H.4 In the last three years, the condition of these children's play areas has:
lmproved Worsened Remained the same
Does this community have a security or police force?
Yes No
This service is provided by:
The police 1 1 1 The community 1 1 2 A private company 1 1 3
This security service is provided to:
'The entire community 1 1 1 Most of the community 1 1 2 About half the community 1 1 3 Less than halflvery few 1 1 4
In the last three years, the quality of the security service has:
Improved 1 1 1 Worsened 1 1 2 Remained the same 1 1 3
3.1 Are there members of this communitv who go to other places to work during certain periods of the year?
Yes No
3.2 Do more women than men leave to work? Do more men than women leave to work? Or equal numbers of women and men?
More women than men 1 1 1 More men than women 1 1 2 Equal numbers 1 1 3
Community-Driven Development projects towards poverty alleviation 249
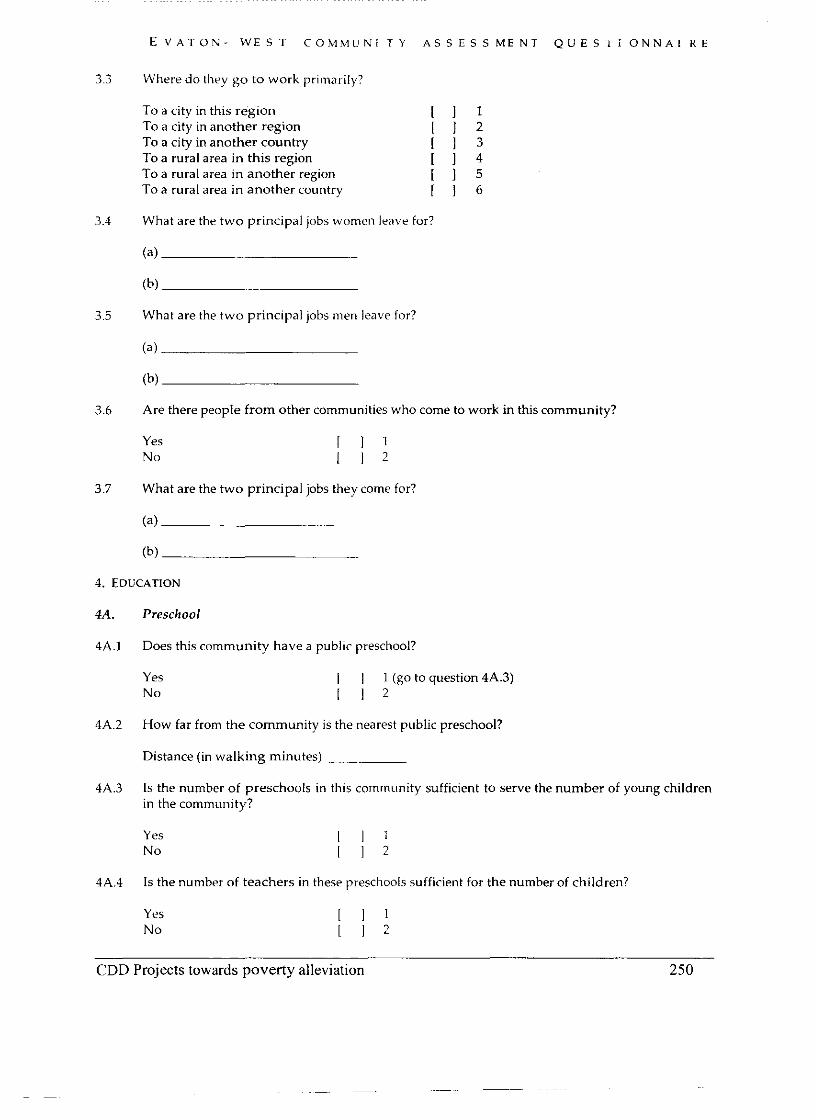
E V A T O N - W E S T C O M M U N i T Y A S S E S S M E N T Q U E S I i O N N A I R E
3.3 Where do they g o to work primarily?
To a city in this region To a city in another region To a city in another country To a rural area in this region To a rural area in another region To a rural area in another country
3.1 What are the two principal jobs women le,we for?
(b)
3.5 What are the two principal jobs men leave for?
3.6 Are there people f rom other communities who come to work in this community?
Yes No
3.7 What are the two principal jobs they come for?
4. EDUCATION
4A. Preschool
4A.l Does this community have a public preschool?
Yes No
[ ] 1 (go to question 4A.3) 1 1 2
4A.2 How far from the community is the nearest public preschool?
Distance (in walking minutes)
4A.3 Is the number of preschools in this community sufficient to serve the number of young children in the community?
Yes No
4A.4 Is the number of teachers in these preschools sufficient for the number of children?
Yes No
CDD Projects towards poverty alleviation 250
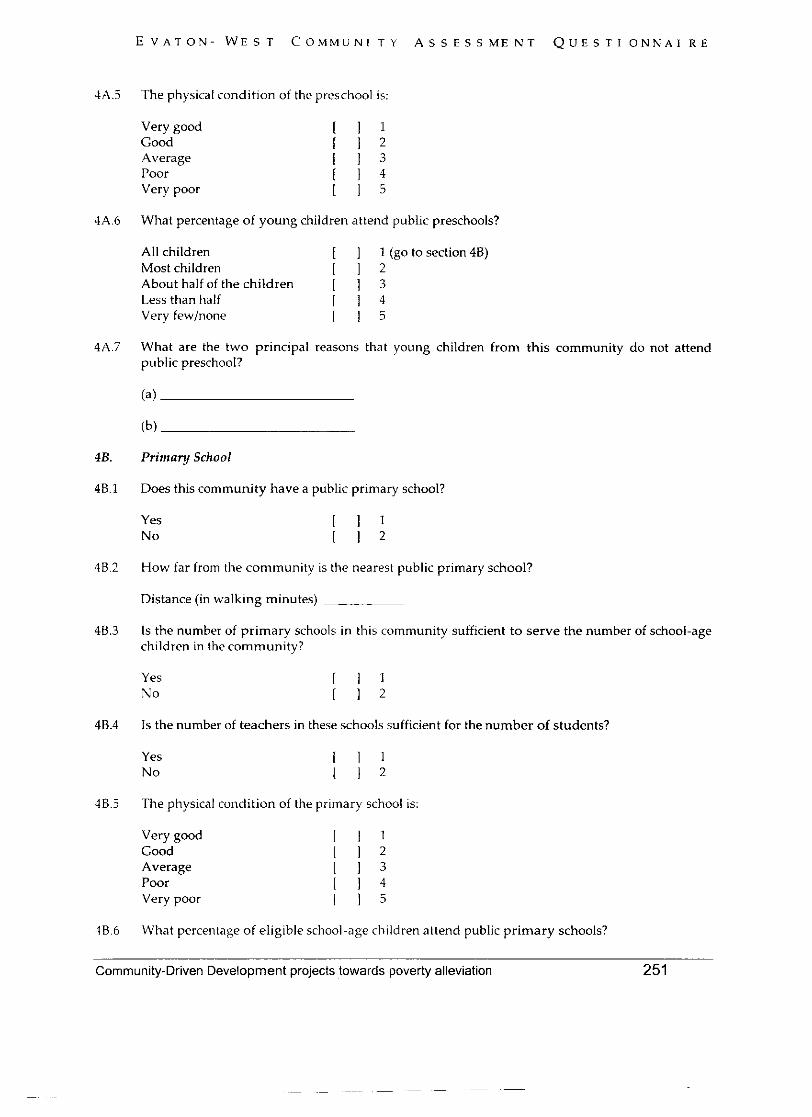
E V A T O N - W E S T C O M M U N l T Y A S S E S S M E N T Q U E S T 1 O N N A I R E
A . The physical condition of the preschool is:
Very good Good Average Poor Very poor
4A.6 What percentage of young children attend public preschools?
All children [ ] 1 (go to section 48) Most children 1 1 2 About half of the children 1 1 3 Less than half 1 1 4 Very fewinone 1 1 3
4A.7 What are the two principal reasons that young children from this community do not attend public preschool?
dB. Primary School
48.1 Does this community have a public primary school?
Yes No
4B.2 How far from the community is the nearest public primary school?
Distance (in walking minutes)
4B.3 Is the number of primary schools in this community sufficient to serve the number of school-age children in the community?
Yes No
4B.4 Is the number of teachers in these schools sufficient for the number of students?
Yes No
48.5 The physical condition of the primary school is:
Very good Good Average Poor Very poor
48.6 What percentage of eligible school-age children attend public primary schools?
Community-Driven Development projects towards poverty alleviation 251
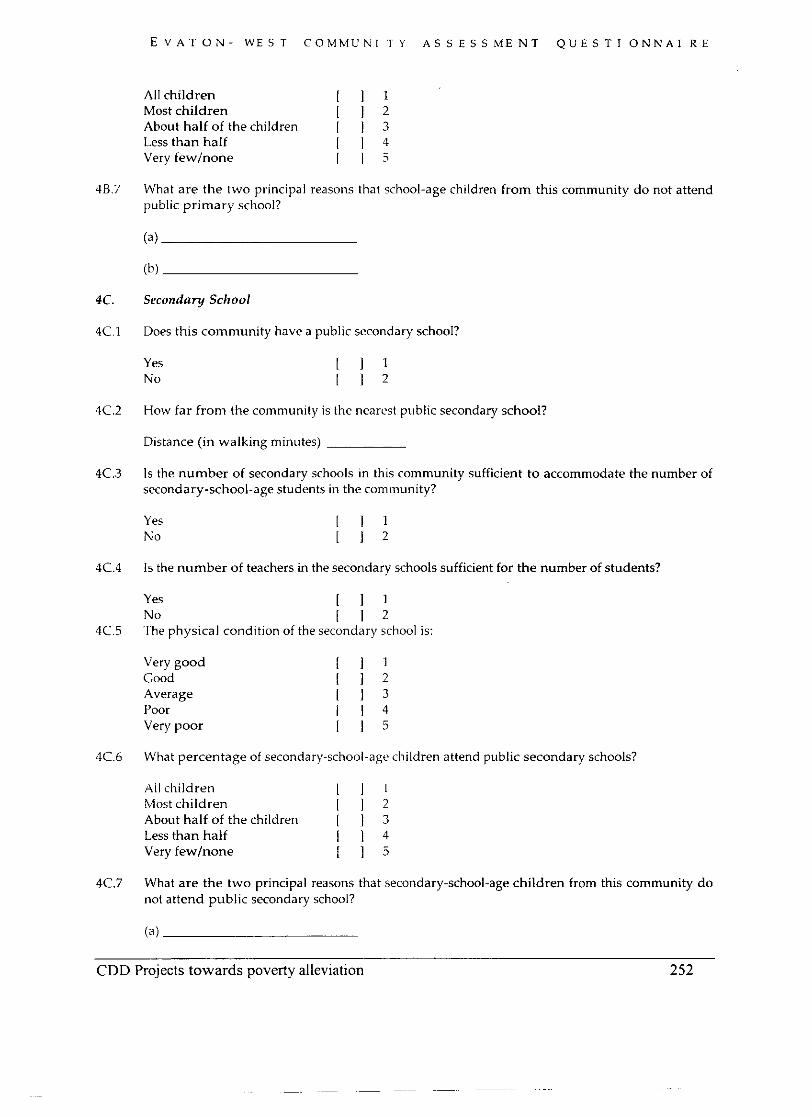
E V A T O N - W E S T C O M M U N I T Y A S S E S S M E N T Q U E S T 1 O N N A I R E
All children 1 1 1 Most children 1 1 2 About half of the children 1 1 3 Less than half 1 1 4 Very fewlnone 1 1 3
What are the two principal reasons that school-age children from this community d o not attend public primary school?
Secondary School
Does this community have a public secondary school?
Yes No
How far from the community is the nearest public secondary school?
Distance (in walking minutes)
Is the number of secondary schools in this community sufficient to accommodate the number of secondary-school-age students in the community?
Yes No
Is the number of teachers in the secondary schools sufficient for the number of students?
Yes 1 1 1 No 1 1 2 The physical condition of the secondary school is:
Very good Good Average Poor Very poor
What percentage of secondary-school-age children attend public secondary schools?
All children 1 1 1 Most children 1 1 2 About half of the children 1 1 3 Less than half 1 1 4 Very f e w h o n e [ I 5
What are the two principal reasons that secondary-school-age children from this community do not attend public secondary school?
CDD Projects towards poverty alleviation 252
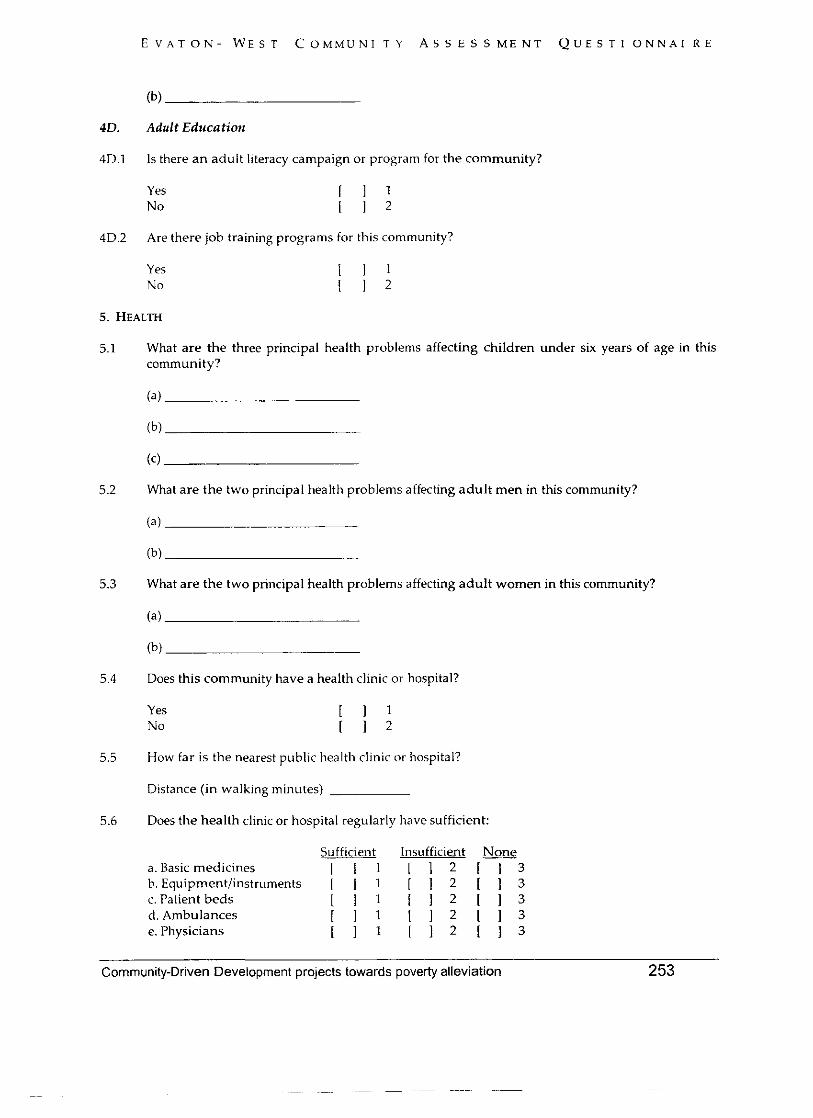
(b)
Adult Education
Is there a n adult literacy campaign or program for the community?
Yes 1 1 1 No 1 1 2
Are there job training programs for this community?
Yes 1 1 1 No 1 1 2
5. HEALTH
What are the three principal health problems affecting children under six years of age in this community?
(a)
What are the two principal health problems affecting adul t men in this community?
(a)
(b)
What are the two principal health problems affecting adult women in this community?
(a)
Does this community have a health clinic or hospital?
Yes No
How far is the nearest public health clinic or hospital?
Distance (in walking minutes) -
Does the health clinic or hospital regularly have sufficient:
Sufficient Insufficient a. Basic medicines [ I 1 I 1 2 1 1 3 b. Equipment/instruments [ ] 1 [ 1 2 [ ] 3 c. Patient beds [ I 1 [ 1 2 [ 1 3 d. Ambulances 1 1 1 [ 1 2 [ 1 3 e. Physicians 1 1 1 I 1 2 [ 1 3
- ~ ~ ~~~
Community-Driven Development projects towards poverty alleviation 253
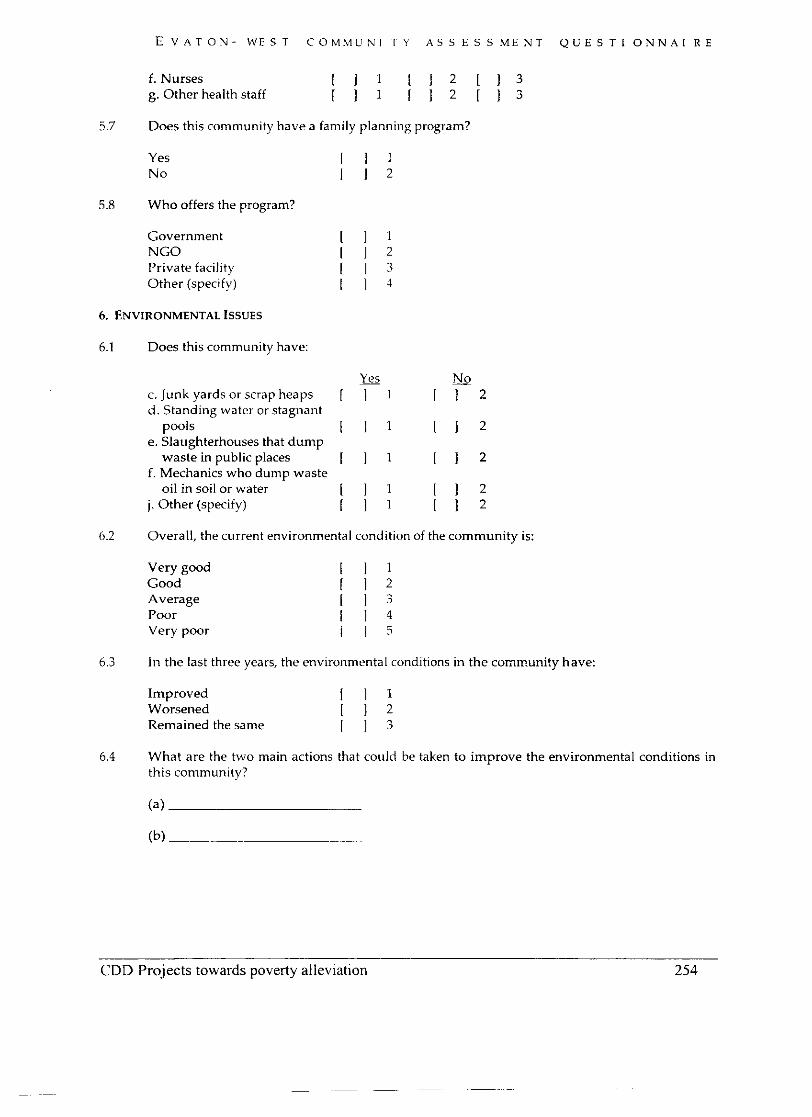
E V A T O N - W E S T C O M h l L l N I I Y A S S E S S M E N T Q U E S T 1 O N N A l R E
f. Nurses [ I 1 I 1 2 [ 1 3 g. Other health staff 1 1 1 I l 2 [ j s
5.7 Does this community have a family planning program?
Yes No
5.8 Who offers the program?
Government NGO Private facility Other (specify)
6. ENVIRONMENTAL ISSUES
6.1 Does this community have:
uc.s No c. Junk yards or scrap heaps [ ] 1 1 1 2 d . Standing water or stagnant
pools 1 1 1 I 1 2 e. Slaughterhouses that dump
waste in public places 1 1 1 1 1 2 f. Mechanics who dump waste
oil in soil or water 1 1 1 1 1 2 j. Other (specify) 1 1 1 1 1 2
6.2 Overall, the current environmental condition of the community is:
Very good Good Average Poor Very poor
6.3 In the last three years, the environmental conditions in the cor;.munity have:
Improved 1 1 1 Worsened 1 1 2 Remained the same I 1 3
6.4 What are the two main actions that could be taken to improve the environmental conditions in this community?
CDD Projects towards poverty alleviation 254
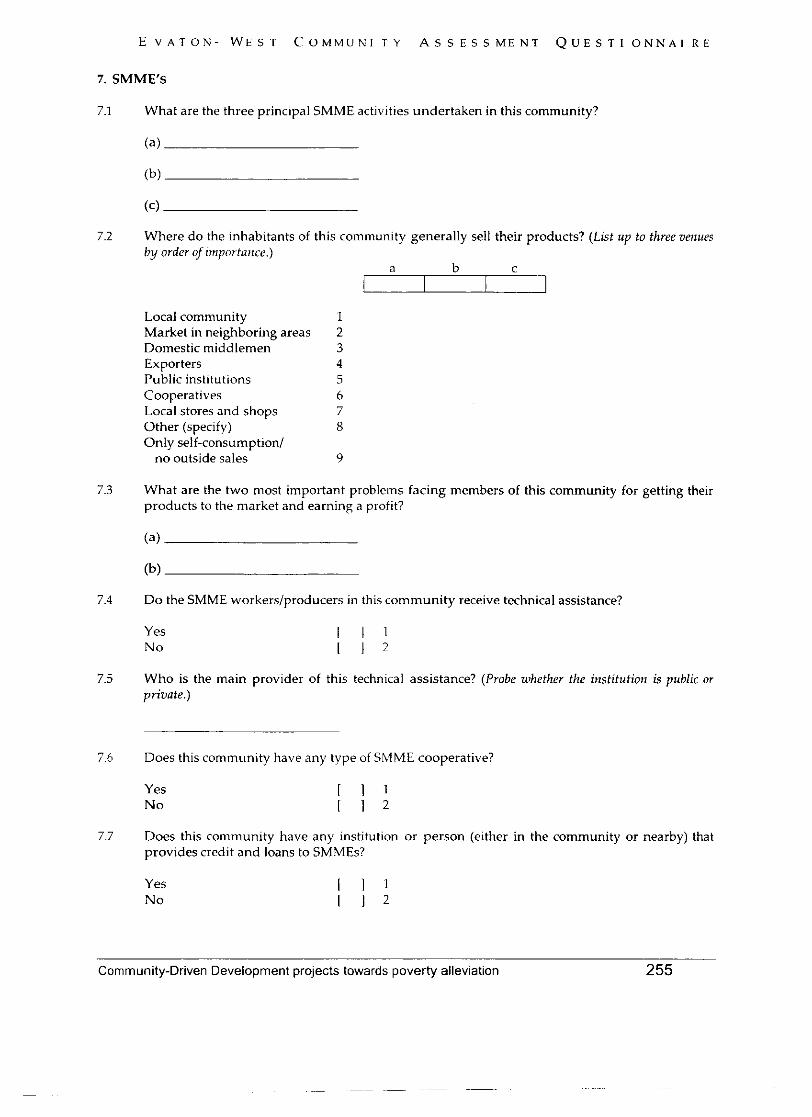
E V A T O N - W E S T C O M M U N I T Y A S S E S S M E N T Q U E S T I O N N A I R E
7.1 What are the three principal SMME activities undertaken in this community?
7.2 Where do the inhabitants of this community generally sell their products? (List up to three venues by order of importauce.)
Local community Market in neighboring areas Domestic middlemen Exporters Public institutions Cooperatives Local stores and shops Other (specify) Only self-consumption/
no outside sales
7.3 What are the two most important problems facing members of this community for getting their products to the market and earning a profit?
7.4 Do the SMME workers/producers in this community receive technical assistance?
Yes No
7.5 Who is the main provider of this technical assistance? (Probe whether the institution is public or private.)
7.6 Does this community have any type of SMME cooperative?
Yes No
7.7 Does this community have any institution or person (either in the community or nearby) that provides credit and loans to SMMEs?
Yes No
Community-Driven Development projects towards poverty alleviation 255
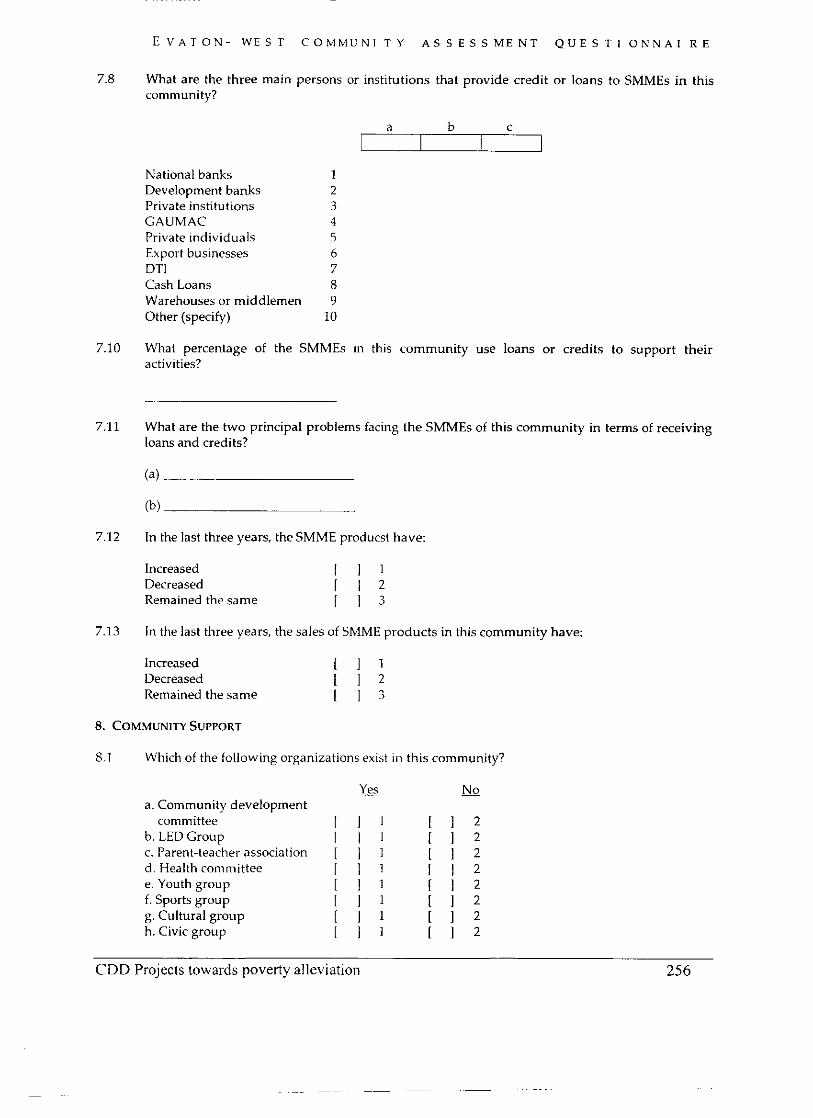
E V A T O N - W E S T COMMUNI T Y A S S E S S M E N T Q U E S T 1 O N N A I R E
7.8 What are the three main persons or institutions that provide credit or loans to SMMEs in this community?
National banks Development banks Private institutions GAUMAC Private individuals Export businesses DTI Cash Loans Warehouses or middlen Other (specify)
7.10 What percentage of the SMMEs in this community use loans or credits to support their activities?
7.11 What are the two principal problems facing the SMMEs of this community in terms of receiving loans and credits?
7.12 In the last three years, the SMME producst have:
Increased 1 1 1 Decreased 1 1 2 Remained the same 1 1 3
7.13 In the last three years, the sales of SMME products in this community have:
Increased 1 1 1 Decreased [ I 2 Remained the same 1 1 3
8.1 Which of the following organizations exist in this community?
a. Community development committee
b. LED Group c. Parent-teacher association d . Health conlnlittee e. Youth group f. Sports group g. Cultural group h. Civic group
Yes - No
CDD Projects towards poverty alleviation 256
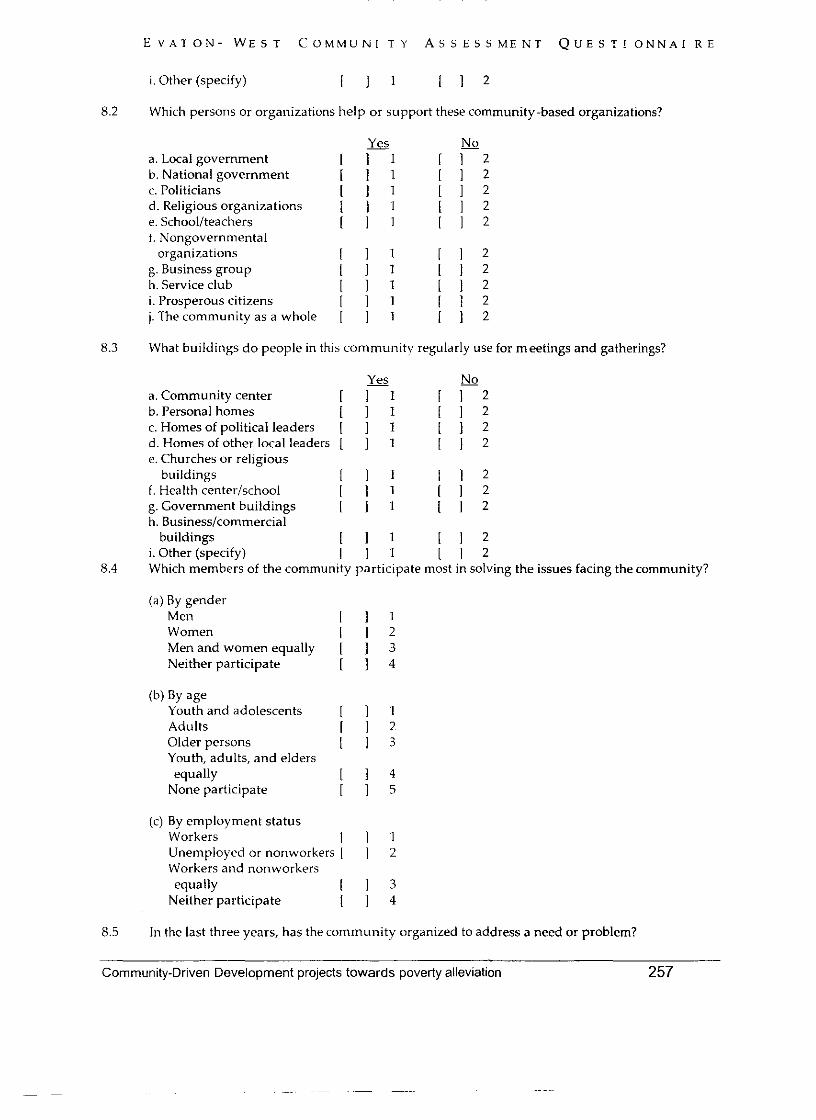
E V A T O N - W E S T C O M M U N I T Y A S S E S S M E N T Q U E S T ! O N N A I R E
i . Other (specify) [ I 1 ( 1 2
8.2 Which persons or organizations help or support these community-based organizations?
Yes No a. Local eovernment 1 1 1 r 1-2 " b. National government c. Politicians
i i l i i 2 [ I ] 1 1 2
d. Religious organizations 1 1 1 1 1 2 e. Schoollteachers [ I 1 1 1 2 f. Nongovernmental
organizations 1 1 1 1 1 2 g. Business group 1 1 1 [ I 2 h. Service club 1 1 1 1 1 2 i. Prosperous citizens 1 1 1 1 1 2 j. The community as a whole [ I 1 1 1 2
8.3 What buildings do people in this community regularly use for meetings and gatherings?
Yes No a. Community center b. Personal homes
r rl r 1 2 1 1 1 ( 1 2
c. Homes of political leaders ] 1 [ I 2 d. Homes of other local leaders [ ] 1 1 1 2 e. Churches or religious
buildings [ I 1 1 1 2 f . Health centerlschool 1 1 1 [ I 2 g. Government buildings 1 1 1 [ I 2 h. Business/commercial
buildings [ I 1 1 1 2 i. Other (specify) 1 1 1 1 1 2
8.4 Which members of the community participate most in solving the issues facing the community?
(a) By gender Men 1 1 1 Women I 1 2 Men and women equally [ 3 Neither participate [ I 4
(b) BY age Youth and adolescents 1 1 1 Adults 1 1 2 Older persons 1 1 3 Youth, adults, and elders equally 1 1 4
None participate 1 1 5
(c) By employment status Workers 1 1 1 Unemployed or nonworkers [ I 2 Workers and nonworkers equally 1 1 3
Neither participate I 1 4
8.5 In the last three years, has the community organized to address a need or problem?
Community-Driven Development projects towards poverty alleviation 257
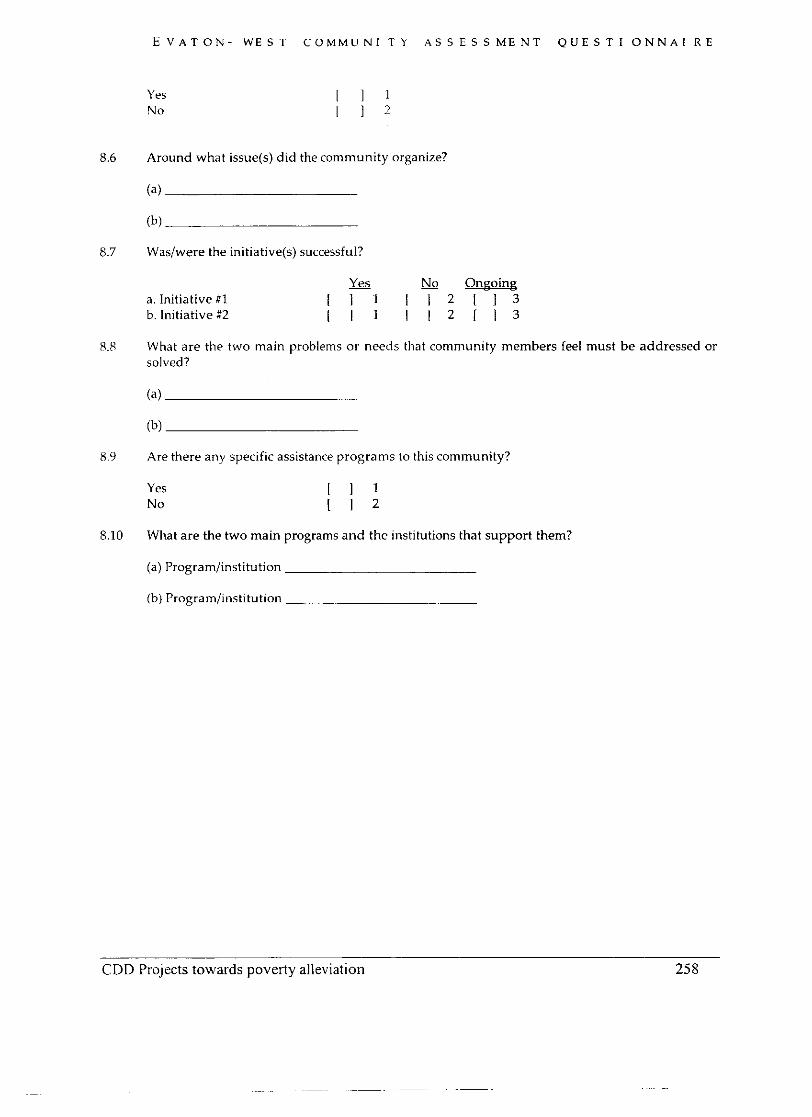
E V A T O N - W E S T C O M M U N I T Y A S S E S S M E N T Q U E S T 1 O N N A I R E
Yes No
8.6 Around what issue(s) did the community organize?
(a)
8.7 Waslwere the initiative@) successful?
a. Initiative #1 b. Initiative #2
8.8 What are the two main problems or needs that community members feel must be addressed or solved?
8.9 Are there any specific assistance programs to this community?
Yes No
8.10 What are the two main programs and the institutions that support them?
(a) Program/institution
(b) Program/institution
CDD Projects towards poverty alleviation 258
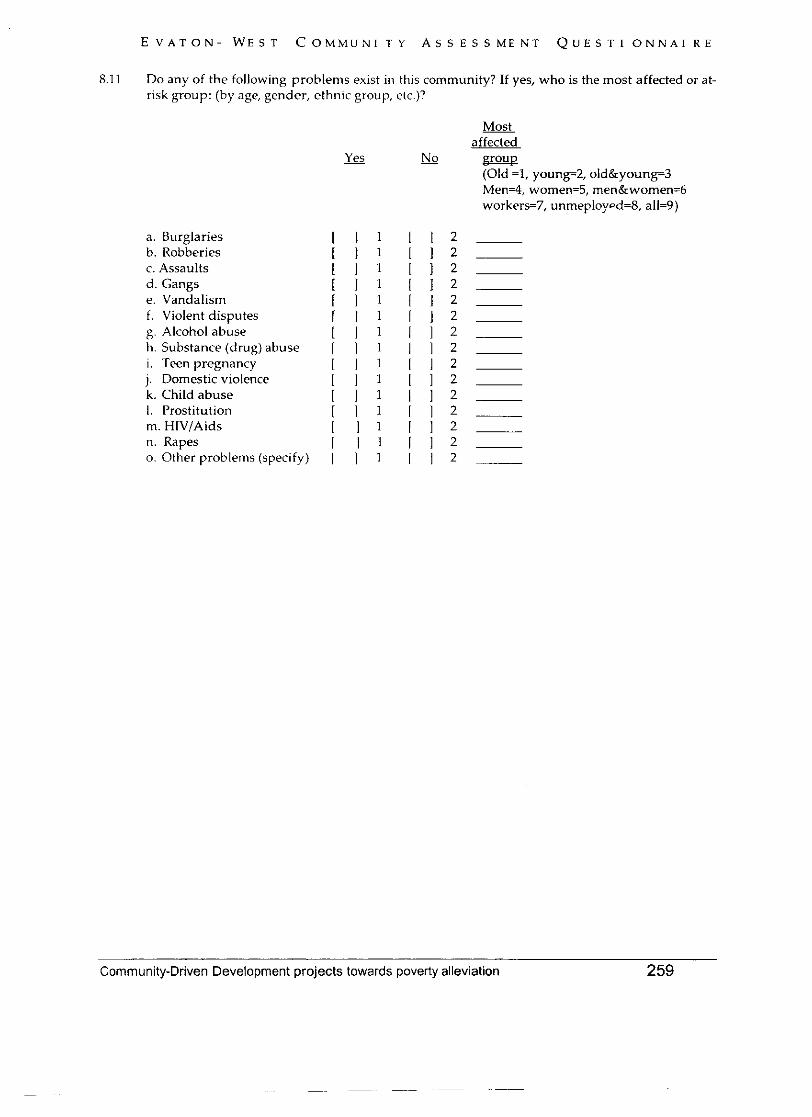
E V A T O N - W E S T C O M M U N I T Y A S S E S S M E N T Q U E S T 1 O N N A I R E
8.11 Do any of the following problenls exist i n this community? If yes, who is the most affected or at- risk group: (by age, gender, ethnic group, etc.)?
Most affected
& - No (Old =I, young=2, old&young=3 Men=% womend, men&women=h workers=7, unmeployed=S, all=9)
a. Burglaries 1 1 1 1 1 2 b. Robberies 1 1 1 1 1 2 c. Assaults [ I 1 I 1 2 d. Gangs [ I 1 I 1 2 e. Vandalism 1 1 1 I 1 2 f. Violent disputes [ I 1 1 1 2 g. Alcohol abuse [ I 1 1 1 2 h. Substance (drug) abuse [ ] 1 ] 2 i. Teen pregnancy 1 1 1 1 1 2 j. Domestic violence 1 1 1 [ I 2 k. Child abuse [ I 1 1 1 2 I. Prostitution [ I 1 f 1 2 m. HlViAids 1 1 1 1 1 2 n. Rapes I 1 1 1 1 2 o. Other problems (specify) I 1 1 I 1 2
Community-Driven Development projects towards poverty alleviation 259
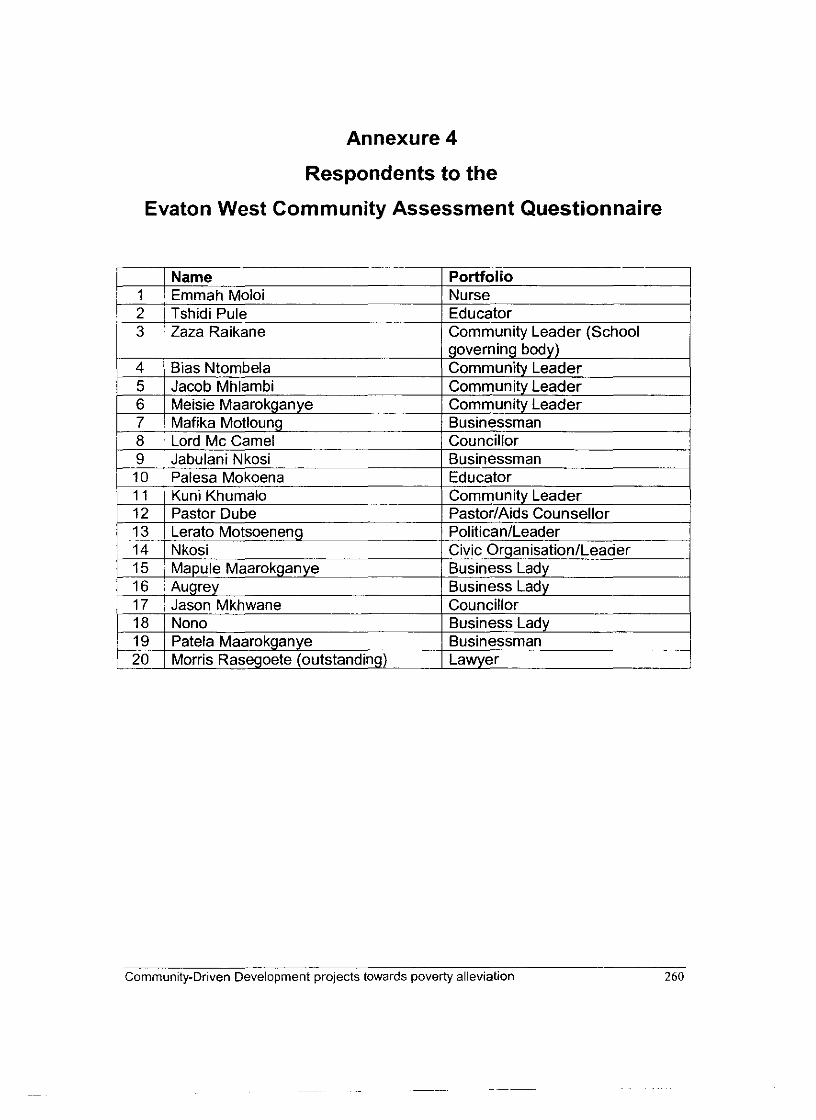
Annexure 4
Respondents to the
Evaton West Community Assessment Questionnaire
Community-Driven Development projects towards poverty alleviation 260
Portfolio Nurse Educator Community Leader (School
I 1 2
1 3
Name Emmah Moloi Tshidi Pule Zaza Raikane
Annexure 5
Methodology for the measuring of unemployment
This annexure contains the methodologies employed in Chapter 4 of this essay. The methodologies have been obtained from Slabbert (2003: 35-39).
METHODS FOR THE MEASUREMENT OF UNEMPLOYMENT
Various methods are used to measure unemployment. The following three are more
or less standard methods (Slabbert & Levin, 1997).
a. The census method
This method is used for measuring the economic status of the entire population.
However, censuses take place only periodically and even then only a limited number
of questions pertaining to employment can be included.
b. Registration method
This method provides for the unemployed to register at placement offices - in South
Africa these are offices of the Department of Labour. Registration is compulsory to
qualify for unemployment benefits. In South Africa some categories of civil servants,
domestic workers, farm workers, casual and seasonal workers, those earning more
than the ceiling income and those whose period of beneft (6 months) has run out,
are excluded from the fund. Many persons, therefore, have no reason to register.
Registered unemployment figures published by the Department of Labour in South
Africa consequently do not show the level of unemployment accurately.
c. Sample surveys
Surveys are undertaken on a sample basis to obtain the data required to calculate
unemployment rates for specific groups of people. In earlier years the Central
Statistical Services conducted surveys on a monthly basis for Blacks, Coloureds and
Asians. It was called the Current Population Survey (CPS). However, since the
figures obtained for Blacks were found to be inaccurate, their results have not been
Cornmun~ty-Drwen Development projects towards poverty allevlat~on
-- -
published since April 1990 (Baker, 1992: 83). In 1994, the CPS was terminated and
the October Household Survey was introduced. Statistics South Africa (Stats SA) has
conducted October Household Surveys (OHS) since 1996. It is an annual survey,
based on a probability sample of a large number of households. It covers a range of
development and poverty indicators, including unemployment (official and
expanded), according to the definitions of the International Labour Organisation
(ILO).
Because of the lack of reliable sources of information on a regional basis, surveys
were conducted in the Vaal Triangle by Slabbert et a1 (1987; 1988; 1991; 1994 and
1999) to determine the unemployment and poverty rate. The method used to
determine the unemployment rate in Sedibeng district is explained below.
Definition of unemployment
Statistics South Africa (Stats SA) uses the following definition of unemployment as its
official definition:
The unemployed are hose people wmin the economkdty active populaibn who:
a) did not work during the seven days prior to the interview;
b) want to work and are available to start wifhin a week of fhe interview: md
C) have taken acthe steps to look for work or to start some form of selfemp/oyment in the four weeks prior to the interview.
These general criteria are translated into statistically meaningful criteria, namely:
the population of potential working age (i.e. 15 years and older);
the economically non-active (i.e. those who prefer not to or who cannot
work - for instance housewives, persons 65 years and older, the
disabled, etc);
the economically active population (all those who are fit to work, wish
to work, have no employment and are ready for and actively looking for
work, plus the employed and self-employed).
Community-Driven Development projects towards poverty alleviation
p~ ~~ p~
The unemployment rate (Ur) then, is calculated according to the standard equation:
number of unemploj~ed I00 x-- - Ur
Economiccrl~ active pol~ulrrlion (EAP) I
In developed countries this definition is relatively simple to apply. The criteria for
measuring unemployment are straight and definite, i.e. a person is out of work, and is
actively looking for a job by means of a listing at a placement or other government
office. However, in developing countries circumstances are very different, and it is not
always clear whether or not a person is seeking employment. In South Africa some -
unemployed persons become discouraged and therefore refrain from taking active -
steps to seek employment.
In the survey for this section only one criterion was taken as an indication of seeking
work, namely if a person "has the desire to work and to take up employment or self-
employment". The question asked was simply: "Do you want to work?" When the
standard Stats SA definition is used, but its strict criteria are relaxed - as was done in
this survey - it is referred to as an expanded definition of unemployment. The
expanded definition includes (a) and (b) but not (c) (Stats SA, 2000: xv).
Stats SA's definition for employment which defines 'employed' as those who
performed work for pay, profit or family gain in the seven days prior to the household
survey interview, or who were absent from work during these seven days, but had
some form of paid work to which they can return (Stats SA, 2000) was also
simplified. The question was simply asked: "Do you work for a business, for yourself
or for your family?" Working for a business was regarded as formal employment.
Self-employment and family employment were taken as working in the informal
sector.
Source: Slabbert & Slabbert, 2002: 17.
Commun~ty-Drtven Development projects towards poverty allev~at~on 263
-- -- -- -
Methodology for the measuring of poverty
Following the guidelines of the World Bank, a poor household is defined as a
household of which the combined income of all its members is less than the
Household subsistence Level (HSL) as determined for the specific household. If the
combined income of a household is described by yi and the poverty line (HSL) of the
same household is described by z, , the extent of poverty, P,, of this household is
described by P, (y,; z, ).
The headcount index is defined as the fraction of the population below the poverty
line. The higher the index the higher the number of the poor within a given
population. For example an index of 0.53 would indicate that 53% of the population
lies below the given poverty line (or are poor). In this thesis the headcount index is
adapted to indicate the fraction of households that fall below their individual poverty
lines, and is described by means of the equation:
Where: H = the fraction of households below the poverty line;
y = household income;
z = the poverty line of households;
M = the number of households with incomes less than z;
N = the total number of households.
The poverty gap usually measures the average shortfall of the incomes of the poor
from the poverty line while the poverty gap index measures the extent of the shodfall
of incomes below the poverty line at a given time period. In this report the poverty
gap index i s adapted to b e a measure of a specific household, described by the
equation:
Where: Ri = the income shortfall of a household expressed as a
proportion of the household's poveriy line;
Community-Driven Development projects towards poverty alleviation 264
y, = the income of a specific household; and
zi = the poverty line of a specific household.
The poverty gap of an individual household (in monetaly terms) can therefore be
expressed by the equation:
Where: Gi = the income shortfall of a household;
yi = the income of a specific household; and
zi = the poverty line of a specific household.
From the three equations above it is clear that the poverty gap can only be reduced
by increasing household income.
Source: Slabbert, 1997: 47.
Community-Driven Development projects towards poverty alleviation 265
~ ~~p ~p
p~~ ~ -~
Annexure 6
Transcript of the Focus Group Interview held in Evaton
West on the 2oth November 2003 at 18H00 to 19H30.
Interviewer: TD Mokoena
Participants: 8 Evaton West Community Development Forum Members:
Interviewer: Interview eo re tlo bang le yona, e nale question tse twelve, tseo ke
tlo di botsang. Ke kopa hore re be relaxed, re qoqeng feela ne, through the
questions. Di tloba based haholo around mosebetsi o entsweng ke Coltapia ho
ba neng ba attenda, ne le attenda kaofela?
Respondent A: Ho attendile 1,2,3,4
Interviewer: Bathong ban a ba attenda, and then le mosebetsi o etsuwang ke
Eindhoven Municipality. Ee hore ba e tsang Coltapia e ne e etsang hoya ka
lona, and then may be dibenefits tsa teng e bile difeng the same le ka
Eindhoven, mara ke tla le guider ka diquestion seka la wara ha Manini a ntse a
ngola o tlo nka di notes, and then re tlo le nka di TV tape, re ne re shebile ho
spenda one and half hour, mara ka baka la nako re tlo spenda about an hour.
Ho lokile?
Interviewees: E!
Interviewer: And re be relaxed so forget hore re nale camera. OK, question ya
pele ke hore.
Respondent A: Before ha eba re araba, ka camereng o tlo tseba b a n g hore ke
ya araba kapa ke bua feela?
Interviewer: E le hlahisitse kaofela hona jwale so o tla hlahella hore o ho bua
wena.
-- -
Cornrnuntty-Dr~ven Development projects towards poverty alleviation 266
Respondent A: Re bua feela?
Interviewer: Ya ho tlo hlahella hore ke mang a buang. Ene ke ne ke kopa re
bueng kaofela. 0 mong le o mong a be le chance.
Interviewee: Correct, kaofela
Interviewer: Ya, ho tlo thusa jwalo, cause ke ya tseba ho na le nth0 eo batlang
ho e bua tloha ya ba bate feela mona.
Respondent A: That's why ke tlile ka morao
Interviewer: Ok, ha re qaleng he. Over the past three years the are number of
programmes has been established in a written work. This programmes has been
initiated particularly by Coltapia and the Eindhoven Municipality, I would like to
ask few questions based on this two groups.
Question 1
Ha ke botsa question tseo ka English mara ha ho thwe o arabe ka English. Ee re
batho ba batsho kaofela, ha ke nahane re na le bothata. Ke tla yak e nke ke dise
RCL. Now question one "tell me what you understand Coltapia to be, ho ya ka
lona Coltapia ene e le eng?
Respondent A: According to the understanding that you had. A Coltapia o
understadile the institution that Coltapia is the abbreviation for Centre for
Learning to alleviate poverty, so it had programmes that they want to run, or they
ran in community should contribute in alleviating poverty.
Interviewer: Alright, Ee how do they go about
Respondent A: Normally for a short period that we had with them together with
the Technikon they taught us the leadership, at the same time they gave us
some assignment to go and find out from the community. What are their needs or
Community-Driven Development projects towards poverty alleviation 267
what do they plan about their community. And it is that the community wants to
do or we can do to alleviate poverty in our community. Normally most of the time
the would give us some assignment to go and execute in our community, and
come back to the classroom and there they c apasitate y uu the leadership, o n
how to go about dealing with the community.
Interviewer: Oe, ee what is their approach to poverty alleviation
Respondent A: Their approach is based on establishing small groups and
empowering them so that those groups can sustain themselves. Normally they
call that they want to establish small industries that will work from that particular
area with other groups in other areas, so that at the end of the day they can have
a bigger group, where if they have something that they could do, they can be
able to meet the target that is in the, for example if we talk aboui sewing. In
sewing they will establish groups of sewing from one region to other regions, so
that where they go about in a to deal with programmes on the community
internationally then they can have a tender and they can be able to reach the
requirements of that tender because if they want per day 6 000, then they will go
from one group to the other group. Give them task to do such to meet the target
that is the administrative
Respondent B: Mm I think that because one way of approaching poverty is to
the recken community and people won't just follow us, who want just to do what
they think is right for the community, but who will go to the community and ask
them what do they need and implement those needs unlike doing what you think
is right for the community.
Interviewer: Ok ee so in other words the community driven approach. Ok you
wanted to say something.
Respondent C: Yes, in an instance that means to engage the community itself,
and to empower itself and not only just sit there and look at things happen so
that's how, hore I think the influence came about in helping the community in our
area.
Community-Driven Development projects towards poverty alleviation 268
Interviewer: Ee the next question. In your opinion how did Coltapia benefit your
community kapo do you think transailor or business how did you benefit.
Respondent B: Specifically I will focus on the dealers that, on the course of call
a propratiers ee, most of the people can now stand in public and still, because of
that course and we a no longer afraid of anything we a capable of bringing up
change in Evaton West, although projects we did'nt have projects ih Evaton
West.
Respondent A: And just to add on that Coltapia ya, we did a lot in volunteer the
only thing is that we never see the change so we never reach our main objective,
and I think there that's how I see failure because they never reach their objective
that we all hope for it.
Interviewer: Ee Ok
Respondent C: And it did unblock the minds of those who think they cannot do
anything for themselves. They did saw that the reason for them to go out there
and see what is it that they can do for themselves in empowering their
community and themselves.
Interviewer: Ok ee let's say it went up to the end, what do you think is worth in
the benefit.
Respondent A: We are going to our areas in the sense that the locking time
that we spend at the Technikon with Coltapia it had a lot of impact to us,
especially the leaders hip which was attending to that institution and then we
were so impressed, that the others they even wanted buying other leadership
books and we had this thing of a (what do we call that thing) Ok. I will come back
to that question. There's some words the word that I want specifically.
Interviewer: Ok
Community-Driven Development projects towards poverty alleviation 269
Respondent A: That describes the calibre of a person that is went to assist the
course.
Respondent B: And I think It's good again, because what we had from that
course, we transfer it to other people. We share with other people who could'nt
manage to attend the course. It is not something that we can keep to ourselves.
Interviewer: Ok
Respondent C: And it did benefit our organization. As we can see it is the one
who is the most effective especially in the Vaal Triangle, because it has set an
example to other NGO's to see that there is a need for them to work and deliver
for their community.
Interviewer: Ok do you think they would have been a impact on poverty
alleviation had the proper agenda accomplished.
Respondent A: A lot because it produced movers and sinkers.
Respondent B: And since we had different groups, all of us we are going to
specialize in different things.
Interviewer: Ok ee which way, for example?
Respondent B: Gardens, Decorations
Interviewer: Ok
Respondent C: And manager
Interviewer: Ok, An the next question, in your opinion, what are the short
comings of Coltapia and how can they be overcomed? Ke eng se le nahanang
ne se ka lokiswa in Coltapia?
Community-Driven Development projects towards poverty alleviation 270
Respondent A: The shortcomings are that when they are teaching, they don't
give us materials. Their information is not jotted down so that we can be able to
read it by ourselves and do something about that. That is their shortcoming and
secondly, their shortcoming was that they mainly concerntrated on their business
only. I would simply say that in a sense that, by the time when they fail to get
their money, they stopped the course and we the people who were so inspired
and coming from the poor community, we are just being dropped there.
Respondent B: To add on what Bias just said I think it was a question of
business, because when they bring people should start by saying they are
coming to observe, and at the end they end up working together, so we don't
understand what is going on, as if they say there is a lot of money you can come
and add something in the community.
Interviewer: Ok, how can this thing be overcomed
Respondent A: By approaching them and tell them about their weak points.
because thing they take the are looking un to poverty alleviation/ alleviate poverty
in the community. What happened there is still going to happen in other areas so
it is better to approach them and tell them about their programmes.
Interviewer: Ok
Respondent B: And the position of the people who did it must be clear
Interviewer: Ee Meisie the point about visitors you mean people who come in as
if they are observers?
Respondent B: Ya that is started as an observer.
Interviewer: Ok
Respondent B: At the end I didn't understand his position, and I think there is
going to be the same in Veronica if she didn't say she had a lot of work to do.
Community-Driven Development projects towards poverty alleviation 271
Interviewer: Ok
Respondent B: And I think that is the question of colour again.
Interviewer: Ok the programme itself apart form this problem, is it a good
programme, would it have worked?
Interviewees: Yes
Interviewer: If this problem could have been sorted out the programme would
work?
Interviewees: Ya
Interviewer: How do you think the Technikon should be involved in this
problem?
Respondent A: Ah. I think the Technikon was involved initially by sponsoring
the part of that programme but at the same time a, by meaning the other part
failing to contribute more like the municipality, because the Technikon was
supposed to hand in the document to the municipality probably they should have
looked for other sponsors to sponsor the course so that we can finish it.
Respondent B: And we still need the value because it's a learning environment
and can feel that you are studying.
Respondent C: An they should have made sure that they monitor that course
until it come to an end.
Interviewer: Ok you mean they should have been there to see what is going on.
Respondent C: Yes
Community-Driven Development projects towards poverty alleviation 272
Interviewer: Ok Ah next question was or is the Eindhoven municipality
inlvolvement in Evaton West community, how is the Eindhoven being involved in
Evaton West community? Now all of you now can answer becaused all of you
are interviewed.
Respondent D: Ya no a involvement ya Eindhoven ka hara Evaton West,
Eindhoven e bapala a big role because haholo-holo, e tlile ka idea le ho tlo
empower batho ba Evaton West, hore bas eke ba ithola ba nahana hsre ke, the
community e ke se kgone ho iketsetsa niks. Like ha ba hathwe ba dula mo di
two rooms because end of the day ba tshwanetse ba tsebe hore na bona ba ka
tla ka di projects tse ka reng hosane le ha Eindhoven ele siyo ka hara this area,
kappa ka mora dilemo tseo e tlabeng e le siyo ho ba thusa, hobane e ya ba
trainer, e ya ba kopanya, e ba bontsha hore bophelo ba boan e bo tsamaisa
jwang, because e ruta motho hore a ka nna, hore a itjhehele fish, e sen hore all
the time a dule a ntse a fuwa fish, ke tseo Eindhoven e tlileng ka yona ka kwano
ka hara Evaton West, because e startile this groups tsena tseo e naleng tsona
mona ka hara Evaton West, like LED groups, environment and cleaning, health
and then HIV and AIDS and then sports and then safety, e startile le empower
tse ka reng old age and then le ya di-creche, le yak e naharia ke tsona di groups
tseo, hore batho ba Evaton West ba kopane ba kgone ho ba tseba, ba ka nne ba
kgona hore ho be ne le something eo ba etsang, le ha e entse ele bona feela,
because discourse tseo ba di tholang di bafa idea yah ore ha ba kopane bona ka
bona self ba etse hore ba nahane. Bat le ba fihlella mosebetsi e itseng. E tle
be ere le government ha a fihla wa mo this country mo South Africa o fumane ele
hore batho ba mona ho nale something eo ba e etsang ka area eo ba dulang ho
yona.
Interviewer: Ee project tse di groups tse difonngwe ke bo-mang.
Respondent D: Di groups tsee di fonngwe ke bona
Interviewer: Ok ene di ranwa ke mang? Dia irana?
Community-Driven Development projects towards poverty alleviation 273
-~~ -
Respondent D: Di groups tseno di a irana tsona ka bo tsona, mara di irana ka
tlasa lepheyo la Eindhoven.
Respondent A: Yak e hore di a irana bo tsona ho na le dico-ordinator.
Respondent D: Co-ordinator ya
Respondent D: E dinkang le bona ya
Respondent A: In a sense that di ranwa, you look unto provincial programmes
tsa government on all aspects tse mentioned kaofela.
Interviewer: Co-ordinator ke motho wa hokae?
Inte~iewees: Ke motho wa mono
Interviewer: Ke motho wa mona
Interviewees: Ya
Respondent D: 0 tswa ka hara NGO ya Evaton West Community Development
Forum co-ordinator.
Interviewer: Ok
Respondent B: Ke vise
Respondent D: Ke vise
Interviewer: Alright anything else eo le ka e etsang ka Eindhoven.
Respondent A: So normally Eindhoven, its involvement is also empowering our
municipality in a sense that its area as it is Evaton West, it's not made mostly in a
budget of the municipality so municipality does'nt have capacity to render
Community-Driven Development projects towards poverty alleviation 274
service. In this area that is something enspiring Eindhoven to can say they will
help the community of this area to can be able to do something about, the
services. When I am talking about services, I am talking about waste removal;
health issues anything, those issues that are mentioned by Jacob, because if you
can see this area you can see only houses in this area. There are no community
facilities, so they came on that note. They will empower us, and they also
capacitate the municipality because their saying is that they empowering our
municipality and governing the local municipality.
Respondent B: People who are in the group they are also expected to grow and
give other people a chance. It is not only people who are still in a group who
benefit in a project. They must grow and give other people a chance, so it is
going to be a community thing, it won't have a lot to do with people who will
benefit from the project.
Respondent C: And is bringing down the government down to the community,
to that they should link, have a relationship a working relationship.
Interviewer: So you mean they got to bring people into the government or the
community.
Interviewee: Ya
Interviewer: Government including the people
Interviewee: Ya
Respondent A: In a sense that all the communities that are formed, they have
people who are from the municipality and communities. Sitting down together
planning and ensuring that what is being planned differently put there by them
together.
Interviewer: Ok now that's interesting, tell me di-groups tsena how are they
constituted?
Cornrnun~ty-Dr~ven Development projects towards poverty allevlat~or~
- - - -
Respondent A: Mainly those groups they are formed by people from this
community.
Interviewer: So it's the community
Respondent A: The officials from the municipality who are being deployed to
work with those groups, they meet once in a week as individual groups.
Interviewer: Are there any specialists in the groups, say for health diseases,
nurses or doctors
Interviewees: Yes
Respondent A: Those are the officials receible for programmes with by cocas
were community groups. That's on the health group we have a see some form
Emma from our neighbouring and Doctor Stephen was there as well.
Interviewer: Ok
Respondent A: And even the sustainment that was going to take place in that
group.
Interviewer: Meisie o thini
Respondent B: A kere ne ke nahana except from my group wa bo n eke tsheha
nthwe bjalo, ko group ya ka ha re na nthwe clean.
Interviewer: Ya
Respondent B: Voluntary Economic development.
Interviewer: Ok
Community-Driven Development projects towards poverty alleviation 276
Respondent D: An another thing eo re e ratang ka hara issue ya bona
dispecialists, di hlokang ka hara ward committee ya bona. E nka karolo ka hare
dicornmunity tse ding ke hore department e nngwe le e nngwe e teng ya ward
committee, e nka part moo ka hara digroups tseo. Ward committee hona le
motho ya headang health o teng ka hara group yeo ya health. Motho ya
headang nth0 e environment of teng ka hara kaofela digroups tseo di ya
representiwa.
Interviewer: Ok so digroups tsee din ale matlo a makae? Ha o etsa dintlo.
Respondent A: A maholo because obviously they could treat about the
community, and the municipality. And the people who are there on those groups
are ordinary people.
Interviewer: Ok, and then all this big institutions.
Respondent A: Yes
Interviewer: Ok
Respondent A: They are empowered to take those teams as they consult to the
entire community for example if they have to plant trees. They go and do a small
research to ask people do they want trees, where and what kind of trees, so that
means they do a prior consultation with the community.
Interviewer: Ok is there a lot of support in the community for the Eindhoven.
Interviewees: Ya
Respondent A: More than a lot
Interviewer: Alright benefits have been raised by the community from this
involvement with Eindhoven.
Community-Driven Development projects towards poverty alleviation 277
Respondent A: What?
Interviewer: Benefits tse tlileng ka baka la involvement ya lona le Eindhoven.
Mona re ka bua ka diproject mohlomong tse seng di etsahetse, all those.
Respondent A: The benefits are that I'm sorry can I give someone at least.
Interviewer: Ha o so bue, ene o ka pele ke shebile wena
Respondent E: Community e ya , kore ba ho na le di eish Sotho sa ka
Interviewer: Bua seshangane or Afrikaans
Respondent E: Ha e sale, re etsa diproject tse di etsang tse hodisang
community le especially like hence, ke bua ka hara digroups. Ho na le project e
re e etsan ya kitchen makes you clean, so ne re etsa bo diposter mo re di
plakang teng. Batho ba kgone ho tseba ka tsatsi le itseng re tlo etsa eng. And
then ha community e re re kopane le bona be re ba hlalosetsa, re ba approacha
re etsa so le so, he ba undestander like, ba ban makgowa a mangata ha ba ba
tsebe but pele re ne re starta re etsa diprojecteng tsa rona. Ba kgona ho tswa
motho a sa tshabe ho bua jwalo, a kgona ho yak o cliniking re tjeke le mafu ana
ba nang le ona, and the ba re supporter haholo. Le ha ho tlile batho ba
Eindhoven, ba shower support ya bona like the time environment nurse e tlile
campaigning community. E ne e le teng ho na moo di re supporter haholo.
Respondent C: And in sports an event like June 16 tse re assistang ka ho etsa,
ka ho tlisa di price tse e le ho reng, well give out to the community in price giving.
Respondent A: In addition to that, like as I said we work according to calendar
of our government. Again in days like Abour week they manage to contribute
about eight hundred and twenty five trees that are already been planted there,
and they also donated about three thousand trees that are to be planted here.
On top of all trees that we got from the Technikon, so their impact is so much
Community-Driven Development projects towards poverty alleviation 278
contributing because they community only proposed, what they think is needed
and when both functions, we can find the return back.
Interviewer: Ok so the process that the community proposes.
Respondent A: Ya
Interviewer: What it needs?
Respondent A: What it needs?
Interviewer: 0 k now this comes from the groups. T he g roups would d o the
consultation with the community.
Interviewees: Ya
Interviewer: Alright, and then after the community agrees on what it needs then
you would act by where you can, and for the rest, do the groups have other
sources of funding and staff.
Respondent A: No we don't have any source of funding, because our
municipality stopped bank cards. Everything that is being done from the
Eindhoven. We are holding functions to be financially embarrassed.
Interviewer: Ok
Respondent A: So the other way I would see is that at the same stage with
local team, we also come to the Technikon and I guess we met with the
department of community service industry irientator, to see if what time actually
they can help locally here to empower people. That's the last time we shared
when they said that together in partnership with the Eindhoven municipality.
Cornrnunlty-Driven Development projects towards poverty alleviation
- -
Interviewer: Ok, but do people understand Eindhoven could be giving them
something or could be empowering them to do things on their own. What is their
understanding.
Respondent A: Initially they did'nt understand they thought that the Eindhoven
are just donors, who are coming with lots of money. To can just give to anybody
whether you take it or do wonders, but later they realized that its not that way
Eindhoven is here to try and empower people, educae them give them most
education because they don't fund things like buildings int eh Tech. They mainly
concerntrate on spending and funding small projects that would bring awareness
to the community, so that they made people aware what is their role here,
because they are so transparent that we managed to share their presence here
with people from different political organizations, church groups, NGO's to tell
them why they are here and what are they doing so that merely show motivate
and show people what is their involvement here.
Interviewer: Ok so that's what they are understanding now that it's about
empowerment.
Interviewees: Yes
Interviewer: Ok next question. In your opinion what are the short comings of
this involvement and how can it be overcomed? Ha re sheba nth0 ya Eindhoven,
di short comings tsa yona ke tse feng? Moo e le hore ho ka ba le improvement
ka nth0 tse etsahalang.
Respondent A: The shortcomings that we are better to be improved, mostly are
on the side of our municipality. In terms of making the other constitutions
including the municipality to understand especially the counsellors to understand
how this things work and also to be committed in this churning, because mostly
is the community that shows much commitment than the municipality, hence the
Technikon is based on municipal to municipality and NGO to NGO's, but on the
sudden they still lack the way of making this thing and appreciating it.
Community-Driven Development projects towards poverty alleviation 280
Respondent C: And one more thing is that they just give us a go ahead,
because we are still lacking facilities for an example, multipurpose center
whereby our community would engage itself in everyday activities so we don't sot
that is one other thing that we would still lack in a future to come because we
won't have those substations we are going to use.
Interviewer: Who should provide them systems NYP purpose community
centre?
Respondent C: I should think it's our local municipality
Interviewer: Ok
Respondent C: Ya, so in doing that I think the municipality from Eindhoven is
altering our own government at issues engaged to hold the resources at our
community because they have made an awareness in our community, so as to
stand on its own.
Interviewer: Ok
Respondent A: In addition to that what are we saying on the municipality. There
should be improvements when coming to the programmes that rjirr national
government have like in terms of multi-purpose centres, in terms of business
centres community halls, all those staffs. The municipality department that is
responsible for that they should'nt make applications, so the relevant department
like public works or to the premiers office in the provincial government so that
they can be able to buy the product we got here, so thast the people who are
from the Eindhoven can just come and find the other parts, because they come
as partners. But so we don't find some start saying that were expected those
reports t o give d epartments. Y ou can access the valuable resources that a re
here, and then you will have a bit of information and partner, so that you could
have a complete thing.
Community-Driven Development projects towards poverty alleviation 28 1
~ ~ ~~ ~~ - - p ~ ~ ~ ~ ~~- ~ ~~ ~
Respondent B: Our grievances are mostly considered in any offence that being
followed.
Interviewer: Ok, how can these be overcomed?
Respondent A: In order to overcome this thing we just need more commitment
on the side of the municipality although much has been done. But the nation has
been giving up on the municipality, like for example. There are things that have
been done in the province and people who are in the department they are
educating to such things and they are also being put down say how is their
commitment. They only agree when the every person is here and here or when
they are there Eindhoven whey they come back home they start concentrating on
mostly o n their a reas, where they come f rom o f w hich they f rom the a reas o f
were they got education.
Respondent 6: And again they seem to be they seem to differentiate between
us and them. They refer to us as community they are not part of us it they were
part of us they were going to feel what feel down here and referring to us, as the
community and them being different. I don't know what.
Respondent C: And they've been too of politics not bringing down the delivery
Interviewer: 0 k s o I ack o f delivery but that point, I I ike that point. Y ou a re
saying this is us and them mentality where the counselors don't always see
themselves like others, the community.
Interviewees: Like others
Interviewer: Alright, lack of delivery
Respondent C: Lack of delivery
Interviewer: So you're saying promise are made
Community-Driven Development projects towards poverty alleviation 282
Respondent C: They promised us, but they never keep their promises
Respondent E: Even those that we elect
Interviewer: Ok, promised to buy us a car but never deliver, then Ok how much
community participation happened during this initiating? Do you think the
community participates a lot. I mean do just these groups or the office, do the
community at large also participates improving.
Respondent D: Ya community e ya participator a lot like last ha re ne re tswile
ka this thing ya environment ba ne etseha grand mo officing ya bona, le ha
departemente ya municipality e nee le teng community e ne e tswile ka bongata,
because re ile ra etsa invitation almost about tsa batho ba fifty, mare e la re at
the end o f the d ay r e i le re fumana community e nale almost batho ba bang,
more than three hundred. Ban eng ba tlile contracting le campaigning ena, and
then secondly saeteng ya community mo youthing always ha re entse
tournament tsa di sports. Re fumana hore youth e participator on iilat ntho tseo
ka bongata bo makatsang because ele letsatsi la bona, mm eke ho re participate.
Thirdly last ne re entse this thing ya bana ba le bangata ka mokgwa o makatsang
mono, and then ba fumana di present, whatever ntho tse tshwanang le tseo.
Hoo re boning hore all departments tse nang le tsona di ya participator on behalf
of the community, le di old age, le bona ba participator haholo mo di activities tse
re batlang hore bat lo di kenela. Hoba re ba kenyeditse role ya community e re
furnanang hore no, nth0 tse kang tse re di etsang rnona ba di amohela haholo
from the Eindhoven and nth0 ena e re leng ho yona.
Interviewer: Ok
Respondent D: Ya
Interviewer: 0 no o batla ho bua?
Respondent E: A-a ha ke bue
Community-Driven Development projects towards poverty alleviation 283
Interviewer: Ok o thotse
Respondent F: In addition ho e buuwang ke chief ne, eitse ma Russia a na le
teng ne, re bona batjha haholoholo ba kgutlie crimeng wa bona, then batjha ke
batho ba e leng ho ba nkile part ho tsona ho nth0 tsena tsa digroup tse teng,
especially ho health le ho environment wa bona. So batjha ba participator
haholo le community e nkile bohato.
Interviewer: Actually nka nna ka seke ka re o behelle pelo yaka ka ntle.
Interviewees: No
Respondent C: In addition to that I can say we've bring some co-students in the
community because also deductions they can work around here in Evaton West
without any fear of being hijacked, or doing what so ever. So that I think is an
achievement.
Respondent A: They work with their stupidity, they just work without being
encouraged and they interact with anybody at anywhere to ask how are you
doing? How is life? So they should be together.
Interviewer: Ok do you personally prefer that authorities decide what the
community needs, and provide it or do you prefer that the community itself
decide what it needs. And decide how to deal with their different needs?
Respondent C : I think the community will decide for itself.
Interviewer: Why
Respondent C: Because they are ones who can identify where the problem is,
and in order for the problem to be rectified. It is the community who'll have to
take responsibility of its own.
Respondent A: Ownership is very important
Community-Driven Development projects towards poverty alleviation 284
Respondent B: In most cases when the authorities decide for the community.
they end up having like for instance dibuilding tse sa tlo hirwang ke community its
waste of money.
Interviewer: Ok so what other things, Ok le dumela jwalo kaofela kappa hona le
batho ba nang le di differences
Interviwees: Ya, re dumela jwalo
Interviewer: Why?
Respondent G: No because as re se re tjholo hore if !he community e sa decide
for bona ka bo bona diauthorities always di dula di etsa dintho tse e leng hore, ha
re kgone ho ban a le participation. As the community ho tsona, since ho na le
this thing yah ore community and it's the authority. Usually we are owned by the
community.
Respondent D: Ho edela hape moo ke hore why ho tshwanetse community e
decide kapa e nke karolo haholo because nako e leng hore ha dintho di etsahala,
because community e tswhanetse e be yona security se tlo ba securing ka
property, hobane ba tlabe ba ba tseba hore ke nthwe e leng hore rona re le
community re decidileng, because if ha o ka community e ka bow feela se re
nka palo re e hloma mane unknown. Hore na palo eo e tlo etsang e tlo
sebetsang hosane re tlo fumana hore community eo ba e pota ka thoko kapa ba
fihla ba entsha palo eo ba tsamaya ka yona. Hobane ha ba tsebe hore na e
bolelang taba ya palo eo.
Respondent B : Le di authorities bat la be bare jwetsa hore ba etsa hostel,
empa ba ntse ba tseba hore ha re batle hostel mona.
Respondent D: Re batla di hotel
Commumty-Dr~ven Development projects towards poverty allev~ation 285
- - - -- --
Interviewer: But then once the community has decided what they need how do
you think, should they also decide? How it should be done? or should the
authorities come and provide the way forward.
Respondent A: The community decides how it should be done, that is what is
actually happeing it that progress of the Eindhoven. The community itself decide
what to do and they are the ones that decide how it should be done when they
wanna do it.
Respondent B: Like mainly most cases because sometimes they, the
community they d id'nt even know how t 0, you k now. T here the a uthority can
decide how to.
Interviewer: Where there's a lot of know how
Respondent B: Yes
Interviewer: Alright, do you think after these initiatives people are more positive
and motivated to deal on their own way.
Interviwee: Ya, I think so
Respondent A: When we are talking about Evaton West and combine it with
other areas, we realize that most ya batho ba dulang rnona ba tlwaetse ho
volunteer compared to other areas. The number of people who are wanting to do
something for our community they improve each and every day.
Respondent D: And le most of the people e leng hore ba kena ka hara Evaton
West ba sa undestande hore ho what is the meaning of volunteer. Ba nahana
hore no, if ha a volunteera feela it's money and le ha ba fihla mona re ba
workshopa hore ba be ba understande hore ho volunteera ke ho etsa eng e
loketseng, and then at the end of the day income ya teng you ho volunteera e tla
le ditlamorao tsa teng. And then lentswe la Sesotho leo re le sebedisang
"moketa o tsoswa o itekang" because you can't that hore o tle o phahamise
Community-Driven Development projects towards poverty alleviation 286
motho a wetseng e re ha a mo tlohela a ba wela hape fatshe a robala. That's
why d i volunteers d i t samaellana l e n thwe h o t hweng k e m oketa h o t soswa o
itekang.
Respondent C : And what is interesting about Evaton West the leaders
themselves they lead by example, they don't just say do this. They are the ones
who are moving on the forth again of the delivery of the thing. So that is why
most of us infact most of the leaders they are growing in tho~lght for the
community.
Interviewer: So the community is motivated
Interviwees: Ya, it's motivated
Interviewer: Now ke tjhentjha track ha nyane, In your opinion what is poverty?
And when do you think people are poor?
Respondent A: I think when people are poor is when they can't..
Respondent C: Is when they don't think of possibilities, because if you can see
they don't think of the possibilities that you can see as a person. That's when
you become poor, but if you of thing on your own that I must. l should start
something and need an invite from people around you, and that way you,ll get
direction and that's how you move forward.
Respondent A: So it's very brought this thing of poverty like as they put it, and
also has to do with something to do with rand as well.
Interviewer: With?
Respondent A: With Rand, Ranta
Interviewer: Ok
Community-Driven Development projects towards poverty alleviation 287
Respondent A: Ya in a sense that, we think people ars poor, that you find one
family with about a number of about seven maintained ne.
Interviewer: Ok
Respondent A: And they are depending on the grants lets say one person on
that family that comes once in a month, and when they eat when they get people
bay a ja. You find that ba ja dijo tse ka etsang four rand ka letsatsi.
Respondent D: Ee hobane ha o re o poor, ke hore o destroya rnotho yono le ho
feta, because once o bolela hore of poor, o tshwanetse hore wens 3 kgone ho
thola because rno dernocracying, re batjha rno dernocracying e ne ha o re motho
of poor. Ke hore of rno bolaya rnaikutlo hore a nahane hore of poor. Ho na le
nth0 e re ka reng mo bophelong, like ha ne ba tjho ke re, ho na le hore o rute
rnotho ho ja tlhapi, o ka rnpa wa rno ruta ho e tjeha, and then o tlosa kelello yah
ore o poor, kappa ke bona bofurna moo kelellong because re dutse dilerno tse
telele haholo ka hara this country.Re feptjwa re se na understanding yah ore re
le rona ka hara country, re ka nna ra bapala karolo yah ore re ithole. Ho na le
dintlha kapa kelello e re ka tlang ka yona hore re participate on this country.
That's why h o t hwe this country k e d ernocracy because e b atla hore motho o
rnong le o rnong a tle ka ho developer countrying ena, jwale ha ke durnellane le
haholo, because ho tshwana le ha o kare rona mona, nako e nngwe ho thwe re
batho ba tshwanang le ho thwe teng the poor and the poorest, ke tlhapa ho rona,
Ke tlhapa ho rona nthwena. Ha ke le rate lentswe leno, because batho ba
tswanang le rona, re batla di workshops that is why re qalang ka di training tsena
tse ka hara Evaton West, because re batla ho itokisa hore re dule rnona hobane
government o re file di shelter tsa hore, re na le marulelo. Re na le dijarete ka
hara dijarete tsa rona re ka nna ra ithola re jala di vegetables, tse di ka nna tsa
hore re robale re jele, like ha ba ntse ba re ruta hore na rneroho e na le bophelo
bo bottle. Ntho e neng re di etsa boholoholong ba rona ko mahaeng.ka ntle re
ne re dula dipolasing re dula bo kaekae rnara rno dijareteng mona ho ne ho
lenngwe rneroho nth0 tse kaofela, le bo masirnong ho lenngwe bo nahapu bo
rnekopu nth0 tseo kaofela and then ne re di qeta nth0 tseno, re ne re sa feptjwe
ko dipolasing ne re iphepa hobane ka kgwedi mrne wa hao le nkgono wa hao
- ~~
Community-Driven Development projects towards poverty alleviation 288
kapa ntatemoholo wa hao one a fumana mokotla wa phoofo le di beans ka mora
ha ho qetwa ho etsa separation jwale mona batho ban a le dijarete. Ba na le
mobunyana o ba ka o sebedisang and then ba na le shelter, ban a le metsi wa
utlwisisa, jwale ke nahana hore ba batla hore ba fumane the training e ne ntseng
re bua ka yona. Hona jwale tjena ha ho na bofuma mo bathing ba rona. The
only thing ba batla training le ho hlokomelwa hore now is the time, yah ore motho
a itshwarele ka matsoho a hae, a inahanele ka kelello ya hae.
Interviewer: Ok ba bang ba ka reng?
Respondent E: Nna ho ya ka nna ke bona ho sen bofuma especially ho motho
ya phetseng hantle, ntle le motho eo e leng hore ke motho ya sa pheleng hantle
hobane mmuso o a kgona ho re o ka mo thusa ka tse ding tsa dintho, tse etsang
hore mohlornong a thole tjhelete ya grant kappa a etse eng. Mara motho a nang
le kelello a ka kgona ho sebedisa kelello ya hae a etse recycling a nke mathini
mona a kopanye le bo diciment ke part e nngwe yah ore motho a iempoware bo
yena, kapa rnotho a nahane hore a be le batjha ba kopaneng. Re etse di
contribution tsa bo closed co-operation then re kgone ho iketsetsa rnesebetsi for
rona le batjha ba bang. Ha ke nahane poverty e le nth0 e leng hore re ke e etsa
nthwe serious ha kalo re le batho.
Respondent A: The only important thing is to have access to the information
and to have resources available, so that we can empower ourselves and also be
empowered and be able to come up with something to address this problem of
unemployment the so called poverty.
Respondent C: And our leaders they are dealers, so if they start preaching that
people are poor, then they will know that the very same people of which
tomorrow will be the official leaders.
Respondent B: The people who don't have information they are the one's who
will be very poor although some people feel good about it, and it's a question of
education and then our backgrounds they contribute a lot rno rnaphelong a rona
kajeno. I've seen people who eat everday, but because they lack information
Community-Driven Development projects towards poverty alleviation 289
about their surroundings where they can obtain. I mean things that they need on
daily basis, then they end up being poor. Ha ba kgone ho engager ntho tse ban
a le tsona, and they are not even aware hore di teng nth0 tseo and that is
poverty.
Respondent D: Wa tseba nna n eke nahana hore lentswe lena la poverty, ne re
le poor nakong ya mmuso wa apartheid hobane ne re le poor hore re inahanele.
Now today re ka se sebedise lentswe leo because re mo democracing ke rona re
tswanetseng re nahane and you can't hore of bites lebitso la hore o ntse o le
poor, because o lo affectuwa ke yena a poor, because a poor minded hore o ka
etsa bokamoso rno kelellong. And now ha e sale nako ya apartheid ho thwe ho
na le motho ya o hatelletseng ho sebedisa that word, ya hore of poor because
lentswe la poor le tswa mmusong wa kgale wa apartheid, and hona jwale tjena. I
don't know if ho na le motho ya poor minded, not hore of poor o le poor ke poor-
minded, not hore o poor o le o tlohe o sa robale o jele, but o poor-minded hore o
ka hloleha hore o inahanele.
Respondent A: Ya, but that's why we're saying people are poor because even if
you don't know about the information and you don't access to other things, then
you are poor because you can be poor spiritually you ca be poor physically, you
can be poor with many other mentally and other wise as well as you are not
empowered with education or you are not empowered with information. I'm not
saying information in a sense that you can have access to the available
resources from our government for example if I'm saying I'm employed,
department of labour is there, If I have problems I don't know that labour is there
then I'm poor because I don't have that information if we don't have like for
example we don't have access to internet we won't know about the available
resources that are here in our country. We cant even have ari access to
computer, s o hat we can be able t o work on other things s o that d efinition o f
poverty is very broad, in sense that you have to accept that as long as we are not
having that necessary education or we are not having that information about
available resources. It is then that we usually tell you that you are poor, poverty
is there.
-
Commun~ty-Dr~ven Development projects towards poverty allevlatlon 290
Interviewer: Alright, now let's talk the situation of a family of two parents and
threee children, which is a family of five. How much do you think that this family
must earn per month. Just make estimate.
Respondent A: An no other income, that way.
Interviewer: Ya, where we say this is how much he must earn to make
arrangements, to meet their basic needs, food for example. How much do you
think they must earn?
Respondent A: N ot m ore than two thousand five h undred (R2500) when we
combine both the salaries of the parents, both parents.
Interviewer: The household income, ya
Respondent A: Ya it should not be less than two thousand five.
Interviewer: It is interesting, let us just go from person to person and let's hear,
what you have to say. He said two five.
Respondent A: Ya not less that two five
Interviewer: I just wan't the minimum
Respondent A: Ya the minimum is two five
Interviewer: The minimum they can use to buy what they need
Respondent A: Ya, two point five, looking at the costs of living and the costs of
transport
Interviewer: And looking at after deduction, the take home pay, that we need
per month to survive. You think two five will be fine. Ok
Community-Driven Development projects towards poverty alleviation 291
Respondent 6: I'm saying four thousand, looking at the area that we are in.
How much does it cost to cover the Evaton West expenses thinking cf the things
that we don't have in Evaton West. We need to go to town for other services that
we don't have like we could only have one family. If you, we to spend for
transport and three kids and yourself, and the husband you'll be spending too
much.
Respondent C: Going through the needs of individual is really tough especially,
they are five I should think three and a half should be enough.
Interviewer: Three thousand five hundred
Respondent C: Ya
Interviewer: Ok, what to do you think?
Respondent E: Ya, le nna ke nahana jwalo Three thousand e right.
Respondent G: Noh, I think three thousand
Interviewer: Three thousand
Respondent G: Ya
Interviewer: Ok what do you think?
Respondent F: Three thousand five hobane ba bang ba palama ha bedi
Respondent D: Hey, nna kore ha ka understanda hantle potso, hore re ke tsebe
tjhelete ho ya the way nka estimating, hore o ka e fumana from the, kore a ka
phelang ka yona a sebetsa kapa e be ya ba e fumanang, kapa ya ka phelang ka
yona feela e be e le hore ha a sebetse.
Community-Driven Development projects towards poverty alleviation
~p ~
~
Interviewer: Ha re re ho sebetsa maybe batho ba babedi ka rno ntlong.
Combine income ya bona. Lelapa le le kalo le ka nahana ka hore bat hole
tjhelete e kae nahana ka hore ba hloka bo kae?
Respondent D: Four thousand five
Interviewer: Hore ba tswelelle, you think four thousand ho na le batho ba family
e kalo ba tswellang pele ba na le four hundred ranta feela. 0 ipotsa hore ba
kgona jwang, so ha se ha kaalo hore tjhelete ho batho bao.
Respondent F: It all depends hore oo e spenda jwang
Interviewer: Wa bona wena o tla be o etsa bo moriri, bo mrne ba batla tjhelete e
hodimo because o sa nahanne hore eish, tshwanetse ke ye salon hona moo.
Respondent B: Ke bona batho ba bolawang ke fashion. Nna ke tla ka morao
mara bona ba ka ba tswanetse ba be le dintlo tse ban eng di ya kgotsofatsa.
Interviewer: That's why you say.
Respondent B: Four thousand
Interviewer: E re mohlang o no nahanne ka koloi, e ne koloi e etsa bokae, Ok.
How do you think poverty can be evaluated in Evaton West? If re re ke acceptor
nth0 e ntate Mhlambi a buwang mara batho ba ba sa kgoneng ba ka thuseha
jwang? Re ka fedisa bofuma jwang?
Respondent B: Education
Interviewer: You think education, ha re through the whole lot tackle that
question. Ok you think educating
Respondent C: The mind set
Community-Driven Development projects towards poverty alleviation 293
Interviewer: You're saying change the mind set.
Respondent E: Ke re Education le nna
Interviewer: Alright
Respondent D: Le nna ntse ke dumellana le nthwe ya Education
Interviewer: Ok
Respondent F : Thuto eo o e thotseng o le motho, o le an individual. 0 e
fitisetsa ho motho o mong le yena a tlo kgona ho e fitisetsa ho o mong le
twelleng pele.
Interviewer: Ok we are going to each one
Respondent G: It is not everyone a ka kgonang ho kena sekolo in Evatong
West, batho ba bangata ba hloka different things like ho sebetsa ka matsoho.
Interviewer: Ok. so o na le di skills
Respondent A: And also to have the centre which will help the community with
access to the information that is available
Interviewer: E re ke botse potso ha nyane feela. Education ye, batho ba nang
le education e, how do you think this people can help to fight poverty.
Respondent D: Ya, education ke hore, e ho education or ha se hore ho rutwa
ke ho ya sekolong feela. Ha se ho ya sekolong feela hore of tshwmetse hore o
ka phela, because o ka nna ruta motho like ho na jwale tjena. Mona o ruta
motho hore ha o jala, o ka nna wa ruta motho ho lokisa tsela, o ka nna wa ruta
motho ko re ho na le dintho tse ngata tse batlang hore motho a ka ithuta tsona,
tse batho ba dutseng ka tsona feela. Tseo ba believing hore no, nna ha ken a
hona, nna ha ke na bophelao. Ha ke kgone ho ja ka tlung mara a tshwere ke
Community-Driven Development projects towards poverty alleviation 294
hore, a ka iphedisa ka tlung, ke hore motho ono ha o tla ho yena o bua le yena,
ke hore oa mo hlabolla e bile wa mo ruta hore no bona, bona ho nka pipe ho
nwesetsa, ho nka peo ho e jala fatshe ho nka trofolo ho haha ke ho ruta hore
motho eo hore ha o morutile nth0 eo o tla kgona hore ha a tsamaya mona ha a
fihla mona, hore ba a nka spitforoko le haraka, ho sebetsa ke ho educator ho o
ruta hore a kgone hore a iphedise, hore no poverty eno e ne alleviation e kgone
hore e fele mona ho yena.
Interviewer: Ok
Respondent F: Taba ya bo dijalo, oa kgona ho direkisa, then o kgone income e
kgone ho iphedisa ka yona.
Interviewer: Ok
Ma Likhethe: An then hao hloke hore o reke di vegetables hobane o se ntse o
na le tsona
Interviewer: Ok, question ya MaLikhethe o bolela jwang?
Respondent C: If people they can, you know free their find they will be able to
think of possibilities. They can be able to think that now is the time that i use, the
resources that I have and go out there and do something about them.
Respondent B: And to add on that I think again that, people should stop
blaming apartheid the other time that they spend, and do something about their
lives because we are now free and it seems as if they are not aware.
Respondent A: Then if the dependence syndrome is what we mainly that what
we have to give it from the people. People have this thing of thing somebody will
come and do something for myself for example if I have to throw the paper down
I am expecting the government to come and collect that paper. Hence, I'm not
saying, we government yourself and we are the government is the people by the
look by people all those institution. So people have to understand that, there is
Community-Driven Development projects towards poverty alleviation 295
one who should bring change. The one who come there are free people; they
will take responsibilities every thing is happening to communities, so that's what
David is saying.
Interviewer: Free their mind
Respondent A: Ya because if you can, you can during the apartheid days we
were fighting another battle, and even today when we were governing things that
things should happen like they did happen in that time we where making things
happen.
Respondent F: Le hore ba, ba tlohele ho sheba di qualifications tseo ba nang le
tsona, like re a tseba hore motho o bare yena o tswa University o na le BA, MA
but ha ho kgethwa batho ba yo sebetsang matlakala mane, a bare yena ha a
yela nth0 eno sekolong. So motho ke hore a bule kelello feela, hore o batla
mosebetsi a phedise then a nke mosebetsi o hlahileng feela from there o tla
bona'feela hore o ya kae moo.
Respondent D: Haholoholo hape ho nth0 ya eduation, ke nahana hore now is
the time ya hore batho ba bo rona, ba tshwanetse ba nahane culture ya bona. E
ne e na le something e ka ba etsang hore no, ha ba iphedisa ko re ho nale dintho
tse ngata tseo re ileng re dilahla cultureng ya rona. Tseo re neng re phela ka
tsona kgale-kgale. Ha ba ka kgutlela hape haholo sethong , and then ba sheba
hore na ho nale dintho tse feng tse lahlehileng, tseo rona re neng re phela ka
tsona, and then tseo e leng ka sheno lena ha dile siko be re re no, ha re ke re se
kgone ho phela.
Interviewer: Ok
Respondent D: Re ne re etsa motoho ko hae, then bana ba neb a kgone hoja,
like today se re batla ho phela renwa tee, and then pele nkgono o ne a, bo
diplokwane kore nth0 tse tshwanang le tseo kore batho ba ka nna ba rutwa ka
nth0 tseo tse ngata, hore no dijo tse ngata o ka nna wa iketsetsa tsona ka ko
tlung. Motoho ha o ritetse o o behile mane o kwahetse, today re na le difridge ha
Community-Driven Development projects towards poverty alleviation 296
o kentse ka mane everday bana ha ba tsoha ba ka nna ba nwa motoho, ba ya
sekolong, ko re rather than hore o dule o ntse of fura ngwana metsi everyday e
leng tee. 0 a utlwisisa kapa of dula o mo fura borotho, ke hore o a ba educator
hore no batho ba tsebe no re ka fetsa nth0 ena jwang. Le ka phetoho dintho
tsena di ka nna tsa feela.
Respondent G: Ha re shebang ho batho ba sebetsang ka matsoho. I think
batho bao those who are qualified hore they should also work together, because
working as an individual they end up not doing any work.
Interviewer: Mmh
Respondent G: Because whoever is also doing something on that, that are near
somewhere.
Interviewer: Ok
Respondent D: Ha ba ka tlohella pride, le boikgomoso then ke o na mantswe
ao Jeff a buang, and then batswa mo priding, ko re nth0 e no e costwa keng. Re
na le pride too much le boikgokgomoso too much, that is why re sa batleng hore
always re e tse dintho together, ke nahana hore ha ke di etsa ke le mong ke tla
succeeda, and then ke hona moo ke ipakelang mathata teng.
Interviewer: Alright in other words you are saying the idea is difficult?
Interviewees: Ya
Interviewer: Ke yona e ka thusang
Community-Driven Development projects towards poverty alleviation 297
- - -- ~- --