gd matthew - nwu-ir home
TRANSCRIPT
Measuring the cognitive load induced by subtitled audiovisual texts in an educational context
GD Matthew orcid.org 0000-0003-3952-5413
Thesis accepted in fulfilment of the requirements for the degree Doctor of Philosophy in Linguistics and Literary Theory
at the North-West University
Promoter: Prof J Kruger Co-Promoter: Dr S Doherty
Graduation: April 2019
Student number: 20684886

ii

i
ACKNOWLEDGEMENTS
I would like to acknowledge and thank the following individuals for their contribution to my study:
The Lord Almighty, for giving me the skills and mental ability to be able to complete this
thesis.
My promoter, Prof. Jan-Louis Kruger, who, although he lives in Australia, was always
willing to assist, motivate and give guidance when things got difficult.
To my co-promoter, Dr Stephen Doherty, for providing an outside perspective on the
subject and assisting in the technical aspects of my study.
For Peter Humburg, for his statistical consultation to help make sense of all the data.
To the research area, UPSET, for providing funding for me to visit my promoter in
Australia for three months.
For the North-West University in Vanderbijl Park, for the financial support and
opportunity for me to complete my PhD.
To my parents, who have always assisted me with everything I did and without whom I
would not have been alive.
To my sister, who was always there to support me in her own special kind of way.
Special thanks to all the participants who contributed to the study. Without you nothing
would have been possible.
To all my colleagues and co-researchers at the North-West University’s Vaal Triangle
Campus, for all your valuable advice, motivation and copious amounts of coffee you
provided me.
To the North-West University for providing me the funding to be able to complete my
study.

ii
iii
ABSTRACT
Audiovisual aids are nowadays commonly utilised in classroom environments where lecturers
are able to supplement verbal instruction with pictures or videos to enhance learning. To make
these resources more accessible, subtitles are added to make them easier to understand.
Although much research has already been done on the effect of subtitles on cognitive load,
there is to date no conclusive evidence of the benefits of subtitles or the hindrances that they
may cause. The aim of the study was to provide clear evidence of the effect of subtitles on
cognitive load (CL) by looking at their effect on processing different amounts of information, the
effect of different types of subtitles (verbatim or edited) and how the composition of subtitled
stimuli (containing redundant and non-redundant information) affects CL. Two experiments were
conducted. The first was exploratory, to determine the effects of subtitles on CL. The
participants (n=64) watched a recorded lecture in one of four presentation modes: 1) audio only,
2) audio and video, 3) audio and video with verbatim subtitles, and 4) audio and video with
edited subtitles. No significant differences were found for either the CL experienced or the
performance between the presentation modes. The second experiment was more
comprehensive than the first and included the recording of eye-tracking data and personal data
(such as English proficiency, working memory capacity, etc.). The participants (n=23) watched
four recorded lectures, randomly presented in one of the four presentation modes (the same as
in the first experiment). The results indicated no significant difference for either CL or
performance between the presentation modes. However, a linear mixed effect model indicated
that the participants focused longer (higher CL) on the verbatim subtitles then on the edited
subtitles (+23.41 ms). Significant differences were also found with the CL of subtitles, where
edited subtitles imposed 52% less cognitive load than verbatim subtitles, but were 24% less
likely to be processed in the presence of redundant information. A significant difference was
also found regarding the processing of subtitles in the presence of redundant information, as
edited subtitles are 24% less likely to be processed while in the presence of redundant
information, compared to the verbatim subtitles. Edited subtitles were also found to be 45%
more likely to be processed than verbatim subtitles. This study seems to indicate that subtitles
do not have a significant effect on either CL or performance, but that the difference is rather
between different types of subtitles and how they are composed (the amount of redundant
information included).
KEYWORDS
Subtitles, Cognitive Load Theory, Multimedia Learning, Instructional Design, Eye Tracking

iv
v
TABLE OF CONTENTS
CHAPTER 1: INTRODUCTION ............................................................................................ 1
1.1 Research hypotheses ................................................................................................... 4
1.1.1 There will be a difference in cognitive load and performance between the difference
sources of information ............................................................................................. 4
1.1.2 There will be a difference in the processing of the different subtitle presentation
modes (verbatim and edited) ................................................................................... 4
1.1.3 There will be a difference in the cognitive load induced by the different subtitle
presentation modes (verbatim and edited) ............................................................... 5
1.1.4 There will be a difference in the processing and cognitive load of the different subtitle
presentation modes (verbatim and edited) where subtitles are in the presence of
redundant visual information .................................................................................... 5
1.2 Outline of the rest of the thesis ................................................................................... 5
CHAPTER 2: SUBTITLES AS EDUCATIONAL AIDS ......................................................... 7
2.1 A history of instructional media in education ............................................................. 7
2.2 Subtitling and subtitles ................................................................................................ 9
2.3 Reading static text versus dynamic text in the presence of video .......................... 11
2.4 Cognitive load theory and cognitive load ................................................................. 13
2.4.1 Short-term (or working) memory ............................................................................. 14
2.4.2 Working memory capacity ....................................................................................... 14
2.4.3 Long-term memory ................................................................................................. 15
2.4.4 Cognitive load ......................................................................................................... 16
2.4.5 Assessment factors ................................................................................................ 19
2.4.6 Cognitive overload .................................................................................................. 20
2.4.7 Summary of the use of cognitive load theory to analyse audiovisual texts .............. 21
2.5 Instructional design .................................................................................................... 22
2.5.1 The reduction of information irrelevant to learning .................................................. 22
2.5.2 Enhancing schemata formation in long-term memory ............................................. 24
2.5.3 The effect of instructional design on the causal factors of cognitive load ................ 25
2.5.4 The difficulty of developing instructional material that imposes no extraneous
cognitive load ......................................................................................................... 25
2.5.5 Summary of the use of instructional design to lower the effects of cognitive load.... 26
2.6 The effects of subtitles on cognitive load ................................................................. 28
2.6.1 Early studies on presentation mode versus performance ........................................ 28
2.6.2 Studies on cognitive load and subtitles ................................................................... 30

vi
2.6.3 Studies on subtitles and language acquisition ......................................................... 30
2.6.4 Studies on subtitles and comprehension (or retention) of information ..................... 35
2.6.5 Summary of studies on the effects of subtitles on cognitive load ............................. 38
CHAPTER 3: METHODOLOGY ......................................................................................... 41
3.1 Introduction ................................................................................................................. 41
3.2 An overview of general measurement techniques of cognitive load ...................... 41
3.2.1 Subjective rating scales .......................................................................................... 42
3.2.2 Physiological measurements .................................................................................. 43
3.2.3 Primary and dual task performance measurement .................................................. 47
3.3 Experimental design ................................................................................................... 48
3.4 Details of the first experiment .................................................................................... 48
3.4.1 Participants ............................................................................................................. 48
3.4.2 Materials ................................................................................................................. 49
3.4.3 Design of the second experiment ............................................................................ 53
3.5 Details of materials for the second phase of the second experiment ..................... 57
3.5.1 Working memory capacity test (memory-span task) ................................................ 57
3.5.2 Video lectures ......................................................................................................... 59
3.5.3 Comprehension test and cognitive load questionnaire ............................................ 62
3.5.4 Equipment and environment ................................................................................... 62
3.6 Statistical analyses ..................................................................................................... 63
CHAPTER 4: RESULTS .................................................................................................... 65
4.1 Introduction ................................................................................................................. 65
4.2 Results of the first experiment................................................................................... 65
4.3 The second experiment .............................................................................................. 69
4.3.1 Introduction ............................................................................................................. 69
4.3.2 Results for RQ1: How do the different sources of information (audio-only, audio and
video, audio and video with verbatim subtitles, and audio and video with edited
subtitles) in a subtitled educational video contribute to cognitive load and
performance? ........................................................................................................ 70
4.3.3 Results for RQ2: What is the difference in processing between verbatim and edited
subtitles as measured with objective eye-tracking measures? ............................... 77
4.3.4 Results for RQ3: What is the effect of redundant and non-redundant information on
cognitive load (mean fixation duration) for each version of subtitles (verbatim and
edited)? ................................................................................................................. 85

vii
4.3.5 Results for RQ4: What is the effect of redundant and non-redundant information on
subtitle processing (modified RIDT) for each version of subtitles (verbatim and
edited)? ................................................................................................................. 87
CHAPTER 5: DISCUSSION ............................................................................................... 93
5.1 RQ1: How do the different sources of information (audio-only, audio and video,
audio and video with verbatim subtitles, and audio and video with edited subtitles)
in a subtitled educational video contribute to cognitive load and performance? .. 93
5.2 RQ2: What is the difference in processing between verbatim and edited subtitles
as measured with objective eye-tracking measures? .............................................. 94
5.3 RQ3 & RQ4: What is the effect of redundant and non-redundant information on
cognitive load (mean fixation duration) and subtitle processing (modified RIDT) for
each version of subtitles (verbatim and edited)? ..................................................... 97
CHAPTER 6: CONCLUSION ............................................................................................. 99
6.1 Limitations .................................................................................................................. 99
6.2 Contribution ................................................................................................................ 99
6.3 Future research ......................................................................................................... 100
APPENDIX A ............................................................................................................................. 2
APPENDIX B ............................................................................................................................. 1
APPENDIX C ............................................................................................................................. 2
APPENDIX D ............................................................................................................................. 1
APPENDIX E ............................................................................................................................. 2
APPENDIX F .............................................................................................................................. 1
APPENDIX G ............................................................................................................................. 2
APPENDIX H ............................................................................................................................. 1
viii
LIST OF FIGURES
Figure 1: Components of audiovisual texts ................................................................................ 8
Figure 2: The two axes of audiovisual communication ............................................................. 12
Figure 3: Causal and assessment factors of cognitive load ..................................................... 17
Figure 4: Visual representation of fixations and saccades ....................................................... 45
Figure 5: Experimental design of first experiment .................................................................... 49
Figure 6: Screenshot of verbatim subtitles ............................................................................... 50
Figure 7: Screenshot of edited subtitles ................................................................................... 51
Figure 8: Item and person reliability output from Winsteps ...................................................... 52
Figure 9: Experimental design of Phase 1 of the second experiment....................................... 53
Figure 10: Experimental design of Phase 2 of the second experiment ..................................... 53
Figure 11: Language range of participants in second experiment ............................................ 54
Figure 12: Example of a counting-span task (Case et al., 1982) .............................................. 58
Figure 13: SMI’s iViewX™ RED500 eye-tracking system ........................................................ 62
Figure 14: Visual representation of distribution of data for variables ........................................ 66
Figure 15 : Winsteps output for person and item reliability of comprehension questions.......... 67
Figure 16: Histogram of distribution of data for variables ......................................................... 70
Figure 17: Distribution of English proficiency data after scaling and centring ........................... 71
Figure 18: An EMMs plot for comprehension based on the interaction of English proficiency and
presentation mode ..................................................................................................... 72
Figure 19: An EMMs plot for ICL between the different presentation modes ............................ 74
Figure 20: An EMMs plot for ECL between the different presentation modes .......................... 76
Figure 21: Q-Q plot for MFD distribution .................................................................................. 78
Figure 22: Histogram of the distribution of original MFD distribution ........................................ 78
Figure 23: Screen shot of fixation duration for 8 000 ms on a subtitle ...................................... 79
Figure 24: Histogram of the distribution for the cleaned MFD distribution ................................ 80
Figure 25: Q-Q plot for cleaned data for MFD .......................................................................... 80
Figure 26: Boxplot of the prediction capability of the model ..................................................... 82
Figure 27: Probability density graph for the prediction of processed and unprocessed subtitles83
ix
Figure 28: ROC curve of model fit to predict processed subtitles ............................................. 84
Figure 29: Q-Q plot of the model fit.......................................................................................... 87
Figure 30: Graph of fitted values with residuals along the mean .............................................. 87
Figure 31: ROC curve of model fit for processing of subtitles .................................................. 89
Figure 32: Q-Q plot for model fit of UFMW and CPS_scaled ................................................... 91
Figure 33: Graph of fitted values with residuals along the mean of the model ......................... 92
Figure 34: The average CPS for the two subtitle types across the four videos ........................ 95
Figure 35: Variability of subtitle speeds between the subtitle types ......................................... 95
Figure 36: Distribution of subtitles according to CPS in the two subtitle modes ....................... 96
Figure 37: The total amount of time redundant visual elements were visible compared to rest of
the video (sec) ........................................................................................................... 98

x
LIST OF TABLES
Table 1: Differences between the characteristics of subtitles and captions .............................. 10
Table 2: Description of the different categories ........................................................................ 12
Table 3: Summary of effects that reduce extraneous cognitive load ........................................ 26
Table 4: Summary of studies of the effect of native- and foreign-language subtitles on
performance .............................................................................................................. 37
Table 5: Comparison of subtitle modes across all the videos................................................... 51
Table 6: Raw scores and their equivalent proficiency levels .................................................... 56
Table 7: The order of each presentation mode in each of the experiments .............................. 60
Table 8: Comparability with Lexile measures between all four videos ...................................... 60
Table 9: Comparability with coh-metric measures between all four videos .............................. 61
Table 10: Flesch-Kincaid reading ease score for the transcripts of the four video.................... 62
Table 11: Summary of fixed and random effect variables ........................................................ 64
Table 12: Descriptive statistics for variables used in the first experiment ................................. 65
Table 13: Output of estimates from the linear model based on Model 1 .................................. 66
Table 14: Output of estimates from the linear model based on Model 2 .................................. 67
Table 15: Output of estimates from the linear model based on Model 3 .................................. 68
Table 16: Output of estimates from the linear model based on Model 4 .................................. 71
Table 17: Output of estimates from the linear model based on Model 5 .................................. 73
Table 18: Output of estimates from the linear model based on Model 5 .................................. 74
Table 19: Output of estimates from the linear model based on Model 7 .................................. 75
Table 20: Output of estimates from the linear model based on Model 8 .................................. 75
Table 21: Output of estimates from the linear model based on Model 9 .................................. 77
Table 22: Distribution of data for mean fixation duration .......................................................... 78
Table 23: Exponentiated values for fixed effects...................................................................... 82
Table 24: Results and exponentiated estimates for the GLMER of mean fixation duration ...... 85
Table 25: AIC and BIC values for Model 11 and Model 12 fit ................................................... 86
Table 26 : AIC and BIC values for Model 11 and Model 13 fit .................................................. 86
Table 27: Subtitles that had zero RIDT index but a fixation count ............................................ 88

xi
Table 28: Exponentiated values for fixed effects...................................................................... 90
Table 29: AIC and BIC values of Models 14 and 15 ................................................................ 90
Table 30: AIC and BIC values of models 15 and 16 ................................................................ 91

xii
1
CHAPTER 1: INTRODUCTION
The inclusion of instructional aids to facilitate learning has been an important aspect of
education since the early 1900s. During this time the first instructional aids were established in
the United States, where school museums were used as an extra source of visual instructional
material to help facilitate learning (Saettler, 1968). These school museums consisted of portable
museums exhibits, slides and films to help teachers with their teaching (Saettler, 1968). With the
advances in radio broadcasting, sound recordings and motion pictures during the late 1920s
and early 1930s, the interest in using instructional media in education became even greater
(Reiser, 2001). The incorporation of both sound and visual instructional material enhanced the
processing capability of educational materials and led to the audiovisual instruction movement
(Finn, 1972; McCluskey, 1981).
In World War II, audiovisual aids were used by the United States military to help soldiers learn
foreign languages (e.g. German) and to facilitate rapid learning of military and industrial skills
(Chandler & Cypher, 1948). These aids were also used in simulators to train soldiers in various
fighting scenarios by incorporating sounds and projected visuals in an enclosed room (Chandler
& Cypher, 1948). Over the past five decades, audiovisual aids have become an essential
component of teaching. Projectors, educational films and multimedia materials have been
successfully integrated into various applications and contexts of education to enhance and
facilitate a student’s learning experience.
The concept related to the effectiveness of audiovisual aids (e.g. videos) in teaching and
learning has to do with the dual coding theory. Generally, audiovisual materials are constructed
of two types of elements, namely auditory and visual elements. Recent studies have indicated
that presenting students with materials that consist of both auditory and visual sources of
information can assist with the comprehension of the content (Shea, 2000). The effectiveness of
audiovisual materials is based on the dual channel assumption. The assumption is that working
memory gathers and processes information through two channels of information (Paivio, 1986;
Baddeley, 1986; Mayer, 2002a). Imagery information is processed by the visual channel and
auditory information is gathered and processed by the verbal channel of working memory
(Mayer, 2002a). The assumption is then that presenting the same information in both modalities
will be easier to process than just presenting it in one.
Audiovisual aids are nowadays commonly utilised in diverse learning settings. In classroom
environments, lecturers are able to supplement verbal instruction with either pictures or videos
to enhance the learning experience (Almedag & Cagiltay, 2018). However, many of these
educational materials are not accessible to all the students, especially those not studying in
their native languages (i.e. foreign language students). In order to make these educational
2
sources more accessible, subtitles (or captions) are added to the material in order to make them
easier to understand (Kruger, 2013). Although this seems to be a viable option, there are a few
aspects that need to be taken into consideration before a valid conclusion can be made.
The most important aspect to consider is the introduction of an extra source of information that
needs to be processed by working memory (Kruger, 2013:31). As subtitles or captions are
visual representations of verbal information they have to be “processed at the same time as all
the other visual elements” (Kruger, 2013:31). This means that subtitle processing is in constant
competition with other sources of information. This aspect could place an additional strain on
the student’s working memory.
Another aspect to consider is the dynamic aspect of subtitles. The speed with which subtitles
are presented is generally established by the subtitler. With static reading, the pace at which a
person reads is determined by the person himself or herself, whereas reading subtitles requires
the reader to adapt to the pace of the subtitles. For a foreign language student this can
sometimes cause problems as the language proficiency of the student may not be sufficient to
read the subtitles efficiently. The final aspect to consider when adding subtitles to a video is that
most subtitles are presented on a moving background, which means that the viewer’s attention
is constantly shifting between various sources of information, and consequently the viewer does
not benefit from the subtitles as was intended (Kruger et al., 2015)
The effect of subtitles on cognitive load also needs to be considered. Cognitive load theory “is
mainly concerned with the learning of complex cognitive tasks …” and “… the relationship
between working (short-term) and long-term memory and the effect of their relationship on
learning and problem solving ...” (Pass, Renkel & Sweller, 2004:11; Diao et al., 2007:237). By
adding an extra source of information to a video (i.e. subtitles), the assumption is that working
memory will be overwhelmed (as it has a limited capacity for processing) and will result in
cognitive overload. Different scenarios can contribute to higher cognitive load, such as complex
or high element-interactivity, split attention, redundancy, superficial information and also low
element-interactivity.
Complex element-interactivity refers to material that consists of many elements that need to be
processed at the same time, for example, the three sources of relevant information that need to
be processed during a subtitled educational video. The split attention effect refers to the division
of attention of a viewer between different sources of information. In a subtitled educational
video, this is usually between the subtitled area and the lecturer. The redundancy effect refers
to an instance where the information that needs to be processed from one source of information
is repeated in another source of information at the same time, for example in a subtitled
3
educational video when a graph is presented onscreen at the same time that an explanation of
the graph is given in the subtitles and dialogue.
Superficial information refers to information that is repeated in more than one source, for
example when a diagram that is easy to understand on its own is given alongside explanatory
text of the diagram. The process of trying to incorporate both sources of information can put
unnecessary strain on working memory. Finally, low element-interactivity refers to material that
is easily understood. If a person is given two sources of information that are both equally
intelligible, the second source will put unnecessary strain on working memory because it is
unnecessary to learning. This type of cognitive load is mostly a waste of time and effort.
A higher amount of cognitive load (cognitive overload) typically has negative effects on learning
(Paas & Van Merriënboer, 1993) because the cognitive load produced by learning is altered (or
limited) if cognitive overload occurs (Khalil et al., 2005). As working memory has a limited
capacity, the relation between working memory capacity and cognitive load can provide an
indication of whether an individual has experienced cognitive overload or not.
Unfortunately, because subtitles are such a new source of instructional aid, and because of the
complex nature of the environment in which they occur, they have received little attention as a
viable research field. It was not until the 1980s that research into subtitling started to flourish.
The problem, however, is that the effect of subtitles on cognitive load is inconclusive. For
example, in educational design subtitles are assumed to increase cognitive load (Kalyuga,
2011; Mayer, Heiser & Lohn, 2001; Paas et al., 2004), but in other fields, such as language
acquisition, subtitles are found to decrease cognitive load and are thought to have a positive
impact on performance (Mayer, 2002b). These findings cause a great amount of uncertainty
and inconsistency regarding the possible benefits of subtitles on learning and performance. This
is largely due to the fact that most of the effects reported for subtitle-related studies are based
on assumptions, a large number of variables and different types of material to provide results on
performance. There seems to be a gap here, where the effect of subtitles on cognitive load is
blurred and the results are determined on the assumptions of the researchers according to the
participant samples and stimuli used.
In order to determine the effects of subtitles on cognitive load, this study set out to provide
answers to the following questions:
RQ1: How do the different sources of information (audio-only, audio and video, audio and
video with verbatim subtitles, and audio and video with edited subtitles) in a subtitled
educational video contribute to cognitive load and performance?
4
RQ2: What is the difference in processing between verbatim and edited subtitles as
measured with objective eye-tracking measures?
RQ3: What is the effect of redundant and non-redundant information on cognitive load
(mean fixation duration) for each subtitle mode (verbatim and edited)?
RQ4: What is the effect of redundant and non-redundant information on subtitle
processing (modified RIDT) for each subtitle mode (verbatim and edited)?
1.1 Research hypotheses
1.1.1 There will be a difference in cognitive load and performance between the
difference sources of information
Research in recent years has shown that fewer sources of information mean less strain on
working memory, which leads to better processing and understanding of the information. It is
hypothesised that no significant cognitive load will be measured for the audio-only and audio
and video presentation modes, as these are in line with the processing capability of working
memory (visual and verbal processing channels). The main problem is then that when you have
more than two sources of information (such as with a subtitled video), your attention will
constantly shift between the sources of information, which should inhibit the overall processing
and understanding of the information. It is therefore hypothesised that the presentation modes
that have only one or two sources of information to process will be less affected by cognitive
load and will result in better performance than the presentation modes with three sources of
information to process (i.e. subtitled videos.)
1.1.2 There will be a difference in the processing of the different subtitle
presentation modes (verbatim and edited)
In recent years computer algorithms have been implemented on social media sites, such as
YouTube, to automatically caption (or subtitle) the speech onto the video in real-time (verbatim
subtitles). This was done to make the content more accessible for deaf and hard-of-hearing
viewers who might struggle with the dialogue. The problem is that these algorithms are
programmed to produce a generic text that is related to the dialogue and does not take into
account the timing of the speech, compared to standardised subtitling (edited subtitles), main
goal of which is to sync the dialogue and subtitles so there is no delay between them. It is
therefore hypothesised that, due to the unsynchronised timing of verbatim subtitles and the
variability in presentation speed of the subtitles (due to the timing issue), these types of subtitle
would be more difficult to process and will result in lower performance than will be measured for
edited subtitles.
5
1.1.3 There will be a difference in the cognitive load induced by the different
subtitle presentation modes (verbatim and edited)
Because verbatim subtitles are sometimes out of sync with the dialogue in a video, the viewer
has to keep information for longer periods of time in working memory, which puts extra stain on
the processing of the information. It is therefore hypothesised that because of this
unsynchronised effect between the dialogue and the subtitles, verbatim subtitles will record a
higher cognitive load than edited subtitles.
1.1.4 There will be a difference in the processing and cognitive load of the
different subtitle presentation modes (verbatim and edited) where subtitles
are in the presence of redundant visual information
Most compositions of subtitled educational videos (i.e. audiovisual text) include visual elements,
such as diagrams or graphs, which are edited into the video to facilitate or explain the visuals
being discussed. Although most of these visual elements are fine to process in normal
educational videos, there can be a problem when they need to be processed simultaneously
with subtitles. The problem here is that attention needs to be shifted between the visual
elements and the subtitles, which puts an extra strain on the processing of the redundant
information provided by the visual elements that is also repeated in the subtitles. It is therefore
hypothesised that in the presence of visual elements (redundant information), the processing of
subtitles (either verbatim or edited) will be lower and the cognitive load will be higher than when
there are no visual elements.
1.2 Outline of the rest of the thesis
If cognitive load is affected by the amount of source of information that needs to be processed
by working memory at the same time, it can be assumed that the cognitive load for instructional
material containing one source of information (e.g. just audio) will be lower than for instructional
material containing three sources of information (e.g. a subtitled video). The effect of cognitive
load will also be visible in the results of a comprehension test, as higher cognitive load will be
indicated by a lower comprehension score. The effect of cognitive load could also be due to the
type of subtitles used (edited or verbatim) or the composition of the stimulus itself (redundant vs.
non-redundant information). The aim of the study is to provide definite evidence of the effect of
subtitles on cognitive load by examining the effect of subtitles on different amounts of
information, the influence of different types of subtitle (verbatim or edited) and the composition
of stimuli containing subtitles (redundant and non-redundant information).
Chapter 2 gives a brief history of instructional media in education, an introduction to subtitles
and subtitling, an introduction to cognitive load theory and instructional design, and a summary
6
of previous research done on the effects of subtitles on cognitive load. Chapter 3 gives an
overview of the general measures of cognitive load. This is followed by a description of the
experimental design and details of the two experiments that were conducted (including
information on materials, participants and equipment). Chapter 4 presents the results
associated with each of the research questions mentioned above. Chapter 5 discusses the
findings from Chapter 4, and Chapter 6 contains concluding remarks on limitations,
contributions and future works from this study.
7
CHAPTER 2: SUBTITLES AS EDUCATIONAL AIDS
2.1 A history of instructional media in education
Instructional media is defined as the physical means by which instruction can be presented to
learners (Reiser & Gagné, 1983, Reiser, 2001). This definition encompasses all the different
physical ways in which instructional material can be delivered to learners (e.g. textbooks,
computers, projectors, etc.), but usually excludes the teacher, as without the teacher, no
instruction can take place (Reiser, 2001). In the early 1900s, school museums started to appear
in the United States, and their function was to help facilitate learning through the use of extra
visual instructional material. These materials generally consisted of portable museum exhibits,
slides, films and other instructional material to assist teachers with their teachings (Saettler,
1968). The development of these school museums also gave rise to the “visual instruction” or
“visual education” movement (Reiser, 2001). From the late 1920s to the latter part of the 1930s,
the advances in radio broadcasting, sound recordings and motion pictures, led to a greater
interest in the use of instructional media in education (Reiser, 2001). The incorporation of both
sound and visual instructional material led to the development of audiovisual aids, which also
gave rise to the audiovisual instruction movement (Finn, 1972; McCluskey, 1981).
Audiovisual aids, also known as audiovisual materials (e.g. pictures, audio, videos, etc.),
became a well-known concept in education and have been in use in most general teaching and
learning environments. For example, in museums, projectors and audio recordings were used to
make exhibitions more enjoyable and easy to understand (Chandler & Cypher, 1948). They
were also used to help soldiers learn foreign languages (e.g. German), and in simulators to train
soldiers in various fighting scenarios by incorporating projected visuals and sounds inside an
enclosed room or structure (Olsen & Bass, 1982; Saettler, 1990). During World War II in
America, audiovisual aids were also implemented to facilitate the rapid learning of military and
industrial skills for both men and women (Chandler & Cypher, 1948). The importance of visual
enrichment was quickly realised by educators as an effective method to deliver information
through both visual and auditory sources (Chandler & Cypher, 1948). In the past five decades,
audiovisual aids have become an essential component of teaching with the introduction of
projectors, educational films and multimedia materials, which have been integrated successfully
into various applications and contexts of education to enhance and facilitate a student’s learning
experience.
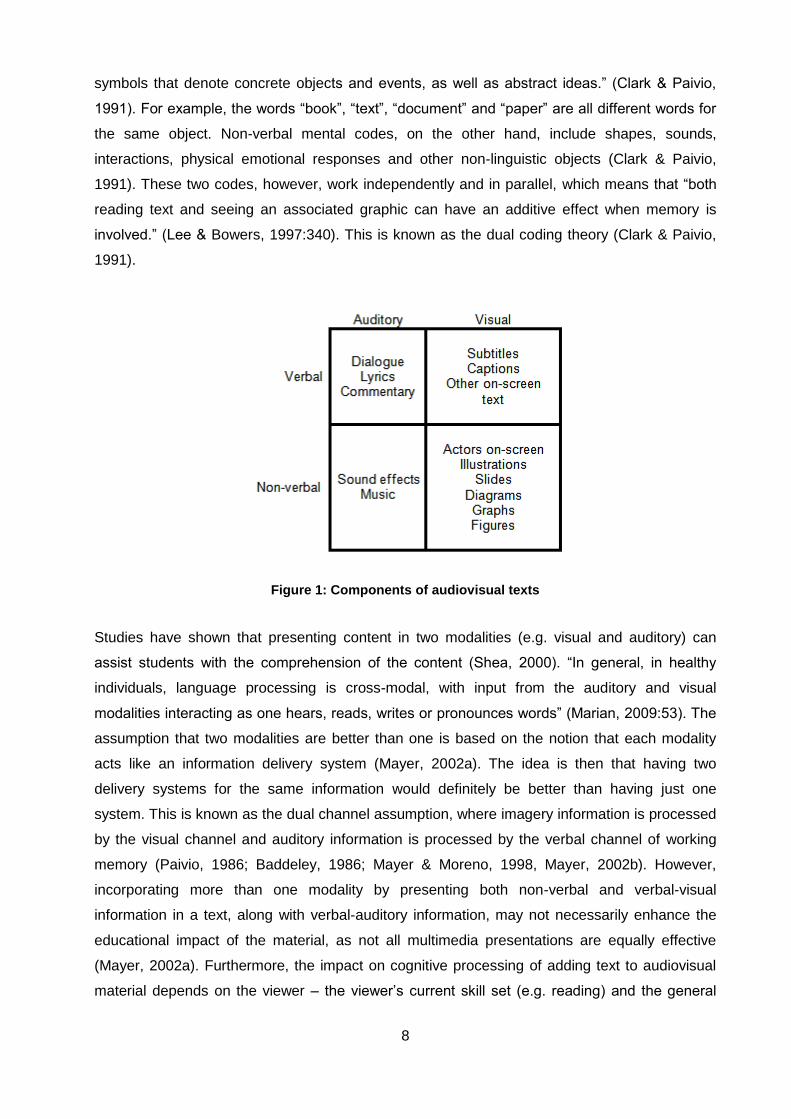
The construction of audiovisual materials consists of two channels (visual and auditory) that
interact with each other, as demonstrated in Figure 1 (adapted from Zabalbeascoa, 2008).
These visual and auditory channels (also known as modalities) can also be presented by either
verbal or non-verbal mental codes (Lee & Bowers, 1997). Verbal mental codes are “arbitrary
8
symbols that denote concrete objects and events, as well as abstract ideas.” (Clark & Paivio,
1991). For example, the words “book”, “text”, “document” and “paper” are all different words for
the same object. Non-verbal mental codes, on the other hand, include shapes, sounds,
interactions, physical emotional responses and other non-linguistic objects (Clark & Paivio,
1991). These two codes, however, work independently and in parallel, which means that “both
reading text and seeing an associated graphic can have an additive effect when memory is
involved.” (Lee & Bowers, 1997:340). This is known as the dual coding theory (Clark & Paivio,
1991).
Figure 1: Components of audiovisual texts
Studies have shown that presenting content in two modalities (e.g. visual and auditory) can
assist students with the comprehension of the content (Shea, 2000). “In general, in healthy
individuals, language processing is cross-modal, with input from the auditory and visual
modalities interacting as one hears, reads, writes or pronounces words” (Marian, 2009:53). The
assumption that two modalities are better than one is based on the notion that each modality
acts like an information delivery system (Mayer, 2002a). The idea is then that having two
delivery systems for the same information would definitely be better than having just one
system. This is known as the dual channel assumption, where imagery information is processed
by the visual channel and auditory information is processed by the verbal channel of working
memory (Paivio, 1986; Baddeley, 1986; Mayer & Moreno, 1998, Mayer, 2002b). However,
incorporating more than one modality by presenting both non-verbal and verbal-visual
information in a text, along with verbal-auditory information, may not necessarily enhance the
educational impact of the material, as not all multimedia presentations are equally effective
(Mayer, 2002a). Furthermore, the impact on cognitive processing of adding text to audiovisual
material depends on the viewer – the viewer’s current skill set (e.g. reading) and the general

9
cognitive capacity that the viewer has to process the extra channel of information (Linebarger,
Piotrowski & Greenwood, 2010).
Less than a decade after World War II, research began on the different characteristics of
audiovisual material and their effect on learning (Reiser, 2001). These were also the first studies
to identify the different aspects of learning and audiovisual material, and how this knowledge
could be used to facilitate the design of new audiovisual material. By the 1980s, given the
results from these studies, the use of audiovisual aids became a more permanent addition to
most educational curricula across the United States – other parts of the world soon followed
suit. It was also during this time that subtitling, specifically in foreign-language education, made
its appearance and has since become a valid addition to the multimedia paradigm as a visual-
verbal source of information.
2.2 Subtitling and subtitles
Subtitling can be defined as “a translation practice that consists of presenting a written text,
generally on the lower part of the screen, that endeavours to recount the original dialogue of the
speakers, as well as the discursive elements that appear in the image (letters, inserts, graffiti,
inscriptions, placards, etc.) and (in the case of deaf and hard-of-hearing viewers) the information
that is contained within the soundtrack (song, voice off)” (Diaz-Cintaz & Remeal, 2007:8). Zanón
(2006) identifies three types of subtitling:
1. Bimodal or intralingual (the dialogue and subtitles are in the same language)
2. Standard or interlingual (e.g. English dialogue and mother tongue subtitles)
3. Reversed (e.g. mother tongue dialogue and English subtitles).
In some countries the term “captions” is used to refer to intralingual subtitles although the terms
are sometimes used interchangeably. Because subtitles are generally either translations or
transcriptions of speech that have to be presented in sync with the dialogue, subtitles are on
screen for a limited time during which they have to be processed. In a multimodal presentation,
such as a subtitled video, there is constant competition between the subtitles and the moving
background they are presented on. The effect of element-interactivity (many sources of
information that need to be processed simultaneously) means that subtitles also have to
compete their share of cognitive resources with other verbal (dialogue) and non-verbal sounds
(Kruger, Swarkowska & Krejtz, 2015; Kruger & Steyn, 2014).
Although there is broad consensus on the characteristics of subtitles and captions, most of the
characteristics are interchangeable (Linebarger et al., 2010; Screenfront.ca, 2015). Table 1
provides the general differences between subtitles and captions. For this study, however, the
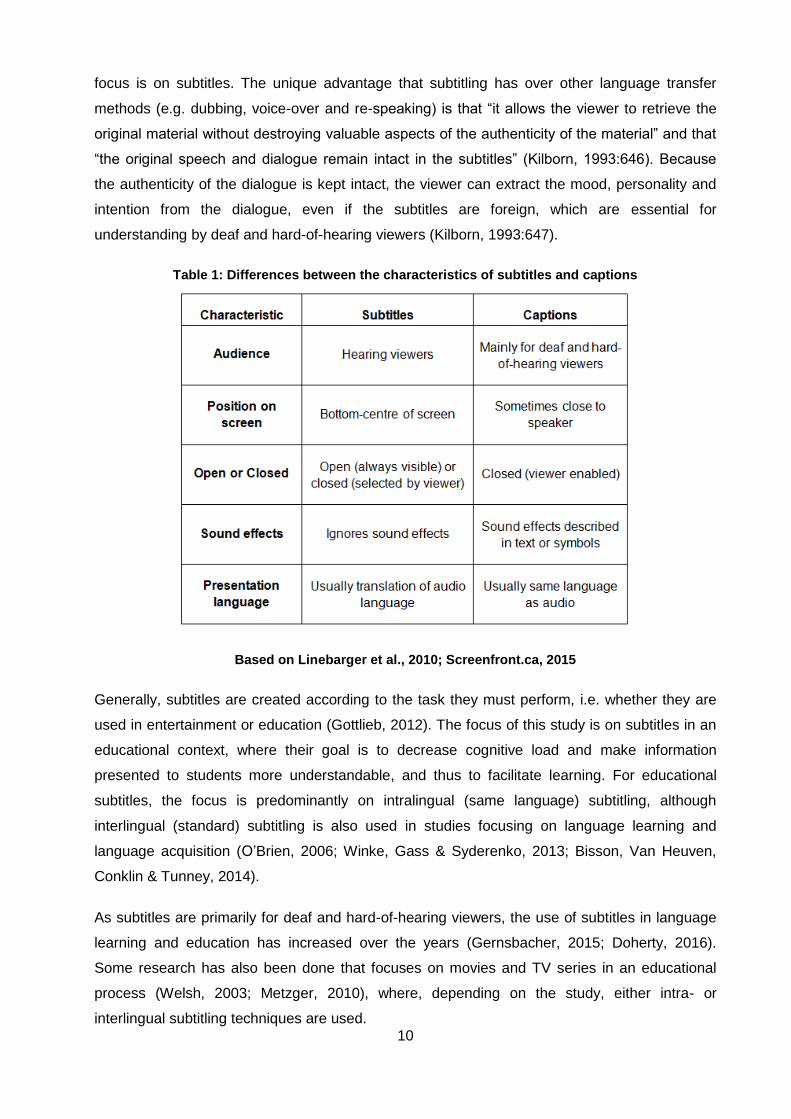
10
focus is on subtitles. The unique advantage that subtitling has over other language transfer
methods (e.g. dubbing, voice-over and re-speaking) is that “it allows the viewer to retrieve the
original material without destroying valuable aspects of the authenticity of the material” and that
“the original speech and dialogue remain intact in the subtitles” (Kilborn, 1993:646). Because
the authenticity of the dialogue is kept intact, the viewer can extract the mood, personality and
intention from the dialogue, even if the subtitles are foreign, which are essential for
understanding by deaf and hard-of-hearing viewers (Kilborn, 1993:647).
Table 1: Differences between the characteristics of subtitles and captions
Based on Linebarger et al., 2010; Screenfront.ca, 2015
Generally, subtitles are created according to the task they must perform, i.e. whether they are
used in entertainment or education (Gottlieb, 2012). The focus of this study is on subtitles in an
educational context, where their goal is to decrease cognitive load and make information
presented to students more understandable, and thus to facilitate learning. For educational
subtitles, the focus is predominantly on intralingual (same language) subtitling, although
interlingual (standard) subtitling is also used in studies focusing on language learning and
language acquisition (O’Brien, 2006; Winke, Gass & Syderenko, 2013; Bisson, Van Heuven,
Conklin & Tunney, 2014).
As subtitles are primarily for deaf and hard-of-hearing viewers, the use of subtitles in language
learning and education has increased over the years (Gernsbacher, 2015; Doherty, 2016).
Some research has also been done that focuses on movies and TV series in an educational
process (Welsh, 2003; Metzger, 2010), where, depending on the study, either intra- or
interlingual subtitling techniques are used.
11
Subtitles are part of a multimodal, polysemiotic, audiovisual text. Polysemiotic means that
subtitles are part of an array of channels that communicate simultaneously to the viewer. For a
multimodal, polysemiotic, audiovisual text, this means that it consists of four channels that
deliver information simultaneously, which is defined by Gottlieb (1998; 2012) as:
a visual-verbal channel (e.g. subtitles and captions)
a verbal-auditory channel (e.g. words uttered by an on- or off-screen character,
narrator or presenter)
a nonverbal-auditory channel (e.g. sound effects and music)
a nonverbal-visual channel (e.g. the speaker or presenter himself or herself,
illustrations, diagrams, graphs, etc.).
Because subtitles are such a new source of instructional aid, not much research has been done
on reading text in the presence of moving images (e.g. subtitles on video), the focus being more
on static reading (e.g. books, newspapers, etc.). Unfortunately, it is difficult to apply findings on
static text reading to the reading of text in the presence of video, because although both are
text, the volume of text and the environment they are presented in are completely different.
2.3 Reading static text versus dynamic text in the presence of video
As previously mentioned, research done on subtitle reading, in contrast to research on static
text reading, has received comparatively little scientific attention. Kruger et al. (2015) ascribe the
reluctance to do research on subtitle reading to the complex nature of the environment in which
subtitles are presented (Kruger et al., 2015). It was not until the late 1980s that subtitle
processing became the object of academic study, gaining momentum in recent years with the
focus divided between vocabulary learning, comprehension (or retention) of information,
language acquisition and language proficiency training (Gottlieb, 2002).
Because subtitles appear and disappear as “one or more lines of written text presented on the
screen in sync with the original verbal content” (Gottlieb, 2002:2), they are in fact “dynamic” in
nature. Subtitles are also sometimes referred to as “televised, on-screen print” (Linebarger et
al., 2010:150), but this does not imply that they attribute the same cognitive complexity as the
reading of static text (e.g. newspapers, magazines, books, e-books, etc.). The difference
between subtitles and static text can be made clearer by plotting both types of text according to
their audiovisual communication capabilities on a graph (see Figure 2). The graph is based on a
concept by Zabalbeascoa (2008) and is divided into four quadrants. In each of the four
quadrants the extremes of each quadrant are represented in terms of the degree of verbal, non-
12
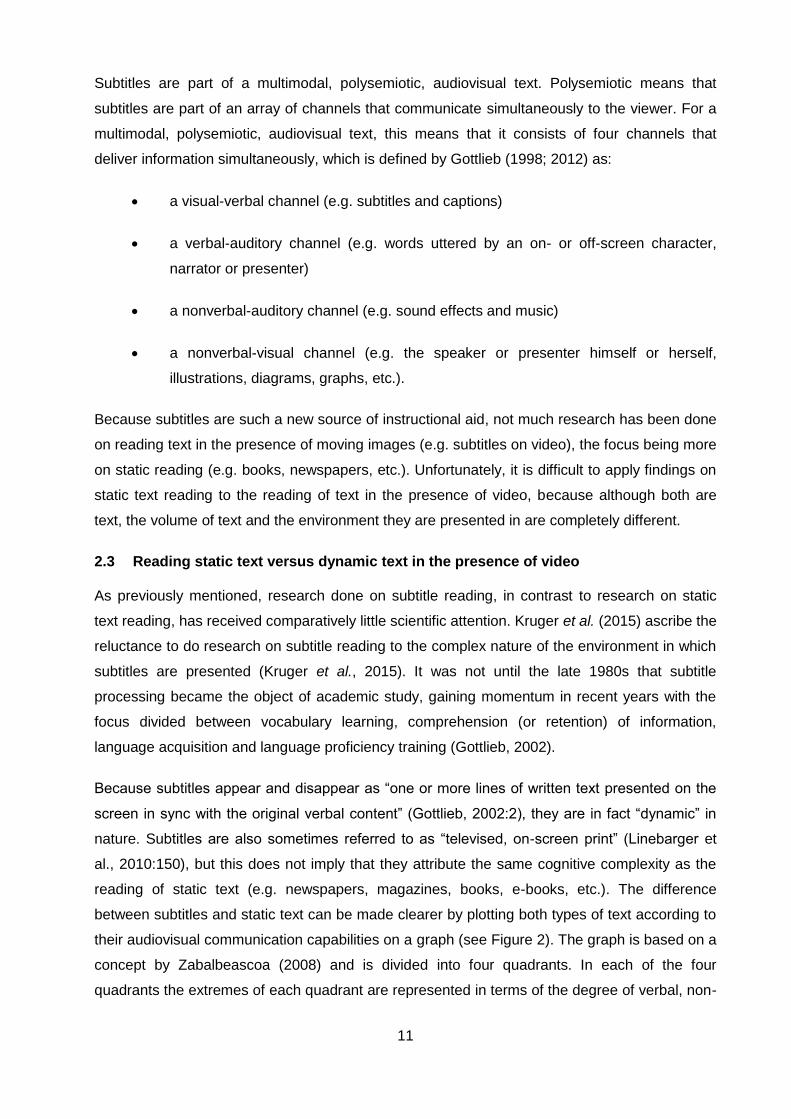
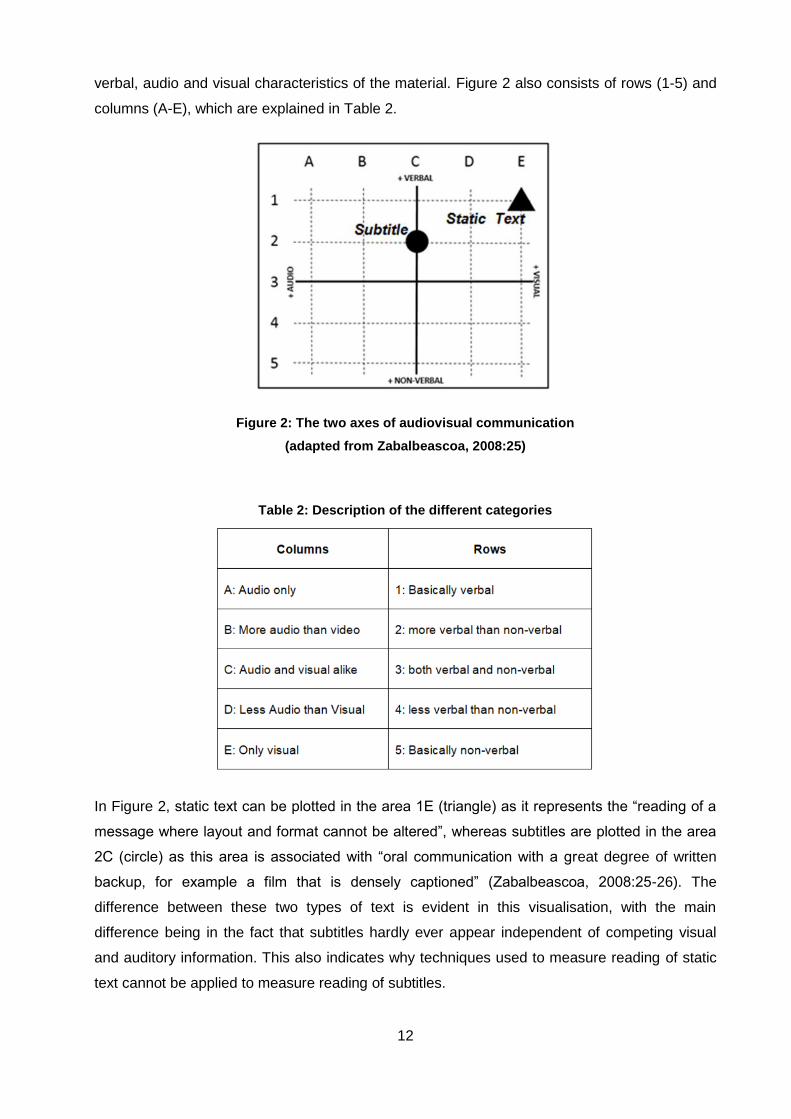
verbal, audio and visual characteristics of the material. Figure 2 also consists of rows (1-5) and
columns (A-E), which are explained in Table 2.
Figure 2: The two axes of audiovisual communication
(adapted from Zabalbeascoa, 2008:25)
Table 2: Description of the different categories
In Figure 2, static text can be plotted in the area 1E (triangle) as it represents the “reading of a
message where layout and format cannot be altered”, whereas subtitles are plotted in the area
2C (circle) as this area is associated with “oral communication with a great degree of written
backup, for example a film that is densely captioned” (Zabalbeascoa, 2008:25-26). The
difference between these two types of text is evident in this visualisation, with the main
difference being in the fact that subtitles hardly ever appear independent of competing visual
and auditory information. This also indicates why techniques used to measure reading of static
text cannot be applied to measure reading of subtitles.
13
What also makes subtitles more difficult to read is that they are mostly presented on moving
backgrounds (videos) and the attention of the viewer is constantly shifting, resulting in split
attention (Kruger et al., 2015). Another important difference between subtitles and static text
concerns the pace of reading. For static texts, the pace of reading is controlled by the reader,
whereas for subtitles, the reader has no control over the presentation speed and therefore has
to adjust his or her pace of reading accordingly. This is because the subtitles have to be
presented in sync with the dialogue or narration of the stimulus (e.g. a video) being watched.
They also constantly disappear, which means that the viewer cannot re-read the text as in static
texts.
Because of the above-mentioned differences between static and dynamic texts, the analyses
found to work for static text cannot be applied unaltered to dynamic text reading. It is thus
necessary to find a method to examine the interaction between different sources of information.
In the late 1900s, with the integration of computer-based multimedia material in education, a
new research field emerged, known as multimedia learning. Multimedia is the incorporation of
different materials (sounds, pictures, videos, subtitles, etc.) into one complete learning
experience.
Multimedia learning mainly focuses on the way learners process and integrate words and
pictures (Mayer, 2002a). The principle of multimedia learning is built on the notion that a person
learns better from stimuli that combine both words and pictures than from one that consists of
words alone (Mayer, 2002a; Mousavi, Low & Sweller, 1995). However, research on the addition
of an extra, third source of information (e.g. text), along with material containing both visual and
auditory information, has provided no conclusive evidence on whether the cognitive processing
capacity of the viewer will be influenced positively or negatively. In order to determine the
cognitive effects induced by adding subtitles (text) to, for example, an educational video, the
different modalities (i.e. visual-verbal, verbal-auditory, nonverbal-auditory and nonverbal-visual)
must be examined according to their effect on cognitive load. These modalities must be tested
in isolation to determine what amount of cognitive load they impose on an individual. In order to
determine the effect on cognitive load, the field of Educational Psychology, more specifically
cognitive load theory and the effect of cognitive load on multimedia elements, must be explored.
2.4 Cognitive load theory and cognitive load
Since the turn of the century, cognitive load theory has been following two distinct branches.
One branch focuses on the development of knowledge through basic human cognitive
architecture, while the other branch focuses on the effects of instructional design on cognitive
functions. Cognitive load theory “is mainly concerned with the learning of complex cognitive
tasks …” and “… the relationship between working (short-term) and long-term memory and the
14
effect of their relationship on learning and problem solving ...” (Pass, Renkel & Sweller,
2004:11; Diao, Chandler & Sweller, 2007:237).
2.4.1 Short-term (or working) memory
Short-term or working memory is the memory used for all our conscious activities (Kirschner,
2002) and plays an essential role in the selection, organisation and integration of processes to
manage information (Schmidt-Weigand, 2006). Recent models of cognitive load describe
working memory as “mechanisms and processes that control, regulate, and actively maintain
task-relevant information” (Brünken, Plass & Leutner, 2003:54). The architecture of working
memory consists of two sub-systems: one used for auditory/verbal material (e.g. spoken text or
music) and the other used for visual (two- or three-dimensional) information (e.g. texts or
pictures) (Pass, Renkel & Sweller, 2004). It is also assumed that both of these components are
limited in capacity and independent of one another (Brünken et al., 2003). This means that “the
processing capacities of one system cannot compensate for lack of capacity in the other.”
(Brünken et al. 2003). This is known as the limited capacity assumption (Mayer, 2002b), which
further implies that if a viewer is only presented with visual information, the visual processing
channel will be overwhelmed, which could lead to cognitive overload and a decrease in
learning.
Because working memory is used both to organise and process information, its processing
capabilities are limited to only two or three items of information simultaneously (Kirschner,
2002), and it can only store up to seven items at a time (or nine chunks of data). Furthermore, it
is capable of handling information for a maximum of 20 seconds (Van Merriënboer & Sweller,
2005; Baddeley, 1986), which implies that working memory is limited with regard to the amount
of information elements it can process at once (Van Merriënboer & Sweller, 2005) and steps
should be taken to limit the amount of information. It should also be noted that the limited
processing capability of this working memory (i.e. working memory capacity) is different for each
individual. For research purposes it is, however, important to be able to determine the amount of
information an individual can process at a time, as this can help to determine whether cognitive
overload has occurred.
2.4.2 Working memory capacity
Working memory capacity refers to the amount of information and the duration that information
can be kept in working memory to be processed and eventually stored in long-term memory.
Generally, the way to determine working memory capacity of an individual is through a working
memory span task. Working memory span tasks are based on Baddeley and Hitch’s (1974)
principle that working memory consists of a temporary memory capacity in which information is
15
tagged to be either relevant for processing or not. Engle (2002:20) discusses the idea that
working memory capacity is not only about “individual differences in how many items can be
stored …” but also “… the ability to control attention to maintain information in an active, quickly
retrievable state.”
Working memory capacity is therefore not only useful to determine the amount of information a
person can remember, but it is also necessary for an individual to retain a single representation
of information (Engle, 2002). It is also important to note that working memory capacity is not
only directly related to the storing of information in memory, but is also related to the ability an
individual has to use attention to suppress information for quick access and recall. Working
memory capacity can therefore also be used as an indication of an individual’s ability to use
attention and avoid distractions and focus on the task at hand.
Research has shown that performance on working memory capacity correlates with
performance on a variety of higher-order cognitive tasks (Engle, 2002), such as:
reading and listening comprehension
complex learning
language comprehension
vocabulary learning
writing
In general, four types of working memory-span tasks are used to measure working memory
capacity, namely: reading-span, digit-span, counting-span, and operation-span tasks (Engle,
2002). In each of these tasks the subject receives items to recall while also performing another
attention-demanding task which is presented simultaneously with the items needed for recall.
Methodologically speaking, studies have shown that working memory-span tasks are both
reliable and valid measures of working memory capacity (Conway, Kane, Bunting, Hambrick,
Wilhelm & Engle, 2005).
2.4.3 Long-term memory
Long-term memory, in contrast to working memory, is believed to be a memory with unlimited
storage capacity, and thus a permanent record of everything that we have learned. Long-term
memory is what we use to make sense of and give meaning to what we are doing and is the
repository for more permanent knowledge and skills (Bower, 1975). The storage in long-term
16
memory is assumed to be based on association, as different items are related to one another
based on the current context being perceived (Ericsson & Kintsch, 1995).
As long-term memory is deemed to be a large repository of schematically organised information,
it is central to human cognition (Van Merriënboer & Sweller, 2005) and is able to change the
processing capability of working memory from limited to unlimited (Paas, Renkel & Sweller,
2004). The process of schematically organising information into associative relations is known
as schema theory (Kirschner, 2002). Schema theory suggests that knowledge is stored in long-
term memory in the form of schemata (Kirschner, 2002). In order to construct schemata in long-
term memory, novel information first needs to be processed by working memory (Van
Merriënboer & Sweller, 2005). When these schemata are integrated and repeatedly applied,
their production rules can sometimes become automated (Kirschner, 2002).
When schemata become automated, working memory is freed up for other activities because
the automated schemata do not need a lot of memory resources to be processed by working
memory. Because automated schemata are self-acting, it means that schemata can contain
huge amounts of information, but are processed as one unit of information, since working
memory is not limited to either the size or complexity of an element when processing
information (Ericsson & Kintsch, 1995). This is the reason why giving instructional help to novice
learners can be beneficial to their learning (new information), but when the same instructional
help is given to advanced students the help may seem redundant or unnecessary, because the
prior knowledge is better for the advanced learners. However, because automation requires a
great deal of practice and repetition, automated schemata can only be developed for certain
aspects of performance that are consistent across specific problem situations (Ericsson &
Kintsch, 1995), such as learning to ride a bicycle or driving a car. Because learning is not a
natural process, the act of learning is mostly affected by two factors: 1) the degree of complexity
of the new material; and 2) the manner in which the information on this material is presented
(Leppink & Van den Heuvel, 2015). These are also the aspects that contribute to the cognitive
load imposed by the material.
2.4.4 Cognitive load
Cognitive load can be defined as “a multi-dimensional construct representing the load that
performing a particular task imposes on the learner’s cognitive system.” (Paas, Tuovinen,
Tabbers & Van Gerven, 2003:64). Cognitive load is also central to cognitive load theory,
because it imposes strain on the functionality of working memory, and therefore can alter
learning efficiency. Paas and Van Merriënboer (1993) describe cognitive load as containing
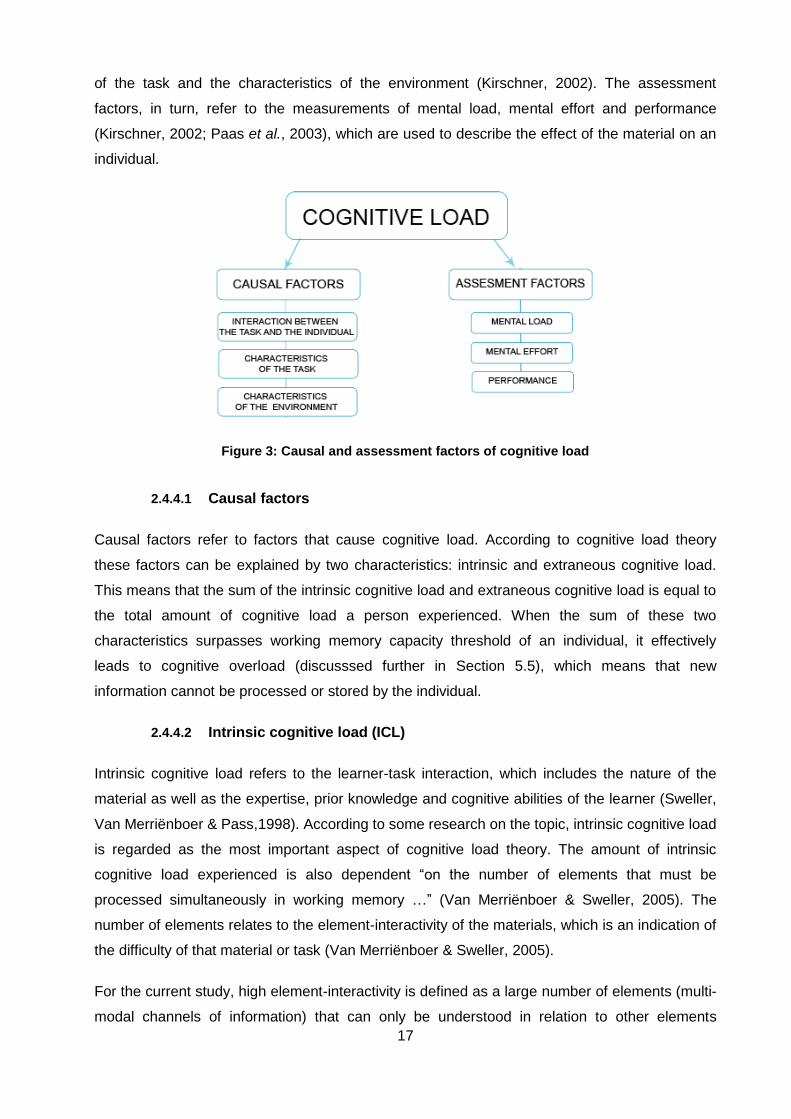
both causal and assessment factors (see Figure 3). The causal factors refer to the interaction
between the task and the characteristics of the individual, as well as between the characteristics
17
of the task and the characteristics of the environment (Kirschner, 2002). The assessment
factors, in turn, refer to the measurements of mental load, mental effort and performance
(Kirschner, 2002; Paas et al., 2003), which are used to describe the effect of the material on an
individual.
Figure 3: Causal and assessment factors of cognitive load
2.4.4.1 Causal factors
Causal factors refer to factors that cause cognitive load. According to cognitive load theory
these factors can be explained by two characteristics: intrinsic and extraneous cognitive load.
This means that the sum of the intrinsic cognitive load and extraneous cognitive load is equal to
the total amount of cognitive load a person experienced. When the sum of these two
characteristics surpasses working memory capacity threshold of an individual, it effectively
leads to cognitive overload (discusssed further in Section 5.5), which means that new
information cannot be processed or stored by the individual.
2.4.4.2 Intrinsic cognitive load (ICL)
Intrinsic cognitive load refers to the learner-task interaction, which includes the nature of the
material as well as the expertise, prior knowledge and cognitive abilities of the learner (Sweller,
Van Merriënboer & Pass,1998). According to some research on the topic, intrinsic cognitive load
is regarded as the most important aspect of cognitive load theory. The amount of intrinsic
cognitive load experienced is also dependent “on the number of elements that must be
processed simultaneously in working memory …” (Van Merriënboer & Sweller, 2005). The
number of elements relates to the element-interactivity of the materials, which is an indication of
the difficulty of that material or task (Van Merriënboer & Sweller, 2005).
For the current study, high element-interactivity is defined as a large number of elements (multi-
modal channels of information) that can only be understood in relation to other elements
18
(polysemiotics) and which require more cognitive resources to process. For example, in a
multimedia presentation, an individual needs to process the information of various elements (the
dialogue, video, pictures and other sounds) in order to make sense of the instruction or task
provided, i.e. high element-interactivity. Low element-interactivity, on the other hand, refers to a
lesser amount of interactivity between elements, to such an extent that each element can be
processed separately and in isolation without any reference to others (Van Merriënboer &
Sweller, 2005). For example, when someone learns the vocabulary of a foreign language, each
word can be learned in isolation without any problems, because the information of the previous
words learned is not necessary to process and learn the next word in the list.
It must also be noted that the difficulty of a task is dependent on the abilities of the individual
carrying out that task. Given a specific number of elements in a task, the more knowledgeable a
person is, the less that person will experience the effect of intrinsic cognitive load. This is due to
schemata that have already been formed in long-term memory, by the knowledgeable person,
for this specific task. The opposite effect can also occur. This means that the same material can
be experienced as redundant for a knowledgeable person but beneficial for a novice and is
known as the expertise reversal effect. Knowing this, the task of determining the intrinsic
cognitive load on an individual can be difficult, as the determination must be done for a specific
person, on a specified task, with a specified level of difficulty (De Jong, 2010).
2.4.4.3 Extraneous cognitive load (ECL)
Unlike intrinsic load, extraneous load is caused by the way information or materials in a task are
presented (Brünken et al., 2003), and does not facilitate comprehension and learning, but can
be raised or lowered by external factors (Van Merriënboer & Sweller, 2005). Extraneous load
generally results from an unnecessarily high degree of element-interactivity in working memory,
which leads to irrelevant cognitive activities – activities not directed to schema acquisition or
automation (Schnotz & Kürschner, 2007). Generally, extraneous cognitive load occurs when a
task needs to be completed under unfavourable conditions or environments and where the task
difficulty is not aligned with the learner’s level of expertise. In other words, if effective learning is
to take place during this task, the amount of extraneous cognitive load imposed will have to be
reduced.
Early research measuring the effect of cognitive load only measured the total amount of
cognitive load induced, but has thus far not been able to find any measurement techniques to
differentiate between the different causal factors of cognitive load (Paas et al., 2003). In the last
three to four years, however, new methods (in the form of questionnaires) have emerged to
measure separately each cause of the cognitive load (Leppink, Paas, Van der Vleuten, Van
Gog & Van Merriënboer, 2013; Leppink & Van den Heuvel, 2015). By minimising the number of
19
elements that influence cognitive load, these questionnaires make it easier to pin-point the
specific type of cognitive load that has an effect on a specific task for a specific individual.
2.4.4.4 Germane cognitive load (GCL)
According to Paas et al. (2003:65) germane cognitive load is “the load related to processes that
contribute to the construction and automation of schemas.” Germane cognitive load also “refers
to working memory resources that the learner devotes to dealing with the intrinsic cognitive load
associated with the information.” (Sweller, 2010:126). This means that the process of learning
can occur without germane cognitive load, as it only improves the process of learning and does
not help to initiate it (Schnotz & Kürschner, 2007). Germane cognitive load is also limited by the
learner’s self-regulations and general learning orientations (Schnotz & Kürschner, 2007). For
example, the learners’ willingness to use their full mental capacity to process a specific task in
order to enhance their learning can affect the formation of schemata and therefore also the
impact of germane cognitive load. This also means that the cognitive processing ability of an
individual is not only influenced by the task being performed, but also by individual factors such
as the viewer’s current skill set (e.g. reading, prior knowledge, etc.) and the general cognitive
capacity of the viewer (Linebarger et al., 2010).
For many years germane cognitive load has been deemed a third characteristic of the causal
factors of cognitive load. However, in recent years, the theory of cognitive load has been
revised, and new evidence suggests that germane cognitive load is a mere sub-type of intrinsic
cognitive load (Leppink & Van den Heuvel, 2015). This new classification was due to the
conceptual and methodological issues to quantify germane cognitive load as a measure of
learning and as a process involved in schema formation (Leppink & Van den Heuvel, 2015).
Cognitive load theory is therefore reliant on working memory capacity of an individual. The more
memory capacity is needed to process the presentation mode of the material (extraneous
cognitive load), the less capacity remains to deal with other, intrinsic elements (intrinsic
cognitive load). The assessment factors of cognitive load indicate the effect this lack of memory
capacity has on learning.
2.4.5 Assessment factors
Research conducted on the assessment of cognitive load has been limited, as these factors are
associated with the measurable effect of cognitive load and are indicators of the effect of
cognitive load, rather than a cause. Assessment factors are then the means with which
cognitive load is measured and include mental load, mental effort and performance.
20
Mental load is the aspect of cognitive load that originates from the interaction between task and
subject characteristics (Paas et al., 2003). Because mental load can indicate the expected
cognitive capacity demands of an individual, it can provide an indication of an estimated
cognitive load on an individual (Paas et al., 2003) while a task is performed.
Mental effort refers to the capacity or number of resources that are actually allocated to
accommodate the task demands (Paas & Van Merriënboer, 1993). This means that mental
effort is associated with the cognitive capacity allocated to the task being performed (Kirschner,
2002) and can therefore reflect on actual cognitive load experienced by an individual during the
task (Paas et al., 2003). The amount of mental effort invested can also be referred back to the
extraneous, causal factor of cognitive load.
The last of the assessment factors, performance, is determined by the achievements of the
individual completing a task. This is usually measured by the number of errors or the completion
time for the task (Paas et al., 2003). This means that performance can either be determined
during the completion of a task or thereafter (Paas et al., 2003). According to Kirschner
(2002:4), an individual’s performance encompasses all the aforementioned cognitive load
factors as it “is a reflection of mental load, mental effort and the aforementioned causal factors.”
When any one of these assessment factors is very low for a certain task, it could be an
indication that an individual has experienced cognitive load, and this means that the individual
was unable to complete the task successfully.
2.4.6 Cognitive overload
Due to the limited capacity associated with working memory and the complex nature of an
audiovisual environment (competition between four channels of audiovisual text), there is a
reasonable possibility that exposure to a multi-modal, audiovisual text may result in cognitive
overload. At the very least it could have a negative impact on the cognitive resources of an
individual required to engage in learning (Tracy & Albers, 2006). A higher amount of cognitive
load typically has negative effects on learning (Paas & Van Merriënboer, 1993) because the
cognitive load produced by learning is altered (or limited) if cognitive overload occurs (Khalil, et
al., 2005). As previously mentioned, the cognitive load measured for a task is generally
determined by the sum of the extraneous cognitive load and the intrinsic cognitive load. As
working memory has a limited capacity, the relationship between working memory capacity and
cognitive load can provide an indication of whether an individual has experienced cognitive
overload or not. There are consequently certain scenarios where cognitive overload can occur
(Mayer & Moreno, 2003), namely: the overloading of the visual channel, both the visual and
auditory channels, format-related attributes of a material (extraneous cognitive load), overload
21
caused by redundant information and the overload of channels throughout consecutive material
presentations (Mayer & Moreno, 2003). However, because these scenarios have been
identified, there are steps that can be taken to prevent cognitive overload.
Van Merriënboer, Schuurman, De Croock & Paas (2002) mention controlling the amount of
intrinsic cognitive load imposed on individuals to decrease the formation of cognitive overload.
This is done by exposing individuals to a task in sequence, from a simple representation to a
gradually more complex version of the task, until the full complexity of the task is experienced.
This approach seems to lower the effect of experiencing the full onset of the task from the start,
which also lowers the amount of intrinsic cognitive load (i.e. task difficulty) imposed on the
individual. Pollock, Chandler & Sweller (2002) also mention a procedure in which one can
reduce the influence of intrinsic cognitive load by first presenting different elements of a task in
isolation and then presenting more elements together, until the full complexity of the task is
revealed and processed. Gerjets, Scheiter & Catrambone (2004) also mention that by training
with small parts of a task separate from the other parts (part-whole sequencing), one can
reduce the impact of intrinsic cognitive load. The reverse of this procedure can also be used by
exposing an individual to the full complexity of the task, but only focusing their attention on
smaller parts of the task in sequence (Van Merriënboer, Kester & Paas, 2006). By implementing
one or all of these steps to design instructional material, it seems possible to counter the effects
that may introduce cognitive overload.
2.4.7 Summary of the use of cognitive load theory to analyse audiovisual texts
For this study, it seems that the effect of extraneous cognitive load will play a major role in
distinguishing the effectiveness of different presentation modes on performance. As explained
in the previous sections, extraneous cognitive load is the load caused due to the format of the
task being presented. Because working memory consists of two processing channels (visual
and auditory) it is hypothesised that exposing individuals to information in more than one
channel may result in increased cognitive load, particularly if there are different levels of
redundancy between the information in the different channels. It is thus possible that a subtitled
video, which contains information in more than one channel simultaneously, may increase the
extraneous cognitive load but also decrease the performance. This also means that watching a
subtitled video could hinder the formation of schemata, which in turn means that less
information would be stored in long-term memory, which then leads to a decrease in
performance and retention of information. This lack in memory processing may also result in
cognitive overload. However, there are ways to minimise the effect of extraneous load and
prevent cognitive overload from occurring. One such approach is through the instructional
design of learning material. The following section will explore this field in order to determine to
22
what extent subtitled video could be designed in a way that will counter the dangers of
increased cognitive load.
2.5 Instructional design
Whereas the previous section focused on the effects of the development of knowledge on
cognitive load, this section will focus on the effects of instructional design on cognitive load,
known as instructional design theory. Instructional design theory “encompasses the analysis of
learning and performance problems, and the design, development, implementation, evaluation
and management of instructional and non-instructional processes and resources intended to
improve learning and performance in a variety of settings” (Reiser, 2001:57). Instructional
design theory therefore offers explicit guidance to help with the learning and development of
people in more efficient ways (Reigeluth, 1999). It may also include cognitive, emotional,
physical or spiritual types of learning and development (Reigeluth, 1999). The main purpose of
instructionally designed material is to assist with a “deep understanding of the material, which
includes attending to important aspects of the presented material, mentally organizing it into a
coherent and cohesive structure, and integrating it with relevant existing knowledge” (Mayer &
Moreno, 2002:43).
According to Tempelman-Kluit (2006), the goal of instructional design is also to decrease the
cognitive load on a limited working memory and to ensure that long-term memory is used more
often to assist with processing. In order to achieve this goal, instructional designers usually
employ three different strategies: i) the reduction of information that is irrelevant to the learning
of a task; ii) the grouping and separating of different sources of information; and iii) aiming to
use both verbal and visual processing channels (Tempelman-Kluit, 2006). Because intrinsic
cognitive load (task-learner interaction) may also have an impact on the effectiveness of
instructionally designed material, it will also be considered as a fourth strategy that can be
implemented by instructional designers to facilitate the lowering of processing strain on working
memory. These strategies are explained in more detail below.
2.5.1 The reduction of information irrelevant to learning
Given the limited capacity of working memory, it is not unusual to find that instructional materials
that contain several information elements which are presented in different modalities, will place
some type of cognitive strain on the processing of working memory. This type of cognitive strain
is usually related to the format of the instructional material. It is not surprising then that most
research on instructional design focuses on eliminating irrelevant (or redundant) information that
may impose extraneous cognitive load on an individual.
23
Schnotz and Kürschner (2007) identify five situations in which extraneous cognitive load can
occur:
Complex element-interactivity: This scenario occurs when the element-interactivity of
a task is too complex for the individual’s working memory to process, and this results in
exaggerated interactivity between relevant information (as a result of an over-
complicated design). This usually occurs for task novices, as they do not possess a
sufficient amount of schemata to deal with the complexity of the information provided.
The cognitive load imposed on working memory then prohibits learning and may result
in cognitive overload. This may therefore occur in subtitled video, which also includes a
large amount of relevant visual information.
Split attention effect: This scenario occurs when individuals have to split their
attention so as to integrate different sources of information displayed at different times
in order to complete a given task. Here the extraneous cognitive load is caused by the
individual needing to apply more cognitive effort to keep the information in working
memory because of limitations to the processing time of working memory. This
increase of cognitive effort results in a high cognitive load on working memory, which
means a lower performance on the task. In subtitled video this may occur when a
sentence is distributed over too many consecutive subtitles, requiring viewers to keep a
lot of information in their working memory to complete the processing of the sentence.
There may also be interaction between this effect and high element-interactivity.
Redundancy effect: This scenario occurs when an individual’s expertise is higher than
is needed to complete a task. For example, if a learner with an advanced level of
expertise is given a picture (or diagram), which is completely understandable, together
with a text explaining the diagram, the text will be deemed to be redundant information
for understanding the diagram. This is known to cause extraneous cognitive load due
to the extra, unnecessary load imposed on working memory to process the additional
information. This usually occurs in subtitled educational videos, where graphs (or
tables) and the explanation thereof appear simultaneously with subtitles.
Processing of superficial information: This scenario is usually caused by the
processing of superficial information by working memory, for example, when an
individual is given a diagram which is perfectly aligned with the expertise of the
individual, but also consists of integrated, explanatory text. The effect of trying to
integrate the elements in the diagram with elements in the text may cause unnecessary
strain (extraneous cognitive load) on working memory (Kalyuga 2000; Kalguya,
Chandler & Sweller, 2000).
24
Low element-interactivity: Extraneous cognitive load is also known to occur when
there is low element-interactivity, for example, when a learner is given two sources of
the same information to learn one after the other, and both sources are of equivalent
intelligibility. The fact that both sources of information are equally understandable
results in extraneous cognitive load, because the second source of information is
deemed unnecessary for learning. Kalguya, Chandler and Sweller (1998) reason that
processing unnecessary information is irrelevant for learning and that the
corresponding cognitive load counts as extraneous. This means that the effect of
extraneous load is mostly due to the waste of time and effort even if there is low to no
element-interactivity present.
Because most of these effects are contributors to cognitive load, this study focuses on the
degree to which they apply to subtitled educational stimuli.
2.5.2 Enhancing schemata formation in long-term memory
The second purpose of instructional design is to enhance schema formation in long-term
memory by either grouping or separating different sources of information. Because instructional
design works on the principle that the human cognitive architecture includes a substantial long-
term memory that holds uncountable schemas, a well-designed instruction should, therefore,
encourage schema construction and automation of certain procedures or skills (Van
Merriënboer et al., 2002, Paas, Renkel & Sweller, 2003). It is therefore important for
instructional designers to take into consideration how information is stored and processed in
long-term memory when developing instructional material (Pass & Van Merriënboer, 1993). For
the correct knowledge to be gained in long-term memory, instructional material needs to be
presented in such a way that it reduces the load on working memory. The aim then of
instructional material should be to accumulate rapidly systematised, coherent knowledge in
long-term memory (Pass & Van Merriënboer, 1993).
This is, however, not always possible as working memory is limited in its processing power,
which can result in overload of working memory capacity. Overload of working memory may
either be due to an individual’s lack of combining certain relevant sources of information (e.g.
cognitive flexibility), and redundant information that needs to be separated (e.g. redundancy
effect). The contiguity effect also comes into play here. This is when some relevant sources of
information (that need to be processed together) are separated either by their position in the
material (spatial) or by display time (temporal), which could also have an effect on working
memory capacity. For a subtitled video to be designed to overcome the effect of cognitive
overload, the subtitles need to be synchronised with the dialogue. This means that the subtitle’s
display time must precisely follow the dialogue in the video in order to limit the effect of cognitive
25
flexibility and contiguity. However, it is still unclear as to what extent the subtitled video might
cause any of the effects identified above.
2.5.3 The effect of instructional design on the causal factors of cognitive load
The majority of studies in the traditional cognitive load theory approach to instructional design
have focused on reducing extraneous cognitive load (see for example Mayer & Chandler, 2001;
Mayer & Moreno 2002; 2003). Cognitive load theory therefore predicts that learning will become
more efficient when using instructional techniques such as goal-free problems, worked
examples and completion problems to lower extraneous load (Van Merriënboer et al., 2003).
This principle works as follows: if intrinsic cognitive load is high and extraneous cognitive load is
low, learning will take place. This is due to the devotion of large portions of cognitive resources
to processing the element-interactivity (difficulty) of the task, which means that if materials are
designed so that cognitive processing is focused solely on the task (intrinsic), it will increase
schema formation, which in turn will improve learning.
Furthermore, when instructionally designed material results in unused working memory
capacity, because of low intrinsic cognitive load of the instructional material or low extraneous
cognitive load, appropriately designed material may improve learning and also encourage
further engagement (Kirschner, 2002). There are generally three types of engagement:
1. Behavioural engagement: This encompasses a student’s effort, persistence,
participation and compliance with learning structures.
2. Cognitive engagement: This is a matter of the student’s will: how students feel
about themselves and their work, their skills and the strategies they employ to master
their work (Metallidou & Vlachou, 2007).
3. Emotional or relational engagement: This relates to the student’s feelings or
interest, happiness, anxiety and anger during achievement-related activities (Skinner
& Belmont, 1993).
2.5.4 The difficulty of developing instructional material that imposes no
extraneous cognitive load
The question then arises as to whether it is indeed possible to design material that imposes no
extraneous load. De Jong (2010) questions whether it is indeed possible to design instructional
material that is completely free of extraneous load. According to De Jong (2010), this seems not
to be the case as the reduction of extraneous cognitive load may result in unreadable material.
He also reasons that a better option would be to spread information throughout material rather
than clumping all of the information in one area (De Jong, 2010). This reasoning also seems to
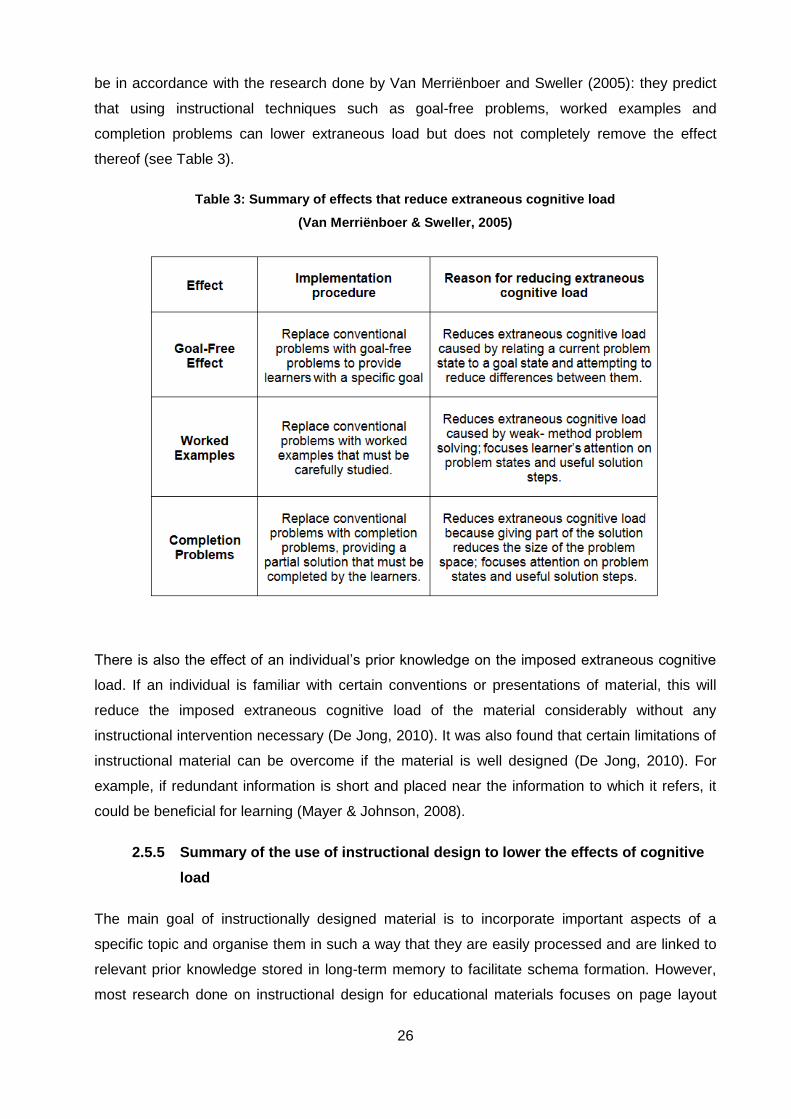
26
be in accordance with the research done by Van Merriënboer and Sweller (2005): they predict
that using instructional techniques such as goal-free problems, worked examples and
completion problems can lower extraneous load but does not completely remove the effect
thereof (see Table 3).
Table 3: Summary of effects that reduce extraneous cognitive load
(Van Merriënboer & Sweller, 2005)
There is also the effect of an individual’s prior knowledge on the imposed extraneous cognitive
load. If an individual is familiar with certain conventions or presentations of material, this will
reduce the imposed extraneous cognitive load of the material considerably without any
instructional intervention necessary (De Jong, 2010). It was also found that certain limitations of
instructional material can be overcome if the material is well designed (De Jong, 2010). For
example, if redundant information is short and placed near the information to which it refers, it
could be beneficial for learning (Mayer & Johnson, 2008).
2.5.5 Summary of the use of instructional design to lower the effects of cognitive
load
The main goal of instructionally designed material is to incorporate important aspects of a
specific topic and organise them in such a way that they are easily processed and are linked to
relevant prior knowledge stored in long-term memory to facilitate schema formation. However,
most research done on instructional design for educational materials focuses on page layout
27
and multimedia presentations (e.g. animations in slide shows and videos), with little focus on the
instructional design of videos with subtitles. Although there are standardised rules which
professionally subtitled material needs to adhere to, the main focus of these rules on facilitating
reading and not on the instructional efficiency of the subtitled videos as educational material.
This may explain the inconclusive results regarding whether or not subtitles are beneficial for
learning.
Two of the most common problems that can occur in subtitled videos relate to the split attention
effect and the redundancy effect. The split attention effect occurs when an individual needs to
integrate different sources of information, displayed at different times, to complete a specific
task (e.g. in a multimedia presentation). This problem is more prominent with audiovisual texts
as they consist of multiple channels of information that are simultaneously in competition for
working resources. This means that, given the limited capacity and dual channel processing of
working memory, the individual watching an audiovisual text has to prioritise which of the
information channels (visual-verbal, verbal-auditory, nonverbal-auditory and nonverbal-visual)
are more important than others (known as cognitive engagement or deep processing of
information). This should be an important aspect to consider when designing instructional
materials that contain subtitles, because subtitles appear in small chunks at a time and these
chunks of information need to be kept in working memory for as long as possible until the entire
sentence is processed. This also means that when the focus is shifted away from the subtitled
area, information could be lost, which can influence the performance of an individual.
Sometimes, as is often the case with automatically generated subtitles (verbatim subtitles), the
subtitles are not fully synchronised with the dialogue and the presentation speed of the subtitles
is inconsistent. This means that individuals watching a video with verbatim subtitles have to
constantly shift their attention between the dialogue and the subtitled area to gather a sufficient
amount of information to make sense of the task. This may also result in high levels of
extraneous load and even cognitive overload.
The other effect that is present in predominantly subtitled videos is the redundancy effect of
information. The redundancy effect occurs when presenting the same information to an
individual in more than one channel of information (e.g. dialogue and picture), rendering one of
the sources unnecessary and placing additional cognitive load on working memory, for
example, when a diagram is presented on screen with dialogue and subtitles that explain the
diagram. The fact that the diagram is fully comprehensible through the dialogue alone makes
the subtitles a redundant source of information. This also causes extraneous cognitive load
(sometimes also cognitive overload), because the subtitles provide unnecessary information
needed to understand the diagram, which puts more strain on working memory.
28
It seems then that a successful subtitled video (one that facilitates learning) needs to be
designed with the minimum of redundant information and the important aspects need to be
placed in close proximity to one another to limit the effect of extraneous load and possible
cognitive overload. The following section examines studies that investigate the effects of
subtitles on performance. These studies also highlight the tension between the effective
management of cognitive load and the risk of introducing cognitive overload.
2.6 The effects of subtitles on cognitive load
For subtitles to be acknowledged as having a positive influence on learning (making difficult
materials easier to understand), they have to effectively lower the extraneous cognitive load
required to processes the original material and also increase performance on a given task.
Because a large number of different sources of information need to be processed at once in an
audiovisual text, all the sources of information are in competition with each other for working
memory resources. However, some research has found that the addition of an extra source of
information may facilitate the lowering of cognitive load, where other research has found no
noticeable effect of adding additional sources of information. This gives rise to a great amount
of uncertainty and inconsistency regarding the possible benefits of subtitles on learning and
performance. This is largely due to the fact that most of the results on performance reported by
studies on subtitles are based on assumptions, a large number of variables and different types
of material.
2.6.1 Early studies on presentation mode versus performance
One of the earliest studies done on learning was concerned with the effect of the presentation
modes of material (e.g. video vs. text) and combinations thereof on performance. This research
also indirectly measured the effect of cognitive load on the performance of individuals. In the
late 1990s, Lee and Bowers (1997) conducted an experiment to determine the effect of
multimedia components on learning. Generally, multimedia stimuli consist of a combination of
text, audio and video. For their experiment, Lee and Bowers randomly assigned participants to
one of eight experimental conditions based on the presentation mode of the stimuli:
1. Control (computer training software)
2. Audio only (auditory component of text with unrelated graphics)
3. Text only (visual component)
4. Video (animation)
5. Audio and Video;
29
6. Audio and Text
7. Video and Text
8. Audio, Video and Text.
The researchers recorded their data for each presentation mode by using a pre-test, a post-test,
the time spent on a computer training system and a spatial ability test. The results from this
study showed better performance for the “audio and graphics” and “text and graphics”
combinations than the “audio and text” combination. The results also showed better
performance when combining audio and visual components (pictures and videos) than when
testing each of the modes separately. However, the combination of three channels of
information (audio, video and text) did not provide any additional benefit to the participants than
was obtained by employing only two channels of information.
A similar study by Kim and Gilman (2008) on the effects of text, audio and graphic aids in
multimedia instruction showed that students performed better during vocabulary learning when
the information was presented to them with on-screen text and graphics. In contradiction to the
previous study, Kim and Gilman (2008) found that students performed best with material in
which the information was presented in all three channels (audio, text and graphics) rather than
just two channels.
Bird and Williams (2002) conducted two experiments that both examined the effect of single
(audio or text) and bimodal (audio and text) presentation during a word learning exercise. For
their experiment, sixteen native speakers of English and sixteen non-native speakers of English
participated. Four of the non-native speakers were Italian and the rest were Spanish speakers.
The findings from the study indicated that the fastest reaction time to recall words, for both
native and non-native groups, was during the inclusion of text. This was either with “audio and
text” or with “text only” presentation modes. However, the bimodal (two modalities) input failed
to show any significant advantage over the “audio-only” modes, suggesting that the addition of
text did not boost learning, although it did help with the recall of words. The conclusion was that
the inclusion of text (either dynamic or static text) did not make a substantial contribution
towards learning and that for both groups of participants audio was a better contributor to word
recognition memory than text only.
Although these results seem to point in the direction of the beneficial nature of text with audio
and graphics – except for the last example mentioned, which had no significant effect on
learning – the effect of adding subtitles to a video (i.e. an audiovisual text) has to date provided
contradictory evidence as to whether subtitles are beneficial for learning or not. The following

30
sections will discuss the proposed contradictory evidence for subtitle inclusion in an educational
context and whether it is beneficial or not for learning.
2.6.2 Studies on cognitive load and subtitles
Generally, research conducted on the effect of subtitles in an educational context is done in
three different focus areas or combinations thereof: 1) foreign language acquisition studies; 2)
vocabulary learning studies; and 3) comprehension (or retention) studies. According to Almeida
and Costa (2014) language acquisition can be achieved in many ways:
Watching subtitled programs may result in different kinds of language acquisition. In addition to word meaning, the viewer may learn the meaning of expressions or standard sentences, and in which situations these sentences may be used. There may also be improvement in the capability to distinguish separate words in the course of spoken language, word pronunciation, and proficiency in constructing correct sentences. (Almeida & Costa, 2014).
This statement is supported by Huang and Eskey (1999), who give five reasons why they think
captioned (or subtitled) television shows are so useful in foreign language acquisition:
Students infer the meanings of words better through the combination of pictures and
sounds of television shows (see also Neuman & Koskinen, 1992).
The entertainment quality of television makes it easier to learn from the text.
Television shows minimise the learners’ fear of failure while learning.
Students engage in making meaningful predictions of new words they encounter.
Hearing the language elaborately spoken also has a positive effect on the learner’s
language and communication skills.
In the studies discussed below, the effect of subtitles on cognitive load can be inferred from the
results of performance. In other words, when the addition of subtitles resulted in reduced
performance for a specific task, it can be inferred that the individual experienced high levels of
extraneous cognitive load (even cognitive overload), which shows that subtitles have a negative
effect on learning. On the other hand, if there was an increase in performance in tasks that
included subtitles, it means that little to no effect of extraneous cognitive load was experienced,
and further implies that the addition of subtitles was beneficial for learning.
2.6.3 Studies on subtitles and language acquisition
Mitterer and McQueen (2009) conducted a study to determine if subtitles helped with the
perceptual learning of foreign language speech. The premise of the study is that subtitles

31
provide additional lexical information, which can facilitate foreign language learning. Their study
was conducted on 121 native Dutch-speaking university students. All the students had between
seven and eight years of experience in reading and writing in English and were divided into the
following six groups for the study:
1. Australian English dialogue with English subtitles
2. Australian English dialogue with Dutch subtitles
3. Australian English dialogue with no subtitles
4. Scottish English dialogue with English subtitles
5. Scottish English dialogue with Dutch subtitles
6. Scottish English dialogue with no subtitles.
The researchers measured the performance of the students’ language acquisition by having
them repeat back 80 audio phrases from the main characters of the two videos. The findings
from the study showed that native-language subtitles caused lexical interference (hindered
learning), but that foreign-language subtitles were beneficial for speech learning, possibly
because they guided participants to reference sounds that were made for the words that were
spoken.
Rokni and Ataee (2014) conducted a study in which they tested the effect that watching English
movies had on the speaking ability of Iranian English second-language (ESL) students. Their
experiment was conducted on 38 intermediate Iranian students of English. The participants
were native Persian speakers between the ages of 13 and 17. They were divided into two
groups (experimental and control) and each student was instructed to watch 15-25 minutes of a
film segment twice a week for ten weeks (20 viewings in total). The control group watched the
segments without subtitles, while the experimental group watched the segments with English
subtitles. At the start of the experiment an Oxford placement test was used to test the students’
English proficiency. A speaking test, consisting of ten questions, was also administered before
the experiment and the students’ responses were recorded during interviews. The students’
performance was measured by the improvement of their speaking ability after watching the film.
The post-test performances indicated a considerable improvement in the English speaking
ability of the students who watched the video with English subtitles.
d’Ydewalle and Van de Poel (1999) conducted a study on the accidental foreign-language
acquisition of children watching a foreign film with subtitles. The study was conducted on 327
Dutch-speaking primary school pupils (Grades 3-6) with little or no experience in French. All the

32
children were between 8 and 12 years old and were monolingual native speakers of Dutch.
Except for the Grades 5 and 6 children, none of the other participants had any form of formal
training in French. Five different versions of the film were constructed, one for each
experimental condition, depending on the foreign language used (French vs. Danish) and
whether it was presented in the soundtrack or in the subtitles:
Dutch subtitles with a French sound track
French subtitles with a Dutch sound track
Dutch subtitles with a Danish sound track
Danish subtitles with a Dutch sound track
Dutch subtitles with a Dutch soundtrack (control condition).
Their findings indicated that the availability of a foreign language (French in this study) had no
influence on the scores for the syntax or morphology tests. In general, the results showed that
the Danish soundtrack (but not the subtitles) facilitated language acquisition, whereas neither
the French soundtrack nor the French subtitles showed any significant language acquisition.
The consensus of this study is that participants do not acquire new language skills just by
watching a foreign-language film even if they have some prior knowledge of the foreign
language.
Kvitnes (2013) conducted a study on whether subtitles were beneficial for second language
acquisition for Norwegian students of English. The study was conducted on 65 upper secondary
school students (VG1) who were specialising in general studies. The participants included 34
females and 31 males with an average age of 16. All the participants were native-language
speakers of Norwegian and were proficient in English as a second language. Findings from this
study indicate that both groups that viewed the video clip with subtitles (in both Norwegian and
English) achieved higher scores in the comprehension test than those who viewed it without
subtitles. In general, for the word recognition task, the group that had Norwegian subtitles
scored higher than the other two groups. These findings seem to indicate that native-language
subtitles have a positive effect on word definition tasks. For the lexical decision task the results
show no significant difference between the performances of the groups, with an average
difference of 2% between the group scores.
Harji, Woods and Alavi (2010) conducted a study on the effectiveness of English subtitles on
vocabulary learning for English foreign-language Iranian students. The study was conducted 92
Persian native-language undergraduate students who were studying translation. The
33
participants were divided into two groups: 1) one group watched an English video with English
subtitles; and 2) the other group watched an English video without subtitles. The students were
given a Michigan English proficiency test to record their initial English proficiency. After watching
the video they were asked to complete a content-specific test. No significant differences were
found between the two groups on their English proficiency. The findings also indicated that
there were no significant differences in both groups’ performance in the content-specific test.
For the vocabulary acquisition subset of the content-specific test, a significant difference was
found between the two groups: the group that watched the video with subtitles performed better.
In general, the findings of this study indicated that subtitles do assist English language learners
in the context of vocabulary acquisition.
Zarei (2009) conducted a study to determine which of the three modes of presenting subtitles
(bimodal, standard or reversed) contributed the best to L2-vocabulary recognition and recall.
The study was conducted with 93 native-language Persian-speaking students. The students
were divided into three groups according to the video and subtitle configuration they had to
watch: 1) English soundtrack with English subtitles (bimodal); 2) English soundtrack with
Persian subtitles (standard); or 3) Persian soundtrack with English subtitles (reversed). The
results from this study indicated that both the bimodal (English soundtrack with English
subtitles) and standard (English soundtrack with Persian subtitles) groups were better at L2-
vocabulary comprehension and significantly better than those participants who viewed the
reversed subtitles.
Etemadi (2012) conducted a study on the effect of bimodal subtitles on comprehension and
vocabulary recognition. The study was conducted with 44 senior undergraduate English
Translation students who were native-language speakers of Persian,. All of the students had
had a minimum of six years’ exposure to English reading and writing, and were between the
ages of 20 and 27. Findings from this study showed better performance in the comprehension
tests when the documentary included bimodal (same-language) subtitles. The findings,
however, show no significant differences in the vocabulary performance when watching a
documentary with or without subtitles.
Matielo, Collet and d’Ely (2013) conducted a study on the effects of interlingual and intralingual
subtitles on vocabulary learning. The study was conducted on 27 Portuguese native-language
speakers who were intermediate English foreign-language (EFL) students. The participants
consisted of both males (n=10) and females (n=17) between the ages of 16 and 48 (M=22).
They were divided into three groups: 1) an intralingual subtitle group; 2) an interlingual subtitle
group; and 3) a control group. The findings from this study showed that the intralingual subtitle
group achieved better results than the other two groups for all three tests; however, these
results were not statistically significant. Both the interlingual and control groups’ scores did not
34
show any significant improvement after they had watched the video. However, these groups did
better in the post-test that was administered a week after the experiment. For the intralingual
group, the findings suggest that there was a positive effect on vocabulary learning, even a week
after the experiment, although the increase in these scores was not statistically significant.
Koolstra and Beentjes (1999) conducted a study on the effect of subtitles on the foreign
language acquisition of primary school children. The study was conducted on 246 Grade 4
(n=126, mean age 9.7) and Grade 6 (n=120, mean age 11.7) learners from primary schools in
the district of Rotterdam, the Netherlands. The learners were divided into three groups
according to their score on a pre-experiment vocabulary test. The first group watched an
English documentary with Dutch subtitles, the second group watched the same English
documentary without subtitles and the third group watched a Dutch documentary. The findings
from this study indicated a significant difference between the vocabulary recognition score
achieved by the subtitled and non-subtitled groups, with the scores for the subtitled group being
higher. The non-subtitled group, however, did significantly better in vocabulary acquisition than
the control group. The Grade 6 group also achieved significantly better results than the Grade 4
group. The findings also indicated that the children with a higher frequency of watching subtitled
programs at home had significantly higher English vocabulary scores than children with a low or
medium frequency of watching subtitled programs.
Stewart and Pertusa (2004) did a study in which they explored the advantages for language
learners of viewing closed-captioned films in their native language (i.e. Spanish). This study was
conducted with seven (7) intermediate-level conversation classes during two semesters. The
findings from this study show that the participants who viewed the Spanish films with Spanish
subtitles (in the first semester) could correctly recognise two words more on average than the
participants who watched the films with English subtitles. In the second semester, with another
segment of another film, the English subtitle participants did slightly better than the Spanish
subtitle participants. Although the overall differences between the two subtitle groups were not
conclusive, the general impression of the participants was that the Spanish subtitles had a
positive effect on their language learning.
A study by Markham (1999) examined the effects of captions on listening and word recognition.
The study was conducted on 118 advanced university-level English second-language (ESL)
students. The majority of the students were of Asian language backgrounds (Chinese,
Japanese and Korean) and had lived in the United States for a maximum time of one year. The
students were drawn from three fields of study: 1) science and engineering (56%); 2) business
(23%); and 3) the humanities (21%). The student population consisted of more males (62%)
than females (38%) and more undergraduates (55%) than graduates (45%) with age groups
between 17 and 27 years. The findings from this study indicated that captions significantly
35
improved the students’ ability to listen for words used in the videos. It was also found that the
effects of the captions on learning remained constant regardless of the content of the videos
that the students watched. The findings also showed that demographic background had no
effect on the performance of the students.
2.6.4 Studies on subtitles and comprehension (or retention) of information
Comprehension or retention tests are the most common studies done on subtitles. These types
of study usually measure either listening, reading or content comprehension. Hayathi and
Mohmedi (2011) conducted a study on the influence of subtitled movies on the listening
comprehension of English foreign-language students. The study was conducted on 90 junior
and senior students majoring in teaching English as a foreign language. All the participants
were Persian native-language speakers with an average age of 22 years. The participants were
randomly assigned to three groups: 1) an English subtitled group; 2) a Persian subtitled group;
and 3) a group without subtitles. The findings from this study showed that the English subtitled
group did significantly better in the comprehension tests than the Persian-subtitled group. In
turn, the Persian-subtitled group performed significantly better in the comprehension tests than
the control group (without subtitles). From the self-evaluation questionnaire, it was clear that the
participants in the English-subtitled group felt that the English subtitles helped them to
understand the clip and also assisted them in the tests.
In a study by Northrop (1952) (see Chu & Schramm, 2004:29-30) students were shown three
English training videos on chemical warfare, fire control and survival. The students were divided
into three groups: 1) no subtitles; 2) subtitles (English) and outline of major plots; and 3)
subtitles (English) and major plots and sub-plots. For the chemical warfare video, the students
who viewed the video with subtitles and major plots and sub-plots did much better in a post-
experiment comprehension test than the other two groups. Miller (1952) (see Chu & Schramm,
2004:29-30) did a study on the various versions of subtitles in a film: no subtitles, major subtitles
(paraphrased) and complete subtitles (transcription). The stimulus of the study consisted of an
instructional video on Ohm’s Law. The participants of the study were military trainees. No
significant differences were found in the comprehension between the three groups.
In 2011 Hwang and Huang (2011) conducted a study to examine the effect of a video with
English captions on the reading comprehension of English foreign-language (EFL) students.
The study was conducted on 80 first-year students from a college in Taiwan. All of them had a
minimum of seven years’ English experience. The participants were randomly divided into two
groups: 1) an experimental group; and 2) a control group. The experimental group watched
English videos with captions and the control group watched the same English videos without
captions. The participants watched instructional videos for one hour every two weeks for 10
36
weeks (five viewings in total). The findings from the study showed that the experimental group
scored higher in the reading comprehension test than the control group.
Kruger et al. (2014) conducted an eye-tracking study on the effects that subtitles had on split
attention and cognitive load for an academic lecture. The study was conducted on 68 Sesotho
native-language speakers who were studying through the medium of English as second
language. The participants were randomly selected from a group of Sesotho L1-speaking
students and were divided into three groups: 1) a group that watched a recorded English lecture
without subtitles (Group E); 2) a group that watched the same lecture with English subtitles
(Group EE); and 3) a group that watched the same lecture with Sesotho subtitles (Group ES).
The findings from their study showed that the presence or lack of subtitles did not have any
effect on performance. However, the group that watched the recorded lecture with Sesotho
subtitles (Group ES), showed more retention of information after two weeks than the other
groups. Given that the results related to the self-reported task load questionnaire, Group E
experienced more frustration, while Group ES felt that the task was on average easier for them.
Kruger & Steyn (2014) conducted a study on the influence of subtitles on reading and
performance. The study was conducted on 36 first-year students majoring in Psychology and
who were English second-language speakers, their mother-tongue being Sesotho (an
indigenous language of South Africa). The participants were randomly grouped into a test group
and a control group. The test group watched video recordings of a lecture (English dialogue)
with English subtitles and the control group watched the same videos without subtitles. All 36
participants watched six recordings of a second semester, Psychology lecture over the course
of two weeks. These recorded lectures included major topics discussed during the semester.
After watching all of the recorded lectures, the participants were asked to complete a 40-item
comprehension test on the content of all the videos. The results from this study indicated no
statistically significant differences between the two groups (test and control) regarding the
participant’s performance on the comprehension test given after they had watched all the
videos.
Mayer, Lee and Peebles (2014) studied the effect of subtitles on learning. Their study was
conducted on 73 international undergraduate students. The majority of the participants were
Chinese native-speakers (n=61), with the rest being either Korean natives (n=8) or Japanese
natives (n=4). The findings from the experiment indicated that there were no significant
differences between the retention scores of the two groups. The results also showed that there
were no significant differences between the two groups for the transfer test scores. The same
results were found with the self-reported scores for enjoyment and perceived difficulty of the
video. There was, however, a significant difference in the reported effort the participants used to
understand the lesson. The subtitle group showed to have exerted less effort in understanding
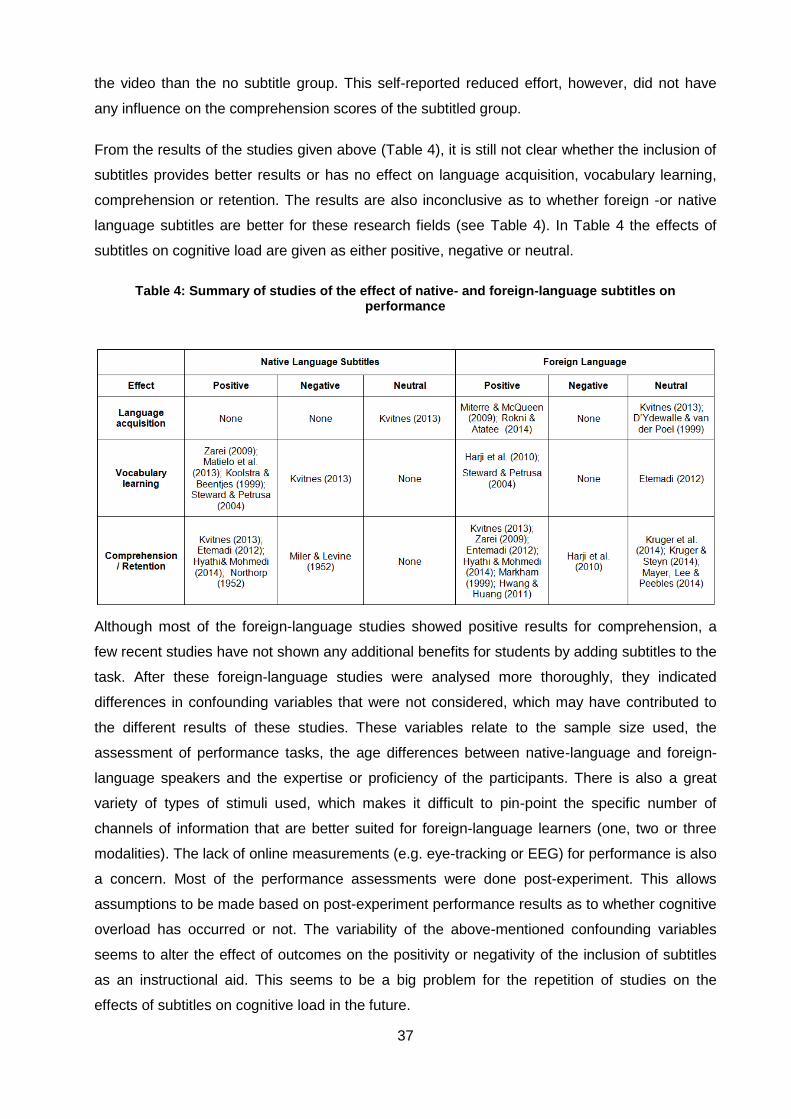
37
the video than the no subtitle group. This self-reported reduced effort, however, did not have
any influence on the comprehension scores of the subtitled group.
From the results of the studies given above (Table 4), it is still not clear whether the inclusion of
subtitles provides better results or has no effect on language acquisition, vocabulary learning,
comprehension or retention. The results are also inconclusive as to whether foreign -or native
language subtitles are better for these research fields (see Table 4). In Table 4 the effects of
subtitles on cognitive load are given as either positive, negative or neutral.
Table 4: Summary of studies of the effect of native- and foreign-language subtitles on performance
Although most of the foreign-language studies showed positive results for comprehension, a
few recent studies have not shown any additional benefits for students by adding subtitles to the
task. After these foreign-language studies were analysed more thoroughly, they indicated
differences in confounding variables that were not considered, which may have contributed to
the different results of these studies. These variables relate to the sample size used, the
assessment of performance tasks, the age differences between native-language and foreign-
language speakers and the expertise or proficiency of the participants. There is also a great
variety of types of stimuli used, which makes it difficult to pin-point the specific number of
channels of information that are better suited for foreign-language learners (one, two or three
modalities). The lack of online measurements (e.g. eye-tracking or EEG) for performance is also
a concern. Most of the performance assessments were done post-experiment. This allows
assumptions to be made based on post-experiment performance results as to whether cognitive
overload has occurred or not. The variability of the above-mentioned confounding variables
seems to alter the effect of outcomes on the positivity or negativity of the inclusion of subtitles
as an instructional aid. This seems to be a big problem for the repetition of studies on the
effects of subtitles on cognitive load in the future.
38
2.6.5 Summary of studies on the effects of subtitles on cognitive load
The current study reasons that, given the aspects identified in related studies on subtitles and
cognitive load, it is almost impossible to arrive at conclusions on the effect subtitles have on
performance (considering comprehension, and language and vocabulary acquisition). There
seems to be strong support for the finding that subtitles can be beneficial under certain
conditions; however, these conditions are hard to identify as some studies that seem to be quite
similar on the surface fail to show benefits of subtitles when considering the confounding
variables involved.
From the examples of studies given in this section, it is impossible to say with certainty that
subtitles are beneficial or detrimental to learning in an educational context. The evidence
provided by these studies is either not conclusive or is often contradictory, and the reasons for
any benefits remain speculative in most cases. Furthermore, most of the effects on cognitive
load found are based on performance in post-experiment assessments, the general assumption
being that the lower the performance of an individual on a specific task, the greater the cognitive
load that individual experienced. Although this may be true in principle, there are a lot of other
factors that can also contribute to lower performance, such as the language proficiency of the
participants, prior knowledge of the subject being discussed and the size of the participant pool
in the study (to name but a few). Other factors associated with cognitive load that were not
mentioned in the studies above may include individual differences such as working memory
capacity, the ability of the individual to handle the imposed cognitive load, the ability of an
individual to process numerous sources simultaneously (cognitive flexibility) and the amount of
attention or engagement an individual contributes to the task.
There are also other external or task-related factors that may influence the performance of an
individual. For example, the presentation format of the material (extraneous load), the amount of
elements in the material that have to be processed simultaneously (element-interactivity), how
close or far apart relevant sources of information are to each other (e.g. split attention, contiguity
effect, etc.), the type of stimuli used, the duration of the stimuli or whether the sources provide
the same information but are presented in different modalities. It may also be possible that the
design or method of the studies influences the effect that subtitles have on performance, for
example long breaks (sometimes weeks) between the interaction of one stimulus and the next.
Although the above-mentioned factors may or may not have contributed to one group of
participants doing better at a certain task than another, they are all concerned with the true
multimodal nature of a subtitled video. The performance on a subtitled task may well be due to
the interaction or competition for attention between different modalities, or combinations thereof,
that result in better or poorer performance. The purpose of this study is therefore to analyse
39
these modalities within the context of instructional design, based on an audiovisual text of a
classroom lecture, not just by looking at post-experiment assessments, but also by using pre-
experiment tests (prior knowledge), online measures of cognitive load (mean fixation durations)
and the degree to which subtitles were processed to make more accurate assumptions as to
whether subtitles do contribute to cognitive load development. One of the focuses of this study
is to determine which of the modalities (in isolation and in combinations with each other) of an
audiovisual text contribute the most to cognitive load, or if it even contributes to cognitive load at
all. Another focus is to provide the necessary knowledge to be able to modify various channels
of information in audiovisual texts to facilitate efficient learning.

40
41
CHAPTER 3: METHODOLOGY
3.1 Introduction
In this section the operationalization of the research questions given in Chapter 1 will be
explained. In order to determine the effect of subtitles on cognitive load (RQ1) for different
source of information, each source of information was isolated and/or combined with another
source within a given stimulus to determine its effect on cognitive load. For this study the focus
was on the isolation and combination of three sources of information: audio, audio and video;
and audio, video and subtitle (with a variation of the type of subtitle, see Section 3.4.2.2.).
RQ1 was operationalised in two experiments. The first experiment was conducted to determine
the impact on comprehension and self-rated cognitive load in a between-participant design, for
different sources of information (i.e. audio-only, audiovisual and audiovisual with text). The
second experiment builds on the first and addresses all three research questions (RQ1, RQ2,
and RQ3), but with specific focus on individual attributes (e.g. English proficiency, prior
knowledge, working memory capacity, language and subtitle experience) and eye-tracking data
in a within-participant designed experiment.
To determine the degree to which the different subtitle types (verbatim or edited) had an effect
on cognitive load (RQ2), linear mixed-effect models were developed to determine cognitive load
(i.e. mean fixation duration, see Section 3.2.2.1) and processing of the subtitles (unique
fixations over mean words, see Section 3.2.1.1). The same models were also used to determine
the effect of redundant information on cognitive load and the processing of the different subtitle
types (RQ3).
There are, however, a variety of different ways to measure cognitive load, some of which are
more suited to certain experimental designs than others. In the next section, an overview is
given of the various measurements used to measure cognitive load and how these
measurement techniques were incorporated in this study.
3.2 An overview of general measurement techniques of cognitive load
In general, cognitive load cannot be directly measured and must be inferred from behavioural
measurements (e.g. emotions, respiration, etc.) or measurement of psychological (e.g. self-
reported task load questionnaires, subjective rating scales, etc.) and physiological (e.g. eye
movements, blink rate, heart rate, skin conductivity, pupillometrics, EEG, ERP, fMRI, etc.)
processes (Casali & Wierwille, 1982). De Jong (2010) also emphasises that most of the
indicators of cognitive overload are based on the assumptions made due to a decrease in
performance or increase in error rate (which was also prominent in the studies analysed in the

42
previous sections). The following sections provide a basic overview of the different techniques
(online and offline) that are generally used to measure cognitive load and its effect. These
techniques are covered through three main categories: 1) subjective rating scales; 2)
physiological measures; and 3) primary and dual task performance.
3.2.1 Subjective rating scales
Subjective rating scales are based on the assumption that individuals are able to accurately
evaluate their own perceived experiences and report the perceived effort they exerted on the
task (Paas et al., 2003) and assume that the amount of mental effort used to perform a given
task is linked to the perceived effort (Rubio, Diaz, Martin & Puente, 2004). The first subjective
and indirect measure of cognitive load was introduced by Paas, Van Merriënboer and Adam
(1994) in the early 1990s, which was used after treatments where learners were asked to report
the amount of mental activity that was required to understand and complete tasks. Generally,
subjective techniques such as self-rating scales involve a questionnaire containing one or
multiple Likert-scales (of variable index values) where participants can indicate their
experienced level of, for example, cognitive load (Paas et al., 2003). Over the years, many
subjective rating scales were developed to evaluate perceived mental effort. The most
prominent and most often used are:
the Cooper-Harper scale (Cooper & Harper, 1969)
the SWAT scale (Subjective Assessment Technique) (Reid & Nygren, 1988)
the NASA-TLX scale (Task Load Index developed by NASA) (Hart & Staveland,
1988)
the Bedford Scale (Roscoe, 1987; Roscoe & Ellis, 1990)
the single-item cognitive load-rating scale (Paas, 1992)
a psychometric instrument for measuring intrinsic and extraneous cognitive load
(Leppink & Van den Heuvel, 2015).
Generally, most of the subjective rating scales are task based or task directed, meaning that
they are designed with specific tasks in mind. For example, the NASA-TLX (Hart & Staveland,
1988) questionnaire also measures physical demand, performance and effort of a task, which
relates to the skills required for astronauts. The single-item, cognitive-load rating scale (Paas,
1992) consists of only one item of measurement and only focuses on the mental effort
experienced by an individual during the completion of a task or set of tasks. This is, however, a
one-dimensional approach and only provides a summary of the overall experienced cognitive
43
load rather than differentiating between the effect of the different types of cognitive load (i.e.
intrinsic and extraneous cognitive load). Although subjective self-ratings of experiences may
appear questionable, research has shown that people are indeed capable of assigning an
accurate numerical value to their perceived experiences and efforts (Gopher & Braune, 1984).
For this study the preferred subjective rating scale for measuring cognitive load is that
developed by Leppink and Van den Heuvel (2015).
In 2015, Leppink and Van den Heuvel conducted experiments on the effectiveness of
psychometric instruments to differentiate between the three causal factors associated with
cognitive load, focusing specifically on intrinsic and extraneous cognitive load. Germane
cognitive load (the other causal factor of cognitive load) was excluded from their final
questionnaire after re-evaluation of their first 13-item questionnaire (Leppink et al., 2013). The
new mental load questionnaire (Leppink & Van den Heuvel, 2015), which was used in this
study, consists of eight items which focus only on the intrinsic and extraneous causal factors.
This rating scale is used to evaluate the perceived intrinsic and extraneous cognitive load
experienced by each participant while they complete a task containing audiovisual texts. The
reason for choosing this specific scale is that the questionnaire by Leppink and Van den Heuvel
(2015) does not measure an overall effect of cognitive load, but rather distinguishes between
intrinsic (learner-task interaction) and extraneous (format of task) cognitive load, which provide
a more dimensional approach to analysing the imposed cognitive load and also makes it easier
to isolate these cognitive loads for individual analyses.
3.2.2 Physiological measurements
Physiological measurements of cognitive load assume that changes in cognitive functioning are
reflected in the changes of physiological states, which can be measured through galvanic skin
response (GSR), brain activity measured by electroencephalography (EEG) or heart rate
variability.
GSR involves an electrical current being passed through the body (Schnotz & Kürschner, 2007).
The skin resistance to the current is then measured to give an index of the skin conductivity of
an individual (Schnotz & Kürschner, 2007). An increase in this conductivity means that the
individual has increased perspiration on the skin, which can be assumed to be an indication of
an increase in cognitive load. However, GSR can sometimes be influenced by other emotional
situations (e.g. arousal or stress) and, because of the unnatural and complicated procedure to
set it up, it cannot be used to record data in natural environments or settings (Schnotz &
Kürschner, 2007). Due to the influence of external factors, the reliability of GSR is
compromised, which means that GSR was not considered in this study as a measurement of
cognitive load.
44
Electrophysiological measurements (such as EEG, fMRI and event-related potential-ERP) are
based on measurements of brain activity. EEG is a popular neuro-imaging technique that
measures electrical activity produced by the brain by means of electrodes that are placed
directly on an individual’s scalp (Antonenko, Paas, Grabner & Van Gog, 2010). EEG
measurements vary predictably in response to changing levels of cognitive stimuli, which
implies that certain changes in brain wave frequencies are associated with certain cognitive
processes (e.g. meditation, concentration and other cognitive functions). Due to the complexity
and resource intensiveness of analysing electrophysiological measurements, as well as a lack
of validation of EEG measures for cognitive load, in the context of multimodal texts such as
video, this measurement was not used in this study.
Cardiovascular systems (such as heart rate monitors) are low-cost physiological measures that
are generally related to emotional (affective) states. These affective states can also be related
to cognitive load (Ikehara & Crosby, 2005). Cardiovascular systems are considered to be good
indicators of both physical and cognitive stresses (Frederick, Timmermann, Russel & Lubar,
2005). Although heart rate monitoring (which is a cardiovascular measurement) is a low-cost
method, it can also be easily influenced by other factors, such as generic heart conditions or
unplanned physical responses (Wilson, 2002). For this reason heart-rate monitoring was not
used as a cognitive load measurement in this study. There is, however, another set of
physiological measurements that have been extensively researched and validated over the past
three decades which involves the movement of the eyes.
3.2.2.1 Eye movement measurements of cognitive load
Eye movements were first used in reading research (in the late 1960s), but nowadays are used
in a variety of other fields ranging from user experience analyses to translation studies.
Generally, eye movements are measured using eye trackers, which record the fixations (focus
points) and saccades (movement between fixations) that the eyes make during a specific task
(Figure 4). Fixations are “slow-moving eye movements, which coincide with the certain area that
is focused on” (SMI, 2011b:16). More precisely, fixations are defined as “the periods when the
eyes are relatively still, and at which point visual information is processed” (Rayner & Pollatsek,
2006:614).
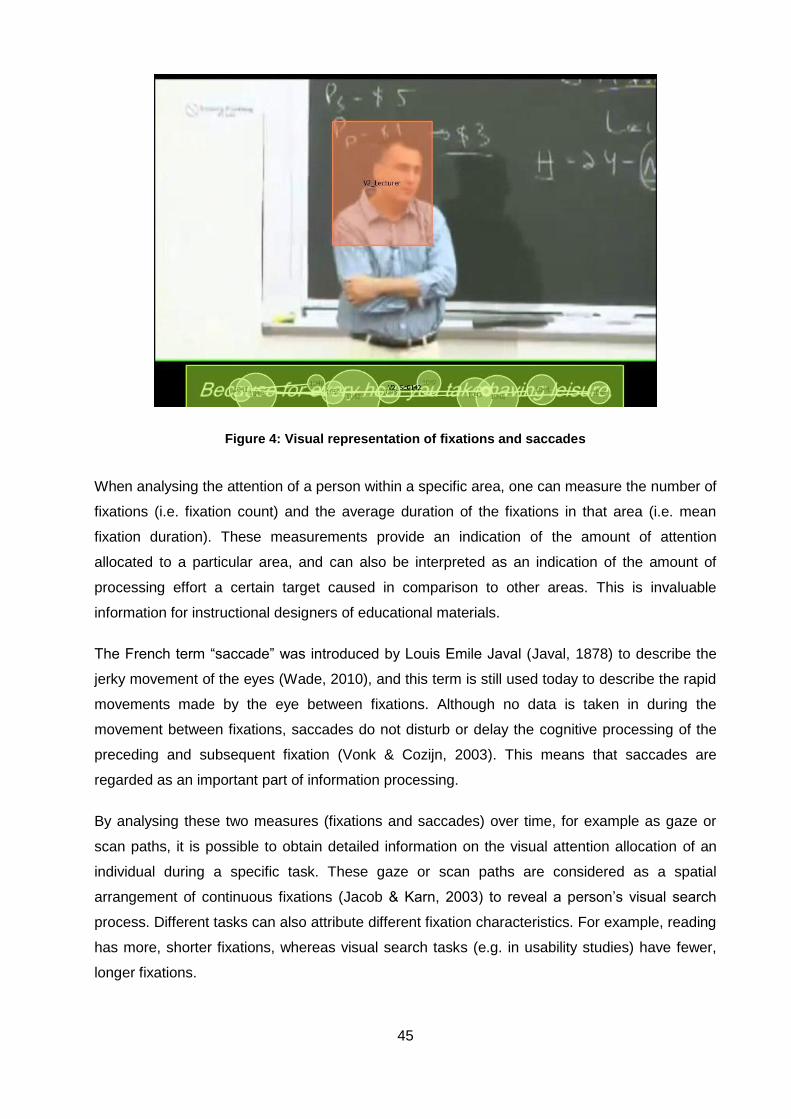
45
Figure 4: Visual representation of fixations and saccades
When analysing the attention of a person within a specific area, one can measure the number of
fixations (i.e. fixation count) and the average duration of the fixations in that area (i.e. mean
fixation duration). These measurements provide an indication of the amount of attention
allocated to a particular area, and can also be interpreted as an indication of the amount of
processing effort a certain target caused in comparison to other areas. This is invaluable
information for instructional designers of educational materials.
The French term “saccade” was introduced by Louis Emile Javal (Javal, 1878) to describe the
jerky movement of the eyes (Wade, 2010), and this term is still used today to describe the rapid
movements made by the eye between fixations. Although no data is taken in during the
movement between fixations, saccades do not disturb or delay the cognitive processing of the
preceding and subsequent fixation (Vonk & Cozijn, 2003). This means that saccades are
regarded as an important part of information processing.
By analysing these two measures (fixations and saccades) over time, for example as gaze or
scan paths, it is possible to obtain detailed information on the visual attention allocation of an
individual during a specific task. These gaze or scan paths are considered as a spatial
arrangement of continuous fixations (Jacob & Karn, 2003) to reveal a person’s visual search
process. Different tasks can also attribute different fixation characteristics. For example, reading
has more, shorter fixations, whereas visual search tasks (e.g. in usability studies) have fewer,
longer fixations.
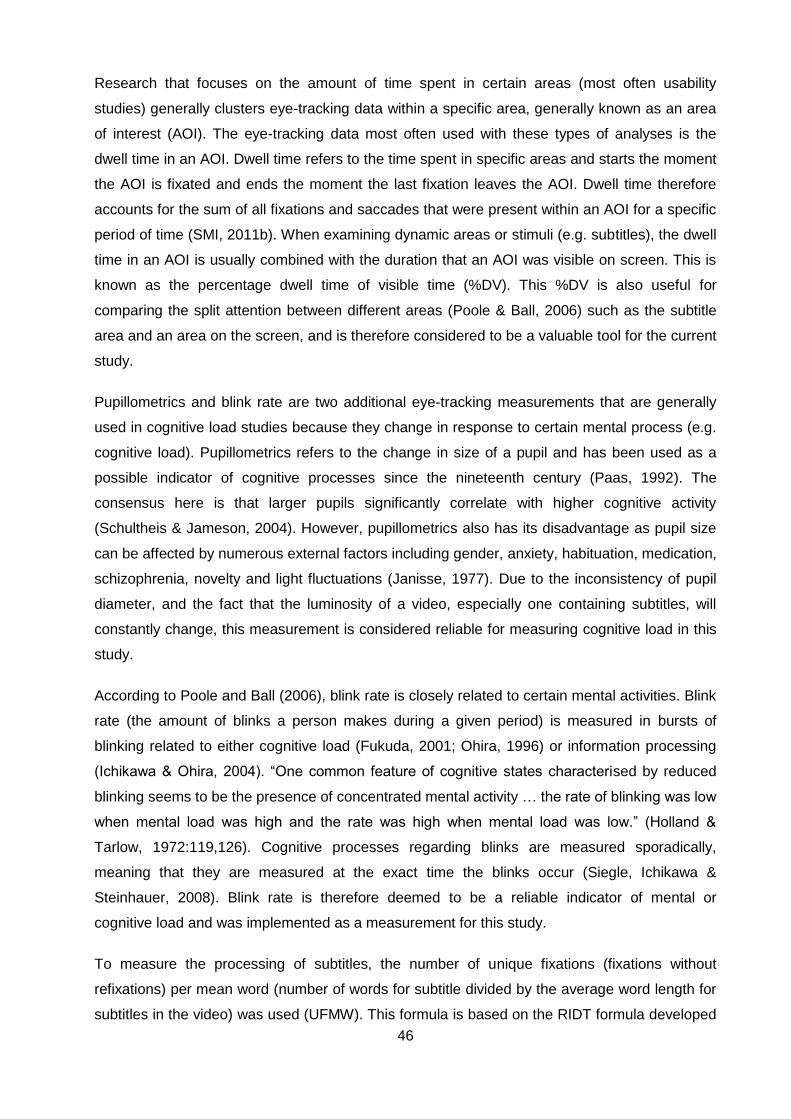
46
Research that focuses on the amount of time spent in certain areas (most often usability
studies) generally clusters eye-tracking data within a specific area, generally known as an area
of interest (AOI). The eye-tracking data most often used with these types of analyses is the
dwell time in an AOI. Dwell time refers to the time spent in specific areas and starts the moment
the AOI is fixated and ends the moment the last fixation leaves the AOI. Dwell time therefore
accounts for the sum of all fixations and saccades that were present within an AOI for a specific
period of time (SMI, 2011b). When examining dynamic areas or stimuli (e.g. subtitles), the dwell
time in an AOI is usually combined with the duration that an AOI was visible on screen. This is
known as the percentage dwell time of visible time (%DV). This %DV is also useful for
comparing the split attention between different areas (Poole & Ball, 2006) such as the subtitle
area and an area on the screen, and is therefore considered to be a valuable tool for the current
study.
Pupillometrics and blink rate are two additional eye-tracking measurements that are generally
used in cognitive load studies because they change in response to certain mental process (e.g.
cognitive load). Pupillometrics refers to the change in size of a pupil and has been used as a
possible indicator of cognitive processes since the nineteenth century (Paas, 1992). The
consensus here is that larger pupils significantly correlate with higher cognitive activity
(Schultheis & Jameson, 2004). However, pupillometrics also has its disadvantage as pupil size
can be affected by numerous external factors including gender, anxiety, habituation, medication,
schizophrenia, novelty and light fluctuations (Janisse, 1977). Due to the inconsistency of pupil
diameter, and the fact that the luminosity of a video, especially one containing subtitles, will
constantly change, this measurement is considered reliable for measuring cognitive load in this
study.
According to Poole and Ball (2006), blink rate is closely related to certain mental activities. Blink
rate (the amount of blinks a person makes during a given period) is measured in bursts of
blinking related to either cognitive load (Fukuda, 2001; Ohira, 1996) or information processing
(Ichikawa & Ohira, 2004). “One common feature of cognitive states characterised by reduced
blinking seems to be the presence of concentrated mental activity … the rate of blinking was low
when mental load was high and the rate was high when mental load was low.” (Holland &
Tarlow, 1972:119,126). Cognitive processes regarding blinks are measured sporadically,
meaning that they are measured at the exact time the blinks occur (Siegle, Ichikawa &
Steinhauer, 2008). Blink rate is therefore deemed to be a reliable indicator of mental or
cognitive load and was implemented as a measurement for this study.
To measure the processing of subtitles, the number of unique fixations (fixations without
refixations) per mean word (number of words for subtitle divided by the average word length for
subtitles in the video) was used (UFMW). This formula is based on the RIDT formula developed
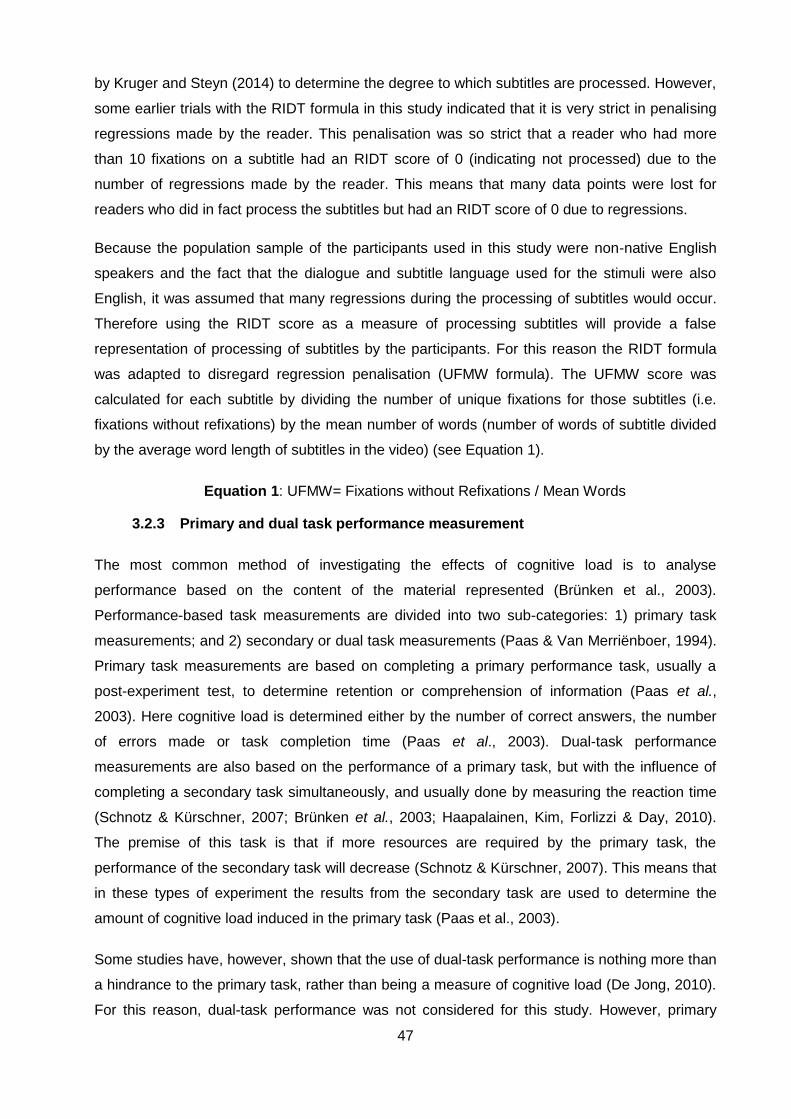
47
by Kruger and Steyn (2014) to determine the degree to which subtitles are processed. However,
some earlier trials with the RIDT formula in this study indicated that it is very strict in penalising
regressions made by the reader. This penalisation was so strict that a reader who had more
than 10 fixations on a subtitle had an RIDT score of 0 (indicating not processed) due to the
number of regressions made by the reader. This means that many data points were lost for
readers who did in fact process the subtitles but had an RIDT score of 0 due to regressions.
Because the population sample of the participants used in this study were non-native English
speakers and the fact that the dialogue and subtitle language used for the stimuli were also
English, it was assumed that many regressions during the processing of subtitles would occur.
Therefore using the RIDT score as a measure of processing subtitles will provide a false
representation of processing of subtitles by the participants. For this reason the RIDT formula
was adapted to disregard regression penalisation (UFMW formula). The UFMW score was
calculated for each subtitle by dividing the number of unique fixations for those subtitles (i.e.
fixations without refixations) by the mean number of words (number of words of subtitle divided
by the average word length of subtitles in the video) (see Equation 1).
Equation 1: UFMW= Fixations without Refixations / Mean Words
3.2.3 Primary and dual task performance measurement
The most common method of investigating the effects of cognitive load is to analyse
performance based on the content of the material represented (Brünken et al., 2003).
Performance-based task measurements are divided into two sub-categories: 1) primary task
measurements; and 2) secondary or dual task measurements (Paas & Van Merriënboer, 1994).
Primary task measurements are based on completing a primary performance task, usually a
post-experiment test, to determine retention or comprehension of information (Paas et al.,
2003). Here cognitive load is determined either by the number of correct answers, the number
of errors made or task completion time (Paas et al., 2003). Dual-task performance
measurements are also based on the performance of a primary task, but with the influence of
completing a secondary task simultaneously, and usually done by measuring the reaction time
(Schnotz & Kürschner, 2007; Brünken et al., 2003; Haapalainen, Kim, Forlizzi & Day, 2010).
The premise of this task is that if more resources are required by the primary task, the
performance of the secondary task will decrease (Schnotz & Kürschner, 2007). This means that
in these types of experiment the results from the secondary task are used to determine the
amount of cognitive load induced in the primary task (Paas et al., 2003).
Some studies have, however, shown that the use of dual-task performance is nothing more than
a hindrance to the primary task, rather than being a measure of cognitive load (De Jong, 2010).
For this reason, dual-task performance was not considered for this study. However, primary
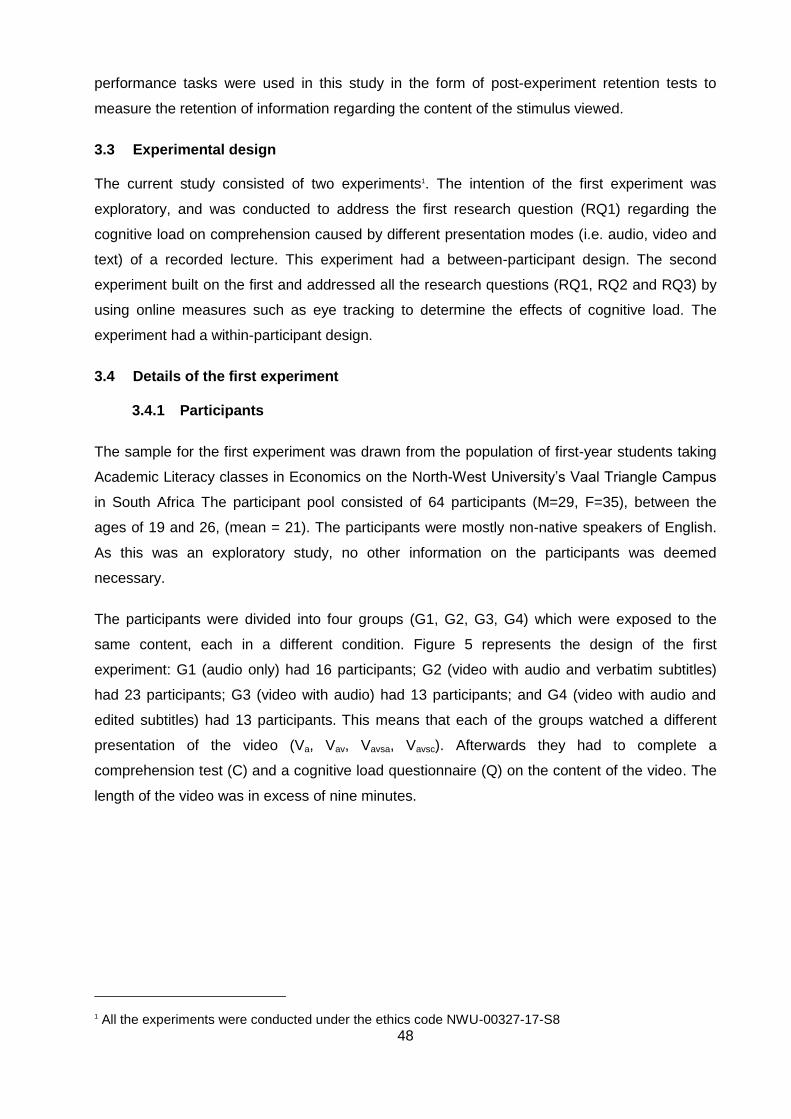
48
performance tasks were used in this study in the form of post-experiment retention tests to
measure the retention of information regarding the content of the stimulus viewed.
3.3 Experimental design
The current study consisted of two experiments1. The intention of the first experiment was
exploratory, and was conducted to address the first research question (RQ1) regarding the
cognitive load on comprehension caused by different presentation modes (i.e. audio, video and
text) of a recorded lecture. This experiment had a between-participant design. The second
experiment built on the first and addressed all the research questions (RQ1, RQ2 and RQ3) by
using online measures such as eye tracking to determine the effects of cognitive load. The
experiment had a within-participant design.
3.4 Details of the first experiment
3.4.1 Participants
The sample for the first experiment was drawn from the population of first-year students taking
Academic Literacy classes in Economics on the North-West University’s Vaal Triangle Campus
in South Africa The participant pool consisted of 64 participants (M=29, F=35), between the
ages of 19 and 26, (mean = 21). The participants were mostly non-native speakers of English.
As this was an exploratory study, no other information on the participants was deemed
necessary.
The participants were divided into four groups (G1, G2, G3, G4) which were exposed to the
same content, each in a different condition. Figure 5 represents the design of the first
experiment: G1 (audio only) had 16 participants; G2 (video with audio and verbatim subtitles)
had 23 participants; G3 (video with audio) had 13 participants; and G4 (video with audio and
edited subtitles) had 13 participants. This means that each of the groups watched a different
presentation of the video (Va, Vav, Vavsa, Vavsc). Afterwards they had to complete a
comprehension test (C) and a cognitive load questionnaire (Q) on the content of the video. The
length of the video was in excess of nine minutes.
1 All the experiments were conducted under the ethics code NWU-00327-17-S8
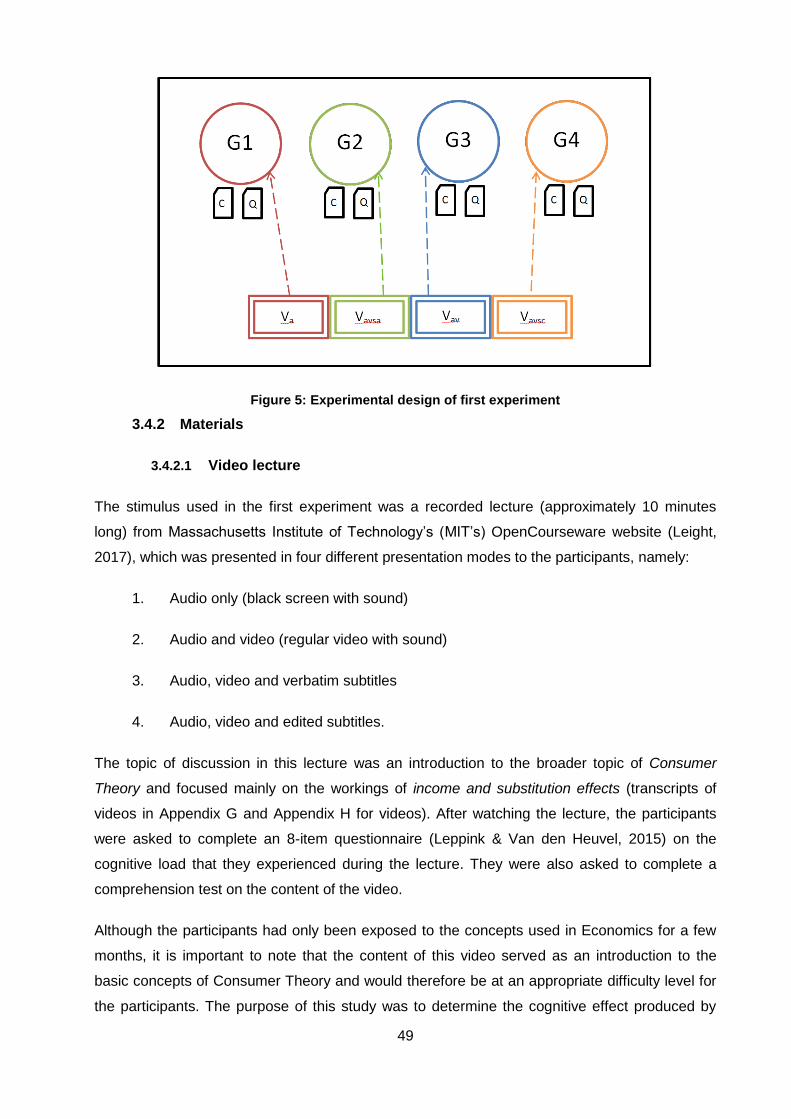
49
Figure 5: Experimental design of first experiment
3.4.2 Materials
3.4.2.1 Video lecture
The stimulus used in the first experiment was a recorded lecture (approximately 10 minutes
long) from Massachusetts Institute of Technology’s (MIT’s) OpenCourseware website (Leight,
2017), which was presented in four different presentation modes to the participants, namely:
1. Audio only (black screen with sound)
2. Audio and video (regular video with sound)
3. Audio, video and verbatim subtitles
4. Audio, video and edited subtitles.
The topic of discussion in this lecture was an introduction to the broader topic of Consumer
Theory and focused mainly on the workings of income and substitution effects (transcripts of
videos in Appendix G and Appendix H for videos). After watching the lecture, the participants
were asked to complete an 8-item questionnaire (Leppink & Van den Heuvel, 2015) on the
cognitive load that they experienced during the lecture. They were also asked to complete a
comprehension test on the content of the video.
Although the participants had only been exposed to the concepts used in Economics for a few
months, it is important to note that the content of this video served as an introduction to the
basic concepts of Consumer Theory and would therefore be at an appropriate difficulty level for
the participants. The purpose of this study was to determine the cognitive effect produced by
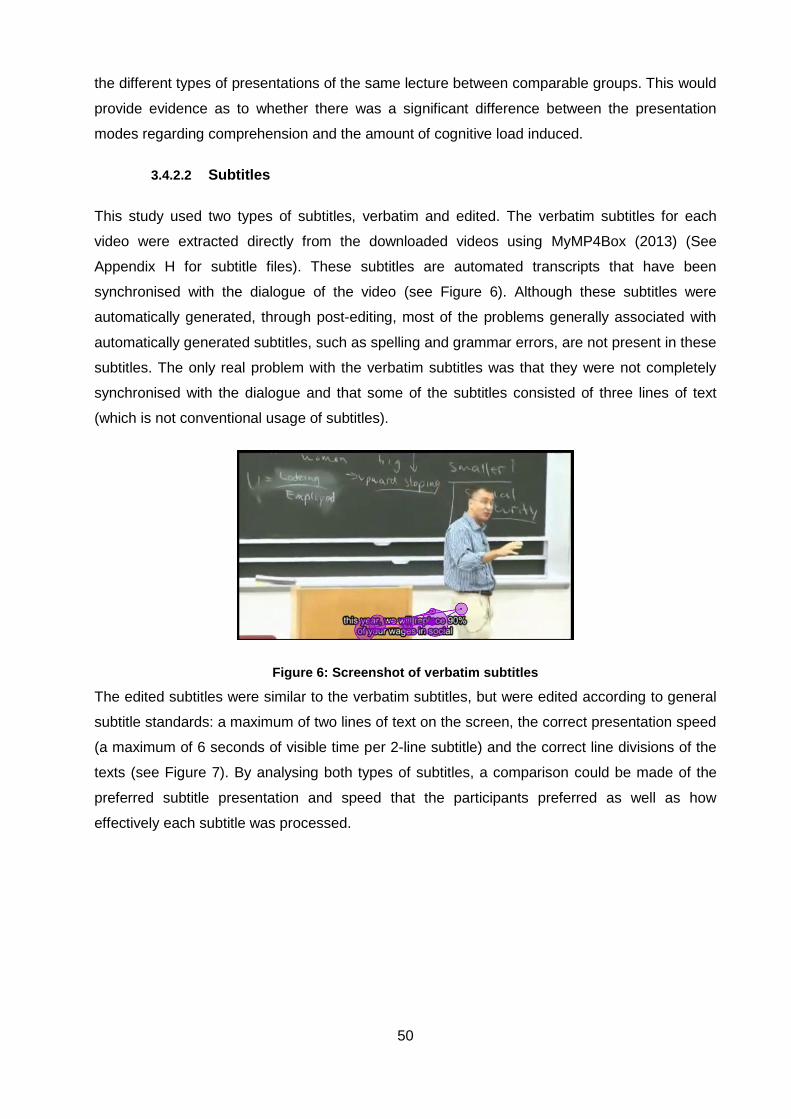
50
the different types of presentations of the same lecture between comparable groups. This would
provide evidence as to whether there was a significant difference between the presentation
modes regarding comprehension and the amount of cognitive load induced.
3.4.2.2 Subtitles
This study used two types of subtitles, verbatim and edited. The verbatim subtitles for each
video were extracted directly from the downloaded videos using MyMP4Box (2013) (See
Appendix H for subtitle files). These subtitles are automated transcripts that have been
synchronised with the dialogue of the video (see Figure 6). Although these subtitles were
automatically generated, through post-editing, most of the problems generally associated with
automatically generated subtitles, such as spelling and grammar errors, are not present in these
subtitles. The only real problem with the verbatim subtitles was that they were not completely
synchronised with the dialogue and that some of the subtitles consisted of three lines of text
(which is not conventional usage of subtitles).
Figure 6: Screenshot of verbatim subtitles
The edited subtitles were similar to the verbatim subtitles, but were edited according to general
subtitle standards: a maximum of two lines of text on the screen, the correct presentation speed
(a maximum of 6 seconds of visible time per 2-line subtitle) and the correct line divisions of the
texts (see Figure 7). By analysing both types of subtitles, a comparison could be made of the
preferred subtitle presentation and speed that the participants preferred as well as how
effectively each subtitle was processed.
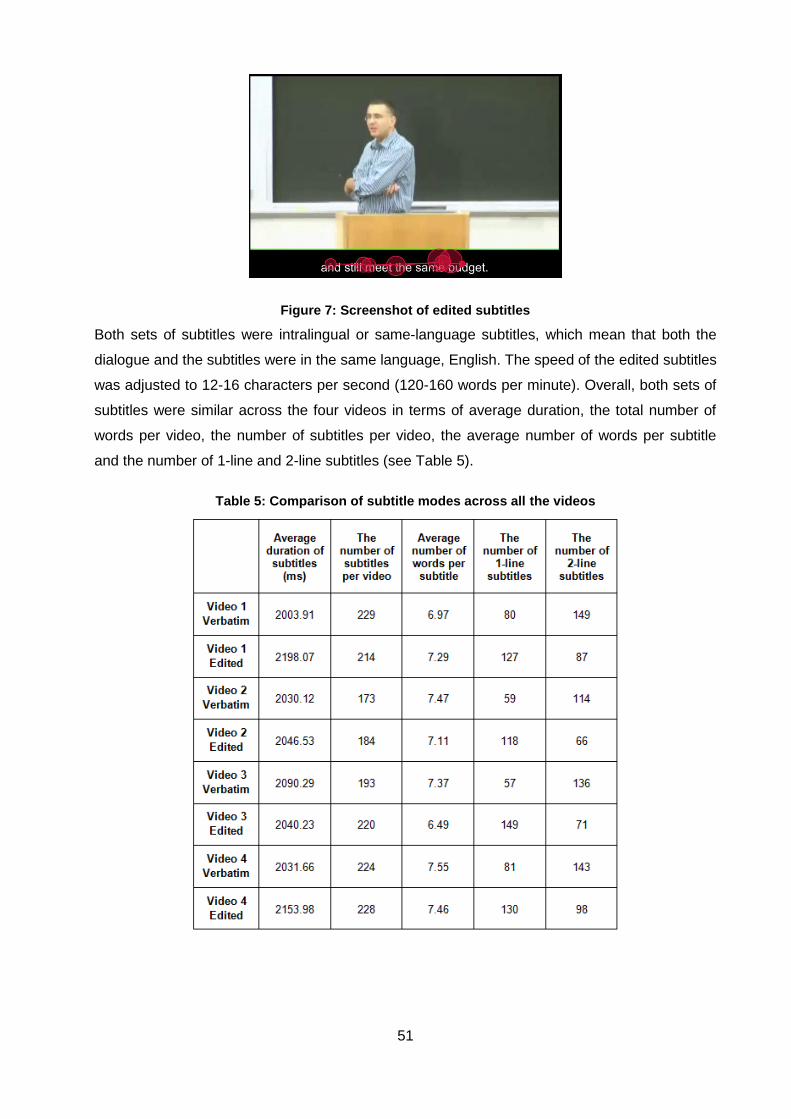
51
Figure 7: Screenshot of edited subtitles
Both sets of subtitles were intralingual or same-language subtitles, which mean that both the
dialogue and the subtitles were in the same language, English. The speed of the edited subtitles
was adjusted to 12-16 characters per second (120-160 words per minute). Overall, both sets of
subtitles were similar across the four videos in terms of average duration, the total number of
words per video, the number of subtitles per video, the average number of words per subtitle
and the number of 1-line and 2-line subtitles (see Table 5).
Table 5: Comparison of subtitle modes across all the videos
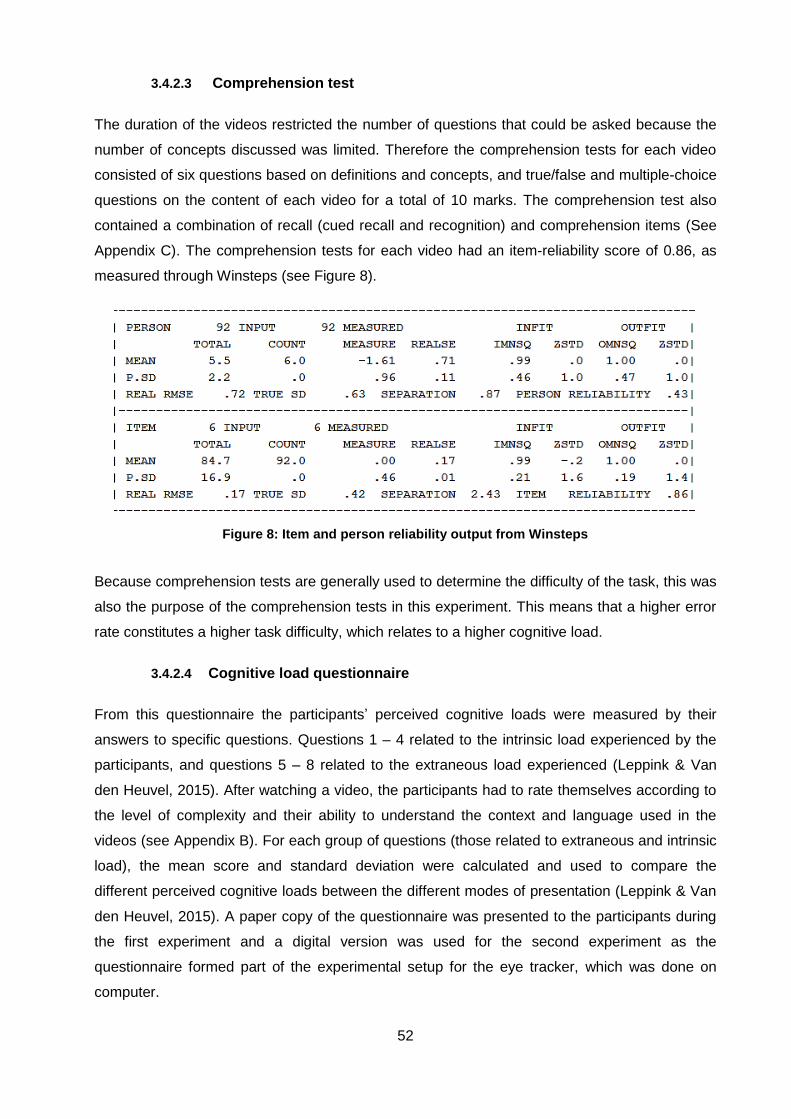
52
3.4.2.3 Comprehension test
The duration of the videos restricted the number of questions that could be asked because the
number of concepts discussed was limited. Therefore the comprehension tests for each video
consisted of six questions based on definitions and concepts, and true/false and multiple-choice
questions on the content of each video for a total of 10 marks. The comprehension test also
contained a combination of recall (cued recall and recognition) and comprehension items (See
Appendix C). The comprehension tests for each video had an item-reliability score of 0.86, as
measured through Winsteps (see Figure 8).
Figure 8: Item and person reliability output from Winsteps
Because comprehension tests are generally used to determine the difficulty of the task, this was
also the purpose of the comprehension tests in this experiment. This means that a higher error
rate constitutes a higher task difficulty, which relates to a higher cognitive load.
3.4.2.4 Cognitive load questionnaire
From this questionnaire the participants’ perceived cognitive loads were measured by their
answers to specific questions. Questions 1 – 4 related to the intrinsic load experienced by the
participants, and questions 5 – 8 related to the extraneous load experienced (Leppink & Van
den Heuvel, 2015). After watching a video, the participants had to rate themselves according to
the level of complexity and their ability to understand the context and language used in the
videos (see Appendix B). For each group of questions (those related to extraneous and intrinsic
load), the mean score and standard deviation were calculated and used to compare the
different perceived cognitive loads between the different modes of presentation (Leppink & Van
den Heuvel, 2015). A paper copy of the questionnaire was presented to the participants during
the first experiment and a digital version was used for the second experiment as the
questionnaire formed part of the experimental setup for the eye tracker, which was done on
computer.
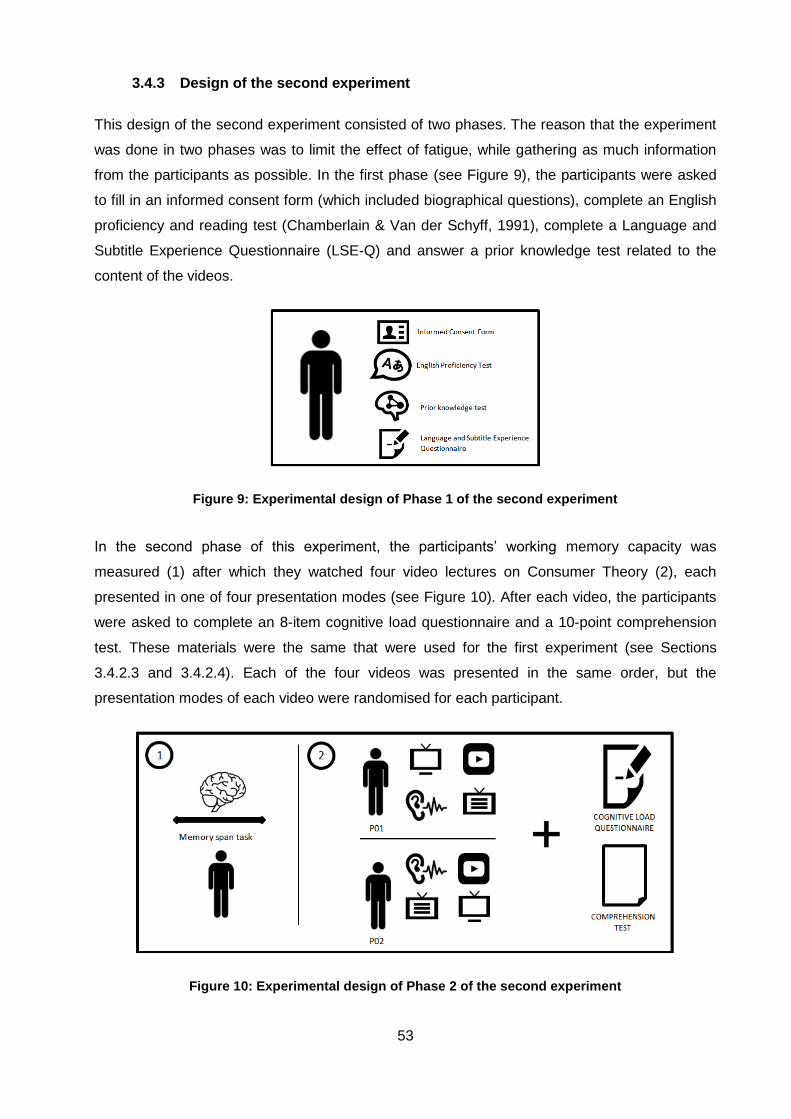
53
3.4.3 Design of the second experiment
This design of the second experiment consisted of two phases. The reason that the experiment
was done in two phases was to limit the effect of fatigue, while gathering as much information
from the participants as possible. In the first phase (see Figure 9), the participants were asked
to fill in an informed consent form (which included biographical questions), complete an English
proficiency and reading test (Chamberlain & Van der Schyff, 1991), complete a Language and
Subtitle Experience Questionnaire (LSE-Q) and answer a prior knowledge test related to the
content of the videos.
Figure 9: Experimental design of Phase 1 of the second experiment
In the second phase of this experiment, the participants’ working memory capacity was
measured (1) after which they watched four video lectures on Consumer Theory (2), each
presented in one of four presentation modes (see Figure 10). After each video, the participants
were asked to complete an 8-item cognitive load questionnaire and a 10-point comprehension
test. These materials were the same that were used for the first experiment (see Sections
3.4.2.3 and 3.4.2.4). Each of the four videos was presented in the same order, but the
presentation modes of each video were randomised for each participant.
Figure 10: Experimental design of Phase 2 of the second experiment
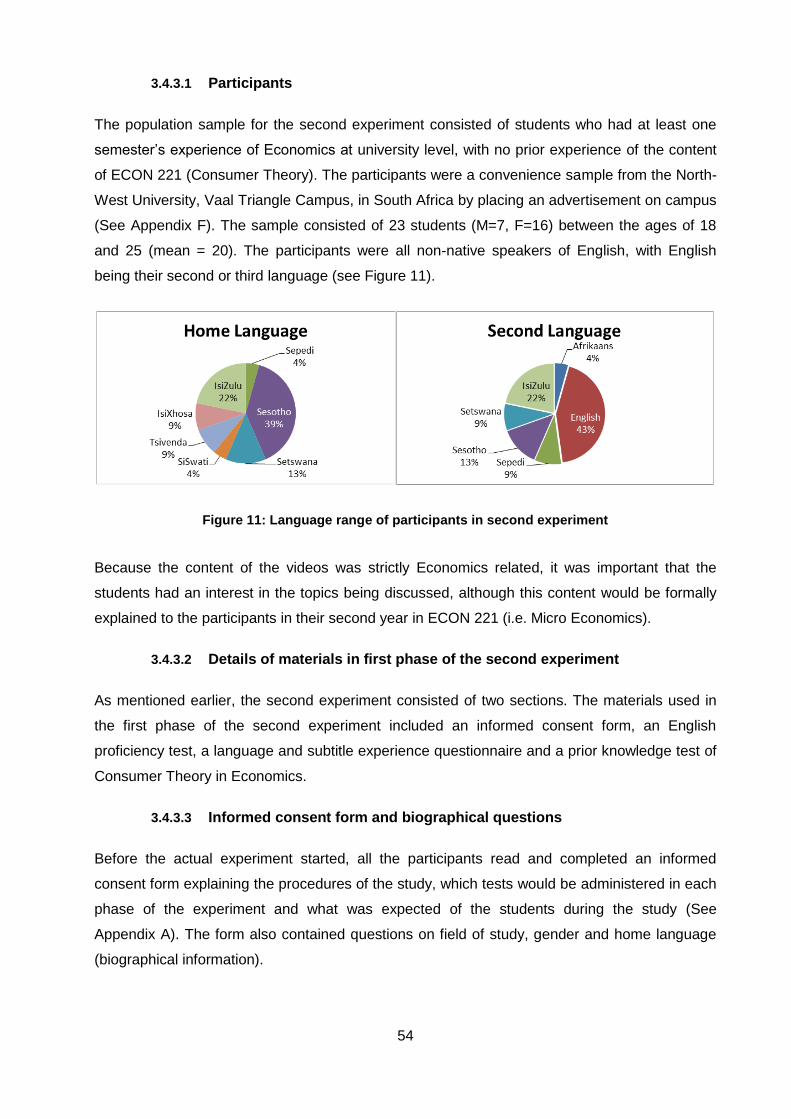
54
3.4.3.1 Participants
The population sample for the second experiment consisted of students who had at least one
semester’s experience of Economics at university level, with no prior experience of the content
of ECON 221 (Consumer Theory). The participants were a convenience sample from the North-
West University, Vaal Triangle Campus, in South Africa by placing an advertisement on campus
(See Appendix F). The sample consisted of 23 students (M=7, F=16) between the ages of 18
and 25 (mean = 20). The participants were all non-native speakers of English, with English
being their second or third language (see Figure 11).
Figure 11: Language range of participants in second experiment
Because the content of the videos was strictly Economics related, it was important that the
students had an interest in the topics being discussed, although this content would be formally
explained to the participants in their second year in ECON 221 (i.e. Micro Economics).
3.4.3.2 Details of materials in first phase of the second experiment
As mentioned earlier, the second experiment consisted of two sections. The materials used in
the first phase of the second experiment included an informed consent form, an English
proficiency test, a language and subtitle experience questionnaire and a prior knowledge test of
Consumer Theory in Economics.
3.4.3.3 Informed consent form and biographical questions
Before the actual experiment started, all the participants read and completed an informed
consent form explaining the procedures of the study, which tests would be administered in each
phase of the experiment and what was expected of the students during the study (See
Appendix A). The form also contained questions on field of study, gender and home language
(biographical information).
55
3.4.3.4 English proficiency test
In general, most proficiency tests are created with a specific audience in mind and some can
take up to six hours to complete. Given these contentious issues and the fact that most
proficiency tests are not validated, not reliable, do not measure all the required proficiency fields
and the time limit associated with this study, these general English proficiency tests were not be
used for this experiment. Instead, students were given an advanced-level, English second-
language proficiency and reading test (Chamberlain & Van der Schyff, 1991) consisting of forty
question that tested the students’ denotation and connotation of words, phrases and sentences,
their use of language passages and acceptable language usage (See Appendix H). The test
consisted of a mixture of morphological, syntactical and comprehension questions and
controlled for the effect of language proficiency on watching subtitled videos (Chamberlain &
Van der Schyff, 1991).
This specific language proficiency test was developed by the Human Sciences Research
Council (HSRC) of South Africa as a test to be used in the South African Education system.
This proficiency test was also validated and tested on a population of English second language
South African students. In 1990, 50 items of this test were tested on about 1 500 Grade 10 to 12
pupils (500 pupils on average per grade) ((Chamberlain & Van der Schyff, 1991: 18). The
results from these validation and reliability tests showed a difficulty level of 52.5% (optimal
difficulty between 50% and 70%) and a reliability coefficient of 0.89. The validity of the test was
accepted by subject experts to measure the English proficiency of non-native English-speaking
students (Chamberlain & Van der Schyff, 1991:18-19), which made it suitable for this study.
The participants’ proficiency level was determined by the number of correct answers given (raw
score). These raw scores were compared to the measures in Table 6 to determine the
proficiency level of each participant (adapted from (Chamberlain & Van der Schyff, 1991: 20).
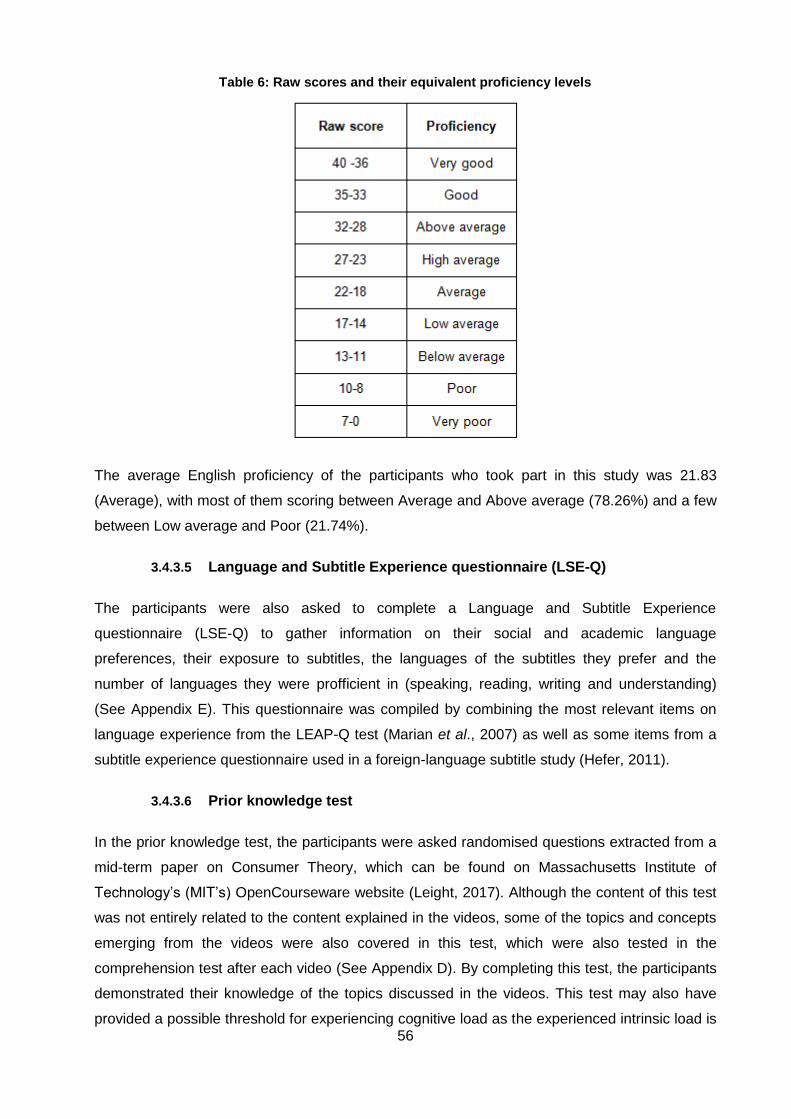
56
Table 6: Raw scores and their equivalent proficiency levels
The average English proficiency of the participants who took part in this study was 21.83
(Average), with most of them scoring between Average and Above average (78.26%) and a few
between Low average and Poor (21.74%).
3.4.3.5 Language and Subtitle Experience questionnaire (LSE-Q)
The participants were also asked to complete a Language and Subtitle Experience
questionnaire (LSE-Q) to gather information on their social and academic language
preferences, their exposure to subtitles, the languages of the subtitles they prefer and the
number of languages they were profficient in (speaking, reading, writing and understanding)
(See Appendix E). This questionnaire was compiled by combining the most relevant items on
language experience from the LEAP-Q test (Marian et al., 2007) as well as some items from a
subtitle experience questionnaire used in a foreign-language subtitle study (Hefer, 2011).
3.4.3.6 Prior knowledge test
In the prior knowledge test, the participants were asked randomised questions extracted from a
mid-term paper on Consumer Theory, which can be found on Massachusetts Institute of
Technology’s (MIT’s) OpenCourseware website (Leight, 2017). Although the content of this test
was not entirely related to the content explained in the videos, some of the topics and concepts
emerging from the videos were also covered in this test, which were also tested in the
comprehension test after each video (See Appendix D). By completing this test, the participants
demonstrated their knowledge of the topics discussed in the videos. This test may also have
provided a possible threshold for experiencing cognitive load as the experienced intrinsic load is
57
influenced by the prior knowledge of a certain topic. It is therefore the assumption that the
participants with a higher score on the prior test would experience less intrinsic load during the
experiment than the participants who did not score as high.
3.5 Details of materials for the second phase of the second experiment
3.5.1 Working memory capacity test (memory-span task)
Generally, the way to determine working memory capacity of an individual is through a memory-
span task. The concept behind memory-span tasks is based on Baddeley & Hitch’s (1974)
principle that working memory consists of a limited (or temporary) memory capacity in which
information is filtered and will be either relevant for processing or not. Research has shown that
the performance on working memory capacity correlates with the performance on a variety of
higher-order cognitive tasks, for example (according to Engle, 2002):
Reading and listening comprehension
Complex learning
Language comprehension
Vocabulary learning
Writing
According to Engle (2002) working memory capacity is not directly linked to memory but more to
the use of attention to maintain or suppress information. In each of these tasks, the subject
receives items to recall (such as numbers or letters), while in some cases another attention-
demanding task needs to be completed, which is presented simultaneously with the items
needed for recall. In general, four types of working memory-span tasks are used, namely:
reading-span, digit-span, counting-span and operation-span tasks (Engle, 2002).
Reading and digit-span tasks were the first tasks used to study working memory capacity and
the relationship between working memory and higher-order cognition (Daneman & Carpenter,
1980). In a reading-span task, subjects are given between two and seven sentences to read
aloud, which are each followed by an unrelated word that must be remembered. When the
subject reads the last sentence-word combination aloud, the subject must try to recall the list of
unrelated words. A working memory capacity score is then determined according to the
numbers that were recalled correctly.
The digit-span task works in more all less the same way as the reading-span task, except that
the focus is more on remembering digits and recalling them correctly in the order they were
presented (sometimes the reverse order). The digit-span task is done by presenting digits to
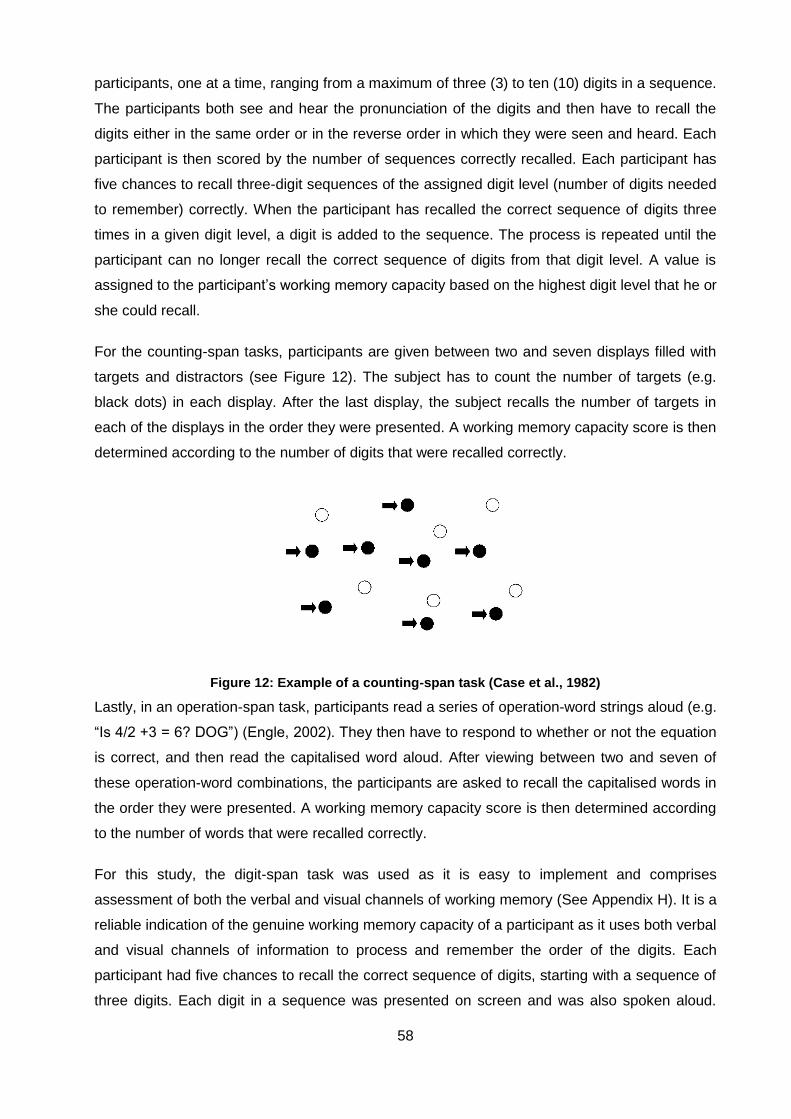
58
participants, one at a time, ranging from a maximum of three (3) to ten (10) digits in a sequence.
The participants both see and hear the pronunciation of the digits and then have to recall the
digits either in the same order or in the reverse order in which they were seen and heard. Each
participant is then scored by the number of sequences correctly recalled. Each participant has
five chances to recall three-digit sequences of the assigned digit level (number of digits needed
to remember) correctly. When the participant has recalled the correct sequence of digits three
times in a given digit level, a digit is added to the sequence. The process is repeated until the
participant can no longer recall the correct sequence of digits from that digit level. A value is
assigned to the participant’s working memory capacity based on the highest digit level that he or
she could recall.
For the counting-span tasks, participants are given between two and seven displays filled with
targets and distractors (see Figure 12). The subject has to count the number of targets (e.g.
black dots) in each display. After the last display, the subject recalls the number of targets in
each of the displays in the order they were presented. A working memory capacity score is then
determined according to the number of digits that were recalled correctly.
Figure 12: Example of a counting-span task (Case et al., 1982)
Lastly, in an operation-span task, participants read a series of operation-word strings aloud (e.g.
“Is 4/2 +3 = 6? DOG”) (Engle, 2002). They then have to respond to whether or not the equation
is correct, and then read the capitalised word aloud. After viewing between two and seven of
these operation-word combinations, the participants are asked to recall the capitalised words in
the order they were presented. A working memory capacity score is then determined according
to the number of words that were recalled correctly.
For this study, the digit-span task was used as it is easy to implement and comprises
assessment of both the verbal and visual channels of working memory (See Appendix H). It is a
reliable indication of the genuine working memory capacity of a participant as it uses both verbal
and visual channels of information to process and remember the order of the digits. Each
participant had five chances to recall the correct sequence of digits, starting with a sequence of
three digits. Each digit in a sequence was presented on screen and was also spoken aloud.
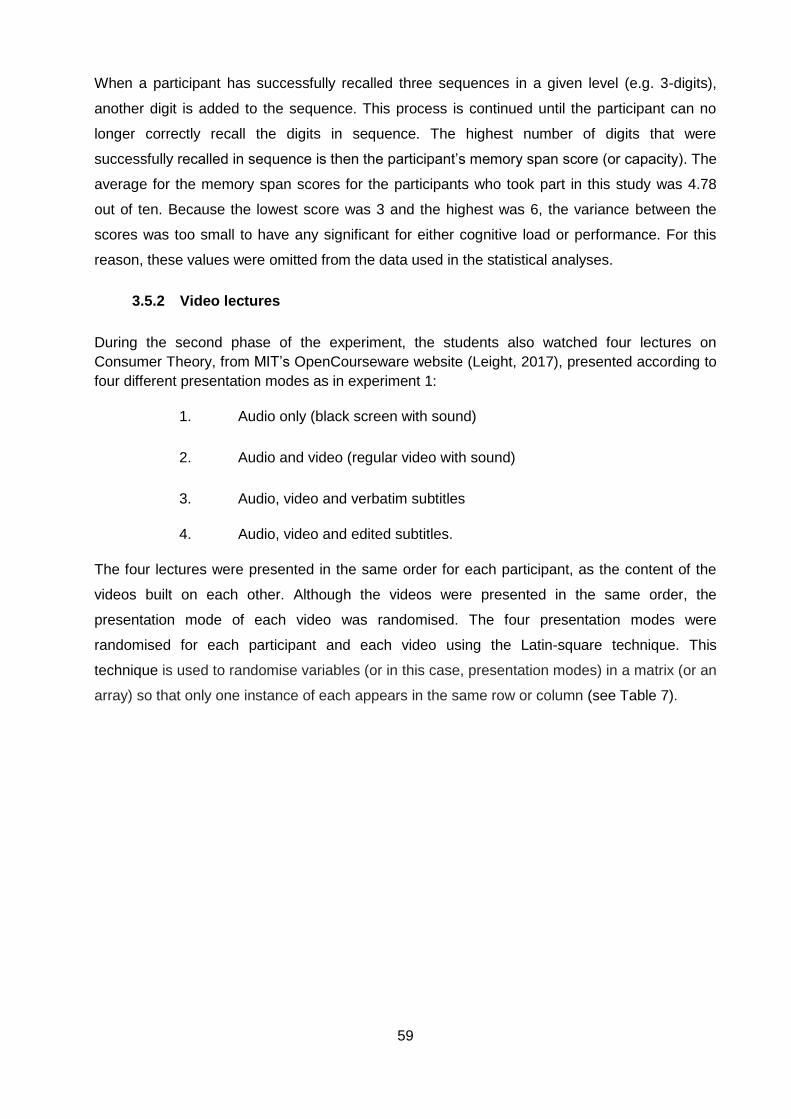
59
When a participant has successfully recalled three sequences in a given level (e.g. 3-digits),
another digit is added to the sequence. This process is continued until the participant can no
longer correctly recall the digits in sequence. The highest number of digits that were
successfully recalled in sequence is then the participant’s memory span score (or capacity). The
average for the memory span scores for the participants who took part in this study was 4.78
out of ten. Because the lowest score was 3 and the highest was 6, the variance between the
scores was too small to have any significant for either cognitive load or performance. For this
reason, these values were omitted from the data used in the statistical analyses.
3.5.2 Video lectures
During the second phase of the experiment, the students also watched four lectures on
Consumer Theory, from MIT’s OpenCourseware website (Leight, 2017), presented according to
four different presentation modes as in experiment 1:
1. Audio only (black screen with sound)
2. Audio and video (regular video with sound)
3. Audio, video and verbatim subtitles
4. Audio, video and edited subtitles.
The four lectures were presented in the same order for each participant, as the content of the
videos built on each other. Although the videos were presented in the same order, the
presentation mode of each video was randomised. The four presentation modes were
randomised for each participant and each video using the Latin-square technique. This
technique is used to randomise variables (or in this case, presentation modes) in a matrix (or an
array) so that only one instance of each appears in the same row or column (see Table 7).
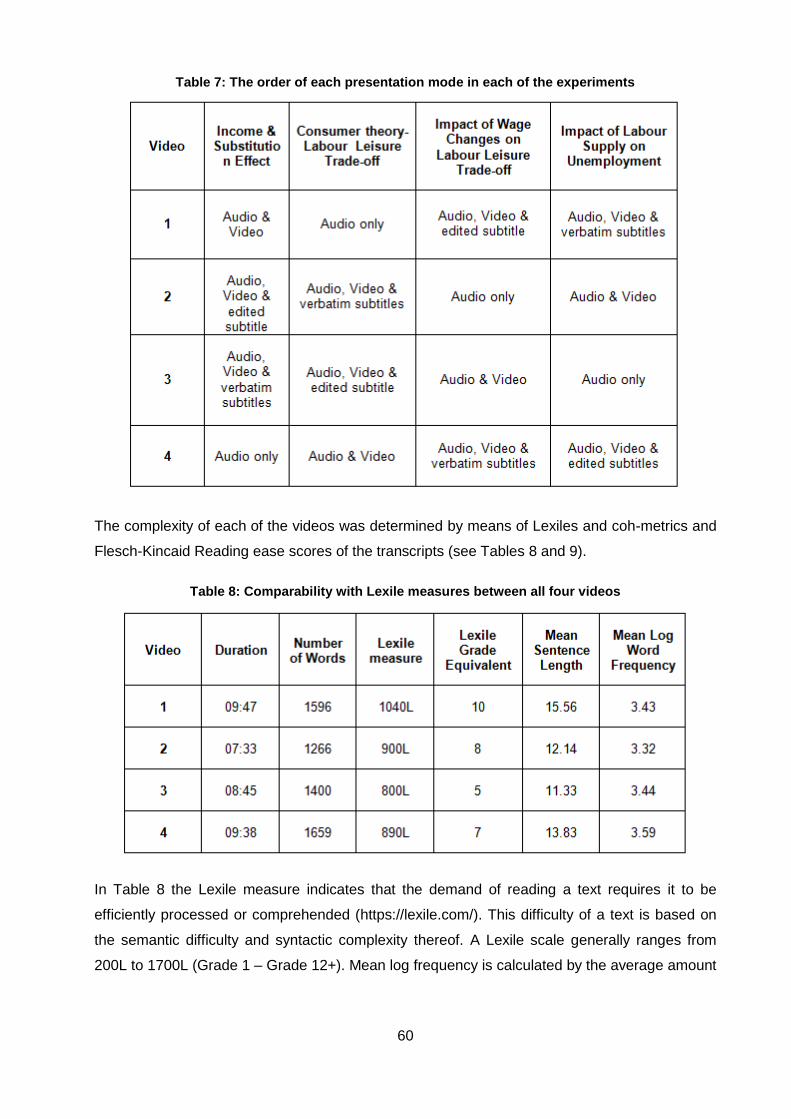
60
Table 7: The order of each presentation mode in each of the experiments
The complexity of each of the videos was determined by means of Lexiles and coh-metrics and
Flesch-Kincaid Reading ease scores of the transcripts (see Tables 8 and 9).
Table 8: Comparability with Lexile measures between all four videos
In Table 8 the Lexile measure indicates that the demand of reading a text requires it to be
efficiently processed or comprehended (https://lexile.com/). This difficulty of a text is based on
the semantic difficulty and syntactic complexity thereof. A Lexile scale generally ranges from
200L to 1700L (Grade 1 – Grade 12+). Mean log frequency is calculated by the average amount
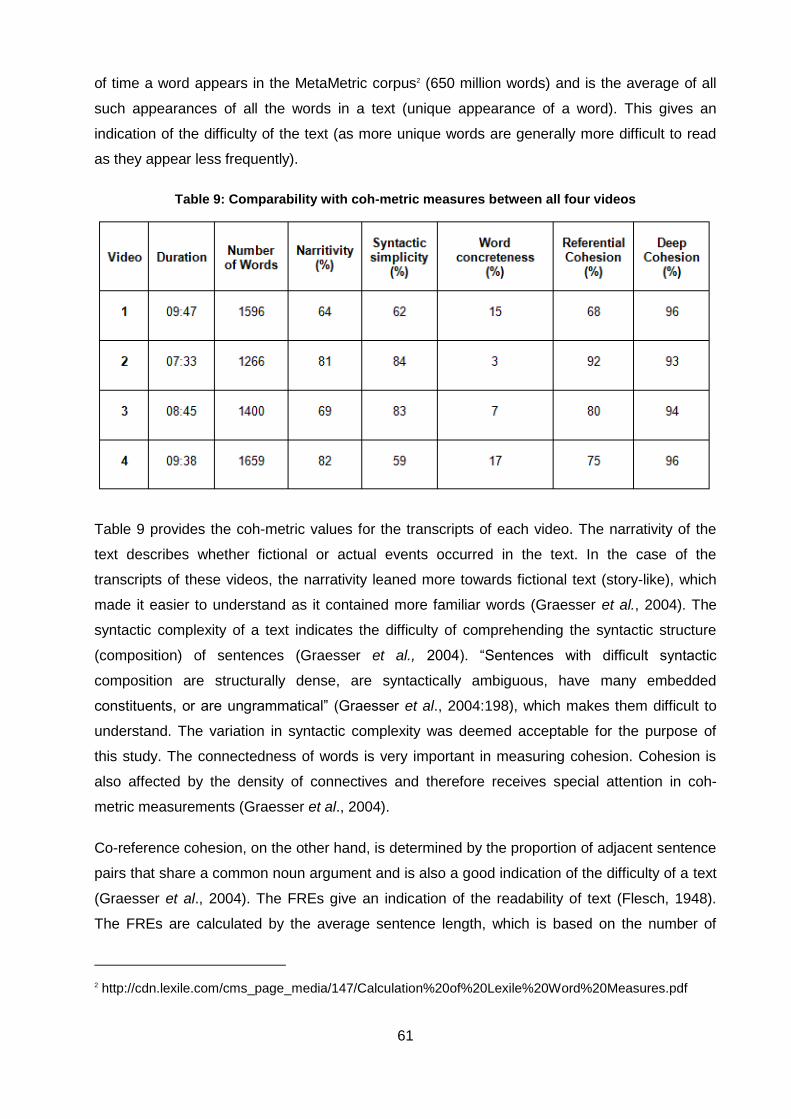
61
of time a word appears in the MetaMetric corpus2 (650 million words) and is the average of all
such appearances of all the words in a text (unique appearance of a word). This gives an
indication of the difficulty of the text (as more unique words are generally more difficult to read
as they appear less frequently).
Table 9: Comparability with coh-metric measures between all four videos
Table 9 provides the coh-metric values for the transcripts of each video. The narrativity of the
text describes whether fictional or actual events occurred in the text. In the case of the
transcripts of these videos, the narrativity leaned more towards fictional text (story-like), which
made it easier to understand as it contained more familiar words (Graesser et al., 2004). The
syntactic complexity of a text indicates the difficulty of comprehending the syntactic structure
(composition) of sentences (Graesser et al., 2004). “Sentences with difficult syntactic
composition are structurally dense, are syntactically ambiguous, have many embedded
constituents, or are ungrammatical” (Graesser et al., 2004:198), which makes them difficult to
understand. The variation in syntactic complexity was deemed acceptable for the purpose of
this study. The connectedness of words is very important in measuring cohesion. Cohesion is
also affected by the density of connectives and therefore receives special attention in coh-
metric measurements (Graesser et al., 2004).
Co-reference cohesion, on the other hand, is determined by the proportion of adjacent sentence
pairs that share a common noun argument and is also a good indication of the difficulty of a text
(Graesser et al., 2004). The FREs give an indication of the readability of text (Flesch, 1948).
The FREs are calculated by the average sentence length, which is based on the number of
2 http://cdn.lexile.com/cms_page_media/147/Calculation%20of%20Lexile%20Word%20Measures.pdf

62
words per sentence, and the average word length, which is based on the number of syllables of
each word (Friedman & Hoffman-Goetz, 2006). For this experiment, the FREs showed that the
transcripts were easy to read (100=easiest and 0=hardest) (see Table 10).
Table 10: Flesch-Kincaid reading ease score for the transcripts of the four video
3.5.3 Comprehension test and cognitive load questionnaire
The comprehension tests were administered after the participants had watched each of the four
videos. The comprehension tests tested cued recall (a multiple-choice question)and recognition
(a true or false question), and included some content-specific comprehension questions. The
tests consisted of six questions that tested definitions, concepts, true/false and recognition of
phrases uttered in the associated video (10 marks in total). The purpose of these
comprehension tests was the same as that for the first experiment (see Section 3.4.2.3).
3.5.4 Equipment and environment
To record the eye movements of the participants, SMI’s iViewX™ RED500 eye-tracking system
was used (see Figure 13).
Figure 13: SMI’s iViewX™ RED500 eye-tracking system
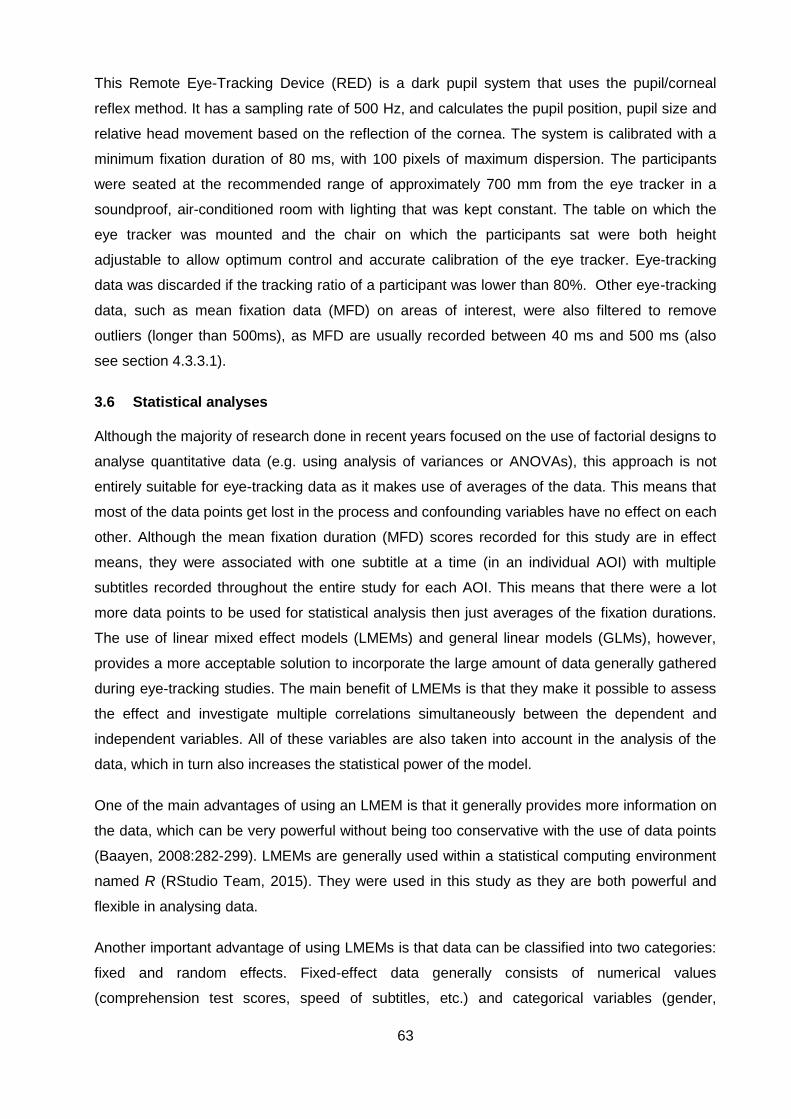
63
This Remote Eye-Tracking Device (RED) is a dark pupil system that uses the pupil/corneal
reflex method. It has a sampling rate of 500 Hz, and calculates the pupil position, pupil size and
relative head movement based on the reflection of the cornea. The system is calibrated with a
minimum fixation duration of 80 ms, with 100 pixels of maximum dispersion. The participants
were seated at the recommended range of approximately 700 mm from the eye tracker in a
soundproof, air-conditioned room with lighting that was kept constant. The table on which the
eye tracker was mounted and the chair on which the participants sat were both height
adjustable to allow optimum control and accurate calibration of the eye tracker. Eye-tracking
data was discarded if the tracking ratio of a participant was lower than 80%. Other eye-tracking
data, such as mean fixation data (MFD) on areas of interest, were also filtered to remove
outliers (longer than 500ms), as MFD are usually recorded between 40 ms and 500 ms (also
see section 4.3.3.1).
3.6 Statistical analyses
Although the majority of research done in recent years focused on the use of factorial designs to
analyse quantitative data (e.g. using analysis of variances or ANOVAs), this approach is not
entirely suitable for eye-tracking data as it makes use of averages of the data. This means that
most of the data points get lost in the process and confounding variables have no effect on each
other. Although the mean fixation duration (MFD) scores recorded for this study are in effect
means, they were associated with one subtitle at a time (in an individual AOI) with multiple
subtitles recorded throughout the entire study for each AOI. This means that there were a lot
more data points to be used for statistical analysis then just averages of the fixation durations.
The use of linear mixed effect models (LMEMs) and general linear models (GLMs), however,
provides a more acceptable solution to incorporate the large amount of data generally gathered
during eye-tracking studies. The main benefit of LMEMs is that they make it possible to assess
the effect and investigate multiple correlations simultaneously between the dependent and
independent variables. All of these variables are also taken into account in the analysis of the
data, which in turn also increases the statistical power of the model.
One of the main advantages of using an LMEM is that it generally provides more information on
the data, which can be very powerful without being too conservative with the use of data points
(Baayen, 2008:282-299). LMEMs are generally used within a statistical computing environment
named R (RStudio Team, 2015). They were used in this study as they are both powerful and
flexible in analysing data.
Another important advantage of using LMEMs is that data can be classified into two categories:
fixed and random effects. Fixed-effect data generally consists of numerical values
(comprehension test scores, speed of subtitles, etc.) and categorical variables (gender,
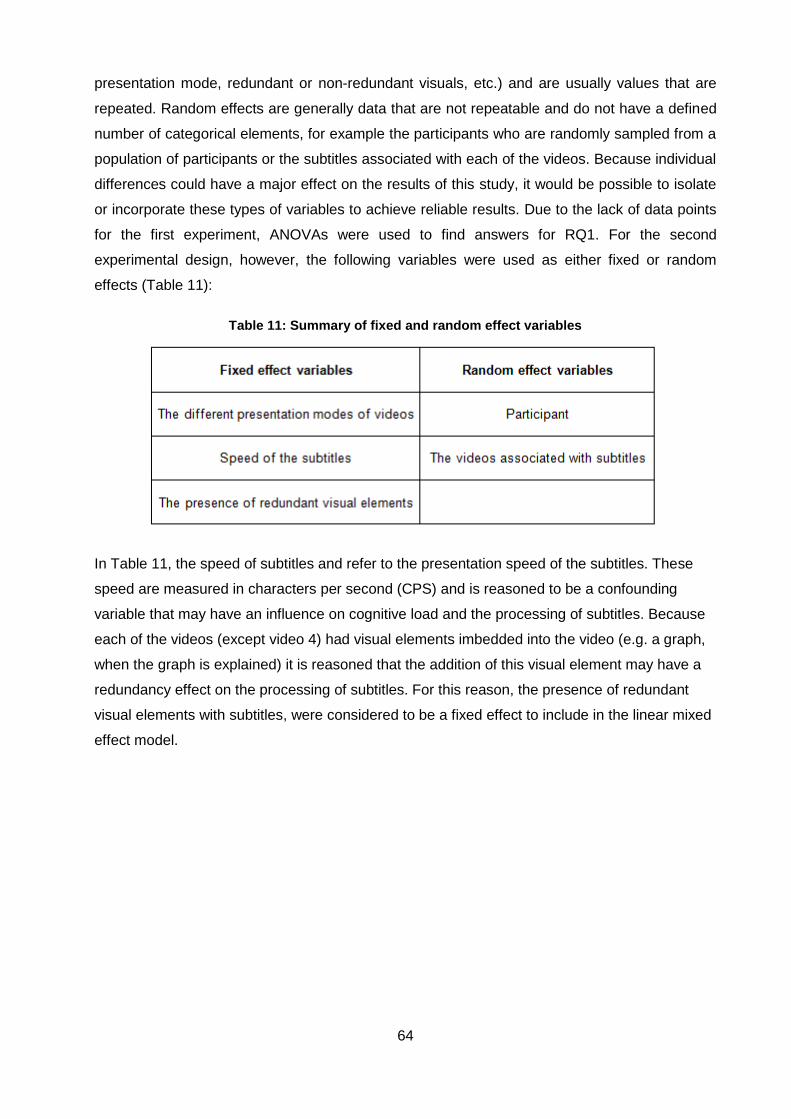
64
presentation mode, redundant or non-redundant visuals, etc.) and are usually values that are
repeated. Random effects are generally data that are not repeatable and do not have a defined
number of categorical elements, for example the participants who are randomly sampled from a
population of participants or the subtitles associated with each of the videos. Because individual
differences could have a major effect on the results of this study, it would be possible to isolate
or incorporate these types of variables to achieve reliable results. Due to the lack of data points
for the first experiment, ANOVAs were used to find answers for RQ1. For the second
experimental design, however, the following variables were used as either fixed or random
effects (Table 11):
Table 11: Summary of fixed and random effect variables
In Table 11, the speed of subtitles and refer to the presentation speed of the subtitles. These
speed are measured in characters per second (CPS) and is reasoned to be a confounding
variable that may have an influence on cognitive load and the processing of subtitles. Because
each of the videos (except video 4) had visual elements imbedded into the video (e.g. a graph,
when the graph is explained) it is reasoned that the addition of this visual element may have a
redundancy effect on the processing of subtitles. For this reason, the presence of redundant
visual elements with subtitles, were considered to be a fixed effect to include in the linear mixed
effect model.
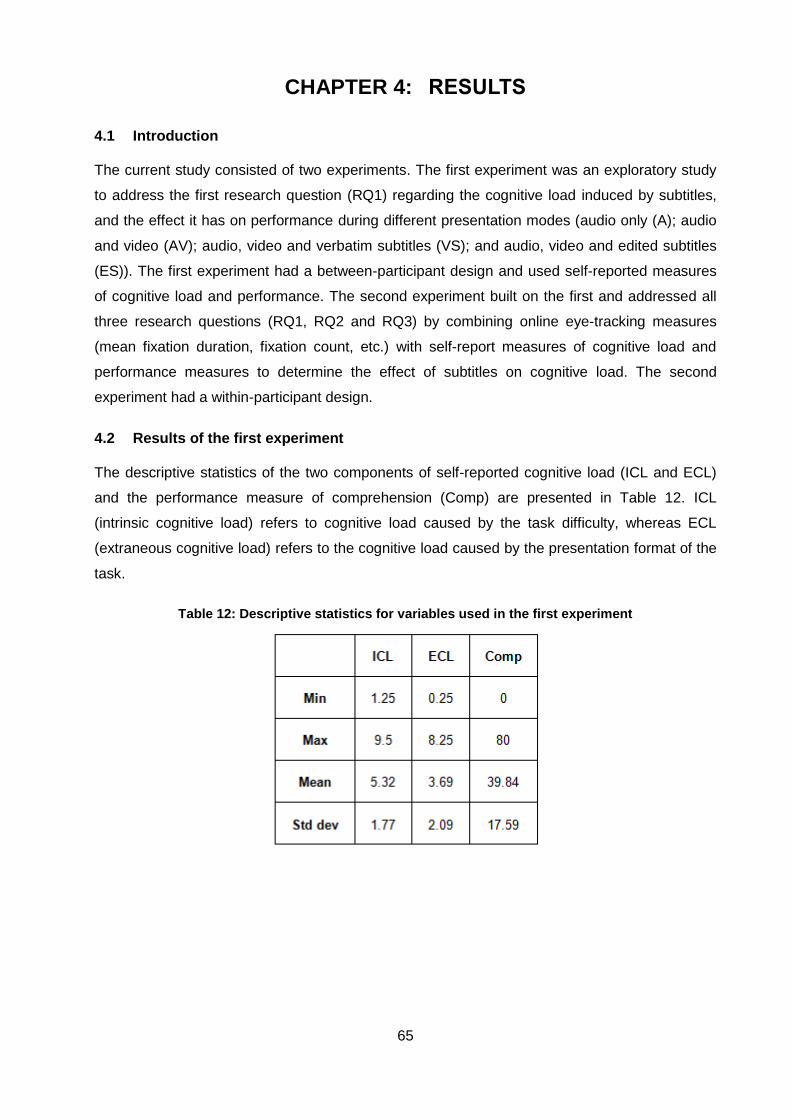
65
CHAPTER 4: RESULTS
4.1 Introduction
The current study consisted of two experiments. The first experiment was an exploratory study
to address the first research question (RQ1) regarding the cognitive load induced by subtitles,
and the effect it has on performance during different presentation modes (audio only (A); audio
and video (AV); audio, video and verbatim subtitles (VS); and audio, video and edited subtitles
(ES)). The first experiment had a between-participant design and used self-reported measures
of cognitive load and performance. The second experiment built on the first and addressed all
three research questions (RQ1, RQ2 and RQ3) by combining online eye-tracking measures
(mean fixation duration, fixation count, etc.) with self-report measures of cognitive load and
performance measures to determine the effect of subtitles on cognitive load. The second
experiment had a within-participant design.
4.2 Results of the first experiment
The descriptive statistics of the two components of self-reported cognitive load (ICL and ECL)
and the performance measure of comprehension (Comp) are presented in Table 12. ICL
(intrinsic cognitive load) refers to cognitive load caused by the task difficulty, whereas ECL
(extraneous cognitive load) refers to the cognitive load caused by the presentation format of the
task.
Table 12: Descriptive statistics for variables used in the first experiment
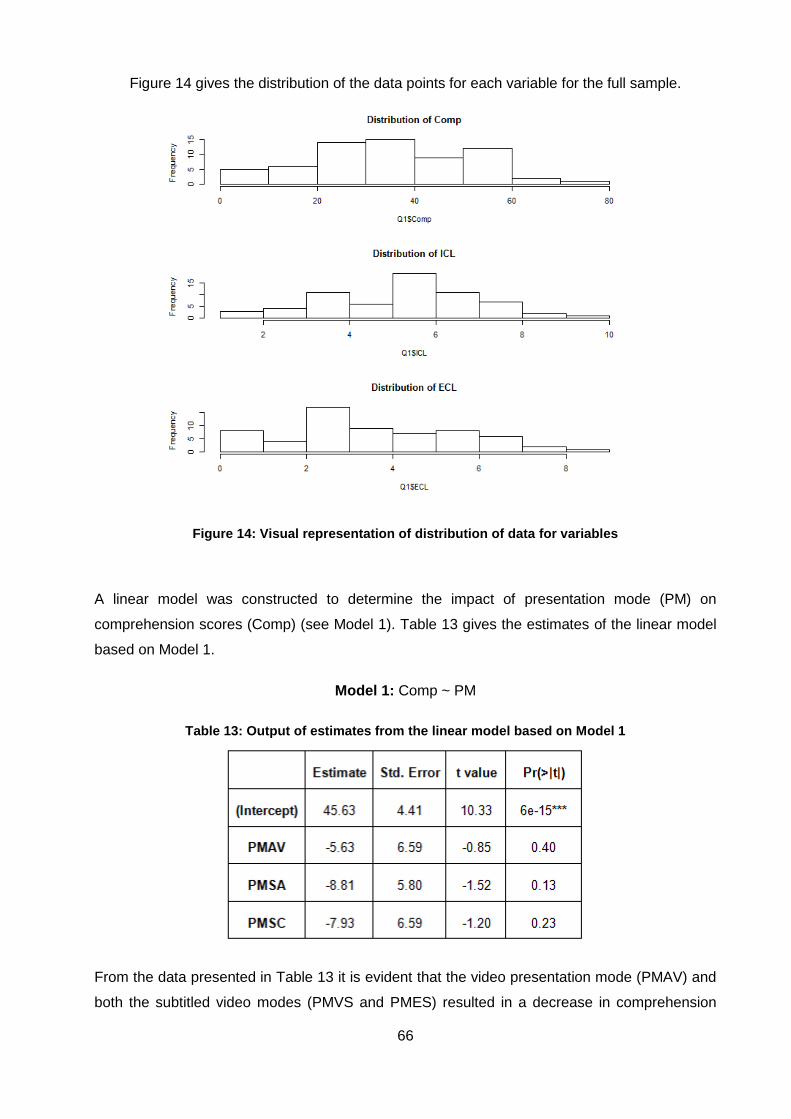
66
Figure 14 gives the distribution of the data points for each variable for the full sample.
Figure 14: Visual representation of distribution of data for variables
A linear model was constructed to determine the impact of presentation mode (PM) on
comprehension scores (Comp) (see Model 1). Table 13 gives the estimates of the linear model
based on Model 1.
Model 1: Comp ~ PM
Table 13: Output of estimates from the linear model based on Model 1
From the data presented in Table 13 it is evident that the video presentation mode (PMAV) and
both the subtitled video modes (PMVS and PMES) resulted in a decrease in comprehension
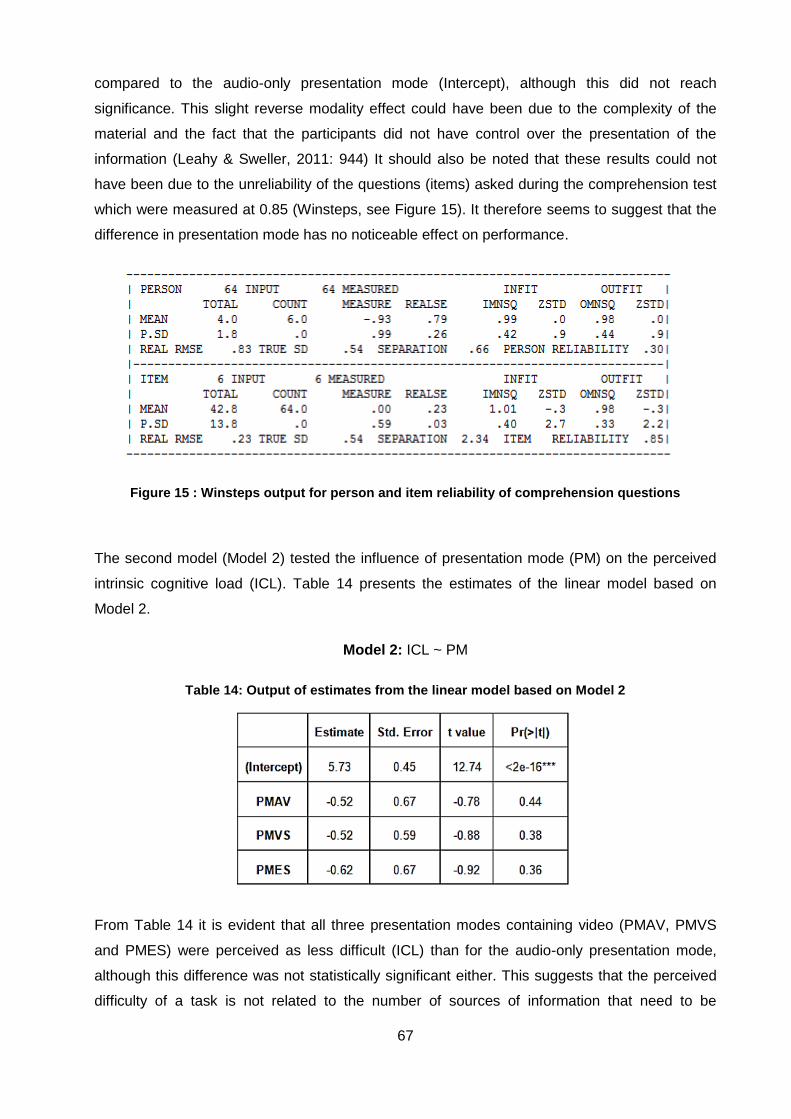
67
compared to the audio-only presentation mode (Intercept), although this did not reach
significance. This slight reverse modality effect could have been due to the complexity of the
material and the fact that the participants did not have control over the presentation of the
information (Leahy & Sweller, 2011: 944) It should also be noted that these results could not
have been due to the unreliability of the questions (items) asked during the comprehension test
which were measured at 0.85 (Winsteps, see Figure 15). It therefore seems to suggest that the
difference in presentation mode has no noticeable effect on performance.
Figure 15 : Winsteps output for person and item reliability of comprehension questions
The second model (Model 2) tested the influence of presentation mode (PM) on the perceived
intrinsic cognitive load (ICL). Table 14 presents the estimates of the linear model based on
Model 2.
Model 2: ICL ~ PM
Table 14: Output of estimates from the linear model based on Model 2
From Table 14 it is evident that all three presentation modes containing video (PMAV, PMVS
and PMES) were perceived as less difficult (ICL) than for the audio-only presentation mode,
although this difference was not statistically significant either. This suggests that the perceived
difficulty of a task is not related to the number of sources of information that need to be
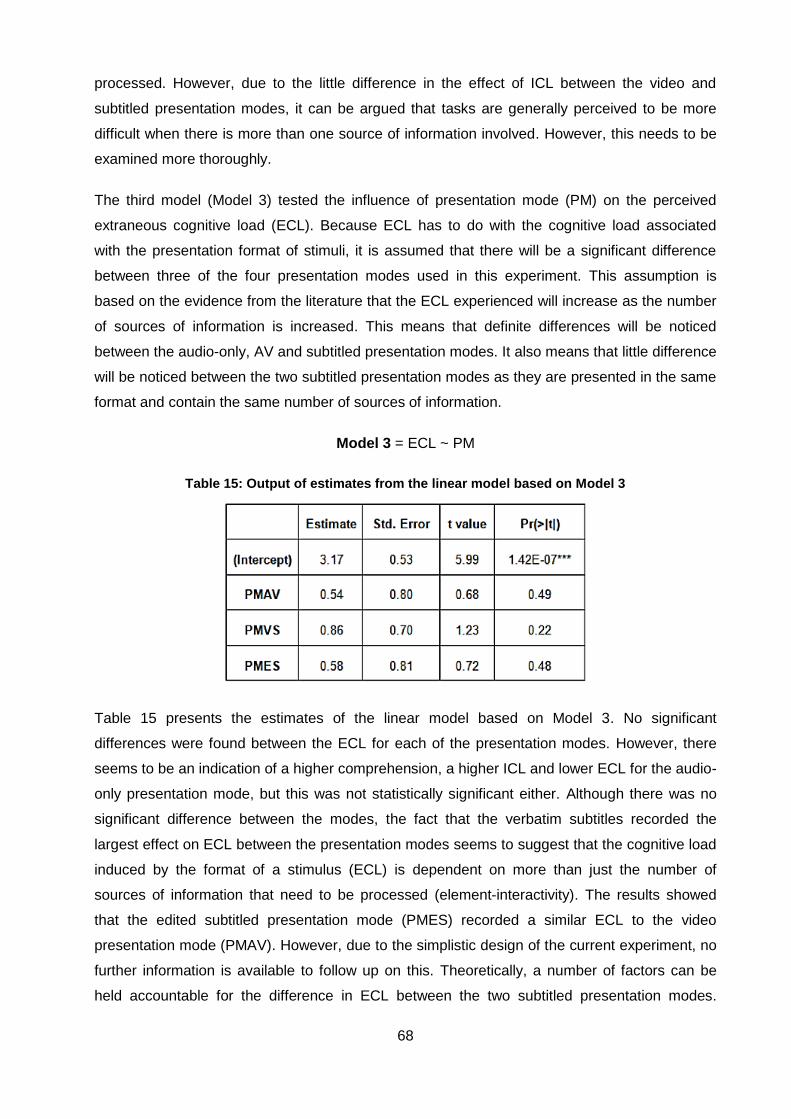
68
processed. However, due to the little difference in the effect of ICL between the video and
subtitled presentation modes, it can be argued that tasks are generally perceived to be more
difficult when there is more than one source of information involved. However, this needs to be
examined more thoroughly.
The third model (Model 3) tested the influence of presentation mode (PM) on the perceived
extraneous cognitive load (ECL). Because ECL has to do with the cognitive load associated
with the presentation format of stimuli, it is assumed that there will be a significant difference
between three of the four presentation modes used in this experiment. This assumption is
based on the evidence from the literature that the ECL experienced will increase as the number
of sources of information is increased. This means that definite differences will be noticed
between the audio-only, AV and subtitled presentation modes. It also means that little difference
will be noticed between the two subtitled presentation modes as they are presented in the same
format and contain the same number of sources of information.
Model 3 = ECL ~ PM
Table 15: Output of estimates from the linear model based on Model 3
Table 15 presents the estimates of the linear model based on Model 3. No significant
differences were found between the ECL for each of the presentation modes. However, there
seems to be an indication of a higher comprehension, a higher ICL and lower ECL for the audio-
only presentation mode, but this was not statistically significant either. Although there was no
significant difference between the modes, the fact that the verbatim subtitles recorded the
largest effect on ECL between the presentation modes seems to suggest that the cognitive load
induced by the format of a stimulus (ECL) is dependent on more than just the number of
sources of information that need to be processed (element-interactivity). The results showed
that the edited subtitled presentation mode (PMES) recorded a similar ECL to the video
presentation mode (PMAV). However, due to the simplistic design of the current experiment, no
further information is available to follow up on this. Theoretically, a number of factors can be
held accountable for the difference in ECL between the two subtitled presentation modes.
69
These factors can include either the characteristics of the subtitles (e.g. presentation speed,
number of words, etc.) or the composition and implementation of the subtitles within the
stimulus (e.g. the redundancy effect). Given that there were some unanswered questions from
the first experiment, a second experiment was proposed, where subtitle-related variables (such
as presentation speed, number of words, composition, etc.) were controlled for. It is also
proposed that attention to the subtitles can have an effect on the processing and perceived
cognitive load of the subtitles, which necessitated the recording of eye-tracking data in the
second experiment.
4.3 The second experiment
4.3.1 Introduction
The second experiment built on the first, but addressed all three research questions (RQ1, RQ2
and RQ3) that were set out in Chapter 1. The main difference with the second experiment is the
addition of objective, online measures of cognitive load and performance (i.e. eye-tracking
measures). The design of the second experiment was also changed from a between-participant
design to a within-participant design. The addition of objective measures, along with the
subjective measures that were used in the first experiment, allows a better interpretation of the
experiences of the participants to be made. The number of stimuli was also increased from one
video (in four presentation modes) to four videos in all four of the presentation modes.
For the second experiment, additional data was collected on the participants’ experience of
reading subtitles, their prior knowledge of Economics, their English proficiency and their working
memory capacity (the amount of information they can keep in their working memory). An
additional requirement for the participants who took part in the second experiment was that they
needed to have had at least one semester of university experience in Economics. This meant
that the participants had prior experience of the terminology used in Economics and would be
more at ease with the content of the videos. Table 16 provides a summary of the variables that
were used in this study.
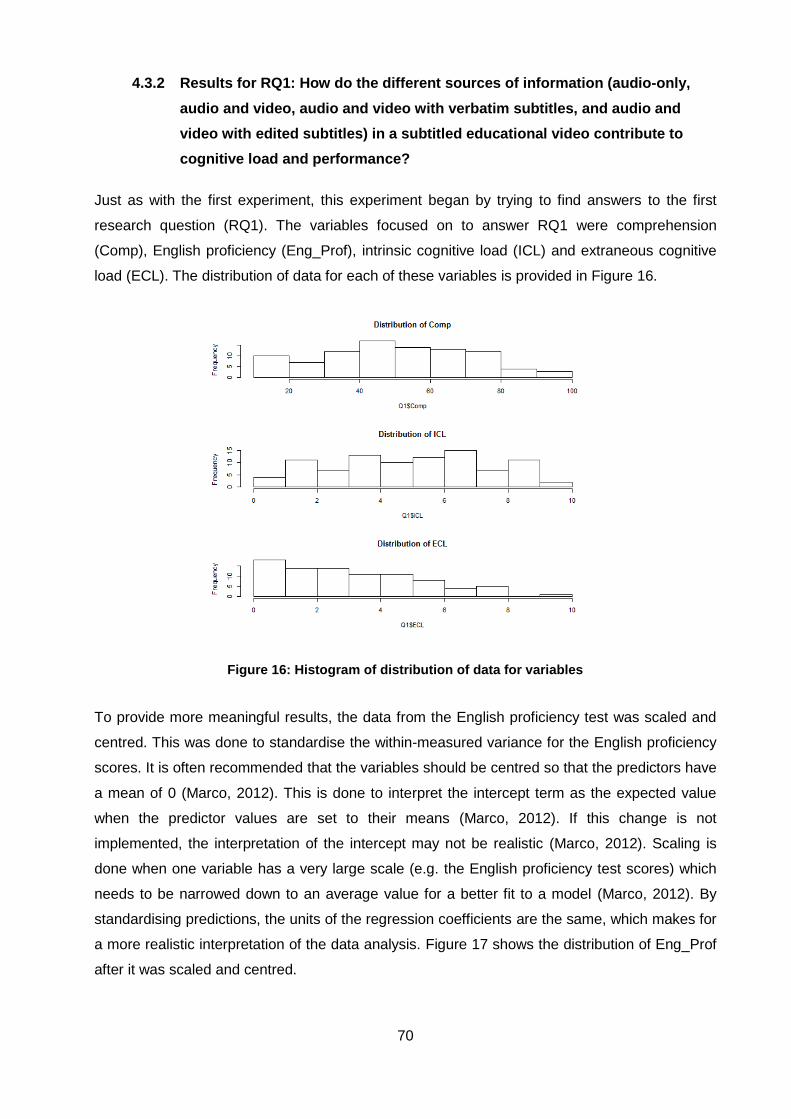
70
4.3.2 Results for RQ1: How do the different sources of information (audio-only,
audio and video, audio and video with verbatim subtitles, and audio and
video with edited subtitles) in a subtitled educational video contribute to
cognitive load and performance?
Just as with the first experiment, this experiment began by trying to find answers to the first
research question (RQ1). The variables focused on to answer RQ1 were comprehension
(Comp), English proficiency (Eng_Prof), intrinsic cognitive load (ICL) and extraneous cognitive
load (ECL). The distribution of data for each of these variables is provided in Figure 16.
Figure 16: Histogram of distribution of data for variables
To provide more meaningful results, the data from the English proficiency test was scaled and
centred. This was done to standardise the within-measured variance for the English proficiency
scores. It is often recommended that the variables should be centred so that the predictors have
a mean of 0 (Marco, 2012). This is done to interpret the intercept term as the expected value
when the predictor values are set to their means (Marco, 2012). If this change is not
implemented, the interpretation of the intercept may not be realistic (Marco, 2012). Scaling is
done when one variable has a very large scale (e.g. the English proficiency test scores) which
needs to be narrowed down to an average value for a better fit to a model (Marco, 2012). By
standardising predictions, the units of the regression coefficients are the same, which makes for
a more realistic interpretation of the data analysis. Figure 17 shows the distribution of Eng_Prof
after it was scaled and centred.
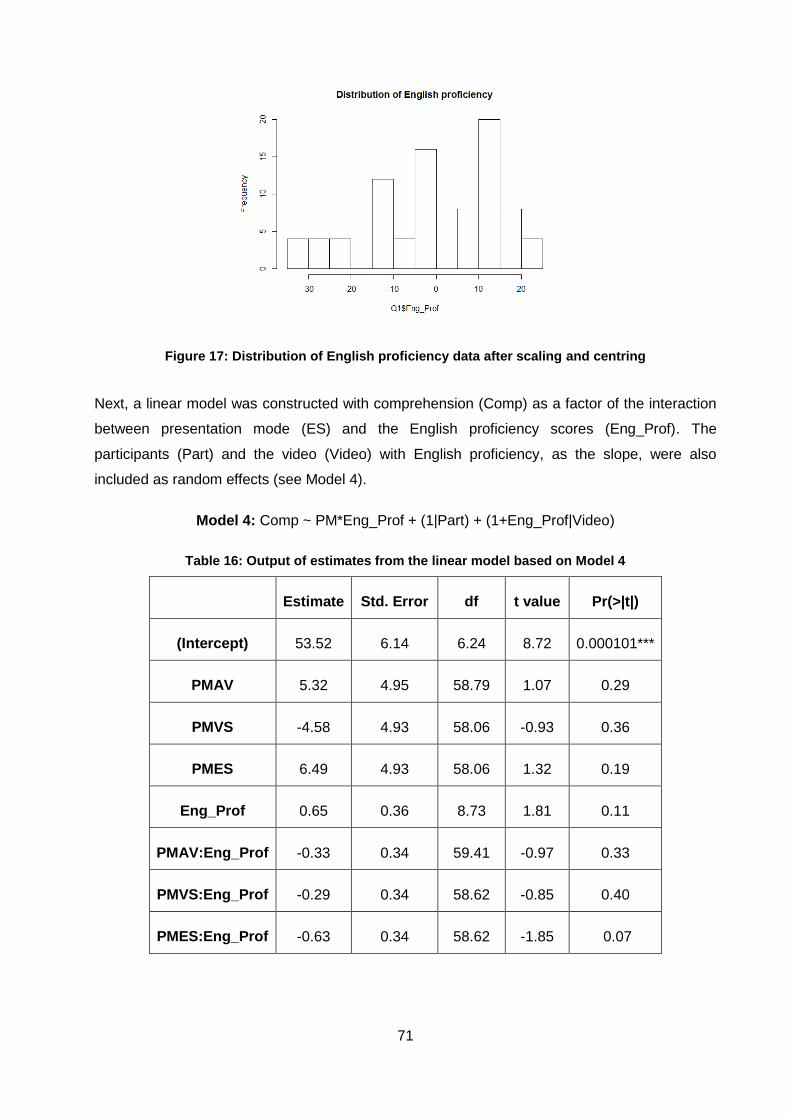
71
Figure 17: Distribution of English proficiency data after scaling and centring
Next, a linear model was constructed with comprehension (Comp) as a factor of the interaction
between presentation mode (ES) and the English proficiency scores (Eng_Prof). The
participants (Part) and the video (Video) with English proficiency, as the slope, were also
included as random effects (see Model 4).
Model 4: Comp ~ PM*Eng_Prof + (1|Part) + (1+Eng_Prof|Video)
Table 16: Output of estimates from the linear model based on Model 4
Estimate Std. Error df t value Pr(>|t|)
(Intercept) 53.52 6.14 6.24 8.72 0.000101***
PMAV 5.32 4.95 58.79 1.07 0.29
PMVS -4.58 4.93 58.06 -0.93 0.36
PMES 6.49 4.93 58.06 1.32 0.19
Eng_Prof 0.65 0.36 8.73 1.81 0.11
PMAV:Eng_Prof -0.33 0.34 59.41 -0.97 0.33
PMVS:Eng_Prof -0.29 0.34 58.62 -0.85 0.40
PMES:Eng_Prof -0.63 0.34 58.62 -1.85 0.07
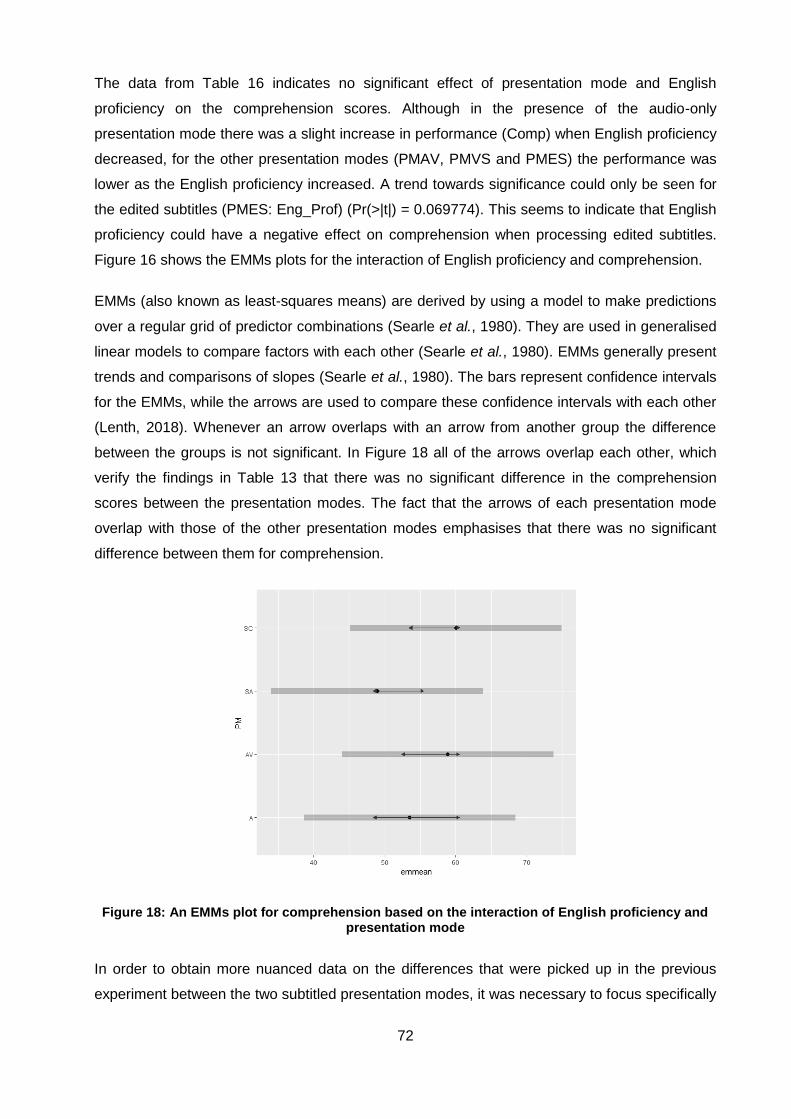
72
The data from Table 16 indicates no significant effect of presentation mode and English
proficiency on the comprehension scores. Although in the presence of the audio-only
presentation mode there was a slight increase in performance (Comp) when English proficiency
decreased, for the other presentation modes (PMAV, PMVS and PMES) the performance was
lower as the English proficiency increased. A trend towards significance could only be seen for
the edited subtitles (PMES: Eng_Prof) (Pr(>|t|) = 0.069774). This seems to indicate that English
proficiency could have a negative effect on comprehension when processing edited subtitles.
Figure 16 shows the EMMs plots for the interaction of English proficiency and comprehension.
EMMs (also known as least-squares means) are derived by using a model to make predictions
over a regular grid of predictor combinations (Searle et al., 1980). They are used in generalised
linear models to compare factors with each other (Searle et al., 1980). EMMs generally present
trends and comparisons of slopes (Searle et al., 1980). The bars represent confidence intervals
for the EMMs, while the arrows are used to compare these confidence intervals with each other
(Lenth, 2018). Whenever an arrow overlaps with an arrow from another group the difference
between the groups is not significant. In Figure 18 all of the arrows overlap each other, which
verify the findings in Table 13 that there was no significant difference in the comprehension
scores between the presentation modes. The fact that the arrows of each presentation mode
overlap with those of the other presentation modes emphasises that there was no significant
difference between them for comprehension.
Figure 18: An EMMs plot for comprehension based on the interaction of English proficiency and presentation mode
In order to obtain more nuanced data on the differences that were picked up in the previous
experiment between the two subtitled presentation modes, it was necessary to focus specifically
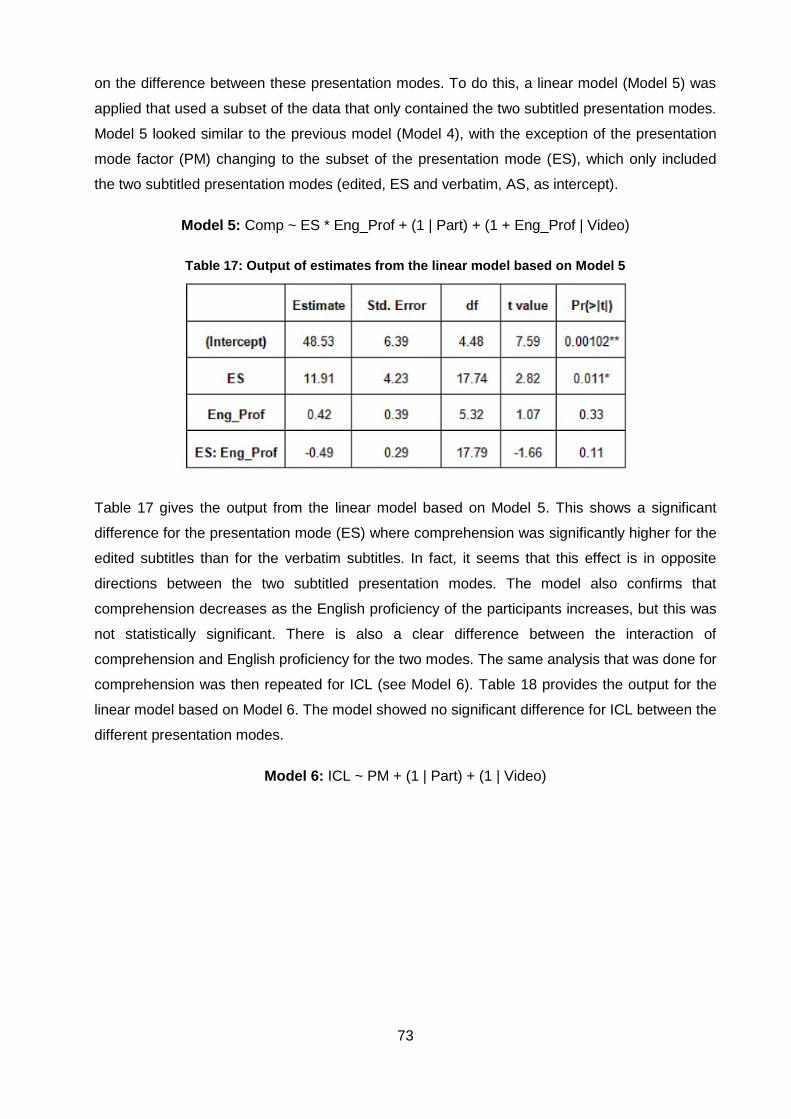
73
on the difference between these presentation modes. To do this, a linear model (Model 5) was
applied that used a subset of the data that only contained the two subtitled presentation modes.
Model 5 looked similar to the previous model (Model 4), with the exception of the presentation
mode factor (PM) changing to the subset of the presentation mode (ES), which only included
the two subtitled presentation modes (edited, ES and verbatim, AS, as intercept).
Model 5: Comp ~ ES * Eng_Prof + (1 | Part) + (1 + Eng_Prof | Video)
Table 17: Output of estimates from the linear model based on Model 5
Table 17 gives the output from the linear model based on Model 5. This shows a significant
difference for the presentation mode (ES) where comprehension was significantly higher for the
edited subtitles than for the verbatim subtitles. In fact, it seems that this effect is in opposite
directions between the two subtitled presentation modes. The model also confirms that
comprehension decreases as the English proficiency of the participants increases, but this was
not statistically significant. There is also a clear difference between the interaction of
comprehension and English proficiency for the two modes. The same analysis that was done for
comprehension was then repeated for ICL (see Model 6). Table 18 provides the output for the
linear model based on Model 6. The model showed no significant difference for ICL between the
different presentation modes.
Model 6: ICL ~ PM + (1 | Part) + (1 | Video)
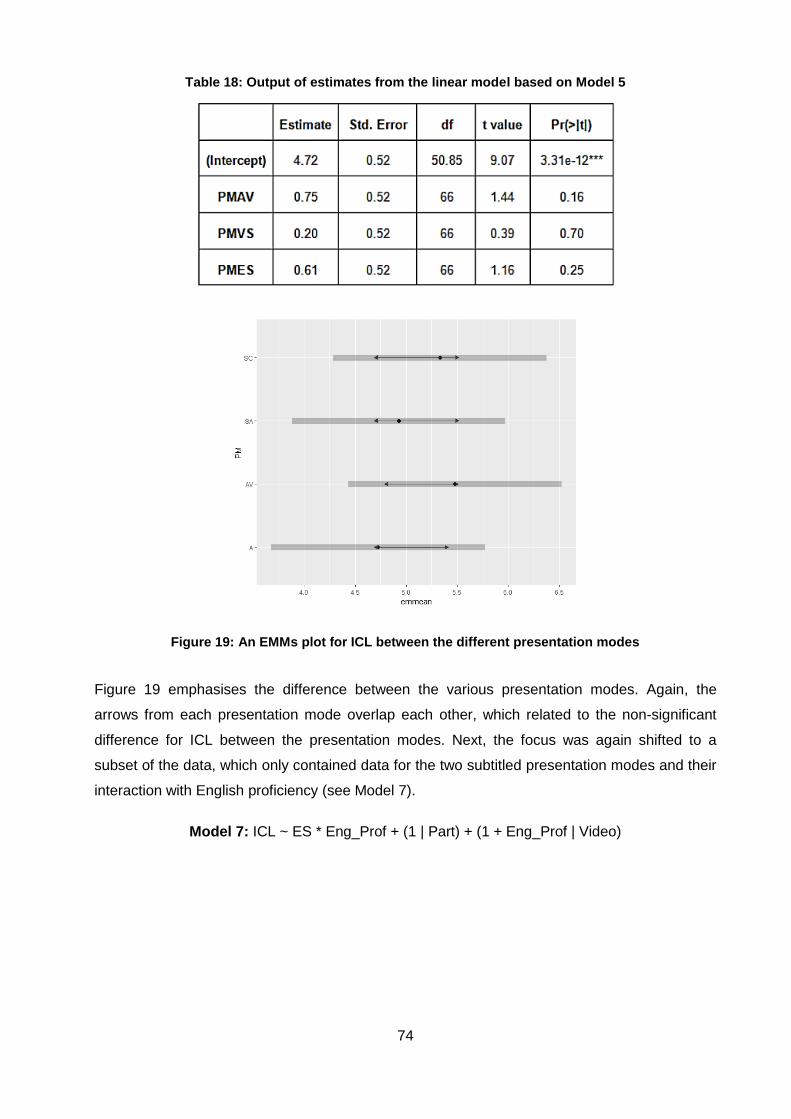
74
Table 18: Output of estimates from the linear model based on Model 5
Figure 19: An EMMs plot for ICL between the different presentation modes
Figure 19 emphasises the difference between the various presentation modes. Again, the
arrows from each presentation mode overlap each other, which related to the non-significant
difference for ICL between the presentation modes. Next, the focus was again shifted to a
subset of the data, which only contained data for the two subtitled presentation modes and their
interaction with English proficiency (see Model 7).
Model 7: ICL ~ ES * Eng_Prof + (1 | Part) + (1 + Eng_Prof | Video)
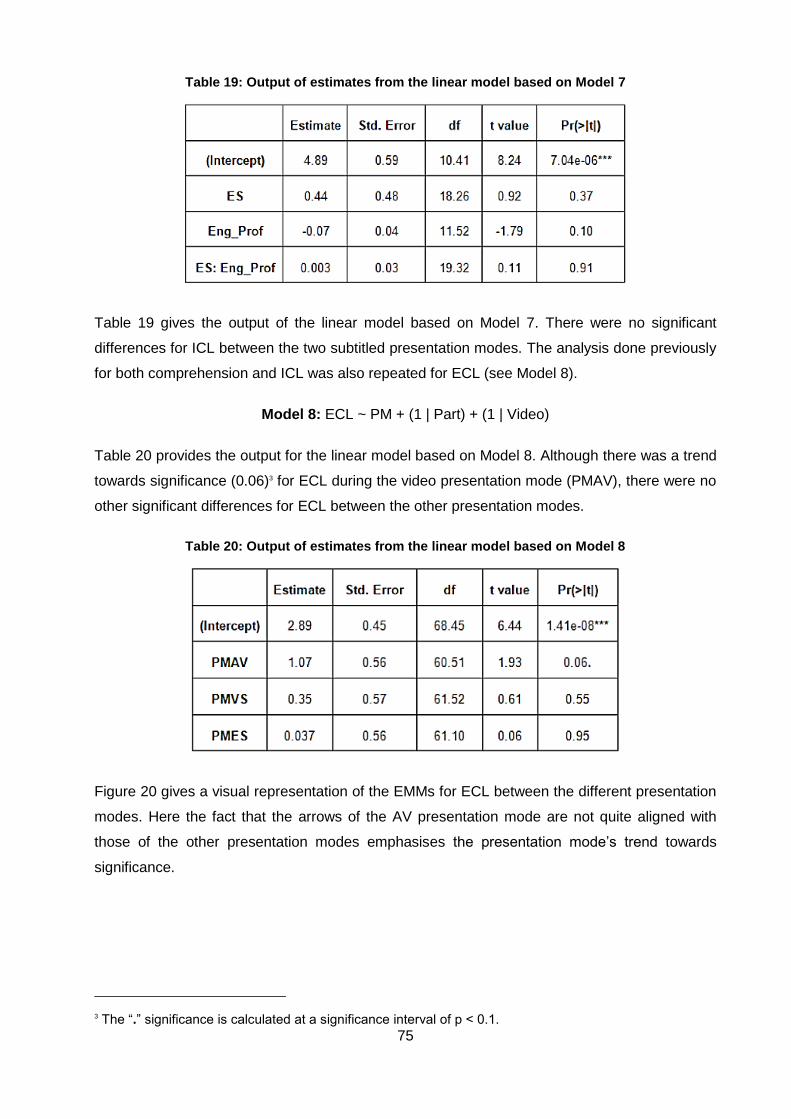
75
Table 19: Output of estimates from the linear model based on Model 7
Table 19 gives the output of the linear model based on Model 7. There were no significant
differences for ICL between the two subtitled presentation modes. The analysis done previously
for both comprehension and ICL was also repeated for ECL (see Model 8).
Model 8: ECL ~ PM + (1 | Part) + (1 | Video)
Table 20 provides the output for the linear model based on Model 8. Although there was a trend
towards significance (0.06)3 for ECL during the video presentation mode (PMAV), there were no
other significant differences for ECL between the other presentation modes.
Table 20: Output of estimates from the linear model based on Model 8
Figure 20 gives a visual representation of the EMMs for ECL between the different presentation
modes. Here the fact that the arrows of the AV presentation mode are not quite aligned with
those of the other presentation modes emphasises the presentation mode’s trend towards
significance.
3 The “.” significance is calculated at a significance interval of p < 0.1.
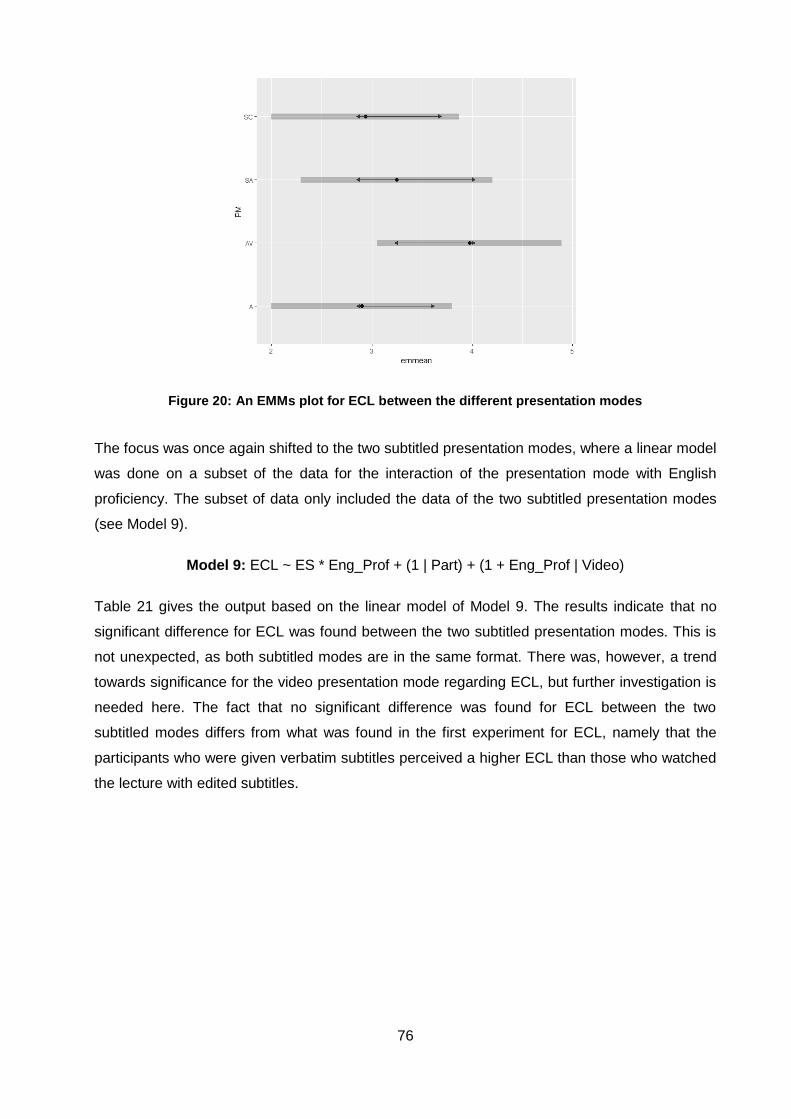
76
Figure 20: An EMMs plot for ECL between the different presentation modes
The focus was once again shifted to the two subtitled presentation modes, where a linear model
was done on a subset of the data for the interaction of the presentation mode with English
proficiency. The subset of data only included the data of the two subtitled presentation modes
(see Model 9).
Model 9: ECL ~ ES * Eng_Prof + (1 | Part) + (1 + Eng_Prof | Video)
Table 21 gives the output based on the linear model of Model 9. The results indicate that no
significant difference for ECL was found between the two subtitled presentation modes. This is
not unexpected, as both subtitled modes are in the same format. There was, however, a trend
towards significance for the video presentation mode regarding ECL, but further investigation is
needed here. The fact that no significant difference was found for ECL between the two
subtitled modes differs from what was found in the first experiment for ECL, namely that the
participants who were given verbatim subtitles perceived a higher ECL than those who watched
the lecture with edited subtitles.
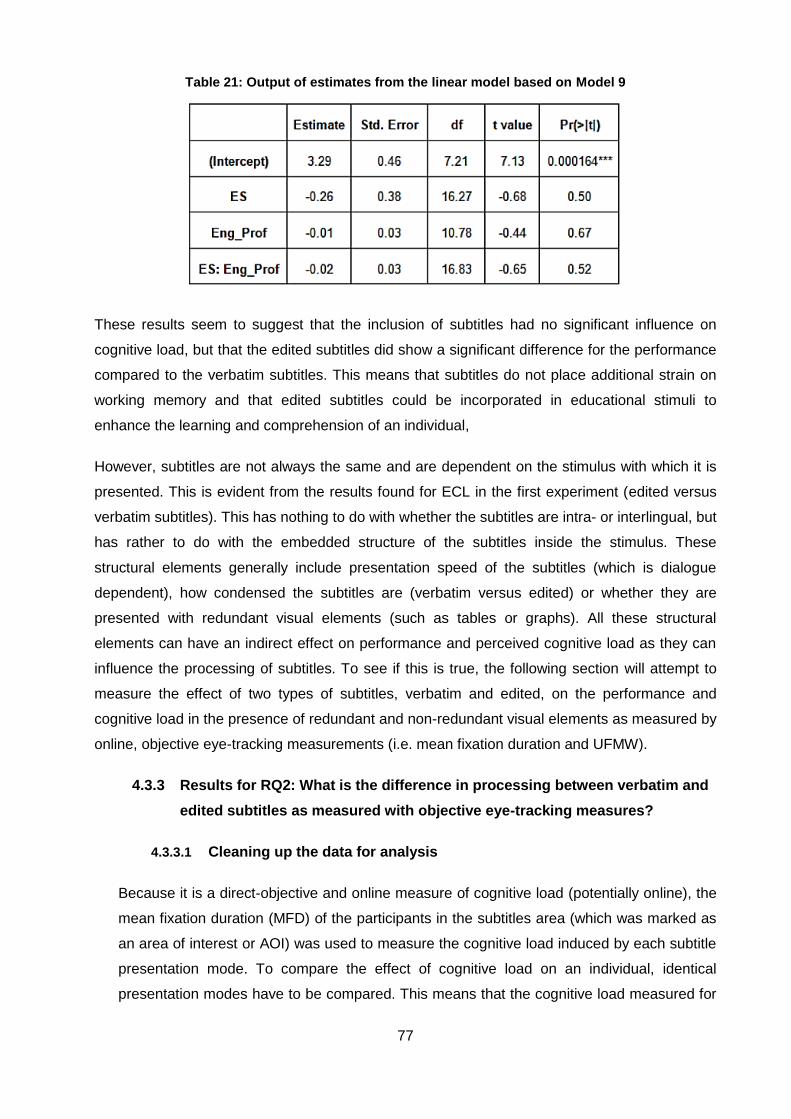
77
Table 21: Output of estimates from the linear model based on Model 9
These results seem to suggest that the inclusion of subtitles had no significant influence on
cognitive load, but that the edited subtitles did show a significant difference for the performance
compared to the verbatim subtitles. This means that subtitles do not place additional strain on
working memory and that edited subtitles could be incorporated in educational stimuli to
enhance the learning and comprehension of an individual,
However, subtitles are not always the same and are dependent on the stimulus with which it is
presented. This is evident from the results found for ECL in the first experiment (edited versus
verbatim subtitles). This has nothing to do with whether the subtitles are intra- or interlingual, but
has rather to do with the embedded structure of the subtitles inside the stimulus. These
structural elements generally include presentation speed of the subtitles (which is dialogue
dependent), how condensed the subtitles are (verbatim versus edited) or whether they are
presented with redundant visual elements (such as tables or graphs). All these structural
elements can have an indirect effect on performance and perceived cognitive load as they can
influence the processing of subtitles. To see if this is true, the following section will attempt to
measure the effect of two types of subtitles, verbatim and edited, on the performance and
cognitive load in the presence of redundant and non-redundant visual elements as measured by
online, objective eye-tracking measurements (i.e. mean fixation duration and UFMW).
4.3.3 Results for RQ2: What is the difference in processing between verbatim and
edited subtitles as measured with objective eye-tracking measures?
4.3.3.1 Cleaning up the data for analysis
Because it is a direct-objective and online measure of cognitive load (potentially online), the
mean fixation duration (MFD) of the participants in the subtitles area (which was marked as
an area of interest or AOI) was used to measure the cognitive load induced by each subtitle
presentation mode. To compare the effect of cognitive load on an individual, identical
presentation modes have to be compared. This means that the cognitive load measured for
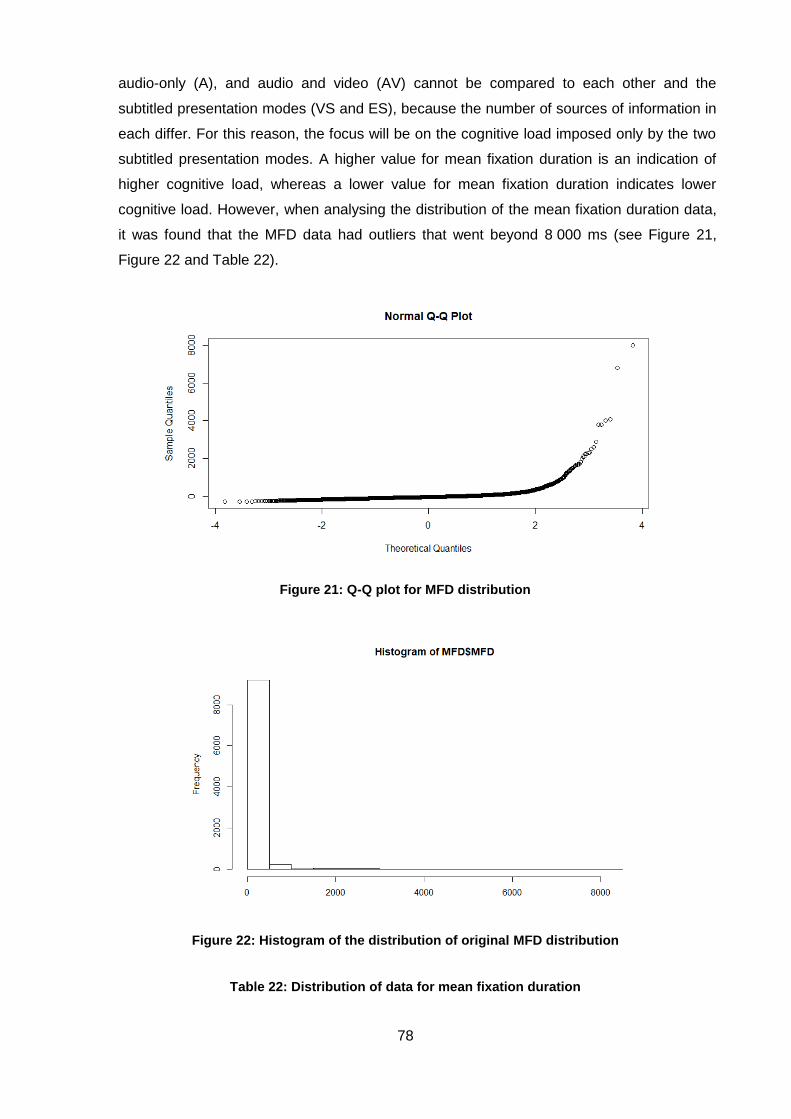
78
audio-only (A), and audio and video (AV) cannot be compared to each other and the
subtitled presentation modes (VS and ES), because the number of sources of information in
each differ. For this reason, the focus will be on the cognitive load imposed only by the two
subtitled presentation modes. A higher value for mean fixation duration is an indication of
higher cognitive load, whereas a lower value for mean fixation duration indicates lower
cognitive load. However, when analysing the distribution of the mean fixation duration data,
it was found that the MFD data had outliers that went beyond 8 000 ms (see Figure 21,
Figure 22 and Table 22).
Figure 21: Q-Q plot for MFD distribution
Figure 22: Histogram of the distribution of original MFD distribution
Table 22: Distribution of data for mean fixation duration
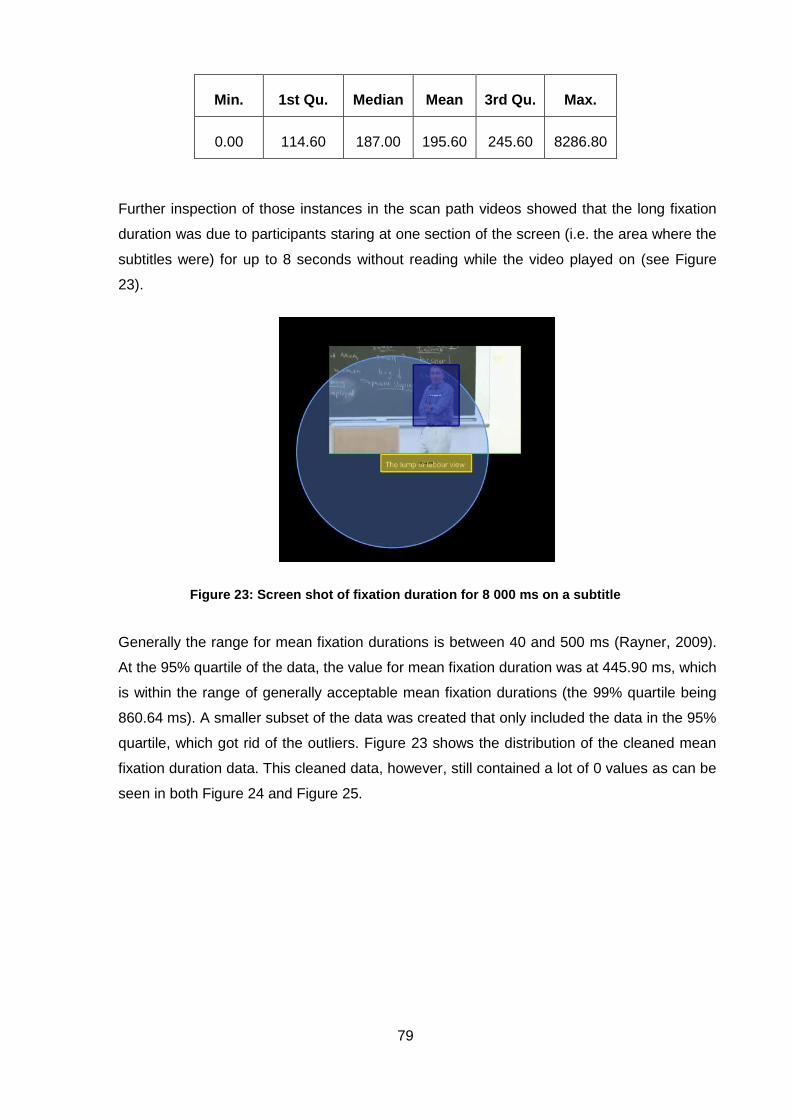
79
Min. 1st Qu. Median Mean 3rd Qu. Max.
0.00 114.60 187.00 195.60 245.60 8286.80
Further inspection of those instances in the scan path videos showed that the long fixation
duration was due to participants staring at one section of the screen (i.e. the area where the
subtitles were) for up to 8 seconds without reading while the video played on (see Figure
23).
Figure 23: Screen shot of fixation duration for 8 000 ms on a subtitle
Generally the range for mean fixation durations is between 40 and 500 ms (Rayner, 2009).
At the 95% quartile of the data, the value for mean fixation duration was at 445.90 ms, which
is within the range of generally acceptable mean fixation durations (the 99% quartile being
860.64 ms). A smaller subset of the data was created that only included the data in the 95%
quartile, which got rid of the outliers. Figure 23 shows the distribution of the cleaned mean
fixation duration data. This cleaned data, however, still contained a lot of 0 values as can be
seen in both Figure 24 and Figure 25.
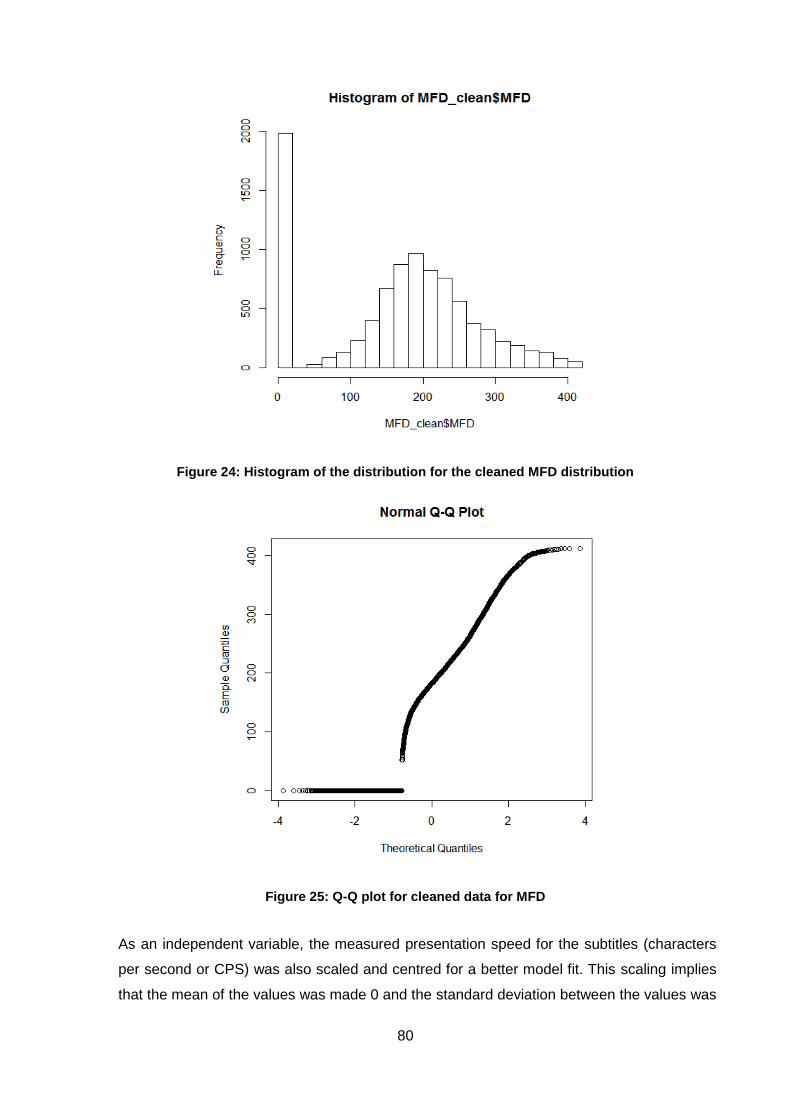
80
Figure 24: Histogram of the distribution for the cleaned MFD distribution
Figure 25: Q-Q plot for cleaned data for MFD
As an independent variable, the measured presentation speed for the subtitles (characters
per second or CPS) was also scaled and centred for a better model fit. This scaling implies
that the mean of the values was made 0 and the standard deviation between the values was
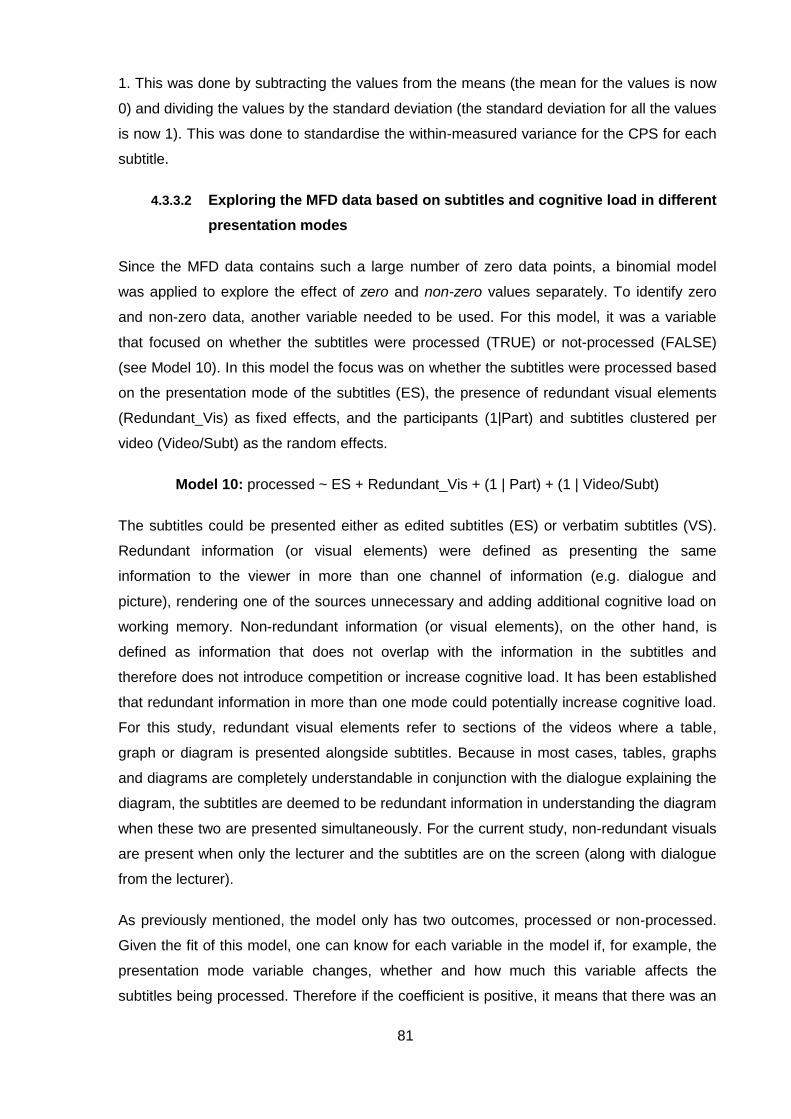
81
1. This was done by subtracting the values from the means (the mean for the values is now
0) and dividing the values by the standard deviation (the standard deviation for all the values
is now 1). This was done to standardise the within-measured variance for the CPS for each
subtitle.
4.3.3.2 Exploring the MFD data based on subtitles and cognitive load in different
presentation modes
Since the MFD data contains such a large number of zero data points, a binomial model
was applied to explore the effect of zero and non-zero values separately. To identify zero
and non-zero data, another variable needed to be used. For this model, it was a variable
that focused on whether the subtitles were processed (TRUE) or not-processed (FALSE)
(see Model 10). In this model the focus was on whether the subtitles were processed based
on the presentation mode of the subtitles (ES), the presence of redundant visual elements
(Redundant_Vis) as fixed effects, and the participants (1|Part) and subtitles clustered per
video (Video/Subt) as the random effects.
Model 10: processed ~ ES + Redundant_Vis + (1 | Part) + (1 | Video/Subt)
The subtitles could be presented either as edited subtitles (ES) or verbatim subtitles (VS).
Redundant information (or visual elements) were defined as presenting the same
information to the viewer in more than one channel of information (e.g. dialogue and
picture), rendering one of the sources unnecessary and adding additional cognitive load on
working memory. Non-redundant information (or visual elements), on the other hand, is
defined as information that does not overlap with the information in the subtitles and
therefore does not introduce competition or increase cognitive load. It has been established
that redundant information in more than one mode could potentially increase cognitive load.
For this study, redundant visual elements refer to sections of the videos where a table,
graph or diagram is presented alongside subtitles. Because in most cases, tables, graphs
and diagrams are completely understandable in conjunction with the dialogue explaining the
diagram, the subtitles are deemed to be redundant information in understanding the diagram
when these two are presented simultaneously. For the current study, non-redundant visuals
are present when only the lecturer and the subtitles are on the screen (along with dialogue
from the lecturer).
As previously mentioned, the model only has two outcomes, processed or non-processed.
Given the fit of this model, one can know for each variable in the model if, for example, the
presentation mode variable changes, whether and how much this variable affects the
subtitles being processed. Therefore if the coefficient is positive, it means that there was an
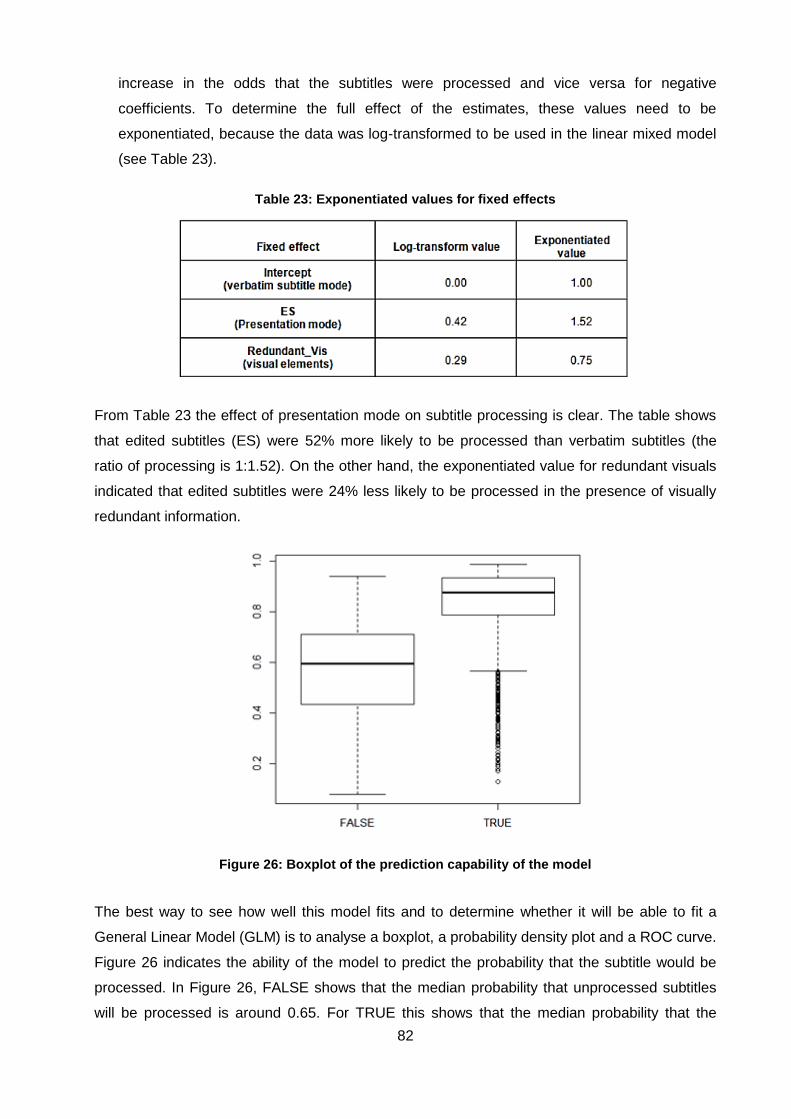
82
increase in the odds that the subtitles were processed and vice versa for negative
coefficients. To determine the full effect of the estimates, these values need to be
exponentiated, because the data was log-transformed to be used in the linear mixed model
(see Table 23).
Table 23: Exponentiated values for fixed effects
From Table 23 the effect of presentation mode on subtitle processing is clear. The table shows
that edited subtitles (ES) were 52% more likely to be processed than verbatim subtitles (the
ratio of processing is 1:1.52). On the other hand, the exponentiated value for redundant visuals
indicated that edited subtitles were 24% less likely to be processed in the presence of visually
redundant information.
Figure 26: Boxplot of the prediction capability of the model
The best way to see how well this model fits and to determine whether it will be able to fit a
General Linear Model (GLM) is to analyse a boxplot, a probability density plot and a ROC curve.
Figure 26 indicates the ability of the model to predict the probability that the subtitle would be
processed. In Figure 26, FALSE shows that the median probability that unprocessed subtitles
will be processed is around 0.65. For TRUE this shows that the median probability that the
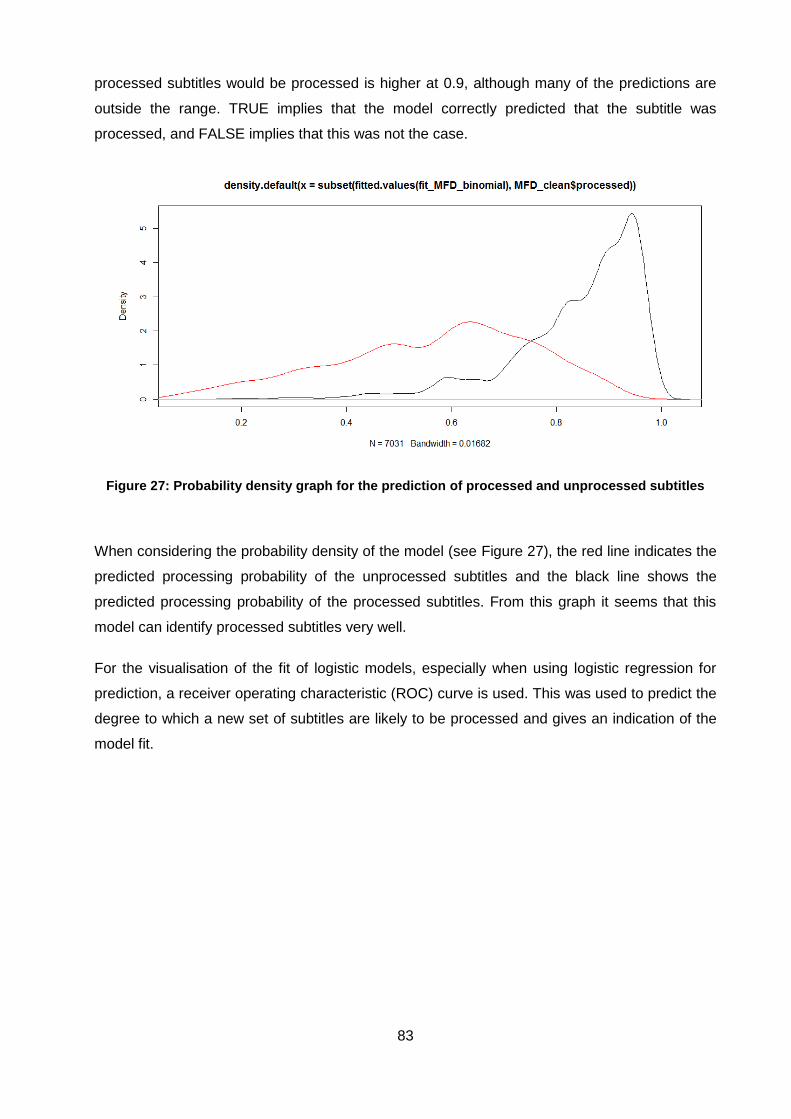
83
processed subtitles would be processed is higher at 0.9, although many of the predictions are
outside the range. TRUE implies that the model correctly predicted that the subtitle was
processed, and FALSE implies that this was not the case.
Figure 27: Probability density graph for the prediction of processed and unprocessed subtitles
When considering the probability density of the model (see Figure 27), the red line indicates the
predicted processing probability of the unprocessed subtitles and the black line shows the
predicted processing probability of the processed subtitles. From this graph it seems that this
model can identify processed subtitles very well.
For the visualisation of the fit of logistic models, especially when using logistic regression for
prediction, a receiver operating characteristic (ROC) curve is used. This was used to predict the
degree to which a new set of subtitles are likely to be processed and gives an indication of the
model fit.
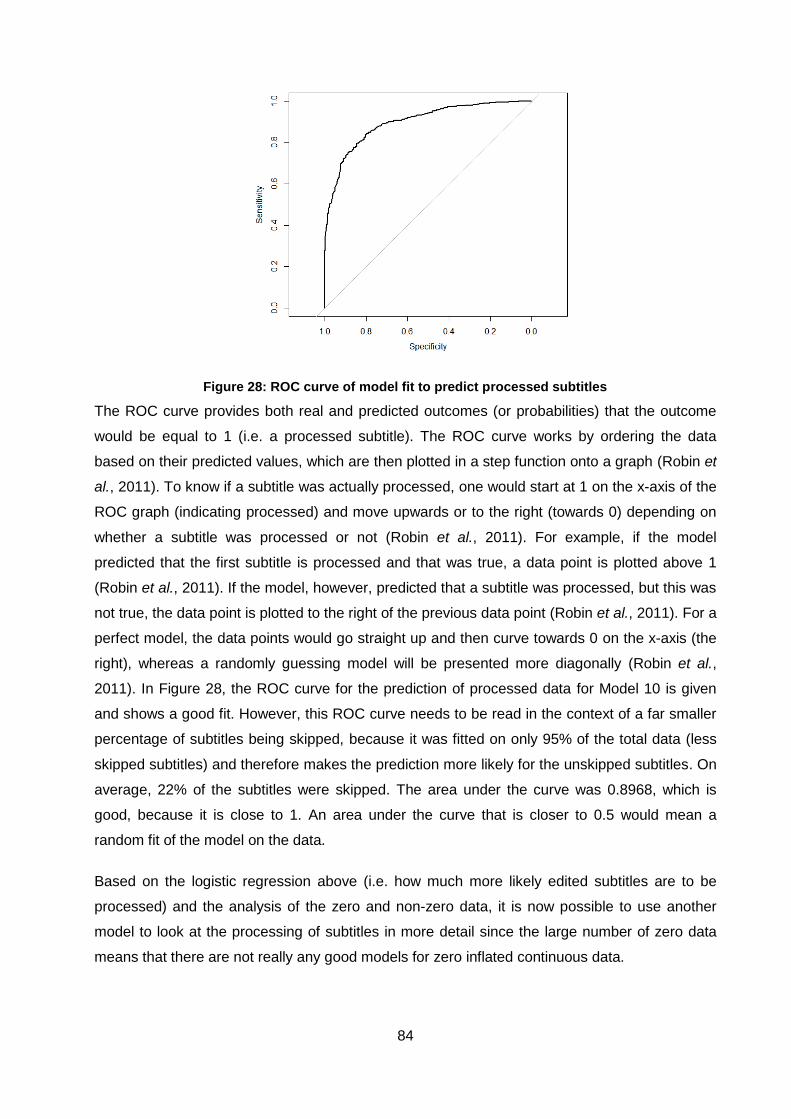
84
Figure 28: ROC curve of model fit to predict processed subtitles
The ROC curve provides both real and predicted outcomes (or probabilities) that the outcome
would be equal to 1 (i.e. a processed subtitle). The ROC curve works by ordering the data
based on their predicted values, which are then plotted in a step function onto a graph (Robin et
al., 2011). To know if a subtitle was actually processed, one would start at 1 on the x-axis of the
ROC graph (indicating processed) and move upwards or to the right (towards 0) depending on
whether a subtitle was processed or not (Robin et al., 2011). For example, if the model
predicted that the first subtitle is processed and that was true, a data point is plotted above 1
(Robin et al., 2011). If the model, however, predicted that a subtitle was processed, but this was
not true, the data point is plotted to the right of the previous data point (Robin et al., 2011). For a
perfect model, the data points would go straight up and then curve towards 0 on the x-axis (the
right), whereas a randomly guessing model will be presented more diagonally (Robin et al.,
2011). In Figure 28, the ROC curve for the prediction of processed data for Model 10 is given
and shows a good fit. However, this ROC curve needs to be read in the context of a far smaller
percentage of subtitles being skipped, because it was fitted on only 95% of the total data (less
skipped subtitles) and therefore makes the prediction more likely for the unskipped subtitles. On
average, 22% of the subtitles were skipped. The area under the curve was 0.8968, which is
good, because it is close to 1. An area under the curve that is closer to 0.5 would mean a
random fit of the model on the data.
Based on the logistic regression above (i.e. how much more likely edited subtitles are to be
processed) and the analysis of the zero and non-zero data, it is now possible to use another
model to look at the processing of subtitles in more detail since the large number of zero data
means that there are not really any good models for zero inflated continuous data.
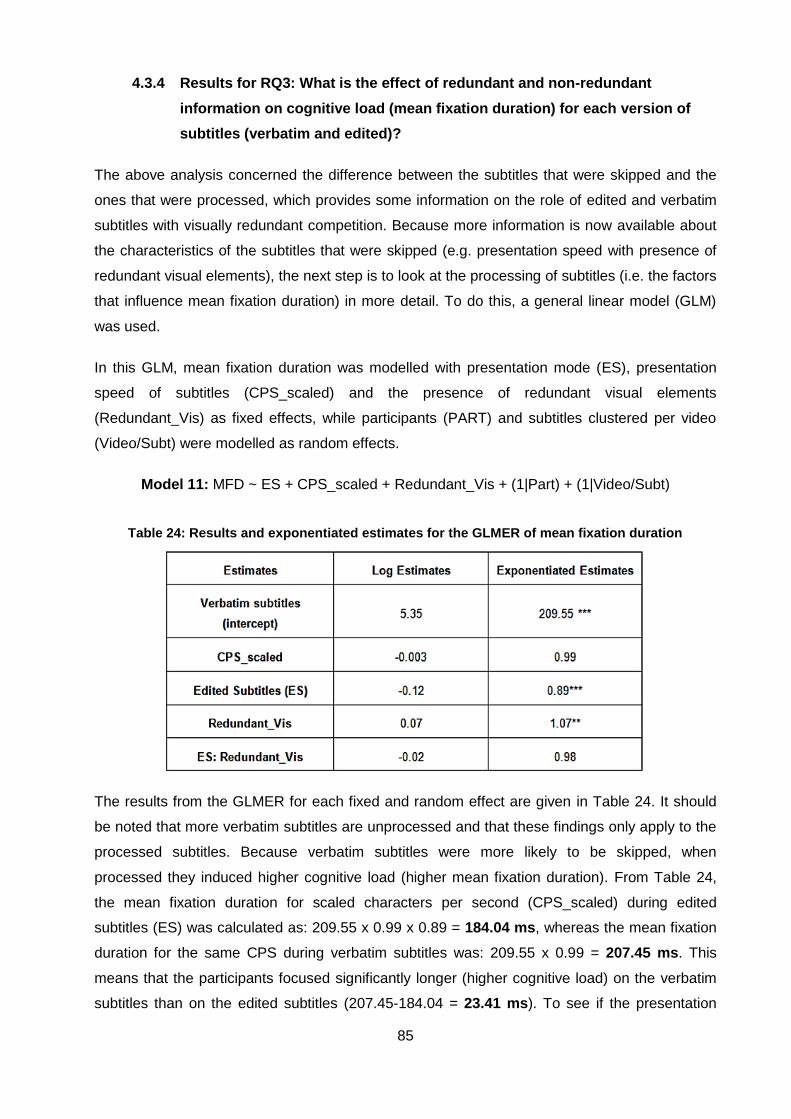
85
4.3.4 Results for RQ3: What is the effect of redundant and non-redundant
information on cognitive load (mean fixation duration) for each version of
subtitles (verbatim and edited)?
The above analysis concerned the difference between the subtitles that were skipped and the
ones that were processed, which provides some information on the role of edited and verbatim
subtitles with visually redundant competition. Because more information is now available about
the characteristics of the subtitles that were skipped (e.g. presentation speed with presence of
redundant visual elements), the next step is to look at the processing of subtitles (i.e. the factors
that influence mean fixation duration) in more detail. To do this, a general linear model (GLM)
was used.
In this GLM, mean fixation duration was modelled with presentation mode (ES), presentation
speed of subtitles (CPS_scaled) and the presence of redundant visual elements
(Redundant_Vis) as fixed effects, while participants (PART) and subtitles clustered per video
(Video/Subt) were modelled as random effects.
Model 11: MFD ~ ES + CPS_scaled + Redundant_Vis + (1|Part) + (1|Video/Subt)
Table 24: Results and exponentiated estimates for the GLMER of mean fixation duration
The results from the GLMER for each fixed and random effect are given in Table 24. It should
be noted that more verbatim subtitles are unprocessed and that these findings only apply to the
processed subtitles. Because verbatim subtitles were more likely to be skipped, when
processed they induced higher cognitive load (higher mean fixation duration). From Table 24,
the mean fixation duration for scaled characters per second (CPS_scaled) during edited
subtitles (ES) was calculated as: 209.55 x 0.99 x 0.89 = 184.04 ms, whereas the mean fixation
duration for the same CPS during verbatim subtitles was: 209.55 x 0.99 = 207.45 ms. This
means that the participants focused significantly longer (higher cognitive load) on the verbatim
subtitles than on the edited subtitles (207.45-184.04 = 23.41 ms). To see if the presentation
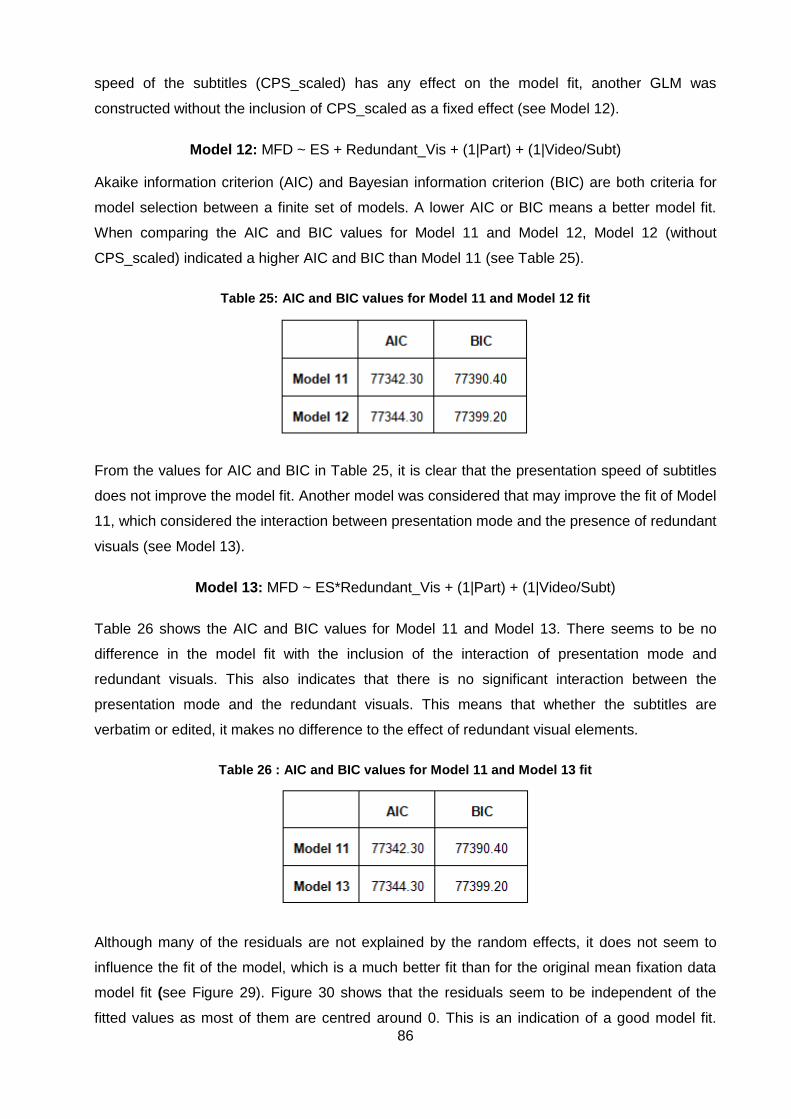
86
speed of the subtitles (CPS_scaled) has any effect on the model fit, another GLM was
constructed without the inclusion of CPS_scaled as a fixed effect (see Model 12).
Model 12: MFD ~ ES + Redundant_Vis + (1|Part) + (1|Video/Subt)
Akaike information criterion (AIC) and Bayesian information criterion (BIC) are both criteria for
model selection between a finite set of models. A lower AIC or BIC means a better model fit.
When comparing the AIC and BIC values for Model 11 and Model 12, Model 12 (without
CPS_scaled) indicated a higher AIC and BIC than Model 11 (see Table 25).
Table 25: AIC and BIC values for Model 11 and Model 12 fit
From the values for AIC and BIC in Table 25, it is clear that the presentation speed of subtitles
does not improve the model fit. Another model was considered that may improve the fit of Model
11, which considered the interaction between presentation mode and the presence of redundant
visuals (see Model 13).
Model 13: MFD ~ ES*Redundant_Vis + (1|Part) + (1|Video/Subt)
Table 26 shows the AIC and BIC values for Model 11 and Model 13. There seems to be no
difference in the model fit with the inclusion of the interaction of presentation mode and
redundant visuals. This also indicates that there is no significant interaction between the
presentation mode and the redundant visuals. This means that whether the subtitles are
verbatim or edited, it makes no difference to the effect of redundant visual elements.
Table 26 : AIC and BIC values for Model 11 and Model 13 fit
Although many of the residuals are not explained by the random effects, it does not seem to
influence the fit of the model, which is a much better fit than for the original mean fixation data
model fit (see Figure 29). Figure 30 shows that the residuals seem to be independent of the
fitted values as most of them are centred around 0. This is an indication of a good model fit.
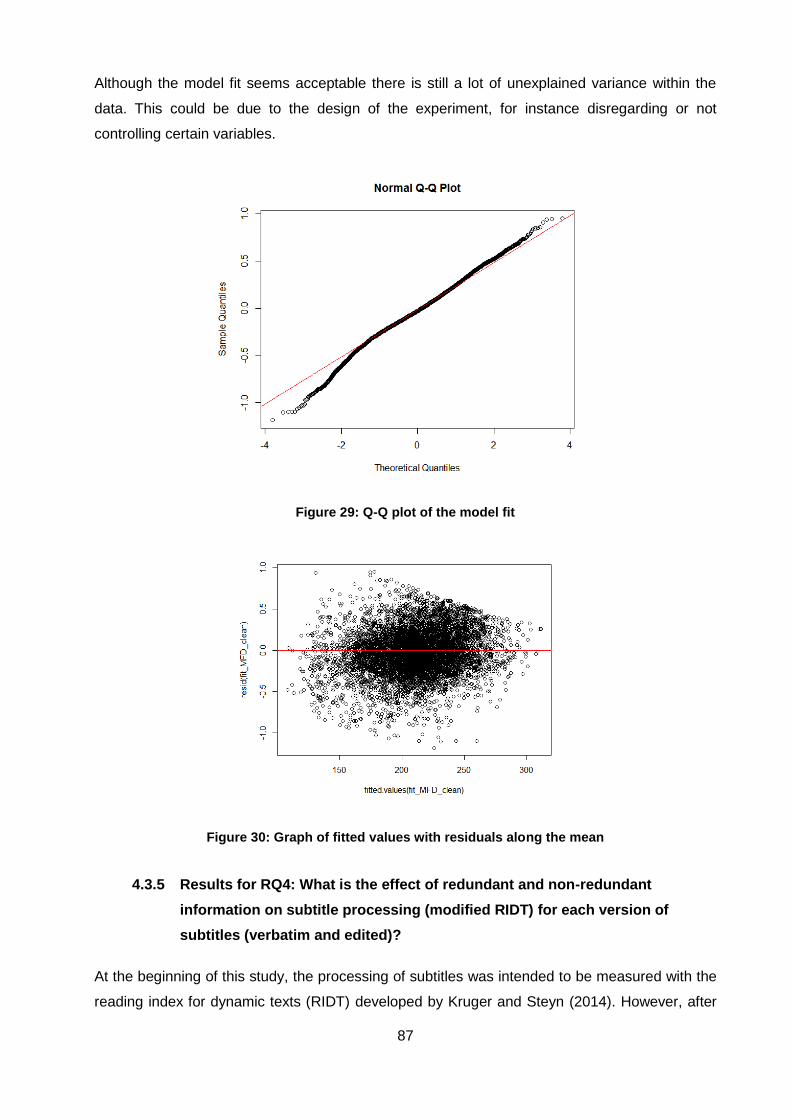
87
Although the model fit seems acceptable there is still a lot of unexplained variance within the
data. This could be due to the design of the experiment, for instance disregarding or not
controlling certain variables.
Figure 29: Q-Q plot of the model fit
Figure 30: Graph of fitted values with residuals along the mean
4.3.5 Results for RQ4: What is the effect of redundant and non-redundant
information on subtitle processing (modified RIDT) for each version of
subtitles (verbatim and edited)?
At the beginning of this study, the processing of subtitles was intended to be measured with the
reading index for dynamic texts (RIDT) developed by Kruger and Steyn (2014). However, after
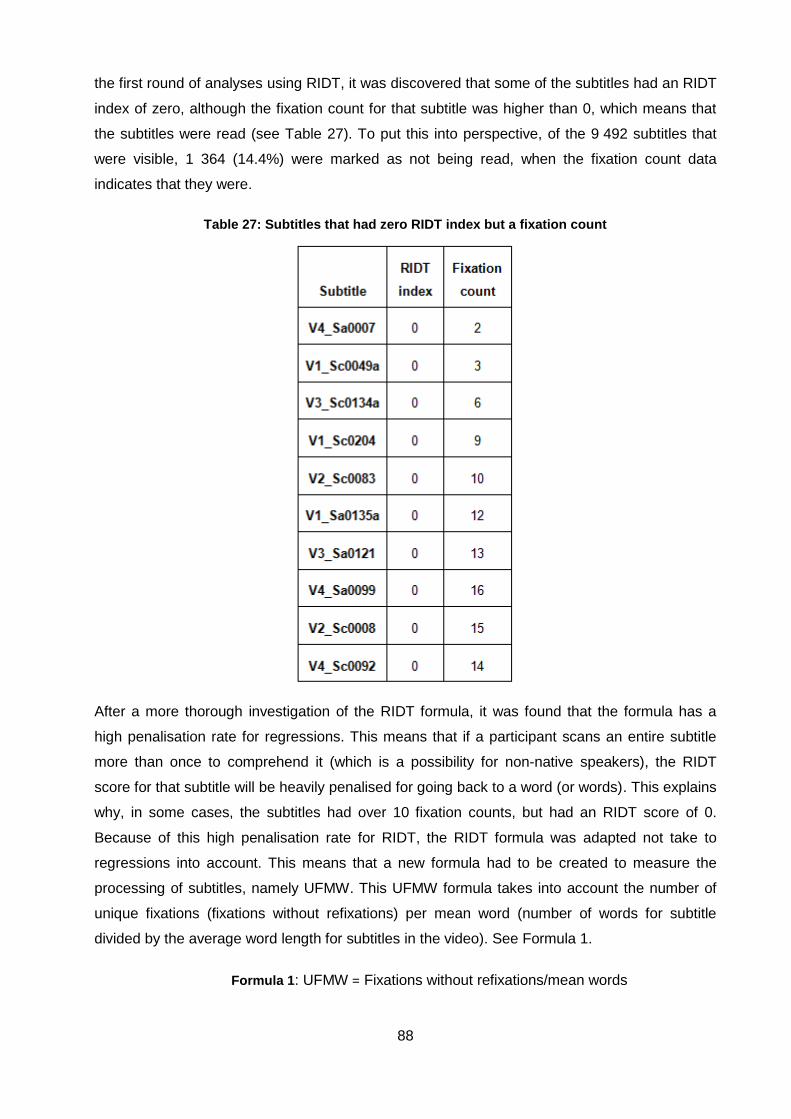
88
the first round of analyses using RIDT, it was discovered that some of the subtitles had an RIDT
index of zero, although the fixation count for that subtitle was higher than 0, which means that
the subtitles were read (see Table 27). To put this into perspective, of the 9 492 subtitles that
were visible, 1 364 (14.4%) were marked as not being read, when the fixation count data
indicates that they were.
Table 27: Subtitles that had zero RIDT index but a fixation count
After a more thorough investigation of the RIDT formula, it was found that the formula has a
high penalisation rate for regressions. This means that if a participant scans an entire subtitle
more than once to comprehend it (which is a possibility for non-native speakers), the RIDT
score for that subtitle will be heavily penalised for going back to a word (or words). This explains
why, in some cases, the subtitles had over 10 fixation counts, but had an RIDT score of 0.
Because of this high penalisation rate for RIDT, the RIDT formula was adapted not take to
regressions into account. This means that a new formula had to be created to measure the
processing of subtitles, namely UFMW. This UFMW formula takes into account the number of
unique fixations (fixations without refixations) per mean word (number of words for subtitle
divided by the average word length for subtitles in the video). See Formula 1.
Formula 1: UFMW = Fixations without refixations/mean words
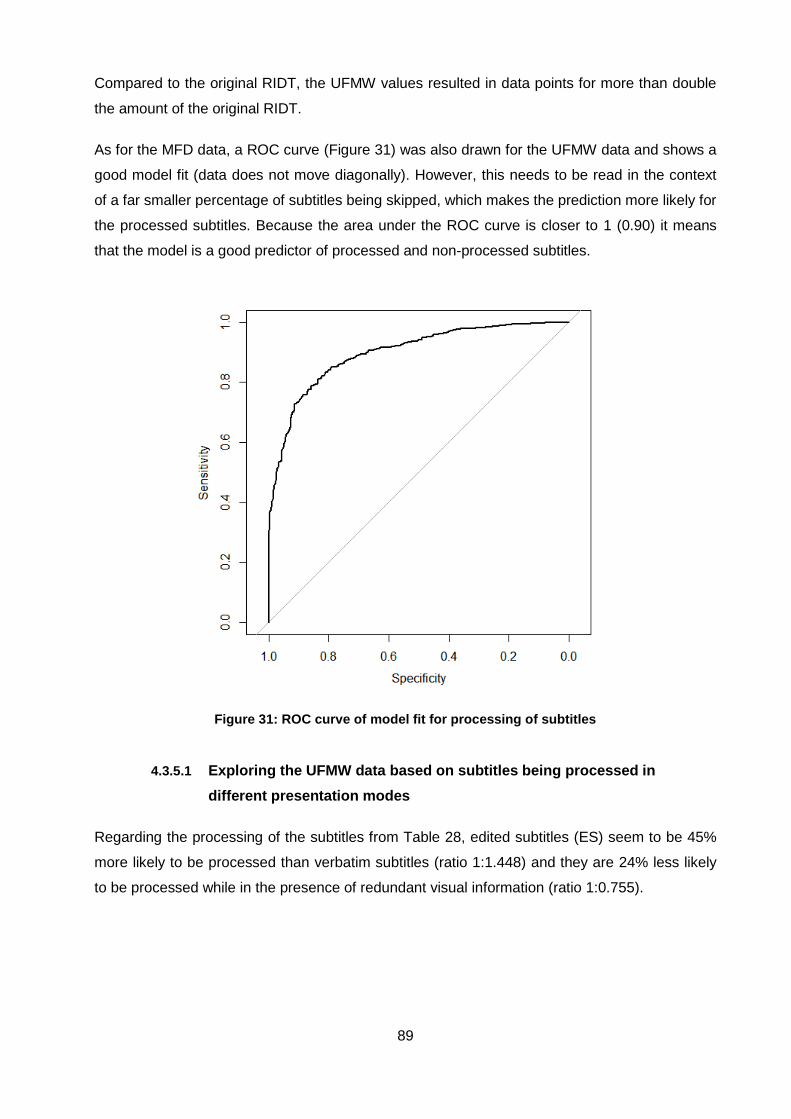
89
Compared to the original RIDT, the UFMW values resulted in data points for more than double
the amount of the original RIDT.
As for the MFD data, a ROC curve (Figure 31) was also drawn for the UFMW data and shows a
good model fit (data does not move diagonally). However, this needs to be read in the context
of a far smaller percentage of subtitles being skipped, which makes the prediction more likely for
the processed subtitles. Because the area under the ROC curve is closer to 1 (0.90) it means
that the model is a good predictor of processed and non-processed subtitles.
Figure 31: ROC curve of model fit for processing of subtitles
4.3.5.1 Exploring the UFMW data based on subtitles being processed in
different presentation modes
Regarding the processing of the subtitles from Table 28, edited subtitles (ES) seem to be 45%
more likely to be processed than verbatim subtitles (ratio 1:1.448) and they are 24% less likely
to be processed while in the presence of redundant visual information (ratio 1:0.755).
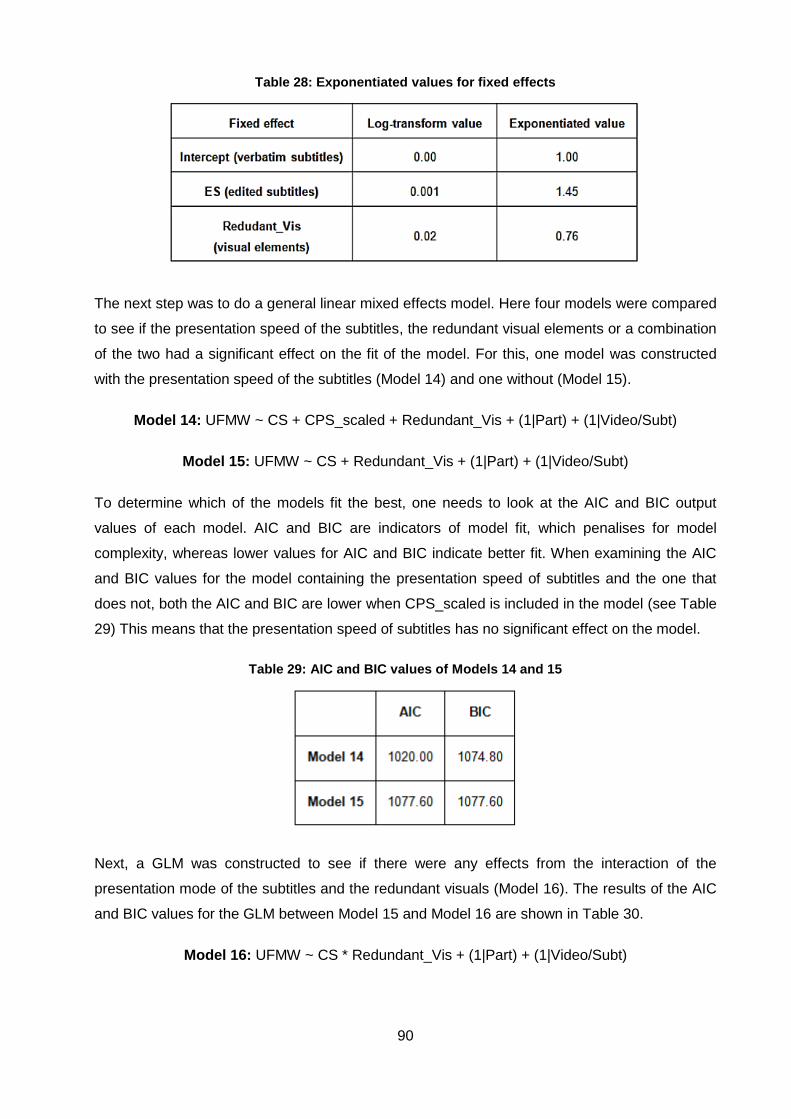
90
Table 28: Exponentiated values for fixed effects
The next step was to do a general linear mixed effects model. Here four models were compared
to see if the presentation speed of the subtitles, the redundant visual elements or a combination
of the two had a significant effect on the fit of the model. For this, one model was constructed
with the presentation speed of the subtitles (Model 14) and one without (Model 15).
Model 14: UFMW ~ CS + CPS_scaled + Redundant_Vis + (1|Part) + (1|Video/Subt)
Model 15: UFMW ~ CS + Redundant_Vis + (1|Part) + (1|Video/Subt)
To determine which of the models fit the best, one needs to look at the AIC and BIC output
values of each model. AIC and BIC are indicators of model fit, which penalises for model
complexity, whereas lower values for AIC and BIC indicate better fit. When examining the AIC
and BIC values for the model containing the presentation speed of subtitles and the one that
does not, both the AIC and BIC are lower when CPS_scaled is included in the model (see Table
29) This means that the presentation speed of subtitles has no significant effect on the model.
Table 29: AIC and BIC values of Models 14 and 15
Next, a GLM was constructed to see if there were any effects from the interaction of the
presentation mode of the subtitles and the redundant visuals (Model 16). The results of the AIC
and BIC values for the GLM between Model 15 and Model 16 are shown in Table 30.
Model 16: UFMW ~ CS * Redundant_Vis + (1|Part) + (1|Video/Subt)

91
Table 30: AIC and BIC values of models 15 and 16
There seems to be no difference in the model fit with the inclusion of the interaction of the
presentation mode and the redundant visuals (see Table 30). This also indicates that there was
no significant interaction between the presentation mode and the redundant visuals. This means
that whether subtitles are verbatim or edited makes no difference to the effect of redundant
visual elements. It also means that presentation speed improves the model fit. Although the
residuals are still large, the model fit is still good according to the Q-Q plot and fitted residual
values around the mean (Figures 32 and 33).
Figure 32: Q-Q plot for model fit of UFMW and CPS_scaled
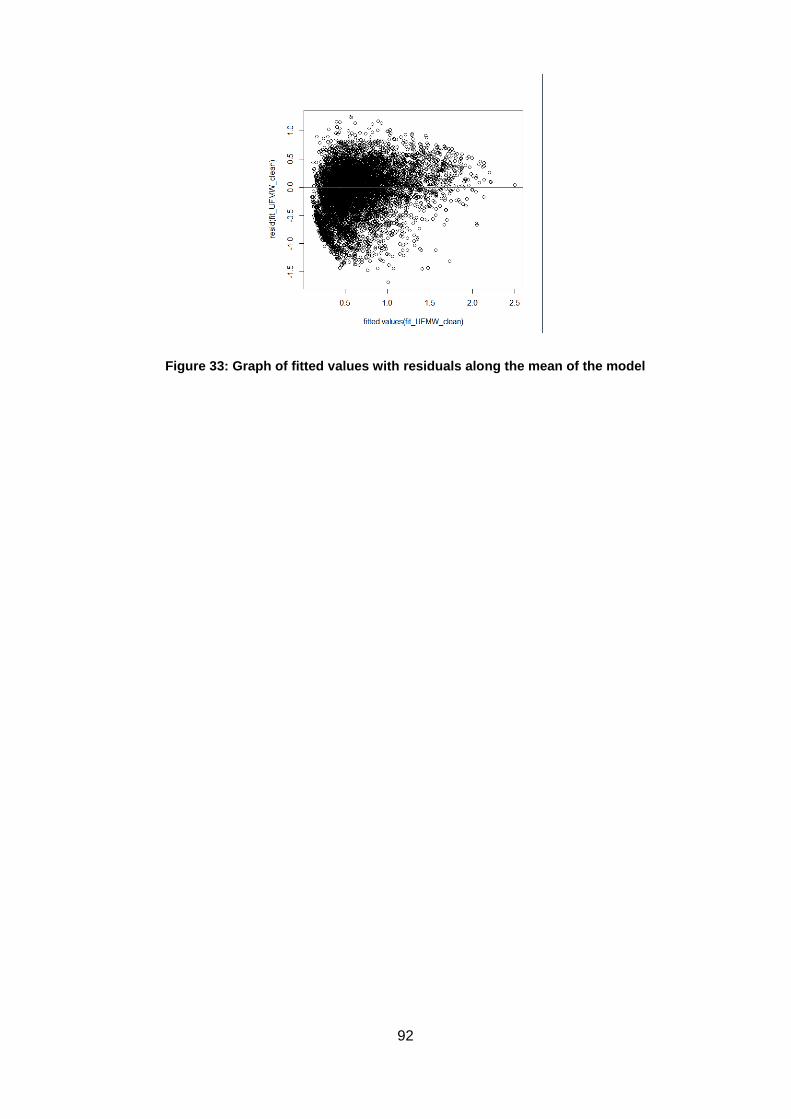
92
Figure 33: Graph of fitted values with residuals along the mean of the model
93
CHAPTER 5: DISCUSSION
5.1 RQ1: How do the different sources of information (audio-only, audio and video,
audio and video with verbatim subtitles, and audio and video with edited subtitles)
in a subtitled educational video contribute to cognitive load and performance?
The findings from this study suggest that presentation mode has an effect on performance, but
only between the two subtitled presentation modes. The findings indicate a significant difference
between the performance of participants who watched the edited subtitles and those who
watched the verbatim subtitles. It seems then that although verbatim subtitles are convenient to
use, the standardised procedures used for creating edited subtitles (e.g. controlling for
presentation speed, character restrictions, etc.) are more beneficial for learning and worth the
effort. This factor could also have an influence on the performance of participants in previous
subtitle studies, and could be the cause of the inconsistencies in the results.
However, it is important to note that the participants who watched the edited subtitles performed
better than those who watched the verbatim subtitles, which indicates some underlying
differences between the two modes. These seem to be associated either with the structural
differences, compositional difference or the presentation speed of the subtitles, as the other
characteristics of these subtitles are more or less identical (see Section 3.4.2.2). This warranted
more exploration, which led to the design of a second experiment (see Section 5.2).
As the first experiment was only exploratory, no individual data for the participants was
collected, such as language proficiency, prior knowledge on the subject, etc. However, in the
second experiment, these variables as well as eye-tracking data were explicitly captured to form
a better picture of the participants’ experience. Although no significant differences were found
between the presentation modes for performance or cognitive load, there was a trend towards
significance (p<0.1) for performance based on the interaction between English proficiency and
the processing of the edited subtitles. The trend showed that the performance of the students
who watched the edited subtitles was negatively influenced by their English proficiency scores.
A possible explanation for this could be that, although their English proficiency was mostly
average or above average, this was for the proficiency of reading and understanding static text
(normal reading) and not dynamic text (subtitle reading) (see Section 2.3). As a subtitled video
contains more sources of information, which are in constant competition for attention, compared
to static text in a normal reading environment, the processing of information could be made
more complicated. The fact that the verbatim subtitles did not have the same significance for
this occurrence will be discussed in the next section.
Regarding cognitive load, ICL showed no significant difference between the various
presentation modes. This means that the participants did not experience any significant
94
increase or decrease in difficulty (ICL) between the presentation modes. For ECL, however,
there was a trend towards significance (p<0.1) for the video presentation mode. This trend was
positive, which means that the video presentation mode was perceived to induce a significantly
greater cognitive load compared to the other presentation modes, specifically the subtitled
presentation mode. A possible explanation could be that, due to the low element-interactivity of
the video presentation mode and as it is a format to known most of the participants, they
perceived the presentation mode to be more difficult. Kalyuga, Chandler and Sweller (1998)
mention that processing unnecessary information is irrelevant for learning, and can lead to
extraneous cognitive load. Another possible explanation for the higher ECL for the video
presentation mode could be the participants’ familiarity with the presentation format. Because
the other presentation formats (audio-only and the two subtitled modes) were unfamiliar to
them, they had to incorporate other strategies to process the information, which they had not felt
necessary to do for the video presentation mode. This of course would need to be further
investigated. From the findings of this study, it could be concluded that the processing of three
sources of information had no significant effect on performance compared to the processing of
either one or two sources.
5.2 RQ2: What is the difference in processing between verbatim and edited subtitles as
measured with objective eye-tracking measures?
Given that there were some unanswered questions in the first experiment regarding the two
subtitled presentation modes (verbatim and edited), a second research question (RQ2) was
created which focused specifically on the comparison between these two modes. This new
focus also contributed to setting up a second experiment to address these issues. Findings from
the second experiment indicated that the edited subtitles were 52% more likely to be processed
than the verbatim subtitles. This means that verbatim subtitles were less likely to be processed,
which could be the result of the higher ECL recorded by the participants in the first experiment.
The possible difference here could have been related to the presentation speed of the subtitles
(CPS). However, on average, the presentation speed of the two subtitle modes was almost
identical: verbatim subtitles = 13.93 cps and edited subtitles = 14.03 cps (Figure 32).
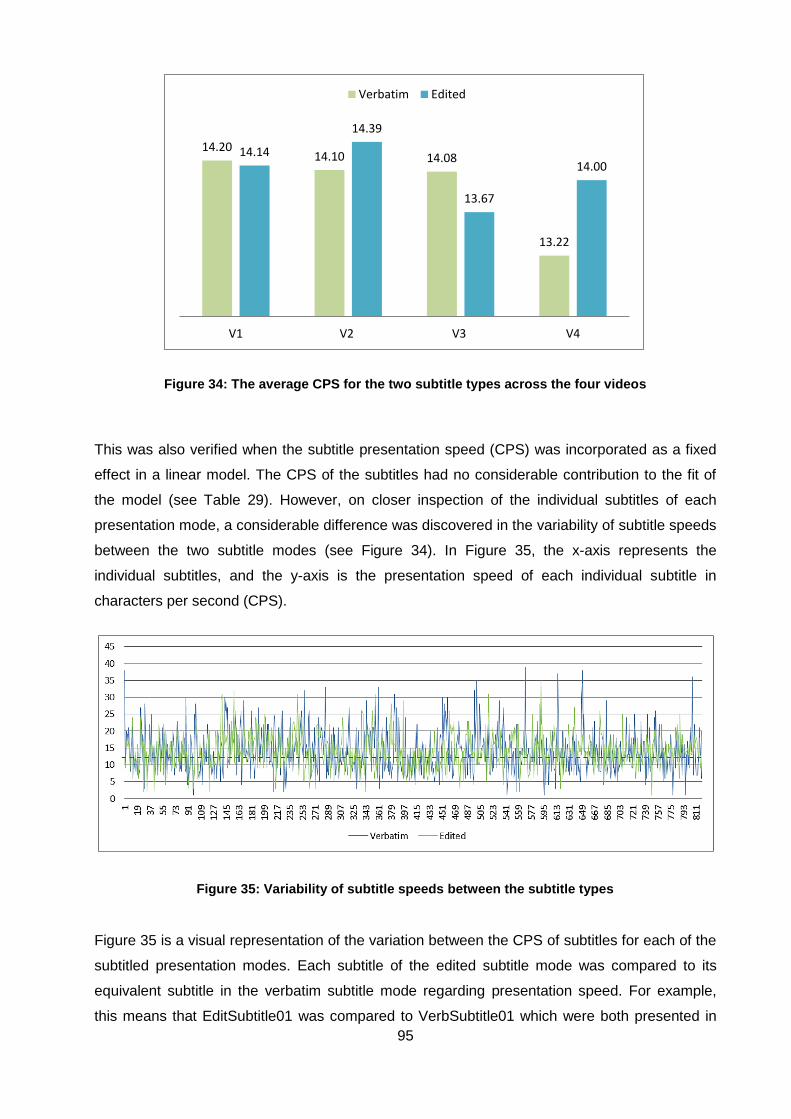
95
Figure 34: The average CPS for the two subtitle types across the four videos
This was also verified when the subtitle presentation speed (CPS) was incorporated as a fixed
effect in a linear model. The CPS of the subtitles had no considerable contribution to the fit of
the model (see Table 29). However, on closer inspection of the individual subtitles of each
presentation mode, a considerable difference was discovered in the variability of subtitle speeds
between the two subtitle modes (see Figure 34). In Figure 35, the x-axis represents the
individual subtitles, and the y-axis is the presentation speed of each individual subtitle in
characters per second (CPS).
Figure 35: Variability of subtitle speeds between the subtitle types
Figure 35 is a visual representation of the variation between the CPS of subtitles for each of the
subtitled presentation modes. Each subtitle of the edited subtitle mode was compared to its
equivalent subtitle in the verbatim subtitle mode regarding presentation speed. For example,
this means that EditSubtitle01 was compared to VerbSubtitle01 which were both presented in
14.20 14.10 14.08
13.22
14.14
14.39
13.67
14.00
V1 V2 V3 V4
Verbatim Edited
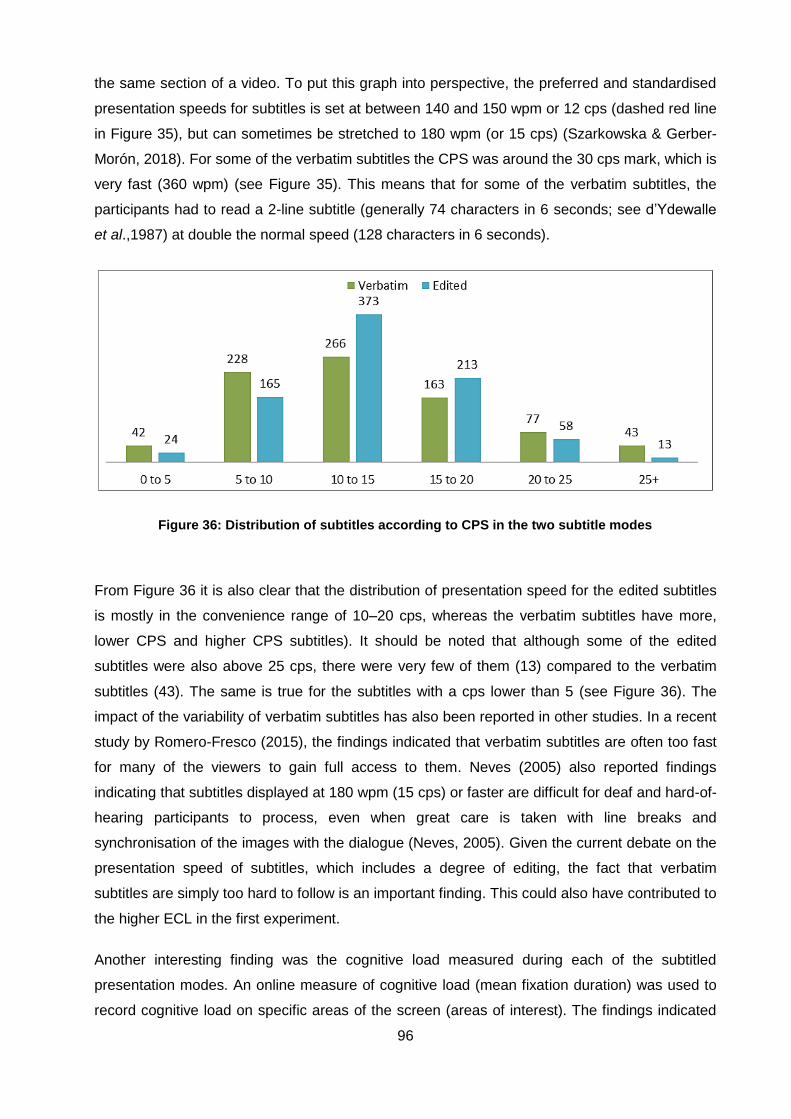
96
the same section of a video. To put this graph into perspective, the preferred and standardised
presentation speeds for subtitles is set at between 140 and 150 wpm or 12 cps (dashed red line
in Figure 35), but can sometimes be stretched to 180 wpm (or 15 cps) (Szarkowska & Gerber-
Morón, 2018). For some of the verbatim subtitles the CPS was around the 30 cps mark, which is
very fast (360 wpm) (see Figure 35). This means that for some of the verbatim subtitles, the
participants had to read a 2-line subtitle (generally 74 characters in 6 seconds; see d’Ydewalle
et al.,1987) at double the normal speed (128 characters in 6 seconds).
Figure 36: Distribution of subtitles according to CPS in the two subtitle modes
From Figure 36 it is also clear that the distribution of presentation speed for the edited subtitles
is mostly in the convenience range of 10–20 cps, whereas the verbatim subtitles have more,
lower CPS and higher CPS subtitles). It should be noted that although some of the edited
subtitles were also above 25 cps, there were very few of them (13) compared to the verbatim
subtitles (43). The same is true for the subtitles with a cps lower than 5 (see Figure 36). The
impact of the variability of verbatim subtitles has also been reported in other studies. In a recent
study by Romero-Fresco (2015), the findings indicated that verbatim subtitles are often too fast
for many of the viewers to gain full access to them. Neves (2005) also reported findings
indicating that subtitles displayed at 180 wpm (15 cps) or faster are difficult for deaf and hard-of-
hearing participants to process, even when great care is taken with line breaks and
synchronisation of the images with the dialogue (Neves, 2005). Given the current debate on the
presentation speed of subtitles, which includes a degree of editing, the fact that verbatim
subtitles are simply too hard to follow is an important finding. This could also have contributed to
the higher ECL in the first experiment.
Another interesting finding was the cognitive load measured during each of the subtitled
presentation modes. An online measure of cognitive load (mean fixation duration) was used to
record cognitive load on specific areas of the screen (areas of interest). The findings indicated
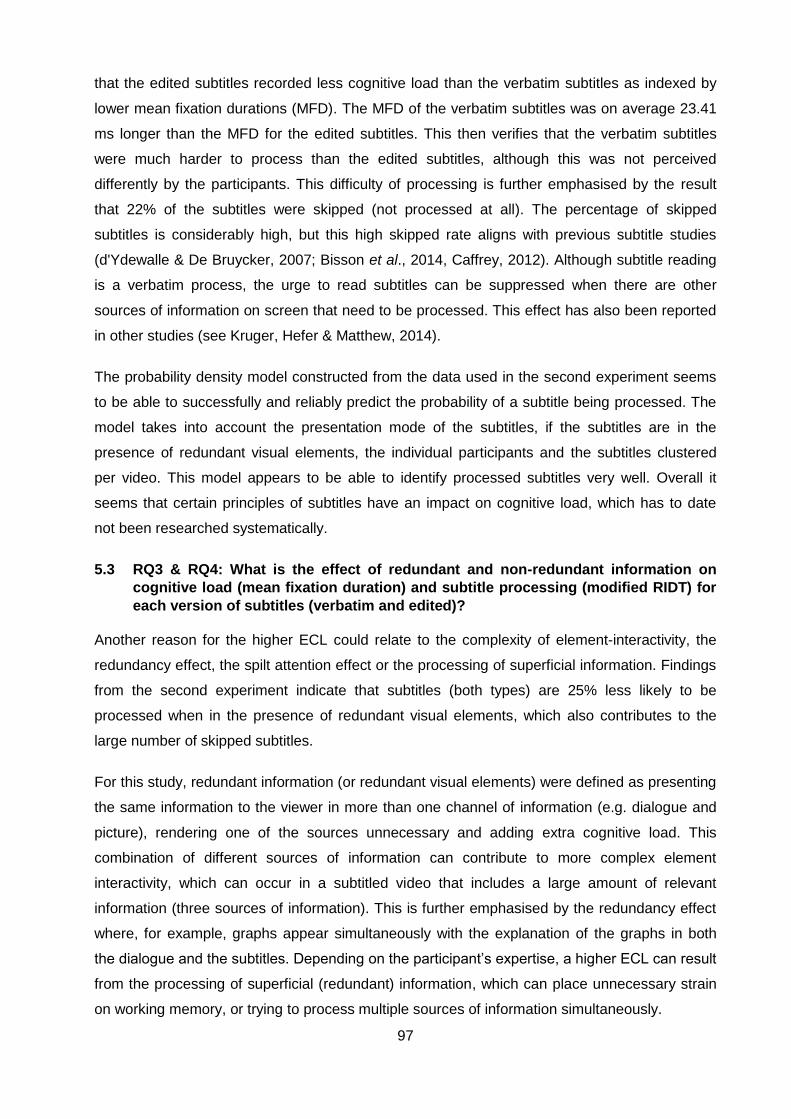
97
that the edited subtitles recorded less cognitive load than the verbatim subtitles as indexed by
lower mean fixation durations (MFD). The MFD of the verbatim subtitles was on average 23.41
ms longer than the MFD for the edited subtitles. This then verifies that the verbatim subtitles
were much harder to process than the edited subtitles, although this was not perceived
differently by the participants. This difficulty of processing is further emphasised by the result
that 22% of the subtitles were skipped (not processed at all). The percentage of skipped
subtitles is considerably high, but this high skipped rate aligns with previous subtitle studies
(d'Ydewalle & De Bruycker, 2007; Bisson et al., 2014, Caffrey, 2012). Although subtitle reading
is a verbatim process, the urge to read subtitles can be suppressed when there are other
sources of information on screen that need to be processed. This effect has also been reported
in other studies (see Kruger, Hefer & Matthew, 2014).
The probability density model constructed from the data used in the second experiment seems
to be able to successfully and reliably predict the probability of a subtitle being processed. The
model takes into account the presentation mode of the subtitles, if the subtitles are in the
presence of redundant visual elements, the individual participants and the subtitles clustered
per video. This model appears to be able to identify processed subtitles very well. Overall it
seems that certain principles of subtitles have an impact on cognitive load, which has to date
not been researched systematically.
5.3 RQ3 & RQ4: What is the effect of redundant and non-redundant information on
cognitive load (mean fixation duration) and subtitle processing (modified RIDT) for
each version of subtitles (verbatim and edited)?
Another reason for the higher ECL could relate to the complexity of element-interactivity, the
redundancy effect, the spilt attention effect or the processing of superficial information. Findings
from the second experiment indicate that subtitles (both types) are 25% less likely to be
processed when in the presence of redundant visual elements, which also contributes to the
large number of skipped subtitles.
For this study, redundant information (or redundant visual elements) were defined as presenting
the same information to the viewer in more than one channel of information (e.g. dialogue and
picture), rendering one of the sources unnecessary and adding extra cognitive load. This
combination of different sources of information can contribute to more complex element
interactivity, which can occur in a subtitled video that includes a large amount of relevant
information (three sources of information). This is further emphasised by the redundancy effect
where, for example, graphs appear simultaneously with the explanation of the graphs in both
the dialogue and the subtitles. Depending on the participant’s expertise, a higher ECL can result
from the processing of superficial (redundant) information, which can place unnecessary strain
on working memory, or trying to process multiple sources of information simultaneously.
98
Bisson et al. (2014) comment on the number of skipped subtitles during redundant information
on screen. They state that “... it is possible that subtitles are more likely to be skipped if their
appearance on the screen co-occurs with a more salient feature in the image area. In addition, it
has been shown that text in a visual scene is also salient and therefore likely to attract the
participant’s gaze, even when it is not relevant to the task at hand” (Bisson et al., 2014:401). In
another study by Caffrey (2012) it is mentioned that around 30% of subtitles were skipped
“when a one-line subtitle was on screen with a pop-up. This could be because of the larger
amount of information in the pop-up gloss relative to one-line subtitle ...” (Caffrey, 2012:247).
These statements validate the findings regarding the effect of redundant information on the
processing of subtitles.
Figure 37: The total time redundant visual elements were visible compared to rest of the video
Figure 37 gives the time when redundant visual elements were visible on-screen compared to
the rest of the video. It must be noted here that the fourth video had no redundant visual
elements added. Although redundant visual elements were only visible for about 25% of the
duration of the video (excluding Video 2), these elements still had an effect on the processing of
subtitles.
These results seem to indicate that even when a small percentage of the videos contained
additional visual elements, such as graphs, tables or diagrams, the effect it has on subtitle
processing is quite comprehensive. This effect should, therefore, be taken into account when
design subtitled videos, for non-native speakers of the dialogue of a video.
99
CHAPTER 6: CONCLUSION
The findings from this study suggest that the addition of subtitles in educational material as an
extra source of information has no significant effect on the performance of students. Neither
does this extra source of information significantly influence the cognitive load (either ICL or
ECL) experienced by the student. In fact, no significant difference in performance or cognitive
load was found between either of the four presentation modes (audio-only, audio and video,
audio and video with verbatim subtitles, and audio and video with edited subtitles). This seems
to suggest that students are able to adapt their learning strategies to process the different
number of sources of information they are confronted with. Other studies in the past also found
no substantial improvement in performance of participants by adding foreign-language (or non-
native language) subtitles to recorded stimuli (Kruger et al., 2014; Kruger & Steyn, 2014; Mayer,
Lee & Peebles, 2014; Kvitnes; 2013; Etemadi, 2012). These findings also contribute to the
ongoing debate on whether subtitles are beneficial or detrimental to learning.
6.1 Limitations
Due to the time limit of this study and the difficulty of getting participants to participate in this
study, the number of participants was very low (n=23). This also meant that there were too few
participants to make sufficient and significant assumptions on the effect of cognitive load and
performance between the videos and presentation modes.
Because the duration of the videos was short (less than 10 minutes), the robustness of the
models presented in this study are mitigated. This means that more studies are needed to be
conducted on longer video clips to determine the effects of cumulative cognitive load over a
longer period of time. The videos used in this study were pre-edited, which means that the
duration of graphs, tables or diagrams on screen could not be controlled. As this was found to
be a significant factor in the processing of subtitles, this will need to be controlled for.
The scope of this study was also limited to a specific group of students for a specific subject
field on a specific campus, which makes the findings of this study very specific. To determine
whether the findings of this study are reliable, similar studies on other subject fields need to be
conducted.
6.2 Contribution
Due to the growing interest in online (or e-learning) environments and the fact that most of the
material available online is in English, there is a need to make the material more accessible
specifically to non-native speakers of English. A general approach to making online materials
100
more accessible is to add same-language subtitles to the video material. The easiest way to do
this is to use an algorithm that converts speech to text (also known as verbatim subtitles).
During this study, the participants who watched videos with edited subtitles had a significantly
higher performance than the participants who watched videos with verbatim subtitles. The
cognitive load (as measured with MFD) was also higher for the verbatim subtitles than for the
edited subtitles. On average, edited subtitles were also 52% more likely to be processed than
verbatim subtitles. The reason for this was that there was a higher variability in the presentation
speed of the verbatim subtitles than for the edited subtitles. Overall, 22% of subtitles were
skipped (for both subtitle modes). In some way this was due to the high presentation speed of
some of the subtitles, but the main reason for subtitles being skipped was because of redundant
visual elements. In fact, edited subtitles were found to be 24% less likely to be processed while
in the presence of redundant visual elements. However, this is not an uncommon finding and
has been reported in numerous studies in the past as described in previous sections.
As has been demonstrated in this study, verbatim subtitles are found to lower performance and
the irregularity of the presentation speed of the subtitles induces cognitive load. For this reason,
and based on findings of this study, it is advised that recorded material should be subtitled
based on the standard rules that professional subtitlers use. It is also advised that when
constructing a subtitled video, redundant visual elements should be minimised as these will
reduce the processing of the subtitles. This will be more beneficial for the participants in the
long run.
6.3 Future research
Ideally, future research should be done to repeat this study using more participants from other
subject fields, longer videos presented in different presentation modes, and controls for the
amount of redundant information, and should include edited subtitles. This setup should provide
a clear indication whether subtitles do, in fact, induce cognitive load and decrease performance.
Other future research could be done on applying the probability density model which was
created in this study to unprocessed subtitles to predict whether subtitles would be processed or
not. Because this model takes into account the type of subtitle and whether it is presented with
non-redundant visual elements, it can assist in the construction of subtitled videos for online
learning platforms that would have a high probability of subtitles being processed by the viewer.
Another possible avenue for future studies can be to differ the language of the dialogue and
language of the subtitles to determine if that has an influence on the processing of the subtitles
(automatic or edited).
101
This study set out to provide empirical evidence for the debate on whether the inclusion of
subtitles with recorded materials is beneficial for learning or not. The study found that it was not
the subtitles (as a third source of information) that affected the performance, but rather the type
of subtitle used (verbatim or edited) and how the subtitled recording was constructed (presence
of redundant information) that had the biggest influence on performance and the amount of
cognitive load induced in a viewer.

102
103
BIBLIOGRAPHY
Alemdag, E. & Cagiltay, K. 2018. A systematic review of eye tracking research on multimedia
learning. Computers & Education, 125, pp.413-428.
Almeida, P.A., & Costa, P.D. 2014. Foreign language acquisition: the role of subtitling.
Procedia-Social and Behavioral Sciences, 141, p.1234-1238.
Antonenko, P., Paas, F., Grabner, R. & Van Gog, T. 2010. Using electroencephalography to
measure cognitive load. Educational Psychology Review, 22(4), pp.425-438.
Baayen, R.H., 2008. Exploratory data analysis: an introduction to R for the language sciences.
Cambridge: Cambridge UP.
Baddeley, A.D. 1986. Working memory. New York: Oxford University Press.
Baddeley, A.D. & Hitch, G. 1974. Working memory. In G.A. Bower (Ed.), The psychology of
learning and motivation, 8(1), p.47–89. New York: Academic Press.
Bird, S.A. & Williams, J.N. 2002. The effect of bimodal input on implicit and explicit memory: An
investigation into the benefits of within-language subtitling. Applied Psycholinguistics,
23(04), pp.509-533.
Bisson, M.J., Van Heuven, W.J., Conklin, K. & Tunney, R.J. 2014. Processing of native and
foreign language subtitles in films: An eye tracking study. Applied Psycholinguistics,
35(02), pp.399-418.
Bower, G.H. 1975. Cognitive psychology: an introduction. In W.K. Estes (Ed.), Handbook of
learning and cognitive processes. Introduction to concepts and issues. Hillsdale, NJ:
Erlbaum, 1(1), p.25–80.
Brünken, R., Plass, J.L. & Leutner, D. 2003. Direct measurement of cognitive load in
multimedia learning. Educational Psychologist, 38(1), 53–61. doi:
10.1207/S15326985EP3801_7
Caffrey, C. 2012. Using an eye-tracking tool to measure the effects of experimental subtitling
procedures on viewer perception of subtitled AV content. Eye Tracking in Audiovisual
Translation. Rome: Aracne, pp.223-258.
Casali, J.G., & Wierwille, W.W.A. 1982. Sensitivity intrusion comparison of mental workload
estimation techniques using flight task emphasizing perceptual piloting activities. In
Proceedings of the 1982 International IEEE Conference on Cybernetics. New York:
IEEE, p.598-602.
Case, R., Kurland, D.M. & Goldberg, J. 1982. Operational efficiency and the growth of short-
term memory span. Journal of experimental child psychology, 33(3), pp.386-404.
Chamberlain, J.C. & Van der Schyff, E. 1991. Manual for proficiency test: English Second
Language Advanced Level. Human Science Research Council, Pretoria, South Afica.
Chandler, A.C., & Cypher, I.F. 1948. Audio-visual techniques for enrichment of the curriculum.
New York: Noble and Noble.
104
Chu, G. and Schramm, W. 2004. Learning from television: What the research says. Information
Age Publishing Inc.(IAP), USA.
Clark, J.M. & Paivio, A. 1991. Dual coding theory and education. Educational Psychology
Review, 3(3), pp.149-210.
Conway, A.R., Kane, M.J., Bunting, M.F., Hambrick, D.Z., Wilhelm, O. & Engle, R.W. 2005.
Working memory span tasks: A methodological review and user’s guide. Psychonomic
Bulletin & Review, 12(5), pp.769-786.
Cooper, G.E. & Harper Jr, R.P. 1969. The use of pilot rating in the evaluation of aircraft handling
qualities (No. AGARD-567). Advisory Group for Aerospace Research and Development,
Neuilly-Sur-Seine (France).
d'Ydewalle, G. & De Bruycker, W. 2007. Eye movements of children and adults while reading
television subtitles. European Psychologist, 12(3), pp.196-205.
d'Ydewalle, G. & Van de Poel, M. 1999. Incidental foreign-language acquisition by children
watching subtitled television programs. Journal of Psycholinguistic Research, 28(3),
p227-244.
d'Ydewalle, G., Van Rensbergen, J. & Pollet, J. 1987. Reading a message when the same
message is available auditorily in another language: The case of subtitling. In Eye
movements from physiology to cognition, pp.313-321.
Daneman, M. & Carpenter, P.A. 1980. Individual differences in working memory and reading.
Journal of Verbal Learning and Verbal Behavior, 19(4), pp.450-466.
Díaz-Cintas, J. & Remael, A. 2007. Audiovisual translation: subtitling. Manchester: St. Jerome.
De Jong, T. 2010. Cognitive load theory, educational research, and instructional design: some
food for thought. Instructional Science, 38(2), p.105-134.
Diao, Y., Chandler, P. & Sweller, J. 2007. The effect of written text on comprehension of spoken
English as a foreign language. American Journal of Psychology, pp.237-261.
Doherty, S. 2016. The Impact of translation technologies on the process and product of
translation. International Journal of Communication, 10, pp.947-969. Vancouver.
Engle, R. W. 2002. Working memory capacity as executive attention. Current Directions in
Psychological Science, 11(1), p.19-23.
Ericsson, K.A. & Kintsch, W. 1995. Long-term working memory. Psychological Review, 102(2),
p.211.
Etemadi, A. 2012. Effects of bimodal subtitling of English movies on content comprehension
and vocabulary recognition. International Journal of English Linguistics, 2(1), p239.
Finn, J.D. 1972. The emerging technology of education. Extending education through
technology. Selected writings by James D. Finn, Washington: AECT.
Flesch, R. 1948. A new readability yardstick. Journal of Applied Psychology, 32(3), p.221.
105
Frederick, J.A., Timmermann, D.L., Russell, H.L. & Lubar, J.F. 2005. EEG coherence effects of
audio-visual stimulation (AVS) at dominant and twice dominant alpha frequency. Journal
of Neurotherapy, 8(4), pp.25-42.
Friedman, D.B. & Hoffman-Goetz, L. 2006. A systematic review of readability and
comprehension instruments used for print and web-based cancer information. Health
Education & Behavior, 33(3), pp.352-373.
Fukuda, K. 2001. Eye blinks: new indices for the detection of deception. International Journal of
Psychophysiology, 40(3), pp.239-245.
Graesser, A.C., McNamara, D.S., Louwerse, M.M. & Cai, Z. 2004. Coh-Metrix: Analysis of text
on cohesion and language. Behavior Research Methods, Instruments, & Computers,
36(2), pp.193-202.
Gerjets, P., Scheiter, K. & Catrambone, R. 2004. Designing instructional examples to reduce
intrinsic cognitive load: Molar versus modular presentation of solution procedures.
Instructional Science, 32, p.33–58.
Gernsbacher, M.A. 2015. Video captions benefit everyone. Policy Insights from the Behavioral
and Brain Sciences, 2(1), pp.195-202
Gopher, D. & Braune, R. 1984. On the psychophysics of workload: Why bother with subjective
measures? Human Factors, 26(5), pp.519-532.
Gottlieb, H. 1998. Subtitling. In Routledge Encyclopaedia of Translation Studies, edited by
Mona Baker, 244-248. London & New York: Routledge.
Gottlieb, H. 2002. Titles on subtitling 1929-1999: An International Annotated Bibliography:
Interlingual Subtitling for Cinema, TV, Video & DVD. Rassegna Italiana di Linguistica
Applicata, 34(1), 215.
Gottlieb, H. 2012. Subtitles: Readable dialogue?. In E Perego (ed.), Eye-tracking in
Audiovisual Translation. Aracne Editrice, Roma. Scienze dell'Antichità, Filologico-
Letterarie e Storico-Artistiche, no. 895.
Haapalainen, E., Kim, S., Forlizzi, J.F. & Dey, A.K. 2010, September. Psycho-physiological
measures for assessing cognitive load. In Proceedings of the 12th ACM International
Conference on Ubiquitous Computing, pp.301-310. ACM.
Harji, M. B., Woods, P. C. & Alavi, Z. K. 2010. The effect of viewing subtitled videos on
vocabulary learning. Journal of College Teaching & Learning (TLC), 7(9).
Hart, S.G. & Staveland, L.E. 1988. Development of NASA-TLX (Task Load Index): Results of
empirical and theoretical research. Advances in Psychology, 52, pp.139-183. North-
Holland.
Hayati, A. & Mohmedi, F. 2011. The effect of films with and without subtitles on listening
comprehension of EFL learners. British Journal of Educational Technology, 42(1), p181-
192.
106
Hefer, E. 2011. Reading second language subtitles: a case study of South African viewers
reading in their native language and L2-English (Doctoral dissertation, North-West
University, Vanderbijlpark, South Africa).
Holland, M.K. and Tarlow, G. 1972. Blinking and mental load. Psychological Reports, 31(1),
pp.119-127.
Hwang, Y. & Huang, P. 2011. Using subtitles to enliven reading. English Language and
Literature Studies, 1(1), p2.
Huang, H.C. & Eskey, D.E. 1999. The effects of closed-captioned television on the listening
comprehension of intermediate English as a second language (ESL) students. Journal of
Educational Technology Systems, 28(1), pp.75-96.
Ichikawa, N. & Ohira, H. 2004. Eyeblink activity as an index of cognitive processing: Temporal
distribution of eyeblinks as an indicator of expectancy in semantic priming. Perceptual
and Motor Skills, 98(1), pp.131-140.
Ikehara, C.S. & Crosby, M.E. 2005, January. Assessing cognitive load with physiological
sensors. In Null, p.295a. IEEE.
Jacob, R.J. & Karn, K.S. 2003. Eye tracking in human-computer interaction and usability
research: Ready to deliver the promises. The Mind's Eye, pp 573-605).
Janisse, M.P. 1977. Pupillometry. The psychology of the pupillary response. Series in Clinical
and Community Psychology. Washington DC: Hemisphere Publishing Corporation.
Javal, E., 1878. Essai sur la physiologie de la lecture. Annales d'Ocilistique, 80, pp.61-73.
Kalyuga, S. 2000. When using sound with a text or picture is not beneficial for
learning. Australian Journal of Educational Technology, 16(2), pp.161-172.
Kalyuga, S. 2011. Cognitive load theory: Implications for affective computing. In McCarthy, P.M.
& Murray, R.C. (Eds). Proceedings of the 24th International Florida Artificial Intelligence
Research Society Conference. Menlo Park, CA: Association for the Advancement of
Artificial Intelligence (AAAI), 105ñ110.
Kalyuga, S., Chandler, P. and Sweller, J. 1998. Levels of expertise and instructional
design. Human Factors: The Journal of the Human Factors and Ergonomics
Society, 40(1), pp.1-17.
Kalyuga, S., Chandler, P. and Sweller, J. 2000. Incorporating learner experience into the design
of multimedia instruction. Journal of Educational Psychology, 92(1), p.126.
Khalil, M.K., Paas, F., Johnson, T.E. & Payer, A.F. 2005. Design of interactive and dynamic
anatomical visualizations: the implication of cognitive load theory. The Anatomical
Record Part B: The New Anatomist, 286(1), pp.15-20.
Kilborn, R., 1993. Speak my language: current attitudes to television subtitling and dubbing.
Media, Culture & Society, 15(4), pp.641-660.
Kim, D. & Gilman, D.A., 2008. Effects of text, audio, and graphic aids in multimedia instruction
for vocabulary learning. Educational Technology & Society, 11(3), pp.114-126.
107
Kirschner, P.A. 2002. Cognitive load theory: Implications of cognitive load theory on the design
of learning. Learning and Instruction, 12, pp.1–10.
Koolstra, C.M. & Beentjes, J.W. 1999. Children's vocabulary acquisition in a foreign language
through watching subtitled television programs at home. Educational Technology
Research and Development, 47(1), pp.51-60.
Kruger, J. 2013. Subtitles in the classroom: balancing the benefits of dual coding with the cost
of increased cognitive load. Journal for Language Teaching, 47(1), 55-71.
Kruger, J. & Steyn, F. 2014. Subtitles and eye tracking: reading and performance. Reading
Research Quarterly, 49 (1): 105-120.
Kruger, J., Hefer, E. & Matthew, G. 2014. Attention distribution and cognitive load in a subtitled
academic lecture: L1 vs. L2. Journal of Eye Movement Research, 7(5):4, 1-15.
Kruger, J., Szarkowska, A. & Krejtz, I. 2015. Subtitles on the moving image: an overview of eye
tracking studies. Refractory: a Journal of Entertainment Media, 25(5).
http://refractory.unimelb.edu.au/2015/02/07/kruger-szarkowska-krejtz/ Date of access:
10 March 2015.
Kruger, J., Doherty, S. 2016. Measuring cognitive load in the presence of educational video:
towards a multimodal methodology. Australasian Journal of Educational Technology
(AJET).
Kruger, J., Doherty, S., Fox, W. & De Lissa, P. 2016. Multimodal measurement of cognitive load
during subtitle processing: Same-language subtitles for foreign language viewers, ATA.
Kvitnes, I.E.N. 2013. Subtitles in the second language classroom: An experimental study with
Norwegian learners of English. Master’s Thesis, Norwegian University of Science and
Technology.
Leahy, W. and Sweller, J. 2011. Cognitive load theory, modality of presentation and the
transient information effect. Applied Cognitive Psychology, 25(6), pp.943-951.
Lee, A.Y. & Bowers, A.N. 1997. The effect of multimedia components on learning. In De Lucia,
P.R. (ed.), Proceedings of the Human Factors and Ergonomics Society Annual Meeting,
41(1), pp.340-344). SAGE Publications.
Lenth, R. 2018. EMMeans Comparisons. URL: https://cran.r-
project.org/web/packages/emmeans/vignettes/comparisons.html, Date of access: 21
September 2018.
Leppink, J., Paas, F., Van der Vleuten, C.P., Van Gog, T. & Van Merriënboer, J.J. 2013.
Development of an instrument for measuring different types of cognitive load. Behavior
Research Methods, 45(4), pp.1058-1072.
Leppink, J. & Van den Heuvel, A. 2015. The evolution of cognitive load theory and its
application to medical education. Perspectives on Medical Education, 4(3), pp.119-127.
108
Linacre, J.M. 2006. WINSTEPS Rasch measurement computer program. Chicago:
Winsteps.com.
Linebarger, D., Piotrowski, J.T. & Greenwood, C.R. 2010. On-screen print: the role of captions
as a supplemental literacy tool. Journal of Research in Reading 33(2): 148-167. doi:
10.1111/j.1467-9817.2009.01407.x
Leight, J. 2017. Applying Consumer Theory: Labor. 1st term. Massachusetts Institute of
Technology: MIT OpenCourseWare, https://ocw.mit.edu/courses/economics/14-01sc-
principles-of-microeconomics-fall-2011/unit-2-consumer-theory. License: Creative
Commons BY-NC-SA.
Marco, M. 2012. When conducting multiple regression, when should you center your predictor
variables & when should you standardize them? URL:
https://stats.stackexchange.com/questions/29781/when-conducting-multiple-regression-
when-should-you-center-your-predictor-variables. Date of access: 24 October 2018.
Marian, V. 2009. Audio-visual integration during bilingual language processing. The Bilingual
Mental Lexicon: Interdisciplinary approaches, p.52-78.
Marian, V., Blumenfeld, H.K. & Kaushanskaya, M. 2007. The Language Experience and
Proficiency Questionnaire (LEAP-Q): Assessing language profiles in bilinguals and
multilinguals. Journal of Speech, Language, and Hearing Research, 50(4), pp.940-967.
Markham, P. 1999. Captioned videotapes and second‐language listening word recognition.
Foreign Language Annals, 32(3), p.321-328.
Marks, H.M., 2000. Student engagement in instructional activity: Patterns in the elementary,
middle, and high school years. American Educational Research Journal, 37(1), pp.153-
184.
Matielo, R., Collet, T. & D’ely, R.C.S.F. 2013. The effects of interlingual and intralingual
subtitles on vocabulary learning by Brazilian EFL learners: an exploratory study.
Intercâmbio. Revista do Programa de Estudos Pós-Graduados em Linguística Aplicada
e Estudos da Linguagem, 27.
McCluskey, F.D. 1981. DVI, DAVI, AECT: A long view. Educational Media Yearbook, pp.17-36.
Mayer, R.E. & Moreno, R. 1998. A cognitive theory of multimedia learning: Implications for
design principles. Journal of Educational Psychology, 91(2), pp.358-368.
Mayer, R.E. 2002a. Multimedia learning. Psychology of Learning and Motivation, 41, pp.85-139.
Mayer, R.E. 2002b. Cognitive theory and the design of multimedia instruction: an example of
the two‐way street between cognition and instruction. New Directions for Teaching and
Learning, 2002(89), pp.55-71.
Mayer, R.E. & Moreno, R. 2002. Aids to computer-based multimedia learning. Learning and
Instruction, 12(1), pp.107-119.
Mayer, R.E. & Moreno, R. 2003. Nine ways to reduce cognitive load in multimedia learning.
Educational Psychologist, 38(1), p.43-52.
109
Mayer, R.E. & Chandler, P. 2001. When learning is just a click away: Does simple user
interaction foster deeper understanding of multimedia messages? Journal of Educational
Psychology, 93(2), p.390.
Mayer, R.E., Heiser, J. & Lohn, S. 2001. Cognitive constraints on multimedia learning: When
presenting more material results in less understanding. Journal of Educational
Psychology, 93(1), 187-198.
Mayer, R.E. & Johnson, C.I. 2008. Revising the redundancy principle in multimedia
learning. Journal of Educational Psychology, 100(2), p.380.
Mayer, R.E., Lee, H. & Peebles, A. 2014. Multimedia learning in a second language: A cognitive
load perspective. Applied Cognitive Psychology, 28(5), 653-660.
Mayer, R.E. 2014. Incorporating motivation into multimedia learning. Learning and Instruction,
29, pp.171-173.
Metallidou, P. & Vlachou, A. 2007. Motivational beliefs, cognitive engagement, and achievement
in language and mathematics in elementary school children. International Journal of
Psychology, 42(1), pp.2-15.
Metzger, S.A. 2010. Maximizing the educational power of history movies in the classroom. The
Social Studies, 101(3), pp.127-136.
Miller, H.G. 1951. A study of the interference effects of high intensity sound on the retention of
visually and auditoriallly learned material (Doctoral dissertation, Pennsylvania State
College).
Mitterer, H. & McQueen, J.M. 2009. Foreign subtitles help but native-language subtitles harm
foreign speech perception. PLoS ONE, 4(11), e7785.
Mousavi, S.Y., Low, R. & Sweller, J. 1995. Reducing cognitive load by mixing auditory and
visual presentation modes. Journal of Educational Psychology, 87(2), p.319.
MyMP4Box GUI, version 0.606. 2013. Freeware, Video De/Multiplexers, URL:
https://www.videohelp.com/software/My-MP4Box-GUI
Neuman, S.B. & Koskinen, P. 1992. Captioned television as comprehensible input: Effects of
incidental word learning from context for language minority students. Reading Research
Quarterly, pp.95-106.
Neves, J. 2005. Audiovisual translation: Subtitling for the deaf and hard-of-hearing. Doctoral
dissertaion, School of Arts, Surrey University.
Northrop, D.S. 1952. Effects on learning of the prominence of organizational outlines in the
instructional film. Technical Report SDC 269-7-33. Instructional Film Research Reports.
Port Washington, N.Y.: U.S. Naval Special Devices Centre.
O’Brien, S. 2006. Eye tracking and translation memory matches. Perspectives - Studies in
Translatology, 14 (3), 185-205.
Ohira, H., 1996. Eyeblink activity in a word-naming task as a function of semantic priming and
cognitive load. Perceptual and Motor Skills, 82(3), pp.835-842.
110
Olsen, J.R. & Bass, V.B. 1982. The application of performance technology in the military: 1960‐
1980. Performance & Instruction, 21(6), pp.32-36.
Owen, E. & Sweller, J. 1985. What do students learn while solving mathematics
problems? Journal of Educational Psychology, 77(3), p.272.
Paas, F. (1992). Training strategies for attaining transfer of problem-solving skill in statistics: A
cognitive-load approach. Journal of Educational Psychology, 84, 429-434.
Paas, F., Tuovinen, J., Tabbers, H. & Van Gerven, P.W.M. 2003. Cognitive load measurement
as a means to advance cognitive load theory. Educational Psychologist, 38(1), 63-71.
doi: 10.1207/S15326985EP3801_8
Paas, F. & Van Merriënboer, J.G. 1993. The efficiency of instructional conditions: An approach
to combine mental effort and performance measures. Human Factors, 35(4), 737-741.
Paas, F., Van Merriënboer, J.J. & Adam, J.J. 1994. Measurement of cognitive load in
instructional research. Perceptual and Motor Skills, 79(1), pp.419-430.
Pass, F., Renkel, A. & Sweller, J. 2004. Cognitive Load Theory: Instructional implications of the
interaction between information structures and cognitive architecture. Instructional
Science, 32, 1-8.
Paivio, A. 1986. Mental representations: a dual-coding approach. New York: Oxford University
Press.
Parasuraman, R., Warm, J.S. & See, J.E. 1998. The Attentive Brain, The MIT Press, London.
pp. 221-256
Pashler, H.E. & Sutherland, S. 1998. The psychology of attention (Vol. 15). Cambridge, MA:
MIT press.
Pollock, E., Chandler, P. & Sweller, J. 2002. Assimilating complex information. Learning and
Instruction, 12, 61–86.
Poole, A. & Ball, L.J. 2006. Eye tracking in HCI and usability research. Encyclopedia of Human
Computer Interaction, pp.211-219. IGI Global.
RStudio Team. 2015. RStudio: Integrated Development for R. RStudio Inc.: Boston, MA.
http://www.rstudio.com/.
Rayner, K. & Pollatsek, A. 2006. Eye-movement control in reading. Handbook of
Psycholinguistics (2nd Edition),pp.613-657).
Raz, A. & Buhle, J. 2006. Typologies of attentional networks. Nature Reviews
Neuroscience, 7(5), pp.367-379.
Reder, L.M. 1979. The role of elaborations in memory for prose. Cognitive Psychology, 11(2),
pp.221-234.
Reiser, R.A. 2001. A history of instructional design and technology: Part I: A history of
instructional media. Educational Technology Research and Development, 49(1), pp.53-
64.
111
Reid, G.B. and Nygren, T.E. 1988. The subjective workload assessment technique: A scaling
procedure for measuring mental workload. Advances in Psychology 52, pp.185-218.
North-Holland.
Reigeluth, C.M. 1999. What is instructional-design theory and how is it changing? Instructional-
design theories and models: A new paradigm of instructional theory, 2, pp.5-29.
Reiser, R.A. & Gagné, R.M. 1983. Selecting media for instruction. Educational Technology.
Englewood Cliffs, NJ: Educational Technology.
Robin, X., Turck, N., Hainard, A., Tiberti, N., Lisacek, F., Sanchez, J. & Müller, M. 2011. pROC:
an open-source package for R and S+ to analyze and compare ROC curves. BMC
Bioinformatics, 12, p.77. doi: 10.1186/1471-2105-12-77.
Rokni, S.J. & Ataee, A.J. 2014. The effect of movie subtitles on EFL learners' oral performance.
International Journal of English Language, Literature and Humanities, 1(4), p201-215.
Romero-Fresco, P., 2015. The Reception of Subtitles for the Deaf and Hard of Hearing in
Europe: UK, Spain, Italy, Poland, Denmark, France and Germany. Peter Lang AG,
Internationaler Verlag der Wissenschaften.
Roscoe, A.H. 1987. In-flight assessment of workload using pilot ratings and heart rate. Britannia
Airways Ltd, Luton, UK.
Roscoe, A.H. & Ellis, G.A. 1990. A subjective rating scale for assessing pilot workload in flight:
A decade of practical use (No. RAE-TR-90019). Royal Aerospace Establishment
Farnborough (United Kingdom).
Rubio, S., Díaz, E., Martín, J. & Puente, J.M. 2004. Evaluation of subjective mental workload: A
comparison of SWAT, NASA‐TLX, and workload profile methods. Applied Psychology,
53(1), pp.61-86.
Saettler, P. 1968. A history of instructional technology. New York: McGraw-Hill.
Schmidt-Weigand, F., 2006. Dynamic visualizations in multimedia learning: The influence of
verbal explanations on visual attention, cognitive load and learning outcome (Doctoral
dissertation, Universitätsbibliothek Giessen).
Schnotz, W., & Kürschner, C. 2007. A reconsideration of cognitive load theory. Educational
Psychology Review, 19(4), p.469-508.
Schultheis, H. & Jameson, A. 2004, August. Assessing cognitive load in adaptive hypermedia
systems: Physiological and behavioral methods. In International Conference on Adaptive
Hypermedia and Adaptive Web-Based Systems (pp. 225-234). Berlin, Heidelberg:
Springer.
Screenfront.ca. 2015. Understanding captions & subtitles. http://screenfont.ca/learn/. Date of
access: June 2015.
Searle, S.R., Speed, F.M. & Milliken, G.A. 1980. Population marginal means in the linear model:
an alternative to least squares means. The American Statistician, 34(4), pp.216-221.
112
Siegle, G.J., Ichikawa, N. & Steinhauer, S. 2008. Blink before and after you think: blinks occur
prior to and following cognitive load indexed by pupillary responses. Psychophysiology,
45(5), pp.679-687.
Shea, P. 2000. Leveling the playing field: A study of captioned interactive video for second
language learning. Journal of Educational Computing Research, 22(1), p243-263.
Skinner, E.A. & Belmont, M.J. 1993. Motivation in the classroom: Reciprocal effects of teacher
behavior and student engagement across the school year. Journal of Educational
Psychology, 85(4), p.571.
SMI (SensoMotoric Instruments). 2011a. iView X™ system manual: version 2.2. Teltow: SMI.
SMI (SensoMotoric Instruments). 2011b. BaGaze™ manual: version 2.3. Teltow: SMI.
Smiley, W. & Anderson, R. 2011. Measuring students' cognitive engagement on assessment
tests: a confirmatory factor analysis of the short form of the cognitive engagement
scale. Research & Practice in Assessment, 6.
Spiro, R.J. & Jehng, J.C. 1990. Cognitive flexibility and hypertext: Theory and technology for the
nonlinear and multidimensional traversal of complex subject matter. Cognition,
Education, and Multimedia: Exploring Ideas in High Technology, 205, pp.163-205.
Stewart, M.A. & Pertusa, I. 2004. Gains to language learners from viewing target language
closed‐captioned films. Foreign Language Annals, 37(3), pp.438-442.
Sweller, J., Van Merriënboer, J.J. & Paas, F. 1998. Cognitive architecture and instructional
design. Educational Psychology Review, 10(3), pp.251-296.
Sweller, J., Mawer, R.F. 7 Ward, M.R. 1983. Development of expertise in mathematical problem
solving. Journal of Experimental Psychology: General, 112(4), p.639.
Sweller, J., 2010. Element interactivity and intrinsic, extraneous, and germane cognitive load.
Educational Psychology Review, 22(2), pp.123-138.
Szarkowska, A. & Gerber-Morón, O. 2018. Viewers can keep up with fast subtitles: Evidence
from eye movements. PloS one, 13(6), p.e0199331.
Tempelman-Kluit, N. 2006. Multimedia learning theories and online instruction. College &
Research Libraries, 67(4), pp.364-369.
Tracy, J.P. & Albers, M.J. 2006, May. Measuring cognitive load to test the usability of web sites.
In Annual Conference - Society for Technical Communication, 53(1), p.256.
Van Merriënboer, J.J.G., Schuurman, J.G., De Croock, M.B.M. & Paas, F. 2002. Redirecting
learners' attention during training: Effects on cognitive load, transfer test performance
and training efficiency. Learning and Instruction, 12(1), pp.11-37.
Van Merriënboer, J.J., Kirschner, P.A. & Kester, L. 2003. Taking the load off a learner's mind:
Instructional design for complex learning. Educational psychologist, 38(1), pp.5-13.
Van Merriënboer, J.J. & Sweller, J., 2005. Cognitive load theory and complex learning: Recent
developments and future directions. Educational Psychology Review, 17(2), pp.147-177.
113
Van Merriënboer, J.J., Kester, L. & Paas, F. 2006. Teaching complex rather than simple tasks:
Balancing intrinsic and germane load to enhance transfer of learning. Applied Cognitive
Psychology: The Official Journal of the Society for Applied Research in Memory and
Cognition, 20(3), pp.343-352.
Vonk, W. & Cozijn, R. 2003. On the treatment of saccades and regressions in eye movement
measures of reading time. In The Mind's Eye, pp. 291-311.
Wade, N.J. 2010. Pioneers of eye movement research. i-Perception, 1(2), pp.33-68.
Welsh, C.J. 2003. OD’s and DT’s: using movies to teach intoxication and withdrawal syndromes
to medical students. Academic Psychiatry, 27(3), pp.182-186.
Wilson, G.F. 2002. An analysis of mental workload in pilots during flight using multiple
psychophysiological measures. International Journal of Aviation Psychology, 12(1), pp.3-
18.
Winke, P., Gass, S. & Syderenko. T. 2013. Factors Influencing the use of captions by foreign
language learners: an eye tracking study. The Modern Language Journal, 97(1) pp.254-
275.
Zabalbeascoa, P. 2008. The nature of the audiovisual text and its parameters. The Didactics of
Audiovisual Translation. John Benjamins, p.21-37.
Zanón, N.T. 2006. Using subtitles to enhance foreign language learning. Porta Linguarum, p.41-
52.
Zarei, A.A. 2009. The effect of bimodal, standard, and reversed subtitling on L2 vocabulary
recognition and recall. Pazhuhesh-e Zabanha-ye Khareji, 49(1), pp.65-85.

1

2
APPENDIX A
INFORMED CONSENT FORM & BIOGRAPHICAL INFORMATION

3

1
Informed consent form
Part 1: General project information
This section provides you, as participant in the project, with more information, so that you can make an informed decision about whether or not you want to participate in the experiment.
1. Title of the project
Measuring the cognitive load induced by subtitled audiovisual texts in an educational context.
2. Institution: Focus area UPSET at the NWU.
3. Name(s) and contact details of project leader(s)
3.1 Mr. Gordon Matthew
-Function in project: project leader / contact person
-Qualifications: MA
-Telephone: 016 910 3496
-Office: Building 7, Room 221.
-Postal address: PO Box 1174, Vanderbijlpark 1900
4. You are approached to take part in this project and may now have the following questions:
4.1 What are the set requirements that persons must meet to be able to take part in the project? Why and how was I chosen?
You are a second-year student at the Vaal Triangle Campus of the North West University in Vanderbijlpark and not a Native speaker of English.
4.2 What is the purpose of this project?
The purpose of this project is to determine whether the introduction of subtitles in an educational video imposes more mental (cognitive) processing than not being present in the video.

2
4.3 What will be expected of me as participant? In which interventions/procedures will I have to take part? What exactly will it involve?
In the first part of the study, you will be asked to complete a variety of forms and tests in order to gather general information to qualify you for the second part of the study. The tests that will be taken in the first section of this study will include an English proficiency and reading test (Van Der Schyff, 1991), a Language Experience Questionnaire (LEAP-Q), a prior knowledge test on the content of the videos that you will watch in the second section.
In the second section of the experiment you will complete a working memory capacity test to test your brain’s ability to remember. Then you will watch four videos, each presented in one of three different presentation modes. After each of these videos you will be asked to answer a 10-point comprehension test as well as a 13-item questionnaire to measure the impact of the video on your brain activity.
During your participation in the second part of the experiment, your eye movements will be monitored by a non-invasive eye tracker, which is fitted on the bottom of the screen. When you have watched all four videos and completed all the tests successfully, you’ll be compensated for your time with a R300 Van Schaik voucher.
4.4 What are the potential discomforts and/or potential dangers and/or potential permanent consequences (however negligible) that participation in this project holds?
This study involves no dangers, nor negative temporary or permanent consequences apart from the potential benefits of double exposure to the videos’ content. Since the eye tracking equipment that will be used is a remote system, the only requirement is that you should not move too much during the second part of the experiment, but this should not cause any discomfort.
4.5 What precautions have been taken to protect me as participant?
The reporting of data will be completely anonymous. Your name will not be mentioned and your data will only be allowed to be given to you and no one else.
4.6 How long am I expected to be involved in the project?
The project will consist of two sessions, each taking about an hour and a half to complete. When you will participate in the project is determined by your scheduled time slots.
4.7 What direct benefits can I expect from the project? What remuneration (monetary or services) can I expect for my participation?
By taking part in the experiment, and completing both of the sessions, you will be rewarded with a R300, Van Schaik voucher. The project may lead to the implementation of a method to improve the academic literacy and academic performance of students. It can also help to determine which of the elements in videos need to be changed to facilitate better learning in e-learning environments.
4.8 What potential general benefits are there for the broader community, which may arise from the project?

3
The project may lead to the implementation of a method to improve the design of online learning material and academic performance of tertiary students in general.
4.9 How will the findings of the project (general and individual results) be made available or conveyed to me?
The results of this project will be reported in academic journals and reports. Should you wish to find out about the results of the study, please contact Mr. Gordon Matthew (see 3.1 for contact details).
4.10 What measures have been taken to handle and store my data confidentially?
No names or university numbers will be used when reporting on the data. Although your biographical details will be used to organise the data, this information will not be linked to your identity and it will not be possible to identify you from the data.
As project leader, I confirm to participants that the above information is complete and correct.
______________________
Signature of project leader
Date: 14 February 2017
Signed at: Vanderbijlpark (Place of signature)

4
Part 2: General principles
To the signatory of the consent contained in Part 3 of this document.
You are invited to take part in the research project described in Part 1 of this informed consent form. It is important that you also read and understand the following general principles, which are applicable to all participants in this research project.
1. Participation in this research project is voluntary, i.e. no pressure will be put on you to take part. However, you will still be expected to attend all the sessions according to the schedule that will be agreed with you.
2. It is possible that you will not derive any personal benefit from taking part in this research project. However, the knowledge that may be gained by means of this project may benefit other people or communities in the future.
3. You are free to withdraw from the project at any time, without stating reasons, and you will not be harmed in any way by doing so. You may also request that your data no longer be used in the project. However, you are kindly requested not to withdraw without careful consideration since this may have a detrimental effect on the statistical reliability of the project, among others.
4. By agreeing to take part in this project, you are also giving consent for the data that will be generated. In return, we commit ourselves to keep the data confidential and anonymous.
5. You will be given access to your own data upon request, unless the Ethics Committee has approved temporary non-disclosure. In this case, the reasons will be explained to you.
6. A summary of the nature of the project, the potential risks, factors that may cause you possible inconvenience or discomfort, the benefits that can be expected and the known and/or probable permanent consequences that your participation in the project may have for you as a participant, are set out in Part 1.
7. You are encouraged to ask the project leader or co-workers any questions you may have regarding the project and the related procedures at any stage. They will gladly answer your queries.
8. If you are a minor, the written consent of your parent or legal guardian is required before you participate in this project as well as (in writing if possible) your voluntary assent to take part.
9. The objectives of the project are always secondary to your well-being and actions taken will always place your interests above those of the project.
10. No project may be commenced before it is approved by the Ethics Committee. Furthermore, the project leader must report any detrimental effects experienced during the implementation of the project in full and without delay to the chairman of the Ethics Committee. If any unforeseen serious detrimental effects are observed during the project, it may be necessary to terminate the project immediately.

5
Part 3: Consent
Title of the project: To what degree does a subtitled video influence your mental abilities
I have read the preceding premises in connection with the project, as discussed in Part 1 and Part 2 of this informed consent form, and have also heard the oral version thereof, and I declare that I understand it. I was given the opportunity to discuss relevant aspects of the project with the project leader and I hereby declare that I am taking part in the project voluntarily. I also declare that I understand I will forfeit the R300 Van Schaik voucher when I do not complete the both sections of this experiment.
______________________________________ ___________________
Signature of participant Date
Signed at: ______________________________________
Place of signature
Biographical Information
Please supply the correct answers to the given questions below. The information will be
kept anonymous and only be used as demographic information for the experiment.
1. Name & surname
____________________________________
2. Student number
____________________________________
3. Email address
____________________________________
4. What is your age?
_____________________________________
5. What gender are you?
_____________________________________
6. What is the language you speak at home (with your parents or guardian)?
_____________________________________

6
7. What is your field of study?
_____________________________________
8. Are you taking ECON221 in the second semester?
_____________________________________
9. Have you previously taken ECON221?
_____________________________________
1
APPENDIX B
COGNITIVE LOAD QUESTIONNAIRE

2
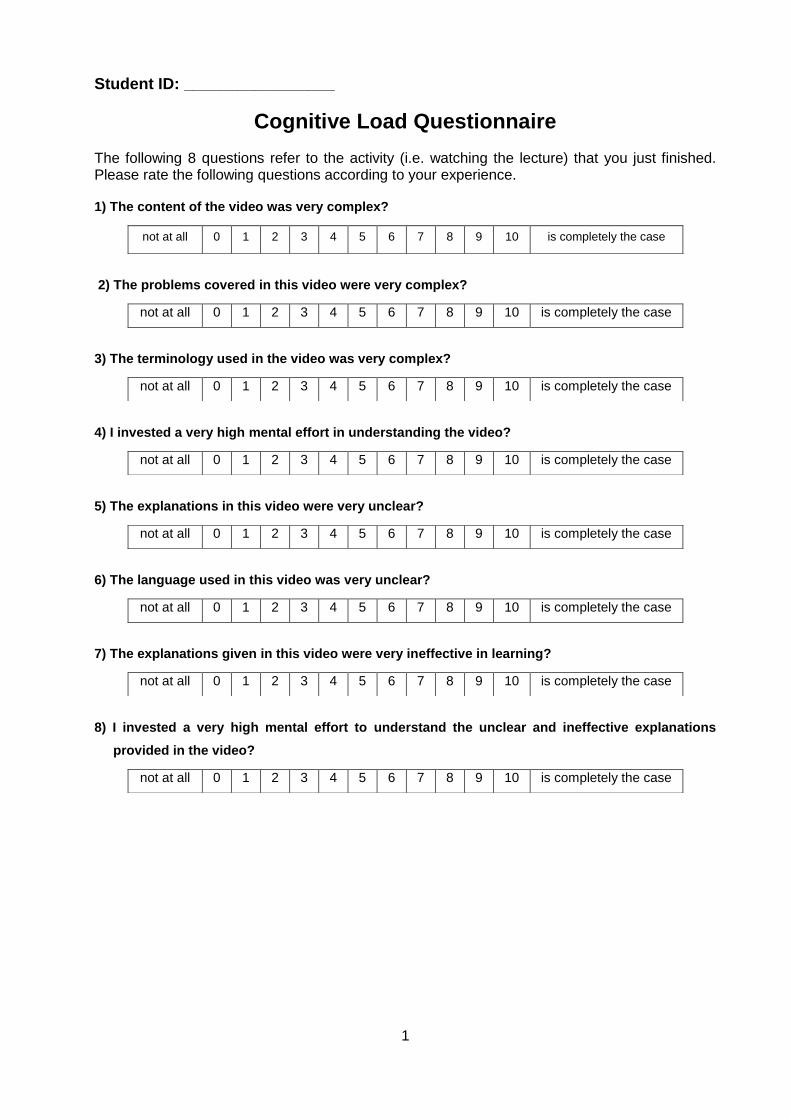
1
Student ID: _________________
Cognitive Load Questionnaire
The following 8 questions refer to the activity (i.e. watching the lecture) that you just finished. Please rate the following questions according to your experience.
1) The content of the video was very complex?
2) The problems covered in this video were very complex?
3) The terminology used in the video was very complex?
4) I invested a very high mental effort in understanding the video?
5) The explanations in this video were very unclear?
6) The language used in this video was very unclear?
7) The explanations given in this video were very ineffective in learning?
8) I invested a very high mental effort to understand the unclear and ineffective explanations
provided in the video?
not at all 0 1 2 3 4 5 6 7 8 9 10 is completely the case
not at all 0 1 2 3 4 5 6 7 8 9 10 is completely the case
not at all 0 1 2 3 4 5 6 7 8 9 10 is completely the case
not at all 0 1 2 3 4 5 6 7 8 9 10 is completely the case
not at all 0 1 2 3 4 5 6 7 8 9 10 is completely the case
not at all 0 1 2 3 4 5 6 7 8 9 10 is completely the case
not at all 0 1 2 3 4 5 6 7 8 9 10 is completely the case
not at all 0 1 2 3 4 5 6 7 8 9 10 is completely the case

1
2
APPENDIX C
COMPREHENSION TESTS FOR ALL THE VIDEOS

1

2
INCOME AND SUBSTITUTION EFFECTS – VIDEO 1
1. In Economics, which two effects can cause a price change? (2)
The income effect and the substitution effect
2. Describe what you understand under concept of the substitution effect. (2)
The substitution effect is the change in the quantity demanded when the price
changes, holding utility constant.
3. Describe what you understand about the income effect. (2)
Then we have an income effect which is, in fact, utility isn't held constant when
prices change. In fact, utility falls, because you're effectively poorer and since
you’re effectively poorer, that further reduces demand if the good is normal.
4. What happens to the substitution effect when the price of a product goes up? (1)
The substitution effect becomes negative. B
1. True or False: The income effect can be so large that it can offset the substitution effect? (1) True.
2. What is a Giffen good? (2)
When the income effect of a good is so large it offsets the substitution effect, and the price increase actually leads to more of the good being consumed.
TOTAL: /10

3
LABOUR LEISURE TRADE-OFF – VIDEO 2
1. True or False: Labour is not an inferior good (1).
False 2. Describe the labour-leisure trade-off effect. (3)
The more labour you provide to the market, the more you consume, but the less fun you get to have. The less labour you provide to the market, the more fun you get to have, the more leisure you get, but the less you get to consume, because you have less income. And that's the trade-off we talked about when we talked about the effect of minimum wage.
3. Is labour a good or a bad? (1)
Bad
4. Describe what can be found under a labour supply curve. (2)
The trade-off between how much leisure you want and how much consumption you can have.
5. What determines the slope of a budget constraint, according to the video? (1)
The marginal rate of transformation, which is the ratio between prices. Prices determine the slope of the budget constraint.
6. What is the price of leisure and why? (2)
Wage. Because for every hour you take having leisure, you are effectively using money that you could gain at work.
TOTAL: /10

4
THE IMPACT OF WAGE CHANGES ON LABOUR-LEISURE TRADE-OFF – VIDEO 3
1. What happens to both labour and leisure when the wage changes? (2) Leisure is reduced and labour increases.
2. True or False: A wage increase can make you work less. (1)
True
3. Describe target income. (2)
If someone has a target income, and their wage goes up, they'll work less.
4. When does one get a upward-sloping labour supply curve? (2)
As long as substitution effects dominate income effects, we'll get an upward sloping labour supply curve.
5. What causes a down-ward sloping labour supply curve? (2)
When the income effect dominates the substitution effect.
6. What is a Backward-bending supply curve? (1)
A supply curve that goes the wrong way.
TOTAL: /10

5
IMPACT OF LABOUR SUPPLY ON UNEMPLOYMENT – VIDEO 4
1. Give the definition of the unemployment rate. (2) So the unemployment rate is how many people are looking for work over how many are employed.
2. What is the social security program?(2)
It provides income when you're retired to help you deal with the fact that you don't have a source of labour income anymore.
3. True or False. The social Security program works the same in all of the counties around the world. (1)
False.
3. At what age is retirement in the Netherlands compared to retirement in the USA?(2)
N=55, USA = 62
4. What is the reasoning for the lower retirement age in the Netherlands? (2) They want to get those old guys out to make jobs for the young guys. They need to pay those old guys to stay at home to make jobs for the young guys.
5. When was the negative income tax experiment, ran in the USA?(1)
1970’s
TOTAL: /10

1
APPENDIX D
PRIOR KNOWLEDGE TEST

1

2
Prior Knowledge tests
Describe the following terms:
1) Substitution effect:
Returns to working are higher; each worker may want to work more.
2) Income effect:
Each worker is now richer, and may want to work less (consume more leisure).
4) Equilibrium wage:
The competitive market wage rate, and the quantity of labour employed, is determined by the interaction of demand and supply. The equilibrium wage rate is the rate that equates demand and supply.
5) Net income:
Net income (NI) is a company's total earnings (or profit); net income is calculated by taking revenues and subtracting the costs of doing business such as depreciation, interest, taxes and other expenses.
6) Utility function:
Is a function that transfers bundles of goods into a scale of utils; however, it provides only an ordinal ranking, not a cardinal one.
True or False:
7) Innovations in the production of batteries lead to a rightward shift in the market supply for hybrid cars, while demand stays the same.
TRUE
8) A consumer finds two goods to be perfectly substitutable. That means that the optimal bundle for this consumer will always be a corner solution.
TRUE
9) When market demand and supply shift in opposite directions, we can un- ambiguously say how the equilibrium price and quantity change.
FALSE
10) A risk adverse individual that has to decide between two different lotteries will always prefer a lottery with less risk.
TRUE

1

2
APPENDIX E
LANGAUGE AND SUBTITLE EXPERIENCE QUESTIONNAIRE

1

2
LANGUAGE AND SUBTITLE EXPERIENCE QUESTIONNAIRE 1. Please mark (with an X) ALL the languages you know in the grid below.
Afrikaans 1 Shona 12
Dutch 2 Southern Sotho 13
English 3 Spanish 14
French 4 Swati 15
German 5 Tsonga / Shangaan 16
Hebrew 6 Tswana 17
Italian 7 Venda 18
Ndebele 8 Xhosa 19
Ndonga 9 Zulu 20
Northern Sotho 10 Other (specify below):
Portuguese 11
2. Please list all the languages you know in order of your proficiency / ability in them. In other words, my L1 is the language with which I express myself the easiest and people who understand my L1 understand what I want to communicate the best. Therefore, this is my strongest language: Order the languages selected above according of their strength:
L1 / strongest language
L2 / second strongest language
L3 / third strongest language
L4 / fourth strongest language
L5 / fifth strongest language

3
Please put a cross (X) or a tick () in the block that represents the appropriate answer at the
following questions, or write down an answer.
3. Please rate how often you read L1 subtitles when watching television.
Do not read L1 subtitles a lot 1 2 3 4 Read L1 subtitles a lot
* Please not that L1 is the language you are the most proficient in, or your strongest language.
Any comments about reading subtitles in your L1?
____________________________________________________________________________
____________________________________________________________________________
____________________________________________________________________________
____________________________________________________________________________
________________________
4. Please rate how often you read L2 subtitles when watching television.
Do not read L2 subtitles a lot 1 2 3 4 Read L2 subtitles a lot
* Please note that L2 is the language you are the second most proficient in, or your second
strongest language.
Any comments about reading subtitles in your L2?
____________________________________________________________________________
____________________________________________________________________________
____________________________________________________________________________
____________________________________________________________________________
________________________
5. In general, how much do you LIKE to read subtitles on television?
Dislike 1 2 3 4 Like
6. I first started reading subtitles when I was_________________ years old.

4
7. Please rate how easy / difficult it is for you to read subtitles. Choose ONE.
Extent of reading subtitles Choose the statement that best describes you
1 I cannot read any part of the subtitle before it goes off the screen.
2 I start reading the subtitle but cannot finish before it goes off the screen.
3 I can read most of a subtitle before it goes off the screen.
4 I can read the whole subtitle before it goes off the screen.
8. Please rate to what extent you feel subtitles help you to understand the programme or film
you are watching. Choose ONE.
Understanding of the film or programme
Rate the help of subtitles to you while watching a film or programme
1 The subtitles never help me to understand what I’m watching.
2 Sometimes the subtitles help me to understand what I’m watching.
3 The subtitles always help me to understand what I’m watching.
4 I need the subtitles to understand what I’m watching.
9. Please rate to what extent you think subtitles can help you learn.
Disagree 1 2 3 4 Agree

5
Ways of helping you learn
Please select one or more of the following
Subtitling helps me read faster.
Subtitling helps me pronounce English words that I am unfamiliar
with.
Subtitling helps me understand what I’m watching.
Subtitling helps me express myself better in English.
END OF QUESTIONNAIRE
Thank you for your time

1
APPENDIX F
ADVERTISEMENT

1

2
WANTED
ECONOMICS STUDENTS FOR PHD
STUDY
Criteria for taking part in the study:
-Non-English first-language speaker
-Had at least one semester of an Economics module
-Have not had ECON221 as a subject
Students who complete the study will be compensated
with a R300 Van Schaik-voucher (valid for 1 year).
If you are interested...?
Please email me at: [email protected]

1
2
APPENDIX G
TRANSCRIPTS OF VIDEOS

1

2
TRANSCRIPT: VIDEO 1

1
2
All right. So today we are going to start by reviewing income and substitution effects. Because
that's a pretty hard concept and pretty central to a lot of what we'll do for the rest of the
semester. And then we're going to dive in and talk about an application, a more interesting
application, of income and substitution effects which is the effects of wages on labor supply.
So let's review. If you take the handout, grab the handout and look at the first figure, it's the
same as the last figure of the previous lecture. To review, remember, whenever the price
changes, a price change can be decomposed into two effects, the substitution effect and the
income effect. The substitution effect is the change in the quantity demanded when the price
changes, holding utility constant.
And as we proved last time, that is always negative, 0 or negative. It is always non-positive. It's
always true that when a price goes up, the substitution effect is negative. We proved that both
mathematically and graphically last time showing that if you're going to hold utility constant, and
the price of a good is going to go up, you're going to shift away from that good. OK. That's the
substitution effect.
In our example, we showed graphically how you measure a substitution effect. You draw a new
imaginary budget constraint, BC3, which is parallel to the new budget constraint, BC2. So it's
got the new price ratio but tangent to the old indifference curve.
So the key thing to understand is the imaginary budget constraint, BC3, where it comes from.
It's parallel to the new budget constraint. That is it's got the new marginal rate of transformation,
the new slope, but it's tangent to the old indifference curve. That gets you to point B. And so the
movement from A to B is the substitution effect.
Then we have an income effect which is, in fact, utility isn't held constant when prices change.
In fact, utility falls, because you're effectively poorer. You're effectively poorer. Utility is falling.
And since you're effectively poorer, that further reduces demand if the good is normal. So if it's a
normal good, if it's a good where lower income causes less consumption of it, the fact that
you're effectively poorer further lowers the consumption from point B to point C.
So the total price effect is the one we demonstrated at the beginning of the last lecture. We
raised the price of movies from $8 to $12. And we saw the number of movies consumed fell
from 6 to 4. But what we can see now to understand what's underneath that is two things, an
effect of the fact that prices change holding utility constant, and the fact that you're effectively
poorer.
And that's the key thing. No, your income hasn't actually gone down. But that $96 your parents
gave you can buy you less. Your opportunity set has been restricted. And that makes you
3
effectively poorer. And so you buy less for that reason. And so you get the total movement from
A to C.
Now, as we emphasized last time, this will be the case if it's a normal good. So substitution
effects are done. Substitute effects are always negative, nothing fun about that. Income effects
are a little more interesting, because goods can be not normal but inferior. We have inferior
goods which are ones such that they're crummy stuff that as your income goes up, you want
less of it.
And that can change the analysis. So if we look at Figure 7-2, now we're talking about the price
change with an inferior good. And now imagine someone choosing between steak and
potatoes. So now the choice is between steak and potatoes. And steak costs $5 a pound,
initially, and potatoes cost $1 a pound. Initially, you have an income of $25. So someone has an
income of y equals $25. The price of steak is $5, and the price of potatoes is $1.
So your budget constraint, your original BC1, runs from you can either have 5 steak, or 25
potatoes, or something in between. And so individuals choose point A where they're consuming
8.3 potatoes. They choose point A.
I don't know what the number of steaks is. We probably also ought to label that, the number of
steaks that comes from that. But whatever. It comes out of the utility function. So then we say,
now let's imagine that the price of potatoes rises to $3 a pound. There's a blight on the potatoes
like there was in Ireland in the 1800s. There's a potato blight, and that shifts in the supply curve
for potatoes raising the price of potatoes from $1 a pound to $3 a pound.
Now, what we know is that that will move consumers, given the utility function that we've chosen
here, that will move consumers from point A to point C. Once again, that's not labeled, but some
lower amount of potatoes. That will move them from point A to point C. So, ultimately, they'll
choose fewer potatoes and fewer steaks.
But, in fact, what we can see is that's the composition of a substitution effect which is negative,
and an income effect which is positive.
So if we do our standard decomposition, we draw a new monetary budget constraint BC3. It's
parallel to the new budget constraint, BC2, so the same price ratio. It's parallel. But it's tangent
to the old indifference curve at point B which is actually to the left of the ultimate choice at point
C.
So the substitution effect takes us from A to B. The income effect actually takes us back from B
to C. That is as that budget constraint shifts from BC3 to BC2, as you get poorer, you choose
4
more potatoes. So the substitution effect would say that from the price change of potatoes
alone, we go all the way to point B. We massively reduce our consumption of potatoes.
But because we're poorer, effectively, we now consume more potatoes. Because we're
effectively poorer, we now consume more potatoes. And so, on net, you get a reduction in
potato consumption. But it offsets the substitution effect. So that's when income effects can be a
little more interesting. It's going to be a little more interesting exercise.
When you think about substitute effects in the same way, it's not that interesting. It's just look,
quantity fell. It doesn't really matter why. You don't see, in the real world, substitution income
effects. What's interesting is when they're opposed to each other. That's when it gets more
interesting. And so you see this small reduction you get from the substitution effect alone.
By the way, there's two handouts. Right? Jessica, is there two handouts? There should be.
There's tables as well. I didn't actually get it. Jessica, grab me one of those. There's tables as
well as graphs. So make sure you have both handouts. Anyone else need tables? Am I the only
one who didn't get it? OK, good.
So, in principle, the income effect could be so large it could offset the substitution effect. There's
no reason, theoretically, that couldn't happen. That is, in principle, you could derive preferences
such that the income effect is so large it offsets the substitution effect-- thank you-- and the price
increase actually leads to more potatoes being consumed. That is what we'd call a Giffen good
as I talked about last time.
So if you look at the table, the top table, this sort of lays out our possibilities. So look at the top
table. It sort of maps out the possible sets of things that can happen. So if we have a normal
good, and the price of that good rises, then we know that the substitution effect is negative. The
income effect is negative. So the total effect is negative. Quantity falls. That's the law of
demand. We talked about that last time, downward sloping demand curves.
Likewise, if the price falls, the substitution effect is positive. The income effect is positive. You're
now richer because the price of the good fell. And so, therefore, demand goes up. Quantity
consumed goes up, once again, downward sloping demand curve. Price rises, you consume
less of it. Price falls, you consume more of it. That's what we learned about in the first lecture.
However, once goods are inferior, all bets are off. Because now the income effect is the
opposite sign of the substitution effect. It's possible it could be larger. So the total effect is
ambiguous. You could actually get an upward sloping demand curve. You could actually get
that a price rise leads to more of a good, and a fall leads to less of a good. Now will you? Only if
it's a Giffen good. And, in fact, there's a lot of controversy in economics about whether any good

5
in the world has ever been a Giffen good. At most, there's maybe one or two examples people
can find. Even then, it's controversial.
So I think it's fine in life to assume that demand curves slope down. I think, in fact, I don't see
convincing evidence that any subset or set of goods are Giffen goods. I think it's just generally
fine it life to assume demand curves slope down. Nonetheless, it's important to understand this
theoretical possibility even if it's just theoretical. Because it's important to understand income
and substitution effects. OK. Questions about that, either on substitution effect or price
changes? OK.

1
TRANSCRIPT: VIDEO 2

1
2
So now, armed with that, let's go onto the more interesting case which is labor supply. It's more
interesting, because as I'll come to in a few minutes, we talk about labor supply, labor is
typically going to be an inferior good. So things are going to get a little more interesting. So let's
talk about that.
So the question you want to ask here is how hard do folks decide to work? How many hours of
labor do folks decide to provide? As we talked about when we talked about minimum wage, just
as we all have to decide between consuming pizza and consuming movies, or consuming steak
and consuming potatoes, we also have to decide between how much labor we're going to
provide and how much we're going to consume.
The more labor you provide to the market, the more you consume, but the less fun you get to
have. Fun, we call leisure. The less labor you provide to the market, the more fun you get to
have, the more leisure you get, but the less you get to consume, because you have less
income. And that's the trade-off we talked about when we talked about the effect of minimum
wage.
Now let's come back and get underneath that labor supply curve. So we talked about the
minimum wage. We talked about the labor supply curve which was how the hours you provide
respond to the wage and a labor demand curve, which was how the hours that firms want
respond to the wage.
Now let's get underneath the supply curve. A minute ago, we were talking about the demand
curves and getting underneath the demand curve for consumers. Well, now let's get underneath
the supply curve for labor.
Now, the key thing is that when we talk about labor, it's not a good, it's a bad. The typical person
doesn't want to work. The typical person is not in this room. You guys like to work. The typically
person actually doesn't like to work.
Leisure is a normal good. For the typical person, leisure is a normal good. They like time off.
Leisure is a good, which means labor is a bad. They don't like to work.
The problem is we don't know how to model bads in economics. It's just we're used to trading
off between two things you want. When I used to trade-off, we know how to model something
you want to get something you don't want. Indifference curves wouldn't work, because more
wouldn't be better. If you drew an indifference curve for labor, it would violate the more is better
assumption. Because you wouldn't want more. You'd want less.

3
So the modeling trick we're going to use whenever we're modeling bads, is to model the
complementary good and then, in the end, solve for the bad. We're not going to model labor.
We're going to model leisure. And given the total amount of hours you have to supply, the total
hours minus the amount of leisure is the amount of labor. So we're going to model leisure.
We're going to model the good and then solve for labor at the end.
So, in other words, if you have 24 hours a day you can work, then your amount of hours of work
is 24 minus the amount of leisure N. Call it N or call it L. We'll call it N because L, typically, we
think of as labor. Let's call leisure N for reasons I don't quite understand. Let's just use that.
Basically the amount of hours you can work is 24 minus leisure. So if we solve for the optimal
amount of leisure you want, we can obviously get the amount of labor you supply. So the trick
when modeling a bad is not to model the bad. It's to model the complementary good. In this
case, the complementary good is leisure.
So we're going to model the trade-off between leisure and consumption and use the result of
that to solve for the amount of labor you supply. So it's the general modeling trick you need to
understand, which is turn a bad into a good. That's the modeling trick. Because we know how to
model the trade-off between two goods. We don't know how to model the trade-off with a bad.
So to think about that, let's go to Figure 7-3, and let's talk about what's underneath a labor
supply curve. What's underneath a labor supply curve is the trade-off between how much
leisure you want and how much consumption you can have. So you see here, here's a trade-off.
On the y-axis is the amount of goods you can have. You earn a wage, w. The y-axis is the
amount of goods you can have from a day's work.
So you earn w per hour. That means the most goods you can have from a day's work is 24w. If
you worked all 24 hours at that wage, you can have 24w goods. On the other hand, if you work
not at all, then you take 24 hours in leisure and have no consumption from that day.
So we see as you move to the right on the x-axis, that's leisure. That's the good. As you move
to the left, that's labor. That's the bad. OK? That's just illustrating. But we're going to model the
good. We're going to model leisure. Your trade-off is between how much you want to consume
and how much leisure you want to take.
Now, here's what's interesting. In general, what determines the slope of a budget constraint?
What determines the slope of a budget constraint?
AUDIENCE: Marginal rate of transformation.
PROFESSOR: Which is what?

4
AUDIENCE: Ratio between prices.
PROFESSOR: Ratio between prices. Prices determine the slope of the budget constraint. But
here's what's tricky. What's the price of leisure?
AUDIENCE: Wage.
PROFESSOR: The wage. Why?
AUDIENCE: Because for every hour you take having leisure, you are effectively using money
that you could gain at work.
PROFESSOR: Exactly. The key is the economic concept of opportunity cost, which we've talked
about and will continue to talk about this semester, opportunity cost. By not working, you are
forgoing earning a wage. So that is the price of leisure. You may not think of it this way, but,
once again, that's why we're the dismal science.
When you go home today, and you sit on the couch, and you watch TV for an hour, you have
just paid a price. And that price is what you could have earned by working that hour. Every
action has a price. And the price of leisure is the wage you forgo, The wage you forgo by sitting
around is the price of leisure.
Let's assume here that the price of goods is $1, that the goods you're going to buy cost $1.
Whatever your consumption, it costs $1. That's the trick we always use with modeling. Make as
many things $1 as you can. That makes the model easy. So let's assume that the price of the
goods you're going to buy are $1.
So the slope of the budget constraint is minus w over 1. The slope of the budget constraint is
just the price of leisure which is minus w . So the trade-off with the price of goods of $1, the
trade-off between taking leisure and consuming is that if you take leisure, an hour of leisure, you
get w fewer goods. And if you work an hour, you get w more goods, but you lose an hour of
leisure. And that gives you the trade-off between how much you consume and how much
leisure you take which determines how much you work. OK. Questions about that?

1

2
TRANSCRIPT: VIDEO 3

1
2
Now let's take this framework and ask, what happens when the wage changes, Figure 7-4. So
we have an original outcome with the budget constraint BC1. We have an original budget
constraint, BC1. Now imagine the wage goes up, so we move to BC2. BC2 is a budget
constraint with a higher wage. The wage goes up.
So what we're going to see is you're going to move from point A where you work N1 hours to
point C where you work N3 hours. That's where your indifference curves are tangent with the
new budget constraint. Not work, take leisure. I'm sorry. We take leisure of N1 hours to leisure
of N3 hours. The wage going up has reduced your leisure which makes sense. If the wage goes
up, you work harder. Right?
So your wage going up, we always first take if there's a leisure and then convert to labor. Wage
goes up, leisure falls from N1 to N3, which means labor goes up. But actually two things are
happening here, the substitution and income effect. The substitution effect, which we see by
drawing the imaginary budget constraint BC* which is parallel to BC2 but tangent to the original
difference curve, the substitution effect is a very large reduction in leisure. It moves all the way
from N1 to N2. The substitution effect is a very large reduction in leisure.
The income effect is that leisure is a normal good. I'm now richer, because my wage has gone
up. So I want to buy more of it. So I buy more leisure. And that moves me from N2 to N3.
So, basically, now the income effect offsets the substitution effect even with a normal good, or
with a normal good. With a normal good, the income effect offsets that substitution effect. And
that's because the money you're getting, you're using to buy leisure.
So, in fact, if you flip to 7-5, you can see a case where the income effect dominates. And you
actually get that a wage increase leads you to work less hard. Now, think about that. If I'd said
to you-- I probably should have started with this-- if you increase the wage, will people work
more or less hard? Your initial instinct would have been more hard. You would have thought,
well, if your wage goes up, you work harder. But that's because your instinct was focused on the
substitution effect. You're thinking about the income effect.
Here's a case where I started at N1. The substitution effect leads me to N2. But I feel so much
richer from that higher wage that I actually move all the way to N3. My leisure goes up, and I
work less hard.
Now, unlike a Giffen good, this is totally plausible. Why is it plausible? Well, let me do give you a
simple intuition for why it's plausible.
3
Let's say that you're someone who has a certain amount of things you want to buy every week.
You don't save. You have a certain amount of things you want to buy every week. You have to
pay your rent, you have to buy your food, you have to buy your other goodies, a certain budget.
A lot of people live on a budget. You have a certain budget. And the truth is you're happy with
that budget. That's kind of what you want to do.
Now let's say I doubled your wage. Well, now to meet the budget you can work half as hard and
still meet the same budget. So you'll work less hard. You could say, look, I can get more leisure
and consume the same amount of goods as I did before. So I'll work less hard.
That's a totally plausible case. That's a case of what we call target income. If someone has a
target income, and their wage goes up, they'll work less. Now, that's not necessarily the truth.
But it's, at least to me, sort of a plausible case of how people might behave. And that's a case
where income effects can dominate.
So if we, once again, go to the second chart on that page, now we see the income and
substitution effects for labor supply. Once again, we're assuming leisure is a normal good.
We're always going to assume leisure is a normal good. We're never going to assume people
don't like leisure. Assuming leisure is a normal good, then as the wage rises, the substitution
effect is you take less leisure.
This table is a bit different than the other table. Instead of the first panel being normal and the
second panel being inferior, the first panel is what happens to leisure. The second panel
converts it to what happens to labor. So for instance, in the first cell, when the wage rises, the
substitution effect on leisure is unambiguously negative. You clearly take less leisure when the
wage rises. So, likewise, you have more labor. So on the bottom panel, labor is clearly greater
than or less than 0.
But the income effect is positive for leisure. You're rich, you take more leisure. Or, likewise,
negative for labor, you're richer, so your work less hard. And, therefore, the net is ambiguous.
So with goods consumption, we needed goods to be inferior for there to be a Giffen good type
phenomena. Here, even with leisure being normal, you can have a Giffen good type
phenomena. It's much less random.
And, in some sense, this is why we learn income substitution effects. To be honest, they're just
not that interesting for consumption. The book makes a big deal out of them and talks about
consumer price indices and all that. It's just not that important for consumption. Because we
know in consumption if prices goes up, you consume less. It's just not that interesting.

4
It's much more interesting for things like labor supply. And we talk about savings in a number of
lectures. It's the same thing. There, it's more interesting. Because now they can often offset
each other in meaningful ways. And so now this is why the tools of income and substitution
effects become much more important. OK?
So if we put this together, if we go to Figure 7-6, we can now think about deriving where labor
supply comes from. Where does labor supply come from? Well, first, you've got the consumer's
decision of how hard to work.
So here's a case. It's sort of small, but you can take a look. Here's a case where you've got
someone initially working, taking 16 hours of leisure and, therefore, working eight hours, at a
wage of W1. Now their wage goes up to W2. They choose to take 12 hours of leisure and,
therefore, work 12 hours. This is someone who works harder when the wage goes up. That is,
the income effect does not offset the substitution effect.
Now, we can take that to draw a demand for leisure curve just like we drew any other demand
curve. It's the same technique as last time. Just bring those point and say, look, at a wage of
W1, leisure is 16. At a wage of W2, leisure is 12. We have a downward sloping demand for
leisure, standard downward sloping demand for leisure.
But we can convert that to a supply of labor, which is what we care about. Nobody cares about
the demand for leisure curve. We care about the supply of labor curve. You just subtract these
from 24. You use the supply of labor curve which is upward sloping. So as long as substitution
effects dominate income effects, we'll get an upward sloping labor supply curve.
But it's certainly possible that if income effects dominates substitution effects, you could get a
downward sloping supply curve, if you will, what we call in labor economics, a backward-
bending supply curve, a supply curve that goes the wrong way. Instead of sloping up like supply
curves are supposed to, it goes the wrong way and slopes down.
And we can see that's plausible. The target income case I just described to you would deliver
that. The target income case I just described to you would deliver a downward sloping supply of
labor. As the wage rose, people would work less and less.
That's a totally plausible case. And that's why income and substitution effects are interesting.
Because they can deliver this weird result. They can get the wrong signed supply curve.
Questions about income and substitution effects or labor supply?

1

2
TRANSCRIPT: VIDEO 4

1
2
PROFESSOR: That's a really good question. And let me talk about that for a couple of minutes.
The definition of unemployment is those employed over looking for work. If the number of
people employed does not change, and women suddenly want to work, and they report to
surveyors that they're looking for work-- that's the employment rate. I'm sorry.
The unemployment rate-- I'm sorry-- is going to be those looking over employed. My bad. The
unemployment rate is going to be those looking over those employed. So the unemployment
rate is how many people are looking for work over how many are employed. If women start
suddenly looking for work, and there's no jobs to be had, that will raise the unemployment rate.
So one thing that's been a focus of a lot of research has been do increases in the supply of
labor lead to increases in unemployment? What you've expressed is what's often called the
lump of labour view. The lump of labour view is basically the view that there's a fixed box of
production in the economy. And as more workers come in to fill that box, there will be more
unemployment.
The alternative view is that the economy is dynamic. And as more women are working, and
earning income, and buying stuff, that makes more jobs. So our standard of consumption is way
higher than 40 years ago. We all have much cooler stuff than 40 years ago. You have no idea
how bad life sucked 40 years ago. We have way better stuff. We have that stuff, because
women are working and making the income to buy it, which means people have to make it
which makes jobs.
So, in fact, the existing evidence is labor supply shocks do not cause unemployment increases.
This is something I've worked a lot on. What you see, a very interesting case is in Europe. In the
US and all over
the world, we have assistance of what we call Social Security, a term you've all heard, I'm sure.
The Social Security program is a program which provides income when you're retired. So it
provides income when you're retired to help you deal with the fact that you don't have a source
of labor income anymore. And that's a program that virtually every country, and all developed
countries have a very generous social security program.
But they're different in the US than in other countries. In the US, the way the social security
program works is when you hit 62, you get a choice. You can stop working and get your benefits
from Social Security, and then you get them every year until you die. Or you can keep working,
delay getting your benefits, but they'll increase what you get to offset the delay. So, in other
words, if I retire at 63 rather than 62, given that I'm going to die at the same date, I'm going to
get one fewer year of benefits in my life. But they raise them by 6.7% to compensate for that. So

3
I get one fewer year of benefits, but every year it's 6.7% higher. And it turns out, given life
expectancy, that works out to be a roughly fair deal.
So, basically, at 62, your choice is I can get one more year of benefits or I get higher benefits for
one fewer years. And that's a choice that's a roughly fair deal. OK. Questions about that? Am I
making sense of that?
In Europe, it's not a fair deal. In Europe the way it works is they say, you can get one more year
of benefits. But if you decide to work this year, we're not given you any more in the future.
So let me describe how it works in the Netherlands. At age 55, the Netherlands says, if you
decide to retire this year, we will replace 90% of your wages in social security payments to
make sure your income doesn't suffer when you retire. If you don't retire and work, you're going
to give up sitting at home earning 90% of your wage. That is the opportunity cost of working. It's
that you have forgone the ability to sit at home and get 90% of your wage. So what is your net
wage if you work? 10% of what you would have earned.
So if you're earning $20 an hour, then your choice is you can sit at home for $18 or work for $20
an hour. So your net wage for working is $2 an hour. The return to work, the opportunity cost of
leisure is only $2 an hour. You're only forgoing $2 an hour by sitting at home.
But wait, there's more. If you sit at home, you don't have to pay the payroll taxes of financing the
system that are almost 50%. If you work, you have to pay the payroll taxes. Which means that if
you work, you lose money. Because if you work, you forgo getting to sit at home at 90% of your
wage, and you pay a tax that's about 40% of your wages. So, actually, you will lose 30% of your
salary by working relative to sitting at home.
Guess what people do in the Netherlands at 55? They sit at home. No one works after 55 in the
Netherlands on the books. They work off the books painting houses and doing odd jobs. No one
works on the books after 55. Economics works, guys. If you pay your guys to stay at home, they
stay at home.
Now, if you ask European politicians, why do you have this screwed up system? They'll say,
well, it's easy. We want to get those old guys out to make jobs for the young guys. We need to
pay those old guys to stay at home to make jobs for the young guys.
And then you point out, have you noticed that Europe has higher unemployment than American,
even though we don't do that and you do? And that's because you're wrong. It doesn't work that
way. Because by paying the old guys to sit at home, you have to have such high taxes that no
one makes new businesses. And so there's not jobs for the young guys to have.
4
So it's true. In theory, you've made jobs for the young guys by leaving the old guys at home. But
by imposing the 40% tax rate that you've had to impose to make it possible to pay the old guys
to sit at home, you've killed job creation in your country. And, as a result, there's not the jobs for
young guys to get.
That's a very long-winded way of answering your question that supply, in substance, creates its
own demand. So more labor supply will not necessarily cause more unemployment.
And we're going to talk about one more thing before we stop. I've just talked about a vast
empirical literature in how people understand the effects of wages on labor supply. Well, how do
they do it? Well, you could say, look, we can just look at how you earn a higher wage than you
do. And we'll ask, do you work harder than you? And we'll say, the guys who earn higher wages
work harder. If guys who earn higher wages work harder, that means labor supply slopes up. If
guys who earn higher wages don't work harder, that means labor supply slopes down. What's
wrong with that? Yeah.
AUDIENCE: Those who are getting paid more probably are getting paid because they want to
work harder.
PROFESSOR: Yeah. Maybe you guys are different. Maybe you're talented, and you're not. And
maybe because you're talented, maybe you're driven, and you're not. And because you're
driven, you work harder and get paid a higher wage.
So I'm not learning anything about the causal effect of the wage on your labor supply. I've just
documented a correlation between wage and labor supply. How can we get the causal effect of
your wage on your labor supply?
Well, once again, ideally we'd run an experiment. We'd assign you a higher wage. We'd find
someone just like you. Not you, you're not driven. We find someone just like you. No offense.
You know I'm joking. We'd find someone just like you and, randomly, by a flip of a coin, assign
them a lower wage. And we'd see how your labor supply differed.
Now, it seems like you couldn't do that. But, in fact, the US did that. In the 1970s, we ran what
was called the negative income tax experiment where we literally assigned people different
wage rates through taxing them by different amounts. And that was part of what gave us this
very convincing evidence from 40 years ago of these responses. So where we get this is from a
real experiment we ran 40 years ago.

5
The problem is that's a pretty hard experiment to run. It's pretty expensive, and there's some
ethical issues. So what do you do today to estimate that? What you can do today is say, well,
we can't run the experiment. But the government runs it for us every time they change tax rates.
Because if you take two people that are identical-- so let's say you and you were identical-- and
I change your tax rate because you live in Massachusetts. I don't change your tax rate because
you live in New York. I can see what happens to you relative to you. Because I've now
essentially run this experiment by the government changing someone's tax rate and not
someone else's. That's the way we do it if we can't run a true, randomized experiment. And that
gives very, very similar answers.
Let me stop there. And we will come back. Next lecture we'll talk about applying this model. So I
guess in section on Friday, we review for the exam. In section on Friday, we review for the
exam. So show up to that. And the exam is next week. The exam will cover through my next
lecture.

1
APPENDIX H
DVD

2