wj kleynhans - nwu-ir home
TRANSCRIPT

Investigating the influence of
operations management
decisions on overall equipment
effectiveness in an engineering
company
WJ Kleynhans
orcid.org/0000-0002-7087-7495
Mini-dissertation accepted in fulfillment of the requirements for the degree Master of Business
Administration at the North-West University
Supervisor: Mr B Manda
Graduation: June 2022Student number: 28327276
ii
ABSTRACT
The study investigating the influence of operations management decisions on overall
equipment effectiveness in an engineering company. The company is based in
Gauteng and 139 employees are involved in producing engineering solutions. The
objective of this study was to find out what influence management decisions have on
the over equipment efficiency, which currently stands at 46%, with the company
improvement target set to 60%.
The literature was meant to give a theoretical understanding on the following
principles such the definition of OEE, factors effecting OEE such as the elements of
overall equipment efficiency, the calculations for overall equipment efficiency, overall
equipment effectiveness, OEE benefits, a typical form of operational decisions in any
business, and the decision challenges in operations management.
The population of the study design involved the manufacturing unit, which consists of
139 employees and over 20 CNC and other machines. A qualitative approach was
used, and the sample was 6 CNC machines in the technical study analysis. The
response rate was 33 from 139 employees. The data collection was done through a
management questionnaire that was distributed in the company, and the technical
data collection instrument was used to calculate the prior average OEE score. The
OEE scores are from the company’s historical data (2019 -2021).
The results were obtained from factors that influence operations management
decisions and included and discussed in the report and recommendations will
addressed in the final chapter.

iii
ACKNOWLEDGEMENTS
I want to start by thanking our Saviour who guided and provided me with this
opportunity to study, who kept me going in these difficult times, and to gain from a
self-learning experience that taught me a lot about self-discipline, motivation, and
faith.
This research is dedicated to my employer and colleagues, including other industries
who intend to drive continuous improvement by cultivating overall equipment
effectiveness.
A study of this extend requires collaboration and support of diverse people who
deserve to be acknowledged. Firstly, I would like to thank my wife and family for their
support and encouragement during this research.
Mrs Wilma Pretorius for her continued supports to resolve clearance seeking
questions related to MBA, Prof Manda Badnock for his great mentorship and
guidance, especially during this research, Prof Christoff Botha and Prof Yvonne du
Plessis for facilitating the mini dissertation, and lastly Prof Johan Jordaan for his role
at the scientific committee.
Thank you to Ms Marieta Grundling for the editing and Dr Bothma (FC) for assisting
with the data analysis.

iv
NWU SCHOOL OF BUSINESS AND GOVERNANCE
Declaration Regarding Plagiarism
I (full names &
surname): Wynand Jan Kleynhans
Student number: 28327276
Declare the following:
1. I understand what plagiarism entails and am aware of the University’s policy in
this regard.
2. I declare that this assignment is my own, original work. Where someone
else’s work was used (whether from a printed source, the Internet or any other
source) due acknowledgement was given and reference was made according
to departmental requirements.
3. I did not copy and paste any information directly from an electronic source
(e.g., a web page, electronic journal article or CD ROM) into this document.
4. I did not make use of another student’s previous work and submitted it as my
own.
5. I did not allow and will not allow anyone to copy my work with the intention of
presenting it as his/her own work.
10.12.2021
Signature Date
v
TABLE OF CONTENTS
ABSTRACT ............................................................................................................................................................... II
ACKNOWLEDGEMENTS ........................................................................................................................................... III
NWU SCHOOL OF BUSINESS AND GOVERNANCE ................................................................................................... IV
TABLE OF CONTENTS ............................................................................................................................................... V
LIST OF FIGURES ...................................................................................................................................................... X
LIST OF TABLES ........................................................................................................................................................ XI
LIST OF ABBREVIATIONS ........................................................................................................................................ XII
CHAPTER 1: ...................................................................................................................................................... 1
CHAPTER 1: CONTEXTUALISATION OF THE STUDY .................................................................................................. 1
1.1 INTRODUCTION ...................................................................................................................................................... 1
1.2 BACKGROUND ....................................................................................................................................................... 1
1.3 PROBLEM STATEMENT ............................................................................................................................................ 2
1.4 CORE RESEARCH QUESTION ...................................................................................................................................... 3
1.4.1 Aim of the study ............................................................................................................................................. 4
1.5 RESEARCH QUESTIONS ............................................................................................................................................ 4
1.6 RESEARCH OBJECTIVES ............................................................................................................................................ 4
1.6.1 Secondary objectives ..................................................................................................................................... 4
1.7 RESEARCH DESIGN ................................................................................................................................................. 5
1.7.1 The Target Population ................................................................................................................................... 5
1.7.2 Sampling ........................................................................................................................................................ 5
1.7.3 Data collection ............................................................................................................................................... 6
1.7.4 Management Questionnaire .......................................................................................................................... 7
1.7.5 Technical Data collection instrument ............................................................................................................ 7
1.8 RESEARCH ETHICS................................................................................................................................................... 8
1.9 IMPORTANCE AND BENEFITS OF THE PROPOSED STUDY ................................................................................................... 8
1.10 DELIMITATIONS AND ASSUMPTIONS ......................................................................................................................... 8
1.10.1 Delimitations (scope) ................................................................................................................................... 8
1.10.2 Assumptions................................................................................................................................................. 9
1.11 STRUCTURE OF THE STUDY ..................................................................................................................................... 9
1.12 CONCLUSION .................................................................................................................................................... 10
CHAPTER 2: LITERATURE REVIEW ......................................................................................................................... 11
2.1 Introduction .................................................................................................................................................... 11
2.2 History of Overall Equipment Efficiency .......................................................................................................... 11
2.3 Elements of Overall Equipment Efficiency ...................................................................................................... 11

vi
2.4 Overall Equipment Effectiveness ..................................................................................................................... 11
2.5 The calculation for overall equipment efficiency ............................................................................................ 13
2.6 Overall equipment effectiveness (OEE) benefits ............................................................................................. 15
2.7 Total Productive Maintenance (TPM) ............................................................................................................. 16
2.8 The core elements of TPM .............................................................................................................................. 17
2.9 Operations ...................................................................................................................................................... 17
2.10 A typical form of Operational decisions in any business ............................................................................... 18
2.10.1 Pricing ........................................................................................................................................................... 19
2.10.2 Promotions .................................................................................................................................................... 19
2.10.3 Maintaining Inventory ................................................................................................................................... 19
2.10.4 Customer management ................................................................................................................................ 19
2.10.5 Employee management ................................................................................................................................ 20
2.10.6 Logistical decisions ........................................................................................................................................ 20
2.10.7 Sales and outreach ........................................................................................................................................ 20
2.11 OTHER OPERATIONAL DECISIONS ........................................................................................................................... 20
2.11.1 Service product and design ........................................................................................................................ 20
2.11.2 Quality Management ................................................................................................................................. 21
2.11.3 Process Capacity Design ............................................................................................................................ 21
2.11.4 Location ..................................................................................................................................................... 22
2.11.5 Inventory Management ............................................................................................................................. 22
2.11.6 Scheduling .................................................................................................................................................. 22
2.11.7 Maintenance .............................................................................................................................................. 23
2.12 CHARACTERISTICS OF OPERATIONAL DECISIONS ....................................................................................................... 23
2.13 MAINTENANCE SCHEDULES .................................................................................................................................. 25
2.14 AUTOMATION OF OPERATIONAL DECISIONS ............................................................................................................ 26
2.15 CONCLUSION .................................................................................................................................................... 27
CHAPTER 3: RESEARCH DESIGN ............................................................................................................................. 28
3.1 INTRODUCTION .................................................................................................................................................... 28
3.2 DESCRIPTION OF OVERALL RESEARCH DESIGN ............................................................................................................. 28
3.2.1 The quantitative method ............................................................................................................................. 28
3.3 TECHNICAL ANALYSIS ............................................................................................................................................ 29
3.4 POPULATION/SAMPLING ....................................................................................................................................... 29
3.4.1 The Target Population ................................................................................................................................. 29
3.4.2 Sampling ...................................................................................................................................................... 30
3.5 DATA COLLECTION ................................................................................................................................................ 31
3.5.1 Management Questionnaire ........................................................................................................................ 31
3.5.2 Technical Data collection instrument .......................................................................................................... 31
3.6 DATA ANALYSIS.................................................................................................................................................... 32
3.6.1 Descriptive statistics conducted ................................................................................................................... 32
vii
3.6.2 Inferential statistics conducted .................................................................................................................... 32
3.7 DATA VALIDITY AND RELIABILITY ............................................................................................................................. 32
3.7.1 Validity ......................................................................................................................................................... 33
3.7.2 Reliability ..................................................................................................................................................... 33
3.8 ETHICAL CONSIDERATION ...................................................................................................................................... 33
3.9 RESEARCH CONSTRAINTS ....................................................................................................................................... 34
3.9.1 Limitations of the study ............................................................................................................................... 34
3.9.2 Delimitations of the study ............................................................................................................................ 34
1.10 CONCLUSION .................................................................................................................................................... 34
CHAPTER 4: RESULTS, DISCUSSION AND ANALYSIS ............................................................................................... 35
4.1 INTRODUCTION .................................................................................................................................................... 35
4.2 RESPONSE RATE ................................................................................................................................................... 35
4.3 DEMOGRAPHICAL DATA ........................................................................................................................................ 35
4.3.1 Distribution by gender ................................................................................................................................. 35
4.3.2 Distribution by years of experience .............................................................................................................. 36
4.3.3 Distribution by department ......................................................................................................................... 36
4.3.4 Distribution by years current position .......................................................................................................... 37
4.3.5 Distribution by education............................................................................................................................. 38
4.3.6 Distribution by employment -level ............................................................................................................... 38
4.4 DESCRIPTIVE STATISTICS ........................................................................................................................................ 39
4.4.1 Quality Management (OM) ......................................................................................................................... 39
4.4.2 Location Strategy (LOS) ............................................................................................................................... 40
4.4.3 Human Resources and Job Design (HR) ....................................................................................................... 40
4.4.4 Supply Chain Management (SCM) ............................................................................................................... 41
4.4.5 Inventory Management (IM) ....................................................................................................................... 42
4.4.6 Maintenance (MT) ....................................................................................................................................... 43
4.4.7 Scheduling (SC) ............................................................................................................................................ 43
4.4.8 Process and Capacity Design (PC) ................................................................................................................ 44
4.4.9 Layout Strategy (LS) ..................................................................................................................................... 45
4.4.10 Design of Goods and Services (DG) ............................................................................................................ 45
4.4.11 Management decisions impact on OEE ..................................................................................................... 46
4.5 RELIABILITY ANALYSIS OF QUESTIONNAIRE SCALES ....................................................................................................... 47
4.6 QUANTITATIVE INFERENTIAL STATISTICS FOR THE STUDY ............................................................................................... 48
4.7 INTER-CORRELATIONS BETWEEN SUB-SCALES ............................................................................................................. 48
4.8 SUMMARY OF DESCRIPTIVE STATISTICAL FINDINGS ...................................................................................................... 52
4.9 TECHNICAL DATA ON OEE ..................................................................................................................................... 53
4.10 OPERATING EQUIPMENT EFFECTIVENESS (OEE) ....................................................................................................... 54
4.11 OEE TECHNICAL ANALYSIS ................................................................................................................................... 54
viii
4.11.1 OEE August 2019 ........................................................................................................................................... 55
4.11.2 OEE September 2019 .................................................................................................................................... 56
4.11.3 OEE October 2019 ......................................................................................................................................... 57
4.11.4 OEE November 2019 ..................................................................................................................................... 58
4.11.5 OEE December 2019 ..................................................................................................................................... 58
4.11.6 OEE January 2020 .......................................................................................................................................... 59
4.11.7 OEE February 2020 ........................................................................................................................................ 60
4.11.8 OEE March 2020 ............................................................................................................................................ 61
4.11.9 OEE January 2021 .......................................................................................................................................... 62
4.11.10 OEE February 2021 ...................................................................................................................................... 63
4.11.11 OEE April 2021 ............................................................................................................................................ 64
4.11.12 OEE May 2021 ............................................................................................................................................. 65
4.12 AVERAGE OEE OVER THE STUDY PERIOD ................................................................................................................. 66
4.13 CONCLUSION .................................................................................................................................................... 67
CHAPTER 5: CONCLUSION AND RECOMMENDATION ........................................................................................... 68
5.1INTRODUCTION .................................................................................................................................................... 68
5.2 RESEARCH OBJECTIVES .......................................................................................................................................... 68
5.3 FINDINGS FROM THE STUDY.................................................................................................................................... 68
5.3.1 Research findings from the literature review .............................................................................................. 68
5.3.2 Findings from the primary research ............................................................................................................. 70
5.3.3 Demographical findings ............................................................................................................................... 70
5.3.4 Research objective 1 .................................................................................................................................... 71
5.3.5 Research objective 2 .................................................................................................................................... 72
5.3.6 Research objective 3 .................................................................................................................................... 72
5.4 RESEARCH CONCLUSIONS ....................................................................................................................................... 73
5.4.1 Research question 1 ..................................................................................................................................... 73
5.4.2 Research question 2 ..................................................................................................................................... 73
5.4.3 Research question 3 ..................................................................................................................................... 74
5.4.4 Research question 4 ..................................................................................................................................... 74
5.5 RECOMMENDATIONS ............................................................................................................................................ 74
5.6 AREAS FOR FURTHER RESEARCH .............................................................................................................................. 76
5.7 CONCLUSION ...................................................................................................................................................... 77
REFERENCES ................................................................................................................................................... 78
APPENDIX A: CONSENT FORM .............................................................................................................................. 84
APPENDIX B: APPLICATION FOR ETHICAL CLEARANCE .......................................................................................... 87
APPENDIX C: QUESTIONNAIRE .............................................................................................................................. 89
APPENDIX: AUGUSTUS 2019 ................................................................................................................................. 95
APPENDIX: SEPTEMBER 2019 ................................................................................................................................ 96

ix

x
LIST OF FIGURES
Figure 2.1 Overall Equipment Effectiveness (OEE) Factor Layout 14
Figure 2.2 Typical 5 S -Total Maintenance Model 17
Figure 2.3 Operational Decision structure 24
Figure 3.1 Organogram of Operations 30
Figure 4.1 Summary of OEE Values August 2019 – May 2021 55
Figure 4.2 Actual OEE versus Target OEE for August 2019 56
Figure 4.3 Actual OEE versus Target OEE for September 2019 57
Figure 4.4 Actual OEE versus Target OEE for October 2019 57
Figure 4.5 Actual OEE versus Target OEE for November 2019 58
Figure 4.6 Actual OEE versus Target OEE for December 2019 59
Figure 4.7 Actual OEE versus Target OEE for January 2020 60
Figure 4.8 Actual OEE versus Target OEE for February 2020 61
Figure 4.9 Actual OEE versus Target OEE for March 2020 62
Figure 4.10 Actual OEE versus Target OEE for January 2021 63
Figure 4.11 Actual OEE versus Target OEE for February 2021 63
Figure 4.12 Actual OEE versus Target OEE for April 2021 64
Figure 4.13 Actual OEE versus Target OEE for May 2021 65
Figure 4.14 Actual Average OEE versus Target OEE for period August
2019 to May 2021 66
xi
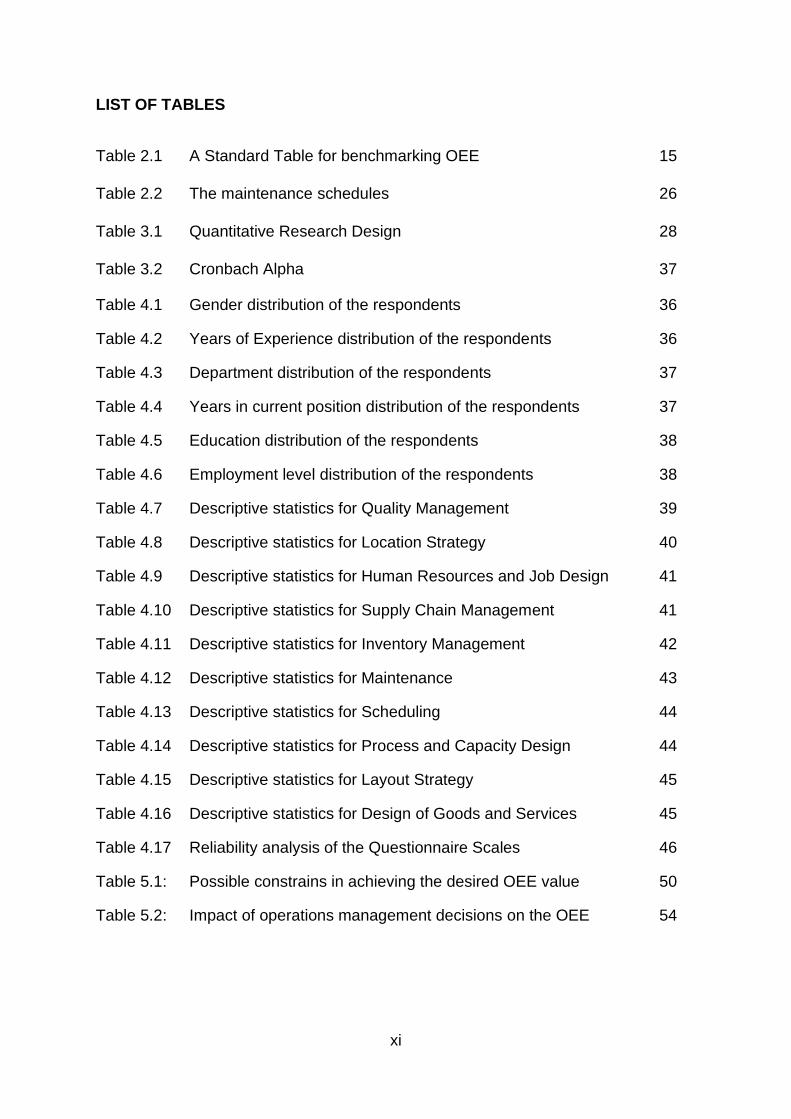
LIST OF TABLES
Table 2.1 A Standard Table for benchmarking OEE 15
Table 2.2 The maintenance schedules 26
Table 3.1 Quantitative Research Design 28
Table 3.2 Cronbach Alpha 37
Table 4.1 Gender distribution of the respondents 36
Table 4.2 Years of Experience distribution of the respondents 36
Table 4.3 Department distribution of the respondents 37
Table 4.4 Years in current position distribution of the respondents 37
Table 4.5 Education distribution of the respondents 38
Table 4.6 Employment level distribution of the respondents 38
Table 4.7 Descriptive statistics for Quality Management 39
Table 4.8 Descriptive statistics for Location Strategy 40
Table 4.9 Descriptive statistics for Human Resources and Job Design 41
Table 4.10 Descriptive statistics for Supply Chain Management 41
Table 4.11 Descriptive statistics for Inventory Management 42
Table 4.12 Descriptive statistics for Maintenance 43
Table 4.13 Descriptive statistics for Scheduling 44
Table 4.14 Descriptive statistics for Process and Capacity Design 44
Table 4.15 Descriptive statistics for Layout Strategy 45
Table 4.16 Descriptive statistics for Design of Goods and Services 45
Table 4.17 Reliability analysis of the Questionnaire Scales 46
Table 5.1: Possible constrains in achieving the desired OEE value 50
Table 5.2: Impact of operations management decisions on the OEE 54
xii
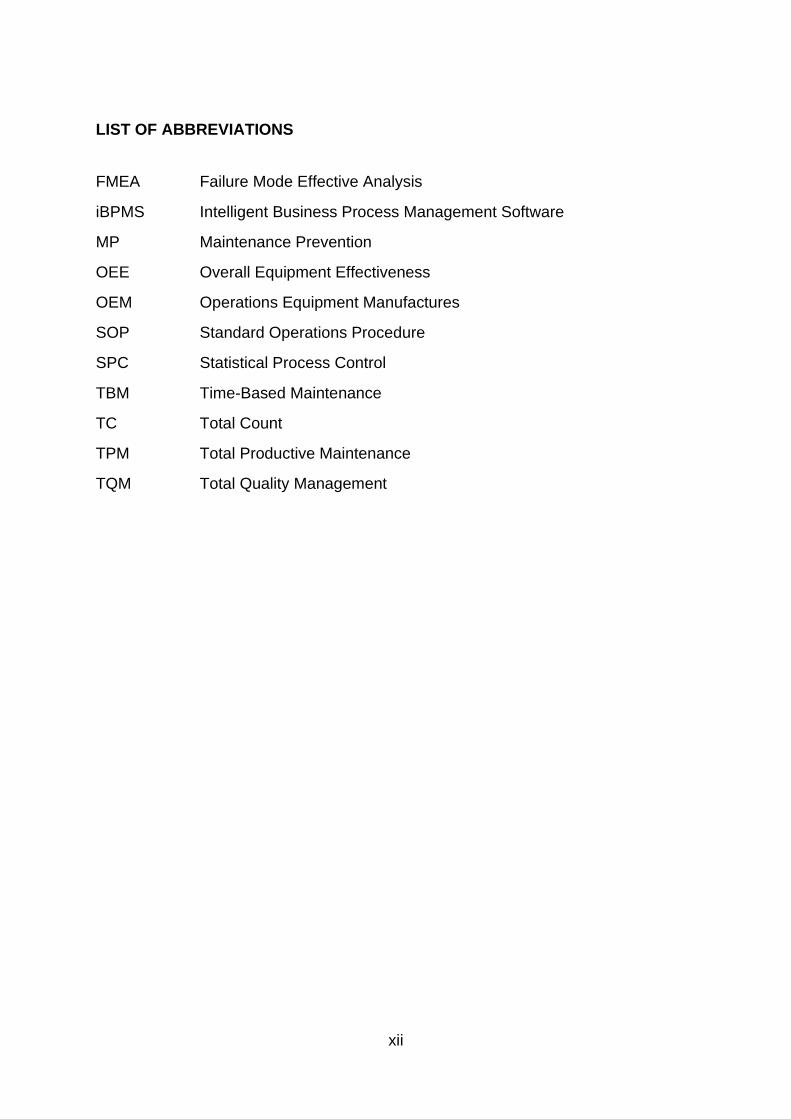
LIST OF ABBREVIATIONS
FMEA Failure Mode Effective Analysis
iBPMS Intelligent Business Process Management Software
MP Maintenance Prevention
OEE Overall Equipment Effectiveness
OEM Operations Equipment Manufactures
SOP Standard Operations Procedure
SPC Statistical Process Control
TBM Time-Based Maintenance
TC Total Count
TPM Total Productive Maintenance
TQM Total Quality Management
1
CHAPTER 1:
CHAPTER 1: CONTEXTUALISATION OF THE STUDY
1.1 Introduction
This chapter introduces the study and presents the background to the study and the
problem statement will be formulated. The aim of the study as well as the research
objectives and questions formulated are presented. The theoretical and managerial
significance of the study are presented. The chapter concludes with the format of the
study, per chapter.
1.2 Background
Company A is a world-leading provider of engineering technology, and has been a
leader in the field for more than 100 years. The company is headquartered in
Chicago, Illinois. It is a global leader in applying advanced technologies for the safety
and security sectors, contraband detection, energy, medical devices,
communications, and engineered components. (Company A, 2020)
Company A is a well-organised global company that has a total of 54 branches and 4
manufacturing facilities across the globe. Company A employs more than 5,800
workers around the globe; Company A is both the supplier and service choice for
products while in use. Company A’s reputation for outstanding design and
engineering of the highest quality, durability, and customised products and solutions
allows them to retain their competitive advantage. One of the core focal points is to
align partnerships with the customers and assist in meeting the latest environmental
standards, whilst keeping their operations safe and controlled. (Klassen, R.D. and
Vereecke, A., 2012)
Company A is in partnership with customers globally to deliver innovative solutions
designed to improve the reliability of the equipment and the process through
unrelenting focus on quality, a desire for best service with an uncompromising
commitment to people, safety, the environment, and ethical business practices.
2
Overall equipment effectiveness (OEE) is a tool for assessing the efficiency of assets
throughout the manufacturing process. The OEE can be equally successful in the
investigation on equipment, processes, and tools that impact how assets operate.
The OEE provides a great foundation for identifying areas of an operation that can
be improved and a quantifiable way to measure progress.
Furthermore, the OEE is a tool to measure overall productivity using the three
elements of performance, availability, and quality. It identifies potential losses and
provides corrective actions that could be used to eliminate potential losses. As
stated, Company A is global. However, this study is to focus on the South African-
based unit situated in Gauteng. It uses numerical control machines (CNC) to make
engineering products and solutions. There are about 20 CNC machines. The total
number of employees are 120 all headed by a CEO.
The need for continuous improvement (CI) is one of the key fundamentals that
cannot be overemphasised. Measuring OEE is a manufacturing best practice. OEE
is the single best metric for identifying underlying losses and improving the
productivity of manufacturing equipment (eliminating waste) and gaining insight on
how to improve the manufacturing process. The operation’s management team has
embarked on a project namely “Apollo” to focus on all the manufacturing facilities to
achieve a global standard of 60% OEE for the CNC machines.
Business is focused on optimisation and improvement of productivity to prevent
unplanned production losses and eliminate defects. This not only improves the
quality of the product, but also lowers manufacturing costs, which helps to meet
customer specifications or demands, and remains competitive in the market. (Ross,
2017)
1.3 Problem statement
At Company A, the current machine operating capacity curve on the operating
equipment efficiency shows that the company has an average of 40% of equipment
operating efficiency. This is the average for all the 20 CNC machines. Management
has set a target of 60% as an acceptable OEE. The global design standard is 60%.
3
(Lean Production, 2021) The concern is the OEE rate that does not meet the global
standard of 60%.
Certain operations management decisions can influence the overall equipment
effectiveness namely.
• Designing of goods and service
• Human Resources and Job design
• Inventory management
• Layout Strategy
• Location analysis and strategy
• Process and Capacity Design
• Process Maintenance
• Quality management
• Scheduling
• Supply chain management
The extent of how these affect the OEE is not known. Currently, the machine
operating capacity curve on the operating equipment efficiency shows that the
company has an average of 45% of equipment operating efficiency that can be
improved.
Consequently, this research is to conduct an in-depth research study on the
influence of operations management decisions on overall equipment effectiveness in
computer numerical control machines. According to (Hill, 2017) in manufacturing
industries, production machines are critical. They are required to be available for
production if the company needs to stay competitive in the market. (Hill, 2017)
The research will be conducted through a quantitative method. Certain operations
management decisions will have an impact on overall equipment effectiveness.
1.4 Core research question
4
The research question is “to what extent do operations management decisions
influence the overall equipment effectiveness of CNC machines”.
1.4.1 Aim of the study
The study aims to investigate the influence of operations management decisions on
the overall equipment effectiveness.
1.5 Research questions
The specific research questions are:
1. What are the constraints in achieving the desired OEE value?
2. Which operations management decisions impact negatively and positively on
the OEE?
3. What other alternatives are available and how can they be implemented to
achieve an OEE global standard of 60%?
4. Is the current data collection system sufficient to quantify the OEE score on
the CNC machines?
1.6 Research objectives
The main objective is to determine why the operations team is not reaching the OEE
target in all the shifts.
1.6.1 Secondary objectives
The secondary objectives are:
1. To determine which OEE management decisions are least emphasised.
5
2. To determine which OEE operations management decisions impact
negatively and positively.
3. To come up with a recommendation to improve the OEE.
1.7 Research Design
The population and sampling consist of theory and practice. The theory will be aimed
at the OEE efficiency, and the sampling will be done through a questionnaire that will
be addressing the outcome of the respondents.
1.7.1 The Target Population
The target population is the entire manufacturing unit situated in Springs, Gauteng,
South Africa. The unit consists of 139 employees, and over 20 CNC and other
machines. There are 34 managerial and supervisory workers, and 15 CNC
operators. Out of 139 dedicated employees (population) at the Springs facility, the
study is going to focus on six CNC machines. A draft of the questionnaire will be
discussed and shared among the decisional managers, and includes three
managers from operations, quality, and planning, with two operators on the CNC
machines.
1.7.2 Sampling
The sample from 20 machines, 6 CNC machines will be used as a sample in the
technical study analysis. These machines were selected as they are used to make
the most critical components that generate 60% of the revenue. Out of the 139
employees, 12 managers and operators will be selected for the questionnaire.
The data sampling is involved under several continuities, which form part of master
data capturing, computing production orders, material issuing, and production. One
operations manager is overseeing the quality manager and the production manager,
whereas the management team forms part of three managers and the specified
equipment of 6 CNC machines with two operators. The research approach consists
6
of quantitative research, where data from 2015 to 2020 to be retrieved and used,
discussed, and revised.
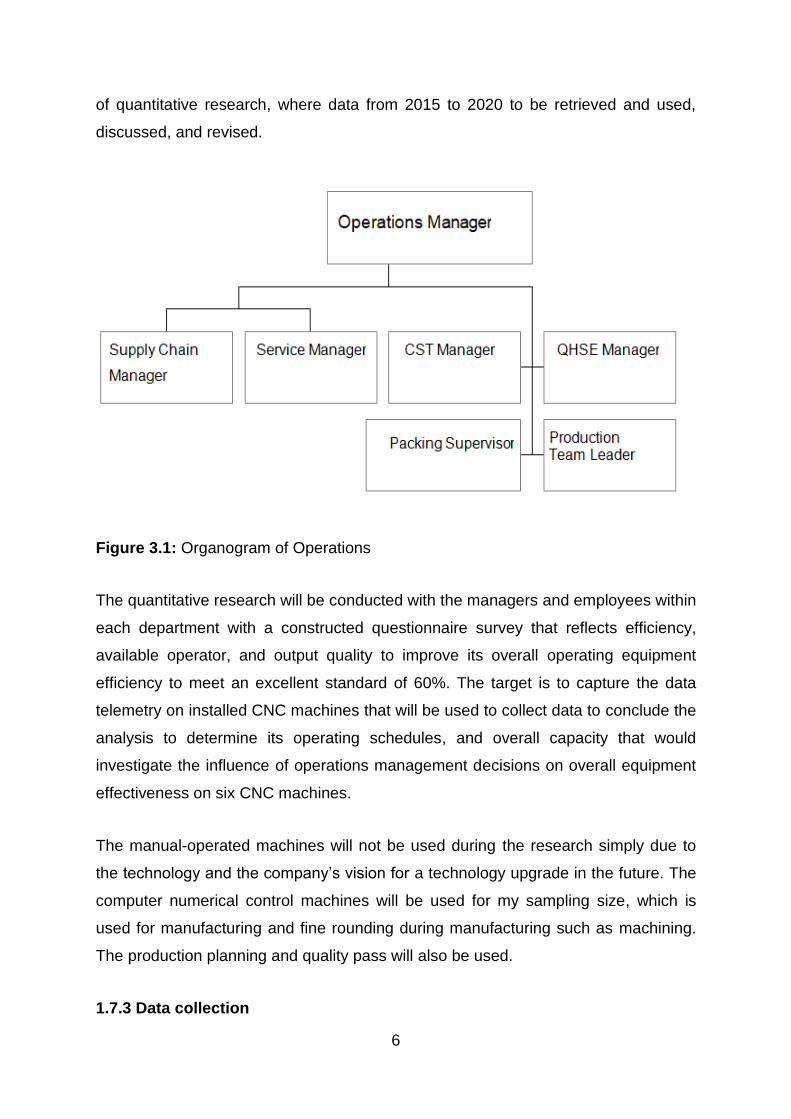
Figure 3.1: Organogram of Operations
The quantitative research will be conducted with the managers and employees within
each department with a constructed questionnaire survey that reflects efficiency,
available operator, and output quality to improve its overall operating equipment
efficiency to meet an excellent standard of 60%. The target is to capture the data
telemetry on installed CNC machines that will be used to collect data to conclude the
analysis to determine its operating schedules, and overall capacity that would
investigate the influence of operations management decisions on overall equipment
effectiveness on six CNC machines.
The manual-operated machines will not be used during the research simply due to
the technology and the company’s vision for a technology upgrade in the future. The
computer numerical control machines will be used for my sampling size, which is
used for manufacturing and fine rounding during manufacturing such as machining.
The production planning and quality pass will also be used.
1.7.3 Data collection
7
In this section, the data collection instruments used is presented.
1.7.4 Management Questionnaire
To the operations management part of overall equipment, effectiveness aligns with
decisional aspects such as the task of designing, establishing, planning, and
running, controlling, maintaining, and improving on overall equipment effectiveness
systems. The planning, scheduling, and forecasting are assisted by developing the
processes required for product realization. Planning of product realization shall be
consistent with the requirements of the other processes, which form the Quality
Management System.
The first instrument, namely a designed questionnaire, will be used to measure the
management decisions to determine the influence it has on the current OEE score
on the CNC machines. A questionnaire will be utilised to measure managers'
decisions appended in Appendix C. The questionnaire was taken and approved by
the company.
A few examples of operational decisions in the day-to-day operations of a business:
• How much tax should this customer pay?
• What are the products or services that can be offered to a customer?
• Is this transaction likely to be fraudulent?
• How do we handle exceptions in this claim process?
• Are we compliant with state regulations?
1.7.5 Technical Data collection instrument
The second instrument will be utilised to collect the computer-calculated data prior to
the OEE percentage score. The quantitative data will be collected by using a
machine-operated efficiency chart from 2019 to 2021. This includes the date when
the equipment was used, the day on the date. The autonomous maintenance /
preventative maintenance hours will be captured.
8
The machine housekeeping, in hours will be captured. Breakdowns such as the
mechanical breakdown, electrical breakdown in hours will also be retrieved. The new
program will be allocated to a certain type of work that is planned for manufacturing,
followed by the setup time, tool change time, dimensional checking. The quality
forms part of the next information capturing where quality decision delay is to be
included, followed by the number of materials, metrication, number load, and
electricity to be included that will provide a total time in minutes spent.
1.8 Research ethics
A letter of consent was supplied by Company A, which was selected for this
research. The letter serves as proof and the understanding that the investigation in
the organisation is permitted in terms of the field of study and research prospectus.
The confidentiality of the data is guaranteed and only the combined results will be
used for research and publication purposes.
No actual figures will be published due to competitor interest. All data gathered from
the questionnaires will only be used for research purposes. Participation in the study
is voluntary. The participants can withdraw from the study if they wish to do so.
1.9 Importance and benefits of the proposed study
The importance of this study is to identify the constraints, issues, to look for an
alternative approach as management. To improve the efficiency on overall
equipment effectiveness. The benefit of the research is based on improvement, the
adoption capability within production, and the productivity that forms part of the
company vision and mission. The study will identify the problem and will bring new
ideas with the thought that will be discussed through management to capitalize, to
meet the objective at a given time.
1.10 Delimitations and assumptions
The delimitations and assumptions of the study will be presented.
1.10.1 Delimitations (scope)
9
The study is established in an operations management environment, with the basic
principles of availability, efficiency, and effectiveness of production machines,
including computer numerical machines in a high volume-driven manufacturing
environment. The research is limited to the subsidiary of Company A situated in
Gauteng.
1.10.2 Assumptions
The participants will answer the questionnaire honestly. Secondly, the participants
are experienced and subject experts in the field of CNC machines and throughout
the organisation.
1.11 Structure of the study
The study has five chapters, starting with the introduction, literature review, research
design, and methodology, results, discussions, and analysis and concluding with
recommendations. The structure of the study will also give the reader different
research areas where the impact of management decisions and the OEE
effectiveness are discussed.
Chapter 1: Introduction: This chapter introduces the background and problem
statement; followed by the aim, research questions and objectives, as well as a
summary on the methodology used to conduct the research.
Chapter 2: A literature review: In this chapter, the history of overall equipment
efficiency and the elements of overall equipment efficiency are presented, as well as
the concept of total production management and operational decisions.
Chapter 3: Research design and methodology: This chapter gives an overview of
the research methodology, design, research paradigm selected, and the population
and sample selected. The data collection instrument and methods are justified, and
ethical considerations are described.
10
Chapter 4: Results, Discussion, and Analysis: The chapter presents the data
collected and analysed, the results from the data analysis in tables and figures, as
well as discussions on the results.
Chapter 5: Conclusion and Recommendations: The last chapter presents the
conclusions from the findings and presents recommendations and conclusions from
the study.
1.12 Conclusion
In this chapter, a brief explanation on the study was provided, which explained with
the objectives that this research aims to achieve in the field of operations. The
problem statement and the core questions formulated were provided, including the
significance of the study. Chapter 1 gave a structure on what the other chapters in
the study will deliver regarding the impact of management decisions on the OEE in a
manufacturing company. In the next chapter, the literature review conducted for the
study is presented.
11
CHAPTER 2: LITERATURE REVIEW
2.1 Introduction
This chapter presents the literature on the areas under study, explains the history of
the OEE with a formulated equation of how the OEE are measured and calculated.
The standards benchmark for a good OEE efficiency rate will be provided with the
benefits of OEE in a manufacturing company. It then dwells on the management
decisions that effect OEE.
2.2 History of Overall Equipment Efficiency
The OEE effectiveness was invented in the the1960s in Japan, where the
pioneerand creator of the Total Productive Maintenance (TPM) system, Seiichi
Nakajima, who was later hailed as the the father of TPM. (Parikh & Mahamuni, 2015)
OEE primarily focuses on sub-components of the manufacturing process, which are
listed as Availability, Performance, and Quality. (Noon, Jenkins & Lucio, 2000)
2.3 Elements of Overall Equipment Efficiency
OEE is mainly applied as a measuring tool to assess the efficiency of assets in the
manufacturing process. The OEE is just as effective in the investigating of people,
processes, and tools that might have an impact on the manner in which assets
operate. In addiction OEE also provides a basis for the identification areas in an
operation that could benefit from improvement, as it is a quantifiable way to measure
progress.
2.4 Overall Equipment Effectiveness
OEE is the ultimate in measuring manufacturing productivity, and is referred to as
the gold standard in the industry. OEE identifies the proportion of manufacturing time
that is truly productive. The OEE score is counted out of 100%, and refers to
12
manufacturing only. In short, the manufacturing of good parts in the fastest time
possible with no stop time. According to Binti Aminuddin, Garza-Reyes, Kumar,
Antony and Rocha-Lona (2015: 4431), “the OEE score means 100% Quality (only
good parts), 100% performance (as fast as possible), and 100% availability (no stop
time).”
Therefore, OEE measures manufacturing best practices as well as the underlying
losses. Important insights can be gained by understanding how to improve the
manufacturing process. OEE is the single best metric for identifying losses,
benchmarking progress, and improving the productivity of manufacturing equipment
(Bhadury, 2000). According to (Clarke, 2018), OEE is one of the most important
performance measurements in modern manufacturing facilities.
As a manufacturing and cross-selling company serving as a global leader in its
market, directors, stakeholders, and investors are eager to have a well-performed
and accurate drive towards manufacturing and equipment efficiency including the
quality of production to meet global score standards of 85% overall equipment
efficiency. Furthermore, (Clark, 2018) states that overall equipment efficiency has
the following problematic areas such as.
• Availability: Planned stops in production for setups and adjustments such as
planned maintenance, cleaning, and quality inspections. Besides, unplanned
stops in production, typically because of breakdowns, also negatively
influence OEE. Shortstops and short periods are important too. These stops
can occur for a range of different reasons including blocked sensors,
misfeeds, and jams.
• Performance: This applies when production does not run at its full capacity.
This could be because of worn-out equipment, poorly maintained equipment,
environmental factors, or operator issues. Examples of the latter include
operator errors, inexperience, or availability.

13
• Quality: Defective products as well as the reduced yield that occurs because
of defective products. Examples include operator error, wrong settings, and
inefficient batch changeover processes.
2.5 The calculation for overall equipment efficiency
The literature defines OEE as a hierarchy of standard measurement, which was
developed to evaluate how high volume-driven manufacturing operations could be
applied to effectively use machines and raw materials in manufacturing operations.
(Binti Aminuddin et al., 2015) OEE is based on four factors namely, labour efficiency,
availability, performance, and quality as presented in Figure 2.1 below.
Figure 2.1: Overall Equipment Effectiveness (OEE) Factor Layout
Overall Equipment Effectiveness (OEE) is depicted in Figure 2.1 as a hierarchy of
standard measurement. It is based on the labour efficiency, availability, performance,
and quality. A detailed description of the formulas is presented below:
14
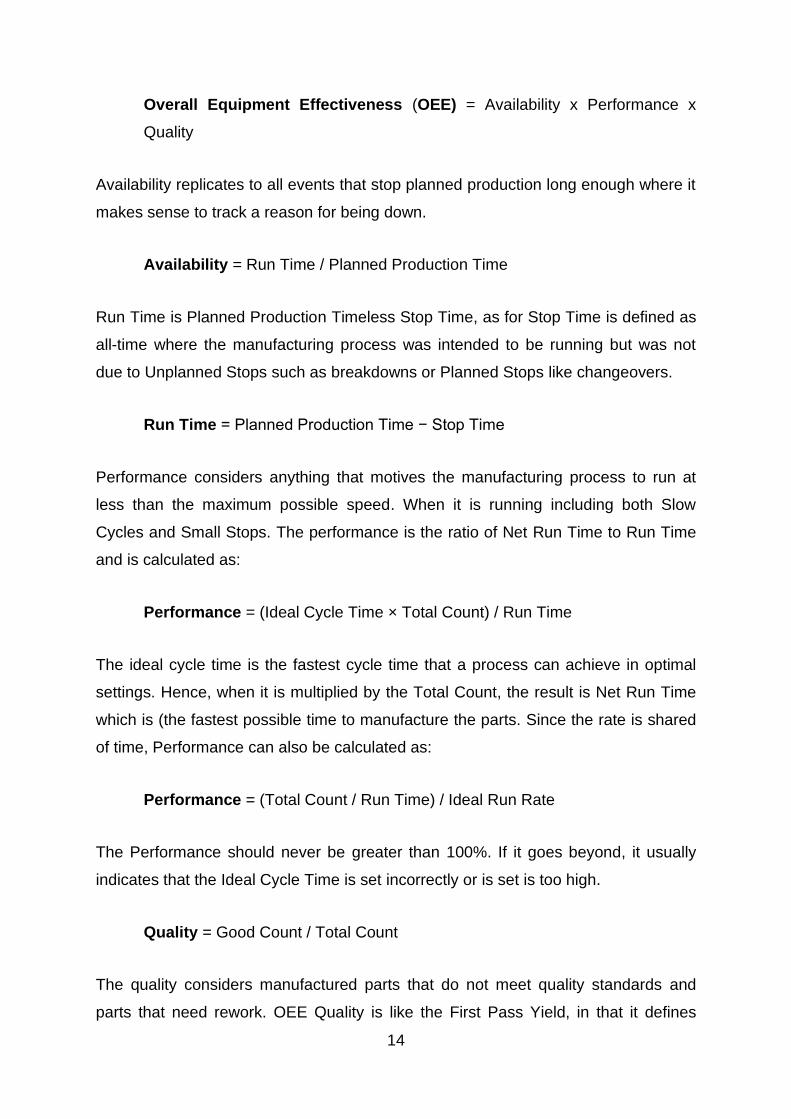
Overall Equipment Effectiveness (OEE) = Availability x Performance x
Quality
Availability replicates to all events that stop planned production long enough where it
makes sense to track a reason for being down.
Availability = Run Time / Planned Production Time
Run Time is Planned Production Timeless Stop Time, as for Stop Time is defined as
all-time where the manufacturing process was intended to be running but was not
due to Unplanned Stops such as breakdowns or Planned Stops like changeovers.
Run Time = Planned Production Time − Stop Time
Performance considers anything that motives the manufacturing process to run at
less than the maximum possible speed. When it is running including both Slow
Cycles and Small Stops. The performance is the ratio of Net Run Time to Run Time
and is calculated as:
Performance = (Ideal Cycle Time × Total Count) / Run Time
The ideal cycle time is the fastest cycle time that a process can achieve in optimal
settings. Hence, when it is multiplied by the Total Count, the result is Net Run Time
which is (the fastest possible time to manufacture the parts. Since the rate is shared
of time, Performance can also be calculated as:
Performance = (Total Count / Run Time) / Ideal Run Rate
The Performance should never be greater than 100%. If it goes beyond, it usually
indicates that the Ideal Cycle Time is set incorrectly or is set is too high.
Quality = Good Count / Total Count
The quality considers manufactured parts that do not meet quality standards and
parts that need rework. OEE Quality is like the First Pass Yield, in that it defines
15
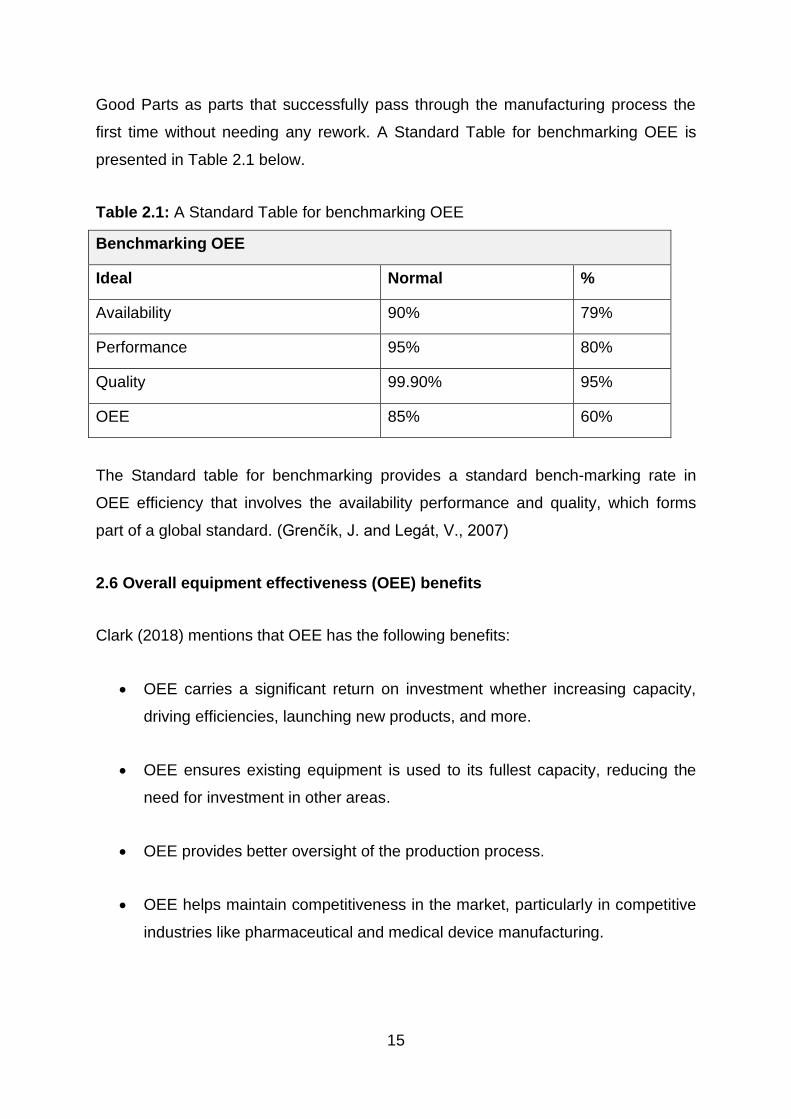
Good Parts as parts that successfully pass through the manufacturing process the
first time without needing any rework. A Standard Table for benchmarking OEE is
presented in Table 2.1 below.
Table 2.1: A Standard Table for benchmarking OEE
Benchmarking OEE
Ideal Normal %
Availability 90% 79%
Performance 95% 80%
Quality 99.90% 95%
OEE 85% 60%
The Standard table for benchmarking provides a standard bench-marking rate in
OEE efficiency that involves the availability performance and quality, which forms
part of a global standard. (Grenčík, J. and Legát, V., 2007)
2.6 Overall equipment effectiveness (OEE) benefits
Clark (2018) mentions that OEE has the following benefits:
• OEE carries a significant return on investment whether increasing capacity,
driving efficiencies, launching new products, and more.
• OEE ensures existing equipment is used to its fullest capacity, reducing the
need for investment in other areas.
• OEE provides better oversight of the production process.
• OEE helps maintain competitiveness in the market, particularly in competitive
industries like pharmaceutical and medical device manufacturing.
16
• Enhanced process quality will save time and money, as well as helping
maintain reputation in the market while also avoiding the risks and
consequences of product recalls.
• OEE advances the scalability of the production line.
• OEE decreases machine maintenance and repair costs as you can put proper
plans and schedules in place.
2.7 Total Productive Maintenance (TPM)
Total productive maintenance (TPM) is a “Japanese philosophy that focuses upon
achieving zero breakdowns and zero defects by maintaining the equipment”
throughout its use. (Parikh & Mahamuni, 2015) It is thus the process whereby
machines, equipment, employees, and supporting processes are used to not only
maintain, but also improve production integrity quality of the systems. Traditional
total productive maintenance was developed by Seiichi Nakajima of Japan. The
results of his work on the subject led to the TPM process in the late 1960s and early
1970s.
Nipponese became the leading company after implementing a TPM program. The
company is now used as the international accepted benchmark for the
implementation of TPM. It incorporates lean manufacturing techniques, and TPM is
built on eight pillars based on the 5-S system. (Singh, Gohil, Shah & Desai, 2013)
17
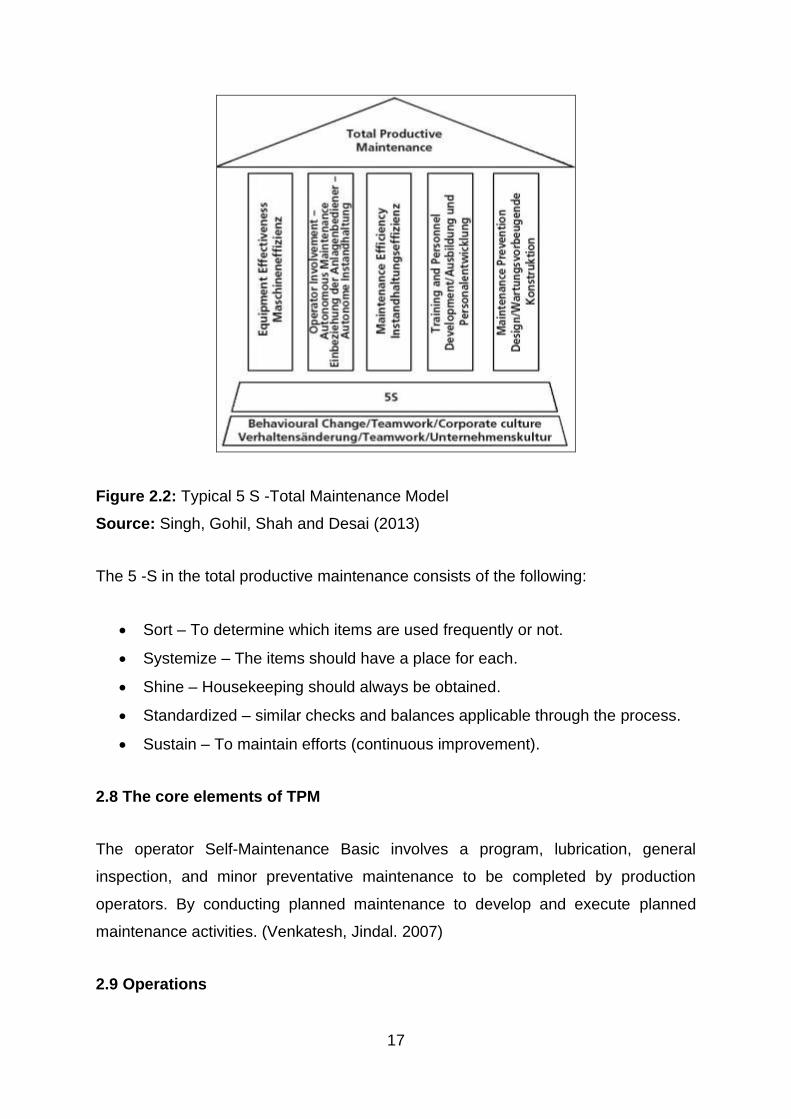
Figure 2.2: Typical 5 S -Total Maintenance Model
Source: Singh, Gohil, Shah and Desai (2013)
The 5 -S in the total productive maintenance consists of the following:
• Sort – To determine which items are used frequently or not.
• Systemize – The items should have a place for each.
• Shine – Housekeeping should always be obtained.
• Standardized – similar checks and balances applicable through the process.
• Sustain – To maintain efforts (continuous improvement).
2.8 The core elements of TPM
The operator Self-Maintenance Basic involves a program, lubrication, general
inspection, and minor preventative maintenance to be completed by production
operators. By conducting planned maintenance to develop and execute planned
maintenance activities. (Venkatesh, Jindal. 2007)
2.9 Operations
18
Operations management is defined by (Bellgran & Säfsten, 2009; Galvin, 2009;
Gunether, 2018; Stevenson, 2002; Kazi, 2010) As the management of systems or
processes that create goods and provide services. It is an area of management
concerned with designing and controlling the process of production and redesigning
business operations in the productions of goods and services. Operations
management involves the planning, organising, coordinating, and controlling all the
resources needed to produce a company’s goods and services, it also involves
managing people, equipment, technology, information, and all the other resources
needed in the production of goods and services. (Smit, P.J., Cronje, G.D., Brevis, T.,
and Vrba, M.J. eds., 2011)
The part of operation management in the company is the transformation role in the
process of changing inputs. This includes changing raw materials into finished goods
and services (Domingues & Machado, 2017; Fiorentino, 2018). It is directly
responsible for many decisions inside the company including activities that give
escalation to product design and delivery problems (Peinado et al., 2018). The
operation's purpose is the doing part of the organization (Barnes 2008). No
organization can hope to be successful unless its operations are well managed. The
importance of operations is emphasised by Hill (2005), points out that it is the
“function” that is responsible for 60-70 percent of costs, assets, and people.
Operations management (OM) is the set of activities that creates value in the form of
goods and services by transforming inputs into outputs (Waters, 2002)
Operations management decisions affect the inputs, operations, and outputs and
operation managers use feedback on performance and additional information, which
are relevant to update their decisions. Any firm, which is into business including wide
variety of businesses, involving finance, consulting, marketing, and graphic design
firms, is faced with 100 decisions that they must take in a day. Technology
Developments is full of useful insights into today’s technology that makes an impact
based on how companies adapt to their operations. (Hill, 2005)
2.10 A typical form of Operational decisions in any business
A typical form of Operational decisions in any business is set in the following types:
19
2.10.1 Pricing
Pricing is important since it defines the value of a product. It is the tangible price
point to let customers know whether it is worth their time and investment. (Bardakci,
A. and Whitelock, J., 2003)
2.10.2 Promotions
Promotions involve a lot of operating decisions, like how to promote the product, and
which areas or mediums will give the best ROI after promotions. Similarly, getting the
promotional material ready and ensuring that the promotions are done properly in the
market are all operational decisions that are to be taken from time to time. This is a
task that is vast and can make a big influence on the overall running of an
organisation. From the bottom level upwards, a lot of information are collected, which
must be summarized through the operations management level and finally submitted
at the director level. The major operational decisions must be taken every day and
are mostly outsourced or are managed via a chain of command in between. There
are other operational decisions also which are made in the day-to-day running of a
business. (Banker, R.D., Kauffman, R.J. and Morey, R.C., 1990)
2.10.3 Maintaining Inventory
It allows for a variety of practical and financial benefits including consistently meeting
the increases in demand without having to wait for a full production cycle to complete
before receiving more products. It allows you to fill orders quickly and efficiently.
Although there are a few problems when it comes to maintaining inventory such as
inconsistent tracking, warehouse efficiency, inaccurate data, and changes, in
demand, manual documentation, stock faulty, and supply chain complexity. There
are several stock control methods to assist with maintaining inventory. The Just in
Time (JIT) aims to reduce costs by cutting stock to a minimum. Items will be needed
and used immediately. (Hiltrop, Jean M. 1992)
2.10.4 Customer management
20
Customer management is defined as the process of managing the relationship
between an organisation, its people, and its customers over time. (Adhikari, Balaram,
and Bibhav Adhikari, 2009) The company uses a CRM system that helps to capture
leads, that systematizes messaging, to action daily tasks, to follow up on the task, to
generate a weekly plan or action plan that is online with support if required. The
CRM namely C4C referred to as customer for cloud was implemented in the 2000s.
2.10.5 Employee management
Employee management is the determination to help employees do their best work
each day to reach the larger goals of the organisation. Some various tasks and
duties fall under employee management. Most of them can fit into one of five
categories namely. (Abrahamson, E. and Eisenman, M., 2008)
2.10.6 Logistical decisions
As defined earlier, logistics involves delivering the right product to the right customer
at the right place, at the right time, and with the right cost and quality (Armington,
Chen & Babbitt, 2021)
2.10.7 Sales and outreach
In general, calculating the time spent on operations is important for any organization
as a manager you do not want to waste your resources. Operational decisions need
to be managed through the day-to-day activities especially when the organization
grows including daily activities. Henceforth the business needs to hire more
employees, or an organization needs to hire managers to manage such operational
decisions. (Hales, Colin, 2005)
2.11 Other operational decisions
Other known operational decisions in the day-to-day operations of a business are as
follows:
2.11.1 Service product and design
21
Product requirements are clearly defined Contract or order requirements differing
from those previously expressed are resolved the organization could meet the
defined requirements. The overall responsibility for manufacturing process control
lies with the company’s Operations Manager. (Kumar, S.A. and Suresh, N., 2006)
This responsibility is exercised in conjunction with local Team Leaders/Managers. All
team members are responsible for the quality of the work they produce and for
ensuring that only acceptable products are passed for further operations. The
manufacture of components and the reconditioning of products are planned by each
location and recorded on a routing document. (Juran, J.M. and De Feo, J.A., 2010)
2.11.2 Quality Management
Company A ensures that planning and development of the processes for product
and service awareness are consistent with the requirements of other processes of
the QMS. Management is responsible for adherence to and documentation of site
quality requirements regarding product and service realization planning.
Confirmation, proof, monitoring, and test activities and records as related to product
and service acceptance have been established. These can take the form of standard
operating procedures, work instructions, test frequency, sample, and product
identification, as well as preservation of the product. Customer-specific requirements
and references will be involved in the planning of product realization. Changes that
affect product and service realization shall be controlled and reacted to through the
change management processes. Documented information stating the results of a
review of changes, the personnel authorizing change, and any necessary actions
must be retained. (Board, B.A.C., 2014)
2.11.3 Process Capacity Design
To determine how company A will plan and develop the processes needed for
product realization. Planning of product realization shall be consistent with the
requirements of the other processes, which form the Quality Management System. In
the planning of product realization, company A will determine, as appropriate, the
following: Quality Objectives and requirements for the product. The processes,
documents, and resources are specific to the products. (Pióro, M. and Medhi, D.,
22
2004) Records will be maintained to provide evidence of the realization process and
that the resulting product meets the initial requirements
2.11.4 Location
Company A is situated in Springs, South Africa where it is central to most of its
customers within its targeted markets. The manufacturing facility has the following
equipment where some will be used in the research.
• 6 Braiding Machines
• 2 Bobbing winders
• 10 ton & 160ton press
• All common sizes and styles available Ex-stock
• Pre-cut rings available on request
• Technical support
• 24/7 service
2.11.5 Inventory Management
Storage areas/stores equipped with appropriate facilities are provided at all locations
to prevent deterioration, loss of identity, or damage of materials, work-in-progress
and finished products pending use, inspection/test, or delivery. Receipts and access
to and from such areas are controlled. The organisation uses an inventory
management system to optimise inventory turnover times. Consideration is given to
storage conditions and climatic conditions. (Kolias, G.D., Dimelis, S.P. and Filios,
V.P., 2011) All raw materials bought-out or manufactured components,
subassemblies, and assemblies are identified at all stages from receipt to dispatch,
to ensure correct items are being processed, and to provide the necessary
traceability. Minimum identification is by the company’s part number through physical
marking, labeling, or containment. In addition, all raw materials are supplied,
identifiable to a purchase order item, and a cast/heat number with commonly used
bar and strip colour coded for ease of identification. (Speight, J.G., 2014)
2.11.6 Scheduling
23
Scheduling develops aggregate level production plans into part-number level
production schedules and associated production orders. Horizon is from 1 week to
the longest cumulative product lead-time. (Tallon, W.J., 1987) Company A develops
aggregate level production plans into part-number level production schedules and
associated production orders.
2.11.7 Maintenance
Having accurate inventory and regular updates are vital. Collecting continuous
improvement ideas at the site level to review and ensure the best one is rewarded.
Communication regarding manufacturing updates should be communicated more
often; perhaps a direct display on the manufacturing list can be more beneficial.
(Coronado, R.B. and Antony, J., 2002)
Access from all branches to the manufacturing outlet is essential. Critical spares
should be kept at a central place. Deploy waste elimination methodology, and
develop and publish waste elimination site training plan. Housekeeping should be
obtained regularly, and lastly, prestart machining inspection to followed and
monitored frequently. By creating a safer working environment, the organisation can
improve maintenance, especially secure that incidents will occur, resulting in loss of
time in production and other value time to execute tasks. (Iverson, D.L., Martin, R.,
Schwabacher, M., Spirkovska, L., Taylor, W., Mackey, R., Castle, J.P. and
Baskaran, V., 2012) Improving equipment effectiveness should be available when
needed and producing as expected. Delight the customer. Moving from reactive to
preventive and predictive maintenance assist by reducing operating costs.
2.12 Characteristics of Operational Decisions
Operational decisions are typically structured and are mostly repeated many times
every day. The operational decisions can be exhibited once, and then reused and
executed multiple times against many records and transactions, such as the
calculation of tax for a portfolio of investments, or the calculation of a bill for a patient
in a hospital.
24
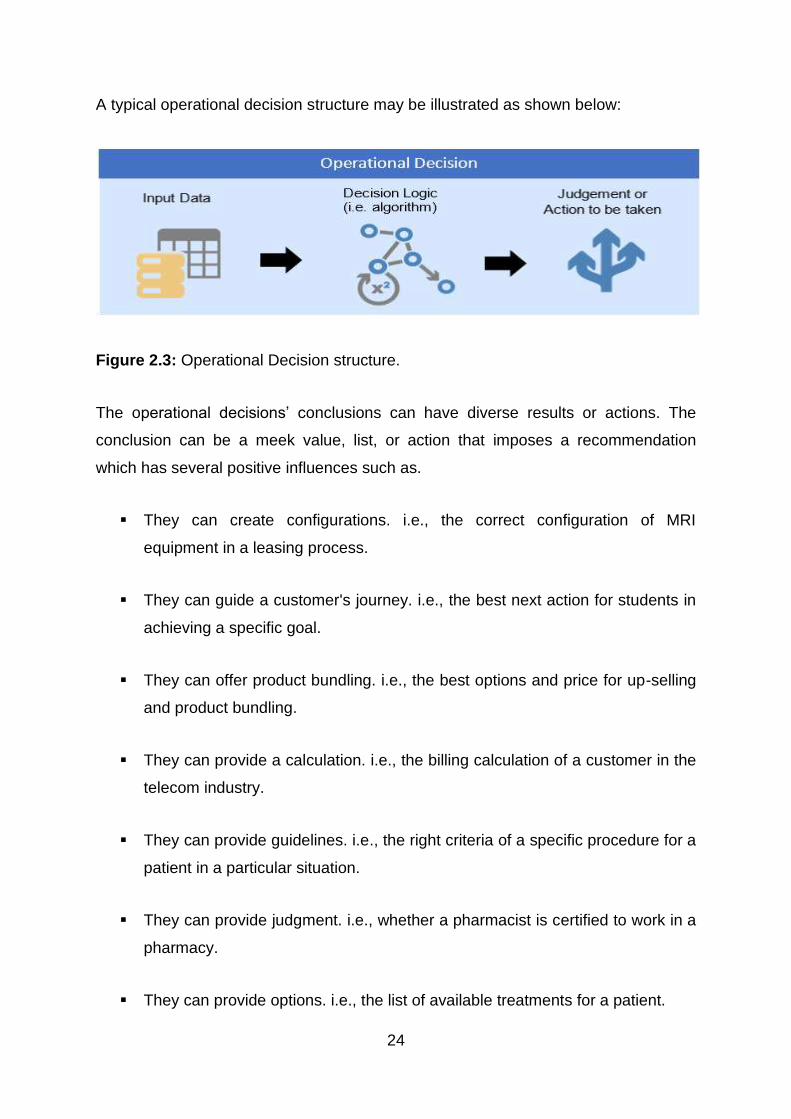
A typical operational decision structure may be illustrated as shown below:
Figure 2.3: Operational Decision structure.
The operational decisions’ conclusions can have diverse results or actions. The
conclusion can be a meek value, list, or action that imposes a recommendation
which has several positive influences such as.
▪ They can create configurations. i.e., the correct configuration of MRI
equipment in a leasing process.
▪ They can guide a customer's journey. i.e., the best next action for students in
achieving a specific goal.
▪ They can offer product bundling. i.e., the best options and price for up-selling
and product bundling.
▪ They can provide a calculation. i.e., the billing calculation of a customer in the
telecom industry.
▪ They can provide guidelines. i.e., the right criteria of a specific procedure for a
patient in a particular situation.
▪ They can provide judgment. i.e., whether a pharmacist is certified to work in a
pharmacy.
▪ They can provide options. i.e., the list of available treatments for a patient.
25
All these decisions require input to describe parameters, situations, and a case. The
decision logic is run, and contrary to the situation, it produces a result. The
effectiveness and efficiency of these operational decisions are critical to the success
of a business in a rapidly changing and competitive environment. Up till now, the
details of the decision and the decision logic are often concealed within the
organisation. (Velasquez, M. and Hester, P.T., 2013)
As shown, a decision has both a conclusion such as an answer, and includes a
method of deciding or processing, which we call the “decision logic”. Operational
decisions are not excluded from this definition. There are many differences between
operational decisions and other types of decisions, such as strategical and tactical,
which makes operational decisions ideal candidates for systematization.
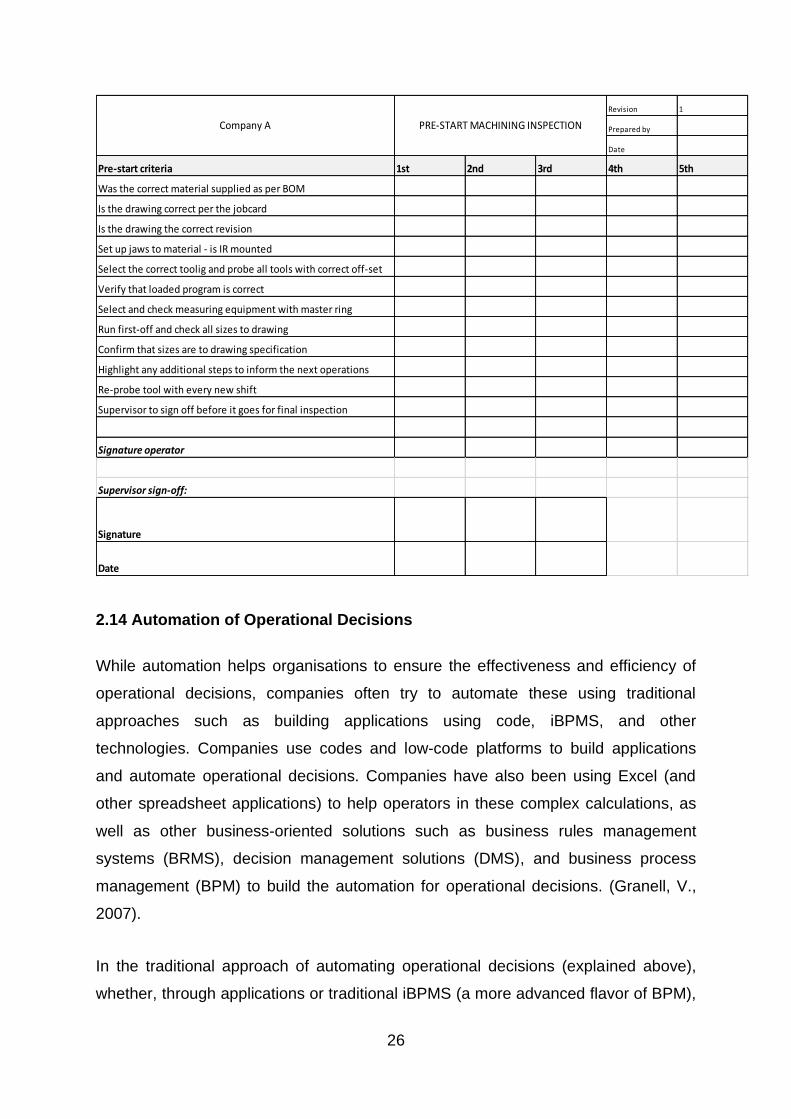
2.13 Maintenance schedules
The maintenance schedules have been constructed in a table format that involves
prestart machining inspection. The table below provides the important aspect of the
maintenance and the pre-start on machines to ensure that the important aspects on
all machines are met before utilized. The maintenance schedule on machinery is
done every six months depending on the hours in which they have been in operation.
Maintenance schedules serves a purpose to keeps costs down and property function
and appearance up. (Lim, J.H. and Park, D.H., 2007)
Table 2.2: The maintenance schedules
26
Revision 1
Prepared by
Date
Pre-start criteria 1st 2nd 3rd 4th 5th
Was the correct material supplied as per BOM
Is the drawing correct per the jobcard
Is the drawing the correct revision
Set up jaws to material - is IR mounted
Select the correct toolig and probe all tools with correct off-set
Verify that loaded program is correct
Select and check measuring equipment with master ring
Run first-off and check all sizes to drawing
Confirm that sizes are to drawing specification
Highlight any additional steps to inform the next operations
Re-probe tool with every new shift
Supervisor to sign off before it goes for final inspection
Signature operator
Supervisor sign-off:
Signature
Date
Company A PRE-START MACHINING INSPECTION
2.14 Automation of Operational Decisions
While automation helps organisations to ensure the effectiveness and efficiency of
operational decisions, companies often try to automate these using traditional
approaches such as building applications using code, iBPMS, and other
technologies. Companies use codes and low-code platforms to build applications
and automate operational decisions. Companies have also been using Excel (and
other spreadsheet applications) to help operators in these complex calculations, as
well as other business-oriented solutions such as business rules management
systems (BRMS), decision management solutions (DMS), and business process
management (BPM) to build the automation for operational decisions. (Granell, V.,
2007).
In the traditional approach of automating operational decisions (explained above),
whether, through applications or traditional iBPMS (a more advanced flavor of BPM),
27
all of these operational decisions are buried in process or code. When these are
confronted with the required frequency of change and volume of data, it becomes
critical to manage them independently. Otherwise, it makes it hard to understand the
decisions, much less understand how to use and apply them. The problem with that
is simply that organisations cannot keep up the pace.
As shown in the illustrated formula for operational decisions, these rely on data and
have actions and/or judgment associated with them. Over time, the data, integration,
and circumstances driving different decisions change for various situations. The
actions are taken mature over time, based on the results of these operational
decisions, as well as the decision logic itself. When automation of operational
decisions is critical to the success of the business, hiding decisions, data, and
required actions within processes and applications make it very difficult for the
business to keep pace. It stretches the boundaries of technology platforms and
business practices and leads to less effective results. (Von Halle, B. and Goldberg,
L., 2009)
2.15 Conclusion
Most companies have complex operational decisions, they simply cannot scale with
traditional approaches. Some have even tried to use one of the many decision
management platforms to plug into data and processes. However, that approach
creates a disconnected decision experience that often becomes unmanageable in
complex and changing situations. That is where we need to take another approach.
The impact of the disconnected decision experience is that it draws organisations
back, when there is a need to balance the control between IT and business, which in
turn leads organisations to implement these types of solutions in the first place.
28
CHAPTER 3: RESEARCH DESIGN
3.1 Introduction
In this chapter, the research design is discussed, including the type of method used
to capture the data and the technical analysis. This chapter also covers the selection
process of individuals involved in the research, as well as the research instrument,
which was a questionnaire.
3.2 Description of overall research design
The research design includes a quantitative approach and technical data analysis. It
is a combined approach. A questionnaire was used to collect data with the
quantitative approach, while existing OEE data were analysed with the CNC
machines.
3.2.1 The quantitative method
According to Cohen (1980), quantitative research is defined as social research that
employs empirical methods and empirical statements. The quantitative method
produces good results from the data collected in a group as stated by (Darmer and
Freytag, 1995). Quantitative research is the numerical representation and
manipulation of observations to describe and explain the phenomena that those
observations reflect. It is used in a wide variety of natural and social sciences,
including physics, biology, psychology, sociology, and geology.
Table 3.1: Quantitative Research Design
Quantitative Research
Objective/Purpose To quantify data and generalise results from a sample to the population of interest.
➢ Reduce sampling by the adequate size of the sampling
➢ Random Sampling
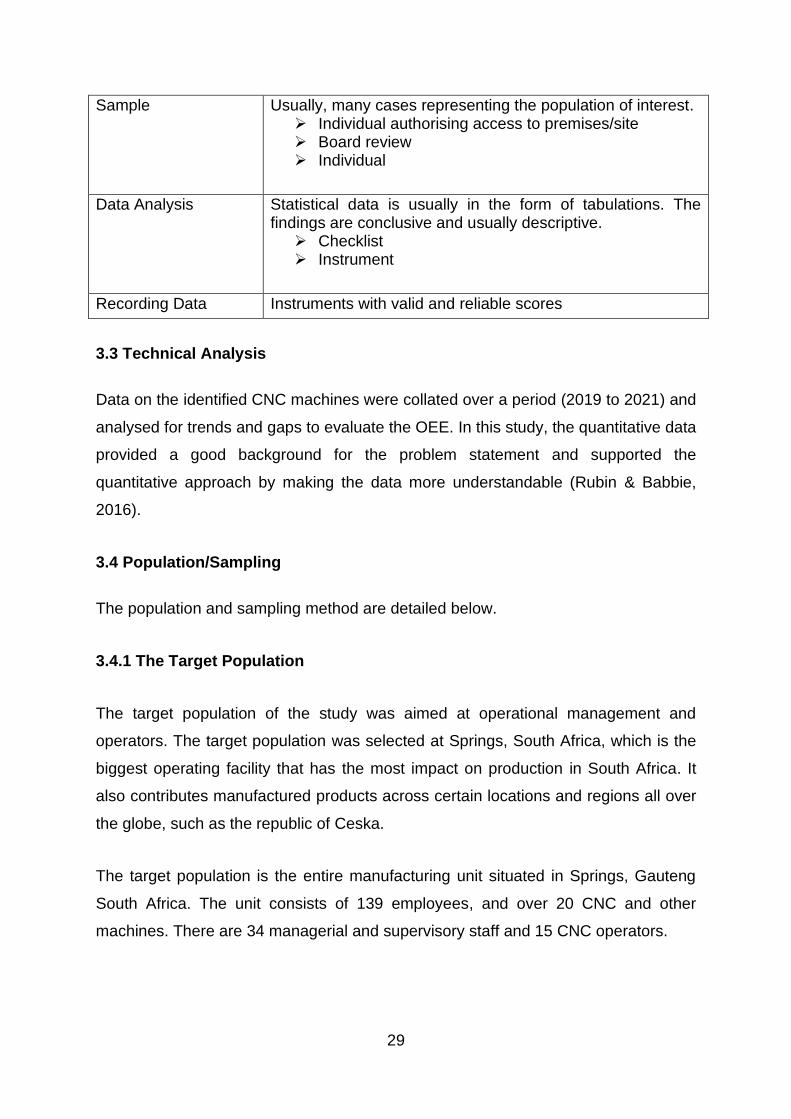
29
Sample Usually, many cases representing the population of interest. ➢ Individual authorising access to premises/site ➢ Board review ➢ Individual
Data Analysis Statistical data is usually in the form of tabulations. The findings are conclusive and usually descriptive.
➢ Checklist ➢ Instrument
Recording Data Instruments with valid and reliable scores
3.3 Technical Analysis
Data on the identified CNC machines were collated over a period (2019 to 2021) and
analysed for trends and gaps to evaluate the OEE. In this study, the quantitative data
provided a good background for the problem statement and supported the
quantitative approach by making the data more understandable (Rubin & Babbie,
2016).
3.4 Population/Sampling
The population and sampling method are detailed below.
3.4.1 The Target Population
The target population of the study was aimed at operational management and
operators. The target population was selected at Springs, South Africa, which is the
biggest operating facility that has the most impact on production in South Africa. It
also contributes manufactured products across certain locations and regions all over
the globe, such as the republic of Ceska.
The target population is the entire manufacturing unit situated in Springs, Gauteng
South Africa. The unit consists of 139 employees, and over 20 CNC and other
machines. There are 34 managerial and supervisory staff and 15 CNC operators.
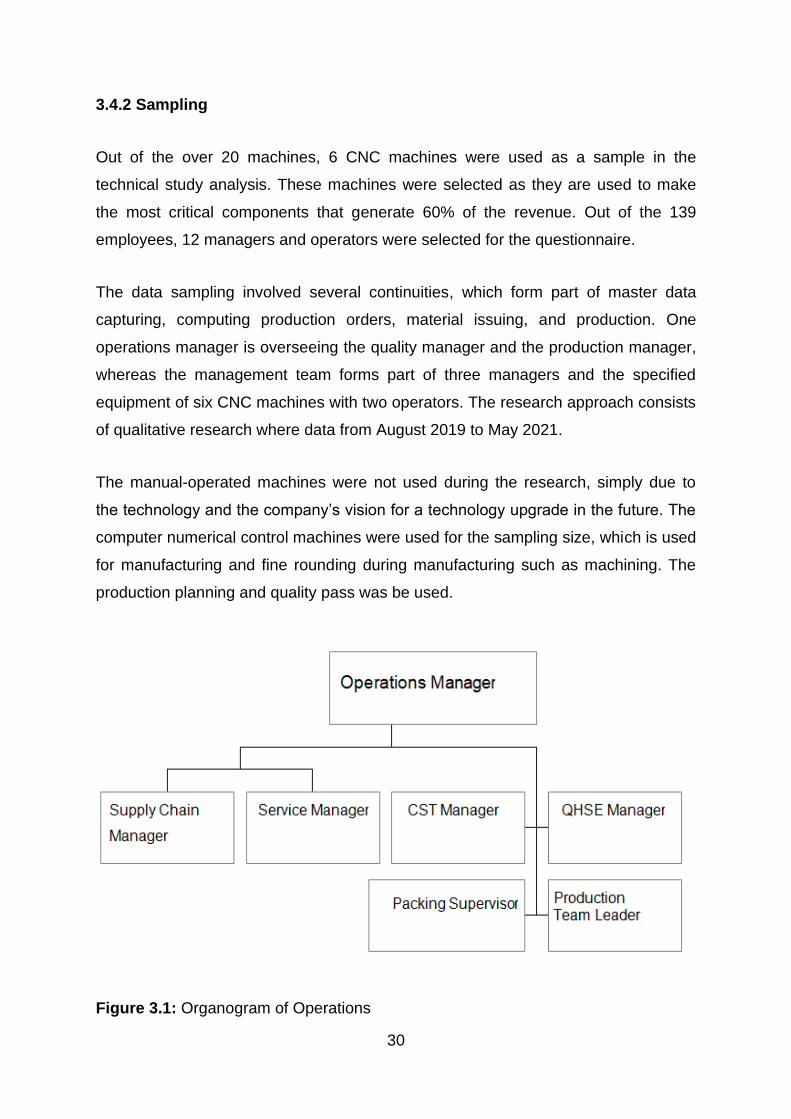
30
3.4.2 Sampling
Out of the over 20 machines, 6 CNC machines were used as a sample in the
technical study analysis. These machines were selected as they are used to make
the most critical components that generate 60% of the revenue. Out of the 139
employees, 12 managers and operators were selected for the questionnaire.
The data sampling involved several continuities, which form part of master data
capturing, computing production orders, material issuing, and production. One
operations manager is overseeing the quality manager and the production manager,
whereas the management team forms part of three managers and the specified
equipment of six CNC machines with two operators. The research approach consists
of qualitative research where data from August 2019 to May 2021.
The manual-operated machines were not used during the research, simply due to
the technology and the company’s vision for a technology upgrade in the future. The
computer numerical control machines were used for the sampling size, which is used
for manufacturing and fine rounding during manufacturing such as machining. The
production planning and quality pass was be used.
Figure 3.1: Organogram of Operations
31
Out of 139 dedicated employees (population) at the Springs facility, the study
selected the managers and supervisors. A draft of the questionnaire was discussed
and shared among the decisional managers that included three managers from
operations, quality, and planning, and included two operators on the CNC machines.
The quantitative research was conducted with the managers and employees within
each department, with a structured questionnaire survey, that reflects efficiency,
available operator, and output quality to improve its overall operating equipment
efficiency to meet an excellent standard of 60%. The target was to capture the data
telemetry on installed CNC machines that was used to collect data to conclude the
analysis to determine its operating schedules, and overall capacity that investigated
the influence of operations management decisions on overall equipment
effectiveness on six CNC machines.
3.5 Data collection
In this section, the instruments used to collect the data will be presented.
3.5.1 Management Questionnaire
The first instrument namely a designed questionnaire will be used to measure the
management decisions to determine the influence it has on the current OEE score
on the CNC machines. A questionnaire will be utilized to measure managers'
decisions added in Appendix C.
3.5.2 Technical Data collection instrument
The second instrument will be utilized to collect the computer calculated date prior
OEE percentage score. The quantitative data will be collected by using a machine-
operated efficiency chart from 2019 - 2021. This includes the date when the
equipment was used, the day on the date. The autonomous maintenance /
preventative maintenance hours will be captured.
The Machine housekeeping in hours will be captured. Breakdowns such as the
mechanical breakdown, electrical breakdown in hours will also be retrieved. The new

32
program will be given to a certain type of work that is planned for manufacturing,
followed by the setup time, tool change time, dimensional checking. The quality
forms part of the next information capturing where quality decision delay is to be
included, followed by the number of materials, metrication, number load and
electricity to be included that will give us a total time in minutes spent.
3.6 Data analysis
Data analysis is a procedure of inspecting, cleansing, transforming, and modelling
data with the goal of discovering useful information, informing conclusions, and
supporting decision-making. The quantitative data collected with the research were
analyzed with SPSS version 23 and was presented in two sections namely
descriptive statistics and inferential statistical methods.
3.6.1 Descriptive statistics conducted
The purpose of descriptive statistics is to summarise collected quantitative data in
tables and graphics the use and calculation of statistical measures e.g., mean and
standard (Field, 2013). The mean is the sum of all the values in a data set, divided
by the number of values and the standard deviation is a measure that indicated how
far a set of numbers lay apart. (Mentz & Botha, 2012) The data collected were
analyzed through SPSS descriptive methods, descriptive statistics, correlations,
validity, and reliability.
3.6.2 Inferential statistics conducted
The primary purpose of inferential statistics is to draw conclusions and make
predictions about the broader population. (Tabachnick & Fidell, 2007) The inferential
statistics were used from the data from samples and to make generalizations about
the population.
3.7 Data Validity and Reliability
33
Validity refers to the integrity and application of the methods undertaken and the
precision in which the findings accurately reflect the data, while reliability describes
consistency within the employed analytical procedure.
3.7.1 Validity
Validity refers to the degree to which the instrument measures what it is supposed to
be measuring. (Field, 2013) The researcher mostly focused on content validity,
which refers to the accuracy with which an instrument measures the factors under
study. The validity refers to how well the results between the study participants
represent true findings among similar individuals outside the study. It is important
because it determines what survey questions to use and helps ensure that
researchers are using questions that accurately measure matters of importance. In
this section data validity and reliability will be presented.
3.7.2 Reliability
Reliability refers to how dependably a method measure something. If the same result
can be consistently achieved by using the same methods under the same
circumstances, the measurement is considered reliable. Reliability is important
because it determines the value of a psychological test or study. (Sürücü, L. and
MASLAKÇI, A., 2020) If test results remain consistent when researchers conduct a
study, its reliability ensures value to the field of psychology and other areas in which
it has relevance, such as education or business.
3.8 Ethical Consideration
Ethical issues are raised when the relationship in the research area leads to some
degree of therapeutic communication for the participants. Thus, the researchers
must be aware of the impact of the questioning on the participants, and to decrease
such harmful effects on human subjects, the “reflexive approach” is recommended.
(Eide, 2008)
34
Several recent studies and observations have described virtual modes of research
and data collection that may move forward in the pandemic; to a limited extent, these
have included qualitative methodologies. (Lobe et al., 2020; Marhefka et al., 2020)
3.9 Research Constraints
A minimum of 33 employees has responded during the research. The company had
a restructuring phase twice within two years which means that the research could not
be measured to a total of 139 employees.
3.9.1 Limitations of the study
Since the start of the Covid epidemic, Company was pushed into a position where
the company did a civil restructuring phase twice since 2020 and 2021. This made it
difficult to have a full respondent figure. The data collection process was not fully
captured to change of organisation where employees were positioned in new roles
whereas some employees left the organisation.
3.9.2 Delimitations of the study
The study is set in an operations management environment. It involves the principles
of availability, efficiency, and effectiveness of production machines such as the
computer numerical machines in a high volume-driven manufacturing environment.
The research is limited to the subsidiary of Company A situated in Gauteng.
1.10 Conclusion
In this chapter, the description of the overall research design was explained through
the type of research method that was used. The population and sampling were given
to the respondents who participated in the questionnaire. A technical data collection
instrument (questionnaire) was explained. Following the data analysis, an
explanation of the descriptive statistics was announced. In the upcoming chapter, the
analysis, discussion and results will be explained and displayed.
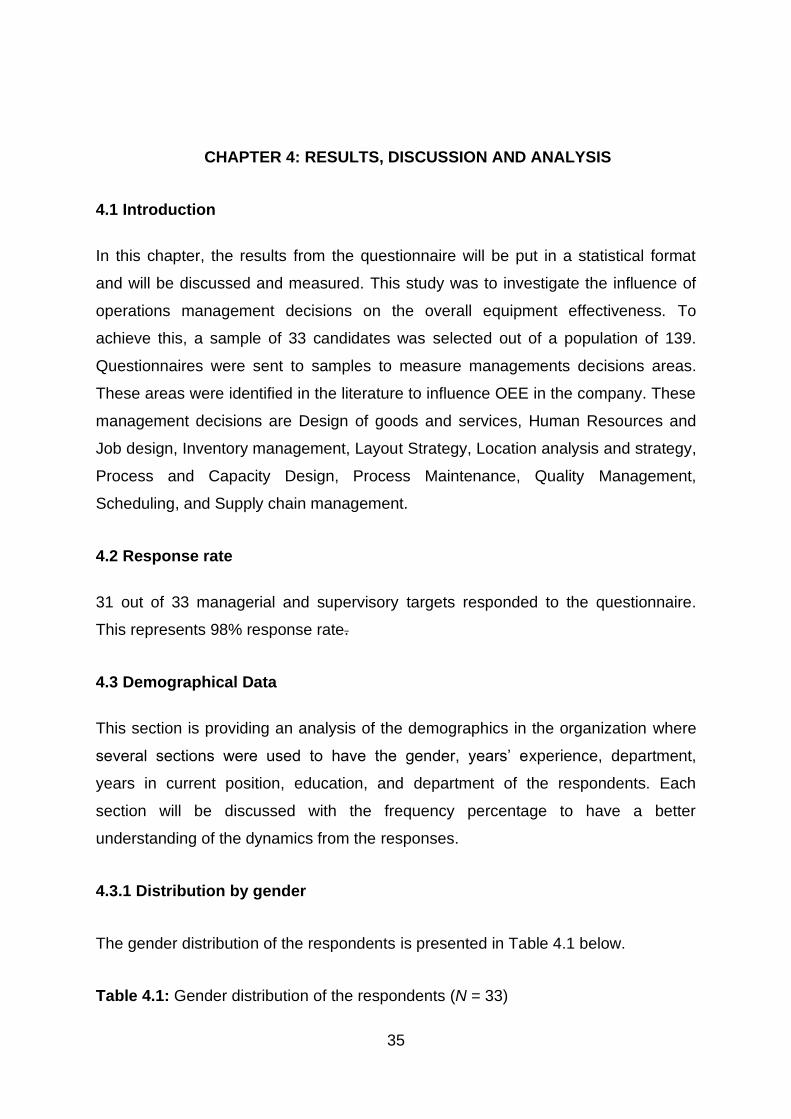
35
CHAPTER 4: RESULTS, DISCUSSION AND ANALYSIS
4.1 Introduction
In this chapter, the results from the questionnaire will be put in a statistical format
and will be discussed and measured. This study was to investigate the influence of
operations management decisions on the overall equipment effectiveness. To
achieve this, a sample of 33 candidates was selected out of a population of 139.
Questionnaires were sent to samples to measure managements decisions areas.
These areas were identified in the literature to influence OEE in the company. These
management decisions are Design of goods and services, Human Resources and
Job design, Inventory management, Layout Strategy, Location analysis and strategy,
Process and Capacity Design, Process Maintenance, Quality Management,
Scheduling, and Supply chain management.
4.2 Response rate
31 out of 33 managerial and supervisory targets responded to the questionnaire.
This represents 98% response rate.
4.3 Demographical Data
This section is providing an analysis of the demographics in the organization where
several sections were used to have the gender, years’ experience, department,
years in current position, education, and department of the respondents. Each
section will be discussed with the frequency percentage to have a better
understanding of the dynamics from the responses.
4.3.1 Distribution by gender
The gender distribution of the respondents is presented in Table 4.1 below.
Table 4.1: Gender distribution of the respondents (N = 33)
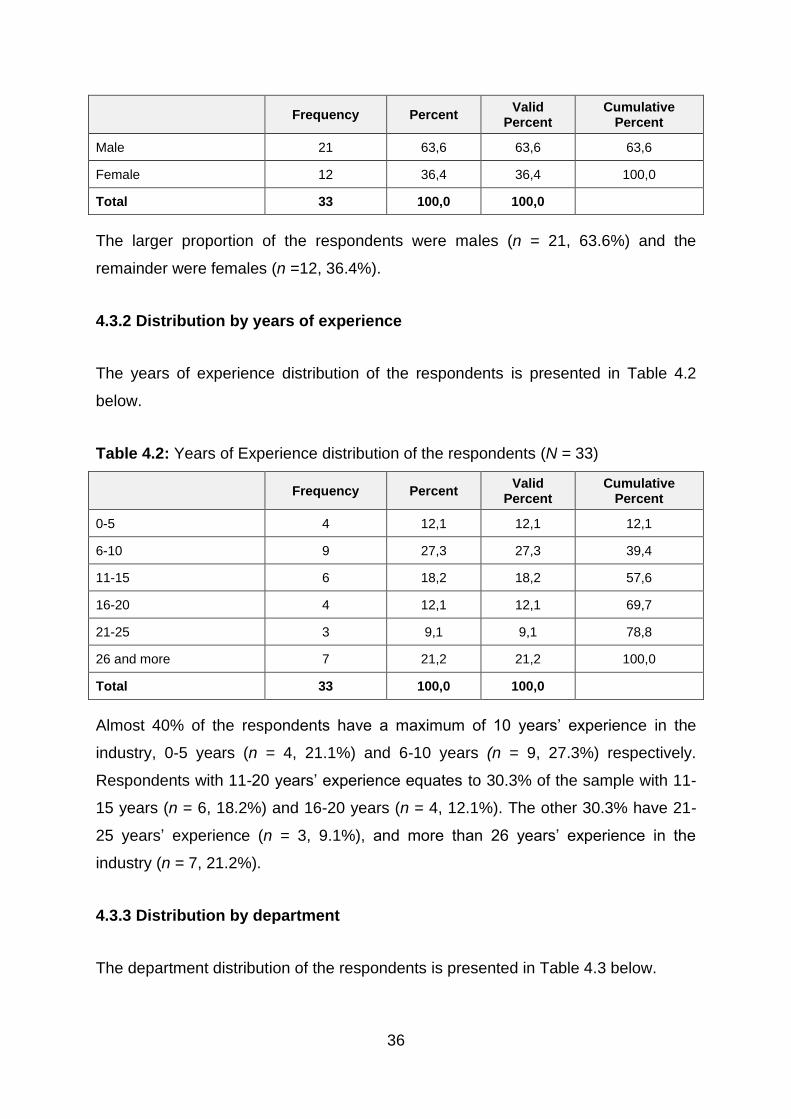
36
Frequency Percent Valid
Percent Cumulative
Percent
Male 21 63,6 63,6 63,6
Female 12 36,4 36,4 100,0
Total 33 100,0 100,0
The larger proportion of the respondents were males (n = 21, 63.6%) and the
remainder were females (n =12, 36.4%).
4.3.2 Distribution by years of experience
The years of experience distribution of the respondents is presented in Table 4.2
below.
Table 4.2: Years of Experience distribution of the respondents (N = 33)
Frequency Percent Valid
Percent Cumulative
Percent
0-5 4 12,1 12,1 12,1
6-10 9 27,3 27,3 39,4
11-15 6 18,2 18,2 57,6
16-20 4 12,1 12,1 69,7
21-25 3 9,1 9,1 78,8
26 and more 7 21,2 21,2 100,0
Total 33 100,0 100,0
Almost 40% of the respondents have a maximum of 10 years’ experience in the
industry, 0-5 years (n = 4, 21.1%) and 6-10 years (n = 9, 27.3%) respectively.
Respondents with 11-20 years’ experience equates to 30.3% of the sample with 11-
15 years (n = 6, 18.2%) and 16-20 years (n = 4, 12.1%). The other 30.3% have 21-
25 years’ experience (n = 3, 9.1%), and more than 26 years’ experience in the
industry (n = 7, 21.2%).
4.3.3 Distribution by department
The department distribution of the respondents is presented in Table 4.3 below.
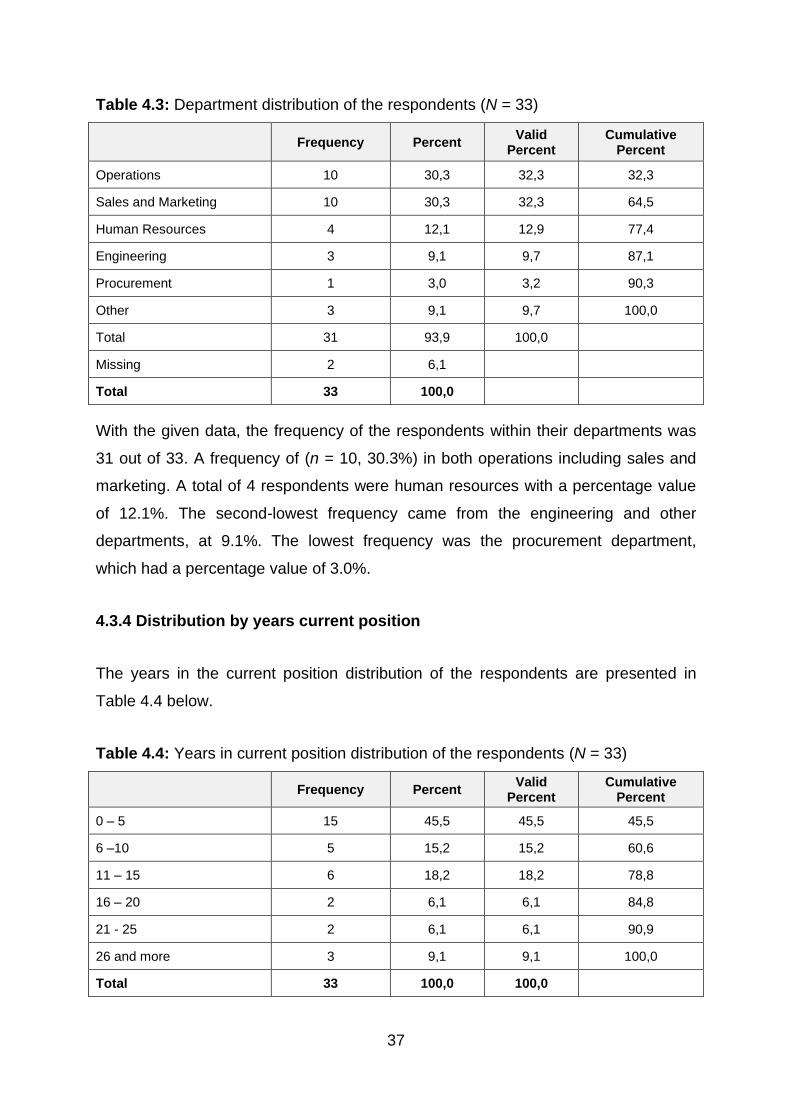
37
Table 4.3: Department distribution of the respondents (N = 33)
Frequency Percent Valid
Percent Cumulative
Percent
Operations 10 30,3 32,3 32,3
Sales and Marketing 10 30,3 32,3 64,5
Human Resources 4 12,1 12,9 77,4
Engineering 3 9,1 9,7 87,1
Procurement 1 3,0 3,2 90,3
Other 3 9,1 9,7 100,0
Total 31 93,9 100,0
Missing 2 6,1
Total 33 100,0
With the given data, the frequency of the respondents within their departments was
31 out of 33. A frequency of (n = 10, 30.3%) in both operations including sales and
marketing. A total of 4 respondents were human resources with a percentage value
of 12.1%. The second-lowest frequency came from the engineering and other
departments, at 9.1%. The lowest frequency was the procurement department,
which had a percentage value of 3.0%.
4.3.4 Distribution by years current position
The years in the current position distribution of the respondents are presented in
Table 4.4 below.
Table 4.4: Years in current position distribution of the respondents (N = 33)
Frequency Percent Valid
Percent Cumulative
Percent
0 – 5 15 45,5 45,5 45,5
6 –10 5 15,2 15,2 60,6
11 – 15 6 18,2 18,2 78,8
16 – 20 2 6,1 6,1 84,8
21 - 25 2 6,1 6,1 90,9
26 and more 3 9,1 9,1 100,0
Total 33 100,0 100,0
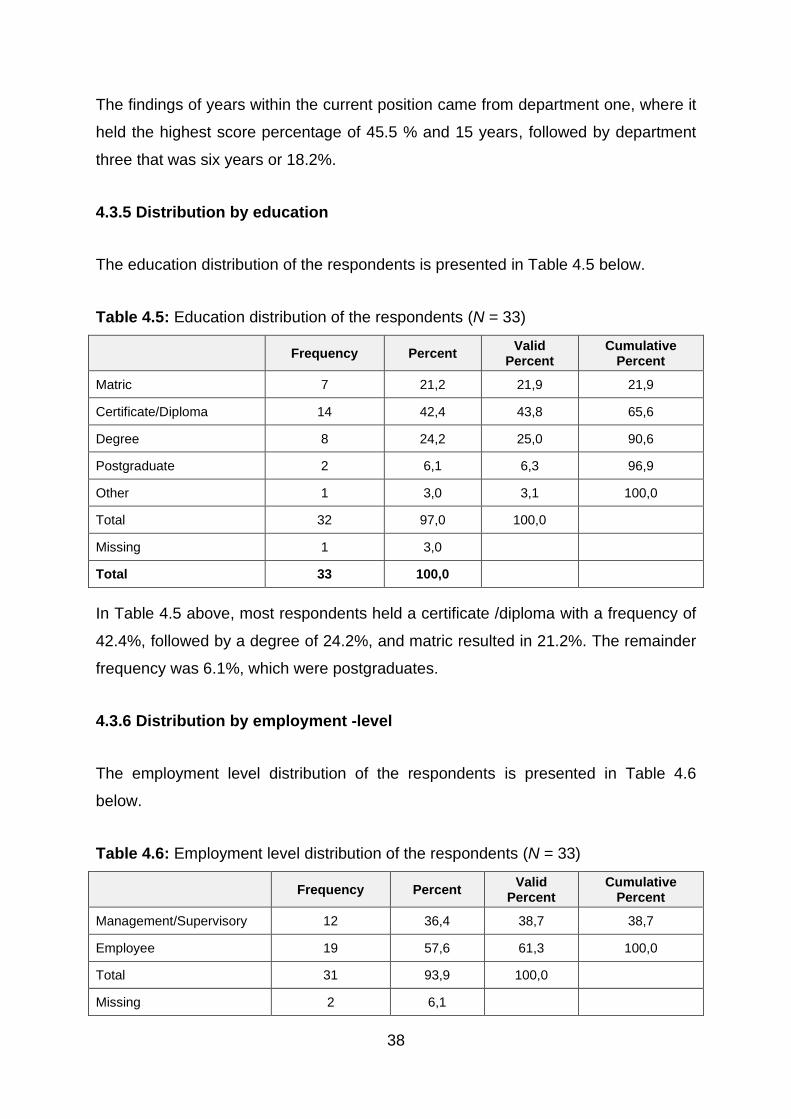
38
The findings of years within the current position came from department one, where it
held the highest score percentage of 45.5 % and 15 years, followed by department
three that was six years or 18.2%.
4.3.5 Distribution by education
The education distribution of the respondents is presented in Table 4.5 below.
Table 4.5: Education distribution of the respondents (N = 33)
Frequency Percent Valid
Percent Cumulative
Percent
Matric 7 21,2 21,9 21,9
Certificate/Diploma 14 42,4 43,8 65,6
Degree 8 24,2 25,0 90,6
Postgraduate 2 6,1 6,3 96,9
Other 1 3,0 3,1 100,0
Total 32 97,0 100,0
Missing 1 3,0
Total 33 100,0
In Table 4.5 above, most respondents held a certificate /diploma with a frequency of
42.4%, followed by a degree of 24.2%, and matric resulted in 21.2%. The remainder
frequency was 6.1%, which were postgraduates.
4.3.6 Distribution by employment -level
The employment level distribution of the respondents is presented in Table 4.6
below.
Table 4.6: Employment level distribution of the respondents (N = 33)
Frequency Percent Valid
Percent Cumulative
Percent
Management/Supervisory 12 36,4 38,7 38,7
Employee 19 57,6 61,3 100,0
Total 31 93,9 100,0
Missing 2 6,1
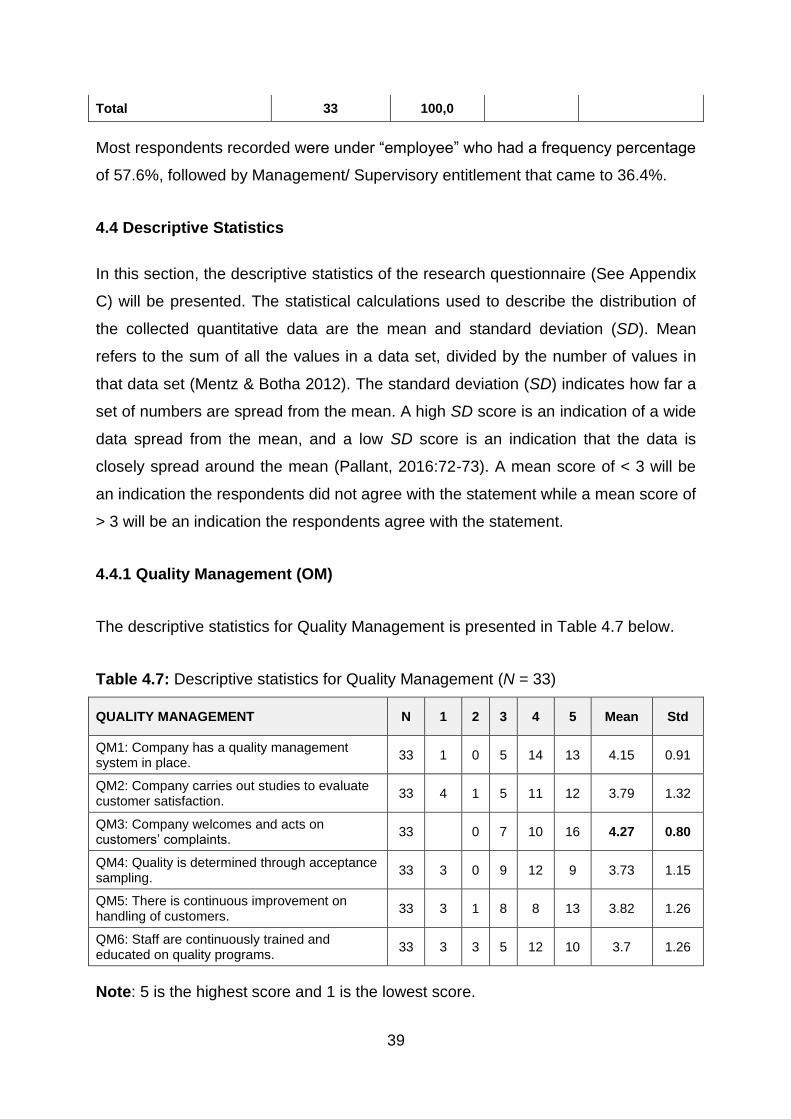
39
Total 33 100,0
Most respondents recorded were under “employee” who had a frequency percentage
of 57.6%, followed by Management/ Supervisory entitlement that came to 36.4%.
4.4 Descriptive Statistics
In this section, the descriptive statistics of the research questionnaire (See Appendix
C) will be presented. The statistical calculations used to describe the distribution of
the collected quantitative data are the mean and standard deviation (SD). Mean
refers to the sum of all the values in a data set, divided by the number of values in
that data set (Mentz & Botha 2012). The standard deviation (SD) indicates how far a
set of numbers are spread from the mean. A high SD score is an indication of a wide
data spread from the mean, and a low SD score is an indication that the data is
closely spread around the mean (Pallant, 2016:72-73). A mean score of < 3 will be
an indication the respondents did not agree with the statement while a mean score of
> 3 will be an indication the respondents agree with the statement.
4.4.1 Quality Management (OM)
The descriptive statistics for Quality Management is presented in Table 4.7 below.
Table 4.7: Descriptive statistics for Quality Management (N = 33)
QUALITY MANAGEMENT N 1 2 3 4 5 Mean Std
QM1: Company has a quality management system in place.
33 1 0 5 14 13 4.15 0.91
QM2: Company carries out studies to evaluate customer satisfaction.
33 4 1 5 11 12 3.79 1.32
QM3: Company welcomes and acts on customers’ complaints.
33 0 7 10 16 4.27 0.80
QM4: Quality is determined through acceptance sampling.
33 3 0 9 12 9 3.73 1.15
QM5: There is continuous improvement on handling of customers.
33 3 1 8 8 13 3.82 1.26
QM6: Staff are continuously trained and educated on quality programs.
33 3 3 5 12 10 3.7 1.26
Note: 5 is the highest score and 1 is the lowest score.
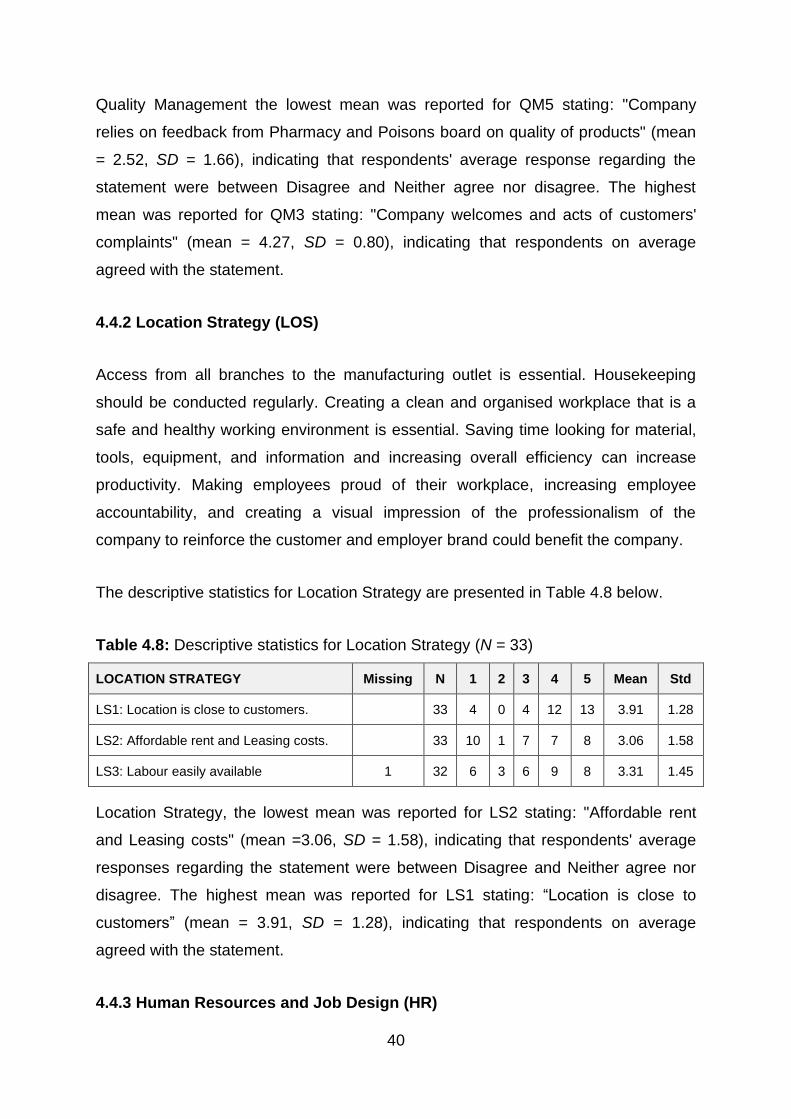
40
Quality Management the lowest mean was reported for QM5 stating: "Company
relies on feedback from Pharmacy and Poisons board on quality of products" (mean
= 2.52, SD = 1.66), indicating that respondents' average response regarding the
statement were between Disagree and Neither agree nor disagree. The highest
mean was reported for QM3 stating: "Company welcomes and acts of customers'
complaints" (mean = 4.27, SD = 0.80), indicating that respondents on average
agreed with the statement.
4.4.2 Location Strategy (LOS)
Access from all branches to the manufacturing outlet is essential. Housekeeping
should be conducted regularly. Creating a clean and organised workplace that is a
safe and healthy working environment is essential. Saving time looking for material,
tools, equipment, and information and increasing overall efficiency can increase
productivity. Making employees proud of their workplace, increasing employee
accountability, and creating a visual impression of the professionalism of the
company to reinforce the customer and employer brand could benefit the company.
The descriptive statistics for Location Strategy are presented in Table 4.8 below.
Table 4.8: Descriptive statistics for Location Strategy (N = 33)
LOCATION STRATEGY Missing N 1 2 3 4 5 Mean Std
LS1: Location is close to customers. 33 4 0 4 12 13 3.91 1.28
LS2: Affordable rent and Leasing costs. 33 10 1 7 7 8 3.06 1.58
LS3: Labour easily available 1 32 6 3 6 9 8 3.31 1.45
Location Strategy, the lowest mean was reported for LS2 stating: "Affordable rent
and Leasing costs" (mean =3.06, SD = 1.58), indicating that respondents' average
responses regarding the statement were between Disagree and Neither agree nor
disagree. The highest mean was reported for LS1 stating: “Location is close to
customers” (mean = 3.91, SD = 1.28), indicating that respondents on average
agreed with the statement.
4.4.3 Human Resources and Job Design (HR)
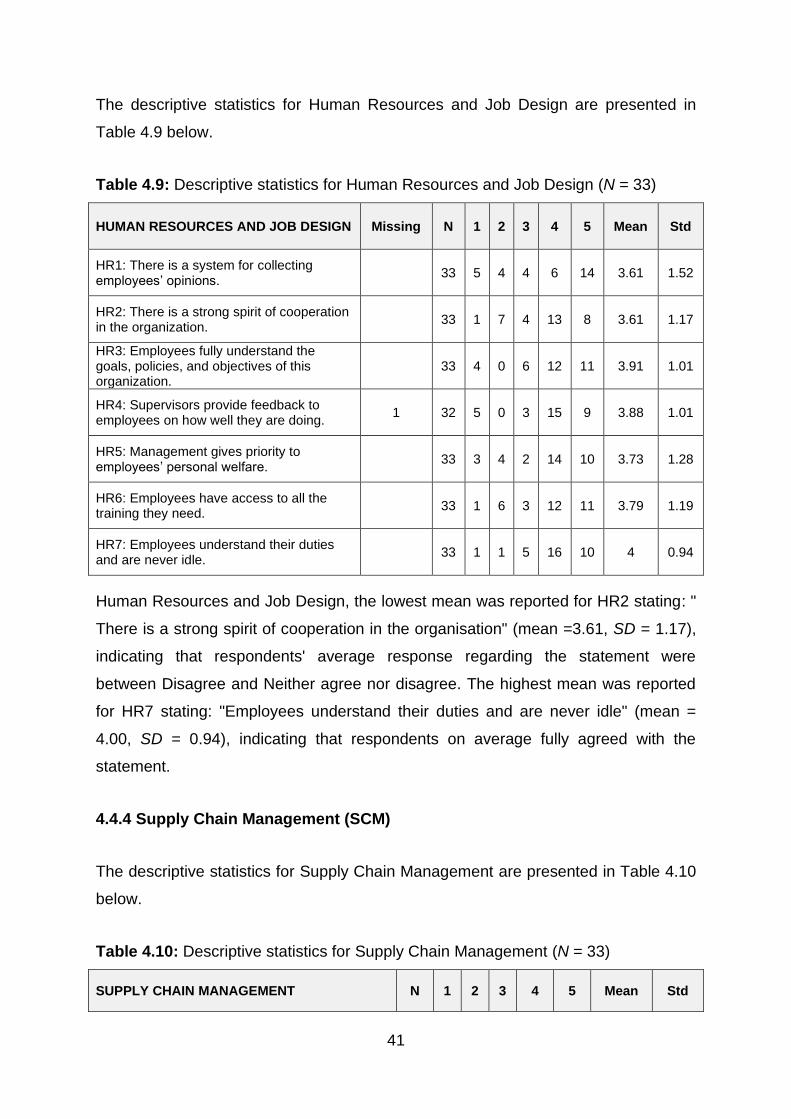
41
The descriptive statistics for Human Resources and Job Design are presented in
Table 4.9 below.
Table 4.9: Descriptive statistics for Human Resources and Job Design (N = 33)
HUMAN RESOURCES AND JOB DESIGN Missing N 1 2 3 4 5 Mean Std
HR1: There is a system for collecting employees’ opinions.
33 5 4 4 6 14 3.61 1.52
HR2: There is a strong spirit of cooperation in the organization.
33 1 7 4 13 8 3.61 1.17
HR3: Employees fully understand the goals, policies, and objectives of this organization.
33 4 0 6 12 11 3.91 1.01
HR4: Supervisors provide feedback to employees on how well they are doing.
1 32 5 0 3 15 9 3.88 1.01
HR5: Management gives priority to employees’ personal welfare.
33 3 4 2 14 10 3.73 1.28
HR6: Employees have access to all the training they need.
33 1 6 3 12 11 3.79 1.19
HR7: Employees understand their duties and are never idle.
33 1 1 5 16 10 4 0.94
Human Resources and Job Design, the lowest mean was reported for HR2 stating: "
There is a strong spirit of cooperation in the organisation" (mean =3.61, SD = 1.17),
indicating that respondents' average response regarding the statement were
between Disagree and Neither agree nor disagree. The highest mean was reported
for HR7 stating: "Employees understand their duties and are never idle" (mean =
4.00, SD = 0.94), indicating that respondents on average fully agreed with the
statement.
4.4.4 Supply Chain Management (SCM)
The descriptive statistics for Supply Chain Management are presented in Table 4.10
below.
Table 4.10: Descriptive statistics for Supply Chain Management (N = 33)
SUPPLY CHAIN MANAGEMENT N 1 2 3 4 5 Mean Std
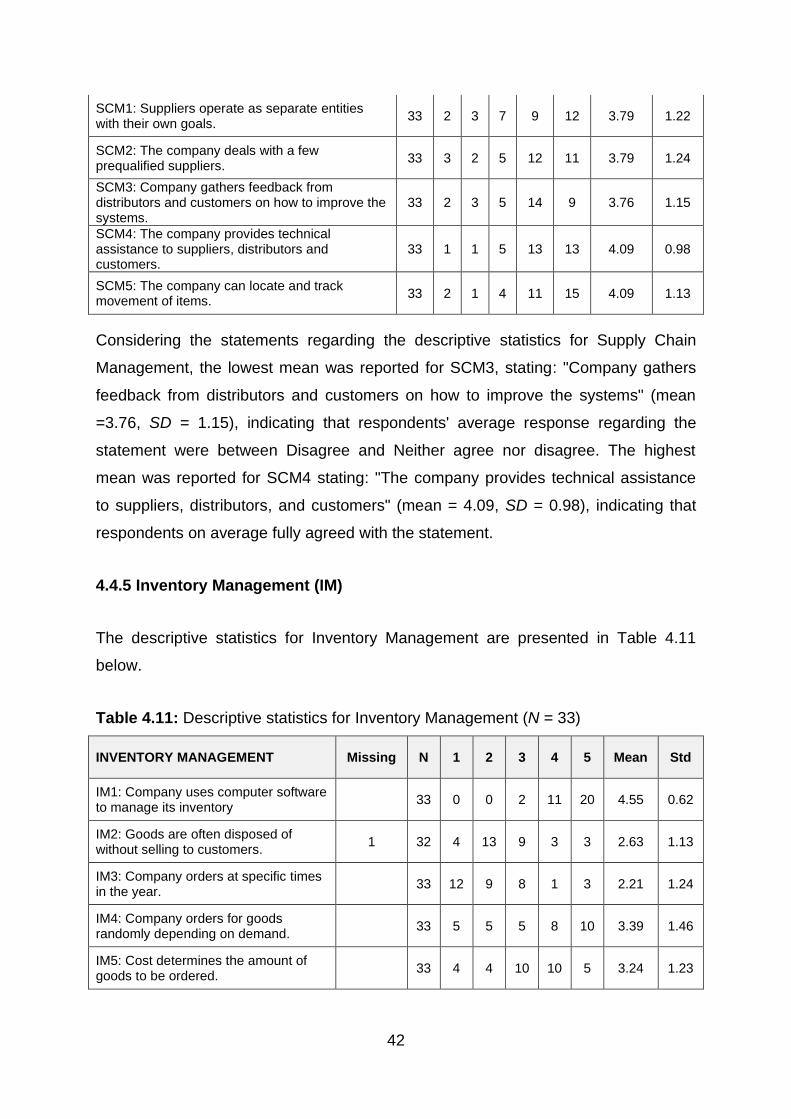
42
SCM1: Suppliers operate as separate entities with their own goals.
33 2 3 7 9 12 3.79 1.22
SCM2: The company deals with a few prequalified suppliers.
33 3 2 5 12 11 3.79 1.24
SCM3: Company gathers feedback from distributors and customers on how to improve the systems.
33 2 3 5 14 9 3.76 1.15
SCM4: The company provides technical assistance to suppliers, distributors and customers.
33 1 1 5 13 13 4.09 0.98
SCM5: The company can locate and track movement of items.
33 2 1 4 11 15 4.09 1.13
Considering the statements regarding the descriptive statistics for Supply Chain
Management, the lowest mean was reported for SCM3, stating: "Company gathers
feedback from distributors and customers on how to improve the systems" (mean
=3.76, SD = 1.15), indicating that respondents' average response regarding the
statement were between Disagree and Neither agree nor disagree. The highest
mean was reported for SCM4 stating: "The company provides technical assistance
to suppliers, distributors, and customers" (mean = 4.09, SD = 0.98), indicating that
respondents on average fully agreed with the statement.
4.4.5 Inventory Management (IM)
The descriptive statistics for Inventory Management are presented in Table 4.11
below.
Table 4.11: Descriptive statistics for Inventory Management (N = 33)
INVENTORY MANAGEMENT Missing N 1 2 3 4 5 Mean Std
IM1: Company uses computer software to manage its inventory
33 0 0 2 11 20 4.55 0.62
IM2: Goods are often disposed of without selling to customers.
1 32 4 13 9 3 3 2.63 1.13
IM3: Company orders at specific times in the year.
33 12 9 8 1 3 2.21 1.24
IM4: Company orders for goods randomly depending on demand.
33 5 5 5 8 10 3.39 1.46
IM5: Cost determines the amount of goods to be ordered.
33 4 4 10 10 5 3.24 1.23
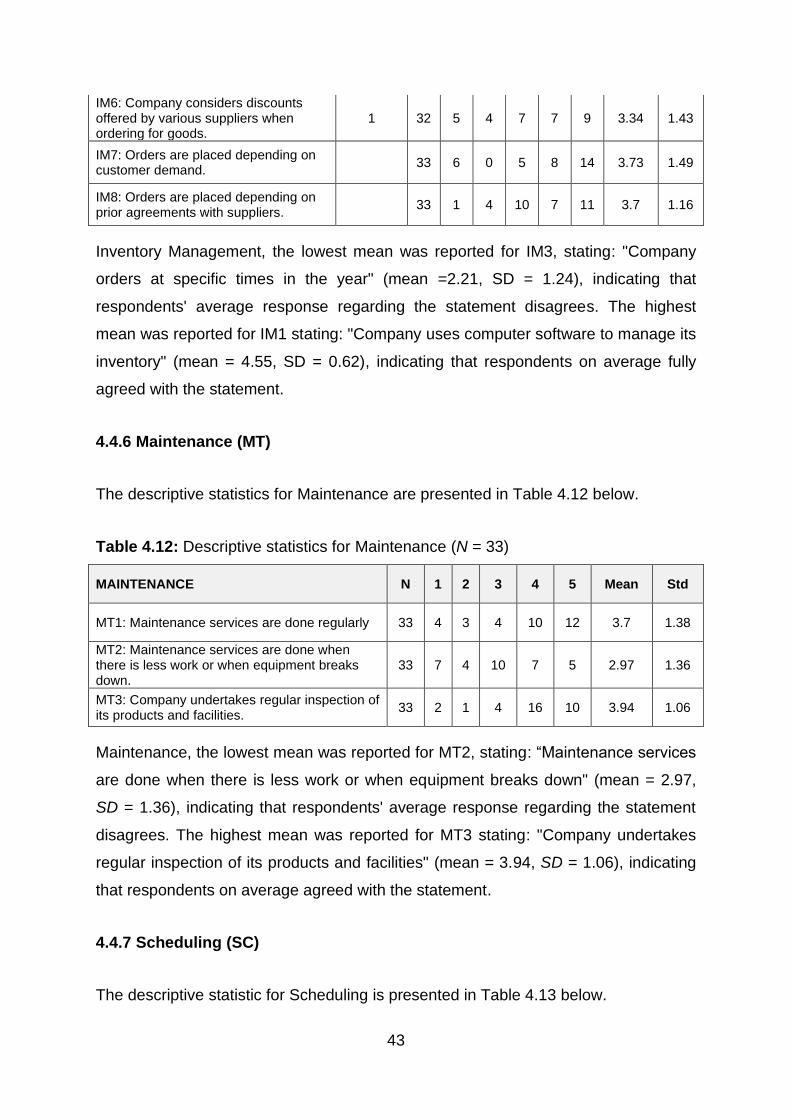
43
IM6: Company considers discounts offered by various suppliers when ordering for goods.
1 32 5 4 7 7 9 3.34 1.43
IM7: Orders are placed depending on customer demand.
33 6 0 5 8 14 3.73 1.49
IM8: Orders are placed depending on prior agreements with suppliers.
33 1 4 10 7 11 3.7 1.16
Inventory Management, the lowest mean was reported for IM3, stating: "Company
orders at specific times in the year" (mean =2.21, SD = 1.24), indicating that
respondents' average response regarding the statement disagrees. The highest
mean was reported for IM1 stating: "Company uses computer software to manage its
inventory" (mean = 4.55, SD = 0.62), indicating that respondents on average fully
agreed with the statement.
4.4.6 Maintenance (MT)
The descriptive statistics for Maintenance are presented in Table 4.12 below.
Table 4.12: Descriptive statistics for Maintenance (N = 33)
MAINTENANCE N 1 2 3 4 5 Mean Std
MT1: Maintenance services are done regularly 33 4 3 4 10 12 3.7 1.38
MT2: Maintenance services are done when there is less work or when equipment breaks down.
33 7 4 10 7 5 2.97 1.36
MT3: Company undertakes regular inspection of its products and facilities.
33 2 1 4 16 10 3.94 1.06
Maintenance, the lowest mean was reported for MT2, stating: “Maintenance services
are done when there is less work or when equipment breaks down" (mean = 2.97,
SD = 1.36), indicating that respondents' average response regarding the statement
disagrees. The highest mean was reported for MT3 stating: "Company undertakes
regular inspection of its products and facilities" (mean = 3.94, SD = 1.06), indicating
that respondents on average agreed with the statement.
4.4.7 Scheduling (SC)
The descriptive statistic for Scheduling is presented in Table 4.13 below.
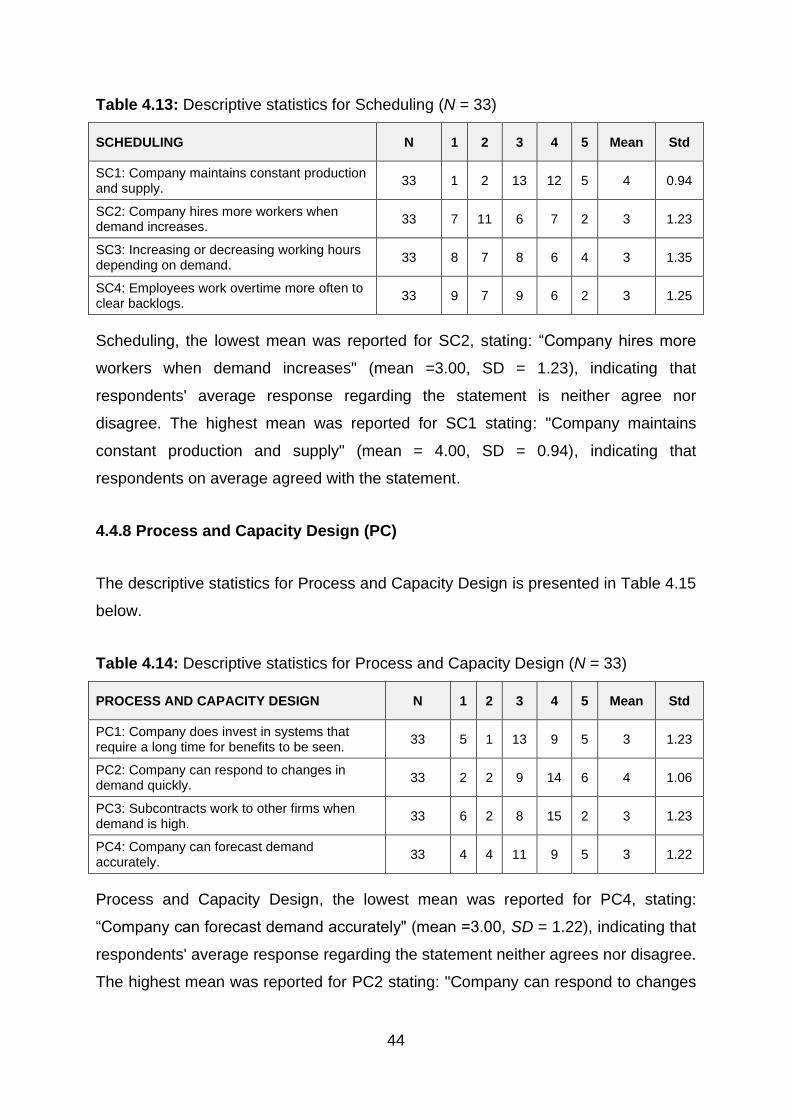
44
Table 4.13: Descriptive statistics for Scheduling (N = 33)
SCHEDULING N 1 2 3 4 5 Mean Std
SC1: Company maintains constant production and supply.
33 1 2 13 12 5 4 0.94
SC2: Company hires more workers when demand increases.
33 7 11 6 7 2 3 1.23
SC3: Increasing or decreasing working hours depending on demand.
33 8 7 8 6 4 3 1.35
SC4: Employees work overtime more often to clear backlogs.
33 9 7 9 6 2 3 1.25
Scheduling, the lowest mean was reported for SC2, stating: “Company hires more
workers when demand increases" (mean =3.00, SD = 1.23), indicating that
respondents' average response regarding the statement is neither agree nor
disagree. The highest mean was reported for SC1 stating: "Company maintains
constant production and supply" (mean = 4.00, SD = 0.94), indicating that
respondents on average agreed with the statement.
4.4.8 Process and Capacity Design (PC)
The descriptive statistics for Process and Capacity Design is presented in Table 4.15
below.
Table 4.14: Descriptive statistics for Process and Capacity Design (N = 33)
PROCESS AND CAPACITY DESIGN N 1 2 3 4 5 Mean Std
PC1: Company does invest in systems that require a long time for benefits to be seen.
33 5 1 13 9 5 3 1.23
PC2: Company can respond to changes in demand quickly.
33 2 2 9 14 6 4 1.06
PC3: Subcontracts work to other firms when demand is high.
33 6 2 8 15 2 3 1.23
PC4: Company can forecast demand accurately.
33 4 4 11 9 5 3 1.22
Process and Capacity Design, the lowest mean was reported for PC4, stating:
“Company can forecast demand accurately" (mean =3.00, SD = 1.22), indicating that
respondents' average response regarding the statement neither agrees nor disagree.
The highest mean was reported for PC2 stating: "Company can respond to changes
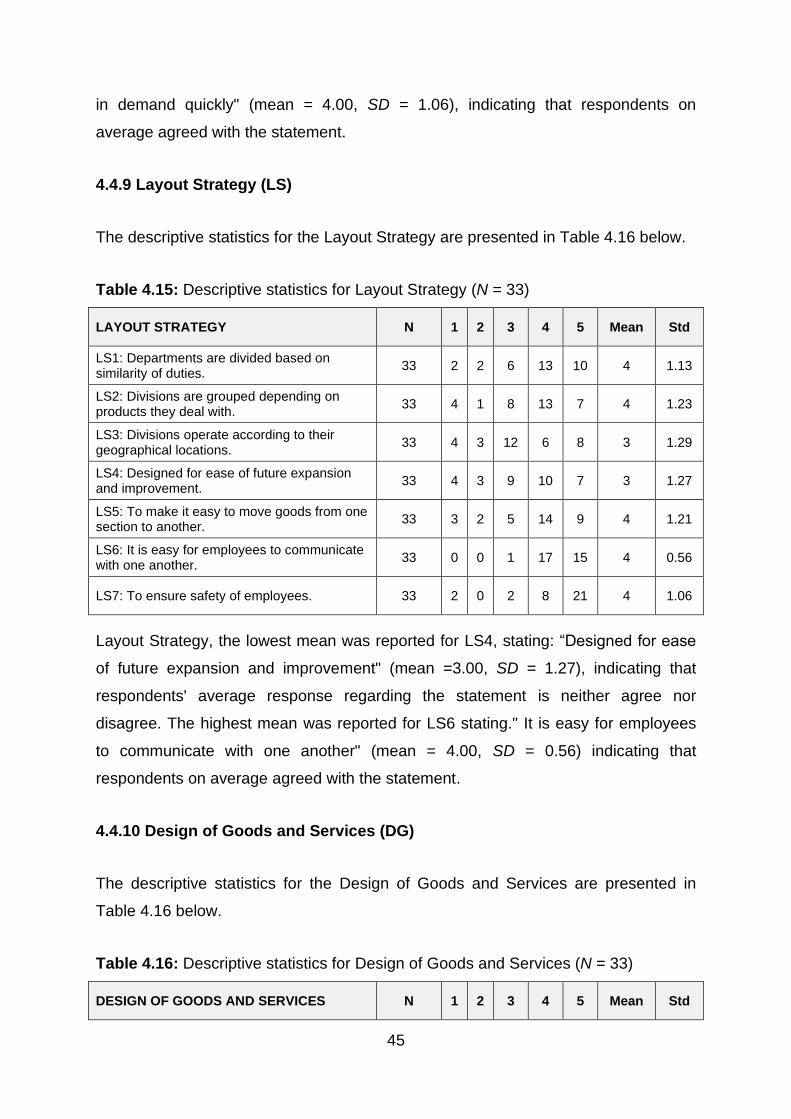
45
in demand quickly" (mean = 4.00, SD = 1.06), indicating that respondents on
average agreed with the statement.
4.4.9 Layout Strategy (LS)
The descriptive statistics for the Layout Strategy are presented in Table 4.16 below.
Table 4.15: Descriptive statistics for Layout Strategy (N = 33)
LAYOUT STRATEGY N 1 2 3 4 5 Mean Std
LS1: Departments are divided based on similarity of duties.
33 2 2 6 13 10 4 1.13
LS2: Divisions are grouped depending on products they deal with.
33 4 1 8 13 7 4 1.23
LS3: Divisions operate according to their geographical locations.
33 4 3 12 6 8 3 1.29
LS4: Designed for ease of future expansion and improvement.
33 4 3 9 10 7 3 1.27
LS5: To make it easy to move goods from one section to another.
33 3 2 5 14 9 4 1.21
LS6: It is easy for employees to communicate with one another.
33 0 0 1 17 15 4 0.56
LS7: To ensure safety of employees. 33 2 0 2 8 21 4 1.06
Layout Strategy, the lowest mean was reported for LS4, stating: “Designed for ease
of future expansion and improvement" (mean =3.00, SD = 1.27), indicating that
respondents' average response regarding the statement is neither agree nor
disagree. The highest mean was reported for LS6 stating." It is easy for employees
to communicate with one another" (mean = 4.00, SD = 0.56) indicating that
respondents on average agreed with the statement.
4.4.10 Design of Goods and Services (DG)
The descriptive statistics for the Design of Goods and Services are presented in
Table 4.16 below.
Table 4.16: Descriptive statistics for Design of Goods and Services (N = 33)
DESIGN OF GOODS AND SERVICES N 1 2 3 4 5 Mean Std
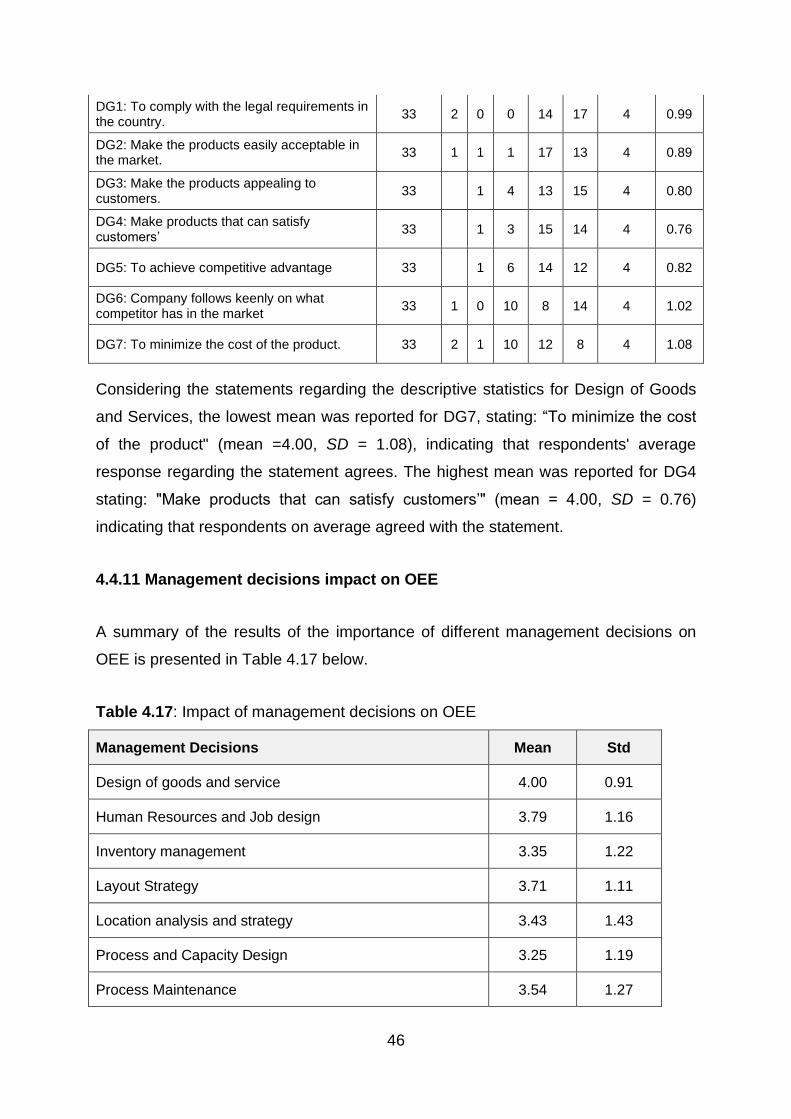
46
DG1: To comply with the legal requirements in the country.
33 2 0 0 14 17 4 0.99
DG2: Make the products easily acceptable in the market.
33 1 1 1 17 13 4 0.89
DG3: Make the products appealing to customers.
33 1 4 13 15 4 0.80
DG4: Make products that can satisfy customers’
33 1 3 15 14 4 0.76
DG5: To achieve competitive advantage 33 1 6 14 12 4 0.82
DG6: Company follows keenly on what competitor has in the market
33 1 0 10 8 14 4 1.02
DG7: To minimize the cost of the product. 33 2 1 10 12 8 4 1.08
Considering the statements regarding the descriptive statistics for Design of Goods
and Services, the lowest mean was reported for DG7, stating: “To minimize the cost
of the product" (mean =4.00, SD = 1.08), indicating that respondents' average
response regarding the statement agrees. The highest mean was reported for DG4
stating: "Make products that can satisfy customers’" (mean = 4.00, SD = 0.76)
indicating that respondents on average agreed with the statement.
4.4.11 Management decisions impact on OEE
A summary of the results of the importance of different management decisions on
OEE is presented in Table 4.17 below.
Table 4.17: Impact of management decisions on OEE
Management Decisions Mean Std
Design of goods and service 4.00 0.91
Human Resources and Job design 3.79 1.16
Inventory management 3.35 1.22
Layout Strategy 3.71 1.11
Location analysis and strategy 3.43 1.43
Process and Capacity Design 3.25 1.19
Process Maintenance 3.54 1.27
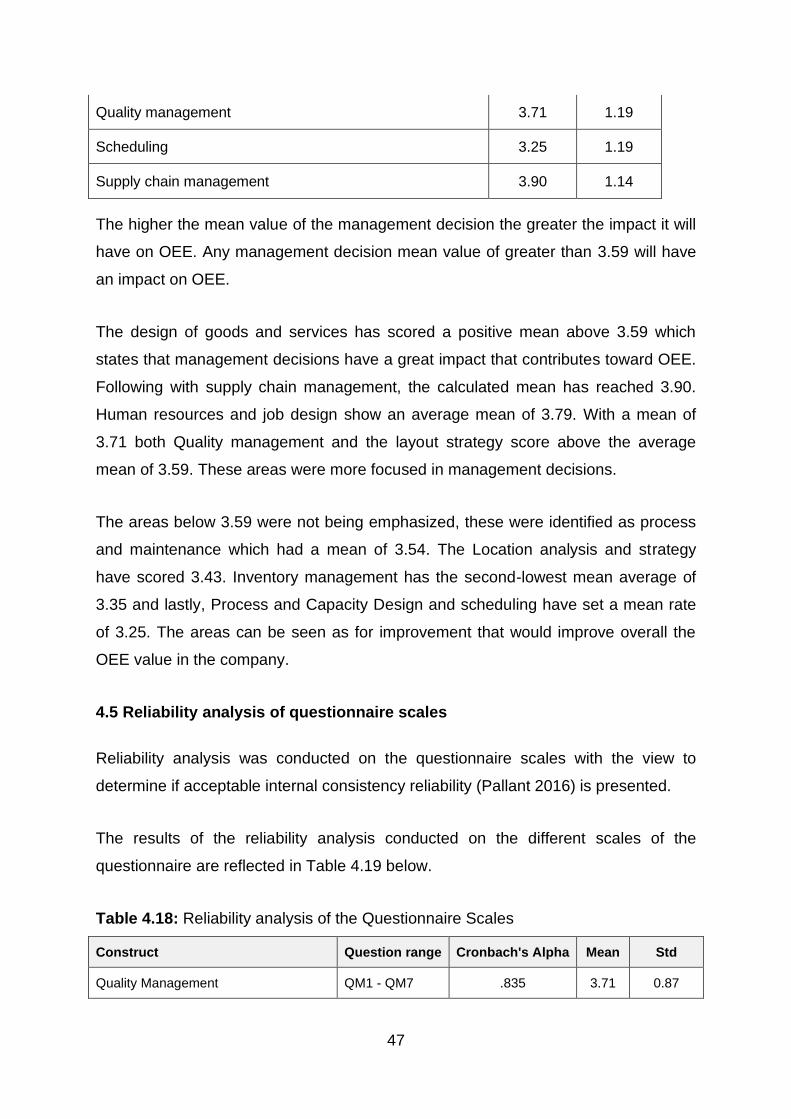
47
Quality management 3.71 1.19
Scheduling 3.25 1.19
Supply chain management 3.90 1.14
The higher the mean value of the management decision the greater the impact it will
have on OEE. Any management decision mean value of greater than 3.59 will have
an impact on OEE.
The design of goods and services has scored a positive mean above 3.59 which
states that management decisions have a great impact that contributes toward OEE.
Following with supply chain management, the calculated mean has reached 3.90.
Human resources and job design show an average mean of 3.79. With a mean of
3.71 both Quality management and the layout strategy score above the average
mean of 3.59. These areas were more focused in management decisions.
The areas below 3.59 were not being emphasized, these were identified as process
and maintenance which had a mean of 3.54. The Location analysis and strategy
have scored 3.43. Inventory management has the second-lowest mean average of
3.35 and lastly, Process and Capacity Design and scheduling have set a mean rate
of 3.25. The areas can be seen as for improvement that would improve overall the
OEE value in the company.
4.5 Reliability analysis of questionnaire scales
Reliability analysis was conducted on the questionnaire scales with the view to
determine if acceptable internal consistency reliability (Pallant 2016) is presented.
The results of the reliability analysis conducted on the different scales of the
questionnaire are reflected in Table 4.19 below.
Table 4.18: Reliability analysis of the Questionnaire Scales
Construct Question range Cronbach's Alpha Mean Std
Quality Management QM1 - QM7 .835 3.71 0.87
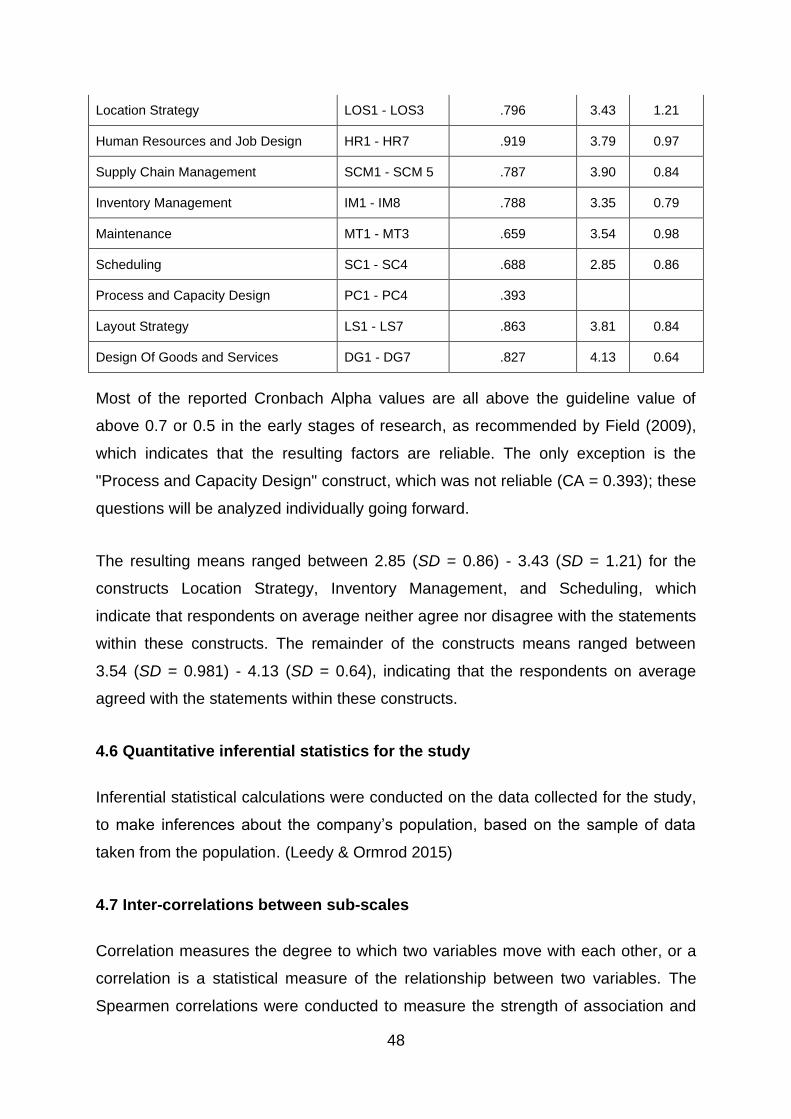
48
Location Strategy LOS1 - LOS3 .796 3.43 1.21
Human Resources and Job Design HR1 - HR7 .919 3.79 0.97
Supply Chain Management SCM1 - SCM 5 .787 3.90 0.84
Inventory Management IM1 - IM8 .788 3.35 0.79
Maintenance MT1 - MT3 .659 3.54 0.98
Scheduling SC1 - SC4 .688 2.85 0.86
Process and Capacity Design PC1 - PC4 .393
Layout Strategy LS1 - LS7 .863 3.81 0.84
Design Of Goods and Services DG1 - DG7 .827 4.13 0.64
Most of the reported Cronbach Alpha values are all above the guideline value of
above 0.7 or 0.5 in the early stages of research, as recommended by Field (2009),
which indicates that the resulting factors are reliable. The only exception is the
"Process and Capacity Design" construct, which was not reliable (CA = 0.393); these
questions will be analyzed individually going forward.
The resulting means ranged between 2.85 (SD = 0.86) - 3.43 (SD = 1.21) for the
constructs Location Strategy, Inventory Management, and Scheduling, which
indicate that respondents on average neither agree nor disagree with the statements
within these constructs. The remainder of the constructs means ranged between
3.54 (SD = 0.981) - 4.13 (SD = 0.64), indicating that the respondents on average
agreed with the statements within these constructs.
4.6 Quantitative inferential statistics for the study
Inferential statistical calculations were conducted on the data collected for the study,
to make inferences about the company’s population, based on the sample of data
taken from the population. (Leedy & Ormrod 2015)
4.7 Inter-correlations between sub-scales
Correlation measures the degree to which two variables move with each other, or a
correlation is a statistical measure of the relationship between two variables. The
Spearmen correlations were conducted to measure the strength of association and
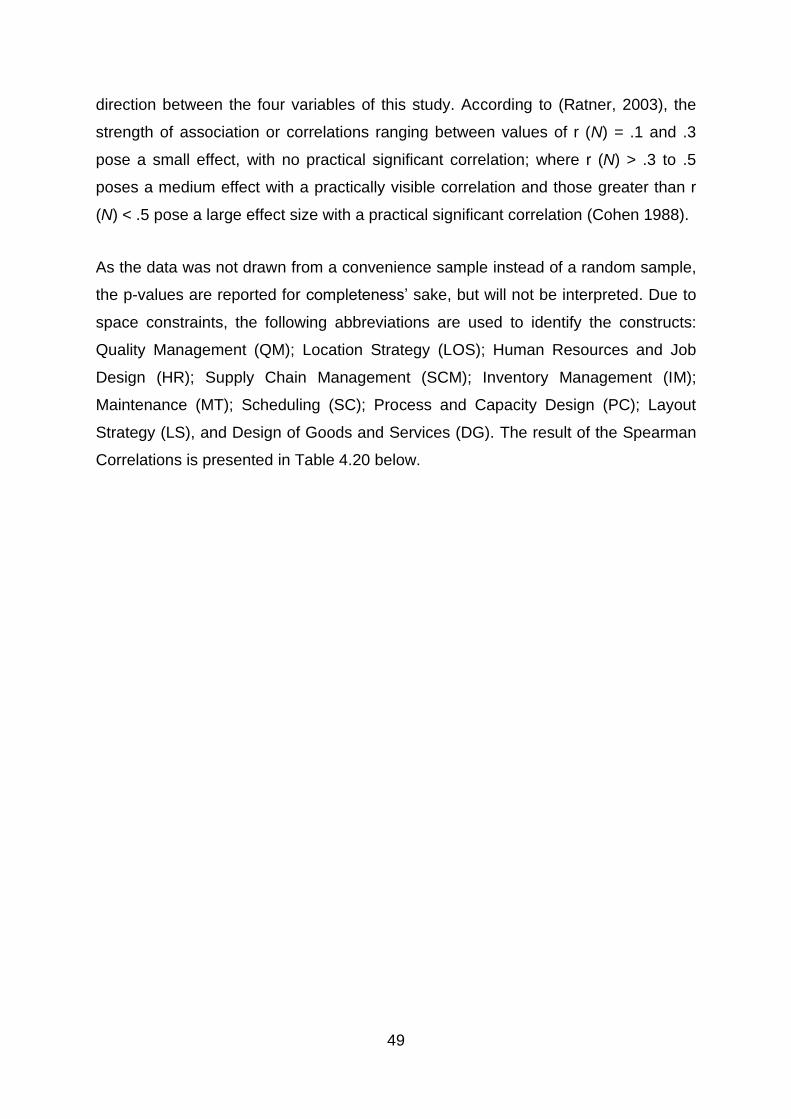
49
direction between the four variables of this study. According to (Ratner, 2003), the
strength of association or correlations ranging between values of r (N) = .1 and .3
pose a small effect, with no practical significant correlation; where r (N) > .3 to .5
poses a medium effect with a practically visible correlation and those greater than r
(N) < .5 pose a large effect size with a practical significant correlation (Cohen 1988).
As the data was not drawn from a convenience sample instead of a random sample,
the p-values are reported for completeness’ sake, but will not be interpreted. Due to
space constraints, the following abbreviations are used to identify the constructs:
Quality Management (QM); Location Strategy (LOS); Human Resources and Job
Design (HR); Supply Chain Management (SCM); Inventory Management (IM);
Maintenance (MT); Scheduling (SC); Process and Capacity Design (PC); Layout
Strategy (LS), and Design of Goods and Services (DG). The result of the Spearman
Correlations is presented in Table 4.20 below.
50
Table 4.19: Inter-correlations matrix (Spearman Correlations) of the constructs (N =
33)
OM LOS HR SCM IM MT SCM PC1 PC2 PC3 PC4 LS DGCorrelation Coefficient 1.000
Sig. (2-tailed)
Correlation Coefficient 0.239 1.000
Sig. (2-tailed) 0.180
Correlation Coefficient 0.751 0.260 1.000
Sig. (2-tailed) <0,0001 0.143
Correlation Coefficient 0.523 0.387 0.778 1.000
Sig. (2-tailed) 0.002 0.026 <0,0001
Correlation Coefficient 0.288 0.468 0.346 0.456 1.000
Sig. (2-tailed) 0.105 0.006 0.049 0.008
Correlation Coefficient 0.355 0.281 0.379 0.456 0.315 1.000
Sig. (2-tailed) 0.043 0.113 0.029 0.008 0.074
Correlation Coefficient 0.203 0.607 0.167 0.265 0.643 0.396 1.000
Sig. (2-tailed) 0.256 <0,0001 0.351 0.136 <0,0001 0.023
Correlation Coefficient 0.135 0.278 0.372 0.596 0.427 0.230 0.181 1.000
Sig. (2-tailed) 0.453 0.118 0.033 <0,0001 0.013 0.199 0.312
Correlation Coefficient 0.637 0.247 0.620 0.497 0.244 0.197 0.242 0.316 1.000
Sig. (2-tailed) <0,0001 0.166 <0,0001 0.003 0.172 0.272 0.175 0.073
Correlation Coefficient 0.195 0.125 0.038 0.157 0.209 0.349 0.095 0.063 -0.058 1.000
Sig. (2-tailed) 0.276 0.487 0.833 0.384 0.243 0.047 0.598 0.728 0.747
Correlation Coefficient 0.283 0.316 0.517 0.347 0.269 0.272 0.237 0.192 0.333 -0.165 1.000
Sig. (2-tailed) 0.111 0.073 0.002 0.048 0.130 0.126 0.185 0.285 0.059 0.360
Correlation Coefficient 0.526 0.470 0.592 0.574 0.370 0.405 0.424 0.362 0.648 -0.231 0.523 1.000
Sig. (2-tailed) 0.002 0.006 <0,0001 <0,0001 0.034 0.019 0.014 0.038 <0,0001 0.195 0.002
Correlation Coefficient 0.680 0.359 0.608 0.501 0.381 0.487 0.423 0.220 0.632 -0.021 0.463 0.653 1.000
Sig. (2-tailed) <0,0001 0.040 <0,0001 0.003 0.029 0.004 0.014 0.219 <0,0001 0.906 0.007 <0,0001DG
SCM
PC1
PC2
PC3
PC4
LS
OM
LOS
HR
SCM
IM
MT
Quality Management (QM): The correlations between Quality Management and the
following constructs are all large or practically significant: Human Resources and Job
Design (r = 0,751), Supply Chain Management (r = 0.523), Process and Capacity
Design2 (r = 0.637), Layout Strategy (r = 0.526) and lastly Design of Goods and
Services (r = 0.680). The correlations are positive, reflecting that as respondents
tend to Strongly Agree with the statements within the Quality Management construct
they will also tend to Strongly Agree with the statements within the other constructs.
Layout Strategy (LOS): The correlations between Layout Strategy and the following
construct are large or practically significant: Supply Chain Management (r = 0.607).
The correlations are positive, reflecting that as respondents tend to Strongly Agree
with the statements within the Layout Strategy construct, the participants also tend to
Strongly Agree with the statements within the Supply Chain Management construct.
51
Human Resources and Job Design (HR)
The correlations between Human Resources and Job Design and the following
constructs are large or practically significant: Supply Chain Management (r = 0.778),
Process and Capacity Design2 (r = 0.620), Layout Strategy (r = 0.592) and lastly
Design of Goods and Services (r = 0.608). The correlations are positive, reflecting
that as respondents tend to Strongly Agree with the statements within the Human
Resources and Job Design construct they will also tend to Strongly Agree with the
statements within the other constructs.
Supply Chain Management (SCM)
The correlations between Supply Chain Management and the following constructs
are large or practically significant: Process and Capacity Design1 (r = 0.596), Layout
Strategy (r = 0.574), and lastly Design of Goods and Services (r = 0.501). The
correlations are positive, reflecting that as respondents tend to Strongly Agree with
the statements within the Supply Chain Management construct they will also tend to
Strongly Agree with the statements within the other constructs.
Inventory Management (IM)
The correlations between Inventory Management and the following construct are
large or practically significant: Supply Chain Management (r = 0.643). The
correlations are positive, reflecting that as respondents tend to Strongly Agree with
the statements within the Inventory Management construct they will also tend to
Strongly Agree with the statements within the other constructs.
Process and Capacity Design (PC2)
The correlations between Process and Capacity Design2 and the following
constructs are large or practically significant: Layout Strategy (r = 0.648) and Design
of Goods and Services (r = 0.632). The correlations are positive, reflecting that as
respondents tend to Strongly Agree with the statements within the Process and
52
Capacity Design2 construct they will also tend to Strongly Agree with the statements
within the other constructs.
Process and Capacity Design (PC4)
The correlations between Process and Capacity Design4 and the following construct
are large or practically significant: Layout Strategy (r = 0.523). The correlations are
positive, reflecting that as respondents tend to Strongly Agree with the statements
within the Process and Capacity Design4 construct they will also tend to Strongly
Agree with the statements within the other constructs.
Layout Strategy (LS)
The correlations between Layout Strategy and the following construct are large or
practically significant: Design of Goods and Services (r = 0.653). The correlations are
positive, reflecting that as respondents tend to Strongly Agree with the statements
within the Layout Strategy construct, they will also tend to Strongly Agree with the
statements within the other constructs.
4.8 Summary of descriptive statistical findings
A total of 21 of the participants are male and 12 are female that will give a balanced
view from a gender perspective. The majority had more than 6 years of experience
an indication the company employs an experienced workforce (not really- workforce
relatively inexperienced) of which 13 works in the operations or engineering sections.
Eighteen of the respondents are in the same position for more than 6 years an
indication of a flat organisational structure. The majority of the participants possess a
diploma or higher qualification an indication of a well-educated workforce. Twelve of
the participants held management or supervisory roles and the other operational
roles.
The company responds to customers –replace the word and do not rely on others to
provide quality feedback. The facility is located strategically close to the customers
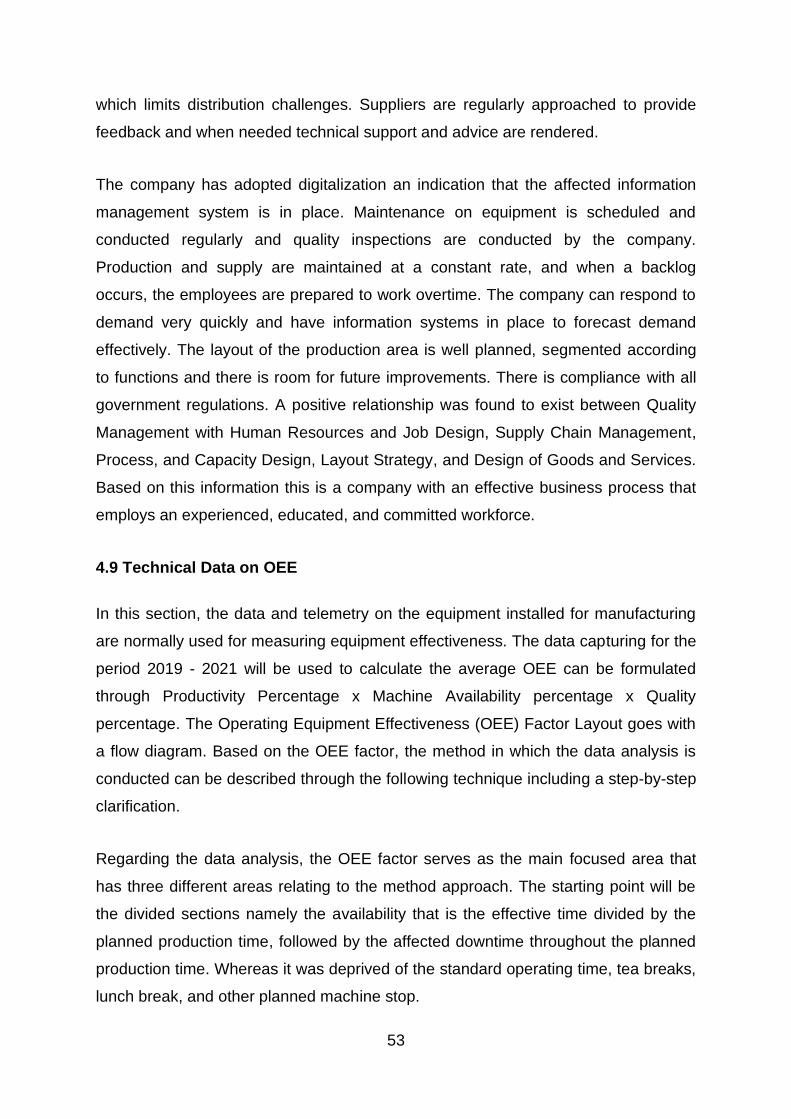
53
which limits distribution challenges. Suppliers are regularly approached to provide
feedback and when needed technical support and advice are rendered.
The company has adopted digitalization an indication that the affected information
management system is in place. Maintenance on equipment is scheduled and
conducted regularly and quality inspections are conducted by the company.
Production and supply are maintained at a constant rate, and when a backlog
occurs, the employees are prepared to work overtime. The company can respond to
demand very quickly and have information systems in place to forecast demand
effectively. The layout of the production area is well planned, segmented according
to functions and there is room for future improvements. There is compliance with all
government regulations. A positive relationship was found to exist between Quality
Management with Human Resources and Job Design, Supply Chain Management,
Process, and Capacity Design, Layout Strategy, and Design of Goods and Services.
Based on this information this is a company with an effective business process that
employs an experienced, educated, and committed workforce.
4.9 Technical Data on OEE
In this section, the data and telemetry on the equipment installed for manufacturing
are normally used for measuring equipment effectiveness. The data capturing for the
period 2019 - 2021 will be used to calculate the average OEE can be formulated
through Productivity Percentage x Machine Availability percentage x Quality
percentage. The Operating Equipment Effectiveness (OEE) Factor Layout goes with
a flow diagram. Based on the OEE factor, the method in which the data analysis is
conducted can be described through the following technique including a step-by-step
clarification.
Regarding the data analysis, the OEE factor serves as the main focused area that
has three different areas relating to the method approach. The starting point will be
the divided sections namely the availability that is the effective time divided by the
planned production time, followed by the affected downtime throughout the planned
production time. Whereas it was deprived of the standard operating time, tea breaks,
lunch break, and other planned machine stop.
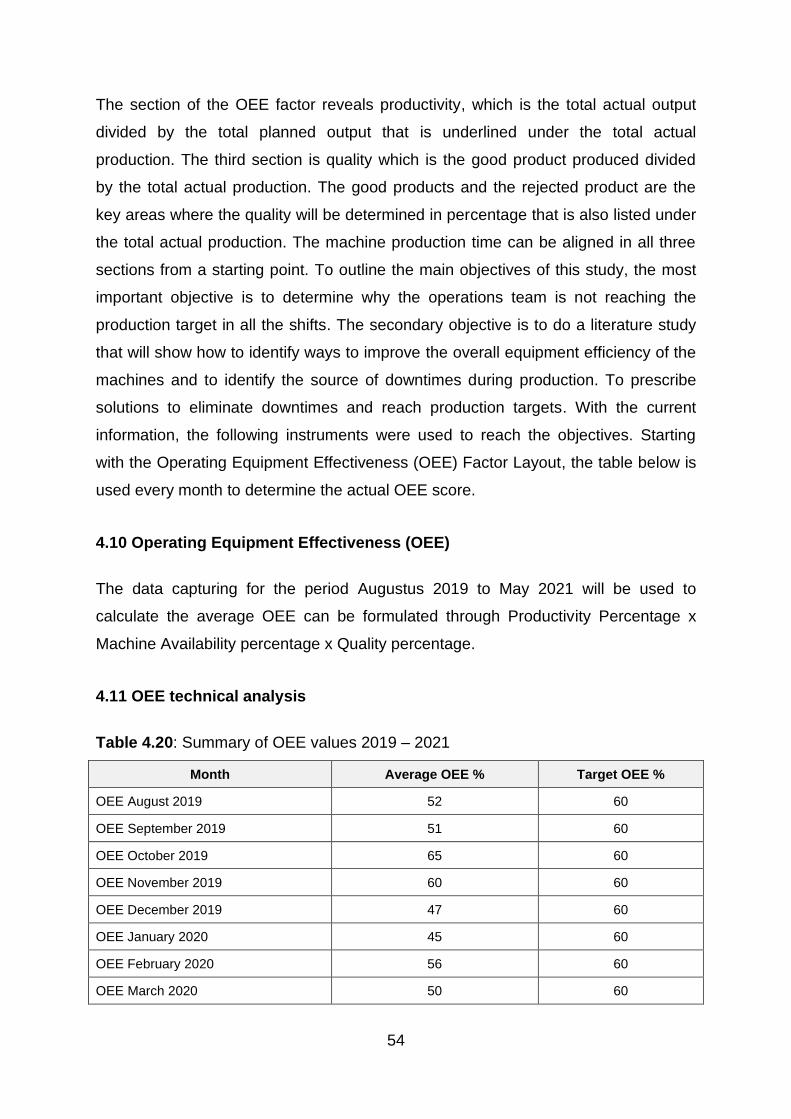
54
The section of the OEE factor reveals productivity, which is the total actual output
divided by the total planned output that is underlined under the total actual
production. The third section is quality which is the good product produced divided
by the total actual production. The good products and the rejected product are the
key areas where the quality will be determined in percentage that is also listed under
the total actual production. The machine production time can be aligned in all three
sections from a starting point. To outline the main objectives of this study, the most
important objective is to determine why the operations team is not reaching the
production target in all the shifts. The secondary objective is to do a literature study
that will show how to identify ways to improve the overall equipment efficiency of the
machines and to identify the source of downtimes during production. To prescribe
solutions to eliminate downtimes and reach production targets. With the current
information, the following instruments were used to reach the objectives. Starting
with the Operating Equipment Effectiveness (OEE) Factor Layout, the table below is
used every month to determine the actual OEE score.
4.10 Operating Equipment Effectiveness (OEE)
The data capturing for the period Augustus 2019 to May 2021 will be used to
calculate the average OEE can be formulated through Productivity Percentage x
Machine Availability percentage x Quality percentage.
4.11 OEE technical analysis
Table 4.20: Summary of OEE values 2019 – 2021
Month Average OEE % Target OEE %
OEE August 2019 52 60
OEE September 2019 51 60
OEE October 2019 65 60
OEE November 2019 60 60
OEE December 2019 47 60
OEE January 2020 45 60
OEE February 2020 56 60
OEE March 2020 50 60
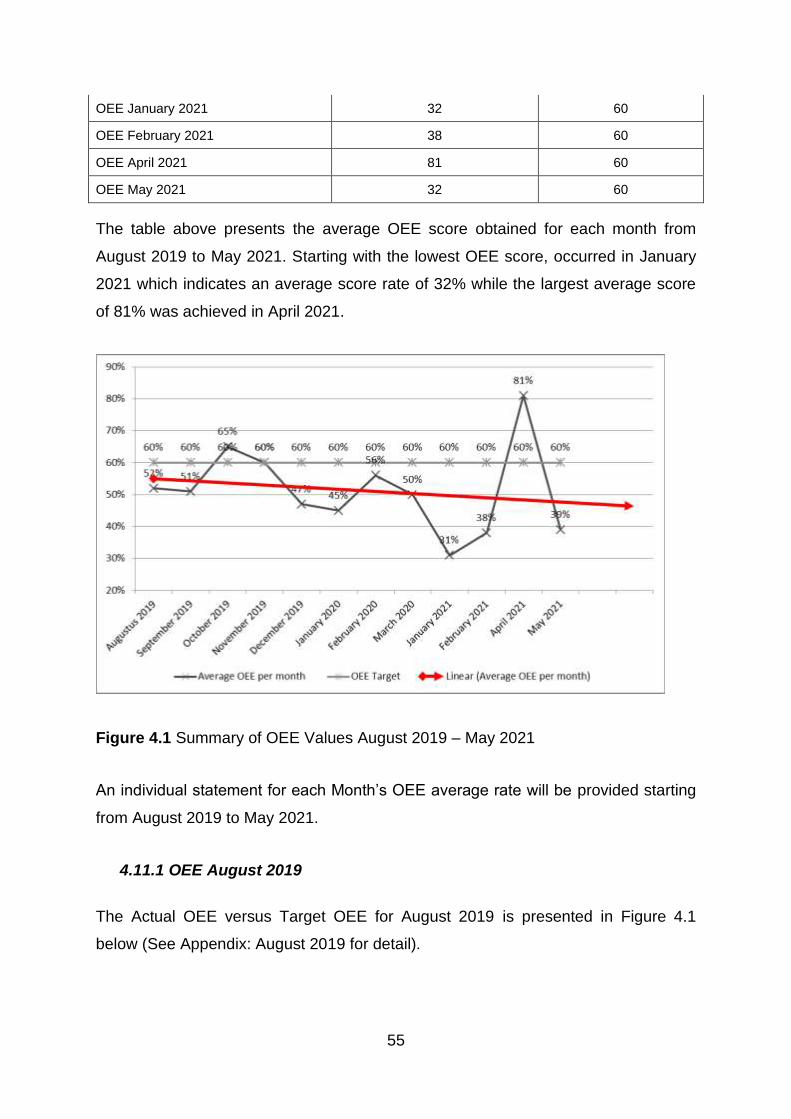
55
OEE January 2021 32 60
OEE February 2021 38 60
OEE April 2021 81 60
OEE May 2021 32 60
The table above presents the average OEE score obtained for each month from
August 2019 to May 2021. Starting with the lowest OEE score, occurred in January
2021 which indicates an average score rate of 32% while the largest average score
of 81% was achieved in April 2021.
Figure 4.1 Summary of OEE Values August 2019 – May 2021
An individual statement for each Month’s OEE average rate will be provided starting
from August 2019 to May 2021.
4.11.1 OEE August 2019
The Actual OEE versus Target OEE for August 2019 is presented in Figure 4.1
below (See Appendix: August 2019 for detail).
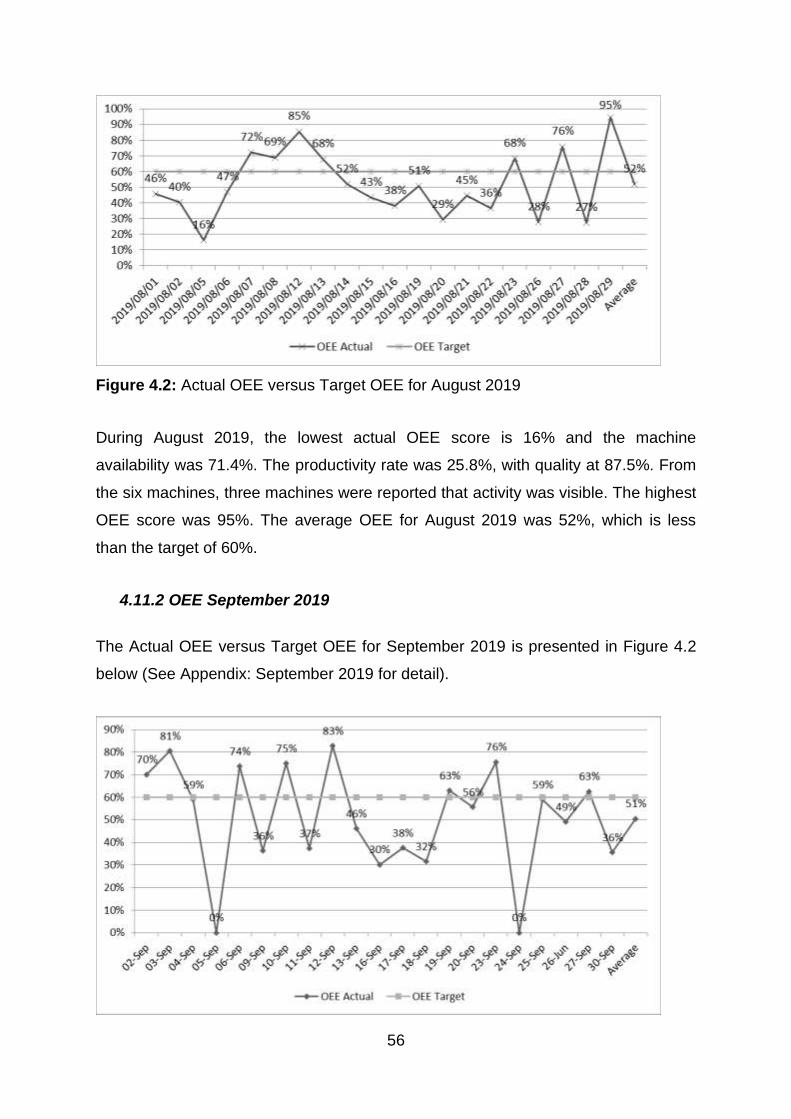
56
Figure 4.2: Actual OEE versus Target OEE for August 2019
During August 2019, the lowest actual OEE score is 16% and the machine
availability was 71.4%. The productivity rate was 25.8%, with quality at 87.5%. From
the six machines, three machines were reported that activity was visible. The highest
OEE score was 95%. The average OEE for August 2019 was 52%, which is less
than the target of 60%.
4.11.2 OEE September 2019
The Actual OEE versus Target OEE for September 2019 is presented in Figure 4.2
below (See Appendix: September 2019 for detail).
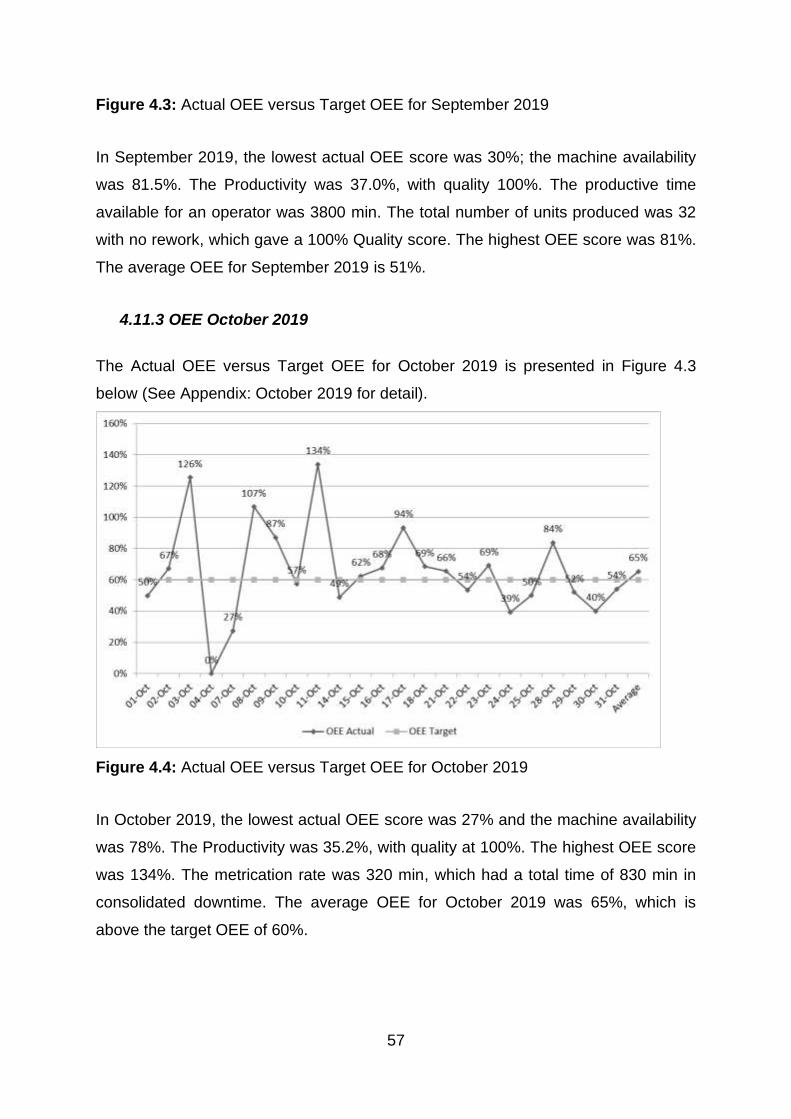
57
Figure 4.3: Actual OEE versus Target OEE for September 2019
In September 2019, the lowest actual OEE score was 30%; the machine availability
was 81.5%. The Productivity was 37.0%, with quality 100%. The productive time
available for an operator was 3800 min. The total number of units produced was 32
with no rework, which gave a 100% Quality score. The highest OEE score was 81%.
The average OEE for September 2019 is 51%.
4.11.3 OEE October 2019
The Actual OEE versus Target OEE for October 2019 is presented in Figure 4.3
below (See Appendix: October 2019 for detail).
Figure 4.4: Actual OEE versus Target OEE for October 2019
In October 2019, the lowest actual OEE score was 27% and the machine availability
was 78%. The Productivity was 35.2%, with quality at 100%. The highest OEE score
was 134%. The metrication rate was 320 min, which had a total time of 830 min in
consolidated downtime. The average OEE for October 2019 was 65%, which is
above the target OEE of 60%.
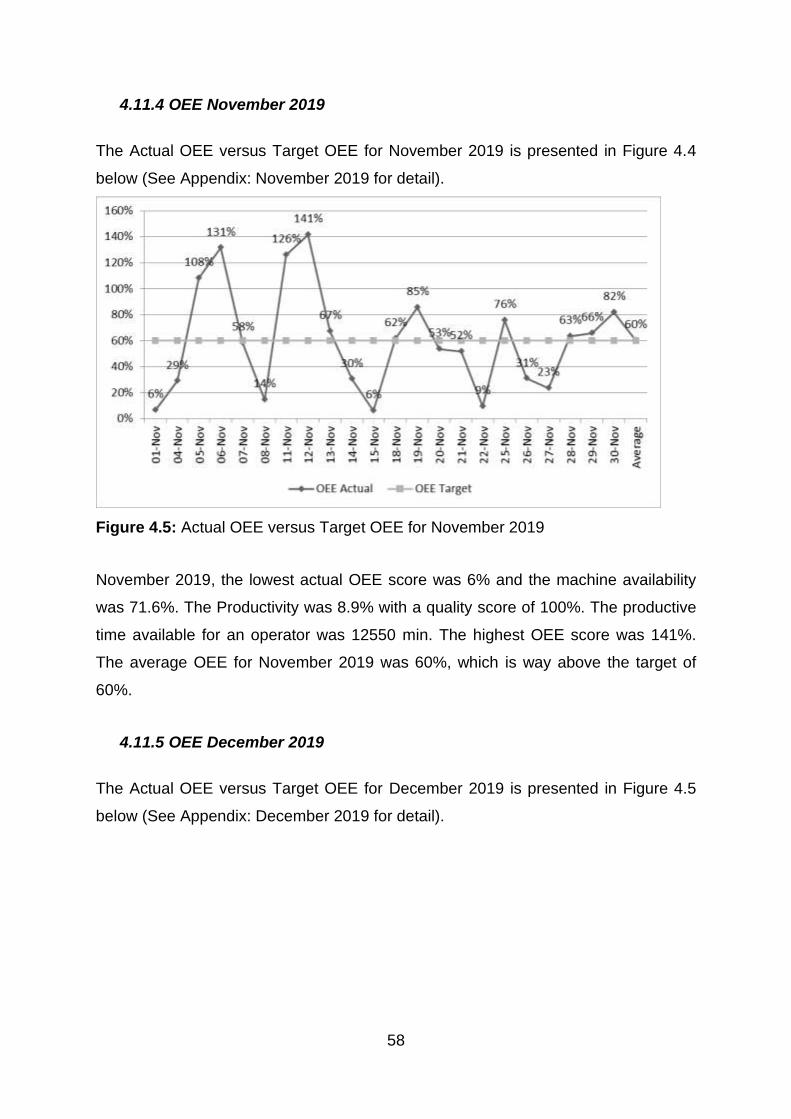
58
4.11.4 OEE November 2019
The Actual OEE versus Target OEE for November 2019 is presented in Figure 4.4
below (See Appendix: November 2019 for detail).
Figure 4.5: Actual OEE versus Target OEE for November 2019
November 2019, the lowest actual OEE score was 6% and the machine availability
was 71.6%. The Productivity was 8.9% with a quality score of 100%. The productive
time available for an operator was 12550 min. The highest OEE score was 141%.
The average OEE for November 2019 was 60%, which is way above the target of
60%.
4.11.5 OEE December 2019
The Actual OEE versus Target OEE for December 2019 is presented in Figure 4.5
below (See Appendix: December 2019 for detail).
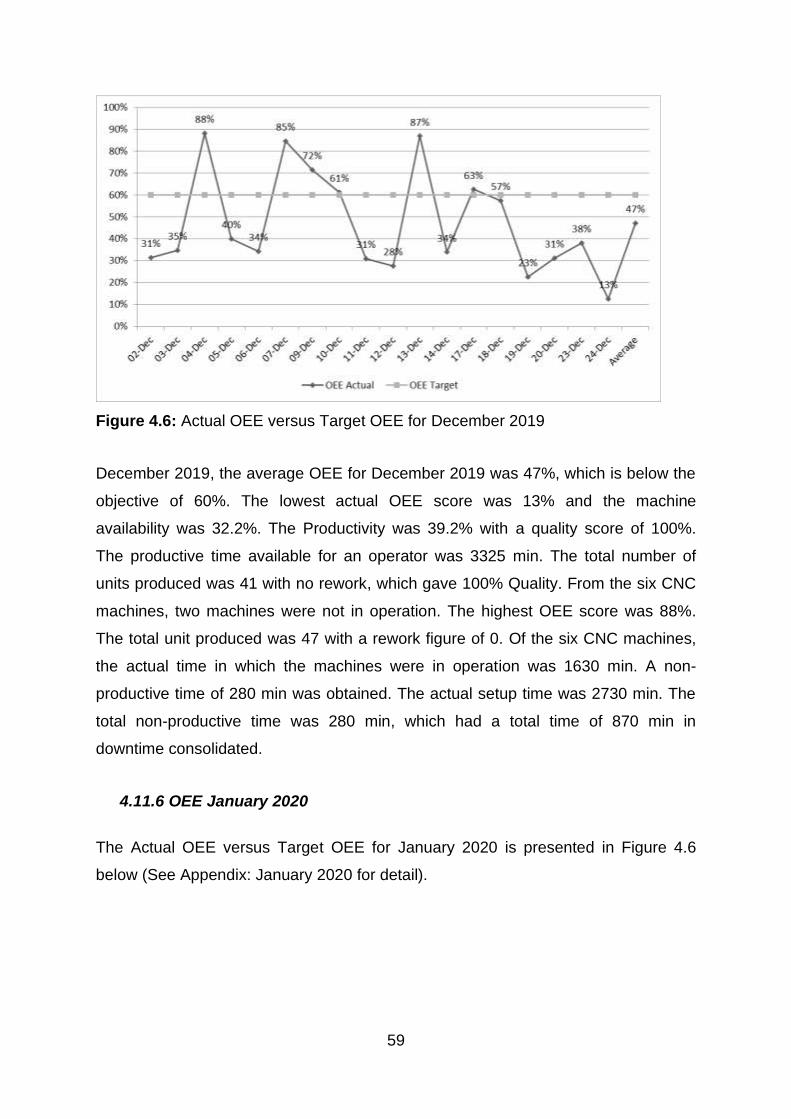
59
Figure 4.6: Actual OEE versus Target OEE for December 2019
December 2019, the average OEE for December 2019 was 47%, which is below the
objective of 60%. The lowest actual OEE score was 13% and the machine
availability was 32.2%. The Productivity was 39.2% with a quality score of 100%.
The productive time available for an operator was 3325 min. The total number of
units produced was 41 with no rework, which gave 100% Quality. From the six CNC
machines, two machines were not in operation. The highest OEE score was 88%.
The total unit produced was 47 with a rework figure of 0. Of the six CNC machines,
the actual time in which the machines were in operation was 1630 min. A non-
productive time of 280 min was obtained. The actual setup time was 2730 min. The
total non-productive time was 280 min, which had a total time of 870 min in
downtime consolidated.
4.11.6 OEE January 2020
The Actual OEE versus Target OEE for January 2020 is presented in Figure 4.6
below (See Appendix: January 2020 for detail).
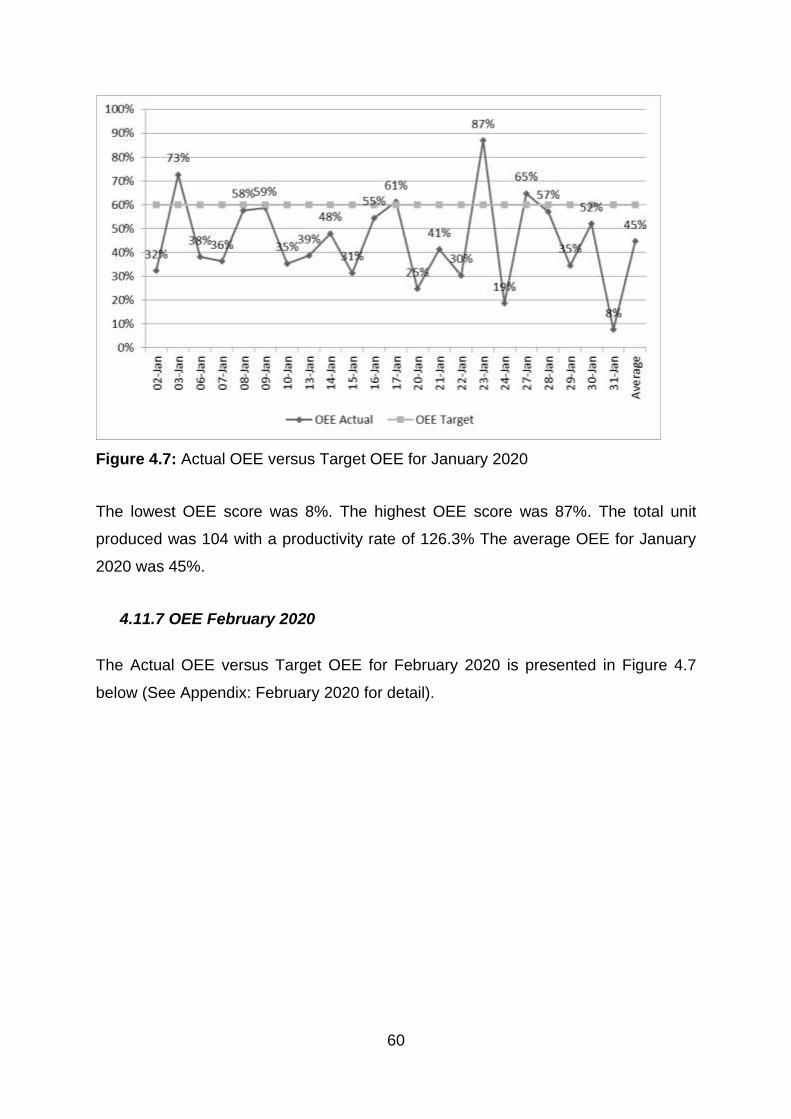
60
Figure 4.7: Actual OEE versus Target OEE for January 2020
The lowest OEE score was 8%. The highest OEE score was 87%. The total unit
produced was 104 with a productivity rate of 126.3% The average OEE for January
2020 was 45%.
4.11.7 OEE February 2020
The Actual OEE versus Target OEE for February 2020 is presented in Figure 4.7
below (See Appendix: February 2020 for detail).
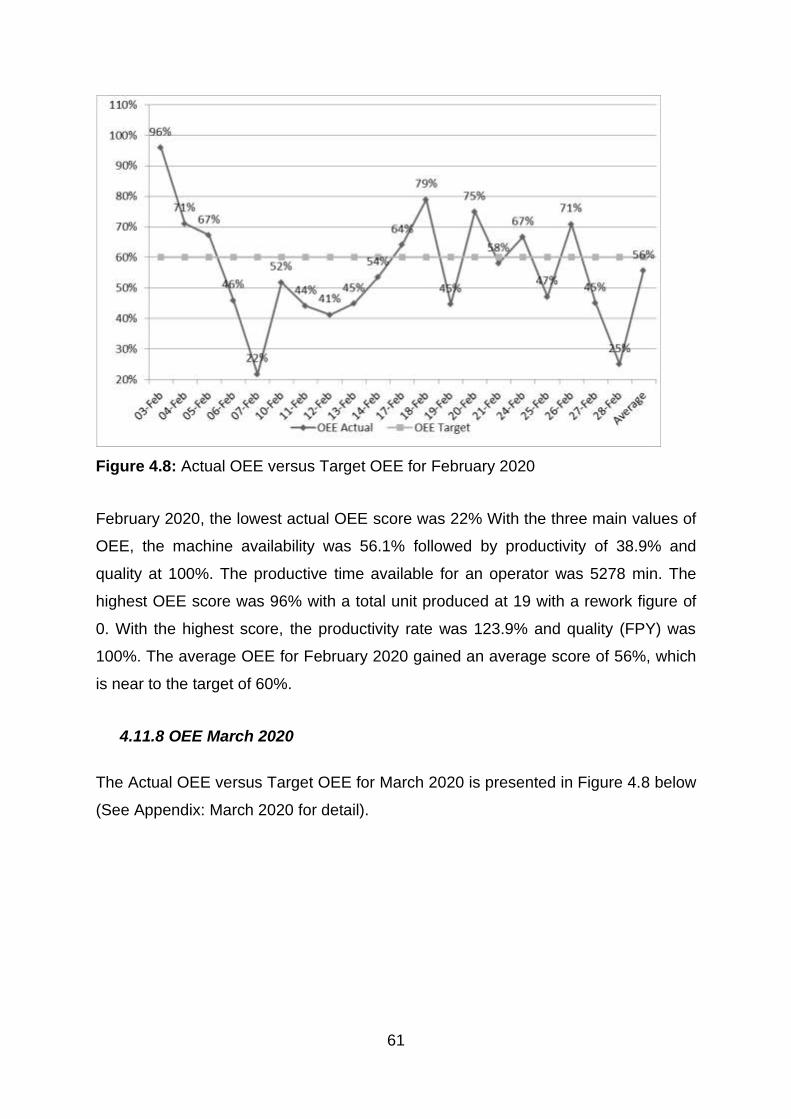
61
Figure 4.8: Actual OEE versus Target OEE for February 2020
February 2020, the lowest actual OEE score was 22% With the three main values of
OEE, the machine availability was 56.1% followed by productivity of 38.9% and
quality at 100%. The productive time available for an operator was 5278 min. The
highest OEE score was 96% with a total unit produced at 19 with a rework figure of
0. With the highest score, the productivity rate was 123.9% and quality (FPY) was
100%. The average OEE for February 2020 gained an average score of 56%, which
is near to the target of 60%.
4.11.8 OEE March 2020
The Actual OEE versus Target OEE for March 2020 is presented in Figure 4.8 below
(See Appendix: March 2020 for detail).
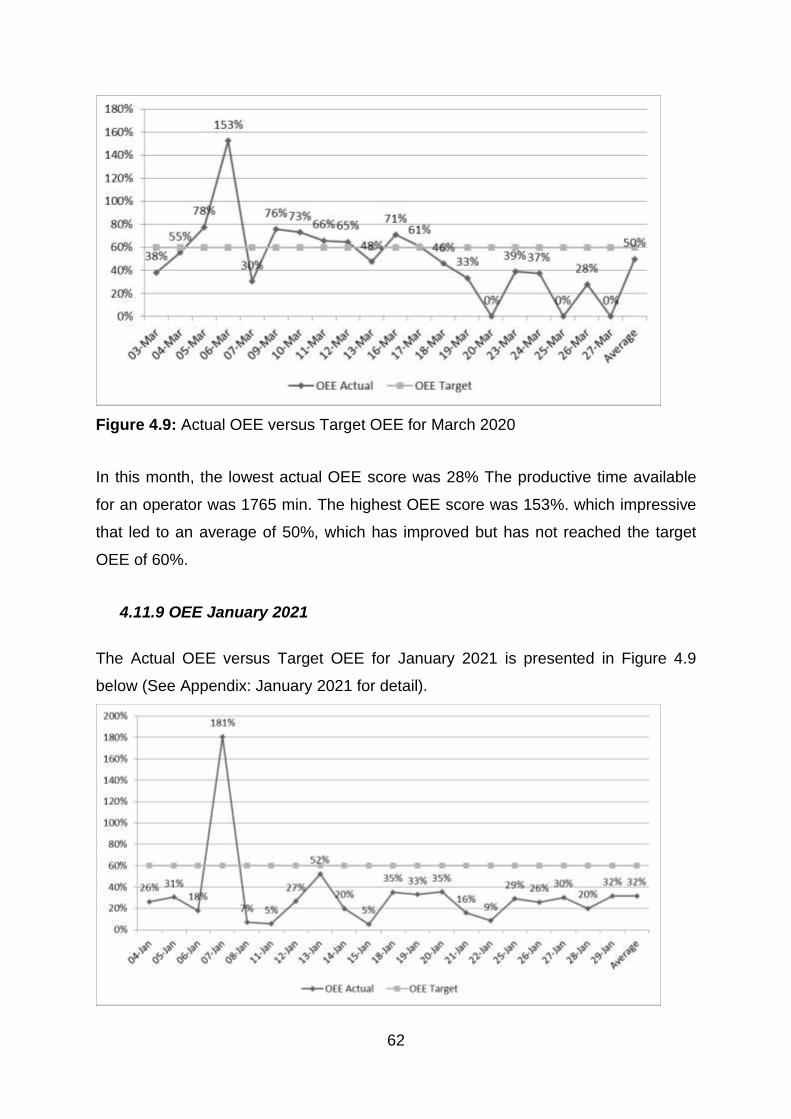
62
Figure 4.9: Actual OEE versus Target OEE for March 2020
In this month, the lowest actual OEE score was 28% The productive time available
for an operator was 1765 min. The highest OEE score was 153%. which impressive
that led to an average of 50%, which has improved but has not reached the target
OEE of 60%.
4.11.9 OEE January 2021
The Actual OEE versus Target OEE for January 2021 is presented in Figure 4.9
below (See Appendix: January 2021 for detail).
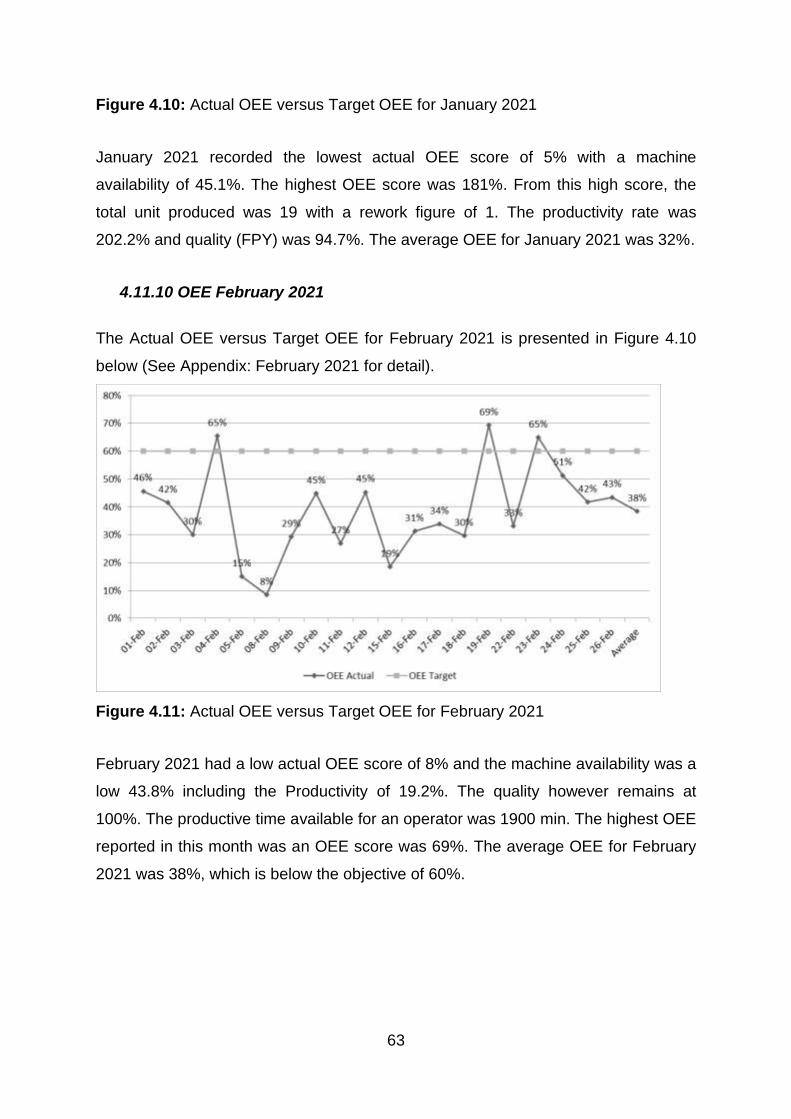
63
Figure 4.10: Actual OEE versus Target OEE for January 2021
January 2021 recorded the lowest actual OEE score of 5% with a machine
availability of 45.1%. The highest OEE score was 181%. From this high score, the
total unit produced was 19 with a rework figure of 1. The productivity rate was
202.2% and quality (FPY) was 94.7%. The average OEE for January 2021 was 32%.
4.11.10 OEE February 2021
The Actual OEE versus Target OEE for February 2021 is presented in Figure 4.10
below (See Appendix: February 2021 for detail).
Figure 4.11: Actual OEE versus Target OEE for February 2021
February 2021 had a low actual OEE score of 8% and the machine availability was a
low 43.8% including the Productivity of 19.2%. The quality however remains at
100%. The productive time available for an operator was 1900 min. The highest OEE
reported in this month was an OEE score was 69%. The average OEE for February
2021 was 38%, which is below the objective of 60%.
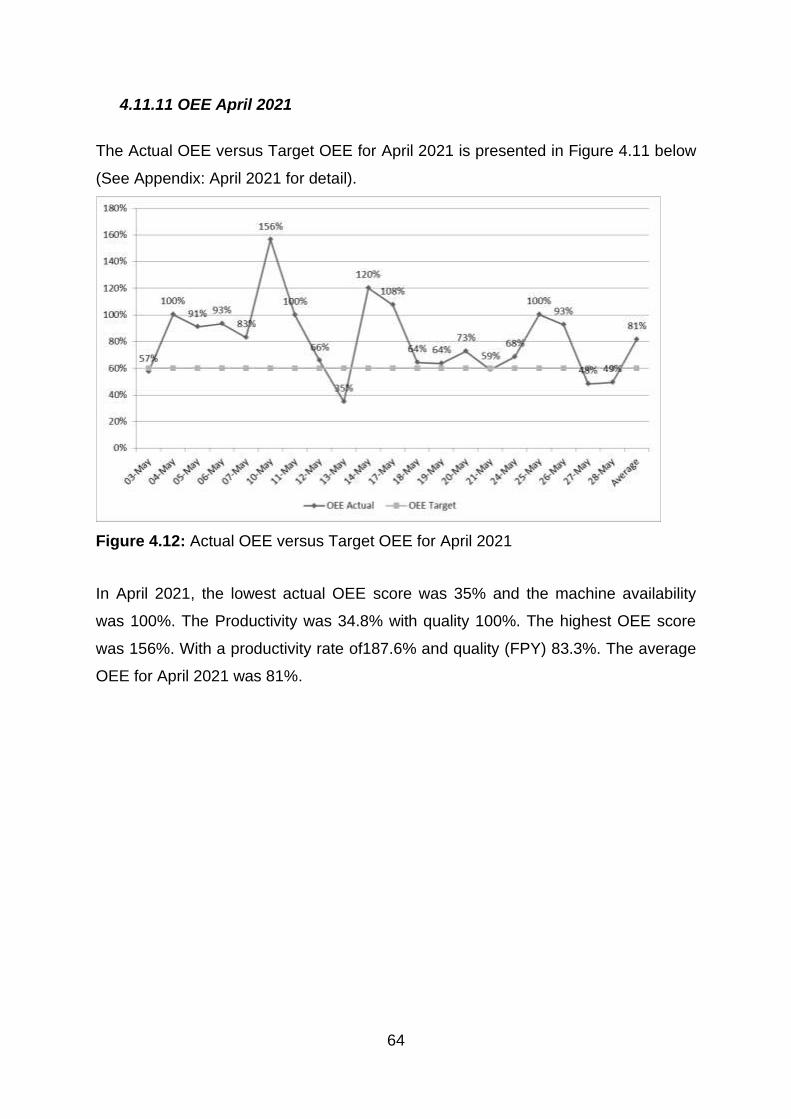
64
4.11.11 OEE April 2021
The Actual OEE versus Target OEE for April 2021 is presented in Figure 4.11 below
(See Appendix: April 2021 for detail).
Figure 4.12: Actual OEE versus Target OEE for April 2021
In April 2021, the lowest actual OEE score was 35% and the machine availability
was 100%. The Productivity was 34.8% with quality 100%. The highest OEE score
was 156%. With a productivity rate of187.6% and quality (FPY) 83.3%. The average
OEE for April 2021 was 81%.
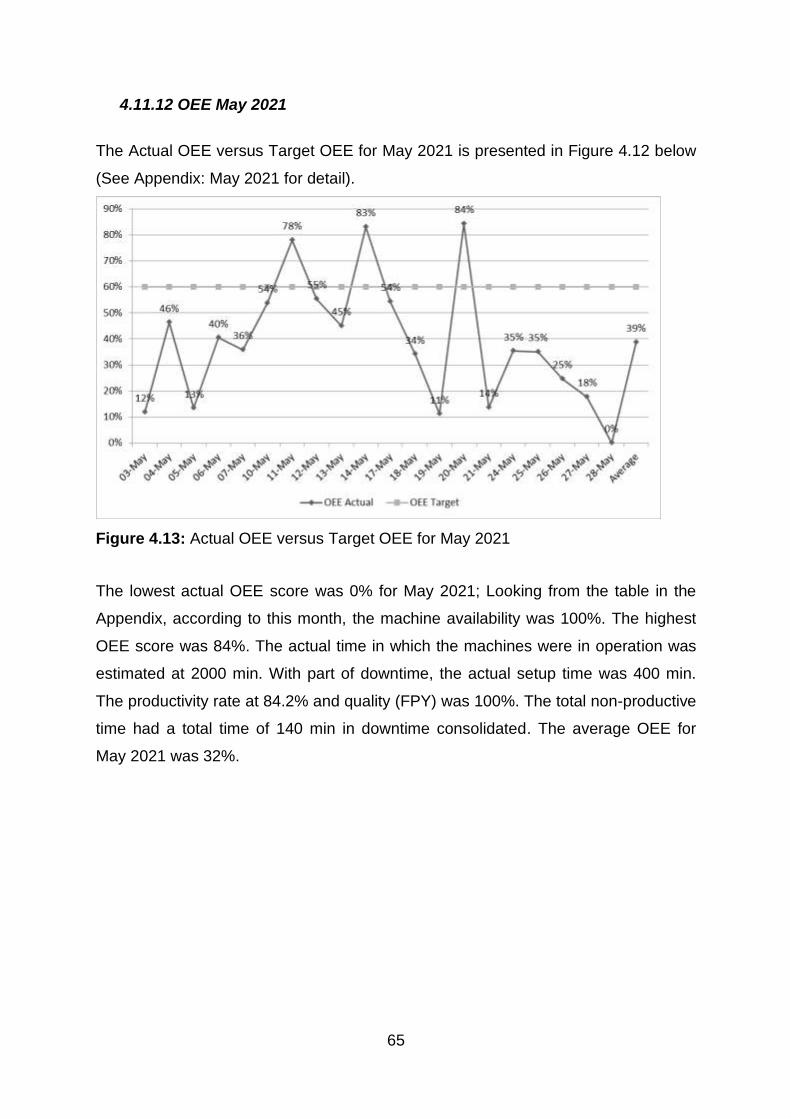
65
4.11.12 OEE May 2021
The Actual OEE versus Target OEE for May 2021 is presented in Figure 4.12 below
(See Appendix: May 2021 for detail).
Figure 4.13: Actual OEE versus Target OEE for May 2021
The lowest actual OEE score was 0% for May 2021; Looking from the table in the
Appendix, according to this month, the machine availability was 100%. The highest
OEE score was 84%. The actual time in which the machines were in operation was
estimated at 2000 min. With part of downtime, the actual setup time was 400 min.
The productivity rate at 84.2% and quality (FPY) was 100%. The total non-productive
time had a total time of 140 min in downtime consolidated. The average OEE for
May 2021 was 32%.
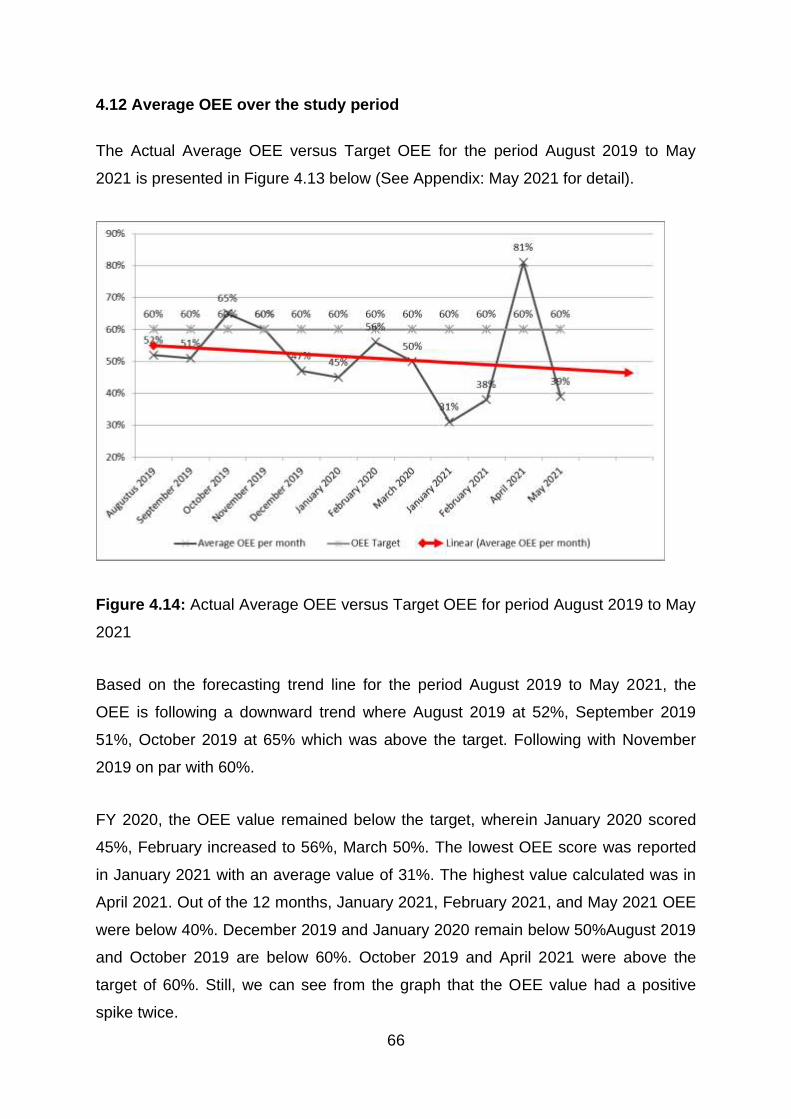
66
4.12 Average OEE over the study period
The Actual Average OEE versus Target OEE for the period August 2019 to May
2021 is presented in Figure 4.13 below (See Appendix: May 2021 for detail).
Figure 4.14: Actual Average OEE versus Target OEE for period August 2019 to May
2021
Based on the forecasting trend line for the period August 2019 to May 2021, the
OEE is following a downward trend where August 2019 at 52%, September 2019
51%, October 2019 at 65% which was above the target. Following with November
2019 on par with 60%.
FY 2020, the OEE value remained below the target, wherein January 2020 scored
45%, February increased to 56%, March 50%. The lowest OEE score was reported
in January 2021 with an average value of 31%. The highest value calculated was in
April 2021. Out of the 12 months, January 2021, February 2021, and May 2021 OEE
were below 40%. December 2019 and January 2020 remain below 50%August 2019
and October 2019 are below 60%. October 2019 and April 2021 were above the
target of 60%. Still, we can see from the graph that the OEE value had a positive
spike twice.

67
4.13 Conclusion
In this chapter, the results of the data analysis conducted on the data collected with
the survey questionnaire were presented. The data were analyzed with both
descriptive and inferential analyzing methods. Graphs and tables were used to
present the data.
68
CHAPTER 2:
CHAPTER 5: CONCLUSION AND RECOMMENDATION
5.1 Introduction
In this chapter, the research objectives will be discussed with the findings from the
study with recommendations and areas for further research. This chapter will give us
the outcomes from the study with a recommendation approach.
5.2 Research objectives
The main purpose of this study is to determine why the operations team is not
reaching the OEE target in all the shifts. The research objectives defined for the
study in Chapter 1 are as follows:
• Research Objective 1: To determine which OEE management decisions are
least emphasised.
• Research Objective 2: To determine which OEE operations management
decisions impact negatively and positively.
• Research Objective 3: To come up with recommendation to improve OEE.
5.3 Findings from the study
In this section, the findings of the literature review and the primary research are
presented with the statics based on the OEE data and the questionnaire.
5.3.1 Research findings from the literature review
Overall equipment effectiveness is furthermost seen as a tool for use in production
operations. A major goal for overall equipment effectiveness programs is to reduce
and/or eliminate namely the Six Big Losses, which are the most common causes of
equipment-based productivity loss in manufacturing.
69
The processes, documents, and resources specific to the products and the methods
of verification, validation, monitoring, measurement, and test activities specific to the
product and the criteria are located for product acceptance. All records will be
maintained to provide evidence of the realization process and that the resulting
product meets the initial requirements. The output may be in the form of an
engineering design review in quality, the project plan, and the customer-specific
order process. The customer-related processes will determine the review/processing
of customer inquiries/orders and the coordination of these activities with the
internal/external parties.
The main goal for the operations management goes in three ways; the firm
strategizes to meet its mission including differentiation, cost leadership, and
response. Concerns to take into consideration when deciding on overall equipment
effectiveness systems conclude that the system reveals as a metric and does it drive
the right behaviour. In other essences, some companies use overall equipment
effectiveness systems when they only look when its operation becomes a bottleneck.
Some overall equipment effectiveness systems have poor optimization capabilities it
all comes at a price. So, operation managers should think very clear when obtaining
or upgrading old machines with overall equipment effectiveness systems. Associates
are often turned off by the system's complexity and unclear apportionments are
typically part of the overall equipment effectiveness measurement system. The other
fact allies that great figure do not mean anything to objectives of the value stream
the overall equipment effectiveness is a local measure of a single piece of
equipment.
The overall equipment effectiveness system can be difficult for some manufacturing
entities especially when the results towards manufacturing in setting its goal can be
miss achieved through overproduction, reducing changeover, and start-up losses by
impacting the quality of the product. Furthermore, the overall equipment
effectiveness system also influences the use of a general benchmark figure across
machines and locations.
70
On the other hand, many companies have achieved better results when choosing the
best fitted overall equipment effectiveness system with their manufacturing
processes such as by resulting overall equipment effectiveness score of 60% that
can be considered world-class for discrete manufacturers. However, an overall
equipment effectiveness score of 60% can be typical for substantial improvement.
Another key point for overall equipment effectiveness goes with maintenance
including key performance indicators that measures an asset level of productivity.
The overall equipment effectiveness score is calculated by multiplying the availability
rate (utilization) by production rate (efficiency) by first-pass yield (quality). For me,
this topic has a deeper thought based on the impact on decisions for operations
management.
5.3.2 Findings from the primary research
The findings of the primary research are presented by the research objective.
5.3.3 Demographical findings
Gender - A larger proportion of the respondents were males (n=21, 63.6%) and the
remainder were females (n-12, 36.4%) Thus 1 = Male, 2 = Female.
Years’ experience - With the given data, most of the respondents had a frequency of
9, with a total of 27.3% having between 6 -10 years of work experience in the
organisation
Departments - With the given data, the frequency of the respondents in their
departments was 31 out of 33, a frequency of 10 (30.3%).
Years in position - The findings of years within the current position, came from
department one, whereas it held the highest score percentage of 45.5 % and 15
years followed with department three that was six years or 18.2%.
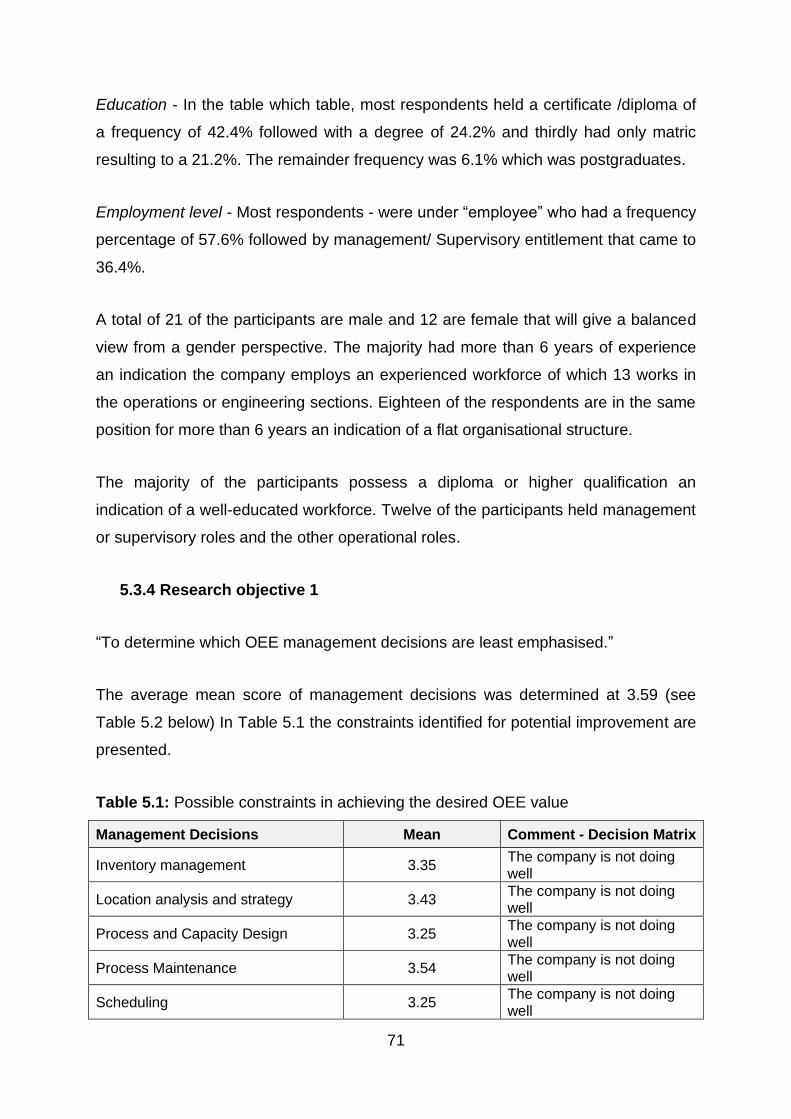
71
Education - In the table which table, most respondents held a certificate /diploma of
a frequency of 42.4% followed with a degree of 24.2% and thirdly had only matric
resulting to a 21.2%. The remainder frequency was 6.1% which was postgraduates.
Employment level - Most respondents - were under “employee” who had a frequency
percentage of 57.6% followed by management/ Supervisory entitlement that came to
36.4%.
A total of 21 of the participants are male and 12 are female that will give a balanced
view from a gender perspective. The majority had more than 6 years of experience
an indication the company employs an experienced workforce of which 13 works in
the operations or engineering sections. Eighteen of the respondents are in the same
position for more than 6 years an indication of a flat organisational structure.
The majority of the participants possess a diploma or higher qualification an
indication of a well-educated workforce. Twelve of the participants held management
or supervisory roles and the other operational roles.
5.3.4 Research objective 1
“To determine which OEE management decisions are least emphasised.”
The average mean score of management decisions was determined at 3.59 (see
Table 5.2 below) In Table 5.1 the constraints identified for potential improvement are
presented.
Table 5.1: Possible constraints in achieving the desired OEE value
Management Decisions Mean Comment - Decision Matrix
Inventory management 3.35 The company is not doing well
Location analysis and strategy 3.43 The company is not doing well
Process and Capacity Design 3.25 The company is not doing well
Process Maintenance 3.54 The company is not doing well
Scheduling 3.25 The company is not doing well

72
As reflected in Table 5.1 it was found that the management decisions inventory
management; location analysis and strategy; process and capacity design; process
maintenance and scheduling are the primary constraints that impact the
achievement of OEE targets.
5.3.5 Research objective 2
“To determine which OEE operations management decisions impact negatively and
positively.”
The operations management decisions that impact OEE are presented in Table 5.2
below.
Table 5.2: Impact of operations management decisions on the OEE
Management Decisions Mean Comment Decision Matrix
Design of goods and service 4.00 Company is doing well above mean 3.59
Human Resources and Job design 3.79 Company is doing well above mean 3.60
Layout Strategy 3.71 Company is doing well above mean 3.59
Quality management 3.71 Company is doing well above mean 3.59
Supply chain management 3.90 Company is doing well above mean 3.59
Inventory management 3.35 Company is not doing well below mean 3.60
Location analysis and strategy 3.43 Company is not doing well below mean 3.60
Process and Capacity Design 3.25 Company is not doing well below mean 3.60
Process Maintenance 3.54 Company is not doing well below mean 3.60
Scheduling 3.25 Company is not doing well below mean 3.60
Average mean score 3.593
The element in which the company has reached above 3.59 is doing well. The
decision areas which are not doing well are not being emphasized. Despite the
emphases, the OEE is going down as illustrated in (Figure 4.13).
5.3.6 Research objective 3
“To come up with recommendation to improve OEE.”
By calculating the speed loss rather than the downtime, it will assist production
effectiveness, thereby improving the OEE score. Speed loss has three areas
73
namely, human-related, product-related, and technology-related that may have a
possible area for improvement.
The human factors can be improved from knowing the steps of the process, with the
right people in the right places, with the right tools, by using better tools such as
electrical tools instead of manual. The design of tasks to be physically conformable
will allow for performance to increase. The product factors involved with the quality of
finished goods can create small stops as the line should be stopped to perform
fixing. Technology factors such as equipment design weakness can portray speed
loss. Looking into improved equipment such as motion control systems will create
smoother and faster movement, especially on the CNC machines.
From the research, in figure 4.13, the data measured during the different periods
provided accurate information. Based on the information the OEE rate went
downwards. New OEE measuring programs can be looked into depending on the
CAPEX availability and if the need is required to do so.
5.4 Research conclusions
The research conclusions are given by the research question based on the findings
as defined in the research objectives.
5.4.1 Research question 1
It can be concluded that the management decisions inventory management; location
analysis and strategy; process and capacity design; process maintenance and
scheduling are the primary constraints that impact the achievement of OEE targets.
5.4.2 Research question 2
“Which operations management decisions impact negatively and positively on the
OEE?
From the research results, it can be concluded that the design of goods and
services, affected management’s decisions positively. The human resources and job
74
design also indicated a positive decision impact on the OEE. This is to say that the
people who work on the equipment are trained and have the capabilities to utilise the
equipment properly. The layout strategy has a positive effect on the management’s
decisions, as the equipment is aligned according to the manufacturing process that
improves lean techniques.
It can be concluded that operations management decisions have a positive impact
on the quality, to ensure that the product quality meets the global standards in which
the company presents. It can be concluded that operations management should
optimize its decisions towards scheduling to have all equipment prepared to
eliminate improved downtime as this decision harms the data. The decisions on
quality management are good; from the statistics, the mean over the standard rate is
greater which has a positive impact on the OEE.
5.4.3 Research question 3
“What other alternatives are available and how can they be implemented to achieve
an OEE global standard of 60%?”
It can be concluded that the alternative for speed loss is an option for the company
that will be a benefit towards OEE improvement.
5.4.4 Research question 4
“Is the current data collection system sufficient to quantify the OEE score on the
CNC machines?”
It can be concluded that the current OEE calculated system is on par based on the
trends shown. The company may investigate new programs that will be more cost-
efficient with new technology compatibility.
5.5 Recommendations
Based on the findings of this study the following recommendation can be made -
these should come from the results.
75
The company should focus on the operations management decisions with means
that were scored below 3.59. This does not state that the impact decisions were
correct, but management can investigate these areas to focus and to improve their
overall average OEE.
• Area 1: Inventory management
• Area 2: Location analysis and strategy
• Area 3: Quality management
• Area 4: Scheduling
The areas below 3.59 were not being emphasized, these were identified as process
and maintenance which had a mean of 3.54. The Location analysis and strategy
have scored 3.43. Inventory management has the second-lowest mean average of
3.35 and lastly, Process and Capacity Design and scheduling have set a mean rate
of 3.25. The areas can be seen as for improvement that would improve overall the
OEE value in the company.
Most operations decisions such as Design of goods and services, Human Resources
and Job design, Layout Strategy, Quality management, and Supply chain
management have contributed a positive effect on the OEE. However, with the
decline in the OEE value towards the positive effect out of the research, the
company can appoint a committee to investigate further why the OEE value declines
based on the decisions.
Note: Additional unplanned measures due to breakdowns of machines might require
preventive maintenance or vibration analysis. Upcoming research may be done to
reconnoitre:
• Frequency studies on man-hours (Human OEE)
• Machine design or mechanical design
• Operation and production design
• Terms of cost
• The dynamics of translating equipment effectiveness or loss of effectiveness.
76
5.6 Areas for further research
An important aspect that might further improve the work now carried out in this
dissertation would be qualitative research.
Some areas of difficulties were encountered during this work that included:
• The unavailability of data from some machines limiting the research
• Incomplete data from some machines
• Number of questionnaires received compared to the total which were sent to
the participants.
Contact methods may gather information through mail, telephone, or personal
interview. The questionnaire consists of a set of questions presented to the various
industries to get their interpretation. This will support answers to some of the
questions that might help solve the OEE problem in return. High quality can be
established due to effectiveness and efficiency due to effort put by man, machine,
method, and material.
Conducting frequent research on the latest equipment will be a guide towards
upgrades or improvement on manufacturing and to eliminate areas that have a
negative impact in the production line that may result to a low OEE rate.
Data from a build cross-functional teamwork possibly will help create more reliable
and valuable data. Added unplanned measures due to breakdowns of machines
might require preventive maintenance or vibration analysis. Future research may be
done to explore.
• Frequency studies on man hours (Human OEE)
• Machine design or mechanical design.
• Operation and production design.
77
• The dynamics of translating equipment effectiveness or loss of effectiveness
in terms of cost.
5.7 Conclusion
In this chapter, the research findings of the literature review and the primary findings
by objectives were presented. Conclusions were presented by research questions
based on the results from the study. The study concluded with recommendations
and suggested areas for further research. The results of this study indicated that all
the research objectives were achieved, and the research questions were answered
by the data obtained from this study.
78
REFERENCES
Abrahamson, E. and Eisenman, M., 2008. Employee-management techniques:
transient fads or trending fashions?. Administrative Science Quarterly, 53(4), pp.719-
744.
Adhikari, Balaram, and Bibhav Adhikari. "Managing customer relationships in service
organizations." Administration and Management Review 21.2 (2009): 64-78.
Aghlara, A. (2021). Operational Decisions, what are they and challenges of
automating them? [online] Advanced Decision Management Suite. Available at:
<https://www.flexrule.com/archives/what-are-operational-decisions/> [Accessed 8
December 2021].
Banker, R.D., Kauffman, R.J. and Morey, R.C., 1990. Measuring gains in operational
efficiency from information technology: a study of the Positran deployment at
Hardee’s Inc. Journal of Management Information Systems, 7(2), pp.29-54.
Bardakci, A. and Whitelock, J., 2003. Mass‐customisation in marketing: the
consumer perspective. Journal of consumer marketing.
Bhadury, B. (2000). Management of productivity through TPM, Productivity, 41(2):
240-251.
Binti Aminuddin, N., Garza-Reyes, J., Kumar, V., Antony, J. and Rocha-Lona, L
(2015). An analysis of managerial factors affecting the implementation and use of
overall equipment effectiveness. International Journal of Production Research,
54(15): 4430-4447.
Board, B.A.C., 2014. Professional and ethical compliance code for behavior
analysts.
79
Bryman, A. & Bell, E. (2017). Research Methodology: Business and Management
Contexts, Oxford University Press: Southern Africa, ABC Press: Cape Town. ISBN
978-0-19907613-0
Cohen, J. (1988) Statistical power analysis for the behavioral sciences (2nd ed.)
(Hillsdale, NJ: Erlbaum)
Coronado, R.B. and Antony, J., 2002. Critical success factors for the successful
implementation of six sigma projects in organisations. The TQM magazine.
Desai, P. S., & Purohit, D. (2004). “Let me talk to my manager”: Haggling in a
competitive environment. Marketing Science, 23(2), 219-233.
Diap.online. 2020. The Definition Of OEE (Overall Equipment Effectiveness). [online]
Available at: <https://www.diap.online/blog/the-definition-of-oee/> [Accessed 10 April
2020].
Field, A. (2013). Discovering Statistics using IBM SPSS, 4th ed.
Granell, V., 2007. Levels of automation in manufacturing systems: aligning strategic
and tactical decisions by means of operational measurement (Doctoral dissertation,
Chalmers University of Technology).
Grenčík, J. and Legát, V., 2007. Maintenance audit and benchmarking-search for
evaluation criteria on global scale. Eksploatacja i Niezawodnosc–Maintenance and
Reliability, 3(35), pp.34-39.
Hales, Colin. "Rooted in supervision, branching into management: Continuity and
change in the role of first‐line manager." Journal of Management Studies 42.3
(2005): 471-506.
Heizer, J., Render, B. & Munson, C. (2017). Operations Management. Sustainability
and Supply Chain Management. 12th Ed. Pearson: New Jersey.
80
Hill, T. (2017). Manufacturing Strategy. London: Macmillan Education, Limited.
Hiltrop, Jean M. "Just-in-time manufacturing: implications for the management of
human resources." European Management Journal 10.1 (1992): 49-55.
Iverson, D.L., Martin, R., Schwabacher, M., Spirkovska, L., Taylor, W., Mackey, R.,
Castle, J.P. and Baskaran, V., 2012. General purpose data-driven monitoring for
space operations. Journal of Aerospace Computing, Information, and
Communication, 9(2), pp.26-44.
Juran, J.M. and De Feo, J.A., 2010. Juran's quality handbook: the complete guide to
performance excellence. McGraw-Hill Education.
Kazi, T., Baig, J., Shah, A., Arain, M., Jamali, M., Kandhro, G., Afridi, H., Kolachi, N.,
Khan, S., Wadhwa, S. & Shah, F. (2010). Determination of Arsenic in Scalp Hair of
Children and its Correlation with Drinking Water in Exposed Areas of Sindh Pakistan.
Biological Trace Element Research, 143(1): 153-162.
Klassen, R.D. and Vereecke, A., 2012. Social issues in supply chains: Capabilities
link responsibility, risk (opportunity), and performance. International Journal of
production economics, 140(1), pp.103-115.
Koch, A. (2007). OEE for the Production Team. Makigami. ISBN 978-90-78210-08-5.
(English). ISBN 978-90-78210-07-8 (Dutch). ISBN 978-3-940775-04-7 (German).
Kolias, G.D., Dimelis, S.P. and Filios, V.P., 2011. An empirical analysis of inventory
turnover behaviour in Greek retail sector: 2000–2005. International Journal of
Production Economics, 133(1), pp.143-153.
Kumar, S.A. and Suresh, N., 2006. Production and operations management. New
Age International.
Libguides.usc.edu. 2021. Research Guides: Organizing Your Social Sciences
Research Paper: Quantitative Methods. [3 February 2021].
81
Mentz, M. & Botha, A. (2012). Measurement. In C. Wagner, B. Kawulich and M.
Garner (Eds.) Doing Social Research: A global context. London: McGraw-Hill Higher
Education.
Noon, M., Jenkins, S. & Lucio, M.M. (2000). FADS, techniques and control: the
competing agendas of TPM and Tecax at the Royal Mail (UK), Journal of
Management Studies, 37(4): 499-519.
Parikh, Y. & Mahamuni, P. (2015). Total productive maintenance: need & framework.
International Journal of Innovative Research in Advanced Engineering, 2(2): 126-
130.
Pióro, M. and Medhi, D., 2004. Routing, flow, and capacity design in communication
and computer networks. Elsevier.
Poor, P., Basl, J. & Ženíšek, D. (2020). Assessing the predictive maintenance
readiness of enterprises in West Bohemian region. Procedia Manufacturing, 42: 422-
428.
Productivity Press Development Team (1999), OEE for Operators: Overall
Equipment Effectiveness, Productivity Press, ISBN 978-1-56327-221-9
Quan, G., Greenwood, G.W., Liu, D. and Hu, S., 2007. Searching for multiobjective
preventive maintenance schedules: Combining preferences with evolutionary
algorithms. European Journal of Operational Research, 177(3), pp.1969-1984.
Reliableplant.com. 2021. Total Productive Maintenance: An Overview. (3 February
2021).
Rossi, P.H., Lipsey, M.W. & Henry, G.T. (2018). Evaluation: A systematic approach.
Sage publications.
82
Singh, R., Gohil, A.M., Shah, D.B. & Desai, S. (2013). Total productive maintenance
(TPM) implementation in a machine shop: A case study. Procedia Engineering, 51:
592-599.
Slcontrols.com. 2021. OEE and Why It’s Important – SL Controls. [online] Available
at: <https://slcontrols.com/oee-and-why-its-important (3 February 2021).
Smit, P.J., Cronje, G.D., Brevis, T. and Vrba, M.J. eds., 2011. Management
principles: A contemporary edition for Africa. Juta and Company Ltd.
Speight, J.G., 2014. Oil and gas corrosion prevention: From surface facilities to
refineries. Gulf Professional Publishing.
Sürücü, L. and MASLAKÇI, A., 2020. Validity and reliability in quantitative research.
Business & Management Studies: An International Journal, 8(3), pp.2694-2726.
Tabachnick, B. G., & Fidell, L. S. (2007). Using multivariate statistics (5th ed.).
Boston, MA: Allyn & Bacon
Tallon, W.J., 1987. The design and performance of master production scheduling
techniques for assemble-to-order products (Doctoral dissertation, The University of
Iowa).
Velasquez, M. and Hester, P.T., 2013. An analysis of multi-criteria decision making
methods. International journal of operations research, 10(2), pp.56-66.
Venkatesh, Jindal. "An introduction to total productive maintenance (TPM)." The
plant maintenance resource center (2007): 3-20.
Von Halle, B. and Goldberg, L., 2009. The decision model: a business logic
framework linking business and technology. CRC Press.

83
APPENDIX A
–
84
APPENDIX A: CONSENT FORM
INFORMED CONSENT
Dear Participant
This Informed Consent Statement serves to confirm the following information as it
relates to the officially approved research project at the North-West University on “your
Research Topic”.
1. The sole purpose of this study is to obtain information from customers like yourself to determine the nature of your everyday green buying behaviour experience related to the research topic.
2. Participation is completely voluntary and you may opt-out at any time. You may also decide not to answer specific questions.
3. The procedure to be followed is quantitative research design, which entails a questionnaire. Basic background information will be asked e.g. your age, function and related experience to the topic.
4. Confidentiality of the data is guaranteed and only the combined results will be used for research and publication purposes.
5. The data gathered from the questionnaires will only be used for research purposes.
6. Please note that there are four classifying variables in Section 5 (age, employment, gender and ethnicity) which will be used only to profile the respondents who partook in this study. It will be used in comparative analysis to distinguish green customer behaviour among different customer profiles. Note that only the combined results will be used and at no stage can any specific respondent or his/her data entry be isolated and analysed. (You may also select the option not to answer the specific question should you feel like it.)
7. Also note that this study does not have a correct or incorrect answer to any of the questions. This means that in comparing profiles of respondents, there is not a correct or incorrect behavioural profile. The study merely analyse green consumer behaviour as is.
Please indicate your consent
I hereby give my consent after having read the above
information that my data may be used as stated
YES NO
85
above.
I hereby give my consent that my demographic data
may be used to develop a profile for green consumer
behaviour
YES NO
Thank you for your time.
The researcher

86
APPENDIX B
–
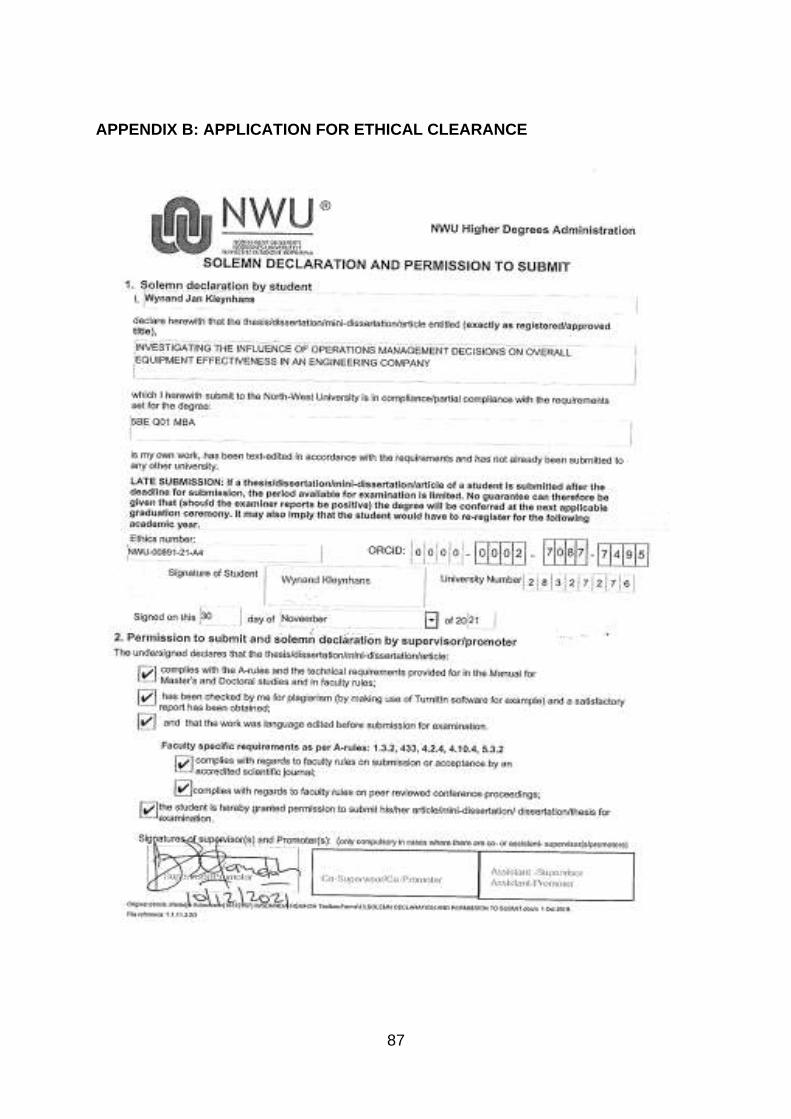
87
APPENDIX B: APPLICATION FOR ETHICAL CLEARANCE

88
APPENDIX C
–
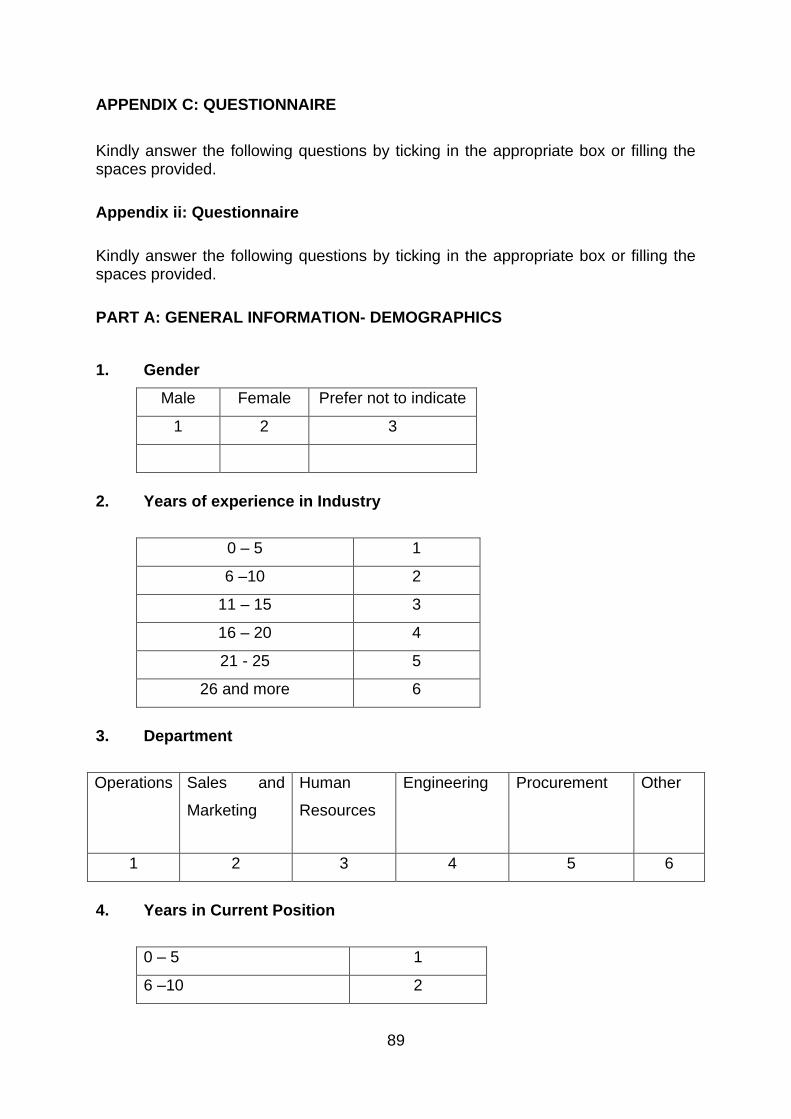
89
APPENDIX C: QUESTIONNAIRE
Kindly answer the following questions by ticking in the appropriate box or filling the spaces provided.
Appendix ii: Questionnaire
Kindly answer the following questions by ticking in the appropriate box or filling the spaces provided.
PART A: GENERAL INFORMATION- DEMOGRAPHICS
1. Gender
Male Female Prefer not to indicate
1 2 3
2. Years of experience in Industry
0 – 5 1
6 –10 2
11 – 15 3
16 – 20 4
21 - 25 5
26 and more 6
3. Department
Operations Sales and
Marketing
Human
Resources
Engineering Procurement Other
1 2 3 4 5 6
4. Years in Current Position
0 – 5 1
6 –10 2
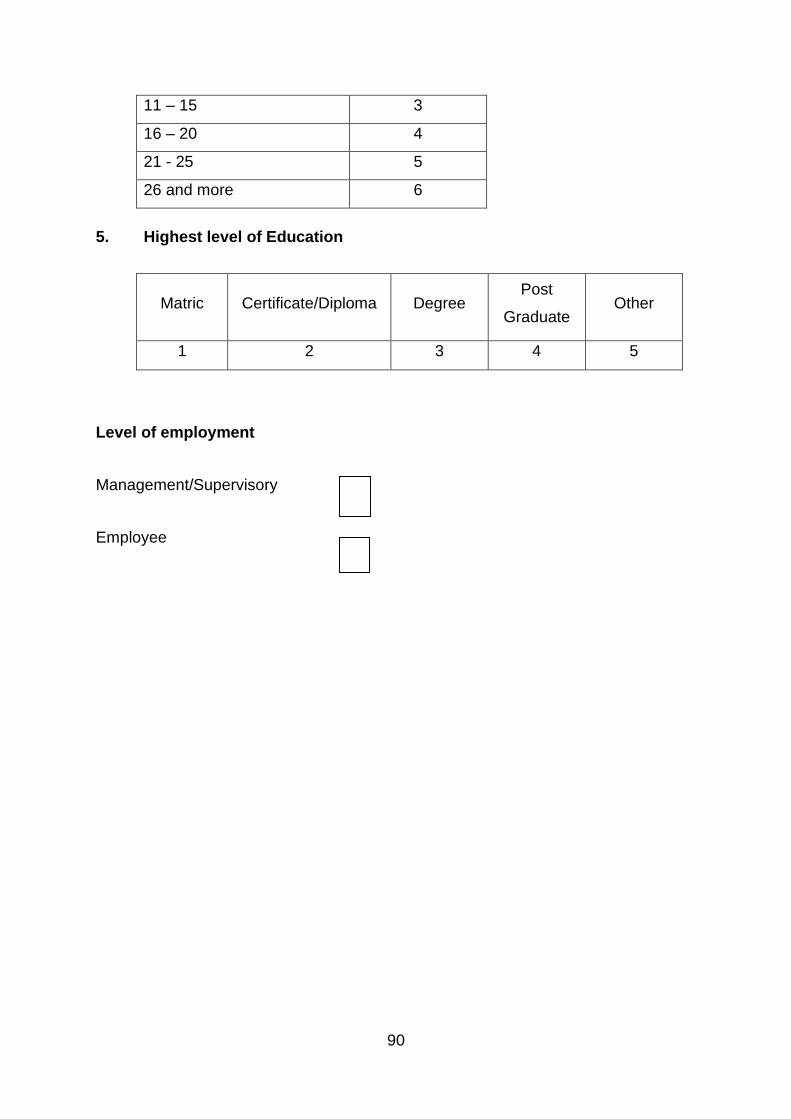
90
11 – 15 3
16 – 20 4
21 - 25 5
26 and more 6
5. Highest level of Education
Matric Certificate/Diploma Degree Post
Graduate Other
1 2 3 4 5
Level of employment
Management/Supervisory
Employee
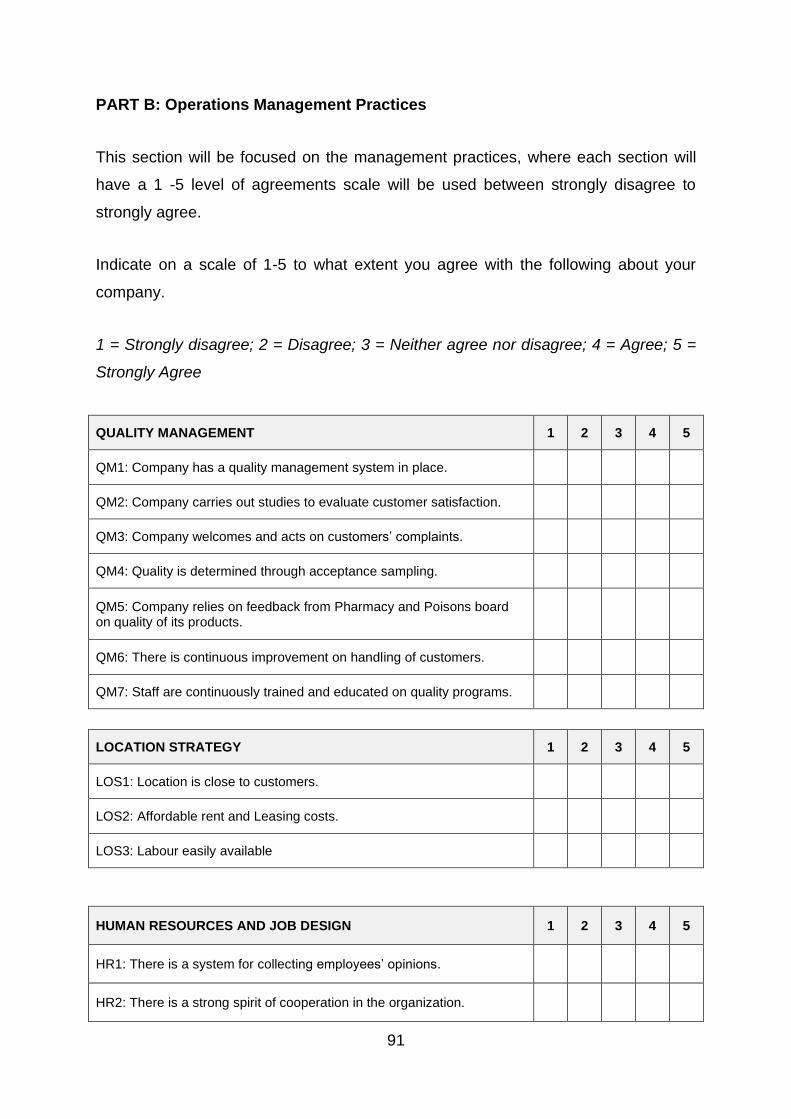
91
PART B: Operations Management Practices
This section will be focused on the management practices, where each section will
have a 1 -5 level of agreements scale will be used between strongly disagree to
strongly agree.
Indicate on a scale of 1-5 to what extent you agree with the following about your
company.
1 = Strongly disagree; 2 = Disagree; 3 = Neither agree nor disagree; 4 = Agree; 5 =
Strongly Agree
QUALITY MANAGEMENT 1 2 3 4 5
QM1: Company has a quality management system in place.
QM2: Company carries out studies to evaluate customer satisfaction.
QM3: Company welcomes and acts on customers’ complaints.
QM4: Quality is determined through acceptance sampling.
QM5: Company relies on feedback from Pharmacy and Poisons board on quality of its products.
QM6: There is continuous improvement on handling of customers.
QM7: Staff are continuously trained and educated on quality programs.
LOCATION STRATEGY 1 2 3 4 5
LOS1: Location is close to customers.
LOS2: Affordable rent and Leasing costs.
LOS3: Labour easily available
HUMAN RESOURCES AND JOB DESIGN 1 2 3 4 5
HR1: There is a system for collecting employees’ opinions.
HR2: There is a strong spirit of cooperation in the organization.
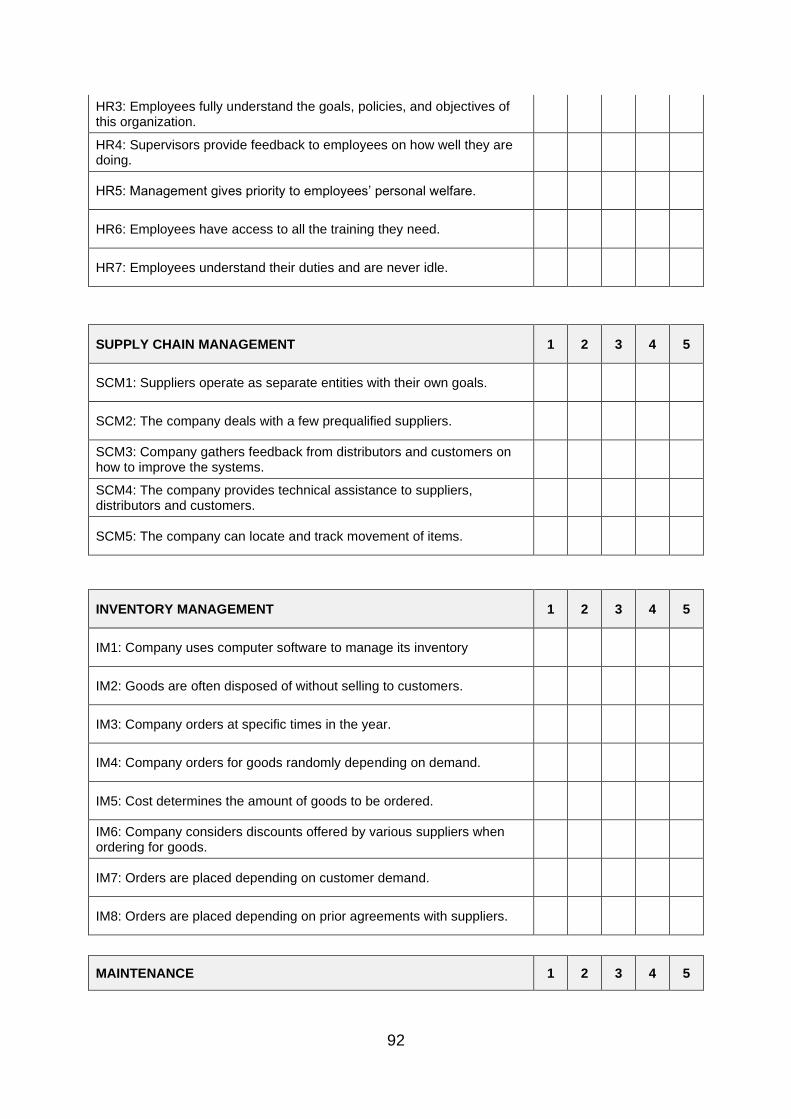
92
HR3: Employees fully understand the goals, policies, and objectives of this organization.
HR4: Supervisors provide feedback to employees on how well they are doing.
HR5: Management gives priority to employees’ personal welfare.
HR6: Employees have access to all the training they need.
HR7: Employees understand their duties and are never idle.
SUPPLY CHAIN MANAGEMENT 1 2 3 4 5
SCM1: Suppliers operate as separate entities with their own goals.
SCM2: The company deals with a few prequalified suppliers.
SCM3: Company gathers feedback from distributors and customers on how to improve the systems.
SCM4: The company provides technical assistance to suppliers, distributors and customers.
SCM5: The company can locate and track movement of items.
INVENTORY MANAGEMENT 1 2 3 4 5
IM1: Company uses computer software to manage its inventory
IM2: Goods are often disposed of without selling to customers.
IM3: Company orders at specific times in the year.
IM4: Company orders for goods randomly depending on demand.
IM5: Cost determines the amount of goods to be ordered.
IM6: Company considers discounts offered by various suppliers when ordering for goods.
IM7: Orders are placed depending on customer demand.
IM8: Orders are placed depending on prior agreements with suppliers.
MAINTENANCE 1 2 3 4 5
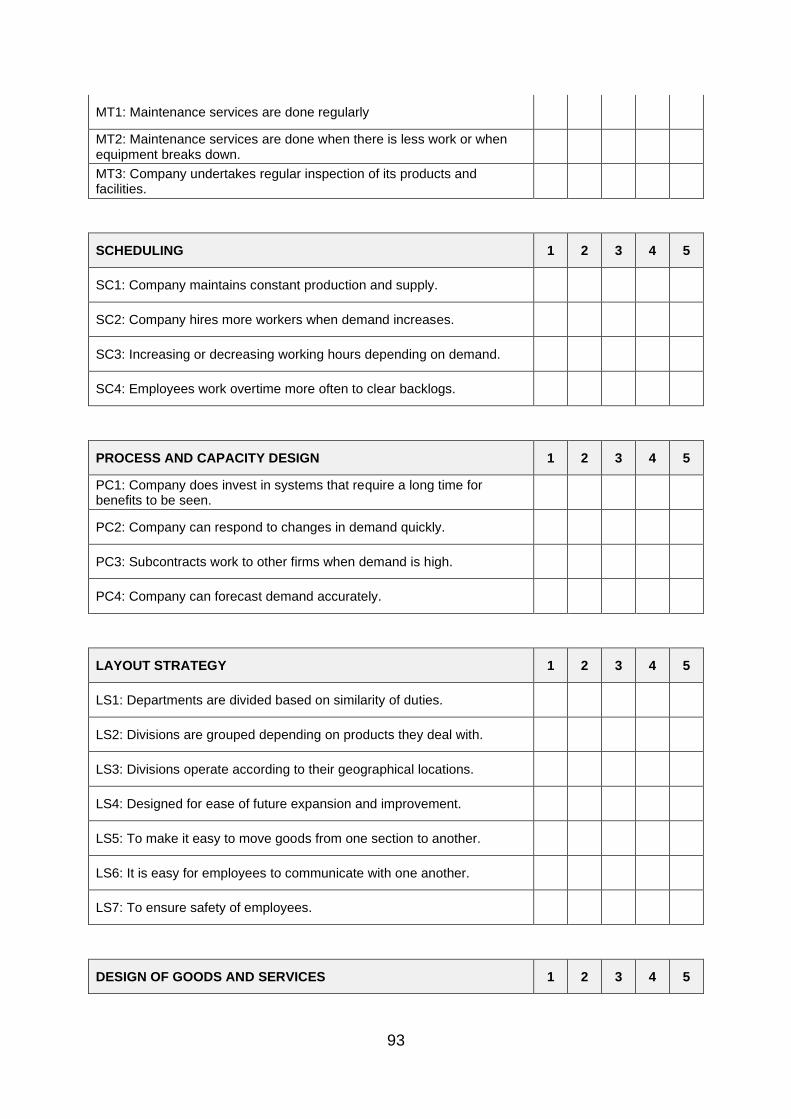
93
MT1: Maintenance services are done regularly
MT2: Maintenance services are done when there is less work or when equipment breaks down.
MT3: Company undertakes regular inspection of its products and facilities.
SCHEDULING 1 2 3 4 5
SC1: Company maintains constant production and supply.
SC2: Company hires more workers when demand increases.
SC3: Increasing or decreasing working hours depending on demand.
SC4: Employees work overtime more often to clear backlogs.
PROCESS AND CAPACITY DESIGN 1 2 3 4 5
PC1: Company does invest in systems that require a long time for benefits to be seen.
PC2: Company can respond to changes in demand quickly.
PC3: Subcontracts work to other firms when demand is high.
PC4: Company can forecast demand accurately.
LAYOUT STRATEGY 1 2 3 4 5
LS1: Departments are divided based on similarity of duties.
LS2: Divisions are grouped depending on products they deal with.
LS3: Divisions operate according to their geographical locations.
LS4: Designed for ease of future expansion and improvement.
LS5: To make it easy to move goods from one section to another.
LS6: It is easy for employees to communicate with one another.
LS7: To ensure safety of employees.
DESIGN OF GOODS AND SERVICES 1 2 3 4 5
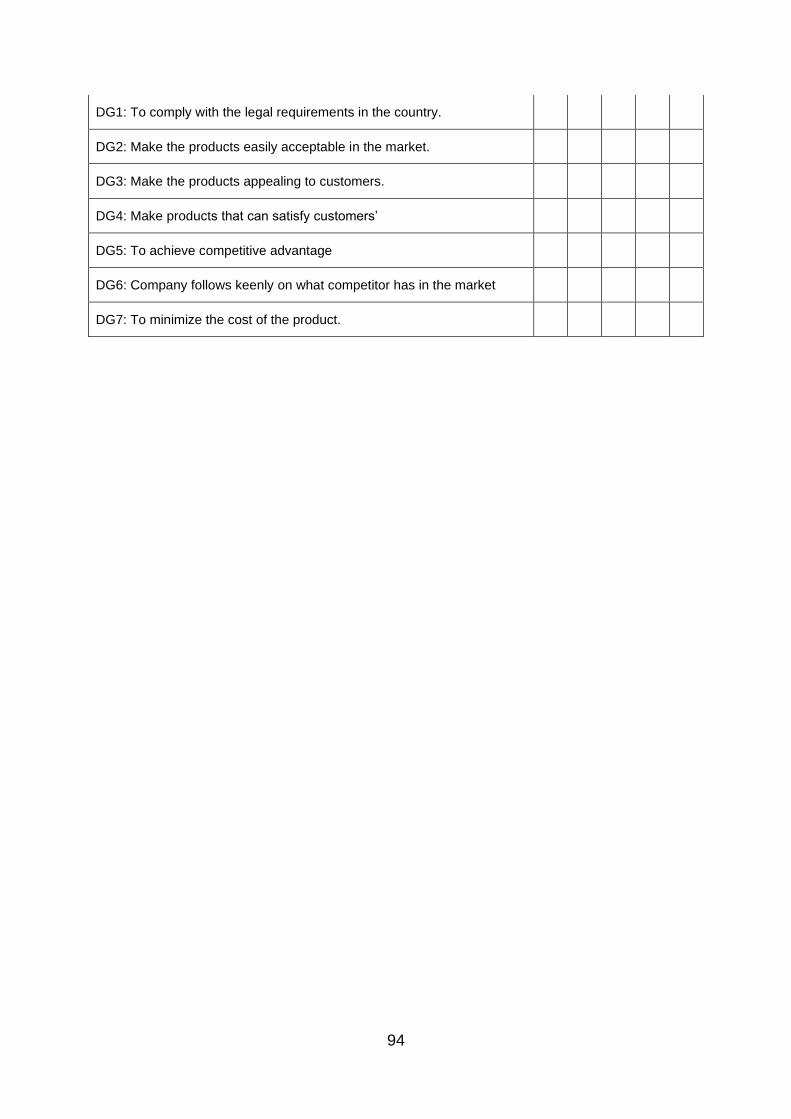
94
DG1: To comply with the legal requirements in the country.
DG2: Make the products easily acceptable in the market.
DG3: Make the products appealing to customers.
DG4: Make products that can satisfy customers’
DG5: To achieve competitive advantage
DG6: Company follows keenly on what competitor has in the market
DG7: To minimize the cost of the product.

95
APPENDIX: AUGUSTUS 2019
Dat
e
Day
No
rmal
Ho
urs
(CN
C)
No
rmal
Ho
urs
(Op
era
tor)
OT
Ho
urs
Re
sou
rce
s
(Mac
hin
es)
Re
sou
rce
s
(He
ads)
Sch
ed
ule
d
Op
era
tin
g
Tim
e m
in
(Op
era
tor)
Sch
ed
ule
d
Op
era
tin
g
Tim
e m
in
(CN
C)
No
n-
pro
du
ctiv
e
tim
e m
in
Spin
dle
Do
wn
tim
e m
in
Pro
du
ctiv
e
tim
e
avai
lab
le
(Op
era
tor)
Tota
l Un
its
Pro
du
ced
Re
wo
rkA
ctu
al t
ime
min
(se
t u
p)
Act
ual
tim
e
min
(ru
n)
Mac
hin
e
Ava
ilab
ility
%
Pro
du
ctiv
ity
95
%
Qu
alit
y
(FP
Y%
)O
EE A
ctu
alO
EE T
arge
t
01
-Au
gTh
ur
98
.50
0.8
47
84
48
3.2
37
80
28
00
42
03
.21
20
17
51
75
01
00
.0%
45
.8%
10
0.0
%4
6%
60
%
02
-Au
gFr
i6
6.0
00
.84
78
32
83
.22
52
02
00
03
08
3.2
30
02
20
10
25
10
0.0
%4
0.4
%1
00
.0%
40
%6
0%
05
-Au
gM
on
98
.50
0.8
47
84
48
3.2
37
80
28
01
08
04
20
3.2
16
23
65
72
07
1.4
%2
5.8
%8
7.5
%1
6%
60
%
06
-Au
gTu
e9
8.5
00
.84
78
44
83
.23
78
02
80
17
54
20
3.2
20
02
80
17
85
95
.4%
49
.1%
10
0.0
%4
7%
60
%
07
-Au
gW
ed9
8.5
00
.84
78
44
83
.23
78
02
80
10
04
20
3.2
12
03
00
28
20
97
.4%
74
.2%
10
0.0
%7
2%
60
%
08
-Au
gTh
ur
96
.00
0.8
47
83
28
3.2
37
80
28
01
30
30
03
.21
33
75
52
03
09
6.6
%9
2.7
%7
6.9
%6
9%
60
%
12
-Au
gFr
i6
6.0
00
.84
78
32
83
.22
52
02
00
03
08
3.2
44
26
30
21
30
10
0.0
%8
9.5
%9
5.5
%8
5%
60
%
13
-Au
gM
on
98
.50
0.8
47
84
48
3.2
37
80
28
00
42
03
.21
70
53
52
31
51
00
.0%
67
.8%
10
0.0
%6
8%
60
%
14
-Au
gTu
e9
8.5
00
.84
78
44
83
.23
78
02
80
04
20
3.2
12
05
00
16
75
10
0.0
%5
1.7
%1
00
.0%
52
%6
0%
15
-Au
gW
ed9
8.5
00
.84
78
44
83
.23
78
02
80
04
20
3.2
51
38
01
90
51
00
.0%
54
.4%
80
.0%
43
%6
0%
16
-Au
gTh
ur
98
.50
0.8
47
84
48
3.2
37
80
28
00
42
03
.23
50
32
01
28
01
00
.0%
38
.1%
10
0.0
%3
8%
60
%
19
-Au
gFr
i6
6.0
00
.84
76
24
62
.42
52
01
50
80
52
31
2.4
50
40
51
31
56
8.1
%7
4.4
%1
00
.0%
51
%6
0%
20
-Au
gM
on
98
.50
0.8
47
63
36
2.4
37
80
21
07
80
31
52
.47
02
75
89
07
9.4
%3
7.0
%1
00
.0%
29
%6
0%
21
-Au
gTu
e9
8.5
00
.84
77
39
22
.83
78
02
45
39
03
67
7.8
31
78
51
95
58
9.7
%7
4.5
%6
6.7
%4
5%
60
%
22
-Au
gW
ed9
8.5
00
.84
77
39
22
.83
78
02
45
81
53
67
7.8
12
03
95
13
15
78
.4%
46
.5%
10
0.0
%3
6%
60
%
23
-Au
gTh
ur
96
.00
0.8
47
72
87
2.8
37
80
24
53
75
26
27
.81
35
11
83
12
09
0.1
%1
23
.2%
61
.5%
68
%6
0%
26
-Au
gFr
i6
6.0
00
.84
77
28
72
.82
52
01
75
30
52
69
7.8
33
07
07
80
87
.9%
31
.5%
10
0.0
%2
8%
60
%
27
-Au
gM
on
98
.50
0.8
47
84
48
3.2
37
80
28
03
80
42
03
.27
03
45
32
00
89
.9%
84
.3%
10
0.0
%7
6%
60
%
28
-Au
gTu
e9
8.5
00
.84
78
44
83
.23
78
02
80
66
04
20
3.2
18
86
25
18
70
82
.5%
59
.4%
55
.6%
27
%6
0%
29
-Au
gW
ed9
8.5
00
.84
78
44
83
.23
78
02
80
44
04
20
3.2
31
35
45
32
00
88
.4%
16
0.5
%6
6.7
%9
5%
60
%
90
.8%
66
.0%
89
.5%
52
%6
0%
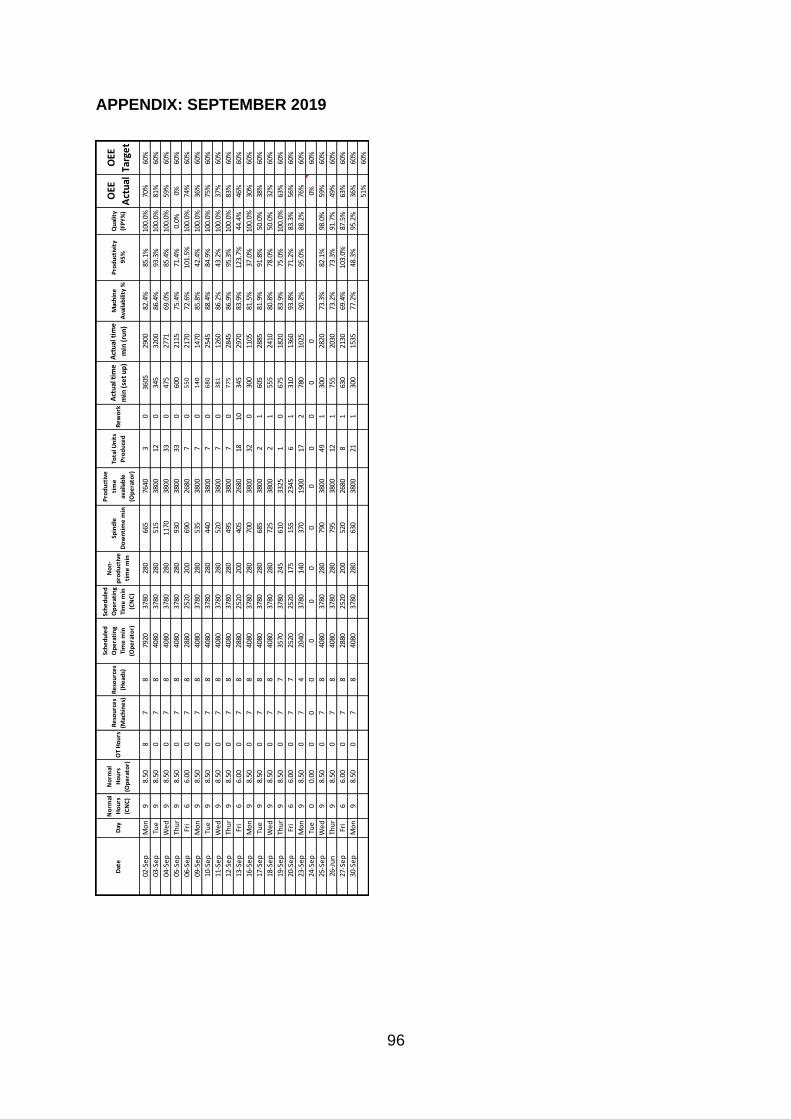
96
APPENDIX: SEPTEMBER 2019
Dat
e
Day
No
rmal
Ho
urs
(CN
C)
No
rmal
Ho
urs
(Op
era
tor)
OT
Ho
urs
Re
sou
rce
s
(Mac
hin
es)
Re
sou
rce
s
(He
ads)
Sch
ed
ule
d
Op
era
tin
g
Tim
e m
in
(Op
era
tor)
Sch
ed
ule
d
Op
era
tin
g
Tim
e m
in
(CN
C)
No
n-
pro
du
ctiv
e
tim
e m
in
Spin
dle
Do
wn
tim
e m
in
Pro
du
ctiv
e
tim
e
avai
lab
le
(Op
era
tor)
Tota
l Un
its
Pro
du
ced
Re
wo
rkA
ctu
al t
ime
min
(se
t u
p)
Act
ual
tim
e
min
(ru
n)
Mac
hin
e
Ava
ilab
ility
%
Pro
du
ctiv
ity
95
%
Qu
alit
y
(FP
Y%
)
OEE
Act
ual
OEE
Targ
et
02-S
ep
Mo
n9
8.50
87
879
2037
8028
066
576
403
036
0529
0082
.4%
85.1
%10
0.0%
70%
60%
03-S
ep
Tue
98.
500
78
4080
3780
280
515
3800
120
345
3200
86.4
%93
.3%
100.
0%81
%60
%
04-S
ep
We
d9
8.50
07
840
8037
8028
011
7038
0033
047
527
7169
.0%
85.4
%10
0.0%
59%
60%
05-S
ep
Thu
r9
8.50
07
840
8037
8028
093
038
0033
060
021
1575
.4%
71.4
%0.
0%0%
60%
06-S
ep
Fri
66.
000
78
2880
2520
200
690
2680
70
55
021
7072
.6%
101.
5%10
0.0%
74%
60%
09-S
ep
Mo
n9
8.50
07
840
8037
8028
053
538
007
01
40
1470
85.8
%42
.4%
100.
0%36
%60
%
10-S
ep
Tue
98.
500
78
4080
3780
280
440
3800
70
68
025
4588
.4%
84.9
%10
0.0%
75%
60%
11-S
ep
We
d9
8.50
07
840
8037
8028
052
038
007
03
81
1260
86.2
%43
.2%
100.
0%37
%60
%
12-S
ep
Thu
r9
8.50
07
840
8037
8028
049
538
007
07
75
2845
86.9
%95
.3%
100.
0%83
%60
%
13-S
ep
Fri
66.
000
78
2880
2520
200
405
2680
1810
345
2970
83.9
%12
3.7%
44.4
%46
%60
%
16-S
ep
Mo
n9
8.50
07
840
8037
8028
070
038
0032
030
011
0581
.5%
37.0
%10
0.0%
30%
60%
17-S
ep
Tue
98.
500
78
4080
3780
280
685
3800
21
605
2885
81.9
%91
.8%
50.0
%38
%60
%
18-S
ep
We
d9
8.50
07
840
8037
8028
072
538
002
155
524
1080
.8%
78.0
%50
.0%
32%
60%
19-S
ep
Thu
r9
8.50
07
735
7037
8024
561
033
251
067
518
2083
.9%
75.0
%10
0.0%
63%
60%
20-S
ep
Fri
66.
000
77
2520
2520
175
155
2345
61
310
1360
93.8
%71
.2%
83.3
%56
%60
%
23-S
ep
Mo
n9
8.50
07
420
4037
8014
037
019
0017
278
010
2590
.2%
95.0
%88
.2%
76%
60%
24-S
ep
Tue
00.
000
00
00
00
00
00
00%
60%
25-S
ep
We
d9
8.50
07
840
8037
8028
079
038
0049
130
028
2073
.3%
82.1
%98
.0%
59%
60%
26-J
un
Thu
r9
8.50
07
840
8037
8028
079
538
0012
175
520
3073
.2%
73.3
%91
.7%
49%
60%
27-S
ep
Fri
66.
000
78
2880
2520
200
520
2680
81
630
2130
69.4
%10
3.0%
87.5
%63
%60
%
30-S
ep
Mo
n9
8.50
07
840
8037
8028
063
038
0021
130
015
3577
.2%
48.3
%95
.2%
36%
60%
51%
60%