information seeking behavior of vegetable - hru-ir home
TRANSCRIPT

INFORMATION SEEKING BEHAVIOR OF VEGETABLE
FARMERS: THE CASE OF HARAMAYA WOREDA, EAST
HARARGHE ZONE, OROMIA REGIONAL STATE, ETHIOPA
M.Sc. Thesis
GETAHUN MILIYON AGAGO
MAY 2016
HARAMAYA UNIVERSITY, HARAMAYA

II
INFORMATION SEEKING BEHAVIOR OF VEGETABLE
FARMERS: THE CASE OF HARAMAYA WOREDA, EAST
HARARGHE ZONE, OROMIA REGIONAL STATE, ETHIOPA
A Thesis Submitted to the Postgraduate Program Directorate
(Department of Rural Development and Agricultural Extension)
HARAMAYA UNIVERSITY
In Partial Fulfillment of the Requirements for the Degree of
MASTER OF SCIENCE IN RURAL DEVELOPMENT AND AGRICULTURAL
EXTENSION
(AGRICULTURAL INFORMATION AND COMMUNICATION
MANAGEMENT)
By
GETAHUN MILIYON AGAGO
MAY 2016
HARAMAYA UNIVERSITY, HARAMAYA

III
HARAMAYA UNIVERSITY
Postgraduate Program Directorate
As Thesis Research advisor, we hereby certify that we have read and evaluated this
thesis prepared under our guidance, by Getahun Miliyon Agago, entitled “Information
Seeking Behavior of Vegetable Farmers: The Case of Haramaya Woreda, East
Hararghe Zone, Oromia Regional State, Ethiopia”. We recommend that it be
submitted as fulfilling the Thesis requirement.
Jemal Yousuf (PhD) ___________________ _______________
Major Advisor Signature Date
Eric Ndemo (PhD) ___________________ _______________
Co-Advisor Signature Date
As member of the Board of Examiners of the M.Sc Thesis Open Defense Examination,
We certify that we have read, evaluated the Thesis prepared by Getahun Miliyon Agago
and examined the candidate. We recommended that the Thesis be accepted as fulfilling
the Thesis requirement for the Degree of Master of Science in Agricultural information
and Communication management
___________________ _________________ _______________
Chair Person Signature Date
_________________ _________________ _______________
Internal Examiner Signature Date
__________________ _______________ _______________
External Examiner Signature Date

IV
DEDICATION
I dedicate this thesis manuscript to Dr. Jemal Yousuf who practically taught me
what helping means! He made me walk while I was crawling and showed me
the right track to run.

V
STATEMENT OF THE AUTHOR
First, I declare that this thesis is the result of my own work and that all sources or
materials used for this thesis have been duly acknowledged. This thesis is submitted in
partial fulfillment of the requirements for a M.Sc. degree at Haramaya University and to
be made available at the University’s Library under the rules of the Library. I confidently
declare that this thesis has not been submitted to any other institutions anywhere for the
award of any academic degree, diploma, or certificate.
Brief quotations from this thesis are allowable without special permission, provided that
accurate acknowledgement of source is made. Requests for permission for extended
quotation from or reproduction of this manuscript in whole or in part may be granted by
the head of the major department or the Dean of the School of Graduate Studies when in
his or her judgment the proposed use of the material is in the interests of scholarship. In
all other instances, however, permission must be obtained from the author.
Name: Getahun Miliyon Agago
Signature: ……………………
Place: Haramaya University
Date of Submission: May, 2016

VI
BIOGRAPHICAL SKETCH
The author was born in Girawa Woreda, East Hararghe zone of Oromia Region on
November 13, 1982. He completed primary and junior secondary education at Girawa
Primary and Junior School. He attended High School education at Girawa Senior
Secondary School. He then joined Bale Robe Teachers College in 2003 and graduated
with Diploma in Teaching in June 2005.
In July 2005, he was employed by the Ministry of Education and served in Ilubabore
Zone, Oromia Region for one year and he was relocated to Bedeno Woreda, East
Hararghe. After serving for one year again he relocated to Haramaya University Primary,
Secondary and Preparatory Model School. He joined Haramaya University in July 2006
and graduated with B.Ed in History in September 2009. In June 2010, he once again
joined Haramaya University for a post graduate study leading to the degree of Masters
Science in Agricultural information and communication management stream. The author
is married, with a son.

VII
ACKNOWLEDGEMENTS
First of all, I would like to thank the almighty GOD for giving me the opportunity and
helping me to successfully complete this work.
My heart-felt appreciation and gratitude goes to my major advisor Dr. Jemal Yousuf, who
took a great care to improve the content of this paper from problem identification to the
final write-up of the manuscript. I am greatly indebted to him since without his insight
and frequent guidance, encouragement, constructive criticisms, and professional
expertise, the success of this work would not have been possible.
My sincere thanks and appreciation go to my co-advisor Dr. Eric Ndemo for his positive
responses for any help I demanded and for his valuable comments, suggestions and
guidance throughout my research work. He has worked hard to keep me on the right track
and timely completion of the study.
I wish to acknowledge Haramaya Woreda Office of Agriculture for their cooperation in
getting all secondary data. I wish to express my sincere thanks to those household heads,
data enumerators, and extension workers for facilitating the survey.
My special and particular thanks go to Mr. Basha Haile for providing me with the
necessary facilities during the research work. Mr. Degu Werku, Mr. Mahdi Mume,
Mr.Barudin, and Mr.Debebe who helped me in filling the questionnaire and gave me
valuable information and material required for this thesis work. I would like also to
express my sincere gratitude to RUFORUM Project for funding my research expenses.
Last but not least, I would like to express my special thanks to my beloved wife Birtukan
Jemal, my kid Bimnet Getahun, my father Miliyon Agago , my mother Menen Abebe and
all my family members for their consistent encouragement through out my academic
work.

VIII
LIST OF ABRIVIATION
AKIS Agricultural Knowledge and Information System
BoA Bureau of Agriculture
CC Contingency Coefficient
CSA Central Statistical Authority
CTA Technical Centre for Agricultural and Rural Cooperation
DA Development Agent
FAO Food and Agricultural Organization of the United Nations
FHH Female-Headed Household
FTC Farmer Training Center
GDP Gross Domestic Product
ha Hectare
HU Haramaya University
HWARDO Haramaya Woreda Agricultural and Rural Development Office
HYVs High Yielding Varieties
ICTs Information and Communication Technologies
IPMS Improving Productivity and Market Success
IS Information System
KA Kebele Administration
MHH Male-Headed Household
MoA Ministry of Agriculture
MoARD Ministry of Agriculture and Rural Development
NGOs Non-Governmental Organizations
PLS Pilot Learning Site
RAAKS Rapid Appraisal of Agricultural Knowledge System
SMS Subject Matter Specialist
SNA Social Network Analysis
SPSS Statistical Package for Social Science
TLU Tropical Livestock Unit

IX
LIST OF ABRIVIATION (Continued)
TOL Tolerance
T&V Training & Visit
VIF Variance Inflation Factor

X
TABLE OF CONTENTS
Contents Pages DEDICATION IV
STATEMENT OF THE AUTHOR V
BIOGRAPHICAL SKETCH VI
ACKNOWLEDGEMENTS VII
LIST OF ABRIVIATION VIII
LIST OF ABRIVIATION (Continued) IX
TABLE OF CONTENTS X
Lists of tables XII
Tables Pages XII
Lists of Figures XIII
LIST OF TABLES IN THE APPENDICES XIV
ABSTRACT XV
INTRODUCTION 1
1.1 Background of the Study 1
1.2. Statement of the Problem 4
1.3. Objectives of the Study 5
1.4. Research Questions 5
1.5. Scope and Limitation of the Study 5
1.6. Significance of the Study 6
1.7 Organization of the Study 7
2. LITERATURE REVIEW 8
2.1 Concept of Agricultural Knowledge and Information 8
2.2. The Role of Agricultural Knowledge and Information in Agricultural Development 10
2.3. Sources of Information for Farmer 11
2.4. Knowledge Sharing and Communication Network 12
2.5. Farmers’ Information Need 14
2.6. Information-Seeking Behavior 16
2.6.1 Models of Information Seeking 17
2.6.2 Wilson First Model 17
2.6.3 Krikelas Model 18
2.6.4 Leckie Model 20
2.6.5 Byström and Järvelin Model 21
2.6.6 Johnson Model 22
2.6.7 Wilson Second Model 23
2.7. Factor Affecting Information Seeking Behavior of Vegetable Farmers 26
2.7.1. Household’s personal and demographic variables 26

XI
TABLE OF CONTENTS Continued
2.8.2. Household’s socio-economic variables 28
2.8.3. Institutional factors 29
2.8.4. Psychological factors 30
2.9. Conceptual Framework of the Study 31
3. METHODOLOGY 33
3.1. Description of the Study Area 33
3.2. Sampling Procedure and Sample Size 34
3.3. Data type and Data Source 36
3.4 Methods of Data Collection 36
3.5. Methods of Data Analysis 37
3.6 Econometric Model 37
3.7. Definition of Variables and Working Hypothesis 41
4. RESULTS AND DISCUSSION 46
4.1 Distribution of Vegetable Farmers based on Information Seeking Behaviors 46
4.2 Information Sharing Behavior of Vegetable Farmers 47
4.3 Information Source for Vegetable Farmers 48
4.4 The most Reliable Source of Information for Vegetable Farmers 49
4.5 Description of Factors that Affect the Information Seeking Behavior of Vegetable Farmers 51
4.5.1Personal and demographic variable 51
4.5.2 Socio-economic variables 54
4.5.3 Institutional variables 58
4.5.4 Psychological factors 62
4.6 Strength and direction of relationship between dependent and independent variables 65
4.7. Multicollinearity Test and Model Results 67
4.8. Determinants of Information Seeking Behavior of Vegetable Farmers 70
5. SUMMARY, CONCLUSION AND RECOMMENDATIONS 76
5.1 Summary 76
5.2. Conclusions 78
5.3. Recommendation 79
REFERENCES 81
APPENDIXES 94
QUESTIONNAIRE 96

XII
Lists of tables
Tables Pages
Table 1: Proportion of sample respondents from each kebele 36
Table 2: Distribution of sample respondent by frequency of information sharing (n=150) 47
Table 3: Distribution of information source for vegetable farmers in terms of their frequency of use (n = 150) 48
Table 4: Frequency distribution of information sources in terms of their reliability (N=150) 50
Table 5: Age of the respondents by information seeking category of vegetable farmers (n=150) 52
Table 6: Sex of the respondents by information seeking behaviors category (n=150) 53
Table 7: Education level of the house hold by information seeking category (150) 54
Table 8: On-farm income of the household by information seeking category (n=150) 55
Table 9: Land ownership of respondents by information seeking behavior category (n=150) 56
Table 10: Livestock ownership of respondents by information seeking behavior category (n=150) 56
Table 11: Household labor availability in adult equivalent by information seeking category (n=150) 57
Table 12: Household participation in non-farm activities by information seeking category (n=150) 58
Table 13: Radio ownership of household by information seeking behavior category (n=150) 58
Table 14: Frequency of extension contact by information seeking category (n=150) 59
Table 15: Respondents mean score of social participation by information seeking category (n=150) 60
Table 16: Distance to the market center (km) in relation to information seeking category (n=150) 61
Table 17: Access to credit by information seeking category (n=150) 62
Table 18: Innovation proneness of respondents by information seeking category (n=150) 63
Table 19: Level of production motivation based on information seeking categories (n=150) 64
Table 20: Mean attitude score of vegetable farmers by information seeking category (n=150) 65
Table 21: Strength and Direction of relationship between dependent and continuous independent variables 66
Table 22: Strength and Direction of relationship between dependent and discrete/dummy independent variables 67
Table 23: Multicollinearity test result for the continuous explanatory variables (n=150) 69
Table 24: Contingency coefficient for discrete and dummy variables 70
Table 25: The Maximum Likelihood estimation of the Ordered logit model 71

XIII
Lists of Figures
Figures Pages
Figure 1: Wilson's 1981 model of information-seeking behavior. 18
Figure 2: The Krikelas model. 19
Figure 3:The information seeking of professionals model 20
Figure 4:The Byström and Järvelin model 22
Figure 5:The Comprehensive Model of Information Seeking 23
Figure 6: Wilson’s second model 25
Figure 7: Wilson's nested model of information behavior 26
Figure 8: Conceptual Framework Diagram 32
Figure 9: Sampling procedures 35

XIV
LIST OF TABLES IN THE APPENDICES
Appendix 1: Conversion factor used to estimate Tropical Livestock Unit 95
Appendix 2: Conversion factor used to compute family size 96
Appendix 3: Household Level Interview Schedule 97

XV
INFORMATION SEEKING BEHAVIOR OF VEGETABLE
FARMERS: THE CASE OF HARAMAYA WOREDA, EAST
HARARGHE ZONE, OROMIA REGIONAL STATE, ETHIOPIA
ABSTRACT
The study set out to assess determinants of information seeking behavior of vegetable
farmers and to identify the source of information for vegetable farmers in Haramaya
Woreda, East Harargh zone of Oromia Regional State. The study employed multi-stage
sampling procedures to select four Kebele administrations and 150 sample respondents.
Primary data for this study were collected using interview schedule. Simple descriptive
statistical analyses and an econometric model (Ordered Logit model) were used to
analyze the data. Neighbors or friends, Progressive farmers, and Development agents are
the first, the second, the third information source for vegetable farmers., Haramaya
University, Woreda Office of Agriculture and Rural Development, and Kebele
Administration are the fourth, the fifth and the sixth information source for vegetable
farmers. Mass media, Farmers cooperatives, Training, demonstration and filled visit and
NGOs are the seventh, the eighth, the ninth, and the tenth information source for
vegetable farmers according to priority used. The study also found, education level, farm
size, on-farm income, non farm income extension contact, social participation, innovation
proneness and production motivation having positive and significant influence on
information seeking behavior of vegetable farmers. The outcome of this research
indicates as farmers education level, extension contact, social participation and
innovation proneness increases the tendency to seek information became higher.
Haramaya woreda agricultural office should arrange in service training, build
networking among farmers and planning and ensuring vegetable related technical
information for vegetable farmers in the study area.

1
INTRODUCTION
1.1 Background of the Study
Agriculture is the mainstay of developing countries providing food, employment, foreign
exchange and raw material for industries. Agricultural sector has been described as the engine for
economic growth and improved livelihoods in Africa (Diao et al., 2007). In Ethiopia Agriculture
is a dominant sector and contributing 43% to the Gross Domestic Product (GDP); nearly 85%
employment of the total labor force and contributes about 90% of exports. Ethiopian agriculture
is dominated by small-scale farmers account for 95% of the total area under crop cultivation and
more than 93% of total agricultural output (CSA, 2010). Despite its importance in the livelihood
of the people and its potential, the sector has remained at subsistence level. In general, low
productivity characterizes Ethiopian agriculture. The poor performance in food production
coupled with rapid population growth of 3.19% during 1980-1990 aggravated the problem of
household food security and per capita food production. In addition, climate change, reduced soil
fertility, recurrent and prolonged drought, environmental degradation, reliance on traditional
agricultural practices, inadequate financial services and human capital, weak agricultural markets,
lack of information and poor infrastructure were believed to have responsible for the low
productivity of the agricultural sector (Berhanu , 2002).
Agriculture covers food crops, horticulture, animal husbandry, fisheries, forestry, and estate
crops. Horticultural commodities, especially vegetables contribute significantly to the Ethiopian
economy as a source of high-value nutritious food, income, employment and business
opportunity, agro-industrial raw material and foreign exchanges. Additionally, vegetable
agribusiness is an important market for non agricultural goods and service, namely fertilizers,
pesticides, agricultural equipment, and transportation (Hadi, 2001).
Fruit and vegetable cultivation is certainly not a new activity in Ethiopia as the production of
horticultural crops has been undertaken for decades. In addition, there are numerous small
producers growing a small range of vegetables for the local and regional export market. The

2
sector comprises large state farms supplying fruits and vegetables to the local market and for
exports. There are still only a few private companies involved in the commercial production of
vegetables and fruit for export trade. The total area under fruit and vegetable cultivation
(including potatoes and other roots and tuber crops) in Ethiopia amounts to around 800 thousand
ha which accounts for around 5% of the total land under cultivation (MOoARD, 2007).
According to Fekadu and Dandena (2006) Ethiopian population is expected to double within the
next 30 years. Almost 80% of the population lives in the countryside while the rest situated in
urban area. An estimated five million people suffer from lack of vitamins and essential minerals,
of which 80% are children. Vegetables are the major source of most micronutrient and the only
practical and sustainable way to ensure their supply. Ethiopia has a variety of vegetable crops
grown in different agro-ecological zones produced through commercial as well as small farmers
both as a source of income and food. However, production is concentrated to some pocket areas.
The major economic activities of the Haramaya Woreda include farming, and off-farm activities,
especially for urban dwellers. The dominant crops grown in the study district were sorghum,
maize, wheat, haricot beans, potato, carrot and chat. Vegetables and chat are the two major cash
crops grown in the area. From these two cash crops, Chat becomes the first as a means of income
generating followed by vegetable. Agriculture sector is highly dependent on rainfall. Coupled
with low modern input use and land fragmentation, the farm productions are mostly for subsistent
or household consumption and not aimed at marketing except for chat and vegetables. In addition
to various impediments such as high population pressure, natural disaster, like frost and
environmental imbalance resulting to drought and poor infrastructure development had hampered
the development of the sector in the woreda (HWARDO, 2006).
Information is conceived as an important resource that contributes immensely towards the
development of a nation. Ideally, information brings about knowledge, and a knowledgeable
community is also an informed community. This signifies that a community can not develop
without knowledge, and a community can only become knowledgeable if they recognize and use
3
information as their tool for development (Kamba, 2009). Moore (2007: 6) mentioned that
‘‘Information is a key contributor to the development of individuals and communities. People
need information to develop their potential through education and training, to succeed in
business, to enrich their cultural experience, and to take control of their daily lives.’’
Human efforts towards attaining goals depend highly on effective communication of information,
and the major ingredient that makes communication possible is information. Information is an
important resource for individual growth and survival. The progresses of modern societies as well
as farmers depend on a great deal upon the provision of the right kind of information, in the right
form and at the right time. Information is needed to be able to take a right decision and reduce
uncertainty. Vegetable farmer needs information to be able to improve his production just like a
specialist also needs information to be up to-date and well informed in his area of specialization.
If information is to this much valuable, it must be put to proper use that is, made available to
farmers who need it, after ascertaining the vegetable farmers’ information need and information
seeking behavior (Ngozi, 2001).
Information seeking behavior is a broad term encompassing the ways individuals articulate their
information needs, seek, evaluate, select, and use information. In other words, information-
seeking behavior is purposive in nature and is a consequence of a need to satisfy some goal. In
the course of information seeking, the individual may interact with people, manual information
systems, or with computer-oriented information systems (Mahari, 2012).
Information seeking behavior is a way of gathering sufficient data to address perceived
information gaps. According to Owolade (2008), Information-seeking behavior is the “totality of
human behavior in relation to sources and channels of information sought”. The information
seeking-behavior of an individual arises from the need to satisfy identified goals and move from
the level of uncertainty to the level of certainty.
Snail farmers need to seek and use information that can improve the farming system in Nigeria.
This will not only increase their agricultural productivity but also improve their standard of
living. For farmers to increase their agricultural production, they must have good information-

4
seeking behavior that will enable them to adopt improved production technology (Ali-
Olubandwa, Odero-Wanga,Kathuri & Shivoga, 2010).
Despite the presence of vary few study on the needs and information seeking behavior of
vegetable farmers in Ethiopia, most of these writings have concentrated on the educated elite who
have been provided with different types/ sources of information with which to satisfy his/her
information needs. To this end, a study on information seeking behavior of vegetable farmers in
Haramaya woreda is paramount importance to inform future interventions.
1.2. Statement of the Problem
Information is one of the most important resources that our farming systems are impoverished
off. The farmers are impoverished of the information about potential demand for their crops in a
specified time schedule, prices prevailing in different places, availability of agricultural inputs,
weather conditions, etc. Consequently, farmers have not been able to tune themselves to cover
their land area with appropriate crops that might minimize risks and maximize their profits. On
top of these, a farmer as farm manager has to make decisions. To this effect and to develop a
greater self-confidence in facing the present day competitive agriculture and better sense of
dignity in being good farmer, the farmer requires the right information at the right time (Kumar,
2006).
Different types of information have been provided to the farmers of Ethiopia to increase their
productivity. On the contrary, Ethiopian farmers did not maintain their food self sufficiency. This
is because there is a problem of means of providing information to all farmers especially to those
vegetable farmers in Haramaya woreda. All stakeholders in agriculture activity from the
beginning provide information to the farmers with out having clear understanding about
vegetable farmers; information seeking behaviors, source of information and factors affecting
information seeking behavior of vegetable farmers. So due to the above mentioned problems in
delivering information to the vegetable farmers in Haramaya woreda, farmers are not getting the
right benefit from their production.

5
In general there is urgency need for providing up to date information to farmers by all actors in
agriculture such as MoARD, Regional Agricultural Bureau, Zone Agriculture Office, Woreda
Agriculture Office, Extension services, NGOs and other development agencies involved in
agricultural development. Vegetable farmers are no exception to such need. In order to make
meaningful contribution, development actors need to know the information seeking behavior of
farmers and thus provide information accordingly. Interestingly no specific study has been
conducted in Haramaya woreda. This study, therefore aimed at assessing determinants of
information seeking behavior of vegetable farmers in Haramaya
1.3. Objectives of the Study
The general objective of the study is to assess the information seeking behavior of vegetable
farmers in the study area.
The Specific objectives of the study are to:
1. identify the source of information for vegetable farmers
2. assess determinants of information seeking behavior of vegetable farmers
1.4. Research Questions
The study tries to provide answer for the following research questions:
1. What are the sources of information for vegetable farmers?
2. What factors affects the information seeking behavior of vegetable farmers?
1.5. Scope and Limitation of the Study
The main objectives of the study were to assess the determinants of information seeking behavior
of vegetable farmers in Haramaya Woreda. However, due to constraints that arise from shortage

6
of financial and time related problems, the study is carried out only in one woreda, Haramaya and
an attempt was made to interview 150 farm households selected from four kebeles administration
out of the thirty-five found in the woreda.
Ethiopia is a diverse population in terms of culture, agro-ecology, ethnicity, resource endowment
and the farming system varies from location to location. Hence, the research does not claim to
provide conclusive findings on information seeking behavior of vegetable farmers in Ethiopia in
general and the zone in particular. However, the research finding could be used to raise
awareness among different stakeholders and also serve as background information for others who
seek to do further related research.
1.6. Significance of the Study
To bring about agricultural development, the provision of agricultural information plays a
decisive role. Agricultural information can flow to different farm households from different
sources. Currently beside the indigenous farm experience, government designed programs that
contribute to provide agricultural information in order to improve the life of rural people.
Knowledge about the information-seeking behavior of vegetable farmers is crucial for effectively
meeting the information needs of vegetable farmers. This knowledge may also lead to the
discovery of novel information behavior of farmers and user profiles that could be used to
enhance existing information models or even develop new ones. Moreover, the research help to
know vegetable farmers information sources, and what motivate farmers to seek information.
Knowing the information seeking behavior of vegetable farmers is crucial for increasing
vegetable farmers’ productivity, transferring agricultural technology to the farmers and sharing
agricultural information among stakeholders

7
The research finding could be used to raise awareness among different stakeholders and also
serve as background information for others who seek to do further related researches and would
help server in formulating and revising agricultural information seeking behavior of vegetable
farmers in the region as well as other places with similar socio-economic conditions.
1.7 Organization of the Study
The contents of this thesis are classified in to five major chapters. The first chapter consists of
background of the research, statement of the problem, the objectives, the significance as well as
the scope and limitation of the study. The second chapter deals with the review of literature on
topics relevant to the study. The third chapter presents the research methodology. The fourth
chapter presents the results and discussion, and the final chapter present summary, conclusions
and recommendations.

8
2. LITERATURE REVIEW
A comprehensive review of the literature is an eventual part of any investigation. Future is the
manifestation of the past. So past research studies would pave the way for the future researches.
It also provides a basis to develop theoretical framework in addition to helping researcher to get
an insight into methods and procedures. In view of the above facts, efforts were made to collect
the research findings on the subject possessing similar characteristics. Since, there is less research
studies on information seeking behavior of vegetable growers the studies directly or indirectly
related to the topic are reviewed and presented under the following sub-headings.
2.1 Concept of Agricultural Knowledge and Information
Some people use the words information and knowledge interchangeably. However, these are two
different but linked concepts. Knowledge does not have precise and comprehensive definition.
Different people define the word knowledge in different ways.
According to Ondari-Okemwa E. (2006) knowledge is defined as a fluid mix of framed
experience, values, contextual information and expert insight that provides a frame work for
evaluating and incorporating new experiences and information. It is originated and applied in the
minds of the knower’s. The core essentials of all definitions consider “knowledge” as the sum of
all coherent information, which conforms to detectable environmental conditions (Kemper et al.,
2008).
The term “knowledge” is understood as the conscious or subconscious perception, information
processing and accumulation of experiences (Bergeron B., 2003). It includes familiarity,
awareness and understanding gained through experience or study, and results from making
comparisons, identifying consequences, and making connections. In organizational terms,
knowledge is generally thought of as being “know how”, or “applied action (Servin G., 2005).
Some other authors defined it as:
Knowledge is information in the context to produce an actionable understanding (Ermias,
2004).

9
Regarding the definition of information:
Leeuwis (2004) describes information as knowledge expressed in a tangible form and with help
of it (information) and related terms (perception, meaning, interpretation) human beings reduces
uncertainty and brings order to the world around them. The term information is often knowledge
that has been captured and stored in a physical (now a day from such as a book, leaflet, file,
newspaper, picture, sound, website, etc). It is better to differentiate that information (the symbolic
representation of knowledge) is not the only way that the knowledge is made tangible. Practices,
actions, technologies, materials like: improved seed varieties, contraceptive methods, machines,
tablets, buildings etc, can be tangible forms of knowledge. Samuel (2001) defined agricultural
information as the data for decision-making and as a resource that must be acquired and used in
order to make an informed decision.
Knowledge can also be seen from the view point of coverage and degree of understanding of
certain things such as: common knowledge is held by most people in a community; e.g. almost
everyone knows how to cook rice (or the local staple food); shared knowledge is held by many,
but not all community members; e.g. villagers who raise livestock will know more about basic
animal husbandry than those without livestock; specialized knowledge is held by a few people
who might have had special training or an apprenticeship (Leeuwis, 2004).Therefore knowledge
can be categorized depending on our interest using various criteria.
Information is the collection, storage, processing, and dissemination of new data, pictures, facts,
messages, opinions, and comments required to understand and react accurately to personal,
environmental, national, and international conditions, as well as to be in a position to take
appropriate decisions (David, 2006).
In this ‘Era of Information Technology’ the ability to acquire and use information is regarded as a
national asset. Information is considered as a ‘resource’, much like land, labor and capital.
Access to information and improved communication is a crucial requirement for the success of
any developmental efforts and ‘agriculture’ is no exception to this. ‘Information’ refers to
patterned matter-energy that affects the probabilities available to an individual making decision.
It performs three major functions. First, it increases the knowledge level of the recipients; second,
10
it reduces the uncertainty in decision-making; and it serves as a representation of situation
(Kumer, 2006).
Some people use the words ‘Information’ and ‘Knowledge’ interchangeably. However, these are
two different but linked concepts. Different people define the word knowledge in different ways.
Sunasee and Sewery (2002) defined knowledge as the human expertise stored in a person’s mind,
gained through experience, and interaction with the person’s environment. Ermias (2004) define
knowledge as information in the context to produce an actionable understanding. Samuel (2001)
also defined agricultural information as the data for decision-making and as a resource that must
be acquired and used in order to make an informed decision. Knowledge is a range of information
gained from interaction and information combined with experience, and it is organized and
interpreted by the human mind with confident understanding for the purpose of decisions and
actions.
There are various types of knowledge depending on its functions and its carrier systems, for
example, agricultural knowledge, management knowledge, manager knowledge etc. Knowledge
varies depending on cultural, social, and economical factors. The type of knowledge people have
depends on their age, sex, occupation, labor division within the family, enterprise or community,
socio-economic status, experience, environment and history. Therefore, knowledge can be
categorized depending on our interest using various criteria.
2.2. The Role of Agricultural Knowledge and Information in Agricultural Development
In this dynamic world, the rural people’s information need is increasing constantly. Agricultural
knowledge is changing rapidly; it is obvious that the development of agriculture is highly
dependent on the new knowledge and information. According to FAO (2002), rural farmers need
a wide variety of information such as availability of agricultural support services, Government
regulations, crop production and managements, disease outbreaks, adaptation of technologies by
other farmers, wages rates, and so on. The content of the information services needs to reflect
their diverse circumstances and livelihoods. Therefore, information can be seen as the basic

11
element in any development activity and it must be available and accessible to all farmers
including vegetable farmers in order to bring the desired development.
Quality information rests on three pillars, which include: accuracy, timeliness, and relevance.
Accuracy of information is when information is free of bias, while timeliness means recipients
can get information when needed. Information is an essential resource that individuals,
government officials, and professionals should have access to (Bentley, Barea, Priou, Equise, &
Thiele, 2007).
Agricultural information is useful for farmers covering up their inadequacies in knowledge of
certain basic practices that may include technical, marketing, social, and legal agricultural
information. It often involves face-to-face communication, as well as passive reception through
advertisements in print and electronic media (Yahaya, 2003).
2.3. Sources of Information for Farmer
Farmers receive agricultural information from a multitude of sources, such as extension agencies,
mass media, fellow farmers, input dealers, etc. These sources can be classified based on (i)
whether the information flow from a source is one-way or two way process, and (ii) the
specificity of information that is multi-purpose or specialized. Radio, television and newspapers
are one-way multipurpose communication sources; village fairs are two-way multi-purpose
sources; trainings, field demonstrations, study tours, extension workers, private agencies /NGOs,
input dealers, fellow progressive farmers, credit agencies, primary cooperative societies and
output buyers/food processors are the two-way specialized information sources (Kwake and
Ocholla, 2007).
Research and extension system have the potential to generate and disseminate agricultural
information. Those farmers who have access to innovation for the improvement of their farm
productivity at every step of the production process can benefit from agricultural information. For

12
this purpose, different farmers approach different information sources to get appropriate and
reliable information (Korra, 2009).
The study conducted in South Africa and Kenya by Kwake and Ocholla (2007) stated that
agricultural information flow only 40 per cent farm households’ access information from one or
the other source. The popular information sources among farmers have been reported to be fellow
progressive farmers and input dealers, followed by mass media. The public extension system has
been found to be accessed by only 5.7 per cent households. Only 4.8 per cent of the small farmers
have access to public extension workers as compared to 12.4 per cent of large farmers.
Research conducted in Indian by (Adhigurua, Birthalb and Kumara, 2009) stated that Farmers’
access to publicly-funded sources like extension workers, training programs, study tours is low.
These programs are to be made cost-effective and easily accessible to resource-poor farmers and
farm-women. As these scholars, public extension system is the predominant source of farm
information dissemination. However, it’s spreading of information only small proportion of farm
households. The causes of limited accessibility of information by farmers from the public
extension systems, lack of manpower and operational autonomy could be the possible reasons
that observed for inefficiency in delivery of information and services.
The research conducted in Ethiopia and Philippine by Ricardo (2010) reported farmers and
farmer groups are stakeholders in a rural community, just as much as municipal authorities,
public servants, private for profit and non-profit organizations salesmen, traders, bankers,
researchers, women's groups, private entrepreneurs, religious groups, etc. These stakeholders
interact constantly, seeking to negotiate and create opportunities to fulfill their needs and pursue
their interests. In these negotiations, information is exchanged on prices, market opportunities,
technology and practices, policy changes and politics. Much of the information travels freely, but
some may also come at a price.
2.4. Knowledge Sharing and Communication Network
Communication can be defined "the exchange of messages" between two or more partners, or
establishing "commonness" between two or more parties through a particular medium, or an

13
active, dynamic process in which ideas and information are exchanged leading to modification of
people's knowledge, attitudes and practices (Burnett, 2003). The knowledge sharing and
communication network of AKI is highly variable, very complex and dynamic. The presence of
high diversity in the nature, attitudes and experience, leads to the existence of different
communication networks among the farmers.
To boost the economy, vegetable farmers should have the right kind of knowledge and
information. However, there are gaps between what certain individuals and what other
individuals know in any society, even in a homogenous society such as farmers. The
consequences of these gaps can often be serious, amid poverty. Not everyone in an economy
could have the right kind of knowledge and information to produce output efficiently. People are
poor not because of lazy, they may be hard working people but lack of proper knowledge and
information (Suhermanto, 2002).To close this gap Suhermanto (2002), suggested that two ways
of distribution of knowledge and information. First, public sector or government-facilitated
efforts might close the gap through the distribution of knowledge and information to the needy.
Many farmers involved in training activities reported that they had shared information with other
farmers, and a few trained farmers took on a training role themselves, motivated to defend new
technologies and to demonstrate technologies to other farmers. Secondly, communication among
individuals can help knowledge and information to be transmitted from one individual to another.
According to Katungi (2006), a household can participate in information exchange as an
information receiver, information provider (sender) or both. There is a links among the
households in form of clubs (associations) and/or private social networks. Associations describe
finite closed groups with a common interest while private networks refer to a set of bilateral links
the household is directly connected to. The linkages between these households are used in the
exchange of resources based on norms of reciprocity. Let information be one of those resources
that households exchange among themselves through their links. This allows us to model the
social network as exogenous to information exchange. Each household can engage in information
exchange with other households it has a direct link with, whether through associations or private
networks. Thus, information from other households, indirectly linked to the household, is only
accessed from direct contacts through the other established links (Katungi, 2006).

14
Social institutions and the underlying social norms within a village influence the extent to which
rural households interact and hence the rate at which information is exchanged. To strengthen
these information exchanges, extension can serve as information source and information
exchange facilitator. The learning opportunities in local market areas are the main (informal)
means for information dissemination across a community. Therefore, agricultural extension
service is expected to contribute the well functioning of the existing local information exchange,
taking into account the diverse sources of information.
2.5. Farmers’ Information Need
Information need is recognition that your knowledge is inadequate to satisfy the goal that you
have (Case, 2007).
Vegetable farmers need timely and relevant information, which can fundamentally alter their
decision-making capacity as well as critical to increasing agricultural productivity. Information
needs of vegetable farmers includes information on new plant, new seeds pests and diseases,
transport availability, new marketing opportunities, and the market prices of farm inputs and
outputs is fundamental (Deribe, 2007). The study conducted by Egyir (2006 cited in Nkruma,
2008) supported Deribe's suggestion; adequate/relevant information is one of the key
requirements for increased productivity, increased income and therefore poverty reduction among
food producers in underprivileged communities.
An information-literate individual is able to: 1) determine the extent of information needed, 2)
access the needed information effectively and efficiently, 3) evaluate information and its sources
critically, 4) incorporate selected information into his or her knowledge base, 5) use information
effectively to accomplish a specific purpose and 6) understand the economic, legal, and social
issues surrounding the use of information and access and use information ethically and legally
(Rockman, 2002).
Different studies have shown that agricultural information influences agricultural productivity in
a variety of ways. It can help rural people in making decisions regarding land, labor, livestock,

15
capital and management. Agricultural productivity can also be improved by relevant, reliable and
useful information and knowledge (Shibanda 1991; Chifwepa 1993; Demiryureket al. 2008;
Ballantyne 2009). The World Bank has recognized the need for up-to-date information for
accelerating agricultural growth and innovation. According to the World Bank (2007),
agricultural development depends to a great extent on how successfully knowledge is generated,
shared and applied. It suggests that investments in knowledge – especially in science and
technology – have to be adjusted to rapid changes in the wider agricultural environment. Rural
farmers need a regular supply of up-to-date information on all agricultural sectors and sub-
sectors. They need a constant flow of information on modern technology, seed selection and
quality assurance, various cropping systems and cultivation processes, agricultural insects and
diseases, symptom and disease identification, treatment, choice of remedy, fertilizer information,
irrigation requirements by crop, soil and season, irrigation input market information, prices,
government support, flood forecasts and control, commercial agriculture, contract farming,
support institutions, crop processing, pest control, etc. This information would enable them to
carry out various agricultural activities smoothly, which in turn would result in greater
agricultural output and sustainability. Ballantyne (2009) asserts: More than ever, the developing
world needs reliable information and knowledge on agricultural issues. It needs this knowledge to
be accessible and well communicated. On its own, more information is not enough: access is
needed to additional, different knowledge, from different people across the full spectrum of
producers, scientists, educators, advisors and policy makers (p.260).However, farmers and
agricultural entrepreneurs must receive the information on time, and in a manner and format best
suited to their needs and their ability to understand. Government agricultural extension workers
also could play an important role in this regard by collaborating with information workers.
Together, they could supplement and complement each other to provide the most effective
information
A well-established and well-designed information system to facilitate decision making in various
agricultural development projects is critical to the success of any organization. To be successful,
every project requires efficient management of human and material resources. This cannot be
done unless accurate, timely, and relevant information is available to decision maker (Pezeshki-
Rad and Zamani, 2005).

16
2.6. Information-Seeking Behavior
Information seeking behaviors is a process of construction with-in .Information seeking involves
fitting information in with what one already knows and extending this knowledge to create new
perspectives (Kuhlthau, 2004). According to Case (2002) information seeking behavior is a
conscious effort to acquire information in response to a need or gap in your knowledge.
Information use is a behavior that leads an individual to the use of information in order to meet
his or her information needs. Information use is an indicator of information needs, but they are
not identical (Meho and Hass, 2001).This variable is reflecting the degree at which the
respondent was eager to get information from various sources on different agricultural activities.
According to Deribe (2007) there is significant and positive relationship between information
seeking behavior and knowledge of dairy farming. Asres (2005) found that similar finding
between information seeking behavior and productive role of women. This indicated that as
information seeking behavior of vegetable farmer increases which resulted in increasing their
productivity.
The information seeking-behavior of an individual arises from the need to satisfy identified goals
and move from the level of uncertainty to the level of certainty. Information seeking behavior is a
way of gathering sufficient data to address perceived information gaps (Kayode, 2012).
According to Owolade (2008), Information-seeking behavior is the “totality of human behavior
in relation to sources and channels of information sought”.
The main reason for seeking information by farmers was to increase productivity, followed by
solving daily problems that they face and updating their knowledge. Information seeking
behavior of vegetable farmers encompassing the following stages: (1) finding (codified)
vegetable related information, (2) organizing personal information concerning vegetable. (3)
making sense of acquired information, (4) negotiating with other farmers and discussion,
(5)"Creating" new ideas, (6) establishing and maintaining a personal network, (7) collaborating in
communities (Martin, 2004).

17
2.6.1 Models of Information Seeking
A model may be described as a framework for thinking about a problem and may evolve into a
statement of the relationships among theoretical propositions. Most models in the general field of
information behavior are of the former variety: they are statements, often in the form of diagrams
that attempt to describe an information-seeking activity, the causes and consequences of that
activity, or the relationships among stages in information-seeking behavior.
Theoretical models of information seeking must address three key issues. First, models should
provide a sound theoretical basis for predicting changes in information-seeking behaviors
Second, models should provide guidance for designing effective strategies for enhancing
information seeking ….Third, models should explicitly conceptualize information seeking
behavior, developing rich descriptions of it. Finally, models should answer the “why’’ question,
they should explicitly address the underlying forces that impel particular types of information
seeking (Johnson, 1997). Many models of information seeking exist, but seven of them were the
most-cited and general models of information seeking.
Each of them resembles a conventional flow-chart and suggests sequences of events. They all aim
to describe and explain circumstances that predict actions by individuals to find information of
some kind. Following a bit of background information regarding models, each of the five models
will be depicted.
2.6.2 Wilson First Model
Wilson’s information user has a need, which may (or may not) stem from his or her level of
satisfaction (or dissatisfaction) with previously acquired information. Wilson suggests that the
perceived need then leads the user into a cluster of activities, the most straightforward of which is
to make direct demands on sources or systems of information. The results of these demands lead
either to success (in which case the information is “used’’) or to failure, which is presumed to be
a dead end, as information that is not “found’’ cannot be used. It is odd, however, that “failure’’

18
of “demands on other information sources’’ are not depicted as directly feeding back to “need’’
by way of another arrow
Figure 1: Wilson's 1981 model of information-seeking behavior.
Source: Wilson's 1981
An important aspect of Wilson’s model is the recognition that information is exchanged with
other people (a process he calls information transfer) in the course of information use and seeking
behaviors. As he points out, relatively little attention has been paid to informal transfer of
information among individuals. But other people are an important source of information in many
circumstances, even during direct interaction with a formal system such as a library.
2.6.3 Krikelas Model
Provided here partly for its historical value is the early and widely cited model of James Krikelas
(1983). In addition to being one of the first explicit depictions of information seeking, Krikelas’
model was prescient in emphasizing both the importance of uncertainty as a motivating factor,
and of the potential for an information seeker to retrieve an answer from their own memory or

19
those of nearby persons. The Krikelas model contains 13 components. The causal process
generally flows downward, with some provision for feedback loops.
The Krikelas model (Figure 2) thus claims to be a general one that would apply to “ordinary
life’’. At the top of the model (implying a beginning) are the twin actions of “information
gathering’’ and “information giving.’’ The activities of information gathering come about in
response to deferred needs, which in turn have been stimulated by an event or the general
environment of the seeker.
Figure 2: The Krikelas model.
Source: Krikelas (1983)

20
2.6.4 Leckie Model
The model by Leckie, Pettigrew, and Sylvain (1996) resembles Johnson’s model in its surface
format yet is more like the Krikelas model in its limitation to a range of people—in this case,
“professionals.’’ It features six factors connected by arrows, all but one of them unidirectional
(i.e., “outcomes’’ and “characteristics of information needs’’ influence each other in mutual
fashion).The Leckie model is depicted as flowing from top to bottom (Figure 3 ).The causal
process begins on the top with “work roles,’’ which in turn influence “tasks.’’
Figure 3:The information seeking of professionals model
Source: Leckie, Pettigrew, and Sylvain (1996)

21
2.6.5 Byström and Järvelin Model
The Byström and Järvelin Model has been cited in the information retrieval literature as a useful
way of thinking about the way in which information users operate (see, for example, Ingwersen
& Järvelin, 2005; and Vakkari,1999). Their model was based on earlier work by Colin Mick and
others (e.g., Mick, Lindsey, and Callahan 1980). Byström and Järvelin’s use of their model in an
empirical study drew attention to the importance of “task complexity” in information seeking;
that is, how an information seeker proceeds depends on the degree to which they see the task as
complicated. Complex tasks are those for which a person lacks an adequate “mental model” that
would enable them to judge exactly what needs to be done, or to evaluate information efficiently;
such tasks are quite distinct from those of a routine variety. Byström and Järvelin’s painstaking
study of 14 civil servants demonstrated that as the complexity of a task increases needs grow for
more complex information, for more information about the problem domain and problem
solving; the successfulness of information seeking tends to decrease with complexity.

22
Figure 4:The Byström and Järvelin model
Source: Byström and Järvelin (1995)
2.6.6 Johnson Model
Johnson’s model contains seven factors under three headings. It is pictured as a causal process
that flows from left to right (Figure 4), beginning with four “antecedent’’ factors under two
categories. The significance of Johnson’s model components is not obvious in its depiction, but
rather is explained in depth in his writings (e.g., 1997).Therefore, I will need to say somewhat
more about this model than the others.

23
In Johnson’s model, it is the antecedent factors that motivate a person to seek information. The
first two are grouped together under the label of background factors. One factor is demographics:
one’s age, gender, and ethnicity, along with socioeconomic variables like education, occupation,
and wealth. Historically, such demographic variables are the mainstay of social research, which
tries to find patterns among the behaviors, beliefs, and attitudes of populations based on
correlations with such demographic variables. In any consumer oriented research, dividing a
population by such variables is referred to as audience segmentation.
Figure 5:The Comprehensive Model of Information Seeking
Source: Johnson (1997)
2.6.7 Wilson Second Model
Wilson’s second model is a complex one (Figure 6.). It invokes explicit theories at points to
explain the following three aspects of information seeking:
● Why some needs prompt information seeking more so than others (stress/coping theory, from
psychology)
● why some sources of information are used more than others (risk/reward theory, from
consumer research)

24
● Why people may, or may not, pursue a goal successfully, based on their perceptions of their
own efficacy (social learning theory, from psychology
We might think of Wilson’s “activating mechanisms’’ as motivators: What motivates a person to
search for information, and how and to what extent? These motivators are affected by intervening
variables of six types: psychological predispositions (e.g., tending to be curious or averse to risk);
demographic background (e.g., age or education); factors related to one’s social role (e.g.,
whether one is acting as a manager or a mother); environmental variables (e.g., the resources
available); and characteristics of the sources (e.g., accessibility and credibility).
An important aspect of Wilson’s new model is that it recognizes that there are different types of
search behaviors: passive attention, passive search, active search, and ongoing search. These
differentiations parallel comments made earlier in the book regarding different modes of
information seeking: simply being exposed to relevant information versus actively looking for it.
By “information processing and use’’ Wilson implies that the information is evaluated as to its
effect on need, and forms part of a feedback loop that may start the process of seeking all over
again if the need is not satisfied.

25
Figure 6: Wilson’s second model
Source: Wilson (1999)
With the next model (Figure 7) presented in 1999, Wilson pointed out that information search
behaviour is a subset of information seeking behaviour and that information seeking behaviour i
s in turn only a subset of all possible information behaviour. As such, the existence of modes of
information behaviour, other than information seeking, is implied.

26
Figure 7: Wilson's nested model of information behavior
Source: Wilson (1999)
2.7. Factor Affecting Information Seeking Behavior of Vegetable Farmers
2.7.1. Household’s personal and demographic variables
Household’s personal and demographic variables are among the most common household
characteristics that are mostly associated with farmers' information seeking behavior. From this
category of variables age, sex and education will reviewed in this study but there is a limitation of
empirical study on other variables.
Age is also one of demographic variable which is important to describe households and can
provide a clue as to age structure of the sample and the population too. Young farmers are keen to
get knowledge and information than older farmers. It may be also older farmers are more risk
averse and less likely to be flexible than younger farmers and thus have a lesser likelihood of
information utilization and new technologies. With regard to age, different studies report
different results. Haba (2004), he assessed that the willingness to pay for agricultural information
delivery technologies such as print, radio, farmer-to-farmer, expert visit, and television. He
revealed that, as age increased, the willingness to pay for these agricultural information delivery
technologies decreased, meaning that older farmers were less willing to get information than
younger ones. On the other hand, study conducted by Katungi (2006), on social capital and

27
information exchange in rural Uganda reveal that older men are less likely to engage in
simultaneous receiving and providing of information, perhaps due to the low ability to
communicate associated with old age. All this points assure that, as age increase the getting of
agricultural information also decrease.
Gender is another factor that limits information seeking behavior of vegetable farmers. Due to the
prevailing socio-cultural values and norms males have freedom of mobility, participate in
different meetings and trainings consequently have greater chance of getting information.
Male-headed households are said to have better access to agricultural information than female
headed households, which is attributed to negative influence of cultural norms and traditions
(Habtemariam, 2004). A study conducted by Pipy (2006), reveals that, there were significant
difference between male and female in poultry production information source and utilization of
information. Yahaya (2001) reported similar results in previous studies that sourcing of
agricultural information and utilization is along gender lines. They had posited that women are
less likely to participate because they have limited time to seek available information due to
pressure of household responsibilities. Married women in particular are bypassed in the transfer
of improved agricultural technologies assuming that they will get the information through their
husbands (EARO, 2000). According to EARO (2000), female farmers are not considered and
their agricultural activities and/or issues concerning them have been the last priorities in the
country’s agricultural research agenda, and so lacked improved extension packages and services
that assist them to improve their productivity. This report explains that often it is observed that
major emphasis in agriculture is given to men’s activities while the role of women and children in
the Ethiopian farming systems has been ignored.
With regard to education, there is a general agreement that education is associated with receiving
and absorbing agricultural information. Because education is believed to increase farmers’ ability
to obtain, process and analyze information disseminated by different sources and helps him to
make appropriate decision to utilize agricultural information through reading and analyzing in a
better way. A study conducted by Katungi (2006), on social capital and information exchange in
rural Uganda reveal that, among women’s; more educated women are more likely to engage in

28
two way information sharing, so that more educated farmers have more information access.
Pipy,(2006) found that, significant difference between different educational level in poultry
production sources of information and information seeking behavior. In the same line several
authors reported significant and positive relationships that exist between formal education and
literacy level and adoption of new technology (Freeman et al., 1996; Haji, 2003; Habtemariam,
2004). In addition, Mulugeta (2000) have reported that education has positive relation with
information behavior.
2.8.2. Household’s socio-economic variables
Knowledge systems are dynamic, people adapt to changes in their environment and absorb and
assimilate ideas from a variety of sources. However, knowledge and access to knowledge are not
spread evenly throughout a community or between communities. People may have different
objectives, interests, perceptions, beliefs and access to information and resources. Knowledge is
generated and transmitted through interactions within specific social and agro ecological
contexts. It is linked to access and control over power. Differences in social status can affect
perceptions, access to knowledge and, crucially, the importance and credibility attached to what
someone knows. Often, the knowledge possessed by the rural poor, in particular women, is
overlooked, and ignored (FAO, 2004). Therefore, information seeking behaviors of vegetable
farmers depends on the individual social and economic status.
Among different factors, annual farm income obtained from sale of crop and/or vegetable crop
are important income sources in the rural households. Off-farm activities are the other important
activities through which rural households get additional income. The households’ income
position is one of the important factors determining the information seeking behavior of
vegetable farmers and different improved technologies. Regarding annual farm income, almost
all empirical studies reviewed show the effect of farm income on household’s adoption decision
to be positive and significant. For example, Kidane (2001); Degnet et al. (2001) and Getahun
(2004), reported positive influence of household’s farm income on access to and adoption of
improved technologies. In the same line, Gockowski and Ndoumbe, (2004) found positive effect
of cocoa revenue on intensive mono-crop horticulture.

29
2.8.3. Institutional factors
In the context of this study, institutional factors include various formal and informal institutions,
and organizations. These factors facilitating and enhancing the information seeking behaviors of
vegetable farmers such as credit, social participation, enhancing farmers’ participation and joint
planning, development agents’ support, visiting market place and different formal and informal
social organizations.
Credit has strong and significant influence in determining use of combined packages depending
on the production type. It helps in alleviating current financial constraints enhancing the use of
technology packages correspondingly. Different studies have shown that access to credit plays a
significant role in enhancing the use of improved varieties (Bezabih 2000; Tesfaye et al., 2001).
All of them reported that access to credit, had a significant and positive influence on the
information seeking behavior of farmers regarding improved technologies.
In agricultural development, the importance of social capital (multidirectional social network) is
perceived as a willingness and ability to work together. The very likely assumption on which the
relationship between social capital and adoption is anchored is that neighboring agricultural
households are, de facto, members of a social structure who exchange information about
improved agricultural practices. Rogers (1995) concludes that: “The heart of the diffusion process
consists of interpersonal network exchanges between those individuals who have already adopted
an innovation and those who are then influenced to do so. Similarly, the findings of Habtemariam
(2004) also detected a positive relationship between social participation and adoption of all dairy
practices.
To assure the need of farmers’ agricultural information provision, the planning process should be
bottom top, based on the farmers’ problem, aspirations, needs, resource, and environment.
Market distance and frequency of market visiting is also another factor in the information seeking
behavior of vegetable farmers. A study conducted in Uganda explained that, market serve as
forum for the exchange of goods, and organized weekly, biweekly or monthly and constitute an
important place where agricultural information is exchanged and men go to markets more often

30
than women (Katungi, 2006). Moreover farmers located near to a market will have a chance to
get information from other farmers and input suppliers. The closer they are to the nearest market,
the more likely it is that the farmer will receive valuable information (Abadi, 1999; Roy,
1999).Therefore, the frequency of market and distance from residence play important role in the
shaping the information seeking behaviors of vegetable farmers.
2.8.4. Psychological factors
Psychological factors also plays influential role in the information seeking behavior of vegetable
farmers. In this study attitude towards improved farming, innovation proneness and production
motivation are considered as important variable having influence on formation seeking behavior
of vegetable farmers.
Attitudes are usually defined as a disposition or tendency to respond positively or negatively
towards a certain thing (idea, object, person, and situation). They encompass, or are closely
related to, our opinions and beliefs and are based upon our experiences. Since attitudes often
relate in some way to interaction with others, they represent an important link between cognitive
and social psychology (Kearsley, 2008). In this study, attitude towards improved farming is
defined as the degree of positive or negative opinion of respondent farmers towards improved
farming. Positive attitude towards improved farming is one of the factors the can speed up the
farm change process. Attitude formation is also a prerequisite for behavioral change to occur. A
study conducted in Adami Tulu District, Ebrahim (2006) reported that attitude towards change is
statistically significant relation with dairy adoption.
Innovation proneness in this study is operationally defined as the receptivity of the individual to
new ideas related to different agricultural information. A study conducted in Dire Dawa
administrative council, eastern Ethiopia, Asres (2005) reported that innovation proneness is
statistically significant relationship with access to productive role information and utilization of
accessible development information of farmers.

31
2.9. Conceptual Framework of the Study
To enhance the agricultural production and productivity in developing countries, seeking
agricultural information by farmers play crucial roles. Due to different external and internal
factors (such as high illiteracy level of farmers, limited application of modern inputs, poor
provision of agricultural information, etc) Ethiopian agricultural sector remains under low
production and productivity. To enhance the production and productivity, one of the options
would be to increase farmers’ information seeking behavior through identifying and working on
the problem that affects the information seeking behavior. This can be done through analyzing
the personal, socio- economical, institutional and psychological factors that might significantly
influence information seeking behavior.
In this study, efforts were made to identify factors affecting information seeking behavior of
vegetable farmer from literature, practical experiences and field observations of the research. The
conceptual framework of this study is based on the assumption that information seeking behavior
of vegetable farmers are influenced by a number of personal, socio- economic, institutional and
psychological factors of the farmers. The conceptual framework presented in Figure 1 presents
the most important variables hypothesized to influence the information seeking behavior of
vegetable farmer in the study area.

32
Figure 8: Conceptual Framework Diagram
Source: Owen Design (2013)
Information Seeking
Behavior of Vegetable
Farmers
of Vegetable Farmers
Household and
Demographic Factor
• Age
• Sex
• Education
Psychological Factors
• Attitude towards
improved farming
• Innovation
proneness
• Production
Motivation
Socio Economic Factors
• Farm income
• Active Labor Force
• Livestock ownership
• Non-farm income
• Farm size
Institutional Factor
• Radio ownership
• Frequency of
extension contact
• Social participation
• Distance from the
nearest market
• Formal credit
utilization

33
3. METHODOLOGY
3.1. Description of the Study Area
Haramaya Woreda is one of the eighteen Woredas in Eastern Hararghe Zone. It is located at a
distance of 510 kms away from Addis Abeba along the main road towards Harar town. The
woreda lies between 90 09` and 90 32` N latitude and 41050` and 42005` E longitude to the west
of Harar town. It is bordered by Dire Dawa Administrative Council in the north, Kombolcha
woreda in the north east, Harari Peoples’ National Regional State in the east, Fedis woreda in the
south east, Kurfachele woreda in the south west and Kersa woreda in the west. Haramaya has a
total area of 52163 km2, accounting for about 2.31% of the total area of the zone. Its capital city,
Haramaya is located at 16kms west of Harar town, (HWAO, 2010).
It is situated in the semi-arid tropical belt of eastern Ethiopia and characterized by a sub-humid
climate with an average annual rainfall of about 188-866 mm, annual mean temperature of 18.8
ºc with mean minimum and maximum temperatures of 9.4 and 24 ºc, respectively. The area
experiences biannual type of rainfall classified as short and long rainy seasons. The short rainy
season usually occurs from end of February to mid May and the long rainy seasons occur from
July to end of September. Its altitude ranges from 1600 to 2100 meters above sea level (HWAO,
2010).
According to the information obtained from the woreda Agricultural and Rural Development
Office, currently the total population of the woreda is 271,394 which comprises of 138,376 male
and 133, 018 female. Out of the total population, about 220,408 are living in the rural areas
among these 112,311 are males and 108,097 are females. And 50, 986 are living in urban area
which consists of 26, 065 male, and 24, 921 are female. The majority of the population who live
in this woreda belongs to Oromo ethnic group and the dominant religion is Islamic religion. The
land coverage comprises cultivated land (38.487ha) grazing land (32.4ha) bushes (825ha),
slipslop (985ha), gully land (47ha), and the rest used for house construction (485ha).

34
The livelihood of the farmers is based on a mixed type of agriculture that is subsistence in nature.
The most important cereal crops are sorghum and maize, chat (13,012h) and vegetables are cash
crops. Sorghum and maize with chat and varieties of vegetable crops are the most important
agriculture crops in the area dominantly consumed by rural community and export to Djibouti
and Somalia.
Access to information need of farmers facilitated by availability of effective extension services.
To this effect, the government assigned development extension staff at Kebele Administration
level. Three development agents (DAs) were assigned to give extension advice to the farmers in
the areas of natural resource conservation, animal production, and agronomy in each kebele
administration of the woreda. The woreda constructed 33 farmer training center (FTC) in each
kebele, in order to enhance the production of the farmer.
3.2. Sampling Procedure and Sample Size
The study population was all vegetable growers in the woreda. Multi-stage sampling procedures
were applied to select kebeles and the required number of sample units. First 11 kebele were
selected purposively, known for being major vegetable growers in the woreda. Secondly, four
kebeles were randomly selected from 11 vegetable growing kebele. From experience, the woreda
was known that almost all kebeles in the woreda are relatively homogenous in terms of agro
ecology, access to resources, history of extension and others.
The selected four kebele namely Finkile has1041HHs, Damota has 1483HHs, Ifa Oromiya has
1936HHs and Tuji Gabisa has1574HHs.The total number of HHs in the four kebeles was 6034
From each kebele namely Finkile 26HHs, Damota 37HHs, Ifa Oromiya 48HHs and Tuji Gabisa
39HHs totally 150 Vegetable growers were randomly selected as sample of the study using
probability proportional to size sampling techniques. The sample size for collecting quantitative
data for this research is determined using Yamane (1967) formula.
n = N
1+N (e) ²

35
Where:
n = designates the sample size the research uses;
N =designates total number of households in each Kebeles
e = designates maximum variability or margin of error (0.1) and level of confidence 90%
1 = designates the probability of the event occurring
Figure 9: Sampling procedures
Source: Own design
HARAMAYA WOREDA
11 Potential vegetable
Growing KA
KA1 KA2 KA3 KA4
150 Sample households
Purposively
Purposively
Randomly
PPS

36
Table 1: Proportion of sample respondents from each kebele
Sample Kebele No of Vegetable grower HHs No of Sample HHs
Finkile 1041 26
Damota 1483 37
Ifa Oromiya 1936 48
Tuji Gabisa 1574 39
Total 6034 150
Source: Woreda Agricultural and Rural Development Office, 2012
3.3. Data type and Data Source
Data collected for this research were quantitative in nature. Both primary and secondary data
sources were used. The primary data sources were vegetable farmers in the four kebele
Administrations, DAs and SMSs. The secondary data sources were reports, records of DAs,
published and unpublished documents of office of the Agricultural and Rural Development of the
woreda, journals and different websites. Primary and secondary data were collected to answer the
objectives of the study.
3.4 Methods of Data Collection
Data necessary for this study were collected from sample respondents by using structured
interview schedule. Both open- ended and close - ended questions were used to gather data from
sample respondents. For the purpose of data collection, enumerators with knowledge of the
culture, acquaintance with the socio-economic concepts and proficiency of local language were
recruited, trained and employed before the actual data collection commenced. The actual data
gathering process carried out from 09/10/12 -16/10/12 EC.

37
3.5. Methods of Data Analysis
Descriptive statistics including percentages, mean values, standard deviation and frequencies
were used to analyze the quantitative data. To see the association of explanatory variables with
the response variables Chi-square test for discrete /categorical variables, Pearson correlation
analysis for continuous variables and Spearman’s rho correlation analysis for dummy variables
were used. Among the measures of correlation, Karl Pearson and spearman’s Coefficient of
Correlation(r) were applied to analyze the data. The degree of association or correlation between
two variables X and Y were answered by the use of correlation analysis (Gomez and Gomez,
1984; Kothari, 2003).
Karl Pearson’s coefficient of correlation(r) is also known as the Product Moment Correlation
Coefficient. The value of ‘r’ lies between. +1 and -1 Positive values of ‘r’ indicate positive
correlation between the two variables (i.e., changes in both variables take place in the same
direction), whereas negative values of ‘r’ indicate negative correlation i.e., changes in the two
variables taking place in the opposite directions. A zero value of ‘r’ indicates that there is no
association between the two variables. When r = (+) 1, it indicates perfect positive correlation
and when it is (-) 1, it indicates perfect negative correlation. The value of ‘r’ nearer to +1 or -1
indicates high degree of correlation between the two variables (Kothari, 2003).
The existence of a significantly high correlation between two variables tells us nothing about why
the correlation exists. In particular, the correlation does not tell us that one variable is the cause
and the other is the effect (Browen and Starr, 1983).
3.6 Econometric Model
Aldrich and Nelson (1984) revealed that descriptive statistics fails to predict the combined effect
of the explanatory variables on the dependent variable. Thus, this gap is to be bridged by
selecting and running appropriate econometric models for inferential purpose. Depending up on
the assumption that, distribution of the random disturbance term follows several qualitative
choice models such as linear probability model, a logit, or probit models could be estimated

38
(Pindyck and Rubinfeld, 1997; Green, 2000). Qualitative choice models are useful to estimate the
probability that an individual with a given set of attributes will make one choice rather than an
alternative (ibid). Of the three functional relationships often specified, the linear probability
model is computationally simpler and easier to interpret parameter estimates than the other two
models.
However, as its specification creates estimation problems involving the application of OLS such
as heterosecedasticity error terms, predicted values may fall outside the (0, 1) interval, and non-
normal distribution of error term. Although, transformation could provide homosecedastic
disturbance terms and then apply weighted least square procedures, there is no guarantee that the
predicated value will lie in the (0, 1) probability range. These difficulties with linear probability
model compelled econometricians to look for model specification (Pindyick and Rubinfeld, 1997;
Green, 2000). The two most popular functional forms used in adoption modeling are the probit
and logit. These models have got desirable statistical properties as the probabilities are bound
between 0 and 1 (ibid).
Ordinal logit Model
Sometimes response categories are ordered but do not form an interval scale. There is a clear
ranking among the categories, but the difference among adjacent categories cannot be treated as
the same. Responses like these with ordered categories cannot be easily modeled with classical
regression. Ordinary linear regression is inappropriate because of the non-interval nature of the
dependent variable. Ordinal logit and probit models have been widely used for analyzing such
data (Liao, 1994).
Some polychotomous dependent variables are inherently ordered. Although the outcome is
discrete, the multinomial logit or probit models would fail to account for the ordinal nature of the
dependent variable (Green, 2000). Hence, the ordered probit and logit models is relatively the
right frame-work to be used for analyzing such responses (Zavoina and MacElvey, 1975). Since
in this study the nature of the dependent variable was of ordinal type, ordered logit model was
used for inferential purpose.

39
Model specification
Following Green (2000) and Liao (1994) the functional form of ordered logit model is specified
as follows:
𝑦 ∗ = ∑ β𝑘 x𝑘+∈𝑘
𝑘=1
(1)
y* = is unobserved and thus can be thought of as the underlying tendency of an observed
phenomenon.
= we assume it follows a certain symmetric distribution with zero mean such as normal or
logistic distribution.
What we do observe is:
y = 1 if y* ≤ μ1 (=0)
y = 2 if μ1 < y*≤ μ2
y = 3 if μ2 < y* ≤ μ3 (2)
y = j if μj-1< y*
Where y is observed in j number of ordered categories, 𝜇s is unknown threshold parameters
separating the adjacent categories to be estimated with βs. The general form for the probability
that the observed y falls into category j and the μs and the βs are to be estimated with an ordinal
logit model is;
Prob(y=j)= 1-L { µj−1
− ∑ 𝛽𝑘 ×𝑘 } (3)
𝑘
𝑘=1
Where L (·) represents cumulative logistic distribution. Marginal effects on the probabilities of
each adoption status were calculated by:

40
𝜕 𝑝𝑟𝑜𝑏(𝑦 = 𝑗)
𝜕 ×𝑘= [ 𝑓 ( µ
j−1− ∑
𝛽𝑘 ×𝑘) − f ( µj
− ∑ 𝛽𝑘 ×𝑘
k
k=1
] 𝛽𝑘 (4)
𝑘
𝑘=1
Where f (·) represents the probability density function.
Like logistic regression, ordered logit uses maximum likelihood methods, and finds the best set
of regression coefficients to predict values of the logit-transformed probability that the dependent
variable falls into one category rather than another. Logistic regression assumes that if the fitted
probability, p, is greater than 0.5, the dependent variable should have value 1 rather than 0.
Ordered logit doesn't have such a fixed assumption. Instead, it fits a set of cutoff points. If there
are r levels of the dependent variable (1 to r), it will find r-1 cutoff values 𝑘1 to 𝑘𝑟−1 such
that if the fitted value of logit (p) is below k1, the dependent variable is predicted to take value 0,
if the fitted value of logit (p) is between k1 and k2, the dependent variable is predicted to take
value 1, and so on (Bruin, 2006). The interpretation of the marginal effects for the first and the
third alternative (low and high information source utilization) was straightforward. For the low
level, a positive value for the marginal effect means the probability of using information sources
for low level category increases whereas a negative marginal effect means the probability of
shifting out of the low level into higher categories increases. Shifting out of the low level does
not necessarily mean moving into the next level but simply means a probability of using more
information sources shifts into higher categories (Borooah, 2001 as cited in Bekel, 2008). In the
case of the high level, a positive marginal effect implies an increased probability for the
smallholder farmers to use all information sources, whereas a negative marginal effect indicates
increased probability for smallholder farmers to move into low level of information seeking
category. The impact of each explanatory variable on the probability of information seeking
behavior of vegetable farmer was calculated by keeping the continuous variables at their mean
values and the dummy or discrete variables at their most frequent value (zero or one or two or
three).

41
3.7. Definition of Variables and Working Hypothesis
Dependent Variable: The dependent variable in this study is information seeking behavior of
vegetable farmers. The information seeking behavior refers to the activities performed by an
individual farmer in relation to acquisition of scientific information with regard to the improved
cultivation practices of vegetable crop from various information sources. In this study
information seeking behavior of vegetable farmers were measured by frequency of contact with
different information sources respondents have on a three point continuum of ‘always’,
‘sometimes’ and ‘never’ with a scoring of 3, 2 and 1 respectively. Based on the score obtained by
the respondent, they were categorized in to three Categories viz., low, medium and high with the
help of mean and standard deviation as a measure. The frequency assessment was done keeping
in view of the ten identified information sources for vegetable farmers. The expected score ranges
from 10 to 30. The calculated score of every individual farmer was divided by number of
information source which was ten. The calculated mean score of frequency of contact with
different information source was 1.85 with standard deviation of 0.69 and the minimum and
maximum score of 1 and 3 respectively. Finally those farmer who score below mean mines
standard deviation were categorized under low information seeking, while those farmers who
score above mean plus standard deviation were categorized under high information seeking
category and those in between the two were categorized under medium information seeking. The
actual score found to be from1up to1.16 for low, from1.17 upto2.54 for medium and from2.55 up
to2.9 for high information seeker. It was in accordance to this method that all the analysis work
was done
Independent or Explanatory Variables: The explanatory variables of importance in this study
are those variables, which were thought to have influence on information seeking behavior of
vegetable farmers. These include household’s personal and demographic characteristics, socio-
economic variables, institutional variables, and psychological variables.

42
Household’s Personal and Demographic Characteristics
Age (AGE): This refers to the age of the household in years. Vegetable production is a
knowledge demanding business; particularly it requires modern knowledge production and
marketing. Moreover, it entails risk.. Although young farmers are keen to get knowledge and
information than older ones, increase in age might lead to less seeking due to the elder farmers might
be more or less risk averse to new technologies (Daniel, 2008). The study assumes age to be
negatively associated with information seeking behavior. That is older people tends to more
reluctant to seek information.
Sex (SEX): It is a dummy variable, which takes a value of 1 if the respondent is male and 0
otherwise. In most cases, males have more information on improved technologies and are more
likely to seek information better than women. Therefore, male was expected to positively
influence information seeking behaviors of vegetable farmers.
Education level of the household (EDUHH): It represents the level of formal schooling
completed by the household head at the time of the survey. Education level increases farmer’s
ability to get process and use information and increase farmer’s willingness to adopt a new
technology (Ataklti, 2008). Therefore, in this study education level of the household was
expected to positively related with information seeking behavior of vegetable farmers.
Socio-Economic Factors
Active labor force (ACLABF): It is measured in terms of man equivalent and it refers to the
active labor force the household owns. The higher number of family members leads to decision to
search new information about agricultural technology from various information sources (Deribe,
2007) Availability of labor in the family was expected to positively related to information
seeking behavior of vegetable farmers.
Non-farm income (NONFRMINC): is the income that farmers generate from activities not
related to agriculture. Non-farm income is dummy variable which indicates whether the farmer
earns income from non-farm activities or not. It takes a value of 1 if the household is involved in
non-farm activities or 0, otherwise. Therefore, it was hypothesized that generating non-farm
income is related to information seeking behavior of vegetable farmers positively.

43
Farm size (FARMSIZE): Farm size is an indicator of wealth and social status and influence
within a community. It was expected to be positively associated with the information seeking
behavior of vegetable farmers. This means that farmers who had relatively large farm size were
more initiated to seek information and the reverse is true for small size farmers. Owolade (2008)
also found “significant positive relationship between information seeking behavior of farmers in
Oyo state Nigeria and their farm size” (p.41).
Livestock ownership (LIVOWN): It refers to the total TLU that the household owns. Farmers
with large number of stocks may seek and utilize more information than small-scale farmers in
order to maximize profits. Livestock are good sources of cash to be used for purchasing
agricultural inputs and hence it was expected to be positively affecting information seeking
behavior of vegetable farmers.
Farm income (FARMINC): This refers to annual income obtained from sale of vegetable and
livestock. The amount of income left from consumption was used for purchase of farm inputs.
Therefore, a household with better income was expected to be better in information seeking.
Social participation (SOCIALPA): Social participation in this study refers to the involvement
in social activities and membership of respondent in various formal and informal organizations,
either as member or as an office bearer. It was measured in terms of frequency of participation
and type of organization in which he/she is a member. Social participation was expected to have
positive relationship with the dependant variable.
Institutional Factors
Radio ownership (RAOWSHIP): It is a dummy variable which indicates whether the farmer
have radio or not. It takes a value of 1 if the household have or 0, otherwise. The farmers who
own radio have the opportunity of getting more agricultural information. This was corroborated
by Ayandiji, (2003), who stated that the “radio is the cheapest and quickest means of passing
information to farmers in Oyo state” (p.4). Kock, Harder, and Saisi (2010) also agreed that “radio
is an effective medium of communicating market information to farmers “The study assumes that
it affects the information seeking behavior of vegetable farmers positively.

44
Farmers contact with extension agents (FACONWEXT): This refers to the number of times
the farmers visit the extension agent to get advices on vegetable production in a given period.
Farmers contact with extension agent was hypothesized to positively influence farmer’s
information seeking behaviors.
Distance from market (MARKDIS): It is measured in kilometers to reach market from the
house of the farmer. As farm households are nearer to market places, it is expected to be more
likely to participate in intensive farming activities that demand information seeking. When the
farmer is far away from market places, the likelihood of seeking the agricultural information will
decrease. Farmers residing near the town will have a chance to get information from other farmers
(Daniel, 2008). Hypothetically, there was an inverse relationship between market distance and the
information seeking behaviors.
Access to credit (ACCRED): It is a dummy variable, which takes the value 1 if the farm
household uses credit from money lender and 0 otherwise. Access to credit can relax the financial
constraints of farmers (Edlu, 2006). It was expected that the variable will have a positive
relationship with the dependant variable as households having credit access can afford expenses
that could enable farmers to seek information.
Psychological Factors
Psychological factors also plays influential role in information seeking behavior of vegetable
farmers. In this study attitude towards improved farming, innovation proneness and production
motivation were considered as important variable having influence on information seeking
behavior of vegetable farmers.
Attitude towards improved farming (ATTOIMFA): is operationally defined as the degree of
positive, moderate and negative opinion of respondent farmers towards improved farming.
Positive attitude towards improved farming is one of the factors that can speed up the farm
change process. Attitude formation is a prerequisite for behavioral change to occur. It was
hypothesized that positive attitude towards improved farming influences information-seeking
behaviors of vegetable farmers positively.

45
Innovation proneness (INNOPRON): will be measured based on rapidity of accepting new idea
relative to others (3 = whenever I come across a new idea, 2 = after consulting others who are
more knowledgeable, 1= after most of the people accept it, 0= never) and is based on the
receptivity of the individual to new ideas. Farmers having quickly accepting behavior will have
higher probability of utilizing agricultural information. So this variable was expected to influence
positively information seeking behaviors of vegetable farmers.
Production motivation (PROMOTIV): will be measured based on the number of agricultural
technologies that farmers’ plan to use in next year’s cropping season to increase production.
Farmers having such behavior will search for information and technology to produce more.
Therefore, this variable was expected to influence information seeking behaviors of vegetable
farmers positively.

46
4. RESULTS AND DISCUSSION
In this chapter, the results of the study are presented and discussed in detail to address the two
objectives of the research. The chapter is divided into four sections. These sections are
information seeking behaviors of vegetable farmers and source of information for vegetable
farmers; descriptions of personal, socio-economic, institutional and psychological characteristics
of sample respondents; and influence of independent variables on dependent variable.
4.1 Distribution of Vegetable Farmers based on Information Seeking Behaviors
As indicated earlier under the methodology part pertaining to independent variable, the calculated
mean score of the level of information seeking was 1.85 and the standard deviation was 0.69 with
minimum and maximum score of 1 and 3 respectively. Then based on mean and standard
deviation, the respondent households were categorized into three, as low, medium and high
information seeker. In view of this, the distribution of sample households’ by their level of
information seeking category is presented in Table 2 below:
Table 2: Distribution of vegetable farmers based on information seeking Behavior (n=150)
Information seeking
Category
Number
Score
Percent
Low 48 1-1.16 32
Medium 76 1.17-2.54 50.7
High 26 2.55-2.9 17.3
Total 150 100
Source: own survey data, 2012
From the result presented in the table, of the total surveyed households, 48(32%), 76(50.7%) and
26(17.3%) were found to be low, medium and high information seekers respectively. As it is
clear from the table 2, majority of the information source user fall in to the medium category of
information seeker behavior.

47
4.2 Information Sharing Behavior of Vegetable Farmers
In this study, information sharing behavior was measured in terms of the number of farmers to
whom he or she had communicated information on improved agricultural practices. To measure
the quantum of information sharing, values were attached to different socially related groups as
(Husband=1, Wife=2 Neighbors=3 Friends=4 and other farmers=5). Accordingly, summation
score was taken for each individual respondent and entered in to SPSS version 16 for analysis.
Thereafter, the dates’ were processed in relation to each information sharing group and shown in
the following Table 3.
Table 2: Distribution of sample respondent by frequency of information sharing (n=150)
Information sharing
Group
Number
Percent
Rank
Friends 63 42 1th
Neighbors 52 34.7 2rd
Wife 35 233 3nd
Husband 0 0 4th
Other farmers
Total
0
150
0
100
5th
Source: own survey data, 2012
As explicitly indicated in the above table, among the five identified information sharing groups,
friends, neighbors or relatives and wife were perceived as important partner for sharing
information among the sample households in their rank order of 1st, 2nd and 3rd.The other
information partner husband and other farmers were ranked as 4th . Friends were valued at the 1st
rank which may be due to their presence in the same village, available to be approached at any
time and the intimacy they have. The other sources were not preferred as they are not in a
position to share vegetable related information.

48
4.3 Information Source for Vegetable Farmers
Information source and its use pattern were analyzed to assess the actors’ strengths and
weaknesses with respect to information exchange in a particular direction. Actors who are
networking for information exchange can be looked at and compared on the basis of many
different characteristics, but in this subsection they are seen only as agricultural information
source particularly for vegetable farmer. Distribution of frequency of use of actors as information
source for vegetable farmer in terms of their use is presented in Table 4.
Table 3: Distribution of information source for vegetable farmers in terms of their frequency of use (n = 150)
No Source Frequency of use Score Rank
Never
(0)
Sometimes
(1)
Always
(2)
N % N % N %
1 Neighbors/friend 18 12.0 97 58.0 45 30.0 187 1st
2 Progressive
farmers
17 11.3 99 66.0 34 27.7 163 2nd
3 Development
agent
56 37.3 65 43.3 29 19.3 123 3rd
4 Haramaya
University
78 52.0 42 28.0 30 20.0 102 4th
5 WOoARD 92 61.3 22 14.5 36 24.0 92 5th
6 Kebele
Adminsteration
74 49.3 63 42.0 13 8.7 89 6th
7 Mass Media 70 46.7 72 48.0 8 5.3 88 7th
8 Farmers
cooperatives
10368.7 39 26. 6 8 5.3 55 8th
9 Training
demonstration and
filed days
11576.7 31 20.7 4 2.7 39 9th
10 NGOs 11281.3 17 11.3 11 7.3 39 10th
Source: own survey data, 2012

49
The number of source used to assess information, were ten. It could be observed from Table 4
that, neighbors or friends are the major and the first important sources of information for the
vegetable farmers. According to this study, progressive farmers (other than neighbors or friends)
serve as the second important information source. The survey result showed that the third and
fourth major sources of information were development agents and Haramaya University
respectively. As showed in the Table 4, WOoARD (Woreda Office of Agriculture and Rural
Development) and kebele administration serve as fifth and sixth sources of information
respectively. Rural radio program ;farmers’ cooperative; serve as seventh, eighth, and ninth
information sources respectively Where as training, demonstration & field days and NGOs ,
serves as the ninth information sources in the area. This is probably because they never had
access to them.
According to the study result of Deribe (2007), women farmers in Dale woreda put high
preference on Neighbors/friends as first choice followed by other farmers and DAs as a third;
while the study result of Bekele (2008) in Metu showed that maize package farmers preferred
WARDO, neighbors, DA and kebele Administration as the importance sources of information.
Thus, the result of this research showed similarity with Deribe’s (2007) outcome while there is a
slight difference with Bekele’s (2008) result whereby WARDO was ranked first.
Thus, it is clear that consideration has to be given on these information sources preferred by the
respondents which are ranked from 1-3 in a way that vegetable farmers will easily seek and use
vegetable related quality information timely; and also on the others which were differently
preferred in accordance to each categories.
4.4 The most Reliable Source of Information for Vegetable Farmers
This subsection indicates how respondents perceived the reliability of the information sources to
obtain information on vegetable farming. Distribution of source for vegetable farmers in terms of
their reliability is presented in Table 5.

50
Table 4: Frequency distribution of information sources in terms of their reliability (N=150)
No Information source Frequency Present Rank
1 Progressive farmers 53 35.3% 1st
2 Development agent 26 17.3% 2nd
3 Neighbors 20 13.3% 3rd
4 Relatives 17 11.3% 4th
5 Haramaya University 16 10.7% 5th
6 Kebele Administration 6 4% 6th
7 Rural radio program 5 3.3% 7th
8 Farmers cooperatives 4 2.7% 8th
9 Training,demonstratio
and filed days
3 2% 9th
10 NGO 2 1.3% 10th
Source: own survey data, 2012
In the table 5, the result indicated that the source that is very much reliable is progressive farmers
(35.3%), DAs (17.3%) and neighbors (13.3%) ranked 1st, 2nd and3rd respectively.
Relatives(11.3%),Haramaya University(,10.7%),Kebele Administration(4%),rural radio
program(3.3%),farmers cooperatives(2.7%), were the 4th,5th,6th and 7th reliable source of
information. Training, demonstration and filed days and NGOs were the least trusted source. The
probable reason for this might be farmers have more trust by the change they see on progressive
farmers that came as result of effective utilization new information and new technology they seek
from different sources. In addition to these NGOs, training, demonstration and filed days and
farmers cooperatives ranked the 10th, 9th and 8th mainly because the frequency of contact they
have with farmers is very few and limited.

51
4.5 Description of Factors that Affect the Information Seeking Behavior of Vegetable Farmers
4.5.1Personal and demographic variable
Personal characteristics include the variables related to personal identity such as age of farmer,
sex, and level of education. The survey results are presented in detail as follows:
Age of the Sample household
Age is one of the demographic factors that is useful to describe households and provide clue
about the age structure of the sample and the population. Age is usually considered in
information seeking behavior studies with the assumption that older people have more farming
experience which enables them to easily seek new information and new technologies. However,
on the other side, age is related to the risk management nature of an individual farmer. In
vegetable production, the high production cost, variability in yield, the perishable nature of the
products, frequent fluctuation of market price entail greater production and marketing risks.
Because of their risk averting nature, older people are usually reluctant to seek new information.
Based on this fact, age hypothesized to have negative relationship with information seeking
behavior of vegetable farmers. But, as indicated in the Table 6 below the mean age of sample
households was 40.91 years with standard deviation of 10.74. The maximum age for the sample
farmers was 61 years while the minimum was 20 years. The age of the respondent households
ranges from 20- 58, 20-60 and 20-61 in the order category of low, medium and high information
seeking behavior respectively with the mean of 43.12, 39.70 and 40.38 respectively. The one way
ANOVA value indicated that there is not significant mean difference (F=1.548, P=.216) among
the three categories, indicating that there is no statistically significant relationship of age with
information seeking behavior of vegetable farmers. Non-significant relationship is evident from
non-significant mean difference in average age among information seeking categories of
respondents. The result is in line with the study of Getahun (2008).

52
Table 5: Age of the respondents by information seeking category of vegetable farmers (n=150)
Information
Seeking category N Mean SD Min Max Range F P
Low 48 43.12 9.37 20 58 38
Medium 76 39.70 11.20 20 60 40
High 26 40.38 11.49 20 61 41
Total 150 40.91 10.74 20 61 41 1.548NS 0.216
Source: Own survey data, 2012 NS= not significant
Sex of the sample household
Sex of the household head was one of the demographic variables hypothesized to influence the
information seeking behavior of vegetable farmers. This is because male headed households were
culturally expected to make a decision weather to use or not to use new agricultural technology,
so to make right decision the husband seek information from different sources than female
headed households. In this study, from the total 150 sample households 21 (7.3) % were
composed of female respondents and 129 (92.7) % were male respondents. The survey output
shows that the proportion of respondents according to information seeking category ranged 37,
69, 23 for male and 11, 7, 3 for female in low, medium and high information seeking category
respectively. On the other hand, the majority 11 of female respondents were found in low
information seeking category while 7 and 3 were in medium and high category respectively. The
majority of the male respondents 69 failed in medium category, 37 in low and 23 in high
information seeking category respectively. The chi-square result (χ2 = 4.749, p = 0.093) shows
statistically significant mean difference between the sex of respondents and information seeking
category at less than 10% significant level.

53
Table 6: Sex of the respondents by information seeking behaviors category (n=150)
Sex of the household Information Seeking category
χ 2- test
Low Medium High Total
4.749*
N % N % N % N %
Female 11 7.3 7 4.6 3 2 21 14
Male 37 24.7 69 46 23 15.3 129 86
Total 48 32 76 50.6 26 17.3 150 100
Source: Own survey data, 2012, *=significant at less than 10% significant level
Education of household head
Education enhances the capacity of individuals to obtain, process, and utilize information
disseminated by different sources. On the other hand, educated farmers find it easy to manage
vegetable production and marketing activities which needs certain skill of management.
Therefore, education level of household head was hypothesized to have positive influence on
information seeking behavior of vegetable farmers.
As indicated in the Table 8, the average education level of sample households was 4.67 years of
schooling with standard deviation of 2.99. The maximum education level for the sample farmers
was 10 while the lowest was 0. Result of mean test showed that there was significant mean
difference (F= 5.429, p=.0.000) in education level among information seeking categories at 1%
significance level. The finding of this study is in agreement with many of the previously
conducted studies. For example, Itana, (1985); Chilot et al. (1996); Kansana (1996); Asfaw et al.
(1997); Mwanga et al. (1998) and Tesfaye (2001) have reported positive and significant
relationship of education with information seeking behavior.

54
Table 7: Education level of the house hold by information seeking category (150)
Information
Seeking category N Mean SD Min Max Range F P
Low 48 3.58 3.14 0 10 10
Medium 76 5.00 2.79 0 10 10
High 26 5.69 2.84 0 9 9
Total 150 4.67 2.99 0 10 10 5.429*** 0.000
Source: Owen survey data, 2012, ***=significant at less than 1% significant level
4.5.2 Socio-economic variables
Household’s annual on farm income
On farm income refers to the total annual earnings of the family from the sales of agricultural
products such as crop, vegetables, livestock and livestock products after meeting their family
requirements. Households’ income is believed to be one of the important factors determining
information seeking behavior of vegetable farmers. Thus, those households with a relatively
higher level of annual on farm income are more likely to purchase improved seeds and other
agricultural inputs. Therefore, in this study, on farm income was expected to have positive
influence on information seeking behavior of vegetable farmers. As shown in Table 9, the
average annual farm income of the sample households was 50,640 ET Birr. The maximum annual
farm income was 90,876.00 ET Birr while the minimum was 10,000.00 Birr. On the other hand
the mean difference of the household on farm income on information seeking category were
48,240.00 ET,46,640.00 ET and 66,640.00 ET for low, medium and high information seeking
category respectively. Accordingly, the result indicated that on farm income was significantly
associated (f=10.731, p=.000) with information seeking category of vegetable farmers as it was
seen from Table 9 at 1% significant level. From this finding, we can conclude that lower income
group of the society face difficulty to seek information that enhances their productivity. This
implies the need to support lower income groups through different mechanisms such as through
strengthening friendly relations with progressive farmers and facilitating the provision of credit
service for the farmer. From this finding, we can conclude that even though, vegetable production is
more labor and time demanding practice, it is rewarding in the return. Almost all empirical studies

55
reviewed shows that the effect of farm income on household’s adoption decision is positive and
significant. To mention some of them, Getahun (2004) reported positive influence of household’s
farm income on adoption of improved technologies. In the same line, Taha (2007) reported that
household’s income position and resource ownership was found to be important in adoption of
improved onion production package.
Table 8: On-farm income of the household by information seeking category (n=150)
Information
Seeking category N Mean SD Min Max Range F P
Low 48 48240 21645 10500 85700 75200
Medium 76 46640 17629 10000 89765 79765
High 26 66640 20197 22345 90876 68531
Total 150 50640 20660 10000 90876 80876 3.557** 0.031
Source: Owen survey data, 2012, **=significant at less than 5% significant level
Land holding of the sample households
Land is a primary source of livelihood for all rural households in the study area. Farm size is an
indicator of wealth and social status within a community. In the study area land is very scarce due
to high population pressure. Almost all available land is already cultivated and further expansion
is hardly possible. The land holding of the sampled farmers ranges from 0.13ha to 1.50ha.
Average land holding of total respondents was about 0.73 hectare. Analysis of the disaggregated
data in table 10 indicates the minimum land holding of 0.13ha, 0.13ha and 0.25ha for low,
medium and high information seeking category and a maximum of 1.4ha, 1.5ha and 1.5ha in
order of information seeking margin respectively. The mean and standard deviation for all are
also indicated in Table 10.
Result of One way ANOVA indicated that farm size of the household was significantly (f=5.327,
P=.000) associated with information seeking behavior of vegetable farmers at less than 1%
significant level. This implies that as the farm size of sampled households increased, the
probability to seek new information is also found to be increased.

56
Table 9: Land ownership of respondents by information seeking behavior category (n=150)
Information
Seeking category N Mean SD Min Max Range F P
Low 48 0.61 0.31 0.13 1.4 1.27
Medium 76 0.79 0.39 0.13 1.5 1.37
High 26 0.79 0.32 0.25 1.5 1.25
Total 150 0.73 0.34 0.13 1.5 1.37 4.438** 0.013
Source: Owen survey data, 2012, **=significant at less than 5% significant level
Livestock ownership of the sample households
In rural context, livestock holding is an important indicator of household's wealth position.
Livestock serve as an important source of cash. Vegetable production is capital-intensive
business and to this end, livestock could be used as one of the important cash sources. Based on
this assumption this variable was hypothesized to have positive and significant relation with
information seeking behavior of vegetable farmers. In this study, livestock holding by the total
sample households were converted into TLU. The mean differences among the information
seeking category of vegetable farmer were 1.98, 2.36 and 1.97 for low, medium and high
respectively. The average, minimum and maximum number of livestock unit owned by
respondents were 2.17, 0.65 and 5.30 respectively. Accordingly, the study indicated that there is
significant (f= 3.518, p=0.032) mean difference among information seeking category of vegetable
farmers at less than 5% level, as shown in Table 12
Table 10: Livestock ownership of respondents by information seeking behavior category (n=150)
Information
Seeking category N Mean SD Min Max Range F P
Low 48 1.98 0.96 0.65 5.30 4.65
Medium 76 2.36 0.87 1.00 4.40 3.4
High 26 1.97 0.87 1.00 3.31 2.31
Total 150 2.17 0.92 0.65 5.30 4.65 3.518** 0.032
Source: Owen survey data, 2012, **=significant at less than 5% significant level

57
Labor availability
A household with large working labor force is in a position to manage the production activity.
Therefore, it was hypothesized to have positive and significant relationship with information
seeking behavior of vegetable farmers. In this study, household labor availability had no
significant relationship with information seeking behavior of vegetable farmers. This is evident
from insignificant mean difference among information seeking categories. The average labor
force available for sample households in man-equivalent was 2.44 with standard deviation of
1.11 with a mean of 2.6, 2.31 and 2.5 for low, medium and high information seeking category
respectably. However, statistically the one way ANOVA value confirmed that there is no
significant (f=1.070, p=.346) available labor mean difference among the three categories. This
indicated that the three groups almost have similar family size mean distribution among
themselves. As indicated in Table 12, there was no significant mean difference in labor
availability among the information seeking categories implying absence of significant
relationship of the variable with information seeking category.
Table 11: Household labor availability in adult equivalent by information seeking category (n=150)
Information
Seeking category N Mean SD Min Max Range F P
Low 48 2.6 1.13 1.00 5 4
Medium 76 2.31 1.06 1.00 6 5
High 26 2.5 1.21 1.00 5 4
Total 150 2.44 1.11 1.00 6 5 1.070NS 0.346
Source: Owen survey data, 2012, NS = not significant
Participation in non-farm activities
This refers to the participation of the farmer or any of the household members in non- farm
activities. Participation in non-farm activities improves farmers’ financial capacity and enables
them to seek and search new technology. As indicated in Table 13, about 37.3% of the total
sample households or their family members were involved in non-farm activities, while 62.7% of
households were not involved in non-farm activity. The result of chi-square test indicated that

58
there was insignificant association between information seeking category of vegetable farmers
and participating in non-farm activities ( 2=4.087, P=0.130). This result agrees with the findings
reported by Tigist (2010) but contradicts with that of Mesfin (2005).
Table 12: Household participation in non-farm activities by information seeking category (n=150)
Participation in non
farm activity
Information Seeking category
Low Medium High Total χ 2- test
4.087NS
N % N % N % N %
Yes 13 8.7 30 20 13 8.7 56 37.3
No 35 23.3 46 30.7 13 8.7 94 62.7
Total 48 32 76 50.7 26 17.3 150 100
Source: Own survey data, 2012NS=not significant, P=o.130
4.5.3 Institutional variables
Radio ownership
The assumption was that respondents who own radio have a higher opportunity of getting
agricultural information. The finding of the study indicates that, out of the total respondents 35.3
% owned a radio while 64.7 % were do not own radio The result of chi-square test indicated that
there was significant association between information seeking category and radio ownership at
less than 1% significant level ( 2=10.431, P=0.000).This shows that there were significant
variations among vegetable farmers who own radio and who do not own radio in seeking
information.
Table 13: Radio ownership of household by information seeking behavior category (n=150)
House hold radio
ownership
Information Seeking category
Low Medium High Total χ 2- test
10.431***
N % N % N % N %
Yes 13 8.7 36 24 4 2.7 53 35.3
No 36 24 40 26.7 22 14.6 97 64.7
Total 48 32 76 50.7 26 17.3 150 100
Source: Owen survey data, 2012, = significant at less than 1% significant level

59
Frequency of extension contact
This refers to the frequency of contact that extension agents made with respondent. The effort to
disseminate new agricultural technologies is within the field of communication between the
change agent (extension agent) and the farmers at the grassroots level. Here, the frequency of
contact between the extension agent and the farmers is hypothesized to be the potential force
which accelerates the effective dissemination of adequate agricultural information to the farmers,
thereby enhancing farmers' decision to seek new technologies.
Table 14: Frequency of extension contact by information seeking category (n=150)
Information
Seeking category N Mean SD Min Max Range F P
Low 48 2.21 0.87 1 4 3
Medium 76 2.87 0.97 1 4 3
High 26 2.88 1.11 1 4 3
Total 150 2.66 1.01 1 4 3 7.714*** 0.000
Source: Owen survey data, 2012, ***=significant at less than 1% significant level
The score for frequency of contact with extension agent was calculated on the basis of scores
given for the frequency of contact farmers have with extension agent, while zero was given for
having no contact with extension agent, 1 for those who have contact once in a year, 2 for those
who have one contact with extension agent per six month, 3 for those who have contact with the
extension agents per three month and 4 given for those having monthly contact with the agent.
Accordingly, the maximum score to be achieved by a farmer was 4. Table 15 shows that the
average score of sample respondents was 2.66 with standard deviation of 1.01. The mean
difference among information seeking category of vegetable famers were 2.21, 2.87 and2.88 for
low, medium and high information seeking category. Test of mean variance using one-way
ANOVA showed that there was significant mean difference (f=7.714, p=0.000) among
information seeking categories at 1% significance level in relation to score achieved for
frequency of contact with extension agent.

60
Social participation
Participation in social organization is expected to have an indirect influence on the information
seeking behavior of vegetable farmers. It links the individual to the larger society and exposes
him to a variety of ideas. This exposure makes him positively predisposed towards innovative
ideas and practices. The social participation scores of the vegetable farmers were calculated on
the basis of scores given for their frequency of participation farmers have with formal or informal
social organization. The score 0 was given for non participant, 1 for those who says sometimes
participate, 2 for those who says often participate, and 3 was given for those who say always
participate. To see each farmer’s level of social participation in local organizations, 6
organizations were included in the interview schedule. A farmer’s minimum and maximum total
score to be achieved accordingly was 0 and18 the calculated score then divided by the number of
organization they participate. The mean score for information seeking categories is presented in
Table.16.
Table 15: Respondents mean score of social participation by information seeking category (n=150)
Information
Seeking category N Mean SD Min Max Range F P
Low 48 1.58. 0.55 0.11 2.5 2.39
Medium 76 1.75. 0.42 1 2.5 1.5
High 26 2.00 0.53 1 2.5 1.5
Total 150 1.73. 0.50 0.11 2.5 2.39 5.940*** 0.000
Source: Own survey data, 2012, ***=significant at less than 1% significant level
The above table indicates that the mean score of social participation for low, medium and high
information seeking category was 1.58, 1.75, and 2, respectively. The results of one way
ANOVA (F=5.940 and P=0.000) reveals statistically significant mean difference among
information seeking categories in relation to social participation score at 1% probability level.
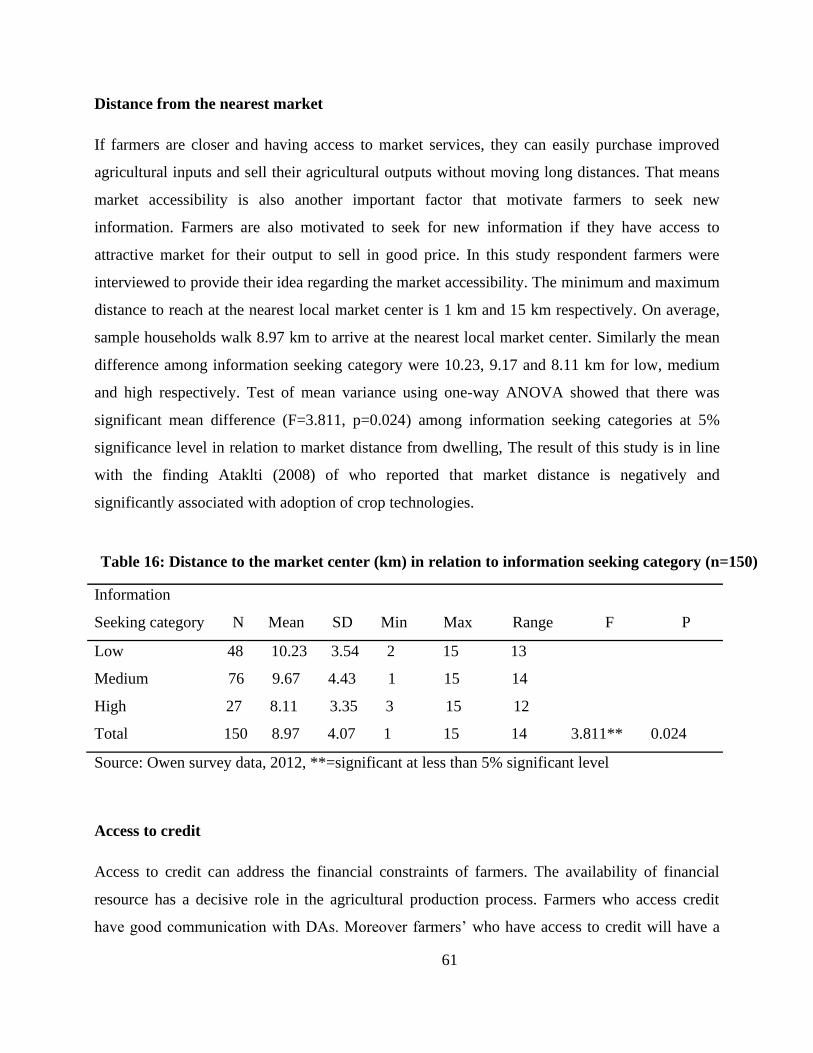
61
Distance from the nearest market
If farmers are closer and having access to market services, they can easily purchase improved
agricultural inputs and sell their agricultural outputs without moving long distances. That means
market accessibility is also another important factor that motivate farmers to seek new
information. Farmers are also motivated to seek for new information if they have access to
attractive market for their output to sell in good price. In this study respondent farmers were
interviewed to provide their idea regarding the market accessibility. The minimum and maximum
distance to reach at the nearest local market center is 1 km and 15 km respectively. On average,
sample households walk 8.97 km to arrive at the nearest local market center. Similarly the mean
difference among information seeking category were 10.23, 9.17 and 8.11 km for low, medium
and high respectively. Test of mean variance using one-way ANOVA showed that there was
significant mean difference (F=3.811, p=0.024) among information seeking categories at 5%
significance level in relation to market distance from dwelling, The result of this study is in line
with the finding Ataklti (2008) of who reported that market distance is negatively and
significantly associated with adoption of crop technologies.
Table 16: Distance to the market center (km) in relation to information seeking category (n=150)
Information
Seeking category N Mean SD Min Max Range F P
Low 48 10.23 3.54 2 15 13
Medium 76 9.67 4.43 1 15 14
High 27 8.11 3.35 3 15 12
Total 150 8.97 4.07 1 15 14 3.811** 0.024
Source: Owen survey data, 2012, **=significant at less than 5% significant level
Access to credit
Access to credit can address the financial constraints of farmers. The availability of financial
resource has a decisive role in the agricultural production process. Farmers who access credit
have good communication with DAs. Moreover farmers’ who have access to credit will have a

62
tendency to seek agricultural information and agricultural technologies than farmers without. It
was hypothesized credit can influence positively information seeking behavior of vegetable
farmers.
Table 17: Access to credit by information seeking category (n=150)
Access to credit Information Seeking category
Low Medium High Total χ 2- test
2.207NS
N % N % N % N %
Yes 10 6.6 13 8.6 8 5.3 31 20.6
No 38 25.3 63 42 28 18.6 119 79.4
Total 48 32 76 50.7 26 17.3 150 100
Source: Owen survey data2012, NS=not significant p= 0.332
The survey output indicated that 78.7% respondents had no access to credit, and 21.3% had
access to credit. This implies that majority of vegetable farmer had no access to credit. As
indicated in Table 18, the chi-square test ( 2=2.207, p= 0.332) shows that there was statistically
insignificant relation between access to credit and information seeking category of vegetable
farmer.
4.5.4 Psychological factors
Innovation proneness
Innovation proneness in this study was operationalized as the receptivity of an individual to new
ideas related to their agricultural activities. According to the research design, it was measured in
terms of the quickness of the respondents in accepting new technological and information, be it
physical or pure information. To reach at the result, initially eight activities related to the
vegetable farmer’s life situation were identified. These activities were fruit and vegetable HYV,
fertilizer use, compost, motor pump, animal husbandry, post harvest management, vegetable and
fruit production and insecticide. Then, response continuum to each activity was developed on
scale as (1=after most of the people accept it, 2=after consulting others who are knowledgeable,
3=whenever I come across a new idea or information). The score point ranges from 8 to 24 as

63
eight activities were selected, and then each individual score was divided for the eight activities.
By following the rating method indicated above, the results obtained are summarized in Table 19.
Table 18: Innovation proneness of respondents by information seeking category (n=150)
Information
Seeking category N Mean SD Min Max Range F P
Low 48 2.52 0.62 1 3 2
Medium 76 2.14 0.69 1 3 2
High 26 2.38 0.7 1 3 2
Total 150 2.31 0.69 1 3 2 4.881*** 0.000
Source: Own survey data, 2012, *** = significant at less than 1% significant level
The innovation proneness result in the table above, showed a mean of 2.52, 2.14 and 2.38 with a
standard deviation of 0.62, 0.69 and 0.7 for low, medium and high in formation seeking behavior
of vegetable category, respectively. Statistically, there was significant mean difference observed
among the different categories of information seeking behavior (f=4.881 and P=0.000).This
means the respondents are found in the different level with regard to innovation proneness. Those
farmers having the behavior of quickly accepting or adopt new idea seek different agricultural
information than those slowly accept.
Production motivation
Production motivation was operationally defined as the desire of the farmer to produce more.
Hence, the respondent farmers are asked about their wish or plan at what level his or her needs to
increase the production, three questions were used having (5 choices) and a total score of 15 were
considered .To measure this variable mean and standard deviation were used. The result of one way
ANOVA shows that significant mean difference observed among the information seeking
category (f=4.338**, p=.015) at 5% significant level. Therefore, this variable influences
information seeking behavior of vegetable farmers positively. This idea is also in line with the
study conducted by Daniel (2008). Finally, the survey result reveals the following finding in
Table 20.

64
Table 19: Level of production motivation based on information seeking categories (n=150)
Information
Seeking category N Mean SD Min Max Range F P
Low 48 9 2.94 1 13 12
Medium 76 7.27 3.89 1 14 13
High 26 7.58 3.08 1 12 11
Total 150 7.88 3.54 1 14 13 3.760** 0.026
Source: Owen survey data, 2012, ** = significant at less than 5% significant level
Attitude towards improved farming
Farmers' attitude towards improving farming was measured by the Likert Scale (5point scale)
which is designed to analyze the influence of attitude towards information seeking behavior of
vegetable farmers. Accordingly, different attitude statements were presented to the sampled
households. Hence, a total of 4 attitude statements (two positive and two negative statements)
were developed and all four statements were presented to all respondents. The response for each
question was coded with numbers (1= Strongly disagree, 2= disagree 3= Somewhat
agree,4=Agree and5=Strongly agree for positive statements and (1= Strongly agree, 2=Agree, 3=
Somewhat agree, 4= disagree and 5= Strongly disagree for negative statement ). Finally, by
summing up the value of each statement, and divided by the number of sentences were taken as
the mean value of the respondent as negative, moderate, and positive attitude values in attitude.
The result on mean score of attitude towards information seeking behavior is given in the Table
21.

65
Table 20: Mean attitude score of vegetable farmers by information seeking category (n=150)
Information
Seeking category N Mean SD Min Max Range F P
Low 48 3.48 0.71 2 5 3
Medium 76 3.20 0.95 2 5 3
High 26 3.69 0.74 2 5 3
Total 150 3.37 0.86 2 5 3 3.855** 0.023
Source: Owen survey data, 2012, ** =significant at less than 5% significant level
The highest and lowest attitude scores for sample respondents were found to be 5 and 2
respectively. The mean attitude score for low, medium and high information seeking category
were .3.48, 3.20 and 3.69 respectively out of an obtainable potential score of 5. Mean score
comparison using one way ANOVA shows significant mean difference among information
seeking categories in their attitude towards vegetable production technology. Of the total 150
sample respondents 27(18%) ,112(74.7%) and 11(7.3%) have negative, moderate and positive
attitude toward improving production respectively, In this study, the relation between information
seeking categories and attitude of sample respondents towards vegetable production technology
was found to be positive and significant (f=4.931, p=0.000) at 1% probability level..
4.6 Strength and direction of relationship between dependent and independent variables
Before passing to the order logit econometric model analysis part, it is important to summarize
the degree of association between dependent and independent variables, so that this section
covers the findings on relationship between dependent and independent variables (13 continuous
and 5 dummy or discrete). To analysis the relationship between dependent and independent
variables Pearson’s Product-Moment Correlation and Spearman’s rho were employed for
continuous and for discrete or dummy variables respectively.
Result of bivariate correlation analysis revealed positive and significant relationship of sex,
education, farm size, on farm income, extension contact, social participation and nonfarm income
with information seeking behaviors of vegetable farmers. Where as age, farming experience,

66
active labor force, market distance, innovation proneness, production motivation, attitude towards
vegetable production, and radio ownership, were negatively and insignificantly associated with
information seeking behavior. Credit availability and input availability have positive, but
insignificant relationship with information seeking behavior. The summarized results are
presented in Table 22 and 23.
Table 21: Strength and Direction of relationship between dependent and continuous independent
variables
Variables Information seeking behavior
r p
Demographic variable
1 Age of the household -.109 0.185
2 Education level 0.256*** 0.002
3 Farm experience -.098 0.232
Socio economic variables
1 Farm size 0.202** 0.013
2 On farm income 0.250*** 0.002
3 Active labor force -0.056 0.497
4 Livestock 0.044 0.591
Institutional variables
1 Extension contact 0.266*** 0.001
2 Social participation 0.272*** 0.001
3 Market distance -0.001 0.986
Psychological variables
1 Innovation proneness -0.117 0.153
2 production motivation -0.170** 0.038
3 Attitude towards improving production 0.036 0.660
***, **, * N.S=significant at 1%, 5%, 10% and not significant, r = Pearson
Source: survey data analysis result

67
Table 22: Strength and Direction of relationship between dependent and discrete/dummy independent
variables
Variable Information seeking behavior
rho p
Demographic variables
1 Sex of the household 0.145* 0.077
Socio-economic variable
1 Non farm activities 0.165** 0.044
Institutional variables
1 Radio ownership -0.007NS 0.935
2 Credit availability 0.054 0.513
***, **, *, N.S = significant at 1%, 5%, 10% level and not significant; rho = Spearman’s rho
Source: survey data analysis result
4.7. Multicollinearity Test and Model Results
The descriptive analysis done in the previous section dealt solely with relationship existence
between the dependent and explanatory variables to identify factors that affect the information
seeking behavior of vegetable farmers in the study area. However, identification of these factors
is not enough for meaningful conclusions. Therefore the relative influence of each explanatory
variable has to be known for priority based interventions. To this end, in this study, Ordinal logit
econometric model was used to see the relative influence of different variables on information
seeking behavior of vegetable farmers.
Out of the 18 hypothesized variables 13 were found to be significant in descriptive statistics test.
Therefore, these independent variables were considered for further analysis using the Ordinal
logit model Subsequently, the hypothesized explanatory variables were checked for the existence
of multicollinearity problem, before entering in to the model. In this case the VIF (Variance
inflation Factor) was applied. VIF (variance inflation factor) and tolerance (TOL) were used for
testing the association between the hypothesized continuous variables using the formula,

68
VIF (xi) = 21
1
iR−
Where, 2
iR was the squared multiple correlation coefficient between Xi and the other explanatory
variables. A statistical package known as SPSS version 16 was employed to compute the2
iR
values and substituting 2
iR values were further used in the formula to compute VIF values. To
avoid the problem of multicollinearity, it is essential to exclude the variables with the high VIF
value (10), which will happen when2
iR exceeds 0.9.
The VIF values obtained from multicollinearity test is given in Table 9 and displayed values
show that all the continuous explanatory variables have no serious multicollinearity problem.
According to Gujarati, D.N (2003), tolerance (TOL) can also be used to detect multicollinarity. In
general, when2
iR is 1, TOL value will be 0, and variable Xi is perfectly correlated with other
regressors. Where R2i is 0, TOL will be 1 and it indicates, Xi is not related to other regressors.
Accordingly, both VIF and TOL values indicates absence of significant collinearity problem
among the variables. Similarly, there might also be association between discrete variables. In
order to test for multicollinearity problem between discrete variables, contingency coefficient
(CC) was computed. This coefficient measures the strength and significance of the relationship
between row and column variables of cross tabulation. Accordingly, its value ranges between 0
and 1, where 0 indicates the existence of no association and value nearest to 1 indicates high
degree of association between the variables. The computation of CC was computed using the
formula.
C.C= 2
2
+n
Where: CC = Contingency Coefficient, n= sample size and 2
=Chi-square value.

69
Table 23: Multicollinearity test result for the continuous explanatory variables (n=150)
Model Unstandardized
Coefficients
Standardized
Coefficients
Colliniarity
Statistics
B Stad.Erro Beta t sig Tolerance VIF
Constant .810 .509 -.091 1.591 .114 .597 1.676
AGE -.006 .006 .113 -.951 .343 .813 1.230
EDUCLEV .026 .019 -.001 1.377 .171 .552 1.810
LIVSTOC .042 .159 .057 1.532 .128 .863 1.159
LABORFO .006 .060 .010 .708 .480 .799 1.251
ONFARIN 7.219 .052 .216 .120 .905 .909 1.100
EXTENCO .104 .000 .153 2.784 .006 .860 1.163
SOCPAR .046 .055 .193 1.910 .058 .829 1.206
MARKDIS .012 .020 .069 2.377 .019 .902 1.109
INOVPRO -.123 .013 -.122 .878 .382 .941 1.063
PROMOTI -.026 .077 -.133 -1.595 .113 .907 1.103
ATTIT .038 .062 .047 -1.707 .090 .912 1.097
Source: Owen survey data, 2012

70
Table 24: Contingency coefficient for discrete and dummy variables
SEX NONFAR RADIO CREDIT INPUTAVI
SEX 1
NONFARMINC -0.086 1
RADIOOWN 0.057 -0.109 1
CREDITAVI 0.111 -0.020 -0.136 1
Source: Owen survey data, 2012
4.8. Determinants of Information Seeking Behavior of Vegetable Farmers
As indicated in the methodology and other previous sections, a number of independent
explanatory factors were expected to influence the information seeking behavior of vegetable
farmers in the study area. Among the selected hypothesized explanatory variables considered by
the model, eight variables were found to have significant effect on information seeking behavior
of vegetable farmer.
The variables affecting information seeking behavior were education level of the household head,
farm size, on-farm income, nonfarm activities, extension service, social participation, and
innovation proneness and production motivation. All those significant independent variables
related with information seeking behavior positively and their sign confirms the prior expectation
as indicated in Table 28. The rest independent variables; age, sex, distance, radio ownership,
livestock, labor force, access to credit, and attitude were found to be insignificant.

71
Table 25: The Maximum Likelihood estimation of the Ordered logit model
Variables Coefficient P[|Z|>z Y=00 Y=01 Y=02
Age -0.02656 0.215 .0052501 -.0031092 -.0021409
Sex -0.38082 0.516 .0703965 -.0359923 -.0344042
Education 0.132421** 0.047 -.0261756 .0155018 .0106738
Farm size 0.932868* 0.074 -.1843995 .1092056 .0751939
Livestock 0.284413 0.163 -.0562198 .0332947 .0229251
Labor force -0.00483 0.978 .0009541 -.000565 -.000389
On-farm activities 1.94005** 0.033 -3.830006 2.270006 1.560006
Non farm income 0.01945** 0.027 -0.38306 .22706 .15606
Extension Contact 0.510958*** 0.008 -.1010008 .059815 .0411858
Radio ownership 0.169716 0.695 -.0331569 .0191859 .0139709
Social participation 0.8071981** 0.041 -.0244767 .0144957 .009981
Access to credit 0.466212 0.336 -.0861669 .0440021 .0421649
Market distance 0.016415 0.729 -.0032448 .0019217 .0013232
Innovation proneness 0.47433** 0.07 .0937601 -.0555269 -.0382332
Production motivation 0.09821* 0.055 .0194132 -.0114969 -.0079163
Attitude 0.063187 0.761 -.01249 .0073969 .0050932
Threshold parameters for index Log likelihood = -120.19955
Number of obs = 150
LR chi2(18) = 51.39
Prob > chi2 = 0.0000
Pseudo R2 = 0.1761
***, ** and * are significant at less than 1%, 5% and 10% probability level respectively
Source: Model output
As it can been seen from Table 28, a positive sign of the estimated coefficient of the model result
indicates more information seeker behavior when the value of the independent variable is
increased. To the contrary negative estimated coefficient indicates less information seeking

72
behavior when the value of the independent variable increases. Moreover, the marginal values
(Table 26) give the effect that a unit changes in the single independent variable has on different
information seeking categories, keeping all other variables at their mean values.
Level of education (LEDURES): the variable was significant at less than 5% significance level
and positively related with information seeking behavior of vegetable farmers in the study area.
The marginal effect result indicated that holding other variables constant at their mean, a unit
increase in the education level of the household head resulted a decrease in information seeking
behavior of the households by-2.62% for low information seeking category, and an increase of
1.55% and 1.07% for medium and high information seeking category respectively. The possible
elaboration for this is that education helps the literate rural farmers to access the information,
analyze and interpret and make use of it than uneducated farmers of the study area. The result is
similar with Yigzaw (2007).In addition to this Mahari (2012) indicate as the farmers’ education
level increase the ability to obtain information, process, understand and consequently utilization
of agricultural information also increase. In addition, such farmers had good communication with
the DAs and served as model farmers, so that they will have more exposure for agricultural
information, information utilization and technology utilization.
The finding of this study is in agreement with many of the previously conducted studies. A study
conducted by (Katungi, 2006; Ebrahim, 2006) reveal that educated farmers have more
information access. Pipy, (2006), also found that significant difference between different
educational level in poultry production sources of information and utilization of information.
Others like (Daniel, 2008) found that, as the level of education increase, the utilization of
agricultural input also increase. Tesfaye(2001) have reported positive and significant relationship
of education with adoption. Therefore, either directly or indirectly understanding levels of
farmers have role in agricultural development.
Farm size (FARMSIZ): from the econometric ordered logit model result, it was observed that
farm size is positively and significantly associated with the dependent variable at 10% probability
level. The result is in line with what was hypothesized to be. This could be explained with regard

73
to the study area as land in the rural area has become scarce resource and turned out to be
difficult to accommodate the ever increasing population, households with large number of adult
man equivalent family members can choose vegetable production as an opportunity in order to
improve their livelihood. Thus, this economic motive can facilitate them to use the accessible
vegetable production related information from any available sources. The marginal effect of the
model showed being other things held constant, a difference in a unit increase in farm size
decrease information seeking behavior by -18.44% for low category and increases for the other
groups by 10.92% and 7.52% as medium and high accordingly.
On-farm Income (ONFARMINC): in this study on-farm income showed positive and
significant relationship with the dependent variable at 5% probability level. The result is in-line
with prior expectation. This clearly pictured that vegetable farmer with more farm income are
more likely to seek and have the tendency of quickness in accepting new ideas or technologies
have more probability of information utilization than the others. The marginal effect of the
variable revealed that other variables being held constant, a unit change in on farm income
decreases information seeking behavior of the low category by-38% and an increase for medium
and high groups by 22% and 15% respectively. This result is similar to the empirical studies
conducted by Asres (2005) and Daniel (2008). On the contrary, low income and resource poor
farmer face difficulty to seek information. This suggests the need to support low income farmers
to enhance the production process.
Non-farm activities: is the income that farmers generate from activities not related to
agriculture. In this study non farm income showed positive and significant relationship with the
dependent variable at 5% probability level. The probable reason for this is farmers who earn
income from other activity have a probability to seek information from various sources whereas
those who not generate income from other sources faces financial constraint in buying new
technology that enhance productivity. Participation of non farm activities of the respondent
increase by one unit results in decrees by-15.60 % for low category and an increase by 8.18%
,7.42% for medium and high information seeking category respectively.

74
Frequency of Extension Contact: It is one of the important events that play a role by serving as
the source of agricultural information for farmers. For the vegetable farmers’ seeking and
utilizing agricultural information regarding vegetable production, advisory services and technical
assistances are very crucial. The result of the study shows that the frequency of visit by extension
agents is positively correlated with respondents’ information seeking behavior regarding
vegetable production at 10% significant level (Table 26).
As indicted in Table 26, an increase in the frequency of extension contact of the respondent by
one unit results in an decrease in the probability of agricultural information seeking regarding
vegetable production by -10.1% for low information seeing category and increase by 5.98% and
4.12% for medium and high information seeking category respectively. This implies that
respondents with regular frequency of extension contacts with DAs, exposure visits and
participating in farmers’ field days will get information, inputs and can observe relevant practices
on vegetable production, processing and marketing. Therefore, those respondents who have
frequently participated in extension events, trainings and field visits will likely to gain skill and
information knowledge on modern vegetable production. Thus, the availability of extension
participation in the rural areas is a paramount importance to smallholder vegetable farmer.
Moreover, extension participation improves the knowledge and increases concern of farmers
about agricultural activities. The finding of this study is more or less in agreement with the
findings of the studies conducted by Jemal (2010).
Social participation (SOCIALPAR): in this study social participation showed positive and
significant relationship with the dependent variable at 5% probability level. The result is in line
with prior expectation. This clearly pictured that these households who have the tendency to
engage in social activity in their community have more probability of information seeking than
the others. The marginal effect of the variable revealed that other variables being held constant, a
unit change in social participation decreases information seeking of the low groups by -2.45%
and increases the other medium and high seeking category by 1.45% and0.99% respectively. This
result is similar to the empirical studies conducted by Asres (2009).

75
Innovation proneness (INNOVPP): in this study innovation proneness showed positive and
significant relationship with the dependent variable at 5% probability level. The result is inline
with prior expectation. This clearly indicates that these households who have the tendency of
quickness in accepting new ideas or technologies have more probability of information seeking
than the others. This result is similar to the empirical studies conducted by Asres(2005) and
Daniel (2008). The marginal effect of the variable revealed that other variables being held
constant, a unit change in innovation proneness increase in information seeking of the low
groups by 9.38% and decreases the other medium and high groups by -5.55% and-3.82%
correspondingly.
Production motivation (PRODUCTINMOT): It is one of the important variables that explain
the motivation behavior of individual. It influenced information seeking behavior positively at
5% significance level. As indicted in Table 28,a unit increase in household’s level of production
motivation would increase in the probability of information seeking by 9.38%.for low
information seeking category and decrease by-5.55%,3.82% for medium and high information
seeking category. The probable reason of this result is that the farmer having strong desire to
produce more and more in the production process will seek and utilize more information and
agricultural technologies. The finding of this study is more or less in agreement with the findings
of the studies conducted by (Daniel, 2008; Tilahun,2008).

76
5. SUMMARY, CONCLUSION AND RECOMMENDATIONS
5.1 Summary
Under this summary part, the whole processes of the research work are briefed. To begin with,
the study was made in Haramaya Woreda , Oromia Region, Ethiopia. The research was aimed to
attained two objectives; i.e. to assess determinants of information seeking behavior of vegetable
farmers and to identify the source of information for vegetable farmers in the study area.
Multi-stage sampling procedures were applied to select Kebele and the required number of
sample units. Out of the 35 Kebele Haramaya woreda has 11Kebele were selected purposively for
the study, this is because these Kebeles were the major vegetable grower in the Woreda.
Secondly, four Kebele were randomly selected from eleven vegetable growing Kebele.
The principle of probability proportion to size sampling was used as a basis to fix the number of
sample households to be selected from each Kebele and totally 150 Vegetable growers were
randomly selected as sample of the study. Structured interview schedule, after pre-testing, was
used to collect primary data. Key informant interviews and focus group discussions conducted in
the Kebele helped to generate the necessary qualitative data. With regard to data type and
sources, both quantitative and qualitative data were collected from primary and secondary
sources. Primary data were collected from the respondents, through interview schedule and group
discussion; whereas secondary data were obtained from woreda office of agriculture and rural
development. Enumerators were used for data collection from respondents.
For data analysis both descriptive and inferential statistics were used. In applying descriptive
statistics, mean, std.deviation, range, minimum and maximum, percentages were used. Statistical
tests like chi-square, one-way ANOVA, Cramer’s V, contingency coefficients and Spearman’s
correlation were applied at different levels. Lastly, for inferential purpose, ordered logit
econometric model was used. The analysis results with regard to each objective were briefed as
follows.

77
In relation to information sources, about ten sources were identified in the study area for
vegetable farmers to get information. These were neighbors or friends, progressive farmers, DAs,
Haramaya University, WOoARD, Kebele administration, Mass media, farmers’ cooperatives,
Training and demonstration and NGOs. When information seeking pattern from those identified
sources were observed, neighbors or friends are the major and the first important source of
information for the vegetable farmers. This survey result is similar with the result of focused
group discussion conducted in this study. According to this study, progressive farmers (other than
neighbors or friends) serve as the second important information source. The survey result showed
that the third and fourth major sources of information are development agents and Haramaya
University respectively. As showed in the Table 4, WOoARD (Woreda Office of Agriculture and
Rural Development) and Kebele Administration serve as fifth and sixth source of information
respectively. Rural radio program, farmers’ cooperatives, training, demonstration and field days
serve as seventh, eighth, and ninth information sources respectively. NGOs serve as the least
important sources of information for vegetable farmer in the study area.
According to the reliability of information sources preferential ranking, progressive farmers
33.3% ranked first, DAs 17.3% serve as the second reliable information source. The survey result
showed that the third and fourth major reliable sources of information are neighbors 13.3% and
relatives 11.3%.
As showed in Table 4, Haramaya University10.7%, Kebele administration 4%, rural radio 3.3%,
farmers’ cooperatives 2.4%, training and demonstration 2% serves as fifth, sixth, seventh, eighth
and ninth reliable information source and NGOs1.3% serve as the least reliable source of
information for vegetable farmers in the study area respectively In relation to information seeking
behavior of vegetable farmer.
Analysis was made with respect to the ten identified package practices. In view of that,
respondents were categorized into three groups as low, medium and high on the basis of
frequency of seeking information from the source, by using mean plus and minus with std.
deviation. With this analysis, majority of the respondents 84 (56 %) were in the medium
information seeking category and the others 39 (26 %) in low and 27 (18%) were in higher

78
category. Thus, information seeking level of the majority was observed to be in the medium
category. These show that there is a variation in information seeking behavior among vegetable
farmers.
In the analysis of factors affect information seeking behavior of vegetable farmers, ordered logit
model was applied. To run the model, 18 explanatory variables were fitted in to the model after
they were checked for mullticoloniarity effect. To obtain marginal effect for each category
STATA version 10 was used. Finally, out of the 18 explanatory variables eight were found to be
significant at deferent levels and with directional effects. These were education level, farm size,
on farm income, non farm income, extension contact, social participation, innovation proneness
and production motivation.
5.2. Conclusions
Education level of the respondents is positively and significantly associated with respondents’
information seeking behavior of vegetable farmer, i.e., the households who have a better
education level increase the ability to seek information, process, understand and consequently
utilization of agricultural information related to vegetable production also increase. This shows
that being literate would improve access to information, capable to interpret the information,
easily understand and analyze the situation better than illiterate farmers and thus help to try out
new practices.
The frequency of extension contacts of vegetable farmers household (MHH and FHH) positively
and significantly associated with the information seeking behavior regarding vegetable
production. As shown from the study result, the frequency of extension contact of the male
headed household is higher than female headed household in seeking and searching for new
technology regarding vegetable production. i.e., those respondents who have frequently
participated in extension events, trainings, farmers’ cooperative and field visits are likely to gain
skill and information knowledge on modern vegetable production. It is through extension

79
services that the farmers get training on variety of seeds, pesticide, and fertilizers and utilize all
aspect of modern agricultural technologies.
In this study households’ income position was found to have significant influence, on information
seeking behavior of vegetable farmers’ Hence, farmers who earns high income from on farm or
off farm activity were motivated to buy input, seek information and agricultural technology. This
shows the need of initial capital to involve in vegetable production. Therefore, giving special
attention and provide credit to the poor, has to be considered as a central and core component of
any development intervention in the sector.
The respondents’ exposure to different social organization is positively and significantly
associated to information seeking behavior of vegetable farmer. As the respondents exposure to
different formal or informal organization like farmers cooperative/union, religious organization
(mosques and church), Iqub, Ider, Parent committee in school and HIV club increases,
information seeking behavior of respondents also increases. Hence, the farmers who have better
participation to different organization are more likely to be aware of different types of new
information and technology of farming regarding improved production.
5.3. Recommendation
Based on the research findings and conclusion of the study, the following points are
recommended to improve the performance of agricultural information seeking behavior of
vegetable farmers in the study area.
As the results of this study revealed, education level of the respondent has significantly
influenced information seeking behavior of vegetable farmer. This result shows that education
level of farmers has a role to increase the ability to obtain process and use agriculture related
information and use technologies in an improved way. Therefore, haramaya woreda agricultural
office and education office should give due emphasis towards strengthening adult education at
different levels for youth and adults

80
Farmers’ attendance in extension events like field visit, training, hosting demonstration and
extension service; and frequency of contact with development agent was found to be high
information seeker. Hence, woreda agricultural office should give due attention in organizing and
facilitating such events. Likewise, extension service provision has to be strengthened in order to
improve farmers’ access to information and extension advice, because vegetable production
compared to other cereals crops is complex in which it needs modern technical knowledge and
know how of application of different inputs. As the result of this study indicates, WoARD is the
most frequently mentioned actor by sample respondents as a provider of most of the extension
events, especially training. Hence, other actors such as Haramaya University and concerned
NGOs should contribute their role through forming innovation platform.
The amount of income earned significantly affects information seeking behavior of vegetable
farmers positively. The study shows that new information and new technology is more likely to
be searched by farmers with high income. While low income earners faces difficulty in seeking
agricultural technology. This implies the woreda finance office and credit union must be sensitive
to the financial need of smaller farmers and provide credit to the poor farmer.
Farmer to farmer contact and relation determines their engagement in agricultural related
information.. It was argued that most of farmers were having strong reliance and believe in
progressive farmers, development agents (DAs), neighbors or relatives and, Haramaya University
to get information, advice and benefits respectively in the study area. Since vegetable farming
community cannot sustain efficiently without support from progressive farmer, development
agents, and neighbor or relatives. Woreda agriculture office should organize farmers into some
sort of gropes having 5 members in order to share their knowledge, experience and information
among them

81
REFERENCES
Abadi, A. K. and D.J., Pnnel, 1999. A Conceptual Frame Work of Adoption of an Agricultural
Innovation. Agricultural Economics, University of Western Australia, Perth,2(9): 145-154.
Abay Akalu, 2007. Vegetable Market Chain Analysis in Amhara National Regional State: the
case of Fogera Woreda, South Gondar Zone. An M.Sc. Thesis Submitted to School of graduate
studies of Haramaya University. 1-2P.
Adugna Gessesse, 2009. Analysis of Fruit and Vegetable Market Chains in Alamata, Southern
Zone of Tigray: the case of Onion, Tomato, and Papaya. An M.Sc. Thesis Submitted to the
School of Graduate Studies of Haramaya University. 1P.
Asante M. S. and Seepersad, J.,1992. Factors influencing the Adoption of Recommended
Practices by Cocoa farmers in Ghana. Journal of Extension Systems,Vol. 8, No 1.
Asfaw Negassa, K., Gungal, W., Mwangi, and Beyene Seboka, 1997. Factors Affecting Adoption
of Maize Production Technologies in Ethiopia. Ethiopian Journal of Agricultural Economics,
Vol. 2: 52-69.
Asfew Negassa, K., Gungal, W., Mwangi, and Beyene Seboka, 1997. Factors Affecting Adoption
of Maize Production Technologies in Ethiopia. Ethiopian Journal of Agricultural Economics,
Vol. 2: 52-69.
Ali-Olubandwa, A., Odero-Wanga, D.,Kathuri, N. J., & Shivoga, W.,(2010). Adoption of
improved maize production practices among small scale farmers in the agricultural reform era:
The case of Western province of Kenya, Journal of International Agricultural Education and
Extension, 17(1), 21-30.
Asres Elias, 2005. Access and Utilization of Development Communication by Rural Women in
Dire Dawa Administrative Council, Eastern Ethiopia. M.Sc. Thesis, Alemaya University. 34p.

82
Ataklti Tesfay,2008 Determinants Of Adoption And Intensity Of Adoption Of Vegetable
Cultivation In The Irrigated Fields :The Case Of Laelaymychew District, Central Tigray,
Ethiopia. An M.Sc. Thesis Submitted to the School of Graduate Studies of Haramaya University.
Authority, Addis Ababa
Bekele Mulatu, 2008. Information sharing and utilization among farmers: The case of Maize
package in Metu Woreda, Oromiya Region. An M.Sc. Thesis submitted to Haramaya
Berhanu Bedassa, 2002. Analysis of factors affecting the adoption of crossbred dairy cows in the
central highlands of Ethiopia. An MSc Thesis presented to the School of Graduate Studies of
Alemaya University
Bergeron B. 2003. Essentials of Knowledge Management. John Wiley & Sons, Inc. Hoboken,
New Jersey.
Berhanu Gebremedhin, Hoekstra D and Azage Tegegne. 2006. Commercialization of Ethiopian
agriculture: Extension service from input supplier to knowledge broker and facilitator. IPMS
(Improving Productivity and Market Success) of Ethiopian Farmers Project Working Paper 1.
ILRI (International Livestock Research Institute), Nairobi, Kenya. 36 pp.
Bezabih Emana and Hadera Gebremedhin, 2007. Constraints and Opportunities of Horticulture
Production and Marketing in Eastern Ethiopia. DCG Report No. 46.
Bezabih Emana, 2000. The Role of New Crop Varieties and Chemical Fertilizer under Risk:
Bhople, P. P., Shinde AND Bhople, S. R., 1995, Pattern of information management by orange
growers. Maharastra Journal of Extension Education, 17: 184-187
Browen, Earl K. and Starr, Martin K. 1983. Basic statistics for business and economics.McGraw-
Hill, Tokyo.

83
Bruin, J. 2006. New test: command to compute new test. UCLA: Academic Technology
Services,Statistical Consulting Group.
Burnett, H., 2003. The influence of communication on the success of micro and small business: a
case study, AGSE, Swinburne University of Technology, Hawthorn Victoria, Australia.
Byström & Järvelin, 1995 Byström, K. and Järvelin, K., Task complexity affects information
seeking and use. Journal of Information Processing and Management, 31(2):191-213, 1995.
Carr, M. 1985. Technologies for rural women: Impact and dissemination, in technology and rural
women. pp.115-53. In: I. Ahmed and A. Unwin (eds). Conceptual and empirical issues, London.
Case Looking for information (2007),5.
Chilot Yirga, Shapiro, B.I., and Mulat Demeke, 1996. Factors influencing the adoption of new
wheat technologies in Wolmera and Addis Alem Areas of Ethiopia. Ethiopian Journal of
Agricultural Economics, Addis Ababa. 1(1).
CSA (Central Statistical Authority), 2010. Ethiopia: Statistical Abstract. Central Statistical
Dagnachew Tesfaye, 2002. Factors hampering women farmers’ involvement in current extension
packages: case studies of Sulta and Mulu districts of Ethiopia, Senior Research Report, Alemaya
University.
Daniel Tadesse, 2008. Access and utilization of Agricultural Information by Re-settler farming
households: The case of Metema Woreda, North Gondar, Ethiopia. An M.Sc. Thesis submitted to
Haramaya University school of Graduate Studies, Ethiopia.

84
David, L.O., (2006). The role of radio broadcasting in Nigeria agriculture. A case study of
selected agricultural radio programme broadcast in Oyo state. Unpublished B.Sc. Project, Dept of
Agric. Extension, University of Ibadan, Nigeria. Pp. 20-23.
Degnet, and Kidane, 2001. Adoption High Yielding Varieties of Maize in Jimma Zone. Evidence
from Farm Level Data. Journal of Agricultural Economics.Vol.5 (1&2).
Degu Worku 2012, Factors Affecting Adoption of Improved Potato Varieties: The Case of
Haramaya Woreda, East Hararghe, Ethiopia. An M.Sc. Thesis submitted to Haramaya University
school of Graduate Studies.
Deribe Kaske, 2007. Agricultural Information Networks Of Farm Women And Role Of
Agricultural Extension: The Case Of Dale Woreda, Southern Nations, Nationalities & Peoples’
Region. M.Sc. Thesis, Alemaya University. 74p.
Diao, X., P. Hazell, D. Resnick and J. Thurlow, (2007).the role of agriculture in development:
EARO, 2000. Institutionalizing Gender Planning in Agricultural Technology. Generation and
Donald O. Case, Looking for information: a survey of research on information ... needs and
behavior, Academic Press (2002)
Ebrahim Jemal, 2006. Adoption dairy innovations: its income and gender implications in Adami
Tulu district. Unpublished M.Sc. Thesis, Haramaya University.
Ellis, D. (1989) A behavioural approach to information retrieval system design. Journal of
Documentation, 45, 171-212.
Ellis, F., 1992. Peasant Economics, Farm Households and Agrarian Development Cambridge
University Press, New York,U.S.A

85
Endrias Geta, 2003. Adoption and Improved Sweet Potato Verities in Boloso Sore Woreda,
Southern Ethiopia. Agricultural Economics Department. Unpublished M.Sc. thesis. Alemaya
University
Ermias Sehai, June 30th - July 1st, 2004. Improving Productivity & Market Success of Ethiopian
Farmers, Knowledge Management, Alternative Approaches. Project Launch in & Planning
Workshop. ILRI, Ethiopia .
FAO, 1996. Improving Extension work with Rural Women. Food and Agricultural Organization
the United Nations Rome, Italy.
Farmers in Alamata Woreda, Southern Tigray,Ethiopia. AnM.Sc.Thesis presented to Haramaya
University School of Graduate Studies.
Fekadu And Dandena, 2006. Review of the Status of Vegetable Crops Production and Marketing
in Ethiopia, Uganda Journal of Agricultural Sciences, Vol. 12 No.2
Fekadu Beyene, 1997. Integration of Farmers’ Knowledge into Agricultural Research:
Challenges and Strategies: the case of Ada’a District, Central Oromia (Ethiopia), Wageningen
Agricultural University, The Netherlands.
Freeman, H.A., Ehui, S.K, and N. G/silassie, 1996. The Role of Credit in the Uptake of Improved
Dairy Technologies. Ethiopian Journal of Agricultural economics. 1: 11-17
Germany.
Getahun Degu, 2004. Assessment of Factors influencing Adoption of Wheat Technology and Its
Impact: The Case of Hula Woreda, Ethiopia An M.Sc. Thesis Submitted to School of Graduate
Studies of Haramaya University.

86
Getahun Shibeshi, 2008. Access to and Utilization of Agricultural Information on Bread wheat:
The case of Small Holder Farmers in Tach Gayint District, South Gondar Zone, Ethiopia.An
M.Sc. Thesis submitted to Haramaya University School of Graduate Studies.
Girma Abera 2010. Horticultural Crops Production in Ethiopia Associate Research
Officer/Horticulture Research Division, Oromiya Agricultural Research Institute Addis Ababa,
Ethiopia.
Gockowski, J. and Ndoumbe, M., 2004. The Adoption of Intensive Mono-Crop Horticulture
Gogoi D.K, 1990. Agricultural Communication Networks. A village Level Analysis of Punjab.
Gomez,K.A. and A.A.Gomez, 1984. Statistical Procedures for Agricultural Research, John Wiley
and Sons, New York. Green, W.H., 2000. Econometric Analysis (4th ed.), Prentice-hall, Inc.
Upper Saddle River, New Jersey.
Haba Sharon, (2004). Factors influencing the willingness to pay for agricultural information
delivery technologies by cooperative-oriented agribusinesses in Rwanda: evidence from the
Abahuzamugambi Coffee Growers Cooperative of Maraba. Master's thesis, Texas A &
MUniversity.
Habtemariam Abate, 2004. The comparative influence of intervening variables in the adoption
behavior of maize and dairy farmers in Shashemene and Debre Zeit, Ethiopia. Ph. D. Thesis,
University of Pretoria, Pretoria, 294p.
Habtemariam Kassa, 1996. Agricultural Education, Research and Extension in Ethiopia:
Problems and Linkages. In: Mulat, D., Aregay W., Tesfaye Z, Solomon B., Sustainable
Intensification of Agriculture in Ethiopia. Proceedings of the Second Conference of the
Agricultural Economics Society of Ethiopia, held in Addis Ababa 3-October 1996. Agricultural
Economics Society of Ethiopia, Addis Ababa, pp 229-236.

87
Habtemariam Kassa, 2004. Agricultural Extension with Particular Emphasis on Ethiopia.
Ethiopian Economic Policy Research Institute, Addis Ababa, pp 80.
Haji Biru, 2003. Adoption of Cross bred Dairy Cows in Aris Zone. The Case of Tiyo and Lemu
Bilbilo Woreds. M.Sc Thesis (Unpublished), School of Graduate Studies of Alemya
Haramaya Woreda Agricultural and Rural Development Office, 2006. Haramaya Woreda
Agricultural and Rural Development Office. Annual Report for the year 2006. Unpublished
Documents, Haramaya, Oromia
Hedija Mohammed, November, 1999. Investigation on Smallholders’ Behavior As Factors
Influencing Farm Performance in Ethiopia: The Case of Smallholders in Eastern Hararghe. M.
Sc. Thesis, Department of Holiculture, Hanover University.
Ibekwe U.C. and O.M. Adesope, 2010. Analysis of dry season vegetable production in Owerri
West Local Government, Department of Agricultural Economics, Federal University of
Technology. Imo State, Nigeria. Implications for Sub-Saharan Africa. IFPRI Report 153.
Washington:IFPRI.inSouthernCameroon.ElsevierB.V:Younde,CameroonHttp://Www.Worldcoco
a foundation.Org.
Itana Ayana, 1985. An Analysis of Factors Affecting the Adoption and Diffusion Patterns of
Package of Agricultural Technologies in Subsistence Agriculture: A Case Study in Two Districts
of Ethiopia. M.Sc. Thesis [Resented to School of Graduate Studies of Addis Ababa University.
Jemal Kuru Mama,2010: Acess and utilization of Agricutural knowledge and information by
women dairy farmers: The case of Ada’a district, Oromia Regional state, Ethiopia,MSc Thesis.
School of Graduate studies of Haramaya University.
Johnson, J. D. (1997). Cancer-related information seeking. Cresskill, NJ: Hampton Press.

88
Kalaitzandonakes, N. (1999). The Agricultural knowledge system: Appropriate roles and
interactions for the public and private sectors. University of Missouri Ag Bio Forum, 2(1), 1-4.
Kemper D, M. Noltze, R. Weber, and H.Faust, (2008).The role of agricultural ‘knowledge’ in
rural communities of Central Sulawesi. Georg-August-Universität Göttingen. Büsgenweg.
Kansana, H.S., Sharma, R.P., and Sharma, S.K., 1996. Knowledge and Adoption of Wheat
Technologies among Contact and Non-Contact Farmers. Agricultural Science, Digest Karnal,
16:154-156.
Katungi E, 2006. Gender, Social Capital and Information Exchange in Rural Uganda IFPRI and
Melinda Smale, IFPRI (International Food Policy Research Institute) CAPRI Working Paper
No.59,UniversityofPretoriaUganda.
Katungi E, 2006. Gender, Social Capital and Information Exchange in Rural Uganda IFPRI and
Melinda Smale, IFPRI (International Food Policy Research Institute) CAPRi Working Paper No.
Kamba MA (2009) Access to information: The dilemma for rural community development in
Africa. Paper presented at 7th GLOBELICS Conference, October 6–8, Dakar,Senegal.
Kidane Gebremariam, 2001. Factors Influencing the Adoption of New Wheat and Maize
Varieties in Tigray, Ethiopia: The Case of Hawzien Woreda. M.S.C. Thesis Presented To School
Of Graduate Studies Of Alemaya University, Ethiopia. 140p.
Korra Yayisito,2009 Access to and Utilization of Poultry Package Information among Package
Users in Konso Special Woreda, Southern Nations, Nationalities and Peoples Regional State’
Msc. Thesis Presented to School of Graduate Studies of HaramayaUniversity.
Leckie, G.J., Pettigrew, K.E., & Sylvain, C. (1996). Modeling the information seeking of professionals: A general model derived from research on engineers, health care professionals, and
lawyers. Library Quarterly, 66(2), 161–193.
89
Liao, T.F., 1994. Interpreting Probability Models: Logit, Probit, and Other Generalized Linear
Maddala, G.S., 1997. Limited Dependent and Quantitative Variables in Econometrics.
Cambridge University Press.
Martin R (2004). Distributed KM -Improving Knowledge Workers' Productivity and
Organizational Knowledge Sharing with Weblog-based Personal Publishing. Paper presented to
BlogTalk 2.0, "The European Conference on Weblogs", Vienna, July 5th and 6th 2004.
Mehari Desalegn, 2012, Access to and Utilization of Agricultural Information by Women Dairy
Farmers: The case of Chiro Woreda Oromia Regional State, Ethiopia Msc. Thesis Presented to
School of Graduate Studies of HaramayaUniversity.
Mesfin Astatkie, 2005. Analysis of factors Influencing Adoption of Triticale and its Impact. The
Case Farta Wereda. Msc. Thesis (Unpublished) Presented to School of Graduate Studies of
Alemaya University.
Mikinay Hailemariam, 2008. Social Networks and Gender Dimensions in use of Irrigation by
Models. Series: On Qualitative Applications in the Social Sciences. Thousand Oaks. Landon,
New Delhi. 88p.
Mohammadi D (2002). An Investigation of the factors influencing information-seeking behavior
of extension workers in Zanjan province
Moris J. 1991. Extension alternatives in tropical Africa. Overseas Development Institute,
London, UK.
Moore N (2007) Community information and technology centers: Focus on South-East Asia.
Bangkok:UNESCO.Availableat:http://portal.unesco.org/ci/en/files/25659/11962595511telecente
_study_en.pdf/telecentre_study_en.pdf.

90
Meho, L. I.,and Hass, S. W. (2001). Information Seeking Behavior and Use of Social Science
Faculty Studying Stateless Nations: A Case Study. Library and Information Science Research,
23, 5-25.
Mulugeta Enki, Belay Kassa and Legesse Dadi, 2001. Determinants of Adoption of Soil
Conservation Measures in Central Highlands of Ethiopia. The Case of Three Districts of North
Shoa. Agrekon, Vol.40, No 3.
Mulugeta Mekuria, 1994. An Economic Analysis of Smallholder Wheat Production and
Technology Adoption in the South Eastern Highlands of Ethiopia. PhD. Thesis, Michigan State
University.
Ondari-Okemwa E. (2006). Knowledge Management in a Research Organization: International
Livestock Research Institute (ILRI). University of Cape Town, Rondebosch,South Africa.
Owolade, E.O., (2008). Information seeking behavior and utilization among snail farmers in Oyo
state. Unpublished M.Sc. project, Dept .of Agricultural Extension and Rural Development,
University of Ibadan, pp 3-45.
Pettigrew, K. E. 1996. Modeling the information seeking of professionals. Library Quarterly,
66(2). 161-193.
Pezeshki-Rad Gh, Zamani N (2005). Information-seeking behavior of Iranian extension managers
and specialists. Inf. Res., 10(3): 22-25.
Pipy F. O, 2006. Poultry Farmers’ Utilization of Information in Lagelu Local Government Area,
Oyo State of Nigeria International Journal of Poultry Science 5 (5): Pp. 499-501.
Purcell DL and Anderson JR. 1997. Agricultural research and extension: Achievements and
problems in national systems. World Bank Operations Evaluation study, World Bank,
Washington, DC, USA.RADIANT PUBLISHERS.

91
Rockman IF (2002). Introduction: The Importance of Information Literacy. Rogers and E. M.,
1995. Diffusion of Innovation, (4th ed.), the free press, a division of Macmillan Inc.
Salomon, L. and Engel, (1997). Networking for innovation: A participatory actor-oriented
methodology. Royal Tropical Institute, KIT Press, Amsterdam, The Netherlands
Samuel Gebreselassie, 2006. Food Aid and Small-holder Agriculture in Ethiopia: Options and
Scenarios. A paper for the Future Agricultures Consortium workshop, Institute of Development
Studies, 20-22 March 2006.
Servin G.(2005).ABC of Knowledge Management.NHS National Library for Health: Knowledge
management specialist Library.
Taha Mume, 2007. Determinants of Intensity of Adoption of Improved Onion Production Package
In Dugda Bora Woreda,East Shoa, Ethiopia. An M.Sc Thesis Submitted to School of Graduate
Studies of Haramaya University.
Teressa Adugna, 1997. " Factors Influencing the Adoption and Intensity of Use of Fertilizer: The
Case of Lume District, Central Ethiopia, Quarterly Journal of International Agriculture, 36: 173-
187.
Tesfaye Beshah, 2003. Understanding Farmers: Explaining Soil and Water Conservation in
Konso, Wolaita and Wello, Ethiopia. Tropical Resources Management Papers
No.41.Wageningen University: The Netherlands.
Tesfaye Zegeye, Bedassa Tadesse, and Shiferaw Tesfaye, 2001. Determinants of high yielding
maize technology adoption. Empirical evidence from Southwestern Oromia. Research Report No.
38. Ethiopia Agricultural Research Organization (EARO), 2001. 39p.the Case of Smallholders in
Eastern Oromia, Ethiopia. Ph.D. Thesis, University of Hannover,

92
Tilahun S., 2007. Present Status and Future Prospects of Postharvest Preservation Technology of
Fresh Fruit and Vegetables in Ethiopia Haramaya University, College of Agriculture, Department
of Food Science and Postharvest Technology Haramaya, Ethiopia, 10(1) 4.
Tilahun Seifu, 2008. Access to and Utilization of Family planning Information among Rural
tomato growers. M.Sc. (Agri.) Thesis, University of Agricultural Sciences ,Bangalore. Transfer
Processes, Addis Ababa, Ethiopia.
Tsegaye Tadesse, 2003. The Impact Of The Participatory Demonstration And Training Extension
System On Production And Income Of The Farmers In Potential Areas Of The Amhara Regional
State Ethiopia: The Case of Yilmana Densa Woreda. Agricultural Economics Department.
Unpublished M.Sc. thesis. Alamaya University. Ethiopia.
Ukachi,Ngozi,Belessing,2001.Information needs,Sources And Information Seeking Behaviores
of rural Women In Badgry,Lagose Nigeria.
Van den Ban and Hawkins, H.S, 1996. Agricultural Extension, Second edition. Blackwell
Sciences Ltd. Carlton, Victoria, Australia.
Workneh Negatu, 2004. Reasons for Food Insecurity of Farm Households in South Wollo,
Ethiopia: Explanations at Grassroots. Institute of Development Research (IDR), Addis Ababa
University, Ethiopia.
World Bank, 1995. Toward Gender Equality: The Role of Public Policy. The World bank,
Washington D.C.
Wilson, T.D. (1981). On user studies and information needs. Journal of Documentation, 37(1),
3-15
Wilson, Thomas D (1999). "Models in information behaviour research". Journal of
Documentation 55 (3): 249–270.

93
T. D. Wilson, “Models in Information Behavior Research,” Journal of Documentation, Vol. 55,
No. 3, 1999, pp. 249- 270
Yahaya, M.K., 2001. Media use pattern of Women farmers in Northern Nigeria: Imperatives for
Sustainable gender sensitive extension delivery. African Crop Science Proceedings. Part 2, Vol.
5: 747-754.
Yigzaw, K., 2006. Contraceptive Prevalence in Dembia District, northwest Ethiopia. Ethiopian
Journal of Health Development 20(1):1-71.
Yishak Gecho, 2005. Determinants of Adoption of Improved Maize Technology in Damot Gale
Woreda, Wollayta Zone, Ethiopia. An M.Sc. Thesis presented to School of Graduate Studies,
Haramaya University.

94
APPENDIXES
7.1 Appendix I
Appendix table 1: Conversion Factor Used to estimate Tropical Livestock Unit
Animal Category TLU Animal Category TLU
Calf 0.25 Donkey 0.70
Weaned Calf 0.34 Donkey (Young) 0.35
Heifer 0.75 Sheep/Goat 0.13
Cows/oxen 1.00 Sheep/Goat (Young) 0.06
Horse/Mule 1.10 Camel 1.25
Chicken 0.013
Source: Storck, et al., (1991)

95
7.2 Appendix 2: Conversion factor used to compute family size (Adult man equivalent)
Age group(years)
Sex
Male Female
< 10 years of age 0.6 0.6
10-13 years of age 0.9 0.8
14-16 years of age 1 0.75
17-50 years of age 1 0.75
Over 50 years of age 1 0.765
Source: Strock et al., (1991)

96
QUESTIONNAIRE
Haramaya University
School of Graduate Studies
An interview Schedule of Farm Households Survey on Information Seeking Behavior of
Vegetable Farmers: The Case of Haramaya Woreda, East Hararghe, Oromia Region,
Ethiopia
The objective of this Interview Schedule is to collect information from farmer on
Information Seeking Behavior of Vegetable Farmers: The Case of Haramaya Woreda,
East Hararghe, Oromia Region, Ethiopia from November/2012 to December/ 2012. The
study is conducted for academic purpose. Hence, we request your honest & fair responses
to fill up this interview schedule.
Instruction (for enumerators)
❖ Introduce yourself to the respondent and ask his/her permission politely.
❖ Tell to the respondent about the purpose of the study.
❖ Check that all questions are asked and responses are filled accordingly.
Haramaya woreda, 2012

97
General Information
Date of interview ______________
Identification code _________________
Name of the Peasant Association ____________
Name of the Village _______________
Name of the enumerator______________
I Personal factor
1.1 Name of the respondent _________________________
1.2 Age of respondent ______
1.3 Sex of the respondent____
1.4 Marital status 4= Married 3=Widowed 2= Divorced 1= Single
1.5 Educational level in grade______

98
1.6 Rank vegetables that grown on your backyard?
No. Vegetables Area of coverage
(hectare)
Marginally
Important
Important Very important
1 Head cabbage
2 Carrot
3 Potato
4 Onion
5 Garlic
6 Tomatoes
7 Pepper
8 Radish
9 Kurumba
10 lettuce
11 Swiss chard
12 Other specify
II SOCIO-ECONOMIC CHARACTERISTICS
2.1 Do you own land? 1= Yes 0= No
2.2 Total land holding________(in ha)
2.3 If yes, total land size covered by Vegetable crops __________ (in ha)

99
2.4 Number of livestock owned at present
No.
Category
Number
1 Cows
2 Oxen
3 Heifers
4 Calves
5 Bulls
6 Goats
7 Sheep
8 Poultry
9 Donkey
10 Camel
11 Others(specify)
Total

100
2.5. Household Active Labor force
2.5.1 Household Family size---------
2.5.2 House hold active labor force (between 15-64) ------------
2.6 On-farm income
2.6.1 Household’s annual farm income from sale of crops in 2004 E.C
No
Commodity
Annual
harvest(qt)
Consumed
(qt)
Amount
sold(qt)
Unit
price
Total
price
1 Maize
2 Khat
3 Onion
4 Cabbage
5 Tomato
6 Potato
7 Sorghum
8 Carrot
9 Others
Total income

101
2.6.2 Annual income from sale of livestock in 2004 E.C
No. Category Number sold Unit price Total price
1 Cows
2 Oxen
3 Heifers
4 Calves
5 Goats
6 Sheep
7 Poultry
8 Donkey
9 Camel
10 Livestock
Products
Milk
Egg
11 Others(specify)
Total
2.6.3. Do you participate in non-farm activities? 1. Yes 0. No

102
2.6.4 If yes, in which of the following non-farm activities do you participate in 2004?
2.6.5. If you do not participate what is the reason?
1. I have not time 2. I don’t have initial capital 3. I don’t have interest
4. I don’t have skill 5. More than one reason 6. Other specify
III Institutional Factors
3.1. Have you ever got training in the last five years?
1. Yes 0.No
3.1.1 If yes, who provided the training?
1. Woreda ARDO 2. Research institution 3. Cooperative union
4. NGOs 5. Private dealers 6. More than one source 7. Haramaya University
8. Others (specify)
3.1.2 If yes, on what activities did you get training?
S/N Operations involved Total number of working days Total income received in Birr/year
1 Daily laborer
2 Petty trading
3 Handicraft
4 Firewood /charcoal selling
5 Homemade drinks
6 Others ( specify)

103
1. Vegetable 2. Livestock production 3.Both 4. Others
3.1.3 How frequent did you get the training?
1. Once per month 2. Once in three month
3. Once in six month 4. Once per year 5. Others (specify)
3.1.4 Did you utilize the training information 1. Yes 0. No.
3.1.5 If no, Why? ---------
3.1.6 Do you get weather related information to enhance your vegetable production?
1. Yes 0. No
3.1.7 If yes, which organizations provide weather related information?
1. Woreda ARDO 2. Research institution 3. Cooperative union
4. NGOs 5. Private dealers 6. More than one source 7. Haramaya University
8. Others (specify)
3.1.8 Did you get written materials that describes about vegetable production?
1 = Yes 0 = No
3.1.9 From where did you get the written material information?
1. DA 2.From NGOs 3. From neighbors 4.Haramaya University
5. Others (specify)
3.1.10 If yes who can interpret or read the materials?
1. Yourself 2.Your children 3.Your friends or neighbors 4. Others
3.2 Do you utilize the accessed information from the written materials?

104
1 = Yes 0 = No
3.2.1 If no, Why?
1. Lack of time 2.Lack of interest 3. Lack of understanding
4. Lack of money 5. More than one source 6. Other
3.2.2 Do you share the information with others? 1. Yes 0. No
3.2.3 If yes, with whom do you share?
1. Husband 2. Wife 3. Neighbors
4. Friends 5. Other specify
3.2.4 If no, why? ---------------
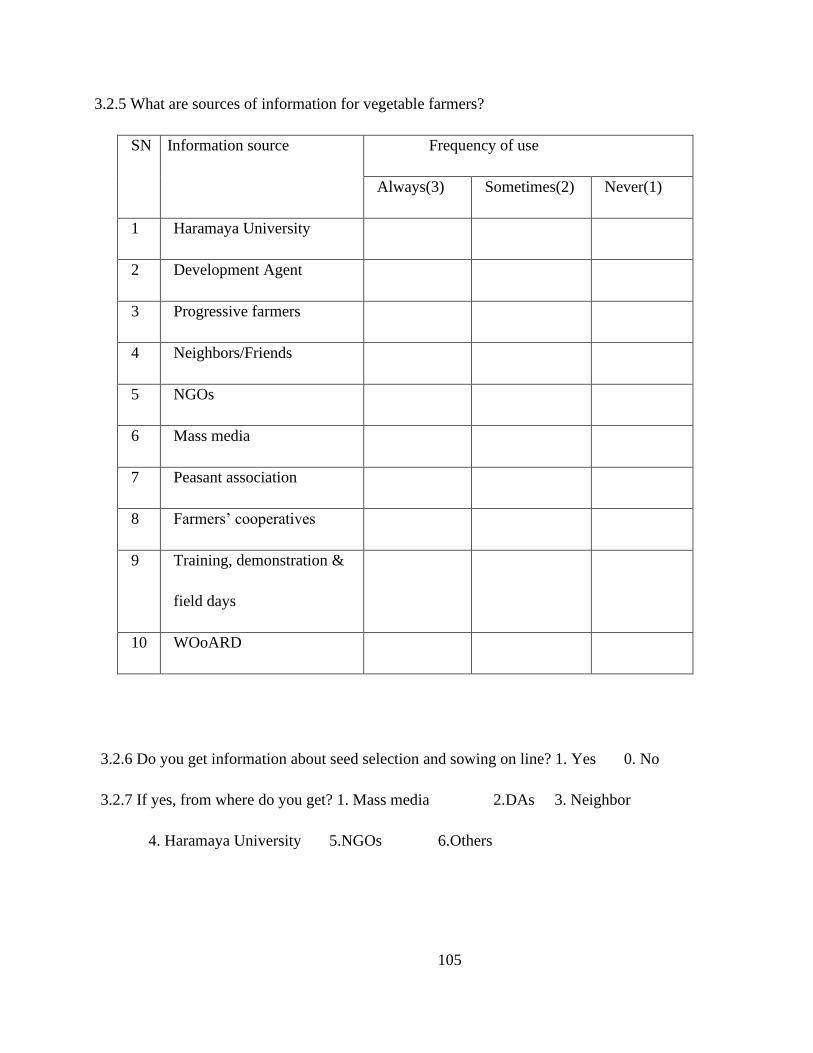
105
3.2.5 What are sources of information for vegetable farmers?
SN Information source Frequency of use
Always(3) Sometimes(2) Never(1)
1 Haramaya University
2 Development Agent
3 Progressive farmers
4 Neighbors/Friends
5 NGOs
6 Mass media
7 Peasant association
8 Farmers’ cooperatives
9 Training, demonstration &
field days
10 WOoARD
3.2.6 Do you get information about seed selection and sowing on line? 1. Yes 0. No
3.2.7 If yes, from where do you get? 1. Mass media 2.DAs 3. Neighbor
4. Haramaya University 5.NGOs 6.Others

106
3.2.8 Did you get new information about improved vegetable varieties in last year?
1. Yes 0. No
3.2.9 If yes, from where do you get?
1. Haramaya University 2. Development agent
3. Progressive farmer 4. Mass media
5. Neighbors6. NGOS 7. Other specify
3.2.10 Did you utilize the accessed information? 1. Yes 0. No
3.2.11 If not, why?
1. Lack of knowledge 2. Lack of money 5. Lack of time
3. Lack of labor 4. Lack of interest 6. Other specify

107
3.3. How much do you seek information in the following activities?
Type of information
Amount of new information wish to get:
(2)All
information
(1)some
information
(0)No
information
Agricultural information
Health information
Food and nutritional information
Environmental information
Technological information
Educational and training information
Business and trade information
Government policy and plans
Credit system
Any other

108
3.3.1 What is Frequency of seeking information as vegetable farmers?
Type of information Frequency of seeking information
Often(3) Sometimes(2) Rarely(1) Never(0)
Agricultural land
Varity of seeds
pesticide
fertilizers
irrigation
Post harvest technology
credit facility
store
Market trend and price
Adoption of new technology
weather
Any other
3.3.2 Have you participated in any farmer’s field day in the last year?
1. Yes 0. No

109
3.3.3 If yes, which organization provided it?
1. Kebele agricultural office 2. Woreda agricultural office 3. Haramaya
University 4. 1 and 2 5. 1 and 3 6. 2 and 3 7. 1, 2 and 3 8. Other
3.3.4 If no why?
1. Not invited to participate 2. Not interest in the program
3. I have no time 4. Other specify
3.3.5 If yes, did you utilize the accessed filed day information? 1. Yes 0. No
3.3.6 If not utilized what is your reason
1. Lack of time 2. Lack of knowledge 5. Not timely relevant
3. Lack of labor 4. Lack of interest 6. Lack of money
7. Other specify
3.3.7 Do you have access to irrigation? 1. Yes 0. No

110
3.3.8 What are the most reliable sources of agricultural information?
SN Source of
information
Reliable source
Vary reliable
(3)
Reliable
(2)
Somewhat
reliable (1)
Not reliable
(0)
1 Haramaya University
2 Development Agent
3 Progressive farmers
4 Neighbors/Friends
5 NGOs
6 Mass media
7 Peasant association
8 Farmers’ cooperatives
9 Training, demonstration &
field days
10 WOoARD
3.3.9 Did you get extension service in the last production year?
1. Yes 0. No

111
3.4. If yes, how long per year did you get extension service in the last year?
1. Once in a month 2. Once in three months
3. Once in six month 4.Once in a year 5. Others (specify)
3.4.1 If no, what are the reasons?
1. They do not treat males and females equally
2. I don’t need the services
3. Possessed the required information
4. Non availability of contact farmers in the area
5. Less skilled and poor experience of DA (not attractive to contact)
6. I don’t know the presence of DA in the area
7. More than one source
8. Other reasons (specify) ___________________________
3.4.2. What is the most common place where you usually contact development agents?
1. in my farm field 2.In my home 3. DAs office
4. at demonstration centre 5. Others
3.4.3 Which sex of DA do you prefer to contact with?
1. Male 2 Female 3. Both are equal
3.4.4 Did you utilize the accessed extension information 1. Yes 0. No

112
3.4.5 If not utilize the accessed extension information why
1. I have no time 2. I have no interest 3. I have no knowledge
4. Lack of follow up of DA 5. Other
3.4.6 Do you have your own radio? 1. Yes 0. No
3, 4.7.If yes, which program do you listen to mostly? (Rank according to their importance)
Rank
Agricultural program ( )
News ( )
Drama ( )
Music ( )
Others (specify) ______________ ( )
3.4.8. Why 1st ranked program is the most important to you? _________________

113
3.4.9 How frequently do you have access to media for the 3 last year?
No.
Mass media exposure Frequency of using them
Never (0) Rarely(1) Occasionally(2) Often(3) Vary often(4)
1 Radio
2 Television
3 News paper
4 Posters
5 Leaflets
3.4.10. Are you involved in any activities of formal and informal institutions/ Organizations in
your area? (Social participation) 1= Yes 0= No

114
3.4.11. If yes, type of institutions/ Organizations & type of membership
Organization Non-
participant
(0)
Member
(1)
Committee
member(2)
Leader
(3)
Frequency of Participation
in Activity
Never
(0)
Sometimes
(1)
Often
(2)
Always
(3)
Farmers
cooperative/union
Religious organization
(mosques and church)
Iqub
Ider
Parent committee in
school
HIV club
3.5 Credit access
3.5.1 Is credit service available in your area?
1. Yes 0. No
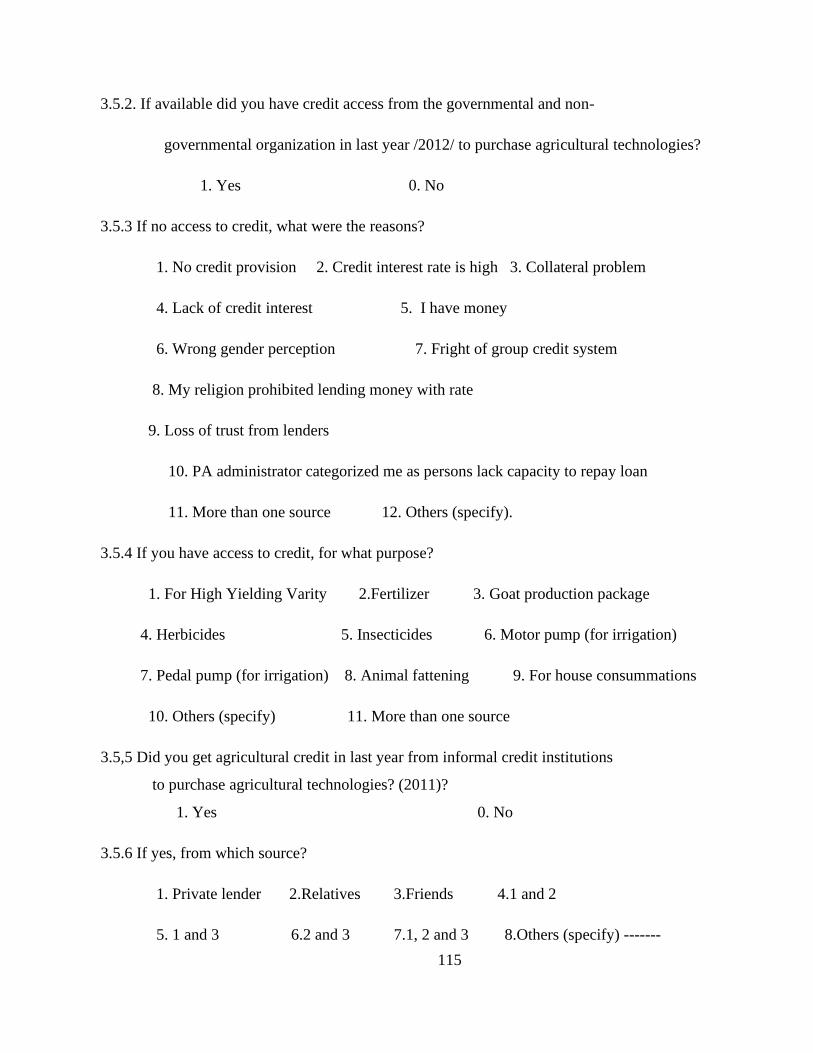
115
3.5.2. If available did you have credit access from the governmental and non-
governmental organization in last year /2012/ to purchase agricultural technologies?
1. Yes 0. No
3.5.3 If no access to credit, what were the reasons?
1. No credit provision 2. Credit interest rate is high 3. Collateral problem
4. Lack of credit interest 5. I have money
6. Wrong gender perception 7. Fright of group credit system
8. My religion prohibited lending money with rate
9. Loss of trust from lenders
10. PA administrator categorized me as persons lack capacity to repay loan
11. More than one source 12. Others (specify).
3.5.4 If you have access to credit, for what purpose?
1. For High Yielding Varity 2.Fertilizer 3. Goat production package
4. Herbicides 5. Insecticides 6. Motor pump (for irrigation)
7. Pedal pump (for irrigation) 8. Animal fattening 9. For house consummations
10. Others (specify) 11. More than one source
3.5,5 Did you get agricultural credit in last year from informal credit institutions
to purchase agricultural technologies? (2011)?
1. Yes 0. No
3.5.6 If yes, from which source?
1. Private lender 2.Relatives 3.Friends 4.1 and 2
5. 1 and 3 6.2 and 3 7.1, 2 and 3 8.Others (specify) -------

116
3.6 Market distance
3.6.1 How far you travel to reach the nearest market? ________(km or walking hours)
3.6.2 Which market centers are accessible to you?
No
Name of the market
Distance(in km or walking hours)
Commodities sold at the market place
1
2
3
4
IV PSYCHOLOGICAL FACTORS
4.1 Innovation proneness
4.1.1 Did you previously utilize Agricultural technologies related to crop, livestock,
natural resource and Fruit and vegetable production? (In 2011/12)
1 yes 0. no

117
4.1.2 If yes, what is the technology? Tick, how the respondent accept/adopt the new
idea
Agricultural technologies Tick How do you accept/adopt a new idea?
yes no 1 2 3
1 Sorghum HYV
2 Fruit Vegetable HYV
3 Chat
4 Maize HYV
5 Fertilizer use
6 compost
7 Herbicide utilization/round up/
8 Herbicide utilization/2-4D/
9 Insecticide
10 Animal feed collection and
11 preservation
12 Cattle fattening
13 Milk churner
14 Motor utilization
15 Poultry production
16 Modern honey production
17 Pedal pump utilization
18 New forest tree
19 fuel saving stove
Others (specify)
1= after most of the people accept/adopt it?
2= after consulting others who are more knowledgeable and using it?
3= whenever I come across a new idea such as after getting training, field visiting etc...

118
4.2 Production motivation
4.2.1 Are you satisfied with the current level of production in your farming?
1. Yes 0.No
4.2.2 If no, how much you work to increase in future?
1. No plan to increase 2. By 25%
3. By 50 % 4.By 75% 5. By double or more
4.2.3 How do you wish to improve your production?
1By repeating what I did last year
2. By using new technologies 3. By adding more land
4. By improving my practices 5. By asking other who produce more than me
4.2.4 Do you have a plan to use different or new agricultural technology in the next
Cropping season?
1. Yes 0.No
4.2.5 If no plan to use agricultural technology, what is the reason?
1. Lack of money 2. Lack of awareness to new technologies
3. Lack of interest 4. Lack of interest to stay here
5. The technologies are not profitable
4.3 Attitude towards improved farming
4.3.1 To what degree do you agree on the following statement?
1 .We should do farming in the way our ancestors did
1. Strongly disagree 2, Disagree 3, somewhat agree 4, Agree 5.Sterongly agree
4 3 2. Farming should be considered as a way of life and not as business
1, strongly disagree 2, Disagree 3, somewhat agree 4, Agree 5.Strongly agree
4.3.3. Change in traditional farming is always good and shall be encouraged
1. Strongly disagree 2, Disagree 3, somewhat agree 4, Agree 5.Sterongly agree
4.3.4 .New agricultural knowledge and information is important in life and development
1, strongly disagree 2, Disagree 3, somewhat agree 4, Agree 5.Sterongly agree

119