low-temperature gas generation from marine shales: wet gas to dry gas over experimental time
TRANSCRIPT
BioMed CentralGeochemical Transactions
ss
Open AcceResearch articleLow-temperature gas from marine shales: wet gas to dry gas over experimental timeFrank D Mango*1 and Daniel M Jarvie2Address: 1Petroleum Habitats, 806 Soboda Ct, Houston, Texas 77079, USA and 2Worldwide Geochemistry, 218 Higgins Street, Humble, Texas 77338, USA
Email: Frank D Mango* - [email protected]; Daniel M Jarvie - [email protected]
* Corresponding author
AbstractMarine shales exhibit unusual behavior at low temperatures under anoxic gas flow. They generatecatalytic gas 300° below thermal cracking temperatures, discontinuously in aperiodic episodes, andlose these properties on exposure to trace amounts of oxygen. Here we report a surprisingreversal in hydrocarbon generation. Heavy hydrocarbons are formed before light hydrocarbonsresulting in wet gas at the onset of generation grading to dryer gas over time. The effect ismoderate under gas flow and substantial in closed reactions. In sequential closed reactions at100°C, gas from a Cretaceous Mowry shale progresses from predominately heavy hydrocarbons(66% C5, 2% C1) to predominantly light hydrocarbons (56% C1, 8% C5), the opposite of thatexpected from desorption of preexisting hydrocarbons. Differences in catalyst substratecomposition explain these dynamics. Gas flow should carry heavier hydrocarbons to catalytic sites,in contrast to static conditions where catalytic sites are limited to in-place hydrocarbons. In-placehydrocarbons and their products should become lighter with conversion thus generating lighterhydrocarbon over time, consistent with our experimental results.
We recognize the similarities between low-temperature gas generation reported here and thenatural progression of wet gas to dry gas over geologic time. There is now substantial evidence fornatural catalytic activity in source rocks. Natural gas at thermodynamic equilibrium and the resultsreported here add to that evidence. Natural catalysis provides a plausible and unique explanationfor the origin and evolution of gas in sedimentary basins.
IntroductionMarine shales release gas under isotherm gas flow at low-temperatures [1]. Gas is released discontinuously, in dis-tinct aperiodic episodes that continue over time. It is non-linear kinetic behavior resembling chaotic catalysis bytransition metals [2]. Trace levels of oxygen suppress gasemission, and gas compositions reflect equilibrium con-trol. The recent disclosure of natural gas at thermody-namic equilibrium and catalytic gas from marine shales
similarly constrained, strongly suggests natural catalysis asthe source of natural gas [3].
The origin of natural gas remains controversial, however.Many believe that thermal cracking is the source and citevarious pyrolysis simulation experiments to support thisview [4-14]. Recent hydrous pyrolysis experiments wouldseem to rule out natural catalytic activity in general [15],and activity by transition metals [16] in particular. This
Published: 9 November 2009
Geochemical Transactions 2009, 10:10 doi:10.1186/1467-4866-10-10
Received: 9 June 2009Accepted: 9 November 2009
This article is available from: http://www.geochemicaltransactions.com/content/10/1/10
© 2009 Mango and Jarvie; licensee BioMed Central Ltd. This is an Open Access article distributed under the terms of the Creative Commons Attribution License (http://creativecommons.org/licenses/by/2.0), which permits unrestricted use, distribution, and reproduction in any medium, provided the original work is properly cited.
Page 1 of 7(page number not for citation purposes)
Geochemical Transactions 2009, 10:10 http://www.geochemicaltransactions.com/content/10/1/10
conclusion was based on the premise that any natural cat-alytic activity that might exist would express itself underhydrous pyrolysis conditions. However, natural activity isa low-temperature phenomenon that is not observed atpyrolysis temperatures (> 300°C) [1].
Here we address catalytic gas generation under open andclosed conditions to distinguish it from alternative expla-nations, desorption and thermal degradation in particu-lar. Gas compositions change very little over time inthermal degradation experiments under open and closedconditions. Methane concentrations remain within a nar-row range between 20 and 60% vol (C1-C5) irrespectiveof kerogen type, temperatures, or reaction conditions [17-21]. Desorption under isothermal gas flow follows first-order kinetics with the lighter hydrocarbons elutingbefore the heavier hydrocarbons [22], as typically seen ingas chromatography. Both processes should give charac-teristic compositions over time, easily distinguishablefrom catalytic generation.
Rates of catalytic reactions are controlled by substrate con-centrations at catalytic sites. They can vary in molecularweight if mass transport controls hydrocarbon transit toactive centers. This is particularly the case in heterogene-ous systems where active sites can be isolated from thehydrocarbon pools surrounding them. Mass transport canthen control concentrations at active sites and thus prod-uct compositions. Under these circumstances, productcompositions can be very different under gas flow wheremass transport is active [22] and static conditions where itis not. In our systems, we would expect gas flow to carryhigher hydrocarbons to active sites while static conditionswill limit these sites to the hydrocarbons in-place. Thepurpose of this research was to see if there were dramaticdifferences in the gasses emitted under gas flow and staticconditions consistent with catalytic generation asopposed to desorption or thermal degradation.
Results and DiscussionThe kinetics of generation and desorption are differentand their products reflect the differences. Desorption isfirst order and therefore yields characteristic exponentialcurves over time [22]. Rates are proportional to ka* [a],where ka is the first order rate constant and [a] is the con-centration of hydrocarbon a in the rock's kerogen andbitumen. Under isothermal gas flow, the gas-phase ratioof two desorbing hydrocarbons, (a) and (b), will be pro-portional to ka* [a]/kb* [b], where (a) and (b) denote con-centrations in the effluent gas and [a] and [b] denoteconcentrations in solution (kerogen and bitumens). If a isthe lighter hydrocarbon (ka > kb), the ratio (a)/(b) emerg-ing from the rock will fall exponentially over time as theratio of their concentrations in solution ([a]/[b]) fallsexponentially over time. The ratio (a)/(b) will changewith [a]/[b], but the exponential fall over time will not. In
first order desorption, the ratio (a)1/(b)1 at any point intime t1 is greater than (a)2/(b)2 at dt: [(a)1/(b)1]* [(1-ka)/(1-kb)] = (a)2/(b)2. This will be true at all points in time,from the onset of desorption where [a] and [b] are high,to infinite time when they are in trace amounts. Thus, thefall in (a)/(b) is independent of [a]/[b] and time. It is there-fore independent of sample history and preparation. Itshall make no difference how much a and b are lost orretained in sample preparation. Desorption can only bethe major source of a and b if (a)/(b) falls exponentiallyover time.
The dynamics of generation are different. The concentra-tions of a and b in the emerging gas now become propor-tional to concentrations of precursors that generate a andb. These could be free hydrocarbons or hydrocarbonappendages to kerogen. The ratio (a)/(b) now becomes afunction of the average molecular weight (MW) of thesubstrates feeding the reaction. If the catalytic rate con-stants are about equal, (a)/(b) = [Sa]/[Sb], where Sa and Sbare light and heavier substrates, respectively. SubstrateMW will diminish over time as higher MW substrates areconverted to lower MW substrates. Thus, [Sa]/[Sb] willincrease as [Sb] → [Sa]. We anticipate two possibilities forcatalytic gas generation. With mass transport under gasflow, [Sa]/[Sb] should remain relatively constant (steady-state) as higher hydrocarbons are delivered to active sites.Under static conditions where active sites are limited tothe hydrocarbons in-place, average MW will decline overtime and [Sa]/[Sb] will increase. Thus, the ratio (a)/(b)should increase under static conditions were mass trans-port is minimal and remain relatively constant under flowconditions where mass transport is active.
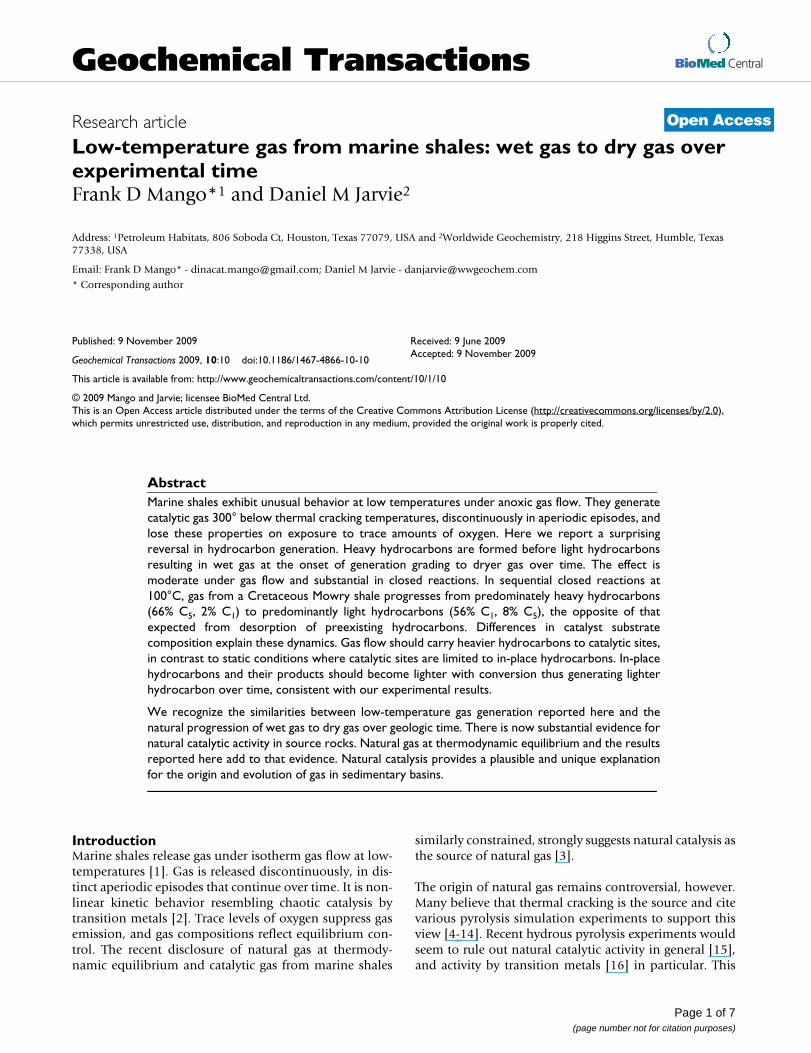
We analyzed gas compositions (% mol C1-C5) from threeshales under isothermal gas flow using a proceduredescribed elsewhere [1]. Figure 1 shows the ratio (C3)/(n-C4) increasing under He flow at 50°C (Floyd shale). A sim-ilar curve obtains from New Albany shale at 100°C, and aslightly declining curve is seen from Mowry shale at 50°C(Table 1). The propane and butane released under isother-mal gas flow is therefore generated under gas flow. The factthat it occurs at 50°C, is suppressed by oxygen, and is epi-sodic [1], points to catalytic generation, as opposed tothermal generation.
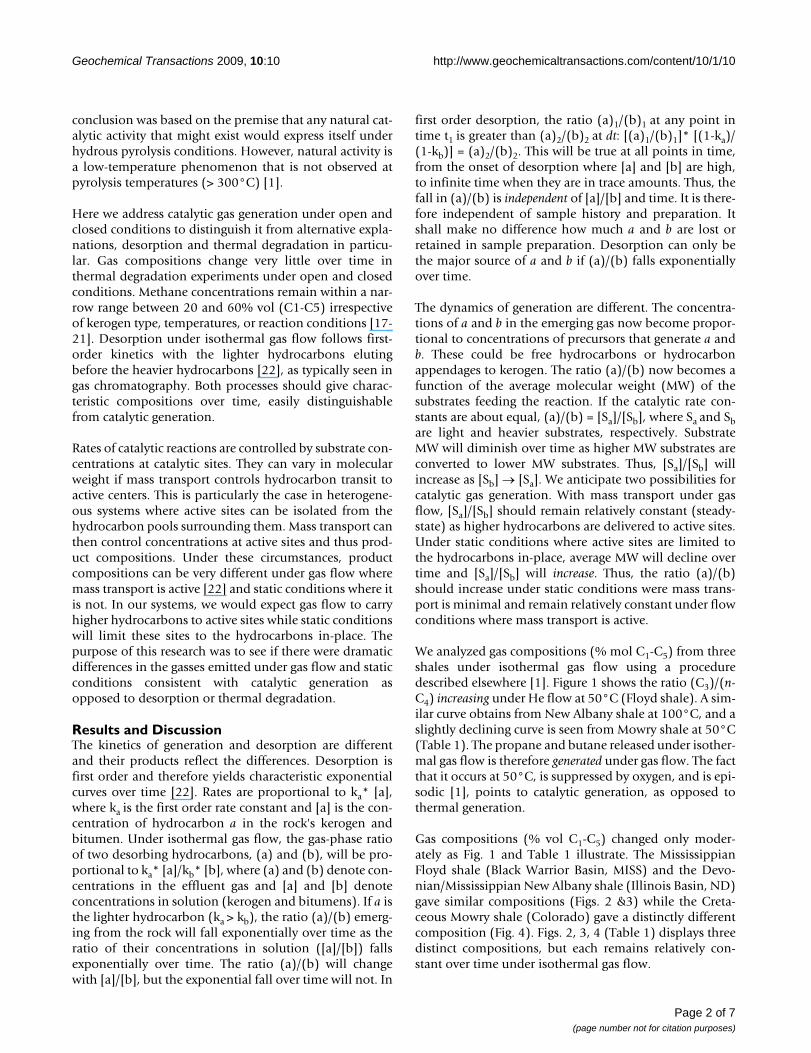
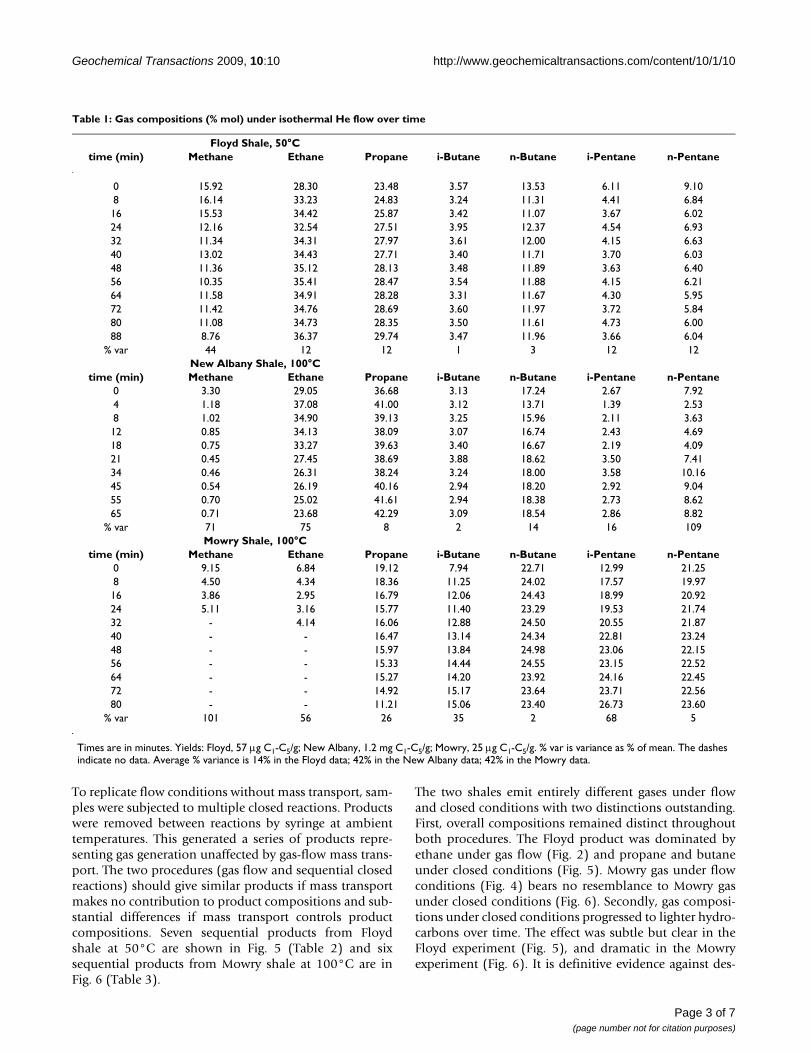
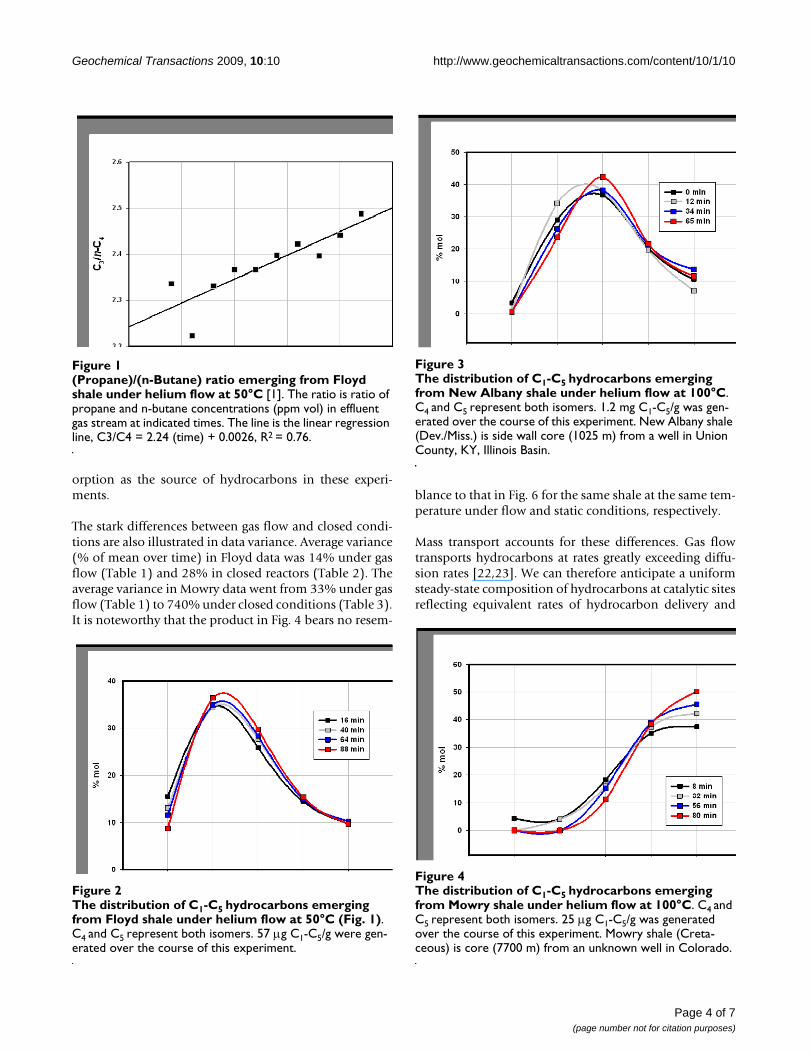
Gas compositions (% vol C1-C5) changed only moder-ately as Fig. 1 and Table 1 illustrate. The MississippianFloyd shale (Black Warrior Basin, MISS) and the Devo-nian/Mississippian New Albany shale (Illinois Basin, ND)gave similar compositions (Figs. 2 &3) while the Creta-ceous Mowry shale (Colorado) gave a distinctly differentcomposition (Fig. 4). Figs. 2, 3, 4 (Table 1) displays threedistinct compositions, but each remains relatively con-stant over time under isothermal gas flow.
Page 2 of 7(page number not for citation purposes)
Geochemical Transactions 2009, 10:10 http://www.geochemicaltransactions.com/content/10/1/10
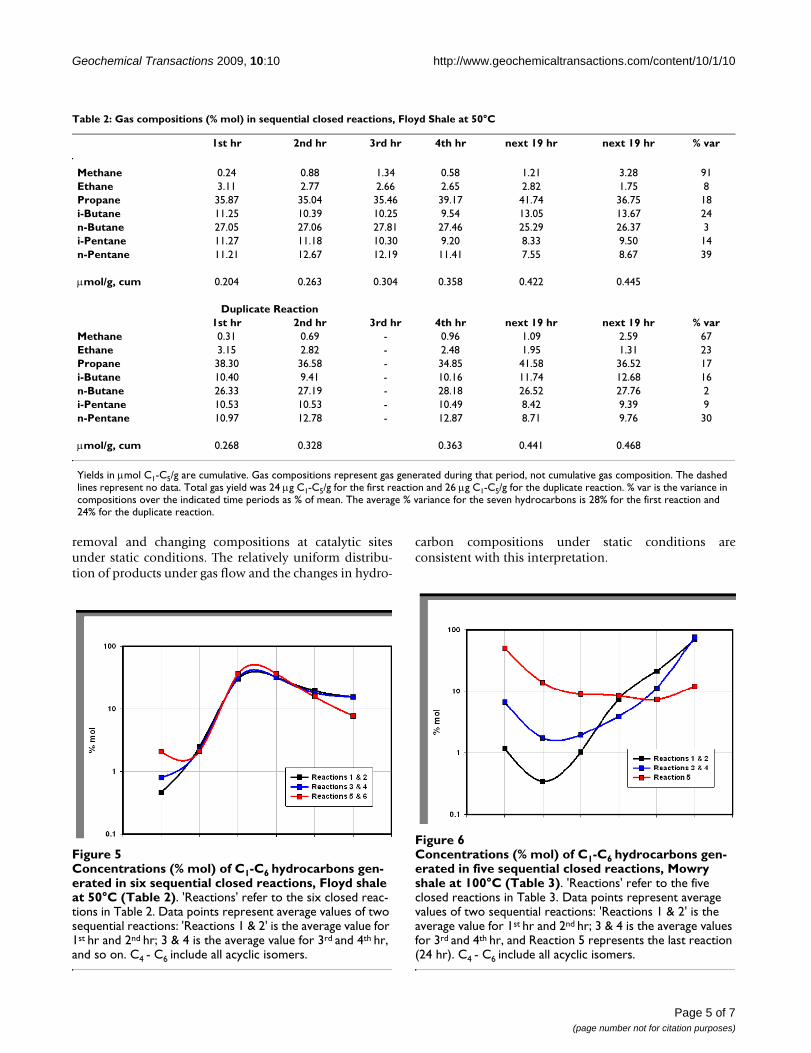
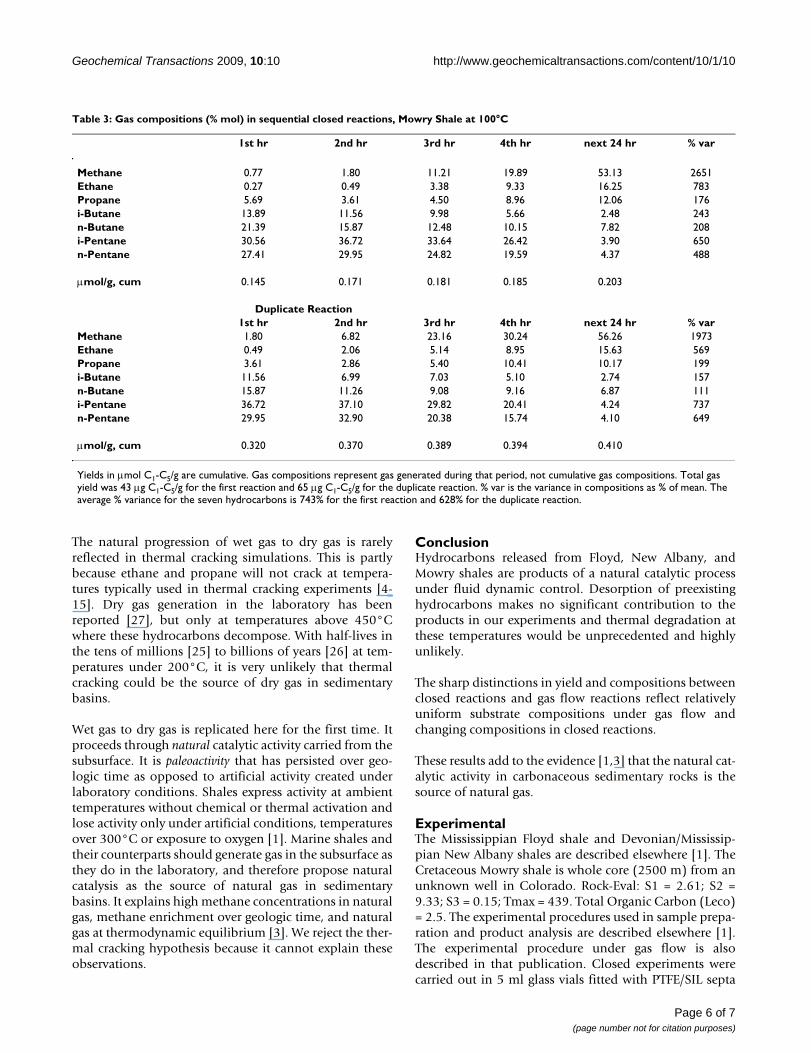
To replicate flow conditions without mass transport, sam-ples were subjected to multiple closed reactions. Productswere removed between reactions by syringe at ambienttemperatures. This generated a series of products repre-senting gas generation unaffected by gas-flow mass trans-port. The two procedures (gas flow and sequential closedreactions) should give similar products if mass transportmakes no contribution to product compositions and sub-stantial differences if mass transport controls productcompositions. Seven sequential products from Floydshale at 50°C are shown in Fig. 5 (Table 2) and sixsequential products from Mowry shale at 100°C are inFig. 6 (Table 3).
The two shales emit entirely different gases under flowand closed conditions with two distinctions outstanding.First, overall compositions remained distinct throughoutboth procedures. The Floyd product was dominated byethane under gas flow (Fig. 2) and propane and butaneunder closed conditions (Fig. 5). Mowry gas under flowconditions (Fig. 4) bears no resemblance to Mowry gasunder closed conditions (Fig. 6). Secondly, gas composi-tions under closed conditions progressed to lighter hydro-carbons over time. The effect was subtle but clear in theFloyd experiment (Fig. 5), and dramatic in the Mowryexperiment (Fig. 6). It is definitive evidence against des-
Table 1: Gas compositions (% mol) under isothermal He flow over time
Floyd Shale, 50°Ctime (min) Methane Ethane Propane i-Butane n-Butane i-Pentane n-Pentane
0 15.92 28.30 23.48 3.57 13.53 6.11 9.108 16.14 33.23 24.83 3.24 11.31 4.41 6.8416 15.53 34.42 25.87 3.42 11.07 3.67 6.0224 12.16 32.54 27.51 3.95 12.37 4.54 6.9332 11.34 34.31 27.97 3.61 12.00 4.15 6.6340 13.02 34.43 27.71 3.40 11.71 3.70 6.0348 11.36 35.12 28.13 3.48 11.89 3.63 6.4056 10.35 35.41 28.47 3.54 11.88 4.15 6.2164 11.58 34.91 28.28 3.31 11.67 4.30 5.9572 11.42 34.76 28.69 3.60 11.97 3.72 5.8480 11.08 34.73 28.35 3.50 11.61 4.73 6.0088 8.76 36.37 29.74 3.47 11.96 3.66 6.04
% var 44 12 12 1 3 12 12New Albany Shale, 100°C
time (min) Methane Ethane Propane i-Butane n-Butane i-Pentane n-Pentane0 3.30 29.05 36.68 3.13 17.24 2.67 7.924 1.18 37.08 41.00 3.12 13.71 1.39 2.538 1.02 34.90 39.13 3.25 15.96 2.11 3.6312 0.85 34.13 38.09 3.07 16.74 2.43 4.6918 0.75 33.27 39.63 3.40 16.67 2.19 4.0921 0.45 27.45 38.69 3.88 18.62 3.50 7.4134 0.46 26.31 38.24 3.24 18.00 3.58 10.1645 0.54 26.19 40.16 2.94 18.20 2.92 9.0455 0.70 25.02 41.61 2.94 18.38 2.73 8.6265 0.71 23.68 42.29 3.09 18.54 2.86 8.82
% var 71 75 8 2 14 16 109Mowry Shale, 100°C
time (min) Methane Ethane Propane i-Butane n-Butane i-Pentane n-Pentane0 9.15 6.84 19.12 7.94 22.71 12.99 21.258 4.50 4.34 18.36 11.25 24.02 17.57 19.9716 3.86 2.95 16.79 12.06 24.43 18.99 20.9224 5.11 3.16 15.77 11.40 23.29 19.53 21.7432 - 4.14 16.06 12.88 24.50 20.55 21.8740 - - 16.47 13.14 24.34 22.81 23.2448 - - 15.97 13.84 24.98 23.06 22.1556 - - 15.33 14.44 24.55 23.15 22.5264 - - 15.27 14.20 23.92 24.16 22.4572 - - 14.92 15.17 23.64 23.71 22.5680 - - 11.21 15.06 23.40 26.73 23.60
% var 101 56 26 35 2 68 5
Times are in minutes. Yields: Floyd, 57 μg C1-C5/g; New Albany, 1.2 mg C1-C5/g; Mowry, 25 μg C1-C5/g. % var is variance as % of mean. The dashes indicate no data. Average % variance is 14% in the Floyd data; 42% in the New Albany data; 42% in the Mowry data.
Page 3 of 7(page number not for citation purposes)
Geochemical Transactions 2009, 10:10 http://www.geochemicaltransactions.com/content/10/1/10
orption as the source of hydrocarbons in these experi-ments.
The stark differences between gas flow and closed condi-tions are also illustrated in data variance. Average variance(% of mean over time) in Floyd data was 14% under gasflow (Table 1) and 28% in closed reactors (Table 2). Theaverage variance in Mowry data went from 33% under gasflow (Table 1) to 740% under closed conditions (Table 3).It is noteworthy that the product in Fig. 4 bears no resem-
blance to that in Fig. 6 for the same shale at the same tem-perature under flow and static conditions, respectively.
Mass transport accounts for these differences. Gas flowtransports hydrocarbons at rates greatly exceeding diffu-sion rates [22,23]. We can therefore anticipate a uniformsteady-state composition of hydrocarbons at catalytic sitesreflecting equivalent rates of hydrocarbon delivery and
(Propane)/(n-Butane) ratio emerging from Floyd shale under helium flow at 50°C [1]Figure 1(Propane)/(n-Butane) ratio emerging from Floyd shale under helium flow at 50°C [1]. The ratio is ratio of propane and n-butane concentrations (ppm vol) in effluent gas stream at indicated times. The line is the linear regression line, C3/C4 = 2.24 (time) + 0.0026, R2 = 0.76.
The distribution of C1-C5 hydrocarbons emerging from Floyd shale under helium flow at 50°C (Fig. 1)Figure 2The distribution of C1-C5 hydrocarbons emerging from Floyd shale under helium flow at 50°C (Fig. 1). C4 and C5 represent both isomers. 57 μg C1-C5/g were gen-erated over the course of this experiment.
The distribution of C1-C5 hydrocarbons emerging from New Albany shale under helium flow at 100°CFigure 3The distribution of C1-C5 hydrocarbons emerging from New Albany shale under helium flow at 100°C. C4 and C5 represent both isomers. 1.2 mg C1-C5/g was gen-erated over the course of this experiment. New Albany shale (Dev./Miss.) is side wall core (1025 m) from a well in Union County, KY, Illinois Basin.
The distribution of C1-C5 hydrocarbons emerging from Mowry shale under helium flow at 100°CFigure 4The distribution of C1-C5 hydrocarbons emerging from Mowry shale under helium flow at 100°C. C4 and C5 represent both isomers. 25 μg C1-C5/g was generated over the course of this experiment. Mowry shale (Creta-ceous) is core (7700 m) from an unknown well in Colorado.
Page 4 of 7(page number not for citation purposes)
Geochemical Transactions 2009, 10:10 http://www.geochemicaltransactions.com/content/10/1/10
removal and changing compositions at catalytic sitesunder static conditions. The relatively uniform distribu-tion of products under gas flow and the changes in hydro-
carbon compositions under static conditions areconsistent with this interpretation.
Table 2: Gas compositions (% mol) in sequential closed reactions, Floyd Shale at 50°C
1st hr 2nd hr 3rd hr 4th hr next 19 hr next 19 hr % var
Methane 0.24 0.88 1.34 0.58 1.21 3.28 91Ethane 3.11 2.77 2.66 2.65 2.82 1.75 8Propane 35.87 35.04 35.46 39.17 41.74 36.75 18i-Butane 11.25 10.39 10.25 9.54 13.05 13.67 24n-Butane 27.05 27.06 27.81 27.46 25.29 26.37 3i-Pentane 11.27 11.18 10.30 9.20 8.33 9.50 14n-Pentane 11.21 12.67 12.19 11.41 7.55 8.67 39
μmol/g, cum 0.204 0.263 0.304 0.358 0.422 0.445
Duplicate Reaction1st hr 2nd hr 3rd hr 4th hr next 19 hr next 19 hr % var
Methane 0.31 0.69 - 0.96 1.09 2.59 67Ethane 3.15 2.82 - 2.48 1.95 1.31 23Propane 38.30 36.58 - 34.85 41.58 36.52 17i-Butane 10.40 9.41 - 10.16 11.74 12.68 16n-Butane 26.33 27.19 - 28.18 26.52 27.76 2i-Pentane 10.53 10.53 - 10.49 8.42 9.39 9n-Pentane 10.97 12.78 - 12.87 8.71 9.76 30
μmol/g, cum 0.268 0.328 0.363 0.441 0.468
Yields in μmol C1-C5/g are cumulative. Gas compositions represent gas generated during that period, not cumulative gas composition. The dashed lines represent no data. Total gas yield was 24 μg C1-C5/g for the first reaction and 26 μg C1-C5/g for the duplicate reaction. % var is the variance in compositions over the indicated time periods as % of mean. The average % variance for the seven hydrocarbons is 28% for the first reaction and 24% for the duplicate reaction.
Concentrations (% mol) of C1-C6 hydrocarbons generated in six sequential closed reactions, Floyd shale at 50°C (Table 2)Figure 5Concentrations (% mol) of C1-C6 hydrocarbons gen-erated in six sequential closed reactions, Floyd shale at 50°C (Table 2). 'Reactions' refer to the six closed reac-tions in Table 2. Data points represent average values of two sequential reactions: 'Reactions 1 & 2' is the average value for 1st hr and 2nd hr; 3 & 4 is the average value for 3rd and 4th hr, and so on. C4 - C6 include all acyclic isomers.
Concentrations (% mol) of C1-C6 hydrocarbons generated in five sequential closed reactions, Mowry shale at 100°C (Table 3)Figure 6Concentrations (% mol) of C1-C6 hydrocarbons gen-erated in five sequential closed reactions, Mowry shale at 100°C (Table 3). 'Reactions' refer to the five closed reactions in Table 3. Data points represent average values of two sequential reactions: 'Reactions 1 & 2' is the average value for 1st hr and 2nd hr; 3 & 4 is the average values for 3rd and 4th hr, and Reaction 5 represents the last reaction (24 hr). C4 - C6 include all acyclic isomers.
Page 5 of 7(page number not for citation purposes)
Geochemical Transactions 2009, 10:10 http://www.geochemicaltransactions.com/content/10/1/10
The natural progression of wet gas to dry gas is rarelyreflected in thermal cracking simulations. This is partlybecause ethane and propane will not crack at tempera-tures typically used in thermal cracking experiments [4-15]. Dry gas generation in the laboratory has beenreported [27], but only at temperatures above 450°Cwhere these hydrocarbons decompose. With half-lives inthe tens of millions [25] to billions of years [26] at tem-peratures under 200°C, it is very unlikely that thermalcracking could be the source of dry gas in sedimentarybasins.
Wet gas to dry gas is replicated here for the first time. Itproceeds through natural catalytic activity carried from thesubsurface. It is paleoactivity that has persisted over geo-logic time as opposed to artificial activity created underlaboratory conditions. Shales express activity at ambienttemperatures without chemical or thermal activation andlose activity only under artificial conditions, temperaturesover 300°C or exposure to oxygen [1]. Marine shales andtheir counterparts should generate gas in the subsurface asthey do in the laboratory, and therefore propose naturalcatalysis as the source of natural gas in sedimentarybasins. It explains high methane concentrations in naturalgas, methane enrichment over geologic time, and naturalgas at thermodynamic equilibrium [3]. We reject the ther-mal cracking hypothesis because it cannot explain theseobservations.
ConclusionHydrocarbons released from Floyd, New Albany, andMowry shales are products of a natural catalytic processunder fluid dynamic control. Desorption of preexistinghydrocarbons makes no significant contribution to theproducts in our experiments and thermal degradation atthese temperatures would be unprecedented and highlyunlikely.
The sharp distinctions in yield and compositions betweenclosed reactions and gas flow reactions reflect relativelyuniform substrate compositions under gas flow andchanging compositions in closed reactions.
These results add to the evidence [1,3] that the natural cat-alytic activity in carbonaceous sedimentary rocks is thesource of natural gas.
ExperimentalThe Mississippian Floyd shale and Devonian/Mississip-pian New Albany shales are described elsewhere [1]. TheCretaceous Mowry shale is whole core (2500 m) from anunknown well in Colorado. Rock-Eval: S1 = 2.61; S2 =9.33; S3 = 0.15; Tmax = 439. Total Organic Carbon (Leco)= 2.5. The experimental procedures used in sample prepa-ration and product analysis are described elsewhere [1].The experimental procedure under gas flow is alsodescribed in that publication. Closed experiments werecarried out in 5 ml glass vials fitted with PTFE/SIL septa
Table 3: Gas compositions (% mol) in sequential closed reactions, Mowry Shale at 100°C
1st hr 2nd hr 3rd hr 4th hr next 24 hr % var
Methane 0.77 1.80 11.21 19.89 53.13 2651Ethane 0.27 0.49 3.38 9.33 16.25 783Propane 5.69 3.61 4.50 8.96 12.06 176i-Butane 13.89 11.56 9.98 5.66 2.48 243n-Butane 21.39 15.87 12.48 10.15 7.82 208i-Pentane 30.56 36.72 33.64 26.42 3.90 650n-Pentane 27.41 29.95 24.82 19.59 4.37 488
μmol/g, cum 0.145 0.171 0.181 0.185 0.203
Duplicate Reaction1st hr 2nd hr 3rd hr 4th hr next 24 hr % var
Methane 1.80 6.82 23.16 30.24 56.26 1973Ethane 0.49 2.06 5.14 8.95 15.63 569Propane 3.61 2.86 5.40 10.41 10.17 199i-Butane 11.56 6.99 7.03 5.10 2.74 157n-Butane 15.87 11.26 9.08 9.16 6.87 111i-Pentane 36.72 37.10 29.82 20.41 4.24 737n-Pentane 29.95 32.90 20.38 15.74 4.10 649
μmol/g, cum 0.320 0.370 0.389 0.394 0.410
Yields in μmol C1-C5/g are cumulative. Gas compositions represent gas generated during that period, not cumulative gas compositions. Total gas yield was 43 μg C1-C5/g for the first reaction and 65 μg C1-C5/g for the duplicate reaction. % var is the variance in compositions as % of mean. The average % variance for the seven hydrocarbons is 743% for the first reaction and 628% for the duplicate reaction.
Page 6 of 7(page number not for citation purposes)
Geochemical Transactions 2009, 10:10 http://www.geochemicaltransactions.com/content/10/1/10
purchased from Cole-Parmer (Vernon Hills, IL, USA).Rocks were prepared for analysis by grinding to 60 meshat ambient temperatures in glove bags under argon,placed in vials under argon, and sealed with open caps fit-ted with septa. The caps were then wrapped tightly withplastic electrical tape at the vial-screw cap interface to pre-vent leakage under heating. The vials proved to be leak-proof for the duration of our experiments at 100°C. Insequential experiments, a charged vial containing about 1gm sample was heated for a time segment, usually 1 hourat constant temperature (± 5°C), then cooled. Product gaswas removed by syringe and analyzed as previouslydescribed. The vial was then purged of all hydrocarbonsby flowing argon in and out of the vial through two nee-dles inserted through the septa (15 min, ~5 ml/min). Thepurged vials were then reheated for a period of time, usu-ally one hour, and purged again. This procedure wasrepeated several times. Hydrocarbon compositions inTables 2 &3 reflect the gas generated in the time segmentsindicated. The Floyd shale was heated four times at 50°Cfor one hour, a fifth time for 19 hours at 50°C, and a finaltime for 19 hours at 50°C. The experiments were dupli-cated with another sample of Floyd shale (Duplicate Reac-tion, Table 2). The product from the 3rd heating wasinadvertently lost and therefore not analyzed. Duplicatereactions of Mowry shale were carried out in four sequen-tial one-hour reactions at 100°C and a fifth reaction at100°C for 24 hours (Table 3). Duplicate experiments didnot use aliquots of 60 mesh shale. Different samples fromthe same source were subjected to the same experimentalprocedures: grinding in argon, sieving, and so forth. Thevariations in yield and product compositions shown inTables 2 &3 therefore reflect heterogeneity in samples aswell as the variance in our analytical procedure.
Competing interestsThe authors declare that they have no competing interests.
Authors' contributionsFM formulated theory, and both authors contributed tothe experimental work and the final the paper.
AcknowledgementsWe thank Petroleum Habitats and Worldwide Geochemistry for their gen-erous support of this research.
References1. Mango FD, Jarvie DM: Low temperature gas from marine
shales. Geochemical Transactions 2009, 10:3.2. Eiswirth M: Chaos in surface-catalyzed reactions. In Chaos in
Chemistry & Biochemistry Volume Ch. 6. Edited by: Field J, Gyorgyi L.World Scientific Publishing Co., River Edge, NJ; 1993:141-174.
3. Mango FD, Jarvie DM, Herriman E: Natural gas at thermody-namic equilibrium: Implications for the origin of natural gas.Geochemical Transactions 2009, 10:6.
4. Burnham AK, Braun RL: General kinetic model of oil shalepyrolysis. In Situ 1985, 9:1-23.
5. Lewan MD: Evaluation of petroleum generation by hydrouspyrolysis. Philosophical Transactions Royal Society 1985, 315:123-134.
6. Ungerer P, Pelet R: Extrapolation of oil and gas formationkinetics from laboratory experiments to sedimentary basins.Nature 1987, 327:52-54.
7. Castelli A, Chiaramonte MA, Beltrame PL, Carniti P, Del Bianco A,Stroppa F: Thermal degradation of kerogen by hydrous pyrol-ysis. A kinetic study. In Advances in Organic Geochemistry Edited by:Durand B, Behar F. Pergamon Press, Oxford; 1989:1077-1101.
8. Horsfield B, Disko V, Leistner F: The micro-scale simulation ofmaturation: outline of a new technique and its potentialapplications. Geologische Rundschau 1989, 78:361-374.
9. Behar F, Kressmann S, Rudkiewicz JL, Vandenbroucke M: Experi-mental simulation in a confined system and kinetic modelingof kerogen and oil cracking. Organic Geochemistry 1992,19:173-189.
10. Lewan MD: Laboratory simulation of petroleum formation -hydrous pyrolysis. In Organic Geochemistry Edited by: Engle M,Macko S. Plenum Press, New York; 1993:419-442.
11. Muscio GPA, Horsfield B, Welte DH: Occurrence of thermogenicgas in the immature zone - implications from the Bakken in-source reservoir system. Organic Geochemistry 1994, 22:461-476.
12. Lewan MD, Ruble TE: Composition of petroleum generationkinetics by isothermal hydrous and non-isothermal open-sys-tem pyrolysis. Organic Geochemistry 2002, 33:1457-1475.
13. Erdman M, Horsfield B: Enhanced late gas generation potentialof petroleum source rocks via recombination reactions: Evi-dence from the Norwegian North Sea. Geochimica et Cosmo-chimica Acta 2006, 70:3943-3956.
14. Lehne E, Dieckmann V, di Primio R, Fuhrmann A, Horsfield B:Changes in gas composition during simulated maturation ofsulfur rich type II-S source rock and related petroleumasphaltenes. Organic Geochemistry 2009, 40:604-616.
15. Lewan MD, Kotarba MJ, Wieclaw D, Piestrzynski A: Evaluatingtransition-metal catalysis in gas generation from the Per-mian Kupferschiefer by hydrous pyrolysis. Geochimica et Cosmo-chimica Acta 2008, 72:4069-4093.
16. Mango FD: Transition metal catalysis in the generation ofpetroleum and natural gas. Geochimica et Cosmochimica Acta1992, 56:553-555.
17. Voge HH, Good GM: Thermal cracking of higher paraffins. Jour-nal American Chemical Society 1949, 71:593-597.
18. Fabuss BM, Smith JO, Lait RI, Borsanyi AS, Satterfield CN: Rapidthermal cracking of n-hexadecane at elevated temperatures.Industrial and Engineering Chemistry, Product Develoment 1962,1:293-299.
19. Behar F, Ungerer P, Kressmann S, Rudkiewiez JL: Thermal evolu-tion of crude oils in sedimentary basins: experimental simu-lation in a confined system and kinetic modeling. Revue del'Institut Francais du Pétrole 1991, 46:151-181.
20. Horsfield B, Schenk HJ, Mills N, Welte DH: An investigation of thein-reservoir conversion of oil to gas: compositional andkinetic findings from closed-system programmed-tempera-ture pyrolysis. Organic Geochemistry 1992, 19:191-204.
21. Burkle-Vitzum V, et al.: Kinetics of alkyl aromatics on the ther-mal stability of hydrocarbons under geologic conditions.Organic Geochemistry 2004, 35:3-33.
22. Tokoro Y, Misono M, Uchijima T, Yoneda Y: Analysis of thermaldesorption curves for heterogeneous surfaces. I. A linearvariation of the activation energy of desorption. Bulletin of theChemical Society of Japan 1978, 51:85-89.
23. Schaefer RG, Weiner B, Leythaeuser D: Determination of sub-nanogram per gram quantities of light hydrocarbons (C2-C9) in rock samples by hydrogen stripping in the flow systemof a capillary gas chromatograph. Analytical Chemistry 1978,50:1848-1854.
24. Mango FD: Methane concentrations in natural gas: the geneticimplications. Organic Geochemistry 2001, 32:1283-1287.
25. Laidler KJ, Sagert NH, Wojciechowske BW: Kinetics and mecha-nisms of the thermal decomposition of propane. ProceedingsRoyal Society 1962, A270:242-253.
26. Laidler KJ, Wojciechowske BW: Kinetics and mechanisms of thethermal decomposition of ethane. I. The uninhibited reac-tion. Proceedings Royal Society 1961, A260:91-102.
27. Erdmann M, Horsfield B: Enhanced late gas generation potentialof petroleum source rocks via recombination reactions: Evi-dence from the Norwegian North Sea. Geochimica Cosmochim-ica Acta 2006, 70:3943-3956.
Page 7 of 7(page number not for citation purposes)