investigation of wet paper cohesive properties - smartech
TRANSCRIPT
INVESTIGATION OF WET PAPER COHESIVE PROPERTIES
A Thesis Presented to
The Academic Faculty
by
Alexander Guerrero Serrato
In Partial Fulfillment of the Requirements for the Master’s Degree in
Paper Science and Engineering in the School of Mechanical Engineering
Georgia Institute of Technology August, 2008
INVESTIGATION OF WET PAPER COHESIVE PROPERTIES
Approved by:
Dr. Timothy Patterson, Advisor School of Mechanical Engineering Georgia Institute of Technology Dr. Cyrus K. Aidun School of Mechanical Engineering Georgia Institute of Technology Dr. Sujit Banerjee School of Chemical and Biomolecular Engineering Georgia Institute of Technology Date Approved: July 1, 2008
ACKNOWLEDGEMENTS
I wish to thank God for all the blesses I have received from him. I wish to thank
my wife Luz Amanda, for all her support during these two years, without her it would be
almost impossible to have accomplished this goal. Also I wish to thank my daughter
Sofia and my son Samuel, for all the time I could not spent playing with them, I promise
it will change. I also would like to thank Dr. Timothy Patterson, his assistance and
support were essential to be able to comply with this requirement. Thanks to my
company, Smurfit Kappa Carton de Colombia, who gave me the opportunity to realize
this Master. Finally I wish to thank my parents (Gentil and Aminia) from the very
beginning they have showed to me the importance that studying has for ones life.
iii
TABLE OF CONTENTS
Page
ACKNOWLEDGEMENTS iii
LIST OF TABLES ix
LIST OF FIGURES x
LIST OF SYMBOLS AND ABBREVIATIONS xiii
SUMMARY xv
CHAPTER
1 INTRODUCTION 1
2 LITERATURE REVIEW 6
Paper Production Process 6
Wet Web Strength 7
Surface Tension Mechanism 18
Inter Fiber Bonding Mechanism 19
Strength Development and Mechanical Treatment 21
Strength Development and Chemical Treatment 23
Fillers 26
Starch 27
Retention 28
Starch Modified Clay 31
Strength Development and Web Consolidation 32
Forming 33
Pressing 34
iv
Drying 34
Wet Web Cohesive Strength 35
3 EXPERIMENTAL PROCEDURES 40
Pulp Preparation and Mechanical Treatment 40
Chemical Preparation and Chemical Treatment 41
Web Formation 43
Web Pressing 46
Web Drying 48
Experiment Design 49
Splitting Energy Determination 50
Cohesive and Bending Energy Determination 50
Paper Splitting Apparatus 52
Apparatus Description 53
Strip Samples Preparation 56
Apparatus Operation 57
Energy Calculation 59
Apparatus Mechanical Losses 61
Instron Testing 66
4 RESULTS AND DISCUSSION 67
Introduction
Testing and Analysis Methodology 69
Friction Calculation 76
Splitting Energy 84
Basis Weight Effect 87
Mechanical Treatment 88
v
Normal Clay Addition 89
Starch Modified Clay Addition 90
Cationic Corn Starch Effect 91
Normal Clay Versus Starch Modified Clay Addition 93
Cohesive and Bending Energy Determination 96
Cohesive Energy Determination 97
Bending Energy Determination 101
Tensile Test Results 103
Envelope Curves 109
Splitting Energy Results Validation 111
Page Equation for Wet Webs 111
Osterberg Strain Calculation 121
5 CONCLUSION 128
6 RECOMENDATION 131
APPENDIX A.1: APPARATUS ENERGY LOSS VS DISTANCE – CASES 1 TO 3 132
Case 1: Refining 560 C.S.F.; No Chemicals; Basis Weight [100 to 340 g/m2]
Case 2: Refining 740 C.S.F.; No Chemicals; Basis Weight [100 to 400 g/m2]
Case 3: Refining 560 C.S.F.; ASH 17% (Normal Clay), No Starch; Basis Weight [100 to 400 g/m2]
APPENDIX A.2: SPLITTING ENERGY VS PAPER SOLIDS – CASES 1 TO 3 183
APPENDIX A.3: COHESIVE ENERGY DETERMINATION AT DIFFERENT SOLIDS – CASES 1 TO 3 187
APPENDIX A.4: BENDING ENERGY VS BASIS WEIGHT AT DIFFERENT SOLIDS – CASES 1 TO 3 191
APPENDIX B.1: APPARATUS ENERGY LOSS VS DISTANCE –
vi
CASES 4 TO 12 195
Case 4: Refining 440 C.S.F.; No Chemicals; Basis Weight 300 g/m2
Case 5: Refining 560 C.S.F.; ASH 13% (Normal Clay), No Starch; Basis Weight 314 g/m2
Case 6: Refining 560 C.S.F.; ASH 22% (Normal Clay), No Starch; Basis Weight 305 g/m2
Case 7: Refining 560 C.S.F.; ASH 13% (Modified Clay), No Starch; Basis Weight 317 g/m2
Case 8: Refining 560 C.S.F.; ASH 18% (Modified Clay), No Starch; Basis Weight 318 g/m2
Case 9: Refining 560 C.S.F.; ASH 24% (Modified Clay), No Starch; Basis Weight 318 g/m2
Case 10: Refining 560 C.S.F.; 15 kg/ton C-Starch, No Clay; Basis Weight 303 g/m2
Case 11: Refining 560 C.S.F.; ASH 23% (Normal Clay), 15 kg/ton C-Starch; Basis Weight 346 g/m2
Case 12: Refining 560 C.S.F.; ASH 23% (Normal Clay), 30 kg/ton C- Starch; Basis Weight 341 g/m2
APPENDIX C: MEAN AND STANDARD DEVIATION FOR APPARATUS ENERGY LOSS 231
APPENDIX D: FRICTION ENERGY LOSS VS SPLITTING WEIGHT AND COUNTER WEIGHT 235
Splitting Weight = 125g
Splitting Weight = 233g
Splitting Weight = 330g
Splitting Weight = 550g
Splitting Weight = 770g
APPENDIX E.1: STRESS – STRAIN CURVES 269
APPENDIX E.2: TENSILE STRENGTH VS SOLIDS 276
APPENDIX E.3: TENSILE STRAIN VS SOLIDS 282
vii
APPENDIX E.4: TENSILE STRENGTH VS SOLIDS FOR DIFFERENT BASIS WEIGHTS – CASES 1 TO 3 288
APPENDIX F: ENVELOPE CURVES 292
APPENDIX G: TENSILE AND COHESIVE STRENGTH INDEX DATA FOR ALL BASIS WEIGHTS – CASE 1 TO 3 298
LITERATURE CITED 300
viii
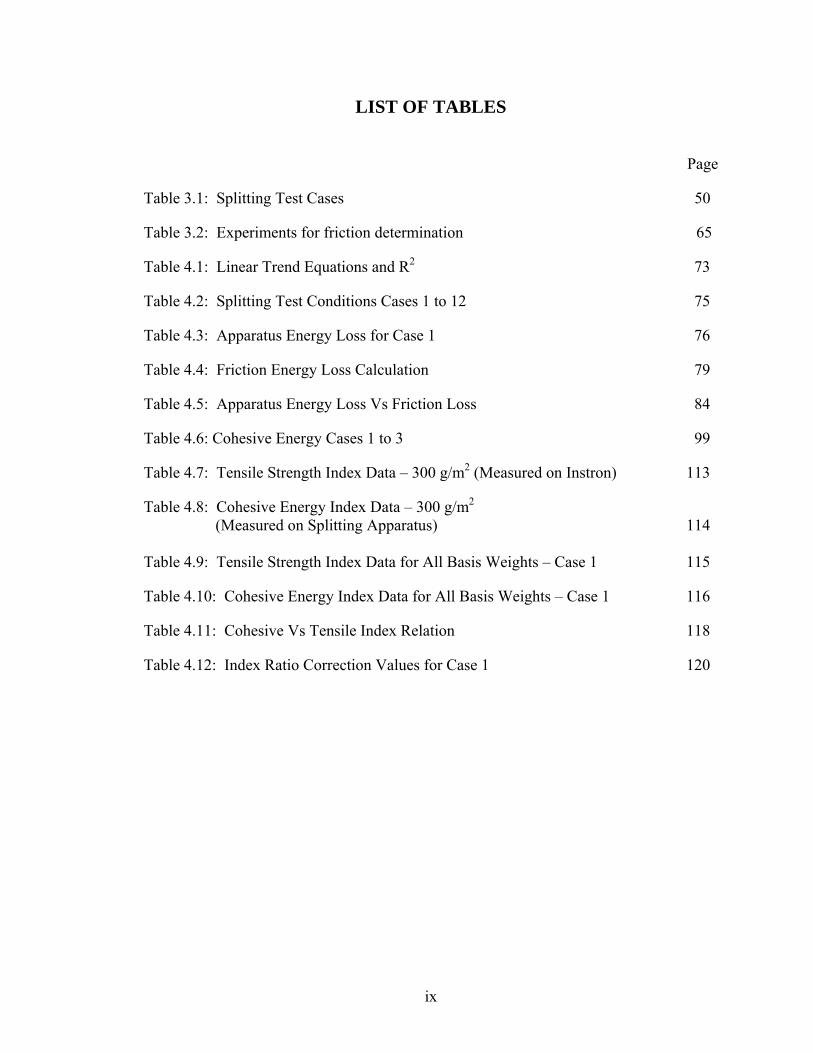
LIST OF TABLES
Page
Table 3.1: Splitting Test Cases 50
Table 3.2: Experiments for friction determination 65
Table 4.1: Linear Trend Equations and R2 73
Table 4.2: Splitting Test Conditions Cases 1 to 12 75
Table 4.3: Apparatus Energy Loss for Case 1 76
Table 4.4: Friction Energy Loss Calculation 79
Table 4.5: Apparatus Energy Loss Vs Friction Loss 84
Table 4.6: Cohesive Energy Cases 1 to 3 99
Table 4.7: Tensile Strength Index Data – 300 g/m2 (Measured on Instron) 113
Table 4.8: Cohesive Energy Index Data – 300 g/m2
(Measured on Splitting Apparatus) 114 Table 4.9: Tensile Strength Index Data for All Basis Weights – Case 1 115
Table 4.10: Cohesive Energy Index Data for All Basis Weights – Case 1 116
Table 4.11: Cohesive Vs Tensile Index Relation 118
Table 4.12: Index Ratio Correction Values for Case 1 120
ix
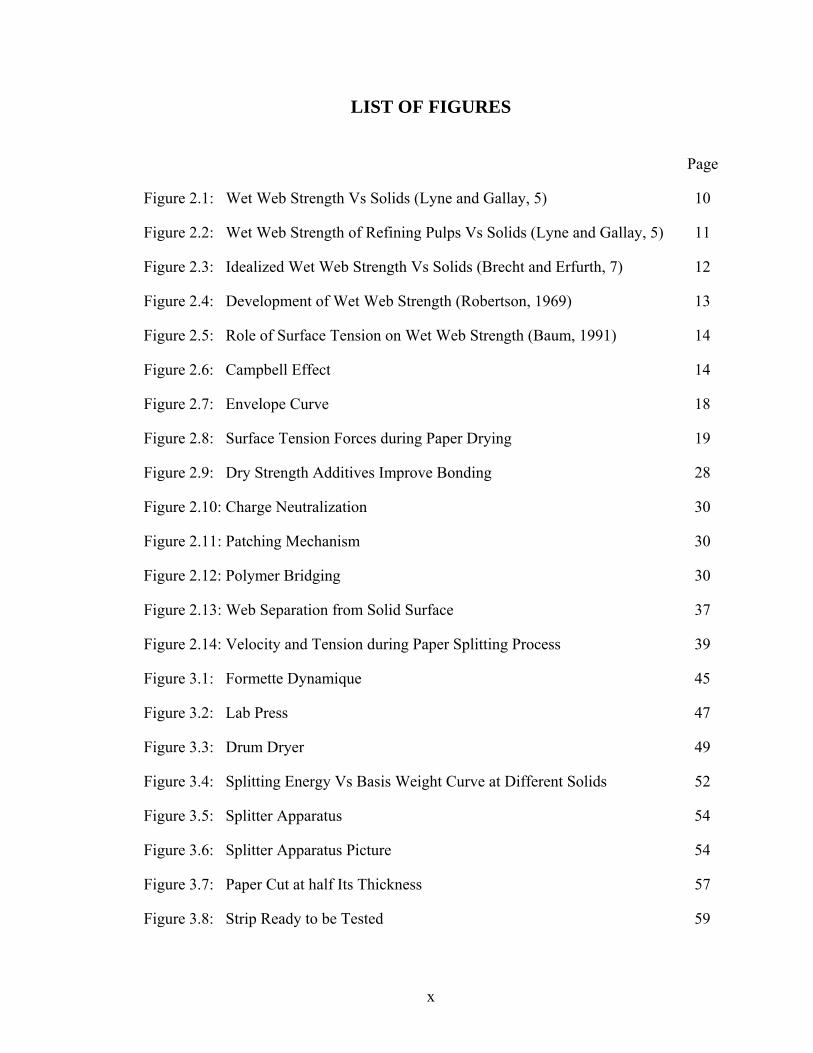
LIST OF FIGURES
Page
Figure 2.1: Wet Web Strength Vs Solids (Lyne and Gallay, 5) 10
Figure 2.2: Wet Web Strength of Refining Pulps Vs Solids (Lyne and Gallay, 5) 11
Figure 2.3: Idealized Wet Web Strength Vs Solids (Brecht and Erfurth, 7) 12
Figure 2.4: Development of Wet Web Strength (Robertson, 1969) 13
Figure 2.5: Role of Surface Tension on Wet Web Strength (Baum, 1991) 14
Figure 2.6: Campbell Effect 14
Figure 2.7: Envelope Curve 18
Figure 2.8: Surface Tension Forces during Paper Drying 19
Figure 2.9: Dry Strength Additives Improve Bonding 28
Figure 2.10: Charge Neutralization 30
Figure 2.11: Patching Mechanism 30
Figure 2.12: Polymer Bridging 30
Figure 2.13: Web Separation from Solid Surface 37
Figure 2.14: Velocity and Tension during Paper Splitting Process 39
Figure 3.1: Formette Dynamique 45
Figure 3.2: Lab Press 47
Figure 3.3: Drum Dryer 49
Figure 3.4: Splitting Energy Vs Basis Weight Curve at Different Solids 52
Figure 3.5: Splitter Apparatus 54
Figure 3.6: Splitter Apparatus Picture 54
Figure 3.7: Paper Cut at half Its Thickness 57
Figure 3.8: Strip Ready to be Tested 59
x
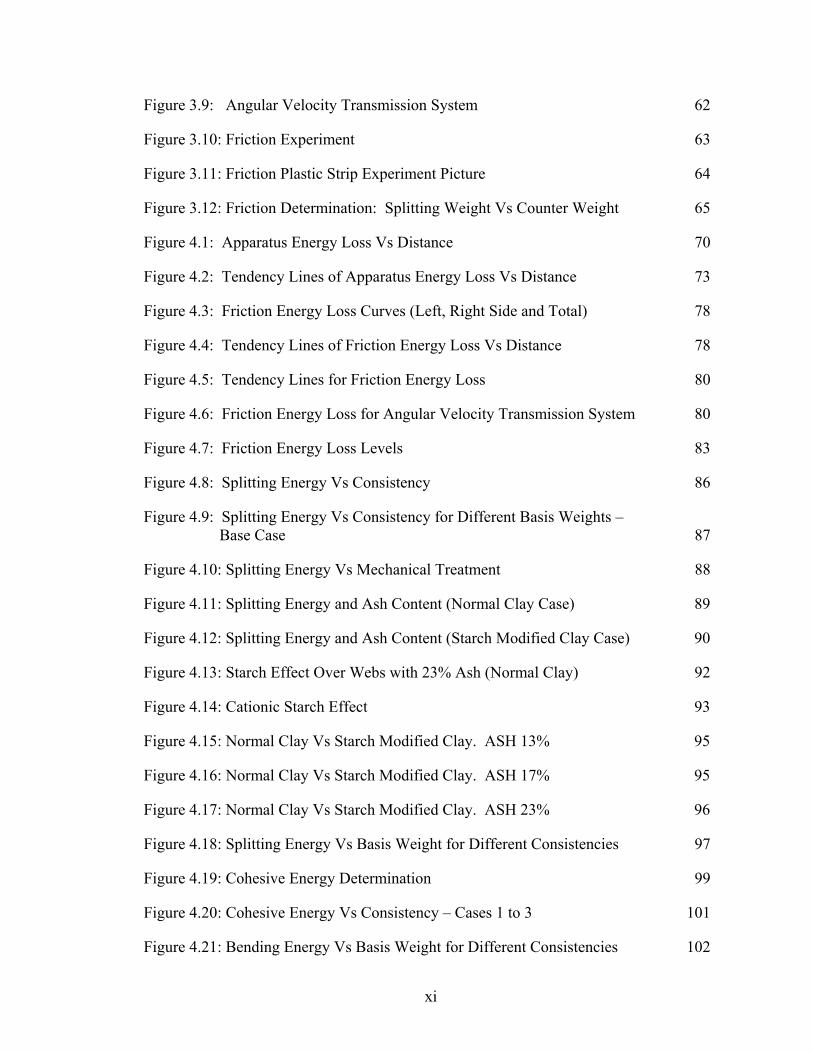
Figure 3.9: Angular Velocity Transmission System 62
Figure 3.10: Friction Experiment 63
Figure 3.11: Friction Plastic Strip Experiment Picture 64
Figure 3.12: Friction Determination: Splitting Weight Vs Counter Weight 65
Figure 4.1: Apparatus Energy Loss Vs Distance 70
Figure 4.2: Tendency Lines of Apparatus Energy Loss Vs Distance 73
Figure 4.3: Friction Energy Loss Curves (Left, Right Side and Total) 78
Figure 4.4: Tendency Lines of Friction Energy Loss Vs Distance 78
Figure 4.5: Tendency Lines for Friction Energy Loss 80
Figure 4.6: Friction Energy Loss for Angular Velocity Transmission System 80
Figure 4.7: Friction Energy Loss Levels 83
Figure 4.8: Splitting Energy Vs Consistency 86
Figure 4.9: Splitting Energy Vs Consistency for Different Basis Weights – Base Case 87
Figure 4.10: Splitting Energy Vs Mechanical Treatment 88
Figure 4.11: Splitting Energy and Ash Content (Normal Clay Case) 89
Figure 4.12: Splitting Energy and Ash Content (Starch Modified Clay Case) 90
Figure 4.13: Starch Effect Over Webs with 23% Ash (Normal Clay) 92
Figure 4.14: Cationic Starch Effect 93
Figure 4.15: Normal Clay Vs Starch Modified Clay. ASH 13% 95
Figure 4.16: Normal Clay Vs Starch Modified Clay. ASH 17% 95
Figure 4.17: Normal Clay Vs Starch Modified Clay. ASH 23% 96
Figure 4.18: Splitting Energy Vs Basis Weight for Different Consistencies 97
Figure 4.19: Cohesive Energy Determination 99
Figure 4.20: Cohesive Energy Vs Consistency – Cases 1 to 3 101
Figure 4.21: Bending Energy Vs Basis Weight for Different Consistencies 102
xi
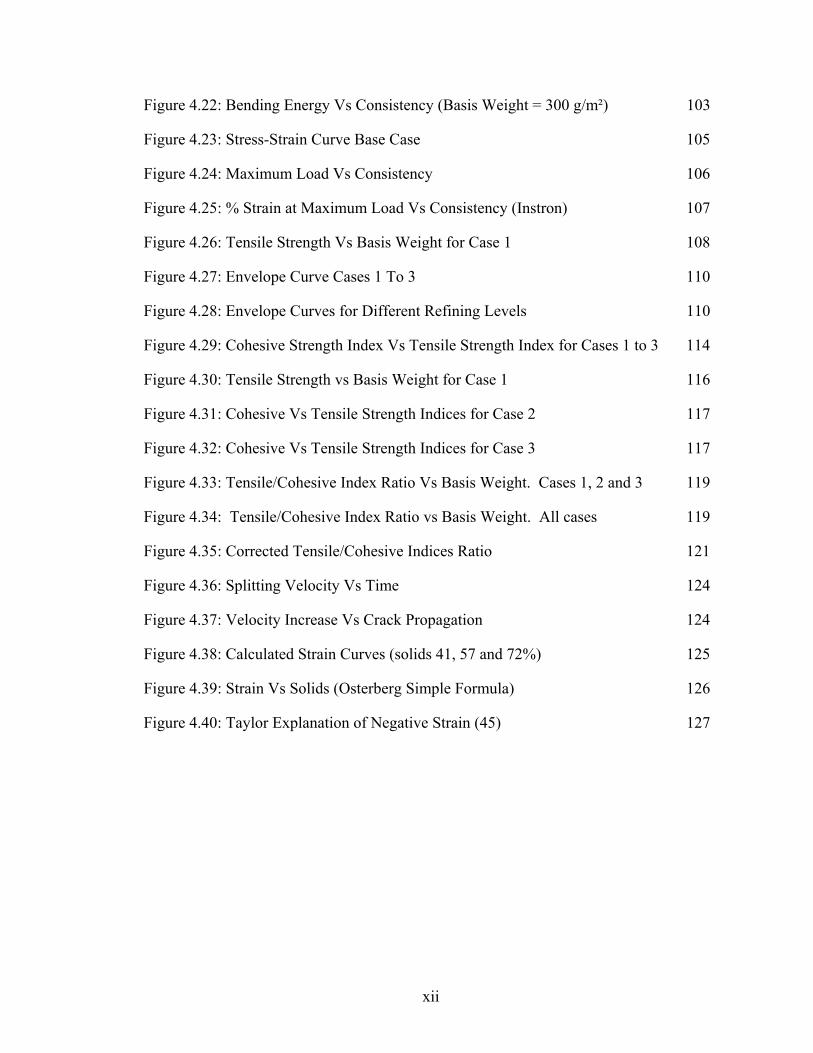
Figure 4.22: Bending Energy Vs Consistency (Basis Weight = 300 g/m²) 103
Figure 4.23: Stress-Strain Curve Base Case 105
Figure 4.24: Maximum Load Vs Consistency 106
Figure 4.25: % Strain at Maximum Load Vs Consistency (Instron) 107
Figure 4.26: Tensile Strength Vs Basis Weight for Case 1 108
Figure 4.27: Envelope Curve Cases 1 To 3 110
Figure 4.28: Envelope Curves for Different Refining Levels 110
Figure 4.29: Cohesive Strength Index Vs Tensile Strength Index for Cases 1 to 3 114
Figure 4.30: Tensile Strength vs Basis Weight for Case 1 116
Figure 4.31: Cohesive Vs Tensile Strength Indices for Case 2 117
Figure 4.32: Cohesive Vs Tensile Strength Indices for Case 3 117
Figure 4.33: Tensile/Cohesive Index Ratio Vs Basis Weight. Cases 1, 2 and 3 119
Figure 4.34: Tensile/Cohesive Index Ratio vs Basis Weight. All cases 119
Figure 4.35: Corrected Tensile/Cohesive Indices Ratio 121
Figure 4.36: Splitting Velocity Vs Time 124
Figure 4.37: Velocity Increase Vs Crack Propagation 124
Figure 4.38: Calculated Strain Curves (solids 41, 57 and 72%) 125
Figure 4.39: Strain Vs Solids (Osterberg Simple Formula) 126
Figure 4.40: Taylor Explanation of Negative Strain (45) 127
xii
LIST OF SYMBOLS AND ABBREVIATIONS
Tw web tension [N/m]
Ww work of separation [N/m]
Ø angle of take off
mw mass of web per unit area [kg/m²]
Vw wire speed [m/s]
T tensile strength [Nm/g]
Z zero span tensile strength [Nm/g]
b shear strength of the fiber to fiber bond [N/m²]
P fiber perimeter of the average fiber cross section [m]
Lf fiber length [m]
C fiber coarseness [g/m]
RBA relative bonded area in the dry sheet
Tww tensile strength for wet webs [Nm/g]
RBAww the proportion of the fiber surface that is contained within a water meniscus holding adjacent fibers together
γ surface tension of water [dynes/cm] or [N/m]
μ coefficient of friction between the two wet fibers
A area within the water meniscus over which the surface tension forces act
r radius of curvature of the water meniscus
F force that pulls the fiber together
L length of the line of contact between air, water and fiber
∆P compacting pressure gradient
X thickness of the liquid film
xiii
-OH hydroxyl groups
S2 fiber secondary wall
PAC polyaluminum chloride
A/C PAM anionic/cationic polyacrylamides
PCC precipitated calcium carbonate
W´ Mardon total work done in the paper
ε strain of the web
WT Osterberg total work done on the paper
WS work of separating the two surfaces
WE work of extension
WM work involved in increasing the web moment of inertia
C.S.F. Canadian standard freeness
ADM Archer Daniels Midland Company
CD machine cross direction
MD machine direction
hi initial height of the splitting weights
ht the height at a moment t > 0
m total splitting weight
Vt mean velocity of the splitting weights at time = t
NC ash content obtained with normal clay
MC ash content obtained with starch modified clay
xiv
SUMMARY
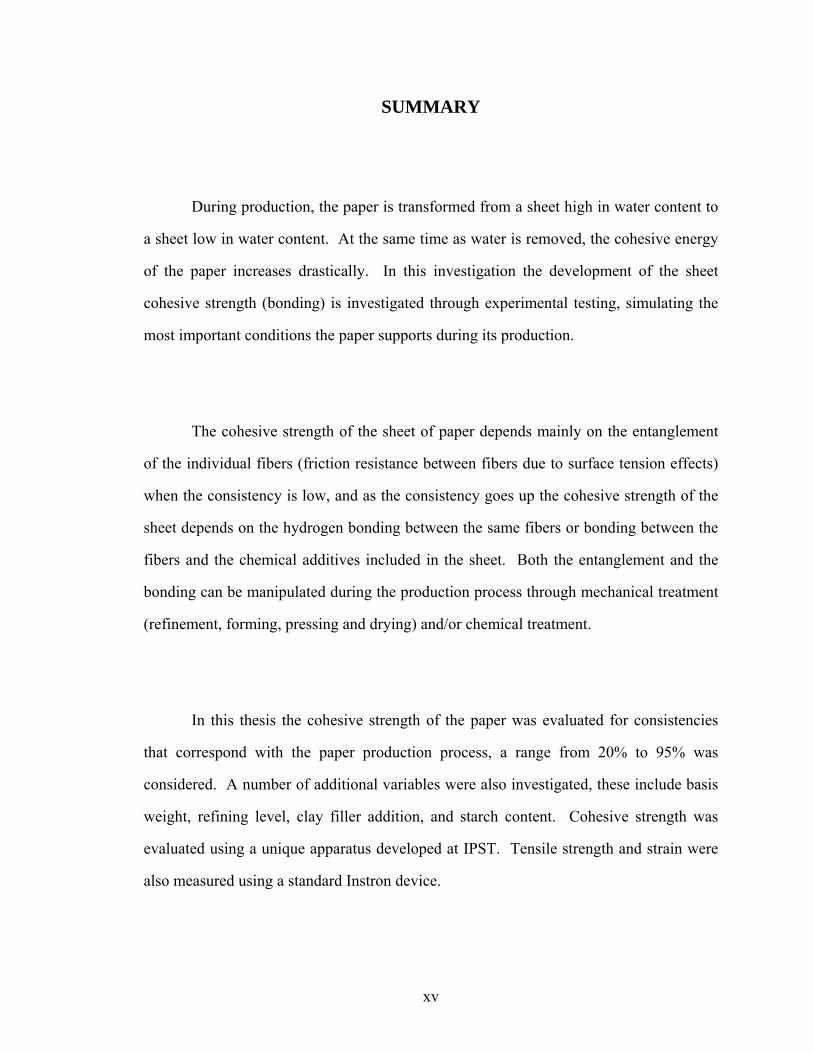
During production, the paper is transformed from a sheet high in water content to
a sheet low in water content. At the same time as water is removed, the cohesive energy
of the paper increases drastically. In this investigation the development of the sheet
cohesive strength (bonding) is investigated through experimental testing, simulating the
most important conditions the paper supports during its production.
The cohesive strength of the sheet of paper depends mainly on the entanglement
of the individual fibers (friction resistance between fibers due to surface tension effects)
when the consistency is low, and as the consistency goes up the cohesive strength of the
sheet depends on the hydrogen bonding between the same fibers or bonding between the
fibers and the chemical additives included in the sheet. Both the entanglement and the
bonding can be manipulated during the production process through mechanical treatment
(refinement, forming, pressing and drying) and/or chemical treatment.
In this thesis the cohesive strength of the paper was evaluated for consistencies
that correspond with the paper production process, a range from 20% to 95% was
considered. A number of additional variables were also investigated, these include basis
weight, refining level, clay filler addition, and starch content. Cohesive strength was
evaluated using a unique apparatus developed at IPST. Tensile strength and strain were
also measured using a standard Instron device.
xv
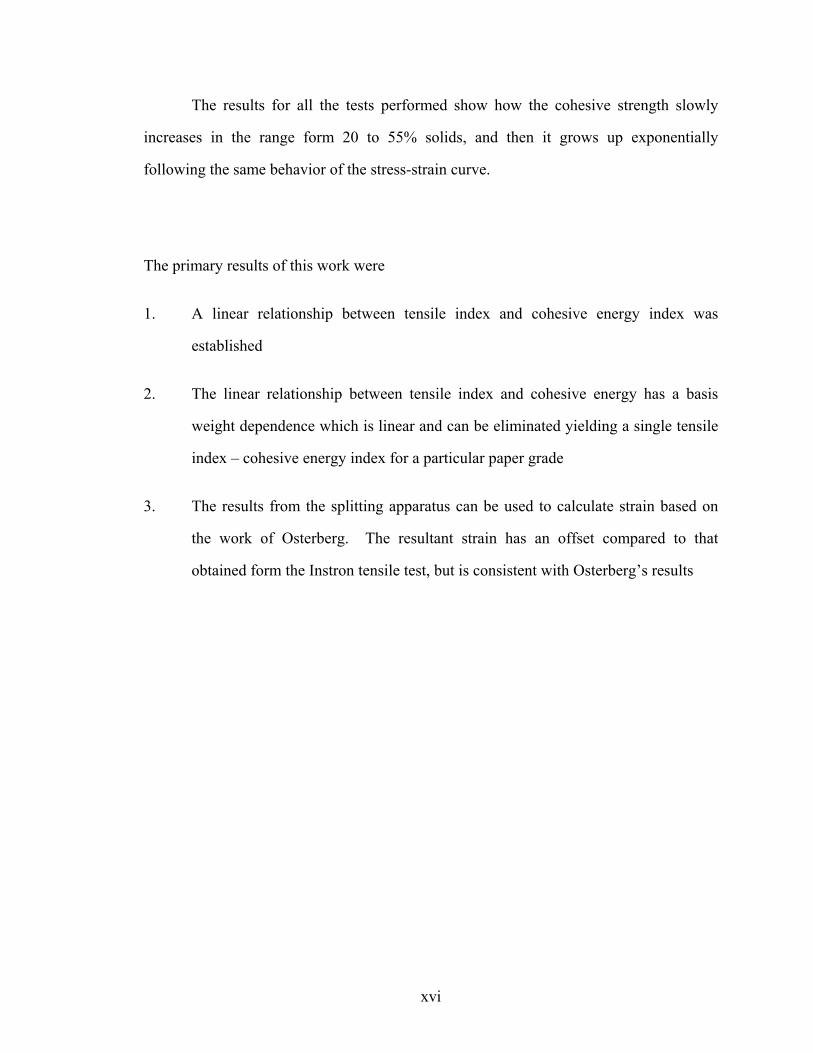
The results for all the tests performed show how the cohesive strength slowly
increases in the range form 20 to 55% solids, and then it grows up exponentially
following the same behavior of the stress-strain curve.
The primary results of this work were
1. A linear relationship between tensile index and cohesive energy index was
established
2. The linear relationship between tensile index and cohesive energy has a basis
weight dependence which is linear and can be eliminated yielding a single tensile
index – cohesive energy index for a particular paper grade
3. The results from the splitting apparatus can be used to calculate strain based on
the work of Osterberg. The resultant strain has an offset compared to that
obtained form the Instron tensile test, but is consistent with Osterberg’s results
xvi
CHAPTER 1
INTRODUCTION
The trend in today’s paper industry is toward lower grammage papers, increased
use of short fiber pulps, higher machine speeds and increased use of fillers as fiber
substitutes. All these factors affect the properties of the paper, including reducing the
strength properties of the final product. The wet web strength of the paper is also
reduced, producing a web that can easily break during the normal production process,
limiting the production capacity of the machine. To solve this problem, new paper
machines have reduced or eliminated open draws in the sections of the machine where
the sheet is at a low consistency. Some new machines have the first open draw after the
web leaves the press section, when the sheet strength is high enough to support the
tension required to peel the web from the press roll. The situation for old paper machines
is quite different. They still have open draws between the wire and the first press, and
among the different press sections, where the wet web is not yet consolidated and
consequently the strength is still low. In many cases, the investment required to eliminate
the open draws in this machines is so high that is not possible to accomplish such a
change. This is one of the main reasons why the study of the wet web properties is of
importance.
Paper properties are developed throughout the production process, starting at the
wet end where different mechanical and chemical treatments are applied to the pulp
suspension. This continues during the consolidation process, where the pulp suspension
1
is converted into a paper web that finally will develop the properties that the customer
requires. Although the final properties of the sheet are of crucial importance, the
evolution of properties through the process is a concern for the paper maker. Among
these properties, the cohesive strength of the paper is one of the most important as it
impacts peeling from press rolls fabrics and dryer cylinders.
The are two main sources for strength development as water is removed from the
wet web: the first one, present at low consistencies, is due to internal surface tension
forces and fiber entanglement, and the other one present at higher consistencies is due to
the inter fiber bonding. There is not a single consistency where one source ends and the
other starts, in reality there exists a region where both of them are present. At a high
enough consistency the only source that remains is due to inter fiber bonding.
In this study the effects of the mechanical treatment (refining) and the chemical
treatment were taken into consideration when analyzing the development of the wet web
strength. For the case of mechanical treatment, three different levels of refining were
evaluated. In the case of chemical treatment starch and filler additives were evaluated.
Due to the importance of fillers as fiber substitutes, three different levels of ash (filler)
content were evaluated. Additionally, the roll of the cationic starch as paper strength
additive was also evaluated. A primary objective was to quantify the cohesive strength
loss due to the filler addition and also quantify how much of this loss could be recovered
by cationic starch addition. Finally, the effect of the starch modified clay was also
evaluated, to establish a comparison with the standard uncoated clay.
2
All the experiments were done using the same pulp (bleached softwood). The
sheet formation was done using a Formette Dynamique. The same forming and pressing
operation were used for all the samples produced. A steam heated drum dryer was used
to dry the sample to the higher consistency levels. Since the forming and pressing
operations were not changed the refining, starch addition, ash content, basis weight and
solids content were the only variables.
Sheets were made using a Formette Dynamique and cut into strips which were
then tested in the splitting apparatus. The splitting apparatus allows a determination of
the cohesive strength of paper sheets at different solids content. An initial split is made at
one end of the paper strip so clamps can be attached to each end of the split. The two
clamps are connected via flexible bands to the splitting weights. Once the splitting
weights are released the initial potential energy is transformed into kinetic energy. The
difference between the initial potential energy and the kinetic energy is the total energy
used in the splitting process. This last energy is composed of the splitting energy
(cohesive and bending energy) and the friction energy loss of the apparatus.
Chapter Two provides a summary of the pertinent literature. A brief summary of
the paper production process is presented first. The relation between the mechanical and
chemical treatment of the pulp suspension and the consolidation of the paper and wet web
strength development are discussed. The importance of filler, cationic starch, the
retention system and the starch modified clay in the strength evolution of the sheet is also
discussed. Previous studies related to the peeling of the sheet from rigid surfaces are
reviewed and how these studies can be related to the paper splitting situation. Chapter
Three describes the procedure for the pulp and chemical preparation, the sheet
3
consolidation, the paper splitter apparatus and how it operates. The calculation of the
friction loss of the apparatus is also described. A brief review of the Instron tester is
presented. Chapter Four of this thesis presents the paper splitting results. Cohesive and
bending energy are calculated from the experimental results. The impact of the
experimental variables on cohesive strength is described along with the correlation with
the tensile tests. Calculations of sheet strain using relationships developed by Ostgerberg
are also presented. These results are compared to strain obtained from Instron tensile
tests. Chapter Five presents the conclusions of the research and how they can help for
implementing modifications in paper machines. Chapter Six discusses recommendations
for future work.
In this study the splitting energy of the paper was measured, this energy can be
further divided in the bending energy and in the cohesive energy. It was found that the
splitting energy behaves similar to wet web strength properties usually measured (tensile
properties). From consistencies around 20% to consistencies near 55%, there is no
significant growth in the energy. At 55% consistency an inflexion point occurs, and the
energy starts to grow exponentially. Finally at consistencies around 88 to 92 % the
splitting energy reaches its maximum value and a new inflexion point occurs, but in this
case a sharp decrease in the energy results. It must be noted that splitting energy consists
of both the cohesive energy holding the sheet together and the bending energy required to
bend the sheet at right angles during the splitting test. The bending energy contributes to
the peak in splitting energy. The effect of mechanical treatment can be clearly seen when
comparing the pulp with freeness around 740 C.S.F. and the pulps with freenesses of 560
and 440 C.S.F.. In the former case a lower degree of cohesive energy is developed. The
cationic starch addition results in an increase in the splitting energy. The addition of
starch modified clay results in a stronger paper, when compared with the same level of
4
ash content obtained when normal clay was used. It is to be noted that the differences in
splitting energy caused by the chemical additions, are more clearly seen as the
consistencies increases. At low consistencies, between 20 and 55%, the differences are
not as obvious.
5
CHAPTER 2
LITERATURE REVIEW
Paper Production Process
During the paper production process, the pulp suspension that is produced in the
pulp plant is treated in the paper machine in a continuous way through several steps. The
first one is called the stock preparation, which usually starts with the dilution of the high
consistency stock in the discharge of one of the storage tanks, and ends with the blended
papermaking furnish in the machine chest. During the stock preparation the fibrous raw
material is mechanically and chemically treated in order to obtain a stable paper machine
operation and a high standard of paper quality. Depending on the final use of the paper
the mechanical and chemical treatment will be different. Among the most important
treatments are the refining of fibers and the utilization of wet end additives. At the end
the various fibrous and non fibrous furnish components are continuously combined and
blended to form the papermaking stock. The next step is called the consolidation process,
during this process the stock suspension is converted into a paper web with desired end
use properties. The consolidation process is divided into the forming, pressing and
drying processes; an additional calendaring process may also be included. During the
forming process water is removed from the suspension up to the point where no more
water can be economically removed using vacuum. During the pressing process
additional water is removed by compressing the web several times between rotating press
rolls. Then the remaining water is removed by thermal treatment until the final moisture
content is obtained.
6
Wet Web Strength
In conventional paper machines, as soon as the sheet is formed in the forming
section, and before it enters the press section, it is exposed to tensile stress when it is
removed from the forming wire. The sheet is also stressed in all the open draws the
machine has either in the press section or in the dryer section. The application of such a
stress is necessary in order to overcome the force of adhesion between the wet web and
the wire, the rolls, and the felts. If the tension is higher than the mechanical strength the
wet web can withstand, a paper rupture may occur. In other cases paper delamination can
also be a result of this external force. The higher the wet web strength properties, the less
likely any of these problems will occur.
Traditionally the strength properties of the wet web have been characterized by
the tensile strength and stretch, and different apparatuses have been used to measure these
properties. The wet web strength determination is not a simple task, because the web is
too weak to be able to support any significant applied force. The results obtained can
therefore have considerable error. An additional problem is that there is no accepted
laboratory procedure for preparing the wet webs or to modify the moisture content of the
web.
In order to model the open draw effect, Mardon, Truman, Meadley and O´Blenes
(1) developed a theory that was extended and modified by Osterberg (2) and that can be
described by the following equation:
Tw = Ww + mwVw
2 2.1 1 - cosø
7
Where: Tw = web tension [N/m]
Ww = work of separation [N/m]
Ø = angle of take off
mw = mass of web per unit area [kg/m²]
Vw = wire speed [m/s]
As can be observed, the web tension required to peel the web from a surface will
increase rapidly with the speed, and the tension necessary to overcome the sticking of the
wet web to the wire or roll (work of separation) is dependent on the take off angle. If the
web tension is greater than the tension the web can support a sheet break will occur.
According to Mardon and Short (3) the wet web strength depends on the
following factors:
1. Fiber components: Chemical pulps have greater wet web strength than
mechanical pulps. Hardwood has lower strength than softwood, and fibers with a
higher content of hemicellulose also have higher strength
2. Fiber dispersion in the plane of the sheet (xy): The lower the basis weight the
lower the strength. If the formation of the web is poor, lower strength will be
achieved due to the presence of weak points
8
3. Fiber dispersion in z plane: The web is a layered structure, if components
different than fibers separate the layers, the strength properties can change
4. Fiber orientation: If fibers are preferentially oriented in the machine direction, the
wet web strength is higher in that direction
5. Moisture content of the sheet: The higher moisture content the lower the sheet
strength
6. Specific sheet defects: All these defects lower locally the strength, affecting the
overall performance
7. The extent of previous stretching: Reduces the load stretch property
There are other factors that alter the wet web strength and are not in the above list.
Lyne and Gallay (4) showed how the beating time and the wet pressing affect the wet
web strength properties. The effect of chemical additives also can contribute to the
variation in the wet web strength.
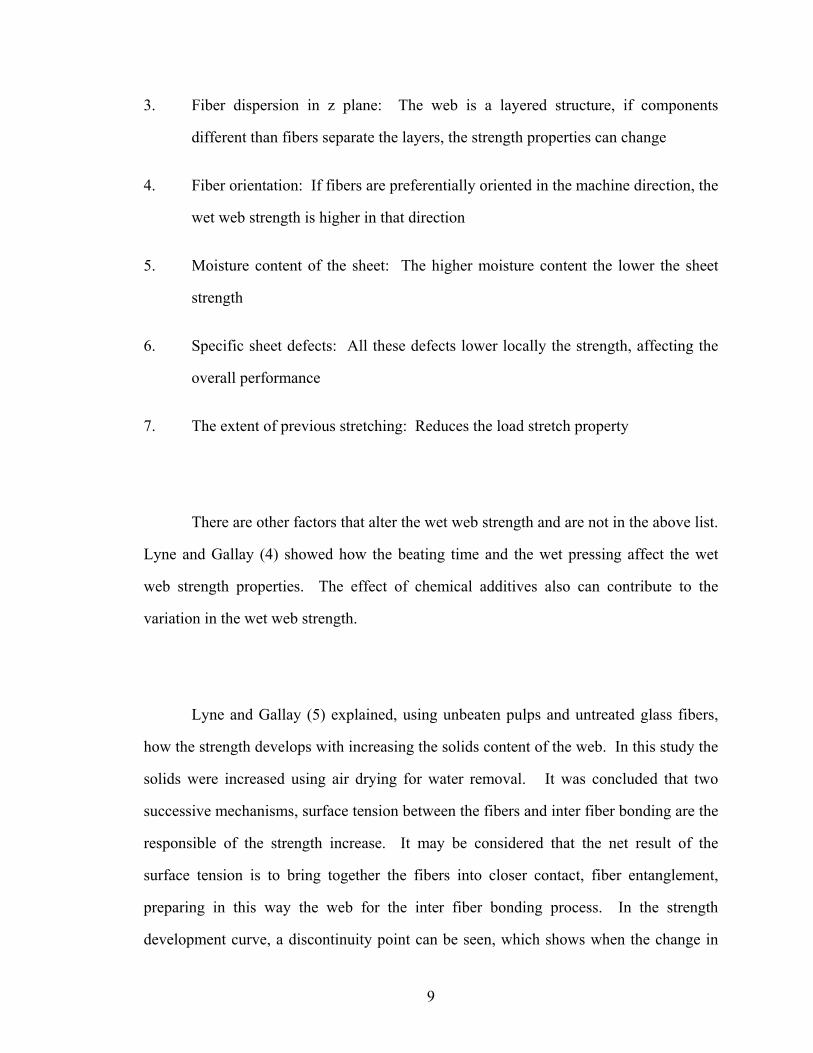
Lyne and Gallay (5) explained, using unbeaten pulps and untreated glass fibers,
how the strength develops with increasing the solids content of the web. In this study the
solids were increased using air drying for water removal. It was concluded that two
successive mechanisms, surface tension between the fibers and inter fiber bonding are the
responsible of the strength increase. It may be considered that the net result of the
surface tension is to bring together the fibers into closer contact, fiber entanglement,
preparing in this way the web for the inter fiber bonding process. In the strength
development curve, a discontinuity point can be seen, which shows when the change in
9
the main mechanism responsible for the strength development occurs (Figure 2.1). Up to
20 to 25% the strength increases through increasing surface tension forces. As water is
removed more fiber-water-air interfaces are created where the forces of surface tension
can act resulting in an increase of the fiber to fiber interaction and the corresponding
increase in the web strength. After this point the effect of surface tension goes down and
the fiber to fiber interaction becomes controlled by the forces between the fibers at a
molecular level, the inter fiber bonding becomes the major factor in strength development
and the strength increases with increasing dryness. It is to be noted that although one
force dominates in each range, both forces are present during almost all of the process. In
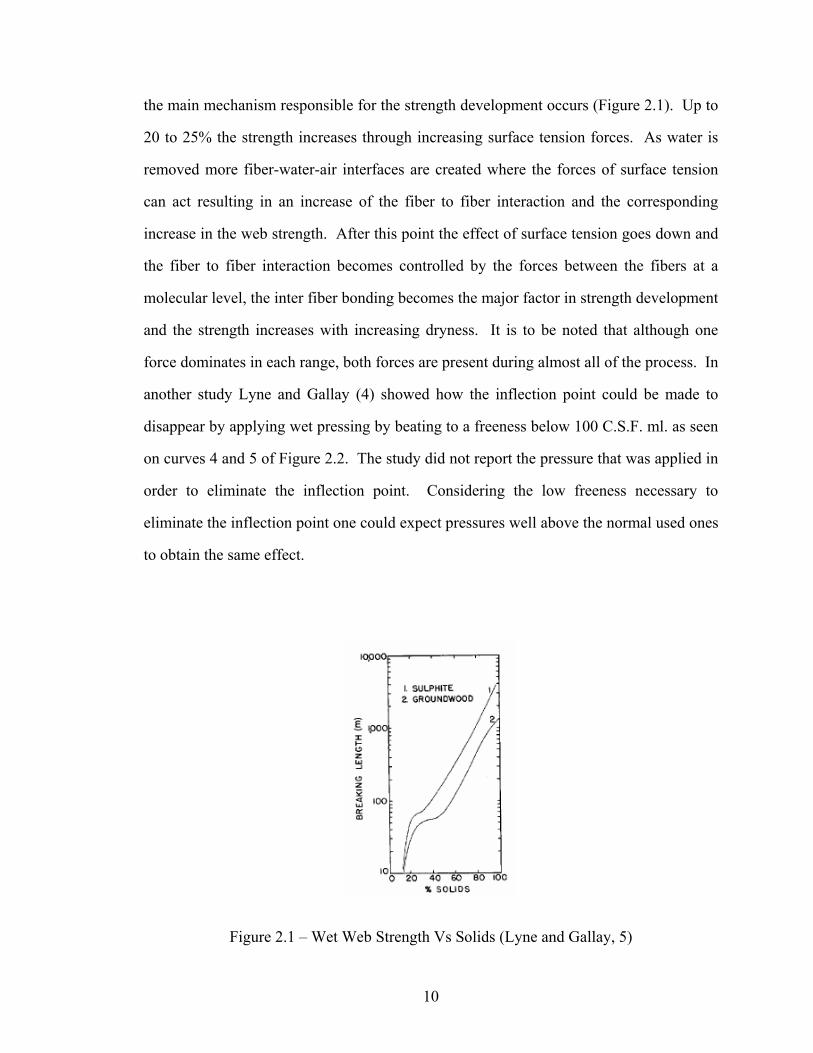
another study Lyne and Gallay (4) showed how the inflection point could be made to
disappear by applying wet pressing by beating to a freeness below 100 C.S.F. ml. as seen
on curves 4 and 5 of Figure 2.2. The study did not report the pressure that was applied in
order to eliminate the inflection point. Considering the low freeness necessary to
eliminate the inflection point one could expect pressures well above the normal used ones
to obtain the same effect.
Figure 2.1 – Wet Web Strength Vs Solids (Lyne and Gallay, 5)
10
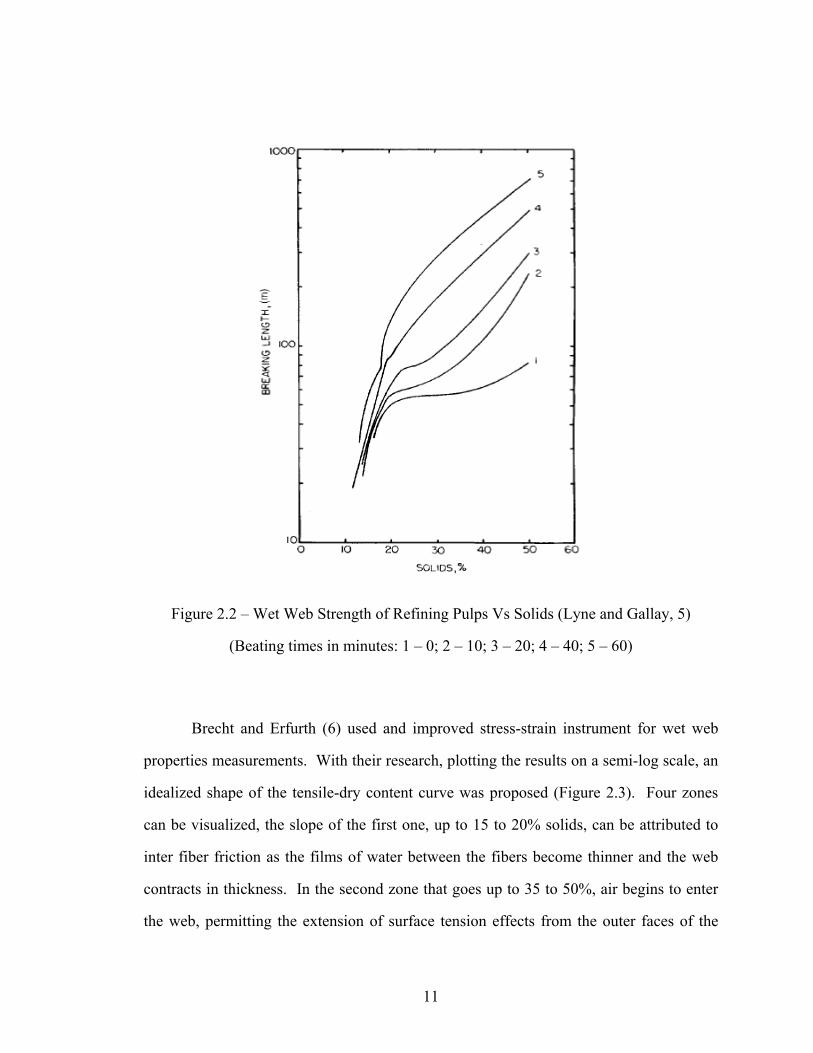
Figure 2.2 – Wet Web Strength of Refining Pulps Vs Solids (Lyne and Gallay, 5)
(Beating times in minutes: 1 – 0; 2 – 10; 3 – 20; 4 – 40; 5 – 60)
Brecht and Erfurth (6) used and improved stress-strain instrument for wet web
properties measurements. With their research, plotting the results on a semi-log scale, an
idealized shape of the tensile-dry content curve was proposed (Figure 2.3). Four zones
can be visualized, the slope of the first one, up to 15 to 20% solids, can be attributed to
inter fiber friction as the films of water between the fibers become thinner and the web
contracts in thickness. In the second zone that goes up to 35 to 50%, air begins to enter
the web, permitting the extension of surface tension effects from the outer faces of the
11
sheet into the interior, the slope is decreased due to the reduction of the water interfaces
after the surface tension effects reaches its maximum. In the third zone up to 60 to 90%
solids, the slope begins to increase more rapidly because inter fibrillar hydrogen bonding
is accelerated as water is removed. Finally in the fourth zone, around 80% and up, the
slope is caused by the usual increase in tensile strength with increased dryness. In this
region the lower slope can be explained because the loss of moisture in the almost dry
sheet stiffens the fibers and reduces the ability of some elements lying at a small angle to
the stress direction to move and better support the applied force.
Figure 2.3 – Idealized Wet Web Strength Vs Solids (Brecht and Erfurth, 7)
In more recent studies Robertson (1966) and Rance (1980) obtained similar
results to the ones obtained by Brecht and Erfurth. As shown in Figure 2.4, four zones
12
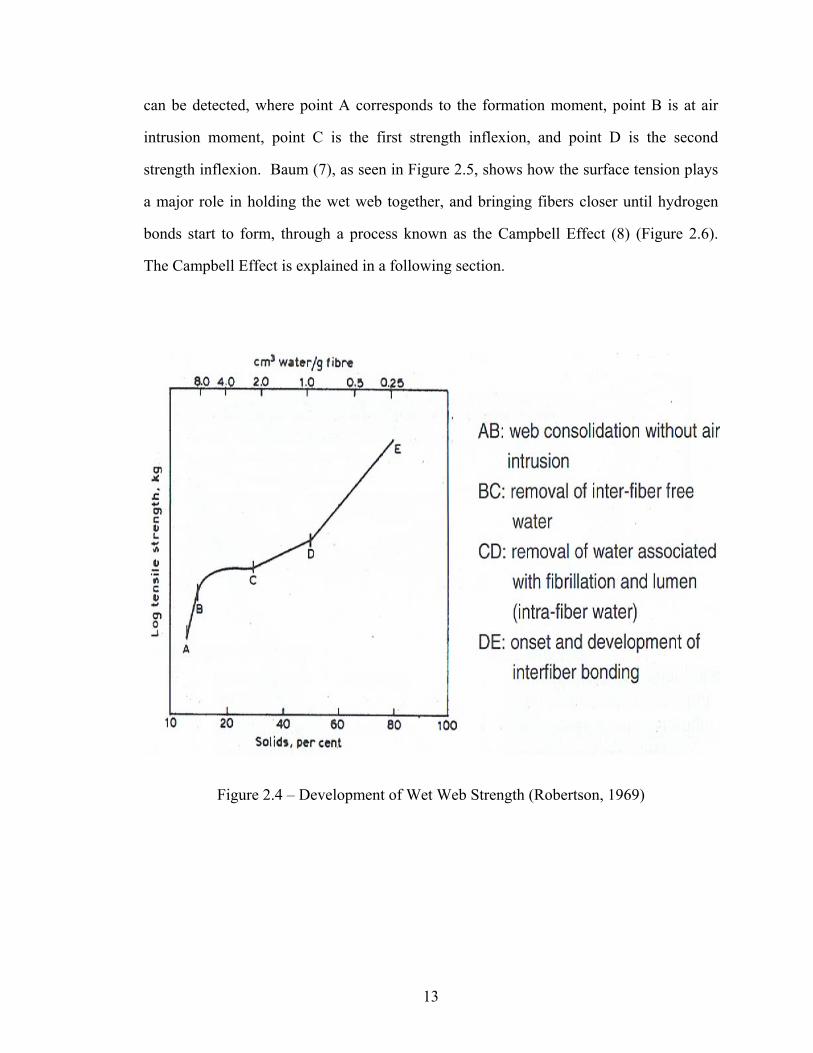
can be detected, where point A corresponds to the formation moment, point B is at air
intrusion moment, point C is the first strength inflexion, and point D is the second
strength inflexion. Baum (7), as seen in Figure 2.5, shows how the surface tension plays
a major role in holding the wet web together, and bringing fibers closer until hydrogen
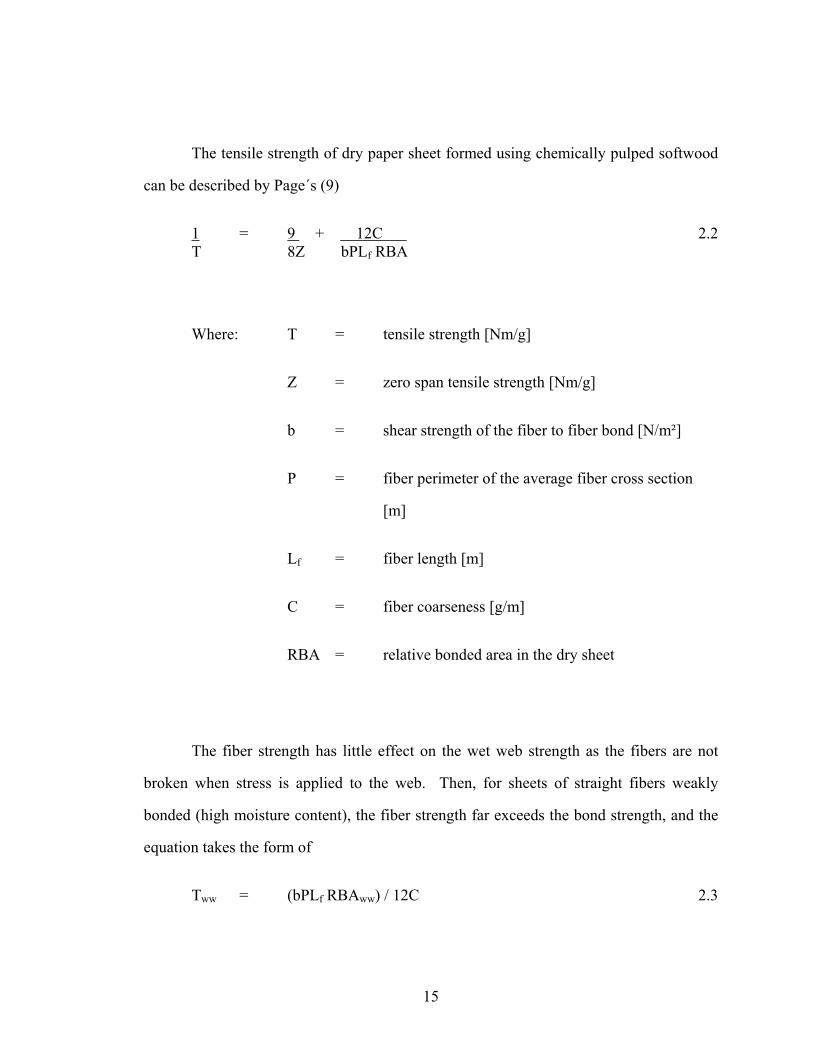
bonds start to form, through a process known as the Campbell Effect (8) (Figure 2.6).
The Campbell Effect is explained in a following section.
Figure 2.4 – Development of Wet Web Strength (Robertson, 1969)
13
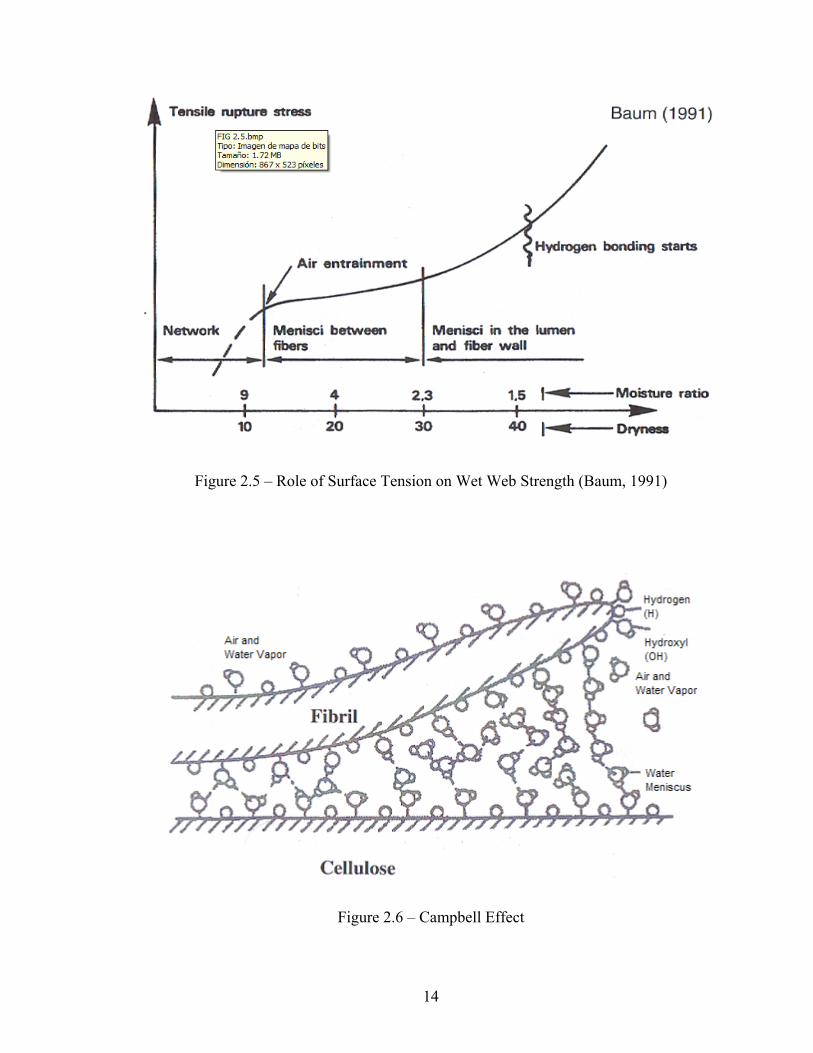
Figure 2.5 – Role of Surface Tension on Wet Web Strength (Baum, 1991)
Figure 2.6 – Campbell Effect
14
The tensile strength of dry paper sheet formed using chemically pulped softwood
can be described by Page´s (9)
1 = 9 + 12C 2.2 T 8Z bPLf RBA
Where: T = tensile strength [Nm/g]
Z = zero span tensile strength [Nm/g]
b = shear strength of the fiber to fiber bond [N/m²]
P = fiber perimeter of the average fiber cross section
[m]
Lf = fiber length [m]
C = fiber coarseness [g/m]
RBA = relative bonded area in the dry sheet
The fiber strength has little effect on the wet web strength as the fibers are not
broken when stress is applied to the web. Then, for sheets of straight fibers weakly
bonded (high moisture content), the fiber strength far exceeds the bond strength, and the
equation takes the form of
Tww = (bPLf RBAww) / 12C 2.3
15
Where: Tww = wet web tensile strength [Nm/g]
RBAww = the proportion of the fiber surface that is
contained within a water meniscus holding
adjacent fibers together
Williams (10), takes into account that this equation could be used for considering
the strength of wet web. Page (11), used the results obtained by Lyne and Gallay (4) to
further develop this equation. He concluded that the shear force required to slide one
fiber over another, for wet webs with solids below 30%, is γAμ/r, where γ is the surface
tension of water, μ is the coefficient of friction between the two wet fibers, A is the area
within the water meniscus over which the surface tension forces act and r is the radius of
curvature of the water meniscus. Finally Page arrived at an equation for wet webs of the
form of
Tww = μγ PLf RBAww / (12Cr) 2.4
The problem with this equation is that it has several unknowns. For example the
value of the RBAww is arbitrarily taken to be 0.5, for the coefficient of friction a value of
0.44 is taken from values for wet cotton fibers. If a more accurate value of the shear
strength of the fiber to fiber bond (N/m²) for wet webs could be determined, the validity
of the equation could be established. The problem is that it is not easy to measure this
property for wet webs.
16
Although almost all the discussion has been related to the wet web tensile
strength, it has to be noted that the wet web stretch is an important parameter governing
the ability of the web to withstand the stresses in the draws of the paper machine.
Usually the tensile strength level of the wet web is higher than the required to avoid a
sheet break, however the web must be able to redistribute the stresses associated with the
draws and this ability is related to the stretch of the web.
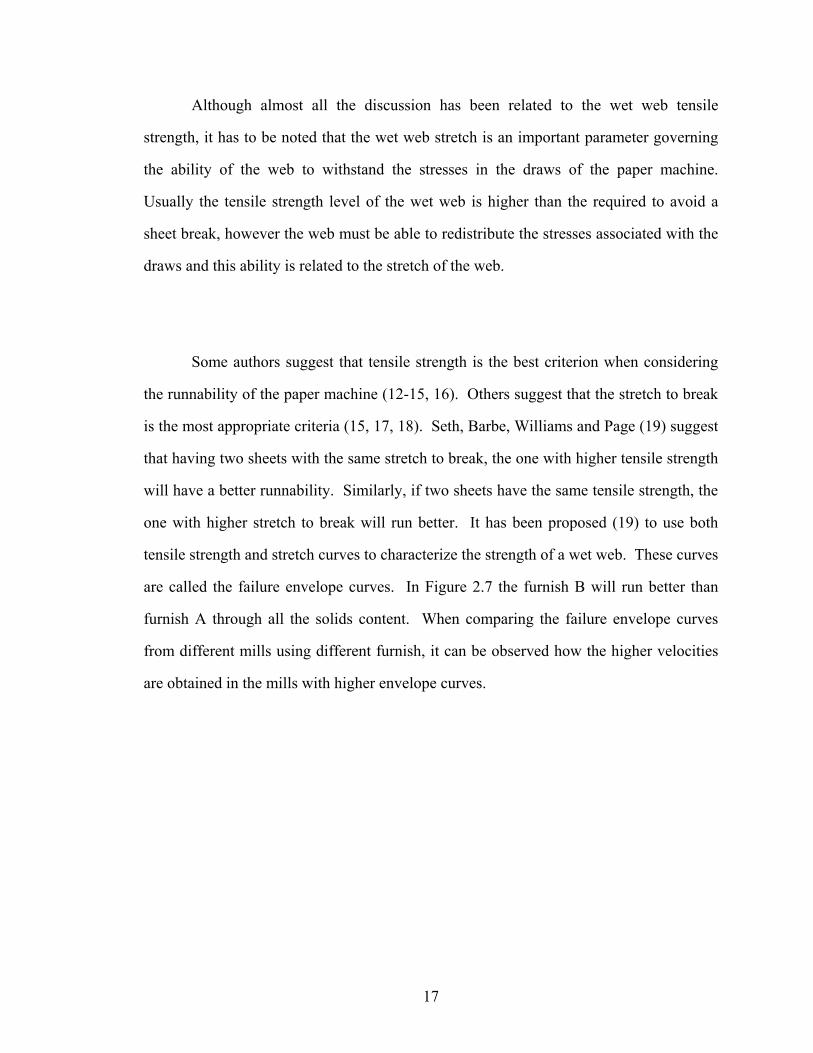
Some authors suggest that tensile strength is the best criterion when considering
the runnability of the paper machine (12-15, 16). Others suggest that the stretch to break
is the most appropriate criteria (15, 17, 18). Seth, Barbe, Williams and Page (19) suggest
that having two sheets with the same stretch to break, the one with higher tensile strength
will have a better runnability. Similarly, if two sheets have the same tensile strength, the
one with higher stretch to break will run better. It has been proposed (19) to use both
tensile strength and stretch curves to characterize the strength of a wet web. These curves
are called the failure envelope curves. In Figure 2.7 the furnish B will run better than
furnish A through all the solids content. When comparing the failure envelope curves
from different mills using different furnish, it can be observed how the higher velocities
are obtained in the mills with higher envelope curves.
17
Increased WaterRemoval
Furnish B
Furnish A
LOG
(Ten
sile
Str
engt
h)STRETCH
Figure 2.7 – Envelope Curve (19)
Surface Tension Mechanism
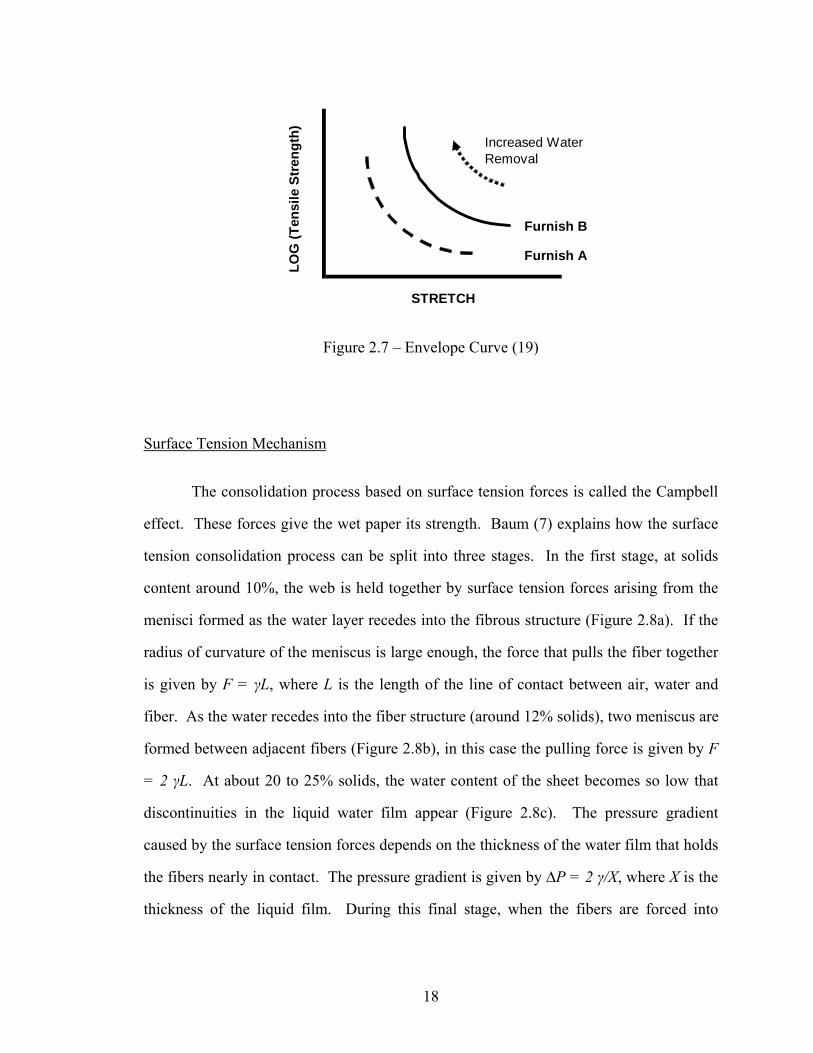
The consolidation process based on surface tension forces is called the Campbell
effect. These forces give the wet paper its strength. Baum (7) explains how the surface
tension consolidation process can be split into three stages. In the first stage, at solids
content around 10%, the web is held together by surface tension forces arising from the
menisci formed as the water layer recedes into the fibrous structure (Figure 2.8a). If the
radius of curvature of the meniscus is large enough, the force that pulls the fiber together
is given by F = γL, where L is the length of the line of contact between air, water and
fiber. As the water recedes into the fiber structure (around 12% solids), two meniscus are
formed between adjacent fibers (Figure 2.8b), in this case the pulling force is given by F
= 2 γL. At about 20 to 25% solids, the water content of the sheet becomes so low that
discontinuities in the liquid water film appear (Figure 2.8c). The pressure gradient
caused by the surface tension forces depends on the thickness of the water film that holds
the fibers nearly in contact. The pressure gradient is given by ∆P = 2 γ/X, where X is the
thickness of the liquid film. During this final stage, when the fibers are forced into
18
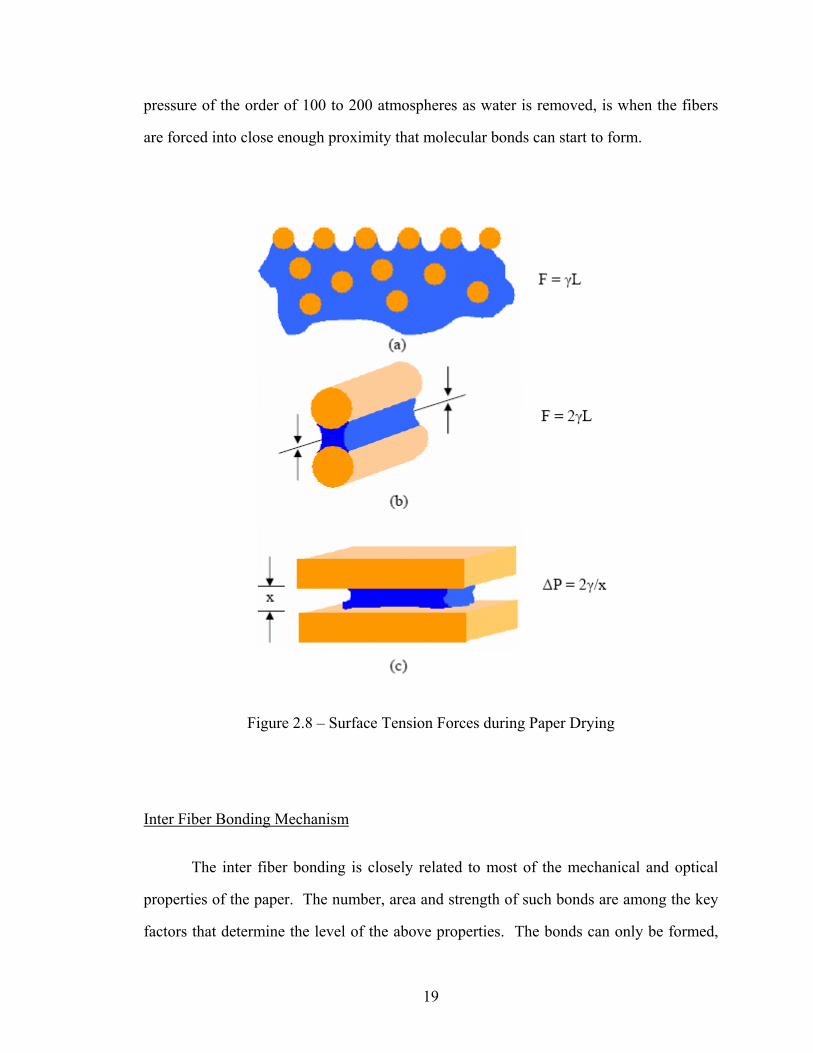
pressure of the order of 100 to 200 atmospheres as water is removed, is when the fibers
are forced into close enough proximity that molecular bonds can start to form.
Figure 2.8 – Surface Tension Forces during Paper Drying
Inter Fiber Bonding Mechanism
The inter fiber bonding is closely related to most of the mechanical and optical
properties of the paper. The number, area and strength of such bonds are among the key
factors that determine the level of the above properties. The bonds can only be formed,
19
when the solids content of the paper increases during the production process. As stated
by Campbell, the fibers are held close together by the effect of surface tension forces and
as water is removed, the fibers can start to form bonds between them. There is a gradual
change from the Campbell effect to the hydrogen bonding formation, which starts at
around 50% of solids content.
There exist three different types of bonding mechanism:
1. Chemical bonds within cellulose molecules and acid-base interactions between
them. For the fibers, the hydrogen bonding is considered to be the main source
for bonding. The bonding energy ranges from 8-32 KJ/mol and depends on the
surrounding molecular structure
2. Intermolecular van der Waals bonds: have a smaller bonding energy (25% of the
hydrogen bond energy), but act in all directions and can contribute to the cohesion
of the paper web
3. Entanglements of polymer chains: mechanical interlocking process
The inter fiber bonding occurs in the zone where two fibers are so close together
that any of the above types of bonding may occur. External fibrillation and fines in the
interface aid the formation of these kinds of bonds by linking the fiber surfaces more
closely together during the Campbell process. The external fibrils and fines significantly
increase the total fiber surface area.
20

Strength Development and Mechanical Treatment
During paper production the main mechanical treatment process is pulp refining.
The objective of refining is to improve the bonding ability of the fibers so that they can
form a strong paper sheet that will not cause problems during the production process and
to produce a sheet of the desired properties.
Refining affects the fiber in many ways such as (20):
• Cutting and shortening fibers
• Fines production removing parts from the fiber walls
• External fibrillation
• Internal fibrillation or swelling
• Internal changes in the wall structure, such as delamination
• Curling (high consistency) or straightening (low consistency) of the fiber
• Creating nodes, kinks, slip planes, microcompressions in the cell wall
• Redistribution of hemicelluloses from interior to exterior of the fiber
All the above factors affect the bonding capacity of the fiber. As beating
increases, the fibers become more flexible and more easily collapsed resulting in
increased bonding surface area. The production of fibrils also plays an important role for
strength development. If these properties were obtained without the internal rupture of
21
the fibers, the final strength properties would be lower. This was shown in an experiment
performed by Smith and Murphy (21) with viscose fibers, were the fibers were subjected
to water pressure that made them swell, without internal fibrillation, but at the end no
strength was developed. The existence of fibrils causes the Campbell pressure to become
greater because the fibrils can come into closer contact. As a result there is greater fiber
to fiber bond area and an overall increased level of bonding.
Da Silva (22) found that wet web strength properties develop linearly with
beating-energy consumption, contrary to the nonlinear curve obtained when wet web
tensile strength is plotted versus freeness. He also concluded that the swelling and
delamination of the cell wall are critical for sheet consolidation, fiber to fiber bonding
and that the presence of fines significantly increases wet web tensile strength. The effect
of refining result, for the same refining treatment, depends on the flexibility of the fibers,
thickness of the cell walls, packing density of the cell walls, S2 fibrillar angle and
chemical composition of the fiber essentially hemicelluloses. The hemicelluloses interact
strongly with the water and promote the fiber swelling during the refining, in addition
they participate in the inter fiber boning by contributing hydrogen bonds. Da Silva also
found that the wet web stretch develops linearly with beating-energy consumption.
Refining not only increases the wet web strength, it also increases the wet web
stretch, since the fiber curl and microcompressions are better utilized due to increased
fiber to fiber interaction. Previous studies (23) have shown that the induction of curl,
kinks and microcompresions in the fibers, through high consistency refining treatment
(consistencies around 30 to 35%), can produce a very large increase in the wet web
22
stretch, especially at low solids. The problem is that this increase in stretch is
accompanied by a decrease in wet web tensile strength.
Strength Development and Chemical Treatment
The main objective of the chemical treatment during the paper making process is
to use wet end additives that help to achieve the paper properties set by the customers and
enhance the paper machine runnability. The chemical additives can affect the following
paper properties (24):
• Structural: Basis weight, formation, porosity, etc.
• Mechanical: Tensile, bursting, internal bonding and surface strength, tearing
resistance, stiffness, etc.
• Appearance: Color, brightness, opacity, gloss
• Barrier and resistance: Sizing
• Permanence: Durability, color reversion, chemical stability
Other types of chemicals are used improve the drainage, minimize entrained air
and foam, keep machines clean and retain other additives in the paper. If the wet end
chemistry is not well designed and balanced, the chemicals that initially were added for
positive results can produce machine deposits, scale and foam spots, reduce drainage and
pressing efficiencies, and all the positive results desired in the final paper can be reduced
or eliminated.
23
The trend toward increasing machine speeds, producing lighter paper with the
same strength properties, increasing the filler content to replace fiber and optimizing
chemical consumption, has increased the attention on the management of wet end
chemistry.
Pikulik (25) using Page´s equation 2.4, considered the Campbell effect and the
importance of the surface tension during the early part of the web formation concluded
that any reduction in surface tension of the white water (around 72 mN/m) results in a
lower strength of the wet web, at least in the zone where the surface tension is the
dominant mechanism. Surface active chemicals, such as soap of fatty and resin acids
extracted from wood or the lignosulphates from the pulping process lower the surface
tension of the water considerably, thus highlighting the importance of a good washing
process for the pulp before it enters the paper machine. Additionally, almost all the
chemicals currently used in the wet end also lower the white water surface tension. One
of the important objectives of the wet end chemistry is to control the chemical addition so
the surface tension is not unnecessarily reduced.
Laleg, Ono, Barbe, Pikulik and Seth (26) showed how a small amount of cationic
starch increased the white water surface tension, they explain this by a possible complex
reaction between the starch and other surface active materials which result in a
deactivation of the surfactant ingredients. When the starch addition was further
increased, the surface tension of the water went down.
24
The chemicals that reduce the surface tension the most are the so called
surfactants. These materials are widely used during the paper process to improve the
pulp washing, for softening of the paper, as defoaming and antifoaming agents, to
improve the absorbency of the paper, to control deposits, to wash and condition the felts,
and as corrosion inihibitors.
Other wet end additives include fillers, dry strength and wet strength additives.
Fillers and other materials can interfere with fiber to fiber interactions and interrupt the
capillaries of water that reinforce the wet webs thus lowering its strength. The dry
strength additives (such as starch) only have an important effect when the solids content
is above 60%. Wet strength additives, requires the formation of covalent chemical bonds
that usually can be only formed at high temperatures that exist in the dryer section, so
their importance for wet web strength is not relevant.
Pikulik (25) stated that for a chemical to be able to increase the wet web strength,
it has to be able to crosslink the fibrous network, even in the presence of water. It is not
easy to design such a chemical considering that the only chemically reactive groups that
can be used for this purpose are the hydroxyl groups, -OH. However in the wet web
there are many more of these groups available from water molecules than those from
cellulose. Thus any chemical additive reactive towards the –OH groups has a greater
chance of reacting with water than crosslinking the fibrous network. Recently several
polymers capable of increasing the wet web strength have been identified. Among them
is the cationic aldehyde starch that improves the wet web strength of webs formed with
chemical fibers (27, 28). Also a product called Chitosan and other polymers containing
25
the primary amino groups can increase the strength of wet webs made from mechanical
pulps (29).
Fillers
For many paper grades mineral fillers are the second most important component
in the paper furnish. One of the main reason for using fillers for the paper production is
the reduction in the furnish cost, while also reducing the energy consumption (especially
during the drying process), and increasing the paper machine production capacity. The
fillers also improve other properties such as (24):
• Formation and sheet structure: Filing sheet voids
• Appearance properties: Brightness, opacity, whiteness, gloss
• Texture and feel: Smoothness
• Printability: Smoothness, opacity
• Dimensional stability
There are different type of fillers, including Titanium dioxide, Kaolin clay, Talc
and Calcium carbonate. Filler selection depends on the properties to be improved and the
final quality of the paper. Although most filled paper are produced for the printing and
writing, in recent years there has been an increased use in package board, newsprint and
tissue paper.
26
The main problem associated with the filler increase is the reduction in the
strength capacity of the paper, not only in the final state, but also during the paper
production. To be able to increase the amount of filler used during paper production,
several options can be considered. One is the use of dry strength additives, such as
modified starch. Other methods such as pre-floculation of the filler, modification of the
fillers, synthesized fillers with different structures and chemistries, polymer treated
fillers, lumen loading and multi-layer forming have been explored (30).
Starch
Is the most common dry strength additive. Starch is not only used as dry strength
additive, it also is used as a filler retention agent, drainage agent, as an emulsifying aid
for synthetic sizing materials and as the cationic component of multiple-components
retention systems. Starch additions range from 0.25 to 2.5% of the total solids content.
Because the retention of unmodified starch, which enhances attachment to the negatively
charged fibers, is low (below 40%) it is necessary to attach cationic substituents to it.
The cationic starch improves the web strength by enhancing the inter fiber bonding
because it can participate in forming hydrogen bonds with the fiber surface cellulose
molecules and can increase the number of hydrogen bonds that would naturally occur in
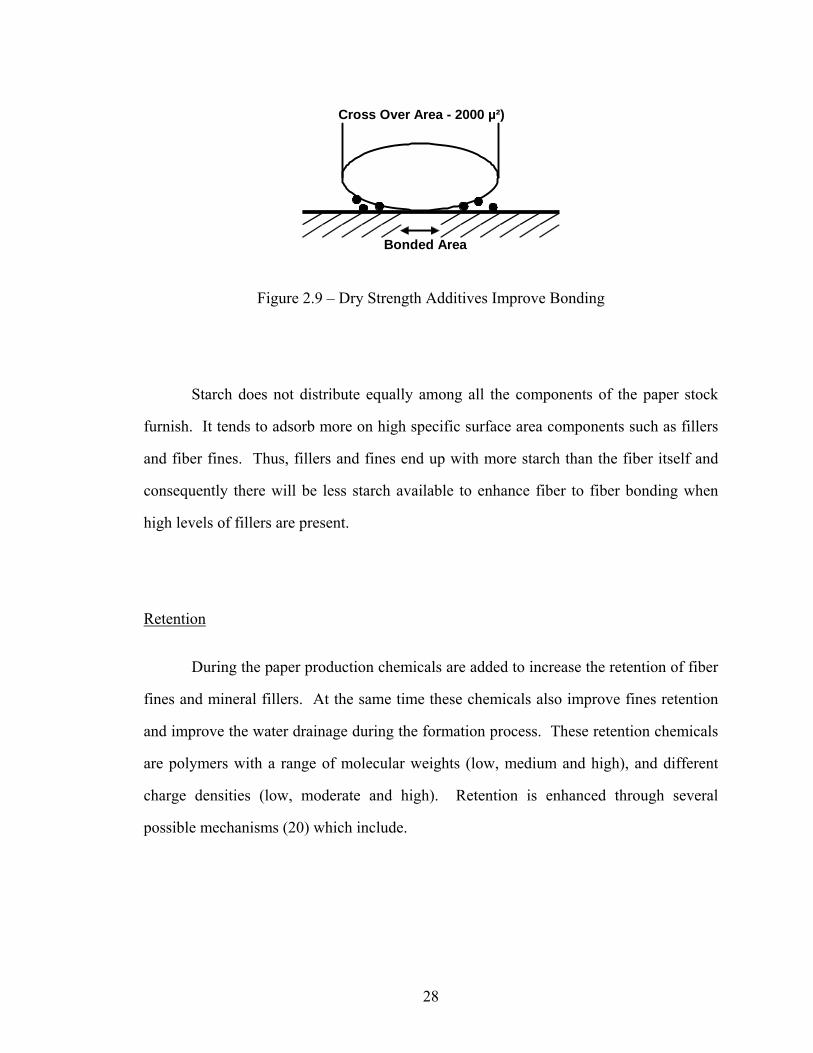
the bonded area between two fibers (Figure 2.9).
27
Bonded Area
Cross Over Area - 2000 µ²)
Figure 2.9 – Dry Strength Additives Improve Bonding
Starch does not distribute equally among all the components of the paper stock
furnish. It tends to adsorb more on high specific surface area components such as fillers
and fiber fines. Thus, fillers and fines end up with more starch than the fiber itself and
consequently there will be less starch available to enhance fiber to fiber bonding when
high levels of fillers are present.
Retention
During the paper production chemicals are added to increase the retention of fiber
fines and mineral fillers. At the same time these chemicals also improve fines retention
and improve the water drainage during the formation process. These retention chemicals
are polymers with a range of molecular weights (low, medium and high), and different
charge densities (low, moderate and high). Retention is enhanced through several
possible mechanisms (20) which include.
28
1. Agglomeration/Coagulation: The attachment of the small particles in a furnish to
the large fibers and their retention with the fibers
i) Charge neutralization: Uses the addition of an electrolyte or a very low
molecular weight high charge polyelectrolyte. Typically alum or
polyaluminum chloride (PAC) is used for this purpose (Figure 2.10)
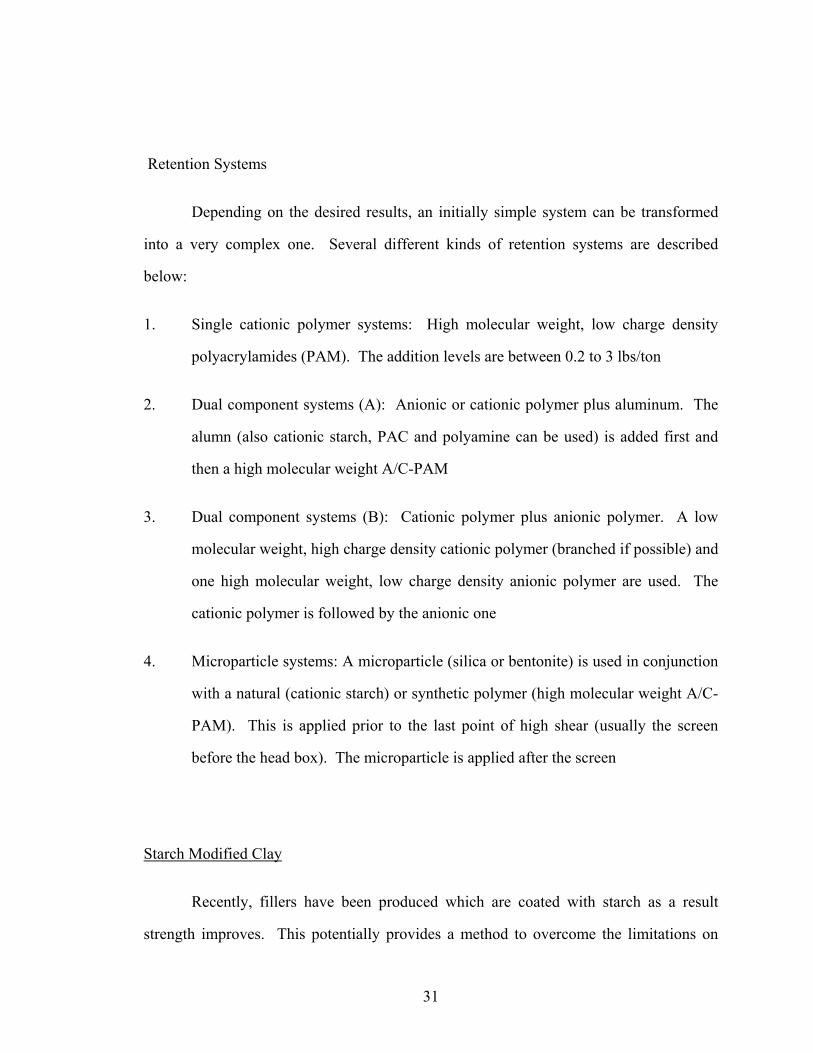
ii) Patching: The polyelectrolyte has high charge density and low to medium
molecular weight, such as modified polyethyleneimine, polyamines, and
polyamideamine epichlorohydrin resins (Figure 2.11)
iii) Heterocoagulation: Is the aggregation of unlike particles by one of the
first two mechanism
2. Floculation
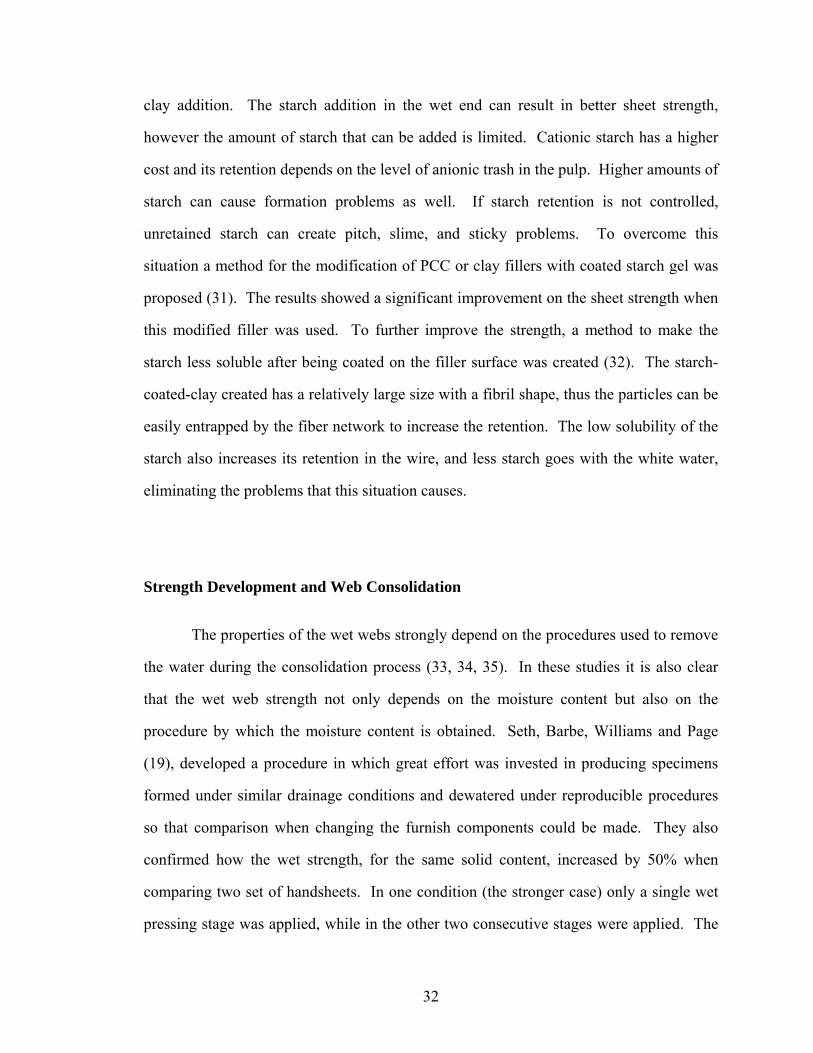
i) Bridging flocculation: The gathering together of the small particles in a
furnish into a macroparticle (floc) and their retention in the interstices of a
web as it is formed. Uses the addition of high molecular weight and low
charge density polyelectrolytes (Figure 2.12)
ii) Network flocculation: Two or more polymers react together in a first step
to form a polymer network. This network entraps the particles
mechanically
29
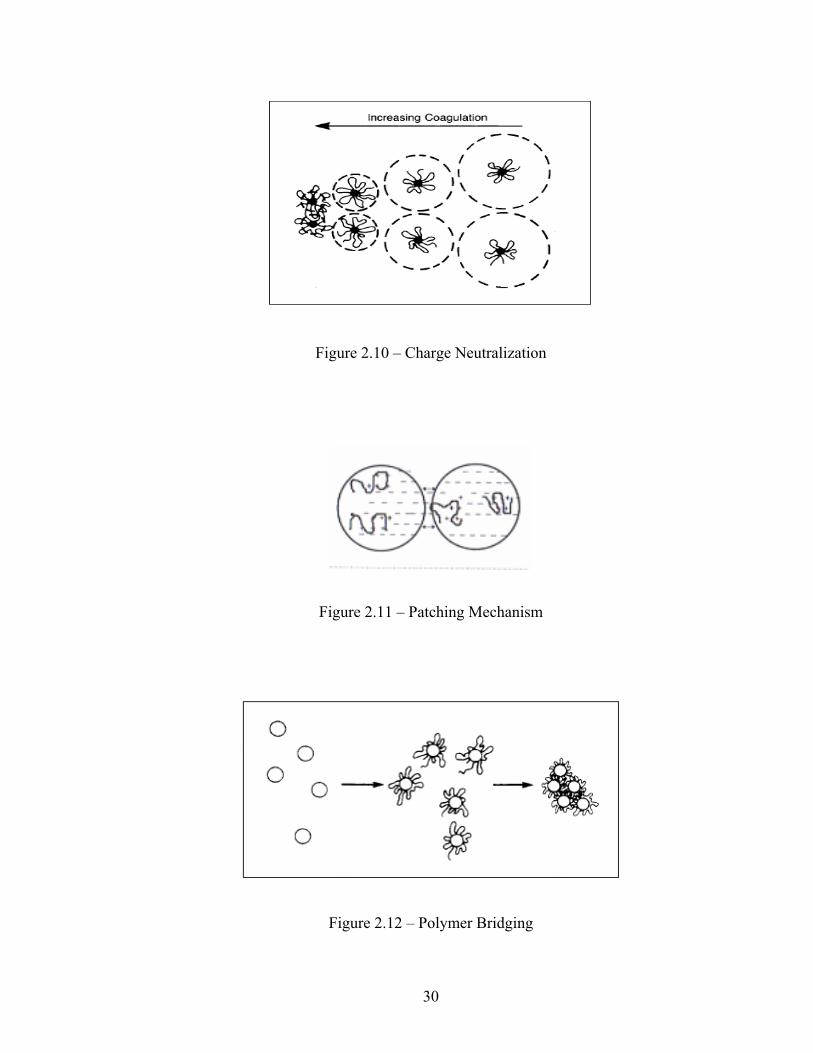
Figure 2.10 – Charge Neutralization
Figure 2.11 – Patching Mechanism
Figure 2.12 – Polymer Bridging
30
Retention Systems
Depending on the desired results, an initially simple system can be transformed
into a very complex one. Several different kinds of retention systems are described
below:
1. Single cationic polymer systems: High molecular weight, low charge density
polyacrylamides (PAM). The addition levels are between 0.2 to 3 lbs/ton
2. Dual component systems (A): Anionic or cationic polymer plus aluminum. The
alumn (also cationic starch, PAC and polyamine can be used) is added first and
then a high molecular weight A/C-PAM
3. Dual component systems (B): Cationic polymer plus anionic polymer. A low
molecular weight, high charge density cationic polymer (branched if possible) and
one high molecular weight, low charge density anionic polymer are used. The
cationic polymer is followed by the anionic one
4. Microparticle systems: A microparticle (silica or bentonite) is used in conjunction
with a natural (cationic starch) or synthetic polymer (high molecular weight A/C-
PAM). This is applied prior to the last point of high shear (usually the screen
before the head box). The microparticle is applied after the screen
Starch Modified Clay
Recently, fillers have been produced which are coated with starch as a result
strength improves. This potentially provides a method to overcome the limitations on
31
clay addition. The starch addition in the wet end can result in better sheet strength,
however the amount of starch that can be added is limited. Cationic starch has a higher
cost and its retention depends on the level of anionic trash in the pulp. Higher amounts of
starch can cause formation problems as well. If starch retention is not controlled,
unretained starch can create pitch, slime, and sticky problems. To overcome this
situation a method for the modification of PCC or clay fillers with coated starch gel was
proposed (31). The results showed a significant improvement on the sheet strength when
this modified filler was used. To further improve the strength, a method to make the
starch less soluble after being coated on the filler surface was created (32). The starch-
coated-clay created has a relatively large size with a fibril shape, thus the particles can be
easily entrapped by the fiber network to increase the retention. The low solubility of the
starch also increases its retention in the wire, and less starch goes with the white water,
eliminating the problems that this situation causes.
Strength Development and Web Consolidation
The properties of the wet webs strongly depend on the procedures used to remove
the water during the consolidation process (33, 34, 35). In these studies it is also clear
that the wet web strength not only depends on the moisture content but also on the
procedure by which the moisture content is obtained. Seth, Barbe, Williams and Page
(19), developed a procedure in which great effort was invested in producing specimens
formed under similar drainage conditions and dewatered under reproducible procedures
so that comparison when changing the furnish components could be made. They also
confirmed how the wet strength, for the same solid content, increased by 50% when
comparing two set of handsheets. In one condition (the stronger case) only a single wet
pressing stage was applied, while in the other two consecutive stages were applied. The
32
first case was chosen and by changing the pressing pressure they could test specimens
between 15 to 55% of solids content. The specimens were tested using a conventional
Instron universal tensile testing machine, under this conditions they are held vertically
during the test, water migrates due to gravity and the load is affected. These effects were
examined and found to be negligible for the wet web solids considered. Horizontal
testing was not considered necessary.
There exist two theories on how to compare modifications in the wet web. The
first theory is that webs should be compared at similar solids contents, the second is that
webs should be compared similar specimen preparation conditions (36, 37, 38). The first
approach finds its justification because in the actual production process, the moisture
content of the paper generally remains constant at the different points along the paper
machine. The second approach considers that the solids content of a sheet depends on the
response of the furnish to the drainage and the machine operating conditions.
Forming
The objective of forming is to deposit a dilute suspension of fibers, fines and
fillers, uniformly onto one or between two forming fabrics. The water is the removed by
forces generated between the fabrics, or by suction developed by different drainage
elements. At the end of this stage the web is still weak and wet, only minimal
consolidation has occured. During the early steps, the vacuum produced by the drainage
elements provides the suction necessary to remove the water. As the wet gets dryer,
progressively increasing vacuum levels are applied with the help of vacuum legs and low
vacuum pumps. As the machine speed goes up, the time available for the dewatering
33
process is shorter and the water removal is more difficult to accomplish. The drainage
elements become less efficient and the web leaves the couch containing more water than
in a slower machine (39). The solids content can go down from 20%, in the traditional
machines, to 12 - 14% in some modern twin formers (40). Despite the lower solids
content it has been shown that the web can be effectively pressed without affecting the
quality of the paper (41).
Pressing
The web that comes from the forming section is compressed in one or more rolls
or shoe presses. In each press either one or two press felts are used to receive water from
the sheet. If multiple presses are used, higher press loads are used with each successive
press (20). The solids content at the end of the press section is around 40 to 45%.
During pressing, the contact between the fibers is improved, yielding higher RBA and as
a result the wet web strength is increased.
Drying
The final water removal step is drying. This is accomplished by circulating the
paper around steam heated cylinders. The sheet is held against the steam cylinder by a
dryer fabric which is under tension. The pressure with which the sheet can be held
against the cylinders is limited by the tension in the dryer fabric and the radius of the
cylinder. Along with other factors this limits the maximum attainable drying rate. If the
drying rate could be increased, compact and shorter machines could be constructed (42).
During the drying process, the shear stresses (produced by the shrinkage of the fibers in
the lateral direction) at the inter fiber bonds form microcompresions, that modify the
34
mechanical properties of the bonded segments and the final paper performance. Most of
the papermaking bonds which link fibers, fines and fillers are developed during the
drying process, consequently the dry paper strength can be ten or more times greater than
the pressed wet web strength.
Wet Web Cohesive Strength
As can be seen from equation 2.3, the tensile strength is dependent on the shear
strength of the fiber to fiber bond. To solve equation 2.3, when the surface tension is the
dominant mechanism, Page related the strength of the fiber to fiber bond to the shear
force required to slide one fiber over another (γAμ/r) and approximated the value of the
coefficient of friction (μ) to one obtained from wet cotton fibers, he also assumed a value
of 0.5 for the RBA. In this way he obtained values for tensile strength that agree with
many values found in the literature for wet webs at 30% solids. The standards methods
for measuring the internal bond strength, described by Tappi T 541 (Internal Bond
Strength of Paperboard (Z-Direction)) and Tappi T 569 (Internal Bond Strength (Scott
Type)), requires the application of a pressure sensitive tape to the sheet surface. This can
be easily done for dry sheets, but in even slightly damp sheets, the presence of water
degrades the adhesion of the tape and makes the test impractical for wet sheets.
A better approach could be obtained if the cohesive energy that held the fibers
together could be directly measured from the wet web at different moisture contents.
Patterson and Taylor (43) designed and created a new apparatus, a paper splitter, which is
able to determine the energy needed to overcome the cohesive strength of a paper sheet.
The main advantage of the apparatus is its ability to test sheets over almost the entire
35
range of moisture contents that are present on a paper machine. In this device, falling
weights are used to supply the force needed to split the sheet. The data recorded by the
instrument while the sample is being split, are used to calculate the difference between
the kinetic energy and the potential energy of the falling weights. This difference is
closely related to the energy needed to split the paper.
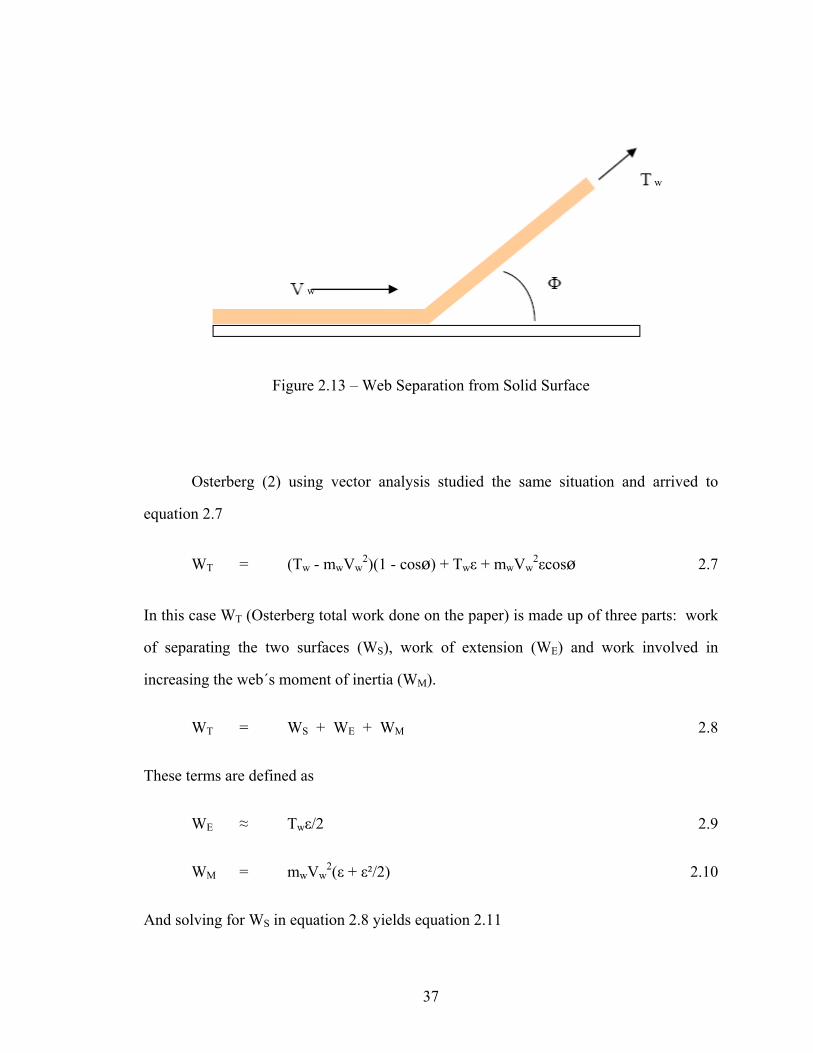
Previous works have dealt with the issue of separating a wet web from rigid
surfaces such as wires and press rolls. Among the first investigators were Mardon,
Truman, Meadley and O´Blenes (1) and Osterberg (2) who developed equation 2.1,
considering the case for an inextensible web, solving equation 2.1 for Ww we have:
Ww = (Tw - mwVw2)(1 - cosø) 2.5
In this equation the work (Ww) and the tension (Tw) are in units of N/m, the mass (mw) is
in kg/m2 and the velocity (Vw) in m/s. The equation is solved by calculating the power
required by the web (moving at a velocity Vw) to separate from a static surface (Figure
2.13). This power is consumed by the kinetic energy increase and the energy used in
doing work (Ww) on the paper. Mardon (44) also considered the situation when the web
stretches as it separates from the base, then following the same procedure he arrived to
equation 2.6.
W´ = (Tw - mwVw2)(1 - cosø) + Twε - mwVw
2ε(1 - cosø + ε/2) 2.6
Where W´ is the total work done on the paper and ε is the strain of the web. Mardon
studied the case when the separation point was stationary and the solid surface moves at a
velocity VW, this case is similar to the situation in the paper machine. The equation
obtained considering this situation is identical to equation 2.6.
36
w
w
Figure 2.13 – Web Separation from Solid Surface
Osterberg (2) using vector analysis studied the same situation and arrived to
equation 2.7
WT = (Tw - mwVw2)(1 - cosø) + Twε + mwVw
2εcosø 2.7
In this case WT (Osterberg total work done on the paper) is made up of three parts: work
of separating the two surfaces (WS), work of extension (WE) and work involved in
increasing the web´s moment of inertia (WM).
WT = WS + WE + WM 2.8
These terms are defined as
WE ≈ Twε/2 2.9
WM = mwVw2(ε + ε²/2) 2.10
And solving for WS in equation 2.8 yields equation 2.11
37
WS = (Tw - mwVw2)(1 - cosø) + Twε - mwVw
2ε(1 - cosø + ε/2) - Twε/2
2.11
The equation found by Mardon and Osterberg can be related by:
WT = W´ + WM 2.12
During the splitting test the work required to separate the paper from the same
paper is measured. The situation can be approximated by equation 2.11, considering that
during the test the take off angle is 90º (Fig. 2.14), this equation reduces to:
WS = (Tw - mwVw2) - mwVw
2ε(1 + ε/2) + Twε/2 2.13
From the experiment the tension, velocity and mass are known. The work of separation
(WS) can also be calculated, but to be able to compare the experimental results with
equation 2.13, it is necessary to measure the strain of the wet web, which is something
the apparatus is not designed to do, although approximate measurements between zero
and two percent have been made (44).
38
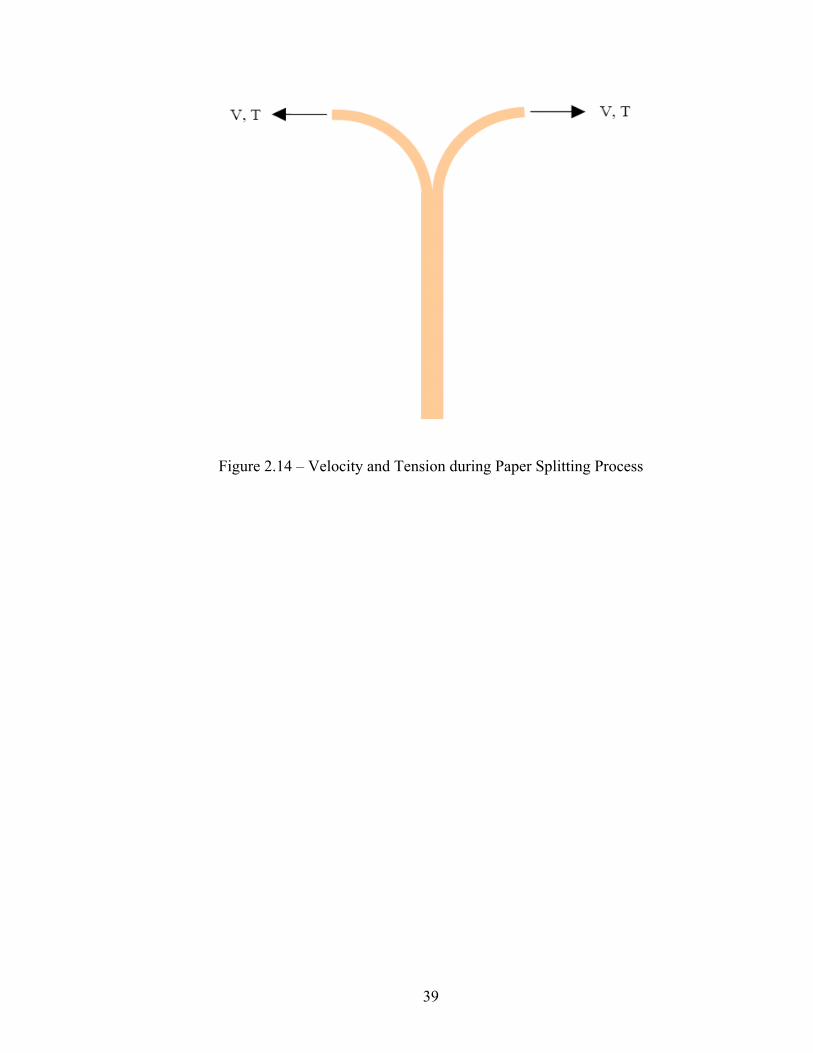
Figure 2.14 – Velocity and Tension during Paper Splitting Process
39
CHAPTER 3
EXPERIMENTAL PROCEDURES
The experiment was designed to simulate the dewatering processes the paper is
subjected to during its production. The sheets were formed using a Formette Dynamique.
The wet web solids after forming were around 18 to 22%, similar to the solids obtained at
the couch roll of a Fourdrinier machine. The sheet were then pressed resulting in a solids
content of 38 to 42%, which is similar to that obtained after the press section in a paper
machine. Finally heat was applied using a drum dryer to obtain solids contents in the
range of 50 to 95%. The web production process was similar for all the cases, allowing
comparisons between the different treatments performed on the pulp suspension.
Pulp Preparation and Mechanical Treatment
A bleached softwood kraft pulp supplied in dry lap form was used to produce the
paper sheets. The pulp was refined according to Tappi method T 200 (Laboratory
Beating of Pulp (Valley Beater Method)). Each batch of pulp was prepared using 5 lb of
pulp. The Valley Beater was run for 10 minutes with no weight applied to disintegrate
the pulp. The consistency of the pulp suspension was 1.4% and the initial freeness was
780 C.S.F.. The freeness level was determined using Tappi method T 227 (Freeness of
Pulp (Canadian Standard Method)). The beater was operated for different amounts of
time in order to obtain three levels of refining. For the first level the freeness was around
740 C.S.F., indicating a slight mechanical treatment performed on the pulp. In the
second condition the freeness obtained was between 540 to 560 C.S.F. and in the final
40
high mechanical treatment case the freeness level was around 440 C.S.F.. After the
mechanical treatment, the fiber suspension was stored in a refrigerated room for less than
one week, prior to being used to form the test sheets.
Chemical Preparation and Chemical Treatment
The chemicals used during the experiment were: clay (provided by Imerys),
cationic corn starch (provided by ADM), C-PAM (provided by EKA) and starch
modified clay (provided by Imerys). The first three chemicals were obtained in powder
form while the last one was a slurry at solids content of 70%. The powder chemicals
were prepared and used the same day the sheets were formed. All the chemicals were
diluted with water until reaching 25% solids for the clay, 1% solids for the cationic
starch, 0.5% solids for the C-PAM and 25% for the starch modified clay. Once diluted,
they were kept under agitation to ensure an even dispersion of the suspension. The clay
and the starch modified clay have a strong tendency toward sedimentation, in these cases
it was extremely important to provide a good agitation, otherwise the suspension would
not have an even distributed concentration. The C-PAM was prepared using a magnetic
agitator. This chemical preparation requires great attention because it can easily form
flocs which can affect the retention performance and the evenness of the solution
concentration. Before adding to the stock, it is necessary to agitate the suspension for
more than 30 minutes, this allows enough time for the polymer chains to straighten. The
diluted cationic starch was stirred and slowly cooked for 50 minutes until the mixture
reached a temperature of 92º, then the temperature was kept at this level for 25 minutes,
after which the heat was removed and dilution water was added to reduce the temperature
and the solids content to 0.5%. Enough C-PAM and cationic starch was prepared at the
41
beginning of each day to be used in the corresponding sheets, excess amounts were
discarded.
Once prepared, and depending on the case to be evaluated, the chemicals were
added as follows
1. The refined pulp suspension initially at 1.4% of consistency, was diluted to obtain
a consistency between 0.5 and 0.7%
2. Once measured, the required amount (ml) of clay or of starch modified clay
(depending on the case), the suspensions were additionally diluted with 8 liters of
water before adding them to the pulp furnish. A final chemical concentration of
around 0.5% was obtained
3. The required amount of C-PAM and the C-Starch were also measured (depending
on the case) and then diluted adding 5 liters more of water to each suspension.
The final concentration for the C-PAM was below 0.005% and for the C-Starch
was below 0.04%
4. The chemicals were added in the following order:
i) Clay or Starch Modified Clay: Wait for two minutes for suspension
dispersion before adding the next chemical
ii) Cationic Starch: Wait for one minute before the next chemical addition
iii) C-PAM: Just before adding the fiber stock to the Formette holding tank.
0.1 kg/ton of product was added every time clay or starch modified clay
was added
42
The same basic procedure was followed for all the sheets. The additional dilution
of the chemical was required to ensure a well mixed furnish and to allow the chemicals to
have the ability to evenly react between each other and with the fibers and fines.
The ash content in the webs were measured using Tappi method T 211 (Ash in
Wood, Pulp, Paper and Paperboard: Combustion at 525 ºC ).
Web Formation
Once in the Formette holding tank, the pulp furnish was ready to be transformed
into a web. To be able to produce webs with similar conditions the equipment (Figure
3.1) was operated in all the cases following the same procedure:
1. The pulp consistency was below 0.8% in order to obtain even formation and to
avoid pipe and nozzle plugging. In addition to working at consistencies lower
than 0.8% it is necessary to:
i) Keep all the pulp storage tanks clean and closed
ii) Always prepare the furnish necessary to produce one sheet at the time
iii) Before adding the furnish to the holding tank, the agitator should be
working, otherwise the fiber may settle and plug the system
iv) When there is no more furnish in the tank add water and let the equipment
work for 20 more cycles, before starting the dewatering process. With this
43
step one can be sure that no fiber will remain in the system to plug it while
not working. The formation is also improved
v) Once the sheet is formed and taken out from the equipment, add water to
the holding tank and start the system as if normal operation to flush the
system
vi) Work the system in manual mode
vii) At the end of the day the equipment should be completely cleaned to avoid
any remaining fiber to dry and cause problems in the future
2. Two regular forming wires (one over the other) were adapted to be the support of
the fiber mat during the formation process. With this configuration one wire
helps as a support for the wire that will finally support the fibers
3. The rotor velocity was set to 900 RPM during the wet formation and increased to
1500 RPM during the dewatering process. In this way the solids at the end of the
process is in the range of 18 to 22%
4. The nozzle at the end of the pulp pipe should always remain at the same angle
when measured against the forming surface. In this case the nozzle jet was
perpendicular to the equipment front face
5. The pulp pressure was set to 1.6 bar
44
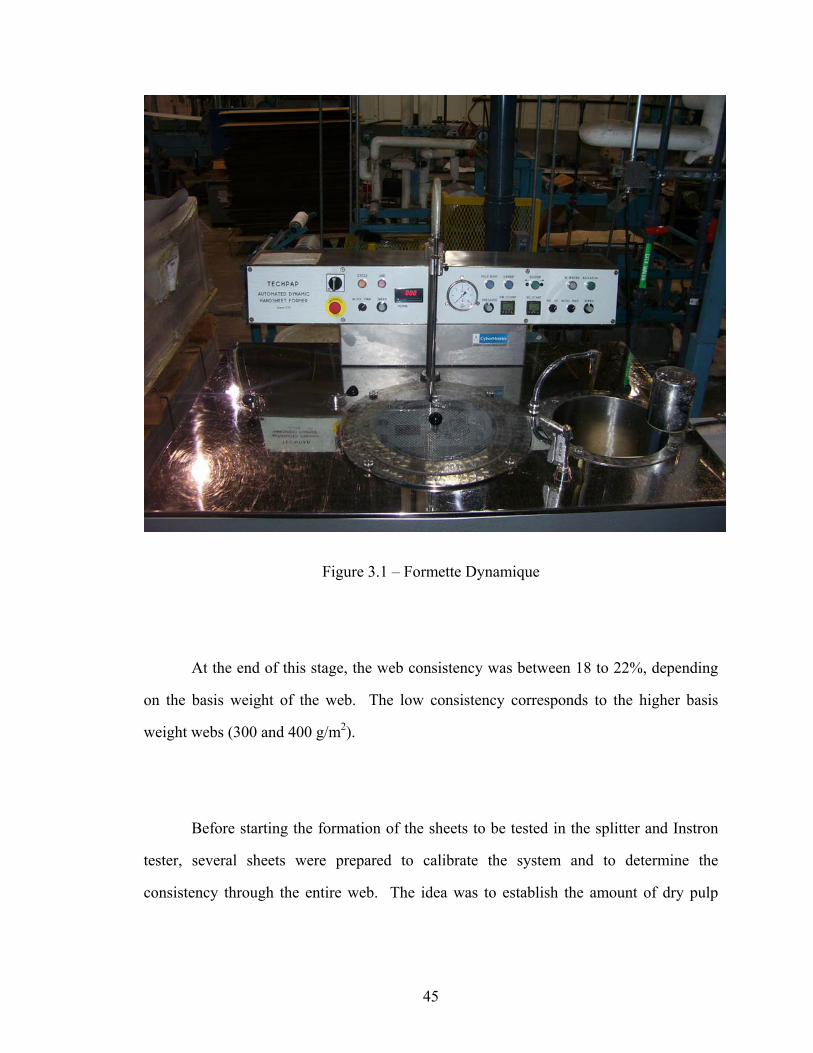
Figure 3.1 – Formette Dynamique
At the end of this stage, the web consistency was between 18 to 22%, depending
on the basis weight of the web. The low consistency corresponds to the higher basis
weight webs (300 and 400 g/m2).
Before starting the formation of the sheets to be tested in the splitter and Instron
tester, several sheets were prepared to calibrate the system and to determine the
consistency through the entire web. The idea was to establish the amount of dry pulp
45
required to form a sheet of a certain basis weight and to identify if the pulp was evenly
distributed through the whole sheet. Some problems were found and corrected.
After formation all the wet webs were trimmed to remove the wet borders. If the
web did not require any other treatment, they were stored in fully sealed plastic bags and
placed in the refrigerator until the strips formation time arrived. This process was
accomplished usually in the following two days. The paper was cut into strips 2 inches
(5.08 cm) wide by 22 inches long (55.88 cm), obtaining 12 strips per sheet. These strips
were again stored in a fully sealed plastic bag for 5 days until testing started. When
making the sheets, samples were taken to measure the basis weight content of each sheet.
Web Pressing
As previously stated, the consistency going out from the forming section can be as
low as 18%. When a web with such a low consistency is pressed, the web can be
severely damaged and ribbing problems can appear. To avoid this, all the sheets were
subjected to a preliminary pressing step. During this intermediate step, the web was
placed between two blotter papers and with the help of a manually operated roll pressure
was applied to dewater the sheet even more. The procedure was repeated, using new dry
blotter papers each time, until no more water was removed from the wet web. At this
time the paper could go safely through the pressing stage.
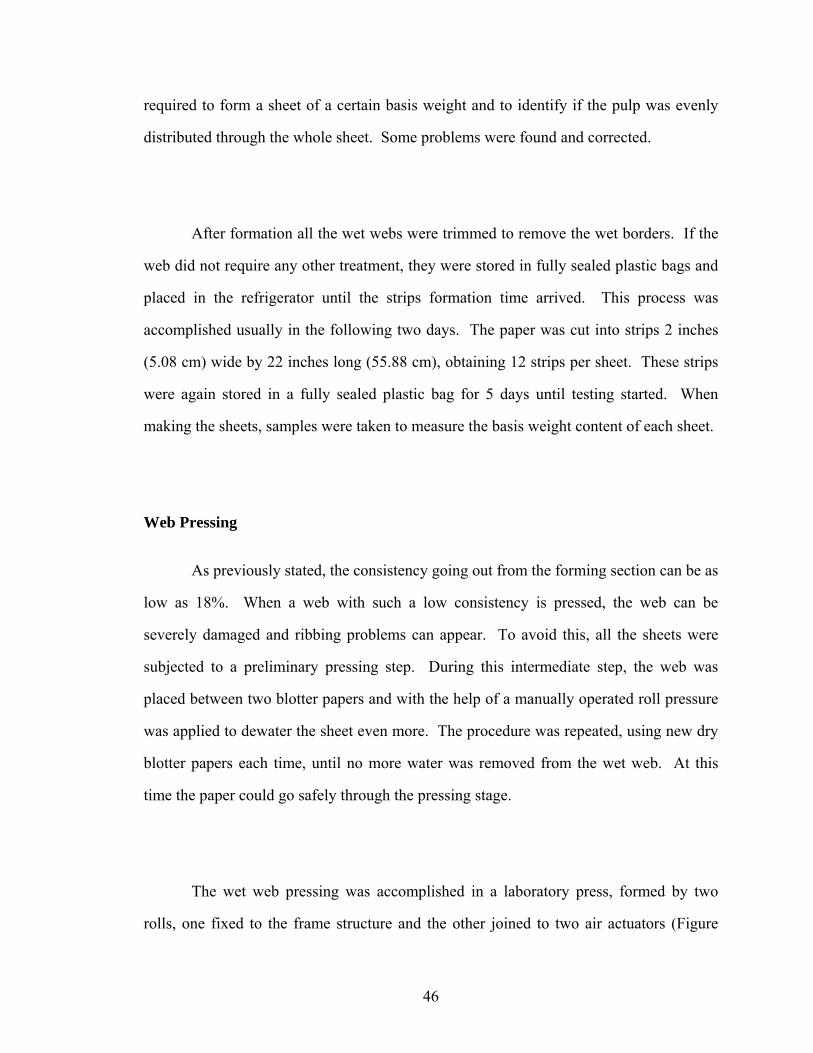
The wet web pressing was accomplished in a laboratory press, formed by two
rolls, one fixed to the frame structure and the other joined to two air actuators (Figure
46
3.2). The air pressure applied to the actuators was always the same, 3 bars. To determine
the pressure effect in the wet web, two conditions were tested, the first one with only a
single press stage and the other with two press stages. In both cases blotter paper was
used as the water receiver in both sides of the sheet. The consistency obtained for the
single step case was around 38 to 42%. When the wet was pressed a second time using
new blotters, the consistency increased by 5 to 7% percentage points raising to a range
between 45 to 49% of solids content. The single step was chosen as the standard
procedure due to its close relation with the results obtained in a real paper machine.
Figure 3.2 – Lab Press
47
As was done with the formation process, several sheets were prepared to calibrate
the system and to determine the consistency at different points in the CD and MD
directions. Significant variations in consistency across the web CD were found, the
cause of them where found and corrected. If the pressed paper did not require any further
treatment, the wet webs were stored in fully sealed plastic bags and placed in the
refrigerator.
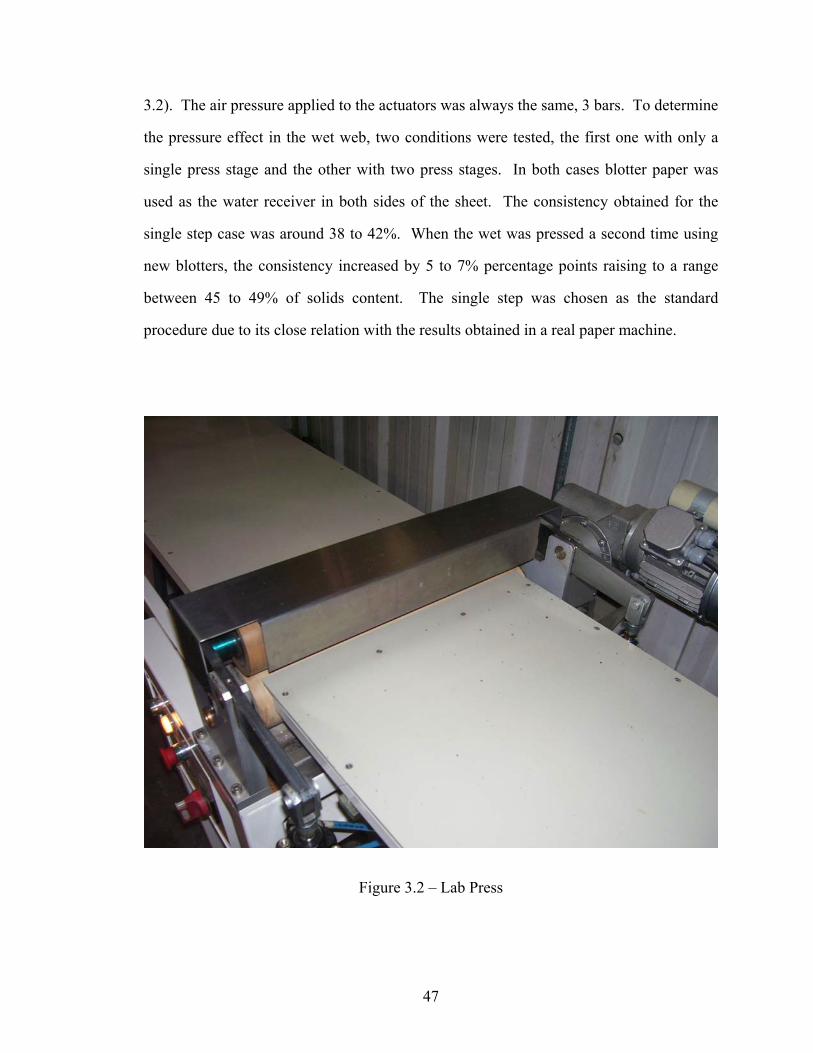
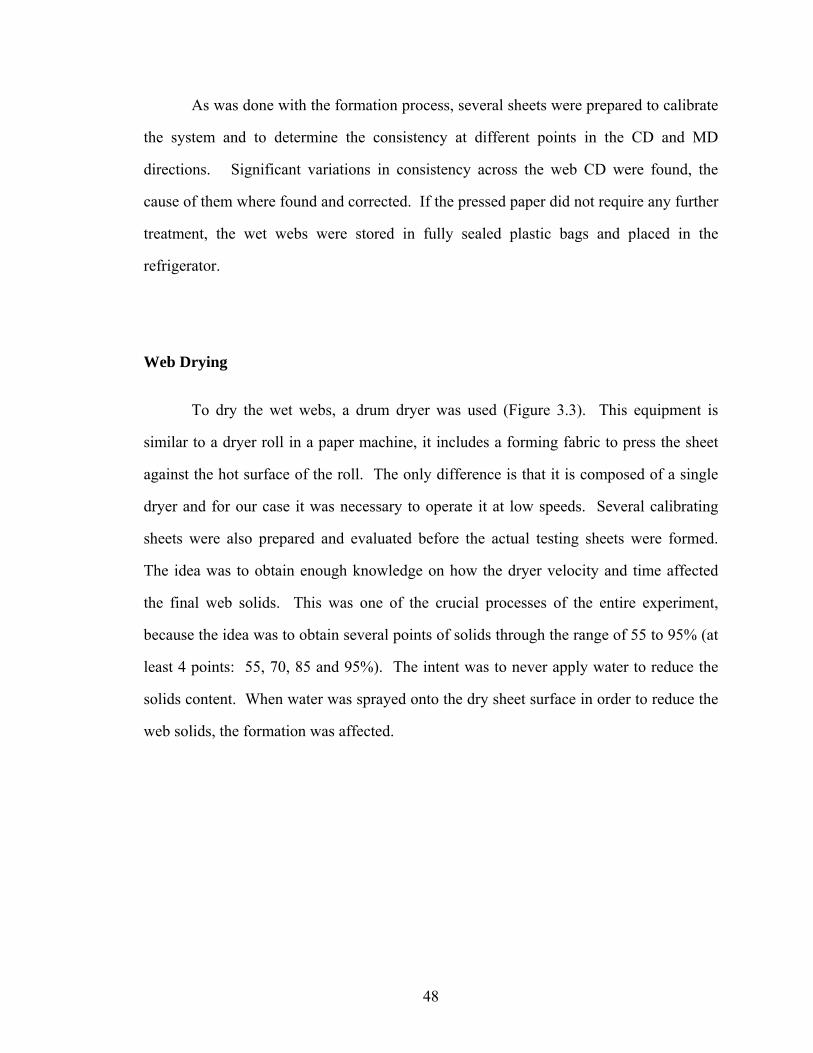
Web Drying
To dry the wet webs, a drum dryer was used (Figure 3.3). This equipment is
similar to a dryer roll in a paper machine, it includes a forming fabric to press the sheet
against the hot surface of the roll. The only difference is that it is composed of a single
dryer and for our case it was necessary to operate it at low speeds. Several calibrating
sheets were also prepared and evaluated before the actual testing sheets were formed.
The idea was to obtain enough knowledge on how the dryer velocity and time affected
the final web solids. This was one of the crucial processes of the entire experiment,
because the idea was to obtain several points of solids through the range of 55 to 95% (at
least 4 points: 55, 70, 85 and 95%). The intent was to never apply water to reduce the
solids content. When water was sprayed onto the dry sheet surface in order to reduce the
web solids, the formation was affected.
48
Figure 3.3 – Drum Dryer
After drying to the desired solids level the webs were stored in fully sealed plastic
bags and placed in the refrigerator.
Experiment Design
In total 12 cases were tested, in order to evaluate the effect of the basis weight and
the different mechanical and chemical treatments. A base case or case 1 was designed to
be used as a reference point relative to the other cases. For this case the pulp was refined
49
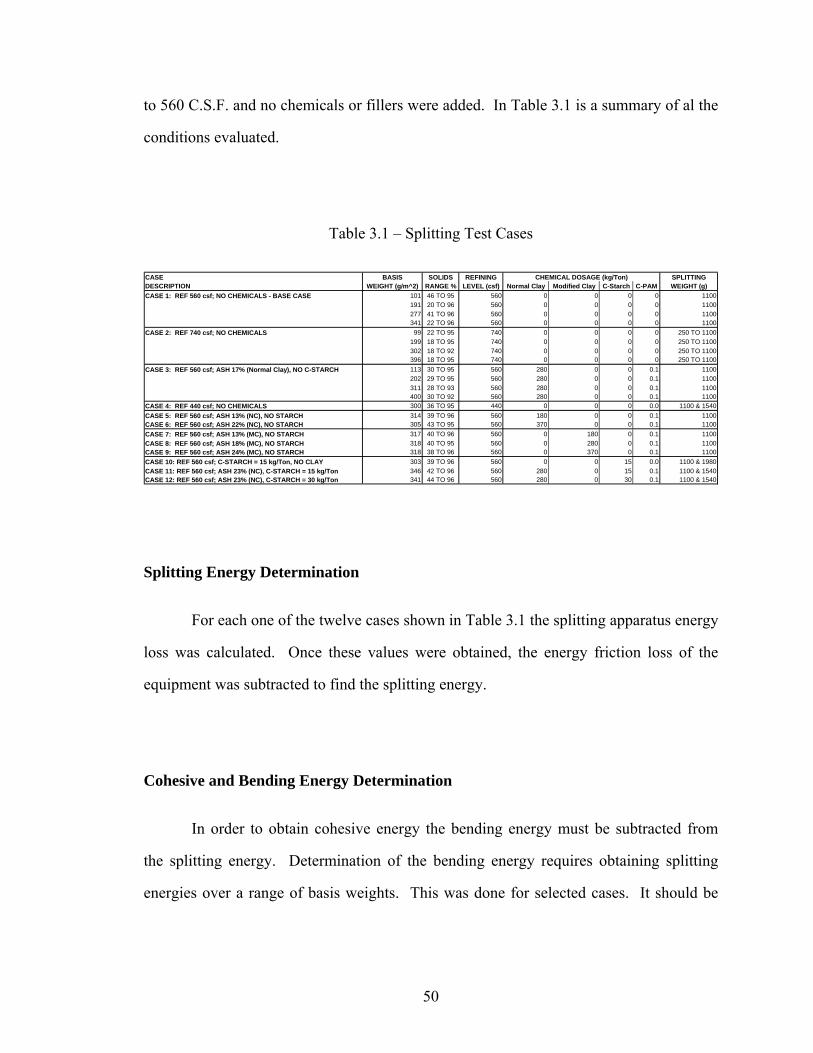
to 560 C.S.F. and no chemicals or fillers were added. In Table 3.1 is a summary of al the
conditions evaluated.
Table 3.1 – Splitting Test Cases
CASE BASIS SOLIDS REFINING SPLITTINGDESCRIPTION WEIGHT (g/m^2) RANGE % LEVEL (csf) Normal Clay Modified Clay C-Starch C-PAM WEIGHT (g)CASE 1: REF 560 csf; NO CHEMICALS - BASE CASE 101 46 TO 95 560 0 0 0 0 1100
191 20 TO 96 560 0 0 0 0 1100277 41 TO 96 560 0 0 0 0 1100341 22 TO 96 560 0 0 0 0 1100
CASE 2: REF 740 csf; NO CHEMICALS 99 22 TO 95 740 0 0 0 0 250 TO 1100199 18 TO 95 740 0 0 0 0 250 TO 1100302 18 TO 92 740 0 0 0 0 250 TO 1100396 18 TO 95 740 0 0 0 0 250 TO 1100
CASE 3: REF 560 csf; ASH 17% (Normal Clay), NO C-STARCH 113 30 TO 95 560 280 0 0 0.1 1100202 29 TO 95 560 280 0 0 0.1 1100311 28 TO 93 560 280 0 0 0.1 1100400 30 TO 92 560 280 0 0 0.1 1100
CASE 4: REF 440 csf; NO CHEMICALS 300 36 TO 95 440 0 0 0 0.0 1100 & 1540CASE 5: REF 560 csf; ASH 13% (NC), NO STARCH 314 39 TO 96 560 180 0 0 0.1 1100CASE 6: REF 560 csf; ASH 22% (NC), NO STARCH 305 43 TO 95 560 370 0 0 0.1 1100CASE 7: REF 560 csf; ASH 13% (MC), NO STARCH 317 40 TO 96 560 0 180 0 0.1 1100CASE 8: REF 560 csf; ASH 18% (MC), NO STARCH 318 40 TO 95 560 0 280 0 0.1 1100CASE 9: REF 560 csf; ASH 24% (MC), NO STARCH 318 38 TO 96 560 0 370 0 0.1 1100CASE 10: REF 560 csf; C-STARCH = 15 kg/Ton, NO CLAY 303 39 TO 96 560 0 0 15 0.0 1100 & 1980CASE 11: REF 560 csf; ASH 23% (NC), C-STARCH = 15 kg/Ton 346 42 TO 96 560 280 0 15 0.1 1100 & 1540CASE 12: REF 560 csf; ASH 23% (NC), C-STARCH = 30 kg/Ton 341 44 TO 96 560 280 0 30 0.1 1100 & 1540
CHEMICAL DOSAGE (kg/Ton)
Splitting Energy Determination
For each one of the twelve cases shown in Table 3.1 the splitting apparatus energy
loss was calculated. Once these values were obtained, the energy friction loss of the
equipment was subtracted to find the splitting energy.
Cohesive and Bending Energy Determination
In order to obtain cohesive energy the bending energy must be subtracted from
the splitting energy. Determination of the bending energy requires obtaining splitting
energies over a range of basis weights. This was done for selected cases. It should be
50

noted that cohesive energy and splitting energy are related and that trends can be
determined by examining only splitting energy.
During this part of the investigation four basis weights were chosen (100, 200,
300 and 400 g/m2), and for each basis weight different moisture content were also
prepared as shown in Table 3.1 cases 1 to 3.
The principle behind the procedure that allows dividing the splitting energy into
cohesive and bending energy is the fact that the cohesive energy is theoretically
independent on the amount of fiber per unit area of the sheet (basis weight), while the
bending energy depends on this factor. Considering this if the splitting energy versus
basis weight curve is projected to zero basis weight for different solids content (Figure
3.4), the value of the cohesive energy can be found for each case and at the same time the
bending energy can also be determined.
51
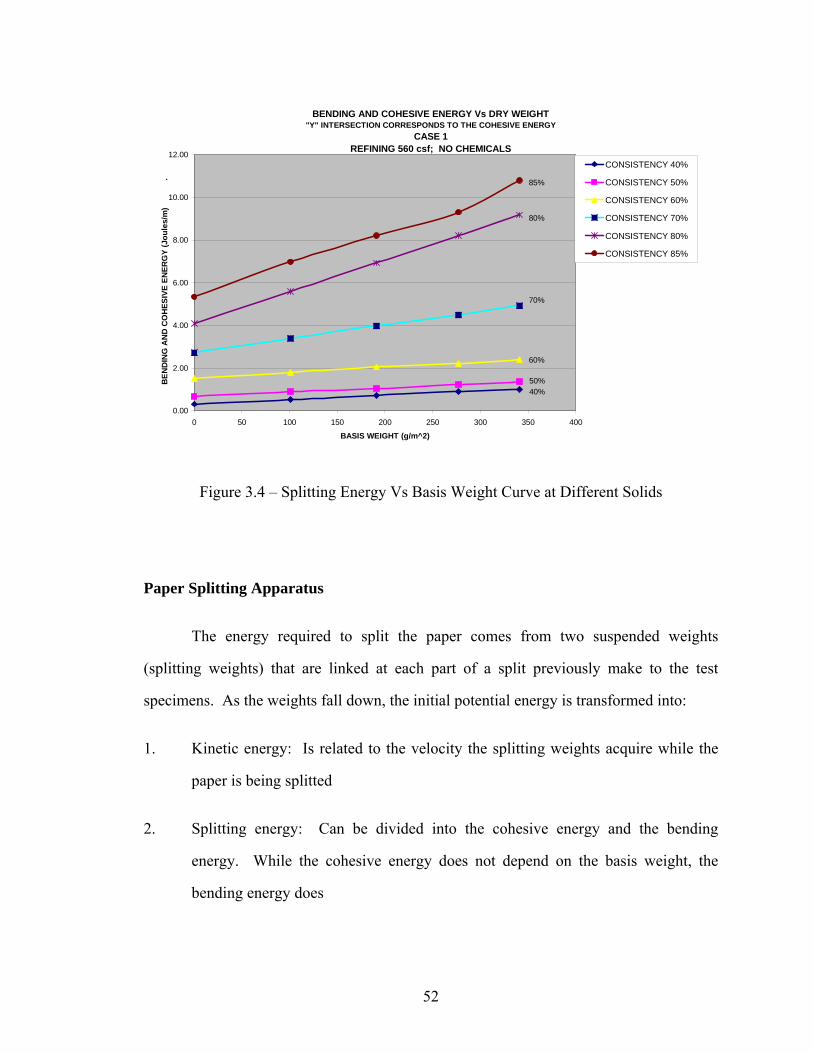
BENDING AND COHESIVE ENERGY Vs DRY WEIGHT"Y" INTERSECTION CORRESPONDS TO THE COHESIVE ENERGY
CASE 1REFINING 560 csf; NO CHEMICALS
0.00
2.00
4.00
6.00
8.00
10.00
12.00
0 50 100 150 200 250 300 350 400
BASIS WEIGHT (g/m^2)
BEN
DIN
G A
ND
CO
HES
IVE
ENER
GY
(Jou
les/
m)
.
CONSISTENCY 40%
CONSISTENCY 50%
CONSISTENCY 60%
CONSISTENCY 70%
CONSISTENCY 80%
CONSISTENCY 85%
50%
85%
80%
70%
60%
40%
Figure 3.4 – Splitting Energy Vs Basis Weight Curve at Different Solids
Paper Splitting Apparatus
The energy required to split the paper comes from two suspended weights
(splitting weights) that are linked at each part of a split previously make to the test
specimens. As the weights fall down, the initial potential energy is transformed into:
1. Kinetic energy: Is related to the velocity the splitting weights acquire while the
paper is being splitted
2. Splitting energy: Can be divided into the cohesive energy and the bending
energy. While the cohesive energy does not depend on the basis weight, the
bending energy does
52
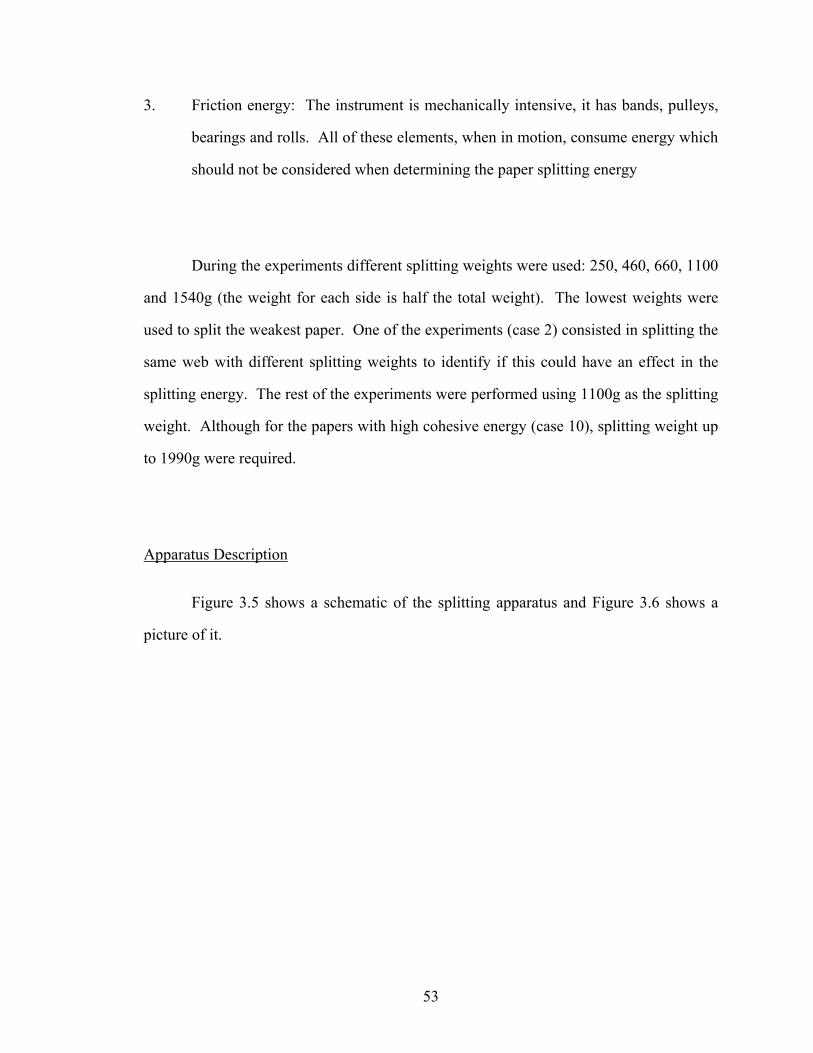
3. Friction energy: The instrument is mechanically intensive, it has bands, pulleys,
bearings and rolls. All of these elements, when in motion, consume energy which
should not be considered when determining the paper splitting energy
During the experiments different splitting weights were used: 250, 460, 660, 1100
and 1540g (the weight for each side is half the total weight). The lowest weights were
used to split the weakest paper. One of the experiments (case 2) consisted in splitting the
same web with different splitting weights to identify if this could have an effect in the
splitting energy. The rest of the experiments were performed using 1100g as the splitting
weight. Although for the papers with high cohesive energy (case 10), splitting weight up
to 1990g were required.
Apparatus Description
Figure 3.5 shows a schematic of the splitting apparatus and Figure 3.6 shows a
picture of it.
53
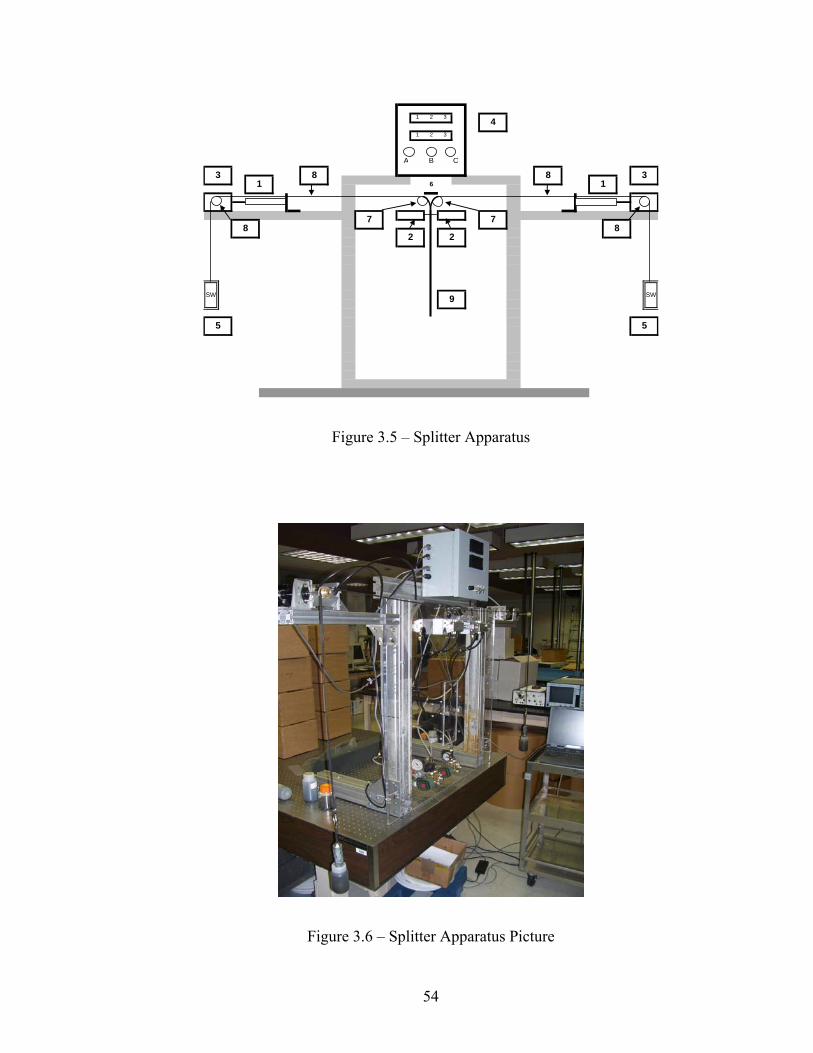
1 2 3
1 2 3
A B C
5
2
77
9
2
5
8
688
SWSW
4
13
13
8
Figure 3.5 – Splitter Apparatus
Figure 3.6 – Splitter Apparatus Picture
54
1. Pneumatic Brake Actuators: Allow the splitting weight to be released at the same
time the paper is released. These are needed for wet webs so that the sheet does
not support the splitting weights prior to the start of the test. The air pressure
supplied to the pistons is controlled by pressure regulators. Enough pressure
(around 30 Psi) is required to avoid the splitting weight movement but low
enough to avoid damage in the shaft of the rotation sensor
2. Pneumatic Sheet Actuators: Holds the paper strip prior to the start of the test.
The air pressure supplied to the pistons is controlled by pressure regulators. A
low pressure (maximum 10 Psi) is required to avoid the paper strip damage
3. Rotation Sensors: Transmit a voltage (between 1 to 5 Volts) proportional to the
velocity of the splitting weights. The information is sent to the display panel (4)
and to the data acquisition system connected to the test apparatus. The velocity
measurement is used to calculate the position of the splitting weights
4. Display Panel: Two LED displays used to displaying data from the two rotation
sensors and for calibrating the sensors. The range should be the same for both
sensors. The main power switch (A), run switch (B) and fuse (C) are located in
this panel
5. Splitting weights: Used to split the paper. The difference between the potential
energy and the kinetic energy of the weights, over the course of the test,
correspond to the energy dissipated during the test. Energy is dissipated in three
ways. (1) overcoming the cohesive energy of the sheet, (2) bending the sheet 90º,
and (3) friction losses
55
6. Clamps Support: Used to attach the clips (that hold the paper during the splitting
test) during the set up of the experiment
7. Wet Web Supporting Rolls: Once the clips hold each part of the initially split
paper and if the wet web has solids bellow 30% the supporting rolls help to
support the clips and avoid the paper rupture, due to the clip and band weights.
When the test starts, the supporting rolls support the wet web (consistencies
below 50%) and help to obtain a splitting angle of 90º. For higher consistencies
the rolls are not used
8. Band and Geared Pulley: Links the paper strip with the splitting weight and
transmit angular velocity to the sensor
9. Paper Test Sample: Paper strip is previously pre-split at one end and then inserted
in the machine to perform the splitting test
Strip Samples Preparation
In each test case ten samples were prepared to be split in the apparatus. It is
necessary to make a pre-split at one end of the strip, so the clips can be attached to that
end of the strip. The split extends for approximately one inch of the total length of the
strip. The pre-split was made using a razorblade to cut the strip in the plane of the paper
as shown by the arrow in Figure 3.7. For wet webs this can be easily performed. For dry
sheets it is necessary to wet the tip of the strip, in this condition the web expands in
thickness and the cohesive energy of the sheet is reduced dramatically, allowing the
procedure to be easy performed. Any excess of water was removed to avoid its
propagation through the web. In this way two pieces of almost identical thickness can be
obtained.
56
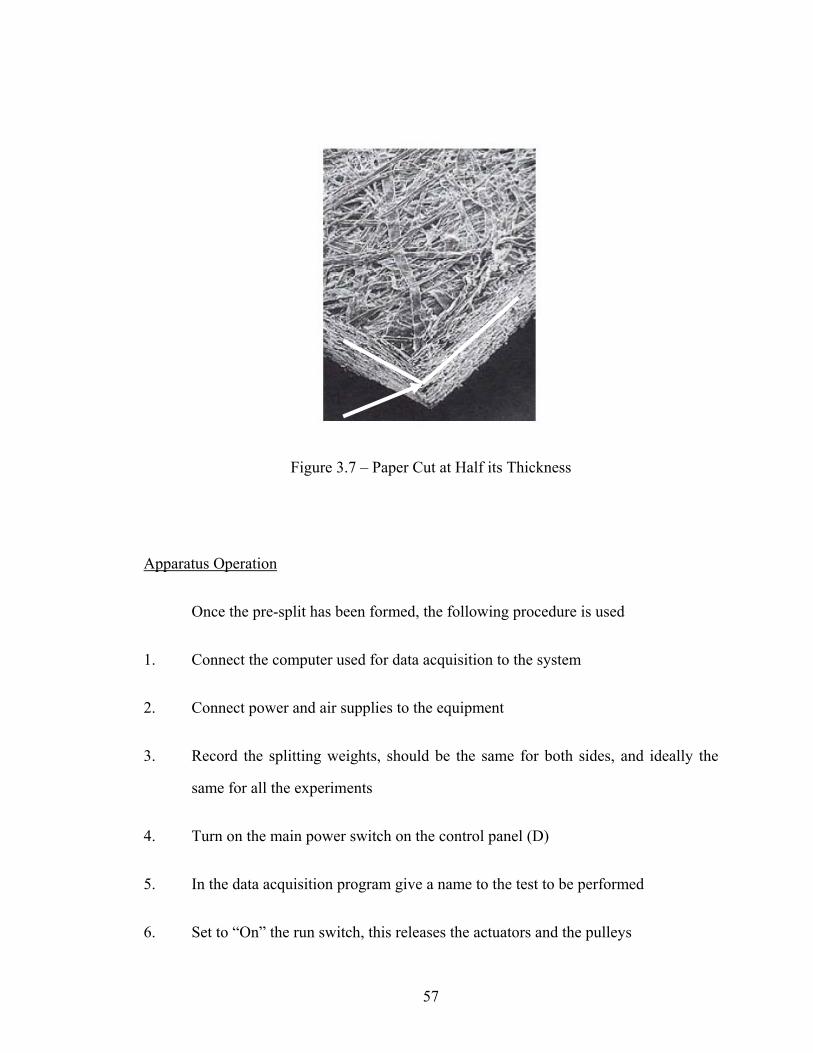
Figure 3.7 – Paper Cut at Half its Thickness
Apparatus Operation
Once the pre-split has been formed, the following procedure is used
1. Connect the computer used for data acquisition to the system
2. Connect power and air supplies to the equipment
3. Record the splitting weights, should be the same for both sides, and ideally the
same for all the experiments
4. Turn on the main power switch on the control panel (D)
5. In the data acquisition program give a name to the test to be performed
6. Set to “On” the run switch, this releases the actuators and the pulleys
57
7. Place the belts that connect the splitting weights to the paper over the geared
pulley that is on the rotation sensor shaft. Clip the bands clamp to the clamp
support (Figure 3.8)
8. Insert the test sample with the wire side facing to the right and protruding from
the pneumatic clamps long enough to be able to reach the top of each of the
supporting rolls (Figure 3.8)
9. While holding the sample strip, turn the run switch to “Off”, be careful with your
fingers. At this moment the sheet is held in position by the actuators (Figure 3.8)
10. Connect the clamps to the split tops of the test strip (Figure 3.8)
11. Adjust the band so enough tension is applied to the web, without breaking it
12. Set the data acquisition system to start recording when a high signal is seen on the
run switch
13. Switch the run button to “On” to start the experiment and start recording data
14. When the test is complete, remove the pieces of paper from the clamps and return
to step 5
In Figure 3.8 the following parts can be identified:
1. Clamp support
2. Clamps to hold the paper strip
3. Supporting rolls
58
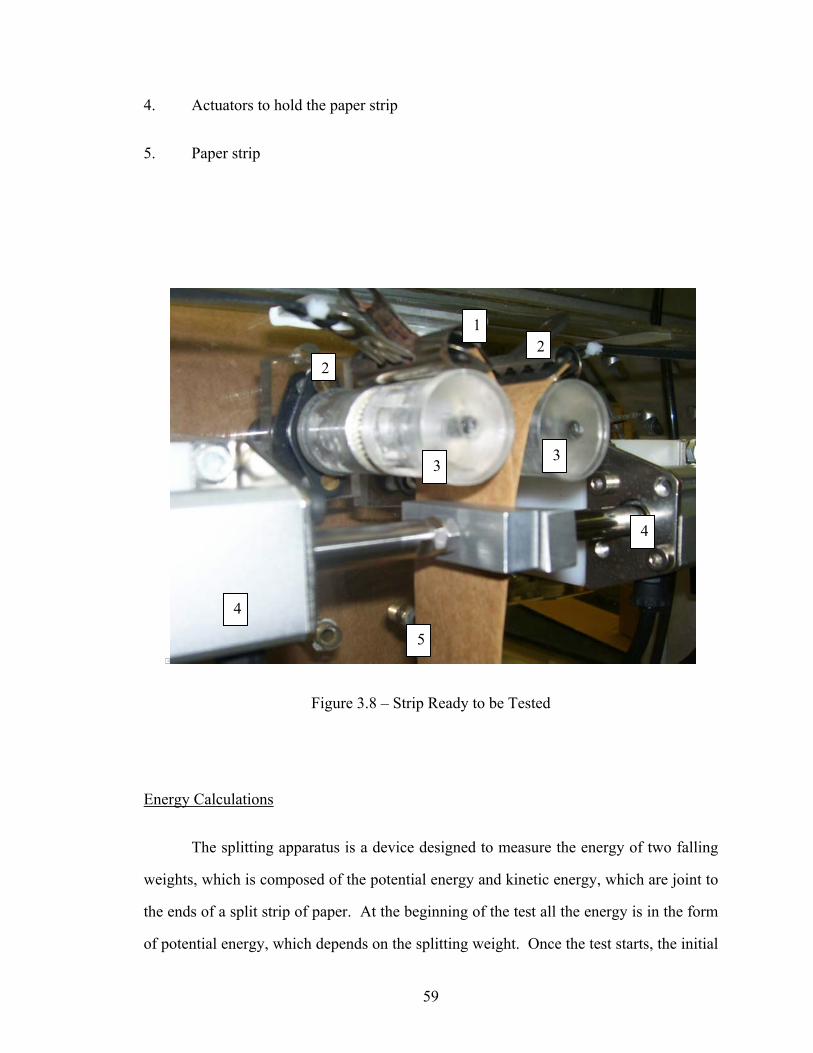
4. Actuators to hold the paper strip
5. Paper strip
4
21
2
3
4
4
3
5
Figure 3.8 – Strip Ready to be Tested
Energy Calculations
The splitting apparatus is a device designed to measure the energy of two falling
weights, which is composed of the potential energy and kinetic energy, which are joint to
the ends of a split strip of paper. At the beginning of the test all the energy is in the form
of potential energy, which depends on the splitting weight. Once the test starts, the initial
59
potential energy is transformed into kinetic energy and the energy consumed by the
apparatus. During the test, the splitting weights start to fall and their velocity increases
from 0 at the beginning to some value during the test. The kinetic energy can be
calculated because the splitting weight velocity can be measured. The splitting weight
velocity also allows calculation of the position of the weights during the experiment and
then the potential energy associated with this position. The difference of these energies is
the energy required to run the apparatus. This energy is composed of the friction energy
associated with the mechanical devices and the energy required to split the web. Finally
the energy required to split the web is also composed by the cohesive or internal energy
of the paper and the energy required to bend the paper strip. All the energies are in the
form of Joules per meter.
The equations that govern the apparatus operation are:
Potential Energy(initial) = Potential Energyt + Kinetic Energyt + Apparatus Energy Losst
3.1
Apparatus Energy Loss = Friction Energy + Splitting Energy 3.2
Splitting Energy = Cohesive Energy + Bending Energy 3.3
Equation 3.1 can be restated as
mghi = mght + (½)mVt2 + Apparatus Energy Losst 3.4
Where: hi = initial height of the splitting weights, [m]
ht = height at time t, [m]
m = total splitting weight, [kg]
60
Vt = mean velocity of the splitting weights at time
t, [m/s]
Taking hi to be the origin of the system, the equation 3.4 can be written as
Apparatus Energy Loss = - mght - (½)mVt2 3.5
Considering that ht will always be negative, the equation can finally be written as
Apparatus Energy Loss = m(ght - (½)Vt2) 3.6
Apparatus Mechanical Losses
The splitting apparatus has several mechanical components which consume
energy during the test procedure. Two main systems can be identified, the rotational
sensor system, items 3 and 8 in Figure 3.5, and the supporting rolls, item 7 in Figure 3.5.
Several components interact during this process. The band that links the splitting weight
with the splitting paper and moves over the geared pulley. The geared pulley is mounted
in a shaft that transmits the angular velocity to the rotation sensor. This shaft is
supported between to sets of bearings and connected to the rotation sensor through a
coupling. In Figure 3.9 the following parts can be identified.
1. Rotation sensor
2. Flexible coupling
3. Pulley shaft
4. Geared pulley
5. Band
61
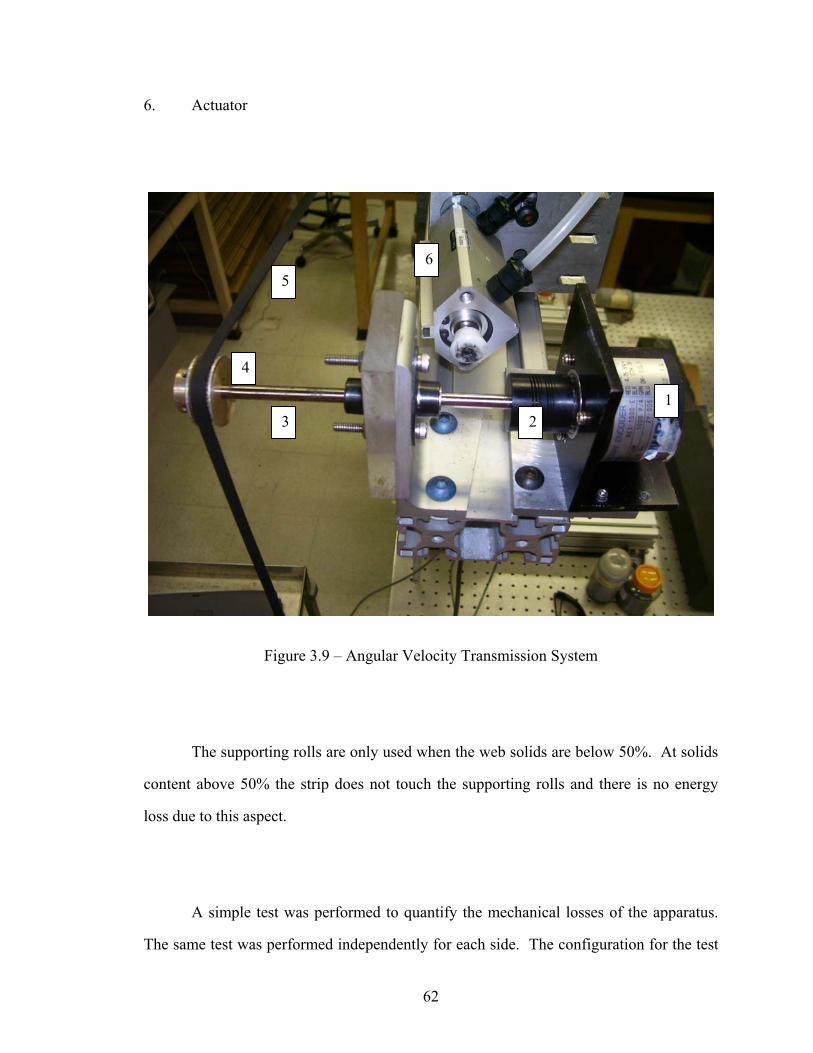
6. Actuator
65
4
13 2
Figure 3.9 – Angular Velocity Transmission System
The supporting rolls are only used when the web solids are below 50%. At solids
content above 50% the strip does not touch the supporting rolls and there is no energy
loss due to this aspect.
A simple test was performed to quantify the mechanical losses of the apparatus.
The same test was performed independently for each side. The configuration for the test
62
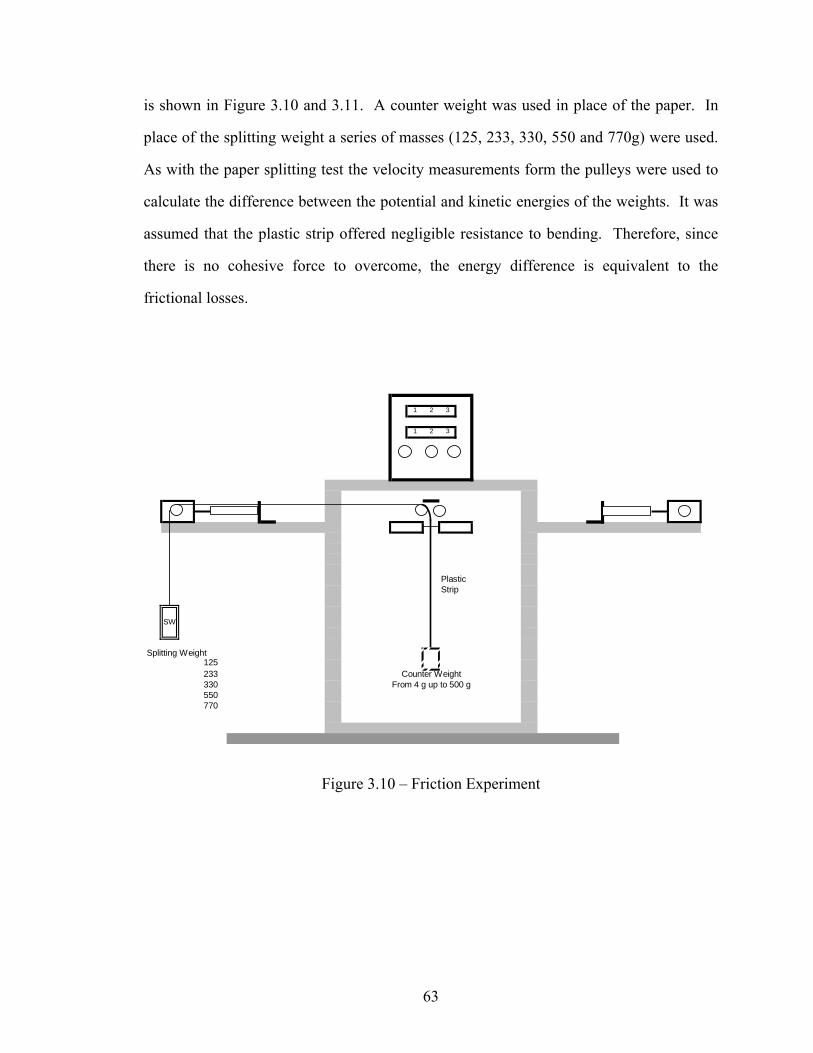
is shown in Figure 3.10 and 3.11. A counter weight was used in place of the paper. In
place of the splitting weight a series of masses (125, 233, 330, 550 and 770g) were used.
As with the paper splitting test the velocity measurements form the pulleys were used to
calculate the difference between the potential and kinetic energies of the weights. It was
assumed that the plastic strip offered negligible resistance to bending. Therefore, since
there is no cohesive force to overcome, the energy difference is equivalent to the
frictional losses.
1 2 3
1 2 3
PlasticStrip
Splitting Weight
SW
Counter Weight125233330550770
From 4 g up to 500 g
Figure 3.10 – Friction Experiment
63
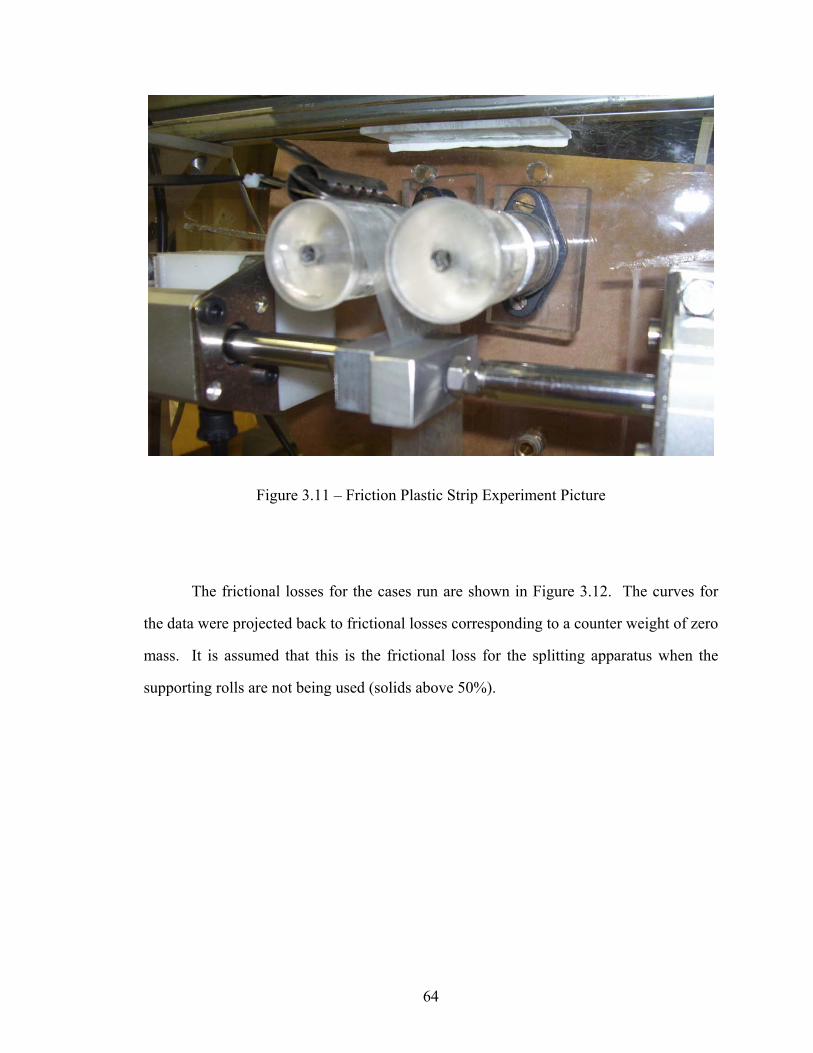
Figure 3.11 – Friction Plastic Strip Experiment Picture
The frictional losses for the cases run are shown in Figure 3.12. The curves for
the data were projected back to frictional losses corresponding to a counter weight of zero
mass. It is assumed that this is the frictional loss for the splitting apparatus when the
supporting rolls are not being used (solids above 50%).
64
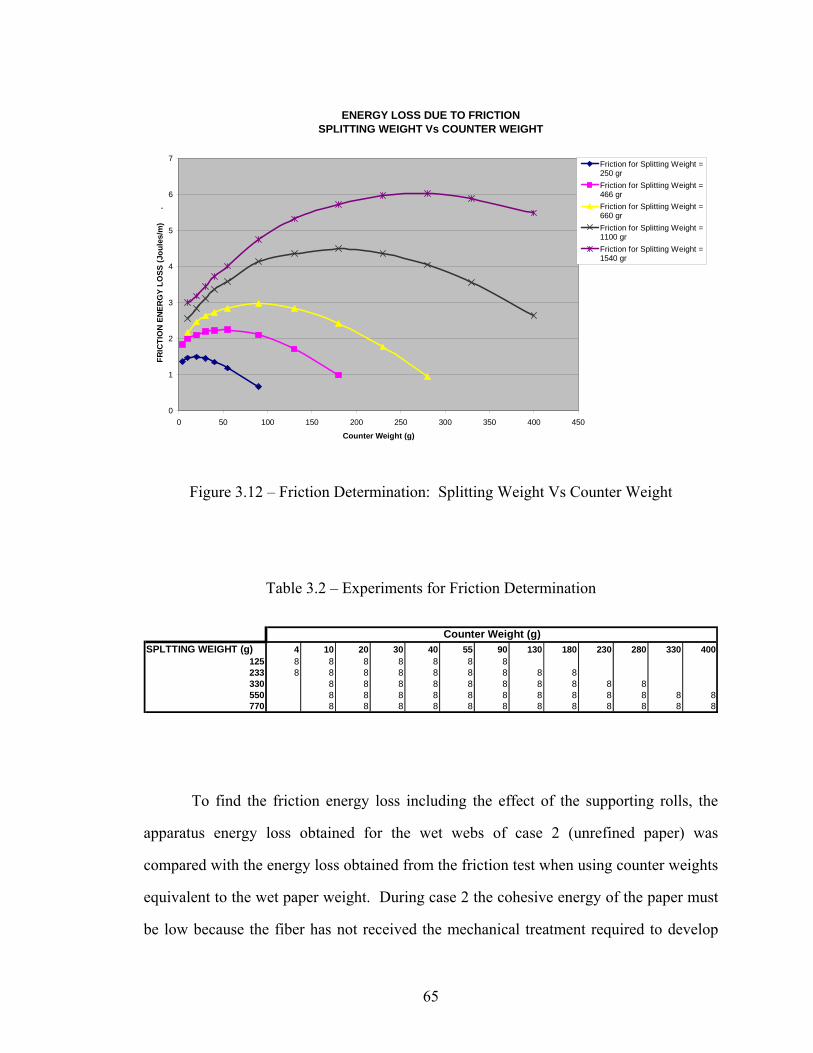
ENERGY LOSS DUE TO FRICTIONSPLITTING WEIGHT Vs COUNTER WEIGHT
0
1
2
3
4
5
6
7
0 50 100 150 200 250 300 350 400 450
Counter Weight (g)
FRIC
TIO
N E
NER
GY
LOSS
(Jou
les/
m)
.
Friction for Splitting Weight =250 grFriction for Splitting Weight =466 grFriction for Splitting Weight =660 grFriction for Splitting Weight =1100 grFriction for Splitting Weight =1540 gr
Figure 3.12 – Friction Determination: Splitting Weight Vs Counter Weight
Table 3.2 – Experiments for Friction Determination
SPLTTING WEIGHT (g) 4 10 20 30 40 55 90 130 180 230 280 330 400125 8 8 8 8 8 8 8233 8 8 8 8 8 8 8 8 8330 8 8 8 8 8 8 8 8 8 8550 8 8 8 8 8 8 8 8 8 8 8 8770 8 8 8 8 8 8 8 8 8 8 8 8
Counter Weight (g)
To find the friction energy loss including the effect of the supporting rolls, the
apparatus energy loss obtained for the wet webs of case 2 (unrefined paper) was
compared with the energy loss obtained from the friction test when using counter weights
equivalent to the wet paper weight. During case 2 the cohesive energy of the paper must
be low because the fiber has not received the mechanical treatment required to develop
65
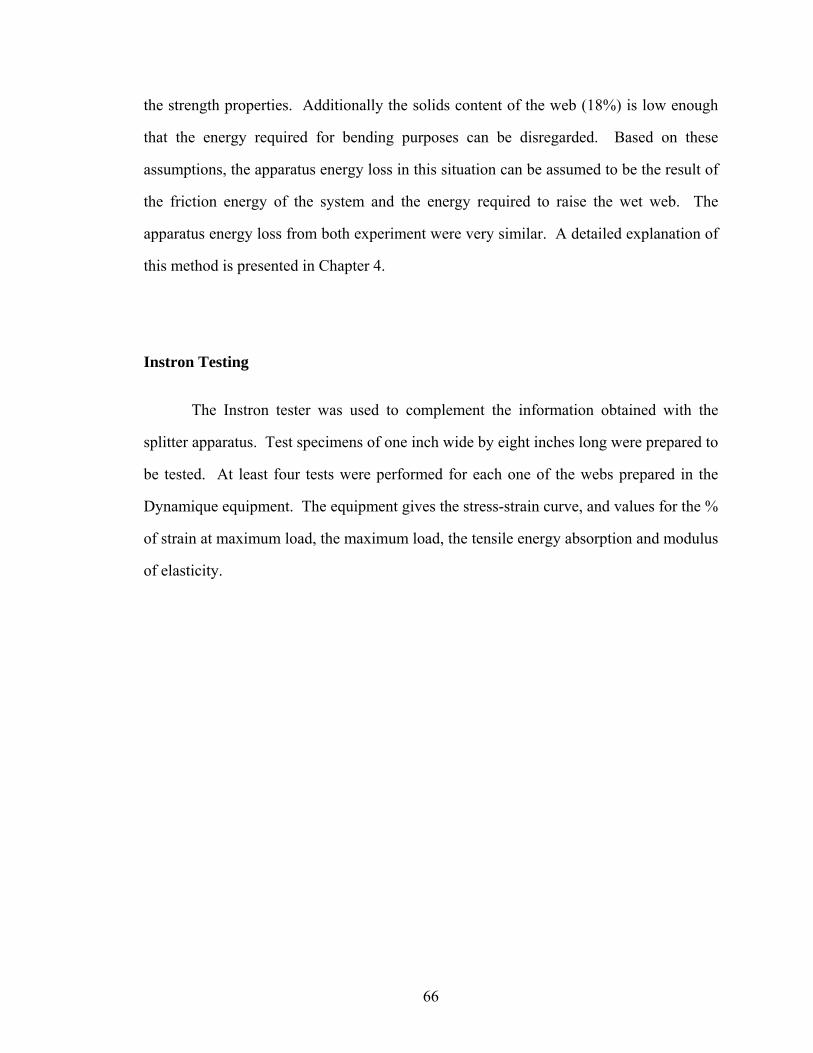
the strength properties. Additionally the solids content of the web (18%) is low enough
that the energy required for bending purposes can be disregarded. Based on these
assumptions, the apparatus energy loss in this situation can be assumed to be the result of
the friction energy of the system and the energy required to raise the wet web. The
apparatus energy loss from both experiment were very similar. A detailed explanation of
this method is presented in Chapter 4.
Instron Testing
The Instron tester was used to complement the information obtained with the
splitter apparatus. Test specimens of one inch wide by eight inches long were prepared to
be tested. At least four tests were performed for each one of the webs prepared in the
Dynamique equipment. The equipment gives the stress-strain curve, and values for the %
of strain at maximum load, the maximum load, the tensile energy absorption and modulus
of elasticity.
66
CHAPTER 4
RESULTS AND DISCUSSION
Introduction
The two primary pieces of experimental equipment used in this study were the
splitter apparatus and the Instron tester. Experiments were designed in order to obtain the
friction energy loss of the splitter apparatus, the variation of the web splitting energy with
solids content when different mechanical and chemical treatments are used, the cohesive
and bending energy variation with the web solids content and the usual tensile and strain
properties obtained from the Instron instrument.
In section two of this chapter the testing and analysis methodology is presented.
The procedure used to obtain the apparatus energy loss versus distance graphs (the basis
for all results obtained from the apparatus) is explained as well as the most important
considerations taken into account in analyzing the results. The data is presented for all
the cases evaluated with the splitter apparatus and the Instron tester. Finally an
explanation on how the information obtained from the apparatus energy loss graph can be
used to make the splitting energy versus solids graph for the different cases is discussed.
67
In the third part of this chapter the details of the method used to calculate the
apparatus friction energy loss is presented. The apparatus was divided in the left and
right sides and for each side two main sources of friction were identified, the loss due to
the angular velocity transmission and the loss due to the supporting rolls. This loss was
subtracted from the apparatus energy loss to obtain the splitting energy of the paper.
The method used to determine the splitting energy for all the cases is presented in
section four. The effect of the different mechanical and chemical treatments on the
splitting energy with the solids variation is also presented. The results are compared
against a base case.
Section five presents the results for splitting energy calculated with the apparatus.
This energy is composed of the cohesive energy and the bending energy of the paper.
The method used to find the cohesive and bending energy variation against the solids is
also presented along with the results obtained for selected cases.
To support the data obtained with the splitter tester standard tensile tests were
performed on paper samples from all the cases studied. The tensile test provides tensile
strength and strain at maximum load, the information related to this test is presented in
section six.
68
Finally section seven compares the results from the splitter apparatus and Instron
instrument, graphs of the cohesive strength index and the tensile strength index are
provided for selected cases. According to the Page equation for wet web tensile strength
there should be a linear relation between both indices. As an additional source to validate
the splitter apparatus results, the Osterberg equations developed to model the web
behavior when pulled from a solid surface were used. The apparatus offers data for all
the variables required on the equation except strain, so the equations were solved for the
strain and its value was compared to that obtained from the Instron tests.
Testing and Analysis Methodology
The splitting apparatus allows the determination of the energy (Joules) required to
split a strip of paper under a wide range of conditions. This information is obtained by
recording the time, the velocity of the crack propagation (velocity of falling splitting
weight) and calculating the distance traveled by the splitting weights which corresponds
to the crack propagation distance through the strip. With this information the behavior of
the splitting paper can be described in terms of the energy expended in splitting the sheet.
The base graph produced in the experiments is the apparatus energy loss versus
distance graph, presented in Figure 4.1.
69
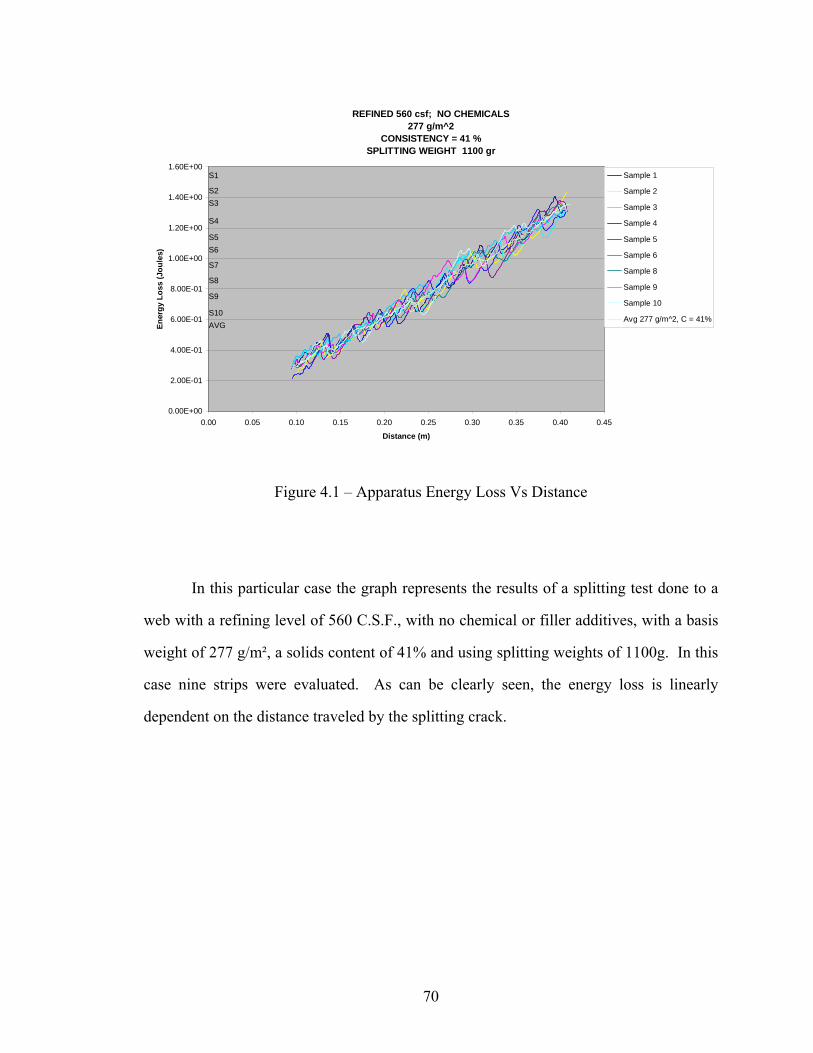
REFINED 560 csf; NO CHEMICALS277 g/m^2
CONSISTENCY = 41 %SPLITTING WEIGHT 1100 gr
0.00E+00
2.00E-01
4.00E-01
6.00E-01
8.00E-01
1.00E+00
1.20E+00
1.40E+00
1.60E+00
0.00 0.05 0.10 0.15 0.20 0.25 0.30 0.35 0.40 0.45
Distance (m)
Ener
gy L
oss
(Jou
les)
Sample 1
Sample 2
Sample 3
Sample 4
Sample 5
Sample 6
Sample 8
Sample 9
Sample 10
Avg 277 g/m^2, C = 41%
S1
AVGS10
S9
S8
S7
S6S5
S4
S3S2
Figure 4.1 – Apparatus Energy Loss Vs Distance
In this particular case the graph represents the results of a splitting test done to a
web with a refining level of 560 C.S.F., with no chemical or filler additives, with a basis
weight of 277 g/m², a solids content of 41% and using splitting weights of 1100g. In this
case nine strips were evaluated. As can be clearly seen, the energy loss is linearly
dependent on the distance traveled by the splitting crack.
70
The two main sources of energy consumption are the friction loss and the energy
required to split the paper. The effect of the splitting weights, the angular velocity
transmission system and the supporting rolls, the elements contributing to friction, do not
change during the test so the friction will be the same. Additionally a well formed web
will have the same properties at all points along the strip, so no change in splitting energy
should occur.
It is important to emphasize that the splitting weights should offer the system
enough energy to overcome the energy consumed by friction and by splitting. If there is
not enough energy stored, the splitting process will start (in some cases with too low
energy the process can not start) but the velocity of the crack propagation will go down
until the process stops. In this case the results obtained are not reliable.
Another important factor to consider is the low strength of strips with low solids
content (below 20%). When the web is too weak it can not support the tension applied
when the samples are clamped to the splitting weights, even though the tension is low due
to the action of the pneumatic break actuators (element 1 in Figure 3.5). In some cases
the weight of the clamp is enough to break the strip.
71
During the splitting test, to eliminate any external noise that could affect the
results associated with the initial and final part of the procedure, only the data that were
produced between distances of 0.1 m to 0.4 m were recorded. The system can collect
data from a distance corresponding to 0.0 m and up to the strip longitude that was around
0.5 m. Disregarding the first and last 0.1 m gives confidence that the data collected
corresponds to the time when the paper was being split.
Since there is a linear dependence between the energy losses during the
experiment, and the crack propagation distance, a linear trend line was fit to the data
obtained from each sample. The slope of the trend lines represents the apparatus energy
loss per unit distance in Joules per meter. Figure 4.2 shows the results for the data shown
in Figure 4.1. Table 4.1 presents the equations for the trend lines and the corresponding
R2 values.
72
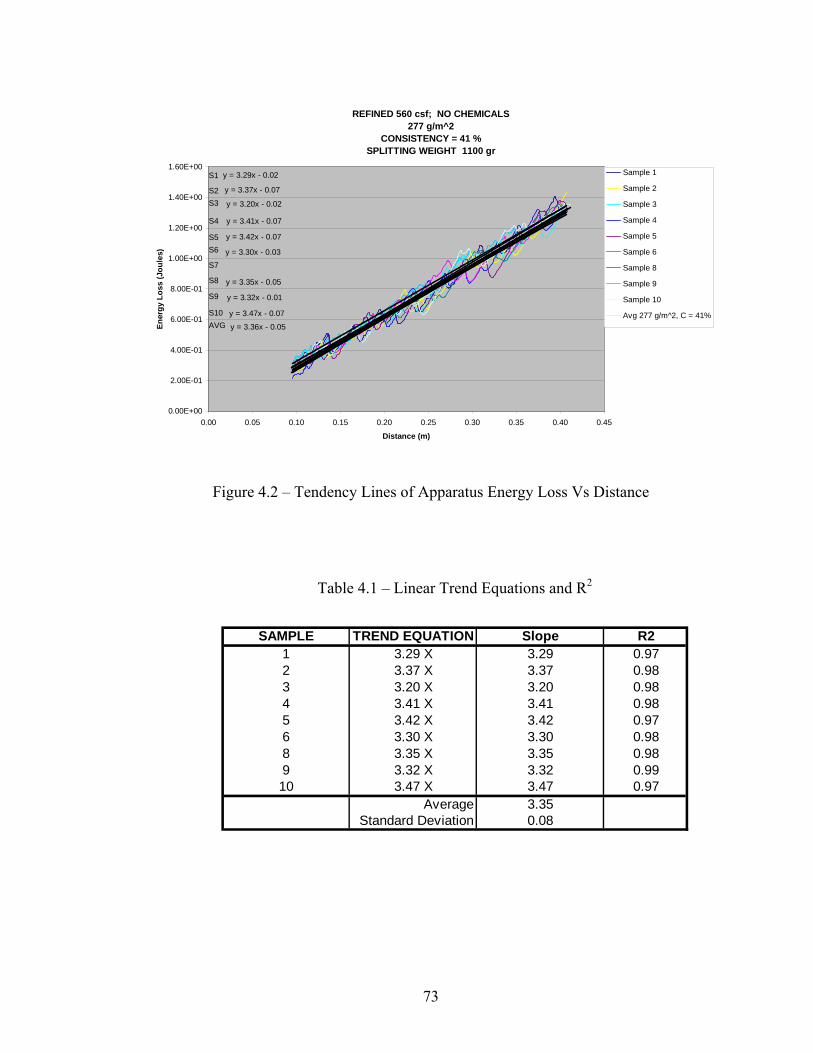
REFINED 560 csf; NO CHEMICALS277 g/m^2
CONSISTENCY = 41 %SPLITTING WEIGHT 1100 gr
y = 3.29x - 0.02
y = 3.37x - 0.07
y = 3.20x - 0.02
y = 3.41x - 0.07
y = 3.42x - 0.07
y = 3.30x - 0.03
y = 3.35x - 0.05
y = 3.32x - 0.01
y = 3.47x - 0.07
y = 3.36x - 0.05
0.00E+00
2.00E-01
4.00E-01
6.00E-01
8.00E-01
1.00E+00
1.20E+00
1.40E+00
1.60E+00
0.00 0.05 0.10 0.15 0.20 0.25 0.30 0.35 0.40 0.45
Distance (m)
Ener
gy L
oss
(Jou
les)
Sample 1
Sample 2
Sample 3
Sample 4
Sample 5
Sample 6
Sample 8
Sample 9
Sample 10
Avg 277 g/m^2, C = 41%
S1
AVGS10
S9
S8
S7
S6S5
S4
S3S2
Figure 4.2 – Tendency Lines of Apparatus Energy Loss Vs Distance
Table 4.1 – Linear Trend Equations and R2
SAMPLE TREND EQUATION Slope R21 3.29 X 3.29 0.972 3.37 X 3.37 0.983 3.20 X 3.20 0.984 3.41 X 3.41 0.985 3.42 X 3.42 0.976 3.30 X 3.30 0.988 3.35 X 3.35 0.989 3.32 X 3.32 0.9910 3.47 X 3.47 0.97
Average 3.35Standard Deviation 0.08
73
In Table 4.1 it can be seen that the slope dispersion is low which allows us to
conclude that the reproducibility of the test is high. The mean value is 3.35 J/m, the
highest value is 3.47 J/m and the lowest value is 3.20 J/m, the standard deviation is 0.08.
The same procedure was applied to all the cases shown in Table 4.2. It is to be
noted that the base case or case 1, serves as the comparison case for the rest of the results.
This case was made with pulp refined to 560 C.S.F. and with no chemicals or filler
addition. With the data obtained from cases 1, 2 and 3 it was possible to determine the
cohesive and bending energy, with the rest of the cases only the splitting energy was
obtained. In Table 4.3 are the results for the apparatus energy loss mean value and
standard deviation for case 1. The apparatus energy loss versus distance graphs for cases
1 to 3 are presented in Appendix A.1. The apparatus energy loss versus distance graphs
for cases 4 to 12 are presented in Appendix B.1. The mean and standard deviation for the
apparatus energy loss as well as the friction energy loss and the splitting energy are
provided in Appendix C for all the cases.
Almost all the experiments were performed using a total splitting weight of
1100g. One exception was the tests performed to the unrefined pulp (case 2) that helped
to determine the friction energy loss of the instrument for wet webs, during this
conditions several splitting weights between 250 and 1100g were used. The other
exception was when performing the experiment for the higher solids content webs (above
85%) in the cases were the pulp was highly refined and when starch was added to the
furnish. In these cases 1100g of splitting weight could not split the paper, so the splitting
weight was increased to 1540g and even to 1980g for the case when the starch was the
only chemical added, this case corresponds to the strongest web made.
74
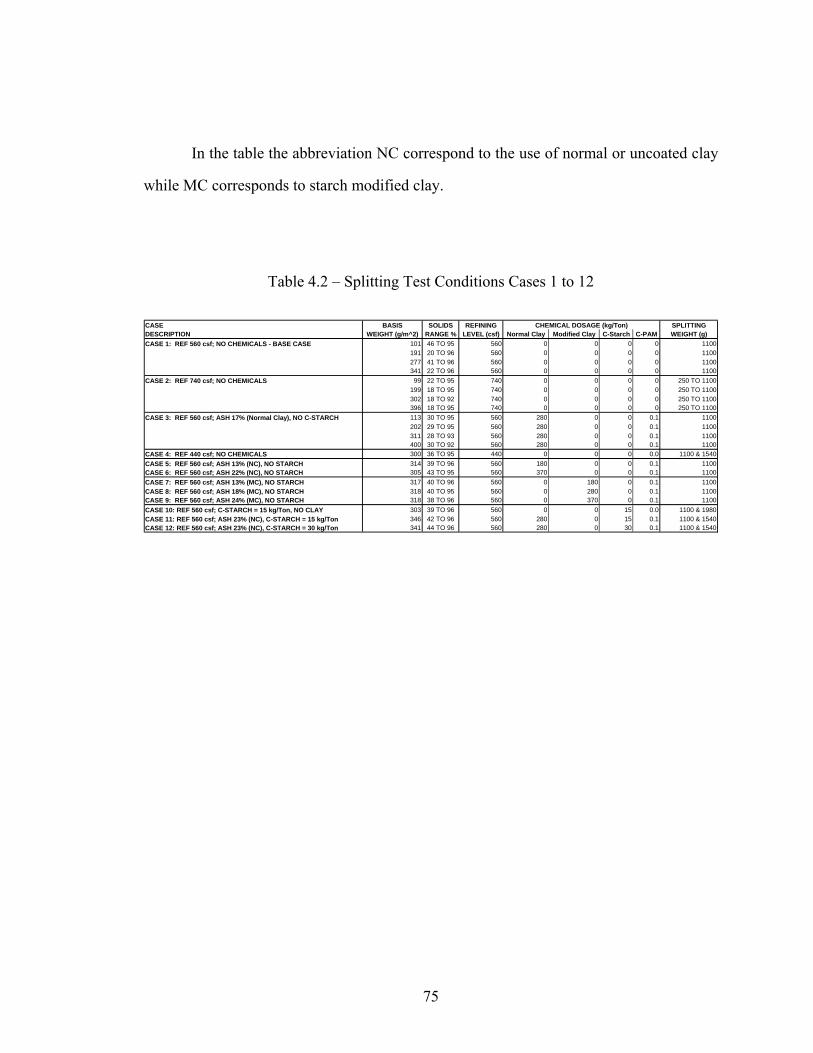
In the table the abbreviation NC correspond to the use of normal or uncoated clay
while MC corresponds to starch modified clay.
Table 4.2 – Splitting Test Conditions Cases 1 to 12
CASE BASIS SOLIDS REFINING SPLITTINGDESCRIPTION WEIGHT (g/m^2) RANGE % LEVEL (csf) Normal Clay Modified Clay C-Starch C-PAM WEIGHT (g)CASE 1: REF 560 csf; NO CHEMICALS - BASE CASE 101 46 TO 95 560 0 0 0 0 1100
191 20 TO 96 560 0 0 0 0 1100277 41 TO 96 560 0 0 0 0 1100341 22 TO 96 560 0 0 0 0 1100
CASE 2: REF 740 csf; NO CHEMICALS 99 22 TO 95 740 0 0 0 0 250 TO 1100199 18 TO 95 740 0 0 0 0 250 TO 1100302 18 TO 92 740 0 0 0 0 250 TO 1100396 18 TO 95 740 0 0 0 0 250 TO 1100
CASE 3: REF 560 csf; ASH 17% (Normal Clay), NO C-STARCH 113 30 TO 95 560 280 0 0 0.1 1100202 29 TO 95 560 280 0 0 0.1 1100311 28 TO 93 560 280 0 0 0.1 1100400 30 TO 92 560 280 0 0 0.1 1100
CASE 4: REF 440 csf; NO CHEMICALS 300 36 TO 95 440 0 0 0 0.0 1100 & 1540CASE 5: REF 560 csf; ASH 13% (NC), NO STARCH 314 39 TO 96 560 180 0 0 0.1 1100CASE 6: REF 560 csf; ASH 22% (NC), NO STARCH 305 43 TO 95 560 370 0 0 0.1 1100CASE 7: REF 560 csf; ASH 13% (MC), NO STARCH 317 40 TO 96 560 0 180 0 0.1 1100CASE 8: REF 560 csf; ASH 18% (MC), NO STARCH 318 40 TO 95 560 0 280 0 0.1 1100CASE 9: REF 560 csf; ASH 24% (MC), NO STARCH 318 38 TO 96 560 0 370 0 0.1 1100CASE 10: REF 560 csf; C-STARCH = 15 kg/Ton, NO CLAY 303 39 TO 96 560 0 0 15 0.0 1100 & 1980CASE 11: REF 560 csf; ASH 23% (NC), C-STARCH = 15 kg/Ton 346 42 TO 96 560 280 0 15 0.1 1100 & 1540CASE 12: REF 560 csf; ASH 23% (NC), C-STARCH = 30 kg/Ton 341 44 TO 96 560 280 0 30 0.1 1100 & 1540
CHEMICAL DOSAGE (kg/Ton)
75
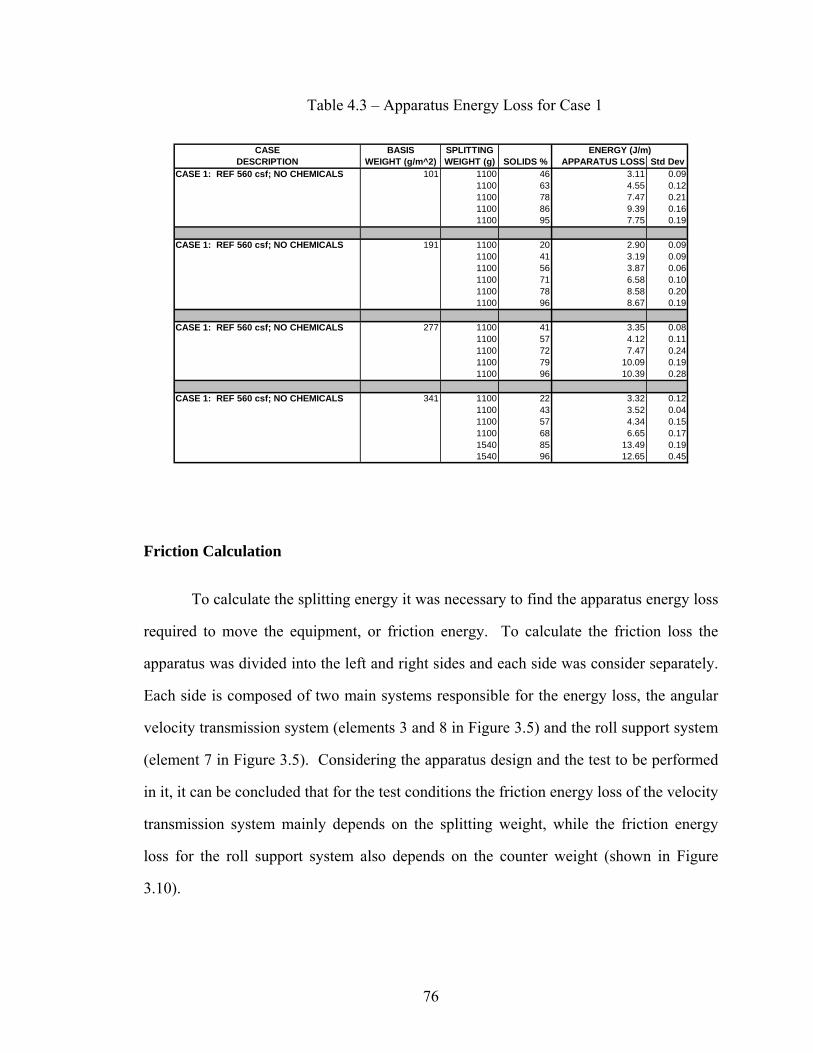
Table 4.3 – Apparatus Energy Loss for Case 1
CASE BASIS SPLITTINGDESCRIPTION WEIGHT (g/m^2) WEIGHT (g) SOLIDS % APPARATUS LOSS Std Dev
CASE 1: REF 560 csf; NO CHEMICALS 101 1100 46 3.11 0.091100 63 4.55 0.121100 78 7.47 0.211100 86 9.39 0.161100 95 7.75 0.19
CASE 1: REF 560 csf; NO CHEMICALS 191 1100 20 2.90 0.091100 41 3.19 0.091100 56 3.87 0.061100 71 6.58 0.101100 78 8.58 0.201100 96 8.67 0.19
CASE 1: REF 560 csf; NO CHEMICALS 277 1100 41 3.35 0.081100 57 4.12 0.111100 72 7.47 0.241100 79 10.09 0.191100 96 10.39 0.28
CASE 1: REF 560 csf; NO CHEMICALS 341 1100 22 3.32 0.121100 43 3.52 0.041100 57 4.34 0.151100 68 6.65 0.171540 85 13.49 0.191540 96 12.65 0.45
ENERGY (J/m)
Friction Calculation
To calculate the splitting energy it was necessary to find the apparatus energy loss
required to move the equipment, or friction energy. To calculate the friction loss the
apparatus was divided into the left and right sides and each side was consider separately.
Each side is composed of two main systems responsible for the energy loss, the angular
velocity transmission system (elements 3 and 8 in Figure 3.5) and the roll support system
(element 7 in Figure 3.5). Considering the apparatus design and the test to be performed
in it, it can be concluded that for the test conditions the friction energy loss of the velocity
transmission system mainly depends on the splitting weight, while the friction energy
loss for the roll support system also depends on the counter weight (shown in Figure
3.10).
76
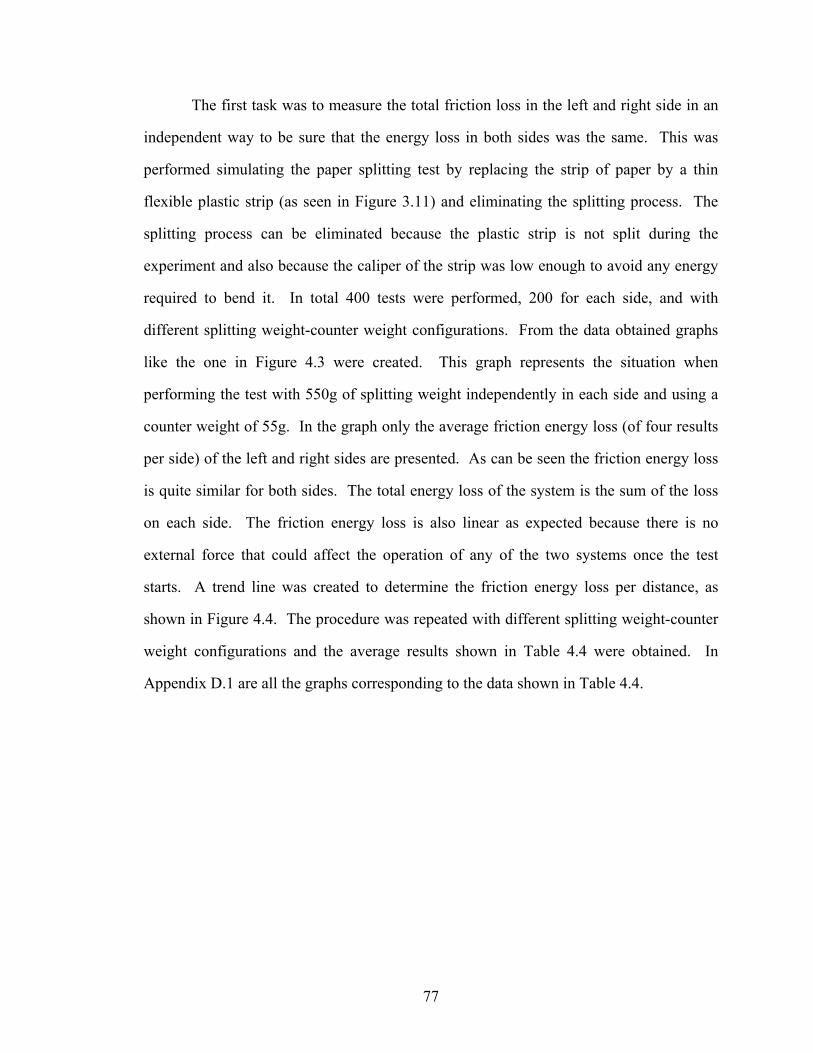
The first task was to measure the total friction loss in the left and right side in an
independent way to be sure that the energy loss in both sides was the same. This was
performed simulating the paper splitting test by replacing the strip of paper by a thin
flexible plastic strip (as seen in Figure 3.11) and eliminating the splitting process. The
splitting process can be eliminated because the plastic strip is not split during the
experiment and also because the caliper of the strip was low enough to avoid any energy
required to bend it. In total 400 tests were performed, 200 for each side, and with
different splitting weight-counter weight configurations. From the data obtained graphs
like the one in Figure 4.3 were created. This graph represents the situation when
performing the test with 550g of splitting weight independently in each side and using a
counter weight of 55g. In the graph only the average friction energy loss (of four results
per side) of the left and right sides are presented. As can be seen the friction energy loss
is quite similar for both sides. The total energy loss of the system is the sum of the loss
on each side. The friction energy loss is also linear as expected because there is no
external force that could affect the operation of any of the two systems once the test
starts. A trend line was created to determine the friction energy loss per distance, as
shown in Figure 4.4. The procedure was repeated with different splitting weight-counter
weight configurations and the average results shown in Table 4.4 were obtained. In
Appendix D.1 are all the graphs corresponding to the data shown in Table 4.4.
77
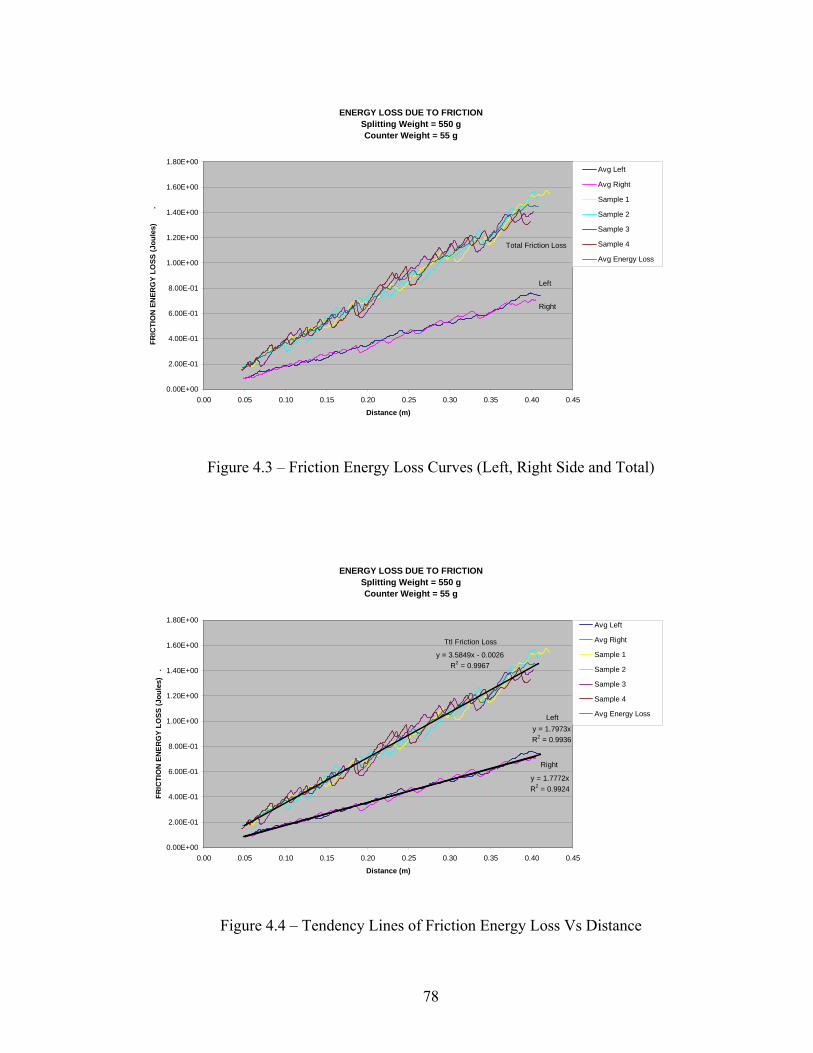
ENERGY LOSS DUE TO FRICTIONSplitting Weight = 550 gCounter Weight = 55 g
0.00E+00
2.00E-01
4.00E-01
6.00E-01
8.00E-01
1.00E+00
1.20E+00
1.40E+00
1.60E+00
1.80E+00
0.00 0.05 0.10 0.15 0.20 0.25 0.30 0.35 0.40 0.45
Distance (m)
FRIC
TIO
N E
NER
GY
LOSS
(Jou
les)
.
Avg Left
Avg Right
Sample 1
Sample 2
Sample 3
Sample 4
Avg Energy Loss
Left
Right
Total Friction Loss
Figure 4.3 – Friction Energy Loss Curves (Left, Right Side and Total)
ENERGY LOSS DUE TO FRICTIONSplitting Weight = 550 gCounter Weight = 55 g
y = 1.7973xR2 = 0.9936
y = 1.7772xR2 = 0.9924
y = 3.5849x - 0.0026R2 = 0.9967
0.00E+00
2.00E-01
4.00E-01
6.00E-01
8.00E-01
1.00E+00
1.20E+00
1.40E+00
1.60E+00
1.80E+00
0.00 0.05 0.10 0.15 0.20 0.25 0.30 0.35 0.40 0.45
Distance (m)
FRIC
TIO
N E
NER
GY
LOSS
(Jou
les)
.
Avg Left
Avg Right
Sample 1
Sample 2
Sample 3
Sample 4
Avg Energy LossLeft
Right
Ttl Friction Loss
Figure 4.4 – Tendency Lines of Friction Energy Loss Vs Distance
78
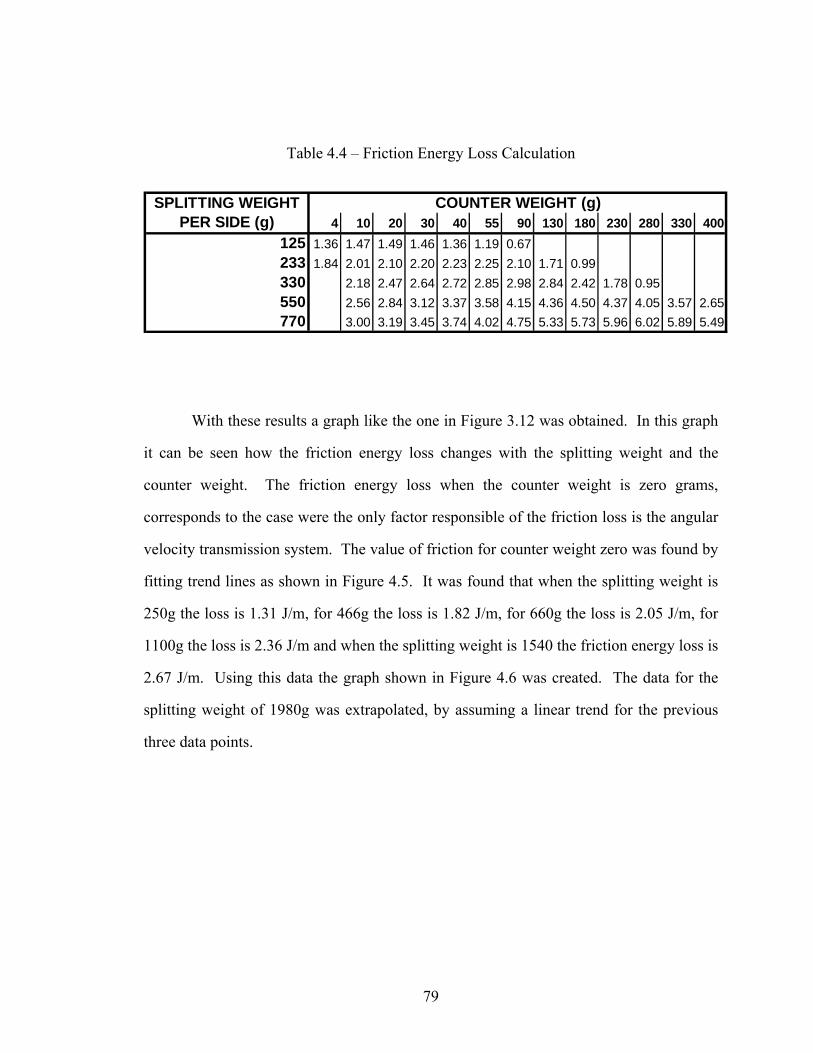
Table 4.4 – Friction Energy Loss Calculation
SPLITTING WEIGHTPER SIDE (g) 4 10 20 30 40 55 90 130 180 230 280 330 400
125 1.36 1.47 1.49 1.46 1.36 1.19 0.67233 1.84 2.01 2.10 2.20 2.23 2.25 2.10 1.71 0.99330 2.18 2.47 2.64 2.72 2.85 2.98 2.84 2.42 1.78 0.95550 2.56 2.84 3.12 3.37 3.58 4.15 4.36 4.50 4.37 4.05 3.57 2.65770 3.00 3.19 3.45 3.74 4.02 4.75 5.33 5.73 5.96 6.02 5.89 5.49
COUNTER WEIGHT (g)
With these results a graph like the one in Figure 3.12 was obtained. In this graph
it can be seen how the friction energy loss changes with the splitting weight and the
counter weight. The friction energy loss when the counter weight is zero grams,
corresponds to the case were the only factor responsible of the friction loss is the angular
velocity transmission system. The value of friction for counter weight zero was found by
fitting trend lines as shown in Figure 4.5. It was found that when the splitting weight is
250g the loss is 1.31 J/m, for 466g the loss is 1.82 J/m, for 660g the loss is 2.05 J/m, for
1100g the loss is 2.36 J/m and when the splitting weight is 1540 the friction energy loss is
2.67 J/m. Using this data the graph shown in Figure 4.6 was created. The data for the
splitting weight of 1980g was extrapolated, by assuming a linear trend for the previous
three data points.
79
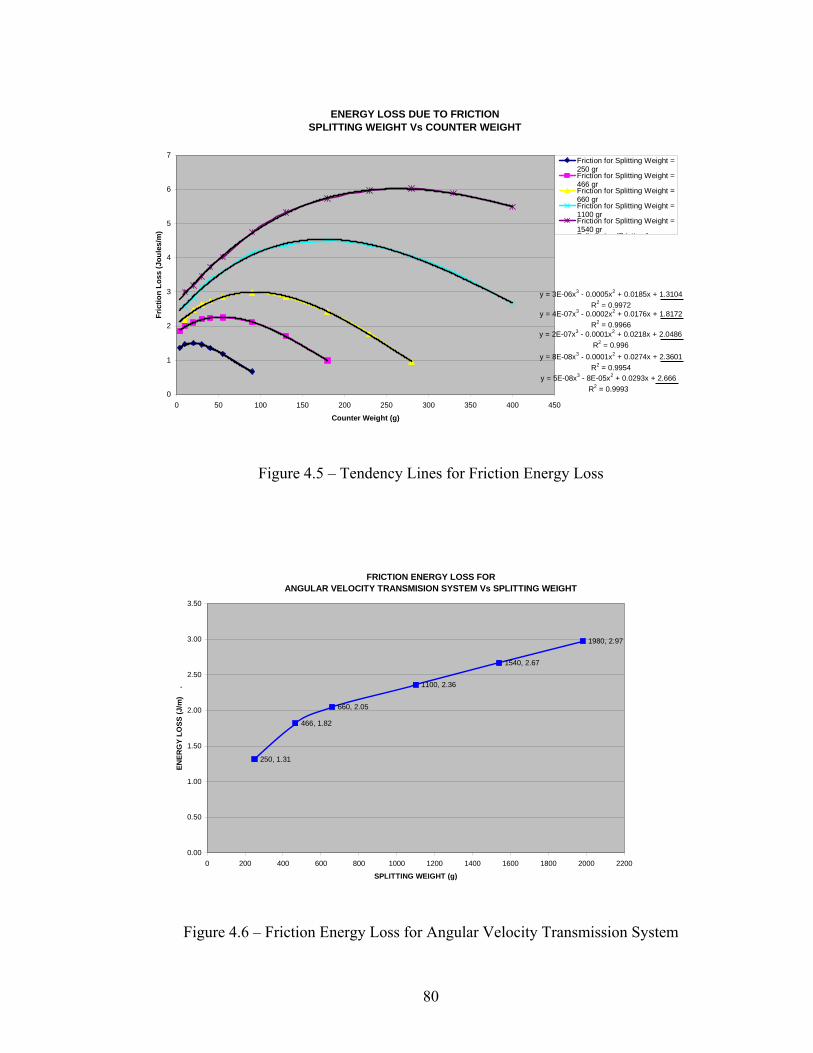
ENERGY LOSS DUE TO FRICTIONSPLITTING WEIGHT Vs COUNTER WEIGHT
y = 3E-06x3 - 0.0005x2 + 0.0185x + 1.3104R2 = 0.9972
y = 4E-07x3 - 0.0002x2 + 0.0176x + 1.8172R2 = 0.9966
y = 2E-07x3 - 0.0001x2 + 0.0218x + 2.0486R2 = 0.996
y = 8E-08x3 - 0.0001x2 + 0.0274x + 2.3601R2 = 0.9954
y = 5E-08x3 - 8E-05x2 + 0.0293x + 2.666R2 = 0.9993
0
1
2
3
4
5
6
7
0 50 100 150 200 250 300 350 400 450
Counter Weight (g)
Fric
tion
Loss
(Jou
les/
m)
Friction for Splitting Weight =250 grFriction for Splitting Weight =466 grFriction for Splitting Weight =660 grFriction for Splitting Weight =1100 grFriction for Splitting Weight =1540 grP li ó i (F i ti f
Figure 4.5 – Tendency Lines for Friction Energy Loss
FRICTION ENERGY LOSS FOR ANGULAR VELOCITY TRANSMISION SYSTEM Vs SPLITTING WEIGHT
250, 1.31
466, 1.82
660, 2.05
1100, 2.36
1540, 2.67
1980, 2.97
0.00
0.50
1.00
1.50
2.00
2.50
3.00
3.50
0 200 400 600 800 1000 1200 1400 1600 1800 2000 2200
SPLITTING WEIGHT (g)
ENER
GY
LOSS
(J/m
) .
Figure 4.6 – Friction Energy Loss for Angular Velocity Transmission System
80
As previously discussed, the friction energy loss at the zero counter weight
condition represents the energy loss when splitting strips with solids content higher than
50%. At such solids the internal energy of the web is high enough to avoid the contact
between the strip and the supporting rolls while the strips are being split and the only
source of energy loss due to friction is the velocity transmission system. When splitting
webs with lower solids the strip touches the supporting rolls adding losses to the system.
To be able to determine the energy friction loss for these conditions, webs with low
mechanical treatment (740 C.S.F.), at low solids content (18 to 25%) and corresponding
to different basis weights were evaluated in the splitter tester using different splitting
weights. As with a normal splitting test, the apparatus energy loss measured is equal to
the sum of the splitting energy (cohesive plus bending energy) and the friction energy
loss. A wet web with solids content between 18 and 25% and produced from pulp with
low refining level will show a cohesive and a bending energy that was assumed to be
negligible when compared with the friction energy loss of the system. Therefore, the
apparatus energy loss when splitting these strips will be considered to be the friction
energy loss of the supporting rolls and the velocity transmission system together. The
results obtained during the experiments does not show any major difference in the
apparatus energy loss when considering different basis weights, so it can be concluded
that for this solids content range the effect of basis weight on the bending energy is
negligible.
81
When the solids start to increase the wet paper starts to weigh less and the
cohesive energy of the fiber starts to increase, under these conditions the friction induced
by the paper strip to the supporting rolls will decrease. This situation will continue until
testing webs with solids higher than 50% when the paper strip does not touch the
supporting rolls and the friction energy loss is only the one due to the velocity
transmission system. To consider the reduction in the friction loss due to this effect an
intermediate friction energy loss was created based on the observations made during the
experimentation process. At the end and depending on the web solids three different
friction levels were considered. Friction level 1 for webs with solids between 18 and
37%, level 2 for web with solids between 38 and 50% and level 3 for solids higher than
50%. Figure 4.7 shows how depending on the splitting weight and on the solids content
the friction of the apparatus can be determined.
To prove the assumption of the low bending and cohesive energy for high wet
unrefined webs, the apparatus energy loss results obtained under these conditions were
compared with the results obtained form the friction test performed on the plastic strip
when the counter weight was equal to the paper strip weight. As previously stated when
performing the test with the plastic strip, the splitting energy can be considered as zero
and the apparatus energy loss will depend on the friction loss due to the velocity
transmission and the supporting roll systems. Both systems losses depend on the splitting
energy and the counter weight. The results for both experiments are shown in Table 4.5.
82
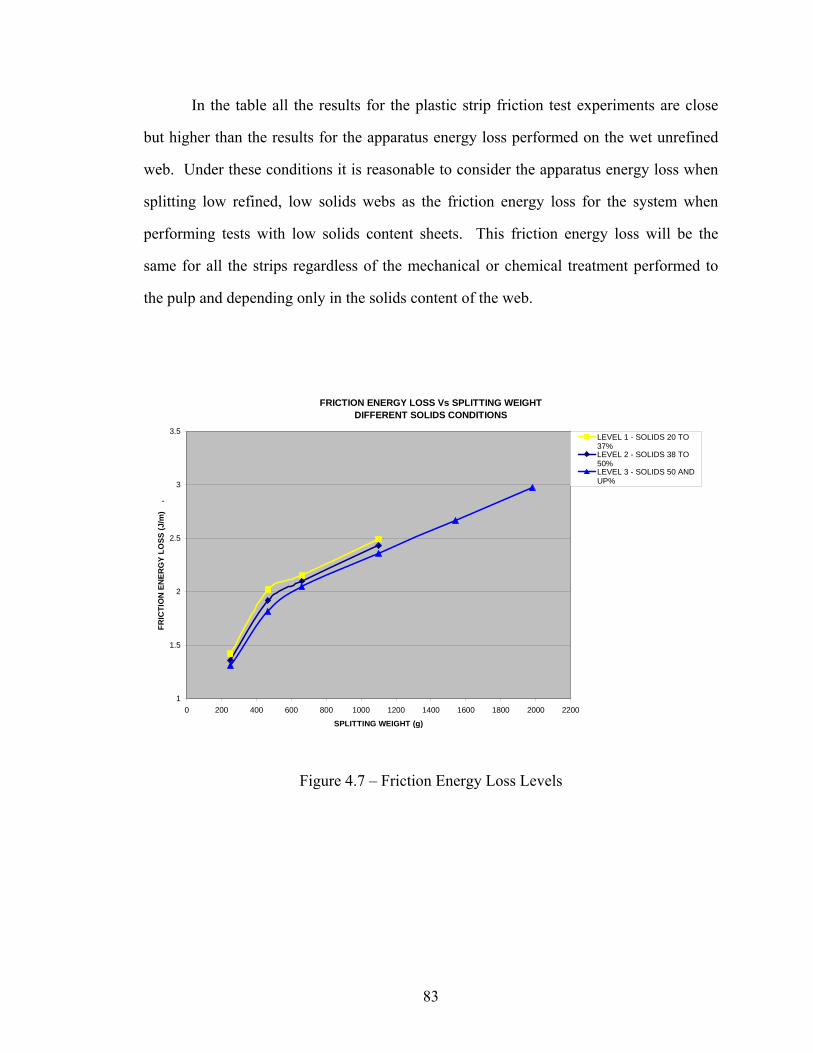
In the table all the results for the plastic strip friction test experiments are close
but higher than the results for the apparatus energy loss performed on the wet unrefined
web. Under these conditions it is reasonable to consider the apparatus energy loss when
splitting low refined, low solids webs as the friction energy loss for the system when
performing tests with low solids content sheets. This friction energy loss will be the
same for all the strips regardless of the mechanical or chemical treatment performed to
the pulp and depending only in the solids content of the web.
FRICTION ENERGY LOSS Vs SPLITTING WEIGHTDIFFERENT SOLIDS CONDITIONS
1
1.5
2
2.5
3
3.5
0 200 400 600 800 1000 1200 1400 1600 1800 2000 2200
SPLITTING WEIGHT (g)
FRIC
TIO
N E
NER
GY
LOSS
(J/m
) .
LEVEL 1 - SOLIDS 20 TO37%LEVEL 2 - SOLIDS 38 TO50%LEVEL 3 - SOLIDS 50 ANDUP%
Figure 4.7 – Friction Energy Loss Levels
83
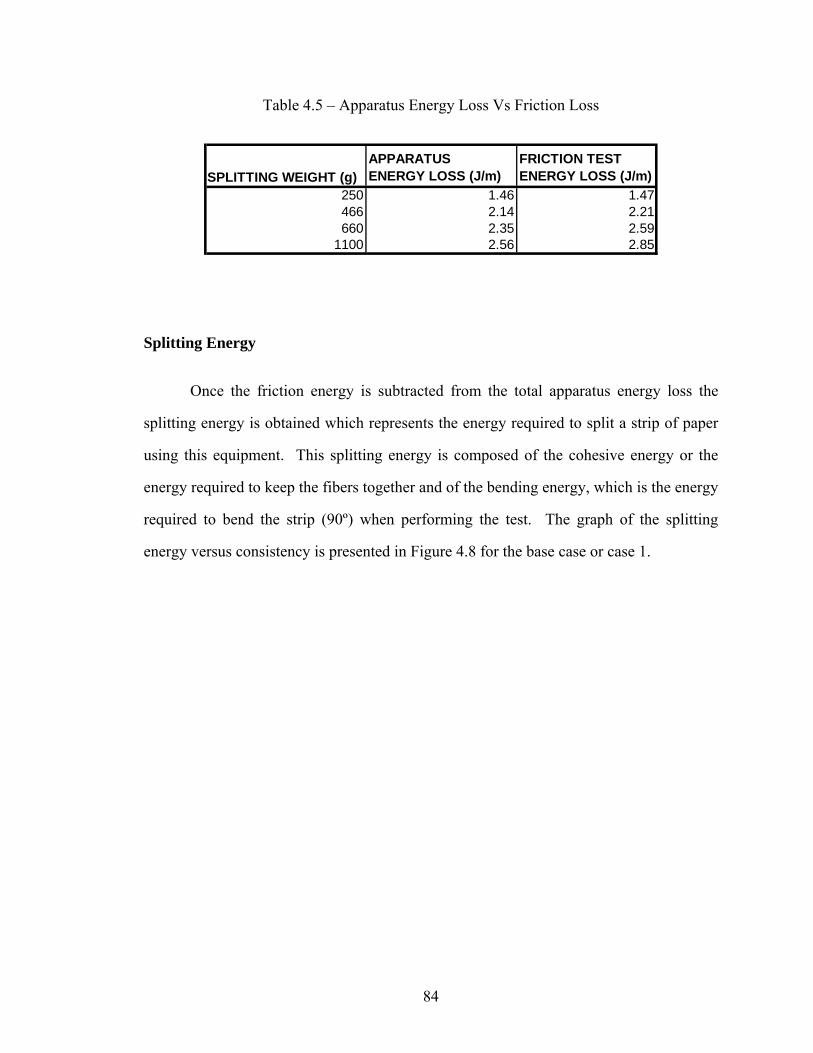
Table 4.5 – Apparatus Energy Loss Vs Friction Loss
SPLITTING WEIGHT (g)APPARATUS ENERGY LOSS (J/m)
FRICTION TEST ENERGY LOSS (J/m)
250 1.46 1.47466 2.14 2.21660 2.35 2.59
1100 2.56 2.85
Splitting Energy
Once the friction energy is subtracted from the total apparatus energy loss the
splitting energy is obtained which represents the energy required to split a strip of paper
using this equipment. This splitting energy is composed of the cohesive energy or the
energy required to keep the fibers together and of the bending energy, which is the energy
required to bend the strip (90º) when performing the test. The graph of the splitting
energy versus consistency is presented in Figure 4.8 for the base case or case 1.
84
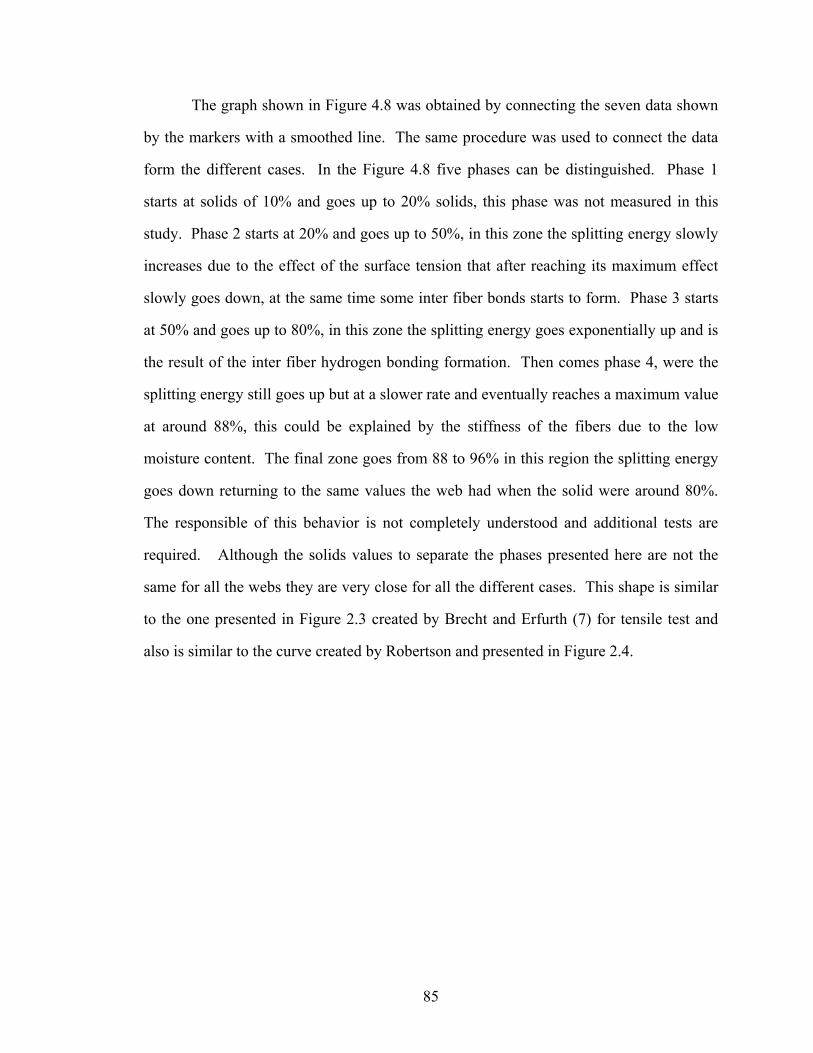
The graph shown in Figure 4.8 was obtained by connecting the seven data shown
by the markers with a smoothed line. The same procedure was used to connect the data
form the different cases. In the Figure 4.8 five phases can be distinguished. Phase 1
starts at solids of 10% and goes up to 20% solids, this phase was not measured in this
study. Phase 2 starts at 20% and goes up to 50%, in this zone the splitting energy slowly
increases due to the effect of the surface tension that after reaching its maximum effect
slowly goes down, at the same time some inter fiber bonds starts to form. Phase 3 starts
at 50% and goes up to 80%, in this zone the splitting energy goes exponentially up and is
the result of the inter fiber hydrogen bonding formation. Then comes phase 4, were the
splitting energy still goes up but at a slower rate and eventually reaches a maximum value
at around 88%, this could be explained by the stiffness of the fibers due to the low
moisture content. The final zone goes from 88 to 96% in this region the splitting energy
goes down returning to the same values the web had when the solid were around 80%.
The responsible of this behavior is not completely understood and additional tests are
required. Although the solids values to separate the phases presented here are not the
same for all the webs they are very close for all the different cases. This shape is similar
to the one presented in Figure 2.3 created by Brecht and Erfurth (7) for tensile test and
also is similar to the curve created by Robertson and presented in Figure 2.4.
85
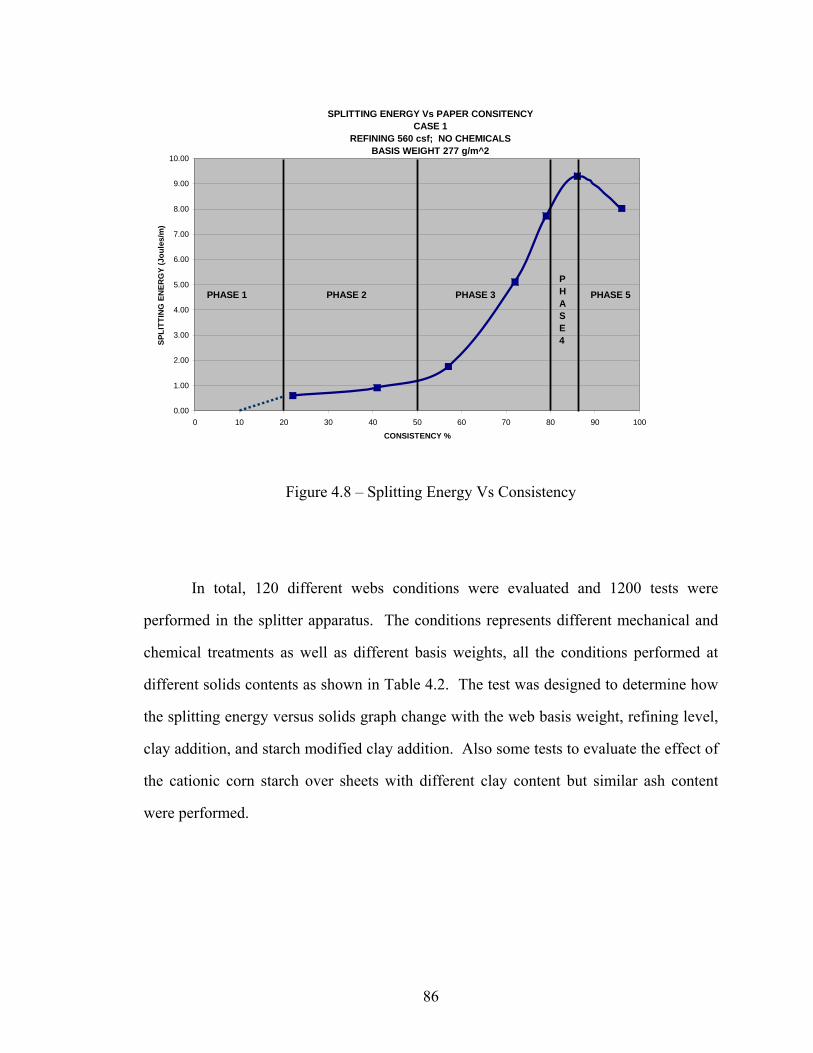
SPLITTING ENERGY Vs PAPER CONSITENCYCASE 1
REFINING 560 csf; NO CHEMICALSBASIS WEIGHT 277 g/m^2
0.00
1.00
2.00
3.00
4.00
5.00
6.00
7.00
8.00
9.00
10.00
0 10 20 30 40 50 60 70 80 90 100
CONSISTENCY %
SPLI
TTIN
G E
NER
GY
(Jou
les/
m)
PHASE 1 PHASE 5PHASE 3PHASE 2PHASE 4
Figure 4.8 – Splitting Energy Vs Consistency
In total, 120 different webs conditions were evaluated and 1200 tests were
performed in the splitter apparatus. The conditions represents different mechanical and
chemical treatments as well as different basis weights, all the conditions performed at
different solids contents as shown in Table 4.2. The test was designed to determine how
the splitting energy versus solids graph change with the web basis weight, refining level,
clay addition, and starch modified clay addition. Also some tests to evaluate the effect of
the cationic corn starch over sheets with different clay content but similar ash content
were performed.
86
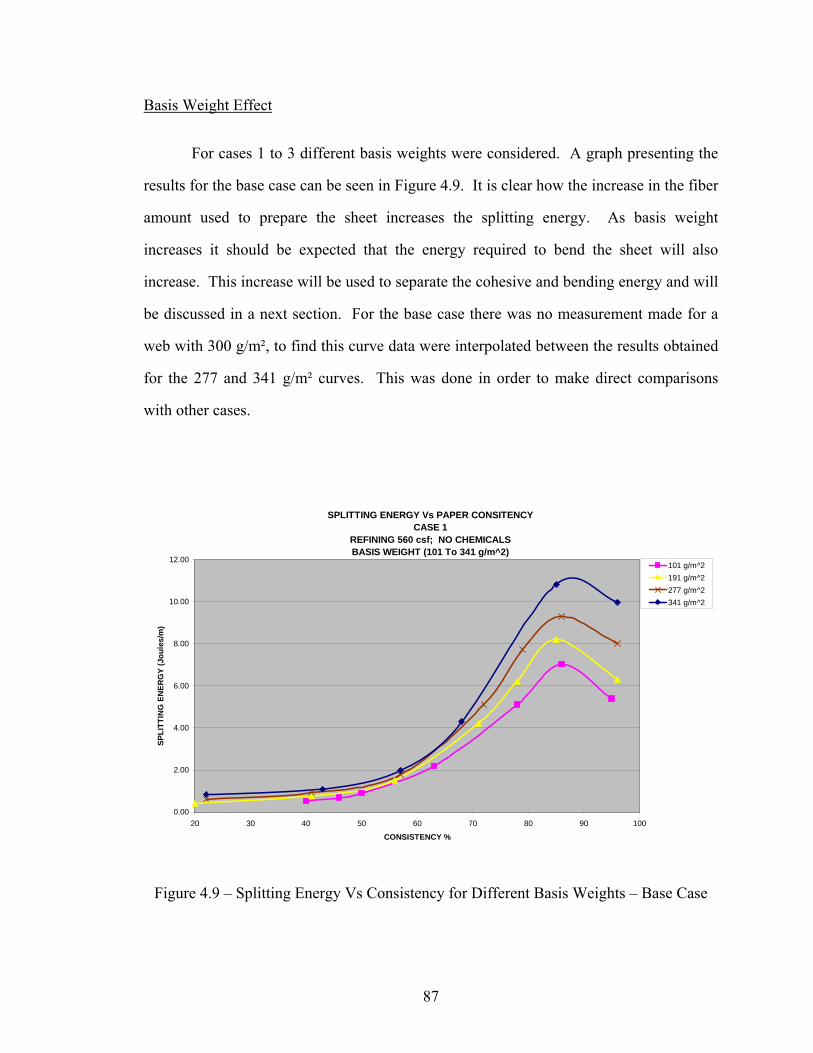
Basis Weight Effect
For cases 1 to 3 different basis weights were considered. A graph presenting the
results for the base case can be seen in Figure 4.9. It is clear how the increase in the fiber
amount used to prepare the sheet increases the splitting energy. As basis weight
increases it should be expected that the energy required to bend the sheet will also
increase. This increase will be used to separate the cohesive and bending energy and will
be discussed in a next section. For the base case there was no measurement made for a
web with 300 g/m², to find this curve data were interpolated between the results obtained
for the 277 and 341 g/m² curves. This was done in order to make direct comparisons
with other cases.
SPLITTING ENERGY Vs PAPER CONSITENCYCASE 1
REFINING 560 csf; NO CHEMICALSBASIS WEIGHT (101 To 341 g/m^2)
0.00
2.00
4.00
6.00
8.00
10.00
12.00
20 30 40 50 60 70 80 90 100
CONSISTENCY %
SPLI
TTIN
G E
NER
GY
(Jou
les/
m)
101 g/m^2191 g/m^2277 g/m^2341 g/m^2
Figure 4.9 – Splitting Energy Vs Consistency for Different Basis Weights – Base Case
87
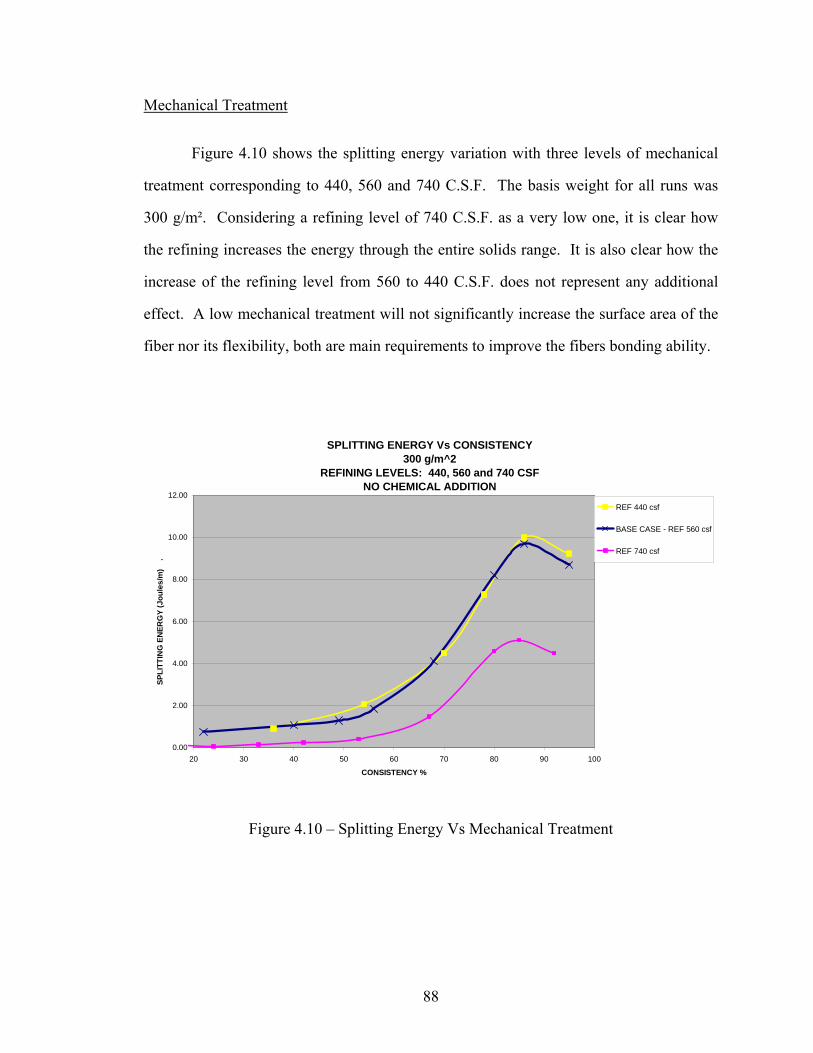
Mechanical Treatment
Figure 4.10 shows the splitting energy variation with three levels of mechanical
treatment corresponding to 440, 560 and 740 C.S.F. The basis weight for all runs was
300 g/m². Considering a refining level of 740 C.S.F. as a very low one, it is clear how
the refining increases the energy through the entire solids range. It is also clear how the
increase of the refining level from 560 to 440 C.S.F. does not represent any additional
effect. A low mechanical treatment will not significantly increase the surface area of the
fiber nor its flexibility, both are main requirements to improve the fibers bonding ability.
SPLITTING ENERGY Vs CONSISTENCY300 g/m^2
REFINING LEVELS: 440, 560 and 740 CSFNO CHEMICAL ADDITION
0.00
2.00
4.00
6.00
8.00
10.00
12.00
20 30 40 50 60 70 80 90 100
CONSISTENCY %
SPLI
TTIN
G E
NER
GY
(Jou
les/
m)
.
REF 440 csf
BASE CASE - REF 560 csf
REF 740 csf
Figure 4.10 – Splitting Energy Vs Mechanical Treatment
88
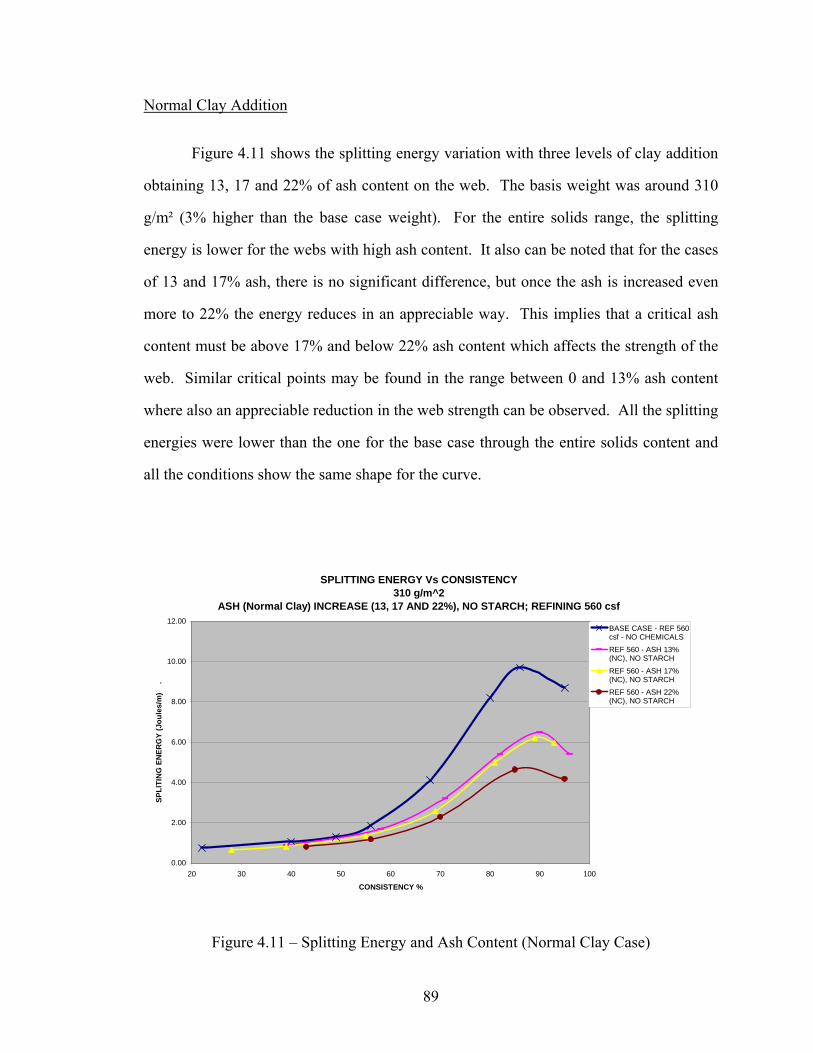
Normal Clay Addition
Figure 4.11 shows the splitting energy variation with three levels of clay addition
obtaining 13, 17 and 22% of ash content on the web. The basis weight was around 310
g/m² (3% higher than the base case weight). For the entire solids range, the splitting
energy is lower for the webs with high ash content. It also can be noted that for the cases
of 13 and 17% ash, there is no significant difference, but once the ash is increased even
more to 22% the energy reduces in an appreciable way. This implies that a critical ash
content must be above 17% and below 22% ash content which affects the strength of the
web. Similar critical points may be found in the range between 0 and 13% ash content
where also an appreciable reduction in the web strength can be observed. All the splitting
energies were lower than the one for the base case through the entire solids content and
all the conditions show the same shape for the curve.
SPLITTING ENERGY Vs CONSISTENCY310 g/m^2
ASH (Normal Clay) INCREASE (13, 17 AND 22%), NO STARCH; REFINING 560 csf
0.00
2.00
4.00
6.00
8.00
10.00
12.00
20 30 40 50 60 70 80 90 100
CONSISTENCY %
SPLI
TIN
G E
NER
GY
(Jou
les/
m)
.
BASE CASE - REF 560csf - NO CHEMICALSREF 560 - ASH 13%(NC), NO STARCH
REF 560 - ASH 17%(NC), NO STARCHREF 560 - ASH 22%(NC), NO STARCH
Figure 4.11 – Splitting Energy and Ash Content (Normal Clay Case)
89
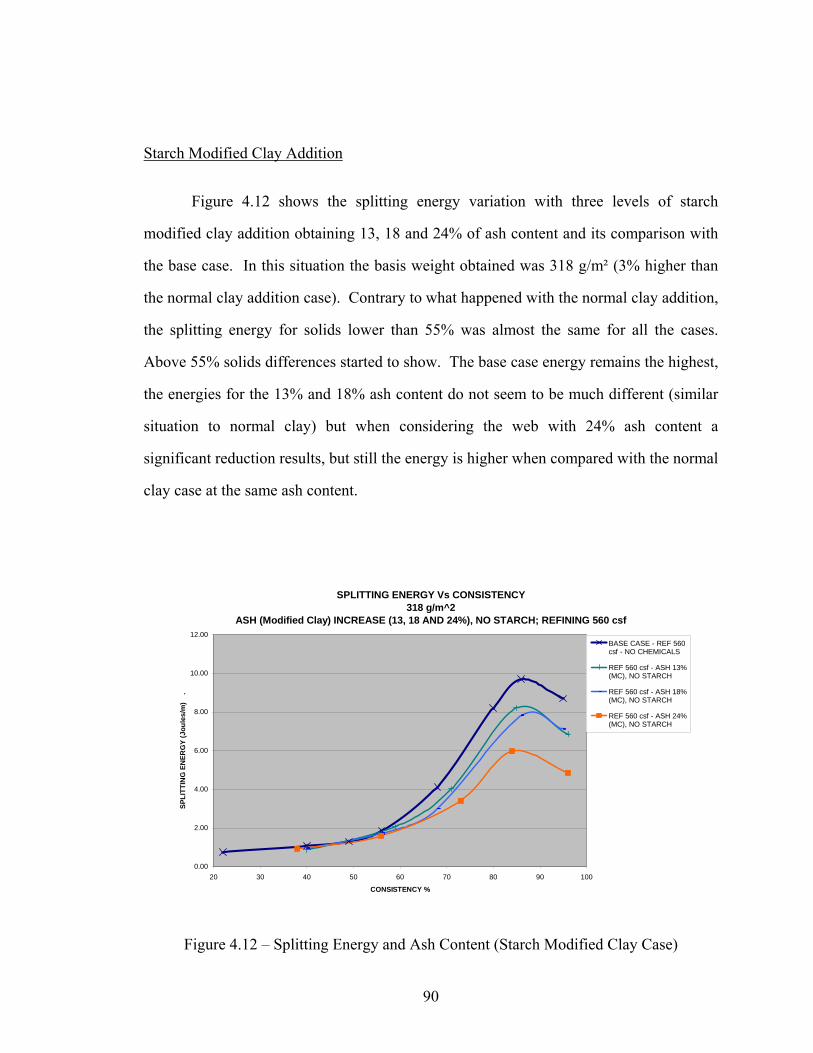
Starch Modified Clay Addition
Figure 4.12 shows the splitting energy variation with three levels of starch
modified clay addition obtaining 13, 18 and 24% of ash content and its comparison with
the base case. In this situation the basis weight obtained was 318 g/m² (3% higher than
the normal clay addition case). Contrary to what happened with the normal clay addition,
the splitting energy for solids lower than 55% was almost the same for all the cases.
Above 55% solids differences started to show. The base case energy remains the highest,
the energies for the 13% and 18% ash content do not seem to be much different (similar
situation to normal clay) but when considering the web with 24% ash content a
significant reduction results, but still the energy is higher when compared with the normal
clay case at the same ash content.
SPLITTING ENERGY Vs CONSISTENCY318 g/m^2
ASH (Modified Clay) INCREASE (13, 18 AND 24%), NO STARCH; REFINING 560 csf
0.00
2.00
4.00
6.00
8.00
10.00
12.00
20 30 40 50 60 70 80 90 100
CONSISTENCY %
SPLI
TTIN
G E
NER
GY
(Jou
les/
m)
.
BASE CASE - REF 560csf - NO CHEMICALS
REF 560 csf - ASH 13%(MC), NO STARCH
REF 560 csf - ASH 18%(MC), NO STARCH
REF 560 csf - ASH 24%(MC), NO STARCH
Figure 4.12 – Splitting Energy and Ash Content (Starch Modified Clay Case)
90
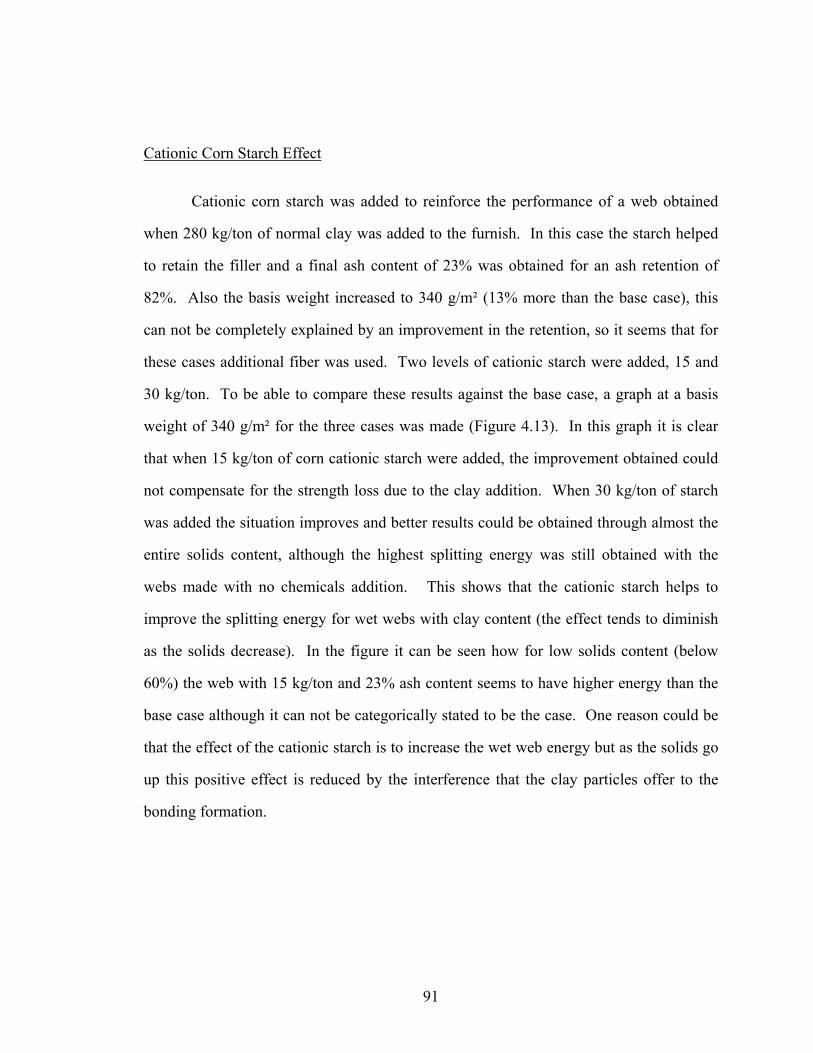
Cationic Corn Starch Effect
Cationic corn starch was added to reinforce the performance of a web obtained
when 280 kg/ton of normal clay was added to the furnish. In this case the starch helped
to retain the filler and a final ash content of 23% was obtained for an ash retention of
82%. Also the basis weight increased to 340 g/m² (13% more than the base case), this
can not be completely explained by an improvement in the retention, so it seems that for
these cases additional fiber was used. Two levels of cationic starch were added, 15 and
30 kg/ton. To be able to compare these results against the base case, a graph at a basis
weight of 340 g/m² for the three cases was made (Figure 4.13). In this graph it is clear
that when 15 kg/ton of corn cationic starch were added, the improvement obtained could
not compensate for the strength loss due to the clay addition. When 30 kg/ton of starch
was added the situation improves and better results could be obtained through almost the
entire solids content, although the highest splitting energy was still obtained with the
webs made with no chemicals addition. This shows that the cationic starch helps to
improve the splitting energy for wet webs with clay content (the effect tends to diminish
as the solids decrease). In the figure it can be seen how for low solids content (below
60%) the web with 15 kg/ton and 23% ash content seems to have higher energy than the
base case although it can not be categorically stated to be the case. One reason could be
that the effect of the cationic starch is to increase the wet web energy but as the solids go
up this positive effect is reduced by the interference that the clay particles offer to the
bonding formation.
91
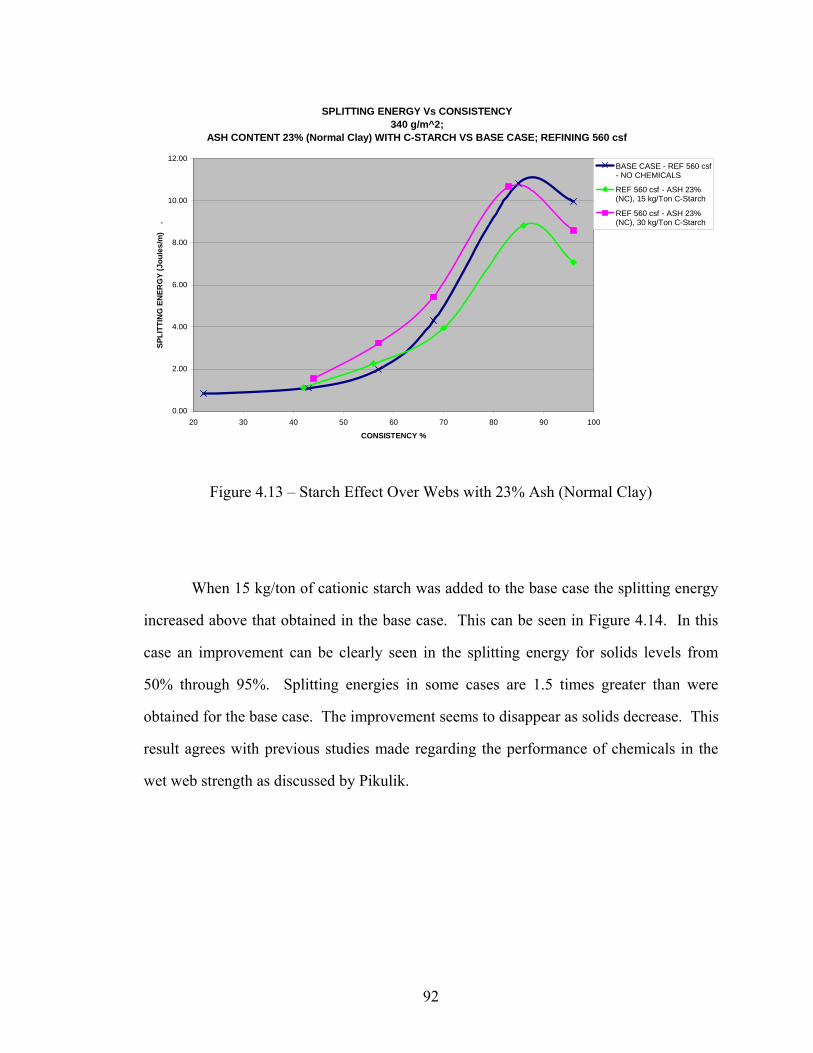
SPLITTING ENERGY Vs CONSISTENCY340 g/m^2;
ASH CONTENT 23% (Normal Clay) WITH C-STARCH VS BASE CASE; REFINING 560 csf
0.00
2.00
4.00
6.00
8.00
10.00
12.00
20 30 40 50 60 70 80 90 100
CONSISTENCY %
SPLI
TTIN
G E
NER
GY
(Jou
les/
m)
.BASE CASE - REF 560 csf- NO CHEMICALS
REF 560 csf - ASH 23%(NC), 15 kg/Ton C-Starch
REF 560 csf - ASH 23%(NC), 30 kg/Ton C-Starch
Figure 4.13 – Starch Effect Over Webs with 23% Ash (Normal Clay)
When 15 kg/ton of cationic starch was added to the base case the splitting energy
increased above that obtained in the base case. This can be seen in Figure 4.14. In this
case an improvement can be clearly seen in the splitting energy for solids levels from
50% through 95%. Splitting energies in some cases are 1.5 times greater than were
obtained for the base case. The improvement seems to disappear as solids decrease. This
result agrees with previous studies made regarding the performance of chemicals in the
wet web strength as discussed by Pikulik.
92
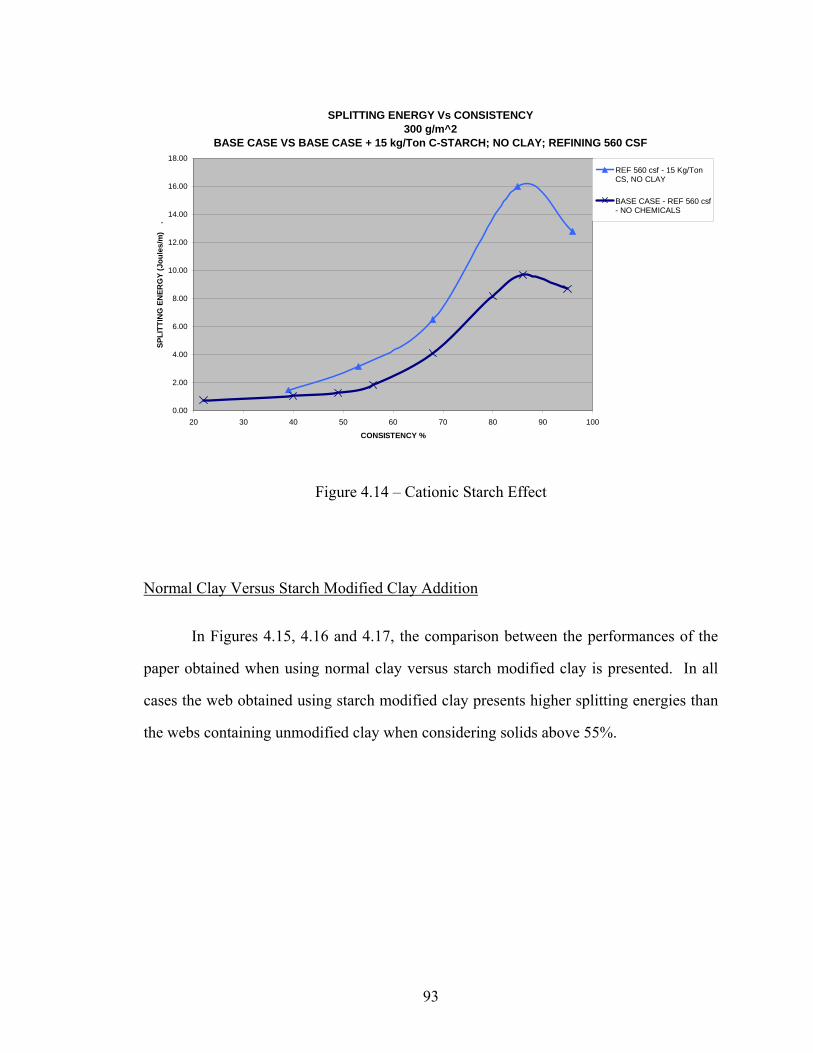
SPLITTING ENERGY Vs CONSISTENCY300 g/m^2
BASE CASE VS BASE CASE + 15 kg/Ton C-STARCH; NO CLAY; REFINING 560 CSF
0.00
2.00
4.00
6.00
8.00
10.00
12.00
14.00
16.00
18.00
20 30 40 50 60 70 80 90 100
CONSISTENCY %
SPLI
TTIN
G E
NER
GY
(Jou
les/
m)
.REF 560 csf - 15 Kg/TonCS, NO CLAY
BASE CASE - REF 560 csf- NO CHEMICALS
Figure 4.14 – Cationic Starch Effect
Normal Clay Versus Starch Modified Clay Addition
In Figures 4.15, 4.16 and 4.17, the comparison between the performances of the
paper obtained when using normal clay versus starch modified clay is presented. In all
cases the web obtained using starch modified clay presents higher splitting energies than
the webs containing unmodified clay when considering solids above 55%.
93
For 13% ash content, at solids below 55% all the cases have approximately the
same splitting energy. When considering 18% ash content a slight difference can be seen
among the three cases. In this situation the splitting energy for the base case and for the
starch modified clay remains almost the same, but a small gap can be seen between them
and the lower splitting energy obtained when using normal clay. For 23% ash content the
situation is similar but the gap is greater. The lower splitting energies obtained with the
normal clay at low solids level can be explained because the clay presentation is in
suspension form (at 70% solids), with a surfactant added to avoid the clay sedimentation.
The surfactants reduce the surface tension of the water and as a consequence the energy
that holds the fibers together also go down. The starch modified clay presentation was in
powder form and normal water was used to make the suspension preparation so no
surface tension reduction resulted. It can be concluded that the effect of the clay over the
splitting energy reduction is not as important as the effect of the surfactant for wet web
strengths when the surface tension is the dominant mechanism.
94
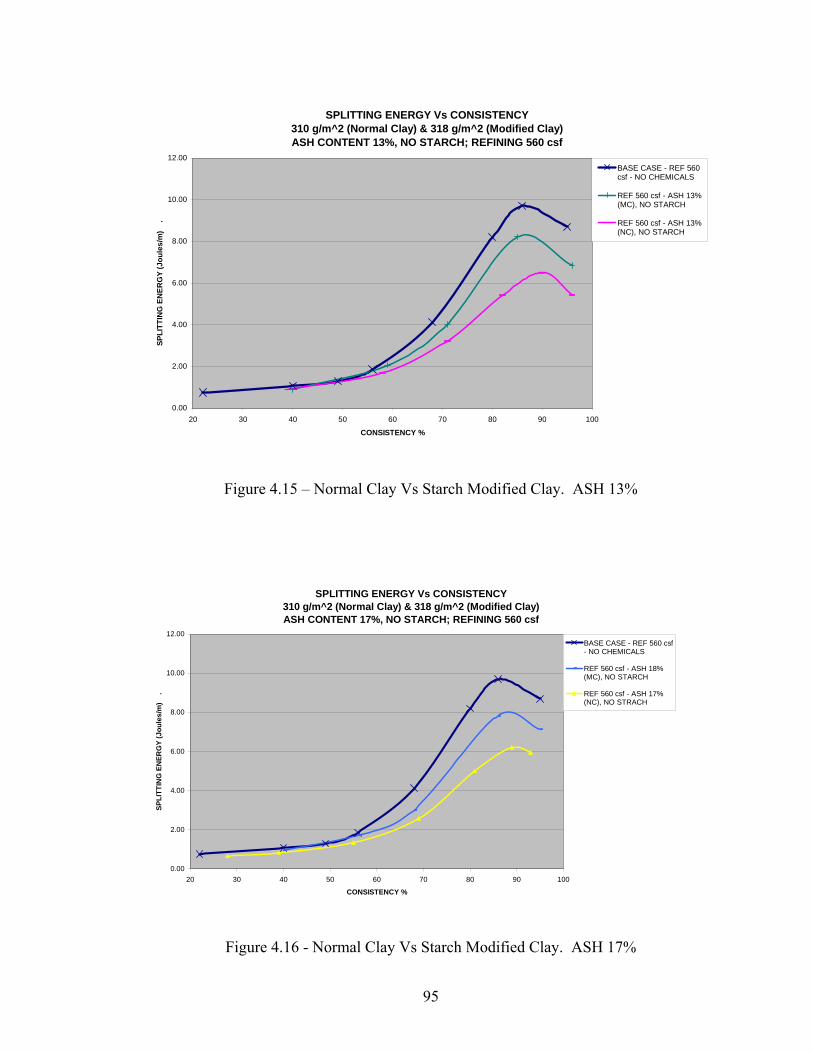
SPLITTING ENERGY Vs CONSISTENCY310 g/m^2 (Normal Clay) & 318 g/m^2 (Modified Clay)ASH CONTENT 13%, NO STARCH; REFINING 560 csf
0.00
2.00
4.00
6.00
8.00
10.00
12.00
20 30 40 50 60 70 80 90 100
CONSISTENCY %
SPLI
TTIN
G E
NER
GY
(Jou
les/
m)
.BASE CASE - REF 560csf - NO CHEMICALS
REF 560 csf - ASH 13%(MC), NO STARCH
REF 560 csf - ASH 13%(NC), NO STARCH
Figure 4.15 – Normal Clay Vs Starch Modified Clay. ASH 13%
SPLITTING ENERGY Vs CONSISTENCY310 g/m^2 (Normal Clay) & 318 g/m^2 (Modified Clay)ASH CONTENT 17%, NO STARCH; REFINING 560 csf
0.00
2.00
4.00
6.00
8.00
10.00
12.00
20 30 40 50 60 70 80 90 100
CONSISTENCY %
SPLI
TTIN
G E
NER
GY
(Jou
les/
m)
.
BASE CASE - REF 560 csf- NO CHEMICALS
REF 560 csf - ASH 18%(MC), NO STARCH
REF 560 csf - ASH 17%(NC), NO STRACH
Figure 4.16 - Normal Clay Vs Starch Modified Clay. ASH 17%
95
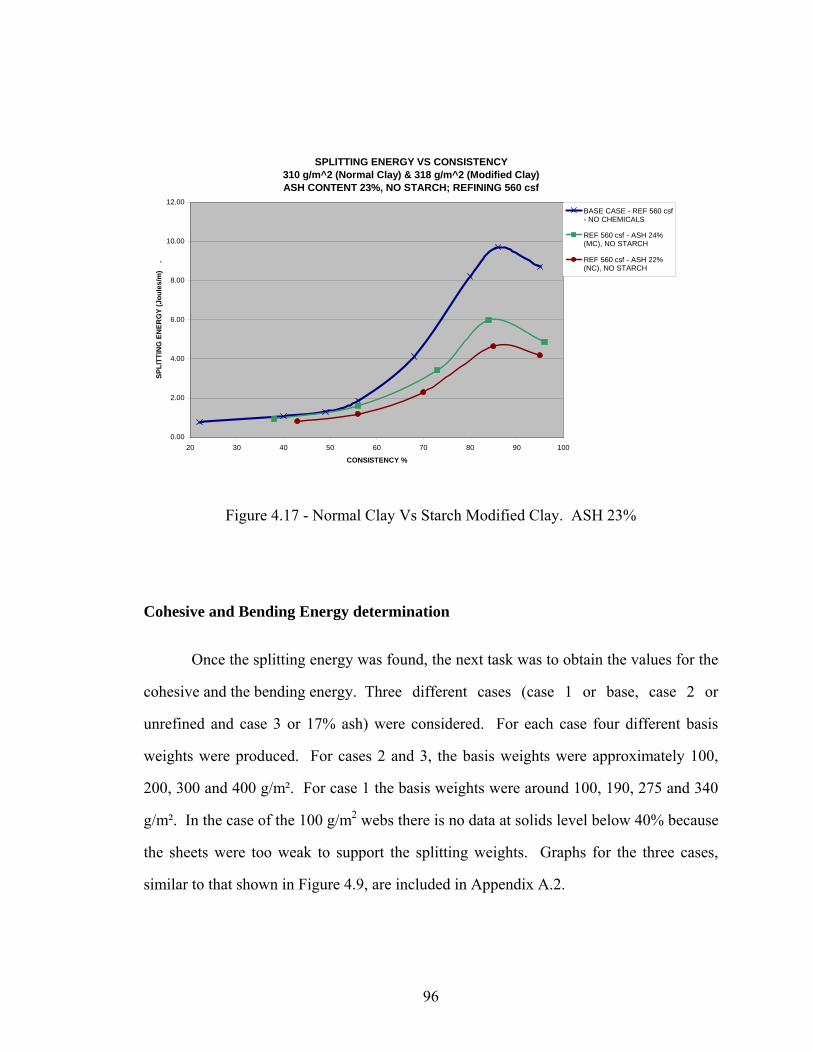
SPLITTING ENERGY VS CONSISTENCY310 g/m^2 (Normal Clay) & 318 g/m^2 (Modified Clay)ASH CONTENT 23%, NO STARCH; REFINING 560 csf
0.00
2.00
4.00
6.00
8.00
10.00
12.00
20 30 40 50 60 70 80 90 100
CONSISTENCY %
SPLI
TTIN
G E
NER
GY
(Jou
les/
m)
.
BASE CASE - REF 560 csf- NO CHEMICALS
REF 560 csf - ASH 24%(MC), NO STARCH
REF 560 csf - ASH 22%(NC), NO STARCH
Figure 4.17 - Normal Clay Vs Starch Modified Clay. ASH 23%
Cohesive and Bending Energy determination
Once the splitting energy was found, the next task was to obtain the values for the
cohesive and the bending energy. Three different cases (case 1 or base, case 2 or
unrefined and case 3 or 17% ash) were considered. For each case four different basis
weights were produced. For cases 2 and 3, the basis weights were approximately 100,
200, 300 and 400 g/m². For case 1 the basis weights were around 100, 190, 275 and 340
g/m². In the case of the 100 g/m2 webs there is no data at solids level below 40% because
the sheets were too weak to support the splitting weights. Graphs for the three cases,
similar to that shown in Figure 4.9, are included in Appendix A.2.
96
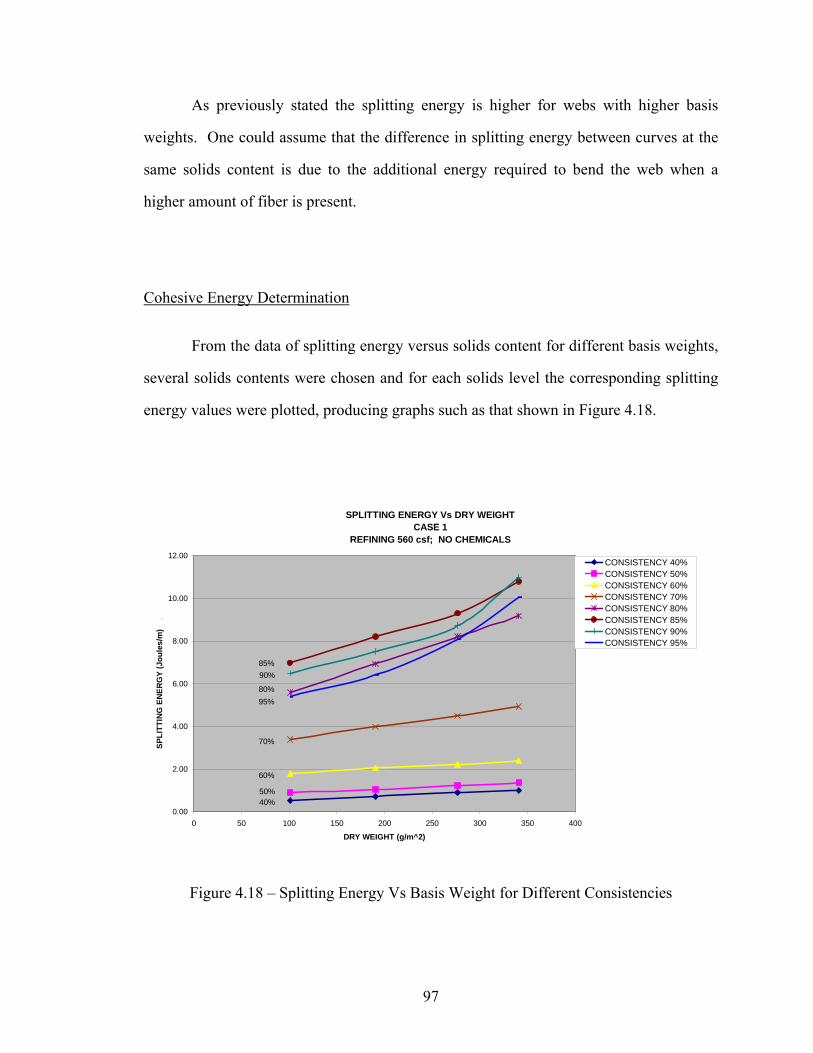
As previously stated the splitting energy is higher for webs with higher basis
weights. One could assume that the difference in splitting energy between curves at the
same solids content is due to the additional energy required to bend the web when a
higher amount of fiber is present.
Cohesive Energy Determination
From the data of splitting energy versus solids content for different basis weights,
several solids contents were chosen and for each solids level the corresponding splitting
energy values were plotted, producing graphs such as that shown in Figure 4.18.
SPLITTING ENERGY Vs DRY WEIGHTCASE 1
REFINING 560 csf; NO CHEMICALS
0.00
2.00
4.00
6.00
8.00
10.00
12.00
0 50 100 150 200 250 300 350 400
DRY WEIGHT (g/m^2)
SPLI
TTIN
G E
NER
GY
(Jou
les/
m)
.
CONSISTENCY 40%CONSISTENCY 50%CONSISTENCY 60%CONSISTENCY 70%CONSISTENCY 80%CONSISTENCY 85%CONSISTENCY 90%CONSISTENCY 95%
50%
95%
90%85%
80%
70%
60%
40%
Figure 4.18 – Splitting Energy Vs Basis Weight for Different Consistencies
97
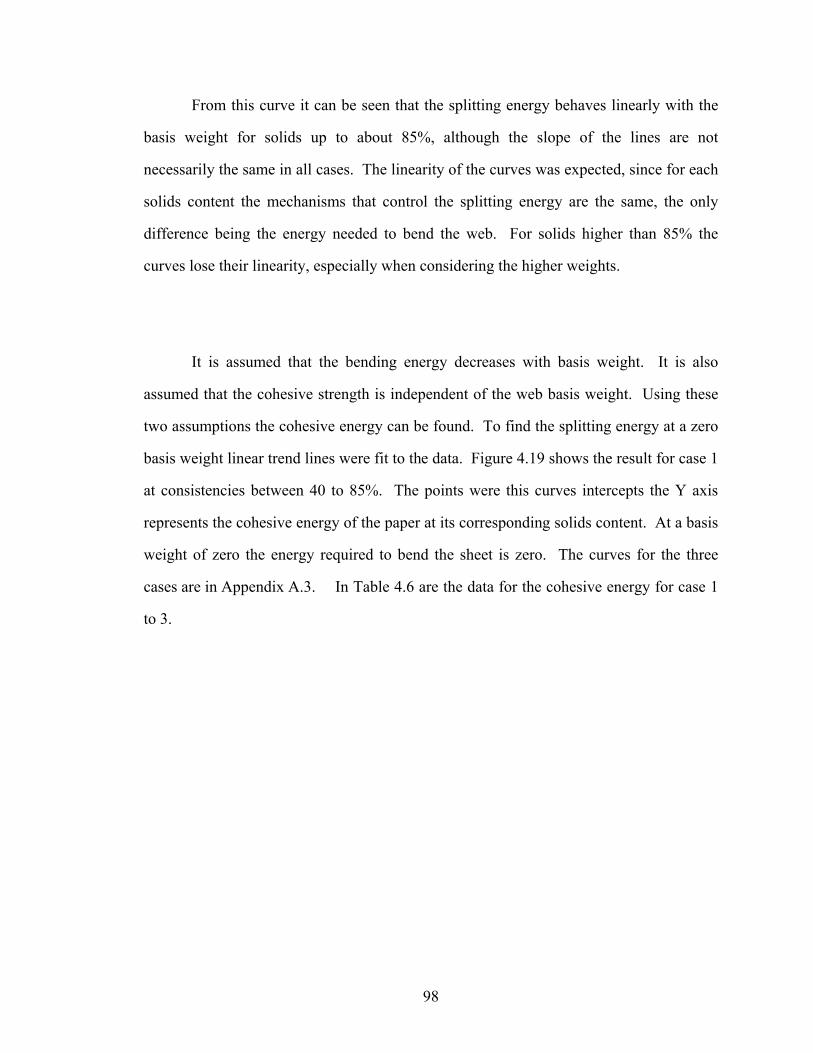
From this curve it can be seen that the splitting energy behaves linearly with the
basis weight for solids up to about 85%, although the slope of the lines are not
necessarily the same in all cases. The linearity of the curves was expected, since for each
solids content the mechanisms that control the splitting energy are the same, the only
difference being the energy needed to bend the web. For solids higher than 85% the
curves lose their linearity, especially when considering the higher weights.
It is assumed that the bending energy decreases with basis weight. It is also
assumed that the cohesive strength is independent of the web basis weight. Using these
two assumptions the cohesive energy can be found. To find the splitting energy at a zero
basis weight linear trend lines were fit to the data. Figure 4.19 shows the result for case 1
at consistencies between 40 to 85%. The points were this curves intercepts the Y axis
represents the cohesive energy of the paper at its corresponding solids content. At a basis
weight of zero the energy required to bend the sheet is zero. The curves for the three
cases are in Appendix A.3. In Table 4.6 are the data for the cohesive energy for case 1
to 3.
98
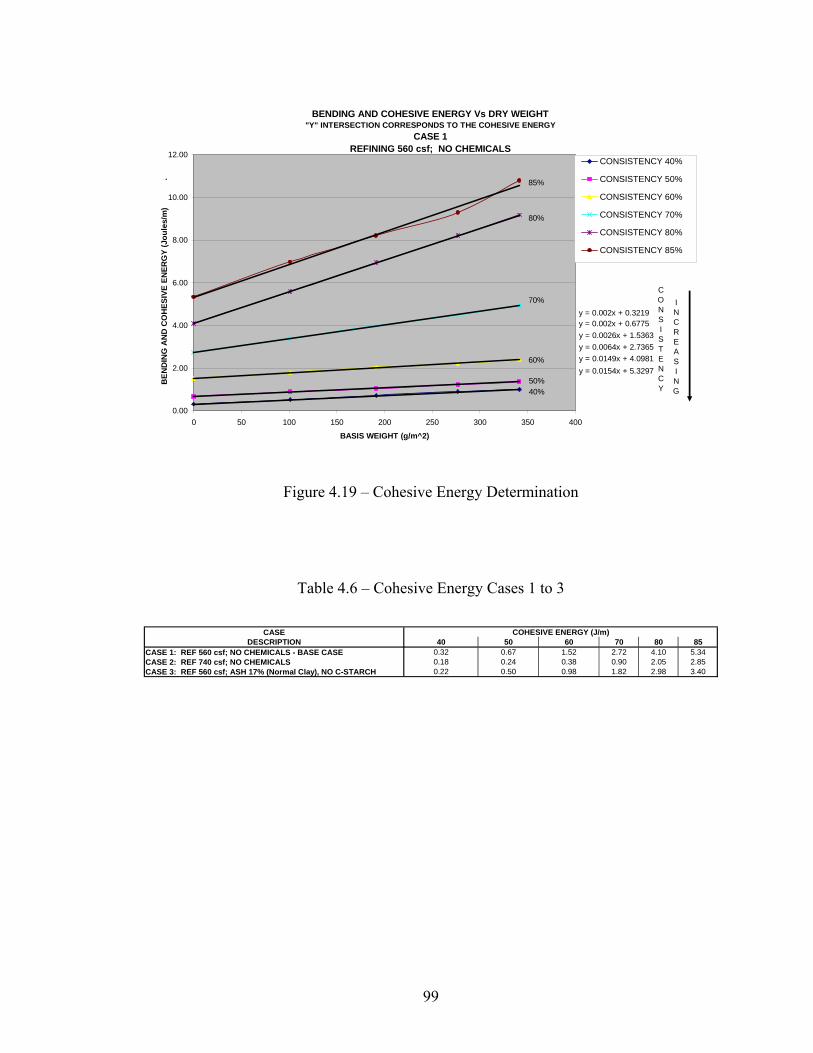
BENDING AND COHESIVE ENERGY Vs DRY WEIGHT"Y" INTERSECTION CORRESPONDS TO THE COHESIVE ENERGY
CASE 1REFINING 560 csf; NO CHEMICALS
y = 0.0149x + 4.0981y = 0.0064x + 2.7365y = 0.0026x + 1.5363y = 0.002x + 0.6775y = 0.002x + 0.3219
y = 0.0154x + 5.3297
0.00
2.00
4.00
6.00
8.00
10.00
12.00
0 50 100 150 200 250 300 350 400
BASIS WEIGHT (g/m^2)
BEN
DIN
G A
ND
CO
HES
IVE
ENER
GY
(Jou
les/
m)
.
CONSISTENCY 40%
CONSISTENCY 50%
CONSISTENCY 60%
CONSISTENCY 70%
CONSISTENCY 80%
CONSISTENCY 85%
CONSISTENCY
INCREASING
50%
85%
80%
70%
60%
40%
Figure 4.19 – Cohesive Energy Determination
Table 4.6 – Cohesive Energy Cases 1 to 3
CASEDESCRIPTION 40 50 60 70 80 85
CASE 1: REF 560 csf; NO CHEMICALS - BASE CASE 0.32 0.67 1.52 2.72 4.10 5.34CASE 2: REF 740 csf; NO CHEMICALS 0.18 0.24 0.38 0.90 2.05 2.85CASE 3: REF 560 csf; ASH 17% (Normal Clay), NO C-STARCH 0.22 0.50 0.98 1.82 2.98 3.40
COHESIVE ENERGY (J/m)
99
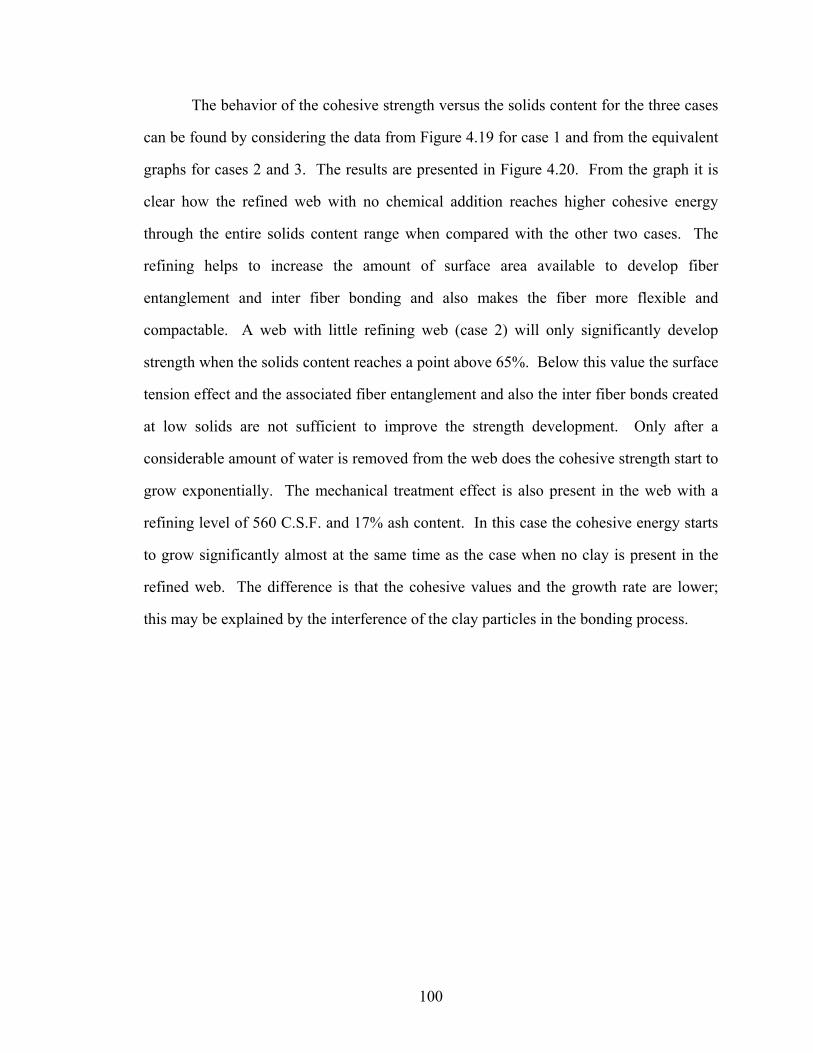
The behavior of the cohesive strength versus the solids content for the three cases
can be found by considering the data from Figure 4.19 for case 1 and from the equivalent
graphs for cases 2 and 3. The results are presented in Figure 4.20. From the graph it is
clear how the refined web with no chemical addition reaches higher cohesive energy
through the entire solids content range when compared with the other two cases. The
refining helps to increase the amount of surface area available to develop fiber
entanglement and inter fiber bonding and also makes the fiber more flexible and
compactable. A web with little refining web (case 2) will only significantly develop
strength when the solids content reaches a point above 65%. Below this value the surface
tension effect and the associated fiber entanglement and also the inter fiber bonds created
at low solids are not sufficient to improve the strength development. Only after a
considerable amount of water is removed from the web does the cohesive strength start to
grow exponentially. The mechanical treatment effect is also present in the web with a
refining level of 560 C.S.F. and 17% ash content. In this case the cohesive energy starts
to grow significantly almost at the same time as the case when no clay is present in the
refined web. The difference is that the cohesive values and the growth rate are lower;
this may be explained by the interference of the clay particles in the bonding process.
100
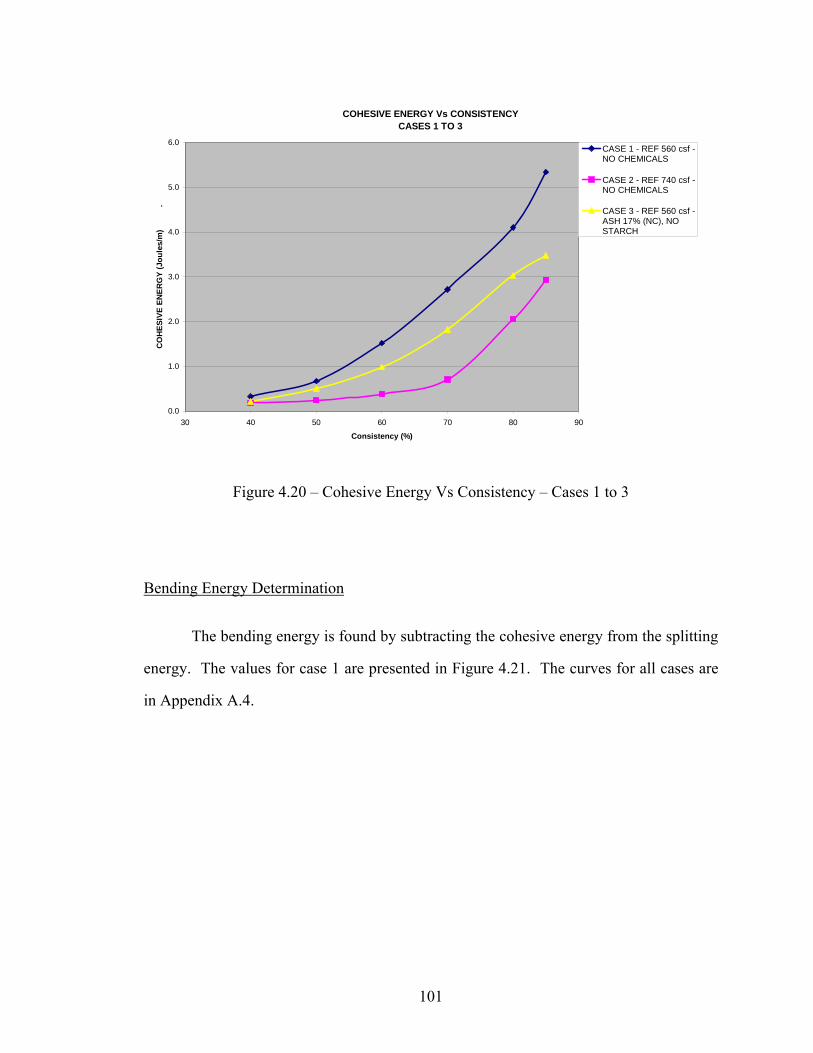
COHESIVE ENERGY Vs CONSISTENCYCASES 1 TO 3
0.0
1.0
2.0
3.0
4.0
5.0
6.0
30 40 50 60 70 80 90
Consistency (%)
CO
HES
IVE
ENER
GY
(Jou
les/
m)
.CASE 1 - REF 560 csf -NO CHEMICALS
CASE 2 - REF 740 csf -NO CHEMICALS
CASE 3 - REF 560 csf -ASH 17% (NC), NOSTARCH
Figure 4.20 – Cohesive Energy Vs Consistency – Cases 1 to 3
Bending Energy Determination
The bending energy is found by subtracting the cohesive energy from the splitting
energy. The values for case 1 are presented in Figure 4.21. The curves for all cases are
in Appendix A.4.
101
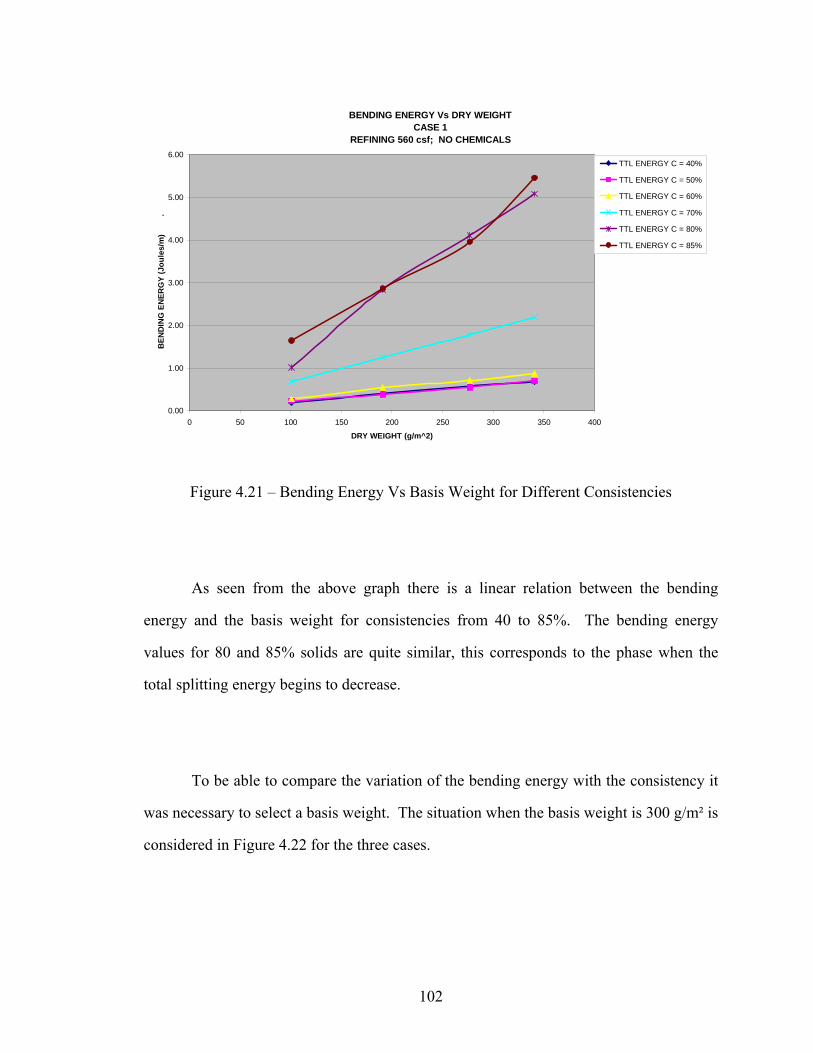
BENDING ENERGY Vs DRY WEIGHTCASE 1
REFINING 560 csf; NO CHEMICALS
0.00
1.00
2.00
3.00
4.00
5.00
6.00
0 50 100 150 200 250 300 350 400
DRY WEIGHT (g/m^2)
BEN
DIN
G E
NER
GY
(Jou
les/
m)
. �
TTL ENERGY C = 40%
TTL ENERGY C = 50%
TTL ENERGY C = 60%
TTL ENERGY C = 70%
TTL ENERGY C = 80%
TTL ENERGY C = 85%
Figure 4.21 – Bending Energy Vs Basis Weight for Different Consistencies
As seen from the above graph there is a linear relation between the bending
energy and the basis weight for consistencies from 40 to 85%. The bending energy
values for 80 and 85% solids are quite similar, this corresponds to the phase when the
total splitting energy begins to decrease.
To be able to compare the variation of the bending energy with the consistency it
was necessary to select a basis weight. The situation when the basis weight is 300 g/m² is
considered in Figure 4.22 for the three cases.
102
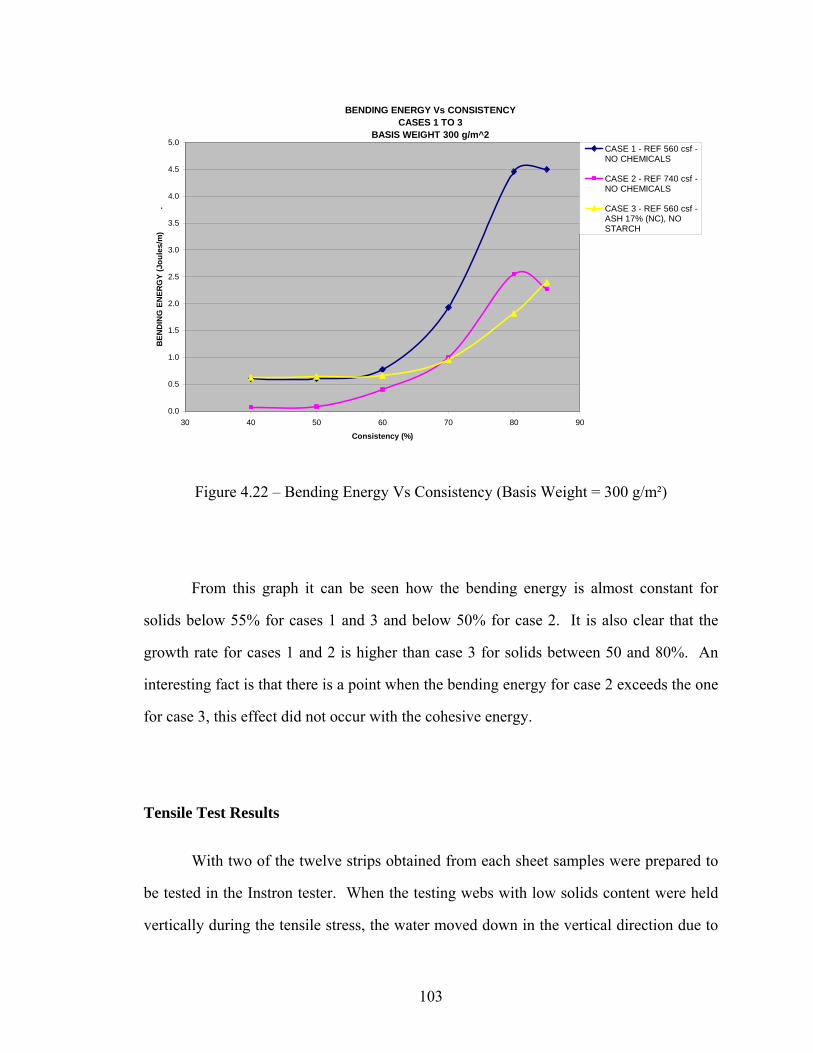
BENDING ENERGY Vs CONSISTENCYCASES 1 TO 3
BASIS WEIGHT 300 g/m^2
0.0
0.5
1.0
1.5
2.0
2.5
3.0
3.5
4.0
4.5
5.0
30 40 50 60 70 80 90
Consistency (%)
BEN
DIN
G E
NER
GY
(Jou
les/
m)
.CASE 1 - REF 560 csf -NO CHEMICALS
CASE 2 - REF 740 csf -NO CHEMICALS
CASE 3 - REF 560 csf -ASH 17% (NC), NOSTARCH
Figure 4.22 – Bending Energy Vs Consistency (Basis Weight = 300 g/m²)
From this graph it can be seen how the bending energy is almost constant for
solids below 55% for cases 1 and 3 and below 50% for case 2. It is also clear that the
growth rate for cases 1 and 2 is higher than case 3 for solids between 50 and 80%. An
interesting fact is that there is a point when the bending energy for case 2 exceeds the one
for case 3, this effect did not occur with the cohesive energy.
Tensile Test Results
With two of the twelve strips obtained from each sheet samples were prepared to
be tested in the Instron tester. When the testing webs with low solids content were held
vertically during the tensile stress, the water moved down in the vertical direction due to
103
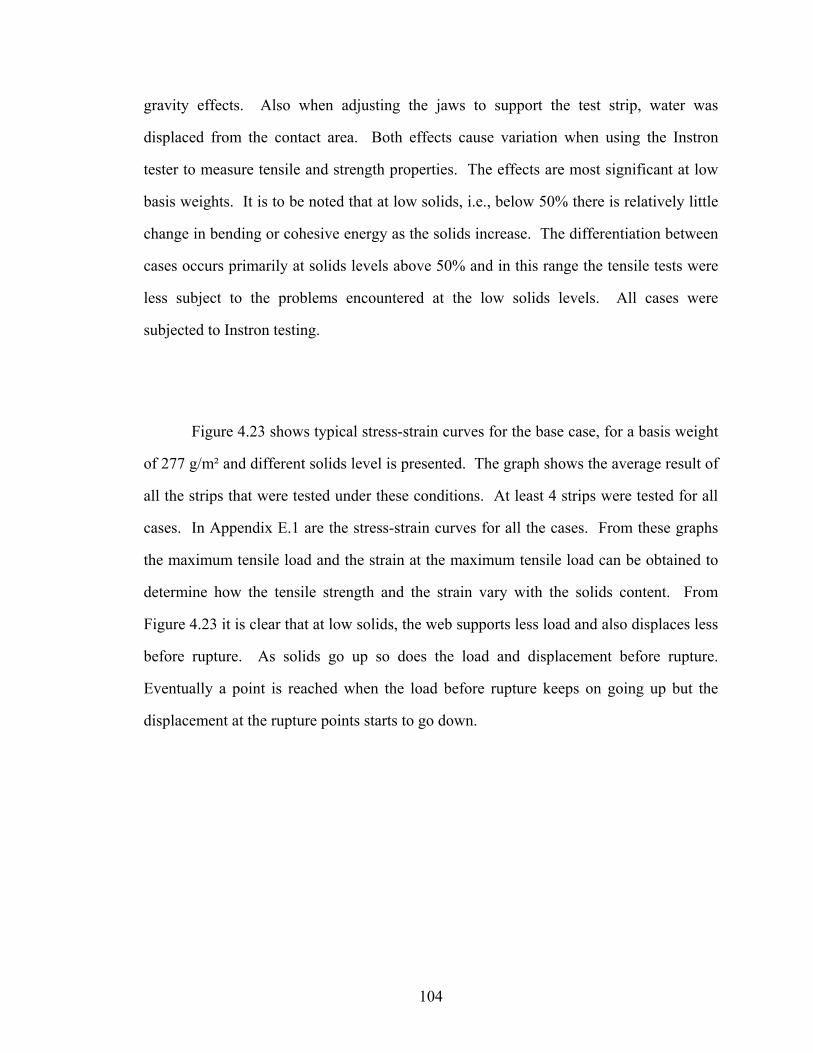
gravity effects. Also when adjusting the jaws to support the test strip, water was
displaced from the contact area. Both effects cause variation when using the Instron
tester to measure tensile and strength properties. The effects are most significant at low
basis weights. It is to be noted that at low solids, i.e., below 50% there is relatively little
change in bending or cohesive energy as the solids increase. The differentiation between
cases occurs primarily at solids levels above 50% and in this range the tensile tests were
less subject to the problems encountered at the low solids levels. All cases were
subjected to Instron testing.
Figure 4.23 shows typical stress-strain curves for the base case, for a basis weight
of 277 g/m² and different solids level is presented. The graph shows the average result of
all the strips that were tested under these conditions. At least 4 strips were tested for all
cases. In Appendix E.1 are the stress-strain curves for all the cases. From these graphs
the maximum tensile load and the strain at the maximum tensile load can be obtained to
determine how the tensile strength and the strain vary with the solids content. From
Figure 4.23 it is clear that at low solids, the web supports less load and also displaces less
before rupture. As solids go up so does the load and displacement before rupture.
Eventually a point is reached when the load before rupture keeps on going up but the
displacement at the rupture points starts to go down.
104
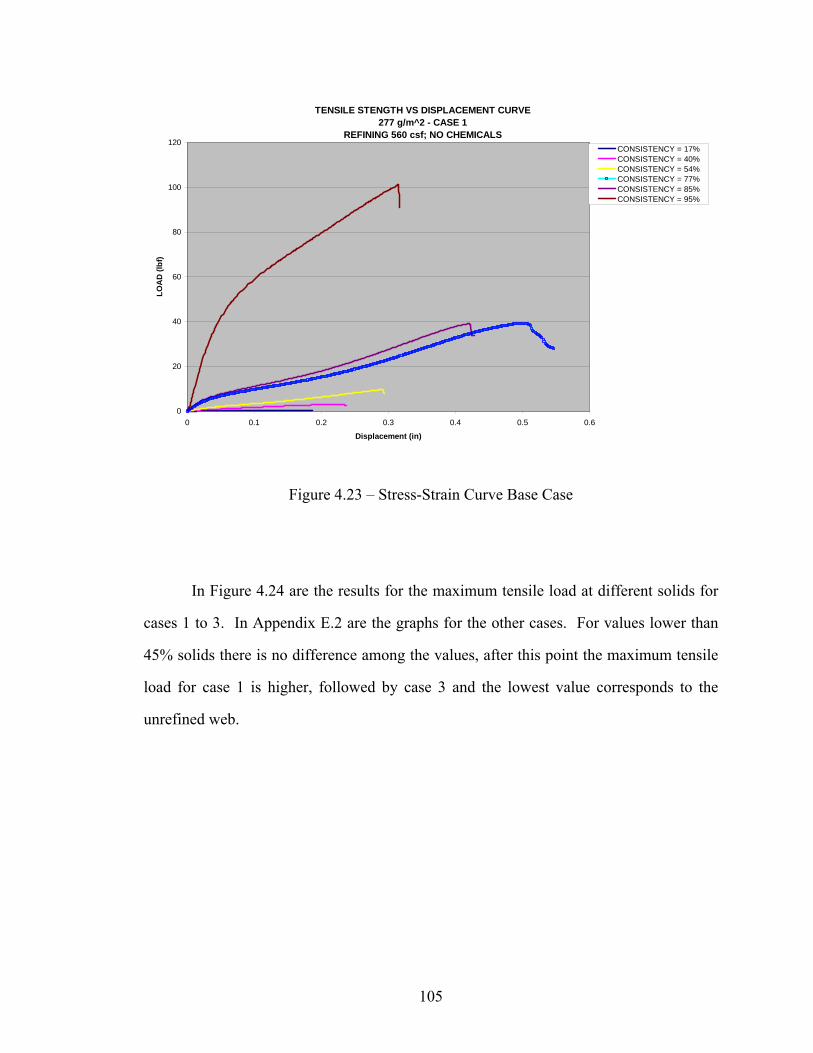
TENSILE STENGTH VS DISPLACEMENT CURVE277 g/m^2 - CASE 1
REFINING 560 csf; NO CHEMICALS
0
20
40
60
80
100
120
0 0.1 0.2 0.3 0.4 0.5 0.6
Displacement (in)
LOA
D (l
bf)
CONSISTENCY = 17%CONSISTENCY = 40%CONSISTENCY = 54%CONSISTENCY = 77%CONSISTENCY = 85%CONSISTENCY = 95%
Figure 4.23 – Stress-Strain Curve Base Case
In Figure 4.24 are the results for the maximum tensile load at different solids for
cases 1 to 3. In Appendix E.2 are the graphs for the other cases. For values lower than
45% solids there is no difference among the values, after this point the maximum tensile
load for case 1 is higher, followed by case 3 and the lowest value corresponds to the
unrefined web.
105
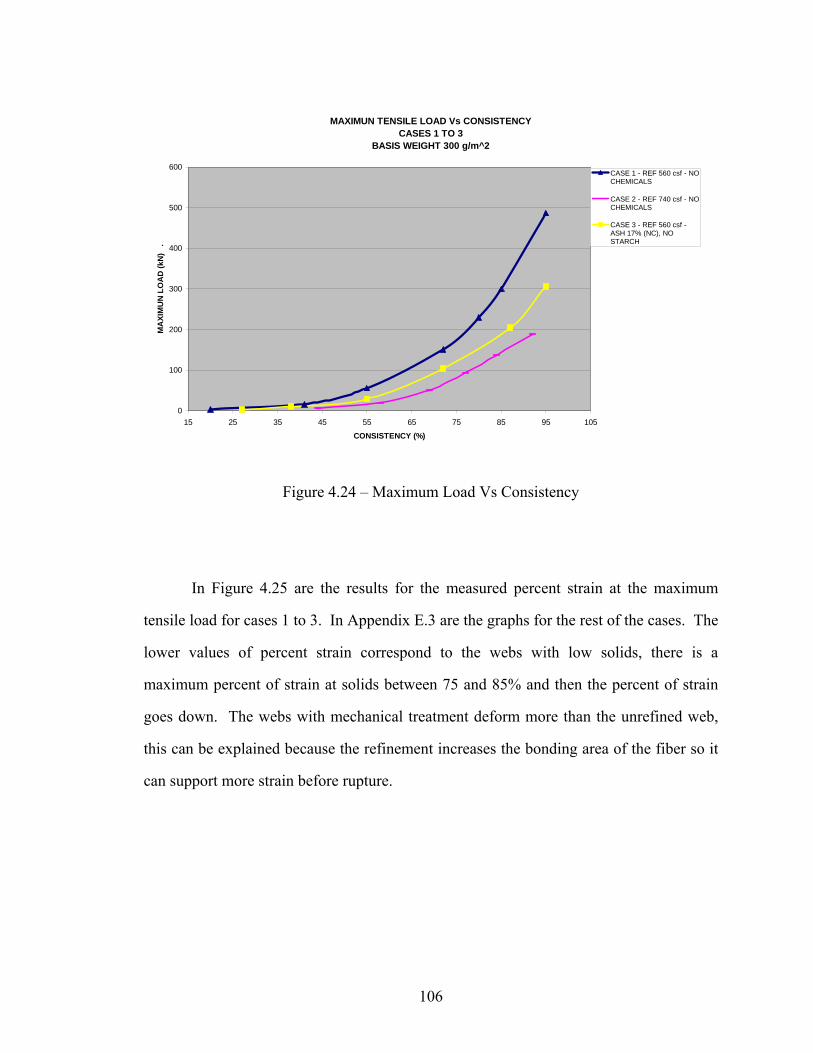
MAXIMUN TENSILE LOAD Vs CONSISTENCYCASES 1 TO 3
BASIS WEIGHT 300 g/m^2
0
100
200
300
400
500
600
15 25 35 45 55 65 75 85 95 105
CONSISTENCY (%)
MA
XIM
UN
LO
AD
(kN
) .
CASE 1 - REF 560 csf - NOCHEMICALS
CASE 2 - REF 740 csf - NOCHEMICALS
CASE 3 - REF 560 csf -ASH 17% (NC), NOSTARCH
Figure 4.24 – Maximum Load Vs Consistency
In Figure 4.25 are the results for the measured percent strain at the maximum
tensile load for cases 1 to 3. In Appendix E.3 are the graphs for the rest of the cases. The
lower values of percent strain correspond to the webs with low solids, there is a
maximum percent of strain at solids between 75 and 85% and then the percent of strain
goes down. The webs with mechanical treatment deform more than the unrefined web,
this can be explained because the refinement increases the bonding area of the fiber so it
can support more strain before rupture.
106
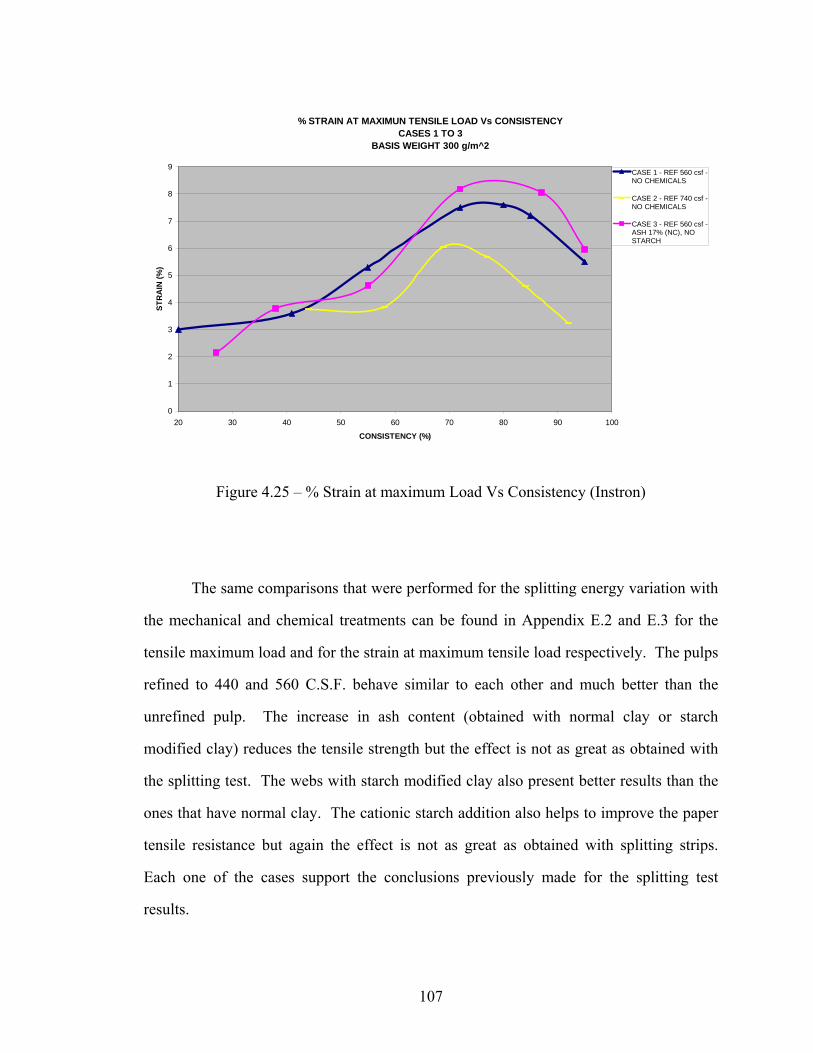
% STRAIN AT MAXIMUN TENSILE LOAD Vs CONSISTENCYCASES 1 TO 3
BASIS WEIGHT 300 g/m^2
0
1
2
3
4
5
6
7
8
9
20 30 40 50 60 70 80 90 100
CONSISTENCY (%)
STR
AIN
(%)
CASE 1 - REF 560 csf -NO CHEMICALS
CASE 2 - REF 740 csf -NO CHEMICALS
CASE 3 - REF 560 csf -ASH 17% (NC), NOSTARCH
Figure 4.25 – % Strain at maximum Load Vs Consistency (Instron)
The same comparisons that were performed for the splitting energy variation with
the mechanical and chemical treatments can be found in Appendix E.2 and E.3 for the
tensile maximum load and for the strain at maximum tensile load respectively. The pulps
refined to 440 and 560 C.S.F. behave similar to each other and much better than the
unrefined pulp. The increase in ash content (obtained with normal clay or starch
modified clay) reduces the tensile strength but the effect is not as great as obtained with
the splitting test. The webs with starch modified clay also present better results than the
ones that have normal clay. The cationic starch addition also helps to improve the paper
tensile resistance but again the effect is not as great as obtained with splitting strips.
Each one of the cases support the conclusions previously made for the splitting test
results.
107
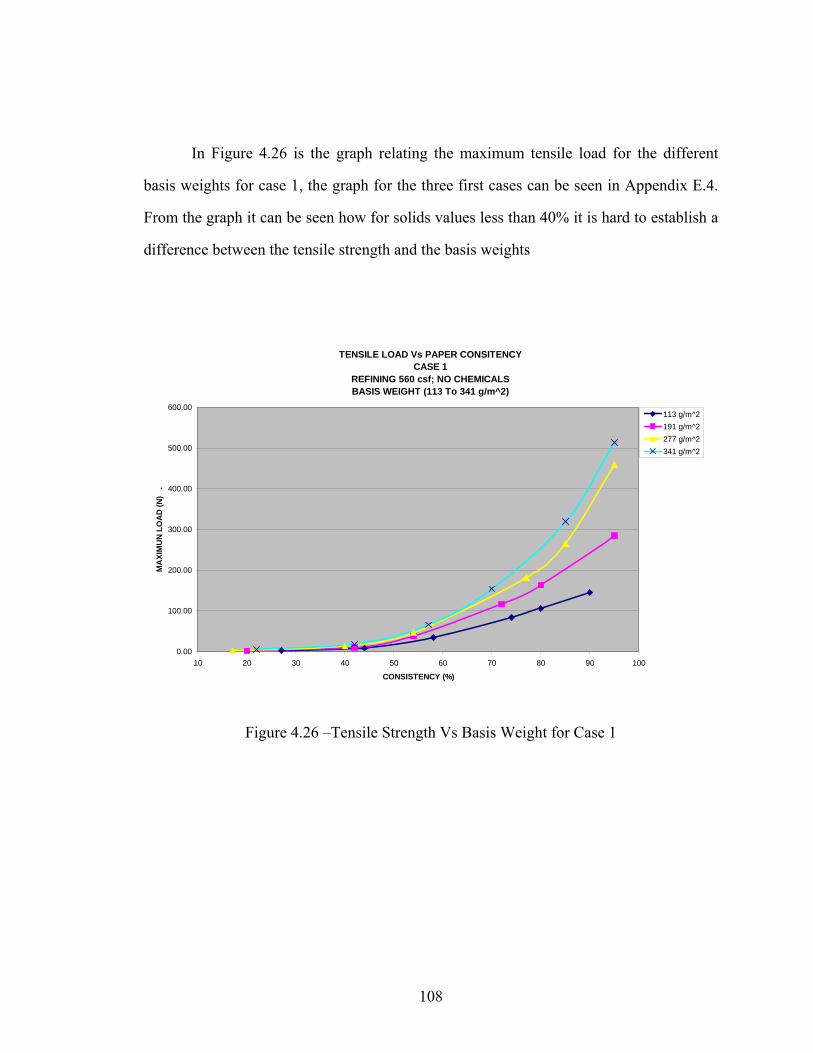
In Figure 4.26 is the graph relating the maximum tensile load for the different
basis weights for case 1, the graph for the three first cases can be seen in Appendix E.4.
From the graph it can be seen how for solids values less than 40% it is hard to establish a
difference between the tensile strength and the basis weights
TENSILE LOAD Vs PAPER CONSITENCYCASE 1
REFINING 560 csf; NO CHEMICALSBASIS WEIGHT (113 To 341 g/m^2)
0.00
100.00
200.00
300.00
400.00
500.00
600.00
10 20 30 40 50 60 70 80 90 100
CONSISTENCY (%)
MA
XIM
UN
LO
AD
(N)
.
113 g/m^2191 g/m^2277 g/m^2341 g/m^2
Figure 4.26 –Tensile Strength Vs Basis Weight for Case 1
108
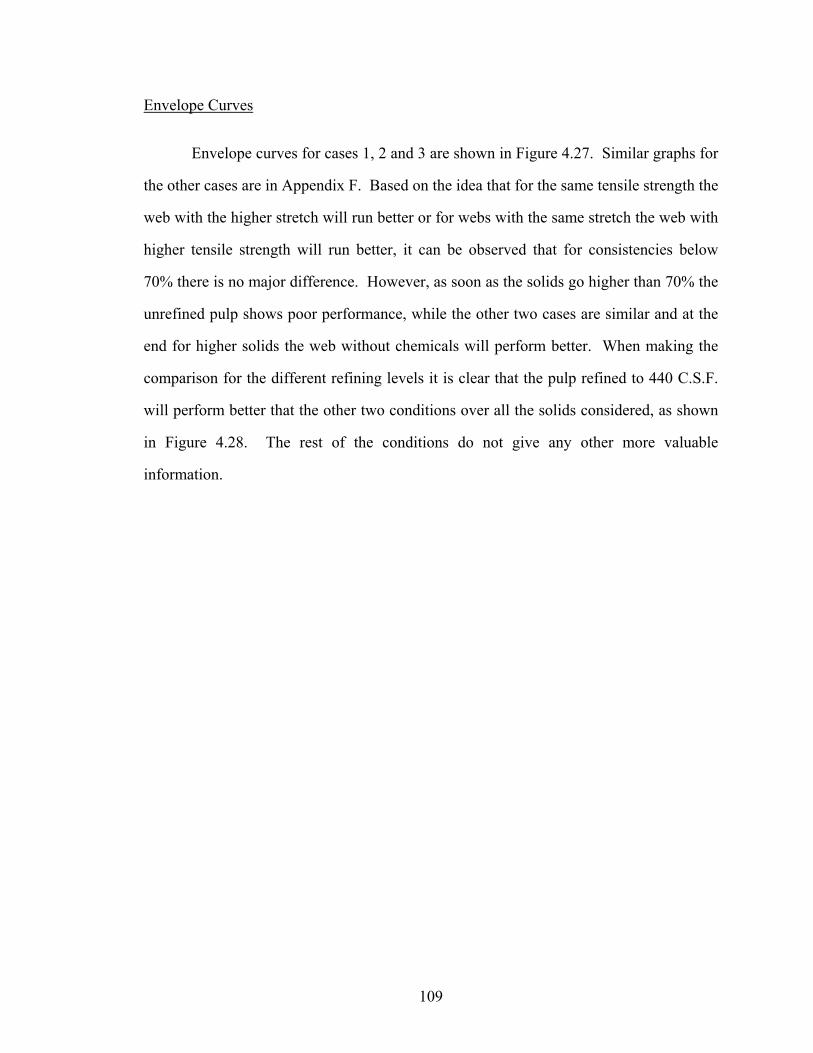
Envelope Curves
Envelope curves for cases 1, 2 and 3 are shown in Figure 4.27. Similar graphs for
the other cases are in Appendix F. Based on the idea that for the same tensile strength the
web with the higher stretch will run better or for webs with the same stretch the web with
higher tensile strength will run better, it can be observed that for consistencies below
70% there is no major difference. However, as soon as the solids go higher than 70% the
unrefined pulp shows poor performance, while the other two cases are similar and at the
end for higher solids the web without chemicals will perform better. When making the
comparison for the different refining levels it is clear that the pulp refined to 440 C.S.F.
will perform better that the other two conditions over all the solids considered, as shown
in Figure 4.28. The rest of the conditions do not give any other more valuable
information.
109
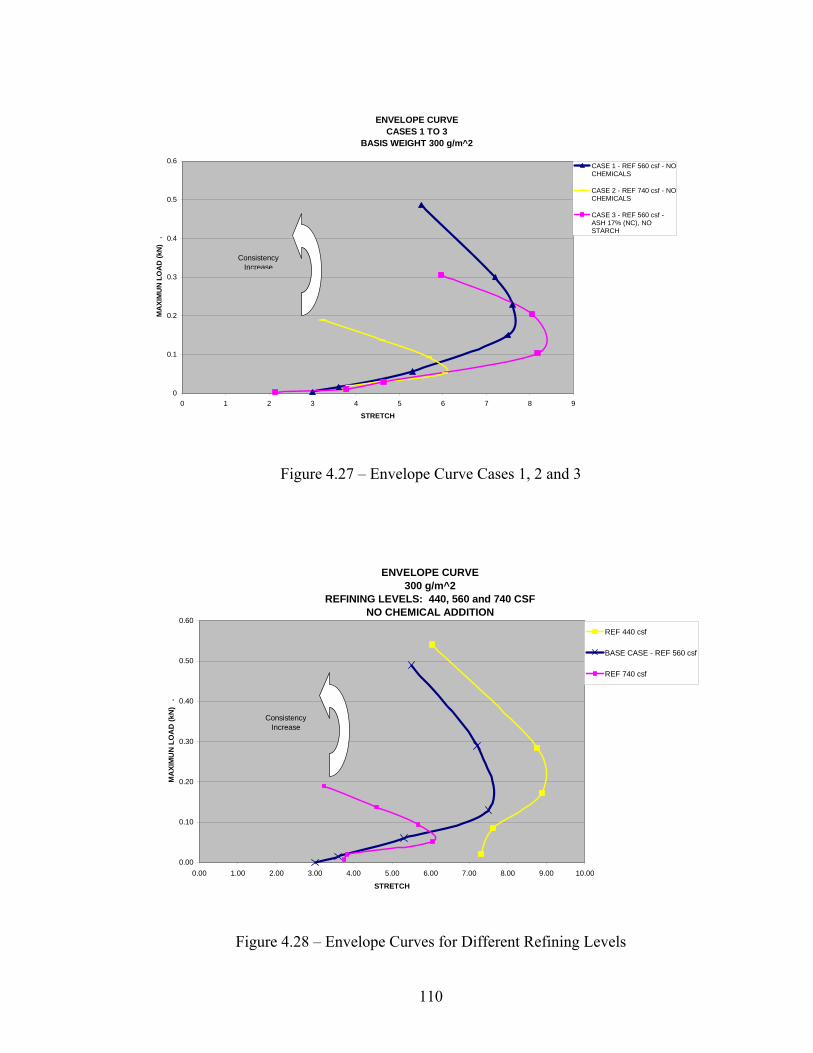
ENVELOPE CURVECASES 1 TO 3
BASIS WEIGHT 300 g/m^2
0
0.1
0.2
0.3
0.4
0.5
0.6
0 1 2 3 4 5 6 7 8 9
STRETCH
MA
XIM
UN
LO
AD
(kN
) .
CASE 1 - REF 560 csf - NOCHEMICALS
CASE 2 - REF 740 csf - NOCHEMICALS
CASE 3 - REF 560 csf -ASH 17% (NC), NOSTARCH
ConsistencyIncrease
Figure 4.27 – Envelope Curve Cases 1, 2 and 3
ENVELOPE CURVE300 g/m^2
REFINING LEVELS: 440, 560 and 740 CSFNO CHEMICAL ADDITION
0.00
0.10
0.20
0.30
0.40
0.50
0.60
0.00 1.00 2.00 3.00 4.00 5.00 6.00 7.00 8.00 9.00 10.00
STRETCH
MA
XIM
UN
LO
AD
(kN
) .
REF 440 csf
BASE CASE - REF 560 csf
REF 740 csf
ConsistencyIncrease
Figure 4.28 – Envelope Curves for Different Refining Levels
110
Splitting Energy Results Validation
Page Equation for Wet Webs
It has been established that the tensile strength depends, in part, on the internal
energy that bonds the fibers together in the web. This internal bond strength is related to
the cohesive energy found previously for cases 1, 2 and 3.
As previously discussed, Williams and Page dealt with the issue of determining
the relation between the tensile index and the shear strength of the fiber to fiber bond for
wet webs, starting with the known relation between both factors (eqn 2.2) for chemically
pulped softwood made dry sheets. For wet webs the strength depends on the fiber to
fiber interaction and the strength of the bonds in the area of contact. During the tensile
test of wet webs, the fibers are not broken. In this case it can be assumed that for sheets
made of straight fibers weakly bonded (low solids content) the fiber strength by far
exceeds the bond strength or Z >> b in equation 2.2. Based on this assumption equation
2.2 takes the form of equation 2.3. In our case the tensile strength can not be determined
using Page equation 2.3 because in that equation it is necessary to find b (the shear
strength of the fiber to fiber bond). Equation 2.3 also shows that there exists a constant
linear relation, defined by the value K, between the tensile index and the shear strength of
the fiber to fiber bond. The expression for K is given by the expressions in equation 4.1
and 4.2.
1 = 9 + 12C 2.2 T 8Z bPLf RBA
Tww = (bPLf RBAww) / 12C 2.3
111
K = (PLf RBAww) / 12C 4.1
T = Kb 4.2
With the splitter apparatus the cohesive energy measured is not the same as would
be measured in a test which subjects the sheet to a pure shear loading. Such a test would
be required to directly determine b. However the cohesive energy is controlled in part by
fiber to fiber bonding and it could be expected that the two are directly related.
Therefore, it should be possible to use the Page model to develop a relationship between
tensile index and cohesive energy index. To investigate the relationship a comparison of
the two parameters was made for cases 1, 2 and 3 at a basis weight of 300 g/m2 and for
different solids content. Data for different consistencies were collected from Figures 4.20
for the cohesive strength and from Figure 4.24 for the maximum tensile strength, these
data were then divided by the sample width (2” for cohesive and 1” for tensile indices
respectively) and the result divided by the basis weight of the web (300 g/m²) to obtain
the cohesive strength index and the tensile strength index at several solids. The data are
shown in Tables 4.7 and 4.8 and presented in Figure 4.29. The values for case 1
corresponding to 300 g/m2 was obtained interpolated the actual measurement for this case
(277 and 341 g/m2).
112
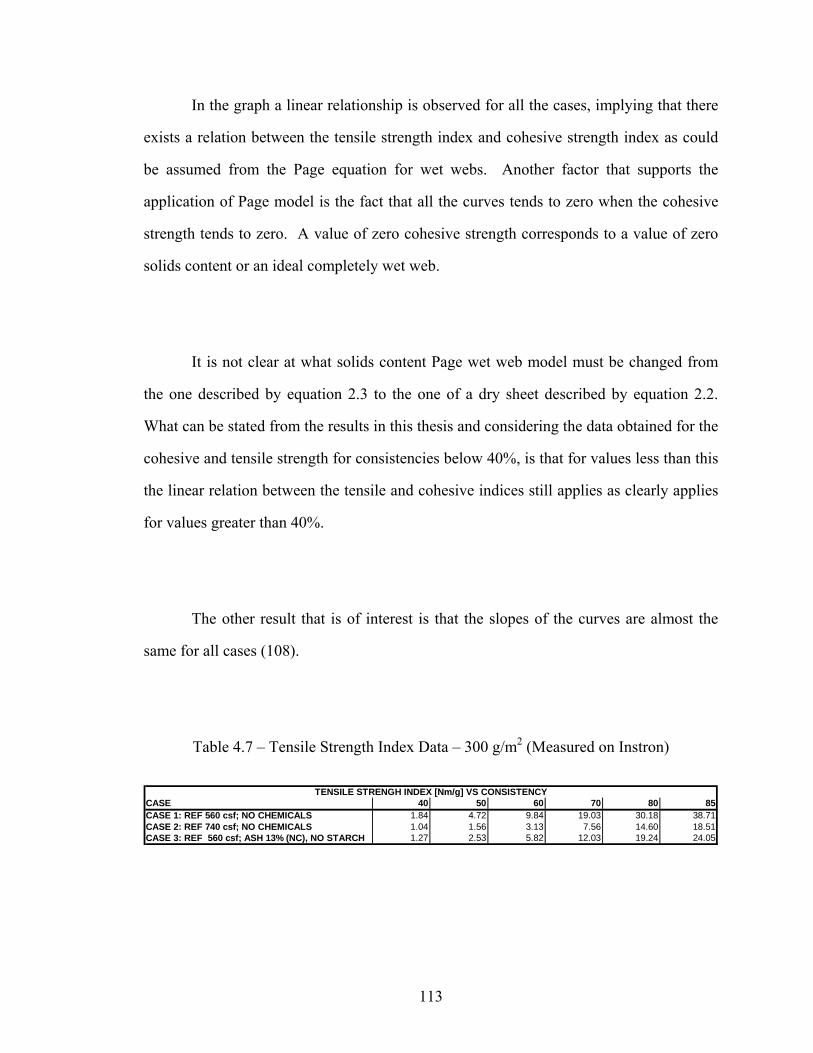
In the graph a linear relationship is observed for all the cases, implying that there
exists a relation between the tensile strength index and cohesive strength index as could
be assumed from the Page equation for wet webs. Another factor that supports the
application of Page model is the fact that all the curves tends to zero when the cohesive
strength tends to zero. A value of zero cohesive strength corresponds to a value of zero
solids content or an ideal completely wet web.
It is not clear at what solids content Page wet web model must be changed from
the one described by equation 2.3 to the one of a dry sheet described by equation 2.2.
What can be stated from the results in this thesis and considering the data obtained for the
cohesive and tensile strength for consistencies below 40%, is that for values less than this
the linear relation between the tensile and cohesive indices still applies as clearly applies
for values greater than 40%.
The other result that is of interest is that the slopes of the curves are almost the
same for all cases (108).
Table 4.7 – Tensile Strength Index Data – 300 g/m2 (Measured on Instron)
CASE 40 50 60 70 80 85CASE 1: REF 560 csf; NO CHEMICALS 1.84 4.72 9.84 19.03 30.18 38.71CASE 2: REF 740 csf; NO CHEMICALS 1.04 1.56 3.13 7.56 14.60 18.51CASE 3: REF 560 csf; ASH 13% (NC), NO STARCH 1.27 2.53 5.82 12.03 19.24 24.05
TENSILE STRENGH INDEX [Nm/g] VS CONSISTENCY
113
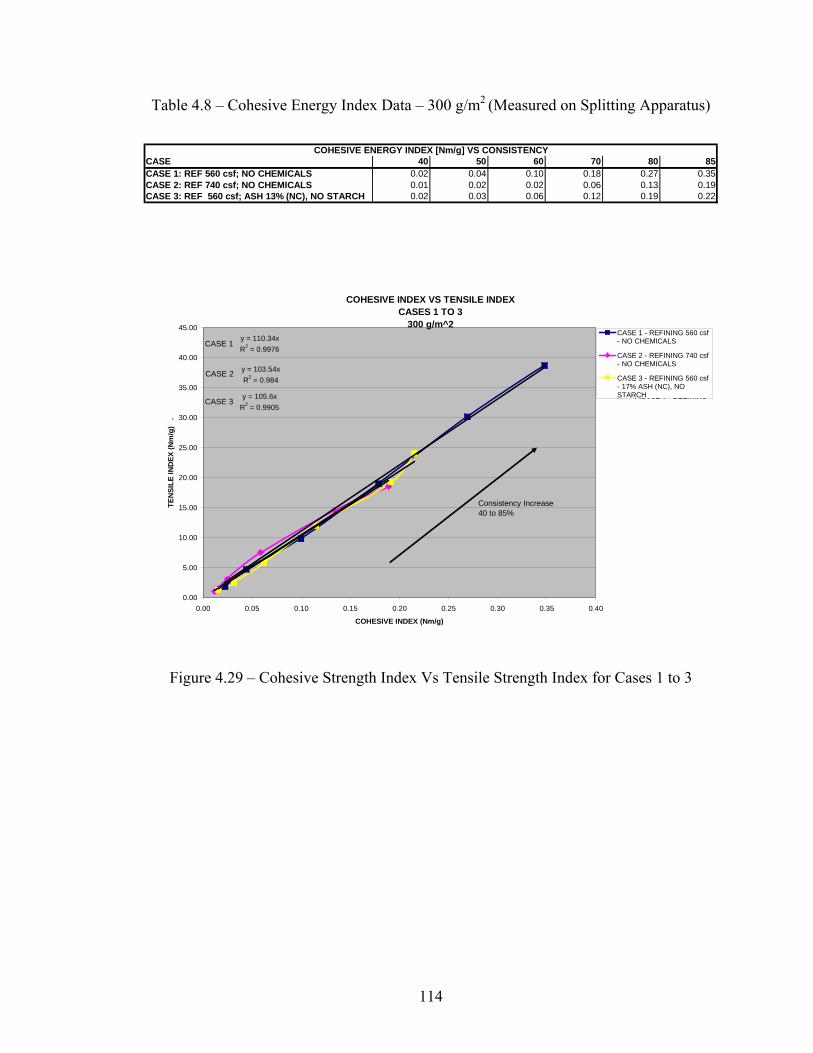
Table 4.8 – Cohesive Energy Index Data – 300 g/m2 (Measured on Splitting Apparatus)
CASE 40 50 60 70 80 85CASE 1: REF 560 csf; NO CHEMICALS 0.02 0.04 0.10 0.18 0.27 0.35CASE 2: REF 740 csf; NO CHEMICALS 0.01 0.02 0.02 0.06 0.13 0.19CASE 3: REF 560 csf; ASH 13% (NC), NO STARCH 0.02 0.03 0.06 0.12 0.19 0.22
COHESIVE ENERGY INDEX [Nm/g] VS CONSISTENCY
COHESIVE INDEX VS TENSILE INDEXCASES 1 TO 3
300 g/m^2y = 110.34xR2 = 0.9976
y = 105.6xR2 = 0.9905
y = 103.54xR2 = 0.984
0.00
5.00
10.00
15.00
20.00
25.00
30.00
35.00
40.00
45.00
0.00 0.05 0.10 0.15 0.20 0.25 0.30 0.35 0.40
COHESIVE INDEX (Nm/g)
TEN
SILE
IND
EX (N
m/g
) .
CASE 1 - REFINING 560 csf- NO CHEMICALS
CASE 2 - REFINING 740 csf- NO CHEMICALS
CASE 3 - REFINING 560 csf- 17% ASH (NC), NOSTARCHLi l (CASE 1 REFINING
Consistency Increase40 to 85%
CASE 3
CASE 1
CASE 2
Figure 4.29 – Cohesive Strength Index Vs Tensile Strength Index for Cases 1 to 3
114
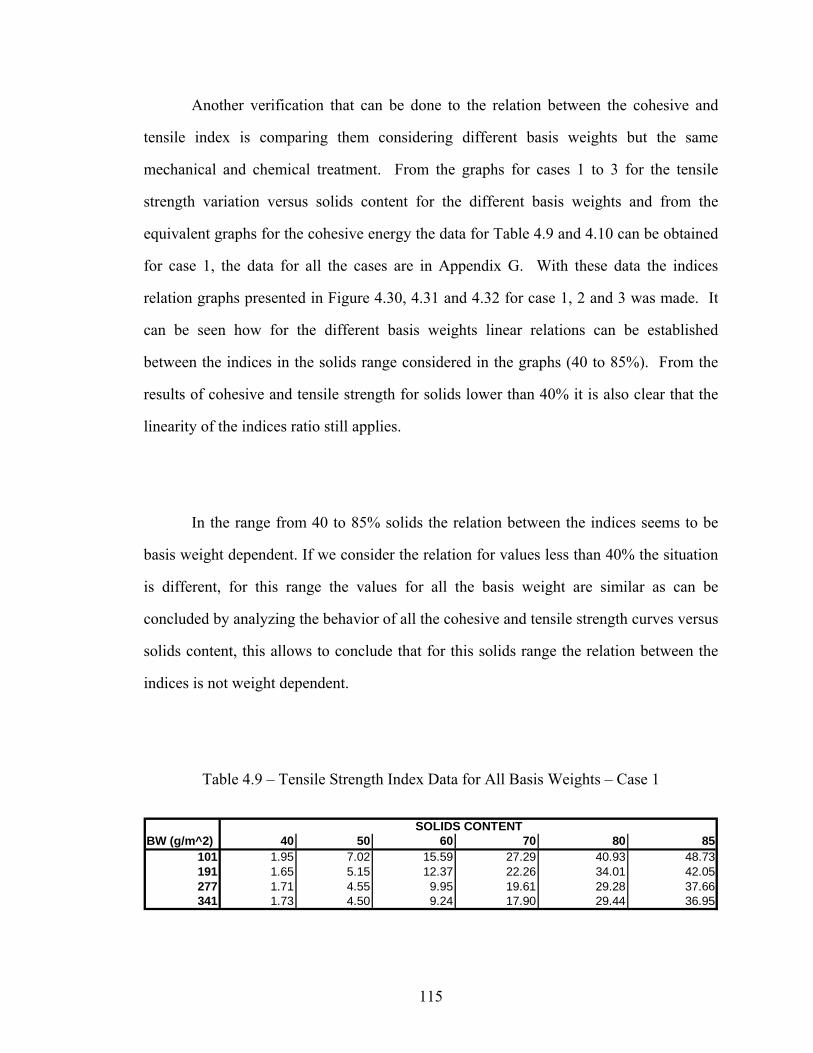
Another verification that can be done to the relation between the cohesive and
tensile index is comparing them considering different basis weights but the same
mechanical and chemical treatment. From the graphs for cases 1 to 3 for the tensile
strength variation versus solids content for the different basis weights and from the
equivalent graphs for the cohesive energy the data for Table 4.9 and 4.10 can be obtained
for case 1, the data for all the cases are in Appendix G. With these data the indices
relation graphs presented in Figure 4.30, 4.31 and 4.32 for case 1, 2 and 3 was made. It
can be seen how for the different basis weights linear relations can be established
between the indices in the solids range considered in the graphs (40 to 85%). From the
results of cohesive and tensile strength for solids lower than 40% it is also clear that the
linearity of the indices ratio still applies.
In the range from 40 to 85% solids the relation between the indices seems to be
basis weight dependent. If we consider the relation for values less than 40% the situation
is different, for this range the values for all the basis weight are similar as can be
concluded by analyzing the behavior of all the cohesive and tensile strength curves versus
solids content, this allows to conclude that for this solids range the relation between the
indices is not weight dependent.
Table 4.9 – Tensile Strength Index Data for All Basis Weights – Case 1
BW (g/m^2) 40 50 60 70 80 8101 1.95 7.02 15.59 27.29 40.93 48.73191 1.65 5.15 12.37 22.26 34.01 42.05277 1.71 4.55 9.95 19.61 29.28 37.66341 1.73 4.50 9.24 17.90 29.44 36.95
5SOLIDS CONTENT
115
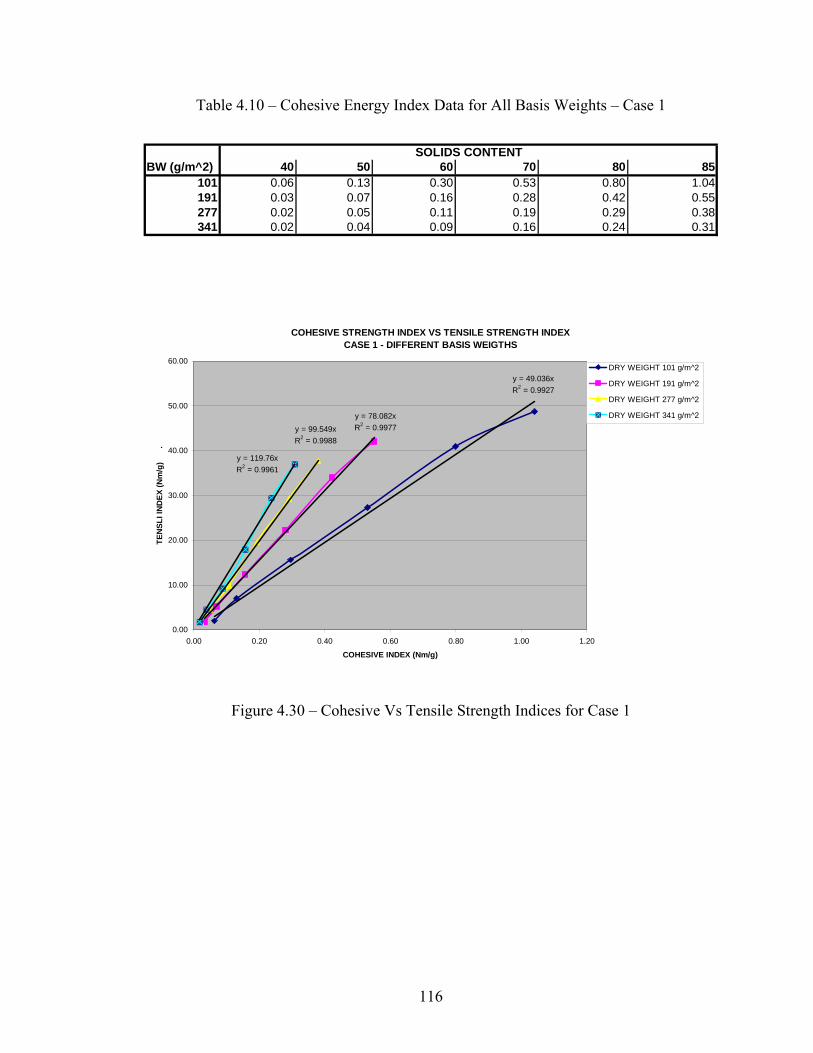
Table 4.10 – Cohesive Energy Index Data for All Basis Weights – Case 1
BW (g/m^2) 40 50 60 70 80 8101 0.06 0.13 0.30 0.53 0.80 1.04191 0.03 0.07 0.16 0.28 0.42 0.55277 0.02 0.05 0.11 0.19 0.29 0.38341 0.02 0.04 0.09 0.16 0.24 0.31
5SOLIDS CONTENT
COHESIVE STRENGTH INDEX VS TENSILE STRENGTH INDEXCASE 1 - DIFFERENT BASIS WEIGTHS
y = 119.76xR2 = 0.9961
y = 99.549xR2 = 0.9988
y = 78.082xR2 = 0.9977
y = 49.036xR2 = 0.9927
0.00
10.00
20.00
30.00
40.00
50.00
60.00
0.00 0.20 0.40 0.60 0.80 1.00 1.20
COHESIVE INDEX (Nm/g)
TEN
SLI I
ND
EX (N
m/g
)
.
DRY WEIGHT 101 g/m^2
DRY WEIGHT 191 g/m^2
DRY WEIGHT 277 g/m^2
DRY WEIGHT 341 g/m^2
Figure 4.30 – Cohesive Vs Tensile Strength Indices for Case 1
116
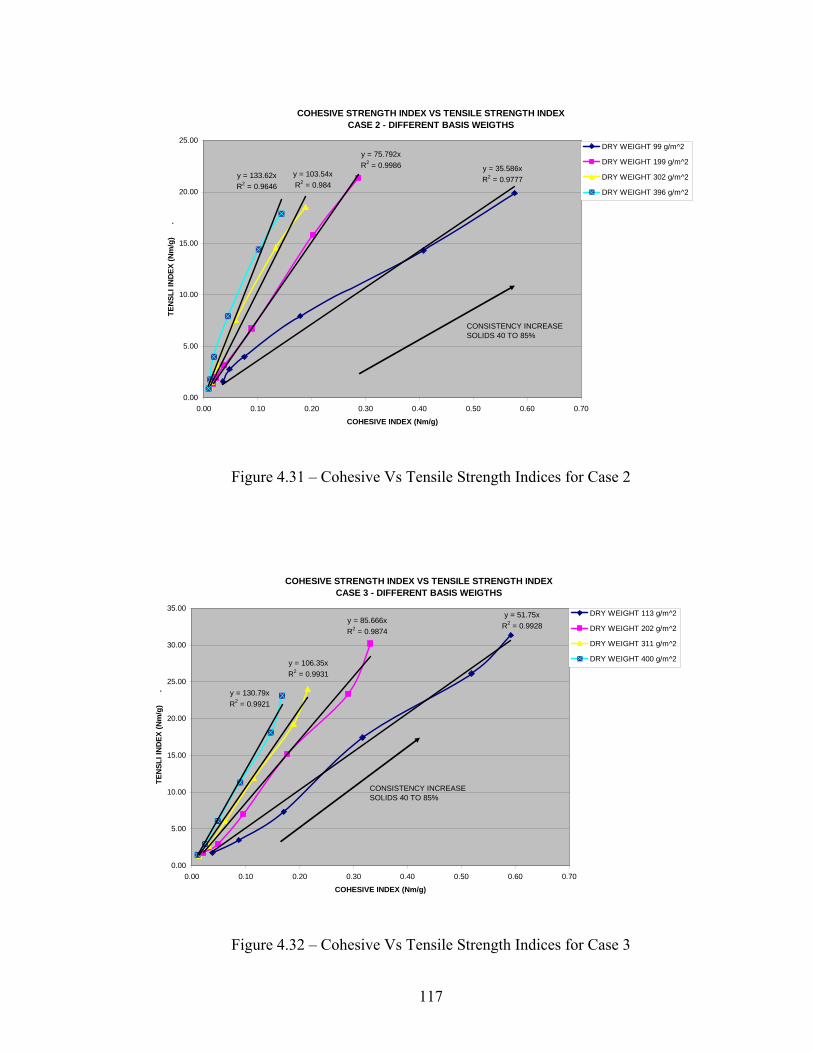
COHESIVE STRENGTH INDEX VS TENSILE STRENGTH INDEXCASE 2 - DIFFERENT BASIS WEIGTHS
y = 133.62xR2 = 0.9646
y = 103.54xR2 = 0.984
y = 75.792xR2 = 0.9986 y = 35.586x
R2 = 0.9777
0.00
5.00
10.00
15.00
20.00
25.00
0.00 0.10 0.20 0.30 0.40 0.50 0.60 0.70
COHESIVE INDEX (Nm/g)
TEN
SLI I
ND
EX (N
m/g
)
.
DRY WEIGHT 99 g/m^2
DRY WEIGHT 199 g/m^2
DRY WEIGHT 302 g/m^2
DRY WEIGHT 396 g/m^2
CONSISTENCY INCREASESOLIDS 40 TO 85%
Figure 4.31 – Cohesive Vs Tensile Strength Indices for Case 2
COHESIVE STRENGTH INDEX VS TENSILE STRENGTH INDEXCASE 3 - DIFFERENT BASIS WEIGTHS
y = 51.75xR2 = 0.9928
y = 85.666xR2 = 0.9874
y = 106.35xR2 = 0.9931
y = 130.79xR2 = 0.9921
0.00
5.00
10.00
15.00
20.00
25.00
30.00
35.00
0.00 0.10 0.20 0.30 0.40 0.50 0.60 0.70
COHESIVE INDEX (Nm/g)
TEN
SLI I
ND
EX (N
m/g
)
.
DRY WEIGHT 113 g/m^2
DRY WEIGHT 202 g/m^2
DRY WEIGHT 311 g/m^2
DRY WEIGHT 400 g/m^2
CONSISTENCY INCREASESOLIDS 40 TO 85%
Figure 4.32 – Cohesive Vs Tensile Strength Indices for Case 3
117
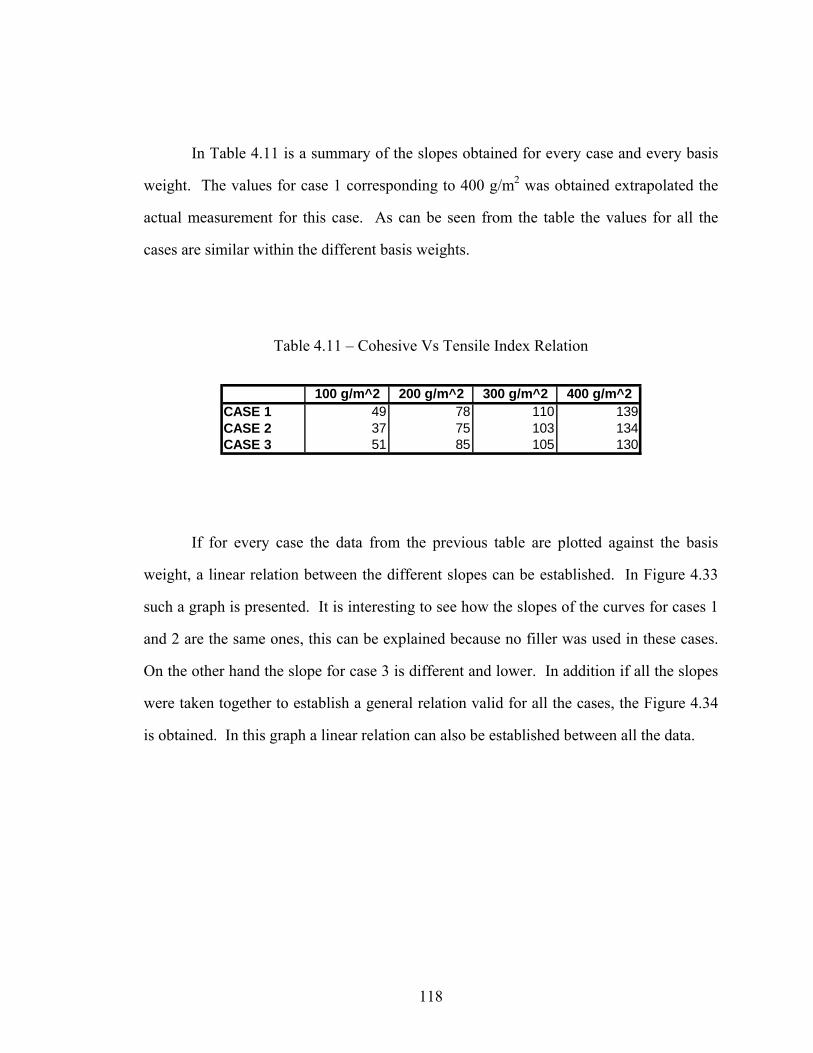
In Table 4.11 is a summary of the slopes obtained for every case and every basis
weight. The values for case 1 corresponding to 400 g/m2 was obtained extrapolated the
actual measurement for this case. As can be seen from the table the values for all the
cases are similar within the different basis weights.
Table 4.11 – Cohesive Vs Tensile Index Relation
100 g/m^2 200 g/m^2 300 g/m^2 400 g/m^2CASE 1 49 78 110 139CASE 2 37 75 103 134CASE 3 51 85 105 130
If for every case the data from the previous table are plotted against the basis
weight, a linear relation between the different slopes can be established. In Figure 4.33
such a graph is presented. It is interesting to see how the slopes of the curves for cases 1
and 2 are the same ones, this can be explained because no filler was used in these cases.
On the other hand the slope for case 3 is different and lower. In addition if all the slopes
were taken together to establish a general relation valid for all the cases, the Figure 4.34
is obtained. In this graph a linear relation can also be established between all the data.
118
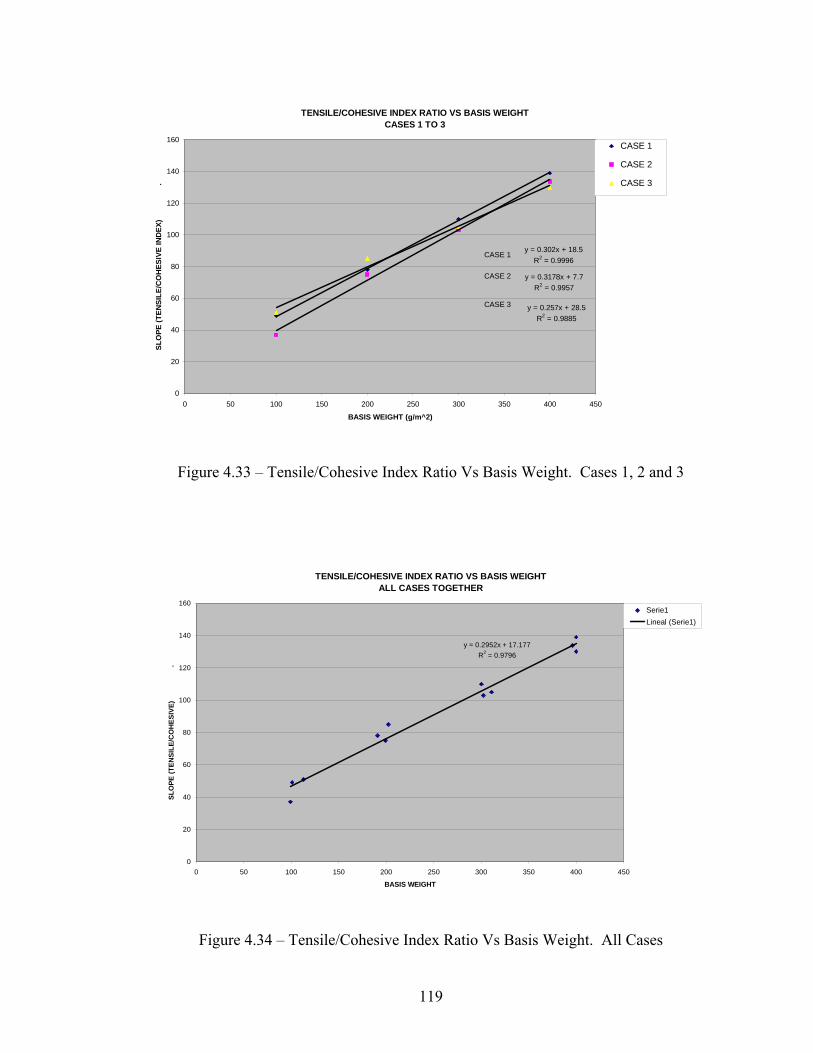
TENSILE/COHESIVE INDEX RATIO VS BASIS WEIGHTCASES 1 TO 3
y = 0.3178x + 7.7R2 = 0.9957
y = 0.302x + 18.5R2 = 0.9996
y = 0.257x + 28.5R2 = 0.9885
0
20
40
60
80
100
120
140
160
0 50 100 150 200 250 300 350 400 450
BASIS WEIGHT (g/m^2)
SLO
PE (T
ENSI
LE/C
OH
ESIV
E IN
DEX
)
.
CASE 1
CASE 2
CASE 3
CASE 1
CASE 2
CASE 3
Figure 4.33 – Tensile/Cohesive Index Ratio Vs Basis Weight. Cases 1, 2 and 3
TENSILE/COHESIVE INDEX RATIO VS BASIS WEIGHTALL CASES TOGETHER
y = 0.2952x + 17.177R2 = 0.9796
0
20
40
60
80
100
120
140
160
0 50 100 150 200 250 300 350 400 450
BASIS WEIGHT
SLO
PE (T
ENSI
LE/C
OH
ESIV
E)
.
Serie1Lineal (Serie1)
Figure 4.34 – Tensile/Cohesive Index Ratio Vs Basis Weight. All Cases
119
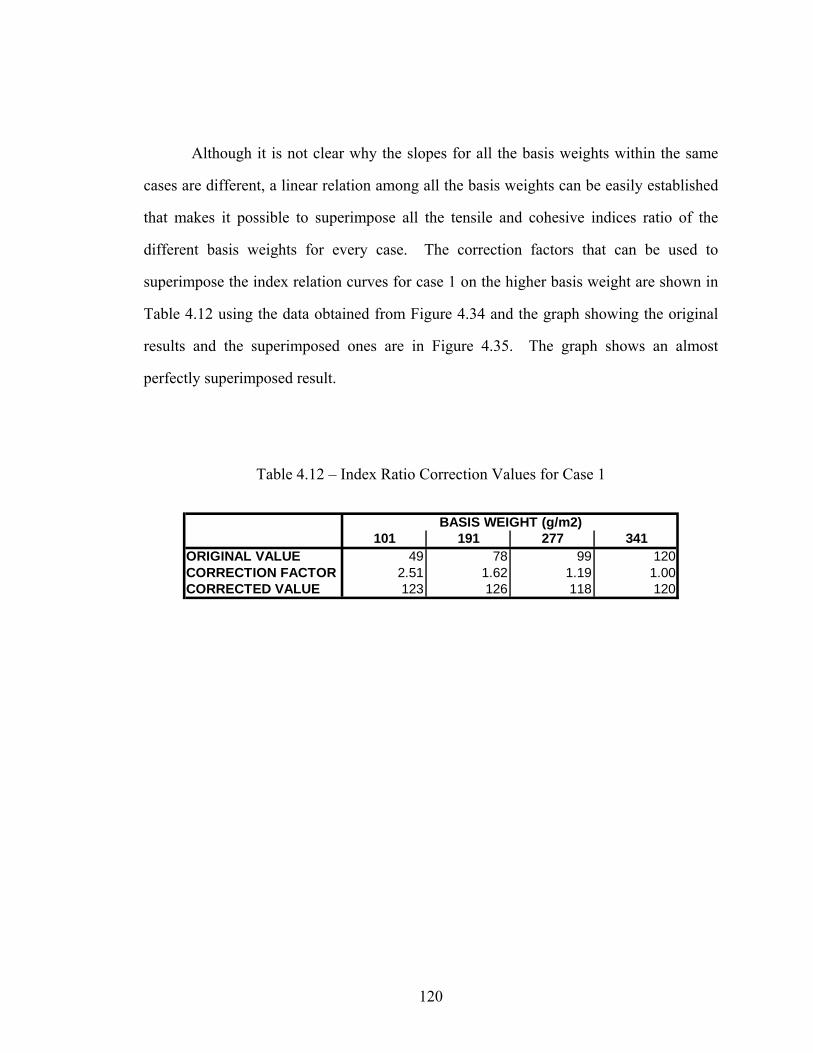
Although it is not clear why the slopes for all the basis weights within the same
cases are different, a linear relation among all the basis weights can be easily established
that makes it possible to superimpose all the tensile and cohesive indices ratio of the
different basis weights for every case. The correction factors that can be used to
superimpose the index relation curves for case 1 on the higher basis weight are shown in
Table 4.12 using the data obtained from Figure 4.34 and the graph showing the original
results and the superimposed ones are in Figure 4.35. The graph shows an almost
perfectly superimposed result.
Table 4.12 – Index Ratio Correction Values for Case 1
101 191 277 341ORIGINAL VALUE 49 78 99 120CORRECTION FACTOR 2.51 1.62 1.19 1.00CORRECTED VALUE 123 126 118 120
BASIS WEIGHT (g/m2)
120
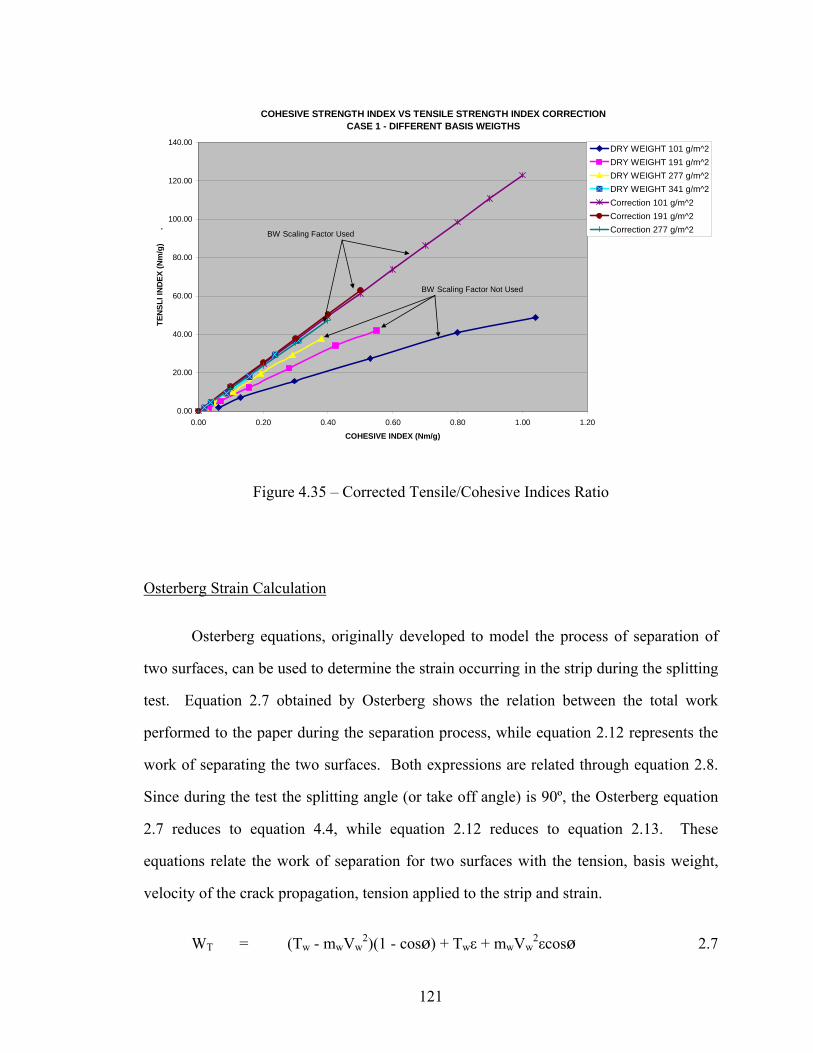
COHESIVE STRENGTH INDEX VS TENSILE STRENGTH INDEX CORRECTIONCASE 1 - DIFFERENT BASIS WEIGTHS
0.00
20.00
40.00
60.00
80.00
100.00
120.00
140.00
0.00 0.20 0.40 0.60 0.80 1.00 1.20
COHESIVE INDEX (Nm/g)
TEN
SLI I
ND
EX (N
m/g
)
.DRY WEIGHT 101 g/m^2DRY WEIGHT 191 g/m^2DRY WEIGHT 277 g/m^2DRY WEIGHT 341 g/m^2Correction 101 g/m^2Correction 191 g/m^2Correction 277 g/m^2BW Scaling Factor Used
BW Scaling Factor Not Used
Figure 4.35 – Corrected Tensile/Cohesive Indices Ratio
Osterberg Strain Calculation
Osterberg equations, originally developed to model the process of separation of
two surfaces, can be used to determine the strain occurring in the strip during the splitting
test. Equation 2.7 obtained by Osterberg shows the relation between the total work
performed to the paper during the separation process, while equation 2.12 represents the
work of separating the two surfaces. Both expressions are related through equation 2.8.
Since during the test the splitting angle (or take off angle) is 90º, the Osterberg equation
2.7 reduces to equation 4.4, while equation 2.12 reduces to equation 2.13. These
equations relate the work of separation for two surfaces with the tension, basis weight,
velocity of the crack propagation, tension applied to the strip and strain.
WT = (Tw - mwVw2)(1 - cosø) + Twε + mwVw
2εcosø 2.7
121
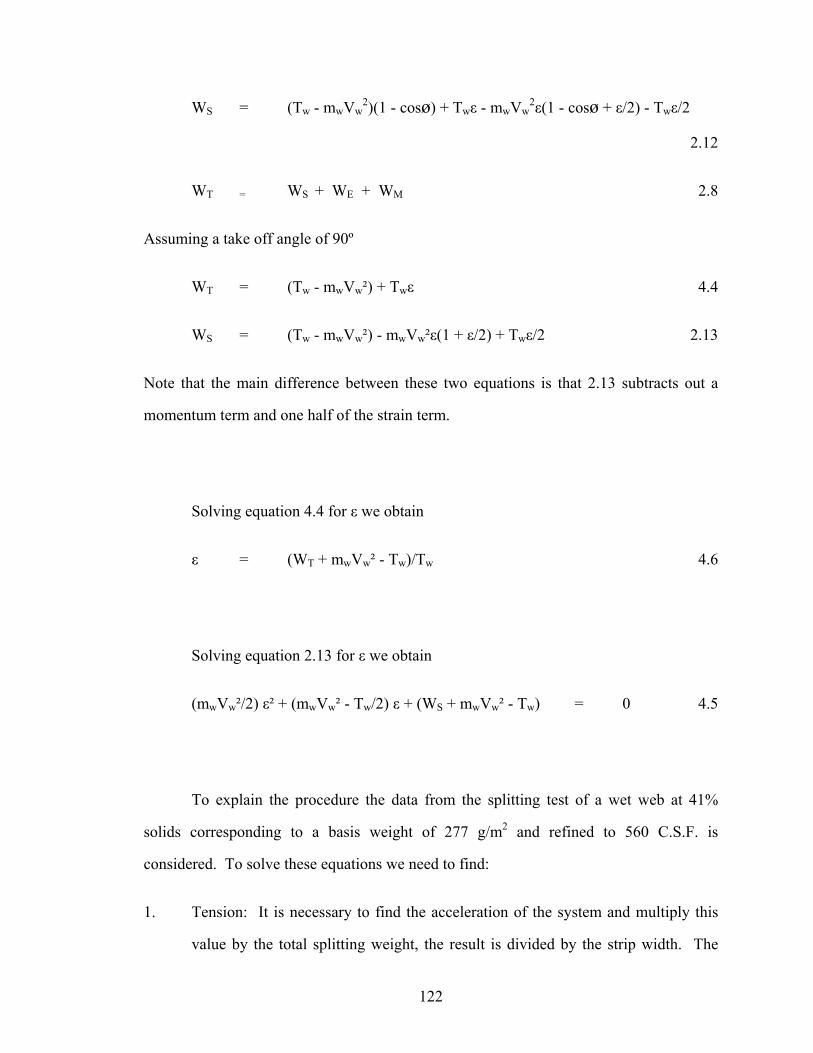
WS = (Tw - mwVw2)(1 - cosø) + Twε - mwVw
2ε(1 - cosø + ε/2) - Twε/2
2.12
WT = WS + WE + WM 2.8
Assuming a take off angle of 90º
WT = (Tw - mwVw²) + Twε 4.4
WS = (Tw - mwVw²) - mwVw²ε(1 + ε/2) + Twε/2 2.13
Note that the main difference between these two equations is that 2.13 subtracts out a
momentum term and one half of the strain term.
Solving equation 4.4 for ε we obtain
ε = (WT + mwVw² - Tw)/Tw 4.6
Solving equation 2.13 for ε we obtain
(mwVw²/2) ε² + (mwVw² - Tw/2) ε + (WS + mwVw² - Tw) = 0 4.5
To explain the procedure the data from the splitting test of a wet web at 41%
solids corresponding to a basis weight of 277 g/m2 and refined to 560 C.S.F. is
considered. To solve these equations we need to find:
1. Tension: It is necessary to find the acceleration of the system and multiply this
value by the total splitting weight, the result is divided by the strip width. The
122
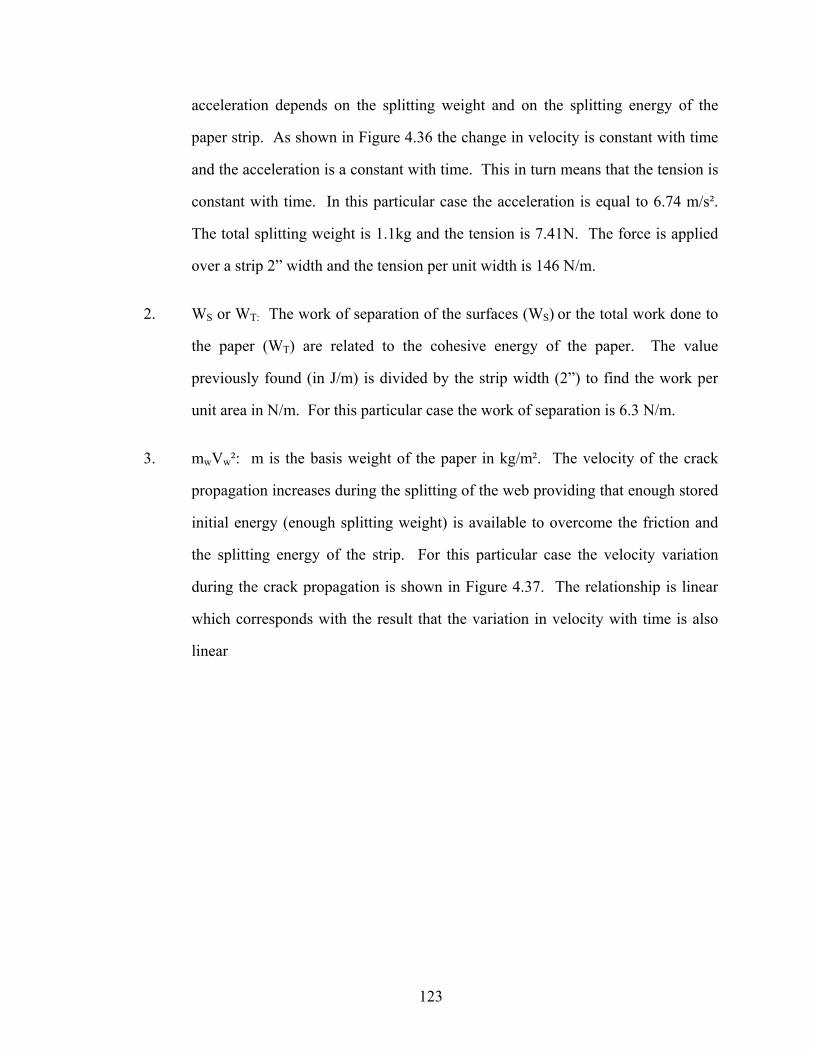
acceleration depends on the splitting weight and on the splitting energy of the
paper strip. As shown in Figure 4.36 the change in velocity is constant with time
and the acceleration is a constant with time. This in turn means that the tension is
constant with time. In this particular case the acceleration is equal to 6.74 m/s².
The total splitting weight is 1.1kg and the tension is 7.41N. The force is applied
over a strip 2” width and the tension per unit width is 146 N/m.
2. WS or WT: The work of separation of the surfaces (WS) or the total work done to
the paper (WT) are related to the cohesive energy of the paper. The value
previously found (in J/m) is divided by the strip width (2”) to find the work per
unit area in N/m. For this particular case the work of separation is 6.3 N/m.
3. mwVw²: m is the basis weight of the paper in kg/m². The velocity of the crack
propagation increases during the splitting of the web providing that enough stored
initial energy (enough splitting weight) is available to overcome the friction and
the splitting energy of the strip. For this particular case the velocity variation
during the crack propagation is shown in Figure 4.37. The relationship is linear
which corresponds with the result that the variation in velocity with time is also
linear
123
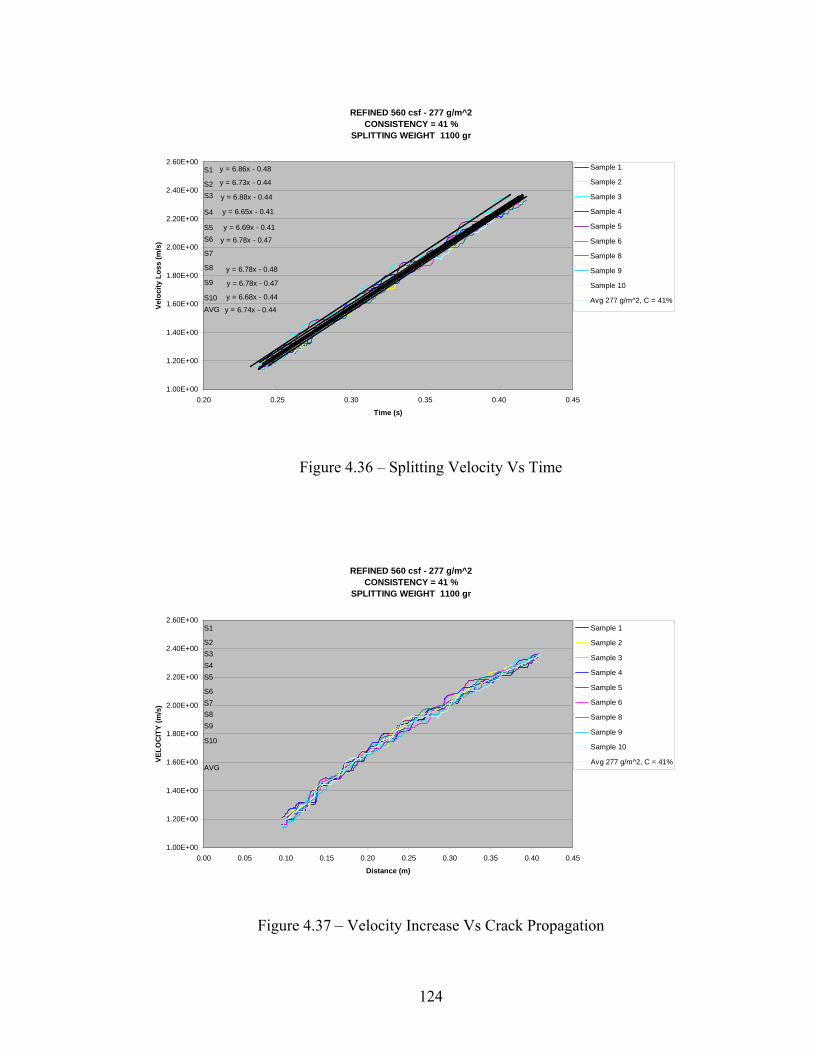
REFINED 560 csf - 277 g/m^2CONSISTENCY = 41 %
SPLITTING WEIGHT 1100 gr
y = 6.86x - 0.48
y = 6.73x - 0.44
y = 6.88x - 0.44
y = 6.65x - 0.41
y = 6.69x - 0.41
y = 6.78x - 0.47
y = 6.78x - 0.48
y = 6.78x - 0.47
y = 6.68x - 0.44
y = 6.74x - 0.44
1.00E+00
1.20E+00
1.40E+00
1.60E+00
1.80E+00
2.00E+00
2.20E+00
2.40E+00
2.60E+00
0.20 0.25 0.30 0.35 0.40 0.45
Time (s)
Velo
city
Los
s (m
/s)
Sample 1
Sample 2
Sample 3
Sample 4
Sample 5
Sample 6
Sample 8
Sample 9
Sample 10
Avg 277 g/m^2, C = 41%
S1
AVGS10
S9
S8
S7
S6S5
S4
S3S2
Figure 4.36 – Splitting Velocity Vs Time
REFINED 560 csf - 277 g/m^2CONSISTENCY = 41 %
SPLITTING WEIGHT 1100 gr
1.00E+00
1.20E+00
1.40E+00
1.60E+00
1.80E+00
2.00E+00
2.20E+00
2.40E+00
2.60E+00
0.00 0.05 0.10 0.15 0.20 0.25 0.30 0.35 0.40 0.45
Distance (m)
VELO
CIT
Y (m
/s)
Sample 1
Sample 2
Sample 3
Sample 4
Sample 5
Sample 6
Sample 8
Sample 9
Sample 10
Avg 277 g/m^2, C = 41%
S1
AVG
S10
S9S8S7S6
S5S4S3S2
Figure 4.37 – Velocity Increase Vs Crack Propagation
124
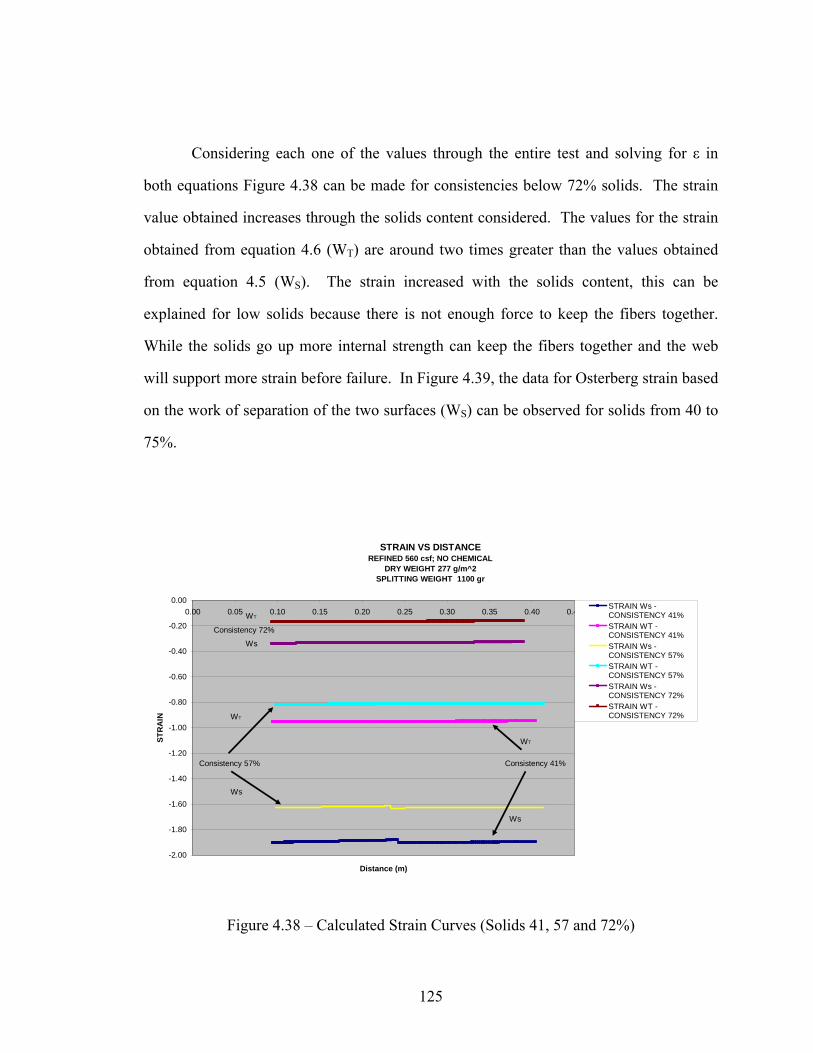
Considering each one of the values through the entire test and solving for ε in
both equations Figure 4.38 can be made for consistencies below 72% solids. The strain
value obtained increases through the solids content considered. The values for the strain
obtained from equation 4.6 (WT) are around two times greater than the values obtained
from equation 4.5 (WS). The strain increased with the solids content, this can be
explained for low solids because there is not enough force to keep the fibers together.
While the solids go up more internal strength can keep the fibers together and the web
will support more strain before failure. In Figure 4.39, the data for Osterberg strain based
on the work of separation of the two surfaces (WS) can be observed for solids from 40 to
75%.
STRAIN VS DISTANCEREFINED 560 csf; NO CHEMICAL
DRY WEIGHT 277 g/m^2SPLITTING WEIGHT 1100 gr
-2.00
-1.80
-1.60
-1.40
-1.20
-1.00
-0.80
-0.60
-0.40
-0.20
0.000.00 0.05 0.10 0.15 0.20 0.25 0.30 0.35 0.40 0.45
Distance (m)
STR
AIN
STRAIN Ws -CONSISTENCY 41%STRAIN WT -CONSISTENCY 41%STRAIN Ws -CONSISTENCY 57%STRAIN WT -CONSISTENCY 57%STRAIN Ws -CONSISTENCY 72%STRAIN WT -CONSISTENCY 72%
Consistency 72%
Consistency 57% Consistency 41%
WT
WT
WT
Ws
Ws
Ws
Figure 4.38 – Calculated Strain Curves (Solids 41, 57 and 72%)
125
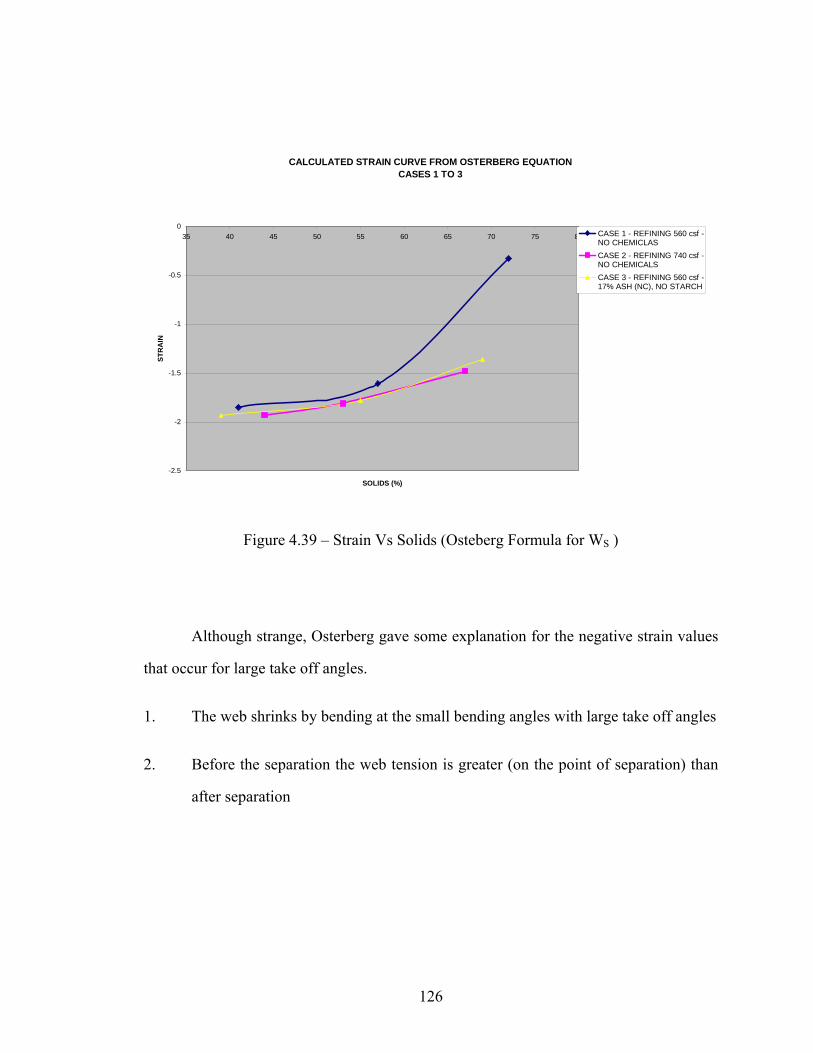
CALCULATED STRAIN CURVE FROM OSTERBERG EQUATIONCASES 1 TO 3
-2.5
-2
-1.5
-1
-0.5
035 40 45 50 55 60 65 70 75 80
SOLIDS (%)
STR
AIN
CASE 1 - REFINING 560 csf -NO CHEMICLASCASE 2 - REFINING 740 csf -NO CHEMICALSCASE 3 - REFINING 560 csf -17% ASH (NC), NO STARCH
Figure 4.39 – Strain Vs Solids (Osteberg Formula for WS )
Although strange, Osterberg gave some explanation for the negative strain values
that occur for large take off angles.
1. The web shrinks by bending at the small bending angles with large take off angles
2. Before the separation the web tension is greater (on the point of separation) than
after separation
126
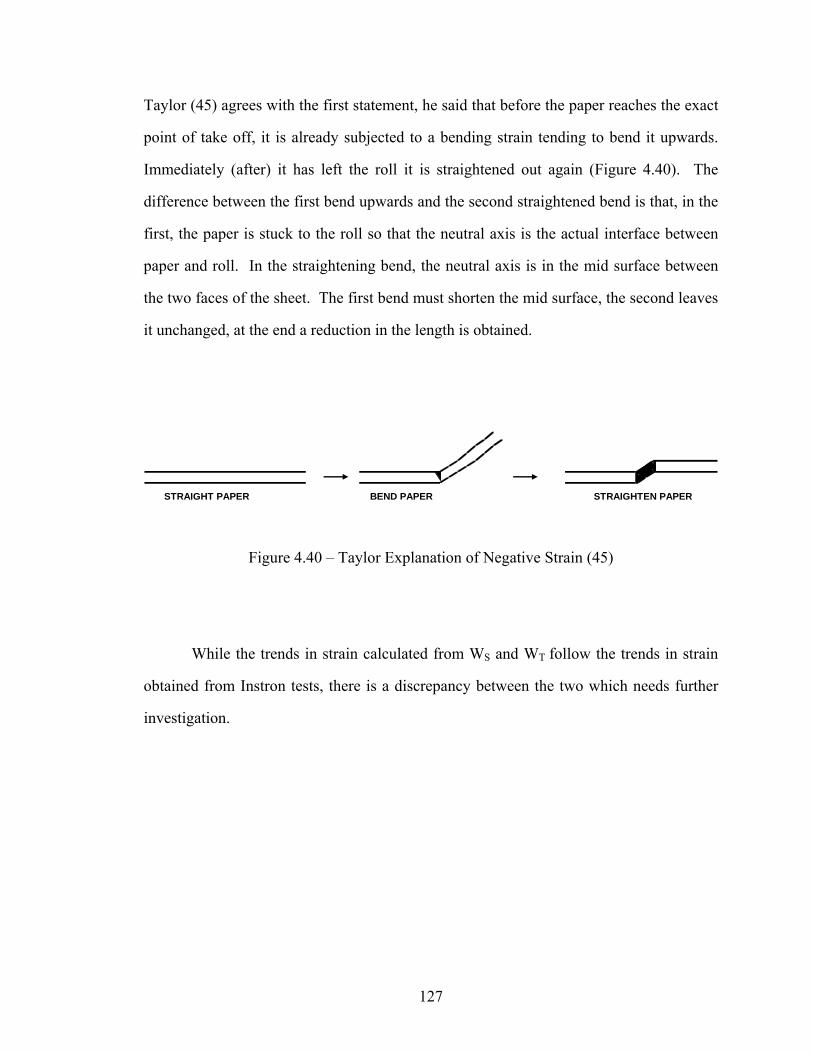
Taylor (45) agrees with the first statement, he said that before the paper reaches the exact
point of take off, it is already subjected to a bending strain tending to bend it upwards.
Immediately (after) it has left the roll it is straightened out again (Figure 4.40). The
difference between the first bend upwards and the second straightened bend is that, in the
first, the paper is stuck to the roll so that the neutral axis is the actual interface between
paper and roll. In the straightening bend, the neutral axis is in the mid surface between
the two faces of the sheet. The first bend must shorten the mid surface, the second leaves
it unchanged, at the end a reduction in the length is obtained.
STRAIGHT PAPER BEND PAPER STRAIGHTEN PAPER
Figure 4.40 – Taylor Explanation of Negative Strain (45)
While the trends in strain calculated from WS and WT follow the trends in strain
obtained from Instron tests, there is a discrepancy between the two which needs further
investigation.
127
CHAPTER 5
CONCLUSIONS
The main objective of the thesis was to find a way to validate the results obtained
for the cohesive energy of a paper web at various conditions usually encountered during
the papermaking process. The most important characteristic of the apparatus is its ability
to measure wet web properties at different solids starting at 20%, a value usually found
after the couch roll and up to 95% corresponding to the solids of the web at the pope reel.
To validate the results obtained with the splitter apparatus, the variation of the two
measuring energies, cohesive and bending, were compared with the variation of the
tensile properties (obtained using an Instron tester) at different solids content. As
expected the three kinds of energies behaves in a similar way allowing the identification
of three main strength development stages during the production process. The first one
between 20 and 55% corresponding to a low increase of the strength, the next one
between 55 and 88% corresponding to a high increase of the strength and finally above
88% the growing process slows down. Below 20% solids it is not clear how the strength
behaves and above 90% more test should be performed with the splitter test to explain the
cohesive and bending abrupt reduction.
128
In addition to the evidence offered by the strength versus solids curves, the graph
between the cohesive strength index and the tensile strength index at different solids
content shows a linear relation between the indices, as stated by Page equation for wet
webs. Although the relation for the different basis weights within the same case is not
the same, the offset can be easily cancelled out by using a linear relation between the
indices relation and the basis weight.
The final support is found when the strain is calculated using the formulas
developed by Osterberg. In this case very reasonable values were obtained showing that
the strain increases with the solids up to a level when they go down. The same effect is
present in the strain obtained using the Instron test.
The work presented allows comparisons to be made for webs prepared using
different mechanical and chemical treatments but following the same consolidation
process. From this set of experiments several conclusions can be made:
1. The refining or mechanical treatment is a key factor to develop the web strength
this is clear for all solids content
2. The clay addition reduces the strength of the paper, clearly seen for solids above
60%, bellow this point the reduction is small
3. When the ash content goes up from a critical value between 18 and 23%, the
result is that the strength goes down to the values originally obtained with
unrefined pulp
129
4. The webs produced using starch modified clay show a reduced strength loss when
compared with normal clay. The effect can also be seen at solids below 60%
although the effects vanish with the solids reduction. The reason for this is the
presence of surfactants in the normal clay suspension that reduces the surface
tension of the water
5. The starch addition increases the strength of the webs with ash. Also when starch
was added as the only chemical, the strengths obtained were the higher ones
through the entire solids levels
The splitter apparatus offers a new validated alternative to measure the web
properties through the entire solids content found during the papermaking production. It
also provides a reliable source to investigate how changes in the furnish, the mechanical
and chemical treatments performed to the pulp suspension and how the consolidation
process variations can affect the final performance of the web.
130
CHAPTER 6
RECOMENDATIONS
It is still necessary to investigate more the behavior of the web for solids greater
than 88%. It is not completely clear with the strength drops in such a critical way above
this value. One guess is that when testing the strips with high solids, the splitting weight
that was enough to create a crack propagated at a constant positive acceleration for
weaker webs, is not enough to obtain a positive acceleration with this new condition.
This was observed in several samples, when the velocity goes down some strange low
splitting results were obtained. To be safe it is necessary to choose the splitting weight in
such a way that for the higher energy requirement the acceleration obtained will be at
least 1.5 m/s². The problem with choosing an excessive high splitting weight is that the
low solids weak web can break during the assembly of the test. Also it is better to make
all the test using the same splitting weights because doing so the effect of friction is
diminished.
More testing should be done to explain the different behavior of the cohesive and
tensile strength indices when comparing different basis weights. The results showed that
the relation between the indices is dependent on the basis weight. This should not be the
case for webs formed following the same procedures with its only difference being the
basis weight. It would also be helpful to pursue a theoretical investigation of the results.
131
APPENDIX A.1: APPARATUS ENERGY LOSS VS DISTANCE –
CASE 1 TO 3
Case 1: Refining 560 C.S.F.; No Chemicals; Basis Weight 101 g/m²
132
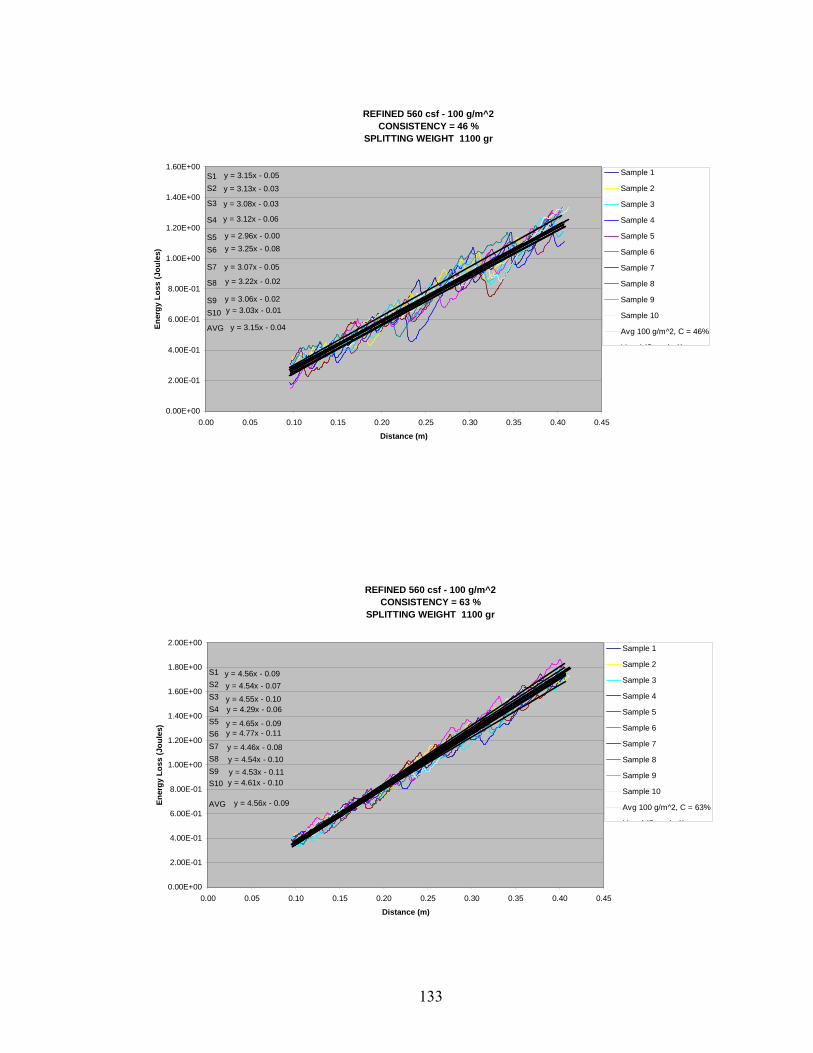
REFINED 560 csf - 100 g/m^2CONSISTENCY = 46 %
SPLITTING WEIGHT 1100 gr
y = 3.15x - 0.05
y = 3.13x - 0.03
y = 3.08x - 0.03
y = 3.12x - 0.06
y = 2.96x - 0.00y = 3.25x - 0.08
y = 3.07x - 0.05
y = 3.22x - 0.02
y = 3.06x - 0.02y = 3.03x - 0.01
y = 3.15x - 0.04
0.00E+00
2.00E-01
4.00E-01
6.00E-01
8.00E-01
1.00E+00
1.20E+00
1.40E+00
1.60E+00
0.00 0.05 0.10 0.15 0.20 0.25 0.30 0.35 0.40 0.45
Distance (m)
Ener
gy L
oss
(Jou
les)
Sample 1
Sample 2
Sample 3
Sample 4
Sample 5
Sample 6
Sample 7
Sample 8
Sample 9
Sample 10
Avg 100 g/m^2, C = 46%
Li l (S l 1)
S1
AVG
S10S9
S8
S7
S6S5
S4
S3
S2
REFINED 560 csf - 100 g/m^2CONSISTENCY = 63 %
SPLITTING WEIGHT 1100 gr
y = 4.56x - 0.09y = 4.54x - 0.07
y = 4.55x - 0.10y = 4.29x - 0.06
y = 4.65x - 0.09y = 4.77x - 0.11
y = 4.46x - 0.08y = 4.54x - 0.10y = 4.53x - 0.11y = 4.61x - 0.10
y = 4.56x - 0.09
0.00E+00
2.00E-01
4.00E-01
6.00E-01
8.00E-01
1.00E+00
1.20E+00
1.40E+00
1.60E+00
1.80E+00
2.00E+00
0.00 0.05 0.10 0.15 0.20 0.25 0.30 0.35 0.40 0.45
Distance (m)
Ener
gy L
oss
(Jou
les)
Sample 1
Sample 2
Sample 3
Sample 4
Sample 5
Sample 6
Sample 7
Sample 8
Sample 9
Sample 10
Avg 100 g/m^2, C = 63%
Li l (S l 1)
S1
AVG
S10S9S8S7S6S5S4S3S2
133
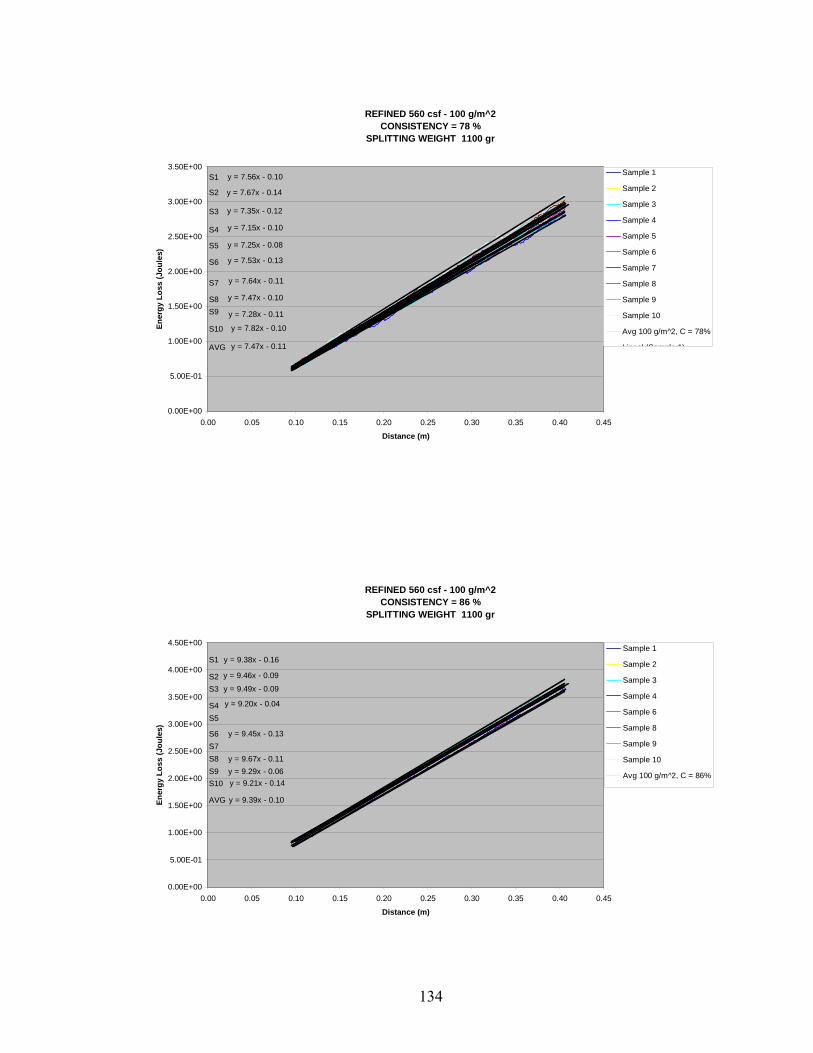
REFINED 560 csf - 100 g/m^2CONSISTENCY = 78 %
SPLITTING WEIGHT 1100 gr
y = 7.56x - 0.10
y = 7.67x - 0.14
y = 7.35x - 0.12
y = 7.15x - 0.10
y = 7.25x - 0.08
y = 7.53x - 0.13
y = 7.64x - 0.11
y = 7.47x - 0.10
y = 7.28x - 0.11
y = 7.82x - 0.10
y = 7.47x - 0.11
0.00E+00
5.00E-01
1.00E+00
1.50E+00
2.00E+00
2.50E+00
3.00E+00
3.50E+00
0.00 0.05 0.10 0.15 0.20 0.25 0.30 0.35 0.40 0.45
Distance (m)
Ener
gy L
oss
(Jou
les)
Sample 1
Sample 2
Sample 3
Sample 4
Sample 5
Sample 6
Sample 7
Sample 8
Sample 9
Sample 10
Avg 100 g/m^2, C = 78%
Lineal (Sample 1)
S1
AVG
S10
S9S8
S7
S6
S5
S4
S3
S2
REFINED 560 csf - 100 g/m^2CONSISTENCY = 86 %
SPLITTING WEIGHT 1100 gr
y = 9.38x - 0.16
y = 9.46x - 0.09
y = 9.49x - 0.09
y = 9.20x - 0.04
y = 9.45x - 0.13
y = 9.67x - 0.11y = 9.29x - 0.06y = 9.21x - 0.14
y = 9.39x - 0.10
0.00E+00
5.00E-01
1.00E+00
1.50E+00
2.00E+00
2.50E+00
3.00E+00
3.50E+00
4.00E+00
4.50E+00
0.00 0.05 0.10 0.15 0.20 0.25 0.30 0.35 0.40 0.45
Distance (m)
Ener
gy L
oss
(Jou
les)
Sample 1
Sample 2
Sample 3
Sample 4
Sample 6
Sample 8
Sample 9
Sample 10
Avg 100 g/m^2, C = 86%
S1
AVG
S10S9S8S7S6
S5S4
S3S2
134
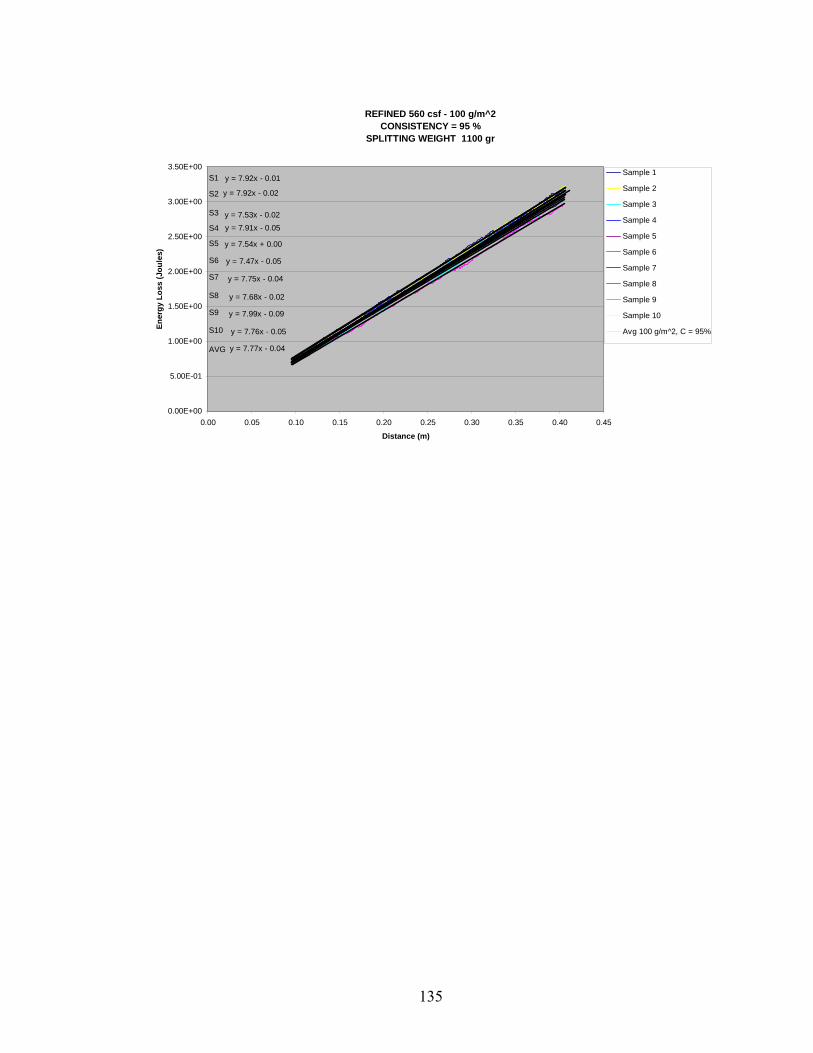
REFINED 560 csf - 100 g/m^2CONSISTENCY = 95 %
SPLITTING WEIGHT 1100 gr
y = 7.92x - 0.01
y = 7.92x - 0.02
y = 7.53x - 0.02y = 7.91x - 0.05
y = 7.54x + 0.00
y = 7.47x - 0.05
y = 7.75x - 0.04
y = 7.68x - 0.02
y = 7.99x - 0.09
y = 7.76x - 0.05
y = 7.77x - 0.04
0.00E+00
5.00E-01
1.00E+00
1.50E+00
2.00E+00
2.50E+00
3.00E+00
3.50E+00
0.00 0.05 0.10 0.15 0.20 0.25 0.30 0.35 0.40 0.45
Distance (m)
Ener
gy L
oss
(Jou
les)
Sample 1
Sample 2
Sample 3
Sample 4
Sample 5
Sample 6
Sample 7
Sample 8
Sample 9
Sample 10
Avg 100 g/m^2, C = 95%
S1
AVG
S10
S9
S8
S7
S6
S5
S4
S3
S2
135
Case 1: Refining 560 C.S.F.; No Chemicals; Basis Weight 191 g/m²
136
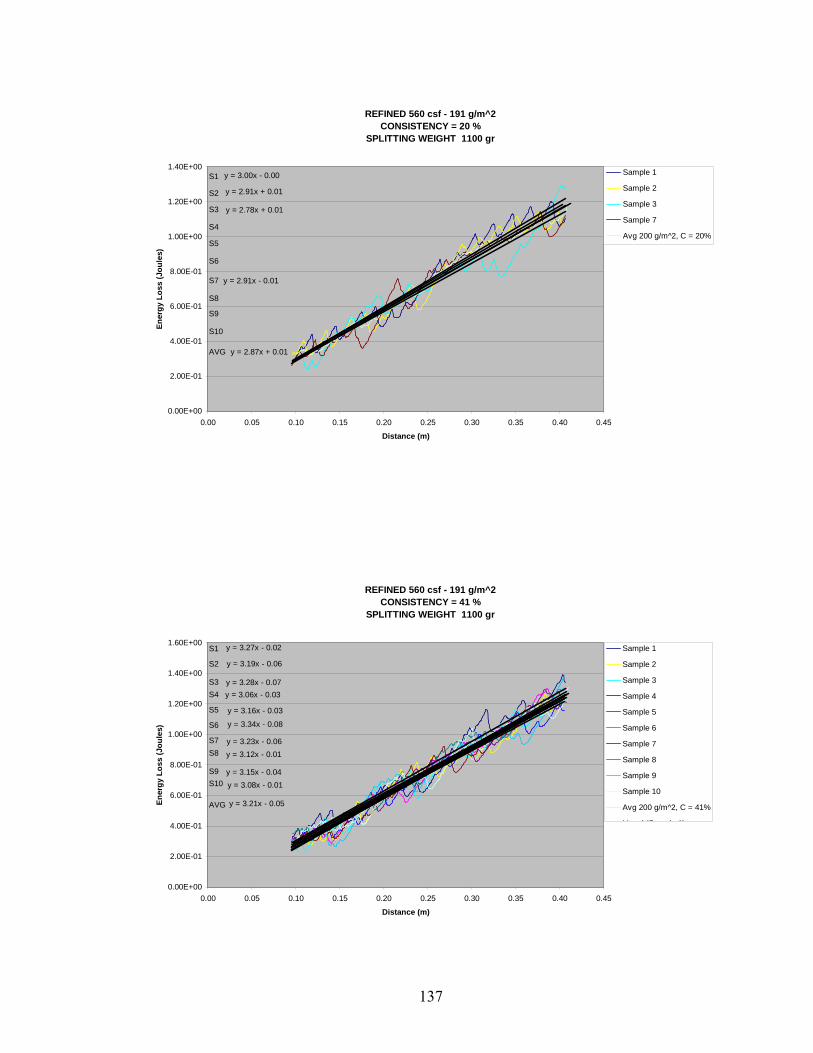
REFINED 560 csf - 191 g/m^2CONSISTENCY = 20 %
SPLITTING WEIGHT 1100 gr
y = 3.00x - 0.00
y = 2.91x + 0.01
y = 2.78x + 0.01
y = 2.91x - 0.01
y = 2.87x + 0.01
0.00E+00
2.00E-01
4.00E-01
6.00E-01
8.00E-01
1.00E+00
1.20E+00
1.40E+00
0.00 0.05 0.10 0.15 0.20 0.25 0.30 0.35 0.40 0.45
Distance (m)
Ener
gy L
oss
(Jou
les)
Sample 1
Sample 2
Sample 3
Sample 7
Avg 200 g/m^2, C = 20%
S1
AVG
S10
S9
S8
S7
S6
S5
S4
S3
S2
REFINED 560 csf - 191 g/m^2CONSISTENCY = 41 %
SPLITTING WEIGHT 1100 gr
y = 3.27x - 0.02
y = 3.19x - 0.06
y = 3.28x - 0.07y = 3.06x - 0.03
y = 3.16x - 0.03
y = 3.34x - 0.08
y = 3.23x - 0.06y = 3.12x - 0.01
y = 3.15x - 0.04y = 3.08x - 0.01
y = 3.21x - 0.05
0.00E+00
2.00E-01
4.00E-01
6.00E-01
8.00E-01
1.00E+00
1.20E+00
1.40E+00
1.60E+00
0.00 0.05 0.10 0.15 0.20 0.25 0.30 0.35 0.40 0.45
Distance (m)
Ener
gy L
oss
(Jou
les)
Sample 1
Sample 2
Sample 3
Sample 4
Sample 5
Sample 6
Sample 7
Sample 8
Sample 9
Sample 10
Avg 200 g/m^2, C = 41%
Li l (S l 1)
S1
AVG
S10S9
S8S7
S6
S5
S4S3
S2
137
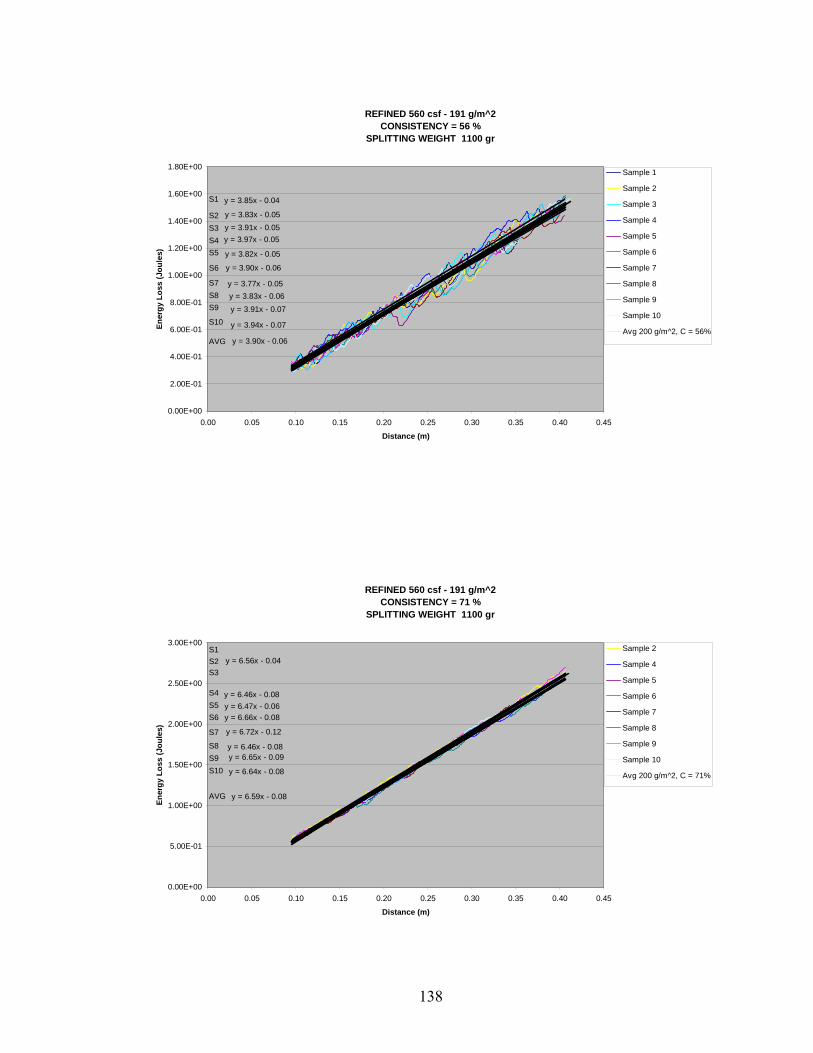
REFINED 560 csf - 191 g/m^2CONSISTENCY = 56 %
SPLITTING WEIGHT 1100 gr
y = 3.85x - 0.04
y = 3.83x - 0.05y = 3.91x - 0.05y = 3.97x - 0.05
y = 3.82x - 0.05
y = 3.90x - 0.06
y = 3.77x - 0.05y = 3.83x - 0.06y = 3.91x - 0.07
y = 3.94x - 0.07
y = 3.90x - 0.06
0.00E+00
2.00E-01
4.00E-01
6.00E-01
8.00E-01
1.00E+00
1.20E+00
1.40E+00
1.60E+00
1.80E+00
0.00 0.05 0.10 0.15 0.20 0.25 0.30 0.35 0.40 0.45
Distance (m)
Ener
gy L
oss
(Jou
les)
Sample 1
Sample 2
Sample 3
Sample 4
Sample 5
Sample 6
Sample 7
Sample 8
Sample 9
Sample 10
Avg 200 g/m^2, C = 56%
Li l (S l 1)
S1
AVG
S10
S9S8S7
S6
S5S4S3S2
REFINED 560 csf - 191 g/m^2CONSISTENCY = 71 %
SPLITTING WEIGHT 1100 gr
y = 6.56x - 0.04
y = 6.46x - 0.08y = 6.47x - 0.06y = 6.66x - 0.08
y = 6.72x - 0.12
y = 6.46x - 0.08y = 6.65x - 0.09
y = 6.64x - 0.08
y = 6.59x - 0.08
0.00E+00
5.00E-01
1.00E+00
1.50E+00
2.00E+00
2.50E+00
3.00E+00
0.00 0.05 0.10 0.15 0.20 0.25 0.30 0.35 0.40 0.45
Distance (m)
Ener
gy L
oss
(Jou
les)
Sample 2
Sample 4
Sample 5
Sample 6
Sample 7
Sample 8
Sample 9
Sample 10
Avg 200 g/m^2, C = 71%
S1
AVG
S10S9S8
S7
S6S5S4
S3S2
138
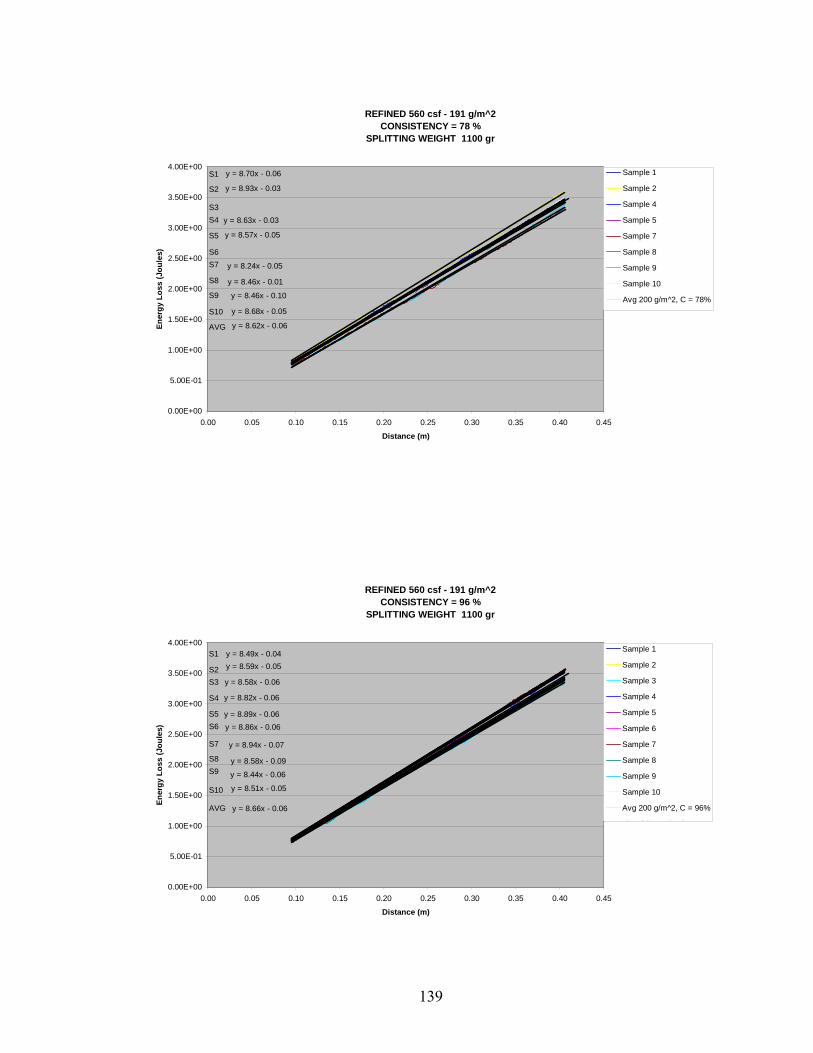
REFINED 560 csf - 191 g/m^2CONSISTENCY = 78 %
SPLITTING WEIGHT 1100 gr
y = 8.70x - 0.06
y = 8.93x - 0.03
y = 8.63x - 0.03
y = 8.57x - 0.05
y = 8.24x - 0.05
y = 8.46x - 0.01
y = 8.46x - 0.10
y = 8.68x - 0.05
y = 8.62x - 0.06
0.00E+00
5.00E-01
1.00E+00
1.50E+00
2.00E+00
2.50E+00
3.00E+00
3.50E+00
4.00E+00
0.00 0.05 0.10 0.15 0.20 0.25 0.30 0.35 0.40 0.45
Distance (m)
Ener
gy L
oss
(Jou
les)
Sample 1
Sample 2
Sample 4
Sample 5
Sample 7
Sample 8
Sample 9
Sample 10
Avg 200 g/m^2, C = 78%
S1
AVG
S10
S9
S8
S7S6
S5
S4S3
S2
REFINED 560 csf - 191 g/m^2CONSISTENCY = 96 %
SPLITTING WEIGHT 1100 gr
y = 8.49x - 0.04y = 8.59x - 0.05
y = 8.58x - 0.06
y = 8.82x - 0.06
y = 8.89x - 0.06y = 8.86x - 0.06
y = 8.94x - 0.07
y = 8.58x - 0.09
y = 8.44x - 0.06
y = 8.51x - 0.05
y = 8.66x - 0.06
0.00E+00
5.00E-01
1.00E+00
1.50E+00
2.00E+00
2.50E+00
3.00E+00
3.50E+00
4.00E+00
0.00 0.05 0.10 0.15 0.20 0.25 0.30 0.35 0.40 0.45
Distance (m)
Ener
gy L
oss
(Jou
les)
Sample 1
Sample 2
Sample 3
Sample 4
Sample 5
Sample 6
Sample 7
Sample 8
Sample 9
Sample 10
Avg 200 g/m^2, C = 96%
Li l (S l 1)
S1
AVG
S10
S9S8
S7
S6S5
S4
S3S2
139
Case 1: Refining 560 C.S.F.; No Chemicals; Basis Weight 277 g/m²
140

REFINED 560 csf - 277 g/m^2CONSISTENCY = 41 %
SPLITTING WEIGHT 1100 gr
y = 3.29x - 0.02
y = 3.37x - 0.07
y = 3.20x - 0.02
y = 3.41x - 0.07
y = 3.42x - 0.07
y = 3.30x - 0.03
y = 3.35x - 0.05
y = 3.32x - 0.01
y = 3.47x - 0.07
y = 3.36x - 0.05
0.00E+00
2.00E-01
4.00E-01
6.00E-01
8.00E-01
1.00E+00
1.20E+00
1.40E+00
1.60E+00
0.00 0.05 0.10 0.15 0.20 0.25 0.30 0.35 0.40 0.45
Distance (m)
Ener
gy L
oss
(Jou
les)
Sample 1
Sample 2
Sample 3
Sample 4
Sample 5
Sample 6
Sample 8
Sample 9
Sample 10
Avg 277 g/m^2, C = 41%
S1
AVGS10
S9
S8
S7
S6S5
S4
S3S2
REFINED 560 csf - 277 g/m^2CONSISTENCY = 57 %
SPLITTING WEIGHT 1100 gr
y = 4.33x - 0.10
y = 4.16x - 0.10y = 3.92x - 0.04y = 4.10x - 0.07
y = 4.12x - 0.07y = 4.01x - 0.06y = 4.21x - 0.07y = 4.15x - 0.06
y = 4.04x - 0.07
y = 4.12x - 0.09
y = 4.13x - 0.08
0.00E+00
2.00E-01
4.00E-01
6.00E-01
8.00E-01
1.00E+00
1.20E+00
1.40E+00
1.60E+00
1.80E+00
2.00E+00
0.00 0.05 0.10 0.15 0.20 0.25 0.30 0.35 0.40 0.45
Distance (m)
Ener
gy L
oss
(Jou
les)
Sample 1
Sample 2
Sample 3
Sample 4
Sample 5
Sample 6
Sample 7
Sample 8
Sample 9
Sample 10
Avg 277 g/m^2, C = 57%
S1
AVG
S10S9S8S7S6S5S4S3S2
141
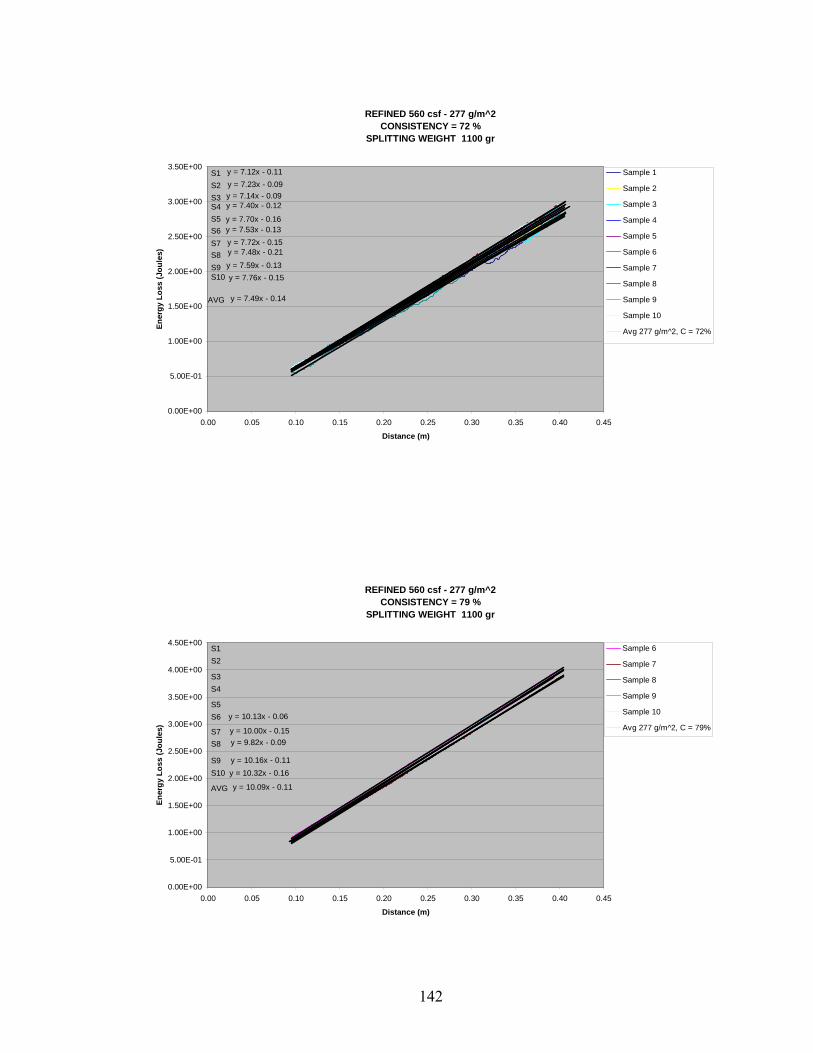
REFINED 560 csf - 277 g/m^2CONSISTENCY = 72 %
SPLITTING WEIGHT 1100 gr
y = 7.12x - 0.11y = 7.23x - 0.09y = 7.14x - 0.09y = 7.40x - 0.12
y = 7.70x - 0.16y = 7.53x - 0.13y = 7.72x - 0.15y = 7.48x - 0.21
y = 7.59x - 0.13y = 7.76x - 0.15
y = 7.49x - 0.14
0.00E+00
5.00E-01
1.00E+00
1.50E+00
2.00E+00
2.50E+00
3.00E+00
3.50E+00
0.00 0.05 0.10 0.15 0.20 0.25 0.30 0.35 0.40 0.45
Distance (m)
Ener
gy L
oss
(Jou
les)
Sample 1
Sample 2
Sample 3
Sample 4
Sample 5
Sample 6
Sample 7
Sample 8
Sample 9
Sample 10
Avg 277 g/m^2, C = 72%
S1
AVG
S10S9S8S7S6S5S4S3S2
REFINED 560 csf - 277 g/m^2CONSISTENCY = 79 %
SPLITTING WEIGHT 1100 gr
y = 10.13x - 0.06
y = 10.00x - 0.15y = 9.82x - 0.09
y = 10.16x - 0.11y = 10.32x - 0.16
y = 10.09x - 0.11
0.00E+00
5.00E-01
1.00E+00
1.50E+00
2.00E+00
2.50E+00
3.00E+00
3.50E+00
4.00E+00
4.50E+00
0.00 0.05 0.10 0.15 0.20 0.25 0.30 0.35 0.40 0.45
Distance (m)
Ener
gy L
oss
(Jou
les)
Sample 6
Sample 7
Sample 8
Sample 9
Sample 10
Avg 277 g/m^2, C = 79%
S1
AVG
S10S9
S8S7
S6S5
S4S3
S2
142
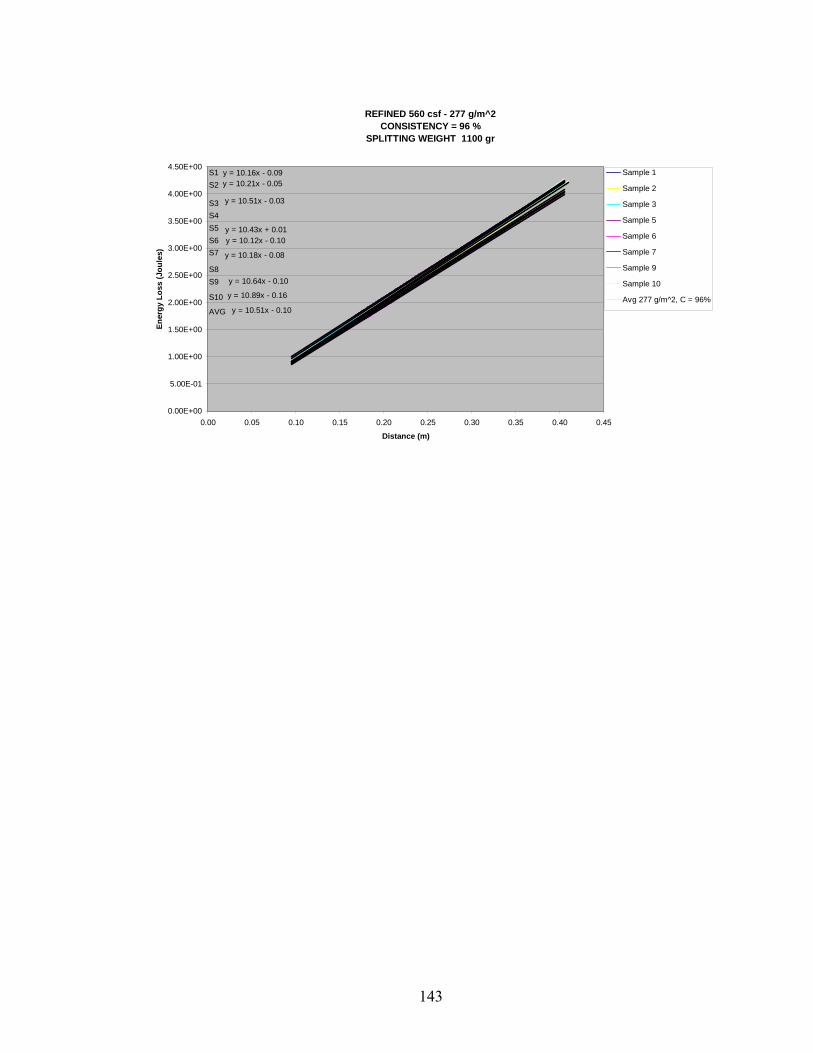
REFINED 560 csf - 277 g/m^2CONSISTENCY = 96 %
SPLITTING WEIGHT 1100 gr
y = 10.16x - 0.09y = 10.21x - 0.05
y = 10.51x - 0.03
y = 10.43x + 0.01y = 10.12x - 0.10
y = 10.18x - 0.08
y = 10.64x - 0.10
y = 10.89x - 0.16
y = 10.51x - 0.10
0.00E+00
5.00E-01
1.00E+00
1.50E+00
2.00E+00
2.50E+00
3.00E+00
3.50E+00
4.00E+00
4.50E+00
0.00 0.05 0.10 0.15 0.20 0.25 0.30 0.35 0.40 0.45
Distance (m)
Ener
gy L
oss
(Jou
les)
Sample 1
Sample 2
Sample 3
Sample 5
Sample 6
Sample 7
Sample 9
Sample 10
Avg 277 g/m^2, C = 96%
S1
AVG
S10
S9S8
S7S6S5S4S3
S2
143
Case 1: Refining 560 C.S.F.; No Chemicals; Basis Weight 341 g/m²
144
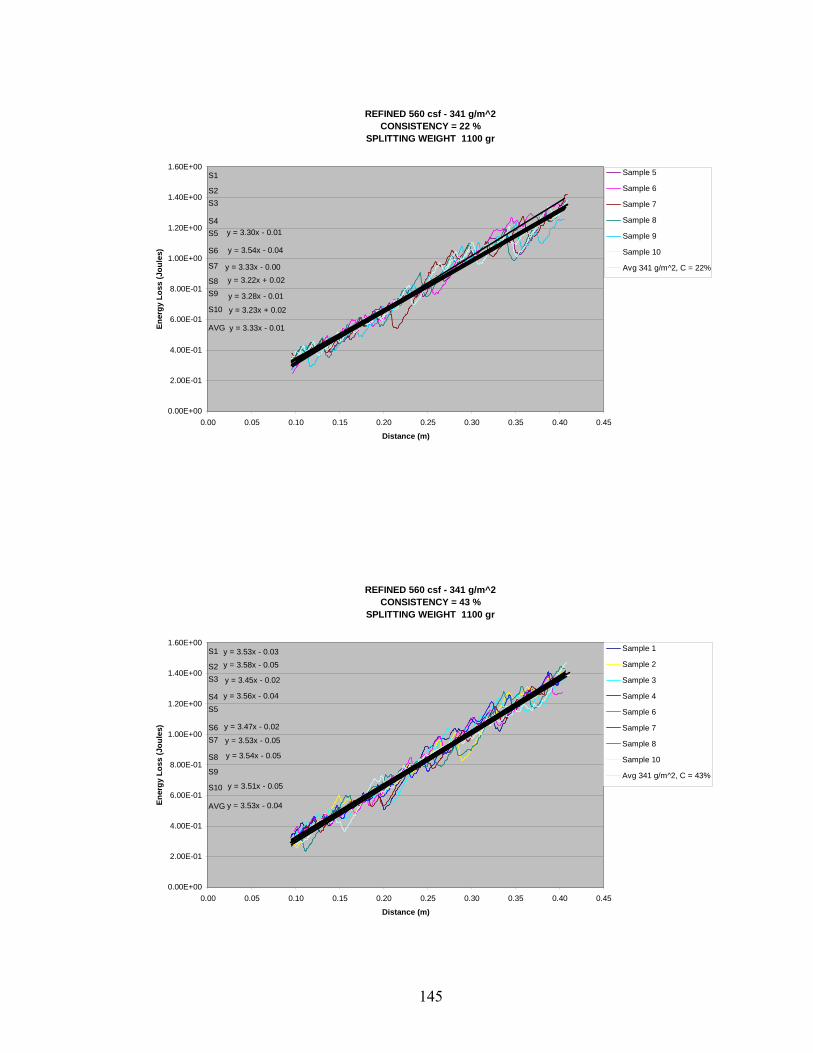
REFINED 560 csf - 341 g/m^2CONSISTENCY = 22 %
SPLITTING WEIGHT 1100 gr
y = 3.30x - 0.01
y = 3.54x - 0.04
y = 3.33x - 0.00y = 3.22x + 0.02
y = 3.28x - 0.01
y = 3.23x + 0.02
y = 3.33x - 0.01
0.00E+00
2.00E-01
4.00E-01
6.00E-01
8.00E-01
1.00E+00
1.20E+00
1.40E+00
1.60E+00
0.00 0.05 0.10 0.15 0.20 0.25 0.30 0.35 0.40 0.45
Distance (m)
Ener
gy L
oss
(Jou
les)
Sample 5
Sample 6
Sample 7
Sample 8
Sample 9
Sample 10
Avg 341 g/m^2, C = 22%
S1
AVG
S10
S9S8
S7
S6
S5S4
S3S2
REFINED 560 csf - 341 g/m^2CONSISTENCY = 43 %
SPLITTING WEIGHT 1100 gr
y = 3.53x - 0.03y = 3.58x - 0.05
y = 3.45x - 0.02
y = 3.56x - 0.04
y = 3.47x - 0.02
y = 3.53x - 0.05
y = 3.54x - 0.05
y = 3.51x - 0.05
y = 3.53x - 0.04
0.00E+00
2.00E-01
4.00E-01
6.00E-01
8.00E-01
1.00E+00
1.20E+00
1.40E+00
1.60E+00
0.00 0.05 0.10 0.15 0.20 0.25 0.30 0.35 0.40 0.45
Distance (m)
Ener
gy L
oss
(Jou
les)
Sample 1
Sample 2
Sample 3
Sample 4
Sample 6
Sample 7
Sample 8
Sample 10
Avg 341 g/m^2, C = 43%
S1
AVG
S10
S9
S8
S7S6
S5S4
S3S2
145
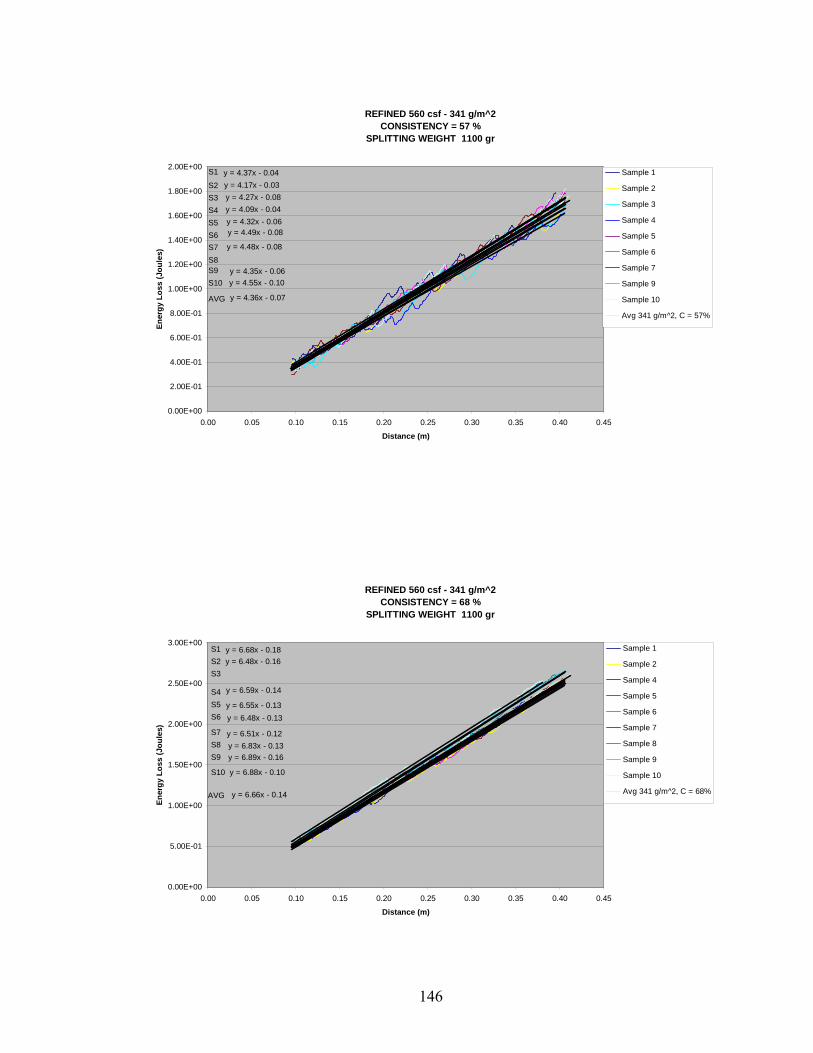
REFINED 560 csf - 341 g/m^2CONSISTENCY = 57 %
SPLITTING WEIGHT 1100 gr
y = 4.37x - 0.04y = 4.17x - 0.03y = 4.27x - 0.08y = 4.09x - 0.04y = 4.32x - 0.06y = 4.49x - 0.08
y = 4.48x - 0.08
y = 4.35x - 0.06y = 4.55x - 0.10
y = 4.36x - 0.07
0.00E+00
2.00E-01
4.00E-01
6.00E-01
8.00E-01
1.00E+00
1.20E+00
1.40E+00
1.60E+00
1.80E+00
2.00E+00
0.00 0.05 0.10 0.15 0.20 0.25 0.30 0.35 0.40 0.45
Distance (m)
Ener
gy L
oss
(Jou
les)
Sample 1
Sample 2
Sample 3
Sample 4
Sample 5
Sample 6
Sample 7
Sample 9
Sample 10
Avg 341 g/m^2, C = 57%
S1
AVG
S10S9S8S7S6S5S4S3S2
REFINED 560 csf - 341 g/m^2CONSISTENCY = 68 %
SPLITTING WEIGHT 1100 gr
y = 6.68x - 0.18y = 6.48x - 0.16
y = 6.59x - 0.14
y = 6.55x - 0.13y = 6.48x - 0.13
y = 6.51x - 0.12y = 6.83x - 0.13y = 6.89x - 0.16
y = 6.88x - 0.10
y = 6.66x - 0.14
0.00E+00
5.00E-01
1.00E+00
1.50E+00
2.00E+00
2.50E+00
3.00E+00
0.00 0.05 0.10 0.15 0.20 0.25 0.30 0.35 0.40 0.45
Distance (m)
Ener
gy L
oss
(Jou
les)
Sample 1
Sample 2
Sample 4
Sample 5
Sample 6
Sample 7
Sample 8
Sample 9
Sample 10
Avg 341 g/m^2, C = 68%
S1
AVG
S10
S9S8S7
S6S5S4
S3S2
146
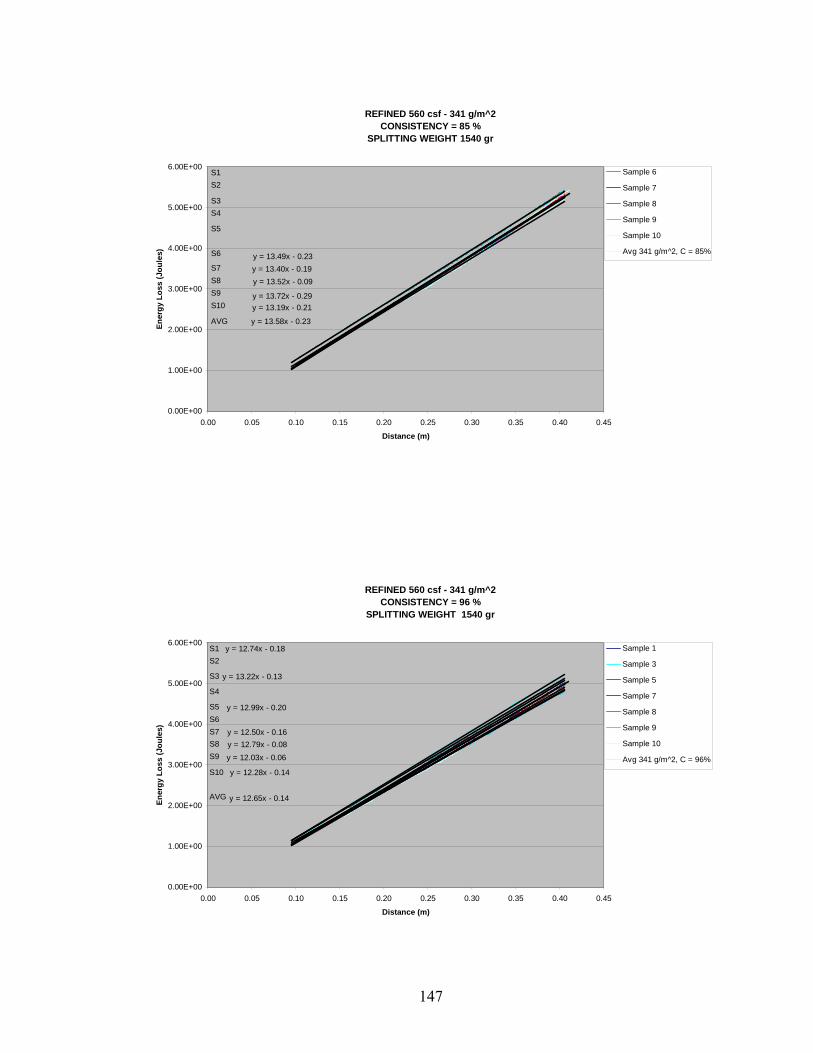
REFINED 560 csf - 341 g/m^2CONSISTENCY = 85 %
SPLITTING WEIGHT 1540 gr
y = 13.49x - 0.23y = 13.40x - 0.19y = 13.52x - 0.09
y = 13.72x - 0.29y = 13.19x - 0.21
y = 13.58x - 0.23
0.00E+00
1.00E+00
2.00E+00
3.00E+00
4.00E+00
5.00E+00
6.00E+00
0.00 0.05 0.10 0.15 0.20 0.25 0.30 0.35 0.40 0.45
Distance (m)
Ener
gy L
oss
(Jou
les)
Sample 6
Sample 7
Sample 8
Sample 9
Sample 10
Avg 341 g/m^2, C = 85%
S1
AVG
S10S9S8S7
S6
S5
S4S3
S2
REFINED 560 csf - 341 g/m^2CONSISTENCY = 96 %
SPLITTING WEIGHT 1540 gr
y = 12.74x - 0.18
y = 13.22x - 0.13
y = 12.99x - 0.20
y = 12.50x - 0.16y = 12.79x - 0.08y = 12.03x - 0.06
y = 12.28x - 0.14
y = 12.65x - 0.14
0.00E+00
1.00E+00
2.00E+00
3.00E+00
4.00E+00
5.00E+00
6.00E+00
0.00 0.05 0.10 0.15 0.20 0.25 0.30 0.35 0.40 0.45
Distance (m)
Ener
gy L
oss
(Jou
les)
Sample 1
Sample 3
Sample 5
Sample 7
Sample 8
Sample 9
Sample 10
Avg 341 g/m^2, C = 96%
S1
AVG
S10
S9S8S7S6S5
S4
S3
S2
147
Case 2: Refining 740 C.S.F.; No Chemicals; Basis Weight 99 g/m²
148
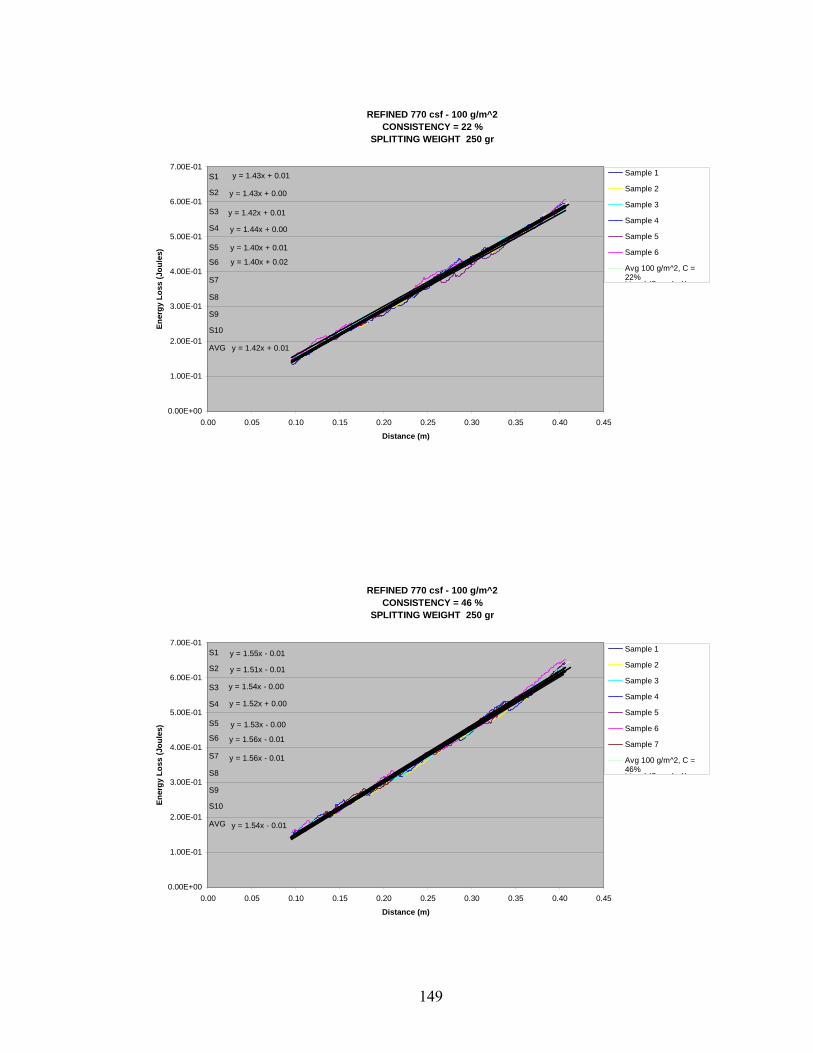
REFINED 770 csf - 100 g/m^2CONSISTENCY = 22 %
SPLITTING WEIGHT 250 gr
y = 1.43x + 0.00
y = 1.43x + 0.01
y = 1.42x + 0.01
y = 1.44x + 0.00
y = 1.40x + 0.01
y = 1.40x + 0.02
y = 1.42x + 0.01
0.00E+00
1.00E-01
2.00E-01
3.00E-01
4.00E-01
5.00E-01
6.00E-01
7.00E-01
0.00 0.05 0.10 0.15 0.20 0.25 0.30 0.35 0.40 0.45
Distance (m)
Ener
gy L
oss
(Jou
les)
Sample 1
Sample 2
Sample 3
Sample 4
Sample 5
Sample 6
Avg 100 g/m^2, C =22%Li l (S l 1)
S1
AVG
S10
S9
S8
S7
S6
S5
S4
S3
S2
REFINED 770 csf - 100 g/m^2CONSISTENCY = 46 %
SPLITTING WEIGHT 250 gr
y = 1.55x - 0.01
y = 1.51x - 0.01
y = 1.54x - 0.00
y = 1.52x + 0.00
y = 1.53x - 0.00
y = 1.56x - 0.01
y = 1.56x - 0.01
y = 1.54x - 0.01
0.00E+00
1.00E-01
2.00E-01
3.00E-01
4.00E-01
5.00E-01
6.00E-01
7.00E-01
0.00 0.05 0.10 0.15 0.20 0.25 0.30 0.35 0.40 0.45
Distance (m)
Ener
gy L
oss
(Jou
les)
Sample 1
Sample 2
Sample 3
Sample 4
Sample 5
Sample 6
Sample 7
Avg 100 g/m^2, C =46%Li l (S l 1)
S1
AVG
S10
S9
S8
S7
S6
S5
S4
S3
S2
149
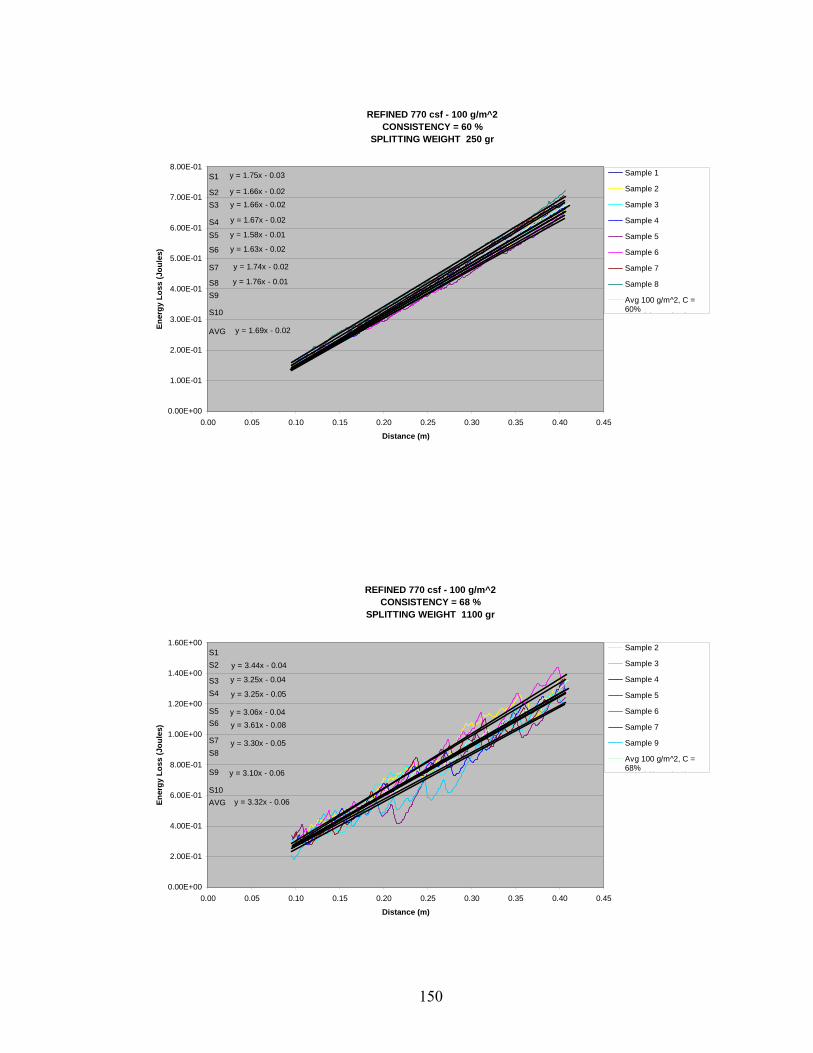
REFINED 770 csf - 100 g/m^2CONSISTENCY = 60 %
SPLITTING WEIGHT 250 gr
y = 1.75x - 0.03
y = 1.66x - 0.02
y = 1.66x - 0.02
y = 1.67x - 0.02
y = 1.58x - 0.01
y = 1.63x - 0.02
y = 1.74x - 0.02
y = 1.76x - 0.01
y = 1.69x - 0.02
0.00E+00
1.00E-01
2.00E-01
3.00E-01
4.00E-01
5.00E-01
6.00E-01
7.00E-01
8.00E-01
0.00 0.05 0.10 0.15 0.20 0.25 0.30 0.35 0.40 0.45
Distance (m)
Ener
gy L
oss
(Jou
les)
Sample 1
Sample 2
Sample 3
Sample 4
Sample 5
Sample 6
Sample 7
Sample 8
Avg 100 g/m^2, C =60%Li l (S l 1)
S1
AVG
S10
S9S8
S7
S6
S5S4
S3S2
REFINED 770 csf - 100 g/m^2CONSISTENCY = 68 %
SPLITTING WEIGHT 1100 gr
y = 3.44x - 0.04
y = 3.25x - 0.04
y = 3.25x - 0.05
y = 3.06x - 0.04y = 3.61x - 0.08
y = 3.30x - 0.05
y = 3.10x - 0.06
y = 3.32x - 0.06
0.00E+00
2.00E-01
4.00E-01
6.00E-01
8.00E-01
1.00E+00
1.20E+00
1.40E+00
1.60E+00
0.00 0.05 0.10 0.15 0.20 0.25 0.30 0.35 0.40 0.45
Distance (m)
Ener
gy L
oss
(Jou
les)
Sample 2
Sample 3
Sample 4
Sample 5
Sample 6
Sample 7
Sample 9
Avg 100 g/m^2, C =68%Li l (S l 2)
S1
AVGS10
S9
S8S7
S6S5
S4S3
S2
150
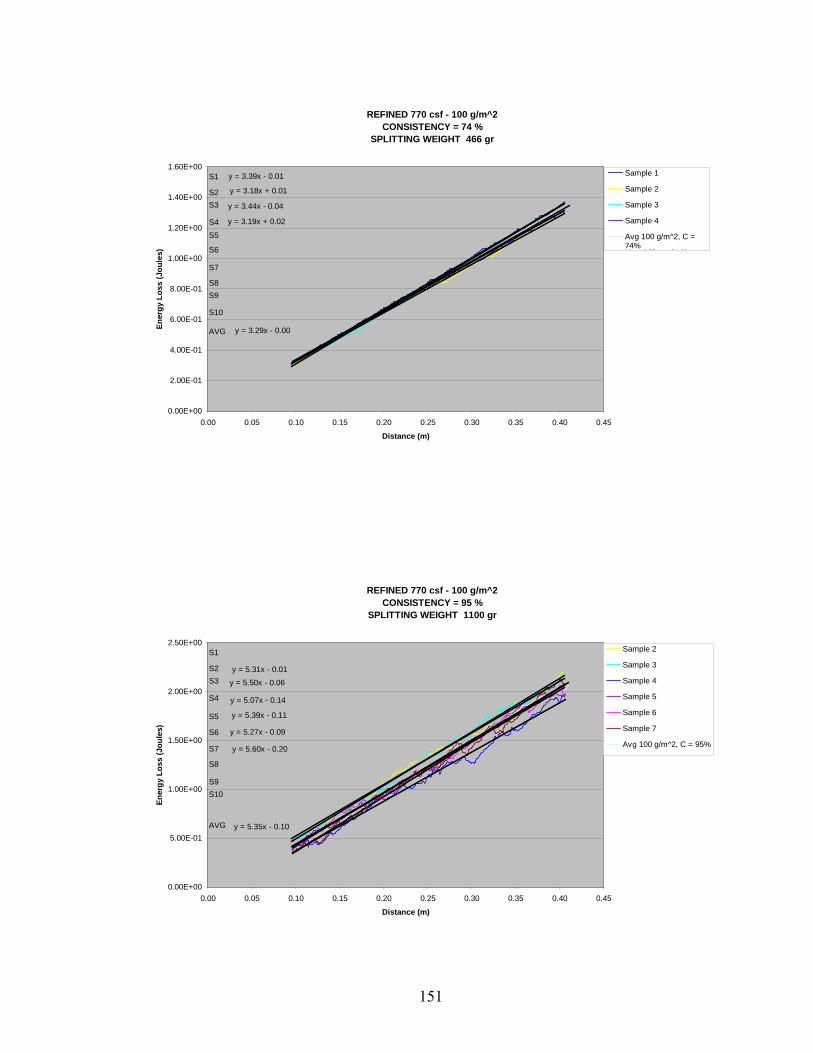
REFINED 770 csf - 100 g/m^2CONSISTENCY = 74 %
SPLITTING WEIGHT 466 gr
y = 3.39x - 0.01
y = 3.18x + 0.01
y = 3.44x - 0.04
y = 3.19x + 0.02
y = 3.29x - 0.00
0.00E+00
2.00E-01
4.00E-01
6.00E-01
8.00E-01
1.00E+00
1.20E+00
1.40E+00
1.60E+00
0.00 0.05 0.10 0.15 0.20 0.25 0.30 0.35 0.40 0.45
Distance (m)
Ener
gy L
oss
(Jou
les)
Sample 1
Sample 2
Sample 3
Sample 4
Avg 100 g/m^2, C =74%Li l (S l 1)
S1
AVG
S10
S9S8
S7
S6
S5S4
S3S2
REFINED 770 csf - 100 g/m^2CONSISTENCY = 95 %
SPLITTING WEIGHT 1100 gr
y = 5.31x - 0.01
y = 5.50x - 0.06
y = 5.07x - 0.14
y = 5.39x - 0.11
y = 5.27x - 0.09
y = 5.60x - 0.20
y = 5.35x - 0.10
0.00E+00
5.00E-01
1.00E+00
1.50E+00
2.00E+00
2.50E+00
0.00 0.05 0.10 0.15 0.20 0.25 0.30 0.35 0.40 0.45
Distance (m)
Ener
gy L
oss
(Jou
les)
Sample 2
Sample 3
Sample 4
Sample 5
Sample 6
Sample 7
Avg 100 g/m^2, C = 95%
S1
AVG
S10S9
S8
S7
S6
S5
S4
S3S2
151

Case 2: Refining 740 C.S.F.; No Chemicals; Basis Weight 199 g/m²
152
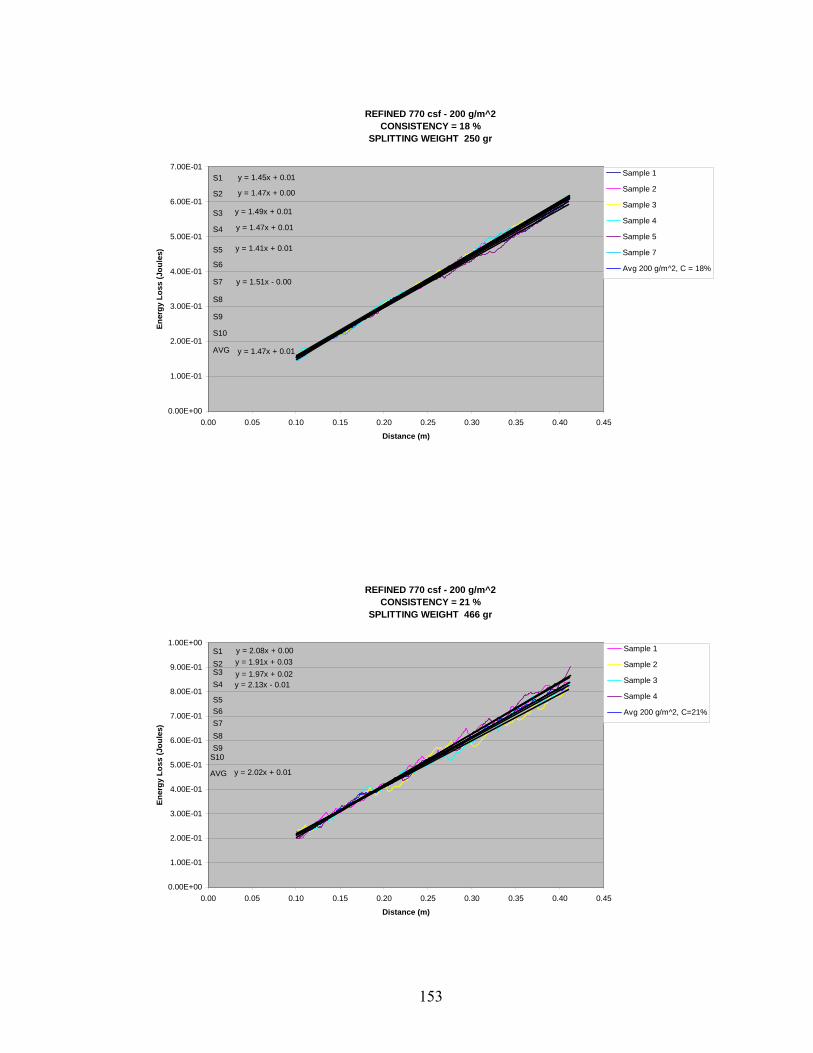
REFINED 770 csf - 200 g/m^2CONSISTENCY = 18 %
SPLITTING WEIGHT 250 gr
y = 1.45x + 0.01
y = 1.51x - 0.00
y = 1.47x + 0.00
y = 1.49x + 0.01
y = 1.47x + 0.01
y = 1.41x + 0.01
y = 1.47x + 0.01
0.00E+00
1.00E-01
2.00E-01
3.00E-01
4.00E-01
5.00E-01
6.00E-01
7.00E-01
0.00 0.05 0.10 0.15 0.20 0.25 0.30 0.35 0.40 0.45
Distance (m)
Ener
gy L
oss
(Jou
les)
Sample 1
Sample 2
Sample 3
Sample 4
Sample 5
Sample 7
Avg 200 g/m^2, C = 18%
S1
AVG
S10
S9
S8
S7
S6
S5
S4
S3
S2
REFINED 770 csf - 200 g/m^2CONSISTENCY = 21 %
SPLITTING WEIGHT 466 gr
y = 2.08x + 0.00y = 1.91x + 0.03y = 1.97x + 0.02y = 2.13x - 0.01
y = 2.02x + 0.01
0.00E+00
1.00E-01
2.00E-01
3.00E-01
4.00E-01
5.00E-01
6.00E-01
7.00E-01
8.00E-01
9.00E-01
1.00E+00
0.00 0.05 0.10 0.15 0.20 0.25 0.30 0.35 0.40 0.45
Distance (m)
Ener
gy L
oss
(Jou
les)
Sample 1
Sample 2
Sample 3
Sample 4
Avg 200 g/m^2, C=21%
S1
AVG
S10S9S8S7S6S5
S4S3S2
153
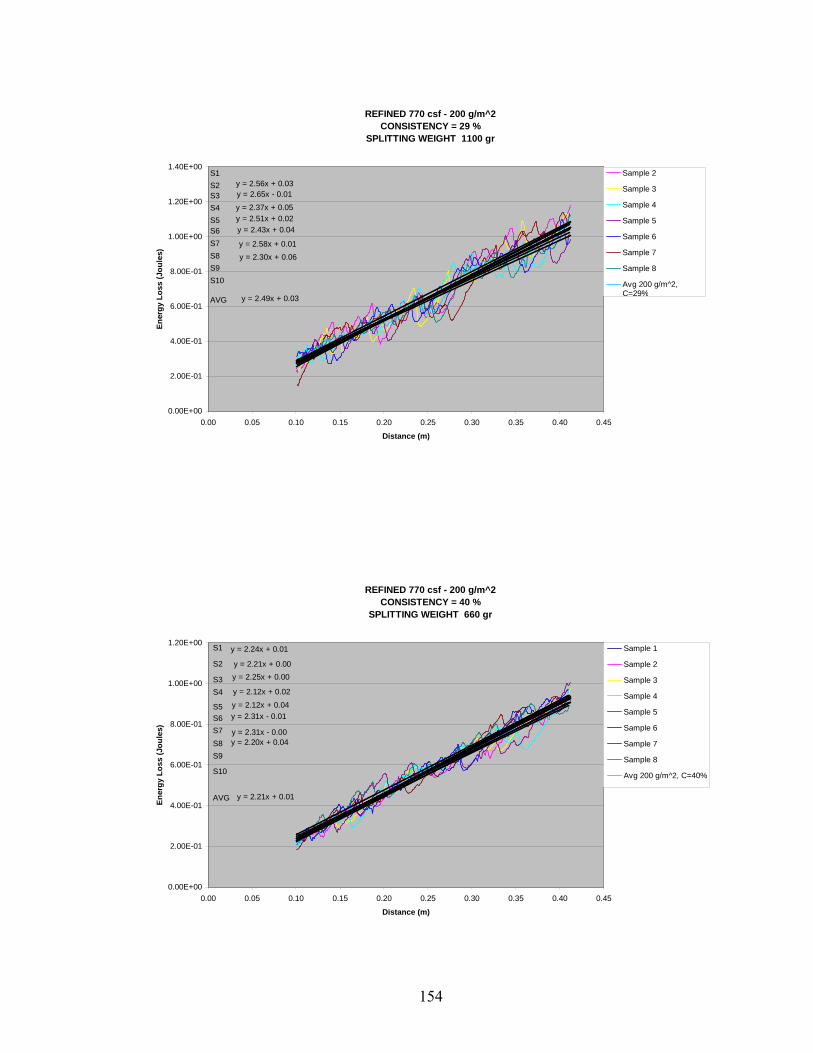
REFINED 770 csf - 200 g/m^2CONSISTENCY = 29 %
SPLITTING WEIGHT 1100 gr
y = 2.56x + 0.03y = 2.65x - 0.01
y = 2.37x + 0.05y = 2.51x + 0.02y = 2.43x + 0.04
y = 2.58x + 0.01y = 2.30x + 0.06
y = 2.49x + 0.03
0.00E+00
2.00E-01
4.00E-01
6.00E-01
8.00E-01
1.00E+00
1.20E+00
1.40E+00
0.00 0.05 0.10 0.15 0.20 0.25 0.30 0.35 0.40 0.45
Distance (m)
Ener
gy L
oss
(Jou
les)
Sample 2
Sample 3
Sample 4
Sample 5
Sample 6
Sample 7
Sample 8
Avg 200 g/m^2,C=29%
S1
AVG
S10S9S8S7S6S5S4S3S2
REFINED 770 csf - 200 g/m^2CONSISTENCY = 40 %
SPLITTING WEIGHT 660 gr
y = 2.24x + 0.01
y = 2.21x + 0.00y = 2.25x + 0.00
y = 2.12x + 0.02
y = 2.12x + 0.04y = 2.31x - 0.01
y = 2.31x - 0.00y = 2.20x + 0.04
y = 2.21x + 0.01
0.00E+00
2.00E-01
4.00E-01
6.00E-01
8.00E-01
1.00E+00
1.20E+00
0.00 0.05 0.10 0.15 0.20 0.25 0.30 0.35 0.40 0.45
Distance (m)
Ener
gy L
oss
(Jou
les)
Sample 1
Sample 2
Sample 3
Sample 4
Sample 5
Sample 6
Sample 7
Sample 8
Avg 200 g/m^2, C=40%
S1
AVG
S10
S9S8S7S6S5
S4S3
S2
154
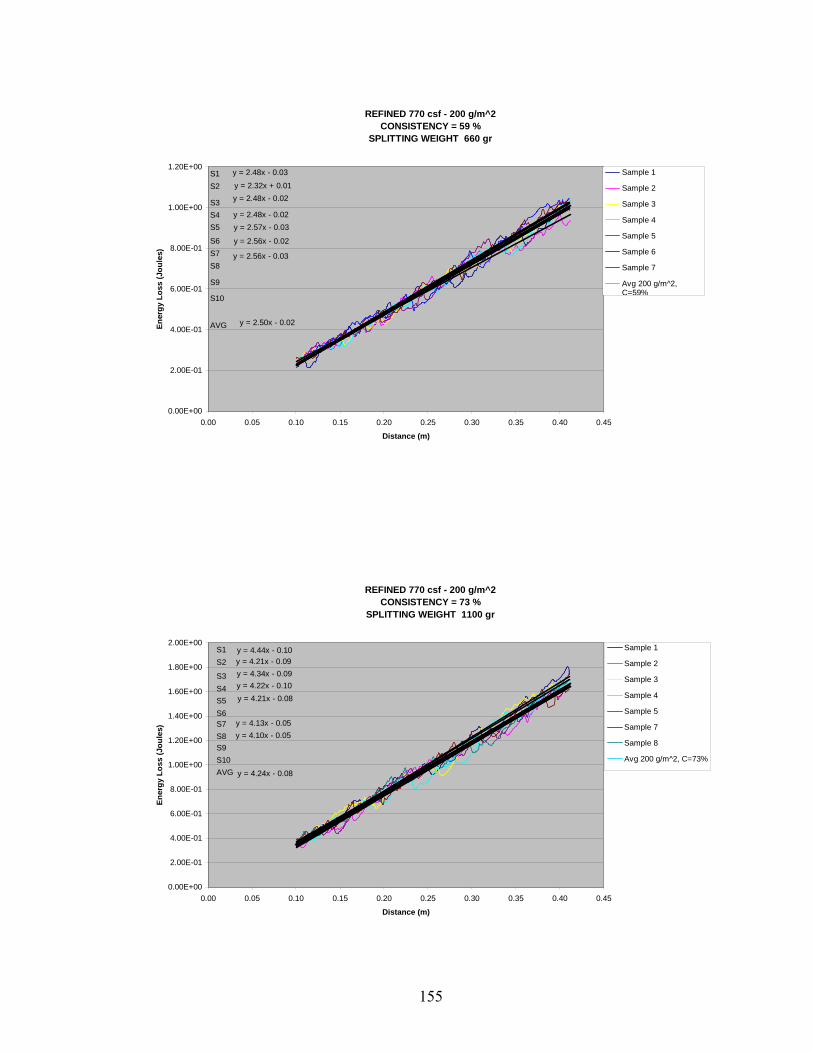
REFINED 770 csf - 200 g/m^2CONSISTENCY = 59 %
SPLITTING WEIGHT 660 gr
y = 2.48x - 0.03
y = 2.32x + 0.01y = 2.48x - 0.02
y = 2.48x - 0.02y = 2.57x - 0.03
y = 2.56x - 0.02
y = 2.56x - 0.03
y = 2.50x - 0.02
0.00E+00
2.00E-01
4.00E-01
6.00E-01
8.00E-01
1.00E+00
1.20E+00
0.00 0.05 0.10 0.15 0.20 0.25 0.30 0.35 0.40 0.45
Distance (m)
Ener
gy L
oss
(Jou
les)
Sample 1
Sample 2
Sample 3
Sample 4
Sample 5
Sample 6
Sample 7
Avg 200 g/m^2,C=59%
S1
AVG
S10
S9
S8S7S6
S5S4S3
S2
REFINED 770 csf - 200 g/m^2CONSISTENCY = 73 %
SPLITTING WEIGHT 1100 gr
y = 4.44x - 0.10y = 4.21x - 0.09y = 4.34x - 0.09y = 4.22x - 0.10y = 4.21x - 0.08
y = 4.13x - 0.05y = 4.10x - 0.05
y = 4.24x - 0.08
0.00E+00
2.00E-01
4.00E-01
6.00E-01
8.00E-01
1.00E+00
1.20E+00
1.40E+00
1.60E+00
1.80E+00
2.00E+00
0.00 0.05 0.10 0.15 0.20 0.25 0.30 0.35 0.40 0.45
Distance (m)
Ener
gy L
oss
(Jou
les)
Sample 1
Sample 2
Sample 3
Sample 4
Sample 5
Sample 7
Sample 8
Avg 200 g/m^2, C=73%
S1
AVGS10S9S8S7S6S5S4S3
S2
155
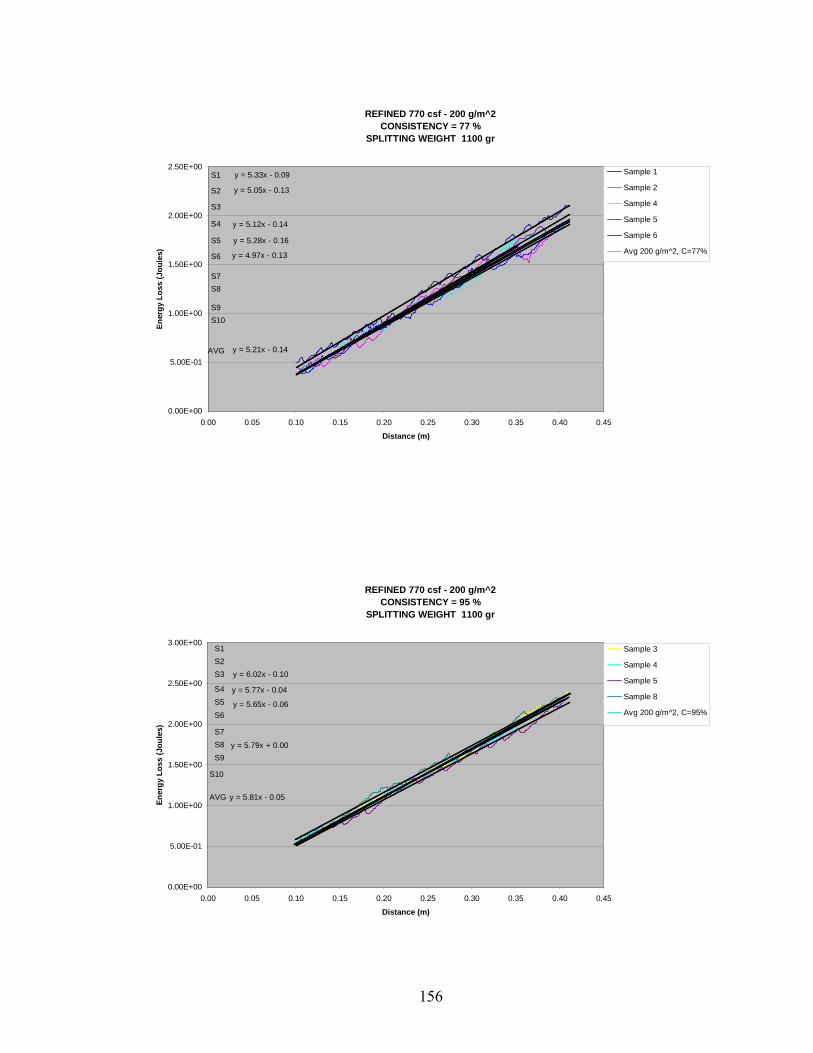
REFINED 770 csf - 200 g/m^2CONSISTENCY = 77 %
SPLITTING WEIGHT 1100 gr
y = 5.33x - 0.09
y = 5.05x - 0.13
y = 5.12x - 0.14
y = 5.28x - 0.16
y = 4.97x - 0.13
y = 5.21x - 0.14
0.00E+00
5.00E-01
1.00E+00
1.50E+00
2.00E+00
2.50E+00
0.00 0.05 0.10 0.15 0.20 0.25 0.30 0.35 0.40 0.45
Distance (m)
Ener
gy L
oss
(Jou
les)
Sample 1
Sample 2
Sample 4
Sample 5
Sample 6
Avg 200 g/m^2, C=77%
S1
AVG
S10S9
S8S7
S6
S5
S4
S3
S2
REFINED 770 csf - 200 g/m^2CONSISTENCY = 95 %
SPLITTING WEIGHT 1100 gr
y = 6.02x - 0.10
y = 5.77x - 0.04
y = 5.65x - 0.06
y = 5.79x + 0.00
y = 5.81x - 0.05
0.00E+00
5.00E-01
1.00E+00
1.50E+00
2.00E+00
2.50E+00
3.00E+00
0.00 0.05 0.10 0.15 0.20 0.25 0.30 0.35 0.40 0.45
Distance (m)
Ener
gy L
oss
(Jou
les)
Sample 3
Sample 4
Sample 5
Sample 8
Avg 200 g/m^2, C=95%
Li l (A 200 / ^2
S1
AVG
S10
S9S8S7
S6S5S4
S3S2
156
Case 2: Refining 740 C.S.F.; No Chemicals; Basis Weight 302 g/m²
157
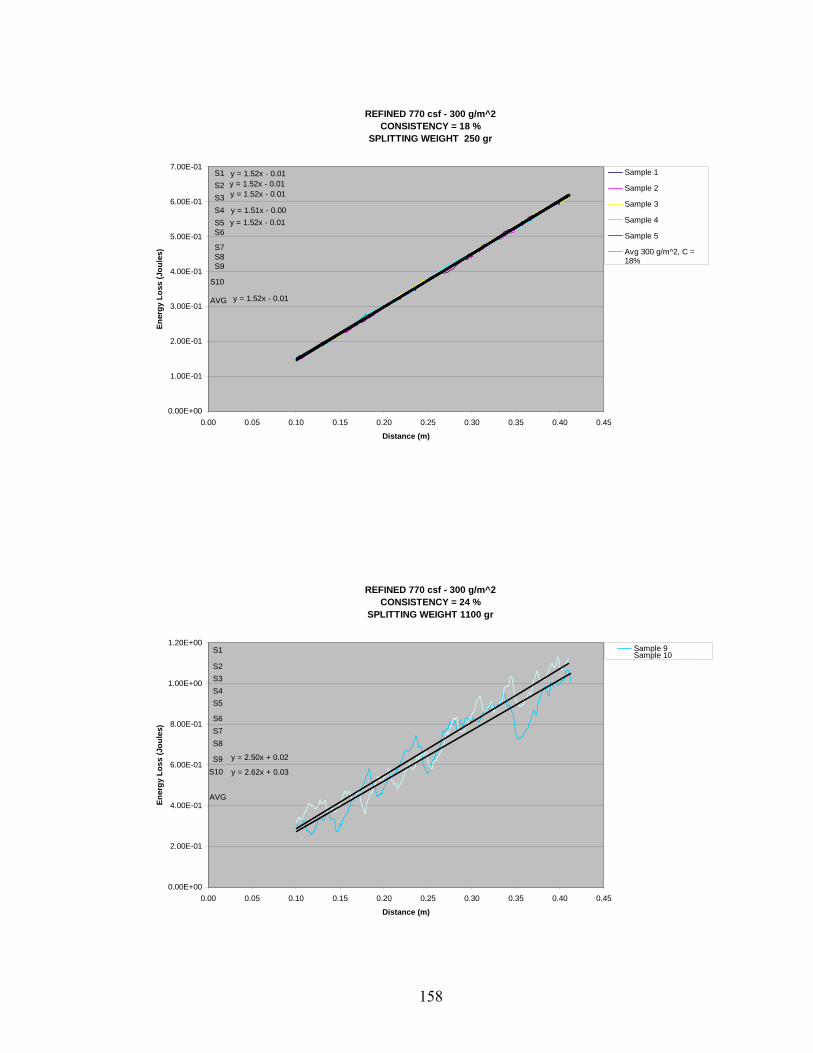
REFINED 770 csf - 300 g/m^2CONSISTENCY = 18 %
SPLITTING WEIGHT 250 gr
y = 1.52x - 0.01y = 1.52x - 0.01y = 1.52x - 0.01
y = 1.51x - 0.00y = 1.52x - 0.01
y = 1.52x - 0.01
0.00E+00
1.00E-01
2.00E-01
3.00E-01
4.00E-01
5.00E-01
6.00E-01
7.00E-01
0.00 0.05 0.10 0.15 0.20 0.25 0.30 0.35 0.40 0.45
Distance (m)
Ener
gy L
oss
(Jou
les)
Sample 1
Sample 2
Sample 3
Sample 4
Sample 5
Avg 300 g/m^2, C =18%
S1
AVG
S10
S9S8S7
S6S5S4S3S2
REFINED 770 csf - 300 g/m^2CONSISTENCY = 24 %
SPLITTING WEIGHT 1100 gr
y = 2.50x + 0.02
y = 2.62x + 0.03
0.00E+00
2.00E-01
4.00E-01
6.00E-01
8.00E-01
1.00E+00
1.20E+00
0.00 0.05 0.10 0.15 0.20 0.25 0.30 0.35 0.40 0.45
Distance (m)
Ener
gy L
oss
(Jou
les)
Sample 9Sample 10Li l (S l 9)
S1
AVG
S10S9
S8S7S6
S5S4S3S2
158
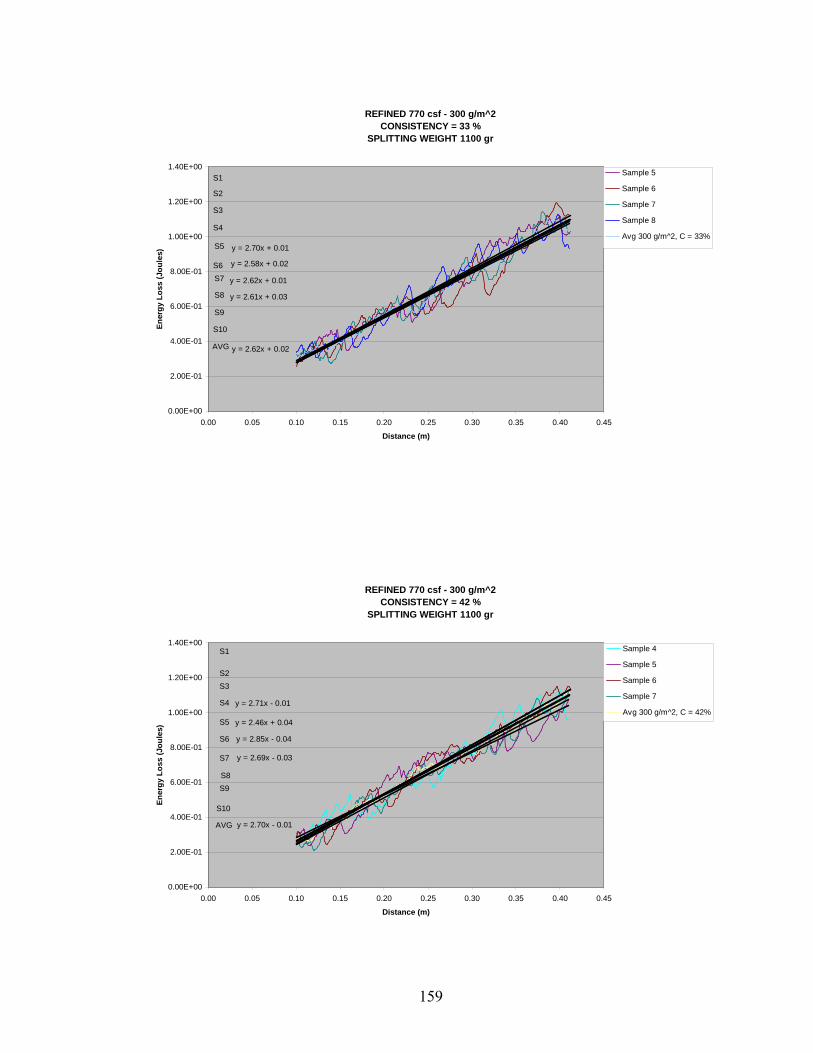
REFINED 770 csf - 300 g/m^2CONSISTENCY = 33 %
SPLITTING WEIGHT 1100 gr
y = 2.70x + 0.01
y = 2.58x + 0.02
y = 2.62x + 0.01
y = 2.61x + 0.03
y = 2.62x + 0.02
0.00E+00
2.00E-01
4.00E-01
6.00E-01
8.00E-01
1.00E+00
1.20E+00
1.40E+00
0.00 0.05 0.10 0.15 0.20 0.25 0.30 0.35 0.40 0.45
Distance (m)
Ener
gy L
oss
(Jou
les)
Sample 5
Sample 6
Sample 7
Sample 8
Avg 300 g/m^2, C = 33%
S1
AVG
S10
S9
S8
S7S6
S5
S4
S3
S2
REFINED 770 csf - 300 g/m^2CONSISTENCY = 42 %
SPLITTING WEIGHT 1100 gr
y = 2.71x - 0.01
y = 2.46x + 0.04
y = 2.85x - 0.04
y = 2.69x - 0.03
y = 2.70x - 0.01
0.00E+00
2.00E-01
4.00E-01
6.00E-01
8.00E-01
1.00E+00
1.20E+00
1.40E+00
0.00 0.05 0.10 0.15 0.20 0.25 0.30 0.35 0.40 0.45
Distance (m)
Ener
gy L
oss
(Jou
les)
Sample 4
Sample 5
Sample 6
Sample 7
Avg 300 g/m^2, C = 42%
S1
AVG
S10
S9S8
S7
S6
S5
S4
S3S2
159
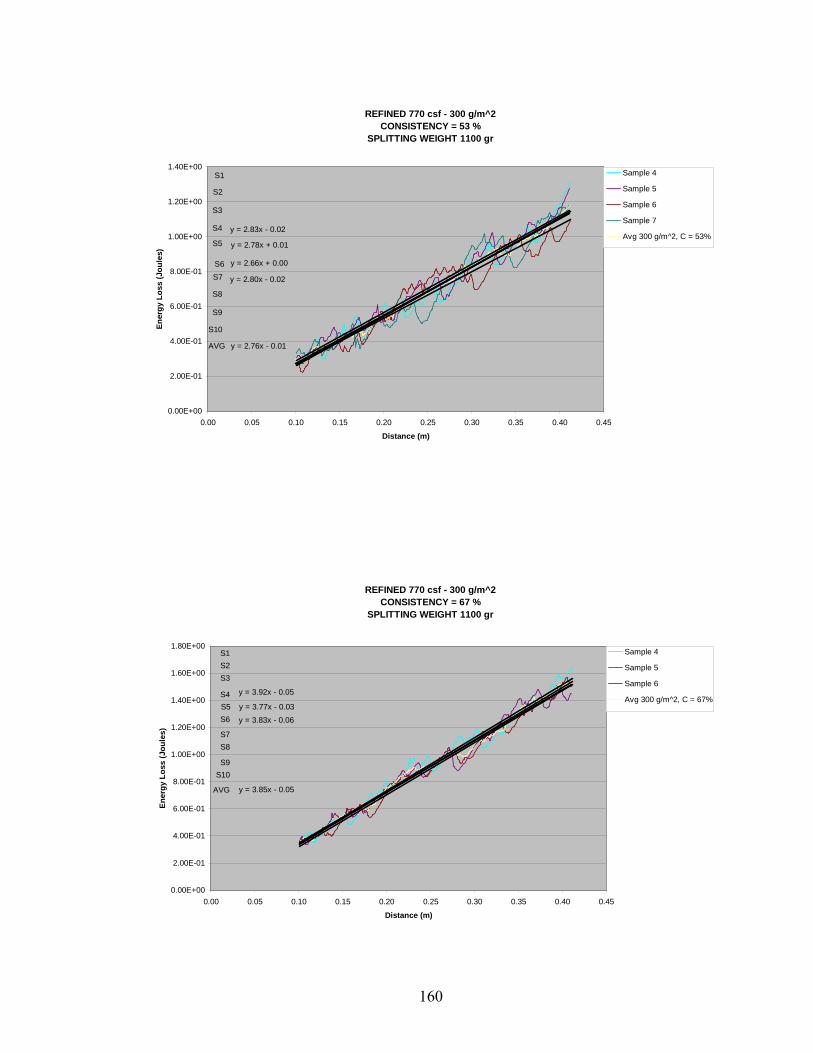
REFINED 770 csf - 300 g/m^2CONSISTENCY = 53 %
SPLITTING WEIGHT 1100 gr
y = 2.83x - 0.02
y = 2.78x + 0.01
y = 2.66x + 0.00
y = 2.80x - 0.02
y = 2.76x - 0.01
0.00E+00
2.00E-01
4.00E-01
6.00E-01
8.00E-01
1.00E+00
1.20E+00
1.40E+00
0.00 0.05 0.10 0.15 0.20 0.25 0.30 0.35 0.40 0.45
Distance (m)
Ener
gy L
oss
(Jou
les)
Sample 4
Sample 5
Sample 6
Sample 7
Avg 300 g/m^2, C = 53%
S1
AVG
S10
S9
S8
S7S6
S5
S4
S3
S2
REFINED 770 csf - 300 g/m^2CONSISTENCY = 67 %
SPLITTING WEIGHT 1100 gr
y = 3.92x - 0.05
y = 3.77x - 0.03
y = 3.83x - 0.06
y = 3.85x - 0.05
0.00E+00
2.00E-01
4.00E-01
6.00E-01
8.00E-01
1.00E+00
1.20E+00
1.40E+00
1.60E+00
1.80E+00
0.00 0.05 0.10 0.15 0.20 0.25 0.30 0.35 0.40 0.45
Distance (m)
Ener
gy L
oss
(Jou
les)
Sample 4
Sample 5
Sample 6
Avg 300 g/m^2, C = 67%
S1
AVG
S10S9
S8S7
S6S5S4
S3S2
160
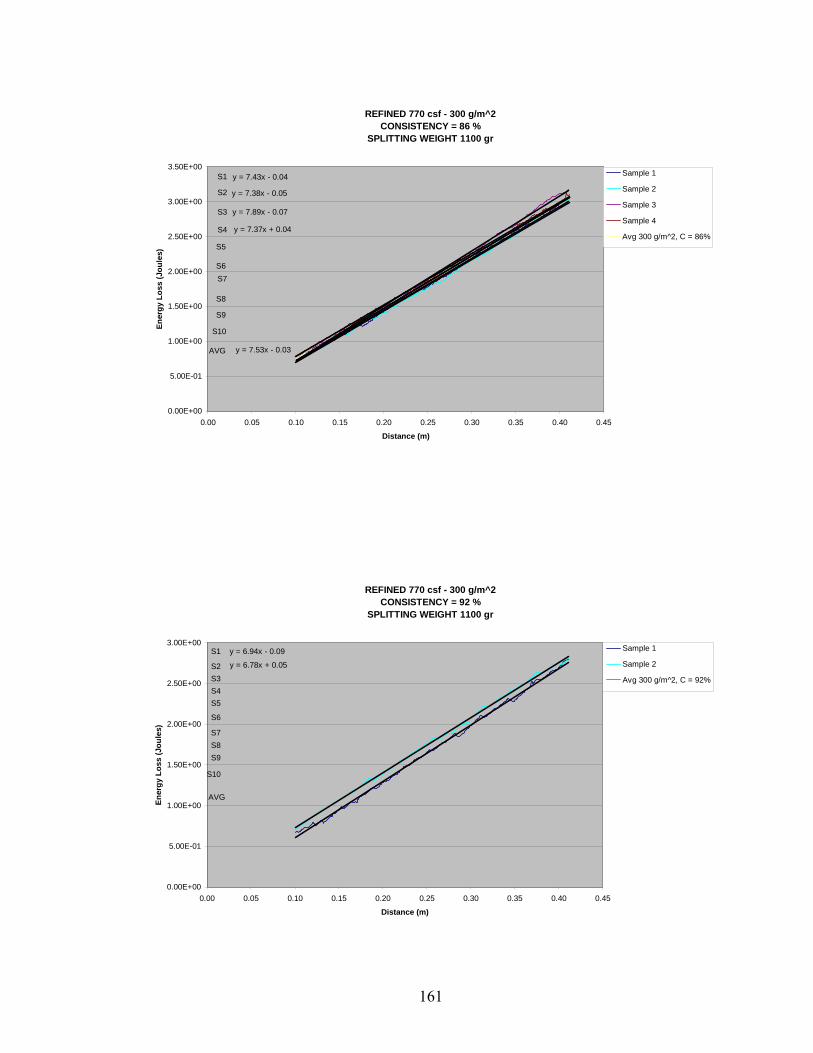
REFINED 770 csf - 300 g/m^2CONSISTENCY = 86 %
SPLITTING WEIGHT 1100 gr
y = 7.43x - 0.04
y = 7.38x - 0.05
y = 7.89x - 0.07
y = 7.37x + 0.04
y = 7.53x - 0.03
0.00E+00
5.00E-01
1.00E+00
1.50E+00
2.00E+00
2.50E+00
3.00E+00
3.50E+00
0.00 0.05 0.10 0.15 0.20 0.25 0.30 0.35 0.40 0.45
Distance (m)
Ener
gy L
oss
(Jou
les)
Sample 1
Sample 2
Sample 3
Sample 4
Avg 300 g/m^2, C = 86%
S1
AVG
S10
S9
S8
S7S6
S5
S4
S3
S2
REFINED 770 csf - 300 g/m^2CONSISTENCY = 92 %
SPLITTING WEIGHT 1100 gr
y = 6.94x - 0.09
y = 6.78x + 0.05
0.00E+00
5.00E-01
1.00E+00
1.50E+00
2.00E+00
2.50E+00
3.00E+00
0.00 0.05 0.10 0.15 0.20 0.25 0.30 0.35 0.40 0.45
Distance (m)
Ener
gy L
oss
(Jou
les)
Sample 1
Sample 2
Avg 300 g/m^2, C = 92%
S1
AVG
S10
S9S8S7
S6
S5S4S3S2
161
Case 2: Refining 740 C.S.F.; No Chemicals; Basis Weight 396 g/m²
162
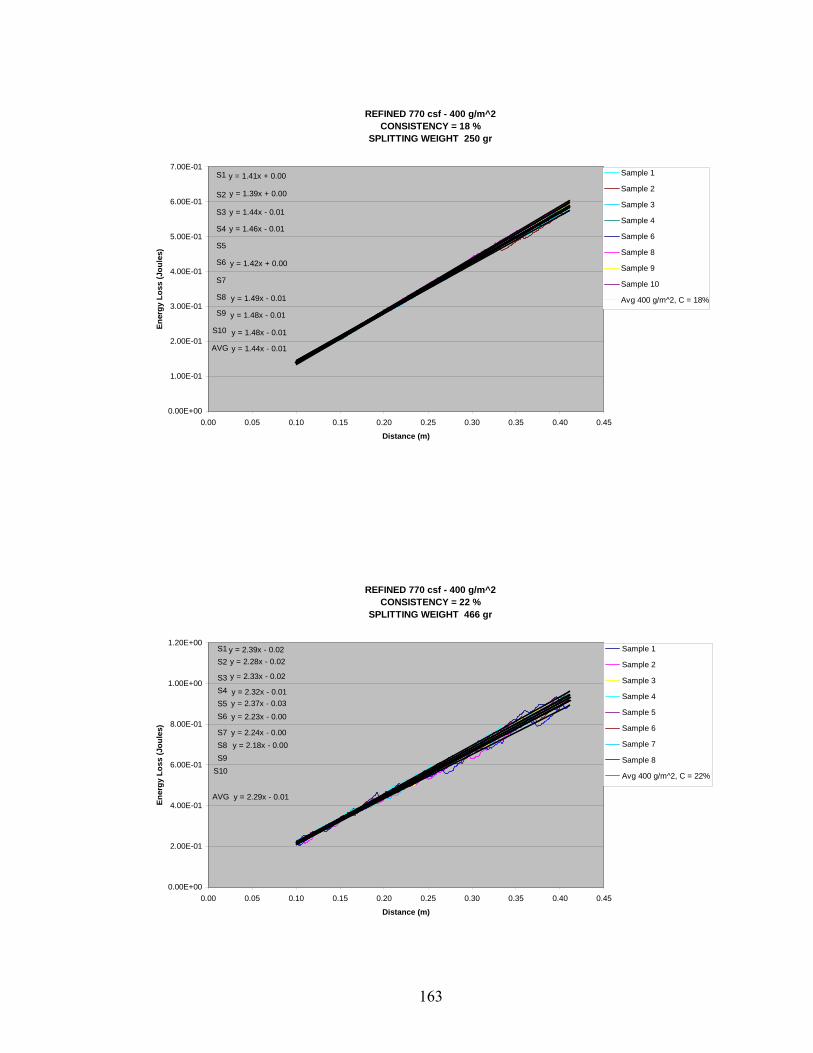
REFINED 770 csf - 400 g/m^2CONSISTENCY = 18 %
SPLITTING WEIGHT 250 gr
y = 1.41x + 0.00
y = 1.39x + 0.00
y = 1.44x - 0.01
y = 1.46x - 0.01
y = 1.42x + 0.00
y = 1.49x - 0.01
y = 1.48x - 0.01
y = 1.48x - 0.01
y = 1.44x - 0.01
0.00E+00
1.00E-01
2.00E-01
3.00E-01
4.00E-01
5.00E-01
6.00E-01
7.00E-01
0.00 0.05 0.10 0.15 0.20 0.25 0.30 0.35 0.40 0.45
Distance (m)
Ener
gy L
oss
(Jou
les)
Sample 1
Sample 2
Sample 3
Sample 4
Sample 6
Sample 8
Sample 9
Sample 10
Avg 400 g/m^2, C = 18%
S1
AVG
S10
S9
S8
S7
S6
S5
S4
S3
S2
REFINED 770 csf - 400 g/m^2CONSISTENCY = 22 %
SPLITTING WEIGHT 466 gr
y = 2.39x - 0.02y = 2.28x - 0.02
y = 2.33x - 0.02
y = 2.32x - 0.01y = 2.37x - 0.03
y = 2.23x - 0.00
y = 2.24x - 0.00y = 2.18x - 0.00
y = 2.29x - 0.01
0.00E+00
2.00E-01
4.00E-01
6.00E-01
8.00E-01
1.00E+00
1.20E+00
0.00 0.05 0.10 0.15 0.20 0.25 0.30 0.35 0.40 0.45
Distance (m)
Ener
gy L
oss
(Jou
les)
Sample 1
Sample 2
Sample 3
Sample 4
Sample 5
Sample 6
Sample 7
Sample 8
Avg 400 g/m^2, C = 22%
S1
AVG
S10S9S8S7
S6S5S4S3
S2
163
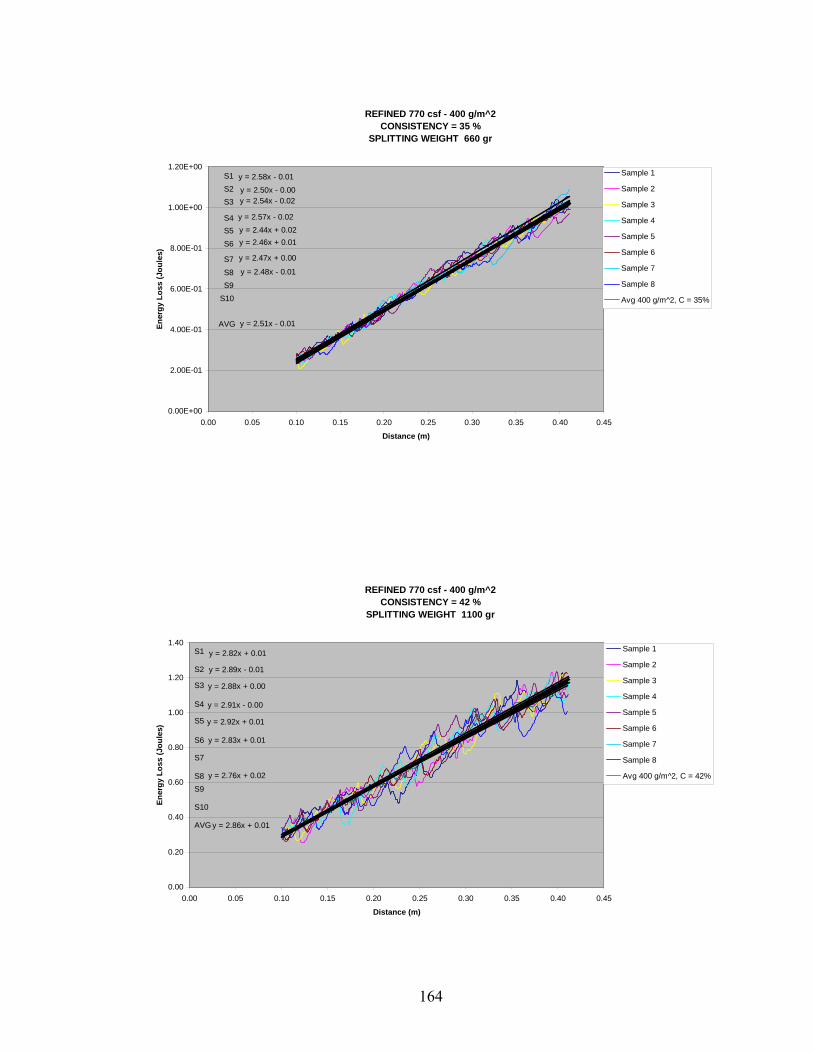
REFINED 770 csf - 400 g/m^2CONSISTENCY = 35 %
SPLITTING WEIGHT 660 gr
y = 2.58x - 0.01
y = 2.50x - 0.00y = 2.54x - 0.02
y = 2.57x - 0.02y = 2.44x + 0.02y = 2.46x + 0.01
y = 2.47x + 0.00
y = 2.48x - 0.01
y = 2.51x - 0.01
0.00E+00
2.00E-01
4.00E-01
6.00E-01
8.00E-01
1.00E+00
1.20E+00
0.00 0.05 0.10 0.15 0.20 0.25 0.30 0.35 0.40 0.45
Distance (m)
Ener
gy L
oss
(Jou
les)
Sample 1
Sample 2
Sample 3
Sample 4
Sample 5
Sample 6
Sample 7
Sample 8
Avg 400 g/m^2, C = 35%
S1
AVG
S10S9S8
S7
S6S5S4
S3S2
REFINED 770 csf - 400 g/m^2CONSISTENCY = 42 %
SPLITTING WEIGHT 1100 gr
y = 2.82x + 0.01
y = 2.89x - 0.01
y = 2.88x + 0.00
y = 2.91x - 0.00
y = 2.92x + 0.01
y = 2.83x + 0.01
y = 2.76x + 0.02
y = 2.86x + 0.01
0.00
0.20
0.40
0.60
0.80
1.00
1.20
1.40
0.00 0.05 0.10 0.15 0.20 0.25 0.30 0.35 0.40 0.45
Distance (m)
Ener
gy L
oss
(Jou
les)
Sample 1
Sample 2
Sample 3
Sample 4
Sample 5
Sample 6
Sample 7
Sample 8
Avg 400 g/m^2, C = 42%
S1
AVG
S10
S9S8
S7
S6
S5
S4
S3
S2
164
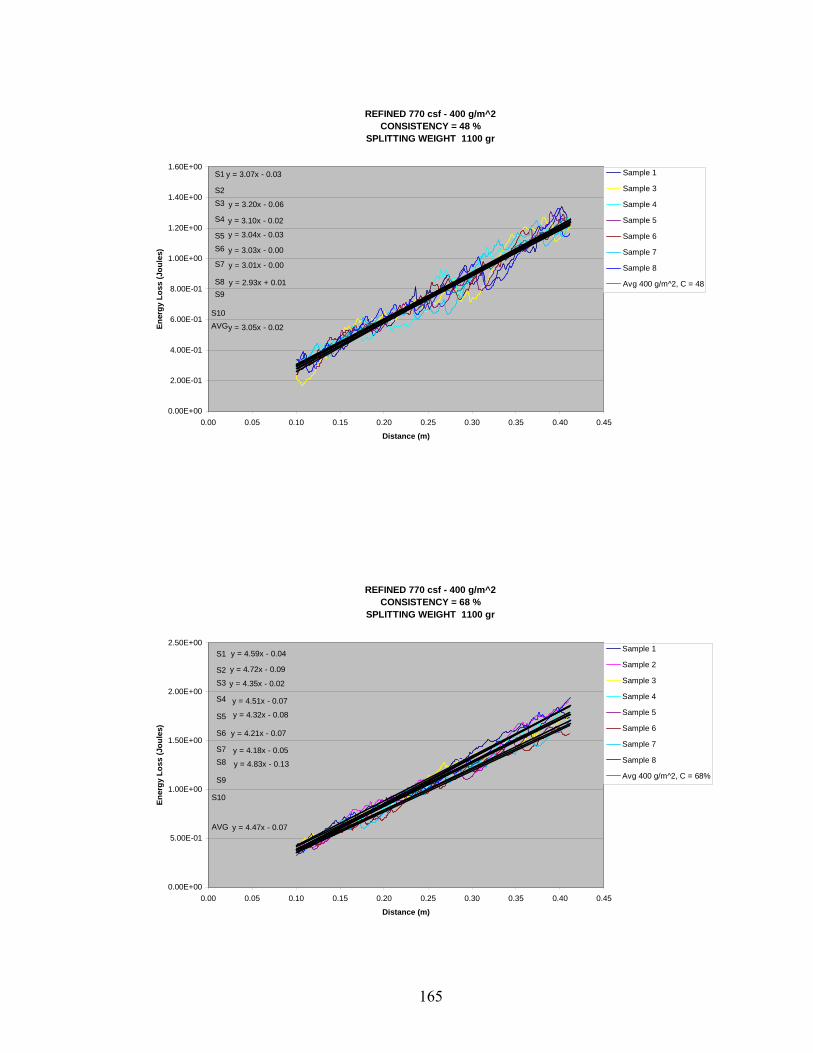
REFINED 770 csf - 400 g/m^2CONSISTENCY = 48 %
SPLITTING WEIGHT 1100 gr
y = 3.07x - 0.03
y = 3.20x - 0.06
y = 3.10x - 0.02
y = 3.04x - 0.03
y = 3.03x - 0.00
y = 3.01x - 0.00
y = 2.93x + 0.01
y = 3.05x - 0.02
0.00E+00
2.00E-01
4.00E-01
6.00E-01
8.00E-01
1.00E+00
1.20E+00
1.40E+00
1.60E+00
0.00 0.05 0.10 0.15 0.20 0.25 0.30 0.35 0.40 0.45
Distance (m)
Ener
gy L
oss
(Jou
les)
Sample 1
Sample 3
Sample 4
Sample 5
Sample 6
Sample 7
Sample 8
Avg 400 g/m^2, C = 48
S1
AVGS10
S9S8
S7
S6S5
S4
S3S2
REFINED 770 csf - 400 g/m^2CONSISTENCY = 68 %
SPLITTING WEIGHT 1100 gr
y = 4.59x - 0.04
y = 4.72x - 0.09
y = 4.35x - 0.02
y = 4.51x - 0.07
y = 4.32x - 0.08
y = 4.21x - 0.07
y = 4.18x - 0.05
y = 4.83x - 0.13
y = 4.47x - 0.07
0.00E+00
5.00E-01
1.00E+00
1.50E+00
2.00E+00
2.50E+00
0.00 0.05 0.10 0.15 0.20 0.25 0.30 0.35 0.40 0.45
Distance (m)
Ener
gy L
oss
(Jou
les)
Sample 1
Sample 2
Sample 3
Sample 4
Sample 5
Sample 6
Sample 7
Sample 8
Avg 400 g/m^2, C = 68%
S1
AVG
S10
S9
S8S7
S6
S5
S4
S3S2
165
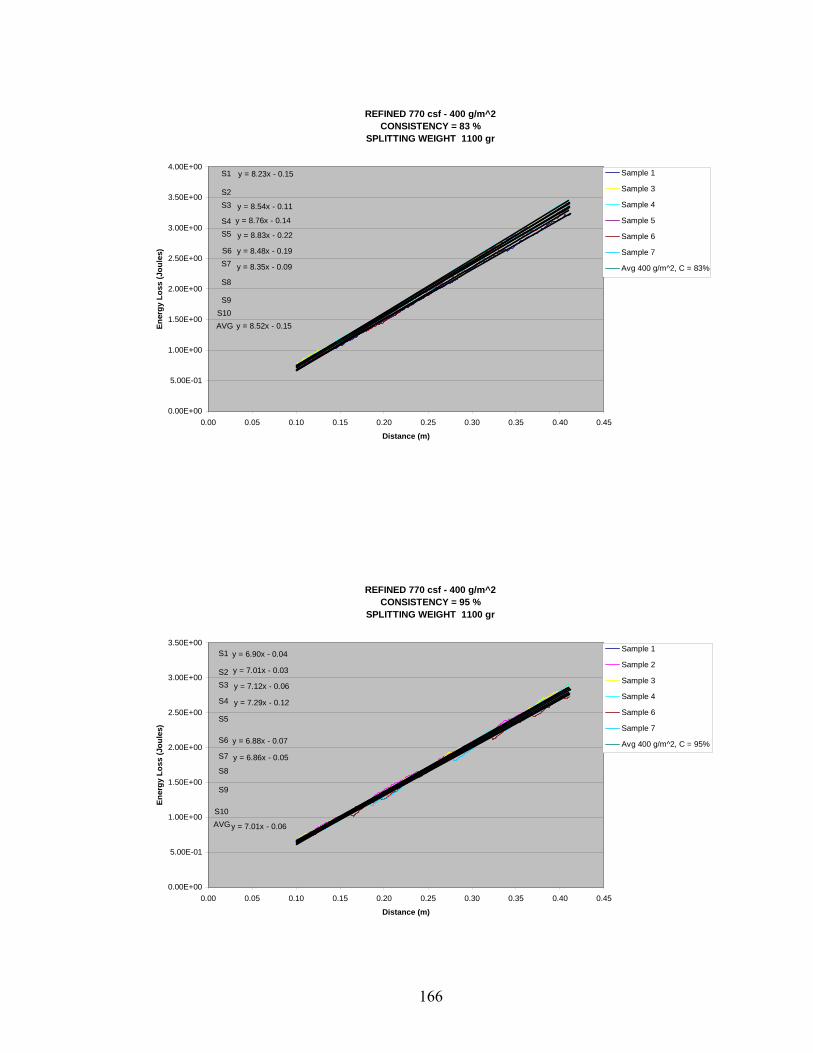
REFINED 770 csf - 400 g/m^2CONSISTENCY = 83 %
SPLITTING WEIGHT 1100 gr
y = 8.23x - 0.15
y = 8.54x - 0.11
y = 8.76x - 0.14
y = 8.83x - 0.22
y = 8.48x - 0.19
y = 8.35x - 0.09
y = 8.52x - 0.15
0.00E+00
5.00E-01
1.00E+00
1.50E+00
2.00E+00
2.50E+00
3.00E+00
3.50E+00
4.00E+00
0.00 0.05 0.10 0.15 0.20 0.25 0.30 0.35 0.40 0.45
Distance (m)
Ener
gy L
oss
(Jou
les)
Sample 1
Sample 3
Sample 4
Sample 5
Sample 6
Sample 7
Avg 400 g/m^2, C = 83%
S1
AVGS10S9
S8
S7S6
S5S4
S3S2
REFINED 770 csf - 400 g/m^2CONSISTENCY = 95 %
SPLITTING WEIGHT 1100 gr
y = 6.90x - 0.04
y = 7.01x - 0.03
y = 7.12x - 0.06
y = 7.29x - 0.12
y = 6.88x - 0.07
y = 6.86x - 0.05
y = 7.01x - 0.06
0.00E+00
5.00E-01
1.00E+00
1.50E+00
2.00E+00
2.50E+00
3.00E+00
3.50E+00
0.00 0.05 0.10 0.15 0.20 0.25 0.30 0.35 0.40 0.45
Distance (m)
Ener
gy L
oss
(Jou
les)
Sample 1
Sample 2
Sample 3
Sample 4
Sample 6
Sample 7
Avg 400 g/m^2, C = 95%
S1
AVGS10
S9
S8
S7
S6
S5
S4
S3S2
166

Case 3: Refining 560 C.S.F.; ASH 17% (Normal Clay), No Starch; Basis Weight 113 g/m²
167
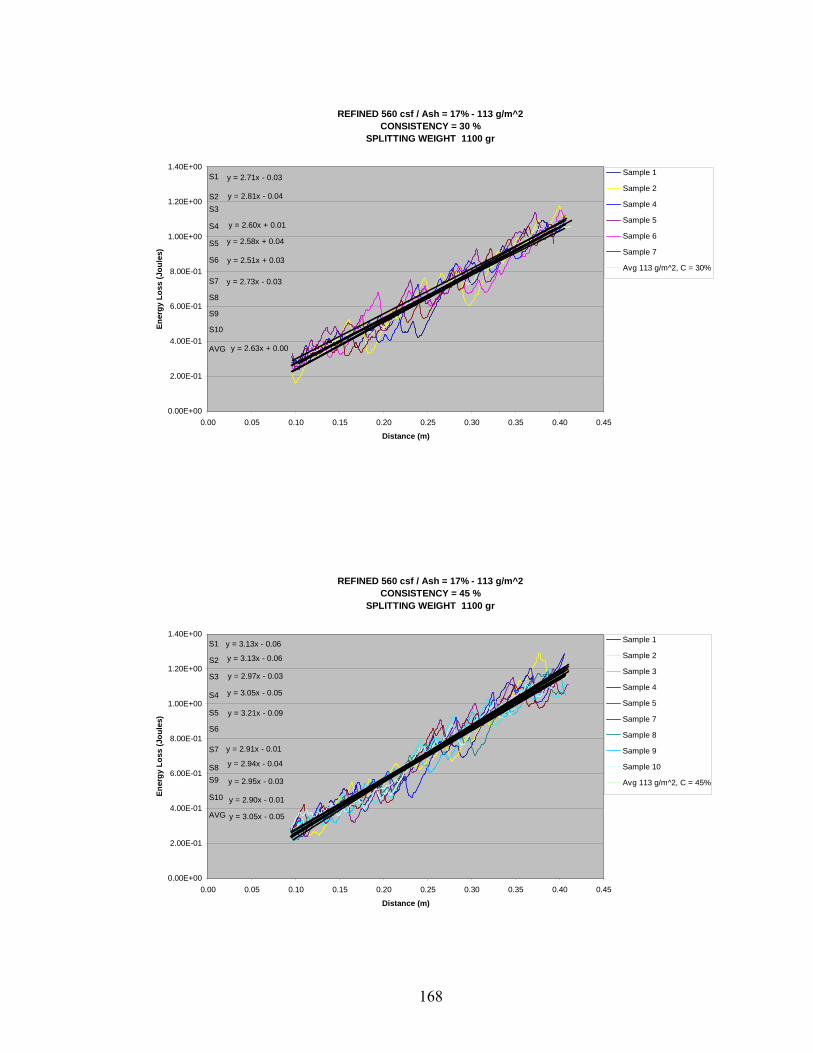
REFINED 560 csf / Ash = 17% - 113 g/m^2CONSISTENCY = 30 %
SPLITTING WEIGHT 1100 gr
y = 2.71x - 0.03
y = 2.81x - 0.04
y = 2.60x + 0.01
y = 2.58x + 0.04
y = 2.51x + 0.03
y = 2.73x - 0.03
y = 2.63x + 0.00
0.00E+00
2.00E-01
4.00E-01
6.00E-01
8.00E-01
1.00E+00
1.20E+00
1.40E+00
0.00 0.05 0.10 0.15 0.20 0.25 0.30 0.35 0.40 0.45
Distance (m)
Ener
gy L
oss
(Jou
les)
Sample 1
Sample 2
Sample 4
Sample 5
Sample 6
Sample 7
Avg 113 g/m^2, C = 30%
S1
AVG
S10
S9
S8
S7
S6
S5
S4
S3S2
REFINED 560 csf / Ash = 17% - 113 g/m^2CONSISTENCY = 45 %
SPLITTING WEIGHT 1100 gr
y = 3.13x - 0.06
y = 3.13x - 0.06
y = 2.97x - 0.03
y = 3.05x - 0.05
y = 3.21x - 0.09
y = 2.91x - 0.01
y = 2.94x - 0.04
y = 2.95x - 0.03
y = 2.90x - 0.01
y = 3.05x - 0.05
0.00E+00
2.00E-01
4.00E-01
6.00E-01
8.00E-01
1.00E+00
1.20E+00
1.40E+00
0.00 0.05 0.10 0.15 0.20 0.25 0.30 0.35 0.40 0.45
Distance (m)
Ener
gy L
oss
(Jou
les)
Sample 1
Sample 2
Sample 3
Sample 4
Sample 5
Sample 7
Sample 8
Sample 9
Sample 10
Avg 113 g/m^2, C = 45%
S1
AVG
S10
S9S8
S7
S6
S5
S4
S3
S2
168
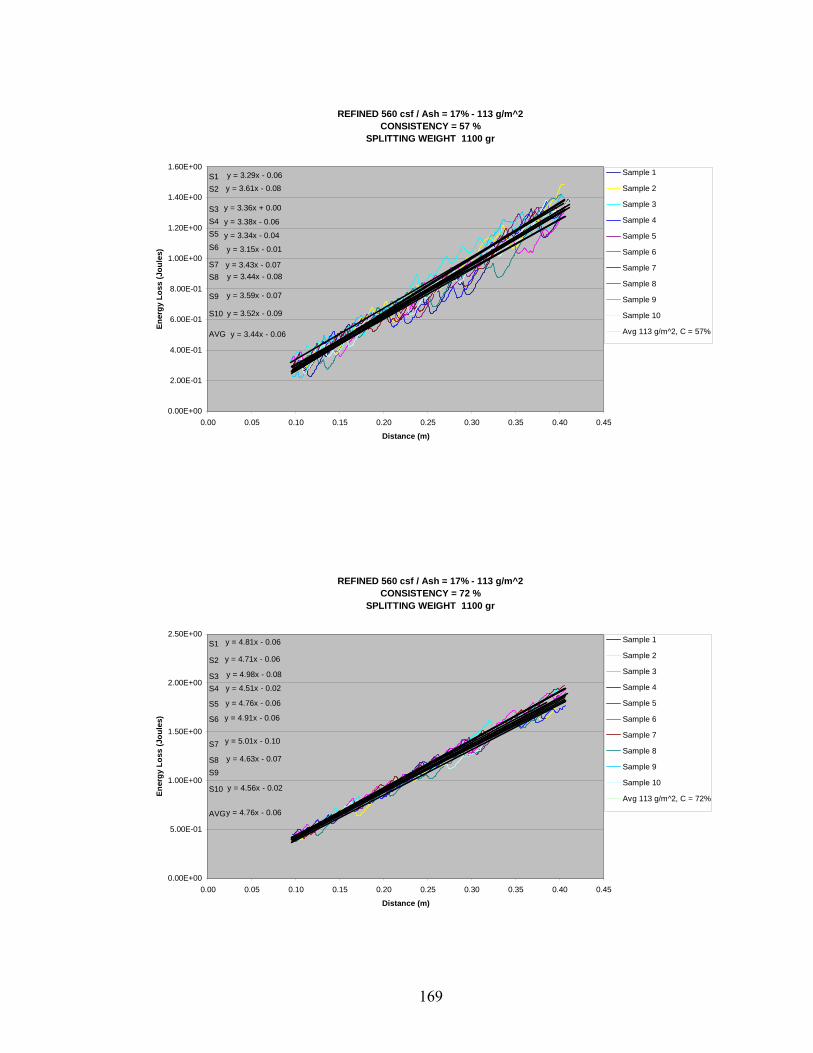
REFINED 560 csf / Ash = 17% - 113 g/m^2CONSISTENCY = 57 %
SPLITTING WEIGHT 1100 gr
y = 3.29x - 0.06y = 3.61x - 0.08
y = 3.36x + 0.00
y = 3.38x - 0.06
y = 3.34x - 0.04
y = 3.15x - 0.01
y = 3.43x - 0.07y = 3.44x - 0.08
y = 3.59x - 0.07
y = 3.52x - 0.09
y = 3.44x - 0.06
0.00E+00
2.00E-01
4.00E-01
6.00E-01
8.00E-01
1.00E+00
1.20E+00
1.40E+00
1.60E+00
0.00 0.05 0.10 0.15 0.20 0.25 0.30 0.35 0.40 0.45
Distance (m)
Ener
gy L
oss
(Jou
les)
Sample 1
Sample 2
Sample 3
Sample 4
Sample 5
Sample 6
Sample 7
Sample 8
Sample 9
Sample 10
Avg 113 g/m^2, C = 57%
S1
AVG
S10
S9
S8S7
S6
S5S4S3
S2
REFINED 560 csf / Ash = 17% - 113 g/m^2CONSISTENCY = 72 %
SPLITTING WEIGHT 1100 gr
y = 4.81x - 0.06
y = 4.71x - 0.06
y = 4.98x - 0.08
y = 4.51x - 0.02
y = 4.76x - 0.06
y = 4.91x - 0.06
y = 5.01x - 0.10
y = 4.63x - 0.07
y = 4.56x - 0.02
y = 4.76x - 0.06
0.00E+00
5.00E-01
1.00E+00
1.50E+00
2.00E+00
2.50E+00
0.00 0.05 0.10 0.15 0.20 0.25 0.30 0.35 0.40 0.45
Distance (m)
Ener
gy L
oss
(Jou
les)
Sample 1
Sample 2
Sample 3
Sample 4
Sample 5
Sample 6
Sample 7
Sample 8
Sample 9
Sample 10
Avg 113 g/m^2, C = 72%
Li l (S l 1)
S1
AVG
S10
S9S8
S7
S6
S5
S4S3
S2
169
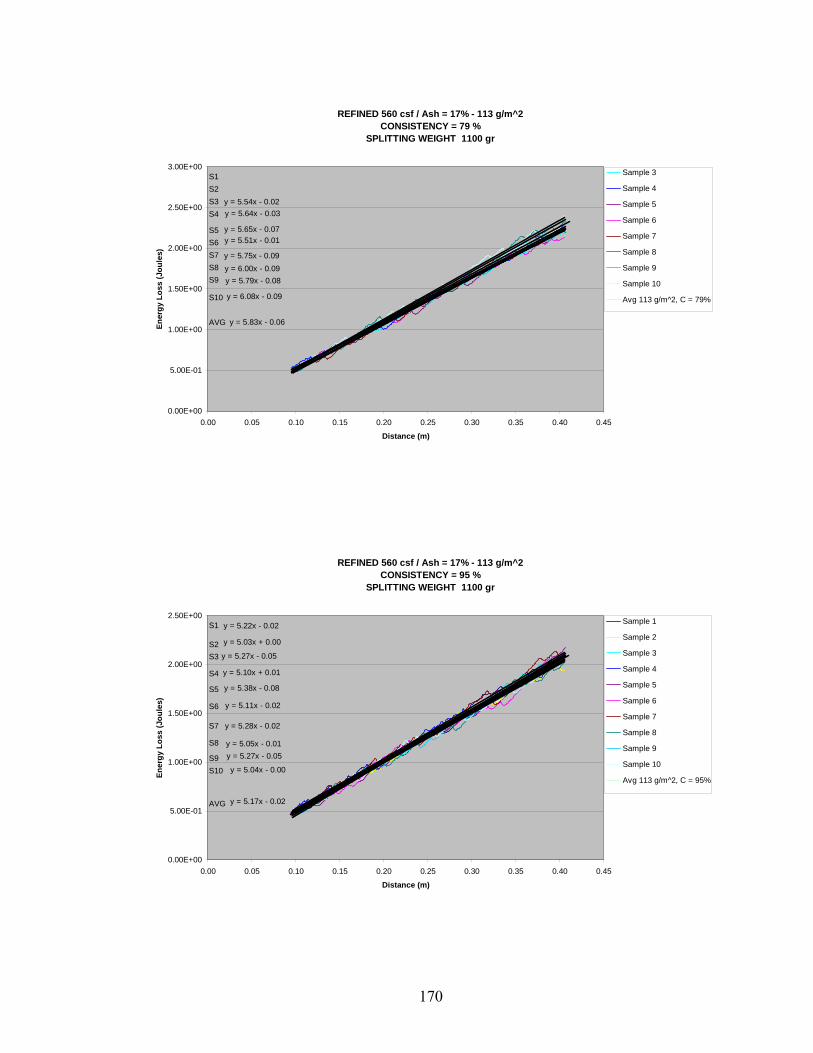
REFINED 560 csf / Ash = 17% - 113 g/m^2CONSISTENCY = 79 %
SPLITTING WEIGHT 1100 gr
y = 5.54x - 0.02y = 5.64x - 0.03
y = 5.65x - 0.07y = 5.51x - 0.01
y = 5.75x - 0.09y = 6.00x - 0.09y = 5.79x - 0.08
y = 6.08x - 0.09
y = 5.83x - 0.06
0.00E+00
5.00E-01
1.00E+00
1.50E+00
2.00E+00
2.50E+00
3.00E+00
0.00 0.05 0.10 0.15 0.20 0.25 0.30 0.35 0.40 0.45
Distance (m)
Ener
gy L
oss
(Jou
les)
Sample 3
Sample 4
Sample 5
Sample 6
Sample 7
Sample 8
Sample 9
Sample 10
Avg 113 g/m^2, C = 79%
S1
AVG
S10
S9S8S7S6S5
S4S3S2
REFINED 560 csf / Ash = 17% - 113 g/m^2CONSISTENCY = 95 %
SPLITTING WEIGHT 1100 gr
y = 5.22x - 0.02
y = 5.03x + 0.00
y = 5.27x - 0.05
y = 5.10x + 0.01
y = 5.38x - 0.08
y = 5.11x - 0.02
y = 5.28x - 0.02
y = 5.05x - 0.01y = 5.27x - 0.05
y = 5.04x - 0.00
y = 5.17x - 0.02
0.00E+00
5.00E-01
1.00E+00
1.50E+00
2.00E+00
2.50E+00
0.00 0.05 0.10 0.15 0.20 0.25 0.30 0.35 0.40 0.45
Distance (m)
Ener
gy L
oss
(Jou
les)
Sample 1
Sample 2
Sample 3
Sample 4
Sample 5
Sample 6
Sample 7
Sample 8
Sample 9
Sample 10
Avg 113 g/m^2, C = 95%
Li l (S l 1)
S1
AVG
S10S9
S8
S7
S6
S5
S4
S3S2
170
Case 3: Refining 560 C.S.F.; ASH 17% (Normal Clay), No Starch; Basis Weight 202 g/m²
171
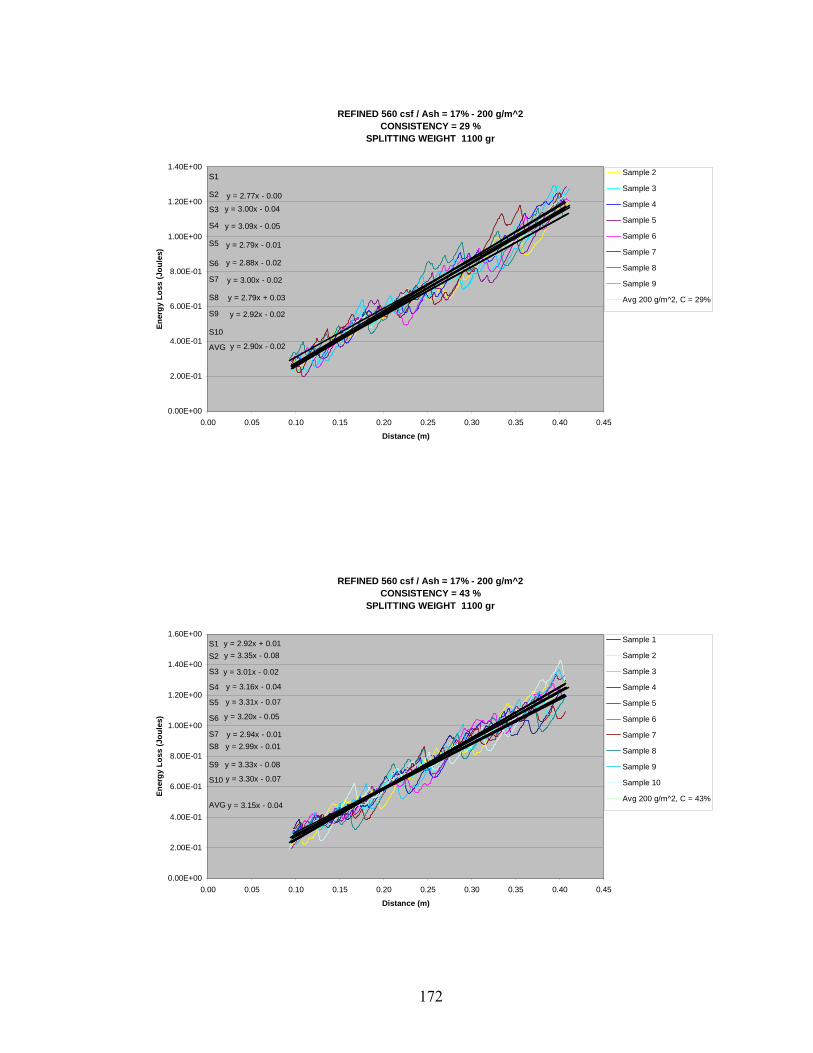
REFINED 560 csf / Ash = 17% - 200 g/m^2CONSISTENCY = 29 %
SPLITTING WEIGHT 1100 gr
y = 2.77x - 0.00y = 3.00x - 0.04
y = 3.09x - 0.05
y = 2.79x - 0.01
y = 2.88x - 0.02
y = 3.00x - 0.02
y = 2.79x + 0.03
y = 2.92x - 0.02
y = 2.90x - 0.02
0.00E+00
2.00E-01
4.00E-01
6.00E-01
8.00E-01
1.00E+00
1.20E+00
1.40E+00
0.00 0.05 0.10 0.15 0.20 0.25 0.30 0.35 0.40 0.45
Distance (m)
Ener
gy L
oss
(Jou
les)
Sample 2
Sample 3
Sample 4
Sample 5
Sample 6
Sample 7
Sample 8
Sample 9
Avg 200 g/m^2, C = 29%
S1
AVG
S10
S9
S8
S7
S6
S5
S4
S3
S2
REFINED 560 csf / Ash = 17% - 200 g/m^2CONSISTENCY = 43 %
SPLITTING WEIGHT 1100 gr
y = 2.92x + 0.01y = 3.35x - 0.08
y = 3.01x - 0.02
y = 3.16x - 0.04
y = 3.31x - 0.07
y = 3.20x - 0.05
y = 2.94x - 0.01y = 2.99x - 0.01
y = 3.33x - 0.08
y = 3.30x - 0.07
y = 3.15x - 0.04
0.00E+00
2.00E-01
4.00E-01
6.00E-01
8.00E-01
1.00E+00
1.20E+00
1.40E+00
1.60E+00
0.00 0.05 0.10 0.15 0.20 0.25 0.30 0.35 0.40 0.45
Distance (m)
Ener
gy L
oss
(Jou
les)
Sample 1
Sample 2
Sample 3
Sample 4
Sample 5
Sample 6
Sample 7
Sample 8
Sample 9
Sample 10
Avg 200 g/m^2, C = 43%
S1
AVG
S10
S9
S8S7
S6
S5
S4
S3
S2
172
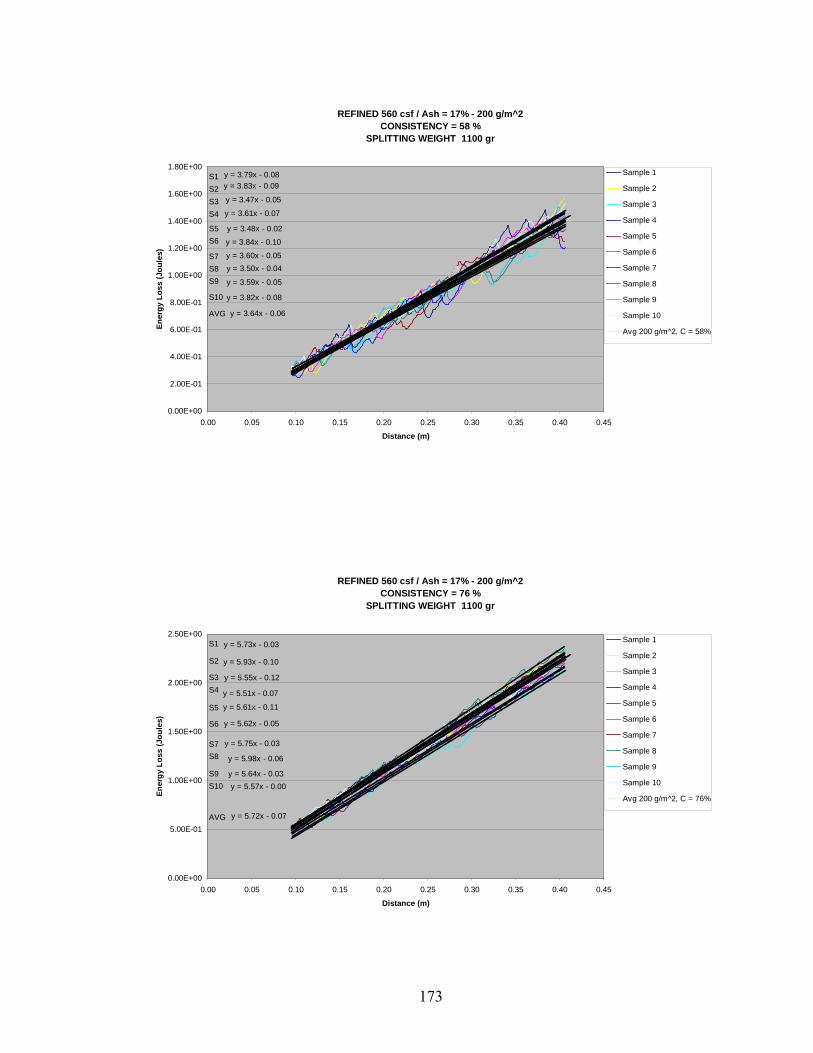
REFINED 560 csf / Ash = 17% - 200 g/m^2CONSISTENCY = 58 %
SPLITTING WEIGHT 1100 gr
y = 3.79x - 0.08y = 3.83x - 0.09
y = 3.47x - 0.05
y = 3.61x - 0.07
y = 3.48x - 0.02
y = 3.84x - 0.10
y = 3.60x - 0.05y = 3.50x - 0.04
y = 3.59x - 0.05
y = 3.82x - 0.08
y = 3.64x - 0.06
0.00E+00
2.00E-01
4.00E-01
6.00E-01
8.00E-01
1.00E+00
1.20E+00
1.40E+00
1.60E+00
1.80E+00
0.00 0.05 0.10 0.15 0.20 0.25 0.30 0.35 0.40 0.45
Distance (m)
Ener
gy L
oss
(Jou
les)
Sample 1
Sample 2
Sample 3
Sample 4
Sample 5
Sample 6
Sample 7
Sample 8
Sample 9
Sample 10
Avg 200 g/m^2, C = 58%
S1
AVG
S10
S9S8S7
S6S5
S4S3S2
REFINED 560 csf / Ash = 17% - 200 g/m^2CONSISTENCY = 76 %
SPLITTING WEIGHT 1100 gr
y = 5.73x - 0.03
y = 5.93x - 0.10
y = 5.55x - 0.12
y = 5.51x - 0.07
y = 5.61x - 0.11
y = 5.62x - 0.05
y = 5.75x - 0.03
y = 5.98x - 0.06
y = 5.64x - 0.03y = 5.57x - 0.00
y = 5.72x - 0.07
0.00E+00
5.00E-01
1.00E+00
1.50E+00
2.00E+00
2.50E+00
0.00 0.05 0.10 0.15 0.20 0.25 0.30 0.35 0.40 0.45
Distance (m)
Ener
gy L
oss
(Jou
les)
Sample 1
Sample 2
Sample 3
Sample 4
Sample 5
Sample 6
Sample 7
Sample 8
Sample 9
Sample 10
Avg 200 g/m^2, C = 76%
S1
AVG
S10S9
S8S7
S6
S5
S4S3
S2
173
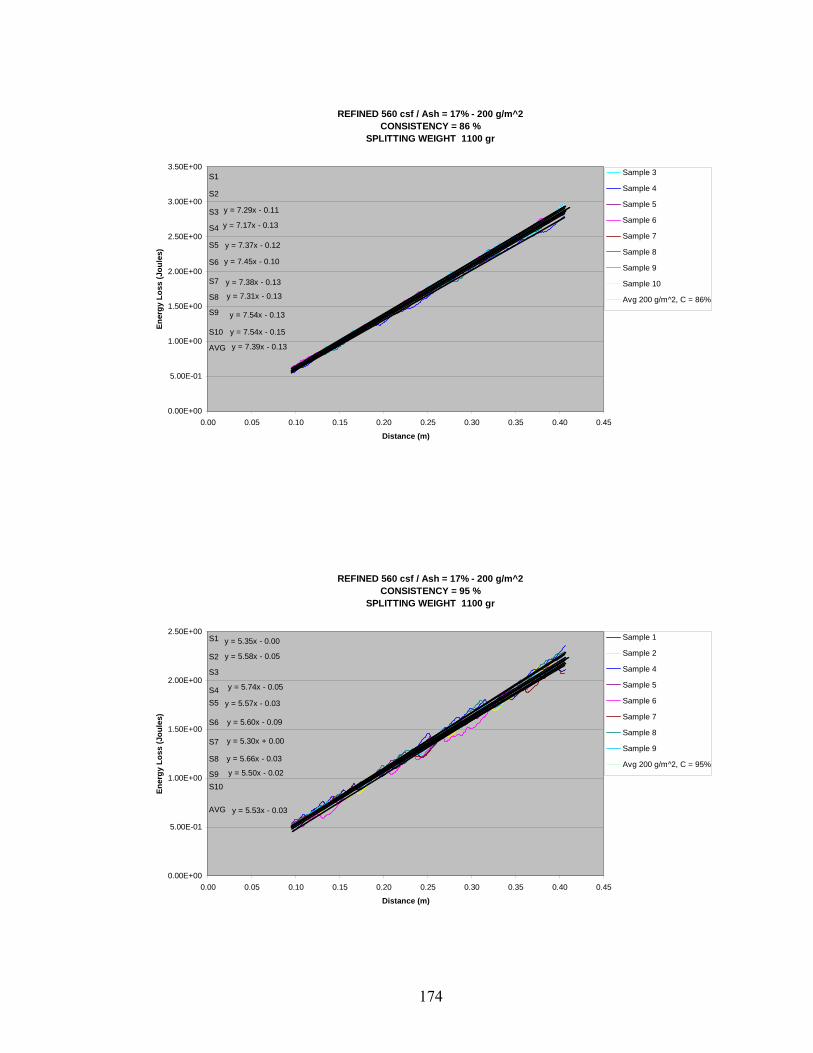
REFINED 560 csf / Ash = 17% - 200 g/m^2CONSISTENCY = 86 %
SPLITTING WEIGHT 1100 gr
y = 7.29x - 0.11
y = 7.17x - 0.13
y = 7.37x - 0.12
y = 7.45x - 0.10
y = 7.38x - 0.13
y = 7.31x - 0.13
y = 7.54x - 0.13
y = 7.54x - 0.15
y = 7.39x - 0.13
0.00E+00
5.00E-01
1.00E+00
1.50E+00
2.00E+00
2.50E+00
3.00E+00
3.50E+00
0.00 0.05 0.10 0.15 0.20 0.25 0.30 0.35 0.40 0.45
Distance (m)
Ener
gy L
oss
(Jou
les)
Sample 3
Sample 4
Sample 5
Sample 6
Sample 7
Sample 8
Sample 9
Sample 10
Avg 200 g/m^2, C = 86%
S1
AVG
S10
S9
S8
S7
S6
S5
S4
S3
S2
REFINED 560 csf / Ash = 17% - 200 g/m^2CONSISTENCY = 95 %
SPLITTING WEIGHT 1100 gr
y = 5.35x - 0.00
y = 5.58x - 0.05
y = 5.74x - 0.05
y = 5.57x - 0.03
y = 5.60x - 0.09
y = 5.30x + 0.00
y = 5.66x - 0.03
y = 5.50x - 0.02
y = 5.53x - 0.03
0.00E+00
5.00E-01
1.00E+00
1.50E+00
2.00E+00
2.50E+00
0.00 0.05 0.10 0.15 0.20 0.25 0.30 0.35 0.40 0.45
Distance (m)
Ener
gy L
oss
(Jou
les)
Sample 1
Sample 2
Sample 4
Sample 5
Sample 6
Sample 7
Sample 8
Sample 9
Avg 200 g/m^2, C = 95%
S1
AVG
S10S9
S8
S7
S6
S5S4
S3
S2
174

Case 3: Refining 560 C.S.F.; ASH 17% (Normal Clay), No Starch; Basis Weight 311 g/m²
175
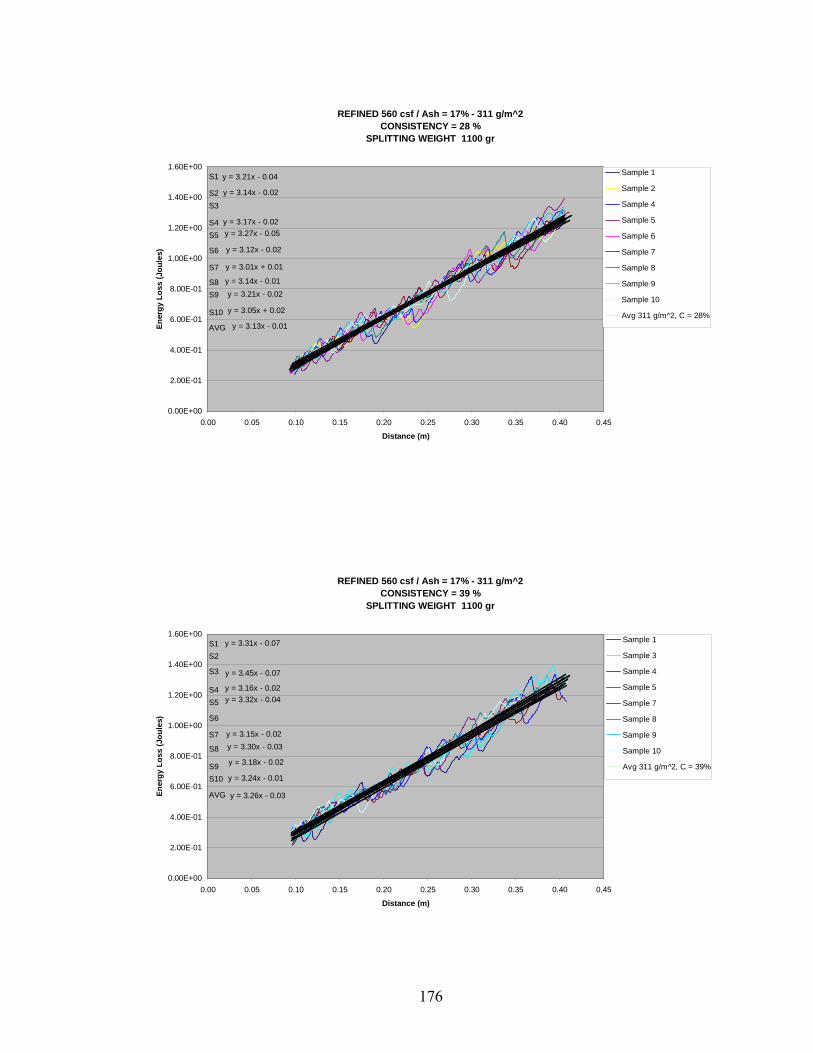
REFINED 560 csf / Ash = 17% - 311 g/m^2CONSISTENCY = 28 %
SPLITTING WEIGHT 1100 gr
y = 3.21x - 0.04
y = 3.14x - 0.02
y = 3.17x - 0.02y = 3.27x - 0.05
y = 3.12x - 0.02
y = 3.01x + 0.01
y = 3.14x - 0.01y = 3.21x - 0.02
y = 3.05x + 0.02
y = 3.13x - 0.01
0.00E+00
2.00E-01
4.00E-01
6.00E-01
8.00E-01
1.00E+00
1.20E+00
1.40E+00
1.60E+00
0.00 0.05 0.10 0.15 0.20 0.25 0.30 0.35 0.40 0.45
Distance (m)
Ener
gy L
oss
(Jou
les)
Sample 1
Sample 2
Sample 4
Sample 5
Sample 6
Sample 7
Sample 8
Sample 9
Sample 10
Avg 311 g/m^2, C = 28%
S1
AVG
S10
S9S8
S7
S6
S5S4
S3S2
REFINED 560 csf / Ash = 17% - 311 g/m^2CONSISTENCY = 39 %
SPLITTING WEIGHT 1100 gr
y = 3.31x - 0.07
y = 3.45x - 0.07
y = 3.16x - 0.02y = 3.32x - 0.04
y = 3.15x - 0.02y = 3.30x - 0.03
y = 3.18x - 0.02
y = 3.24x - 0.01
y = 3.26x - 0.03
0.00E+00
2.00E-01
4.00E-01
6.00E-01
8.00E-01
1.00E+00
1.20E+00
1.40E+00
1.60E+00
0.00 0.05 0.10 0.15 0.20 0.25 0.30 0.35 0.40 0.45
Distance (m)
Ener
gy L
oss
(Jou
les)
Sample 1
Sample 3
Sample 4
Sample 5
Sample 7
Sample 8
Sample 9
Sample 10
Avg 311 g/m^2, C = 39%
S1
AVG
S10S9
S8
S7
S6
S5S4
S3
S2
176
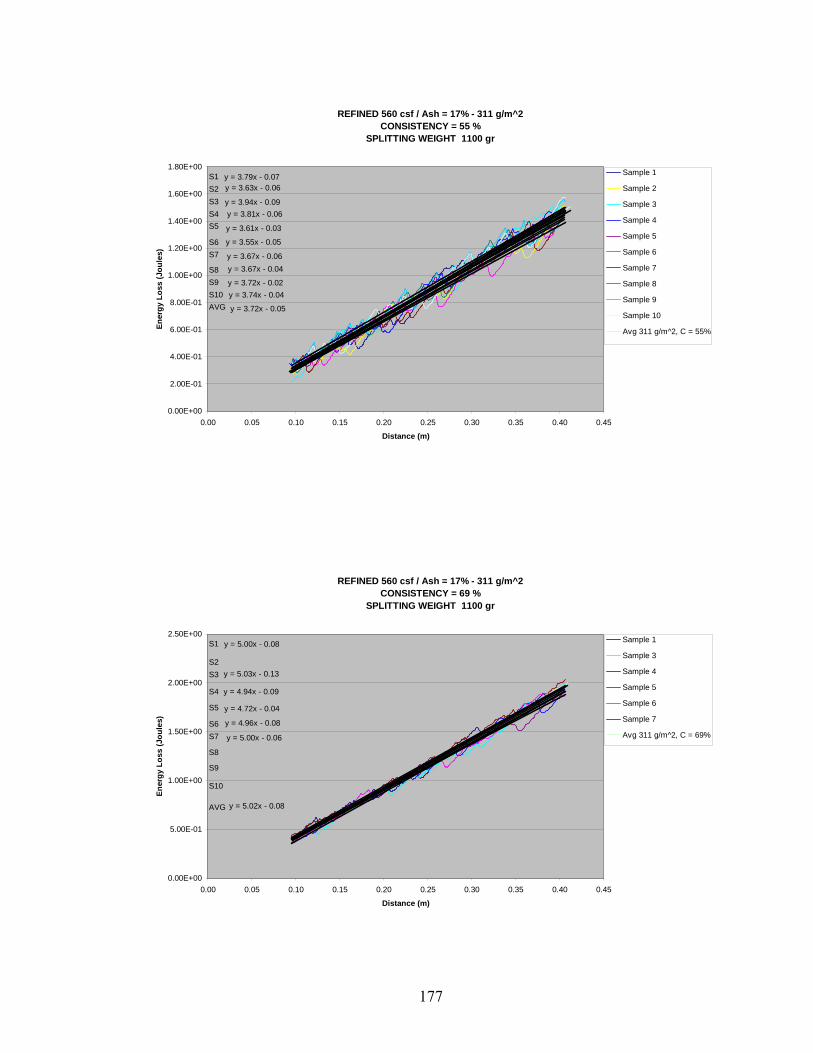
REFINED 560 csf / Ash = 17% - 311 g/m^2CONSISTENCY = 55 %
SPLITTING WEIGHT 1100 gr
y = 3.79x - 0.07y = 3.63x - 0.06
y = 3.94x - 0.09y = 3.81x - 0.06
y = 3.61x - 0.03
y = 3.55x - 0.05
y = 3.67x - 0.06y = 3.67x - 0.04
y = 3.72x - 0.02y = 3.74x - 0.04
y = 3.72x - 0.05
0.00E+00
2.00E-01
4.00E-01
6.00E-01
8.00E-01
1.00E+00
1.20E+00
1.40E+00
1.60E+00
1.80E+00
0.00 0.05 0.10 0.15 0.20 0.25 0.30 0.35 0.40 0.45
Distance (m)
Ener
gy L
oss
(Jou
les)
Sample 1
Sample 2
Sample 3
Sample 4
Sample 5
Sample 6
Sample 7
Sample 8
Sample 9
Sample 10
Avg 311 g/m^2, C = 55%
Li l (S l 1)
S1
AVGS10S9S8
S7S6
S5S4S3S2
REFINED 560 csf / Ash = 17% - 311 g/m^2CONSISTENCY = 69 %
SPLITTING WEIGHT 1100 gr
y = 5.00x - 0.08
y = 5.03x - 0.13
y = 4.94x - 0.09
y = 4.72x - 0.04
y = 4.96x - 0.08
y = 5.00x - 0.06
y = 5.02x - 0.08
0.00E+00
5.00E-01
1.00E+00
1.50E+00
2.00E+00
2.50E+00
0.00 0.05 0.10 0.15 0.20 0.25 0.30 0.35 0.40 0.45
Distance (m)
Ener
gy L
oss
(Jou
les)
Sample 1
Sample 3
Sample 4
Sample 5
Sample 6
Sample 7
Avg 311 g/m^2, C = 69%
S1
AVG
S10
S9
S8
S7S6
S5
S4
S3S2
177
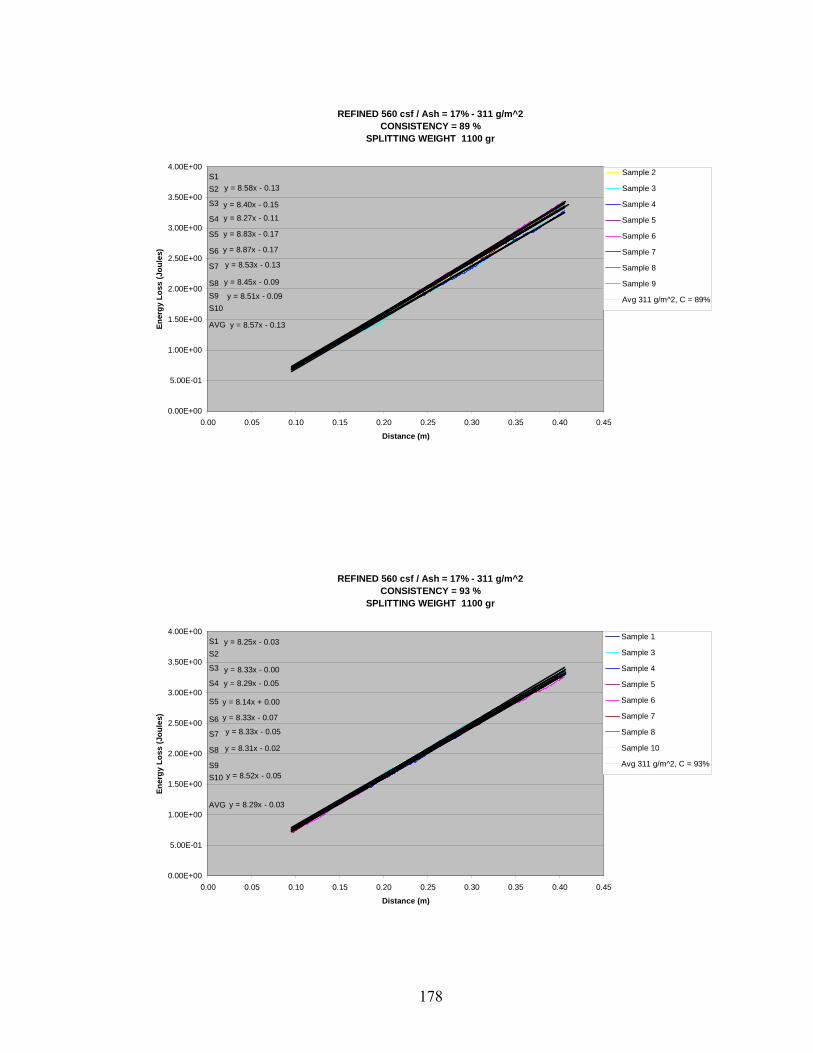
REFINED 560 csf / Ash = 17% - 311 g/m^2CONSISTENCY = 89 %
SPLITTING WEIGHT 1100 gr
y = 8.58x - 0.13
y = 8.40x - 0.15
y = 8.27x - 0.11
y = 8.83x - 0.17
y = 8.87x - 0.17
y = 8.53x - 0.13
y = 8.45x - 0.09
y = 8.51x - 0.09
y = 8.57x - 0.13
0.00E+00
5.00E-01
1.00E+00
1.50E+00
2.00E+00
2.50E+00
3.00E+00
3.50E+00
4.00E+00
0.00 0.05 0.10 0.15 0.20 0.25 0.30 0.35 0.40 0.45
Distance (m)
Ener
gy L
oss
(Jou
les)
Sample 2
Sample 3
Sample 4
Sample 5
Sample 6
Sample 7
Sample 8
Sample 9
Avg 311 g/m^2, C = 89%
S1
AVG
S10S9S8
S7
S6
S5
S4
S3
S2
REFINED 560 csf / Ash = 17% - 311 g/m^2CONSISTENCY = 93 %
SPLITTING WEIGHT 1100 gr
y = 8.25x - 0.03
y = 8.33x - 0.00
y = 8.29x - 0.05
y = 8.14x + 0.00
y = 8.33x - 0.07
y = 8.33x - 0.05
y = 8.31x - 0.02
y = 8.52x - 0.05
y = 8.29x - 0.03
0.00E+00
5.00E-01
1.00E+00
1.50E+00
2.00E+00
2.50E+00
3.00E+00
3.50E+00
4.00E+00
0.00 0.05 0.10 0.15 0.20 0.25 0.30 0.35 0.40 0.45
Distance (m)
Ener
gy L
oss
(Jou
les)
Sample 1
Sample 3
Sample 4
Sample 5
Sample 6
Sample 7
Sample 8
Sample 10
Avg 311 g/m^2, C = 93%
S1
AVG
S10S9
S8
S7
S6
S5
S4
S3
S2
178
Case 3: Refining 560 C.S.F.; ASH 17% (Normal Clay), No Starch; Basis Weight 400 g/m²
179
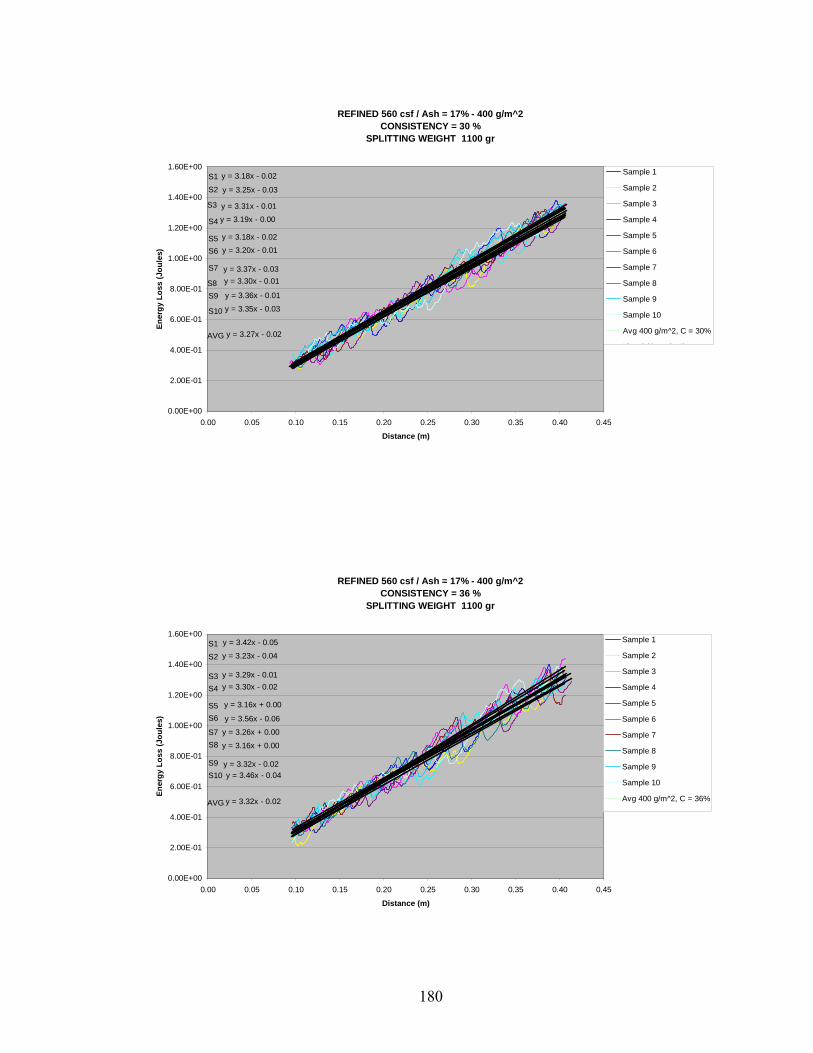
REFINED 560 csf / Ash = 17% - 400 g/m^2CONSISTENCY = 30 %
SPLITTING WEIGHT 1100 gr
y = 3.18x - 0.02
y = 3.25x - 0.03
y = 3.19x - 0.00
y = 3.31x - 0.01
y = 3.18x - 0.02
y = 3.20x - 0.01
y = 3.37x - 0.03y = 3.30x - 0.01
y = 3.36x - 0.01
y = 3.35x - 0.03
y = 3.27x - 0.02
0.00E+00
2.00E-01
4.00E-01
6.00E-01
8.00E-01
1.00E+00
1.20E+00
1.40E+00
1.60E+00
0.00 0.05 0.10 0.15 0.20 0.25 0.30 0.35 0.40 0.45
Distance (m)
Ener
gy L
oss
(Jou
les)
Sample 1
Sample 2
Sample 3
Sample 4
Sample 5
Sample 6
Sample 7
Sample 8
Sample 9
Sample 10
Avg 400 g/m^2, C = 30%
Li l (S l 1)
S1
AVG
S10
S9S8
S7
S6S5
S4
S3
S2
REFINED 560 csf / Ash = 17% - 400 g/m^2CONSISTENCY = 36 %
SPLITTING WEIGHT 1100 gr
y = 3.42x - 0.05
y = 3.23x - 0.04
y = 3.30x - 0.02y = 3.29x - 0.01
y = 3.16x + 0.00
y = 3.56x - 0.06
y = 3.26x + 0.00
y = 3.16x + 0.00
y = 3.32x - 0.02y = 3.46x - 0.04
y = 3.32x - 0.02
0.00E+00
2.00E-01
4.00E-01
6.00E-01
8.00E-01
1.00E+00
1.20E+00
1.40E+00
1.60E+00
0.00 0.05 0.10 0.15 0.20 0.25 0.30 0.35 0.40 0.45
Distance (m)
Ener
gy L
oss
(Jou
les)
Sample 1
Sample 2
Sample 3
Sample 4
Sample 5
Sample 6
Sample 7
Sample 8
Sample 9
Sample 10
Avg 400 g/m^2, C = 36%
Li l (S l 1)
S1
AVG
S10S9
S8S7
S6S5
S4S3
S2
180
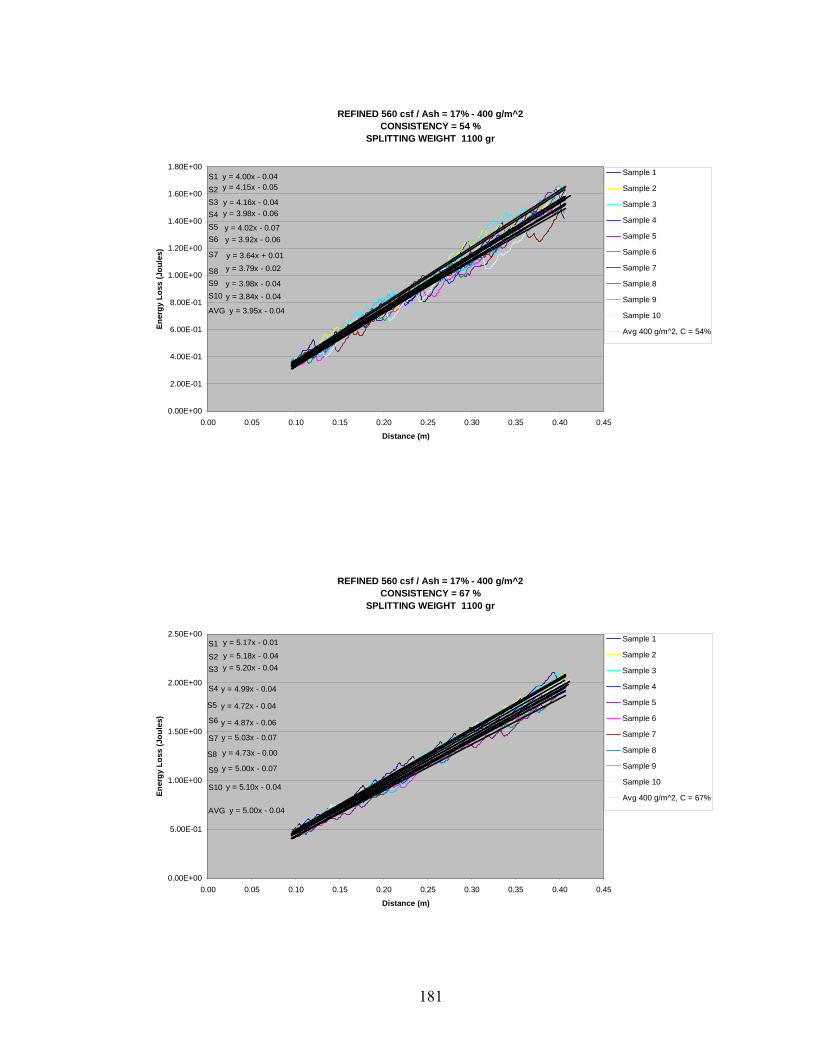
REFINED 560 csf / Ash = 17% - 400 g/m^2CONSISTENCY = 54 %
SPLITTING WEIGHT 1100 gr
y = 4.00x - 0.04y = 4.15x - 0.05
y = 4.16x - 0.04y = 3.98x - 0.06
y = 4.02x - 0.07y = 3.92x - 0.06
y = 3.64x + 0.01y = 3.79x - 0.02
y = 3.98x - 0.04y = 3.84x - 0.04
y = 3.95x - 0.04
0.00E+00
2.00E-01
4.00E-01
6.00E-01
8.00E-01
1.00E+00
1.20E+00
1.40E+00
1.60E+00
1.80E+00
0.00 0.05 0.10 0.15 0.20 0.25 0.30 0.35 0.40 0.45
Distance (m)
Ener
gy L
oss
(Jou
les)
Sample 1
Sample 2
Sample 3
Sample 4
Sample 5
Sample 6
Sample 7
Sample 8
Sample 9
Sample 10
Avg 400 g/m^2, C = 54%
S1
AVG
S10S9S8
S7
S6S5S4S3S2
REFINED 560 csf / Ash = 17% - 400 g/m^2CONSISTENCY = 67 %
SPLITTING WEIGHT 1100 gr
y = 5.17x - 0.01
y = 5.18x - 0.04y = 5.20x - 0.04
y = 4.99x - 0.04
y = 4.72x - 0.04
y = 4.87x - 0.06
y = 5.03x - 0.07
y = 4.73x - 0.00
y = 5.00x - 0.07
y = 5.10x - 0.04
y = 5.00x - 0.04
0.00E+00
5.00E-01
1.00E+00
1.50E+00
2.00E+00
2.50E+00
0.00 0.05 0.10 0.15 0.20 0.25 0.30 0.35 0.40 0.45
Distance (m)
Ener
gy L
oss
(Jou
les)
Sample 1
Sample 2
Sample 3
Sample 4
Sample 5
Sample 6
Sample 7
Sample 8
Sample 9
Sample 10
Avg 400 g/m^2, C = 67%
S1
AVG
S10
S9
S8
S7
S6
S5
S4
S3S2
181
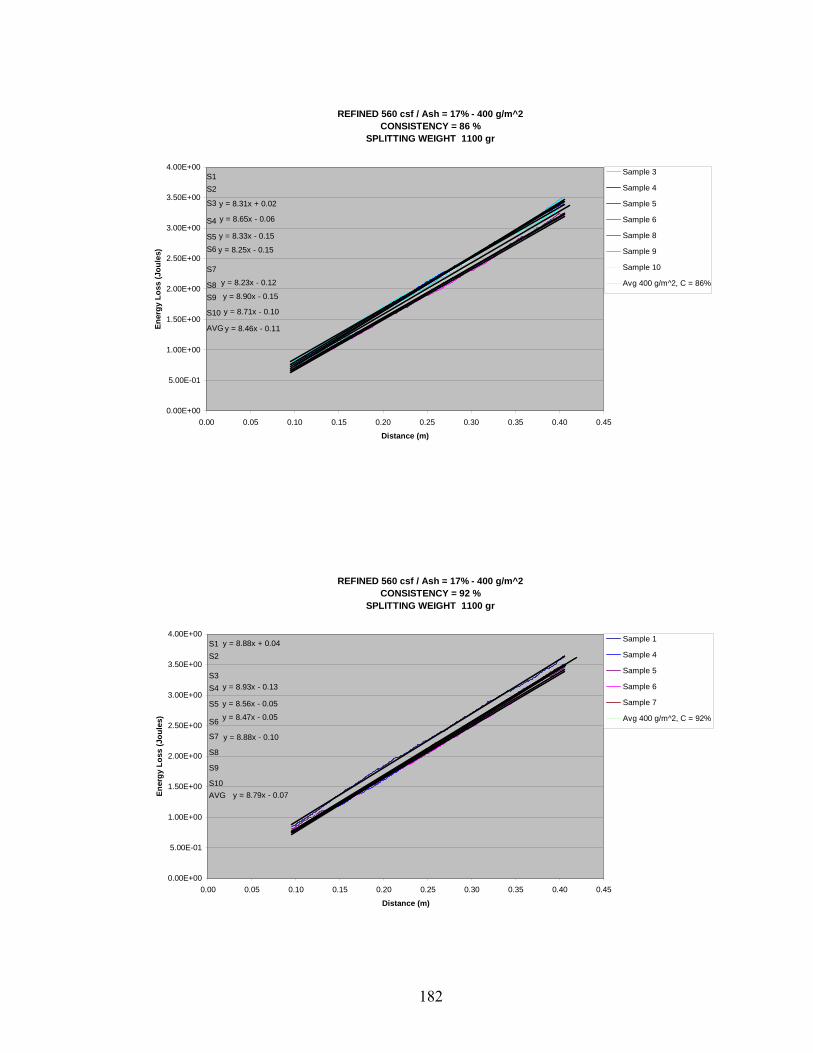
REFINED 560 csf / Ash = 17% - 400 g/m^2CONSISTENCY = 86 %
SPLITTING WEIGHT 1100 gr
y = 8.31x + 0.02
y = 8.65x - 0.06
y = 8.33x - 0.15
y = 8.25x - 0.15
y = 8.23x - 0.12
y = 8.90x - 0.15
y = 8.71x - 0.10
y = 8.46x - 0.11
0.00E+00
5.00E-01
1.00E+00
1.50E+00
2.00E+00
2.50E+00
3.00E+00
3.50E+00
4.00E+00
0.00 0.05 0.10 0.15 0.20 0.25 0.30 0.35 0.40 0.45
Distance (m)
Ener
gy L
oss
(Jou
les)
Sample 3
Sample 4
Sample 5
Sample 6
Sample 8
Sample 9
Sample 10
Avg 400 g/m^2, C = 86%
S1
AVG
S10
S9S8
S7
S6S5
S4
S3
S2
REFINED 560 csf / Ash = 17% - 400 g/m^2CONSISTENCY = 92 %
SPLITTING WEIGHT 1100 gr
y = 8.88x + 0.04
y = 8.93x - 0.13
y = 8.56x - 0.05
y = 8.47x - 0.05
y = 8.88x - 0.10
y = 8.79x - 0.07
0.00E+00
5.00E-01
1.00E+00
1.50E+00
2.00E+00
2.50E+00
3.00E+00
3.50E+00
4.00E+00
0.00 0.05 0.10 0.15 0.20 0.25 0.30 0.35 0.40 0.45
Distance (m)
Ener
gy L
oss
(Jou
les)
Sample 1
Sample 4
Sample 5
Sample 6
Sample 7
Avg 400 g/m^2, C = 92%
S1
AVGS10
S9
S8
S7
S6
S5
S4S3
S2
182
APPENDIX A.2: SPLITTING ENERGY VS PAPER SOLIDS – CASES 1 TO 3
183
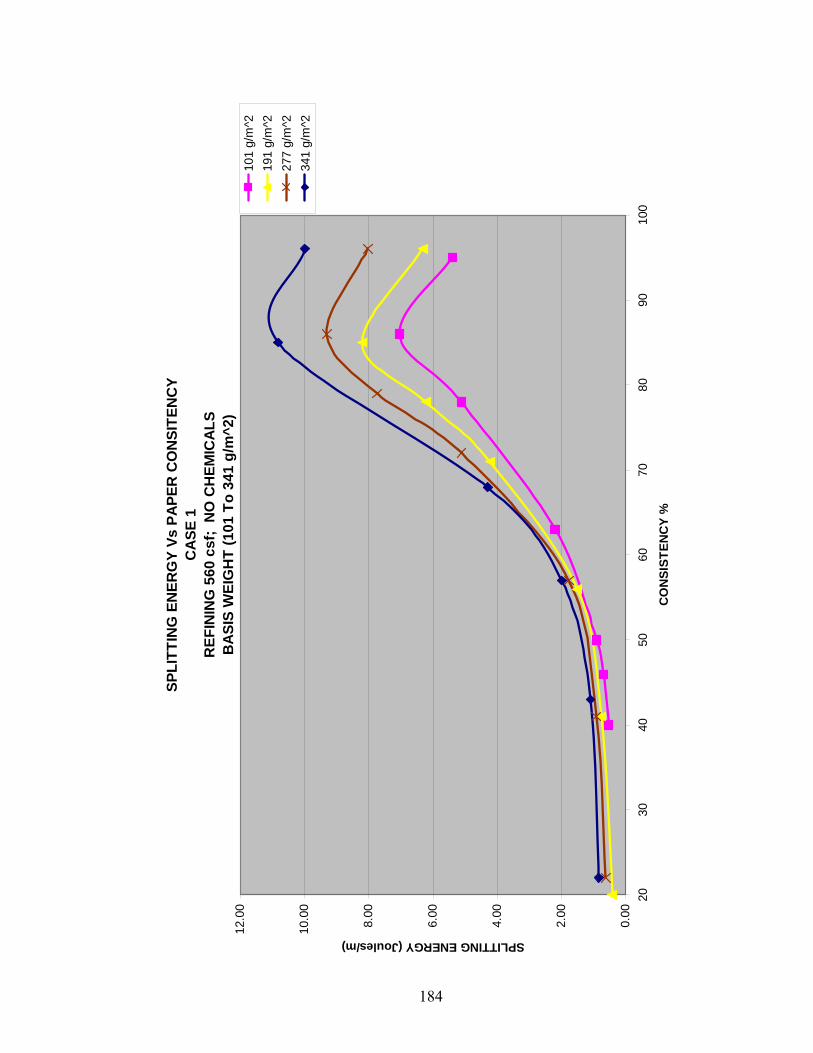
184
SPLI
TTIN
G E
NER
GY
Vs P
APE
R C
ON
SITE
NC
YC
ASE
1R
EFIN
ING
560
csf
; N
O C
HEM
ICA
LSB
ASI
S W
EIG
HT
(101
To
341
g/m
^2)
0.00
2.00
4.00
6.00
8.00
10.0
0
12.0
0
2030
4050
6070
8090
100
CO
NSI
STEN
CY
%
SPLITTING ENERGY (Joules/m)
101
g/m
^219
1 g/
m^2
277
g/m
^234
1 g/
m^2
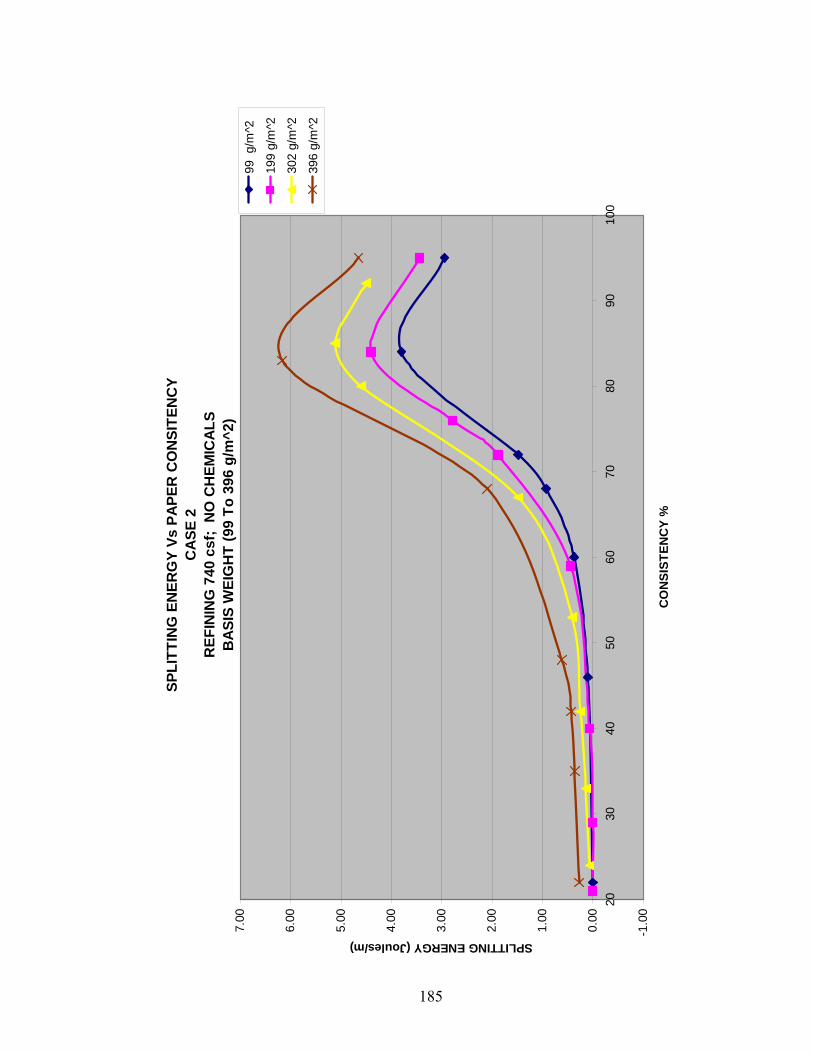
185
SPLI
TTIN
G E
NER
GY
Vs P
APE
R C
ON
SITE
NC
YC
ASE
2R
EFIN
ING
740
csf
; N
O C
HEM
ICA
LSB
ASI
S W
EIG
HT
(99
To 3
96 g
/m^2
)
-1.0
0
0.00
1.00
2.00
3.00
4.00
5.00
6.00
7.00
2030
4050
6070
8090
100
CO
NSI
STEN
CY
%
SPLITTING ENERGY (Joules/m)
99 g
/m^2
199
g/m
^2
302
g/m
^2
396
g/m
^2
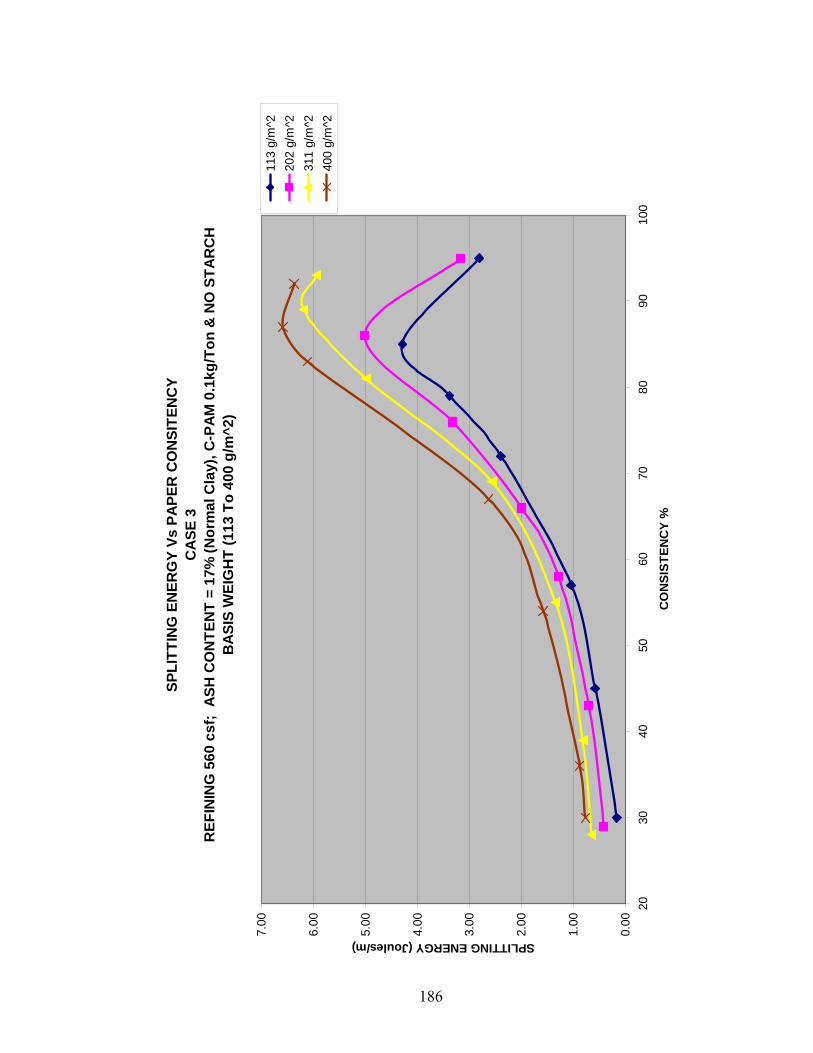
186
SPLI
TTIN
G E
NER
GY
Vs P
APE
R C
ON
SITE
NC
YC
ASE
3R
EFIN
ING
560
csf
; A
SH C
ON
TEN
T =
17%
(Nor
mal
Cla
y), C
-PA
M 0
.1kg
/Ton
& N
O S
TAR
CH
BA
SIS
WEI
GH
T (1
13 T
o 40
0 g/
m^2
)
0.00
1.00
2.00
3.00
4.00
5.00
6.00
7.00
2030
4050
6070
8090
100
CO
NSI
STEN
CY
%
SPLITTING ENERGY (Joules/m)
113
g/m
^220
2 g/
m^2
311
g/m
^240
0 g/
m^2
APPENDIX A.3: COHESIVE ENERGY DETERMINATION AT DIFFERENT SOLIDS – CASES 1 TO 3
187
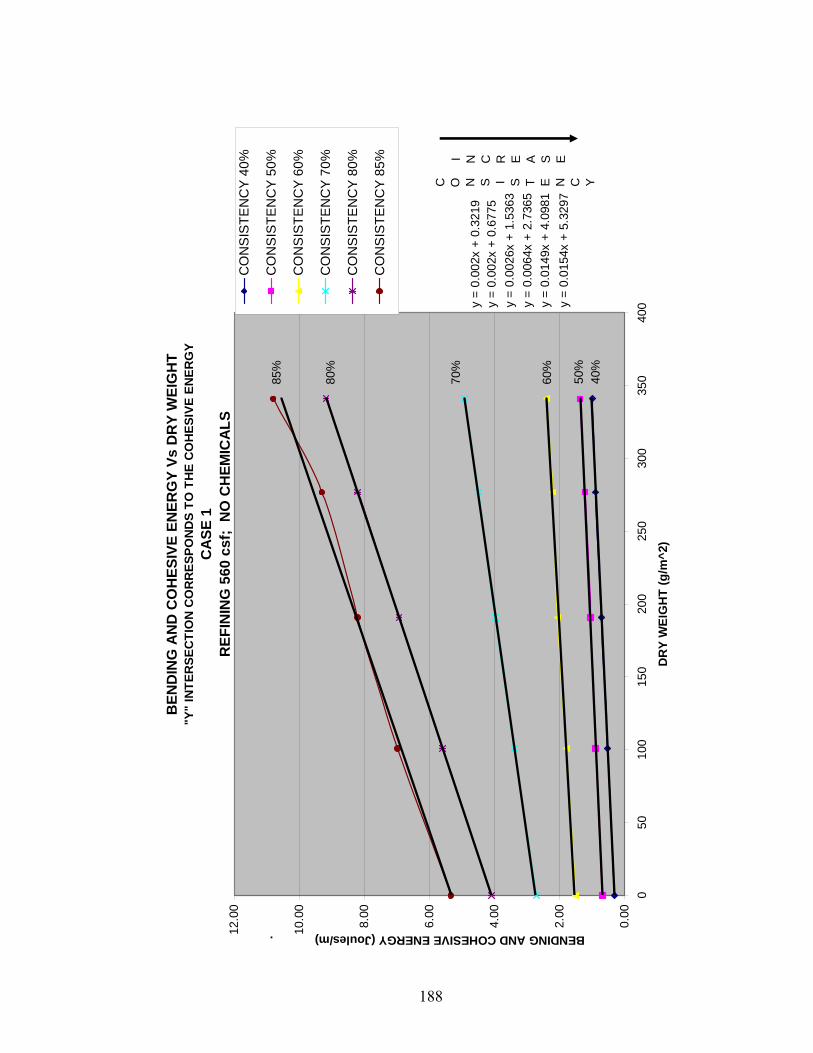
188
BEN
DIN
G A
ND
CO
HES
IVE
ENER
GY
Vs D
RY
WEI
GH
T"Y
" IN
TER
SEC
TIO
N C
OR
RES
PON
DS
TO T
HE
CO
HES
IVE
ENER
GY
CA
SE 1
REF
ININ
G 5
60 c
sf;
NO
CH
EMIC
ALS
y =
0.01
49x
+ 4.
0981
y =
0.00
64x
+ 2.
7365
y =
0.00
26x
+ 1.
5363
y =
0.00
2x +
0.6
775
y =
0.00
2x +
0.3
219
y =
0.01
54x
+ 5.
3297
0.00
2.00
4.00
6.00
8.00
10.0
0
12.0
0
050
100
150
200
250
300
350
400
DR
Y W
EIG
HT
(g/m
^2)
BENDING AND COHESIVE ENERGY (Joules/m) .
CO
NS
ISTE
NC
Y 40
%
CO
NS
ISTE
NC
Y 50
%
CO
NS
ISTE
NC
Y 60
%
CO
NS
ISTE
NC
Y 70
%
CO
NS
ISTE
NC
Y 80
%
CO
NS
ISTE
NC
Y 85
%
C O N S I S T E N C Y
I N C R E A S E50
%
85%
80%
70%
60%
40%
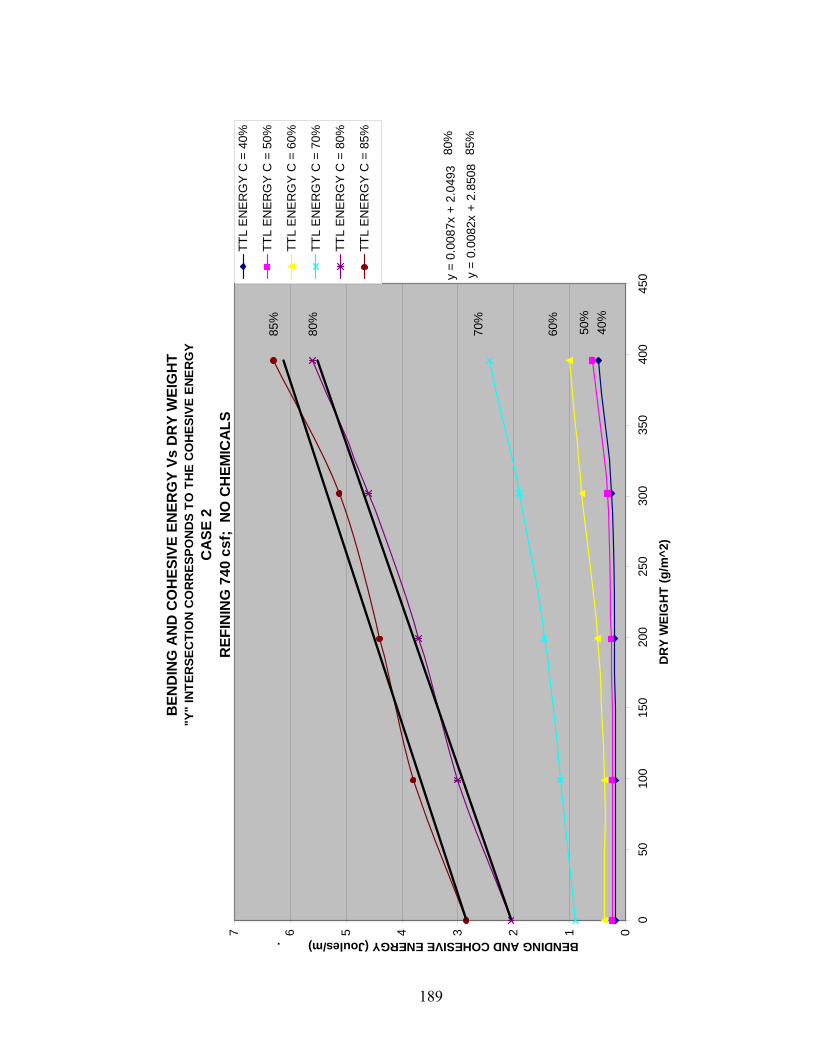
189
BEN
DIN
G A
ND
CO
HES
IVE
ENER
GY
Vs D
RY
WEI
GH
T"Y
" IN
TER
SEC
TIO
N C
OR
RES
PON
DS
TO T
HE
CO
HES
IVE
ENER
GY
CA
SE 2
REF
ININ
G 7
40 c
sf;
NO
CH
EMIC
ALS
y =
0.00
87x
+ 2.
0493
y =
0.00
82x
+ 2.
8508
01234567
050
100
150
200
250
300
350
400
450
DR
Y W
EIG
HT
(g/m
^2)
BENDING AND COHESIVE ENERGY (Joules/m) . �
TTL
EN
ER
GY
C =
40%
TTL
EN
ER
GY
C =
50%
TTL
EN
ER
GY
C =
60%
TTL
EN
ER
GY
C =
70%
TTL
EN
ER
GY
C =
80%
TTL
EN
ER
GY
C =
85%
50%
85%
80%
70%
60%
40%
85%
80%
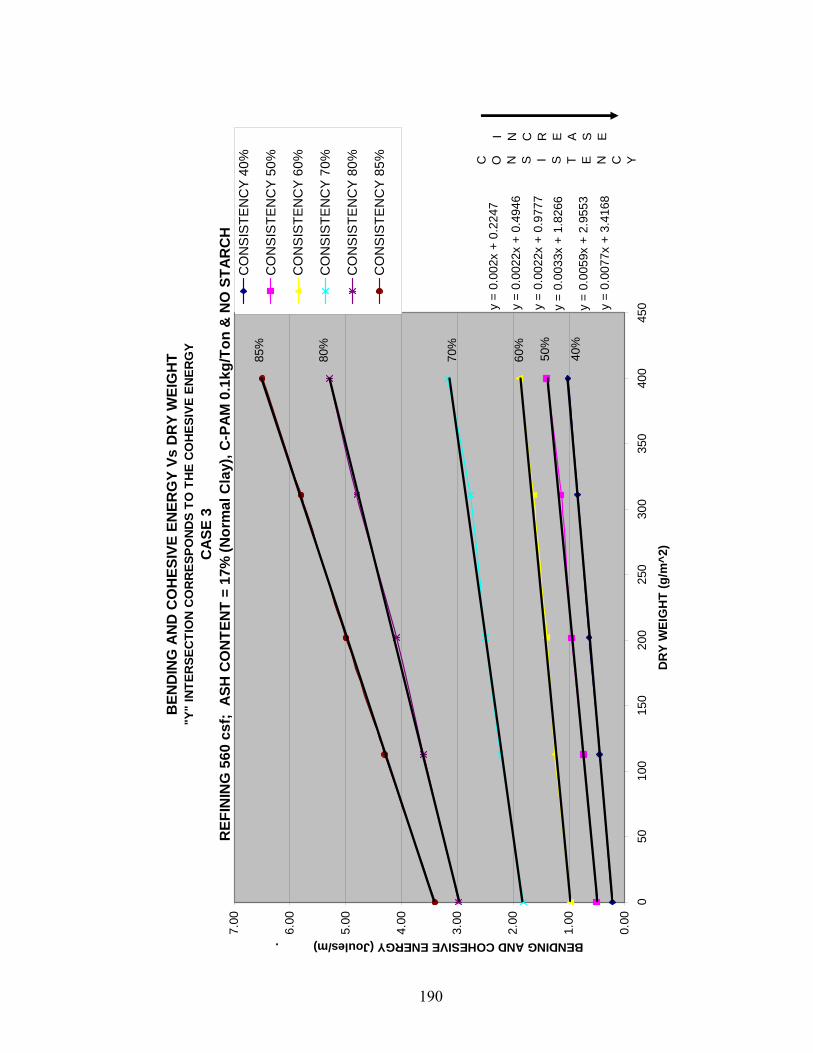
190
BEN
DIN
G A
ND
CO
HES
IVE
ENER
GY
Vs D
RY
WEI
GH
T"Y
" IN
TER
SEC
TIO
N C
OR
RES
PON
DS
TO T
HE
CO
HES
IVE
ENER
GY
CA
SE 3
REF
ININ
G 5
60 c
sf;
ASH
CO
NTE
NT
= 17
% (N
orm
al C
lay)
, C-P
AM
0.1
kg/T
on &
NO
STA
RC
H
y =
0.00
59x
+ 2.
9553
y =
0.00
33x
+ 1.
8266
y =
0.00
22x
+ 0.
9777
y =
0.00
22x
+ 0.
4946
y =
0.00
2x +
0.2
247
y =
0.00
77x
+ 3.
4168
0.00
1.00
2.00
3.00
4.00
5.00
6.00
7.00
050
100
150
200
250
300
350
400
450
DR
Y W
EIG
HT
(g/m
^2)
BENDING AND COHESIVE ENERGY (Joules/m) .
Lil(
CO
NS
ISTE
NC
Y
CO
NS
ISTE
NC
Y 40
%
CO
NS
ISTE
NC
Y 50
%
CO
NS
ISTE
NC
Y 60
%
CO
NS
ISTE
NC
Y 70
%
CO
NS
ISTE
NC
Y 80
%
CO
NS
ISTE
NC
Y 85
% C O N S I S T E N C Y
I N C R E A S E
50%
85%
80%
70%
60%
40%
APPENDIX A.4: BENDING ENERGY VS BASIS WEIGHT AT DIFFERENT SOLIDS – CASES 1 TO 3
191
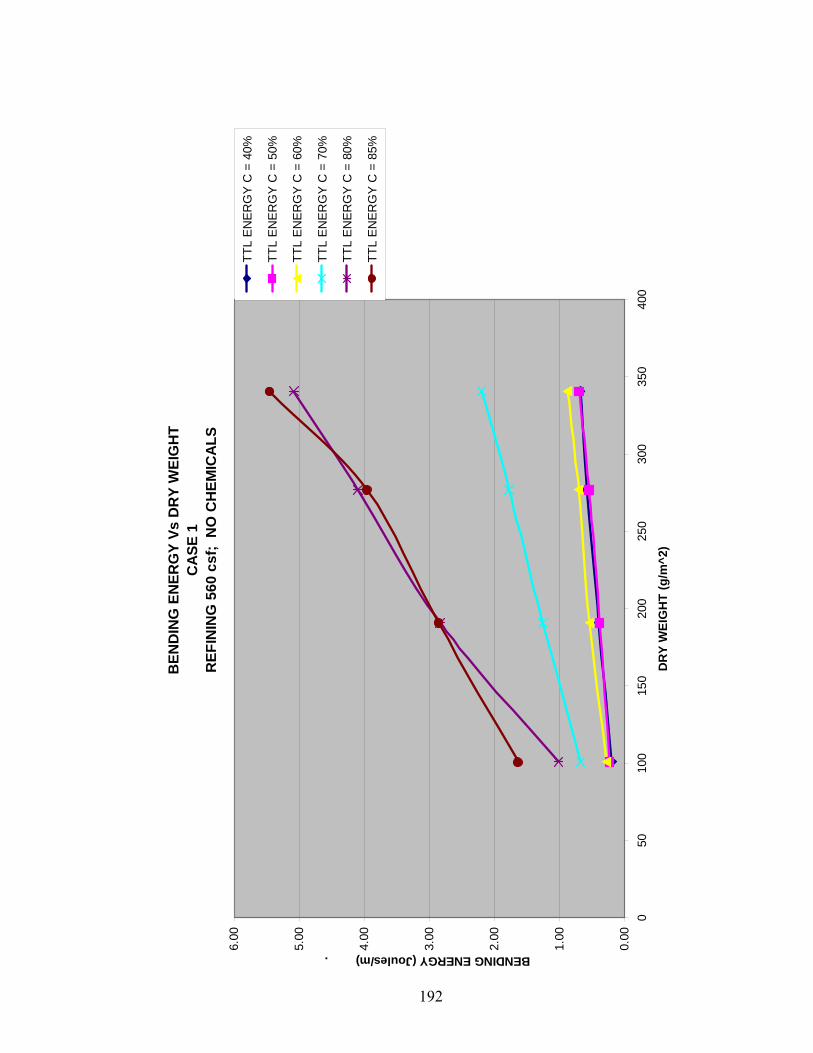
192
BEN
DIN
G E
NER
GY
Vs D
RY
WEI
GH
TC
ASE
1R
EFIN
ING
560
csf
; N
O C
HEM
ICA
LS
0.00
1.00
2.00
3.00
4.00
5.00
6.00
050
100
150
200
250
300
350
400
DR
Y W
EIG
HT
(g/m
^2)
BENDING ENERGY (Joules/m) . �
TTL
ENER
GY
C =
40%
TTL
ENER
GY
C =
50%
TTL
ENER
GY
C =
60%
TTL
ENER
GY
C =
70%
TTL
ENER
GY
C =
80%
TTL
ENER
GY
C =
85%
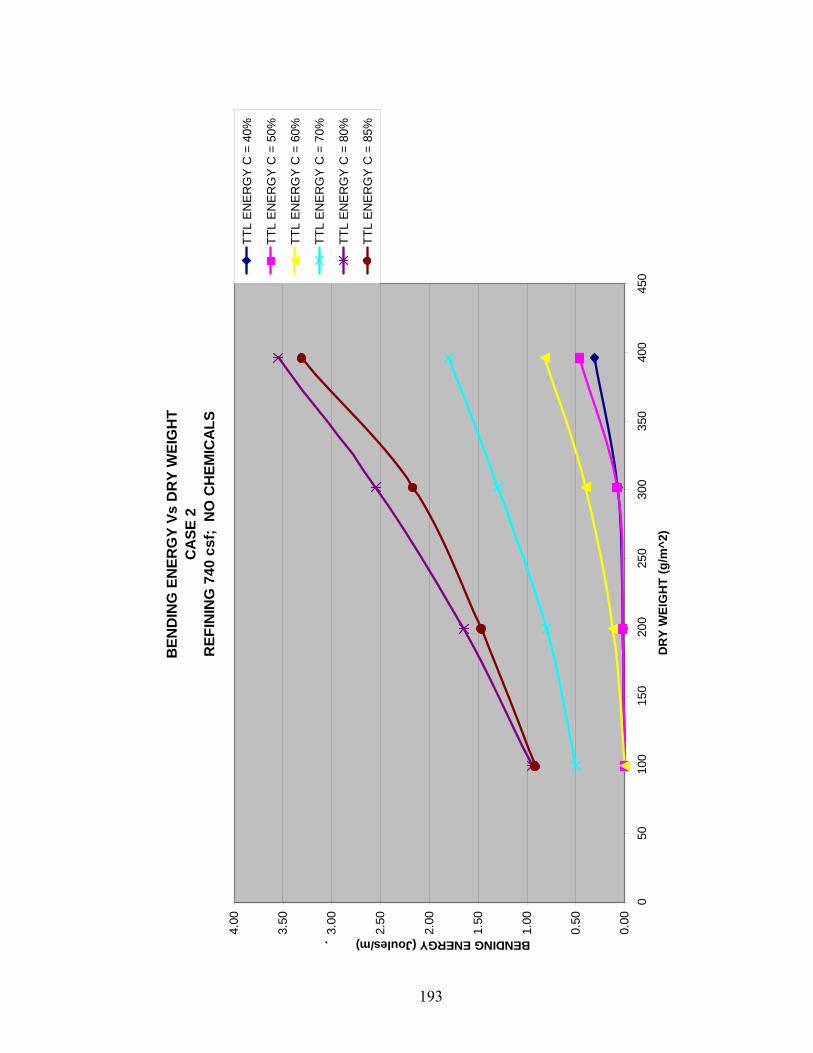
193
BEN
DIN
G E
NER
GY
Vs D
RY
WEI
GH
TC
ASE
2R
EFIN
ING
740
csf
; N
O C
HEM
ICA
LS
0.00
0.50
1.00
1.50
2.00
2.50
3.00
3.50
4.00
050
100
150
200
250
300
350
400
450
DR
Y W
EIG
HT
(g/m
^2)
BENDING ENERGY (Joules/m) . �
TTL
ENER
GY
C =
40%
TTL
ENER
GY
C =
50%
TTL
ENER
GY
C =
60%
TTL
ENER
GY
C =
70%
TTL
ENER
GY
C =
80%
TTL
ENER
GY
C =
85%
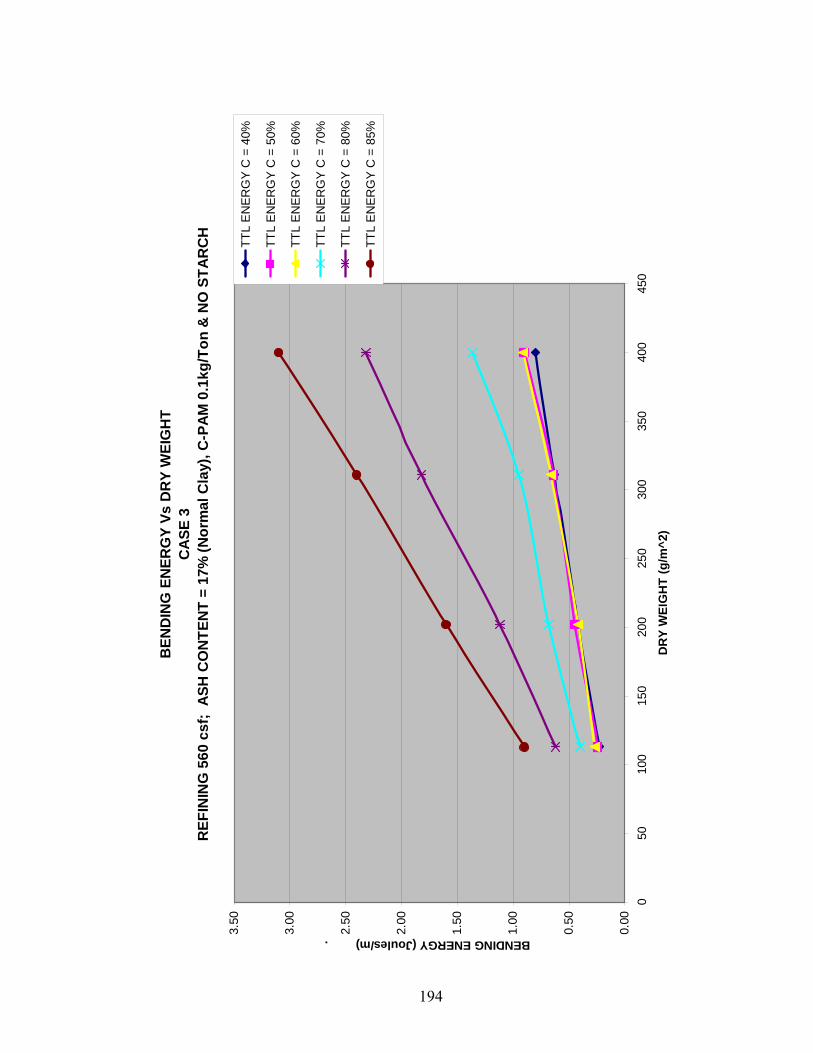
194
BEN
DIN
G E
NER
GY
Vs D
RY
WEI
GH
TC
ASE
3R
EFIN
ING
560
csf
; A
SH C
ON
TEN
T =
17%
(Nor
mal
Cla
y), C
-PA
M 0
.1kg
/Ton
& N
O S
TAR
CH
0.00
0.50
1.00
1.50
2.00
2.50
3.00
3.50
050
100
150
200
250
300
350
400
450
DR
Y W
EIG
HT
(g/m
^2)
BENDING ENERGY (Joules/m) . �
TTL
EN
ERG
Y C
= 4
0%
TTL
EN
ERG
Y C
= 5
0%
TTL
EN
ERG
Y C
= 6
0%
TTL
EN
ERG
Y C
= 7
0%
TTL
EN
ERG
Y C
= 8
0%
TTL
EN
ERG
Y C
= 8
5%
APPENDIX B.1: APPARATUS ENERGY LOSS VS DISTANCE – CASES 4 TO 12
Case 4: Refining 440 C.S.F.; No Chemicals; Basis Weight 300 g/m²
195
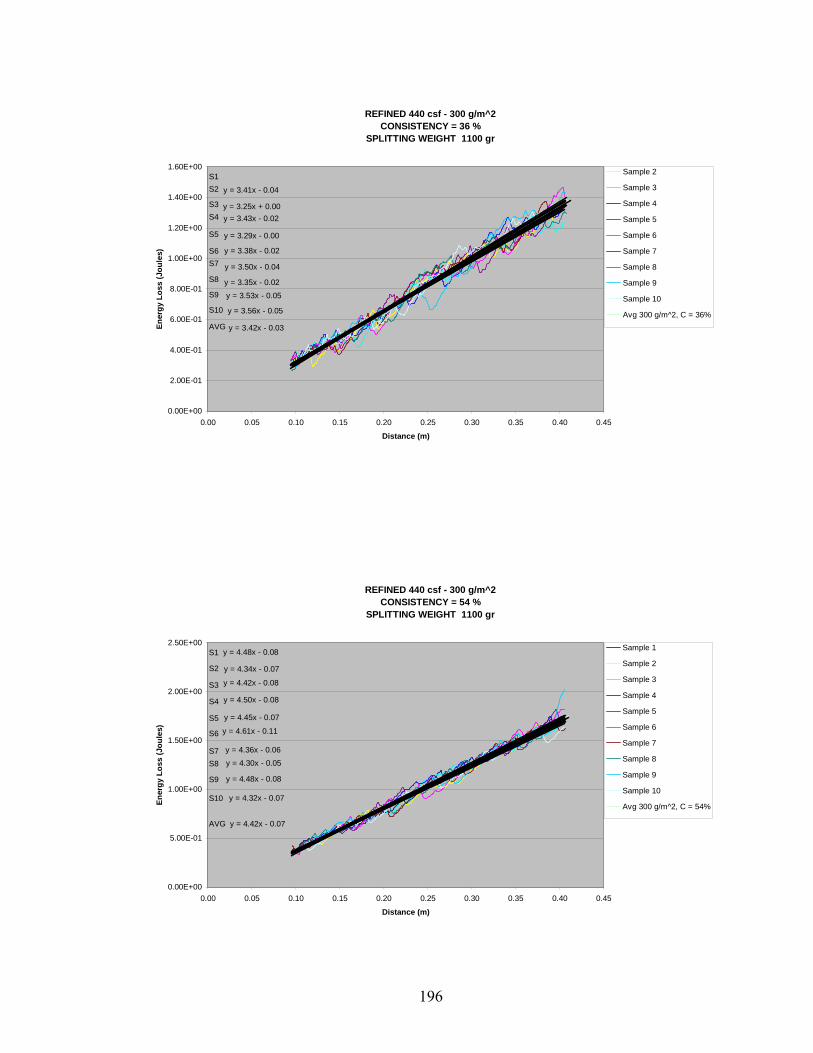
REFINED 440 csf - 300 g/m^2CONSISTENCY = 36 %
SPLITTING WEIGHT 1100 gr
y = 3.41x - 0.04
y = 3.25x + 0.00y = 3.43x - 0.02
y = 3.29x - 0.00
y = 3.38x - 0.02
y = 3.50x - 0.04
y = 3.35x - 0.02
y = 3.53x - 0.05
y = 3.56x - 0.05
y = 3.42x - 0.03
0.00E+00
2.00E-01
4.00E-01
6.00E-01
8.00E-01
1.00E+00
1.20E+00
1.40E+00
1.60E+00
0.00 0.05 0.10 0.15 0.20 0.25 0.30 0.35 0.40 0.45
Distance (m)
Ener
gy L
oss
(Jou
les)
Sample 2
Sample 3
Sample 4
Sample 5
Sample 6
Sample 7
Sample 8
Sample 9
Sample 10
Avg 300 g/m^2, C = 36%
S1
AVG
S10
S9
S8
S7S6
S5
S4S3
S2
REFINED 440 csf - 300 g/m^2CONSISTENCY = 54 %
SPLITTING WEIGHT 1100 gr
y = 4.48x - 0.08
y = 4.34x - 0.07
y = 4.42x - 0.08
y = 4.50x - 0.08
y = 4.45x - 0.07
y = 4.61x - 0.11
y = 4.36x - 0.06
y = 4.30x - 0.05
y = 4.48x - 0.08
y = 4.32x - 0.07
y = 4.42x - 0.07
0.00E+00
5.00E-01
1.00E+00
1.50E+00
2.00E+00
2.50E+00
0.00 0.05 0.10 0.15 0.20 0.25 0.30 0.35 0.40 0.45
Distance (m)
Ener
gy L
oss
(Jou
les)
Sample 1
Sample 2
Sample 3
Sample 4
Sample 5
Sample 6
Sample 7
Sample 8
Sample 9
Sample 10
Avg 300 g/m^2, C = 54%
S1
AVG
S10
S9
S8S7
S6
S5
S4
S3
S2
196
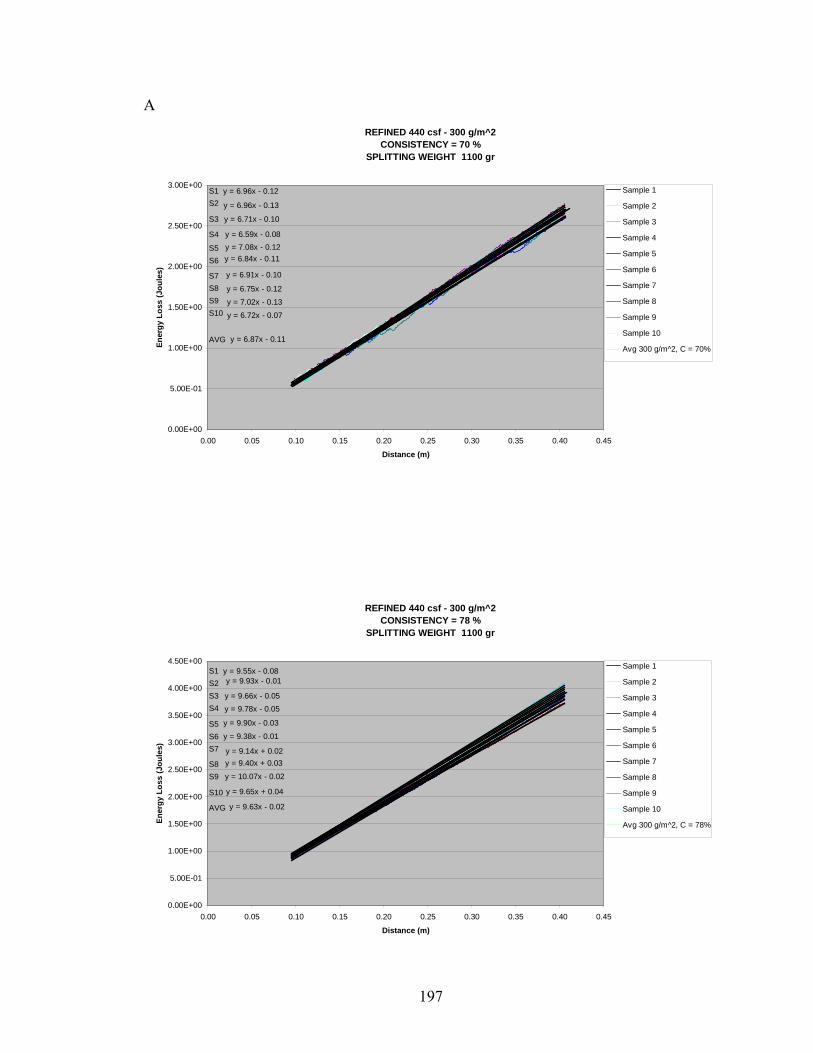
AREFINED 440 csf - 300 g/m^2
CONSISTENCY = 70 %SPLITTING WEIGHT 1100 gr
y = 6.96x - 0.12
y = 6.96x - 0.13
y = 6.71x - 0.10
y = 6.59x - 0.08y = 7.08x - 0.12y = 6.84x - 0.11
y = 6.91x - 0.10
y = 6.75x - 0.12
y = 7.02x - 0.13
y = 6.72x - 0.07
y = 6.87x - 0.11
0.00E+00
5.00E-01
1.00E+00
1.50E+00
2.00E+00
2.50E+00
3.00E+00
0.00 0.05 0.10 0.15 0.20 0.25 0.30 0.35 0.40 0.45
Distance (m)
Ener
gy L
oss
(Jou
les)
Sample 1
Sample 2
Sample 3
Sample 4
Sample 5
Sample 6
Sample 7
Sample 8
Sample 9
Sample 10
Avg 300 g/m^2, C = 70%
S1
AVG
S10S9S8S7
S6S5
S4
S3
S2
REFINED 440 csf - 300 g/m^2CONSISTENCY = 78 %
SPLITTING WEIGHT 1100 gr
y = 9.55x - 0.08y = 9.93x - 0.01
y = 9.66x - 0.05y = 9.78x - 0.05
y = 9.90x - 0.03
y = 9.38x - 0.01
y = 9.14x + 0.02y = 9.40x + 0.03
y = 10.07x - 0.02
y = 9.65x + 0.04
y = 9.63x - 0.02
0.00E+00
5.00E-01
1.00E+00
1.50E+00
2.00E+00
2.50E+00
3.00E+00
3.50E+00
4.00E+00
4.50E+00
0.00 0.05 0.10 0.15 0.20 0.25 0.30 0.35 0.40 0.45
Distance (m)
Ener
gy L
oss
(Jou
les)
Sample 1
Sample 2
Sample 3
Sample 4
Sample 5
Sample 6
Sample 7
Sample 8
Sample 9
Sample 10
Avg 300 g/m^2, C = 78%
S1
AVG
S10
S9S8
S7S6S5
S4S3S2
197
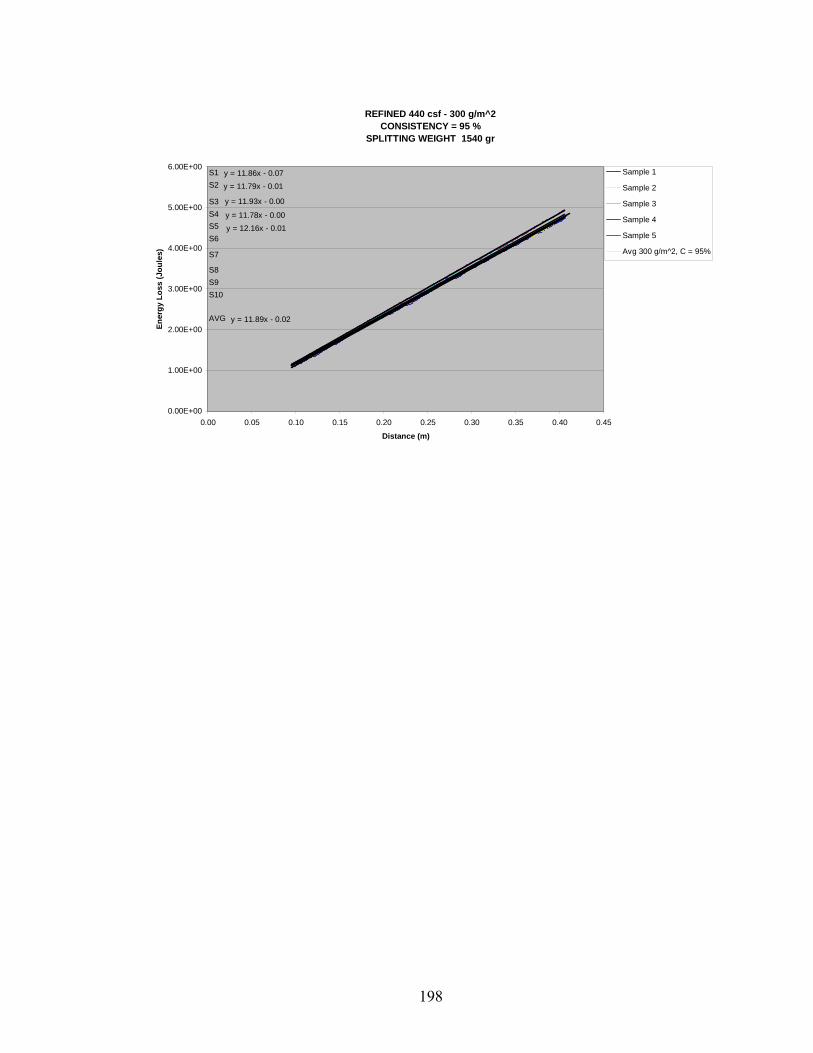
REFINED 440 csf - 300 g/m^2CONSISTENCY = 95 %
SPLITTING WEIGHT 1540 gr
y = 11.86x - 0.07y = 11.79x - 0.01
y = 11.93x - 0.00
y = 11.78x - 0.00y = 12.16x - 0.01
y = 11.89x - 0.02
0.00E+00
1.00E+00
2.00E+00
3.00E+00
4.00E+00
5.00E+00
6.00E+00
0.00 0.05 0.10 0.15 0.20 0.25 0.30 0.35 0.40 0.45
Distance (m)
Ener
gy L
oss
(Jou
les)
Sample 1
Sample 2
Sample 3
Sample 4
Sample 5
Avg 300 g/m^2, C = 95%
S1
AVG
S10S9S8
S7
S6S5S4S3
S2
198
Case 5: Refining 560 C.S.F.; ASH 13% (Normal Clay), No Starch; Basis Weight 314g/m²
199
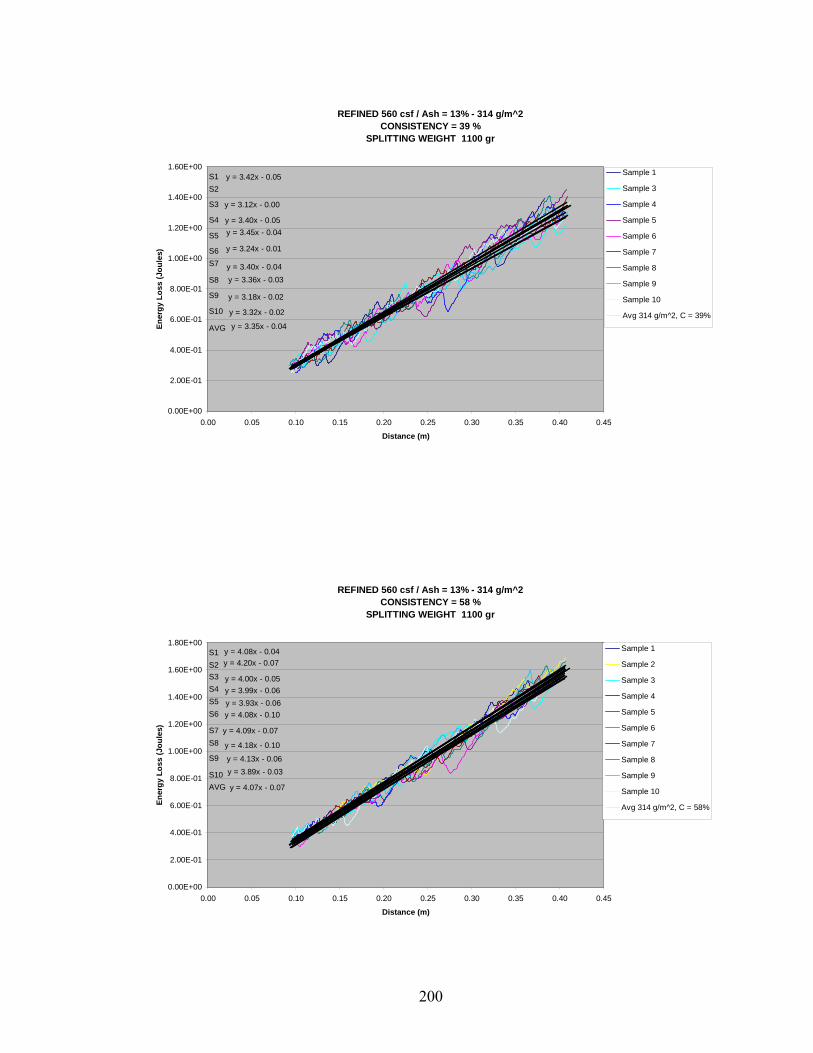
REFINED 560 csf / Ash = 13% - 314 g/m^2CONSISTENCY = 39 %
SPLITTING WEIGHT 1100 gr
y = 3.42x - 0.05
y = 3.12x - 0.00
y = 3.40x - 0.05y = 3.45x - 0.04
y = 3.24x - 0.01
y = 3.40x - 0.04y = 3.36x - 0.03
y = 3.18x - 0.02
y = 3.32x - 0.02
y = 3.35x - 0.04
0.00E+00
2.00E-01
4.00E-01
6.00E-01
8.00E-01
1.00E+00
1.20E+00
1.40E+00
1.60E+00
0.00 0.05 0.10 0.15 0.20 0.25 0.30 0.35 0.40 0.45
Distance (m)
Ener
gy L
oss
(Jou
les)
Sample 1
Sample 3
Sample 4
Sample 5
Sample 6
Sample 7
Sample 8
Sample 9
Sample 10
Avg 314 g/m^2, C = 39%
S1
AVG
S10
S9
S8
S7S6
S5
S4
S3
S2
REFINED 560 csf / Ash = 13% - 314 g/m^2CONSISTENCY = 58 %
SPLITTING WEIGHT 1100 gr
y = 4.08x - 0.04y = 4.20x - 0.07
y = 4.00x - 0.05y = 3.99x - 0.06y = 3.93x - 0.06y = 4.08x - 0.10
y = 4.09x - 0.07
y = 4.18x - 0.10
y = 4.13x - 0.06y = 3.89x - 0.03
y = 4.07x - 0.07
0.00E+00
2.00E-01
4.00E-01
6.00E-01
8.00E-01
1.00E+00
1.20E+00
1.40E+00
1.60E+00
1.80E+00
0.00 0.05 0.10 0.15 0.20 0.25 0.30 0.35 0.40 0.45
Distance (m)
Ener
gy L
oss
(Jou
les)
Sample 1
Sample 2
Sample 3
Sample 4
Sample 5
Sample 6
Sample 7
Sample 8
Sample 9
Sample 10
Avg 314 g/m^2, C = 58%
S1
AVGS10
S9
S8S7
S6S5S4S3S2
200
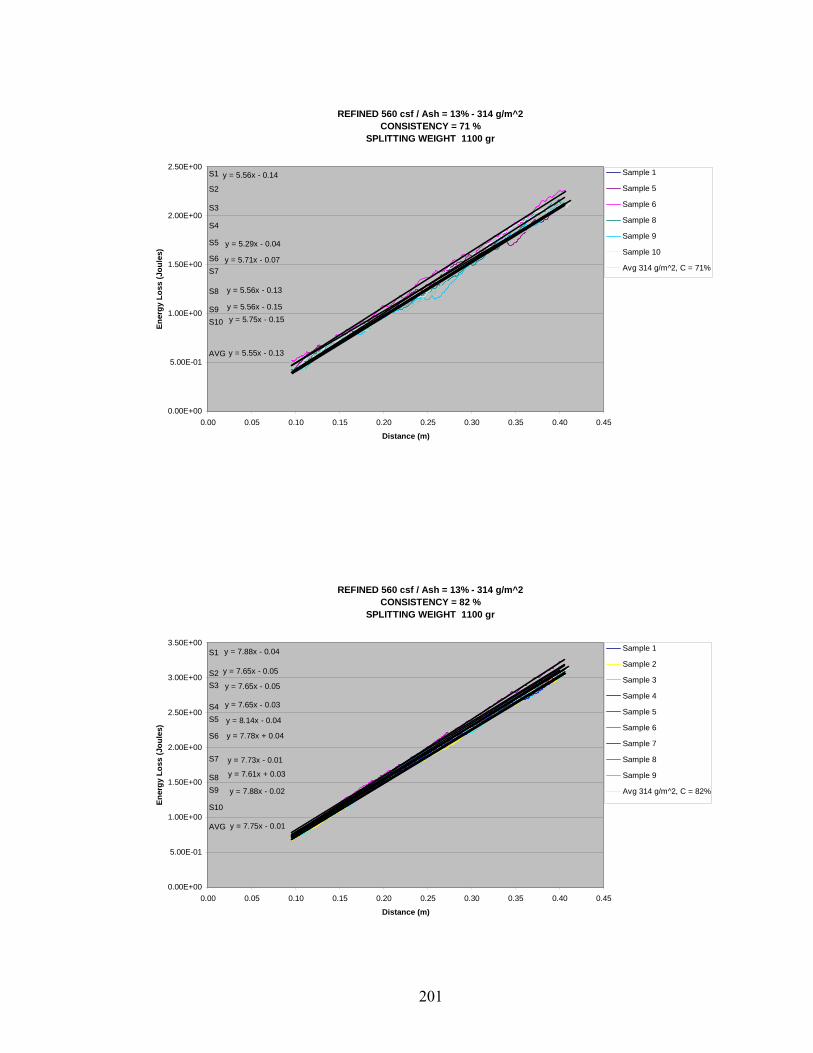
REFINED 560 csf / Ash = 13% - 314 g/m^2CONSISTENCY = 71 %
SPLITTING WEIGHT 1100 gr
y = 5.56x - 0.14
y = 5.29x - 0.04
y = 5.71x - 0.07
y = 5.56x - 0.13
y = 5.56x - 0.15y = 5.75x - 0.15
y = 5.55x - 0.13
0.00E+00
5.00E-01
1.00E+00
1.50E+00
2.00E+00
2.50E+00
0.00 0.05 0.10 0.15 0.20 0.25 0.30 0.35 0.40 0.45
Distance (m)
Ener
gy L
oss
(Jou
les)
Sample 1
Sample 5
Sample 6
Sample 8
Sample 9
Sample 10
Avg 314 g/m^2, C = 71%
S1
AVG
S10S9
S8
S7S6
S5
S4
S3
S2
REFINED 560 csf / Ash = 13% - 314 g/m^2CONSISTENCY = 82 %
SPLITTING WEIGHT 1100 gr
y = 7.88x - 0.04
y = 7.65x - 0.05
y = 7.65x - 0.05
y = 7.65x - 0.03
y = 8.14x - 0.04
y = 7.78x + 0.04
y = 7.73x - 0.01
y = 7.61x + 0.03
y = 7.88x - 0.02
y = 7.75x - 0.01
0.00E+00
5.00E-01
1.00E+00
1.50E+00
2.00E+00
2.50E+00
3.00E+00
3.50E+00
0.00 0.05 0.10 0.15 0.20 0.25 0.30 0.35 0.40 0.45
Distance (m)
Ener
gy L
oss
(Jou
les)
Sample 1
Sample 2
Sample 3
Sample 4
Sample 5
Sample 6
Sample 7
Sample 8
Sample 9
Avg 314 g/m^2, C = 82%
S1
AVG
S10
S9S8
S7
S6
S5S4
S3S2
201
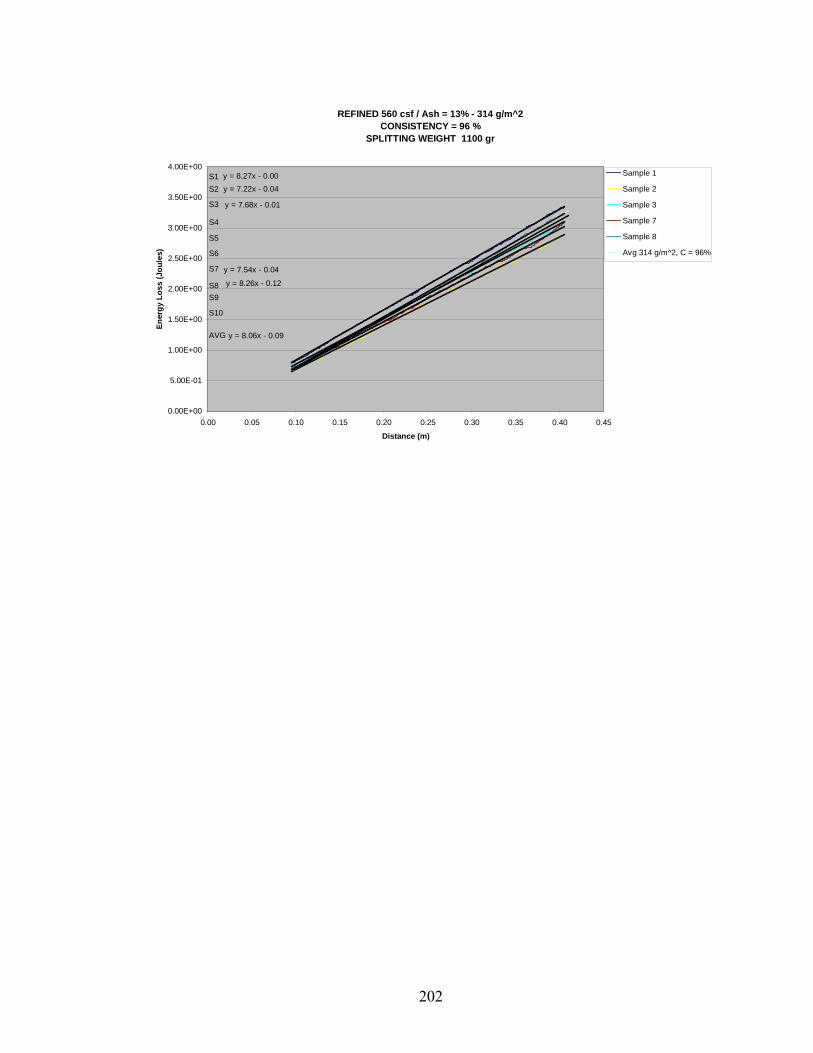
REFINED 560 csf / Ash = 13% - 314 g/m^2CONSISTENCY = 96 %
SPLITTING WEIGHT 1100 gr
y = 8.27x - 0.00y = 7.22x - 0.04
y = 7.68x - 0.01
y = 7.54x - 0.04
y = 8.26x - 0.12
y = 8.06x - 0.09
0.00E+00
5.00E-01
1.00E+00
1.50E+00
2.00E+00
2.50E+00
3.00E+00
3.50E+00
4.00E+00
0.00 0.05 0.10 0.15 0.20 0.25 0.30 0.35 0.40 0.45
Distance (m)
Ener
gy L
oss
(Jou
les)
Sample 1
Sample 2
Sample 3
Sample 7
Sample 8
Avg 314 g/m^2, C = 96%
S1
AVG
S10
S9S8
S7
S6
S5
S4
S3
S2
202
Case 6: Refining 560 C.S.F.; ASH 22% (Normal Clay), No Starch; Basis Weight 305 g/m²
203
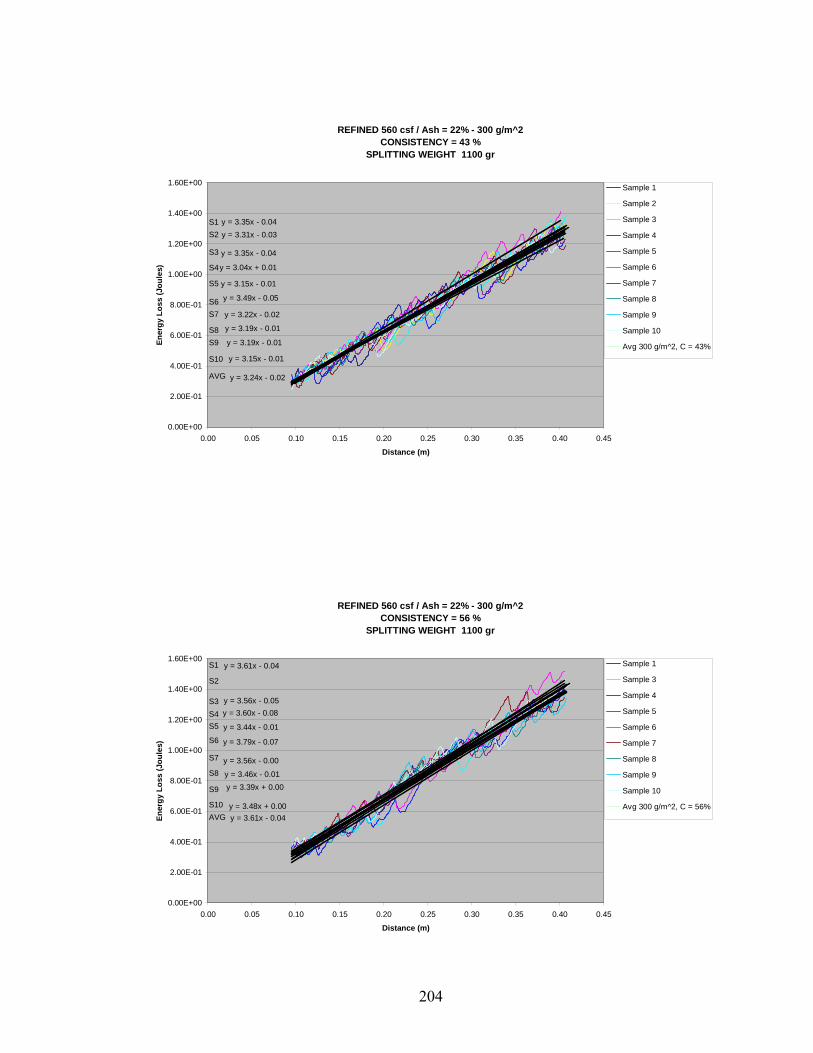
REFINED 560 csf / Ash = 22% - 300 g/m^2CONSISTENCY = 43 %
SPLITTING WEIGHT 1100 gr
y = 3.35x - 0.04y = 3.31x - 0.03
y = 3.35x - 0.04
y = 3.04x + 0.01
y = 3.15x - 0.01
y = 3.49x - 0.05
y = 3.22x - 0.02
y = 3.19x - 0.01
y = 3.19x - 0.01
y = 3.15x - 0.01
y = 3.24x - 0.02
0.00E+00
2.00E-01
4.00E-01
6.00E-01
8.00E-01
1.00E+00
1.20E+00
1.40E+00
1.60E+00
0.00 0.05 0.10 0.15 0.20 0.25 0.30 0.35 0.40 0.45
Distance (m)
Ener
gy L
oss
(Jou
les)
Sample 1
Sample 2
Sample 3
Sample 4
Sample 5
Sample 6
Sample 7
Sample 8
Sample 9
Sample 10
Avg 300 g/m^2, C = 43%
S1
AVG
S10
S9S8
S7S6
S5
S4
S3
S2
REFINED 560 csf / Ash = 22% - 300 g/m^2CONSISTENCY = 56 %
SPLITTING WEIGHT 1100 gr
y = 3.61x - 0.04
y = 3.56x - 0.05y = 3.60x - 0.08
y = 3.44x - 0.01
y = 3.79x - 0.07
y = 3.56x - 0.00
y = 3.46x - 0.01y = 3.39x + 0.00
y = 3.48x + 0.00y = 3.61x - 0.04
0.00E+00
2.00E-01
4.00E-01
6.00E-01
8.00E-01
1.00E+00
1.20E+00
1.40E+00
1.60E+00
0.00 0.05 0.10 0.15 0.20 0.25 0.30 0.35 0.40 0.45
Distance (m)
Ener
gy L
oss
(Jou
les)
Sample 1
Sample 3
Sample 4
Sample 5
Sample 6
Sample 7
Sample 8
Sample 9
Sample 10
Avg 300 g/m^2, C = 56%
S1
AVGS10
S9
S8
S7
S6
S5S4S3
S2
204
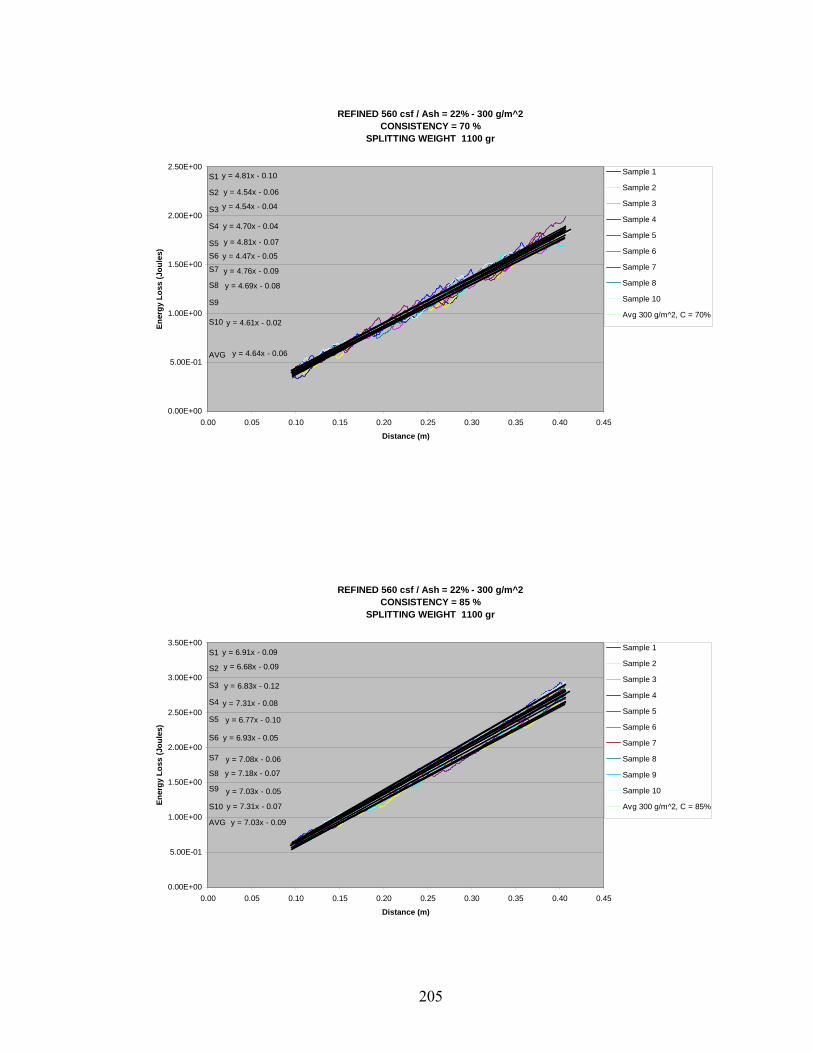
REFINED 560 csf / Ash = 22% - 300 g/m^2CONSISTENCY = 70 %
SPLITTING WEIGHT 1100 gr
y = 4.81x - 0.10
y = 4.54x - 0.06
y = 4.54x - 0.04
y = 4.70x - 0.04
y = 4.81x - 0.07
y = 4.47x - 0.05
y = 4.76x - 0.09
y = 4.69x - 0.08
y = 4.61x - 0.02
y = 4.64x - 0.06
0.00E+00
5.00E-01
1.00E+00
1.50E+00
2.00E+00
2.50E+00
0.00 0.05 0.10 0.15 0.20 0.25 0.30 0.35 0.40 0.45
Distance (m)
Ener
gy L
oss
(Jou
les)
Sample 1
Sample 2
Sample 3
Sample 4
Sample 5
Sample 6
Sample 7
Sample 8
Sample 10
Avg 300 g/m^2, C = 70%
S1
AVG
S10
S9
S8
S7
S6S5
S4
S3
S2
REFINED 560 csf / Ash = 22% - 300 g/m^2CONSISTENCY = 85 %
SPLITTING WEIGHT 1100 gr
y = 6.91x - 0.09
y = 6.68x - 0.09
y = 6.83x - 0.12
y = 7.31x - 0.08
y = 6.77x - 0.10
y = 6.93x - 0.05
y = 7.08x - 0.06
y = 7.18x - 0.07
y = 7.03x - 0.05
y = 7.31x - 0.07
y = 7.03x - 0.09
0.00E+00
5.00E-01
1.00E+00
1.50E+00
2.00E+00
2.50E+00
3.00E+00
3.50E+00
0.00 0.05 0.10 0.15 0.20 0.25 0.30 0.35 0.40 0.45
Distance (m)
Ener
gy L
oss
(Jou
les)
Sample 1
Sample 2
Sample 3
Sample 4
Sample 5
Sample 6
Sample 7
Sample 8
Sample 9
Sample 10
Avg 300 g/m^2, C = 85%
S1
AVG
S10
S9
S8
S7
S6
S5
S4
S3
S2
205
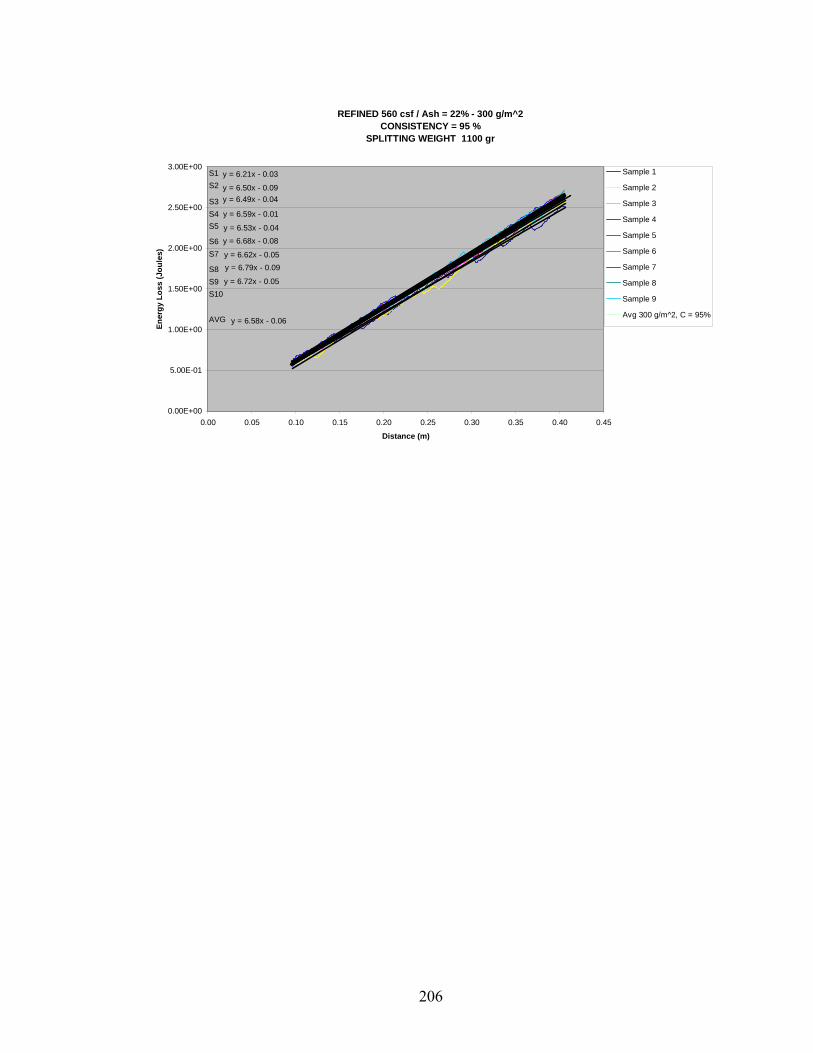
REFINED 560 csf / Ash = 22% - 300 g/m^2CONSISTENCY = 95 %
SPLITTING WEIGHT 1100 gr
y = 6.21x - 0.03
y = 6.50x - 0.09y = 6.49x - 0.04
y = 6.59x - 0.01
y = 6.53x - 0.04y = 6.68x - 0.08
y = 6.62x - 0.05y = 6.79x - 0.09
y = 6.72x - 0.05
y = 6.58x - 0.06
0.00E+00
5.00E-01
1.00E+00
1.50E+00
2.00E+00
2.50E+00
3.00E+00
0.00 0.05 0.10 0.15 0.20 0.25 0.30 0.35 0.40 0.45
Distance (m)
Ener
gy L
oss
(Jou
les)
Sample 1
Sample 2
Sample 3
Sample 4
Sample 5
Sample 6
Sample 7
Sample 8
Sample 9
Avg 300 g/m^2, C = 95%
S1
AVG
S10S9S8
S7S6
S5S4S3
S2
206
Case 7: Refining 560 C.S.F.; ASH 13% (Modified Clay), No Starch; Basis Weight 317 g/m²
207
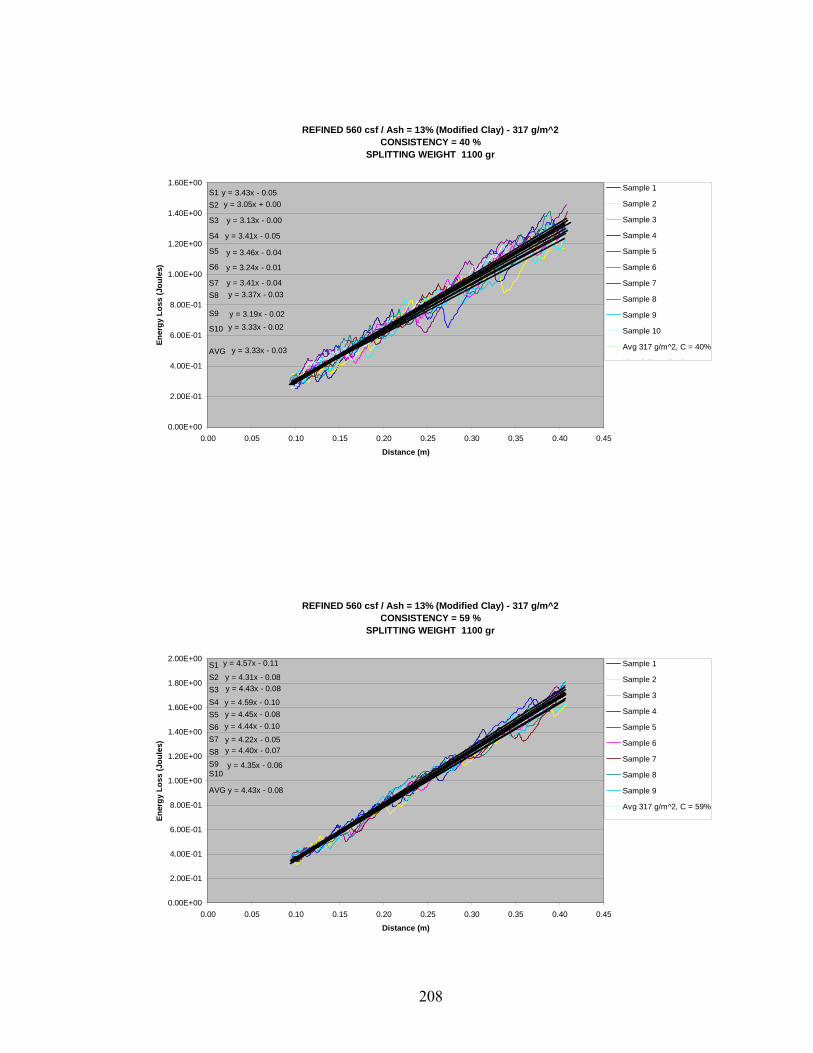
REFINED 560 csf / Ash = 13% (Modified Clay) - 317 g/m^2CONSISTENCY = 40 %
SPLITTING WEIGHT 1100 gr
y = 3.43x - 0.05y = 3.05x + 0.00
y = 3.13x - 0.00
y = 3.41x - 0.05
y = 3.46x - 0.04
y = 3.24x - 0.01
y = 3.41x - 0.04y = 3.37x - 0.03
y = 3.19x - 0.02y = 3.33x - 0.02
y = 3.33x - 0.03
0.00E+00
2.00E-01
4.00E-01
6.00E-01
8.00E-01
1.00E+00
1.20E+00
1.40E+00
1.60E+00
0.00 0.05 0.10 0.15 0.20 0.25 0.30 0.35 0.40 0.45
Distance (m)
Ener
gy L
oss
(Jou
les)
Sample 1
Sample 2
Sample 3
Sample 4
Sample 5
Sample 6
Sample 7
Sample 8
Sample 9
Sample 10
Avg 317 g/m^2, C = 40%
Li l (S l 1)
S1
AVG
S10
S9
S8S7
S6
S5
S4
S3
S2
REFINED 560 csf / Ash = 13% (Modified Clay) - 317 g/m^2CONSISTENCY = 59 %
SPLITTING WEIGHT 1100 gr
y = 4.57x - 0.11
y = 4.31x - 0.08y = 4.43x - 0.08
y = 4.59x - 0.10y = 4.45x - 0.08y = 4.44x - 0.10
y = 4.22x - 0.05y = 4.40x - 0.07
y = 4.35x - 0.06
y = 4.43x - 0.08
0.00E+00
2.00E-01
4.00E-01
6.00E-01
8.00E-01
1.00E+00
1.20E+00
1.40E+00
1.60E+00
1.80E+00
2.00E+00
0.00 0.05 0.10 0.15 0.20 0.25 0.30 0.35 0.40 0.45
Distance (m)
Ener
gy L
oss
(Jou
les)
Sample 1
Sample 2
Sample 3
Sample 4
Sample 5
Sample 6
Sample 7
Sample 8
Sample 9
Avg 317 g/m^2, C = 59%
S1
AVG
S10S9S8S7S6S5S4S3S2
208
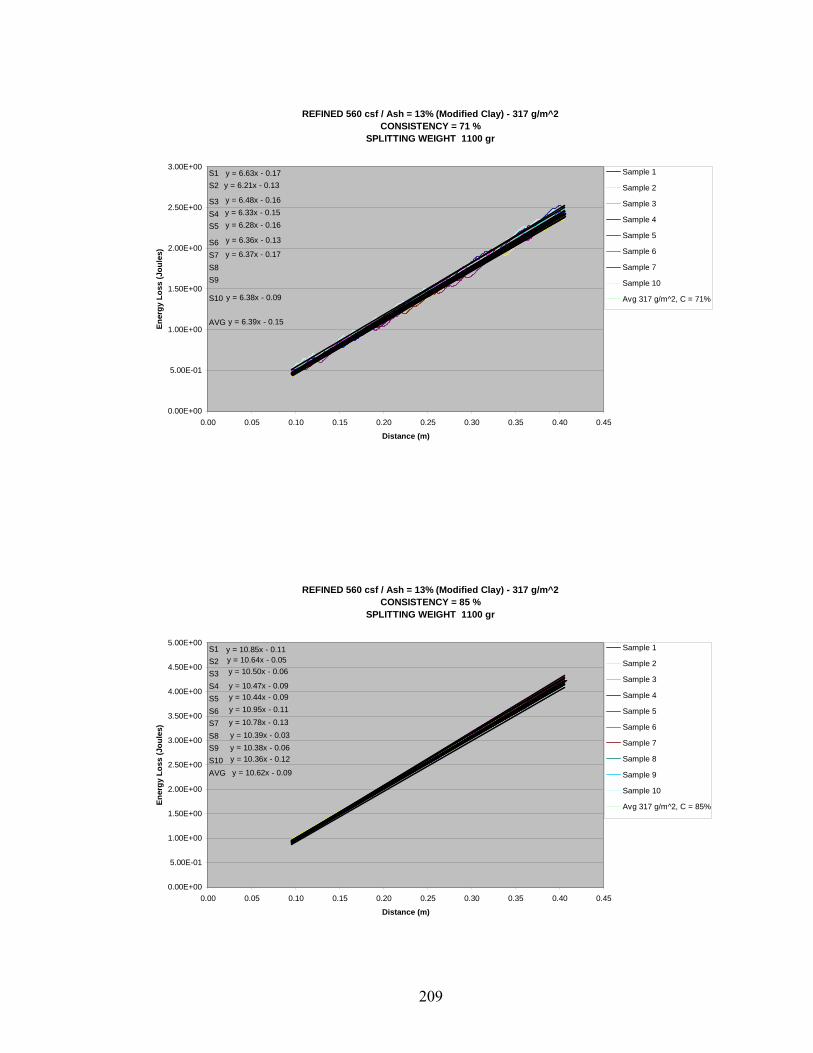
REFINED 560 csf / Ash = 13% (Modified Clay) - 317 g/m^2CONSISTENCY = 71 %
SPLITTING WEIGHT 1100 gr
y = 6.63x - 0.17y = 6.21x - 0.13
y = 6.48x - 0.16y = 6.33x - 0.15y = 6.28x - 0.16
y = 6.36x - 0.13
y = 6.37x - 0.17
y = 6.38x - 0.09
y = 6.39x - 0.15
0.00E+00
5.00E-01
1.00E+00
1.50E+00
2.00E+00
2.50E+00
3.00E+00
0.00 0.05 0.10 0.15 0.20 0.25 0.30 0.35 0.40 0.45
Distance (m)
Ener
gy L
oss
(Jou
les)
Sample 1
Sample 2
Sample 3
Sample 4
Sample 5
Sample 6
Sample 7
Sample 10
Avg 317 g/m^2, C = 71%
S1
AVG
S10
S9S8S7S6
S5S4S3
S2
REFINED 560 csf / Ash = 13% (Modified Clay) - 317 g/m^2CONSISTENCY = 85 %
SPLITTING WEIGHT 1100 gr
y = 10.85x - 0.11y = 10.64x - 0.05y = 10.50x - 0.06
y = 10.47x - 0.09y = 10.44x - 0.09y = 10.95x - 0.11y = 10.78x - 0.13y = 10.39x - 0.03y = 10.38x - 0.06y = 10.36x - 0.12
y = 10.62x - 0.09
0.00E+00
5.00E-01
1.00E+00
1.50E+00
2.00E+00
2.50E+00
3.00E+00
3.50E+00
4.00E+00
4.50E+00
5.00E+00
0.00 0.05 0.10 0.15 0.20 0.25 0.30 0.35 0.40 0.45
Distance (m)
Ener
gy L
oss
(Jou
les)
Sample 1
Sample 2
Sample 3
Sample 4
Sample 5
Sample 6
Sample 7
Sample 8
Sample 9
Sample 10
Avg 317 g/m^2, C = 85%
S1
AVGS10S9S8S7S6S5S4S3S2
209
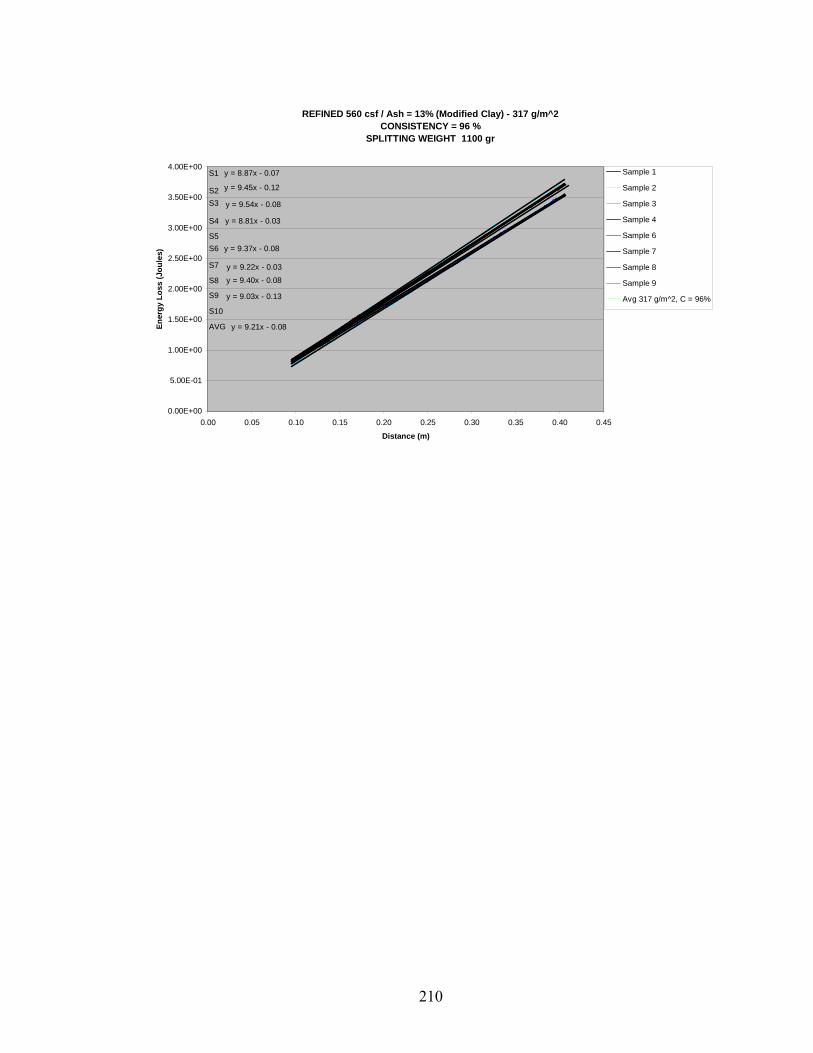
REFINED 560 csf / Ash = 13% (Modified Clay) - 317 g/m^2CONSISTENCY = 96 %
SPLITTING WEIGHT 1100 gr
y = 8.87x - 0.07
y = 9.45x - 0.12
y = 9.54x - 0.08
y = 8.81x - 0.03
y = 9.37x - 0.08
y = 9.22x - 0.03
y = 9.40x - 0.08
y = 9.03x - 0.13
y = 9.21x - 0.08
0.00E+00
5.00E-01
1.00E+00
1.50E+00
2.00E+00
2.50E+00
3.00E+00
3.50E+00
4.00E+00
0.00 0.05 0.10 0.15 0.20 0.25 0.30 0.35 0.40 0.45
Distance (m)
Ener
gy L
oss
(Jou
les)
Sample 1
Sample 2
Sample 3
Sample 4
Sample 6
Sample 7
Sample 8
Sample 9
Avg 317 g/m^2, C = 96%
S1
AVG
S10
S9
S8
S7
S6S5
S4
S3S2
210

Case 8: Refining 560 C.S.F.; ASH 18% (Modified Clay), No Starch; Basis Weight 318 g/m²
211
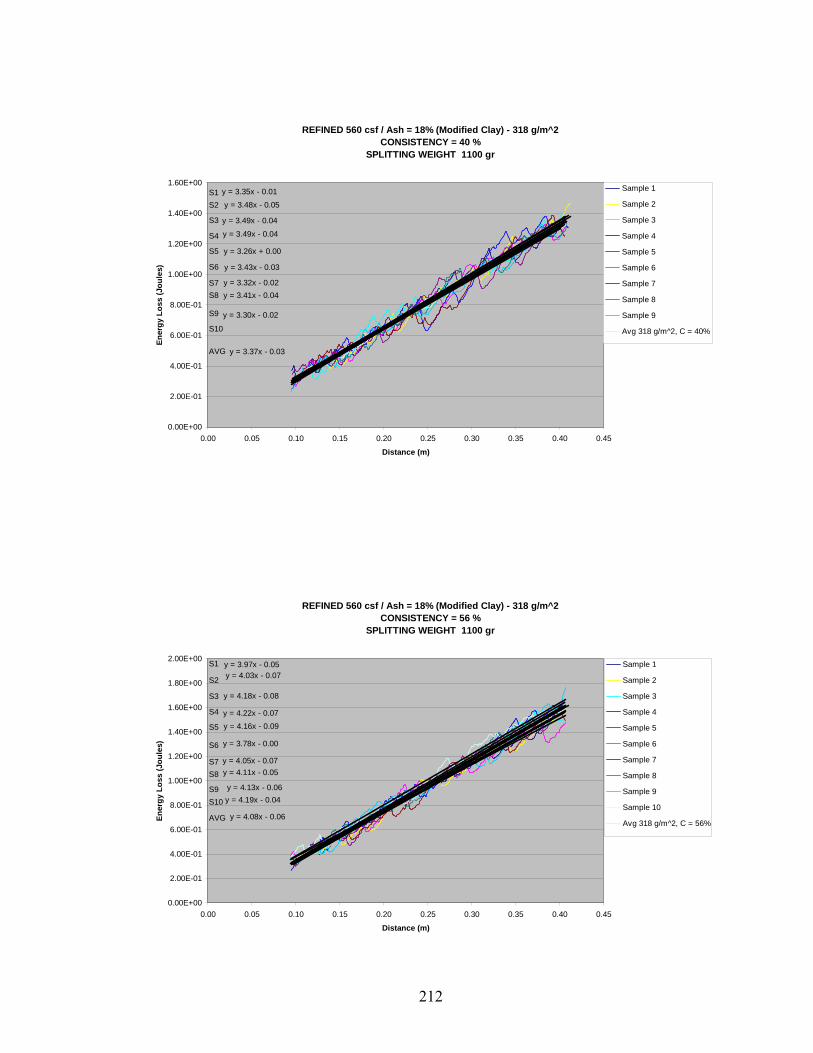
REFINED 560 csf / Ash = 18% (Modified Clay) - 318 g/m^2CONSISTENCY = 40 %
SPLITTING WEIGHT 1100 gr
y = 3.35x - 0.01
y = 3.48x - 0.05
y = 3.49x - 0.04
y = 3.49x - 0.04
y = 3.26x + 0.00
y = 3.43x - 0.03
y = 3.32x - 0.02y = 3.41x - 0.04
y = 3.30x - 0.02
y = 3.37x - 0.03
0.00E+00
2.00E-01
4.00E-01
6.00E-01
8.00E-01
1.00E+00
1.20E+00
1.40E+00
1.60E+00
0.00 0.05 0.10 0.15 0.20 0.25 0.30 0.35 0.40 0.45
Distance (m)
Ener
gy L
oss
(Jou
les)
Sample 1
Sample 2
Sample 3
Sample 4
Sample 5
Sample 6
Sample 7
Sample 8
Sample 9
Avg 318 g/m^2, C = 40%
S1
AVG
S10
S9
S8S7
S6
S5
S4
S3
S2
REFINED 560 csf / Ash = 18% (Modified Clay) - 318 g/m^2CONSISTENCY = 56 %
SPLITTING WEIGHT 1100 gr
y = 3.97x - 0.05y = 4.03x - 0.07
y = 4.18x - 0.08
y = 4.22x - 0.07y = 4.16x - 0.09
y = 3.78x - 0.00
y = 4.05x - 0.07y = 4.11x - 0.05
y = 4.13x - 0.06y = 4.19x - 0.04
y = 4.08x - 0.06
0.00E+00
2.00E-01
4.00E-01
6.00E-01
8.00E-01
1.00E+00
1.20E+00
1.40E+00
1.60E+00
1.80E+00
2.00E+00
0.00 0.05 0.10 0.15 0.20 0.25 0.30 0.35 0.40 0.45
Distance (m)
Ener
gy L
oss
(Jou
les)
Sample 1
Sample 2
Sample 3
Sample 4
Sample 5
Sample 6
Sample 7
Sample 8
Sample 9
Sample 10
Avg 318 g/m^2, C = 56%
Li l (S l 1)
S1
AVG
S10S9
S8S7
S6
S5
S4
S3
S2
212
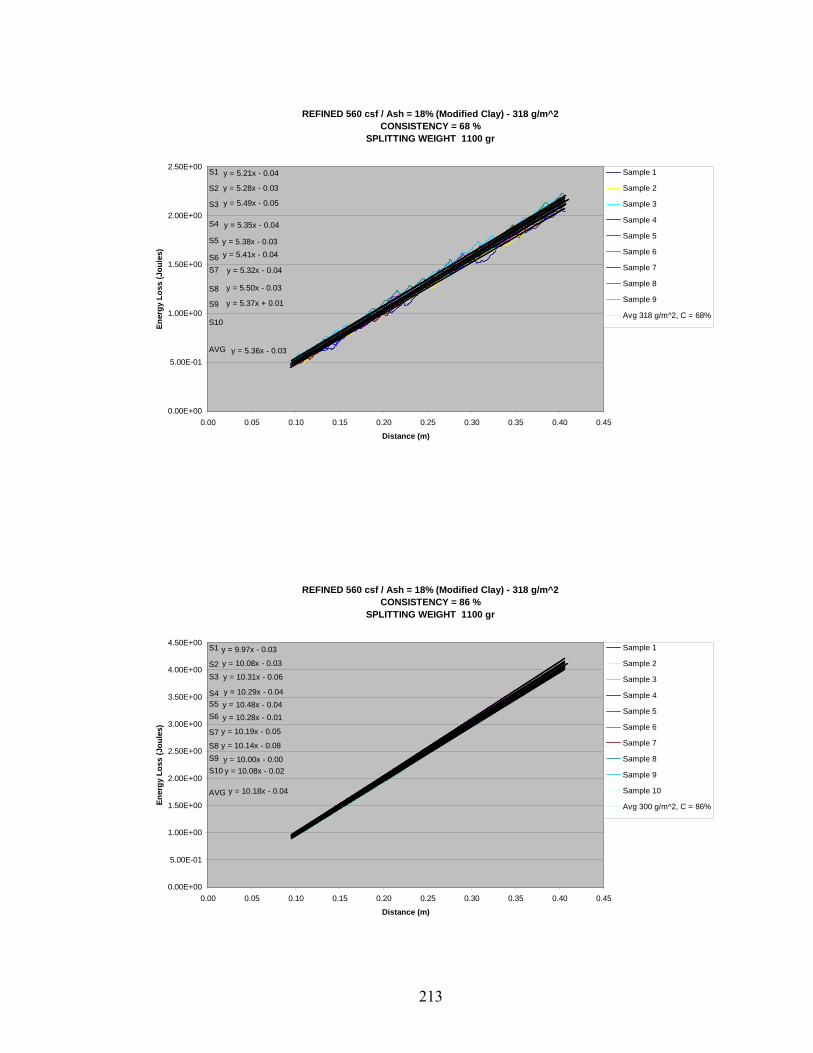
REFINED 560 csf / Ash = 18% (Modified Clay) - 318 g/m^2CONSISTENCY = 68 %
SPLITTING WEIGHT 1100 gr
y = 5.21x - 0.04
y = 5.28x - 0.03
y = 5.49x - 0.05
y = 5.35x - 0.04
y = 5.38x - 0.03y = 5.41x - 0.04
y = 5.32x - 0.04
y = 5.50x - 0.03
y = 5.37x + 0.01
y = 5.36x - 0.03
0.00E+00
5.00E-01
1.00E+00
1.50E+00
2.00E+00
2.50E+00
0.00 0.05 0.10 0.15 0.20 0.25 0.30 0.35 0.40 0.45
Distance (m)
Ener
gy L
oss
(Jou
les)
Sample 1
Sample 2
Sample 3
Sample 4
Sample 5
Sample 6
Sample 7
Sample 8
Sample 9
Avg 318 g/m^2, C = 68%
S1
AVG
S10
S9
S8
S7S6
S5
S4
S3
S2
REFINED 560 csf / Ash = 18% (Modified Clay) - 318 g/m^2CONSISTENCY = 86 %
SPLITTING WEIGHT 1100 gr
y = 9.97x - 0.03
y = 10.08x - 0.03
y = 10.31x - 0.06
y = 10.29x - 0.04y = 10.48x - 0.04y = 10.28x - 0.01
y = 10.19x - 0.05
y = 10.14x - 0.08
y = 10.00x - 0.00y = 10.08x - 0.02
y = 10.18x - 0.04
0.00E+00
5.00E-01
1.00E+00
1.50E+00
2.00E+00
2.50E+00
3.00E+00
3.50E+00
4.00E+00
4.50E+00
0.00 0.05 0.10 0.15 0.20 0.25 0.30 0.35 0.40 0.45
Distance (m)
Ener
gy L
oss
(Jou
les)
Sample 1
Sample 2
Sample 3
Sample 4
Sample 5
Sample 6
Sample 7
Sample 8
Sample 9
Sample 10
Avg 300 g/m^2, C = 86%
S1
AVG
S10S9S8
S7
S6S5S4
S3S2
213
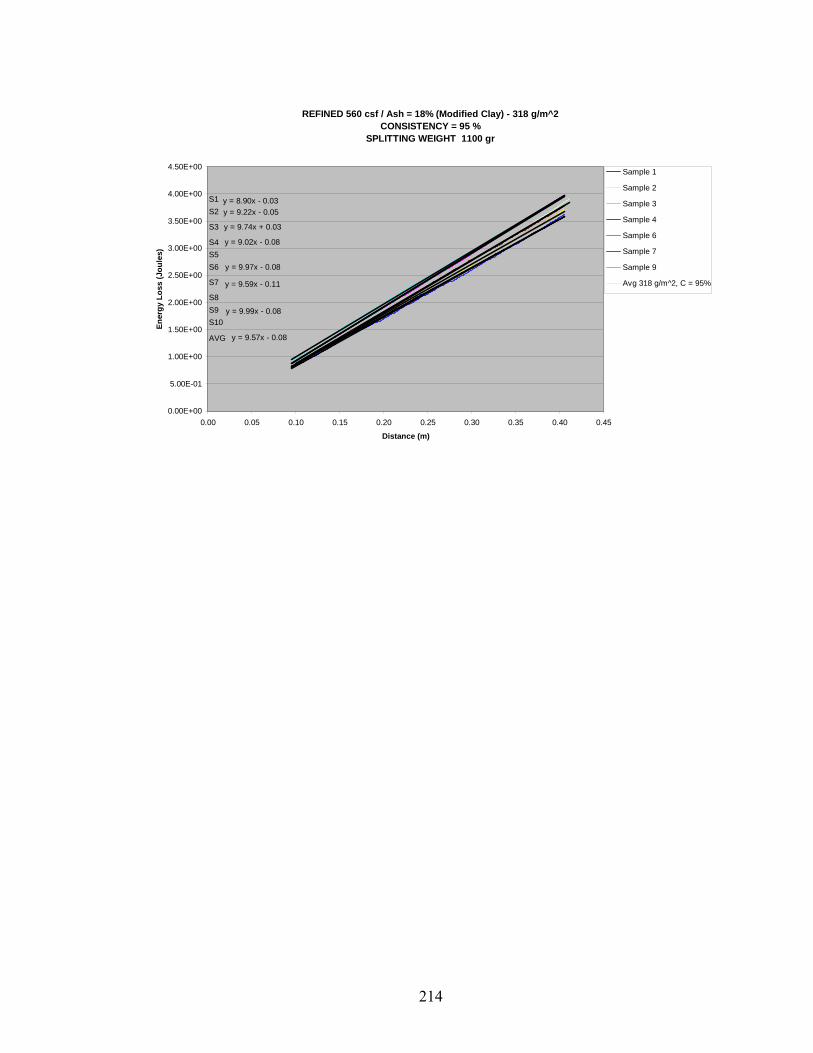
REFINED 560 csf / Ash = 18% (Modified Clay) - 318 g/m^2CONSISTENCY = 95 %
SPLITTING WEIGHT 1100 gr
y = 8.90x - 0.03y = 9.22x - 0.05
y = 9.74x + 0.03
y = 9.02x - 0.08
y = 9.97x - 0.08
y = 9.59x - 0.11
y = 9.99x - 0.08
y = 9.57x - 0.08
0.00E+00
5.00E-01
1.00E+00
1.50E+00
2.00E+00
2.50E+00
3.00E+00
3.50E+00
4.00E+00
4.50E+00
0.00 0.05 0.10 0.15 0.20 0.25 0.30 0.35 0.40 0.45
Distance (m)
Ener
gy L
oss
(Jou
les)
Sample 1
Sample 2
Sample 3
Sample 4
Sample 6
Sample 7
Sample 9
Avg 318 g/m^2, C = 95%
S1
AVG
S10S9S8
S7
S6S5S4
S3
S2
214
Case 9: Refining 560 C.S.F.; ASH 24% (Modified Clay), No Starch; Basis Weight 318 g/m²
215
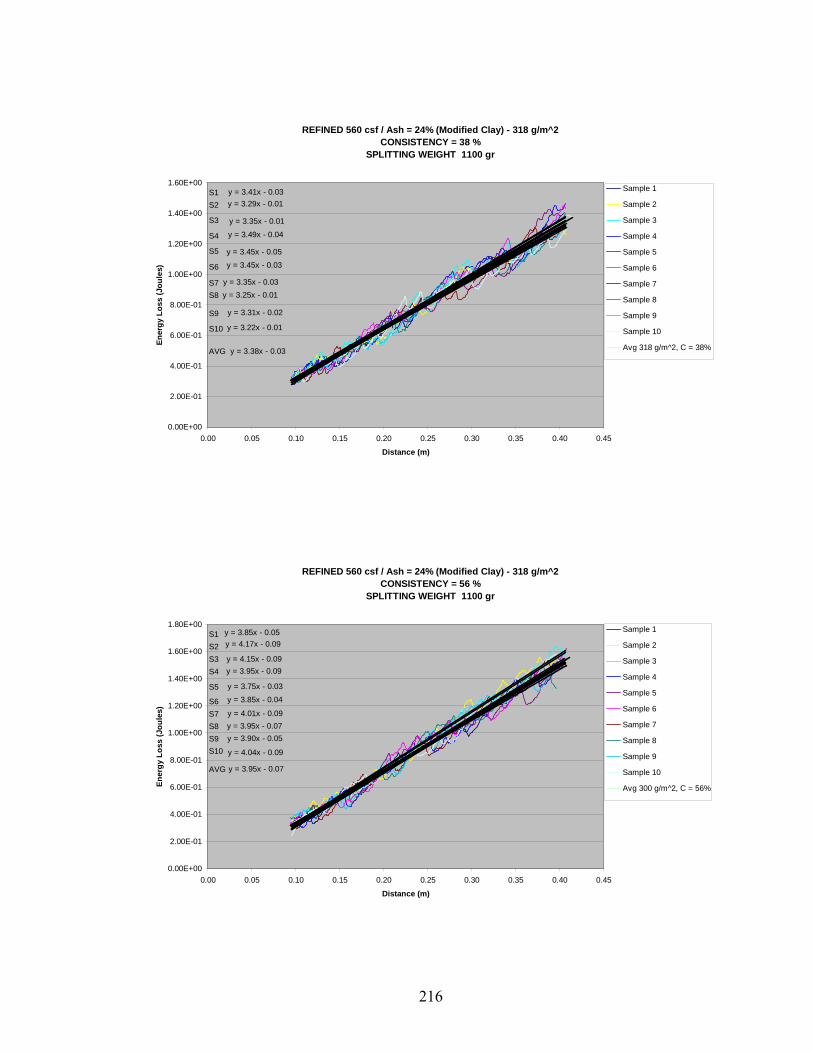
REFINED 560 csf / Ash = 24% (Modified Clay) - 318 g/m^2CONSISTENCY = 38 %
SPLITTING WEIGHT 1100 gr
y = 3.41x - 0.03y = 3.29x - 0.01
y = 3.35x - 0.01
y = 3.49x - 0.04
y = 3.45x - 0.05
y = 3.45x - 0.03
y = 3.35x - 0.03y = 3.25x - 0.01
y = 3.31x - 0.02
y = 3.22x - 0.01
y = 3.38x - 0.03
0.00E+00
2.00E-01
4.00E-01
6.00E-01
8.00E-01
1.00E+00
1.20E+00
1.40E+00
1.60E+00
0.00 0.05 0.10 0.15 0.20 0.25 0.30 0.35 0.40 0.45
Distance (m)
Ener
gy L
oss
(Jou
les)
Sample 1
Sample 2
Sample 3
Sample 4
Sample 5
Sample 6
Sample 7
Sample 8
Sample 9
Sample 10
Avg 318 g/m^2, C = 38%
S1
AVG
S10
S9
S8S7
S6
S5
S4
S3
S2
REFINED 560 csf / Ash = 24% (Modified Clay) - 318 g/m^2CONSISTENCY = 56 %
SPLITTING WEIGHT 1100 gr
y = 3.85x - 0.05y = 4.17x - 0.09
y = 4.15x - 0.09y = 3.95x - 0.09
y = 3.75x - 0.03
y = 3.85x - 0.04
y = 4.01x - 0.09y = 3.95x - 0.07y = 3.90x - 0.05
y = 4.04x - 0.09
y = 3.95x - 0.07
0.00E+00
2.00E-01
4.00E-01
6.00E-01
8.00E-01
1.00E+00
1.20E+00
1.40E+00
1.60E+00
1.80E+00
0.00 0.05 0.10 0.15 0.20 0.25 0.30 0.35 0.40 0.45
Distance (m)
Ener
gy L
oss
(Jou
les)
Sample 1
Sample 2
Sample 3
Sample 4
Sample 5
Sample 6
Sample 7
Sample 8
Sample 9
Sample 10
Avg 300 g/m^2, C = 56%
S1
AVG
S10S9S8S7S6
S5
S4S3S2
216
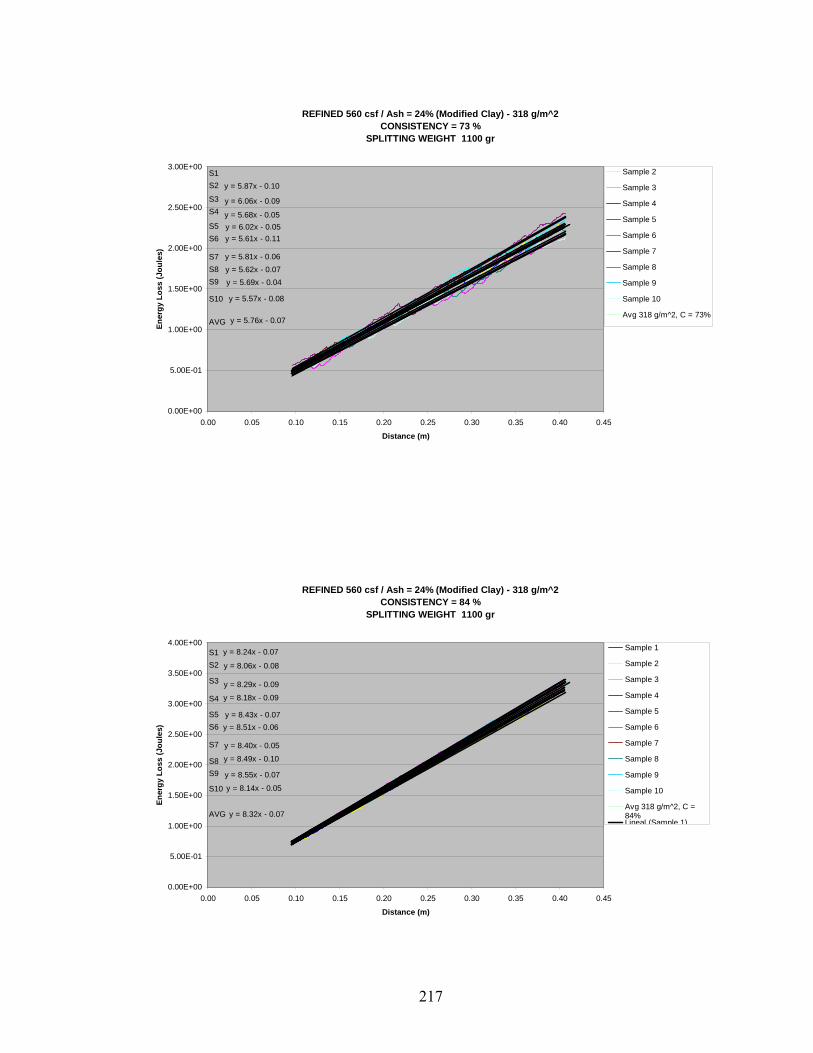
REFINED 560 csf / Ash = 24% (Modified Clay) - 318 g/m^2CONSISTENCY = 73 %
SPLITTING WEIGHT 1100 gr
y = 5.87x - 0.10
y = 6.06x - 0.09
y = 5.68x - 0.05y = 6.02x - 0.05y = 5.61x - 0.11
y = 5.81x - 0.06y = 5.62x - 0.07y = 5.69x - 0.04
y = 5.57x - 0.08
y = 5.76x - 0.07
0.00E+00
5.00E-01
1.00E+00
1.50E+00
2.00E+00
2.50E+00
3.00E+00
0.00 0.05 0.10 0.15 0.20 0.25 0.30 0.35 0.40 0.45
Distance (m)
Ener
gy L
oss
(Jou
les)
Sample 2
Sample 3
Sample 4
Sample 5
Sample 6
Sample 7
Sample 8
Sample 9
Sample 10
Avg 318 g/m^2, C = 73%
S1
AVG
S10
S9S8S7
S6S5
S4S3
S2
REFINED 560 csf / Ash = 24% (Modified Clay) - 318 g/m^2CONSISTENCY = 84 %
SPLITTING WEIGHT 1100 gr
y = 8.24x - 0.07
y = 8.06x - 0.08
y = 8.29x - 0.09
y = 8.18x - 0.09
y = 8.43x - 0.07y = 8.51x - 0.06
y = 8.40x - 0.05
y = 8.49x - 0.10
y = 8.55x - 0.07
y = 8.14x - 0.05
y = 8.32x - 0.07
0.00E+00
5.00E-01
1.00E+00
1.50E+00
2.00E+00
2.50E+00
3.00E+00
3.50E+00
4.00E+00
0.00 0.05 0.10 0.15 0.20 0.25 0.30 0.35 0.40 0.45
Distance (m)
Ener
gy L
oss
(Jou
les)
Sample 1
Sample 2
Sample 3
Sample 4
Sample 5
Sample 6
Sample 7
Sample 8
Sample 9
Sample 10
Avg 318 g/m^2, C =84%Lineal (Sample 1)
S1
AVG
S10
S9S8
S7
S6S5
S4
S3
S2
217
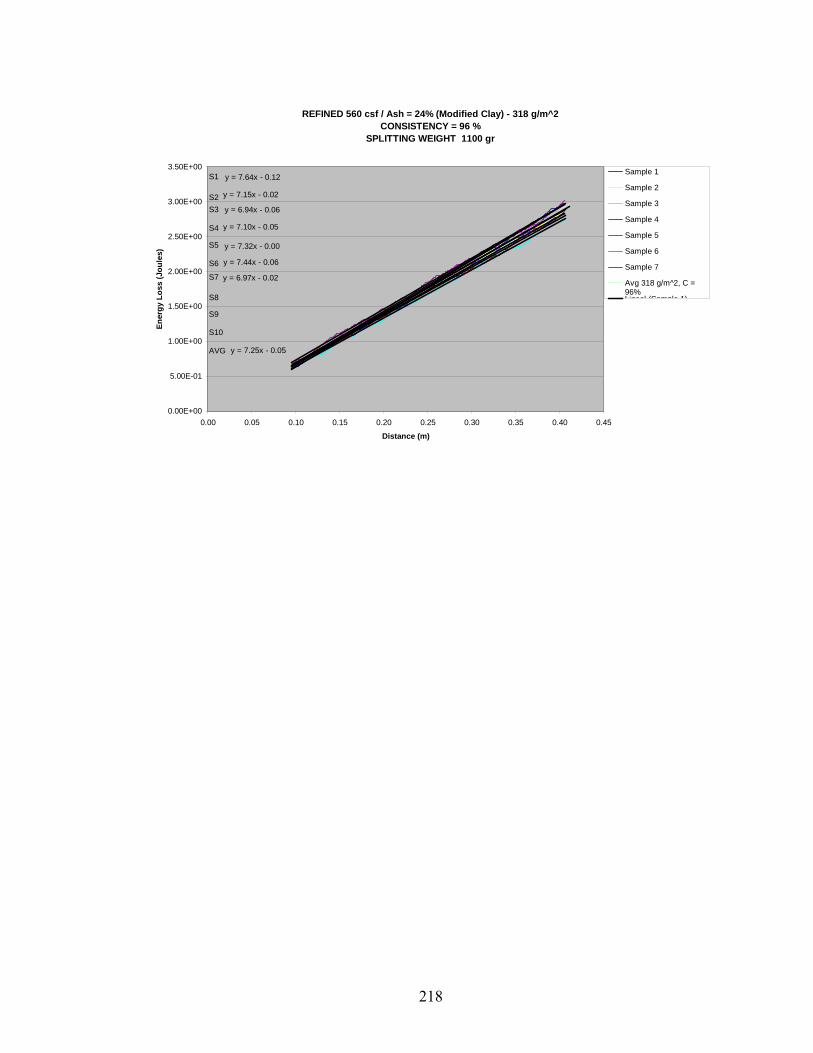
REFINED 560 csf / Ash = 24% (Modified Clay) - 318 g/m^2CONSISTENCY = 96 %
SPLITTING WEIGHT 1100 gr
y = 7.64x - 0.12
y = 7.15x - 0.02
y = 6.94x - 0.06
y = 7.10x - 0.05
y = 7.32x - 0.00
y = 7.44x - 0.06
y = 6.97x - 0.02
y = 7.25x - 0.05
0.00E+00
5.00E-01
1.00E+00
1.50E+00
2.00E+00
2.50E+00
3.00E+00
3.50E+00
0.00 0.05 0.10 0.15 0.20 0.25 0.30 0.35 0.40 0.45
Distance (m)
Ener
gy L
oss
(Jou
les)
Sample 1
Sample 2
Sample 3
Sample 4
Sample 5
Sample 6
Sample 7
Avg 318 g/m^2, C =96%Lineal (Sample 1)
S1
AVG
S10
S9
S8
S7
S6
S5
S4
S3S2
218
Case 10: Refining 560 C.S.F.; 15 kg/ton C-Starch, No Clay; Basis Weight 303 g/m²
219
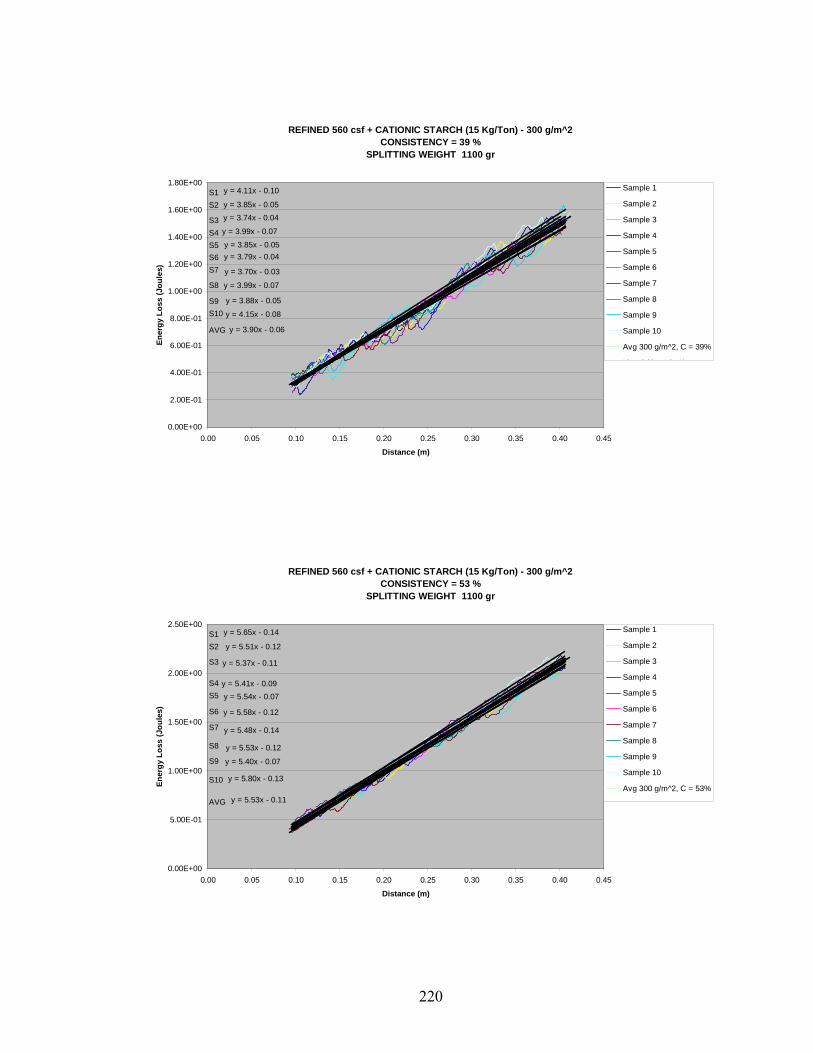
REFINED 560 csf + CATIONIC STARCH (15 Kg/Ton) - 300 g/m^2CONSISTENCY = 39 %
SPLITTING WEIGHT 1100 gr
y = 4.11x - 0.10
y = 3.85x - 0.05y = 3.74x - 0.04
y = 3.99x - 0.07
y = 3.85x - 0.05y = 3.79x - 0.04
y = 3.70x - 0.03
y = 3.99x - 0.07
y = 3.88x - 0.05
y = 4.15x - 0.08
y = 3.90x - 0.06
0.00E+00
2.00E-01
4.00E-01
6.00E-01
8.00E-01
1.00E+00
1.20E+00
1.40E+00
1.60E+00
1.80E+00
0.00 0.05 0.10 0.15 0.20 0.25 0.30 0.35 0.40 0.45
Distance (m)
Ener
gy L
oss
(Jou
les)
Sample 1
Sample 2
Sample 3
Sample 4
Sample 5
Sample 6
Sample 7
Sample 8
Sample 9
Sample 10
Avg 300 g/m^2, C = 39%
Li l (S l 1)
S1
AVG
S10S9
S8
S7S6S5S4S3
S2
REFINED 560 csf + CATIONIC STARCH (15 Kg/Ton) - 300 g/m^2CONSISTENCY = 53 %
SPLITTING WEIGHT 1100 gr
y = 5.65x - 0.14
y = 5.51x - 0.12
y = 5.37x - 0.11
y = 5.41x - 0.09y = 5.54x - 0.07
y = 5.58x - 0.12
y = 5.48x - 0.14
y = 5.53x - 0.12
y = 5.40x - 0.07
y = 5.80x - 0.13
y = 5.53x - 0.11
0.00E+00
5.00E-01
1.00E+00
1.50E+00
2.00E+00
2.50E+00
0.00 0.05 0.10 0.15 0.20 0.25 0.30 0.35 0.40 0.45
Distance (m)
Ener
gy L
oss
(Jou
les)
Sample 1
Sample 2
Sample 3
Sample 4
Sample 5
Sample 6
Sample 7
Sample 8
Sample 9
Sample 10
Avg 300 g/m^2, C = 53%
Li l (S l 1)
S1
AVG
S10
S9
S8
S7
S6
S5S4
S3
S2
220
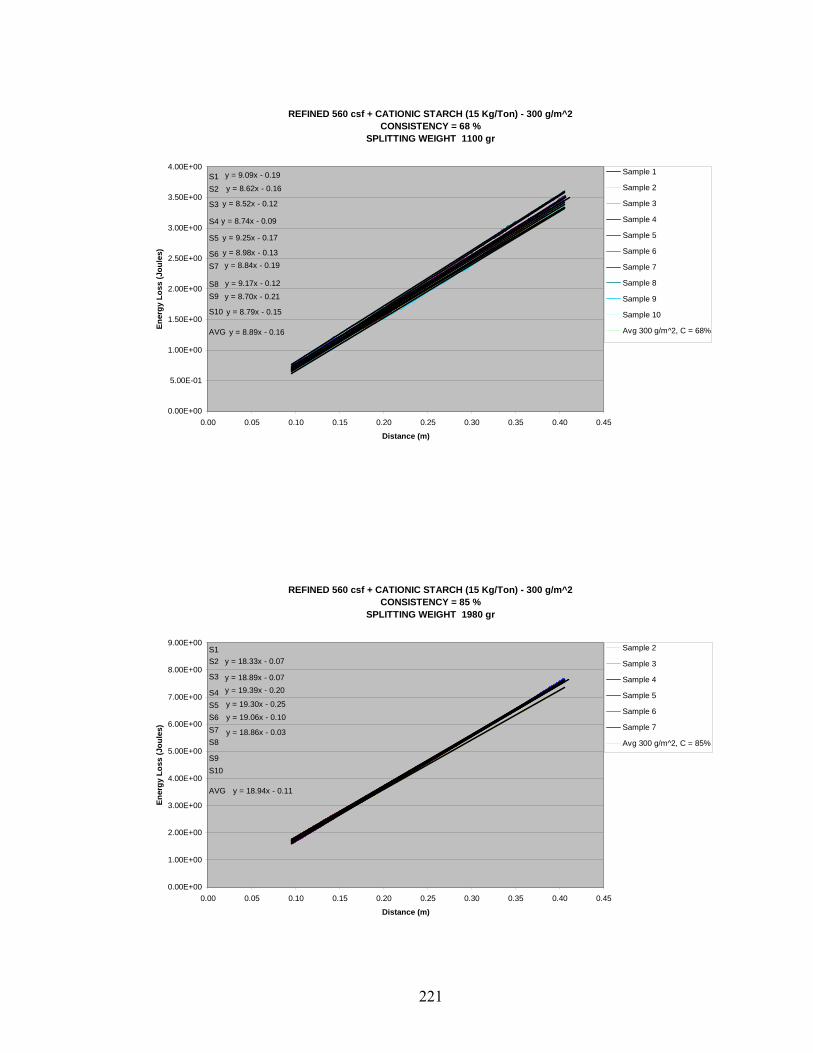
REFINED 560 csf + CATIONIC STARCH (15 Kg/Ton) - 300 g/m^2CONSISTENCY = 68 %
SPLITTING WEIGHT 1100 gr
y = 9.09x - 0.19
y = 8.62x - 0.16
y = 8.52x - 0.12
y = 8.74x - 0.09
y = 9.25x - 0.17
y = 8.98x - 0.13y = 8.84x - 0.19
y = 9.17x - 0.12
y = 8.70x - 0.21
y = 8.79x - 0.15
y = 8.89x - 0.16
0.00E+00
5.00E-01
1.00E+00
1.50E+00
2.00E+00
2.50E+00
3.00E+00
3.50E+00
4.00E+00
0.00 0.05 0.10 0.15 0.20 0.25 0.30 0.35 0.40 0.45
Distance (m)
Ener
gy L
oss
(Jou
les)
Sample 1
Sample 2
Sample 3
Sample 4
Sample 5
Sample 6
Sample 7
Sample 8
Sample 9
Sample 10
Avg 300 g/m^2, C = 68%
S1
AVG
S10
S9S8
S7S6
S5
S4
S3
S2
REFINED 560 csf + CATIONIC STARCH (15 Kg/Ton) - 300 g/m^2CONSISTENCY = 85 %
SPLITTING WEIGHT 1980 gr
y = 18.33x - 0.07
y = 18.89x - 0.07y = 19.39x - 0.20
y = 19.30x - 0.25y = 19.06x - 0.10
y = 18.86x - 0.03
y = 18.94x - 0.11
0.00E+00
1.00E+00
2.00E+00
3.00E+00
4.00E+00
5.00E+00
6.00E+00
7.00E+00
8.00E+00
9.00E+00
0.00 0.05 0.10 0.15 0.20 0.25 0.30 0.35 0.40 0.45
Distance (m)
Ener
gy L
oss
(Jou
les)
Sample 2
Sample 3
Sample 4
Sample 5
Sample 6
Sample 7
Avg 300 g/m^2, C = 85%
S1
AVG
S10S9
S8S7S6S5S4
S3
S2
221
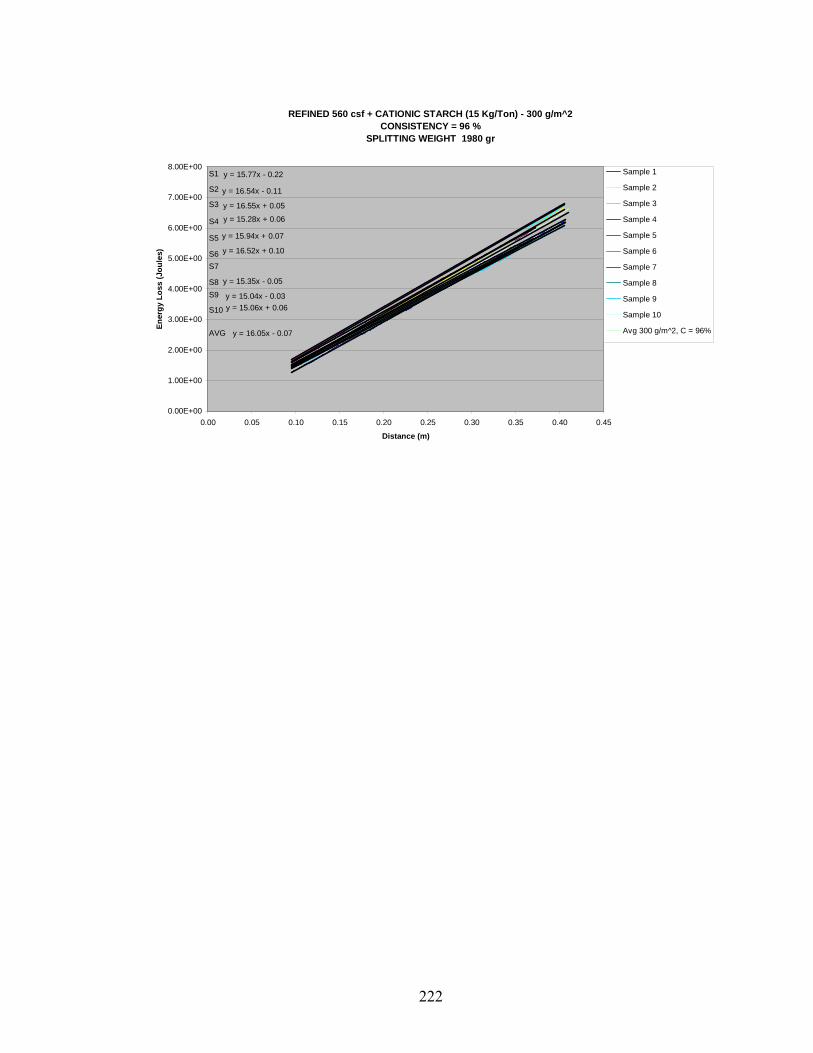
REFINED 560 csf + CATIONIC STARCH (15 Kg/Ton) - 300 g/m^2CONSISTENCY = 96 %
SPLITTING WEIGHT 1980 gr
y = 15.77x - 0.22
y = 16.54x - 0.11
y = 16.55x + 0.05
y = 15.28x + 0.06
y = 15.94x + 0.07
y = 16.52x + 0.10
y = 15.35x - 0.05
y = 15.04x - 0.03y = 15.06x + 0.06
y = 16.05x - 0.07
0.00E+00
1.00E+00
2.00E+00
3.00E+00
4.00E+00
5.00E+00
6.00E+00
7.00E+00
8.00E+00
0.00 0.05 0.10 0.15 0.20 0.25 0.30 0.35 0.40 0.45
Distance (m)
Ener
gy L
oss
(Jou
les)
Sample 1
Sample 2
Sample 3
Sample 4
Sample 5
Sample 6
Sample 7
Sample 8
Sample 9
Sample 10
Avg 300 g/m^2, C = 96%
S1
AVG
S10
S9S8
S7S6
S5
S4
S3
S2
222
Case 11: Refining 560 C.S.F.; ASH 23% (Normal Clay), 15 kg/ton C-Starch; Basis Weight [346 g/m^2]
223
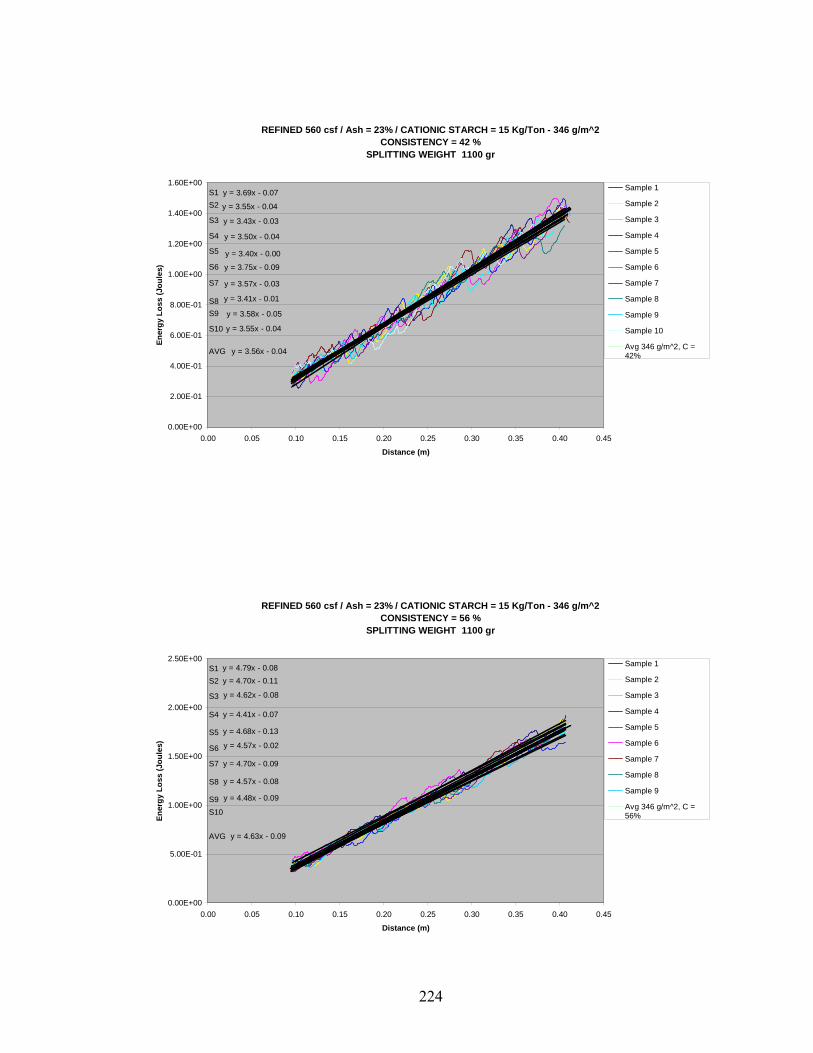
REFINED 560 csf / Ash = 23% / CATIONIC STARCH = 15 Kg/Ton - 346 g/m^2CONSISTENCY = 42 %
SPLITTING WEIGHT 1100 gr
y = 3.69x - 0.07
y = 3.55x - 0.04
y = 3.43x - 0.03
y = 3.50x - 0.04
y = 3.40x - 0.00
y = 3.75x - 0.09
y = 3.57x - 0.03
y = 3.41x - 0.01
y = 3.58x - 0.05
y = 3.55x - 0.04
y = 3.56x - 0.04
0.00E+00
2.00E-01
4.00E-01
6.00E-01
8.00E-01
1.00E+00
1.20E+00
1.40E+00
1.60E+00
0.00 0.05 0.10 0.15 0.20 0.25 0.30 0.35 0.40 0.45
Distance (m)
Ener
gy L
oss
(Jou
les)
Sample 1
Sample 2
Sample 3
Sample 4
Sample 5
Sample 6
Sample 7
Sample 8
Sample 9
Sample 10
Avg 346 g/m^2, C =42%
S1
AVG
S10
S9S8
S7
S6
S5
S4
S3
S2
REFINED 560 csf / Ash = 23% / CATIONIC STARCH = 15 Kg/Ton - 346 g/m^2CONSISTENCY = 56 %
SPLITTING WEIGHT 1100 gr
y = 4.79x - 0.08y = 4.70x - 0.11
y = 4.62x - 0.08
y = 4.41x - 0.07
y = 4.68x - 0.13
y = 4.57x - 0.02
y = 4.70x - 0.09
y = 4.57x - 0.08
y = 4.48x - 0.09
y = 4.63x - 0.09
0.00E+00
5.00E-01
1.00E+00
1.50E+00
2.00E+00
2.50E+00
0.00 0.05 0.10 0.15 0.20 0.25 0.30 0.35 0.40 0.45
Distance (m)
Ener
gy L
oss
(Jou
les)
Sample 1
Sample 2
Sample 3
Sample 4
Sample 5
Sample 6
Sample 7
Sample 8
Sample 9
Avg 346 g/m^2, C =56%
S1
AVG
S10S9
S8
S7
S6
S5
S4
S3
S2
224
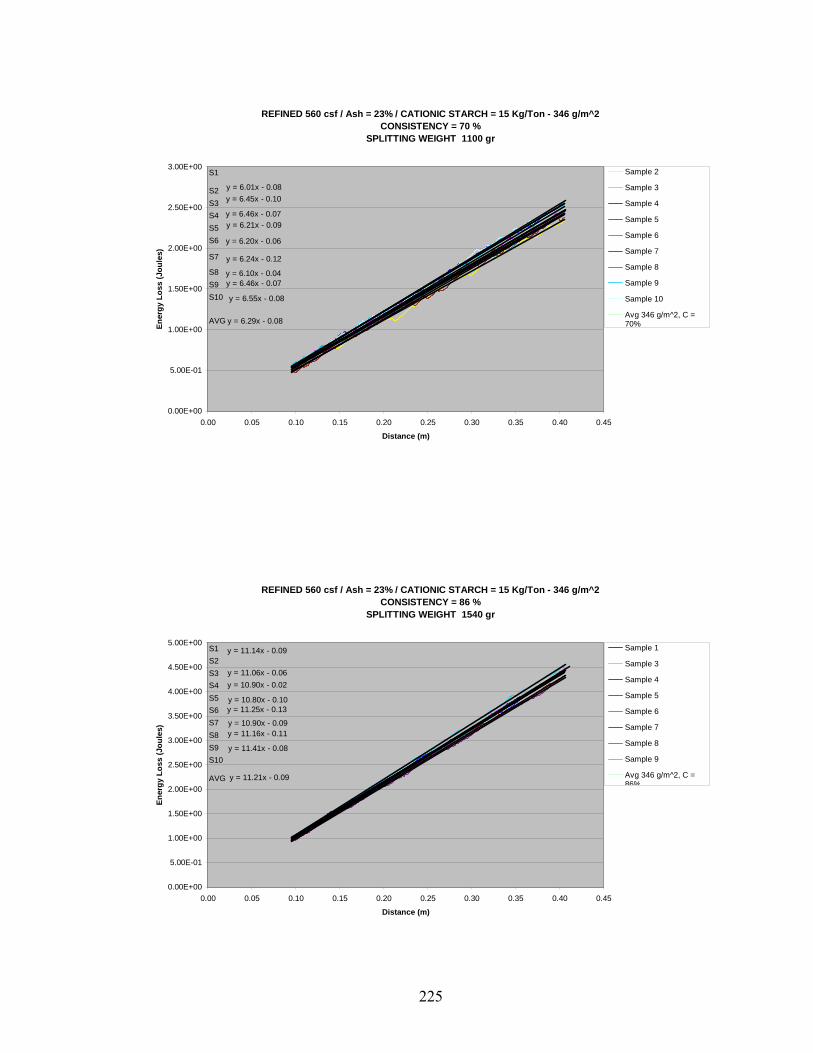
REFINED 560 csf / Ash = 23% / CATIONIC STARCH = 15 Kg/Ton - 346 g/m^2CONSISTENCY = 70 %
SPLITTING WEIGHT 1100 gr
y = 6.01x - 0.08y = 6.45x - 0.10
y = 6.46x - 0.07y = 6.21x - 0.09
y = 6.20x - 0.06
y = 6.24x - 0.12
y = 6.10x - 0.04y = 6.46x - 0.07
y = 6.55x - 0.08
y = 6.29x - 0.08
0.00E+00
5.00E-01
1.00E+00
1.50E+00
2.00E+00
2.50E+00
3.00E+00
0.00 0.05 0.10 0.15 0.20 0.25 0.30 0.35 0.40 0.45
Distance (m)
Ener
gy L
oss
(Jou
les)
Sample 2
Sample 3
Sample 4
Sample 5
Sample 6
Sample 7
Sample 8
Sample 9
Sample 10
Avg 346 g/m^2, C =70%
S1
AVG
S10S9S8
S7
S6S5S4S3S2
REFINED 560 csf / Ash = 23% / CATIONIC STARCH = 15 Kg/Ton - 346 g/m^2CONSISTENCY = 86 %
SPLITTING WEIGHT 1540 gr
y = 11.14x - 0.09
y = 11.06x - 0.06y = 10.90x - 0.02
y = 10.80x - 0.10y = 11.25x - 0.13
y = 10.90x - 0.09y = 11.16x - 0.11
y = 11.41x - 0.08
y = 11.21x - 0.09
0.00E+00
5.00E-01
1.00E+00
1.50E+00
2.00E+00
2.50E+00
3.00E+00
3.50E+00
4.00E+00
4.50E+00
5.00E+00
0.00 0.05 0.10 0.15 0.20 0.25 0.30 0.35 0.40 0.45
Distance (m)
Ener
gy L
oss
(Jou
les)
Sample 1
Sample 3
Sample 4
Sample 5
Sample 6
Sample 7
Sample 8
Sample 9
Avg 346 g/m^2, C =86%
S1
AVG
S10S9S8S7S6S5S4S3S2
225
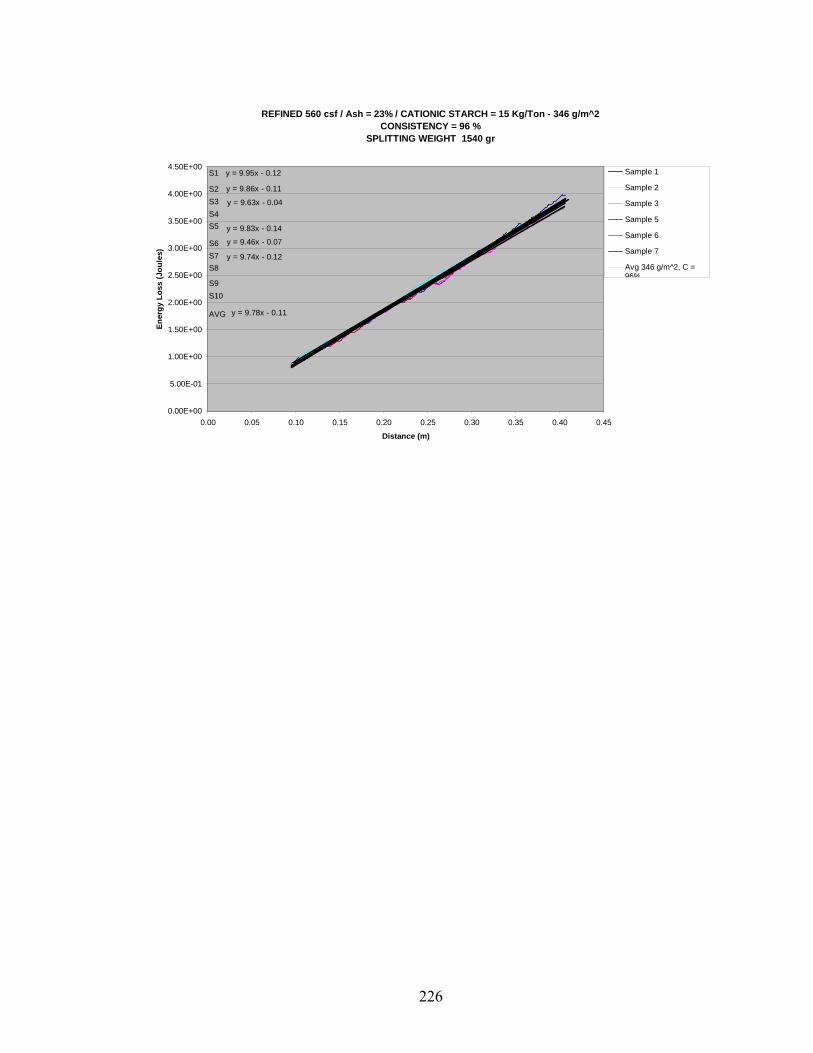
REFINED 560 csf / Ash = 23% / CATIONIC STARCH = 15 Kg/Ton - 346 g/m^2CONSISTENCY = 96 %
SPLITTING WEIGHT 1540 gr
y = 9.95x - 0.12
y = 9.86x - 0.11
y = 9.63x - 0.04
y = 9.83x - 0.14
y = 9.46x - 0.07
y = 9.74x - 0.12
y = 9.78x - 0.11
0.00E+00
5.00E-01
1.00E+00
1.50E+00
2.00E+00
2.50E+00
3.00E+00
3.50E+00
4.00E+00
4.50E+00
0.00 0.05 0.10 0.15 0.20 0.25 0.30 0.35 0.40 0.45
Distance (m)
Ener
gy L
oss
(Jou
les)
Sample 1
Sample 2
Sample 3
Sample 5
Sample 6
Sample 7
Avg 346 g/m^2, C =96%
S1
AVG
S10S9
S8S7S6
S5S4S3S2
226

Case 12: Refining 560 C.S.F.; ASH 23% (Normal Clay), 30 kg/ton C-Starch; Basis Weight [341 g/m^2]
227
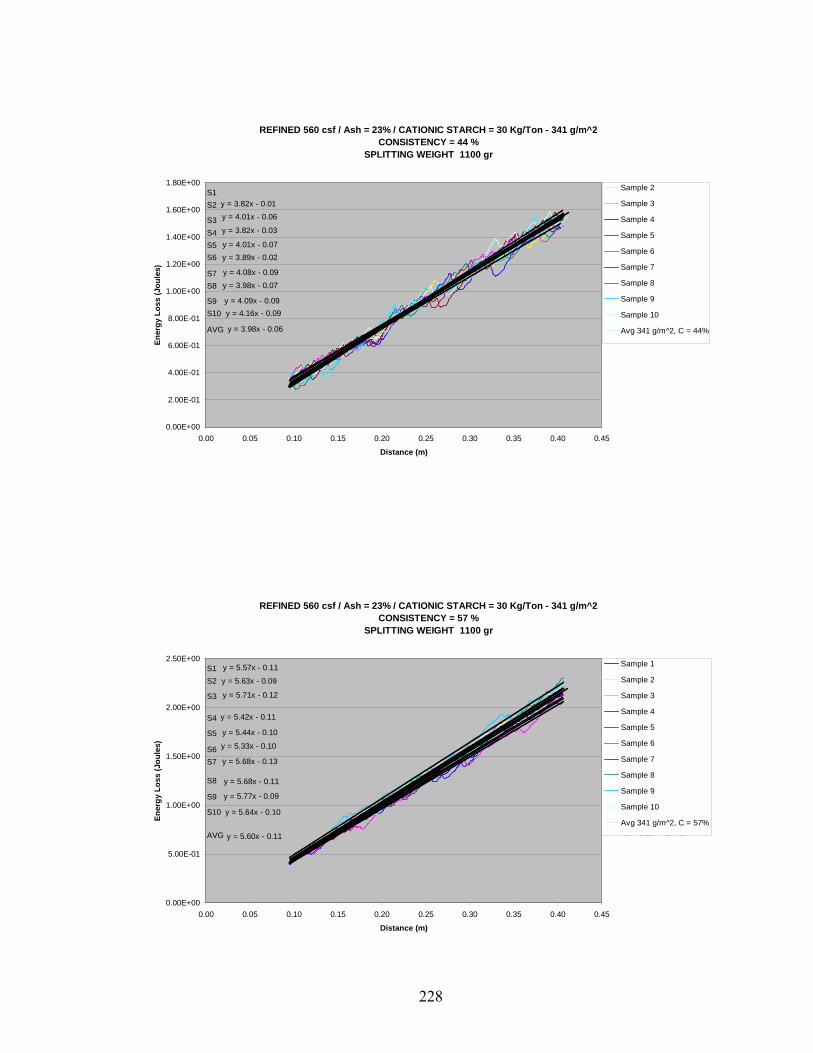
REFINED 560 csf / Ash = 23% / CATIONIC STARCH = 30 Kg/Ton - 341 g/m^2CONSISTENCY = 44 %
SPLITTING WEIGHT 1100 gr
y = 3.82x - 0.01y = 4.01x - 0.06
y = 3.82x - 0.03
y = 4.01x - 0.07y = 3.89x - 0.02
y = 4.08x - 0.09y = 3.98x - 0.07
y = 4.09x - 0.09y = 4.16x - 0.09
y = 3.98x - 0.06
0.00E+00
2.00E-01
4.00E-01
6.00E-01
8.00E-01
1.00E+00
1.20E+00
1.40E+00
1.60E+00
1.80E+00
0.00 0.05 0.10 0.15 0.20 0.25 0.30 0.35 0.40 0.45
Distance (m)
Ener
gy L
oss
(Jou
les)
Sample 2
Sample 3
Sample 4
Sample 5
Sample 6
Sample 7
Sample 8
Sample 9
Sample 10
Avg 341 g/m^2, C = 44%
S1
AVG
S10S9
S8S7
S6S5S4S3
S2
REFINED 560 csf / Ash = 23% / CATIONIC STARCH = 30 Kg/Ton - 341 g/m^2CONSISTENCY = 57 %
SPLITTING WEIGHT 1100 gr
y = 5.57x - 0.11
y = 5.63x - 0.09
y = 5.71x - 0.12
y = 5.42x - 0.11
y = 5.44x - 0.10
y = 5.33x - 0.10
y = 5.68x - 0.13
y = 5.68x - 0.11
y = 5.77x - 0.09
y = 5.64x - 0.10
y = 5.60x - 0.11
0.00E+00
5.00E-01
1.00E+00
1.50E+00
2.00E+00
2.50E+00
0.00 0.05 0.10 0.15 0.20 0.25 0.30 0.35 0.40 0.45
Distance (m)
Ener
gy L
oss
(Jou
les)
Sample 1
Sample 2
Sample 3
Sample 4
Sample 5
Sample 6
Sample 7
Sample 8
Sample 9
Sample 10
Avg 341 g/m^2, C = 57%
Li l (S l 1)
S1
AVG
S10
S9
S8
S7S6
S5
S4
S3
S2
228
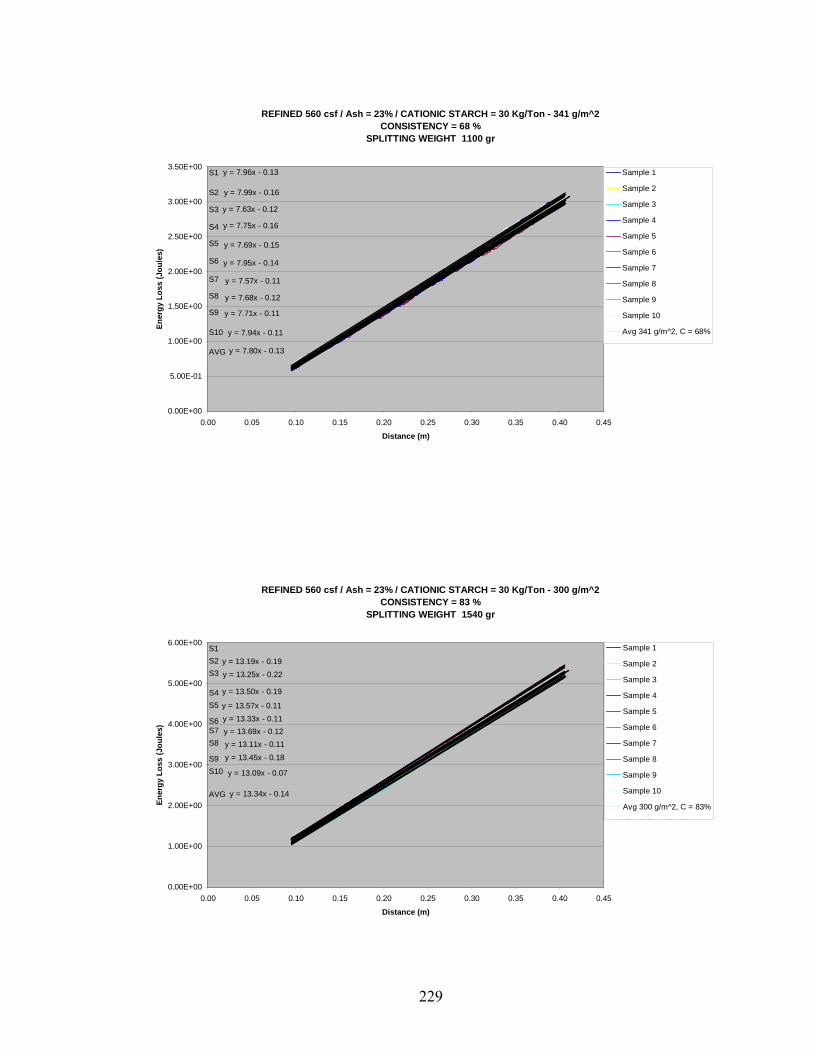
REFINED 560 csf / Ash = 23% / CATIONIC STARCH = 30 Kg/Ton - 341 g/m^2CONSISTENCY = 68 %
SPLITTING WEIGHT 1100 gr
y = 7.96x - 0.13
y = 7.99x - 0.16
y = 7.63x - 0.12
y = 7.75x - 0.16
y = 7.69x - 0.15
y = 7.95x - 0.14
y = 7.57x - 0.11
y = 7.68x - 0.12
y = 7.71x - 0.11
y = 7.94x - 0.11
y = 7.80x - 0.13
0.00E+00
5.00E-01
1.00E+00
1.50E+00
2.00E+00
2.50E+00
3.00E+00
3.50E+00
0.00 0.05 0.10 0.15 0.20 0.25 0.30 0.35 0.40 0.45
Distance (m)
Ener
gy L
oss
(Jou
les)
Sample 1
Sample 2
Sample 3
Sample 4
Sample 5
Sample 6
Sample 7
Sample 8
Sample 9
Sample 10
Avg 341 g/m^2, C = 68%
S1
AVG
S10
S9
S8
S7
S6
S5
S4
S3
S2
REFINED 560 csf / Ash = 23% / CATIONIC STARCH = 30 Kg/Ton - 300 g/m^2CONSISTENCY = 83 %
SPLITTING WEIGHT 1540 gr
y = 13.19x - 0.19y = 13.25x - 0.22
y = 13.50x - 0.19
y = 13.57x - 0.11y = 13.33x - 0.11y = 13.69x - 0.12y = 13.11x - 0.11
y = 13.45x - 0.18
y = 13.09x - 0.07
y = 13.34x - 0.14
0.00E+00
1.00E+00
2.00E+00
3.00E+00
4.00E+00
5.00E+00
6.00E+00
0.00 0.05 0.10 0.15 0.20 0.25 0.30 0.35 0.40 0.45
Distance (m)
Ener
gy L
oss
(Jou
les)
Sample 1
Sample 2
Sample 3
Sample 4
Sample 5
Sample 6
Sample 7
Sample 8
Sample 9
Sample 10
Avg 300 g/m^2, C = 83%
Li l (S l 1)
S1
AVG
S10S9
S8S7S6
S5S4
S3S2
229
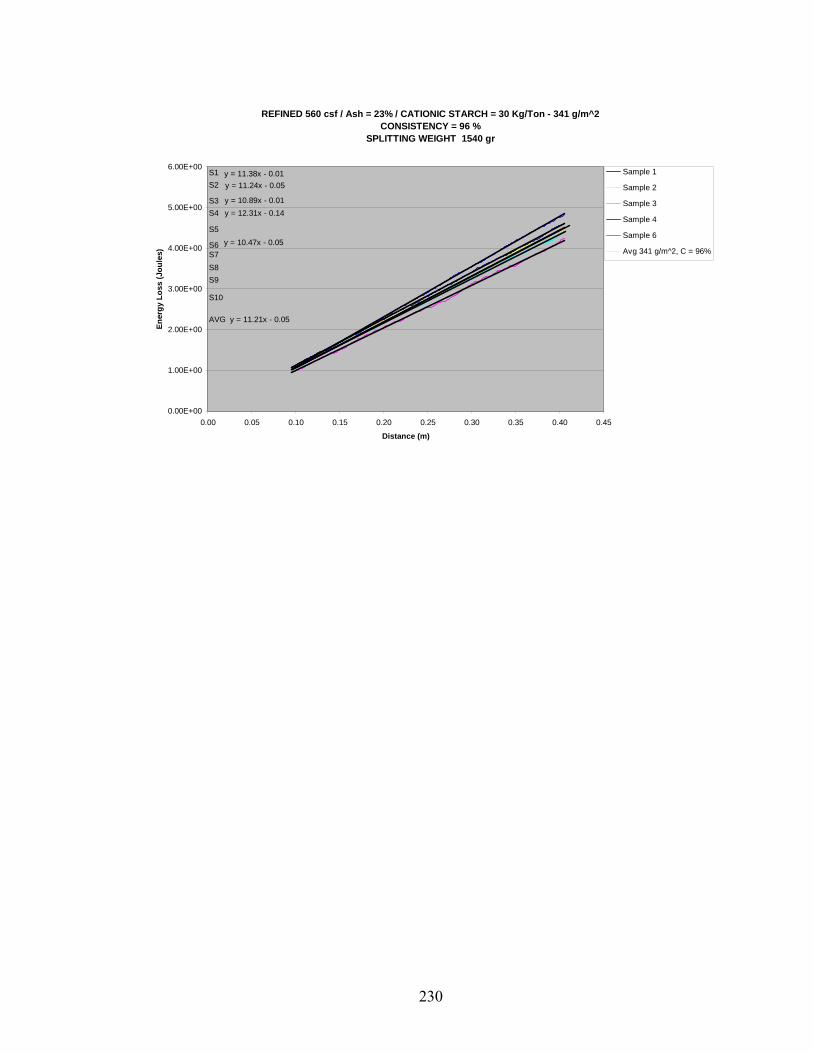
REFINED 560 csf / Ash = 23% / CATIONIC STARCH = 30 Kg/Ton - 341 g/m^2CONSISTENCY = 96 %
SPLITTING WEIGHT 1540 gr
y = 11.38x - 0.01y = 11.24x - 0.05
y = 10.89x - 0.01y = 12.31x - 0.14
y = 10.47x - 0.05
y = 11.21x - 0.05
0.00E+00
1.00E+00
2.00E+00
3.00E+00
4.00E+00
5.00E+00
6.00E+00
0.00 0.05 0.10 0.15 0.20 0.25 0.30 0.35 0.40 0.45
Distance (m)
Ener
gy L
oss
(Jou
les)
Sample 1
Sample 2
Sample 3
Sample 4
Sample 6
Avg 341 g/m^2, C = 96%
S1
AVG
S10
S9S8S7S6
S5
S4S3
S2
230
APPENDIX C: MEAN AND STANDARD DEVIATION FOR APPARATUS ENERGY LOSS
231
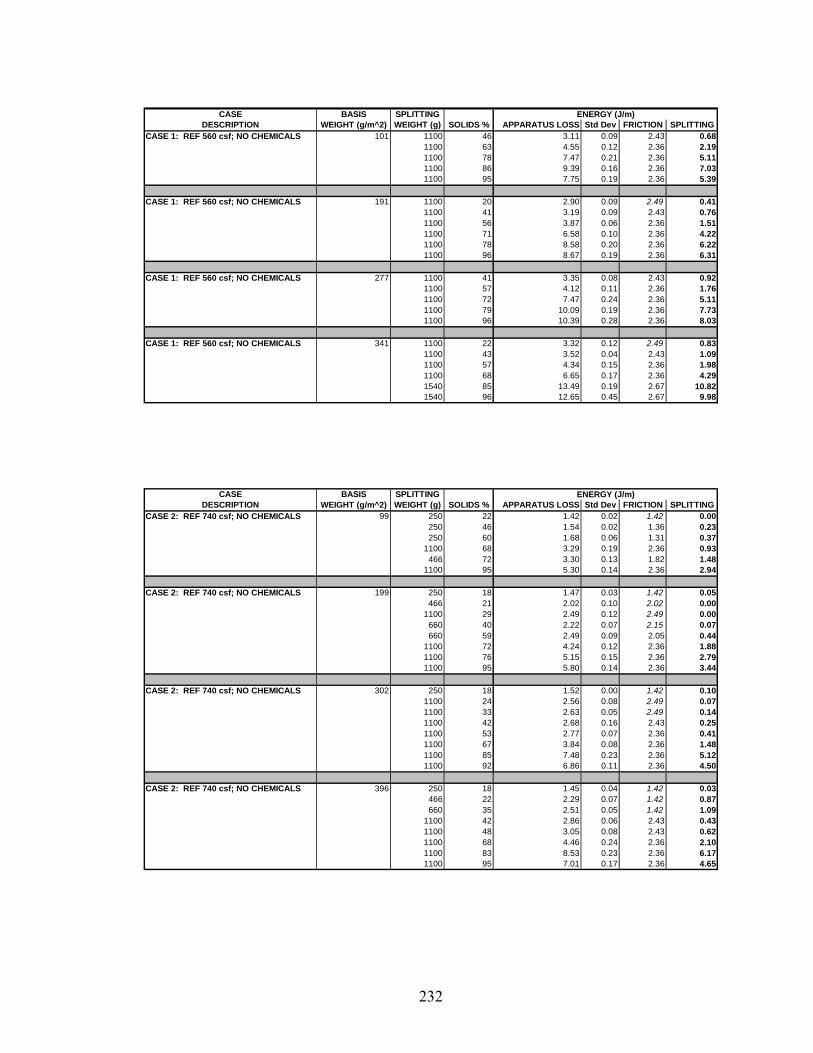
CASE BASIS SPLITTINGDESCRIPTION WEIGHT (g/m^2) WEIGHT (g) SOLIDS % APPARATUS LOSS Std Dev FRICTION SPLITTING
CASE 1: REF 560 csf; NO CHEMICALS 101 1100 46 3.11 0.09 2.43 0.681100 63 4.55 0.12 2.36 2.191100 78 7.47 0.21 2.36 5.111100 86 9.39 0.16 2.36 7.031100 95 7.75 0.19 2.36 5.39
CASE 1: REF 560 csf; NO CHEMICALS 191 1100 20 2.90 0.09 2.49 0.411100 41 3.19 0.09 2.43 0.761100 56 3.87 0.06 2.36 1.511100 71 6.58 0.10 2.36 4.221100 78 8.58 0.20 2.36 6.221100 96 8.67 0.19 2.36 6.31
CASE 1: REF 560 csf; NO CHEMICALS 277 1100 41 3.35 0.08 2.43 0.921100 57 4.12 0.11 2.36 1.761100 72 7.47 0.24 2.36 5.111100 79 10.09 0.19 2.36 7.731100 96 10.39 0.28 2.36 8.03
CASE 1: REF 560 csf; NO CHEMICALS 341 1100 22 3.32 0.12 2.49 0.831100 43 3.52 0.04 2.43 1.091100 57 4.34 0.15 2.36 1.981100 68 6.65 0.17 2.36 4.291540 85 13.49 0.19 2.67 10.821540 96 12.65 0.45 2.67 9.98
ENERGY (J/m)
CASE BASIS SPLITTINGDESCRIPTION WEIGHT (g/m^2) WEIGHT (g) SOLIDS % APPARATUS LOSS Std Dev FRICTION SPLITTING
CASE 2: REF 740 csf; NO CHEMICALS 99 250 22 1.42 0.02 1.42 0.00250 46 1.54 0.02 1.36 0.23250 60 1.68 0.06 1.31 0.37
1100 68 3.29 0.19 2.36 0.93466 72 3.30 0.13 1.82 1.48
1100 95 5.30 0.14 2.36 2.94
CASE 2: REF 740 csf; NO CHEMICALS 199 250 18 1.47 0.03 1.42 0.05466 21 2.02 0.10 2.02 0.00
1100 29 2.49 0.12 2.49 0.00660 40 2.22 0.07 2.15 0.07660 59 2.49 0.09 2.05 0.44
1100 72 4.24 0.12 2.36 1.881100 76 5.15 0.15 2.36 2.791100 95 5.80 0.14 2.36 3.44
CASE 2: REF 740 csf; NO CHEMICALS 302 250 18 1.52 0.00 1.42 0.101100 24 2.56 0.08 2.49 0.071100 33 2.63 0.05 2.49 0.141100 42 2.68 0.16 2.43 0.251100 53 2.77 0.07 2.36 0.411100 67 3.84 0.08 2.36 1.481100 85 7.48 0.23 2.36 5.121100 92 6.86 0.11 2.36 4.50
CASE 2: REF 740 csf; NO CHEMICALS 396 250 18 1.45 0.04 1.42 0.03466 22 2.29 0.07 1.42 0.87660 35 2.51 0.05 1.42 1.09
1100 42 2.86 0.06 2.43 0.431100 48 3.05 0.08 2.43 0.621100 68 4.46 0.24 2.36 2.101100 83 8.53 0.23 2.36 6.171100 95 7.01 0.17 2.36 4.65
ENERGY (J/m)
232
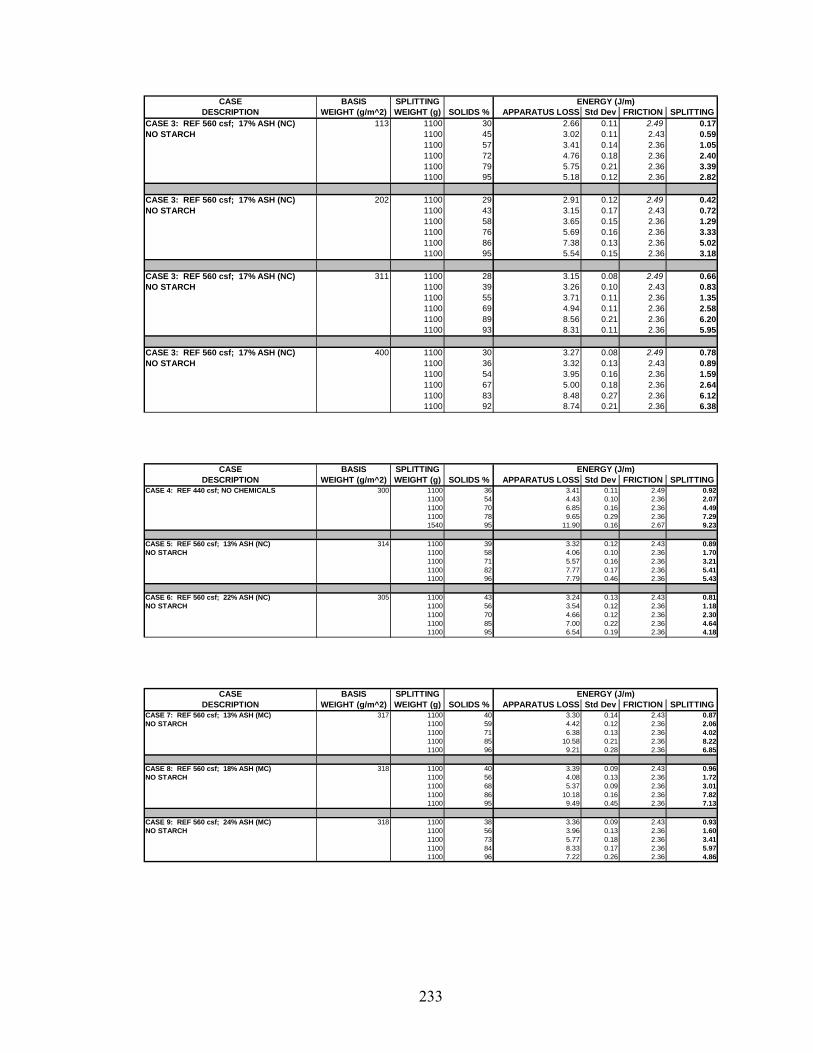
CASE BASIS SPLITTINGDESCRIPTION WEIGHT (g/m^2) WEIGHT (g) SOLIDS % APPARATUS LOSS Std Dev FRICTION SPLITTING
CASE 3: REF 560 csf; 17% ASH (NC) 113 1100 30 2.66 0.11 2.49 0.17NO STARCH 1100 45 3.02 0.11 2.43 0.59
1100 57 3.41 0.14 2.36 1.051100 72 4.76 0.18 2.36 2.401100 79 5.75 0.21 2.36 3.391100 95 5.18 0.12 2.36 2.82
CASE 3: REF 560 csf; 17% ASH (NC) 202 1100 29 2.91 0.12 2.49 0.42NO STARCH 1100 43 3.15 0.17 2.43 0.72
1100 58 3.65 0.15 2.36 1.291100 76 5.69 0.16 2.36 3.331100 86 7.38 0.13 2.36 5.021100 95 5.54 0.15 2.36 3.18
CASE 3: REF 560 csf; 17% ASH (NC) 311 1100 28 3.15 0.08 2.49 0.66NO STARCH 1100 39 3.26 0.10 2.43 0.83
1100 55 3.71 0.11 2.36 1.351100 69 4.94 0.11 2.36 2.581100 89 8.56 0.21 2.36 6.201100 93 8.31 0.11 2.36 5.95
CASE 3: REF 560 csf; 17% ASH (NC) 400 1100 30 3.27 0.08 2.49 0.78NO STARCH 1100 36 3.32 0.13 2.43 0.89
1100 54 3.95 0.16 2.36 1.591100 67 5.00 0.18 2.36 2.641100 83 8.48 0.27 2.36 6.121100 92 8.74 0.21 2.36 6.38
ENERGY (J/m)
CASE BASIS SPLITTINGDESCRIPTION WEIGHT (g/m^2) WEIGHT (g) SOLIDS % APPARATUS LOSS Std Dev FRICTION SPLITTING
CASE 4: REF 440 csf; NO CHEMICALS 300 1100 36 3.41 0.11 2.49 0.921100 54 4.43 0.10 2.36 2.071100 70 6.85 0.16 2.36 4.491100 78 9.65 0.29 2.36 7.291540 95 11.90 0.16 2.67 9.23
CASE 5: REF 560 csf; 13% ASH (NC) 314 1100 39 3.32 0.12 2.43 0.89NO STARCH 1100 58 4.06 0.10 2.36 1.70
1100 71 5.57 0.16 2.36 3.211100 82 7.77 0.17 2.36 5.411100 96 7.79 0.46 2.36 5.43
CASE 6: REF 560 csf; 22% ASH (NC) 305 1100 43 3.24 0.13 2.43 0.81NO STARCH 1100 56 3.54 0.12 2.36 1.18
1100 70 4.66 0.12 2.36 2.301100 85 7.00 0.22 2.36 4.641100 95 6.54 0.19 2.36 4.18
ENERGY (J/m)
CASE BASIS SPLITTINGDESCRIPTION WEIGHT (g/m^2) WEIGHT (g) SOLIDS % APPARATUS LOSS Std Dev FRICTION SPLITTING
CASE 7: REF 560 csf; 13% ASH (MC) 317 1100 40 3.30 0.14 2.43 0.87NO STARCH 1100 59 4.42 0.12 2.36 2.06
1100 71 6.38 0.13 2.36 4.021100 85 10.58 0.21 2.36 8.221100 96 9.21 0.28 2.36 6.85
CASE 8: REF 560 csf; 18% ASH (MC) 318 1100 40 3.39 0.09 2.43 0.96NO STARCH 1100 56 4.08 0.13 2.36 1.72
1100 68 5.37 0.09 2.36 3.011100 86 10.18 0.16 2.36 7.821100 95 9.49 0.45 2.36 7.13
CASE 9: REF 560 csf; 24% ASH (MC) 318 1100 38 3.36 0.09 2.43 0.93NO STARCH 1100 56 3.96 0.13 2.36 1.60
1100 73 5.77 0.18 2.36 3.411100 84 8.33 0.17 2.36 5.971100 96 7.22 0.26 2.36 4.86
ENERGY (J/m)
233
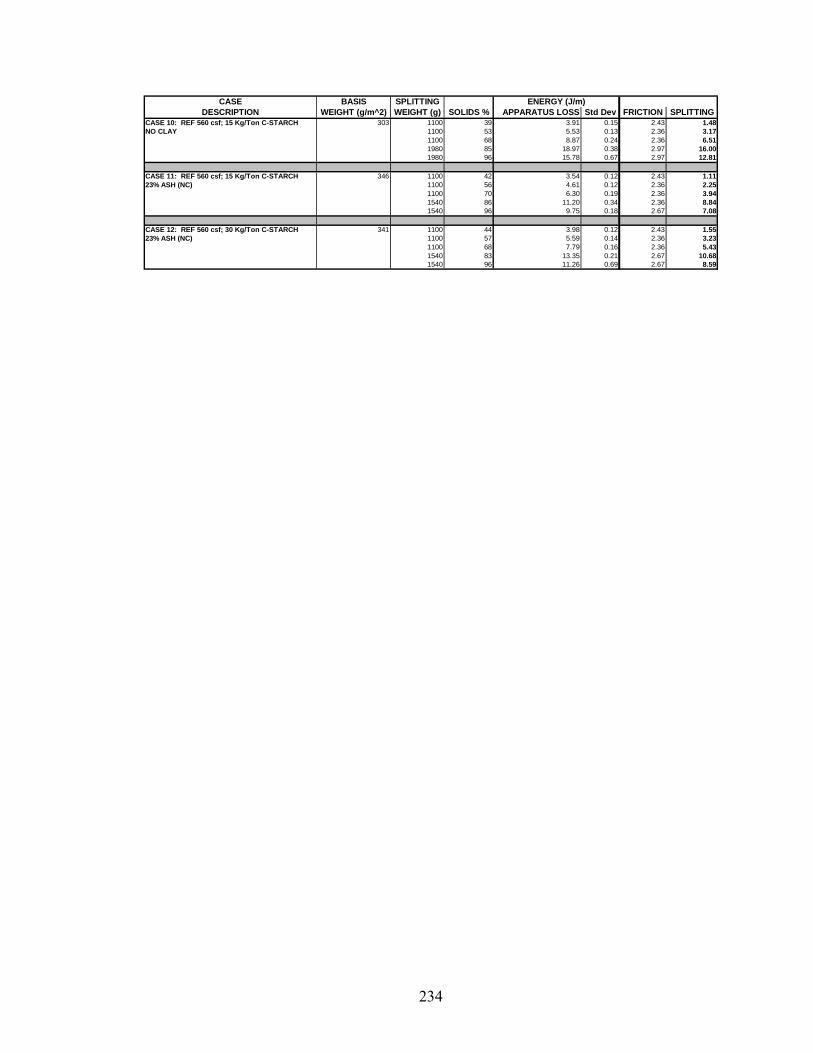
CASE BASIS SPLITTINGDESCRIPTION WEIGHT (g/m^2) WEIGHT (g) SOLIDS % APPARATUS LOSS Std Dev FRICTION SPLITTING
CASE 10: REF 560 csf; 15 Kg/Ton C-STARCH 303 1100 39 3.91 0.15 2.43 1.48NO CLAY 1100 53 5.53 0.13 2.36 3.17
1100 68 8.87 0.24 2.36 6.511980 85 18.97 0.38 2.97 16.001980 96 15.78 0.67 2.97 12.81
CASE 11: REF 560 csf; 15 Kg/Ton C-STARCH 346 1100 42 3.54 0.12 2.43 1.1123% ASH (NC) 1100 56 4.61 0.12 2.36 2.25
1100 70 6.30 0.19 2.36 3.941540 86 11.20 0.34 2.36 8.841540 96 9.75 0.18 2.67 7.08
CASE 12: REF 560 csf; 30 Kg/Ton C-STARCH 341 1100 44 3.98 0.12 2.43 1.5523% ASH (NC) 1100 57 5.59 0.14 2.36 3.23
1100 68 7.79 0.16 2.36 5.431540 83 13.35 0.21 2.67 10.681540 96 11.26 0.69 2.67 8.59
ENERGY (J/m)
234
APPENDIX D: FRICTION ENERGY LOSS VS SPLITTING WEIGHT AND COUNTER WEIGHT
Splitting Weight = 125g
235
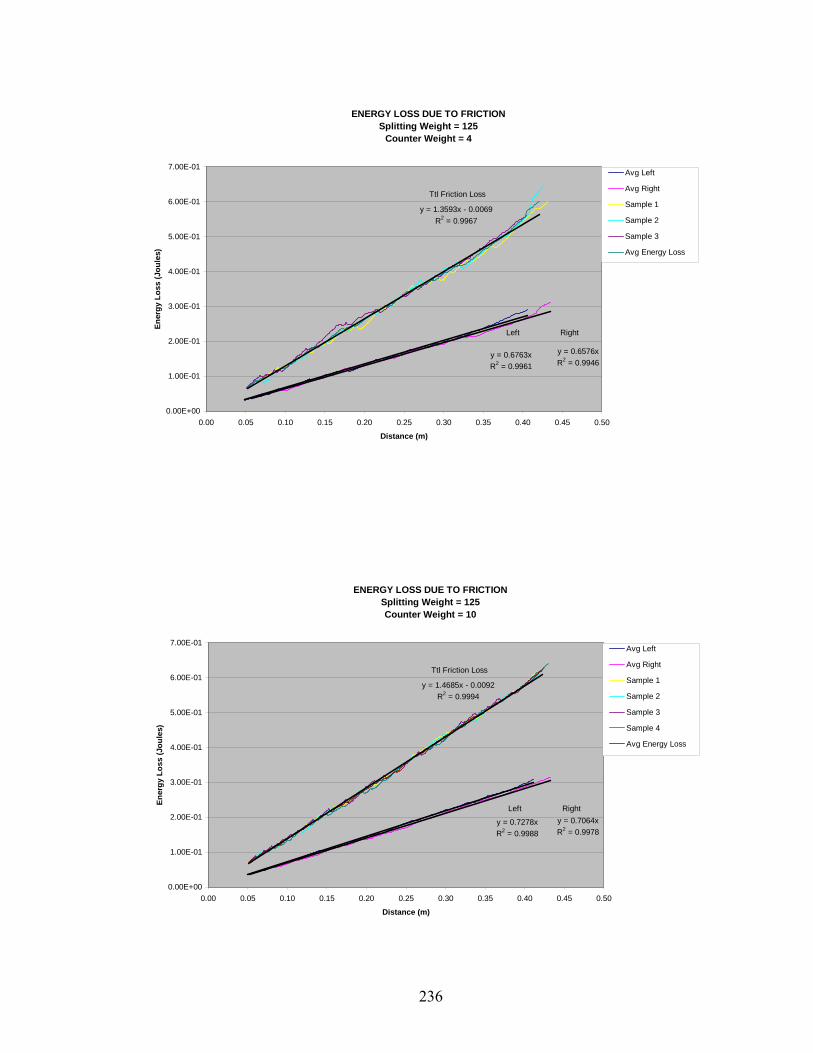
ENERGY LOSS DUE TO FRICTIONSplitting Weight = 125
Counter Weight = 4
y = 0.6763xR2 = 0.9961
y = 0.6576xR2 = 0.9946
y = 1.3593x - 0.0069R2 = 0.9967
0.00E+00
1.00E-01
2.00E-01
3.00E-01
4.00E-01
5.00E-01
6.00E-01
7.00E-01
0.00 0.05 0.10 0.15 0.20 0.25 0.30 0.35 0.40 0.45 0.50
Distance (m)
Ener
gy L
oss
(Jou
les)
Avg Left
Avg Right
Sample 1
Sample 2
Sample 3
Avg Energy Loss
Left Right
Ttl Friction Loss
ENERGY LOSS DUE TO FRICTIONSplitting Weight = 125Counter Weight = 10
y = 0.7278xR2 = 0.9988
y = 0.7064xR2 = 0.9978
y = 1.4685x - 0.0092R2 = 0.9994
0.00E+00
1.00E-01
2.00E-01
3.00E-01
4.00E-01
5.00E-01
6.00E-01
7.00E-01
0.00 0.05 0.10 0.15 0.20 0.25 0.30 0.35 0.40 0.45 0.50
Distance (m)
Ener
gy L
oss
(Jou
les)
Avg Left
Avg Right
Sample 1
Sample 2
Sample 3
Sample 4
Avg Energy Loss
Left Right
Ttl Friction Loss
236
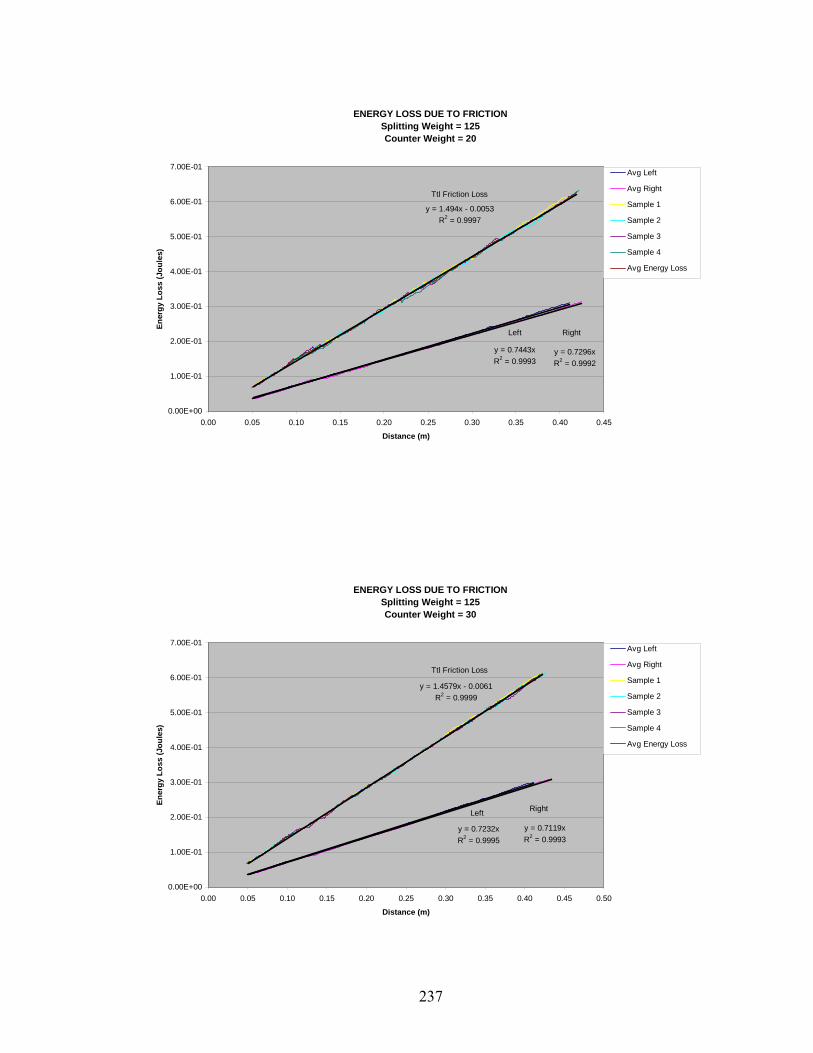
ENERGY LOSS DUE TO FRICTIONSplitting Weight = 125Counter Weight = 20
y = 0.7443xR2 = 0.9993
y = 0.7296xR2 = 0.9992
y = 1.494x - 0.0053R2 = 0.9997
0.00E+00
1.00E-01
2.00E-01
3.00E-01
4.00E-01
5.00E-01
6.00E-01
7.00E-01
0.00 0.05 0.10 0.15 0.20 0.25 0.30 0.35 0.40 0.45
Distance (m)
Ener
gy L
oss
(Jou
les)
Avg Left
Avg Right
Sample 1
Sample 2
Sample 3
Sample 4
Avg Energy Loss
Left Right
Ttl Friction Loss
ENERGY LOSS DUE TO FRICTIONSplitting Weight = 125Counter Weight = 30
y = 0.7232xR2 = 0.9995
y = 0.7119xR2 = 0.9993
y = 1.4579x - 0.0061R2 = 0.9999
0.00E+00
1.00E-01
2.00E-01
3.00E-01
4.00E-01
5.00E-01
6.00E-01
7.00E-01
0.00 0.05 0.10 0.15 0.20 0.25 0.30 0.35 0.40 0.45 0.50
Distance (m)
Ener
gy L
oss
(Jou
les)
Avg Left
Avg Right
Sample 1
Sample 2
Sample 3
Sample 4
Avg Energy Loss
Left Right
Ttl Friction Loss
237
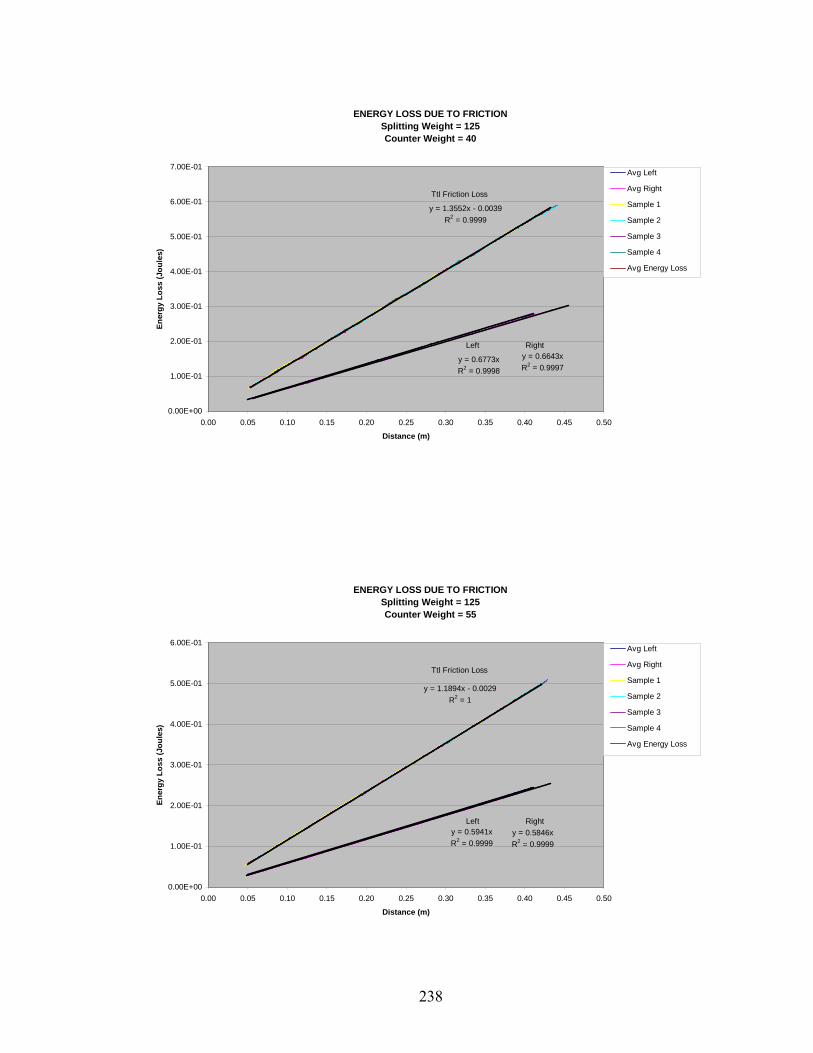
ENERGY LOSS DUE TO FRICTIONSplitting Weight = 125Counter Weight = 40
y = 0.6773xR2 = 0.9998
y = 0.6643xR2 = 0.9997
y = 1.3552x - 0.0039R2 = 0.9999
0.00E+00
1.00E-01
2.00E-01
3.00E-01
4.00E-01
5.00E-01
6.00E-01
7.00E-01
0.00 0.05 0.10 0.15 0.20 0.25 0.30 0.35 0.40 0.45 0.50
Distance (m)
Ener
gy L
oss
(Jou
les)
Avg Left
Avg Right
Sample 1
Sample 2
Sample 3
Sample 4
Avg Energy Loss
Left Right
Ttl Friction Loss
ENERGY LOSS DUE TO FRICTIONSplitting Weight = 125Counter Weight = 55
y = 0.5941xR2 = 0.9999
y = 0.5846xR2 = 0.9999
y = 1.1894x - 0.0029R2 = 1
0.00E+00
1.00E-01
2.00E-01
3.00E-01
4.00E-01
5.00E-01
6.00E-01
0.00 0.05 0.10 0.15 0.20 0.25 0.30 0.35 0.40 0.45 0.50
Distance (m)
Ener
gy L
oss
(Jou
les)
Avg Left
Avg Right
Sample 1
Sample 2
Sample 3
Sample 4
Avg Energy Loss
Left Right
Ttl Friction Loss
238
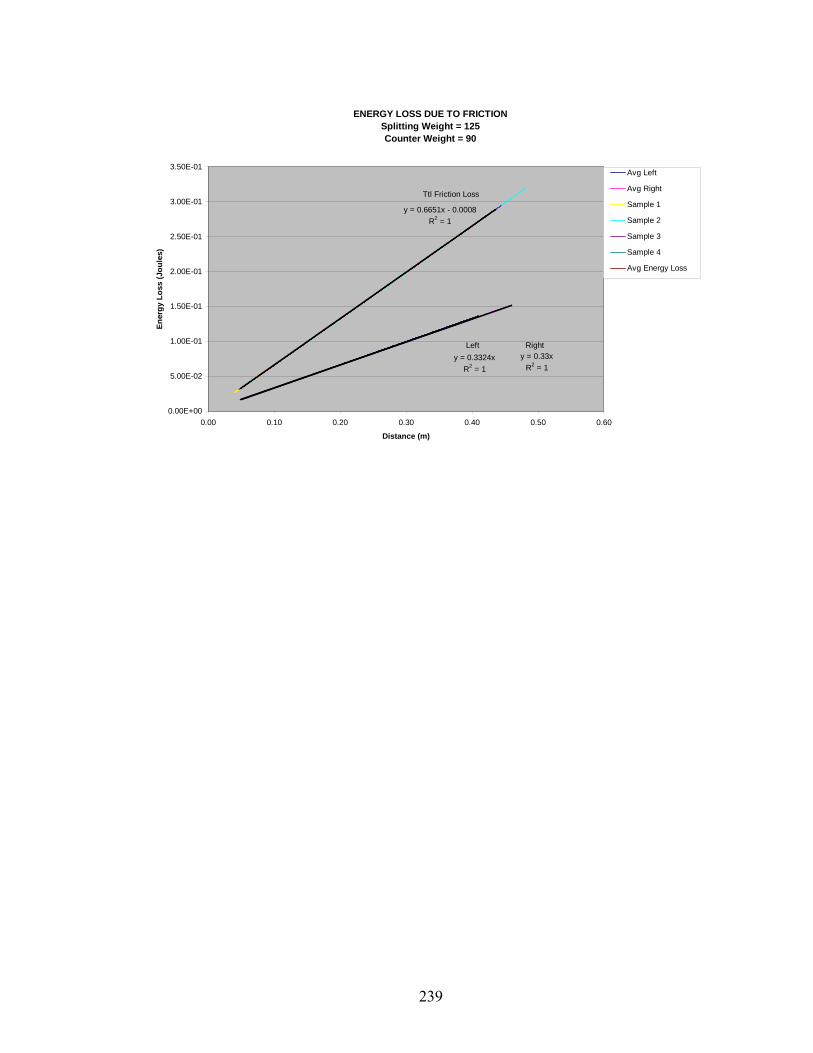
ENERGY LOSS DUE TO FRICTIONSplitting Weight = 125Counter Weight = 90
y = 0.3324xR2 = 1
y = 0.33xR2 = 1
y = 0.6651x - 0.0008R2 = 1
0.00E+00
5.00E-02
1.00E-01
1.50E-01
2.00E-01
2.50E-01
3.00E-01
3.50E-01
0.00 0.10 0.20 0.30 0.40 0.50 0.60
Distance (m)
Ener
gy L
oss
(Jou
les)
Avg Left
Avg Right
Sample 1
Sample 2
Sample 3
Sample 4
Avg Energy Loss
Left Right
Ttl Friction Loss
239

APPENDIX D: FRICTION ENERGY LOSS VS SPLITTING WEIGHT AND COUNTER WEIGHT
Splitting Weight = 233g
240
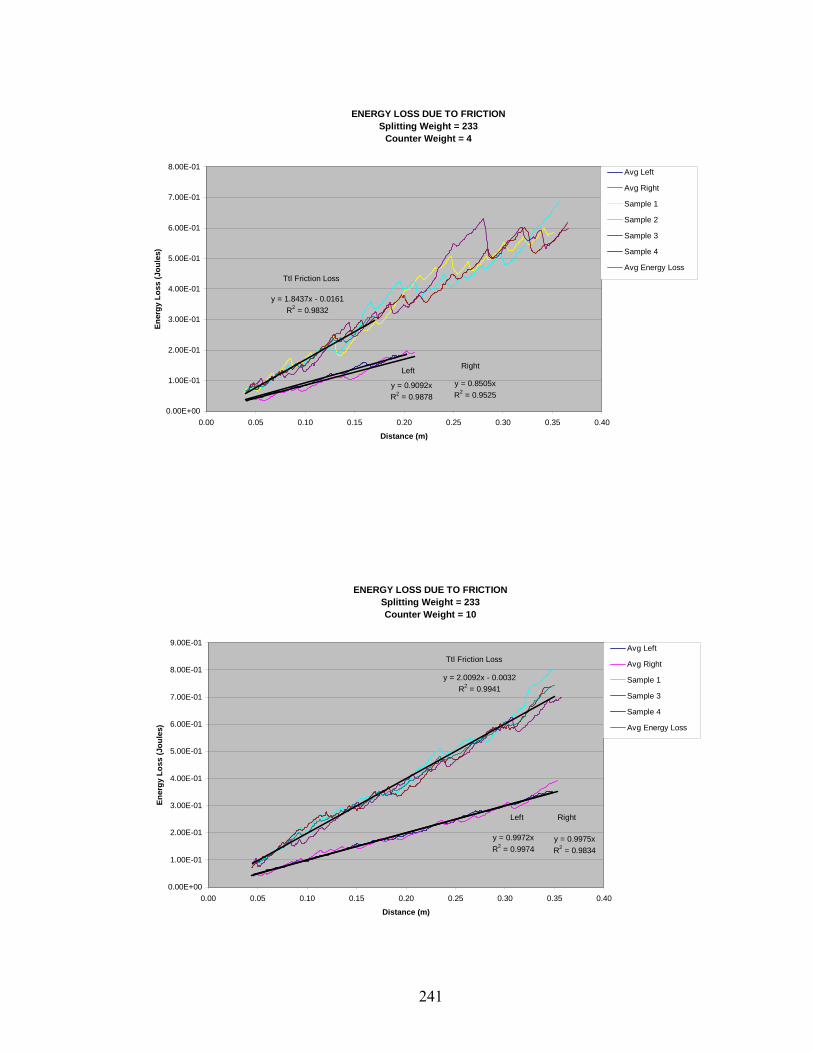
ENERGY LOSS DUE TO FRICTIONSplitting Weight = 233
Counter Weight = 4
y = 0.9092xR2 = 0.9878
y = 0.8505xR2 = 0.9525
y = 1.8437x - 0.0161R2 = 0.9832
0.00E+00
1.00E-01
2.00E-01
3.00E-01
4.00E-01
5.00E-01
6.00E-01
7.00E-01
8.00E-01
0.00 0.05 0.10 0.15 0.20 0.25 0.30 0.35 0.40
Distance (m)
Ener
gy L
oss
(Jou
les)
Avg Left
Avg Right
Sample 1
Sample 2
Sample 3
Sample 4
Avg Energy Loss
Left Right
Ttl Friction Loss
ENERGY LOSS DUE TO FRICTIONSplitting Weight = 233Counter Weight = 10
y = 0.9972xR2 = 0.9974
y = 0.9975xR2 = 0.9834
y = 2.0092x - 0.0032R2 = 0.9941
0.00E+00
1.00E-01
2.00E-01
3.00E-01
4.00E-01
5.00E-01
6.00E-01
7.00E-01
8.00E-01
9.00E-01
0.00 0.05 0.10 0.15 0.20 0.25 0.30 0.35 0.40
Distance (m)
Ener
gy L
oss
(Jou
les)
Avg Left
Avg Right
Sample 1
Sample 3
Sample 4
Avg Energy Loss
Left Right
Ttl Friction Loss
241
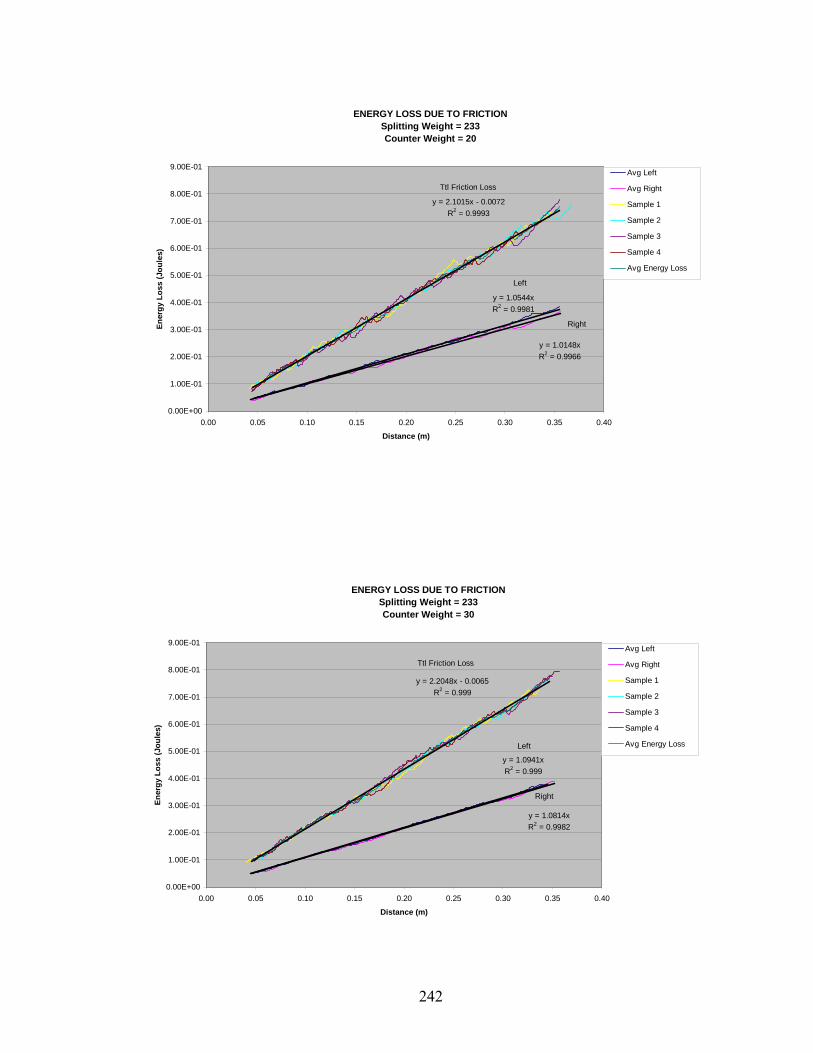
ENERGY LOSS DUE TO FRICTIONSplitting Weight = 233Counter Weight = 20
y = 1.0544xR2 = 0.9981
y = 1.0148xR2 = 0.9966
y = 2.1015x - 0.0072R2 = 0.9993
0.00E+00
1.00E-01
2.00E-01
3.00E-01
4.00E-01
5.00E-01
6.00E-01
7.00E-01
8.00E-01
9.00E-01
0.00 0.05 0.10 0.15 0.20 0.25 0.30 0.35 0.40
Distance (m)
Ener
gy L
oss
(Jou
les)
Avg Left
Avg Right
Sample 1
Sample 2
Sample 3
Sample 4
Avg Energy Loss
Left
Right
Ttl Friction Loss
ENERGY LOSS DUE TO FRICTIONSplitting Weight = 233Counter Weight = 30
y = 1.0941xR2 = 0.999
y = 1.0814xR2 = 0.9982
y = 2.2048x - 0.0065R2 = 0.999
0.00E+00
1.00E-01
2.00E-01
3.00E-01
4.00E-01
5.00E-01
6.00E-01
7.00E-01
8.00E-01
9.00E-01
0.00 0.05 0.10 0.15 0.20 0.25 0.30 0.35 0.40
Distance (m)
Ener
gy L
oss
(Jou
les)
Avg Left
Avg Right
Sample 1
Sample 2
Sample 3
Sample 4
Avg Energy LossLeft
Right
Ttl Friction Loss
242
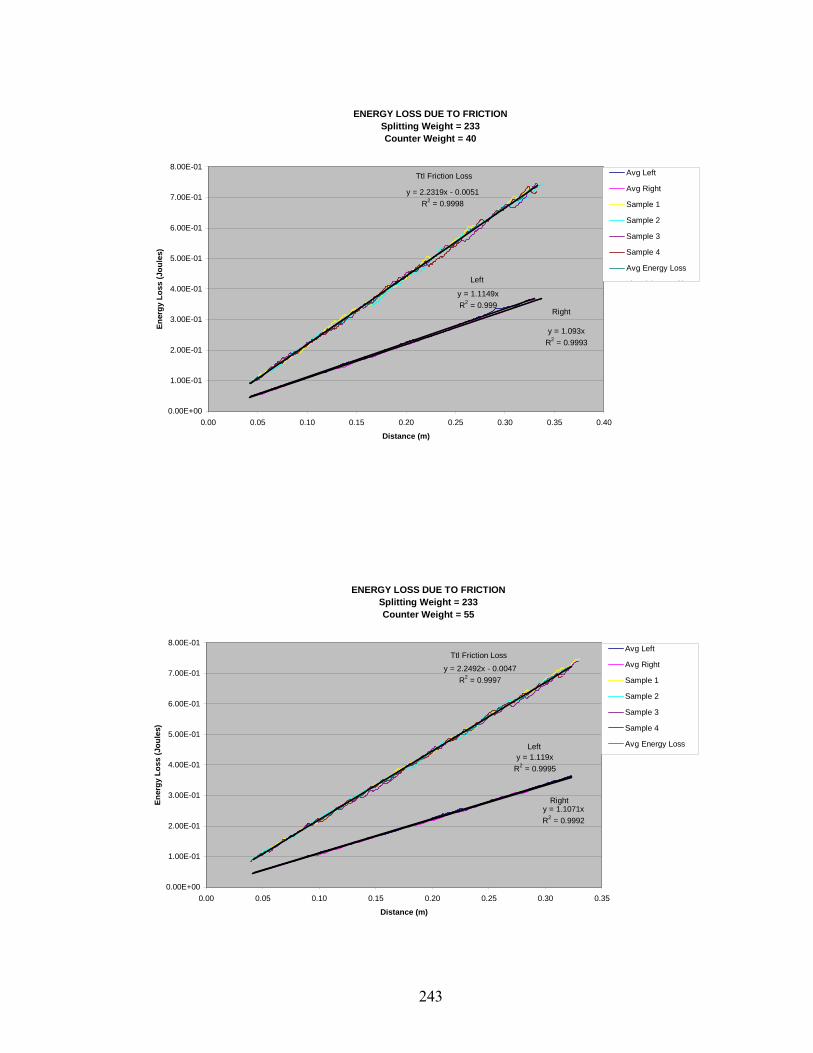
ENERGY LOSS DUE TO FRICTIONSplitting Weight = 233Counter Weight = 40
y = 1.1149xR2 = 0.999
y = 1.093xR2 = 0.9993
y = 2.2319x - 0.0051R2 = 0.9998
0.00E+00
1.00E-01
2.00E-01
3.00E-01
4.00E-01
5.00E-01
6.00E-01
7.00E-01
8.00E-01
0.00 0.05 0.10 0.15 0.20 0.25 0.30 0.35 0.40
Distance (m)
Ener
gy L
oss
(Jou
les)
Avg Left
Avg Right
Sample 1
Sample 2
Sample 3
Sample 4
Avg Energy Loss
Li l (A L ft)Left
Right
Ttl Friction Loss
ENERGY LOSS DUE TO FRICTIONSplitting Weight = 233Counter Weight = 55
y = 1.119xR2 = 0.9995
y = 1.1071xR2 = 0.9992
y = 2.2492x - 0.0047R2 = 0.9997
0.00E+00
1.00E-01
2.00E-01
3.00E-01
4.00E-01
5.00E-01
6.00E-01
7.00E-01
8.00E-01
0.00 0.05 0.10 0.15 0.20 0.25 0.30 0.35
Distance (m)
Ener
gy L
oss
(Jou
les)
Avg Left
Avg Right
Sample 1
Sample 2
Sample 3
Sample 4
Avg Energy LossLeft
Right
Ttl Friction Loss
243
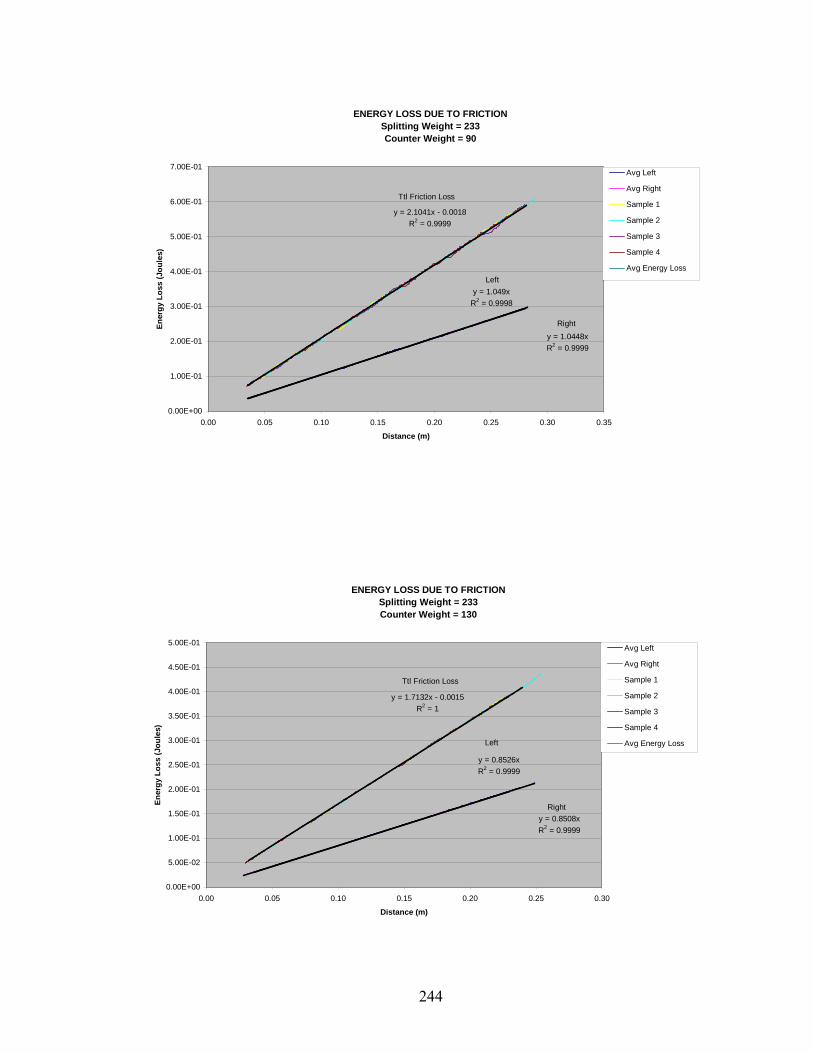
ENERGY LOSS DUE TO FRICTIONSplitting Weight = 233Counter Weight = 90
y = 1.049xR2 = 0.9998
y = 1.0448xR2 = 0.9999
y = 2.1041x - 0.0018R2 = 0.9999
0.00E+00
1.00E-01
2.00E-01
3.00E-01
4.00E-01
5.00E-01
6.00E-01
7.00E-01
0.00 0.05 0.10 0.15 0.20 0.25 0.30 0.35
Distance (m)
Ener
gy L
oss
(Jou
les)
Avg Left
Avg Right
Sample 1
Sample 2
Sample 3
Sample 4
Avg Energy LossLeft
Right
Ttl Friction Loss
ENERGY LOSS DUE TO FRICTIONSplitting Weight = 233Counter Weight = 130
y = 0.8526xR2 = 0.9999
y = 0.8508xR2 = 0.9999
y = 1.7132x - 0.0015R2 = 1
0.00E+00
5.00E-02
1.00E-01
1.50E-01
2.00E-01
2.50E-01
3.00E-01
3.50E-01
4.00E-01
4.50E-01
5.00E-01
0.00 0.05 0.10 0.15 0.20 0.25 0.30
Distance (m)
Ener
gy L
oss
(Jou
les)
Avg Left
Avg Right
Sample 1
Sample 2
Sample 3
Sample 4
Avg Energy LossLeft
Right
Ttl Friction Loss
244
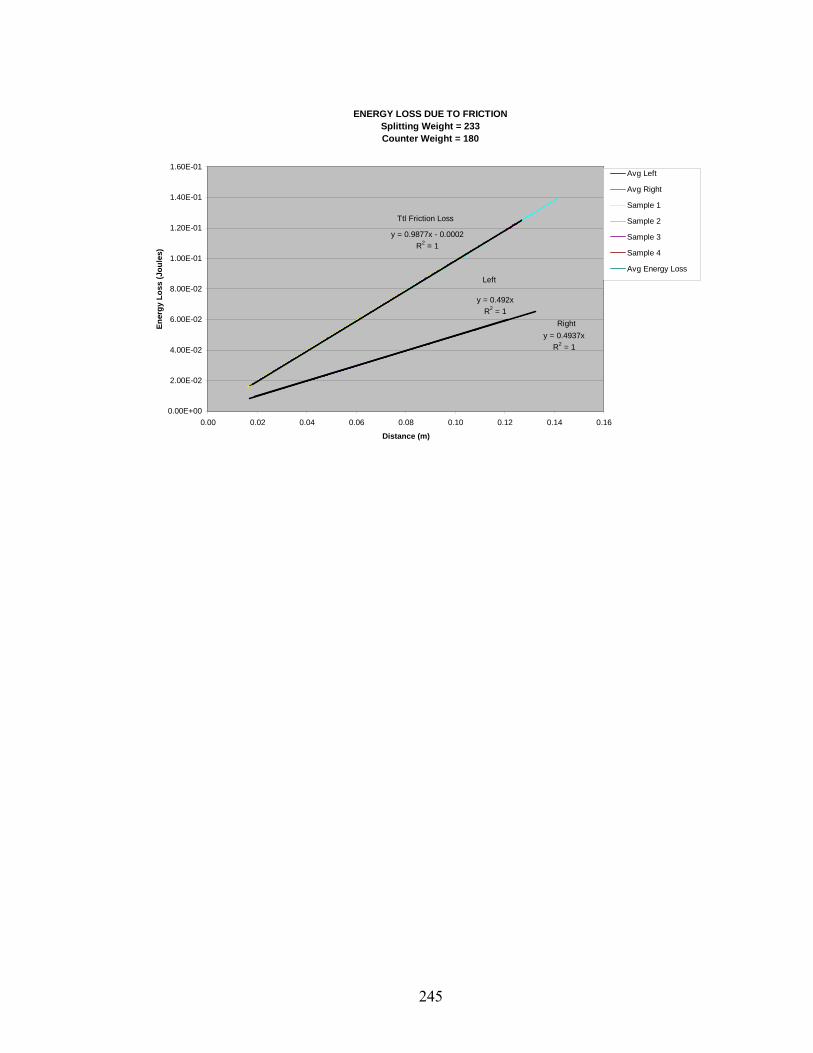
ENERGY LOSS DUE TO FRICTIONSplitting Weight = 233Counter Weight = 180
y = 0.492xR2 = 1
y = 0.4937xR2 = 1
y = 0.9877x - 0.0002R2 = 1
0.00E+00
2.00E-02
4.00E-02
6.00E-02
8.00E-02
1.00E-01
1.20E-01
1.40E-01
1.60E-01
0.00 0.02 0.04 0.06 0.08 0.10 0.12 0.14 0.16
Distance (m)
Ener
gy L
oss
(Jou
les)
Avg Left
Avg Right
Sample 1
Sample 2
Sample 3
Sample 4
Avg Energy LossLeft
Right
Ttl Friction Loss
245

APPENDIX D: FRICTION ENERGY LOSS VS SPLITTING WEIGHT AND COUNTER WEIGHT
Splitting Weight = 330g
246
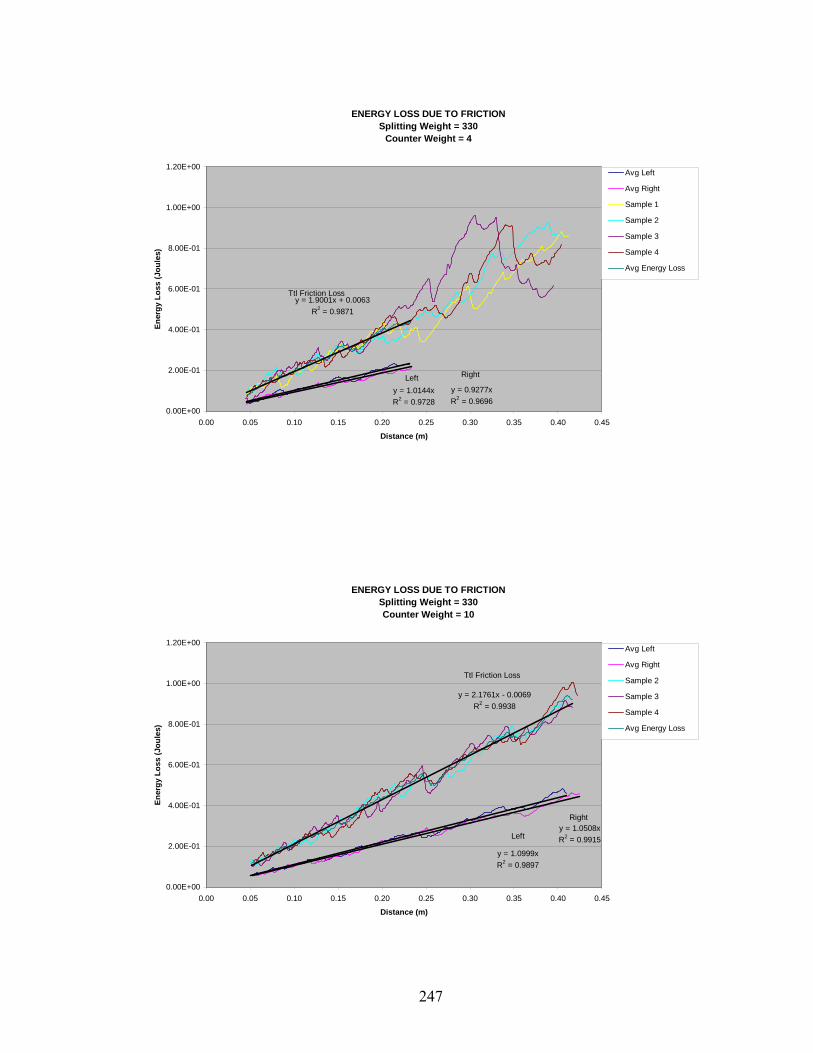
ENERGY LOSS DUE TO FRICTIONSplitting Weight = 330
Counter Weight = 4
y = 1.0144xR2 = 0.9728
y = 0.9277xR2 = 0.9696
y = 1.9001x + 0.0063R2 = 0.9871
0.00E+00
2.00E-01
4.00E-01
6.00E-01
8.00E-01
1.00E+00
1.20E+00
0.00 0.05 0.10 0.15 0.20 0.25 0.30 0.35 0.40 0.45
Distance (m)
Ener
gy L
oss
(Jou
les)
Avg Left
Avg Right
Sample 1
Sample 2
Sample 3
Sample 4
Avg Energy Loss
Left Right
Ttl Friction Loss
ENERGY LOSS DUE TO FRICTIONSplitting Weight = 330Counter Weight = 10
y = 1.0999xR2 = 0.9897
y = 1.0508xR2 = 0.9915
y = 2.1761x - 0.0069R2 = 0.9938
0.00E+00
2.00E-01
4.00E-01
6.00E-01
8.00E-01
1.00E+00
1.20E+00
0.00 0.05 0.10 0.15 0.20 0.25 0.30 0.35 0.40 0.45
Distance (m)
Ener
gy L
oss
(Jou
les)
Avg Left
Avg Right
Sample 2
Sample 3
Sample 4
Avg Energy Loss
Left
Right
Ttl Friction Loss
247
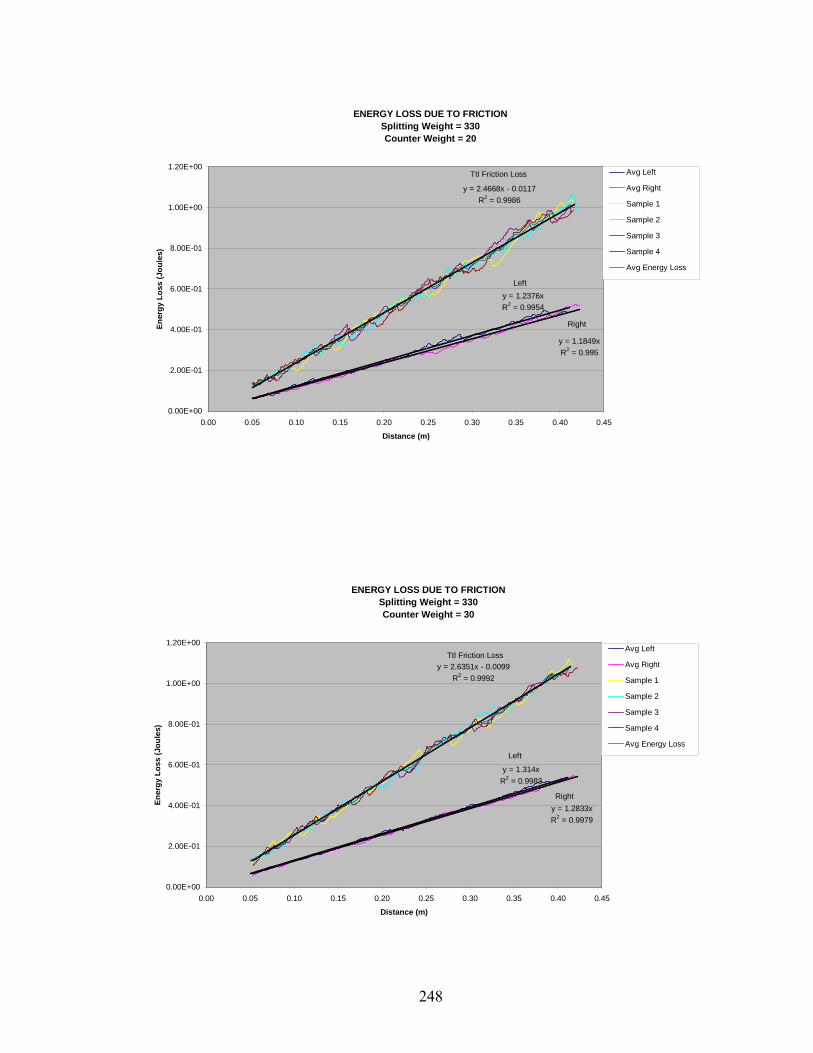
ENERGY LOSS DUE TO FRICTIONSplitting Weight = 330Counter Weight = 20
y = 1.2376xR2 = 0.9954
y = 1.1849xR2 = 0.995
y = 2.4668x - 0.0117R2 = 0.9986
0.00E+00
2.00E-01
4.00E-01
6.00E-01
8.00E-01
1.00E+00
1.20E+00
0.00 0.05 0.10 0.15 0.20 0.25 0.30 0.35 0.40 0.45
Distance (m)
Ener
gy L
oss
(Jou
les)
Avg Left
Avg Right
Sample 1
Sample 2
Sample 3
Sample 4
Avg Energy Loss
Left
Right
Ttl Friction Loss
ENERGY LOSS DUE TO FRICTIONSplitting Weight = 330Counter Weight = 30
y = 1.314xR2 = 0.9983
y = 1.2833xR2 = 0.9979
y = 2.6351x - 0.0099R2 = 0.9992
0.00E+00
2.00E-01
4.00E-01
6.00E-01
8.00E-01
1.00E+00
1.20E+00
0.00 0.05 0.10 0.15 0.20 0.25 0.30 0.35 0.40 0.45
Distance (m)
Ener
gy L
oss
(Jou
les)
Avg Left
Avg Right
Sample 1
Sample 2
Sample 3
Sample 4
Avg Energy LossLeft
Right
Ttl Friction Loss
248
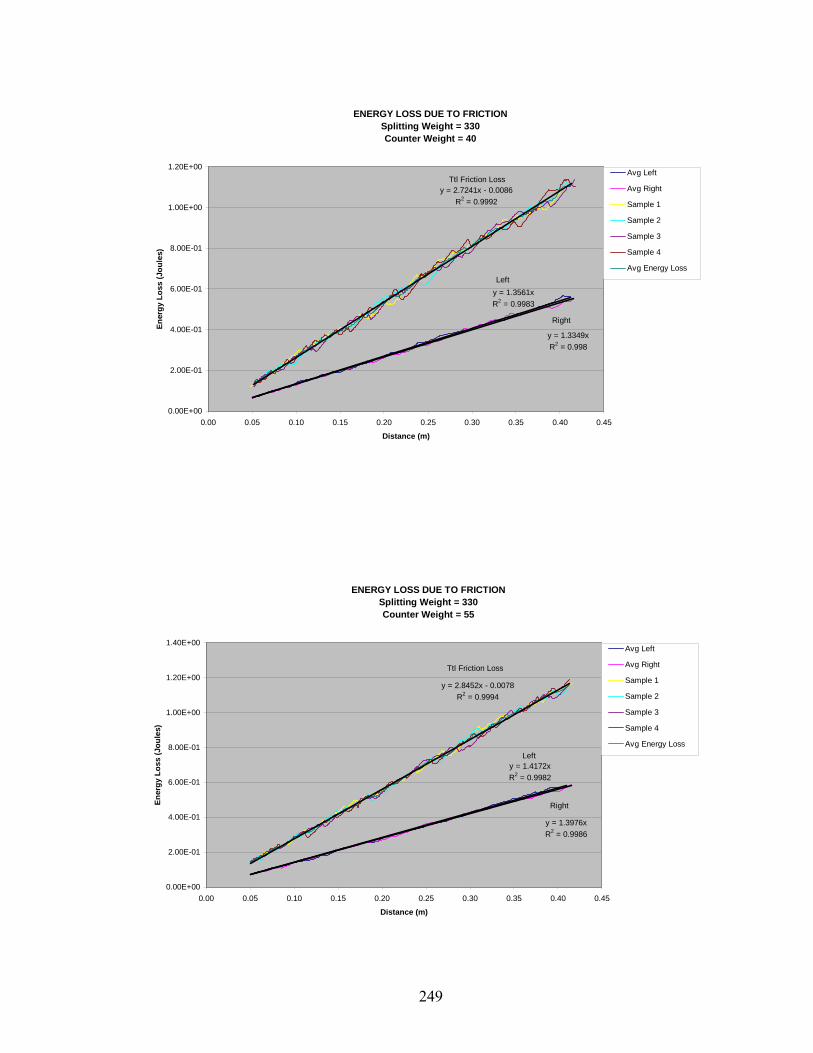
ENERGY LOSS DUE TO FRICTIONSplitting Weight = 330Counter Weight = 40
y = 1.3561xR2 = 0.9983
y = 1.3349xR2 = 0.998
y = 2.7241x - 0.0086R2 = 0.9992
0.00E+00
2.00E-01
4.00E-01
6.00E-01
8.00E-01
1.00E+00
1.20E+00
0.00 0.05 0.10 0.15 0.20 0.25 0.30 0.35 0.40 0.45
Distance (m)
Ener
gy L
oss
(Jou
les)
Avg Left
Avg Right
Sample 1
Sample 2
Sample 3
Sample 4
Avg Energy LossLeft
Right
Ttl Friction Loss
ENERGY LOSS DUE TO FRICTIONSplitting Weight = 330Counter Weight = 55
y = 1.4172xR2 = 0.9982
y = 1.3976xR2 = 0.9986
y = 2.8452x - 0.0078R2 = 0.9994
0.00E+00
2.00E-01
4.00E-01
6.00E-01
8.00E-01
1.00E+00
1.20E+00
1.40E+00
0.00 0.05 0.10 0.15 0.20 0.25 0.30 0.35 0.40 0.45
Distance (m)
Ener
gy L
oss
(Jou
les)
Avg Left
Avg Right
Sample 1
Sample 2
Sample 3
Sample 4
Avg Energy LossLeft
Right
Ttl Friction Loss
249
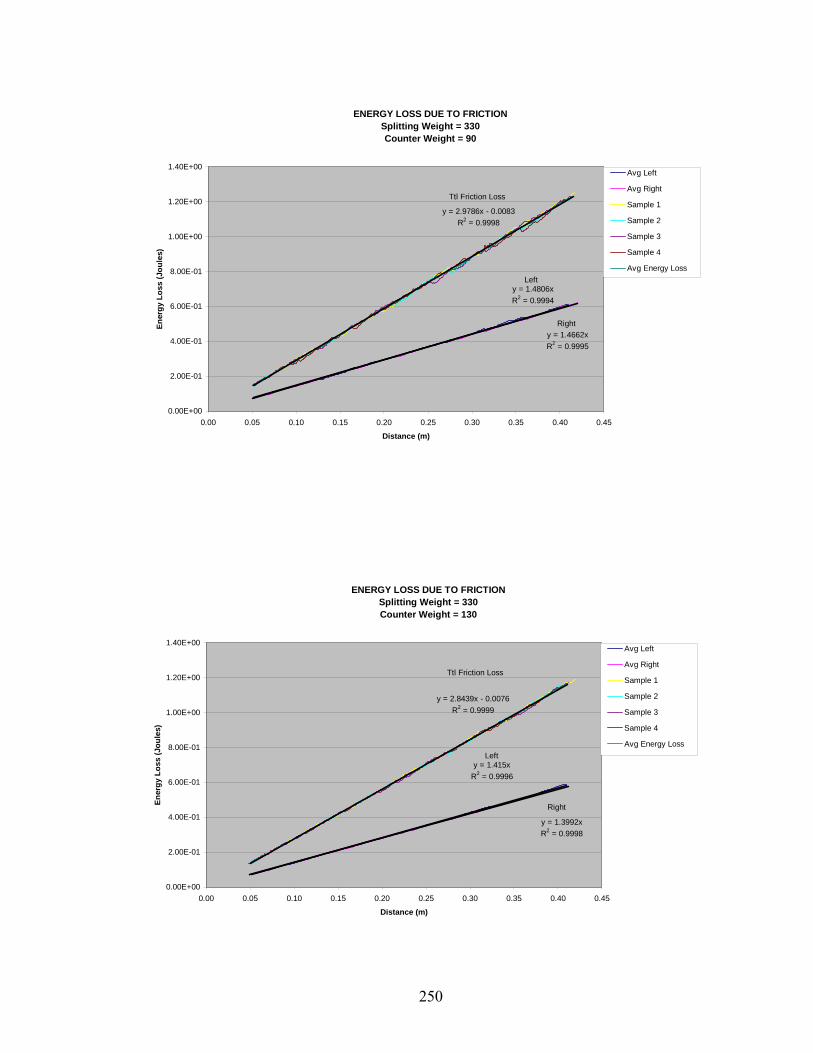
ENERGY LOSS DUE TO FRICTIONSplitting Weight = 330Counter Weight = 90
y = 1.4806xR2 = 0.9994
y = 1.4662xR2 = 0.9995
y = 2.9786x - 0.0083R2 = 0.9998
0.00E+00
2.00E-01
4.00E-01
6.00E-01
8.00E-01
1.00E+00
1.20E+00
1.40E+00
0.00 0.05 0.10 0.15 0.20 0.25 0.30 0.35 0.40 0.45
Distance (m)
Ener
gy L
oss
(Jou
les)
Avg Left
Avg Right
Sample 1
Sample 2
Sample 3
Sample 4
Avg Energy LossLeft
Right
Ttl Friction Loss
ENERGY LOSS DUE TO FRICTIONSplitting Weight = 330Counter Weight = 130
y = 1.415xR2 = 0.9996
y = 1.3992xR2 = 0.9998
y = 2.8439x - 0.0076R2 = 0.9999
0.00E+00
2.00E-01
4.00E-01
6.00E-01
8.00E-01
1.00E+00
1.20E+00
1.40E+00
0.00 0.05 0.10 0.15 0.20 0.25 0.30 0.35 0.40 0.45
Distance (m)
Ener
gy L
oss
(Jou
les)
Avg Left
Avg Right
Sample 1
Sample 2
Sample 3
Sample 4
Avg Energy LossLeft
Right
Ttl Friction Loss
250
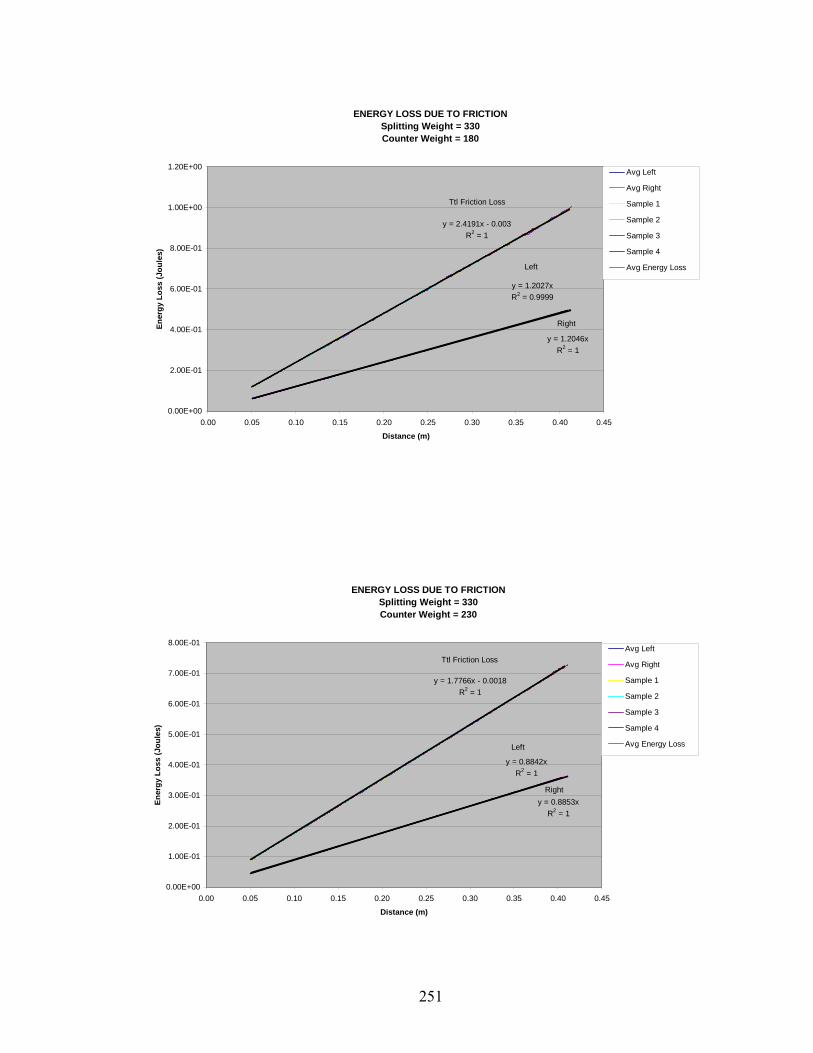
ENERGY LOSS DUE TO FRICTIONSplitting Weight = 330Counter Weight = 180
y = 1.2027xR2 = 0.9999
y = 1.2046xR2 = 1
y = 2.4191x - 0.003R2 = 1
0.00E+00
2.00E-01
4.00E-01
6.00E-01
8.00E-01
1.00E+00
1.20E+00
0.00 0.05 0.10 0.15 0.20 0.25 0.30 0.35 0.40 0.45
Distance (m)
Ener
gy L
oss
(Jou
les)
Avg Left
Avg Right
Sample 1
Sample 2
Sample 3
Sample 4
Avg Energy LossLeft
Right
Ttl Friction Loss
ENERGY LOSS DUE TO FRICTIONSplitting Weight = 330Counter Weight = 230
y = 0.8842xR2 = 1
y = 0.8853xR2 = 1
y = 1.7766x - 0.0018R2 = 1
0.00E+00
1.00E-01
2.00E-01
3.00E-01
4.00E-01
5.00E-01
6.00E-01
7.00E-01
8.00E-01
0.00 0.05 0.10 0.15 0.20 0.25 0.30 0.35 0.40 0.45
Distance (m)
Ener
gy L
oss
(Jou
les)
Avg Left
Avg Right
Sample 1
Sample 2
Sample 3
Sample 4
Avg Energy LossLeft
Right
Ttl Friction Loss
251
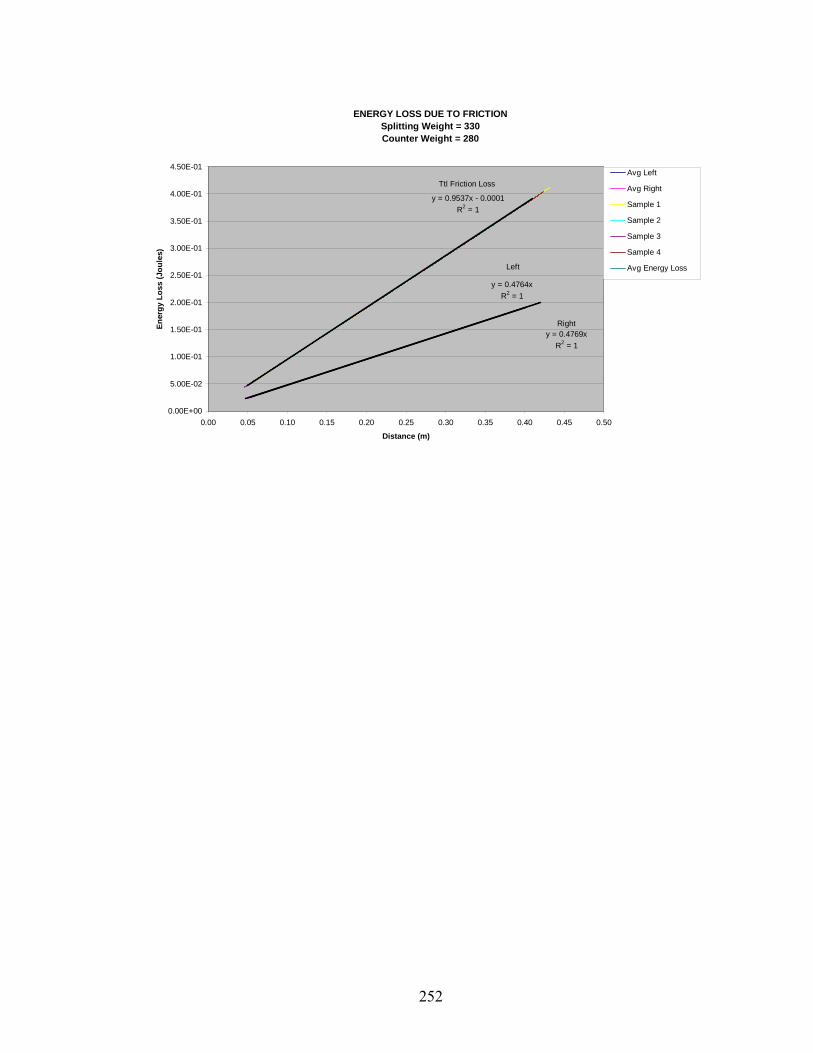
ENERGY LOSS DUE TO FRICTIONSplitting Weight = 330Counter Weight = 280
y = 0.4764xR2 = 1
y = 0.4769xR2 = 1
y = 0.9537x - 0.0001R2 = 1
0.00E+00
5.00E-02
1.00E-01
1.50E-01
2.00E-01
2.50E-01
3.00E-01
3.50E-01
4.00E-01
4.50E-01
0.00 0.05 0.10 0.15 0.20 0.25 0.30 0.35 0.40 0.45 0.50
Distance (m)
Ener
gy L
oss
(Jou
les)
Avg Left
Avg Right
Sample 1
Sample 2
Sample 3
Sample 4
Avg Energy LossLeft
Right
Ttl Friction Loss
252

APPENDIX D: FRICTION ENERGY LOSS VS SPLITTING WEIGHT AND COUNTER WEIGHT
Splitting Weight = 550g
253
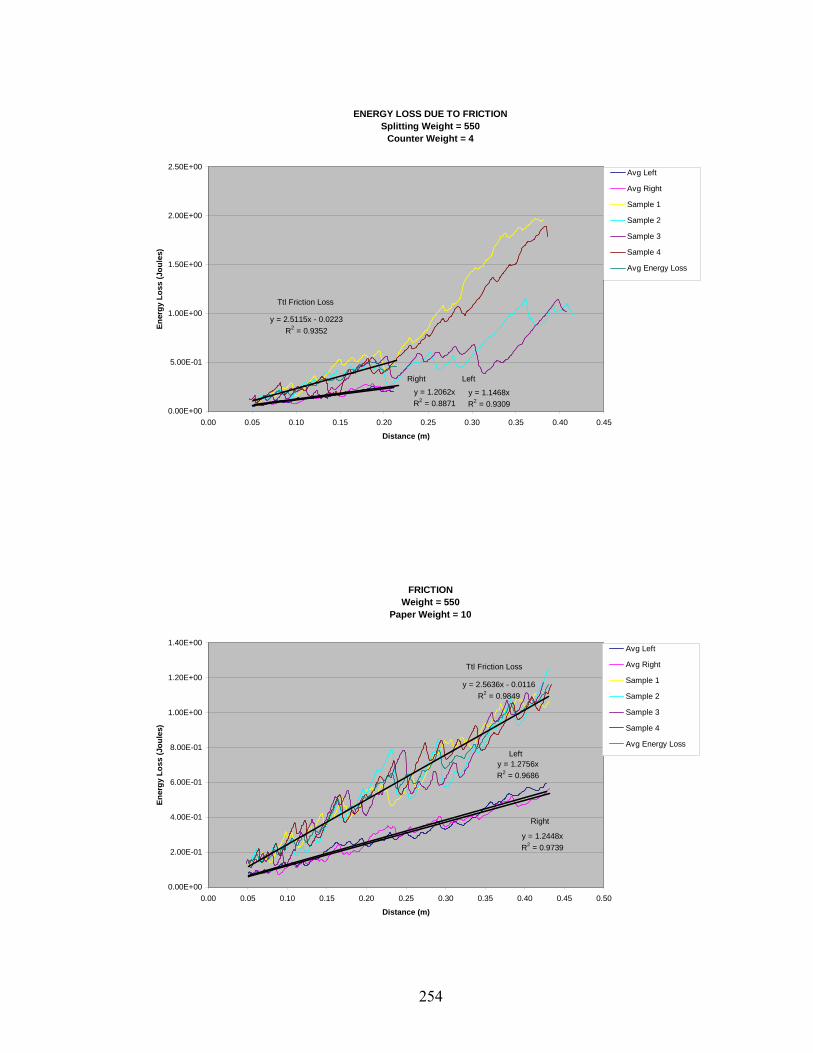
ENERGY LOSS DUE TO FRICTIONSplitting Weight = 550
Counter Weight = 4
y = 1.1468xR2 = 0.9309
y = 1.2062xR2 = 0.8871
y = 2.5115x - 0.0223R2 = 0.9352
0.00E+00
5.00E-01
1.00E+00
1.50E+00
2.00E+00
2.50E+00
0.00 0.05 0.10 0.15 0.20 0.25 0.30 0.35 0.40 0.45
Distance (m)
Ener
gy L
oss
(Jou
les)
Avg Left
Avg Right
Sample 1
Sample 2
Sample 3
Sample 4
Avg Energy Loss
LeftRight
Ttl Friction Loss
FRICTIONWeight = 550
Paper Weight = 10
y = 1.2756xR2 = 0.9686
y = 1.2448xR2 = 0.9739
y = 2.5636x - 0.0116R2 = 0.9849
0.00E+00
2.00E-01
4.00E-01
6.00E-01
8.00E-01
1.00E+00
1.20E+00
1.40E+00
0.00 0.05 0.10 0.15 0.20 0.25 0.30 0.35 0.40 0.45 0.50
Distance (m)
Ener
gy L
oss
(Jou
les)
Avg Left
Avg Right
Sample 1
Sample 2
Sample 3
Sample 4
Avg Energy LossLeft
Right
Ttl Friction Loss
254
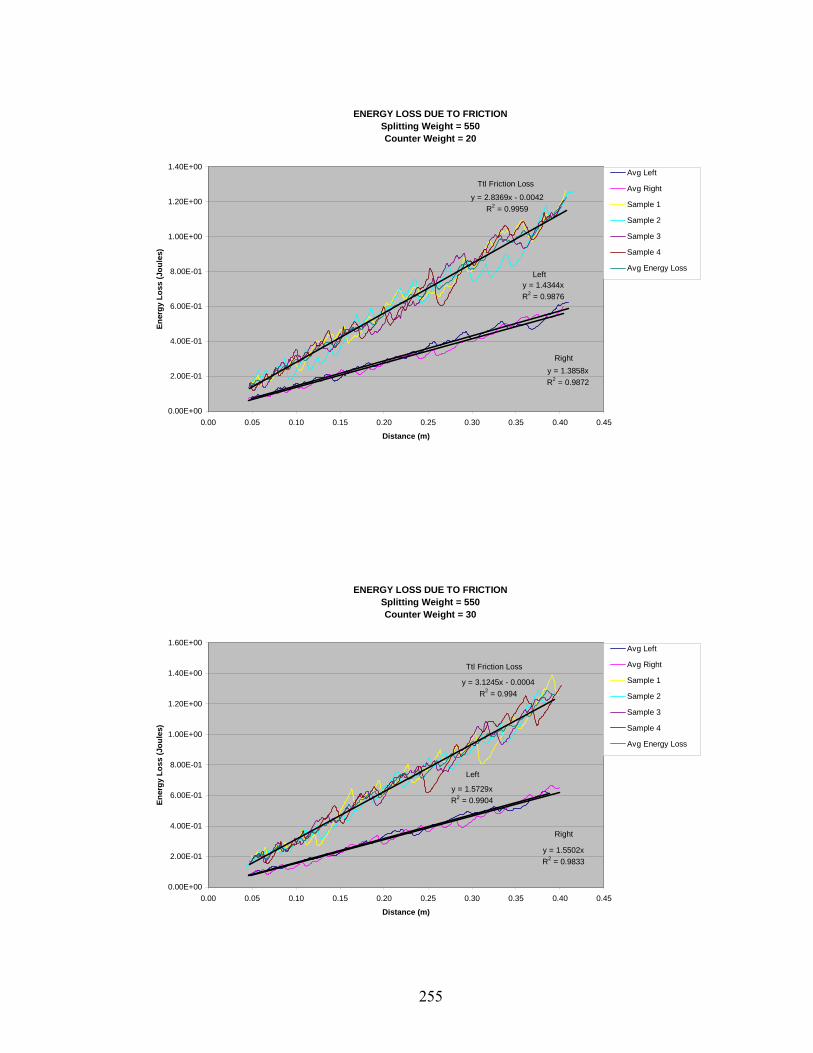
ENERGY LOSS DUE TO FRICTIONSplitting Weight = 550Counter Weight = 20
y = 1.4344xR2 = 0.9876
y = 1.3858xR2 = 0.9872
y = 2.8369x - 0.0042R2 = 0.9959
0.00E+00
2.00E-01
4.00E-01
6.00E-01
8.00E-01
1.00E+00
1.20E+00
1.40E+00
0.00 0.05 0.10 0.15 0.20 0.25 0.30 0.35 0.40 0.45
Distance (m)
Ener
gy L
oss
(Jou
les)
Avg Left
Avg Right
Sample 1
Sample 2
Sample 3
Sample 4
Avg Energy LossLeft
Right
Ttl Friction Loss
ENERGY LOSS DUE TO FRICTIONSplitting Weight = 550Counter Weight = 30
y = 1.5729xR2 = 0.9904
y = 1.5502xR2 = 0.9833
y = 3.1245x - 0.0004R2 = 0.994
0.00E+00
2.00E-01
4.00E-01
6.00E-01
8.00E-01
1.00E+00
1.20E+00
1.40E+00
1.60E+00
0.00 0.05 0.10 0.15 0.20 0.25 0.30 0.35 0.40 0.45
Distance (m)
Ener
gy L
oss
(Jou
les)
Avg Left
Avg Right
Sample 1
Sample 2
Sample 3
Sample 4
Avg Energy Loss
Left
Right
Ttl Friction Loss
255
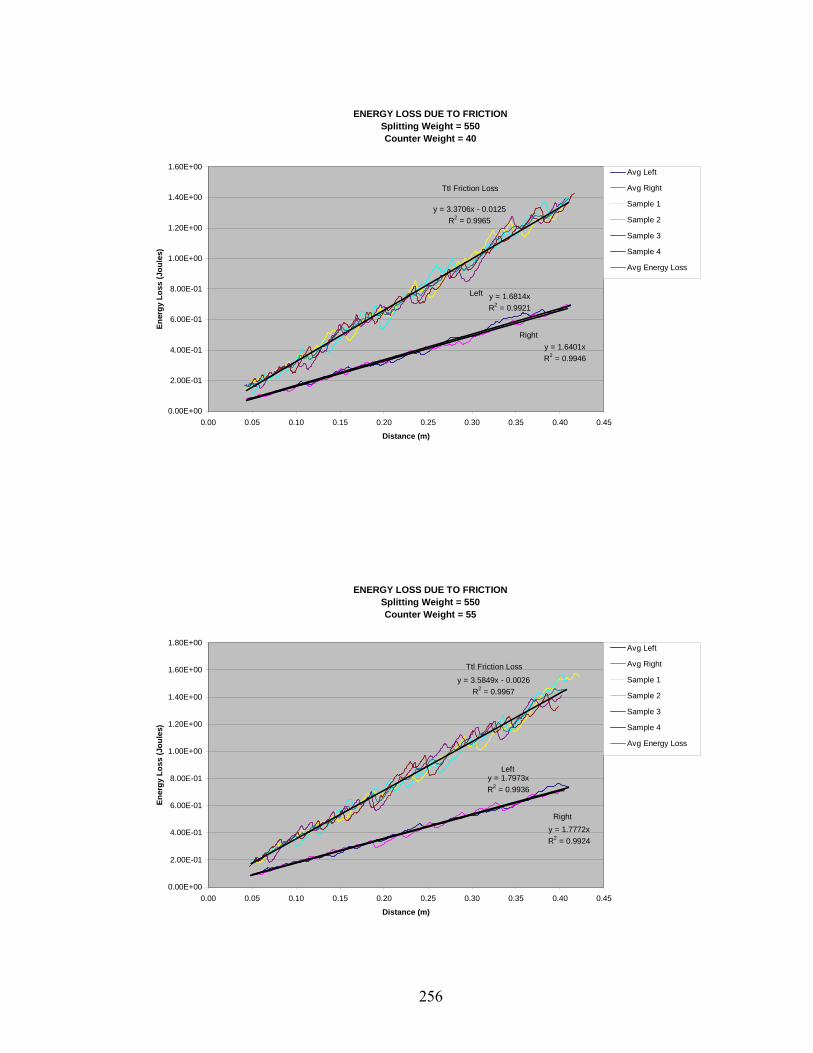
ENERGY LOSS DUE TO FRICTIONSplitting Weight = 550Counter Weight = 40
y = 1.6814xR2 = 0.9921
y = 1.6401xR2 = 0.9946
y = 3.3706x - 0.0125R2 = 0.9965
0.00E+00
2.00E-01
4.00E-01
6.00E-01
8.00E-01
1.00E+00
1.20E+00
1.40E+00
1.60E+00
0.00 0.05 0.10 0.15 0.20 0.25 0.30 0.35 0.40 0.45
Distance (m)
Ener
gy L
oss
(Jou
les)
Avg Left
Avg Right
Sample 1
Sample 2
Sample 3
Sample 4
Avg Energy Loss
Left
Right
Ttl Friction Loss
ENERGY LOSS DUE TO FRICTIONSplitting Weight = 550Counter Weight = 55
y = 1.7973xR2 = 0.9936
y = 1.7772xR2 = 0.9924
y = 3.5849x - 0.0026R2 = 0.9967
0.00E+00
2.00E-01
4.00E-01
6.00E-01
8.00E-01
1.00E+00
1.20E+00
1.40E+00
1.60E+00
1.80E+00
0.00 0.05 0.10 0.15 0.20 0.25 0.30 0.35 0.40 0.45
Distance (m)
Ener
gy L
oss
(Jou
les)
Avg Left
Avg Right
Sample 1
Sample 2
Sample 3
Sample 4
Avg Energy Loss
Left
Right
Ttl Friction Loss
256
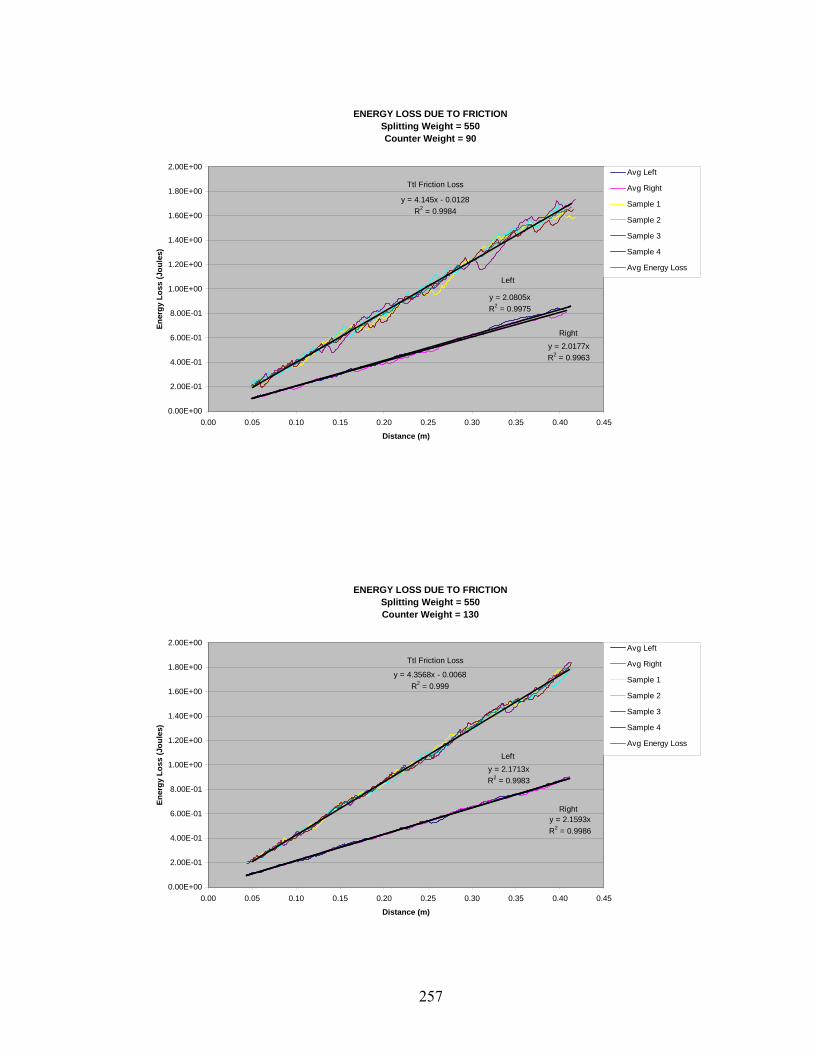
ENERGY LOSS DUE TO FRICTIONSplitting Weight = 550Counter Weight = 90
y = 2.0805xR2 = 0.9975
y = 2.0177xR2 = 0.9963
y = 4.145x - 0.0128R2 = 0.9984
0.00E+00
2.00E-01
4.00E-01
6.00E-01
8.00E-01
1.00E+00
1.20E+00
1.40E+00
1.60E+00
1.80E+00
2.00E+00
0.00 0.05 0.10 0.15 0.20 0.25 0.30 0.35 0.40 0.45
Distance (m)
Ener
gy L
oss
(Jou
les)
Avg Left
Avg Right
Sample 1
Sample 2
Sample 3
Sample 4
Avg Energy LossLeft
Right
Ttl Friction Loss
ENERGY LOSS DUE TO FRICTIONSplitting Weight = 550Counter Weight = 130
y = 2.1713xR2 = 0.9983
y = 2.1593xR2 = 0.9986
y = 4.3568x - 0.0068R2 = 0.999
0.00E+00
2.00E-01
4.00E-01
6.00E-01
8.00E-01
1.00E+00
1.20E+00
1.40E+00
1.60E+00
1.80E+00
2.00E+00
0.00 0.05 0.10 0.15 0.20 0.25 0.30 0.35 0.40 0.45
Distance (m)
Ener
gy L
oss
(Jou
les)
Avg Left
Avg Right
Sample 1
Sample 2
Sample 3
Sample 4
Avg Energy LossLeft
Right
Ttl Friction Loss
257
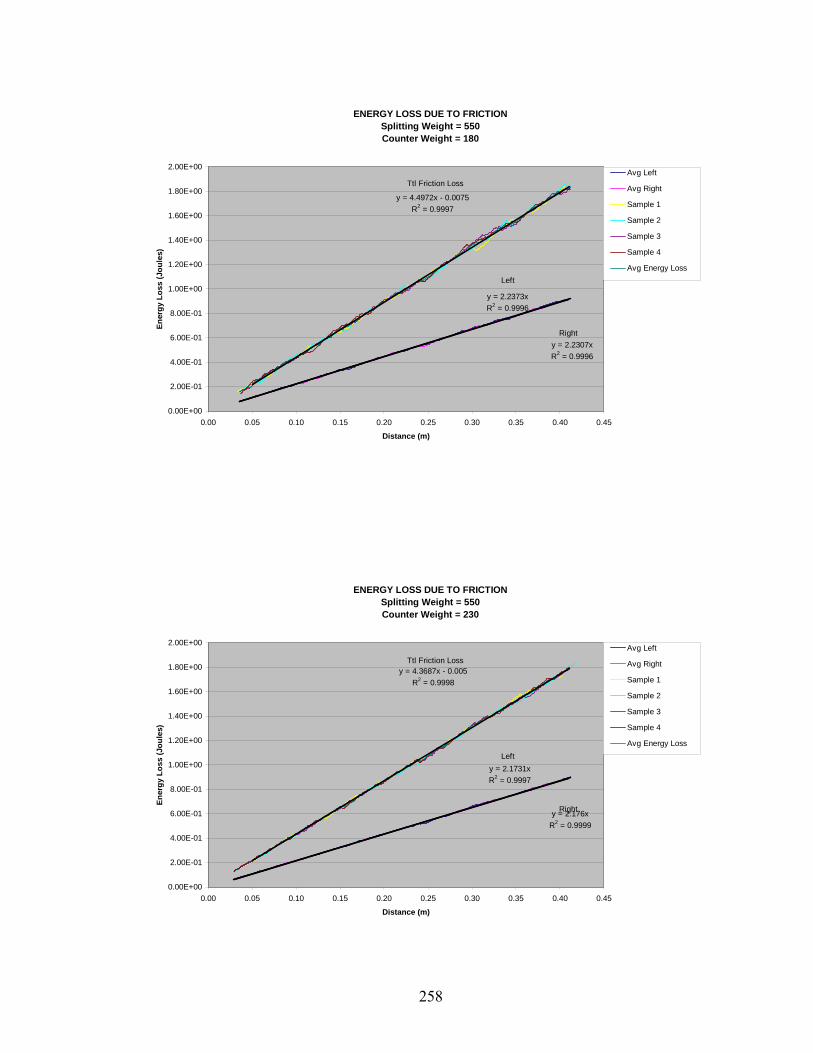
ENERGY LOSS DUE TO FRICTIONSplitting Weight = 550Counter Weight = 180
y = 2.2373xR2 = 0.9996
y = 2.2307xR2 = 0.9996
y = 4.4972x - 0.0075R2 = 0.9997
0.00E+00
2.00E-01
4.00E-01
6.00E-01
8.00E-01
1.00E+00
1.20E+00
1.40E+00
1.60E+00
1.80E+00
2.00E+00
0.00 0.05 0.10 0.15 0.20 0.25 0.30 0.35 0.40 0.45
Distance (m)
Ener
gy L
oss
(Jou
les)
Avg Left
Avg Right
Sample 1
Sample 2
Sample 3
Sample 4
Avg Energy LossLeft
Right
Ttl Friction Loss
ENERGY LOSS DUE TO FRICTIONSplitting Weight = 550Counter Weight = 230
y = 2.1731xR2 = 0.9997
y = 2.176xR2 = 0.9999
y = 4.3687x - 0.005R2 = 0.9998
0.00E+00
2.00E-01
4.00E-01
6.00E-01
8.00E-01
1.00E+00
1.20E+00
1.40E+00
1.60E+00
1.80E+00
2.00E+00
0.00 0.05 0.10 0.15 0.20 0.25 0.30 0.35 0.40 0.45
Distance (m)
Ener
gy L
oss
(Jou
les)
Avg Left
Avg Right
Sample 1
Sample 2
Sample 3
Sample 4
Avg Energy LossLeft
Right
Ttl Friction Loss
258
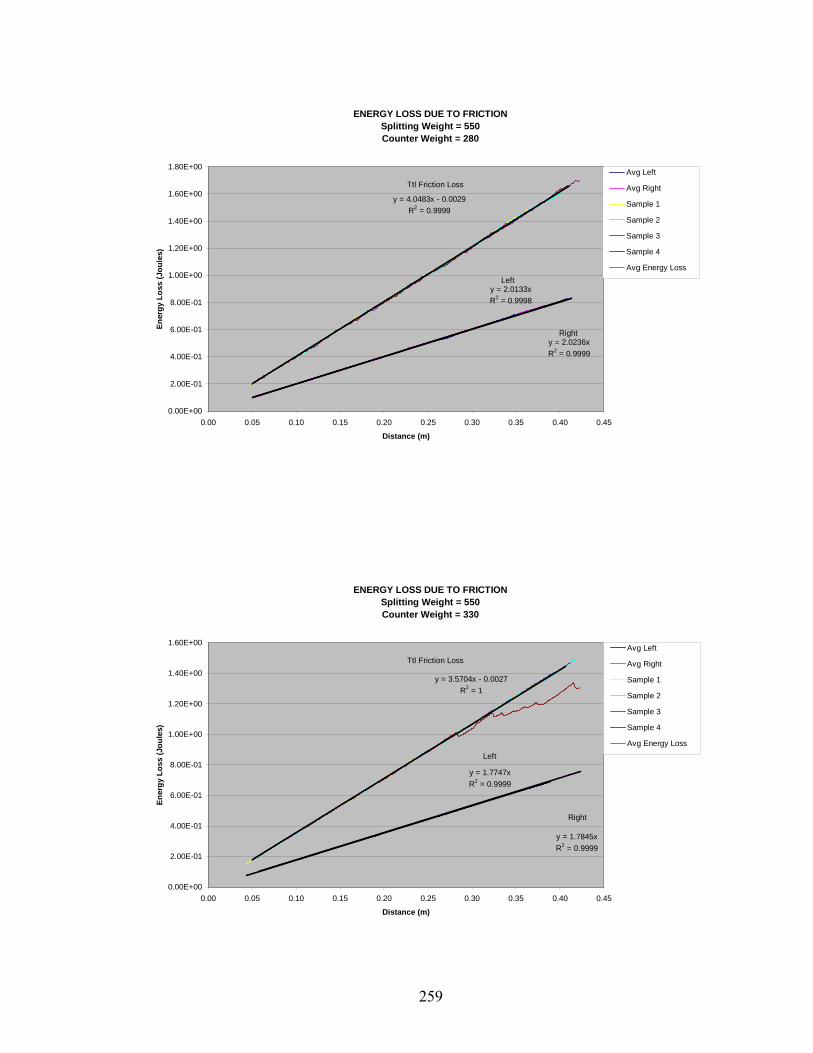
ENERGY LOSS DUE TO FRICTIONSplitting Weight = 550Counter Weight = 280
y = 2.0133xR2 = 0.9998
y = 2.0236xR2 = 0.9999
y = 4.0483x - 0.0029R2 = 0.9999
0.00E+00
2.00E-01
4.00E-01
6.00E-01
8.00E-01
1.00E+00
1.20E+00
1.40E+00
1.60E+00
1.80E+00
0.00 0.05 0.10 0.15 0.20 0.25 0.30 0.35 0.40 0.45
Distance (m)
Ener
gy L
oss
(Jou
les)
Avg Left
Avg Right
Sample 1
Sample 2
Sample 3
Sample 4
Avg Energy LossLeft
Right
Ttl Friction Loss
ENERGY LOSS DUE TO FRICTIONSplitting Weight = 550Counter Weight = 330
y = 1.7747xR2 = 0.9999
y = 1.7845xR2 = 0.9999
y = 3.5704x - 0.0027R2 = 1
0.00E+00
2.00E-01
4.00E-01
6.00E-01
8.00E-01
1.00E+00
1.20E+00
1.40E+00
1.60E+00
0.00 0.05 0.10 0.15 0.20 0.25 0.30 0.35 0.40 0.45
Distance (m)
Ener
gy L
oss
(Jou
les)
Avg Left
Avg Right
Sample 1
Sample 2
Sample 3
Sample 4
Avg Energy LossLeft
Right
Ttl Friction Loss
259
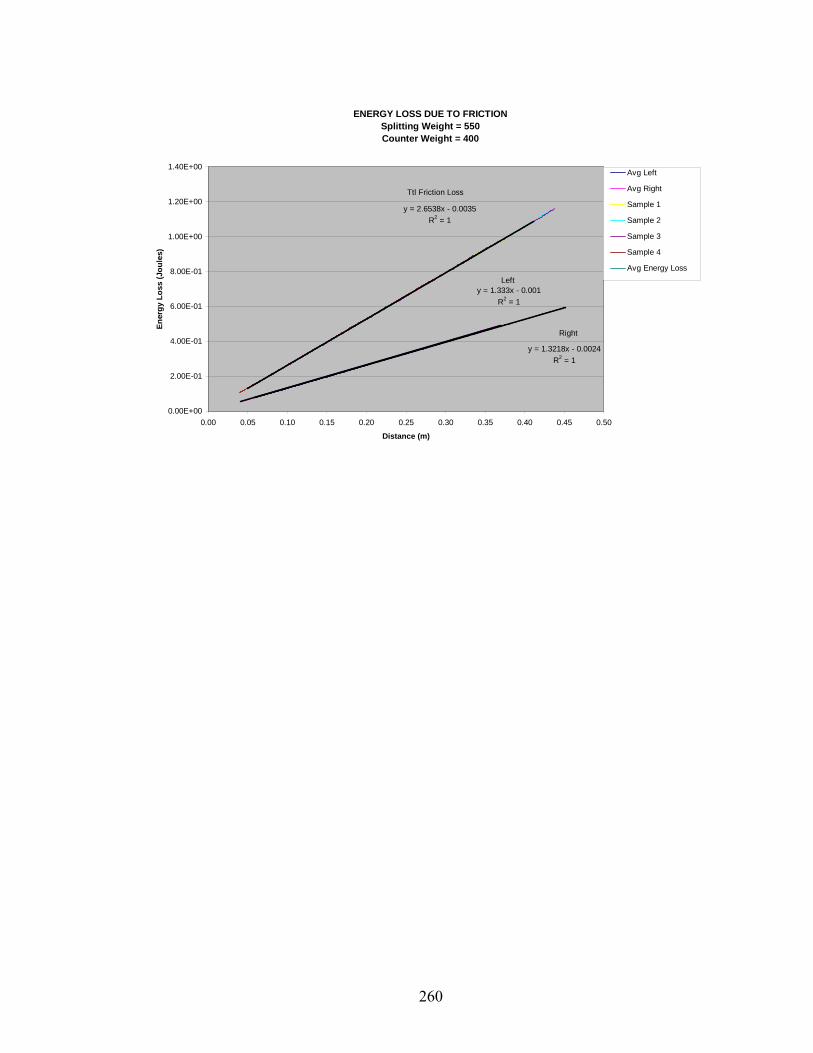
ENERGY LOSS DUE TO FRICTIONSplitting Weight = 550Counter Weight = 400
y = 2.6538x - 0.0035R2 = 1
y = 1.3218x - 0.0024R2 = 1
y = 1.333x - 0.001R2 = 1
0.00E+00
2.00E-01
4.00E-01
6.00E-01
8.00E-01
1.00E+00
1.20E+00
1.40E+00
0.00 0.05 0.10 0.15 0.20 0.25 0.30 0.35 0.40 0.45 0.50
Distance (m)
Ener
gy L
oss
(Jou
les)
Avg Left
Avg Right
Sample 1
Sample 2
Sample 3
Sample 4
Avg Energy LossLeft
Right
Ttl Friction Loss
260

APPENDIX D: FRICTION ENERGY LOSS VS SPLITTING WEIGHT AND COUNTER WEIGHT
Splitting Weight = 770g
261
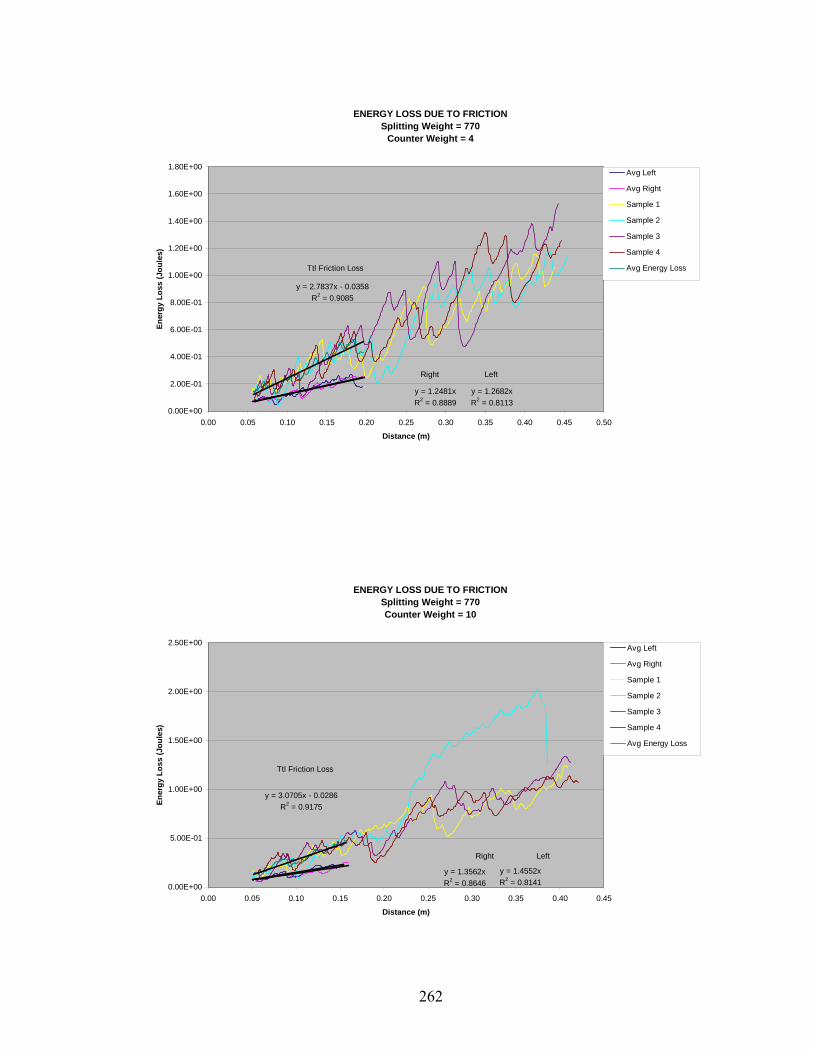
ENERGY LOSS DUE TO FRICTIONSplitting Weight = 770
Counter Weight = 4
y = 1.2682xR2 = 0.8113
y = 1.2481xR2 = 0.8889
y = 2.7837x - 0.0358R2 = 0.9085
0.00E+00
2.00E-01
4.00E-01
6.00E-01
8.00E-01
1.00E+00
1.20E+00
1.40E+00
1.60E+00
1.80E+00
0.00 0.05 0.10 0.15 0.20 0.25 0.30 0.35 0.40 0.45 0.50
Distance (m)
Ener
gy L
oss
(Jou
les)
Avg Left
Avg Right
Sample 1
Sample 2
Sample 3
Sample 4
Avg Energy Loss
LeftRight
Ttl Friction Loss
ENERGY LOSS DUE TO FRICTIONSplitting Weight = 770Counter Weight = 10
y = 1.4552xR2 = 0.8141
y = 1.3562xR2 = 0.8646
y = 3.0705x - 0.0286R2 = 0.9175
0.00E+00
5.00E-01
1.00E+00
1.50E+00
2.00E+00
2.50E+00
0.00 0.05 0.10 0.15 0.20 0.25 0.30 0.35 0.40 0.45
Distance (m)
Ener
gy L
oss
(Jou
les)
Avg Left
Avg Right
Sample 1
Sample 2
Sample 3
Sample 4
Avg Energy Loss
LeftRight
Ttl Friction Loss
262
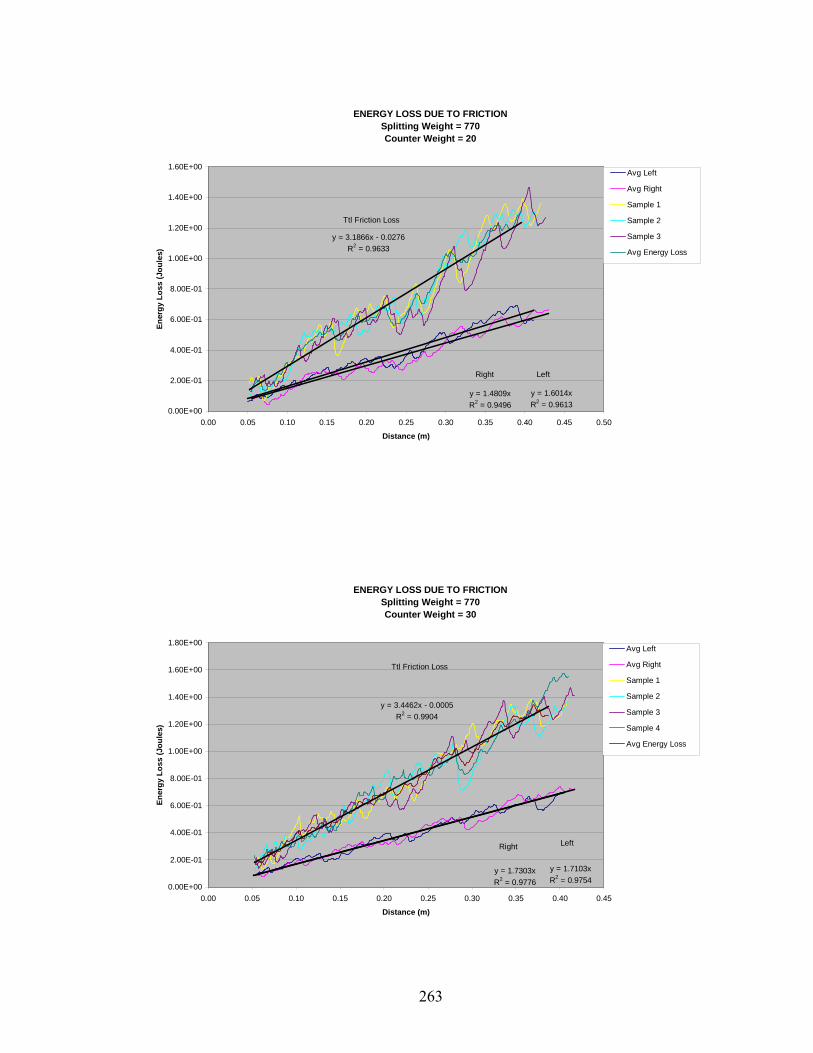
ENERGY LOSS DUE TO FRICTIONSplitting Weight = 770Counter Weight = 20
y = 1.6014xR2 = 0.9613
y = 1.4809xR2 = 0.9496
y = 3.1866x - 0.0276R2 = 0.9633
0.00E+00
2.00E-01
4.00E-01
6.00E-01
8.00E-01
1.00E+00
1.20E+00
1.40E+00
1.60E+00
0.00 0.05 0.10 0.15 0.20 0.25 0.30 0.35 0.40 0.45 0.50
Distance (m)
Ener
gy L
oss
(Jou
les)
Avg Left
Avg Right
Sample 1
Sample 2
Sample 3
Avg Energy Loss
LeftRight
Ttl Friction Loss
ENERGY LOSS DUE TO FRICTIONSplitting Weight = 770Counter Weight = 30
y = 1.7103xR2 = 0.9754
y = 1.7303xR2 = 0.9776
y = 3.4462x - 0.0005R2 = 0.9904
0.00E+00
2.00E-01
4.00E-01
6.00E-01
8.00E-01
1.00E+00
1.20E+00
1.40E+00
1.60E+00
1.80E+00
0.00 0.05 0.10 0.15 0.20 0.25 0.30 0.35 0.40 0.45
Distance (m)
Ener
gy L
oss
(Jou
les)
Avg Left
Avg Right
Sample 1
Sample 2
Sample 3
Sample 4
Avg Energy Loss
LeftRight
Ttl Friction Loss
263
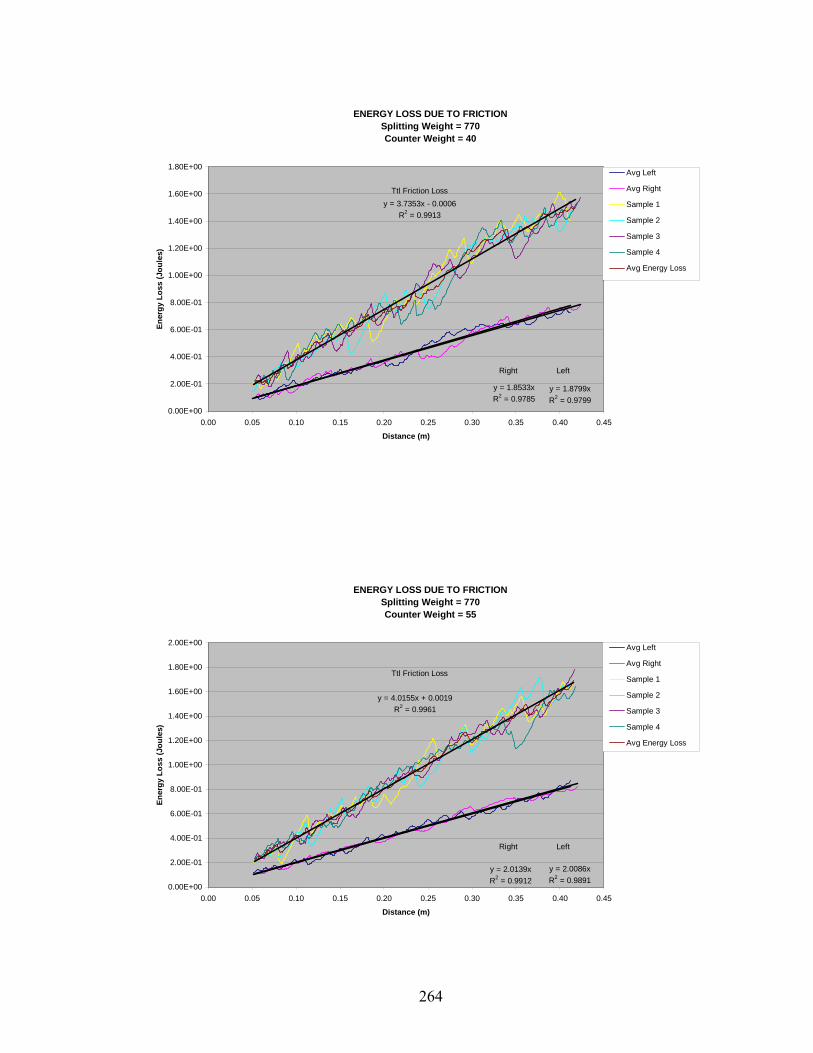
ENERGY LOSS DUE TO FRICTIONSplitting Weight = 770Counter Weight = 40
y = 1.8799xR2 = 0.9799
y = 1.8533xR2 = 0.9785
y = 3.7353x - 0.0006R2 = 0.9913
0.00E+00
2.00E-01
4.00E-01
6.00E-01
8.00E-01
1.00E+00
1.20E+00
1.40E+00
1.60E+00
1.80E+00
0.00 0.05 0.10 0.15 0.20 0.25 0.30 0.35 0.40 0.45
Distance (m)
Ener
gy L
oss
(Jou
les)
Avg Left
Avg Right
Sample 1
Sample 2
Sample 3
Sample 4
Avg Energy Loss
LeftRight
Ttl Friction Loss
ENERGY LOSS DUE TO FRICTIONSplitting Weight = 770Counter Weight = 55
y = 2.0086xR2 = 0.9891
y = 2.0139xR2 = 0.9912
y = 4.0155x + 0.0019R2 = 0.9961
0.00E+00
2.00E-01
4.00E-01
6.00E-01
8.00E-01
1.00E+00
1.20E+00
1.40E+00
1.60E+00
1.80E+00
2.00E+00
0.00 0.05 0.10 0.15 0.20 0.25 0.30 0.35 0.40 0.45
Distance (m)
Ener
gy L
oss
(Jou
les)
Avg Left
Avg Right
Sample 1
Sample 2
Sample 3
Sample 4
Avg Energy Loss
LeftRight
Ttl Friction Loss
264
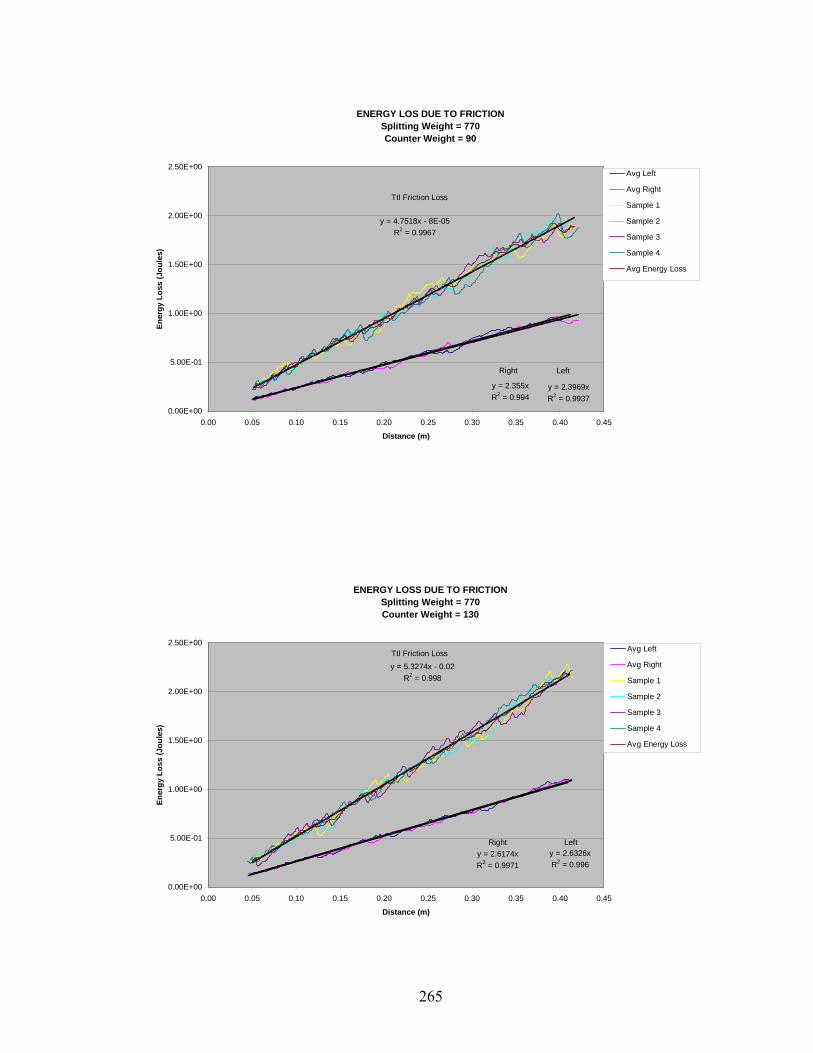
ENERGY LOS DUE TO FRICTIONSplitting Weight = 770Counter Weight = 90
y = 2.3969xR2 = 0.9937
y = 2.355xR2 = 0.994
y = 4.7518x - 8E-05R2 = 0.9967
0.00E+00
5.00E-01
1.00E+00
1.50E+00
2.00E+00
2.50E+00
0.00 0.05 0.10 0.15 0.20 0.25 0.30 0.35 0.40 0.45
Distance (m)
Ener
gy L
oss
(Jou
les)
Avg Left
Avg Right
Sample 1
Sample 2
Sample 3
Sample 4
Avg Energy Loss
LeftRight
Ttl Friction Loss
ENERGY LOSS DUE TO FRICTIONSplitting Weight = 770Counter Weight = 130
y = 2.6326xR2 = 0.996
y = 2.6174xR2 = 0.9971
y = 5.3274x - 0.02R2 = 0.998
0.00E+00
5.00E-01
1.00E+00
1.50E+00
2.00E+00
2.50E+00
0.00 0.05 0.10 0.15 0.20 0.25 0.30 0.35 0.40 0.45
Distance (m)
Ener
gy L
oss
(Jou
les)
Avg Left
Avg Right
Sample 1
Sample 2
Sample 3
Sample 4
Avg Energy Loss
LeftRight
Ttl Friction Loss
265
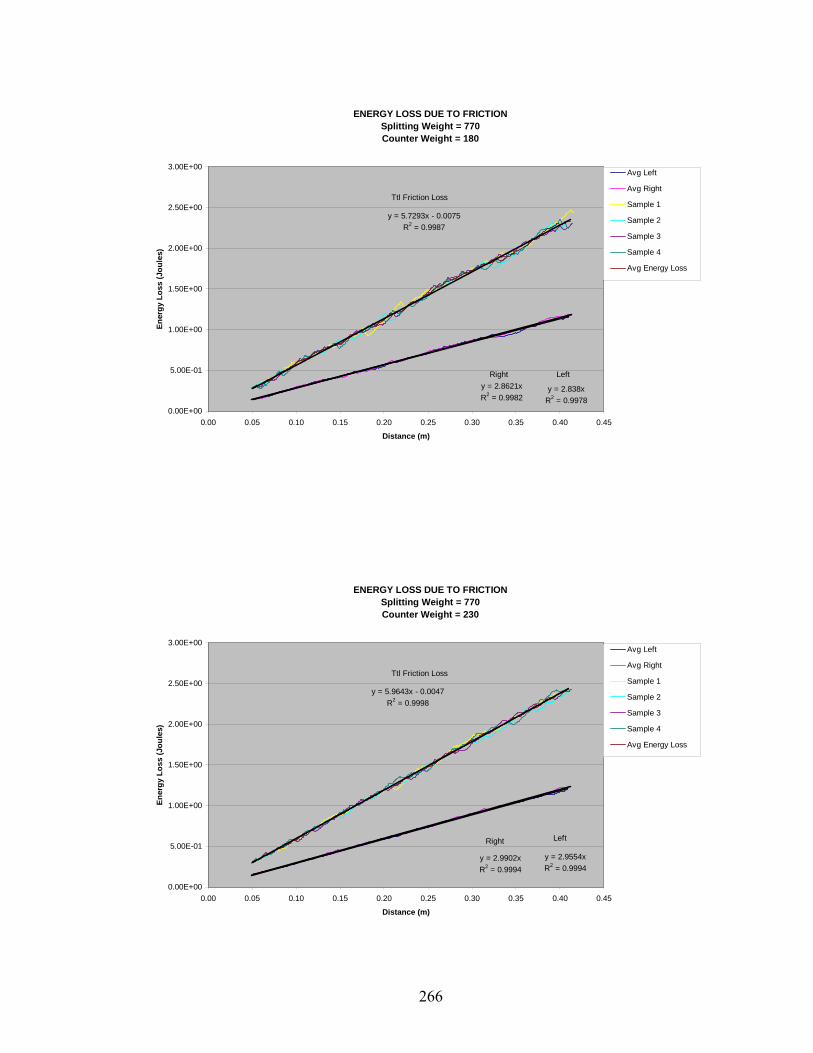
ENERGY LOSS DUE TO FRICTIONSplitting Weight = 770Counter Weight = 180
y = 2.838xR2 = 0.9978
y = 2.8621xR2 = 0.9982
y = 5.7293x - 0.0075R2 = 0.9987
0.00E+00
5.00E-01
1.00E+00
1.50E+00
2.00E+00
2.50E+00
3.00E+00
0.00 0.05 0.10 0.15 0.20 0.25 0.30 0.35 0.40 0.45
Distance (m)
Ener
gy L
oss
(Jou
les)
Avg Left
Avg Right
Sample 1
Sample 2
Sample 3
Sample 4
Avg Energy Loss
LeftRight
Ttl Friction Loss
ENERGY LOSS DUE TO FRICTIONSplitting Weight = 770Counter Weight = 230
y = 2.9554xR2 = 0.9994
y = 2.9902xR2 = 0.9994
y = 5.9643x - 0.0047R2 = 0.9998
0.00E+00
5.00E-01
1.00E+00
1.50E+00
2.00E+00
2.50E+00
3.00E+00
0.00 0.05 0.10 0.15 0.20 0.25 0.30 0.35 0.40 0.45
Distance (m)
Ener
gy L
oss
(Jou
les)
Avg Left
Avg Right
Sample 1
Sample 2
Sample 3
Sample 4
Avg Energy Loss
LeftRight
Ttl Friction Loss
266
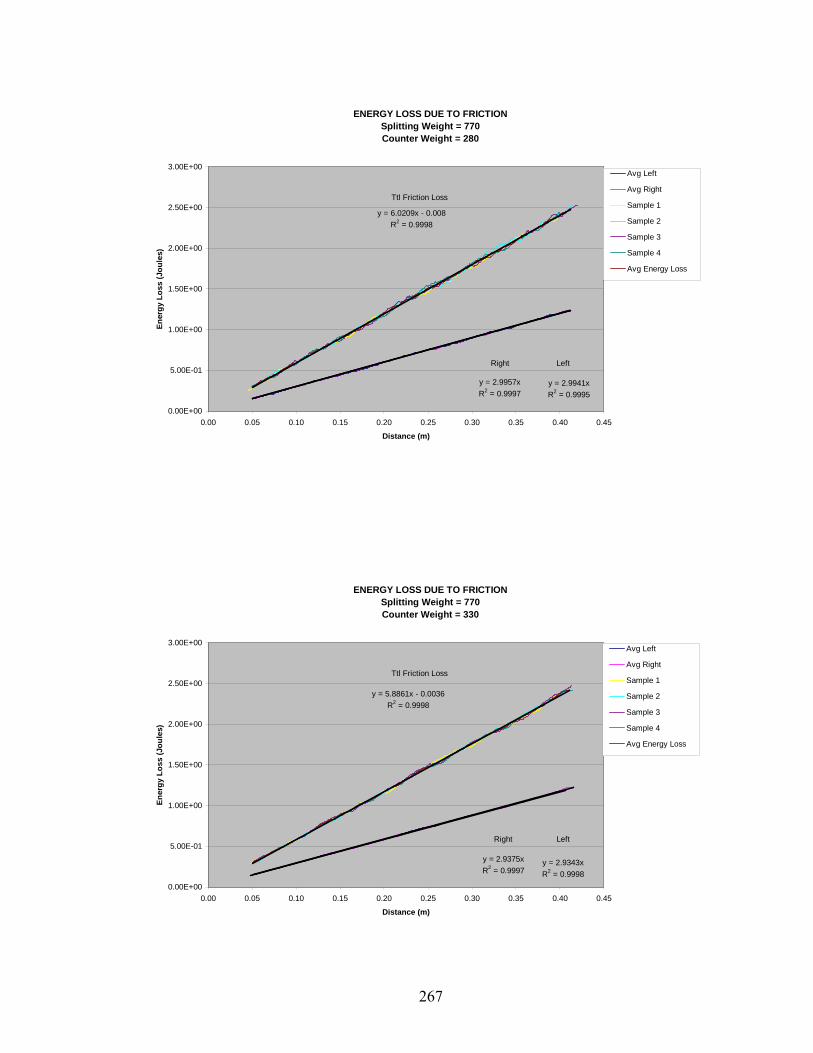
ENERGY LOSS DUE TO FRICTIONSplitting Weight = 770Counter Weight = 280
y = 2.9941xR2 = 0.9995
y = 2.9957xR2 = 0.9997
y = 6.0209x - 0.008R2 = 0.9998
0.00E+00
5.00E-01
1.00E+00
1.50E+00
2.00E+00
2.50E+00
3.00E+00
0.00 0.05 0.10 0.15 0.20 0.25 0.30 0.35 0.40 0.45
Distance (m)
Ener
gy L
oss
(Jou
les)
Avg Left
Avg Right
Sample 1
Sample 2
Sample 3
Sample 4
Avg Energy Loss
LeftRight
Ttl Friction Loss
ENERGY LOSS DUE TO FRICTIONSplitting Weight = 770Counter Weight = 330
y = 2.9343xR2 = 0.9998
y = 2.9375xR2 = 0.9997
y = 5.8861x - 0.0036R2 = 0.9998
0.00E+00
5.00E-01
1.00E+00
1.50E+00
2.00E+00
2.50E+00
3.00E+00
0.00 0.05 0.10 0.15 0.20 0.25 0.30 0.35 0.40 0.45
Distance (m)
Ener
gy L
oss
(Jou
les)
Avg Left
Avg Right
Sample 1
Sample 2
Sample 3
Sample 4
Avg Energy Loss
LeftRight
Ttl Friction Loss
267
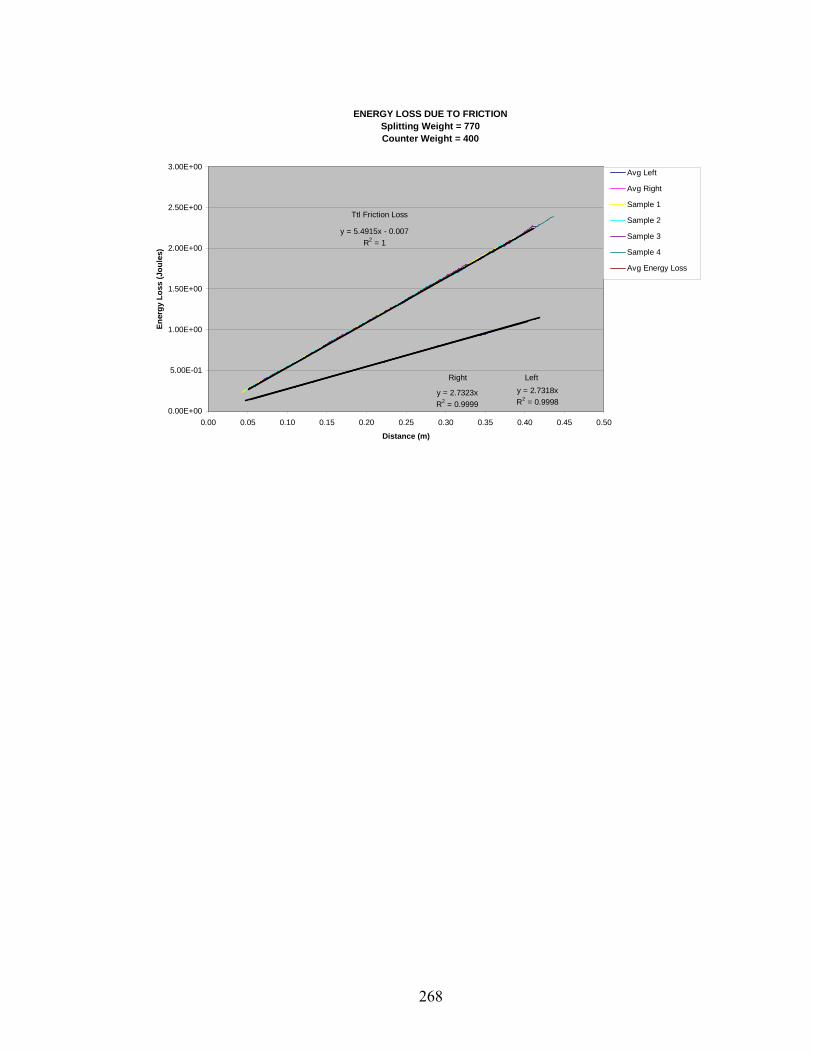
ENERGY LOSS DUE TO FRICTIONSplitting Weight = 770Counter Weight = 400
y = 2.7318xR2 = 0.9998
y = 2.7323xR2 = 0.9999
y = 5.4915x - 0.007R2 = 1
0.00E+00
5.00E-01
1.00E+00
1.50E+00
2.00E+00
2.50E+00
3.00E+00
0.00 0.05 0.10 0.15 0.20 0.25 0.30 0.35 0.40 0.45 0.50
Distance (m)
Ener
gy L
oss
(Jou
les)
Avg Left
Avg Right
Sample 1
Sample 2
Sample 3
Sample 4
Avg Energy Loss
LeftRight
Ttl Friction Loss
268

APPENDIX E.1: STRESS – STRAIN CURVES
269
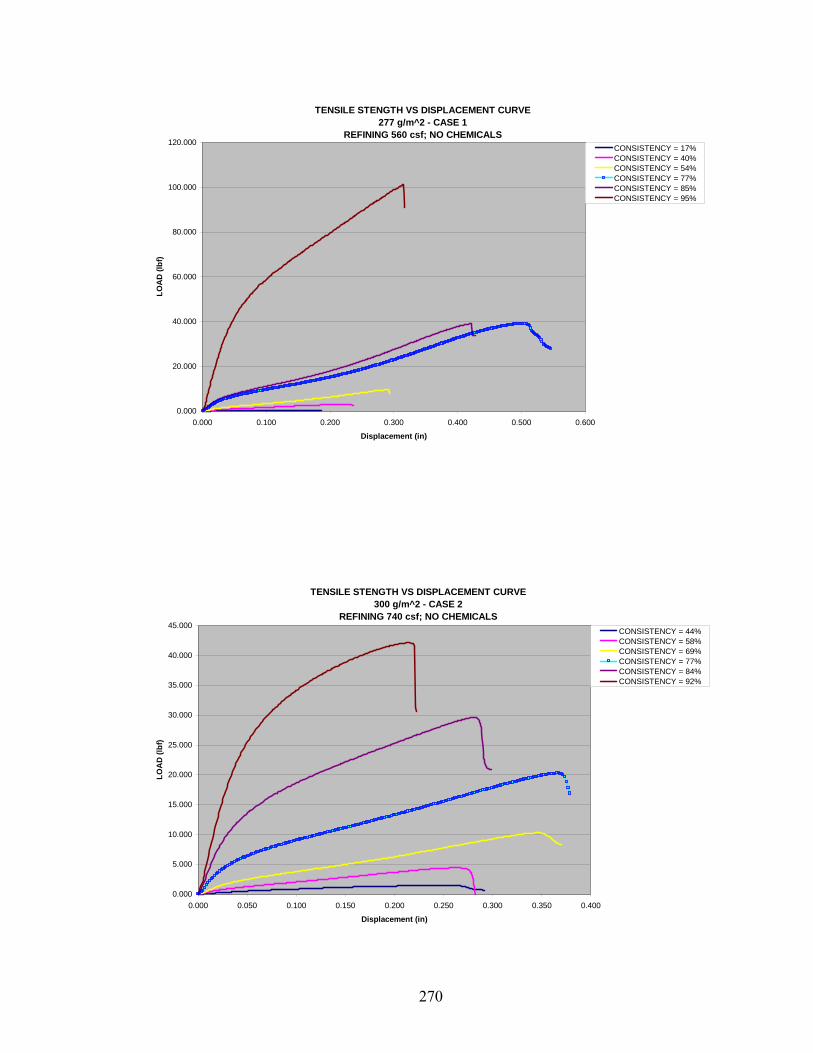
TENSILE STENGTH VS DISPLACEMENT CURVE277 g/m^2 - CASE 1
REFINING 560 csf; NO CHEMICALS
0.000
20.000
40.000
60.000
80.000
100.000
120.000
0.000 0.100 0.200 0.300 0.400 0.500 0.600
Displacement (in)
LOA
D (l
bf)
CONSISTENCY = 17%CONSISTENCY = 40%CONSISTENCY = 54%CONSISTENCY = 77%CONSISTENCY = 85%CONSISTENCY = 95%
TENSILE STENGTH VS DISPLACEMENT CURVE300 g/m^2 - CASE 2
REFINING 740 csf; NO CHEMICALS
0.000
5.000
10.000
15.000
20.000
25.000
30.000
35.000
40.000
45.000
0.000 0.050 0.100 0.150 0.200 0.250 0.300 0.350 0.400
Displacement (in)
LOA
D (l
bf)
CONSISTENCY = 44%CONSISTENCY = 58%CONSISTENCY = 69%CONSISTENCY = 77%CONSISTENCY = 84%CONSISTENCY = 92%
270
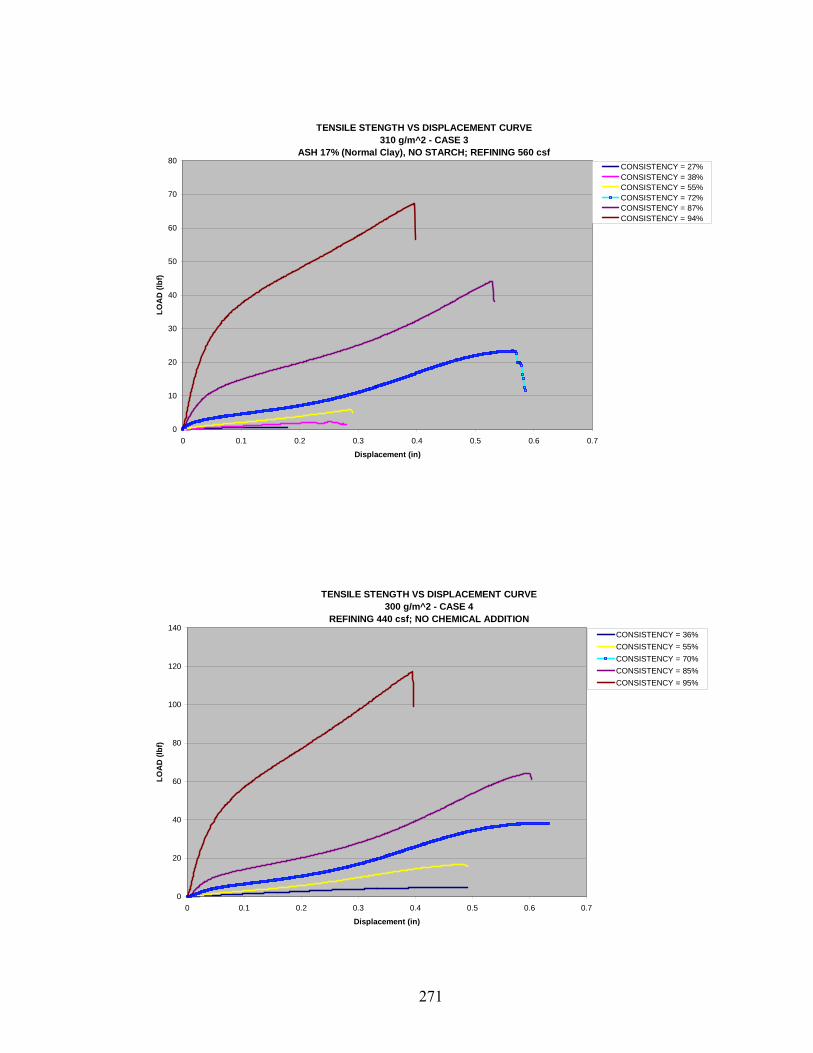
TENSILE STENGTH VS DISPLACEMENT CURVE
310 g/m^2 - CASE 3ASH 17% (Normal Clay), NO STARCH; REFINING 560 csf
0
10
20
30
40
50
60
70
80
0 0.1 0.2 0.3 0.4 0.5 0.6 0.7
Displacement (in)
LOA
D (l
bf)
CONSISTENCY = 27%CONSISTENCY = 38%CONSISTENCY = 55%CONSISTENCY = 72%CONSISTENCY = 87%CONSISTENCY = 94%
TENSILE STENGTH VS DISPLACEMENT CURVE300 g/m^2 - CASE 4
REFINING 440 csf; NO CHEMICAL ADDITION
0
20
40
60
80
100
120
140
0 0.1 0.2 0.3 0.4 0.5 0.6 0.7
Displacement (in)
LOA
D (l
bf)
CONSISTENCY = 36%CONSISTENCY = 55%CONSISTENCY = 70%CONSISTENCY = 85%CONSISTENCY = 95%
271
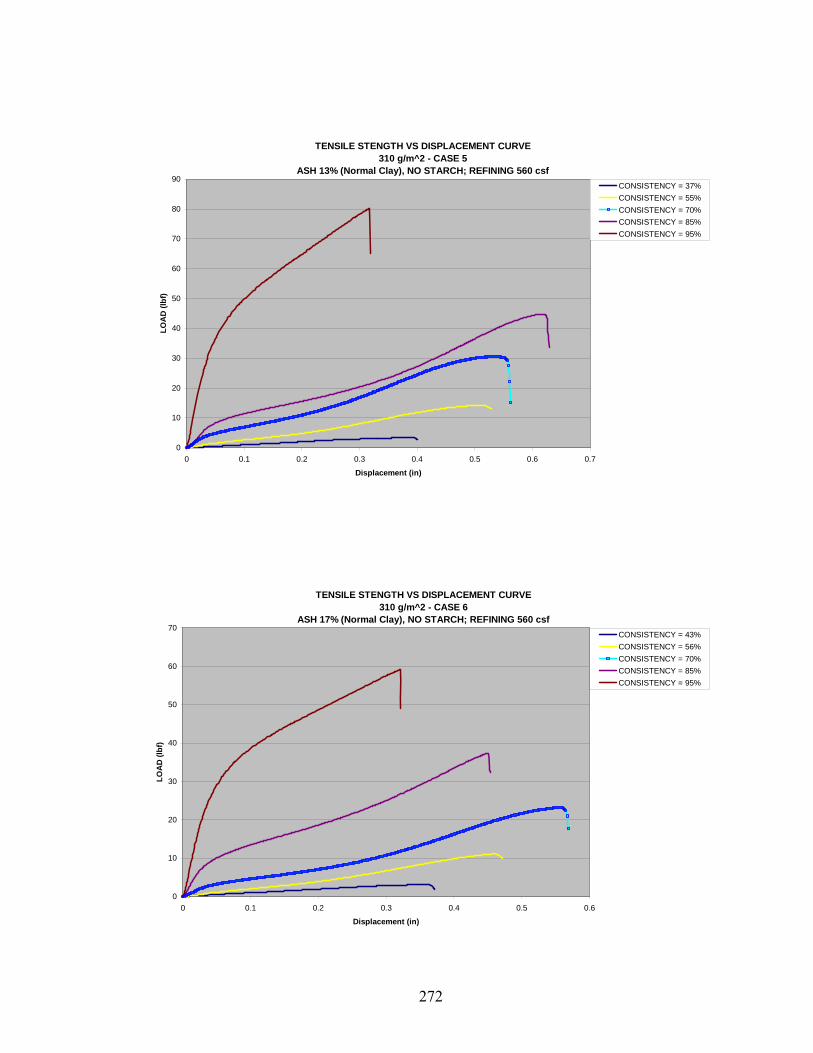
TENSILE STENGTH VS DISPLACEMENT CURVE310 g/m^2 - CASE 5
ASH 13% (Normal Clay), NO STARCH; REFINING 560 csf
0
10
20
30
40
50
60
70
80
90
0 0.1 0.2 0.3 0.4 0.5 0.6 0.7
Displacement (in)
LOA
D (l
bf)
CONSISTENCY = 37%CONSISTENCY = 55%CONSISTENCY = 70%CONSISTENCY = 85%CONSISTENCY = 95%
TENSILE STENGTH VS DISPLACEMENT CURVE310 g/m^2 - CASE 6
ASH 17% (Normal Clay), NO STARCH; REFINING 560 csf
0
10
20
30
40
50
60
70
0 0.1 0.2 0.3 0.4 0.5 0.6
Displacement (in)
LOA
D (l
bf)
CONSISTENCY = 43%CONSISTENCY = 56%CONSISTENCY = 70%CONSISTENCY = 85%CONSISTENCY = 95%
272
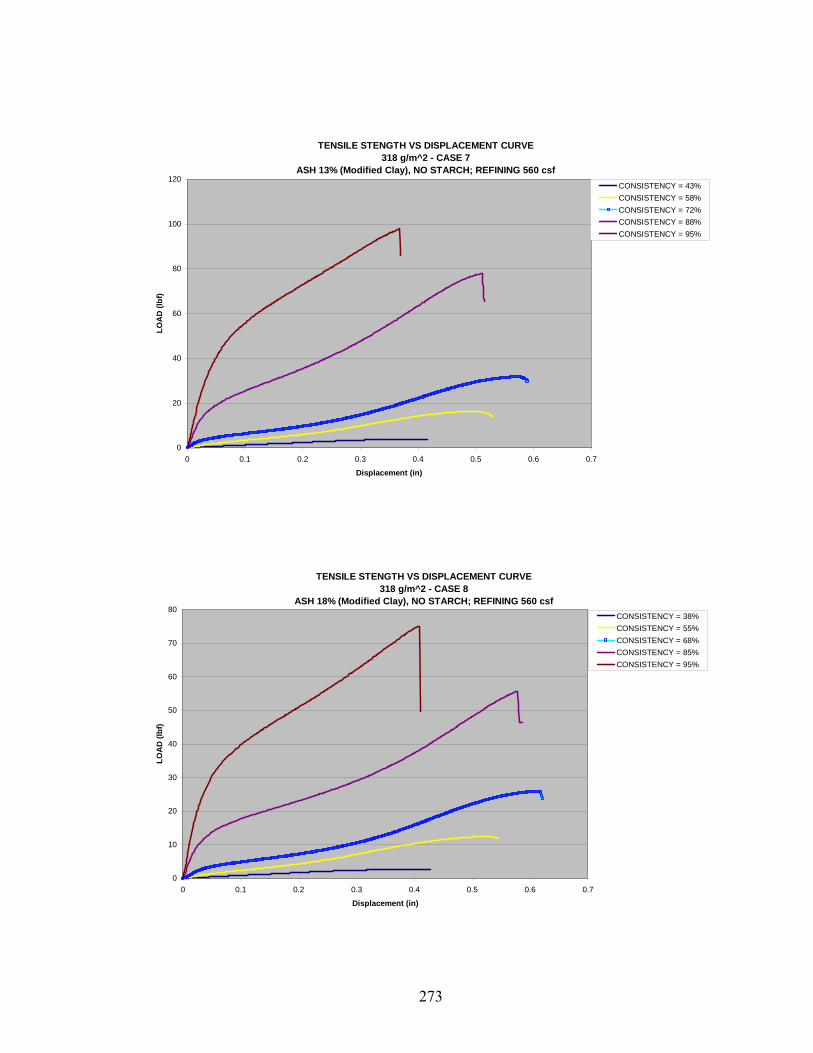
TENSILE STENGTH VS DISPLACEMENT CURVE318 g/m^2 - CASE 7
ASH 13% (Modified Clay), NO STARCH; REFINING 560 csf
0
20
40
60
80
100
120
0 0.1 0.2 0.3 0.4 0.5 0.6 0.7
Displacement (in)
LOA
D (l
bf)
CONSISTENCY = 43%CONSISTENCY = 58%CONSISTENCY = 72%CONSISTENCY = 88%CONSISTENCY = 95%
TENSILE STENGTH VS DISPLACEMENT CURVE318 g/m^2 - CASE 8
ASH 18% (Modified Clay), NO STARCH; REFINING 560 csf
0
10
20
30
40
50
60
70
80
0 0.1 0.2 0.3 0.4 0.5 0.6 0.7
Displacement (in)
LOA
D (l
bf)
CONSISTENCY = 38%CONSISTENCY = 55%CONSISTENCY = 68%CONSISTENCY = 85%CONSISTENCY = 95%
273
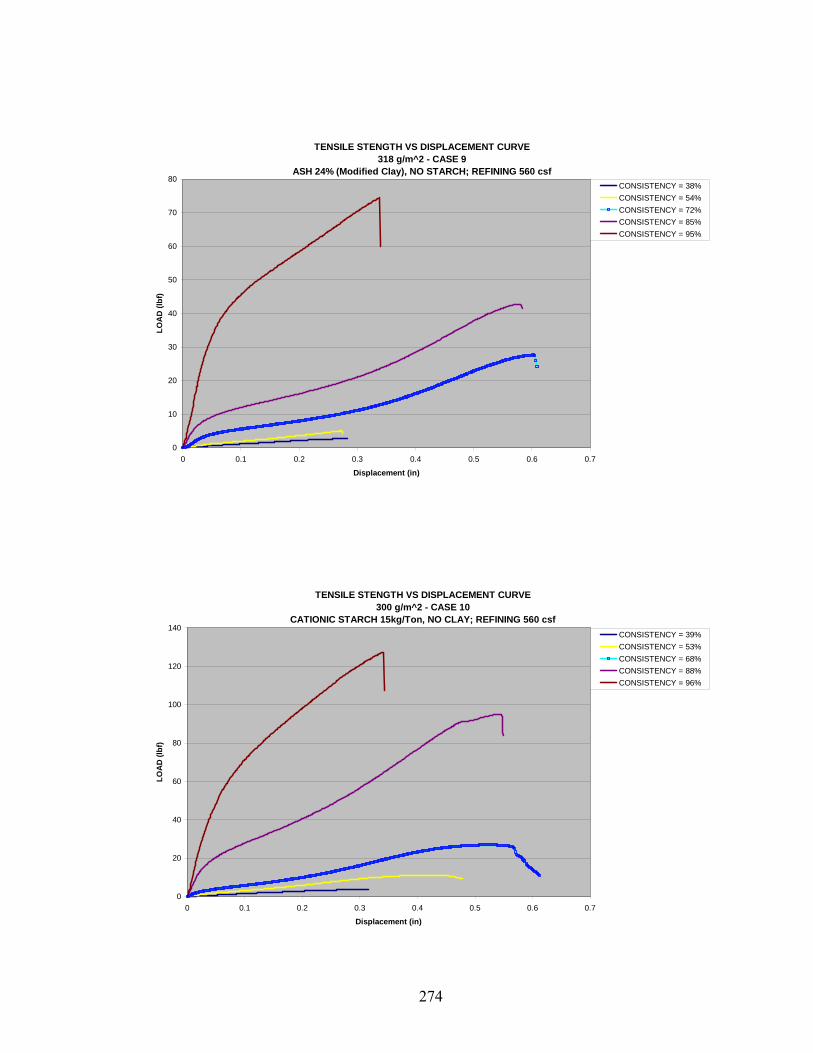
TENSILE STENGTH VS DISPLACEMENT CURVE318 g/m^2 - CASE 9
ASH 24% (Modified Clay), NO STARCH; REFINING 560 csf
0
10
20
30
40
50
60
70
80
0 0.1 0.2 0.3 0.4 0.5 0.6 0.7
Displacement (in)
LOA
D (l
bf)
CONSISTENCY = 38%CONSISTENCY = 54%CONSISTENCY = 72%CONSISTENCY = 85%CONSISTENCY = 95%
TENSILE STENGTH VS DISPLACEMENT CURVE300 g/m^2 - CASE 10
CATIONIC STARCH 15kg/Ton, NO CLAY; REFINING 560 csf
0
20
40
60
80
100
120
140
0 0.1 0.2 0.3 0.4 0.5 0.6 0.7
Displacement (in)
LOA
D (l
bf)
CONSISTENCY = 39%CONSISTENCY = 53%CONSISTENCY = 68%CONSISTENCY = 88%CONSISTENCY = 96%
274
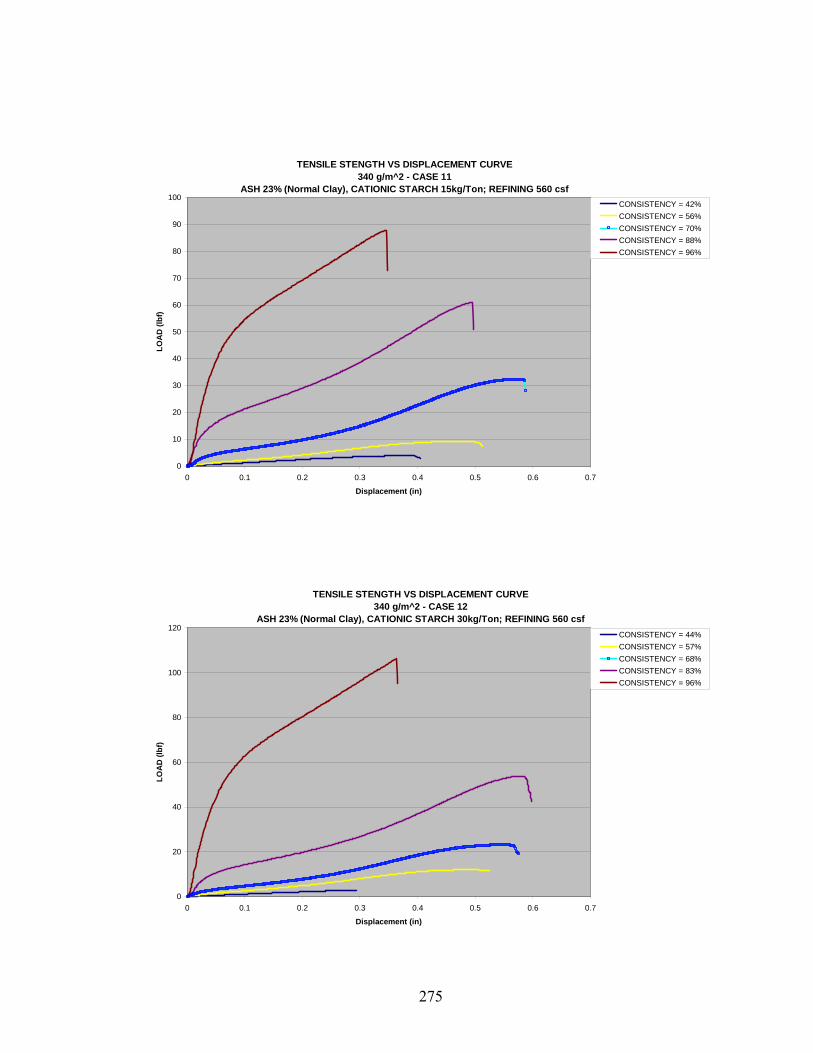
TENSILE STENGTH VS DISPLACEMENT CURVE340 g/m^2 - CASE 11
ASH 23% (Normal Clay), CATIONIC STARCH 15kg/Ton; REFINING 560 csf
0
10
20
30
40
50
60
70
80
90
100
0 0.1 0.2 0.3 0.4 0.5 0.6 0.7
Displacement (in)
LOA
D (l
bf)
CONSISTENCY = 42%CONSISTENCY = 56%CONSISTENCY = 70%CONSISTENCY = 88%CONSISTENCY = 96%
TENSILE STENGTH VS DISPLACEMENT CURVE340 g/m^2 - CASE 12
ASH 23% (Normal Clay), CATIONIC STARCH 30kg/Ton; REFINING 560 csf
0
20
40
60
80
100
120
0 0.1 0.2 0.3 0.4 0.5 0.6 0.7
Displacement (in)
LOA
D (l
bf)
CONSISTENCY = 44%CONSISTENCY = 57%CONSISTENCY = 68%CONSISTENCY = 83%CONSISTENCY = 96%
275
APPENDIX E.2: TENSILE STRENGTH VS SOLIDS
276
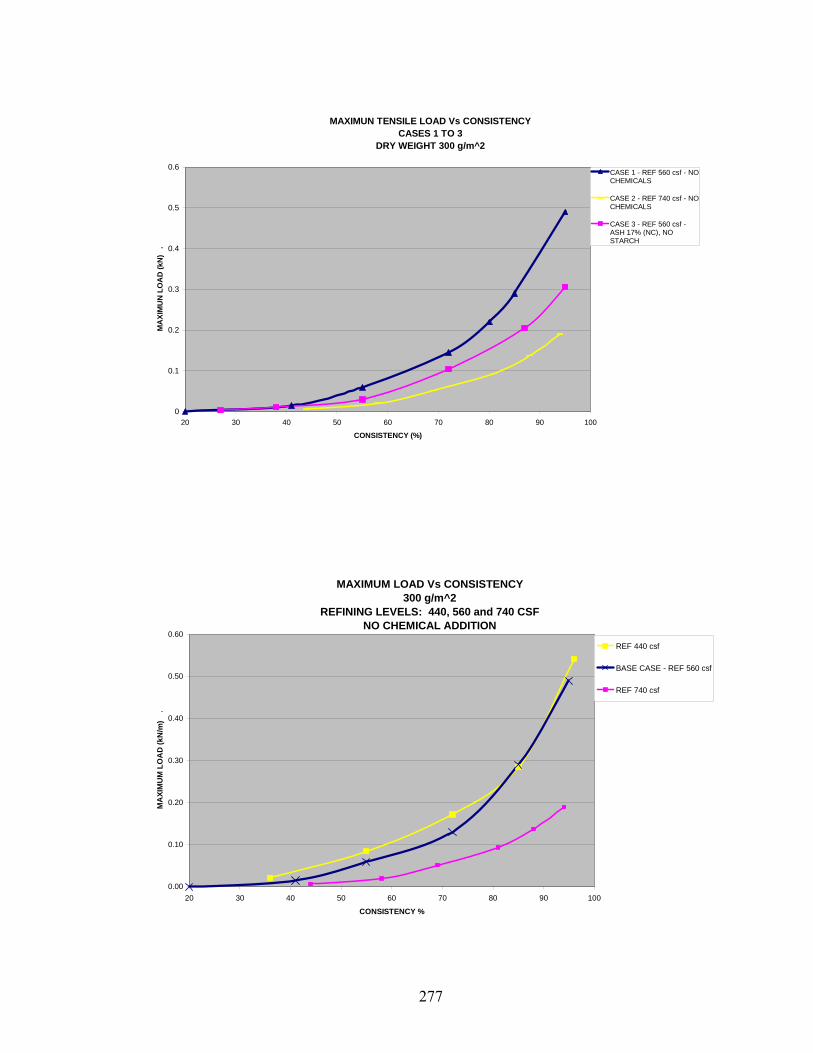
MAXIMUN TENSILE LOAD Vs CONSISTENCYCASES 1 TO 3
DRY WEIGHT 300 g/m^2
0
0.1
0.2
0.3
0.4
0.5
0.6
20 30 40 50 60 70 80 90 100
CONSISTENCY (%)
MA
XIM
UN
LO
AD
(kN
) .
CASE 1 - REF 560 csf - NOCHEMICALS
CASE 2 - REF 740 csf - NOCHEMICALS
CASE 3 - REF 560 csf -ASH 17% (NC), NOSTARCH
MAXIMUM LOAD Vs CONSISTENCY300 g/m^2
REFINING LEVELS: 440, 560 and 740 CSFNO CHEMICAL ADDITION
0.00
0.10
0.20
0.30
0.40
0.50
0.60
20 30 40 50 60 70 80 90 100
CONSISTENCY %
MA
XIM
UM
LO
AD
(kN
/m)
.
REF 440 csf
BASE CASE - REF 560 csf
REF 740 csf
277
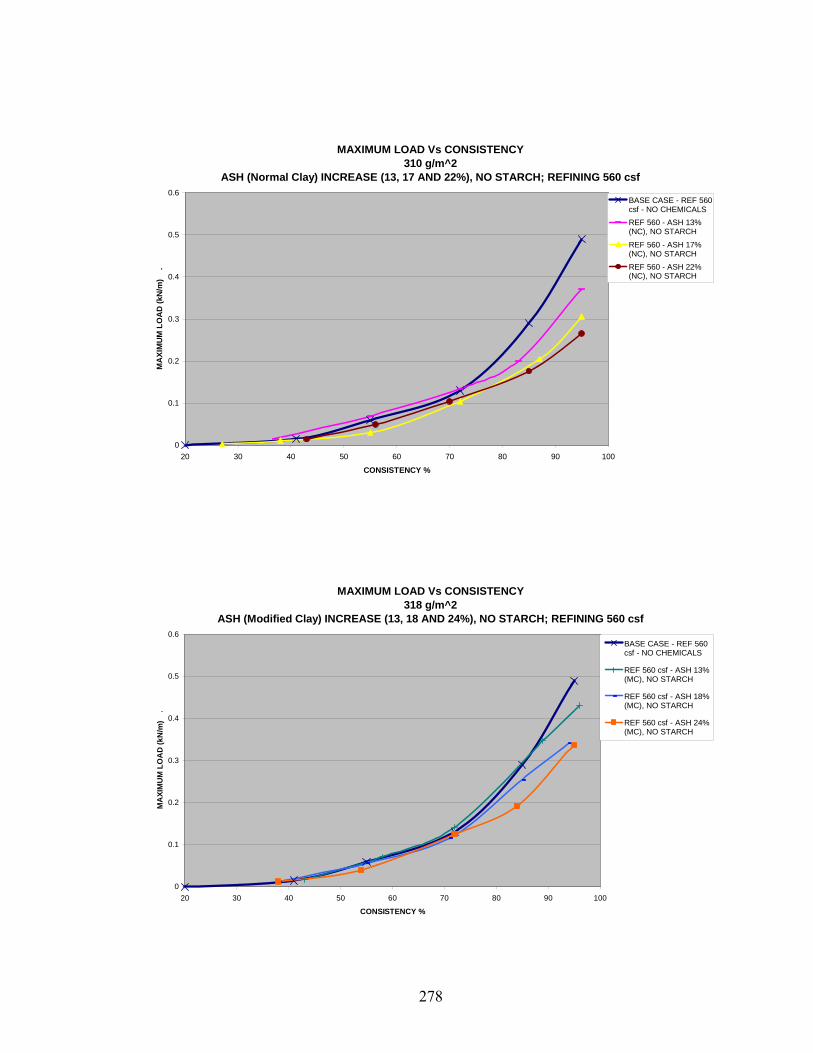
MAXIMUM LOAD Vs CONSISTENCY310 g/m^2
ASH (Normal Clay) INCREASE (13, 17 AND 22%), NO STARCH; REFINING 560 csf
0
0.1
0.2
0.3
0.4
0.5
0.6
20 30 40 50 60 70 80 90 100
CONSISTENCY %
MA
XIM
UM
LO
AD
(kN
/m)
.
BASE CASE - REF 560csf - NO CHEMICALSREF 560 - ASH 13%(NC), NO STARCH
REF 560 - ASH 17%(NC), NO STARCHREF 560 - ASH 22%(NC), NO STARCH
MAXIMUM LOAD Vs CONSISTENCY318 g/m^2
ASH (Modified Clay) INCREASE (13, 18 AND 24%), NO STARCH; REFINING 560 csf
0
0.1
0.2
0.3
0.4
0.5
0.6
20 30 40 50 60 70 80 90 100
CONSISTENCY %
MA
XIM
UM
LO
AD
(kN
/m)
.
BASE CASE - REF 560csf - NO CHEMICALS
REF 560 csf - ASH 13%(MC), NO STARCH
REF 560 csf - ASH 18%(MC), NO STARCH
REF 560 csf - ASH 24%(MC), NO STARCH
278
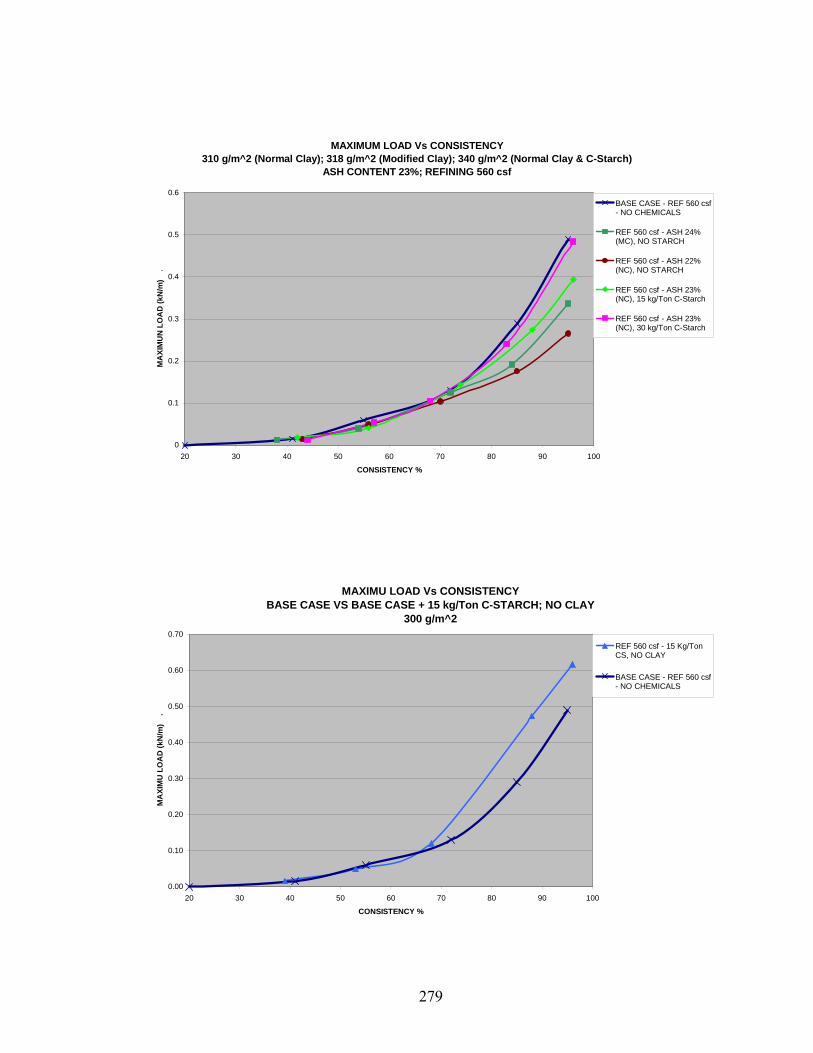
MAXIMUM LOAD Vs CONSISTENCY310 g/m^2 (Normal Clay); 318 g/m^2 (Modified Clay); 340 g/m^2 (Normal Clay & C-Starch)
ASH CONTENT 23%; REFINING 560 csf
0
0.1
0.2
0.3
0.4
0.5
0.6
20 30 40 50 60 70 80 90 100
CONSISTENCY %
MA
XIM
UN
LO
AD
(kN
/m)
.
BASE CASE - REF 560 csf- NO CHEMICALS
REF 560 csf - ASH 24%(MC), NO STARCH
REF 560 csf - ASH 22%(NC), NO STARCH
REF 560 csf - ASH 23%(NC), 15 kg/Ton C-Starch
REF 560 csf - ASH 23%(NC), 30 kg/Ton C-Starch
MAXIMU LOAD Vs CONSISTENCYBASE CASE VS BASE CASE + 15 kg/Ton C-STARCH; NO CLAY
300 g/m^2
0.00
0.10
0.20
0.30
0.40
0.50
0.60
0.70
20 30 40 50 60 70 80 90 100
CONSISTENCY %
MA
XIM
U L
OA
D (k
N/m
) .
REF 560 csf - 15 Kg/TonCS, NO CLAY
BASE CASE - REF 560 csf- NO CHEMICALS
279
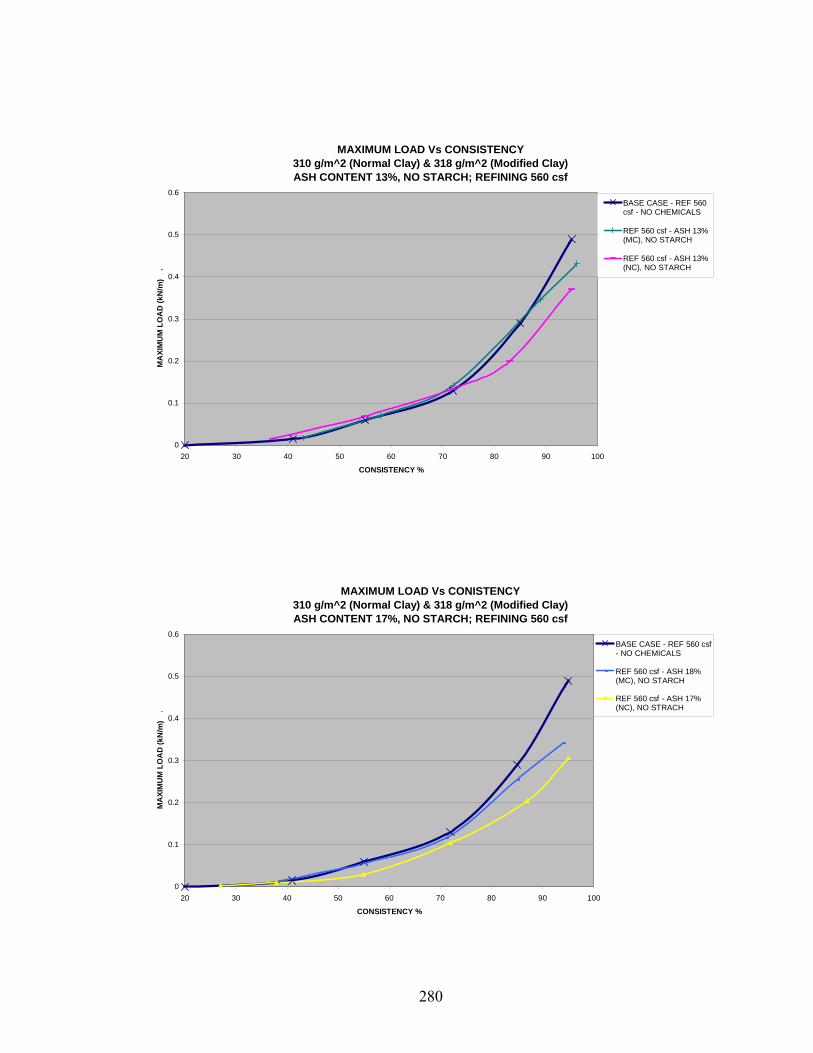
MAXIMUM LOAD Vs CONSISTENCY310 g/m^2 (Normal Clay) & 318 g/m^2 (Modified Clay)ASH CONTENT 13%, NO STARCH; REFINING 560 csf
0
0.1
0.2
0.3
0.4
0.5
0.6
20 30 40 50 60 70 80 90 100
CONSISTENCY %
MA
XIM
UM
LO
AD
(kN
/m)
.
BASE CASE - REF 560csf - NO CHEMICALS
REF 560 csf - ASH 13%(MC), NO STARCH
REF 560 csf - ASH 13%(NC), NO STARCH
MAXIMUM LOAD Vs CONISTENCY310 g/m^2 (Normal Clay) & 318 g/m^2 (Modified Clay)ASH CONTENT 17%, NO STARCH; REFINING 560 csf
0
0.1
0.2
0.3
0.4
0.5
0.6
20 30 40 50 60 70 80 90 100
CONSISTENCY %
MA
XIM
UM
LO
AD
(kN
/m)
.
BASE CASE - REF 560 csf- NO CHEMICALS
REF 560 csf - ASH 18%(MC), NO STARCH
REF 560 csf - ASH 17%(NC), NO STRACH
280
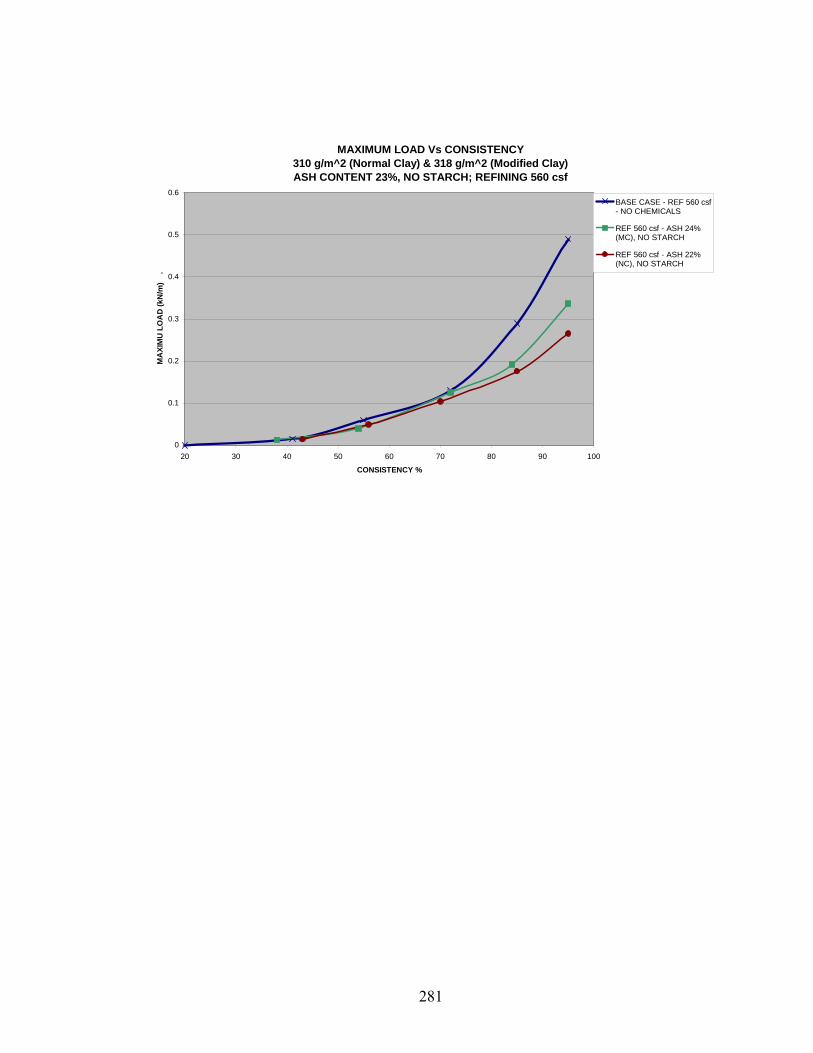
MAXIMUM LOAD Vs CONSISTENCY310 g/m^2 (Normal Clay) & 318 g/m^2 (Modified Clay)ASH CONTENT 23%, NO STARCH; REFINING 560 csf
0
0.1
0.2
0.3
0.4
0.5
0.6
20 30 40 50 60 70 80 90 100
CONSISTENCY %
MA
XIM
U L
OA
D (k
N/m
) .
BASE CASE - REF 560 csf- NO CHEMICALS
REF 560 csf - ASH 24%(MC), NO STARCH
REF 560 csf - ASH 22%(NC), NO STARCH
281
APPENDIX E.3: TENSILE STRAIN VS SOLIDS
282
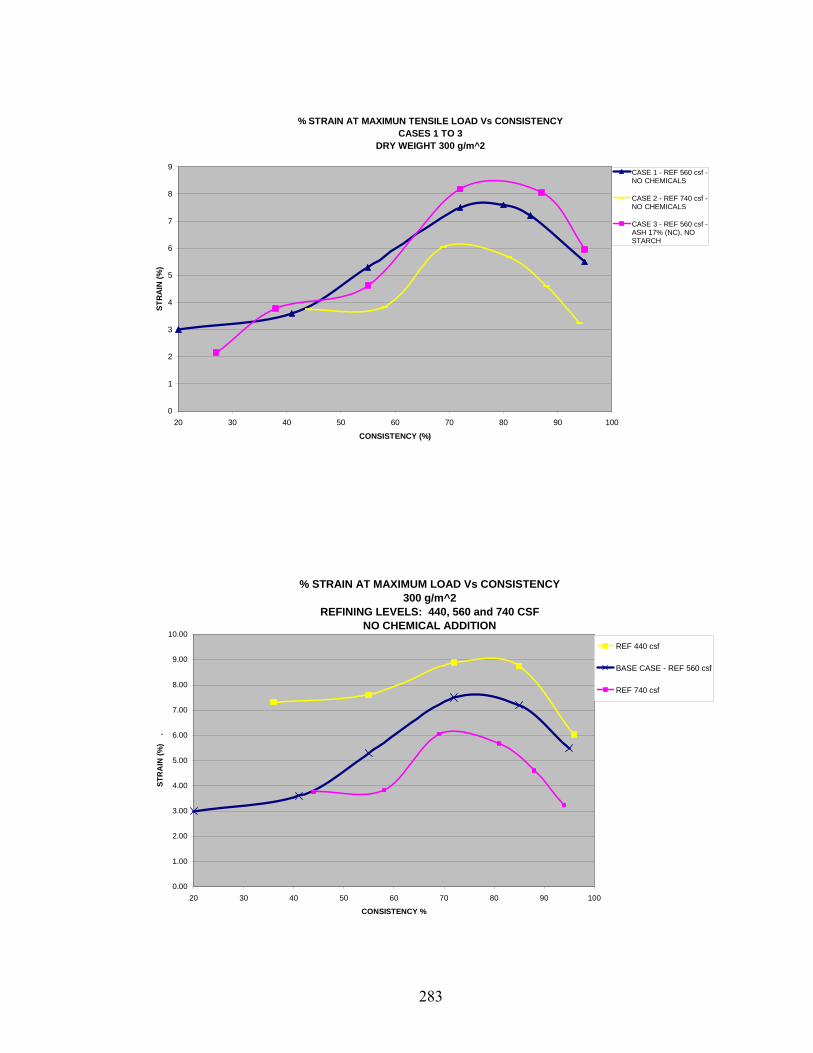
% STRAIN AT MAXIMUN TENSILE LOAD Vs CONSISTENCYCASES 1 TO 3
DRY WEIGHT 300 g/m^2
0
1
2
3
4
5
6
7
8
9
20 30 40 50 60 70 80 90 100
CONSISTENCY (%)
STR
AIN
(%)
CASE 1 - REF 560 csf -NO CHEMICALS
CASE 2 - REF 740 csf -NO CHEMICALS
CASE 3 - REF 560 csf -ASH 17% (NC), NOSTARCH
% STRAIN AT MAXIMUM LOAD Vs CONSISTENCY300 g/m^2
REFINING LEVELS: 440, 560 and 740 CSFNO CHEMICAL ADDITION
0.00
1.00
2.00
3.00
4.00
5.00
6.00
7.00
8.00
9.00
10.00
20 30 40 50 60 70 80 90 100
CONSISTENCY %
STR
AIN
(%)
.
REF 440 csf
BASE CASE - REF 560 csf
REF 740 csf
283
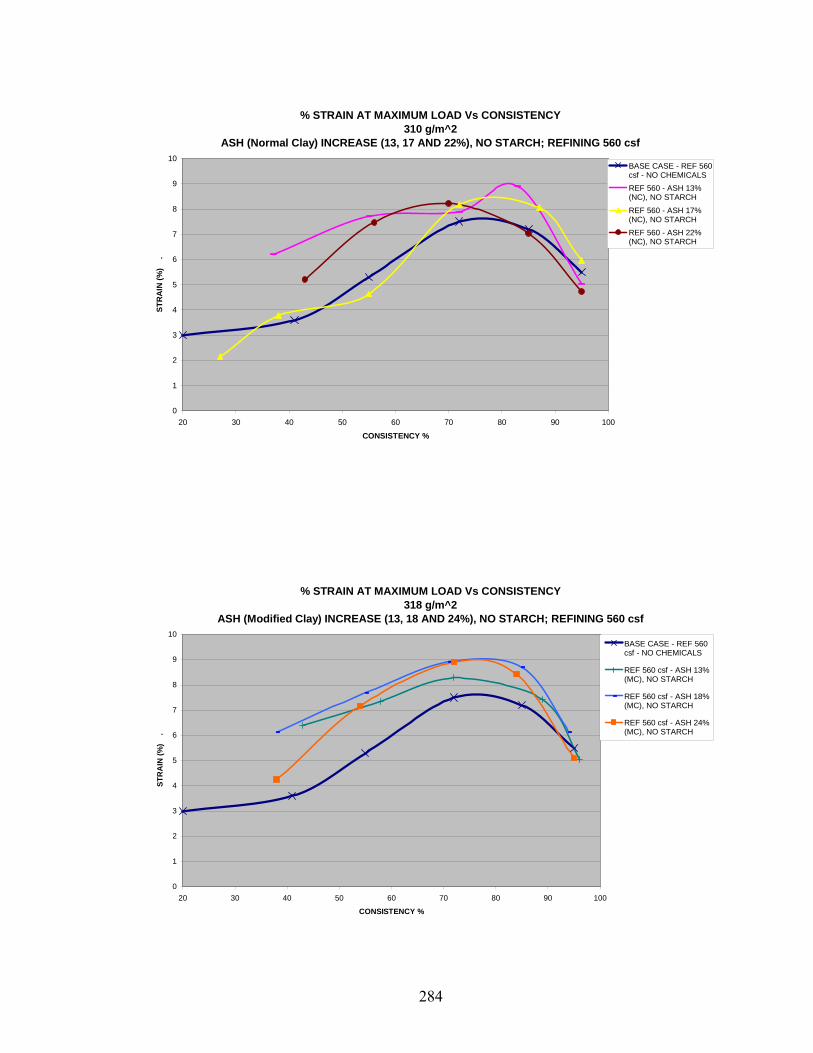
% STRAIN AT MAXIMUM LOAD Vs CONSISTENCY310 g/m^2
ASH (Normal Clay) INCREASE (13, 17 AND 22%), NO STARCH; REFINING 560 csf
0
1
2
3
4
5
6
7
8
9
10
20 30 40 50 60 70 80 90 100
CONSISTENCY %
STR
AIN
(%)
.BASE CASE - REF 560csf - NO CHEMICALSREF 560 - ASH 13%(NC), NO STARCH
REF 560 - ASH 17%(NC), NO STARCHREF 560 - ASH 22%(NC), NO STARCH
% STRAIN AT MAXIMUM LOAD Vs CONSISTENCY318 g/m^2
ASH (Modified Clay) INCREASE (13, 18 AND 24%), NO STARCH; REFINING 560 csf
0
1
2
3
4
5
6
7
8
9
10
20 30 40 50 60 70 80 90 100
CONSISTENCY %
STR
AIN
(%)
.
BASE CASE - REF 560csf - NO CHEMICALS
REF 560 csf - ASH 13%(MC), NO STARCH
REF 560 csf - ASH 18%(MC), NO STARCH
REF 560 csf - ASH 24%(MC), NO STARCH
284
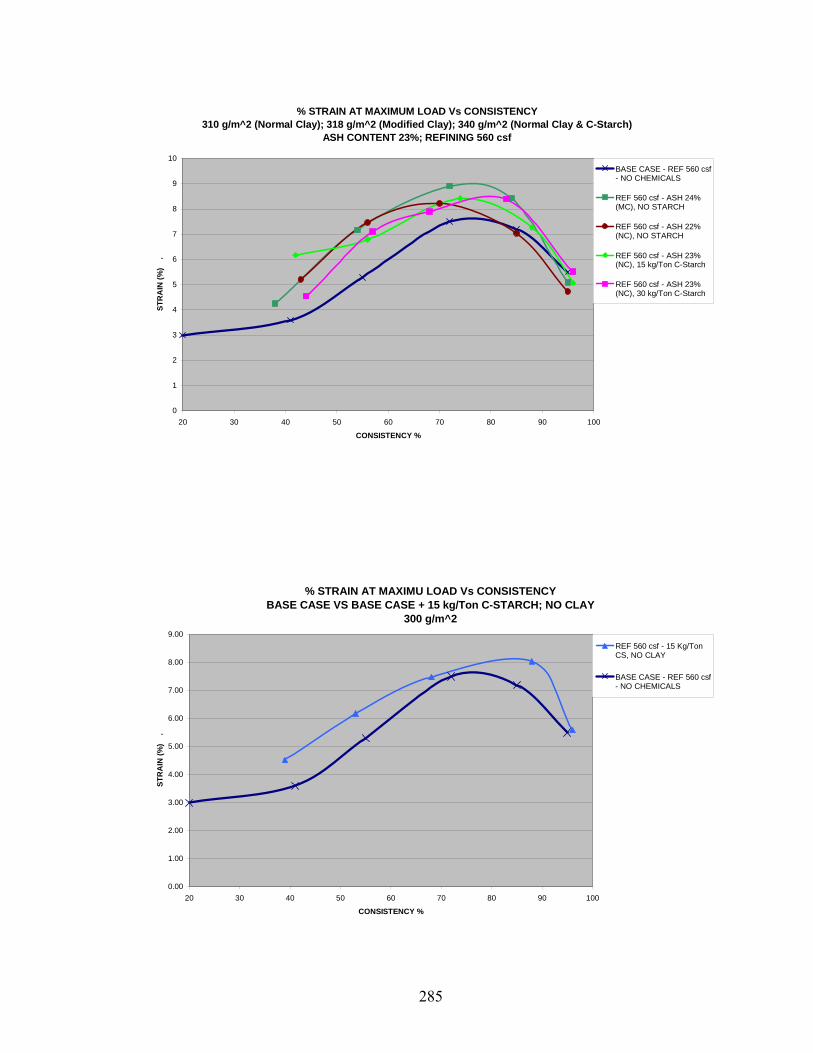
% STRAIN AT MAXIMUM LOAD Vs CONSISTENCY310 g/m^2 (Normal Clay); 318 g/m^2 (Modified Clay); 340 g/m^2 (Normal Clay & C-Starch)
ASH CONTENT 23%; REFINING 560 csf
0
1
2
3
4
5
6
7
8
9
10
20 30 40 50 60 70 80 90 100
CONSISTENCY %
STR
AIN
(%)
.BASE CASE - REF 560 csf- NO CHEMICALS
REF 560 csf - ASH 24%(MC), NO STARCH
REF 560 csf - ASH 22%(NC), NO STARCH
REF 560 csf - ASH 23%(NC), 15 kg/Ton C-Starch
REF 560 csf - ASH 23%(NC), 30 kg/Ton C-Starch
% STRAIN AT MAXIMU LOAD Vs CONSISTENCYBASE CASE VS BASE CASE + 15 kg/Ton C-STARCH; NO CLAY
300 g/m^2
0.00
1.00
2.00
3.00
4.00
5.00
6.00
7.00
8.00
9.00
20 30 40 50 60 70 80 90 100
CONSISTENCY %
STR
AIN
(%)
.
REF 560 csf - 15 Kg/TonCS, NO CLAY
BASE CASE - REF 560 csf- NO CHEMICALS
285
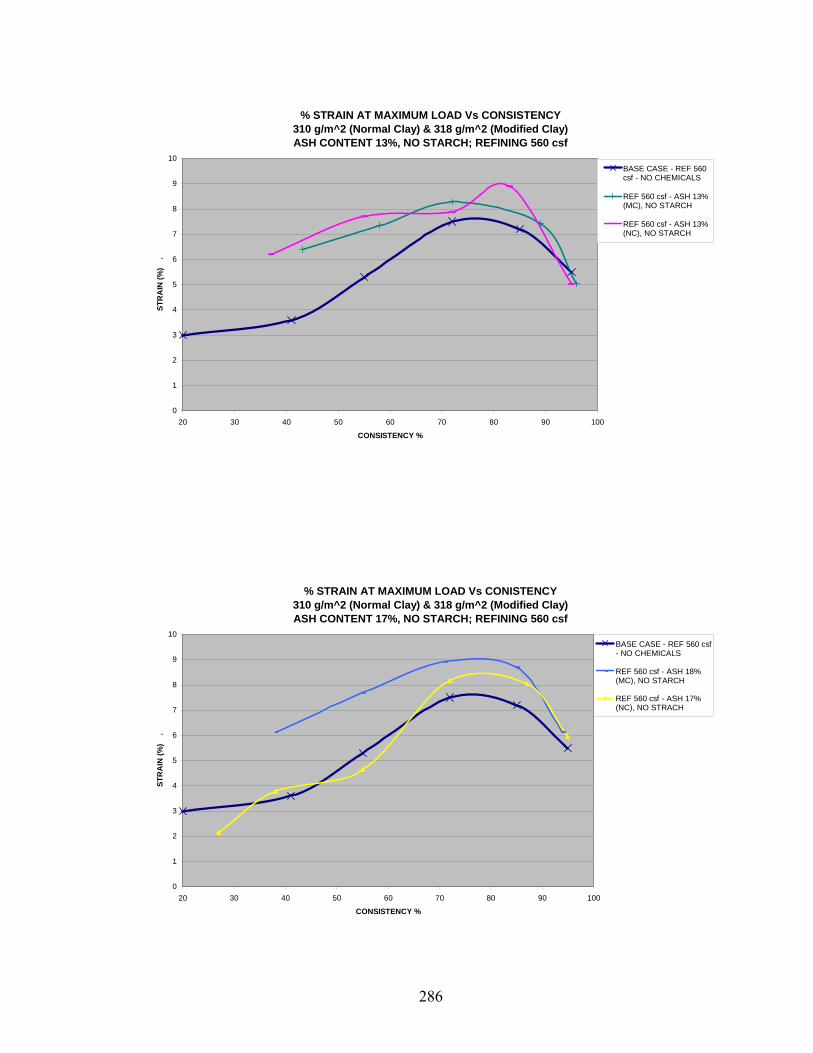
% STRAIN AT MAXIMUM LOAD Vs CONSISTENCY310 g/m^2 (Normal Clay) & 318 g/m^2 (Modified Clay)ASH CONTENT 13%, NO STARCH; REFINING 560 csf
0
1
2
3
4
5
6
7
8
9
10
20 30 40 50 60 70 80 90 100
CONSISTENCY %
STR
AIN
(%)
.BASE CASE - REF 560csf - NO CHEMICALS
REF 560 csf - ASH 13%(MC), NO STARCH
REF 560 csf - ASH 13%(NC), NO STARCH
% STRAIN AT MAXIMUM LOAD Vs CONISTENCY310 g/m^2 (Normal Clay) & 318 g/m^2 (Modified Clay)ASH CONTENT 17%, NO STARCH; REFINING 560 csf
0
1
2
3
4
5
6
7
8
9
10
20 30 40 50 60 70 80 90 100
CONSISTENCY %
STR
AIN
(%)
.
BASE CASE - REF 560 csf- NO CHEMICALS
REF 560 csf - ASH 18%(MC), NO STARCH
REF 560 csf - ASH 17%(NC), NO STRACH
286
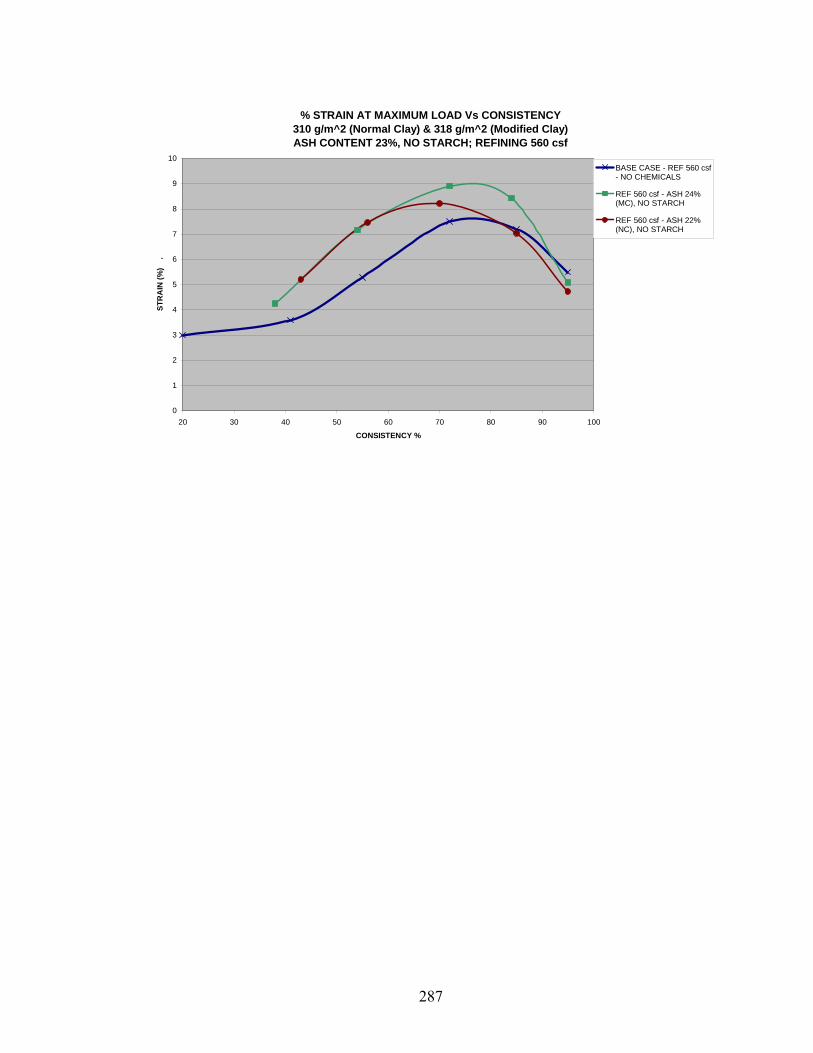
% STRAIN AT MAXIMUM LOAD Vs CONSISTENCY310 g/m^2 (Normal Clay) & 318 g/m^2 (Modified Clay)ASH CONTENT 23%, NO STARCH; REFINING 560 csf
0
1
2
3
4
5
6
7
8
9
10
20 30 40 50 60 70 80 90 100
CONSISTENCY %
STR
AIN
(%)
.BASE CASE - REF 560 csf- NO CHEMICALS
REF 560 csf - ASH 24%(MC), NO STARCH
REF 560 csf - ASH 22%(NC), NO STARCH
287
APPENDIX E.4: TENSILE STRENGTH VS SOLIDS FOR DIFFERENT BASIS WEIGHTS – CASES 1 TO 3
288
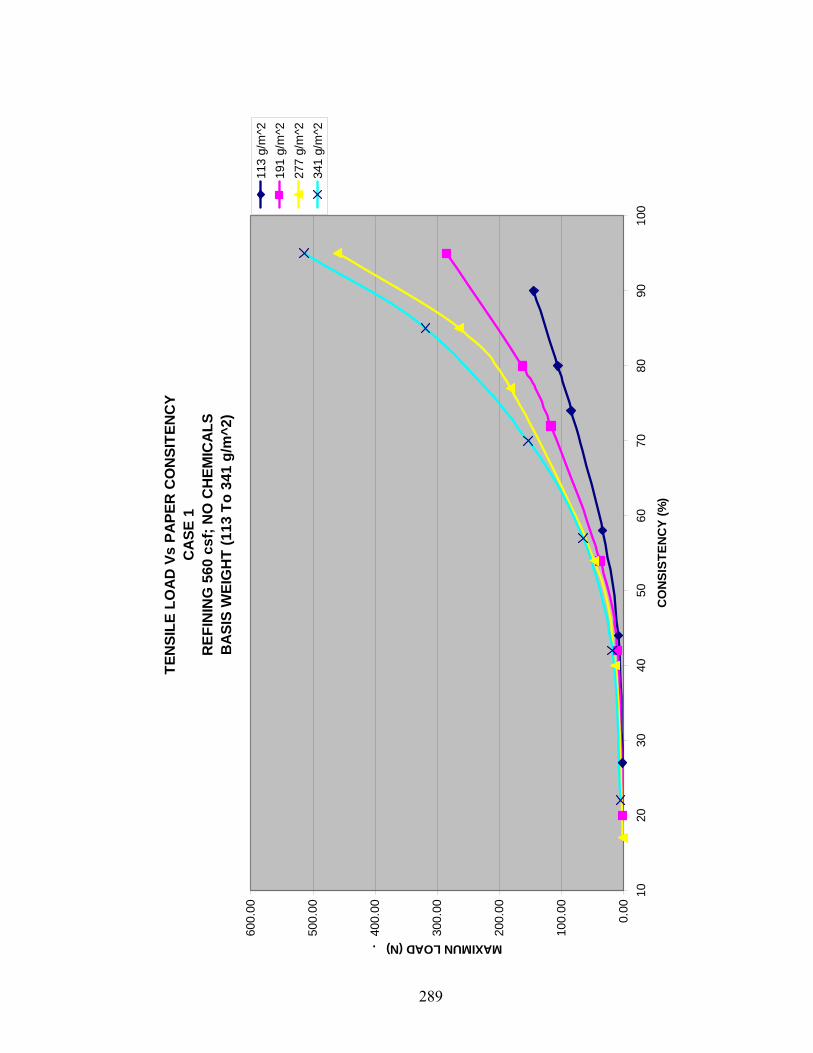
289
TEN
SILE
LO
AD
Vs
PAPE
R C
ON
SITE
NC
YC
ASE
1R
EFIN
ING
560
csf
; NO
CH
EMIC
ALS
BA
SIS
WEI
GH
T (1
13 T
o 34
1 g/
m^2
)
0.00
100.
00
200.
00
300.
00
400.
00
500.
00
600.
00
1020
3040
5060
7080
9010
0
CO
NSI
STEN
CY
(%)
MAXIMUN LOAD (N) .
113
g/m
^219
1 g/
m^2
277
g/m
^234
1 g/
m^2
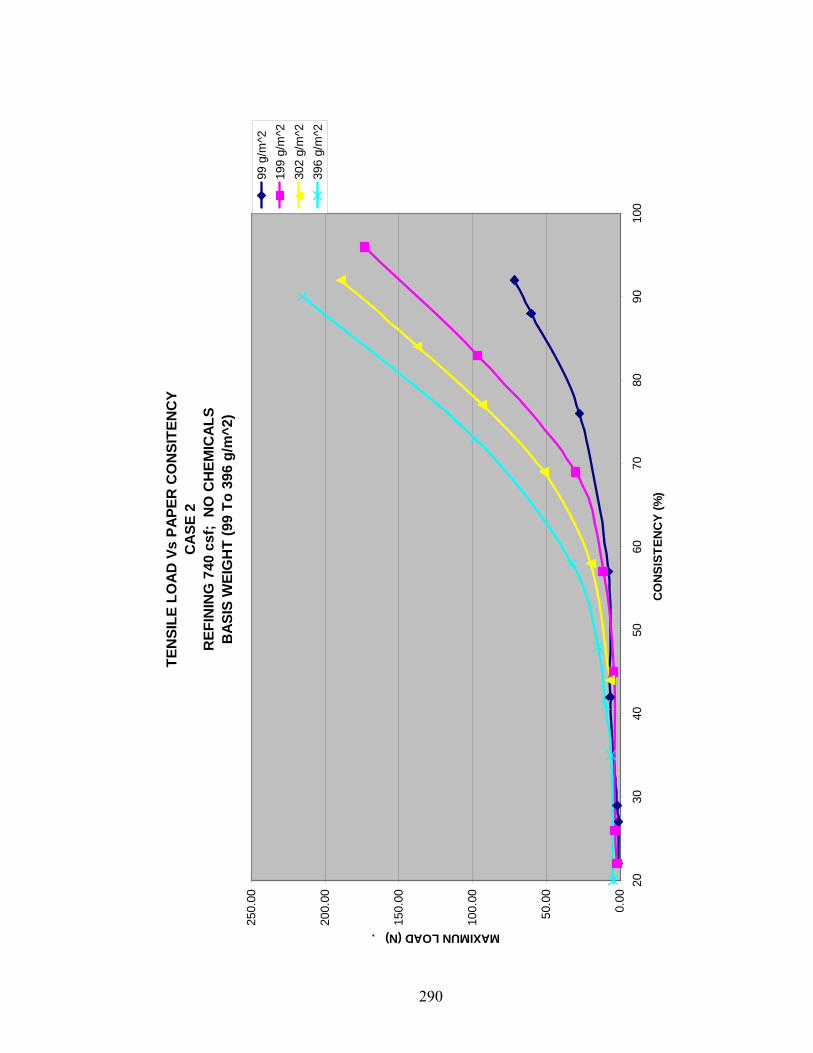
290
TEN
SILE
LO
AD
Vs
PAPE
R C
ON
SITE
NC
YC
ASE
2R
EFIN
ING
740
csf
; N
O C
HEM
ICA
LSB
ASI
S W
EIG
HT
(99
To 3
96 g
/m^2
)
0.00
50.0
0
100.
00
150.
00
200.
00
250.
00
2030
4050
6070
8090
100
CO
NSI
STEN
CY
(%)
MAXIMUN LOAD (N) .
99 g
/m^2
199
g/m
^230
2 g/
m^2
396
g/m
^2
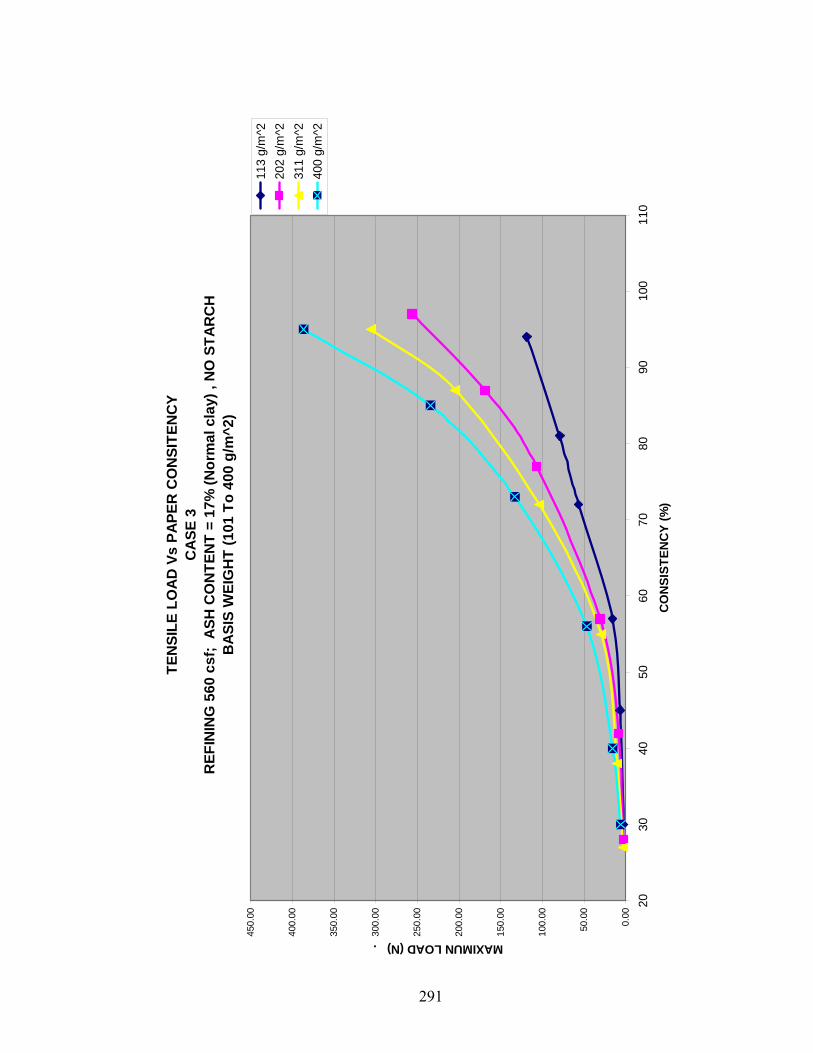
291
TEN
SILE
LO
AD
Vs
PAPE
R C
ON
SITE
NC
YC
ASE
3R
EFIN
ING
560
csf
; A
SH C
ON
TEN
T =
17%
(Nor
mal
cla
y) ,
NO
STA
RC
HB
ASI
S W
EIG
HT
(101
To
400
g/m
^2)
0.00
50.0
0
100.
00
150.
00
200.
00
250.
00
300.
00
350.
00
400.
00
450.
00
2030
4050
6070
8090
100
110
CO
NSI
STEN
CY
(%)
MAXIMUN LOAD (N) .
113
g/m
^220
2 g/
m^2
311
g/m
^240
0 g/
m^2
APPENDIX F: ENVELOPE CURVES
292
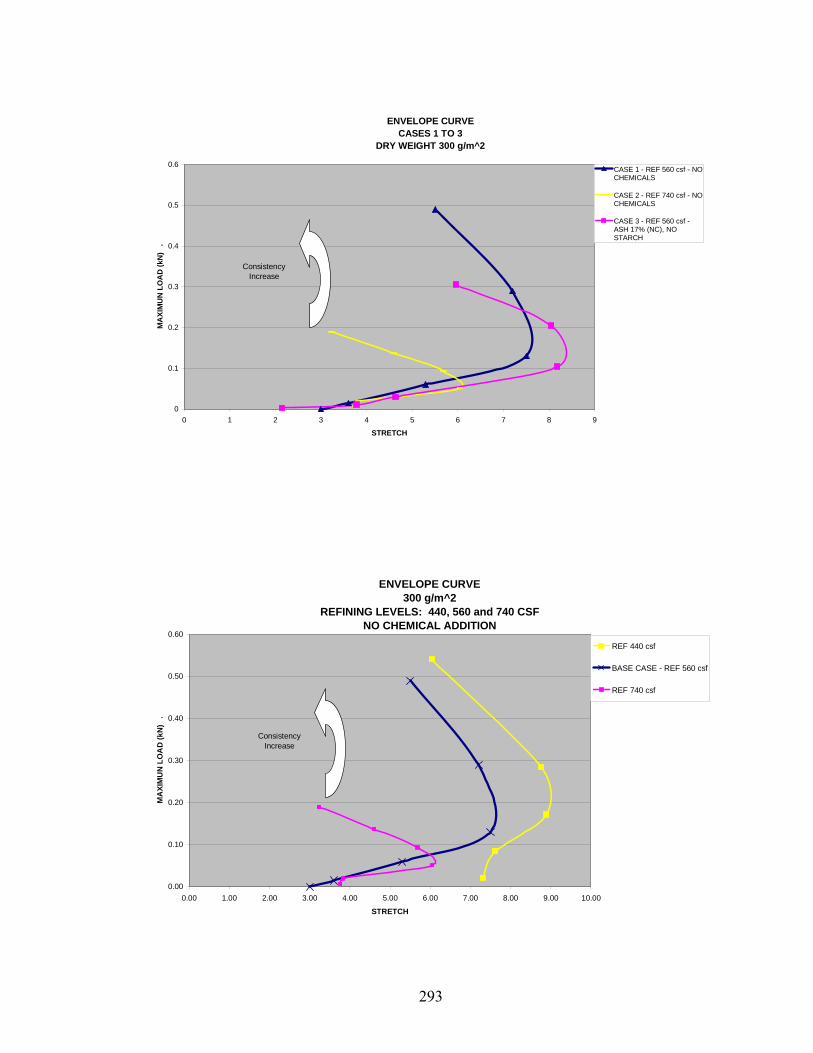
ENVELOPE CURVECASES 1 TO 3
DRY WEIGHT 300 g/m^2
0
0.1
0.2
0.3
0.4
0.5
0.6
0 1 2 3 4 5 6 7 8 9
STRETCH
MA
XIM
UN
LO
AD
(kN
) .
CASE 1 - REF 560 csf - NOCHEMICALS
CASE 2 - REF 740 csf - NOCHEMICALS
CASE 3 - REF 560 csf -ASH 17% (NC), NOSTARCH
ConsistencyIncrease
ENVELOPE CURVE300 g/m^2
REFINING LEVELS: 440, 560 and 740 CSFNO CHEMICAL ADDITION
0.00
0.10
0.20
0.30
0.40
0.50
0.60
0.00 1.00 2.00 3.00 4.00 5.00 6.00 7.00 8.00 9.00 10.00
STRETCH
MA
XIM
UN
LO
AD
(kN
) .
REF 440 csf
BASE CASE - REF 560 csf
REF 740 csf
ConsistencyIncrease
293
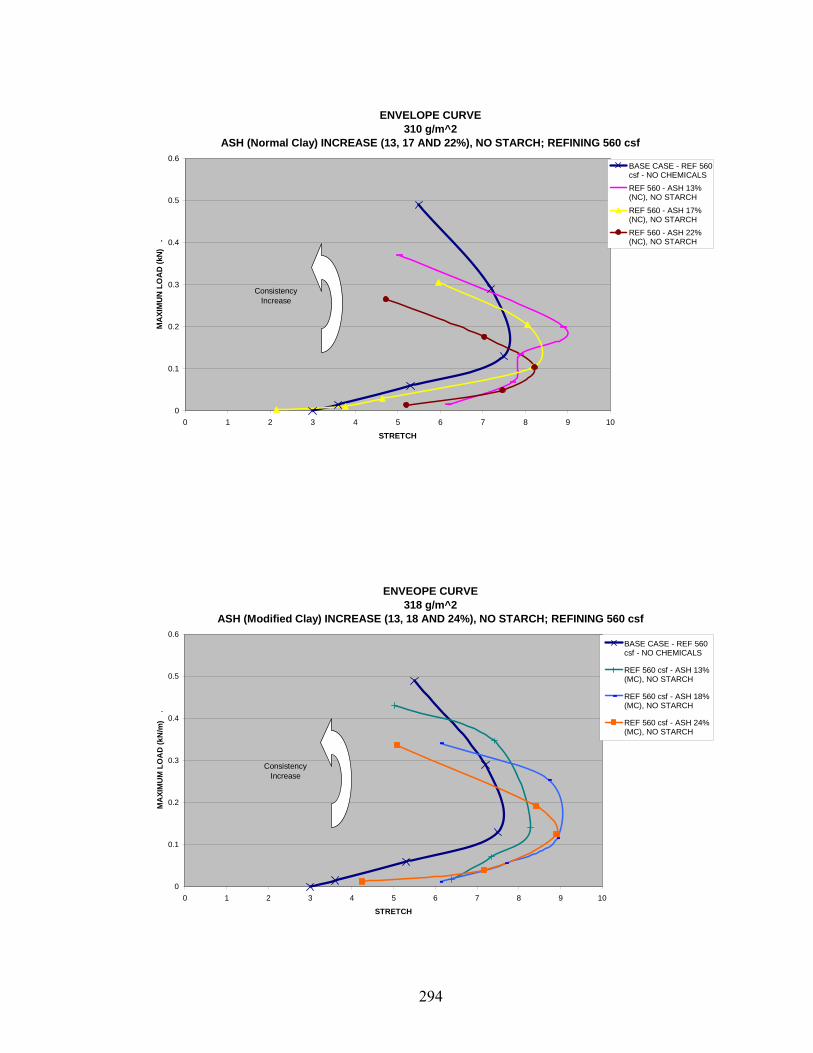
ENVELOPE CURVE310 g/m^2
ASH (Normal Clay) INCREASE (13, 17 AND 22%), NO STARCH; REFINING 560 csf
0
0.1
0.2
0.3
0.4
0.5
0.6
0 1 2 3 4 5 6 7 8 9 10
STRETCH
MA
XIM
UN
LO
AD
(kN
) .
BASE CASE - REF 560csf - NO CHEMICALSREF 560 - ASH 13%(NC), NO STARCH
REF 560 - ASH 17%(NC), NO STARCHREF 560 - ASH 22%(NC), NO STARCH
ConsistencyIncrease
ENVEOPE CURVE318 g/m^2
ASH (Modified Clay) INCREASE (13, 18 AND 24%), NO STARCH; REFINING 560 csf
0
0.1
0.2
0.3
0.4
0.5
0.6
0 1 2 3 4 5 6 7 8 9 10
STRETCH
MA
XIM
UM
LO
AD
(kN
/m)
.
BASE CASE - REF 560csf - NO CHEMICALS
REF 560 csf - ASH 13%(MC), NO STARCH
REF 560 csf - ASH 18%(MC), NO STARCH
REF 560 csf - ASH 24%(MC), NO STARCH
ConsistencyIncrease
294
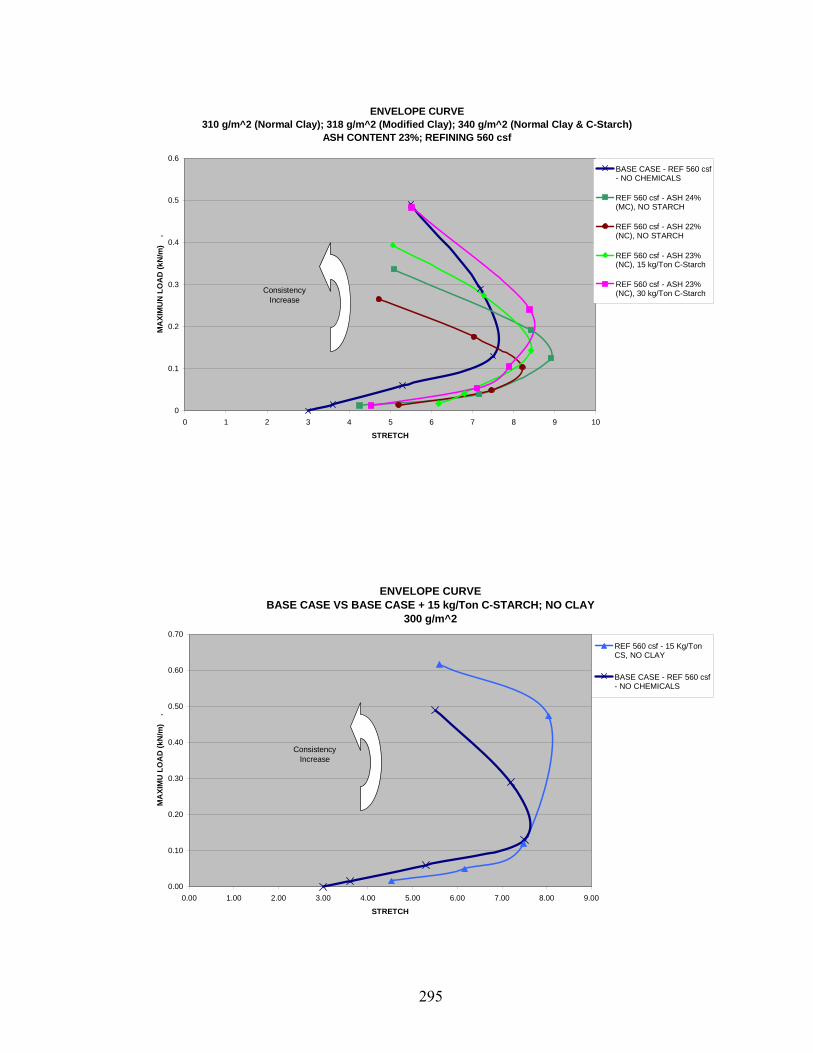
ENVELOPE CURVE310 g/m^2 (Normal Clay); 318 g/m^2 (Modified Clay); 340 g/m^2 (Normal Clay & C-Starch)
ASH CONTENT 23%; REFINING 560 csf
0
0.1
0.2
0.3
0.4
0.5
0.6
0 1 2 3 4 5 6 7 8 9 10
STRETCH
MA
XIM
UN
LO
AD
(kN
/m)
.BASE CASE - REF 560 csf- NO CHEMICALS
REF 560 csf - ASH 24%(MC), NO STARCH
REF 560 csf - ASH 22%(NC), NO STARCH
REF 560 csf - ASH 23%(NC), 15 kg/Ton C-Starch
REF 560 csf - ASH 23%(NC), 30 kg/Ton C-StarchConsistency
Increase
ENVELOPE CURVEBASE CASE VS BASE CASE + 15 kg/Ton C-STARCH; NO CLAY
300 g/m^2
0.00
0.10
0.20
0.30
0.40
0.50
0.60
0.70
0.00 1.00 2.00 3.00 4.00 5.00 6.00 7.00 8.00 9.00
STRETCH
MA
XIM
U L
OA
D (k
N/m
) .
REF 560 csf - 15 Kg/TonCS, NO CLAY
BASE CASE - REF 560 csf- NO CHEMICALS
ConsistencyIncrease
295
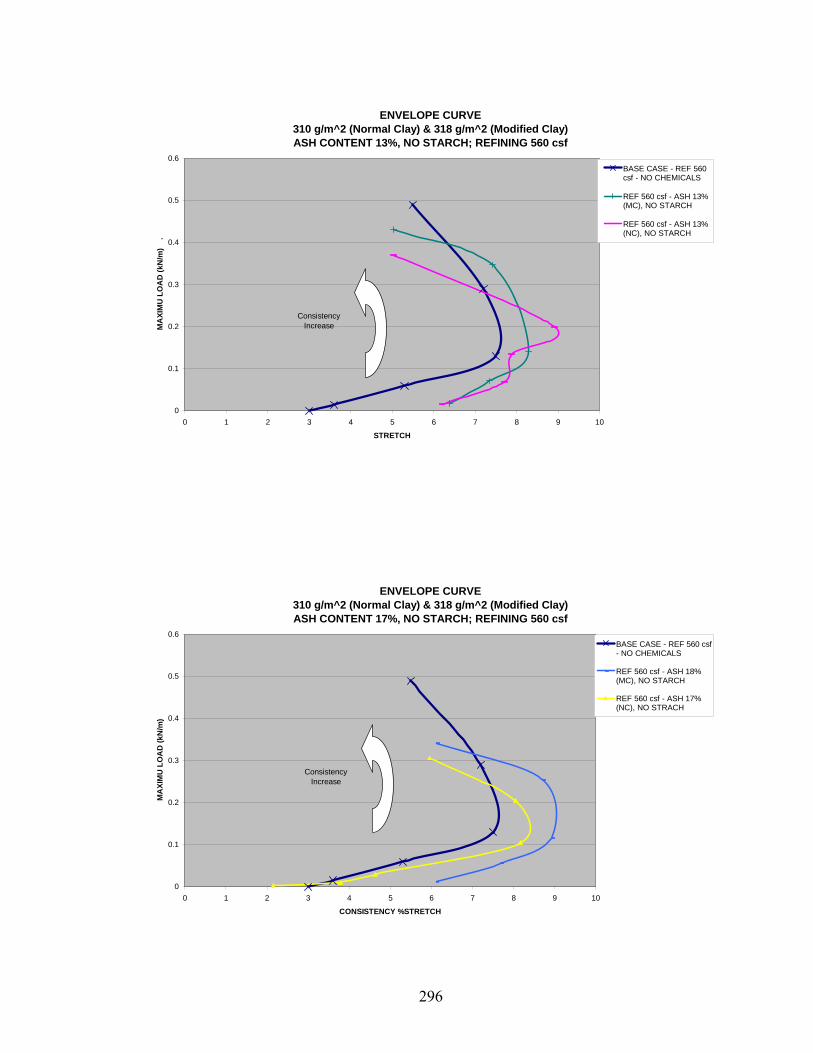
ENVELOPE CURVE310 g/m^2 (Normal Clay) & 318 g/m^2 (Modified Clay)ASH CONTENT 13%, NO STARCH; REFINING 560 csf
0
0.1
0.2
0.3
0.4
0.5
0.6
0 1 2 3 4 5 6 7 8 9 10
STRETCH
MA
XIM
U L
OA
D (k
N/m
) .
BASE CASE - REF 560csf - NO CHEMICALS
REF 560 csf - ASH 13%(MC), NO STARCH
REF 560 csf - ASH 13%(NC), NO STARCH
ConsistencyIncrease
ENVELOPE CURVE310 g/m^2 (Normal Clay) & 318 g/m^2 (Modified Clay)ASH CONTENT 17%, NO STARCH; REFINING 560 csf
0
0.1
0.2
0.3
0.4
0.5
0.6
0 1 2 3 4 5 6 7 8 9 10
CONSISTENCY %STRETCH
MA
XIM
U L
OA
D (k
N/m
)
BASE CASE - REF 560 csf- NO CHEMICALS
REF 560 csf - ASH 18%(MC), NO STARCH
REF 560 csf - ASH 17%(NC), NO STRACH
ConsistencyIncrease
296
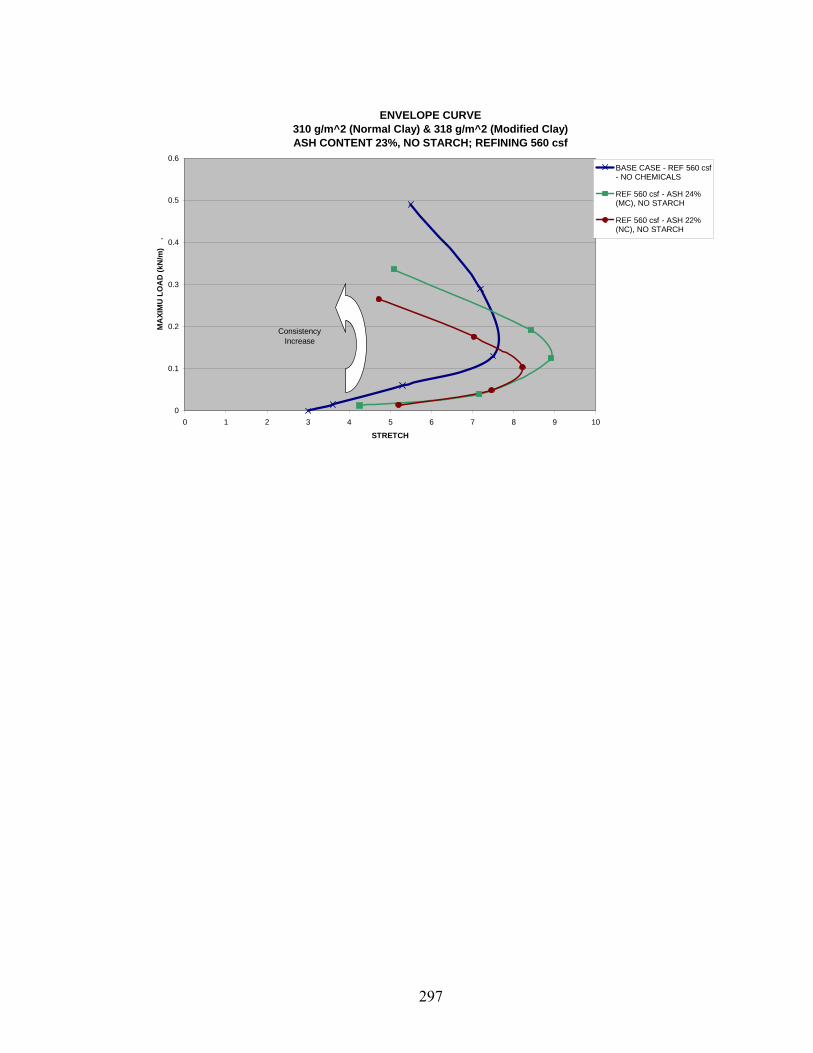
ENVELOPE CURVE310 g/m^2 (Normal Clay) & 318 g/m^2 (Modified Clay)ASH CONTENT 23%, NO STARCH; REFINING 560 csf
0
0.1
0.2
0.3
0.4
0.5
0.6
0 1 2 3 4 5 6 7 8 9 10
STRETCH
MA
XIM
U L
OA
D (k
N/m
) .
BASE CASE - REF 560 csf- NO CHEMICALS
REF 560 csf - ASH 24%(MC), NO STARCH
REF 560 csf - ASH 22%(NC), NO STARCH
ConsistencyIncrease
297
APPENDIX G: TENSILE AND COHESIVE STRENGTH INDEX DATA FOR ALL BASIS WEIGHTS – CASE 1 TO 3
298
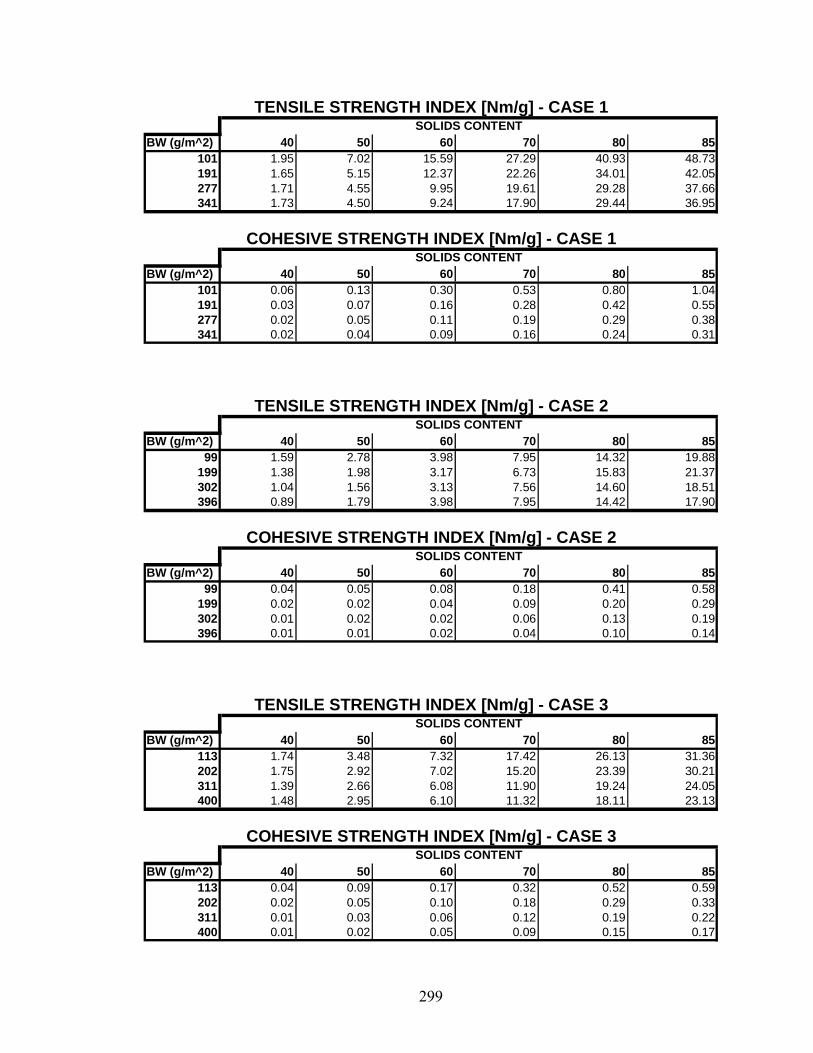
BW (g/m^2) 40 50 60 70 80 8101 1.95 7.02 15.59 27.29 40.93 48.73191 1.65 5.15 12.37 22.26 34.01 42.05277 1.71 4.55 9.95 19.61 29.28 37.66341 1.73 4.50 9.24 17.90 29.44 36.95
BW (g/m^2) 40 50 60 70 80 8101 0.06 0.13 0.30 0.53 0.80 1.04191 0.03 0.07 0.16 0.28 0.42 0.55277 0.02 0.05 0.11 0.19 0.29 0.38341 0.02 0.04 0.09 0.16 0.24 0.31
SOLIDS CONTENT
SOLIDS CONTENT
TENSILE STRENGTH INDEX [Nm/g] - CASE 1
COHESIVE STRENGTH INDEX [Nm/g] - CASE 1
5
5
BW (g/m^2) 40 50 60 70 80 899 1.59 2.78 3.98 7.95 14.32 19.88
199 1.38 1.98 3.17 6.73 15.83 21.37302 1.04 1.56 3.13 7.56 14.60 18.51396 0.89 1.79 3.98 7.95 14.42 17.90
BW (g/m^2) 40 50 60 70 80 899 0.04 0.05 0.08 0.18 0.41 0.58
199 0.02 0.02 0.04 0.09 0.20 0.29302 0.01 0.02 0.02 0.06 0.13 0.19396 0.01 0.01 0.02 0.04 0.10 0.14
TENSILE STRENGTH INDEX [Nm/g] - CASE 2SOLIDS CONTENT
COHESIVE STRENGTH INDEX [Nm/g] - CASE 2SOLIDS CONTENT
5
5
BW (g/m^2) 40 50 60 70 80 8113 1.74 3.48 7.32 17.42 26.13 31.36202 1.75 2.92 7.02 15.20 23.39 30.21311 1.39 2.66 6.08 11.90 19.24 24.05400 1.48 2.95 6.10 11.32 18.11 23.13
BW (g/m^2) 40 50 60 70 80 8113 0.04 0.09 0.17 0.32 0.52 0.59202 0.02 0.05 0.10 0.18 0.29 0.33311 0.01 0.03 0.06 0.12 0.19 0.22400 0.01 0.02 0.05 0.09 0.15 0.17
TENSILE STRENGTH INDEX [Nm/g] - CASE 3SOLIDS CONTENT
COHESIVE STRENGTH INDEX [Nm/g] - CASE 3SOLIDS CONTENT
5
5
299
LITERATURE CITED
(1) Mardon, J., Truman, A. B., O´Blenes, G. and Meadley, C. K.: A Consideration of the Factors Involved at the Open Draws at Couch and Presses of Fourdrinier Machines, Pulp Paper Mag. Can. 59:10, 135 – 155 (September 1958).
(2) Osterberg, A. L.: Separation of the Paper Web From Press Rolls, Svensk Papperstidn. 65, 222 – 233 (March 31, 1962).
(3) Mardon, J., Short, R. J.: Wet Web Strength Related to Papermaking. Part I, Papper Och Trä. 4a. 203 – 215 (1971).
(4) Lyne, L. M. and Gallay, W.: Fiber Properies and Fiber-Water Relationships in Relation to the Strength and Rheology of Wet Webs, Tappi. 37:12, 581 – 596 (December 1954)
(5) Lyne, L. M. and Gallay, W., Tappi. 37:698 (1954)
(6) Brecht, W. and Erfurth, H., Tappi. 42(12):959, (1959)
(7) Baum, G. A.: Moisture and Bonding, Institute of Paper Chemistry
(8) Campbell, W.B., Paper Trade Journal 95. No. 8:29 – 32 (1932)
(9) Page, D. H., Tappi. 52(4):674 (1969)
(10) Williams, D. G.: A Fiber Network Model Theory for the Wet Web Strength of Paper, Tappi. 66(3):159 (1983)
(11) Page, D. H.: A Quantitative Theory of the Strength of Wet Webs, Journal of Pulp and Paper Science. Vol 19 No 4, J175 - J 176 (July 1993)
(12) Langins, E., Pulp Paper Mag. Can. 53(C):163 (1952)
(13) McCallum, J. R., Pulp Paper Mag. Can. 58(C):232 (1957)
300
(14) Herwig, G., Pulp Paper Mag. Can. 59(10):130 (1958)
(15) Ullman, U., Svensk Papperstid. 61(14):445 (1958)
(16) Lebel, R. G., Nobleza, G. C., and Paquet, R., Pulp Paper Can. 80(5):T135 (1979)
(17) Barnet, A. J. and Harvey, D. M., Pulp Paper Can. 80(4):T132 (1979)
(18) Barnet, A. J. and Harvey, D. M., Pulp Paper Can. 81(11):T302 (1980); 81(11):T306 (1980)
(19) Seth, R. S., Barbe, M. C., Williams, J. C. R., and Page, D. H.: The Strength of Wet Webs: A New Approach, Tappi. Vol 65 No 3, 135 - 138 (March 1982)
(20) Gullichsen, J. and Paulapuro, H.: Papermaking Part 1, Stock Preparation and Wet End, Finnish Paper Engineers´ Association and Tappi Press (2000)
(21) Smith, H. O., Murphy, A. L. and Goldthwait, C. F., Textile Research J., 18(2):124 (1948)
(22) Claudio-da-Silva, E., Jr.: Effect of Beating on Wet Web Properties, Tappi Journal. 99 - 103 (November 1982)
(23) Seth, R. S., Page, D. H., Barbe, M. C. and Jordan, B. D.: The Mechanism of the Strength and Extensibility of Wet Webs, Svenks Papperstidn. 87(6):R36 (1984)
(24) Scott, W. E.: Principles of Wet End Chemistry, Tappi Press (1996)
(25) Pikulik, I. I.: Wet Web Properties and Their Effect on Picking and Machine Runnability, Pulp & Paper Canada. 98:12, 161 – 165 (1997)
(26) Laleg, M., Ono, H., Barbe, M. C., Pikulik, I. I. and Seth, R. S.: The Effect of Starch on the Properties of Groundwood Papers, Paper Technology. 32(5):24 (1991)
(27) Laleg, M., Pikulik, I. I. and Seth, R. S.: Paper Strength Increase by a Cationic Starch and a Cationic Aldehyde Starch. PPR 758 (November 1989)
301
(28) Britt, K. W.: Wet Strength. In Pulp and Paper Chemistry and Technology, 3rd Ed. Vol. III, Ed. Casey. New York: John Wiley and Sons, p. 1618 (1981)
(29) Laleg, M. and Pikulik, I. I.: Wet Web Strength Increased by Chitosan, Nodic Pulp & Paper Res J. 6(3):99 (1991)
(30) Yan, Z, Liu, Q., Deng, Y. and Ragauskas, A.: Improvement of Paper Strength with Starch Modified Clay, Wiley Interscience (November 2004)
(31) Zhao, Y., Hu, Y., Ragauskas, A. and Deng, Y. Tappi 2005, 4, 3
(32) Yoon, W. Y. and Deng, Y.: Clay-Starch Composites and Their Application in Papermaking, Wiley Interscience (August 2005)
(33) Nordman, L. and Eravuo, V., Paperi jaa Puu. 37(8):313 (1955)
(34) Robertson, A. A., Tappi. 42(12):969 (1959)
(35) Lyne, L. M. and Gallay, W., Tappi. 37(12):694 (1954)
(36) Stephens, J. R. and Pearson, A. J. Appita 23(4):261 (1970)
(37) Ionides, G. N., Jackson, M., Smith, M. K. and Forgacs, O. L.: Fiber – Water Interactions in Papermaking, Technical Division, The British Paper and Board Industry Federation, London, 1978, p. 357
(38) Yang, C. and Thorpe, J., Tappi. 60(12):141 (1977); Svensk Papperstid. 7(82):207 (1979)
(39) Hansen, V. E.: Water Management for the Wet End. Part 1. technical Section, CPPA Theory and Practice of Papermaking Course, Vancouver 1990, page B62
(40) Pikulik, I. I. and Owston, T. H.: Press Sections of Canadian Newsprint Machines, Pulp Paper Can. 94(6):T186 (1993)
(41) Pikulik, I. I., Garner, R. G., Daunais, R. and McDonald, J. D.: Pressing of Low Solids Content Webs, Pulp Paper Can. 93(1):30 (1992)
302
(42) Pikulik, I. I., Sparkes, D. G., Poirier, N. A. and Crotogino, R. H.: Dewatering and Consolidation of Wet Webs, Pulp & Paper Canada. 97:2, 34 - 41 (1996)
(43) Taylor, S.: Investigation of Wet Paper Viscoelastic Structural Properties, Georgia Institute of Technology (2006)
(44) Mardon, J.: Theoretical and Experimental investigations into Peeling of Paper Webs from Solid Surfaces, Papper Och Trä.. No 11, 797 – 815 (1976)
(45) Taylor, G. I.: Private Comunications. 1963, 1964
303