frequency-dependent seismic attenuation in shales: experimental results and theoretical analysis
TRANSCRIPT

Geophysical Journal InternationalGeophys. J. Int. (2014) 198, 504–515 doi: 10.1093/gji/ggu148Advance Access publication 2014 May 27GJI Seismology
Frequency-dependent seismic attenuation in shales: experimentalresults and theoretical analysis
Claudio Delle Piane,1 Joel Sarout,1 Claudio Madonna,2 Erik H. Saenger,2
David N. Dewhurst1 and Mark Raven3
1CSIRO Earth Science and Resource Engineering, Australian Resources Research Centre, 26 Dick Perry Avenue, Kensington, WA 6151, Australia.E-mail: [email protected] Department ETH, Sonneggstrasse 5, CH-8092 Zurich, Switzerland3CSIRO Land and Water, Waite Rd, Urrbrae, SA 5064, Australia
Accepted 2014 April 17. Received 2014 February 2; in original form 2013 August 2
S U M M A R YSamples of shales from the Ordovician Bongabinni and Goldwyer source rock formationswere recovered from the Canning Basin (Western Australia). Attenuation was experimentallymeasured on preserved plugs from these formations in the frequency range between 10−2 and102 Hz. Samples cored with different orientations with respect to the sedimentary beddingwere prepared and tested in their native saturated state and after drying in the oven at 105 ◦Cfor 24 hr to assess the effect of fluids and of the sediment anisotropy on attenuation. To aid theinterpretation of the experimental results, the clay-rich samples were characterized in terms ofmineralogy, water content, porosity, permeability and microstructure.
The two shales have significantly different quality factors; and this is seen to be dependenton both the saturation state of the samples and the propagation direction of the oscillatorysignal. The attenuation coefficient for compression/extension parallel to bedding is less thanthat vertical to bedding in both the preserved and partially dehydrated situations.
No frequency dependency is observed in the preserved samples within the range of fre-quencies explored in this study. On the other hand partially saturated samples show peaks inattenuation at around 40 Hz when the stress perturbation is transmitted normal to the macro-scopic bedding. The interpretation of the attenuation measurements in terms of well-establishedtheoretical models is discussed in view of the physical characteristics and microstructure ofthe tested rocks.
Key words: Seismic anisotropy; Seismic attenuation; Wave propagation.
1 I N T RO D U C T I O N
Seismic wave attenuation is an anelastic phenomenon that isresponsible for dissipation of the mechanical energy during thepropagation of the wave through a body of rocks. It results in the de-cay of amplitude of the seismic wave. From a geophysical perspec-tive, understanding attenuation in rocks is of paramount importanceas most of the information available on the structure, compositionand organization of the earth below the surface is gathered fromseismic waves. Global geodynamic models are constrained by theattenuation of teleseismic waves (e.g. Carpenter & Flinn 1965). Onthe other hand, interactions between the rock frame and the possiblepore fluids can induce attenuation, which in turn might be detectedby borehole/exploration geophysics tools providing important in-sights into the fluid content and type in shallow porous rock bodies(e.g. Klimentos 1995).
In porous rocks attenuation is generally associated with the pres-ence of fluids in the pore network; moreover the capacity of fluidsto move as a consequence of transient stress perturbation inducesfrequency dependency in the attenuation (Winkler & Murphy 1995;Muller et al. 2010; Sarout 2012). Broad frequency measurementsare therefore needed to reconcile laboratory ultrasonic measure-ments (∼MHz range) and borehole (∼tens of kHz) and exploration(∼10–100 Hz) geophysics. It should be noted that dispersion andattenuation at these frequencies is typically ignored in field seismicapplications partly due to the lack of experimental data. The resultsof low frequency laboratory tests are therefore relevant for applica-tions like traditional Amplitude Versus Offset (AVO, Allen & Petty1993) analysis.
Experimental studies on low frequency attenuation of rockshave been reported since the 1980s (e.g. Spencer 1981; Murphy1982; Winkler & Nur 1982). They indicated the importance of the
504C© The Authors 2014. Published by Oxford University Press on behalf of The Royal Astronomical Society. This is an Open Access articledistributed under the terms of the Creative Commons Attribution License (http://creativecommons.org/licenses/by/3.0/), which permitsunrestricted reuse, distribution, and reproduction in any medium, provided the original work is properly cited.
by guest on June 23, 2014http://gji.oxfordjournals.org/
Dow
nloaded from
Frequency-dependent attenuation in shales 505
pore-saturating fluids in inducing a frequency dependent seismicresponse of the rock. Such behaviour contrasts with the case of avacuum-dried rock for which a negligible dependency of the seismicresponse on frequency was observed.
Batzle et al. (2006) explained such behaviour in terms of fluidmobility M defined as the ratio of rock permeability on fluid vis-cosity and pore pressure distribution within porous rocks: loweringfluid mobility (by low rock permeability, or by high fluid viscosity)increases the relaxation time required to equilibrate the pore pres-sure altered by a passing wave within a rock. Consequently, underconditions where the period of the elastic perturbation is shorterthan the fluid relaxation time, the fluid saturated rock will appearstiffer than at lower frequencies.
Experimental evidence to support this thesis has been providedfor sandstones (Batzle et al. 2006) and carbonates (Adam et al.2006). Recently Adelinet et al. (2010) also reported a comparisonof low and high frequency elastic moduli measured on basalt sam-ples and explained their difference through a combination of localviscous flow (squirt flow) of pore fluid between compliant and stiffpores and chemical interactions between the pore fluid and the rockframe.
Experiments aimed at measuring frequency dependant attenua-tion on shales are strikingly rare: Hofmann (2006) reported mea-surements on two types of shales with contrasting behaviour whichwas qualitatively attributed to their different pore space arrange-ment. Sarker & Batzle (2010) also performed tests on samples ofdry and decane-saturated Mancos shale observing negligible fre-quency dependence of the anisotropic elastic moduli on frequencybetween 0.2 and 1000 Hz.
This paper reports results of direct measurements of attenuationin the frequency range 0.1–100 Hz, on shale samples extractedfrom an onshore well in Western Australia. The samples belongingto two distinct geological formations, are first characterized in termsof mineralogy, microstructure and porosity and permeability, andthen tested at room conditions to measure their attenuation firstly intheir preserved state and secondly in a partially saturated state afterdrying in an oven for 24 hr at 105 ◦C. Where possible, orthogonallyoriented specimens have been tested to also assess the anisotropyof attenuation.
These experiments indicate that attenuation is frequency depen-dent and is higher in the partially saturated than in the preservedstate. It is also shown that attenuation has an anisotropic expressionand is higher for simulated wave propagation perpendicular to theshale bedding plane then parallel to it. The experimental results areinterpreted in the light of well-established attenuation theories andan attempt is made to invert the data in terms of rock microstruc-tural parameters. The magnitude of these parameters is found to beconsistent with classical results on rock microstructures.
2 S A M P L E P ROV E NA N C E
The shales specimen used in this study are sampled from an on-shore well drilled in the Canning Basin (Western Australia). Thegeothermal history and depth of burial constrained by apatite fissiontrack and vitrinite reflectance analyses, indicate that the sedimentreached the maximum burial depth of approximately 5000 m inthe Early Jurassic and witnessed maximum temperatures of 160–180 ◦C (Ghori & Haines 2006).
The Middle Ordovician Goldwyer Formation is mainly of openmarine to intertidal origin (Haines 2004), while the BongabinniFormation is mostly an oxidised marginal marine to supratidaldeposit.
The fine-grained nature of shales and their characteristic physico-and electrochemistry necessitate the use of special techniques toensure that samples are tested in as close to a representative state aspossible. This requires therefore that precautions are taken to avoiddesiccation of shales after coring to avoid fracturing of the shale,inducing large capillary stresses and changes of strength, particleorientation and pore size distribution.
The parent shale cores were extracted from depths ranging be-tween 1505 and 1852 meters (i.e. significantly shallower than theirestimated maximum burial depth) and preserved under oil in asealed PVC core liner to maintain their native water content. Sub-samples for attenuation and permeability testing, were plugged andtrimmed using oil as a drilling fluid and stored under light processoil to prevent evaporation of pore fluids. Offcuts from these sampleswere used for sample characterisation in terms of grain size distri-bution, pore size distribution, porosity, composition, grain densityand microstructural evaluation. These samples were similarly storedand preserved under oil until tested.
3 E X P E R I M E N TA L M E T H O D S
3.1 General characterization
Computed tomography (CT) images corresponding to a 2-D linearX-ray attenuation pixel matrix were acquired with a Toshiba medicalimager. The whole core section, still sealed in its plastic liner, wasfirst screened by passing through the X-ray apparatus in scanogrammode, producing a projection radiograph. This showed the beddingorientation and the presence of fractures. The core plug samplepositions and orientations were selected based on these preliminaryobservations. Once cored, the specimens were stored in a glass jarfilled with mineral oil and scanned again to visualise any additionalinternal features possibly present in each specimen.
Quantitative mineralogy analysis of each sample was performedthrough X-ray powder diffraction (XRD) using the same proceduresand sample preparation described in Delle Piane et al. (2011a).
The XRD patterns were recorded with a PANalytical X’PertPro multipurpose X-ray diffractometer using iron-filtered CobaltKα radiation. The diffraction patterns were recorded in steps of2θ = 0.017◦ with a 0.5 s counting time per step, and logged todata files for further processing and analysis. Quantitative analysiswas performed on the XRD data using the commercial packageSIRO-QUANT from Sietronics Pty Ltd. The results are normalisedto 100 per cent and hence do not include unidentified or amorphousmaterials.
Results of the XRD analysis are used to calculate the clay content(CC) and clay fraction (CF) of the shale defined as follows
C F = wt% < 2 µm fraction (1)
CC =∑
wt% clay minerals. (2)
Interconnected porosity and pore-size distribution of the sam-ples was quantified by mercury injection porosimetry using a Mi-cromeritics Autopore III. This equipment is capable of injectingmercury at user-defined pressure increments up to 60 000 psi(∼413 MPa) into a dry and porous rock sample. Cubic sampleswere resin-coated on four faces such that mercury was forced tointrude through two opposite faces of the cube, normal to the shalebedding plane.
The determination of the pore size distribution assumes that therock is made of a bundle of parallel capillary tubes with different
by guest on June 23, 2014http://gji.oxfordjournals.org/
Dow
nloaded from
506 C. Delle Piane et al.
radii. Following Jurin (1719), the capillary pressure Pc in a circulartube of radius r is given by
PC = 2γ cos θ
r(3)
where γ is the mercury-air surface tension and θ is the contact anglebetween the mercury and the solid phase (140◦).
Water content of the shales was measured as well by weighinga chunk of preserved rock in its (assumed) saturated state (wtw),followed by drying in a vacuum oven at 105 ◦C and remeasuring ofthe dry weight (wtd ). Water content (w) is then given by
w = wtw − wtd
wtd× 100. (4)
For an evaluation of the drying stage of the shale samples, theirweights were monitored as a function of time at constant temper-ature in the oven. Each weight measurement was taken after thesample cooled down under vacuum to room temperature. FollowingGhorbani et al. (2009), the characteristic time (τ ) required to reachthermal equilibrium is estimated as
τ = L2c
λ, (5)
where L is the thermal diffusion characteristic length of the sample;c is the volumetric heat capacity and λ is the thermal conductivity.Approximately 2 hr are needed at room conditions for the sample tocool down if one considers L ≈ 0.01 m; c ≈ 2 × 10⁶ J m−3 K−1 andλ ≈ 1.5 W m−1 K−1 (Ghorbani et al. 2009 and references therein).After the weight measurement at these conditions the samples areplaced back in the oven until the next reading is taken with the sameprocedure.
This procedure also allowed for the estimation of the saturationstate of the sample at each step, assuming that each sample wasinitially fully saturated. The saturation state (Sw) at each dryingstage is calculated as
Sw = φ − wv
φ, (6)
where φ and (wv) are the total volumetric fractions of interconnectedporosity and water content, respectively.
3.2 Permeability measurements
The membrane efficiency screening equipment was used for theexperimental determination of the permeability of shale specimensusing the steady-state flow method (Brace 1980; Neuzil 1994; Jones& Meredith 1998; Boisson et al. 2001). The choice of this methodfor measuring permeability is dictated by its reliability since it doesnot require any data processing such as model inversion; neither isit influenced by the specific experimental setup used to perform themeasurement (e.g. downstream dead volume).
The specimens were prepared to the following dimensions: lengthL ∼ 12 mm and diameter D ∼ 25 mm. The flow of fluid during thetest occurred over the length of the cylindrical sample, character-izing therefore the permeability at the centimetre scale. During thetest, confining pressure was maintained constant at PC = 20 MPa.The tests were performed at room temperature, generally with ob-served variations less than ±0.5 ◦C over the course of the test(few weeks). The preliminary resaturation and further permeabilitytesting of the shale samples was performed with a simulated porefluid with 3.5 wt% of sodium chloride simulating average sea watercomposition. Such choice was made in consideration of the original
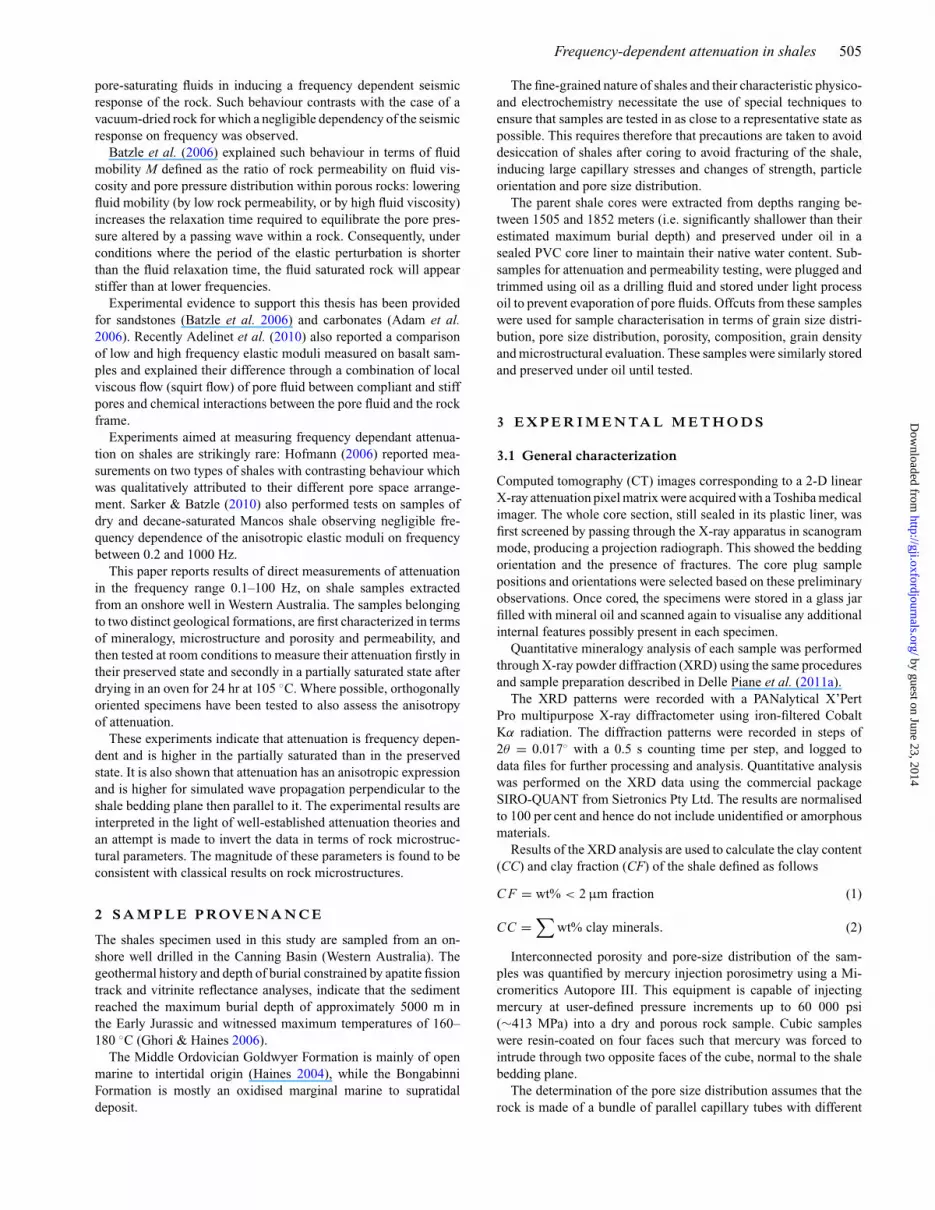
Figure 1. (a) Schematic illustration of the experimental setup allowing forthe measurement of the water permeability of a shale sample using thesteady-state flow method. (b) Typical output dataset of a permeability testwere the volume of water injected upstream in the shale sample with timeis monitored (few tenths of millilitres over few weeks).
sedimentation environment of the Goldwyer and Bongabinni shaleformations.
Initial re-saturation of the samples was performed by imposingan upstream fluid pressure of PU
P = 10 MPa for up to 10 d whilemonitoring the fluid pressure at the downstream end of the spec-imen (large volume reservoir, see Fig. 1a). At the initial stage ofthe re-saturation process, the downstream reservoir (top end of thespecimen) was filled with the simulated pore fluid at room pressure.It then experienced an increase in fluid pressure to reach 10 MPa,
by guest on June 23, 2014http://gji.oxfordjournals.org/
Dow
nloaded from
Frequency-dependent attenuation in shales 507
equalling the pressure imposed upstream (bottom end of the sam-ple). This procedure ensures the effective saturation of the specimenwith the simulated pore fluid.
Following the saturation stage, the downstream pressure wasmaintained at P D
P = 10 MPa (reservoir). The upstream pressurewas suddenly increased from PU
P = 10 MPa to PUP = 15 MPa and
maintained at that value using a high accuracy volumetric pump(DigiFlowTM). The difference in fluid pressure between the up-stream and downstream ends of the sample was therefore held con-stant at �PP = PU
P − P DP = 5 MPa throughout the test. In order
to maintain the PUP = 15 MPa in the upstream circuit, the pump
adjusts the rate of fluid injection into the specimen. This pump al-lows for an accurate measurement and a stable displacement of theinjection piston for few tenths of millilitres over few weeks.
Once a steady flow was achieved (volume injected depends lin-early on time, see Fig. 1b), the constant injection rate imposed bythe pump was used to compute the specimen’s permeability usingDarcy’s law, that is,
Q = Ak
η
�PP
L⇒ k = μQL
A�PP,
where Q is the pump’s steady-state injection rate in (m3 s−1), k is thesought permeability in (m2), η is the fluid dynamic viscosity (equalto 10−3 Pa s for water at room conditions), �PP is the difference influid pressure across the specimen in (Pa), A is the cross-sectionalarea of the cylindrical specimen in (m2) and L is its length in (m).
3.3 Frequency-dependent attenuation measurements
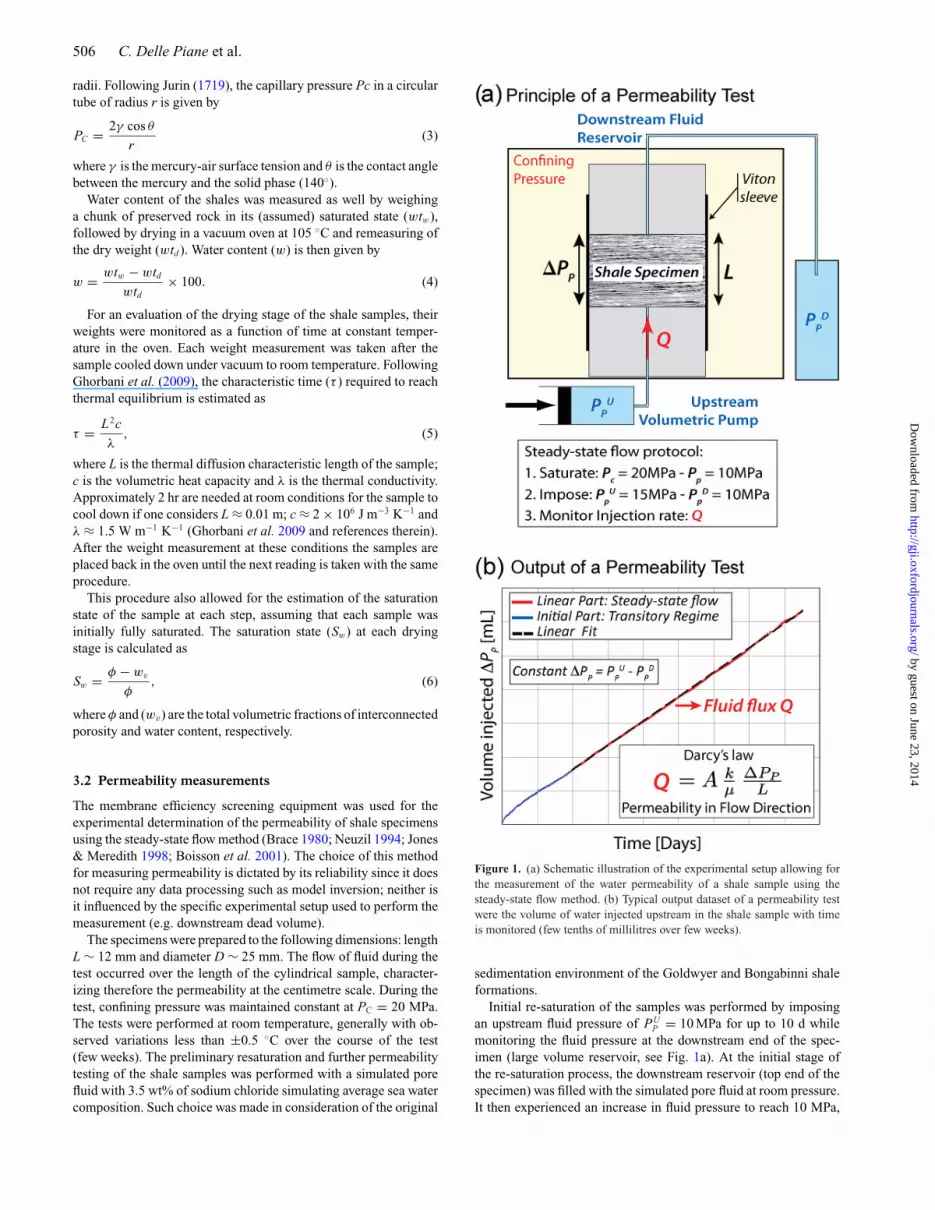
Direct attenuation tests were performed in the rock deformationlaboratory of ETH-Zurich using the new experimental apparatusdescribed by Madonna & Tisato (2013). Tests were conducted ap-plying small sinusoidal oscillatory stress (10−2–102 Hz) and mea-suring the strain of the cylindrical sample (60 mm in length and25.4 mm in diameter) with respect to aluminium standard in linewith the tested plug. The method employs linear variable differen-tial transformer (LVDT) to measure a bulk strain, by recording thedisplacement across the whole sample.
The current operating system (Fig. 2a) comprises three mainelements. A piezo-electric stack actuator (PZA) generates the si-nusoidal axial compressive stress. Two displacement measurementmodules consist of linear variable differential transformers. The
LVDTs measure the compression and extension displacement ofboth the sample and the elastic standard with a nanometric resolu-tion. The displacement across the elastic standard is the referencesignal to which we compare the displacement across the sample forany phase shift induced by anelasticity (Fig. 2b).
Assuming that the rock behaves as a linear time invariant system,the attenuation factor Q−1 is equal to the tangent of the phase shiftbetween the input and the output signal as shown in eq. (7) (e.g.Nowick & Berry 1972; O’Connell & Budiansky 1978; Jackson &Paterson 1987)
Q−1 = �E
2π E= tan |θ |, (7)
where θ is the phase shift in radians, �E is the energy loss duringeach stress–strain cycle and E is the energy introduced into the rock.The phase shift is calculated by the difference between the input andoutput signals’ phases obtained using the Fourier transform.
Preserved samples cored with different orientation with respectto the bedding were prepared and tested first in their saturated stateand then dried in the oven at 105 ◦C for 24 hr to assess the effect ofpartial saturation and of anisotropy on attenuation. During attenua-tion measurements samples were sealed on their cylindrical surfaceusing several layers of cling film to minimize water evaporationduring testing. This procedure was tested against measurementsof weight before and after the experiments and was found to givesatisfactory results.
Due to the prototype nature of the experimental apparatus noabsolute displacement calibration could be performed as the dis-placement signals were not amplified exactly with the same fac-tor between different tests. Hence, it was not possible to calculateYoung’s modulus and compare it between tests. Nevertheless, be-fore each test a relative calibration was performed to be sure that thestrain applied to the samples was between 10−6 and 10−7. The ac-curacy of the experimental apparatus in terms of attenuation valuesfor benchmark samples is discussed in Madonna & Tisato (2013).
Following Madonna & Tisato (2013) we estimated the uncertaintyof our measurements based on the statistical error recorded duringa test with two aluminium plugs in series within the apparatus.With such a configuration the expected phase shift between the twoplugs is zero; however during the test the maximum spread of datarecorded amounts to 9.57 × 10⁻³ rad, and this value is used as theamplitude of error bars around our measurements (see Fig. 8)
Figure 2. (a) Schematics of the experimental set up for the measurements of frequency dependent attenuation. (b) Conceptual sketch of the experimentalmeasurements: see text for details.
by guest on June 23, 2014http://gji.oxfordjournals.org/
Dow
nloaded from
508 C. Delle Piane et al.
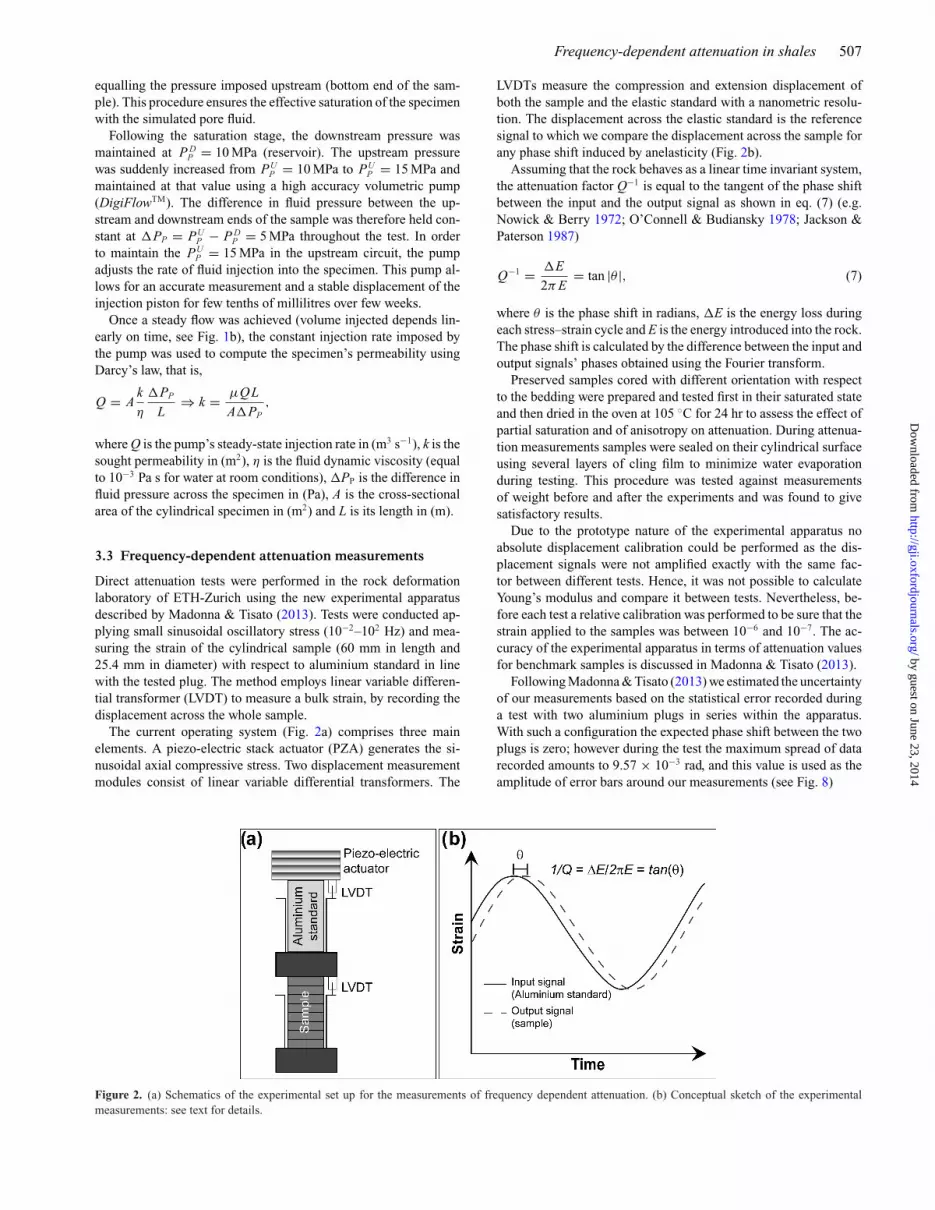
Figure 3. Reproducibility test run on a sample of Goldwyer shale. Theexperiment was repeated twice on the same specimen removing it and re-installing it in the experimental apparatus after the first measurement cy-cle. Maximum difference between the two tests amounts to approximately10 per cent at the lower end of the frequency range.
There are other factors that may induce spurious results such asmiscentering of the loading piston with respect to the sample axisor slight lack of parallelism between the flat end surfaces of thecylindrical specimen. These factors may induce a flexural loadingand alter the strain measurement on the LVDT, and may results inanomalous phase shift recordings.
The above mentioned artefacts can be recognised as ‘jerky’ fluc-tuations of the phase lag when plotted in the frequency domain andcan be easily discarded from the recorded data set.
To check the reproducibility of the experimental results we runa broad frequency attenuation test twice on the same sample fromthe Goldwyer formation. The tested plug was removed from theexperimental set-up at the end of the first frequency sweep and thenmeasured again over a limited frequency range. This procedure wasmainly aimed at checking that the alignment during sample set upin the attenuation module was accurate enough to give reproducibleresults as was already verified for simpler standard material (i.e.aluminium, and Berea sandstone and PMMA by Madonna & Tisato2013).
The tests were performed at room conditions (i.e. no confiningpressure applied to the samples), while ultrasonic and geomechan-ical data collected at high pressure on the same rock types arereported in Delle Piane et al. (2011b,c).
The outcome of the test is reported in Fig. 3. The measured phaseshift angle θ between the sample and aluminium standard for the firstand the second test is plotted against frequency. There is generallyan excellent overlap in the data recorded during the two runs, exceptat the lower frequencies where a greater mismatch is observed. Themaximum difference between the two tests amounts to a value of2.04 × 10−3 rad, corresponding to approximately 10 per cent.
4 R E S U LT S
4.1 Sample description
The whole cores were CT-scanned and imaged as received, thatis, still in plastic liners filled with preserving oil. The BongabinniFormation core appears as a homogeneous dense material with noevident sedimentary features (Fig. 4). The Goldwyer Formation coreshows thin laminations oriented normal to the core axis which can
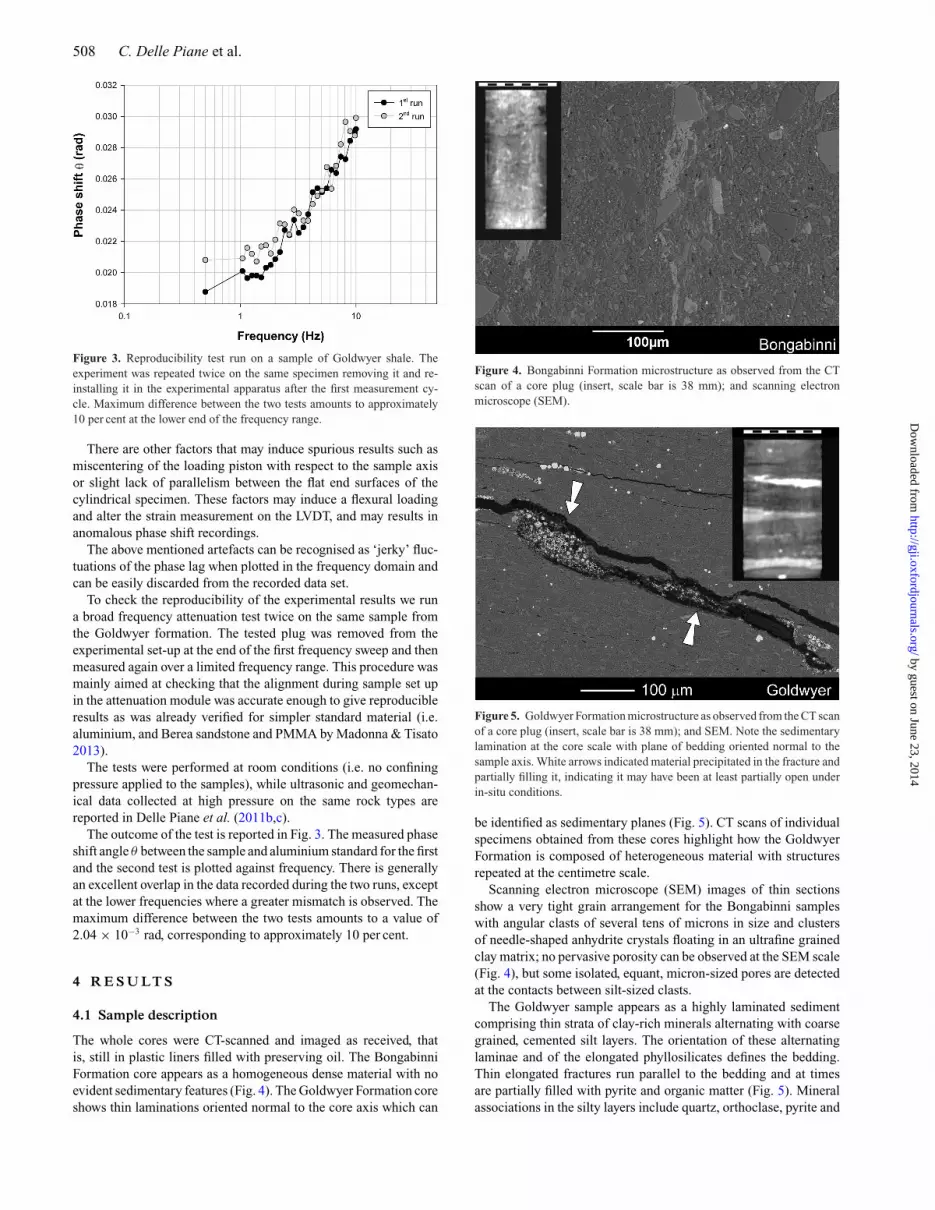
Figure 4. Bongabinni Formation microstructure as observed from the CTscan of a core plug (insert, scale bar is 38 mm); and scanning electronmicroscope (SEM).
Figure 5. Goldwyer Formation microstructure as observed from the CT scanof a core plug (insert, scale bar is 38 mm); and SEM. Note the sedimentarylamination at the core scale with plane of bedding oriented normal to thesample axis. White arrows indicated material precipitated in the fracture andpartially filling it, indicating it may have been at least partially open underin-situ conditions.
be identified as sedimentary planes (Fig. 5). CT scans of individualspecimens obtained from these cores highlight how the GoldwyerFormation is composed of heterogeneous material with structuresrepeated at the centimetre scale.
Scanning electron microscope (SEM) images of thin sectionsshow a very tight grain arrangement for the Bongabinni sampleswith angular clasts of several tens of microns in size and clustersof needle-shaped anhydrite crystals floating in an ultrafine grainedclay matrix; no pervasive porosity can be observed at the SEM scale(Fig. 4), but some isolated, equant, micron-sized pores are detectedat the contacts between silt-sized clasts.
The Goldwyer sample appears as a highly laminated sedimentcomprising thin strata of clay-rich minerals alternating with coarsegrained, cemented silt layers. The orientation of these alternatinglaminae and of the elongated phyllosilicates defines the bedding.Thin elongated fractures run parallel to the bedding and at timesare partially filled with pyrite and organic matter (Fig. 5). Mineralassociations in the silty layers include quartz, orthoclase, pyrite and
by guest on June 23, 2014http://gji.oxfordjournals.org/
Dow
nloaded from
Frequency-dependent attenuation in shales 509
Table 1. Quantitative X-ray diffraction data for the six shale specimens separated by particle size. Qz, quartz; Chl,chlorite; Mica/Ill, mica illite; Ab, albite; Orth, orthoclase; Calc, calcite; Dol, dolomite; Pyr, pyrite; Hem, hematite;Anh, anhydrite.
Formation Qz Chl Mica/Ill Ab Orth Calc Dol Pyr Hem Anh
Bongabinni 14 1 41 <1 5 29 1 9 BulkGoldwyer 25 4 56 1 6 8 1
Bongabinni 3 1 92 1 2 0.2–2 µm fractionGoldwyer 6 5 84 5 <1
Bongabinni 1 2 97 <0.2 µm fractionGoldwyer 3 97
Table 2. Particle size distribution (wt%) and physical properties of the Canning Basin shales. Loss is mainly due to dissolution of carbonates duringsample preparation for XRD. CEC, cation exchange capacity; w, water content (wt%); ρb, bulk density; φ, porosity (by water evaporation); φHg,porosity by mercury injection.
Formation <0.2 µm (wt%) 0.2–2 µm (wt%) >2 µm (wt%) Loss (wt%) w (wt%) ρb (g cm−3) φ (per cent) φHg (per cent)
Bongabinni 7.7 0.8 81.0 10.4 3.8 2.6 9.5 5.7
Goldwyer 10.8 33.5 50.5 5.3 4.6 2.6 11.3 3.6
minor rutile; calcite is also present as intragranular cement reducingthe primary porosity; the clay rich layers are mainly composed ofultrafine grained illite and mica with occasional chlorite.
4.2 Mineralogy
4.2.1 Bongabinni formation
The cores appear red in colour with streaks of greenish reducedmaterial. There is no evidence of macroscopic bedding or pervasivefractures at the core scale.
Major mineralogical components are illite/mica and dolomite,with subordinate quartz and anhydrite (Table 1). Minor amounts ofdisseminated hematite are responsible for the red colour. The fine-grained fraction of the sediment is dominated by illite/mica withsporadic occurrence of orthoclase and chlorite. A significant portionof material is lost during sample preparation for XRD analyses,and is thought to be mainly of carbonate composition. Particle sizedistribution indicates that the sediment is mainly composed of grainslarger than 2 µm. The clay content sums up to 42 per cent while theclay fraction is 19 per cent (Table 1).
4.2.2 Goldwyer formation
The cores appear dark green to greyish in colour, they show veryfine lamination down to the millimetre scale and due to their fissilenature require particular handling care.
Quantitative XRD analyses reveal that illite is the dominant phasewith abundant quartz and subordinate calcite, chlorite and ortho-clase. Subordinate calcite occurs with content ranging between 1and 8 per cent, and pyrite is also observed. The fine-grained frac-tion is illite/mica-dominated with chlorite as a second constituent.50 per cent in weight of the sediments is constituted of particleslarger than 2 µm. The clay content is 60 per cent and the clay frac-tion is 50 per cent (Tables 1 and 2).
4.3 Porosity and water content
The results shown in Fig. 6 were obtained from tests where mer-cury was injected normal to the macroscopic bedding. Both theBongabinni and Goldwyer formations show a unimodal pore size
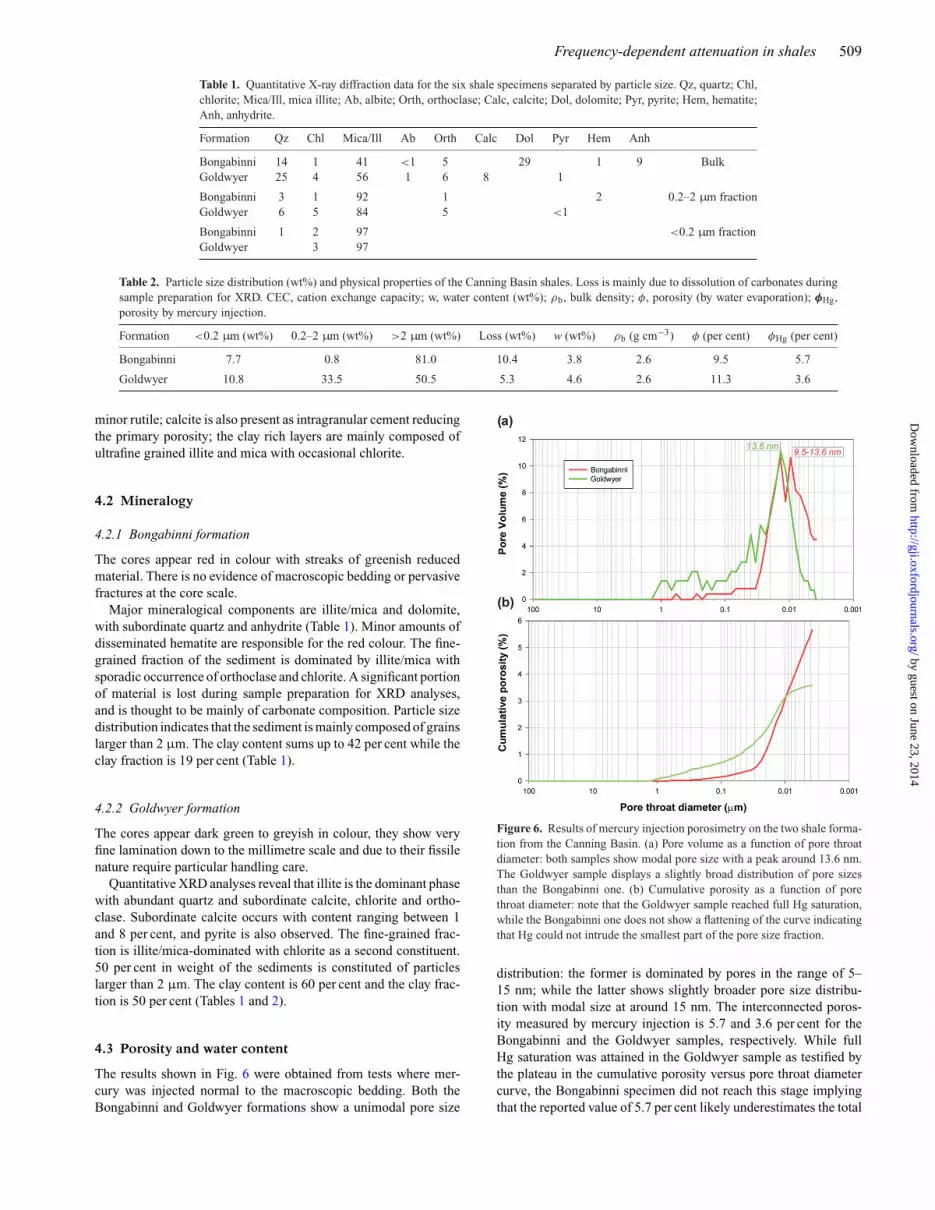
Figure 6. Results of mercury injection porosimetry on the two shale forma-tion from the Canning Basin. (a) Pore volume as a function of pore throatdiameter: both samples show modal pore size with a peak around 13.6 nm.The Goldwyer sample displays a slightly broad distribution of pore sizesthan the Bongabinni one. (b) Cumulative porosity as a function of porethroat diameter: note that the Goldwyer sample reached full Hg saturation,while the Bongabinni one does not show a flattening of the curve indicatingthat Hg could not intrude the smallest part of the pore size fraction.
distribution: the former is dominated by pores in the range of 5–15 nm; while the latter shows slightly broader pore size distribu-tion with modal size at around 15 nm. The interconnected poros-ity measured by mercury injection is 5.7 and 3.6 per cent for theBongabinni and the Goldwyer samples, respectively. While fullHg saturation was attained in the Goldwyer sample as testified bythe plateau in the cumulative porosity versus pore throat diametercurve, the Bongabinni specimen did not reach this stage implyingthat the reported value of 5.7 per cent likely underestimates the total
by guest on June 23, 2014http://gji.oxfordjournals.org/
Dow
nloaded from
510 C. Delle Piane et al.
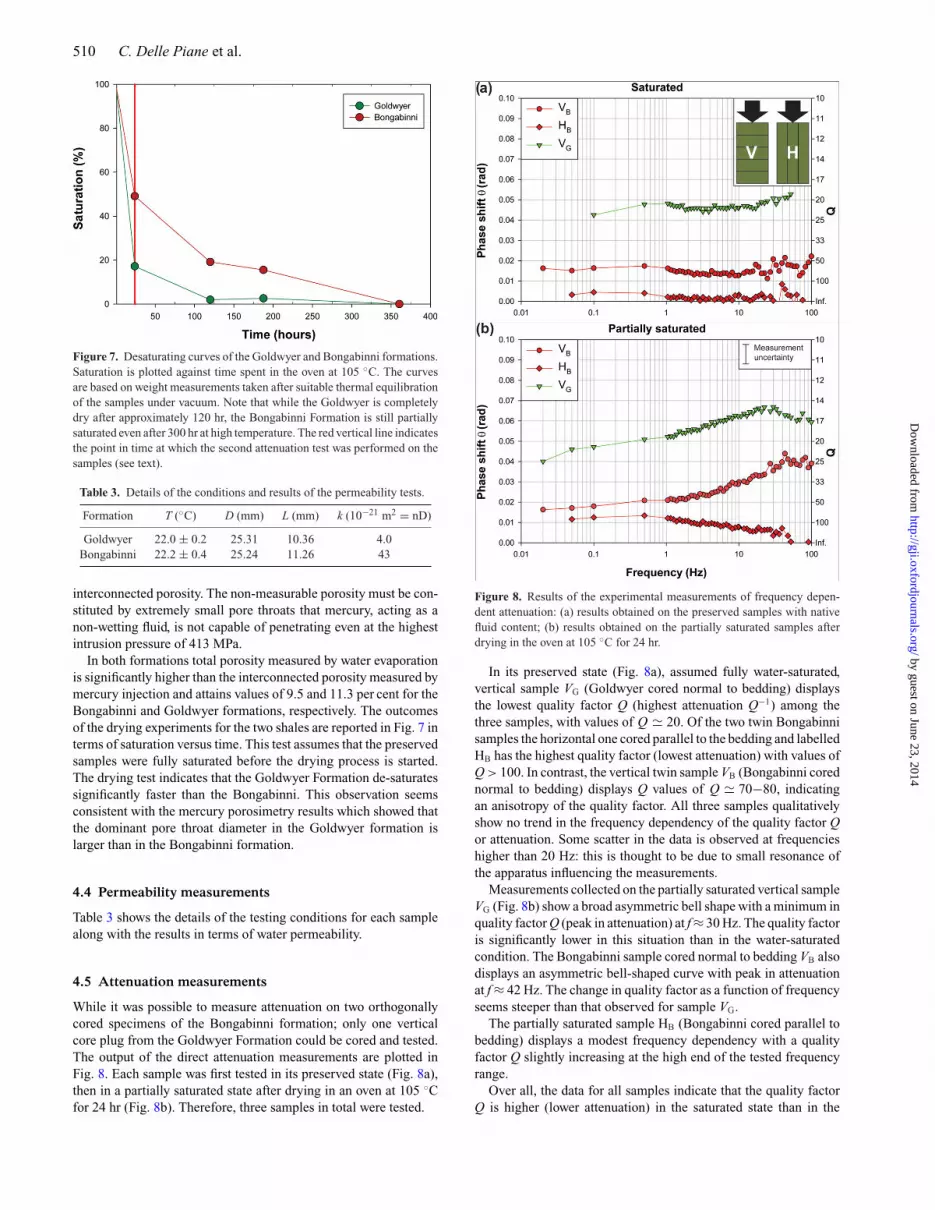
Figure 7. Desaturating curves of the Goldwyer and Bongabinni formations.Saturation is plotted against time spent in the oven at 105 ◦C. The curvesare based on weight measurements taken after suitable thermal equilibrationof the samples under vacuum. Note that while the Goldwyer is completelydry after approximately 120 hr, the Bongabinni Formation is still partiallysaturated even after 300 hr at high temperature. The red vertical line indicatesthe point in time at which the second attenuation test was performed on thesamples (see text).
Table 3. Details of the conditions and results of the permeability tests.
Formation T (◦C) D (mm) L (mm) k (10−21 m2 = nD)
Goldwyer 22.0 ± 0.2 25.31 10.36 4.0Bongabinni 22.2 ± 0.4 25.24 11.26 43
interconnected porosity. The non-measurable porosity must be con-stituted by extremely small pore throats that mercury, acting as anon-wetting fluid, is not capable of penetrating even at the highestintrusion pressure of 413 MPa.
In both formations total porosity measured by water evaporationis significantly higher than the interconnected porosity measured bymercury injection and attains values of 9.5 and 11.3 per cent for theBongabinni and Goldwyer formations, respectively. The outcomesof the drying experiments for the two shales are reported in Fig. 7 interms of saturation versus time. This test assumes that the preservedsamples were fully saturated before the drying process is started.The drying test indicates that the Goldwyer Formation de-saturatessignificantly faster than the Bongabinni. This observation seemsconsistent with the mercury porosimetry results which showed thatthe dominant pore throat diameter in the Goldwyer formation islarger than in the Bongabinni formation.
4.4 Permeability measurements
Table 3 shows the details of the testing conditions for each samplealong with the results in terms of water permeability.
4.5 Attenuation measurements
While it was possible to measure attenuation on two orthogonallycored specimens of the Bongabinni formation; only one verticalcore plug from the Goldwyer Formation could be cored and tested.The output of the direct attenuation measurements are plotted inFig. 8. Each sample was first tested in its preserved state (Fig. 8a),then in a partially saturated state after drying in an oven at 105 ◦Cfor 24 hr (Fig. 8b). Therefore, three samples in total were tested.
Figure 8. Results of the experimental measurements of frequency depen-dent attenuation: (a) results obtained on the preserved samples with nativefluid content; (b) results obtained on the partially saturated samples afterdrying in the oven at 105 ◦C for 24 hr.
In its preserved state (Fig. 8a), assumed fully water-saturated,vertical sample VG (Goldwyer cored normal to bedding) displaysthe lowest quality factor Q (highest attenuation Q−1) among thethree samples, with values of Q � 20. Of the two twin Bongabinnisamples the horizontal one cored parallel to the bedding and labelledHB has the highest quality factor (lowest attenuation) with values ofQ > 100. In contrast, the vertical twin sample VB (Bongabinni corednormal to bedding) displays Q values of Q � 70−80, indicatingan anisotropy of the quality factor. All three samples qualitativelyshow no trend in the frequency dependency of the quality factor Qor attenuation. Some scatter in the data is observed at frequencieshigher than 20 Hz: this is thought to be due to small resonance ofthe apparatus influencing the measurements.
Measurements collected on the partially saturated vertical sampleVG (Fig. 8b) show a broad asymmetric bell shape with a minimum inquality factor Q (peak in attenuation) at f ≈ 30 Hz. The quality factoris significantly lower in this situation than in the water-saturatedcondition. The Bongabinni sample cored normal to bedding VB alsodisplays an asymmetric bell-shaped curve with peak in attenuationat f ≈ 42 Hz. The change in quality factor as a function of frequencyseems steeper than that observed for sample VG.
The partially saturated sample HB (Bongabinni cored parallel tobedding) displays a modest frequency dependency with a qualityfactor Q slightly increasing at the high end of the tested frequencyrange.
Over all, the data for all samples indicate that the quality factorQ is higher (lower attenuation) in the saturated state than in the
by guest on June 23, 2014http://gji.oxfordjournals.org/
Dow
nloaded from
Frequency-dependent attenuation in shales 511
Table 4. Material parameters used for the identification of the dominant attenuation mechanism: φ,porosity; η, viscosity of the pore fluid; ρfl, density of the pore fluid; k, permeability; Eu, saturatedundrained Young’s modulus; Ku, saturated undrained bulk modulus calculated from Eu and using anassumed Poisson’s ratio of 0.3.
Formation φ (%) η (Pa s−1) ρfl (kg m–3) k (10−21 m2 = nD) Eu (GPa) Ku (GPa)
Bongabinni 9.5 10−3 103 43.0 6.9 5.8Goldwyer 11.3 10−3 103 4.0 4.2 3.5
partially saturated state. Moreover, the frequency dependency of thequality factor seems to be significant only in the partially saturatedstate.
5 D I S C U S S I O N
This section discusses (1) the possible sources of attenuation in thetested specimens and (2) the correlations between elastic, mechan-ical and attenuation anisotropies in shales.
5.1 Attenuation mechanisms
An important cause of attenuation/dispersion of seismic waves prop-agating in rocks is the presence of fluids in the pore space and theirphysical interactions with the rock’s solid frame. The ability of afluid to move within the connected porosity is controlled by the fre-quency of the wave. In the high frequency limit, the fluid has no timeto move following pressure gradients induced by the propagatingwave. In contrast, in the low frequency limit, fluid has the time toflow until pore pressure is equilibrated (uniform) at all scales. Be-tween these two limiting situations several attenuation/dispersionmechanisms can be triggered depending on the frequency of thepropagating wave, the microstructure of the rock, the boundaryconditions and the scale of heterogeneities (Winkler & Murphy1995; Muller et al. 2010; Sarout 2012).
Our analysis is based on the physical parameters characterizingthe Bongabinni and Goldwyer formations samples reported in Ta-ble 4 and focuses on the following mechanisms already identifiedin the literature:
(1) Fluid diffusion in the pore space at the meso- or macroscopicscale.
(2) Transition from viscous flow of fluid to inertial drag betweensolid matrix and pore fluid (macroscopic scale).
(3) Squirt-flow between different pore types (microscopic scale).
5.1.1 Macroscopic diffusion in water-saturated shales
Dimensional analysis of diffusion processes reveals that a diffusioncoefficient D (in m2 s−1) is proportional to a squared characteristiclength L2 and inversely proportional to a characteristic relaxationtime τ d = 1/fd.
D ≈ τd L2 = 1
fdL2. (8)
This is the fundamental relation for the estimation of the cut-off frequencies associated with attenuation/dispersion due to fluidmotion in the pore space and it is based on the assumption thata representative volume element exists such that diffusion occursacross such volume in a continuous media (Cleary 1978). The diffu-sion coefficient is well defined for fully saturated porous media (seefor example, Wang 2000) and is related to the permeability of the
porous rock k (in m2), to the fluid dynamic viscosity η (in Pa s−1)and to the rock bulk modulus K (in Pa),
D ≈ k
ηKu . (9)
Two situations can be distinguished when stress perturbations arepassing through rocks: the drained regime and the undrained regime,each corresponding to a specific bulk modulus. In the drained regimethe fluid has time to flow in response to a stress perturbation (ex-tremely low frequency). No pore pressure changes are expected andthe fluid does not contribute to the overall stiffness of the rock,therefore the drained and dry bulk moduli coincide Kd = Kdry.In the undrained regime the fluid does not have enough time to flow,that is, its mass and volume are constant within a given volume ofrock subject to a stress perturbation and contributes to the overallstiffness of the rock and the corresponding undrained bulk modulusKu > Kd.
The cut-off frequency separating the drained and the undrainedregimes (fd) can be estimated combining eqs (8) and (9)
fd ≈ k
η
Ku
L2, (10)
where fd can be compared to the frequency range explored in theexperiments reported above (10−2 to 102 Hz) using the data avail-able in Table 4 and the samples dimensions (60 mm in length and25.4 mm in diameter). Using eq. (10) with L equal to the half-length(axial diffusion) or to the radius (radial diffusion) of the samples,estimated values of fd in the fully saturated samples are betweenfd = 2.7 × 10⁻⁴ and 1.5 × 10⁻³ Hz for the Bongabinni Formationsamples; and between fd = 1.6 × 10⁻⁵ and 8.7 × 10⁻⁵ Hz for theGoldwyer Formation sample. Therefore the attenuation associatedwith diffusion across the water-saturated samples is expected tooccur at frequencies much lower than those explored in the experi-ments, consistent with the lack of attenuation peak measured duringthe tests (Fig. 8a). The water-saturated samples are effectively testedin the undrained regime and no macroscopic flow occurs. Note thatfd also corresponds to the cut-off frequency associated with the ‘ar-tificial attenuation’ caused by the experiment open-pore boundarycondition as extensively described by Dunn (1986).
5.1.2 Macroscopic interactions: diffusive-inertial transition
In a water-saturated rock, at frequencies higher than fd, inertial ef-fects are expected, mainly due to the difference in density betweenthe fluid and solid phases. This phenomenon is predicted by Biot’stheory of poroelasticity (Biot 1962): the cut-off frequency associ-ated with the transition between the quasi-static (Gassmann limit)and the dynamic (inertial) domains is called Biot’s frequency fB.Around fB, viscous and drag forces are of comparable magnitudeand peak attenuation associated with this transition is expected. Thisfrequency can be expressed as
fB = φη
2πρflk. (11)
by guest on June 23, 2014http://gji.oxfordjournals.org/
Dow
nloaded from
512 C. Delle Piane et al.
Using the parameters reported in Table 4, fB = 3.5 × 10¹¹ Hz andfB = 4.5 × 10¹² Hz for the Bongabinni and Goldwyer formations,respectively. The attenuation peak associated with this transition isoutside the experimental frequency range explored in this study.This also implies that the samples tested in range f = 10−2 to102 Hz in the laboratory lie in the viscous flow regime.
5.1.3 Mesoscopic diffusion
Mesocale defines features in the rock that have a characteristiclength sale (size and/or spacing) Lm smaller than the size of thesample, yet larger than the characteristic size of the fluid bearingfeatures that constitute the rock microstructure.
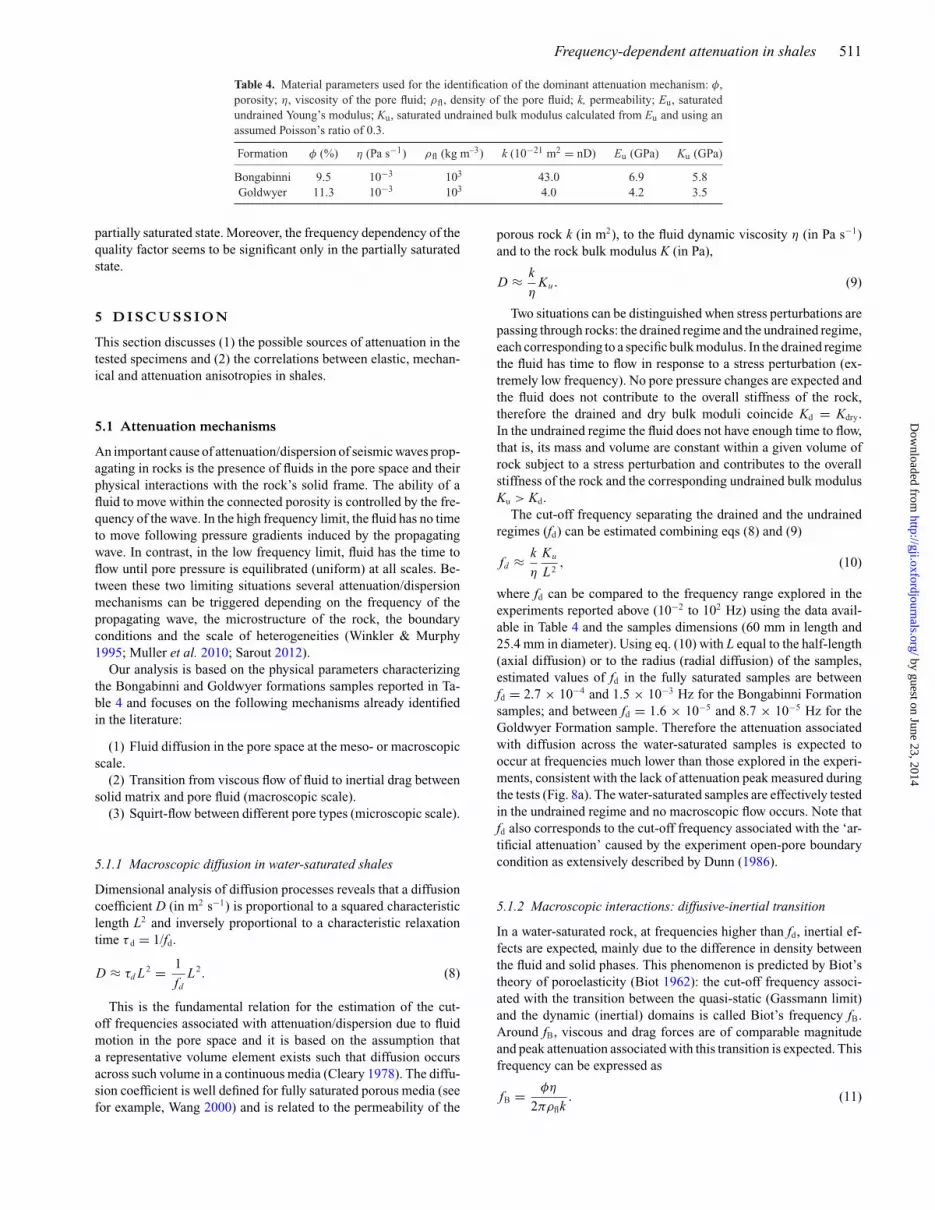
Eq. (10) can be used to relate the cut-off frequency fd associ-ated with an attenuation mechanism in the partially saturated shalesamples (Fig. 8b) to the mesoscale diffusion length Lm and the pa-rameters reported in Table 4. However, since the bulk modulus of theshales in this partially saturated situation is not available, Ku is usedinstead. This is a reasonable approximation since the bulk modulusof the shales in the partially saturated situation is not expected tobe different from Ku by orders of magnitude. Inverting eq. (10) forLm using the peak attenuation frequencies measured during the testson the partially saturated samples (Fig. 8b) yields the characteristiclength Lm = 77 and 22 µm for the Bongabinni and the Goldwyervertical samples, respectively (Fig. 9a).
These values are analysed in relation to the possible existence of(1) fluid saturation patches (Dvorkin & Nur 1998; Johnson 2001)and (2) mesoscopic fractures (Pride & Berryman 2003).
Patchy saturation refers to a heterogeneous spatial distributionof fluids in the pore space, that is, the existence of several patcheswhere one fluid saturates the pore space, while the remaining volumeis saturated with another fluid (e.g. water and air). Fluid motion insuch a medium can be responsible for the observed attenuation if(1) the wavelength of the stress perturbation is much larger thana representative volume element and (2) if the patches are muchlarger than the characteristic pore size.
A characteristic patch size of Lm = 77 and 22 µm for theBongabinni and the Goldwyer vertical samples, respectively in-dicates that the estimated patches sizes are much larger than themodal pore size (14 nm) obtained from the mercury injection testson sub-samples of the two shales. The ultrasonic wave velocitiesmeasured on these shales (Delle Piane et al. 2011c) yield a wave-length of the order of few millimetres. Therefore in the frequencyrange of stress perturbations applied in the present oscillation ex-periments (10−2 to 102 Hz), the wavelength is even larger so thatthe saturation patches are also much smaller than this wavelength.These two observations support the patchy saturation mechanism asa possible cause of the observed attenuation peaks in the partiallysaturated shales investigated.
The existence of mesoscopic fractures with a characteristicsize/spacing larger than the modal pore size (14 nm) of the twoshales can also be responsible for the observed attenuation peaks.If such fractures are filled with water and are deformed by theapplied stress perturbation, water can diffuse into the surround-ing porous material containing much smaller pores, cracks, graincontacts, and/or pore throats. The relevant characteristic diffusionlength is then the average half-distance between such fractures. Us-ing eq. (10) yields a fractures’ average half-spacing Lm = 77 and22 µm for the Bongabinni and the Goldwyer vertical samples, re-spectively. In Fig. 4 (Bongabinni Formation shale), no mesoscalefracture can be observed, despite the relatively wide field of view of
Figure 9. Inversion of the experimental results according to two of theattenuation mechanisms discussed in the text. (a) Mesoscopic fluid flowassociated with the patchy saturation mechanism: the inclined lines arecalculated using eq. (10) and the rock specific values reported in Table 4;vertical reference frequencies for the Goldwyer and Bongabinni samplescorrespond to the attenuation peaks identified during the tests under partialsaturation state and reported in Fig. 8(b); horizontal lines indicate the patchsize (L) inverted from eq. (10). The transition between drained and undrainedfields corresponds to the characteristic frequency fd discussed in the text. (b)Microscopic fluid flow associated with the squirt mechanism: the inclinedlines are calculated using eq. (12) and the rock specific values listed inTable 4. Vertical reference frequencies for the Goldwyer and Bongabinnisamples correspond to the attenuation peaks identified during the tests underpartial saturation state and reported in Fig. 8(b). Horizontal lines indicatethe aspect ratio inverted from eq. (12). See text for the definition of Biot’scritical frequency fB.
the SEM image. Therefore water diffusion out of mesoscale frac-tures is not a likely mechanism for explaining the attenuation peakobserved in the Bongabinni Formation shale.
In Fig. 5 (Goldwyer Formation), mesoscale fractures are visibleand a half-spacing between them of the order of Lm = 22 µm seemsreasonable. However, it is likely that these fractures are the resultof sample handling and preparation. If these fractures exist in the
by guest on June 23, 2014http://gji.oxfordjournals.org/
Dow
nloaded from

Frequency-dependent attenuation in shales 513
preserved Goldwyer shale sample, the attenuation peak should alsobe observed in the preserved sample, which is not the case. On theother hand, if these fractures are artificially induced by the dryingprocess (e.g. due to clays shrinkage), they are most likely dry due tothe extremely low permeability of the porous material surroundingthe fractures and the large capillary forces keeping water inside thesmall pores (∼14 nm). Therefore this mesoscale mechanism is notlikely to contribute to the attenuation peak observed in the partiallysaturated Goldwyer Formation test (Fig. 8b).
5.1.4 Microscopic scale: squirt-flow
At the microscopic level, fluid flow can take place between indi-vidual pores within any representative volume element. This mech-anism is referred to as ‘squirt flow’ and it is associated with fluidsquirting from a stress-sensitive type of pore (e.g. cracks,) into astiffer one (e.g. equant pore) when a stress perturbation is appliedto the rock.
Squirt flow attenuation peak occurs at a frequency fs related to thegeometry of the stress-sensitive type of pores (their aspect ratio).Several authors provided estimates of this cut-off frequency andmost of them bear the same dependency of fs to the cubed aspectratio of the pores, although there are some differences regarding theelastic modulus used in the calculation. Following Le Ravalec &Gueguen (1996) or Sarout (2012), fs can be approximated by
fs ≈ α3 E0
24η, (12)
where α is the aspect ratio of the compliant pore and E0 is theYoung’s modulus of the solid medium in which a single compliantpore is embedded.
Solving eq. (12) for α using the parameters listed in Table 4, andthe peak frequencies obtained on the partially saturated samples,one can derive a characteristic pore geometry expressed as an aspectratio α ∼ 5 × 10⁻⁴ (Fig. 9b). Such a value is consistent with theones reported by other authors as inverted from ultrasonic tests,dipole wireline log investigations and low frequency laboratoryexperiments (e.g. Jones 1986; Bayuk et al. 2008; Angus et al. 2009)and numerical simulations (Mavko & Nur 1979; Palmer & Traviolia1980).
On the other hand, if squirt-flow is to contribute significantly tothe attenuation peak observed in the partially saturated shales, itis expected to induce an attenuation peak in the preserved shalesamples as well, which is not the case. This rationale is valid only ifthe solid frame of the shales remains unchanged during the dryingprocess but,. as discussed above in the case of mesoscale fractures,shales can be damaged by the drying process itself and microscalecracks be generated in the partially saturated sample that were notinitially present in the preserved sample.
Based on the characteristic frequencies associated with five pos-sible wave-induced attenuation mechanisms and on the measuredproperties of two different shales, mesoscale diffusion associatedwith patchy saturation is likely to contribute to the attenuation peaksobserved in the partially saturated samples of both shales. In con-trast, Biot mechanism, mesoscale diffusion associated with fracturesand the artificial sample boundary condition effects are not likely tobe applicable for both preserved shale samples. It is more difficult toreach a definitive conclusion regarding squirt-flow associated withmicroscale cracks. The conditions for the microscale squirt-flow tocontribute to the observed attenuation peaks in both partially sat-urated shales without being visible in the preserved shales can besummarized as follows (1) microscale cracks do not truly exist in the
preserved samples; (2) they are generated in the partially saturatedsample by the drying process. In the partially saturated samples cer-tain microscale cracks can potentially remain filled with water to thesame extent as equant pores can; high pressure experiments wouldbe required to discriminate the contribution of compliant cracks tothe measured attenuation.
This analysis constitutes a first attempt in improving our un-derstanding of the new experimental data available on shales andprovides information about the field of validity of end-membermechanisms. Nevertheless, it seems likely that in the laboratory aswell as in field different attenuation mechanisms may be compet-ing with variable relative contributions given that natural rocks andshales in particular present a wide range of pore sizes, shapes andmicrostructures.
5.2 Attenuation anisotropy
Rock fabric (i.e. minerals and pore space arrangement), can give riseto significant elastic, mechanical and/or permeability anisotropy. Asrock fabric and fluid distribution in the pore space control attenu-ation, it is expected that a macroscopically anisotropic rock willdisplay a directional dependency of the quality factor Q (or attenu-ation Q−1).
Shales are known to show various degrees of elastic anisotropyand are normally described as transversely anisotropic rocks (e.g.Podio et al. 1968; Hornby 1998; Sarout & Gueguen 2008). Thesamples tested in this study are no exception: dynamic elastic mod-uli measured on samples of the Bongabinni and Goldwyer fromthe same parent cores used in this study indicate a significantanisotropy of ultrasonic wave velocities, due to clay particle align-ment and presence of bedding parallel thin cracks (Delle Piane et al.2011b,c).
The experimental results collected on the Bongabinni pair of sam-ples indicate that attenuation is higher when low frequency wavespropagate across the macroscopic bedding than parallel to it. Thisobservation is in agreement with the ultrasonic measurements ofStanley & Christensen (2001) and of Deng et al. (2009); the nar-row band measurements of Domnesteanu et al. (2002) on saturatedshales from the North Sea under over pressured conditions; and thebroad band tests of Hofmann (2006) who reported higher lossesfor oscillations applied along a direction normal to the bedding.Indeed previous studies identified the symmetry axis of shales (nor-mal to symmetry/bedding plane) as the most compliant axis fromthe elastic point of view suggesting an analogy with the attenuationcase.
Anisotropy of attenuation is consistently seen in both the sat-urated and the partially saturated situations and in both experi-ments sample HB (Bongabinni horizontal) shows negligible fre-quency dependency as opposed to the two vertically cored samples.Planar discontinuities tend to be aligned with the macroscopic bed-ding and have high compliance when compared to the surround-ing porous material. An oscillatory stress perturbation travellingnormal to the short axis of these discontinuities will cause themto close and open alternatively; the relatively impermeable wallsof the discontinuities being squeezed together will induce a fluidpressure gradients resulting in fluid movements toward regions oflower pressures. In the opposite situation for which a stress per-turbation is travelling along the macroscopic bedding, virtually noload transfer occurs between the solid framework and the fluid lo-cated in the elongated discontinuities, thus fluid motion is relativelylimited.
by guest on June 23, 2014http://gji.oxfordjournals.org/
Dow
nloaded from
514 C. Delle Piane et al.
6 C O N C LU S I O N S
Experimental measurements of attenuation were collected on sam-ples of two shale formations in the frequency range 0.01–100 Hz.Experiments were designed to assess the role of saturation andanisotropy on attenuation by repeating the measurements first onsamples with their preserved native fluid content, and then follow-ing dehydration in an oven at 105 ◦C for 24 hr.
Results indicate that both shale types show some degree of atten-uation with the highest values recorded normal to the macroscopicbedding. Moreover no frequency dependency is observed in thepreserved samples within the range of frequencies explored in thisstudy. On the other hand partially saturated samples show peaks inattenuation at around 40 Hz when the stress perturbation is transmit-ted normal to the macroscopic bedding. We interpret this behaviourto be due to fluid motion at the meso- and microscale; that is, a com-bination of (1) mesoscale fluid diffusion around saturated patchesof the samples; (2) microscale squirt-flow between compliant pores(cracks, grain contacts) and neighbour cavities, either non-coplanarcompliant pores or stiffer equant pores; and possibly (3) mesoscalefluid diffusion from fractures into the surrounding porous materialin one of the two shale samples.
This interpretation is compatible with microstructural investiga-tion by SEM and mercury injection revealing both quantitative andqualitative information on the pore geometry and size within thetwo shales.
A C K N OW L E D G E M E N T S
We wish to dedicate this contribution to the late Luigi Burlini. Wethank Nicola Tisato and Robert Hoffman for their contribution tothe development of the experimental apparatus. Tobias Muller andBeatriz Quintal are thanked for several stimulating discussions.
The Australian Academy of Science supported part of the re-search trough a travel grant to CDP. Samples were kindly providedby A. Mory (Geological Survey of Western Australia). Ian Jacksonand an anonymous reviewer are thanked for their comments andcritical reading of the manuscript.
R E F E R E N C E S
Adam, L., Batzle, M. & Brevik, I., 2006. Gassmann’s fluid substitutionand shear modulus variability in carbonates at laboratory seismic andultrasonic frequencies, Geophysics, 71(6), F173–183.
Adelinet, M., Fortin, J, Gueguen, Y., Schubnel, A. & Geoffroy, L., 2010. Fre-quency and fluid effects on elastic properties of basalt: experimental inves-tigations, Geophys. Res. Lett., 37, L02303, doi:10.1029/2009gl041660.
Allen, J.L. & Peddy, C.P., 1993. Amplitude Variation with Offset: Gulf CoastCase Studies, Society of Exploration Geophysicists, 126 pp.
Angus, D.A., Verdon, J.P., Fisher, Q.J. & Kendall, J.M., 2009. Exploringtrends in microcrack properties of sedimentary rocks: an audit of dry-core velocity-stress measurements, Geophysics, 74, E193–E203.
Batzle, M.L., Han, D. & Hofmann, R., 2006. Fluid mobility and frequency-dependent seismic velocity—direct measurements, Geophysics, 71(1),N1–N9.
Bayuk, I.O., Ammerman, M. & Chesnokov, E.M., 2008. Upscaling of elasticproperties of anisotropic sedimentary rocks, Geophys. J. Int., 172(2), 842–860.
Biot, M.A., 1962. Mechanics of deformation and acoustic propagation inporous media, J. appl. Phys., 33(4), 1482–1498.
Boisson, J.Y., Bertrand, L., Heitz, J.F. & Golvan, Y., 2001. In situ andlaboratory investigations of fluid flow through an argillaceous formationat different scales of space and time, Tournemire tunnel, southern France,Hydrogeol. J., 9(1), 108–123.
Brace, W.F., 1980. Permeability of crystalline and argillaceous rocks, Int. J.Rock Mech. Min. Sci. Geomech. Abstr., 17, 241–245.
Carpenter, E.W. & Flinn, E.A., 1965. Attenuation of teleseismic body waves,Nature, 207(4998), 745–746.
Cleary, M.P., 1978. Elastic and dynamic response regimes of fluid-impregnated solids with diverse microstructures, Int. J. Solids Struct.,14(10), 795–819.
Delle Piane, C., Dewhurst, D.N., Siggins, A.F. & Raven, M.D., 2011a.Stress-induced anisotropy in brine saturated shale, Geophys. J. Int. 184(2),897–906.
Delle Piane, C., Almqvist, B., Raven, M. & Dewhurst, D., 2011b. Shaleanisotropy: linking mineral fabric and elastic properties, in Proceedings ofthe Euroconference on Rock Physics and Geomechanics, 17–21 October,Trondheim, Norway.
Delle Piane, C., Esteban, L., Dewhurst, D., Clennell, B. & Raven, M., 2011c.Rock physics and petrophysics testing of shales from the Canning Basin,Western Australia, SEG Tech. Prog. Expanded Abstracts, 30(1), 2135–2139.
Deng, J., Wang, S. & Han, D.H., 2009. The velocity and attenuationanisotropy of shale at ultrasonic frequency, J. Geophys. Eng., 6(3), 269–278.
Domnesteanu, P., McCann, C. & Sothcott, J., 2002. Velocity anisotropy andattenuation of shale in under- and overpressured conditions, Geophys.Prospect., 50(5), 487–503.
Dunn, K.-J., 1986. Acoustic attenuation in fluid-saturated porous cylindersat low frequencies, J. acoust. Soc. Am., 79, 1709–1721.
Dvorkin, J. & Nur, A., 1998. Acoustic signature of patchy saturation, Int. J.Solids Struct., 34–35, 4803–4810.
Ghorbani, A., Zamora, M. & Cosenza, P., 2009. Effects of desiccation on theelastic wave velocities of clay-rocks, Int. J. Rock Mech. Min. Sci., 46(8),1267–1272.
Ghori, K.A.R. & Haines, P.W., 2006. Petroleum geochemistry of the Can-ning Basin, Western Australia: basic analytical data 2004–05: WesternAustralia Geological Survey, Record 2006/7.
Haines, P.W., 2004. Depositional facies and regional correlations of the Or-dovician Goldwyer and Nita Formations, Canning Basin, Western Aus-tralia, with implications for petroleum exploration, Western AustraliaGeological Survey. Report number 2004/7.
Hofmann, R., 2006. Frequency dependent elastic and anelastic properties ofclastic rocks, Colorado School of Mines, PhD thesis, 332 pp.
Hornby, B., 1998. Experimental laboratory determination of the dynamicelastic properties of wet, drained shales, J. geophys. Res.-Solid Earth,103(B12), 29 945–29 964.
Jackson, I. & Paterson, M.S., 1987. Shear modulus and internal friction ofcalcite rocks at seismic frequencies: pressure, frequency and grain sizedependence, Phys. Earth planet. Inter., 45(4), 349–367.
Johnson, D.L., 2001. Theory of frequency dependent acoustics in patchy-saturated porous media, J. acoust. Soc. Am., 110, 682–694.
Jones, T.D., 1986. Pore fluids and frequency-dependent wave propagation inrocks, Geophysics, 51, 1939–1953.
Jones, C. & Meredith, P., 1998. An experimental study of elastic wavepropagation anisotropy and permeability anisotropy in an illitic shale,SPE/ISRM Rock Mechanics in Petroleum Engineering. Paper #47369.
Jurin, J., 1719. An account of some experiments shown before the RoyalSociety; with an enquiry into the cause of the ascent and suspension ofwater in capillary tubes, Trans. R. Soc., 30, 739–747.
Klimentos, T., 1995. Attenuation of P- and S-waves as a method of distin-guishing gas and condensate from oil and water, Geophysics, 60, 447–458.
Le Ravalec, M. & Gueguen, Y., 1996. High- and low-frequency elasticmoduli for a saturated porous/cracked rock: differential self-consistentand poroelastic theories, Geophysics, 61, 1080–1094.
Madonna, C. & Tisato, N., 2013. Seismic Wave Attenuation Module(SWAM): a tool for laboratory low-frequency seismic attenuation mea-surements, Geophys. Prospect., 61(2), 302–314.
Mavko, G. & Nur, A., 1979. Wave attenuation in partially saturated rocks,Geophysics, 44(2), 161–178.
Muller, T.M., Gurevich, B. & Lebedev, M., 2010. Seismic wave attenua-tion and dispersion resulting from wave-induced flow in porous rocks—areview, Geophysics, 75(5), 75A147–75A164.
by guest on June 23, 2014http://gji.oxfordjournals.org/
Dow
nloaded from

Frequency-dependent attenuation in shales 515
Murphy, W.F., 1982. Effects of partial water saturation on attenuation inMassilon sandstone and Vycor porous glass, J. acoust. Soc. Am., 71,1458–1468.
Neuzil, C.E., 1994. How permeable are clay sand shales? Water Resour.Res., 30(2), 145–150.
Nowick, A.S. & Berry, B.S., 1972. Anelastic Relaxation in CrystallineSolids, Academic Press.
O’Connell, R.J. & Budiansky, B., 1978. Measures of dissipation in vis-coelastic media, Geophys. Res. Lett., 5(1), 5–8.
Palmer, I.D. & Traviolia, M.L., 1980. Attenuation by squirt flow in under-saturated gas sands, Geophysics, 45(12), 1780–1792.
Podio, A.L., Gregory, A.R. & Gray, K.E., 1968. Dynamic properties of dryand water-saturated Gree River shale under stress, SPE J., 8, 389–404.
Pride, S.R. & Berryman, J.G., 2003. Linear dynamics of double-porositydual-permeability materials. I. Governing equations and acoustic attenu-ation, Phys. Rev. E, 68(3), doi:036603-1-036603-10.
Sarker, R. & Batzle, M., 2010. Anisotropic elastic moduli of the MancosB Shale – An experimental study, SEG Tech. Prog. Expanded Abstracts,29(1), 2600–2605.
Sarout, J., 2012. Impact of pore space topology on permeability, cut-offfrequencies and validity of wave propagation theories. Geophys. J. Int.,189(1), 481–492.
Sarout, J. & Gueguen, Y., 2008. Anisotropy of elastic wave velocities indeformed shales, Part 2: modeling results, Geophysics, 73(5), D91–D103.
Spencer, J.W., 1981. Stress Relaxations at low frequencies in fluid-saturatedrocks: attenuation and modulus dispersion, J. geophys. Res., 86(B3),1803–1812.
Stanley, D. & Christensen, N.I., 2001. Attenuation anisotropy in shale atelevated confining pressures, Int. J. Rock. Mech. Min. Sci., 38(7), 1047–1056.
Wang, H.F., 2000. Theory of Linear Poroelasticity with Applications toGeomechanics and Hydrogeology, Princeton Univ. Press, 276 pp.
Winkler, K.W. & Murphy, W.F. III., 1995. Acoustic velocity and attenuationin porous rocks, in Rock Physics & Phase Relations: A Handbook ofPhysical Constants, AGU Ref. Shelf, Vol. 3, pp. 20–34, ed. Ahrens, T.J.,AGU.
Winkler, K.W. & Nur, A., 1982. Seismic attenuation: effects of pore fluidsand frictional sliding, Geophysics, 47(1), 2–16.
by guest on June 23, 2014http://gji.oxfordjournals.org/
Dow
nloaded from