time-lapse seismic
TRANSCRIPT
GEOHORIZONS January 2012/66
Time-Lapse Seismic*-Concept, Technology & InterpretationHemant Kumar Dixit1, Akhil Puri2 and Rajat Rathore3
CGGVeritas, Mumbai India
IntroductionTime lapse seismic measurement proved an important
reservoir surveillance tool as success has been reported invarious basins all around the globe. Seismic surveysrecorded over the period of time in hydrocarbon producingfield have the capability to record the production relatedchanges in the field. Analyzing the difference in Seismicsurveys provide the vital information about the dynamicproperties such as Saturation, Pressure and Temperature. Inthis paper a brief attempt made to discuss about the Time-Lapse concept, Technology and interpretation of time-lapsedata.
Concept: Hydrocarbon production affects the followingreservoir properties.
• Saturation (gas, oil & water)• Pressure• Temperature
Saturation, pressure and temperature directly affect thefollowing seismic parameters.
• P-Wave• S-Wave• Density
For time lapse to be effective, changes in the reservoirproperties must cause a detectable change in the seismicparameters. With this concept seismic surveys are recordedover the time span in a hydrocarbon producing field tomeasure elastic changes and transferring the knowledgeinto dynamic properties such as Saturation, Pressure andTemperature.
A time lapse study relies on two factors, calledrepeatability and detectability. Below is the brief description ofvarious factors which should be considered during acquisitionand processing of the surveys for time-lapse studies.
Abstract:Time Lapse seismic studies proved to be an important reservoir management technology over the past few
years as success reported in many basins around the globe. Brief attempt made in this paper to discuss the concept,technology and interpretation of time lapse data along with the CGGVeritas novel approach, 4D Global Inversion.Comparison between traditional time lapse inversion and 4D Global inversion shows the superiority of this newtechnique over the traditional inversion. Bayesian Litho-Classification technique for interpretation of time lapse dataalso discussed along with associated uncertainties.
Key words: Time-Lapse Seismic, 4D Global Inversion, Time-Lapse Interpretation, Bayesian Litho Classification
Repeatability is the indicator of how identical base andmonitor surveys acquired and processed. Repeatability canbe divided in two categories which are related withacquisition and processing.
Acquisition Repeatability• Shooting directions• Acquisition systems• Geometry/positioning• Seasonal
Processing Repeatability• Processing algorithm• Processing software• Processing hardware
For good time-lapse surveys, we should have two abovementioned component as identical as possible. If seismicsurveys are repeatable then they should have almostidentical traces at respective locations.Repeatibility can bemeasure by a factor termed as NRMS (Normalized RootMean Squre). This factor measures the relative differencebetween two traces and sensitive to time, phase andamplitude differences.
The normalized RMS amplitude (NRMS) of two traces Aand B within a given time window is expressed as (Kragh andChristie, 2002):
NRMS=RMS (B-A)/1/2{RMS (B) +RMS (A)}The values of the NRMS are limited to the range of 0-2. If
both traces are anti-correlated (i.e., 180 degree phase shift, orif one trace contains only zeroes), the NRMS equals 2. If theamplitude of one trace is half that of the other trace, the valueof NRMS is equal to 0.667.
GEOHORIZONS January 2012/67
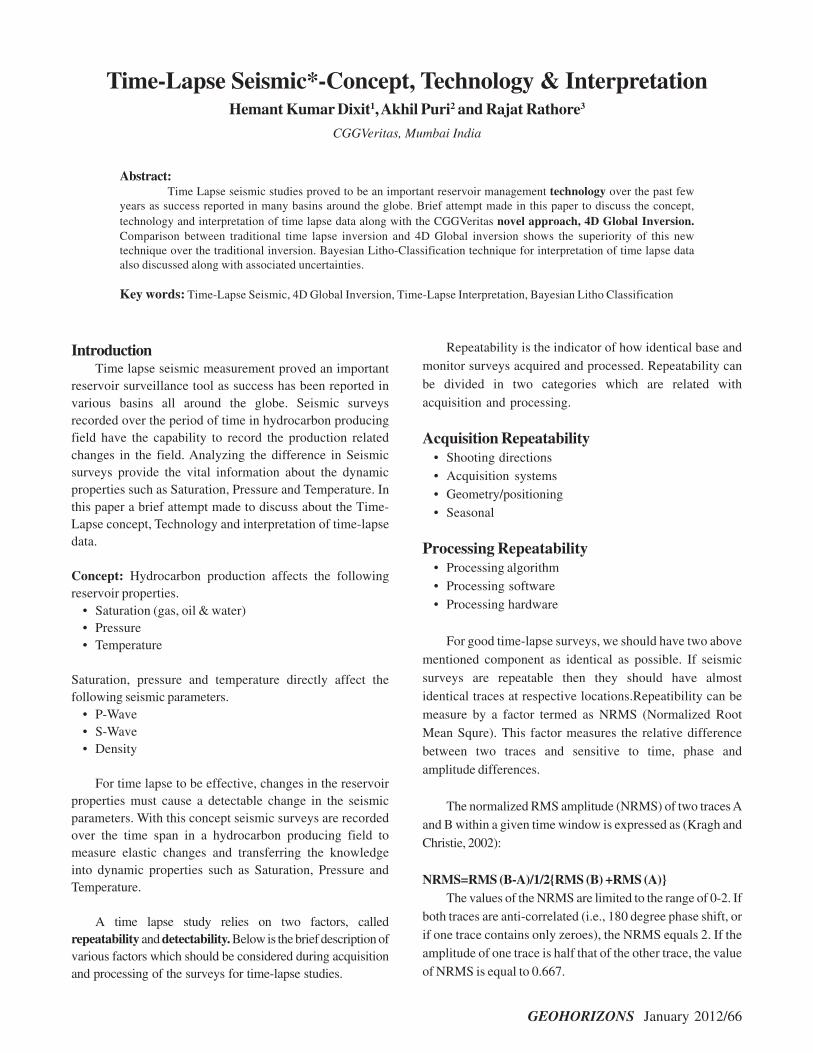
NRMS tracking at various 4D constrained processing
stages is an important step to QC the improvement inrepeatability factor. Figure 1 shows one such measurement
at various processing stages. As indicated in figure 1, NRMS
should have a decrease nature as we advance in processingproject. Figure 2 also shows the NRMS values extracted
within a certain interval of 4D interest. Low values of NRMS
in area of interest suggest the good repeatability. HighNRMS can indicate poor repeatability, production signal or
low RMS amplitude levels in the Base and Monitor surveys.
In Summary, few factors which could be considered for 4Dconstrained processing are listed below.
• Keep processing simple and deterministic
• Same software and algorithmo Simultaneous processing
• Make data as similar as possible as early as possible
• QC 4D signal at each stage
Fig. 1: NRMS tracking at various stages of 4D constrained processing
Fig. 2: NRMS map in the 4D interval. Blue numbers indicate the lowvalues of NRMS and suggest the good repeatability in the areaof interest
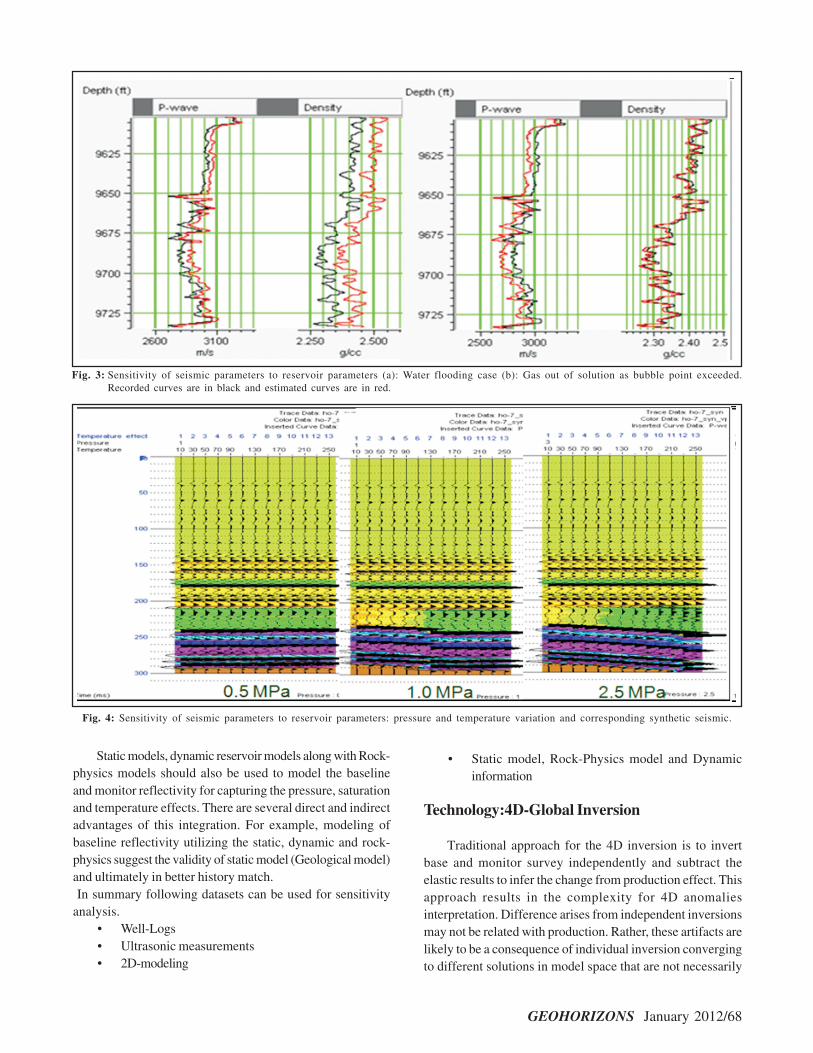
V =P_sat ρK +sat sat
µ4
3
sat
V =S_sat
satµρsat
Two important terms in above equation are related withthe matrix (Lithology) and fluid. During sensitivity analysis
matrix properties should be estimated with right mixing rule
which suites to specific area. In case of fluid properties,someone should take care of method i.e. Batzle-Wang, FLAG
model and type of saturation i.e. Homogenous, Big patches
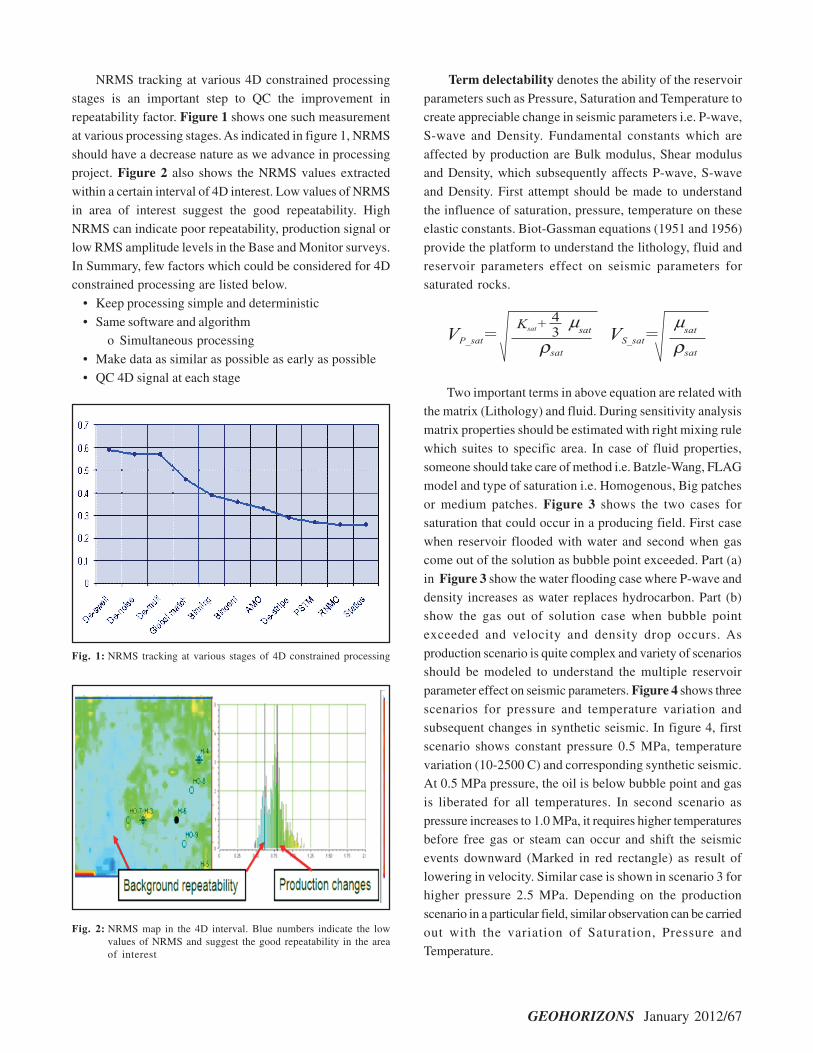
or medium patches. Figure 3 shows the two cases forsaturation that could occur in a producing field. First case
when reservoir flooded with water and second when gascome out of the solution as bubble point exceeded. Part (a)
in Figure 3 show the water flooding case where P-wave and
density increases as water replaces hydrocarbon. Part (b)show the gas out of solution case when bubble point
exceeded and velocity and density drop occurs. As
production scenario is quite complex and variety of scenariosshould be modeled to understand the multiple reservoir
parameter effect on seismic parameters. Figure 4 shows three
scenarios for pressure and temperature variation andsubsequent changes in synthetic seismic. In figure 4, first
scenario shows constant pressure 0.5 MPa, temperature
variation (10-2500 C) and corresponding synthetic seismic.At 0.5 MPa pressure, the oil is below bubble point and gas
is liberated for all temperatures. In second scenario as
pressure increases to 1.0 MPa, it requires higher temperaturesbefore free gas or steam can occur and shift the seismic
events downward (Marked in red rectangle) as result of
lowering in velocity. Similar case is shown in scenario 3 forhigher pressure 2.5 MPa. Depending on the production
scenario in a particular field, similar observation can be carried
out with the variation of Saturation, Pressure andTemperature.
Term delectability denotes the ability of the reservoir
parameters such as Pressure, Saturation and Temperature tocreate appreciable change in seismic parameters i.e. P-wave,
S-wave and Density. Fundamental constants which are
affected by production are Bulk modulus, Shear modulusand Density, which subsequently affects P-wave, S-wave
and Density. First attempt should be made to understand
the influence of saturation, pressure, temperature on theseelastic constants. Biot-Gassman equations (1951 and 1956)
provide the platform to understand the lithology, fluid and
reservoir parameters effect on seismic parameters forsaturated rocks.
GEOHORIZONS January 2012/68
Fig. 3: Sensitivity of seismic parameters to reservoir parameters (a): Water flooding case (b): Gas out of solution as bubble point exceeded.Recorded curves are in black and estimated curves are in red.
Fig. 4: Sensitivity of seismic parameters to reservoir parameters: pressure and temperature variation and corresponding synthetic seismic.
Static models, dynamic reservoir models along with Rock-physics models should also be used to model the baselineand monitor reflectivity for capturing the pressure, saturationand temperature effects. There are several direct and indirectadvantages of this integration. For example, modeling ofbaseline reflectivity utilizing the static, dynamic and rock-physics suggest the validity of static model (Geological model)and ultimately in better history match. In summary following datasets can be used for sensitivityanalysis.
• Well-Logs• Ultrasonic measurements• 2D-modeling
• Static model, Rock-Physics model and Dynamicinformation
Technology:4D-Global Inversion
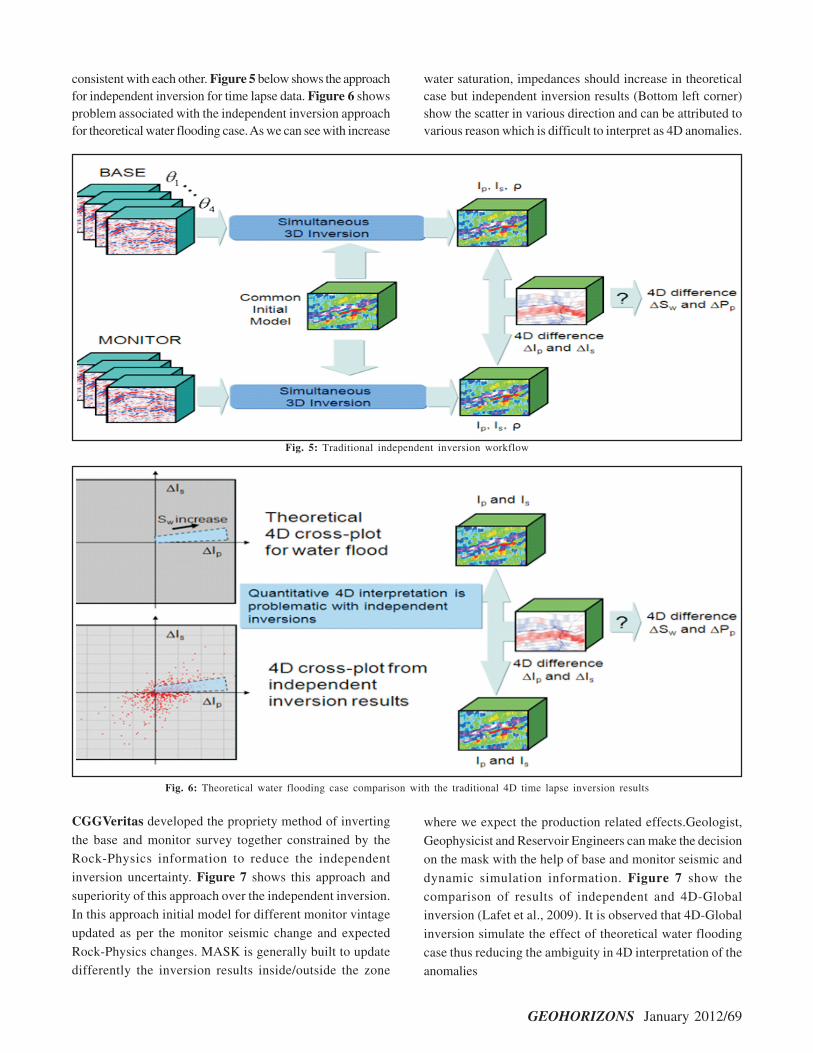
Traditional approach for the 4D inversion is to invertbase and monitor survey independently and subtract theelastic results to infer the change from production effect. Thisapproach results in the complexity for 4D anomaliesinterpretation. Difference arises from independent inversionsmay not be related with production. Rather, these artifacts arelikely to be a consequence of individual inversion convergingto different solutions in model space that are not necessarily
GEOHORIZONS January 2012/69
consistent with each other. Figure 5 below shows the approachfor independent inversion for time lapse data. Figure 6 showsproblem associated with the independent inversion approachfor theoretical water flooding case. As we can see with increase
water saturation, impedances should increase in theoreticalcase but independent inversion results (Bottom left corner)show the scatter in various direction and can be attributed tovarious reason which is difficult to interpret as 4D anomalies.
Fig. 5: Traditional independent inversion workflow
Fig. 6: Theoretical water flooding case comparison with the traditional 4D time lapse inversion results
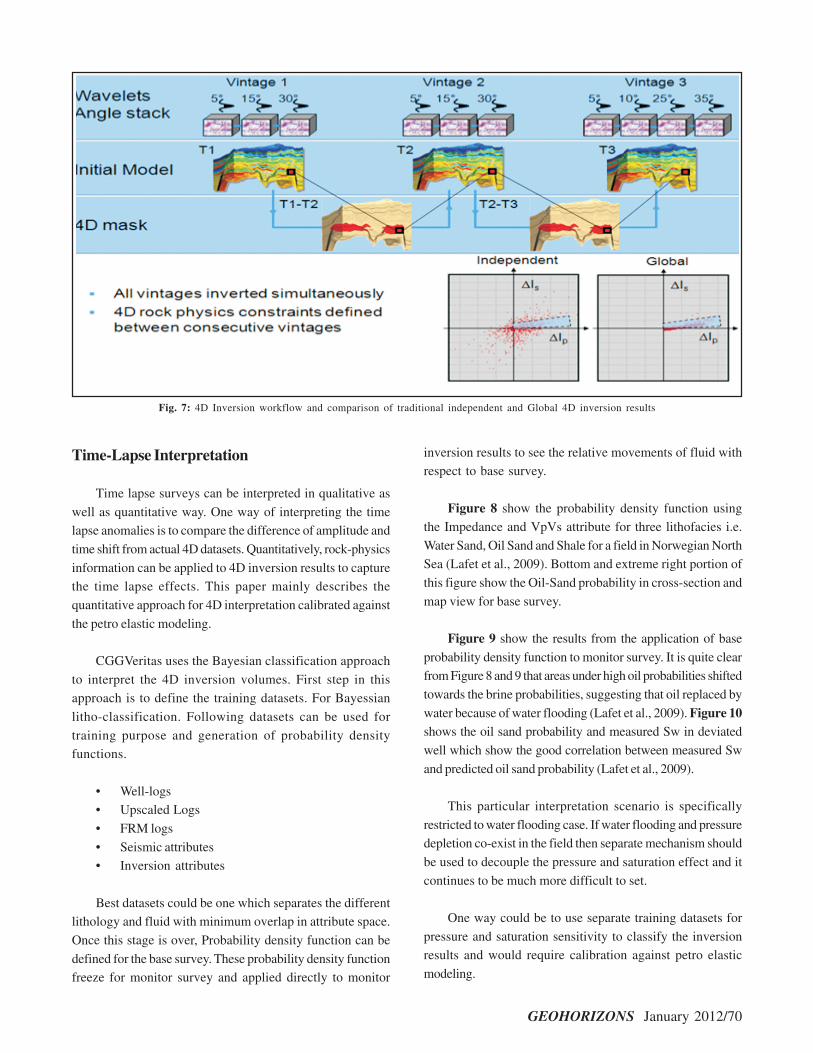
CGGVeritas developed the propriety method of inverting
the base and monitor survey together constrained by theRock-Physics information to reduce the independent
inversion uncertainty. Figure 7 shows this approach and
superiority of this approach over the independent inversion.In this approach initial model for different monitor vintage
updated as per the monitor seismic change and expected
Rock-Physics changes. MASK is generally built to updatedifferently the inversion results inside/outside the zone
where we expect the production related effects.Geologist,
Geophysicist and Reservoir Engineers can make the decisionon the mask with the help of base and monitor seismic and
dynamic simulation information. Figure 7 show the
comparison of results of independent and 4D-Globalinversion (Lafet et al., 2009). It is observed that 4D-Global
inversion simulate the effect of theoretical water flooding
case thus reducing the ambiguity in 4D interpretation of theanomalies
GEOHORIZONS January 2012/70
Fig. 7: 4D Inversion workflow and comparison of traditional independent and Global 4D inversion results
Time-Lapse Interpretation
Time lapse surveys can be interpreted in qualitative as
well as quantitative way. One way of interpreting the timelapse anomalies is to compare the difference of amplitude and
time shift from actual 4D datasets. Quantitatively, rock-physics
information can be applied to 4D inversion results to capturethe time lapse effects. This paper mainly describes the
quantitative approach for 4D interpretation calibrated against
the petro elastic modeling.
CGGVeritas uses the Bayesian classification approach
to interpret the 4D inversion volumes. First step in thisapproach is to define the training datasets. For Bayessian
litho-classification. Following datasets can be used for
training purpose and generation of probability densityfunctions.
• Well-logs• Upscaled Logs
• FRM logs
• Seismic attributes• Inversion attributes
Best datasets could be one which separates the differentlithology and fluid with minimum overlap in attribute space.
Once this stage is over, Probability density function can be
defined for the base survey. These probability density functionfreeze for monitor survey and applied directly to monitor
inversion results to see the relative movements of fluid withrespect to base survey.
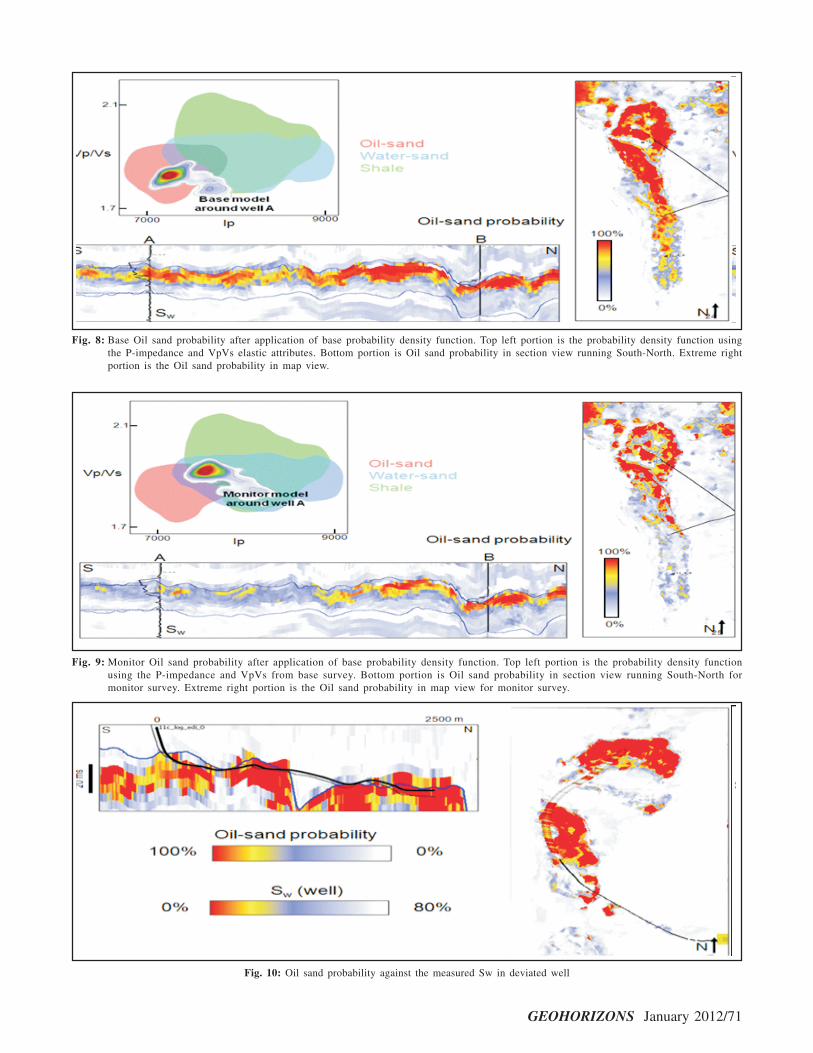
Figure 8 show the probability density function usingthe Impedance and VpVs attribute for three lithofacies i.e.
Water Sand, Oil Sand and Shale for a field in Norwegian NorthSea (Lafet et al., 2009). Bottom and extreme right portion of
this figure show the Oil-Sand probability in cross-section and
map view for base survey.
Figure 9 show the results from the application of base
probability density function to monitor survey. It is quite clearfrom Figure 8 and 9 that areas under high oil probabilities shifted
towards the brine probabilities, suggesting that oil replaced by
water because of water flooding (Lafet et al., 2009). Figure 10shows the oil sand probability and measured Sw in deviated
well which show the good correlation between measured Sw
and predicted oil sand probability (Lafet et al., 2009).
This particular interpretation scenario is specifically
restricted to water flooding case. If water flooding and pressuredepletion co-exist in the field then separate mechanism should
be used to decouple the pressure and saturation effect and it
continues to be much more difficult to set.
One way could be to use separate training datasets for
pressure and saturation sensitivity to classify the inversionresults and would require calibration against petro elastic
modeling.
GEOHORIZONS January 2012/71
Fig. 8: Base Oil sand probability after application of base probability density function. Top left portion is the probability density function usingthe P-impedance and VpVs elastic attributes. Bottom portion is Oil sand probability in section view running South-North. Extreme rightportion is the Oil sand probability in map view.
Fig. 9: Monitor Oil sand probability after application of base probability density function. Top left portion is the probability density functionusing the P-impedance and VpVs from base survey. Bottom portion is Oil sand probability in section view running South-North formonitor survey. Extreme right portion is the Oil sand probability in map view for monitor survey.
Fig. 10: Oil sand probability against the measured Sw in deviated well
GEOHORIZONS January 2012/72
Conclusions
Concept, technology and interpretation of time lapseanomalies discussed in this paper.4D Global inversiondiscussed in detail in comparison with the traditional inversionapproach. It is proved that 4D-global inversion approach isinclined to bring information which is related with productionchanges rather than the noise or convergence of inversionmodel space. Bayesian litho-classification is powerful tool tointerpret the time-lapse inversion data but should be usedcarefully with appropriate information for particular productionscenario.
Acknowledgements
Authors would like to thank CGGVeritas for permissionto present this paper
References
Buland, A. and El Ouair, Y., 2006, Bayesian time-lapse inversion,Geophysics, Vol. 71, 3, R43-R48.
Coulon, J.-P., Lafet, Y., Deschizeaux, B., Doyen, P.M. and Duboz,P., 2006, Stratigraphic elastic inversion for seismic lithology
discrimination in a turbiditic reservoir, SEG ExpandedAbstract, 2092-2096.
El Ouair, Y., and Strønen, L., 2006, Value creation from 4D seismic atthe Gullfaks Field: achievements and new challenges, SEGExpanded Abstract, 3250-3254.
Helgerud, M.B.,Miller,A.C., Johnston,D.H., Udoh, M.S.,Jardine,B.G., Harris, C.,Aubuchon,N.,2011,4D in the deepwater Gulfof Maxico: Hoover,Madison and Marshall fields,The LeadingEdge, 1008-1018.
Kragh, E.D., and Christie, P., 2002, Seismic repeatability, normalizedrms, and predictability, The Leading Edge, 640-647
Kvalheim, A.K. Sandø, I.A., Skogland, S.M., Vinje V. and Carpenter,M., 2007, Impact of time and depth imaging methods onquantitative 4D reservoir management, 69th EAGEConference& Exhibition, Madrid, Expanded Abstract H017.
Lafet, Y., Duboz, P., Deschizeaux, B., Lefeuvre, F., and Hubans, C.,2005, 4D Stratigraphic inversion of the Girassol fieldTowards a more quantitative approach, 67th EAGEConference and Technical Exhibition, Madrid, ExpandedAbstract C018.
Lafet, Y.,Roure,B., Doyen, P.M., and Buran, H., 2009,Global 4-Dseismic inversion and time lapse fluid classification,SEGExpanded Abstract 28,3830-3834