seismic cone penetration test and seismic tomography in permafrost
TRANSCRIPT
Seismic cone penetration test and seismictomography in permafrost
Anne-Marie LeBlanc, Richard Fortier, Michel Allard, Calin Cosma, andSylvie Buteau
Abstract: Two high-resolution multi-offset vertical seismic profile (VSP) surveys were carried out in a permafrostmound near Umiujaq in northern Quebec, Canada, while performing seismic cone penetration tests (SCPT) to study thecryostratigraphy and assess the body waves velocities and the dynamic properties of warm permafrost. Penetrometer-mounted triaxial accelerometers were used as the VSP receivers, and a swept impact seismic technique (SIST) sourcegenerating both compressional and shear waves was moved near the surface following a cross configuration of 40 seis-mic shot-point locations surrounding each of the two SCPTs. The inversion of travel times based on a simultaneousiterative reconstruction technique (SIRT) provided tomographic images of the distribution of seismic velocities in per-mafrost. The Young’s and shear moduli at low strains were then calculated from the seismic velocities and the perma-frost density measured on core samples. The combination of multi-offset VSP survey, SCPT, SIST, and SIRT fortomographic imaging led to new insights in the dynamic properties of permafrost at temperatures close to 0 °C. TheP- and S-wave velocities in permafrost vary from 2400 to 3200 m/s and from 900 to 1750 m/s, respectively, for a tem-perature range between –0.2 and –2.0 °C. The Young’s modulus varies from 2.15 to 13.65 GPa, and the shear modulusvaries from 1.00 to 4.75 GPa over the same range of temperature.
Key words: permafrost, seismic cone penetration test, vertical seismic profiling, seismic tomography, dynamic proper-ties.
Résumé : Des profils sismiques verticaux (VSP) à haute-résolution et à points de tir déportés ont été effectués lors dedeux essais de pénétration au cône sismique (SCPT) dans une butte de pergélisol à Umiujaq au Québec nordique, Ca-nada, afin d’étudier la cryostratigraphie et d’évaluer les vitesses sismiques des ondes de volume et les propriétés dyna-miques d’un pergélisol chaud. Des accéléromètres triaxiaux insérés dans le fût du pénétromètre ont été utilisés commecapteurs sismiques en profondeur alors qu’une source sismique à impacts par balayage (SIST), qui génère simultané-ment des ondes de compression et de cisaillement, a été déplacée près de la surface. Quarante points de tir sismiqueont été disposés en forme de croix autour de chacun des deux essais de pénétration au cône sismique. L’inversion destemps de propagation a été réalisée à l’aide d’un algorithme de reconstruction d’image tomographique par itérationsimultanée (SIRT). Cette inversion a permis d’obtenir des images tomographiques de la distribution des vitesses sismi-ques dans le pergélisol. À partir de ces vitesses sismiques et de la masse volumique mesurée sur des échantillons depergélisol, les modules de Young et de cisaillement à petites déformations ont été calculés. La combinaison des métho-des VSP à points de tir déportés, SCPT, SIST et SIRT pour effectuer de l’imagerie tomographique a permis de caracté-riser les propriétés dynamiques du pergélisol. Les vitesses de propagation des ondes sismiques de compression et decisaillement dans le pergélisol varient entre 2400 et 3200 m/s et entre 900 et 1750 m/s, respectivement, pour un inter-valle de température allant de –0,2 à –2,0 °C. Les modules de Young et de cisaillement varient entre 2,15 et13,65 GPa et entre 1,00 et 4,75 GPa, respectivement, pour la même plage de variation de la température.
Mots clés : pergélisol, essai de pénétration au cône sismique, profil sismique vertical, tomographie sismique, propriétésdynamiques.
LeBlanc et al. 813
Can. Geotech. J. 41: 796–813 (2004) doi: 10.1139/T04-026 © 2004 NRC Canada
796
Received 17 June 2003. Accepted 8 March 2004. Published on the NRC Research Press Web site at http://cgj.nrc.ca on15 September 2004.
A.-M. LeBlanc1 and R. Fortier. Centre d’études nordiques and Département de géologie et de génie géologique, Université Laval,Sainte-Foy, QC G1K 7P4, Canada.M. Allard. Centre d’études nordiques and Département de géographie, Université Laval, Sainte-Foy, QC G1K 7P4, Canada.C. Cosma. Vibrometric OY, Sitratori 3, 00420 Helsinki, Finland.S. Buteau. Defence R&D Canada, Valcartier (DRDC), Val-Bélair, QC G3J 1X5, Canada.
1Corresponding author (e-mail: [email protected]).
Introduction
The study of the dynamic behaviour of frozen soils is fun-damental in cold regions engineering for the design of vi-brating machinery on frozen ground, the response of frozensoils to dynamic loading induced by earthquakes, and the ex-cavation of frozen ground (Vinson 1978). The majority ofthe investigations on the dynamic properties of frozen soilshave been conducted in the laboratory on artificially frozensamples or on undisturbed permafrost samples (King et al.1982; Nakano and Froula 1973; Stevens 1975; Zimmermanand King 1986). In the field, various investigations in per-mafrost have been carried out using seismic refraction andreflection surveys (Barnes 1963; Garg 1973; Hunter 1973;Hunter et al. 1978; MacAulay and Hunter 1982; Miller et al.2000; Morack et al. 1983; Morack and Rogers 1982; Neaveand Sellmann 1983; Porturas 1988), not only to detect anddelineate permafrost, but also to study the cryostratigraphyand, to some extent, to assess the dynamic properties of per-mafrost such as the seismic velocities of both compressionaland shear waves, P and S waves, respectively. In situ investi-gations for studying the cryostratigraphy and the variabilityof dynamic properties of permafrost are scarce, however, es-pecially for “warm” permafrost. Vinson (1978) reported thatthere is a severe lack of seismic data between 0 and –1 °C, acritical temperature range for the design of infrastructureslying on the permafrost, since it can be particularly sensitiveto man-induced disturbance or climate warming. A few fieldstudies on perennially frozen bedrock and rock glaciers inthe temperature range between 0 and –1 °C using seismicsurveys can be found in the literature (Musil et al. 2002), butthe substrate is quite different from the perennially frozenand ice-rich soils studied in the present paper.
The two most relevant dynamic stress–strain properties ofsoils are the Young’s modulus, E, and the shear modulus, G.They can be expressed in terms of the velocities of com-pressional and shear waves, Vp and Vs, respectively, by thefollowing equations (Shearer 1999):
[1] E V= + −−
ρ ν ν
νp2 1 1 2
1( )( )
( )
[2] G V= ρ s2
[3] ν =−
−[ / ) ]
[ / ) ]
0.5(
(p s
p s
V V
V V
2
2
1
1
where ρ is the soil density, and ν is the Poisson’s ratio. TheYoung’s and shear moduli are indicative of the com-pressional and shear deformability and the mechanicalstrength of soils. High values of these parameters are associ-ated with stiff soils. The measurement of ρ, Vp, and Vs in amedium therefore allows the dynamic properties of the me-dium to be fully established at low strain.
In addition to the laboratory experiments and indirect sur-face geophysical methods such as seismic refraction and re-flection surveys, new geophysical methods for near-surfaceapplications have been recently developed to measure in situVp and Vs and assess the dynamic properties of soils: verticalseismic profile (VSP) surveys in boreholes (Hunter et al.1998), VSP survey while carrying out seismic cone penetra-
tion tests (SCPT) (Jarvis and Knight 2000; Robertson et al.1986), and seismic tomography in boreholes (Saito et al.1988; Wright et al. 1988). VSP surveys and seismic tomog-raphy were first developed for the exploration of oil and gasin sedimentary formations (Balch and Lee 1984), and it isonly recently that they have been used for investigation insoils at a small scale. On one hand, the VSP survey is apowerful technique to obtain high-quality measurements ofsubsurface velocities. The use of penetrometer-mounted geo-phones or accelerometers during an SCPT instead of lower-ing seismic receivers in a borehole for performing a VSPsurvey gives the following additional advantages while re-taining all of the benefits of the VSP survey (Jarvis andKnight 2000): (i) decreased cost compared with drillingboreholes; (ii) better acoustic coupling; (iii) avoidance of theproblems caused by tube waves in boreholes; and (iv) gath-ering of cone data, such as cone resistance, friction ratio,pore pressure, and temperature, along with the seismic data.The geotechnical parameters measured during the cone pen-etration test (CPT), such as cone resistance, friction ratio,temperature, and electrical resistivity, provide a useful set ofdata for assessing the soil stratigraphy and for comparisonwith VSP data. Seismic tomography, on the other hand, hasproven to be an effective technique for obtaining seismicimages of the spatial distribution of seismic velocities inbedrock (Cosma et al. 2001a, 2001b).
Skvortsov et al. (1992) have carried out shear-wave VSPsurveys in permafrost to locate massive ice bodies. More-over, CPTs have been performed in frozen soils and perma-frost (Buteau 2002; Buteau and Fortier 2000; Campanella etal. 1984; Fortier et al. 1994b; Ladanyi 1976, 1982, 1985;Ladanyi and Huneault 1989; Ladanyi et al. 1991, 1995) butwithout using the seismic capabilities of the CPT. Two dif-ferent types of CPT can be performed in permafrost forstratigraphic profiling and creep testing (Buteau 2002;Buteau and Fortier 2000; Ladanyi 1976, 1982, 1985). Thefirst type is a quasi-static CPT at a constant penetration rate,providing a stratigraphic profile of permafrost (Buteau 2002;Buteau and Fortier 2000); the second type is a series ofquasi-static CPTs at incremental penetration rates (Buteau2002; Buteau and Fortier 2000) or loads (Fortier et al.1994b; Ladanyi 1976) carried out in a homogeneous layerfor studying the creep behaviour of permafrost. To theknowledge of the present authors, however, no attempt hasbeen made to carry out VSP surveys in permafrost whileperforming SCPTs.
In the research project presented herein, the penetration-rate-controlled CPT developed by Buteau (2002) and Buteauand Fortier (2000) was used to perform multi-offset VSPsurveys in a permafrost mound in Nunavik, Quebec, Canada.Triaxial accelerometers embedded in the penetrometer wereused as the VSP receivers, and a swept impact seismic tech-nique (SIST) source (Park et al. 1996) was moved at the sur-face. The purposes of the present study are to (i) study thecryostratigraphy, (ii) assess the spatial variation of bodywaves velocities in permafrost, and (iii) determine theYoung’s and shear moduli of permafrost at small strain fromthe in situ measurements of both compressional and shearwave velocities based on seismic tomography. In this paper,the field methodology, including multi-offset vertical seismic
© 2004 NRC Canada
LeBlanc et al. 797
profiling, seismic cone penetration testing, and tomographicimaging, and the field results are reported in detail.
Seismic velocities in frozen soils
The compressional and shear wave velocities of soils andtherefore the Young’s and shear moduli depend principallyon the lithology and grain size, the porosity and pore struc-ture, the water content and nature of the pore water, the tem-perature and the water phase, the confining pressure, thematrix composition, and the degree of cementation (Garg1973). A summary of the influence of these parameters onthe response of frozen ground to dynamic loading is givenby Vinson (1978).
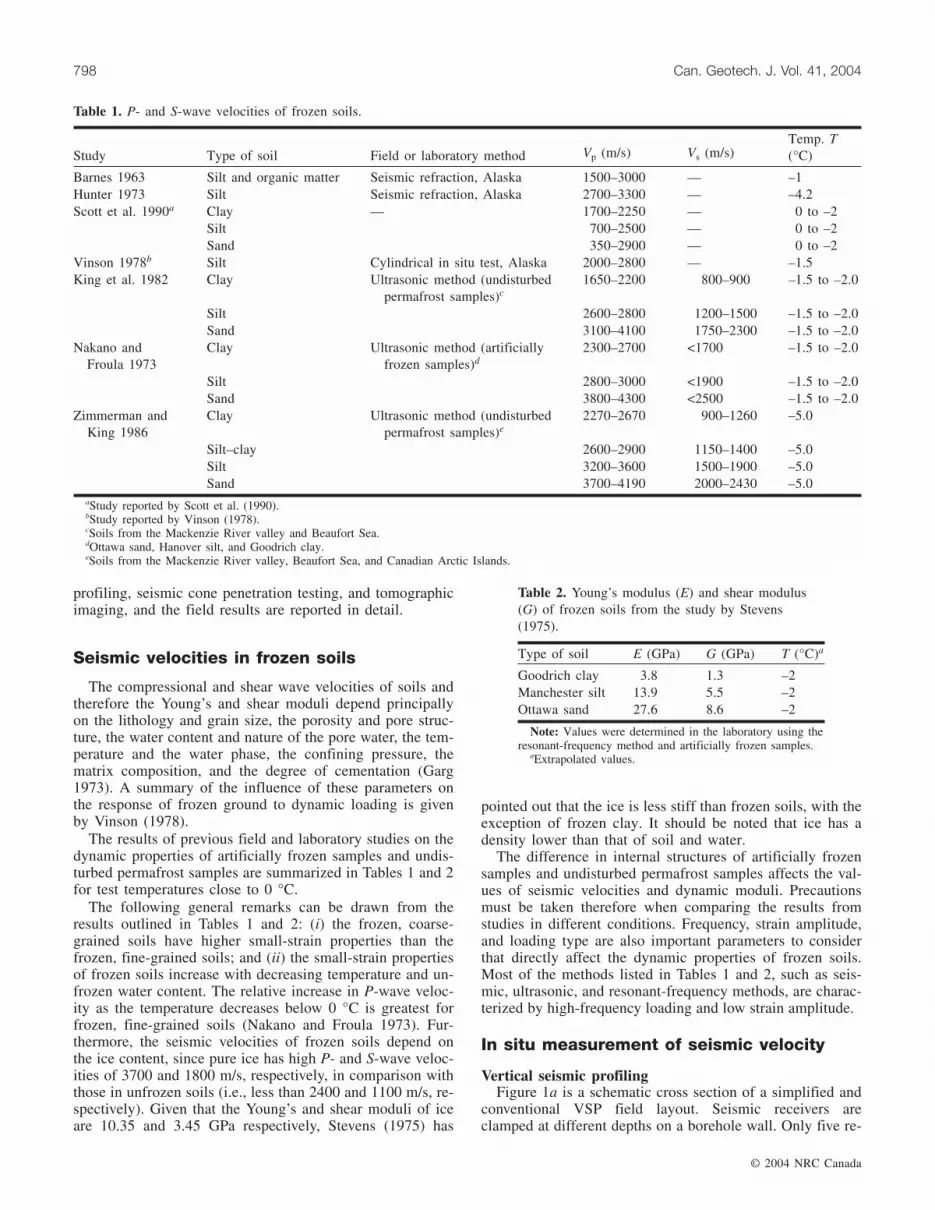
The results of previous field and laboratory studies on thedynamic properties of artificially frozen samples and undis-turbed permafrost samples are summarized in Tables 1 and 2for test temperatures close to 0 °C.
The following general remarks can be drawn from theresults outlined in Tables 1 and 2: (i) the frozen, coarse-grained soils have higher small-strain properties than thefrozen, fine-grained soils; and (ii) the small-strain propertiesof frozen soils increase with decreasing temperature and un-frozen water content. The relative increase in P-wave veloc-ity as the temperature decreases below 0 °C is greatest forfrozen, fine-grained soils (Nakano and Froula 1973). Fur-thermore, the seismic velocities of frozen soils depend onthe ice content, since pure ice has high P- and S-wave veloc-ities of 3700 and 1800 m/s, respectively, in comparison withthose in unfrozen soils (i.e., less than 2400 and 1100 m/s, re-spectively). Given that the Young’s and shear moduli of iceare 10.35 and 3.45 GPa respectively, Stevens (1975) has
pointed out that the ice is less stiff than frozen soils, with theexception of frozen clay. It should be noted that ice has adensity lower than that of soil and water.
The difference in internal structures of artificially frozensamples and undisturbed permafrost samples affects the val-ues of seismic velocities and dynamic moduli. Precautionsmust be taken therefore when comparing the results fromstudies in different conditions. Frequency, strain amplitude,and loading type are also important parameters to considerthat directly affect the dynamic properties of frozen soils.Most of the methods listed in Tables 1 and 2, such as seis-mic, ultrasonic, and resonant-frequency methods, are charac-terized by high-frequency loading and low strain amplitude.
In situ measurement of seismic velocity
Vertical seismic profilingFigure 1a is a schematic cross section of a simplified and
conventional VSP field layout. Seismic receivers areclamped at different depths on a borehole wall. Only five re-
© 2004 NRC Canada
798 Can. Geotech. J. Vol. 41, 2004
Study Type of soil Field or laboratory method Vp (m/s) Vs (m/s)Temp. T(°C)
Barnes 1963 Silt and organic matter Seismic refraction, Alaska 1500–3000 — –1Hunter 1973 Silt Seismic refraction, Alaska 2700–3300 — –4.2Scott et al. 1990a Clay — 1700–2250 — 0 to –2
Silt 700–2500 — 0 to –2Sand 350–2900 — 0 to –2
Vinson 1978b Silt Cylindrical in situ test, Alaska 2000–2800 — –1.5King et al. 1982 Clay Ultrasonic method (undisturbed
permafrost samples)c1650–2200 800–900 –1.5 to –2.0
Silt 2600–2800 1200–1500 –1.5 to –2.0Sand 3100–4100 1750–2300 –1.5 to –2.0
Nakano andFroula 1973
Clay Ultrasonic method (artificiallyfrozen samples)d
2300–2700 <1700 –1.5 to –2.0
Silt 2800–3000 <1900 –1.5 to –2.0Sand 3800–4300 <2500 –1.5 to –2.0
Zimmerman andKing 1986
Clay Ultrasonic method (undisturbedpermafrost samples)e
2270–2670 900–1260 –5.0
Silt–clay 2600–2900 1150–1400 –5.0Silt 3200–3600 1500–1900 –5.0Sand 3700–4190 2000–2430 –5.0
aStudy reported by Scott et al. (1990).bStudy reported by Vinson (1978).cSoils from the Mackenzie River valley and Beaufort Sea.dOttawa sand, Hanover silt, and Goodrich clay.eSoils from the Mackenzie River valley, Beaufort Sea, and Canadian Arctic Islands.
Table 1. P- and S-wave velocities of frozen soils.
Type of soil E (GPa) G (GPa) T (°C)a
Goodrich clay 3.8 1.3 –2Manchester silt 13.9 5.5 –2Ottawa sand 27.6 8.6 –2
Note: Values were determined in the laboratory using theresonant-frequency method and artificially frozen samples.
aExtrapolated values.
Table 2. Young’s modulus (E) and shear modulus(G) of frozen soils from the study by Stevens(1975).
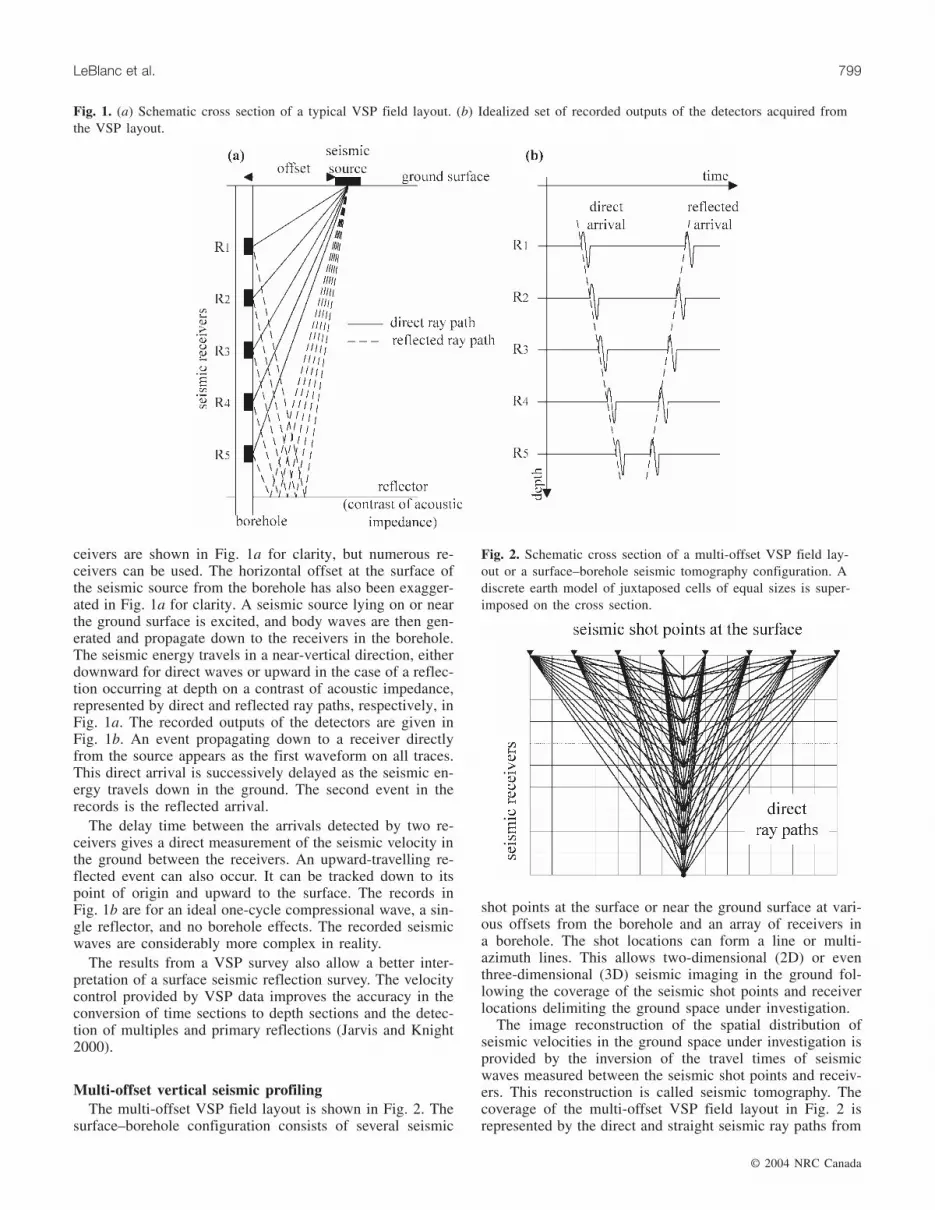
ceivers are shown in Fig. 1a for clarity, but numerous re-ceivers can be used. The horizontal offset at the surface ofthe seismic source from the borehole has also been exagger-ated in Fig. 1a for clarity. A seismic source lying on or nearthe ground surface is excited, and body waves are then gen-erated and propagate down to the receivers in the borehole.The seismic energy travels in a near-vertical direction, eitherdownward for direct waves or upward in the case of a reflec-tion occurring at depth on a contrast of acoustic impedance,represented by direct and reflected ray paths, respectively, inFig. 1a. The recorded outputs of the detectors are given inFig. 1b. An event propagating down to a receiver directlyfrom the source appears as the first waveform on all traces.This direct arrival is successively delayed as the seismic en-ergy travels down in the ground. The second event in therecords is the reflected arrival.
The delay time between the arrivals detected by two re-ceivers gives a direct measurement of the seismic velocity inthe ground between the receivers. An upward-travelling re-flected event can also occur. It can be tracked down to itspoint of origin and upward to the surface. The records inFig. 1b are for an ideal one-cycle compressional wave, a sin-gle reflector, and no borehole effects. The recorded seismicwaves are considerably more complex in reality.
The results from a VSP survey also allow a better inter-pretation of a surface seismic reflection survey. The velocitycontrol provided by VSP data improves the accuracy in theconversion of time sections to depth sections and the detec-tion of multiples and primary reflections (Jarvis and Knight2000).
Multi-offset vertical seismic profilingThe multi-offset VSP field layout is shown in Fig. 2. The
surface–borehole configuration consists of several seismic
shot points at the surface or near the ground surface at vari-ous offsets from the borehole and an array of receivers ina borehole. The shot locations can form a line or multi-azimuth lines. This allows two-dimensional (2D) or eventhree-dimensional (3D) seismic imaging in the ground fol-lowing the coverage of the seismic shot points and receiverlocations delimiting the ground space under investigation.
The image reconstruction of the spatial distribution ofseismic velocities in the ground space under investigation isprovided by the inversion of the travel times of seismicwaves measured between the seismic shot points and receiv-ers. This reconstruction is called seismic tomography. Thecoverage of the multi-offset VSP field layout in Fig. 2 isrepresented by the direct and straight seismic ray paths from
© 2004 NRC Canada
LeBlanc et al. 799
Fig. 1. (a) Schematic cross section of a typical VSP field layout. (b) Idealized set of recorded outputs of the detectors acquired fromthe VSP layout.
Fig. 2. Schematic cross section of a multi-offset VSP field lay-out or a surface–borehole seismic tomography configuration. Adiscrete earth model of juxtaposed cells of equal sizes is super-imposed on the cross section.
the shot points to the receivers; no consideration is given inthis schematic cross section for potential refractions in theground and ray path curvature.
In the field, the ground coverage for image reconstructionis provided by the configuration of shot points and receivers.The two principal configurations are surface–borehole andcross-hole. The combination of multi-offset VSP survey andSCPT used in the present study therefore allows the seismicimaging with the surface–borehole configuration.
Seismic tomographyThe word tomography is derived from the Greek tomos
(section or slice) and graphos (graphic representation or im-age). Tomography is defined as an imaging technique of amedium from data that are line integrals of the parameterto be imaged (McMechan 1983). The purpose of seismictomography is to assess the spatial distribution of seismicvelocities in the ground, or the image reconstruction, by theinversion of travel times, also known as travel-time tomogra-phy. From the observed travel times, the spatial distributionof velocities can be found. The procedure consists of divid-ing the ground section into a grid of juxtaposed cells(Fig. 2). The travel time of each shot point – receiver pair isthen expressed as a weighted linear sum of delays in thecells crossed by the ray path. Each member of the summa-tion involves the velocity in a cell traversed by the ray pathfrom the shot point to the receiver and the ray path length inthe cell. Various mathematical techniques can be used to as-sess the cell velocities by best fitting of the synthetic traveltimes to the observed ones (Dines and Lytle 1979). A simul-taneous iterative reconstruction technique (SIRT) algorithm(Gilbert 1972) for the inversion of the observed travel timeswas used in the present study. In first approximation, an ini-tial slowness model, the reciprocal of velocity for linearizingthe inversion problem, is created assuming straight raypaths. Then, starting with this initial slowness model, curvedwave paths are computed iteratively during the tomographicinversion using a combination of smoothing method for thecoarse ray path estimates and bending method for the refine-ment of the ray path (Um and Thurber 1987). When the er-ror is minimized between the synthetic travel times and theobserved ones, the final velocity model of the ground spaceunder investigation is calculated from the reciprocal of theoptimized slowness model.
Study site
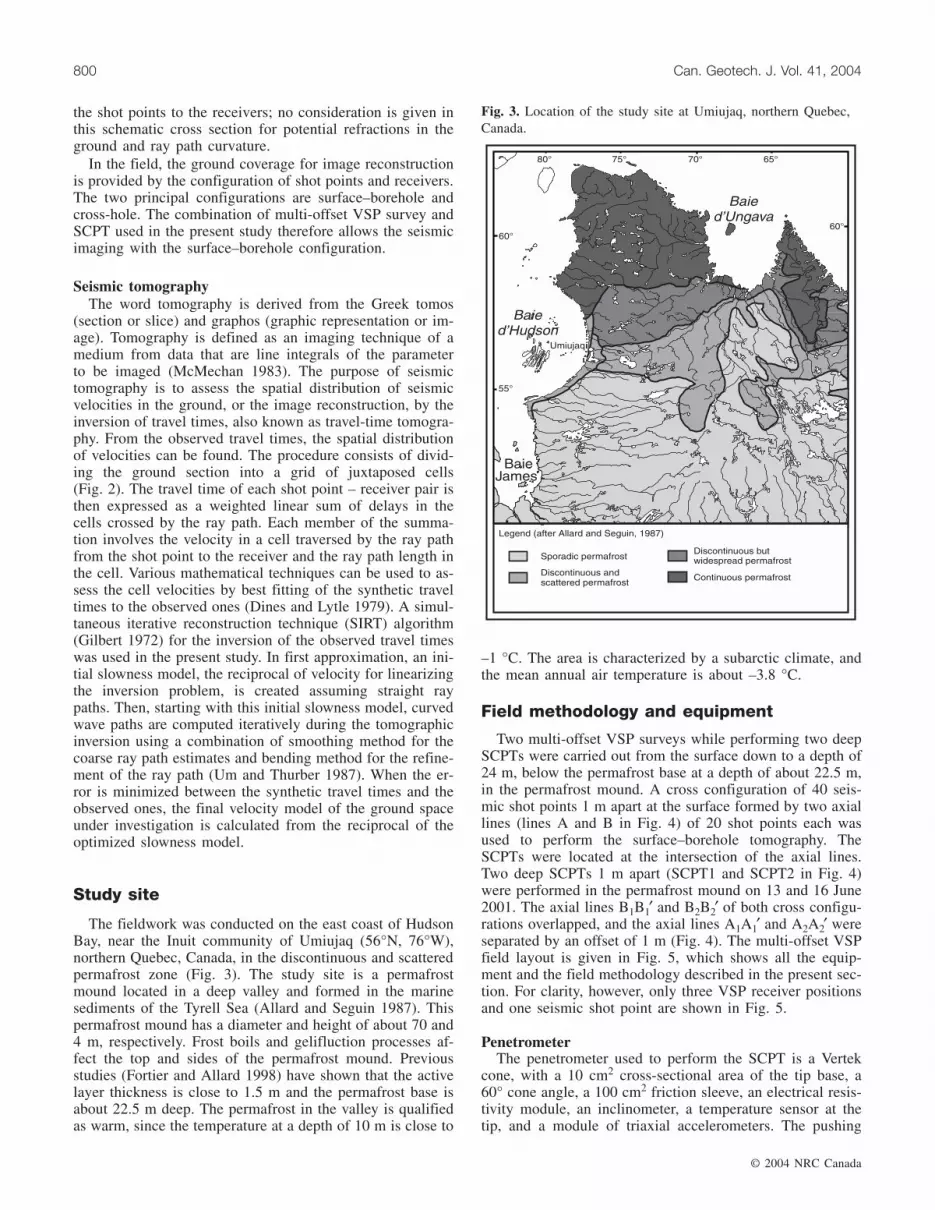
The fieldwork was conducted on the east coast of HudsonBay, near the Inuit community of Umiujaq (56°N, 76°W),northern Quebec, Canada, in the discontinuous and scatteredpermafrost zone (Fig. 3). The study site is a permafrostmound located in a deep valley and formed in the marinesediments of the Tyrell Sea (Allard and Seguin 1987). Thispermafrost mound has a diameter and height of about 70 and4 m, respectively. Frost boils and gelifluction processes af-fect the top and sides of the permafrost mound. Previousstudies (Fortier and Allard 1998) have shown that the activelayer thickness is close to 1.5 m and the permafrost base isabout 22.5 m deep. The permafrost in the valley is qualifiedas warm, since the temperature at a depth of 10 m is close to
–1 °C. The area is characterized by a subarctic climate, andthe mean annual air temperature is about –3.8 °C.
Field methodology and equipment
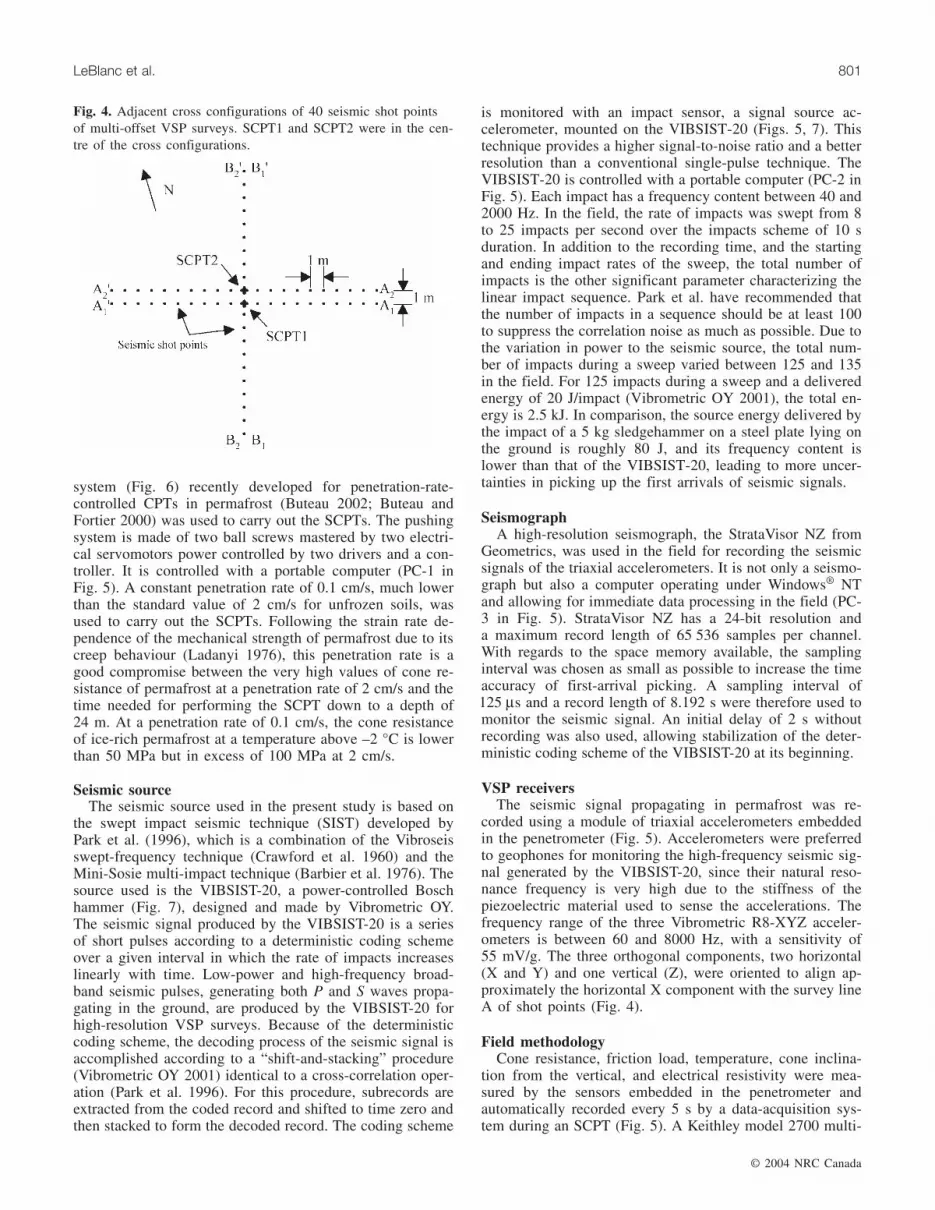
Two multi-offset VSP surveys while performing two deepSCPTs were carried out from the surface down to a depth of24 m, below the permafrost base at a depth of about 22.5 m,in the permafrost mound. A cross configuration of 40 seis-mic shot points 1 m apart at the surface formed by two axiallines (lines A and B in Fig. 4) of 20 shot points each wasused to perform the surface–borehole tomography. TheSCPTs were located at the intersection of the axial lines.Two deep SCPTs 1 m apart (SCPT1 and SCPT2 in Fig. 4)were performed in the permafrost mound on 13 and 16 June2001. The axial lines B1B1′ and B2B2′ of both cross configu-rations overlapped, and the axial lines A1A1′ and A2A2′ wereseparated by an offset of 1 m (Fig. 4). The multi-offset VSPfield layout is given in Fig. 5, which shows all the equip-ment and the field methodology described in the present sec-tion. For clarity, however, only three VSP receiver positionsand one seismic shot point are shown in Fig. 5.
PenetrometerThe penetrometer used to perform the SCPT is a Vertek
cone, with a 10 cm2 cross-sectional area of the tip base, a60° cone angle, a 100 cm2 friction sleeve, an electrical resis-tivity module, an inclinometer, a temperature sensor at thetip, and a module of triaxial accelerometers. The pushing
© 2004 NRC Canada
800 Can. Geotech. J. Vol. 41, 2004
Fig. 3. Location of the study site at Umiujaq, northern Quebec,Canada.
system (Fig. 6) recently developed for penetration-rate-controlled CPTs in permafrost (Buteau 2002; Buteau andFortier 2000) was used to carry out the SCPTs. The pushingsystem is made of two ball screws mastered by two electri-cal servomotors power controlled by two drivers and a con-troller. It is controlled with a portable computer (PC-1 inFig. 5). A constant penetration rate of 0.1 cm/s, much lowerthan the standard value of 2 cm/s for unfrozen soils, wasused to carry out the SCPTs. Following the strain rate de-pendence of the mechanical strength of permafrost due to itscreep behaviour (Ladanyi 1976), this penetration rate is agood compromise between the very high values of cone re-sistance of permafrost at a penetration rate of 2 cm/s and thetime needed for performing the SCPT down to a depth of24 m. At a penetration rate of 0.1 cm/s, the cone resistanceof ice-rich permafrost at a temperature above –2 °C is lowerthan 50 MPa but in excess of 100 MPa at 2 cm/s.
Seismic sourceThe seismic source used in the present study is based on
the swept impact seismic technique (SIST) developed byPark et al. (1996), which is a combination of the Vibroseisswept-frequency technique (Crawford et al. 1960) and theMini-Sosie multi-impact technique (Barbier et al. 1976). Thesource used is the VIBSIST-20, a power-controlled Boschhammer (Fig. 7), designed and made by Vibrometric OY.The seismic signal produced by the VIBSIST-20 is a seriesof short pulses according to a deterministic coding schemeover a given interval in which the rate of impacts increaseslinearly with time. Low-power and high-frequency broad-band seismic pulses, generating both P and S waves propa-gating in the ground, are produced by the VIBSIST-20 forhigh-resolution VSP surveys. Because of the deterministiccoding scheme, the decoding process of the seismic signal isaccomplished according to a “shift-and-stacking” procedure(Vibrometric OY 2001) identical to a cross-correlation oper-ation (Park et al. 1996). For this procedure, subrecords areextracted from the coded record and shifted to time zero andthen stacked to form the decoded record. The coding scheme
is monitored with an impact sensor, a signal source ac-celerometer, mounted on the VIBSIST-20 (Figs. 5, 7). Thistechnique provides a higher signal-to-noise ratio and a betterresolution than a conventional single-pulse technique. TheVIBSIST-20 is controlled with a portable computer (PC-2 inFig. 5). Each impact has a frequency content between 40 and2000 Hz. In the field, the rate of impacts was swept from 8to 25 impacts per second over the impacts scheme of 10 sduration. In addition to the recording time, and the startingand ending impact rates of the sweep, the total number ofimpacts is the other significant parameter characterizing thelinear impact sequence. Park et al. have recommended thatthe number of impacts in a sequence should be at least 100to suppress the correlation noise as much as possible. Due tothe variation in power to the seismic source, the total num-ber of impacts during a sweep varied between 125 and 135in the field. For 125 impacts during a sweep and a deliveredenergy of 20 J/impact (Vibrometric OY 2001), the total en-ergy is 2.5 kJ. In comparison, the source energy delivered bythe impact of a 5 kg sledgehammer on a steel plate lying onthe ground is roughly 80 J, and its frequency content islower than that of the VIBSIST-20, leading to more uncer-tainties in picking up the first arrivals of seismic signals.
SeismographA high-resolution seismograph, the StrataVisor NZ from
Geometrics, was used in the field for recording the seismicsignals of the triaxial accelerometers. It is not only a seismo-graph but also a computer operating under Windows® NTand allowing for immediate data processing in the field (PC-3 in Fig. 5). StrataVisor NZ has a 24-bit resolution anda maximum record length of 65 536 samples per channel.With regards to the space memory available, the samplinginterval was chosen as small as possible to increase the timeaccuracy of first-arrival picking. A sampling interval of125 µs and a record length of 8.192 s were therefore used tomonitor the seismic signal. An initial delay of 2 s withoutrecording was also used, allowing stabilization of the deter-ministic coding scheme of the VIBSIST-20 at its beginning.
VSP receiversThe seismic signal propagating in permafrost was re-
corded using a module of triaxial accelerometers embeddedin the penetrometer (Fig. 5). Accelerometers were preferredto geophones for monitoring the high-frequency seismic sig-nal generated by the VIBSIST-20, since their natural reso-nance frequency is very high due to the stiffness of thepiezoelectric material used to sense the accelerations. Thefrequency range of the three Vibrometric R8-XYZ acceler-ometers is between 60 and 8000 Hz, with a sensitivity of55 mV/g. The three orthogonal components, two horizontal(X and Y) and one vertical (Z), were oriented to align ap-proximately the horizontal X component with the survey lineA of shot points (Fig. 4).
Field methodologyCone resistance, friction load, temperature, cone inclina-
tion from the vertical, and electrical resistivity were mea-sured by the sensors embedded in the penetrometer andautomatically recorded every 5 s by a data-acquisition sys-tem during an SCPT (Fig. 5). A Keithley model 2700 multi-
© 2004 NRC Canada
LeBlanc et al. 801
Fig. 4. Adjacent cross configurations of 40 seismic shot pointsof multi-offset VSP surveys. SCPT1 and SCPT2 were in the cen-tre of the cross configurations.

meter was used for the data acquisition. The test monitoringwas accomplished via a graphical program developed onLabVIEW (National Instruments). The LabVIEW graphicalinterface provided real time data access on a portable com-puter (PC-4 in Fig. 5).
From the surface down to a depth of 24 m, below the per-mafrost base at a depth of about 22.5 m, the cone penetra-tion was stopped at intervals of 1 m to add a new pushingrod, perform the seismic shots with the seismic source fol-lowing the cross configuration (Fig. 4), and record with theseismograph the seismic waves propagating down to theaccelerometers embedded in the penetrometer. The seismicsource stood directly on the thawing front at a depth ofabout 0.75 m in the active layer for better mechanical con-tact and to avoid the signal attenuation in the unfrozenground at the surface. Forty steel striking plates (Figs. 5, 7)were then buried in the active layer, in direct contact with
the thawing front following the cross configuration of seis-mic shot points, to allow the seismic shots to be done fasterand increase the work efficiency. Plastic tubes were used togive permanent access to the striking plates and protect themagainst the collapse of the surrounding material. This al-lowed the seismic source to be moved quickly from one shotpoint to another. An electronic level was used to measurethe depth of the striking plates in the active layer.
An extension rod on the VIBSIST-20 was used to reachthe striking plate (Fig. 7). During a sweep, the ball extremityof the impact rod of the VIBSIST-20 was seated on the balljoint of the striking plate, a machined concave cavity in thestriking plate (Fig. 7). At the end of a sweep, the VIBSIST-20 was then moved to another seismic shot point or strikingplate. The 40 seismic shots were completed in less then30 min at each stop of the SCPT. To avoid any thermal dis-turbance of the active layer and the permafrost, the exca-
© 2004 NRC Canada
802 Can. Geotech. J. Vol. 41, 2004
Fig. 5. Multi-offset VSP field layout (not to scale). DV, differential voltage; I, electric current.

vated material and vegetation were replaced after thetemporary burial of the striking plates.
Permafrost sampling
On 8 June 2001, one borehole was drilled a few metresfrom the SCPTs to a depth of 4.6 m in the permafrostmound to measure the physical properties and study thecryostratigraphy of the permafrost. The marine sediments ofthe Tyrell Sea are fine silty sand with a few sand beds. The
depth of the thawing front was 0.75 m at that time. A fewice lenses 0.5–1.0 mm thick were present in the still frozenactive layer below the thawing front. The permafrost table ata depth of 1.64 m is clearly marked by an increase in icecontent (Fig. 8a). A complex reticulate network of horizon-tal and vertical ice lenses from 1 to 4 cm thick is character-istic of the permafrost cryofacies (Fig. 8b). The averagedensity of the active layer and permafrost is 2000 and1750 kg/m3, respectively. The total water content is less than20% in the active layer and greater than 40% in the perma-frost.
Cryostratigraphy of permafrost
The cryostratigraphy of the permafrost mound has beendefined in terms of its mechanical and electrical propertiesfrom the results of the SCPT carried out on 16 June 2001(Fig. 9). As a general interpretation rule of CPTs in unfrozenground, coarse-grained materials such as sand produce ahigh cone resistance and a low friction ratio, whereas fine-grained materials such as clay or silt produce a low cone re-sistance and a high friction ratio. According to previousstudies of CPTs in frozen ground (Campanella et al. 1984;Buteau 2002), cone resistance is very high and the frictionratio very low for ice-rich frozen soils. Moreover, the electri-cal resistivity of frozen soils depends on the soil type, watersalinity, unfrozen water and ice contents, and ground tem-perature. According to Fortier et al. (1994a), the frozen siltysand of the Tyrell Sea is characterized by resistivity valuesover 1000 Ω·m, with values as high as 100 000 Ω·m for anice-rich layer.
Three temperature curves are shown in Fig. 9. The solidline is the dynamic temperature measured during the conepenetration. The friction mobilized along the penetrometer
© 2004 NRC Canada
LeBlanc et al. 803
Fig. 6. Penetration-rate-controlled SCPT in permafrost.
Fig. 7. VIBSIST-20 seismic source consisting of a power-controlled Bosch hammer.
Fig. 8. Examples of cryofacies in permafrost. (a) Permafrosttable at a depth of 1.64 m characterized by an increase in icecontent with an increase in depth. (b) Network of reticulate icelenses in permafrost. The thickness of the lenses ranges between1 and 4 cm.

shaft warmed up the penetrometer and the surrounding soil,so the dynamic temperature does not reflect the in situ con-ditions (Dlugach et al. 1995). Therefore the depth of thethawing front and permafrost base cannot be accuratelylocated from this temperature profile. During the seismicshots, the penetration was stopped but the data acquisitionsystem was still recording the temperature to assess theequilibrium temperature after the heat dissipation. The bro-ken line in Fig. 9 gives the temperature profile about 20 minafter the penetration was stopped. This relaxation period wasnot long enough, however, for an equilibrium temperature tobe reached. An average difference of 0.26 °C between thedynamic and relaxation temperatures has been observed inpermafrost compared with 1.45 °C in the unfrozen ground.The line with solid circles is the temperature profile mea-sured on 16 June 2001 using a thermistor cable permanentlyburied in the permafrost mound a few metres from theSCPT. This profile is of course colder than the two otherprofiles.
Two electrical resistivity curves are also shown in Fig. 9.The solid line is the dynamic electrical resistivity measuredduring the cone penetration with a resistivity module of fourelectrodes in line, 3 cm apart, following a Wenner array(Telford et al. 1984) where the dipole of voltage electrodesis located between the dipole of current electrodes. The linewith solid circles is an electrical resistivity logging carriedout on 19 July 1998 on an electrode cable together with the
thermistor cable (Fortier and Allard 1998). A Wenner arrayof four electrodes, 50 cm apart, was moved downward alongthe electrode cable by selecting the appropriate electrodes ina contact box at the ground surface. The access hole for theinstallation of the thermistor cable and the electrode cablewas bored on 12 August 1989 by water-jet drilling (Veilletteand Nixon 1980). The water jet completely destroyed thesequence of cryofacies and the original cryostratigraphy.Therefore, the resistivity values measured on the electrodecable are characteristic of the zone disturbed by the drillingoperation and the frozen slurry in the borehole. This electri-cal resistivity profile is then given in Fig. 9 as a referencefor comparison with the dynamic electrical resistivity mea-sured during the SCPT. However, the variations in dynamicelectrical resistivity are characteristic of the complex cryo-facies of permafrost (Fig. 8b), since the cone was pushedinto undisturbed frozen ground.
The relative tilt angle of the penetrometer from the verti-cal is given in Fig. 9. The changes in tilt angle are due to thepresence of small stones or stiff layers along the penetrationpath such as those at 11 and 18 m depth. The tilt variationshould be considered for tomographic inversion, since theexact location of the receivers relative to the sources at thesurface is needed. This was not possible in the present studybecause only a relative tilt angle was measured during theSCPT. The tilt angle was less than 2.5° throughout theSCPT, however, inducing a lateral displacement of about
© 2004 NRC Canada
804 Can. Geotech. J. Vol. 41, 2004
Fig. 9. Stratigraphic profiles of the cone resistance qc, friction ratio fs/qc (where fs is the friction along the penetrometer shaft), temper-ature T, electrical resistivity ρ, vertical tilt θ , P-wave velocity Vp, S-wave velocity Vs, Young’s modulus E, and shear modulus G as afunction of depth z in the permafrost mound. SCPT2 was carried out on 16 June 2001 in a permafrost mound near Umiujaq, northernQuebec, Canada.
1 m from the vertical at a depth of 24 m reached at the endof the SCPT.
There are major variations in cone resistance, friction ra-tio, and electrical resistivity with depth due to the complexsequence of frozen soil layers and ice lenses in the perma-frost mound (Fig. 9). Despite this high degree of heterogene-ity, however, some important features can be highlighted inthe SCPT profiles.
As observed by Buteau (2002) in a permafrost mound be-side the present study site, four boundaries and five distinctzones in the permafrost mound can be identified in theSCPT profiles (see the cryostratigraphic column in Fig. 9based on the interpretation of the SCPT profiles). The thaw-ing front is clearly marked at a depth of 0.75 m by a sharpincrease in cone resistance from a few kilopascals in the un-frozen ground up to 10 MPa in the frozen active layer and anincrease in friction ratio and electrical resistivity (Fig. 9).The permafrost table at a depth of about 1.7 m is indicatedby an increase in resistivity over the limit of 1000 Ω·mbetween the unfrozen and frozen silty sand (Fortier et al.1994a). Observations made on core samples recovered dur-ing the drilling of the permafrost mound are also in agree-ment with the SCPT profiles. Below the permafrost table,the complex network of frozen soil layers and ice lensescauses major variations in cone resistance, friction ratio, andelectrical resistivity. The ice-rich permafrost layers identifiedby the arrows in Fig. 9 are characterized by very highcone resistances of over 20–30 MPa, low friction ratios ofless than 1%, and high resistivity values in excess of10 000 Ω·m. For instance, an ice-rich layer of about 0.75 mthick just below 10 m depth is clearly identified in the SCPTprofiles. Another distinct layer at a depth of 13 m is alsoidentified in all SCPTs carried out in the permafrost mound.A few decimetres above 13 m depth, the low cone resistanceassociated with an increase in friction ratio and a low electri-cal resistivity suggest a fine-grained soil with high unfrozenwater content. At 13 m depth, high cone resistances and fric-tion ratios greater than 1% indicate a dense sand layer in-stead of an ice-rich layer. Below 13 m depth, the variabilityof cone resistance and friction ratio with depth is lower thanthat initially observed above 13 m. The ice-rich layers below13 m are probably thinner than those above 13 m, since nohigh cone resistances over 25 MPa are noted below 13 m,except at 17.8, 18.2, and 19.2 m depths corresponding prob-ably to the last thick ice-rich layers. Unlike the cone resis-tance and friction profiles, the variability of the resistivityprofile between 13.0 and 17.5 m depth is not significantlydifferent from that at shallow depths. Even if the ice-richlayers are thinner, the ice lenses still act as a barrier to theflow of electric current in permafrost and therefore affect theelectrical resistivity more than the cone resistance and fric-tion ratio. At depths greater than 19.5 m, changes in groundconditions can be identified through a sharp decrease inelectrical resistivity to values less than 1000 Ω·m. The dy-namic temperature is still below 0 °C at these depths, how-ever, despite the cone tip warming by the heat of frictionproduced during the cone penetration. The permafrost baseat a depth of about 21.5 m is marked by a fast rise in dy-namic temperature with an increase in depth. The thermalconductivity of the perennially noncryotic ground below the
permafrost base lower than that of the permafrost induces adecrease in the dissipation capacity of frictional heat. Thedifference between the dynamic temperature and the groundtemperature is then higher in the perennially noncryoticground than in permafrost (Buteau 2002). Between 19.5 and21.5 m depth, the ground is then cryotic but unfrozenbecause the temperature is below 0 °C and the electrical re-sistivity is less than 1000 Ω·m (Fortier et al. 1994a). Thefreezing-point depression at 19.5 m is about –0.5 °C, and itis probably due to the overburden pressure (Fortier andAllard 1998).
Dynamic properties of permafrost
Seismic velocitiesThe VIBSIST-20 simultaneously generates P and S waves.
The use of triaxial accelerometers and the variation of theincident angle of the ray path to the receivers as a functionof the seismic shot points and receiver locations allow thedetection of the P- and S-wave arrivals. The seismic signalsmonitored by the vertical accelerometer (Z component) areused to pick up the first arrivals of the P waves, and the hor-izontal accelerometers (X and Y components) are used topick up the arrivals of the S waves.
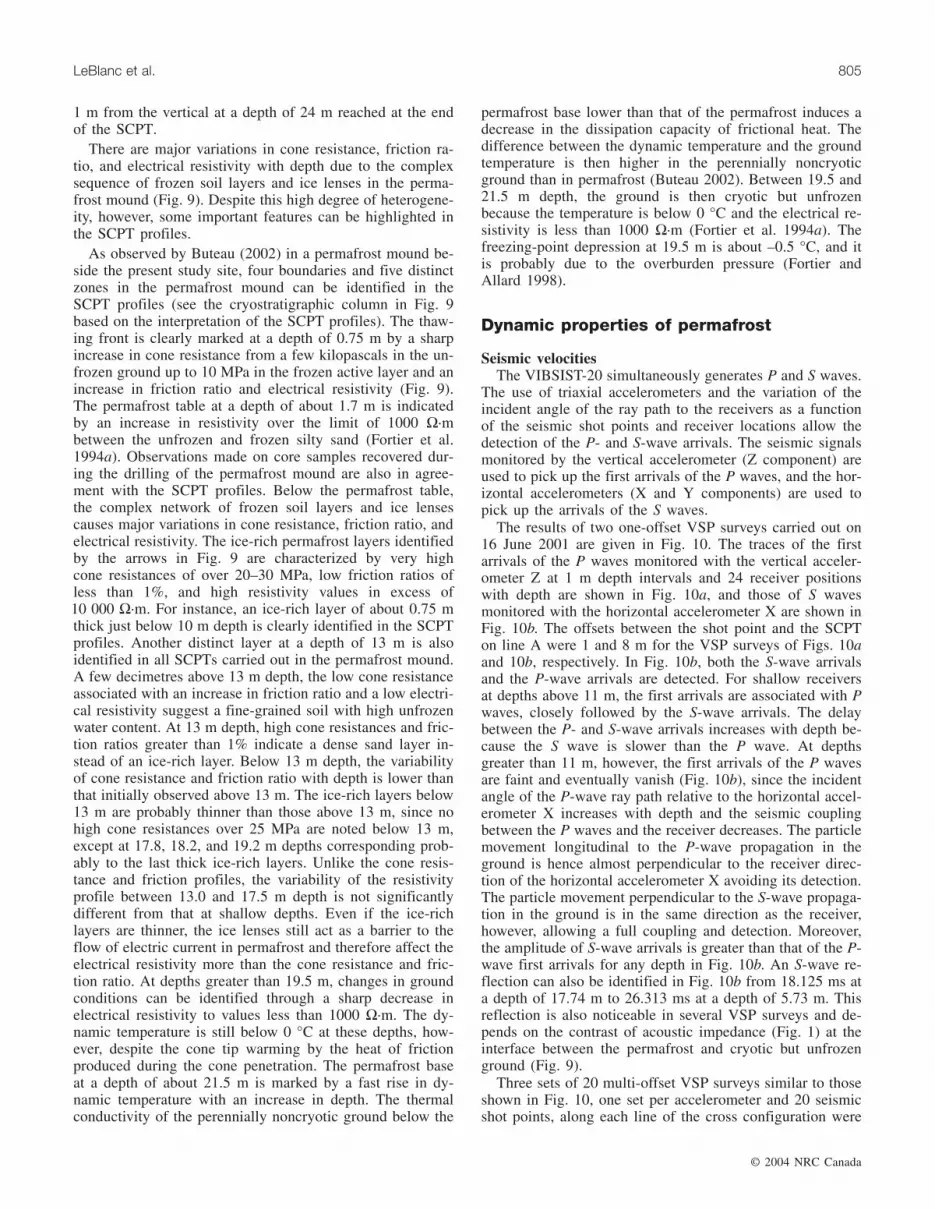
The results of two one-offset VSP surveys carried out on16 June 2001 are given in Fig. 10. The traces of the firstarrivals of the P waves monitored with the vertical acceler-ometer Z at 1 m depth intervals and 24 receiver positionswith depth are shown in Fig. 10a, and those of S wavesmonitored with the horizontal accelerometer X are shown inFig. 10b. The offsets between the shot point and the SCPTon line A were 1 and 8 m for the VSP surveys of Figs. 10aand 10b, respectively. In Fig. 10b, both the S-wave arrivalsand the P-wave arrivals are detected. For shallow receiversat depths above 11 m, the first arrivals are associated with Pwaves, closely followed by the S-wave arrivals. The delaybetween the P- and S-wave arrivals increases with depth be-cause the S wave is slower than the P wave. At depthsgreater than 11 m, however, the first arrivals of the P wavesare faint and eventually vanish (Fig. 10b), since the incidentangle of the P-wave ray path relative to the horizontal accel-erometer X increases with depth and the seismic couplingbetween the P waves and the receiver decreases. The particlemovement longitudinal to the P-wave propagation in theground is hence almost perpendicular to the receiver direc-tion of the horizontal accelerometer X avoiding its detection.The particle movement perpendicular to the S-wave propaga-tion in the ground is in the same direction as the receiver,however, allowing a full coupling and detection. Moreover,the amplitude of S-wave arrivals is greater than that of the P-wave first arrivals for any depth in Fig. 10b. An S-wave re-flection can also be identified in Fig. 10b from 18.125 ms ata depth of 17.74 m to 26.313 ms at a depth of 5.73 m. Thisreflection is also noticeable in several VSP surveys and de-pends on the contrast of acoustic impedance (Fig. 1) at theinterface between the permafrost and cryotic but unfrozenground (Fig. 9).
Three sets of 20 multi-offset VSP surveys similar to thoseshown in Fig. 10, one set per accelerometer and 20 seismicshot points, along each line of the cross configuration were
© 2004 NRC Canada
LeBlanc et al. 805
then used to pick the arrivals of both P and S waves andmeasure their travel times for seismic imaging of the spatialdistribution of the P- and S-wave velocities. A correlation-based algorithm for automatic time picking of P- and S-wave first arrivals was used. Thereafter, manual time pick-ing was used to modify, if necessary, the time picking ofsome seismic traces. The values of the seismic velocitieswere calculated using the SIRT algorithm and the traveltimes of the P and S waves in the permafrost mound. Pro-cessing and analysis of seismic data were performed withthe Vibro Tomography version 7.101 software developed byVibrometric OY. The technique used for imaging the seis-mic velocities assumes that the medium is isotropic.
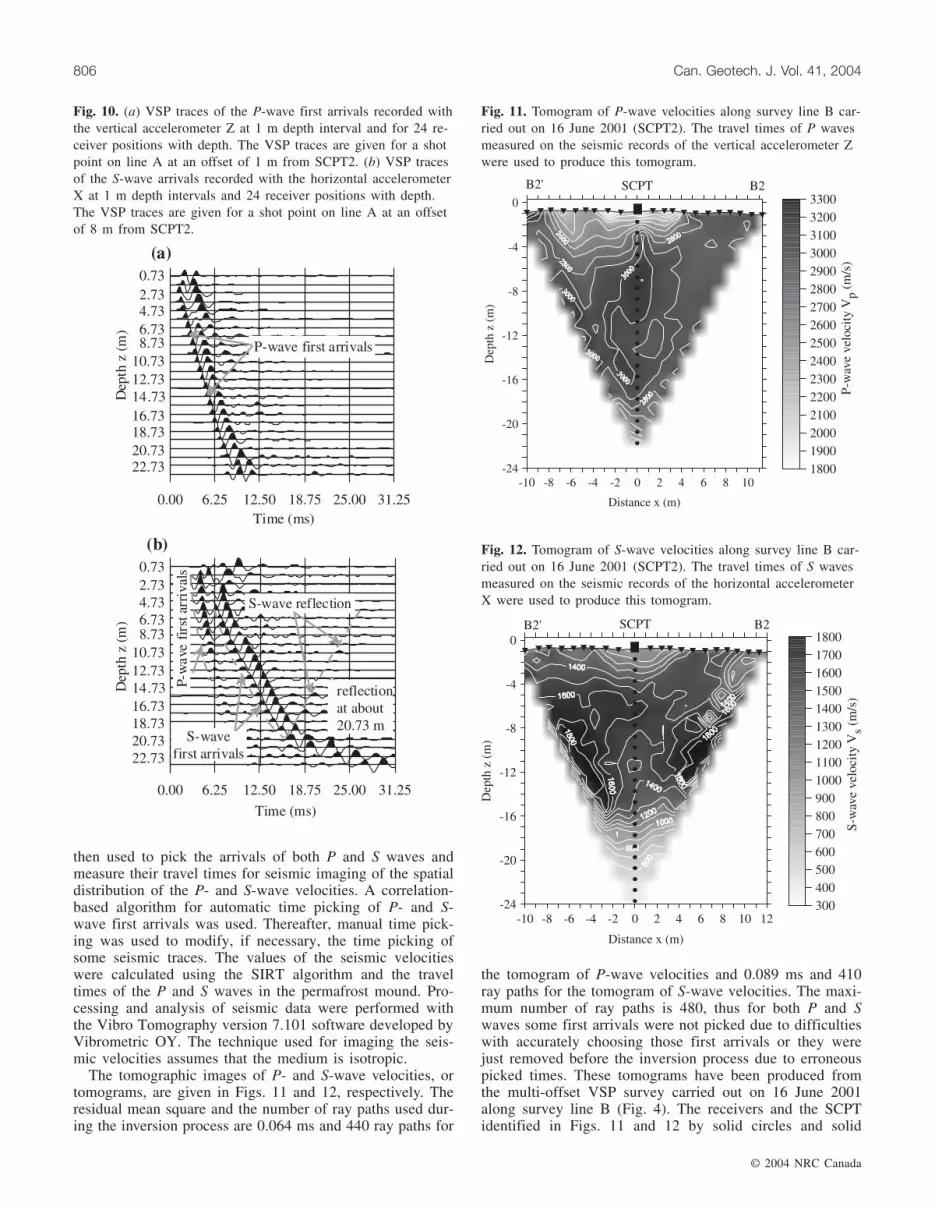
The tomographic images of P- and S-wave velocities, ortomograms, are given in Figs. 11 and 12, respectively. Theresidual mean square and the number of ray paths used dur-ing the inversion process are 0.064 ms and 440 ray paths for
the tomogram of P-wave velocities and 0.089 ms and 410ray paths for the tomogram of S-wave velocities. The maxi-mum number of ray paths is 480, thus for both P and Swaves some first arrivals were not picked due to difficultieswith accurately choosing those first arrivals or they werejust removed before the inversion process due to erroneouspicked times. These tomograms have been produced fromthe multi-offset VSP survey carried out on 16 June 2001along survey line B (Fig. 4). The receivers and the SCPTidentified in Figs. 11 and 12 by solid circles and solid
© 2004 NRC Canada
806 Can. Geotech. J. Vol. 41, 2004
Fig. 10. (a) VSP traces of the P-wave first arrivals recorded withthe vertical accelerometer Z at 1 m depth interval and for 24 re-ceiver positions with depth. The VSP traces are given for a shotpoint on line A at an offset of 1 m from SCPT2. (b) VSP tracesof the S-wave arrivals recorded with the horizontal accelerometerX at 1 m depth intervals and 24 receiver positions with depth.The VSP traces are given for a shot point on line A at an offsetof 8 m from SCPT2.
Fig. 11. Tomogram of P-wave velocities along survey line B car-ried out on 16 June 2001 (SCPT2). The travel times of P wavesmeasured on the seismic records of the vertical accelerometer Zwere used to produce this tomogram.
Fig. 12. Tomogram of S-wave velocities along survey line B car-ried out on 16 June 2001 (SCPT2). The travel times of S wavesmeasured on the seismic records of the horizontal accelerometerX were used to produce this tomogram.
squares, respectively, are located at a distance of zero in thetomograms, and the seismic shot points identified by solidtriangles are located on the thawing front at different dis-tances from the SCPT.
The vertical seismic profiles of P- and S-wave velocitiescalculated from the tomograms of Figs. 11 and 12 are alsogiven in Fig. 9 for correlating the mechanical and dynamicproperties with the temperature conditions. These profileswere calculated from the mean velocities of the two centralcells of the earth model on both sides of the distance of zeroin the tomograms (Figs. 11, 12).
The permafrost table is not clearly highlighted by a sharpincrease in velocities, but rather a gradual increase in veloc-ity marks the passage between the frozen active layer andpermafrost. The seismic velocities in the permafrost layerrange between 2400 and 3100 m/s for P waves and between900 and 1650 m/s for S waves (Figs. 9, 11, and 12). Theseismic velocity variation in permafrost is associated withthree principal factors: (i) ground temperature, (ii) ice con-tent, and (iii) unfrozen water content. Maximum P- and S-waves velocities are 3100 and 1650 m/s, respectively, andoccur at a depth of about 6 m where the ice content of per-mafrost is probably highest. However, the lowest tempera-ture of –2 °C where the unfrozen water content is lowestwas measured at a depth of about 5 m (Fig. 9). The seismicvelocities in permafrost for depths greater than 11 m de-crease with depth as the temperature increases (Fig. 9). Asmall decrease in P-wave velocity at a depth of 13 m is alsoapparent in the seismic vertical profile and tomographic im-age (Figs. 9, 11). It is due to a layer of fine-grained soil withhigher unfrozen water content previously identified at thisdepth in the SCPT profiles (Fig. 9). However, the S-wave ve-locity is less affected by this layer than the P-wave velocity(Fig. 9). Below the permafrost base, at a depth of 21.5 m, alow S-wave velocity of about 500 m/s indicates the presenceof the perennially noncryotic ground (Fig. 9).
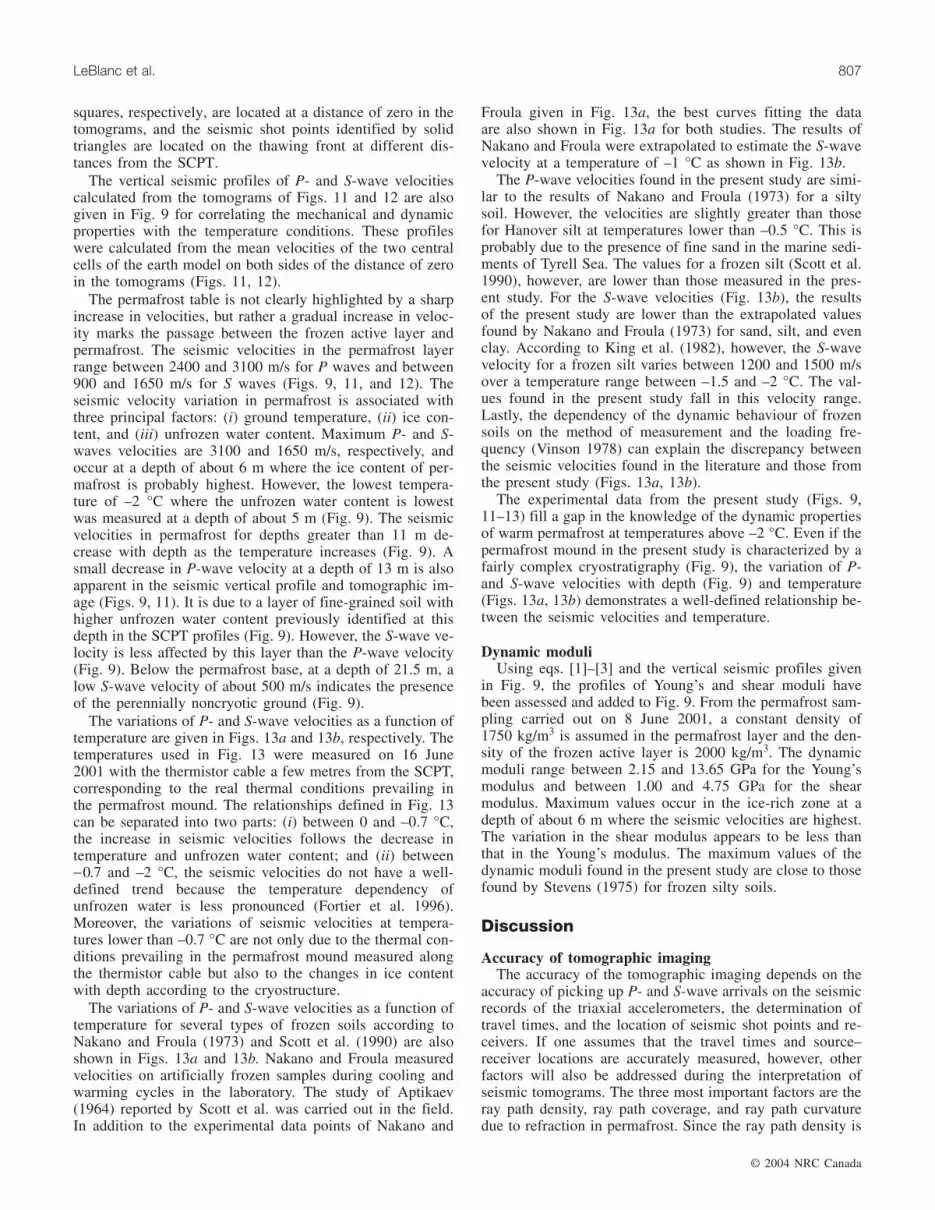
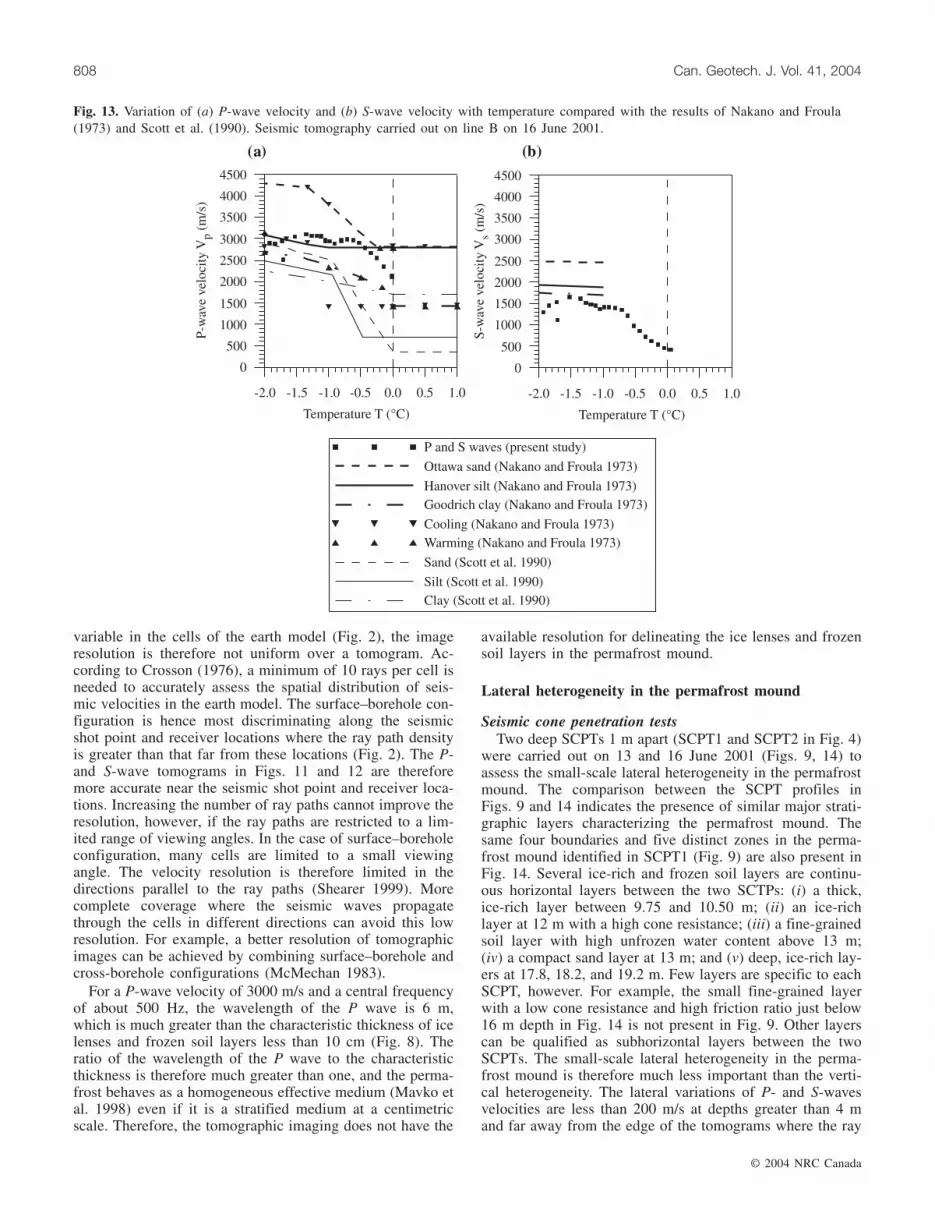
The variations of P- and S-wave velocities as a function oftemperature are given in Figs. 13a and 13b, respectively. Thetemperatures used in Fig. 13 were measured on 16 June2001 with the thermistor cable a few metres from the SCPT,corresponding to the real thermal conditions prevailing inthe permafrost mound. The relationships defined in Fig. 13can be separated into two parts: (i) between 0 and –0.7 °C,the increase in seismic velocities follows the decrease intemperature and unfrozen water content; and (ii) between−0.7 and –2 °C, the seismic velocities do not have a well-defined trend because the temperature dependency ofunfrozen water is less pronounced (Fortier et al. 1996).Moreover, the variations of seismic velocities at tempera-tures lower than –0.7 °C are not only due to the thermal con-ditions prevailing in the permafrost mound measured alongthe thermistor cable but also to the changes in ice contentwith depth according to the cryostructure.
The variations of P- and S-wave velocities as a function oftemperature for several types of frozen soils according toNakano and Froula (1973) and Scott et al. (1990) are alsoshown in Figs. 13a and 13b. Nakano and Froula measuredvelocities on artificially frozen samples during cooling andwarming cycles in the laboratory. The study of Aptikaev(1964) reported by Scott et al. was carried out in the field.In addition to the experimental data points of Nakano and
Froula given in Fig. 13a, the best curves fitting the dataare also shown in Fig. 13a for both studies. The results ofNakano and Froula were extrapolated to estimate the S-wavevelocity at a temperature of –1 °C as shown in Fig. 13b.
The P-wave velocities found in the present study are simi-lar to the results of Nakano and Froula (1973) for a siltysoil. However, the velocities are slightly greater than thosefor Hanover silt at temperatures lower than –0.5 °C. This isprobably due to the presence of fine sand in the marine sedi-ments of Tyrell Sea. The values for a frozen silt (Scott et al.1990), however, are lower than those measured in the pres-ent study. For the S-wave velocities (Fig. 13b), the resultsof the present study are lower than the extrapolated valuesfound by Nakano and Froula (1973) for sand, silt, and evenclay. According to King et al. (1982), however, the S-wavevelocity for a frozen silt varies between 1200 and 1500 m/sover a temperature range between –1.5 and –2 °C. The val-ues found in the present study fall in this velocity range.Lastly, the dependency of the dynamic behaviour of frozensoils on the method of measurement and the loading fre-quency (Vinson 1978) can explain the discrepancy betweenthe seismic velocities found in the literature and those fromthe present study (Figs. 13a, 13b).
The experimental data from the present study (Figs. 9,11–13) fill a gap in the knowledge of the dynamic propertiesof warm permafrost at temperatures above –2 °C. Even if thepermafrost mound in the present study is characterized by afairly complex cryostratigraphy (Fig. 9), the variation of P-and S-wave velocities with depth (Fig. 9) and temperature(Figs. 13a, 13b) demonstrates a well-defined relationship be-tween the seismic velocities and temperature.
Dynamic moduliUsing eqs. [1]–[3] and the vertical seismic profiles given
in Fig. 9, the profiles of Young’s and shear moduli havebeen assessed and added to Fig. 9. From the permafrost sam-pling carried out on 8 June 2001, a constant density of1750 kg/m3 is assumed in the permafrost layer and the den-sity of the frozen active layer is 2000 kg/m3. The dynamicmoduli range between 2.15 and 13.65 GPa for the Young’smodulus and between 1.00 and 4.75 GPa for the shearmodulus. Maximum values occur in the ice-rich zone at adepth of about 6 m where the seismic velocities are highest.The variation in the shear modulus appears to be less thanthat in the Young’s modulus. The maximum values of thedynamic moduli found in the present study are close to thosefound by Stevens (1975) for frozen silty soils.
Discussion
Accuracy of tomographic imagingThe accuracy of the tomographic imaging depends on the
accuracy of picking up P- and S-wave arrivals on the seismicrecords of the triaxial accelerometers, the determination oftravel times, and the location of seismic shot points and re-ceivers. If one assumes that the travel times and source–receiver locations are accurately measured, however, otherfactors will also be addressed during the interpretation ofseismic tomograms. The three most important factors are theray path density, ray path coverage, and ray path curvaturedue to refraction in permafrost. Since the ray path density is
© 2004 NRC Canada
LeBlanc et al. 807
variable in the cells of the earth model (Fig. 2), the imageresolution is therefore not uniform over a tomogram. Ac-cording to Crosson (1976), a minimum of 10 rays per cell isneeded to accurately assess the spatial distribution of seis-mic velocities in the earth model. The surface–borehole con-figuration is hence most discriminating along the seismicshot point and receiver locations where the ray path densityis greater than that far from these locations (Fig. 2). The P-and S-wave tomograms in Figs. 11 and 12 are thereforemore accurate near the seismic shot point and receiver loca-tions. Increasing the number of ray paths cannot improve theresolution, however, if the ray paths are restricted to a lim-ited range of viewing angles. In the case of surface–boreholeconfiguration, many cells are limited to a small viewingangle. The velocity resolution is therefore limited in thedirections parallel to the ray paths (Shearer 1999). Morecomplete coverage where the seismic waves propagatethrough the cells in different directions can avoid this lowresolution. For example, a better resolution of tomographicimages can be achieved by combining surface–borehole andcross-borehole configurations (McMechan 1983).
For a P-wave velocity of 3000 m/s and a central frequencyof about 500 Hz, the wavelength of the P wave is 6 m,which is much greater than the characteristic thickness of icelenses and frozen soil layers less than 10 cm (Fig. 8). Theratio of the wavelength of the P wave to the characteristicthickness is therefore much greater than one, and the perma-frost behaves as a homogeneous effective medium (Mavko etal. 1998) even if it is a stratified medium at a centimetricscale. Therefore, the tomographic imaging does not have the
available resolution for delineating the ice lenses and frozensoil layers in the permafrost mound.
Lateral heterogeneity in the permafrost mound
Seismic cone penetration testsTwo deep SCPTs 1 m apart (SCPT1 and SCPT2 in Fig. 4)
were carried out on 13 and 16 June 2001 (Figs. 9, 14) toassess the small-scale lateral heterogeneity in the permafrostmound. The comparison between the SCPT profiles inFigs. 9 and 14 indicates the presence of similar major strati-graphic layers characterizing the permafrost mound. Thesame four boundaries and five distinct zones in the perma-frost mound identified in SCPT1 (Fig. 9) are also present inFig. 14. Several ice-rich and frozen soil layers are continu-ous horizontal layers between the two SCTPs: (i) a thick,ice-rich layer between 9.75 and 10.50 m; (ii) an ice-richlayer at 12 m with a high cone resistance; (iii) a fine-grainedsoil layer with high unfrozen water content above 13 m;(iv) a compact sand layer at 13 m; and (v) deep, ice-rich lay-ers at 17.8, 18.2, and 19.2 m. Few layers are specific to eachSCPT, however. For example, the small fine-grained layerwith a low cone resistance and high friction ratio just below16 m depth in Fig. 14 is not present in Fig. 9. Other layerscan be qualified as subhorizontal layers between the twoSCPTs. The small-scale lateral heterogeneity in the perma-frost mound is therefore much less important than the verti-cal heterogeneity. The lateral variations of P- and S-wavesvelocities are less than 200 m/s at depths greater than 4 mand far away from the edge of the tomograms where the ray
© 2004 NRC Canada
808 Can. Geotech. J. Vol. 41, 2004
Fig. 13. Variation of (a) P-wave velocity and (b) S-wave velocity with temperature compared with the results of Nakano and Froula(1973) and Scott et al. (1990). Seismic tomography carried out on line B on 16 June 2001.
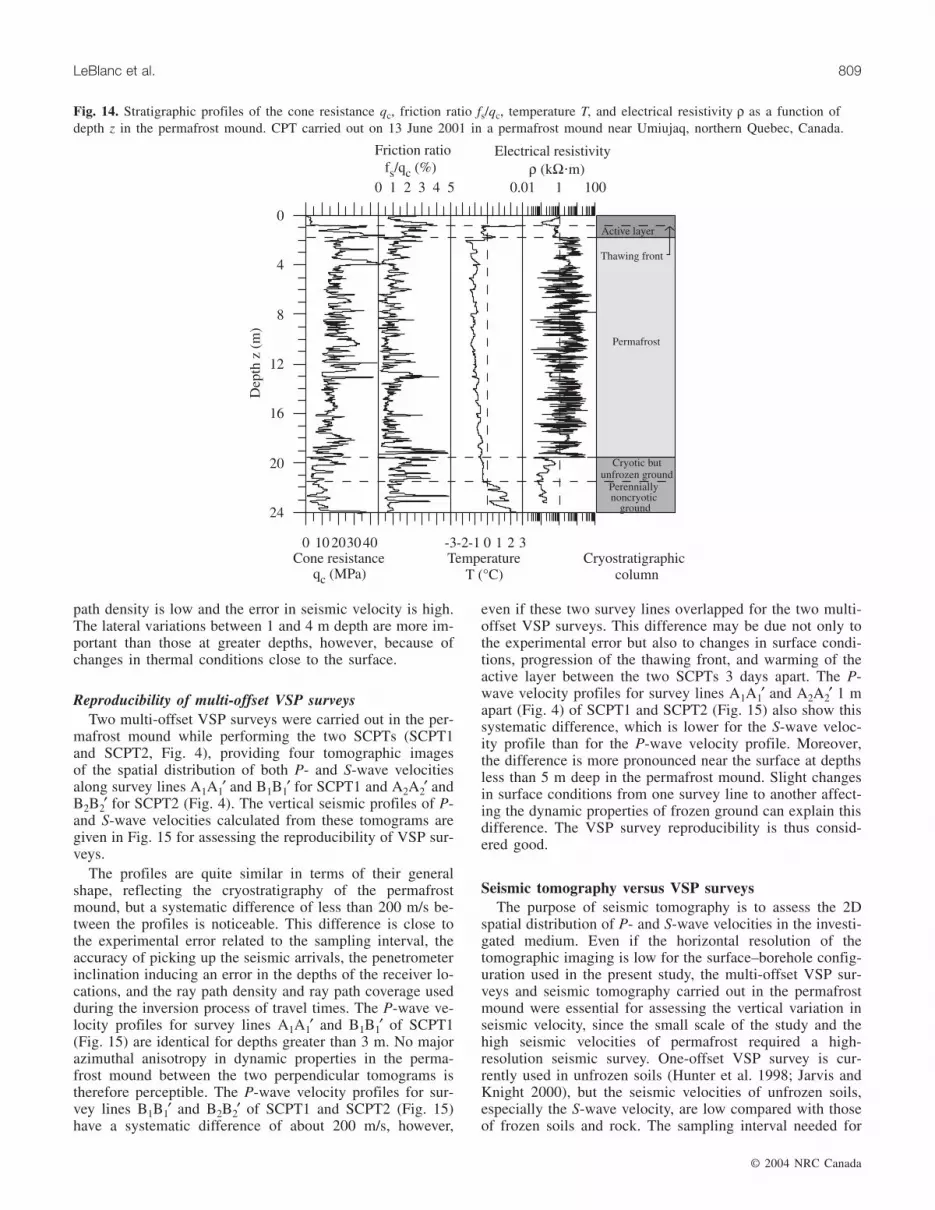
path density is low and the error in seismic velocity is high.The lateral variations between 1 and 4 m depth are more im-portant than those at greater depths, however, because ofchanges in thermal conditions close to the surface.
Reproducibility of multi-offset VSP surveysTwo multi-offset VSP surveys were carried out in the per-
mafrost mound while performing the two SCPTs (SCPT1and SCPT2, Fig. 4), providing four tomographic imagesof the spatial distribution of both P- and S-wave velocitiesalong survey lines A1A1′ and B1B1′ for SCPT1 and A2A2′ andB2B2′ for SCPT2 (Fig. 4). The vertical seismic profiles of P-and S-wave velocities calculated from these tomograms aregiven in Fig. 15 for assessing the reproducibility of VSP sur-veys.
The profiles are quite similar in terms of their generalshape, reflecting the cryostratigraphy of the permafrostmound, but a systematic difference of less than 200 m/s be-tween the profiles is noticeable. This difference is close tothe experimental error related to the sampling interval, theaccuracy of picking up the seismic arrivals, the penetrometerinclination inducing an error in the depths of the receiver lo-cations, and the ray path density and ray path coverage usedduring the inversion process of travel times. The P-wave ve-locity profiles for survey lines A1A1′ and B1B1′ of SCPT1(Fig. 15) are identical for depths greater than 3 m. No majorazimuthal anisotropy in dynamic properties in the perma-frost mound between the two perpendicular tomograms istherefore perceptible. The P-wave velocity profiles for sur-vey lines B1B1′ and B2B2′ of SCPT1 and SCPT2 (Fig. 15)have a systematic difference of about 200 m/s, however,
even if these two survey lines overlapped for the two multi-offset VSP surveys. This difference may be due not only tothe experimental error but also to changes in surface condi-tions, progression of the thawing front, and warming of theactive layer between the two SCPTs 3 days apart. The P-wave velocity profiles for survey lines A1A1′ and A2A2′ 1 mapart (Fig. 4) of SCPT1 and SCPT2 (Fig. 15) also show thissystematic difference, which is lower for the S-wave veloc-ity profile than for the P-wave velocity profile. Moreover,the difference is more pronounced near the surface at depthsless than 5 m deep in the permafrost mound. Slight changesin surface conditions from one survey line to another affect-ing the dynamic properties of frozen ground can explain thisdifference. The VSP survey reproducibility is thus consid-ered good.
Seismic tomography versus VSP surveysThe purpose of seismic tomography is to assess the 2D
spatial distribution of P- and S-wave velocities in the investi-gated medium. Even if the horizontal resolution of thetomographic imaging is low for the surface–borehole config-uration used in the present study, the multi-offset VSP sur-veys and seismic tomography carried out in the permafrostmound were essential for assessing the vertical variation inseismic velocity, since the small scale of the study and thehigh seismic velocities of permafrost required a high-resolution seismic survey. One-offset VSP survey is cur-rently used in unfrozen soils (Hunter et al. 1998; Jarvis andKnight 2000), but the seismic velocities of unfrozen soils,especially the S-wave velocity, are low compared with thoseof frozen soils and rock. The sampling interval needed for
© 2004 NRC Canada
LeBlanc et al. 809
Fig. 14. Stratigraphic profiles of the cone resistance qc, friction ratio fs/qc, temperature T, and electrical resistivity ρ as a function ofdepth z in the permafrost mound. CPT carried out on 13 June 2001 in a permafrost mound near Umiujaq, northern Quebec, Canada.

good accuracy in picking up the first arrivals in unfrozensoils is hence not as critical as in the case of frozen soils.The dynamic properties of bedrock are also studied usingVSP surveys. Even if the seismic velocities of rocks aregreater than those of permafrost, the investigation depths forbedrock study (Cosma and Enescu 2002) are much greaterthan the maximum depth of 24 m reached in the presentstudy, and consequently the distance between two receiversis greater. The delay time between the arrivals detected bytwo distant receivers is then greater than the sampling inter-val, and good resolution can be achieved in a bedrock study.Performing only a one-offset VSP survey in the permafrostmound would not have been conclusive, however, andwould not have provided accurate measurement of seismicvelocities, since the delay in seismic arrivals between twoconsecutive receiver positions at different depths was of thesame order as the sampling interval. For example, the com-parison between the P-wave velocity profiles of Fig. 15 andthe profile calculated from a one-offset VSP is shown inFig. 16. Even if the average velocity found with the one-offset VSP falls on the P-wave velocity profile, the discrep-ancy is significant. The relative error in P-wave velocity wasevaluated as 37% for the one-offset VSP based on the delayin seismic arrivals and the sampling interval. One major ad-vantage of seismic tomography is that many ray paths areused to calculate a constant seismic velocity for each cell.From a statistical point of view, the accuracy increases withan increase in the number of samples. Making the assump-tion that the distribution is normal, the relative error will bereduced by a factor of n1/2, where n is the number of seismicray paths crossing one cell. The central cells along the re-ceivers contain about 45 ray paths each, and therefore therelative error of the P-wave velocity of the vertical profiles
extracted from the tomograms decreases to a value of about6%. For a P-wave velocity of 3000 m/s, the error is 180 m/sand the same order as the systematic difference found in theprevious section.
Furthermore, with just one VSP survey, it would not havebeen possible to simultaneously study the propagation of Pand S waves generated by the VIBSIST-20 and discriminatetheir arrivals. S waves are usually generated by the impact ofa sledgehammer on both sides of a horizontal beam an-chored on the ground surface to produce reversed polarizedS waves. To generate P waves, another seismic source mustthen be used, such as the impact of a sledgehammer on asteel plate. The bandwidth of these seismic sources typicallybelow 500 Hz is significantly lower than that of the seismicsource used in the present study (as high as 1000 Hz). Seis-mic signals with a high-frequency content propagating insoils allow more accurate picking of the first arrivals thanlow-frequency content signals. It was therefore possible togenerate P and S waves and study in situ their propagationusing a combination of multi-offset VSP survey, SCPT, andSIST for carrying out the seismic tomography.
Summary and conclusion
Near-surface and high-resolution multi-offset vertical seis-mic profile (VSP) surveys were carried out in a permafrostmound near the Inuit community of Umiujaq in northernQuebec, Canada, to study the cryostratigraphy and assess thedynamic properties of permafrost. The field methodologydescribed herein is based on the seismic cone penetrationtest (SCPT) providing a better acoustic coupling of the VSPreceivers with the ground and avoiding the problems causedby tube waves in boreholes. Large bandwidth and high-
© 2004 NRC Canada
810 Can. Geotech. J. Vol. 41, 2004
Fig. 15. Spatial variability in P- and S-wave velocities. Seismic tomographies carried out on lines A and B on 13 and 16 June 2001.

frequency content compressional and shear waves weregenerated simultaneously using a swept impact seismic tech-nique (SIST) source. The seismic source was standing di-rectly on the thawing front in the active layer for goodmechanical coupling to avoid attenuation of the seismicsignal propagating in unfrozen ground. The seismic signalpropagating in permafrost was recorded with large-bandwidth triaxial accelerometers embedded in the cone. Asurface–borehole seismic tomography configuration, ormulti-offset VSP configuration, was used, consisting of theseismic source moving near the surface according to a crossconfiguration of seismic shot points and the receivers mov-ing downwards in the permafrost during the progress of theSCPT. The P- and S-wave arrivals were discriminated in theseismic records of the triaxial accelerometers following thevariation of the incident angle of the ray path to the receiv-ers as a function of the seismic shot point and receiver loca-tions and based on the propagation modes of body waves.The combination of the SIST source, large-bandwidth tri-axial accelerometers, and high-resolution seismograph per-mitted an increase in the signal-to-noise ratio, the pickingaccuracy of the seismic arrivals on the accelerometer re-cords, the accuracy of travel times, and the resolution oftomographic imaging and an enhancement of the data qual-ity. The inversion of the travel times of P and S waves tak-ing into account the seismic shot point and receiverlocations based on a simultaneous iterative reconstructiontechnique (SIRT) algorithm provided tomographic images ofthe 2D spatial distribution of P- and S-wave velocities.
The use of only one-offset VSP, the standard way of car-rying out the SCPT, is simply not enough to provide accu-rate measurements of seismic velocities in permafrost. Thesurface–borehole seismic tomography, however, provides anacceptable accuracy. Further field studies would be interest-ing to compare the results of seismic tomography with those
of one-offset VSP but carried out several times to increasethe accuracy. Despite the good accuracy of tomographic im-ages, the surface–borehole configuration seems to alter thelateral variability of the tomograms, especially for the bordercells of the images. On the contrary, the central cells alongthe receivers present very good accuracy for assessing theseismic velocities. Vertical seismic profiles of P- and S-wave velocities were then extracted from the tomograms andcompared with the CPT profiles of cone resistance, frictionratio, cone temperature, and electrical resistivity. The CPTprofiles show the fine variability of the cryostratigraphy, andthe vertical seismic profiles from the tomographic imagesrepresent smoothed curves. These smoothed trends dependon the thermal and physical conditions in the permafrostmound, however.
The combination of multi-offset VSP surveys, SCPT,SIST, and SIRT for tomographic imaging provided new in-sights into the dynamic properties of permafrost. The coneresistance in permafrost varies mainly between 10 and30 MPa, with maximum values near 40 MPa. According tothe results of the multi-offset VSP surveys carried out inpermafrost, the P- and S-wave velocities vary from 2400 to3200 m/s and from 900 to 1750 m/s, respectively, for a tem-perature range between –0.2 and –2 °C. In the permafrostzone, the dynamic moduli vary between 2.15 and 13.65 GPafor the Young’s modulus and between 1.00 and 4.75 GPa forthe shear modulus over the same range of temperatures. Theseismic velocities and dynamic moduli found in the presentstudy are characteristic of a silty frozen soil and filled a gapin the knowledge of the dynamic properties of warm perma-frost at temperatures above –2 °C.
Acknowledgements
The authors would like to express their sincere gratitudeto the Inuit community of Umiujaq and to Willie Kumarlukfor their hospitality and friendly help during the fieldwork.This research has been supported by the Natural Sciencesand Engineering Research Council of Canada and by theFonds de la recherche sur la nature et les technologies of theProvince of Quebec. The assistance in the field of the Centred’études nordiques members and geological engineering stu-dents, especially Martin Fleury, Châtelaine Beaudry, FabriceCalmels, Éric Larrivée, and Véronique Tremblay, has beenvery appreciated.
References
Allard, M., and Seguin, M.K. 1987. Le pergélisol au Québec nor-dique: bilan et perspective. Géographie physique et Quaternaire,41(1): 141–152.
Aptikaev, F.F. 1964. Temperature field effect on the distribution ofseismic velocities in the permafrost zone. Akademiya NaukSSSR Sibjskoe otd-ie Institut Merzlotovedeniia Teplovyeprotesessy v merzlykh porod. [In Russian.]
Balch, A.H., and Lee, M.W. 1984. Vertical seismic profiling: tech-nique, applications and case histories. International Human Re-sources Development Corporation, Boston, Mass.
Barbier, M.G., Bondon, P., Mellinger, R., and Viallix, J.R. 1976.Mini-SOSIE for land seismology. Geophysical Prospecting, 24:518–527.
© 2004 NRC Canada
LeBlanc et al. 811
Fig. 16. Vertical profiles of P-wave velocities extracted fromtomographic images compared with a one-offset VSP from sur-vey line A on 16 June 2001.
Barnes, D.F. 1963. Geophysical methods for delineating perma-frost. In Proceedings of the 1st International Conference on Per-mafrost, Lafayette, Ind. National Academy of Sciences,Washington, D.C., Publication 1287, pp. 349–355.
Buteau, S. 2002. Étude de l’affaiblissement du comportementmécanique du pergélisol au réchauffement. Ph.D. thesis,Université Laval, Sainte-Foy, Que.
Buteau, S., and Fortier, R. 2000. Penetration rate-controlled CPTin permafrost. In Proceedings of the 53th Annual Conferenceof the Canadian Geotechnical Society, Montréal, Que., 15–18 October 2000. Canadian Geotechnical Society, Alliston, Ont.pp. 1225–1235.
Campanella, R.G., Robertson, P.K., Gillespie, D., and Klohn, E.J.1984. Piezometric-friction cone investigation at a tailing dam.Canadian Geotechnical Journal, 21: 551–562.
Cosma, C., and Enescu, N. 2002. Multi-azimuth VSP methods forfractured rock characterization. In Proceedings of the 5th Work-shop of the International Society for Rock Mechanics Commis-sion on the Application of Geophysics in Rock Engineering,Toronto, Ont., 7 July 2002. Edited by R.P. Young. InternationalSociety for Rock Mechanics, Lisbon, Portugal. pp. 54–60.
Cosma, C., Heikkinen, P., Keskinen, J., and Enescu, n. 2001a. VSPin crystalline rocks — from downhole velocity profiling to 3-Dfracture mapping. International Journal of Rock Mechanics andMining Sciences, 38(6): 843–850.
Cosma, C., Olsson, O., Keskinen, J., and Heikkinen, P. 2001b.Seismic characterization of fracturing at the Äspö Hard RockLaboratory, from the kilometre scale to the metre scale. Interna-tional Journal of Rock Mechanics and Mining Sciences, 38(6):859–865.
Crawford, J.M., Doty, W., and Lee, M.R. 1960. Continuous signalseismograph. Geophysics, 25: 95–105.
Crosson, R.A. 1976. Crustal structure modelling of earthquake data1. Simultaneous least squares estimation of hypocenter and ve-locity parameters. Journal of Geophysical Research, 81: 3036–3046.
Dines, K.A., and Lytle, R.J. 1979. Computerized geophysical to-mography. Proceedings of the IEEE, 67(7): 1065–1073.
Dlugach, A., Loktev, A., Okko, O., and Rokos, S. 1995. Soil me-chanical properties and in situ temperature from arctic offshoreCPT data. In Proceedings of the International Symposiumon Cone Penetration Testing, CPT’95, Linköping, Sweden, Oc-tober 1995. Swedish Geotechnical Society, Linköping. Vol. 2,pp. 167–172.
Fortier, R., and Allard, M. 1998. Induced polarization and resistiv-ity logging in permafrost. In Proceedings of the 7th InternationalConference on Permafrost, Yellowknife, N.W.T., 23–27 June1998. Edited by A.G. Lewkowicz and M. Allard. Centred’études nordiques, Université Laval, Sainte-Foy, Que.Nordicana Collection, pp. 275–282.
Fortier, R., Allard, M., and Seguin, M.K. 1994a. Effects of physi-cal properties of frozen ground on electrical resistivity logging.Cold Regions Science and Technology, 22: 361–384.
Fortier, R., Ladanyi, B., and Allard, M. 1994b. Cone penetrationstrength of ice-poor saline permafrost at Kangiqsualujjuaq,Nunavik (Québec). In Proceedings of the 7th International ColdRegions Engineering Specialty Conference, Edmonton, Alta.Edited by D.W. Smith and D.C. Sego. Canadian Society forCivil Engineering, Edmonton, Alta. pp. 697–719.
Fortier, R., Allard, M., and Sheriff, F. 1996. Field estimation ofwater–ice phase composition of permafrost samples using a ca-lorimetric method. Canadian Geotechnical Journal, 33: 355–362.
Garg, O.P. 1973. In situ physicomechanical properties of perma-frost using geophysical techniques. In Proceedings of the 2nd
International Conference on Permafrost, North AmericanContribution, Yakutsk, USSR, July 1973. National Academy ofSciences, Washington, D.C. pp. 508–516.
Gilbert, P. 1972. Iterative methods for the three-dimensional recon-struction of an object from projections. Journal of TheoreticalBiology, 36: 105–117.
Hunter, J.A. 1973. The application of shallow seismic methods tomapping of frozen surficial materials. In Proceedings of the 2ndInternational Conference on Permafrost, North American Con-tribution, Yakutsk, USSR. July 1973. National Academy of Sci-ences, Washington, D.C. pp. 527–535.
Hunter, J.A., Neave, K.G., MacAulay, H.A., and Hobson, G.D.1978. Interpretation of sub-seabottom permafrost in the BeaufortSea by seismic methods. Part I: Seismic refraction methods. InProceedings of the 3rd International Conference on Permafrost,Edmonton, Alta., 10–13 July 1978. National Research Councilof Canada, Ottawa, Ont. pp. 515–521.
Hunter, J.A., Pullan, S.E., Burns, R.A., Good, R.L., Harris, J.B.,Pugin, A., Skvortsov, A., and Goriainov, N.N. 1998. Downholeseismic logging for high-resolution reflection surveying in un-consolidated overburden. Geophysics, 63(4): 1371–1384.
Jarvis, K.D., and Knight, R. 2000. Near-surface VSP survey usingthe seismic cone penetrometer. Geophysics, 65(4): 1048–1056.
King, M.S., Pandit, B.I., Hunter, J.A., and Gajtani, M. 1982. Someseismic, electrical, and thermal properties of sub-seabottom per-mafrost from the Beaufort Sea. In Proceedings of the 4th Cana-dian Permafrost Conference, Calgary, Alta., 2–6 March 1981.National Research Council of Canada, Ottawa, Ont. pp. 268–273.
Ladanyi, B. 1976. Use of the static penetration test in frozen soils.Canadian Geotechnical Journal, 13(2): 95–110.
Ladanyi, B. 1982. Determination of geotechnical parameters offrozen soils by means of the cone penetration test. In Penetra-tion Testing: Proceedings of the 2nd European Symposium onPenetration Testing, ESOPT II, Amsterdam, 24–27 May 1982.A.A. Balkema, Rotterdam, The Netherlands. Vol. 2, pp. 671–678.
Ladanyi, B. 1985. Use of the cone penetration test for the design ofpiles in permafrost. Journal of Energy Resources Technology,107: 183–187.
Ladanyi, B., and Huneault, P. 1989. Cone penetration tests in per-mafrost — the Fox Tunnel, Alaska. In Proceedings of the Inter-national Symposium on Mining in the Arctic, Fairbanks, Alaska.Edited by S. Bandopadhyay and F.J. Skudrzyk. A.A. Balkema,Rotterdam, The Netherlands. pp. 75–82.
Ladanyi, B., Lunne, T., and Winsor, W. 1991. Experience with theperformance of load-controlled cone penetration test in perma-frost and ice. In Proceedings of the 44th Canadian GeotechnicalConference, Calgary, Alta. Canadian Geotechnical Society,Alliston, Ont. Reprint 1, pp. 41-1–41-8.
Ladanyi, B., Lunne, T., Vergobbi, P., and Lhuillier, B. 1995. Pre-dicting creep settlements of foundations in permafrost from theresults of cone penetration tests. Canadian Geotechnical Journal,32: 835–847.
MacAulay, H.A., and Hunter, J.A. 1982. Detailed seismic refrac-tion of ice-bonded permafrost layering in the Canadian BeaufortSea. In Proceedings of the 4th Canadian Permafrost Conference,Calgary, Alta., 2–6 March 1981. National Research Council ofCanada, Ottawa, Ont. pp. 256–267.
Mavko, G., Mukerji, T., and Dvorkin, J. 1998. The rock physicshandbook: tools for seismic analysis of porous media. Cam-bridge University Press, Cambridge, Mass.
McMechan, G.A. 1983. Seismic tomography in boreholes. Geo-physical Reprint Series, 9: 348–359.
© 2004 NRC Canada
812 Can. Geotech. J. Vol. 41, 2004
Miller, R.D., Hunter, J.A., Doll, W.E., Carr, B.J., Burns, R.A.,Good, R.L., Laflen, D.R., and Douma, M. 2000. Imaging perma-frost with shallow P- and S-wave reflection. In Proceedings ofthe 7th Annual International Meeting of the Society of Explora-tion Geophysicists, Expanded Abstracts, Calgary, Alta., 6–11 August 2000. Society of Exploration Geophysicists, Tulsa,Okla. pp. 1339–1342.
Morack, J.L., and Rogers, J.C. 1982. Marine seismic refractionmeasurements of near-shore subsea permafrost. In Proceedingsof the 4th Canadian Permafrost Conference, Calgary, Alta., 2–6 March 1981. National Research Council of Canada, Ottawa,Ont. pp. 249–255.
Morack, J.L., MacAulay, H.A., and Hunter, J.A. 1983. Geophysicalmeasurements of subbottom permafrost in the Canadian Beau-fort Sea. In Proceedings of the 4th International Conference onPermafrost, Fairbanks, Alaska. National Academy of Sciences,Washington, D.C. pp. 866–871.
Musil, M., Maurer, H., Green, A.G., Horstmeyer, H., Nitsche, F.O.,Vonder Mühll, D., and Springman, S. 2002. Shallow seismicsurveying of an Alpine rock glacier. Geophysics, 67(6): 1701–1710.
Nakano, Y., and Froula, N.H. 1973. Sound and shock transmissionin frozen soils. In Proceedings of the 2nd International Confer-ence on Permafrost, North American Contribution, Yakutsk,USSR, July 1973. National Academy of Sciences, Washington,D.C. pp. 359–369.
Neave, K.G., and Sellmann, P.V. 1983. Seismic velocities andsubsea permafrost in the Beaufort Sea, Alaska. In Proceedingsof the 4th International Conference on Permafrost, Fairbanks,Alaska. National Academy of Sciences, Washington, D.C.pp. 894–898.
Park, C.B., Miller, R.M., Steeples, D.W., and Black, R.A. 1996.Swept impact seismic technique (SIST). Geophysics, 61(6):1789–1803.
Porturas, F. 1988. Reflection seismic exploration and data process-ing in cold regions. In Proceedings of the 5th International Con-ference on Permafrost, Trondheim, Norway, 2–5 August 1988.Tapir Publishers, Trondheim, Norway. pp. 1459–1465.
Robertson, P.K., Campanella, R.G., Gillespie, D., and Rice, A.H.1986. Seismic CPT to measure in situ shear wave velocity. Jour-nal of Geotechnical Engineering, ASCE, 112(8): 791–803.
Saito, H., Shima, H., Toshioka, T., and Ohtomo, H. 1988. Applica-tion of geotomography techniques to site investigations for civilengineering purposes. In Proceedings of the 58th Annual Inter-national Meeting of the Society of Exploration Geophysicists,
Expanded Abstracts, Anaheim, Calif. 30 October – 3 November1988. Society of Exploration Geophysicists, Tulsa, Okla.pp. 324–327.
Scott, W.J., Sellmann, P.V., and Hunter, J.A. 1990. Geophysics inthe study of permafrost. In Geotechnical and environmental geo-physics. Edited by S.H. Ward. Society of Exploration Geophysi-cists, Tulsa, Okla. Vol. I, pp. 355–383.
Shearer, P.M. 1999. Introduction to seismology. Cambridge Uni-versity Press, Cambridge, Mass. Chapt. 5, pp. 64–91.
Skvortsov, A.G., Hunter, J.A., Gorianinov, G.G., Burns, R.A.,Tsarov, A.M., and Pullan, S.E. 1992. High-resolution shear-wave reflection technique for permafrost engineering applica-tions: new results from Siberia. In Proceedings of the 62ndAnnual International Meeting of the Society of ExplorationGeophysicists, Expanded Abstracts, New Orleans, La. Societyof Exploration Geophysicists, Tulsa, Okla. pp. 382–384.
Stevens, H.W. 1975. The response of frozen soils to vibratoryloads. U.S. Army Cold Regions Research and Engineering Lab-oratory (CRREL), Technical Report 265.
Telford, W.M., Geldart, L.P., Sheriff, R.E., and Keys, D.A. 1984.Applied geophysics. Cambridge University Press, Cambridge,Mass.
Um, J., and Thurber, C. 1987. A fast algorithm for two-point seis-mic ray tracing. Bulletin of the Seismological Society of Amer-ica, 77(9): 972–986.
Veillette, J.J., and Nixon, F.M. 1980. Portable drilling equipmentfor shallow permafrost sampling. Geological Survey of Canada,Paper 79-21.
Vibrometric OY. 2001. VIBSIST-20 seismic source operating andmaintenance manual. Vibrometric OY, Helsinki, Finland.
Vinson, T.S. 1978. Response of frozen ground to dynamic loading.In Geotechnical engineering for cold regions. Edited by O.B.Andersland and D.M. Anderson. McGraw-Hill Book Company,New York. Chapt. 8, pp. 405–458.
Wright, J., Hunter, C.H., Wong, J., Nelson, J.S., and Gibbs, D.1988. Cross-hole seismic tomography for engineering evalua-tion at Theodore Roosevelt Dam, Arizona. In Proceedings ofthe 58th Annual International Meeting of the Society of Explo-ration Geophysicists, Expanded Abstracts, Anaheim, Calif.30 October – 3 November 1988. Society of Exploration Geo-physicists, Tulsa, Okla. pp. 320–323.
Zimmerman, R.W., and King, M.S. 1986. The effect of the extentof freezing on velocities in unconsolidated permafrost. Geo-physics, 51(6): 1285–1290.
© 2004 NRC Canada
LeBlanc et al. 813