microbial properties and habitats of permafrost solls - epic
TRANSCRIPT
Microbial Properties and Habitats of Permafrost Solls On Taimyr Peninsula, Central Siberia
Mikrobiologische Eigenschaften und Habitate in Permafrostböde der Taimyr Halbinsel, Mittelsibirien
Nicole Schmidt
Ber. Polarforsch. 340 (1 999) ISSN 0176 - 5027
Nicole Schmidt
Institut fü Polarokologie
Wischhofstr. 1-3, Geb. 12
D-24 148 Kiel
Deutschland
Die vorliegende Arbeit ist die inhaltlich unveranderte Fassung einer Dissertation, die irn
Dezember 1998 der Mathematisch-Naturwissenschaftlichen Fakultä der Christian-Albrechts-
Universitä zu Kiel vorgelegt wurde.
Contents
Page
. . . . ............................................................................................................................. Contents I-111
........................................................................................................... Acknowledgements .i V-V . . . . . . . . . . . . . . . . . . . . . . . . . . . . . . . . . . . . . . . . . . . . . . . . . . . . . . . . . . . . . . . . . . . . . . . . . . . . . . . . . . . . . . . . . . . . . . . . . Summary and conclusions V I-IX
. . . . . . . . . . . . . . . . . . . . . . . . . . . . . . . . . . . . . . . . . . . . . . . . . . . . . . . . . . . . . . . . . . . . . . . Zusammenfassung und Schlußfolgerunge X-xiii . . ............................................................................................ Abbreviations and glossary .xi V-xv
........................................................................................................................ List of tables xvi ... ............................................................................................................ List of figures .xvi i-xvm
. ......................................................................................... 1 Introduction and approach 1
2 . Study area and experimental sites .............................................................................. 4
................................................................................................ 2.1 Taimyr Peninsula 4
.......................................................................................................... 2.1.1 Location 4
........................................................................................... 2.1.3. Tundra vegetation 7
........................................................................... 2.1.4. Geology and geomorphology 9 . . ........................................................................................... 2.1 . 4.1 Geologic history 9 . .
.................................................................................... 2.1.4.2 Per~glacial processes 10
..................................................................... 2.1.5 Soils and pedogenetic processes 12
............................................................................. 2.1.6 Human history and impact 16 ............................................................................................. 2.1.6.1 Human history 16 . .
......................................................................................... 2.1.6.2 Scientific history 17 . . ................................................................................. 2.1.6.3 Anthropogenic Impact 18
.......................................................................... 2.2 Sites at Lake Levinson-Lessing 20 ............................................................................................ 2.3 Sites at Lake Labaz 22
3 . State of the ar t ........................................................................................................... 24
..................................................................................... 3.1.1 Community structure 24 . . .......................................................................................... 3.1.2 Microbial ecology 28 . .
............................................................................................. 3.1.2.1 Abiotic factors 28 . . ............................................................................................... 3.1.2.2 Biotic factors 30 . .
........................................................................................ 3.1.2.3 Microbial habitats 30
...................................................................................................... 3.2 Methodology 32
4 . Materials & Methods ................................................................................................ 35
................................................................................................. 4.1 Field procedures 35
4.1.1 Soil survey and selection of sites .................................................................... 35 .......................................................................................... 4.1.2 Profile description 35
................................................................................................ 4.1.3 Soil sampling 36 . . ................................................................................ 4.1.4 Statistical considerations 36
....................................................................................... 4.2 Pedological Parameters 38
................. 4.2.1 Total and organic carbon (Ct and Corej and total nitrogen contents 38 . .
................................................................................ 4.2.2 Determination of soil pH 38 .......................................................... 4.2.3 Bulk density and carbon inventory (Cf) 38
. . . . ..................................................................................... 4.2.4 Pore size distnbution 40
.......................................................................................... 4.3 Microbial parameters 42
..................................................... 4.3.1 Total hyphal length and m a l biovolume 42 ........................................................................................... 4.3.2 Microcalorimetry 43
......................................................................................... 4.3.2.1 Basal heat output 44 . . . . . . . . . . . . . . . . . . . . . . . . . . . . . . . . . . . . . . . . . . . . . . . . . . . . . . . . . . . . . . . . . . . . 4.3.2.2 Substrate induced heat output 45
.................................................................................. 4.3.3 Adenosine triPhosphate 46
..................................................................................................... 4.4. External data 48
................................................................................ 4.4.1 Field procedure at Labaz 48 .............................................................. 4.4.1.1 Soil survey and profile description. 48
.............................................................................................. 4.4.1.2 Soil sampling 48 ................................................................ 4.4.2 Bulk density and carbon inventory 49
............................................. 44.3 Total bacterial number and bacterial biovolume 49
....................................................................................... 4.5.1 Regression analyses 50 ........................................................... 4.5.2 Testing of equality of two populations 50
..................................................................... 4.5.3 Correlation between parameters 50
5 . Results ........................................................................................................................ 51
................................................................................................................... 5.1 Soils 51 ..................................................................................................... 5.1.1 Soll survey 51 . .
................................................................................... 5.1.2 Soil profile descnption 53 ............................................................................ 5.1.2.1 Soils at Levinson-Lessing 53
.............................................................................................. 5.1.2.2 Soils at Labaz 59
...................................................................................... 5.2 Pedological Parameters 68
5.2.1 Total and organic carbon (C, and Corej and nitrogen contents ......................... 68 ......................................................................................................... 5.2.2 Soil pH 76
5.2.3 Bulk density and carbon inventory ................................................................. 77 . . . . 5.2.4 Pore size distribution ..................................................................................... 79
. . .......................................................................................... 5.3. Microbral parameterh 82
............................................................................................................. 5.3.1 Fungi 82 5.3.2 ßacteri ......................................................................................................... 88
.......................................................................................... 5.3.3 Microcalorimetry 90 ................................................................................... 5.3.3.1 Basal heat output (Q) 90
............................................................ 5.3.3.2 Substrate induced heat output (SIQj 95 .................................................................................. 5.3.4 Adenosine triphosphate 96
...................................................................................... 5.4 Ecological Parameters 101
................................................................................ 5.4.1 Fungal to bacterial ratio 101 ............................................................................................ 5.4.2 Caloric quotient 102 . . .
...................................................................................... 5.4.3 Microbial inventory 103 .................................................................... 5.4.4 Allocation of microbial activity 107
5.4.5 Controls of microbial habitats ...................................................................... 111
6. 1 Microbial pool in tundra soils .............................................................................. 115
. . . 6.1.1 Vertical distrrbution ..................................................................................... 115 6.1.2 Variation between sites ................................................................................ 118
6.2 Spotting the active microbial pool .................................................................... 121
6.3 Microbial habitats in tundra soils ...................................................................... 132
6.3.1 Topsoils ....................................................................................................... 132 6.3.1.1 Wet topsoils .............................................................................................. 132 6.3.1.2 Dry topsoils ............................................................................................... 133
' , 6.3.2 'Frontier .................................................................................................... 136 6.3.3 Subsoils ....................................................................................................... 141
6.4 Tundra soils in a changing climate .................................................................... 143
6.5 Future research needs ....................................................................................... 146
7 . References ................................................................................................................ 148
8 . Appendices ............................................................................................................... 164
Summary and conchisions
The poetry of earth is ceasing never. John Keats
Within the scope of a joint Russian-German research project, pedological and botanical studies
have been carried out in order to investigate carbon fluxes in tundra soils of Central Siberia.
Turnover of soil organic matter, CO2 and CI& efflux represent biologically mediated processes,
in which the soil microbiota plays the major part. The goal of this study was the description of
the microbial pool of the decomposer cycle as well as its spatial variability.
For this study, field procedures were carried out on Taimyr Peninsula, Central Siberia, during
July and August 1995 and 1996. The experimental site at Lake Labaz (72ON, 100°E is situ-
ated within the belt of the Southern Arctic Tundra'. The other site at Lake Levinson-Lessing
(74.5'N, 98.5¡E is characterized by the vegetation of the 'Typical Arctic Tundra'. During the
1995 expedition at Lake Labaz, field procedures were carried out by the IfB (Hamburg) and
the IPÃ (Kiel). Three tundra soils and two ditterent types of brown earth had been sampled. In
the following year at Lake Levinson-Lessing, soils were mapped by the author in CO-operation
with the IfB (Hamburg). The soil sampling technique by the author accounted for variability of
soil-patterned ground and vegetation complexes and was flirther designed to capture presumed
successional Stages. Thus, three sites in a polygonal tundra, two at solifluction slopes and an-
other two in fellfields were selected. All soil profiles were sampled at all depths of the active
layer.
A modern technique of direct microscopy (epifluorescence microscopy equipped with com-
puter based image analysis) was applied to deterrnine iünga hyphal length and biovolume, of
which fünga biomass was calculated (BLOEM et al., 1995). Quantification and characterisation
of the microbial pool was supplemented by bacteriological data by PD Dr. M. Bölte (PO,
Kiel). Viable and active micro-organisms were investigated by activity dependent methods such
as adenosine triphosphate (HOLM-HANSEN & BooTH, 1966; GRAF, 1977; VOSJAN et al., 1987)
and microcalorimetry (SPARLING, 1983). Basal and substrate-induced heat output provided
fürthe information on the microbial community structure, substrate requirements and inhibi-
tion (RAUBUCH & BEESE, 1995). Investigation of stnictural and chemical soil properties was
aimed at fürthe characterisation of microbial habitats.
vii
The results showed high variability of microbial biomass and activity between sites. Differences
were mainly restricted to topsoil horizons as the microbiota was. Microbial biomass generally
decreased with depth This decrease was more prominent for hngi than for bacteria. The latter
also decreased with depth, but occurred throughout the soil profile and showed a relative in-
crease above the permafrost table. The soils generally showed high hngi to bacteria ratios
showing that the microbiota was clearly dominated by fungi. Image analysis had shown that
bacterial biomass values were rather low because of very small mean cell volumes. Yet, in
comparison to other arctic soils values of fungal hyphal length were also within the lower
range. At a depth of 10 to 20 centimetres, profiles generally showed strong increases of hngi
(and bacteria) due to a rhizosphere effect and soil moisture conditions.
Vegetation cover was found to account for differences in microbial properties between sites. In
the soiis of solifluction slopes and in fellfields, the microbiota reflected the presence or absence
of vegetation. Whereas bacteria predominated in unvegetated soils, hngi were largely re-
stricted to vegetated sites indicating their importance in soil organic matter decomposition.
Bacteria were fürthe inhibited by the presence of lichens in the vegetation cover. Soil moisture
conditions accounted for hrther differences in microbial properties. In wet micro-sites, bacte-
ria were generally more competitive when compared to fiingi. The latter prevailed in the adja-
Cent drier micro-sites. Although hngi are aerobic micro-organisms, they also showed consid-
erable biomass values in wet micro-sites,
In accordance with low microbial biomass values, contents of adenosine triphosphate (ATP) in
the soils were generally low compared to other biomes. It was hrther hypothesised that proti-
sta may be an important component in tundra soil ecology as indicated by extremely high val-
ues at the respective sites. Interference was also suggested from nutrient Status and lichens.
Lowest ATP to rnicrobial biomass ratios were found in the rhizosphere reflecting lower fbngal
activity. The ATP to substrate-induced heat output (30) successfüll distinguished between
viable micro-organisms and shifts in microbial cornrnunity composition.
In accordance with the other microbial properties, values of heat output were within the lower
range of data from soils of temperate regions. Within profiles, heat output generally decreased
non-linearly with depth, which was more pronounced in unvegetated inorganic soils. In this
study, it was concluded that substrate-induced methods were inappropriate to estimate micro-
bial biomass in tundra soils. This resulted in a misjudgement of the microbiota of the upper-
most topsoil horizons and in anaerobic subsoils and showed different substrate requirements.
In addition, the ratio of basal heat output to substrate-induced heat output (i.e., caloric quo-
tient) fusther elucidated successional Stages of the microbiota as well as exposure to environ-
mental stress. Yet, the caloric quotient failed to distinguish between the two in tlie polygonal
tundra soils and in transitionary horizons between top- and subsoil (i.e., 'frontier'), For subsoil
horizons, it was concluded that the caloric quotient was not applicable.
Statistical analysis of pedological Parameters and microbial properties allowed a generalised
view of microbial habitats in tundra soils. Respectively, wet and dry topsoils, 'frontier' hori-
zons and the subsoil were differentiated. Wet topsoils were charactesized as aquatic habitats
with a sponge-like stnicture of the peat, which allows organisms to float freely. Compared to
their dsier counterpart, vvet topsoils showed higher contents of carbon and nitrogen, higher
Cm-ratios and less acid soil pH. A significant propostion of the energy flux appeared to pass
through protista and bacteria ('microbial loop'j. Decomposers such as hngi occurred in wet
topsoils but were restricted in activity due to water saturation and low temperatures. Dry top-
soils showed stratification of both edaphic conditions and microbiological propesties. Insulat-
ing organic mats create a stable environment with respect to temperature and moisture, in
which highest active microbial biomass was determined. The latter showed high affinity to car-
bon and nitrogen contents indicating heterotrophic micro-organisms. The data further sug-
gested microbial succession during soil organic matter decomposition. In transition to the sub-
soil at wet and dry micro-sites, microbial propeities showed strong gradients leading to a con-
ception of'frontier' horizons. These gradients were explained by a combined effect of a redox
potential discontinuity (RPD) and the rhizosphere. Trontier' horizons were marked by the
interface of iron oxidation bands at the upper boundary and underlying reducing conditions. On
the one hand, redox potentials temporally allowed aerobic respiration, methane and iron oxida-
tion to occur. On the other hand, sulphate reduction and methanogenesis had also been deter-
mined in the namely horizons. Significant greater values of microbial biomass were attributed
to a rhizosphere effect. Yet, this was accompanied with inhibition of microbial activity. High
caloric quotients failed to distinguish between environmental stress and a changes in the rnicro-
bial community stnicture. Subsoil horizons were characterized by anaerobic conditions and
distinct increases in soil organic matter contents above the perrnafrost. The microbial commu-
nity was predominated by anaerobic heterotrophic bactesia. It has been discussed that the re-

spective microbial habitats represent a generalised view. In the field, they are likely to vary
temporally and spatially and may as well interlock.
In a changing climate, microbial cornmunities showed a high potential for increasing minerali-
sation rates at a short-term scale. Evaluation of the long-term response, however, bears more
uncertainties mainly because of the incalculable response of the vegetation canopy. Yet at pre-
sent, the Taimyr Peninsula appears to be relatively stable to climate change.
Zusammenfassung und Schlu§folgerunge
Im Rahmen eines Russisch-Deutschen Verbundprojektes wurden bodenkundliche und botani-
sche Untersuchungen zu den Kohlenstoffflüsse in Tundraböde Mittelsibiriens durchgeführt
Umsatz von organischer Bodensubstanz, C02- und CH.i-Austräg steilen hierbei biologisch
induzierte Prozesse dar, in denen die bodenmikrobiellen Gemeinschaften Hauptmotor sind.
Ziel dieser Arbeit war es, sowohl die Gesamtheit der an der Mineralisation beteiligten Mikro-
organismen zu charakterisieren als auch ihre raumliche Variabilitä zu beschreiben.
Die Gelandearbeiten fÅ ̧ diese Arbeit wurden im Juli und August 1995 und 1996 auf der
Tairnyr Halbinsel, Mittelsibirien durchgefuhrt. Das Untersuchungsgebiet am Labaz See
(7ZCN, 100'0) befindet sich in der Zone der Sudlichen Arktischen Tundra. Das andere Unter-
suchungsgebiet am Levinson-Lessing See ist von Typischer Arktischer Tundrenvegetation
geprägt
Am Labaz See wurden wahrend der 1995er Expedition die Gelandearbeiten vom IfE3 (Ham-
burg) und dem IPÃ (Kiel) durchgefi~hrt. Drei Tundrastandorte und zwei verschiedene
Braunerden waren beprobt worden. Tm Folgejahr am Levinson-Lessing See, wurde die Bo-
denaufnahme von der Autorin in Zusammenarbeit mit dem IfB (Hamburgj durchgefuhrt. Die
Bodenprobennahme orientierte sich an Boden-Frostmuster-Vegetationskomplexen und war
dasübe hinaus so anlegt, eventuelle Sukzessionsstadien zu erfassen. So wurden drei Standorte
in der Polygontundra, zwei an den Solifluktionshänge und zwei weitere in den Frostschutt-
fläche ausgewahlt. Samtliche Bodenprofile wurden in gänzliche Tiefe der sommerlichen
Auftauschicht beprobt.
Eine moderne Methode der direkten Mikroskopie (Epifluoreszenzmikroskopie mit EDV ge-
stützte Bildauswertungj wurde zur Bestimmung von Pilzhyphenlangen und -biovolumina
eingesetzt. Die Pilzbiomasse wurde aus den entsprechenden Biovolumina berechnet (BLOEM
et al., 1995 j. Die Quantifizierung und Charakterisierung der Gesamtheit der Mikroorganismen
wurden durch Bakterienkennwerte von PD Dr. M. Bölte ergänzt Zur Untersuchung der le-
benden und aktiven Mikroorganismen wurden aktivitätsabhängi Methoden wie die Be-
stimmung des ATP-Gehalts (HOLM-HANSEN & BOOTH, 1966; GRAF, 1977; VOSJAN et al.,
1987) und die Mikrokalorimetrie (SPARLING, 1983) eingesetzt. Die basale und substrat-
induzierte Wärmeproduktio geben darübe hinaus Auskunft übe die Struktur der mikrobiel-
len Gemeinschaft, Substratanspruche und eine eventuelle Hemmung ihrer Aktivitä
(RAUBUCH & BEESE. 1995). Der weiteren Beschreibung der mikrobiellen Habitate diente die
Untersuchung von strukturellen und chemischen Bodeneigenschaften.
Die Ergebnisse zeigten eine groß Variabilitat in mikrobieller Biomasse und Aktivitä zwi-
schen einzelnen Standorten. Unterschiede waren in der Hauptsache ebenso wie die mikro-
bielle Biomasse auf den Oberboden beschränkt Im allgemeinen nahm die mikrobielle Bio-
masse mit zunehmender Tiefe ab. Diese Abnahme war deutlicher bei den Pilzen als bei den
Bakterien. Letztere waren fÅ ̧das gesamte Profil konstatierbar, wiesen jedoch einen relativen
Anstieg oberhalb der Permafrosttafel auf. Die Böde zeigten gemeinhin hohe Pilz-Bakterien-
Verhältnisse was aufzeigt, da die mikrobiellen Gemeinschaften deutlich von Pilzen domi-
niert wurden. Die bakterielle Biomasse hatte dagegen eher niedrige Werte aufgewiesen, was
durch kleine Zellvolumina erklart worden war. Irn Vergleich mit anderen arktischen Böde
wiesen die Pilzhyphenlänge jedoch ebenfalls niedrige Werte auf. Eine starke Zunahme an
pilzlichlicher (und bakterieller) Biomasse wurde in einer Tiefe von 10 bis 20 cm aufgrund
eines Rhizosphäreneffekte und der Bodenwasserverhältniss festgestellt.
Die Vegetationsbedeckung stellt eine wesentliche Steuergroß fÅ ̧Unterschiede in den mikro-
biellen Eigenschaften dar. In den Böde der Solifluktionshange und Schuttfläche spiegelten
die mikrobiellen Gemeinschaften An- oder Abwesenheit von Vegetation wider. Währen
Bakterien hierbei an unbewachsenen Standorten dominierten, waren Pilze zumeist auf be-
wachsene Standorte beschrankt, was deren Bedeutung in der Mineralisation organischer Bo-
densubstanz aufzeigt. Durch Flechtenbewuchs wurden Bakterien limitiert. Eine weitere Steu-
ergröà stellen die Bodenwasserverhältniss dar. An feuchten Kleinstandorten zeigten sich
Bakterien im Vergleich zu Pilzen konkurrenzfähiger Letztere herrschten in den benachbarten
trockeneren Kleinstandorten vor. Trotz aerober Lebensweise erreichten Pilze an feuchten
Kleinstandorten beachtliche Biomassewerte.
Im Einklang mit den niedrigen Werten an mikrobieller Biomasse, waren die Adenosintriphos-
phat (ATP)-Gehalte im Vergleich zu anderen Biomen ebenfalls gering. Des weiteren wurde
die Hypothese aufgestellt, da Protisten einen weiteren wichtigen Bestandteil in der Ökologi
von Tundraböde darstellen konnten, wie äußer hohe ATP-Gehalte an den entsprechenden
Standorten aufzeigten. Der Nahrstoffgehalt und Flechtenbewuchs stellten möglicherweis
weitere Einflußgröà dar. Die Rhizosphere wies die engsten Verhältniss von ATP zu mi-
krobieller Biomasse auf, welches eine weniger aktive Pilzflora widerspiegelt. Das Verhältni
xii
von ATP-Gehalt zur substrat-induzierten Warmeproduktion (SIQ) unterschied erfolgreich
zwischen lebenden Mikroorganismen und Veranderungen in der Gemein-
schafizusammensetzu~~g.
Entsprechend der übrige mikrobiellen Eigenschaften, lagen die Werte der Warmeproduktion
im unteren Bereich derjenigen fÅ ̧gemäßig Breiten. Innerhalb des Profils nahm die Wärme
produktion gemeinhin nicht-linear mit der Tiefe ab, dies stärke in unbewachsenen minerali-
schen Boden. Ein Ergebnis dieser Arbeit ist es, da substrate-induzierte Methoden zur Ab-
schätzun mikrobieller Biomasse fü Tundraböde ungeeignet sind. Dies fŸhr in den obersten
Zentimetern des Oberbodens sowie im anaeroben Unterboden zu einer Fehleinschätzun der
mikrobielle Gemeinschaften und zeigte andere Substratansprüch auf. Das Verhältni von
basaler und substrat-induzierter Wärmeproduktio (d.h. der kalorische Quotient) fand eine
weitere Anwendung in der Beschreibung von Sukzessionsstadien und physiologischem Streß
Die jeweilige Differenzierung war jedoch im Falle der Polygontundra sowie in den Uber-
gangshorizonten zwischen Ober- und Unterboden ('Frontier') nicht möglich Irn anaeroben
Unterboden erwies der kalorische Quotient mangelnde Anwendbarkeit.
Die statistische Analyse der pedologischen Parameter und mikrobiellen Eigenschaften er-
möglicht eine generalisierte Darstellung von mikrobiellen Habitaten in Tundraböden Ent-
sprechend wurden jeweils staunasse und trockene Oberboden, 'Frontier'-Horizonte und Un-
terböde differenziert. Staunasse Oberboden wurden als aquatisches Habitat mit einer
schwammartigen Struktur der Torfauflage beschrieben, das Organismen freies Schwimmen
ermöglicht Irn Gegensatz zu den entsprechenden trockenen Oberböden waren Kohlenstoff-
und Stickstoffgehalte höher Cm-Verhältniss weiter und pH-Werte weniger sauer. Ein signi-
fikanter Anteil des Energieflusses passiert möglicherweis Protisten und Bakterien ('Microbi-
al Loop'). Zersetzer wie z.B. Pilze wurden in geringerer Biomasse festgestellt, deren Aktivitä
durch Wassersättigun und niedrige Temperaturen gehemmt wurde. Trockene Oberböde
wiesen eine Stratifizierung sowohl der edaphischen als auch mikrobiellen Eigenschaften auf.
Die isolierende Wirkung der organischen Auflagen schafft ein temperatur- und feuchtestabiles
Habitat, fÅ ̧ das Höchstwert an aktiver mikrobieller Biomasse ermittelt wurden. Diese wies
eine hohe Affinitä zu den Kohlenstoff- und Stickstoffgehalten auf, was ihre heterotrophe
Natur aufzeigt. DarŸbe hinaus lieà die Datengrundlage auf mikrobielle Sukzession währen
der Mineralisierung von organischer Bodensubstanz schließen Sowohl an staunassen als auch
an trockenen Kleinstandorten wiesen die mikrobiellen Parameter im ~ b e r g a n g zum Unterbo-
den starke Gradienten auf, welches zur Auffassung von 'Frontier'-Horizonten fŸhrte Diese
Gradienten wurden mit der gekoppelten Wirkung einer Redoxsprungschicht (RPD) und der
Rhizosphare erklart. 'Frontier'-Horizonte stellen die Grenzschicht zwischen Eisenoxidbän
dem an der oberen Grenze und den unmittelbar darunter befindlichen anaerob geprägte Ho-
rizonten dar. Temporä sind einerseits aerobe Atmung, Methan- und F.isenoxidation möglic
sowie andererseits temporar auch Sulfatreduktion und Methanbildung nachgewiesen worden
waren. Signifikant höher W-erte mikrobieller Biomasse resultierten aus einem Rhi-
zosphäreneffekt der jedoch von geringer mikrobieller Aktivitä begleitet war. Hohe kalori-
sche Quotienten konnten hierbei jedoch nicht zwischen physiologischem Streà oder Verände
rungen in der Gemeinschaftszusammensetzung unterscheiden. Der Unterboden war durch
anaerobe Verhältniss und einen deutlichen Anstieg an organischer Bodensubstanz übe der
Permafrosttafel gekennzeichnet. Die mikrobiellen Gemeinschaften wurden hier in der Regel
von anaeroben heterotrophen Bakterien dominiert. In der Diskussion wurde darauf hingewie-
sen, da es sich bei den namentlichen Habitaten lediglich um eine generalisierte Darstellung
handelt. Unter naturlichen Bedingungen variieren diese in zeitlicher und räumliche Hinsicht
und konnen sich darŸbe hinaus überlagern
Im Hinblick auf globale Klimaveranderungen, weisen die mikrobiellen Gemeinschaften kurz-
fristig ein hohes Potential fÅ ̧ eine erhohte Umsetzung an organischer Bodensubstanz auf
Eine Einschätzun des langfristigen Wandels birgt hohe Unsicherheiten, da die Resonanz der
Vegetation schwer zu ermessen ist. Dennoch gilt die Taimyr Halbinsel gegenwärti als ver-
hältnismäà stabil gegenübe globalen Klimaveranderungen.
XIV
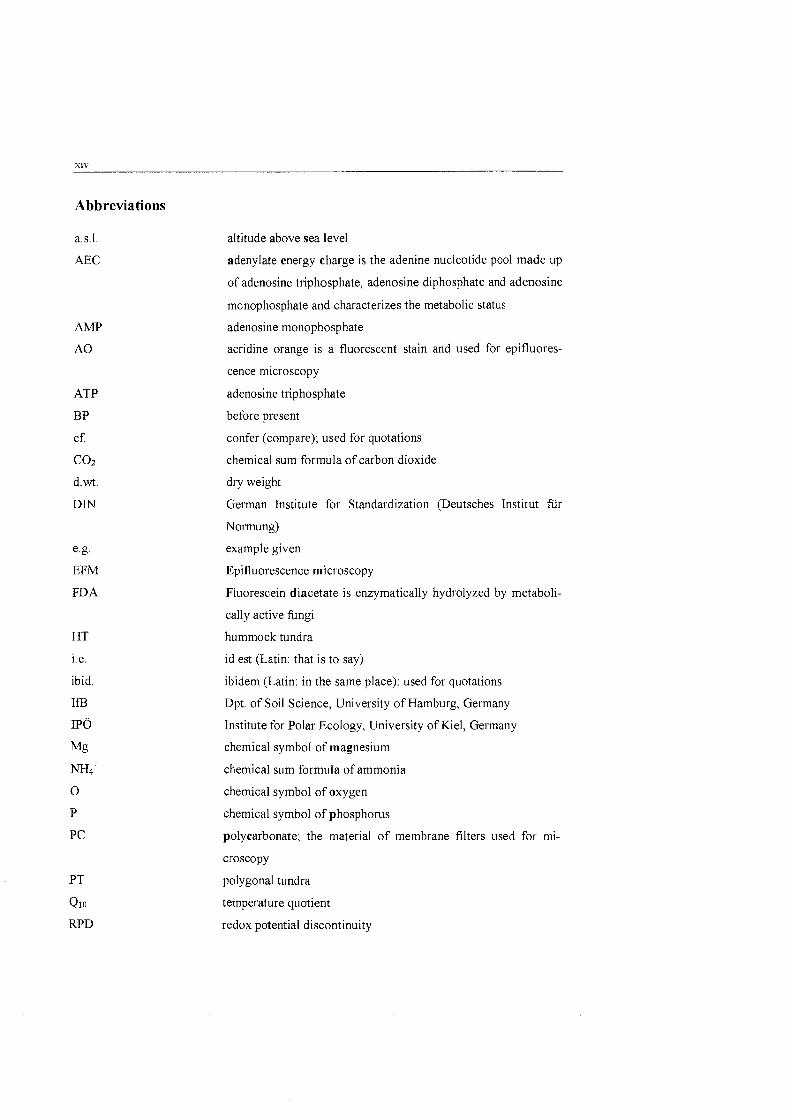
Abbreviations
a.s.1.
AEC
ATP
BP
C f
C02
d.wt.
DIN
e.g.
EFM
FDA
HT
1.e.
ibid.
I fB
PO
Mg
m+ 0
P
PC
altitude above sea level
adenylate energy Charge is the adenine nucleotide pool made up
of adenosine triphosphate, adenosine diphosphate and adenosine
mcnophosphate and characterizes the metabolic Status
adenosine monophosphate
acridine orange is a fluorescent stain and used for epifluores-
cence microscopy
adenosine triphosphate
before present
confer (comparej; used for quotations
chemical sum formula of carbon dioxide
dry weight
German Institute for Standardization (Deutsches Institut fÅ̧
Normung)
example given
Epifluorescence microscopy
Fluorescein diacetate is enzymatically hydrolyzed by metaboli-
cally active hngi
hummock tundra
id est (Latin: that is to sayj
ibidem (Latin: in the Same place); used for quotations
Dpt. of Soil Science, University of Hamburg, Germany
Institute for Polar Ecology, University of Kiel, Germany
chemical symbol of magnesium
chemical sum formula of ammonia
chemical symbol of oxygen
chemical symbol of phosphorus
polycarbonate; the material of membrane filters used for mi-
croscopy
polygonal tundra
temperature quotient
redox potential discontinuity
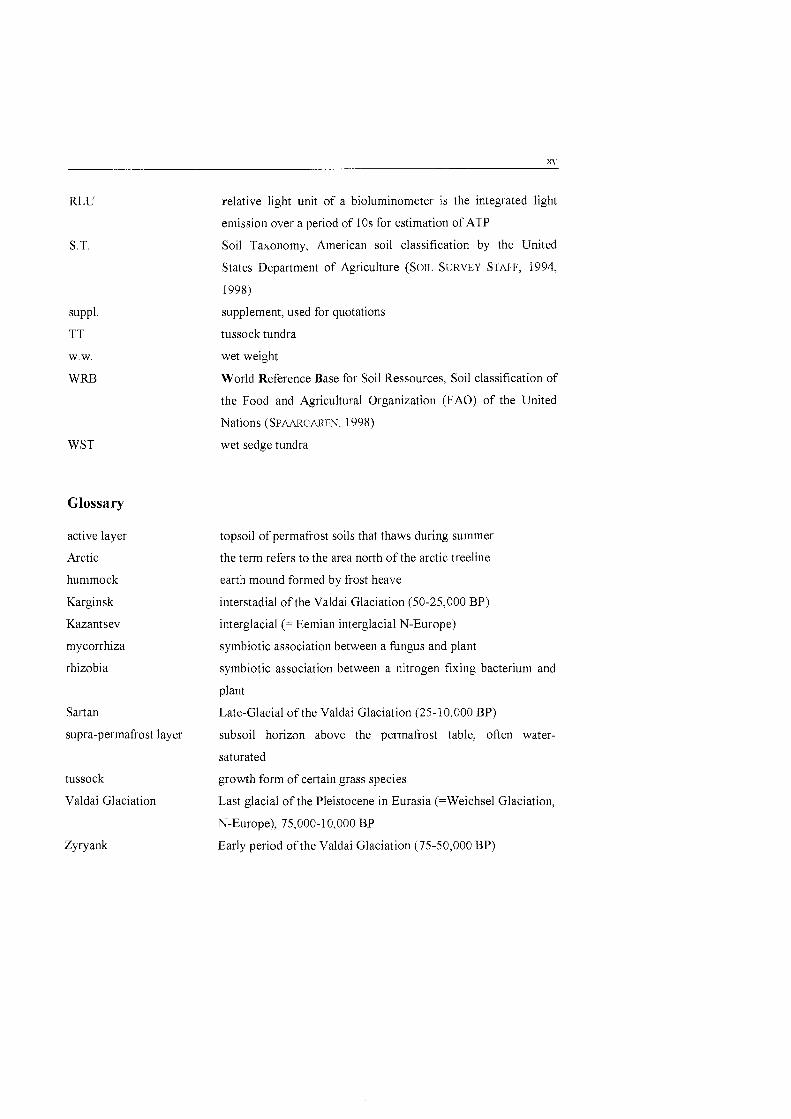
RLU
S.T.
suppl.
TT
W.W.
wRl3
WST
Glossary
active layer
Arctic
hun~mock
Karginsk
Kazantsev
mycorrhiza
rhizobia
Sart an
supra-permafrost layer
tussock
Valdai Glaciation
relative light unit of a bioluminometer is the integrated light
emission over a period of 10s for estimation of ATP
Soil Taxonomy, American soil classification by the United
States Department of Agriculture (SOLL SURVEY STAFF, 1994,
1998)
supplement, used for quotations
tussock tundra
wet weight
World Reference Base for Soil Ressources, Soil classification of
the Food and Agricultural Organization (FAO) of the United
Nations (SPAARGAREN, 1998)
wet sedge tundra
topsoil of permafrost soils that thaws during summer
the term refers to the area north of the arctic treeline
earth mound formed by frost heave
interstadial of the Valdai Glaciation (50-25,000 BP)
interglacial (= Eemian interglacial N-Europe)
symbiotic association between a fungus and plant
symbiotic association between a nitrogen fixing bacterium and
plant
Late-Glacial of the Valdai Glaciation (25-10,000 BP)
subsoil horizon above the permafrost table, often water-
saturated
growth form of certain grass species
Last glacial of the Pleistocene in Eurasia (=Weichsel Glaciation,
N-Europe), 75,000-10,000 BP
Early period of the Valdai Glaciation (75-50,000 BP)
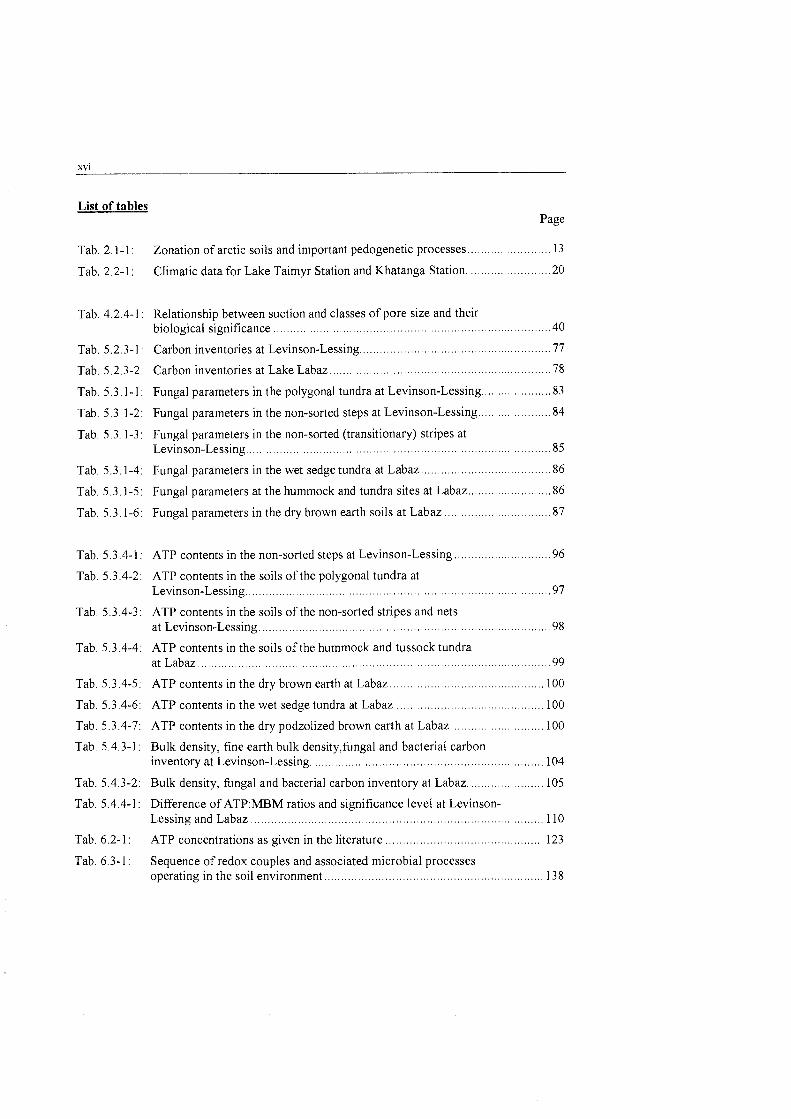
List of tables Page
Tab . 2.1-1:
Tab . 2.2-1:
Tab . 4.2.4-1
Tab . 5.2.3-1
Tab . 5.2.3-2
Tab . 5,3.1-1
Tab . 5.3.1-2
Tab . 5.3.1-3
Tab . 5.3.1-4
Tab . 5.3.1-5
Tab . 5.3.1-6
Tab . 5.3.4-1
Tab . 5.3.4-2
Tab . 5.3.4-3
Tab . 5.3.4-4:
Tab . 5.3.4-5:
Tab . 5.3.4-6:
Tab . 5.3.4-7:
Tab . 5.4.3-1:
Tab . 5.4.3-2:
Tab . 5.4.4-1:
Tab . 6.2-1 :
Tab . 6.3-1:
Zonation of arctic soils and inlportant pedogenetic processes ......................... 13
Climatic data for Lake Taimyr Station and Khatanga Station. ........................ 20
Relationship between suction and classes of pore size and their . . ................................................................................... biological significance 40
......................................................... Carbon inventories at Levinson-Lessing 77
.................................................................. Carbon inventories at Lake Labaz 78
..................... Fungal Parameters in the polygonal tundra at Levinson-Lessing 83
...................... Fungal Parameters in the non-sorted steps at Levinson-Lessing 84
Fungal parameters in the non-sorted (transitionary) stripes at ........................................................................................... Levinson-Lessing 85
Fungal Parameters in the wet sedge tundra at Labaz ....................................... 86
Fungal Parameters at the hummock and tundra sites at Labaz ......................... 86
Fungal Parameters in the dry brown earth soils at Labaz ................................ 87
ATP contents in the non-sorted steps at Levinson-Lessing ............................. 96
ATP contents in the soils of the polygonal tundra at Levinson-Lessing ........................................................................................... 97
ATP contents in the soils of the non-sorted stripes and nets at Levinson-Lessing ....................................................................................... 98
ATP contents in the soils of the hummock and tussock tundra ......................................................................................................... at Labaz 99
ATP contents in the dry brown earth at Labaz .............................................. 100
ATP contents in the wet sedge tundra at Labaz ............................................ 100
............................ ATP contents in the dry podzolized brown earth at Labaz 100
Bulk density, fine earth bulk density. fimgal and bacterial carbon inventory at Levinson-Lessing ..................................................................... 104
Bulk density. fŸnga and bacterial carbon inventory at Labaz ....................... 105
Differente of ATP:MBM ratios and significance level at Levinson- Lessing and Labaz ....................................................................................... 110
ATP concentrations as given in the literature ............................................... 123
Sequence of redox couples and associated microbial processes operating in the soil environment ................................................................. 138
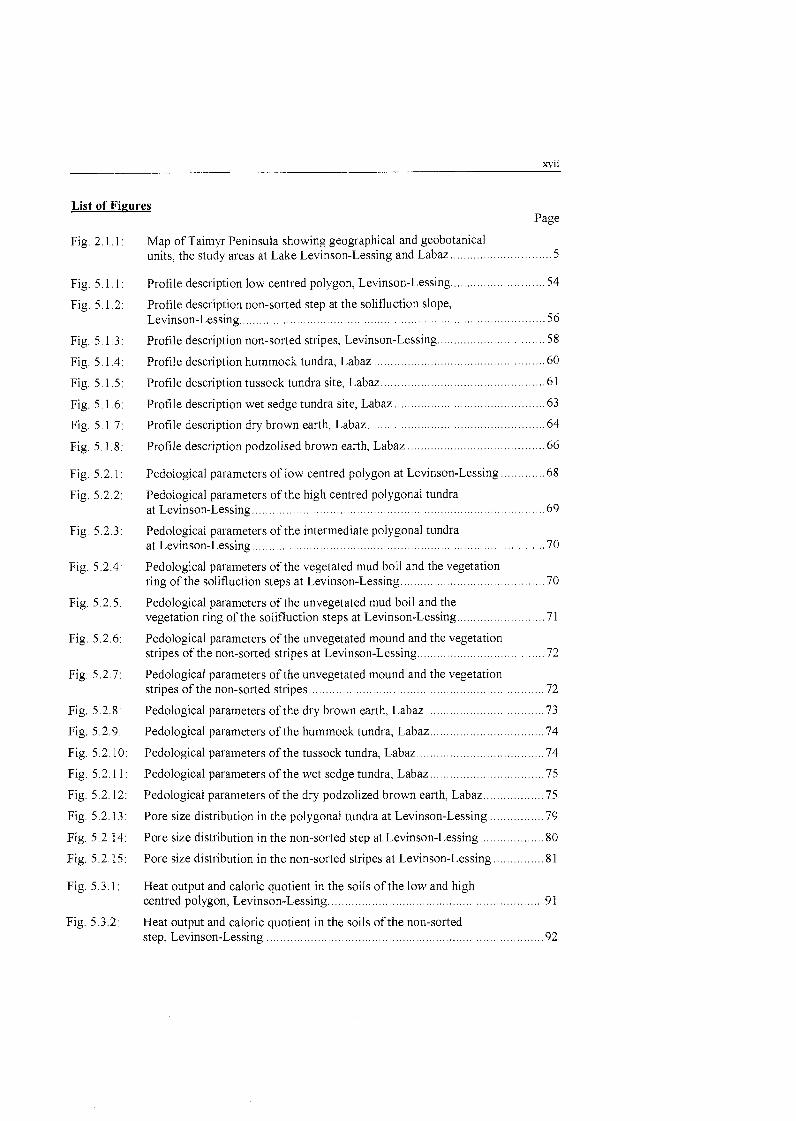
List of Figures Page
Fig . 2 . I . 1 :
Fig . 5.1.1:
Fig . 5.1.2:
Fig . 5.1.3:
Fig . 5.1.4:
Fig . 5.1.5:
Fig . 5.1.6:
Fig . 5.1.7:
Fig . 5.1.8:
Fig . 5.2.1 :
Fig. 5.2.2:
Fig . 5.2.3:
Fig . 5.2.4:
Fig . 5.2.5:
Fig . 5.2.6:
Fig . 5.2.7:
Fig . 5.2.8:
Fig . 5.2.9:
Fig . 5.2.10:
Fig . 5.2.1 1 :
Fig . 5.2.12:
Fig . 5.2.13:
Fig . 5.2.14:
Fig . 5.2.15:
Fig . 5.3.1:
Fig . 5.3.2:
Map of Taimyr Peninsula showing geographical and geobotanical units. the study areas at Lake Levinson-Lessing and Labaz .............................. 5
Profile description low centred polygon. Levinson-Lessing ............................ 54
Profile description non-sorted step at the solifluction slope, .......................................................................................... Levinson-Lessing 56
Profile description non-sorted stripes, Levinson-Lessing . . . . . . . . . . . . . . . . . . . . . . . . . . . . . . . . 58
................................................... Profile description hummock tundra, Labaz 60
................................................. Profile description tussock tundra site. Labaz 61
............................................. Profile description wet sedge tundra site. Labaz 63
..................................................... Profile description dry brown earth. Labaz 64
......................................... Profile description podzolised brown earth. Labaz 66
. . . . . . . . . . . . . Pedological Parameters of low centred polygon at Levinson-Lessing 68
Pedological parameters of the high centred polygonal tundra ....................................................................................... at Levinson-Lessing 69
Pedological parameters of the intermediate polygonal tundra . . . . . . . . . . . . . . . . . . . . . . . . . . . . . . . . . . . . . . . . . . . . . . . . . . . . . . . . . . . . . . . . . . . . . . . . . . . . . . . . . . . . . . at Levinson-Lessing 70
Pedological parameters of the vegetated mud boil and the vegetation ring of the solifluction steps at Levinson-Lessing ........................................... 70
Pedological parameters of the unvegetated mud boil and the vegetation ring of the solifluction steps at Levinson-Lessing . . . . . . . . . . . . . . . . . . . . . . . . . 71
Pedological parameters of the unvegetated mound and the vegetation stripes of the non-sorted stripes at Levinson.Lessing ...................................... 72
Pedological parameters of the unvegetated mound and the vegetation stripes of the non-sorted stripes ...................................................................... 72
Pedological Parameters of the dry brown earth. Labaz ................................... 73
Pedological Parameters of the hummock tundra. Labaz .................................. 74
Pedological Parameters of the tussock tundra. Labaz ...................................... 74
Pedological Parameters of the wet sedge tundra. Labaz .................................. 75
Pedological Parameters of the dry podzolized brown earth. Labaz .................. 75
Pore size distribution in the polygonal tundra at Levinson-Lessing ................ 79
Pore size distribution in the non-sorted step at Levinson-Lessing ................... 80
Pore size distribution in the non-sorted stripes at Levinson-Lessing ............... 81
Heat output and caloric quotient in the soils of the low and high centred polygon. Levinson.Lessing ................................................................ 91
Heat output and caloric quotient in the soils of the non-sorted step. Levinson-Lessing .................................................................................. 92
Fig. 5.3.3:
Fig. 5.3.4:
Fig. 5.3.5:
Fig. 5.3.6:
Fig. 5.4.1:
Fig. 5.4.2:
Fig. 5.4.3:
Fig. 5,4.4:
Page Heat output and caloric quotient in the soils of the non-sorted stripes, Levinson-Lessing. ............................................................................. .93
Heat output and caloric quotient in the soils of the transitionary ............................................................................ stripes, Levinson-Lessing.. .93
Heat output and caloric quotient in the hummock and the tussock ............................................................................................... tundra, Labaz.. 94
Heat output and caloric quotient in the wet sedge tundra; Labaz. ................... 94
Relationship of fbngal biomass and substrate induced heat output in soils with predominant hngal microbial biomass ..................................... 106
Relationship of bacterial biomass and substrate induced heat output in the uppermost 5 cm of soils with predominating bacterial microbiota
..................................................................................... at Levinson-Lessing 107
Relationship of ATP contents and substrate induced heat output .................. 108
Impact of lichens on bacterial biomass in lichenized and non- lichenised soils ............................................................................................. 112
1. Introduction and approach 1
1. Introduction and approach
And if I have prophetic powers, and understand all the mysteries, and all the knowledge, and if I have all faith, so as to remove mountains, but do not have love, I am nothing.
1 Cor 13,2
Tundra is commonly referred to as the treeless landscape nosth of the arctic treeline. The geo-
graphic region is further defined as an area with pesmafrost, which include tree-covered areas
called 'forest tundra' in Russian tesminology. Tundra Covers 7.34*106 km2 world-wide and
represents some 10 % of the land-cover (MATTHEWS, 1983). Its importance is based On its
functioning as a carbon sink in the global carbon cycle. Soil carbon stocks and turnover time
are related to mean annual air temperature by negative exponential functions (SCHIMEL et al.,
1994). As a result decomposition in the Arctic is slow and arctic soils contain 12 to 33 % of
the total world soil carbon pool within the active layer and the permafrost (OECHEL &
VOURLITIS, 1995; 1997). Within tersestrial systems, 90 to 98 % of the primary production
passes through the decomposer cycle of the soil microbiota (BLISS, 1997; GOKS0YR, 1975),
which therefore link to trace gas effluxes from soil to the atmosphere. Retarded decomposi-
tion is usually indicative for low biological productivity. Yet, PARINKINA (1974) has already
suggested that relative microbial productivity must be gseater in tundra than in temperate re-
gions because of the shost gsowing season. It is therefore assumed that tundra soils have a
gseat potential for enhanced soil organic matter mineralisation. In a changing climate, they
may therefore become a carbon source.
In the early 1970s, microbial studies in tundra soils have been carried out during the compre-
hensive tundra biome studies of the International Biological Programme (IBP). The IBP data
are the most extensive available, but since then, little new infosmation has been gained and
techniques in soil microbiology have progsessed. The present study is past of the Joint Rus-
sian-German Research Project 'Late Quatemary Enviromnental Development of Central Sibe-
ria' (German Federal Ministry of Science and Technology (BMBF) gsant 03PL014B), in-
volving the Arctic and Antarctic Research Institute (St. Petersburg), the Alfred Wegener In-
stitute of Polar and Marine Research (Potsdam), the Depastment of Soil Science (University of
Hamburg) and the Institute for Polar Ecology (Kiel). This investigation was embedded in the
research fields investigating actual processes in soil organic matter tumover, C02 and CH4
effluxes in two different study areas on Taimyr Peninsula. The experimental site at Lake La-
2 1. Introduction and approach
baz (72ON, 100°E is situated within the belt of the 'Southem Arctic Tundra'. The other site at
Lake Levinson-Lessing (74.SGN, 98.S0E) is characterized by the vegetation of the 'Typical
Arctic Tundra'.
The overall objective of this study was to characterize the microbial pool of the decomposer
cycle in the context of site vasiability. Fusther emphasis was given to the microbial fitness for
the environment. The following questions formed the background of this study:
What is the order of magnitude and the microbial community stsucture, and what are the
differences between sites?
e To which extent is microbial activity inhibited, and what are the controlling factors in mi-
cro-sites?
e What is the potential for enhanced mineralisation at these sites?
Does a generalised view of microbial habitats contribute to hture research in tundra soils?
At Lake Labaz, three tundra soils and two different types brown easth were sampled. At Lev-
inson-Lessing three polygonal tundra soils, two sites at the solifluction slopes and another two
in fellfields were sampled. Profile description provides the data base on both abiotic and bio-
logical propesties of the microbial habitats. Within profiles, sampling techniques were de-
signed to capture small spatial differences.
Direct obsesvation methods quantify fungal and bacterial biomass. The fimgi to bacterial ratio
varies between different ecosystems and is used as an index for the microbial community
structure. Studies at the IBP Tundra Biome sites of the 1970s draw different conclusions with
respect to importance of fungal OS bactesial components of the microbiota. Activity dependent
indirect methods provide fusther estimates of microbial biomass and thus verifj data by direct
obsesvation methods. Quotients of microbial Parameters fiisther elucidate the comrnunity
stsucture and environmental Stress. Analyses of soil stsuctural and chemical propesties aimed
at the abiotic charactesisation of the habitat.
I wish to end this introduction with a personal remark:
Within this joint CO-operation many Papers, Ph.D. and M.%. theses were wsitten. The plethora
of research interests becomes evident by the reposts on the three expeditions to Taimyr
1, Introduction and approach 3
Peninsula (MELLES et al., 1997; BOLSHIYANOV & HUBBERTEN, 1996; SIEGERT &
BOLSHIYANOV, 1995). Scientific exchange by joint publications as well as during conferences,
workshops and the expeditions themselves make this interdisciplinary approach so fruitiül
After all, science is meant to be about the exchange of knowledge.
The study of microbial habitats and properties, as any ecosystematical approach, ideally
includes any information available On both abiotic and biotic factors. One advantage of
research projects of this magnitude is the availability of many data sets. The present study
attempted to make iül use of extemal data in order to enhance the synergistic effect. Hence,
extemal data were included in a separate Section 4.4 and only in full appreciation of my
colleagues' work. For readability, some extemal data were partly cited in the result chapter,
where the reader would expect to find the respective information. These, in particular,
comprise bacterial biomass data as well as data on the experimental site at Lake Labaz, of the
expedition in which I did not participate.
Quotations have been indicated as usual. However, some of these data, have not been
published yet or publication is in preparation. In these cases the source has been stated as clear
as possible. Furthermore, many valuable references and a lot of research by Russian scientists
is naturally published in Russian, only Part of which was available in English or Gennan. Due
to my extremely restricted knowledge of the Russian language, I often relied On translations
by colleagues having command of the language. These sources generally have been indicated
as personal communication and, if applicable the source of reference has been added.
4 2 . Study area and experimental sites
2. Study area and experimental sites
Wenn der Mensch mit regsamem Sinne die Natur durchforscht oder in seiner Phantasie die weiten Räum der organischen Schöpfun mißt so wirkt unter den vielfachen Eindrücken die er empfängt keiner so tief und mächti als der, welchen die allverbreitete Füll des Lebens erzeugt. Ÿberall selbst nahe an den beeisten Polen, ertön die Luft von dem Gesang der Vöge wie von dem Summen schwirrender Insekten.
Alexander V. Humboldt
2.1 Taimyr Peninsula
2.1.1 Location
Taimyr Peninsula is located in northem Central Siberia and stretches from the Putorana
Plateau (70°N to the Arctic Ocean (Cape Chelyuskin, approximately 77ON). The peninsula is
bordered by the river Jennesej (86OE) in the west and by the river Khatanga (1 15OE) in the
east. FRANZ (1973) even defined the river Olenjok as the eastem border (1 15OE). Taimyr
Peninsula thus comprises a total area of about 400,000 km2 and equals thus Great Britain in
size.
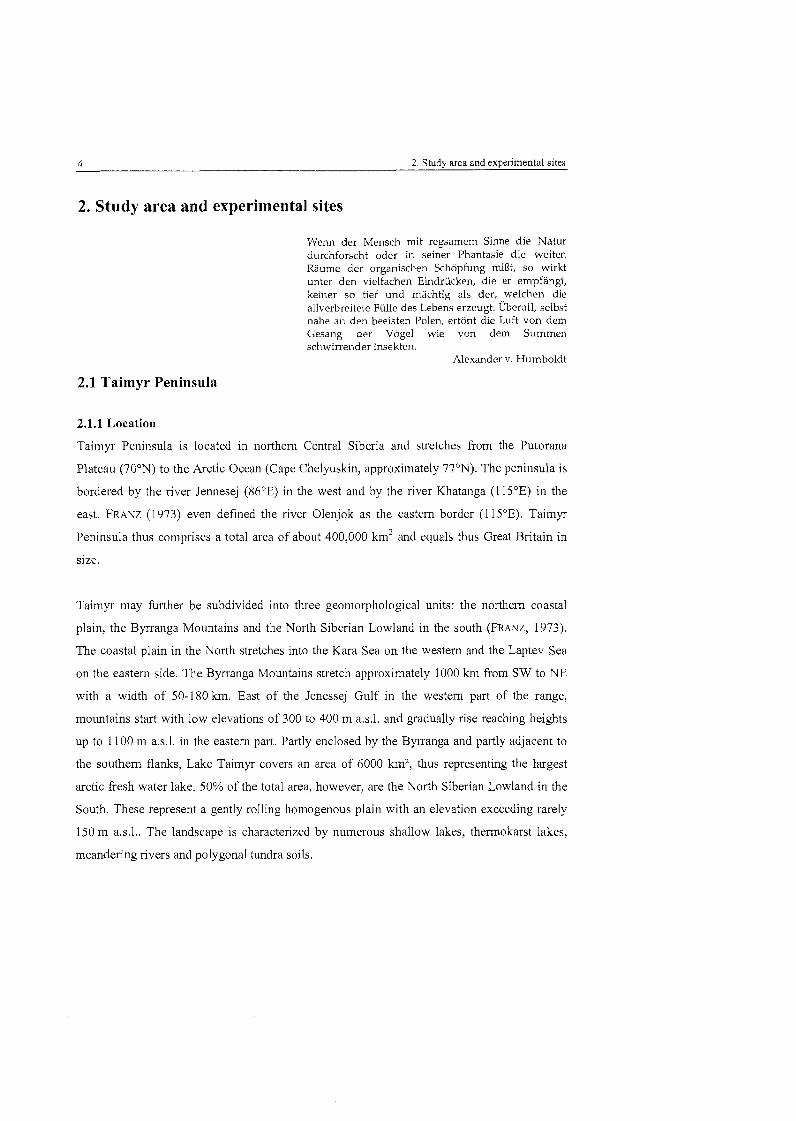
Taimyr may hrther be subdivided into three geomorphological units: the northem coastal
plain, the Byrranga Mountains and the North Siberian Lowland in the south (FRANZ, 1973).
The coastal plain in the North stretches into the Kara Sea on the westem and the Laptev Sea
on the eastern side. The Byrranga Mountains stretch approximately 1000 km from SW to NE
with a width of 50-180 km. East of the Jenessej Gulf in the westem part of the range,
mountains start with low elevations of 300 to 400 m a.s.1. and gradually rise reaching heights
up to 1100 m a.s.1. in the eastern part. Partly enclosed by the Byrranga and partly adjacent to
the southem flanks, Lake Taimyr Covers an area of 6000 km2, thus representing the largest
arctic fresh water lake. 50% of the total area, however, are the North Siberian Lowland in the
South. These represent a gently rolling homogenous plain with an elevation exceeding rarely
150 m a.s.1.. The landscape is characterized by numerous shallow lakes, thermokarst lakes,
meandering rivers and polygonal tundra soils.
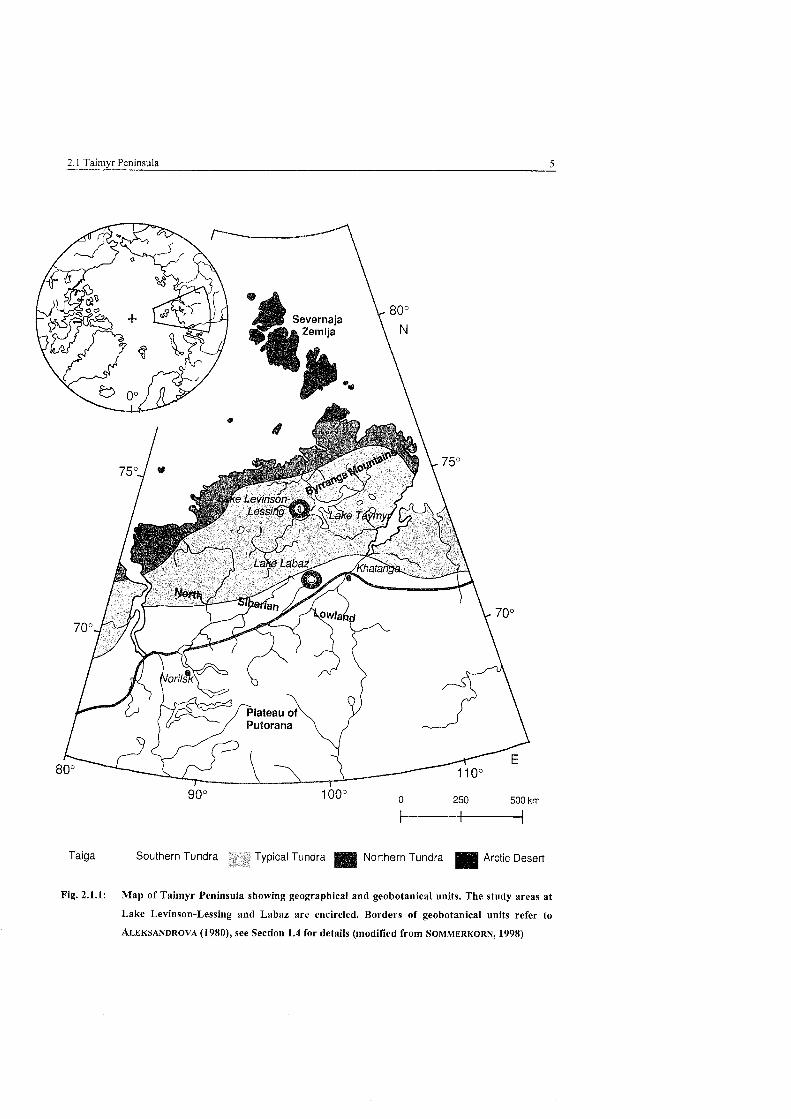
2.1 Taimyr Peninsula 5
Taiga Southern Tundra ypical Tundra Northern Tundra Arctic Desert
Fig. 2.1.1: Map of Taimyr Peninsula showing geographical and geobotanical units. The study areas at
Lake Levinson-Lessing and Labaz are encircled. Borders of geobotanical units refer to
ALEKSANDROVA (1980), See Section 1.4 for details (modified from SOMMERKORN, 1998)
6 2. Study area and experimental sites
2.1.2 Climate
The climate of Taimyr Peninsula represents a cold dry-continental regime. Continentality
increases from north to south. The main characteristics are the lack of heat, low temperatures,
short frost fsee periods, low precipitation and a high relative air humidity (CHERNOV &
MATVEYEVA, 1997; WALTER & BRECKLE, 1986).
Solar radiation
On average the total annual solar radiation is approximately 70 kcal y''. It shows a
seasonal peak from May to July, when 25 to 30% of the total radiation is received (CHERNOV
& MATVEYEVA, 1997). Insolation increases in summer due to longer day length (up to 24
hours = polar day). Yet, a low radiation angle results in low heating. In addition, the albedo is
generally very high. 80 to 95% of the solar radiation are reflected in snow-covered areas. The
highest amount of radiation is absorbed in July. Thus, solar radiation already declines, when it
can be used by organisms.
Temperature
As a result of low solar radiation, the frost-free period in the tundra may range between 55 and
1 18 days (WALTER & BRECKLE. 1986). Yet, on Taimyr Peninsula at Agapa, longest fsost fsee
period is 65 days at the border of southern tundra to forest tundra (VASSILJEVSKAYA et al.,
1975). Thus, the growing season, which is marked by the frost free period, is 1.5 months in
the polar desert increasing to 2.5 months the southern tundra. The mean air annual
temperature ranges between -14. 1° at Cape Chelyuskin in the north and -13.5OC at Khatanga
in the south (WALTER & BRECKLE, 1986). Along this sequence, climate varies particularly in
mean July temperatures reflecting increasing continentality. Mean January temperatures are
only 4OC higher in the north (-29.6OC at Cape Chelyuskin) than in the south (-33.8OC at
Khatanga), whereas mean July temperatures vary more than 10° (1.5OC at Cape Chelyuskin,
13OC at Khatanga) (ibid.). The July isotherm is the main criterion for further subdivision of
the vegetation zones (see below). Furthesmore, winter is accompanied by high wind speeds (8-
8.6 m s") compared to 5.3-5.6 m s" in summer (BARRY et al., 1981).
precipitation
The annual amount of precipitation range from 150-200 mm in the arctic desert to 300-
350 mm in the typical and southern tundra (see Sect. 2.1.3 and 2.1.5 for nomenclature). The
Byrranga Mountains with 450-500 mm y'' clearly show an orographic effect. A third of the
annual precipitation falls as rain during July and August of which 30% is lost by
evapotranspiration. The snow Cover ranges between 10 and 50 cm in thickness but is usually
2.1 Taimyr Peninsula 7
20 to 30 Cm. Massive snow-drifts are common because of strong winds.
Taimyr Peninsula is characterized by high relative air humidity typically 80%, which is a
common feature in the Arctic. In the Summer relative air humidity is some 20% lower in the
southem tundra reflecting higher temperatures. Yet, this hardly represents a decrease in
absolute humidity since there is abundant melt water (BARRY et al., 1981).
2.1.3 Tundra vegetation
World-wide the Taimyr Peninsula is unique in that respect that it shows the whole
geobotanical sequence from the arctic desert to the taiga. As can be Seen from Figure 2.1.1
vast areas are covered by tundra vegetation. Tundra conventionally represents the vegetation
zone north of the arctic treeline and south of the arctic desest. By definition, its borders
coincide with the 12OC July isotherm in the south and the 2OC July isotherm in the north. Yet,
a unique subdivision of the vegetation Zone is somewhat lacking and depends very much on
the underlying criteria and individual points of view (ALEKSANDROVA, 1980; ANDREEV &
ALEKSANDROVA, 1981; WALTER & BRECKLE, 1986; BLISS & MATVEYEVA, 1992,
MATVEYEVA, 1994; CHERNOV & MATVEYEVA, 1997). Subzones were distinguished either
along the July isotherm or floristic elements (presence of charactesistic species; coverage). In
this study, the geobotanical zonation of the Taimyr Peninsula by ALEKSANDROVA (1980) and
the terminology of WALTER & BRECKLE (1986) will be adopted, the latter because of the
significance of the ecological factors (SOMMERKORN, 1998).
Within subzones, abiotic factors vary leading to hrther differences in the composition and the
structure of the vegetation Cover. Hence, ALEKSANDROVA (1980) assigned the 'plakor'
concept to the zonal type of vegetation. The zonal vegetation hlly reflects the climatic
conditions of the respective zone. 'Plakor' vegetation species inhabit mesic habitats on level
to gently sloping grounds that are neither too wet nor too dry and show average Snow
accumulation. Riverbank teiraces, wet depressions at hillocky and polygonal tundra sites, feil
fields or southfacing drier slopes represent intrazonal or azonal vegetation stands (CHERNOV
& MATVEYEVA, 1997). Thus, tundra vegetation pattems may also be described along an
ecohydrological gradient (DE MOLENAAR, 1987). Intrazonal or azonal stands 'smooth out'
climatic factors and are therefore of gseat ecological significance. Fusthermore, their spatial
proportion may also be impostant.
8 2. Study area and experimental sites
Southertz tundra
The southem tundra represents a narrow belt of 100 to 150 km width in the North Siberian
Lowland. Its limits coincide with the 10 and 12'C July isotherms. 'Plakor' vegetation consists
of bushes like A h s jkuctiosa and Salix lanata reaching heights of 1 to 2 m and 0.5 to 0.8 m
respectively. The lower layer of the vegetation is characterized by subarctic dwarf shrubs,
namely Vaccinium spp., Ledum decunibens, Empetrum nigrum, Arctostaphylos alpinus. The
vegetation Cover shows a mosaic structure enhanced by a hummocky ground. In wet
depressions non-'plakor' species like Eriophorum spp. and Carex spp. occur. Trees (e.g.,
Larix sibirica) only occur extrazonally on river terraces. Boreal species still represent 20% of
the vegetation whereas typical tuncira species represent 10%.
Typical tundra
Typical tundra dominates the Taimyr Peninsula. Its belt is 300-350 km wide and coincides
approximately with 10° July isotherm in the south and the 5° July isotherm in the north.
This subzone covers a vast area of the Nosth Siberian Lowland as well as the shores of Lake
Taimyr and the valleys of the Byrranga Mountains.
The'typical tundra is characterized by the absence of trees, tall bushes and close bush thickets.
The latter comprise Salix spp. reaching heights of 20 cm, many develop semiprostate growth
forms (Betula nana, Salix pulc/~ra). These inhabit intrazonal habitats like river valleys and
lake depressions. The 'plakor' vegetation is dominated by mosses (Aulacomnium turgidum,
Hylocomium alaskanum, Torment/zy'ptiz~/n nitens and Ptilium ciliare). Thus, the typical tundra
truly is a 'kingdom of mosses' (CHERNOV & MATVEYEVA, 1997). Yet, these occur associated
with sedges (Carex ensifolia spp. arctosibirica, Carex globularis and Carex lugens).
Northern tundra
The nosthem tundra only covers a narrow belt along the nosthem coastal belt of the peninsula.
Its southem border coincides with the 5OC July isotherm. In the north, it is either limited by
shores of the Arctic Ocean or by the 2OC July isotherm at Cape Chelyuskin.
For the vegetation, the adverse climatic conditions show its main impact on the coverage.
Bare ground may thus represent more than 50%. Plants are restricted to favourable micro-sites
formed mainly by cryogenic processes. The vegetation furtherrnore impoverishes in diversity
within and between sites. Growth fom~s change to tufted grasses and herbs, cushions and
mats. Sedges and cotton grass are replaced by grasses (e.g., Dupontia fisheri) and forbs
2.1 Taimyr Peninsula 9
(Cardaminepratensis, Cerastium regelii, Saxifraga cernna). Dwarf s h b s are represented by
Salix polaris. Dryas spp. only inhabit extrazonal habitats as for example feil fields. Mosses
are still very abundant (Aulacotnnium tz~rgidum, Hylocomium alaskanum, Tormenthypnum
nitens). Yet, moss Covers can only be found adjacent to brooks.
2.1.4 Geology and geomorpholgy
2.1.4.1 Geologie history
Central Siberia is located between the West Siberian megasyncline in the west and the Lena-
Anabar-Trough and Anabar-Saddle (anticline) in the east. The area is fusther subdivided into
the southem craton of the Central Siberian Plateau, the Jenessej-Khatanga-Trough iüsthe
nosth and the Taimyr-Sevemaja Zen~lja-Fold. Taimyr Peninsula tectonically belongs to the
Taimyr-Sevemaja Zemlja-Fold changing into and Jenessej-Khatanga-Trough in the south.
The Bysranga Mountains belong to the Taimyr-Sevemaja Zemlja-Fold and were formed
during the Pliocene (KHAN, 1985). The rock massif embodies Triassic basalt, Carboniferous
carbonates and Pesmian sandstone (Greywacke). These resulted fsom a sedimentation trough
during the Carboniferous to Triassic. The thickness of these sediments is 5000 to 8000 metres.
Flows of Pre-Cambrian schist and gneiss are also common. The glacial and interglacial
pesiods of the Pleistocene were impostant to hsther landscape fosmation. Thus, glacial till of
at least two glaciations has been suggested. Yet, glacial history is subject of dispute and object
within the present research project (e.g., M0LLER et al., 1997; SIEGERT et al., 1996; SIEGERT et
al., 1995; FRENZEL, 1992; FLINT, 197 1). In the interglacial periods, marine transgressions
formed marine-built terraces of sand and gravel at altitudes of 200 m and abrasion platforms
are found as high as 300 m a.s.1.. A comparison of these terraces with those at Severnaja
Zemlja suggests that the Byrranga Mountains are still being uplifted. The last transgression
occusred during the Kazantsev interglacial pesiod (= Eemian (NW-Europe)) (BOLSHIYANOV &
ANISIMOV, 1995; FRANZ, 1973). Since the Pleistocene, the geomorphology of the Byrranga
Mountains is fusther being fosmed by pesiglacial processes.
The North Siberian Lowland south of the Bysranga Mountains belongs to the Jenessej-
Khatanga-Trough and is separated fiom the southem Altaides (= Vasiscan (Central Europe))
of the Central Siberian Plateau by fault lines. The depression was filled with 4000 to 5000
metres thick Mesozoic and Cainozoic sediments. These consist of mixed layers of sandy-
clayey shallow water sediments and continental-sandy deposits. Dusing the Quatemary
washed-up moraines and littoral sand, silt and gravel deposits were added, partly by marine
10 2. Study area and experimental sites
transgression, partly by glaciation (SUSLOV, 1961). The ice-sheets of the Pleistocene in the
area are believed to have been thin (FLINT, 1971). The North Siberian Lowland was
presumably ice-free during the Sartan-Glaciation, the last stage of the Valdai-Glaciation
(= Weichsel (N-Europe)).
The overall ice-sheet in Siberia diminished fsom West to East supposingly reflecting the
strong continental climate. The only areas capable of supporting glaciers were the maritime
Arctic and mountains of the interior. At maximum glaciation (Saale glacial in N-Europe) a
single ice-sheet is believed to have covered the mountain areas (Putorana Plateau, Byrranga
Mountains) as well as the intervening Lowland. Yet, the sheet was nowhere thick enough to
bury the mountain summits. Furthern~ore, it moved little and thawed slowly having little till
on its bed and leaving no boulders behind (SUSLOV, 1961). At the last glacial maximum (i.e.,
Valdai) the ice-sheet was less extent and disconnected. As a consequence the glaciation
history of the Taimyr Peninsula particularly during the Sartan phase (last maximum of the
Valdai glacial) is still object of scientific research and discussion. GROSSWALD (1989) and
ARKHIPOV (1997) support the hypothesis that the entire peninsula was glaciated. On the
contrary, VELICHKO et al. (1997a, b) argue that ice-caps were restsicted to the mountain areas
and the Nosth Siberian Lowland were ice-free because of lacking moraines and the supposed
aridity. The North Siberian Lowland had thus been a periglacial area subjected to deposition
of glaciofluvial material, formation of glacial lakes and spillways (SLSLOV, 196 1).
2.1.4.2 Periglacial processes
The geomorphology is characterized by periglacial freeze-thaw processes in the active layer.
These result in solifluction and formation of patterned ground which is mainly a hnction of
texture, slope position, drainage and temperature (WILLIAMS & SMITH, 1989; WEISE, 1983).
Freeze-thaw processes
Driving force of all fseeze-thaw processes is the particular property of water inasmuch that it
expands during freezing. Because of its dipole character, water furtherrnore is attracted by
other water or ice molecules. The enlargement of 9% during freezing applies a prying force
(frost wedging) which is complemented by the directional growth of ice crystals (TABER, 1929
cf. WASHBURN, 1979). This growth may be horizontal (e.g., ice lenses) or vertical (ice veins).
Thus, physical weathering of rocks and rock forming minerals is mainly induced by frost
wedging (frost shattering). Frost shattering not only depends on temperature and moisture
2.1 Taimyr Peninsula 11
variations but also on the susceptibility of the rock (LAUTRIDOU, 1988; DOUGLAS et al., 1983).
In unconsolidated material such as soils or fell-fields, frost wedging induces frost heave which
is to say the upfreezing of objects (e.g., stones) or soil (frost stimng). Frost heave thus directly
relates to the amount of water in the freezing Zone (SCHENK, 1955). At subfreezing
temperatures thermal contraction of ice is fracturing at the surface (frost-cracking). The initial
crack is filled by surnrner meltwater and grows to form ice-wedges which are the shape of
polygons.
Repeated freezing and thawing has a size sosting effect on soil due to the migsation of water
and the freezing front. This is accompanied by upfreezing of stones, mass displacement,
cryostatic pressure and gsavity movement of stones into polygonal cracks (WASHBL'RN, 1979).
The movement of pasticles also shows involutions and turbulent pattems (cryoturbation).
Thus, the rate of movement of particles also depends on the rate and direction of freezing
(TEDROW, 1977). Sorting and csyoturbation are the main underlying processes of the
formation of pattemed gsound (see below).
In the Arctic, solifluction is also a major geomorphological process. The seasonally thawed
topsoil is often water saturated above the pesmafsost and instable in sloping positions.
Gravitational forces cause the soil to flow from higher to lower gsound with the pesmafrost
table undemeath as a 'glide plane' (gelifluction).
Some forms ofpatterned ground
A gseat amount of pattemed gsound features (some 1500) were descsibed by TROLL (1944).
WASHBURN (1 956 cf. WASHBURN, 1979) classified the fosms of pattemed gsound based upon
the geometsic shape (circles, polygons, nets, steps, and stripes) and presence or absence of
sosting.
Ice-wedge polygons (Taimyr Polygons)
Frost cracking (see above) is supposed to be initial stage of ice-wedge polygon forrnation. The
border of the polygons coincides with the ice-wedge. This may be elevated or depressed with
respect to its centre. Raised borders characterize low-centred polygons and often have ponds
in their centre during the thawing period. High-centred polygons show a higher centre and
depressed borders in which they often hold water (WASHBURN, 1979). Ice-wedge polygons are
common in level or undulating areas being largest in old landscapes such as nosthem Alaska
and Siberia (FITZ~ATRICK, 1997).
Circles, post boils, mudpits, Gäh~lehmbeule (e.g., HOGBOM 1905 cf. TROLL, 1944)
12 2. Study area and experimental sites
Circles are formed by an upward mass displacement in disruption of the vegetation Cover.
They are common in centres of polygons. As a result of upfreezing stones tend to accumulate
at the surface. Due to the lacking vegetation they have a different thermal regime than the
surrounding.
Hummocks (thufur)
Earth hummocks are mounds formed by csyoturbation (squeezing-up effect) of fine textured
and (nearly) stone-free soil material. They occur in level or undulating areas that have an
imperfect drainage. The initiation of hummock formation is unknown and has been discussed
in detail by SCHUNKE & ZOLTAI (1988).
Steps
In sloping areas, csyoturbation and sorting is super-imposed by a downslope mass
displacement (solifluction). Fine-textured soils form terrace-like fonns consisting of lobes or
steps. Because of higher movement in the upper steeper part, this process also results in
overtuming and involution of topsoil material. The downslope vegetation border encompasses
bare ground upslope. Non-sorted steps are common on slopes with 5-15' inclination.
Stripes und nets
Nets are comparable to circles and polygons but are less distinct in their symmetrical form. At
slopes with an inclination of 6O nets turn into stripes.
Further description of the inter-relationship of patterned ground and soil formation is found in
FITZPATRICK (1 997), RIEGER (1 983), TEDROW (1 977), SCHENK (1 955).
2.1.5 Soils and pedogenetic processes
These is no unique concept of the geography of arctic soils. In addition, the terminology not
only differs but is also somewhat confusing (see Tab. 2.1-1). The conventional geographical
conception of the Arctic comprises the area within the Arctic Circle (66'32'N). Since the
early times of Dokuchaev at the end of last centusy, the Russian conception of soil zonation is
vesy much linked to the soil genesis and the vegetation zones. Thus, in the concept by
IVANOVA et al. (1 969) arctic soils only represent the soils of the arctic desest. On the contrary,
GORYACHKIN et al. (1998) and TEDROW (1977) define the arctic treeline as the southem
demarcation of the arctic soil Zone, which stretches as far to the south as 55ON at Hudson Bay
(Canada). This definition thus includes the soils of the tundra and arctic desert vegetation Zone
Le. , geobotanical units by ALEKSANDROVA, 1980; WALTER & BRECKLE, 1986). BREBURDA
(1 987) stated that the presence of pesmafrost was the most important feature of the respective
2.1 Taimyr Peninsula 13
soils. He thus suggested the term 'permafiost soils'. In the northern hemisphere, these would
include soils from the taiga to the arctic desert and would stretch as far to the south as 52ON
near Irkutsk in Siberia (WEISE, 1983). A further subdivision of arctic soils was generally
tackled according to the predominating soil forming processes. Again this has led to differing
classification systems.
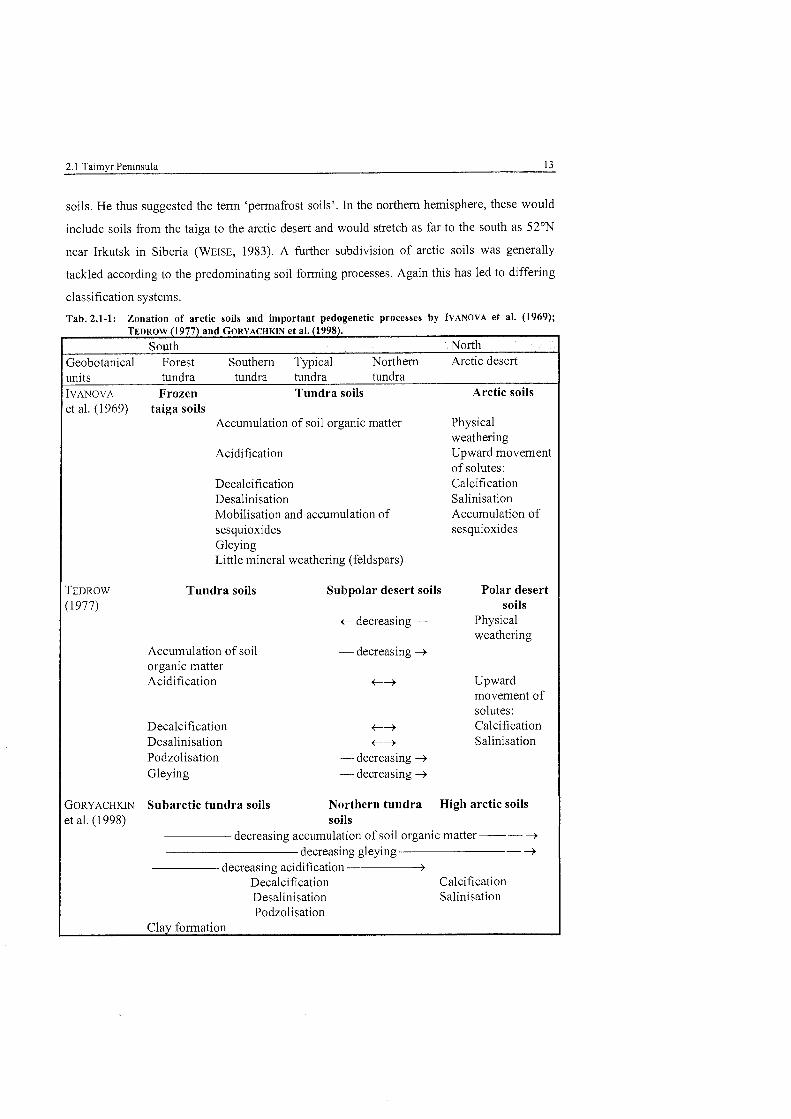
Tab. 2.1-1: Zonation of arctic soiis and important pedogenetic processes by IVANOVA et al. (1969); TEDROW (1977) and GORYACHKIN et al. (1998).-
South North 3eobotanical Forest Southern Typical Northem Arctic desert inits tundra tundra tundra tundra
Frozen Tundra soils Arctic soils VANOVA
;t al. (1969)
EDROW
1977)
JORYACHKIN t al. (1 998)
taiga soils Accumulation of soil organic matter
Acidification
Decalcification Desalinisation Mobilisation and accumulation of sesquioxides Gleying Little mineral weathering (feldspars)
Tundra soils
Accumulation of soil organic matter Acidification
Decalcification Desalinisation Podzolisation Gleying
Subpolar desert soils
+ decreasing -
- decreasing -+
+-+ +-+
- decreasing -+ - decreasing -+
Physical weathering Upward movement of solutes: Calcification Salinisation Accumulation of sesquioxides
Polar desert soils
Physical weathering
Upward movement of solutes: Calcification Salinisation
Subarctic tundra soils Northern tundra High arctic soils soils
decreasing accumulation of soil organic matter -- -+ decreasing gleying -+
decreasing acidification - Decalcification Calcification Desalinisation Salinisation Podzolisation
Clay forrnation
14 2. Studv area and exoerimental sites
One explanation for this ambiguity is that according to GORYACHKIN et al. (1998) almost any
soil forming process in the Arctic may occur in any subzone, which is also the reason for their
objection to current nomenclature in soil zonation.
Humus accumulation
The presence of vegetation results in humus accumulation. The humus form depends on the
composition of the plant canopy and rates of decomposition. Peat formation occurs under
water-logged conditions. At well-drained site mull-moder organic horizons may be formed.
Mull to moder is found in the humid Arctic as well as in the more southem tundra areas of the
continental Arctic (ibid.). On Taimyr Peninsula peat formation was observed up to Cape
Chelyskin. In the mountain tundra soils the annual phytomass production was lower than the
lowland tundra (GUNDELWEIN, 1998). Yet, according to BAZILEVICH (1995), little difference
was found with respect to the net phytomass input (phytomass annual production, dead plant
matter and its degradation rate).
Acidzjkation
In the presence of decomposing organic matter, roots, microbial activity, acidification occurs
as a result of the formation of carbonic and organic acids. These lead to a depletion of basic
cations. Acidification thus decreases from the southem tundra towards the arctic deseris.
Calc$cation - decalcz$cation und salinisation - desalinisation
The movement of solutes is deterrnined by soil moisture and the orientation of the soil water
movement. Leaching (i.e., downward movement) thus diminishes northward the soils
sequence as precipitation decreases. Low soil moisture accompanied with high base saturation
results in precipitation of carbonates and an accumulation of salts. Often precipitation can be
observed macroscopically as calcareous pendings under stones and thin salt coatings.
Calcification and salinisation are therefore characteristic for the arctic deseri soils but may
also be found locally in southern tundra soils at drier vegetation-free sites (see also Sect.
5.1.2.2). It may further be a temporal phenomenon where puddles (in lower micro-sites)
periodically dry out.
Weathering und secondary minerals
In the Arctic biogenic weathering is probably more imporiant than in most other parts of the
world (FITZ~ATRICK, 1997). Biogenic weathering here is understood as biogeochemical
2.1 Taimyr Peninsula 15
weathering brought about by lichens and mosses. Lichens are known to exude organic acids
(particularly oxalic acid) and liehen compounds that release cations from rock forming
minerals (SCHMIDT, 1993; ISKANDAR & SYERS, 1972; JONES & WILSON, 1986).
Sesquioxides are being formed as a result of geochemical weathering. At well-drained sites
brunification ('Verbraunung') occurs. Under wet conditions iron stays in a reduced state
(ferrous iron) and gives soils grey or bluish colour (i.e., gleying). Sesquioxides rarely
crystallise but remain in hydrosol phase (IVANOVA et al, 1969). Yet, findings by ALEKSEEV et
al. (submitted) also suggest that ~ e ~ ^ migrates downwards and crystallises as lepidocrocite
above the permafrost table where it was found to accumulate.
Clay contents, however, tend to be rather low in Arctic soils. Generally, the clay fraction
mainly consists of clay size rock forming minerals such as quartz and feldspar (EVERETT et al.,
1981). In the valley of the river Pyasina (Taimyr Peninsula), GRADUSOV & IVANOV (1974)
found high proportions of smectites and illite in the clay fraction (i.e., 70-80%), which
decreased towards the Byrranga foot slopes (30-40%). This suggested that the smectites
originated from parent material that were presumably sediments from the Putorana Plateau
(IVANOV, Pers. communication). Thus, there is only little evidence for pedogenic clay
formation (IVANOVA et al., 1969; GORYACHKIN et al., 1998)
Gleying
Gleying is a prevailing and prominent feature of soil formation in the Arctic and a principal
process in the tundra (RIEGER, 1974). The underlying perrnaffost represents a barrier above
which soil water stagnates. Iron mottling is only formed in the active layer under partially dry
conditions. During prolonged dry summer periods or in the freezing front during the
refreezing period, ferrous compounds are converted to hydrated ferric oxides (ibid.). Gleying
markedly decreases northward the soil sequence (TEDROW, 1977). According to GORYACHKIN
et al. (1998) this is rather explained by coarse textured and stony substrates than by climatic
conditions. At Cape Chelyuskin gleying occurs on fine textured, decalcified parent material.
Podzolisation
Arctic soils frequently show podzolisation features. Here, podzolisation is understood as the
mobilisation of iron and aluminium by organic acids and transportation into the B horizon
16 2. Study area and experimental sites
which results in the formation of the diagnostic spodic hosizon (WRB). Yet, there is
controversy about podzolisation in Arctic soils. Although TEDROW (1977) reported the
forrnation of podzols on well-drained and coarse textured material in the southern tundra, he
only refers to iron and manganese transpostation. SOKOLOV & GRADUSOV (1978) described
the formation of an eluvial hosizon at a micro-scale with lacking precipitation of organo-
metallic chelates ('ochristye bodbury'). Often it is being argued that podzolisation properties
(as defined above) represent relic features (LIVEROVSKII, 1974 cf. GORYCHAKIN et al., 1998).
Yet, moisture was found to be sufficient for podzolisation under present climatic conditions
(STONER et al., 1983, UGOLINI et al., 1987). In Antarctica, BLUME et al. (1998; 1996) have also
shown that podzolisation takes place with mean annual precipitation as low as 180 mm.
Bleached eluvial horizons of 1 to 3 cm thickness had forrned in soils at ancient penguin
rookeries (ibid) as well as under lichen-moss vegetation Cover (BOLTER et al., 1995). A
preceding review (BOCKHEIM & UGOLINI, 1990), however, has concluded that podzolisation
was unlikely to occur in Antarctica. Summing up, there appears to be little doubt about
sufficient acidity for eluviation of sesquioxides under present Arctic (OS Antarctic) climatic
conditions (GORYACHKIN et al., 1998). Illuvial horizons of organo-metallic complex on the
contrary are subject of dispute.
2.1.6 Human history and impact
2.1.6.1 Human history
In Siberia, human history dates back as early as to the Palaeolithic or early Neolithic Periods.
7,000 to 8,000 years BP, man (which naturally comprises men, women and children) is
believed to have colonised Taimyr Peninsula (CHERNOV, 1985; ANDREEV, 198 1). During the
TAYMYR 1996 expedition, archaeological findings represented ceramic fragments, worked
and fsagmented bones from a reindeer hunting site at the brook Oleny in the upper Taimyr
river area (PITUL'KO, 1997). These were approximately 1,800 to 2,000 years old (ibid.). The
name of the brook (i.e., Oleny) translates to reindeer brook and probably suggests sich
grounds of the respective mammal. Reindeer represented the main food resource although fish
and birds were also part of the diet.
Historical records On the Siberia started with the European development after armexation of
the khanate sibir in the 16* century (POSSELT, 1990). In the following period, all efforts were
committed to the implementation of the Tsarian power, the collection of taxes in kind (i.e., a
sable fur tax called Jasak) and trading. Administrative outposts became necessary and
2.1 Taimyr Peninsula 17
settlements of Europeans came into being. Khatanga for instance was also founded in that
period (1 626). Bondage in the European Part of the Russian empire made poor farmers move
to the East. First reposts on Siberia were written by trading travellers. Thus, the reports by the
Dutch trader Nicolaas Witsen, who travelled through Siberia to China from 1697-1701,
delivered important maps for scientific expeditions later On.
The indigenous people of Taimyr Peninsula comprise some 3,000 'Dolgans', 1,000 'Ngasans'
as well as descendants of 'Nentsens' and 'Evenkens'. These peoples were nomads following
the migrating reindeer herds. In the 1930s the indigenous people were settled in settlements
and organised in Sowchos leading a modern Soviet life with some remaining elements of their
original culture (such as hunting and fishing). With certain reservations to modern life style,
reindeer and fish still represents the main food resource as well as a source of income.
Taimyr Peninsula has some 350,000 inhabitants, most of which (i.e., 300,000) live in the
mining town Norilsk. The smelters of Norilsk represent a major source of pollutants.
2.1.6.2 Scie?tttj'ic history
Scientific interest in Siberia arose in the period of Enlightenment during the tsardom of
Peter I. (POSSELT, 1990). Peter I. had founded the Russian Academy of Sciences in
St. Petersburg which was fi~lly established in 1725 and happened to guide many of the
Siberian expeditions later On. The new Academy attracted many scientists from Germany
since it offered many opportunities (and Jobs) that were not found back home due to the
Gesman pasticularism. Thus, it was the Geman medical scientist Daniel Gottlieb
Messerschmidt who guided the first scientific expedition to Siberia by appointment of Tsar
Peter I. (1720-1727). Many expeditions followed. In 1724, the Dane Vitus Bering was put in
charge of the First Kamchatka Expedition to explore the supposed land-bridge between Asia
and America. The Second Kamchatka Expedition also by Bering was aimed at the exploration
of further sea-routes to America and Japan. This expedition hrthermore intended the
description of the Arctic Sea, the natural history and ethnological studies. It was thus the
biegest Russian scientific project until 19 17 (ibid.). The material of above mentioned
Messerschmidt was the basis for this expedition. The Germans Johann Georg Gmelin (natural
scientist and botanist) and Georg Wilhelm Steller (medical and natural scientist) were past of
the Pacific and Siberian group (ibid.). Gmelin and Steller described Eurasian peoples, flora
18 2. Siudy area and experimental sites
( e g , Larix gmelinii) and fauna (the legendary Steller's sea-cow, Hydroamalis gigas). In lgth
century more systematical ecological studies in a modern sense started with the works by
SCHRENK (1848; 1854 cf. CHERNOV & MATVEYEVA, 1997) and MIDDENDORF ( I 869; ibid.).
Alexander V. Middendorf was the first h o w n European who travelled to Taimyr Peninsula.
His botanical studies introduced previously unknown plant species, which was also
appreciated by their names (e.g., Betula tiziddendot$i> Oxytropis middendorfii ). He already
had recognised High tundra (mountain tundra) and Low tundra (wet plains) (TEDROW, 1977).
This was followed by the Russian Polar expedition of Toll from 1900-1903. Scientific
expeditions naturally ceased during the sestless times of the Revolutions and World War I and
11. In the 1950s ecological studies On Taimyr were reinstated. The botanical studies of
ALEKSANDROVA (195 1; 1956; 1959; 1960; cf. CHERNOV & MATVEYEVA, 1997) fall in this
period. Her description of the Siberian flora and her assignation of the 'plakor' concept to the
tundra is still essential to any ecologist working in the Siberian tundsa. In the early 1970s four
research sites On Tai~nyr Peninsula were included of the International Biological Programme
IBP (ROSSWALL & HEAL, 1974). The fall of the Iron Curtain in 1989 was a stimulus for
hrther expeditions with Western participation. Several expeditions were carried out in co-
operation with the World Wildlife Fund fos Nature with the aim at a better protection of the
vast breeding grounds of migrating birds (PROKOSCH & HOFKER, 1995). The present joint
Russian-German research project to study Quatemary Environmental Development of Middle
Siberia was launched in 1993. Between 1993 and 1997 a total number of fous joint Russian-
German expeditions were carried out to investigate the pemafiost-soil-hydrosphere-biosphere
System (MELLES, 1994; SIEGERT & BOLSHIYANOV, 1995; BOLSHIYANOV & HUBBERTEN, 1996;
MELLES et al., 1997).
2. I . 6.3 Anthropogenic i~tzpact
Anthropogenic impact On the tundra ecosystems was mainly reported as induced changes in
thc vegetational but also in soil microfloral composition (CHERNOV & MATVEYEVA ,1997;
ANDFEEV, 198 1, KIRTSIDELY et al., 1994). This may be caused by utilisation of biological
resources, physical disruption of the vegetation cover or input of substances.
ARer mechanical disturbance by vehicles, aircrafts andlor trampling (the latter particularly
around settlements) the vegetation cover may restore slowly depending On the degree of
destmction. Yet, the species composition and the structure will be completely different
2. I Taimyr Peninsula 19
(CHERNOV & MATVEYEVA 1997). Particularly in the vicinity of settlements the invasion of
new plant species brought into the system (fos example as a food sousce) leads to the
fosmation of a different vegetation Cover. Unless the uppes soil is affected by disruptive
psocesses this may cause the fonnation of meadows. Anothes consequence of the psesence of
people in both histosical and psesent times was the input of substances. This comprises the
dumping of domestic sefuse and burial of the deceased. In modern times, garbage certainly
differs in quality and quantity. Furthermose, soil pollution by coal heaps and oil spillage is a
more secent phenomenon, which mainly occurs around settlements. Oil spillage also occurs
locally everywhese in the tundra due to rehelling of vehicles and aircrafts.
Despite its semote location, Taimyr Peninsula is also affected by ais pollution as for example
acid deposition and heavy meta1 pollution (WOODIN, 1997; KIRTSIDELY et al., 1994; 1995).
Although inputs of pollutants may be comparably low, these is evidence that the tolesance of
arctic ecosystems is exceeded, As elsewhese, soils ase sensitive to acidification where acid,
shallow and poos in bases, which makes tundra soils particularly vulnerable. Some Arctic
sivess, as fos example the river Jenessej, ase significant pathways fos contaminants such as
suspended solids of DDT OS PCB. These enter the food web by birds of psey or fish (AMAP,
1998). Due to their high sensitivity, the 'tolerance' of Arctic ecosystems is exceeded in the
sense that sevese distusbances of functioning wese observed (WOODIN, 1997). In contrast to
ubiquitous air pollution, the above mentioned smeltess of Norilsk represent a located sousce of
pollutants (i.e., heavy metals) fos the Taimyr Peninsula. Yet, these also contribute sevesely to
Arctic pollution in genesal (AMAP, 1998).
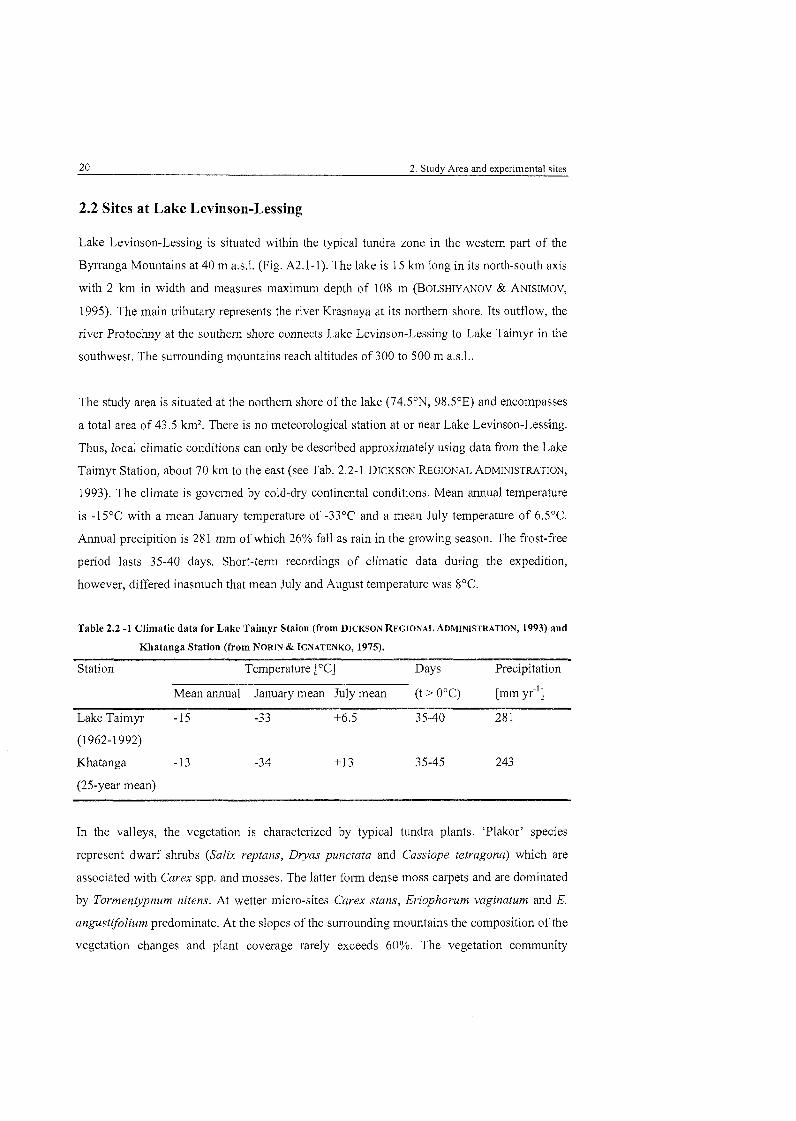
20 2. Study Area and experimental sites
2.2 Sites at Lake Levinson-Lessing
Lake Levinson-Lessing is situated within the typical tundra Zone in the western Part of the
Byrranga Mountains at 40 m a.s.1. (Fig. A2.1-1). The lake is 15 km long in its north-south axis
with 2 km in width and measuses maximum depth of 108 m (BOLSHIYANOV & ANISIMOV,
1995). The main tributary repsesents the river Krasnaya at its nos-thern shose. Its outflow, the
]+ver Protochny at the southern shore connects Lake Levinson-Lessing to Lake Taimyr in the
southwest. The surrounding mountains reach altitudes of 300 to 500 m as.1.'
The study area is situated at the northern shose of the lake (74S0N, 98.s0E) and encompasses
a total area of 43.5 km2. There is no meteorological station at or near Lake Levinson-Lessing.
Thus, local climatic conditions can only be described approximately using data ffom the Lake
Taimyr Station, about 70 km to the east (see Tab. 2.2-1 DICKSON REGIONAL ADMNISTRATION,
1993). The climate is goves-ned by cold-dry continental conditions. Mean annual temperature
is -15OC with a mean January temperature of -33OC and a mean July temperature of 6.S°C
Annual precipition is 281 mm of which 26% fall as rain in the growing season. The fiost-fiee
period lasts 35-40 days. Short-term recordings of climatic data during the expedition,
however, differed inasmuch that mean July and August temperature was 8OC.
Table 2.2 -1 Clin~atic data for Lake Taimyr Staion (from DICKSON REGIONAL ADMINISTRATION, 1993) and
Khatanga Station (from NORIN & IGKATENKO, 1975).
Station Temperature [OC] Days Precipitation
Mean annual January mean July mean (t > O°C [mm yr-l]
Lake Taimyr - 15 -3 3 +6.5 35-40 28 1
Khatanga -13 -34 +13 35-45 243
(25-year mean)
In the valleys, the vegetation is characterized by typical tundra plants. 'Plakor' species
represent dwarf shrubs (Salix reptans, Diyas punctata and Cassiope tetragona) which are
associated with Carex spp. and mosses. The latter form dense moss carpets and are dominated
by Tormengpnz~m nitens. At wetter micso-sites Carex stans, Eriophorum vaginatum and E.
angustiJolium predominate. At the slopes of the surrounding mountains the composition of the
vegetation changes and plant coverage rasely exceeds 60%. The vegetation community
2.2 Sites at Lake Levinson-Lessinz 2 1
compsises D ~ y a s punctata, Curex arctosibiricu, Novosiviersia glacialis and mosses. On the
mountain tops, plant covesage fusthes decseases (< 10%). Typical plants wese Salix arctica,
Novosiviersiu glacialis, Minnz~artia arctica, Papuver polare, Dqus punctata. (SOMMERKORN,
1998; BECKER, 1997)
The Ksasnaya valley is filled with fluvial silty loamy to sandy sediments but ase psesumably
mixed with aeolian and solifluidal sediments fsom solifluction slopes. In the level asea of the
valley polygonal pattemed gsound with high OS low centsed foms and thesmokasst lakes have
developed. The diametes of the polygons sanges fsom 6 to 12 m. At the out banks of the river
the edges ase esoded by thesmokasst. The mosphology at the slopes of the su~~ounding
mountains is fosmed by solifluction and intensive kost-shattesing. The solid sock consists of
gseywacke, gneiss and schist. Soils developing hese show little or no pedogenic diffesentiation
in sesquioxide, silt OS clay content (MULLER-LUPP, 1997). Smectite and illite are the psincipal
clay minesals. Pasticulasly, in fine-textused soils kaolinite, chlosite and intesstsatified minesals
ase also common. Yet, very little clay is thought to have fosmed by pedogenesis (HAGEDORN,
pess. comm.). Geochemical investigations have shown that feldspas and montmosillonite may
fusthes dissolved undes present thesmodynamic conditions (HAGEDORN et al., SUBMITTED).
22 2. Siudy area and experimental sites
2.3 Sites at Lake Labaz
The experimental sites ase at the nosthesn shore of Lake Labaz (72'2'N, 99'4'E) which is
situated within the southern tundsa Zone in the Nosth Sibesian Iaowland at 47.5 m a.s.1.
(Fig. A2.1-2). Tlie lake is 30 km in its diametes and measuses a shallow depth of less than
5 m. The landscape shows a uniform chasactes of a low hill country with polygonal and
tussock tundsa as well as numesous thelmokasst lakes and watescousses. Elevations sasely
exceed 150m a.s.1. and the watesshed is i~~egu las because of the low selief intensity.
Consequently, the disection of flow of the main two watescousses of the study asea stsongly
divert. They both finally sepsesent tsibutasies to the rives Khatanga but some 350 km apart.
The study asea encompasses a total asea of 8 km2. As was the case fos the study asea at Lake
Levinson-Lessing, these was no ~neteosological station at or neas Lake Labaz. Thus, local
climatic conditions wese descsibed using data of the neasest station at Khatanga (72ON,
102OE) (Tab. 2.2-1 modified fsom NORIN & IGANTENKO, 1975) in the fosest tundsa Zone.
Mean July tempesatuse and the dusation of the gsowing season may differ. In addition
precipitation is likely to be highes at Lake Labaz (Sects. 1.2 and 1.3). The study asea is
chasacterized by a cold-dry continental climate. Mean annual tempesatuse is -13OC with a
mean January tempesatuse of -34OC and a mean July tempesatuse of +13OC. Annual
precipitation is 243 mm of which 31% fall as sain in growing season. The fi-ost-f?ee penod
lasts 35-45 days. During the 1994 and 1995 expeditions shost-tesm secosdings did not delives
differing climatic data (SOMMERKORN, 1995; 1997).
The vegetation is chasacterized by typical plants of the southem tundsa. 'Plakor' vegetation
comprises bush thickets of Salix spp., Betula spp. and Larix spp.. Salix spp. in particulas
reaches lleights of 0.8 metses. Dwasf s h b s (P'accirzium vitis-idea, Cassiope tetragona, Betula
nana) and lichens (Cetraria cucullata, Thamnolia ve~micularis) ase a furthes 'plakos' plants.
At wetter sites, sedges (Carex spp.), cotton gsass (Ei.iophorum spp.) and mosses
(Tormen~pzum nitens, Drepanocladz~s uncinatus) psedominate (SOMMERKORN, 1998; 1995).
The mountain tops sepsesent well aerated dry rudesal habitats whese the plant covesage
decreases (< 80%). The vegetation is dominated by chinophobous (e.g., Certraria nivalis) and
rudesal species (Carex ?-upestris).
During the last glaciation maximum, a glacial lake had fosmed a Pse-Labaz lake of which the
2.3 Sites at Lake Labaz 23
present and neighbouring lakes developed as relicts (SIEGERT & BOLSHIYANOV, 1995;
ISAYEVA, 1984). The northern shore of Lake Labaz consists of marine terraces (Sect. 1.4.1)
and deposits of the Kazantsev interglacial (= Eemian interglacial N-Europe) and the Karginsk
interstadial (FISHER et al., 1990). These deposits generally show silty-loamy texture. Peat
lenses with thickness of up to 2 m occurred in mixed layers and were dated to the Karginsk
interstadial as well as to the Holocene (SIEGERT, pers. comm.).
24 3. State of the art
3. State of the art
Wohin der Blick des Naturforschers dringt, ist Leben oder Keim zum Leben verbreitet.
Alexander V. Humboldt
3.1 Microbiota in arctic soils
Soil microbial ecology is concemed with the structure and function of soil micro-organisms.
Microbial communities are considered to inhabit microhabitats in soil. Yet, the terminology is
rather ambiguous and invariably subject of dispute (HARRIS, 1994). At its simplest, 'microbial
cornm~inity' is regarded as the coincident occurrence of micro-organisms. As such the term is
used in this study, aware of insufficient information on interactions between components of
the community. 'Microbial habitat' is also poorly defined but suggests a spatial and even time
dimension. It is therefore a question of scale, which will be elucidated in a separate section of
this chapter.
3.1.1 Community structure
In the Arctic, comprehensive studies of the soil microbiota were carried out at the
experimental sites of the IBP Tundra Biome Programme (HOLDING et al., 1974, ROSSWALL &
HEAL, 1975; BLISS et al., 1981). Since then very little new infoimation on the cornmunity
structure has been gained (ROBINSON & WOOKEY, 1997). Within terrestrial ecosystems, soil
microbiota represents the main component of the decomposer cycle thsough which between
90 to 98% of the primary production passes (BLISS, 1997; GOKS~YR, 1975). Soil micro-
organisms not only govem decomposition processes but they furthermore pasticipate in
psimary production processes (COLEMAN & CROSSIEY, 1996).
Primary production
Symbiotic associations between micro-organisms and plants enhance the nutrient acquisition
of the host. In exchange the involved micro-organism receives assimilates. In tundra
basidiomycetes for instance form ectomycosshizal associations with Betula and Salix spp. but
are also reposted with ericaceous shrubs and D y a s spp.. The diversity of mycosshizae is
interwoven with the vegetation Cover but is generally lower than in other biomes (MILLER &
LAURSEN, 1978). In the Arctic, ectomycorrhizal enzyme Systems appear to be adapted to cold
(TIBBETT et al., 1998a) and nutrient deficiency (TIBBETT et al., 1998b). Endomycosshizae (i.e.,
vesicular-arbuscular mycosshizae) are also common and found in association with Ranunculus
spp., Saxifraga spp. and Graminae (MILLER & LAURSEN, 1978). At drier sites mycorrhizal
forming kngi are as common as saprophytic (decomposing) kngi (BUNNELL et al., 1975).
3. State of the art 25
Furthermore nitrogen fixing bacteria are also known to form symbiotic associations with
plants. The latter occurs as nodules at root hairs, which develop after infection of the host's
roots by the bactesium Rhizobium (KILLHAM, 1994). In the Arctic, rhizobia were occasionally
observed in association with Alnus, D~yas spp., Astragalus alpinus, Lotus croniculatus and
two species of Oxytropis but may also be absent (WALTER & BRECKLE, 1986; GRANHALL &
LID-TORSVIK., 1975; CHAPIN & BLEDSOE, 1992) and is subject to seasonal variation (NOSKO
et al., 1994). Although nitrogen fixation by rhizobia may be locally important, it is generally
of subordinate significance in tundra (HOLDING, 198 1). Detailed description of symbiotic
microbial-plant associations are given e.g., by TATE (1995), GILLER & DAY (1985), READ
et al. (1985), and BULL & SLATER (1982).
However, in tundra soils cyanobacteria (former blue-gseen algae) are by far the more
impostant taxonomic gsoup of micro-organisms with respect to nitrogen fixation
(ALEXANDER, 1974a,b; ALEXANDER & BILL~NGTON, 1986; CHAPIN & BLEDSOE, 1992). The
nitrogen input by fixation may be fourfold gseater (CHAPIN & BLEDSOE, 1992) than fsom other
sources (as for instance fsom precipitation). The predominant genera (i.e., Nostoc, Anabaena)
occur in wet depressions and melt ponds (ALEXANDER et al., 1978) as well as associated with
fungi and soil algae in ci-usts (GRANHALL & LID-TORSVIK, 1975) or with plants (HENRIKSON et
al., 1987; SOLHEIM et al., 1996). Other nitrogen fixing bactesia are less impostant (DUNICAN &
ROSSWALL, 1974) or not found in tundra (e.g., MATVEYEVA et al., 1975). In addition
cyanobactesia, along with gseen algae and diatoms also release other nutrients into the soil not
only upon the decay of dead cells but also as metabolites (e.g., polysacchasides, polypeptides
(CAMERON et al., 1978). Because of their ability of photosynthesis, they formerly had been
sumrnarised as soil algae. Consequently cyanobacteria and soil algae take up and release COz
by photosynthesis and respiration respectively. Some gsoups are even known to be 'fertilised'
by CO2 supplied by live and decaying roots (ibid.). Photoautotrophs are largely restsicted to
the upper few centimetres of soils and decrease logasithmically with depth. In the Arctic, they
are practically found in all habitats although their biomass, species composition and
productivity largely depends on moisture (BUNNELL et al., 1975). At wetter sites, the species
composition was found to approximate that of aquatic environments (ibid.) but was also
reported to be generally less diverse and more specialised in arctic terrestsial Systems (ELSTER
et al., 1994). Depending on the author and the methodology, green algae are thought to prevail
over diatoms or cyanobactesia (BUNNELL et al., 1975). The latter, however, are more difficult
to culture. Therefore, the relationship was also reported to be inverse (CAMERON et al., 1978).
26 3. State of the art
The ecological significance in the Arctic is particularly high because cyanobacteria and soil
algae represent the first organisms in psimary succession on land. In the high Arctic, they may
even represent the only life foms. In association with bacteria, they from cmsts on bare rock
and soil surfaces. During the last decade, intense studies were carsied out on these cryptobiotic
crusts in high alpine (BELNAP & GARDNER, 1993; BELNAP et al.,1993; BELNAP, 1992; ST.
CLAIR & JOHANSEN, 1993) and polar desert systems (PARIKKINA & PIIN, 1992; WYNN-
WILLIAMS, 1985; 1994; BOCKHEIM & WILSON, 1992, FRIEDMANN, 1982). On the contrary,
algal biocenoses of moist terrestsial ecosystems are largely unknown (SVOBODA &
FREEDMANN, 1994; ELSTER et al., 1994).
Symbiotic microbe-plant relationships as well as cyanobactesia and soil algae represent
primary producers. Microbial aid of nutrient uptake by plants as well as microbial C and N2
fixation are pathways of nutrient input in soils from above- and belowground and thus primary
production processes (COLEMAN & CROSSELY, 1996).
Decomposer cycle
As mentioned above, pasticular importance of the soil microbiota lies in its predominance in
the decomposer cycle. Yet, the microbiota is gseatly reduced in the Arctic. In wetter habitats
bacteria are more numerous than fimgi, and hngi are more abundant in mesic habitats (BLISS,
1997; SYZOVA & PANIKOV, 1995; BUNNELL et al., 1975). FEDOROV-DAVYDOV (1998) reckons
about 32% of the microbiota tundra among micro-organisms decomposing fsesh plant
remains, another 15% among decomposers of organic substances in peat and 52% among the
microbial population living On decaying roots and root exudates.
In drier and warmer (mesic) arctic soils, fungi have been reposted to predominate in the
decomposition of organic matter because of the acid reaction of the humus layer. Bacteria
have been considered to be of secondary importance (BUNNELL, et al., 1975; WALTER &
BRECKLE, 1986). In wetter habitats, fungi have been observed to play a subordinate role and
have only been found as sterile mycelia (SYZOVA & PANIKOV, 1995; MATVEYEVA et al., 1975;
CHERNOV et al., 1975). Yet, fungal productivity (i.e., production of fbngal biomass per unit
area and time) is greater than the productivity determined for bacteria (ROSSWALL, 1975).
Fungi convert between 50-60% of the carbon in litter to COz (HOLDING, 1981). They may be
subdivided into three groups according to their carbon source. Sugar fungi utilise simple
Sugars, proteins and organic acids as their carbon source. Cellulolytic fbngi are able to utilise
3. State of the art 27
cellulose in addition. Last but not least, xylolytic fungi are capable of decomposing complex
polymers such as lignin and lignified cellulose. In tundra, cellulose decomposition is mainly
carried out by fungi (HOLDING, 1981). Fungi are very competitive in (GOKS~YR, 1975)
utilising structurally intact plant material. Thus, standing dead plant material as well as litter
and roots are heavily invaded by fungi and by bacteria only to a lesser degree (ibid.). In tundra
soils, fungi are less divers than in other biomes (BUNNELL et al., 1975; BAB'YEVA &
CHERNOV, 1982). Species composition is also different and furthermore varies between sites.
Cladosporium, Mortierella and Penicillium are the most widespread genera. At Tareya (W.-
Taimyr), cellulolytic species such as Phoma eupirena, Aspergillus versicolor, Penicillium spp.
(CHERNOV et al., 1975) were isolated. Estimates of yeasts represent up to 17% of the fungal
biomass (BAB'YEVA & CHERNOV, 1982) but may vary dramatically between years (BWELL
et al., 1975). They seem to be largely restricted to the upperrnost centimetres of drier soils
(ibid.; HOLDING, 198 1). Data provide conflicting evidence with respect to the significance of
sterile mycelia. Many authors (HOLDING, 1981; ROSSWALL, et al., 1975) consider sterile
mycelia as very widespread fungi. Yet, FLANAGAN & SCARBOROUGH (1974) rarely found
sterile mycelia in litter or soil. Abundance and diversity also change between tundra types and
within profiles. Thus, fungal species that were observed to colonise standing plant material
differed from the rhizosphere with respect to species composition (CHERNOV et al., 1975) and
physiology (FLANAGAN & SCARBOROUGH, 1974).
Bacteria become more competitive once the plant material has mechanically been
disintegrated for example by passing through the gut of an invertebrate (GOKS~YR, 1975).
Fungi are very much confined to the presence of plant material. Therefore they predominate in
the upper few centimetres of soil and decrease with depth. Bacteria also predominate in the
upper horizons and decrease with depth (PARINKINA, 1974). Yet, in contrast to fungi, they
occur throughout the soil profile down to the permafrost table or even within the permafiost
(MATVEYEVA et al., 1975; LYSAK & DOBROVOL'SKAYA, 1982, GILICHINSKY et al., 1995).
Tundra soils are generally marked by moist to very wet conditions. Under these conditions,
fungi are less competitive and bacteria may represent up to 75% of the microbiota (BUNNELL
et al., 1975). Nevertheless, compared to dry sites, the bacterial productivity is much smaller at
wet sites (PARINKINA, 1974). Also, aerobic bacteria are manifold more numerous than
anaerobic OS facultative anaerobic groups (DUNICAN & ROSSWALL, 1974). Among the
physiological groups, those involved in nitrogen cycling predominate: utilisers of organic and
inorganic nitrogen as well as aerobic and anaerobic ammonifying bacteria. Yet, nitrifying and
28 3. State of the art
denitrifying bacteria are either rare or absent (MATVEYEVA et al., 1975; BUNNELL et al., 1975).
Some physiological groups of bacteria participate in carbon cycling. Despite the fact that
cellulolytic bacteria are generally less common in tundra (DUNICAN & ROSSWALL, 1974),
bacteria were found to be responsible for anaerobic cellulolytic activity (ROSSWALL et al.,
1975). Under anaerobic conditions in wet habitats, methanogenic bacteria are present (ibid.).
Methane produced in subsoil horizons may further be oxidised by bacteria in better aerated
upper or adjacent horizons (e.g., SLOBODKIN et al., 1992; SCHIMEL et al., 1993; WHALEN,
et al., 1996). Despite the fact that methane oxidation appears to be an obligatory aerobic
process (SCHIMEL et al., 1993), methanotrophs were also determined in water saturated soils
(VECHERSKAYA et al., 1993). Methane nlay further be oxidised by nitrifiers due to similar
shape and size (i.e., tetrahedral molecule and Van der Waals radii) of CH4 and NH3 and low
specificity of the responsible monooxygenase enzymes (SCHIMEL et al., 1993). Yet in tundra,
this process is presumably of minor importance since nitrifiers were reported to be less
abundant. In addition to the just mentioned chemoautrophic bacteria, sulphate oxidising and
reducing bacteria as well as iron oxidising and few reducing bacteria have been isolated (ibid.,
BUNNELL et al., 1975; DUNICAN & ROSSWALL, 1974; VAINSHTEIN & GOGOTOVA, 1992).
DUNICAN & ROSSWALL (1974) have concluded that the bacteria present in soils at the IBP
sites are not specific for tundra (tundraphilic). Yet, the biome provides environrnental
conditions suitable for autotrophs that are less common in other environments (ibid.).
3.1.2 Microbial ecology
In the Arctic, as elsewhere, soil microbiota is controlled by both abiotic and biotic factors.
Synoptic descriptions are given for instance by COLEMAN & CROSSLEY (1996), TATE (1995),
KILLHAM (1994) or PAUL & CLARK (1989).
3.1.2.1 Abiotic factors
The microbiota is influenced by soil temperature and moisture, redox potential, pH and
nutrients. In the Arctic, the most important and most evident controlling factors represent soil
temperature and moisture. They both show independent and interactive effects (NADELHOFFER
et al., 1997). Having a pergelic soil temperature regime with hard or dry, loose permafiost
within the soil profile (S.T.), arctic soils insinuate a psycrophilic microbiota although it is
rather cold tolerant than cold adapted. True psycrophilic micro-organisms represent the minor
proportion (e.g., 10-20% fungi) (BLISS, 1975; FLANAGAN & SCARBOROUGH, 1974). For
bacteria, this proportion increases in wetter and colder habitats (VASSILYEVSKAYA et al.,
1975). Also fungi are more affected by moisture than bacteria (BUNNELL et al., 1975).
3. State of the art 79
Microbiological and enzyme activities show many temperature optima (FLANAGAN &
SCARBOROUGH, 1974). Furthermore, micro-organisms may also compensate for lower enzyme
activities at low temperature by an increase of enzyme production (TIBBETT et al., 1998~) .
Thus, a complex of functional differences in both microbial community stmcture and
physiology influence decomposition processes. At any scale, decomposition is generally slow
and incomplete with increasing moisture and decreasing temperature (NADELHOFFER et al.,
1992). On the other hand. lacking moisture inhibits decomposition independently of
temperature. Microbiota is influenced by the litter quality and nutrients, particularly nitrogen
(WALKER; 1996). Nutrient availability influences microbial growth. Although fungal gsowth
is limited by nitrogen ( K J ~ L L E R & STRUWE, 1982), hngi are less influenced by nitrogen
contents than bacteria (HOLDING, 1981). The microbial carbon source may be subdivided into
two groups: substrates with low molecular weight that are soluble in water (i.e., simple Sugars,
organic acids) and complex polymer compounds such as starch, cellulose, hemicellulose,
lignin and pectin (BLISS, 1997). Decomposition of the latter is slow particularly in the Arctic.
Differentes are enhanced by difference in substrate quality and different combination of soil
moisiure and temperature regime (NADELHOFFER et al., 1992). Soil pH influences the
microbial community composition. Most fungi predominate in acid habitats (FLANAGAN &
SCARBOROUGH, 1974). Actinomycetes occur in soils with neutral to alkaline soil reaction.
This requirement along with their heterotrophic nature may explain their lower abundance in
tundra (DUNICAN & ROSSWALL, 1974). Bacteria inhabit soils with more neutral reaction. Yet,
they predominate in soils with acid pH when the site is water-logged (CLARHOLM et al., 1975)
which suggests that bacteria are less competitive when hngi are present. In addition to
cornmunity stmcture, soil pH influences microbial processes as for example methanogenesis
(DUNFIELD et al., 1993; SCHIMEL et al., 1993). During the last decade, the general interest in
soil stsucture and microbiota interrelationships increased (e.g., SMILES, 1988; BRUSSAARD &
KOOISTRA, 1993; MONREAL & KODAMA, 1997). Soil physical properties influence for instance
substrate location and accessibility, enzyme activity (PAGLIAI & DENOBILI, 1993; KANDELER
& MURER, 1993) and gsazing pressure (HASSINK et al., 1993). Yet, to date there are only few
investigation of these relationships in arctic soils (e.g., GEBAUER et al., 1996).
30 3. State of the art
3.1.2.2 Biotic factors
The composition of the plant canopy, roots and fauna are among the biotic controls of the
microbiota. Detailed descriptions are given for example by FITTER et al. (1985) and COLEMAN
& CROSSLEY (1 996).
Symbiotic relationship between micro-organisms of plants have been described above.
Furthemore, cestain fi~ngi and yeasts occur in association with particular plants (CHERNOV et
al., 1975; BAB'YEVA & CHERNOV, 1982). Tliis relationship is pastly symbiotic (BLISS, 1997;
BUNNELL et al., 1975; MILLER & LAURSEN, 1974) and partly not well understood.
An~mensalism that is to say inhibition by toxins, is known for lichens. They exude antibiotics
that pasticularly suppress bacteria. Plant-microbe relationships may partly be explained by a
plant specific rhizosphere (see below). Roots exudates (e.g., soluble carbohydrates) enhance
microbial proliferation (BARBER & LYNCH, 1977). In the Arctic, roots have developed specific
interactions to exploit the resources of the soil (SCHIMEL et al., 1996).
Despite the impostance of trophic interactions between fauna and microbiota for soil fimction
(COUTEAUX & BOTTNER, 1994; LAVELLE et al., 1996), in the Arctic these relationships are
only partially investigated (BLISS, 1997). Protozoa and invertebrates directly influence the
microbiota by grazing, inhibition, faeces addition and dispersal (WHITTAKER, 1974). Fauna1
impact is not restricted to soil animals. As such cyanobacteria on the soil surface for instance,
are being grazed by herbivore geese (SOLHEIM et al., 1996). An indirect effect results from the
input of nutrients (e.g., ammonium, nitrate, phosphate) by animal faeces of birds and
lemmings (CHERNOV & MATVEYEVA, 1997; WU~HRICH, 1994).
3.1.2.3 Microbial habitats
The fimctioning of the microbial cornmunity is inteswoven with space, time and food
resource. These represent the three dimensions of the original 'niche' concept that define the
role of an organism in a community (LOESCHKE, 1987). Thus, space, or habitat, where
hnctioning takes place, represents one dimension. The concept was largely applied to the
understanding of population and its linkage to competition. Its limitation lies in the separation
of organisms and environmental factors as well as in neglecting scale (ibid.). Tlie microbial
loop concept elucidated the role of protozoa and bacteria in the oceanic food web (POMEROY,
1974). Its applicability to soil is subject of discussion (CLARHOLM, 1994). In order to
determine the hnction of the microbial loop in soil, the investigation of the environmental
controls led to the forrnulation of a hierarchical concept of 'spheres' of influence (COLEMAN,
1994; BEARE et al., 1995). This concept was already beyond the microbial loop concept
3. State of the art 3 1
inasmuch that it included soil biota in general. It aims at the explanation of the spatial
heterogeneity of biotic communities and functioning, one hierarchical level influencing
another. The 'spheres' of influence include the rhizosphere and detritusphere as well as the
drilosphere (the region of faunal activity), the porosphere (the Zone of aerated or water-filled
pores), and the aggregatussphere of macro- and micro-aggregates. In this study, the conception
of 'spheres' of influence is adopted. Furtherrnore, 'microbial habitat' is used as a more general
term in awareness of its hierarchical and interlocking nature. The respective habitats are
investigated to different degrees and so is the evaluation of the significance for biodiversity
and biogeochemical cycling (e.g., COUTEAUX & BOTTNER, 1994; BOLTON et al., 1993). The
hierarchical concept narrows the problem of spatial dimension. Yet, as for example
experienced for the rhizosphere, definition of spatial profiles show experimental constraints
that may consequently be tackled by mathematical models (e.g., SMITH, 1982, p. 37). In
addition to the hierarchical approach, ZVYAGINTSEV et al. (1994) and ZVYAGINTSEV (1994)
suggest a stratigraphic concept that describes changes in microbial communities between
layers of vegetation and soil. According to the authors, temporal and spatial differences
elucidate ecosystem functioning at ecosystem level and even between vegetation zones as
suggested by MISHUSTIN (1975). Further implications of the microbial scale for the ecosystem
level are discussed by SCHIMEL (1 995).
3.2 Methodology
In early studies on soil micro-organisms, culture plates and direct microscopy were common
tools to characterize the microbial pool. As a consequence, these direct methods were also
applied for the analysis of the microflora at the IBP sites (HOLDING, 1981). Quantitative esti-
mates of the microbial pool by culture methods are lo2 to 1 0 smaller than by direct micros-
copy (PARINKINA, 1974). This is explained by the fact that only a small propostion of soil mi-
cro-organisms may be cultured. The inaccuracy of culture methods is even more dramatic as
recent application of molecular techniques has revealed. Thus, the phylogeny of bactesia fsom
a wide variety of habitats differs substantially fsom characterized bacteria cultured from those
same environments (DELONG, 1996). The problem of culturability is irrelevant to direct mi-
croscopy (bright field or fluorescence microscopy). More recently, Computer based image
analysis has facilitated enumeration and biovolume determination (BOLTER et al., 1993).
Methods differ depending On the target gsoup of micro-organisms and with respect to staining.
Procedure protocols are given for instance by BLOEM et al. (1995), TROLLDENIER (1993), ALEF
(1991), or FEGRI et al. (1977). A constraint of direct microscopy represents lacking differen-
tiation between dead cells or 'ghost' hyphae (JENKINSON & LADD, 1981; PARINKINA, 1974).
The use of specific stains as acsidine orange and fluorescein diacetate (SODERSTROM, 1979)
pastially overcame this constraint. Further sources of inaccuracy are sample homogenisation,
dilution factors, magnification and conversion factors (BLOEM et al., 1995; RICHAUME et al.,
1993).
As mentioned before, DNA extraction (SAANO & LINDSTROM, 1995; TORSVIK et al., 1994;
PIETRAMELLARA et al., 1997) along with determination of specific biomarkers (ZELLES &
ALEF, 1995) elucidate microbial community stnicture pastially down to the species level.
However, to date many aspects of specific fimctions remain unknown despite this increasing
knowledge about structure.
In studies on mineral cycling and energy flow, the microbial pool has often been considered as
an undifferentiated whole (NANNIPIERI et al., 1994). Indirect methods provided tools for the
estimation of microbial biomass. The use of chloroform fumigation methods (JENKINSON &
LADD, 198 1; JOERGENSEN, 1995; VANCE et al., 1987; HORWARTH, et al., 1996), substrate in-
duced respiration (ANDERSON & DOMSCH, 1978; SPARLING, 1995) and heat output (SPARLING,
1983) enabled indirect determination of microbial biomass. As an example given, SPARLING
3.2 State of the art 3 3
(1983) calculated the relationship between heat output at 22OC and microbial biomass of soil
amended with glucose to a saturated level. Heat evolution is measured by means of microcalo-
x-imetsy, which is based on the principles of thermodynamics of irreversible processes
(GUSTAFSSON, 1991). These are descsibed in classical textbooks about bioenergetics or in re-
views On microcalosimetsy (e.g., GNAIGER, 1989; FORREST, 1972). This calculation of micro-
bial biomass only applies to the heat production immediately after substrate amendment and
before cell proliferation (SPARLING, 1983). The latter is always accompanied with a much
greater heat production (BELAICH, 1980; LAMPRECHT, 1980). Accordingly, calculation of mi-
crobial biomass may not always be done accurately. Furthesmore, it has to be bome in mind
that only the active microbial biomass is measured and the proportion of dosmant micro-
organisms may be significant. As it is known for substrate induced respiration (SIR), only
particular micro-organisms are stimulated by substrate amendment whereas others are not
(e.g., anaerobic micro-organisms). Microbial biomass may thus be underestimated in for in-
stance forest soils or waterlogged soils (HEILMANN, 1993). Since heat output also (with or
without substrate amendment) represents biological activity, the tool has proved to be a sensi-
tive method to investigate the overall microbiological activity in soils (MORTENSEN et al.,
1973; LJUNGHOLM et al., 1979a,b; ZELLES et al., 1990; RAUBUCH & BEESE, 1995). ZELLES et
al. (1987a;b) even consider heat production (along with ATP analysis and respiration) a better
Parameter for these purposes than specific activity measurements. Heat output is associated
with respiration (SPARLING, 198 1 b; BOLTER, 1994) and shows good correlation with enzyme
activity analyses (ALEF et al., 1988). Equipped with a perhsion System, microcalosimetsy may
also be designed to investigate anaerobic processes only (ALBERS et al., 1995). High costs of
microcalosimeters limit the use as a routine analysis. Thus, data for comparability are not
widely spread. Furtherrnore, data fiom the bibliography have to be read cautiously because
standardisation of the method is still in its infancy.
Other methods to determine the microbial pool are based On the extraction of specific cell
components such as adenosine-triphosphate (ATP). The use of ATP as an index of microbial
biomass (OADES & JENKINSON, 1979; BROOKES & OCIO, 1989) is based On the assumption
that ATP is a constant component of diverse microbial cells. ATP is extracted from soil using
either acid extractants such as trichloracetic acid (JENKINSON & OADES, 1979), sulphuric acid
(EILAND, 1983), phosphoric acid (CIARDI & NANNIPIERI, 1990) or DMSO (BAI et al., 1988) or
alkaline extractants such as Tris-EDTA (VAN DE WERF & VERSTRAETE, 1979) or boiling Tris-
34 3. State of the art
buffer (HOLM-HANSEN & BOOTH, 1966, GRAF, 1977). The assays differ with respect to ex-
traction efficiency, recovery of an internal Standard, and quenching effects during measure-
ment. Comparative studies of different extraction methods are given for example by CONTIN et
al. (1995), FRIEDEL (1991), ZELLES et al. (1985), VERSTRAETEN et al. (1983) or EILAND (1983;
1979). SPARLING & EILAND (1983) therefore consider the extraction method as most important
factor causing differences in ATP measurements. The most appropriate method also depends
011 the soil material under investigation since soil properties influence the quality of the assay
(VERSTRAETEN et al., 1983). Thus, most studies have been carried out on agricultural soils
whereas ARNEBRANDT & BAATH (1991) encountered strong quenching effects when measur-
ing ATP-contents of forest humus. Since ATP-contents in soil were found to fluctuate under
field conditions (e.g., BARDGETT & LEEMANS, 1995; WANNER et al., 1994; INUBUSHI et al.,
1989) as well as due to Storage and sample treatment (e.g., SPARLING et al., 1986; AHMED et
al., 1982), it is being argued that the ATP-contents of soils rather reflect the physiological
state of the soil micro-organisms (NANNIPIERI et al., in press). Estimation of microbial bio-
mass is recommended under standardized conditions prior to extraction (i.e., preincubation,
adjustment of water content).
Indirect determination methods only provide an estimate and the risk of error is higher than in
direct methods (NANNIPIERI et al., 1994). Comparative studies or reviews on methods to esti-
mate the microbial pool are given for instance by BECK et al. (1997), ALEF (1993), OCIO &
BROOKES (1 990), JENKINSON & LADD (1 98 1) or ANDERSON & JOERGENSEN (1997).
In addition to deterrnination of the microbial pool, its ecophysiological characterisation gains
importance in understanding ecosystem iünctionin (ANDERSON, 1994; INSAM & ÖHLINGER
1993). Relationships between microbial andlor soil parameters describe for instance the state
of equilibrium of soil organic matter (Cmic:Corg-ratio; ANDERSON & DOMSCH, 1989). The
metabolic (ANDERSON & DOMSCH, 1993) OS caloric quotient (RAUBUCH & BEESE, 1995) char-
acterizes the energetic state of soil micro-organisms.
General books on methods in soil microbiology have been published by ALEF & NANNIPIERI
(1 995); WEAVER et al. (1994), ALEF (199 1) and SCHINNER et al. (1 993). Synoptic reviews are
given by NANNIPIERI et al. (in press), NANNIPIERI (1990), SPARLING (1985) or JENKINSON &
LADD (1 98 1).
4.1 Field procedures 3 5
4. Materials and Methods
Denn da der Beobachter nie das reine Phänome mit Augen sieht, sondern vieles von seiner Geistesstimmung, von der Stimmung des Organs irn Augenblick, von Licht, Luft, Witterung, Körpern Behandlung und tausend andern Umstände abhängt so ist ein Meer auszutrinken, wenn man sich an die Individualitä des Phänomen halten und diese beobachten, messen, wäge und beschreiben will.
J.W. V. Goethe
4.1 Field procedures
4.1.1 Soil survey and selection of sites
Levinson-Lessing
Soil survey had been started during the expedition TAYMYR 1995 (BECKER, 1997; PFEIFFER
et al., 1996) and was completed in the subsequent year during the expedition TAYMYR 1996
in CO-operation with my colleagues H. Becker, A. Gundelwein and Th. Müller-Lup
(GUNDELWEIN et al., 1997). The procedure followed the soil mapping at Labaz (GUNDELWEIN,
1998, PFEIFFER et al., 1996) and is summasised in Section 4.4.1.1.
For this study, three predominant groups of soil-pattemed ground-vegetation complexes were
selected according to their spatial proportion: polygonal tundra, solifluction slope with non-
sorted steps, and soils of mountain tops with non-sorted stripes. Each of these compound
mapping units was represented with either two or three profiles.
4.1.2 Profile description
Levinson-Lessing
Profile description followed the procedure as described for the soils at Labaz (Sect. 5.4.1.1).
As mentioned before a peculiarity of arctic soils represents the presence of patterned ground
due to freeze-thaw processes. The micro-relief was accounted for by separate profile
descriptions with affixes to the profile number (e.g., profile 11.1 and 11.2). In addition to the
assessment of soil drainage according to the Soil Taxonomy (S.T.), site specific soil moisture
conditions were further described (depth of water table, slope water, supra-permafrost water).
In this study soil profiles clearly represented the active layer of a particular soil since no
dsillings of the underlying permafrost were carried out. Besides soil classification according to
the S.T. (SOIL SURVEY STAFF, 1994; 1998), soil types were additionally classified according to
the WRB (SPAARGAREN, 1998).
36 4. Materials & Methods
Labaz
Profile description was carried out by my colleague A. Gundelwein (IfB) and is described in
Section 4.4.1.1. Micro-sites were described separately and differentiated with affixed letters to
the profile numbers (e.g., 2a and 2b). On the basis of the profile description, soil classification
was supplemented by soil types according to the S.T. (SOIL SURVEY STAFF, 1998) and WRB
(SPAARGAREN, 1998).
4.1.3 Soil sampling
Levinson-Lessing
Soil sampling procedure was described in the expedition report (BOLTER & SCHMIDT, 1997)
Sampling generally followed the horizon notations and ensured mixed bulk samples. When
topsoil horizons were thicker than 5 cm subsamples were taken. The top 0.5 cm were sampled
in unvegetated soils. In addition, special features like roots, ferruginated fabric, soil around
roots and water veins were also sampled. These samples were taken in order to investigate
whether these spots showed other microbial properties than the ambient soil horizon.
As far climatic conditions allowed soil samples for pedological analyses were air dried in
aluminium dishes. Mineral horizons were then sieved thsough a 2 mm mesh size sieve. Fresh
samples for microbial analyses were stored in a permafsost pit which sesved as a refsigerator.
During transportation it was ensured that these samples were kept at cool places. In the home
laboratory they were stored deep-frozen at -20° until analysis.
For determination of bulk density and pore size distribution core samples of the top 4 cm were
taken with 100 cm3 cores, where feasible (see appendices for details). The cores had been
driven into the soil by means of a percussion tool that ensured even placement. The core
samples were stored in special sample cases in the permafiost pit. During transport (by
helicopter, aircraft, car and on foot) maximum care was taken to minimalize exposure to
vibrations.
4.1.4 Statistical considerations
Due to methodical restrictions, limited time and financial resources as well as restricted
transportation capacities neither a DIN standardised sampling procedure (HARTGE & HORN,
1989) nor a randomised plot design were applied. Spatial representativity of a particular soil
4.1 Field procedures 37
was decided upon the basis of the soil map (with a grid of 20 to 250 m) and its relative
proportion of the whole study area. As mentioned before, at Levinson-Lessing two to three
profiles per unit of soil-patterned ground-vegetation complex were sampled to account for the
variability within units. For the soils at Labaz, an according selection of sites was not feasible
because of restricted labour. Yet, the most characteristic and dominant soils were sampled as
is described in Sections 4.1.1 and 4.1.2. All soils were sampled over the period of the
respective expeditions during which the vegetation changed from early spring to late autumnal
aspect. Because of the short vegetation period temporal variability could not be accounted for.
3 8 4. Materials & Methods
4.2 Pedological parameters
4.2.1 Total and organic carbon (Ct and Cnre) and total nitrogen content
Total carbon and total nitrogen contents were analysed by a CNS-Analyser. Aluminium cups
with 5-10 mg of air-dried and ground soil (2 replicates) were combusted at 1050° (flash
combustion). The combustion products (CO2 and N2) were measured by thermal conductivity
using helium as a carrier gas and metallic copper in the reduction reactor.
At both experimental sites inorganic carbon content (Cinorg) of the soils was not detectable
(GUNDELWEIN, 1998), fusther analysis of organic carbon (Corg) thus was neglected. The only
exception represented the dry uphill soil (profile Lbl/95), where a mean Cmorg content of
0.2% W.W. had been measured in the mineral horizons (ibid.). In the following Corg is
considered as being equal to C,.
4.2.2 Determination of soil pH
Field analyses
During the 1996 expedition at Levinson-Lessing, detesmination of soil pH was carried out in
the field. Fresh soil was measured in a 0.01 M CaCl2 (soil/solution-ratio was 1 :2.5). Soil pH
was deterrnined potentiometrically in the supematant solution after automatic equilibration of
the pH meter.
Laboratory analyses
The pH of the Labaz 1995 soil samples was measured in the laboratory according to
SCHLICHTING et al. (1 995). Approximately 10 g of air-dried soil was suspended in 25 ml H 2 0
and 0.01 M CaClz respectively. Soil pH was determined potentiometrically in the supematant
solution after 30 min. of equilibration.
4.2.3 Bulk density and carbon inventory (CI)
Levinson-Lessing
After detesmination of the pore size distribution (see below), bulk density was detennined
according to SCHLICHTING et al. (1995). Dried (at 105OC) core samples (100 cm3) were
weighed (DW). Bulk density (Dt,) was calculated by the ratio between the mass (DW) and the
total volume (Vt):
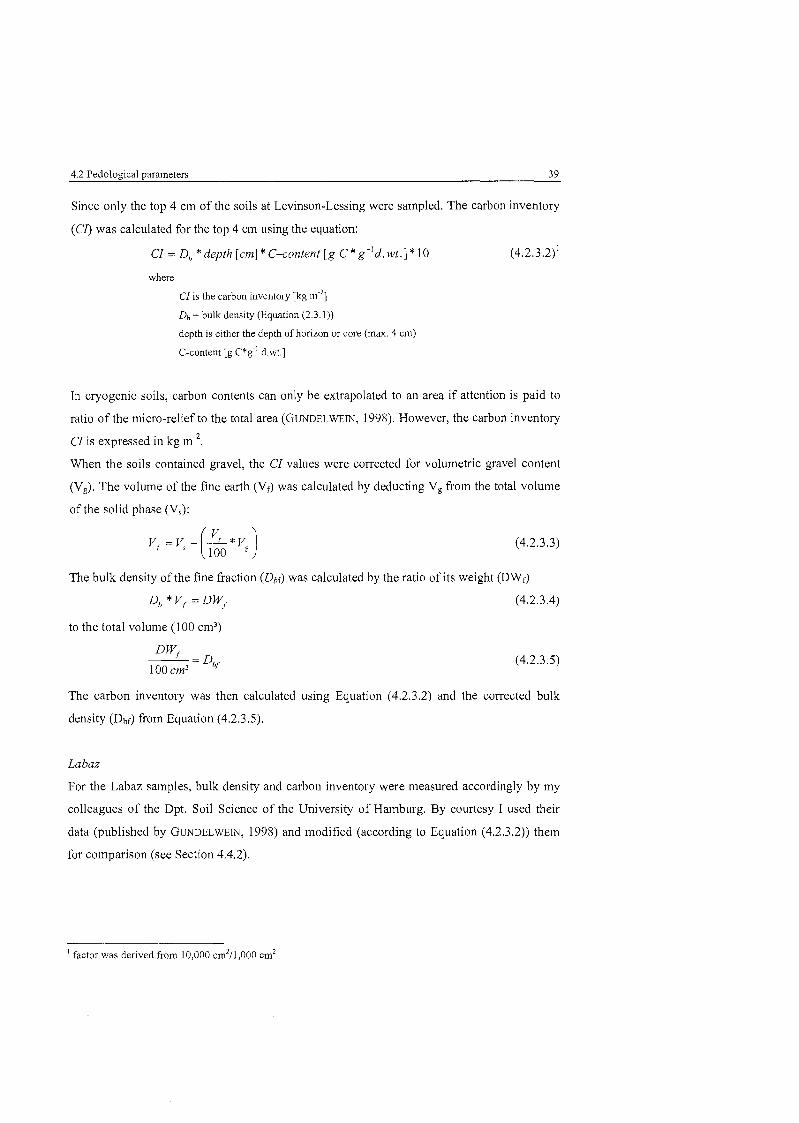
4.2 Pedoloeical nararneters 39
Since only the top 4 cm of the soils at Levinson-Lessing were sampled. The carbon inventory
(Cl) was calculated for the top 4 cm using the equation:
CI = D,, * depth [CM] * C-content [ g ~ * ~ " d . wt.] * 10 (4.2.3.2)'
where
CI is the carbon inventory [kg m""]
Db = bulk density (Equation (2.3. I))
depth is either the depth of horizon or core (max. 4 cm)
C-content [g c * ~ ' d.wt.1
In cryogenic soils, carbon contents can only be extrapolated to an area if attention is paid to
ratio of the micro-relief to the total area (GUNDELWEIN, 1998). However, the carbon inventory
CI is expressed in kg m".
When the soils contained gravel, the CI values were corrected for volumetric gravel content
(Vg). The volume of the fine earth (Vf) was calculated by deducting Vg from the total volume
of the solid phase (Vg):
The bulk density of the fine fraction (Dbf) was calculated by the ratio of its weight (DWf)
D,*V,. = DWf (4.2.3.4)
to the total volume (100 cm3)
The carbon inventory was then calculated using Equation (4.2.3.2) and the corrected bulk
density (Dbf) from Equation (4.2.3.5).
La baz
For the Labaz samples, bulk density and carbon inventox-y were measured accordingly by my
colleagues of the Dpt. Soil Science of the University of Hamburg. By courtesy I used their
data (published by GUNDELWEIN, 1998) and modified (according to Equation (4.2.3.2)) them
for comparison (see Section 4.4.2).
' factor was derived from 10,000 cm2/l,000 cm2
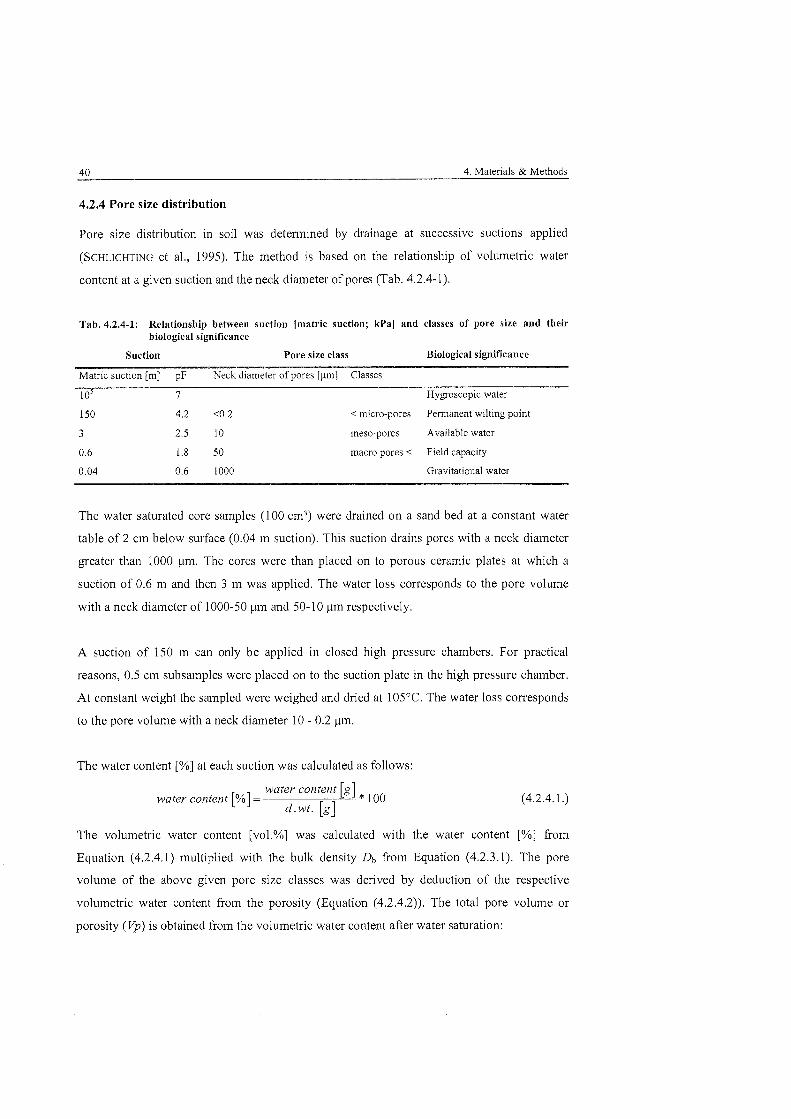
40 4. Materials & Methods
4.2.4 Pore size distribution
Pore size distribution in soil was detesmined by drainage at successive suctions applied
(SCHLICHTING et al., 1995). The method is based on the relationship of volumetric water
content at a given suction and the neck diameter of pores (Tab. 4.2.4-1).
Tab. 4.2.4-1: Relationship between suction [n~atric suction; H a ] and classes of Pore size and their biological significance
Suction Pore size class Biological significance
Matric suction [m] pF Neck diameter of pores [um] Classes
l o5 7 Hygroscopic water
150 4.2 0 . 2 < micro-pores Permanent wilting point
meso-pores Available water
macro pores < Field capacity
Gravitational wate1
The water saturated core samples (100 cm3) were drained on a sand bed at a constant water
table of 2 cm below surface (0.04 m suction). This suction drains pores with a neck diameter
greater than 1000 um. The cores were than placed on to porous ceramic plates at which a
suction of 0.6 m and then 3 m was applied. The water loss cossesponds to the pore volume
with a neck diameter of 1000-50 pm and 50-10 pm respectively.
A suction of 150 m can only be applied in closed high pressure chambers. For practical
reasons, 0.5 cm subsamples were placed on to the suction plate in the high pressure chamber.
At constant weight the sampled were weighed and dried at 105OC. The water loss corresponds
to the pore volume with a neck diameter 10 - 0.2 um.
The water content [%I at each suction was calculated as follows:
water corzient Lg] water conteni [%] = * 100
d.wt. [g]
The volumetric water content [vol.%] was calculated with the water content [%I fsom
Equation (4.2.4.1) multiplied with the bulk density Db from Equation (4.2.3.1). The pore
volume of the above given pore size classes was desived by deduction of the respective
volumetric water content fsom the porosity (Equation (4.2.4.2)). The total pore volume or
porosity (Vp) is obtained from the volumetric water content after water saturation:
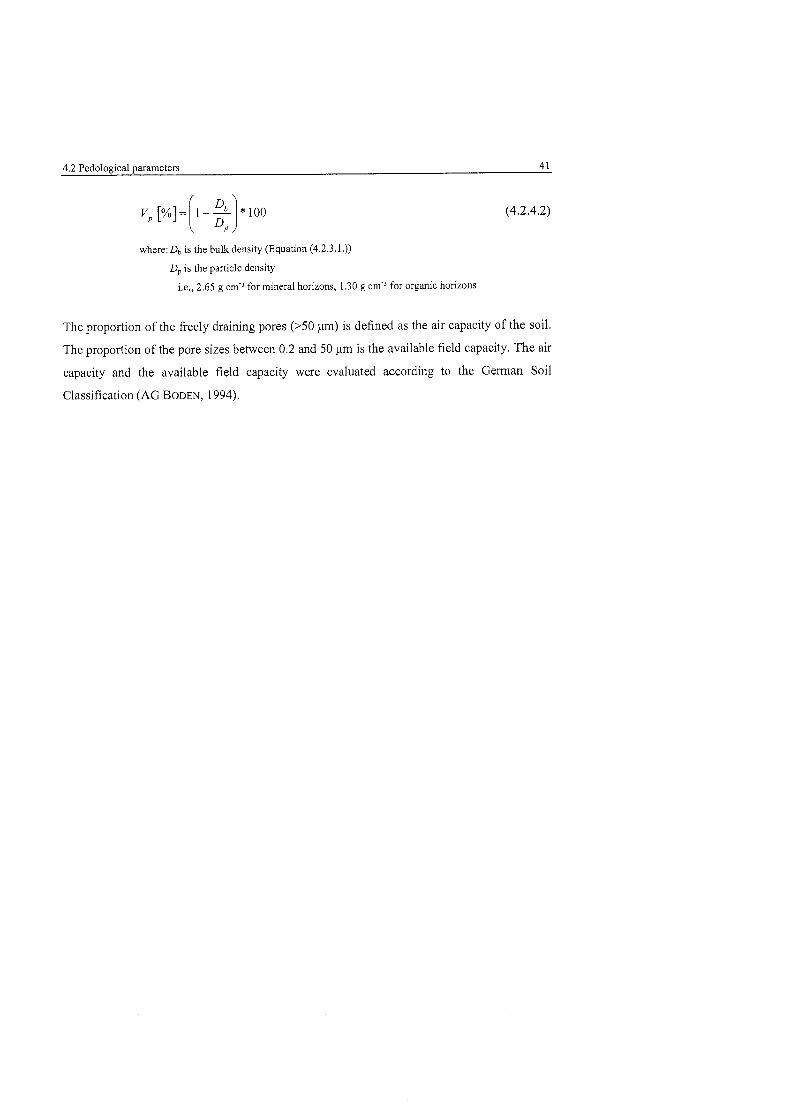
4.2 Pedological Parameters 41
where: Dh is the bulk density (Equation (4.2.3.1 .))
Dp is the particle density
i.e., 2.65 g ~ r n ' ~ for mineral horizons, 1.30 g ~ r n ' ~ for organic horizons
The proportion of the freely draining pores (>50 um) is defined as the air capacity of the soil.
The proportion of the Pore sizes between 0.2 and 50 pm is the available field capacity. The air
capacity and the available field capacity were evaluated according to the Gerrnan Soil
Classification (AG BODEN, 1994).
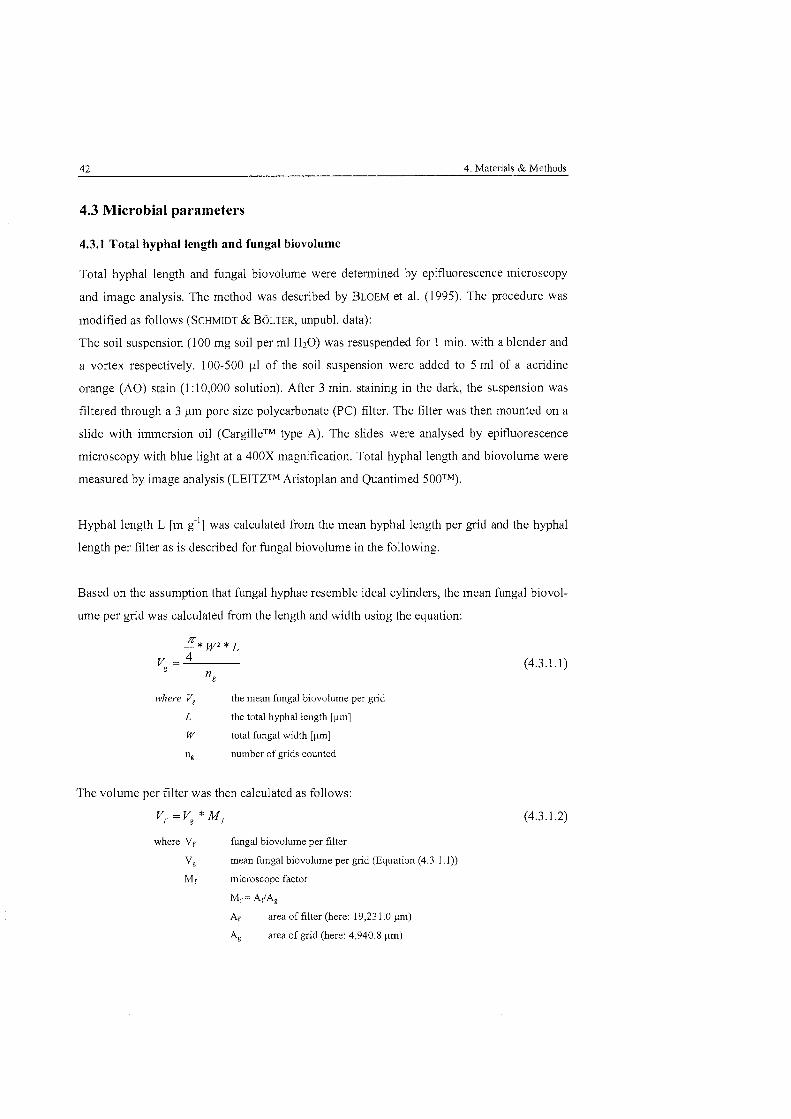
42 4. Materials & Methods
4.3 Microbial parameters
4.3.1 Total hyphal length and fungal biovolume
Total hyphal length and fimgal biovolume were deterrnined by epifluorescence microscopy
and image analysis. The method was described by BLOEM et al. (1995). The procedure was
modified as follows (SCHMIDT &. BOLTER, unpubl. data):
The soil suspension (100 mg soil per ml H20) was resuspended for 1 min. with a blender and
a vortex respectively. 100-500 pl of the soil suspension were added to 5 ml of a acridine
orange (AO) stain (1:10,000 solution). After 3 min. staining in the dark, the suspension was
filtered through a 3 pm pore size polycarbonate (PC) filter. The filter was then mounted 011 a
slide with immersion oil (CargilleTM type A). The slides were analysed by epifluorescence
microscopy with blue light at a 400X magnification. Total hyphal length and biovolume were
measured by image analysis (LEITZTM Aristoplan and Quantimed 5OOTM).
Hyphal length L [m g ] was calculated from the mean hyphal length per grid and the hyphal
length per filter as is described for hngal biovolume in the following.
Based on the assumption that fungal hyphae resemble ideal cylinders, the mean fungal biovol-
ume per grid was calculated from the length and width using the equation:
where Vs the mean fungal biovolume per grid
L the total hyphal length [um]
W total fungal width [um]
"8 number of grids counted
The volume per filter was then calculated as follows:
V^V* M ,
where Vf ftingal biovolume per filter
vg mean ftmgal biovolume per grid (Equation (4.3.1.1))
Mf microscope factor
MC= A(/As
Ar area of filter (here: 19,231.0 pm)
Ag area of grid (here: 4,940.8 pm)
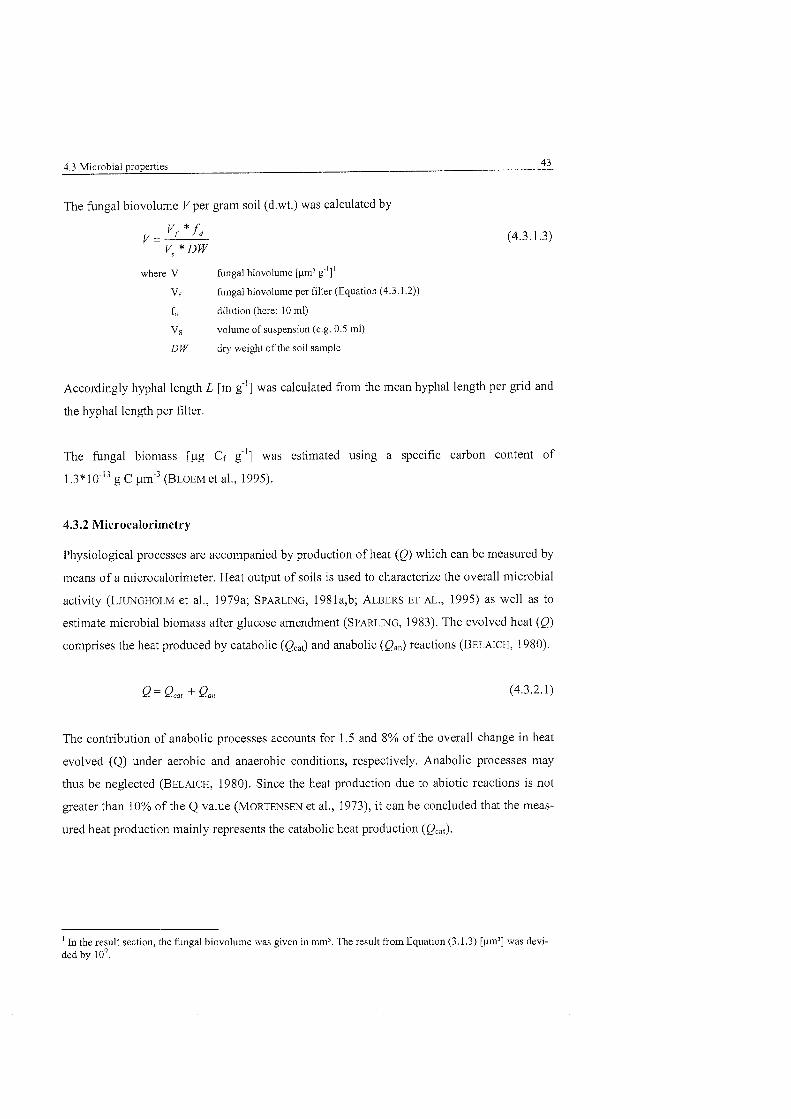
4.3 Microbial properties 43
The hngal biovolume Vper gram soil (d.wt.) was calculated by
where V fungal biovolun~e [pm3 g"]'
vr fungal biovolume per filter (Equation (4.3.1.2))
frt dilrtion (here: 10 ml)
v s volume of Suspension (e.g. 0.5 ml)
DW dry weight of the soil sample
Accordingly hyphal length L [m g''] was calculated fsom the mean hyphal length per gi'id and
the hyphal length per filter.
The hngal biomass [pg Cf g"] was estimated using a specific carbon content of
1.3*10"~ g C ( B L O E M ~ ~ al., 1995).
4.3.2 Microcalorimetry
Physiological processes are accompanied by production of heat (Q) which can be measured by
means of a n~icrocalorimeter. Heat output of soils is used to characterize the overall microbial
activity (LJUNGHOLM et al., 1979a; SPARLING, 1981a,b; ALBERS ET AL., 1995) as well as to
estimate microbial biomass after glucose amendment (SPARLING, 1983). The evolved heat (0 )
comprises the heat produced by catabolic (Qcat) and anabolic (Qan) reactions (BELAICH, 1980).
The contsibution of anabolic processes accounts for 1.5 and 8% of the overall change in heat
evolved (Q) under aerobic and anaerobic conditions, respectively. Anabolic processes may
thus be neglected (BELAICH, 1980). Since the heat production due to abiotic reactions is not
greater than 10% of the Q value (MORTENSEN et al., 1973), it can be concluded that the meas-
ured heat production mainly represents the catabolic heat production (Qm).
' In the result section, the fungal biovolume was given in mm3. The result from Equation (3.1.3) [pm3] was devi- ded by 1 0 .
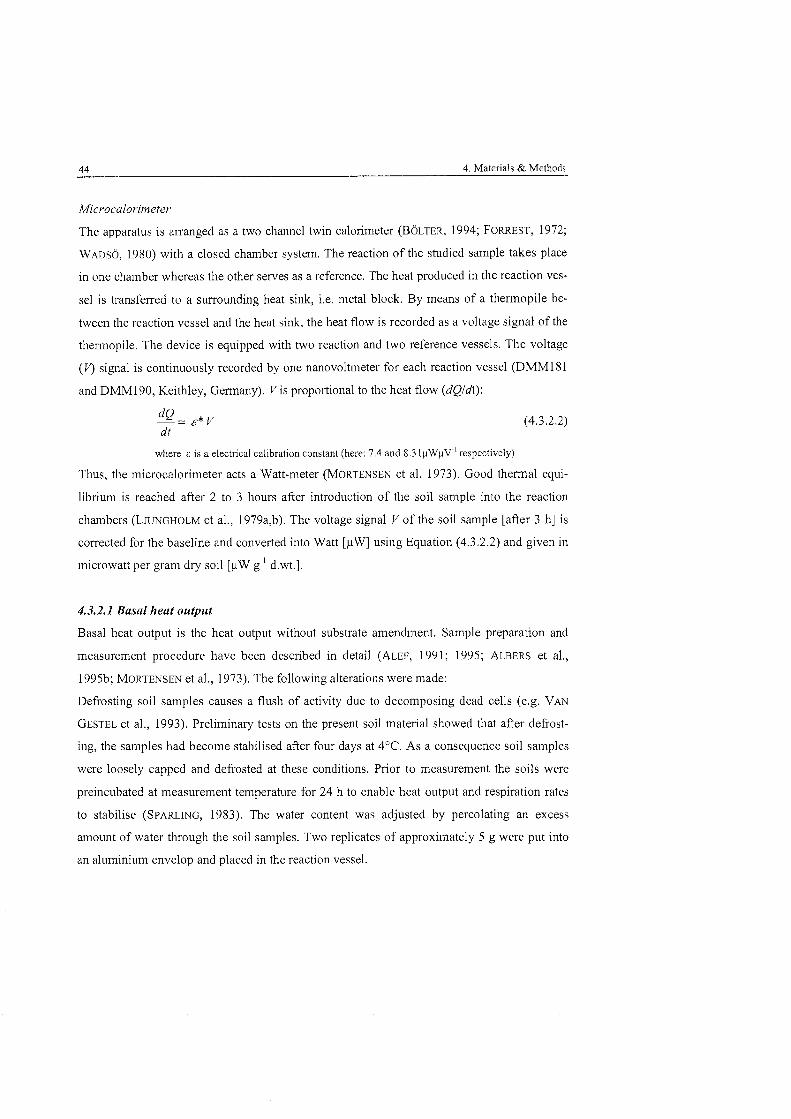
44 4. Materials & Methods
Microcalorimeter
The apparatus is arranged as a two channel twin calorimeter (BOLTER, 1994; FORREST, 1972;
WADSO, 1980) with a closed chamber system. The reaction of the studied sample takes place
in one chamber whereas the other serves as a reference. The heat produced in the reaction ves-
sei is transferred to a surrounding heat sink, i.e. meta1 block. By means of a thermopile be-
tween the reaction vessel and the heat sink, the heat flow is recorded as a voltage signal of the
thesmopile. The device is equipped with two reaction and two reference vessels. The voltage
(V) signal is continuously recorded by one nanovoltmeter for each reaction vessel (DMM181
and DMM 190, Keithley, Germany). V is proportional to the heat flow (dQIdt):
where s is a electrical calibration constant (here: 7.4 and 8.3 l p ~ p ~ ' respectively)
Thus, the microcalorimeter acts a Watt-meter (MORTENSEN et al. 1973). Good thermal equi-
librium is reached after 2 to 3 hours after introduction of the soil sample into the reaction
chambers (LJUNGHOLM et al., 1979a,b). The voltage signal V of the soil sample [after 3 h] is
corrected for the baseline and converted into Watt [pW] using Equation (4.3.2.2) and given in
microwatt per gram dry soil [pW g" d.wt.1.
4.3.2.1 Basal heat output
Basal heat output is the heat output without substrate amendment. Sample preparation and
measurement procedure have been described in detail (ALEF, 1991; 1995; ALBERS et al.,
1995b; MORTENSEX et al., 1973). The following alterations were made:
Defrosting soil samples causes a flush of activity due to decomposing dead cells (e.g. VAN
GESTEL et al., 1993). Preliminary tests on the present soil material showed that after defrost-
ing, the samples had become stabilised after four days at 4OC. As a consequence soil samples
were loosely capped and defiosted at these conditions. Prior to measurement the soils were
preincubated at measurement temperature for 24 h to enable heat output and respiration rates
to stabilise (SPARLING, 1983). The water content was adjusted by percolating an excess
amount of water through the soil samples. Two replicates of approximately 5 g were put into
an aluminium envelop and placed in the reaction vessel.
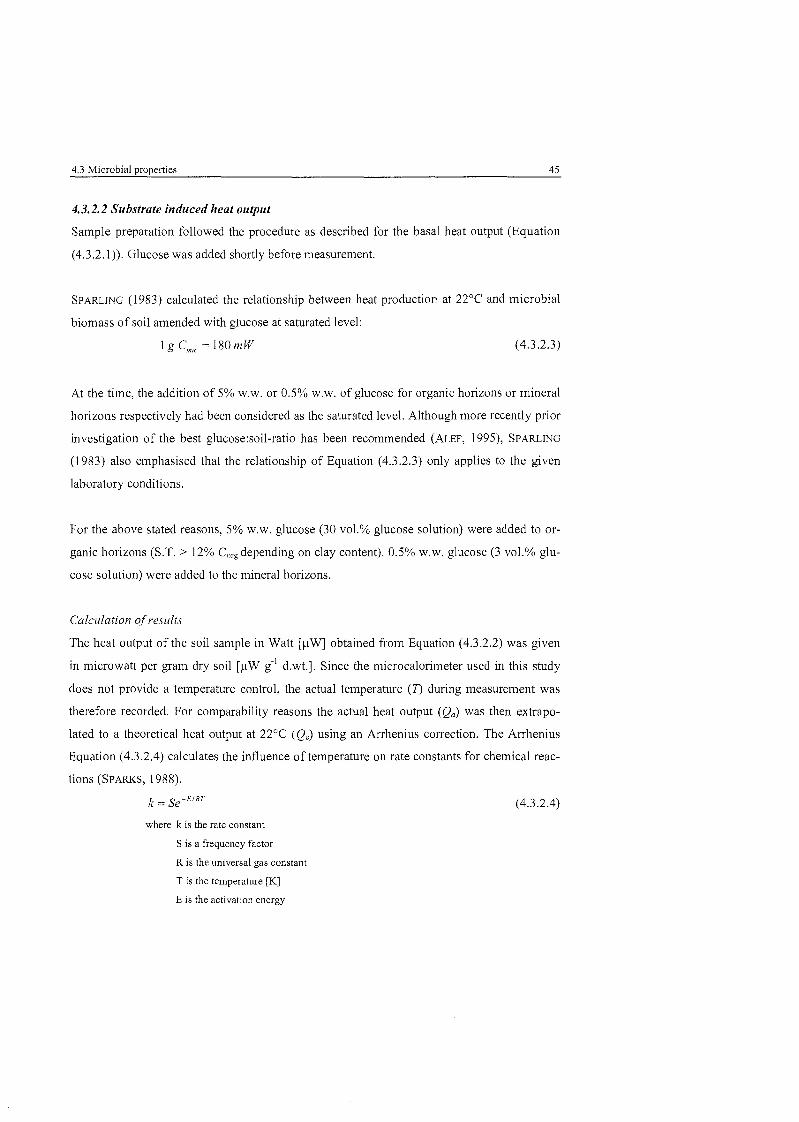
4.3 Microbial ~rouerties 45
4.3.2.2 Substrate induced heat output
Sample preparation followed the procedure as described for the basal heat output (Equation
(4.3.2.1)). Glucose was added shortly before measurement.
SPARLING (1983) calculated the relationship between heat production at 22OC and microbial
biomass of soil amended with glucose at saturated level:
1 g CÃ = 180 m W (4.3.2.3)
At the time, the addition of 5% W.W. or 0.5% W.W. of glucose for organic horizons or mineral
horizons respectively had been considered as the saturated level. Although more recently prior
investigation of the best g1ucose:soil-ratio has been recommended (ALEF, 1995), SPARLING
(1983) also emphasised that the relationship of Equation (4.3.2.3) only applies to the given
laboratory conditions.
For the above stated reasons, 5% W.W. glucose (30 vol.% glucose solution) were added to or-
ganic horizons (S.T. > 12% Corg depending On clay content). 0.5% W.W. glucose (3 vol.% glu-
cose solution) were added to the mineral horizons.
Cahlat ion of results
The heat output of the soil sample in Watt [pW] obtained fiom Equation (4.3.2.2) was given
in microwatt per gram dry soil [pW g" d.wt.1. Since the microcalorimeter used in this study
does not provide a temperature control, the actual temperature (T) during measurement was
therefore recorded. For comparability reasons the actual heat output (Qa) was then extrapo-
lated to a theoretical heat output at 22OC (Oe) using an Arrhenius correction. The Arrhenius
Equation (4.3.2.4) calculates the influence of temperature on rate constants for chemical reac-
tions (SPARKS, 1988).
k 6 - E I R T (4.3.2.4)
where k is the rate constant
S is a frequency factor
R is the universal gas constant
T is the temperature [K]
E is the activation energy
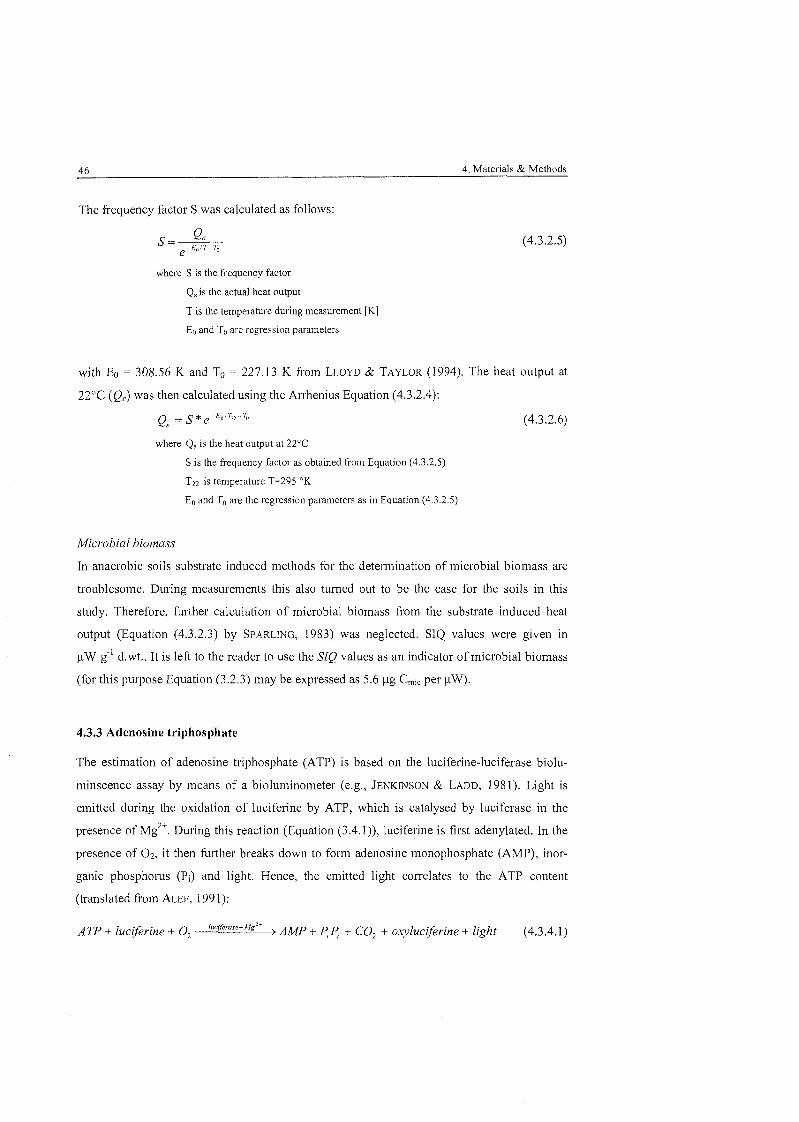
46 4. Materials & Methods
The fiequency factor S was calculated as follows:
where S is the frequency factor
Q, is the actual heat output
T is the temperature during measurement [K]
E. and T. are regression parameters
with E. = 308.56 K and T. = 227.13 K from LLOYD & TAYLOR (1994). The heat output at
22OC (Qe) was then calculated using the Arrhenius Equation (4.3.2.4):
Q~ = s * e - E , , 1 T 2 2 - ~ , (4.3.2.6)
where Qe is the heat output at 22'C
S is the frequency factor as obtained from Equation (4.3.2.5)
TZ2 is temperature T=295 'K
E. and T. are the regression Parameters as in Equation (4.3.2.5)
Microbial biomass
In anaerobic soils substrate induced methods for the determination of microbial biomass are
troublesome. During measurements this also turned out to be the case for the soils in this
study. Therefore, further calculation of microbial biomass from the substrate induced heat
output (Equation (4.3.2.3) by SPARLING, 1983) was neglected. SIQ values were given in
pW d.wt.. It is left to the reader to use the SIQ values as an indicator of microbial biomass
(for this purpose Equation (3.2.3) may be expressed as 5.6 pg Cmic per pW).
4.3.3 Adenosine triphosphate
The estimation of adenosine triphosphate (ATP) is based on the luciferine-luciferase biolu-
minscence assay by means of a bioluminometer (e.g., JENKINSON & LADD, 1981). Light is
emitted during the oxidation of luciferine by ATP, which is catalysed by luciferase in the
presence of M ~ ~ " . During this reaction (Equation (3.4. I)), luciferine is first adenylated. In the
presence of 02, it then iürthe breaks down to form adenosine monophosphate (AMP), inor-
ganic phosphorus (P;) and light. Hence, the emitted light correlates to the ATP content
(translated from ALEF, 1991):
ATP + luciferine + 0,'""~leruse+Mg2* > AMP + 44 + C O + oxylucz~erine + light (4.3.4.1)
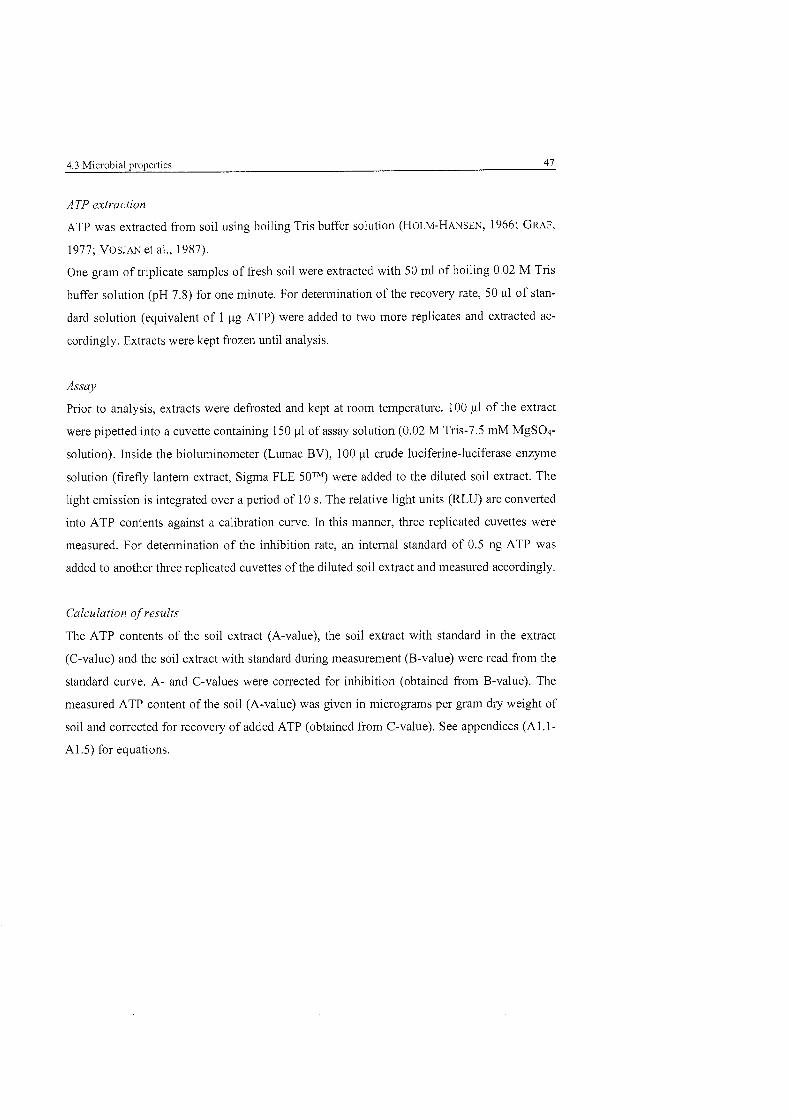
4.3 Microbial properties 47
A TP extruction
ATP was extracted from soil using boiling Tris buffer solution (HOLM-HANSEN, 1966; GRAF,
1977; VOSJAN et al., 1987).
One gram of triplicate samples of fresh soil were extracted with 50 ml of boiling 0.02 M Tris
buffer solution (pH 7.8) for one minute. For determination of the recovery rate, 50 p1 of stan-
dard solution (equivalent of 1 pg ATP) were added to two more replicates and extracted ac-
cordingly. Extracts were kept frozen until analysis.
Assu.y
Prior to analysis, extracts were defiosted and kept at room temperature. 100 pl of the extract
were pipetted into a cuvette containing 150 (il of assay solution (0.02 M Tris-7.5 mM MgS04-
solution). Inside the bioluminometer (Lumac BV), 100 pl crude luciferine-luciferase enzyme
solution (firefly lantern extract, Sigma FLE 50TM) were added to the diluted soil extract. The
light emission is integrated over a period of 10 s. The relative light units (RLU) are converted
into ATP contents against a calibration curve. In this manner, three replicated cuvettes were
measured. For deterrnination of the inhibition rate, an intemal standard of 0.5 ng ATP was
added to another three replicated cuvettes of the diluted soil extract and measured accordingly.
Culculation of results
The ATP contents of the soil extract (A-value), the soil extract with standard in the extract
(C-value) and the soil extract with standard during measurement (B-value) were read from the
standard curve. A- and C-values were corsected for inhibition (obtained from B-value). The
measured ATP content of the soil (A-value) was given in micrograms per gram dry weight of
soil and corrected for recovery of added ATP (obtained from C-value). See appendices (Al. l -
A l .5) for equations.
48 4. Materials & Methods
4.4 External data
4.4.1 Field procedure at Labaz
4.4.1.1 Soil survey und profile description
Soil susvey had been started during the expedition TAYMYR 1994 (PFEIFFER & HARTMANN,
1995) and was completed in the subsequent year during the expedition TAYMYR 1995
(PFEIFFER et al., 1996). The procedure was descsibed in detail by GUNDELWEIN (1998) and is
summarised here as follows:
The study area comprised a total area of 6 km2. Prior to mapping and site selection the area
was walked thoroughly to achieve an ovesview. First, units of pattemed gsound and vegetation
complexes were marked off since these reflect the edaphic conditions particularly well
(THANNHEISER, 1989). Soils and soil boundasies were confismed by control diggings. De-
pending On site specific propesties (mosphology, pattemed gsound) distance between two
controls ranged from 20 to 250 m. Thus, compound mapping units of soil- pattemed gsound
and vegetation complexes were established in accordance with the topography. For each map-
ping unit representative soil pits were selected and profiles descsibed in detail. Soil profiles
were dug up to the pesmafsost table.
Profile description was casried out using the US Soil Taxonomy, 6th edition (SOIL SURVEY
STAFF, 1994). Supplementary characteristics (texture, gravel content, structure, rooting inten-
sity) were described according to the Gennan Soil Survey Manual (Bodenkundliche Kartier-
anleitung, 4th edition, AG BODEN, 1994). Soil colour was given in hue and chsoma values by
the MUNSELL SOIL COLOR CHART (1 988).
Finally, the soils were classified according to the soil taxonomy (S.T.) to the subgsoup level.
The S.T. represents the most commonly used classification system for arctic soils.
4.4.1.2 Soil sampling
During the expedition TAYMYR 1995 (BOLSHIYANOV & HUBBERTEN, 1996), soil sampling
was carried out by my colleague M. Sommerkom (IPO) at Labaz in July 1995 (SOMMERKORN,
1998). Soils were sampled in steps of several centimetres. Topsoils were sampled in steps of
2, 3 and 5 centimetres, whereas subsoil hosizons were sampled in steps of 10 centimetres.
Samples were air-dsied immediately after sampling. At the laboratory in Kiel, subsamples for
microbiological analyses were kept frozen at -20°C Bulk soil samples were sieved thsough
2 rnm mesh size sieve and stored under dry and cool conditions.
4 4 External data 49
4.4.2 Bulk density and carbon inventory
For the Labaz samples, bulk density and carbon inventory were determined by my colleagues
of the Dpt. Soil Sciencc of the University of Hamburg. The procedure was the same as was
described for the Levinson-Lessing sarnples in Section 4.4.2.3. Data were used for carbon
inventory (Section 5.2.3) and microbial inventory (Section 5.4.3).
4.4.3 Total bacterial number and bacterial biovolume
Total bacterial number and bacterial biovolume were determined by means of epifluorescence
and image analysis by M. Bölter IPO Kiel (BOLTER, 1998, SCHMIDT & BOLTER, unpubl. data).
Sample preparation and analysis followed the procedure as described for deterrnination of
hngal biomass in Section 4.3.1 with the following alteration:
The soil suspension was resuspended for 1 min with a vortex and filtered through a 0.2 um
pore size PC filter after AO staining. The slides were analysed by epifluorescence microscopy
with blue light at a 800X magnification. Cells were counted and biovolume was measured by
image analysis (LEITZTM Aristoplan and Quantimed 5OOTM) and calculated according BOLTER
et al. (1 993).
50 4. Materials & Methods
4.5 Statistics
4.5.1 Regression analyses
The relationship between microbiological data sets (i.e., parameters of microbial biomass,
basal and substrate induced heat output, ATP content) was tested by linear regression analysis.
In these pairs of obsesvation of y and X, y was assumed to depend on X, the independent
variable. A relationship was accepted when r220.70.
4.5.2 Testing of equality of two populations
In the soils of this study, populations showed non-normal distribution (difference of variance
si2 + sZ2). For the comparison of two data sets, equality of means (u,, p2) was thus tested using
a Computer package ( S t a t ~ i e w ' ~ ~ ) based significance Mann-Whitney U-test when random
sample size n,, n2 2 7. Difference of means (u,, fit) was accepted as significantly different at
the following significance level p: p 5 0.01, p < 0.05, p < 0.10 and p < 0.15. Difference was
rejected at significance level p > 0.15.
4.5.3. Correlation between parameters
For investigation of the general relationship between Parameters, the degree of association
was investigated by calculating the sample spearman cosselation coefficient p (SystatTM).
Cosselation was accepted when p < -0.6 or p 2 0.6. Positive values show that variables are
positively associated, the dope of the line being positive. Accordingly values are negatively
associated when p values and thus the slope of the line are negative.
5. Results "The Answer to the Great Question (...) Of Life, the Universe and Everything (...) 1s (...) Forty-Two," said Deep Thought, with infinite majesty and calm. (...) "So once you do know what the question actually is, you'll know what the answer means."
D. Adams, The Hitchhiker's Guide to the Galaxy
Levinson-Lessing
The distribution of soils in the study area at Lake Levinson-Lessing can be Seen in Figure
A2.1-1. The soil map Covers an area of 24 km2. At Levinson-Lessing the soils were generally
characterized by very little or no profile differentiation and water-logging. Accumulation of
organic matter generally occurred where vegetation was present.
About a quarter of the total area represented the valley of the river Krasnaya where polygonal
tundra soils formed. These soils developed on alluvial loamy-sandy sediments and were
characterized by accumulation of organic matter and gleying due to wet conditions. Thus the
vegetation was adapted to wet environments. Accordingly, these were classified as Typic
Aquorthels, Typic or Ruptic Historthel (Histic Cryosol, WRB) depending On the thickness of
the organic horizons. At the end of the field season 1996, maximum thickness of the active
layer was 48 centimetres (ANISIMOV & PANASENKOVA, 1997).
At steeper slopes east and West of the river Krasnaya, non-sorted steps and mud pits
developed. These were formed in silty-loamy colluvial sediments of Greywacke. The
thickness of the active layer was  50 cm and showed thixotropic properties. Due to slope
water at a depth of k 40 cm, these soils were rather wet. Yet, gleying features were not
discernible (e.g., iron mottling) although reduced iron ( ~ e ~ ' ) was determined in subsoil
horizons. As was described before, non-sorted steps and mud pits here also represented pits of
bare and raw earthy material surrounded by vegetation rings. Mud pits were also partially
overgrown from the vegetation ring at further Stages of successional development. Due to
solifluction, profiles also showed involution of topsoil organic matter. Thus, the soils of the
solifluction slopes were weakly developed though physically highly dynamic. Accumulation
of organic matter and occasional gleying were the only pedogenic processes. Accordingly,
these soils were classified as Ruptic-Histic Aquiturbel (TurbicIHistic Cryosol, W). The
respective soils were associated with drainage ditches, where no patterned ground was
forrned. Further downhill, organic matter content increased. The soils of the solifluction
slopes covered about 12% of the total area.
52 5. Results
In valleys on top of the 300 to 500 m (a.s.1.) high surrounding mountains, weakly developed
soils were found. These soils developed on frost-shattered rock debris of Greywacke and
generally showed high contents of gravel and coarser fragrnents. Sorted and non-sorted forms
of stripes and nets developed. The soils were comparably dry and showed maximum thaw
depths of > 70 cm (MULLER-LUPP, 1997). The water table was at k 30 cm below surface.
Vegetation cover was sparse (usually 10-20%). When vegetation was present, mats of weakly
decomposed organic matter and roots covered the rock debris. Accordingly, these soils were
classified as Typic Aquorthel (Leptic Cryosol, WRB) and covered approximately 8.8 km2 of
the area.
A peculiarity of the study area represented a lime-stone ridge with a length of 2.5 km that
stretches north-east from Lake Levinson-Lessing. On top and at upper slopes, shallow soils
developed on frost-shattered rock debris. These soils thawed to a depth of > 80 cm and water
table was found at a depth k80 cm (GUNDELWEIN, 1998). Pattemed ground did not develop
although features of solifluction processes were found. As for the soils of other mountain tops,
vegetation coverage was < 20% and accumulation of organic matter only occurred in
vegetated soils. These soils were classified as Carbonatic Pergelic Cryorthents (S.T. 6 Ed.)
(Cryic Leptosols, WRB). At the footslope of this ridge, vegetation cover increased (80%
coverage) and humus rich A-horizons developecl in carbonatic colluvial sediments. These
soils were classified as Pergelic Cryoboroll (Gelic Cambisol, WRB) but only represented
0.6% of the study area.
The soils of this lime-stone ridge were not included in this soil microbiological study because
of their small proportion of the total study area.
Labaz
At Labaz the soil map Covers approximately 8 km2 (see Fig. A2.1-2). The study area was
subdivided into six landscape compartments according to the meso-relief and was described in
detail by GUNDELWEIN (1998). 90% of the study area were covered with clayey-loamy
sediments resulting in poor drainage. Thus, typical tundra soils developed showing weak
profile differentiation, gleying properties and accumulation of organic matter. Thaw depths
were < 50 cm and shallow. Accordingly, the soils were classified as Typic Haplorthel, Ruptic-
Histic/Typic Aquorthel or Typic Historthel (S.T.) and Typic, Haplic, Histic or Gleyic Cryosol
(WRB). Differentes were due to the meso-relief, the form of patterned ground, and the vegetation
cover. At sloping sites, non-sorted circles (hummocks) were formed (profile Lb2195). The
vegetation of the wetter micro-site was dominated by mosses whereas at the drier elevated
micro-site liehen species gained in significance. The hummock tundra also showed features of
cryoturbation (i.e., mudboils). The presence of tussock forming sedges and grasses resulted in
a micro-relief at an even smaller scale. Tussocks also occurred superimposed on the
5.1 Soils 53
hurnrnocks (Lb3195). These tundra soils were associated with drainage ditches where any form
of pattemed ground was lacking. The loamy substrate was covered with distinct mats of
organic matter (Lb4195).
A minor part of the study area at Labaz (i.e., 10%), represented the dry soils of the exposed
tops of mountains or spurs. These showed generally high contents of gravel and coarser
fi-agments. Thaw depths reached maximum values of 80-1 10 cm. Pattsrned gsound was less
common. At these sites, more advanced pedogenetic processes occurred and profile
differentiation was more discernible. For instance, the fosmation of cambic hosizons and
podzolisation was observed. Gleying features occasionally occurred in subsoil horizons. Thus,
Aquic Umbriturbel (Turbic Cryosol, WRB) and Typic Haploturbel (Turbic Csyosol, W B )
developed. However, soils with vesy less or no profile differentiation were associated with
those just described.
5.1.2 Soll profile description
5.1.2.1 Solls at Levinson-Lessing
Po[ygonal tundra
The valley of the river Krasnaya was covered with polygonal tundra soils. These comprised
low centred polygons (profiles LL1196 and LL2/96), high centred polygons (profiles LL3196
and LL4196) as well as transitionary fo rm (profiles LL5196, LL6196 and LL7196). Along the
banks of the river and its affluents, degsaded forrns due to thennokarst were also found.
Figure 5.1.1 shows a transect of a typical low centred polygon and profiles (LL1196 and
LL2196). The diameter of the polygon was approximately 10 m. The depression of the lower
centre (LL2196) covered two thirds of the area whereas the apices (LL1196) only one third.
The apex was some 15 cm higher than the wet depression and in comparison relatively dry.
Profile LL1196 showed exceptionally thick organic ho~%zons with sandy loam deposits up to
the permafrost table. Usually organic topsoil horizons were 6 to 12 centimetses (GUNDELWEIN,
1998). The whole profile was very densely to densely rooted and was stseaked with water
bearing veins. The subsoil showed gleying features (i.e., Fe3--mottling).
In contrast to the drier apex, profile LL2196 of the wet centre was usually below the water
surface. Thaw depth was gseater than in the apex. The soll was charactesized by thinner
organic horizons overlying the mineral subsoil. The subsoil did not show any gleying features
although reduced iron (Fe2-) was determined. The weakly silty sand of the subsoil was
intensely interwoven with weakly decomposed plant debris.
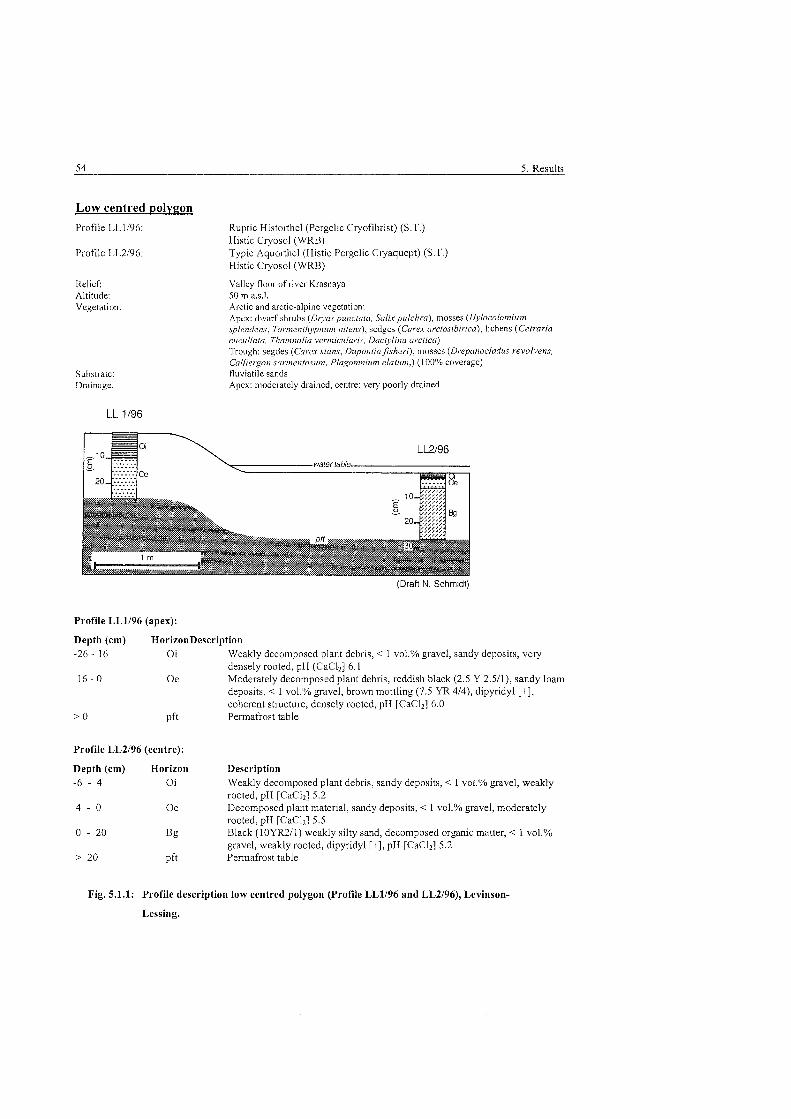
Low centred poly~on
Profile LL1196:
Profile LL2196:
Relief: Altitude: Vegetation:
Substrate: Drainage.
Ruptic Historthel (Pergelic Cqlofibrist) (S.T.) Histic Cryosol (WRB) Typic Aquorthel (Histic Pergelic Cryaquept) (S.T.) Histic Cryosol (WRB)
Valley floor of river Krasnaya 50 m a.s.1. Arctic and arctic-alpine vegetation: Apex: dwarf shrubs ( D y a s punctata, Salixpu!clira), mosses (Hylocolomium splendens, Tor17ie1it/1j'pt;iit1; nitens), sedges (Carex arctosibirica), lichens (Cetraria cucdlata, Tliamnolia vernuciilaris, Dactylitia arctica} Trough: segdes (Carex stans, DupontfaJ?sheri), rnosses (Drepanodadus revolvens, C a l l i e ~ o i i sonnentosum, Plagomnium elatiim,) ( I OO?" coverage) fluviatile sands Apex: moderately drained, centre: very poorly drained
(Draft N. Schrnidt)
Profile LL1196 (apex):
Depth (cm) HorizonDescription -26 - 16 Oi Weakly decomposed plant debris, < 1 vol.% gravel, sandy deposits, very
densely rooted, pH (CaCl;,] 6. l 1 6 - 0 Oe Moderately decomposed plant debris, reddish black (2.5 Y 2.5/1), sandy loam
deposits. < 1 vol.% gravel, brown mottling (7.5 YR 4/4), dipyridyl [+I, coherent structure, densely rooted, pH [CaCI;] 6.0
> 0 ~ f t Permafrost table
Profile LL2/96 (centre):
Depth (cm) Horizon Description -6 - 4 Oi Weakly decomposed plant debris, sandy deposits, < l vol.% gravel, weakly
rooted, pH [CaC12] 5.2 4 - 0 Oe Decomposed plant material, sandy deposits, < l vol.% gravel, moderately
rooted, pH [CaCl;] 5.5 0 - 20 Bg Black (10YR2.11) weakly silty sand, decomposed organic matter, < 1 vol.%
gravel, weakly rooted, dipyridyl [+I, pH [CaCl;] 5.2 > 20 pft Permafrost table
Fig. 5.1.1: Profile description low centred polygon (Profile LL1196 and LL2/96), Levinson-
Lessing.
5.1 Soils 55
The high centred polygon showed an inverse relationship (see Tab. A2.2-1) for profile
description). The centre (Profile LL3196) was some 40 to 50 centimetres higher than the
adjacent frost crack (LL4196). The diameter was 16 m. The soils of the apex covered 87.5% of
the total area whereas the wet frost cracks covered 12.5%. As was described for the low
centred polygon, profile 3 and 4 showed organic horizons (6 to 8 cm thickness) over a mineral
subsoil. In the subsoils reduced iron (~e*') was deteimined whereas unly in the drier centre
iron mottling could be found. Profile 3 showed water bearing veins as well as thick (< 5 cm)
ice veins and oriented stones. Profile 4 was below the water table. Thaw depth was some 2 cm
greater in the wet frost crack.
The polygonal tundra soils of profiles LL5196, LL6196 and LL7196 took an intermediate
position (see Tab. A2.2-2 for profile description). The centre of the polygon (LL5/96) was
clearly elevated in comparison to the frost crack (LL7196). Yet, the apex (LL8196) represented
the most elevated micro-site. A peculiarity in the subsoil of the intermediate polygon was the
presence of silty loamy band (< 6 cm thick) overlying a buried organic horizon. Water in the
upper horizons was found to stagnate due to this loamy band. Roots did not penetrate this
barrier. The diameter of this intermediate polygon was 13 m. Soils of profile 5 covered 40%,
soils of profile 6 covered 54% and soils of profile 7 covered 6% of the total area of this
polygon.
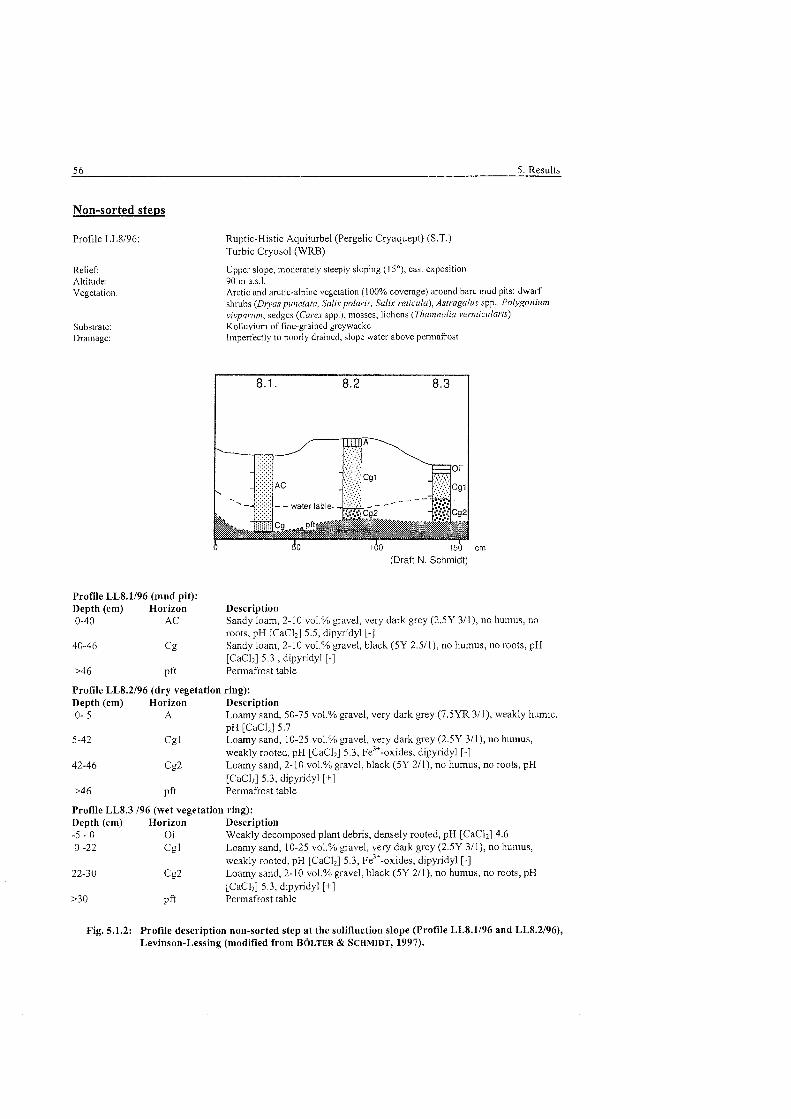
56 5. Results
Non-sorted steps
Profile LL8/96:
Relief: Altitude: Vegetation.
Substrate: Drainage:
Ruptic-Histic Aquiturbel (Pergelic Cryaquept) (S.T.) Turbic Cryosol (WRB)
Upper slope, moderately steeply sloping ( 1 5") , east exposition 90 m a.s.1. Arctic and arctic-alpine vegetation (100% coverage) around bare mud pits: dwarf shrubs (Dtyaspunc~ata, Salixpolaris, Salix reiicula), Astragalus spp., Polygonitm vivp'inim, sedges (Carex spp.), mosses, lichcns (Thamnolia vermicularis) Kolluvium of fine-grained greywacke mperfectly to poorly drained, dope water above permafrost
crn
(Draft N. Schmidt)
Profile LL8.1196 (mud pit): Depth (cm) Horizon Description 0-40 AC Sandy loam, 2-10 vol.% gravel, very dark grey (2.5Y 3/1), no humus, no
roots, pH [CaC12] 5.5, dipyridyl [-I 40-46 Cg Sandy loan~, 2-10 vol.% gravel, black (5Y 2.5/1), no humus, no roots, pH
[CaCl,] 5.3 , dipyridyl [-] >46 ~ f t Permafrost table
Profile LL8.2196 (dry vegetation ring): Depth (cm) Horizon Description 0- 5 A Loamy sand, 50-75 vol.% gravel, very dark grey (7.5YR 3/1), wealdy humic,
pH [CaC12] 5.7 5-42 Cg 1 Loamy sand, 10-25 vol.% gravel, very dark grey (2.5Y 3/1), no humus,
weakly rooted, pH [CaC12] 5.3, Fe3-oxides, dipyridyl [-] 42-46 c g 2 Loamy sand, 2-10 vol.% gravel, black (5Y 2/1), no humus, no roots, pH
[CaCM 5.3, dipyridyl [+I >4 6 ~ f t Pemiafrost table
Profile LL8.3 196 (wet vegetation ring): Depth (cm) Horizon Description -5 - 0 Oi Weakly decomposed plant debris, densely rooted, pH [CaCl;] 4.6 0 -22 Cg 1 Loamy sand, 10-25 vol.% gravel, very dark grey (2.5Y 3/1), no humus,
weakly rooted. pH [CaCL] 5.3, Fe"'-oxides, dipyridyl [-I 22-30 Cg2 Loamy sarid, 2-10 vol.% gravel, black (5Y 2/1), no humus, no roots, pH
[CaC12] 5.3, dipyridyl [+] >30 ~ f t Permafrost table
Fig. 5.1.2: Profile description non-sorted step at the solifluction slope (Profile LL8.1196 and LL8.2/96), Levinson-Lessing (modified froni BOLTER & SCHMIDT, 1997).
Non-sorted steps
As can be seen fsom Figure 5.1.2 the soils of the non-sosted steps only showed weak profile
differentiation. The mud pit (profile LL8.1) showed lower gravel contents than the adjacent
vegetated soils. The soils showed slope water above the pennafrost table. Yet, reduced iron
could only be deterrnined in the subsoils of the vegetation ring. Accumulation of organic
matter occussed when vegetation was present, though in the drier soil (LL8.2) a thin A-
horizon developed. On the contrary, weakly decomposed organic matter accumulated at the
wetter micro-site (LL8.3) of the vegetation ring. In the wetter micro-site thaw depth was lower
than in the adjacent soils.
Profile LL11196 (see Tab. A2.2-3 for profile description) differed fsom profile LL8196 in that
respect that the mud pit was partially overgsown by the sursounding vegetation. An AC-
horizon weakly developed. The organic horizons of the vegetation ring were thicker than
those fond in profile LL8.3.
Non-sorfed stripes
Figure 5.1.3 shows exemplarily the soils ofthe valley On top of mountains. They developed On
fsost-shattered rock debris and contained 50 to 90% gsavel or coarser fragments. Vegetation
coverage was vesy low (10-20%). Organic matter accumulated at these micro-sites. Yet, in
unvegetated topsoils (LL10.1196) AC-horizons could develop. In the respective horizons roots
were found because of horizontal rooting strategies of the sussounding vegetation in the
vegetation stripe (LL10.2).
Profile 9 (see Tab. A2.2-4 for profile description) differed fsom the latter in that respect that it
was situated fŸrthe downhill at a more steeply sloping site. Thus, non-sosted stripes
developed whereas at profile 10 these were transitionasy to nets. Generally the vegetation
coverage was gseater (i.e., 60%). The downslope position led to higher'slope water contents in
the soils ofprofile 9 which was at surface in the vegetation stripes (LL9.2). Thus, the organic
mat was slightly thicker (i.e., 4 cm) and an A- or AC-horizon was lacking. Thaw depths were
also lower than in profile LL10.
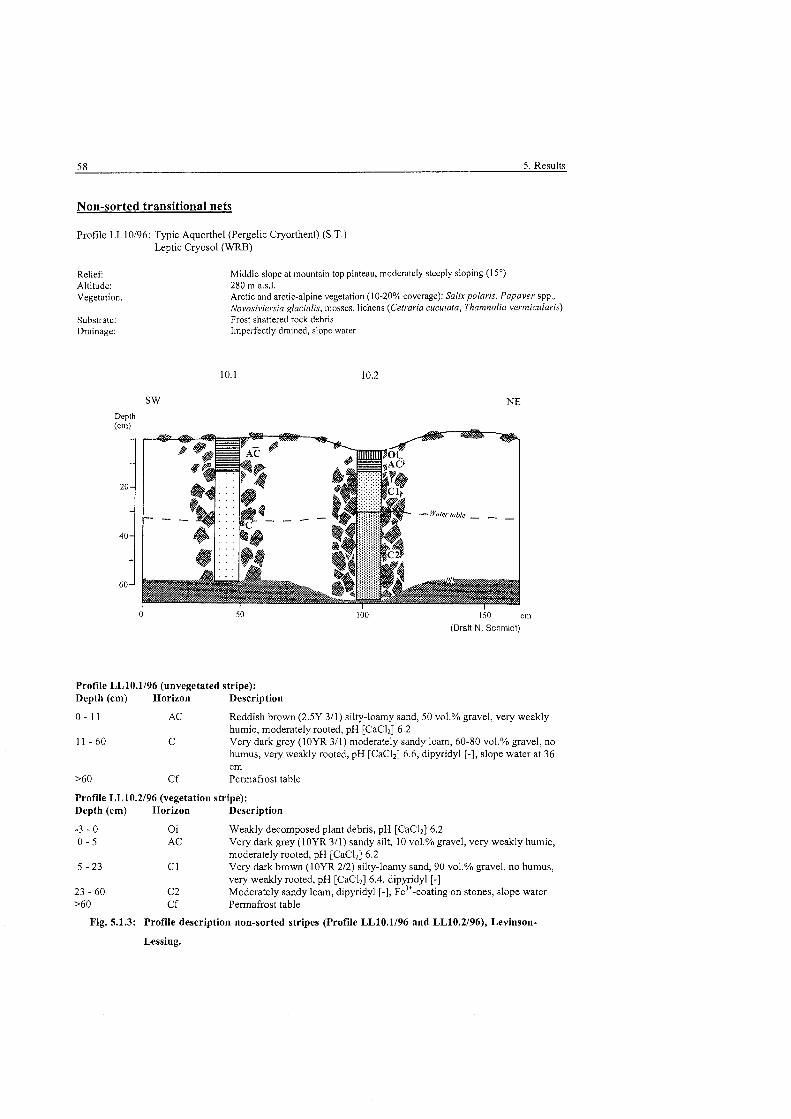
5 8 5. Results
Non-sorted transitional nets
Profile LL10196: Typic Aquorthel (Pergelic Cryorthent) (S.T.) Leptic Cryosol ( W B )
Relief: Altitude: Vegetation.
Substrate: Drainage:
Middle slope at mountain top plateau, rnoderately steeply sloping (15') 280 rn a.s.1. Arctic and arctic-alpine vegetation (10-20% coverage): Salixpolaris, Papaver spp., Novosi~~iersia glacialis, mosses, lichens (Cetraria ciicuiata, Thamnolia vermicularis) Frost shattered rock debris mperfectiy drained, slope water
Depth
100 150 crn
(Drafi N. Schrnidt)
Profile LL10.1196 (unvegetated stripe): Depth (cn~) Horizon Description
0 - 11 AC Reddish brown (2.5Y 311) silty-loamy sand, 50 vol.% gravel, very weakly humic, moderately rooted, pH [CaCli] 6.2
1 1 - 6 0 C Very dark grey (10YR 311) moderately sandy loam, 60-80 vol.% gravel, no humus, very weakly rooted, pH [CaC12] 6.6, dipyridyl [-I, slope water at 36 cm
>60 Cf Permafrost table
Profile LL10.2196 (vegetation stripe): Depth (cm) Horizon Description
-3 - 0 Oi Weakly decomposed plant debris, pH [CaCl;] 6.2 0 - 5 AC Very dark grey (10YR 311) sandy silt, 10 vol.% gravel, very weakly humic,
moderately rooted, pH [CaCl;] 6.2 5 - 2 3 Cl Very dark brown (10YR 212) silty-loamy sand, 90 vol.% gravel, no humus,
very weakly rooted, pH [CaCl;] 6.4, dipyridyl [-I 23 - 60 C2 Moderately sandy loam, dipyridyl [-I, ~ e - c o a t i n g on stones, dope water >60 Cf Permafrost table
Fig. 5.1.3: Profile description non-sorted stripes (Profile LL10.1196 and LL10.2/96), Levinson-
Lessing.
5.1.2.2 Solls at Labaz
In this study three typical tundra soils and two diy soils of top of mountains and spurs were
investigated. Profile descriptions were translated from GUNDELWEIN (1 998).
The soil showed distinct gleying properties. In the wet depressions between easth hummocks,
the water table was predominantly at soil surface. They represented a propostion of 10 to 15%
of the hummock tundra. Layers of organic matter were formed here, pastly of great thickness
with high organic carbon contents. Litter of the exposed hummocks (profile 2a195)
accumulated in these wet depressions. The hummocks, on the contrary, were lacking
0-horizons. They thawed more rapidly and to greater depth.
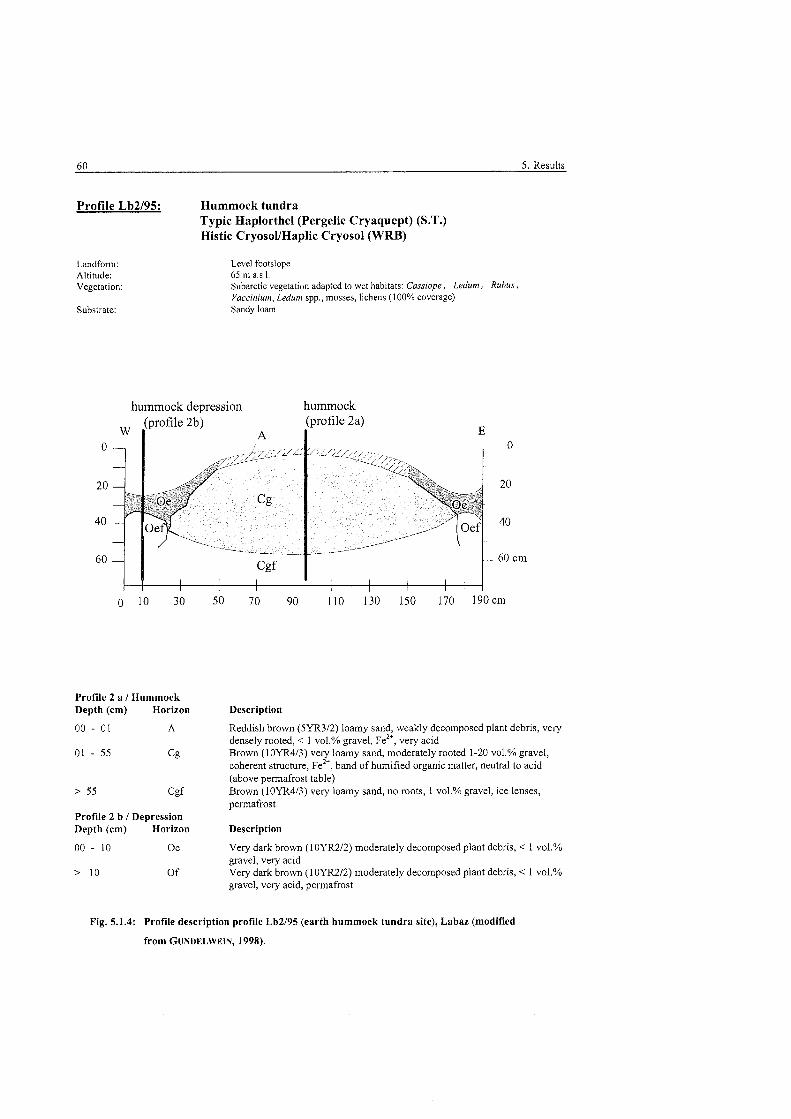
Profile Lb2195: Hummock tundra Typic Haplorthel (Pergelic Cryaquept) (S.T.) Histic Cryosol/Haplic Cryosol (WRB)
Landfonii: Altitude: Vegetation:
Substrate:
Level footslope 65 m a.s.1. Subarctic vegetation adapted to wet habitats: Cassiope, Ledum, Rubus, VacciiŸum Ledum spp., inosses, lichens ( 1 00% coverage) Sandy loam
hummock depression hummock (profile 2a)
E 0
20
40
60
Profile 2 a 1 Humn~ock Depth (cm) Horizon Description
00 - 01 A Reddish brown (5YR312) loamy sand, weakly decomposed plant debris, very densely rooted, < 1 vol.% gravel, ~ e " , very acid
01 - 55 c g Brown (10YR413) very loamy sand, moderately rooted 1-20 vol.% gravel, coherent structure, ~ e ~ ^ , band of humified organic matter, neutral to acid (above permafrost table)
> 55 c g f Brown (10YR413) very loarny sand, no roots, 1 vol.% gravel, ice lenses, permafrost
Profile 2 b 1 Depression Depth (cm) Horizon Description
00 - 10 Oe Very dark brown (10YR212) moderately decomposed plant debris, < 1 vol.% gravel, very acid
> 10 0 f Very dark brown (10YR212) xnoderately decomposed plant debris, < l vol.% gravel, very acid, permafrost
Fig. 5.1.4: Profile description profile Lb2195 (earth hummock tundra site), Labaz (modified
frorn GUNDELWEIN, 1998).
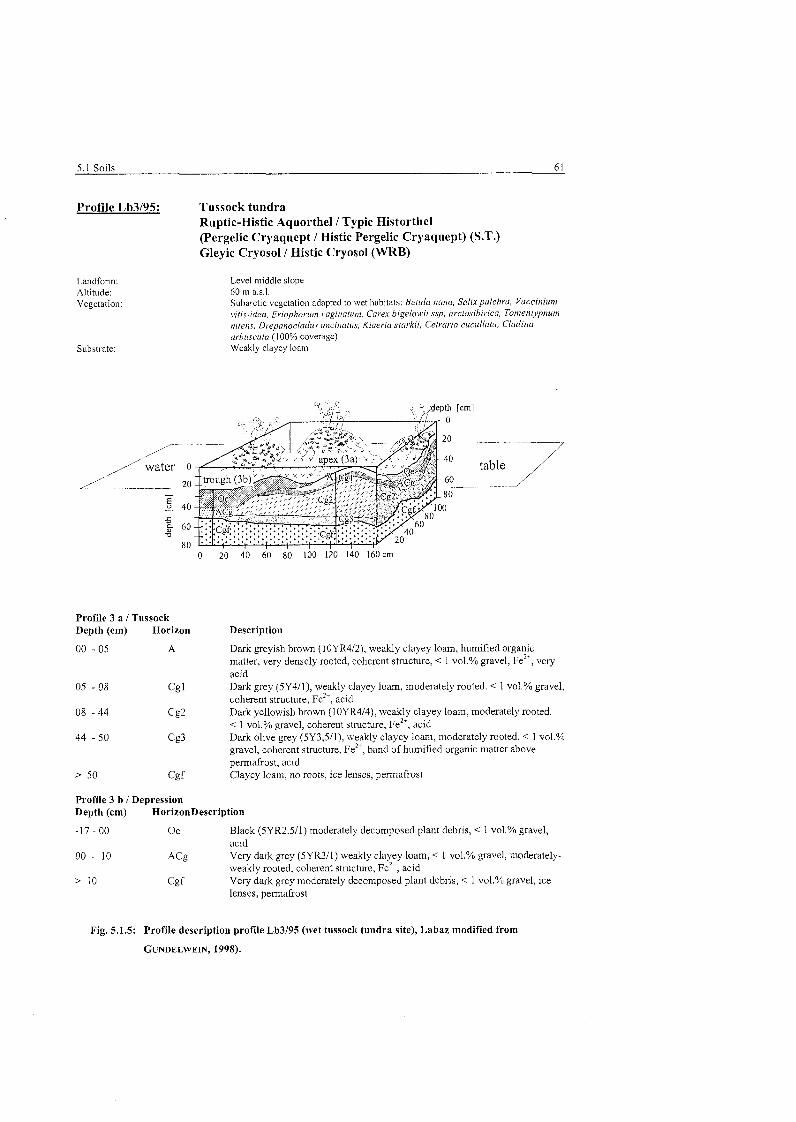
Profile Lb3195: Tussock tundra Ruptic-Histic Aquorthel / Typic Historthel (Pergelic Cryaquept / Histic Pergelic Cryaquept) (S.T.) Gleyic Cryosol / Histic Cryosol (WRB)
Landfonn: Altitude: Vegetation:
Substrate:
Level middle dope 60 m a.s.1. Subarctic vegetation adapted to wet habitats: Betula nana, Salixpulchra, Vaccinium vitis'idea, Eriophorum vaginaturn, Carex bigelowii ssp. arciosibirica, Toniet~typ~iii~ri nitens, Drepanocladus uncinatus, Kiaeria starkii, Cetrwia c u c d a t a , Cladiria arbuscula ( 1 00% coverage) Weakly clayey loam
+ - depth [cm] \ .,
/'---~ ---
/--'/war o table . 20 -
"0 5 3 60 V
80 0 20 40 60 80 100 120 140 160cm
Profile 3 a 1 Tussock Depth (ein) Horizon Description
00 - 05 A Dark greyish brown (lOYR4/2), weakly clayey loam, humified organic matter, very densely rooted, coherent structure, < 1 vol.% gravel, F e T , very acid
05 - 08 c g l Dark grey (5Y4/1), weakly clayey loam, moderately rooted. < 1 vol.% gravel, coherent structure, F e 2 , acid
08 - 44 C@ Dark yellowish brown (10YR4/4), weakly clayey loam, moderately rooted. < l vol.% gravel, coherent structure, F e 2 , acid
44 - 50 c g 3 Dark olive grey (5Y3,5/1), weakly clayey loam, moderately rooted. < 1 vol.% gravel, coherent structure, ~ e ~ " , band of humified organic matter above permafrost, acid
> 50 c g f Clayey loam, no roots, ice lenses, permafrost
Profile 3 b 1 Depression Depth (cm) HorizonDescription
-17 - 00 Oe Black (5YR2.511) moderately decomposed plant debris, < 1 vol.% gravel, acid
00 - 10 ACg Very dark grey (5YR311) weakly clayey loam, < 1 vol.% gravel, moderately- weakly rooted, coherent structure, F e 2 acid
> 10 cgf Very dark grey moderately decomposed plant debris, < 1 vol.% gravel, ice lenses, permafrost
Fig. 5.1.5: Profile description profile Lh3195 (wet tussock tundra site), Lahaz modified from
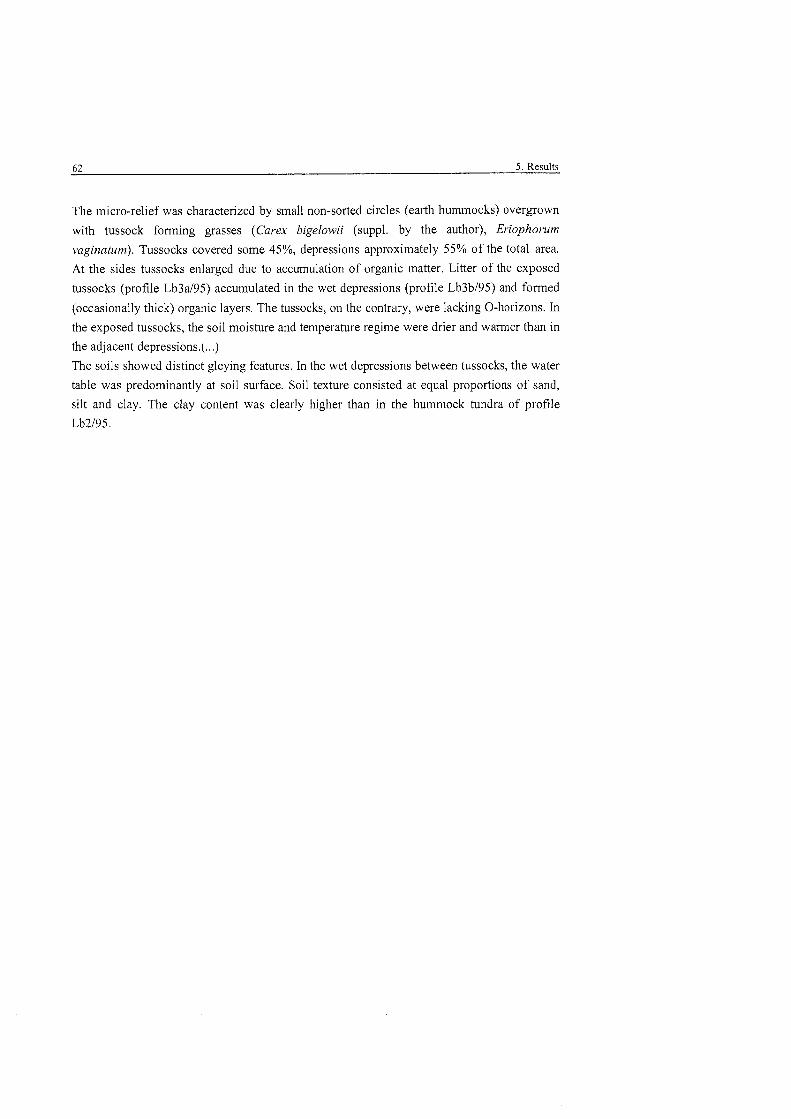
The micro-relief was characterized by small non-sorted circles (earth hummocks) overgrown
with tussock forming grasses (Carex bigelowii (suppl. by the author), Eriophorum
vaginatum). Tussocks covered some 45%, depressions approximately 55% of the total area.
At the sides tussocks enlarged due to accumulation of organic matter. Litter of the exposed
tussocks (profile Lb3aJ95) accumulated in the wet depressions (profile Lb3bl95) and formed
(occasionally thick) organic layers. The tussocks, on the contrary, were lacking 0-horizons. In
the exposed tussocks, the soil moisture and temperature regime were drier and warmer than in
the adj acent depressions.(. . .)
The soils showed distinct gleying features. In the wet depressions between tussocks, the water
table was predominantly at soil surface. Soil texture consisted at equal proportions of sand,
silt and clay. The clay content was clearly higher than in the hummock tundra of profile
Lb2195.
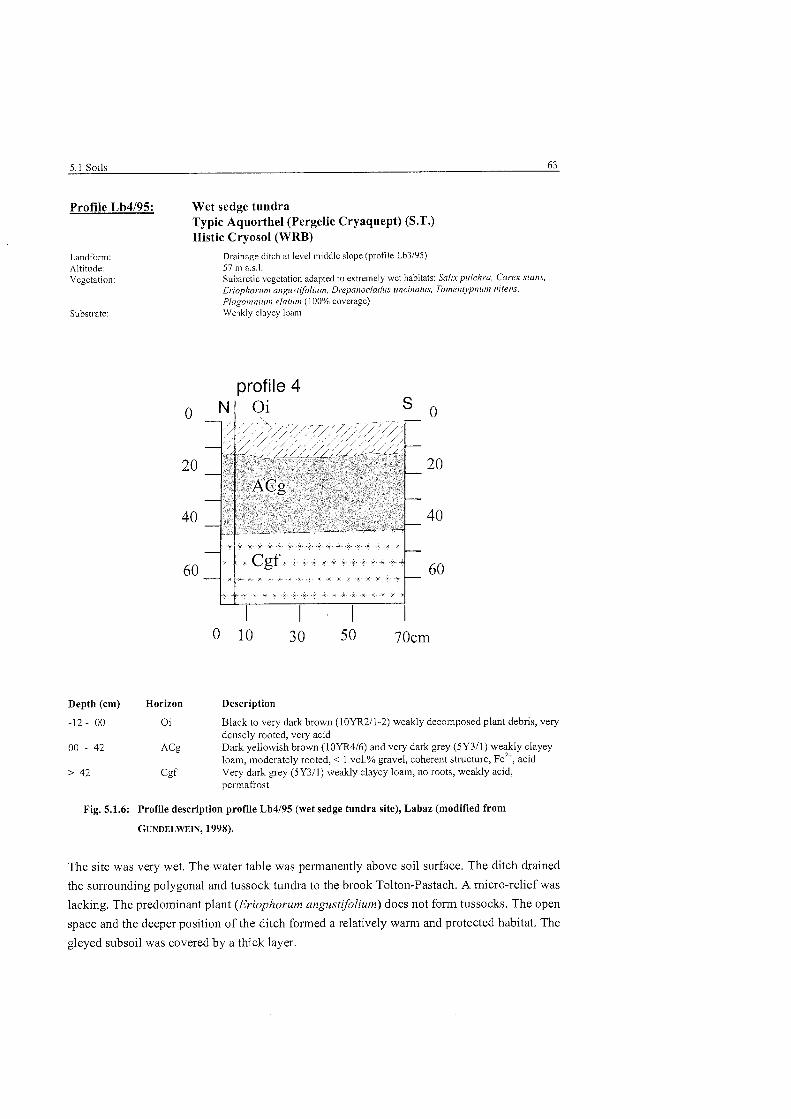
Profile Lb4195: Wet sedge tundra Typic Aquorthel (Pergelic Cryaquept) (S.T.) Histic Cryosol (WRB)
Landfonn: Altitude: Vegetation:
Substrate:
Drainage ditch at level middle slope (profile Lh3195) 57 m a.s.1. Suharctic vegetation adapted to extremely wet hahitats: Salixpulchra, Carex stans, Enophori~m a~~gustifolii~rn, Drepa~iocladus uncinatus, Tomenlypiium nitens, Plc~gomiliiim elaliim ( I 00% coverage) We'ikly clayey loam
profile 4
Depth (ein) Horizon Description
-12 - 00 Oi Black to very dark brown (10YR211-2) weakly decomposed plant debris, very densely rooted, very acid
00 - 42 A c g Dark yellowish brown (10YR416) and very dark grey (5Y311) weakly clayey loarn, rnoderately rooted, < l vol.% gravel, coherent structure, ~ e " , acid
> 42 c g f Very dark grey (5Y311) weakly clayey loam, no roots, weakly acid, permafrost
Fig. 5.1.6: Profile description profile Lb4195 (wet sedge tundra site), Labaz (modified from
GUNDELWEIN, 1998).
The site was very wet. The water table was permanently above soil surface. The ditch drained
the surrounding polygonal and tussock tundra to the brook Tolton-Pastach. A micro-relief was
lacking. The predominant plant (Eriophorum uizgustifoliurn) does not form tussocks. The Open
space and the deeper position of the ditch formed a relatively warm and protected habitat. The
gleyed subsoil was covered by a thick layer.
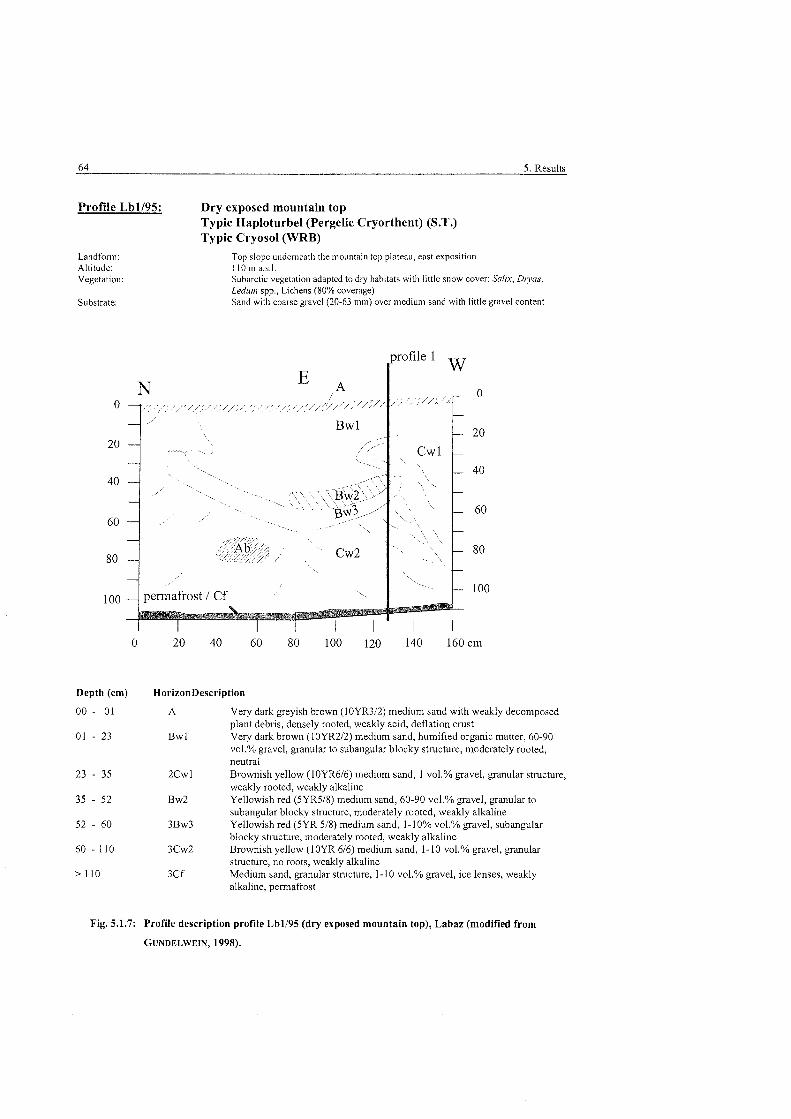
Profile Lbll95: Dry exposed rnountain top Typic Haploturbel (Pergelic Cryorthent) (S.T.) Typic Cryosol (WRB)
Landfonn: Altitude: Vegetation:
Substrate:
Top dope underneath the mountain top plateau, east exposition I I 0 rn a.s.1. Subarctic vegetation adapted to dry habitats with little snow Cover: Salix, Dryas, L e h m spp., Lichens (80% coverage) Sand with coarse gravel (20-63 min) over medium sand with little gravel content
,, ,:. ,,,,,;,,.,,,,;./, ,,;,,,,, ,,,.';,.,; ,,,; ,; ,;,,,{~,,!,/;//;/, . .
Bwl 20
-.-
- , ,,Y,
--.
Depth (cm) HorizonDescription
00 - 01 A Very dark greyish brown (10YR312) medium sand with weakly decomposed plant debris, densely rooted, weakly acid, deflation crust
01 - 23 Bwl Very dark brown (lOYR212) medium sand, humified organic matter, 60-90 vol.% gravel, granular to subangular blocky structure, moderately rooted, neutral
23 - 35 2Cwl Brownish yellow (10YR616) medium sand, 1 vol.% gravel, granular structure, weakly rooted, weakly alkaline
35 - 52 Bw2 Yellowish red (5YR518) medium sand, 60-90 vol.% gravel, granular to subangular blocky structure, moderately rooted, weakly alkaline
52 - 60 3Bw3 Yellowish red (5YR 518) medium sand, 1-10% vol.% gravel, subangular blocky structure, moderately rooted, weakly alkaline
60 - 110 3Cw2 Brownish yellow (10YR 616) medium sand, 1-10 vol.% gravel, granular structure, no roots, weakly alkaline
> 110 3Cf Medium sand, granular structure, 1-10 vol.% gravel, ice lenses, weakly alkaline, permafrost
Fig. 5.1.7: Profile description profile Lbll95 (dry exposed mountain top), Labaz (modified from
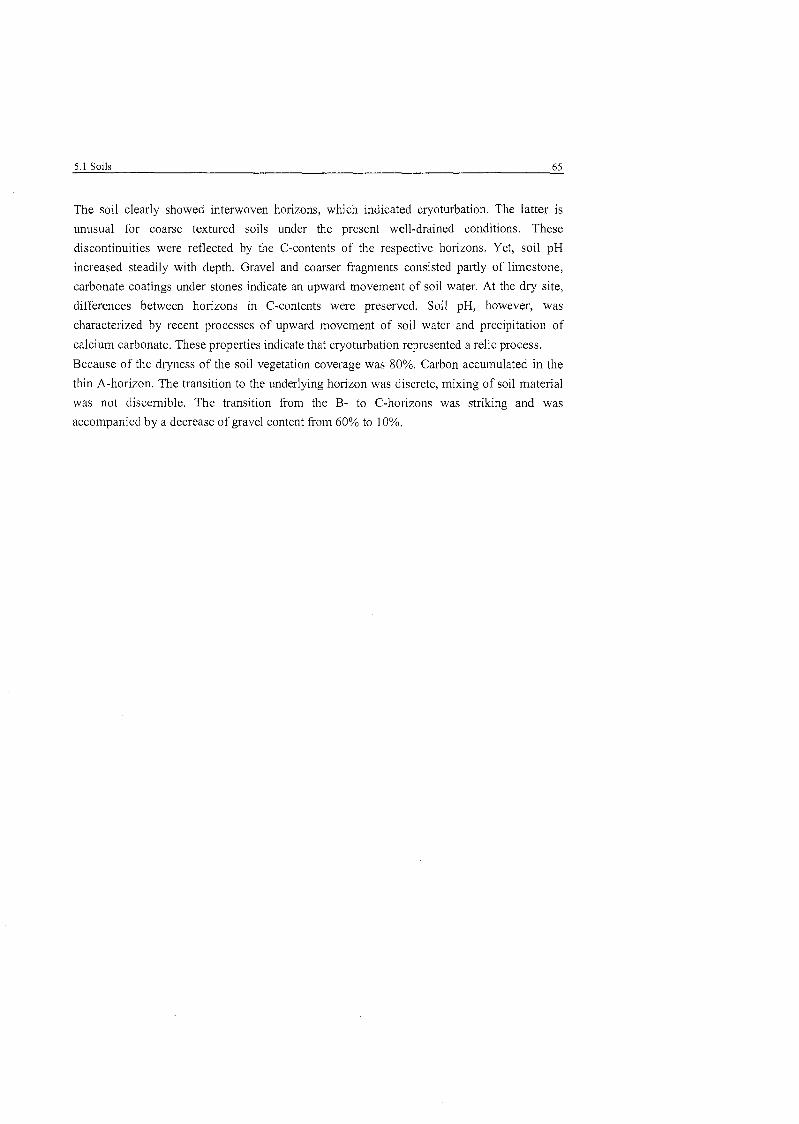
The soil clearly showed interwoven horizons, which indicated csyoturbation. The latter is
unusual for coarse textured soils under the present well-drained conditions. These
discontinuities were reflected by the C-contents of the respective horizons. Yet, soil pH
increased steadily with depth. Gravel and coarser fsagrnents consisted partly of limestone,
carbonate coatings under stones indicate an upward movement of soil water. At the dry site,
differentes between horizons in C-contents were preserved. Soil pH, however, was
characterized by recent processes of upward movement of soil water and precipitation of
calcium carbonate. These properties indicate that csyoturbation represented a relic process.
Because of the dryness of the soil vegetation coverage was 80%. Carbon accumulated in the
thin A-horizon. The transition to the underlying horizon was discrete, mixing of soil material
was not discemible. The transition from the B- to C-horizons was striking and was
accompanied by a decrease of gravel content from 60% to 10%.
66 5. Results
Profile Lb7195: Dry spur Aquic Umbriturbel (Pergelic Cryaquept) (S.T.) Turbic Cryosol (WRB)
Landfonn: Altitude: Vegetation:
Substrate:
Spur above brook valley 50 m a.s.1. Subarctic spotty vegetation adapted to dry habitats: Betiila spp., Cassiope spp. grasses, inosses and lichens (90% coverage) Alternating layers ofsand and loam
Depth (cm) Horizon Description
-1 - 00 Oi Weakly decomposed plant debris, predominantly lichens and mosses, discrete horizon formation
00 - 10 AE Dark yellowish brown (10YR 314) weakly humified, weakly clayey sand, < 1 vol.% gravel, densely rooted, granular structure, very acid
10 - 25 Bhs Brown (7.5YR 414) sand , very weakly humified, < l vol.% gravel, densely rooted, granular structure, cemented illuviation Zone, very acid
25 - 60 Bwg Dark yellowish brown (10YR 414) sand, < 1 vol.% gravel, no roots, granular structure, gleying features, acid
60 - 80 c g Olive grey (5Y 512) sand, < 1 vol.% gravel, no roots, gleying features, weakly acid
> 80 c g f Olive grey (5Y 512) sand, < 1 vol.% gravel, no roots, gleying features, weakly acid, permafrost, little ice-enrichment
Fig. 5.1.8: Profile description profie Lb7195 (dry spur), Labaz (modified from GUNDELWEIN,
Profile 7 represented a dry habitat. The exposed spur position and the sandy texture favoured
good drainage and deep thaw depths. In the topsoil the proportion of the sand fraction was
87% and increased up to 96% above the permafrost table. Porosity was 47-49% in the topsoil
as well as above the permafrost table. At a depth of 40 Cm, the soil showed strong
compaction. Porosity was 39% and bulk density was extremely high (1.9 g ~ m ' ~ ) .
According to the dsyness vegetation Cover was sparse, in particular higher plants occussed
only sporadically. Pronounced and continuous 0-horizons as well as any form of patterned
ground were 1acking.c ...) The topsoil clearly showed podzolisation properties (bleaching,
accumulation of sesquioxides). The upper boundary of the Cg-horizon was very irregular and
indicated cryoturbation. The latter is unusual for sandy, dry soils and was probably a relic
property. Features of csyoturbation were lacking in the topsoil. Despite good drainage and a
high proportion of coarse pores, the subsoil showed iron mottling and precipitates indicating
temporary anaerobic conditions. The soil was thus classified as Pergelic Cryaquept (S.T.,
6"' ed.).
In the WRB System, soil properties of the topsoil (thickness, colour, low base saturation,
organic C content, pH) qualified for an umbric hosizon whereas gleying properties were not
sufficient. However, the soil was classified as Aquic Umbriturbel and (Turbic Cryosol;
S.T., 8'Â edn. and WRB suppl. by the author).
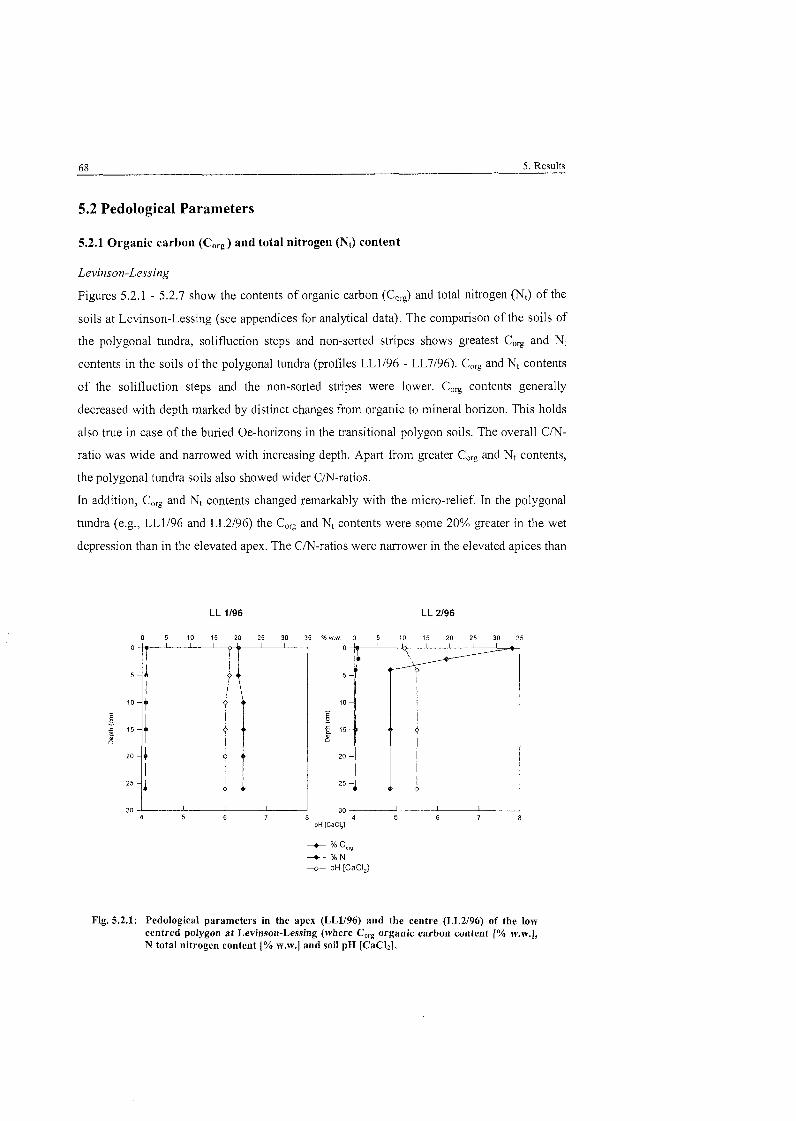
68 5. Results
5.2 Pedological Parameters
5.2.1 Organic carbon (Cãre and total nitrogen (Nt) content
Levii~son-Lessing
Figures 5.2.1 - 5.2.7 show the contents of organic carbon (Co,e) and total nitrogen (Nt) of the
soils at Levinson-Lessing (see appendices for analytical data). The compasison of the soils of
the polygonal tundra, solifluction steps and non-sorted stripes shows greatest Corg and Nt
contents in the soils of the polygonal tundra (profiles LL1196 - LL7196). Core and Nt contents
of the solifluction steps and the non-sorted stripes were lower. Corg contents generally
decreased with depth marked by distinct changes fsom organic to mineral hosizon. This holds
also true in case of the busied Oe-hosizons in the transitional polygon soils. The overall Cm-
ratio was wide and narrowed with increasing depth. Apart from gseater Core and Nt contents,
the polygonal tundra soils also showed wider CiN-ratios.
In addition, Corg and Nt contents changed remarkably with the micro-relief. In the polygonal
tundra (e.g., LL1196 and LL2196) the Cãr and Nt contents were some 20% gseater in the wet
depression than in the elevated apex. The Cm-ratios were narrower in the elevated apices than
Fig. 5.2.1: Pedological Parameters in the apex (LL1196) and the centre (LL2196) of the low centred polygon at Levinson-Lessing (where Core organic carbon content [% w.w.1, N total nitrogen content [% w.w.1 and soil pH [CaCli].
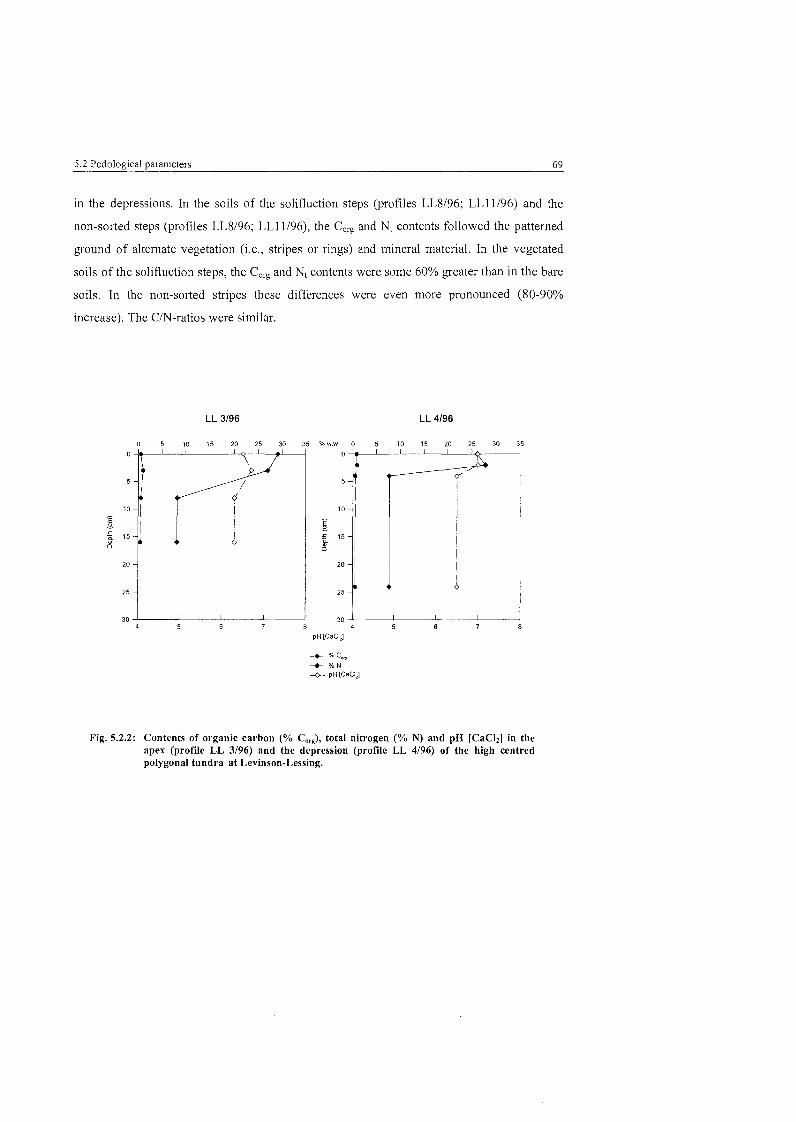
5.2 Pedological Parameters 69
in the depressions. In the soils of the solifluction steps (profiles LL8196; LL11196) and the
non-sorted steps (profiles LL8196; LL11/96), the Corg and Ni contents followed the pattemed
ground of alternate vegetation (i.e., stripes or rings) and mineral material. In the vegetated
soils of the solifluction steps, the Corg and Ni contents were some 60% greater than in the bare
soils. In the non-sorted stripes these differences were even more pronounced (80-90%
increase). The Cm-ratios were similar.
Fig. 5.2.2: Contents of organic carbon (% Co& total nitrogen (% N) and pH [CaCl;] in the apex (profile LL 3/96) and the depression (profile LL 4/96) of the high centred polygonal tundra at Levinson-Lessing.
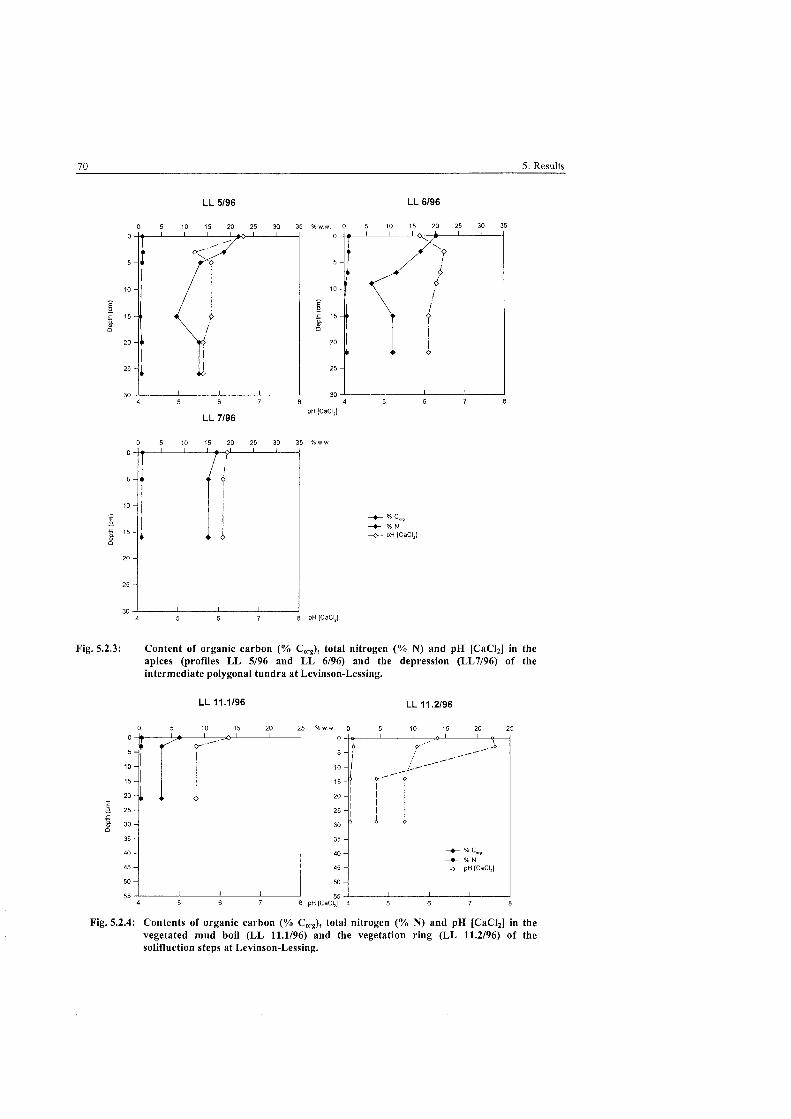
70 5. Results
Fig. 5.2.3: Content of organic carbon (% Co& total nitrogen (% N) and pH [CaCI;] in the apices (profiles LL 5/96 and LL 6/96) and the depression (LL7196) of the intermediate polygonal tundra at Levinson-Lessing.
Fig. 5.2.4: Contents of organic carbon (% Co-), total nitrogen (% N) and pH [CaC12] in the vegetated mud boil (LL 11.1196) and the vegetation ring (LL 11.2196) of the solifluction steps at Levinson-Lessing.
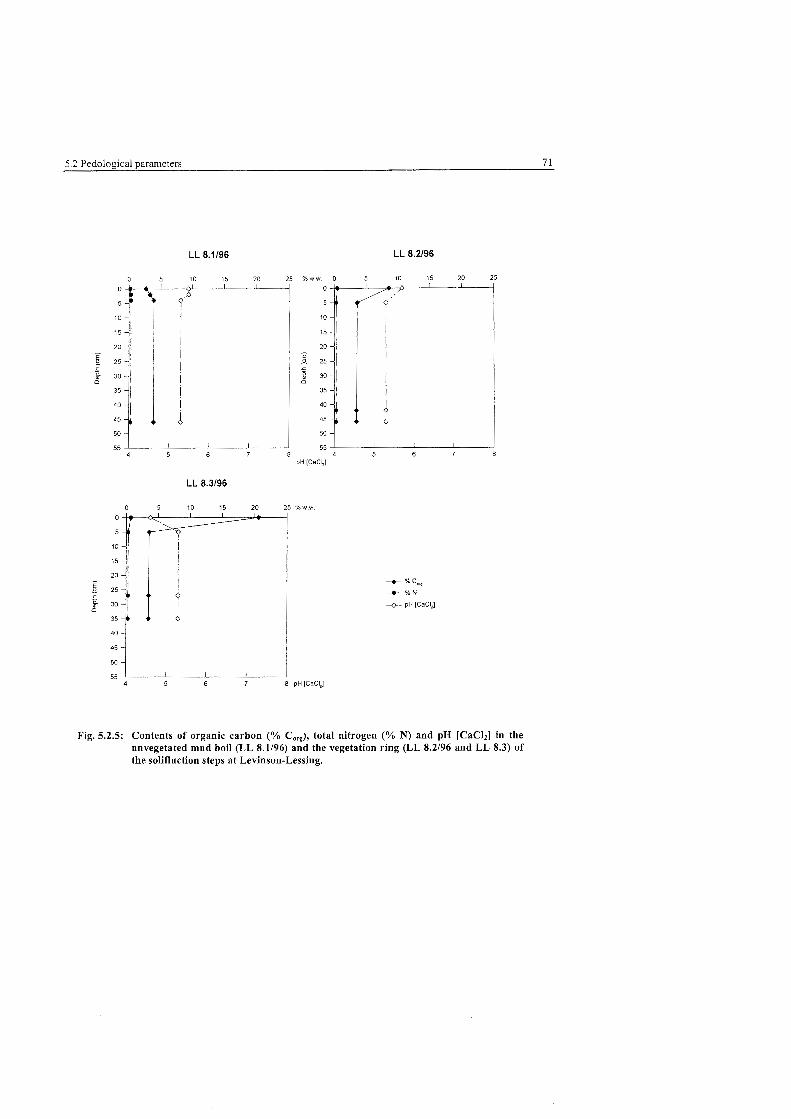
5.2 Pedological parameters 7 1
Fig. 5.2.5: Contents of organic carbon (% Co%), total nitrogen (% N) and pH [CaCl;] in the unvegetated mud boil (LL 8.1196) and the vegetation ring (LL 8-2/96 and LL 8.3) of the solifluction steps at Levinson-Lessing.
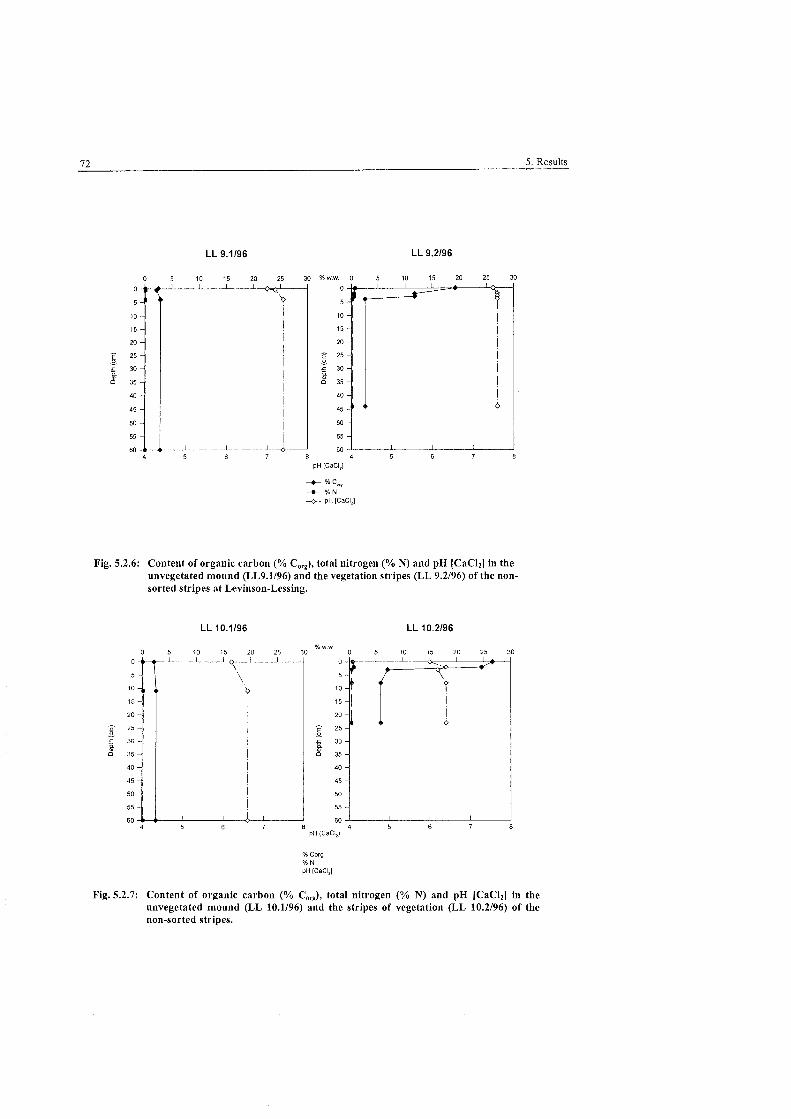
7 2 5. Results
Fig. 5.2.6: Content of organic carbon (% Co& total nitrogen (% 3) and pH [CaCli] in the unvegetated mound (LL9.1196) and the vegetation stripes (LL 9.2196) of the non- sorted stripes at Levinson-Lessing.
Fig. 5.2.7: Content of organic carbon (% CorÈ) total nitrogen (% N) and pH [CaClz] in the unvegetated mound (LL 10.1196) and the stripes of vegetation (LL 10.2196) of the non-sorted stripes.
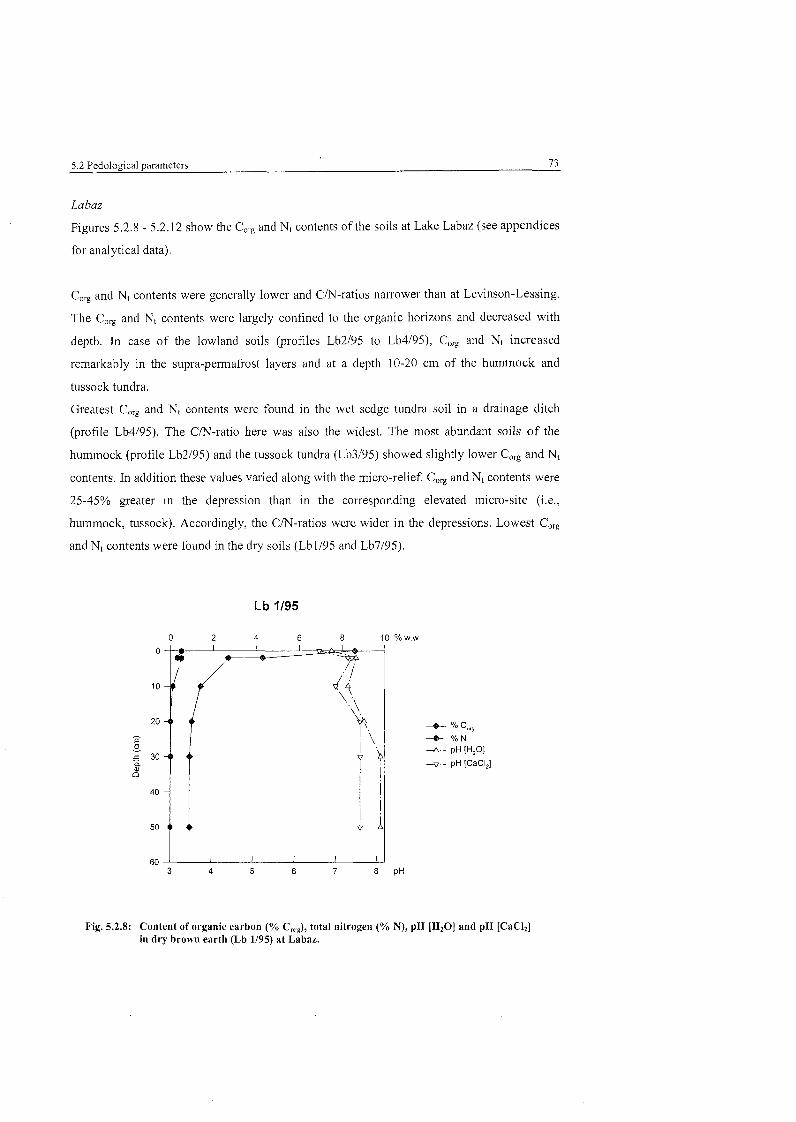
5.2 Pedological Parameters 73
Labaz
Figures 5.2.8 - 5.2.12 show the Core and Nt contents of the soils at Lake Labaz (see appendices
for analytical data).
Corg and Nt contents were generally lower and Cm-ratios narrower than at Levinson-Lessing.
The Corg and Nt contents were largely confined to the organic horizons and decreased with
depth. In case of the lowland soils (profiles Lb2195 to Lb4/95), Corg and N1 increased
remarkably in the supra-perrnafrost layers and at a depth 10-20 cm of the hummock and
tussock tundra.
Greatest Corg and Nt contents were found in the wet sedge tundra soil in a drainage ditch
(profile Lb4/95). The CiN-ratio here was also the widest. The most abundant soils of the
hummock (profile Lb2195) and the tussock tundra (Lb3195) showed slightly lower Corg and Nt
contents. In addition these values varied along with the micro-relief. Corg and Nt contents were
25-45% greater in the depression than in the corresponding elevated micro-site (i.e.,
hummock, tussock). Accordingly, the CiN-ratios were wider in the depressions. Lowest Core
and Nt contents were found in the dry soils (Lbll95 and Lb7195).
Fig. 5.2.8: Content o f organic carbon (% Co& total nitrogen (% N ) , pH [HzO] and pH [CaCl;] in dry brown eartb (Lb 1/95) at Labaz.
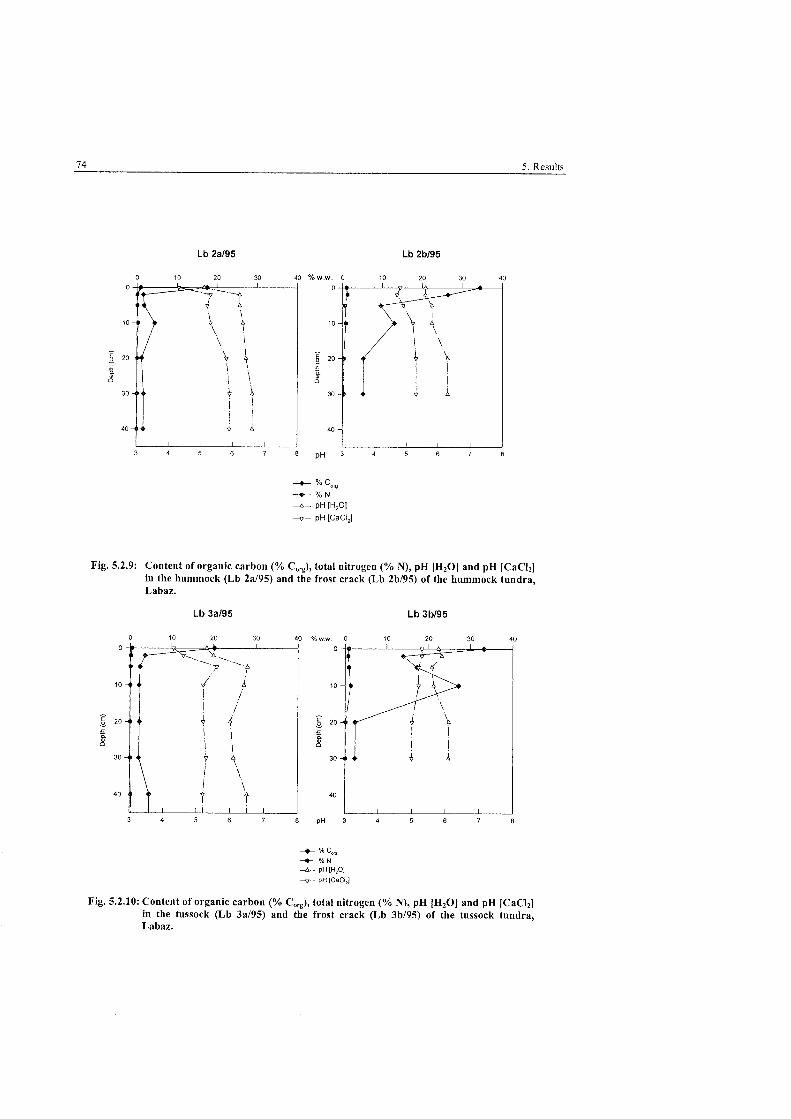
74 5 , Results
Fig. 5.2.9: Content of organic carbon (% Co& total nitrogen (% N), pH [H20] and pH [CaCl;] in the hummock (Lb 2al95) and the frost crack (Lb 2b/95) of the hummock tundra, Labaz.
-*- % Ñ9 % N -4 - pH [HO]
T- pH [CaCI,]
Fig. 5.2.10: Content of organic carbon (% Corg), total nitrogen (% N), pH [H20] and pH [CaClz] in the tussock (Lb 3al95) and the frost crack (Lb 3bl95) of the tussock tundra, Labaz.
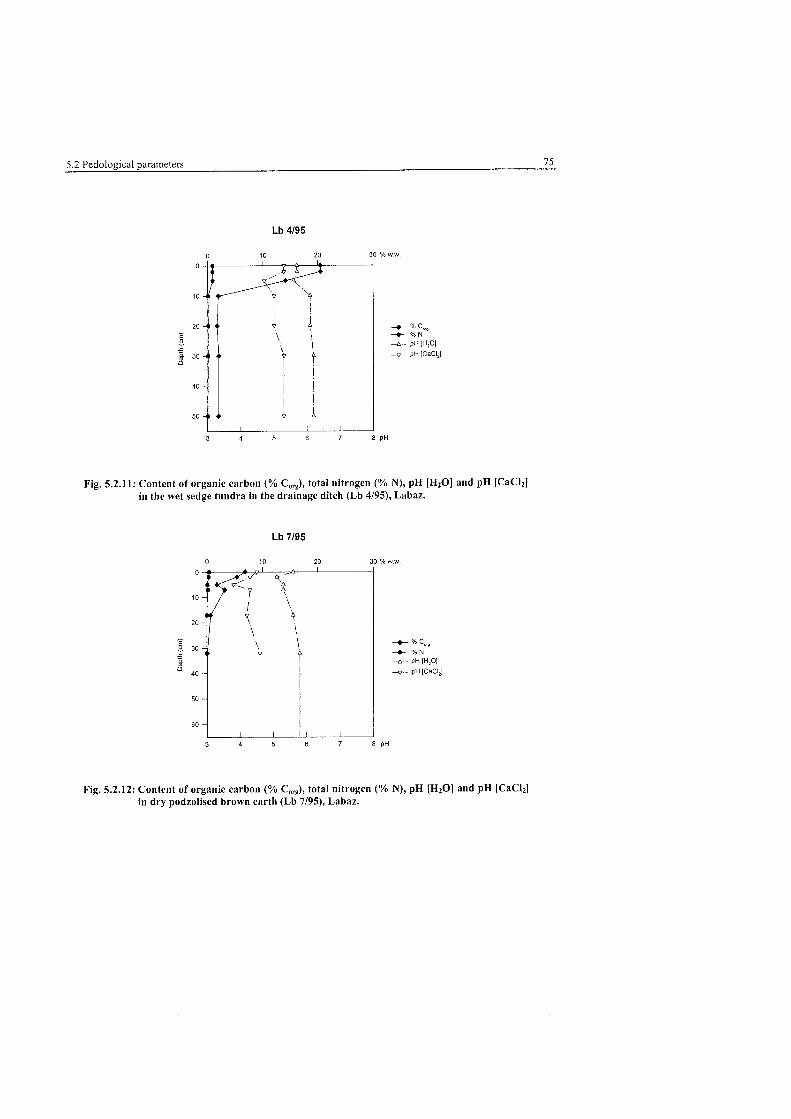
5.2 Pedological Parameters 75
Fig. 5.2.11: Content of organic carbon (% Co& total nitrogen (% N), pH [H20] and pH [CaClz] in tlie wet sedge tundra in the drainage ditch (Lb 4/95), Labaz.
Fig. 5.2.12: Content of organic carbon (% Corg), total nitrogen (% N), pH [H20] and pH [CaCu in dry podzolised brown earth (Lb 7/95), Labaz.
76 5 . Results
Levinson-Lessing
Mean soil pH [CaC12] of the fresh topsoils (0-10 cm) of the polygonal tundra was 6.2. In case
of the soils of solifluction steps mean pH [CaC12] was 5.7. In the soils of the non-sorted
stripes mean pH [CaClz] was 6.7.
In the soils of the solifluction steps, along with the vegetation Cover, the pH [CaC12] was
lower than in the neighbouring unvegetated mudboils. On the contrary, there was no distinct
difference in pH [CaC12] with respect to the micro-relief in the soils of the polygonal tundra
nor in the soils of the non-sorted stripes.
La baz
Mean pH [CaC12] of the upper horizons (0-10 cm) of the tundra soils (profiles Lb2195 -
Lb4195) was 5.2. Mean pH [CaC12] of the dry sites was 7.0 in case of the carbonatic uphill soil
(Lbll95) and 4.3 in case of the podzolic soil (Lb7/95).
The pH values [CaCl2] of the tundra soils varied along with the micro-relief. Thus, in the
depression of the hummock tundra the pH was more acid than in the hummock. On the
contrary, in the elevated micro-site of the tussock tundra (Lb3195) was more acid than in the
corresponding depression.
Mean pH [HsO] of the upper horizons (0-10 cm) of the tundra soils (proflles Lb2195 - Lb4/95)
was 5.8. Mean pH [H201 of the dry sites was 7.3 in case of the uphill soil and 5.3 in case of
the podzolic soil (Lb7195). Thus, the overall exchange acidity was high (mean ApH 0.9) being
highest in the podzolic soil (mean ApH 1.1). The lowest exchange acidity was found in the dry
uphill soil (mean ApH 0.2).
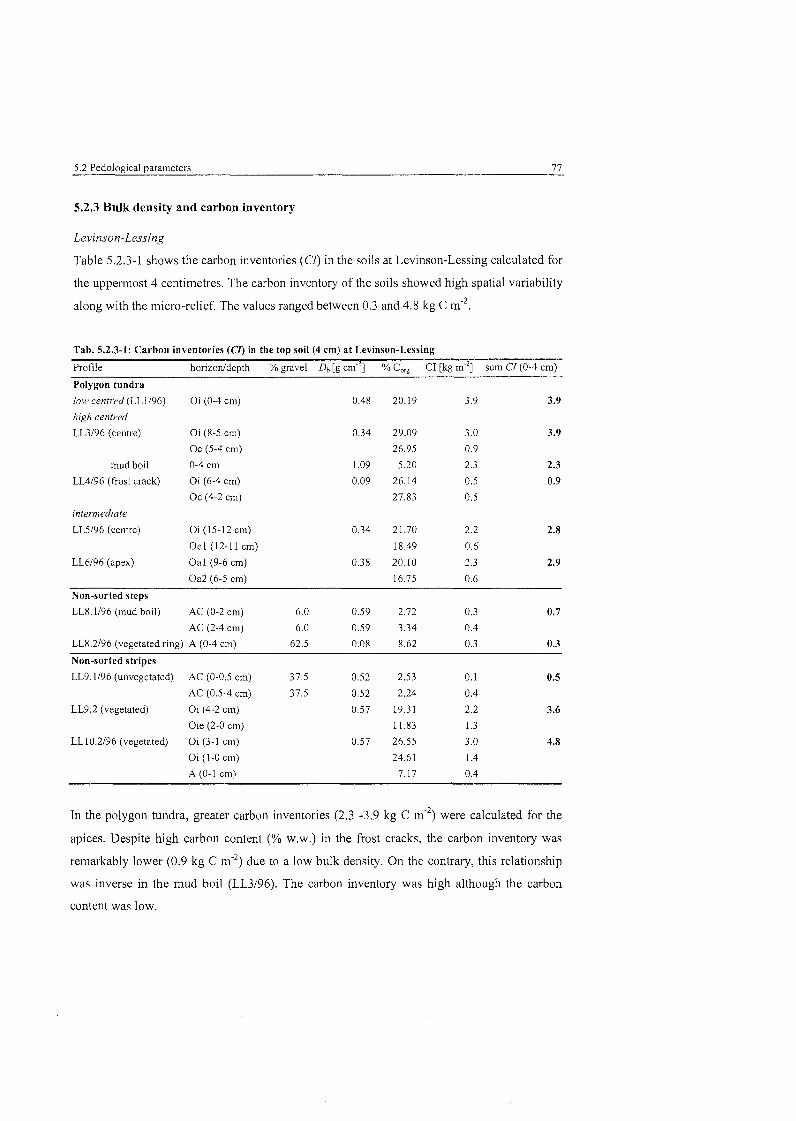
5.2 Pedological Parameters 77
5.2.3 Bulk density and carbon inventory
Levinson-Lessing
Table 5.2.3-1 shows the carbon inventories (Cl) in the soils at Levinson-Lessing calculated for
the uppennost 4 centimetres. The carbon inventory of the soils showed high spatial variability
along with the micro-relief. The values ranged between 0.3 and 4.8 kg C m".
Tab. 5.2.3-1: Carbon inventories (CD in the top soll (4 cm) at Levinson-Lessing
Profile horizonldepth % gravel Db [g ~ m ' ~ ] % Corc CI [kg m'>] sum CI (0-4 cm)
Polygon tundra
loir cenired (LL 1/96) Oi (0-4 cm) 0.48 20.19 3.9 3.9
high centred
LL3196 (centre) Oi (8-5 cm) 0.34 29.09 3.0 3.9
Oe (5-4 cm) 26.95 0.9
mud boil 0-4 cm 1.09 5.20 2.3 2.3
LL4196 (frost crack) Oi (6-4 cm) 0.09 26.14 0.5 0.9
Oe (4-2 cm) 27.83 0.5
intermediate
LL5196 (centre) Oi (15-12 cm) 0.34 21.70 2.2 2.8
Oel (12-11 cm) 18.49 0.6
LL6196 (apex) Oal (9-6 cm) 0.38 20.10 2.3 2.9
Oa2 (6-5 cm) 16.75 0.6
Non-sorted steps
LL8.1196 (mud boil) AC (0-2 cm) 6.0 0.59 2.72 0.3 0.7
AC (2-4 cm) 6.0 0.59 3.34 0.4
LL8.2196 (vegetated ring) A (0-4 cm) 62.5 0.08 8.62 0.3 0.3
Non-sorted stripes
LL9.1196 (unvegetated) AC (0-0.5 cm) 37.5 0.52 2.53 0.1 0.5
AC (0.5-4 cm) 37.5 0.52 2.24 0.4
LL9.2 (vegetated) Oi (4-2 cm) 0.57 19.31 2.2 3.6
Oie (2-0 cm) 11.83 1.3
LL10.2196 (vegetated) Oi (3-1 cm) 0.57 26.55 3.0 4.8
Oi (I -0 cm) 24.61 1.4
A (0- l c1n1 7.17 0.4
In the polygon tundra, greater carbon inventories (2.3 -3.9 kg C m'2) were calculated for the
apices. Despite high carbon content (% w.w.) in the frost cracks, the carbon inventory was
remarkably lower (0.9 kg C m'2) due to a low bulk density. On the contrary, this relationship
was inverse in the mud boil (LL3196). The carbon inventory was high although the carbon
content was low.
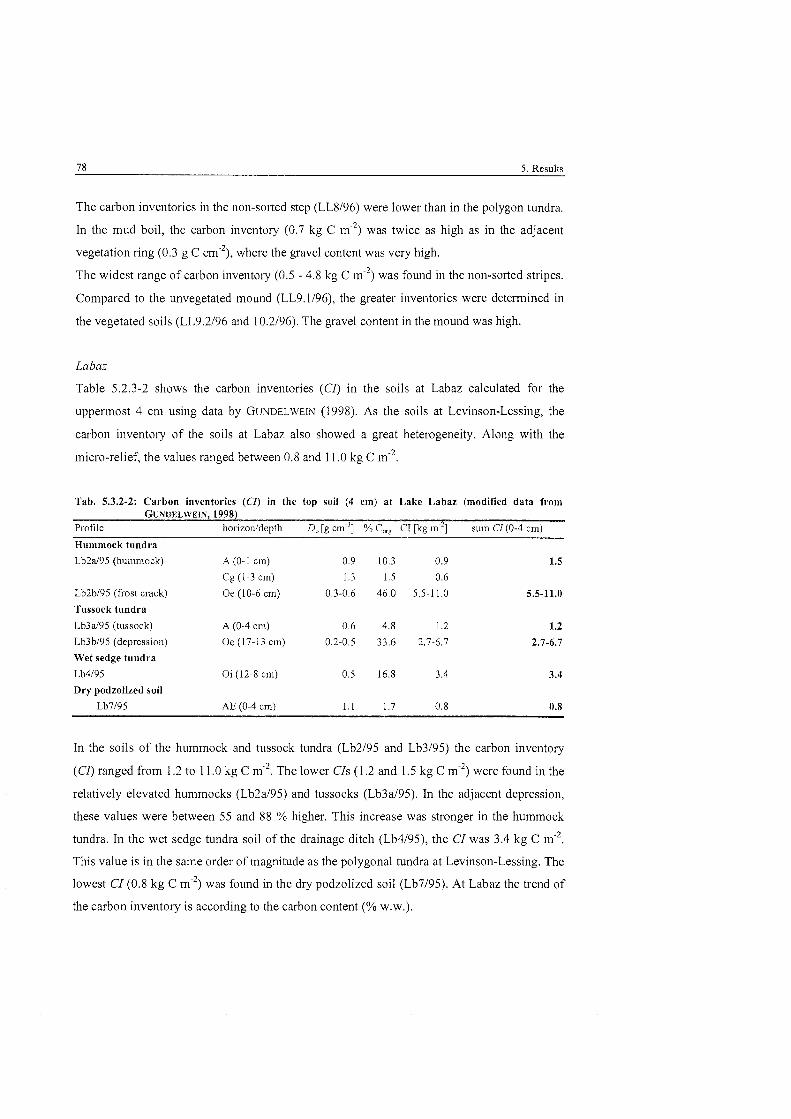
The carbon inventories in the non-sorted step (LL8196) were lower than in the polygon tundra.
In the mud boil, the carbon inventory (0.7 kg C m'2) was twice as high as in the adjacent
vegetation ring (0.3 g C cm"), where the gravel content was very high.
The widest range of carbon inventory (0.5 - 4.8 kg C nY2) was found in the non-sorted stripes.
Compared to the unvegetated mound (LL9.1/96), the greater inventories were determined in
the vegetated soils (LL9.2196 and 10.2196). The gravel content in the mound was high.
Labaz
Table 5.2.3-2 shows the carbon inventories (Cl) in the soils at Labaz calculated for the
uppesmost 4 cm using data by GUNDELWEIN (1998). As the soils at Levinson-Lessing, the
carbon inventory of the soils at Labaz also showed a great heterogeneity. Along with the
micro-relief, the values ranged between 0.8 and 1 1.0 kg C m'2.
Tab. 5.3.2-2: Carbon inventories (CI) in the top soil (4 ein) at Lake Labaz (modified data from GUNBELWEIN, 1998)
Profile l~orizonldepth Db [g crn"j] % Co% CI [kg rn"2] sum CI (0-4 cm)
Hummock tundra
Lb2a195 (hummock) A (0- 1 cm) 0.9 10.3 0.9 1.5
Cg (1-3 cm) 1.3 1.5 0.6
Lb2bl95 (frost crack) Oe (10-6 cm) 0.3-0.6 46,O 5.5-1 1.0 5.5-11.0
Tussock tundra
Lb3a195 (tussock) A (0-4 cm) 0.6 4.8 1.2 1.2
Lb3bl95 (depression) Oe (17-13 crn) 0.2-0,5 33.6 2.7-6.7 2.7-6.7
Wet sedge tundra
L W 9 5 Oi (12-8 cm) 0.5 16.8 3.4 3.4
Dry podzolized soil
Lb7195 AE (0-4 cm) 1.1 1.7 0.8 0.8
In the soils of the hummock and tussock tundra (Lb2195 and Lb3195) the carbon inventory
(CD ranged from 1.2 to 11.0 kg C mM2. The lower CIS (1.2 and 1.5 kg C m'2) were found in the
relatively elevated hummocks (Lb2d95) and tussocks (Lb3d95). In the adjacent depression,
these values were between 55 and 88 % higher. This increase was stronger in the hummock
tundra. In the wet sedge tundra soil of the drainage ditch (Lb4/95), the CI was 3.4 kg C m"2.
This value is in the same order of magnitude as the polygonal tundra at Levinson-Lessing. The
lowest CI (0.8 kg C m'2) was found in the dry podzolized soil (Lb7195). At Labaz the trend of
the carbon inventory is according to the carbon content (% w.w.).
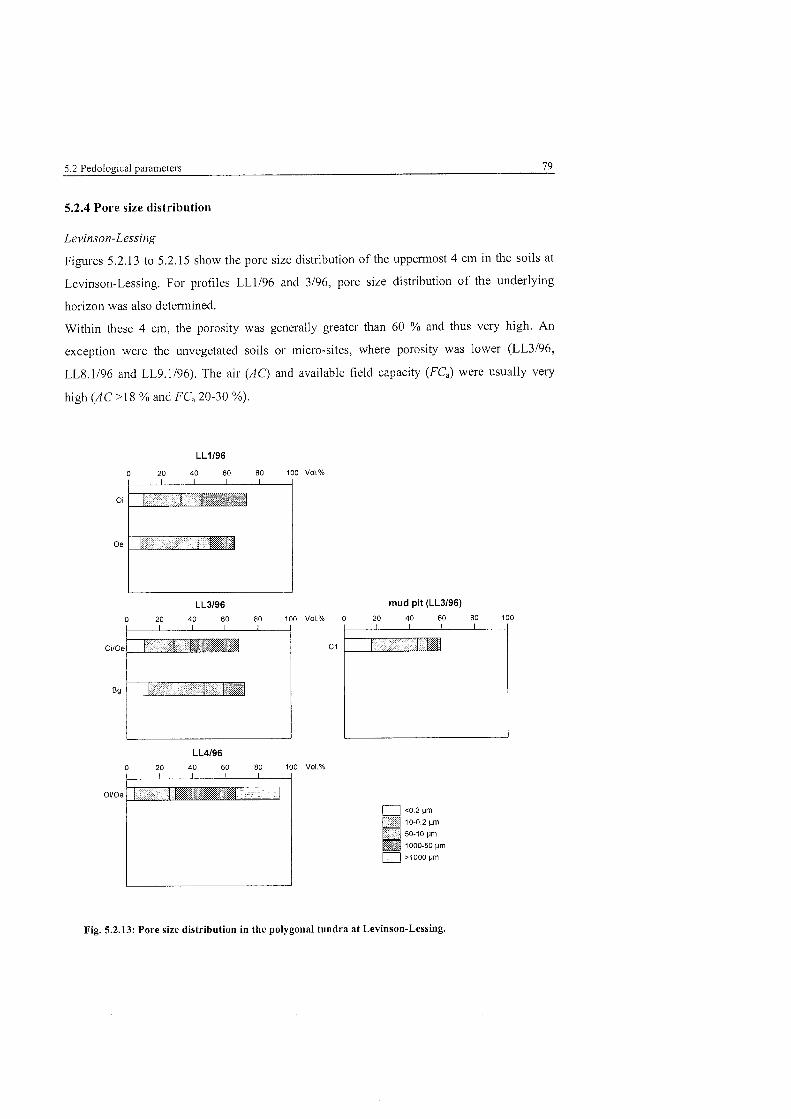
5.2 Pedological Parameters 79
5.2.4 Pore size distribution
Levinson-Lessing
Figures 5.2.13 to 5.2.15 show the Pore size distribution of the uppesmost 4 cm in the soils at
Levinson-Lessing. For profiles LL1/96 and 3/96, pore size distribution of the underlying
horizon was also deterrnined.
Within these 4 cm, the porosity was generally gseater than 60 % and thus vesy high. An
exception were the unvegetated soils or micro-sites, where porosity was lower (LL3196,
LL8.1196 and LL9.1196). The air (AC) and available field capacity (FCa) were usually vesy
high (AC > 18 % and FCa 20-30 %).
LL3196 rnud pit (LL3196) 0 20 40 60 60 l O O V O l % 0 20 40 60 80 100
I I I I
C1 1; , , ,,, &Li.x&
Fig. 5.2.13: Pore size distribution in the polygonal tundra at Levinson-Lessing.
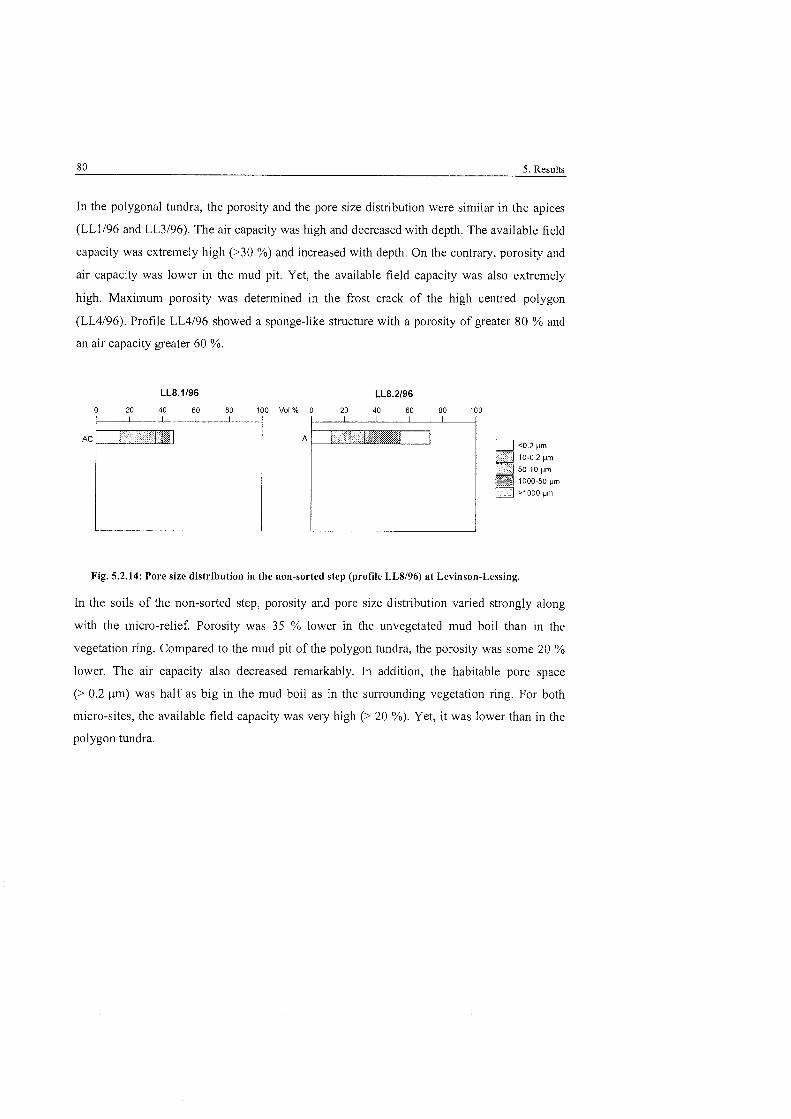
80 5. Results
In the polygonal tundra, the porosity and the pore size distribution were similar in the apices
(LL1196 and LL3196). The air capacity was high and decreased with depth. The available field
capacity was extremely high (>30 %) and increased with depth. On the contrary, porosity and
air capacity was lower in the mud pit. Yet, the available field capacity was also extremely
high. Maximum porosity was determined in the frost crack of the high centred polygon
(LL4196). Profile L,L4/96 showed a sponge-like structure with a porosity of greater 80 % and
an air capacity greater 60 %.
Fig. 5.2.14: Pore size distribution in the non-sorted step (profile LL8196) at Levinson-Lessing.
In the soils of the non-sorted step, porosity and pore size distribution varied strongly along
with the micro-relief. Porosity was 35 % lower in the unvegetated mud boil than in the
vegetation ring. Compared to the mud pit of the polygon tundra, the porosity was some 20 %
lower. The air capacity also decreased remarkably. In addition, the habitable pore space
(> 0.2 um) was half as big in the mud boil as in the sussounding vegetation ring. For both
micro-sites, the available field capacity was very high (> 20 %). Yet, it was lower than in the
polygon tundra.
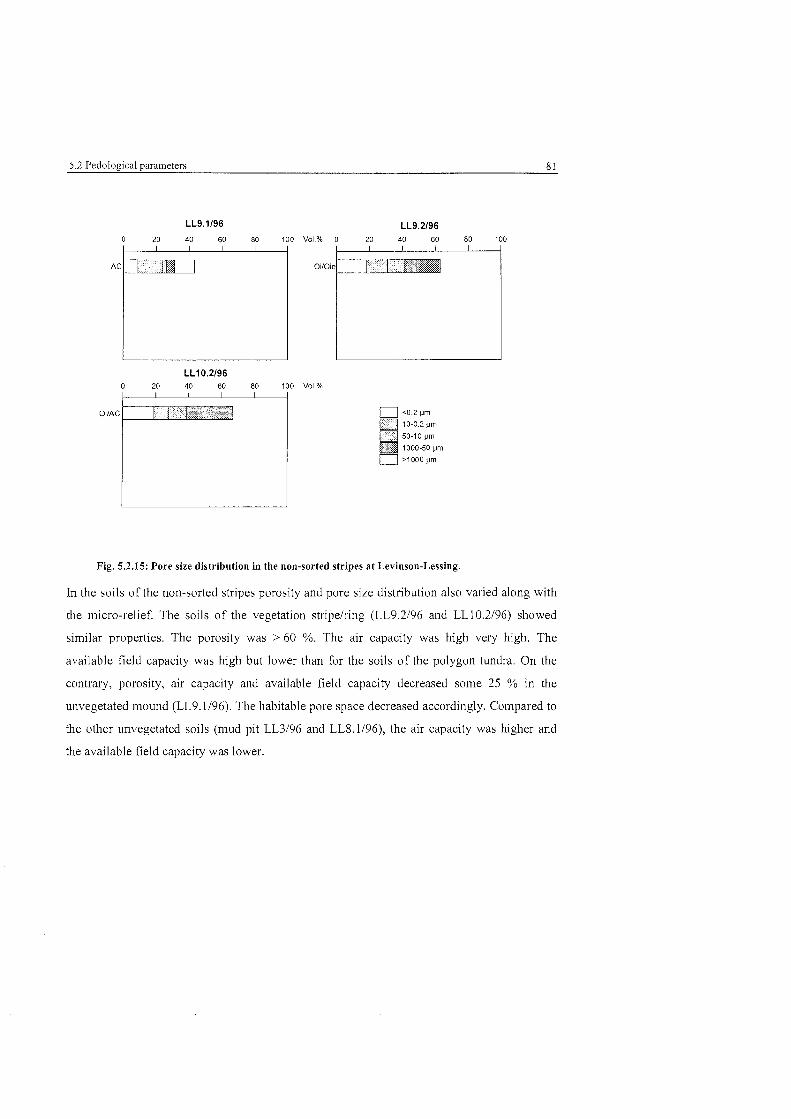
5.2 Pedological parameters 8 1
I I
Fig. 5.2.15: Pore size distribution in the non-sorted stripes at Levinson-Lessing.
In the soils of the non-sorted stripes porosity and pore size distribution also varied along with
the micro-relief. The soils of the vegetation stripelring (LL9.2196 and LL10.2196) showed
similar properties. The porosity was > 60 %. The air capacity was high very high. The
available field capacity was high but lower than for the soils of the polygon tundra. On the
contrary, porosity, air capacity and available field capacity decreased some 25 % in the
unvegetated mound (LL9.1196). The habitable Pore space decreased accordingly. Compared to
the other unvegetated soils (mud pit LL3196 and LL8.1/96), the air capacity was higher and
the available field capacity was lower.
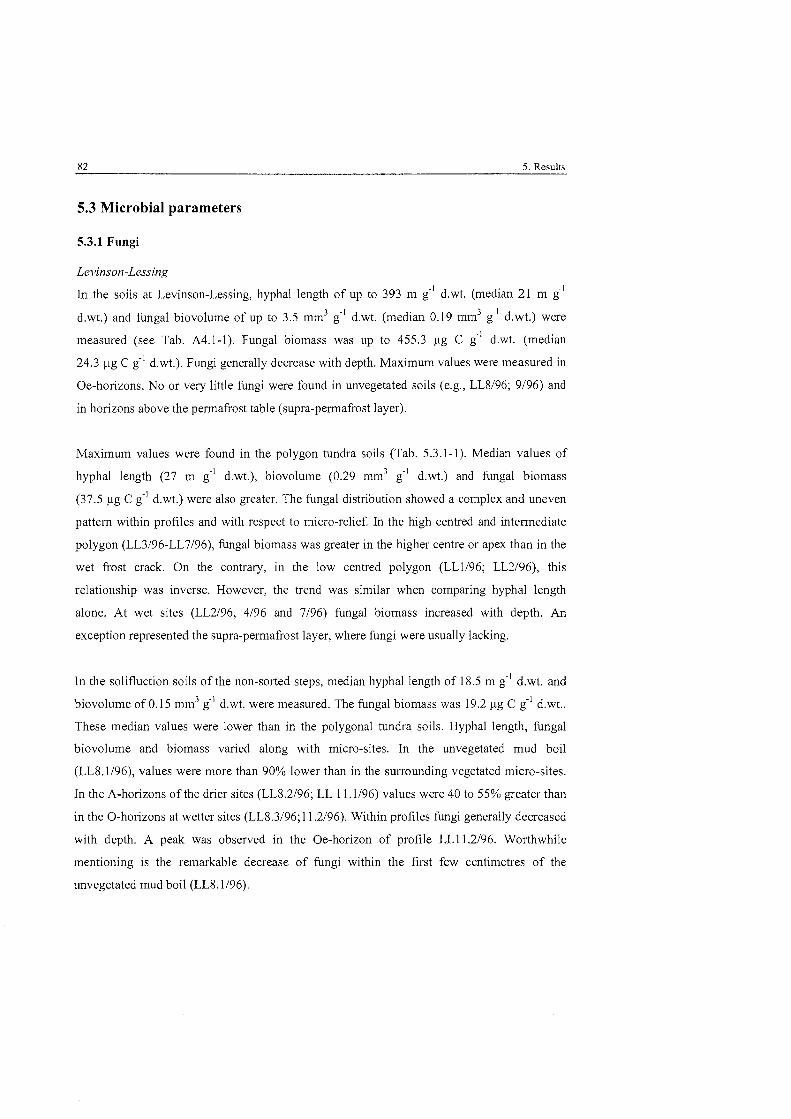
5.3 Microbial parameters
5.3.1 Fungi
Levinson-Lessing
In the soils at Levinson-Lessing, hyphal length of up to 393 m g " d.wt. (median 21 m g"'
d.wt.) and fimgal biovolume of up to 3.5 mm3 g ' d.wt. (median 0.19 mm3 g'l d.wt.) were
measured (see Tab. A4.1-1). Fungal biomass was up to 455.3 pg C g " d.wt. (median
24.3 pg C g " d.wt.). Fungi generally decrease with depth. Maximum values were measured in
Oe-hosizons. No or very little fungi were found in unvegetated soils (e.g., LL8196; 9196) and
in hosizons above the pesmafiost table (supra-pesmafrost layer).
Maximum values were found in the polygon tundra soils (Tab. 5.3.1 - 1). Median values of
hyphal length (27 m g ' d.wt.), biovolume (0.29 mm3 g" d.wt.) and fungal biomass
(37.5 pg C g ' d.wt.) were also greater. The fungal distribution showed a complex and uneven
pattem within profiles and with respect to micro-relief. In the high centred and intermediate
polygon (LL3196-LL7/96), fungal biomass was gseater in the higher centre or apex than in the
wet frost crack. On the contrary, in the low centred polygon (LL1196; LL2/96), this
relationship was inverse. However, the trend was similar when comparing hyphal length
alone. At wet sites (LL2196, 4/96 and 7/96) fungal biomass increased with depth. An
exception represented the supra-permafiost layer, where fungi were usually lacking.
In the solifluction soils of the non-sorted steps, median hyphal length of 18.5 m g ' d.wt. and
biovolume of 0.15 mm3 g ' d.wt. were measured. The fungal biomass was 19.2 pg C d.wt..
These median values were lower than in the polygonal tundra soils. Hyphal length, fungal
biovolume and biomass varied along with micro-sites. In the unvegetated mud boil
(LL8.1/96), values were more than 90% lower than in the surrounding vegetated micro-sites.
In the A-horizons of the drier sites (LL8.2196; LL 1 1.1196) values were 40 to 55% gseater than
in the 0-horizons at wetter sites (LL8.3/96;11.2/96). Within profiles fungi generally decreased
with depth. A peak was obsesved in the Oe-horizon of profile LL11.2196. Worthwhile
mentioning is the remarkable decrease of fungi within the first few centimetres of the
unvegetated mud boil (LL8.1196).
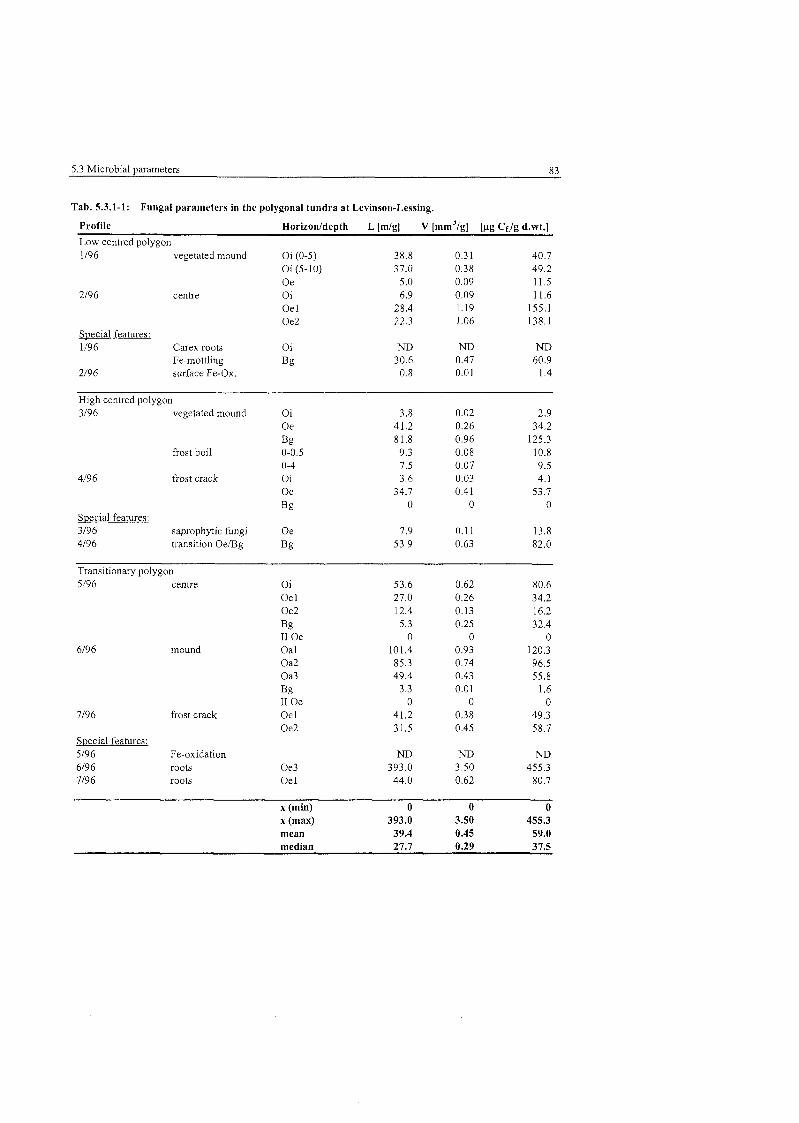
5.3 Microbial varameters X?
Tab. 5.3.1-1: Fungal parameters in the polygonal tundra at Levinson-Lessing.
Profile Horizonldepth L [m/gI V [mm^/g] [us, Cf./g d.wt.1
Low centred polygon 1/96 vegetated mound Oi (0-5) 38.8 0.3 1 40.7
Oi (5-10) 37.0 0.38 49.2 Oe 5.0 0.09 11.5
2/96 centre Oi 6.9 0.09 11.6 Oe 1 28.4 1.19 155.1 Oe2 22.3 1 .06 138.1
Special features: 1/96 Carex roots Oi ND ND ND
Fe-mottling Bg 30.6 0.47 60.9 2/96 surface Fe-Ox. 0.8 0.01 1.4
High centred polygon 3/96 vegetated mound Oi 3.8 0.02 2.9
Oe 41.2 0.26 34.2
Bg 81.8 0.96 125.3 frost boil 0-0.5 9.3 0.08 10.8
0-4 7.5 0.07 9.5 4/96 frost crack Oi 3.6 0.03 4.1
Oe 34.7 0.41 53.7 Bg 0 0 0
Special features: 3/96 saprophytic fimgi Oe 7.9 0.11 13.8 4/96 transition OeIBg Bg 53.9 0.63 82.0
Transitionary polygon 5/96
6/96
7/96
Special features: 5/96 6/96 7/96
centre Oi Oe I Oe2 Bg I1 Oe
mound Oa I Oa2 Oa3 Bg I1 Oe
frost crack Oe 1 Oe2
Fe-oxidation roots Oe3 roots Oe1
X (min) 0 0 0 X (max) 393.0 3.50 455.3 mean 39.4 0.45 59.0 median 27.7 0.29 37.5
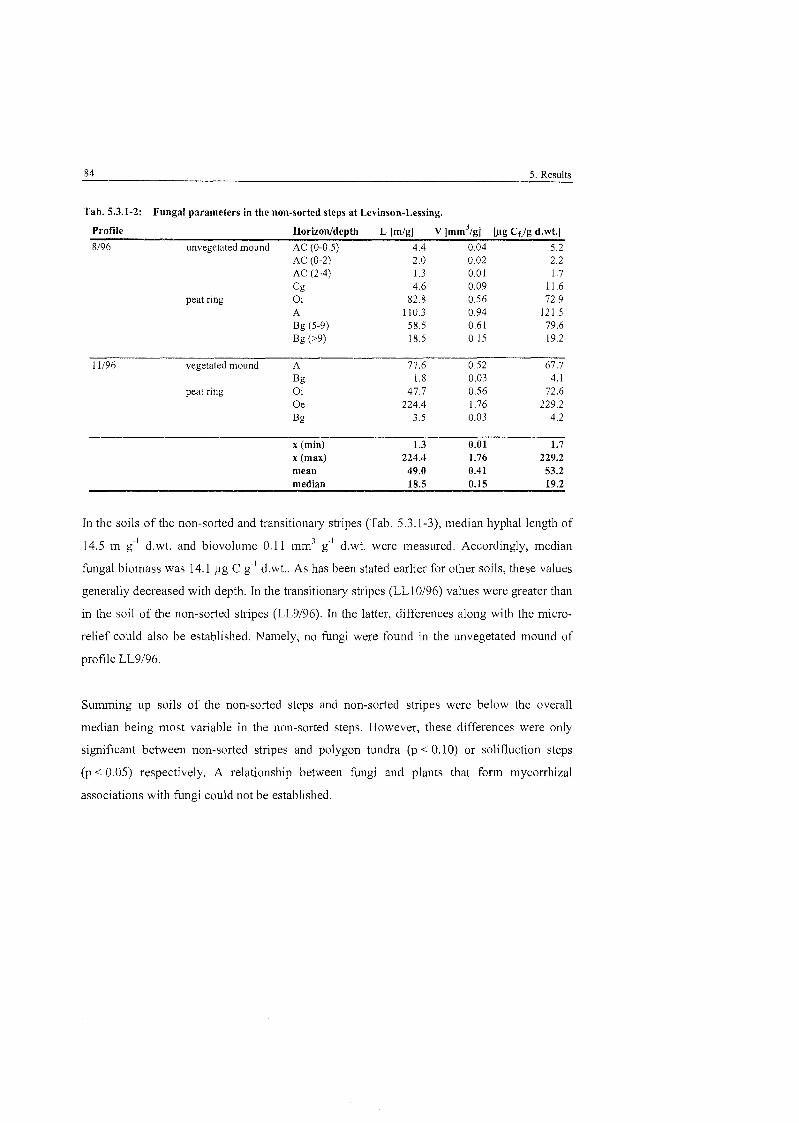
Tab. 5.3.1-2: Fungal Parameters in the non-sorted steps at Levinson-Lessing,
Profile Horizonldepth L [mlg] V [mmJlg] [ f ig Cc/g d.wt.1 8/96 unvegetated mound AC (0-0.5) 4.4 0.04 5.2
AC (0-2) 2.0 0.02 2.2 AC (2-4) 1.3 0.01 1.7
c g 4.6 0.09 11.6 peat ring Oi 82.8 0.56 72.9
A 110.3 0.94 121.5 Bg (5-9) 58.5 0.61 79.6 Bg (>9) 18.5 0.15 19.2
11/96 vegetated nlound A 77.6 0.52 67.7
Bg 1 .X 0.03 4.1 peat ring Oi 47.7 0.56 72.6
Oe 224.4 1.76 229.2
Bg 3.5 0.03 4.2
X (min) 1.3 0.01 1.7 X (max) 224.4 1.76 229.2 mean 49.0 0.41 53.2 median 18.5 0.15 19.2
In the soils of the non-sorted and transitionary stripes (Tab. 5.3.1-3), median hyphal length of
14.5 m g ' d.wt. and biovolume 0.1 1 mm3 g" d.wt. were measured. Accordingly, median
fŸnga biomass was 14.1 pg C g" d.wt.. As has been stated earlier for other soils, these values
generally decreased with depth. In the transitionary stripes (LL10196) values were greater than
in tlie soil of the non-sorted stripes (LL9196). In the latter, differences along with the micro-
relief could also be established. Namely, no fungi were found in the unvegetated mound of
profile LL9196.
Summing up soils of the non-sorted steps and non-sorted stripes were below the overall
median being most variable in the non-sorted steps. However, these differences were only
significant between non-sorted stripes and polygon tundra (p < 0.10) or solifluction steps
(p < 0.05) respectively. A relationship between fŸng and plants that form mycorrhizal
associations with fŸng could not be established.
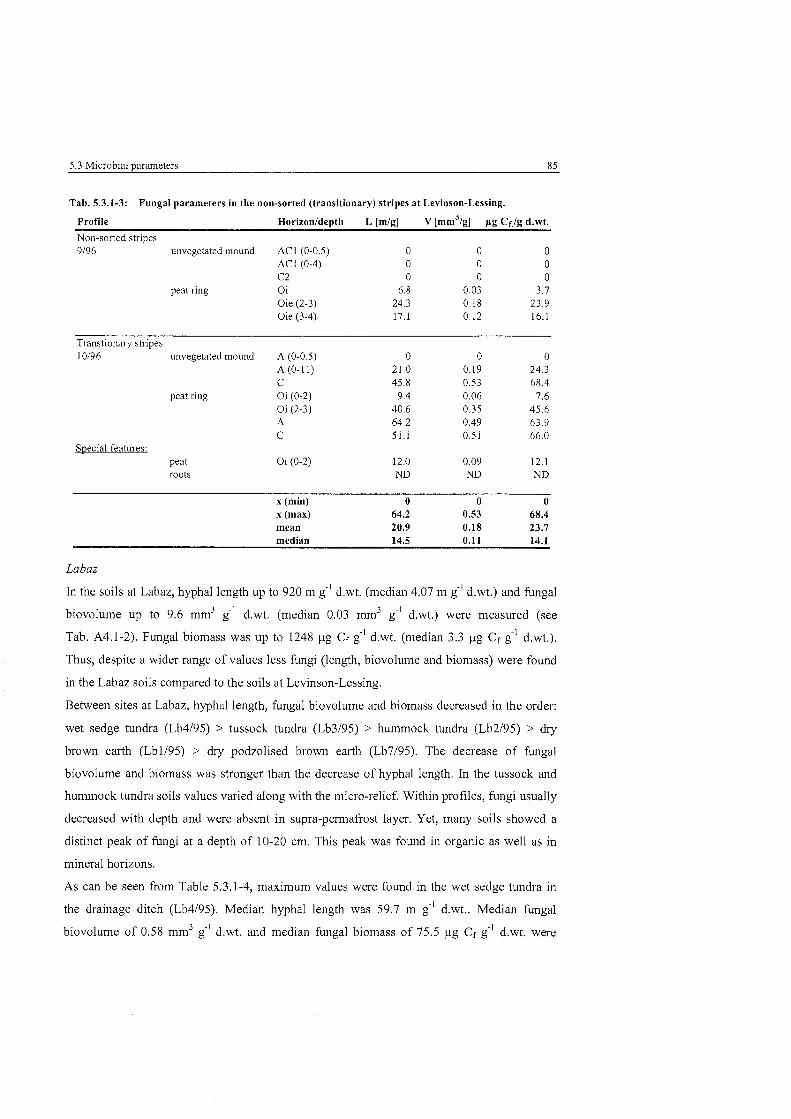
5.3 Microbial Parameters 85
Tab. 5.3.1-3: Fungal parameters in the non-sorted (transitionary) stripes at Levinson-Lessing.
Profile Horizonldepth L [mlg] V [mni31g] fig Cf/g d.wt.
Non-sorted stripes 9/96 unvegetated mound AC1 (0-0.5) 0 0 0
AC 1 (0-4) 0 0 0 C2 0 0 0
peat ring Oi 6.8 0.03 3.7 Oie (2-3) 24.3 0.18 23.9 Oie (3-4) 17.1 0.12 16.1
Transtionary stripes 10196 unvegetated mound A (0-0.5) 0 0 0
A (0-1 1) 21.0 0.19 24.3 C 45.8 0.53 68.4
peat ring Oi (0-2) 9.4 0.06 7.6 Oi (2-3) 40.6 0.35 45.6 A 64.2 0.49 63.9 C 51.1 0.5 1 66.0
Special features: peat Oi (0-2) 12.0 0.09 12.1 roots ND N D ND
X (min) 0 0 0 X (max) 64.2 0.53 68.4 mean 20.9 0.18 23.7 median 14.5 0.11 14.1
Labaz
In the soils at Labaz, hyphal length up to 920 m g"' d.wt. (median 4.07 m g" d.wt.) and fimgal
biovolume up to 9.6 mm3 g" d.wt. (median 0.03 mm3 g" d.wt.) were measured (see
Tab. A4.1-2). Fungal biomass was up to 1248 pg Cf g'' d.wt. (median 3.3 pg Cf g d.wt.).
Thus, despite a wider range of values less fungi (length, biovolume and biomass) were found
in the Labaz soils compared to the soils at Levinson-Lessing.
Between sites at Labaz, hyphal length, fungal biovolume and biomass decreased in the order:
wet sedge tundra (Lb4195) > tussock tundra (Lb3195) > hummock tundra (Lb2195) > dry
brown earth (Lbll95) > dry podzolised brown earth (Lb7195). The decrease of fungal
biovolume and biomass was stronger than the decrease of hyphal length. In the tussock and
hurnmock tundra soils values varied along with the micro-relief. Within profiles, fungi usually
decreased with depth and were absent in supra-permafrost layer. Yet, many soils showed a
distinct peak of fungi at a depth of 10-20 cm. This peak was found in organic as well as in
mineral horizons.
As can be Seen from Table 5.3.1-4, maximum values were found in the wet sedge tundra in
the drainage ditch (Lb4195). Median hyphal length was 59.7 m g'l d.wt.. Median fungal
biovolume of 0.58 mm3 g" d.wt. and median fungal biomass of 75.5 pg Cf g ' d.wt. were
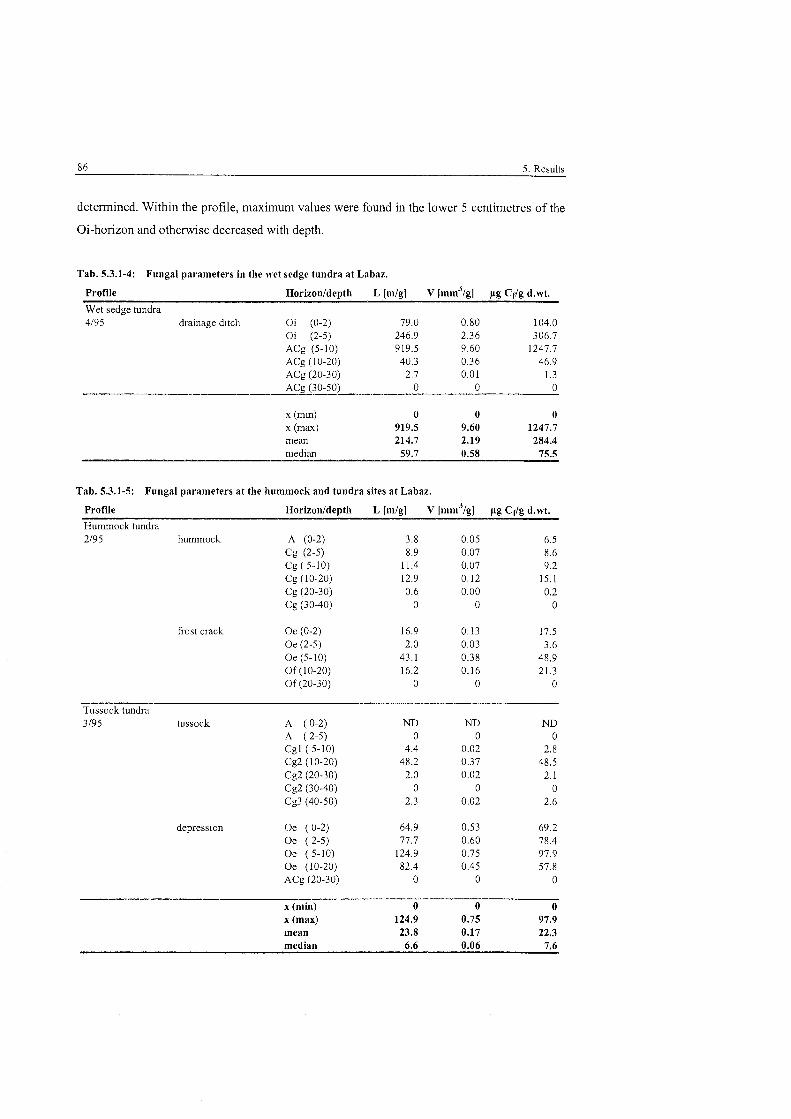
deterrnined. Within the profile, maximum values were found in the lower 5 centimetres of the
Oi-horizon and otherwise decreased with depth.
Tab. 5.3.1-4: Fungal parameters in the wet sedge tundra at Labaz.
Profile Horizon/depth L [m/g] V [ m n ~ ~ / ~ ] pg Cf/g d.wt.
Wet sedge tundra 4/95 drainage ditch Oi (0-2) 79.0 0.80 104.0
Oi (2-5) 246.9 2.36 306.7 ACg (5-10) 919.5 9.60 1247.7 ACg (1 0-20) 40.3 0.36 46.9 ACg (20-30) 2.7 0.01 1.3 ACg (30-50) 0 0 0
x (min) 0 0 0 x (max) 919.5 9.60 1247.7 mean 214.7 2.19 284.4 median 59.7 0.58 75.5
Tab. 5.3.1-5: Fungal parameters at the hummock and tundra sites at Labaz.
Profile Horizon/depth L [mlg] V [ n ~ n ~ " > / ~ ] pg Cf/g d.wt. Hummock tundra 2/95 hummock A (0-2) 3.8 0.05 6.5
Cg (2-5) 8.9 0.07 8.6 Cg (5-10) 11.4 0.07 9.2 Cg (10-20) 12.9 0.12 15.1 Cg (20-30) 0.6 0.00 0.2 Cg (30-40) 0 0 0
frost crack Oe (0-2) 16.9 0.13 17.5 Oe (2-5) 2.0 0.03 3.6 Oe (5-10) 43.1 0.38 48.9 Of (10-20) 16.2 0.16 21.3 Of (20-30) 0 0 0
Tussock tundra 3/95 tussock A ( 0-2) ND ND ND
A (2-5) 0 0 0 Cgl (5-10) 4.4 0.02 2.8 Cg2 (10-20) 48.2 0.37 48.5 Cg2 (20-30) 2.0 0.02 2.1 Cg2 (30-40) 0 0 0 Cg3 (40-50) 2.3 0.02 2.6
depression Oe ( 0-2) 64.9 0.53 69.2 Oe ( 2-5) 77.7 0.60 78.4 Oe (5-10) 124.9 0.75 97.9 Oe (10-20) 82.4 0.45 57.8 ACg (20-30) 0 0 0
X (min) 0 0 0 X (max) 124.9 0.75 97.9 mean 23.8 0.17 22.3 median 6.6 0.06 7.6
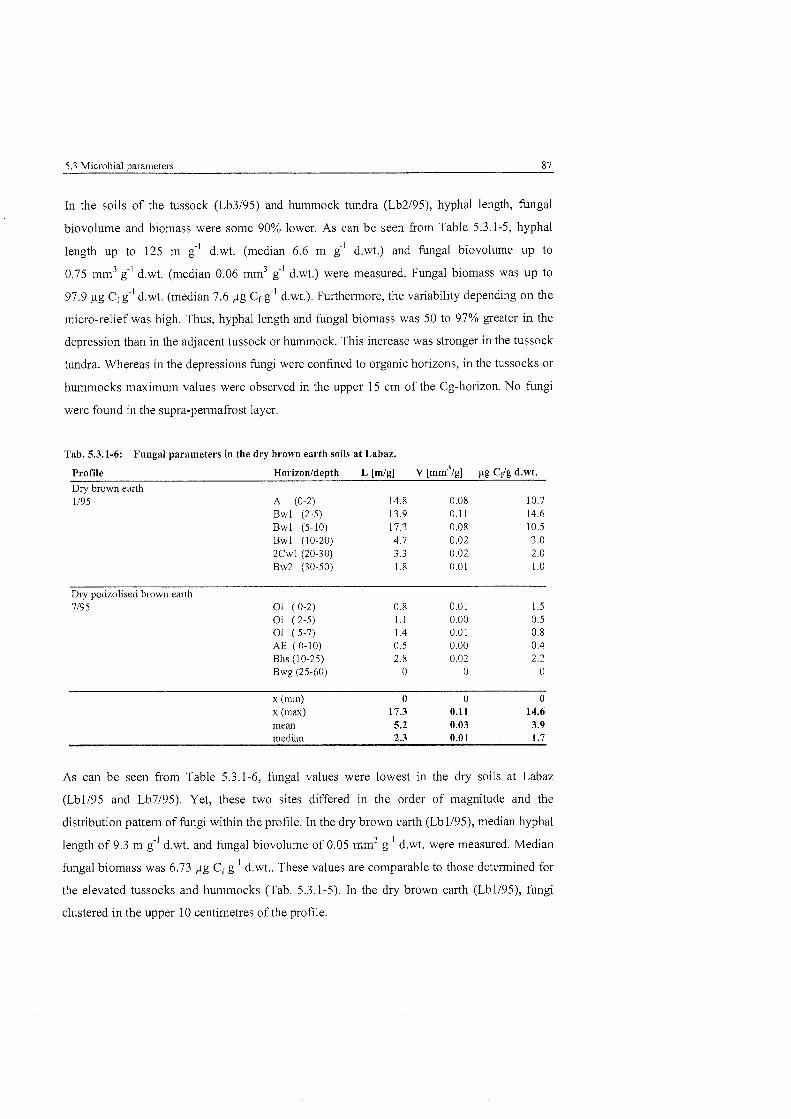
5.3 Microbial parameters 87
In the soils of the tussock (Lb3195) and hummock tundra (Lb2/95), hyphal length, fŸnga
biovolume and biomass were some 90% lower. As can be Seen fsom Table 5.3.1-5, hyphal
length up to 125 m g" d.wt. (median 6.6 m g d.wt.) and fungal biovolume up to
0.75 mm3 g" d.wt. (median 0.06 mm3 g" d.wt.) were measured. Fungal biomass was up to
97.9 pg cf g ' d.wt. (median 7.6 pg cf g" d.wt.). Furthermore, the variability depending On the
micro-relief was high. Thus, hyphal length and hngal biomass was 50 to 97% greater in the
depression than in the adjacent tussock or hummock. This increase was stronger in the tussock
tundra. Whereas in the depressions fungi were confined to organic horizons, in the tussocks or
hummocks nlaximum values were obsesved in the upper 15 cm of the Cg-hosizon. No fungi
were found in the supra-permafrost layer.
Tab. 5.3.1-6: Fungal parameters in the dry brown earth soils at Labaz.
Profile Horizonldepth L [mlg] V [mm31g] pg Cf/g d.wt. Dry brown earth 1/95 A (0-2) 14.8 0.08 10.7
Bwl (2-5) 13.9 0.11 14.6 Bwl (5-10) 17.3 0.08 10.5 Bwl (10-20) 4.7 0.02 3.0 2Cwl (20-30) 3.3 0.02 2.0 Bw2 (30-50) 1.8 0.01 1 .O
Dry podzolised brown earth 7/95 Oi (0-2) 0.8 0.01 1.5
Oi (2-5) 1.1 0.00 0.5 Oi ( 5-7) 1.4 0.01 0.8 AE (0-10) 0.5 0.00 0.4 Bhs (10-25) 2.8 0.02 2.2 Bwg (25-60) 0 0 0
X (min) 0 0 0 X ( m a l 17.3 0.11 14.6 mean 5.2 0.03 3.9 median 2.3 0.01 1.7
As can be Seen from Table 5.3.1-6, fungal values were lowest in the dry soils at Labaz
(Lbll95 and Lb7195). Yet, these two sites differed in the order of magnitude and the
distsibution pattem of fungi within the profile. In the dry brown earth (Lbl/95), median hyphal
length of 9.3 m g " d.wt. and fungal biovolume of 0.05 mm3 g" d.wt. were measured. Median
fungal biomass was 6.73 pg cf g" d.wt.. These values are comparable to those determined for
the elevated tussocks and hummocks (Tab. 5.3.1-5). In the dry brown earth (Lbl/95), fungi
clustered in the upper 10 centimetres of the profile.
On the contrary, in the dry podzolised brown eart11 (Lb7195), hngi were some 90% lower than
in the first brown earth. Median hyphal length of 0.98 m g-' d.wt. and hngal biovolu~ne of
0.01 mm3 g-' d.wt. were measured. Median hngal biomass was 0.63 pg Cf g-' d.wt.. The
distribution pattem within the profile also differed. Higher values were found in the Oi-
horizon, The maximum value, however, was found in the Bhs-horizon.
At Labaz, the distribution of hngi in the drier soils (Lbll95, Lb7195, Lb2d95 and Lb3d95)
was significantly (p < 0.1 5) different fi-om the wetter soils (Lb4195, Lb2bl95 and Lb3bl95).
This relationship could not be established at Levinson-Lessing.
5.3.2 Bacteria
Levinsorz-Lessing
Data of total bacterial number, bacterial biovolume and bacterial biomass were determined by
M. Bölter IPO Kiel (publication SCHMIDT & BOLTER, unpubl. data) and can be Seen in Table
A4.2- I .
At Levinson-Lessing, total bacterial number (TBN) up to 7 . 3 ~ ~ 1 0 ~ g' d.wt. (median
l.16*lo9 g-' d.wt) and bacterial cellvolurne (MCV) up to 0.056 pm3 g-' d.wt. (median
0.039 pm3 g-' d.wt.1 were measured. Bacterial biomass (BBM) was 20.4 pg C g-l d.wt.
(median 4.7 pg C g-' d.wt.1. The distribution Pattern of bacteria was different fiom what could
be established for fbngi. TBN was highest in the polygonal tundra whereas it was of the Same
order of magnitude in the soils of the non-sorted steps and stripes. On the contrary, BBM
along with MCV decreased in the following order: polygonal tundra non-sorted stripes >
non-soried steps. Between micro-sites and within profiles, distribution pattem also differed.
In the soiis of the polygonal tundra, TBN, MVC and BBM generally decreased with depth at
both micro-sites: kost cracks and apiceshigh centres. In the transitionary polygon (LL5-7/96)>
maximum values could be established in the supra-permafiost layer, where no fbngi were
found. Along with hngi, a relative increase in bacteria was foiind in the Oe-horizons of the
apices of the high and low centred polygon (LLl and 3196).
In the soils of the non-sorted steps, TBN, MVC and BBM values were some 50% lower than
in the polygonal tundra. This decrease was stronger for BBM and MCV. Within profiles these
5.3 Microbial paran~etess 89
values decsease with deptl~. A selative incsease could be observed in the anaerobic C- or Bg-
horizons. Between micso-sites, values were gseates undemeath vegetation (LL8.3196,
L1 1.2196) compased to unvegetated soils (LL8.1196). Hence, values wese also gseates in the
ovesgsown step (LL11196).
Despite cotnpasable TBN in the non-sosted stsipes (LL9 and LLlOl96), BBM and MCV were
some 10% gseates. As has been stated fos hngi: in the unvegetated mound values were lower
than in the adjacent vegetation ring. However? this decsease was stsonges in the soil of the
tsansitionasy stsipes (LLlOl96). Thus, the difference between micso-sites was more
psonounced when looking at bactesial population.
La baz
Data of total bacterial numbes, bactesial biovolume and bacterial biomass wese dete~mined by
BOLTER (1998) and can be Seen in Table A4.2-2.
At Labaz, total bactesial number (TBN) up to 6.8l*lo9 g1 d.wt. (median 0.37*1o9 g-I d.wt.1
and bacterial cellvolume (MCV) up to 0.073 pm3 .g-' d.wt. (0.047 prn3 gi d.wt.1 wese
measused. Bactesial biomass (BBM) was 33.1 pg C g-' d.wt. (median 1.5 pg C g-l d.wt.1.
Thus, TBN and BBM wese lower than in the soils at Levinson-Lessing. The distribution
pattesn between sites genesally sesembled the patteln descsibed fos the hngal population.
Thus, TBN, MCV and BBM decseased in the following osdes: wet sedge tundsa > tussock
tundsa > hummock tundsa > dsy bsown earth > dsy podzolised soil. Yet, the diffesences were
less psonounced.
In general bacteria clustesed in the top few centimetses of the psofile and decseased with depth
which was particulasly distinct between 0-IA-hosizons and minesal horizons. Furthesmore, in
the tussock and hummock tundsa (Lb2195 and 3/95) a relative incsease OS peak of TBN and
BBM was observed at a depth of appsoximately 10 Cm. This incsease l ~ a s alseady been
descsibed fos fungi.
The micso-selief affected bactesial population at the hummock and tussock tundra sites. In the
wet depsessions (Lb2bl95 and Lb3b/95), TBN, MCV and BBM wese gseates than in the more
elevated micso-site. This incsease was mose stsonges in the tussock tundsa.
At Labaz, the distribution of bactesia in the dries soils (Lbll95, Lb7195, Lb2d95 and Lb3d95)
was significantly (P < 0.05) different from the wettes soils (Lb4195, Lb2bl95 and Lb3bl95).
5.3.3 Microcalorimetry
5.3.3.1 Basal lteat oiitp~it (@
Levinson-Lessifzg
Basal heat output Q in the soils at Levinson-Lessing was up to 988.6 pW g-I d.wt. (median
60.6 pW g-1 d.wt.). Between sites, Q values decreased in the order polygonal tundra, non-
sorted steps and non-sosted stripeslnets. Within profiles Q values usually decreased witll
depth. Exceptions sepresented the unvegetated soils whese Q ~ ~ a l u e s increased with depth.
In the soils of the polygonal tundra Q values vasied along with the micro-site. In the topsoils
of the drier elevated site (apex and centse) activities were gseater than in the cossesponding
depression. Activities decreased with depth but in mose pronounced Imames at the dries
elevated sites. In the kost boil of profile LL3196 activities were half of the order of magnitude
measured in the surrounding vegetated soil. The low centred polygon (LLl and 2/96) differed
fi-om the high centred polygon (LL3 and 4/96) in that respect that the low centred polygon
soils showed predominating microbial activity in the subsoil whereas in the high centred
polygon highes activities were found in the topsoil.
Micro-sites and vegetation cover also affected the heat o u t p ~ ~ t in the soils of the non-sosied
steps as well as of the non-sosted stripesinets. In the respective topsoils without vegetation
cover heat output was more than 70 % lower than in the adjacent vegetated soil. Also the
activities in the subsoil differed. Thus, in the unvegetated soils (LL8.1196; LL9.1196) Q values
were gseater in the subsoil than in the topsoil wheseas values decreased with depth in the
vegetated soils.
La baz
Basal heat output Q in the soils at Labaz was up to 1516.2 pW g-I d.wt. (median
20.4 pW gl d.wt.1. Thus, despite a wider range the median microbial activity was lowes than
in the soils at Levir~son-Lessing. Between sites, Q values were gseater in the hummock and
tussock tundra than in the wet sedge tundra.
In the tussock tundra soil basai heat output was gseater than in the soil. Also Q values varied
along with the micro-selief although the two sites differed. Whereas at the tussock tundra site
gseater activities were measured in the depression compared to the dries tussock, at the
hummock tundra site activities were lower in the fiost crack. Activities genesally decreased
with depth. A relative peak at a depth of approximately 10 centimetses was observed in the
hummock tundra. In the wet sedge tundra heat output was only detemined in the upper
20 centimetses. In the subsoils values tended to Zero. Maximum activity was found at a depth
of 5 to 10 centi~netses.
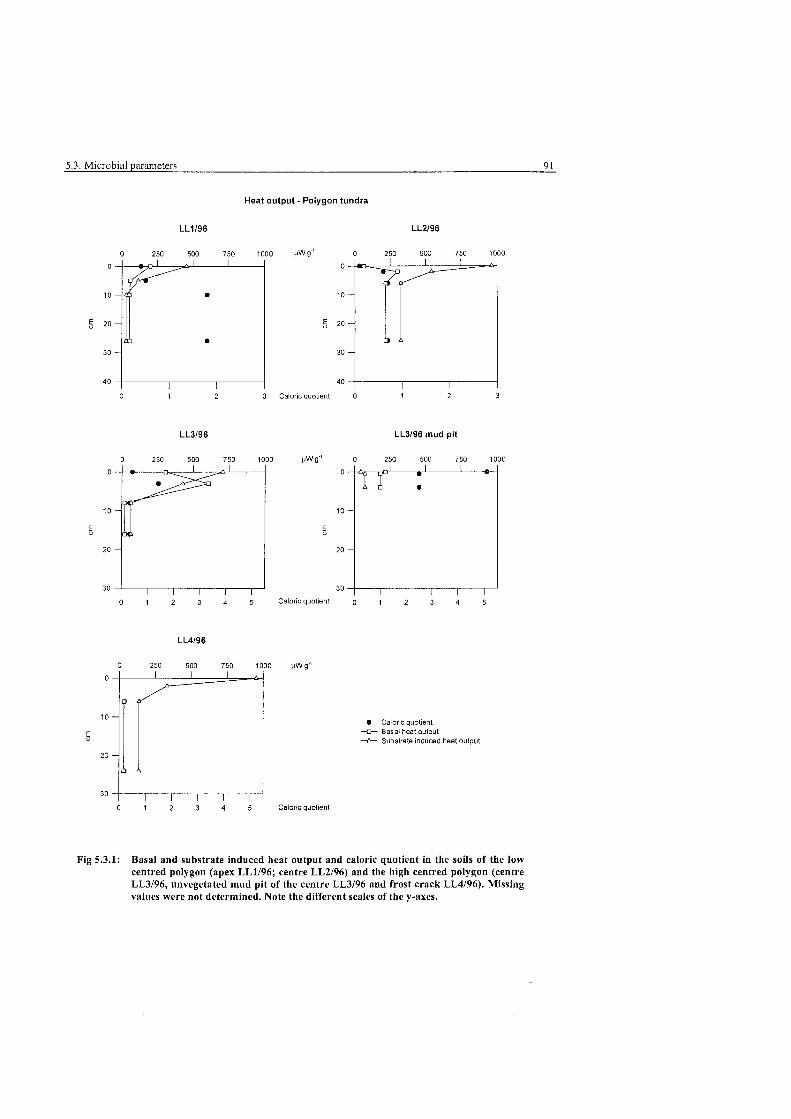
5.3. Microbial parameters 9 1
Heat output - Polygon tundra
0 1 2 3 Caloric quotlent 0 1 2 3
LL3196 LL3196 mud pit
00 v W a '
E
Calortc quotlent
* Caloric quotient -0- Basal heat output + Substrate InduRd heat output
Caloric quotlent
Fig 5.3.1: Basal and Substrate induced heat output and caloric quotient in the soiis of the Iow centred polygon (apex LLll96; centre LL2196) and the high centred polygon (centre LL3196, unvegetated mud pit of the centre LL3196 and frost crack LL4196). Missing values were not determined. Note the different scales of the Y-axes.
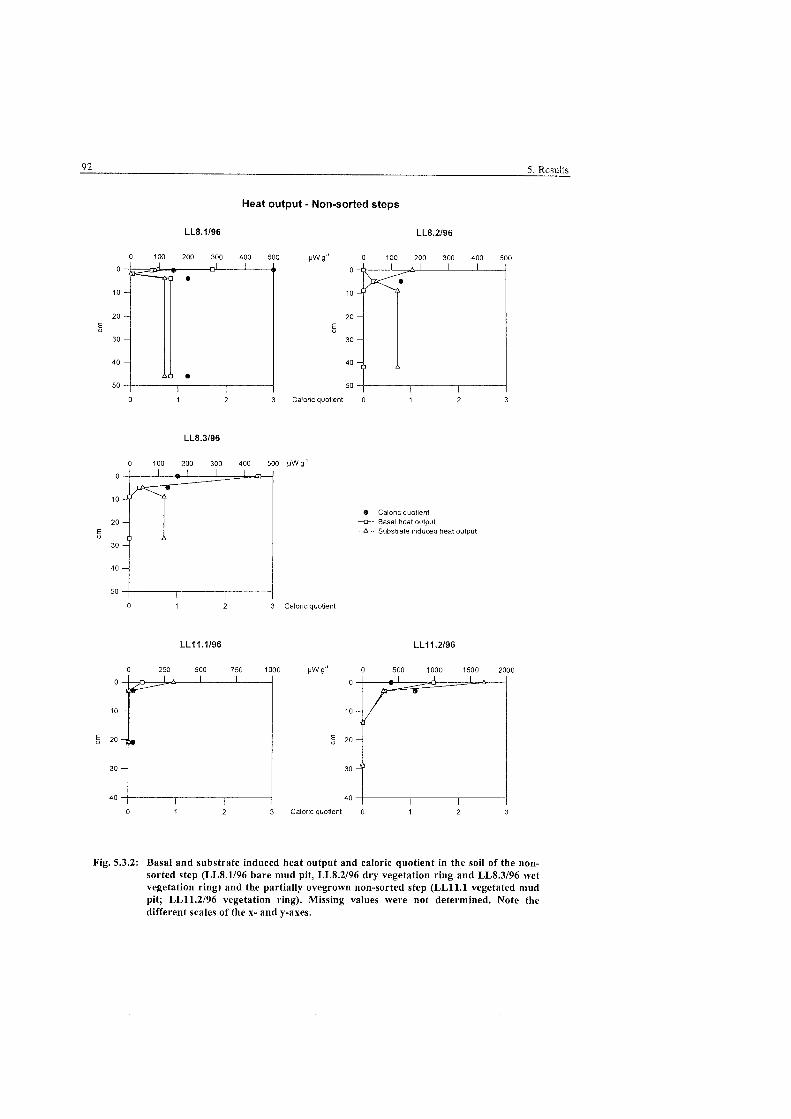
92 5. Resuits
Heat output - Non-sorted steps
Calorhc quotfent + Basal heat output 4 Substrate ~ n d u e d heat output
L L I 1.2196
Calor~c quotient 0 I 2 3
Fig. 5.3.2: Basal and Substrate induced heat output and caloric quotient in the soil of the non- sorted step (LL8.1196 bare mud pit, LL8.2196 dry vegetation ring and LL8.3196 wet vegetation ring) and the partially ovegrown non-sortecl step (LLll .1 vegetated n ~ u d pit; LLll.2196 vegetation ring). Missing values were not determined. Note the different scales of the X- and y-axes.
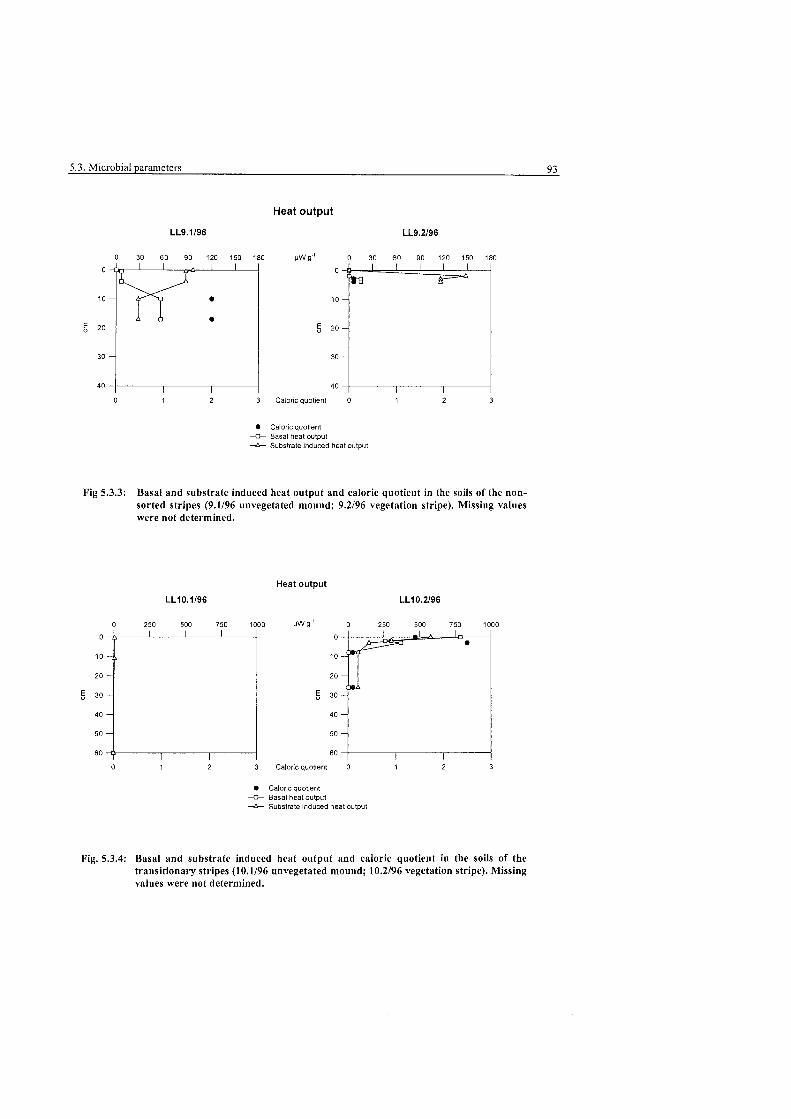
5.3. Microbial parameters 93
Heat output
0 1 2 3 Caloric quotient 0 1 2 3
0 Calorlc quotient  Basal heat output + Substrate induced heat outout
Fig 5.3.3: Basal and substrate induced heat output and caloric quotient in the soils of the non- sorted stripes (9.1196 unvegetated mound; 9.2196 vegetation stripe). Missing values were not determined.
Heat output
LL10.1196 LL10.2196
0 1 2 3 Caloricquotient 0 1 2 3
0 Caloric quotient + Basal heat output -&- Substrate induced heat output
Fig. 5.3.4: Basal and substrate induced heat output and caloric quotient in the soils of the transitionary stripes (10.1196 unvegetated mound; 10.2196 vegetation stripe). Missing values were not determined.
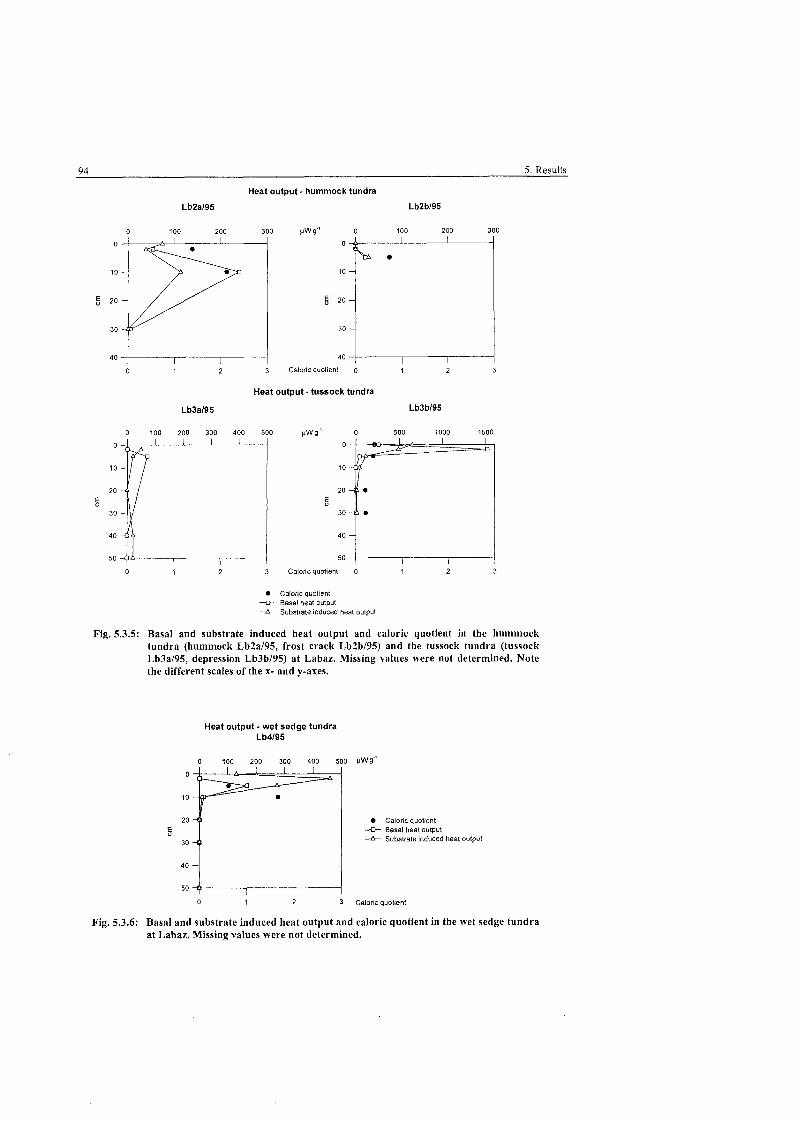
94 5. Results
Heat output - hummock tundra
Lb2al95 Lb2bl95
UW g-' 0 100 200 300 I I
10 -
6 2 0 -
30 -
Calorlc quotienl 0 1 2 3
Heat output - tussock tundra
Lb3al95 Lb3bl95
0 1 2 3 Calonc quotient 0 1 2 3
* Calor!c quotient U Basal heat output 4 Substrate induced heat output
Fig. 5.3.5: Basal and substrate induced heat output and caloric quotient in the hummock tundra (hunirnock Lb2al95, frost crack Lb2bl95) and tbe tussock tundra (tussock Lb3al95, depression Lb3bl95) at Labaz. Missing values were not determined. Note the different scales of the X- and Y-axes.
Heat output - wet sedge tundra Lb4195
Caloric quotient  Basal heat output -A- Substrate induced heat output
I I 0 1 2 3 Calorlc quotient
Fig. 5.3.6: Basal and substrate induced heat output and caloric quotient in the wet sedge tundra at Labaz. Missing values were not determined.
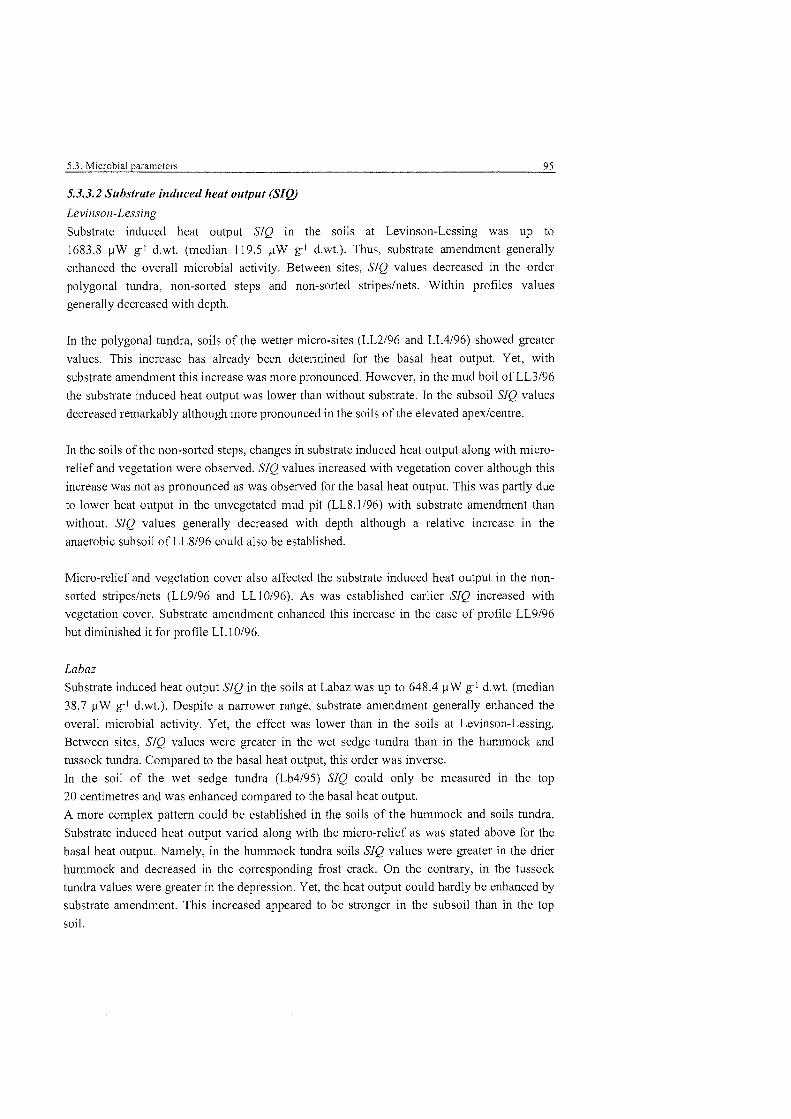
5.3. Microbial parameters 95
5.3.3.2 Substrate induced heat output (SIQ)
Levinson-Lessing
Substrate induced heat output 570 in the soils at Levinson-Lessing was up to
1683.8 pW g-I d.wt. (median 119.5 pW g-1 d.wt.). Thus, substrate amendment generally enhanced the overall microbial activity. Between sites, SIQ values decreased in the order polygonal tundra, non-sosted steps and non-sorted stripednets. Within profiles values
generally decreased with depth.
In the polygonal tundra, soils of the wetter micro-sites (LL2196 and LL4196) showed greater
values. This increase has already been detesmined for the basal heat output. Yet, with substrate amendment this increase was more pronounced. However, in the mud boil of LL3196 the substrate induced heat output was lower than without substrate. In the subsoil SIQ values decreased remarkably although more pronounced in the soils of the elevated apedcentre.
In the soils of the non-sorted steps, changes in substrate induced heat output along with micro- relief and vegetation were observed. SIQ values increased with vegetation cover although this increase was not as pronounced as was observed for the basal heat output. This was partly due
to lower heat output in the unvegetated mud pit (LL8.1196) with substrate amendment than
without. SIQ values generally decreased with depth although a relative increase in the anaerobic subsoil of LL8196 could also be established.
Micro-relief and vegetation cover also affected the substrate induced heat output in the non- sorted stsipeslnets (LL9196 and LL10196). As was established earlier SIQ increased with vegetation cover. Substrate amendment enhanced this increase in the case of profile LL9196 but diminished it for profile LL10196.
Labaz
Substrate induced heat output 570 in the soils at Labaz was up to 648.4 pW g-I d.wt. (median 38.7 pW g-1 d.wt.). Despite a narrower range, substrate amendment generally enhanced the overall microbial activity. Yet, the effect was lower than in the soils at Levinson-Lessing. Between sites, SIQ values were greater in the wet sedge tundra than in the hummock and tussock tundra. Compared to the basal heat output, this order was inverse. In the soil of the wet sedge tundra (Lb4195) SIQ could only be measured in the top 20 centimetres and was enhanced compared to the basal heat output.
A more complex pattem could be established in the soils of the hummock and soils tundra. Substrate induced heat output vasied along with the micro-relief as was stated above for the basal heat output. Namely, in the hummock tundra soils SIQ values were greater in the dsier hummock and decreased in the cossesponding frost crack. On the contsary, in the tussock tundra values were greater in the depression. Yet, the heat output could hardly be enhanced by substrate amendment. This increased appeared to be strenger in the subsoil than in the top soil.
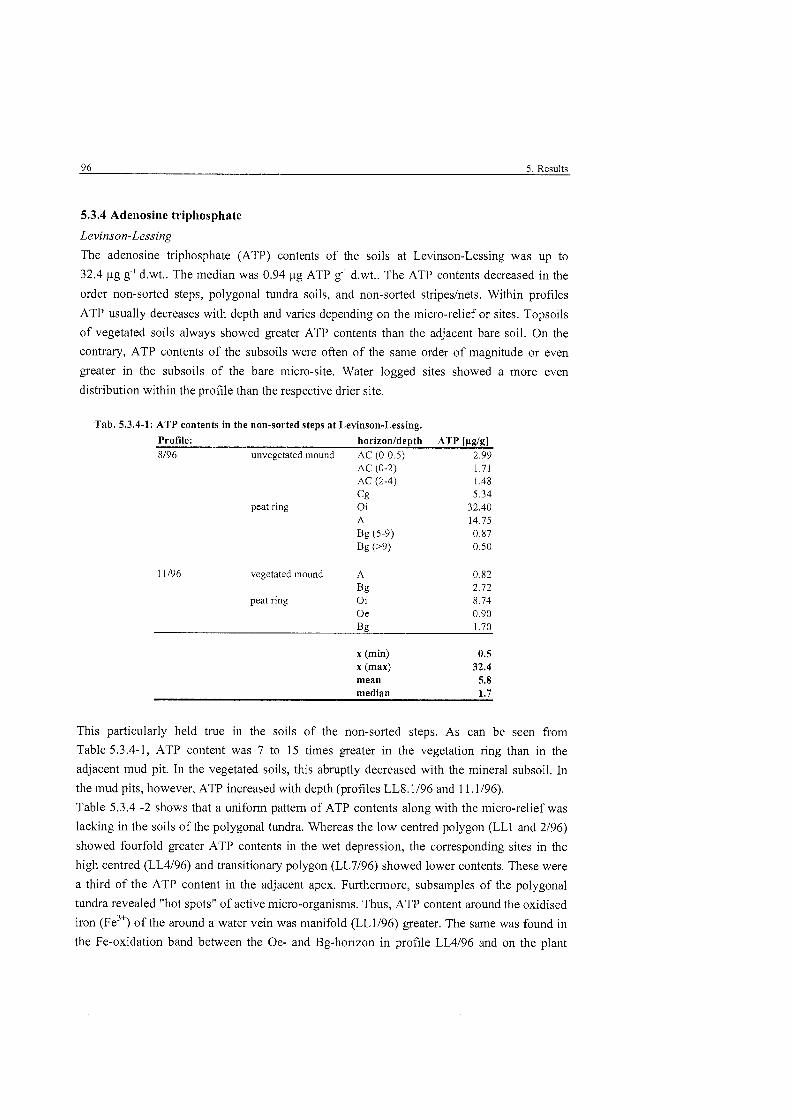
5.3.4 Adenosine triphosphate
Levinson-Lessing
The adenosine triphosphate (ATP) contents of the soils at Levinson-Lessing was up to
32.4 pg g" d.wt.. The median was 0.94 pg ATP g"' d.wt.. The ATP contents decreased in the
order non-sorted steps, polygonal tundra soils, and non-sorted stripeslnets. Within profiles
ATP usually decreases with depth and varies depending 011 the micro-relief or sites. Topsoils
of vegetated soils always showed greater ATP contents than the adjacent bare soil. On the
contrary, ATP contents of the subsoils were often of the same order of magnitude or even
greater in the subsoils of the bare micro-site. Water logged sites showed a more even
distribution within the profile than the respective drier site.
Tab. 5.3.4-1: ATP contents in the non-sorted steps at Levinson-Lessing. Profile: horizonldepth ATP [pglg] 8/96 unvegetated mound AC (0-0.5) 2.99
AC (0-2) 1.71 AC (2-4) 1.48 c g 5.34
peat ring Oi 32.40 A 14.75 Bg (5-9) 0.87 Bg ('9) 0.50
11/96 vegetated mound A 0.82
Bg 2.72 peat ring Oi 8.74
Oe 0.90
Bi? 1.70
X (rnin) 0.5 X (rnax) 32.4 mean 5.8 median 1.7
This particularly held true in the soils of the non-sorted steps. As can be seen from
Table 5.3.4-1, ATP content was 7 to 15 times greater in the vegetation ring than in the
adjacent mud pit. In the vegetated soils, this abruptly decreased with the mineral subsoil. In
the mud pits, however, ATP increased with depth (profiles LL8.1196 and 11.1196).
Table 5.3.4 -2 shows that a uniform Pattern of ATP contents along with the micro-relief was
lacking in the soils of the polygonal tundra. Whereas the low centred polygon (LL1 and 2/96)
showed fourfold greater ATP contents in the wet depression, the corresponding sites in the
high centred (LL4196) and transitionary polygon (LL7196) showed lower contents. These were
a third of the ATP content in the adjacent apex. Furthennore, subsamples of the polygonal
tundra revealed "hot spots" of active micro-organisms. Thus, ATP content around the oxidised
iron (Fe3+) of the around a water vein was manifold (LL1196) greater. The same was found in
the Fe-oxidation band between the Oe- and Bg-horizon in profile LL4196 and on the plant
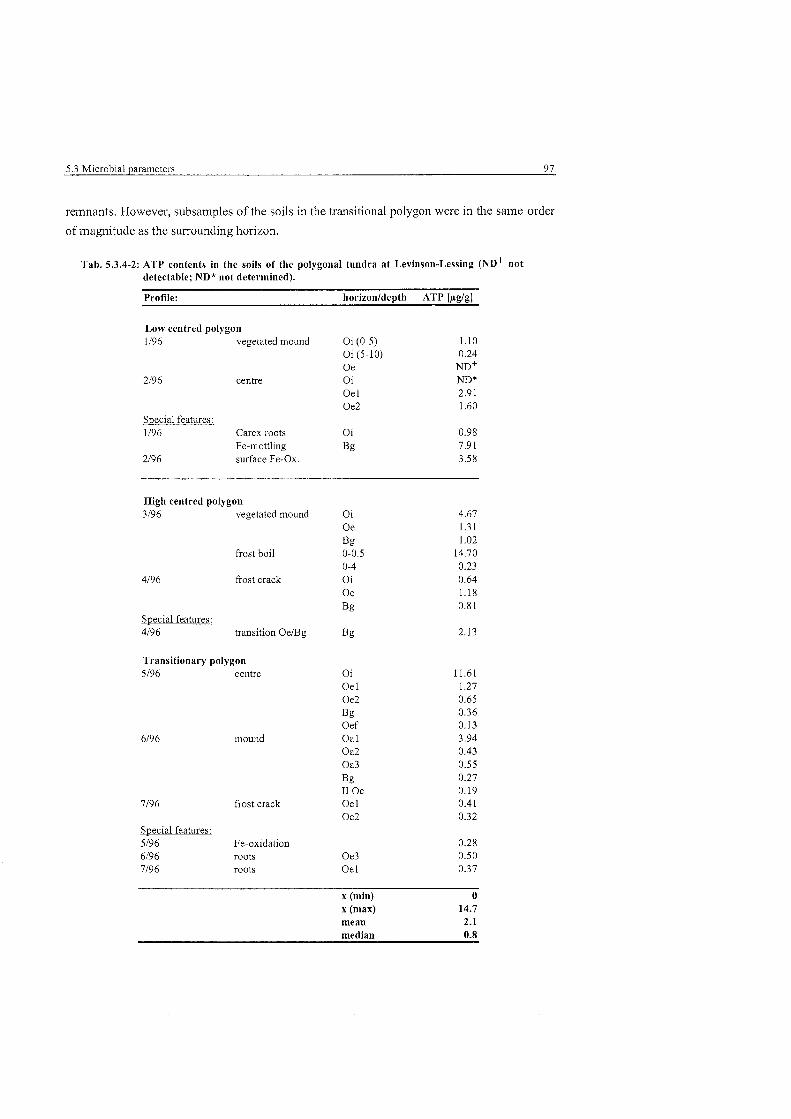
5.3 Microbial parameters 97
remnants. However, subsamples of the soils in the transitional polygon were in the Same order
of magnitude as the surrounding horizon.
Tab. 5.3.4-2: ATP contents in the soils of the polygonal tundra at Levinson-Lessing (ND' not detectahle; ND* not determined).
Profile: horizonldepth ATP [pglg]
Low centred polygon 1/96 vegetated mound Oi (0-5)
Oi (5-10) Oe
2/96 centre Oi Oe 1 Oe2
Special features: 1/96 Carex roots Oi
Fe-mottling Bg 2/96 surface Fe-Ox.
High centred polygon 3/96 vegetated mound
frost boil
4/96 frost crack
Special features: 4/96 transition OeBg
Transitionary polygon 5/96 centre
mound
7/96 frost crack
Special features: 5/96 Fe-oxidation 6/96 roots 7/96 roots
o i Oe
Bg 0-0.5 0-4 Oi Oe
Bg
Bg
Oi Oe 1 Oe2 Bg Oe f Oal Oa2 Oa3
Bg I1 Oe Oe 1 Oe2
Oe3 Oe I
X (min) 0 X (n~ax) 14.7 mean 2.1 median 0.8
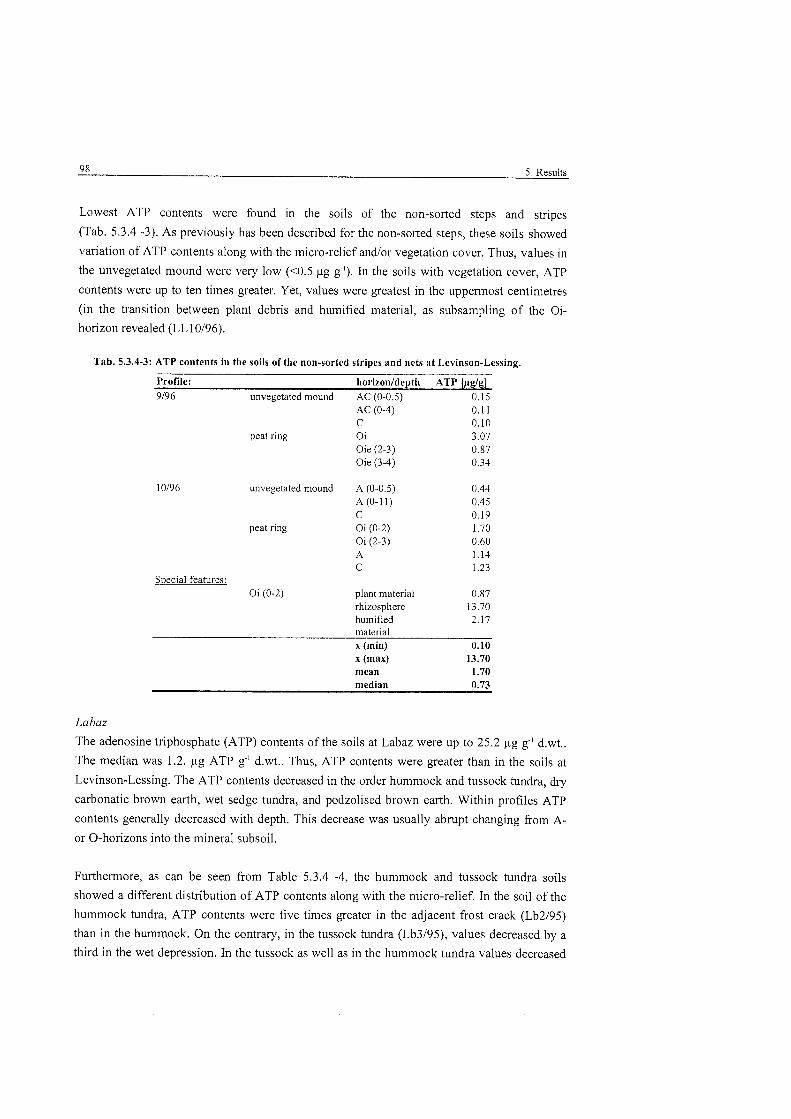
Lowest ATP contents were found in the soils of the non-sorted steps and stripes
(Tab. 5.3.4 -3). As previously has been described for the non-sorted steps, these soils showed
variation of ATP contents along with the micro-relief andlor vegetation cover. Thus, values in
the unvegetated mound were very low (<0.5 pg g"). In the soils with vegetation cover, ATP
contents were up to ten times gseater. Yet, values were greatest in the upperrnost centimetres
(in the transition between plant debris and humified material, as subsampling of the Oi-
horizon revealed (LL 10196).
Tab. 5.3.4-3: ATP contents in the soils of the non-sorted stripes and nets at Levinson-Lessing.
Profile: horizonldepth ATP [pglg] 9/96 unvegetated mound AC (0-0.5) 0.15
peat ring
unvegetated mound
peat ring
Svecial features: Oi (0-2)
AC (0-4) C Oi Oie (2-3) Oie (3-4)
A (0-0.5) A (0-11) C Oi (0-2) Oi (2-3) A c
plant material rhizosphere humified material X (min) 0.10 X (max) 13.70 mean 1.70 median 0.73
Labaz
The adenosine triphosphate (ATP) contents of the soils at Labaz were up to 25.2 pg g-' d.wt..
The median was 1.2. pg ATP g" d.wt.. Thus, ATP contents were gseater than in the soils at
Levinson-Lessing. The ATP contents decreased in the order hummock and tussock tundra, dry
carbonatic brown earth, wet sedge tundra, and podzolised brown earth. Within profiles ATP
contents generally decreased with depth. This decrease was usually abrupt changing fi-om A-
or 0-horizons into the mineral subsoil.
Furthermore, as can be Seen fsom Table 5.3.4 -4, the hummock and tussock tundra soils
showed a different distribution of ATP contents along with the micro-relief. In the soil of the
hummock tundra, ATP contents were five times gseater in the adjacent kost crack (Lb2195)
than in the hummock. On the contrary, in the tussock tundra (Lb3/95), values decreased by a
third in the wet depression. In the tussock as well as in the hummock tundra values decreased
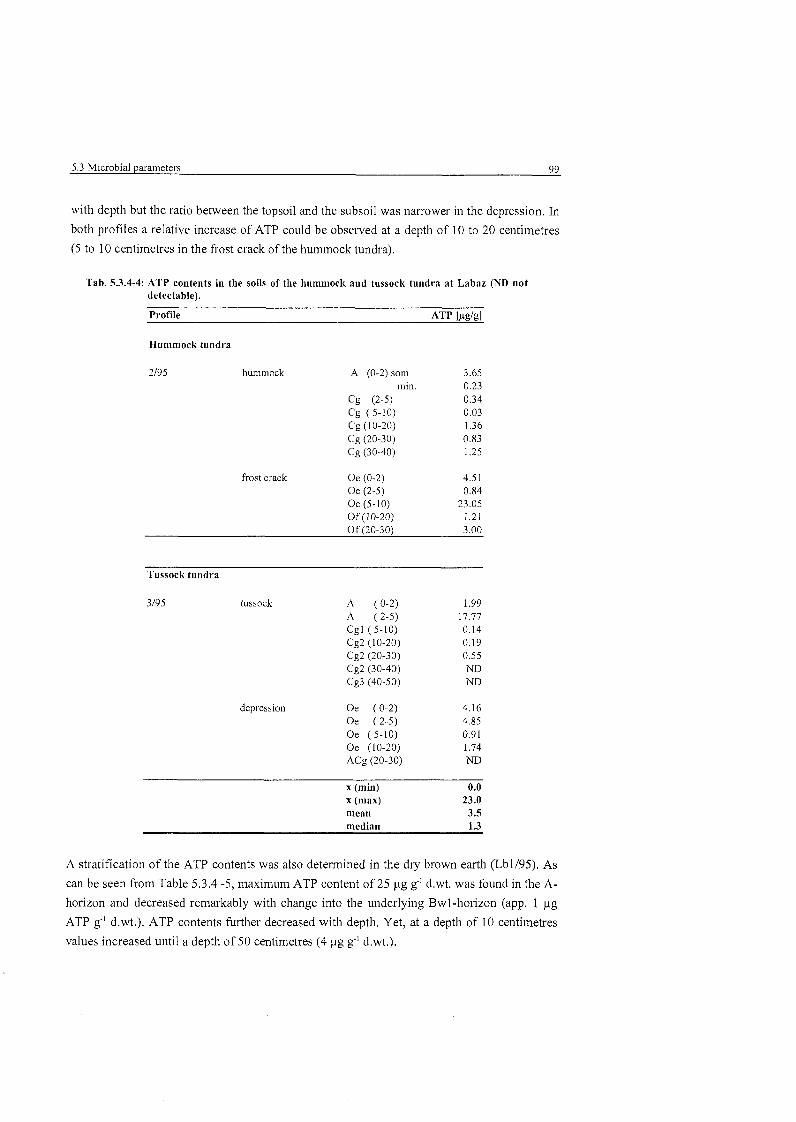
5.3 Microbial parameters 99
with depth but the ratio between the topsoil and the subsoil was narrower in the depression. In
both profiles a relative increase of ATP could be obsei-ved at a depth of 10 to 20 centimetres
(5 to 10 centimetres in the fiost crack of the hummock tundra).
Tab. 5.3.4-4: ATP contents in the soils of the humn~ock and tussock tundra at Labaz (ND not detectable).
Profile ATp [iigkl
Hunimock tundra
2/95 hummock A (0-2) som 3.65 min. 0.23
c g (2-5) 0.34 Cg (5-10) 0.03 Cg (10-20) 1.36 Cg (20-30) 0.83 Cg (30-40) 1.25
frost crack Oe (0-2) 4.5 1 Oe (2-5) 0.84 Oe (5-10) 23.05 Of (10-20) 1.21 Of (20-30) 3.00
Tussock tundra
3/95 tussock A (0-2) 1.99 A ( 2-5) 17.77 Cgl (5-10) 0.14 Cg2 (10-20) 0.19 Cg2 (20-30) 0.55 Cg2 (30-40) ND Cg3 (40-50) ND
depression Oe ( 0-2) 4.16 Oe ( 2-5) 4.85 Oe (5-10) 0.91 Oe (10-20) 1.74 ACg (20-30) ND
X (min) 0.0 X (n~ax) 23.0 mean 3.5 median 1.3
A stratification of the ATP contents was also deterrnined in the dry brown earth (Lbl/95). As
can be seen from Table 5.3.4 -5, maximum ATP content of 25 pg g" d.wt. was found in the A-
horizon and decreased remarkably with change into the underlying Bwl-horizon (app. l pg
ATP g-' d.wt.). ATP contents hrther decreased with depth. Yet, at a depth of 10 centimetres
values increased until a depth of 50 centimetres (4 pg g-' d.wt.).
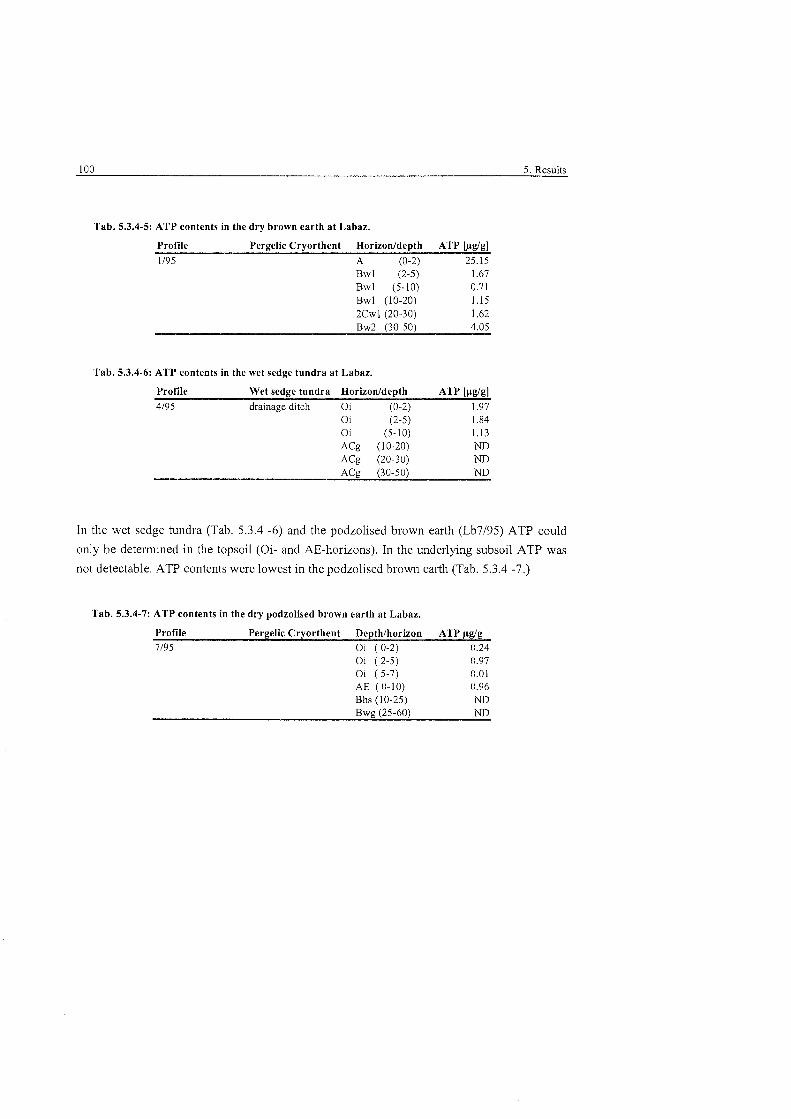
100 5. Results
Tab. 5.3.4-5: ATP contents in the dry brown earth at Labaz.
Profile Pergelic Cryorthent Horizon/depth ATP [pglg] 1/95 A (0-2) 25.15
Bwl (2-5) 1.67 Bwl (5-10) 0.71 Bwl (10-20) 1.15 2Cwl (20-30) 1.62
Tab. 5.3.4-6: ATP contents in the wet sedge tundra at Labaz.
Profile Wet sedge tundra Horizon/depth ATP [pg/g] 4/95 drainage ditch Oi (0-2) 1.97
In the wet sedge tundra (Tab. 5.3.4 -6) and the podzolised brown earth (Lb7195) ATP could
only be determined in the topsoil (Oi- and AE-horizons). In the underlying subsoil ATP was
not detectable. ATP contents were lowest in the podzolised brown earth (Tab. 5.3.4 -7.)
Tab. 5.3.4-7: ATP contents in the dry podzolised brown earth at Labaz.
Profile Pergelic Cryorthent Depthlhorizon ATP pg/g 7/95 Oi ( 0-2) 0.24
5.4 Ecological Parameters 101
5.4 Ecological parameters
5.4.1 Fungal to bacterial ratio
Levinson-Lessing
At Levinson-Lessing fimgal to bacterial ratio (FB-ratio) was up to 174.1 (median 4.5). Thus,
the microbial biomass was clearly dominated by hngi.
In the soils of the polygonal tundra (LL1-7/96), the ratio was narrower due to higher bactesial
biomass (median FB-ratio 3.5). Generally, the FB-ratio widened with depth and tended to Zero
in the supra-pesmafrost layer, where bacteria dominated. Greater values were found in the
apices or the high centre.
In the soils of the non-sorted steps (LL8196 and LL11/96), median FB-ratio was 5.8.
Accordingly, the proportion of the fiingi was higher than in the polygonal tundra. This,
however, depended on the micro-site. In the vegetated soils ratios were wide and culminated
at a depth of approximately 10 centimetres. On the other hand, the FB-ratio was 1 (or smaller)
in the unvegetated mound.
In compa~ison to the non-sorted steps, the FB-ratio narsowed (median 5.5) in the soils of the
non-sorted (transitionary) stripes, which was due to higher bacterial biomass. In the
unvegetated mounds FB-ratios were nil. In the soils of the vegetated stripes, hngi over took.
FB-ratios of profile LL9196 were narrower than of profile LL11196.
Labaz
In the soils at Labaz, FB-ratio was up to 170.0 (median 2.7). Thus, microbial biomass was
dominated by hng i although the proportion of bactesia increased in comparison to the soils at
Levinson-Lessing. At Labaz, FB-ratios were widest in the lower Oe- or upper mineral
horizons. This peak was found regardless of sites or micro-sites. Below, FB-ratios verged to
nil where bactesia dominated and hngi tended to be absent. Differences could only be
established in tesms of absolute figures.
Maximum values were found in the wet sedge tundra. In the tussock and hummock tundra,
FB-ratios vasied along with the micro-relief. In the topsoil of the tussock (Lb3al95) and the
hummock (Lb2a/95), FB-ratios widened with depth. Whereas the A-horizon was dominated
by bacte~ia, hngi over took in the upper Cg-hosizon. In absolute figures, FB-ratio was wider
in the tussock than in the hummock. On the contrary, the composition of the microbiota
differed in the adjacent depression or frost crack. In the fi-ost crack of the hummock tundra
(Lb2b/95), the microbiota was dominated by bacteria (with exception of a peak around
10 cm). In the depression of the tussock tundra (Lb3bl95) fungi dominated in the entire
organic hosizon.
In the uppermost hosizons of the dry soils (Lbl and Lb7/95), fungi and bacteria
counterbalanced. FB-ratios widened with depth, although the increase of fungi in profile
Lb 1 195 was strenger.
102 5 . Results
5.4.2 Caloric quotient
Levinson-Lessing
The ratio of basal to substrate induced heat output (caloric quoticnt) was up to 5.1 (median
0.6) in the soils of Levinson-Lessing. Thus, the substrate induced activity prevailed over the
basal activity. The caloric quotient narrowed in the following order: non-sorted steps>polygon
tundra>non-sorted stripes. Within profiles an apparent pattern was lacking.
In the soils of the non-sorted steps, the caloric quotient was greater 1 when vegetation was
lacking. This diminished in the presence of vegetation. The caloric quotient also decreased
with depth although relatively greater quotients could also be obsei-ved. The latter quotients
were k1. These were determined in the anoxic horizon of profile 8.1. and the aerobic upper
centimetres of the subsoil of the vegetation ring (LL11.2196 and LL8.2196). In contrast values
verged to nil in the anoxic horizon of the soils with vegetation Cover.
In the topsoils of the polygonal tundra, the caloric quotient was smaller 1. Again, the quotient
increased (i.e., >1) with lacking vegetation as in the mud boil of the high centred polygon
(LL3196). However, the caloric quotient charactesistics differed remarkably between the two
types of polygons. They differed with respect to micro-site and to depth. In the soils of the low
centred polygons the quotient increased with depth. This increase was stronger in the apex
than in the wet centre and exceeded 1. In the corresponding profile of the high centred
polygon (LL3196) the quotient decreased with depth although maximum quotient of > l was
determined in the lower organic hosizon.
Caloric quotient in the non-sorted stripes were generally very low and verged to nil. Quotients
>1 were found in the anoxic mineral subsoil of unvegetated mound (e.g., LL9.1196) and the
organic horizons of the vegetated mound (e.g., 10.2196).
Summing up it may be stated that the microbial activity was enhanced by substrate
amendment. Exceptions were the mineral topsoils of the unvegetated soils, the anoxic subsoil
of the unvegetated soils as well as the upper centimetres of the subsoil of the drier elevated
micro-sites. Here, substrate induced heat output was below basal heat output, i.e., quotients
exceeded 1. The different abiotic properties suggest a different composition of the microbiota
at the respective micro-habitats.
Labaz
In the soils at Labaz, the caloric quotient was up to 3.5 (median 0.5). As was observed in the
soils of Levinson-Lessing substrate induced microbial activity predominated.
In the wet sedge tundra (Lb4195) the caloric quotient was only determined in the Oi-horizon
since no activity could be measured in the subsoil. Within the Oi-horizon quotients increased
5.4 Ecological Parameters 103
with depth and exceeded 1 in the lower centimetres. In the hummock and tussock tundra,
values varied along with the micro-relief although both tundra types differed. The relatively
elevated micro-site showed a zigzag pattem of caloric quotients with increasing depth. They
both showed a peak (quotient >1) at lower depth of approximately 10 centimetres. Yet, they
differ in the topsoil and the underlying subsoil. The hummock (Lb2a.195) showed greater
substrate induced activity in the topsoil (caloric quotient <1) and predominating basal activity
above the permafiost table. In the tussock (Lb3al95) on the contrasy quotients were nil since
no basal activity was measured. In the cossesponding depression quotients were always <1 and
showed a peak (>I) in the lower Oe-horizon and a relative increase above the permafrost
table.
As for the soils at Levinson-Lessing the substrate induced microbiota predominated.
Nevertheless micro-habitats with differing calosic quotients were also found in the soils at
Labaz. These represented the transitional hosizons from the topsoil to the mineral subsoil as
well as the supra-permafrost layer.
5.4.3 Microbial inventory
The measurement of trace gas fluxes in the field represent activity studies under natural
conditions. Data are usually given as a flux over a given area. For the soils of this study CO2
(SOMMERKORN, 1998) and CH4 fluxes (GUNDELWEIN, 1998) were measured. As a
consequence an inventosy of fungal and bacterial biomass data from Sections 5.3.1 and 5.3.2.
was also taken [mg Cãà m"] for hrther understanding of the mediating microbial population.
Levinson-Lessing
Fungal and bactesial carbon inventories CI for the soils at Levinson-Lessing are shown in
Table 5.4.3-1. Bulk density changed within profiles and between micro-sites, which results in
a different distribution pattem of fungal or bacterial biomass. In contrast to data related to dsy
weight of soil, decreases of hngi and bacteria within profiles became less pronounced due to
increasing bulk density.
As an example given, increasing bulk density between micro-sites in the soils of the non-
sorted stripes (LL9196) and the transitionary polygon (LL5 and 6/96) amplified increases in
fungi and bacteria. On the contrary, lower bulk density in wet depressions (LL2196) or fsost
cracks (LL4196) for instance balanced differences out. In the case of the high centred polygon
this resulted in an inverse relationship. Fungal CI became gseater in the fiost crack than in the
adjacent higher centre. Bacterial CI, however, became greater in the centre. An inverse
relationship was also observed between the centre and the mud boil of the high centred
polygon (LL3196) and within profile LL1196. In the latter bacteria increased with depth when
given as bactesial CI.
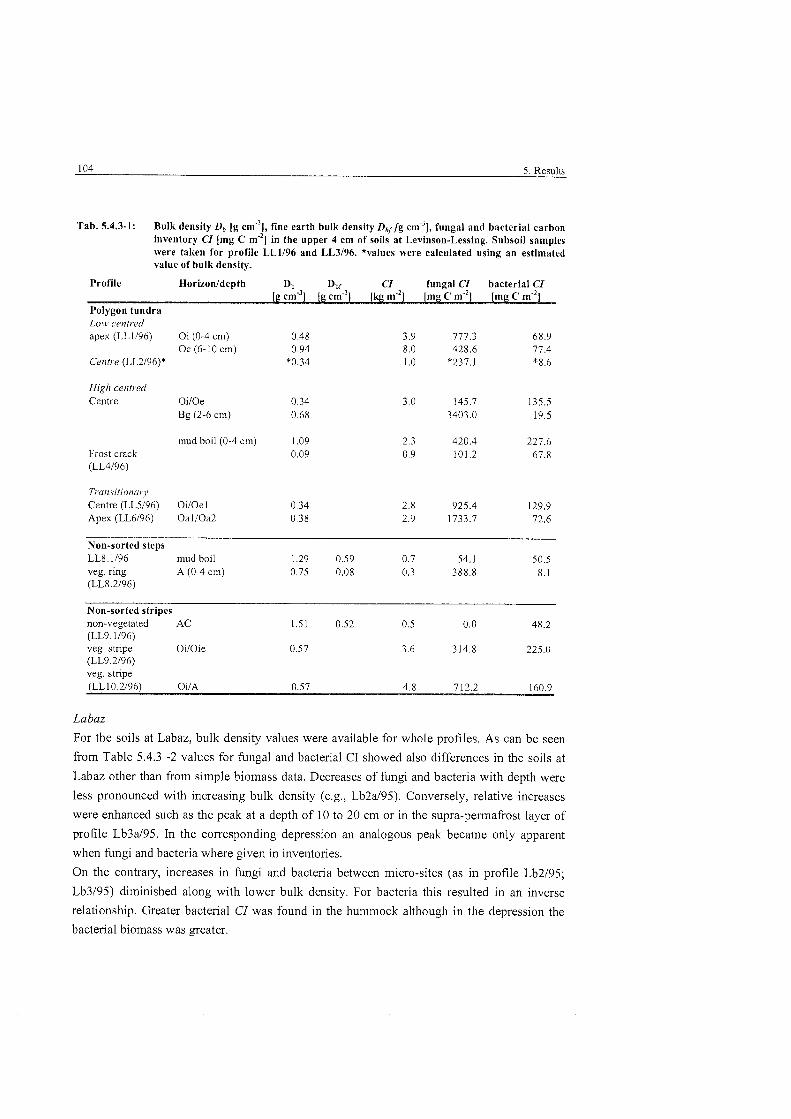
Tab. 5.4.3-1: Bulk density Db [g cm3], fine earth bulk density Dbr[g c n ~ ' ~ ] , fungal and bacterial carbon inventory CI [mg C m'2] in the iipper 4 crn of soils at Levinson-Lessing. Subsoil samples were taken for profile LL1196 and LL3196. *values were calcnlated using an estimated value of bulk density.
Profile Horizonldepth Db D bf CI fungal CI bacterial CI [g ~ r n - ~ ] [g [kg m-2] [mg C rn-2] [mg C m-*]
Polygon tundra Low cenfred apex (L,L 1/96) Oi (0-4 cnl) 0.48 3.9 777.3 68.9
Oc (6- 10 cm) 0.94 8.0 428.6 77.4 Cenire (LL2/96)* '0.34 1 .0 *237. 1 *8.6
High centred Centre OiIOe 0.34
Bg (2-6 cm) 0.68
mud boil (0-4 ein) 1.09 Frost crack 0.09 (LL4196)
Transitionai-}' Centre (LL5196) OiIOe 1 0.34 Apex (LL6196) OallOa2 0.38
Non-sorted steps LL8.1196 mud boil 1.29 0.59 0.7 54.1 50.5 veg. ring A (0 4 cm) 0.75 0.08 0.3 388.8 8.1 (LL8.2196)
Non-sorted stripes non-vegetated AC 1.51 0.52 0.5 0.0 48.2 CLL9.1196) veg. s t~ ipe OilOie (LL9.2196) veg. stripe (LL 10.2196) OilA 0.57 4.8 712.2 160.9
Labaz
For the soils at Labaz, bulk density values were available for whole profiles. As can be seen
from Table 5.4.3 -2 values for fungal and bacterial CI showed also differences in the soils at
Labaz other than from simple biomass data. Decreases of fungi and bacteria with depth were
less pronounced with increasing bulk density (e.g., Lb2a.195). Conversely, relative increases
were enhanced such as the peak at a depth of 10 to 20 cm or in the supra-permafrost layer of
profile Lb3a195. In the corresponding depression an analogous peak became only apparent
when hng i and bacteria where given in inventories.
On the contrary, increases in fungi and bacteria between micro-sites (as in profile Lb2195;
Lb3195) diminished along with lower bulk density. For bacteria this resulted in an inverse
relationship. Greater bacterial CI was found in the hummock although in the depression the
bacterial biomass was greater.
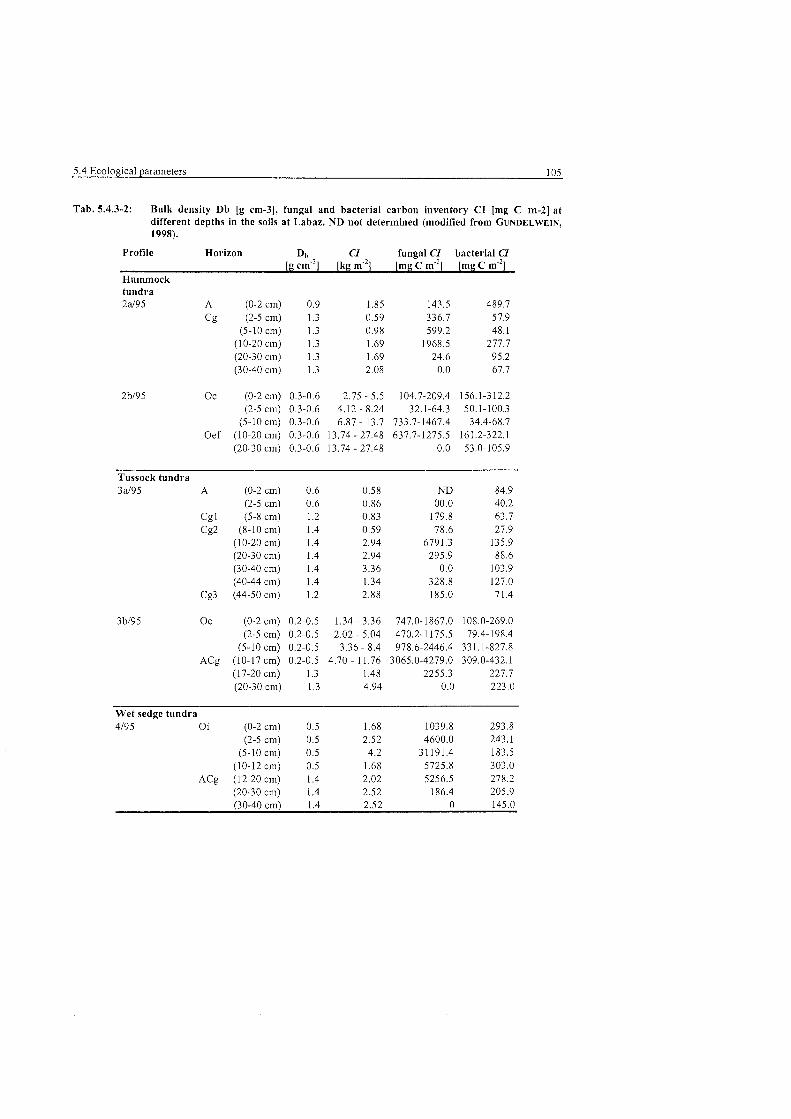
Tab. 5.4.3-2: Bulk density Db [g cnl-31, fungal and bacterial carbon inventory CI [n~g C m-21 at different depths in the soiis at Labaz. ND not determined (modified frorn GUNDELWEIN, 1998).
Profile Horizon D u CI fungal CI bacterial CI [g crn"] [kg [mg C m"2] [mg C
Hummock tundra 2d95 A (0-2 cm) 0.9 1.85 143.5 489.7
Cg (2-5 cm) 1.3 0.59 336.7 57,9 (5-10 cm) 1.3 0.98 599.2 48.1
(10-20cm) 1.3 1.69 1968.5 277.7 (20-30 cm) 1.3 1.69 24.6 95.2 (30-40 cm) 1.3 2.08 0.0 67.7
Oe (0-2 cm) 0.3-0.6 2.75 - 5.5 104.7-209.4 156.1-312.2 (2-5 cm) 0.3-0.6 4.12 - 8.24 32.1-64.3 50.1-100.3
(5-10 cm) 0.3-0.6 6.87 - 13.7 733.7-1467.4 34.4-68.7 Oef (10-20 cm) 0.3-0.6 13.74 - 27.48 637.7-1275.5 161.2-322,l
(20-30 cm) 0.3-0.6 13.74 - 27.48 0.0 53.0-105.9
Tussock tundra 3 d 9 5 A (0-2 cm)
(2-5 cm) Cgl (5-8 cm) Cg2 (8-10 cm)
(10-20 cm) (20-30 cm) (30-40 cm) (40-44 cm)
Cg3 (44-50 cm)
3bi95 Oe (0-2 cm) 0.2-0.5 1.34 - 3.36 747.0-1867.0 108.0-269.0 (2-5 cm) 0.2-0.5 2.02 - 5.04 470.2-1 175.5 79.4-198.4
(5-10 cm) 0.2-0.5 3.36 - 8.4 978.6-2446.4 331.1-827.8 ACg (10-17 cm) 0.2-0.5 4.70 - 11.76 3065.0-4279.0 309.0-432.1
(1 7-20 cm) 1.3 1.48 2255.3 227.7 (20-30 cm) 1.3 4.94 0.0 223.0
Wet sedge tundra 4/95 Oi (0-2 cm) 0.5 1.68 1039.8 293.8
(2-5 cm) 0.5 2.52 4600.0 243.1 (5-10 cm) 0.5 4.2 31191.4 183.5
(10-12 cm) 0.5 1.68 5725.8 303.0 ACg (12-20 cm) 1.4 2.02 5256.5 278.2
(20-30 cm) 1.4 2.52 186.4 205.9 (30-40 cm) 1.4 2.52 0 145.0
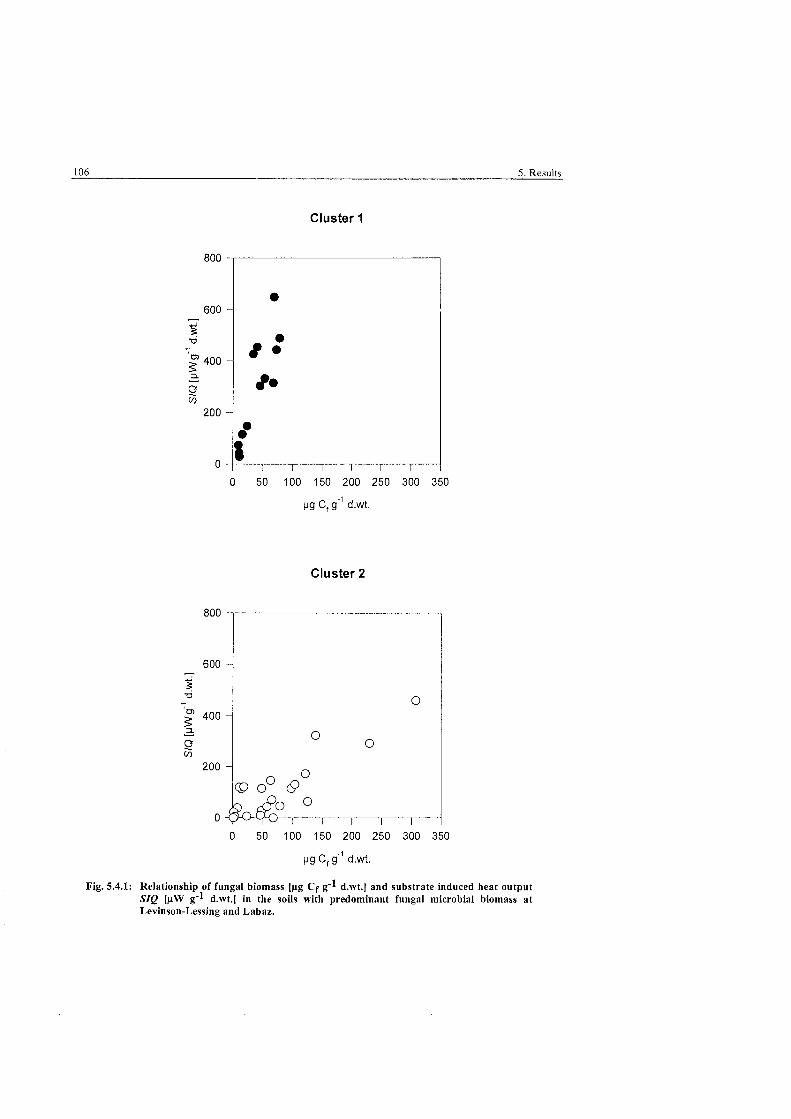
106 5 . Results
Cluster 1
Cluster 2
Fig. 5.4.1: Relationship of fungal biornass [pg Cf g'l d.wt.1 and substrate induced heat output SZQ [pW g'l d.wt.1 in the soils with predorninant fungal rnicrobial biornass at Levinson-Lessing and Labaz.
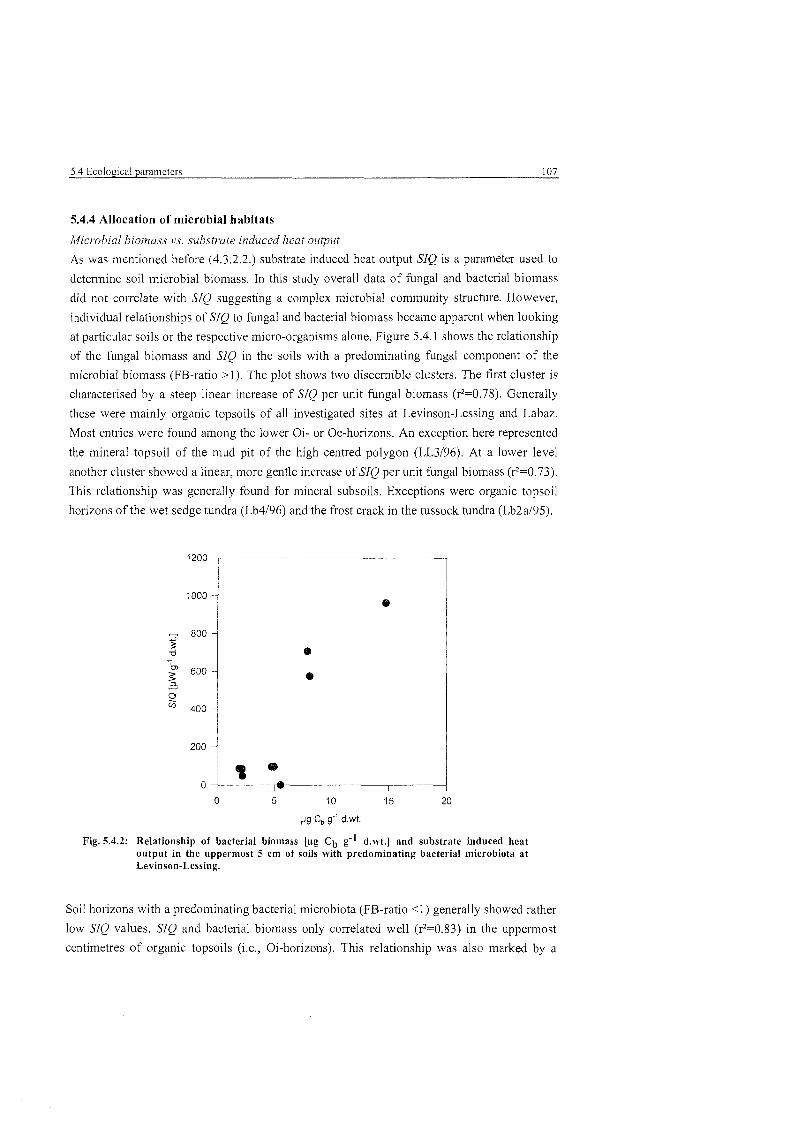
5,4 Ecological Parameters 107
5.4.4 Allocation of microbial habitats
Microbial biomass vs. substrate induced heat output
As was mcntioncd before (4.3.2.2.) substrate induced heat output SIQ is a parameter used to
detemine soil microbial biomass. In this study overall data of fungal and bactesial biomass
did not correlate with SIQ suggesting a complex microbial community structure. However,
individual relationships of SIQ to fungal and bacterial biomass became apparent when looking
at particular soils OS the respective micro-organisms alone. Figure 5.4.1 shows the relationship
of the fungal biomass and 570 in the soils with a predominating fungal component of the
microbial biomass (FB-ratio > I ) . The plot shows two discernible clusters. The first cluster is
characterised by a steep linear increase of SIQ per unit fungal biomass (r2=0.78). Generally
these were mainly organic topsoils of all investigated sites at Levinson-Lessing and Labaz.
Most entries were found among the lower Oi- or Oe-hosizons. An exception here represented
the mineral topsoil of the mud pit of the high centred polygon (LL3/96). At a lower level
another cluster showed a linear, more gentle increase of SIQ per unit fungal biomass (r2=0.73).
This relationship was generally found for mineral subsoils. Exceptions were organic topsoil
horizons of the wet sedge tundra (Lb4196) and the frost crack in the tussock tundra (Lb2a195).
Fig. 5.4.2: Relationship of bacterial biomass [pg Ci, g'l d.wt.1 and substrate induced heat output in the uppermost 5 cm of soils with predominating bacterial microbiota at Levinson-Lessing.
Soil hosizons with a predominating bacterial microbiota (FB-ratio <1) generally showed rather
low SIQ values. SIQ and bacterial biomass only correlated well (r2=0.83) in the uppermost
centimetres of organic topsoils (i.e., Oi-horizons). This relationship was also marked by a
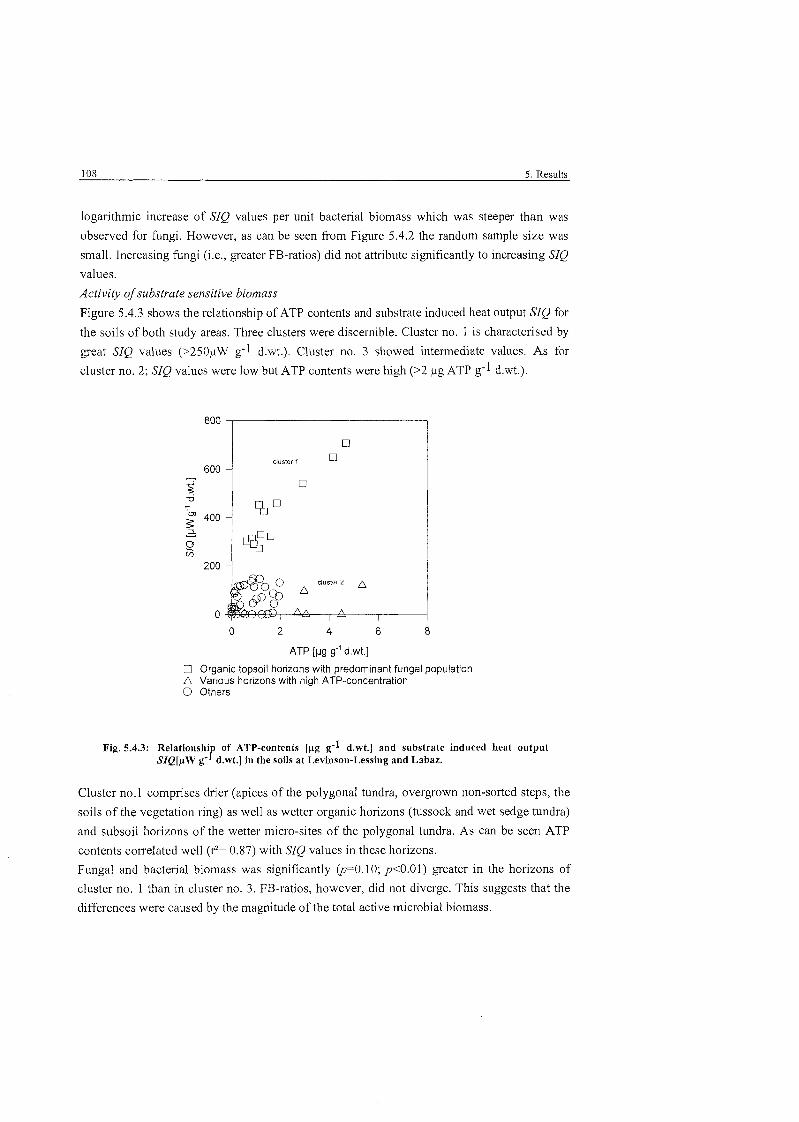
108 5. Results
logarithmic increase of SIQ values per unit bacterial biomass which was steeper than was
observed for hngi. However, as can be seen from Figure 5.4.2 the random sample size was
small. Increasing hngi (i.e., gseater FB-ratios) did not attribute significantly to increasing SIQ
values.
Activity of substrate sensitive biomass
Figure 5.4.3 shows the relationship of ATP contents and substrate induced heat output SIQ for
the soils of bot11 study areas. Three clusters were discemible. Cluster no. 1 is characterised by
great SIQ values (>250pW g-1 d.wt.). Cluster no. 3 showed intermediate values. As for
duster no. 2; SIQ values were low but ATP contents were high (>2 pg ATP g'l d.wt.).
ATP [pg g"' d.wt.1
D Organic topsoil horizons with predominant fungal population A Various horizons with high ATP-concentration 0 Others
Fig. 5.4.3: Relationsh$~ of ATP-contents [pg g1 d.wt.1 and substrate induced heat output SIQ[pW g- d.wt.1 in the soils at Levinson-Lessing and Labaz.
Cluster no. 1 comprises drier (apices of the polygonal tundra, overgsown non-sorted steps, the
soils of the vegetation ring) as well as wetter organic horizons (tussock and wet sedge tundra)
and subsoil horizons of the wetter micro-sites of the polygonal tundra. As can be seen ATP
contents correlated well (r2= 0.87) with SIQ values in these horizons.
Fungal and bacterial biomass was significantly (p=0.10; p<O.Ol) greater in the horizons of
cluster no. 1 than in cluster no. 3. FB-ratios, however, did not diverse. This suggests that the
differences were caused by the magnitude of the total active microbial biomass.
5.4 Ecological Parameters 109
In the horizons of cluster no., 2 SIQ values were low despite high ATP contents. The overall
microbial biomass was low. Yet, this was mainly because of low fungal biomass (median
9.08 pg cfg-' d.wt.) which was similar to the horizons of cluster no. 3. On the contrary,
bacterial biomass in these horizons (median 13.2 pg Cb g" d.wt.) was significantly higher
(~K0.05). This was also reflected by the FB-ratio. The latter was also significantly (D=O.lO)
narrower than in the horizons of cluster l and thus clearly dominated by bacteria. ATP
contents, however, were neither correlated to SIQ nor to basal heat output Q. Cluster no. 2
comprises the very top centimetres of many Oi-horizons (i.e., generally 0-2 centimetres of the
soils of the hummock and tussock tundra as well as the vegetated non-sorted stripe),
furtherrnore the anoxic subsoil of mudpits (non-sorted steps) and the corresponding upper 0.5
centimetres of the unvegetated mudpit.
Active versus restricted microbial bioinass
ATP contents neither correlated with fimgal nor with bacterial biomass. Nevertheless
differences between individual soils were observed when relating ATP to microbial biomass
(here: summed up fkngal and bacterial biomass, Cb).
In the soils at Levinson-Lessing, median ATP content per unit microbial biomass was
0.03 ATP pg" Cfi. At Labaz median value was 0.05 pg ATP pg" Cn, and significantly
(p<0.10) different. Maximum values also were up to seven times greater at Labaz than at
Levinson-Lessing.
Table 5.4.4 -1 shows that values varied with sites at the respective study area. Similarity
between individual sites at Levinson-Lessing and at Labaz could not be established.
Tab. 5.4.4-1: Difference of median ATP:MBM (snmmed up fungal and bacterial biomass) ratios [pg ATP: pg Cm] and significance level lp] between individual sites at Levinson-Lessing and Labaz (PT.: polygonal tundra; Solst.: non-sorted steps with solifluction; Str.: non-sorted stripes; BE: dry brown earth; HT: hnmn~ock tundra; TT: tussock tundra; WST: wet sedge tundra; P. BE: podzolised brown earth).
Profiles ATP:MBM PT Solst. Str. BE HT TT WST p. BE
PT (LL1196-7/96) 0.02 0.07 0.67 0.15 0.10 0.38 0.06 0.30 Solst. (LL8196; LLlll96) 0.19 0.02 0.20 0.21 0.46 0.00 0.69 Str. (LL9- 10196) 0.03 0.14 0.08 0.36 0.01 0.25 BE (Lbll95) 0.56 0.45 0.79 0.12 0.24 HT (Lb2195) 0.10 0.78 0.05 0.39 TT (Lb3195) 0.03 0.32 0.53 WST (Lb4195) 0.00 0.15 p. BE (Lb7195) 0.05
At Levinson-Lessing ATP content per unit microbial biomass was significantly (p<0.10)
higher in the non-sorted steps of the solifluction slopes. These also showed differences along
with the micro-relief. In the unvegetated mud boil (LL8.1196) values were some 90 % gseater
than in the adjacent vegetation ring. On the contrary, in the soils of the overgsown step
(LL11196) this relationship was inverse. Values were 30 % gseater in the vegetation ring. In
the non-sorted stripes, ATP content per unit microbial biomass also increased along with the
vegetation Cover. Yet, this increase was far less pronounced in profiles LL9196 (i.e., 10 %)
than in profiles LL10196 (i.e., 60 %). In the polygonal tundra, values were greater in soils of
the drier micro-sites than in the corresponding depression or frost crack. Yet, this did not
apply to the low centred polygon where no difference could be observed between the micro-
sites. Values were higher in the high centred and intermediate polygon. Within profiles, values
generally decreased with depth. Exceptions here represented the wet micro-sites of the high
and low centred polygon, the drier apex of the intermediate polygon and the subsoils of the
non-sosted steps. In the latter this increase with depth was either an absolute (profile LL11196)
or a relative within the subsoil (LL8.2196).
At Labaz ATP content per unit microbial biomass decreased in the order: dry brown earth >
tussock tundra > hummock tundra > podzolised brown earth > wet sedge tundra. Difference
between dry brown easth and the tussock tundra as well as between the latter and hummock
tundra could not be established. The inconsistency in this relationship was due to a wide range
of values in the tussock tundra along with the micro-relief. The wet sedge tundra soil showed
a significant lower ATP content per unit microbial biomass than the soils of other sites.
Within profiles values generally decreased with depth. Exceptions here could be observed in
the soils of the tussock and the hummock tundra. These showed increased ATP contents per
unit microbial biomass at a lower depth. In the soil of the hummock tundra this increase was
observed at a depth of 5 and 10 centimetres. Values were greater than in the overlying
horizons. In the soils of the tussock tundra this increase represented only a relative one and
5.4 Ecological Parameters 111
was observed at a depth of 10 to 20 centimetres. In the dry brown earth increasing values were
observed at a depth of 10 centimetres and culminated at a depth of 50 to 60 centimetres.
A c t i v e h g i
In soil horizons with predominating fungi, ATP content per unit fungal biomass was up to
3.9 pg ATP pg" Cr. Yet, two thirds of the respective sarnples showed extreme low values of
smaller than 0.04 pg ATP pg" Cf. Nevertheless hngal biomass was significantly (p<0.05)
greater. This relationship particularly held true for subsoil horizons and few organic horizons
in the non-sorted steps and stripes at Levinson-Lessing. In the low centred polygon, values
were lower in the wet centre than in the con'esponding apex. This relationship was inverse in
the high ccntrcd polygon, Values were greater in the drier centre.
In the soils at Labaz, extreme low ATP content per unit iünga biomass were always found in
horizons that showed absolute or relative peaks of fungal biomass.
5.4.5 Controls of microbial habitats
Soil pH
Fungi and bacteria were present in soils over the whole range of soil pH. Fungal biomass
(FBM) showed a normal distribution pattem (see Fig. A4.1-1) along with pH with maximum
FBM at pH (CaCl;) 5.7. On the contrary, no such or only a weak distribution pattern was
discemible for bacterial biomass (BBM). Thus microbial community composition as
expressed by the FB-ratio was also affected by soil pH as FBM was.
For the tundra soil types (Lb2195- Lb4/95) at Labaz, maximum FBM values
(45-120 pg Cf g"d.wt.) at soil pH (CaCl;) around 5.1 were found in most subsoil horizons at a
depth of approximately 10 centimetres. The soils at Levinson-Lessing showed a different
distribution pattern of FBM along with pH. Relatively high FBM values
(60-100 pg Cfg-' d.wt.) were found at pH (CaCl;) 6.2. These comprised most organic topsoils
of the drier micro-sites of the polygonal tundra as well as of the vegetated non-sorted stripes
and steps. Below pH 6.0, FBM was usually smaller than 50 pg Cff' d.wt.. Yet, beside the
relative peak of a normal distribution pattern, a duster of higher FBM values
(> 60 pg Cfg" d.wt.) was also found below pH (CaCl;) 6.0, which could be attributed to the
vegetation ring of the non-sorted step (LL8196) and the wet centre of the low centred polygon
(LL2196).
As mentioned above, bacterial biomass (BBM) only showed a weak normal distribution
pattem along with soil pH. Yet, two clusters were discemible that feil out of this pattern. In
the tundra soil types at Labaz (Lb2-4/95), the uppermost centimetres of organic topsoils
showed high BBM values (>20 pg Cb g-' d.wt.) at low pH 5.1 (CaCl;). BBM values between
15 and 22 pg Cb g" d.wt. were found at higher pH values (6-7.8). This cluster was observed in
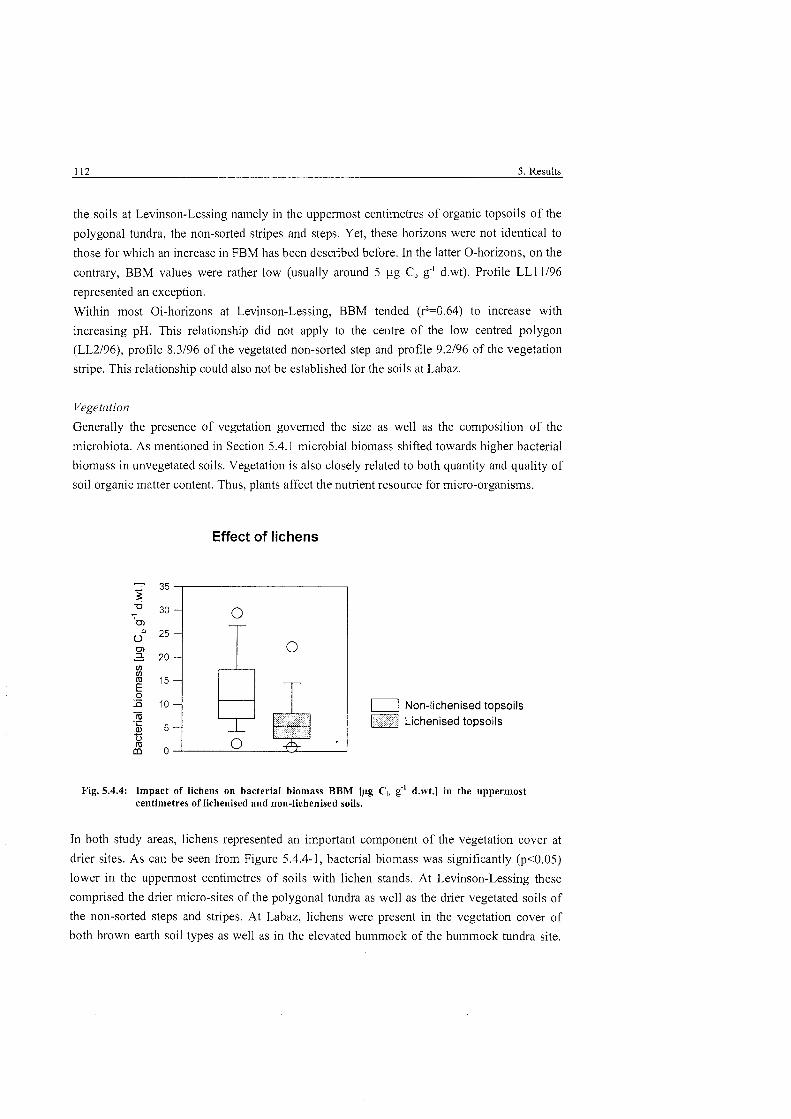
the soils at Levinson-Lessing namely in the uppennost centimetres of organic topsoils of the
polygonal tundra, the non-sosied stripes and steps. Yet, these horizons were not identical to
those for which an increase in FBM has been described before. In the latter 0-horizons, on the
contrary, BBM values were rather low (usually around 5 [IQ Cb g" d.wt). Profile LL11196
represented an exception.
Within most Oi-horizons at Levinson-Lessing, BBM tended (+G.64) to increase with
increasing pH. This relationship did not apply to the centre of the low centred polygon
(LL2196), profile 8.3196 of the vegetated non-sosied step and profile 9.2196 of the vegetation
stripe. This relationship could also not be established for the soils at Labaz.
Vegetation
Generally the presence of vegetation govemed the size as weil as the composition of the
microbiota. As mentioned in Section 5.4.1 microbial biomass shifted towards higher bacterial
biomass in unvegetated soils. Vegetation is also closely related to both quantity and quality of
soil organic matter content. Thus, plants affect the nutrient resource for micro-organisms.
Effect of lichens
Fig. 5.4.4: Impact of Iichens on bacterial biomass BBM [pg Ch g"' d.wt.1 in the uppermost centimetres of lichenised and non-lichenised soils.
In both study areas, lichens represented an important component of the vegetation cover at
drier sites. As can be seen from Figure 5.4.4-1, bacterial biomass was significantly (p<0.05)
lower in the uppermost centimetres of soils with liehen stands. At Levinson-Lessing these
comprised the drier micro-sites of the polygonal tundra as well as the d~ ie r vegetated soils of
the non-soried steps and stripes. At Labaz, lichens were present in the vegetation cover of
both brown earih soil types as well as in the elevated hummock of the hummock tundra site.
5.4 Ecological Parameters 113
On the contrary, this relationship could not be established for fungal biomass. Thus, FB-ratios
tended to be wider in the lichenised soils. Soil pH was not significantly different.
The impact of plants that form mycorrhizal associations could not be investigated because of
the low random sample size of soils with non-mycorrhizal plants (n=4).
Substrate quantit}'
Substrate quantity was found to affect the microbial biomass and influenced furthermore the
microbial community composition and its activity (see Fig. A5-2 and A5-5).
In vegetated dry topsoils as well as in subsoils, bacterial biomass increased with increasing
carbon and nitrogen content (pw0.6-0.8). Fungi only showed greater biomass values with
increasing nitrogen content in dry vegetated topsoils ( ~ ~ 0 . 6 ) . These also showed a positive
correlation of basal Q and substrate induced heat output 570 with increasing carbon content
(pw0.64). The latter was also found to increase with carbon and nitrogen content (pasO.85;
p~0.60). Yet, ATP content did not increase accordingly, which suggests an increasing
proportion of glucose sensitive micro-organisms. In subsoil horizons, increasing substrate
quantity was found to enhance glucose sensitive activity, which correlated with bacterial
biomass ( ~ ~ 0 . 7 1 ) . In dry topsoils, carbon content also increased overall activity (i.e., basal
heat output Q).
On the contrary in topsoils of wet depressions (see Fig. A5-2), overall microbial biomass was
not affected by carbon and nitrogen content. Yet, a negative effect on the composition of the
microbiota was observed. The proportion of the autochtonous microbiota (i.e., caloric
quotient) decreased with increasing carbon content (P=-0.94 ) and Cm-ratio (P=-0.89).
Substrate quality
As has just been described for wet topsoils substrate quality as expressed as Cm-ratio showed
an impact on cornpusition of the microbiota but less on its size and its activity. In contrast to
wet topsoils, substrate quality did not show any affect in dry topsoils. Thus the caloric
quotient decreased with wider CIN-ratios (p-0.89) in wet soils. Substrate quality further
affected the glucose sensitive micro-organisms (SIQ) in subsoils. 570 was inhibited by wider
Cm-ratios (rw-0.9). Accordingly, the caloric quotient increased with higher Cm-ratios
( ~ ~ 0 . 6 3 ) .
114 5 . Results
Water logging
In the two study areas, water logging occurred at any depth within soil profiles. The most
conspicuous type was water saturation up to the soil surface in wet depressions of micro-sites
or in a drainage ditch as at Labaz. These sites had vegetation stands with adaptation to wet
conditions (e.g., Carex spp., Eriophorum spp.). CIN-ratios in soils at wet (micro-)sites
differed significantly (o<0.05) from dry topsoils (see Fig. A5-5). Fungal and bacterial biomass
values were found to be significantly (p<0.15, p<O.Ol) greater in the wetter soils though the
activity parameters (i.e., basal heat output, ATP, ATP content per unit microbial biomass)
were not.
Impeded drainage within profiles occurred above horizons with lower perrneability and above
the perrnafiost table. In supra-perrnafrost horizons, substrate quantity was significantly
different (p=0.01). Carbon contents were four times higher horizons although nitrogen content
were half of the comparable dry subsoil horizons. The increasing carbon contents mainly
affected bacterial biomass (r~0.8), which was twice the biomass of drier subsoils. Activity
parameters did not show any significant difference.
6.1 Microbial pool in tundra soils 115
6. Discussion
This earth is honey to all beings, and all beings are honey to this earth.
Upanishads
6.1 Microbial pool in tundra soils
The data obtained from this study give a detailed picture of the composition of the microbial
pool and habitats in arctic tundra soils. Spatial heterogeneity of both fungal and bactesial
biomass as well as the energetic state proved to be important Parameters for the description
and understanding of the decomposer cycle in this environment.
6.1.1 Vertical distribution
In all tundra soils studied, microbial biomass was largely restricted to topsoil horizons, which
are the upper 10 to 20 centimetres of the active layer. Fungi and bactesia both decreased with
depth. For fbngi, this decrease was more pronounced and ofien marked by a distinct decline or
cessation towards the subsoil (e.g., PT, HT, TT, WST). Bactesia also concentrated in the
topsoil but occurred throughout the soil profile (SCHMIDT & BOLTER, unpubl. data; BOLTER,
1998). This distsibution Pattern of microbial biomass was reported for the soils of the IBP
sites (BUNNELL et al., 1975; CHERNOV et al., 1975; HOLDING, 1981) but also for other biomes
(ZVYAGINTSEV, 1994; PAUL & CLARK, 1989). Generally, this disti-ibution Pattern was linked
to soil organic matter since soil micro-organisms are primasily decomposers. Yet, the results
of this study also showed that microbial biomass did not simply follow the distribution of
organic matter content. For instance, higher values of microbial biomass were found below
organic hosizons (e.g., HT and TT), and drier micro-sites show greater microbial biomass
despite lower Corg contents than adjacent wet sites. Thus, in tundra, soil organic matter did not
represent the only factor that influences soil microbiota. The studied soils also differed fiom
those of most other biomes with respect to the shallowness of the total hosizons, which micro-
organisms predominantly inhabit. Furthetmore, microbial biomass was also lower.
Fungi
At Levinson-Lessing the iünga hyphal length was up to 396 m g" d.wt. with a median of
21 m g ' d.wt.. Although the range of values was wider at the expesimental site Labaz (up to
920 m g"' d.wt.), the median was only 4.1 m g" d.wt.. These values are low compared to those
fiom other biomes (review by KJ0LLER & STRUWE, 1982) and even from IBP tundra sites
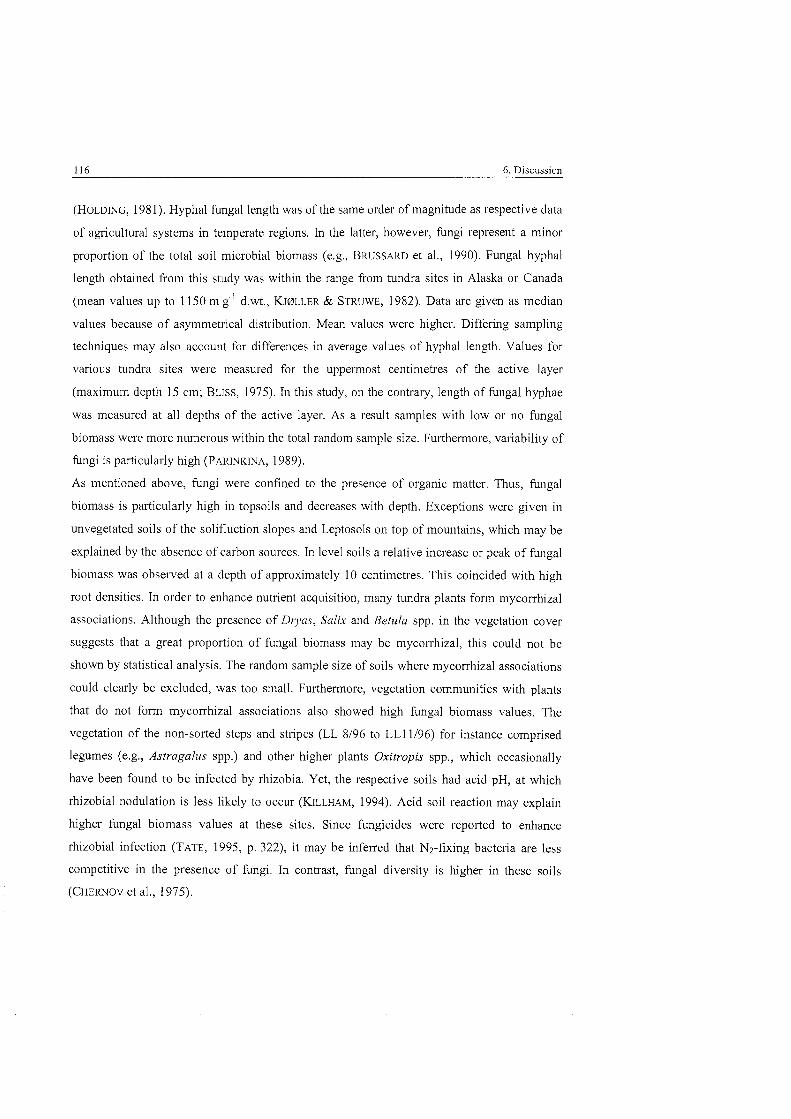
116 6. Discussion
(HOLDING, 198 1). Hyphal fungal length was of the same order of magnitude as respective data
of agricultural Systems in temperate regions. In the latter, liowever, fungi represent a minor
proportion of the total soil microbial biomass (e.g., BRUSSARD et al., 1990). Fungal hyphal
length obtained from this study was within the range from tundra sites in Alaska or Canada
(mean vaiues up to 1150 m g ' d.wt., K J ~ L L E R & STRUWE, 1982). Data are given as median
values because of asymmetrical distribution. Mean values were higher. Differing sampling
techniques may also account for differences in average values of hyphal length. Values for
various tundra sites were measured for the uppermost centimetres of the active layer
(maximum depth 15 cm; BLISS, 1975). In this study, on the contrary, length of fungal hyphae
was measured at all deptlis of the active layer. As a result sainples with low or no fbngal
biomass were more numerous witliin the total random sample size. Furthermore, variability of
fungi is particularly high (PARINKINA, 1989).
As mentioned above, fungi were confined to the presence of organic matter. Thus, fungal
biomass is particularly high in topsoils and decreases with depth. Exceptions were given in
unvegetated soils of the solifluction slopes and Leptosols On top of mountains, which may be
explained by the absence of carbon sources. In level soils a relative increase or peak of fungal
biomass was observed at a depth of approximately 10 centimetres. This coincided with high
root densities. In order to enhance nutrient acquisition, many tundra plants form mycorrhizal
associations. Although the presence of Diyas, Salix and Betula spp. in the vegetation Cover
suggests that a great proportion of fimgal biomass may be mycorrhizal, this could not be
shown by statistical analysis. The random sample size of soils where mycorrhizal associations
could clearly be excluded, was too small. Furtherrnore, vegetation communities with plants
that do not form mycorrhizal associations also showed high fungal biomass values. The
vegetation of the non-sorted steps and stripes (LL 8/96 to LL11196) for instance comprised
legumes (e.g., Astragalus spp.) and other higher plants Oxitropis spp., which occasionally
have been found to be infected by rhizobia. Yet, the respective soils had acid pH, at which
rhizobial nodulation is less likely to occur (KILLHAM, 1994). Acid soil reaction may explain
higher fungal biomass values at these sites. Since fungicides were reported to enhance
rhizobial infection (TATE, 1995, p. 322), it may be inferred that N2-fixing bacteria are less
competitive in the presence of fungi. In contrast, fungal diversity is higher in these soils
(CHERNOV et al., 1975).
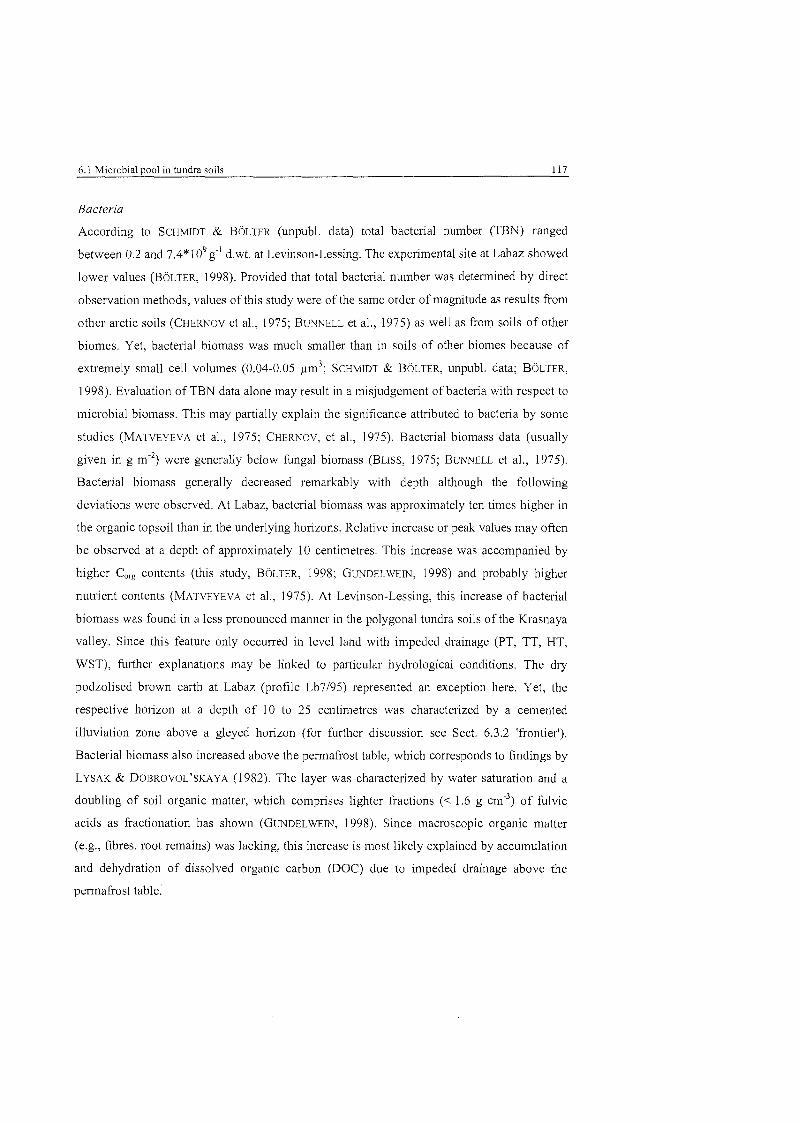
6.1 Microbial pool in tundra soils 117
Bacteria
According to SCHMIDT & BOLTER (unpubl. data) total bactesial number (TBN) ranged
between 0.2 and 7.4*109 g"' d.wt. at Levinson-Lessing. The experimental site at Labaz showed
lower values (BOLTER, 1998). Provided that total bactesial number was deterrnined by direct
obsesvation methods, values of this study were of the Same order of magnitude as results fsom
other arctic soils (CHERNOV et al., 1975; BUNNELL et al., 1975) as well as fiom soils of other
biomes. Yet, bacterial biomass was much smaller than in soils of other biomes because of
extremely sn~all cell volumes (0.04-0.05 pn3 ; SCHMIDT & BOLTER, unpubl. data; BOLTER,
1998). Evaluation of TBN data alone may result in a misjudgement of bacteria with respect to
microbial biomass. This may pastially explain the significance attributed to bacteria by some
studies (MATVEYEVA et al., 1975; CHERNOV, et al., 1975). Bacterial biomass data (usually
given in g m'2) were generally below fungal biomass (BLISS, 1975; BUNNELL et al., 1975).
Bacterial biomass generally decreased remarkably with depth although the following
deviations were observed. At Labaz, bacterial biomass was approximately ten times higher in
the organic topsoil than in the underlying hosizons. Relative increase or peak values may often
be observed at a depth of approximately 10 centimetres. This increase was accompanied by
higher Core contents (this study. BOLTER, 1998; GUNDELWEIN, 1998) and probably higher
nutrient contents (MATVEYEVA et al., 1975). At Levinson-Lessing, this increase of bactesial
biomass was found in a less pronounced manner in the polygonal tundra soils of the Krasnaya
valley. Since this feature only occurred in level land with impeded drainage (PT, TT, HT,
WST), further explanations may be linked to particular hydrological conditions. The dry
podzolised brown easth at Labaz (profile Lb7t95) represented an exception here. Yet, the
respective horizon at a depth of 10 to 25 centimetres was characterized by a cemented
illuviation Zone above a gleyed horizon (for fusther discussion see Sect. 6.3.2 'fiontier').
Bacterial biomass also increased above the permafsost table, which corresponds to findings by
LYSAK & DOBROVOL'SKAYA (1982). The layer was charactesized by water saturation and a
doubling of soil organic matter, which comprises lighter fractions (< 1.6 g cm3) of fulvic
acids as fsactionation has shown (GUNDELWEIN, 1998). Since macroscopic organic matter
(e.g., fibres, root remains) was lacking, this increase is most likely explained by accumulation
and dehydration of dissolved organic carbon (DOC) due to impeded drainage above the
permafsost table.
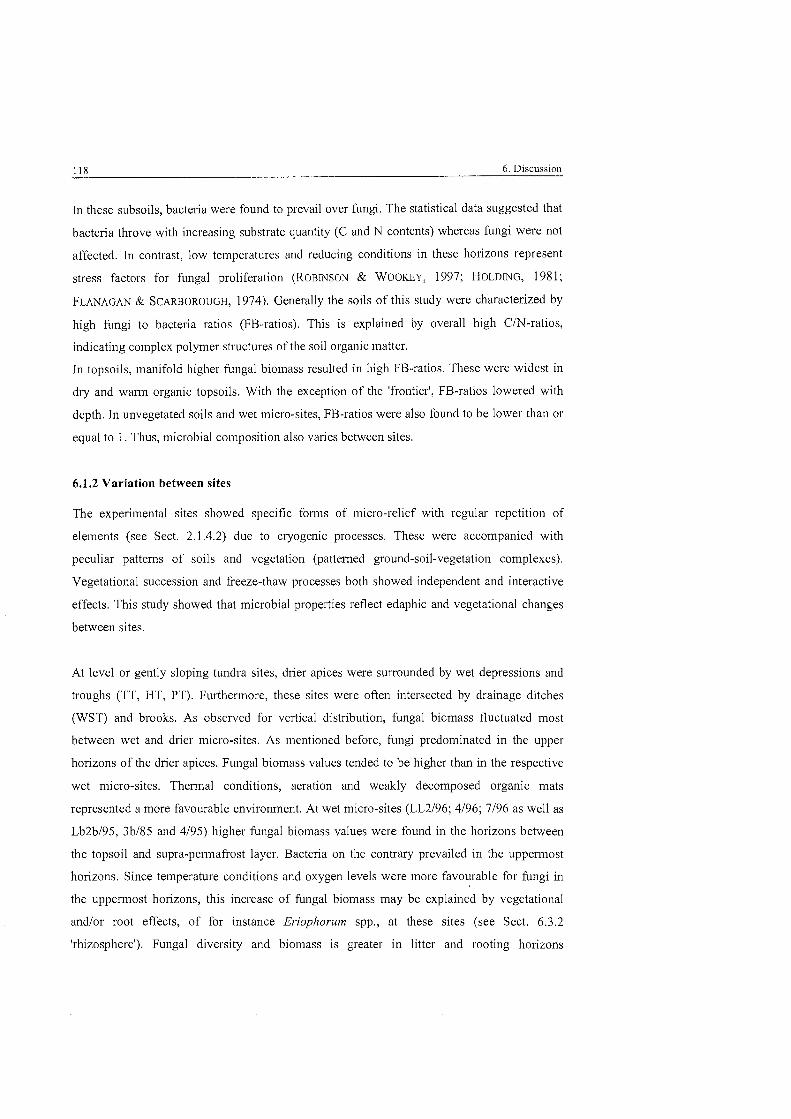
118 6 . Discussion
In these subsoils, bacteria were found to prevail over hngi. The statistical data suggested that
bacteria throve with increasing substrate quantity (C and N contents) whereas fungi were not
affected. In contrast, low temperatures and reducing conditions in these horizons represent
Stress factors for fungal proliferation (ROBINSON & WOOKEY, 1997; HOLDING, 198 1 ;
FLANAGAN & SCARBOROUGH, 1974). Generally the soils of this study were characterized by
high fungi to bacteria ratios (FB-ratios). This is explained by overall high Cm-ratios,
indicating coinplex polymer structures of the soil organic matter.
In topsoils, manifold higher fungal bioinass resulted in high FB-ratios. These were widest in
dry and warm organic topsoils. With the exception of the 'frontier', FB-ratios lowered with
depth. In unvegetated soils and wet micro-sites, FB-ratios were also found to be lower than or
equal to 1. Thus, microbial composition also varies between sites.
6.1.2 Variation between sites
The experimental sites showed specific forms of micro-relief with regular repetition of
elements (see Sect. 2.1.4.2) due to cryogenic processes. These were accompanied with
peculiar pattems of soils and vegetation (pattemed ground-soil-vegetation complexes).
Vegetational succession and fieeze-thaw processes both showed independent and interactive
effects. This study showed that microbial properties reflect edaphic and vegetational changes
between sites.
At level OS gently sloping tundra sites, drier apices were surrounded by wet depressions and
troughs (TT, HT, PT). Furthermore, these sites were often intersected by drainage ditches
(WST) and brooks. As observed for vertical distribution, fungal bicmass fluctuated most
between wet and drier micro-sites. As mentioned before, fungi predominated in the upper
horizons of the drier apices. Fungal biomass values tended to be higher than in the respective
wet micro-sites. Thennal conditions, aeration and weakly decomposed organic mats
represented a more favourable environment. At wet micro-sites (LL2196; 4/96; 7/96 as well as
Lb2b195, 3bl8.5 and 4/95) higher fungal biomass values were found in the horizons between
the topsoil and supra-permafrost layer. Bacteria on the contrary prevailed in the uppermost
horizons. Since temperature conditions and oxygen levels were more favourable for hng i in
the upperrnost horizons, this increase of fungal biomass may be explained by vegetational
andlor root effects, of for instance Eriophorum spp., at these sites (see Sect. 6.3.2
'rhizosphere'). Fungal diversity and biomass is greater in litter and rooting ho~izons
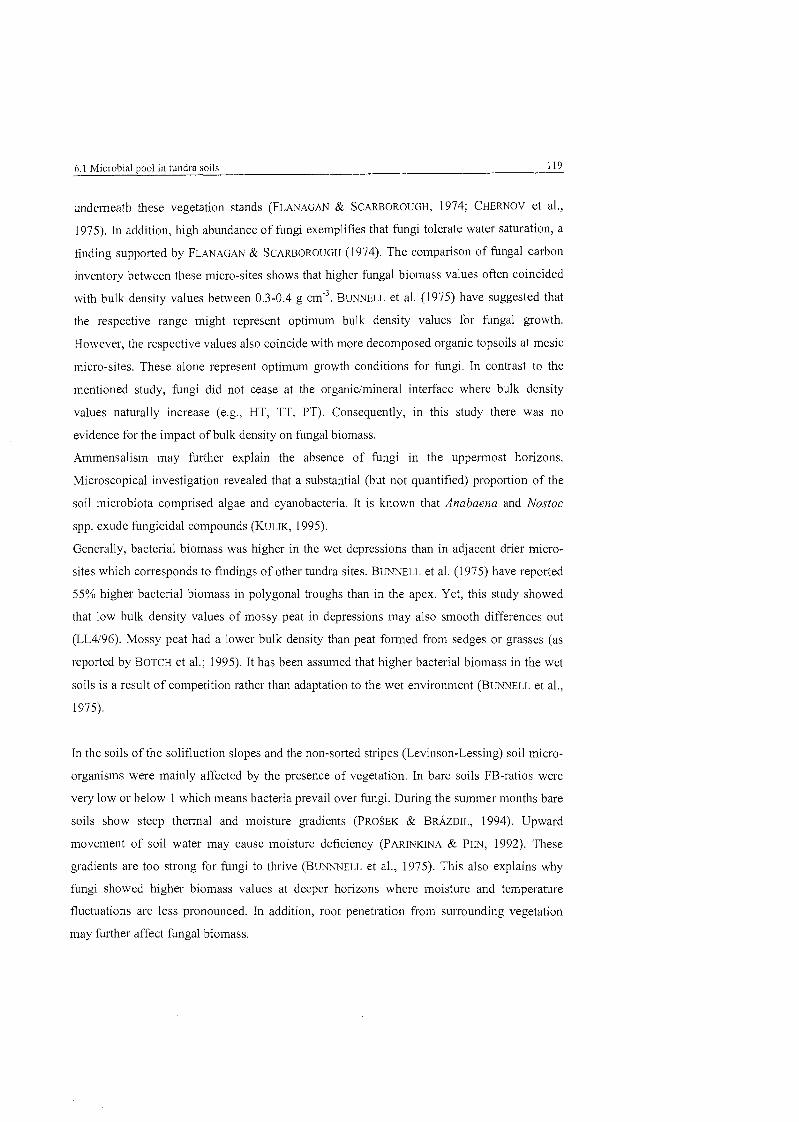
6.1 Microbial pool in tundra soils 119
underneath these vegetation stands (FLANAGAN & SCARBOROUGH, 1974; CHERNOV et al.,
1975). In addition, high abundance of fungi exemplifies that hng i tolerate water saturation, a
finding supposted by FLANAGAN & SCARBOROUGH (1974). The comparison of fungal carbon
inventory between these micro-sites shows that higher fungal biomass values ofien coincided
with bulk density values between 0.3-0.4 g ~ m ' ~ . BUNNELL et al. (1975) have suggested that
the respective range might represent optimum bulk density values for fungal growth.
However, the respective values also coincide with more decomposed organic topsoils at mesic
micro-sites. These alone represent optimum gsowth conditions for fungi. In contrast to the
mentioned study, kng i did not cease at the organiclmineral interface where bulk density
values naturally increase (e.g., HT, TT, PT). Consequently, in this study there was no
evidence for the impact of bulk density On kngal biomass.
Ammensalism may further explain the absence of fungi in the uppermost horizons.
Microscopical investigation revealed that a substantial (but not quantified) propostion of the
soil microbiota comprised algae and cyanobactesia. It is known that Anabaena and Nostoc
spp. exude fungicidal compounds (KULIK, 1995).
Generally, bacterial biomass was higher in the wet depressions than in adjacent dsier micro-
sites which corresponds to findings of other tundra sites. BUNNELL et al. (1975) have reposted
55% higher bactel-ial biomass in polygonal troughs than in the apex. Yet, this study showed
that low bulk density values of mossy peat in depressions may also smooth differences out
(LL4196). Mossy peat had a lower bulk density than peat fosined from sedges or gsasses (as
reported by BOTCH et al.; 1995). It has been assumed that higher bactesial biomass in the wet
soils is a result of competition rather than adaptation to the wet environment (BUNNELL et al.,
1975).
In the soils of the solifluction slopes and the non-sorted stripes (Levinson-Lessing) soil micro-
organisms were mainly affected by the presence of vegetation. In bare soils FB-ratios were
very low or below 1 which means bactesia prevail over fungi. During the surnmer months bare
soils show steep thermal and moisture gradients (PROSEK & BRAZDIL, 1994). Upward
movement of soil water may cause moisture deficiency (PARINKINA & PIIN, 1992). These
gradients are too strong for fungi to thsive (BUNNNELL et al., 1975). This also explains why
fungi showed higher biomass values at deeper horizons where moisture and temperature
fluctuations are less pronounced. In addition, root penetration from sui~ounding vegetation
may further affect fungal biomass.
120 6. Discussion
Inhibition of bacteria has been observed in the presence of lichens in the vegetation cover.
Ammensalism caused by lichens was also described for other arctic areas (PARINKINA & PIIN,
1992). PARINKINA (1989) states that the carbon content increases in soils with lichen
vegetation. In the investigated soils with lichen stands, bacteria were found to correlate with
carbon contents. Whereas ammensalism by lichens only affected the upper two centimetres,
carbon enrichment may represent a stimulus for bacterial growth in underlying horizons.
These findings correspond to the literature (PARINKINA, 1989).
In Summary, direct observation methods have proved to be useful in characterisation of the
microbial pool. Fungi clearly prevailed in the soils at both experimental sites. Fungi were
largely restricted to the pronounced organic horizons and the rooting depth. These findings are
in accordance with data from soils of other biomes (e.g., KJ0LLER & STRUWE, 1982). Bactesia
also dominated in upper organic horizons but inhabit all soil horizons. In unvegetated topsoils,
wet micro-sites and the supra-permafrost layer bacteria predominated. Interactions with the
composition of tlie vegetation cover could also be established. This distribution Pattern was
also described by other authors (e.g., PARINKINA, 1989).
6.2 Spotting the active microbial pool 121
6.2 Spotting the active microbial pool
It is known that only a cestain propostion of soil micro-organisms is viable. For fungi the
percentage of live mycelium ranges between 10 and 16% (KJ~LLER & STRUWE, 1982). The
propostion of live bacterial cells on the contrary is higher, namely 60 to 93% (CHERNOV et al.,
1975). It is therefore important to investigate the active microbial pool in addition to
quantification and differentiation by direct observation methods. ATP content and
measurements of heat output are microbial Parameters that depend on viable micro-organisms.
They hsthermore allow differentiation of active micro-organisms from resting OS donnant
ones and provide hrther infoimation about the cornmunity structure as will be discussed in
the following section.
Adenosine triphosphate
All living microbial cells contain ATP which delivers the energy of its phosphate bonds for
biosynthetic and catabolic reactions. ATP contents in soil of up to 9.0 pg ATP g ' d.wt. have
been reported (JENKINSON & OADES, 1979). For arable soils, ATP contents have been found to
be lowest, but varied depending on land use practices (JENKINSON & OADES, 1979; SPARLING
& EILAND, 1983). Agricultural and quasi natural grassland Systems have shown a wide range
from 1.7 to 7.7 pg ATP g-' d.wt. (ROSS et al., 1980). Variation has mainly been explained by
differentes in nutrient content and nutrient availability of soils (ibid.). In forest Systems, ATP
contents have been in the upper range (3.1 to 9.0 pg ATP g d.wt., JENKINSON & OADES,
1979), which probably also indicates a shift in microbial cornrnunity structure since fungi
contain more ATP per unit biomass than bacteria (AUSMUS, 1973 cf. ROSS et al., 1980). High
ATP contents (up to 7.7 pg ATP g ' d.wt.) have also been reposted in water-logged paddy
soils, but decreased with increasing Oz-depletion (INUBUSHI et al., 1989).
In the soils of this study, median ATP contents were 0.9 pg ATP g ' d.wt. at Levinson-Lessing
and 1.2 pg ATP g ' d.wt. at Lake Labaz. Consequently, values are low compared to soils fiom
other biomes and in the same order of magnitude as arable soils from temperate regions. This
is in accordance with microbial biomass values. However, extremely high values of up to
32.4 pg ATP d.wt. were found in the uppermost topsoil horizons. Whereas ATP contents
of topsoil horizons did not appear to differ significantly from 'frontier' horizons, ATP
concentration values (i.e., ATP content per unit microbial biomass) on the contrasy did.
Extemal ATP sources from vegetation, roots or meso- and macro-fauna may be excluded,
122 6. Discussion
since the chosen ATP extractant (i.e., Tsis buffer) is considered to be very specific for
microbial cells (VERSTRAETE et al., 1983; VERSTRAETEN et al., 1983). Microbial biomass
values in this study compsised fungi and bactesia determined by direct observation methods.
Primary producers among micro-organisms such as cyanobactesia and soil algae have not been
determined. However, in the Arctic, their presence was reposted in the upper horizons of
unvegetated soils, in wet depressions and as epiphytic and soil species at drier sites
(CAMERON et al., 1978; BUNNELL et al., 1975; HOLDING, 198 1 ; ELSTER et al., 1994). Non-
quantified observations during microscopical investigations revealed substantial amounts of
cyanobactesia and algae. They may therefore contribute to the extreme ATP contents found in
the respective horizons. This is supported by the fact that ATP in these horizons appears to be
relatively unaffected by substrate quantity and quality, in which the sites differ. The respective
populations were insensitive to glucose amendment for substrate-induced heat output as
shown in Table 5.4.4-3 (duster No. 3). Weak correlation of nitrogen with carbon content in
wet topsoils might further indicate another nitrogen source than soil organic matter (such as
by NI-fixation). Yet, on the basis of the present data this conclusion is rather daring, However,
the extreme values in ATP content may only pa~tly be explained by algae and cyanobacteria,
since algal ATP contents can contribute 0.02-0.28 pg ATP g" d.wt. in tundra soils (calculated
from data by HOLM-HANSEN & BOOTH, 1966; CAMERON et al., 1978)'. ATP was most likely
be attributed to protozoa (e.g., amoebae, flagellates, ciliates), of which PARINKINA (1989)
noted particular high densities in water-saturated sites. In drier topsoils, interference might
also come from lichens in the vegetation Cover. Furtheimore, these higher values of ATP
content were concomitant with extreme high values of heat output (see below).
As can be seen fiom Table 6.2-1, ATP concentrations (i.e., ATPImicrobial biomass-ratio) in
the literature range from 1 :423 (0.0024) to 1 :82 (0.012). In this study, ATP to microbial
biomass ratios was in this range. Again, extreme ratios were found in the before mentioned
topsoil hosizons.
' mean ATP content of marine algae: 0.074 per centldry weight (HOLM-HANSEN & BOOTH, 1966) maximum algal biomass in tundra soils at a depth of 0-2 Cm: 0.6 g d.wt. m"2 (CAMERON et al., 978) bulk density values in this study ranged between 0.08 and 1.1 g crn-'.
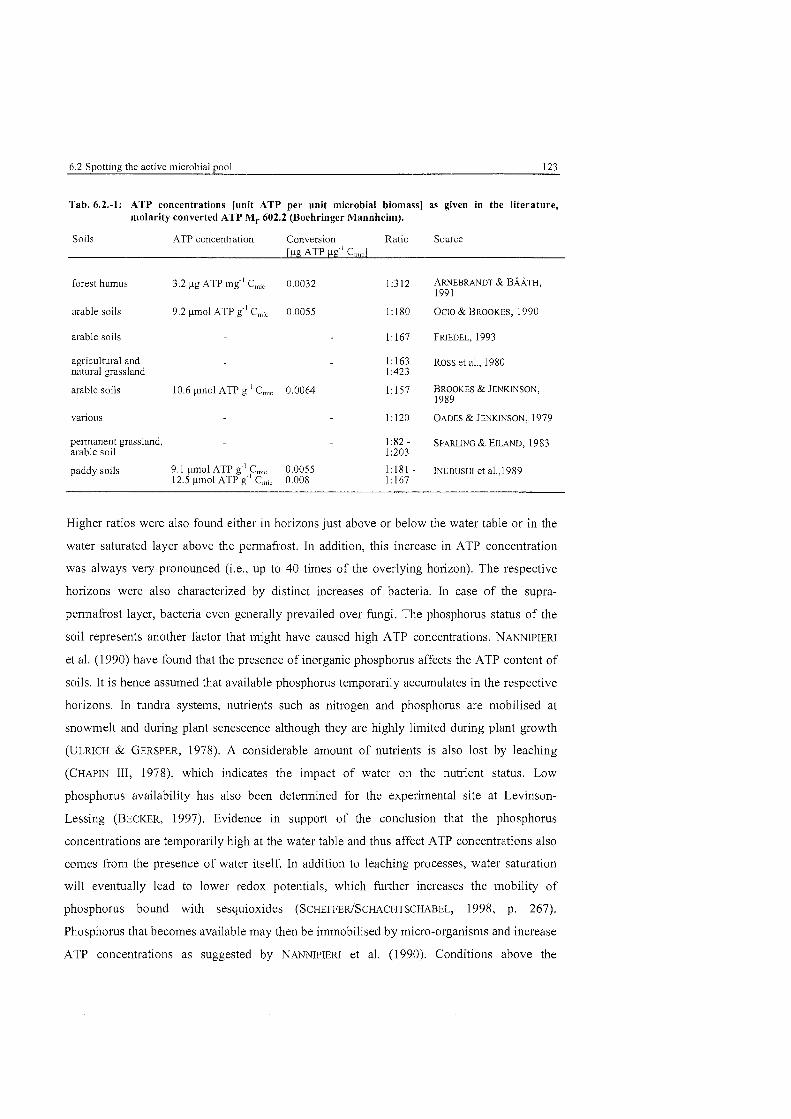
6.2 Spotting the active microbial pool 123
Tab. 6.2.-1: ATP concentrations [unit ATP per unit microbial biomass] as given in the literature, n~olariiy converted ATP Mr 602.2 (Boehringer Mannheim).
Soils ATP concentration Conversion Ratio Source
forest humus 3.2 pg ATP mg-' Cãà 0.0032 1x3 12 ARNEBRANDT & BAATH, 1991
arable soils 9.2 pmol ATP g"' C 0.0055 1: 180 OCIO & BROOKES, 1990
arable soils 1: 167 FRIEDEL. 1993
agriculiural and 1: 163 ROSS et al., 1980 natural grassland 1:423
arable soils 10.6 pmol ATP g ' Cãà 0.0064 1: 157 BROOKES & JENKINSON, 1989
various 1: 120 OADES & JENKINSON, 1979
permanent grassland, 1:82 - SPARLING & EILAND, 1983 arable soil 1:203
paddy soils 9.1 um01 ATP g" C 0.0055 12.5 pmol ATP g"' C 0.008
Higher ratios were also found either in horizons just above or below the water table or in the
water saturated layer above the perrnafrost. In addition, this increase in ATP concentration
was always very pronounced (i.e., up to 40 times of the overlying horizon). The respective
horizons were also characterized by distinct increases of bacteria. In case of the supra-
permafrost layer, bacteria even generally prevailed over fŸngi The phosphorus status of the
soil represents another factor that might have caused high ATP concentrations. NANNIPIERI
et al. (1 990) have found that the presence of inorganic phosphorus affects the ATP content of
soils. It is hence assumed that available phosphorus teinporarily accumulates in the respective
horizons. In tundra Systems, nutrients such as nitrogen and phosphoms are mobilised at
snowmelt and during plant senescence although they are highly limited during plant growth
(ULRICH & GERSPER, 1978). A considerable amount of nutrients is also lost by leaching
(CHAPIN 111, 1978), which indicates the impact of water on the nutrient Status. Low
phosphoms availability has also been determined for the experimental site at Levinson-
Lessing (BECKER, 1997). Evidence in Support of the conclusion that the phosphoms
concentrations are temporarily high at the water table and thus affect ATP concentrations also
comes from the presence of water itself. In addition to leaching processes, water saturation
will eventually lead to lower redox potentials, which fŸsthe increases the mobility of
phosphoms bound with sesquioxides (SCHEFFERISCHACHTSCHABEL, 1998, P. 267).
Phosphoms that becomes available may then be immobilised by micro-organisms and increase
ATP concentrations as suggested by NANNIPIERI et al. (1990). Conditions above the
124 6. Discussion
pennafrost table differ slightly in higher phosphorus availability since the microbial P-demand
is low at temperatures above freezing point (NADELHOFFER ct al., 1992). At L,evinson-Lessing
higher phosphorus contents were found in horizons influenced by slope water (BECKER,
1997), although this does not necessarily mean that it is available pl~ospho~xs. In tundra peat,
however, CIP-ratios increase with depth in contrast to C/N-ratios, which reflects the high
biological deinand for this nutrient (NADELHOFFER et al., 1992). It may thus explain the veiy
low ATP concentrations found in horizons above the water table, the before mentioned
frontier' horizons. The gradient of ATP concentrations between thesc depths was very strong.
Many tundra plants (e.g., Dupontia, Carex and Eriophorum spp.) only form secondary roots
above the water table, where oxygen levels are more favourable for root metabolism
(CHAPIN 111, 1978). At drier sites many plant species form mycorrhizal associations, without
which some plants (e.g., Salix spp.) even cannot exist in tundra (MILLER & LAURSEN, 1978)
Thus, wet as well as dry sites show specific mechanisms to enhance nutrient acquisition. Yet,
these are largely dependent On sufficient aeration. P-deficiency due to nutrient competition
with plants may be one explanation for the lower ATP concentrations in the frontier horizons.
Further differentiation between frontier horizons of wet and diy inicro-sites in this study
appeared to be slightly arbitrary, signals of differing ATP concentrations were very weak.
From these discrepancies between microbial biomass and ATP concentrations, it may first be
concluded that ATP deterrnination as currently used in soil microbiology does not address
primary producers or even protista, which are very common in specific habitats of arctic
Systems. Probably these also account for high ATP contents as detesmined in other wet soils
reported in the literature (INUBUSHI et al., 1989). Furtheimore, in topsoil and fsontier horizons
of this study, ATP also appeared to be controlled by environmental factors other than the
carbon and nitrogen Status of the soil. This is surpi-ising because ATP is usually found to
correlate with C and N contents (JENKINSON et al., 1979). Yet, this anoinaly is supported by a
study by ROSS et al. (1980). Therefore, there is intercession for the use of ATP as an estimate
for microbial activity rather than microbial biomass (NAAWIPIERI et al., in press). ATP
contents of microbial populations were also found to be affected by environmental Stress to
different degrees. In aerobic moist soils, micro-organisms are capable of maintaining high
ATP and adenylate energy charge (AEC) levels at those of actively growing cells (BROOKES &
JENKINSON, 1989) whereas in anaerobic soils ATP and AEC levels were found to decrease
with increasing 02-depletion (INUBUSHI et al., 1989). It has also beeil suggested that ATP
6,2 Spotting the active microbial pool 125
contents represent mean values of high ATP concentrations in a small, active population and
vesy low concentrations in the remaining past (BROOKES & JENKINSON, 1989).
Heat output
Heat measurements approved to elucidate the active microbial pool in the soils of this study.
As shown in Figure 5.4.4-1, fungal biomass showed different response to glucose amendment.
Being heterotrophs most fungi are thought to be sensitive to glucose amendment. A
logarithmic increase in respiration per unit biomass is characteristic for active microbial
populations (ARNEBRANDT & BMTH, 1991). It is surprising that this relationship held true for
wet and dry micro-sites since fungi only thrive under aerobic conditions. One explanation is
that the controlled conditions during substrate-induced heat output (SIQ) measurements
themselves already represented an amelioration of the environment compared to conditions in
the field. This conclusion is supposted by the relationship of SIQ and ATP contents (Tab.
5.4.4.-3). An increase of SIQ per unit ATP could only be deterrnined for topsoil horizons at
drier micro-sites. VANDENHOVE et al. (1991) have found out that the SIQIATP-ratio increased
significantly with environmental stress. As a consequence, hngi were viable in wet micro-
sites, but were restricted in activity. Laboratosy conditions were more favourable with respect
to aeration and temperature. These may thus represent important controlling factors for fungi
since carbon and nitrogen contents appeared to be of minor impostance.
On the contrary, hngi appeared less efficient in using glucose as a substrate in mineral
horizons (Fig. 5.4.4.2), which compsise 'frontier' and subsoil horizons. In 'frontier' horizons,
this was concomitant with low ATP concentrations as previously descsibed. Although ATP
concentrations of 1:250 (OS 0.004) were low, these are still within the range (Tab. 6.2.-1)
Along with lower ATP concentrations, lower 570 values per unit fungal biomass probably
indicate that a significant propostion of hngi may not be viable. A study by ZHU et al. (1996)
has revealed that only 1.3 to 11% of total fungal length was FDA-active (i.e., a Parameter for
hngal metabolic activity). Consequently, in 'frontier' hosizons, this methodical inaccuracy
Sums up as hngal biomass increases despite great care with respect to measurement of intact
fungal hyphae. On the other hand, caloric quotients were found to be rather high in 'frontier'
hosizons of drier micro-sites, which may be explained by a lower energetic efficiency due to
environmental stress as will be discussed below. Thus, inference of the viable proportion of
hngi cannot be made on the present database. Yet, the data rather suggest a low energetic
efficiency than a microbial population that is not viable.
126 6. Discussion
A shift in microbial population fusther explains lower SIQ values per unit fungal biomass in
'frontier' horizons, which showed significantly higher FB-ratios than topsoil hosizons.
Experience with substrate-induced respiration (SIR) demonstrated that inorganic and organic
soils formed distinct clusters of Cmic to SIR ratios (WARDLE & PARKINSON, 1991; BECK et al.,
1997). This was not only explained by different glucose sensitivity (WARDLE & PARKINSON,
1991), but also by a gseater proportion of fungi (CHENG & VIRGINIA, 1993) because these
produce less COz per unit biomass than bactesia (ANDERSON & JOERGENSEN, 1997). Thus,
what looks like a bwer glucose sensitivity may only be the effect of decreasing bactesial
biomass in 'frontier' horizons. Substrate induced detennination of microbial biomass is
therefore known to overestimate bacteria (ibid.). When bacteria took over in subsoil horizons,
no relationship was found between bacterial biomass and SIQ indicating that the respective
microbial population is largely insensitive to glucose.
Data on heat output are not readily available since the use of microcalorimetry in studying
soils is not wide-spread. Yet, the database is sufficient to allow comparison although caution
is required due to poor methodical standardisation (NANNIPIERI et al., in press). Since heat
output is most commonly used to estimate microbial bioinass, it is usually ineasured after
substrate amendment (i.e., SIQ in this study) as descsibed by SPARLING (1983). Furtherrnore,
most studies were done On soils of temperate regions (e.g., RAUBUCH & BEESE, 1995;
ZELLES et al., 1987a; ALEF et al., 1988; SPARLING, 1981a) and only one in Antarctica
(BOLTER, 1994). To date, no heat output measurements have been carried out in arctic tundra
soils. In generalising data from topsoils of temperate regions, it inay be stated that the heat
output increased in the order agricultural < grassland < forest soils. Maximum heat output for
agricultural soils was reported from 30 to 120 pW g-' d.wt. (SPARLING, 1983; ALEF et al.,
1988), whereas grassland soils reached 80 to 330 pW g-' d.wt. (ibid.). Values given for forest
topsoils range between 500-520 pW g"' d.wt. (SPARLING, 1983) and 2500-4000 pW g-' d.wt,
(ZELLES et al., 1987a). Thus, heat output of up to 220 pW g" d.wt. (BOLTER, 1994) measured
in Antarctic soils falls into the lower range.
In comparison with these data, values of median basal heat output (20.4 pW g" d.wt at Labaz;
60.6pWg-'d.wt at Levinson-Lessing) as well as median substrate heat output
(38.7 pW g-' d.wt. at Labaz; 119.5 pW g'l d.wt. at Levinson-Lessing) were within the cited
range. Yet, rnaximum values of up to 1683.8 pW g"' d.wt. SIQ at Levinson-Lessing appear
rather high. The upper range of heat output (approximately 300 to 1683.8 pW g" d.wt.) was
6.2 Spotting the active microbial pool 127
concomitant with high ATP contents per unit hngal and bacterial biomass (ATP
concentrations ATP:MBM > 0.01). Furtherrnore no clear relationship to microbial biomass
was discernible. In addition to the previously discussed algae and cyanobacteria, the
vegetation Cover at the respective dry sites always comprised lichens. These are therefore
assumed to cause interference with heat ineasurements in the studied soils. This evidence is
supported by a study of BOLTER (1 994) who found up to tenfold greater heat output values for
lichens.
In this study, heat output generally decreaseed non-linearly with depth (by roughly a third
between horizons), which was also established for various investigated soils from the
literature (RAUBUCH & BEESE, 1995; ALEF et al., 1988; ZELLES et al., 1987a). Yet, in
inorganic soils from Antarctica, this decrease appeared to be stronger (BOLTER, 1994), which
was confirmed by unvegetated soils of this study (e.g., LL10.1i96; LL8.1196). Exceptions
were often found in soils where the microbial population was insensitive to glucose
amendment and substrate amendment did not produce any further response in heat output.
This has been explained by specific substrate requirements, shifts in microbial population
(WARDLE & PARKINSON, 1991) or sufficient in situ carbon concentrations (NANNIPIERI et al.,
in press). Glucose insensitive microbial populations were predominantly found under
anaerobic conditions, i.e., soil horizons with chroma of 2 or less andior undemeath the water
table, where anaerobic bacteria increase (ROSSWALL et al., 1974). However, this does not
apply to soils where the water table was at soil surface (PT, WST, TT, non-sorted stripes
LL9.2196). It is therefore assumed that these differences reflect different substrate
requirements, which is supported by a shift to a larger propostion of hngi. Under clearly
aerobic conditions, glucose insensitive populations were found in the uppennost centimetres
of both unvegetated soils and aerated 0-horizons. Since ATP concentrations were also higher
and light penetration was possible, it may be assumed that photoautotrophs represent a
significant propostion of the microbiota.
The fact that heat output also included organisms other than the taxonomic target groups as
well as the fact that some microbial populations were glucose insensitive, form the
background, why it is not advisable to estimate microbial biomass from 570 values in tundra
soils. CHENG & VIRGINIA (1993), on the contrary, have recommended substrate-induced
respiration (SIR) methods for arctic tundra soils. Yet, it has to be stated that in the respective
study only the uppermost 5 centimetres of vegetated soils had been sampled, in which
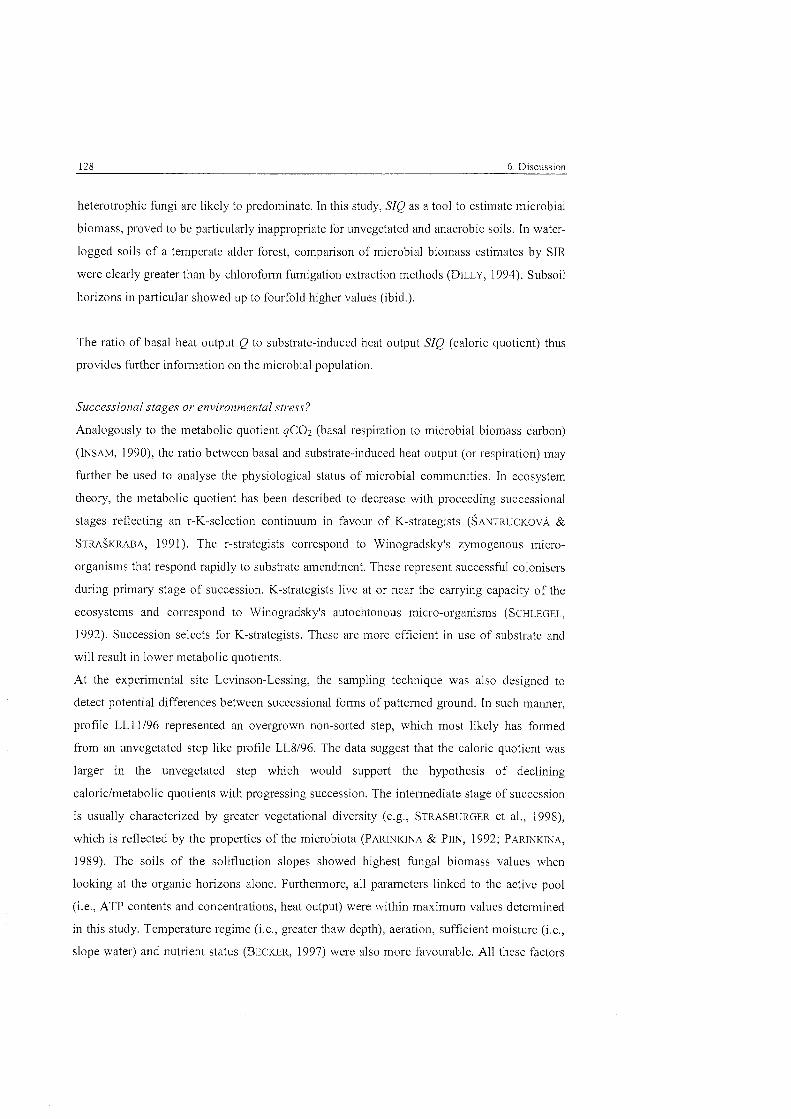
128 6. Discussion
heterotrophic hngi are likely to predominate. In this study, SIQ as a tool to estimate microbial
bion~ass, proved to be particularly inappropsiate for unvegetated and anaerobic soils. In water-
logged soils of a temperate alder forest, comparison of microbial biomass estimates by SIR
were clearly greater than by chloroform hmigation extraction snethods (DILLY, 1994). Subsoil
horizons in particular showed up to fourfold higher values (ibid.).
The ratio of basal heat output Q to substrate-induced heat output SIQ (caloric quotient) thus
provides further information on the microbial population.
Successional stages 0 1 . environmental stress?
Analogously to the metabolic quotient qC02 (basal respiration to microbial biomass carbon)
(INSAM, 1990), the ratio between basal and substrate-induced heat output (or respiration) may
hrther be used to analyse the physiological status of microbial comsnunities. In ecosystem
theoiy, the metabolic quotient has been described to decrcase with proceeding successional
stages reflecting an r-K-selection continuum in favour of K-strategists (SANTRUCKOVA &
STRASKRABA, 199 1). The r-strategists correspond to Winogradsky's zymogenous micro-
organisms that respond rapidly to substrate amendment. These represent successful colonisers
during primary stage of succession. K-strategists live at or near the canying capacity of the
ecosystems and cossespond to Winogradsky's autochionous snicro-organisms (SCHLEGEL.
1992). Succession selects for K-strategists. These are more efficient in use of substrate and
will result in lower metabolic quotients.
At the experimental site Levinson-Lessing, the sampling technique was also designed to
detect potential differences between successional foims of patterned ground. In such malmer.
profile LL11196 represented an overgsown non-sorted step, which most likely has formed
from an unvegetated step like profile LL8196. The data suggest that the caloric quotient was
larger in the unvegetated step which would support the hypothesis of declining
caloric/metabolic quotients with progsessing succession. The intermediate stage of succession
is usually characterized by gseater vegetational diversity (e.g., STRASBURGER et al., 1998),
which is reflected by the properties of the microbiota (PARINKINA & PIIN, 1992; PARINK~NA,
1989). The soils of the solifluction slopes showed highest hngal biomass values when
looking at the organic horizons alone. Furthermore, all Parameters linked to the active pool
(i.e., ATP contents and concentrations, heat output) were within maximum values determined
in this study. Temperature regime (i.e., greater thaw depth), aeration, sufficient moisture (i.e.,
slope water) and nutrient Status (BECKER, 1997) were also more favourable. All these factors
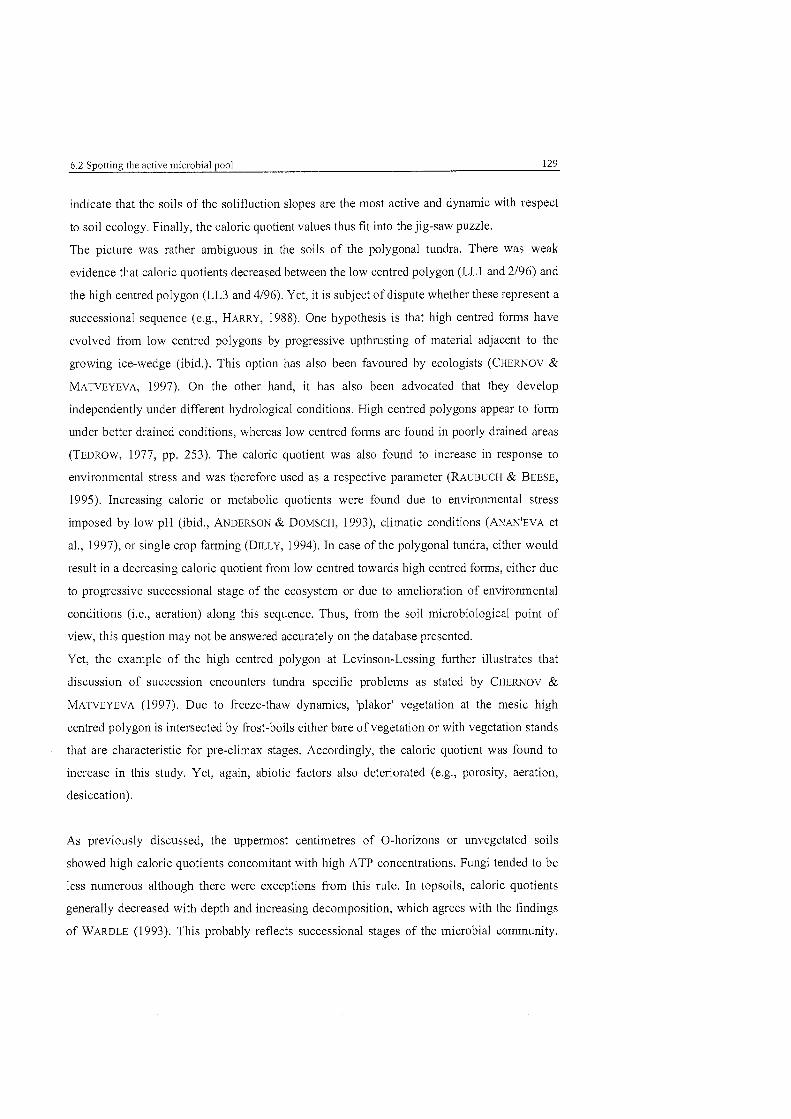
6.2 Spotting the active microbial pool 129
indicate that the soils of the solifluction slopes are the most active and dynamic with respect
to soil ecology. Finally, the caloric quotient values thus fit into the jig-saw puzzle.
The picture was rather ambiguous in the soils of the polygonal tundra. These was weak
evidence that caloric quotients decreased between the low centred polygon (LL1 and 2/96) and
the high centred polygon (LL3 and 4/96). Yet, it is subject of dispute whether these represent a
successional sequence (e.g., HARRY, 1988). One hypothesis is that high centred forrns have
evolved fsom low centred polygons by progressive upthrusting of material adjacent to the
growing ice-wedge (ibid.). This option has also been favoured by ecologists (CHERNOV &
MATVEYEVA, 1997). On the other hand, it has also been advocated that they develop
independently under different hydrological conditions. High centred polygons appear to form
under better drained conditions, whereas low centred forms are found in poorly drained areas
(TEDROW, 1977, pp. 253). The caloric quotient was also found to increase in response to
environmental stress and was therefore used as a respective parameter (RAUBUCH & BEESE,
1995). Increasing caloric OS metabolic quotients were found due to environmental stress
imposed by low pH (ibid., ANDERSON & DOMSCH, 1993), climatic conditions (ANAN'EVA et
al., 1997), or single crop fasming (DILLY, 1994). In case of the polygonal tundra, either would
result in a decreasing caloric quotient fsom low centred towards high centred forrns, either due
to progressive successional stage of the ecosystem OS due to amelioration of environmental
conditions (i.e., aeration) along this sequence. Thus, fsom the soil microbiological point of
view, this question may not be answered accurately on the database presented.
Yet, the example of the high centred polygon at Levinson-Lessing further illustrates that
discussion of succession encounters tundra specific problems as stated by CHERNOV &
MATVEYEVA (1997). Due to fseeze-thaw dynamics, 'plakor' vegetation at the mesic high
centred polygon is intersected by fsost-boils either bare of vegetation or with vegetation stands
that are characteristic for pre-climax stages. Accordingly, the caloric quotient was found to
increase in this study. Yet, again, abiotic factors also deteriorated (e.g., porosity, aeration,
desiccation).
As previously discussed, the uppermost centimetres of 0-horizons or unvegetated soils
showed high caloric quotients concomitant with high ATP concentrations. Fungi tended to be
less numerous although there were exceptions fsom this rule. In topsoils, caloric quotients
generally decreased with depth and increasing decomposition, which agrees with the findings
of WARDLE (1993). This probably reflects successional stages of the microbial community.
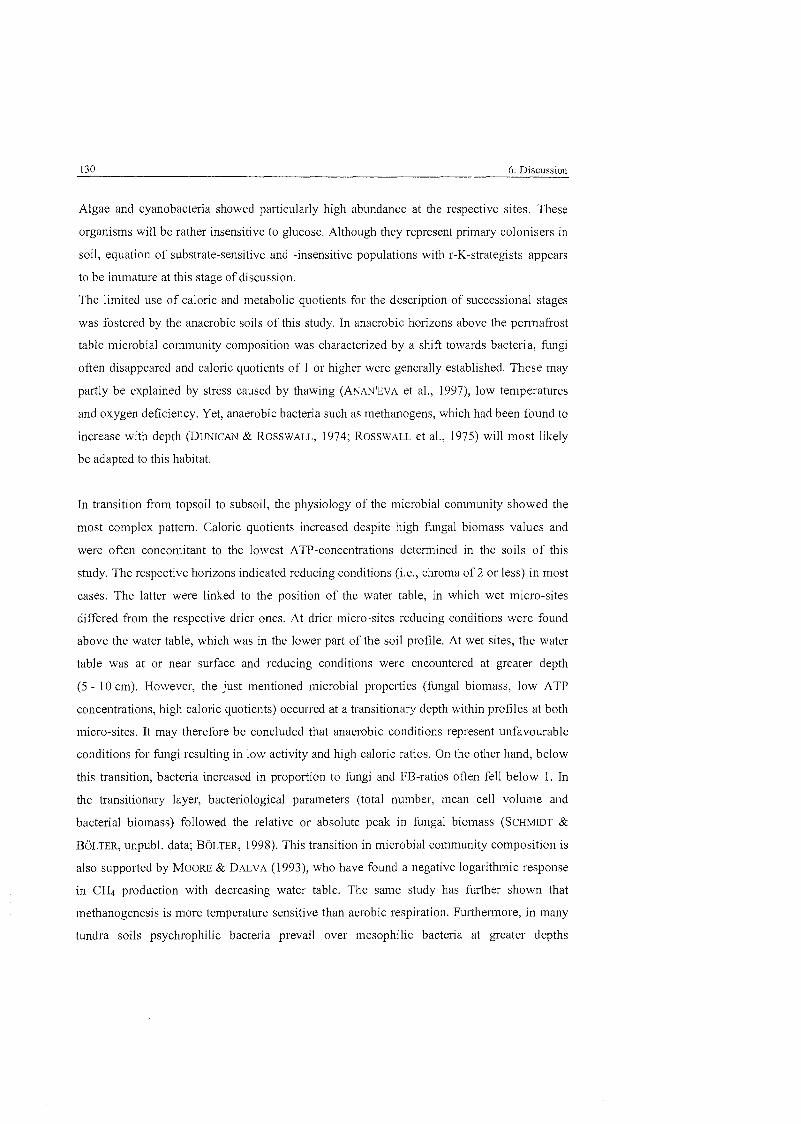
Algae and cyanobacteria showed particularly high abundance at the respective sites. These
organisms will be rather insensitive to glucose. Although they represent primaiy colonisers in
soil, equation of substrate-sensitive and -insensitive populations with r-K-strategists appears
to be immature at this Stage of discussion.
The limited use of caloric and metabolic quotients for the description of successional Stages
was fostered by the anaerobic soils of this study. In anaerobic horizons above the pei-mafiost
table microbial community composition was cliaracterized by a shifi towards bacteria, fungi
ofken disappeared and caloric quotients of l or higher were generally established. These may
partly be explained by Stress caused by thawing (ANAN'EVA et al., 1997), low temperatures
and oxygen deficiency. Yet. anaerobic bactesia such as methanogens, which had been found to
increase with depth (DUNICAN & ROSSWALL, 1974; ROSSWALL et al., 1975) will most likely
be adapted to this habitat.
In transition from topsoil to subsoil, the physiology of the microbial community showed the
most complex pattem. Caloric quotients increased despite high fungal biomass values and
were ofien concon~itant to the lowest ATP-concentrations deterrnined in the soils of this
study. The respective horizons indicated reducing conditions (i.e., chroma of 2 or less) in most
cases. The latter were linked to the position of the water table, in which wet micro-sites
differed fiom the respective drier ones. At drier micro-sites reducing conditions were found
above the water table, which was in the lower part of the soil profile. At wet sites, the water
table was at or near surface and reducing conditions were encountered at greater depth
(5 - 10 cm). However, the just mentioned microbial properties (fimgal biomass, low ATP
concentrations, high caloric quotients) occurred at a transitionary depth within profiles at both
micro-sites. It may therefore be concluded that anaerobic conditions represent unfavourable
conditions for hng i resulting in low activity and high caloric ratios. On the other hand, below
this transition, bacteria increased in proportion to hngi and FB-ratios often feil below 1. In
the transitionary layer, bacteriological Parameters (total number, mean cell volume and
bacterial biomass) followed the relative or absolute peak in fungal biomass (SCHMIDT &
BOLTER, unpubl. data; BOLTER., 1998). This transition in microbial community composition is
also supported by MOORE & DALVA (1 993), who have found a negative logarithmic response
in CH4 production with decreasing water table. The same study has further shown that
methanogenesis is more temperature sensitive than aerobic respiration. Furthemore, in many
tundra soils psychrophilic bacteria prevail over mesophilic bacteria at greater depths
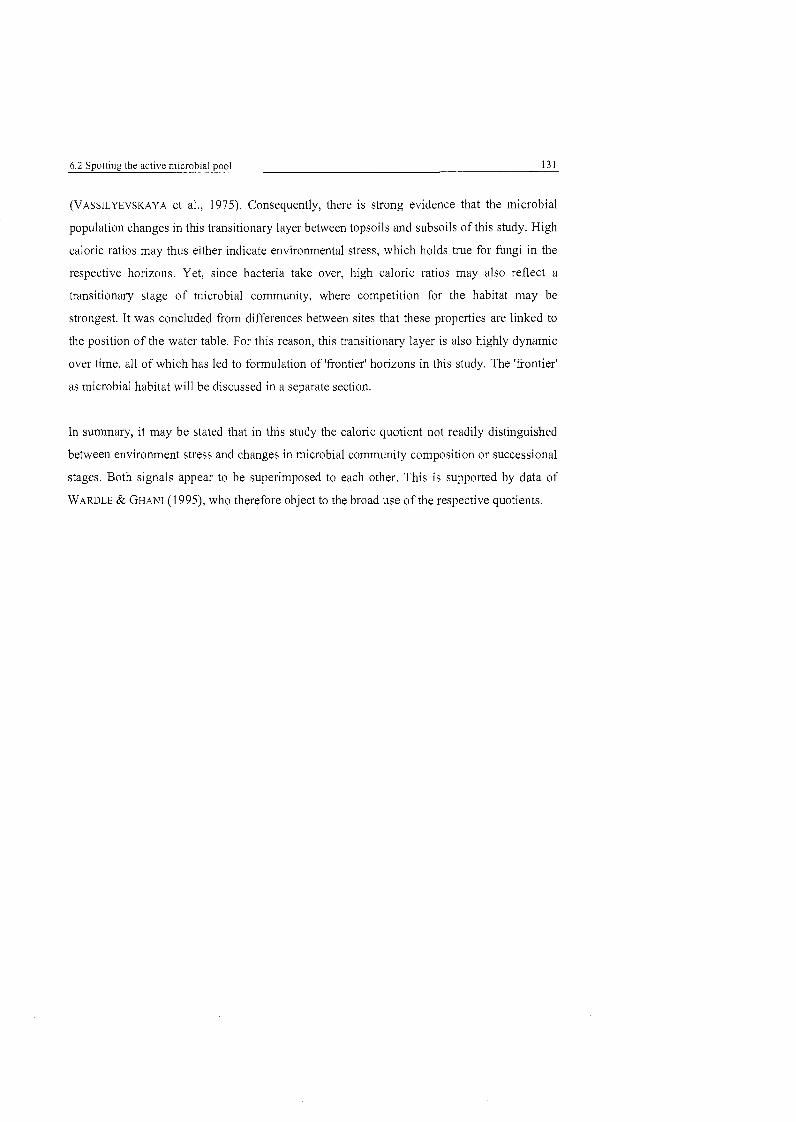
6.2 Spotting the active microbial pool 131
(VASSILYEVSKAYA et al., 1975). Consequently, there is strong evidence that the microbial
population changes in this transitionary layer between topsoils and subsoils of this study. High
caloric ratios may thus either indicate environmental stress, which holds true for hngi in the
respective horizons. Yet, since bacteria take over, high caloric ratios may also reflect a
transitionary stage of microbial community, where competition for the habitat may be
strengest. It was concluded from differences between sites that these properties are linked to
the position of the water table. For this reason, this transitionary layer is also highly dynamic
over time, all of which has led to forrnulation of 'frontier' horizons in this study. The 'frontier'
as microbial habitat will be discussed in a separate section.
In Summary, it may be stated that in this study the caloric quotient not readily distinguished
between environment stress and changes in microbial community composition or successional
Stages. Bot11 signals appear to be superimposed to each other. This is supported by data of
WARDLE & GHANI (1995), who therefore object to the broad use of the respective quotients.
132 6 . Discussion
6.3 Microbial habitats in tundra soils
In this study patterns of microbial propesties are discemible which are closely linked to biotic
and abiotic factors. The microbial habitat may thus be described fiom results of profile
description ancl pedological data (from this study or from references if applicable). In such
manner a generalised view of microbial habitats for tundra soils has evolved, which comprise
wet and dry topsoils, the Trontier' and subsoil horizons.
6.3.1.1 Wet topsoils
Wet topsoils represent organic mats of moss or gsass-sedge peat. Bulk density was lowest in
the mossy peat (i.e., 0.09 g ~ m - ~ ) and increased with increasing grass and sedge content (i.e.,
0.4 g CIT '~) , which corresponds to literature data (BOTCH et al,, 1996). Accordingly, porosity
was very high k 90 vol.% and freely draining macro-pores (i.e., > 1000 pin pore neck
diameter) predominated. Since the wet topsoils contain little mineral soil, the high proportion
of micro-pores (< 0.2 um pore neck diameter) is explained by methodical constraints. As
described in Section 4.2.4. the calculation of pore size distribution is based on the relationship
ofvolumetric water content at a given suction. It is thus assumed that soil water is only held
by capillary forces (MARSHALL et al., 1996; SCHLICHTING et al.. 1995). Yet, surface
adsorption by organic matter will affect the 'water-retention-curve' and particularly
overestiniate the proportion of micro-pores. In tundra, organic topsoils are generally water
saturated under field conditions, since the water table is at or near soil surface. The respective
soils may consequently be pictured as aquatic liabitats with a sponge-like stsucture, which
allows organisms to float fieely. Compared to their drier Counterparts, wet topsoils showed
less acid soil reaction as well as higher carbon and nitrogen contents, but with higher Cm-
ratios. Yet, the microbial propesties seemed to be relatively unaffected by carbon and nitrogen
quantity. At first sight, this is suspsising because it is rarely questioned that microbiota is
positively affected by the respective elements, but CIN-ratios On the contrary showed poor
substrate quality indicating nutrient limitation. CHAPIN & BLEDSOE (1992) fusther repost a
negative effect of a low nutsient status on Nz-fixers, the abundance of which have been
observed during microscopy (see Sect. 6.2). The enzyme System that drives nitrogen fixation
(i.e., nitrogenase) requires specific elements for protein synthesis: inolybdenum, iron, sulphur
and cobalt, but presumably less magnesium (ibid., EADY & POSTGATE, 1974). Analysis of the
soils at Levinson-Lessing showed that the nutrient Status (BECKER, 1997) appeared to be
6.3 Microbial habitats in tundra soils 133
favourable for nitrogen fixation to occur. As mentioned before, other microbial propesties
further supposted the significance of primary producers (algae and cyanobacteria). Nitrogen
fixation in pasticular is known for its feedback on methane production, as it fumishes nitrogen
(i.e., N H ~ ) as a nutrient for methanogens (CHAPIN & BLEDSOE, 1992). ATP contents and
concentrations also suggested the presence of protozoa (Sect. 6.2). This indicates that the
microbial loop may be an impostant component in the energy flux of wet tundra soils.
Generally, fungal and bacterial biomass (given as carbon inventosy) were lower in wet
topsoils than in the respective drier micro-site. However, at wet depressions of the high
centred polygon (LL3-4/96) and the tussock tundra (Lb3195) this relationship was inverse.
These soils differed fsom all other wet micro-sites in their- immediate proximity to mounds of
either the vegetated elevated rim OS tussocks. Since these mounds were some 20 centimetres
higher than the wet depression, gseater fungal and bacterial biomass may therefore be a root
effect (see section 'rhizosphere' below). Both profiles On the contrasy seemed to be quite
different with respect to other propesties. Different thickness of the active layer for instance
indicates more favourable thermal conditions in the tussock tundra than in the wet micro-site
of the high centred polygon. As a result, conditions for soil organic matter decomposition also
differ (GUNDELWEIN, 1998). According to a study by SOMMERKORN (1998) at the respective
sites, Q io values have been higher than in dry topsoils indicating a greater sensitivity to
temperature changes.
In summary, wet topsoils represent an aquatic habitat, in which a significant proportion of the
energy flux appears to pass thsough protista and bacteria ('microbial loop'). However, their
impact on decomposition may not be answered in the present study and only be infessed fsom
the literaiure (CLARHOLM, 1994). Although present in lower biomass, decomposers such as
fungi did occur in these wet habitats and were viable as microcalorimetsic data have shown.
Temperature and aeration are likely to control the inhibition of their activity as derived fsom
laboratory conditions and stated in the literature (HOLDING, 198 1).
6.3.1.2 Dry topsoils
Dsy topsoils generally consisted of organic horizons of vasying thickness and the upper
mineral horizons. In comparison to their wetter Counterpart, dry topsoils showed lower carbon
and nitrogen contents as well as narrower Cm-ratios. Soil reaction was more acid. All of
which reflected higher degrees of organic matter decomposition. As discussed earlier,
microbial biomass occussed in higher abundance in these upper horizons. Although generally
decreasing with depth, relative peaks were found in the lower 0-horizons and few centimetres
134 6, Discussion
of the underlying mineral soil. In addition to higher degrees of clecomposition, the organic
horizons showed a more distinct profilc differentiation. This was reflected by higher bulk
density values, which ranged from 0.4 g ~ r n ' ~ for OiIA-horizons to 0.9 g c n ~ ' ~ for A-horizons.
Porosity was lower than in the wet topsoils but still very high (i.e., 70 to 80 vol.%). Pore size
distribution was favourable with respect to aeration and moisture regime. Yet, bulk density
increased (i.e., 1.1 to 1.4 g c ~ n ' ~ ) and porosity decreased (40 to 60 vol.%) remarkably in
unvegetated soils. In addition, larger micro-pores (0.2 to 10 um pore neck size) represented
the biggest proportion, which corrcsponded to the finer texture of the inud pits. Aeration
conditions became more favourable with increasing gravel content. This has been
supplemented by texture analyses in a study by MULLER-LUPP (1997). The structural
properties of unvegetated soils also held tnie for mineral horizons underneath the organic
layers. This stn~ctural change in transition fusther results in moisture and thermal gsadients
(STONER et al., 1983). Water fiolll precipitation rapidly moves through organic mats.
Infiltration then slows down as the higher matric potential of the mineral soil must be
overcome. Further downward movement of the wetting front progresses slowly and depends
on the soil texture, which may be critical for deep percolation particularly in deeper thawed
soils (ibid.). This physical behaviour is iinportant as it indicates stronger accumulation of
solutes in the topsoils and therefore affects pedogenesis (GRABETSKAYA & CHIGIR, 1992) as
well as the nutrient Status (NADEI,HOFFER et al., 1992; ULRICH & GERSPER, 1978). Thermal
properties change in diurnal and seasonal amplitudes (SOMMERKORN, 1998; BOIKE, 1997;
PROSEK & B ~ Z D I L , 1994; ROMANOVA & UTKINA, 1973; I<OMANOVA, 1970). Within organic
mats amplitudes may be very high. Yet, due to low bulk density, organic mats represent a
thermal insulation resulting in lower temperatures and variability in the inineral soil. As a
consequence, thaw depth generally decreases with increasing thickness of the organic
horizons, which was also found in this study. Conversely in winter, when the soil refreezes,
the downward movement of the freezing front progsesses faster in the organic mats than in the
mineral horizons thus forming a 'zero-curtain', which is accompanied by water migsation to
the freezing front retarding further freezing (RIEGER, 1983). The 'zero-curtain' represents an
irregular front and additionally occurs around freezing cells (BOIKE, 1997).
Thus, in transition to the mineral soil, organic mats provide a favourable habitat with respect
to temperature variability, moisture conditions and nutrient status. Predominant colonisation
underneath the vegetation Cover is supported by PARINKINA (1989). In this study, basal heat
output and substrate-induced heat output cosrelated well and was dependent 011 high levels of
6.3 Microbial habitats in tundra soils 135
carbon and nitrogen. These properties indicate that the microbiota was mainly zymogenous
and sensitive to glucose. This correlation was better for bacteiia than for fungi. Since ATP
concentrations decreased as the fungal proportion of the microbial biomass increased, the
major proportion of fungi seemed to be metabolically inactive or not viable. Yet, insensitivity
of fungi to glucose may fui-ther be explained by substrate requirements other than simple
Sugars. The vegetation stands at mesic sites comprised a higher proportion of wood plants
(Sect. 5.1.2) than wet sites, which is reflected in the quality of soil organic matter
(GUNDELWEIN, 1998). In addition, fungi were more affected by nitrogen levels than by carbon
levels. This suggests microbial succession during decomposition as described by GOKS0YR
(1975). In drier topsoils, fungi may decompose complex polyiners (such as lignin) provided
that nitrogen levels are sufficient. Within profiles fungal biomass values were often followed
by higher bacterial biomass suggesting that bacteria benefit from fungi. Furthermore, bacteria
appeared to require more simple compounds as a substrate due to their strenger affinity to
glucose as well as to carbon and nitrogen levels. Fungal decomposition probably provides
substrate in the form of leachates, or hngi themselves (e.g., fungal cytoplasm) represent a
nutrient source for bacteria. WARDLE (1993) has found a decreasing metabolic quotient during
successional Stages of decomposition. In this study, there was only weak evidence for a
decreasing caloric quotient in this context (e.g., PT, TT, vegetated non-sorted steps). Yet, the
respective topsoils encounter decreasing temperatures and increasing oxygen deficiency with
depth, which imposes environmental stress. Consequently, an assumed decreasing caloric
quotient due to succession would overlay the signal of increasing environrnental Stress.
The uppermost centimetres of dry topsoils showed quite different microbial properties
compared to the transitionary horizons between organic and mineral horizons. ATP contents
and concentration as well as caloric parameters indicated a different cominunity structure such
as a higher proportion of autotrophs (see Sect. 6.2). In horizons with predominating bacteria,
these were found to be sensitive to glucose (Fig. 5.4.4-3). Yet, the trophic relationship remains
unclear since it is unlikely that they decompose structurally intact plant material. For the
respective horizons, it could be hypothesised that they benefit of primary producers in the
same manner as has just been described for lower horizons. It has been suggested in the
literature, that bacteria feed on dissolved organic matter leaching from litter surfaces and on
exudates of algae and protozoa (CLARHOLM, 1994). Nitrogen fixation by cyanobacteria was
also reported to occur in drier topsoils despite decreasing significance in the order wet > mesic
> diy topsoils (BLISS, 1997; ALEXANDER, 1974b). In this study, the bacterial population was
136 6 . Discussion
found to be inhibited by lichens in the vegetation Cover, which was studied in detail for arctic
soils by PARINKINA ( 1 989).
In summary, dry topsoil microbial habitat changed stratigraphically from weakly decomposed
to humitied organic horizons into the mineral topsoil. This was concomitant with an increase
in bulk density and a decrease in porosity. As a result, insulation of the organic mats creates a
more stable environment with respect to temperature and inoisture. Dcspite high affinity to
carbon and nitrogen contents, high microbial biomass was not restricted to organic layers.
Relative peaks were determined for the upper mineral horizons, in which nutrient solutes
accumulate. Furthermore, there is strong evidence that microbial succession occurred during
decomposition spatially (between horizons) and temporally.
6.3.2 'Frontier'
The conception of 'frontier' liosizons developed in this study has evolved kom strong
gradients in microbial propesties which suggested a transition in microbial community
structure between topsoil and subsoil horizons (see Sects. 6.1 . l and 6.2). Within a depth of 10
to 20 centimetres microbial biomass was found to increase strongly, even reaching maximum
values in most soils. Simultaneously, fungi increased manifold stronger than bactesia did as
indicated by tnaximuin FB-ratios. Yet. mean bacterial cell volume increased and followed the
hngal distribution pattem (SCHMIDT & BOLTER, unpubl. data; BOLTER, 1998). As discussed
above, ATP concentrations on the contrary were lowest, indicating restricted microbial
activity, which was supported by high caloric quotients. These exceeded a value of one, being
wider in 'kontiert hosizons at drier sites than in wet sites. Higher caloric quotients indicate
environmental Stress or a changing microbial population (see Sect. 6.2). Either may explain
this microbial gradient since the respective hosizons showed reducing conditions (chroma 2 or
lower) and were found in proximity to the water table. At water-logged, wet sites, reducing
conditions only occurred at greater depth, which may be explained by higher oxygen levels in
the upper part of the water column. At dsier sites, reducing conditions were found above the
water table. This implies that conditions rnay change with fluctuating water table.
Furthermore, these conditions are only stable in level or only gently sloping positions, which
cossesponds to the microbial parameters. Although no relationship could be established
between vegetation stands that form mycorrhizal associations and those that do not, there was
a clear rhizosphere effect since the respective microbial properties coincided with high root
6.3 Microbial habitats in tundra soils 137
densities. In general, roots will be metabolically active above the water table (WEBBER, 1978).
From these propesties it is concluded that 'frontier' horizons represent a Stratum of redox
potential discontinuity (RPD) interlocking with the rhizosphere.
Redoxpotential discontinuity
As mentioned above, soils with impeded drainage (PT, TT, HT, WST) showed the respective
properties suggesting a link to specific hydrological conditions of plains. The dry podzolised
brown easth at Labaz represented an exception here (profile Lb7195). Yet, the subsoil of the
latter (below 25 centimetres) showed gleying features due to water logging. On the contrary,
the upper border of 'frontier' horizons was marked by iron oxidation bands (see profile
descriptions), which had already been described in other arctic pesmafrost soils
(GRABETSKAYA & CHIGIR, 1992). Below these iron bands, soils showed low chroma values of
2 or less, which thus marks a Zone of redox potential discontinuity (RPD) in level tundra soils.
The formation of the iron oxidation bands as well as the fact that these occur as relict features
in fosmerly pesmafkost affected soils (FITZ~ATRICK, 1972; FITZPATRICK, 1987), indicate that
despite shost-term fluctuations, the RPD is temporally rather stable.
The occussence of a RPD has been described in aquatic Systems (e.g., O n , 1988, p. 23 1) and
characterized by decreasing redox potentials with depth and over time. In a marine
environment, the redox Status of the sediment is hrther classified as oxic, oxygen depleted
postoxic, sulfidic (> 1 pM H2S concentration) and methanogenic (lower H2S concentrations)
sediment (BERNER, 198 1 cf. WALLMANN, 1990). Although this represents a helphl analogy,
properties may not readily be transfessed to soils, since marine sediments represent an alkaline
and highly saline environment with a different decomposer cycle. Only for reed belt sediments
of fresh water lakes, decomposition has been reported to be driven by a microbiota
comparable to soils. Although no redox potentials were measured during the field campaign
of this study, there is strong evidence for a gradient in redox potentials. As already mentioned,
there is macroscopic evidence fkom the profile description (Sect. 5.1.2) such as iron oxidation
bands and reduced chroma in the underlying horizons. During soil sampling odour of
hydrogen sulphide in anoxic horizons was perceptible. Although the latter is highly subjective,
it was still indicative for a particular redox environrnent. In soils of the experimental site
Labaz, soil pH was measured in aqueous and CaCl2 suspension, the quotient of which
represents a Parameter of exchangeable H'. 'Frontier' hosizons were charactesized by a low
ratio of pH [H20] and pH [CaC12], which is indicative for reduction reactions since these are
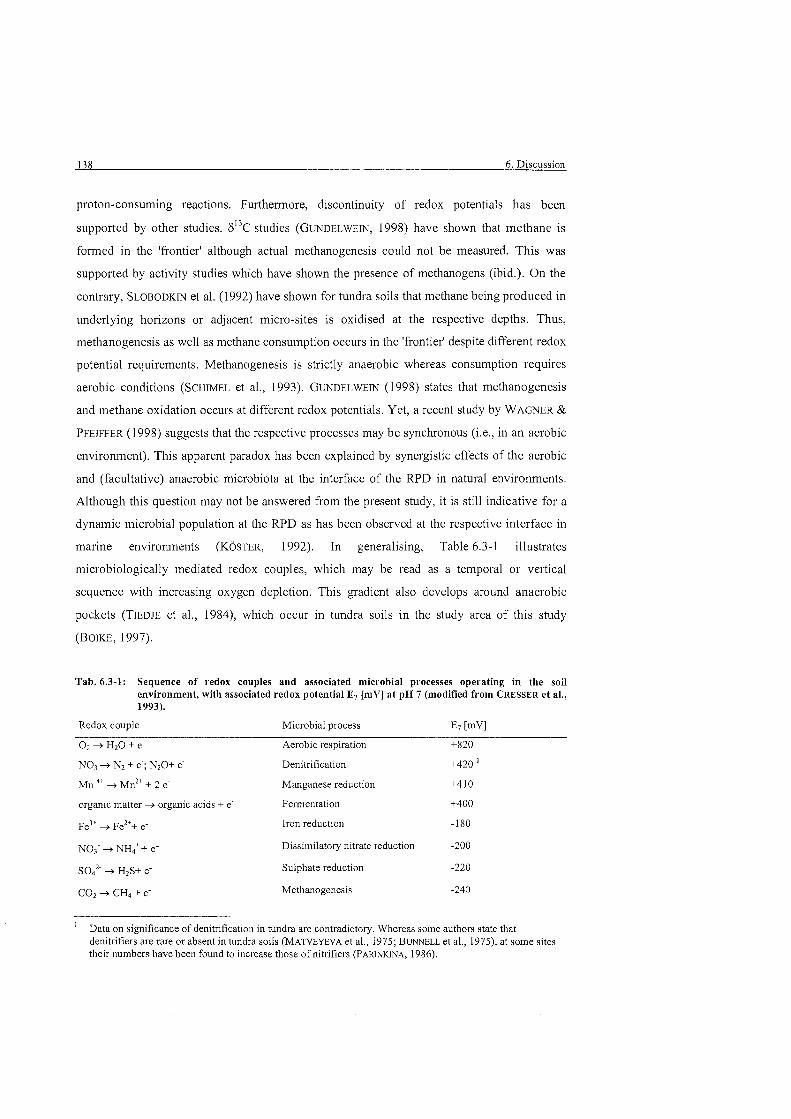
proton-consuming reactions. Furtherrnore, discontinuity of redox potentials has been
supported by other studies. 8 ^ ~ studies (GUNDELWEIN, 1998) have shown that methane is
forrned in the 'fiontier' although actual methanogenesis could not be measured. This was
supported by activity studies which have shown the presence of methanogens (ibid.). On the
contrary, SLOBODKIN et al. (1992) have shown for tundra soils that methane being produced in
underlying horizons or adjacent micro-sites is oxidised at the respective depths. Thus,
methanogenesis as well as methane consumption occurs in the 'frontier' despite different redox
potential requirements. Methanogenesis is strictly anaerobic whereas consumption requires
aerobic conditions (SCHIMEL et al., 1993). GUNDELWEIN (1998) states that methanogenesis
and methane oxidation occurs at different redox potentials. Yet, a recent study by WAGNER &
PFEJFFER (1998) suggests that the respective processes may be synchronous (i.e., in an aerobic
environment). This apparent paradox has been explained by synergistic effects of the aerobic
and (facultative) anaerobic microbiota at the interface of the RPD in natural environments.
Although this question may not be answered from the present study, it is still indicative for a
dynamic microbial population at the RPD as has been observed at the respective interface in
marine environments (KOSTER, 1992). In generalising, Table 6.3-1 illustrates
microbiologically mediated redox couples, which may be read as a temporal or vertical
sequence with increasing oxygen depletion. This gradient also develops around anaerobic
pockets (TIEDJE et al., 1984), which occur in tundra soils in the study area of this study
(BOIKE, 1997).
Tab. 6.3-1: Sequence of redox couples and associated microbial processes operating in the soil environment, with associated redox potential E7 [mV] at pH 7 (modified fro~n CRESSER et al., 1993).
Redox couple Microbial process E7 [mVl
0 2 -r H 2 0 + e- Aerobic respiration +820
NO3 -r N2 + e'; N20+ e' Denitrification +420 ' Mn 4+ -> ~ n ^ + 2 e- Maiiganese reduction +410
organic matter Ñ organic acids + e' Fermentation +400
~ e ' " -+ ~e~ '+ e- Iron reduction -180
N O i + N H + e- Dissimilatory nitrate reduction -200
-> H2S+ e- Sulphate reduction -220
CO2 -r CHs + e- Methanogenesis -240
' Data on significance of denitrification in tundra are contradictory. Whereas some authors state that denitrifiers are rare or absent in tundra soils (MATVEYEVA et al., 1975; BUNNELL et al., 1975), at some sites their numbers have been found to increase those of nitrifiers (PARINKINA, 1986).
6.3 Microbial habitats in tundra soils 139
The involved micro-organisms have been reposted in tundra soils (DUNICAN & ROSSWALL,
1974; MATVEYEVA et al., 1975; BUNNELL et al., 1975; PARINKINA, 1986; VAINSHTEIN &
GOGOTOVA, 1992). Because of the relationship of redox potential and pH, reduction processes
occur over a wide range of pH. DUNICAN & ROSSWALL (1974) for instance reported sulphate
reduction at E11 -200 mV to operate in the range of pH 4.4 to 6.2. Consequently, the position
of the water table is crucial for redox reactions to occur (MOORE & DALVA, 1993; SLOBODKIN
et al., 1992; WHALEN et al., 1996; SOMMERKORN, 1998; GUNDELWEIN, 1998), the water
content and oxygen diffision (SKOPP et al., 1990) and geochemical conditions (STEINMANN &
SHOTYK, 1997). Apart fsom oxygen production at wet sites (abundance of primary producers),
oxygen diffusion may firther explain the position of the RPD below the water table. In
'frontier' horizons at drier sites, porosity and low proportion of macro pores was less
favourable. This indicates that soil physical propesties represent a fiisther control for aerobic
versus anaerobic processes as supported by GEBAUER et al. (1996). However, position of the
RPD and thickness of the aerobic proportion of the active layer varied remarkably between
wet and dry sites. The dsier soils of this study showed a gseater aerobic propostion than wet
sites. Fusthemore, thickness of the aerobic layer ranged between 10 and 20 centimetres at
drier sites and five to ten centimetres at wet sites. These fmdings cossespond to data by
GEBAUER et al. (1996).
In marine environments, it is known that micro-organisms and ciliates interstitially inhabit the
RPD (OTT, 1988). In the soils of the present study, manifold higher ATP concentrations below
'frontier' horizons suppoit the hypothesis, that these may inhabit this habitat. In the respective
hosizons at drier sites, the presence of the water table fiirther represents an ideal habitat for
protozoa (COLEMAN & CROSSLEY, 1996). In addition, protozoa represent a characteristic
feature of the rhizosphere and are intimately linked to rhizobacteria (CLARHOLM, 1994).
Rhizosphere
The rhizosphere is generally thought to stimulate microbial activity in manifold ways
(S~RENSEN, 1997; TATE, 1995; BOLTON et al., 1995; CURL & TRUELOVE, 1986). Yet, despite
gseater microbial biomass, all Parameters that characterize the active pool were found to
decrease from topsoil to 'frontier' horizons. This was pasticularly true for fungi, which
correlated with low ATP concentrations. The latter indicated a great propostion of inactive or
even decaying fingi. Furthennore, they did not show any correlation with heat output values.
140 6 . Discussion
Microscopical investigations revealed that 'frontier' and to a lesser degree subsoils horizons
contain a substantial amounts of hyphae depleted of cytoplasm. GUGGENBERGER et al. (in
press) found that dead fungi in particular may be regarded as microbial 'litter'. Ce11 wall
residues (e.g., amino sugars) contsibute to the intermediate soil organic matter pool that is
more recalcitrant to decomposition than carbohydrates. These residues (particularly hngal
derived glucosamine) have fi~sther been suspected to be of major importance in the formation
of organo-mineral complexes as well as in aggsegation (TISDALL, 1994; TIESSEN & STEWART,
1988; GOLCHIN et al., 1994). Density fractionation of soil organic matter (som) in the
respective horizons showed a distinct increase of the heaviest fsaction (>2.4 g ~ m ' ~ ) , which
contains 2-4% of total som (GUNDELWEIN, 1998). On the other hand, although not
n~etabolising, fungi may still be 'functioning' in transfei-sing nutrients thsough hyphae fsom a
substrate source to metabolically active pasts or plants when in mycosshizal association. These
'pipelines' are thus important for hngal functioning in soil whether as decomposer or as
mycon-hizal symbiont (CLARHOLM, 1994).
In contrast to fungi, carbon and nitrogen contents affected bacteria. Fusthesmore, basal and
substrate-induced heat output also correlated well, which indicates that bacteria feed on
simple compounds as described for topsoil horizons. Root exudates are typically simple
compounds such as simple sugars, amino acids and organic acids (S~RENSEN, 1997,
MARTENS, 1990), which are suitable for a wide range of rhizobacteria. Fungal cytoplasm may
provide another nutrient source (GUGGENBERGER et al., in press). In this study, bacteria
hrtherrnore appeared to thsive well in the rhizosphere at depth of 20 and 45 cm, which was
reflected not only in higher total numbers but also in increased mean cell volume (SCHMIDT &
BOLTER, unpubl. data; BOLTER, 1998). Yet, no differences in the rhizosphere could be
established between different vegetation stands. MATVEYEVA et al. (1975) on the contrary
reposi that roots of different plants stimulate microbiota in different ways. Thus, bacterial
biomass was two times greater in the rhizosphere of Dryas spp., whereas this increase may be
3 to 30 times gseater with Novosiviersia (ibid.). Compared to other biomes, many tundra
vegetation stands are charactesized by high belowground biomass and litter production
(WEBBER, 1978), which may be enhanced by short life Spans (SHAVER, 1995). According to
ZHU et al. (1996) root litter has a stimulating effect on fungal biomass. FEDOROV-DAVYDOV
(1998) calculated that more than half the microbial population in tundra soils utilises root
litter and exudates as a nutrient source.
6.3 Microbial habitats in tundra soils 141
In Summary, the 'frontier' is characterized by interlocking habitats of redox potential
discontinuity (RPD) and rhizosphere. Although microbial biomass in 'frontier' horizons was
significantly higher than in the susrounding hosizons, this increase did not correspond to the
activity Parameters. Fungi appeared to be more restricted in activity than bactesia. High caloric
ratios indicated environmental stress and a shift in microbial community structure towards the
subsoil. Fluctuating reducing and oxidising conditions represent environmental Stress. The
impoi-iance of the water table in this mechanism had already been established in parallel
studies at the respective sites (GUNDELWEIN, 1998; SOMMERKORN, 1998) and was confirrned
by the present study. This was supplemented by soil physical properties that affect soil water
content and oxygen difhsion. The 'frontier' thus appears to be a Zone, in which micro-
organisms compete for the habitats.
6.3.3 Subsoil
Subsoil horizons generally represent anaerobic mineral hosizons above the pei-inafrost table.
The only exception represented the transitionary polygon at Levinson-Lessing which showed a
buried 0-horizon above the permafrost table. As discussed for 'frontier' hosizons, thickness of
anaerobic subsoil ho~izons were dependent On the thickness of the active layer and oxygen
diffusion. Accordingly, the proportion of subsoil horizons within a profile was gseater in wet
depressions than in the respective dsier sites, which corresponded to fmdings in the literature
(GEBAUER et al., 1996). Subsoils were water saturated above the supra-perrnafrost layer and
marked by a distinct increase in soil organic matter with low Cm-ratios, which cossespond to
respective data by GUNDELWEIN (1998). This has been explained by precipitation of low
molecular organic compounds at low temperatures above the pemafrost table (ibid.).
In the respective horizons, bactesia prevailed over fungi, which were even absent in many
cases. A peak in bactesial bioinass values in the supra-permafrost layer was also detesmined
by LYSAK & DOBROVOL'SKAYA (1982). Substrate induced heat output cosselated with carbon
and nitrogen levels but was negatively affected by wider Cm-ratios. The fact that caloric
quotients increased with wider Cm-ratios indicates that the microbial population was apt for
the nutiient resource available in the respective hosizons. Heat output was attsibuted to
bacteria and cosrelated well with the activity dependent Parameters.
In Summary, the microbial properties in a,ccordance with statistical evaluation allowed a
generalised view of microbial habitats in tundra soils, which differed significantly from each
142 6. Discussion
other. Differentes between the topsoils of wet and drier micro-sites were greater than between
individual 'fsontier' or subsoil horizons. As a consequence, variability between sites has only
been discussed with respect to the respective horizons. Furthermore, it has to be stated that the
individual habitats are likely to interlock depending On active layer thickness and proportion
of the aerobic and anaerobic horizons within the profile. Particularly the cumulative wetting
effect and 'zero-curtain', which results in accun~ulation of solutes in the upper part of mineral
horizons is likely to interlock with 'fsontier' habitats when thaw depth is shallow. Topsoils
represent a continuum between wet, aquatic habitats and drier soils charactesized by a
decomposer cycle. 011 the other side, these may spatially and temporally interlock with for
instance fluctuating water table at soil surface. Rhizosphere effects have been suggested when
wet depressions in immediate proximity to vegetated mounds showed very high microbial
biomass values. This is j~istified because of exceptional high belowground biomass production
by tundra plants.
6.4 Tundra soils in a changing climate 143
6.4 Tundra soils in a changing climate
As confismed in this study, the decomposer cycle is detemined by temperature, moisture and
nutrients. Whereas soil temperature and moisture are largely controlled by climatic conditions,
nutrient Status and availability represent an indirect effect of both abiotic conditions and plant
species composition. Yet, all of these factors are intimately linked to each other. In a changing
climate, their effects on soil microbial properties are largely unknown. Impact of climate
change in this context may thus be discussed in a rather simplistic manner. On the other hand,
the presumed increase of CO2 release and CH4 oxidation in the Arctic represent plant-
microbe-mediated processes, which in retum might have a feedback on global climate
(CHAPIN I11 et al., 1992). Since tundra globally Covers 7.34* 1 0 ~ km2 (MATTHEWS, 1983),
addressing consequences of climate change at soil microbe level becomes important.
During the last century, temperatures in Alaskan tundra have increased 2 to 4OC
(LACHENBRUCH & MARSHALL, 1986 and LACHENBRUCH et al., 1988 cf. OECHEL & BILLINGS,
1992). As a result of atmospheric trace gas emissions such as CO2, CH4, and nitrous oxide
(NzO), global temperature might increase ('gseenhouse effect'). In the early 1990s, further
increase was considered to be highly certain (MAXWELL, 1992; CHAPIN I11 et al., 1992). More
recent data qualify observed higher temperatures in the Arctic within range of historic
variability (MAXWELL, 1997). Projections for the Russian Arctic differ from those for other
arctic regions. Thus, mean annual air temperature shows no clear trend in climatic scenarios.
This is explained by different trends of winter temperatures. Mean summer temperatures, in
contrast, are generally expected to increase. In westem Siberia (Yamal), an increase in
tcmperature is also expected for winter but decreases towards the east (ibid.). Projections of
changes in global water balance differ and are subject of discussion. Thus, climate change
may lead to warmer and drier conditions due to increased evapotransipiration (KANE et al.,
1997). On the other hand, precipitation is expected to increase (ROWNTREE, 1997) leading to
warmer and wetter conditions. In the Russian Arctic, annual precipitation trends range from
0.0 to +2.3% per decade. Yet, surnmer precipitation is generally expected to increase
(MAXWELL, 1997).
At both experimental sites of this study, a temperature increase would result in increased soil
respiration, wet (top)soils showing a greater temperature sensitivity than the respective dsier
ones (SOMMERKORN, 1998). A theoretical temperature increase of 10° (Qio) would result in
2.2 to 3.0 greater activity at wet sites compared to 1.2 to 1.6 gseater values at drier sites
144 6. Discussion
(ibid.). Thus, a higher temperature of 1 'C would increase mineralisation by 12 to 16% at drier
sites and 22 to 30% at wet sites. The potential for gseater mineralisation rates at wet sites was
supported by data of this study. Substrate induced heat output (SIQ) of wet topsoils showed
that fungi in the respective horizons were viable. Lower activity under field conditions thus
indicated tliat the microbiota was inhibited most likely due to water logging and low
temperatures. In water saturated soils, a temperature increase would increase CH4 production
to a gseater extent (VOURLITIS & OECHEL, 1997) because of higher temperature sensitivity
(Qio 5.3-16) of methanogenic bacteria (DL'NFIELD et al., 1993). In contrast to microbial
activity, community composition may not change significantly by temperature changes alone
(PANIKOV, 1997)
As can be seen, the position of the water table represents another critical control for
decomposition processes in the soils of this study (SOMMERKORN, 1998; GUNDELWEIN, 1998),
as has also been established for other arctic soils (FEDOROV-DAVYDOV, 1998; VOURLITIS &
OECHEL, 1997; OECHEL & VOURLITIS, 1995; WHALEN et al., 1996; OBERBAUER et al., 1996;
MOORE & DALVA, 1993). Yet, the soil moisture regime is a major variable in predicting
impact of climate change (see above). Increased annual air temperature along with higher
evapotranspiration (i.e., warmer and wetter scenario) is likely to increase thaw depth and to
lower the water table (KANE et al., 1992). In the soils of this study, lowering of the water table
by 10 cm was found to result in almost complete CH4 oxidation (GUNDELWEIN, 1998). In
contrast, influence of water table on CO2 efflux is limited, probably reflecting different
substrates and microbial populations, lower temperatures and root respiration (SOMMERKORN,
1998; MOORE & DALVA, 1993; GEBAUER et al., 1996). Influence of water table was greatest at
a depth of 0-5 cm (SOMMERKORN, 1998; OBERBAUER et al., 1991). For the soils of the
experimental sites, this relationship indicates that tlie bulk CO; efflux originales fiom the
respective horizons (SOMMERKORN, 1998), which corresponds to the microbiological data of
this study. In addition to these considerations, gseater thaw depths and lowering of the water
table would result in a shift of 'fsontier' horizons. Depending 011 the physical properties of the
soil, this would relieve the stress caused by Oz deficiency and microbial community stsucture
might shift towards an aerobic population. In wet habitats, a lower water table will reduce
ciliates and flagellates that are adapted to feeding in water (CLARHOLM, 1994).
However, climate change may not necessarily induce drier soil moisture regimes. Precipitation
is also likely to increase in most areas (i.e., warmer and wetter scenario), as in the Russian
Arctic (MAXWELL, 1997). Yet even in the warmer and dsier scenario, KANE et al. (1997)
6.4 Tundra soils in a changing clin~ate 145
fusther state that downslope soils may receive additional moisture from hillslope soils. This
process would affect many soils of this study. Hence, there is strong evidence that soil
moisture regimes may not change to a great extent.
At long-tem scales, climate change is expected to affect plant species composition, which
bears gseater uncertainties since plant species respond differently to changing environmental
conditions (CHAPIN I11 et al., 1997; BILLINGS, 1992). Yet, vegetation affects soil ecology in
substrate quantity and quality as well as in competition for nutrients. It has generally been
suggested that plant species composition will change towards gseater abundance of grasses
and deciduous shrubs (KIELLAND & CHAPIN, 1992). Soil drying could increase deciduous
shrubs relative to gsaminoids and mosses (CHAPIN I11 et al., 1997). Advance of the treeline
depends on the onset of the gsowing season, which might be delayed as a result of later
snowmelt (SVEINBJORNSSON, 1992). Furthemore, the microbiota of the rhizosphere is vesy
plant specific (PARINKINA, 1974; 1989). Thus, changes in the vegetation Cover will be
accompanied by changes in the microbial population (KIELLAND & CHAPIN, 1992). It has been
suggested that elevated CO2 concentrations of the atmosphere and increasing temperatures
may result in increased plant productivity, which may fŸsthe be counterbalanced by limited
nutrient availability and plant specific water relations (OECHEL & BILLINGS, 1992;
OBERBAUER & DAWSON, 1992). Low nutrient availability may increase mycorrhizal infection
in order to enhance nutrient acquisition (SVEINBJORNSSON, 1992). According to MOORHEAD &
LINKINS (1 997) greater activity associated with nutrient acquisition, will change the microbial
community con~position. This is explained by a gseater availability of simple carbohydrates,
which may lower the decomposition rate of complex polymers. On the other hand, it has been
suggested that microbial biomass may increase but not change in composition since plant litter
production will increase too (ZAK et al., 1993). Thus, there are many uncestainties in
evaluating the long-term effect On plant-microbe relations.
In summing up, it may be stated that even if anticipation of the nature of climatic change was
possible, impact 011 soil ecology of arctic Systems might not be. Yet, the soil microbiota of this
study showed high potential productivity and sensitivity with respect to temperature and soil
water conditions and may therefore be particular vulnerable to climate change.
146 6 . Discussion
6.5 Future research needs
The methods used in this study proved to describe the microbial pool and its spatial variability
successfully. Yet, in order to elucidate (micro)biologically i-nediated carbon fluxes in tundra
soils future research should address the following aspects:
e This study showed that microbiological investigations should include all depths of the
active layer. Changes in microbial properties such as community composition and substrate
requirements indicate the potential productivity of tundra soils. This is substantiated by the
freeze-thaw dynamics of permafrost affected soils, where frost chuming may result in
upside-down orientation of subsoil hosizons. Furthermore, climate change may cause the
soils to thaw to greater depths.
Tundra soils are characterised by a short gsowing season, during which edaphic conditions
and microbial biomass values change remarkably. It is also known for temperate soils, that
microbial Parameters such as for example metabolic quotients vary over time (DILLY,
1994). Therefore, a temporal resolution of the sampling technique is desirable. In addition
to continuous CO2 and CH4 measurements in the field, these would provide further insight
in the underlying microbial processes.
* There is evidence from this study that in wet habitats of tundra soils, a substantial
proportion of the energy flux might pass through protozoa. The fast tumover of carbon and
nutsients through bacteria and protozoa is commonly referred to as 'microbial loop'. FOT
aquatic habitats, the significance of the 'microbial loop' as a link or source of energy flow
is subject of dispute. Yet for tundra soils, there is very little information On the respective
taxonomic gsoups and fkture investigation is recommended.
Tundra plants show specific rooting strategies and high belowground biomass production.
Within the scope of this joint research project, emphasis was put on particulate carbon
input fiom above and belowground. Root litter and exfoliating cells of living roots as well
as ~nicrobial cell residues will stimulate decomposer micro-organisms. Yet, hrther input
Comes from root exudates, upon which different gsoups will feed. Of equal importance are
mycorrhizal associations. In contrast to decomposing fŸngi mycorrhizal hngi receive
assimilates from above-ground plant Parts. Mycorrhiza thus contribute to soil organic
matter but are less important in decomposition. The methodology of this study was not
designed to capture these processes. Yet, a clear rhizosphere effect was discemible in the
studied tundra soils. Further insight in the origin of particulate soil organic matter in the
6 .5 Future research needs 147
rhizosphere may be achieved by CPIMAS ^C N.M.R spectroscopy (BALDOCK et al., 1990).
Fungal and bacterial cell residues may be investigated by contents of glucosamine and
muramic acid (GUGGENBERGER et al., in press). Characterisation of soil pore water and
detemination of dissolved organic matter with respect to root effects are recommended.
0 The hypothesis of a redox potential discontinuity (RPD) needs investigation by redox
potentiometers in the field. Yet, both temporal and spatial resolution are required for
further characterisation. Confismation of the presence of a RPD would have implications
for geochemical element cycling as well as microbial inediated processes and the
microbiota. Marine environments show a dynamic microbiota with respect to carbon
cycling at the interface of aerobic and anaerobic layers. Contradictosy anaerobic and
aerobic processes have also been reported to occur synchronously in water-logged soils of
temperate regions. Future investigation should address all these aspects.
148 7. References
7. References
AG Boden, 1994, Bodenkundliche Kartieranleitung, 4th edn., Schweizerbart'sche Verlagsbuchhandlung, Stuttgart, 392 pp. (in German).
Ahmed, M., J.M. Oades & J.N. Ladd, 1982. Determination of ATP in soils: Effect of soil treatments, Soil Biol. Bioc/iem. 14: 273-279.
Albers, B.P., F. Beese & A. Hartmann, 1995a, Flow-microcalorimetry measurements of aerobic and anaerobic soil microbial activity, Biol. Fert. Solls, 19: 203-208.
Albers, B.P., A. Hartmann & F. Beese, 1995b, Anaerobic heat output. In: Methods in Applied Soil Microbiology arid Biochenii.stiy, K. Alef & P. Nannipieri (Eds.). pp. 304-306, Academic Press, London.
Alef. K., 1995, Heat output. In: Methods in Applied Soil ~Vicrobiology and Biochemistiy, K. Alef & P. Nannipieri (Eds.), pp. 223-224, Academic Press; London, San Diego.
Alef. K., 1993, Bestimmung mikrobieller Biomasse im Boden: Eine kritische Betrachtung, Z Pflanzeneriiahr. Bodetik., 156: 109-1 14 (in Gerrnan).
Alef, K., 199 1 , Methodenhandbuch Bodenmikrobiologie - Aktivitiiten, Biomasse, Differenzierung. Ecomed, Landsberg, 284 pp. (in German).
Alef, K. & P. Nannipieri (Eds.), 1995, Methods in Applied Soil Microbiology arid Biochemistiv, Academic Press, London, 576 pp.
Alef, K.. Th. Beck, L, Zolles & D. Kleiner, 1988, A comparison of methods to estimate tnicrobial biomass m d N-mineralization in agricultural and grassland soils, Soil Biol. Biochem., 20 (4): 561-565.
Aleksandrova, V.D., 1980. The Arctic and Antarctic: their division into geobotanical areas, CUP, Cambridge.
Alekseev, A.. T. Alekseeva, V. Ostroumov. C. Siegelt & B. Gradusov, Mineral transformations in permafrost- affected soils (North Kolyma Lowland), submitted to Pennafrost and Periglacial Processes.
Alexander, V . 1974a. A synthesis of the IBP tundra biome circumpolar study of nitrogen fixation. In: Soil 0rganisni.s m d Decomposition in Tundra, A.J. Holding, O.W. Heal, S.F. Maclean, Jr. & P.W. Flanagan (Eds.), pp. 109-12 1, Tundra Biome Steering Con~mittee, Stockholm.
Alexander, V,, 1974b; The influence of abiotic factors on nitrogen fixation rates at Barrow, Alaska, arctic tundra, Rep. Kevo Siibarctic Res. Sfat. 1 1: 3- 1 1.
Alexander, V. & M.M. Billington, 1986, Nitrogen fixation in Alaskan Taiga, In: Forest Ecosystems in the Alaskan Taiga - A Si,i~t/resis of Structure und Funclion, K . Van Cleve, F.S. Chapin, P.W. Flanagan, L.A. Viereck & C.T. Dyn~ess (Eds.), pp. 112-120. Ecol. Shidies 58, Springer, Berlin.
Alexander, V., M. Billington & D.M. Schell, 1978, Nitrogen fixation in Arctic and Alpine Tundra. In: Vegetation und Production Ecologv o f an Alaska?~ Arctic Tundra, L.L. Tieszen (Ed.), pp. 540-558, Springer; New York. Heidelberg. Berlin.
AMAP, 1998, A,WAPAfse.~si~~ent Report: Arctic Pollution Issiies. Arctic Monitoring und Assessment Programme (AMAP), Oslo, Norway, 859 pp.
Anm'eva. N.D., E.V. Blagodatskaya. & T.S. Demkina, 1997, The Effect of Drying-Moistening and Freezing- Thawing On Soil Microbial Communities' Resilience, Eurasian Soil Sei., 30 (9): 1010-1014.
Anderson, J.P.E. & K.H. Domsch, 1978. A physiological method for the quantitative measurement of microbial biomass in soil, Soil Biol. Biocheni., 10: 215-221.
Anderson, T.-H., 1994, Physiological analysis of microbial cornmuuities in soil: Applications and iimitations. In: Beyond the Biot71as.s"~ K. Ritz, J. Dighton & K.E. Giller (Eds.), pp. 67-76, J . Wiley & Sons, Chichester.
Anderson, T.-H. & R.G. Joergensen, 1997, Relationship between SIR and FE estimates of microbial biomass C in deciduous forest soils at different pH, Soil Biol. Biochem., 29 (7): 1033-1042.
Anderson. T.-H. & K.H. Domsch, 1993, Short communication - The metabolic quotient for CO; (qCO; ) as a specific activity Parameter to assess the effects of environmental conditions such as pH, on the microbial biomass of forest soils, Soil Biol. Biochem., 25 (3): 393-395.
Andreev, V.N., 1981, Influence of man on tundra vegetation. In: Tundra ecosysteins: a comparative analysis, L.C. Bliss, O.W. Heal & J.J. Moore (Eds.), pp. 747-749, Cambridge University Press, Cambridge.
Andreev, V.N. & V.D. Aleksandrova, 198 1. Geobotanical division of the Soviet Arctic. In: Tundra ecosystems: a comparative analysis, L.C. Bliss, O.W. Heal & J.J. Moore (Eds.), pp. 25-34, Cambridge University Press, Cambridge.
Anisimov. M.A. & 0.1. Panasenkova, 1997. Microrelief and Temporal Variations of Active Layer Thickness. In: Russian-Gesman Cooperation: The Expedition TAYMYIUSEVERNAYA ZEMLYA 1996, M. Melles, B. Hagedorn & D. Yu. Bolshiyanov (Eds.), Reports on Polar Research, No. 237, pp. 52-57, Alfred Wegener Institute for Polar and Marine Research. Bremerhaven.
Arkhipov, S.A., 1997, Environment and climate of Sastan maximum and late glacial in Siberia. In: Lote glacial cind po.~tglc~cial environmental changes - Qiiarternaiy, Carboniferous-Permian, und Proterozoic, I.P. Martini (Ed.), pp. 53-60, Oxford University Press, Oxford.
Amebrant, K. & E. Biith. 199 1. Measurements of ATP in forest humus, Soil Biol. Biochem., 23 (6): 50 1-506.
Bab'yeva, I.P. & I.Yu. Chesnov, 1982, Yeasts in the tundra soils of the Taymyr Peninsula, Soviel Soil Sei., 14 (5): 39-44.
Bai, Q.Y., L,. Zelles, I. Scheunert & F. Korte, 1988, A simple effective procedure for the detennination of adenosine triphosphate in soils, Chemosphere, 17 (12): 2461-2470.
Baldock. J.A., J.M. Oades, A.M. Vassallo & M.A. Wilson. 1990, Solid-State CPIMAS 'Â¥'' N.M.R. Analysis of Bactetial and Fungal Cultures Isolated from a Soil Incubated with Glucose, Aust. J. Soil Res., 28: 213- 225.
Barber, D.A. & J.M. Lynch, 1977, Microbial growth in the rhizosphere, Soil Biol. Biochem., 9: 305-308.
Bardgett, R.D. & D.K. Leemans, 1995, The short-term effects of cessation of festiliser applications, liming, and grazing on microbial biomass and activity in a reseeded upland grassland soil, Biol. Fert. Solls, 19: 148- 154.
Bany, R.G.. G.M. Courtin. & C. Labine, 1981, Tundra clin~ate. In: Tundra ecosystetns: a comparative cinalysis, L.C. Bliss. O.W. Heal & J.J. Moore (Eds.). pp, 8 1- 114, Cambridge University Press, Cambridge.
Bazilevich, N.I., 1995, Geographical Patterns in the Biological Porductivity Soil - and - Vegetation-Associations of Northem Eurasia, Eurasian Soil Sci., 27 (3): 1-14.
Beare, M.H., D.C. Coleman, D.A. Crossley Jr., P.F. Hendtix & E.P. Odum, 1995, A hierarchical approach to evaluating the significance of soil biodiversity to biogeochemical cycling, Plant und Soil, 170: 5-22.
Beck, T., R.G. Joergensen, E. Kandeler, F. Makeschin, E. NUSS, H.R. Oberholzer & S. Scheu, 1997, An inter- laboratov comparison of ten different ways of measuring soil microbial biomass C, Soil Biol. Biochem., 29 (7): 1023-1032.
Becker, H., 1997, Untersuchungen zur Biomasse typischer Boden-Vegetations-Komplexe von Pennafroststandorten des Levinson-Lessing-See-GebietesISibirien, unpubl. Thesis, Dpt. of Soil Science. University of Hamburg, 80 pp.
Belaich, J.P., 1980, Growth a id metabolism in bacteria. In: Biological Microcalorimetiy. A.E. Beezer (Ed.), pp. 1-42. Acaden~ic Press; London, New York, Toronto, Sydney, San Francisco.
Belnap, J., 1992, Potential role of cryptobiotic soil crusts in semiarid rangelands; paper presented at the Symposium on Ecology, Management, and Restoration of Intermountain Annual Rangelands, Boise, ID, May 18-22, 1992.
Belnap, J. & J.S. Gardner, 1993, Soil microstructure in soils of the Colorado plateau: The role of the cyanobacterium Microcoleus vaginatus, Great Basin Naturalist, 53 (1): 40-47.
Belnap, J.. K.T. Harper & S.D. Wanen, 1993, Surface Disturbance of Cryptobiotic Soil Crusts: Nitrogenase Activity, Chlorophyll Content and Chlorophyll Degradation, Arid Soll Research und Rehabilitation, 8: 1-8.
Billings, W.D., 1992, Phytogeographie and Evolutionary Potential of the Arctic Flora and Vegetation in a Changing Climate. In: Arctic Ecos~~stems in a Chatiging Cliniate, F.S. Chapin 111, R.L. Jefferies, J.F. Reynolds, G.R. Shaver & J. Svoboda (Eds.); Academic Press, San Diego; pp. 91-109.
Bliss, L.C., 1997, Arctic Ecosystems in North Ametica. In: Polar and alpine tundra, F.E. Wielgolaski (Ed.), pp. 55 1-683, Ecosystems of the World, 3; Elsevier Science, Amsterdam.
Bliss, L.C., 1975, Devon Island, Canada. In: Structure und Function of Tundra Ecosystems, Rosswall, T. & O.W. Heal (Eds.), pp. 17-60, Ecol. Bull. No. 20, Swedish Natural Science Research Council, Stockholm.
Bliss, L.C. & N.V. Matveyeva, 1992. Circumpolar Arctic Vegetation. In: Arctic Ecosystems in a Changing Climate, F.S. Chapin 111, R.L. Jefferies, J.F. Reynolds, G.R. Shaver & J. Svoboda (Eds.); Academic Press, San Diego; pp. 59-89.
Bliss, L.C., O.W. Heal & J.J. Moore (Eds.), 1981, Tundra ecosystems: a comparative analysis, 813 pp., Cambridge University Press, Cambtidge.
150 7. References
Bloem. J.. P.R. Bolhuis, M.R. Veninga & J. Wieringa, 1995, Microscopic methods for counting bacteria and fungi in soll. In: Method.~ in Applied Soil Microbiology und Biochemistiy, K. Alef & P. Nannipieri (Eds.), pp. 162- 173. Acadcniic Press; London, San Diego.
Blume, 11.-P., L. Beyer & D. Schneider, 1998, Soils of the Southern Circurnpolar Region and Their Classification, Eurasiern Soil Sei., 3 1 (5): 477-485.
Blume, H.-P., D. Schneider, & M. Bölter 1996, Organic Matter Accumulation in arid Podzolization of Antarctic Soils, Z. Pflanzenernc?hr. Bedenk.. 159: 4 1 1-4 12.
Bockheim. J.G. & S.C. Wilson, 1992, Soil-forming rates and processes in cold deser; soils. In: Proceedings Joint Riissicm-American Seminar on Crvopedology und Global Change, Pushchino 1992, D.A. Gilichinsky (Ed.), pp. 42-56, Russian Academy of Sciences. Puslicliino.
Bockheim, J.G. & F.C. Ugolini, 1990, A review of pedogenic zonation in well drained soils of the southem circumpolar region, Qualernan' Resecirch, 34: 47-66.
Boike, J., 1997, Tliennal, hydrological arid geocheniical dynamics of tlie active layer at a continuous permafrost site, Tayriiyr Peninsula, Siberia, Reports oti Polar Research, No. 242, 104 pp.
Bolshiyanov, D.Yu. & H.-W. Hubberten (Eds.), 1996, Russian-German Cooperation: The Expedition TAYMYR 1995 and the Expedition KOLYh4A 1995 of the ISSP Pushchino Group, Reports on Polar Research, No. 2 11, Alfred Wegener Institute for Polar and Marine Research. Bremerhaven, 208 pp.
Bolshiyanov, D.Yu. & M.A. Anisiniov, 1995. Geomo~~hological studies arid landscape mapping. In: C. Siegert & D. Bolshiyanov (Eds.), 1995, Russian-Gennan Cooperation: Tlie Expedition TAYMYR 1994, Rej~orls on Polar Research, No. 175, pp. 9-13. Alfred Wegener Institute for Polar and Marine Research, Bremerhaven.
Bolter, M., 1998, Structure of bacterial communities in Arctic pemiafrost soils (Tajmyr Peninsula, Siberia), Proceeding.~ qf the 25"' Polar @nip Ji'ursaw, Polish Academy of Sciences, Warsaw, submitted.
Bölter M., 1994, Microcalorimetry and CO; - evolution of soils arid lichens from Antarctica. Proc. NIPR Symp. Polar Biol., 7: 209-220.
Bolter, M. & H. Kanda, 1997, Preliminary results of botanical and microbiological investigations on Sevemaya Zemlya 1995, Proc. AVPR $mp. Polar Biol., 10: 169-178.
Bölter M. & N. Schmidt 1997, Microbial habitat. In: Russian-German Cooperation: The Expedition TAYMYRISEVERNAYA ZEMLYA 1996, M. Melles, B. Hagedorn & D. Yu. Bolshiyanov (Eds.), Reports on Polar Research, No. 237, pp. 44-46, Alfred Wegener Institute for Polar and Marine Research, Bremerhaven.
Bolter, M., H.-P. Blume & H. Erlenkeuser, 1995. Pedologic, Isotopic and Microbiological Properties of Antarctic Soils, Pola~forsch., 64(1): 1-7.
Bölter M., R. Möller & W. Dzonila, 1993, Determination of bacterial biovolume witli epifluorescence niicroscopy: Comparison of size distributions from image analysis and size classifications, Micron, 24 (I): 31-41.
Bolton Jr., H., J.K. Frederickson & L. F. Elliott, 1993, Microbial Ecology of the Rhizosphere. In: Soil Microbial Ecology - Application in Agricultural attd Enviromental Managtnent, F . Blaine Metting, Jr. (Ed.), pp. 27-64, M. Dekker, Inc., New York.
Botch, M.S, K.I. Kobak, T.S. Vinson & T.P. Kolchugina, 1995, Carbon pools and aceumulation in peatlands of the former Soviet Union, Global Biogeochem. Cycles, 9 (1): 37-46.
Breburda, J., 1987, Bodengeographie der borealen und kontinentalen Gebiete Eurasiers. Agr.- U. Wirtschaftsforscliung d. europ. Ostens, Dundeer & Humboldt, Berlin.
Brookes, P.C. & D.S. Jenkinson, 1989, ATP and adenylate energy charge levels in the soil microbial biomass. In: ATP liiminescence - rapid met/~ocls itz microbiology, P.E. Stanley, B.J. McCarthy & R. Smither (Eds.), Soc. Appl. Bacteriol. Techn. Series 26, pp. 119-127, Blackwell Scientific Publications, Oxford.
Brookes, P.C. & J.A. Ocio, 1989, The use of ATP measurements in soil microbial biomass studies. In: ATP luminescence - rapid methods i t ~ microbio lo~ , P.E. Stanley, B.J. McCarthy & R. Smither (Eds.), Soc. Appl. Bacteriol. Teehii. Series 26, pp. 129-136, Blackwell Scientific Publications, Oxford.
Brussaard, L. & M.J. Kooistra (Eds.), 1993, Soil striicture/soil biota interrelationships. International Workshop on Methods of Research on Soil structurelsoil biota interrelationships, held at the International Agricultural Centre, Wageningen, The Netherlands, 24-28 November 1991; reprinted from Geoderma, vol. 56, nos. 1-4 and vol. 57, nos. 1-2, Elsevier; Amsterdam, London, New York, Tokyo.
Brussaard. L., L.A. Bouwman, M. Geurs, J. Hassink & K.B. Zwart, 1990, Biomass, composition and temporal dynamics of a silt loam soil under conventional and intergrated management, Neth. J Agr. Sci., 38: 283- 302.
Bull. A.T. & J.H. Slater. 1982. Microbial interactions and community structure. In: Microbial [ilteractions and Conimiinit}- Structure, AT. Bull & J.H, Slater (Eds.), pp. 13-44, Acadcmic Press; London, New York, Paris, San Diego, San Francisco. Sä Paulo, Sydney, Tokyo, Toronto.
Bunneli, F.L., S.F. MacLean, Jr. & J. Brown. 1975, Barrow, Alaska, USA. In: Stivcfure und Function of Tundra E c m t e m s . R. Rosswall & O.W. Heal (Eds.), Ecol, Bull. No. 20. pp. 73-1?4, Swedish Natural Science Research Council, Stockholm.
Cameron, R.E,, A.D. Knox. & F.A. Morelli. 1978. The role of algae in tundra soils. In: Vegetation und Production Ecolog}' of an Alaskan Arctic Tundra, L,L. Tieszen (Ed.), pp. 207-227, Springer; New York, Heidelberg, Berlin.
Chapin 111. F.S., 1978, Phosphate uptake and nutrient utilization by Barrow tundra vegetation. In: Vegetation und Production Ecolop o f a n Alaskun Arctic Tundra, L.L. Tieszen (Ed.), pp. 483-507, Springer; New York, Heidelberg, Berlin.
Chapin, D.M. & C.S, Bledsoc, 1992, Nitrogen fixation in Arctic plant communities. In: Arctic Ecosystems in a Changing Climate, F.S. Chapin 111, R.L. Jefferies, J.F. Reynolds, G.R. Shaver & J. Svoboda (Eds.); pp. 30 1-3 19, Academic Press. San Diego.
Chapin 111. F.S, S.E. Hobbie & G.R. Shaver, 1997, Impacts of Global Change on Composition of Arctic Con~munities: Implications for Ecosystem Functioning. In: Global Change and Arctic Terrestrial Eco .~~~.~tems , Ecological Studies 124, W.C. Oechel, T, Callaghan, T. Gilmanov, J.I. Holten, B. Maxwell, U. Molau, B. Sveinbjömsso (Eds.), pp. 22 1.228, Springer; Berlin, Heidelberg.
Chapin 111, F.S, R.L. Jefferies, J.F. Reynolds, G.R. Shaver & J. Svoboda, 1992, Arctic Plant Physiological Ecology in an Ecosystem Context. In: Arctic Ecosystems in a Changing Climafe, F.S. Chapin 111, R.L, Jefferies, J.F. Reynolds, G.R. Shaver & J. Svoboda (Eds.); pp. 441-451; Academic Press, San Diego.
Cheng, W. & R.A. Virginia, 1993, Measurement of n~icrobial biomass in arctic tundra soils using famigation- extraction and substrate-induced respiration procedures, Soll Biol. Biochem., 25 (1): 135-141,
Chemov, Yu.I., 1985, The living tundra. Cambridge University Press, Cambridge. 213 pp.
Chemov, Yu.1. & N.V Matveyeva, 1997. Arctic ecosystems in Russia. In: Polar atzd alpine tundra, F.E. Wielgolaski (Ed.), Ecosystems of the World, 3. pp. 361-507; Elsevier Science, Amsterdam.
Chemov. Yu.I., E.V. Dorogostaiskaya. T.V. Gerasirnenko. I.V. Ignatenko. N.V. Matveyeva. O.M, Parinkina, T.G. Polozova. E.N. Romanova, V.F. Schamurin. N.V. Smirnova, I.V. Stepanova, B.A. Tomilin, A.A. Vinokurov & O.V. Zalenksy, 1975. Tareya, USSR. In: Structure und Function of Tundra Ecos~stems, T . Rosswall & O.W. Heal (Eds.), Ecol. Bull. No. 20, pp. 159-181, Swedish Natural Science Research Council, Stockholm.
Ciardi, C. & P. Nannipieri, 1990, A comparison of methods for measuring ATP in soil, Soil Biol. Stochern., 22 (5): 725-727.
Clarholm. M.. 1994, The microbial loop in soil. In: Beyond the Biomass, K . Ritz, J . Dighton & K.E. Giller (Eds.), pp. 22 1-230, J. Wiley & Sons, Chichester.
Clarholm, M., V. Lid-Torsvik & J.H. Baker. 1975, Bacterial Populations of Same Fennoscandian Tundra Soils. In: Fennoscundian Tundra Ecosystems - Part I , Plants and Microorganisms, F.E. Wielgolaski (Ed.), pp. 25 1-260, Ecological Studies 16; Springer; Heidelberg. Berlin
Coleman, D.C., 1994, Tlie microbial loop concept as used in terrestrial soil ecology studies, Microb. Ecol., 28: 245-250.
Coleman, D.C. & D.A. Crossley, 1996, Fundamentals of Soil Ecology, Academic Press, San Diego, 205 pp.
Contin, M.. M. de Nobili & P.C. Brookes, 1995, Con~parison of two methods for the extraction of ATP from soil, Soil Biol. Biochem., 27 (I I): 1371-1376.
Couteaux, M.-M. & P. Bottner, 1994, Biological interactions between fauna and the microbial community in soils. In: ßeyon the Biotnass, K. Ritz, J. Dighton & K.E, Giller (Eds.), pp. 159-172., J. Wiley & Sons, Chichester
Cresser, M., K. Killham & T. Edwards, 1993. Soil chemistty und its applications, 192 pp., Cambridge University Press, Cambridge.
Curl, E.A. & B. Tmeiove, 1986, The Rhizosphere, Advanced Series in Agricultural Sciences, 288 pp.; Springer, Berlin, Heidelberg.
152 7. References
DeLong, E.F., 1996, Diversity of naturally occurring prokaryotes. In: Microbial Diversity in Time a t ~ d Space, R.R. Colwell, U. Simidu & K. Ohwada (Eds.), Plenum Press; New York, London; pp. 125- 132.
De Molenaar, J.G., 1987, An ecohydrological approach to floral and vegetational Patterns in arctic landscape ecology, A r d . Alp. Res.. 19(4): 414-424.
Dickson Regional Administration, 1993, Climatic Data of the Taimyr Lake Station, Monthly reports of the Russian hydro-meteorological committee 1962- 1992.
Dilly, O., 1994, Mikrobielle Prozesse in Acker-, GrŸnland und Waldböden EcoSys - Beitr. z. Ökosystemforsc/~~ing Suppl. Bd. 8 Projektzentrum ~kos~stemforschung. Universitä Kiel, 127 pp. (in German with English abstract).
Douglas, G.R.. J.P. McGreevy & W.B. Whalley, 1983, Rock weathering by frost shattering processes. In: Proceedings o f the Fo~irt /~ International Conference on Pert7iufro.s"t, Fairbanks, Alaska, Ju1.y 17-22, 1983; University of Alaska, National Academy of Sciences. pp. 244-248, National Acaden~y Press, Washington, D.C..
Dunfield, P.. R. Knowles, R. Dumont & T.R. Moore, 1993, Methane production and consumption in temperate and subarctic peat soils: response to temperature and pH, Soil Biol. Biochem., 25 (3): 32 1-326.
Dunican, L.K. & T. Rosswall, 1974, Taxonomy and physiology of hindra bacteria in relation to site characteristics. In: Soil Organisins and Decomposition in Tundra, A.J. Holding, O.W. Heal, S.F. Maclean, Jr. & P.W. Flanagan (Eds.), pp.79-93, Tundra Biome Steering Conxnittee, Stockholm.
Eady, R.R. & J.R. Postgate, 1974, Nitrogenase, Nature, 249: 805-810
Eiland, F., 1983, A simple method for quantitative determination of ATP in soils, Soil Biol. Biochem., 15 (6): 665-670.
Eiland, F., 1979, An improved niethod for the determination of adenosine triphosphate (ATP) in soil, Soil Biol. Bioc/zem., 11: 31-35.
Elster, J., J. Komkrek & J. Svoboda. 1994, Algal communities of polar wetlands, Scripta Fac. Sei. Nat. Univ. Mas(1tyk. Brun. (Geographie), 24: 13-24.
Everett, K.R., V.D. Vassiljevskaya, J. Brown & B.D. Walker, 1981, Tundra and analogous soils. In: Tundra ecosystems: a comparative anc~lj~.s"is, L.C. Bliss, O.W. Heal & J.J. Moore (Eds.). pp. 139-179, Cambridge University Press, Cambridge.
Fasgri, A., V.L. Torsvik & J. Goksöyr 1977, Bacterial and fungal activities in soil: separation of bacteria and fungi by a rapid fractionated centrifugation technique, Soil Biol. B i o e h . . 9: 105-1 12.
Fedorov-Davydov. D.G., 1998, Respiration Acitivity in Tundra Biocenoses and Soils of the Kolyma Lowland, Eurasiati Soil Sei., 3 1 (3): 263-273.
Fisher, E.L., V.N. Leonov, M.V. Nikol'skaya, O.M. Petrov, A.P. Ratsko, L.D. Sulerzhitskiy & M.M. Cherkasova, 1990, The late Pleistocene in the central part of the North Siberian lowland, Polar Geograph und Geolog~, 14 (4): 3 13-325.
Fitter, A.H., D. Atkinson, D.J. Read & M.B. Usher (Eds.), 1985, Ecological interactions in soil - Planes, microbes und anit~~als. Spec. Publ. No. 4. British Ecological Society. pp. 451, Blackwell, Oxford.
FitzPatrick, E.A., 1997, Arctic soils and permafrost. In: Ecolog}' of Arctic Environments, S.J. Woodin & M. Marquiss (Eds.), Spec. Publ. No. 13, British Ecological Society, pp. 1-39, Blackwell Science, Oxford.
FitzPatrick, E.A., 1987, Periglacial features in the soils of north east Scotland. In: Periglacial processes and la~zdforrns in Britain, J. Boardman (Ed.), pp. 153-162, Cambridge University Press, Cambridge.
FitzPatrick, E.A., 1972, The principal Tertiary and Pleistocene events. In: North-East-Scotland: Geographical Essays, C M . Clapperton (Ed.), pp. 1-5, Aberdeen.
Flanagan, P.W. & A.M. Scarborough, 1974, Physiological Groups of Decomposer Fungi on Tundra Plant Remains. In: Soil Oqpnisms und Decomposition in Tundra, A.J. Holding. O.W. Heal, S.F. Maclean, Jr. & P.W. Flanagan (Eds.), pp. 159-181, Tundra Biome Steering Committee, Stockholm.
Flint, R.F., 1971, Glacial and Qiiarternaiy Geologv, J. Wiley & Sons, New York, pp. 592-671
Forrest, W.W., 1972, Microcalorimetry. In: Methods in Microbiology - Vol. 6B, Norris, J.R. & D.W. Ribbons, (Eds.), pp. 285-318, Academic Press; London, New York.
Franz, H.-J,, 1973, Physische Geographie der Sowjetunion. VEB H. Haack Geographisch-Kartographische Anstalt; Gotha, Leipzig (in Gennan).
Frenzel, B.. 1992, Das Klima der Nordhalbkugel zur Zeit des Inlandeisaufbaus zwischen etwa 35000 und 25000 vor heute, Erdkunde, 46 (314): 165- 187.
Friedel, J.. 1993, Einfluà von Bewirischaftungsmaßnalime auf mikrobielle Eigenschaften im C- und N-Kreislauf von Ackerbeden. Hohenheimer Bodenkundl. Hefte, 1 1 Univ. Hohenlieim, Stuttgart, 201 pp. (in German).
Friedel, J.. 199 1. Bestimmung von Adenosintriphosphat (ATP)-Gehalten in Bodenproben mittels Luminometrie: Ein Vergleich verschiedener Extraktions- und Meßmethoden VDLUFA-Schriftenreihe, Kot~greßbai~ 33.
Friedmann. I.E., 1982. Endolithic Microorganisms in the Antarctic Cold Desert, Science, 215: 1045-1053.
Gebauer. R.L.E., J.D. Tenliunen & J.F. Reynolds, 1996; Soil aeration in relation to soil physical properties, nitrogen availability. and root characteristics within an arctic watershed. Plant & Soil, 178: 37-48.
Geste]. M. van, R. Merckx & K. Viassak. 1993. Microbial bioniass and activity with fluctuating water contents, Geoilerma, 56: 6 17-626.
Gilichinsky, D.A., S. Wagener & T.A. Visnevetskaya, 1995, Pemafrost Microbiology, Pennafrost and Periglacid Processes, 6: 28 1-29 1.
Giller. K.E. & J.M. Day, 1985. Nitrogen fixation in the rhizosphere: significance in natural and agricultural Systems. In: Ecoiogical Interaction in Soil - Plants. Microbes and Animals, A.H. Fitter, D. Atkinson, D.J. Rcad & M.B. Usher (Ms. ) , pp. 127-147, Spec. Publ. No. 4, ßritis Ecological Society, Blackwell, Oxford.
Gnaiger. E., 1989. Physiological Calorimetry: Heat Flux, Metabolie Flux. Entropy and Power, Themochim. A m . 151: 23-34.
Goksoyr, J.. 1975, Decomposition, Microbiology. and Ecosystem Analysis. In: Fennoscandiat~ Tundra Ecosystems - Part I , Plants and Microorgairisms, F.E. Wielgolaski (Ed.), pp. 230-238, Ecological Studies 16; Springer; Hcidelberg, Berlin
Golchin, A., J.M. Oades, J.O. Skjemstad & P. Clarke, 1994, Soil structure and carbon cycling, Austr. J. Soil Res., 32: 1034-68.
Goryachkin, S.V.. N.A. Karavaeva. & V.O. Targulian, 1998. Geography of arctic soils: Current problems, Eurasian Soil Sei., 3 1 (5): 467-476.
Grabetskaya, N.A. & V.G. Chigir, 1992. Differentiation and alteration of materials in the active layer of patchy tundra on the southwest Tayniyr Peninsula, Soviel Soil Sei., 23 (10): 38-54.
Gradusov, B.P. & V.V. Ivanov, 1974. Mineralogical composition of clay material from Taimyr tundra soils. Vestnik Moskovskogo Universiteta. Seriia 6 Biologiia, Pochvovedenie. 4: 9 1-97.
Graf, G, , 1977, ATP-Messungen mittels des Luciferin-Luciferase-Systems und ihre Anwendung in der quantitativen Ökologie Reports SFB 95. Christian-Albrechts-Universitä Kiel, Nr. 34, 77 pp. (in German).
Granhall, U. & V. Lid-Torsvik, 1975, Nitrogen fixation by bacteria and free-hing blue-green algae in tundra areas. In: Plants and Microorgani.sms. Fennoscandian Tundra Ecosystems, 1 , F.E. Wielgolaski (Ed.), pp. 305-3 15, Springer; Berlin, Heidelberg.
Grosswald, M.G., 1989. Last glaciation in Siberia: Palaeogeographical and geomorphological problems. In: Polar G e o m o r p / ~ o l o ~ ' 17. Second Int. Conf. on Geomorphology, Symposium No. 5, Abstracts and Papers, University of Bremen, Dpt. of Geograpliy, pp. 14-15.
Guggenberger, G., S.D. Frey, J. Six, K. Paustian & E.T. Elliot, Bacterial and fungal cell-wall residues in conventional and no-tillage agroecosystems, Soil Sci. Soc. Am. J., in press.
Gundelwein, A., 1998, Eigenschaften und Umsetzung organischer Substanz in nordsibirischen Permafrostböden Hamburger Bodenkundliche Arbeiten, 39, 162 pp.
Gundelwein, A., H. Becker, T. Müller-Lup & N. Schmidt, 1997, Solls, In: Russian-German Cooperation: The Expedition TAYMYWSEVERNAYA ZEMLYA 1996, M. Melles, B. Hagedorn & D.Yu. Bolshiyanov (Eds.), Reports on Polar Research, No. 237, pp.11-14, Alfred Wegener Institute for Polar and Marine Research. Bremerhaven.
Gustafsson, L., 199 1, Microbiological calorimetry, Thermochim. Acta, 193: 145- 17 1.
Hagedorn, B. , J. Boike & H. Becker, Spatial and teniporal geochemical variability of water in die Levinson- Lessing Lake catchment, Taymyr, Siberia (74'N, 9g0E), submitted to Aquatie Geochemistiy.
H a ~ ~ i s , P.J., 1994, Consequences of the spatial distribution of microbial communities in soil. In: Beyond fhe Biomuss, K . Ritz. J. Dighton & K.E. Giller (Eds.), pp. 239-246, J. Wiley & Sons, Chichester.
Hany, D.G., 1988, Ground ice and pennafrost. In: Advances in Perighcial Geomorphology, M.J. Clark (Ed.), pp. 113-149, John Wiley & Sons, Chichester.
154 7. References
Hartge, K.H. & R. Horn, 1989, Die physikalische Untersuchung von Böden Enke, Stuttgart, 175 pp. (in German).
Hassink, J., L.A. Bouwman, K.B. Zwart & L. Brussaard, 1993, Relationships behveen habitable pore space, soil biota and mineralization rates in grassland soils, Soil Biol. Biocl~em.. 25 (I): 47-55.
Heilmami, B., 1993. Bestimmung der mikrobiellen Biomasse mittels Wärmeproduktion In: Bodenbiologische Arbeitsrnethoden. F. Schirmer, R. Öhlinger E. Kandeler & R. Margesin (Eds.), pp. 73-77, Springer; Berlin, Heidelberg.
Henriksson, E.. L.E. Henriksson. J.O. Norrrnan & P.O. Nyman, 1987, Biological dinitrogen fixation (acetylene reduction) exhibited by blue-green algae (cyanobacteria) in association with mosses gathered on Surtsey, Iceland, Ard. Alp. Res., 19 (4): 432-436.
Holding, A.J., 198 1, The microflora of tundra. In: Tundra ecosystems: ( I comparative ana!l~sis, L.C. Bliss, O.W. Heal & J.J. Moore (Eds.), pp. 561-585, Cambridge University Press, Catnbridge.
Holding, A.J., O.W. Heal, S.F. MacLean. Jr. & P.W. Flanagan (Eds.), 1974, Soil Organisnis und decomposition in ttindra, Tundra Biome Steering Committee. Stockholm.
Holm-Hansen, 0 . & C.R. Booth, 1966, The measurement of adenosine triphosphate in the ocean and its ecological significance, Limnol. Oceanogr., 1 1: 5 10-5 19.
Horwarth, W.R., E.A. Paul, D. Harris, J.Norton, L. Jagger & K.A. Horton, 1996, Defining a realistic control for the chloroform hmigation-incubation method using microscopic counting and C-substrates, Can. J. Soil Sei., 76: 459-467.
Humboldt, A, V. , 1969, Ansichten der Natur, Reclam, Stuttgart, (in German).
Insam, H., 1990, Are tlie soil microbial biomass and basal respiration governed by the climatic regime? Soil Biol. Biochem., 22(4): 525-532.
Insam, H. & R. Öhlinger 1993, Ökophysiologisch Parameter. In: Bodenbiologische Arbeitsrnethoden, F . Schimier, R. Öhlinger E. Kandeler, R. Margesin (Eds.), 2nd Edition, pp. 281-284; Springer Labor, Springer, Heidelberg, Berlin, (in Gennan).
Inubushi, K.. P.C. Brookes & D.S. Jenkinson, 1989, Adenosine 5'-triphosphate and adenylate energy charge in waterlogged soils, Soil Biol. Biochem, 21 (5): 733-739.
Isayeva, L.L., 1984, Late Pleistocene glaciation of North-Central Siberia. In: L,afe Quaternat-y Environments of the Sovief Union, A.A. Velsliiko. H.E. Wright & C.W. Barnosky (Eds.). pp. 21-30, University of Minnesota Press, Minnesota,
Iskandar, I.K. & J.K. Syers, 1972, Metal-complex formation by liehen compounds, J. Soil Sci., 23(3): 255-265
Ivanova, Ye.N., Ye. V. Lebova, N.A. Nogina. N.N. Rozov, V.M. Fridland & S.A. Shuvalov, 1969, Present Status of the doctrine of soil genesis in the U.S.S.R., Soviel Soil Science, translated from Pochvovedeniye, 5: 13-26.
Jenkinson, D.S. & J.M. Oades, 1979, A method for measuring adenosine triphosphate in soil, Soil Biol. Biochem.. 11: 193-199.
Jenkinson, D.S. & J.N. Ladd, 1981, Microbial bioniass in soil: Measurement and turnover. In: Soil Biocheinistry, E.A. Paul & J.N. Ladd (Eds.), pp. 415-471, M. Dekker; New York, Basel.
Jenkinson, D.S., S.A. Davidson & D.S. Powlson, 1979, Adenosine triphophate and microbial biomass in soil, Soil Biol. Biochem.. 11: 193-199.
Joergensen, R.G., 1995, The fumigation incubation method. In: Mefhods in Applied Soil Microbiologv and Biocl~entistry, K . Alef & P. Namiipieri (Eds.), pp. 376-38 1, Academic Press; London, San Diego.
Jones, D. &, M.J. Wilson, 1986. Biomineralisation in crustose lichens. In: Bion~ineralisafion in Lower Plants and Animals, B.S.C. Leadbeater & R. Riding (Eds.), The Systematics Association, Clarendon, Oxford, 3: 91-105.
Kandeler, E. & E. Murer, 1993. Aggregate stability and soil microbial processes in a soil wilh different cultivation. In: Soil stmcture/soil biota interrelationships; L. Bmssaard & M.J. Kooistra (Eds.), Geoderriia, 56: 503-5 13.
Kane, D.L., L.D. Hinzman, M.-K. Woo & K.R. Everett, 1997, The Impact of Hydrologie Perturbations on Arctic Ecosystems Induced by Climate Change. In: Global Change and Arctic Terresfrial Ecosystems, W.C. Oechel, T. Callaghan, T. Gilmanov, J.I. Holten, B. Maxwell, U. Molau, B. Sveinbjömsso (Eds.), Ecological Studies 124, pp. 63-8 1, Springer; Berlin, Heidelberg.
Kaie, D.L., L.D. Hinzman, M.-K. Woo & K.R. Everett, 1992, Arctic Hydrology and Climate Change. In: Arctic Ecosystetns in a Chatiging Climate, F.S. Chapin 111, R.L. Jefferies, J.F. Reynolds, G.R. Shaver & J. Svoboda (Eds.); Academic Press, San Diego; pp. 35-57.
Khain, V.E., 1985, Geology of the USSR. In: Beiträg zur Regionalen Geologie der Erde, Bd. I, pp. 118-131, Gebr. Bomtraegcr, Bcrlin.
Kielland: K. & F.S. Chapin. 1992, Nutrient Absorption and Accumulation in Arctic Plants. In: Arctic Ecosystems in a Changing Ciimate, F.S. Chapin 111. R.L. Jefferies, J.F. Reynolds, G.R. Shaver & J. Svoboda (Eds.); pp. 32 1-335; Academic Press, San Dicgo.
Killhan~. K., 1994, Soil ecologv, Cambridge University Press, Cambridge, 242 pp.
Kirtsidely. U,, N.I. Vorob'eva & O.M. Tereshenkova 1995, Influence of industrial pollution On the communities of soil micromycctes of forcst tundra in Taimyr Peninsula, Mikologija i j toptologiju, 29 (4): 12-19.
Kirtsidely, I.J.. N.I. Vorobyov & B.A. Tomilin, 1994. Influence of chemical contaminations to the fungal communities in soil of Peninsula Tain~yr, EERO Symposium 011 Chemical Risk Assessment, Moscow.
Kjaller, A. & S. Struwe, 1982, Microfungi in ecosysteins: Fungal occurrence and activity in litter and soil, Oikos, 39: 389-422.
Köstcr M.. 1992, Mikrobieller Abbau von organischem Material an Grenzzonen - erläuter an Beispielen von der Nordsee und des Europäische Nordmeeres, Ber. Sonderforsc/i~ingsbereich 313, University of Kiel, No. 35. 148 pp. (in German with English sumn~ary).
Kulik, M.M.. 1995, The potential fo1- using cyanobacteria (blue-grcen algae) and algae in the biological control of plant pathogenic bacteria aiid fungi, E~iropean Journal of Plant Palhology, 101: 585-599.
Lamprecl~t, 1.. 1980, Growth and Metabolism in Yeasts. In: Biological Microcalorimeti'y, A.E. Beezer (Ed.), pp. 43-1 12, Academic Press; London. New York.
Lautridou, J.-P., 1988, Recent advances in cryogenic weathcring. In: Advances in Periglacial Geomorpholofy, M.J. Clark (Ed.), pp. 33-47, J. Wiley & Sons, Chichester.
Lavelle, R., C. Lattaud. D. Trigo & I. Barois. 1995. Mutualism and biodiverstiy in soils, Plant & Soil, 170: 23- 33.
Ljungholm, K,, B. Nor6n & I. Wadsö 1979a, Microcalorimetric observation of microbial activity in normal and acidified soils. Oikos, 33: 24-30.
Ljungholm. K.. B. Noren, R. Sköl & I. Wadsö 1979b, Use of ~i~icrocaloriinetry for the characterization of the microbial activity in soil, Oikos. 33: 15-33.
Lloyd, J. & J.A. Taylor, 1994, On the teinperaturc dependence of soil respiration, Functional Ecolos\', 8: 315- 323.
Loeschke, V..1987, Niche stnicturc and evolution in ecosysteins. In: Potentials and limitations of ecosystem anal~:sis> Ecological Studies. Vol, 61; E.-D. Schulze & H. Zwölfe (Eds.), pp. 320-332, Berlin, Heidelberg.
Lysak, L.V. & T.G. Dobrovol'skaya, 1982, Bacteria in the soils of the Western Taymyr tundra, Soviet Soil Sei., 5 (5): 34-38.
Marshall. T.J, J.W. Holmes & C.W. Rose, 1996, Soil Physics, 3rd edition, Cambridge University Press, Cambridge, 453 pp.
Martens, R., 1990, Contribution of rhizodeposits to the maintenance and growth of soil microbial biomass, Soil Biol. Bioehern.. 22 (2): 141-147.
Matthews, E., 1983, Global Vegetation and Land Use: New High-Resolution Data Bases for Climate Studies, J. Climate Appl. Meterol., 22:474-487.
Matveyeva, N.V., 1994, Floristic classification and ecology of tundra vegetation of the Tayinyr Peninsula, norihern Siberia, ./. Veg. Sei., 5: 813-828.
Matveyeva, N.V., O.M. Parinkina, Yu. I. Chemov, 1975, Maria Pronchitsheva Bay, USSR. In: Slivclure und Function of Tundra Ecosystems, Rosswall, T. & O.W. Heal (Eds.), Ecol. Bull. NO. 20, pp. 61-72, Swedish Natural Science Research Council, Stockholin.
Maxwell, B. 1997, Recent Climate Pattcms in the Arctic. In: Global Change und Arctic Terrestrial Ecosystems, W.C. Oechel, T . Callaghan. T. Gilmaiiov, J.I. Holten, B. Maxwell, U. Molau, B. Sveinbjömsso (Eds.), Ecological Studies 124, pp. 2 1-46, Springer; Berlin, Heidelberg.
Maxwell, B. 1992; Arctic Climate: Potential for Change under Global Wanning. In: Arctic Ecosystems in a Changing Climate, F.S. Chapin 111, R.L. Jefferies, J.F. Reynolds, G.R. Shaver & J. Svoboda (Eds.), pp. 11-34; Academic Press, San Diego.
Melles, M. (Ed.). 1994, The expeditions NORILSKITAYMYR 1993 and BUNGER OASIS 1993194 of the AWI Research Unit Potsdam, Reports on Polar Research, No. 148, Alfred Wegener Institute for Polar and Marine Research. Bremerhaven.
156 7. References
Melles, M., B. Hagedorn & D.Yu. Bolshiyanov (Eds.), 1997, Russian-German Cooperation: The Expedition TAYMYWSEVERNAYA ZEMLYA 1996, Reports 011 Polar Research, No. 237, Alfred Wegener Institute for Polar and Marine Research, Bremerhaven, 170 pp.
Miller Jr., O.K. & G.A. Laursen, 1978, Ecto- and endomycorrhizae of arctic plants at Bai~ow, Alaska. In: Vegetation and Production Ecolop of an Alaskan Arclic Tundra, L.L. Tieszen (Ed.), pp. 229-237, Springer-Verlag. New York, Heidelberg, Berlin.
Mishustin, E.N,, 1975, Microbial Associations of Soil Types. Microb. Ecol., 2: 97-1 18.
Maller, P., D.Yu. Bolsliiyanov. A. Dereviagin & G. Carlernalm, 1997, Studies of late Quatemary sediments and geocryology. In: Russian-Gennan Cooperation: The Expedition TAYMYSSEVERNAYA ZEMLYA 1996, M. Melles, B. Hagedorn & D. Yu. Bolshiyanov (Eds.), Reports on Polar Research, No. 237, pp. 79-97, Alfred Wegenes Institute for Polar and Marine Research, Bre~nerhaven.
Monreal, C.M. & H. Kodama. 1997, Influence of aggregate architecture and minerals 011 living habitats and soil organic matter, Can. J Soil Sei., 77: 367-377.
Moore, T.R. & M. Dalva, 1993, Tlie influence of temperature and water table position on carbon dioxide and methanc etnissions from laboratoiy columns of peatland soils, J. Soil Sei., 44: 65 1-664.
Moorhead, D.L. & A.E. Linkins, 1997, Elevated CO; alters belowground exoenzyme activities in tussock tundra, Plant andSoil, 189: 32 1-329.
Mortensen, U., B. NOS& & I. Wadsö 1973. Microcalorimetry in the study of the activity of microorganisms, Bull. Ecol. Res. Coinin (Stockholm), 17: 189- 197.
Müller-Lupp T., 1997, Untersuchungen zur Verbreitung und Ausbildung von Frostmusterböde in der nordsibirischen Arktis. Unpublished Thesis (Geography), Dpt. of Soil Science, Universiiy of Hamburg, 108 pp. (in German).
Munsell Color Company. 1988, Munsell soil color Charts, Munsell Color, Baltimore.
Nadelhoffer. K.J.. G. R. Shaver, A. Giblin, & E.B. Rastetter. 1997, Potential impacts of climate change on nutrient cycling, decon~position, and productivity in arctic ecosystems. In: Global Change and Arctic Terrestrial Ecosyste~n.~~ W.C. Oecliel, T. Callaghan, T. Gilmaiiov, J.I. Holten, B. Maxwell, U. Molau, B. Sveinbjömsso (Eds.), Ecological Studies 124, pp. 349-364, Springer; Berlin, Heidelberg.
Nadelhoffer. K.J., A.E. Giblin, G.R. Shaver, & A.E. Linkins, 1992. Microbial processes and plant nutrient availability in arctic soils. In: Arctic Ecosystems in a Changing Climate, F.S. Chapin 111, R.L. Jefferies, J.F. Reynolds. G.R. Shaver & J. Svoboda (Eds.), pp. 28 1-300, Academic Press, San Diego.
Nannipieri, P., 1990, Ecological Significance of the Biological Activity in Soil. In: Soil Bioe)ze~?list~~~, Vol. 6, J,-M. Bollag & G. Stotzky (Eds.), pp, 293-355, M. Dekker; New York, Basel.
Nannipieri, P., G. Pietramellara, L. Falchini. M.A. Bradford, N. Parekh, F. Pinzari & N. Schmidt, Microbial diversity and activity in soil: meaning. liiiiits and advantages of the present metliods, 'Notes R o m the Underground' Proceedings of the NATO-ASI, NATO publications, 63 pp.; Springer, Heidelberg, Berlin, in press.
Nannipieri, P., L. Badalucco & L. Landi, 1994, Holistic approaches to the study of populations, nutrient pools and fluxes: Limitations and future research needs. In: Beyond the Biomass, K . Ritz, J. Dighton & K.E. Giller (Eds.), pp. 231-238, J. Wiley & Sons, Chichester.
Nannipieri, P., S. Grego & B. Ceccanti, 1990, Ecological significance of the biological activity in soil. In: Soil Biocheinist~, Vol. 6, J.-M. Bollag & G. Stotzky (Eds.), pp, 293-359, Marcel Dekker, Inc., New York.
Norin, B.N. & I.V. Ignatenko, 1975, Ary-Mas, USSR. In: Struct~ire und Function of Tundra Ecosystems, R. Rosswall & O.W. Heal (Eds.), Ecol. Bull. No. 20, pp. 183-191, Swedish Natural Science Research Council, Stockholm.
Nosko, P., L.C. Bliss & F.D. Cook, 1994, The association of free-living nitrogen-fixing bacteria with the roots of high arctic graminoids, Arct. Alp. Res., 26 (2): 180- 186.
Oades, J.M. & D.S. Jenkinson, 1979, Adenosine triphosphate content of the soil microbial biomass, Soil Biol. Biochem., 1 1: 201-204.
Oberbauer, S.T. & T.E. Dawson, 1992. Water Relations of Arctic Vascular Plants. In: Arctic Ecosystems in a Changing Climate, F.S. Chapin 111, R.L. Jefferies, J.F. Reynolds, G.R. Shaver & J. Svoboda (Eds.); pp. 259-279; Academic Press, San Diego.
Oberbauer, S.F., C.T. Gillespie, W. Cheng, A. Sala, R. Gebauer & J.D. Tenhunen, 1996, Diurnal and Seasonal Patterns of Ecosystem CO; Efflux from an Upland Tundra in the Foothills of the Brooks Range, Alaska, U.S.A., Arct. Alp. Res, 28 (3): 328-338.
Oberbauer, S.F.. J.D. Tenhunen & J.F. Reynolds, 1991, Environmental effect on CO; efflux froni water track aiid tussock tundra in arctic Alaska, U.S.A., Arct. Alp. Res. 23 (2): 162-169.
Ocio, J.A. & P.C. Brookes. 1990. An evaluation of methods for measuring the microbial biomass in soils following recent additions of wheat straw and the characterization of the biomass that develops, Soil Biol. Biochem., 22 (5): 685-694.
Oechel, W.C. & G.L. Vourlitis, 1997. Climate Change in Northem 1,atitudes: Alterations in Ecosystem Structure and Function and Effects 011 Carbon Sequestration. In: Global Change und Arctic Ecosystems, W.C. Oechel, T. Callaghan, T. Gil~nanov. J.I. Holten, B. Maxwell, U. Molau & B. Sveinbjömsso (Eds.), pp. 38 1-401; Ecological Studies 124; Springer: Heidelberg, Berlin.
Oechel, W.C. & G.L. Vourlitis, 1995, Effects of Global Change 011 Carbon Storage in Cold Soils. In: Advances in Soil Scicitce: Soil.~ and Global Change, R. Lal. J. Kimbel, E. Levine & B.A. Stewart (Eds,), pp. 117- 129; CRC Press, Lewis Publ., Boca Raton. Florida.
Oechel, W.C. & W.D. Billings, 1992, Carbon Balance of Arctic Plants and Ecosystems. In: Atxfic Ecosystems in a Changing Cliiiiate. F.S. Chapin 111, R.L. Jefferies, J.F. Reynolds, G.R. Shaver & J. Svoboda (Eds.); pp. 139-168; Academic Press, San Diego.
Ott, J.. 1988, Meereskunde, UTB Ulnler, Stuttgart, 386 pp.
Pagliai. M. & M. De Nobili, 1993, Int. Workshop on Methods of Research on Soil struchlre/soii biota intei~elationships; L. Brussaard & M.J. Kooistra (Eds.). Geoderma, 56: 243-256,
Panikov, N.S., 1997, A Kinetic Approach to Microbial Ecology in Arctic and Boreal Ecosystems in Relation to Global Change. In: Global Change arid Arctic Terrestrial Ecos,v.~(ems, W.C. Oechel, T. Callaghan, T. Gilmanov, J.I. Holten, B. Maxwell, U. Molau, B. Sveinbjömsso (Eds.), Ecological Studies 124, pp. 17 1-1 88, Springer; Berlin, Heidelberg.
Parinkina, O.M., 1989, Microflora of Tundra Soil.~ - Ecological-Geographical Properlies und Productivi@. Akadenliia Nauk USSR, Leningrad, 159 pp. (in Russian).
Parinkina. O.M., 1986, Microorganisms in the co~i~munities of Taimyr southem tundras. In: Sout/iern Tundras of Tainw, pp. 1 5 1 - 167, Nauka. Leningrad (in Russian).
Parinkina, O.M., 1974, Bacterial production in tundra soils. In: Soil Organisms and Decomposition in Tundra, A.J. Holding, O.W. Heal. S.F. Maclean. Jr. & P.W. Flanagan (Eds.), pp. 65-77, Tundra Biome Steering Cominittee, Stockholm.
Parinkina, O.M. & T. Piin, 1992, Soil microbial communities under cryptogamic plants in tundra and arctic deserts. In: Proceedings Joint Russia17-American Seminar on Ct~opedology und Global Change, P i~ .~ /~c i~ i t to 1992; D.A. Gilichinsky (Ed.), pp. 185-189, Russian Academy of Sciences, Pushchino.
Paul, E.A. & F.E. Clark, 1989. Soil Microbiolog\' and Biocheinisti~v, Acadernic Press, San Diego.
Pfeiffer, E.-M. & J. Hartmami, 1995, Characterization of the organic matter in permafrost-affected soils. In: Russian-Gennan Cooperation: The Expedition TAYMYR 1994. C. Siegen & D. Yu. Bolshiyanov (Eds.), Reports on Polar Research, No. 175, pp. 36-41, Alfred Wegener Institute for Polar and Marine Research, Bremerhaven.
Pfeiffer, E.-M., A. Gundelwein. T. Nöthen H. Becker & G. Guggenberger. 1996, Characterization of the organic matter in permafrost soils and sediments of the Taymyr PeninsulaISiberia and Severnaya ZemlyaIArctic Region. In: Russian-German Cooperation: The Expedition TAYMYR 1995 and the Expedition Kolyma 1995 of the ISSP Pushchino Group, D. Yu. Bolshiyanov & H.-W. Hubberten (Eds.), Reports on Polar Research, No. 21 1, pp. 46-63, Alfred Wegener Institute for Polar and Marine Research, Bremerhaven.
Pietramellara, G., L. Dal Canto, C. Vettori, E. Gallori & P. Nannipieri, 1997, Effects of air-drying and wetting cycles 011 the transfonning ability of DNA bound 011 clay minerals, Soil Biol. Biochem., 29 (I): 55-61.
Pitul'ko, V.V., 1997, Archaeological survey in the upper Taymyr River area. In: Russian-German Cooperation: The Expedition TAYMYWSEVERNAYA ZEMLYA 1996. M. Melles, B. Hagedorn & D.Yu. Bolshiyanov (Eds.). Reports on Polar Research, No. 237, pp. 105-107, Alfred Wegener Institute for Polar Marine Research, Bremerhaven.
Pomeroy, L.R., 1974, The ocean's food web, a changing paradigm, BioScience, 24(9): 499-504.
Posselt, D., 1990, Die groJe Nordische Expedition von 1733-1743 - Aus Berichten der Forschungsreisenden Johann G e o ~ Gmelin und G e q Wilhelm Steller, 408 pp., Verlag C.H. Beck, Munich (in Gerrnan).
Prokosch, P. & H. Hötker 1995, Faunistik und Naturschutz auf Taimyr - Expeditionen 1989-1991, C o m 16, special publication of the bulletins of the National Park Schleswig-Holsteinisches Wattenmeer, 264 pp. (in German).
158 7. References
Prosek, P. & R. Brazdil, 1994, Thermics of the tuiidi-a underlier and its conditioning by the energy balance at Barentsburg and Reindalen (Spitsbei-gen Island, Svalbard) in the summer seasons of 1988 and 1990. Scripta Fac. Sei. Nai. Univ. Masarvk. Brun. (Geogra/~/~j¥) 24: 6 1-80.
Raubuch, M. & F. Beese, 1995, Pattern of inicrobial indicators in forest soil along an European transect, Biol. Fen. Soils, 19: 362-368.
Read, D.J., R. Francis & R.D. Finlay, 1985, Mycon'liizal mycelia and nutrient cycling in plant communities. In: Ecological Interaction in Soil - Plants, ~bficrobes lind Animu1.s~ A.H. Fittei-, D, Atkinson, D.J. Read & M.13. Usher (Eds.) Spec. Publ, No. 4, British Ecological Society, pp. 193-217, Blackwell, Oxford.
Richaume, A., C. Steinberg, L. Jocteur-Monrozier & G. Faurie. 1993, Sliort communication - Differences bctween dii-ect aiid indirect enumeratioii of soil bacteria: Tlie iiifluence of soil structure and cell location, S'orl Biol. Biochem. 25 (5): 641-643.
Rieger, S., 1983. Thc Genesis and Classification of Cold Soils. Academic Press. New York, 230 pp.
Rieger, S. , 1974, Ai-ctic soils. In: Arctic und Alpine Environments. J.D, lves & R.G. Bany (Eds.), pp. 749-769. Mctliuen & Co.. London.
Robinson. C.H. & P.A. Wookey. 1997, Microbial ecology. decoinposition aiid nutrient cycling. In: Ecology oj Arclic Environments. S.J. Woodin & M. Marquiss (Eds.). Spec. Pubi. 13. Britisli Ecological Society, pp. 4 1-68, Blackwell Science. Oxford.
Ronianova, E.N. 1970, Tlie microclimatic characteristics of the Taimyr tundra. Tru+ Glavn. Geofiz. observatorii, 264: 1 12- 1 18 (in Russian).
Romaiiova. K.N. & Z.A. Utkina, 1973. Sonie data on the thermal 1-egiine of tlie Taimyi- tundra, Tm& Glavn. Geofiz. observuiorii, 306: 100- 107 (in Russian).
Ross, D.J.. K.R. Tate, A. Caims & E.A. Pausicr. 1980. Microbial biomass estimations in soils from hissock grasslaiids by three biocheinical procedures, Soil Biol. Bioehern., 12:375-383.
Rosswall. T., 1975, Introduction. In: F m o ~ c a n d i a n Tundra Eco.sj~.sieni.',, Part I , Plant.'; und Microorganisms, F.E. Wielgolaski (Ed.), Ecological Studies 16, pp. 227-229. Springer-Verlag; Berlin, Heidelberg, New York.
Rosswall, F. & O.W. Heal (Eds.). 1974. Sir~iciure and Function of Tundra Eco.s~~,ste~~~.s, Ecol. Bull. No. 20, 450 pp., Swedisli Natural Science Research Council. Stockholm.
Rosswall, T.. J.G.K. Flower-Ellis. L.G. Johansson. S. Jonsson. B.F.. Rydkn & M. Sonesson, 1975, Stordalen (Abisko), Sweden. In: Sinietui'e und Finiction of Tundra Ecosj~stem, T. Rosswall & O.W. Heal (Eds.). Ecol. Bull. No. 20. pp. 265-294. Swedish Natural Science Research Council. Stockholin.
Rowntree, P.R., 1997, Global Regional Pattenis of Climate Change: Recent Pi-edictions for the Arctic. In: Global Change und Arciic Terrestrial Ecosysiems, Ecological Studies 124. W.C. Oechel, T. Callaghan, T. Gilmaiiov, J.I. Holten, B. Maxwell. U. Molau. B. Sveinbjömsso (Eds.), pp. 82-109, Spriiiger: Berlin, Heidelberg.
SZmo, A. & K. Lindström 1995, Isolation aiid identification of DNA froni soil. In: Methods in Applied Soil Microbiology', K. Alef & P. Nannipien (Eds.). pp. 440-45 1, Academic Press, London.
hntruckova, H. & M. Straskraba, 1991, On the relationship between specific respiration activity and inicrobial biomass in soils, Soil Biol. Biochem.. 23(6): 525-532.
Scheffer/Schacl~tschabel, 1998, Lehrbuch der Bodenkunde, 14th revised and extended edn. by P. Scliaclitschabel. H.-P. Blume, G. Brummer, K.-H. Haitge, U. Schwertmann. K. Auersbach, L. Beyer, W.R. Fischer, I. Kogel-K-nabner, M. Renger & 0 . Strebel; Enke, Stuttgart, 494 pp. (in Gennan).
Schenk, E.. 1955, Die Mechanik der periglazialen Strukturböden Hessisches Landesaint fü Bodenforschung (Ed.), Abhandlungen des hessischen Landesamts fü Bodenforschung, Wiesbaden, (in Geimaii).
Schimel, D.S., B.H. Braswell, E.A. Holland, R.McKeown, D.S. Ojima, T.H. Painter, W.J. Paiton, & A.R. Townsend, 1994, Cliinatic, edaphic, and biotic controls over Storage and turnover of carbon in soils, Global Biogeochemical Cycles, 8(3): 279-293.
Schimel, J.P., 1995, Ecosystem consequences of microbial diversity and community stiucture. In: Arctic und Alpine Biodiversity: Patterns, Causes and Ecosystem Consequences, F.S. Chapin 111 & Chr. Köme (Eds.), pp. 239-254, Ecological Studies 1 13, Springer: Berlin, Heidelberg.
Schimel, J.P., K. Kielland, and F.S. Chapin, 1996, Nutrient availability and uptake by tundra plants. In: Landscape Funciion arid Disiurbance ii? Arctic Tundra, J.F. Reynolds & J.D. Tenhunen (Eds.), pp. 203- 22 I , Ecological Studies 120, Springer: Berlin, Heidelberg.
Schin~el, J.P, E.A. Holland & D. Valentine, 1993, Controls from methane flux from tei~estrial ecosystems, American Society ofAgronoty, 55: 167-1 82.
7. References 159
Schirmer, F., R. Öhliger E. Kandeler & R. Margesin (Eds.), 1993, Bodenbiologische Arbeitstnethoden, 2. Auflg,; Springer; Berlin, Heidelberg, 389 pp. (in German).
Schlegel, 1992, Allgemeine Mikrobiologie. Thieme; Stuttgart, New York, 634 pp.
Schlichting: E., H.-P. Blume & K. Stahr. 1995, Bodenkiindlliches Praktikum - Eine Einfuhrung in peclologisches Arbeiten f Å ¸ Ökologen insbesondere Land- und Forshvirte, undfŸ Geowissenscha~ler, 2., revised edn.. Blackwell-Wissenschaftsverlag; Berlin, Oxford (in German).
Schmidt, N. & M. Bölter Fungal and bacterial biomass in arctic tundra soils from Taymyr Peninsula, Central Siberia, unpubl data.
Schmidt, N.. 1993. Biogenic weathering processes by saxicolous lichens and their significance for pedogenesis, M.%. Thesis (Soil Science). University of Aberdeen, 86 pp.
Schunke. E. & S.C. Zoltai, 1988. Earth Hummocks (Thufur). In: Advances in Periglacial Geomorphology, M.J. Clark (Ed.), pp. 231-245. J. Wiley & Sons, Chichester.
Shaver, G.R., 1995. Plant (Ÿnctiona diversity and resource control of primary production. In: Arctic arid Alpine Biodiver.~itr: Patterns, Causes arid Eco,sj:stem Consequences, F.S. Chapin 111 & Chr. Körne (Eds.), pp. 199-21 1, Ecological Studies 113, Springer; Berlin, Heidelberg.
Siegert, C. & D. Bolshiyanov (Eds.), 1995, Russian-German Cooperation: The Expedition TAYMYR 1994, Reports on Polar Research, No. 175, Alfred Wegener Institute for Polar and Marine Research, Bremerhaven, 9 1 pp.
Siegert, C.. A. Derevyagin & G. Vannahme, 1996, Geociyological a id paleogeographical studies inthe Labaz Lake area. In: Russian-Gennan Cooperation: The Expedition TAYMYR 1995 and the Expedition KOLYMA 1995 of the ISSP Pushchino Group, D.Yu. Bolshiyanov & H.-W. Hubbertsen (Eds.), Reports on Polar Research, No. 21 1, pp. 28-45, Alfred Wegener Institute for Polar and Marine Research, Bremerhaven.
Siegelt, C., S.F. Khrutsky & A.Yu. Derevyagin, 1995, Paleogeographical investigation of permafrost. In: Russian-German Cooperation: The Expedition TAYMYR 1994, C. Siegert & D. Bolshiyanov (Eds.), Reports on Polar Research, No. 175, pp. 27-36, Alfred Wegener Institute for Polar and Marine Research, Bremerhaven.
Skopp, J., M.D. Jawson & J.W. Doran, 1990, Steady-state aerobic microbial activity as a (Ÿnctio of soil water content, Soil Sci. Soc. Am. J . , 54: 1619-1625.
Slobodkin, A L , N.S. Panikov, & G.A. Zavarzin, 1992, Microorganism methane formation and consumption in tundra and middle taiga bogs. M i c r o b i o l o ~ ~ 61 (4): 486-493.
Smiles, D.E., 1988, Aspects of the physical environment of soil organisms, Biol. Fert. Solls, 6: 204-215.
Smith, O.L., 1982, Soll Microbiologv: A Model of Decomposition und Nutrient Cycling, CRC Series in Mathematical Model in Microbiology; CRC Press, Boca Raton, Florida.
Söderströ B.E., 1979, Some problems in assessing the flourescein diacetate-active fungal biomass in the soil, Soil Biol. Biochem., 1 1: 147-148.
Soil Survey Staff, 1998, Keys to Soil Taxonomy, 8th Ed., Pocahontas Press Inc., BlacksburghiVirginia.
Soil Survey Staff, 1994, Keys to Soil Taxonomy, 6th Ed., Pocahontas Press Inc., BlacksburghIVirginia.
Sokolov. I.A. & B.P. Gradusov, 1978, Soil fonnation and weathering on basic rocks in a cold humid climate, Sov. Soil Science: 1 1-22.
Solheim. B., A. Endal & H. Vigstad. 1996, Nitrogen fixation in Arctic vegetation and soil from Svalbard. Norway, Polar Biol., 16: 35-40.
Soinmerkorn, M., 1998. Patterns and control of CO2 fluxes in wet tundra types of the Taimyr Peninsula, Siberia - the contribution of soils and mosses., Dissertation, Reports on Polar Research, No. 298, 219 pp., Alfred Wegener Institute for Polar and Marine Research, Bremerhaven.
Sommerkom, M., 1997, Aerob carbon fluxes. In: Russian-Gerrnan Cooperation: The Expedition TAYMYRISEVERNAYA ZEMLYA 1996, M. Melles, B. Hagedorn & D. Yu. Bolshiyanov (Eds.), Reports on Polar Research, No. 237, pp. 30-35, Alfred Wegener Institute for Polar and Marine Research. Bremerhaven.
Sommerkom, M., 1996, Microbiological and botanical studies - Labaz Lake. In: Russian-German Cooperation: The Expedition TAYMYR 1995 and the Expedition KOLYMA 1995 of the ISSP Pushchino Group D.Yu. Bolshiyanov & H.-W. Hubberten (Eds.), Reporfs on Polar Research, No. 21 1, pp. 64-72; Alfred Wegener Institute for Polar and Marine Research, Bremerhaven.
Sommerkom, M. 1995, Microbial communities and carbon tumover in the tundra. In: Russian-Gennan Cooperation: The Expedition TAYMYR 1994, Siegert, C. & D. Bolshiyanov (Eds.), Reports on Polar Research, No. 175, pp. 41-5 1, Alfred Wegener Institute for Polar and Marine Research, Bremerhaven.
Sarensen. J., 1997, The rhizosphere as a habitat for soil microorganisms. In: Modern Soil Microbiology, J.D. van Elsas, J.T. Trevors & E.M.H. Wellington (Eds.), pp. 21-61, Marcel Dekker, New York.
Spaargaren, O.C. (Ed.), 1998, World Reference Base for Soil Resources. FAO/ISRIC/ISSS, WageningeniRome.
Sparks, D.L., 1988, Kinetics of Reactions in Pure and Mixed Systems. In: Soil Physical Chemistty. D.L. Sparks (Ed.). pp. 83-146, CRC Press, Boca Raton.
Sparling, G.P., 1995, The substrate-induced respiration niethod. In: Methods in Applied Soil A4icrobiolosy, K. Alef & P. Narmipieri (Eds.), pp. 397-404, Academic Press, London.
Sparling. G.P., 1985, The Soil Biomass. In: Soil Organic Matter und Biological Activi?, D. Vaughan & R.E. Malcolm (Eds.), pp. 224-262, M. NijhoffIDr. W. Junk, Dordrecht.
Sparling, G.P., 1983, Estimation of the microbial biomass and activity in soil using microcalorimetry, J. Soil Sci., 34: 381-390.
Sparling, G.P., 1981a, Heat output of the soil biomass. Soil Biol. Biochem., 13: 373-376.
Sparling, G.P., 198 lb, Microcalorimetry and other methods to assess biomass and activity in soil, Soil Biol. Biorliem., 13: 93-98.
Sparling, G.P. & F. Eiland, 1983. A comparison of methods for measuring ATP and microbial biomass. Sod Biol. Biochem., 15: 227-229.
Sparling, G.P., T.W. Speir & K. N. Whale, 1986, Changes in niicrobial biomass C, ATP content, soil phospho- monoesterase and phoso-diesterase activity following air-drying of soils, Soil Biol. Biochem., 18 (4): 363-370.
St. Clair, L.L. & J.R. Johansen, 1993, Introduction to the symposium on soil cmst comnunities, Greaf Busin Akt., 53 (1): 1-4.
Steinmann, P. & W. Shotyk, 1997, Chemical composition, pH, and redox state of sulfur and iron in complete vertical porewater profiles from two Sphagmnn peat bog, Jura Mountains, Switzerland, Geochim. Cosi~iochim. Acta, 61(6): 1 143-1 163.
Stoner, M,G., F.C. Ugolini & D.J. Marrett, 1983, Moisture and temperature changes in the active layer of Arctic Alaska. In: Proceedings of the Fourth International Conference on Pertriafrost, Fairbanks, Alaska, July 17-22, 1983; University of Alaska, National Acadeniy of Sciences, pp. 1194-1 198; National Academy Press; Washington, D.C..
Strasburger, E. , P. Sitte & H. Ziegler (Eds.), 1998, Lehrbuch der Botanik fŸ Hochschulen, 34th edn., Urban & Fischer, Stuttgart, 1078 pp. (in German).
Suslov, S.P., 1961, Physical Geogrciphy of Asiatic Russia, (translated by N.D. Gershevksy & J.E. Williams), W.H. Freeman & Company, San Francisco, London, 594 pp.
Sveinbjö~nsson B., 1992, Arctic Treeline in a Changing Climate. In: Arctic Ecosystems in a Chatiging Clitnute, F.S. Chapin 111. R.L. Jefferies, J.F. Reynolds, G.R. Shaver & J. Svoboda (Eds.); pp. 239-256; Academic Press, San Diego.
Svoboda, J. & B Freedmann, 1994, Ecolosy of Polar Oasis, Alexandra Fiord, Ellesmere Island, Captus University Publications, Toronto, 268 pp.
Syzova, M.V. & N.S. Panikov, 1995, Biomass and composition of microbial communities in soils of Northe~n Russia. In: Global Changd und Arctic Terrestrial Ecosystems, Proccedings Int. Conf., Ecosystems Research Report 10, pp. 263-266, Directorat-General XII, Luxembourg.
Tate, R.L., 1995, Soil Microbiolog\\ John Wiley & Sons; New York, Chichester, Brisbane, Toronto, Singapore. 398 pp.
Tedrow, J.C.F., 1977, Soils ofpolar landscapes, Rutgers University Press, New Brunswick, N.J., 638 pp.
Thannheiser, D., 1989, Eine landschaftsökologisch Detailstudie des Bereichs der Prä-Dorset-Statio Umingmak (Banks Island, Kanada), Polarforschiitig, 59 (1-2): 61-78.
Tibbett, M.. K. Grantham, F.E. Sanders, & J.W.G. Caimey, 1998a, Induction of cold active acid phosphomonoesterase activity at low temperature in psychrotrophic ectomyconhizal Hebeloma spp., Mycol. Res., accepted.
Tibbett, M., F.E. Sanders, S.J. Mintor, M. Dowell, & J.W.G. Caimey, 1998b, Utilization of organic nitrogen by ecto~nycorrl~izal Hebelotmi spp. of arctic and tenlperate origin, A(vco1. Res., accepted.
Tibbett, M, , F.E. Sanders & J.W,G. Caimey, 1998c. The effect of teniperature and inorganic phosphoi-us supply 011 growtli and acid pliosphatase production in arctic and temperate strains ofectomycorrhizal Hebeloma spp. in axenic culturc. m c o l . Res., 102 (2): 129- 135.
Tiedje, J.M.. A.J. Scxstone. T.B. Parkin, N.P. Revsbech & D.R. Shelton, 1984, Anaerobic processes in soil, Plant und Soil, 76: 197-2 12.
Tiessen. 11. & J.W.B. Stewart, 1988, Light and electron microscopy of stained inicroaggregates: The role of organic matter and microbes in soil aggregation. Biogeochem.. 5: 3 12-322.
Tisdall, J.M., 1994. Possible role of soil niicroorganisms in aggregation in soils, Plat:! & Soil, 159: 115-121.
Torsvik. V.. J . Goksoyr, F.L. Daae. R, Sorheim, J. Michalsen & K. Saite, 1994, Use of DNA aiialysis to dctennine the diversity of microbial comiiiiinities. In: Be~ot~cl the Biomass, K. Ritz, J . Dighton & K.E. Gillcr (Eds.). British Soil Science Society (BSSS), pp. 39-48; J. Wiley & Sons, Chichester.
Troll. C.. 1944. Strukturböden Solilluktion und Frostklimate der Erde, Geol. Rundschau, 34: 545-694 (in Geman).
Trolldenier. G, . 1993, Fluoreszenzmikroskopisclie Zahlung von Bodenbakterien. In: Bodenbiologische Arbeitsmethoden, F. Schirmer. R. Öhliger E. Kandeler & R. Margesin (Eds,), 2. Auflg., pp. 16-21; Springer; Berlin, Heidelberg (in German).
Ugolini, F.C., M.G. Stoner & Marrett, D.J.. 1987, Arctic pedogenesis: I. Evidence for contemporary podzolization, Soil Science, 144: 90-100.
Ulrich, A. & P.L. Gersper, 1978, Plant nutrient limitations of tundra plant growth. In: Vegetation und Production Ecolop of an Alaskan Arctic Tundra, L.L, Tieszen (Ed.), pp. 457-481, Springer; New York, Heidelberg, Berlin.
Vainshtein, M.B. & G.I. Gogotova, 1992. The sulfate-reducing bacteria in constant-frozen soils. In: Proceedings Joint Russian-American Setnit;(~i. on Ctyopedology and Global Change, Pushchino 1992, D.A. Gilichinsky (Ed.), pp. 243-247, Russian Academy of Sciences, Puslichino.
Van de Werf, R, & W. Verstraete, 1979, Direct measurement of microbial ATP in soils. In: Proceedings J978 International Symposium on Ana!vtical Applications of Bioluminescence and Chen~oluminescence, E. Schram & P. Stanley (Eds,). pp. 333-338. State Printing and Publ.. West Lake, CA.
Vance. E.D.. P.C. Brookes & D.S. Jenkinson, 1987, Microbial biomass nieasurements in forest soils: The use of tlie chloroform hmigation-incubation method in strongly acid soils, Soil Biol. Bioehern., 19 (6): 697- 702.
Vandenhove, H., K. De Coninck, K. Coorvits, R. Mcrckx & K. Vlassak, 1991, Microcalorimetry as a tool to detect changes in soil microbial biomass. Toxicological and Enviroimiental Chemistt-y, 30: 201-206.
Vassiljevskaya, V.D., V.V. Ivanov, L.G. Bogatyrev, E.B. Pospelova, N.M. Schalaeva & L.A. Grishina, 1975. Agapa, USSR. In: Structure ai7d Fiiiic/ion of Tundra E c o s ~ e n z s . R. Rosswall & O.W. Heal (Eds.), Ecol. Bull. No. 20, pp. 141-158, Swedisi~ Natural Science Research Council, Stockholm.
Vecherskaya, M.S., V.F. Galchcnko. E.N. Sokolova & V.A. Samarkin. 1993, Activity and species composition of aerobic methanotrophic comuni t ies in tundra soils, Curr. Microbiol., 27: 18 1 - 184.
Velichko. A.A.. A.A. Andreev & V.A. Kimanov. 1997a. Cliniate and vegetation dynamics in the tundra and forest Zone during tlie late glacial and Holocene, Qiiuternaiy International, 41/42: 71-96.
Velichko, A.A., Y.M. Kononov & M.A. Faustova. 1997b, The last glaciation of eaith: size and volume of ice- sheets, Qiiaternaty International, 4 1/42: 43-5 1 .
Verstraete, W, , H. van de Werf, F. Kucnerowicz, M. Ilaiwi. L.M.J. Verstraeten & K. Vlassak. 1983, Specific measurement of soil ATP. So(7 Bio/. Biochem., 15 (4): 391-396.
Verstraeten. L.M.J., K. de Conninck, K. Vlassak, W. Verstraete. H. van de Werf & M. Ilaiwi, 1983, ATP content ofsoils estiniated by two contrasting extraction inethods, Soil Biol. Bioehern., 15: 397-402.
Vosjan, J.H.. G. Nieuwland, W. Ernst & T. Bluszcz. 1987, Shipboard comparison of two metiiods of extraction and measurement of ATP applied to antarctic water samples, Neth. J. Sea Res., 21 (2): 107-1 12.
Vourlitis. G.L. & W.C. Oecliel, 1997, The Role of Northem Ecosystems in the Global Methane Budget. In: Global Change and Arctic Terrestrial Ecosystems, Ecological Studies 124, W.C. Oechel, T. Callaghan, T. Gilmanov, J.I. Holten. B. Maxwell, U. Molau, B. Sveinbjömssoi (Eds.), pp. 266-289, Springer; Berlin, Heidelberg.
Wadsö I,, 1980, Some problems in calorimetric measurenients 011 cellular systems. In: Biological Microcaloriinett-y, A.E. Beezer (Ed.), pp. 247-274. Academic Press, London.
162 7, References
Wagner, D. & E.-M. Pfeiffer, 1998, Methanbildung in Marschböde und verschieden texturierten Modellböde unter aeroben Bedingungen, Mitteilungen der Deutschen Bodenkiindlichen Gesellschaft, 88: 43-46 (in Gemian).
Walker. M.D., 1996, Arctic soils and pennafrost: Introduction, Arct. Alp. Res., 28 (3): 254-256
Wallmann. K.. 1990. Die F~hdiagenese und ihr Einfluà auf die Mobilitä der Spurenelemente As, Cd, Co. Cu. Ni, Pb und Zn in Sediment- und Schwebstoff-Suspension, Ph. D. Thesis, Technical University of Hanibiirg-Harburg (in German).
Walter, H. & S.-W. Breckle, 1986, Spezielle Ökologi der Gemaßigte und Arktischen Zonen Euro-Nordasiens, akologie der Erde - Band 3, Gustav Fischer, Stuttgart.
Wanner. M., I . Funke & W. Funke. 1994, Effects of liniing, fertilization and acidification on pH, soil moisture, and ATP content of soil froni a spmce forest in Southern Gennany, Biol. Fert. Solls, 17: 297-300.
Wardle. D.A.. 1993, Changes in the microbial biomass and metabolic quoticnt during leaf litter successio~~ in some New Zealand forest and scrubland ecosystems, Functionul Ecologv, 7: 346-355.
Wardle, D.A. & A. Ghani, 1995, A critique of the microbial metabolic quotient (qC02) as a bioindicator of disturbance and ecosystem development, Soil Biol. Biochem.. 27 ( 12): 160 1 - I6 10.
Wardle, D A . & D. Parkinson, 199 1, A statistical evaluation of equations for predicting total niicrobial biomass carbon using pliysiological and biochemical methods, Agriculture, Ecosysfems arid Environment, 34: 75-86.
Washbum, A.L., 1979, Geoc/:~~olog}:, E. Amold Publishers Ltd., London. 406 pp
Watznauer, A., 1982, WCrterbuch Geowi.~.~emchaften Deutsch-Englisch, Verlag H a r i Deutsch; Thun, FrankfurtIM..
Weaver, R.W., S. Angle, P. Bottomley, D. Bezdicek, S. Smith, A. Tabatabai & A. Wollum (Eds.), 1994, A4ethods of Soll Anali>.s-i.7, Part 2, Microbiological and Biochemical Properties, American Society of Agronomy.
Webber, P., 1978, Spatial and Temporal Variation of the Vegetation and Primary Production. In: Vegetation und Production Ecology o fan Almkan Arctic Tundra, L.L. Tieszen (Ed.), pp. 37-1 12, Springer; New York, Heidelberg, Berlin.
Weise, O.R., 1983, Das Periglazial - Geomorphologie und Klima in gletscherfieien, kalten Regionen, Gebr. Bomtraeger; Berlin, Stuttgart, 199 pp.
Whalen, S.C., W.S. Reeburgh, & C.E. Reimers, 1996, Control of tundra methane emission by microbial oxidation. In: Lat~dscape Functioii and Disturbance in Arctic Tundra, J.F. Reynolds & J.D. Teniiunen (Eds,), pp. 257-274, Ecological Studies 120, Springer; Berlin. Heidelberg.
Whittaker. J.B., 1974, Interaction between Fauna and Microflora at Tundra Sites. In: Soil Organisms a ~ d Decomposition in Tundra, A.J. Holding, O.W. Heal, S.F. Maclean. Jr. & P.W. Flanagan (Eds.), Tundra Biome Steering Committee, pp. 183-196, Stockholni.
Whittow, J.B., 1984, Dictioncn?~ ofPlysica1 Geographv, Penguin Books Ltd.; London.
Williams, P.J. & M.W. Smith, 1989, The Frozen Earth - F~mdamentc~ls of Geoctyolosy, Studies in Polar Research; 302 302 pp., Cambridge University Press, Cambridge.
Woodin, S., 1997, Effects of acid deposition on arctic vegetation. In: Ecolos}' of Arctic Environments, S.J. Woodin & M. Marquiss (Eds.), Spec. Publ. 13, British Ecological Society, pp. 219-239, Blackwell Science, Oxford.
Wüthrich Chr., 1994, The biologiual activity of arctic soils with special consideration of ornitliogenic soils (Spitsbergen and Finmark), Baseler Beiträg zur Phsiogeographie, Bd. 17, 222 pp. (in German with tables and figures in English).
Wynn-Williams, D.D., 1994, Potential effects of ultraviolet radiation on Antarctic primary colonizers: cyanobacteria, algae and cryptogams, Ultraviolet Radiation in Antarctica: Measurements and Biological Effects - Antarctic Res. Series, 62: 243-257.
Wynn-Williams, D.D., 1985, Microbiological studies at the Signy Island fellfield research-programme (FERP) sites during tlie 1984-85 field season, Brit. At~tarct. Sui-vev Bull., 68: 107-108.
Zak, D.R., K.S. Pregitzer, P.S. Curtis, J.A. Teeri, R. Fogel & D.L. Randlett, 1993, Elevated atmospheric CO; and feedback between carbon and nitrogen, Plant und Soil. 15 1 : 105- 1 17.
Zelles, L. & K. Alef, 1995, Biomarkers. In: Methods in Applied Soil A4icrobiolosy, K . Alef & P. Nannipieri (Eds.), pp.422-439, Academic Press, London.
Zelles, L., K. Stepper, & A. Zsolnay, 1990, The effect of lime on microbial activity in spruce (Picea ubies L.) forests, Biol. Fer~. Solls, 9: 78-82.
Zelles, L., I . Scheunert, & K. Kreutzer, 1987a, Bioactivity in limed soils of a spruce forest, Bid . Fert. Soils, 3: 21 1-216.
Zelles. L., K. Hund & K. Stepper, 1987b, Differenzierte Erfassung der Bioaktivitä von Pilzen und Bakterien zweier Böde unter Fichte, Z. Pflanzener~~a~~r. Bodenk., 150: 253-257.
Zelles, L., I. Scheunert & F. Korte, 1985, ATP-measurements in soil: a combination between the TCA and NRB extraction method, Chemosphere, 14 (1): 139-148.
Zhu. W.. J.G. Ehrenfeld, R.W. Parmelee, W.F.J. Parsons & X. Han, 1996, The effects of live and dead roots 011 soil fungi in spodosolic soils of the New Jersey Pinelands, Biol. Fert. Soils, 2 1: 215-226.
Zvyagintsev, D.G., 1994. Vertical distribution of microbial communities in soils. In: Beyond the Biomuss: K . Ritz, J . Dighton & K.E. Giller (Eds,); British Soil Science Society (BSSS), pp. 29-37; J. Wiley & Sons, Chichester.
Zvyagintsev. D.G., T.G. Dobrovol'skaya, L.M. Polyanskaya, & LYu. Chernov, 1994, Theoretical background for the ecological assessment of soil microbial capacity. Eiirasian Soil Sei., 26 (9): 3 1-41.
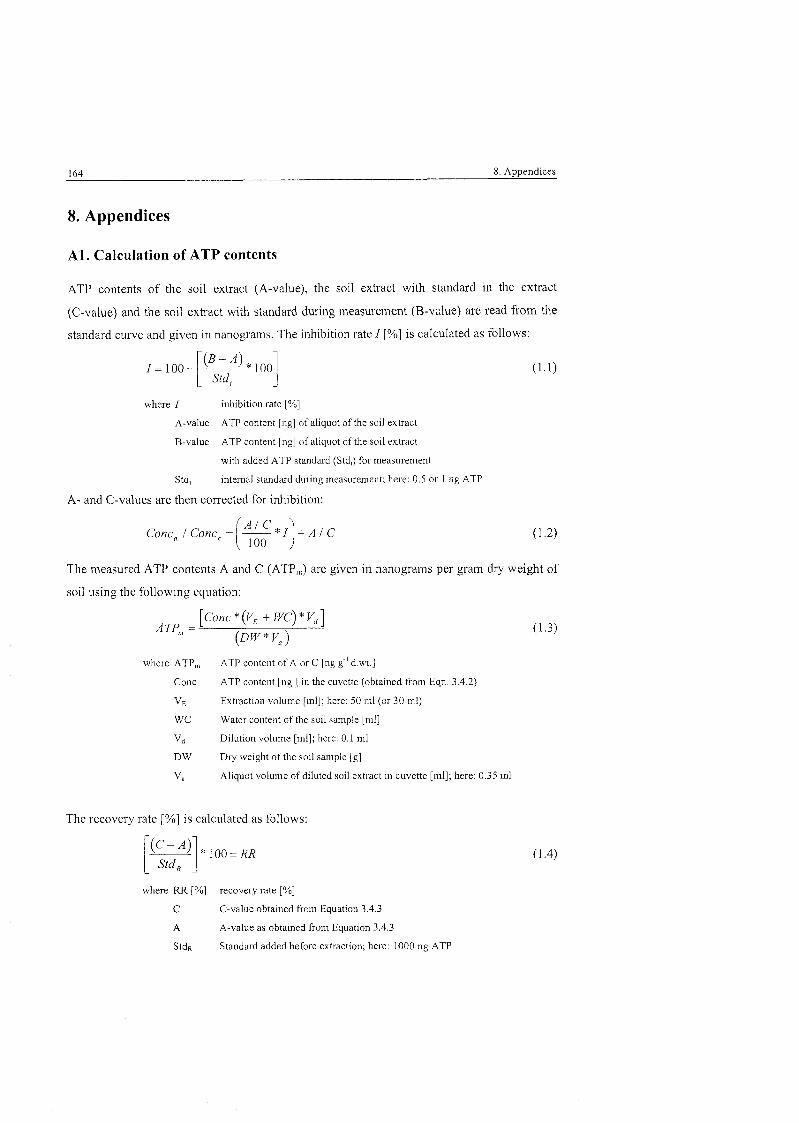
164 8. Appendices
8. Appendices
A l . Calculation of ATP contents
ATP contents of the soil extract (A-value), the soil extract with standard in the extract
(C-value) and the soil extract with standard during ineasurement (B-value) are read fiorn the
standard curve and given in nanogratns. The inhibition rate I [%] is calculated as follows:
where I inhibition rate [%]
A-value ATP content [ng] of aliquot of tlie soii extract
B-value ATP contcnt fng] of aliquot of the soil extract
with added ATP standard (Std,) for measurement
Std, internal standard during measurement; here: 0.5 or l ng ATP
A- and C-values are then corrected for inhibition:
The measured ATP contents A and C (ATPm) are given in nanograms per gram dry weight of
soil using the following equation:
where ATP,,, ATP content of A or C [ng g" d.wt.1
Conc ATP content [ng 1 in the cuvette (obtained from Eqn, 3,4.2)
VE Extraction volume [inl]; here: 50 ml (or 30 ml)
WC Water content of the soil sample [ml]
và Dilution volume [inl]; here: 0.1 ml
DW Dry weight of the soil sample [g]
V, Aliquot volume of diluted soll extract in cuvette [n~l]; here: 0.35 ml
The recovery rate [%I is calculated as follows:
wliere RR [%I recovery rate [%I C C-value obtained from Equation 3.4.3
A A-value as obtained from Equation 3.4.3
Stdc Standard added before extraction; here: 1000 ng ATP
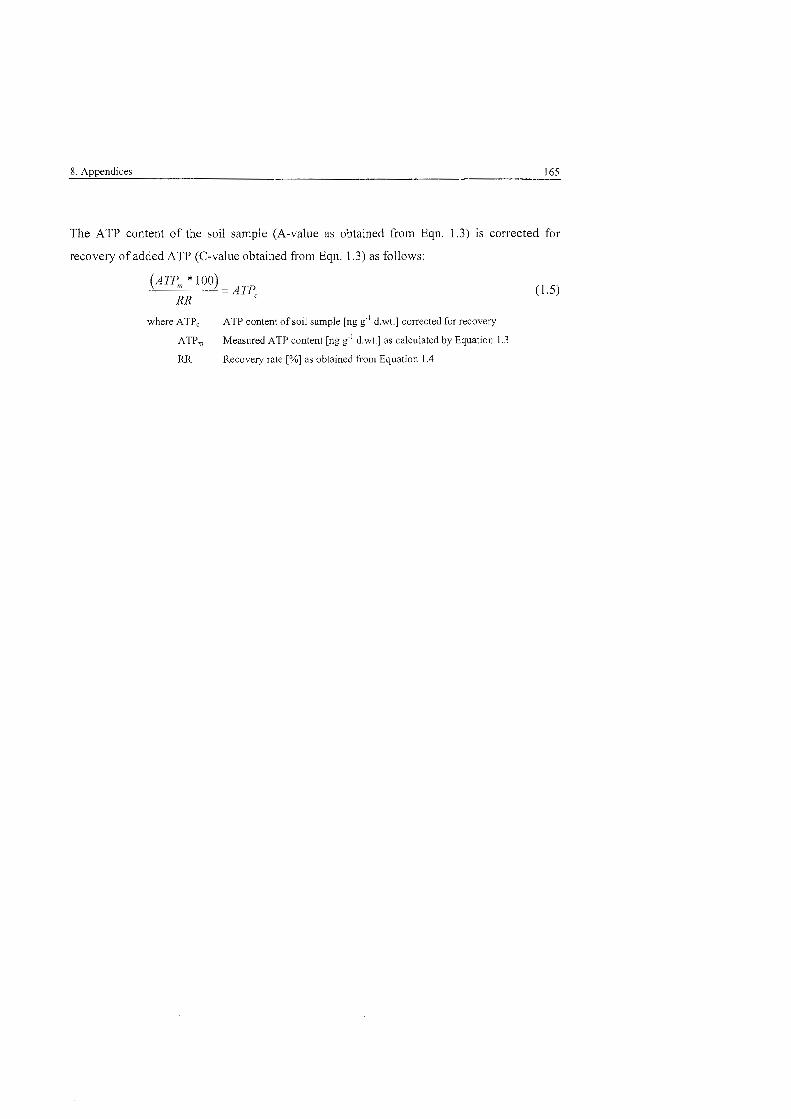
The ATP content of the soil sample (A-value as obtained from Eqn. 1.3) is corrected for
recovery of added ATP (C-value obtained fi-om Eqn. 1.3) as follows:
where ATPc ATP content of soil sample [ng g" d.wt.1 corrected for recovery
ATP,,, Measured ATP content [ng d.wt.1 as calculated by Equation 1.3
RR Recovery rate [%I as obtained from Equation 1.4
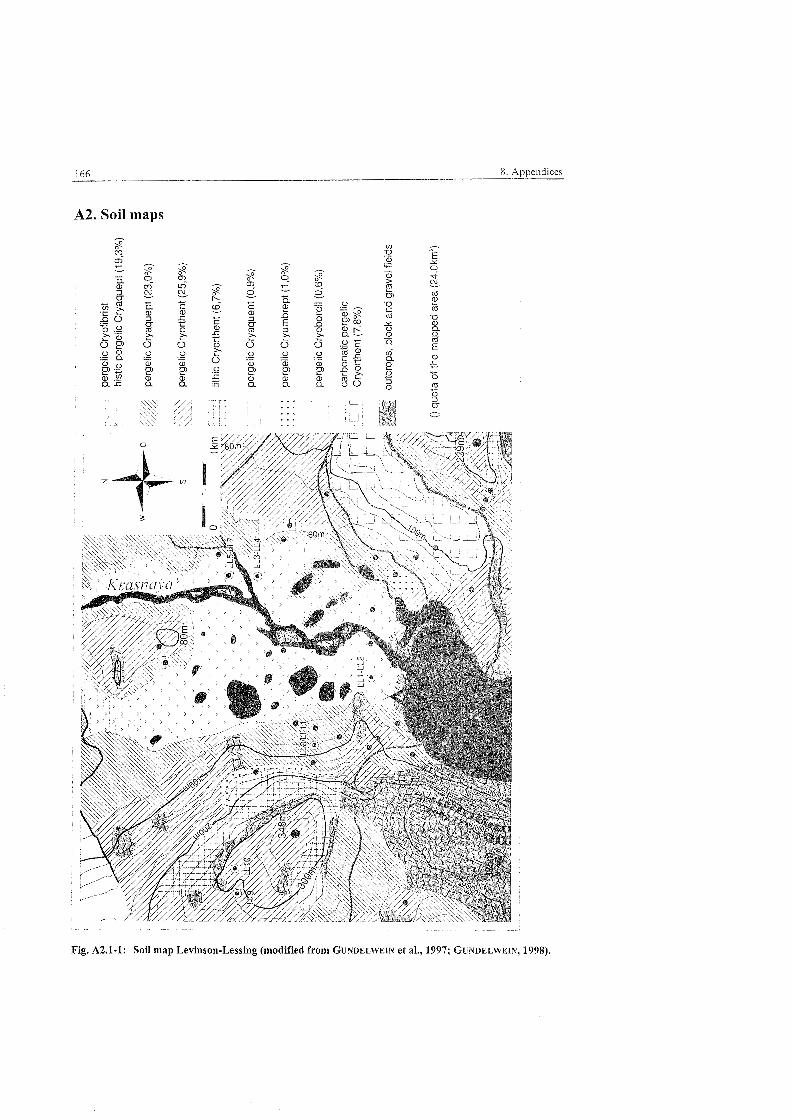
Fig. A2.1-1: $02 map Levinson-Lessing (modified from GUNDELWEIN et al.; 1997; GUNDELWEIN, 1998).
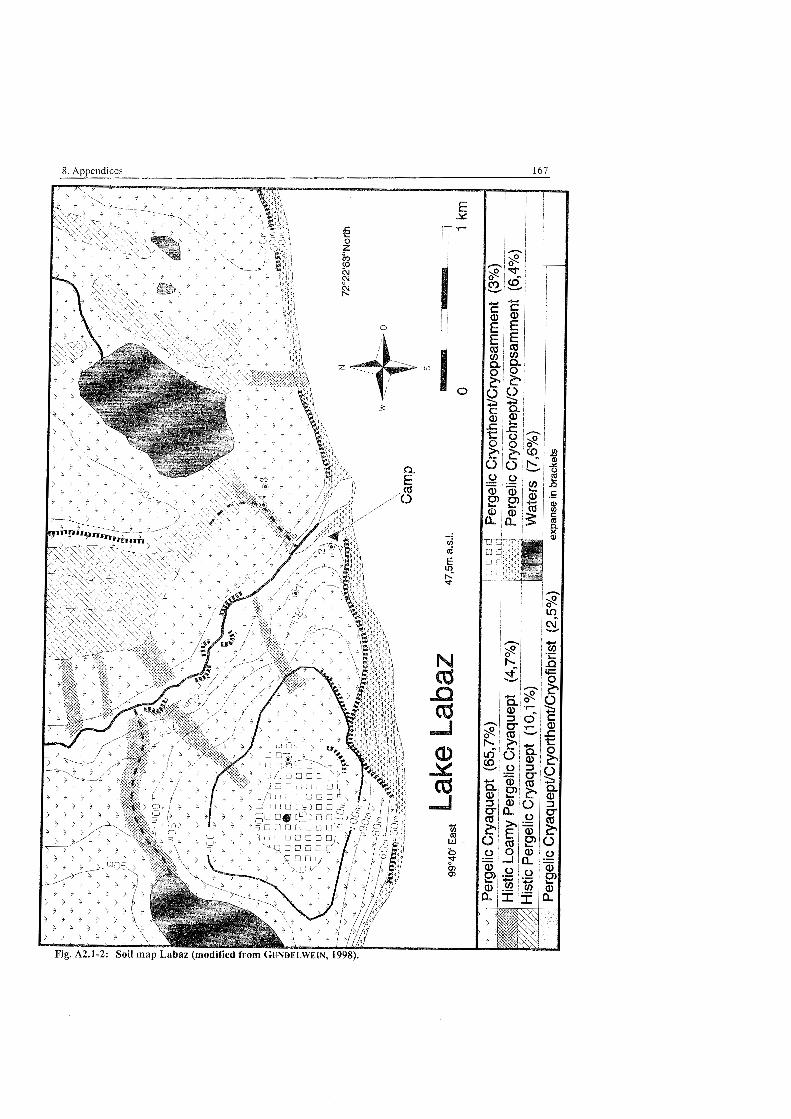
8. Appendices 167
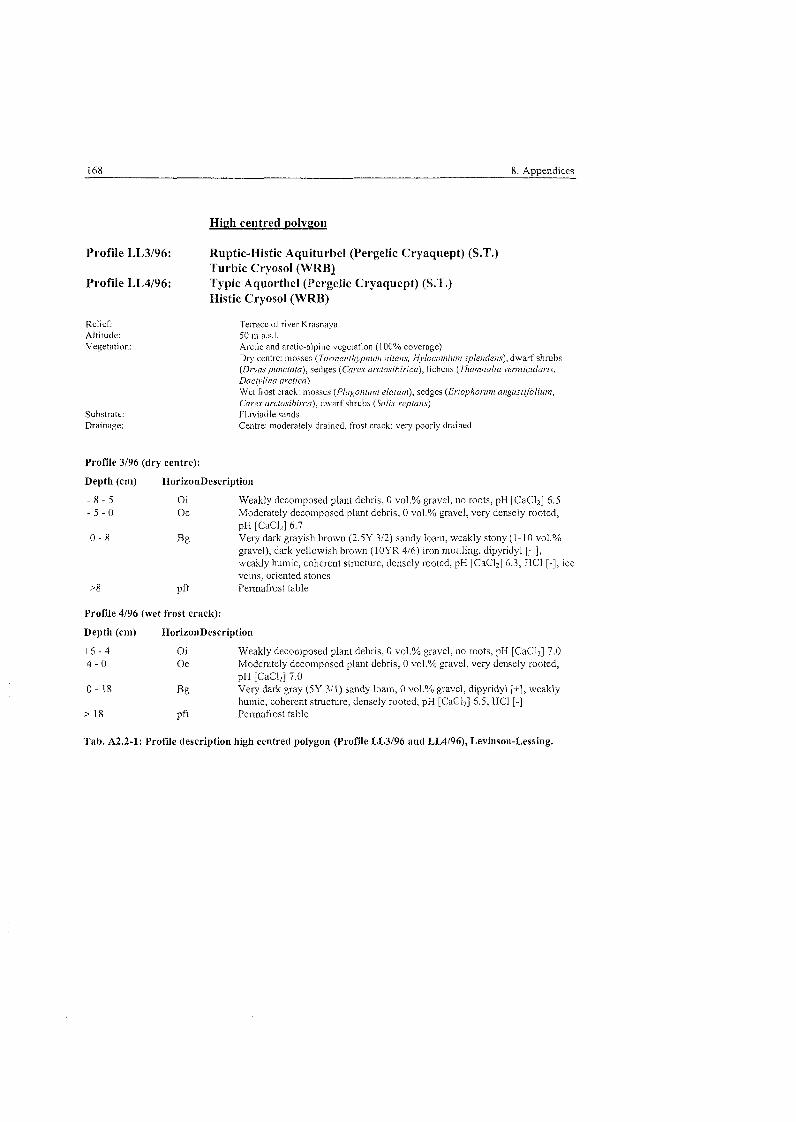
168 8. Appendices
High centred polygon
Profile LL3196: Ruptic-Histic Aquiturbel (Pergelic Cryaquept) (§.T. Turbic Cryosol (WRB)
Profile LL4196: Typic Aquorthel (Pergelic Cryaquept) (S.T.) Histic Cryosol (WRB)
Relief: Altitude: Vegetation:
Substrate: Drainage:
Tes~ace of river Krasnaya 50 m a.s.1. Arctic and arctic-alpine vegctation (1 00% coverage) Dry centrc: inosses (Tormenthvpfwm nitens, Hviocomium splendens), dwarf shrubs (Diyas punctata), sedges (Carex arcfosibir~ca), lichens (Thamnolia vermicularis, Dactyiina arct~ca) Wet frost crack: inosses (Plclgoiiiuns darum), sedges (Eriophorum angusllfolium, Carex arctosibirca), dwarf slirubs (Sa1i.v reptans) Fluviatile sands Cenire: moderately drained. frost crack: very poorly drained
Profile 3/96 (dry centre):
Depth (cm) HorizonDescription
- 8 - 5 Oi Weakly decomposed plant debris, 0 v ~ l . ? ~ gravel, no roots, pH [CaCl*] 6.5 - 5 - 0 Oe Moderately decomposed plant debris, 0 vol.% gravel, very densely rooted,
pH [CaCl2] 6.7 0 - 8 Bg Very dark grayish brown (2.5Y 3/2) sandy loarn, weakly stony (1-10 vol.%
gravel), dark yellowish brown (10YR 416) iron mottling, dipyridyl [+I, weakly liumic. coherent structure, densely rooted, pH [CaCl;] 6.3, HC1 [-I, ice veins, oriented stones
>8 pft Permafrost table
Profile 4/96 (wet frost crack):
Deptli (cm) HorizonDescription
+6 - 4 Oi Weakly decon~posed plant debris, 0 vol.% gravel, no roots, pH [CaCl;] 7.0 4 - 0 Oe Moderately decomposed plant debris, 0 vol.% gravel, very densely rooted,
pH [CaCl;] 7.0 0 - 18 Bg Very dark gray (5Y 311) sandy loam, 0 vol.% gravel, dipyridyl [+I, weakiy
humic, coherent structure, densely rooted, pH [CaCl;] 6.5, HC1 [-I > 18 pfi Permafrost table
Tab. A2.2-1: Profile description high centred polygon (Profile LL3/96 and LL4/96), Levinson-Lessing.
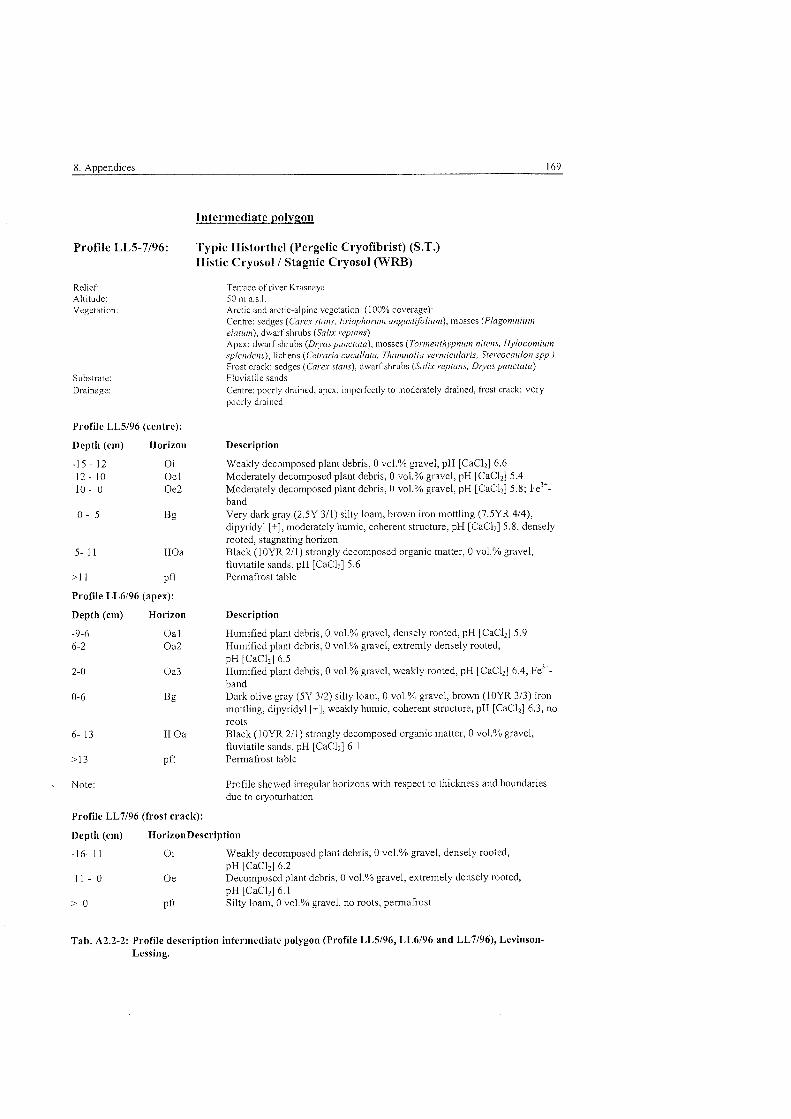
Profile LL5-7/96:
Relief: Altitude: Vegetation
Substrate: Drainage:
Profile LL5196 (centre):
Depth (ein) Horizon
-15 - 12 Oi 12 - 10 Oe 1 1 0 - 0 Oe2
>I 1 pft
Profile LL6196 (apex):
Depth (cm) Horizon
-9-6 Oa 1 6-2 Oa2
Note:
Typic Historthel (Pergelic Cryofibrist) (§.T. Histic Cryosol / Stagnic Cryosol (WRB)
Ten'acc of river Krdsnaya 50 m a.s.1. Arctic and aretic-alpine vegetation (100% coverage): Ccntre: sedges (Carex stans, Eriophorum a~igustfoI;~~m), mosses (Plagot~~i~ium cla~iitn), dwrf shrubs (Sdix reptans} Apex: dwarf shrubs (D~mpunctata). mosses (Torment/;ypt;uri~ nitens, H~~loco~nium .~j~letidet~s), lichens (Cetraria ci~cullata, T/zat;~i~ol;a vern~;cularis, StereocauJoti spp.) Frost crack: sedges (Carex stans), dwarf shrubs (Sa1i.x reptms, Dryas punctata) Fluviatile sands Centre: poorly drained, apex: imperfectly to moderately drained, frost crack: very poorly drained
Description
Weakly decomposed plant debris, 0 vol.% gravel, pH [CaCI;] 6.6 Moderately decomposed plant debris, 0 vol.% gravel, pH [CaCl;] 5.4 Moderately decomposed plant debris, 0 vol.% gravel, pH [CaCl;] 5.8; Fe3"- band Very dark gray (2.5Y 311) silty loam, brown iron mottling (7.5YR 414), dipyridyl [+I, moderately humic, coherent structure, pH [CaCl;] 5.8, densely rooted, stagnating horizon Black (10YR 211) strongly decomposed organic matter, 0 vol.% gravel, fluviatile sands, pH [CaCl;] 5.6 Permafrost table
Description
Plumified plant debris, 0 vol.% gravel, densely rooted, pH [CaCl;] 5.9 Humified plant debris, 0 vol.% gravel, extremly densely rooted, pH [CaC12] 6.5 Humified plant debris, 0 vol.% gravel, weakly rooted, pH [CaCl;] 6.4, Fe3^- band Dark olive gray (5Y 312) silty loam, 0 vol.% gravel, brown (10YR 313) iron mottling, dipyridyl [+I, weakly humic, coherent structure, pH [CaCl;] 6.3, no roots Black (10YR 211) strongly decomposed organic matter, 0 vol.% gravel, fluviatile sands, pH [CaCl;] 6.1 Permafrost table
Profile showed irregular horizons with respect to thickness and boundaries due to cryoturbation
Profile LL7196 (frost crack):
Depth (cm) HorizonDescription
-16- 11 Oi Weakly decomposed plant debris, 0 vol.% gravel, densely rooted, pH [CaCl;] 6.2
1 1 - 0 Oe Decomposed plant debris. 0 vol.% gravel, extremely densely rooted, pH [CaCl;] 6.1
> 0 ~ f t Silty loam, 0 vol.% gravel, no roots, perrnafrost
Tab. A2.2-2: Profile description intermediate polygon (Profile LL5196, LL6196 and LL7/96), Levinson- Lessing.
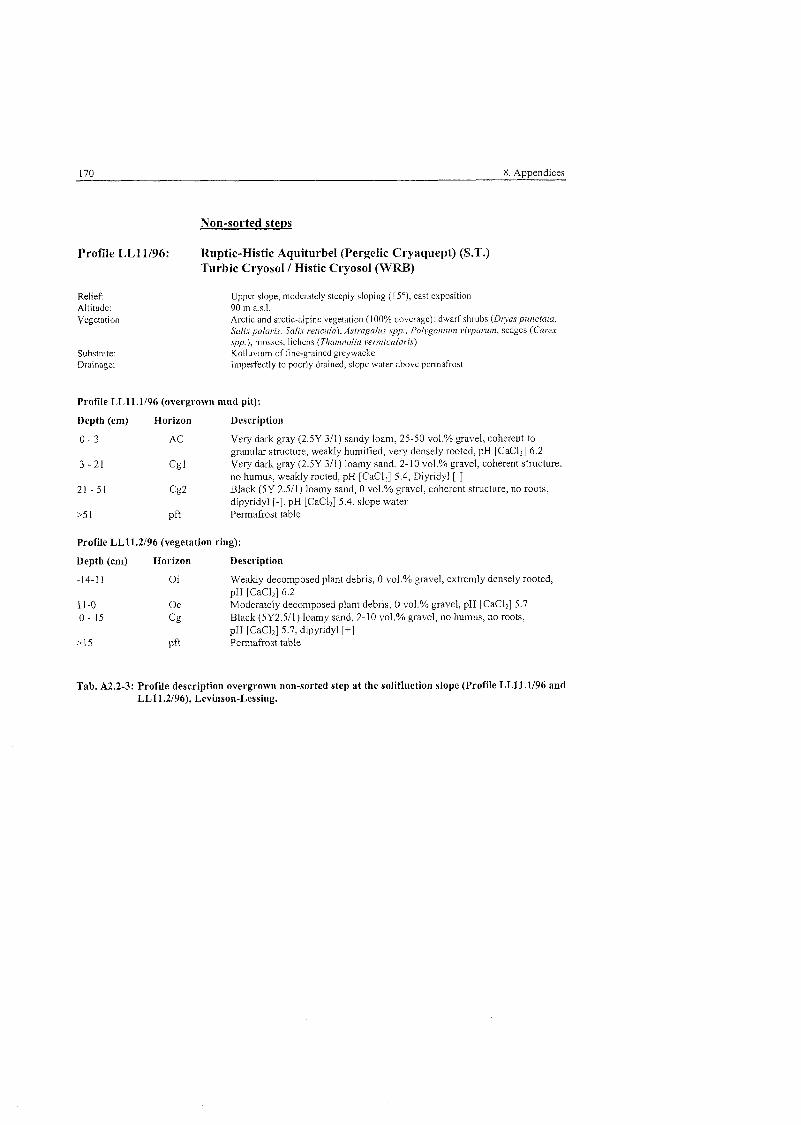
170 8. Appendices
Profile LL11196: Ruptic-Histic Aquiturbel (Pergelic Cryaquept) (S.T.) Turbic Cryosol 1 Histic Cryosol (WRB)
Relief: Altitude: Vegetation
Substrate: Drainage:
Upper slope, moderately steeply sloping ( 1 Y), east exposition 90 m a.s.1. Arctic and arctic-alpine vegetation (1 00% uoverage): dwarf shrubs ( D ~ y a s punctala, Salix pola~is, Salix reticula), Asfragalus spp., Polyson~i~m vivparuri~, sedges (Carex spp.), niosses, lichens (Tl~amnolia sermicularis} Kolluvium of fine-grained grcywacke mpert'ectiy to poorly drained, slopc watcr ahove pennafrost
Profile LLll.1/96 (overgrown mud pit):
Depth (cm) Horizon Description
0 - 3 AC Very dark gray (2.5Y 311) sandy loan~. 25-50 vol.% gravel, coherent to granular structure, weakly humified, very densely rooted, pH [CaC12] 6.2
3 - 2 1 c g 1 Veiy dark gray (2.5Y 311) loamy sand. 2-10 vol.% gravel. coherent structure, no humus, weakly rooted, pH [CaCl;] 5.4, Diyridyl [-I
21 - 51 C@- Black (5Y 2.511) loamy sand, 0 vol.% gravel, coherent structure, no roots, dipyridyl [-I, pH [CaCl;] 5.4, slope water
>5 1 ~ f t Permafrost table
Profile LLll.2196 (vegetation ring):
Depth (cm) Horizon Description
-14-11 Oi Weakly decomposed plant debris, 0 vol.% gravel, extremly densely rooted, pH [CaCl,] 6.2
11-0 Oe Moderately decomposed plant debris, 0 vol.% gravel, pH [CaCl;] 5.7 0 - 15 c g Black (5Y2.511) loamy sand, 2-10 vol.% gravel, no humus, no roots,
pH [CaCl;] 5.7. dipyridyl [+] >15 ~ f t Pem~afrost table
Tab. A2.2-3: Profile description overgrown non-sorted step at the solifluction slope (Profile LL11.1196 and LL11.2/96), Levinson-Lessing.
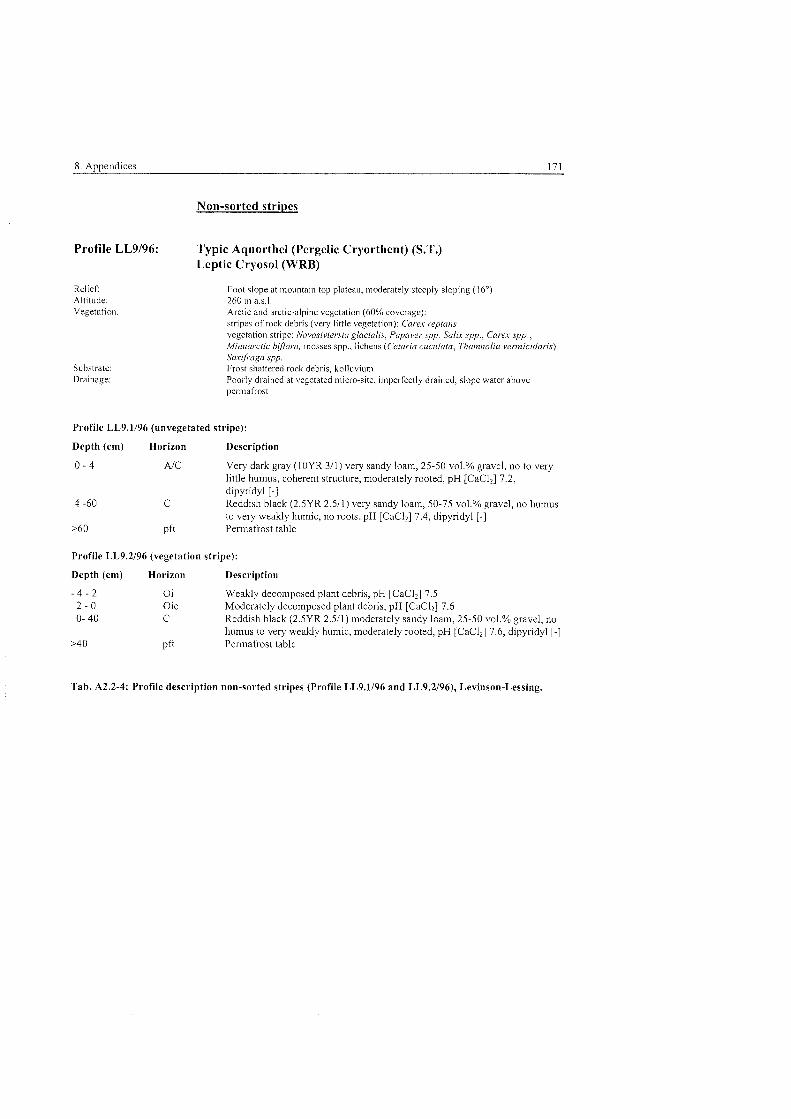
Non-sorted stripes
Profile LL9196: Typic Aquorthel (Pergelic Cryorthent) (S.T.) Leptic Cryosol (WRB)
Relief: Altitude. Vegetation
Substrate: Drainage:
Foot dope at mountain top plateau, moderately steeply sloping (16') 260 m a.s.1. Arctic and arctic-alpine vegetation (60% coverage): stripes of rock debris (very little vegetation): Ccu'ex reptans vegetation stripe: ~Vovosiviersm glacialis, Papaver spp. Salix spp., Carex spp., Minnarctic blJora, inosses spp., lichens (Cetaria c ~ ~ c u l a t ( ~ , Thamnalia ver~nici~laris) Sax fiaga spp . Frost shattered rock debris, kolluvium Poorly drained at vegetated inicro-site, iinperfectly drained, slope water above pennafrost
Profile LL9.1196 (unvegetated stripe):
Depth (cm) Horizon Description
0 - 4 AIC Very dark gray (10YR 3/1) very sandy loam, 25-50 vol.% gravel, no to very little humus, coherent structure, moderately rooted, pH [CaCli] 7.2. dipyridyl [-]
4 -60 C Reddish black (2.5YR 2.511) very sandy loam, 50-75 vol.% gravel, no humus to very weakly humic, no roots, pH [CaCl;] 7.4, dipyridyl [-]
>60 ~ f t Pennafrost table
Profile LL9.2196 (vegetation stripe):
Depth (cm) Horizon Description
- 4 - 2 Oi Weakly decomposed plant debris, pH [CaC12] 7.5 2 - 0 Oie Moderately decomposed plant debris, pH [CaCli] 7.6 0- 40 C Reddish black (2.5YR 2.511) moderately sandy loam, 25-50 vo1.N gravel, no
humus to very weakly humic, moderately rooted, pH [CaCl*] 7.6, dipyridyl [-I >40 ~ f t Permafrost table
Tab. A2.2-4: Profile description non-sorted stripes (Profile LL9.1196 and LL9.2/96), Levinson-Lessing,
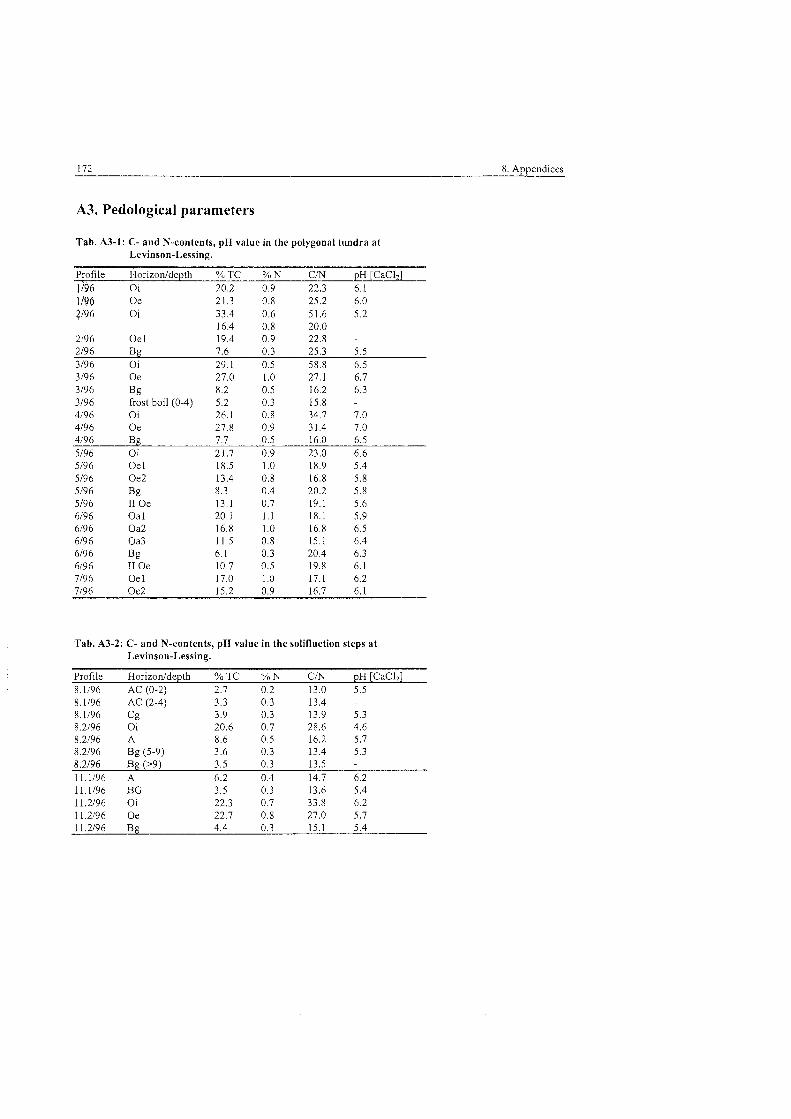
172 8. Awoendices
A3. Pedological parameters
Tab. A3-1: C- and N-contents, pH value in the polygonal tundra at Levinson-Lessing.
Profile Horizoiddepth % T C % N C/N pH [CaCl;] 1/96 Oi 20.2 0.9 22.3 6.1
3/96 Oe 27.0 1.0 27.1 6.7 3/96 Bg 8.2 0.5 16.2 6.3 3/96 frost boil (0-4) 5.2 0.3 15.8 - 4/96 Oi 26.1 0.8 34.7 7.0 4/96 Oe 27.8 0.9 31.4 7.0
5/96 Oe 1 18.5 1.0 18.9 5.4 5/96 Oe2 13.4 0.8 16.8 5.8 5/96 Bg 8.3 0.4 20.2 5.8 5/96 I1 Oe 13.1 0.7 19.1 5.6 6/96 Oal 20.1 1.1 18.1 5.9 6/96 Oa2 16.8 1.0 16.8 6.5 6/96 Oa3 11.5 0.8 15.1 6.4 6/96 Bg 6.1 0.3 20.4 6.3 6/96 I1 Oe 10.7 0.5 19.8 6.1 7/96 Oe 1 17.0 1.0 17.1 6.2 7/96 Oe2 15.2 0.9 16.7 6.1
Tab. A3-2: C- and N-contents, pH value in the solifluction steps at Levinson-Lessing.
Profile Horizonldepth % T C % N C/N pH [CaC12] 8.1196 AC (0-2) 2.7 0.2 13.0 5.5 8.1196 AC (2-4) 3.3 0.3 13.4 -
8.1196 Cg 3.9 0.3 13.9 5.3 8.2196 Oi 20.6 0.7 28.6 4.6 8.2196 A 8.6 0.5 16.2 5.7 8.2196 Bg (5-9) 3.6 0.3 13.4 5.3
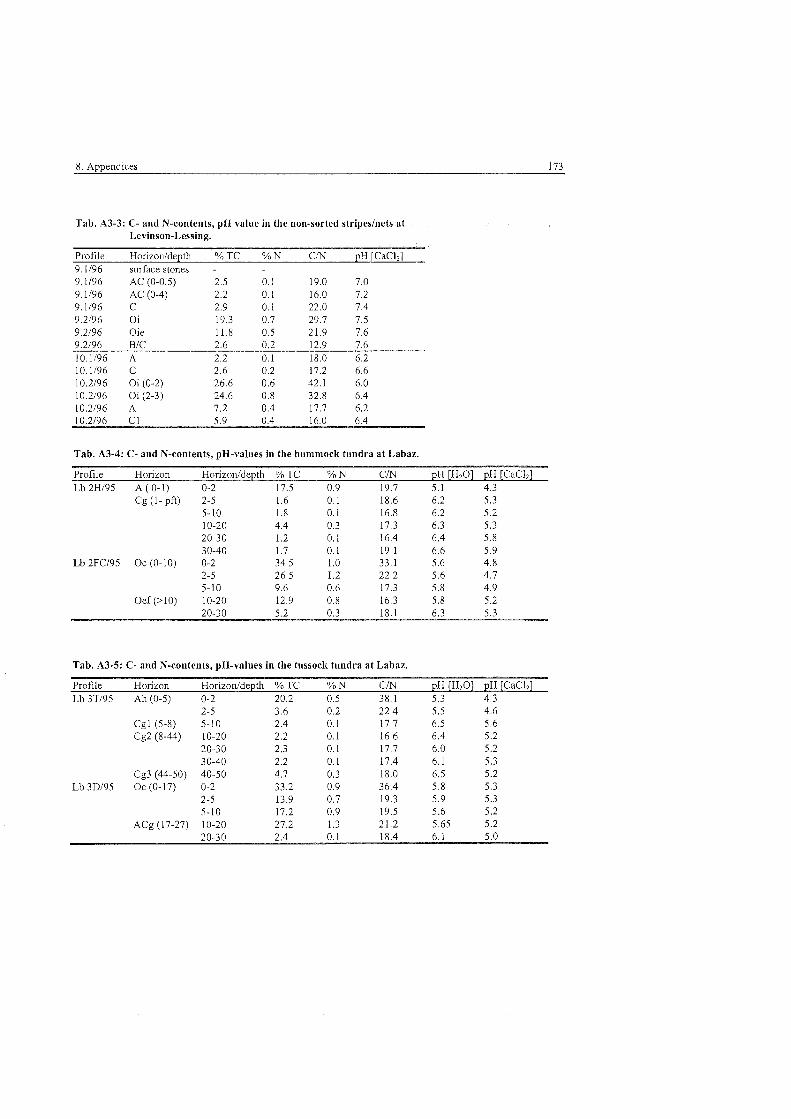
Tab. A3-3: C- and N-contents, pH value in the non-sorted stripeslnets at Levinson-Lessing.
Profile Hor~zonldepth % T C % N C/N pH [CaC12] 9.1196 surface stones - 9.1196 AC (0-0.5) 2.5 0.1 19.0 7.0 9.1196 AC (0-4) 2.2 0.1 16.0 7.2 9.1196 C 2.9 0.1 22.0 7.4 9.2196 Oi 19.3 0.7 29.7 7.5 9.2196 Oie 11.8 0.5 21.9 7.6 9.2196 BIC 2.6 0.2 12.9 7.6 10.1196 A 2.2 0.1 18.0 6.2
Tab. A3-4: C- and N-contents, pH-values in the hummock tundra at Labaz.
Profile Horizon Horizo~ddepth % T C % N C/N pH [H20] pH [CaC12] Lb2Hl95 A(0-1) 0-2 17.5 0.9 19.7 5.1 4.3
~ ~ ~ ( 1 - pft) 2-5 5-10 10-20 20-30 30-40
Lb 2FCl95 Oe (0- 10) 0-2 2-5 5-10
Oef (> 10) 10-20
Tab. A3-5: C- and N-contents, pH-values in the tussock tundra at Labaz.
Profile Horizon Horizonldepth % TC % N C/N pH [H20] pH [CaCl;] Lb 3Tl95 Ah (0-5) 0-2 20.2 0.5 38.1 5.3 4.3
2-5 3.6 0.2 22.4 5.5 4.6 Cgl (5-8) 5-10 2.4 0.1 17.7 6.5 5.6 Cg2 (8-44) 10-20 2.2 0.1 16.6 6.4 5.2
20-30 2.3 0.1 17.7 6.0 5.2 30-40 2.2 0.1 17.4 6.1 5.3
Cg3 (44-50) 40-50 4.7 0.3 18.0 6.5 5.2 Lb 3Dl95 Oe (0- 17) 0-2 33.2 0.9 36.4 5.8 5.3
2-5 13.9 0.7 19.3 5.9 5.3 5-10 17.2 0.9 19.5 5.6 5.2
ACg (17-27) 10-20 27.2 1.3 21.2 5.65 5.2 20-30 2.4 0.1 18.4 6.1 5.0
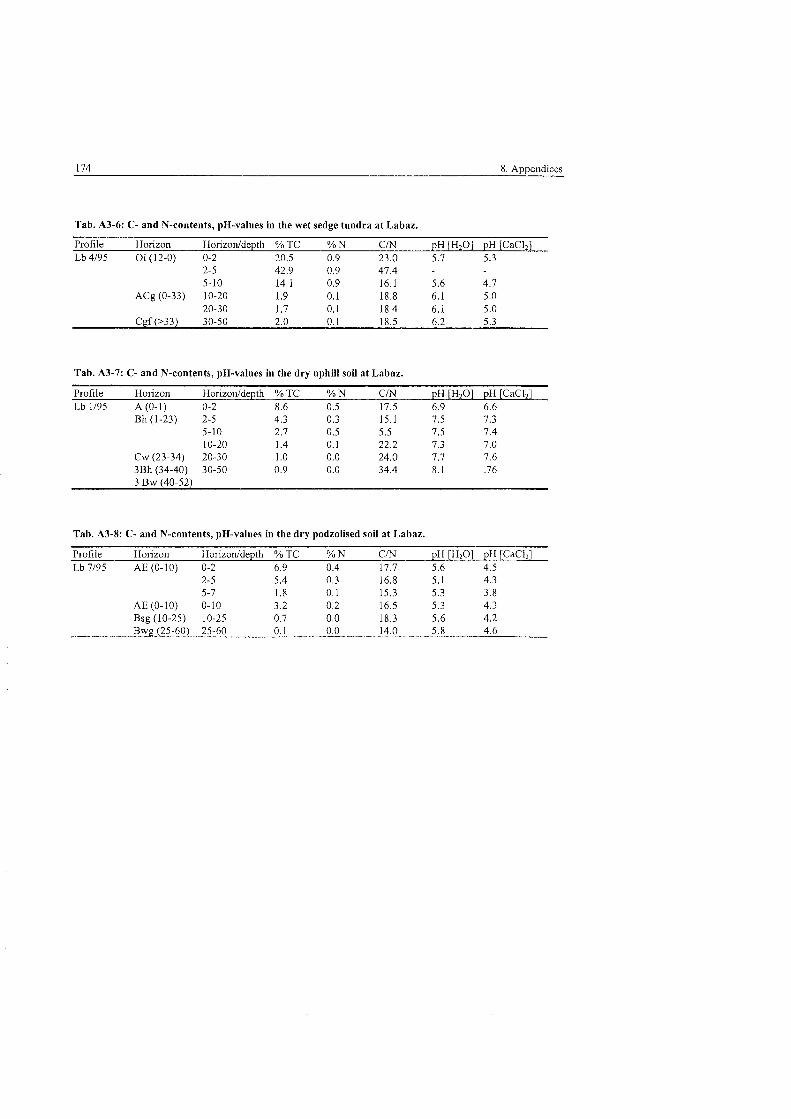
174 8. Appendices
Tab. A3-6: C- and N-contents, pH-values in the wet sedge tundra at Labaz.
Profile Hoz-izon Horizonldepth % T C % N C/N pH [H20] pH [CaCl;] Lb 4/95 Oi (12-0) 0-2 20.5 0.9 23.0 5.7 5.3 . .
2-5 42.9 0.9 47.4 5-10 14.1 0.9 16.1 5.6 4.7
ACg (0-33) 10-20 1.9 0.1 18.8 6.1 5.0 20-30 1.7 0.1 18.4 6. i 5.0
Cgf (>33) 30-50 2.0 0.1 18.5 6.2 5.3
Tab. A3-7: C- and N-contents, pH-values in the dry uphill soil at Labaz.
Profile Horizon Horizonldepth % TC % N CiN pH [H20] pH [CaCI;] Lb 1/95 A (0- 1 ) 0-2 8.6 0.5 17.5 6.9 6.6
Tab. A3-8: C- and N-contents, pH-values in the dry podzolised soil at Labaz.
Profile Horizon Horizonldepth % TC % N C N pH [H20] pH [CaCl;] Lb 7/95 AE (0-10) 0-2 6.9 0.4 17.7 5.6 4.5
2-5 5.4 0.3 16.8 5.1 4.3 5-7 1.8 0.1 15.3 5.3 3.8
AE(0-10) 0-10 3.2 0.2 16.5 5.3 4.3 Bsg (10-25) 10-25 0.7 0.0 18.3 5.6 4.2 Bwg (25-60) 25-60 0.1 0.0 14.0 5.8 4.6
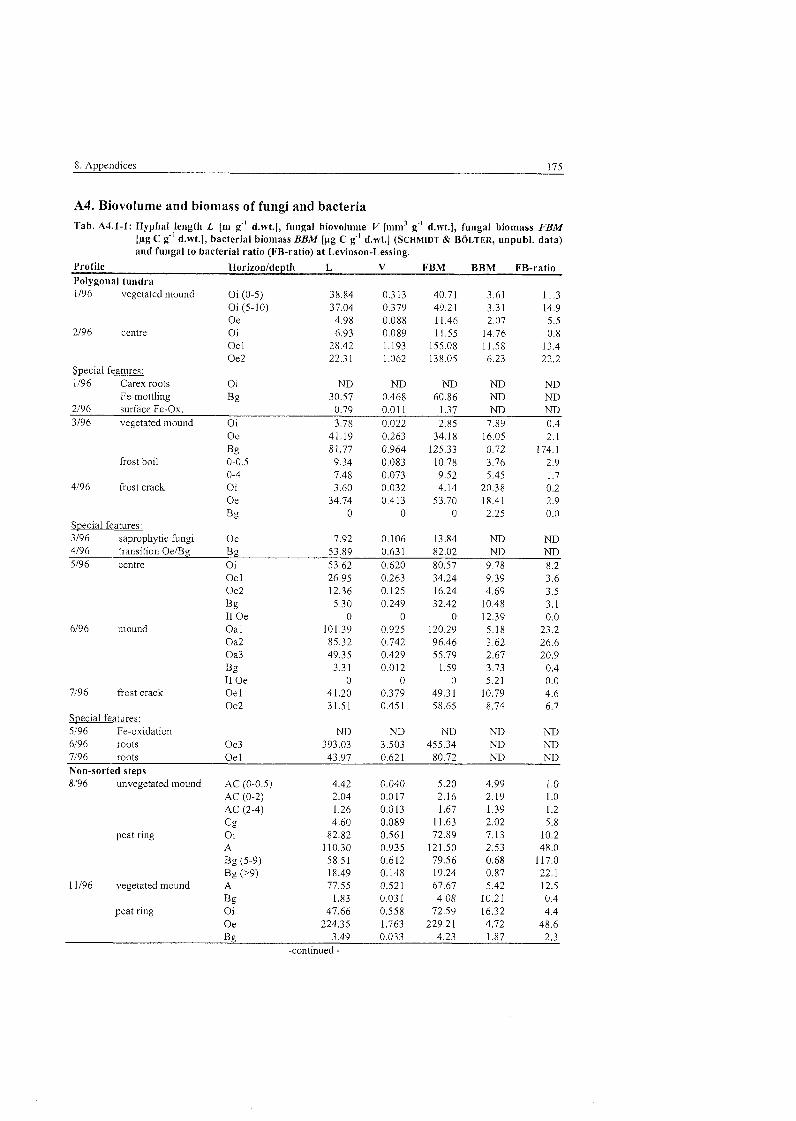
8. Appendices 175
A4. Biovolume and biomass of fungi and bacteria Tab. A4.1-1: Hyphal length L [ni g" d.wt.1, fnngal biovolunie V [mm3 g" d.wt.1, fungal biornass FBM
[pg C g" d.wt.1, bacterial biomass BBM [pg C g"' d.wt.1 (SCHMIDT & BOLTER, unpubl. data) and fungal to bacterial ratio (FB-ratio) at Levinson-Lessing.
Profile Horizonldepth L V FBM BBM FB-ratio Polygonal tundra 1/96 vegetated mound Oi (0-5) 38.84 0.313 40.71 3.61 11.3
Oi (5-10) 37.04 0.379 49.21 3.3 1 14.9 Oe 4.98 0.088 11.46 2.07 5.5
2/96 centre Oi 6.93 0.089 11.55 14.76 0.8 Oe 1 28.42 1.193 155.08 11.58 13.4 Oe2 22.3 1 1.062 138.05 6.23 22.2
Special features: 1196 Carex roots Oi ND ND ND ND ND
Fe-mottling Bg 30.57 0.468 60.86 ND ND 2/96 surface Fc-Ox. 0.79 0.01 1 1.37 ND ND 3/96 vegetated mound Ol 3.78 0.022 2.85 7.89 0.4
Oe 41.19 0.263 34.18 16.05 2.1 Bg 81.77 0.964 125.33 0.72 1 74.1
frost boil 0-0.5 9.34 0.083 10.78 3.76 2.9 0-4 7.48 0.073 9.52 5.45 1.7
4/96 frost crack Oi 3.60 0.032 4.14 20.38 0.2 Oe 34.74 0.413 53.70 18.41 2.9 Bg 0 0 0 2.25 0.0
Special features: 3/96 saprophytic fungi Oe 7.92 0.106 13.84 ND ND 4/96 transition Oe/Bg Bg 53.89 0.631 82.02 ND ND 5/96 centre Oi 53.62 0.620 80.57 9.78 8.2
Oe 1 26.95 0.263 34.24 9.39 3.6 Oe2 12.36 0.125 16.24 4.69 3.5 Bg 5.30 0.249 32.42 10.48 3.1 I1 Oe 0 0 0 12.39 0.0
6/96 nlound Oa 1 101.39 0.925 120.29 5.18 23.2 Oa2 85.32 0.742 96.46 3.62 26.6 Oa3 49.35 0.429 55.79 2.67 20.9 ß 3.31 0.012 1.59 3.73 0.4 I1 Oe 0 0 0 5.21 0.0
7/96 frost crack Oe 1 41.20 0.379 49.31 10.79 4.6 Oe2 31.51 0.451 58.65 8.74 6.7
Special features: 5/96 Fe-oxidation ND ND ND ND ND 6/96 roots Oe3 393.03 3,503 455.34 ND ND 7/96 roots Oe 1 43.97 0.621 80.72 ND ND Non-sorted steps 8/96 unvegetated mound AC (0-0.5)
AC (0-2) AC (2-4) c g
peat ring Oi A ß (5-9) B; (>9)
11/96 vegetated mound A
Bg peat ring Oi
Oe
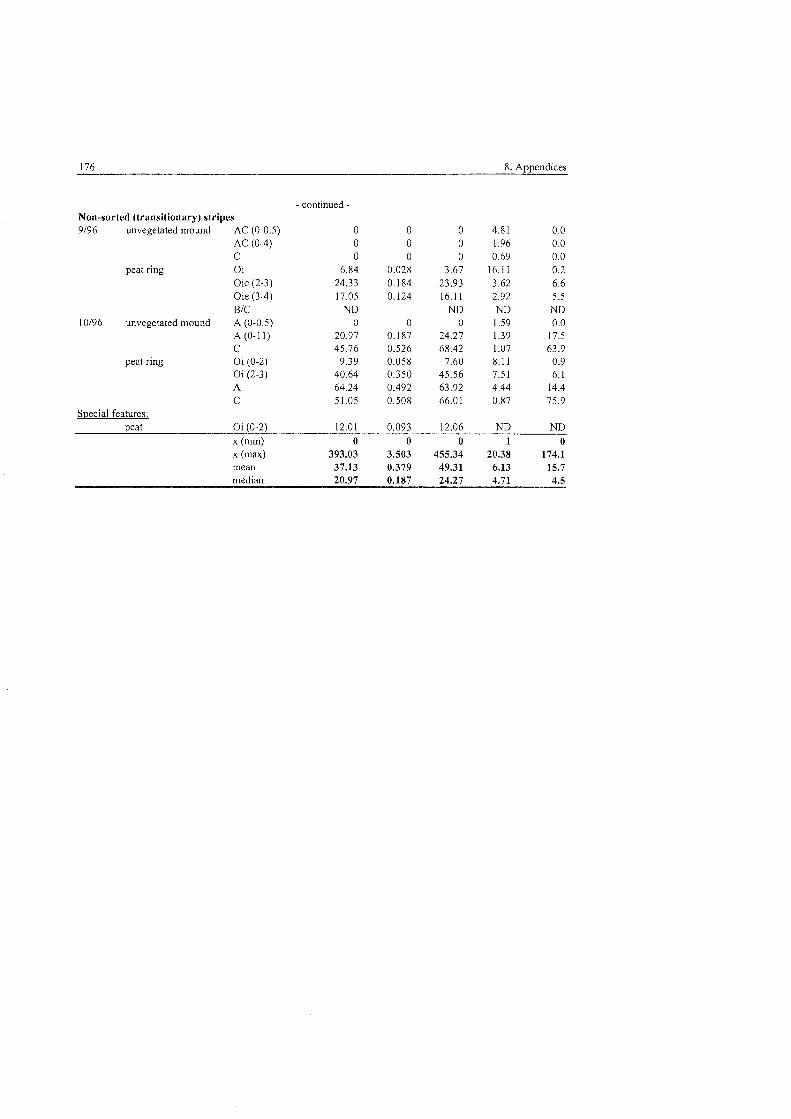
176 8. Appendices
- continued - Non-sorted (transitionary) stripes 9/96 unvegetated mound
peat ring
10196 unvegetated n~ound
peat ring
AC (0-0.5) AC (0-4) C Oi Oie (2-3) Oie (3-4) B!C A (0-0.5) A (0-1 1) C Oi (0-2) Oi (2-3) A c
Special features: Deä Oi (0-2) 12.01 0.093 12.06 ND ND
x (min) 0 0 0 1 0 X (max) 393.03 3.503 455.34 20.38 174.1 mean 37.13 0.379 49.31 6.13 15.7 median 20.97 0.187 24.27 4.71 4.5
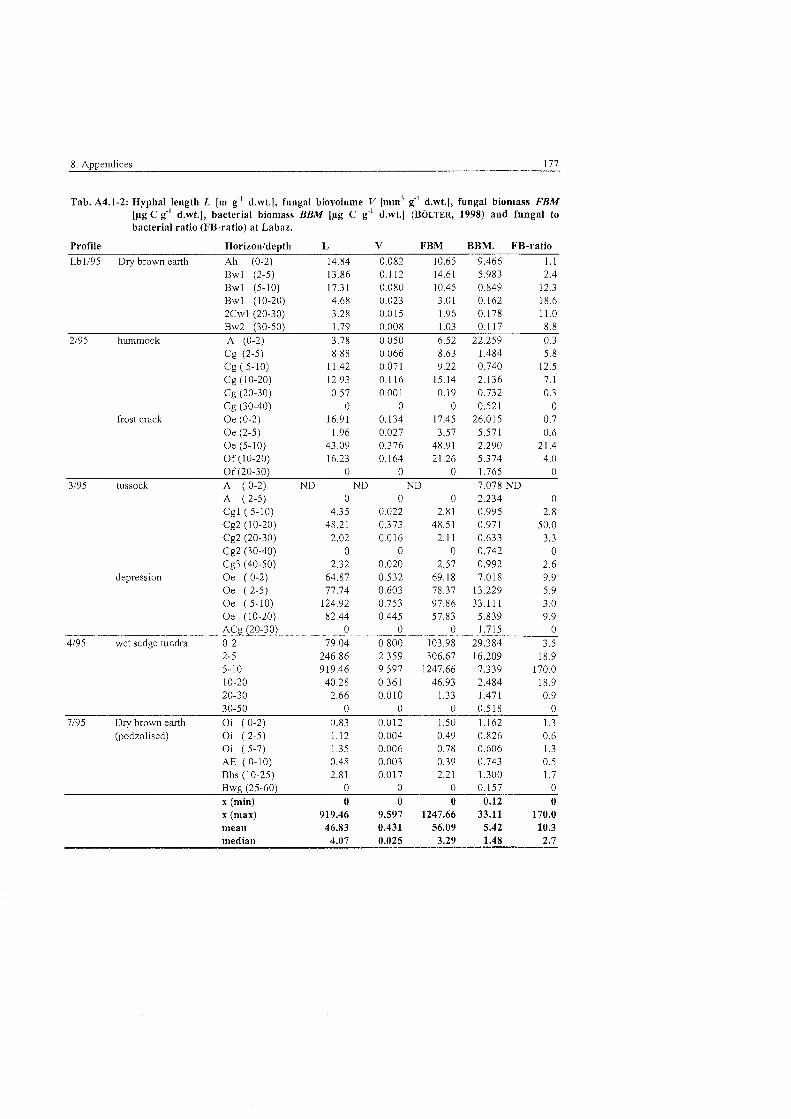
Tab. A4.1-2: Hyphal length L [ n ~ g" d.wt.1, fungal biovolume V [mm3 g.' d.wt.1, fnngal bion~ass FBM [pg C g-' d.wt.1, bacterial bioniass BBM [pg C g" d.wt.1 (BOLTER, 1998) and fungal to bacterial ratio (FR-ratio) at Labaz.
Profile Horizon/depth L V FBM BBM. FB-ratio
Lbll95 Dry brown earth Ah (0-2) 14.84 0.082 10.65 9.466 1.1 Bwl (2-5) 13.86 0.1 12 14.61 5,983 2.4 Bwl (5-10) 17.31 0.080 10.45 0.849 12.3 Bwl (10-20) 4.68 0.023 3.01 0.162 18.6 2Cwl (20-30) 3.28 0.015 1.96 0.178 11.0
Cg (2-5) 8.88 0.066 8.63 1.484 5.8 Cg ( 5-10) 11.42 0.071 9.22 0.740 12.5 Cg (10-20) 12.93 0.1 16 15.14 2.136 7.1 Cg (20-30) 0.57 0.001 0.19 0.732 0.3 Cg (30-40) 0 0 0 0.521 0
frost crack Oe (0-2) 16.91 0.134 17.45 26.015 0.7 Oe (2-5) 1.96 0.027 3.57 5.571 0.6 Oe (5- 10) 43.09 0.376 48.91 2.290 21.4 Of (10.20) 16.23 0.164 21.26 5.374 4.0 Of (20-30) 0 0 0 1.765 0
3/95 tussock A ( 0-2) ND ND ND 7.078 ND A ( 2-5) 0 0 0 2.234 0 Cgl (5-10) 4.35 0.022 2.81 0.995 2.8 Cg2 (10-20) 48.21 0.373 48.51 0.971 50.0 Cg2 (20-30) 2.02 0.016 2.1 1 0.633 3.3 Cg2 (30-40) 0 0 0 0.742 0 Cg3 (40-50) 2.32 0.020 2.57 0.992 2.6
depression Oe ( 0-2) 64.87 0.532 69.18 7.018 9.9 Oe ( 2-5) 77.74 0.603 78.37 13.229 5.9 Oe (5-10) 124.92 0.753 97.86 33.111 3.0 Oe (10-20) 82.44 0.445 57.83 5.839 9.9 ACg (20-30) 0 0 0 1.715 0
4/95 wet sedge tundra 0-2 79.04 0.800 103.98 29.384 3.5
30-50 0 0 0 0.518 0 7/95 Dry brown earth Oi ( 0-2) 0.83 0.012 1.50 1.162 1.3
(podzolised) Oi ( 2-5) 1.12 0.004 0.49 0.826 0.6 Oi ( 5-7) 1.35 0.006 0.78 0.606 1.3 AE (0-10) 0.48 0.003 0.39 0.743 0.5 Bhs (10-25) 2.81 0.017 2.21 1.300 1.7 Bwg (25-60) 0 0 0 0.157 0 X (niin) 0 0 0 0.12 0 X (niax) 919.46 9.597 1247.66 33.11 170.0 mean 46.83 0.431 56.09 5.42 10.3 median 4.07 0.025 3.29 1.48 2.7
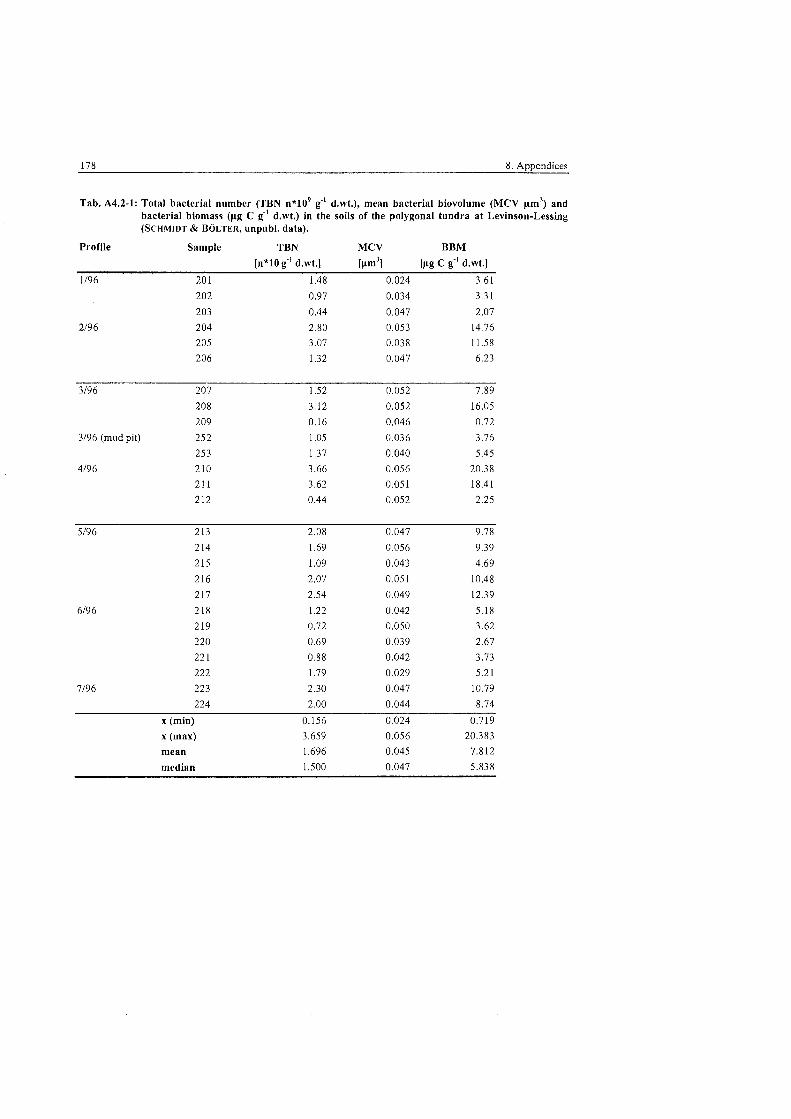
Tab. A4.2-1: Total bacterial number (TBN n*109 g" d.wt.), mean bacterial biovolume (MCV um3) and bacterial bion~ass (pg C g-' d.wt.) in tbe soils of the polygonal tundra at Levinson-Lessing (SCHMIDT & BOLTER, unpubl. data).
Profile Sample TBN MCV BBM
n*lO g d.wt.1 IW'I [us, C g ' d.wt.1
1/96 20 1 1.48 0.024 3.61
202 0.97 0.034 3.31
203 0.44 0.047 2.07
2/96 204 2.80 0.053 14.76
205 3.07 0.038 11.58
206 1.32 0.047 6.23
3/96 207 1 .52 0.052 7.89
208 3.12 0.052 16.05
209 0.16 0.046 0.72
3/96 (mud pit) 252 1.05 0.036 3.76
253 1.37 0.040 5.45
4/96 210 3.66 0.056 20.38
211 3.62 0.05 1 18.41
212 0.44 0.052 2.25
5/96 213 2.08 0.047 9.78
214 1.69 0.056 9.39
215 1.09 0.043 4.69
216 2.07 0.05 1 10.48
217 2.54 0.049 12.39
6/96 218 1.22 0.042 5.18
219 0.72 0.050 3.62
220 0.69 0.039 2.67
22 1 0.88 0.042 3.73
222 1.79 0.029 5.21
7/96 223 2.30 0.047 10.79
224 2.00 0.044 8.74
X (min) 0.156 0.024 0.719
X (max) 3.659 0.056 20.383
mean 1.696 0.045 7.812
median 1.500 0.047 5.838
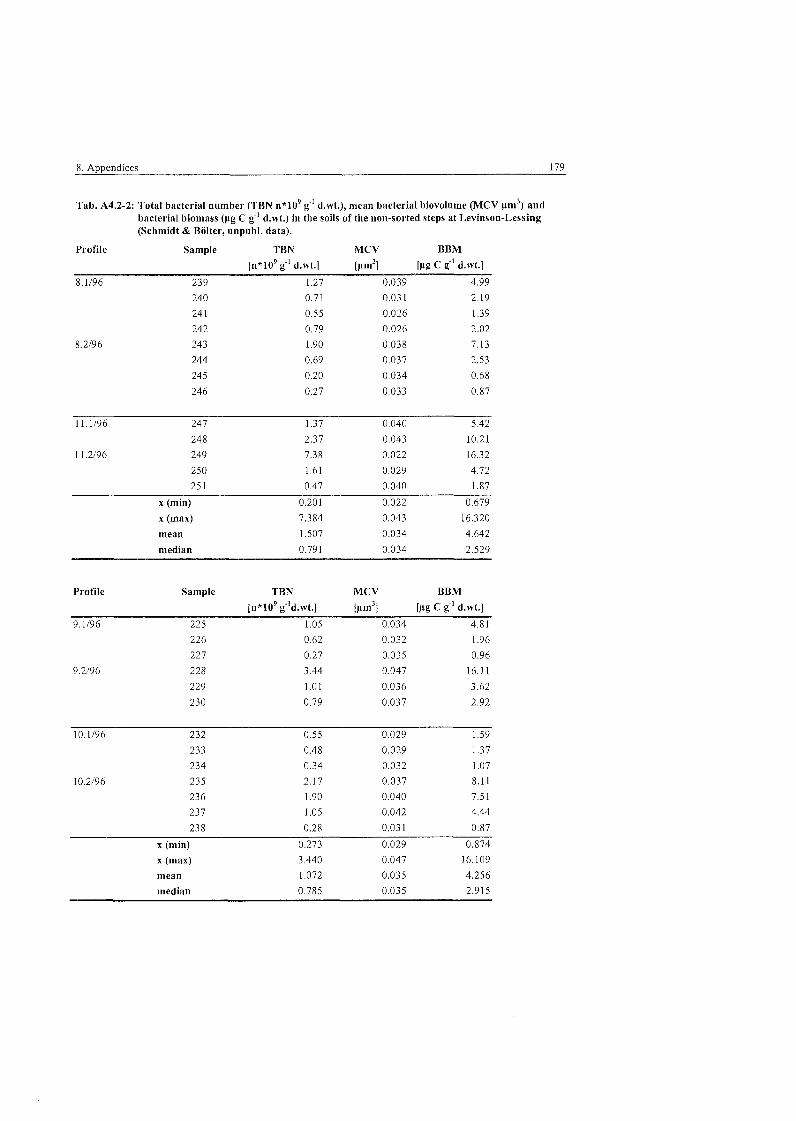
8. Appendices 179
Tab. A4.2-2: Total bacterial number (TBN n*109 g" d.wt.), mean bacterial biovolume (MCV pm3) and bacterial biomass (pg C g f d.wt.) in the soils of the non-sorted steps at Levinson-Lessing (Schmidt & Bölter unpubl. data).
Profile Sample TBN MCV BBM
11*109 g-l d.wt.1 [um3] [pg C g-l d.wt.1
8.1196 239 1.27 0.039 4.99
240 0.71 0.03 1 2,19
24 1 0.55 0.026 1.39
242 0.79 0.026 2.02
8.2196 243 I .90 0.038 7.13
244 0.69 0.037 2.53
245 0.20 0.034 0.68
246 0.27 0.033 0.87
1.1196 247 1.37 0.040 5.42
248 2.37 0.043 10.21
1 1.2196 249 7.38 0.022 16.32
250 1.6 1 0.029 4.72
25 1 0.47 0.040 1.87
X (min) 0.20 1 0.022 0.679
X (max) 7.384 0.043 16.320
mean 1.507 0.034 4.642
median 0.791 0.034 2.529
Profile Sample TBN MCV BBM
[ I ~ * I O ~ g.ld.wt.~ [um3] [pg C g - d . ~ t . ]
9.1!96 225 1 .05 0.034 4.8 1
10.1196 232 0.55 0.029 1.59
233 0.48 0.029 1.37
234 0.34 0.032 1 .07
10.2/96 235 2.17 0.037 8.1 1
236 1.90 0.040 7.51
237 1.05 0.042 4.44
238 0.28 0.03 1 0.87
X (min) 0.273 0.029 0.874
X (max) 3.440 0.047 16.109
mean 1.072 0.035 4.256
median 0.785 0.035 2.915
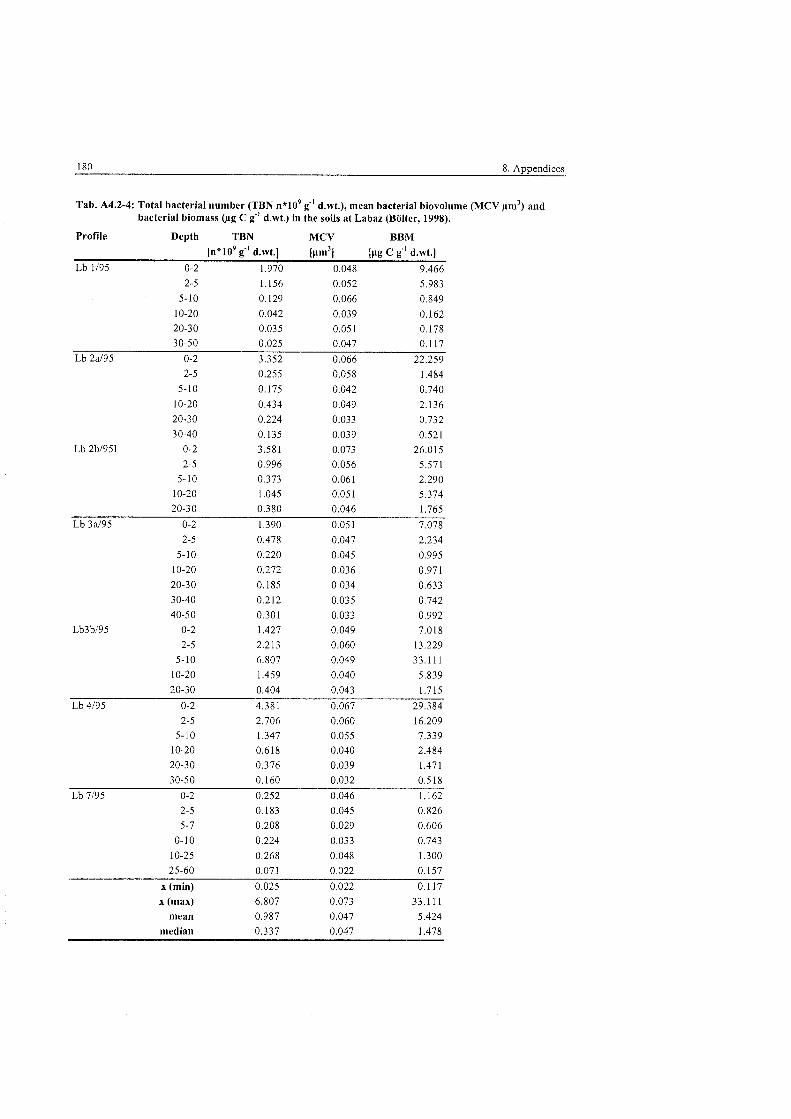
Tab. A4.2-4: Total bacterial number (TBN n*109 g-' d.wt.), mean bacterial biovolun~e (MCV um3) and bacterial biomass (pg C g" d.wt.) in the soils at Labaz (Bölter 1998).
Profile Depth TBN MCV BBM [n*lo9 g-' d.wt.1 [um3] [pg C g"' d.wt.1
Lb 1/95 0-2 1.970 0.048 9.466
X (min) 0.025 0.022 0.117 X (max) 6.807 0.073 33.111
mean 0.987 0.047 5,424 median 0,337 0.047 1.478
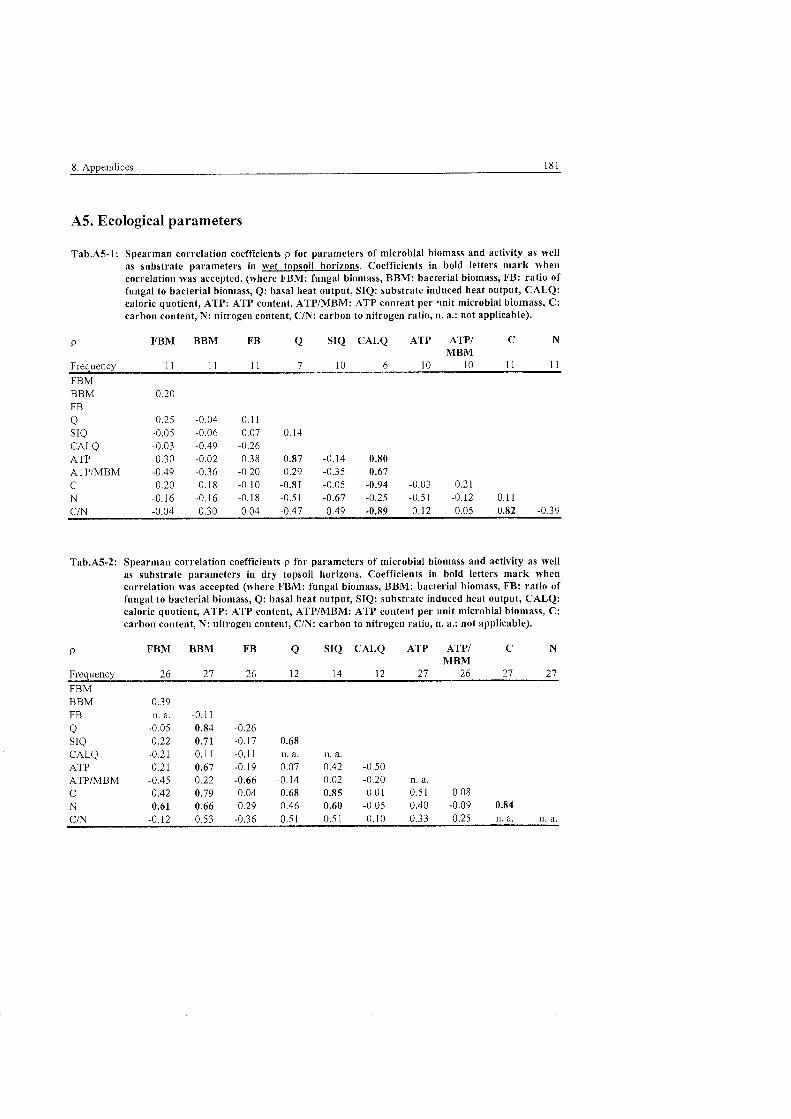
A5. Ecological parameters
Tab.A5-1: Spearman correlation coefficients p for parameters of microbial biomass and activity as well as substrate parameters in wet topsoil horizons. Coefficients in bold letters mark when correlation was accepted. (where FBM: fungal biomass, BBM: bacterial biomass, FB: ratio of fungal to bacterial bion~ass, Q: basal heat output, SIQ: substrate induced heat output, CALQ: caloric quotient, ATP: ATP content, ATPIMBM: ATP content per mi t microbial biomass, C: carbon content, N: nitrogen content, CIN: carbon to nitrogen ratio, n. a.: not applicable).
P FBM BBM FB Q SIQ CALQ ATP ATPI C N MBM
Frequency 11 1 1 1 1 7 10 6 10 10 11 1 1 FBM BBM 0.20 FB Q 0.25 -0.04 0.1 I S Id -0.05 -0.06 0.07 0.14 CALQ -0.03 -0.49 -0.26 ATP 0.30 -0.02 0.38 0.87 -0.14 0.80 ATPIMBM -0.49 -0.36 -0.20 0.29 -0.35 0.67 C -0.20 0.18 -0.10 -0.81 -0.05 -0.94 -0.03 0.21 N -0.16 -0.16 -0.18 -0.51 -0.67 -0.25 -0.51 -0.12 0.11 C/N -0.04 0.30 0.04 -0.47 0.49 -0.89 0.12 0.05 0.82 -039
Tab.A5-2: Spearman correlation coefficients p for parameters of microbial biomass and activity as well as substrate parameters in dry topsoil horizons. Coefficients in bold letters mark when correlation was accepted (where FBM: fungal biomass, BBM: bacterial biomass, FB: ratio of fungal to bacterial biomass, Q: basal heat output, SIQ: substrate induced heat output, CALQ: caloric quotient, ATP: ATP content, ATPIMBM: ATP content per unit microbial biomass, C: carbon content, N: nitrogeil content, Cm: carbon to nitrogen ratio, n. a.: not applicable).
P FBM BBM FB Q SIQ CALQ ATP ATPI C N MBM
Frequency 26 27 26 12 14 12 27 26 27 27 FBM BBM 0.39 FB n. a. -0.1 1
Q -0.05 0.84 -0.26 SIQ 0.22 0.71 -0.17 0.68 CALQ -0.21 0.11 -0.11 n .a . n .a . ATP 0.21 0.67 -0.19 0.07 0.42 -0.50 ATP/MBM -0.45 0.22 -0.66 -0.14 0.02 -0.20 n.a. C 0.42 0.79 0.04 0.68 0.85 0.01 0.51 0.08 N 0.61 0.66 0.29 0.46 0.60 -0.05 0.40 -0.09 0.84 CiN -0.12 0.53 -0.36 0.51 0.51 0.10 0.33 0.25 n.a. n .a .
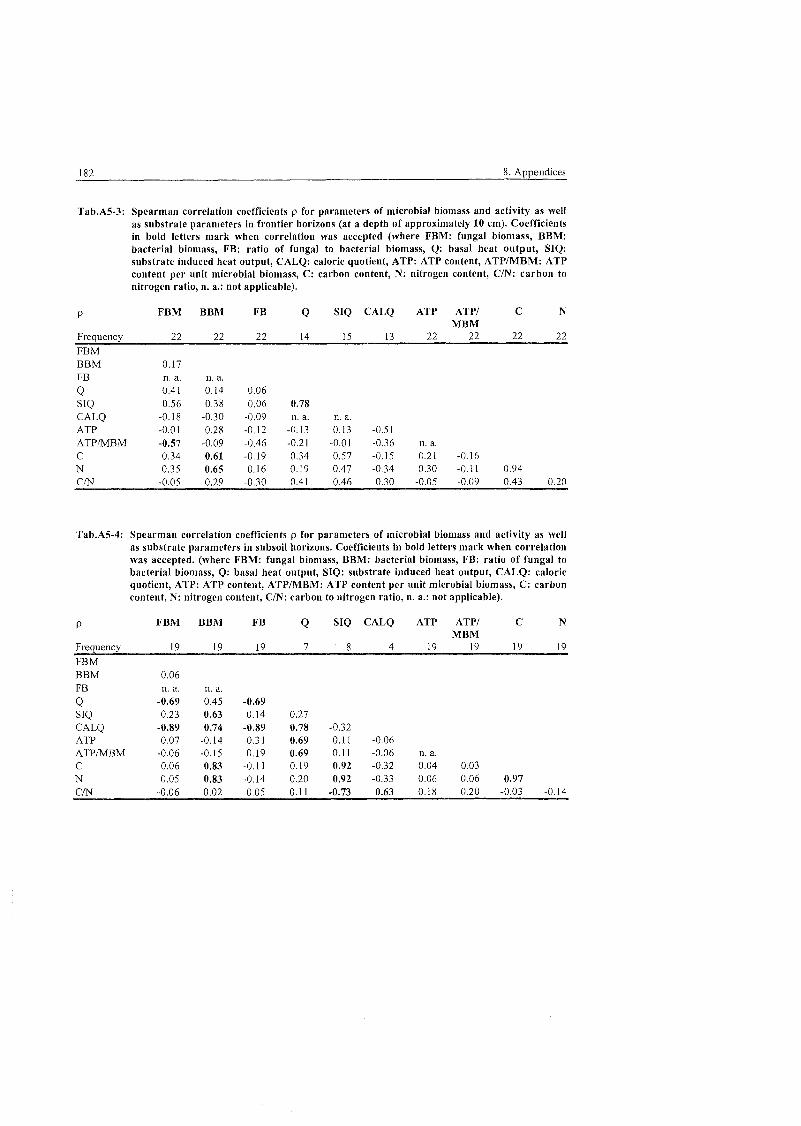
182 8. Appendices
Tab .A5-3: Spearnian correlation coefficients p for paranieters of microbial biomass and activity as well as Substrate paran~eters in frontier horizons (at a depth of approximately 10 cm). Coefficients in bold letters mark when correlation was accepted (where FBM: fungal biomass, BBM: bacterial biomass, FB: ratio of fungal to bacterial biomass, Q: basal heat output, SIQ: Substrate induced heat output, CALQ: caloric quotient, ATP: ATP content, ATPIMBM: ATP content per unit microbial biomass, C: carbon content, N: nitrogen content, C m : carbon to nitrogen ratio, n. a.: not applicable).
FBM BBM FB Q SIQ CALQ ATP ATPI C N MBM
Frequency 22 22 22 14 15 13 22 22 22 22 FBM BBM 0.17 FB n. a. 11. a.
Q 0.41 0.14 0.06 SIQ 0.56 0.38 0.06 0.78 CALQ -0.18 -0.30 -0.09 11.a. n .a . ATP -0.01 0.28 -0.12 -0.13 0.13 -0.51 ATPIMBM -0.57 -0.09 -0.46 -0.21 -0.01 -0.36 n. a. C 0.34 0.61 -0.19 0.34 0.57 -0.15 0.21 -0.16 N 0.35 0.65 -0.16 0.19 0.47 -0.34 0.30 -0.11 0.94 C/N -0.05 0.29 -0.30 0.41 0.46 0.30 -0.05 -0.09 0.43 0.20
Tab.A5-4: Spearman correlation coefficients p for paranieters of microbial biomass and activity as well as substrate Parameters in subsoil horizons. Coefficients in bold letters mark when correlation was accepted. (where FBM: fungal biomass, BBM: bacterial biomass, Fß ratio of fungal to bacterial bioniass, Q: basal heat output, SIQ: substrate induced heat output, CALQ: caloric quotient, ATP: ATP content, ATPIMBM: ATP content per unit microbial biomass, C: carbon content, N: nitrogen content, C m : carbon to nitrogen ratio, n. a.: not applicable).
P FBM BBM F Ã Q SIQ CALQ ATP ATPI C N MBM
Frequency 19 19 19 7 8 4 19 19 19 19 FBM BBM 0.06 FB n. a. n. a.
Q -0.69 0.45 -0.69 S I 0 0.23 0.63 0.14 0.27 CALQ -0.89 0.74 -0.89 0.78 -0.32 ATP 0.07 -0.14 0.31 0.69 0.1 1 -0.06 ATPIMBM -0.06 -0 15 0.19 0.69 0.11 -0.06 n. a. C 0.06 0.83 -0.11 0.19 0.92 -0.32 0.04 0.03 N 0.05 0.83 -0.14 0.20 0.92 -0.33 0.06 0.06 0.97 C/N -0.06 0.02 0.05 0.11 -0.73 0.63 0.18 0.20 -0.03 -0.14
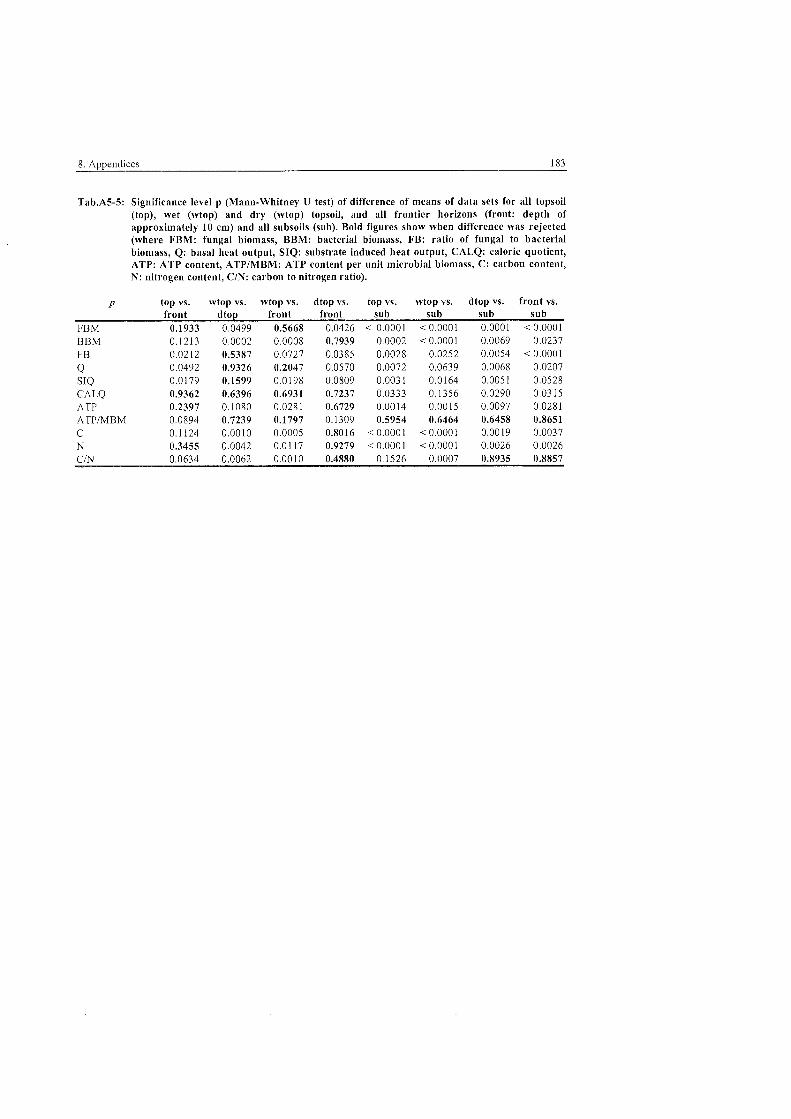
8. Appendices 183
Tab.AS-5: Significance level p (Mann-Whitney U test) of difference of means of data sets for all topsoil (top), wet (wtop) and dry (wtop) topsoil, and all frontier horizons (front: depth of approximately 10 c n ~ ) and all subsoils (sub). Bold figures show when difference was rejected (where FBM: fungal biomass, BBM: bacterial biomass, FB: ratio of fungal to bacterial biomass, Q: basal heat output, SIQ: substrate induced heat output, CALQ: caloric quotient, ATP: ATP content, ATPIMBM: ATP content per unit microbial biomass, C: carbon content, N: nitrogen content, CIN: carbon to nitrogen ratio).
P top vs. wtop vs. wtop vs. dtop vs. top vs. wtop vs. dtop vs. front vs. front dtop front front sub sub sub sub
FBM 0.1933 0,0499 0.5668 0.0426 < 0.0001 < 0.0001 0.0001 < 0.0001 BBM FB
Q SIQ CALQ ATP ATPIMBM C N
Folgende Hefte der Reihe ,,Berichte zur Polarforschung" sind bisher erschienen: ' Sonderheft Nr. 111981 -.Die Antarktis und ihr Lebensraum"
Eine Einfuhrung fü Besucher - Herausgegeben im Auftrag von SCAR Heft Nr. 111982 -*Die Filchner-Schelfeis-Expedition 1980181" zusammengestellt von Heinz Kohnen Heft Nr. 7.11982 - Jeutsche Antarktis-Expedition 1980181 mit FS =Meteor" First International BIOMASS Experiment (FIBEX) - Liste der Zooplankton- und Mikronektonneffäng zusammengestellt von Norbert Klages Heft Nr, 311982 -,,Digitale und analoge Krill-Echolot-Rohdateneriassung an Bord des Forschungs- Schiffes ,Meteor'" (im Rahmen von FIBEX 1980181, Fahrtabschnitt ANT 111). von Bodo Morgenstern Heft Nr. 411982 - ,,Filchner-Schelfeis-Expedition 1980181" Liste der Planktonldnge und Lichtstärkemessunge zusammengestellt von Gerd Hubold und H. Eberhard Drescher
* Heft Nr. 511982 -"Joint Biological Expedition on RRS 'John Biscoe', February 1982 by G. Hempel and R. B. Heywood Heft Nr. 611982 - ãAntarktis-Expeditio 1981182 (Unternehmen ,Eiswarte')" zusammengestellt von Gode Gravenhorst Heft Nr. 711982 - Mann-à oiogisrnes ßegleitprogram zur Stanoorterk~na~ng 1979 80 m t MS ,Polar- sirkel iPre-S IG S~rvev l - Stat ons! sten oer M r<roneKton- ~ n d Zooplan~tonlanqe sow e der ßoden schere! zusammengestellt v o i ' ~ . Schneppenheim Heft Nr. 811983 - 'The Post-Fibex Dala Interpretation Workshop" bv D. L. Cram and J:C. Frevlao with the collaboration of J. W. Schmidt, M. Mall, R, Kresse, T. Schwinghammer ,
Heft Nr. 911983 -"Distribution of some groups of zooplankton in the inner Weddell Sea in summer 1979180" by I. Hempel, G. Hubold, B. Kaczmaruk, R. Keller, R. Weigmann-Haass Heft Nr. 1011983 - ãFluo im antarktischen Ökosystem - DFG-Symposium November 1982 zusammengestellt von Dieter Adelung Heft Nr. 1111983 -"Joint Biological Expedition on RRS'John Biscoe', February 1982 (11)" Data of micronecton and Zooplankton hauls, by Uwe Piatkowski Heft Nr. 1U1983 - ,,Das biologische Programm der ANTARKTIS-I-Expedition 1983 mit FS ,Polarstern"' Stationslisten der Plankton-, Benthos- und Grundschleppnetzfäng und Liste der Probennahme an Robben und Vogeln, von H. E. Drescher, G. Hubold, U. Piatkowski, J. Plöt und J.VoÂ
+ Heft Nr. 1311983 - Jie Antarktis-Expedition von MS ,Polarbjörn 1982183 (Sommerkampagne zur Atka-Bucht und zu den Kraul-Bergen), zusammengestellt von Heinz Kohnen
' Sonderheft Nr. U1983 -=Die erste Antarktis-Expedition von FS ,Polarstern' (Kapstadt, 20. Januar 1983 - Rio de Janeiro, 25. Mär 1983)", Bericht des Fahrtleiters Prof. Dr. Gotthilf Hempel Sonderheft Nr. 311983 -,,Sicherheit und Uberleben bei Polarexpeditionen'' zusammenoestellt von Heim Kohnen Heft Nr. 1411983 - ãDi erste Antarktis-Expedition (ANTARKTIS I) von FS ,Polarstern' 1982183 herausgegeben von Gotthilf Hempel Sonderheft Nr. 411983 -"On the Biology of Krill Euphausia superba'' - Proceedings of the Seminar and Report of the Krill Ecology Group, Bremerhaven 12. - 16. May 1983, edited by S. B. Schnack Heft Nr. 1511983 - "German Antarctic Expedition 1980181 with FRV 'Walther Herwig' and RV 'Meteor'" - First International BIOMASS Experiment (FIBEX) - Data of micronekton and zooplankton hauls by Uwe Piatkowski and Norbert Klages Sonderheft Nr. 511984 -"The observatories of the Georg von Neumayer Station", by Ernst Augstein Heft Nr. 1811984 -"FIBEX cruise zooplankton data" by U. Piatkowski, I. Hempel and S. Rakusa-Suszczewski Heft Nr. 1711984 - Fahrtbericht (cruise report) der ,Polarstern'-Reise ARKTIS I, 1983 von E. Augstein, G. Hempel und J. Thiede Heft Nr. 1811984 - ãDi Expedition ANTARKTIS II mit FS ,Polarstern' 1983184", Bericht von den Fahrtabschnitten 1, 2 und 3, herausgegeben von D. Füttere Heft Nr. 1911984 -,,Die Expedition ANTARKTIS II mit FS ,Polarstern' 1983184, Bericht vom Fahrtabschnitt 4, Punta Arenas-Kapstadt (Ant-1114), herausgegeben von H. Kohnen Heft Nr. 2011984 - Jie Expedition ARKTIS II des FS ,Polarstern' 1984, mit Beiträge des FS ,Valdivia' und des Forschungsflugzeuges ,Falcon 20' zum Marginal lce Zone Experiment 1984 (MIZEX)" von E. Augstein, G. Hempel, J. Schwarz, J. Thiede und W. Weigel Heft Nr. 2111985 -"Euphausiid larvae in plankton from the vicinity of the Antarctic Penisula, February 1982 by Sigrid Marschall and Elke Mizdalski Heft Nr. ZU1985 - "Maps of the geographical distribution of macrozooplankton in the Atlantic sector of the Southern Ocean" by Uwe Piatkowski Heft Nr. 2311985 - ãUntersuchunge zur Funktionsmorphologie und Nahrungsaufnahme der Larven des Antarktischen Krills Euphausia superba Dana" von Hans-Peter Marschall
Heft Nr. 2411985 - ,,Untersuctiungen zum Periglazial auf der König-Georg-Inse Südshetlandinseln Antarktika. Deutsche physiogeographische Forschungen in der Antarktis. - Bericht übe die Kampagne I983184 von Dietrich Barsch, Wolf-Dieter Blumel, Wolfgang Flugel, Roland Mausbacher, Gerhard Stablein, Wolfgang Zick
' Heft Nr. 2511985 -,,Die Expedition ANTARKTIS 111 mit FS ,Polarstern' 198411985" herausgegeben von Gotthilf Hempel. Heft Nr. 2611985 -"The Southern Ocean"; A survey of oceanographic and marine meteorological research work by Hellmer et al. Heft Nr, 2711986 - ,,Spatpleistozane Sedimentationsprozesse am antarktischen Kontinentalhang vor Kapp Norvegia, ostliche Weddell-See" von Hannes Grobe Heft Nr 2811986 - D fl~xpeoit on AHd l S tn,l Po arilcrn 1.385 mit B* iraqcd der ranrlte- lnehmc-r. ncra .sc)r'~cbcti ,011 Rii nr r Gorsonue . . ' Heft Nr. 2911986 - ,,5 Jahre Schwerpunktprogramm ,Antarktisforschung' der Deutschen Forschungsgeme~snchaft.'~ Ruckblick und Ausblick. Zusammengestellt von Gotttiilf Hempel, Sprecher des Schwerpunktprogramms Heft Nr. 3011986 -"The Meteorological Data of the Georg-von-Neumayer-Station for 1981 and 1982' bv Marianne Gube and Friedrich Obleitner Heft Nr. 3111986 ->Zur Biologie der Jugendstadien der Notothenioidei (Pisces) an dei Antarktischen Halbinsel" von A. Kellermann Heft Nr. 3211986 -..Die Expedition ANTARKTIS IV mit FS ,Polarstern' 1985186 mit Beitragen der Fahrtteilnehmer, herausgegeben von Dieter Futterer Heft Nr. 3311987 --Die Expedition ANTARKTIS-IV mit FS ,Polarstern' 1985!86 - Bericht zu den Fahrtabschnitten ANT-lV!3-4 von Dieter Karl Futterer Heft Nr. 3411987 - ,,Zoogeographische Untersuchungen und Gemeinschaftsanalysen an antarktischen Makroplankton" von U. Piatkowski Heft Nr. 3511987 - ãZu Verbreitung des Meso- und Makrozooplanktons in Oberflächenwasse der Weddell See (Antarktis)" von E. Boysen-Ennen Heft Nr. 3611987 - ãZu Nahrungs- und Bewegungsphysiologie von Salpa thompsoni und Salpa fusiformif von M. Reinke Heft Nr. 3711987 - "The Eastern Weddell Sea Drifting Buoy Data Set of the Winter Weddell Sea Project (WWSP)" 1986 by Heinrich Hoeber und Marianne Gube-Lehnhardt Heft Nr. 3811987 -"The Meteorological Data of the Georg von Neumayer Station for 1983 and 1984 by M. Gube-Lenliardt Heft Nr. 3911987 - ãDi Winter-Expedition mit FS ,Polarsterns in die Antarktis (AMT V!1-3)" herausoeoeben von Siarid Schnack-Schiel " - Heft Nr. 4011987 - "Weather and Synoptic Situation during Winter Weddell Sea Project 1986 (ANT Vl2) July 16 - September 10, 1986 by Werner Rabe Heft Nr. 4111988 --Zur Verbreitung und 0kologie der Seegurken im Weddellmeer (Antarktis)" von Julian Gult Heft Nr. 4211988 -"The zooplankton community in the deep bathyal and abyssal zones of the eastern North Atlanticc' by Werner Beckmann Heft Nr. 4311988 -"Scientific cruise report of Arctic Expedition ARK IV l3 Wissenschaftlicher Fahrtbericht der Arktis-Expedition ARK IVl3, compiled by Jorn Thiede Heft Nr. 4411988 -"Data Report for FV 'Polarstern' Cruise ARK IVII, 1987 to the Arctic and Polar Fronts" by Hans-Jürge Hirche Heft Nr. 4511988 - ãZoogeographi und Gemeinschaftsanalyse des Makrozoobenthos des Weddellmeeres (Antarktis)" von Joachim Voà Heft Nr. 4611988 - "Meteorological and Oceanographic Dala of the Winter-Weddell-Sea Project 1986 (ANT Vl3)" by Eberhard Fahrbach Heft Nr. 4711988 - ãVerteilun und Herkunft glazial-mariner Gerolle am Antarktischen Kontinentalrand des östliche Weddellmeeres" von Wolfgang Oskierski Heft Nr. 4811988 - *Variationen des Erdmagnetfeldes an der GvN-Station" von Arnold Brodscholl Heft Nr. 4911988 --Zur Bedeutung der Lipide im antarktischen Zooplankton" von Wilhelm Hagen Heft Nr. 5011988 - -Die gezeitenbedingte Dynamik des Ekslröm-Schelfeises Antarktis" von Wolfgang Kobarg Heft Nr. 5111988 - ..Okomorphologie nototheniider Fische aus dem Weddellmeer, Antarktis" von Werner Ekau Heft Nr. 5211988 -..Zusammensetzung der Bodenfauna in der westlichen Fram-Straße von Dieter Piepenburg Heft Nr. 5311988 -,.Untersuchungen zur Ökologi des Phytoplanktons im südostliche Weddellmeer (Antarktis) im Jan.lFebr. 1985 von Eva-Maria Nothig Heft Nr. 5411988 -.,Die Fisctifauna des ostlichen und sudlichen Weddellmeeres: geographische Verbreitung, Nahrung und trophische Stellung der Fischarten" von Wiebke Schwarzbach Heft Nr. 5511988 -"Weight and length data of Zooplankton in the Weddell Sea in austral spring 1986 (Ant. V13)" by Elke Mizdalski Heft Nr. 5611989 -"Scientific cruise report of Arctic expeditions ARK IVII, 2 & 3 by G. Krause, J. Meinke und J. Thiede
Heft Nr. 5711989 -.,Die Expedition ANTARKTIS V mit FS ,Polarstern' 1986187" Bericht von den Fahrtabschnitten AMT V14-5 von H. Miller und H. Oerter Heft Nr. 5811989 --Die Expedition ANTARKTIS V1 mit FS ,Polarstern' 1987188 von D. K. Futterer Heft Nr. 5911989 -,,Die Expedition ARKTIS Vlla, 1 b und 2 mit FS ,Polarstern' 1988 von M. Spindler Heft Nr. 6011989 - ãEi zweidimensionales Modell zur thermohatinen Zirkulation unter dem Schelfeis" von H. H. Helimer Heft Nr. 6111989 -"Die Vulkanile im westlichen und mittleren Neuschwabenland, Vestfjella und Ahlmannryggen, Antarktika" von M. Peters Heft Nr. 6211989 -"The Expedition ANTARKTIS VllI1 and 2 (EPOS I) of RV 'Polarstern' in 1988189 bv 1. Hemoel ~ , ,
Heft Nr. 6311989 - ,,Die Eisalgenflora des Weddellmeeres (Antarktis): Artenzusammensetzung und Biomasse sowie Okophysiologie ausgewahlter Arten" von Annette Bartsch Heft Nr. 6411989 -"Meteorological Dala of the G.-V.-Neumayer-Station (Antarctica)" by L. Helmes Heft Nr. 6511989 -"Exoedition Antarktis V1113 in 1988189'' bv l Hern~el, P H. Schalk, V Smetacek Heft Nr. 6611989 - Gcomorpno~oqiscn-g az oiogiwic Dotaikart ewng ocs atio-tiocnpo arcts Ÿorqnias . r t . Nc'~sch:.abc!ildno. Antarkt ka von Karsten Br<-nk Heft Nr. 6711990 - "ldentification key and catalogue of larval Anlarctic fishes" edited bv Adolf Kellermann Heft Nr. 6811990 - "The Expedition Antarktis V1114 (Epos leg 3) and Vlll5 01 RV 'Polarstern' in 1989, edited by W. Arntz, W. Ernst, I. Hempel Heft Nr. 6911990 - ,,Abhangigkeilen elastischer und rheologischer Eigenschaften des Meereises vom Eisgefuge", von Harald Hellmann Heft Nr. 7011990 -?Die beschalten benthischen Mollusken (Gastropoda und Bivalvia) des Weddellmeeres, Antarktis", von Stefan Hain Heft Nr. 7111990 - ,.Sedimentologie und Palaomagnetik an Sedimenten der Maudkuppe (Nordostliches Weddellmeer)", von Dieter Cordes Heft Nr. 7211990 -"Distribution and abundance of planklonic copepods (Crustacea) in the Weddell Sea in summer 1980/81", by F. Kurbjeweit and S. Ali-Khan Heft Nr. 7311990 - ãZu Fruhdsayenese von organischem Kohlenstoff und Opal in Sedimenten des sudlichen und ostlichen Weddellmeeres", von M. Schlüte Heft Nr. 7411990 -%Expeditionen ANTARKTIS-VIIIl3 und Vllll4 mit FS ,Polarstern' 1989 von Rainer Gersonde und Gotthilf Hernpel Heft Nr. 7511991 -,,Quartär Sedimentationsprozesse am Kontinentalhang des Sud-Orkey-Plateaus im nordwestlichen Weddellmeer (Antarktis)", von Sigrun Grunig Heft Nr. 7611990 -,,Ergebnisse der faunistischen Arbeiten im Benthal von King George Island fSudshetlandinseln. AnlarktisY'. von Martin Rauschert Heft Nr. 7711990 - Veflo Img .on M K I O ~ an~!on-Organ smcn nora.'~esl.icn aer Anlarkt s(.hefi rtatbinsc Jnter u rm Ezinfl.i s cn cino~-rnfler Lniv.oltood nqunyen irn netost ~ o n r-feini' K osor Heft Nr. 7811991 - ,,Hochaufl6sende ~agnetoscatiiraphie spatquartarer Sedimente arktischer Meeresgebiete", von Norbert R. Novdaczyk Heft Nr. 7911991 - ãÖkophysiologisc Untersuchungen zur Salinitats- und Temperaturtoleranz antarktischer Grunalgen unter besonderer Berucksichtigung des P-Dirnethylsulfoniumpropionat (DMSP) - Stoffwechsels", von Ulf Karsten Heft Nr. 8011991 -,,Die Expedition ARKTIS Vll11 mit FS ,Polarstern' 1990, herausgegeben von Jorn Thiede und Gotthilf Hempel Heft Nr. 8111991 - ,,Palaoglazioloyie und Palaozeanographie im Spatquartar am Kontinentalrand des sudlichen Weddelmeeres, Antarktis", von Martin Melles
. . Heft Nr. 8311991 -,,Das Fließe von Schelfeisen - numerische Sirnulationen mit der Metholde der finiten Differenzen", von Jürge Determann Heft Nr. 8411991 -,,Die Expedition ANTARKTIS-VIIIII-2, 1989 mit der Winter Weddell Gyre Study der Forschungsschiffe ,Polarstern' und ,Akademik Fedorov"', von Ernst Augstein, Nikolai Bagriantsev und Hans Werner Schenke Heft Nr. 8511991 -,,Zur Entstehung von Unlenvassereis und das Wachstum und die Energiebilanz des Meereises in der Atka Bucht, Antarktis", von Josef Kipfstuhl Heft Nr. 8611991 -*Die Expedition ANTARKTIS-VIII mit FS ,Polarstern' 1989190. Bericht vom Fahrtabschnitt ANT-VIIIIV, von Heinz Miller und Hans Oerter Heft Nr. 8711991 - "Scientific cruise reporls of Arctic expeditions ARK Vll l-4 of RV 'Polarstern' in 1989, edrted by G. Krause. J. Meincke & H. J. Schwarz Heft Nr. 8811991 -,,Zur Lebensgeschichte dominanter Copepodenarten (Calanus tinmarchicus, C. glacialis, C. hyperboreus, Metridia longa) in der Framstraße" von Sabine Die!
Heft Nr. 8911991 - Detaillierte seismische Untersuchungen am ostlichen Kontinentalrand des Weddell-Meeres vor Kapp Norvegia, Antarktis", von Norbert E. Kaul Heft Nr. 9011991 - ãDi Expedition ANTARKTIS-VIII mit FS .Polarstern3 1989190. Bericht von den Fahrtabschnitten ANT-VIII!6-T, herausgegeben von Dieter Karl Futterer und Otto Schrems Heft Nr. 9111991 - "Blood physiology and ecological consequences in Weddell Sea fishes (Antarctica)" by Andreas Kunzmann Heft Nr. 9211991 - ,,Zur sommerlichen Verteilung des Mesozooplanktons im Nansen-Becken, Nordpolarmeef', von Nicolai Mumm Heft Nr. 9311991 -*Die Expedition ARKTIS VII mit FS .Polarstern', 1990. Bericht vom Fahrtabschnitt ARKVIII2, herausgegeben von Gunther Krause Heft Nr. 9411991 - ãDi Entwicklung des Phytoplanktons im ostlichen Weddellmeer (Antarktis) beim Ubergang vom Spatwinter zum Fruhjahr", von Renate Scharek Heft Nr. 9511991 - ,,Radioisotopenstratigraphie, Sedimentologie und Geochemie jungquartäre Sedimente des ostlichen Arktischen Ozeans", von Horst Bohrmann Heft Nr. 9611991 -,,Holozän Sedimentationsentv~ickiung im Scoresby Sund, Ost-Gronland, von Peter Marienfeld Heft Nr 9711991 - S i r ~ ~ i ~ r c l l c Eni:. er; ~ n g ~ n a Abrt-in ..ngsgcscticntc von n c mcfrontfle la Wost m e s Llrornifi I fi'aau Land Antaid ka) , i c n oaciiirn J ~ i c o ~ s
Heft Nr. 9811991 - -Zur ~esiedlun~sgeschichte des antarktischen Schelfes am Beispiel der Isopoda (Crustacea, Malacostraca)", von Angelika Brandt Heft Nr. 9911992 - "The Antarctic ice sheet and environmental Change: a three-dimensional modelling study", by Phiiippe Huybrechts Heft Nr. 10011992 -=Die Expeditionen ANTARKTIS 1x11-4 des Forschungsschiffes ,Polarstern1 1990191" herausgegeben von Ulrich Bathmann, Meinhard Schulz-Baldes, Eberhard Fahrbach, Victor Smetacek und Hans-Wolfgang Hubberten Heft Nr. 10111992 - ãWechselbeziehunge zwischen Schwermetallkonzentrationen (Cd, Cu, Pb, Zn) im Meerwasser und in Zooplanktonorganismen (Copepoda) der Arktis und des Atlantiks", von Christa Pohl Heft Nr. 10211992 - ãPhysiologi und Ultrastruktur der antarktischen Grünalg Prasiola crlspa ssp. antarctica unter osmotischem Streà und Austrocknung", von Andreas Jacob Heft Nr. I0311992 -..Zur Ökologi der Fische im Weddellmeer", von Gerd Hubold Heft Nr. I0411992 - ,.Mehrkanalige adaptive Filter fur die Unterdruckung von muitiplen Reflexionen in Verbindung mit der freien Oberfläch in marinen Seismogrammen", von Andreas Rosenberger Heft Nr. 10511992 - "Radiation and Eddy Flux Experiment 1991 (REFLEX V , von Jör Hartmann, Christoph Kottmeier und Christian Wamser Heft Nr. 10611992 - ,,Ostracoden im Epipelagial vor der Antarktischen Halbinsel - ein Beitrag zur Systematik sowie zur Verbreitung und Populalionsstruktur unter Berücksichtigun der Saisonalität" von Rudiger Kock Heft Nr. 10711992 - ,,ARCTIC '91: Die Expedition ARK-VIII13 mit FS ,Polarstern' 1991". von Dieter K. Futterer Heft Nr. I0811992 - ,,Dehnungsbeben an einer Storungszone im Ekstrom-Schelfeis nördlic der Georg-von-Neumayer-Station, Antarktis. - Eine Untersuchung mit seismologischen und geodätische Methoden", von Uwe Nixdorf. Heft Nr. 10911992 - ,,Spatquartär Sedimentation am Kontinentalrand des sudosllichen Weddelimeeres, Antarktis", von Michael Weber. Heft Nr. 11011992 - ,,Sedimentfazies und Bodenwasserstrom am Kontinentalhang des norwestlichen Weddeilmeeres", von Isa Brehme, Heft Nr. 11111992 - ,,Die Lebensbedingungen in den Solekanalchen des antarktischen Meereises", von Jurgen Weissenberger. Heft Nr. I1211992 - -Zur Taxonomie von rezenten benthischen Foraminiferen aus dem Nansen Becken, Arktischer Ozean", von Jutta Wollenburg. Heft Nr. 11311992 -?Die Expedition ARKTIS Vlll11 mit FS .Polarstern' 1991". herausgegeben von Gerhard Kattner. Heft Nr. 11411992 -.Die Grundungsphase deutscher Polarforschung, 1865 - 1875, von Reinhard A. Krause. Heft Nr. 11511992 -"Scientific Cruise Report of the 1991 Arctic Expedition ARK VIIIi2 af RV 'Polarstern' (EPOS III". bv Eike Rachor, Heft Nr. 11611992-"The ~eteorological Data of the Georg-von-Neumayer-Station (Antarctica) for 1988, 1989, 1990 and 1991" by Gert Konig-Langlo. Heft Nr. 11711992 - ,.Petrogenese des metamorphen Grundgebirges der zentralen Heimefrontfjeila (westliches Dronning Maud Land !Antarktis}", von Peter Schulze. Heft Nr. 11811993 - ,,Die mafischen Gange der Shackleton Range 1 Antarktika: Petrographie. Geochemie, Isotopengeochemie und Palaomagnetik. von Rüdige Hotten. Heft Nr. 11911993 - ,,Gelrierschutz bei Fischen der Polarmeere", von Andreas P. A. Wöhrmann
" Heft Nr. 12011993 - "East Siberian Arctic Region Expedition '92; The Laptev Sea - its Significance for Arctic Sea-Ice Formation and Transpolar Sediment Flux", by D. Dethleff, D. Nurnberg, E. Reimnitz, M. Saarso and Y. P. Sacchenko. -"Expedition to Novaja Zen~lja and Franz Josef Land with RV.'Dalnie Zelentsy'", by D. Nurnberg and E. Groth.
Heft Nr. 12111993 -%Die Expedition ANTARKTIS XI3 mit FS ,Polarstern3 1992", herausgegeben von Michael Spindler, Gerhard Dieckmann und David Thomas Heft Nr. 122/1993 - %Die Beschreibung der Korngestalt mit Hille der Fourier-Analyse: Parametrisierung der morphologischen Eigenschaften von Sedimentpartikeln", von Michael Diepenbroek.
* Heft Nr. 12311993 - ..Zerstorungsfreie hochauflösend Dichteuntersuchungen mariner Sedimente", von Sebastian Gerland. Heft Nr. 12411993 - ãUmsat und Verteilung von Lipiden in arktischen marinen Organismen unter besonderer Berücksichtigun unterer trophischer Stufen", von Martin Graeve. Heft Nr. 12511893 - ãOkologi und Respiration ausgewählte arktischer Bodenfischarten", von Christian F. von Dorrten. Heft Nr. 12611993 - O . ~ r i t l--ili. : Ur-SI min .nq 101 f'.i 40 .m:.,; lr,,ir?ni(:l?rn des Aniarkl.scnen Oberf acnon:.assc!fs im 9~31fl-8rt er iiitianci von Trciti'.feri.in~tionon mit D.aionieen , von JInch 7. e irisk Heft Nr. 12717993 - ,,~edi'me"ttrans~ort durch das arktische Meereis: Die rezente lithogene und biogene Materialfracht", von Ingo Wollenburg. Heft Nr. 12811993 -"Cruise ANTARKTIS X/3 of RV 'Polarstern': CTD-Report", von Marek Zwierz Heft Nr. 12911993 - ,,Reproduktion und Lebenszyklen dominanter Copepodenarten aus dem Weddellmeer, Antarktis", von Frank Kurbieweit Heft Nr, 13011993 - ,-,nler->..cn. nqcn < L "Te'-nrc-rat~rtvg ri ic! Lnu Massenha .sha l oes F i~hncr-Rontic--S :he fe.scs. Antar~i 5 , .iiiiot iwsondci~r Bi:" .rks chl fl-nfl von Anff er- Lnu Abschmelzprozessen", von Klaus Grosfeld Heft Nr. 13111993 --Die Expedition ANTARKTIS XI5 mit FS ,Polarstern' 1992, herausgegeben von Rainer Gersonde Heft Nr. 132/1993 --Bildung und Abgabe kurzkettigcr halogenierter Kohlenwasserstoffe durch Makroalgen der Poiarregionen", von Frank Laturnus Heft Nr. 13311994 -"Radiation and Eddy Flux Experiment 1993 (REFLEX 117, by Christoph Kottmeier, Jorg Hartmann, Christian Wamser, Axei Bochert, Christof Lupkes, Dietmar Freese and Wolfgang Colirs
* Heft Nr. 13411994 -"The Expedition ARKTIS-IXII". edited by Hajo Eicken and Jens Meincke Heft Nr. 13511994 - ..Die Expeditionen ANTARKTIS Xl6-8". herausgegeben von Ulrich Bathmann, Victor Smetacek, Hein de Baar, Eberhard Fahrbach und Gunter Krause Heft Nr. 13611994 -.,Untersuchungen zur Ernahrungsokologie von Kaiserpinguinen (Aptenodyfes forsten) und Konigspinguinen (Aptenodyles pataqonicus)", von Klemens Püt
* Heft Nr. 13711994 --Die kanozoische Vereisungsgeschichte der Antarktis". von Werner U. Ehrmann Heft Nr. 13811994 - ãUntersuchunge stratospharischer Aerosole vulkanischen Ursprungs und polarer stratospharischer Wolken mit einem Mehrwellenlangen-Ÿda auf Spitzbergen (72" N, 13 E}', von Georg Beyerle Heft Nr. I3911994 - ,,Charakterisierung der lsopodenfauna (Crustacea, Malacostraca) des Scotia-Bogens aus biogeographischer Sicht: Ein multivariater Ansatz", von Holger Winkler. Heft Nr. 14011994 - ãDi Expedition ANTARKTIS XI4 mit FS ,Polarstern' ISST, herausgegeben von Peter Lemke Heft Nr. 14111994 - ..Sateltitenattimetrie uber Eis - Anwendung des GEOSAT-Altimeters uber dem Ekstrotnisen, Antarktis', von Clemens Heidland Heft Nr. 142/1994 -"The 1993 Northeast Water Expedition. Scientific cruise report of RV 'Polartstern' Arctic cruises ARK 1x12 and 3, USCG 'Polar Beat cruise NEWP and the NEWLand expedition", edited by Hans-Jürge Hirche and Gerhard Kattner Heft Nr. 14311994 -.,Detaillierte refraktionsseismische Untersuchungen im inneren Scoresby Sund Ost-Groniand, von Notker Fechner Heft Nr. 14411994 -"Russian-Gernian Cooperation in the Siberian Shell Seas: Geo-System Laptev Sea", edited by Heidemarie Kassens, Hans-Wolfgang Hubberten, Sergey M. Pryamikov and Rudiger Stein Heft Nr. 14511994 -"The 1993 Northeast Water Expedition. Data Report of RV ,Polarstern' Arctic Cruises 1x12 and 3 , edited by Gerhard Kattner and Hans-Jurgen Hirche. Heft Nr. 14611994 -"Radiation Measurements at the German Antarctic Station Neumayer 1982 - 1992, by Torsten Schmidt and Gerd Konig-Langlo. Heft Nr. 14711994 - ..Krustenstrukturen und Verlaut des Kontinentalrandes im Weddell-Meer / Antarktis", von Christian Hübsche Heft Nr. 14811994 -"The expedilions NORILSWAYMYR 1993 and BUNGER OASIS 1993194 of the AWI Research Unit Potsdam", edited by Martin Melies. Heft Nr. 14911994 -,,Die Expedition ARCTIC '93. Der Fahrtabschnitt ARK-1x14 mit FS ,Polarstern' 1993", herausgegeben von Dieter K. Futterer. Heft Nr. I5011994 --Der Energiebedari der Pygoscelis-Pinguine: eine Synopse", von Boris M. Culik. Heft Nr. 15111994 -"Russian-German Cooperation: The Transdrift l Expedition to the Laptev Sea", edited by Heidemarie Kassens and Valeriy Y. Karpiy, Heft Nr. 15211994 -,,Die Expedition ANTARKTIS-X mit FS ,Polarstern' 1992. Bericht von den Fahrtabschnitten I ANT-X I 1a und 2". herausgegeben von Heinz Miller. Heft Nr. 15311994 - *Aminosauren und H~~minstoffe im Stickstoffkreislauf polarer Meere, von Ulrike Hubberten. Heft Nr. 15411994 -"Regional and seasonal variability in the vertical distribution of mesozooplankton in the Greenland Sea", by Claudio Richter.
Heft Nr. 15511995 -,,Benthos in polaren Gewassern", herausgegeben von Christian Wiencke und Wolf Arntz Heft Nr. 15611995 -"An adjoint model for the determination of the mean oceanic circulation, air-sea fluxes and mixing coefficients", by Reiner Schlitzer. Heft Nr. 15711995 - -Biochemische Untersuchungen zum Lipidstoffwechsel antarktischer Copepoden", von Kirsten Fahl. Heft Nr. 15811995 - Jie Deutsche Polarforschung seit der Jahrhundertwende und der Einfluà Erich von Drygalskis", von Cornelia Ludecke. Heft Nr. 15911995 -"The distribution of P0 in the Arctic Ocean: Implications for the freshwater balance of the halocline and the sources of deep and bottom waters", by Dorothea Bauch.
' Heft Nr. 16011995 -,,Rekonstruktion der spätquartär Tiefenwasserzirkulation und Produktivit%t im ostlichen Sudatlantik anhand von benthischen Foraminiferenvergesellschaftungen", von Gerhard Schmiedl. Heft Nr. 16111995 -..Der Einfluà von Salinitä und Lichtintensitat auf die Osmolvtkonzentrationen, die Zellvolumina
Heft Nr. 16271995 - ,,Meereistransportiertes lithogenes einm material in spatquartaren Tiefseesedimenten des Zentralen östliche Arktischen Ozeans und der Framstraße" von Thomas Letzig, Heft Nr. 16311995 -=Die Expedition ANTARKTIS-XI12 mit FS ,Polarstern' 1993/94", herausgegeben von Rainer Gersonde. Heft Nr. 16411995 - =Regionale und aitersabhangige Variation gesteinsmagnetischer Parameter in marinen Sedimenten der Arktis", von Thomas Frederichs, Heft Nr. 76511995 - ãVorkommen Verteilung und Umsatz biogener organischer Spurenstoffe: Sterole in antarktischen Gewassern", von Georg Hanke. Heft Nr. 16611995 - ãVergleichend Untersuchungen eines optimierten dynamisch-thermodynamischen Meereismodells mit Beobachtungen im Weddellmeer', von Holger Fischer. Heft Nr. 16711995 - ãRekonstruktione von Palao-Umvfeltparametern anhand von stabilen isotopen und Faunen-Vergesellschaftungen planktischer Foraminiferen im Sudatlantik", von Hans-Stefan Niebier Heft Nr. 16811995 - ãDi Expedition ANTARKTIS XI1 mit FS ,Polarstern' 1993194. Bericht von den Fahrtabschnitten ANT Xll l l und 2 , herausgegeben von Gerhard Kattner und Dieter Karl Füttere Heft Nr. 16911995 -.,Medizinische Untersuchung zur Circadianrhyihmik und zum Verhalten bei überwinterer auf einer antarktischen Forschungsstation", von Hans Wortmann Heft-Nr. 17011995 - DFG-Kolloquium: Terrestrische Geowissenschaften - Geologie und Geophysik der Antarktis Heft Nr. 17111995 - ..Strukturentwickluna und Petroaenese des metamor~hen Grundaebiraes der nordlichen " Heimlrontfjella (westliches Dronning Ma id ~andl~ngrkt ika)" , von ~ i l f r i e d Bauer. Heft Nr. 17211995 -..Die Struktur der Erdkruste im Bereich des Scoresby Sund, Ostgrönland Ergebnisse refraktionsseismischer und gravimetrischer Untersuchungen", von Holger Mandler. Heft Nr. 17311995 - ãPalaozoisch Akkretion am palaopazifischen Kontinentalrand der Antarktis in Nordvictorialand - P-T-D-Geschichte und Deformationsmechanismen im Bowers Terrane", von Stefan Matzer. Heft Nr. 17411995 -"The Expedition ARKTIS-XI2 of RV'PolarsternS in 1994" edited by Hans-W. Hubberten Heft Nr. I7511995 -"Russian-German Cooperation: The Expedition TAYMYR 1994, edited by Christine Siegert and Gmitry Bolshiyanov. Heft Nr. 17611995 -"Russian-German Cooperatson: Laptev Sea System", edited by Heidemarie Kassens, Dieter Piepenburg, Jör Thiede, Leonid Timokhov, Hans-Wolfgang Hubberten and Sergey M. Priamikov. Heft Nr, 17711995 -,,Organischer Kohlenstoff in spatquartäre Sedimenten des Arktischen Ozeans: Terrigener Eintrag und marine Produktivität" von Carsten J. Schuber! Heft Nr. 17811995 - "Cruise ANTARKTIS Xlll4 of RV'Polarstern' in 1995: CTD-Report", by Juri Siidam. Heft Nr. 17911995 - ,,Benthische Foraminiferenfaunen als Wassermassen-, Produktions- und Eisdriftanzeiger im Arkti- schen Ozean", von Jutta Wollenburg. Heft Nr. 18014995 - ,,Biogenopal und biogenes Barium ais Indikatoren fur spatquartare Produktivitätsanderunge am antarktischen Kontinentalhang, atlantischer Sektor", von Wolfgang J. Bonn. Heft Nr. 18111995 - -Die Expedition ARKTIS W1 des Forschungsschiffes ,Polarstern' 1994, herausgegeben von Eberhard Fatirbach. Heft Nr. 18211995 -"Laptev Sea System: Expeditions in 1994", edited by Heidemarie Kassens. Heft Nr. 18311996 - ,,Interpretation digitaler Parasound Echolotaufzeichnungen im östliche Arktischen Ozean auf der Grundlage physikalischer Sedimenteigenschaften", von Uwe Bergmann. Heft Nr. 18411996 -'Distribution and dynamics of inorganic nitrogen compounds in the troposphere of continental, coastal, marine and Arctic areas". by Maria Doiores Andres Hernandez. Heft Nr. 18511996 -"*Verbreitung und Lebensweise der Aphroditen und Polynoiden (Poiychaeta) im östliche Weddell- meer und im Lazarevmeer (Antarktis)", von Michael Stiller. Heft Nr. 18611996 -"Reconstruction of Late Quaternary environmental conditions applying the natural radionuclides ^ T h "Be "'Pa and "^U: A study of deep-sea sediments from the eastern sector of the Antarctic Circurnpolar Current Systemn, by Martin Frank Heft Nr. 18711996 -"The Meteorolog!cal Data of the Neumayer Station (Antarctica) for 1992, 1993 and 1994", by Gert König-Langl and Andreas Herber, Heft Nr. 18811996 -=Die Expedition ANTARKTIS-XI13 mit FS ,Polarstern' 1994", herausgegeben von Heinz Miiler und Hannes Grobe. Heft Nr. 18911996 -,,Die Expedition ARKTIS-VII/3 mit FS ,Polarsternx 1990, herausgegeben von Heinz Miller und Hannes Grobe
Heft Nr. I9011996 -"Cruise report of the Joint Chilean-Gernlan-ltalian Magellan ,Victor Hensen' Campalgn in 199c7 edited by Wolf Arntz and Mattnias Gorny. Heft Nr. I9111996 - ,,Leitfähigkeits und Dichtemessung an Eisbohrkernen", von Frank Wilhelms. Heft Nr. 192/1996 - ,,Photosynthese-Charakteristika und Lebensstrategie antarktischer Makroalgen", von Gabriele Weykam. Heft Nr. 19311996 --Heterogene Reaktionen von N205 und Hbr und ihr Einfluà auf den Ozonabbau in der polaren Stratosphäre" von Sabine Seisel. Heft Nr. I9411996 - ãOkologi und Populationsdynamik antarktischer Ophiuroiden (Echinodermata)", von Corinna Dahm, Heft Nr. 19511996 --Die planktische Foraminifere Neogloboquadrina pachyderma (Ehrenberg) im Weddellmeer, Antarktis", von Doris Berberich. Heft Nr. 19611996 - ãUntersuchunge zum Beitrag chemischer und dynamischer Prozesse zur Variabilitat des stratospharischen Ozons uber der Arktis", von Birgit Heese Heft Nr. I9711996 - "The Expedition ARKTIS-XI12 of 'Polarstern'in 1995", edited by Gunther Krause. Heft Nr. 19811996 - ,,Geodynamik des Westantarktischen Riftsystems basierend auf Apatit-Spaltspuranalysen". von Frank Lisker. Heft Nr. I9911996 -"The 1993 Northeast Water Expedition. Data Report on CTD Measurements of RV 'Polarstern' Cruises ARKTIS 1x12 and 3 , by Gerion Budeus and Wolfgang Schneider. Heft Nr. 20011996 - "Stability of the Thermohaline Circulation in analytical and nurnerical models", by Gerrit Lohmann, Heft Nr. 20111996 - ,,Trophische Beziehungen zwischen Makroalgen und Herbivoren in der Potter Cove (King George-Insel, Antarktis)", von Katrin Iken. Heft Nr. 202/1996 -,,Zur Verbreitung und Respiration okologisch wichtiger Bodentiere in den Gewässer um Svalbard (Arktis)", von Michael K. Schmid. Heft Nr. 20311996 --Dynamik, Rauhigkeit und Alter des Meereises in der Arktis - Numerische Untersuchungen mit einem großskalige Modell", von Markus Harder. Heft Nr. 20411996 --Zur Parametrisierung der stabilen atmospharischen Grenzschicht übe einem antarktischen Schelfeisw, von Dorthe Handori. Heft Nr. 20511996 -"Textures and fabrics in the GRiP ice core. in relation to climate history and ice deformation", by Thorsteinn Thorsteinsson. Heft Nr. 20611996 - D e r Ozean als Teil des gekoppelten Klimasystems. Versuch der Rekonstruktion der glazialen Zirkulation mit verschieden komolexen Atmosoharenkom~onenten". von Kerstin Fiea. Hett Nr. 20711996 - i f!ufcns~lratcgi~-ii oornmanicr antarti s:ner O i l i i ~ r ~ dw? C,( 1 po ua. Cop~-'puda iil:J C inrac' rJai-' (Poec cstoinnio oa. Coprpooa) im Dpl ngsria.~sennlefcr , ~ o n Cornci a MO!/ Heft Nr. 20811996 - ,,Atmosphareneinfluà bei der Fernerkundung von Meereis mit passiven Mikrowellenradiometern", von Christoph Oelke. Heft Nr. 20911996 - ãKlassifikatio von Radarsatellitendaten zur Meereiserkennung mit Hilfe von LIne-Scanner-Messun- gen", von Axel Bochert. Heft Nr. 21011996 - ,Die mit ausgewählte Schwammen (Hexactineilida und Demospongiae) aus dem Weddellmeer. Antarktis, vergesellschaftete Fauna", von Kathrin Kunzmann, Heft Nr. 21111996 - "Russian-German Cooperation: The Expedition TAYMYR 1995 and the Expedition KOLYMA 1995, by Dima Yu. Bolshiyanov and Hans-W. Hubberten. Heft Nr. 21211996 - "Surface-sediment composition and sedimentary processes in the central Arctic Ocean and along the Eurasian Continental Margin", by Ruediger Stein, Gennadij I. Ivanov, Michael A, Levitan, and Kirsten Fahl. Heft Nr. 21311996 - ,.Gonadenentviicktung und Eiproduktion dreier Calanus-Arten (Copepoda): Freilandbeobachtungen. Histologie und Experimente", von Barbara Niehoff Heft Nr. 21411996 -..Numerische Modellierung der Ubergangszone zwischen Eisschild und Eisschelf", von Christoph Mayer. Heft Nr. 21511996 -*Arbeiten der AWI-Forschungsstelle Potsdam in Antarktika, 1994195. herausgegeben von Ulrich Wand. Heft Nr. 21611996 - ãRekonstruktio quartäre Klimaanderungen im atlantischen Sektor des Sudpolarmeeres anhand von Radiolarien", von Uta Brathauer. Heft Nr. 21711996 - Adaptive Semi-Lagrange-Finite-Elemente-Methode zur Losung der Flachvdassergieichungen: Implementierung und Parallelisierung", von Jorn Behrens. Heft Nr. 21811997 -"Radiation and Eddy Flux Experiment 1995 (REFLEX 111)". by Jorg Hartmann, Axel Bochert. Dietmar Freese, Christoph Kottmeier, Dagmar Nagel and Andreas Reuter. Heft Nr. 21911997 - ãDi Expedition ANTARKTIS-XI1 mit FS ,Polarstern' 1995. Bericht vom Fahrtabschnitt ANT-XiIl3. herausgegeben von Wilfried Jokat und Hans Oerter. Heft Nr. 22011997 - ãEi Beitrag zum Schwerefeld im Bereich des Weddellmeeres, Antarktis. Nutzung von Altimetermessungen des GEOSAT und ERS-I", von Tilo Schone. Heft Nr. 22111997 -,,Die Expeditionen ANTARKTIS-XIII11-2 des Forschungsschiffes ,Polarstern' 1995/96", herausaeaeben von Uirich Bathmann. Mike Lukas und Victor Smetacek. " "
Heft Nr. 22211997 - "Tectonic Structures and Glaciomarine Sedimentation in the South-Eastern Weddell Sea from Seismic Reflection Data", by Laszlo Oszko.
Heft Nr. 22311997 -.,Bestimmung der Meereisdicke mit seismischen und elektromagnetisch-induktiven Verfahren", von Christian Haas. Heft Nr. 22411997 - ,,Troposphärisch Ozonvariationen in Polarregionen", von Silke Wessel. Heft Nr. 22511997 - .,Biologische und okologische Untersuchungen zur kryopelagischen Amphipodenfauna des arktischen Meereises", von Michael Poltermann. Heft Nr. 22611997 -"Scientific Cruise Report of the Arctic Expedition ARK-XI11 of RV 'Polarstern' in 1995, edited bv Eike Rachor. Heft Nr. 22711997 - Der E nIu kotnpatiocr S..ostanzt-n und Kr,cptoier<lor?n a,f U e Enz,rnc Malaiuoti~urogenase (FAD! i i.nd G ~ ~ 0 ~ i ? - 6 - ~ 1 i o ~ p i i a ! - D o h ~ d r o q c r 1 r ~ ~ e (GGP-Dli ai.8 Acrosiptionia ar~-tci Cn cropnlta ocr Arki s von Katharina Kuck. Heft Nr. 22811997 - ..Die Verbreituno enibenthischer Mollusken im chilenischen Beaole-Kanal", von Katrin Linse. > ,
Hell hr. 22911997 - Das F/csozocpI~in~icn im ~am:in-ns,r LriU osi icneri Nanseii-Bec~en - Vcrlc' IL~K] .nd Genw~iiscn~ftssti~kl i .rL"i i m S~ais~n'in'ier , ,011 hirir.cti rianssei Heft Nr. 23011997 - -Modell eines adaptierbaren, rechnergestützten wissenschaftlichen Arbeitsplatzes am Alfred-Wegener-Institut fur Polar- und Meeresforschung", von Lutz-Peter Kurdelski Heft Nr, 23711997 --Zur Okologie arktischer und antarktischer Fische: Aktivität Sinnesleistungen und Verhalten", von Christopher Zimmermann Heft Nr. 23211997 - ãPersistent chlororganische Verbindungen in hochantarktischen Fischen", von Stephan Zimmermann Heft Nr. 23311997 - ãZu Okologie des Dimethylsulfoniumpropionat (DMSP)-Gehaltes temperierter und polarer Phyioplanktongemeinschaften im Vergieich mit Laborkulturen der Coccolithophoride Erniliania huxleyi und der antarkti- schen Diatomee Nitzschia lecointef, von Doris Meyerdierks, Heft Nr. 23411997 - Jie Expedition ARCTIC '96 des FS ,Polarstern' (ARK XIII) mit der Arctic Climate System Study (ACSYS)", von Ernst Augstein und den Fahrtteilnehmern, Heft Nr. 23511997 - ,,Polonium-210 und Blei-219 im Sudpoiarmeer: Naturiiche Tracer fü biologische und hydrographische Prozesse im Oberflachenwasser des Antarktischen Zirkumpolarstroms und des Weddellmeeres", von Jana Friedrich Heft Nr. 23611997 -"Determination of atmospheric trace gas amounts and corresponding natural isotopic ratios by means of ground-based FTIR spectroscopy in the high Arctic", by Arndt Meier. Heft Nr. 23711997 - "Russian-German Cooperation: The Expedition TAYMYRISEVERNAYA ZEMLYA 1996, edited by Mariin Melles, Birgit Hagedorn and Dmitri Yu. Bolshiyanov Heft Nr. 23811997 -"Life strategy and ecophysiology of Antarctic macroalgae", by Ivan M. Gomez. Heft Nr. 23911997 -..Die Expedition ANTARKTIS Xllll4-5 des Forschungsschifles ,Polarstern' 1996, herausgegeben von Eberhard Fahrbach und Dieter Gerdes. Heft Nr. 24011997 -,,Untersuchungen zur Chrom-Speziation in Meerwasser, Meereis und Schnee aus ausgewahlten Gebieten der Arktis", von Heide Giese, Heft Nr. 24111997 - "Late Quaternary glacial history and paleoceanographic reconstructions along the East Greenland continental margin: Evidence from high-resolution records of stable isotopes and ice-rafted debris", by Seung-11 Nam. Heft Nr. 24211997 -"Thermal, hydrological and geochemical dynamics of Ihe active layer at a continuous permafrost site, Taymyr Peninsula, Siberia", by Julia Boike. Heft Nr. 24311997 - *Zur Palaoozeanographie hoher Breiten: Stellvertreterdaten aus Foraminiferen", von Andreas Mackensen. Heft Nr 24411997 - Trio C-ieopn,sica Onscr.ator, ai Ne..~['a,or Stator Aniarctca Ÿc-ctnciyne '. aiiu se srduoj C A oosni . (~ ions n 1995 ano l9W. nv A Ions t-.c~sIa ai I nomas Schni ut V o a Grä; Cnr st an M..! er an0 Johannes Rogenhagen. Heft Nr. 24511997 - ,,Temperaturbedarf und Biogeographie mariner Makroalgen - Anpassung mariner Makroalgen an tiefe Temperaturen, von Bettina Bischoff-Bäsmann Heft Nr. 24611997 - ,.~kologische Untersuchungen zur Fauna des arktischen Meereises", von Christine Friedrich. Heft Nr. 24711997 - ,,Entstehung und Modifizierung von marinen gelosten organischen Substanzen", von Berit Kirchhoff. Heft Nr. 24811997 -"Laptev Sea System: Expeditions in 1995, edited by Heidemarie Kassens. Heft Nr. 24911997 -"The Expedition ANTARKTIS Xllll3 (EASIZ I) of RV'Polarstern'to the eastern Weddell Sea in 1996, edited by Wolf Arntz and Julian Gutt. Heft Nr, 25011997 - ãVergleichend Untersuchungen zur 0koiogie und Biodiversitä des Mega-Epibenthos der Arktis und Antarktis", von Adreas Starmans. Heft Nr. 25111997 - ãZeitlich und raumliche Verteilung von Mineralvergesellschaftungen in spätquartär Sedimenten des Arktischen Ozeans und ihre Nützlichkei als Klimaindikatoren wahrend der Glazialllnterglazial-Wechsel", von Christoph Vogt. Heft Nr. 25211997 - ,,SoIitare Ascidien in der Potter Cove (King George Island, Antarktis). Ihre okologische Bedeutung und Populationsdynamik, von Stephdn Kuhne. Heft Nr. 25311997 -"Distribution and role of microprotozoa in the Southern Ocean", by Christine Klaas. Heft Nr. 25411997 - ,,Die spätquartar Klima- und Umweltgeschichte der Bunger-Oase, Ostantarktis", von Thornas Kulbe
Heft Nr. 25511997 - "Scientific Cruise Report of the Arctic Expedition ARK-XIIIl2 of RV 'Polarstern' in 1997", edited by Ruediger Stein and Kirsten Fahl. Heft Nr. 25611998 - ãDa Radionuklid Tritium im Ozean: Meßverfahre und Verteilung von Tritium im Sudatlantik und im Weddeilmeer", von Jurgen Suitenfuß Heft Nr. 25711998 -,,Untersuchungen der Saisonalitat von atrnospharischem Dimethylsulfid in der Arktis und Antarktis". von Christoph Kleefeld. Heft Nr. 25811998 - ,,Bellingshausen- und Amundsenmeer: Entwicklung eines Sedimentationsniodeils", von Frank-Oliver Nitsche. Heft Nr. 25911998 -"The Expedition ANTARKTiS.XIVl4 of RV 'Polarstern'in 1997' by Dieter K. Fuiterer. Heft Nr. 26011998 -,,Die Diatomeen der Laptevsee (Arktischer Ozean): Taxonomie und biogeographische Verbreitung. von Holger Cremer Heft Nr. 26111998 - D I? K r ~ s t e n s t r ~ k t ~ r Jna Seaimentaec<e des E-iras scnen R r x f n s Ark!f;rnr:r Ozean Res~ltatc aLs SL'ISIII schon 1.110 meirischen uniers.Ichi.nqen don Eslc .a l
Heft Nr. 262i1998 -"The ~ x ~ e d i t i o n ARKTIS-XIIIl3 of RV '~olarstern' in 1997" by Gunther Krause. Heft Nr. 26311998 - ,,Thermo-tektonische Entwicklung von Oaies Land und der Shackleton Range (Antarktis) basierend auf Spaltspuranalysen", von Thorsten Schäfer Heft Nr. 26411998 - ãMessunge der stratospharischen Spurengase CIO, HCI, O3 N20, H20 und OH mittels flugZeugge- iragener Submiliimetewdeilen-Radiometrie", von Joachim Urban. Heft Nr. 26511998 - ãUntersuchunge zu Massenhaushalt und Dynamik des Ronne Ice Shelfs, Antarktis", von Astrid Lambrecht. Heft Nr. 26611998 -"Scientific Cruise Report of ihe Kara Sea Expedition of RV 'Akademie Boris Pelrov' in 1997", edited by Jens Matthiessen and Oleg Stepaneis. Heft Nr. 26711998 -%Die Expedition ANTARKTIS-XIV mit FS ,Polarstern' 1997. Bericht vom Fahrtabschnitt ANT-XIV13, herausgegeben von Wiifried Jokat und Hans Oerter. Heft Nr. 26811998 - ãNumerisch Modellierung der Wechselwirkung zwischen Airnosphare und Meereis in der arktischen Eisrandzone", von Gerii Birnbaum. Heft Nr. 26911998 -"Katabatic wind and Boundary Layer Front Experiment around Greeniand (KABEG *97V, by Günihe Heinemann. Heft Nr. 27011998 - "Architecture and evolution of the continental crust of East Greenland from integrated geophysical studies", by Vera Schlindv~ein, Heft Nr. 27111998 -"Winter Expedition to the Southwestern Kara Sea - Investigations on Formation and Transport Of Turbid Sea-Ice", by Dirk Dethleff, Per Loewe, Dominik Weiel, Hartmui Nies, Gesa Kuhlmann, Christian Bahe and Gennady Tarasov. Heft Nr. 272i1998 - ..FTIR-Emissionsspektroskopische Untersuchungen der arktischen Atrnosphare", von Edo Becker. Heft Nr. 27311998 -Sedimentation und Tektonik irn Gebiet des Agulhas Ruckens und des Agulhas Plateaus (,SETA- RAP'Y, von Gabriele Uenzelmann-Neben. Heft Nr. 27411988 -"The Exnedition ANTARKTIS X l V l 2 bv Gerhard Kattner.
Heft Nr. 27611998 - ,,Interpretation und Analyse von Potentialfelddaten im Weddellmeer, Antarktis: der Zerfall des Superkontinents Gondwana", von Michael Studinger. Heft Nr 27711998 - Kooromierles Programm Aniarrkl~sforsci~;.ng Bericnlskol orji.-..n"i Rahmen cics Kecro n ruc'n Proqramms Anlarktisforsct~~nq ni I verq e icnerd~i i L'nlcrsuchunqcn n a'f\l.sclwn E qc'b ctor~ heräusaeaebe von Hubert ~ i i i e r . - " , Heft Nr. 27811998 - t/icss~ng stralospnar scncr Spl-rengas'i LUW KI Ae? .no SptULl~sr'Jfn, nii~. t i lfe eincs bodcnqeb~ndenen M.krowc en-Had oinc'tors \On L.%e Rafla SM
Heft Nr. 27911998 -"Arctic Paleo-River Disciiarge (APARD). A New Research Programme of the Arctic Ocean Science Board (AOSB)", edited by Ruediger Stein. Heft Nr. 28011998 - ,,Fernerkundungs- und GIS-Studien in Nordostgronland" von Friedrich Jung-Rothenhäusler Heft Nr. 28111998 -,,Rekonstruktion der Oberilachenwassermassen der ostlichen Laptevsee im Holozä anhand von aquatischen Palynomorphen", von Martina Kunz-Pirrung. Heft Nr. 282i1998 -"Scavenging of "'Pa and "Th in ihe South Atlantic: Implications for the use of the ?="/*-Th ratio as a paleoproduciivity proxy", by Hans-Jürge Walter. Heft Nr. 28311998 --Sedimente im arktischen Meereis - Eintrag, Charakterisierung und Quantifizierung", von Frank Lindemann. Heft Nr. 28411998 - ,,Langzeitanalyse der antarktischen Meereisbedeckung aus passiven Mikrowellendaten", von Christian H. Thomas. Heft Nr. 28511998 - *Mechanismen und Grenzen der Temperaturanpassung beim Pierwurnl Arenicola marina (L.V. von Angela Sommer. Heft Nr. 28611998 - ,,Energieumsätz benthischer Filtrierer der Potter Cove (King George Island, Antarktis)", von Jens Kowalke. Heft Nr. 28711998 - "Scientific Cooperation in the Russian Arctic: Research from ihe Barenis Sea up to the Laptev Sea", ediied by Eike Rachor.
Heft Nr. 28811998 - ,,Alfred Wegener. Kommentiertes Verzeichnis der schriftlichen Dokumente seines Lebens und Wirkens", von Ulrich Wutzke. Heft Nr. 28911998 -"Retrieval of Atmospheric Water Vapor Content in Polar Regions Using Spaceborne Microwave Radiometry", by Jungang Miao. Heft Nr. 29011998 - ãStrukturell Entwicklung und Petrogenese des nordlichen Kristallingürtel der Shackleton Range, Antarktis: Proterozoische und Ross-orogene Krustendynamik am Rand des Ostantarktischen Kratons", von Axel Brommer. Heft Nr. 29711998 - ãDynami des arktischen Meereises - Validierung verschiedener Rheologieansatze fü die Anwendung in Klimamodelien", von Martin Kreyscher. Heft Nr. 292/1996 -,.Anthropogene organische Spurenstoffe im Arktischen Ozean, Untersuchungen chlorierter Bi- phenyle und Pestizide in der Laptevsee, technische und methodische Entwicklungen zur Probenahme in der Arktis und zur Spurenstoffanalyse", von Sven Ulschakowski. Heft Nr. 29311998 -*Rekonstruktion der spatquartaren Klima- und Umweltgeschichte der Schirmacher Oase und des Wohlthat Massivs (Ostantarktika)", von Markus Julius Schwab. Heft Nr. 29411998 - ,,Besiedlungsmuster der benthischen Makrofauna auf dem ostgrönländisch Kontinentalhang", von Klaus Schnack. Heft Nr. 29511998 - ,,Gehauseuntersuchungen an planktischen Foraminiferen hoher Breiten: Hinweise auf Umweltveranderungen wahrend der letzten 140.000 Jahre", von Harald Hommers. Heft Nr. 29611998 -"Scientific Cruise Report of the Arclic Expedition ARK-XIIIII of RV 'Polarstern' in 1997", edited by Michael Spindler, Wilhelm Hagen and Dorothea Stubing. Heft Nr. 29711998 - ,,Radiometrische Messungen im arktischen Ozean - Vergleich von Theorie und Experiment", von Klaus-Peter Johnsen. Heft Nr. 298111996 -"Patterns and Controls of COo Fluxes in Wet Tundra Types of the Taimyr Peninsula. Siberia - the Contribution of Solls and Mosses", by Martin Sommerkorn. Heft Nr. 29911998 - "The Potter Cove coastal ecosystem, Antarctica. Synopsis of research performed within the frame of the Argentinean-German Cooperation at the Dallmann Laboratory and Jubany Station (Kind George Island, Antarctica, 1991 - 1997)", by Christian Wiencke, Gustavo Ferreyra, Wolf Arntz & Carlos Rinaldi. Heft Nr. 30011999 -"The Kara Sea Expedition of RV -Akademik Boris Petrov' 1997: First Results of a Joint Russian- German Pilot Study", edited by Jens Matthiessen, Oleg V. Stepanets, Ruediger Stein, Dieter K. Futterer, and Eric M. Galimov. Heft Nr. 30111999 -"The Expedition ANTARKTIS XVl3 (EASIZ II)", edited by Wolf E. Arntz and Julian Gutt. Heft Nr. 30211999 - ,,Sterole im herbstlichen Weddellmeer (Antarktis): Großraumig Verteilung, Vorkommen und Um- satz", von Anneke Mühlebach Heft Nr. 30311999 --Polare stratosphärisch Wolken: Lidar-Beobachtungen, Charakterisierung von Entstehung und Entwicklung", von Jens Biele. Heft Nr. 30411999 - ,,Spatquartare Paläoumweltbedingunge am nordlichen Kontinentalrand der Barents- und Kara- See. Eine Multi-Parameter-Analyse", von Jochen Knies. Heft Nr. 30511999 - "Arctic Radiation and Turbulence Interaction Study (ARTIST)", by Jorg Hartmann, Frank Albers. Stefania Argentini, Axel Bochert, Ubaldo Bonafe, Wolfgang Cohrs, Alessandro Conidi, Dietmar Freese, Teodoro Geor- giadis, Alessandro Ippoliti, Lars Kaleschke, Christof Lupkes, Uwe Maixner, Giangiuseppe Mastrantonio, Fabrizio Raveg- nani, Andreas Reuter, Giuliano Trivellone and Angelo Viola, Heft Nr. 30611999 - "German-Russian Cooperation: Biogeographic and biostratigraphic investigations On selected sediment cores from the Eurasian continental margin and marginal seas to analyze the Late Quaternary climatic variability", edited by Robert R. Spielhagen, Max S. Barash, Gennady I. Ivanov, and Jorn Thiede. Heft Nr. 30711999 - -Struktur und Kohlenstoffbedarf des Makrobenthos am Kontinentalhang Ostgronlands", von Dan Seiler. Heft Nr. 30811999 -"ARCTIC '98: The Expedition ARK-XIVlla 01 RV 'Polarstern' in 1998, edited by Wilfried Jokat. Heft Nr. 30911999 - ,,Variabilitat der arktischen Ozonschicht: Analyse und Interpretation bodengebundener Millimetewellenmessungen", von Björn-Marti Sinnhuber. Heft Nr. 31011999 - ãRekonstruktio von Meereisdrift und terrigenem Sedimenteintrag im Spätquartar Schwermineral- assoziationen in Sedimenten des La~tev-See-Kontinentalrandes und des zentralen Arktischen Ozeans". von Marion Behrends. Heft Nr. 31111999 - ,.Parameterisierung atmospharischer Grenzschichtprozesse in einem regionalen Klimamodell der Arktis", von Christoph Abegg. Heft Nr. 312/1999 - -Solare und terrestrische Strahlungswechseiwirkung zwischen arktischen Eisflachen und Wolken", von Dietmar Freese. Heft Nr. 31311999 -"Snow accumulation on Ekstromisen, Antarctica, by Elisabeth Schlosser, Hans Oerter and Wolfgang Graf. Heft Nr. 31411999 - Jie Expedition ANTARKTIS XVl4 des Forschungsschiffes ,Polarstern' 1998. herausgegeben von Eberhard Fahrbach. Heft Nr. 31511999 -"Expeditions in Siberia in 1998". edited by Volker Rachold. Heft Nr. 31611999 - -Die postglaziale Sedimentationsgeschichte der Laptewsee, schwermineralogische und sedimentpetrographische Untersuchungen", von Bernhard Peregovich, Heft-Nr. 31711999 -=Adaption an niedrige Temperaturen: Lipide in Eisdiatomeen", von Heidi Lehrnal. Heft-Nr. 31811999 - ,,Effiziente parallele Lösungsverfahre fü elliptische partielle Differentialgleichungen in der numerischen Ozeanmodellierung', von Natalja Rakowsky.
Heft-Nr. 31911999 - Tlio Erology Trophodinar CS anu Elleei 011 iho
of Arclic Deep-Sea Copepods (Euchaetidae Carbon Flux", by Holger Auel.
and Aetideidae) Aspects of their Distribution . .
Heft-Nr. 32011999 - ,,Modellstudien zur arktischen stratospharischen Chemie im Vergleich mit Meßdaten" von Veronika Eyring. Heft-Nr. 32111999 --Analyse der optischen Eigenschaften des arktischen Aerosols", von Dagmar Nagel. Heft-Nr. 32211999 - ,,Messungen des arktischen stratospharischen Ozons: Vergleich der Ozonmessungen in ~y-Alesund, Spitzbergen, 1997 und 1998", von Jens Langer Heft-Nr. 32311999 - ,,Untersuchung struktureller Elemente des sudöstliche Weddellmeeres 1 Antarktis auf der Basis mariner Potentialfelddaten", von Uwe F. Meyer. Heft-Nr. 32411999 - Geocnom sehe Von,.lter ingsirenus c nes oasall sehen A.isqangsgeste ns nacn dem spa1c.c slozanen GleIscncrr.,c~zuo auf aer laim~thaloinsei ,ZentraIs bir e>n - Rckonslr~i<lion an e ner sed moniaren Aololqe ues Larnd Sens von Stefanie K. Garwart. '
Heft-Nr, 32511999 - ,,Untersuchungen zur Hydrologie des arktischen Meereises - Konsequenzen fur den kleinskaligen Stofftransport", von Johannes Freitag. Heft-Nr. 32611999 - ãDi Expedition ANTARKTIS XIVI2 des Forschungsschiffes 'Polarstern' 1998, herausgegeben von Eberhard Fahrbach. Heft-Nr. 32711999 - ,,Gerneinschaflsanalytische Untersuchungen der Harpaclicoidenfauna der Magellanregion, sowie erste simiiaritatsanalvtische Vergleiche mit Assoziationen aus der Antarktis", von Kai Horst Georqe. Heft-Nr. 32811999 - t?okonsiri,~Iion der Pa ao-.lm,~ellbed~ng,ingen am ~ap tev -Soc -K~n i~ncn la i f ana !.anrtino rJd l-'C den lelzlen G a2ia nlerglaz.al-Zyh.en annario seu mcnloluq scher uno 111 ncra og scner LnlerS .cti~i lgen von Claudia MŸller Heft-Nr. 32911999 - fiaurnliche und zeitliche Variationen atmospharischer Spurengase aus bodengebundenen Messungen niit Hilfe eines Michelson Interferometers", von Justus Notholt. Heft-Nr. 33011999 - ..The 1998 Danish-German Excursion to Disko lsland, West Greenland, ediled by Angelika Brandt. Helge A. Thomsen, Henning Heide-Jorgensen, Reinhardt M, Kristensen and Hilke Ruhberg. Heft-Nr. 33111999 - ãPoseidon Cruise No. 243 (Reykjavik - Greenland - Reykjavik, 24 August - 11 September 1998): Climate Change and the Viking-age fsord enviroment of the Eastern Settlement, sw Greenland", by Gerd Hoifmann, Antoon Kuijpers, and Jorn Thiede. Heft-Nr. 33211999 - ,,Modeling of marine biogeochemical cycles with an emphasis On vertical particle fluxes", by Regina Usbeck. Heft-Nr, 33311999 --Die Tanaidaceenfauna des Beagle-Kanals und ihre Beziehungen zur Fauna des antarktischen Festlandsockels". von Ania Schmidt. Heft-Nr. 33411999 - ,,D-Aminosauren als Tracer fur biogeochemische Prozesse im Fluß-Schelf-Ozean-Syste der Arktis', von Hans Peter Fitznar. Heft-Nr. 33511999 - ,,Okophysiologische Ursachen der limitierten Verbreitung reptanter decapoder Krebse in der Antarktis", von Markus Frederich. Heft-Nr. 33611999 - €rgebn.i uer bntcrsi.ch.ing ,!es qror anuiscnon n aout!'se'? T' 1 oc111 ~ ~ l r ~ l r o m a y n e l sci'r" Reflex onsderfahren n der L m q c b ~ f i y 1011 hGRiP \On F- (iar1 GoKlas . . Heft-Nr. 33711999 - ,,Paleozoic and mesozoic tectono-thermal history of central Dronning Maud Land, East Antarclica, - evidence frorn fission-track thermochronology", by Stefanie Meier. Heft-Nr. 33811999 - ,,Probleme hoher Stoffwechselralen bei Cephalopoden aus verschiedenen geographischen Breiten", von Susanne Zielinski. Heft-Nr. 33911999 - ,,The Expedition ARKTIS XVII", edited by Gunther Krause. Heft-Nr. 34011999 - ..Microbial Properties and Habitats of Permafrost Soils On Taimyr Peninsula, Central Siberia", by Nicole Schrnidt.