ipy science program - epic
TRANSCRIPT
P l a n n I n g a n d I m P l e m e n t I n g I P Y 2 0 0 7 – 2 0 0 8 133
IPY Science Program
PA R T T W O
Coordinating Editors: Ian Allison and Jerónimo López-MartínezReviewer: Vladimir Ryabinin
Introduction
Chapter 2.1 Polar Atmosphere
Chapter 2.2 Arctic Ocean
Chapter 2.3 Southern Ocean
Chapter 2.4 Greenland Ice Sheet and Arctic Glaciers
Chapter 2.5 Antarctic Ice Sheet
Chapter 2.6 Subglacial Aquatic Environments
Chapter 2.7 Permafrost
Chapter 2.8 Earth Structure and Geodynamics at the Poles
Chapter 2.9 Polar Terrestrial Ecology and Biodiversity
Chapter 2.10 Polar Societies and Social Processes
Chapter 2.11 Human Health
I PY 20 07–20 0 8134
Introduction
Ian Allison and Jerónimo López-Martínez
PA R T T W O : I P Y S C I E N C E P R O G R A M
As an internationally coordinated research effort, science was at the core of the International Polar Year (IPY) 2007–2008. In this section, the IPY scientific projects
undertaken in major fields and disciplines are summarized, and some of the preliminary results are presented. The scientific results of IPY are still evolving and, as was also the case for previous international polar years, will continue to do so for years after this report is published. The chapters included here were primarily written from late 2009 to early 2010, only a few months after the conclusion of the field campaigns. In some cases, data and samples are not yet analyzed and interpretation and publication of the results is ongoing. In many cases, synthesis of results from different IPY projects will contribute additional outcomes. Hence, this section must be considered only as an early and preliminary summary of IPY scientific outcomes. The IPY science program was closely linked with other key IPY components, particularly with observational and data-management efforts. IPY projects exploited both existing and newly established observing systems. In many cases, new observing systems have been promoted and developed in connection with IPY scientific projects. Hence, some of the chapters included here in Part 2 refer directly to observational efforts discussed in Part 3 and vice versa. In this section, however, the focus is on the scientific problems addressed and on the preliminary results rather than on the observational systems. Throughout IPY planning and implementation, data management was always considered an essential component of each project (Chapter 3.11). The IPY scientific projects also provided fundamental support for other IPY objectives. They were key to attracting and developing a new generation of polar researchers and for engaging the interest of students, polar residents, and the general public. In addition, all endorsed IPY science projects were required to include an integral component of
education, outreach and communication. IPY aimed to establish a scientific program that addressed the six research themes defined by the IPY Planning Group in consultation with the international polar community and relevant organizations (Rapley et al., 2004; Chapter 5.1). These were: Status, Change, Global Linkages, New Frontiers, Vantage Point and Human Dimension of the polar regions. Science projects and research teams were expected to be interdisciplinary and to address relevant questions and issues lying beyond individual disciplines. Considerable effort was given to assembling an IPY science program that addressed these objectives and built on the enthusiastic contribution of a flood of proposals from the community and the great diversity of scientific fields that these encompassed. This process, undertaken in several steps, involved assessing, distilling and combining the 490 initial “ideas” submitted to the ICSU Planning Group by mid 2004 (Chapter 1.3), the more than 1100 ‘expressions of intent’ submitted to the Joint Committee by mid 2005 and the 337 full proposals for science projects and data management submitted by February 2006 (Chapter 1.5). The IPO and the JC members reviewed and assessed the EoIs and full proposals against the stated IPY objectives. They strived to avoid overlap, to increase interdisciplinarity, to fill identified gaps and to integrate smaller proposals within multidisciplinary, internationally coordinated projects. The final outcome of this process resulted in 170 IPY endorsed scientific research projects, plus one integrating data management project: these formed the core IPY science (Chapter 1.5). This IPY science program was documented as it developed in two publications compiled by the Joint Committee (Allison et al., 2007, 2009). IPY 2007–2008 also included an additional 57 EO&C projects. Information available to the IPO at the conclusion of the IPY field period indicated that 170 of the 228 total projects received some support and were able to go ahead. This section (Part 2) consists of 11 chapters,
s C I e n C e P r o g r a m 135
organized by broad disciplinary field. Each chapter summarizes scientific activities in both polar regions, except for the ocean science chapters (2.2 and 2.3) and the ice sheet chapters (2.4 and 2.5) which treat the Arctic and Antarctic research during IPY separately. Chapter 2.1 covers research related to the polar atmosphere. It includes reference to 16 projects that are grouped under two main topics: i) physics of the troposphere and stratosphere, and climate change, and ii) tropospheric chemistry, air pollution and climate impacts. Chapter 2.2 on the Arctic Ocean focuses on the present and future state of northern seas and their role in climate. It describes some of the main advances that were made in research of Arctic and subarctic seas during IPY, and shows how the integrated Arctic Ocean Observing System (iAOOS) served as a coordinating framework for northern oceanographic projects during IPY. This chapter reports on important achievements during IPY that build on existing knowledge of: i) the changing inputs to the Arctic Ocean from subarctic seas; ii) the changing oceanography of the Arctic Ocean itself; and iii) the changing outputs from the Arctic to subarctic seas. IPY research in the Southern Ocean is covered in Chapter 2.3. It summarizes preliminary results on the role of the Southern Ocean in the Earth system resulting from multidisciplinary IPY projects in the Southern Ocean carried out by scientists from more than 25 countries. Activities here are grouped into sections on: i) ocean circulation and climate; ii) biogeochemistry; iii) marine biology, ecology and biodiversity; and iv) Antarctic sea ice. Much of the research covered in this chapter is coordinated with similar activities in the Arctic (Chapter 2.2) providing a bipolar perspective. New measurements during IPY led to important advances in knowledge of the Antarctic and Arctic ice sheets, and these are described in Chapter 2.4 and Chapter 2.5 respectively. IPY projects investigated ice shelves and the interaction between the ice sheets and the ocean; the subglacial domain; surface and subglacial measurements, including satellite,
geological and geophysical observations; and field and numerical modeling studies of climate and glacial history. Advances in the study of subglacial aquatic environments during IPY are summarized in Chapter 2.6. During IPY 2007–2008, subglacial lakes and water movement beneath the ice was recognized as a common feature of ice sheets, with potential influence on ice sheet movement and possibly on past and future climate change. Chapter 2.7 covers regional, bipolar and multidis-ciplinary permafrost research. Activities during IPY focused on assessment of the thermal state of per-mafrost and the thickness of the active layer; on the quantification of carbon pools in permafrost and their potential future remobilization; on quantifica-tion of erosion and release of sediment along perma-frost coasts; and on periglacial process and landform quantification. Chapter 2.8 deals with IPY projects studying Earth structure and geodynamics in polar regions. It includes research into the geodynamic, tectonic and sedimentary processes that drive the topographic formation and the location of the ocean basins and corridors between emergent land masses. These corridors, which determine ocean current paths, have changed over time, with consequences to global climate. New geodynamic observations in several regions during and just prior to IPY, using seismic, magnetic, gravity and ice-penetrating radar techniques, together with satellite imagery and geological observations, contributed to this research. Research into geodynamic processes at the base of polar ice sheets are also covered in this chapter. This chapter shows how the network of polar Earth and geodynamics observatories has been significantly improved during IPY. The research carried out during IPY on terrestrial ecology is covered in Chapter 2.9. Parts of the Arctic and the Antarctic Peninsula are warming twice as fast as elsewhere on Earth and many impacts already affect biodiversity and ecosystem processes, some
I PY 20 07–20 0 8136
References
Allison, I., M. Béland, K. Alverson, R. Bell, D. Carlson, K. Danell, C. Ellis-Evans, E. Fahrbach, E. Fanta, Y. Fujii, G. Gilbertson, L. Goldfarb, G. Hovelsrud-Broda, J. Huber, V. Kotlyakov, I. Krupnik, J. López-Martínez, T. Mohr, D. Qin, V. Rachold, C. Rapley, O. Rogne, E. Sarukhanian, C. Summerhayes and C. Xiao, 2007. The Scope of Science for the International Polar Year 2007–2008. WMO/TD-No.1364, Geneva, 79 pp.
Allison, I., M. Béland, K. Alverson, R. Bell, D. Carlson, P. Cutler, K. Danell, C. Ellis-Evans, E. Fahrbach, G. Hovelsrud, J. Huber, V. Kotlyakov, I. Krupnik, J. López-Martínez, T. Mohr, H. Ödmark, D. Qin, V. Rachold, C. Rapley, O. Rogne, E. Sarukhanian, C.
Summerhayes and T. Yamanouchi, 2009. The State of Polar Research: a statement from the International Council for Science/World Meteorological Organization Joint Committee for the International Polar Year 2007–2008. World Meteorological Organization, Geneva, 16 pp.
Rapley, C., R. Bell, I. Allison, R. Bindschadler, G. Casassa, S. Chown, G. Duhaime, V. Kotlyakov, M. Kuhn, O. Orheim, P. Ch. Pandey, H. Petersen, H. Schalke, W. Janoschek, E. Sarukhanian and Zh. Zhang, 2004. A Framework for the International Polar Year 2007–2008. Produced by the ICSU IPY 2007–2008 Planning Group. ICSU, Paris, 57 pp.
of which have global consequences. Therefore, IPY 2007–2008 took place in a very opportune time to document changes in polar terrestrial ecosystems and their impacts on the atmospheric, hydrological and nutrient cycles as well as on the human communities that occupy and use those ecosystems. Altogether, 30 international projects on polar terrestrial biology and ecology were implemented during IPY, and activity has been intense throughout the Arctic and in the Antarctic. Many IPY projects were multidisciplinary ventures and a common denominator for the research was climate change impacts across the polar regions. IPY 2007–2008 was the first polar year to include social science and humanities, and to involve active leadership from polar residents, particularly indigenous people, in research projects. Chapter 2.10 covers IPY activities of the 35 endorsed research projects in social science (anthropology, archaeology, economics, linguistics, political science) and the
humanities (history, literature, arts). Chapter 2.11 is about human health and medical research in the northern polar regions and it also includes a substantial social component. It provides an overview of the history, which informed health research activities during IPY 2007–2008, and highlight the IPY activities, which were undertaken within a circumpolar health context. This chapter points out the disparities in human health that currently exist across different Arctic nations and regions. Although results from many IPY science projects are still being analyzed and interpreted, this chapter, and the recent publications and web pages referenced in it, provide a much-needed early snapshot of the results of the IPY science program by major fields and disciplines. Another attempt as assessing the IPY science outcomes across six cross-disciplinary themes that were pivotal to the IPY 2007–2008 design is offered in Chapter 5.1.
s C I e n C e P r o g r a m 137
2.1 Polar Atmosphere
Lead Authors:David Bromwich, Andreas Stohl and Takashi Yamanouchi
Contributing Authors:Peter von der Gathen, Hayley Hung, Boris Ivanov, Vladimir Kotlyakov, Thor Eric Nordeng, Florence Rabier, Claudio Tomasi, Taneil Uttal and Jiancheng Zheng
Reviewers:Michel Béland and Eduard Sarukhanian
PA R T T W O : I P Y S C I E N C E P R O G R A M
Introduction While meteorology was the major focus of the first IPY (1882–1883), in the IPY 2007–2008 only 17 from the 170 officially endorsed scientific projects were assigned to the domain of “atmosphere”. This does not mean, however, that the role of atmospheric research in polar sciences is not as high as it used to be. The modern atmospheric science has become inherently multi-disciplinary and there is a very significant “atmospheric dimension” in IPY projects carried out in all IPY domains such as ice, ocean, land, people and others. Many of the critically important changes in the Earth system are occurring in the atmosphere ,including the buildup of greenhouse gases with corresponding increase of temperatures, evolving statistical structure of precipitation and stratospheric ozone depletion - to name just a few. The 17 IPY projects assigned to the domain of “Atmosphere” are listed in Table 2.1-1. We present here an overview of the preliminary results of polar atmosphere studies obtained in the course of implementation of some the above projects. They are grouped into two main topics: (1) physics of the atmosphere, climate change and processes in the stratosphere and (2) tropospheric chemistry, air pollution and climate impacts.
Project No
Abbreviation Main topic of the project
19 NobleMet Pollution Trends
28 CARE/ASR Climate of the Arctic
32 POLARCAT Climate, Chemistry and Aerosols
41 Concordiasi Antarctic Plateau Science
76 ATMOPOL Pollution Monitoring Network
99 ORACLE-O3 Ozone Layer and UV Radiation
121 THORPEX-IPY Polar Weather Forecasts
140 HIAA Hydrological Impacts of Aerosols
171 POLAR-AOD-IPY Aerosol Distribution Network
175 COPOL Polar Region Contaminants
180 AC Atmospheric Circulation and Climate
196 IASOA Arctic Atmosphere Observing System
217 SPARC_IPY Stratosphere = Troposphere Links
267 COMPAS Comprehensive Meteorological Dataset of Active IPY Antarctic Measurement Phase for Scientific and Applied Studies
327 INCATPA Pollution Transport to the Arctic
357 SCSCS Climate System of Spitsbergen
443 RadTrace Tracers of Climate Change
Table 2.1-1. IPY projects for polar atmosphere studies.
I PY 20 07–20 0 8138
Atmospheric physics, climate and stratospheric processes
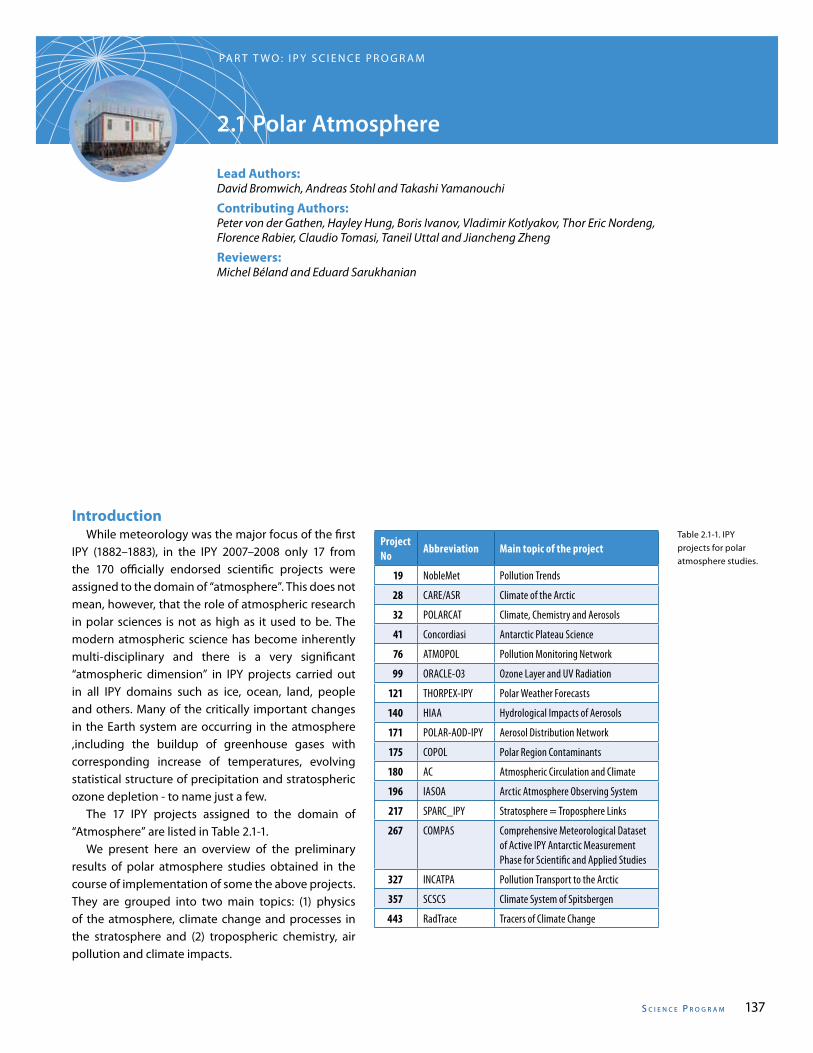
International Arctic Systems for Observing the Atmosphere (IASOA no. 196) aimed to enhance Arc-tic atmospheric research through intensive collabora-tion during the IPY and beyond. It includes the stations Abisko, Sweden; Alert and Eureka, Canada; Barrow, U.S.A.; Cherskii and Tiksi, Russia; Ny-Ålesund, Norway; Pallas and Sodankylä, Finland; and Summit, Greenland. Measurement and building upgrades took place at the stations Tiksi, Eureka, Summit and Barrow observatories (Chapter 3.4). A new observatory building recently completed in Tiksi is available for installation of instruments (Fig. 2.1-1). A second Clean Air Facility (CAF) that is suitable for aerosol, chemistry, pollutant, greenhouse gases, fluxes and radiation measurements was completed in 2008. Instruments for continuous measurement of ozone and black carbon, and flasks for carbon cycle gas mea-surements for the new Tiksi station were obtained. Establishment of the Tiksi observatory is a significant step in the creation of an international circumpolar
network of stations for monitoring of Arctic climate change. During the IPY period many Russian meteo-rological stations were substantially reconstruc ted. Twenty-three meteorological polar stations were up-graded. At several stations, upper-air and geophysical launches of radiosondes and meteorological rockets were restarted. Monitoring of cosmic rays in the Arc-tic atmosphere was also carried out. Fluxes of charged particles observed in the atmosphere from the ground up to altitudes of 30-35 km provide evidence of unusu-ally profound and long-lasting minimum of the solar activity during the IPY period. At the Eureka site many instruments including a flux tower, several CIMELs for the Aeronet Network and a Baseline Surface Radiation Network (BSRN) station were installed in summer 2007. With IPY funding, the level of technical support at the site has been increased to provide more reliable data collection and transmission. The Summit, Greenland observatory has recently released a strategic plan highlighting climate sensi-tive year-round observations, innovative research platforms and operational plans to increase the use
Fig. 2.1-1. The new building of Tiksi Observatory.(Photo: Alexander Makshtas;
Makshtas, 2007)
s C I e n C e P r o g r a m 139
renewable energy and maintain the pristine platform. Summit also has a new multi-channel gas chromo-tograph/mass spectrometer (GC/MS) for continuous measurement of trace halocarbon and CFC gas con-centrations. All NOAA instruments were moved from the science trench to a new atmospheric watch obser-vatory building. The Barrow observatory has two new systems for measurements of aerosol size and chemistry composition, as well as persistent organic pollutants (POPs). The meteorological measurements and data system has been completely upgraded. Current IASOA activities include the development of a web site (www.iasoa.org) that will serve as the “go-to” site for atmospheric Arctic researchers to ob-tain information about the member observatories. Information posted for each station includes a gen-eral overview of the observatory, a listing of available measurements and principal investigators, links to data bases and station contacts. These pages will help Arctic researchers find the data they need to complete their research. The development of these observatory webpages and the “observatories-at-a-glance” page has allowed us to identify gaps in atmospheric mea-surements in the Arctic (detailed information on this project is also given in Chapter 3.4).
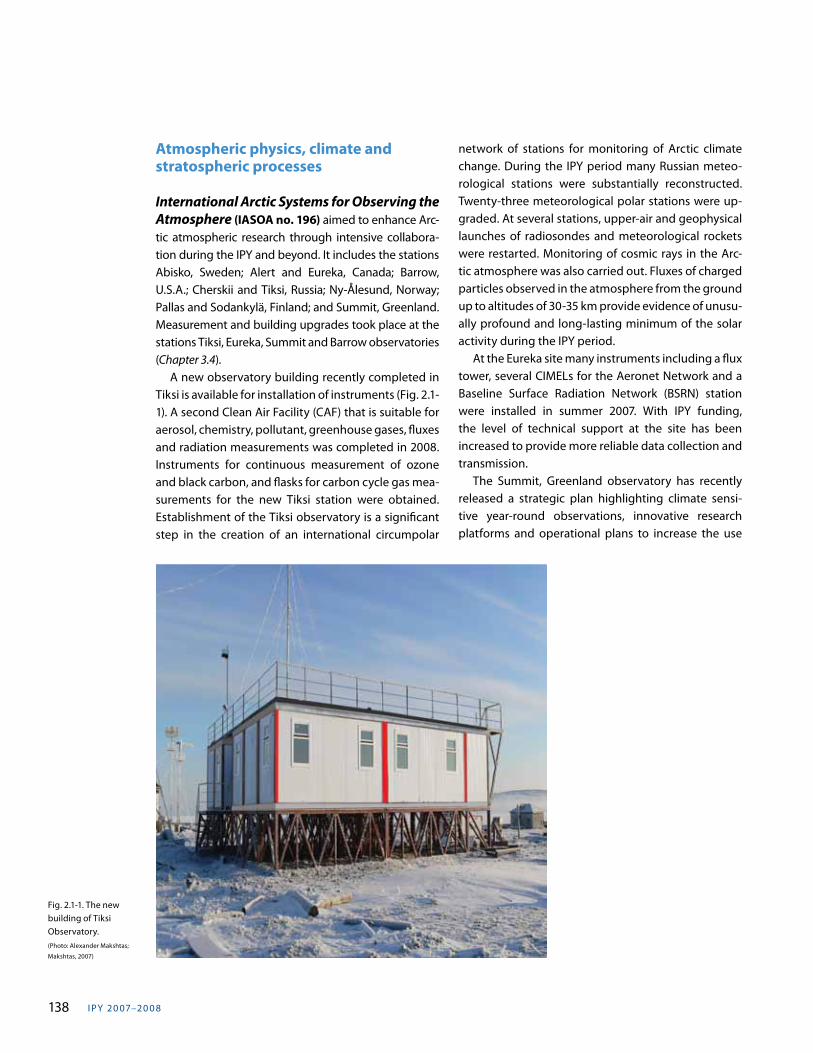
Climate System of Spitsbergen (SCSCS no. 357): Intercomparison and analysis of radiation data obtained by Russian and Norwegian standard radiation sensors at Barentsburg and Ny-Alesund research stations Joint analysis of historical and current data of radiation observations obtained in different countries indicates a need for comparing readings of instruments. This is especially true for the Russian and Norwegian stations on Svalbard (Spitsbergen). From the beginning of regular Russian radiation measurements on Svalbard (Barentsburg settlement), the observation program has used standard Russian sensors (Yanishevsky-Savinov pyranometers M-80 or M-115M). All radiation measurements carried out on the research stations of other countries involved in polar research (Norway, Germany, Italy, U.K., U.S.A., China, Republic of Korea and France) are compactly located in the Norwegian settlement Ny-Alesund (Kings Bay) and combined into one common network in the framework of the international “Kongsfjorden International Research Base” (Fig. 2.1-2). The incoming global, diffuse and reflective radiations are recorded separately. As a rule, the aforementioned countries use universal common measurement
Fig. 2.1-2. Yanishevsky-Savinov (right) and Kipp and Zonen (left) pyranometers used in intercomparisons carried out at the Russian station Barentsburg (Svalbard) in April 2008.(Photo: Boris Ivanov; Ivanov et
al., 2008).
I PY 20 07–20 0 8140
instruments on the basis of “Kipp & Zonen” sensors from The Netherlands (CMP6, CMP11 and CMP21). It seems to be both advisable and necessary to include the Russian observations conducted in Barentsburg into this network. Intercalibration studies in the framework of this program with the use of Russian and Norwegian instruments were carried at the Barentsburg research station in April 2007 and Ny-Alesund (“Sverdrup” research station of The Norwegian Polar Institute) in April 2008. The joint measurements by pyranometers M115M and CM11 have allowed us to obtain representative data for a combined analysis, reveal discrepancies between the Russian and Dutch sensors and take into account these corrections in the analysis of historical and current data aimed at comparative studies of radiation climate of this region. For comparative climatic studies, the data of the Russian station in Barentsburg and the Norwegian stations in Ny-Alesund were used as the reference and most representative and long-term stations. These studies granted mutual access to national data sources for the both partners thereby providing the data for their joint analysis. This project is a continuation and development of the Russian science program “Research of a meteorological regime and climatic changes on Svalbard”, carried out by the AARI in the framework of the IPY and NPI projects “Arctic Climatic
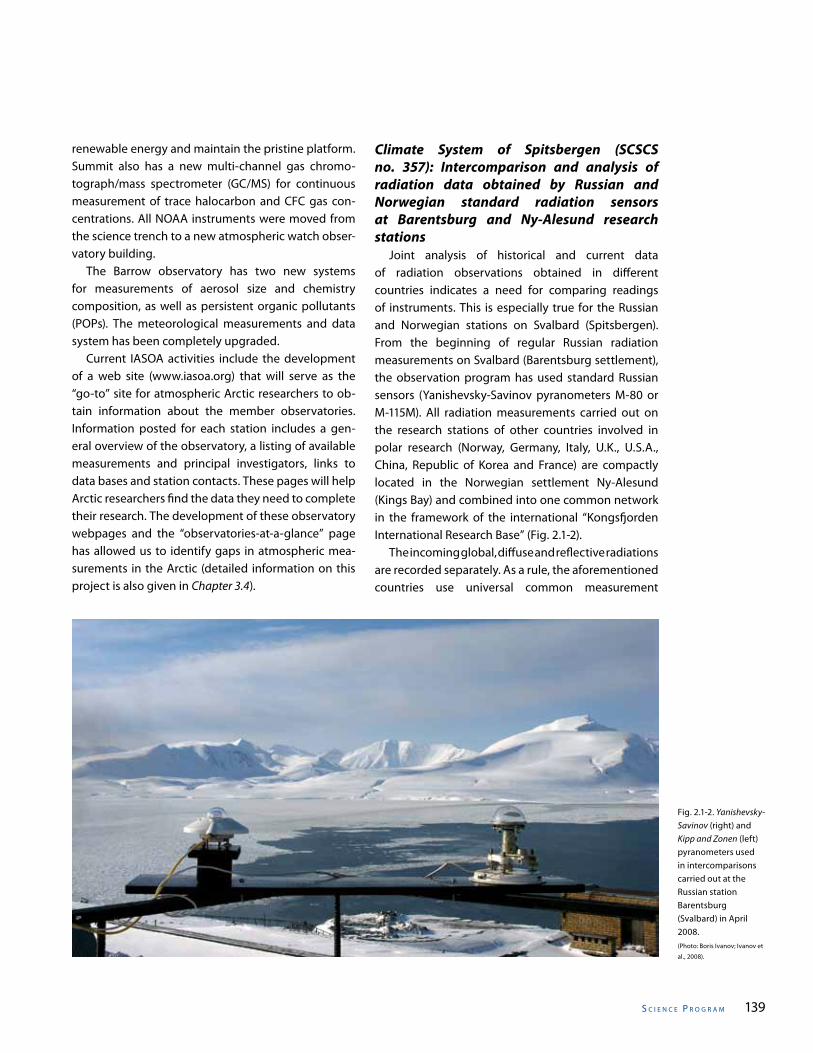
Diversity” (ARCDIV). The conformity between diverse sensors (М115M and “Kipp & Zonen”) is quite satisfactory as is apparent from Fig. 2.1-3. The discrepancies of average values are 6.3 ±5.6 W/m2 for all observations. They were maximal at noon, reaching ~36 W/m2. Nevertheless, in total, these discrepancies do not exceed absolute inaccuracy of measurements (for example, 8% for M115M).
Contribution of the POLAR-AOD (no. 171) The principal aim of this project was to establish a bipolar network of sites, where multi-wavelength sun-photometers have been used to take regular measurements of aerosol optical depth (AOD) and optical properties of aerosols. Integrated regular measurements of aerosol physical and radiative properties at a number of polar stations were planned in order to (i) evaluate the seasonal background concentrations inferred from AOD measurements, (ii) define the spectral characteristics and patterns of the radiative processes induced by both natural and anthropogenic aerosols, and (iii) ameliorate the knowledge of physical, chemical and radiative properties of polar aerosols, and of their horizontal and vertical distributions and temporal variability, for better evaluating the role of polar aerosols in the
Fig. 2.1-3. Relationship between measurements by Yanishevsky-Savinov (M115M) and Kipp and Zonen (CMP11) pyranometers.(Ivanov et al., 2008)
s C I e n C e P r o g r a m 141
climate system. Measurements at Arctic and Antarctic stations have been carried out during IPY with the logistic and financial support of established national programs, while archiving, data management, intercalibration and coordination of other activities have mainly been developed by the leading groups (Italy, Germany, U.S.A.) in cooperation with the other partners (43 research groups from 24 countries). During IPY, field data were recorded at 15 stations in the Arctic (Alert, Eureka, and Resolute Bay, in Canada; ALOMAR in Northern Norway; Barrow in Alaska; Hornsund in Poland; and Ny-Ålesund (five stations of Norway, Germany, Italy, Japan and China) in Svalbard, Norway, Pallas and Sodankylä in Northern Finland, Summit in Greenland and Tiksi in Siberia, Russia), and 23 stations in Antarctica (Aboa/Finland, Belgrano II/Argentina, Casey/Australia, Davis/Australia, Dome Fuji/Japan, Dome Concordia/Italy and France, Halley/U.K., Kohnen/Germany, Machu Picchu/Peru, Mastri/India, Marambio/Argentina, McMurdo/U.S.A., Mirny/Russia, Mario Zucchelli/Italy, Neumayer/Germany, Novolazarevskaya/Russia, Palmer/U.S.A., Princess Elisabeth/Belgium, South Pole/U.S.A., Syowa/Japan, Troll/Norway, Vechernaya Hill/Belarus and Zhongshan/China). All of these field data are still in the process of being archived and analyzed by the participating institutes. The activities developed by the various partners primarily included: (1) management of long-term climate monitoring programs and/or performance of routine sun-photometric measurements over multiannual periods (groups from Italy, Germany, U.S.A., Canada, Japan, Russia, Norway, Switzerland and Finland); (2) implementation of sun-photometric observations and monitoring programs in the Antarctic and/or Arctic, over recent years (groups from Spain, Poland, Norway, France, Argentina, Australia, India, Belgium and Belarus); (3) development of programs to carry out in situ measurements of aerosol radiative parameters, chemical composition of particulate matter, and particle morphology and concentration (groups from U.S.A., United Kingdom, Sweden, Finland, Norway, Holland, Greece, Switzerland and China); and (4) improvement of radiative transfer models to simulate Rayleigh scattering (Tomasi et al., in press), gaseous absorption and aerosol extinction in the polar atmosphere (groups from Italy, U.S.A.,
Canada, Germany, Japan, Russia and Bulgaria). Because sun-photometer measurement activities were performed by the various groups using different instruments, the POLAR-AOD project promoted two international intercalibration workshops with the purpose of attaining more homogeneous evaluations of AOD at the various visible and near-infrared wavelengths in the Arctic and Antarctic. The first workshop was held at the Japanese Rabben station (78° 56´ N, 11° 52´ E, 40 m a.m.s.l.) near the Ny Ålesund Airport, from 25 March to 5 April 2006 about one year before the official start date of the IPY (in February 2006), with the participation of ten research groups from nine countries (Canada, Finland, Germany, Italy, Japan, Norway, Poland, Spain and U.S.A.) using sun-photometers of different design already employed at a number of Arctic and Antarctic. The second workshop was held a few months before the end of the IPY field phase at the Izaña Meteorological Observatory at Tenerife, Spain (28° 19´ N, 16° 30´ W, 2368 m a.m.s.l.) from 5 to 20 October, 2008 with the participation of 13 research groups from ten countries (Canada, Finland, France, Germany, Italy, Japan, Norway, Poland, Spain and U.S.A.) and the participation of instruments employed in the AERONET and SKYNET networks. Results obtained by the POLAR-AOD project are as follows: 1. The characterization of the radiative properties of
Arctic aerosols made by plotting the daily mean values of Ångström (1964) exponent a versus the corresponding values of AOD (500 nm).
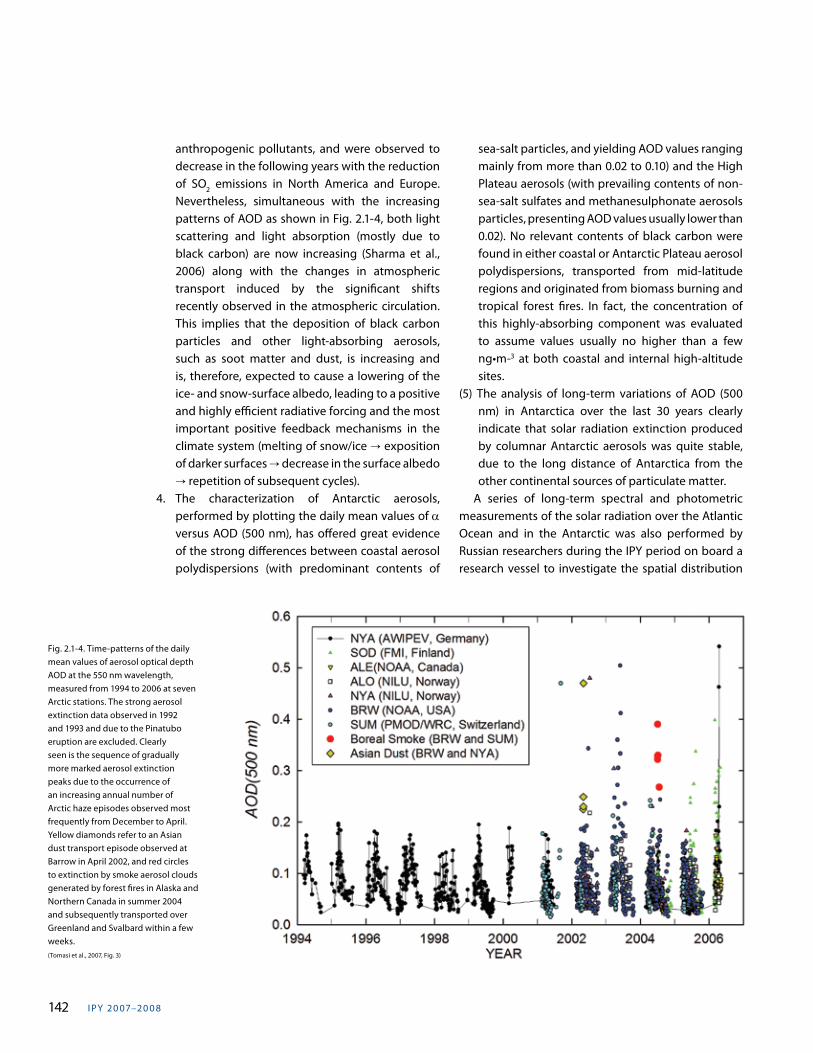
2. Large variations in AOD were often observed at the Arctic sites, passing from the background atmospheric loadings of aerosols (AOD < 0.04) in summer to the period of higher frequency of Arctic haze episodes (often with AOD > 0.30), as shown in Fig. 2.1-4.
3. Such enhanced turbidity characteristics of the Arctic atmosphere are not only due to the emission of anthropogenic pollutants from North America, Europe and Asia, but also to biomass burning, agricultural activities, dust plumes from Asian deserts and (in late spring and summer) smoke plumes from fires burning millions of hectares of boreal forest each year in North America and Siberia. The Arctic haze extinction levels were very high in the 1980s and early 1990s, mainly due to
I PY 20 07–20 0 8142
Fig. 2.1-4. Time-patterns of the daily mean values of aerosol optical depth AOD at the 550 nm wavelength, measured from 1994 to 2006 at seven Arctic stations. The strong aerosol extinction data observed in 1992 and 1993 and due to the Pinatubo eruption are excluded. Clearly seen is the sequence of gradually more marked aerosol extinction peaks due to the occurrence of an increasing annual number of Arctic haze episodes observed most frequently from December to April. Yellow diamonds refer to an Asian dust transport episode observed at Barrow in April 2002, and red circles to extinction by smoke aerosol clouds generated by forest fires in Alaska and Northern Canada in summer 2004 and subsequently transported over Greenland and Svalbard within a few weeks. (Tomasi et al., 2007, Fig. 3)
anthropogenic pollutants, and were observed to decrease in the following years with the reduction of SO2 emissions in North America and Europe. Nevertheless, simultaneous with the increasing patterns of AOD as shown in Fig. 2.1-4, both light scattering and light absorption (mostly due to black carbon) are now increasing (Sharma et al., 2006) along with the changes in atmospheric transport induced by the significant shifts recently observed in the atmospheric circulation. This implies that the deposition of black carbon particles and other light-absorbing aerosols, such as soot matter and dust, is increasing and is, therefore, expected to cause a lowering of the ice- and snow-surface albedo, leading to a positive and highly efficient radiative forcing and the most important positive feedback mechanisms in the climate system (melting of snow/ice Õ exposition of darker surfaces Õ decrease in the surface albedo Õ repetition of subsequent cycles).
4. The characterization of Antarctic aerosols, performed by plotting the daily mean values of a versus AOD (500 nm), has offered great evidence of the strong differences between coastal aerosol polydispersions (with predominant contents of
sea-salt particles, and yielding AOD values ranging mainly from more than 0.02 to 0.10) and the High Plateau aerosols (with prevailing contents of non-sea-salt sulfates and methanesulphonate aerosols particles, presenting AOD values usually lower than 0.02). No relevant contents of black carbon were found in either coastal or Antarctic Plateau aerosol polydispersions, transported from mid-latitude regions and originated from biomass burning and tropical forest fires. In fact, the concentration of this highly-absorbing component was evaluated to assume values usually no higher than a few ng•m-3 at both coastal and internal high-altitude sites.
(5) The analysis of long-term variations of AOD (500 nm) in Antarctica over the last 30 years clearly indicate that solar radiation extinction produced by columnar Antarctic aerosols was quite stable, due to the long distance of Antarctica from the other continental sources of particulate matter.
A series of long-term spectral and photometric measurements of the solar radiation over the Atlantic Ocean and in the Antarctic was also performed by Russian researchers during the IPY period on board a research vessel to investigate the spatial distribution
s C I e n C e P r o g r a m 143
of the aerosol component in the atmosphere over the Atlantic from 60° N to the Antarctic coast (Kotlyakov et al., 2010). A variable, called a spectral aerosol optical thickness (AOT) of the atmosphere, is used to characterize attenuation of the solar radiation by the aerosol particles within the whole air column. Magnitudes of the aerosol attenuation of the solar radiation measured in the Antarctic were the lowest values on the Earth, and they did not exceed limits of their natural variability. This is again the evidence of the fact that still to the present time the Antarctic atmosphere is not polluted by any aerosol of the anthropogenic origin.
ORACLE-O3 (no. 99)LOLITA-PSC and MATCH-PSC campaigns As part of the ORACLE-O3 (“Ozone layer and UV RA-diation in a changing CLimate Evaluated during IPY”) global project, LOLITA-PSC (“Lagrangian Observations with Lidar Investigations and Trajectories in Antarc-tica, of PSC”) is devoted to Polar Stratospheric Clouds (PSC) studies. Understanding the formation and evo-lution of PSC particles is an important issue to quantify the impact of climate changes on their frequency of formation and, further, on chlorine activation and sub-sequent ozone depletion. Statistical studies on PSC and temperature over the Dumont D’Urville in Antarc-tica have been updated (David et al., 2009) and a study based on the “Match” method, developed initially for ozonesondes, has been applied, for the first time, to lidar observations of PSC acquired during campaigns. These campaigns took place in Antarctica during win-ters 2006, 2007 and 2008, involving the three PSC lidar deployed in Antarctica, at Dumont d’Urville (66.67°S, 140.01°E), Davis (68.00°S, 78.50°E) and McMurdo (77.86°S, 166.48°E) and CALIPSO space-borne lidar ob-servations. Observations were performed at each lidar
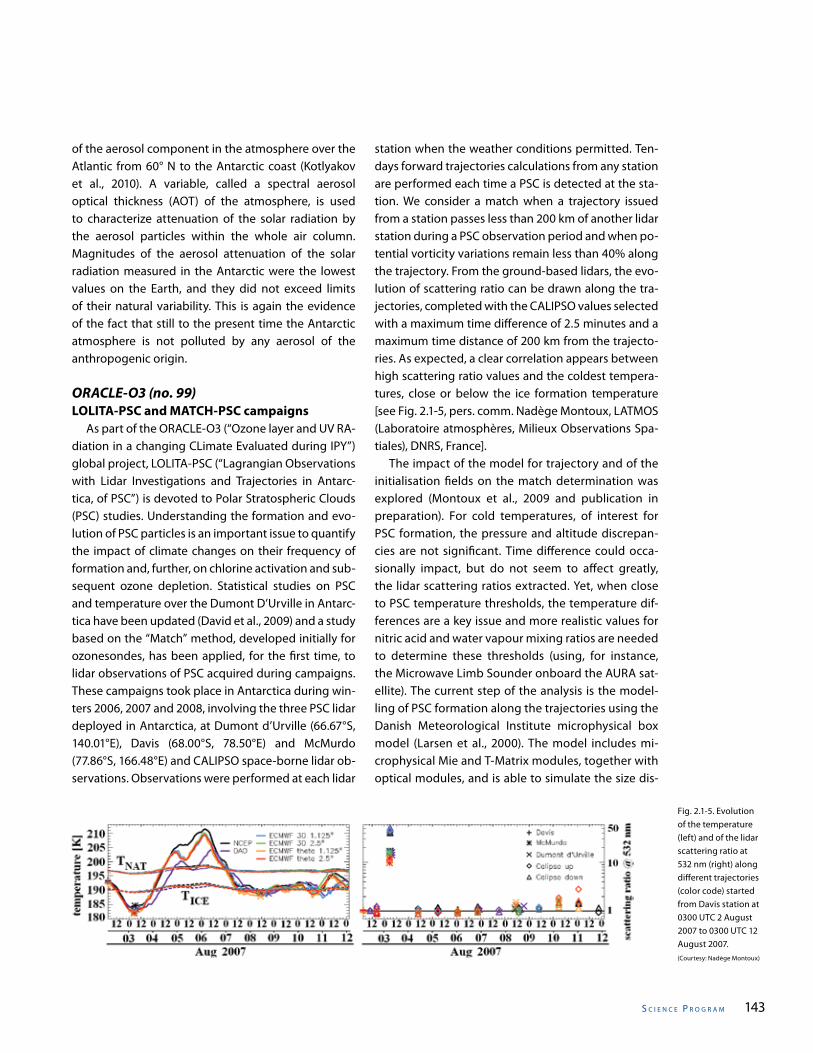
station when the weather conditions permitted. Ten-days forward trajectories calculations from any station are performed each time a PSC is detected at the sta-tion. We consider a match when a trajectory issued from a station passes less than 200 km of another lidar station during a PSC observation period and when po-tential vorticity variations remain less than 40% along the trajectory. From the ground-based lidars, the evo-lution of scattering ratio can be drawn along the tra-jectories, completed with the CALIPSO values selected with a maximum time difference of 2.5 minutes and a maximum time distance of 200 km from the trajecto-ries. As expected, a clear correlation appears between high scattering ratio values and the coldest tempera-tures, close or below the ice formation temperature [see Fig. 2.1-5, pers. comm. Nadège Montoux, LATMOS (Laboratoire atmosphères, Milieux Observations Spa-tiales), DNRS, France]. The impact of the model for trajectory and of the initialisation fields on the match determination was explored (Montoux et al., 2009 and publication in preparation). For cold temperatures, of interest for PSC formation, the pressure and altitude discrepan-cies are not significant. Time difference could occa-sionally impact, but do not seem to affect greatly, the lidar scattering ratios extracted. Yet, when close to PSC temperature thresholds, the temperature dif-ferences are a key issue and more realistic values for nitric acid and water vapour mixing ratios are needed to determine these thresholds (using, for instance, the Microwave Limb Sounder onboard the AURA sat-ellite). The current step of the analysis is the model-ling of PSC formation along the trajectories using the Danish Meteorological Institute microphysical box model (Larsen et al., 2000). The model includes mi-crophysical Mie and T-Matrix modules, together with optical modules, and is able to simulate the size dis-
Fig. 2.1-5. Evolution of the temperature (left) and of the lidar scattering ratio at 532 nm (right) along different trajectories (color code) started from Davis station at 0300 UTC 2 August 2007 to 0300 UTC 12 August 2007.(Courtesy: Nadège Montoux)
I PY 20 07–20 0 8144
tribution of PSC parameters and their optical proper-ties at lidar wavelength.
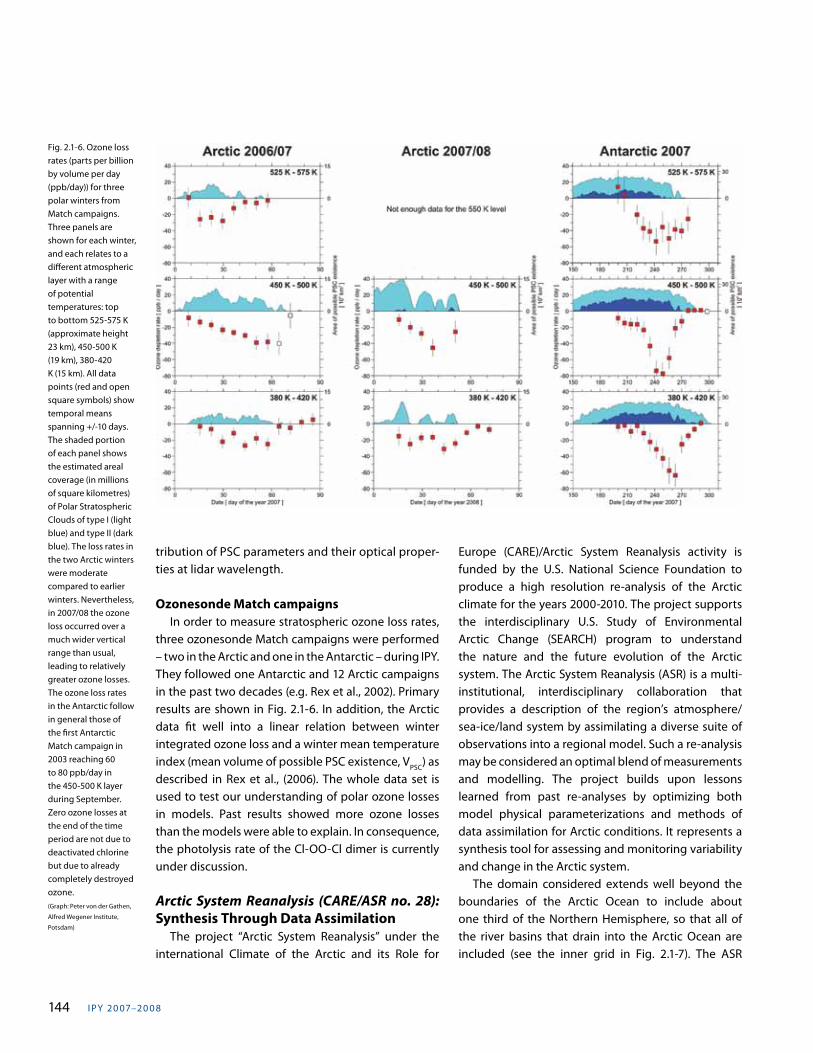
Ozonesonde Match campaigns In order to measure stratospheric ozone loss rates, three ozonesonde Match campaigns were performed – two in the Arctic and one in the Antarctic – during IPY. They followed one Antarctic and 12 Arctic campaigns in the past two decades (e.g. Rex et al., 2002). Primary results are shown in Fig. 2.1-6. In addition, the Arctic data fit well into a linear relation between winter integrated ozone loss and a winter mean temperature index (mean volume of possible PSC existence, VPSC) as described in Rex et al., (2006). The whole data set is used to test our understanding of polar ozone losses in models. Past results showed more ozone losses than the models were able to explain. In consequence, the photolysis rate of the Cl-OO-Cl dimer is currently under discussion.
Arctic System Reanalysis (CARE/ASR no. 28): Synthesis Through Data Assimilation The project “Arctic System Reanalysis” under the international Climate of the Arctic and its Role for
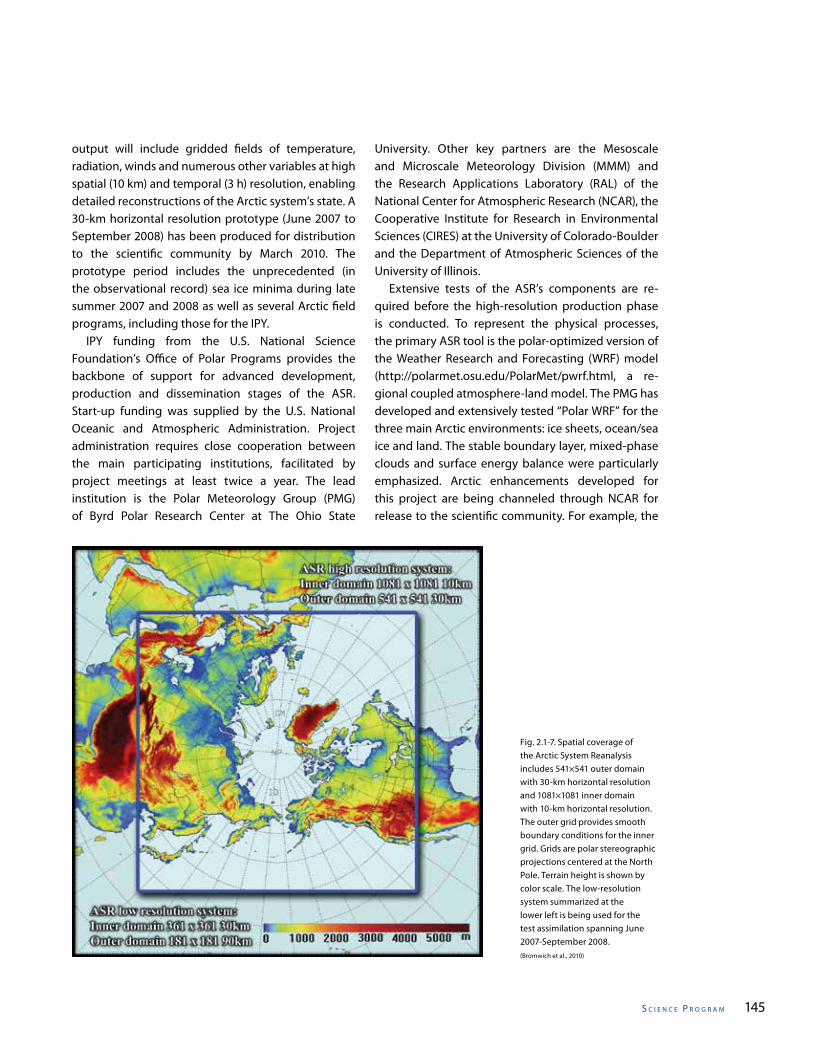
Europe (CARE)/Arctic System Reanalysis activity is funded by the U.S. National Science Foundation to produce a high resolution re-analysis of the Arctic climate for the years 2000-2010. The project supports the interdisciplinary U.S. Study of Environmental Arctic Change (SEARCH) program to understand the nature and the future evolution of the Arctic system. The Arctic System Reanalysis (ASR) is a multi-institutional, interdisciplinary collaboration that provides a description of the region’s atmosphere/sea-ice/land system by assimilating a diverse suite of observations into a regional model. Such a re-analysis may be considered an optimal blend of measurements and modelling. The project builds upon lessons learned from past re-analyses by optimizing both model physical parameterizations and methods of data assimilation for Arctic conditions. It represents a synthesis tool for assessing and monitoring variability and change in the Arctic system. The domain considered extends well beyond the boundaries of the Arctic Ocean to include about one third of the Northern Hemisphere, so that all of the river basins that drain into the Arctic Ocean are included (see the inner grid in Fig. 2.1-7). The ASR
Fig. 2.1-6. Ozone loss rates (parts per billion by volume per day (ppb/day)) for three polar winters from Match campaigns. Three panels are shown for each winter, and each relates to a different atmospheric layer with a range of potential temperatures: top to bottom 525-575 K (approximate height 23 km), 450-500 K (19 km), 380-420 K (15 km). All data points (red and open square symbols) show temporal means spanning +/-10 days. The shaded portion of each panel shows the estimated areal coverage (in millions of square kilometres) of Polar Stratospheric Clouds of type I (light blue) and type II (dark blue). The loss rates in the two Arctic winters were moderate compared to earlier winters. Nevertheless, in 2007/08 the ozone loss occurred over a much wider vertical range than usual, leading to relatively greater ozone losses. The ozone loss rates in the Antarctic follow in general those of the first Antarctic Match campaign in 2003 reaching 60 to 80 ppb/day in the 450-500 K layer during September. Zero ozone losses at the end of the time period are not due to deactivated chlorine but due to already completely destroyed ozone. (Graph: Peter von der Gathen,
Alfred Wegener Institute,
Potsdam)
s C I e n C e P r o g r a m 145
output will include gridded fields of temperature, radiation, winds and numerous other variables at high spatial (10 km) and temporal (3 h) resolution, enabling detailed reconstructions of the Arctic system’s state. A 30-km horizontal resolution prototype (June 2007 to September 2008) has been produced for distribution to the scientific community by March 2010. The prototype period includes the unprecedented (in the observational record) sea ice minima during late summer 2007 and 2008 as well as several Arctic field programs, including those for the IPY. IPY funding from the U.S. National Science Foundation’s Office of Polar Programs provides the backbone of support for advanced development, production and dissemination stages of the ASR. Start-up funding was supplied by the U.S. National Oceanic and Atmospheric Administration. Project administration requires close cooperation between the main participating institutions, facilitated by project meetings at least twice a year. The lead institution is the Polar Meteorology Group (PMG) of Byrd Polar Research Center at The Ohio State
University. Other key partners are the Mesoscale and Microscale Meteorology Division (MMM) and the Research Applications Laboratory (RAL) of the National Center for Atmospheric Research (NCAR), the Cooperative Institute for Research in Environmental Sciences (CIRES) at the University of Colorado-Boulder and the Department of Atmospheric Sciences of the University of Illinois. Extensive tests of the ASR’s components are re-quired before the high-resolution production phase is conducted. To represent the physical processes, the primary ASR tool is the polar-optimized version of the Weather Research and Forecasting (WRF) model (http://polarmet.osu.edu/PolarMet/pwrf.html, a re-gional coupled atmosphere-land model. The PMG has developed and extensively tested “Polar WRF” for the three main Arctic environments: ice sheets, ocean/sea ice and land. The stable boundary layer, mixed-phase clouds and surface energy balance were particularly emphasized. Arctic enhancements developed for this project are being channeled through NCAR for release to the scientific community. For example, the
Fig. 2.1-7. Spatial coverage of the Arctic System Reanalysis includes 541×541 outer domain with 30-km horizontal resolution and 1081×1081 inner domain with 10-km horizontal resolution. The outer grid provides smooth boundary conditions for the inner grid. Grids are polar stereographic projections centered at the North Pole. Terrain height is shown by color scale. The low-resolution system summarized at the lower left is being used for the test assimilation spanning June 2007-September 2008. (Bromwich et al., 2010)
I PY 20 07–20 0 8146
fractional sea ice capability developed by the PMG is a standard WRF option beginning with version 3.1. The specified sea ice representation in the ASR is being enhanced by ice thickness distributions derived from remote sensing observations. Specified variable snow thickness over sea ice is also being represented. Preparations for the ASR at RAL comprise improving the representation of Arctic land surface processes by the Noah Land Surface Model (LSM) that is coupled to WRF. In particular, key goals include improving the representation of spring snow-melt and the soil temperature profile. Detailed improvements to Noah include addition of an organic layer, deeper soil depths and a zero-flux bottom boundary condition. To best represent the land surface in the ASR, high quality fields will be obtained through High-Resolution Land Data Assimilation, driven by satellite data and run with the Noah LSM that interacts periodically with WRF. A key challenge is fully assimilating the available Arctic observational data. The NCAR MMM has contributed considerable resources to enhance assimilation of in situ and remote sensing data in the polar regions, thus optimizing the advanced three-dimensional-variational (3D-Var) data assimilation capabilities of WRF-Var. In assembling the varied data that are to be processed by WRF-Var, Jack Woollen of the National Centers for Environmental Prediction (NCEP) has provided access to operational data streams and valuable advice on their usage. While conventional weather reports and satellite measurements make their way into the operational Binary Universal Format Representation (BUFR) database, other important Arctic data do not. These include the Greenland ice sheet automatic weather station reports, data from automated weather stations at northern Alaskan field sites, Multi-angle Imaging SpectroRadiometer (MISR) cloud-tracked winds supplied by the University of Illinois, Arctic snow water equivalent measurements supplied by CIRES and most of the IPY field measurements. The ASR eagerly solicits additional Arctic datasets from the community for assimilation into ASR or for testing its output. Completion of the ASR for 2000-2010 is scheduled for autumn 2011, and will be distributed to the community by the NOAA Earth System Research Laboratory (formerly CDC) and by NCAR.
World Weather Research Programme-THORPEX IPY cluster (no. 121) From a weather forecasting perspective, the Arctic poses particular challenges for mainly two reasons: the observational data are sparse and the weather phenomena responsible for severe weather, such as polar lows, Arctic fronts and orographic influences on airflow, are inadequately represented in operational numerical weather prediction (NWP) models. The IPY-THORPEX cluster, comprising an international cooperation between ten individual IPY projects from nine countries, was set up to address these challenges. It has the following main objectives:i) Explore the use of satellite data and optimised
observations to improve high impact weather forecasts (from Polar THORPEX Regional Campaigns (TReCs) and/or provide additional observations in real time to the WMO Global Telecommunication System).
ii) Better understand physical/dynamical processes in polar regions.
iii) Achieve a better understanding of small scale weather phenomena.
iv) Utilise improved forecasts to the benefit of society, the economy and the environment.
v) Utilise the THORPEX Interactive Grand Global Ensemble (TIGGE) of weather forecasts for polar prediction.
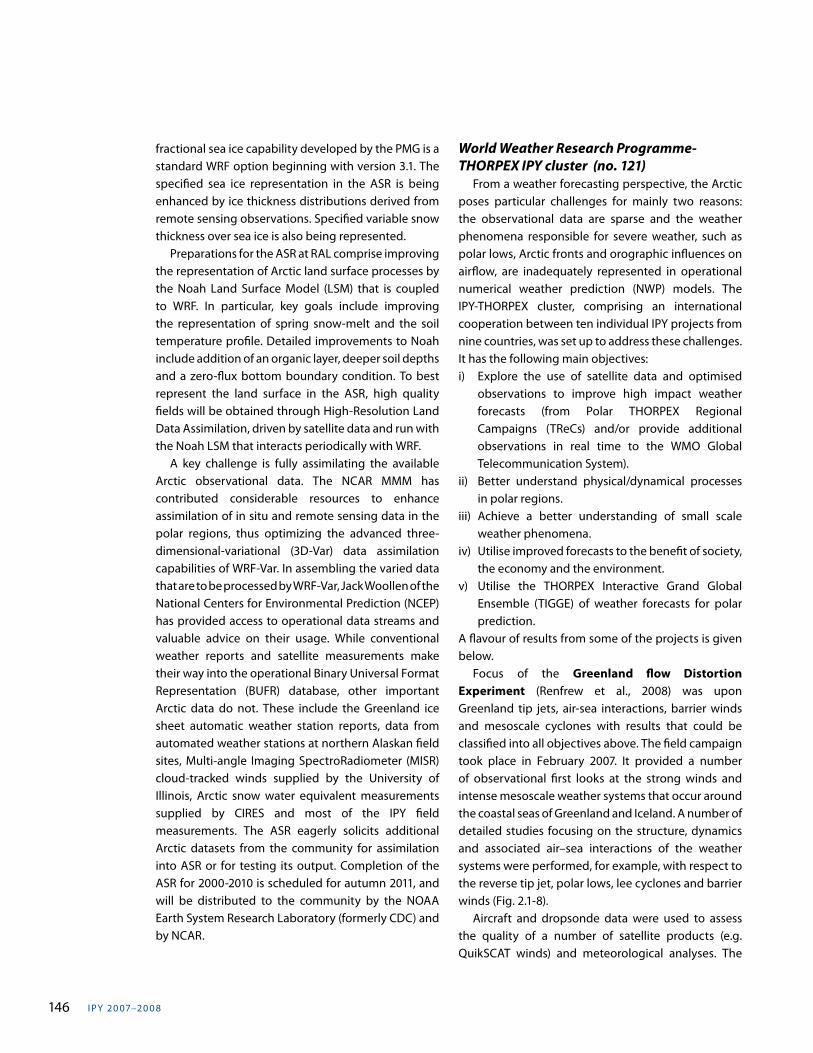
A flavour of results from some of the projects is given below. Focus of the Greenland flow Distortion Experiment (Renfrew et al., 2008) was upon Greenland tip jets, air-sea interactions, barrier winds and mesoscale cyclones with results that could be classified into all objectives above. The field campaign took place in February 2007. It provided a number of observational first looks at the strong winds and intense mesoscale weather systems that occur around the coastal seas of Greenland and Iceland. A number of detailed studies focusing on the structure, dynamics and associated air–sea interactions of the weather systems were performed, for example, with respect to the reverse tip jet, polar lows, lee cyclones and barrier winds (Fig. 2.1-8). Aircraft and dropsonde data were used to assess the quality of a number of satellite products (e.g. QuikSCAT winds) and meteorological analyses. The
s C I e n C e P r o g r a m 147
impact of the targeted observations was assessed by Irvine et al., (2009), who found that the impact of the sondes was mixed. Only two out of the five cases showed clear forecast improvement; the maximum forecast improvement seen over the verifying region was the reduction of approximately 5% of the forecast error 24 hours into the forecast. In one of these cases, the improvement propagates into the verification region with a developing polar low. The impact of targeted sonde observations on the 1-3 day forecasts for northern Europe was evaluated using the U.K. Met Office four-dimensional variational data assimilation scheme and a 24 km grid length limited-area version of the Unified Model (MetUM). Targeted sonde data was assimilated operationally into the MetUM. A study that focused particularly on local communities (objective “iv” above) was Storm Studies of the Artic (STAR, Hanesiak et al., 2010). It was not an international IPY project, but cooperated closely with projects participating in the IPY-THORPEX cluster. It included enhanced observations in the eastern Canadian Arctic and studied gap flow, air-sea interactions, orographic precipitation and interaction of cyclones with topography etc. With 14 research flights from Baffin Island, surface- and satellite-based instruments, STAR aimed to improve understanding and prediction of severe Arctic storms
and their hazards. One of the more important tasks included developing a conceptual model of storms and associated phenomena in the region. Another important task was to evaluate operational and model forecasts of events to examine where improvements need to be made and under what circumstances. The Norwegian IPY-THORPEX project (Kristjansson et al., submitted) sought to improve weather forecasts of phenomena typical for the high latitudes through a combined modelling and observational effort (mainly objectives i, ii and iii). The crux of the observational effort was a 3-week international field campaign out of Northern Norway in early 2008, combining airborne and surface-based observations. The main platform of the field campaign was the DLR (German Aerospace Center) Falcon research aircraft, equipped with LIDAR systems for profiling of aerosols, humidity and wind, in addition to in situ measurements and dropsondes. A total of 11 missions were flown, providing unique observations of polar lows, an Arctic front and orographic low-level jets near Spitsbergen, the coast of Northern Norway and the east coast of Greenland. Two major polar low developments over the Norwegian Sea were captured during the campaign. One of them (3-4 March 2008) was reasonably well predicted by operational models, while in the other case (16-17 March 2008) the operational models had
Fig. 2.1-8. Example of an easterly tip jet showing QuikSCAT-derived 10-m winds for the morning of 21 February 2007 (the satellite passes are from 0718 and 0900 UTC). The colours show wind speed (m s–1). The vectors are shown every third pixel (i.e. every 0.75°) (Renfrew et al., 2008).
I PY 20 07–20 0 8148
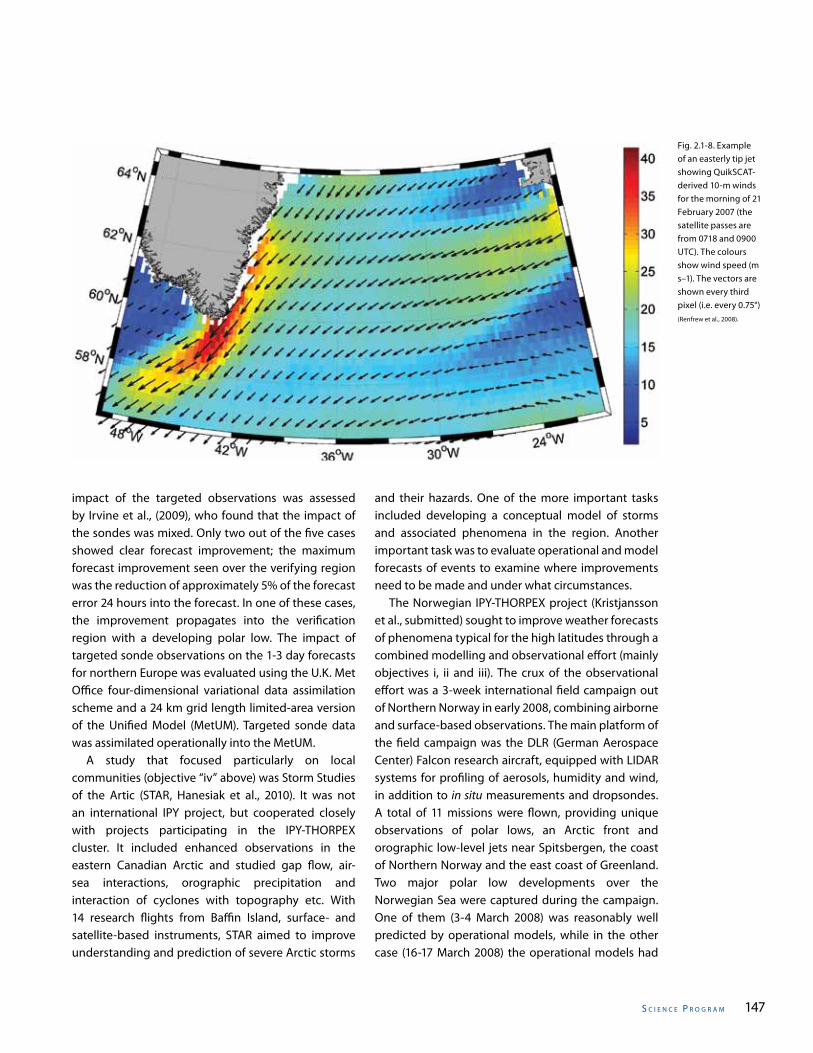
huge errors both in strength and position. In the former case, targeting observations by the aircraft in sensitive areas led to improvements in predicted track and intensity of the polar low. Fig. 2.1-9 shows that the forecast containing targeted observations from 18 UTC 4 March 2008 improves the polar low position and strength, although the region of strong winds extends too far south compared to the analysis. Further work is underway to confirm the impact of the targeted sondes on the forecast and the reasons for this impact. Thorpex Arctic Weather and Environmental Prediction Initiative (TAWEPI) is a science and research project partly funded by the Government of Canada Program of the International Polar Year. The primary objective of TAWEPI is to improve the Environment Canada’s NWP capacity over the Arctic during the IPY observational period and beyond. TAWEPI’s research activities started in April 2007. A research version of the regional GEM model, covering the Arctic basin and surroundings is being used to study the representation of radiative and cloud processes in weather forecasts. A multi-layer snow model coupled to sea-ice and blowing-snow parameterizations, describing processes over the various types of surfaces of the Arctic environment, was tested and evaluated. A methodology to validate model forecasts of cloud and radiation using satellite hyperspectral radiances
was developed. Climatology of the sensitivity of the Arctic weather to disturbances originated elsewhere was generated and archived for the IPY period of 2007–2008. A state-of-the-science sea-ice model is being adjusted to improve the sea-ice representation in the Arctic (Ayrton Zadra, Environment Canada, pers. comm., see www.ec.gc.ca/envirozine). The IPY-THORPEX cluster projects have demonstrated that improvements in NWP for polar regions are possible and have increased our understanding of how to improve models and how to use data from the Arctic; they also deepen our understanding of the physical processes involved. In particular they have acquired data for improving physical parameterization in NWP models (-clouds, microphysics, surface fluxes); improved assimilation techniques for high latitudes with emphasis on satellite data; increased our understanding on the effect of the use of ensemble simulations for high latitudes; increased our understanding of the effect of targeting in high latitudes; increased our understanding of high-latitude dynamics and high-impact weather phenomena; demonstrated the effect of new instruments; and demonstrated the effect of increased Arctic and Antarctic observations for local and extratropical NWP forecasting.
Fig. 2.1-9. Sea-level pressure (black contours) and 10 m wind speed exceeding 10 m/s (coloured shading) for 18 UTC 4 March 2008, for 24-hour forecasts from 18 UTC 3 March 2008 containing (a) routine and targeted observations, (b) only routine observations and (c) ECMWF analysis.(Kristjansson et al., submitted)
s C I e n C e P r o g r a m 149
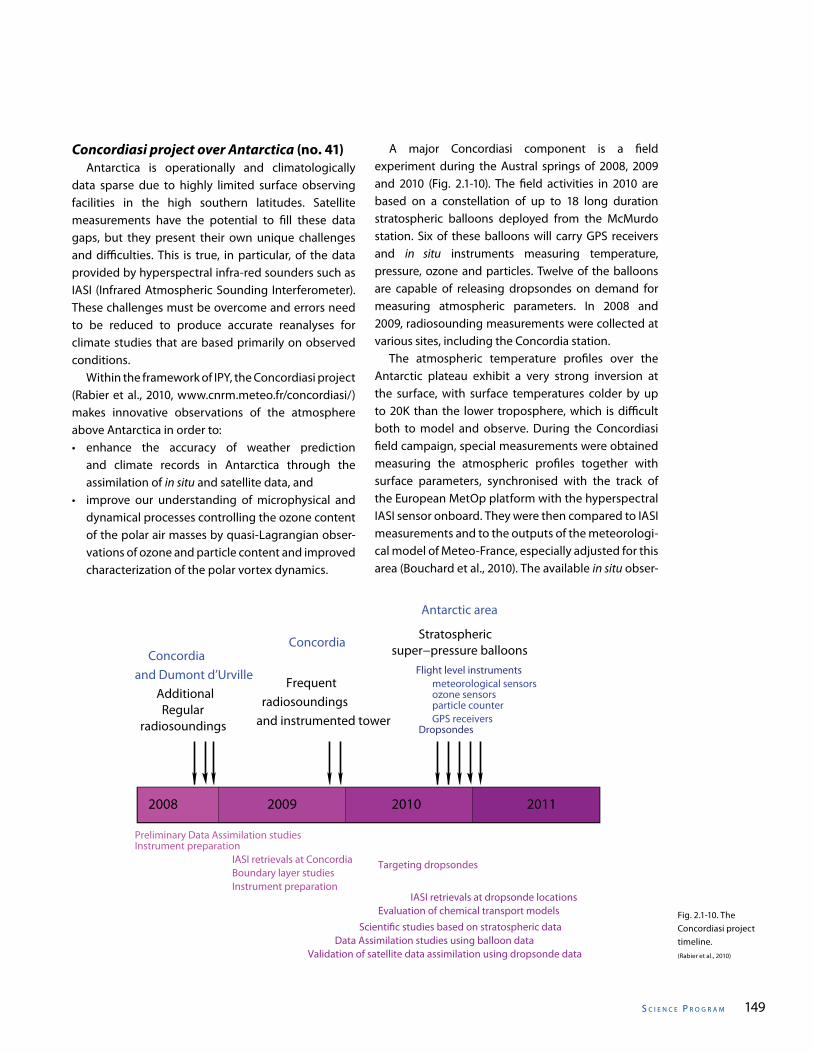
Concordiasi project over Antarctica (no. 41) Antarctica is operationally and climatologically data sparse due to highly limited surface observing facilities in the high southern latitudes. Satellite measurements have the potential to fill these data gaps, but they present their own unique challenges and difficulties. This is true, in particular, of the data provided by hyperspectral infra-red sounders such as IASI (Infrared Atmospheric Sounding Interferometer). These challenges must be overcome and errors need to be reduced to produce accurate reanalyses for climate studies that are based primarily on observed conditions. Within the framework of IPY, the Concordiasi project (Rabier et al., 2010, www.cnrm.meteo.fr/concordiasi/) makes innovative observations of the atmosphere above Antarctica in order to:• enhance the accuracy of weather prediction
and climate records in Antarctica through the assimilation of in situ and satellite data, and
• improve our understanding of microphysical and dynamical processes controlling the ozone content of the polar air masses by quasi-Lagrangian obser-vations of ozone and particle content and improved characterization of the polar vortex dynamics.
A major Concordiasi component is a field experiment during the Austral springs of 2008, 2009 and 2010 (Fig. 2.1-10). The field activities in 2010 are based on a constellation of up to 18 long duration stratospheric balloons deployed from the McMurdo station. Six of these balloons will carry GPS receivers and in situ instruments measuring temperature, pressure, ozone and particles. Twelve of the balloons are capable of releasing dropsondes on demand for measuring atmospheric parameters. In 2008 and 2009, radiosounding measurements were collected at various sites, including the Concordia station. The atmospheric temperature profiles over the Antarctic plateau exhibit a very strong inversion at the surface, with surface temperatures colder by up to 20K than the lower troposphere, which is difficult both to model and observe. During the Concordiasi field campaign, special measurements were obtained measuring the atmospheric profiles together with surface parameters, synchronised with the track of the European MetOp platform with the hyperspectral IASI sensor onboard. They were then compared to IASI measurements and to the outputs of the meteorologi-cal model of Meteo-France, especially adjusted for this area (Bouchard et al., 2010). The available in situ obser-
2008 2009 2010 2011
Preliminary Data Assimilation studiesInstrument preparation
IASI retrievals at ConcordiaBoundary layer studiesInstrument preparation
Targeting dropsondes
and Dumont d’UrvilleConcordia
Additional
Concordia
Frequent
Stratosphericsuper−pressure balloons
Flight level instrumentsmeteorological sensorsozone sensorsparticle counter GPS receivers
DropsondesradiosoundingsRegular
radiosoundingsand instrumented tower
Antarctic area
Validation of satellite data assimilation using dropsonde dataData Assimilation studies using balloon data
Scienti�c studies based on stratospheric dataEvaluation of chemical transport models
IASI retrievals at dropsonde locations
Fig. 2.1-10. The Concordiasi project timeline.(Rabier et al., 2010)
I PY 20 07–20 0 8150
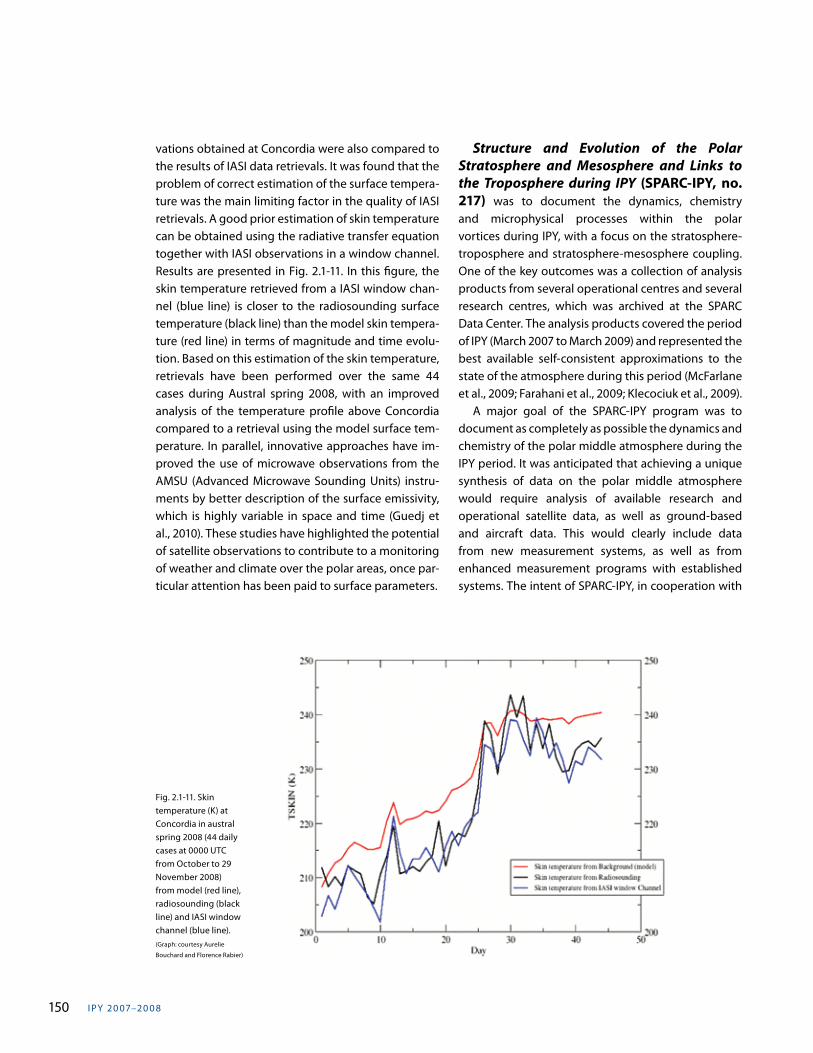
vations obtained at Concordia were also compared to the results of IASI data retrievals. It was found that the problem of correct estimation of the surface tempera-ture was the main limiting factor in the quality of IASI retrievals. A good prior estimation of skin temperature can be obtained using the radiative transfer equation together with IASI observations in a window channel. Results are presented in Fig. 2.1-11. In this figure, the skin temperature retrieved from a IASI window chan-nel (blue line) is closer to the radiosounding surface temperature (black line) than the model skin tempera-ture (red line) in terms of magnitude and time evolu-tion. Based on this estimation of the skin temperature, retrievals have been performed over the same 44 cases during Austral spring 2008, with an improved analysis of the temperature profile above Concordia compared to a retrieval using the model surface tem-perature. In parallel, innovative approaches have im-proved the use of microwave observations from the AMSU (Advanced Microwave Sounding Units) instru-ments by better description of the surface emissivity, which is highly variable in space and time (Guedj et al., 2010). These studies have highlighted the potential of satellite observations to contribute to a monitoring of weather and climate over the polar areas, once par-ticular attention has been paid to surface parameters.
Structure and Evolution of the Polar Stratosphere and Mesosphere and Links to the Troposphere during IPY (SPARC-IPY, no. 217) was to document the dynamics, chemistry and microphysical processes within the polar vortices during IPY, with a focus on the stratosphere-troposphere and stratosphere-mesosphere coupling. One of the key outcomes was a collection of analysis products from several operational centres and several research centres, which was archived at the SPARC Data Center. The analysis products covered the period of IPY (March 2007 to March 2009) and represented the best available self-consistent approximations to the state of the atmosphere during this period (McFarlane et al., 2009; Farahani et al., 2009; Klecociuk et al., 2009). A major goal of the SPARC-IPY program was to document as completely as possible the dynamics and chemistry of the polar middle atmosphere during the IPY period. It was anticipated that achieving a unique synthesis of data on the polar middle atmosphere would require analysis of available research and operational satellite data, as well as ground-based and aircraft data. This would clearly include data from new measurement systems, as well as from enhanced measurement programs with established systems. The intent of SPARC-IPY, in cooperation with
Fig. 2.1-11. Skin temperature (K) at Concordia in austral spring 2008 (44 daily cases at 0000 UTC from October to 29 November 2008) from model (red line), radiosounding (black line) and IASI window channel (blue line).(Graph: courtesy Aurelie
Bouchard and Florence Rabier)
s C I e n C e P r o g r a m 151
related and linked IPY activities, was to facilitate such data acquisition, archiving and analysis activities. In addition to collecting the results of new measurement programs, SPARC-IPY also collected and archived objective analysis products from major centers during the IPY period. This activity was undertaken and coordinated within the SPARC-DA activity (Polavarapu et al., 2007). SPARC-IPY has also encouraged work on data assimilation and inter-comparison of the assimilated data sets.
Tropospheric chemistry: air pollution and climate impacts Several IPY projects investigated the chemical composition of the Arctic troposphere. They studied a large range of different topics, such as the geographical and vertical distribution of pollutants in the Arctic, their sources, concentration trends on various time scales, the physical and chemical processes determining their concentration levels, and the climate impacts of aerosols and trace gases. Arctic ice cores also provide records of contaminant levels that are relevant not only for the Arctic itself, but also for the extra-polar regions where detailed historical records are more difficult to obtain. The motivation for all of these projects arises either from the health and ecological impacts of contaminants or from the climate impacts of aerosols and short-lived trace gases. Arctic air pollutants are emitted mainly by sources in the middle latitudes and are carried northward by the winds in the troposphere. Some contaminants, such as POPs, can partition between different environmental media but the atmosphere generally provides the fastest transport pathway into the Arctic. Of particular concern is that even though Arctic sources are small, POPs can reach their highest concentration levels in the Arctic via a mechanism known as cold condensation whereby POPs (Persistent Organic Pollutants) are “extracted” from the atmosphere preferentially in the polar regions. POPs and heavy metals can furthermore bioaccumulate and biomagnify through food chains and thus pose significant health risks to humans and wildlife in the Arctic. “Classical” pollutants, such as sulfate, can also reach surprisingly high atmospheric concentrations in the
Arctic in winter and early spring, given that their local sources are relatively small. Nevertheless, in winter there is relatively efficient transport into the Arctic from high-latitude regions in Eurasia where strong pollution sources are located. The high static stability and dryness of the arctic troposphere in winter render removal processes such as dry and wet deposition inefficient and chemical degradation is also reduced by low temperatures and light intensity. This leads to long pollutant lifetimes and explains the high arctic pollution loads. Aerosol concentrations can reach such high levels that visible haze layers can form, which have become known as Arctic Haze. In the past, the main interest was in the acidifying properties and the high pollution loads of Arctic Haze. More recently, however, interest into the climate impact of the haze has grown. Aerosols affect the radiation transmission in the atmosphere and, because of the highly reflective surface in the Arctic, even small amounts of light absorbing material such as black carbon (“soot”) can lead to a warming of the atmosphere. If light-absorbing aerosols are deposited on snow or ice, they can also reduce the surface albedo. Sufficiently large aerosols can also hinder the transmission of long-wave radiation and aerosols can also affect the properties of arctic clouds.
Metal pollution in Canadian High Arctic: Pollution trend reconstruction of noble metals (IPY no. 19) project provides a reconstruction of the historical concentrations of heavy metals (lead, cadmium, mercury) and sulfate through snow, firn and ice core measurements. Based on background data back to 4,000 BP, it was found, for instance, that lead (Pb) contamination in the High Arctic has started much earlier than the Industrial Revolution. The first outstanding Pb peak found in Devon Ice Cap was at ~3,100 years ago, which corresponds to the Iberian Peninsula mining and smelting. The second peak was much broader (lasting a longer time) and located from the Roman Period to the Middle Ages. Starting 700 years ago, the lead/scandium (Pb/Sc) ratio exceeded the background value and has not returned to natural values since. In the 1840s, many years before Pb additives were used in gasoline, approximately 80% of the Pb deposition on the Devon Ice Cap was already from anthropogenic sources. Even in the 1920s, still
I PY 20 07–20 0 8152
pre-dating the use of leaded gasoline additives, about 90% of Pb deposition was anthropogenic. Clearly, the use of leaded gasoline is only the most recent chapter in a very long history of atmospheric Pb contamination. Since the 1970s, Pb enrichments in snow and firn from Devon Island have gone into decline in response to the gradual elimination of leaded gasoline. Nevertheless, using the natural, background Pb/Sc ratio and Pb isotope data, it is found that at least 90% of the Pb in the High Arctic is still from anthropogenic sources.
INterContinental Atmospheric Trans port of Anthropogenic Pollutants to the Arctic (INCATPA, no. 327 www.ec.gc.ca/api-ipy/default.asp?lang=En&n=8EBD7558-1) studied the risks associated with the emissions of POPs and mercury (Hg) in the Pacific region for the contaminant loads in the Arctic. Before IPY, air monitoring of POPs and Hg was performed mainly at Alert, Canada and Ny Ålesund, Norway in the 1990s under AMAP. Hg has also been continuously measured in air at Whistler, B.C. and Amderma, Russia under Environment Canada and Roshydromet for AMAP, respectively. During IPY, air measurements of POPs and/or Hg started at Little Fox Lake, Yukon, Canada; Valkarkai, Russia; Barrow, Dillingham and Fairbanks, Alaska, U.S.A.; Waliguan, Mt. Changbai, Wudalianchi and Xuancheng, China; and Ba Vi, Vietnam. At most stations, these measurements will continue until spring 2010. Soil and air samples were collected along the Chilkoot Trail, Yukon/Alaska, in summer 2007, at different elevations. The purpose is to investigate the atmospheric deposition of POPs and emerging chemicals on mountain ranges in the Kluane National Park, Yukon, Canada. Combined with the air concentration data collected at Little Fox Lake, this work will provide insight on the roles that mountains and forests play in intercepting POPs carried by trans-Pacific air masses. Another project, Atmospheric Monitoring Network for Anthropogenic Pollution in Polar Regions (ATMOPOL, no. 76), delivered the first annual data set on POPs in antarctic air. It also studied the influence of climate change on atmospheric distribution patterns of POPs and the identification of new emerging contaminants in arctic environments. INCATPA models simulating the transport and fate of POPs showed that long-range atmospheric transport (LRAT) of POPs from sources in warm
latitudes to the Arctic occurs primarily at the mid-troposphere. Cold condensation is also likely to occur at the mid-troposphere over a source region in warm low latitudes. The temperature dependent vapour pressures and atmospheric degradation rates of POPs exhibit similarities between the lower atmosphere over the Arctic and the mid-troposphere over a tropical region. Convection over warm latitudes transports the chemicals to a higher altitude where some of them may condense/partition to particles or to the aqueous phase and they become more persistent at the lower temperatures. Strong winds at the mid-troposphere then convey the condensed chemicals also to the Arctic where they can be brought down to the surface by large-scale descending motion and wet deposition. These studies provide a new interpretation on the cold condensation (Arctic trapping) effect and revealed major atmospheric pathways of POPs to the Arctic.
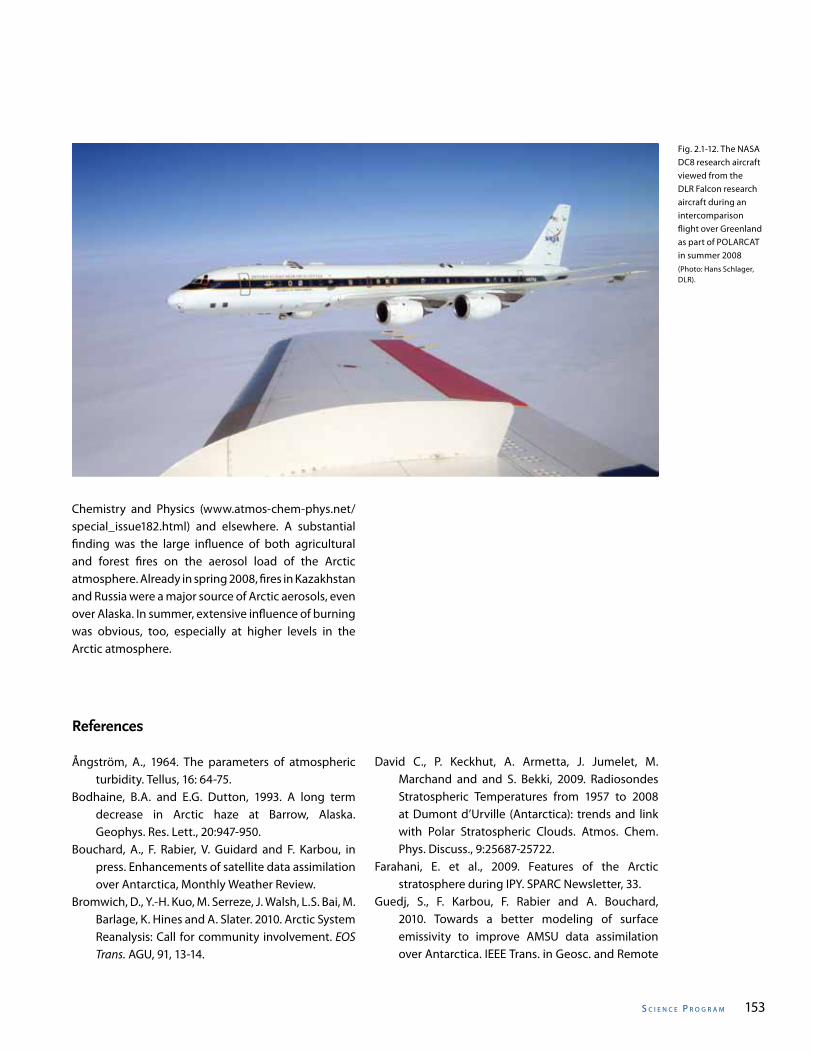
POLar study using Aircraft, Remote sens-ing, surface measurements and model ling of Climate, chemistry, Aerosols and Transport (POLARCAT, no. 32 www.polarcat.no) brought one of the largest atmospheric measurement cam-paigns ever conducted in the Arctic. Eight research aircraft from the United States, France, Germany, Rus-sia, as well as research groups from many other coun-tries, flew research missions in nearly all parts of the Arctic and sub-Arctic during spring 2007, spring 2008 and summer 2008. The campaigns were coordinated (Fig. 2.1-12) such that comparisons between the dif-ferent parts of the Arctic can be made. The aircraft missions were complemented by a ship cruise in spring 2008, a railway campaign in Siberia in sum-mer 2008 and measurement campaigns at several Arctic stations (e.g. Summit, Ny Ålesund). They were also supplemented with extensive use of satellite re-mote sensing products and a large range of different models. Detailed measurements of the gas-phase and particulate-phase chemical composition of the Arctic atmosphere, the optical properties of aerosols, the properties of clouds, etc. were made. In the result, the POLARCAT data set will provide a unique reference for future changes of the Arctic atmosphere. While the data sets are still being processed and analyzed, several research highlights were already published in a POLARCAT special issue in Atmospheric
s C I e n C e P r o g r a m 153
Chemistry and Physics (www.atmos-chem-phys.net/special_issue182.html) and elsewhere. A substantial finding was the large influence of both agricultural and forest fires on the aerosol load of the Arctic atmosphere. Already in spring 2008, fires in Kazakhstan and Russia were a major source of Arctic aerosols, even over Alaska. In summer, extensive influence of burning was obvious, too, especially at higher levels in the Arctic atmosphere.
Fig. 2.1-12. The NASA DC8 research aircraft viewed from the DLR Falcon research aircraft during an intercomparison flight over Greenland as part of POLARCAT in summer 2008(Photo: Hans Schlager, DLR).
References
Ångström, A., 1964. The parameters of atmospheric turbidity. Tellus, 16: 64-75.
Bodhaine, B.A. and E.G. Dutton, 1993. A long term decrease in Arctic haze at Barrow, Alaska. Geophys. Res. Lett., 20:947-950.
Bouchard, A., F. Rabier, V. Guidard and F. Karbou, in press. Enhancements of satellite data assimilation over Antarctica, Monthly Weather Review.
Bromwich, D., Y.-H. Kuo, M. Serreze, J. Walsh, L.S. Bai, M. Barlage, K. Hines and A. Slater. 2010. Arctic System Reanalysis: Call for community involvement. EOS Trans. AGU, 91, 13-14.
David C., P. Keckhut, A. Armetta, J. Jumelet, M. Marchand and and S. Bekki, 2009. Radiosondes Stratospheric Temperatures from 1957 to 2008 at Dumont d’Urville (Antarctica): trends and link with Polar Stratospheric Clouds. Atmos. Chem. Phys. Discuss., 9:25687-25722.
Farahani, E. et al., 2009. Features of the Arctic stratosphere during IPY. SPARC Newsletter, 33.
Guedj, S., F. Karbou, F. Rabier and A. Bouchard, 2010. Towards a better modeling of surface emissivity to improve AMSU data assimilation over Antarctica. IEEE Trans. in Geosc. and Remote
I PY 20 07–20 0 8154
Sensing, 48(4):1976-1985.Hanesiak, J., R. Stewart, D. Barber, G. Liu, J. Gilligan,
D. Desjardins, R. Dyck, S. Fargey, K. Hochheim, R. Martin, P. Taylor, S. Biswas, M. Gordon, M.A. Melzer, K. Moore, R. Field, C. Hay, S. Zhang, G. McBean, W. Strapp, D. Hudak, J. Scott, M. Wolde, R. Goodson, E. Hudson, G. Gascon, H. Greene, W. Henson and A. Laplante, 2010. Storm Studies in the Arctic (STAR). Bull. Am. Met. Soc., 91:47-68.
Irvine, E.A., S.L. Gray, J. Methven, I.A. Renfrew, K. Bovis and R. Swinbank, 2009. The impact of targeted observations made during the Greenland Flow Distortion Experiment. Quart. J. Roy. Met. Soc., 135:2012-2029.
Ivanov B.V., P.N. Svyachshennikov, S.V. Kashin, A.V. Se-menov, K. Nilsen, and T. Svene, 2008. Intercompar-ison of actinometric measurements at Shpitzber-gen archipelago in April 2008. IPY News 2007/08, Information Bulletin 15:6-8. St. Petersburg.
Klekociuk, A.R. et al., 2009. Studies of the Antarctic stratosphere during IPY. SPARC Newsletter, 33.
Kotlyakov, V.M., E.I. Sarukhanian and I.E. Frolov, 2010. The first results of the International Polar Year 2007–2008. Priroda.
Kristjánsson, J.E., I. Barstad, A. Dörnbrack, T. Aspelien, I. Føre, Ø. Hov, E. Irvine, T. Iversen, E. Kolstad, T.E. Nordeng, H. McInnes, R. Randriamampianina, Ø. Sætra, H. Ólafsson, M. Shapiro and T. Spengler, submitted. The Norwegian IPY-THORPEX: Polar Lows and Arctic Fronts during the 2008 Andøya campaign. Quart. J. Roy. Met. Soc.
Larsen, N. 2000. Polar stratospheric clouds Microphysical and optical models, Danish Meteorological Institute. Scientific Report, 00-06, 85 p.
Makshtas, A.P., 2007. Future hydrometeorological obsevatory in Tiksi. IPY News 2007/08, Information Bulletin 3: 8-10. St. Petersburg.
McFarlane, N. et al., 2000. SPARC-IPY and beyond. SPARC Newsletter, 33.
Montoux, N., C. David, A. Klekociuk, M. Pitts, M. Snels, J. Jumelet, P. Keckhut and S. Bekki, 2009. MATCH-PSC Lidar Campaigns in Antarctica during IPY: Polar Stratospheric Clouds formation and evolution. MOCA-09 Join Assembly: Montreal, Quebec, Canada.
Polavarapu, S. et al., 2007. SPARC-IPY update. SPARC
Newsletter, 29.Rabier, F., A. Bouchard, E. Brun, A. Doerenbecher, S.
Guedj, V. Guidard, F. Karbou, V.H. Peuch, D. Puech, C. Genthon, G. Picard, M. Town, A. Hertzog, F. Vial, P. Cocquerez, S. Cohn, T. Hock, D. Parsons, J. Powers, K. Romberg, J. VanAndel, T. Deshler, J. Haase, L. Avallone, C.R. Mechoso, A. Tangborn, A. Pellegrini, Y. Frénot, A. Thépaut, G. McNally, J.-P. Balsamo and P. Steinle, 2010. The Concordiasi project in Antartica. Bull. Am. Met. Soc. 91(1): 69-86
Renfrew, I.A., G.N. Petersen, S. Outten, D. Sproson, G.W.K. Moore, C. Hay, T. Ohigashi, S. Zhang, J.E. Kristjánsson, I. Føre, H. Ólafsson, S.L. Gray, E.A. Irvine, K. Bovis, P.R.A. Brown, R. Swinbank, T. Haine, A. Lawrence, R.S. Pickart, M. Shapiro and A. Woolley, 2008. The Greenland Flow Distortion Experiment. Bull. Am. Met. Soc., 89: 1307-1324.
Rex, M. et al., 2002. Chemical depletion of Arctic ozone in winter 1999/2000, J. Geophys. Res., 107(D20): 8276, doi: 10.1029/2001JD000533.
Rex, M. et al., 2006. Arctic winter 2005: Implications for stratospheric ozone loss and climate change. Geophys. Res. Lett., 33: L23808, doi: 10.1029/2006GL026731.
Sharma, S. et al., 2006. Variations and sources of equivalent black carbon in the high Arctic revealed by long-term observations at Alert and Barrow: 1989-2003, J. Geophys. Res., 111: D14208, doi: 10.1029/2005JD006581.
Tomasi, C., V. Vitale, A. Lupi, C. Di Carmine, M. Campanelli, A. Herber, R. Treffeisen, R. S. Stone, E. Andrews, S. Sharma, V. Radionov, W. von Hoyningen-Huene, K. Stebel, G. H. Hansen, C. L. Myhre, C. Wehrli, V. Aaltonen, H. Lihavainen, A. Virkkula, R. Hillamo, J. Ström, C. Toledano, V. E. Cachorro, P. Ortiz, A. M. de Frutos, S. Blindheim, M. Frioud, M. Gausa, T. Zielinski, T. Petelski and T. Yamanouchi, 2007. Aerosols in polar regions: A historical overview based on optical depth and in situ observations. J. Geophys. Res., 112, D16205, 28 PP., doi:10.1029/2007JD008432.
Tomasi, C., B. Petkov, R.S. Stone, E. Benedetti, V. Vitale, A. Lupi, M. Mazzola, C. Lanconelli, A. Herber and W. von Hoyningen-Huene, in press. Characterizing polar atmospheres and their effect on Rayleigh-scattering optical depth. J. Geophys. Res., paper 2009JD012852.
s C I e n C e P r o g r a m 155
2.2 Arctic Ocean
Lead Authors:Bob Dickson, Eberhard Fahrbach and Jacqueline M. Grebmeier
Contributing Authors:Roberta Boscolo and Sara Bowden
Reviewers:John Calder, Eduard Sarukhanian and Colin Summerhayes
PA R T T W O : I P Y S C I E N C E P R O G R A M
Introduction The integrated Arctic Ocean Observing System (iAOOS), originally conceived and sponsored by the Arctic Ocean Science Board (AOSB), was one of the proposals endorsed by the Joint Committee for International Polar Year. It was designed to optimize the cohesion and coverage of Arctic Ocean science during the IPY. As such, iAOOS is not a funded programme in its own right, but is rather a pan-Arctic framework designed to achieve optimal coordination of funded projects during IPY. It has a science plan (Dickson, 2006) based on the more than 1150 Expressions of Interest received by the IPY program office. Reflecting these proposals, its main concerns are with change in the Arctic, including all aspects of the role of the Northern Seas in climate, and it draws its primary focus on the present state and future fate of the Arctic Ocean perennial sea-ice. Because of its all encompassing aim and design, iAOOS is a suitable framework to use when presenting the oceanographic activities undertaken within IPY. During the development of iAOOS, it became clear to the AOSB and to the investigators involved, that the scope of iAOOS could not be restricted to the Arctic Ocean. We know from major studies, such as the Arctic-Subarctic Ocean Flux Study, that the two-way oceanic exchanges that connect the Arctic and Atlantic oceans through subarctic seas are of fundamental importance to climate; that change may certainly be imposed on the Arctic Ocean from subarctic seas, including a changing poleward ocean heat flux that is central to determining the present state and future fate of the perennial sea-ice. The signal of Arctic
change is expected to have a its major climatic impact by reaching south through subarctic seas, either side of Greenland, to modulate the Atlantic thermohaline conveyor. This report on the achievements during IPY is therefore arranged along three major themes or pathways: a) the changing inputs to the Arctic Ocean from the subarctic seas; b) the changing oceanography of the Arctic Ocean itself; and c) the changing outputs from the Arctic to the subarctic seas.
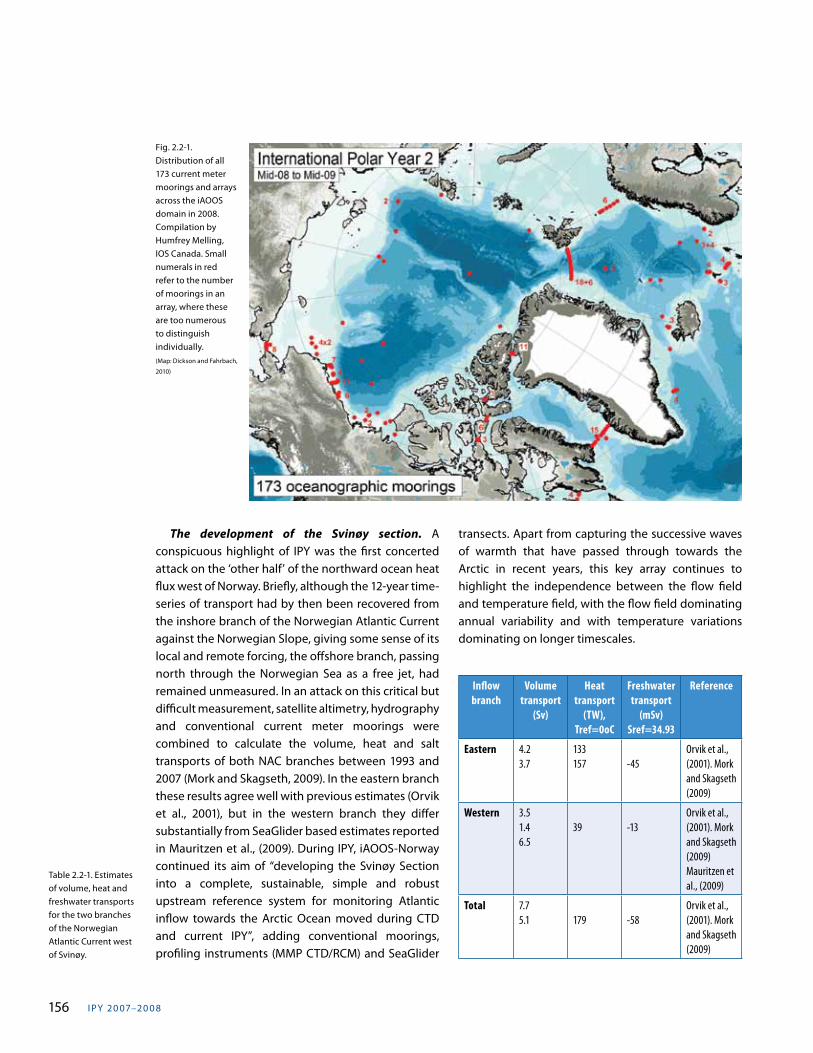
Observing the inputs to the Arctic Ocean Fig 2.2-1 (Melling’s compilation from Dickson, 2009) describes the distribution of all 173 current meter moorings and arrays deployed across the Arctic-subarctic domain during 2008 whether or not they were primarily intended for the support of IPY and its component programs. It is a considerable achievement. Though coverage continues to be thinly spread in places, this mooring network represents a slight increase on the first year of IPY (156) and was a healthy advance on the situation of earlier years, conforming well with the integrated Arctic Ocean Observing Plan (Dickson, 2006). All the main choke-points of ocean exchange between Arctic and subarctic seas are covered, historical time-series moorings have been continued and long-standing ‘gaps’ at climatically-important sites are now properly instrumented. In some key locations (offshore branch of the Norwegian Atlantic Current, Fram Strait, etc), the conventional coverage is now augmented by the use of gliders. Four of these gateway arrays may be picked out for special mention.
I PY 20 07–20 0 8156
The development of the Svinøy section. A conspicuous highlight of IPY was the first concerted attack on the ‘other half’ of the northward ocean heat flux west of Norway. Briefly, although the 12-year time-series of transport had by then been recovered from the inshore branch of the Norwegian Atlantic Current against the Norwegian Slope, giving some sense of its local and remote forcing, the offshore branch, passing north through the Norwegian Sea as a free jet, had remained unmeasured. In an attack on this critical but difficult measurement, satellite altimetry, hydrography and conventional current meter moorings were combined to calculate the volume, heat and salt transports of both NAC branches between 1993 and 2007 (Mork and Skagseth, 2009). In the eastern branch these results agree well with previous estimates (Orvik et al., 2001), but in the western branch they differ substantially from SeaGlider based estimates reported in Mauritzen et al., (2009). During IPY, iAOOS-Norway continued its aim of “developing the Svinøy Section into a complete, sustainable, simple and robust upstream reference system for monitoring Atlantic inflow towards the Arctic Ocean moved during CTD and current IPY”, adding conventional moorings, profiling instruments (MMP CTD/RCM) and SeaGlider
Fig. 2.2-1. Distribution of all 173 current meter moorings and arrays across the iAOOS domain in 2008. Compilation by Humfrey Melling, IOS Canada. Small numerals in red refer to the number of moorings in an array, where these are too numerous to distinguish individually. (Map: Dickson and Fahrbach,
2010)
transects. Apart from capturing the successive waves of warmth that have passed through towards the Arctic in recent years, this key array continues to highlight the independence between the flow field and temperature field, with the flow field dominating annual variability and with temperature variations dominating on longer timescales.
Inflow branch
Volume transport
(Sv)
Heat transport
(TW), Tref=0oC
Freshwater transport
(mSv) Sref=34.93
Reference
Eastern 4.23.7
133157 -45
Orvik et al., (2001). Mork and Skagseth (2009)
Western 3.51.46.5
39 -13Orvik et al., (2001). Mork and Skagseth (2009)Mauritzen et al., (2009)
Total 7.75.1 179 -58
Orvik et al., (2001). Mork and Skagseth (2009)
Table 2.2-1. Estimates of volume, heat and freshwater transports for the two branches of the Norwegian Atlantic Current west of Svinøy.
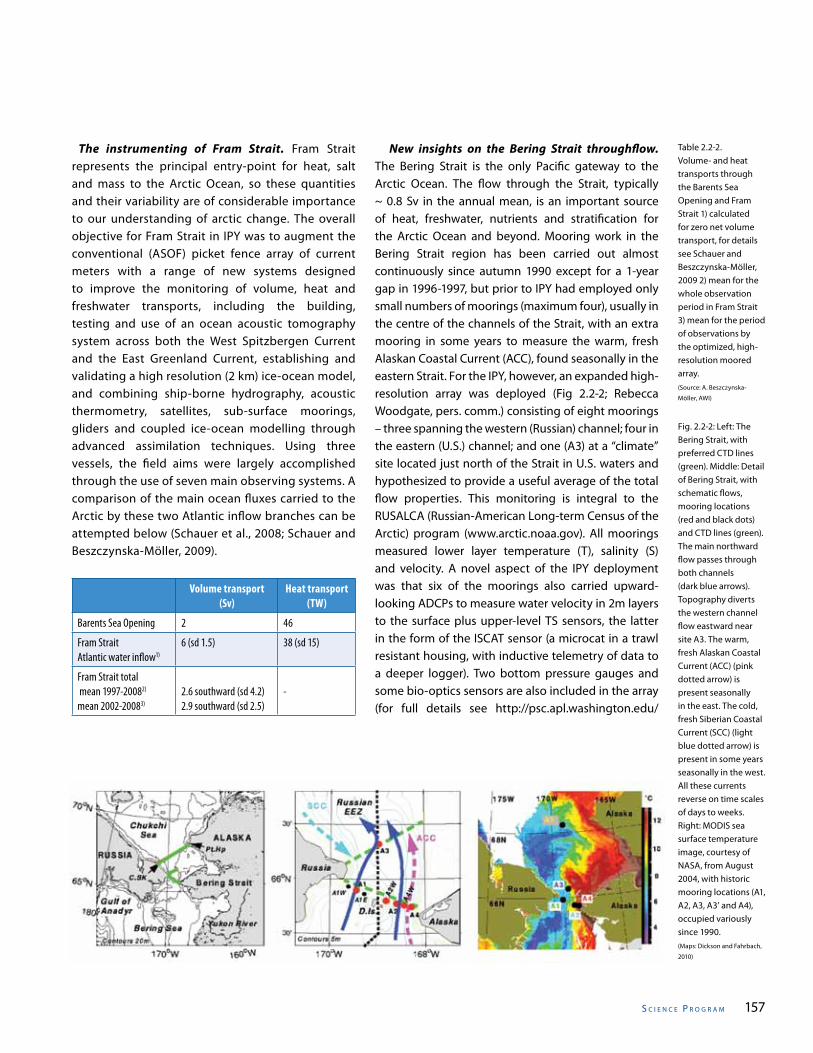
s C I e n C e P r o g r a m 157
The instrumenting of Fram Strait. Fram Strait represents the principal entry-point for heat, salt and mass to the Arctic Ocean, so these quantities and their variability are of considerable importance to our understanding of arctic change. The overall objective for Fram Strait in IPY was to augment the conventional (ASOF) picket fence array of current meters with a range of new systems designed to improve the monitoring of volume, heat and freshwater transports, including the building, testing and use of an ocean acoustic tomography system across both the West Spitzbergen Current and the East Greenland Current, establishing and validating a high resolution (2 km) ice-ocean model, and combining ship-borne hydrography, acoustic thermometry, satellites, sub-surface moorings, gliders and coupled ice-ocean modelling through advanced assimilation techniques. Using three vessels, the field aims were largely accomplished through the use of seven main observing systems. A comparison of the main ocean fluxes carried to the Arctic by these two Atlantic inflow branches can be attempted below (Schauer et al., 2008; Schauer and Beszczynska-Möller, 2009).
Volume transport (Sv)
Heat transport (TW)
Barents Sea Opening 2 46
Fram Strait Atlantic water inflow1)
6 (sd 1.5) 38 (sd 15)
Fram Strait total mean 1997-20082) mean 2002-20083)
2.6 southward (sd 4.2)2.9 southward (sd 2.5)
-
Table 2.2-2. Volume- and heat transports through the Barents Sea Opening and Fram Strait 1) calculated for zero net volume transport, for details see Schauer and Beszczynska-Möller, 2009 2) mean for the whole observation period in Fram Strait 3) mean for the period of observations by the optimized, high-resolution moored array.(Source: A. Beszczynska-
Möller, AWI)
New insights on the Bering Strait throughflow. The Bering Strait is the only Pacific gateway to the Arctic Ocean. The flow through the Strait, typically ~ 0.8 Sv in the annual mean, is an important source of heat, freshwater, nutrients and stratification for the Arctic Ocean and beyond. Mooring work in the Bering Strait region has been carried out almost continuously since autumn 1990 except for a 1-year gap in 1996-1997, but prior to IPY had employed only small numbers of moorings (maximum four), usually in the centre of the channels of the Strait, with an extra mooring in some years to measure the warm, fresh Alaskan Coastal Current (ACC), found seasonally in the eastern Strait. For the IPY, however, an expanded high-resolution array was deployed (Fig 2.2-2; Rebecca Woodgate, pers. comm.) consisting of eight moorings – three spanning the western (Russian) channel; four in the eastern (U.S.) channel; and one (A3) at a “climate” site located just north of the Strait in U.S. waters and hypothesized to provide a useful average of the total flow properties. This monitoring is integral to the RUSALCA (Russian-American Long-term Census of the Arctic) program (www.arctic.noaa.gov). All moorings measured lower layer temperature (T), salinity (S) and velocity. A novel aspect of the IPY deployment was that six of the moorings also carried upward-looking ADCPs to measure water velocity in 2m layers to the surface plus upper-level TS sensors, the latter in the form of the ISCAT sensor (a microcat in a trawl resistant housing, with inductive telemetry of data to a deeper logger). Two bottom pressure gauges and some bio-optics sensors are also included in the array (for full details see http://psc.apl.washington.edu/
Fig. 2.2-2: Left: The Bering Strait, with preferred CTD lines (green). Middle: Detail of Bering Strait, with schematic flows, mooring locations (red and black dots) and CTD lines (green). The main northward flow passes through both channels (dark blue arrows). Topography diverts the western channel flow eastward near site A3. The warm, fresh Alaskan Coastal Current (ACC) (pink dotted arrow) is present seasonally in the east. The cold, fresh Siberian Coastal Current (SCC) (light blue dotted arrow) is present in some years seasonally in the west. All these currents reverse on time scales of days to weeks. Right: MODIS sea surface temperature image, courtesy of NASA, from August 2004, with historic mooring locations (A1, A2, A3, A3’ and A4), occupied variously since 1990. (Maps: Dickson and Fahrbach,
2010)
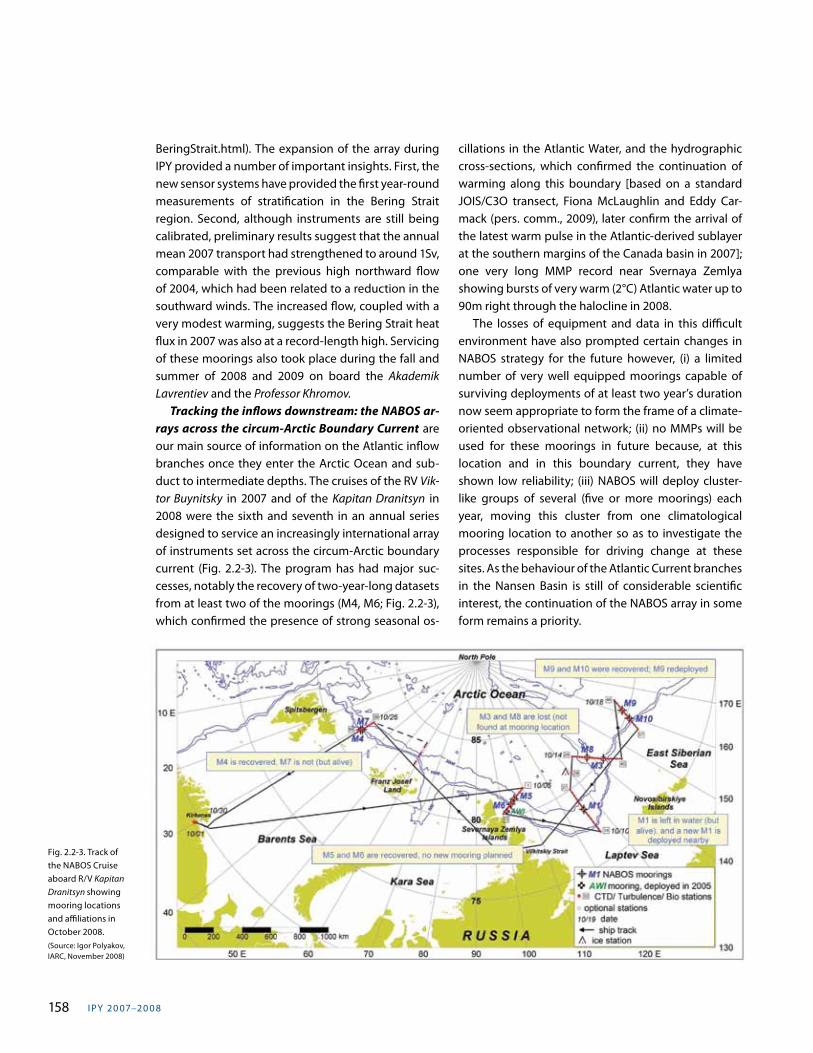
I PY 20 07–20 0 8158
BeringStrait.html). The expansion of the array during IPY provided a number of important insights. First, the new sensor systems have provided the first year-round measurements of stratification in the Bering Strait region. Second, although instruments are still being calibrated, preliminary results suggest that the annual mean 2007 transport had strengthened to around 1Sv, comparable with the previous high northward flow of 2004, which had been related to a reduction in the southward winds. The increased flow, coupled with a very modest warming, suggests the Bering Strait heat flux in 2007 was also at a record-length high. Servicing of these moorings also took place during the fall and summer of 2008 and 2009 on board the Akademik Lavrentiev and the Professor Khromov. Tracking the inflows downstream: the NABOS ar-rays across the circum-Arctic Boundary Current are our main source of information on the Atlantic inflow branches once they enter the Arctic Ocean and sub-duct to intermediate depths. The cruises of the RV Vik-tor Buynitsky in 2007 and of the Kapitan Dranitsyn in 2008 were the sixth and seventh in an annual series designed to service an increasingly international array of instruments set across the circum-Arctic boundary current (Fig. 2.2-3). The program has had major suc-cesses, notably the recovery of two-year-long datasets from at least two of the moorings (M4, M6; Fig. 2.2-3), which confirmed the presence of strong seasonal os-
cillations in the Atlantic Water, and the hydrographic cross-sections, which confirmed the continuation of warming along this boundary [based on a standard JOIS/C3O transect, Fiona McLaughlin and Eddy Car-mack (pers. comm., 2009), later confirm the arrival of the latest warm pulse in the Atlantic-derived sublayer at the southern margins of the Canada basin in 2007]; one very long MMP record near Svernaya Zemlya showing bursts of very warm (2°C) Atlantic water up to 90m right through the halocline in 2008. The losses of equipment and data in this difficult environment have also prompted certain changes in NABOS strategy for the future however, (i) a limited number of very well equipped moorings capable of surviving deployments of at least two year’s duration now seem appropriate to form the frame of a climate-oriented observational network; (ii) no MMPs will be used for these moorings in future because, at this location and in this boundary current, they have shown low reliability; (iii) NABOS will deploy cluster-like groups of several (five or more moorings) each year, moving this cluster from one climatological mooring location to another so as to investigate the processes responsible for driving change at these sites. As the behaviour of the Atlantic Current branches in the Nansen Basin is still of considerable scientific interest, the continuation of the NABOS array in some form remains a priority.
Fig. 2.2-3. Track of the NABOS Cruise aboard R/V Kapitan Dranitsyn showing mooring locations and affiliations in October 2008. (Source: Igor Polyakov, IARC, November 2008)
s C I e n C e P r o g r a m 159
The spread of SeaGliders support of Arctic-sub-arctic exchanges. The SeaGlider (usually the UW version) has proved a versatile and effective means of solving long-standing observational problems of oceanic exchanges between Arctic and subarctic seas. Drawing these uses together into a single paragraph will underscore their versatility. On the Greenland-Scotland Ridge, Eriksen and Rhines employed three UW seagliders to map and measure the small, thin, dense water overflows that have eluded measurement by any more conventional means (see Dickson, 2008). In the case of iAOOS-for-Norway, as we have seen, the observational difficulty was to find some means of ob-serving the offshore free jet of the Norwegian Atlan-tic Current where it passes north through the Svinøy Section, carrying half the northward heat flux through the Norwegian Sea; this was solved by the use of a UW SeaGlider from July 2008. In the case of the Fram Strait throughflow, the need was to resolve the filamented two-way flow through the Strait in a way that even a dense ‘picket fence’ of current meter moorings cannot do; AWI introduced glider surveys for this purpose in both 2007 and 2008 and intend, with Craig Lee’s con-tinued collaboration, to expand this effort westward to recover data from the ice-covered part of the Strait. In the case of Craig Lee’s Davis Strait Monitoring effort, to be described below, the observational need was to measure the totality of ocean exchanges to the west of Greenland, in particular the freshwater flux passing south under the seasonal ice cover in the western part of the Strait. After first trials in December 2006, this was solved in 2009 by a SeaGlider operating autono-mously (acoustic navigation, ice-sensing, independent decision-making) to avoid the surface and continue its westward transit after encountering the ice edge. Prospectively, acoustic gliders operating under the perennial ice of the Arctic deep basins will form the essential third component of the DAMOCLES system to monitor ice keel-depth, acting as the data link be-tween upperward looking sonar (ULS) floats and their acoustic Ice Tethered Platforms (ITP). A first full deploy-ment is intended in spring 2010 at the North Pole. In all five of these examples, a measurement of consid-erable importance to our understanding of the Arctic climate system had stalled until the unique capabilities of SeaGliders were introduced to help solve the obser-vational problem. The new Deepglider development
will add a further dimension. Deepgliders are expected to be able to survey oceanic variability autonomously over the entire water column on deployments and re-coveries made on successive summers, making them well-suited to observing subpolar as well as subtropi-cal and tropical seas. To give only one example, the development of Deepgliders capable of cruising the water column of the subpolar gyre has been called for (Dickson et al., 2008) as a necessary aid to captur-ing the baroclinic adjustments that cause interannual changes in the transport of the dense water overflows from Nordic Seas. We note that the cost of fabrication is estimated to be less than half again that of SeaGlid-ers, while the cost of operation will be perhaps half that of their upper ocean relatives (Charlie Erikson, pers. comm., January 2009). Testing of the first full ocean depth Deepglider took place in mid-2009.
Observing the Arctic Ocean and Circum-arctic shelves. We need little reminding that barely a decade ago, the Arctic Ocean was a data desert. If we did, Fig. 2.2-4 would be all that was needed to remind us. That situ-ation has now changed. In addition to the expanded ship-based CTD coverage achieved during IPY (de-scribed in Dickson, 2008; 2009), the rapid elaboration and expansion of the ice-top observatory brought a range of new autonomous systems to bear on the Arc-tic Ocean and its ice cover that hardly existed before the Millennium. In particular, the spectacular expan-sion of CTD coverage throughout the Arctic deep ba-sins is principally the result of the WHOI Ice Tethered Profiler and JAMSTEC Polar Ocean Profiler Systems. In consequence – and probably for the first time – it is now impractical for a summary such as this to provide a complete accounting of what was achieved, voyage by voyage or instrument by instrument, during IPY. In-stead, we attempt to provide a flavour of that achieve-ment by describing an inconsistent selection of voy-ages, instruments and ideas whose novelty, difficulty, effort, complexity, climatic importance or collaborative nature fulfilled one aspect or another of what IPY set out to do. In paring down our description to a few voy-ages, it is important that we don’t discard all of the de-tail: one suspects that it will be the multi-layered and often internationally-provided complexity of the field
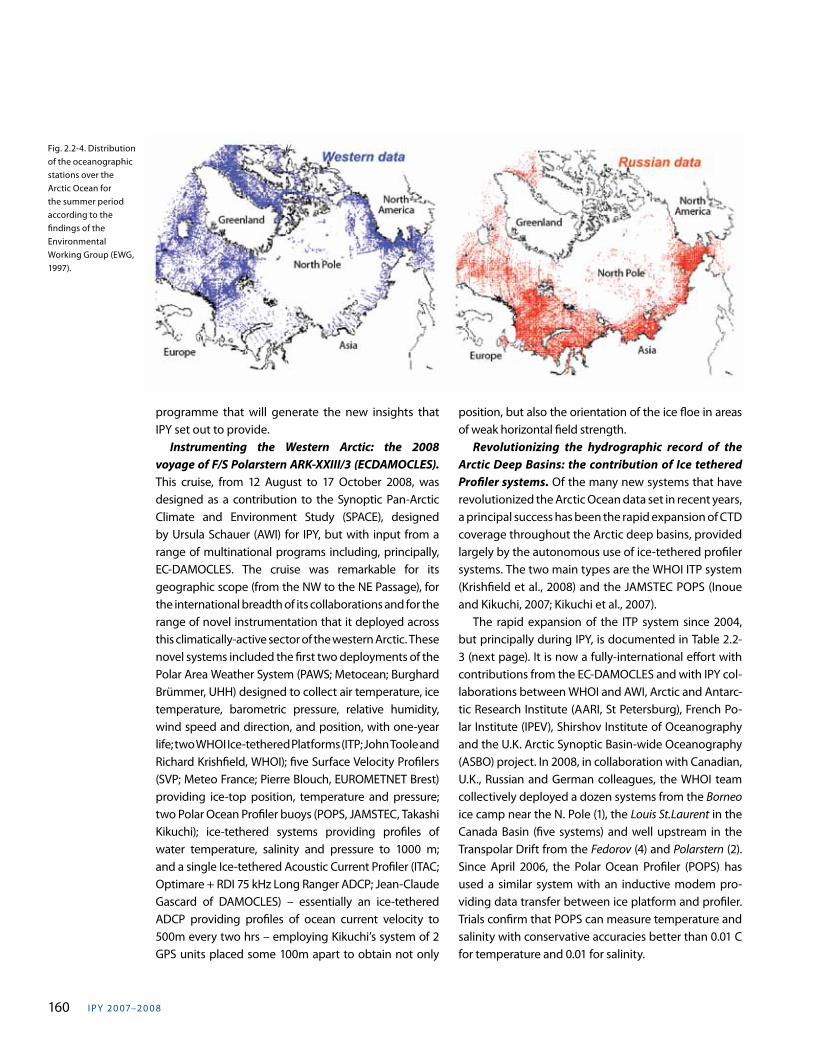
I PY 20 07–20 0 8160
programme that will generate the new insights that IPY set out to provide. Instrumenting the Western Arctic: the 2008 voyage of F/S Polarstern ARK-XXIII/3 (ECDAMOCLES). This cruise, from 12 August to 17 October 2008, was designed as a contribution to the Synoptic Pan-Arctic Climate and Environment Study (SPACE), designed by Ursula Schauer (AWI) for IPY, but with input from a range of multinational programs including, principally, EC-DAMOCLES. The cruise was remarkable for its geographic scope (from the NW to the NE Passage), for the international breadth of its collaborations and for the range of novel instrumentation that it deployed across this climatically-active sector of the western Arctic. These novel systems included the first two deployments of the Polar Area Weather System (PAWS; Metocean; Burghard Brümmer, UHH) designed to collect air temperature, ice temperature, barometric pressure, relative humidity, wind speed and direction, and position, with one-year life; two WHOI Ice-tethered Platforms (ITP; John Toole and Richard Krishfield, WHOI); five Surface Velocity Profilers (SVP; Meteo France; Pierre Blouch, EUROMETNET Brest) providing ice-top position, temperature and pressure; two Polar Ocean Profiler buoys (POPS, JAMSTEC, Takashi Kikuchi); ice-tethered systems providing profiles of water temperature, salinity and pressure to 1000 m; and a single Ice-tethered Acoustic Current Profiler (ITAC; Optimare + RDI 75 kHz Long Ranger ADCP; Jean-Claude Gascard of DAMOCLES) – essentially an ice-tethered ADCP providing profiles of ocean current velocity to 500m every two hrs – employing Kikuchi’s system of 2 GPS units placed some 100m apart to obtain not only
Fig. 2.2-4. Distribution of the oceanographic stations over the Arctic Ocean for the summer period according to the findings of the Environmental Working Group (EWG, 1997).
position, but also the orientation of the ice floe in areas of weak horizontal field strength. Revolutionizing the hydrographic record of the Arctic Deep Basins: the contribution of Ice tethered Profiler systems. Of the many new systems that have revolutionized the Arctic Ocean data set in recent years, a principal success has been the rapid expansion of CTD coverage throughout the Arctic deep basins, provided largely by the autonomous use of ice-tethered profiler systems. The two main types are the WHOI ITP system (Krishfield et al., 2008) and the JAMSTEC POPS (Inoue and Kikuchi, 2007; Kikuchi et al., 2007). The rapid expansion of the ITP system since 2004, but principally during IPY, is documented in Table 2.2-3 (next page). It is now a fully-international effort with contributions from the EC-DAMOCLES and with IPY col-laborations between WHOI and AWI, Arctic and Antarc-tic Research Institute (AARI, St Petersburg), French Po-lar Institute (IPEV), Shirshov Institute of Oceanography and the U.K. Arctic Synoptic Basin-wide Oceanography (ASBO) project. In 2008, in collaboration with Canadian, U.K., Russian and German colleagues, the WHOI team collectively deployed a dozen systems from the Borneo ice camp near the N. Pole (1), the Louis St.Laurent in the Canada Basin (five systems) and well upstream in the Transpolar Drift from the Fedorov (4) and Polarstern (2). Since April 2006, the Polar Ocean Profiler (POPS) has used a similar system with an inductive modem pro-viding data transfer between ice platform and profiler. Trials confirm that POPS can measure temperature and salinity with conservative accuracies better than 0.01 C for temperature and 0.01 for salinity.
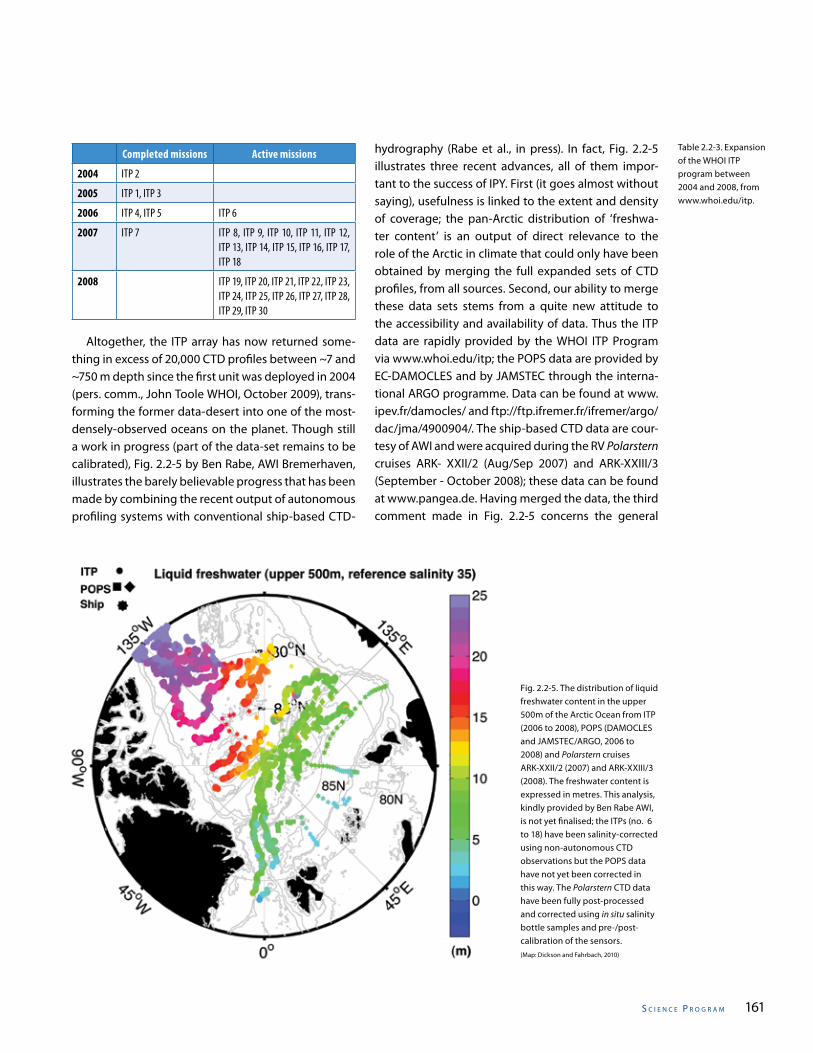
s C I e n C e P r o g r a m 161
Completed missions Active missions
2004 ITP 2
2005 ITP 1, ITP 3
2006 ITP 4, ITP 5 ITP 6
2007 ITP 7 ITP 8, ITP 9, ITP 10, ITP 11, ITP 12, ITP 13, ITP 14, ITP 15, ITP 16, ITP 17, ITP 18
2008 ITP 19, ITP 20, ITP 21, ITP 22, ITP 23, ITP 24, ITP 25, ITP 26, ITP 27, ITP 28, ITP 29, ITP 30
Altogether, the ITP array has now returned some-thing in excess of 20,000 CTD profiles between ~7 and ~750 m depth since the first unit was deployed in 2004 (pers. comm., John Toole WHOI, October 2009), trans-forming the former data-desert into one of the most-densely-observed oceans on the planet. Though still a work in progress (part of the data-set remains to be calibrated), Fig. 2.2-5 by Ben Rabe, AWI Bremerhaven, illustrates the barely believable progress that has been made by combining the recent output of autonomous profiling systems with conventional ship-based CTD-
Table 2.2-3. Expansion of the WHOI ITP program between 2004 and 2008, from www.whoi.edu/itp.
hydrography (Rabe et al., in press). In fact, Fig. 2.2-5 illustrates three recent advances, all of them impor-tant to the success of IPY. First (it goes almost without saying), usefulness is linked to the extent and density of coverage; the pan-Arctic distribution of ‘freshwa-ter content’ is an output of direct relevance to the role of the Arctic in climate that could only have been obtained by merging the full expanded sets of CTD profiles, from all sources. Second, our ability to merge these data sets stems from a quite new attitude to the accessibility and availability of data. Thus the ITP data are rapidly provided by the WHOI ITP Program via www.whoi.edu/itp; the POPS data are provided by EC-DAMOCLES and by JAMSTEC through the interna-tional ARGO programme. Data can be found at www.ipev.fr/damocles/ and ftp://ftp.ifremer.fr/ifremer/argo/dac/jma/4900904/. The ship-based CTD data are cour-tesy of AWI and were acquired during the RV Polarstern cruises ARK- XXII/2 (Aug/Sep 2007) and ARK-XXIII/3 (September - October 2008); these data can be found at www.pangea.de. Having merged the data, the third comment made in Fig. 2. 2- 5 concerns the general
Fig. 2.2-5. The distribution of liquid freshwater content in the upper 500m of the Arctic Ocean from ITP (2006 to 2008), POPS (DAMOCLES and JAMSTEC/ARGO, 2006 to 2008) and Polarstern cruises ARK-XXII/2 (2007) and ARK-XXIII/3 (2008). The freshwater content is expressed in metres. This analysis, kindly provided by Ben Rabe AWI, is not yet finalised; the ITPs (no. 6 to 18) have been salinity-corrected using non-autonomous CTD observations but the POPS data have not yet been corrected in this way. The Polarstern CTD data have been fully post-processed and corrected using in situ salinity bottle samples and pre-/post-calibration of the sensors. (Map: Dickson and Fahrbach, 2010)
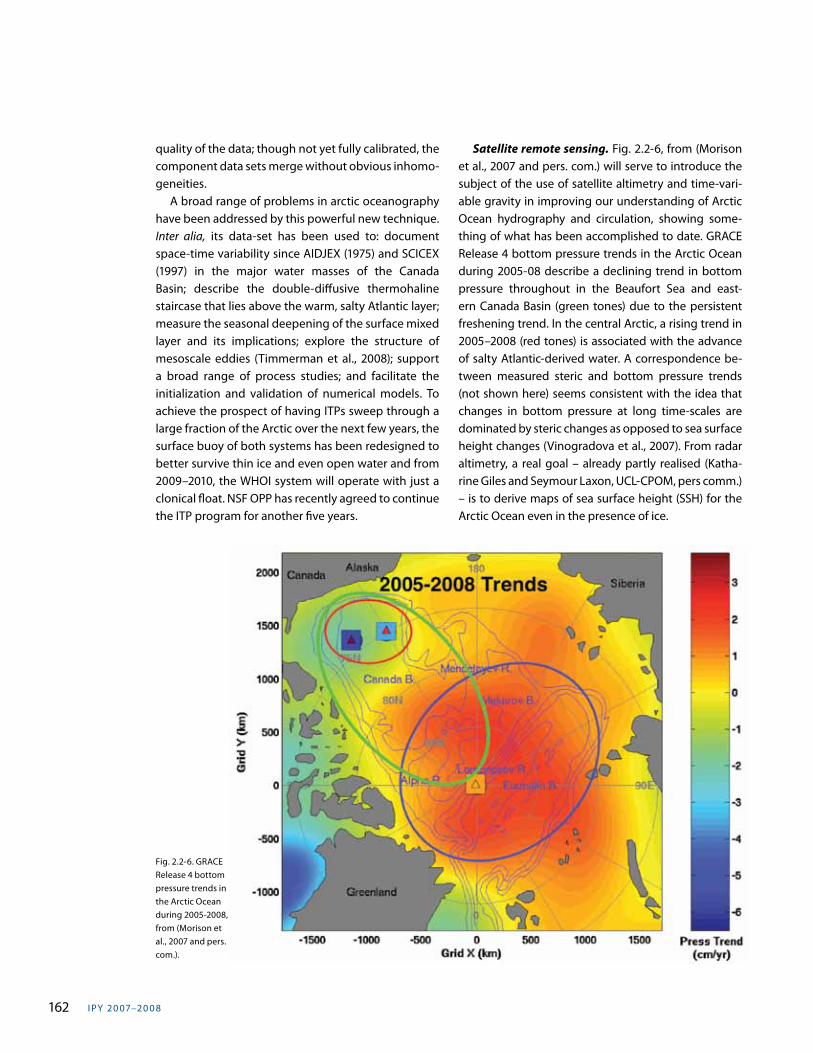
I PY 20 07–20 0 8162
quality of the data; though not yet fully calibrated, the component data sets merge without obvious inhomo-geneities. A broad range of problems in arctic oceanography have been addressed by this powerful new technique. Inter alia, its data-set has been used to: document space-time variability since AIDJEX (1975) and SCICEX (1997) in the major water masses of the Canada Basin; describe the double-diffusive thermohaline staircase that lies above the warm, salty Atlantic layer; measure the seasonal deepening of the surface mixed layer and its implications; explore the structure of mesoscale eddies (Timmerman et al., 2008); support a broad range of process studies; and facilitate the initialization and validation of numerical models. To achieve the prospect of having ITPs sweep through a large fraction of the Arctic over the next few years, the surface buoy of both systems has been redesigned to better survive thin ice and even open water and from 2009–2010, the WHOI system will operate with just a clonical float. NSF OPP has recently agreed to continue the ITP program for another five years.
Satellite remote sensing. Fig. 2.2-6, from (Morison et al., 2007 and pers. com.) will serve to introduce the subject of the use of satellite altimetry and time-vari-able gravity in improving our understanding of Arctic Ocean hydrography and circulation, showing some-thing of what has been accomplished to date. GRACE Release 4 bottom pressure trends in the Arctic Ocean during 2005-08 describe a declining trend in bottom pressure throughout in the Beaufort Sea and east-ern Canada Basin (green tones) due to the persistent freshening trend. In the central Arctic, a rising trend in 2005–2008 (red tones) is associated with the advance of salty Atlantic-derived water. A correspondence be-tween measured steric and bottom pressure trends (not shown here) seems consistent with the idea that changes in bottom pressure at long time-scales are dominated by steric changes as opposed to sea surface height changes (Vinogradova et al., 2007). From radar altimetry, a real goal – already partly realised (Katha-rine Giles and Seymour Laxon, UCL-CPOM, pers comm.) – is to derive maps of sea surface height (SSH) for the Arctic Ocean even in the presence of ice.
Fig. 2.2-6. GRACE Release 4 bottom pressure trends in the Arctic Ocean during 2005-2008, from (Morison et al., 2007 and pers. com.).
s C I e n C e P r o g r a m 163
Towards a new autonomous sub-ice system for monitoring the keel depth of sea-ice; the collaboration between EC-DAMOCLES and the Chinese National Arctic Research Expedition (CHINARE) in 2008. Ice thickness is an important parameter. The 22 ice-prediction groups that participated in the SEARCH-for-DAMOCLES (S4D) Sea Ice Outlook exercise concluded that an improved measure of ice thickness in spring was the prime requirement for improved prediction of ice extent at the time of the late summer minimum. Supplementing remote sensing techniques, including the laser and radar altimetry on ICESAT and ENVISAT, and the use of ice-surface sensors (e.g. tiltmeter buoys), a new autonomous system based on the use of isobaric sub-ice floats fitted with upward-looking sonar has been developed by EC-DAMOCLES during IPY and is now on the point of completion. The ULS floats are designed to drift at a constant depth of 50m beneath the arctic ice for up to two years. The equally-new acoustic ice-tethered platforms (AITP; now ‘amphibious’ rather than ice-tethered) are designed to form the link between ULS floats and satellite transmission, with the EC-DAMOCLES plan calling for ten AITPs and eight ULS floats in total. The first deployment of two ULS floats and four AITP systems were deployed by Canadian twin-otter aircraft above the Alpha Ridge in April 2008, together with seven PAWS weather monitors (Broemmer, UHH) and three ice mass-balance buoys (IMBs; Richter-Menge et al., 2006). The remainder of the 2008 deployment, including four more AITPs, an extensive CTD grid and a complex ice camp of instruments was later set by the Chinese CHINARE 2008 Expedition aboard R/V Xue Long (11 July - 24 September, 2008). The full realization of data retrieval from ULS-floats will depend on the development of acoustic gliders as the third component of the system. DAMOCLES began the stepwise development of such an acoustic glider, starting in autumn 2008, followed by trials off Svalbard in spring 2009 and leading to a first planned deployment in spring 2010 at the North Pole. In the meantime, data retrieval will involve ships approaching ULS floats and forcing a download to an acoustic modem (Gascard, pers comm). Altogether, ten AITPs plus four ULS floats have been deployed to date fulfilling most of the DAMOCLES plan and the unequivocal requirement of the S4D Sea-ice Outlook
exercise for data on sea-ice thickness commends the continued use of this technique into the IPY legacy phase. A further four ULS floats and four new ‘hybrid’ AITPs are being constructed; in addition to having a profiling hydrophone, the new AITPs will begin to contribute to the ITP dataset by carrying a CTD profiler for the first time. The drift of the Russian Ice Island North Pole-35 and the Arktika-2008 expedition aboard R/V Akademik Fedorov. Since 1937–1938, the Russian Arctic and Antarctic Research Institute (AARI) has operated a total of 34 drift stations in the Arctic Ocean making this type of observational platform something of a Russian specialization. After a considerable search for a suitable floe, NP-35 was established on September 25, 2007 at 81°26’N 103°30’E by the Akademik Fedorov working in conjunction with the nuclear icebreaker Russia as part of the “Arktika 2007” expedition. For most of the following year, NP-35 was occupied by AARI as a contribution to IPY, contributing new results in polar oceanography, sea ice studies, processes of greenhouses gas exchange in presence of ice cover and polar meteorology. During the first 7-month winter drift of NP35, the Russian team was joined by Jürgen Graeser from the Potsdam Research Unit in Germany and, during this phase, the investigations of the ocean upper layer, the characteristics of the sea ice, the snow cover and the energy balance above the ice surface were supple-mented with further atmospheric data (temperature, moisture, wind and air pressure) collected by ascents of a tethered balloon up to a height of 400 metres as well as by balloon-borne sensor ascents up to an altitude of 30 kilometres. Both contributed rarely-obtained winter data with high temporal and spatial resolution to the improvement of global climate models. The exchang-es of heat and moisture in the atmospheric boundary layer to an altitude of ~400 metres, now measured for the first time during the complete polar night, were of especial value. As the layer that determines the lower boundary conditions for all model calculations, a real-istic representation of the planetary boundary layer in the Arctic is crucial for the construction of climate mod-els; hitherto, temperature profiles from regional climate models have shown considerable deviation from those measured on the floe. The data set of NP 35 will also contribute significantly to the determination of how
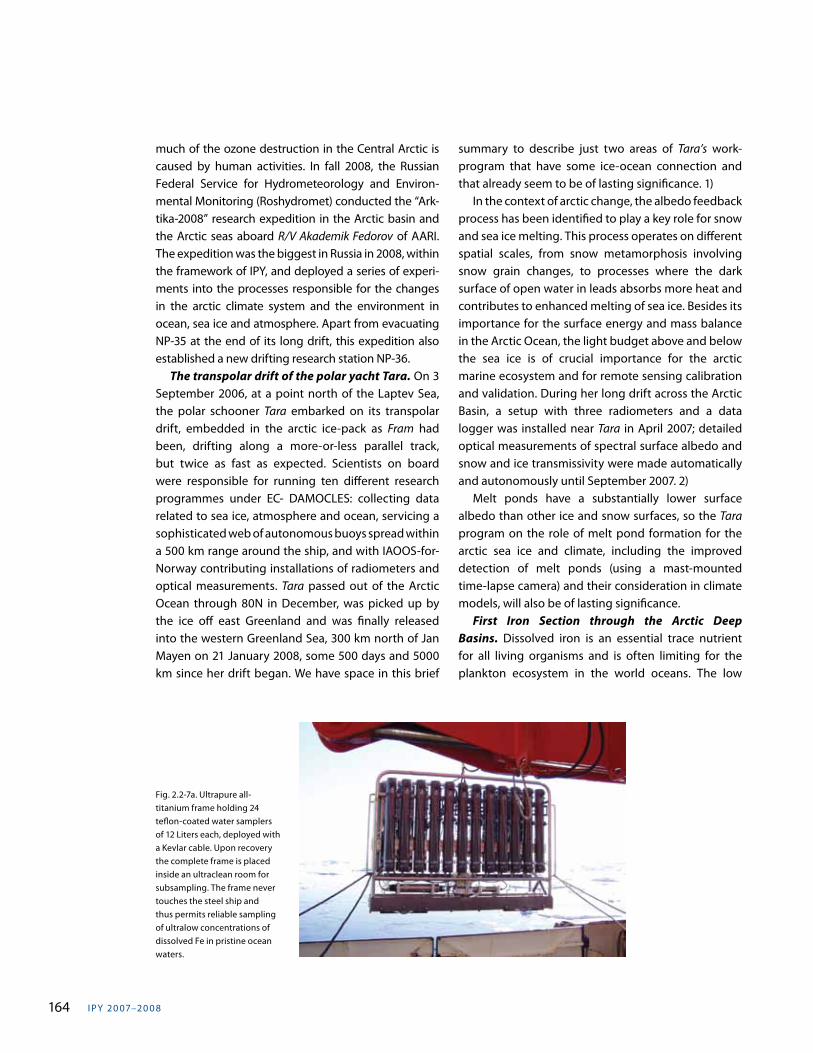
I PY 20 07–20 0 8164
much of the ozone destruction in the Central Arctic is caused by human activities. In fall 2008, the Russian Federal Service for Hydrometeorology and Environ-mental Monitoring (Roshydromet) conducted the “Ark-tika-2008” research expedition in the Arctic basin and the Arctic seas aboard R/V Akademik Fedorov of AARI. The expedition was the biggest in Russia in 2008, within the framework of IPY, and deployed a series of experi-ments into the processes responsible for the changes in the arctic climate system and the environment in ocean, sea ice and atmosphere. Apart from evacuating NP-35 at the end of its long drift, this expedition also established a new drifting research station NP-36. The transpolar drift of the polar yacht Tara. On 3 September 2006, at a point north of the Laptev Sea, the polar schooner Tara embarked on its transpolar drift, embedded in the arctic ice-pack as Fram had been, drifting along a more-or-less parallel track, but twice as fast as expected. Scientists on board were responsible for running ten different research programmes under EC- DAMOCLES: collecting data related to sea ice, atmosphere and ocean, servicing a sophisticated web of autonomous buoys spread within a 500 km range around the ship, and with IAOOS-for-Norway contributing installations of radiometers and optical measurements. Tara passed out of the Arctic Ocean through 80N in December, was picked up by the ice off east Greenland and was finally released into the western Greenland Sea, 300 km north of Jan Mayen on 21 January 2008, some 500 days and 5000 km since her drift began. We have space in this brief
summary to describe just two areas of Tara’s work-program that have some ice-ocean connection and that already seem to be of lasting significance. 1) In the context of arctic change, the albedo feedback process has been identified to play a key role for snow and sea ice melting. This process operates on different spatial scales, from snow metamorphosis involving snow grain changes, to processes where the dark surface of open water in leads absorbs more heat and contributes to enhanced melting of sea ice. Besides its importance for the surface energy and mass balance in the Arctic Ocean, the light budget above and below the sea ice is of crucial importance for the arctic marine ecosystem and for remote sensing calibration and validation. During her long drift across the Arctic Basin, a setup with three radiometers and a data logger was installed near Tara in April 2007; detailed optical measurements of spectral surface albedo and snow and ice transmissivity were made automatically and autonomously until September 2007. 2) Melt ponds have a substantially lower surface albedo than other ice and snow surfaces, so the Tara program on the role of melt pond formation for the arctic sea ice and climate, including the improved detection of melt ponds (using a mast-mounted time-lapse camera) and their consideration in climate models, will also be of lasting significance. First Iron Section through the Arctic Deep Basins. Dissolved iron is an essential trace nutrient for all living organisms and is often limiting for the plankton ecosystem in the world oceans. The low
Fig. 2.2-7a. Ultrapure all-titanium frame holding 24 teflon-coated water samplers of 12 Liters each, deployed with a Kevlar cable. Upon recovery the complete frame is placed inside an ultraclean room for subsampling. The frame never touches the steel ship and thus permits reliable sampling of ultralow concentrations of dissolved Fe in pristine ocean waters.
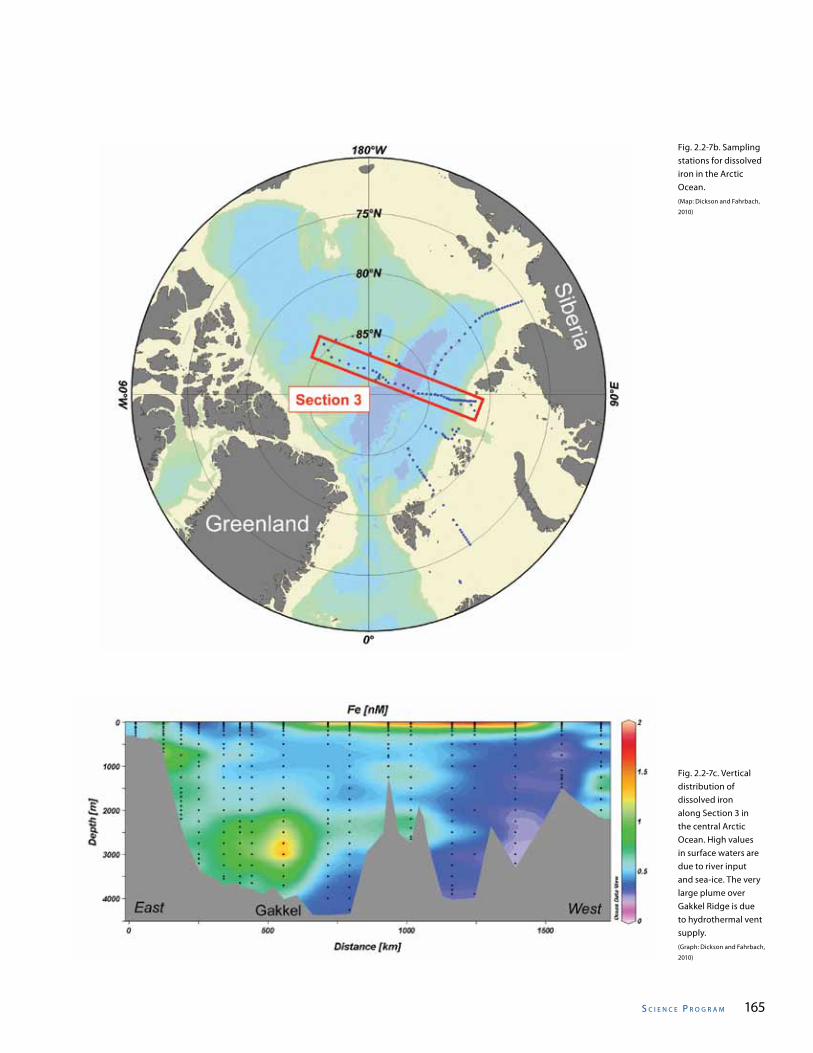
s C I e n C e P r o g r a m 165
Fig. 2.2-7b. Sampling stations for dissolved iron in the Arctic Ocean. (Map: Dickson and Fahrbach,
2010)
Fig. 2.2-7c. Vertical distribution of dissolved iron along Section 3 in the central Arctic Ocean. High values in surface waters are due to river input and sea-ice. The very large plume over Gakkel Ridge is due to hydrothermal vent supply. (Graph: Dickson and Fahrbach,
2010)
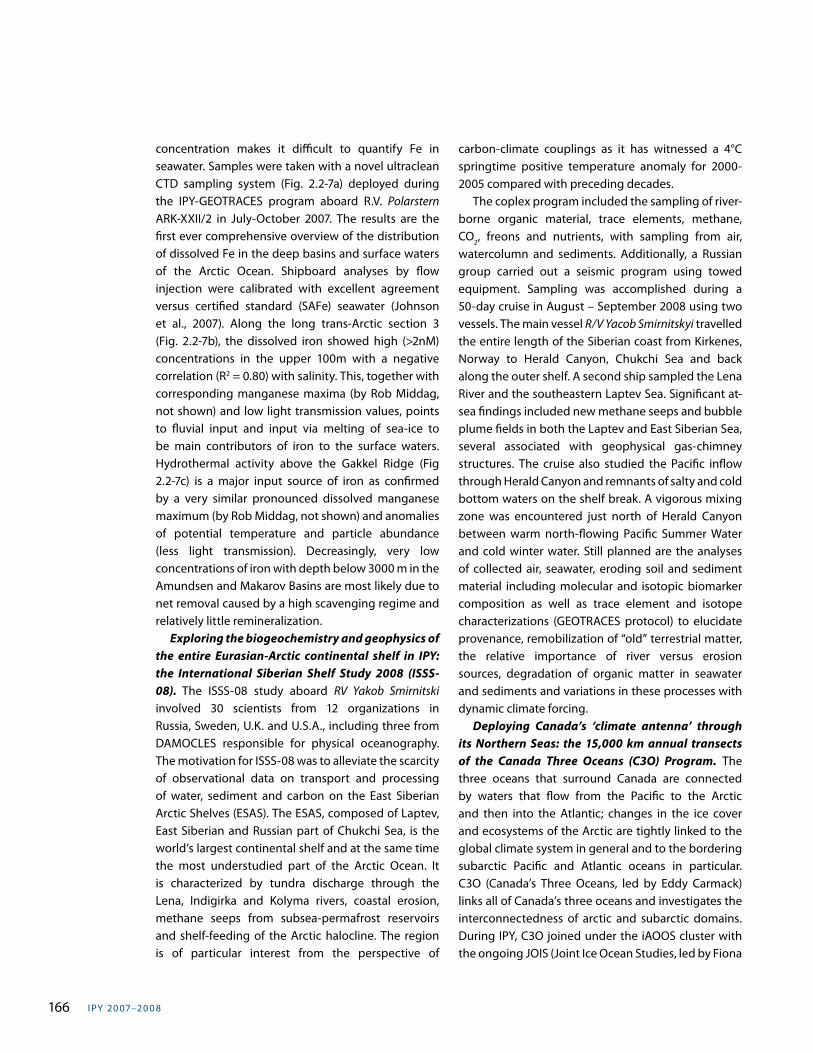
I PY 20 07–20 0 8166
concentration makes it difficult to quantify Fe in seawater. Samples were taken with a novel ultraclean CTD sampling system (Fig. 2.2-7a) deployed during the IPY-GEOTRACES program aboard R.V. Polarstern ARK-XXII/2 in July-October 2007. The results are the first ever comprehensive overview of the distribution of dissolved Fe in the deep basins and surface waters of the Arctic Ocean. Shipboard analyses by flow injection were calibrated with excellent agreement versus certified standard (SAFe) seawater (Johnson et al., 2007). Along the long trans-Arctic section 3 (Fig. 2.2-7b), the dissolved iron showed high (>2nM) concentrations in the upper 100m with a negative correlation (R2 = 0.80) with salinity. This, together with corresponding manganese maxima (by Rob Middag, not shown) and low light transmission values, points to fluvial input and input via melting of sea-ice to be main contributors of iron to the surface waters. Hydrothermal activity above the Gakkel Ridge (Fig 2.2-7c) is a major input source of iron as confirmed by a very similar pronounced dissolved manganese maximum (by Rob Middag, not shown) and anomalies of potential temperature and particle abundance (less light transmission). Decreasingly, very low concentrations of iron with depth below 3000 m in the Amundsen and Makarov Basins are most likely due to net removal caused by a high scavenging regime and relatively little remineralization. Exploring the biogeochemistry and geophysics of the entire Eurasian-Arctic continental shelf in IPY: the International Siberian Shelf Study 2008 (ISSS-08). The ISSS-08 study aboard RV Yakob Smirnitski involved 30 scientists from 12 organizations in Russia, Sweden, U.K. and U.S.A., including three from DAMOCLES responsible for physical oceanography. The motivation for ISSS-08 was to alleviate the scarcity of observational data on transport and processing of water, sediment and carbon on the East Siberian Arctic Shelves (ESAS). The ESAS, composed of Laptev, East Siberian and Russian part of Chukchi Sea, is the world’s largest continental shelf and at the same time the most understudied part of the Arctic Ocean. It is characterized by tundra discharge through the Lena, Indigirka and Kolyma rivers, coastal erosion, methane seeps from subsea-permafrost reservoirs and shelf-feeding of the Arctic halocline. The region is of particular interest from the perspective of
carbon-climate couplings as it has witnessed a 4°C springtime positive temperature anomaly for 2000-2005 compared with preceding decades. The coplex program included the sampling of river-borne organic material, trace elements, methane, CO2, freons and nutrients, with sampling from air, watercolumn and sediments. Additionally, a Russian group carried out a seismic program using towed equipment. Sampling was accomplished during a 50-day cruise in August – September 2008 using two vessels. The main vessel R/V Yacob Smirnitskyi travelled the entire length of the Siberian coast from Kirkenes, Norway to Herald Canyon, Chukchi Sea and back along the outer shelf. A second ship sampled the Lena River and the southeastern Laptev Sea. Significant at-sea findings included new methane seeps and bubble plume fields in both the Laptev and East Siberian Sea, several associated with geophysical gas-chimney structures. The cruise also studied the Pacific inflow through Herald Canyon and remnants of salty and cold bottom waters on the shelf break. A vigorous mixing zone was encountered just north of Herald Canyon between warm north-flowing Pacific Summer Water and cold winter water. Still planned are the analyses of collected air, seawater, eroding soil and sediment material including molecular and isotopic biomarker composition as well as trace element and isotope characterizations (GEOTRACES protocol) to elucidate provenance, remobilization of “old” terrestrial matter, the relative importance of river versus erosion sources, degradation of organic matter in seawater and sediments and variations in these processes with dynamic climate forcing. Deploying Canada’s ‘climate antenna’ through its Northern Seas: the 15,000 km annual transects of the Canada Three Oceans (C3O) Program. The three oceans that surround Canada are connected by waters that flow from the Pacific to the Arctic and then into the Atlantic; changes in the ice cover and ecosystems of the Arctic are tightly linked to the global climate system in general and to the bordering subarctic Pacific and Atlantic oceans in particular. C3O (Canada’s Three Oceans, led by Eddy Carmack) links all of Canada’s three oceans and investigates the interconnectedness of arctic and subarctic domains. During IPY, C3O joined under the iAOOS cluster with the ongoing JOIS (Joint Ice Ocean Studies, led by Fiona
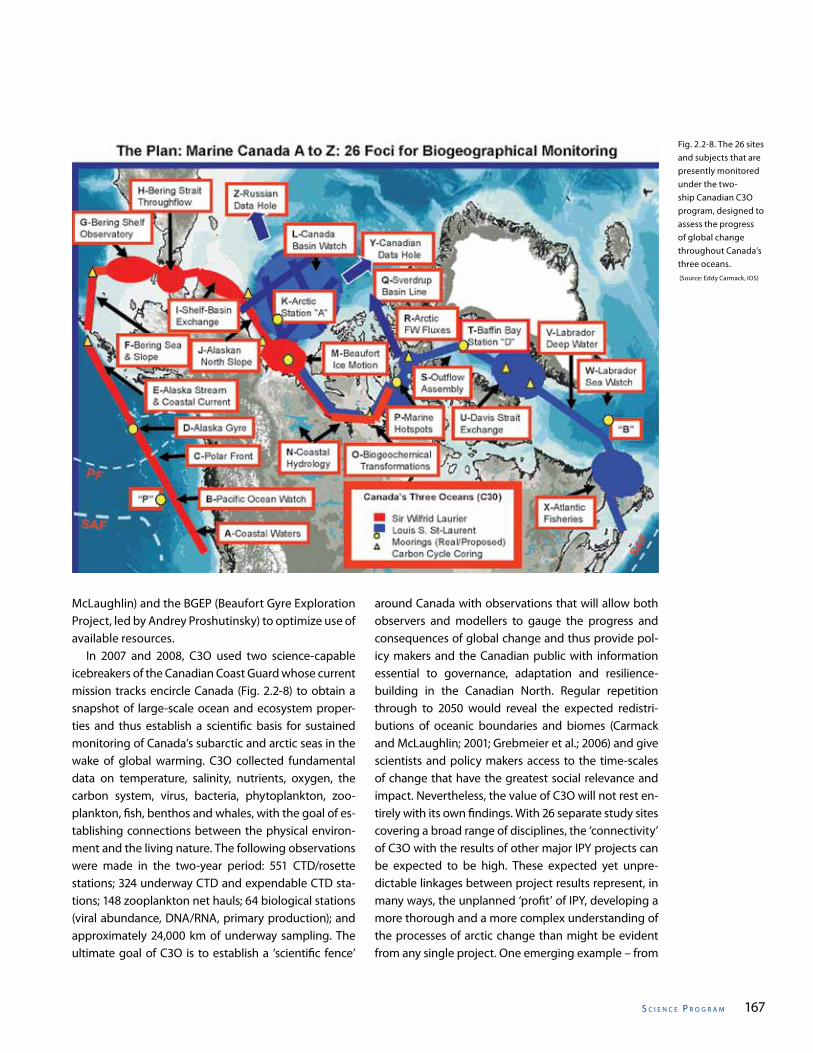
s C I e n C e P r o g r a m 167
McLaughlin) and the BGEP (Beaufort Gyre Exploration Project, led by Andrey Proshutinsky) to optimize use of available resources. In 2007 and 2008, C3O used two science-capable icebreakers of the Canadian Coast Guard whose current mission tracks encircle Canada (Fig. 2.2-8) to obtain a snapshot of large-scale ocean and ecosystem proper-ties and thus establish a scientific basis for sustained monitoring of Canada’s subarctic and arctic seas in the wake of global warming. C3O collected fundamental data on temperature, salinity, nutrients, oxygen, the carbon system, virus, bacteria, phytoplankton, zoo-plankton, fish, benthos and whales, with the goal of es-tablishing connections between the physical environ-ment and the living nature. The following observations were made in the two-year period: 551 CTD/rosette stations; 324 underway CTD and expendable CTD sta-tions; 148 zooplankton net hauls; 64 biological stations (viral abundance, DNA/RNA, primary production); and approximately 24,000 km of underway sampling. The ultimate goal of C3O is to establish a ‘scientific fence’
around Canada with observations that will allow both observers and modellers to gauge the progress and consequences of global change and thus provide pol-icy makers and the Canadian public with information essential to governance, adaptation and resilience-building in the Canadian North. Regular repetition through to 2050 would reveal the expected redistri-butions of oceanic boundaries and biomes (Carmack and McLaughlin; 2001; Grebmeier et al.; 2006) and give scientists and policy makers access to the time-scales of change that have the greatest social relevance and impact. Nevertheless, the value of C3O will not rest en-tirely with its own findings. With 26 separate study sites covering a broad range of disciplines, the ‘connectivity’ of C3O with the results of other major IPY projects can be expected to be high. These expected yet unpre-dictable linkages between project results represent, in many ways, the unplanned ‘profit’ of IPY, developing a more thorough and a more complex understanding of the processes of arctic change than might be evident from any single project. One emerging example – from
Fig. 2.2-8. The 26 sites and subjects that are presently monitored under the two-ship Canadian C3O program, designed to assess the progress of global change throughout Canada’s three oceans. (Source: Eddy Carmack, IOS)
I PY 20 07–20 0 8168
Jackson et al., (in press) – will illustrate the point. For more than a decade, we have known of the existence of a narrow temperature maximum just below the surface (~25m) of the Canada Basin in summer (Maykut and McPhee, 1995), Jackson et al., (in press) have recently combined CTD profiles from four of the Woods Hole ITPs (nos. 1, 6, 8 & 18; Table 2.2-3 above) with shipborne CTD data from IPY (C3O) and from earlier years (JOIS 1997; JWACS 2002-6) to reveal much of what is important about this seemingly-delicate, but in fact extensive and rather robust layer. The Near Surface Temperature Maximum (NSTM) that they describe is first formed in June-July when sufficient solar radiation enters the upper ocean through narrow leads and melt ponds to warm the near-surface waters. Ice melt from these warmed surface waters then accumulates to form a strengthening near-surface halocline, effectively capping-off the NSTM and trapping solar radiation in the ocean until late September when sea ice begins to form once again, allowing penetrative convection (from brine rejection) and air-ocean or ice-ocean stresses to deepen the surface mixed layer. This is not an unvarying process. As the ice has retracted from the western Arctic in what Overland et al., (2008) have called the “Arctic Warm Period” (2000-2007), Jackson et al., (in press) reveal that the temperature of the NSTM in the Canada Basin has increased north of 75ºN at a rate of 0.13ºC per year since 2004. Some of the interconnections between this result and others within the C3O project are already evident: the idea that the warming of the NSTM is closely linked to sea-ice melt receives strong support from the fact that the warmest NSTMs were found in the same region of the Canada Basin that Yamamoto-Kawai et al., (2009) have recently described; a threefold increase in the ice-melt component of the freshwater in the watercolumn between 2003 and 2007. But the external implications of these results have the potential to be even more significant. If the warmer NSTM persists later in the year, which is one scenario discussed by Jackson et al., (in press) ‘heat from the NSTM might maintain thinner sea-ice through winter which would then melt sooner in spring’. As they also point out, thinner sea-ice is likely to alter the effect of wind stress on sea ice, increasing ice drift and air sea coupling in the manner suggested by Shimada et al., (2006). Hence their conclusion that ‘the dynamics of the NSTM should be considered when modelling climate change in the Arctic’.
Observing the outputs from the Arctic Ocean First long term measurements of the freshwater flux east of Greenland. De Steur et al., (2009) report the results of a decade of observations of the freshwater flux in the East Greenland Current at 78° 50’N. The special nature of this result lies in the considerable achievement of recovering 10 years of moorings from these difficult waters and in the usefulness of this result as a missing term in our understanding of the freshwater balance around Greenland. The main finding itself is rather less dramatic: over this decade of measurements, the annual mean liquid freshwater flux passing south through the western Fram Strait proved to be surprisingly constant at ~1150 km3 y-1 (36 mSv). Though based on an earlier dataset, Dodd et al., (2009) have recently used a mix of tracers (hydrographic, oxygen isotope ratio and dissolved barium concentration) to determine the sources and fate of the freshwater carried in the East Greenland Current. Rabe et al., (2009) use hydrographic data and δ18O values with modelling (NAOSIM) to distinguish changes in the various freshwater components and transports in the Fram Strait since the late 1990s, showing inter alia, that the high transport of meteoric water (precipitation and riverine sources) in the Fram Strait in 2005 is in agreement with the temporary storage of river water on the Siberian shelf in the mid-1990s, which reached the north of Greenland in 2003. Ocean Currents of Arctic Canada; new insights on the Canadian Arctic Through-flow during IPY. The Canadian Arctic Through-flow (CAT) study is the culmination of ten years of effort within Canada and the international community to measure flows of freshwater, saltwater and ice through the Canadian Arctic Archipelago (CAA; see Kleim and Greenberg, 2003; Prinsenberg and Hamilton, 2005; Münchow et al., 2007; Falkner et al., 2008; Melling et al., 2008). Although first attempts date back to the early 1980s, the recent revival in activity was stimulated by the development of techniques for measuring the current direction near the geomagnetic pole and for observing the hazardous zone beneath drifting ice pack. The installations in Lancaster Sound and Cardigan Strait have been maintained since 1998. The installation in Nares Strait was discontinued after loss to icebergs of both moorings in Smith Sound
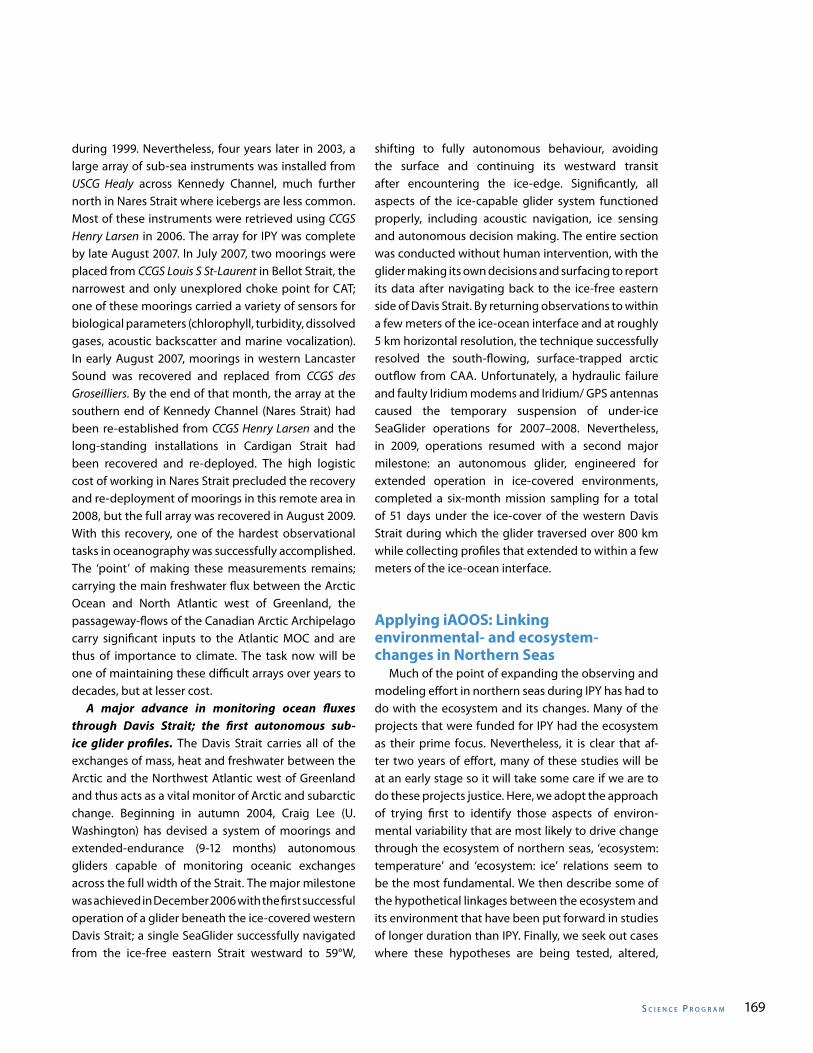
s C I e n C e P r o g r a m 169
during 1999. Nevertheless, four years later in 2003, a large array of sub-sea instruments was installed from USCG Healy across Kennedy Channel, much further north in Nares Strait where icebergs are less common. Most of these instruments were retrieved using CCGS Henry Larsen in 2006. The array for IPY was complete by late August 2007. In July 2007, two moorings were placed from CCGS Louis S St-Laurent in Bellot Strait, the narrowest and only unexplored choke point for CAT; one of these moorings carried a variety of sensors for biological parameters (chlorophyll, turbidity, dissolved gases, acoustic backscatter and marine vocalization). In early August 2007, moorings in western Lancaster Sound was recovered and replaced from CCGS des Groseilliers. By the end of that month, the array at the southern end of Kennedy Channel (Nares Strait) had been re-established from CCGS Henry Larsen and the long-standing installations in Cardigan Strait had been recovered and re-deployed. The high logistic cost of working in Nares Strait precluded the recovery and re-deployment of moorings in this remote area in 2008, but the full array was recovered in August 2009. With this recovery, one of the hardest observational tasks in oceanography was successfully accomplished. The ‘point’ of making these measurements remains; carrying the main freshwater flux between the Arctic Ocean and North Atlantic west of Greenland, the passageway-flows of the Canadian Arctic Archipelago carry significant inputs to the Atlantic MOC and are thus of importance to climate. The task now will be one of maintaining these difficult arrays over years to decades, but at lesser cost. A major advance in monitoring ocean fluxes through Davis Strait; the first autonomous sub-ice glider profiles. The Davis Strait carries all of the exchanges of mass, heat and freshwater between the Arctic and the Northwest Atlantic west of Greenland and thus acts as a vital monitor of Arctic and subarctic change. Beginning in autumn 2004, Craig Lee (U. Washington) has devised a system of moorings and extended-endurance (9-12 months) autonomous gliders capable of monitoring oceanic exchanges across the full width of the Strait. The major milestone was achieved in December 2006 with the first successful operation of a glider beneath the ice-covered western Davis Strait; a single SeaGlider successfully navigated from the ice-free eastern Strait westward to 59°W,
shifting to fully autonomous behaviour, avoiding the surface and continuing its westward transit after encountering the ice-edge. Significantly, all aspects of the ice-capable glider system functioned properly, including acoustic navigation, ice sensing and autonomous decision making. The entire section was conducted without human intervention, with the glider making its own decisions and surfacing to report its data after navigating back to the ice-free eastern side of Davis Strait. By returning observations to within a few meters of the ice-ocean interface and at roughly 5 km horizontal resolution, the technique successfully resolved the south-flowing, surface-trapped arctic outflow from CAA. Unfortunately, a hydraulic failure and faulty Iridium modems and Iridium/ GPS antennas caused the temporary suspension of under-ice SeaGlider operations for 2007–2008. Nevertheless, in 2009, operations resumed with a second major milestone: an autonomous glider, engineered for extended operation in ice-covered environments, completed a six-month mission sampling for a total of 51 days under the ice-cover of the western Davis Strait during which the glider traversed over 800 km while collecting profiles that extended to within a few meters of the ice-ocean interface.
Applying iAOOS: Linking environmental- and ecosystem- changes in Northern Seas Much of the point of expanding the observing and modeling effort in northern seas during IPY has had to do with the ecosystem and its changes. Many of the projects that were funded for IPY had the ecosystem as their prime focus. Nevertheless, it is clear that af-ter two years of effort, many of these studies will be at an early stage so it will take some care if we are to do these projects justice. Here, we adopt the approach of trying first to identify those aspects of environ-mental variability that are most likely to drive change through the ecosystem of northern seas, ‘ecosystem: temperature’ and ‘ecosystem: ice’ relations seem to be the most fundamental. We then describe some of the hypothetical linkages between the ecosystem and its environment that have been put forward in studies of longer duration than IPY. Finally, we seek out cases where these hypotheses are being tested, altered,
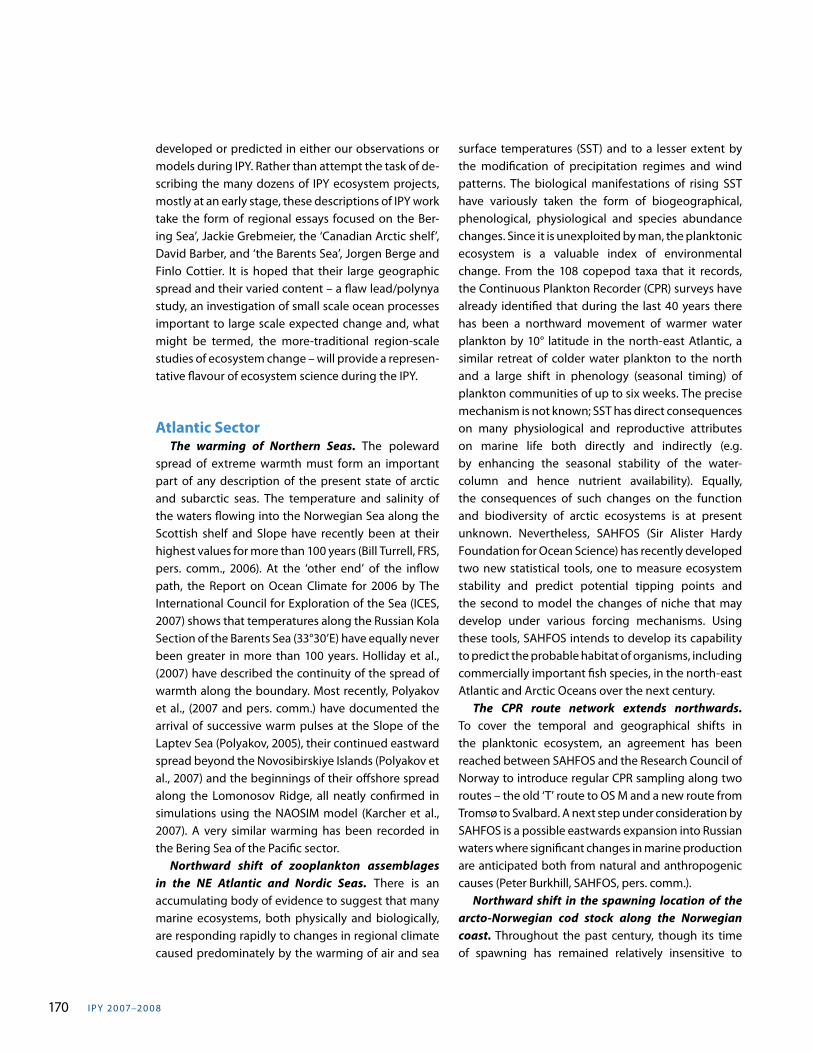
I PY 20 07–20 0 8170
developed or predicted in either our observations or models during IPY. Rather than attempt the task of de-scribing the many dozens of IPY ecosystem projects, mostly at an early stage, these descriptions of IPY work take the form of regional essays focused on the Ber-ing Sea’, Jackie Grebmeier, the ‘Canadian Arctic shelf’, David Barber, and ‘the Barents Sea’, Jorgen Berge and Finlo Cottier. It is hoped that their large geographic spread and their varied content – a flaw lead/polynya study, an investigation of small scale ocean processes important to large scale expected change and, what might be termed, the more-traditional region-scale studies of ecosystem change – will provide a represen-tative flavour of ecosystem science during the IPY.
Atlantic Sector The warming of Northern Seas. The poleward spread of extreme warmth must form an important part of any description of the present state of arctic and subarctic seas. The temperature and salinity of the waters flowing into the Norwegian Sea along the Scottish shelf and Slope have recently been at their highest values for more than 100 years (Bill Turrell, FRS, pers. comm., 2006). At the ‘other end’ of the inflow path, the Report on Ocean Climate for 2006 by The International Council for Exploration of the Sea (ICES, 2007) shows that temperatures along the Russian Kola Section of the Barents Sea (33°30’E) have equally never been greater in more than 100 years. Holliday et al., (2007) have described the continuity of the spread of warmth along the boundary. Most recently, Polyakov et al., (2007 and pers. comm.) have documented the arrival of successive warm pulses at the Slope of the Laptev Sea (Polyakov, 2005), their continued eastward spread beyond the Novosibirskiye Islands (Polyakov et al., 2007) and the beginnings of their offshore spread along the Lomonosov Ridge, all neatly confirmed in simulations using the NAOSIM model (Karcher et al., 2007). A very similar warming has been recorded in the Bering Sea of the Pacific sector. Northward shift of zooplankton assemblages in the NE Atlantic and Nordic Seas. There is an accumulating body of evidence to suggest that many marine ecosystems, both physically and biologically, are responding rapidly to changes in regional climate caused predominately by the warming of air and sea
surface temperatures (SST) and to a lesser extent by the modification of precipitation regimes and wind patterns. The biological manifestations of rising SST have variously taken the form of biogeographical, phenological, physiological and species abundance changes. Since it is unexploited by man, the planktonic ecosystem is a valuable index of environmental change. From the 108 copepod taxa that it records, the Continuous Plankton Recorder (CPR) surveys have already identified that during the last 40 years there has been a northward movement of warmer water plankton by 10° latitude in the north-east Atlantic, a similar retreat of colder water plankton to the north and a large shift in phenology (seasonal timing) of plankton communities of up to six weeks. The precise mechanism is not known; SST has direct consequences on many physiological and reproductive attributes on marine life both directly and indirectly (e.g. by enhancing the seasonal stability of the water-column and hence nutrient availability). Equally, the consequences of such changes on the function and biodiversity of arctic ecosystems is at present unknown. Nevertheless, SAHFOS (Sir Alister Hardy Foundation for Ocean Science) has recently developed two new statistical tools, one to measure ecosystem stability and predict potential tipping points and the second to model the changes of niche that may develop under various forcing mechanisms. Using these tools, SAHFOS intends to develop its capability to predict the probable habitat of organisms, including commercially important fish species, in the north-east Atlantic and Arctic Oceans over the next century. The CPR route network extends northwards. To cover the temporal and geographical shifts in the planktonic ecosystem, an agreement has been reached between SAHFOS and the Research Council of Norway to introduce regular CPR sampling along two routes – the old ‘T’ route to OS M and a new route from Tromsø to Svalbard. A next step under consideration by SAHFOS is a possible eastwards expansion into Russian waters where significant changes in marine production are anticipated both from natural and anthropogenic causes (Peter Burkhill, SAHFOS, pers. comm.). Northward shift in the spawning location of the arcto-Norwegian cod stock along the Norwegian coast. Throughout the past century, though its time of spawning has remained relatively insensitive to
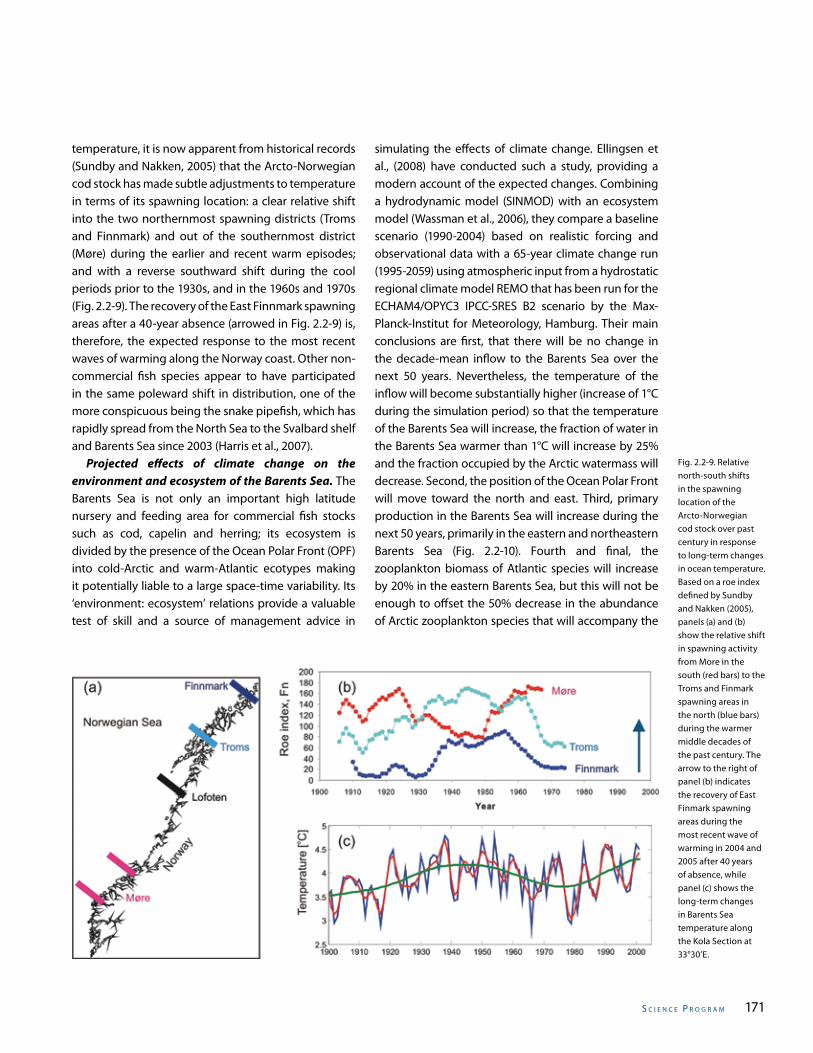
s C I e n C e P r o g r a m 171
temperature, it is now apparent from historical records (Sundby and Nakken, 2005) that the Arcto-Norwegian cod stock has made subtle adjustments to temperature in terms of its spawning location: a clear relative shift into the two northernmost spawning districts (Troms and Finnmark) and out of the southernmost district (Møre) during the earlier and recent warm episodes; and with a reverse southward shift during the cool periods prior to the 1930s, and in the 1960s and 1970s (Fig. 2.2-9). The recovery of the East Finnmark spawning areas after a 40-year absence (arrowed in Fig. 2.2-9) is, therefore, the expected response to the most recent waves of warming along the Norway coast. Other non-commercial fish species appear to have participated in the same poleward shift in distribution, one of the more conspicuous being the snake pipefish, which has rapidly spread from the North Sea to the Svalbard shelf and Barents Sea since 2003 (Harris et al., 2007). Projected effects of climate change on the environment and ecosystem of the Barents Sea. The Barents Sea is not only an important high latitude nursery and feeding area for commercial fish stocks such as cod, capelin and herring; its ecosystem is divided by the presence of the Ocean Polar Front (OPF) into cold-Arctic and warm-Atlantic ecotypes making it potentially liable to a large space-time variability. Its ‘environment: ecosystem’ relations provide a valuable test of skill and a source of management advice in
simulating the effects of climate change. Ellingsen et al., (2008) have conducted such a study, providing a modern account of the expected changes. Combining a hydrodynamic model (SINMOD) with an ecosystem model (Wassman et al., 2006), they compare a baseline scenario (1990-2004) based on realistic forcing and observational data with a 65-year climate change run (1995-2059) using atmospheric input from a hydrostatic regional climate model REMO that has been run for the ECHAM4/OPYC3 IPCC-SRES B2 scenario by the Max-Planck-Institut for Meteorology, Hamburg. Their main conclusions are first, that there will be no change in the decade-mean inflow to the Barents Sea over the next 50 years. Nevertheless, the temperature of the inflow will become substantially higher (increase of 1°C during the simulation period) so that the temperature of the Barents Sea will increase, the fraction of water in the Barents Sea warmer than 1°C will increase by 25% and the fraction occupied by the Arctic watermass will decrease. Second, the position of the Ocean Polar Front will move toward the north and east. Third, primary production in the Barents Sea will increase during the next 50 years, primarily in the eastern and northeastern Barents Sea (Fig. 2.2-10). Fourth and final, the zooplankton biomass of Atlantic species will increase by 20% in the eastern Barents Sea, but this will not be enough to offset the 50% decrease in the abundance of Arctic zooplankton species that will accompany the
Fig. 2.2-9. Relative north-south shifts in the spawning location of the Arcto-Norwegian cod stock over past century in response to long-term changes in ocean temperature. Based on a roe index defined by Sundby and Nakken (2005), panels (a) and (b) show the relative shift in spawning activity from More in the south (red bars) to the Troms and Finmark spawning areas in the north (blue bars) during the warmer middle decades of the past century. The arrow to the right of panel (b) indicates the recovery of East Finmark spawning areas during the most recent wave of warming in 2004 and 2005 after 40 years of absence, while panel (c) shows the long-term changes in Barents Sea temperature along the Kola Section at 33°30’E.
I PY 20 07–20 0 8172
decrease in the Arctic watermass (Fig. 2.2-10). Even though the biophysical model predicted rather modest changes in the climate and plankton production of the Barents Sea (Ellingsen et al., 2008), these changes were nevertheless sufficient to produce responses in capelin abundance, spawning area and adult distribution. New insights into temperature effects on the distribution of capelin of the Barents Sea. The capelin stock of the Barents Sea has long been recognized as a principal food fish for cod and, therefore, as a key component of the ecosystem on the Norwegian arctic shelf. The importance of temperature as a control on distribution of capelin has also long been recognized, in general terms, but the specifics of that relationship have now been examined in a study by Randi Ingvaldsen, IMR Bergen. She finds that when the temperature increases, the capelin spread northwards and the distribution-area increases. When the capelin stock is large, the feeding area is normally extended eastwards. Consequently, the largest distribution areas occur when the temperature is high and the stock is large at the same time. Complementing this study, Huse and Ellingsen (2008) have modelled the likely consequences of global warming on capelin distribution and population dynamics. With input on physics and plankton from a biophysical ocean model, the entire life cycle of capelin including spawning of eggs, larval drift and adult movement is simulated. The model generates output on capelin migration/distribution and population dynamics; simulations are performed using both a present day climate and a future climate scenario. For the present climate, the spatial distributions resemble the typical spatial dynamics of capelin, with the Murman and North Norway coasts as the main spawning areas. Nevertheless, for the climate change simulation, the capelin is predicted to shift spawning eastwards and also utilize new spawning areas along Novaya Zemlya. There is also a shift in the adult distribution towards the north eastern part of the Barents Sea and earlier spawning associated with the warming. As the authors point out, it remains an open question whether capelin will take up spawning at Novaya Zemlya as predicted by the model, but there is some evidence that such easterly spawning has taken place in the past (see Gjøsæter, 1998).
The IPY in the NW Barents Sea. The Svalbard archipelago in the NW Barents Sea is the eastern gateway for Atlantic Water flowing into the Arctic. Consequently the oceanography of the region is characterized by the distinct water masses of Atlantic or Polar origin, contrasting strongly in their temperature and salinity. The sea ice conditions around the archipelago reflect these contrasts, with northern and eastern coasts having seasonal ice cover while the west coast is relatively ice-free. Such a range of conditions permits comparative studies of ecosystem function to be conducted and has enabled the investigation of the likely impact of warm, ice-free conditions on arctic ecosystems (Willis et al., 2006) and of how ecosystems might respond to changes in the seasonal timing of retreat of the ice-edge. Two sites in the archipelago have proved ideal for such studies. Rijpfjorden, a fjord in Nordaustlandet that faces north to the Arctic Ocean, represents the Polar extreme while Kongsfjorden in NW Spitsbergen is a site that is dominated by warm Atlantic Water with water temperatures in excess of 6°C (Cottier et al., 2007). The ice-covered nature of Rijpfjorden and the relatively ice-free conditions in Kongsfjorden provide a natural setting to investigate the role ice plays in structuring arctic ecosystems. A key observational capability is the placement of moored instruments in each fjord, to provide background environmental data or as a means of studying the shelf processes. These moorings have been maintained by the Scottish Association for Marine Science (www.arcticmarine.org.uk) since 2002, with the logistical assistance of Norwegian institutes, particularly University Centre in Svalbard (www.unis.no). The issue of ecosystem response to changes in sea ice conditions have been captured in a Norwegian IPY project called CLEOPATRA (Climate effects on planktonic food quality and trophic transfer in Arctic Marginal Ice Zones). CLEOPATRA was conducted in Rijpfjorden which can be considered as a mesocosm site representative of Arctic processes. The main objectives of the IPY CLEOPATRA project were to study:(1) the timing, quantity and quality of ice algal and
phytoplankton spring bloom;(2) how variations in light and UV radiation affect
algal food quality; and(3) the importance of timing and available food
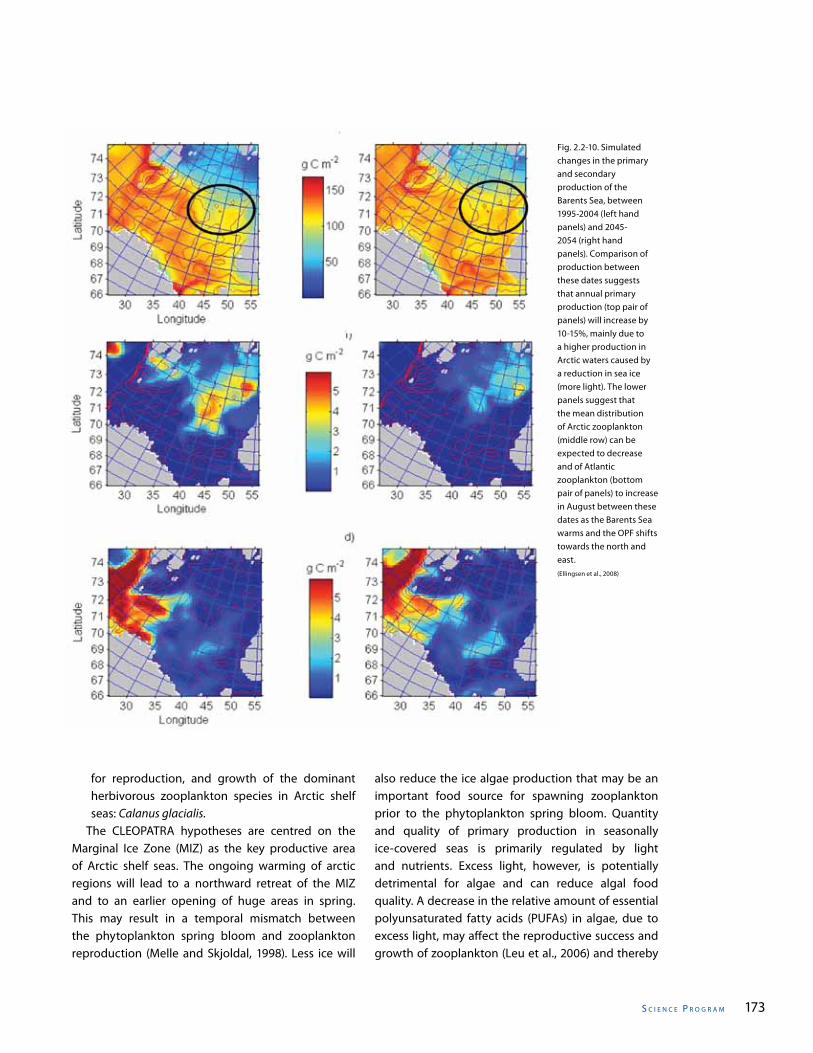
s C I e n C e P r o g r a m 173
Fig. 2.2-10. Simulated changes in the primary and secondary production of the Barents Sea, between 1995-2004 (left hand panels) and 2045-2054 (right hand panels). Comparison of production between these dates suggests that annual primary production (top pair of panels) will increase by 10-15%, mainly due to a higher production in Arctic waters caused by a reduction in sea ice (more light). The lower panels suggest that the mean distribution of Arctic zooplankton (middle row) can be expected to decrease and of Atlantic zooplankton (bottom pair of panels) to increase in August between these dates as the Barents Sea warms and the OPF shifts towards the north and east.(Ellingsen et al., 2008)
for reproduction, and growth of the dominant herbivorous zooplankton species in Arctic shelf seas: Calanus glacialis.
The CLEOPATRA hypotheses are centred on the Marginal Ice Zone (MIZ) as the key productive area of Arctic shelf seas. The ongoing warming of arctic regions will lead to a northward retreat of the MIZ and to an earlier opening of huge areas in spring. This may result in a temporal mismatch between the phytoplankton spring bloom and zooplankton reproduction (Melle and Skjoldal, 1998). Less ice will
also reduce the ice algae production that may be an important food source for spawning zooplankton prior to the phytoplankton spring bloom. Quantity and quality of primary production in seasonally ice-covered seas is primarily regulated by light and nutrients. Excess light, however, is potentially detrimental for algae and can reduce algal food quality. A decrease in the relative amount of essential polyunsaturated fatty acids (PUFAs) in algae, due to excess light, may affect the reproductive success and growth of zooplankton (Leu et al., 2006) and thereby
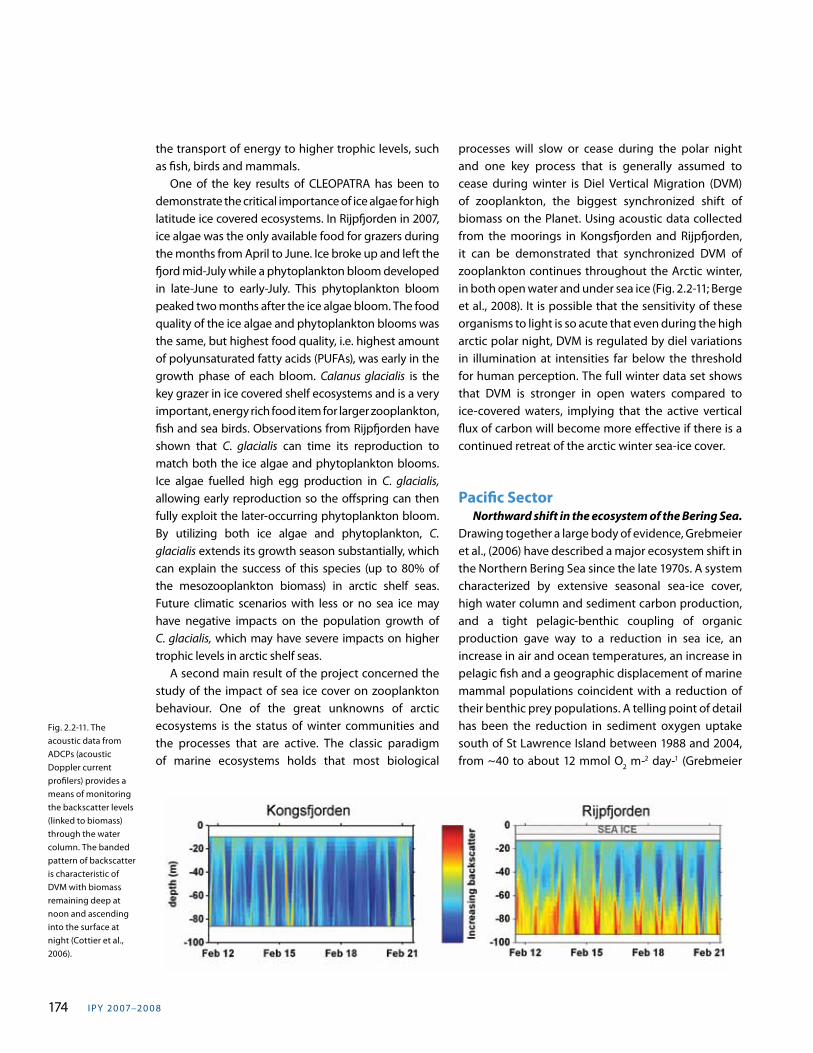
I PY 20 07–20 0 8174
the transport of energy to higher trophic levels, such as fish, birds and mammals. One of the key results of CLEOPATRA has been to demonstrate the critical importance of ice algae for high latitude ice covered ecosystems. In Rijpfjorden in 2007, ice algae was the only available food for grazers during the months from April to June. Ice broke up and left the fjord mid-July while a phytoplankton bloom developed in late-June to early-July. This phytoplankton bloom peaked two months after the ice algae bloom. The food quality of the ice algae and phytoplankton blooms was the same, but highest food quality, i.e. highest amount of polyunsaturated fatty acids (PUFAs), was early in the growth phase of each bloom. Calanus glacialis is the key grazer in ice covered shelf ecosystems and is a very important, energy rich food item for larger zooplankton, fish and sea birds. Observations from Rijpfjorden have shown that C. glacialis can time its reproduction to match both the ice algae and phytoplankton blooms. Ice algae fuelled high egg production in C. glacialis, allowing early reproduction so the offspring can then fully exploit the later-occurring phytoplankton bloom. By utilizing both ice algae and phytoplankton, C. glacialis extends its growth season substantially, which can explain the success of this species (up to 80% of the mesozooplankton biomass) in arctic shelf seas. Future climatic scenarios with less or no sea ice may have negative impacts on the population growth of C. glacialis, which may have severe impacts on higher trophic levels in arctic shelf seas. A second main result of the project concerned the study of the impact of sea ice cover on zooplankton behaviour. One of the great unknowns of arctic ecosystems is the status of winter communities and the processes that are active. The classic paradigm of marine ecosystems holds that most biological
processes will slow or cease during the polar night and one key process that is generally assumed to cease during winter is Diel Vertical Migration (DVM) of zooplankton, the biggest synchronized shift of biomass on the Planet. Using acoustic data collected from the moorings in Kongsfjorden and Rijpfjorden, it can be demonstrated that synchronized DVM of zooplankton continues throughout the Arctic winter, in both open water and under sea ice (Fig. 2.2-11; Berge et al., 2008). It is possible that the sensitivity of these organisms to light is so acute that even during the high arctic polar night, DVM is regulated by diel variations in illumination at intensities far below the threshold for human perception. The full winter data set shows that DVM is stronger in open waters compared to ice-covered waters, implying that the active vertical flux of carbon will become more effective if there is a continued retreat of the arctic winter sea-ice cover.
Pacific Sector Northward shift in the ecosystem of the Bering Sea. Drawing together a large body of evidence, Grebmeier et al., (2006) have described a major ecosystem shift in the Northern Bering Sea since the late 1970s. A system characterized by extensive seasonal sea-ice cover, high water column and sediment carbon production, and a tight pelagic-benthic coupling of organic production gave way to a reduction in sea ice, an increase in air and ocean temperatures, an increase in pelagic fish and a geographic displacement of marine mammal populations coincident with a reduction of their benthic prey populations. A telling point of detail has been the reduction in sediment oxygen uptake south of St Lawrence Island between 1988 and 2004, from ~40 to about 12 mmol O2 m-2 day-1 (Grebmeier
Fig. 2.2-11. The acoustic data from ADCPs (acoustic Doppler current profilers) provides a means of monitoring the backscatter levels (linked to biomass) through the water column. The banded pattern of backscatter is characteristic of DVM with biomass remaining deep at noon and ascending into the surface at night (Cottier et al., 2006).
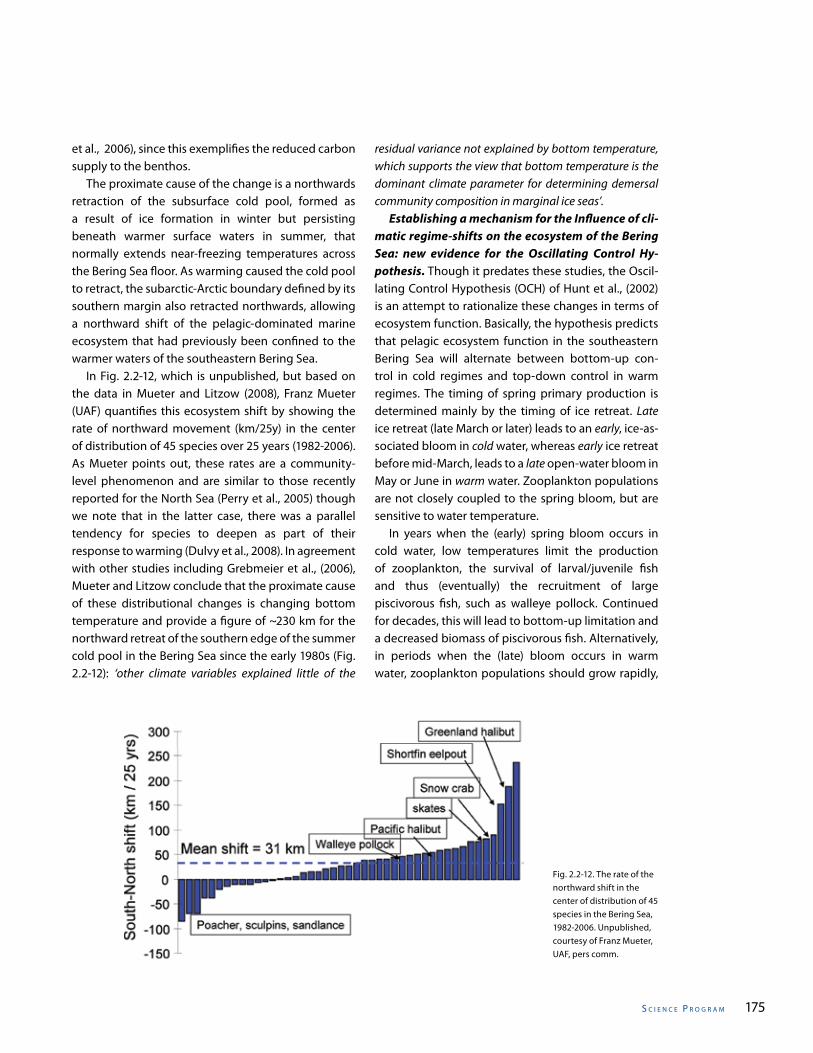
s C I e n C e P r o g r a m 175
et al., 2006), since this exemplifies the reduced carbon supply to the benthos. The proximate cause of the change is a northwards retraction of the subsurface cold pool, formed as a result of ice formation in winter but persisting beneath warmer surface waters in summer, that normally extends near-freezing temperatures across the Bering Sea floor. As warming caused the cold pool to retract, the subarctic-Arctic boundary defined by its southern margin also retracted northwards, allowing a northward shift of the pelagic-dominated marine ecosystem that had previously been confined to the warmer waters of the southeastern Bering Sea. In Fig. 2.2-12, which is unpublished, but based on the data in Mueter and Litzow (2008), Franz Mueter (UAF) quantifies this ecosystem shift by showing the rate of northward movement (km/25y) in the center of distribution of 45 species over 25 years (1982-2006). As Mueter points out, these rates are a community-level phenomenon and are similar to those recently reported for the North Sea (Perry et al., 2005) though we note that in the latter case, there was a parallel tendency for species to deepen as part of their response to warming (Dulvy et al., 2008). In agreement with other studies including Grebmeier et al., (2006), Mueter and Litzow conclude that the proximate cause of these distributional changes is changing bottom temperature and provide a figure of ~230 km for the northward retreat of the southern edge of the summer cold pool in the Bering Sea since the early 1980s (Fig. 2.2-12): ‘other climate variables explained little of the
residual variance not explained by bottom temperature, which supports the view that bottom temperature is the dominant climate parameter for determining demersal community composition in marginal ice seas’. Establishing a mechanism for the Influence of cli-matic regime-shifts on the ecosystem of the Bering Sea: new evidence for the Oscillating Control Hy-pothesis. Though it predates these studies, the Oscil-lating Control Hypothesis (OCH) of Hunt et al., (2002) is an attempt to rationalize these changes in terms of ecosystem function. Basically, the hypothesis predicts that pelagic ecosystem function in the southeastern Bering Sea will alternate between bottom-up con-trol in cold regimes and top-down control in warm regimes. The timing of spring primary production is determined mainly by the timing of ice retreat. Late ice retreat (late March or later) leads to an early, ice-as-sociated bloom in cold water, whereas early ice retreat before mid-March, leads to a late open-water bloom in May or June in warm water. Zooplankton populations are not closely coupled to the spring bloom, but are sensitive to water temperature. In years when the (early) spring bloom occurs in cold water, low temperatures limit the production of zooplankton, the survival of larval/juvenile fish and thus (eventually) the recruitment of large piscivorous fish, such as walleye pollock. Continued for decades, this will lead to bottom-up limitation and a decreased biomass of piscivorous fish. Alternatively, in periods when the (late) bloom occurs in warm water, zooplankton populations should grow rapidly,
Fig. 2.2-12. The rate of the northward shift in the center of distribution of 45 species in the Bering Sea, 1982-2006. Unpublished, courtesy of Franz Mueter, UAF, pers comm.
I PY 20 07–20 0 8176
providing plentiful prey for larval and juvenile fish and the abundant zooplankton will support strong recruitment of the predatory fish that control forage fish. Piscivorous marine birds and pinnipeds may achieve higher production of young and survive longer in cold regimes, when there is less competition from large piscivorous fish for coldwater forage fish, such as capelin (Mallotus villosus). Piscivorous seabirds and pinnipeds may also be expected to have high productivity in periods of transition from cold regimes to warm regimes, when the young of large predatory species of fish are numerous enough to provide forage. The OCH predicts that the ability of large predatory fish populations to sustain fishing pressure will vary between warm and cold regimes. The OCH also underscores the relationship between the timing of ice retreat and water temperatures during the spring bloom and the ‘direction’ of coupling between zooplankton and forage fish. In essence, the early bloom in cold water tends to go to the seabed providing better survival of demersal species; the later bloom in warm conditions tends to favour pelagics (for details see Hunt et al., 2002). It is Hunt’s point that an ecosystem approach to management of the Bering Sea and its fisheries is necessary if all of the ecosystem components valued by society are to thrive; since climatic regimes may fundamentally alter relationships within the ecosystem, there is a demonstrable need to develop an understanding of the causal relationships between climate, primary and secondary production, and the population dynamics of upper trophic-level organisms. The Oscillating Control Hypothesis is Hunt’s attempt to supply it. So, is it valid? Once again we are indebted to unpublished work by Franz Mueter. Based on the data series described in Mueter et al., (2007) the inverse correlation between the survival anomalies of yellowfin sole and walleye pollock does appear to offer support to Hunt’s Oscillating Control Hypothesis, though as Mueter et al., point out, many details of this relationship remain to be explained and tested, including the time-varying roles of cannibalism, larval transport, ice cover and wind mixing. The IPY in the Bering Sea: results from BEST, BSIERP, C3O, CHINARE and other IPY-relevant research in the northern Bering Sea. The longest biological time series data in the northern Bering Sea
(NBS) are from sites south of St. Lawrence Island where significant changes have occurred in the benthic biomass and community structure over the last few decades. Bivalves dominate the benthic biomass in the region and are the key prey base for benthic-feeding spectacled eiders and walrus. Both the recent decline of overall infaunal biomass and the change in species dominance in this region are impacting the coincident decline in spectacled eider populations (Lovvorn et al., 2003; Grebmeier et al., 2006). The time-series studies indicate that chlorophyll biomass differs significantly during a similar timing of ice-melt, but under different oceanographic conditions. Repeat sampling shows that even within-season variation is large and blooms are highly localized both in the water column and underlying sediments, the latter a further indicator of food availability to benthic populations. Sediment oxygen uptake measurements, an indicator of carbon supply to the benthos, show a similar finding that fresh organic matter settles to the benthos quickly. Water mass and nutrient variation, wind mixing and late winter brine formation are potentially important variables that will also impact spring productivity in addition to the timing of ice retreat. The BEST/BSIERP study initiated during IPY (2008) includes late winter field sampling, along with retrospective studies, to evaluate benthic infaunal populations, sediments and oceanographic conditions in the context of walrus feeding sites, both historical and tagged. The study is evaluating a grid of benthic infaunal collections in the walrus feeding area at various spatial scales (<5-20 nautical miles) to evaluate variable prey patches and food quality as well as undertaking a videographic evaluation of epifauna. Within the collaborative program, both helicopter survey and on-ice tagging of walruses are employed to track the their location and feed areas to evaluate predator-prey patch dynamics. As part of the C30 program in 2007 and 2008, stations were occupied in July in the NBS. Both the winter-produced cold pool and now subsurface chlorophyll maximum from the spring bloom are evident looking at the 1000 km point on the Dutch Harbor to Barrow, Alaska transect (Fig. 2.2-13). Repeat of our time series measurements of hydrography, water and sediment chlorophyll, carbon tracers and infaunal populations also occurred. Repeat measurements at our time-series stations for the BEST/BSIERP patch dynamics
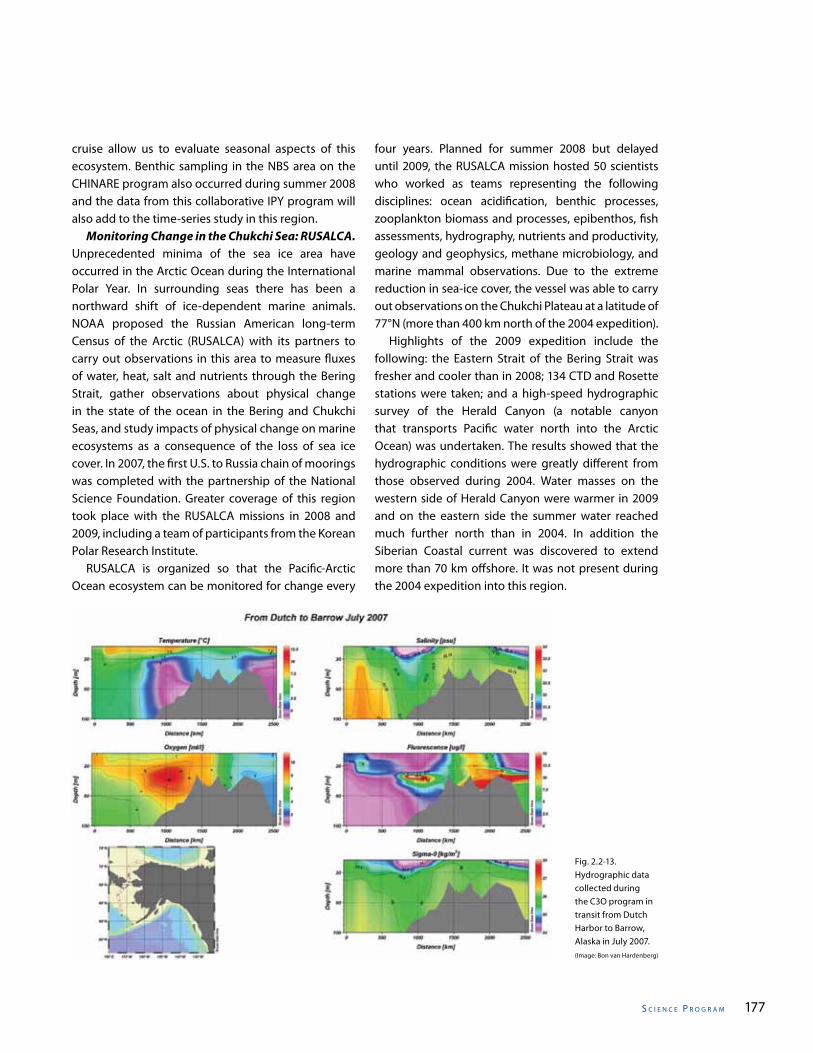
s C I e n C e P r o g r a m 177
cruise allow us to evaluate seasonal aspects of this ecosystem. Benthic sampling in the NBS area on the CHINARE program also occurred during summer 2008 and the data from this collaborative IPY program will also add to the time-series study in this region. Monitoring Change in the Chukchi Sea: RUSALCA. Unprecedented minima of the sea ice area have occurred in the Arctic Ocean during the International Polar Year. In surrounding seas there has been a northward shift of ice-dependent marine animals. NOAA proposed the Russian American long-term Census of the Arctic (RUSALCA) with its partners to carry out observations in this area to measure fluxes of water, heat, salt and nutrients through the Bering Strait, gather observations about physical change in the state of the ocean in the Bering and Chukchi Seas, and study impacts of physical change on marine ecosystems as a consequence of the loss of sea ice cover. In 2007, the first U.S. to Russia chain of moorings was completed with the partnership of the National Science Foundation. Greater coverage of this region took place with the RUSALCA missions in 2008 and 2009, including a team of participants from the Korean Polar Research Institute. RUSALCA is organized so that the Pacific-Arctic Ocean ecosystem can be monitored for change every
four years. Planned for summer 2008 but delayed until 2009, the RUSALCA mission hosted 50 scientists who worked as teams representing the following disciplines: ocean acidification, benthic processes, zooplankton biomass and processes, epibenthos, fish assessments, hydrography, nutrients and productivity, geology and geophysics, methane microbiology, and marine mammal observations. Due to the extreme reduction in sea-ice cover, the vessel was able to carry out observations on the Chukchi Plateau at a latitude of 77°N (more than 400 km north of the 2004 expedition). Highlights of the 2009 expedition include the following: the Eastern Strait of the Bering Strait was fresher and cooler than in 2008; 134 CTD and Rosette stations were taken; and a high-speed hydrographic survey of the Herald Canyon (a notable canyon that transports Pacific water north into the Arctic Ocean) was undertaken. The results showed that the hydrographic conditions were greatly different from those observed during 2004. Water masses on the western side of Herald Canyon were warmer in 2009 and on the eastern side the summer water reached much further north than in 2004. In addition the Siberian Coastal current was discovered to extend more than 70 km offshore. It was not present during the 2004 expedition into this region.
Fig. 2.2-13. Hydrographic data collected during the C3O program in transit from Dutch Harbor to Barrow, Alaska in July 2007.(Image: Bon van Hardenberg)
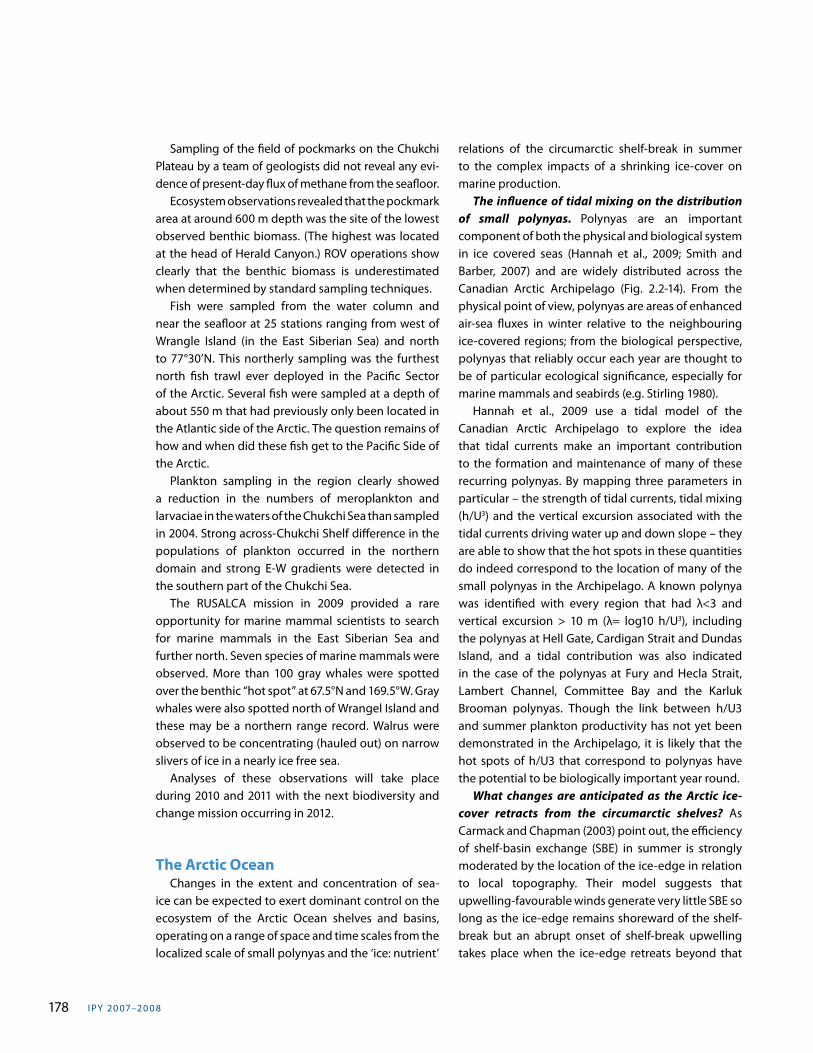
I PY 20 07–20 0 8178
Sampling of the field of pockmarks on the Chukchi Plateau by a team of geologists did not reveal any evi-dence of present-day flux of methane from the seafloor. Ecosystem observations revealed that the pockmark area at around 600 m depth was the site of the lowest observed benthic biomass. (The highest was located at the head of Herald Canyon.) ROV operations show clearly that the benthic biomass is underestimated when determined by standard sampling techniques. Fish were sampled from the water column and near the seafloor at 25 stations ranging from west of Wrangle Island (in the East Siberian Sea) and north to 77°30’N. This northerly sampling was the furthest north fish trawl ever deployed in the Pacific Sector of the Arctic. Several fish were sampled at a depth of about 550 m that had previously only been located in the Atlantic side of the Arctic. The question remains of how and when did these fish get to the Pacific Side of the Arctic. Plankton sampling in the region clearly showed a reduction in the numbers of meroplankton and larvaciae in the waters of the Chukchi Sea than sampled in 2004. Strong across-Chukchi Shelf difference in the populations of plankton occurred in the northern domain and strong E-W gradients were detected in the southern part of the Chukchi Sea. The RUSALCA mission in 2009 provided a rare opportunity for marine mammal scientists to search for marine mammals in the East Siberian Sea and further north. Seven species of marine mammals were observed. More than 100 gray whales were spotted over the benthic “hot spot” at 67.5°N and 169.5°W. Gray whales were also spotted north of Wrangel Island and these may be a northern range record. Walrus were observed to be concentrating (hauled out) on narrow slivers of ice in a nearly ice free sea. Analyses of these observations will take place during 2010 and 2011 with the next biodiversity and change mission occurring in 2012.
The Arctic Ocean Changes in the extent and concentration of sea-ice can be expected to exert dominant control on the ecosystem of the Arctic Ocean shelves and basins, operating on a range of space and time scales from the localized scale of small polynyas and the ‘ice: nutrient’
relations of the circumarctic shelf-break in summer to the complex impacts of a shrinking ice-cover on marine production. The influence of tidal mixing on the distribution of small polynyas. Polynyas are an important component of both the physical and biological system in ice covered seas (Hannah et al., 2009; Smith and Barber, 2007) and are widely distributed across the Canadian Arctic Archipelago (Fig. 2.2-14). From the physical point of view, polynyas are areas of enhanced air-sea fluxes in winter relative to the neighbouring ice-covered regions; from the biological perspective, polynyas that reliably occur each year are thought to be of particular ecological significance, especially for marine mammals and seabirds (e.g. Stirling 1980). Hannah et al., 2009 use a tidal model of the Canadian Arctic Archipelago to explore the idea that tidal currents make an important contribution to the formation and maintenance of many of these recurring polynyas. By mapping three parameters in particular – the strength of tidal currents, tidal mixing (h/U3) and the vertical excursion associated with the tidal currents driving water up and down slope – they are able to show that the hot spots in these quantities do indeed correspond to the location of many of the small polynyas in the Archipelago. A known polynya was identified with every region that had λ<3 and vertical excursion > 10 m (λ= log10 h/U3), including the polynyas at Hell Gate, Cardigan Strait and Dundas Island, and a tidal contribution was also indicated in the case of the polynyas at Fury and Hecla Strait, Lambert Channel, Committee Bay and the Karluk Brooman polynyas. Though the link between h/U3 and summer plankton productivity has not yet been demonstrated in the Archipelago, it is likely that the hot spots of h/U3 that correspond to polynyas have the potential to be biologically important year round. What changes are anticipated as the Arctic ice-cover retracts from the circumarctic shelves? As Carmack and Chapman (2003) point out, the efficiency of shelf-basin exchange (SBE) in summer is strongly moderated by the location of the ice-edge in relation to local topography. Their model suggests that upwelling-favourable winds generate very little SBE so long as the ice-edge remains shoreward of the shelf-break but an abrupt onset of shelf-break upwelling takes place when the ice-edge retreats beyond that
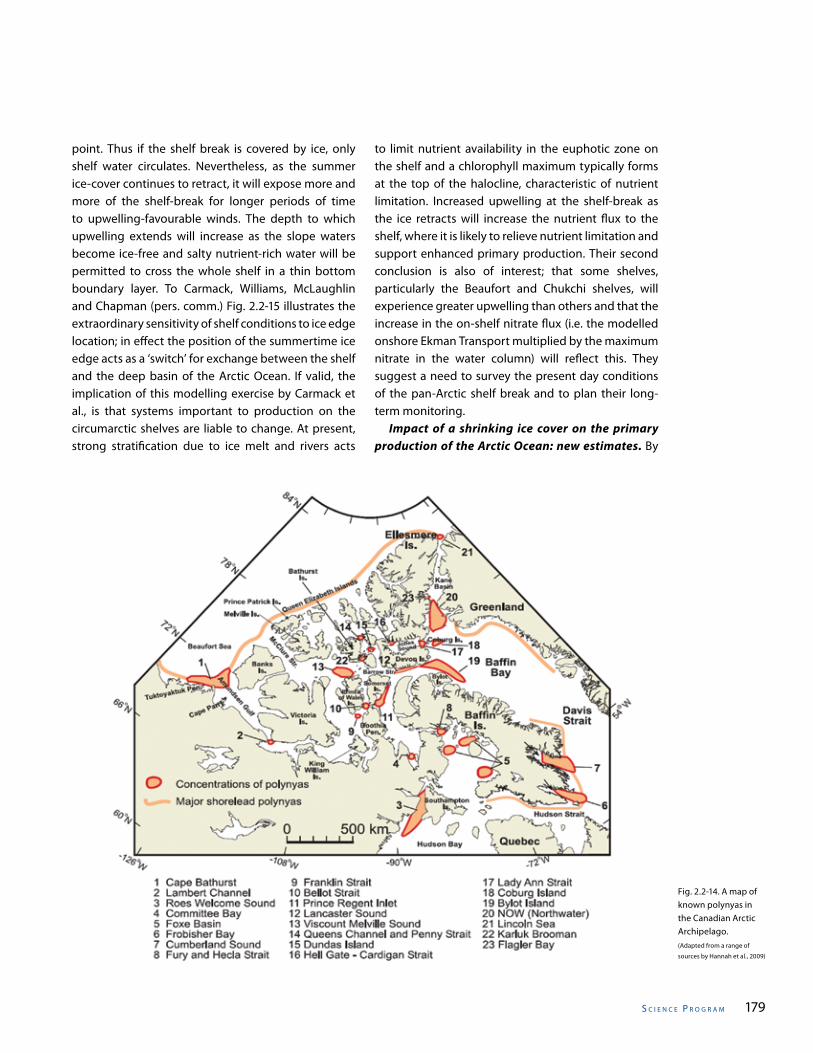
s C I e n C e P r o g r a m 179
point. Thus if the shelf break is covered by ice, only shelf water circulates. Nevertheless, as the summer ice-cover continues to retract, it will expose more and more of the shelf-break for longer periods of time to upwelling-favourable winds. The depth to which upwelling extends will increase as the slope waters become ice-free and salty nutrient-rich water will be permitted to cross the whole shelf in a thin bottom boundary layer. To Carmack, Williams, McLaughlin and Chapman (pers. comm.) Fig. 2.2-15 illustrates the extraordinary sensitivity of shelf conditions to ice edge location; in effect the position of the summertime ice edge acts as a ‘switch’ for exchange between the shelf and the deep basin of the Arctic Ocean. If valid, the implication of this modelling exercise by Carmack et al., is that systems important to production on the circumarctic shelves are liable to change. At present, strong stratification due to ice melt and rivers acts
to limit nutrient availability in the euphotic zone on the shelf and a chlorophyll maximum typically forms at the top of the halocline, characteristic of nutrient limitation. Increased upwelling at the shelf-break as the ice retracts will increase the nutrient flux to the shelf, where it is likely to relieve nutrient limitation and support enhanced primary production. Their second conclusion is also of interest; that some shelves, particularly the Beaufort and Chukchi shelves, will experience greater upwelling than others and that the increase in the on-shelf nitrate flux (i.e. the modelled onshore Ekman Transport multiplied by the maximum nitrate in the water column) will reflect this. They suggest a need to survey the present day conditions of the pan-Arctic shelf break and to plan their long-term monitoring. Impact of a shrinking ice cover on the primary production of the Arctic Ocean: new estimates. By
Fig. 2.2-14. A map of known polynyas in the Canadian Arctic Archipelago. (Adapted from a range of
sources by Hannah et al., 2009)
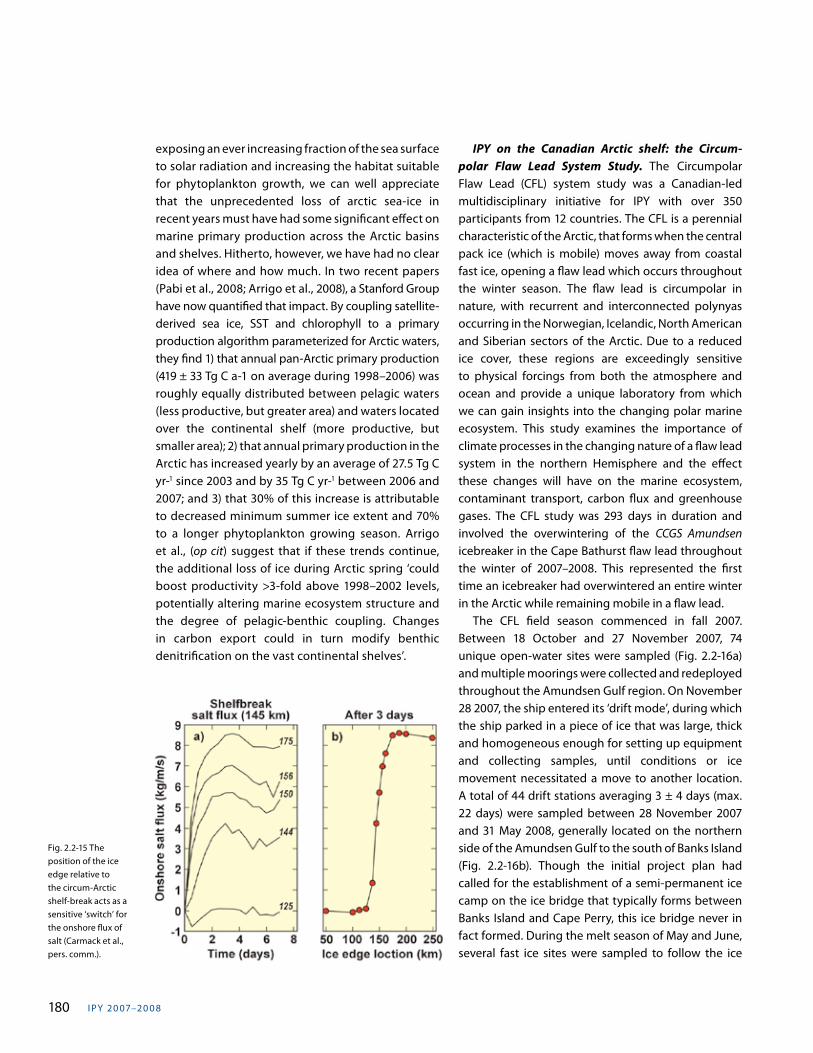
I PY 20 07–20 0 8180
exposing an ever increasing fraction of the sea surface to solar radiation and increasing the habitat suitable for phytoplankton growth, we can well appreciate that the unprecedented loss of arctic sea-ice in recent years must have had some significant effect on marine primary production across the Arctic basins and shelves. Hitherto, however, we have had no clear idea of where and how much. In two recent papers (Pabi et al., 2008; Arrigo et al., 2008), a Stanford Group have now quantified that impact. By coupling satellite-derived sea ice, SST and chlorophyll to a primary production algorithm parameterized for Arctic waters, they find 1) that annual pan-Arctic primary production (419 ± 33 Tg C a-1 on average during 1998–2006) was roughly equally distributed between pelagic waters (less productive, but greater area) and waters located over the continental shelf (more productive, but smaller area); 2) that annual primary production in the Arctic has increased yearly by an average of 27.5 Tg C yr-1 since 2003 and by 35 Tg C yr-1 between 2006 and 2007; and 3) that 30% of this increase is attributable to decreased minimum summer ice extent and 70% to a longer phytoplankton growing season. Arrigo et al., (op cit) suggest that if these trends continue, the additional loss of ice during Arctic spring ‘could boost productivity >3-fold above 1998–2002 levels, potentially altering marine ecosystem structure and the degree of pelagic-benthic coupling. Changes in carbon export could in turn modify benthic denitrification on the vast continental shelves’.
IPY on the Canadian Arctic shelf: the Circum-polar Flaw Lead System Study. The Circum polar Flaw Lead (CFL) system study was a Canadian-led multidisciplinary initiative for IPY with over 350 participants from 12 countries. The CFL is a perennial characteristic of the Arctic, that forms when the central pack ice (which is mobile) moves away from coastal fast ice, opening a flaw lead which occurs throughout the winter season. The flaw lead is circumpolar in nature, with recurrent and interconnected polynyas occurring in the Norwegian, Icelandic, North American and Siberian sectors of the Arctic. Due to a reduced ice cover, these regions are exceedingly sensitive to physical forcings from both the atmosphere and ocean and provide a unique laboratory from which we can gain insights into the changing polar marine ecosystem. This study examines the importance of climate processes in the changing nature of a flaw lead system in the northern Hemisphere and the effect these changes will have on the marine ecosystem, contaminant transport, carbon flux and greenhouse gases. The CFL study was 293 days in duration and involved the overwintering of the CCGS Amundsen icebreaker in the Cape Bathurst flaw lead throughout the winter of 2007–2008. This represented the first time an icebreaker had overwintered an entire winter in the Arctic while remaining mobile in a flaw lead. The CFL field season commenced in fall 2007. Between 18 October and 27 November 2007, 74 unique open-water sites were sampled (Fig. 2.2-16a) and multiple moorings were collected and redeployed throughout the Amundsen Gulf region. On November 28 2007, the ship entered its ‘drift mode’, during which the ship parked in a piece of ice that was large, thick and homogeneous enough for setting up equipment and collecting samples, until conditions or ice movement necessitated a move to another location. A total of 44 drift stations averaging 3 ± 4 days (max. 22 days) were sampled between 28 November 2007 and 31 May 2008, generally located on the northern side of the Amundsen Gulf to the south of Banks Island (Fig. 2.2-16b). Though the initial project plan had called for the establishment of a semi-permanent ice camp on the ice bridge that typically forms between Banks Island and Cape Perry, this ice bridge never in fact formed. During the melt season of May and June, several fast ice sites were sampled to follow the ice
Fig. 2.2-15 The position of the ice edge relative to the circum-Arctic shelf-break acts as a sensitive ‘switch’ for the onshore flux of salt (Carmack et al., pers. comm.).
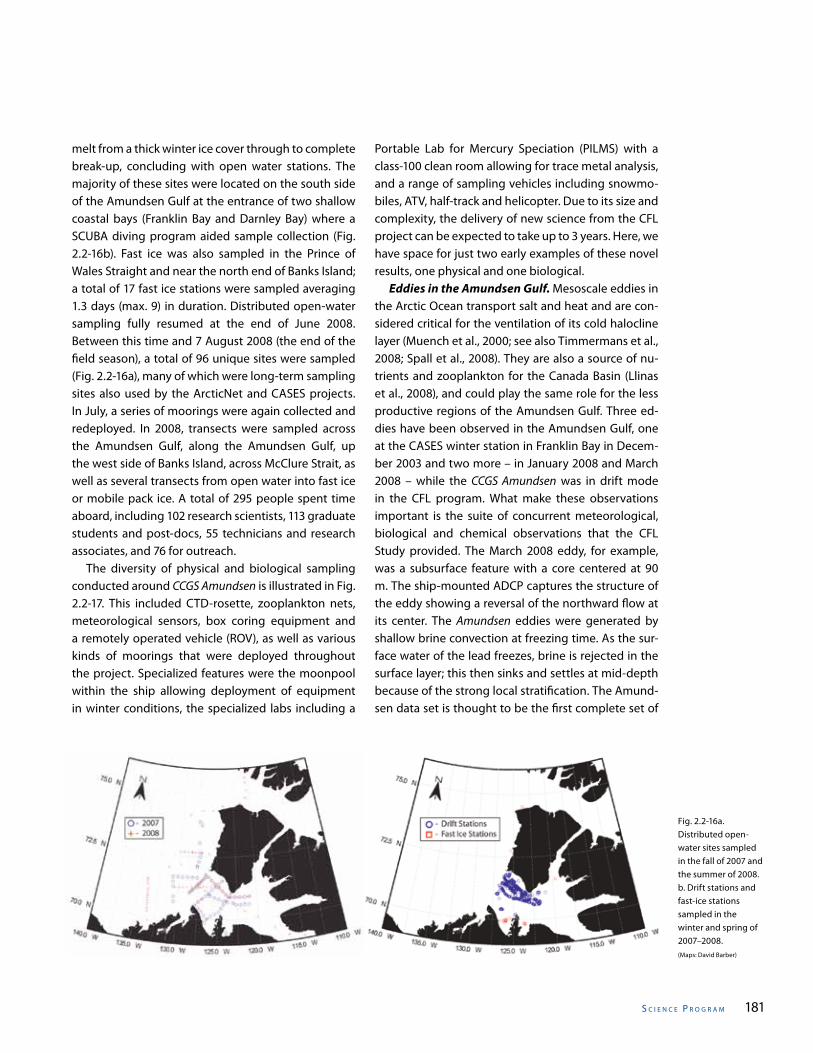
s C I e n C e P r o g r a m 181
melt from a thick winter ice cover through to complete break-up, concluding with open water stations. The majority of these sites were located on the south side of the Amundsen Gulf at the entrance of two shallow coastal bays (Franklin Bay and Darnley Bay) where a SCUBA diving program aided sample collection (Fig. 2.2-16b). Fast ice was also sampled in the Prince of Wales Straight and near the north end of Banks Island; a total of 17 fast ice stations were sampled averaging 1.3 days (max. 9) in duration. Distributed open-water sampling fully resumed at the end of June 2008. Between this time and 7 August 2008 (the end of the field season), a total of 96 unique sites were sampled (Fig. 2.2-16a), many of which were long-term sampling sites also used by the ArcticNet and CASES projects. In July, a series of moorings were again collected and redeployed. In 2008, transects were sampled across the Amundsen Gulf, along the Amundsen Gulf, up the west side of Banks Island, across McClure Strait, as well as several transects from open water into fast ice or mobile pack ice. A total of 295 people spent time aboard, including 102 research scientists, 113 graduate students and post-docs, 55 technicians and research associates, and 76 for outreach. The diversity of physical and biological sampling conducted around CCGS Amundsen is illustrated in Fig. 2.2-17. This included CTD-rosette, zooplankton nets, meteorological sensors, box coring equipment and a remotely operated vehicle (ROV), as well as various kinds of moorings that were deployed throughout the project. Specialized features were the moonpool within the ship allowing deployment of equipment in winter conditions, the specialized labs including a
Portable Lab for Mercury Speciation (PILMS) with a class-100 clean room allowing for trace metal analysis, and a range of sampling vehicles including snowmo-biles, ATV, half-track and helicopter. Due to its size and complexity, the delivery of new science from the CFL project can be expected to take up to 3 years. Here, we have space for just two early examples of these novel results, one physical and one biological. Eddies in the Amundsen Gulf. Mesoscale eddies in the Arctic Ocean transport salt and heat and are con-sidered critical for the ventilation of its cold halocline layer (Muench et al., 2000; see also Timmermans et al., 2008; Spall et al., 2008). They are also a source of nu-trients and zooplankton for the Canada Basin (Llinas et al., 2008), and could play the same role for the less productive regions of the Amundsen Gulf. Three ed-dies have been observed in the Amundsen Gulf, one at the CASES winter station in Franklin Bay in Decem-ber 2003 and two more – in January 2008 and March 2008 – while the CCGS Amundsen was in drift mode in the CFL program. What make these observations important is the suite of concurrent meteorological, biological and chemical observations that the CFL Study provided. The March 2008 eddy, for example, was a subsurface feature with a core centered at 90 m. The ship-mounted ADCP captures the structure of the eddy showing a reversal of the northward flow at its center. The Amundsen eddies were generated by shallow brine convection at freezing time. As the sur-face water of the lead freezes, brine is rejected in the surface layer; this then sinks and settles at mid-depth because of the strong local stratification. The Amund-sen data set is thought to be the first complete set of
Fig. 2.2-16a. Distributed open-water sites sampled in the fall of 2007 and the summer of 2008. b. Drift stations and fast-ice stations sampled in the winter and spring of 2007–2008.(Maps: David Barber)
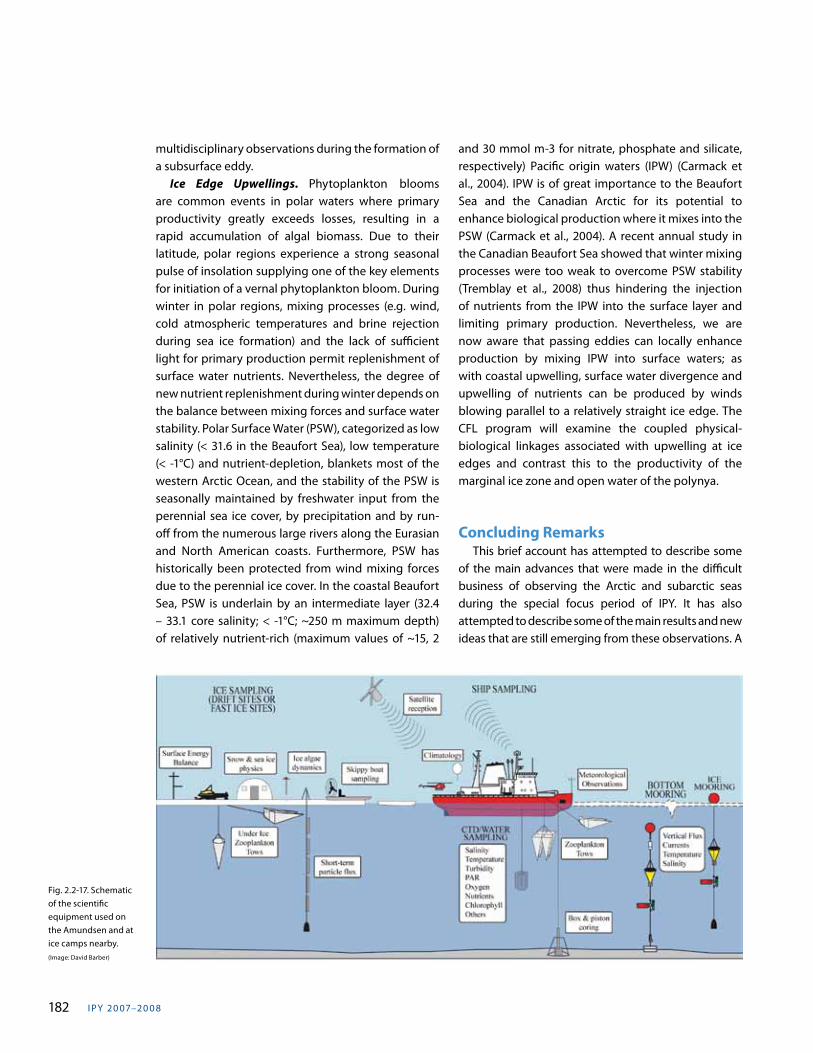
I PY 20 07–20 0 8182
Fig. 2.2-17. Schematic of the scientific equipment used on the Amundsen and at ice camps nearby. (Image: David Barber)
multidisciplinary observations during the formation of a subsurface eddy. Ice Edge Upwellings. Phytoplankton blooms are common events in polar waters where primary productivity greatly exceeds losses, resulting in a rapid accumulation of algal biomass. Due to their latitude, polar regions experience a strong seasonal pulse of insolation supplying one of the key elements for initiation of a vernal phytoplankton bloom. During winter in polar regions, mixing processes (e.g. wind, cold atmospheric temperatures and brine rejection during sea ice formation) and the lack of sufficient light for primary production permit replenishment of surface water nutrients. Nevertheless, the degree of new nutrient replenishment during winter depends on the balance between mixing forces and surface water stability. Polar Surface Water (PSW), categorized as low salinity (< 31.6 in the Beaufort Sea), low temperature (< -1°C) and nutrient-depletion, blankets most of the western Arctic Ocean, and the stability of the PSW is seasonally maintained by freshwater input from the perennial sea ice cover, by precipitation and by run-off from the numerous large rivers along the Eurasian and North American coasts. Furthermore, PSW has historically been protected from wind mixing forces due to the perennial ice cover. In the coastal Beaufort Sea, PSW is underlain by an intermediate layer (32.4 – 33.1 core salinity; < -1°C; ~250 m maximum depth) of relatively nutrient-rich (maximum values of ~15, 2
and 30 mmol m-3 for nitrate, phosphate and silicate, respectively) Pacific origin waters (IPW) (Carmack et al., 2004). IPW is of great importance to the Beaufort Sea and the Canadian Arctic for its potential to enhance biological production where it mixes into the PSW (Carmack et al., 2004). A recent annual study in the Canadian Beaufort Sea showed that winter mixing processes were too weak to overcome PSW stability (Tremblay et al., 2008) thus hindering the injection of nutrients from the IPW into the surface layer and limiting primary production. Nevertheless, we are now aware that passing eddies can locally enhance production by mixing IPW into surface waters; as with coastal upwelling, surface water divergence and upwelling of nutrients can be produced by winds blowing parallel to a relatively straight ice edge. The CFL program will examine the coupled physical-biological linkages associated with upwelling at ice edges and contrast this to the productivity of the marginal ice zone and open water of the polynya.
Concluding Remarks This brief account has attempted to describe some of the main advances that were made in the difficult business of observing the Arctic and subarctic seas during the special focus period of IPY. It has also attempted to describe some of the main results and new ideas that are still emerging from these observations. A
s C I e n C e P r o g r a m 183
References
Arrigo, KR, G. van Dijken and S. Pabi, 2008. Impact of a shrinking Arctic ice/cover on marine primary production. Geophys. Res. Lett., 35, L19603, doi:10.1029/ 2008GL035028,2008
Barber, D. G., M. Asplin, Y. Gratton, J. Lukovich, R. Gal-ley, R. Raddatz and D. Leitch, 2010. The Interna-tional Polar Year (IPY) Circumpolar Flaw Lead (CFL) System Study: Introduction and Physical System. Atmosphere-Ocean 48 (4): 225 243. doi:10.3137/OC317.2010
Beaugrand, G., P.C. Reid, F. Ibanex, J.A. Lindley and M. Edwards, 2002. Reorganisation of North Atlantic MarineCopepod Biodiversity and Climate. Science, 296:1692-1694.
Berge, J., F. Cottier, K. Last, Ø. Varpe, E. Leu, J. Søreide, K. Eiane, S. Falk-Petersen, K. J Willis, H. Nygård, D. Vogedes, C. Griffiths, G. Johnsen, D. Lorentze and A. S Brierley, 2008. Diel vertical migration of Arctic zooplankton during the polar night. Biology Let-ters, published online, October 23, doi:10.1098/rsbl.2008.0484.
Carmack, E. and F. McLaughlin, 2001. Arctic Ocean change and consequences to biodiversity: A per-
spective on linkage and scale. Mem. Natl. Polar. Res., Spec Issue. 54:365-375.
Carmack, E. and D. C. Chapman, 2003. Wind-driven shelf/basin exchange on an Arctic shelf: The joint roles of ice cover extent and shelf-break bathymetry, Geophys. Res. Lett., 30(14):1778, doi:10.1029/2003GL017526.
Carmack, E., R.W. Macdonald and S. Jasper, 2004. Phy-toplankton productivity on the Canadian Shelf of the Beaufort Sea. Marine Ecology Progress Series, 277:37-50.
Cottier, F. R., F. Nilsen, M.E. Inall, S. Gerland, V. Tverberg and H. Svendsen, 2007. Wintertime warming of an Arctic shelf in response to large-scale atmospher-ic circulation. Geophysical Research Letters, 34, doi:10.1029/2007GL029948.
de Steur L, E. Hansen, R. Gerdes, M. Karcher, E. Fahrbach and J. Holfort, 2009. Freshwater fluxes in the East Greenland Current: a decade of observations. Geo-phys. Res. Lett. 36, doi: 10.1029:2009gl041278.
Dickson, R.R., 2006. The integrated Arctic Ocean Ob-serving System (iAOOS): an AOSB-CliC Observing Plan for the International Polar Year. Oceanologia
final third element, provided in Chapter 3.3, attempts to use these results and ideas to make the case for which mix of observations to sustain into the future. The reason for attempting such a forward look is clear: if we are to develop the predictive skills and utility of climate models, we will need to observe, understand and ‘build in’ a list of processes that are not yet represented realistically (or at all) in climate models. In fact, the list is quite long (Dickson et al., 2008). It is also clear that it will be the ‘legacy phase’ of IPY, sustained over years to decades, rather than the two-year project itself that will develop our understanding of these processes, their changes, their feedbacks and their likely climatic impacts to the point where they can be of practical use to climate models. We cannot continue everything;
even if we could, it would surely be ineffectual simply to continue to observe the Arctic according to what we thought we knew before IPY. What have we learned in IPY that might help us design its observational ‘legacy phase’? At the Arctic Science Summit Week (ASSW) in Bergen in March 2009, the Arctic Ocean Sciences Board (AOSB) set itself the task of developing a proposal for an integrated, sustained and pan-Arctic observing effort focused on the role of northern seas in climate in Oslo in 2010. To achieve maximum focus, this plan is being structured around the following three questions: 1) Following IPY, how would we now define the role of the Northern Seas in Climate? 2) What questions should we be testing to help us understand that role? 3) How should we design an ocean observing system to test these questions?
I PY 20 07–20 0 8184
48(1): 5-21. Dickson, R. R., S. Dye, S. Jónsson, A. Köhl, A. Macrand-
er, M. Marnela, J. Meincke, S. Olsen, B. Rudels, H. Valdimarsson and G. Voet, 2008. The overflow flux west of Iceland: variability, origins and forcing. In Arctic Sub-Arctic Ocean fluxes: Defining the role of the Northern Seas in Climate, R. Dickson, J. Meincke and P. Rhines (eds). Springer, p. 443-474.
Dickson, R.R., Meincke, J. and Rhines, P. (eds), 2008. Arc-tic–Subarctic Ocean Fluxes: Defining the Role of the Northern Seas in Climate. Springer: 734pp.
Dickson, R.R., 2009. The integrated Arctic Ocean Ob-serving System in 2008. 82pp.; available from www.aosb.org.
Dickson, R.R. and E. Fahrbach, 2010. Observing Our Northern Seas during the IPY. What was achieved, what have we learned, where do we go from here? A Report of the Arctic Ocean Science Board and of the IPY Joint Committee. AOSB, 36 pp. http://aosb.arcticportal.org/pdf/AOSB-JC.pdf
Dodd P.A., K.J. Heywood, M.P. Meredith, A.C. Naveira-Garabato, A.D. Marca and K.K. Falkner, 2009. Sourc-es and fate of freshwater exported in the East Greenland Current. Geophys Res Lttrs, 36, L19608, doi:10.1029/2009GL039663.
Dulvy N.K., S.I. Rogers, S. Jennings, V. Stelzenmüller, S. R. Dye and H-R. Skjoldal, 2008. Climate change and deepening of the North Sea fish assemblage: a bi-otic indicator of regional warming. J. Applied Ecol-ogy, 45:1029-1039.
Edwards, M. and A.J. Richardson, 2004. Impact of cli-mate change on marine pelagic phenology and trophic mismatch. Nature, 430:881-884.
Ellingsen I.H., P. Dalpadado, D. Slagstad and H. Loeng, 2008. Impact of climatic change on the biological production in the Barents Sea. Climatic Change, 87:155-175 DOI 10.1007/s10584-007-9369-6 Envi-ronmental WG Report 1997.
Falkner, K.K., M.C. O’Brien, E.C. Carmack, F.A. McLaugh-lin, H. Melling, A. Münchow and E.P. Jones, in revi-sion. Implications of nutrient variability in passag-es of the Canadian Archipelago and Baffin Bay for fresh water through-flow and local productivity. Journal of Geophysical Research.
Falkner, K.K., M.C. O’Brien, E.C. Carmack, F.A. McLaugh-lin, H. Melling, A. Münchow and E.P. Jones, submit-ted. Interannual variability of dissolved nutrients
in the Canadian Archipelago and Baffin Bay with implications for freshwater flux. Journal of Geo-physical Research.
Gjøsæter H., 1998. The population biology and exploi-tation of capelin (Mallotus villosus) in the Barents Sea. Sarsia, 83:453–496.
Grebmeier, J. M., J. E. Overland, S. E. Moore, E. V. Farley, E. C. Carmack, L. W. Cooper, K. E. Frey, J. H. Helle, F. A. McLaughlin and S. L. McNutt, 2006. A major eco-system shift in the northern Bering Sea. Science, 311:1461–1464.
Hannah, C.G., F. Dupont, and M. Dunphy, 2009. Polyn-yas and Tidal Currents in the Canadian Arctic Archi-pelago. Arctic, 62(1), 83-95
Harris M.P., D Beare, R. Toresen, L. Nøttestad, M. Kloppmann, H. Dörner, K. Peach, D.R.A. Rushton, J. Foster-Smith and S. Wanless, 2007. A major in-crease in snake pipefish (Entelurus aequoreus) in northern European seas since 2003: potential im-plications for seabird breeding success. Mar. Biol. (2007) 151:973-98.
Holliday N.P., S.L. Hughes, A. Lavin, K.A. Mork, G. Nolan, W. Walcowski and A. Breszczynska-Moller, 2007. The end of a trend? The progression of unusu-ally warm and saline water from the eastern North Atlantic into the Arctic Ocean. CLIVAR Exchanges 12(1)pp 19-20 + figs.
Hunt, G.L., Jr., P. Stabeno, G. Walters, E. Sinclair, R.D. Brodeur, J.M. Napp and N.A. Bond, 2002. Climate change and control of the southeastern Bering Sea pelagic ecosystem. Deep Sea Research Part II, 49:5821-5853.
Huse, G. and I. Ellingsen, 2008. Capelin migrations and climate change – a modelling analysis. Climatic Change, 87, 177-197.
Inoue J. and T. Kikuchi, 2007. Outflow of summertime arctic sea ice observed by ice drifting buoys and its linkage with ice reduction and atmospheric circu-lation Patterns. Journal of the Meteorological Soci-ety of Japan, 85(6):881-887.
Jackson, J. M., E. C. Carmack, F. A. McLaughlin, S. E. Allen and R. G. Ingram, in press. Identification, character-ization and change of the near-surface tempera-ture maximum in the Canada Basin, 1993-2008 J. Geophys. Res., doi:10.1029/2009JC005265.
Johnson, K.S., et al., 2007. Developing standards for dis-solved iron in seawater. Eos, 88 (11):131–132.
s C I e n C e P r o g r a m 185
Karcher M., F. Kauker, R. Gerdes, E. Hunke and J. Zhang, 2007. On the dynamics of Atlantic Water circulation in the Arctic Ocean J. Geophys. Res 112:C04S02, doi:10.1029/2006JC003630.
Karcher M., A. Beszczynska-Möller, F. Kauker, R. Gerdes, S. Heyen, B. Rudels and U. Schauer, unpubl. Weak-ening of Atlantic Overturning as a consequence of Arctic Ocean Warming.
Kikuchi T., J. Inoue and D. Langevin, 2007. Argo-type profiling float observations under the Arctic multi-year ice. Deep-Sea Research I, 54:1675–1686.
Kliem, N. and D.A. Greenberg, 2003. Diagnostic Simu-lations of the Summer Circulation in the Canadian Arctic Archipelago. Atmosphere-Ocean 41(4):273–289.
Krishfield, R., J. Toole, A. Proshutinsky and M.L. Timmer-mans, 2008. Automated Ice-Tethered Profilers for Seawater Observations under Pack Ice in All Sea-sons. J. Atmos. Oceanic Technol., 25:2091–2105.
Leu, E., S. Falk-Petersen, S. Kwasniewski, A. Wulff, K. Ed-vardsen and D. Hessen, 2006. Fatty acid dynamics druring the spring bloom in a High Arctic fjord: importance of abiotic factors versus community changes. Canadian Journal of Fisheries and Aquat-ic Sciences, 63:2760-2779.
Llinas, L., R.S. Pickart, J.T. Mathis and S.L. Smith, 2008. Zooplankton inside an Arctic ocean cold core eddy: probable origin and fate. Deep Sea Res. II, doi: 10.1016/j.dsr2.2008.10.020.
Lovvorn J.R., S. E. Richman, J.M. Grebmeier and L.W. Cooper, 2003. Diet and Body Condition of Spec-tacled Eiders in Pack Ice of the Bering Sea, Polar Biology, 26:259-267.
Mauritzen C. + 41 co-authors., submitted. Closing the Loop – Approaches to monitoring the state of the Arctic Mediterranean during the International Po-lar Year 2007–2008. Prog. Oceanogr. special vol-ume “Arctic Marine Ecosystems in an Era of Rapid Climate Change”.
Maykut, G.A. and M.G. McPhee, 1995. Solar heating of the Arctic mixed layer J. Geophys. Res., 100(24):691-24,703.
Melle, W. and H. Skjoldal, 1998. Reproduction and de-velopment of Calanus finmarchicus, C. glacialis and C. hyperboreus in the Barents Sea. Marine Ecology-Progress Series, 169:211-228.
Melling H., T. Agnew, K. Falkner, D. Greenberg, C. Lee, A.
Muenchow, B. Petrie, S. Prinsenberg, R. Samelsen and R. Woodgate, 2008. Fresh-water fluxes via Pa-cific and Arctic Outflows across the Canadian Po-lar Shelf. In Arctic Sub-Arctic Ocean fluxes: Defining the role of the Northern Seas in Climate, R. Dickson, J. Meincke and P. Rhines (eds). Springer: p193-248.
Mork K.A. and Ø. Skagseth, 2009. Volume, heat, and freshwater fluxes towards the Arctic from com-bined altimetry and hydrography in the Norwe-gian Sea, Ocean Sci. Discuss., 6:2357–2388, www.ocean-sci-discuss.net/6/2357/2009/.
Morison, J., J.Wahr, R.Kwok and C. Peralta-Ferriz, 2007. Recent trends in Arctic Ocean mass distribution revealed by GRACE, Geophys. Lett. 34, L07602, doi:IO1029/2006 GL029016
Muench, R.D., J.T. Gunn, T.E. Withledge, P. Schlosser and W. Smethie, 2000. An Arctic Ocean cold core eddy. J. Geophys. Res., 105:23 997-24 006.
Münchow, A., K.K. Falkner and H. Melling, 2007. Spatial continuity of measured seawater and tracer fluxes through Nares Strait, a dynamically wide channel within the Canadian Archipelago. Journal of Ma-rine Research, 65: 759-788.
Mueter F.J.and M.A. Litzow, 2008. Sea Ice retreat alters the biogeography of the Bering Sea continental shelf. Ecological Applications, 18(2):309–320.
Orvik, K.A., Ø. Skagseth and M. Mork, 2001. Atlantic inflow to the Nordic Seas: current structure and volume fluxes from moored current meters, VM-ADCP and SeaSoar-CTD observations, 1995–1999. Deep-Sea Res. I, 48(4):937-957.
Overland, J.E., M. Wang and S. Salo, 2008. The recent Arctic warm period. Tellus, Ser A, 60:589-597.
Pabi, S., G.L. van Dijken and K.R. Arrigo, 2008. Pri-mary Production in the Arctic Ocean, 1998-2006. J. Geophys. Res.113, C08005, doi:10.1029/ 2007JC004578,2008.
Perry, A. L., P. J. Low, J. R. Ellis and J. D. Reynolds, 2005.Climate change and distribution shifts in marine fishes. Science 308:1912–1915.
Polyakov I.V., A. Beszczynska, E. Carmack, I. Dmitrenko, E. Fahrbach, I. Frolov, R. Gerdes, E. Hansen, J. Hol-fort, V. Ivanov, M. Johnson, M. Karcher, F. Kauker, J. Morison, K. Orvik, U. Schauer, H. Simmons, Ø. Skagseth, V. Sokolov, M. Steele, L. Timkhov, D. Walsh and J. Walsh, 2005. One more step toward a warmer Arctic, Geophys. Res. Lett., 32, L17605,
I PY 20 07–20 0 8186
doi:10.1029/2005GL023740. Polyakov I., L. Timokhov, I. Dmitrenko, V. Ivanov, H. Sim-
mons, F. McLaughlin, R. Dickson, E. Fahrbach, J-C. Gascard, P. Holliday, L. Fortier, E. Hansen, C. Mau-ritzen, J. Piechura, U. Schauer and M. Steele, 2007. The International Polar Year under the banner of Arctic Ocean warming. EOS, 88(40):398-9.
Prinsenberg, S.J. and J. Hamilton, 2005. Monitoring the Volume, Freshwater and Heat Fluxes Passing through Lancaster Sound in the Canadian Arctic Archipelago. Atmosphere-Ocean 43(1):1–22.
Rabe, B.U. Schauer, A. Mackensen, M. Karcher, E. Hansen and A. Beszczynska-Moller, 2009. Freshwater com-ponents and transports in the Fram Strait – recent observations and changes since the late 1990s. Ocean Sci., 5:219–233.
Rabe B., M. Karcher, U. Schauer, J.M. Toole, R.A. Krish-field, S. Pisarev, F. Kauker, R. Gerdes and T. Kikuchi, in press. An assessment of pan-Arctic freshwater content changes from the 1990s to the IPY period. Deep-Sea Res. 1.
Richter-Menge J.A., D.K. Perovich, B.C. Elder, K. Claffey, I. Rigor and M. Ortmeyer, 2006. Icemass-balance buoys; a tool for measuring and attributing chang-es in the thickness of the Arctic sea-ice cover. Anns Glaciol, 44:205-216.
Schauer, U., A. Beszczynska-Möller, W. Walczowski, E. Fahrbach, J. Piechura and E. Hansen, 2008.Varia-tion of Measured Heat Flow Through the Fram Strait Between 1997 and 2006. In Arctic Sub-Arctic Ocean fluxes: Defining the role of the Northern Seas in Climate, R. Dickson, J. Meincke and P. Rhines (eds). Springer: p65-85.
Schauer, U. and A. Beszczynska-Möller, 2009. Problems with estimation and interpretation of oceanic heat transport – conceptual remarks for the case of Fram Strait in the Arctic Ocean. Ocean Sci., 5:487–494, www.ocean-sci.net/5/487/2009/.
Shimada, K., T. Kamoshida, M. Itoh, S. Nishino, E. Car-mack, F. McLaughlin, S. Zimmerman and A. Proshutinsky, 2006. Pacific Ocean inflow: Influence on catastrophic reduction of sea ice cover in the Arctic Ocean” Geophys. Res. Lett., 33, L08605, 596 oi:10.1029/2005GL025624.
Smith, W.O. and D.G Barber, (eds), 2007. Polynyas: Win-dows to the world. Elsevier Oceanographic Series 74. Amsterdam: Elsevier, 458 pages.
Spall, M.A., R.S. Pickart, P.S. Fratatoni and A.J. Plued-demann, 2008. Western Arctic Shelfbreak ed-dies: formation and transport. J. Phys. Oceanogr, 38:1644-1668.
Stirling, I. 1980. The biological importance of polynyas in the Canadian Arctic. Arctic 33: 303-315.
Sundby, S. and Nakken, O., 2005. Spatial shifts in spaw-ing habits of Arcto-Norwegian cod induced by climate change. Globec International Newsletter 11:1, 26.
Timmermans, M.-L., J. Toole, A. Proshutinsky, R. Krish-field and A.J. Plueddemann, 2008. Eddies in the Canada basin, Arctic Ocean, observed from teth-ered profilers. J. Phys. Oceanogr., 38:133-145.
Toole, J.M., M.-L. Timmermans, D. K. Perovich, R. A. Krishfield, A. Proshutinsky and J.A. Richter-Menge in press. Influences of the ocean surface mixed lay-er and thermohaline stratification on arctic sea ice in the Central Canada Basin.
Tremblay, J-E., K. Simpson, J. Martin, L. Miller, Y. Grat-ton, D. Barber and N. Price, 2008. Vertical stabil-ity and the annual dynamics of nutrients and chlorophyll fluorescence in the coastal, south-east Beaufort Sea. J. Geophys. Res., 113, C07S90, doi:10.1029/2007JC004547
Vinogradova, N., R. M. Ponte and D. Stammer, 2007. Relation between sea level and bottom pres-sure and the vertical dependence of oceanic variability. Geophys. Res. Lett., 34, L03608, doi:10.1029.2006GL028588.
Wassmann P., D. Slagstad, C.W. Riser and M. Reigstad, 2006. Modelling the ecosystem dynamics of the Barents Sea including the marginal ice zone II. Car-bon flux and interannual variability. J. Mar. Syst., 59:1–24.
Willis, K. J., F. R Cottier, I. S Kwasniewski., A Wold. and S Falk-Petersen, 2006. The influence of advection on zooplankton community composition in an Arctic fjord (Kongsfjorden, Svalbard). Journal of Marine Systems, 61:39-54.
Yamamoto-Kawai, M., F.A. McLaughlin, E.C. Carmack, S. Nishino, K. Shimada and N. Kurita, 2009. Surface freshening of the Canada Basin 2003-2007: river runoff versus sea-ice meltwater. J. Geophys. Res., 114, C00A05, doi:10.1029/2008JC005000.
s C I e n C e P r o g r a m 187
2.3 Southern Ocean
Lead Authors:Stephen R. Rintoul and Eberhard Fahrbach
Contributing Authors:D. Abele, S. Ackley, I. Allison, A. Bowie, A. Brandt, C. Brussaard, R. D. Cavanagh, B. Danis, H. De Baar, C. De Broyer, C. Evans, K. Heywood, E. Hofmann, M. Hoppema, S.A. Iversen, N. M. Johnston, A. Klepikov, A. J. Luis, E. J. Murphy, H. Segers, V. Strass, C. Summerhayes, C. Tancell, V. Wadley, P. Woodworth and A. Worby
Reviewers:Eduard Sarukhanian and Michael Sparrow
PA R T T W O : I P Y S C I E N C E P R O G R A M
Introduction Recent scientific advances have led to growing recognition that Southern Ocean processes influence climate and biogeochemical cycles on global scales. The Southern Ocean connects the ocean basins and links the shallow and deep limbs of the overturning circulation, a global-scale system of ocean currents that influences how much heat and carbon the ocean can store (Rintoul et al., 2001). The upwelling of deep waters returns carbon (e.g. le Queré et al., 2007) and nutrients (e.g. Sarmiento et al., 2004) to the surface ocean; the compensating sinking of surface waters into the ocean interior sequesters carbon and heat and renews oxygen levels. The capacity of the ocean to moderate the pace of climate change is controlled strongly by the circulation of the Southern Ocean. The future of the Antarctic ice sheet, and therefore sea-level rise, is increasingly understood to be determined by the rate at which the relatively warm ocean can melt floating glacial ice around the margin of Antarctica (Rignot and Jacobs, 2002). The expansion and contraction of Antarctic sea ice influences surface albedo, air-sea exchange of heat and of gases, such as carbon dioxide and oxygen, and the habitat for a variety of marine organisms (Thomas and Dieckmann, 2002). The Southern Ocean is also home to unique and productive ecosystems and rich biodiversity. Given the significance of the Southern Ocean to the Earth system, any change in the region would have impacts that extend well beyond the high southern latitudes. Recent studies suggest change is underway: the Southern Ocean is warming and freshening throughout most of the ocean depth (Gille, 2008;
Böning et al., 2008); major currents are shifting to the south, causing regional changes in sea-level (Sokolov and Rintoul, 2009a,b) and the distribution of organisms (Cubillos et al., 2007), and supplying additional heat to melt ice around the rim of Antarctica (Jacobs, 2006); and the future of the Southern Ocean carbon sink is a topic of vigorous debate (le Queré et al., 2007; Böning et al., 2008). Climate feedbacks involving ocean circulation, changes in sea ice (hence albedo) and the carbon cycle have the potential to alter rates of climate change in the future, but the magnitude and likelihood of such feedbacks remains poorly understood. Progress in understanding Southern Ocean pro-cesses has been slowed by the historical lack of ob-servations in this remote part of the globe. Growing recognition of the importance of the Southern Ocean has resulted in an increasing focus on the region; at the same time, new technologies have led to great improvements in our ability to observe the Southern Ocean. International Polar Year 2007–2008 effectively harnessed the human and logistic resources of the international community and exploited technology developments to deliver an unprecedented view of the status of the Southern Ocean, provided a baseline for assessing change and demonstrated the feasibility, value and timeliness of a Southern Ocean Observing System (Chapter 3.3). During IPY, a circumpolar, mul-tidisciplinary snapshot of the status of the Southern Ocean was obtained for the first time; many proper-ties, processes or regions had not been measured be-fore. Scientists from more than 25 nations participated in Southern Ocean IPY.
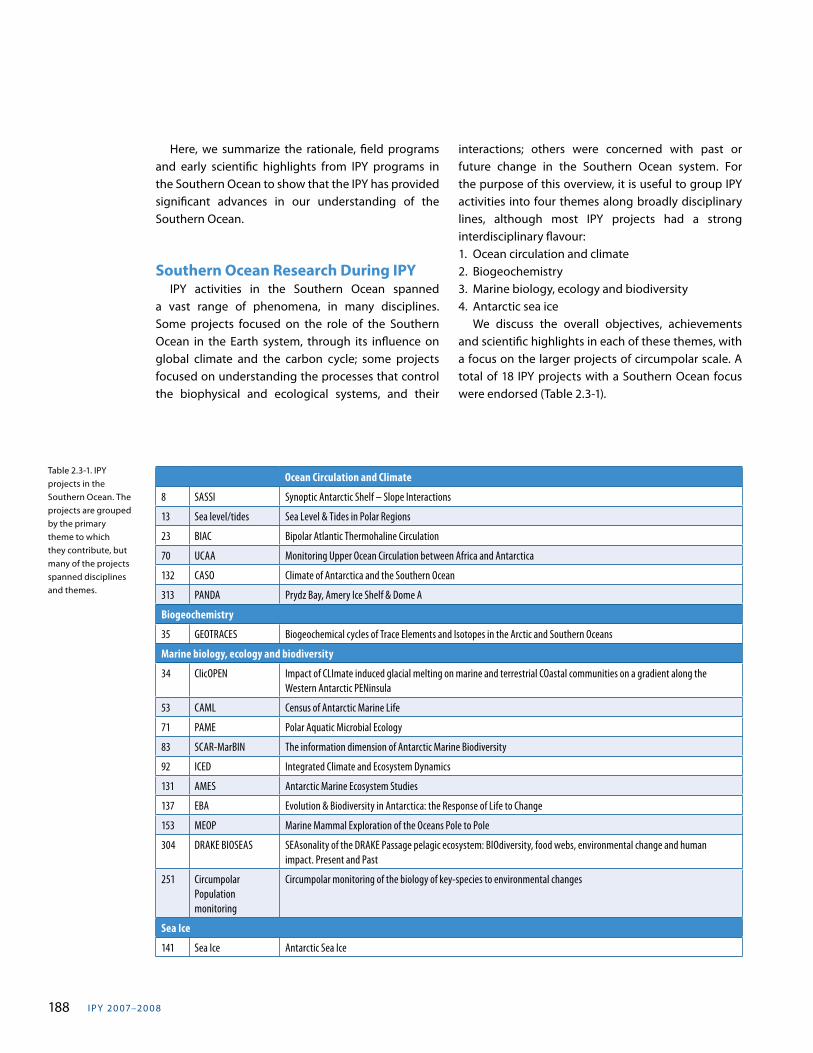
I PY 20 07–20 0 8188
Here, we summarize the rationale, field programs and early scientific highlights from IPY programs in the Southern Ocean to show that the IPY has provided significant advances in our understanding of the Southern Ocean.
Southern Ocean Research During IPY IPY activities in the Southern Ocean spanned a vast range of phenomena, in many disciplines. Some projects focused on the role of the Southern Ocean in the Earth system, through its influence on global climate and the carbon cycle; some projects focused on understanding the processes that control the biophysical and ecological systems, and their
Table 2.3-1. IPY projects in the Southern Ocean. The projects are grouped by the primary theme to which they contribute, but many of the projects spanned disciplines and themes.
interactions; others were concerned with past or future change in the Southern Ocean system. For the purpose of this overview, it is useful to group IPY activities into four themes along broadly disciplinary lines, although most IPY projects had a strong interdisciplinary flavour:1. Ocean circulation and climate2. Biogeochemistry3. Marine biology, ecology and biodiversity4. Antarctic sea ice We discuss the overall objectives, achievements and scientific highlights in each of these themes, with a focus on the larger projects of circumpolar scale. A total of 18 IPY projects with a Southern Ocean focus were endorsed (Table 2.3-1).
Ocean Circulation and Climate
8 SASSI Synoptic Antarctic Shelf – Slope Interactions
13 Sea level/tides Sea Level & Tides in Polar Regions
23 BIAC Bipolar Atlantic Thermohaline Circulation
70 UCAA Monitoring Upper Ocean Circulation between Africa and Antarctica
132 CASO Climate of Antarctica and the Southern Ocean
313 PANDA Prydz Bay, Amery Ice Shelf & Dome A
Biogeochemistry
35 GEOTRACES Biogeochemical cycles of Trace Elements and Isotopes in the Arctic and Southern Oceans
Marine biology, ecology and biodiversity
34 ClicOPEN Impact of CLImate induced glacial melting on marine and terrestrial COastal communities on a gradient along the Western Antarctic PENinsula
53 CAML Census of Antarctic Marine Life
71 PAME Polar Aquatic Microbial Ecology
83 SCAR-MarBIN The information dimension of Antarctic Marine Biodiversity
92 ICED Integrated Climate and Ecosystem Dynamics
131 AMES Antarctic Marine Ecosystem Studies
137 EBA Evolution & Biodiversity in Antarctica: the Response of Life to Change
153 MEOP Marine Mammal Exploration of the Oceans Pole to Pole
304 DRAKE BIOSEAS SEAsonality of the DRAKE Passage pelagic ecosystem: BIOdiversity, food webs, environmental change and human impact. Present and Past
251 Circumpolar Population monitoring
Circumpolar monitoring of the biology of key-species to environmental changes
Sea Ice
141 Sea Ice Antarctic Sea Ice
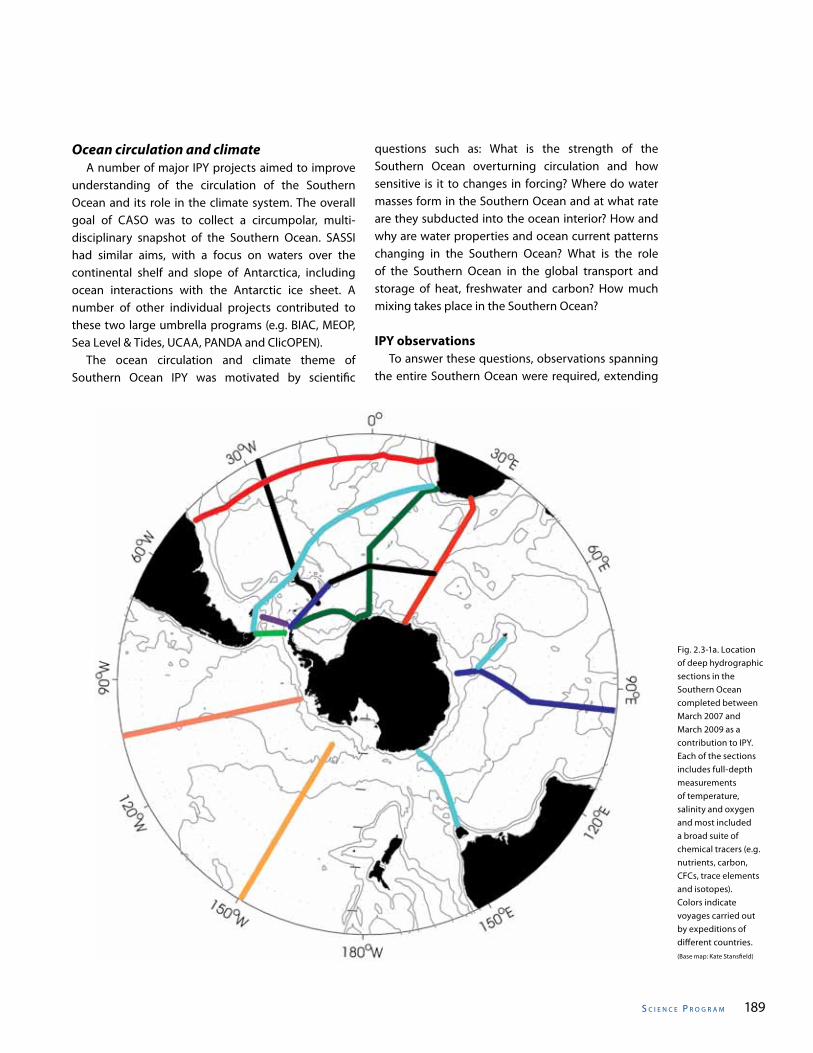
s C I e n C e P r o g r a m 189
Ocean circulation and climate A number of major IPY projects aimed to improve understanding of the circulation of the Southern Ocean and its role in the climate system. The overall goal of CASO was to collect a circumpolar, multi-disciplinary snapshot of the Southern Ocean. SASSI had similar aims, with a focus on waters over the continental shelf and slope of Antarctica, including ocean interactions with the Antarctic ice sheet. A number of other individual projects contributed to these two large umbrella programs (e.g. BIAC, MEOP, Sea Level & Tides, UCAA, PANDA and ClicOPEN). The ocean circulation and climate theme of Southern Ocean IPY was motivated by scientific
questions such as: What is the strength of the Southern Ocean overturning circulation and how sensitive is it to changes in forcing? Where do water masses form in the Southern Ocean and at what rate are they subducted into the ocean interior? How and why are water properties and ocean current patterns changing in the Southern Ocean? What is the role of the Southern Ocean in the global transport and storage of heat, freshwater and carbon? How much mixing takes place in the Southern Ocean?
IPY observations To answer these questions, observations spanning the entire Southern Ocean were required, extending
Fig. 2.3-1a. Location of deep hydrographic sections in the Southern Ocean completed between March 2007 and March 2009 as a contribution to IPY. Each of the sections includes full-depth measurements of temperature, salinity and oxygen and most included a broad suite of chemical tracers (e.g. nutrients, carbon, CFCs, trace elements and isotopes). Colors indicate voyages carried out by expeditions of different countries.(Base map: Kate Stansfield)
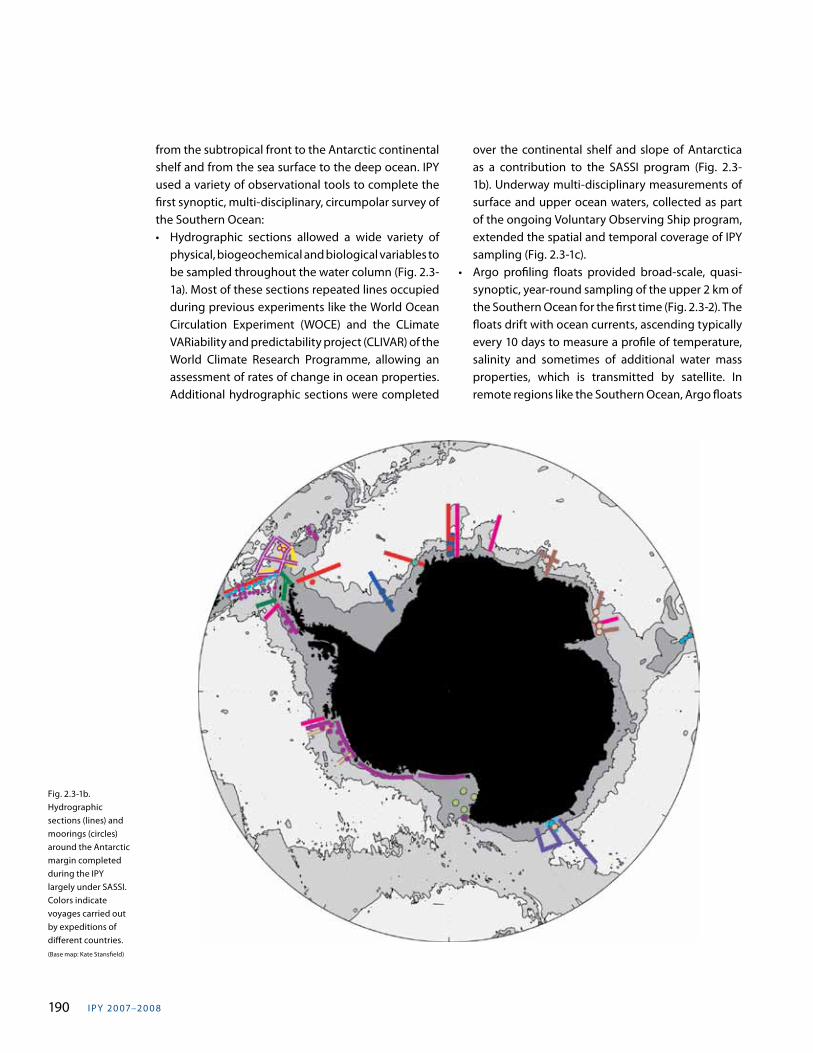
I PY 20 07–20 0 8190
Fig. 2.3-1b. Hydrographic sections (lines) and moorings (circles) around the Antarctic margin completed during the IPY largely under SASSI. Colors indicate voyages carried out by expeditions of different countries.(Base map: Kate Stansfield)
from the subtropical front to the Antarctic continental shelf and from the sea surface to the deep ocean. IPY used a variety of observational tools to complete the first synoptic, multi-disciplinary, circumpolar survey of the Southern Ocean: • Hydrographic sections allowed a wide variety of
physical, biogeochemical and biological variables to be sampled throughout the water column (Fig. 2.3-1a). Most of these sections repeated lines occupied during previous experiments like the World Ocean Circulation Experiment (WOCE) and the CLimate VARiability and predictability project (CLIVAR) of the World Climate Research Programme, allowing an assessment of rates of change in ocean properties. Additional hydrographic sections were completed
over the continental shelf and slope of Antarctica as a contribution to the SASSI program (Fig. 2.3-1b). Underway multi-disciplinary measurements of surface and upper ocean waters, collected as part of the ongoing Voluntary Observing Ship program, extended the spatial and temporal coverage of IPY sampling (Fig. 2.3-1c).
• Argo profiling floats provided broad-scale, quasi-synoptic, year-round sampling of the upper 2 km of the Southern Ocean for the first time (Fig. 2.3-2). The floats drift with ocean currents, ascending typically every 10 days to measure a profile of temperature, salinity and sometimes of additional water mass properties, which is transmitted by satellite. In remote regions like the Southern Ocean, Argo floats
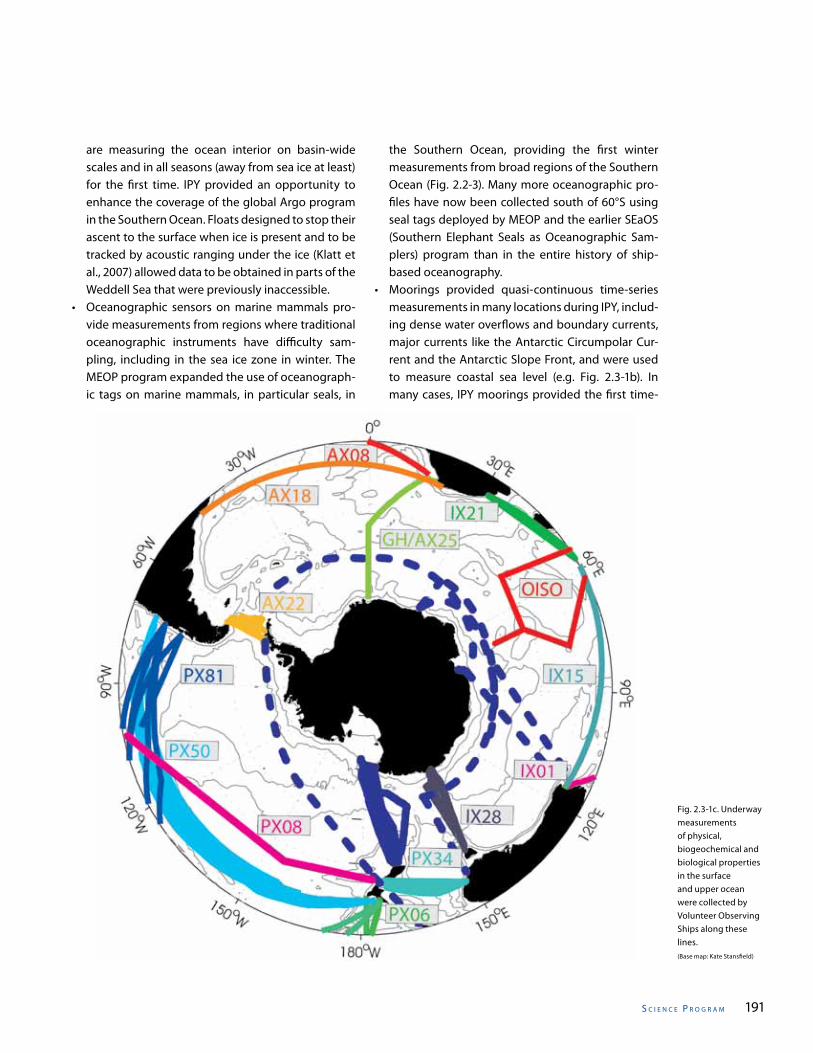
s C I e n C e P r o g r a m 191
are measuring the ocean interior on basin-wide scales and in all seasons (away from sea ice at least) for the first time. IPY provided an opportunity to enhance the coverage of the global Argo program in the Southern Ocean. Floats designed to stop their ascent to the surface when ice is present and to be tracked by acoustic ranging under the ice (Klatt et al., 2007) allowed data to be obtained in parts of the Weddell Sea that were previously inaccessible.
• Oceanographic sensors on marine mammals pro-vide measurements from regions where traditional oceanographic instruments have difficulty sam-pling, including in the sea ice zone in winter. The MEOP program expanded the use of oceanograph-ic tags on marine mammals, in particular seals, in
the Southern Ocean, providing the first winter measurements from broad regions of the Southern Ocean (Fig. 2.2-3). Many more oceanographic pro-files have now been collected south of 60°S using seal tags deployed by MEOP and the earlier SEaOS (Southern Elephant Seals as Oceanographic Sam-plers) program than in the entire history of ship-based oceanography.
• Moorings provided quasi-continuous time-series measurements in many locations during IPY, includ-ing dense water overflows and boundary currents, major currents like the Antarctic Circumpolar Cur-rent and the Antarctic Slope Front, and were used to measure coastal sea level (e.g. Fig. 2.3-1b). In many cases, IPY moorings provided the first time-
Fig. 2.3-1c. Underway measurements of physical, biogeochemical and biological properties in the surface and upper ocean were collected by Volunteer Observing Ships along these lines.(Base map: Kate Stansfield)
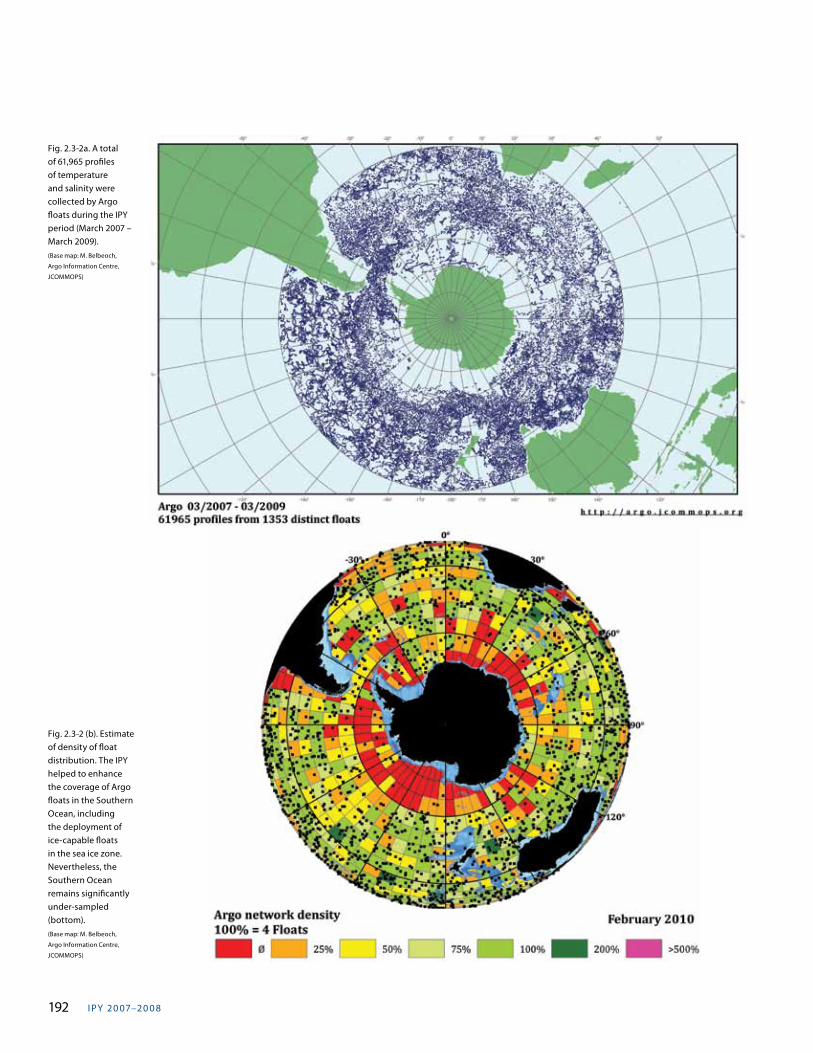
I PY 20 07–20 0 8192
Fig. 2.3-2a. A total of 61,965 profiles of temperature and salinity were collected by Argo floats during the IPY period (March 2007 – March 2009). (Base map: M. Belbeoch,
Argo Information Centre,
JCOMMOPS)
Fig. 2.3-2 (b). Estimate of density of float distribution. The IPY helped to enhance the coverage of Argo floats in the Southern Ocean, including the deployment of ice-capable floats in the sea ice zone. Nevertheless, the Southern Ocean remains significantly under-sampled (bottom).(Base map: M. Belbeoch,
Argo Information Centre,
JCOMMOPS)
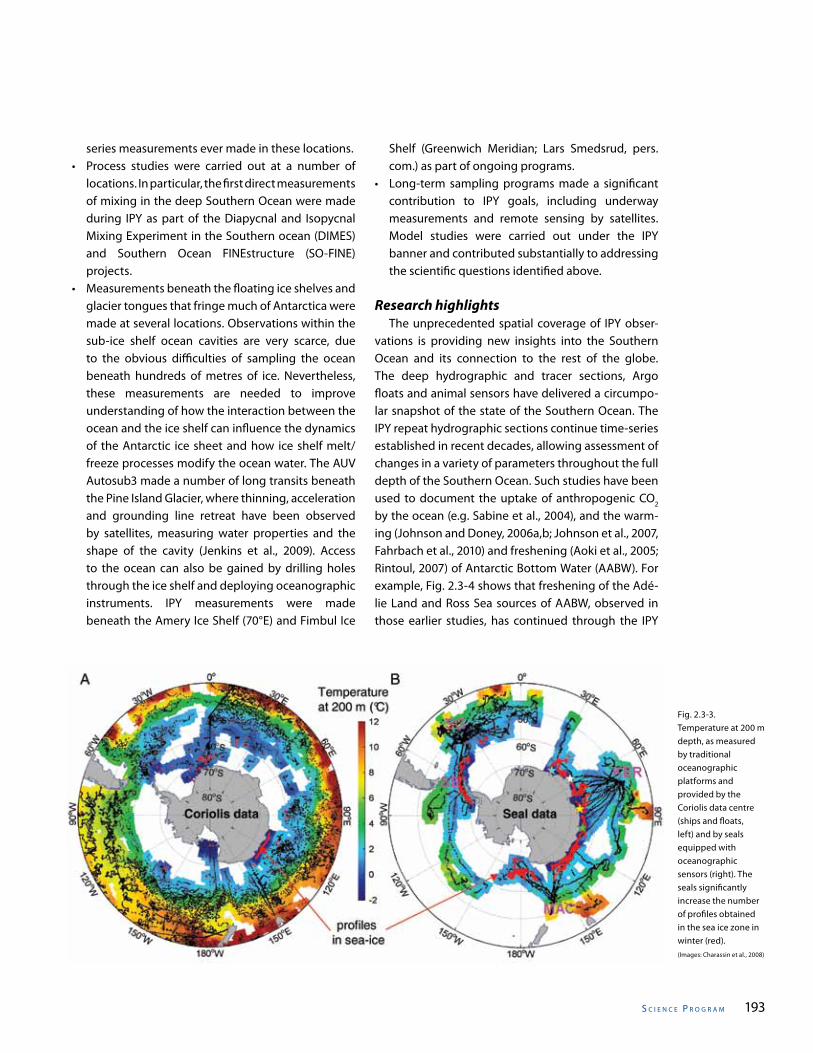
s C I e n C e P r o g r a m 193
series measurements ever made in these locations.• Process studies were carried out at a number of
locations. In particular, the first direct measurements of mixing in the deep Southern Ocean were made during IPY as part of the Diapycnal and Isopycnal Mixing Experiment in the Southern ocean (DIMES) and Southern Ocean FINEstructure (SO-FINE) projects.
• Measurements beneath the floating ice shelves and glacier tongues that fringe much of Antarctica were made at several locations. Observations within the sub-ice shelf ocean cavities are very scarce, due to the obvious difficulties of sampling the ocean beneath hundreds of metres of ice. Nevertheless, these measurements are needed to improve understanding of how the interaction between the ocean and the ice shelf can influence the dynamics of the Antarctic ice sheet and how ice shelf melt/freeze processes modify the ocean water. The AUV Autosub3 made a number of long transits beneath the Pine Island Glacier, where thinning, acceleration and grounding line retreat have been observed by satellites, measuring water properties and the shape of the cavity (Jenkins et al., 2009). Access to the ocean can also be gained by drilling holes through the ice shelf and deploying oceanographic instruments. IPY measurements were made beneath the Amery Ice Shelf (70°E) and Fimbul Ice
Fig. 2.3-3. Temperature at 200 m depth, as measured by traditional oceanographic platforms and provided by the Coriolis data centre (ships and floats, left) and by seals equipped with oceanographic sensors (right). The seals significantly increase the number of profiles obtained in the sea ice zone in winter (red).(Images: Charassin et al., 2008)
Shelf (Greenwich Meridian; Lars Smedsrud, pers. com.) as part of ongoing programs.
• Long-term sampling programs made a significant contribution to IPY goals, including underway measurements and remote sensing by satellites. Model studies were carried out under the IPY banner and contributed substantially to addressing the scientific questions identified above.
Research highlights The unprecedented spatial coverage of IPY obser-vations is providing new insights into the Southern Ocean and its connection to the rest of the globe. The deep hydrographic and tracer sections, Argo floats and animal sensors have delivered a circumpo-lar snapshot of the state of the Southern Ocean. The IPY repeat hydrographic sections continue time-series established in recent decades, allowing assessment of changes in a variety of parameters throughout the full depth of the Southern Ocean. Such studies have been used to document the uptake of anthropogenic CO2 by the ocean (e.g. Sabine et al., 2004), and the warm-ing (Johnson and Doney, 2006a,b; Johnson et al., 2007, Fahrbach et al., 2010) and freshening (Aoki et al., 2005; Rintoul, 2007) of Antarctic Bottom Water (AABW). For example, Fig. 2.3-4 shows that freshening of the Adé-lie Land and Ross Sea sources of AABW, observed in those earlier studies, has continued through the IPY
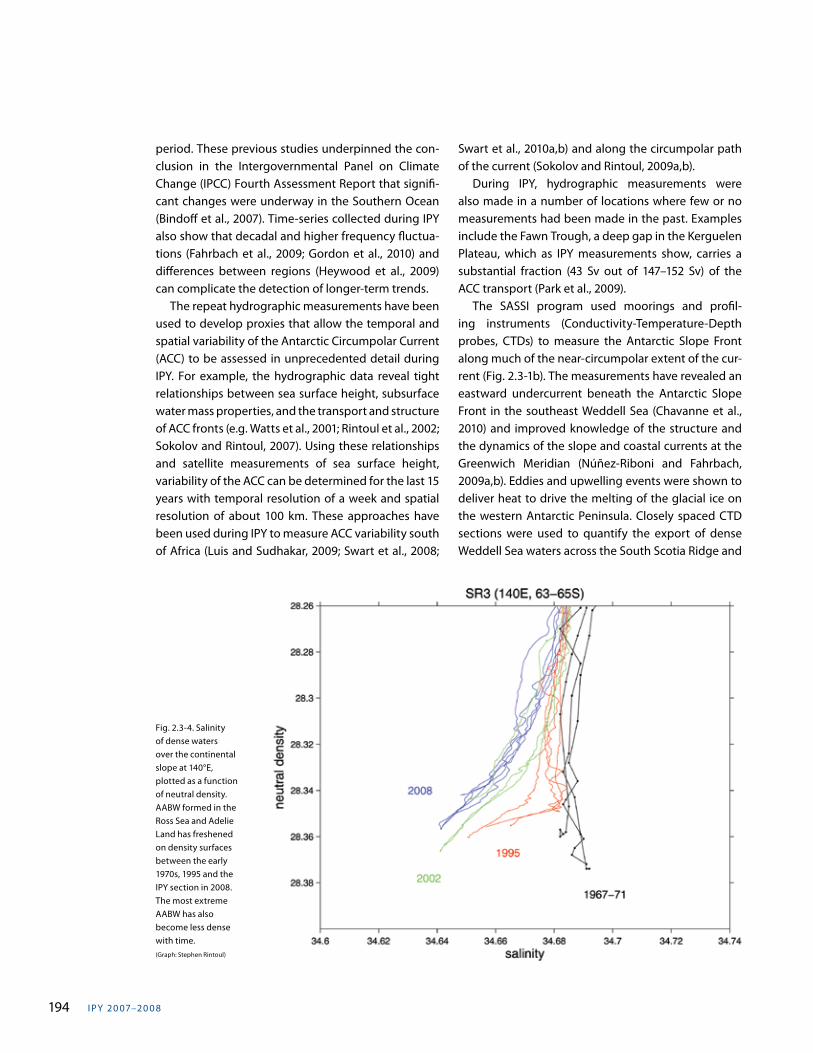
I PY 20 07–20 0 8194
period. These previous studies underpinned the con-clusion in the Intergovernmental Panel on Climate Change (IPCC) Fourth Assessment Report that signifi-cant changes were underway in the Southern Ocean (Bindoff et al., 2007). Time-series collected during IPY also show that decadal and higher frequency fluctua-tions (Fahrbach et al., 2009; Gordon et al., 2010) and differences between regions (Heywood et al., 2009) can complicate the detection of longer-term trends. The repeat hydrographic measurements have been used to develop proxies that allow the temporal and spatial variability of the Antarctic Circumpolar Current (ACC) to be assessed in unprecedented detail during IPY. For example, the hydrographic data reveal tight relationships between sea surface height, subsurface water mass properties, and the transport and structure of ACC fronts (e.g. Watts et al., 2001; Rintoul et al., 2002; Sokolov and Rintoul, 2007). Using these relationships and satellite measurements of sea surface height, variability of the ACC can be determined for the last 15 years with temporal resolution of a week and spatial resolution of about 100 km. These approaches have been used during IPY to measure ACC variability south of Africa (Luis and Sudhakar, 2009; Swart et al., 2008;
Swart et al., 2010a,b) and along the circumpolar path of the current (Sokolov and Rintoul, 2009a,b). During IPY, hydrographic measurements were also made in a number of locations where few or no measurements had been made in the past. Examples include the Fawn Trough, a deep gap in the Kerguelen Plateau, which as IPY measurements show, carries a substantial fraction (43 Sv out of 147–152 Sv) of the ACC transport (Park et al., 2009). The SASSI program used moorings and profil-ing instruments (Conductivity-Temperature-Depth probes, CTDs) to measure the Antarctic Slope Front along much of the near-circumpolar extent of the cur-rent (Fig. 2.3-1b). The measurements have revealed an eastward undercurrent beneath the Antarctic Slope Front in the southeast Weddell Sea (Chavanne et al., 2010) and improved knowledge of the structure and the dynamics of the slope and coastal currents at the Greenwich Meridian (Núñez-Riboni and Fahrbach, 2009a,b). Eddies and upwelling events were shown to deliver heat to drive the melting of the glacial ice on the western Antarctic Peninsula. Closely spaced CTD sections were used to quantify the export of dense Weddell Sea waters across the South Scotia Ridge and
Fig. 2.3-4. Salinity of dense waters over the continental slope at 140°E, plotted as a function of neutral density. AABW formed in the Ross Sea and Adelie Land has freshened on density surfaces between the early 1970s, 1995 and the IPY section in 2008. The most extreme AABW has also become less dense with time. (Graph: Stephen Rintoul)
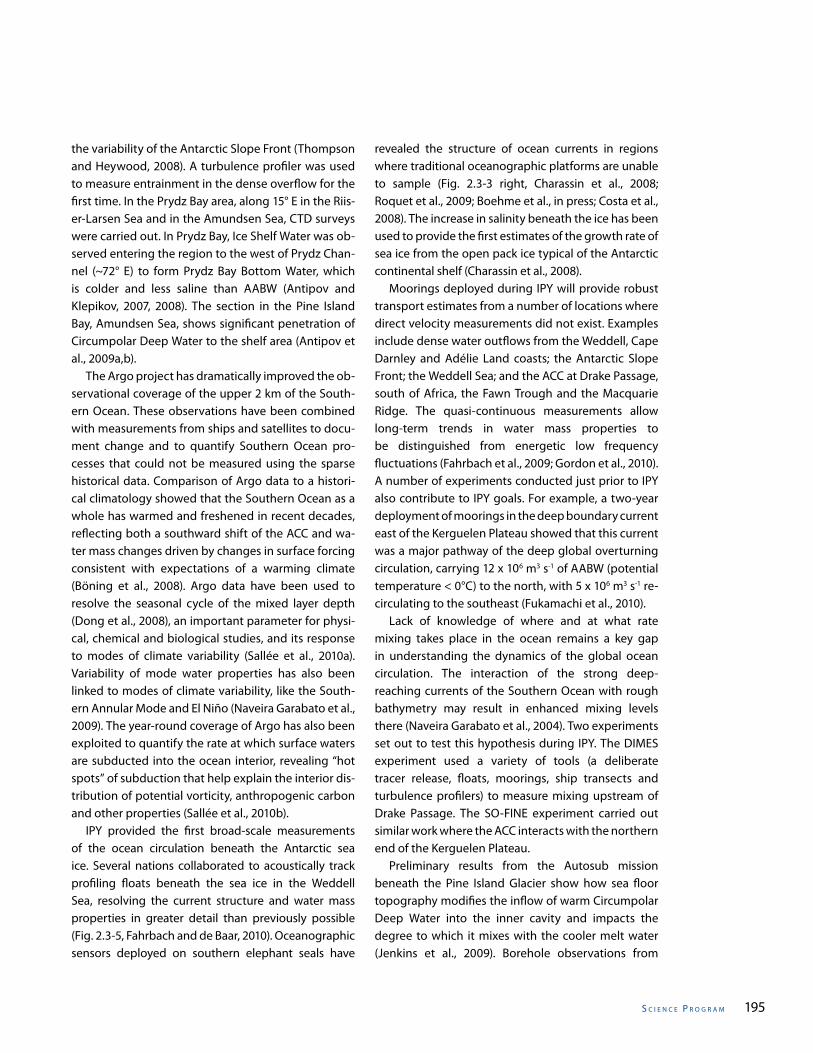
s C I e n C e P r o g r a m 195
the variability of the Antarctic Slope Front (Thompson and Heywood, 2008). A turbulence profiler was used to measure entrainment in the dense overflow for the first time. In the Prydz Bay area, along 15° E in the Riis-er-Larsen Sea and in the Amundsen Sea, CTD surveys were carried out. In Prydz Bay, Ice Shelf Water was ob-served entering the region to the west of Prydz Chan-nel (~72° E) to form Prydz Bay Bottom Water, which is colder and less saline than AABW (Antipov and Klepikov, 2007, 2008). The section in the Pine Island Bay, Amundsen Sea, shows significant penetration of Circumpolar Deep Water to the shelf area (Antipov et al., 2009a,b). The Argo project has dramatically improved the ob-servational coverage of the upper 2 km of the South-ern Ocean. These observations have been combined with measurements from ships and satellites to docu-ment change and to quantify Southern Ocean pro-cesses that could not be measured using the sparse historical data. Comparison of Argo data to a histori-cal climatology showed that the Southern Ocean as a whole has warmed and freshened in recent decades, reflecting both a southward shift of the ACC and wa-ter mass changes driven by changes in surface forcing consistent with expectations of a warming climate (Böning et al., 2008). Argo data have been used to resolve the seasonal cycle of the mixed layer depth (Dong et al., 2008), an important parameter for physi-cal, chemical and biological studies, and its response to modes of climate variability (Sallée et al., 2010a). Variability of mode water properties has also been linked to modes of climate variability, like the South-ern Annular Mode and El Niño (Naveira Garabato et al., 2009). The year-round coverage of Argo has also been exploited to quantify the rate at which surface waters are subducted into the ocean interior, revealing “hot spots” of subduction that help explain the interior dis-tribution of potential vorticity, anthropogenic carbon and other properties (Sallée et al., 2010b). IPY provided the first broad-scale measurements of the ocean circulation beneath the Antarctic sea ice. Several nations collaborated to acoustically track profiling floats beneath the sea ice in the Weddell Sea, resolving the current structure and water mass properties in greater detail than previously possible (Fig. 2.3-5, Fahrbach and de Baar, 2010). Oceanographic sensors deployed on southern elephant seals have
revealed the structure of ocean currents in regions where traditional oceanographic platforms are unable to sample (Fig. 2.3-3 right, Charassin et al., 2008; Roquet et al., 2009; Boehme et al., in press; Costa et al., 2008). The increase in salinity beneath the ice has been used to provide the first estimates of the growth rate of sea ice from the open pack ice typical of the Antarctic continental shelf (Charassin et al., 2008). Moorings deployed during IPY will provide robust transport estimates from a number of locations where direct velocity measurements did not exist. Examples include dense water outflows from the Weddell, Cape Darnley and Adélie Land coasts; the Antarctic Slope Front; the Weddell Sea; and the ACC at Drake Passage, south of Africa, the Fawn Trough and the Macquarie Ridge. The quasi-continuous measurements allow long-term trends in water mass properties to be distinguished from energetic low frequency fluctuations (Fahrbach et al., 2009; Gordon et al., 2010). A number of experiments conducted just prior to IPY also contribute to IPY goals. For example, a two-year deployment of moorings in the deep boundary current east of the Kerguelen Plateau showed that this current was a major pathway of the deep global overturning circulation, carrying 12 x 106 m3 s-1 of AABW (potential temperature < 0°C) to the north, with 5 x 10⁶ m3 s-1 re-circulating to the southeast (Fukamachi et al., 2010). Lack of knowledge of where and at what rate mixing takes place in the ocean remains a key gap in understanding the dynamics of the global ocean circulation. The interaction of the strong deep-reaching currents of the Southern Ocean with rough bathymetry may result in enhanced mixing levels there (Naveira Garabato et al., 2004). Two experiments set out to test this hypothesis during IPY. The DIMES experiment used a variety of tools (a deliberate tracer release, floats, moorings, ship transects and turbulence profilers) to measure mixing upstream of Drake Passage. The SO-FINE experiment carried out similar work where the ACC interacts with the northern end of the Kerguelen Plateau. Preliminary results from the Autosub mission beneath the Pine Island Glacier show how sea floor topography modifies the inflow of warm Circumpolar Deep Water into the inner cavity and impacts the degree to which it mixes with the cooler melt water (Jenkins et al., 2009). Borehole observations from
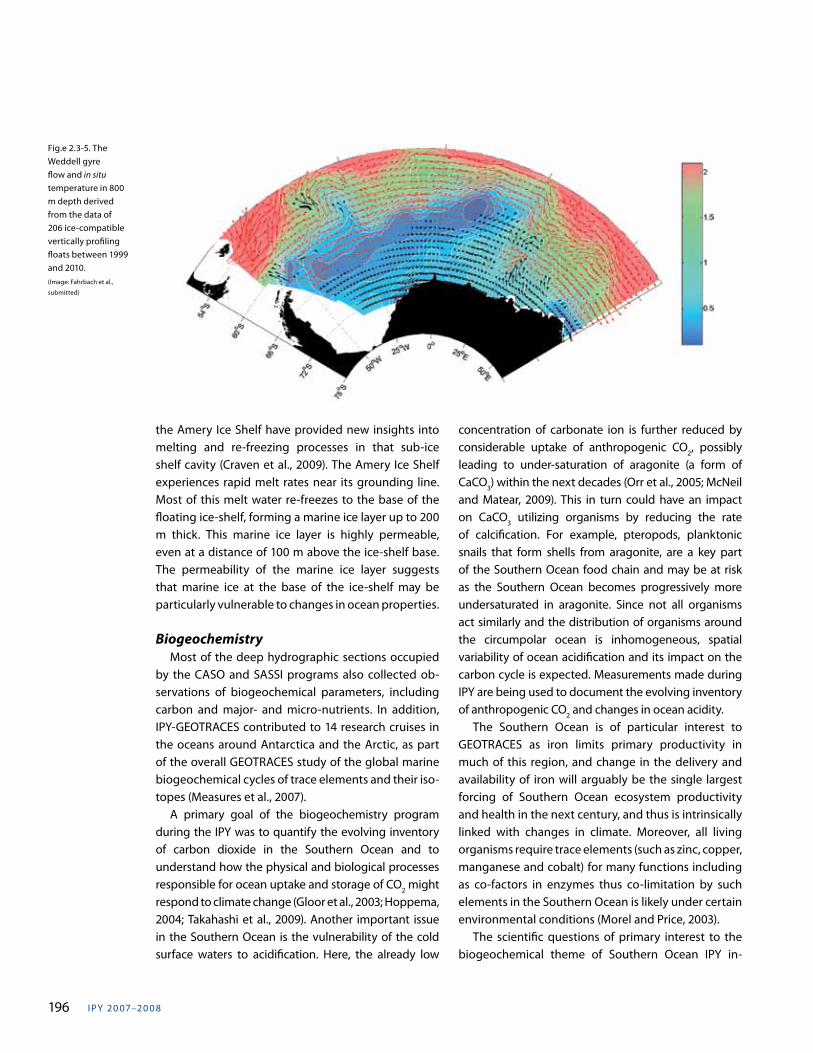
I PY 20 07–20 0 8196
the Amery Ice Shelf have provided new insights into melting and re-freezing processes in that sub-ice shelf cavity (Craven et al., 2009). The Amery Ice Shelf experiences rapid melt rates near its grounding line. Most of this melt water re-freezes to the base of the floating ice-shelf, forming a marine ice layer up to 200 m thick. This marine ice layer is highly permeable, even at a distance of 100 m above the ice-shelf base. The permeability of the marine ice layer suggests that marine ice at the base of the ice-shelf may be particularly vulnerable to changes in ocean properties.
Biogeochemistry Most of the deep hydrographic sections occupied by the CASO and SASSI programs also collected ob-servations of biogeochemical parameters, including carbon and major- and micro-nutrients. In addition, IPY-GEOTRACES contributed to 14 research cruises in the oceans around Antarctica and the Arctic, as part of the overall GEOTRACES study of the global marine biogeochemical cycles of trace elements and their iso-topes (Measures et al., 2007). A primary goal of the biogeochemistry program during the IPY was to quantify the evolving inventory of carbon dioxide in the Southern Ocean and to understand how the physical and biological processes responsible for ocean uptake and storage of CO2 might respond to climate change (Gloor et al., 2003; Hoppema, 2004; Takahashi et al., 2009). Another important issue in the Southern Ocean is the vulnerability of the cold surface waters to acidification. Here, the already low
Fig.e 2.3-5. The Weddell gyre flow and in situ temperature in 800 m depth derived from the data of 206 ice-compatible vertically profiling floats between 1999 and 2010. (Image: Fahrbach et al.,
submitted)
concentration of carbonate ion is further reduced by considerable uptake of anthropogenic CO2, possibly leading to under-saturation of aragonite (a form of CaCO3) within the next decades (Orr et al., 2005; McNeil and Matear, 2009). This in turn could have an impact on CaCO3 utilizing organisms by reducing the rate of calcification. For example, pteropods, planktonic snails that form shells from aragonite, are a key part of the Southern Ocean food chain and may be at risk as the Southern Ocean becomes progressively more undersaturated in aragonite. Since not all organisms act similarly and the distribution of organisms around the circumpolar ocean is inhomogeneous, spatial variability of ocean acidification and its impact on the carbon cycle is expected. Measurements made during IPY are being used to document the evolving inventory of anthropogenic CO2 and changes in ocean acidity. The Southern Ocean is of particular interest to GEOTRACES as iron limits primary productivity in much of this region, and change in the delivery and availability of iron will arguably be the single largest forcing of Southern Ocean ecosystem productivity and health in the next century, and thus is intrinsically linked with changes in climate. Moreover, all living organisms require trace elements (such as zinc, copper, manganese and cobalt) for many functions including as co-factors in enzymes thus co-limitation by such elements in the Southern Ocean is likely under certain environmental conditions (Morel and Price, 2003). The scientific questions of primary interest to the biogeochemical theme of Southern Ocean IPY in-
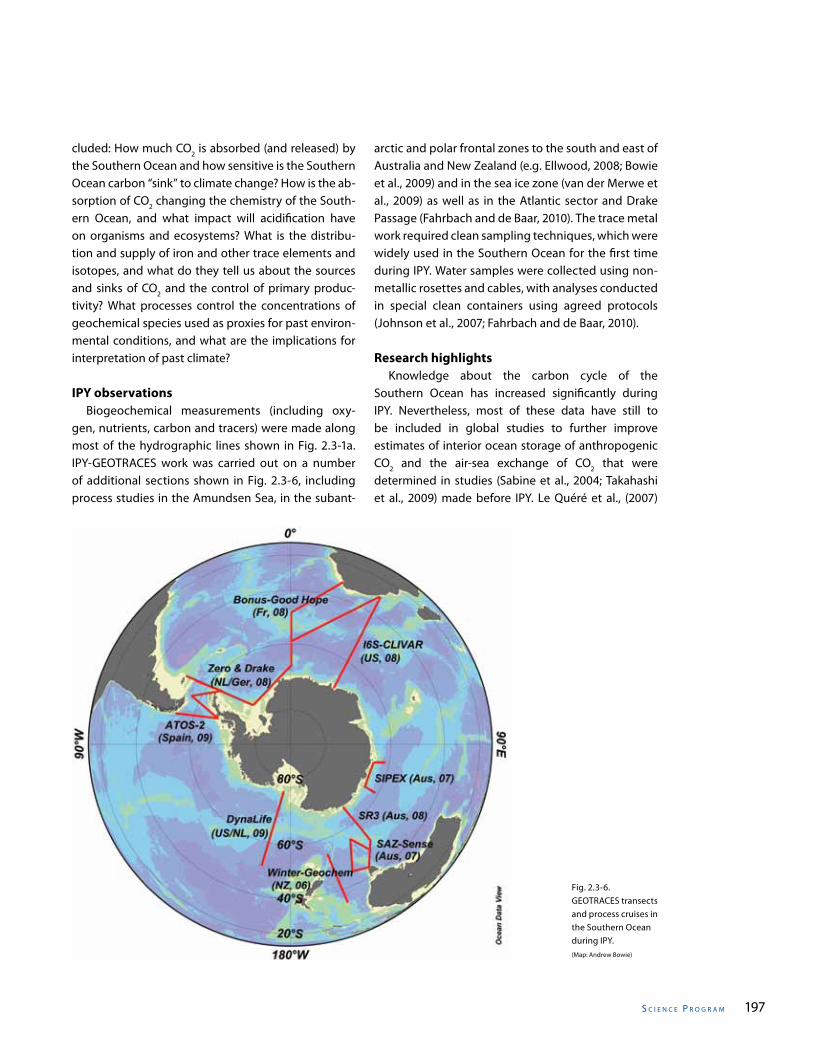
s C I e n C e P r o g r a m 197
cluded: How much CO2 is absorbed (and released) by the Southern Ocean and how sensitive is the Southern Ocean carbon “sink” to climate change? How is the ab-sorption of CO2 changing the chemistry of the South-ern Ocean, and what impact will acidification have on organisms and ecosystems? What is the distribu-tion and supply of iron and other trace elements and isotopes, and what do they tell us about the sources and sinks of CO2 and the control of primary produc-tivity? What processes control the concentrations of geochemical species used as proxies for past environ-mental conditions, and what are the implications for interpretation of past climate?
IPY observations Biogeochemical measurements (including oxy-gen, nutrients, carbon and tracers) were made along most of the hydrographic lines shown in Fig. 2.3-1a. IPY-GEOTRACES work was carried out on a number of additional sections shown in Fig. 2.3-6, including process studies in the Amundsen Sea, in the subant-
arctic and polar frontal zones to the south and east of Australia and New Zealand (e.g. Ellwood, 2008; Bowie et al., 2009) and in the sea ice zone (van der Merwe et al., 2009) as well as in the Atlantic sector and Drake Passage (Fahrbach and de Baar, 2010). The trace metal work required clean sampling techniques, which were widely used in the Southern Ocean for the first time during IPY. Water samples were collected using non-metallic rosettes and cables, with analyses conducted in special clean containers using agreed protocols (Johnson et al., 2007; Fahrbach and de Baar, 2010).
Research highlights Knowledge about the carbon cycle of the Southern Ocean has increased significantly during IPY. Nevertheless, most of these data have still to be included in global studies to further improve estimates of interior ocean storage of anthropogenic CO2 and the air-sea exchange of CO2 that were determined in studies (Sabine et al., 2004; Takahashi et al., 2009) made before IPY. Le Quéré et al., (2007)
Fig. 2.3-6. GEOTRACES transects and process cruises in the Southern Ocean during IPY.(Map: Andrew Bowie)
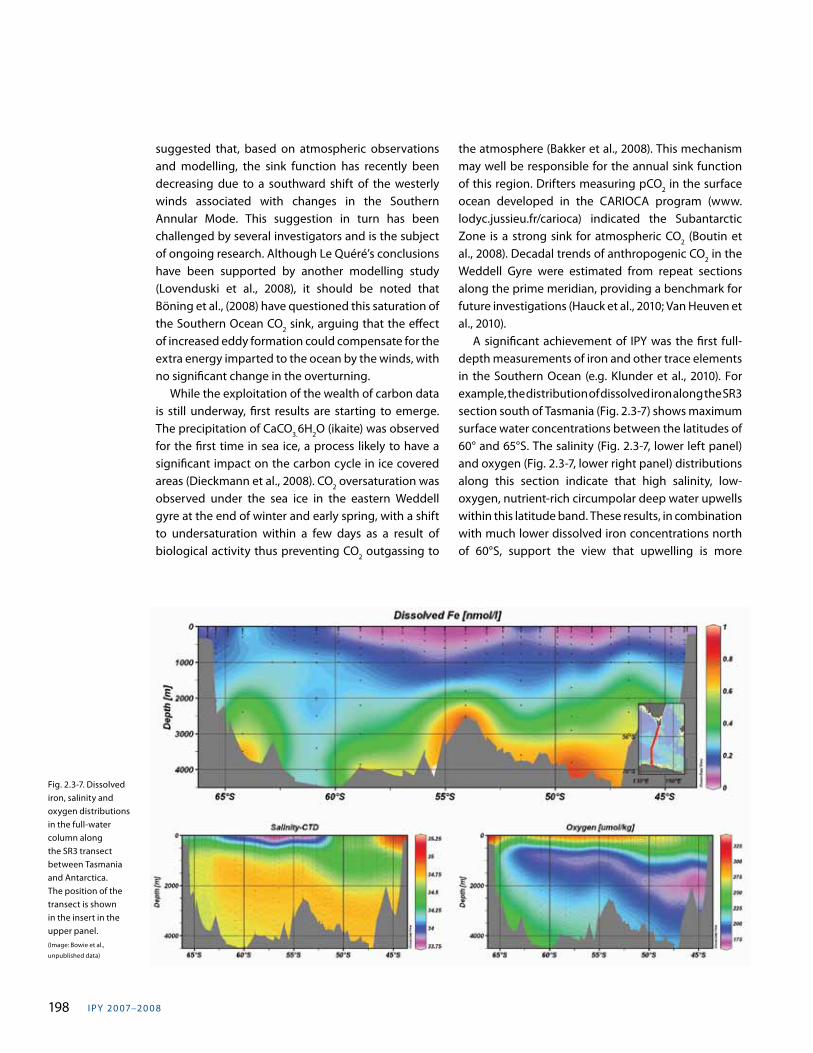
I PY 20 07–20 0 8198
suggested that, based on atmospheric observations and modelling, the sink function has recently been decreasing due to a southward shift of the westerly winds associated with changes in the Southern Annular Mode. This suggestion in turn has been challenged by several investigators and is the subject of ongoing research. Although Le Quéré’s conclusions have been supported by another modelling study (Lovenduski et al., 2008), it should be noted that Böning et al., (2008) have questioned this saturation of the Southern Ocean CO2 sink, arguing that the effect of increased eddy formation could compensate for the extra energy imparted to the ocean by the winds, with no significant change in the overturning. While the exploitation of the wealth of carbon data is still underway, first results are starting to emerge. The precipitation of CaCO3.6H2O (ikaite) was observed for the first time in sea ice, a process likely to have a significant impact on the carbon cycle in ice covered areas (Dieckmann et al., 2008). CO2 oversaturation was observed under the sea ice in the eastern Weddell gyre at the end of winter and early spring, with a shift to undersaturation within a few days as a result of biological activity thus preventing CO2 outgassing to
the atmosphere (Bakker et al., 2008). This mechanism may well be responsible for the annual sink function of this region. Drifters measuring pCO2 in the surface ocean developed in the CARIOCA program (www.lodyc.jussieu.fr/carioca) indicated the Subantarctic Zone is a strong sink for atmospheric CO2 (Boutin et al., 2008). Decadal trends of anthropogenic CO2 in the Weddell Gyre were estimated from repeat sections along the prime meridian, providing a benchmark for future investigations (Hauck et al., 2010; Van Heuven et al., 2010). A significant achievement of IPY was the first full-depth measurements of iron and other trace elements in the Southern Ocean (e.g. Klunder et al., 2010). For example, the distribution of dissolved iron along the SR3 section south of Tasmania (Fig. 2.3-7) shows maximum surface water concentrations between the latitudes of 60° and 65°S. The salinity (Fig. 2.3-7, lower left panel) and oxygen (Fig. 2.3-7, lower right panel) distributions along this section indicate that high salinity, low-oxygen, nutrient-rich circumpolar deep water upwells within this latitude band. These results, in combination with much lower dissolved iron concentrations north of 60°S, support the view that upwelling is more
Fig. 2.3-7. Dissolved iron, salinity and oxygen distributions in the full-water column along the SR3 transect between Tasmania and Antarctica. The position of the transect is shown in the insert in the upper panel.(Image: Bowie et al.,
unpublished data)
s C I e n C e P r o g r a m 199
significant than deposition of aerosols as a source of iron to this polar region during autumn. Furthermore, the iron distribution indicates the importance of bottom sediments and hydrothermalism as sources of iron to the deep Southern Ocean (Tagliabue et al., 2010), sources that have been neglected in previous biogeochemical models for the region. Distributions of total dissolvable iron (TDFe), dissolved iron (DFe) and soluble iron (SFe) were investigated during the BONUS-GoodHope cruise in the Atlantic sector of the Southern Ocean (34°S/17°E, 57°S/0°E) along a transect from the subtropical domain to the Weddell Sea Gyre, in February-March 2008. The highest concentrations of DFe and TDFe were observed in the sub-tropical domain, where continental margins and dust input might be the main Fe sources. Complexation with ligands from biological and continental origin could explain the distributions of SFe and CFe along the transect (Chever et al., submitted). The first measurements of methylmercury in the Southern Ocean were made during IPY, showing high concentrations and an increase in the ratio of methylmercury to apparent oxygen utilization in Antarctic waters (Cossa et al., submitted). The distribution can be explained by the co-location in Antarctic waters of a large atmospheric source of mercury (through mercury depletion events mediated by halogens released during sea ice formation), bacterial decomposition of organic matter produced by intense phytoplankton blooms and upwelling of methylmercury-enriched deep water. These results have improved our understanding of the global mercury cycle, confirmed evidence of open ocean methylation and helped explain the elevated mercury levels observed in Antarctic biota. IPY experiments in the Australasian region revealed that subantarctic phytoplankton blooms during summer were driven by both seasonal iron supply from southward advection of subtropical waters and by wind-blown dust deposition, resulting in a strong decoupling of iron and nutrient cycles (Bowie et al., 2009). These observations have important longer-term climatic implications since the frequency and scale of dust emissions and the poleward extension of western boundary currents are both predicted to increase in the future, resulting in a greater influence of subtropical water on the subantarctic zone.
The origin of the iron in the ocean can be derived by correlating properties of related trace metals such as aluminium and manganese. Dissolved aluminium in the surface waters is a tracer of aeolian dust and dis-solved manganese can help to trace iron input from the bottom. On the Greenwich meridian the near sur-face concentration of aluminium is low (Fig. 2.3-8 top), whereas manganese displays a maximum over the mid-ocean ridge (Fig. 2.3-8 bottom) correlating with dissolved iron (not shown) suggesting an iron input from hydrothermal activity (Middag et al., 2010a,b). A comprehensive examination of the distribution, speciation, cycling and role of iron in fuelling sea ice-based and pelagic algal communities showed that primary productivity in seasonally ice-covered waters around Antarctica is primarily driven by temporal variations in iron supply (seasonal and inter-annual, driven by sea ice formation and melting processes) rather than large-scale spatial forcing (van der Merwe et al., 2009), with strong vertical iron resupply during winter, rapid release from sea ice and uptake during spring, and substantial depletion during summer (Lannuzel et al., 2010). Marine biology, ecology and biodiversity Several major programs, CAML, EBA, ICED, MEOP and SCAR-MarBIN, numerous individual IPY projects, PAME, AMES and certain components of PANDA, focused on the broad issue of marine biology, ecology and biodiversity in the Southern Ocean. These overarching programs included contributions from numerous regional programs, such as DRAKEBIOSEAS and ClicOPEN, which focussed on the effect of climate change on coastal communities at the western Antarctic Peninsula. The objective of the SCAR project Census of Antarctic Marine Life (CAML, see www.caml.aq) was to determine the distribution and abundance of life in the Southern Ocean around Antarctica, providing a benchmark against which future change can be assessed. The Arctic and the Antarctic Peninsula are currently experiencing rapid rates of change (IPCC, 2007; Steig et al., 2009; Mayewski et al., 2009; Convey et al., 2009). The uniquely adapted organisms of the polar regions may be vulnerable to shifts in climate and ocean circulation patterns. The major scientific question for CAML is how the marine life around
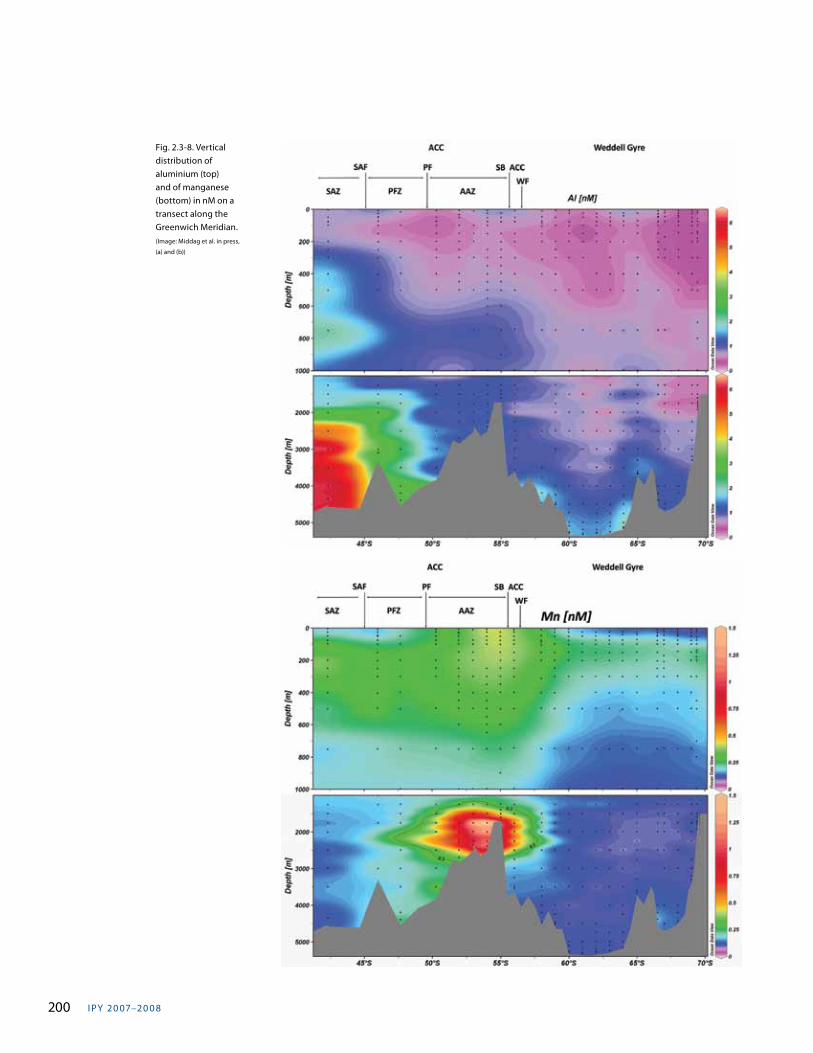
I PY 20 07–20 0 8200
Fig. 2.3-8. Vertical distribution of aluminium (top) and of manganese (bottom) in nM on a transect along the Greenwich Meridian.(Image: Middag et al. in press,
(a) and (b))
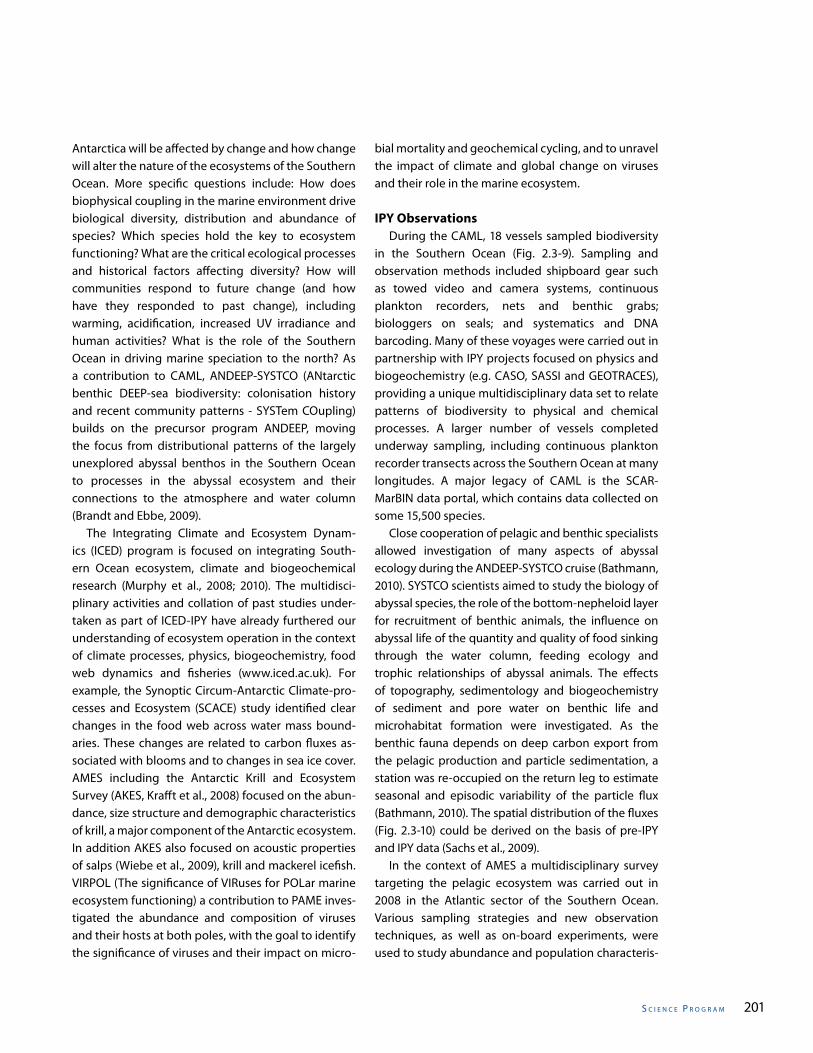
s C I e n C e P r o g r a m 201
Antarctica will be affected by change and how change will alter the nature of the ecosystems of the Southern Ocean. More specific questions include: How does biophysical coupling in the marine environment drive biological diversity, distribution and abundance of species? Which species hold the key to ecosystem functioning? What are the critical ecological processes and historical factors affecting diversity? How will communities respond to future change (and how have they responded to past change), including warming, acidification, increased UV irradiance and human activities? What is the role of the Southern Ocean in driving marine speciation to the north? As a contribution to CAML, ANDEEP-SYSTCO (ANtarctic benthic DEEP-sea biodiversity: colonisation history and recent community patterns - SYSTem COupling) builds on the precursor program ANDEEP, moving the focus from distributional patterns of the largely unexplored abyssal benthos in the Southern Ocean to processes in the abyssal ecosystem and their connections to the atmosphere and water column (Brandt and Ebbe, 2009). The Integrating Climate and Ecosystem Dynam-ics (ICED) program is focused on integrating South-ern Ocean ecosystem, climate and biogeochemical research (Murphy et al., 2008; 2010). The multidisci-plinary activities and collation of past studies under-taken as part of ICED-IPY have already furthered our understanding of ecosystem operation in the context of climate processes, physics, biogeochemistry, food web dynamics and fisheries (www.iced.ac.uk). For example, the Synoptic Circum-Antarctic Climate-pro-cesses and Ecosystem (SCACE) study identified clear changes in the food web across water mass bound-aries. These changes are related to carbon fluxes as-sociated with blooms and to changes in sea ice cover. AMES including the Antarctic Krill and Ecosystem Survey (AKES, Krafft et al., 2008) focused on the abun-dance, size structure and demographic characteristics of krill, a major component of the Antarctic ecosystem. In addition AKES also focused on acoustic properties of salps (Wiebe et al., 2009), krill and mackerel icefish. VIRPOL (The significance of VIRuses for POLar marine ecosystem functioning) a contribution to PAME inves-tigated the abundance and composition of viruses and their hosts at both poles, with the goal to identify the significance of viruses and their impact on micro-
bial mortality and geochemical cycling, and to unravel the impact of climate and global change on viruses and their role in the marine ecosystem.
IPY Observations During the CAML, 18 vessels sampled biodiversity in the Southern Ocean (Fig. 2.3-9). Sampling and observation methods included shipboard gear such as towed video and camera systems, continuous plankton recorders, nets and benthic grabs; biologgers on seals; and systematics and DNA barcoding. Many of these voyages were carried out in partnership with IPY projects focused on physics and biogeochemistry (e.g. CASO, SASSI and GEOTRACES), providing a unique multidisciplinary data set to relate patterns of biodiversity to physical and chemical processes. A larger number of vessels completed underway sampling, including continuous plankton recorder transects across the Southern Ocean at many longitudes. A major legacy of CAML is the SCAR-MarBIN data portal, which contains data collected on some 15,500 species. Close cooperation of pelagic and benthic specialists allowed investigation of many aspects of abyssal ecology during the ANDEEP-SYSTCO cruise (Bathmann, 2010). SYSTCO scientists aimed to study the biology of abyssal species, the role of the bottom-nepheloid layer for recruitment of benthic animals, the influence on abyssal life of the quantity and quality of food sinking through the water column, feeding ecology and trophic relationships of abyssal animals. The effects of topography, sedimentology and biogeochemistry of sediment and pore water on benthic life and microhabitat formation were investigated. As the benthic fauna depends on deep carbon export from the pelagic production and particle sedimentation, a station was re-occupied on the return leg to estimate seasonal and episodic variability of the particle flux (Bathmann, 2010). The spatial distribution of the fluxes (Fig. 2.3-10) could be derived on the basis of pre-IPY and IPY data (Sachs et al., 2009). In the context of AMES a multidisciplinary survey targeting the pelagic ecosystem was carried out in 2008 in the Atlantic sector of the Southern Ocean. Various sampling strategies and new observation techniques, as well as on-board experiments, were used to study abundance and population characteris-
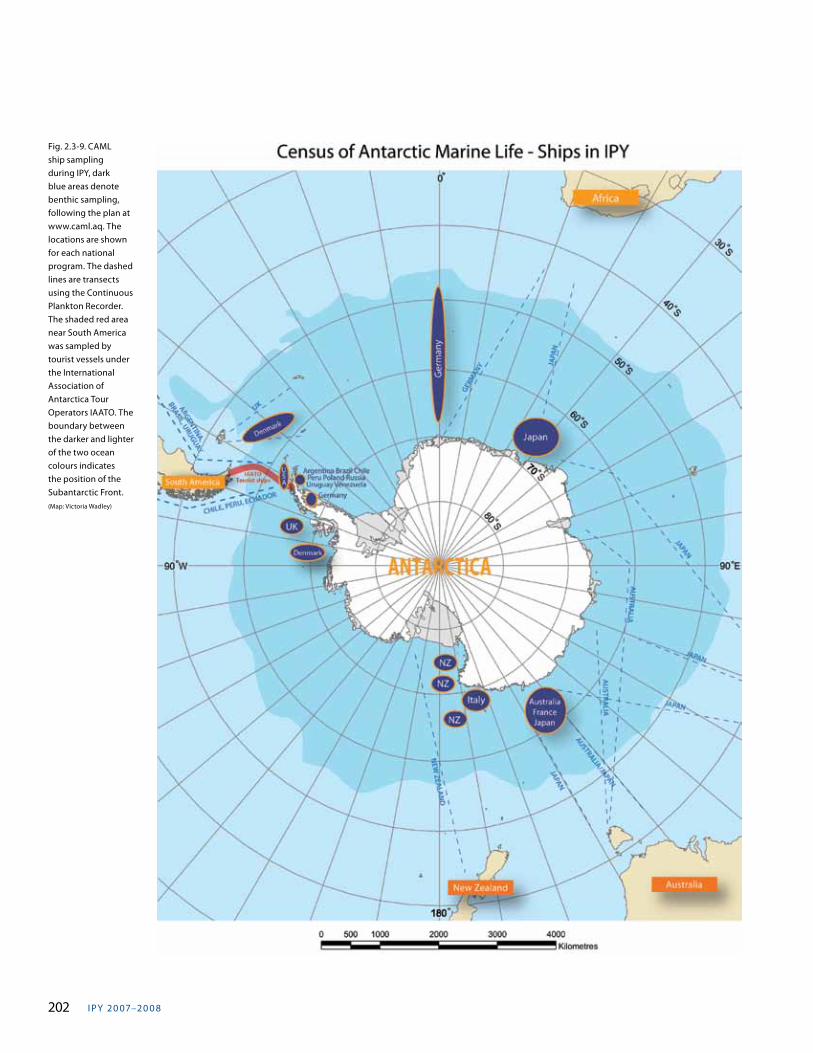
I PY 20 07–20 0 8202
Fig. 2.3-9. CAML ship sampling during IPY, dark blue areas denote benthic sampling, following the plan at www.caml.aq. The locations are shown for each national program. The dashed lines are transects using the Continuous Plankton Recorder. The shaded red area near South America was sampled by tourist vessels under the International Association of Antarctica Tour Operators IAATO. The boundary between the darker and lighter of the two ocean colours indicates the position of the Subantarctic Front.(Map: Victoria Wadley)
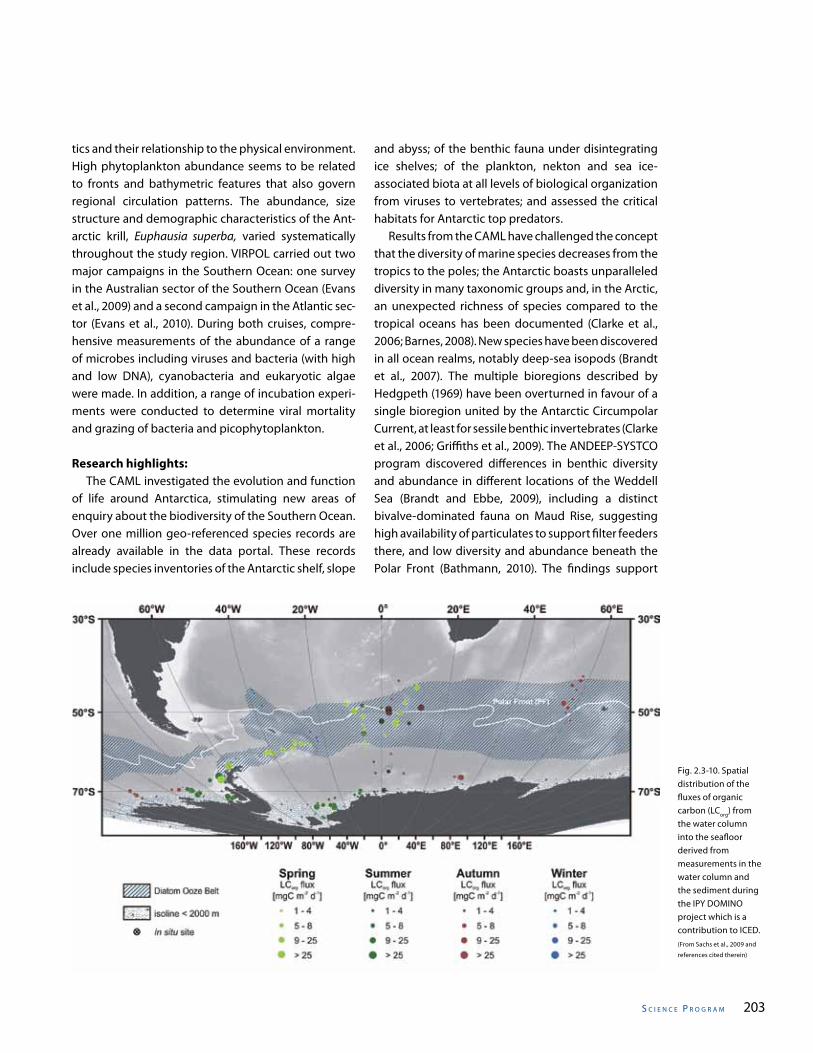
s C I e n C e P r o g r a m 203
tics and their relationship to the physical environment. High phytoplankton abundance seems to be related to fronts and bathymetric features that also govern regional circulation patterns. The abundance, size structure and demographic characteristics of the Ant-arctic krill, Euphausia superba, varied systematically throughout the study region. VIRPOL carried out two major campaigns in the Southern Ocean: one survey in the Australian sector of the Southern Ocean (Evans et al., 2009) and a second campaign in the Atlantic sec-tor (Evans et al., 2010). During both cruises, compre-hensive measurements of the abundance of a range of microbes including viruses and bacteria (with high and low DNA), cyanobacteria and eukaryotic algae were made. In addition, a range of incubation experi-ments were conducted to determine viral mortality and grazing of bacteria and picophytoplankton.
Research highlights: The CAML investigated the evolution and function of life around Antarctica, stimulating new areas of enquiry about the biodiversity of the Southern Ocean. Over one million geo-referenced species records are already available in the data portal. These records include species inventories of the Antarctic shelf, slope
and abyss; of the benthic fauna under disintegrating ice shelves; of the plankton, nekton and sea ice-associated biota at all levels of biological organization from viruses to vertebrates; and assessed the critical habitats for Antarctic top predators. Results from the CAML have challenged the concept that the diversity of marine species decreases from the tropics to the poles; the Antarctic boasts unparalleled diversity in many taxonomic groups and, in the Arctic, an unexpected richness of species compared to the tropical oceans has been documented (Clarke et al., 2006; Barnes, 2008). New species have been discovered in all ocean realms, notably deep-sea isopods (Brandt et al., 2007). The multiple bioregions described by Hedgpeth (1969) have been overturned in favour of a single bioregion united by the Antarctic Circumpolar Current, at least for sessile benthic invertebrates (Clarke et al., 2006; Griffiths et al., 2009). The ANDEEP-SYSTCO program discovered differences in benthic diversity and abundance in different locations of the Weddell Sea (Brandt and Ebbe, 2009), including a distinct bivalve-dominated fauna on Maud Rise, suggesting high availability of particulates to support filter feeders there, and low diversity and abundance beneath the Polar Front (Bathmann, 2010). The findings support
Fig. 2.3-10. Spatial distribution of the fluxes of organic carbon (LCorg) from the water column into the seafloor derived from measurements in the water column and the sediment during the IPY DOMINO project which is a contribution to ICED. (From Sachs et al., 2009 and
references cited therein)
I PY 20 07–20 0 8204
the theory that the high diversity found in some deep-sea taxa could have been developed and sustained through the occupation of distinct ecological niches. In addition to detritus originating from phyto- and zooplankton, foraminifera seem to play an important role in the nutrition of certain polychaete and isopod families. Bacteria were not found to play a significant role in the diet of any polychaetes analysed. The effect of a dramatically changing environment on the benthic realm was observed by monitoring the former ice shelf sea floor with a Remotely Operated Vehicle (ROV, Fig. 2.3-11) after the Larsen A and B ice shelves had collapsed. Species that were adapted to the oligotrophic under-ice conditions will become extinct in that area. Immigration and growth of pelagic key organisms and benthic pioneers contribute to a potential new carbon sink in such areas (Peck et al., 2009). Nevertheless, it will require centuries if not millennia before complex benthic communities like those observed in the Eastern Weddell Sea are established (Gutt et al., 2008). Octopuses provide unequivocal molecular evidence of the colonization pathway from the Antarctic to the deep sea (Strugnell et al., 2008). The research suggests that the Antarctic provides a frozen incubator of biodiversity, which has radiated to other oceans with the advent of the global thermohaline circulation, as Antarctica cooled at the end of the Eocene (37 million years ago). With the sibling IPY project, Arctic Ocean Diversity (ArcOD), CAML has discovered 251 “bipolar” species that are shared by both the Arctic and Antarctic oceans. The question of whether they are genetically the same, or simply look alike, is being answered with DNA barcoding. Russian studies of the marine ecosystem in Nella Fjord, Prydz Bay, contributed to the goals of ICED. Observations were focused on both sea ice cores and under ice water samples at a profile across the Nella Fjord. It was shown that sea ice flora consists of mainly dinoflagellate cysts. Marine diatoms were present only as single cells, probably caused by freshening associated with the formation of sea ice (Melnikov and Gogorev, 2009; Melnikov et al., 2010). Observations collected from Southern Ocean marine mammals by the MEOP program and its predecessor SEaOS have provided new insights into the foraging behaviour of seals and other marine
mammals and the factors influencing their population dynamics (as well as the oceanographic discoveries mentioned above). Changes in the rate of ascent or descent during passive drift dives have been used to infer the distribution of productive and unproductive foraging areas visited by southern elephant seals (Biuw et al., 2007). The study concludes that the decline in elephant seal populations at Kerguelen and Macquarie Islands relative to those at South Georgia can be related to the greater energy expenditure required to reach more distant Antarctic foraging regions. The VIRPOL cruises showed viruses were abundant throughout the Southern Ocean and the virus data correlated well with the distribution of their potential microbial hosts (bacteria, cyanobacteria and eukaryotic algae). Higher virus and microbial concentrations were observed in the Subantarctic Zone (SAZ) with concentrations decreasing near the Polar Front (PF). Microbe concentrations were relatively low in the Antarctic Zone (AZ), but elevated at costal stations. Levels of viral production indicated that viral infection of bacteria was very high in the Southern Ocean relative to other open ocean environments, particularly in the SAZ. ClicOPEN examined the effect of regional rapid warming on the coastal biota of the Western Antarctic Peninsula (WAP) region and concluded that local sediment discharge and iceberg scouring are the two major effects, whereas changes in sea water temperature and salinity have little impact. At King George Island and other WAP areas the volume of fresh water discharged from the land has doubled between 2002-2006, with highest monthly yields in glacial catchment areas measured in January (Dominguez and Eraso, 2007). As a consequence of both fresh water release from melting land glaciers and starvation of the animals due to reduced primary production under the coastal sediment run-off plume, dead krill were washed on to the beach (Fig. 2.3-12). The annual disturbance of the sea floor by icebergs from 2001 to the present day was quantified (Smale et al., 2008). Iceberg scour disturbance on the benthos was found to be inversely proportional to the duration of local sea ice, as icebergs become immobilized by solid sea ice cover. Results of hydrographic and sediment monitoring programs can be linked to observed
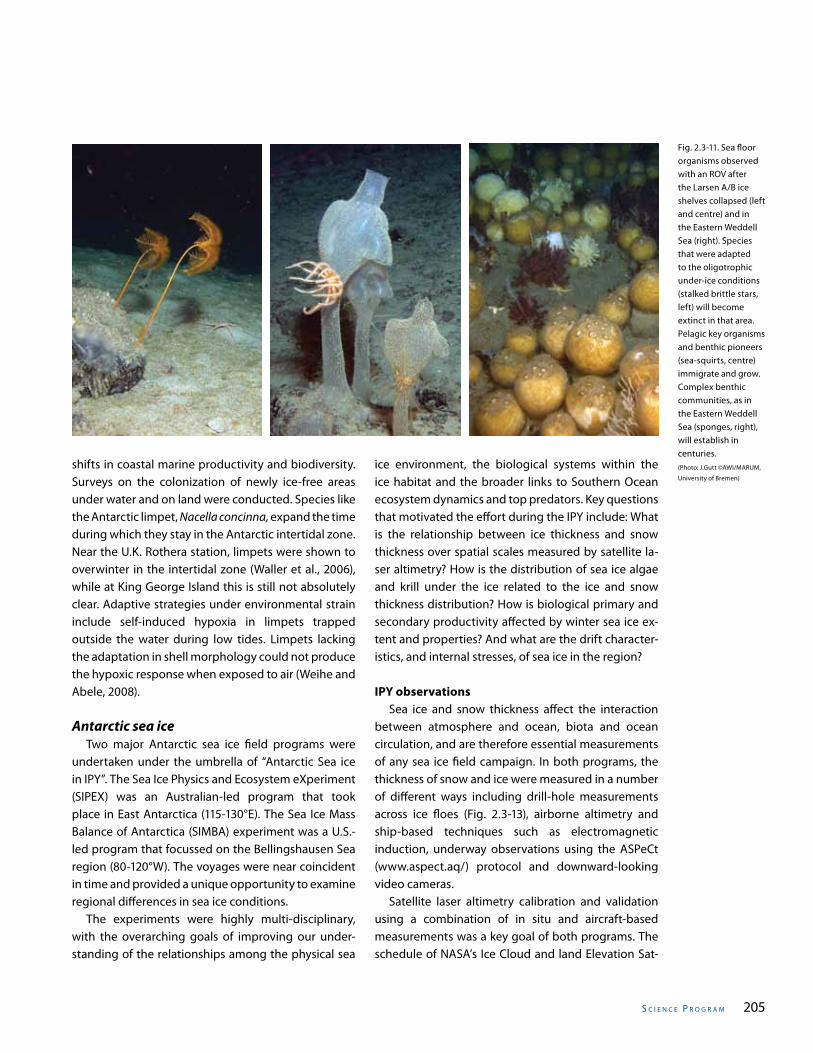
s C I e n C e P r o g r a m 205
Fig. 2.3-11. Sea floor organisms observed with an ROV after the Larsen A/B ice shelves collapsed (left and centre) and in the Eastern Weddell Sea (right). Species that were adapted to the oligotrophic under-ice conditions (stalked brittle stars, left) will become extinct in that area. Pelagic key organisms and benthic pioneers (sea-squirts, centre) immigrate and grow. Complex benthic communities, as in the Eastern Weddell Sea (sponges, right), will establish in centuries.(Photo: J.Gutt ©AWI/MARUM,
University of Bremen)
shifts in coastal marine productivity and biodiversity. Surveys on the colonization of newly ice-free areas under water and on land were conducted. Species like the Antarctic limpet, Nacella concinna, expand the time during which they stay in the Antarctic intertidal zone. Near the U.K. Rothera station, limpets were shown to overwinter in the intertidal zone (Waller et al., 2006), while at King George Island this is still not absolutely clear. Adaptive strategies under environmental strain include self-induced hypoxia in limpets trapped outside the water during low tides. Limpets lacking the adaptation in shell morphology could not produce the hypoxic response when exposed to air (Weihe and Abele, 2008).
Antarctic sea ice Two major Antarctic sea ice field programs were undertaken under the umbrella of “Antarctic Sea ice in IPY”. The Sea Ice Physics and Ecosystem eXperiment (SIPEX) was an Australian-led program that took place in East Antarctica (115-130°E). The Sea Ice Mass Balance of Antarctica (SIMBA) experiment was a U.S.-led program that focussed on the Bellingshausen Sea region (80-120°W). The voyages were near coincident in time and provided a unique opportunity to examine regional differences in sea ice conditions. The experiments were highly multi-disciplinary, with the overarching goals of improving our under-standing of the relationships among the physical sea
ice environment, the biological systems within the ice habitat and the broader links to Southern Ocean ecosystem dynamics and top predators. Key questions that motivated the effort during the IPY include: What is the relationship between ice thickness and snow thickness over spatial scales measured by satellite la-ser altimetry? How is the distribution of sea ice algae and krill under the ice related to the ice and snow thickness distribution? How is biological primary and secondary productivity affected by winter sea ice ex-tent and properties? And what are the drift character-istics, and internal stresses, of sea ice in the region?
IPY observations Sea ice and snow thickness affect the interaction between atmosphere and ocean, biota and ocean circulation, and are therefore essential measurements of any sea ice field campaign. In both programs, the thickness of snow and ice were measured in a number of different ways including drill-hole measurements across ice floes (Fig. 2.3-13), airborne altimetry and ship-based techniques such as electromagnetic induction, underway observations using the ASPeCt (www.aspect.aq/) protocol and downward-looking video cameras. Satellite laser altimetry calibration and validation using a combination of in situ and aircraft-based measurements was a key goal of both programs. The schedule of NASA’s Ice Cloud and land Elevation Sat-
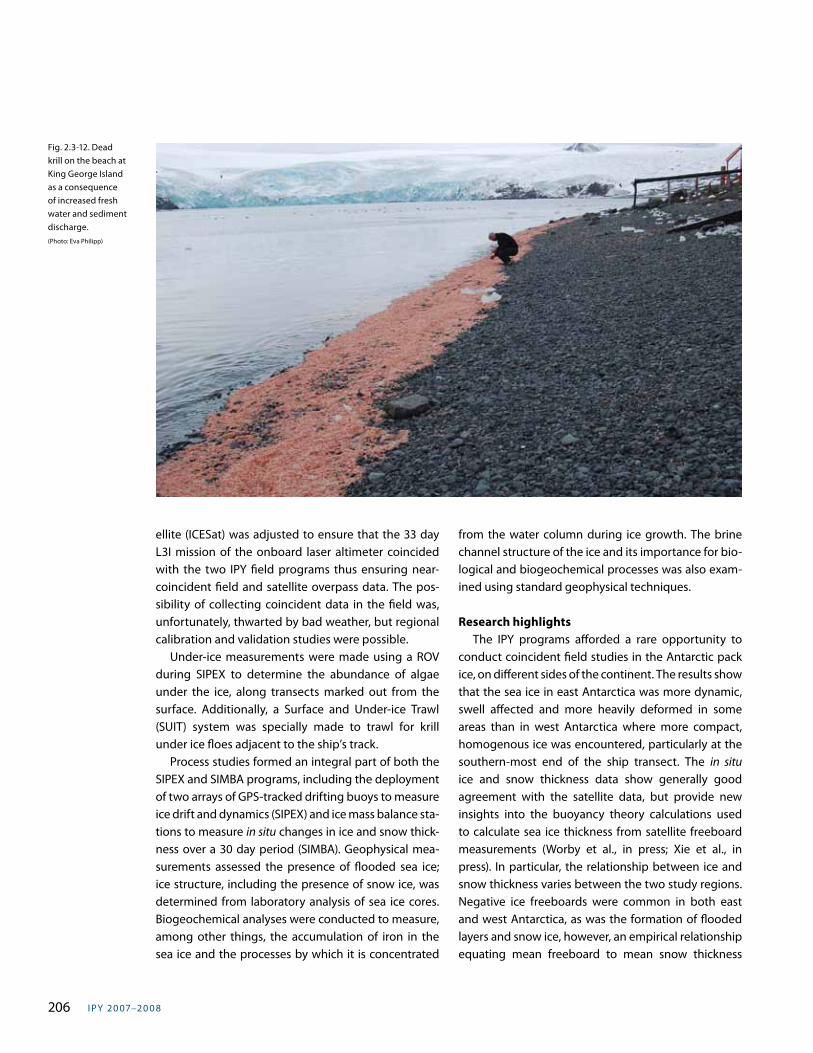
I PY 20 07–20 0 8206
ellite (ICESat) was adjusted to ensure that the 33 day L3I mission of the onboard laser altimeter coincided with the two IPY field programs thus ensuring near-coincident field and satellite overpass data. The pos-sibility of collecting coincident data in the field was, unfortunately, thwarted by bad weather, but regional calibration and validation studies were possible. Under-ice measurements were made using a ROV during SIPEX to determine the abundance of algae under the ice, along transects marked out from the surface. Additionally, a Surface and Under-ice Trawl (SUIT) system was specially made to trawl for krill under ice floes adjacent to the ship’s track. Process studies formed an integral part of both the SIPEX and SIMBA programs, including the deployment of two arrays of GPS-tracked drifting buoys to measure ice drift and dynamics (SIPEX) and ice mass balance sta-tions to measure in situ changes in ice and snow thick-ness over a 30 day period (SIMBA). Geophysical mea-surements assessed the presence of flooded sea ice; ice structure, including the presence of snow ice, was determined from laboratory analysis of sea ice cores. Biogeochemical analyses were conducted to measure, among other things, the accumulation of iron in the sea ice and the processes by which it is concentrated
Fig. 2.3-12. Dead krill on the beach at King George Island as a consequence of increased fresh water and sediment discharge. (Photo: Eva Philipp)
from the water column during ice growth. The brine channel structure of the ice and its importance for bio-logical and biogeochemical processes was also exam-ined using standard geophysical techniques.
Research highlights The IPY programs afforded a rare opportunity to conduct coincident field studies in the Antarctic pack ice, on different sides of the continent. The results show that the sea ice in east Antarctica was more dynamic, swell affected and more heavily deformed in some areas than in west Antarctica where more compact, homogenous ice was encountered, particularly at the southern-most end of the ship transect. The in situ ice and snow thickness data show generally good agreement with the satellite data, but provide new insights into the buoyancy theory calculations used to calculate sea ice thickness from satellite freeboard measurements (Worby et al., in press; Xie et al., in press). In particular, the relationship between ice and snow thickness varies between the two study regions. Negative ice freeboards were common in both east and west Antarctica, as was the formation of flooded layers and snow ice, however, an empirical relationship equating mean freeboard to mean snow thickness
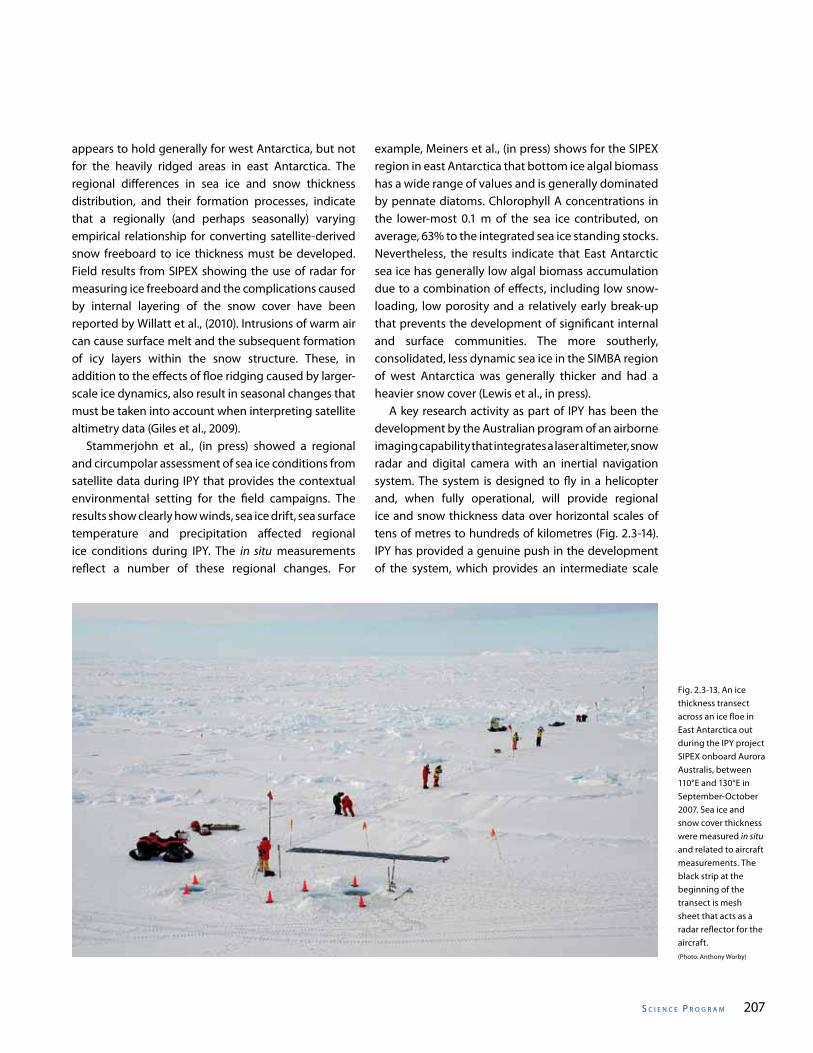
s C I e n C e P r o g r a m 207
Fig. 2.3-13. An ice thickness transect across an ice floe in East Antarctica out during the IPY project SIPEX onboard Aurora Australis, between 110°E and 130°E in September-October 2007. Sea ice and snow cover thickness were measured in situ and related to aircraft measurements. The black strip at the beginning of the transect is mesh sheet that acts as a radar reflector for the aircraft.(Photo: Anthony Worby)
appears to hold generally for west Antarctica, but not for the heavily ridged areas in east Antarctica. The regional differences in sea ice and snow thickness distribution, and their formation processes, indicate that a regionally (and perhaps seasonally) varying empirical relationship for converting satellite-derived snow freeboard to ice thickness must be developed. Field results from SIPEX showing the use of radar for measuring ice freeboard and the complications caused by internal layering of the snow cover have been reported by Willatt et al., (2010). Intrusions of warm air can cause surface melt and the subsequent formation of icy layers within the snow structure. These, in addition to the effects of floe ridging caused by larger-scale ice dynamics, also result in seasonal changes that must be taken into account when interpreting satellite altimetry data (Giles et al., 2009). Stammerjohn et al., (in press) showed a regional and circumpolar assessment of sea ice conditions from satellite data during IPY that provides the contextual environmental setting for the field campaigns. The results show clearly how winds, sea ice drift, sea surface temperature and precipitation affected regional ice conditions during IPY. The in situ measurements reflect a number of these regional changes. For
example, Meiners et al., (in press) shows for the SIPEX region in east Antarctica that bottom ice algal biomass has a wide range of values and is generally dominated by pennate diatoms. Chlorophyll A concentrations in the lower-most 0.1 m of the sea ice contributed, on average, 63% to the integrated sea ice standing stocks. Nevertheless, the results indicate that East Antarctic sea ice has generally low algal biomass accumulation due to a combination of effects, including low snow-loading, low porosity and a relatively early break-up that prevents the development of significant internal and surface communities. The more southerly, consolidated, less dynamic sea ice in the SIMBA region of west Antarctica was generally thicker and had a heavier snow cover (Lewis et al., in press). A key research activity as part of IPY has been the development by the Australian program of an airborne imaging capability that integrates a laser altimeter, snow radar and digital camera with an inertial navigation system. The system is designed to fly in a helicopter and, when fully operational, will provide regional ice and snow thickness data over horizontal scales of tens of metres to hundreds of kilometres (Fig. 2.3-14). IPY has provided a genuine push in the development of the system, which provides an intermediate scale
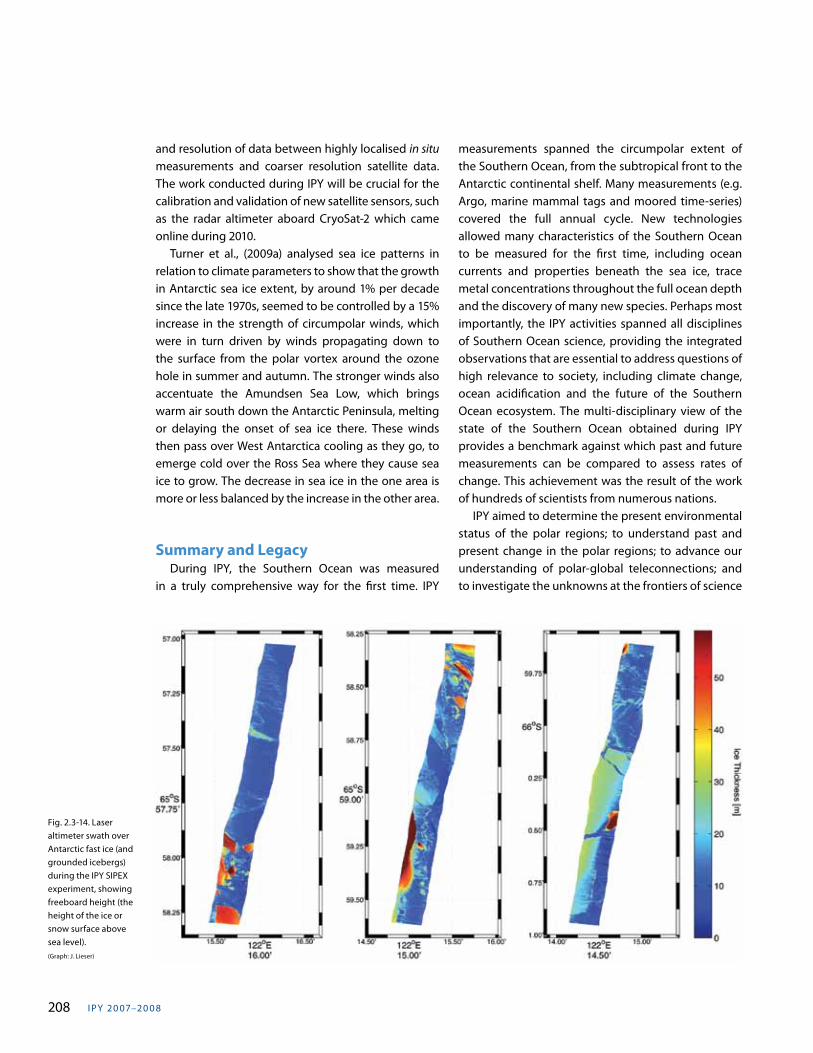
I PY 20 07–20 0 8208
and resolution of data between highly localised in situ measurements and coarser resolution satellite data. The work conducted during IPY will be crucial for the calibration and validation of new satellite sensors, such as the radar altimeter aboard CryoSat-2 which came online during 2010. Turner et al., (2009a) analysed sea ice patterns in relation to climate parameters to show that the growth in Antarctic sea ice extent, by around 1% per decade since the late 1970s, seemed to be controlled by a 15% increase in the strength of circumpolar winds, which were in turn driven by winds propagating down to the surface from the polar vortex around the ozone hole in summer and autumn. The stronger winds also accentuate the Amundsen Sea Low, which brings warm air south down the Antarctic Peninsula, melting or delaying the onset of sea ice there. These winds then pass over West Antarctica cooling as they go, to emerge cold over the Ross Sea where they cause sea ice to grow. The decrease in sea ice in the one area is more or less balanced by the increase in the other area.
Summary and Legacy During IPY, the Southern Ocean was measured in a truly comprehensive way for the first time. IPY
measurements spanned the circumpolar extent of the Southern Ocean, from the subtropical front to the Antarctic continental shelf. Many measurements (e.g. Argo, marine mammal tags and moored time-series) covered the full annual cycle. New technologies allowed many characteristics of the Southern Ocean to be measured for the first time, including ocean currents and properties beneath the sea ice, trace metal concentrations throughout the full ocean depth and the discovery of many new species. Perhaps most importantly, the IPY activities spanned all disciplines of Southern Ocean science, providing the integrated observations that are essential to address questions of high relevance to society, including climate change, ocean acidification and the future of the Southern Ocean ecosystem. The multi-disciplinary view of the state of the Southern Ocean obtained during IPY provides a benchmark against which past and future measurements can be compared to assess rates of change. This achievement was the result of the work of hundreds of scientists from numerous nations. IPY aimed to determine the present environmental status of the polar regions; to understand past and present change in the polar regions; to advance our understanding of polar-global teleconnections; and to investigate the unknowns at the frontiers of science
Fig. 2.3-14. Laser altimeter swath over Antarctic fast ice (and grounded icebergs) during the IPY SIPEX experiment, showing freeboard height (the height of the ice or snow surface above sea level).(Graph: J. Lieser)
s C I e n C e P r o g r a m 209
in the polar regions. Southern Ocean IPY has made a significant contribution to achieving all four of these aims. Much of the research in the Southern Ocean has been closely coordinated with similar activities in the Arctic, which together provide the integrated bipolar perspective required to address the goals of IPY. Southern Ocean IPY leaves a number of legacies. First and foremost, Southern Ocean IPY has demonstrated that an integrated, multi-disciplinary, sustained observing system is feasible, cost-effective
and urgently needed (Rintoul et al., 2010a,b; Turner et al., 2009b). Other legacies include a circumpolar snap-shot to serve as a benchmark for the assessment of past and future change; models capable of simulating interactions among climate, ecosystems and biogeochemical cycles, providing vastly improved projections of future change; a well-integrated interdisciplinary and multi-national polar research community; and inspiration to a new generation of polar researchers.
References
Antipov, N.N. and A.V. Klepikov, 2007. Oceanographic conditions in the Prydz Bay area from the AARI cruises in 1997 - 2007. Problems of Arctic and Ant-arctic, 76:36-48 (in Russian).
Antipov, N.N. and A.V. Klepikov, 2008. On bottom wa-ter formation processes to the west of Prydz Bay, Antarctica. In SCAR/IASC IPY Open Science Con-ference “Polar Research – Arctic and Antarctic perspective in the International Polar Year” Ab-stract volume, p 118. St.-Petersburg, Russia.
Antipov, N.N., A.V. Klepikov, K.V. Batrak and V.V. Maslen-nikov, 2009a. First results of oceanographic stud-ies of the Antarctic waters within the IPY 2007/08 projects in 53rd Russian Antarctic Expedition. In Field studies during the International Polar Year 2007/08. Vol. 2. Expeditions of 2008. A.I. Danilov, (ed), p 169-171. AARI Publishing: St Petersburg (in Russian).
Antipov, NN, K.V. Batrak, L.A. Duhova, Kuznetsov V.L. and V.V. Maslennikov, 2009b. Hydrographic and hydrochemical studies during 53rd Russian Ant-arctic Expedition on r/v “Akademik Fedorov”. Oceanology, 49(1):155-158 (in Russian).
Aoki, S., S.R. Rintoul, S. Ushio, S. Watanabe and N.L. Bindoff, 2005. Freshening of the Adelie Land Bottom Water near 140°E. Geophys. Res. Lett., 32:L23601, doi10.1029/2005GL024246.
Bakker, D.C.E., M. Hoppema, M. Schröder, W. Geibert and H.J.W. de Baar, 2008. A rapid transition from ice covered CO2-rich waters to a biologically me-diated CO2 sink in the eastern Weddell Gyre. Bio-
geosciences, 5:1373-1386.Barnes, D.K.A. 2008. A benthic richness hotspot in the
Southern Ocean: slope and shelf cryptic benthos of Shag Rocks. Antarctic Science, 20:263–270.
Bathmann, U. (ed), 2010. The expedition of the research vessel “Polarstern” to the Antarctic in 2007/2008 (ANT-XXIV/2). / In U. Bathmann, Berichte zur Polar- und Meeresforschung / Reports on polar and marine research, 604, 205 p.
Bindoff, J. Willebrand, V. Artale, A. Cazenave, J. Greg-ory, S. Gulev, K. Hanawa, C. LeQuéré, S. Levitus, Y. Nojiri, C. Shum, L. Talley and A. Unnikrishnan, 2007. Observations: oceanic climate change and sea level. In Climate Change 2007: The Physical Science Basis. Contribution of Working Group 1 to the Fourth Assessment Report of the Intergovern-mental Panel on Climate Change, S. Solomon, D. Qin and M. Manning (eds), Cambridge University Press: United Kingdom and New York, NY, U.S.A..
Biuw, M., L. Boehme, C. Guinet, M. Hindell, D. Costa, J.-B. Charrassin, F. Roquet, F. Bailleul, M. Meredith, S. Thorpe, Y. Tremblay, B. McDonald, Y.-H. Park, S.R. Rintoul, N. Bindoff, M. Goebel, D. Crocker, P. Lovell, J. Nicholson, F. Monks and M.A. Fedak, 2007. Vari-ations in behavior and condition of a Southern Ocean top predator in relation to in situ oceano-graphic conditions. Proceedings of the National Academy of Sciences, 104(34):13705-13710.
Boehme, L. and 22 co-authors, in press. Biologging in the global ocean observing system, Proceedings of the “OceanObs’09: Sustained Ocean Observa-
I PY 20 07–20 0 8210
tions and Information for Society” Conference (Vol. 2), Venice, Italy, 21-25 September 2009, J. Hall, D.E. Harrison and D. Stammer (eds), ESA Pub-lication WPP-306, accepted.
Böning, C.W., A. Dispert, M. Visbeck, S. Rintoul and F.U. Schwarzkopf, 2008. The response of the Antarc-tic Circumpolar Current to recent climate change. Nature Geoscience, 1:864 – 869.
Boutin, J., L. Merlivat, C. Hénocq, N. Martin and J.B. Sallée, 2008. Air–sea CO2 flux variability in fron-tal regions of the Southern Ocean from CARbon Interface OCean Atmosphere drifters. Limnol. Oceanogr., 53(5, part 2):2062–2079.
Bowie, A. R., D. Lannuzel, T.A. Remenyi, T. Wagener, P.J. Lam, P.W. Boyd, C. Guieu, A.T. Townsend and T.W. Trull, 2009. Biogeochemical iron budgets of the Southern Ocean south of Australia: Decoupling of iron and nutrient cycles in the subantarctic zone by the summertime supply. Global Biogeochemi-cal Cycles 23:GB4034, doi:10.1029/2009GB003500.
Brandt, A. and B. Ebbe, 2009. Southern Ocean deep-sea biodiversity – from patterns to processes. Deep-Sea Research II, 56: 1732-1738, doi:10.1016/ j.dsr2.2009.05.017.
Brandt, A., Gooday, A.J., Brix S.B., Brökeland, W., Ced-hagen, T., Choudhury, M., Cornelius, N., B. Danis, I. De Mesel, R.J. Diaz, D.C. Gillan, B. Ebbe, J. Howe, D. Janussen, S. Kaiser, K. Linse, M. Malyutina, S. Brandao, J. Pawlowski and M. Raupach, 2007. The Southern Ocean deep sea: first insights into bio-diversity and biogeography. Nature, 447:307-311.
Charrassin, J.B., M. Hindell, S.R. Rintoul, F. Roquet, S. Sokolov, M. Biuw, D. Costa, L. Boehme, P. Lovell, R. Coleman, R. Timmermann, A. Meijers, M. Mer-edith, Y.H. Park, F. Bailleul, M. Goebel, Y. Tremblay, C.A. Bost, C.R. McMahon, I.C. Field, M.A. Fedak and C. Guinet, 2008. Southern Ocean frontal structure and sea-ice formation rates revealed by elephant seals. Proc. Nat. Acad. Sciences, 105:11634-11639, doi:R 11610.11073/pnas.0800790105.
Chavanne, C., K. Heywood, K. Nicholls, I. Fer and M. Inall, submitted. Observations of the Antarctic Coastal Undercurrent in the Southeastern Wed-dell Sea. Geophys. Res. Lett..
Chever, F., E. Bucciarelli, G. Sarthou, S. Speich, M. Arhan, P. Penven and A. Tagliabue, 2010. Iron physical speciation in the Atlantic sector of the Southern
Ocean, along a transect from the subtropical domain to the Weddell Sea Gyre. J. Geophys. Res. Oceans, 115: C10059.
Clarke, A., W.E. Arntz and C.R. Smith (eds), 2006. EASIZ: Ecology of the Antarctic Sea Ice Zone. Special Issue, Deep-Sea Research, Part II, 53(8-10):803-1140.
Convey, P., R. Bindschadler, G. di Prisco, E. Fahrbach, J. Gutt, D.A. Hodgson, P.A. Mayewski, C.P. Summer-hayes, J. Turner and the ACCE Consortium, 2009. Antarctic climate change and the environment. Antarctic Science, 21(6):541-563.
Cossa D., E. Butler, L.-E. Heimbürger, B. Averty, A.R. Bowie, R. Watson, T. Remenyi and S. Rintoul, sub-mitted. Source of elevated methylmercury con-centrations in Antarctic waters. Geochimica et Cosmochimica Acta.
Costa, D.P., J.M. Klinck, E.E. Hofmann, M.S. Dinniman and J.M. Burns, 2008. Upper ocean variability in West Antarctic Peninsula continental shelf waters as measured using instrumented seals. Deep Sea Research Part II: Topical Studies in Oceanography, 55:323-337.
Craven, M., I. Allison, H.A. Fricker et al., 2009. Properties of a marine ice layer under the Amery Ice Shelf, East Antarctica. Journal of Glaciology, 55:717-728.
Cubillos, J.C., S.W. Wright, G. Nash, M.F.D. Salas, B. Griffiths, B. Tilbrook, A. Poisson and G.M. Hal-legraeff, 2007. Calcification morphotypes of the coccolithophorid Emiliania huxleyi in the South-ern Ocean: changes in 2001 to 2006 compared to historical data. Marine Ecology Progress Series, 248:47-54.
Dieckmann, G.S. et al., 2008. Calcium carbonate as ikaite crystals in Antarctic sea ice. Geophys. Res. Lett., 35:L08501, doi:10.1029/2008GL033540.
Dominguez, C. and Eraso, A. 2007. Substantial changes happened during the last years in the icecap of King George, Insular Antarctica. Karst and Crio-karst, Studies of the Faculty of Earth Sciences, University of Silesia, 45:87-110.
Dong, S., J. Sprintall, S.T. Gille and L. Talley, 2008. Southern Ocean mixed-layer depth from Argo float profiles, J. Geophys. Res., 113:C06013, doi:10.1029/2006JC004051.
Ellwood, M.J., 2008. Wintertime trace metal (Zn, Cu, Ni, Cd, Pb and Co) and nutrient distributions in the Subantarctic Zone between 40–52°S; 155–160°E.
s C I e n C e P r o g r a m 211
Marine Chemistry, 112 (1-2): 107-117, doi:10.1016/j.marchem.2008.07.008.
Evans, C., I. Pearce and C.P.D. Brussaard, 2009. Viral-mediated lysis of microbes and carbon release in the sub-Antarctic and Polar Frontal zones of the Australian Southern Ocean. Environmental Microbiology, 11(11):2924-2934, Doi:10.1111/j.1462-2920.2009.05050.x.
Evans, C., P.G. Thomson, A.T. Davidson, R. van den En-den, H. Witte and C.P.D. Brussaard, in review. Mi-crobial biogeography of the Australian Southern Ocean during the SAZ-Sense. Deep Sea Research II.
Fahrbach, E., O. Boebel, M. Hoppema, O. Klatt, G. Rohardt and A. Wisotzki, 2009. Evidence of Decadal Fluctua-tions in the Water Mass Properties in the Weddell Sea, MOCA-09, Montreal, Canada, 20-29 July.
Fahrbach, E. and H. de Baar, 2010. The Expedition of the Research Vessel Polarstern to the Antarctic in 2008 (ANT-XXIV/3), Reports on Polar and Marine Research, Alfred Wegener Institute for Polar and Marine Research, Bremerhaven, 606, 232 p.
Fahrbach, E, M. Hoppema, G. Rohardt, O. Boebel, O. Klatt and A. Wisotzki, submitted. Warming of deep and abyssal water masses along the Green-wich meridian on decadal time-scale: The Wed-dell gyre as a heat buffer, Deep-Sea Research II.
Fukamachi, Y., S.R. Rintoul, J.A. Church, S. Aoki, S. So-kolov, M. Rosenberg and M. Wakatsuchi, 2010. Strong export of Antarctic Bottom Water east of the Kerguelen Plateau. Nature Geoscience, pub-lished on-line 25 April 2010.
Giles, K.A., S.W. Laxon and A.P. Worby, 2008. Ant-arctic sea ice elevation from satellite ra-dar altimetry, Geophys. Res. Lett., 35:L03503, doi:10.1029/2007GL031572.
Gille, S.T., 2008. Decadal-scale temperature trends in the Southern Hemisphere Ocean. Journal of Cli-mate, 16:4749-4765.
Gloor, M., N. Gruber, J.L. Sarmiento, C.L. Sabine, R.A. Feely and C. Rödenbeck, 2003. A first estimate of present and preindustrial air-sea CO2 flux pat-terns based on ocean interior carbon measure-ments and models. Geophys. Res. Lett., 30(1):1010, 10.1029/2002GL015594.
Gordon, A.L., B. Huber, D. McKee and M. Visbeck, 2010. A seasonal cycle in the export of bottom water from the Weddell Sea, Nature Geoscience, 3, 551-556,
10.1038/ngeo916Griffiths, H.J., D.K.A. Barnes and K. Linse, 2009. To-
wards a generalised biogeography of the South-ern Ocean benthos. J. Biogeography, 36:162-177, doi:10.1111/j.1365-2699.2008.01979.x.
Gutt, J., 2008. The Expedition ANT-XXIII/8 of the Re-search Vessel Polarstern in 2006/2007, Reports on Polar and Marine Research, Alfred Wegener Insti-tute for Polar and Marine Research, Bremerhaven, 569, 152 p.
Hauck, J., M. Hoppema, R.G.J. Bellerby, C. Völker and D. Wolf-Gladrow, in press. Data-based estimation of anthropogenic carbon and acidification in the Wed-dell Sea on a decadal time scale. J. Geophys. Res.
Hedgpeth, J.W., 1969. Introduction to Antarctic Zoo-geography. Antarctic Map Folio Series. New York.
Heywood, K.J., A.F. Thompson and E. Fahrbach, 2009. Changes in the Weddell Sea Outflow, MOCA-09, Montreal, Canada, 20-29 July, 2009.
Hibbert, A., H. Leach, P.L. Woodworth, C.W. Hughes and V.M. Roussenov, 2010. Quasi-biennial modu-lation of the Southern Ocean coherent mode. Quarterly Journal of the Royal Meteorological Soci-ety, 136:755-768.
Hoppema, M., 2004. Weddell Sea turned from source to sink for atmospheric CO2 between pre-industri-al time and present. Global and Planetary Change, 40:219-231.
Jacobs, S.S., 2006. Observations of change in the South-ern Ocean. Phil. Trans. Roy. Soc. America, 364:1657-1681.
Jenkins, A., P. Dutrieux, S.S. Jacobs, S.D. McPhail, J.R. Perrett, A.T. Webb, D. White, 2010. Observations beneath Pine Island Glacier in West Antarctica and implications for its retreat. Nature Geoscience, 3:468-472.
Johnson, G.C. and S.C. Doney, 2006a. Recent western South Atlantic bottom water warming. Geophys. Res. Lett., 33:L14614, doi:10.1029/2006GL026769.
Johnson, G.C. and S.C. Doney, 2006b. Correction to Recent western South Atlantic bottom wa-ter warming. Geophys. Res. Lett., 33:L21604, doi:10.1029/2006GL028294.
Johnson, G.C., S. Mecking, B.M. Sloyan and S.E. Wijffels, 2007. Recent bottom water warming in the Pacific Ocean. Journal of Climate, 20: 5365-5375.
Johnson, K.S. et al., 2007. Developing standards for dis-
I PY 20 07–20 0 8212
solved iron in Seawater. EOS, 88:11.Klatt, O., O. Boebel and E. Fahrbach, 2007. A profiling
float’s sense of ice, J. Atmosph. and Oceanic Techn., 24(7):1301-1308., doi:10.1175/JTECH2026.1.
Klunder M., P. Laan, R. Middag, H.J.W. de Baar and J. van Ooijen, submitted. Dissolved iron in the Southern Ocean (Atlantic sector). Deep-Sea Research II.
Krafft, B., W. Melle, T. Knutsen, E. Bagøyen, C. Broms, B. Ellertsen and V. Siegel, 2010. Distribution and de-mography of Antarctic krill in the South East Atlan-tic sector of the Southern Ocean during the austral summer 2008. DOI:10.1007/s300-010-0774-3.
Lannuzel, D., V. Schoemann, B. Pasquer, P. van der Merwe and A.R. Bowie, in revision. What controls the distribution of dissolved iron in Antarctic sea ice? Spatial, seasonal and inter-annual variability. J. Geophys. Res. Biogeosciences.
Le Quéré, C.L. et al., 2007. Saturation of the Southern Ocean CO2 sink due to recent climate change. Sci-ence, 316: 1735-1738.
Lewis, M.J., J.L. Tison, B. Weissling, B. Delille, S.F. Ackley, F. Brabant and H. Xie, in press. Sea ice and snow cover characteristics during the winter-spring transition in the Bellingshausen Sea: an overview of SIMBA 2007, Deep Sea Research II.
Lovenduski, N. S., N. Gruber and S. C. Doney, 2008. To-ward a mechanistic understanding of the decadal trends in the Southern Ocean carbon sink. Glob. Biogeochem. Cycles 22, GB3016.
Luis, A.L and M. Sudhakar, 2009. Upper-ocean hydro-dynamics along meridional sections in the south-west Indian sector of the Southern Ocean during austral summer 2007, Polar Science 3:13-30.
Mayewski, P.A., M.P. Meredith, C.P. Summerhayes, J. Turner, A. Worby, P.J. Barrett, G. Casassa, N.A.N. Bertler, T. Bracegirdle, A.C. Naveira Garabato, D. Bromwich, H. Campbell, G.H. Hamilton, W.B. Ly-ons, K.A. Maasch, S. Aoki, C. Xiao and T. van Om-men, 2009. State of the Antarctic and Southern Ocean climate system, Rev. Geophys., 47: RG1003, doi:10.1029/2007RG000231. 38pp.
Measures, C.I., 2007. GEOTRACES - An international study of the global marine biogeochemical cycles of trace elements and their isotopes. Chemie der Erde-Geochemistry, 67:85-131.
McNeil, B. I. and R. J. Matear, 2008. Southern Ocean acidification: A tipping point at 450 –ppm atmo-
spheric CO2. Proceedings of the National Academy of Sciences, 105:18860-18864.
Meiners, K., L. Norman, M.A. Granskog, A. Krell, P. Heil and D.N. Thomas, in press. Physico-ecobiogeo-chemistry of East Antarctic pack ice during the winter-spring transition. Deep Sea Research II.
Melnikov I.A. and R.M. Gogorev, 2008. Cryobiological characteristics of sea ice in the Antarctic marginal zone. In Changes of natural environment and cli-mate: natural and possible consequent human-induced catastrophes. Vol. 3, Part 2. Natural pro-cesses in polar regions. V.M. Kotlyakov (ed), p. 226-233. Moscow: IG RAS Publishing (in Russian).
Melnikov I.A., R.L. Osudar and R.M. Gogorev, submitted. Sea ice biological communities at Nella Fjord, Pry-dz Bay, Eastern Antarctic, 2009-2010. Oceanology.
Middag, R., C. Van Slooten, H.J.W. De Baar and P. Laan, in press (a). Dissolved Aluminium in the Southern Ocean. Deep-Sea Research II.
Middag, R., H.J.W. De Baar, P. Laan, P.H. Cai and J. Van Ooijen, in press (b). Dissolved Manganese in the Atlantic sector of the Southern Ocean. Deep Sea Research II.
Morel, F.M.M. and N.M. Price, 2003. The biogeochemi-cal cycles of trace metals in the oceans. Science, 300(5621):944-947.
Murphy, E.J., R.D. Cavanagh, N.M. Johnston and E.E. Hofmann, (eds), 2010. Integrating Climate and Ecosystem Dynamics (ICED): Report of the South-ern Ocean Food Web Modelling Workshop, 16-18 April 2008, Virginia, U.S.A.. (Available from www.iced.ac.uk.)
Murphy, E.J., R.D. Cavanagh, N.M. Johnston, K. Reid and E.E. Hofmann, (eds), 2008. Integrating Climate and Ecosystem Dynamics in the Southern Ocean (ICED): Science Plan and Implementation Strat-egy. GLOBEC Report No. 26 and IMBER Report No. 2. (Available from www.iced.ac.uk.)
Naveira Garabato, A.C., K.L. Polzin, B.A. King, K.J. Hey-wood and M. Visbeck, 2004. Widespread intense turbulent mixing in the Southern Ocean, Science, 3003:210-213.
Naveira Garabato, A.C., L. Jullion, D.P. Stevens, K.J. Heywood and B.A. King, 2009. Variability of Sub-antarctic Mode Water and Antarctic Intermediate Water in the Drake Passage during the late-twen-tieth and early-twenty-first centuries. J. Clim. 22
s C I e n C e P r o g r a m 213
(7):3661-3688. Núñez-Riboni, I. and E. Fahrbach, 2009a. Seasonal
variability of the Antarctic Coastal Current and its driving mechanisms in the Weddell Sea. Deep Sea Research I, 56:1927-1941, DOI:10.1016/j.dsr.2009.06.005.
Núñez-Riboni, I. and E. Fahrbach, in press (b). An ob-servation of the banded structure of the Antarctic Coastal Current at the prime meridian. Polar Res.
Orr, J.C. et al., 2005. Anthropogenic ocean acidification over the twenty-first century and its impact on calcifying organisms. Nature, 437:681–686.
Park, Y. H., F. Vivier, F. Roquet et al., 2009. Direct obser-vations of the ACC transport across the Kerguelen Plateau, Geophys. Res. Lett., 36:L18603.
Peck, L. S., D.K.A. Barnes, A.J. Cook, A.H. Fleming and A. Clarke, 2009. Negative feedback in the cold: ice retreat produces new carbon sinks in Antarc-tica. Global Change Biology, doi: 10.1111/j.1365-2486.2009.02071.x.
Rignot, E. and S.S. Jacobs, 2002. Rapid bottom melting widespread near Antarctic ice sheet grounding lines, Science, 296:2020-2023.
Rintoul., S.R., 2007. Rapid freshening of Antarctic Bottom Water formed in the Indian and Pa-cific Oceans. Geophys. Res. Lett., 34:L06606, doi:10.1029/2006GL028550.
Rintoul, S.R., C.W. Hughes and D. Olbers, 2001. The Antarctic Circumpolar Current system. InOcean circulation and climate; observing and modelling the global ocean, G. Siedler, J. Church and J. Gould (eds), International Geophysics Series, 77:271-302, Academic Press.
Rintoul, S.R., S. Sokolov and J. Church, 2002. A six year record of baroclinic transport variability of the Antarctic Circumpolar Current at 140°E, derived from XBT and altimeter measurements. J. Geo-phys. Res. – Oceans, 107 (C10):art. no. 3155.
Rintoul, S.R. et al., 2010a. Southern Ocean Observ-ing System (SOOS): Rationale and Strategy for Sustained Observations of the Southern Ocean. In Proceedings of OceanObs’09: Sustained Ocean Observations and Information for Society (Vol. 2), Venice, Italy, 21-25 September 2009, J. Hall, D.E. Harrison and D. Stammer (eds), ESA Publication WPP-306, in press.
Rintoul et al., 2010b. The Southern Ocean Observing
System (SOOS): Initial Science and Implementa-tion Strategy. Scientific Committee for Antarctic Research, www.clivar.org/organization/southern/expertgroup
Roquet, F., Y-H. Park, C. Guinet et al., 2009. Observa-tions of the Fawn Trough Current over the Ker-guelen Plateau from instrumented elephant seals. J. Marine Systems, 78:377-393.
Sabine, C.L. et al., 2004. The oceanic sink for anthropo-genic CO2. Science, 305:367-371.
Sachs, O., E.J. Sauter, M. Schlüter, M.R. van der Loeff, K. Jerosch, and O. Holby, 2009. Benthic organic car-bon flux and oxygen penetration reflect different plankton provinces in the Southern Ocean. Deep-Sea Research I, 56:1319–1335.
Sallée, J.B., K. Speer and S.R. Rintoul, 2010a. Zonnally asymmetric response of the Southern Ocean mixed-layer depth to the Southern Annular Mode. Nature Geoscience, 3:273-279, doi:10.1038/ngeo812.
Sallée, J.B., K. Speer, S.R. Rintoul and S. Wijffels, 2010b. Southern Ocean thermocline ventilation. J. Phys. Ocean., 40:509-529, DOI: 10.1175/2009JPO4291.1.
Sarmiento, J. L., N. Gruber, M.A. Brzezinski and J.P. Dunne, 2004. High latitude controls of the global nutricline and low latitude biological productiv-ity. Nature, 427:56-60.
Smale, D. A., K.M. Brown, D.K.A. Barnes, K.P.P. Fraser and A. Clarke, 2008. Ice Scour Disturbance in Ant-arctic Waters. Science:321-371.
Sokolov, S. and Rintoul, S.R., 2007. Multiple jets of the Antarctic Circumpolar Current south of Australia. J. Phys. Oceanography, 37:1394-1412.
Sokolov, S. and S.R. Rintoul, 2009a. Circumpolar struc-ture and distribution of the Antarctic Circumpolar Current fronts: 1. Mean circumpolar paths. J. Geo-phys. Res., 114(c11):C11018.
Sokolov, S. and S.R. Rintoul, 2009b. Circumpolar struc-ture and distribution of the Antarctic Circumpolar Current fronts: 2. Variability and relationship to sea surface height. J. Geophys. Res., 114(c11):C11019.
Stammerjohn, S., T. Maksym, P. Heil, R.A. Massom, M. Vancoppenolle and K.C. Leondard, in press. The in-fluence of winds, sea surface temperature and pre-cipitation anomalies on Antarctic regional sea ice conditions during IPY 2007, Deep Sea Research II.
Steig, E.J., D.P. Schneider, S.D. Rutherford, M.E. Mann, J.C. Comiso and D.T. Shindell, 2009. Warming of the
I PY 20 07–20 0 8214
Antarctic ice sheet surface since the 1957 Interna-tional Geophysical Year. Nature, 457:459-462.
Strugnell, J.M., A.D. Rogers, P.A. Prodohl, M.A. Collins and A.L. Allcock, 2008. The thermohaline express-way: the Southern Ocean as a centre of origin for deep-sea octopuses. Cladistics, 24:1-8.
Swart, S., S. Speich, I.J. Ansorge et al., 2008. Transport and variability of the antarctic circumpolar cur-rent South of Africa. J. Geophys. Res. – Oceans, 113: art. no. C09014.
Swart, S. S. Speich, I.J. Ansorge et al., 2010a. An altime-try-based gravest empirical mode south of Africa: 1. Development and validation. J. Geophys. Res. – Oceans, 115:art. no. C03002.
Swart, S. and S. Speich, 2010b. An altimetry-based grav-est empirical mode south of Africa: 2. Dynamic na-ture of the Antarctic Circumpolar Current fronts. J. Geophys. Res. – Oceans, 115:art. no. C03003.
Tagliabue, A., L. Bopp, J.-C. Dutay, A.R. Bowie, F. Ch-ever, P. Jean-Baptiste, E. Bucciarelli, D. Lannuzel, T. Remenyi, G. Sarthou, O. Aumont, M. Gehlen and C. Jeandel, 2010. Hydrothermal contribution to oceanic dissolved iron inventory. Nature Geosci-ence, 3:252-256.
Takahashi, T. and 30 co-authors, 2009. Climatological mean and decadal change in surface ocean pCO2, and net sea-air CO2 flux over the global oceans. Deep-Sea Research II, 56:554-577.
Thompson A.F. and K.J. Heywood, 2008. Frontal struc-ture and transport in the northwestern Weddell Sea. Deep-Sea Research I, 55:1229-1251.
Thomas, D.N. and G.S. Dieckmann, (eds), 2003. Sea ice: an introduction to its physics, chemistry, biology and geology. Oxford: Blackwell Science.
Turner, J., J.C. Comiso, G.J. Marshall, T.A. Lachlan-Cope, T. Bracegirdle, T. Maksym, M. P. Meredith, Z. Wang and A. Orr, 2009a. Non-annular atmospheric cir-culation change induced by stratospheric ozone depletion and its role in the recent increase of Antarctic sea ice extent. Geophys. Res. Lett., 36:L08502, doi:10.1029/2009GL037524.
Turner, J., R. Binschadler, P. Convey, G. Di Prisco, E. Fah-rbach, J. Gutt, D. Hodgson, P. Mayewski and C.P. Summerhayes, 2009b. Antarctic Climate Change and the Environment. SCAR, Cambridge, 560 p.
van der Merwe P., D. Lannuzel, C.A. Mancuso Nichols, K. Meiners, P. Heil, L. Norman, D. Thomas and A.R.
Bowie, 2009. Biogeochemical observations during the winter-spring transition in East Antarctic sea ice: evidence of iron and exopolysaccharide con-trols. Marine Chemistry, 115:163-175, doi:10.1016/j.marchem.2009.08.001.
Van Heuven, S., M. Hoppema, H. Slagter and H. de Baar, submitted. First direct observation of increasing CO2 over decadal time scale in deep ocean waters: the Antarctic Ocean along the Prime Meridian in the 1973-2008 era. Deep-Sea Res. II.
Waller, C.L., M.R. Worland, P. Convey et al., 2006. Eco-physiological strategies of Antarctic intertidal in-vertebrates faced with freezing stress. Polar Biol-ogy, 29:1077-1083.
Watts, R., C. Sun and S.R. Rintoul, 2001. A two-dimen-sional Gravest Empirical Mode determined from hydrographic observations in the Subantarctic Front. J. Phys. Oceanography, 31(1):2186-2209.
Weihe, E. and D. Abele, 2008. Differences in the physi-ological response of inter- and subtidal Antarc-tic limpets Nacella concinna to aerial exposure. Aquatic Biology, 4:155-166.
Wiebe, P.H., D. Chu, S. Kaartvedt, A. Hundt, W. Melle, E. Ona and P. Batta-Lona, 2009. The acoustic prop-erties of Salpa thompsoni. ICES Journal of Marine Science, 67:583-593.
Willatt, R., S. Laxon, K. Giles and A.P. Worby, 2010. Field investigations of Ku-band radar penetration into snow cover on Antarctic sea ice, Geophys. Res. Lett., 48(1):365-372.
Woodworth, P.L., C.W. Hughes, D.L. Blackman, V.N. Ste-panov, S.J. Holgate, P.R. Foden, J.P. Pugh, S. Mack, G.W. Hargreaves, M.P. Meredith, G. Milinevsky and J.J. Fierro Contreras, 2006. Antarctic Peninsula sea levels: a real time system for monitoring Drake Pas-sage transport. Antarctic Science, 18(3):429-436.
Worby, A.P., A. Steer, J. Lieser, N. Galin, D. Yi, I. Allison, P. Heil, R.A. Massom and H.J. Zwally, in press. Region-al-scale sea ice and snow thickness distributions from in situ and satellite measurements over East Antarctic pack ice during SIPEX.
Xie, H., S.F. Ackley, D. Yi, H.J. Zwally, P. Wagner, B. Weissling, M. Lewis and K. Ye, in press. Sea ice thickness distribution of the Bellingshausen Sea from surface measurements and ICESat altimetry, Deep Sea Research II.
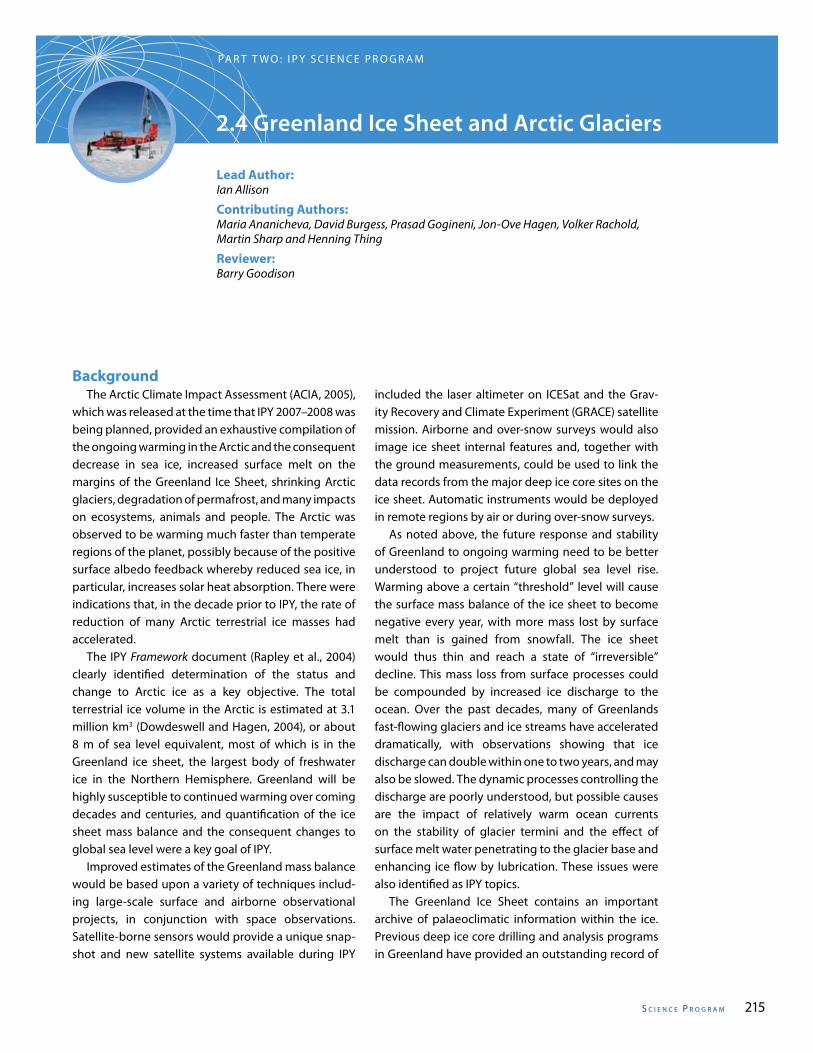
s C I e n C e P r o g r a m 215
2.4 Greenland Ice Sheet and Arctic Glaciers
Lead Author:Ian Allison
Contributing Authors:Maria Ananicheva, David Burgess, Prasad Gogineni, Jon-Ove Hagen, Volker Rachold, Martin Sharp and Henning Thing
Reviewer:Barry Goodison
PA R T T W O : I P Y S C I E N C E P R O G R A M
Background The Arctic Climate Impact Assessment (ACIA, 2005), which was released at the time that IPY 2007–2008 was being planned, provided an exhaustive compilation of the ongoing warming in the Arctic and the consequent decrease in sea ice, increased surface melt on the margins of the Greenland Ice Sheet, shrinking Arctic glaciers, degradation of permafrost, and many impacts on ecosystems, animals and people. The Arctic was observed to be warming much faster than temperate regions of the planet, possibly because of the positive surface albedo feedback whereby reduced sea ice, in particular, increases solar heat absorption. There were indications that, in the decade prior to IPY, the rate of reduction of many Arctic terrestrial ice masses had accelerated. The IPY Framework document (Rapley et al., 2004) clearly identified determination of the status and change to Arctic ice as a key objective. The total terrestrial ice volume in the Arctic is estimated at 3.1 million km3 (Dowdeswell and Hagen, 2004), or about 8 m of sea level equivalent, most of which is in the Greenland ice sheet, the largest body of freshwater ice in the Northern Hemisphere. Greenland will be highly susceptible to continued warming over coming decades and centuries, and quantification of the ice sheet mass balance and the consequent changes to global sea level were a key goal of IPY. Improved estimates of the Greenland mass balance would be based upon a variety of techniques includ-ing large-scale surface and airborne observational projects, in conjunction with space observations. Satellite-borne sensors would provide a unique snap-shot and new satellite systems available during IPY
included the laser altimeter on ICESat and the Grav-ity Recovery and Climate Experiment (GRACE) satellite mission. Airborne and over-snow surveys would also image ice sheet internal features and, together with the ground measurements, could be used to link the data records from the major deep ice core sites on the ice sheet. Automatic instruments would be deployed in remote regions by air or during over-snow surveys. As noted above, the future response and stability of Greenland to ongoing warming need to be better understood to project future global sea level rise. Warming above a certain “threshold” level will cause the surface mass balance of the ice sheet to become negative every year, with more mass lost by surface melt than is gained from snowfall. The ice sheet would thus thin and reach a state of “irreversible” decline. This mass loss from surface processes could be compounded by increased ice discharge to the ocean. Over the past decades, many of Greenlands fast-flowing glaciers and ice streams have accelerated dramatically, with observations showing that ice discharge can double within one to two years, and may also be slowed. The dynamic processes controlling the discharge are poorly understood, but possible causes are the impact of relatively warm ocean currents on the stability of glacier termini and the effect of surface melt water penetrating to the glacier base and enhancing ice flow by lubrication. These issues were also identified as IPY topics. The Greenland Ice Sheet contains an important archive of palaeoclimatic information within the ice. Previous deep ice core drilling and analysis programs in Greenland have provided an outstanding record of
I PY 20 07–20 0 8216
so-called Dansgaard-Oeschger events; very abrupt, millennial-scale, climatic shifts that occurred during the last glacial period. Understanding the cause of these events has implications for predicting future change. Nevertheless, none of the previous ice cores from Greenland provided an undisturbed climate record of the last interglacial, the Eemian, which occurred between about 115,000 and 130,000 years ago and was warmer in the Arctic than our present interglacial period. Obtaining a record of this period from Greenland was an important IPY target. About 50% (in number) of all world glaciers and ice caps are found in the Arctic and, although the surface area of the Greenland ice sheet is about four times the area of all other Arctic glaciers and ice caps, the smaller ice masses are generally at lower elevation and have warmer mean annual temperatures, and so are sus-ceptible to greater percentage mass loss in response to warming. Globally, glaciers and ice caps, including those surrounding the Greenland and Antarctic ice sheets, store ~ 0.5 to 0.7 m of sea level equivalent, and are currently contributing at about the same rate to sea level rise as the combined contributions from the ice sheets in Greenland and Antarctica (IPCC, 2007). They will continue to contribute into the 21st century and beyond. Many of the Arctic glaciers and ice caps terminate in the oceans and 30-40% of their mass loss is from iceberg calving. Nevertheless, the uncertainty both in the surface mass balance and the calving fluxes of the Arctic glaciers is still large. Hence, IPY aimed to obtain baseline glaciological data on extent, dynamics and mass balance of the irregularly distributed Arctic ice masses in regions such as Alaska, the Canadian Arc-tic, Iceland, Svalbard, Franz Josef Land, Novaya Zemlya, Severnaya Zemlya and northern Scandinavia. The vari-ations in space and time of the monitored ice bodies in polar and mountain regions could then be extrap-olated to estimate regional contributions to sea level change and linked to the global hydrological cycle.
Developing Greenland and Arctic Glacier IPY projects The ICSU-WMO call for “Expressions of Intent” (EoI) for IPY projects elicited approximately 30 EoIs between November 2004 and January 2005 which were focused on the terrestrial ice masses of the Arctic.
These can be broadly categorized into five groups.• Characteristics and status of the Greenland ice
sheet. This group included EoIs 74, 94, 581, 607, 883, 933, 951 and 1120.1 Two geoscience EoIs, 763 and 784, were also linked to this group as they planned to share logistics to explore the geophysics of Greenland, including characteristics of the bedrock beneath the ice sheet.
• Future response and stability of Greenland. This included EoIs 69, 136, 187, 245, 334, 381, 418 and 765.
• The record of past environments from Greenland ice cores; EoIs 62, 203 and 561.
• Satellite remote sensing of the Greenland ice sheet; EoI 910, which was bipolar and also included study of the Antarctic ice sheet.
• Changes to Arctic glaciers and ice caps; EoIs 30, 233, 654, 684, 756 and 1007.
Over the next several months the proponents of these EoIs, encouraged by the IPY Joint Committee and the International Programme Office, worked to combine their ideas and resources into larger full IPY proposals. Ultimately, seven full proposals that dealt with the Arctic ice sheets and glaciers were endorsed by the IPY Joint Committee (JC) in 2005–2006 (Allison et al., 2007; Chapter 1.5). Two of these (no. 91 and no. 125 - see below) were satellite remote sensing projects that also included investigation of the Antarctic, and two were “umbrella” projects submitted on behalf of international organizations. These latter projects, which generally did not propose specific research activities but sought to synthesize the results of other relevant projects in the Arctic and Antarctic, were no. 105 (State and Fate of the Polar Cryosphere) linked to the WCRP Climate and Cryosphere (CliC) Project, and no. 117 (International Partnerships in Ice Core Science - International Polar Year Initiative) linked to the International Partnerships in Ice Core Science.
IPY projects on the Greenland ice sheet IPY project no. 118 (The Greenland Ice Sheet – Stability, History and Evolution), led by scientists from Denmark and U.S.A., was a very large and multi-faceted study that linked palaeoclimate, observational and modelling components to investigate past and future stability of the Greenland Ice Sheet, ice dynamics, sea level change and change in fresh water supply
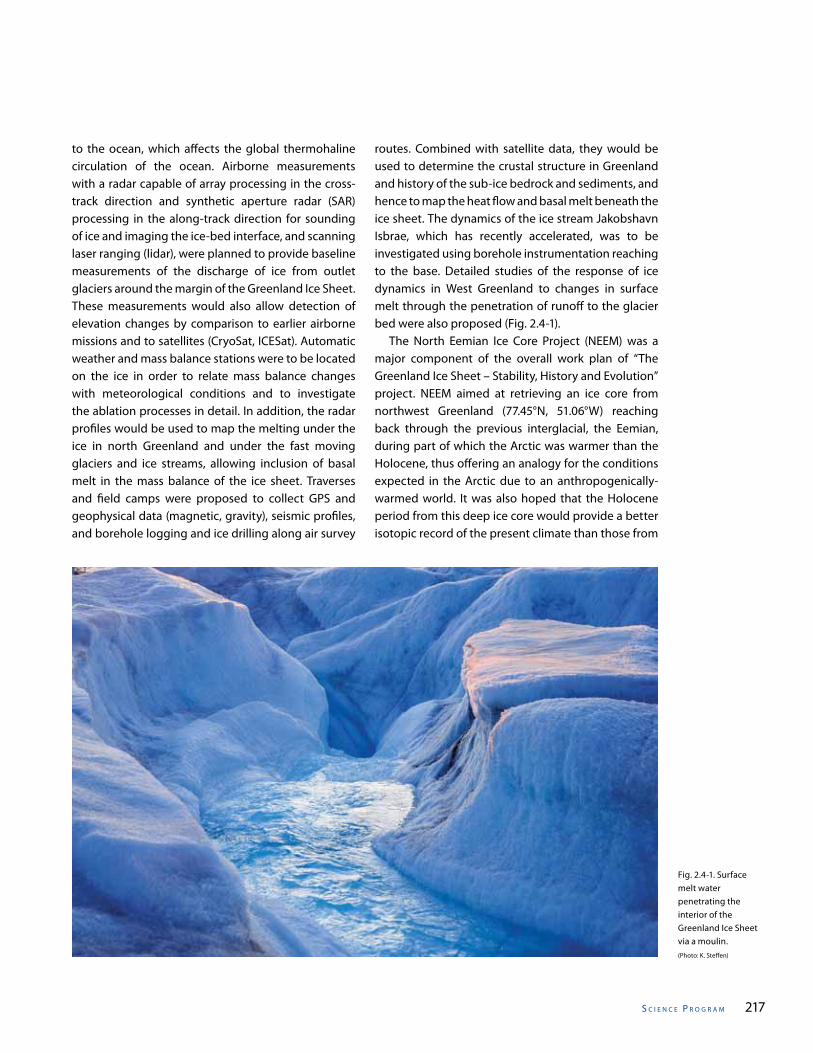
s C I e n C e P r o g r a m 217
to the ocean, which affects the global thermohaline circulation of the ocean. Airborne measurements with a radar capable of array processing in the cross-track direction and synthetic aperture radar (SAR) processing in the along-track direction for sounding of ice and imaging the ice-bed interface, and scanning laser ranging (lidar), were planned to provide baseline measurements of the discharge of ice from outlet glaciers around the margin of the Greenland Ice Sheet. These measurements would also allow detection of elevation changes by comparison to earlier airborne missions and to satellites (CryoSat, ICESat). Automatic weather and mass balance stations were to be located on the ice in order to relate mass balance changes with meteorological conditions and to investigate the ablation processes in detail. In addition, the radar profiles would be used to map the melting under the ice in north Greenland and under the fast moving glaciers and ice streams, allowing inclusion of basal melt in the mass balance of the ice sheet. Traverses and field camps were proposed to collect GPS and geophysical data (magnetic, gravity), seismic profiles, and borehole logging and ice drilling along air survey
routes. Combined with satellite data, they would be used to determine the crustal structure in Greenland and history of the sub-ice bedrock and sediments, and hence to map the heat flow and basal melt beneath the ice sheet. The dynamics of the ice stream Jakobshavn Isbrae, which has recently accelerated, was to be investigated using borehole instrumentation reaching to the base. Detailed studies of the response of ice dynamics in West Greenland to changes in surface melt through the penetration of runoff to the glacier bed were also proposed (Fig. 2.4-1). The North Eemian Ice Core Project (NEEM) was a major component of the overall work plan of “The Greenland Ice Sheet – Stability, History and Evolution” project. NEEM aimed at retrieving an ice core from northwest Greenland (77.45°N, 51.06°W) reaching back through the previous interglacial, the Eemian, during part of which the Arctic was warmer than the Holocene, thus offering an analogy for the conditions expected in the Arctic due to an anthropogenically-warmed world. It was also hoped that the Holocene period from this deep ice core would provide a better isotopic record of the present climate than those from
Fig. 2.4-1. Surface melt water penetrating the interior of the Greenland Ice Sheet via a moulin.(Photo: K. Steffen)
I PY 20 07–20 0 8218
other Greenland ice cores. The deep NEEM core was to be supplemented with a series of shallow to inter-mediate length ice cores providing information on the climate during the last thousand years. Many of these were planned at existing core sites, which would be revisited, to extend the available climate records from these up to modern times with new shallow cores. Another endorsed IPY project focused on the Greenland Ice Sheet was called ‘Measurement and Attribution of Recent Greenland Ice Sheet chaNgeS’ (MARGINS, IPY no. 339), led by researchers from the U.S.A. and U.K. This sought to improve communication, coordination and collaboration among a diverse collection of proposed research initiatives, which were aimed at understanding the changes in surface elevation and discharge speed in outlet glacier systems along the margins of the Greenland Ice Sheet. These studies covered a range of activities from expansions of ongoing efforts to new projects, from individual investigators to consortia of several nations, and a range of observational and modeling techniques exploiting evolving capabilities in atmospheric modeling, remote sensing for measurement of ice motion and surface conditions, and surface-based and aircraft-based measurements. IPY 2007–2008 occurred at a time when new sophisticated and dedicated space-borne instruments were available to directly detect changes to the Greenland and Antarctic ice sheets by measuring gravitational and surface elevation changes. These missions had been initiated well before IPY and, although the scientists involved in these worked closely with those IPY projects making in situ ice sheet observations, they did not generally seek IPY endorsement. One exception, however, that did seek and receive IPY endorsement was the project “Antarctica & Greenland ice and snow mass balance by GRACE satellite gravimetry” (IPY no. 125) led by France. Nevertheless, a very significant contribution to IPY was the coordination of diverse satellite observations made within the ‘Global Inter-agency IPY Polar Snap-shot Year’ project (GIIPSY, IPY no. 91). The objective of GIIPSY was to coordinate space-borne observation of the polar regions and polar processes in order to maximize the scientific benefit and to obtain a bench-mark of processes during IPY. The GIIPSY science com-munity was linked to national and international space
agencies through the Space Task Group (STG) of the IPY Subcommittee on Observations (Chapter 3.1). The GIIPSY project aimed to target satellite data acquisi-tions towards those science problems best served by a focused, time-limited data campaign and by the availability of diverse but integrated observations. A primary data acquisition objective was to obtain pole-to-coast multi-frequency interferometric SAR measurements for determining the ice surface veloc-ity over Greenland and Antarctica. GIIPSY planned to contribute to other IPY activities by making the result-ing data and derived products available to the interna-tional science community.
IPY projects on Arctic glaciers and ice caps The status of, and changes to, Arctic glaciers and ice caps were addressed by the project ‘The dynamic response of Arctic glaciers to global warming’ (GLACIODYN, IPY no. 37), coordinated by the Netherlands and Norway. The overall aim of GLACIODYN was to reduce the uncertainties in estimates of the contribution of Arctic glaciers and ice caps to sea level change. A key question was to what extent a warmer climate may also change the dynamics of the glaciers and not only near-surface processes such as snow accumulation, refreezing both internally and of superimposed ice, and ablation. This involves including iceberg calving in mass budget calculations, improving understanding of calving and basal sliding processes and including dynamics in modeling the future response of glaciers. The specific objectives to achieve this were to: (1) study the current mass budget of selected target glaciers, including the surface mass balance and the calving flux where applicable; (2) study sub-glacial processes such as sliding and basal hydrology; (3) study calving processes; (4) include the dynamics in modeling of future response; and (5) predict future changes of the ice cap or glacier. Predictions of future mass balance and dynamic response require knowledge of boundary conditions such as the thermal structure of the ice, the surface mass balance, meteorological data, surface and bed topography, and ice flow. These were addressed by field and remote sensing investigations. The GLACIODYN proposal was based on an already established network of glaciologists who
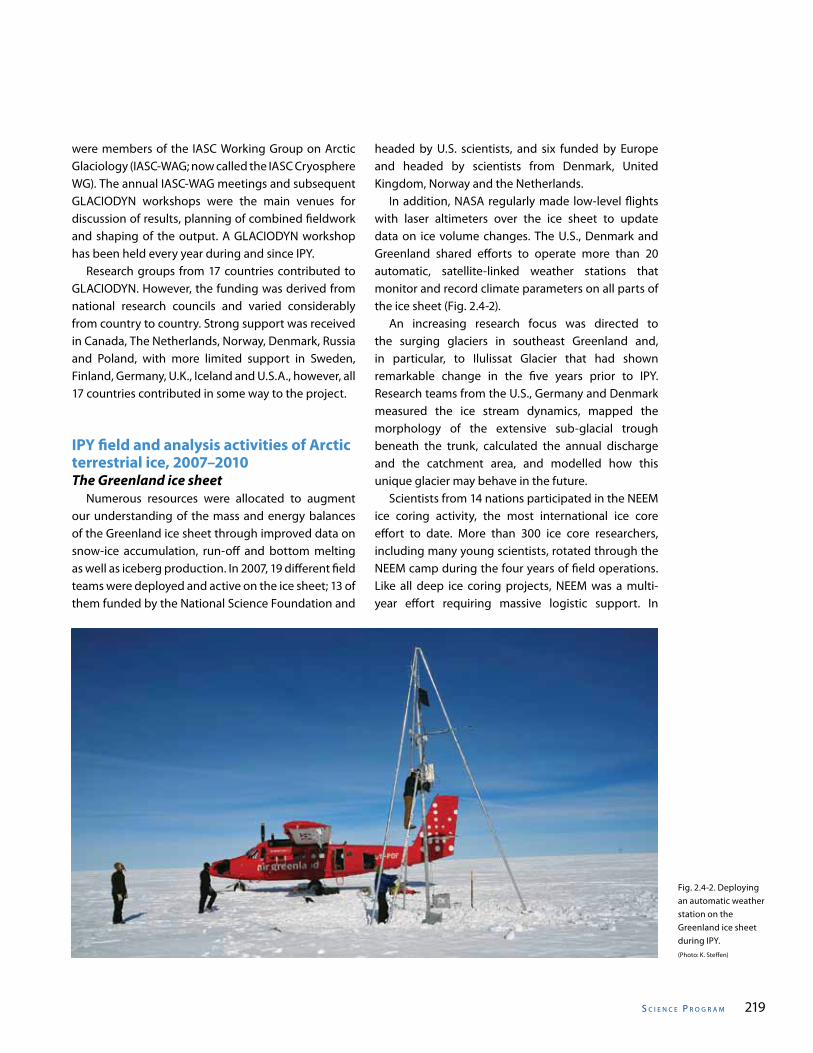
s C I e n C e P r o g r a m 219
were members of the IASC Working Group on Arctic Glaciology (IASC-WAG; now called the IASC Cryosphere WG). The annual IASC-WAG meetings and subsequent GLACIODYN workshops were the main venues for discussion of results, planning of combined fieldwork and shaping of the output. A GLACIODYN workshop has been held every year during and since IPY. Research groups from 17 countries contributed to GLACIODYN. However, the funding was derived from national research councils and varied considerably from country to country. Strong support was received in Canada, The Netherlands, Norway, Denmark, Russia and Poland, with more limited support in Sweden, Finland, Germany, U.K., Iceland and U.S.A., however, all 17 countries contributed in some way to the project.
IPY field and analysis activities of Arctic terrestrial ice, 2007–2010The Greenland ice sheet Numerous resources were allocated to augment our understanding of the mass and energy balances of the Greenland ice sheet through improved data on snow-ice accumulation, run-off and bottom melting as well as iceberg production. In 2007, 19 different field teams were deployed and active on the ice sheet; 13 of them funded by the National Science Foundation and
headed by U.S. scientists, and six funded by Europe and headed by scientists from Denmark, United Kingdom, Norway and the Netherlands. In addition, NASA regularly made low-level flights with laser altimeters over the ice sheet to update data on ice volume changes. The U.S., Denmark and Greenland shared efforts to operate more than 20 automatic, satellite-linked weather stations that monitor and record climate parameters on all parts of the ice sheet (Fig. 2.4-2). An increasing research focus was directed to the surging glaciers in southeast Greenland and, in particular, to Ilulissat Glacier that had shown remarkable change in the five years prior to IPY. Research teams from the U.S., Germany and Denmark measured the ice stream dynamics, mapped the morphology of the extensive sub-glacial trough beneath the trunk, calculated the annual discharge and the catchment area, and modelled how this unique glacier may behave in the future. Scientists from 14 nations participated in the NEEM ice coring activity, the most international ice core effort to date. More than 300 ice core researchers, including many young scientists, rotated through the NEEM camp during the four years of field operations. Like all deep ice coring projects, NEEM was a multi-year effort requiring massive logistic support. In
Fig. 2.4-2. Deploying an automatic weather station on the Greenland ice sheet during IPY.(Photo: K. Steffen)
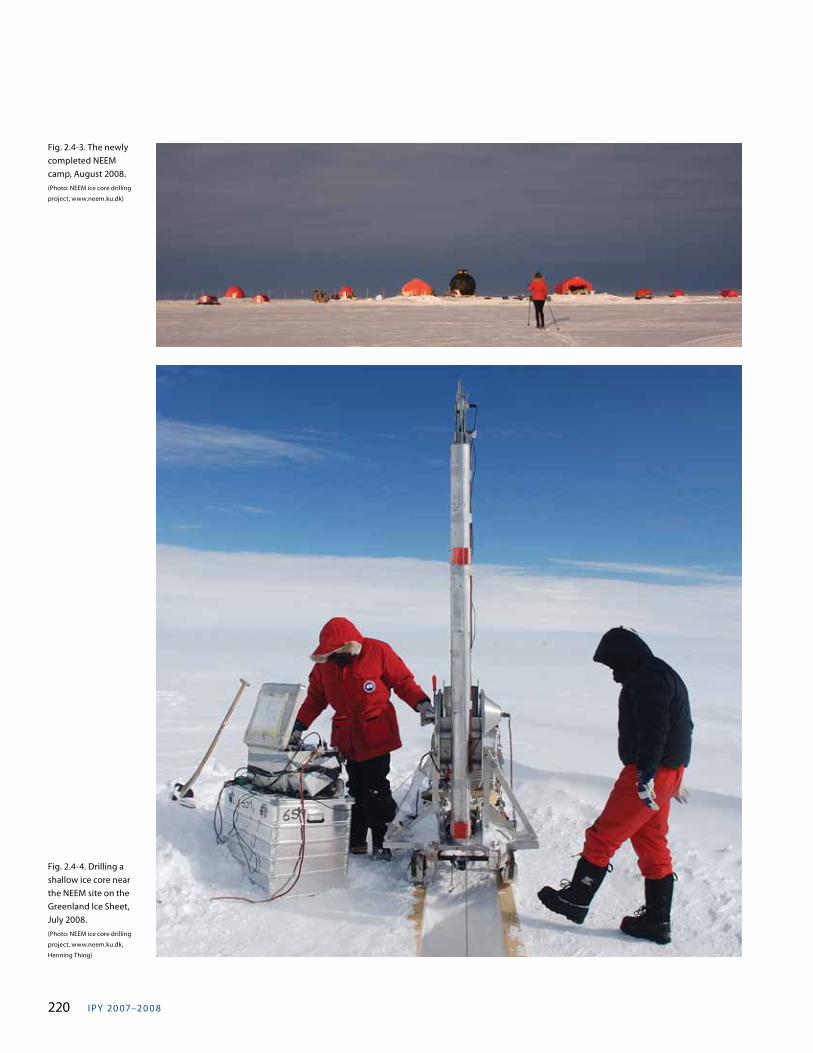
I PY 20 07–20 0 8220
Fig. 2.4-3. The newly completed NEEM camp, August 2008. (Photo: NEEM ice core drilling
project, www.neem.ku.dk)
Fig. 2.4-4. Drilling a shallow ice core near the NEEM site on the Greenland Ice Sheet, July 2008.(Photo: NEEM ice core drilling
project, www.neem.ku.dk,
Henning Thing)
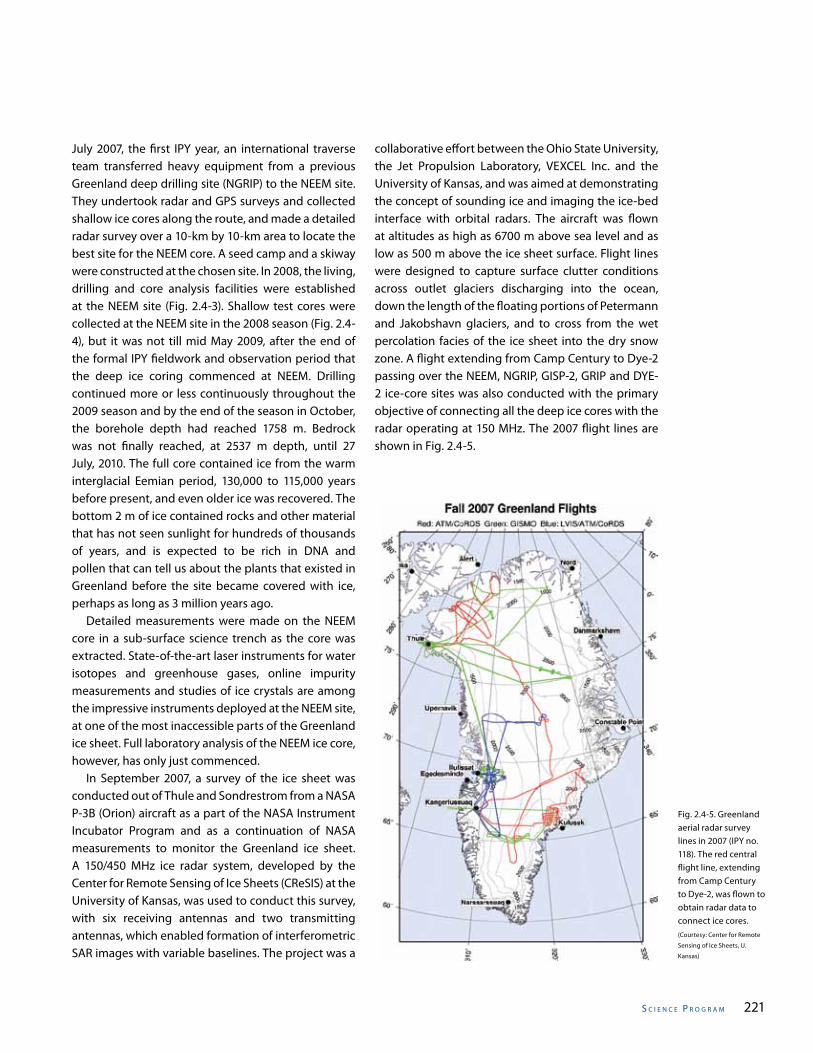
s C I e n C e P r o g r a m 221
July 2007, the first IPY year, an international traverse team transferred heavy equipment from a previous Greenland deep drilling site (NGRIP) to the NEEM site. They undertook radar and GPS surveys and collected shallow ice cores along the route, and made a detailed radar survey over a 10-km by 10-km area to locate the best site for the NEEM core. A seed camp and a skiway were constructed at the chosen site. In 2008, the living, drilling and core analysis facilities were established at the NEEM site (Fig. 2.4-3). Shallow test cores were collected at the NEEM site in the 2008 season (Fig. 2.4-4), but it was not till mid May 2009, after the end of the formal IPY fieldwork and observation period that the deep ice coring commenced at NEEM. Drilling continued more or less continuously throughout the 2009 season and by the end of the season in October, the borehole depth had reached 1758 m. Bedrock was not finally reached, at 2537 m depth, until 27 July, 2010. The full core contained ice from the warm interglacial Eemian period, 130,000 to 115,000 years before present, and even older ice was recovered. The bottom 2 m of ice contained rocks and other material that has not seen sunlight for hundreds of thousands of years, and is expected to be rich in DNA and pollen that can tell us about the plants that existed in Greenland before the site became covered with ice, perhaps as long as 3 million years ago. Detailed measurements were made on the NEEM core in a sub-surface science trench as the core was extracted. State-of-the-art laser instruments for water isotopes and greenhouse gases, online impurity measurements and studies of ice crystals are among the impressive instruments deployed at the NEEM site, at one of the most inaccessible parts of the Greenland ice sheet. Full laboratory analysis of the NEEM ice core, however, has only just commenced. In September 2007, a survey of the ice sheet was conducted out of Thule and Sondrestrom from a NASA P-3B (Orion) aircraft as a part of the NASA Instrument Incubator Program and as a continuation of NASA measurements to monitor the Greenland ice sheet. A 150/450 MHz ice radar system, developed by the Center for Remote Sensing of Ice Sheets (CReSIS) at the University of Kansas, was used to conduct this survey, with six receiving antennas and two transmitting antennas, which enabled formation of interferometric SAR images with variable baselines. The project was a
collaborative effort between the Ohio State University, the Jet Propulsion Laboratory, VEXCEL Inc. and the University of Kansas, and was aimed at demonstrating the concept of sounding ice and imaging the ice-bed interface with orbital radars. The aircraft was flown at altitudes as high as 6700 m above sea level and as low as 500 m above the ice sheet surface. Flight lines were designed to capture surface clutter conditions across outlet glaciers discharging into the ocean, down the length of the floating portions of Petermann and Jakobshavn glaciers, and to cross from the wet percolation facies of the ice sheet into the dry snow zone. A flight extending from Camp Century to Dye-2 passing over the NEEM, NGRIP, GISP-2, GRIP and DYE-2 ice-core sites was also conducted with the primary objective of connecting all the deep ice cores with the radar operating at 150 MHz. The 2007 flight lines are shown in Fig. 2.4-5.
Fig. 2.4-5. Greenland aerial radar survey lines in 2007 (IPY no. 118). The red central flight line, extending from Camp Century to Dye-2, was flown to obtain radar data to connect ice cores.(Courtesy: Center for Remote
Sensing of Ice Sheets, U.
Kansas)
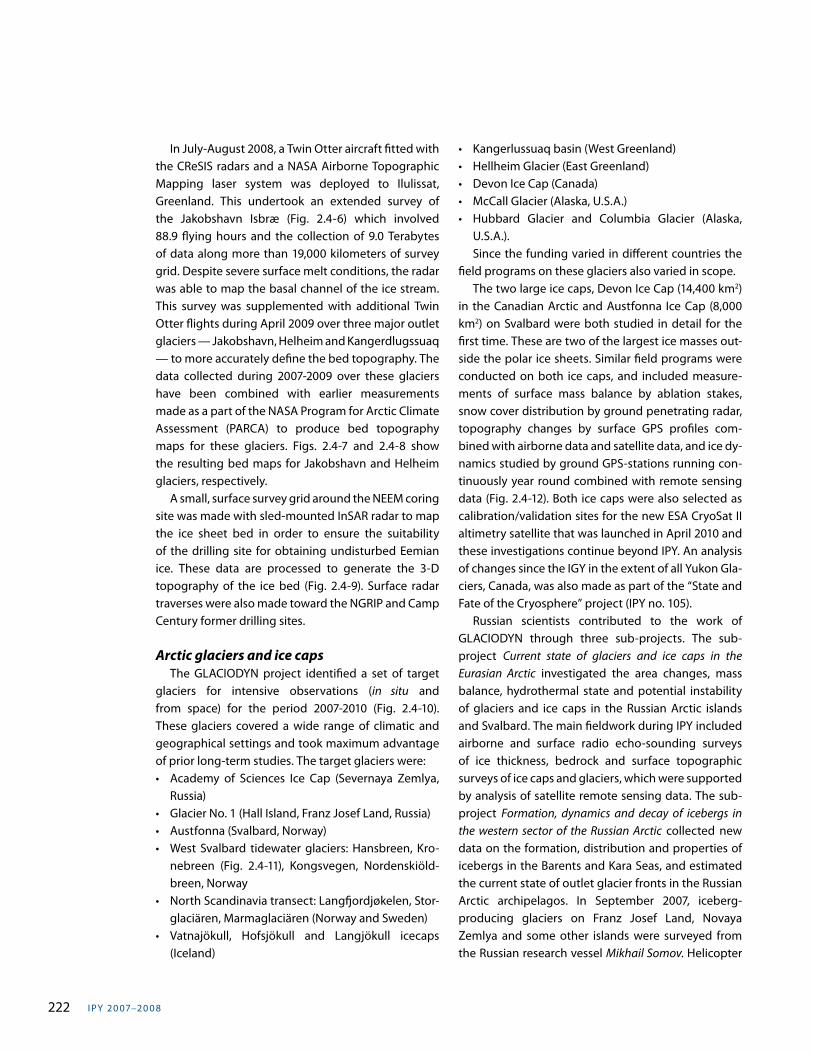
I PY 20 07–20 0 8222
In July-August 2008, a Twin Otter aircraft fitted with the CReSIS radars and a NASA Airborne Topographic Mapping laser system was deployed to Ilulissat, Greenland. This undertook an extended survey of the Jakobshavn Isbræ (Fig. 2.4-6) which involved 88.9 flying hours and the collection of 9.0 Terabytes of data along more than 19,000 kilometers of survey grid. Despite severe surface melt conditions, the radar was able to map the basal channel of the ice stream. This survey was supplemented with additional Twin Otter flights during April 2009 over three major outlet glaciers — Jakobshavn, Helheim and Kangerdlugssuaq — to more accurately define the bed topography. The data collected during 2007-2009 over these glaciers have been combined with earlier measurements made as a part of the NASA Program for Arctic Climate Assessment (PARCA) to produce bed topography maps for these glaciers. Figs. 2.4-7 and 2.4-8 show the resulting bed maps for Jakobshavn and Helheim glaciers, respectively. A small, surface survey grid around the NEEM coring site was made with sled-mounted InSAR radar to map the ice sheet bed in order to ensure the suitability of the drilling site for obtaining undisturbed Eemian ice. These data are processed to generate the 3-D topography of the ice bed (Fig. 2.4-9). Surface radar traverses were also made toward the NGRIP and Camp Century former drilling sites.
Arctic glaciers and ice caps The GLACIODYN project identified a set of target glaciers for intensive observations (in situ and from space) for the period 2007-2010 (Fig. 2.4-10). These glaciers covered a wide range of climatic and geographical settings and took maximum advantage of prior long-term studies. The target glaciers were: • Academy of Sciences Ice Cap (Severnaya Zemlya,
Russia) • Glacier No. 1 (Hall Island, Franz Josef Land, Russia) • Austfonna (Svalbard, Norway) • West Svalbard tidewater glaciers: Hansbreen, Kro-
nebreen (Fig. 2.4-11), Kongsvegen, Nordenskiöld-breen, Norway
• North Scandinavia transect: Langfjordjøkelen, Stor-glaciären, Marmaglaciären (Norway and Sweden)
• Vatnajökull, Hofsjökull and Langjökull icecaps (Iceland)
• Kangerlussuaq basin (West Greenland) • Hellheim Glacier (East Greenland) • Devon Ice Cap (Canada) • McCall Glacier (Alaska, U.S.A.) • Hubbard Glacier and Columbia Glacier (Alaska,
U.S.A.). Since the funding varied in different countries the field programs on these glaciers also varied in scope. The two large ice caps, Devon Ice Cap (14,400 km2) in the Canadian Arctic and Austfonna Ice Cap (8,000 km2) on Svalbard were both studied in detail for the first time. These are two of the largest ice masses out-side the polar ice sheets. Similar field programs were conducted on both ice caps, and included measure-ments of surface mass balance by ablation stakes, snow cover distribution by ground penetrating radar, topography changes by surface GPS profiles com-bined with airborne data and satellite data, and ice dy-namics studied by ground GPS-stations running con-tinuously year round combined with remote sensing data (Fig. 2.4-12). Both ice caps were also selected as calibration/validation sites for the new ESA CryoSat II altimetry satellite that was launched in April 2010 and these investigations continue beyond IPY. An analysis of changes since the IGY in the extent of all Yukon Gla-ciers, Canada, was also made as part of the “State and Fate of the Cryosphere” project (IPY no. 105). Russian scientists contributed to the work of GLACIODYN through three sub-projects. The sub-project Current state of glaciers and ice caps in the Eurasian Arctic investigated the area changes, mass balance, hydrothermal state and potential instability of glaciers and ice caps in the Russian Arctic islands and Svalbard. The main fieldwork during IPY included airborne and surface radio echo-sounding surveys of ice thickness, bedrock and surface topographic surveys of ice caps and glaciers, which were supported by analysis of satellite remote sensing data. The sub-project Formation, dynamics and decay of icebergs in the western sector of the Russian Arctic collected new data on the formation, distribution and properties of icebergs in the Barents and Kara Seas, and estimated the current state of outlet glacier fronts in the Russian Arctic archipelagos. In September 2007, iceberg-producing glaciers on Franz Josef Land, Novaya Zemlya and some other islands were surveyed from the Russian research vessel Mikhail Somov. Helicopter
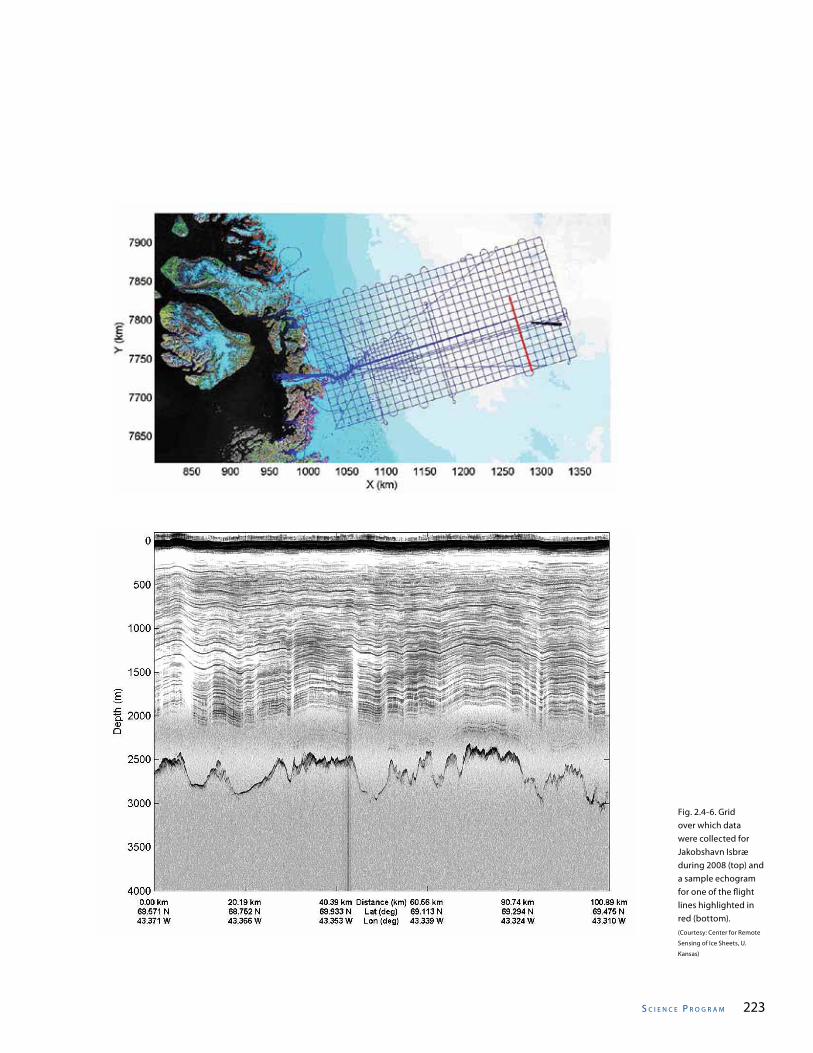
s C I e n C e P r o g r a m 223
Fig. 2.4-6. Grid over which data were collected for Jakobshavn Isbræ during 2008 (top) and a sample echogram for one of the flight lines highlighted in red (bottom).(Courtesy: Center for Remote
Sensing of Ice Sheets, U.
Kansas)
I PY 20 07–20 0 8224
radio echo sounding and aerial photography surveys were made of glaciers across the Franz Josef Land archipelago, on Prince George Land, Salisbury Island, Luigi and Champ Islands, Hall Island and Wilczek Land. Observations were also made on some glaciers of ice movement, the vertical distribution of ice temperature (down to 20 m depth) and surface energy balance. The glaciological studies were supplemented with oceanographic temperature and salinity profiling in the Franz Josef Land straits. A similar survey, which was repeated in fall 2008, was undertaken of the glaciers of the northern end of the Northern Island of Novaya Zemlya (Buzin et al., 2008). Another Russian sub-project, Climatic factors in the contemporary evolution of Northeast Siberia glaciations, continued studies of climate–glacier interactions in the poorly explored region of Northeast Siberia. The climate of this region is influenced by both Atlantic and Pacific air masses. Climatic changes such as weakening of the Siberian High, increase of surface temperature and changes in the cryosphere have recently been detected there. In Iceland, a major IPY activity involved digital terrain mapping of the surface topography of Icelandic ice caps with lidar. The results from this work, which continues after IPY, will be used to compare photographic maps from 1990s to quantify the ice volume changes that have occurred to these ice caps over the last 10-20 years.
Research HighlightsThe Greenland ice sheet Since 1985, West Greenland has experienced a warming of 2 to 4°C, primarily driven by winter temper-ature anomalies. The few and scattered direct climate records from observations on the Greenland Ice Sheet also reveal a warming trend since 1985. As a result, the mass balance of the Greenland Ice Sheet has changed. The high interior parts of the ice sheet have thickened because of the increased snowfall, with the area above 2000 m elevation having gained an average of 5 (±1) cm in altitude each year since 2000. This has added 60 (±30) Gt of mass to the ice sheet annually. Nevertheless, this mass gain is more than offset by the increased loss of ice mass from melting and by discharge into the ocean. About half of the total mass loss from the Greenland Ice Sheet is caused by surface melt and run-off, but the area experiencing surface melting has increased significantly in extent since 1979. The annual net gain in surface mass (snowfall minus mass lost by melt), has a 50-year average value of 290 Gt, but has been reduced by 45 Gt over the past 15 years, a trend that is above the background variability caused by normal fluctuations in climate. Mass is also lost at the margin of the Greenland Ice Sheet, mostly from fast-flowing outlet glaciers and ice streams that discharge into the ocean. Many of these have experienced accelerated flow and the annual
Fig. 2.4-7. Bed topography map for Jakobshavn Isbrae generated by combining 2008 and 2009 radar data with other data sets [Plummer et al., in review].(Courtesy: Center for Remote
Sensing of Ice Sheets, U.
Kansas)
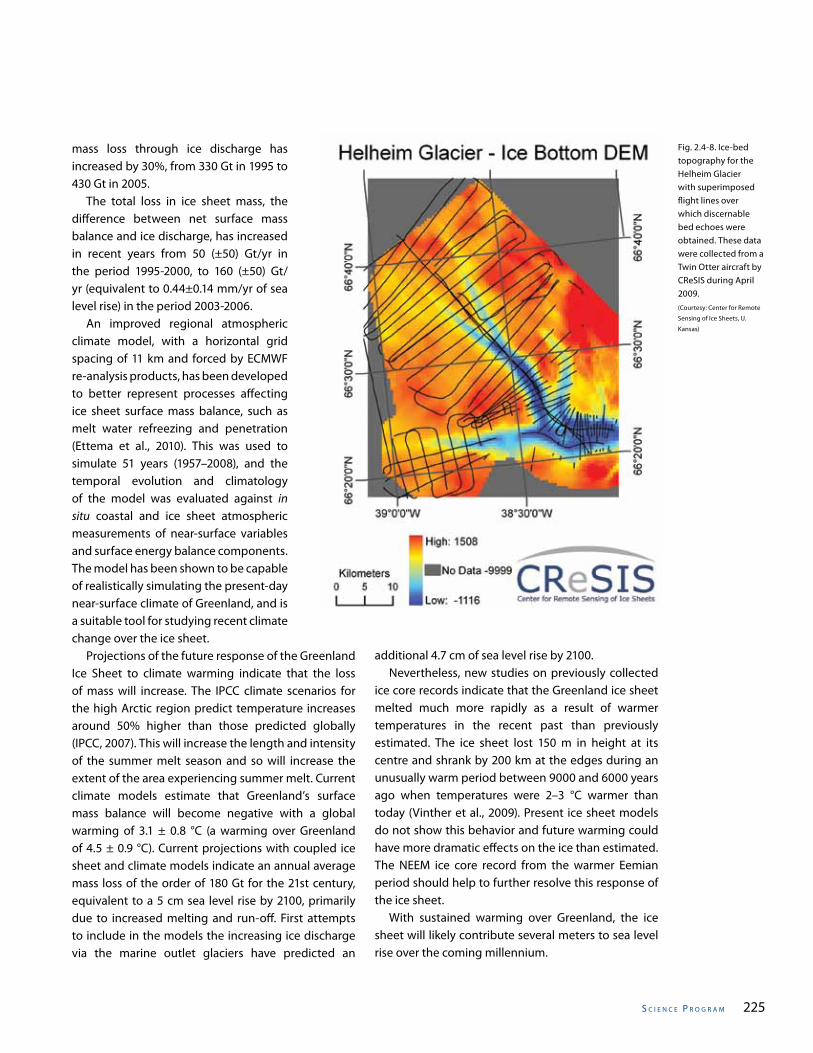
s C I e n C e P r o g r a m 225
Fig. 2.4-8. Ice-bed topography for the Helheim Glacier with superimposed flight lines over which discernable bed echoes were obtained. These data were collected from a Twin Otter aircraft by CReSIS during April 2009.(Courtesy: Center for Remote
Sensing of Ice Sheets, U.
Kansas)
mass loss through ice discharge has increased by 30%, from 330 Gt in 1995 to 430 Gt in 2005. The total loss in ice sheet mass, the difference between net surface mass balance and ice discharge, has increased in recent years from 50 (±50) Gt/yr in the period 1995-2000, to 160 (±50) Gt/yr (equivalent to 0.44±0.14 mm/yr of sea level rise) in the period 2003-2006. An improved regional atmospheric climate model, with a horizontal grid spacing of 11 km and forced by ECMWF re-analysis products, has been developed to better represent processes affecting ice sheet surface mass balance, such as melt water refreezing and penetration (Ettema et al., 2010). This was used to simulate 51 years (1957–2008), and the temporal evolution and climatology of the model was evaluated against in situ coastal and ice sheet atmospheric measurements of near-surface variables and surface energy balance components. The model has been shown to be capable of realistically simulating the present-day near-surface climate of Greenland, and is a suitable tool for studying recent climate change over the ice sheet. Projections of the future response of the Greenland Ice Sheet to climate warming indicate that the loss of mass will increase. The IPCC climate scenarios for the high Arctic region predict temperature increases around 50% higher than those predicted globally (IPCC, 2007). This will increase the length and intensity of the summer melt season and so will increase the extent of the area experiencing summer melt. Current climate models estimate that Greenland’s surface mass balance will become negative with a global warming of 3.1 ± 0.8 °C (a warming over Greenland of 4.5 ± 0.9 °C). Current projections with coupled ice sheet and climate models indicate an annual average mass loss of the order of 180 Gt for the 21st century, equivalent to a 5 cm sea level rise by 2100, primarily due to increased melting and run-off. First attempts to include in the models the increasing ice discharge via the marine outlet glaciers have predicted an
additional 4.7 cm of sea level rise by 2100. Nevertheless, new studies on previously collected ice core records indicate that the Greenland ice sheet melted much more rapidly as a result of warmer temperatures in the recent past than previously estimated. The ice sheet lost 150 m in height at its centre and shrank by 200 km at the edges during an unusually warm period between 9000 and 6000 years ago when temperatures were 2–3 °C warmer than today (Vinther et al., 2009). Present ice sheet models do not show this behavior and future warming could have more dramatic effects on the ice than estimated. The NEEM ice core record from the warmer Eemian period should help to further resolve this response of the ice sheet. With sustained warming over Greenland, the ice sheet will likely contribute several meters to sea level rise over the coming millennium.
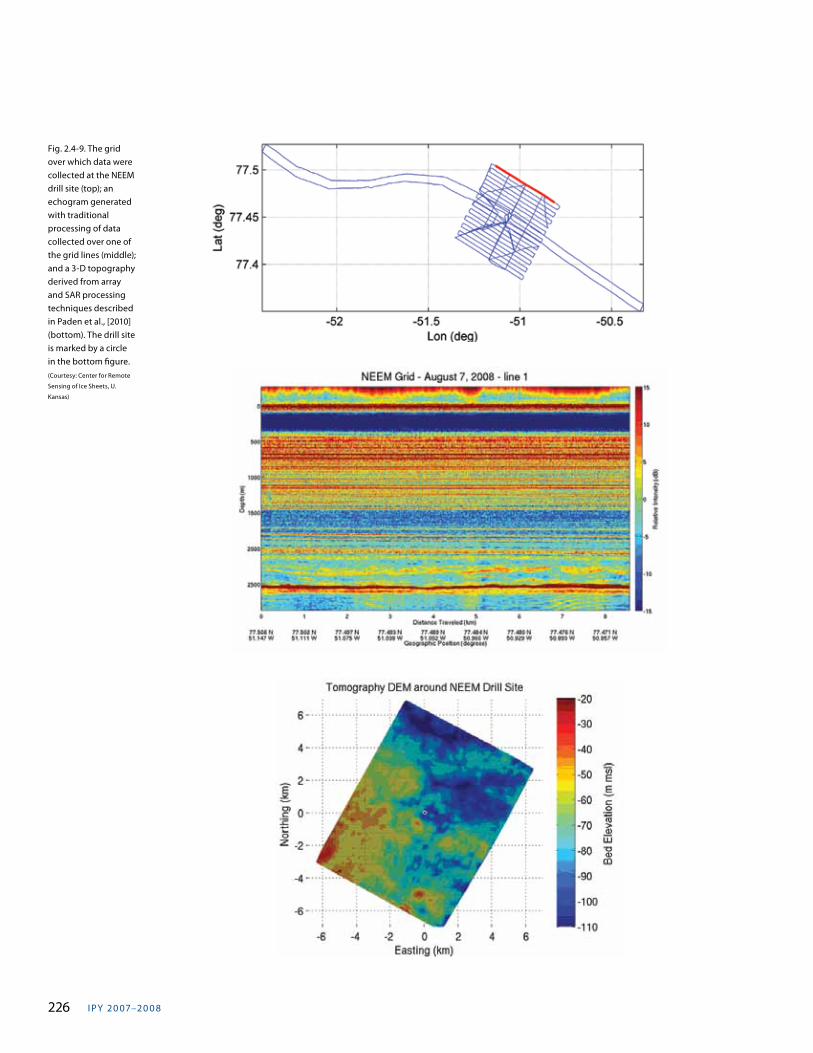
I PY 20 07–20 0 8226
Fig. 2.4-9. The grid over which data were collected at the NEEM drill site (top); an echogram generated with traditional processing of data collected over one of the grid lines (middle); and a 3-D topography derived from array and SAR processing techniques described in Paden et al., [2010] (bottom). The drill site is marked by a circle in the bottom figure.(Courtesy: Center for Remote
Sensing of Ice Sheets, U.
Kansas)
s C I e n C e P r o g r a m 227
The wealth of satellite data collected under coordination of the IPY GIIPSY project is now enabling new SAR image mosaics, interferometrically derived ice sheet velocity fields at various frequencies, and high-resolution SPOT Digital Elevation Models for Greenland to be produced and distributed.
Arctic glaciers and ice caps The Arctic glaciers and ice caps in most regions are experiencing strong thinning at low elevations, while the pattern at higher elevations varies from slight thinning to slight thickening (Moholdt et al., 2010a, b; Nuth et al., 2010). There are also examples of local anomalous elevation changes due to unstable glacier dynamics such as glacier surging (Sund et al., 2009). For the Austfonna ice cap on Svalbard, the net surface mass balance is slightly negative (-0.1 m water eq. yr-1), but less negative than for the westerly ice masses in Svalbard (Moholdt et al., 2010a). Iceberg calving is important and contributes 30-40% of the total mass loss, so the overall mass balance is a loss of ~2 Gt yr-1 (Dowdeswell et al., 2008), however, the elevation change measurements on Austfonna show a thickening in the interior of ~ 0.5 m yr-1, and an increasing thinning closer to the coast of 1-2 m yr-1, indicating a large dynamic instability (Dunse et al., 2009; Moholdt et al., 2010a). This dynamic instability is not seen on the Devon Ice cap. Results from several IPY related research proj-ects have contributed significantly to characterizing short- and long-term variations in the flow of several major tidewater glaciers in the Canadian high Arctic. RADARSAT-2 Fine and UltraFine beam mode data ac-quired over the Devon Ice Cap since early 2009 reveal sub-annual cycles of alternating accelerated/reduced flow along the upper/lower reaches of Belcher Glacier. Analysis of the LandSat image archive over major out-let glaciers that drain the Devon Ice Cap and Manson and Prince of Wales Ice Fields, indicates significant (up to a factor of 4) inter-annual variability in tidewater glacier velocities since 2000. Some, but not all, of this is surge-related. Repeat mapping of glacier velocity fields over the Devon Ice Cap from 1995 ERS 1/2 and RADARSAT-1 data and 2009 RADARSAT-2 Fine beam data indicates that (within limits of error) there has been no net change in ice discharge from the ice cap as a whole over this period of time. Finally, annual glacier
velocity measurements derived from RADARSAT-1 and RADARSAT-2 Fine beam data indicate a net decrease in the rate of flow of 11 target glaciers across the Queen Elizabeth Islands between 2000 and 2010. This trend was driven primarily by a few surge-type glaciers en-tering the quiescent mode of glacier flow. Ongoing IPY related glaciological research in Canada is focused on understanding linkages between external climate forc-ing and glacier dynamics and the impact of changing glacier dynamics on the net mass balance and geom-etry of ice caps in the Canadian Arctic. Continuous GPS-receivers were used to monitor sev-eral valley glaciers and outlet ice streams from the ice caps, mainly in Svalbard and the Canadian Arctic. Clear linkages between high melt events and increased flow velocities can be seen at all (Ouden et al., 2010). The recent increase in mass loss from the Canadian ice caps is a result of strong summer warming, espe-cially since 2005, that is largely confined to the North American side of the Arctic and also affects northern and western Greenland. The IPY boreal summers 2007 and 2008 were two of the warmest five observed since 1948. This warming seems to be attributable to anomalously warm sea surface temperatures in the NW Atlantic, and development of a high pressure anomaly that extends from Iceland over the northern 2/3 of Greenland and the Canadian Arctic islands and into the Canada Basin (sometimes reaching Northeast Siberia). The circulation anomaly associated with this latter feature favours atmospheric heat transport from the northwest Atlantic up Baffin Bay into the areas where strong warming in summer is detected. An impact of this warming has been a major change in the firnification regime of the Canadian ice caps such that any semblance of a dry snow zone has been eradicated and the upper limit of the wet snow zone has risen substantially. Rates of firnification have probably increased along with this. On the basis of radio echo-sounding surveys of glaciers on Franz Josef Land and Novaya Zemlya and satellite altimetry data, characteristic heights and thicknesses of glacier fronts producing icebergs have been determined. This includes data for Glacier No. 1 and the Moscow Ice Cap on Hall Island, the northern part of the glacier complex on George Land (Franz Josef Land), and the glaciers in the Inostrantsev Bay area, Novaya Zemlya. New criteria for the estimation
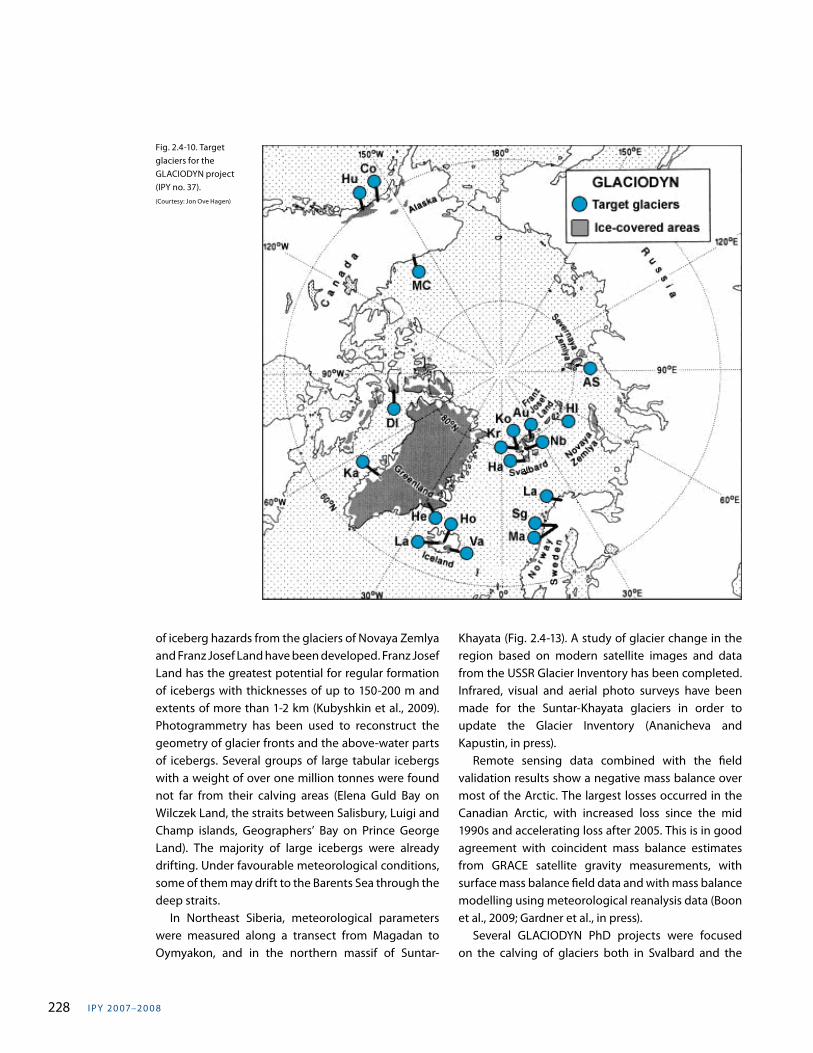
I PY 20 07–20 0 8228
of iceberg hazards from the glaciers of Novaya Zemlya and Franz Josef Land have been developed. Franz Josef Land has the greatest potential for regular formation of icebergs with thicknesses of up to 150-200 m and extents of more than 1-2 km (Kubyshkin et al., 2009). Photogrammetry has been used to reconstruct the geometry of glacier fronts and the above-water parts of icebergs. Several groups of large tabular icebergs with a weight of over one million tonnes were found not far from their calving areas (Elena Guld Bay on Wilczek Land, the straits between Salisbury, Luigi and Champ islands, Geographers’ Bay on Prince George Land). The majority of large icebergs were already drifting. Under favourable meteorological conditions, some of them may drift to the Barents Sea through the deep straits. In Northeast Siberia, meteorological parameters were measured along a transect from Magadan to Oymyakon, and in the northern massif of Suntar-
Fig. 2.4-10. Target glaciers for the GLACIODYN project (IPY no. 37).(Courtesy: Jon Ove Hagen)
Khayata (Fig. 2.4-13). A study of glacier change in the region based on modern satellite images and data from the USSR Glacier Inventory has been completed. Infrared, visual and aerial photo surveys have been made for the Suntar-Khayata glaciers in order to update the Glacier Inventory (Ananicheva and Kapustin, in press). Remote sensing data combined with the field validation results show a negative mass balance over most of the Arctic. The largest losses occurred in the Canadian Arctic, with increased loss since the mid 1990s and accelerating loss after 2005. This is in good agreement with coincident mass balance estimates from GRACE satellite gravity measurements, with surface mass balance field data and with mass balance modelling using meteorological reanalysis data (Boon et al., 2009; Gardner et al., in press). Several GLACIODYN PhD projects were focused on the calving of glaciers both in Svalbard and the
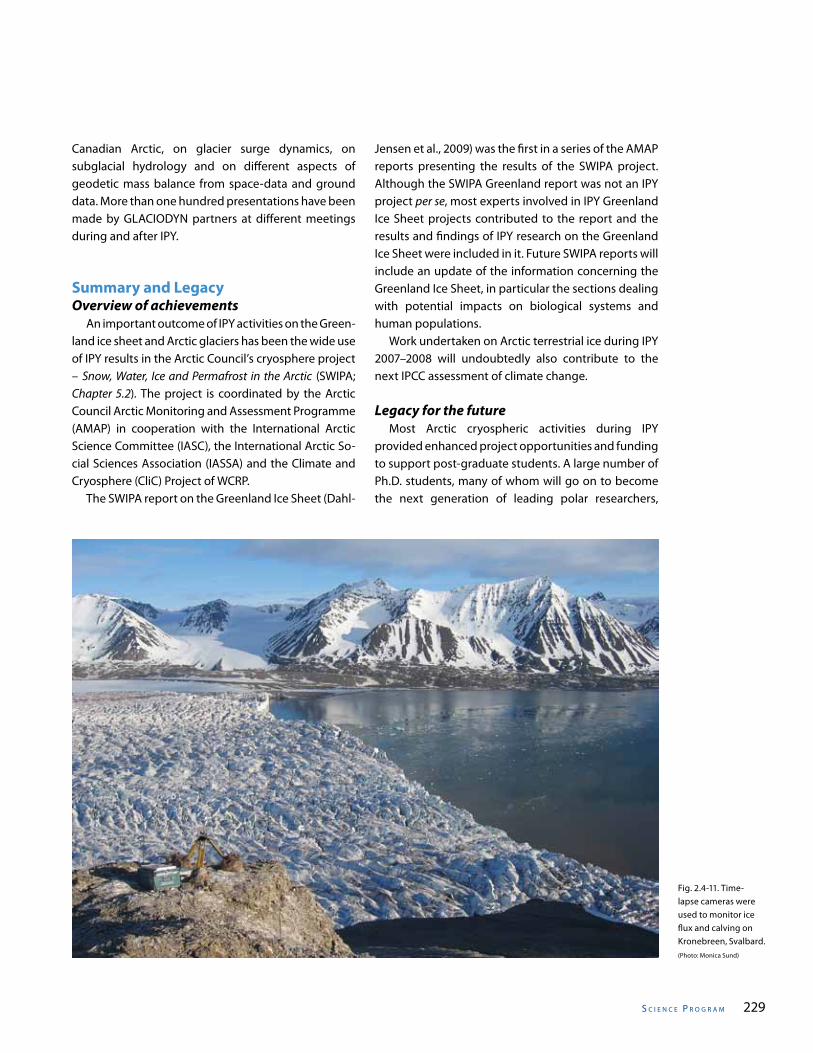
s C I e n C e P r o g r a m 229
Fig. 2.4-11. Time-lapse cameras were used to monitor ice flux and calving on Kronebreen, Svalbard.(Photo: Monica Sund)
Canadian Arctic, on glacier surge dynamics, on subglacial hydrology and on different aspects of geodetic mass balance from space-data and ground data. More than one hundred presentations have been made by GLACIODYN partners at different meetings during and after IPY.
Summary and LegacyOverview of achievements An important outcome of IPY activities on the Green-land ice sheet and Arctic glaciers has been the wide use of IPY results in the Arctic Council’s cryosphere project – Snow, Water, Ice and Permafrost in the Arctic (SWIPA; Chapter 5.2). The project is coordinated by the Arctic Council Arctic Monitoring and Assessment Programme (AMAP) in cooperation with the International Arctic Science Committee (IASC), the International Arctic So-cial Sciences Association (IASSA) and the Climate and Cryosphere (CliC) Project of WCRP. The SWIPA report on the Greenland Ice Sheet (Dahl-
Jensen et al., 2009) was the first in a series of the AMAP reports presenting the results of the SWIPA project. Although the SWIPA Greenland report was not an IPY project per se, most experts involved in IPY Greenland Ice Sheet projects contributed to the report and the results and findings of IPY research on the Greenland Ice Sheet were included in it. Future SWIPA reports will include an update of the information concerning the Greenland Ice Sheet, in particular the sections dealing with potential impacts on biological systems and human populations. Work undertaken on Arctic terrestrial ice during IPY 2007–2008 will undoubtedly also contribute to the next IPCC assessment of climate change.
Legacy for the future Most Arctic cryospheric activities during IPY provided enhanced project opportunities and funding to support post-graduate students. A large number of Ph.D. students, many of whom will go on to become the next generation of leading polar researchers,
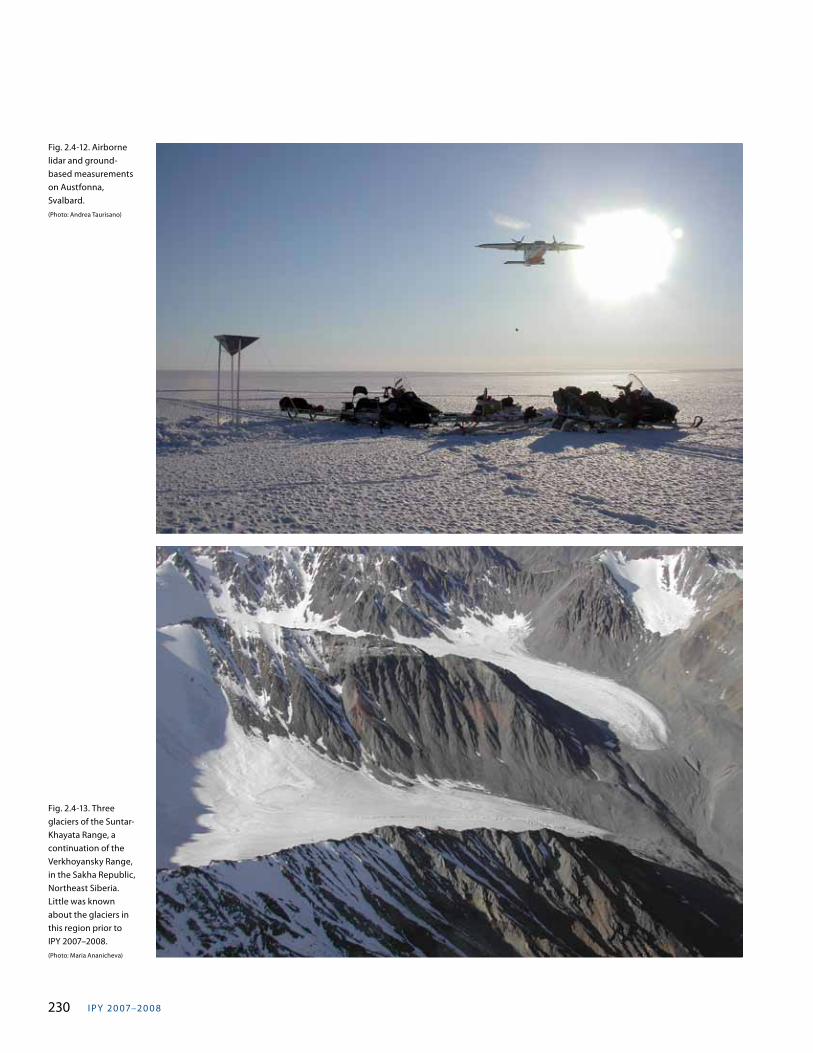
I PY 20 07–20 0 8230
Fig. 2.4-13. Three glaciers of the Suntar-Khayata Range, a continuation of the Verkhoyansky Range, in the Sakha Republic, Northeast Siberia. Little was known about the glaciers in this region prior to IPY 2007–2008.(Photo: Maria Ananicheva)
Fig. 2.4-12. Airborne lidar and ground-based measurements on Austfonna, Svalbard.(Photo: Andrea Taurisano)
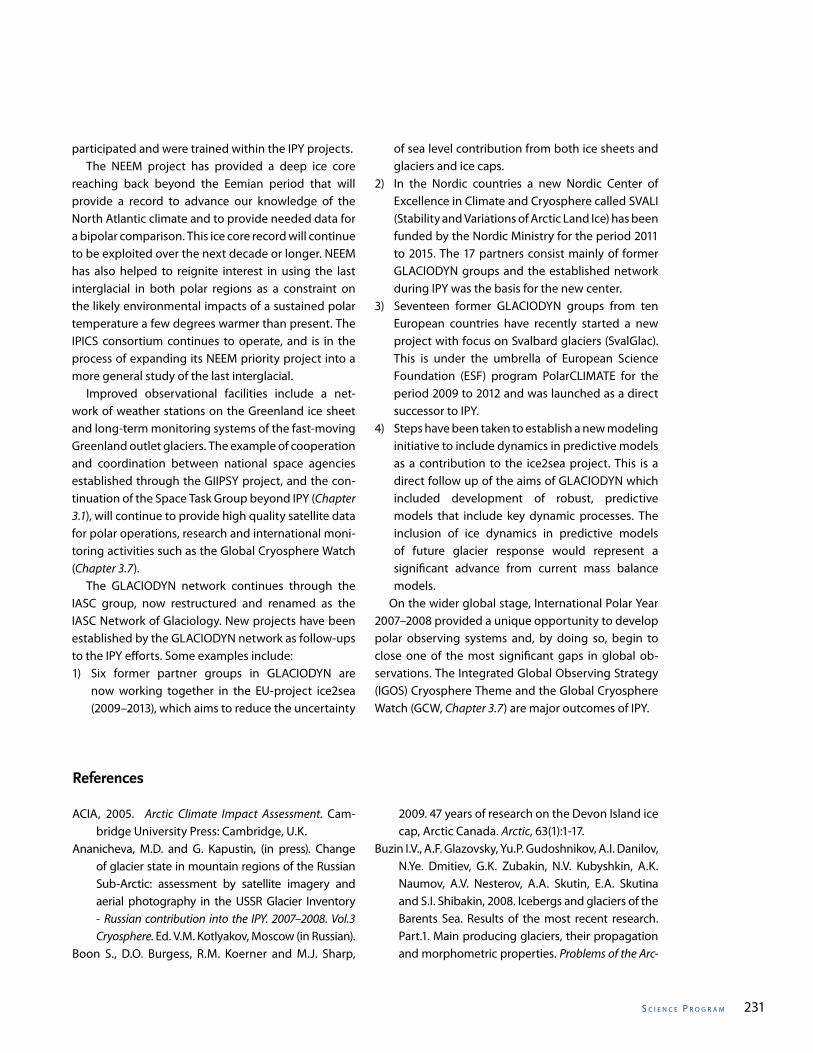
s C I e n C e P r o g r a m 231
participated and were trained within the IPY projects. The NEEM project has provided a deep ice core reaching back beyond the Eemian period that will provide a record to advance our knowledge of the North Atlantic climate and to provide needed data for a bipolar comparison. This ice core record will continue to be exploited over the next decade or longer. NEEM has also helped to reignite interest in using the last interglacial in both polar regions as a constraint on the likely environmental impacts of a sustained polar temperature a few degrees warmer than present. The IPICS consortium continues to operate, and is in the process of expanding its NEEM priority project into a more general study of the last interglacial. Improved observational facilities include a net-work of weather stations on the Greenland ice sheet and long-term monitoring systems of the fast-moving Greenland outlet glaciers. The example of cooperation and coordination between national space agencies established through the GIIPSY project, and the con-tinuation of the Space Task Group beyond IPY (Chapter 3.1), will continue to provide high quality satellite data for polar operations, research and international moni-toring activities such as the Global Cryosphere Watch (Chapter 3.7). The GLACIODYN network continues through the IASC group, now restructured and renamed as the IASC Network of Glaciology. New projects have been established by the GLACIODYN network as follow-ups to the IPY efforts. Some examples include: 1) Six former partner groups in GLACIODYN are
now working together in the EU-project ice2sea (2009–2013), which aims to reduce the uncertainty
of sea level contribution from both ice sheets and glaciers and ice caps.
2) In the Nordic countries a new Nordic Center of Excellence in Climate and Cryosphere called SVALI (Stability and Variations of Arctic Land Ice) has been funded by the Nordic Ministry for the period 2011 to 2015. The 17 partners consist mainly of former GLACIODYN groups and the established network during IPY was the basis for the new center.
3) Seventeen former GLACIODYN groups from ten European countries have recently started a new project with focus on Svalbard glaciers (SvalGlac). This is under the umbrella of European Science Foundation (ESF) program PolarCLIMATE for the period 2009 to 2012 and was launched as a direct successor to IPY.
4) Steps have been taken to establish a new modeling initiative to include dynamics in predictive models as a contribution to the ice2sea project. This is a direct follow up of the aims of GLACIODYN which included development of robust, predictive models that include key dynamic processes. The inclusion of ice dynamics in predictive models of future glacier response would represent a significant advance from current mass balance models.
On the wider global stage, International Polar Year 2007–2008 provided a unique opportunity to develop polar observing systems and, by doing so, begin to close one of the most significant gaps in global ob-servations. The Integrated Global Observing Strategy (IGOS) Cryosphere Theme and the Global Cryosphere Watch (GCW, Chapter 3.7) are major outcomes of IPY.
References
ACIA, 2005. Arctic Climate Impact Assessment. Cam-bridge University Press: Cambridge, U.K.
Ananicheva, M.D. and G. Kapustin, (in press). Change of glacier state in mountain regions of the Russian Sub-Arctic: assessment by satellite imagery and aerial photography in the USSR Glacier Inventory - Russian contribution into the IPY. 2007–2008. Vol.3 Cryosphere. Ed. V.M. Kotlyakov, Moscow (in Russian).
Boon S., D.O. Burgess, R.M. Koerner and M.J. Sharp,
2009. 47 years of research on the Devon Island ice cap, Arctic Canada. Arctic, 63(1):1-17.
Buzin I.V., A.F. Glazovsky, Yu.P. Gudoshnikov, A.I. Danilov, N.Ye. Dmitiev, G.K. Zubakin, N.V. Kubyshkin, A.K. Naumov, A.V. Nesterov, A.A. Skutin, E.A. Skutina and S.I. Shibakin, 2008. Icebergs and glaciers of the Barents Sea. Results of the most recent research. Part.1. Main producing glaciers, their propagation and morphometric properties. Problems of the Arc-
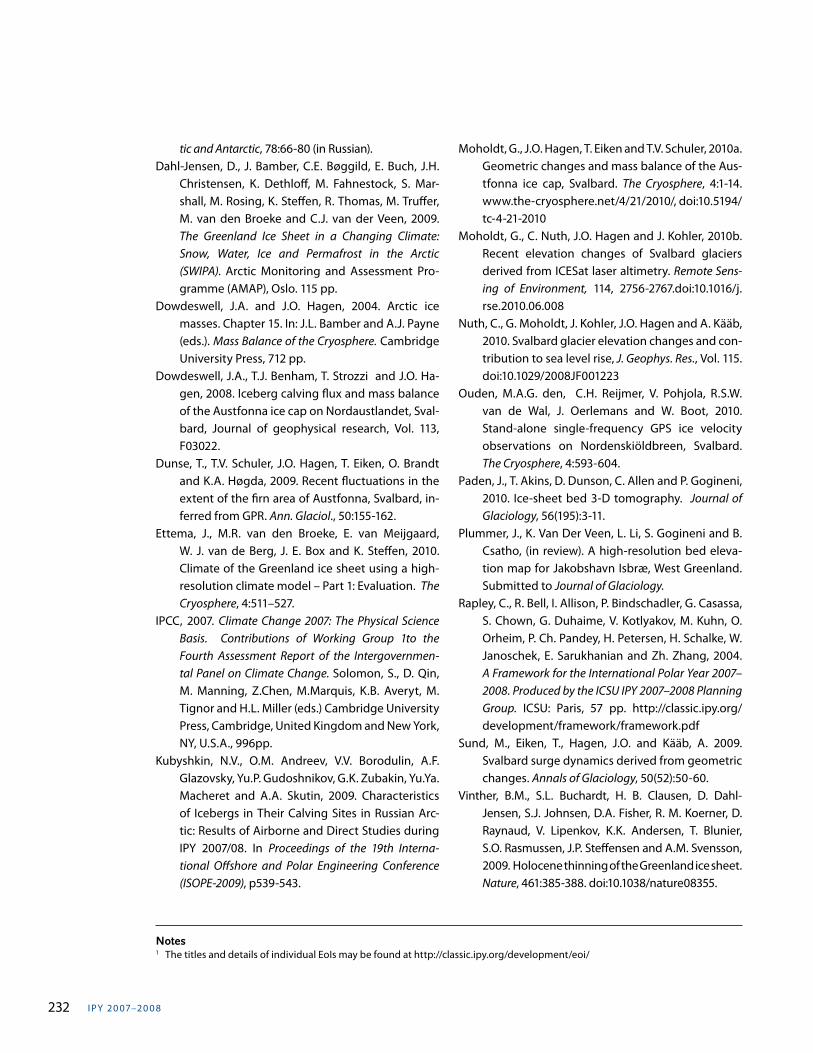
I PY 20 07–20 0 8232
tic and Antarctic, 78:66-80 (in Russian).Dahl-Jensen, D., J. Bamber, C.E. Bøggild, E. Buch, J.H.
Christensen, K. Dethloff, M. Fahnestock, S. Mar-shall, M. Rosing, K. Steffen, R. Thomas, M. Truffer, M. van den Broeke and C.J. van der Veen, 2009. The Greenland Ice Sheet in a Changing Climate: Snow, Water, Ice and Permafrost in the Arctic (SWIPA). Arctic Monitoring and Assessment Pro-gramme (AMAP), Oslo. 115 pp.
Dowdeswell, J.A. and J.O. Hagen, 2004. Arctic ice masses. Chapter 15. In: J.L. Bamber and A.J. Payne (eds.). Mass Balance of the Cryosphere. Cambridge University Press, 712 pp.
Dowdeswell, J.A., T.J. Benham, T. Strozzi and J.O. Ha-gen, 2008. Iceberg calving flux and mass balance of the Austfonna ice cap on Nordaustlandet, Sval-bard, Journal of geophysical research, Vol. 113, F03022.
Dunse, T., T.V. Schuler, J.O. Hagen, T. Eiken, O. Brandt and K.A. Høgda, 2009. Recent fluctuations in the extent of the firn area of Austfonna, Svalbard, in-ferred from GPR. Ann. Glaciol., 50:155-162.
Ettema, J., M.R. van den Broeke, E. van Meijgaard, W. J. van de Berg, J. E. Box and K. Steffen, 2010. Climate of the Greenland ice sheet using a high-resolution climate model – Part 1: Evaluation. The Cryosphere, 4:511–527.
IPCC, 2007. Climate Change 2007: The Physical Science Basis. Contributions of Working Group 1to the Fourth Assessment Report of the Intergovernmen-tal Panel on Climate Change. Solomon, S., D. Qin, M. Manning, Z.Chen, M.Marquis, K.B. Averyt, M. Tignor and H.L. Miller (eds.) Cambridge University Press, Cambridge, United Kingdom and New York, NY, U.S.A., 996pp.
Kubyshkin, N.V., O.M. Andreev, V.V. Borodulin, A.F. Glazovsky, Yu.P. Gudoshnikov, G.K. Zubakin, Yu.Ya. Macheret and A.A. Skutin, 2009. Characteristics of Icebergs in Their Calving Sites in Russian Arc-tic: Results of Airborne and Direct Studies during IPY 2007/08. In Proceedings of the 19th Interna-tional Offshore and Polar Engineering Conference (ISOPE-2009), p539-543.
Moholdt, G., J.O. Hagen, T. Eiken and T.V. Schuler, 2010a. Geometric changes and mass balance of the Aus-tfonna ice cap, Svalbard. The Cryosphere, 4:1-14. www.the-cryosphere.net/4/21/2010/, doi:10.5194/tc-4-21-2010
Moholdt, G., C. Nuth, J.O. Hagen and J. Kohler, 2010b. Recent elevation changes of Svalbard glaciers derived from ICESat laser altimetry. Remote Sens-ing of Environment, 114, 2756-2767.doi:10.1016/j.rse.2010.06.008
Nuth, C., G. Moholdt, J. Kohler, J.O. Hagen and A. Kääb, 2010. Svalbard glacier elevation changes and con-tribution to sea level rise, J. Geophys. Res., Vol. 115. doi:10.1029/2008JF001223
Ouden, M.A.G. den, C.H. Reijmer, V. Pohjola, R.S.W. van de Wal, J. Oerlemans and W. Boot, 2010. Stand-alone single-frequency GPS ice velocity observations on Nordenskiöldbreen, Svalbard. The Cryosphere, 4:593-604.
Paden, J., T. Akins, D. Dunson, C. Allen and P. Gogineni, 2010. Ice-sheet bed 3-D tomography. Journal of Glaciology, 56(195):3-11.
Plummer, J., K. Van Der Veen, L. Li, S. Gogineni and B. Csatho, (in review). A high-resolution bed eleva-tion map for Jakobshavn Isbræ, West Greenland. Submitted to Journal of Glaciology.
Rapley, C., R. Bell, I. Allison, P. Bindschadler, G. Casassa, S. Chown, G. Duhaime, V. Kotlyakov, M. Kuhn, O. Orheim, P. Ch. Pandey, H. Petersen, H. Schalke, W. Janoschek, E. Sarukhanian and Zh. Zhang, 2004. A Framework for the International Polar Year 2007–2008. Produced by the ICSU IPY 2007–2008 Planning Group. ICSU: Paris, 57 pp. http://classic.ipy.org/development/framework/framework.pdf
Sund, M., Eiken, T., Hagen, J.O. and Kääb, A. 2009. Svalbard surge dynamics derived from geometric changes. Annals of Glaciology, 50(52):50-60.
Vinther, B.M., S.L. Buchardt, H. B. Clausen, D. Dahl-Jensen, S.J. Johnsen, D.A. Fisher, R. M. Koerner, D. Raynaud, V. Lipenkov, K.K. Andersen, T. Blunier, S.O. Rasmussen, J.P. Steffensen and A.M. Svensson, 2009. Holocene thinning of the Greenland ice sheet. Nature, 461:385-388. doi:10.1038/nature08355.
Notes1 The titles and details of individual EoIs may be found at http://classic.ipy.org/development/eoi/
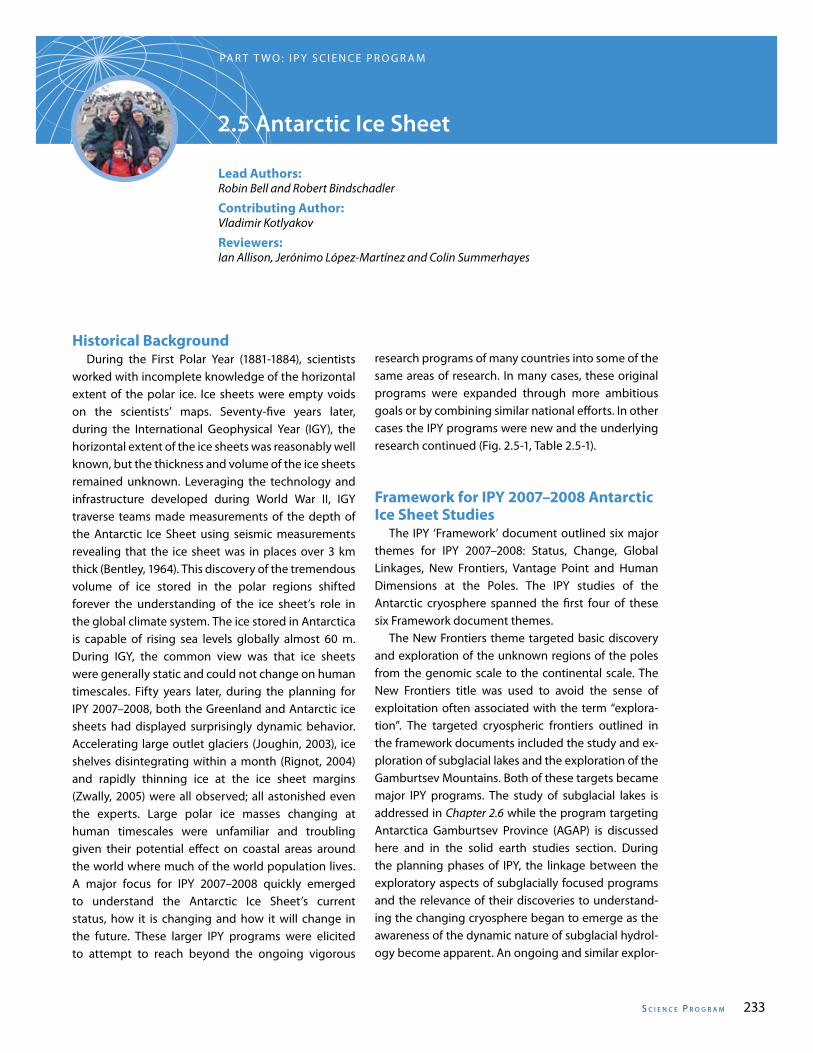
s C I e n C e P r o g r a m 233
2.5 Antarctic Ice Sheet
Lead Authors:Robin Bell and Robert Bindschadler
Contributing Author:Vladimir Kotlyakov
Reviewers:Ian Allison, Jerónimo López-Martínez and Colin Summerhayes
PA R T T W O : I P Y S C I E N C E P R O G R A M
Historical Background During the First Polar Year (1881-1884), scientists worked with incomplete knowledge of the horizontal extent of the polar ice. Ice sheets were empty voids on the scientists’ maps. Seventy-five years later, during the International Geophysical Year (IGY), the horizontal extent of the ice sheets was reasonably well known, but the thickness and volume of the ice sheets remained unknown. Leveraging the technology and infrastructure developed during World War II, IGY traverse teams made measurements of the depth of the Antarctic Ice Sheet using seismic measurements revealing that the ice sheet was in places over 3 km thick (Bentley, 1964). This discovery of the tremendous volume of ice stored in the polar regions shifted forever the understanding of the ice sheet’s role in the global climate system. The ice stored in Antarctica is capable of rising sea levels globally almost 60 m. During IGY, the common view was that ice sheets were generally static and could not change on human timescales. Fifty years later, during the planning for IPY 2007–2008, both the Greenland and Antarctic ice sheets had displayed surprisingly dynamic behavior. Accelerating large outlet glaciers (Joughin, 2003), ice shelves disintegrating within a month (Rignot, 2004) and rapidly thinning ice at the ice sheet margins (Zwally, 2005) were all observed; all astonished even the experts. Large polar ice masses changing at human timescales were unfamiliar and troubling given their potential effect on coastal areas around the world where much of the world population lives. A major focus for IPY 2007–2008 quickly emerged to understand the Antarctic Ice Sheet’s current status, how it is changing and how it will change in the future. These larger IPY programs were elicited to attempt to reach beyond the ongoing vigorous
research programs of many countries into some of the same areas of research. In many cases, these original programs were expanded through more ambitious goals or by combining similar national efforts. In other cases the IPY programs were new and the underlying research continued (Fig. 2.5-1, Table 2.5-1).
Framework for IPY 2007–2008 Antarctic Ice Sheet Studies The IPY ‘Framework’ document outlined six major themes for IPY 2007–2008: Status, Change, Global Linkages, New Frontiers, Vantage Point and Human Dimensions at the Poles. The IPY studies of the Antarctic cryosphere spanned the first four of these six Framework document themes. The New Frontiers theme targeted basic discovery and exploration of the unknown regions of the poles from the genomic scale to the continental scale. The New Frontiers title was used to avoid the sense of exploitation often associated with the term “explora-tion”. The targeted cryospheric frontiers outlined in the framework documents included the study and ex-ploration of subglacial lakes and the exploration of the Gamburtsev Mountains. Both of these targets became major IPY programs. The study of subglacial lakes is addressed in Chapter 2.6 while the program targeting Antarctica Gamburtsev Province (AGAP) is discussed here and in the solid earth studies section. During the planning phases of IPY, the linkage between the exploratory aspects of subglacially focused programs and the relevance of their discoveries to understand-ing the changing cryosphere began to emerge as the awareness of the dynamic nature of subglacial hydrol-ogy become apparent. An ongoing and similar explor-
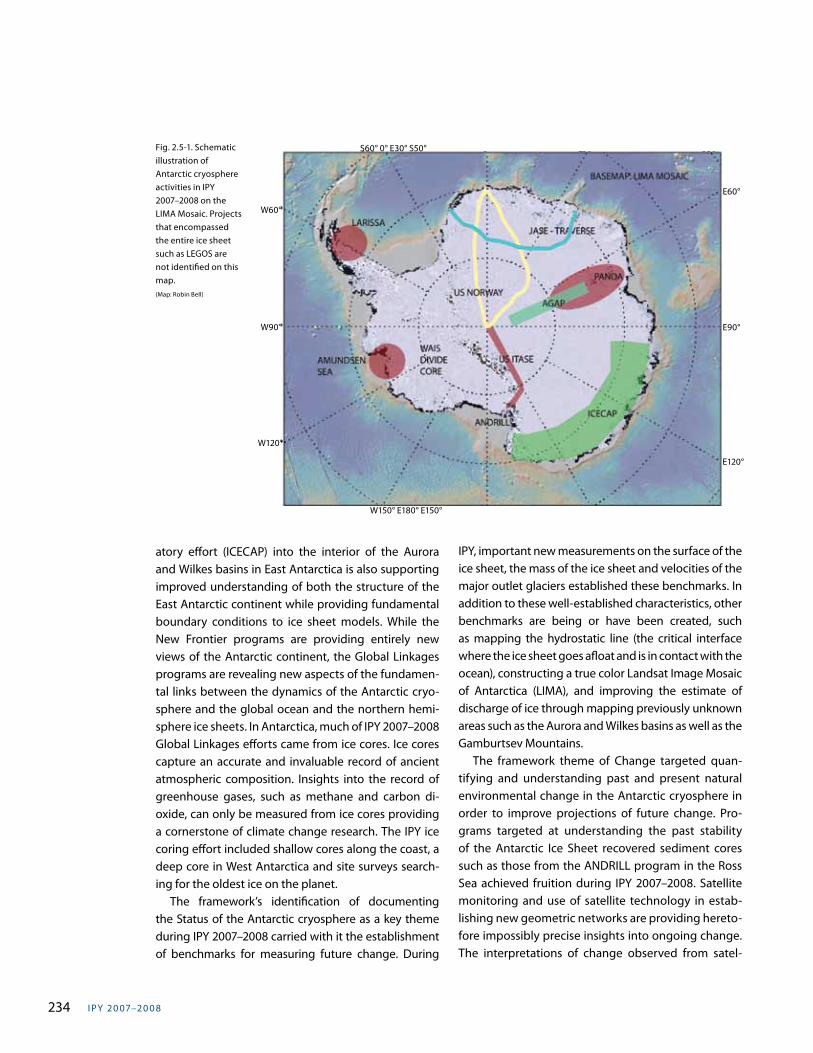
I PY 20 07–20 0 8234
atory effort (ICECAP) into the interior of the Aurora and Wilkes basins in East Antarctica is also supporting improved understanding of both the structure of the East Antarctic continent while providing fundamental boundary conditions to ice sheet models. While the New Frontier programs are providing entirely new views of the Antarctic continent, the Global Linkages programs are revealing new aspects of the fundamen-tal links between the dynamics of the Antarctic cryo-sphere and the global ocean and the northern hemi-sphere ice sheets. In Antarctica, much of IPY 2007–2008 Global Linkages efforts came from ice cores. Ice cores capture an accurate and invaluable record of ancient atmospheric composition. Insights into the record of greenhouse gases, such as methane and carbon di-oxide, can only be measured from ice cores providing a cornerstone of climate change research. The IPY ice coring effort included shallow cores along the coast, a deep core in West Antarctica and site surveys search-ing for the oldest ice on the planet. The framework’s identification of documenting the Status of the Antarctic cryosphere as a key theme during IPY 2007–2008 carried with it the establishment of benchmarks for measuring future change. During
IPY, important new measurements on the surface of the ice sheet, the mass of the ice sheet and velocities of the major outlet glaciers established these benchmarks. In addition to these well-established characteristics, other benchmarks are being or have been created, such as mapping the hydrostatic line (the critical interface where the ice sheet goes afloat and is in contact with the ocean), constructing a true color Landsat Image Mosaic of Antarctica (LIMA), and improving the estimate of discharge of ice through mapping previously unknown areas such as the Aurora and Wilkes basins as well as the Gamburtsev Mountains. The framework theme of Change targeted quan-tifying and understanding past and present natural environmental change in the Antarctic cryosphere in order to improve projections of future change. Pro-grams targeted at understanding the past stability of the Antarctic Ice Sheet recovered sediment cores such as those from the ANDRILL program in the Ross Sea achieved fruition during IPY 2007–2008. Satellite monitoring and use of satellite technology in estab-lishing new geometric networks are providing hereto-fore impossibly precise insights into ongoing change. The interpretations of change observed from satel-
Fig. 2.5-1. Schematic illustration of Antarctic cryosphere activities in IPY 2007–2008 on the LIMA Mosaic. Projects that encompassed the entire ice sheet such as LEGOS are not identified on this map.(Map: Robin Bell)
W60°
W90°
W120°
W150° E180° E150°
S60° 0° E30° S50°
E60°
E90°
E120°
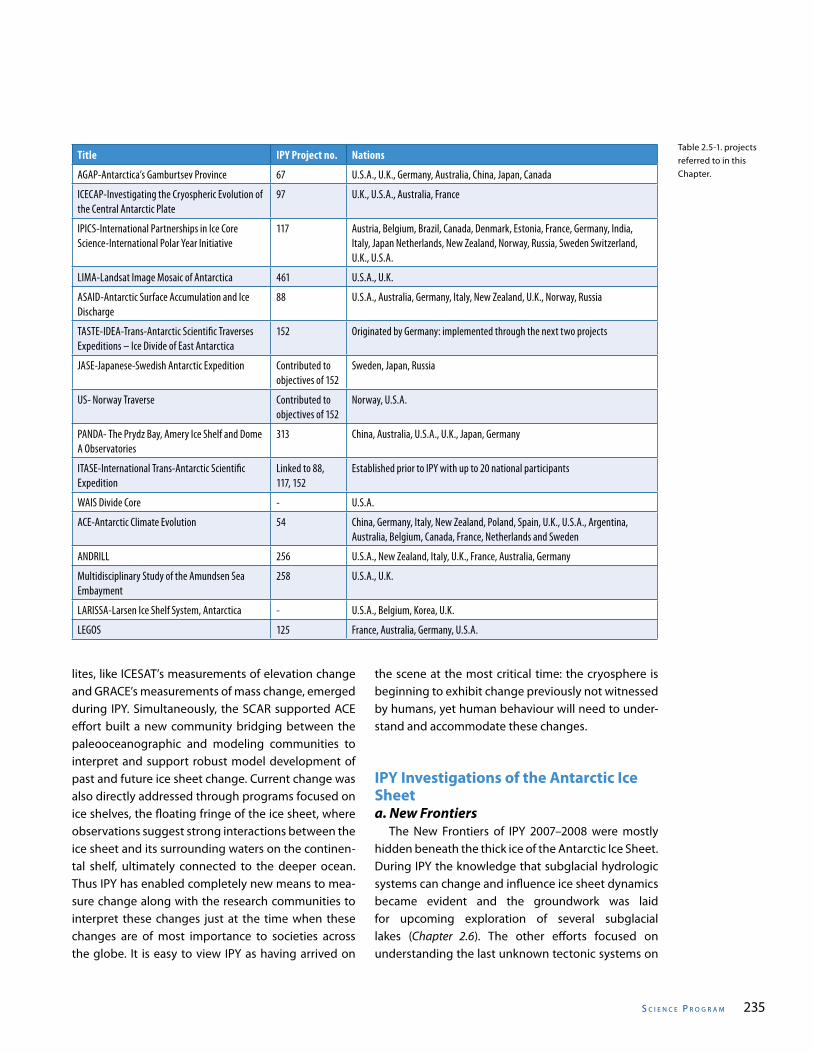
s C I e n C e P r o g r a m 235
Table 2.5-1. projects referred to in this Chapter.
lites, like ICESAT’s measurements of elevation change and GRACE’s measurements of mass change, emerged during IPY. Simultaneously, the SCAR supported ACE effort built a new community bridging between the paleooceanographic and modeling communities to interpret and support robust model development of past and future ice sheet change. Current change was also directly addressed through programs focused on ice shelves, the floating fringe of the ice sheet, where observations suggest strong interactions between the ice sheet and its surrounding waters on the continen-tal shelf, ultimately connected to the deeper ocean. Thus IPY has enabled completely new means to mea-sure change along with the research communities to interpret these changes just at the time when these changes are of most importance to societies across the globe. It is easy to view IPY as having arrived on
the scene at the most critical time: the cryosphere is beginning to exhibit change previously not witnessed by humans, yet human behaviour will need to under-stand and accommodate these changes.
IPY Investigations of the Antarctic Ice Sheeta. New Frontiers The New Frontiers of IPY 2007–2008 were mostly hidden beneath the thick ice of the Antarctic Ice Sheet. During IPY the knowledge that subglacial hydrologic systems can change and influence ice sheet dynamics became evident and the groundwork was laid for upcoming exploration of several subglacial lakes (Chapter 2.6). The other efforts focused on understanding the last unknown tectonic systems on
Title IPY Project no. Nations
AGAP-Antarctica’s Gamburtsev Province 67 U.S.A., U.K., Germany, Australia, China, Japan, Canada
ICECAP-Investigating the Cryospheric Evolution of the Central Antarctic Plate
97 U.K., U.S.A., Australia, France
IPICS-International Partnerships in Ice Core Science-International Polar Year Initiative
117 Austria, Belgium, Brazil, Canada, Denmark, Estonia, France, Germany, India, Italy, Japan Netherlands, New Zealand, Norway, Russia, Sweden Switzerland, U.K., U.S.A.
LIMA-Landsat Image Mosaic of Antarctica 461 U.S.A., U.K.
ASAID-Antarctic Surface Accumulation and Ice Discharge
88 U.S.A., Australia, Germany, Italy, New Zealand, U.K., Norway, Russia
TASTE-IDEA-Trans-Antarctic Scientific Traverses Expeditions – Ice Divide of East Antarctica
152 Originated by Germany: implemented through the next two projects
JASE-Japanese-Swedish Antarctic Expedition Contributed to objectives of 152
Sweden, Japan, Russia
US- Norway Traverse Contributed to objectives of 152
Norway, U.S.A.
PANDA- The Prydz Bay, Amery Ice Shelf and Dome A Observatories
313 China, Australia, U.S.A., U.K., Japan, Germany
ITASE-International Trans-Antarctic Scientific Expedition
Linked to 88, 117, 152
Established prior to IPY with up to 20 national participants
WAIS Divide Core - U.S.A.
ACE-Antarctic Climate Evolution 54 China, Germany, Italy, New Zealand, Poland, Spain, U.K., U.S.A., Argentina, Australia, Belgium, Canada, France, Netherlands and Sweden
ANDRILL 256 U.S.A., New Zealand, Italy, U.K., France, Australia, Germany
Multidisciplinary Study of the Amundsen Sea Embayment
258 U.S.A., U.K.
LARISSA-Larsen Ice Shelf System, Antarctica - U.S.A., Belgium, Korea, U.K.
LEGOS 125 France, Australia, Germany, U.S.A.
I PY 20 07–20 0 8236
our planet: the deep basins beneath the ice sheet and the hidden mountain ranges. The study of Antarctica’s Gamburtsev Province (AGAP, no. 67) was a collaborative effort of seven na-tions (U.S., U.K., Germany, Australia, Germany, China and Canada) bringing together their resources and technologic knowledge to study the Gamburtsev Mountains hidden beneath Dome A in the center of East Antarctica. Using two research Twin Otters aircraft the team collected 130,000 km of data, equivalent to flying the aircraft around the globe three times. The team also installed 26 seismometers around Dome A that will record global seismic events. The seismic data will be used to determine the deep earth structure be-neath Dome A. The aerogeophysical data has revealed a rugged mountain range incised by fluvial river valley in the south and truncated by the landward extension of the Lambert Rift to the North. Capturing measure-ments of some of the thickest ice (over 4600 m) and some of the thinnest ice in the center of the ice sheet (less than 400 m) this work is changing the view of the tectonics and the nature of the ice sheet. Evidence is emerging for complex interconnected system of sub-glacial water and extensive subglacial freezing at the base of the ice sheet. Well-resolved internal layers fa-cilitate the identification of the oldest ice close to the Dome A. East of the Gamburtsev Moutains, the collaborative ICECAP program began a multi-year program (U.K., U.S. and Australia) using an instrumented long-range aircraft to survey the portion of the East Antarctic Ice Sheet underlain by the Wilkes and Aurora subglacial basins. The ice drainage from these regions is dominated by the Byrd and Totten Glacier systems. This program is acquiring a combination of flow-line-oriented and gridded aerogeophysical observations over this portion of the East Antarctic Ice Sheet that is grounded on a bed below sea level, prompting questions of its regional stability. During IPY, the program flew over 30,000 km acquiring ice thickness and internal layers to support of ice sheet modeling to observe flow regime change and to study crustal geology and subglacial hydrological systems. These data will inform future studies on the processes controlling both past and future change of the East Antarctic Ice Sheet.
b. Global Linkages The Global Linkages theme sought to advance the understanding of the links and interactions between polar regions and the rest of the globe. IPY 2007–2008 efforts in this aspect of the Antarctic cryosphere sought to use the climate record held within ice cores to link the climate record from Antarctica to global climate systems. The IPY ice coring efforts included shallow cores along the coast and ongoing deep cores in the interior. During IPY, the relatively new International Partnerships in Ice Core Sciences (IPICS) supported focused site surveys and beginning the West Antarctic Ice Sheet (WAIS) divide core. IPICS partnered in the major aerogeophysical programs (AGAP and ICECAP) that collected the data to be used to locate and identify the oldest ice available in Antarctica—hopefully at least one million years old—providing data that will be fundamental to understanding the orbital forcing of climate change. The ice core recovered from the divide of the West Antarctic Ice Sheet will facilitate the development of climate records with an absolute, annual-layer-counted chronology for the most recent ~40,000 years. This ice core record will have a very small offset between the ages of the ice and the air (i.e. gases) trapped in the ice enabling a decadal-precision climate chronology relative to the Greenland ice cores. In addition to providing the most detailed record of greenhouse gases possible for the last 100,000 years and determining if the climate changes that occurred during the last 100,000 years were initiated by changes in the northern or southern hemisphere, the WAIS core project will investigate the past stability of the West Antarctic Ice Sheet and contribute to efforts to predict its future. During IPY 2007–2008 the deep drilling system was installed and drilling began.
c. Status Determining the present environmental Status of the polar regions during IPY 2007–2008 was crucial to establishing benchmarks for documenting future change. In the Antarctic cryosphere key targets were the exact location of the edge of the ice sheet, the rate of accumulation of snow and the rate at which ice is being discharged. Several projects using techniques ranging from traverses crossing the continent with snow vehicles to detailed analysis of satellite images
s C I e n C e P r o g r a m 237
addressed these goals. High resolution imagery is a commonly used data set to visualize a region and, in Antarctica, often replaces maps. Surprisingly, before IPY, the highest resolution data set of Antarctica used radar, not visible, imagery. As IPY approached, a joint U.S.-U.K. effort to produce the Landsat Image Mosaic of Antarctica (LIMA, http://lima.usgs.gov) began. During IPY, LIMA was released, capturing the status of the of the Antarctic Ice Sheet surface for the period 1999-2003. Extensive image processing was completed to rigorous scientific conditions to produce a scientifically valuable mosaic data set of surface reflectances. The outcome of this IPY project gives the public and educators a new, exciting and flexible tool to increase their familiarity with Antarctica (http://lima.nasa.gov). LIMA has been used extensively in the classroom and by media to add a real-look dimension to Antarctic activities. LIMA also serves the science research community with a new research tool of meaningful surface reflectances to facilitate not just field planning and exploration of the Antarctic surface, but also quantitative analyses that utilize surface reflectance data. LIMA offers parallel views of the surface with synthetic aperture radar from the co-registered Radarsat data set. The LIMA interface allows interested users to download either the mosaiced data or the individual scenes. Two biologists used the LIMA mosaic to map penguin rookeries over all of Antarctica, finding a number of previously unknown rookeries and identifying some abandoned rookeries based on the spectral (true color) signature of rookeries (Fretwell, 2009). Following from the LIMA and during the LIMA period of 1999-2003 was the project ASAID defining the precise position of the Antarctic grounding line by including ICESat and SAR data at 15 meters resolution and, from it, the total ice discharge from the Antarctic continent. Scientists from Norway, the U.K., New Zealand, Italy, Germany, Australia and the U.S. produced a comprehensive estimate of the surface accumulation and ice discharge for the Antarctic cryosphere. Additional products were the first-ever mapping of the “hydrostatic line” where floating ice is in hydrostatic equilibrium, the first complete mapping of surface velocity across the grounding line. Previous estimates of the Antarctic discharge flux had been limited to the fast moving outlet glaciers. Some
field data collected during IPY by the British Antarctic Survey was used for validation. Each of these new data products are benchmark data sets that will be used to measure change of the cryosphere in the future. New techniques were employed to derive surface elevations from Landsat imagery using ICESat altimetry as control while customized software was developed to provide analysts with tools for combining these data and drawing and editing the grounding line. Russian research during IPY included Antarctic Ice Sheet and sea water interaction, geophysical investigations of ice stream-lines and subglacial lakes, and surface ice accumulation and discharge. During IGY, surface traverses across the Antarctic Ice Sheet were used to generate the first accurate estimates of the volume of ice stored on the continent. During IPY 2007–2008, surface traverses were used to make key in situ measurements of the ice sheet in locations many of which had not been visited for decades. During the planning phases of IPY, one of the first concepts offered (by Heinz Miller of AWI under the title IDEA) was traverses along the divides of the ice sheets collecting shallow ice cores to capture the accumulation record and to provide the logistical infrastructure for other detailed work such as aerogeophysics. Much of this concept was implemented, although not always under the umbrella of IDEA. The long running ITASE program targeted where and how Antarctic physical and chemical climate has or has not changed over the last several hundred years with a view toward assessing future climate change over Antarctica. ITASE continued into IPY with traverses extended from McMurdo to the South Pole and from Dronning Maud Land to Dome F and on to the Japanese Base Syowa. Traverses were also completed by a joint Norwegian-U.S. team that covered one of the major ice divides and surveyed major sub-glacial lakes, as well as one component of the PANDA program that traveled from the coast to Dome A. Making use of mobile platforms in the interior of Antarctica, the Japanese-Swedish Antarctic Expedi-tion, JASE (November 2007 – February 2008), made continuous surveys of different parameters, including sampling and snow and ice radar surveys. The JASE tra-verse began in Dronning Maud Land, East Antarctica at the Swedish base Wasa and reached the Japanese
I PY 20 07–20 0 8238
base Syowa via the deep drilling sites at Kohnen and at Dome Fuji. Data collected included radar sound-ings for ice depth and snow layering, air sampling, snow sampling for chemical analyses, snow sampling for physical property measurements, snow pit stud-ies for snow sampling, firn coring for various analyses and 10 m temperature, weather observations, GPS-measurements and ground truth surveys for satellite data. The traverse enabled extensive ground truth sampling of physical snow properties such as snow grain size. Snow grain size is determined by moisture content and air temperature, and shows decreasing size towards the center of Antarctica and larger grains in the coastal areas. The grain size and shape results are correlated with coincident and historical satel-lite data including SAR imagery from ENVISAT ASAR, QuikSCAT scatterometry and optical-thermal satellite data (MERIS & MODIS) over the study area. Preliminary results indicate that the black carbon content in air and snow over the Antarctic plateau is higher than ex-pected. The concentration in air is higher than found near the coast, and the content in snow is about 10 times larger than used in published climate simula-tions, albeit with large spatial variations. Subglacial landforms that may be relicts from the initiation of the Antarctic glaciation about 30 million years ago were described and continuous measurements of aerosols, bed topography, ice layering, snow layering and sur-face topography were measured en route. The Norwegian-U.S. Scientific Traverse of East Antarctica completed two seasons (2007 and 2008/2009) of overland traverses of East Antarctica beginning at the Norwegian Troll Station, following an ice divide to the South Pole and returning to Troll by a route over the Recovery Subglacial Lakes. The main research focus of the program was to examine climate variability in Dronning Maud Land, East Antarctica on time scales of years to a 1000 years by a series of shallow cores, firn studies and temperature profiles. The team has been able to establish spatial and temporal variability in snow accumulation over this area of Antarctic both through ice cores and linking the surface based studies to satellite measurements. Results from new ice cores are providing new constraints on the accumulation in East Antarctica for the past 2000 years. Analysis of the surface radar has enabled a robust relationship between the surface
and space observations. Detailed snow pits enable new insights into the impact of atmospheric and oceanic variability on the chemical composition of firn and ice in the region. The physical properties of snow and firn, from crystal structure to mesoscale strata morphology, reveal a complicated East Antarctic climate history. Five 90 m-long in situ thermal profiles obtained from automated, satellite-uplinked stations provide an independent, new assessment of climate trends in the remotest parts of Antarctica.
d. Change The planners of IPY envisioned that programs targeted at Change in the Polar Regions would seek to quantify, and understand, past and present natural environmental change in the polar regions, and to improve projections of future change. IPY 2007–2008 programs addressing change covered the spectrum of past change through present change to projections of future change. The existing Antarctic Climate Evolution (ACE, www.ace.scar.org) activity, a Scientific Research Proj-ect (SRP) of the Scientific Committee on Antarctic Research (SCAR) emerged as a core IPY project and was an umbrella for many smaller projects fitting be-neath. ACE’s mission is to facilitate the study of Ant-arctic climate and glacial history through integration of numerical modeling with geophysical and geologi-cal data. The overall goal of ACE is to facilitate those model-data interactions for better understanding of Antarctic climate and ice sheet variability over the full range of Cenozoic (last ~65 million years) timescales. Over the last five years, ACE has made major contri-butions to the understanding of the early develop-ment of the Antarctic Ice Sheet in the Oligocene and its variability through the Miocene. Much of this work has led to a new appreciation for the importance of at-mospheric greenhouse gas concentrations relative to other potential forcing mechanisms (e.g. orbital forc-ing, ocean circulation, etc.) in controlling the onset of glaciation and magnitude of subsequent ice volume variability. A direct outcome of ACE was the ANDRILL project that included a major drilling field campaign integrated with a numerical modeling effort. During IPY, ANDRILL completed its first two seasons of sedimentary drilling in the Ross Sea. The drilling effort recovered over 2400
s C I e n C e P r o g r a m 239
meters of high quality core in two locations: under the McMurdo Ice Shelf and in the Southern McMurdo Sound. The McMurdo Ice Shelf core ranges in age from recent to Pliocene, while the Southern McMurdo Sound core is mostly older, providing an expanded Miocene record. While the science associated with Southern McMurdo Sound is still evolving, important discoveries have already been made, including the recognition of exceptional Antarctic warmth in the middle Miocene (Sophie Warny, 2009). The McMurdo Ice Shelf effort and associated numerical modeling has made several important discoveries, including the recognition of a highly variable, orbitally paced West Antarctic Ice Sheet (WAIS) throughout the Pliocene and early Pleistocene (Naish et al., 2009). Based on a combination of sediment analysis and numerical ice sheet-shelf modeling, it is now clear that WAIS is capable of sudden retreats (collapses) within a few thousand years, mostly in response to relatively modest increases in ocean temperature and sub-ice shelf melt rates (Pollard and DeConto, 2009). The most recent WAIS collapse evident in the ANDRILL core occurred around 1 million years ago (Marine Isotope Stage - 31). At that time, WAIS appears to have retreated to the small sub-aerial islands of the West Antarctic archipelago, the Ross Sea was open water (with no ice shelf), mean annual sea surface temperatures were several degrees above freezing and there was little seasonal sea ice in the Ross Embayment. Numerical modeling of Cenozoic ice sheets has been greatly improved in recent years by ACE-facilitated geophysical surveys (e.g. AGAP and ICECAP), providing improved subglacial boundary conditions. New working groups within ACE including Circum-Antarctic Stratigraphy and Paleobathymetry (CASP) and ANTscape have been particularly active over the IPY period, producing new paleotopographic and paleobathymetric reconstructions of the continent and offshore margins at key time slices in the past including the Eocene-Oligocene boundary (34 Ma), Last Glacial Maximum and Holocene. Early in the planning stages of IPY, the Amundsen Sea Embayment was identified as a key location where rapid change was underway. The spatial pattern of change revealed the ocean as the driver of this change and, during IPY, a multi-national program (U.S. and U.K.) began targeting a sustained study of the impact
of warm water circulating in the ice cavity adjacent to the Pine Island Glacier, a major WAIS outlet glacier. The targeted ice shelf turned out to be so heavily crevassed that it was unable to support landings by fixed wing aircraft. An alternative strategy using helicopters has introduced a delay; this multidisciplinary study, begun in early 2008, will continue through 2014. The Amundsen Sea program will be the first sustained sampling of sub-ice shelf circulation in a “warm-ice-shelf” cavity. The instruments lowered through borehole drilled in the floating ice shelf in 2011 will record the high basal melt rates thought to exceed 100m/yr in a region known to be changing rapidly. The Pine Island Glacier, feeding this floating ice shelf, is thinning, accelerating and retreating. Novel technology will be deployed enabling improved imaging systems and small-diameter ocean profiling instruments. The science outcomes are anticipated to be accurate measurements of the temperature, salinity and current changes in the incoming and outgoing water. These sub-ice shelf data will complement IPY data from ocean moorings placed on the continental shelf of the Amundsen Sea. Other well-documented changes are continuing in the Antarctic Peninsula, particularly on the ice shelves and their feeding glaciers. A new interdisciplinary program to investigate environmental change in the LARsen Ice Shelf System, Antarctica (LARISSA) was initiated during IPY 2007–2008. Also delayed because of complex logistical requirements, it will provide a comprehensive approach to questions concerning the past, present and future of this rapidly changing region. Catastrophic ice shelf loss associated with rapid regional warming has resulted in large scale changes in the physical and biologic environment. The LARISSA Project represents an Earth Systems approach to describe and understand the basic physical and geological processes active in the Larsen embayment that contributed to the present phase of massive, rapid environmental change; are participating in the coupled climate-ocean-ice system; and are fundamentally altered by these changes. While observations of modern glacial, oceanic and biological dynamics will address the response of this polar system to global change, marine and terrestrial geologic data in combination with ice core data will provide the context of a paleo-perspective making it
I PY 20 07–20 0 8240
possible to address a suite of questions over a variety of time scales. Existing geologic data indicate the likely existence of a stratigraphic record from prior to the Last Glacial Maximum; this record will further our understanding of the Larsen System under climatic conditions of the penultimate interglacial, when globally, sea level was higher and average climate warmer than today. Sea floor mapping and strategic marine sediment coring combined with land-based geomorphologic work will be used to reconstruct the configuration of the northern Antarctic Peninsula Ice Sheet during the Last Glacial Maximum and the subsequent retreat. Sediment coring coupled to field observations and satellite imagery will be used to evaluate the controls on the dynamics of ice-shelf grounding-line systems. On a much larger spatial scale, the present rate of ice and snow mass change continues to be estimated using multiple satellite approaches. GRACE accomplishes this monitoring role by measuring gravity variations created by regional mass redistributions within the ice sheets. The LEGOS project engaged scientists from four nations, namely France, Australia, Germany and U.S., to analyze GRACE data. The results of this work have documented an important mass loss from the ice sheets for recent year equivalent to an increase of global sea level at ~1mm/yr with recent increases in contributions from the southeast and northwestern coasts of Greenland. A major result is evidence of an increased contribution from the two ice sheets over the past five to seven years. The ice sheet contribution was estimated to be equivalent to about 15% of the total sea-level change for the 1993-2003 decade (IPCC AR4). These studies have shown that it increased to 30% since 2003. The total land ice contribution (ice sheets plus glaciers) amounts to 75% for the 2003-2009 time span (Cazenave, 2009). Post glacial rebound remains the major source of uncertainly in these studies with the modeling of the rebound in Antarctica being the least accurate. POLENET (Polar Earth Observing Network - Chapter 2.8) is another IPY project that includes as one of its geodetic products a much-improved measurement of the spatial pattern and magnitude of post-glacial rebound. This product will directly and significantly improve the correction of GRACE measurements of ice sheet mass loss. Satellite laser altimetry is an independent means
of monitoring ice sheet change and IPY fell within the 2003-2009 lifetime of ICESat-1, NASA’s laser altimetry mission. ICESat data mapped Antarctic ice thinning and thickening rates with greater spatial acuity than GRACE, producing similar results. West Antarctica, especially the Amundsen Sea Embayment remains the region of greatest thinning, with thinning also apparent over the Antarctic Peninsula regions having recently lost ice shelves, allowing an acceleration and thinning of feeding glaciers. East Antarctica has experienced modest thickening over much of the interior during the ICESat period, but the area is so vast the mass balance of the East Antarctic Ice Sheet appears to be positive (+68 +/- 52 Gt/a) in contrast to the significantly negative mass balance (-51 +/- 4 Gt/a) of West Antarctica. The corresponding mass balance for the Antarctic Peninsula is (-25 Gt/a) brings the continental total to near balance.
Looking to The Future of the Antarctic Ice Sheet As in earlier polar years, IPY enabled scientists to make advances that would have been impossible with-out the collaborative framework of the major interna-tional effort. Escalating fuel costs threatened many pro-grams, but the strength of the IPY collaborations and the conviction of the diverse teams enabled remark-able efforts to be launched and completed. The polar environment proved to be a challenge in 2007-2009 as it has in earlier years and some of the work has yet to be finished. For example, the plans to instrument the water beneath the ice shelf in front of the Pine Island Glacier had to be reconfigured to minimize the dan-gers to field personnel. Similarly the high altitude and cold temperatures encountered by the Norwegian-U.S. traverse along the ice divides challenged the vehicles and threatened to end the program early. In the first traverse Antarctic field season the team had to leave their vehicles 300 km away from South Pole before the winter set. For the AGAP project, over four years of planning spanning all seven continents resulted in an effort requiring nine aircraft, dozens of traverse ve-hicles, four airdrops and two major high altitude field camps (Figs. 2.5-2 and 2.5-3). Again the compelling nature of the cryospheric science forged within the collaborative framework of IPY provided the neces-
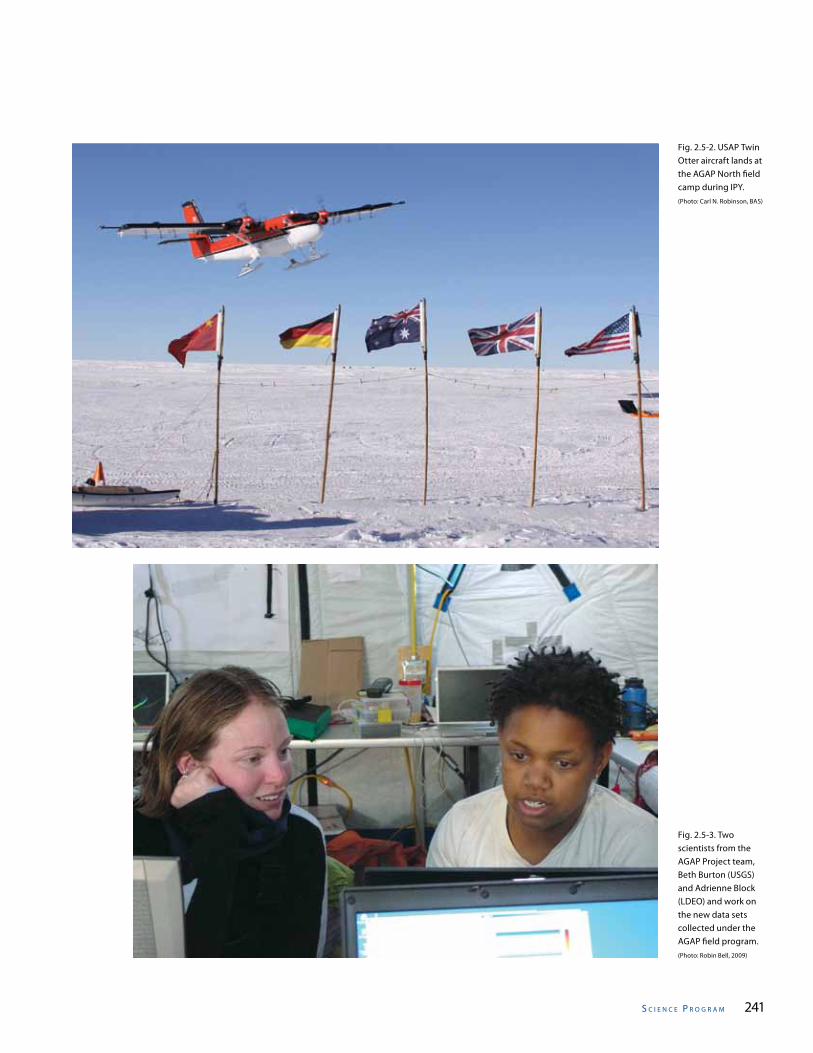
s C I e n C e P r o g r a m 241
Fig. 2.5-2. USAP Twin Otter aircraft lands at the AGAP North field camp during IPY.(Photo: Carl N. Robinson, BAS)
Fig. 2.5-3. Two scientists from the AGAP Project team, Beth Burton (USGS) and Adrienne Block (LDEO) and work on the new data sets collected under the AGAP field program.(Photo: Robin Bell, 2009)
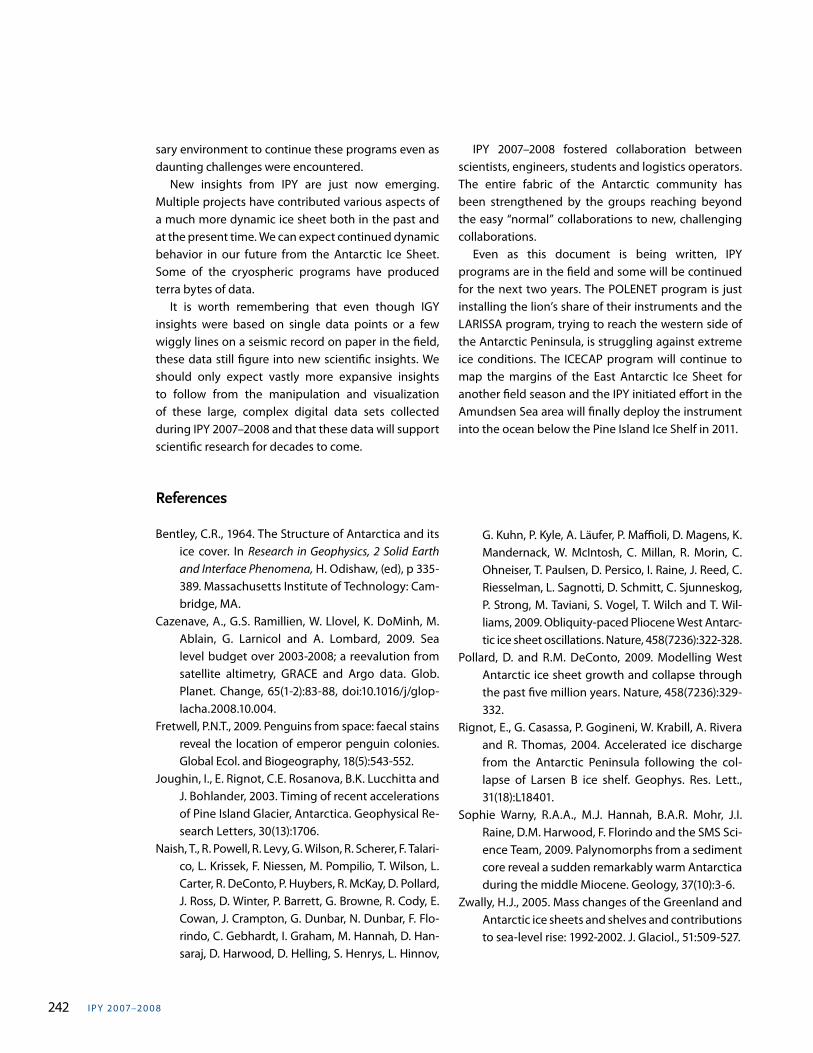
I PY 20 07–20 0 8242
sary environment to continue these programs even as daunting challenges were encountered. New insights from IPY are just now emerging. Multiple projects have contributed various aspects of a much more dynamic ice sheet both in the past and at the present time. We can expect continued dynamic behavior in our future from the Antarctic Ice Sheet. Some of the cryospheric programs have produced terra bytes of data. It is worth remembering that even though IGY insights were based on single data points or a few wiggly lines on a seismic record on paper in the field, these data still figure into new scientific insights. We should only expect vastly more expansive insights to follow from the manipulation and visualization of these large, complex digital data sets collected during IPY 2007–2008 and that these data will support scientific research for decades to come.
References
Bentley, C.R., 1964. The Structure of Antarctica and its ice cover. In Research in Geophysics, 2 Solid Earth and Interface Phenomena, H. Odishaw, (ed), p 335-389. Massachusetts Institute of Technology: Cam-bridge, MA.
Cazenave, A., G.S. Ramillien, W. Llovel, K. DoMinh, M. Ablain, G. Larnicol and A. Lombard, 2009. Sea level budget over 2003-2008; a reevalution from satellite altimetry, GRACE and Argo data. Glob. Planet. Change, 65(1-2):83-88, doi:10.1016/j/glop-lacha.2008.10.004.
Fretwell, P.N.T., 2009. Penguins from space: faecal stains reveal the location of emperor penguin colonies. Global Ecol. and Biogeography, 18(5):543-552.
Joughin, I., E. Rignot, C.E. Rosanova, B.K. Lucchitta and J. Bohlander, 2003. Timing of recent accelerations of Pine Island Glacier, Antarctica. Geophysical Re-search Letters, 30(13):1706.
Naish, T., R. Powell, R. Levy, G. Wilson, R. Scherer, F. Talari-co, L. Krissek, F. Niessen, M. Pompilio, T. Wilson, L. Carter, R. DeConto, P. Huybers, R. McKay, D. Pollard, J. Ross, D. Winter, P. Barrett, G. Browne, R. Cody, E. Cowan, J. Crampton, G. Dunbar, N. Dunbar, F. Flo-rindo, C. Gebhardt, I. Graham, M. Hannah, D. Han-saraj, D. Harwood, D. Helling, S. Henrys, L. Hinnov,
G. Kuhn, P. Kyle, A. Läufer, P. Maffioli, D. Magens, K. Mandernack, W. McIntosh, C. Millan, R. Morin, C. Ohneiser, T. Paulsen, D. Persico, I. Raine, J. Reed, C. Riesselman, L. Sagnotti, D. Schmitt, C. Sjunneskog, P. Strong, M. Taviani, S. Vogel, T. Wilch and T. Wil-liams, 2009. Obliquity-paced Pliocene West Antarc-tic ice sheet oscillations. Nature, 458(7236):322-328.
Pollard, D. and R.M. DeConto, 2009. Modelling West Antarctic ice sheet growth and collapse through the past five million years. Nature, 458(7236):329-332.
Rignot, E., G. Casassa, P. Gogineni, W. Krabill, A. Rivera and R. Thomas, 2004. Accelerated ice discharge from the Antarctic Peninsula following the col-lapse of Larsen B ice shelf. Geophys. Res. Lett., 31(18):L18401.
Sophie Warny, R.A.A., M.J. Hannah, B.A.R. Mohr, J.I. Raine, D.M. Harwood, F. Florindo and the SMS Sci-ence Team, 2009. Palynomorphs from a sediment core reveal a sudden remarkably warm Antarctica during the middle Miocene. Geology, 37(10):3-6.
Zwally, H.J., 2005. Mass changes of the Greenland and Antarctic ice sheets and shelves and contributions to sea-level rise: 1992-2002. J. Glaciol., 51:509-527.
IPY 2007–2008 fostered collaboration between scientists, engineers, students and logistics operators. The entire fabric of the Antarctic community has been strengthened by the groups reaching beyond the easy “normal” collaborations to new, challenging collaborations. Even as this document is being written, IPY programs are in the field and some will be continued for the next two years. The POLENET program is just installing the lion’s share of their instruments and the LARISSA program, trying to reach the western side of the Antarctic Peninsula, is struggling against extreme ice conditions. The ICECAP program will continue to map the margins of the East Antarctic Ice Sheet for another field season and the IPY initiated effort in the Amundsen Sea area will finally deploy the instrument into the ocean below the Pine Island Ice Shelf in 2011.
s C I e n C e P r o g r a m 243
2.6 Subglacial Aquatic Environments
Lead Authors:Mahlon C. Kennicutt II, Martin Siegert and Cynan Ellis-Evans
Contributing Author:Vladimir Lipenkov
Reviewers:Carlo Barbante, Robin Bell, Jill Mikucki and Colin Summerhayes
PA R T T W O : I P Y S C I E N C E P R O G R A M
Recognition as a Focus for Scientific Investigation In 1996 an article, featured on the cover of Nature, reported that a massive subglacial lake containing liquid water was hidden beneath ~4 kilometers of ice in Antarctica (Kapitsa et al., 1996). While the data that suggested the presence of a lake dated to the 1960s and 1970s, this feature had gone largely unnoticed by the broader scientific community until a re-analysis of the data. The article sparked speculation that these environments might be habitats for exotic microbial life long isolated from the open atmosphere. It was speculated that if sediments were preserved at the bottom of the lake they would contain never before seen records of past climate change in the interior of Antarctica. The article demonstrated that the lake (Subglacial Lake Vostok, named after the Russian Antarctic Station famous for its 400,000 year ice core record of climate; Fig. 2.6-1) was an order of magnitude larger than other previously identified subglacial lakes, and was deep (510 m) making it a unique feature on Earth (Kapitsa et al., 1996). Conjecture was that the lake had been entombed for hundreds of thousands, if not millions of years, beneath the East Antarctic ice sheet. A small, but growing, international community of scientists became convinced, based as much on scientific vision as on actual data, that Lake Vostok and other subglacial lakes represented an important new frontier in Antarctic research. The group continued to examine what was already known as well as newly developed information about subglacial environments over the next decade developing the scientific rationale for the study of these environments. The emerging interest in Lake Vostok led to a series of international meetings to develop plans for its exploration. The first, in Cambridge in 1994,
established the dimensions and setting of the lake and led to the first published inventory of subglacial lakes (of which 77 were recorded from analysis of radio-echo sounding records, Siegert et al., 1996). In the second half of the 1990s, three scientific workshops entitled “Lake Vostok Study: Scientific Objectives and Technological Requirements” (St. Petersburg, March 1998), “Lake Vostok: A Curiosity or a Focus for Scientific Research?” (Washington DC, U.S.A., November 1998; Bell and Karl, 1998), and “Subglacial Lake Exploration” (SCAR, Cambridge, September 1999) were held. It was recognized early on that that, in order to explore these remote habitats, a major, sustained investment in time, resources and scientific effort would be necessary. The Scientific Committee on Antarctic Research (SCAR) provided a forum for scientists and technologists to gather, exchange ideas and plan for the future; first as a Group of Specialists (2000-2004) and then as a Scientific Research Program (SCAR Subglacial Antarctic Lake Environments [SALE] 2004–2010). The timing of the SALE program conveniently paralleled the development and implementation of IPY, resulting in valuable mutual benefits for both of these iconic polar activities.
The Early Years From 1998-2006 understanding of subglacial envi-ronments incrementally improved based on remote sensing studies and theoretical modeling. Slowly, the belief that the interface between the ice sheets and basement rock was frozen and devoid of envi-ronments of interest was changing. As knowledge of subglacial lakes increased, the potential importance
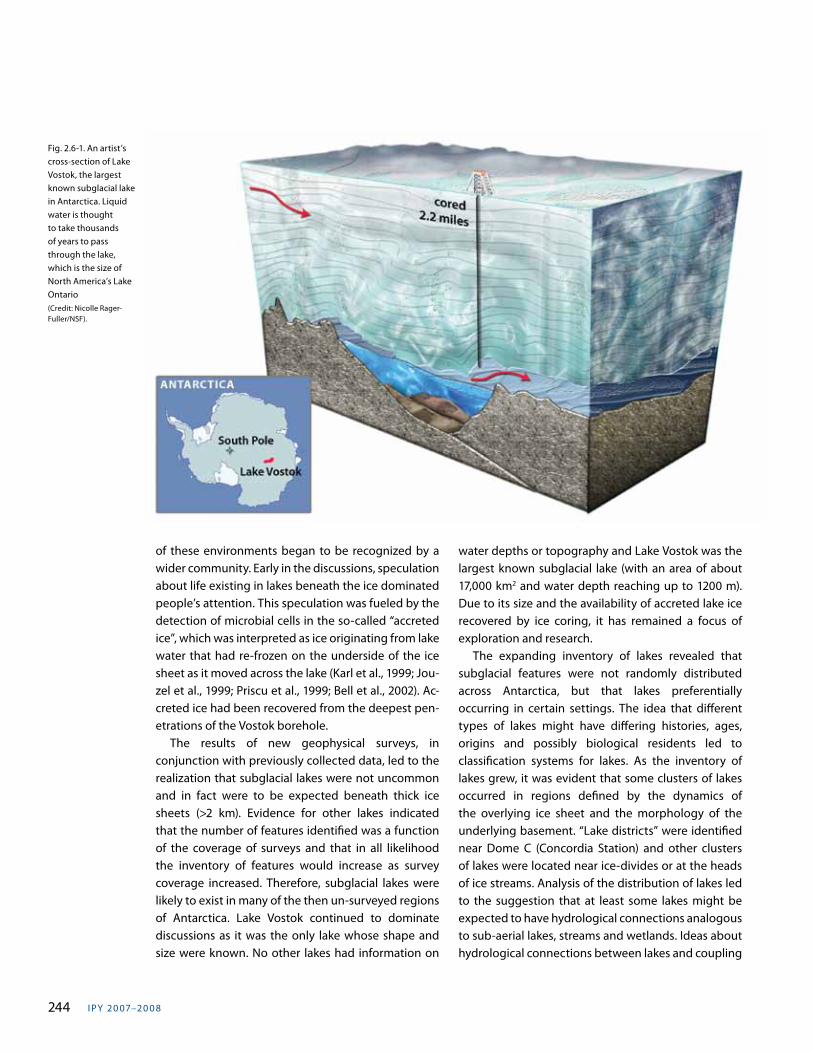
I PY 20 07–20 0 8244
of these environments began to be recognized by a wider community. Early in the discussions, speculation about life existing in lakes beneath the ice dominated people’s attention. This speculation was fueled by the detection of microbial cells in the so-called “accreted ice”, which was interpreted as ice originating from lake water that had re-frozen on the underside of the ice sheet as it moved across the lake (Karl et al., 1999; Jou-zel et al., 1999; Priscu et al., 1999; Bell et al., 2002). Ac-creted ice had been recovered from the deepest pen-etrations of the Vostok borehole. The results of new geophysical surveys, in conjunction with previously collected data, led to the realization that subglacial lakes were not uncommon and in fact were to be expected beneath thick ice sheets (>2 km). Evidence for other lakes indicated that the number of features identified was a function of the coverage of surveys and that in all likelihood the inventory of features would increase as survey coverage increased. Therefore, subglacial lakes were likely to exist in many of the then un-surveyed regions of Antarctica. Lake Vostok continued to dominate discussions as it was the only lake whose shape and size were known. No other lakes had information on
water depths or topography and Lake Vostok was the largest known subglacial lake (with an area of about 17,000 km2 and water depth reaching up to 1200 m). Due to its size and the availability of accreted lake ice recovered by ice coring, it has remained a focus of exploration and research. The expanding inventory of lakes revealed that subglacial features were not randomly distributed across Antarctica, but that lakes preferentially occurring in certain settings. The idea that different types of lakes might have differing histories, ages, origins and possibly biological residents led to classification systems for lakes. As the inventory of lakes grew, it was evident that some clusters of lakes occurred in regions defined by the dynamics of the overlying ice sheet and the morphology of the underlying basement. “Lake districts” were identified near Dome C (Concordia Station) and other clusters of lakes were located near ice-divides or at the heads of ice streams. Analysis of the distribution of lakes led to the suggestion that at least some lakes might be expected to have hydrological connections analogous to sub-aerial lakes, streams and wetlands. Ideas about hydrological connections between lakes and coupling
Fig. 2.6-1. An artist’s cross-section of Lake Vostok, the largest known subglacial lake in Antarctica. Liquid water is thought to take thousands of years to pass through the lake, which is the size of North America’s Lake Ontario (Credit: Nicolle Rager-Fuller/NSF).
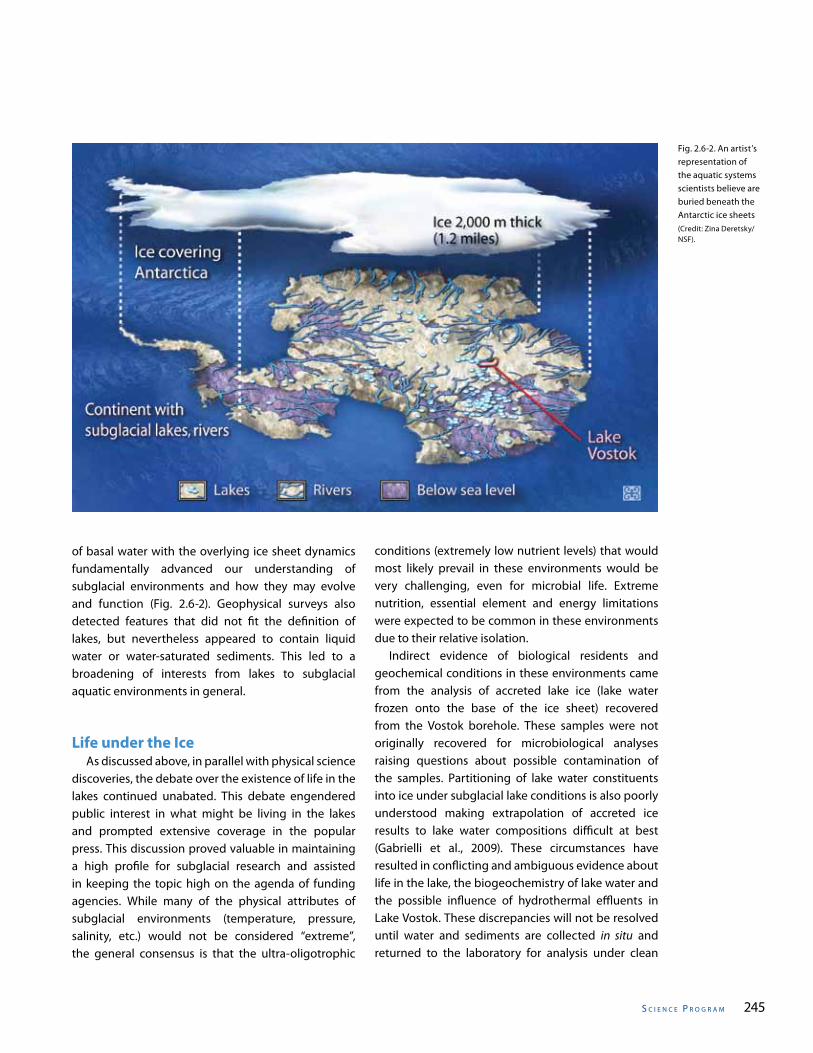
s C I e n C e P r o g r a m 245
of basal water with the overlying ice sheet dynamics fundamentally advanced our understanding of subglacial environments and how they may evolve and function (Fig. 2.6-2). Geophysical surveys also detected features that did not fit the definition of lakes, but nevertheless appeared to contain liquid water or water-saturated sediments. This led to a broadening of interests from lakes to subglacial aquatic environments in general.
Life under the Ice As discussed above, in parallel with physical science discoveries, the debate over the existence of life in the lakes continued unabated. This debate engendered public interest in what might be living in the lakes and prompted extensive coverage in the popular press. This discussion proved valuable in maintaining a high profile for subglacial research and assisted in keeping the topic high on the agenda of funding agencies. While many of the physical attributes of subglacial environments (temperature, pressure, salinity, etc.) would not be considered “extreme”, the general consensus is that the ultra-oligotrophic
conditions (extremely low nutrient levels) that would most likely prevail in these environments would be very challenging, even for microbial life. Extreme nutrition, essential element and energy limitations were expected to be common in these environments due to their relative isolation. Indirect evidence of biological residents and geochemical conditions in these environments came from the analysis of accreted lake ice (lake water frozen onto the base of the ice sheet) recovered from the Vostok borehole. These samples were not originally recovered for microbiological analyses raising questions about possible contamination of the samples. Partitioning of lake water constituents into ice under subglacial lake conditions is also poorly understood making extrapolation of accreted ice results to lake water compositions difficult at best (Gabrielli et al., 2009). These circumstances have resulted in conflicting and ambiguous evidence about life in the lake, the biogeochemistry of lake water and the possible influence of hydrothermal effluents in Lake Vostok. These discrepancies will not be resolved until water and sediments are collected in situ and returned to the laboratory for analysis under clean
Fig. 2.6-2. An artist’s representation of the aquatic systems scientists believe are buried beneath the Antarctic ice sheets (Credit: Zina Deretsky/NSF).
I PY 20 07–20 0 8246
conditions. The general consensus is that all of these environments almost certainly contain life, based on the current knowledge of the settings, but that life more complex than microbes is highly unlikely. Early speculation that the water in these lakes has been isolated for millions of years is also considered far less likely given the degree of hydrological communication apparent among those lakes examined to date.
A New Frontier Continues to Advance during IPY The early phases of subglacial aquatic environment research coincided with initial planning for IPY 2007–2008. As a consequence, a group successfully proposed to become an ICSU-WMO IPY project entitled Subglacial Antarctic Lake Environments Unified International Team for Exploration and Discovery (SALE UNITED). As Antarctic science is funded by National Programs, both SCAR SALE and SALE UNITED served primarily as fora to exchange information and network with others interested in subglacial aquatic environments. SALE UNITED participants included scientists and technologists from Belgium, Canada, China, France, Germany, Italy, Russia, the U.K. and the U.S.A. SCAR SALE (and during IPY, SALE UNITED) held meetings in Austria (2005), France (2006), the U.S. (2007), Russia (2008) and Belgium (2009) to further development of strategic plans and sharing of information on progress. In 2006, a large international workshop “Subglacial Antarctic Lake Environment in the IPY 2007–2008: Advanced Science and Technology Planning Workshop” for the broader community was convened in Grenoble, France by M.C. Kennicutt II and J.R. Petit. The workshop brought together 84 participants from 11 countries. During IPY, significant advances in understanding subglacial environments were achieved. Wingham et al., (2006) detected changes in ice-sheet surface eleva-tions in central East Antarctica using satellite remote sensing and demonstrated that a lake in the Adventure subglacial trench discharged approximately 1.8 km3 of water over a period of 14 months. The water flowed along the axis of the trench and into at least two other lakes some 200 km away. The flux of water, at around 50 m3 s-1, was equivalent to the flow of the River Thames in London. This discovery was particularly significant as
the observations were from the center of East Antarcti-ca, which was considered to be a stable and ancient ice sheet. The conclusion was that the movement of sub-glacial water was likely everywhere in Antarctica and indeed the hydrological processes have subsequently been shown to be common-place. This work also sug-gested that subglacial systems were linked together by a network of hydrological channels defined by the bas-al topography and surface slopes. Siegert et al., (2007) showed the nature of these channels and suggested how groups of lakes may be associated within discrete systems. Later, Wright et al., (2008) revealed that the di-rections of several such channels were sensitive to the ice surface slope. They concluded that small changes in surface slope can result in a major alteration to the basal water flow, especially during periods of ice sheet changes such as after the last glacial maximum or even as a consequence of future global warming. These findings also suggested that water would flow along a hydrologic potential which in some instances might be up topographic slopes (up-hill). Further analysis of satellite remote sensing showed that the process of subglacial discharge and water flow was indeed common-place in Antarctica (Smith et al., 2009). Additionally, many of the newly found lakes and discharge areas were located at the heads of ice streams (Siegert and Bamber, 2000; Bell et al., 2007). Smith et al., (2009) showed, that these lakes actively discharge water to ice stream beds altering basal flow. Satellite investigations of the Byrd Glacier by Stearns et al., (2008) revealed that this was the case and that subglacial lake discharges coincide with 10% anoma-lies in flow velocity in a major outlet glacier (Byrd) draining East Antarctica. Hence, subglacial lakes can and probably always have influenced the dynamics of overlying ice sheets. Additional satellite imagery anal-ysis has confirmed the widespread existence of lakes and episodic water release events. Evidence has also been found of paleo-outbursts from subglacial lakes, most notably the dramatic outflow features present in the Labyrinth area of the McMurdo Dry Valleys. Vast amounts of lake water were released from large lakes and such events have been speculated to affect ocean thermohaline circulation due to the influx of fresh wa-ter possibly interacting with regional climate. During these years, meetings and international workshops facilitated the development of research
s C I e n C e P r o g r a m 247
questions and plans to enter and sample subglacial environments. Critical issues that surfaced were the cleanliness of these experiments and the need for long-term stewardship of subglacial lakes as sites of scientific and public interest. A U.S. National Acad-emies committee reviewed plans for subglacial lake exploration from the perspective of environmental protection and conservation. This review and subse-quent international acceptance of major findings has set standards for conducting future subglacial aquatic environment study and exploration (U.S. National Re-search Council, 2007).
Studies of Lake Vostok during IPY Russian exploration at Lake Vostok continued as part of the drilling program within the framework of the long-term Federal Targeted Program “World Ocean”, subprogram “Antarctica.” It was implemented by a consortium of eight Russian research institutions led by the Arctic and Antarctic Research Institute (AARI) of Roshydromet. In the framework of this program, the Polar Marine Geological Research Expedition (PMGRE) and Russian Antarctic Expedition (RAE) have performed extensive geophysical surveys of the Lake Vostok area and its vicinity by means of ground-based radio-echo sounding (RES) and reflection seismic measurements (Masolov et al., 2006; Popov et al., 2006, 2007; Popov and Masolov, 2007). The overall length of the geophysical traverses completed in February 2009 exceeded 6000 km and included 320 seismic measurements (Fig. 2.6-3). The main output of this large-scale field activity was a series of 1:1,000,000 maps of the Lake Vostok water table limits, the ice and water body thickness, the bedrock relief, its geomorphological zones and the spatial pattern of the internal layers in the overlying ice sheet. While a handful of geophysical transects, involving radio-echo sounding, were acquired over Lake Vostok between 1971-1972 and 1974-1975, it was more than twenty years before the first systematic survey of the lake by Italian geophysicists occurred in 1999. In the Austral season of 1999-2000, twelve new radio-echo sounding transects were collected over the lake, including one continuous flight across the long axis of the lake. From these data, the lake extent was better understood (to be ~260 km by 80 km)
and the steady inclination of the ice-water interface was reconfirmed along the entire length of the lake (Kapitsa et al., 1996). The investigation also revealed the relatively high topography on either side of the lake showing that the lake occupies a deep trough. A year later, U.S. geophysicists undertook what still remains the definitive survey of the lake by airborne measurements (Studinger et al., 2003). More than 20,000 line-km of aerogeophysical data were acquired over an area 160 by 330 km, augmented by 12 regional lines, extending outside of the main grid by between 180 and 440 km. The outcome was the first detailed assessment of the lake and its glaciological locale. Gravity modelling of the lake bathymetry established the existence of two basins (Studinger et al., 2004). The southern basin of the lake is more than 1 km deep. These geophysical investigations supplemented the long-standing geophysical campaigns by Russian scientists from 1995-2008 and resulted in 318 seismic reflection soundings and 5190 km of radio-echo soundings (Masolov et al., 2001, 2006). During IPY, geophysical, geodetic and glaciologi-cal traverse programs carried out by RAE focused on investigating the two ice-flow lines starting at Ridge B, the Vostok flow line (VFL) passing through drilling site 5G at Vostok Station and the North-Vostok flow line (NVFL) crossing the northern part of Lake Vostok (Fig. 2.6-3). These ground traverses were planned and implemented under the IPY TASTE IDEA (Trans-Ant-arctic Scientific Traverses Expeditions – Ice Divide of East Antarctica) project, as part of the Italian/French/Russian traverse from Talos Dome, via Dome C, Vostok and Dome B to Dome A. The data collected in the field were used to constrain a thermo-mechanical ice-flow line model (Richter et al., 2008; Salamatin et al., 2009; Popov et al., submitted). Coordinated field and modeling efforts yielded an improved glacio-logical timescale for the 5G ice core and refined the isotope-temperature transfer functions for converting isotope and borehole temperature data from Vostok into a palaeo-temperature record (Salamatin et al., 2009). Other important outputs of the “Vostok ice flow lines” project were more accurate model estimates of the contemporary distribution of the accreted (lake) ice thickness and freezing rates along the Vostok flow line. In addition, ice age-depth and temperature profiles and the basal melt-rate were predicted for
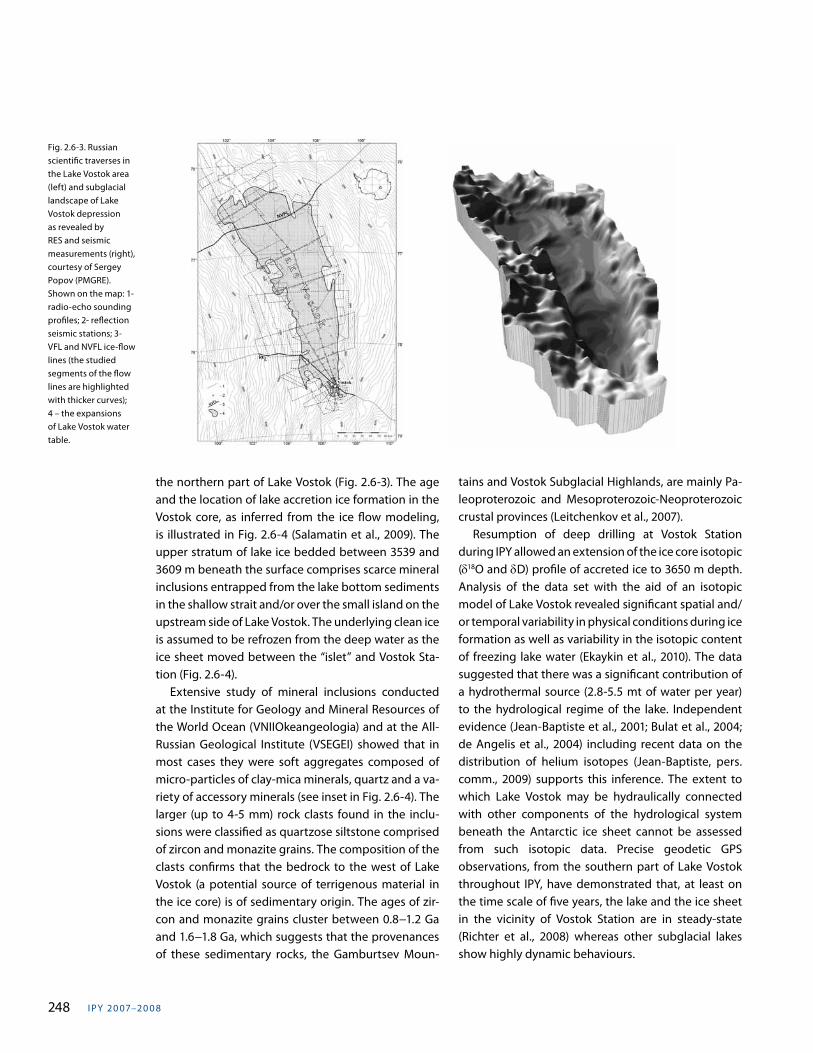
I PY 20 07–20 0 8248
the northern part of Lake Vostok (Fig. 2.6-3). The age and the location of lake accretion ice formation in the Vostok core, as inferred from the ice flow modeling, is illustrated in Fig. 2.6-4 (Salamatin et al., 2009). The upper stratum of lake ice bedded between 3539 and 3609 m beneath the surface comprises scarce mineral inclusions entrapped from the lake bottom sediments in the shallow strait and/or over the small island on the upstream side of Lake Vostok. The underlying clean ice is assumed to be refrozen from the deep water as the ice sheet moved between the “islet” and Vostok Sta-tion (Fig. 2.6-4). Extensive study of mineral inclusions conducted at the Institute for Geology and Mineral Resources of the World Ocean (VNIIOkeangeologia) and at the All-Russian Geological Institute (VSEGEI) showed that in most cases they were soft aggregates composed of micro-particles of clay-mica minerals, quartz and a va-riety of accessory minerals (see inset in Fig. 2.6-4). The larger (up to 4-5 mm) rock clasts found in the inclu-sions were classified as quartzose siltstone comprised of zircon and monazite grains. The composition of the clasts confirms that the bedrock to the west of Lake Vostok (a potential source of terrigenous material in the ice core) is of sedimentary origin. The ages of zir-con and monazite grains cluster between 0.8−1.2 Ga and 1.6−1.8 Ga, which suggests that the provenances of these sedimentary rocks, the Gamburtsev Moun-
tains and Vostok Subglacial Highlands, are mainly Pa-leoproterozoic and Mesoproterozoic-Neoproterozoic crustal provinces (Leitchenkov et al., 2007). Resumption of deep drilling at Vostok Station during IPY allowed an extension of the ice core isotopic (d18O and dD) profile of accreted ice to 3650 m depth. Analysis of the data set with the aid of an isotopic model of Lake Vostok revealed significant spatial and/or temporal variability in physical conditions during ice formation as well as variability in the isotopic content of freezing lake water (Ekaykin et al., 2010). The data suggested that there was a significant contribution of a hydrothermal source (2.8-5.5 mt of water per year) to the hydrological regime of the lake. Independent evidence (Jean-Baptiste et al., 2001; Bulat et al., 2004; de Angelis et al., 2004) including recent data on the distribution of helium isotopes (Jean-Baptiste, pers. comm., 2009) supports this inference. The extent to which Lake Vostok may be hydraulically connected with other components of the hydrological system beneath the Antarctic ice sheet cannot be assessed from such isotopic data. Precise geodetic GPS observations, from the southern part of Lake Vostok throughout IPY, have demonstrated that, at least on the time scale of five years, the lake and the ice sheet in the vicinity of Vostok Station are in steady-state (Richter et al., 2008) whereas other subglacial lakes show highly dynamic behaviours.
Fig. 2.6-3. Russian scientific traverses in the Lake Vostok area (left) and subglacial landscape of Lake Vostok depression as revealed by RES and seismic measurements (right), courtesy of Sergey Popov (PMGRE). Shown on the map: 1- radio-echo sounding profiles; 2- reflection seismic stations; 3- VFL and NVFL ice-flow lines (the studied segments of the flow lines are highlighted with thicker curves); 4 – the expansions of Lake Vostok water table.
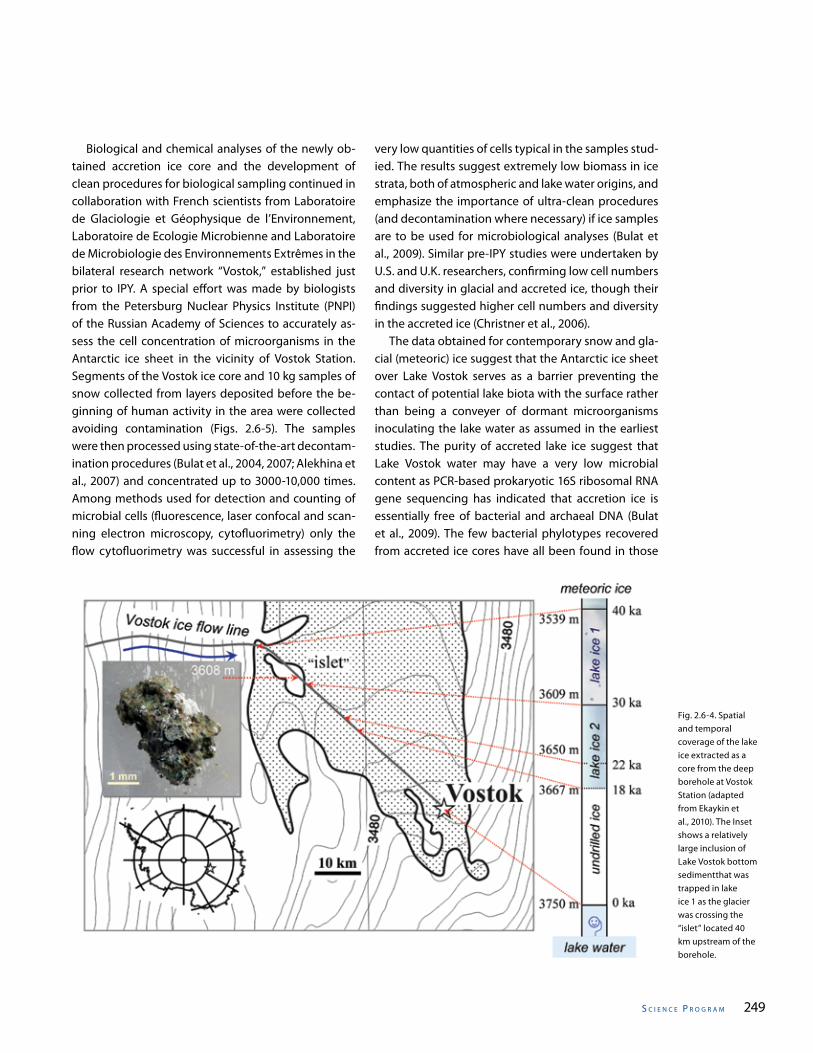
s C I e n C e P r o g r a m 249
Fig. 2.6-4. Spatial and temporal coverage of the lake ice extracted as a core from the deep borehole at Vostok Station (adapted from Ekaykin et al., 2010). The Inset shows a relatively large inclusion of Lake Vostok bottom sedimentthat was trapped in lake ice 1 as the glacier was crossing the “islet” located 40 km upstream of the borehole.
Biological and chemical analyses of the newly ob-tained accretion ice core and the development of clean procedures for biological sampling continued in collaboration with French scientists from Laboratoire de Glaciologie et Géophysique de l’Environnement, Laboratoire de Ecologie Microbienne аnd Laboratoire de Microbiologie des Environnements Extrêmes in the bilateral research network “Vostok,” established just prior to IPY. A special effort was made by biologists from the Petersburg Nuclear Physics Institute (PNPI) of the Russian Academy of Sciences to accurately as-sess the cell concentration of microorganisms in the Antarctic ice sheet in the vicinity of Vostok Station. Segments of the Vostok ice core and 10 kg samples of snow collected from layers deposited before the be-ginning of human activity in the area were collected avoiding contamination (Figs. 2.6-5). The samples were then processed using state-of-the-art decontam-ination procedures (Bulat et al., 2004, 2007; Alekhina et al., 2007) and concentrated up to 3000-10,000 times. Among methods used for detection and counting of microbial cells (fluorescence, laser confocal and scan-ning electron microscopy, cytofluorimetry) only the flow cytofluorimetry was successful in assessing the
very low quantities of cells typical in the samples stud-ied. The results suggest extremely low biomass in ice strata, both of atmospheric and lake water origins, and emphasize the importance of ultra-clean procedures (and decontamination where necessary) if ice samples are to be used for microbiological analyses (Bulat et al., 2009). Similar pre-IPY studies were undertaken by U.S. and U.K. researchers, confirming low cell numbers and diversity in glacial and accreted ice, though their findings suggested higher cell numbers and diversity in the accreted ice (Christner et al., 2006). The data obtained for contemporary snow and gla-cial (meteoric) ice suggest that the Antarctic ice sheet over Lake Vostok serves as a barrier preventing the contact of potential lake biota with the surface rather than being a conveyer of dormant microorganisms inoculating the lake water as assumed in the earliest studies. The purity of accreted lake ice suggest that Lake Vostok water may have a very low microbial content as PCR-based prokaryotic 16S ribosomal RNA gene sequencing has indicated that accretion ice is essentially free of bacterial and archaeal DNA (Bulat et al., 2009). The few bacterial phylotypes recovered from accreted ice cores have all been found in those
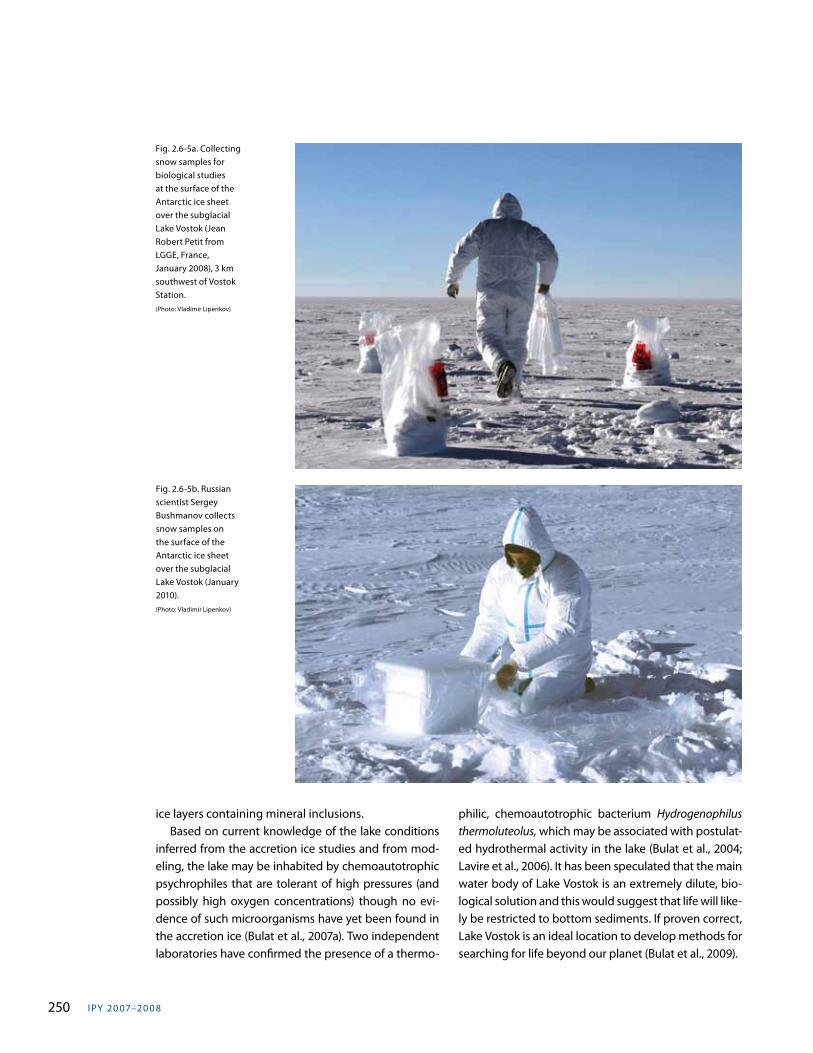
I PY 20 07–20 0 8250
ice layers containing mineral inclusions. Based on current knowledge of the lake conditions inferred from the accretion ice studies and from mod-eling, the lake may be inhabited by chemoautotrophic psychrophiles that are tolerant of high pressures (and possibly high oxygen concentrations) though no evi-dence of such microorganisms have yet been found in the accretion ice (Bulat et al., 2007a). Two independent laboratories have confirmed the presence of a thermo-
philic, chemoautotrophic bacterium Hydrogenophilus thermoluteolus, which may be associated with postulat-ed hydrothermal activity in the lake (Bulat et al., 2004; Lavire et al., 2006). It has been speculated that the main water body of Lake Vostok is an extremely dilute, bio-logical solution and this would suggest that life will like-ly be restricted to bottom sediments. If proven correct, Lake Vostok is an ideal location to develop methods for searching for life beyond our planet (Bulat et al., 2009).
Fig. 2.6-5a. Collecting snow samples for biological studies at the surface of the Antarctic ice sheet over the subglacial Lake Vostok (Jean Robert Petit from LGGE, France, January 2008), 3 km southwest of Vostok Station. (Photo: Vladimir Lipenkov)
Fig. 2.6-5b. Russian scientist Sergey Bushmanov collects snow samples on the surface of the Antarctic ice sheet over the subglacial Lake Vostok (January 2010). (Photo: Vladimir Lipenkov)
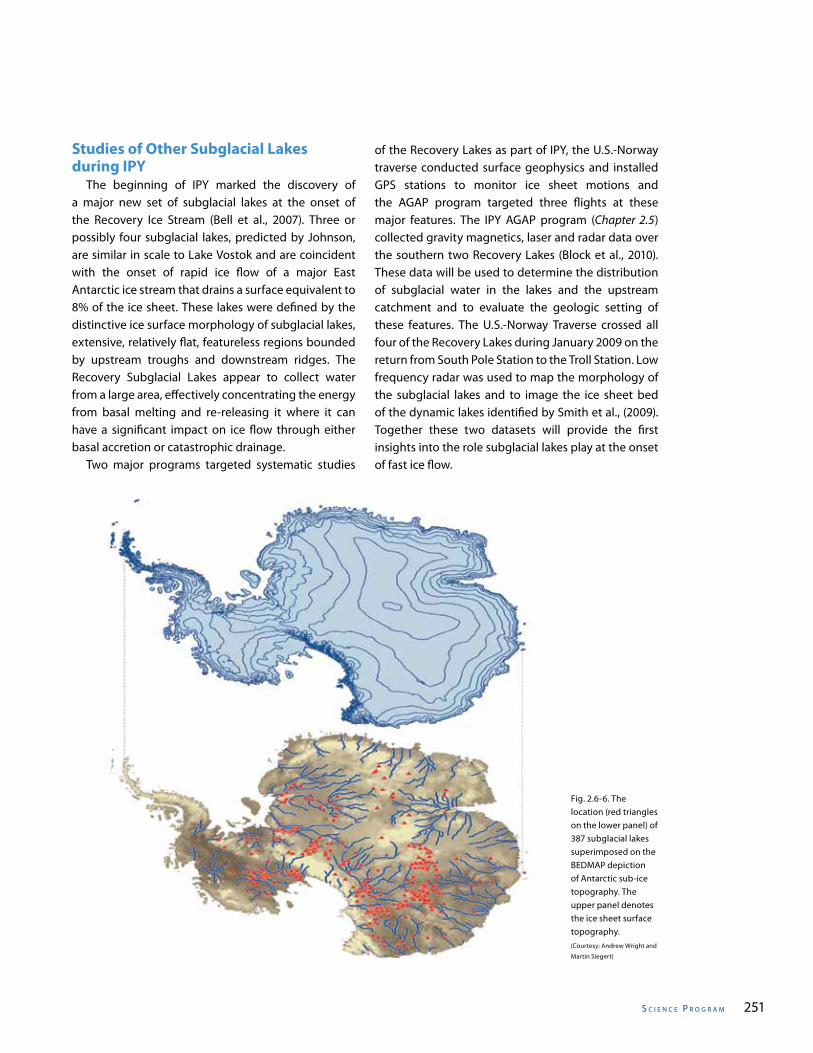
s C I e n C e P r o g r a m 251
Studies of Other Subglacial Lakes during IPY The beginning of IPY marked the discovery of a major new set of subglacial lakes at the onset of the Recovery Ice Stream (Bell et al., 2007). Three or possibly four subglacial lakes, predicted by Johnson, are similar in scale to Lake Vostok and are coincident with the onset of rapid ice flow of a major East Antarctic ice stream that drains a surface equivalent to 8% of the ice sheet. These lakes were defined by the distinctive ice surface morphology of subglacial lakes, extensive, relatively flat, featureless regions bounded by upstream troughs and downstream ridges. The Recovery Subglacial Lakes appear to collect water from a large area, effectively concentrating the energy from basal melting and re-releasing it where it can have a significant impact on ice flow through either basal accretion or catastrophic drainage. Two major programs targeted systematic studies
of the Recovery Lakes as part of IPY, the U.S.-Norway traverse conducted surface geophysics and installed GPS stations to monitor ice sheet motions and the AGAP program targeted three flights at these major features. The IPY AGAP program (Chapter 2.5)collected gravity magnetics, laser and radar data over the southern two Recovery Lakes (Block et al., 2010). These data will be used to determine the distribution of subglacial water in the lakes and the upstream catchment and to evaluate the geologic setting of these features. The U.S.-Norway Traverse crossed all four of the Recovery Lakes during January 2009 on the return from South Pole Station to the Troll Station. Low frequency radar was used to map the morphology of the subglacial lakes and to image the ice sheet bed of the dynamic lakes identified by Smith et al., (2009). Together these two datasets will provide the first insights into the role subglacial lakes play at the onset of fast ice flow.
Fig. 2.6-6. The location (red triangles on the lower panel) of 387 subglacial lakes superimposed on the BEDMAP depiction of Antarctic sub-ice topography. The upper panel denotes the ice sheet surface topography.(Courtesy: Andrew Wright and
Martin Siegert)
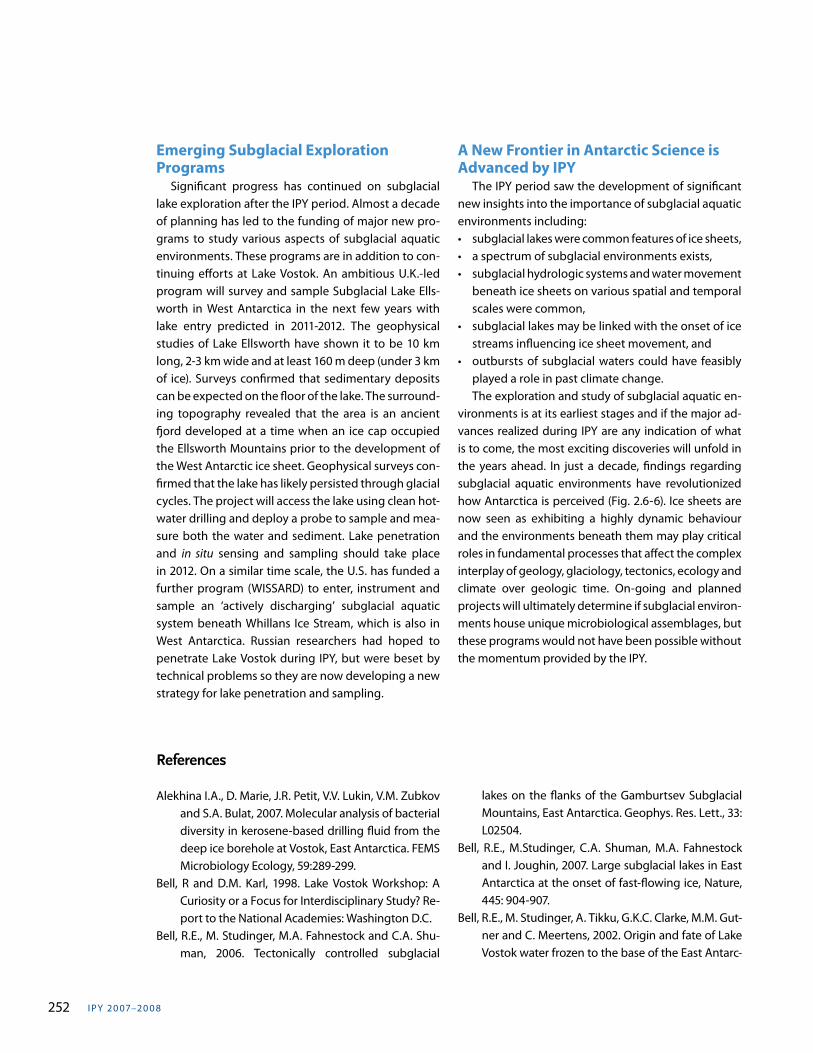
I PY 20 07–20 0 8252
References
Alekhina I.A., D. Marie, J.R. Petit, V.V. Lukin, V.M. Zubkov and S.A. Bulat, 2007. Molecular analysis of bacterial diversity in kerosene-based drilling fluid from the deep ice borehole at Vostok, East Antarctica. FEMS Microbiology Ecology, 59:289-299.
Bell, R and D.M. Karl, 1998. Lake Vostok Workshop: A Curiosity or a Focus for Interdisciplinary Study? Re-port to the National Academies: Washington D.C.
Bell, R.E., M. Studinger, M.A. Fahnestock and C.A. Shu-man, 2006. Tectonically controlled subglacial
lakes on the flanks of the Gamburtsev Subglacial Mountains, East Antarctica. Geophys. Res. Lett., 33: L02504.
Bell, R.E., M.Studinger, C.A. Shuman, M.A. Fahnestock and I. Joughin, 2007. Large subglacial lakes in East Antarctica at the onset of fast-flowing ice, Nature, 445: 904-907.
Bell, R.E., M. Studinger, A. Tikku, G.K.C. Clarke, M.M. Gut-ner and C. Meertens, 2002. Origin and fate of Lake Vostok water frozen to the base of the East Antarc-
Emerging Subglacial Exploration Programs Significant progress has continued on subglacial lake exploration after the IPY period. Almost a decade of planning has led to the funding of major new pro-grams to study various aspects of subglacial aquatic environments. These programs are in addition to con-tinuing efforts at Lake Vostok. An ambitious U.K.-led program will survey and sample Subglacial Lake Ells-worth in West Antarctica in the next few years with lake entry predicted in 2011-2012. The geophysical studies of Lake Ellsworth have shown it to be 10 km long, 2-3 km wide and at least 160 m deep (under 3 km of ice). Surveys confirmed that sedimentary deposits can be expected on the floor of the lake. The surround-ing topography revealed that the area is an ancient fjord developed at a time when an ice cap occupied the Ellsworth Mountains prior to the development of the West Antarctic ice sheet. Geophysical surveys con-firmed that the lake has likely persisted through glacial cycles. The project will access the lake using clean hot-water drilling and deploy a probe to sample and mea-sure both the water and sediment. Lake penetration and in situ sensing and sampling should take place in 2012. On a similar time scale, the U.S. has funded a further program (WISSARD) to enter, instrument and sample an ‘actively discharging’ subglacial aquatic system beneath Whillans Ice Stream, which is also in West Antarctica. Russian researchers had hoped to penetrate Lake Vostok during IPY, but were beset by technical problems so they are now developing a new strategy for lake penetration and sampling.
A New Frontier in Antarctic Science is Advanced by IPY The IPY period saw the development of significant new insights into the importance of subglacial aquatic environments including: • subglacial lakes were common features of ice sheets,• a spectrum of subglacial environments exists,• subglacial hydrologic systems and water movement
beneath ice sheets on various spatial and temporal scales were common,
• subglacial lakes may be linked with the onset of ice streams influencing ice sheet movement, and
• outbursts of subglacial waters could have feasibly played a role in past climate change.
The exploration and study of subglacial aquatic en-vironments is at its earliest stages and if the major ad-vances realized during IPY are any indication of what is to come, the most exciting discoveries will unfold in the years ahead. In just a decade, findings regarding subglacial aquatic environments have revolutionized how Antarctica is perceived (Fig. 2.6-6). Ice sheets are now seen as exhibiting a highly dynamic behaviour and the environments beneath them may play critical roles in fundamental processes that affect the complex interplay of geology, glaciology, tectonics, ecology and climate over geologic time. On-going and planned projects will ultimately determine if subglacial environ-ments house unique microbiological assemblages, but these programs would not have been possible without the momentum provided by the IPY.
s C I e n C e P r o g r a m 253
tic ice sheet. Nature, 416:307-310.Bulat, S.A., I.A. Alekhina, M. Blot, J.R. Petit, M. de An-
gelis, D. Wagenbach, V.Y. Lipenkov, L.P. Vasilyeva, D.M. Wloch, D. Raynaud and V.V. Lukin, 2004. DNA signature of thermophilic bacteria from the aged accretion ice of Lake Vostok, Antarctica: implica-tions for searching life in extreme icy environ-ments. Int. J. Astrobiol., 3(1):1–12, doi: 10.1017/S1473550404001879.
Bulat, S.A., I.A. Alekhina, V.Y. Lipenkov, V.V. Lukin, D. Ma-rie and J.R. Petit, 2009. Cell Concentration of Micro-organisms in Glacial and Lake Ice of the Vostok Ice Core, East Antarctica, Microbiology, 78(6):808–810, Pleiades Publishing, Ltd. (Original Russian text S.A. Bulat, I.A. Alekhina, V.Ya. Lipenkov, V.V. Lukin, D. Ma-rie and J.R. Petit, Mikrobiologiya, 78(6):850–852).
Bulat, S.A., I.A. Alekhina, J.R. Petit, V.Ya. Lipenkov and V.V. Lukin, 2007. Оtsenka biogeochimicheskogo poten-tsiala podlednikovogo ozera Vostok, Vostochnaya Antarktida, v plane podderzhaniya mikrobnoy zhizni. (An assessment of the biogeochemical po-tential of subglacial Lake Vostok, East Antarctica, in relation to microbial life support). Problemy Ark-tiki i Antarktiki (The Problems of the Arctic and the Antarctic), 76: 06-112.
Bulat, S.A., I.A. Alekhina, V.Y. Lipenkov, V.V. Lukin and J.R. Petit, 2007. Microbial Life in Extreme Subglacial Antarctic Lake Environments: Lake Vostok. In: Bre-sler Memorial Lectures II, RAS, PNPI, St Petersburg, 264-269.
Christner, B., G. Royston-Bishop, C.M. Foreman, B.R. Ar-nold, M. Tranter, K. A. W.B. Welch, W.B. Lyons, A.I. Tsapin, M. Studinger and J.C. Priscu, 2006. Limno-logical conditions in Subglacial Lake Vostok, Ant-arctica. Limnology and Oceanogrpahy, 51(6):2485-2501.
de Angelis, M., J.R. Petit, J. Savarino, R. Souchez and M.H. Thiemens, 2004. Contributions of an ancient evaporitic-type reservoir to subglacial Lake Vostok chemistry. Earth Planet. Sci. Lett., 222:751-765.
Ekaykin A.A., V.Y. Lipenkov, J.R. Petit, S. Johnsen, J. Jou-zel and V. Masson-Delmotte, in press. Insights into hydrological regime of Lake Vostok from differen-tial behavior of deuterium and oxygen-18 in ac-creted ice. J. Geophys. Res.
Elia, T., R. Veerapaneni and S.O. Rogers, 2008. Isolation of microbes from Lake Vostok accretion ice. Appl.
Environ. Microbiol, 74:4962–4965.Fricker, H.A., T. Scambos, R. Bindschadler and L. Pad-
man, 2007. An Active Subglacial Water System in West Antarctica Mapped from Space. Science, 31:1544 - 1548.
Gabrielli P., F. Planchon, C. Barbante, C. F. Boutron, J.R. Petit, S. Bulat, S. Hong, G. Cozzi and P. Cescon, 2009. Ultra-low rare earth element content in ac-creted ice from sub-glacial Lake Vostok, Antarctica. Geoch. et Cosmoch. Acta, 73:5959–5974.
Jean-Baptiste, P., J.R. Petit, V.Y. Lipenkov, D. Raynaud and N.I. Barkov, 2001. Constraints on hydrothermal processes and water exchange in Lake Vostok from helium isotopes. Nature, 411:460-462.
Jouzel, J., J.R. Petit, R. Souchez, N.I. Barkov, V.Y. Lipenkov, D. Raynaud, M. Stievenard, M., N.I. Vassiliev, V. Ver-beke and F. Vimeux, 1999. More than 200 meters of lake ice above subglacial lake Vostok, Antarctica. Science, 286(5447):2138-2141.
Kapitsa, AP, J.K. Ridley, G.Q. Robin, M.J. Siegert and I.A. Zotikov, 1996. A large deep freshwater lake be-neath the ice of central East Antarctica. Nature, 381:684-686.
Karl, D.M., D.F. Bird, K. Bjorkman, T. Houlihan, R. Shack-elford and T. Tupas, 1999. Microorganisms in the accreted ice of Lake Vostok, Antarctica. Science, 286(5447):2144-2147.
Lavire, C., P. Normand, I. Alekhina, S. Bulat, D. Prieur, J.L. Birrien, P. Fournier, C. Hänni and J.R. Petit, 2006. Presence of Hydrogenophylus thermoluteolus DNA in accretion ice in the subglacial Lake Vostok, Antarctica, assessed using rrs, cbb and hox, Env. Microbiol., 8(12):2106-2114.
Leitchenkov, G.L., B.V. Belyatsky, N.V. Rodionov and S.A. Sergeev, 2007. Insight into the geology of the East Antarctic hinterland: study of sediment inclusions from ice cores of the Lake Vostok borehole. In: A Keystone in a Changing World, USGS Open-File Report, 1047, A.K. Cooper, C.R. Raymond, (eds), Antarctica: Short Research Paper 014, doi:10.3133/of2007-1047.srp014.
Lipenkov, V.Ya., V.V. Lukin, S.A Bulat, N.I. Vasilyev, A.A. Ekaykin, G.L. Leychenkov, V.N. Masolov, S.B. Popov, L.M. Savatyugin, A.N. Salamatin and Yu. A. Shibaev (in print). The Results of the Studies on the Subgla-cial Lake Vostok during IPY. In: Trudy MPG, Vol. 3, Polar Cryosphere (in Russian).
I PY 20 07–20 0 8254
Masolov V.N., S.V. Popov, V.V. Lukin, A.N. Sheremet’ev and A.M. Popkov, 2006. Russian geophysical stud-ies of Lake Vostok, Central East Antarctica. In: Ant-arctica - Contributions to Global Earth, D.K. Füt-terer, D. Damaske, G. Kleinschmidt, H. Miller and F. Tessensohn, (eds), p 135-140. Springer: New York.
National Research Council, 2007. Exploration of Antarc-tic Subglacial Aquatic Environments: Environmen-tal and Scientific Stewardship, 152 p.
Priscu, J.C., E.E. Adams, W.B. Lyons, M.A. Voytek, D.W. Mogk, R.L. Brown, C.P. McKay, C.D. Takacs, K.A. Welch, C.F Wolf, J.D. Kirshtein and R. Avci, 1999. Geomicrobiology of subglacial ice above Lake Vostok, Antarctica. Science, 286(5447):2141-2144.
Popov, S.V., A.N. Lastochkin, V.N. Masolov and A.M. Pop-kov, 2006. Morphology of the subglacial bed relief of Lake Vostok basin area (Central East Antarctica) based on RES and seismic data. In: Antarctica - Con-tributions to Global Earth Sciences, D.K. Fütterer, D. Damaske, G. Kleinschmidt, H. Miller and F. Tes-sensohn, (eds), p141-146. Springer: New York.
Popov, S.V., V.Y. Lipenkov, A.V. Enalieva and A.V. Preo-brazhenskaya, 2007. “Vnutrilednikovye izohronnie poverhnosti v rayone ozera Vostok, Vostochnaya Antarktida” [Internal isochrone layers in the ice sheet above Lake Vostok, East Antarctica]. Prob-lemy Arktiki i Antarktiki [The Problems of the Arctic and the Antarctic], 76:89-95.
Popov, S.V. and V.N. Masolov, 2007. Forty-seven new subglacial lakes in the 0-110° sector of East Antarc-tica. J. Glaciology, 53(181):289-297.
Popov, S.V., A.N. Salamatin, A.Yu and V.Y. Alekseev, (submitted). Lipenkov, Ice sheet structure along ice flow lines crossing the southern and northern parts of Vostok Subglacial Lake, East Antarctica. Ann. Glaciology.
Richter, A., S.V. Popov, R. Dietrich, V.V. Lukin, M. Fritsche, V.Y. Lipenkov, A.Y. Matveev, J. Wendt, A.V. Yuskevich and V.N. Masolov, 2008. Observational evidence on the stability of the hydro-glaciological regime of subglacial Lake Vostok. Geophys. Res. Lett., 35: L11502, doi:10.1029/2008GL033397.
Salamatin, A.N., E.A. Tsyganova, S.V. Popov and V.Y. Li-penkov, 2009. Ice flow line modeling in ice core data interpretation: Vostok Station (East Antarc-tica). In: Physics of Ice Core Records 2, T. Hondoh (ed), Hokkaido University Press.
Siegert, M.J., 2000. Antarctic subglacial lakes., Earth Sc. Reviews, 50(1/2):29-50.
Siegert, M.J. and J.L. Bamber, 2000. Subglacial water at the heads of Antarctic ice-stream tributaries. J. of Glaciol., 46(155):702-703.
Siegert, M.J., J.A. Dowdeswell, M.R. Gorman and N.F. McIntyre, 1996. An inventory of Antarctic sub-gla-cial lakes. Antarctic Sc., 8:281-286.
Siegert, M. et al., -19 others-, 2007. Exploration of Ells-worth Subglacial Lake: a concept paper on the development, organisation and execution of an experiment to explore, measure and sample the environment of a West Antarctic subglacial lake. Reviews in Env. Sc. and Biotech., 6 (1-3):161-179.
Siegert, M.J., S. Popov and M. Studinger, (submitted). Subglacial Lake Vostok: a review of geophysical data regarding its discovery and topographic set-ting. In Antarctic Subglacial Aquatic Environments, M.J. Siegert, M.C. Kennicutt and R. Bindschadler, (eds). AGU Monograph.
Smith, B.E., H.A. Fricker, I.R. Joughin and S. Tulaczyk, 2009. An inventory of active subglacial lakes in Antarctica detected by ICESat (2003–2008). J. Gla-ciology, 55:192.
Stearns, L.A., B.E. Smith and G.S. Hamilton, 2008. In-creased flow speed on a large East Antarctic outlet glacier caused by subglacial floods. Nature Geosc. 1:827 – 831.
Studinger, M., R.E. Bell, G.D. Karner, A.A. Tikku, J.W. Holt, D.L. Morse, T.G. Richter, S.D. Kempf, M.E. Peters, D.D. Blankenship, R.E. Sweeney and V.L. Rystrom, 2003. Ice cover, landscape setting and geological framework of Lake Vostok, East Antarctica. Earth and Planet. Sc. Lett., 205(3-4):195-210.
Studinger, M., R.E. Bell and A.A. Tikku, 2004. Estimating the depth and shape of subglacial Lake Vostok’s water cavity from aerogravity data. Geophys. Res. Lett., 31: L12401, doi:10.1029/2004GL019801.
Vasiliev, N.I., P.G. Talalay, N.E. Bobin, V.K. Chistyakov, V.M. Zubkov, A.V. Krasilev, A.N. Dmitriev, S.V. Yankilev-ich and V.Y. Lipenkov, 2007. Deep drilling at Vostok Station, Antarctica: history and recent events. Ann. Glaciol., 47:10-23.
Wingham, D.J., M.J. Siegert, A. Shepherd and A.S. Muir, 2006. Rapid discharge connects Antarctic subgla-cial lakes. Nature, 440:1033-1036.
s C I e n C e P r o g r a m 255
2.7 Permafrost
Lead Author:Volker Rachold
Contributing Authors:Jerry Brown, Hanne H. Christiansen, Hans-Wolfgang Hubberten, Peter Kuhry, Hugues Lantuit, Paul Overduin and Gonçalo Vieira
Reviewer:Vladimir E. Romanovsky
PA R T T W O : I P Y S C I E N C E P R O G R A M
Introduction and OverviewHans-Wolfgang Hubberten, Jerry Brown, Hanne H. Christiansen and Hugues Lantuit Permafrost is defined as ground (soil or rock and included ice or organic material) that remains at or below 0°C for at least two consecutive years (van Everdingen, 1998), and exists in approximately 25% of the terrestrial part of the Earth (Fig. 2.7-1). Since permafrost is present on most continents on Earth, in lowlands and in mountains, permafrost research is also undertaken beyond the traditional polar regions (north and south of 60°). During International Polar Year (IPY) 2007–2008, most permafrost research focused on land activities in polar regions. Several coordinated cluster projects had bipolar focus (Fig. 2.7-2). Permafrost research, forming an important part of the cryospheric research, is becoming increasingly multidisciplinary, bringing together geologists, geographers, engineers, biologists, ecologists, and soil and social scientists. IPY 2007–2008 provided a unique opportunity for permafrost science to focus on regional, bipolar and multidisciplinary activities. Late 20th century observations and compilations of recent data indicated a warming of permafrost in many continental, marine-dominated and mountainous regions with resulting degradation of ice-rich and carbon-rich permafrost (Romanovsky et al., 2007). Major activities during IPY focused on the measurement of ground temperatures to assess the thermal state of permafrost and the thickness of the active layer, on the quantification of carbon pools in permafrost and their potential future remobilization, as well as the quantification of erosion and release of sediment along permafrost coasts, and
periglacial process and landform quantification. To address these and related bipolar questions, four permafrost cluster projects were approved by the IPY Joint Committee:• The Permafrost Observatory Project: A Contribution
to the Thermal State of Permafrost (TSP) [IPY Project 50]
• The Antarctic and sub-Antarctic Permafrost, Periglacial and Soil Environments Project (ANTPAS) [IPY Project 33]
• The Arctic Circum-Polar Coastal Observatory Network (ACCO-Net) [IPY Project 90]
• Carbon Pools in Permafrost (CAPP) [Project 373]. These four cluster projects focused on research and observations in the permafrost and periglacial environments of the Planet Earth. They together represented more than 50 individual IPY Expression of Intent (EoI) proposals with participants from more than 25 countries representing both polar regions, as well as mid- and low-latitude, permafrost-dominated mountainous regions. They were coordinated by the International Permafrost Association (IPA) and its Secretariat, then based at the University Centre in Svalbard (UNIS). An overall objective of these coordinated projects was to produce a “snapshot” of permafrost conditions during the IPY period, with emphasis on the thermal state of the permafrost (TSP). This includes active layer thickness measurements as part of the Circumpolar Active Layer Monitoring (CALM) program established in the 1990s (Nelson et al., 2008).
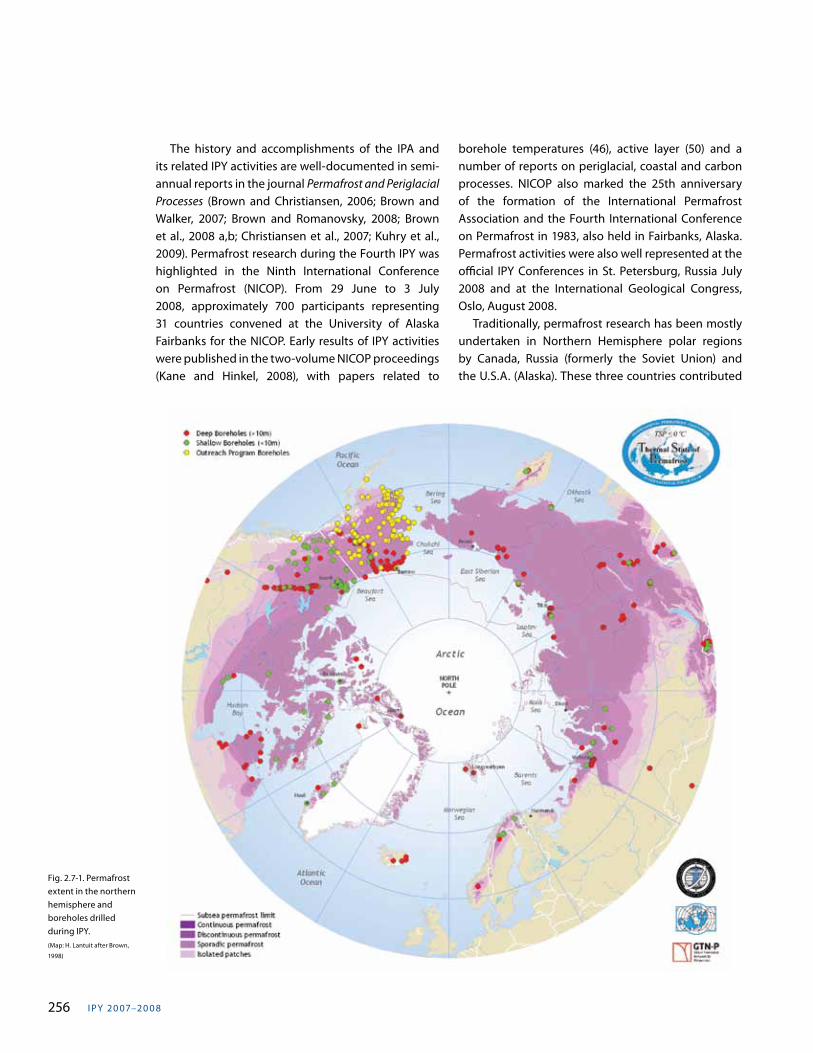
I PY 20 07–20 0 8256
The history and accomplishments of the IPA and its related IPY activities are well-documented in semi-annual reports in the journal Permafrost and Periglacial Processes (Brown and Christiansen, 2006; Brown and Walker, 2007; Brown and Romanovsky, 2008; Brown et al., 2008 a,b; Christiansen et al., 2007; Kuhry et al., 2009). Permafrost research during the Fourth IPY was highlighted in the Ninth International Conference on Permafrost (NICOP). From 29 June to 3 July 2008, approximately 700 participants representing 31 countries convened at the University of Alaska Fairbanks for the NICOP. Early results of IPY activities were published in the two-volume NICOP proceedings (Kane and Hinkel, 2008), with papers related to
borehole temperatures (46), active layer (50) and a number of reports on periglacial, coastal and carbon processes. NICOP also marked the 25th anniversary of the formation of the International Permafrost Association and the Fourth International Conference on Permafrost in 1983, also held in Fairbanks, Alaska. Permafrost activities were also well represented at the official IPY Conferences in St. Petersburg, Russia July 2008 and at the International Geological Congress, Oslo, August 2008. Traditionally, permafrost research has been mostly undertaken in Northern Hemisphere polar regions by Canada, Russia (formerly the Soviet Union) and the U.S.A. (Alaska). These three countries contributed
Fig. 2.7-1. Permafrost extent in the northern hemisphere and boreholes drilled during IPY.(Map: H. Lantuit after Brown,
1998)
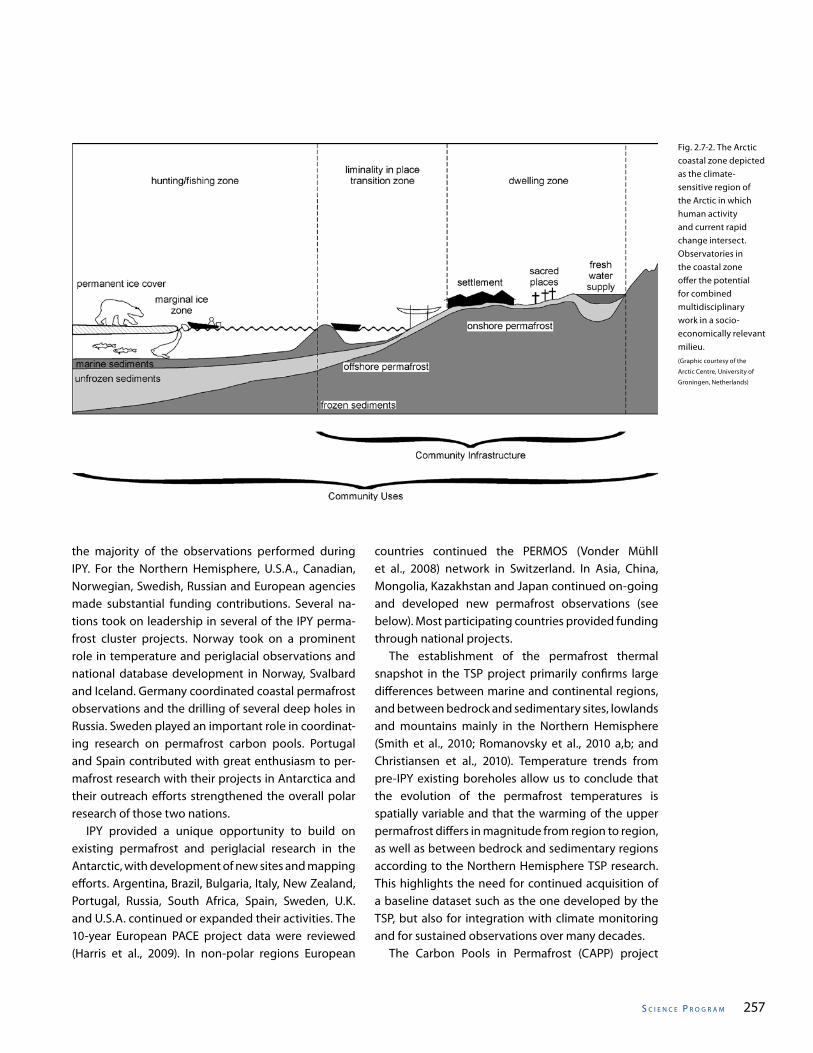
s C I e n C e P r o g r a m 257
the majority of the observations performed during IPY. For the Northern Hemisphere, U.S.A., Canadian, Norwegian, Swedish, Russian and European agencies made substantial funding contributions. Several na-tions took on leadership in several of the IPY perma-frost cluster projects. Norway took on a prominent role in temperature and periglacial observations and national database development in Norway, Svalbard and Iceland. Germany coordinated coastal permafrost observations and the drilling of several deep holes in Russia. Sweden played an important role in coordinat-ing research on permafrost carbon pools. Portugal and Spain contributed with great enthusiasm to per-mafrost research with their projects in Antarctica and their outreach efforts strengthened the overall polar research of those two nations. IPY provided a unique opportunity to build on existing permafrost and periglacial research in the Antarctic, with development of new sites and mapping efforts. Argentina, Brazil, Bulgaria, Italy, New Zealand, Portugal, Russia, South Africa, Spain, Sweden, U.K. and U.S.A. continued or expanded their activities. The 10-year European PACE project data were reviewed (Harris et al., 2009). In non-polar regions European
countries continued the PERMOS (Vonder Mühll et al., 2008) network in Switzerland. In Asia, China, Mongolia, Kazakhstan and Japan continued on-going and developed new permafrost observations (see below). Most participating countries provided funding through national projects. The establishment of the permafrost thermal snapshot in the TSP project primarily confirms large differences between marine and continental regions, and between bedrock and sedimentary sites, lowlands and mountains mainly in the Northern Hemisphere (Smith et al., 2010; Romanovsky et al., 2010 a,b; and Christiansen et al., 2010). Temperature trends from pre-IPY existing boreholes allow us to conclude that the evolution of the permafrost temperatures is spatially variable and that the warming of the upper permafrost differs in magnitude from region to region, as well as between bedrock and sedimentary regions according to the Northern Hemisphere TSP research. This highlights the need for continued acquisition of a baseline dataset such as the one developed by the TSP, but also for integration with climate monitoring and for sustained observations over many decades. The Carbon Pools in Permafrost (CAPP) project
Fig. 2.7-2. The Arctic coastal zone depicted as the climate-sensitive region of the Arctic in which human activity and current rapid change intersect. Observatories in the coastal zone offer the potential for combined multidisciplinary work in a socio-economically relevant milieu.(Graphic courtesy of the
Arctic Centre, University of
Groningen, Netherlands)
I PY 20 07–20 0 8258
contributed to our ability to better estimate the amount of carbon stored in permafrost soils, incorporating the upper three meters of the ground and deeper in some cases. Substantial numbers of new soil pedons from Russia were added to the database. This led to the publication of a revised estimate of the amount of carbon stored in the northern circumpolar permafrost region, amounting to approximately 50% of the estimated global below-ground organic carbon pool (Tarnocai et al., 2009). The increasing awareness that carbon pools in permafrost regions are much larger than previously estimated and the potential importance for the global carbon balance has prompted additional scientific questions. A long-term framework aimed at maintaining both the new operational networks stemming from IPY, as well as the management and capacity-building efforts needed to sustain the level of observation are required. Our overriding goal has been the establishment of the International Networks of Permafrost Observatories including active layer, periglacial, coastal and carbon key study sites, and the development of a sustainable data management system and associated archives. The role of remote sensing in permafrost research has only been touched upon during the IPY and its specific role in detecting key processes relevant to permafrost dynamics as well as its input to modeling will be a future key permafrost technological development in both the Arctic and the Antarctic. IPY made it clear that international research projects need strong coordinated management, data and information platforms. These needs and approaches were well-recognized by the IPA as early as 1988, when it held its first data session in Trondheim, Norway. This was followed by several workshops that led to the implementation of the Global Geocryological Database; a metadata based information service. Successful future integration with other international programs and compliance with data standards will maximize permafrost cross-disciplinary usability. Data management is often overlooked, but a fundamental component of modern research and often the most challenging for developing financial support. Yet, data management ensures the long-term viability and usability of the results of a large research effort such as IPY and for the IPA, this is of course especially so for permafrost observations and research.
An IPY permafrost initiative included also to continue the IPA support and patronage of the development of the Permafrost Young Researchers Network, PYRN (Bonnaventure et al., 2009). PYRN was started in 2005 to establish a network among students and young permafrost researchers in order to promote future generations of permafrost researchers. During IPY, PYRN grew to a web-connected organization of more than 720 students and researchers in 43 different countries. PYRN activities included training in permafrost methodology, development of the PYRN-TSP Nordic boreholes, participation in conferences, development of a database on dissertations and a list of 160 senior researchers in 16 countries to serve as mentors. Another outreach activity focused on education and was the compilation by the IPA Secretariat of a web-based map and associated searchable catalogue of International University Courses on Permafrost (IUCP) containing 136 courses in 17 countries during IPY. Both PYRN and IUCP are still active after IPY and thus are important IPA IPY legacies. The four IPY permafrost cluster projects all were integrated into international research or observing programs. The TSP is part of the Global Terrestrial Network for Permafrost (GTN-P), which is a network of both the Global Climate Observing System (GCOS) and the Global Terrestrial Observing System (GTOS). Links to the Climate and Cryosphere (CliC) project of the WCRP, SCAR and IASC, and more broadly to the World Meteorological Organization (WMO) and the Global Carbon Project of the ESSP facilitated organizing and supporting the CAPP project. The long-term IPA con-nections with the Scientific Committee for Antarctic Research (SCAR) further facilitated the development of ANTPAS. The ACCONet activities, including new in-formation on carbon fluxes from the erosion of per-mafrost coasts are a direct contribution to the Land-Ocean Interaction in the Coastal Zone (LOICZ) project, and its assessment of global coastal biogeochemical fluxes. It is also envisioned that the networks created and/or strengthened during IPY will form an integrat-ed component of the upcoming observing networks of the Arctic (Sustaining Arctic Observing Networkds - SAON) and the Antarctic (Pan-Antarctic Observing System - PanTOS), thereby contributing to the over-arching Global Earth Observation System of Systems (GEOSS). The international permafrost community
s C I e n C e P r o g r a m 259
also contributed during IPY to the Integrated Global Observing Strategy Theme on Cryosphere, which will serve as a strategic document for the elaboration of polar observing networks. The June 2010 IPY Oslo Science Conference (Chapter 5.6), followed by the Third European Conference on Permafrost (EUCOP III) on Svalbard, provided opportunities for permafrost researchers and scientists from both hemispheres from related research fields to discuss IPY results in context with regional and global changes, and related environmental and social consequences. A special issue of the journal Permafrost and Periglacial Processes was presented at the June 2010 conferences, with regional papers for North America (Smith et al., 2010), the Nordic Region (Christiansen et al., 2010), Russia (Romanovsky et al., 2010a) and Antarctica (Vieira et al., 2010), and reports on Central Asia (Zhao et al., 2010), and carbon-rich permafrost (Kuhry et al., 2010), including a Northern Hemisphere synthesis paper on the snapshot of the permafrost thermal state during the IPY period (Romanovsky et al., 2010b; Fig. 2.7-1). The following sections provide more details on our four IPY permafrost cluster project accomplishments.
Permafrost Observatory Project: A Contribution to the Thermal State of Permafrost (TSP, IPY no. 50)Jerry Brown and Hanne H. Christiansen Formal planning of the IPY Project 50, Thermal State of Permafrost (TSP) commenced in late summer 2003 following the IPA Zürich Council recommendations on permafrost monitoring and data management. TSP is a focused extension of the Global Terrestrial Network for Permafrost (GTN-P) program (Smith et al., 2009). In 2003, the GTN-P involved 15 countries in both hemispheres and consisted of 287 candidate boreholes and an additional 125 sites in the Circumpolar Active Layer Network (CALM) network. Inventories of these sites and metadata are found on websites maintained by the Geological Survey of Canada (GTN-P) and the CALM project (Shiklomanov et al., 2008). A TSP planning document, co-authored by Romanovsky et al., (unpubl. 2003), was prepared in fall 2003 with the goal to produce a data set as a standard against which to evaluate future changes and
reanalyze past histories of permafrost development and degradation. Initial results of the TSP project were reported and published in the proceedings of the Ninth International Conference on Permafrost (NICOP) in Fairbanks, Alaska and presented at the 33rd International Geological Congress in Oslo, Norway, in summer 2008. The TSP plans were submitted to the ICSU IPY Planning Group, which assigned TSP to its Theme “To determine the present environmental status of the polar regions by quantifying their spatial and temporal variability”. A more formal TSP plan was prepared in July 2004 focusing on an intensive research campaign, with the overall goals: • obtain standardized temperature measurements
in all permafrost regions of Planet Earth (thermal snapshot);
• produce a global data set and make it available through the GTN-P;
• develop maps of contemporary permafrost temperatures;
• include periglacial process monitoring; and• develop and verify models and reanalysis
approaches for past, present and future permafrost and active layer temperatures and scenarios.
Detailed TSP planning took place at meetings and conferences leading up to the November 2005 Second International Conference on Arctic Research Planning (ICARP II) in Copenhagen where an IPA permafrost planning workshop was supported by the International Union of Geological Sciences (Brown, 2006). The TSP project was formally acknowledged by the IPY Joint Committee in November 2005 and subsequently was assigned as project no. 50. Formally, 26 individual Expression of Intent (EoI) proposals were assigned to Project 50. An international TSP meeting was held in October 2009 in Ottawa to summarize and coordinate the international synthesis of the TSP results including both the permafrost snapshot and analyzing permafrost temperature trends including the conditions during IPY. The TSP snapshot comprises measurements in over 850 boreholes and almost 200 current and pre-IPY CALM active layer sites in both hemispheres with over 25 participating and reporting countries (Table 2.7-1). Globally, nearly 350 new boreholes were drilled and instrumented during IPY. The total number of ground temperature sites
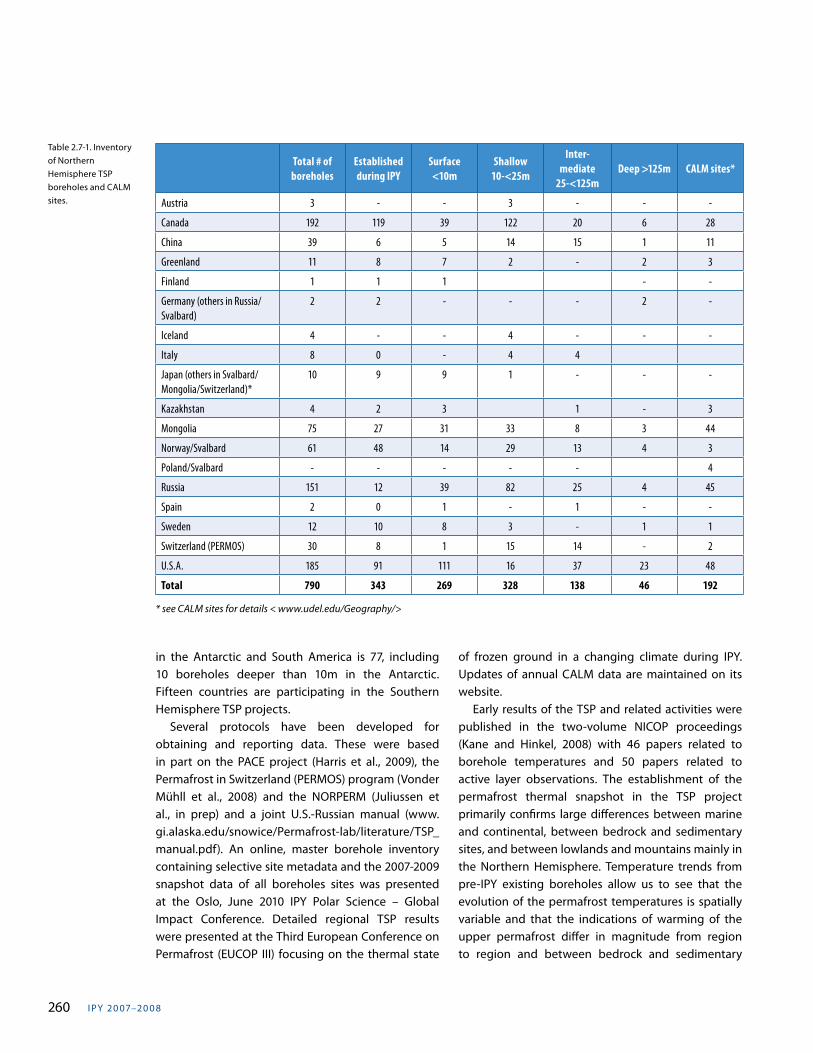
I PY 20 07–20 0 8260
Total # of boreholes
Established during IPY
Surface <10m
Shallow 10-<25m
Inter-mediate
25-<125mDeep >125m CALM sites*
Austria 3 - - 3 - - -
Canada 192 119 39 122 20 6 28
China 39 6 5 14 15 1 11
Greenland 11 8 7 2 - 2 3
Finland 1 1 1 - -
Germany (others in Russia/Svalbard)
2 2 - - - 2 -
Iceland 4 - - 4 - - -
Italy 8 0 - 4 4
Japan (others in Svalbard/Mongolia/Switzerland)*
10 9 9 1 - - -
Kazakhstan 4 2 3 1 - 3
Mongolia 75 27 31 33 8 3 44
Norway/Svalbard 61 48 14 29 13 4 3
Poland/Svalbard - - - - - 4
Russia 151 12 39 82 25 4 45
Spain 2 0 1 - 1 - -
Sweden 12 10 8 3 - 1 1
Switzerland (PERMOS) 30 8 1 15 14 - 2
U.S.A. 185 91 111 16 37 23 48
Total 790 343 269 328 138 46 192
* see CALM sites for details < www.udel.edu/Geography/>
Table 2.7-1. Inventory of Northern Hemisphere TSP boreholes and CALM sites.
in the Antarctic and South America is 77, including 10 boreholes deeper than 10m in the Antarctic. Fifteen countries are participating in the Southern Hemisphere TSP projects. Several protocols have been developed for obtaining and reporting data. These were based in part on the PACE project (Harris et al., 2009), the Permafrost in Switzerland (PERMOS) program (Vonder Mühll et al., 2008) and the NORPERM (Juliussen et al., in prep) and a joint U.S.-Russian manual (www.gi.alaska.edu/snowice/Permafrost-lab/literature/TSP_manual.pdf). An online, master borehole inventory containing selective site metadata and the 2007-2009 snapshot data of all boreholes sites was presented at the Oslo, June 2010 IPY Polar Science – Global Impact Conference. Detailed regional TSP results were presented at the Third European Conference on Permafrost (EUCOP III) focusing on the thermal state
of frozen ground in a changing climate during IPY. Updates of annual CALM data are maintained on its website. Early results of the TSP and related activities were published in the two-volume NICOP proceedings (Kane and Hinkel, 2008) with 46 papers related to borehole temperatures and 50 papers related to active layer observations. The establishment of the permafrost thermal snapshot in the TSP project primarily confirms large differences between marine and continental, between bedrock and sedimentary sites, and between lowlands and mountains mainly in the Northern Hemisphere. Temperature trends from pre-IPY existing boreholes allow us to see that the evolution of the permafrost temperatures is spatially variable and that the indications of warming of the upper permafrost differ in magnitude from region to region and between bedrock and sedimentary
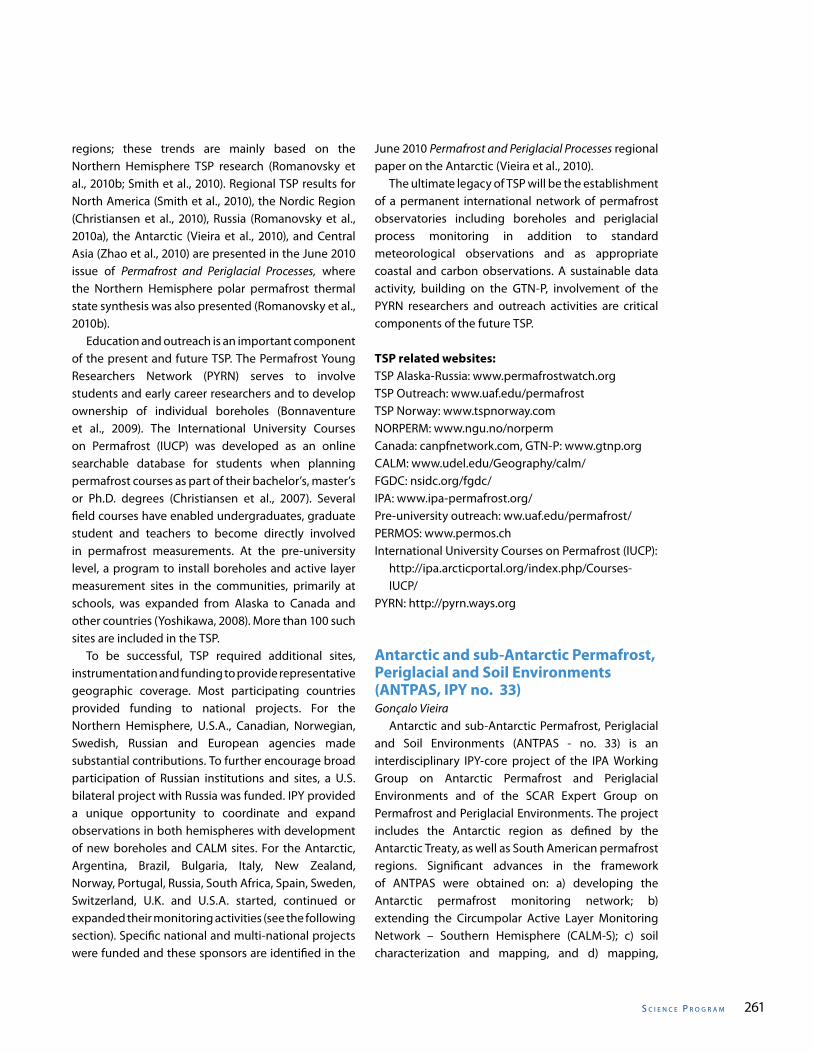
s C I e n C e P r o g r a m 261
regions; these trends are mainly based on the Northern Hemisphere TSP research (Romanovsky et al., 2010b; Smith et al., 2010). Regional TSP results for North America (Smith et al., 2010), the Nordic Region (Christiansen et al., 2010), Russia (Romanovsky et al., 2010a), the Antarctic (Vieira et al., 2010), and Central Asia (Zhao et al., 2010) are presented in the June 2010 issue of Permafrost and Periglacial Processes, where the Northern Hemisphere polar permafrost thermal state synthesis was also presented (Romanovsky et al., 2010b). Education and outreach is an important component of the present and future TSP. The Permafrost Young Researchers Network (PYRN) serves to involve students and early career researchers and to develop ownership of individual boreholes (Bonnaventure et al., 2009). The International University Courses on Permafrost (IUCP) was developed as an online searchable database for students when planning permafrost courses as part of their bachelor’s, master’s or Ph.D. degrees (Christiansen et al., 2007). Several field courses have enabled undergraduates, graduate student and teachers to become directly involved in permafrost measurements. At the pre-university level, a program to install boreholes and active layer measurement sites in the communities, primarily at schools, was expanded from Alaska to Canada and other countries (Yoshikawa, 2008). More than 100 such sites are included in the TSP. To be successful, TSP required additional sites, instrumentation and funding to provide representative geographic coverage. Most participating countries provided funding to national projects. For the Northern Hemisphere, U.S.A., Canadian, Norwegian, Swedish, Russian and European agencies made substantial contributions. To further encourage broad participation of Russian institutions and sites, a U.S. bilateral project with Russia was funded. IPY provided a unique opportunity to coordinate and expand observations in both hemispheres with development of new boreholes and CALM sites. For the Antarctic, Argentina, Brazil, Bulgaria, Italy, New Zealand, Norway, Portugal, Russia, South Africa, Spain, Sweden, Switzerland, U.K. and U.S.A. started, continued or expanded their monitoring activities (see the following section). Specific national and multi-national projects were funded and these sponsors are identified in the
June 2010 Permafrost and Periglacial Processes regional paper on the Antarctic (Vieira et al., 2010). The ultimate legacy of TSP will be the establishment of a permanent international network of permafrost observatories including boreholes and periglacial process monitoring in addition to standard meteorological observations and as appropriate coastal and carbon observations. A sustainable data activity, building on the GTN-P, involvement of the PYRN researchers and outreach activities are critical components of the future TSP.
TSP related websites:TSP Alaska-Russia: www.permafrostwatch.org TSP Outreach: www.uaf.edu/permafrostTSP Norway: www.tspnorway.com NORPERM: www.ngu.no/norperm Canada: canpfnetwork.com, GTN-P: www.gtnp.org CALM: www.udel.edu/Geography/calm/ FGDC: nsidc.org/fgdc/ IPA: www.ipa-permafrost.org/ Pre-university outreach: ww.uaf.edu/permafrost/ PERMOS: www.permos.ch International University Courses on Permafrost (IUCP):
http://ipa.arcticportal.org/index.php/Courses-IUCP/
PYRN: http://pyrn.ways.org
Antarctic and sub-Antarctic Permafrost, Periglacial and Soil Environments (ANTPAS, IPY no. 33)Gonçalo Vieira Antarctic and sub-Antarctic Permafrost, Periglacial and Soil Environments (ANTPAS - no. 33) is an interdisciplinary IPY-core project of the IPA Working Group on Antarctic Permafrost and Periglacial Environments and of the SCAR Expert Group on Permafrost and Periglacial Environments. The project includes the Antarctic region as defined by the Antarctic Treaty, as well as South American permafrost regions. Significant advances in the framework of ANTPAS were obtained on: a) developing the Antarctic permafrost monitoring network; b) extending the Circumpolar Active Layer Monitoring Network – Southern Hemisphere (CALM-S); c) soil characterization and mapping, and d) mapping,
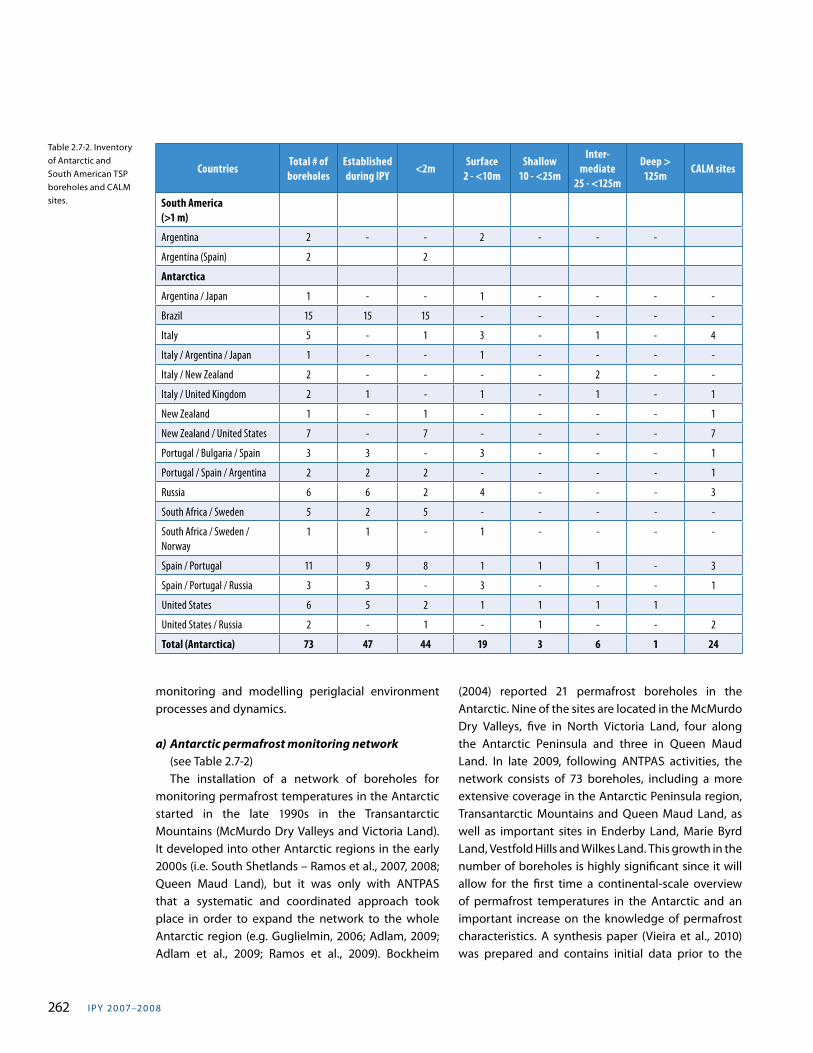
I PY 20 07–20 0 8262
CountriesTotal # of boreholes
Established during IPY
<2mSurface
2 - <10mShallow
10 - <25m
Inter-mediate
25 - <125m
Deep > 125m
CALM sites
South America (>1 m)
Argentina 2 - - 2 - - -
Argentina (Spain) 2 2
Antarctica
Argentina / Japan 1 - - 1 - - - -
Brazil 15 15 15 - - - - -
Italy 5 - 1 3 - 1 - 4
Italy / Argentina / Japan 1 - - 1 - - - -
Italy / New Zealand 2 - - - - 2 - -
Italy / United Kingdom 2 1 - 1 - 1 - 1
New Zealand 1 - 1 - - - - 1
New Zealand / United States 7 - 7 - - - - 7
Portugal / Bulgaria / Spain 3 3 - 3 - - - 1
Portugal / Spain / Argentina 2 2 2 - - - - 1
Russia 6 6 2 4 - - - 3
South Africa / Sweden 5 2 5 - - - - -
South Africa / Sweden / Norway
1 1 - 1 - - - -
Spain / Portugal 11 9 8 1 1 1 - 3
Spain / Portugal / Russia 3 3 - 3 - - - 1
United States 6 5 2 1 1 1 1
United States / Russia 2 - 1 - 1 - - 2
Total (Antarctica) 73 47 44 19 3 6 1 24
Table 2.7-2. Inventory of Antarctic and South American TSP boreholes and CALM sites.
monitoring and modelling periglacial environment processes and dynamics.
a) Antarctic permafrost monitoring network (see Table 2.7-2) The installation of a network of boreholes for monitoring permafrost temperatures in the Antarctic started in the late 1990s in the Transantarctic Mountains (McMurdo Dry Valleys and Victoria Land). It developed into other Antarctic regions in the early 2000s (i.e. South Shetlands – Ramos et al., 2007, 2008; Queen Maud Land), but it was only with ANTPAS that a systematic and coordinated approach took place in order to expand the network to the whole Antarctic region (e.g. Guglielmin, 2006; Adlam, 2009; Adlam et al., 2009; Ramos et al., 2009). Bockheim
(2004) reported 21 permafrost boreholes in the Antarctic. Nine of the sites are located in the McMurdo Dry Valleys, five in North Victoria Land, four along the Antarctic Peninsula and three in Queen Maud Land. In late 2009, following ANTPAS activities, the network consists of 73 boreholes, including a more extensive coverage in the Antarctic Peninsula region, Transantarctic Mountains and Queen Maud Land, as well as important sites in Enderby Land, Marie Byrd Land, Vestfold Hills and Wilkes Land. This growth in the number of boreholes is highly significant since it will allow for the first time a continental-scale overview of permafrost temperatures in the Antarctic and an important increase on the knowledge of permafrost characteristics. A synthesis paper (Vieira et al., 2010) was prepared and contains initial data prior to the
s C I e n C e P r o g r a m 263
availability of data from the Antarctic season of 2009-2010.
b) Circumpolar Active Layer Monitoring Network – Southern Hemisphere (CALM-S)
The Antarctic monitoring network of CALM-S sites includes the active layer thickness and temperatures, as well as measurements of controlling environmental variables. Due to the coarse texture and rocky nature of the terrain in the Antarctic, it is generally impossible to measure active layer depth using mechanical prob-ing thus the protocol focuses on ground temperatures. This also limits the application of the CALM grid con-cept and several sites consist essentially of a shallow borehole with data being collected at closely-spaced depths in the active layer. ANTPAS provided the frame-work for the application of a common CALM-S protocol to the Antarctic (Guglielmin, 2006) and the expansion of the network from 18 sites in 2004 to 24 sites in 2009. This will be extremely valuable for monitoring the in-fluence of climate change on active layer temperatures and processes as these are central for understanding the ecology of the terrestrial environment.
c) Soil characterization and mapping One of the main goals of ANTPAS is to produce a soil map of Antarctica. Because of the size of the continent and the low proportion of ice-free areas, activities concentrate on producing permafrost maps of the eight key ice-free regions: Queen Maud Land, Enderby Land, Vestfold Hills, Wilkes Land, Transantarctic Mountains, Marie Byrd Land, Ellsworth Mountains and Antarctic Peninsula. A soil description and sampling protocol manual and keys for classifying soils has been prepared and is available at http://erth.waikato.ac.nz/antpas/publications.shtml. Field investigations have been conducted all over Antarctica. In Victoria Land reconnaissance and detailed soil maps, as well as soil studies have been produced (Bockheim, 2007, 2008, 2009; Bockheim et al., 2007, 2008a; McLeod et al., 2007, 2008a,b,c; Balks et al., 2008a; Bockheim and McLeod, 2008; O’Neill and Balks, 2008). In the Antarctic Peninsula region, Schaefer and others (Simas et al., 2006, 2007, 2008; Navas et al., 2008; Schaefer et al., 2008) conducted mapping and soil survey, while activities have also taken place in the vicinity of the Russian stations in Queen Maud Land,
Enderby Land, Vestfold Hills, Wilkes Land, Marie Byrd Land, the Oakes Coast and King George Island.
d) Mapping, monitoring and modelling periglacial environments processes and dynamics.
Multi- and interdisciplinarity are one of the main characteristics of ANTPAS and that has become especially evident in the investigations on the dynamics of the periglacial environment. Several studies have taken place, especially in the Transantarctic Mountains, Queen Maud Land, Antarctic Peninsula, Marion Island and also in South America with a focus on a diversity of disciplines. Main themes were permafrost and geomorphological mapping (e.g. Vieira et al., 2007, 2008; Bockheim et al., 2008a,b; Guglielmin et al., 2008a; Serrano et al., 2008, Melo, 2009), dynamics (e.g. Hall et al., 2007a,b; Hauck et al., 2007; Raffi et al., 2007; Boelhouwers et al., 2008; De Ponte et al., 2008, 2009; Strini et al., 2008; Trombotto and Borzotta, 2008; Valcárcel-Díaz et al., 2008; Guglielmin et al., 2008b) and landscape evolution (e.g. Bockheim and Ackert, 2007; Bockheim and McLeod, 2008b; Bockheim et al., 2008c,d, 2009), climate analysis (e.g. Berg, 2009; Trindade, 2009; Nel et al., in press), ground-atmosphere modelling (e.g. Ramos and Vieira, 2009; Rocha, 2009), remote sensing of snow (e.g. Mora, 2009), interactions between vegetation, geomorphological dynamics and climate (e.g. Boelhouwers et al., 2007; Cannone and Guglielmin, 2008; Cannone et al., 2008, 2009; Guglielmin et al., 2008b; Haussmann et al., 2009) and microbial communities. ANTPAS is an important project for Antarctic permafrost research. In its framework, international investigations have been fostered, funding was obtained in several countries and new regions of the Antarctic are now being monitored in the medium to long timescale, providing a legacy of field instrumentation and data. The main results of the project are still to come as the data is still to be collected. ANTPAS will have an impact on Antarctic permafrost research in the next decades. The activities and objectives will continue being promoted within IPA and SCAR, but it is vital that funding continues so that the monitoring sites can be maintained beyond the typical short-term periods of science project funding.
I PY 20 07–20 0 8264
Arctic Circum-Polar Coastal Observatory Network (ACCO-Net, IPY no. 90)Paul Overduin Within the Arctic coastal dynamics community, the IPY was seen as a chance to act on the recommendations of the 3rd Working Group of the Second International Conference on Arctic Research Planning (ICARP II), which laid out a series of six key recommendations centered around the establishment of supersites for the interdisciplinary study of Arctic coastal science (Cogan et al., 2005) (Fig. 2.7-3). IPY Project no. 90, entitled Arctic Circumpolar Coastal Observatory Network (ACCONet), arose from the Arctic Coastal Dynamics Project (ACD) of the International Arctic Science Committee (IASC) and the International Permafrost Association (IPA). ACD also has been identified as an affiliated project of the Land-Oceans Interactions in the Coastal Zone (LOICZ) project of the IHDP/IGBP. In its second science plan, created at a workshop at the Arctic Centre in Groningen, Netherlands in November 2006, plans were laid for a template of observables and the creation and/or adoption of standard operating procedures for all sites (Overduin and Couture, 2008). The IPY JC tasked ACCONet to coordinate the group of IPY projects collectively identified with monitoring of the arctic coastal zone, grouping 21 IPY expressions of intent together with a further six projects that submitted national level IPY project proposals, but were not listed in the international IPY database. IPY has generated sustained international interest in coordinated circumpolar arctic monitoring efforts. As a transitional environment, the Arctic coastal zone is an ideal location for monitoring change. Such systems generally show the greatest sensitivity to climatic or environmental shifts (Committee on Designing an Arctic Observing Network, National Research Council, 2006). The coastal zone is the site of human habitation, industry and transport in the Arctic. A monitoring network here is socio-economically relevant and provides a two-way opportunity to involve residents in monitoring activities and to inform local communities about science. ACCONet’s goal is to provide the infrastructure and networking to establish an observatory network in the arctic coastal zone. ACCONet sites were selected at the national level by national level coastal observatory IPY proposals
and by adoption of ACD Key Sites with existing coastal monitoring records. Criteria for selection included site access and the existence of historical records. At the international level, major classifications of coastal typology were included and sites were selected to include the range of arctic coastal environments as described above. Some sites are solely coastal observatories, while others use permanent infrastructure associated with settlements or science stations. Site selection was further coordinated at an ACCONet meeting in Tromsø, Norway in October 2007 (Flöser et al., 2008) and initial remote sensing data were distributed. Interim results from ACCONet projects were presented at the Ninth International Conference on Permafrost in Fairbanks, U.S.A. in 2008 in a session on subsea permafrost, sea level changes and coastal dynamics (Kane and Hinkel, 2008). To provide a standardized basis for classification and change detection across all network sites, the European Space Agency granted ACCONet access to third party remote sensing data products for all sites currently being sampled. Both archived data and acquisitions of high spatial resolution optical data during and after IPY have been granted so that change detection up to, during and following IPY is possible for all sites. A critical baseline of remotely sensed data is the cornerstone of the network, permitting comparison of observatory sites in terms of many parameters relevant to coastal processes in the human, biological and physical sciences. Current coastline position is a key observable at each site and will be compared to archival data to provide a baseline for past decadal and current and future annual-scale coastal flux assessments based on two and three dimensional change detection. In the absence of an international agency for coordinating and apportioning support for circumpolar projects, the IPY process depended on projects funded piece-wise by national-level funding agencies. Not all of the goals of the ACCONet IPY project were completed during IPY 2007–2008 highlighting the continuing need for international support for monitoring activities, analogous to activities around the Antarctic. Remaining major goals are the provision and expansion of observatory on-site infrastructure and resources for sustained networking between observatories. Two major initiatives are currently
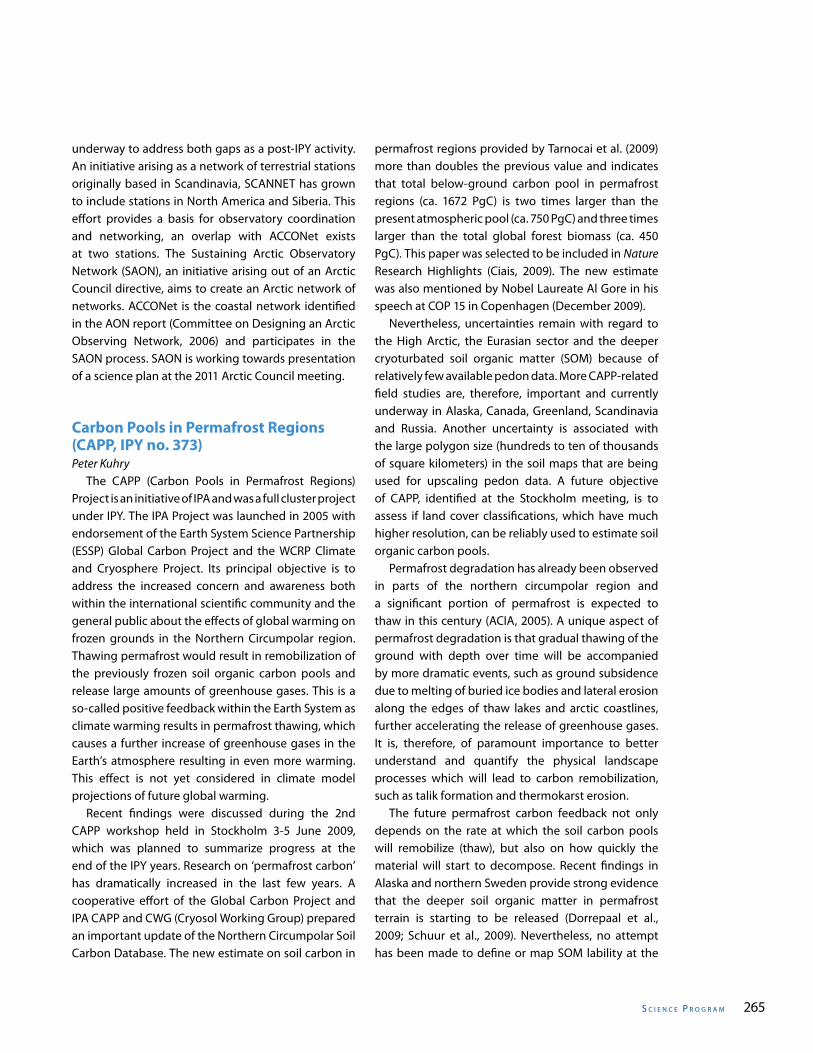
s C I e n C e P r o g r a m 265
underway to address both gaps as a post-IPY activity. An initiative arising as a network of terrestrial stations originally based in Scandinavia, SCANNET has grown to include stations in North America and Siberia. This effort provides a basis for observatory coordination and networking, an overlap with ACCONet exists at two stations. The Sustaining Arctic Observatory Network (SAON), an initiative arising out of an Arctic Council directive, aims to create an Arctic network of networks. ACCONet is the coastal network identified in the AON report (Committee on Designing an Arctic Observing Network, 2006) and participates in the SAON process. SAON is working towards presentation of a science plan at the 2011 Arctic Council meeting.
Carbon Pools in Permafrost Regions (CAPP, IPY no. 373)Peter Kuhry The CAPP (Carbon Pools in Permafrost Regions) Project is an initiative of IPA and was a full cluster project under IPY. The IPA Project was launched in 2005 with endorsement of the Earth System Science Partnership (ESSP) Global Carbon Project and the WCRP Climate and Cryosphere Project. Its principal objective is to address the increased concern and awareness both within the international scientific community and the general public about the effects of global warming on frozen grounds in the Northern Circumpolar region. Thawing permafrost would result in remobilization of the previously frozen soil organic carbon pools and release large amounts of greenhouse gases. This is a so-called positive feedback within the Earth System as climate warming results in permafrost thawing, which causes a further increase of greenhouse gases in the Earth’s atmosphere resulting in even more warming. This effect is not yet considered in climate model projections of future global warming. Recent findings were discussed during the 2nd CAPP workshop held in Stockholm 3-5 June 2009, which was planned to summarize progress at the end of the IPY years. Research on ‘permafrost carbon’ has dramatically increased in the last few years. A cooperative effort of the Global Carbon Project and IPA CAPP and CWG (Cryosol Working Group) prepared an important update of the Northern Circumpolar Soil Carbon Database. The new estimate on soil carbon in
permafrost regions provided by Tarnocai et al. (2009) more than doubles the previous value and indicates that total below-ground carbon pool in permafrost regions (ca. 1672 PgC) is two times larger than the present atmospheric pool (ca. 750 PgC) and three times larger than the total global forest biomass (ca. 450 PgC). This paper was selected to be included in Nature Research Highlights (Ciais, 2009). The new estimate was also mentioned by Nobel Laureate Al Gore in his speech at COP 15 in Copenhagen (December 2009). Nevertheless, uncertainties remain with regard to the High Arctic, the Eurasian sector and the deeper cryoturbated soil organic matter (SOM) because of relatively few available pedon data. More CAPP-related field studies are, therefore, important and currently underway in Alaska, Canada, Greenland, Scandinavia and Russia. Another uncertainty is associated with the large polygon size (hundreds to ten of thousands of square kilometers) in the soil maps that are being used for upscaling pedon data. A future objective of CAPP, identified at the Stockholm meeting, is to assess if land cover classifications, which have much higher resolution, can be reliably used to estimate soil organic carbon pools. Permafrost degradation has already been observed in parts of the northern circumpolar region and a significant portion of permafrost is expected to thaw in this century (ACIA, 2005). A unique aspect of permafrost degradation is that gradual thawing of the ground with depth over time will be accompanied by more dramatic events, such as ground subsidence due to melting of buried ice bodies and lateral erosion along the edges of thaw lakes and arctic coastlines, further accelerating the release of greenhouse gases. It is, therefore, of paramount importance to better understand and quantify the physical landscape processes which will lead to carbon remobilization, such as talik formation and thermokarst erosion. The future permafrost carbon feedback not only depends on the rate at which the soil carbon pools will remobilize (thaw), but also on how quickly the material will start to decompose. Recent findings in Alaska and northern Sweden provide strong evidence that the deeper soil organic matter in permafrost terrain is starting to be released (Dorrepaal et al., 2009; Schuur et al., 2009). Nevertheless, no attempt has been made to define or map SOM lability at the
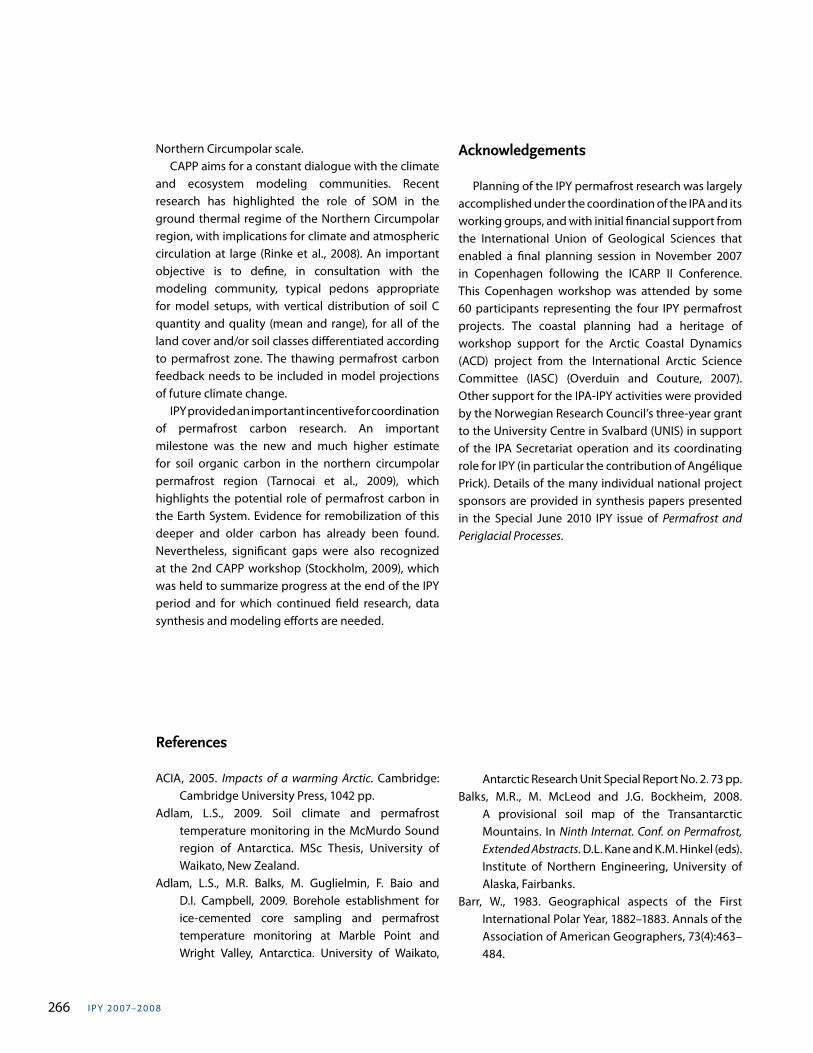
I PY 20 07–20 0 8266
Northern Circumpolar scale. CAPP aims for a constant dialogue with the climate and ecosystem modeling communities. Recent research has highlighted the role of SOM in the ground thermal regime of the Northern Circumpolar region, with implications for climate and atmospheric circulation at large (Rinke et al., 2008). An important objective is to define, in consultation with the modeling community, typical pedons appropriate for model setups, with vertical distribution of soil C quantity and quality (mean and range), for all of the land cover and/or soil classes differentiated according to permafrost zone. The thawing permafrost carbon feedback needs to be included in model projections of future climate change. IPY provided an important incentive for coordination of permafrost carbon research. An important milestone was the new and much higher estimate for soil organic carbon in the northern circumpolar permafrost region (Tarnocai et al., 2009), which highlights the potential role of permafrost carbon in the Earth System. Evidence for remobilization of this deeper and older carbon has already been found. Nevertheless, significant gaps were also recognized at the 2nd CAPP workshop (Stockholm, 2009), which was held to summarize progress at the end of the IPY period and for which continued field research, data synthesis and modeling efforts are needed.
Acknowledgements
Planning of the IPY permafrost research was largely accomplished under the coordination of the IPA and its working groups, and with initial financial support from the International Union of Geological Sciences that enabled a final planning session in November 2007 in Copenhagen following the ICARP II Conference. This Copenhagen workshop was attended by some 60 participants representing the four IPY permafrost projects. The coastal planning had a heritage of workshop support for the Arctic Coastal Dynamics (ACD) project from the International Arctic Science Committee (IASC) (Overduin and Couture, 2007). Other support for the IPA-IPY activities were provided by the Norwegian Research Council’s three-year grant to the University Centre in Svalbard (UNIS) in support of the IPA Secretariat operation and its coordinating role for IPY (in particular the contribution of Angélique Prick). Details of the many individual national project sponsors are provided in synthesis papers presented in the Special June 2010 IPY issue of Permafrost and Periglacial Processes.
References
ACIA, 2005. Impacts of a warming Arctic. Cambridge: Cambridge University Press, 1042 pp.
Adlam, L.S., 2009. Soil climate and permafrost temperature monitoring in the McMurdo Sound region of Antarctica. MSc Thesis, University of Waikato, New Zealand.
Adlam, L.S., M.R. Balks, M. Guglielmin, F. Baio and D.I. Campbell, 2009. Borehole establishment for ice-cemented core sampling and permafrost temperature monitoring at Marble Point and Wright Valley, Antarctica. University of Waikato,
Antarctic Research Unit Special Report No. 2. 73 pp.Balks, M.R., M. McLeod and J.G. Bockheim, 2008.
A provisional soil map of the Transantarctic Mountains. In Ninth Internat. Conf. on Permafrost, Extended Abstracts. D.L. Kane and K.M. Hinkel (eds). Institute of Northern Engineering, University of Alaska, Fairbanks.
Barr, W., 1983. Geographical aspects of the First International Polar Year, 1882–1883. Annals of the Association of American Geographers, 73(4):463–484.
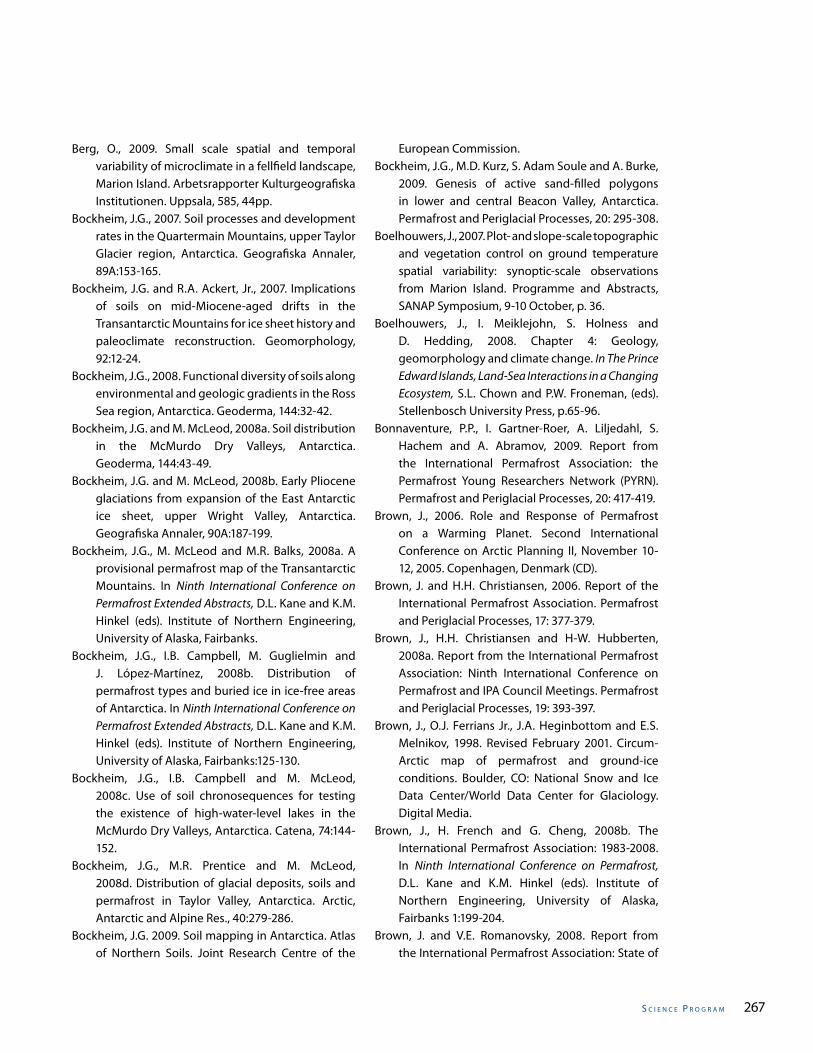
s C I e n C e P r o g r a m 267
Berg, O., 2009. Small scale spatial and temporal variability of microclimate in a fellfield landscape, Marion Island. Arbetsrapporter Kulturgeografiska Institutionen. Uppsala, 585, 44pp.
Bockheim, J.G., 2007. Soil processes and development rates in the Quartermain Mountains, upper Taylor Glacier region, Antarctica. Geografiska Annaler, 89A:153-165.
Bockheim, J.G. and R.A. Ackert, Jr., 2007. Implications of soils on mid-Miocene-aged drifts in the Transantarctic Mountains for ice sheet history and paleoclimate reconstruction. Geomorphology, 92:12-24.
Bockheim, J.G., 2008. Functional diversity of soils along environmental and geologic gradients in the Ross Sea region, Antarctica. Geoderma, 144:32-42.
Bockheim, J.G. and M. McLeod, 2008a. Soil distribution in the McMurdo Dry Valleys, Antarctica. Geoderma, 144:43-49.
Bockheim, J.G. and M. McLeod, 2008b. Early Pliocene glaciations from expansion of the East Antarctic ice sheet, upper Wright Valley, Antarctica. Geografiska Annaler, 90A:187-199.
Bockheim, J.G., M. McLeod and M.R. Balks, 2008a. A provisional permafrost map of the Transantarctic Mountains. In Ninth International Conference on Permafrost Extended Abstracts, D.L. Kane and K.M. Hinkel (eds). Institute of Northern Engineering, University of Alaska, Fairbanks.
Bockheim, J.G., I.B. Campbell, M. Guglielmin and J. López-Martínez, 2008b. Distribution of permafrost types and buried ice in ice-free areas of Antarctica. In Ninth International Conference on Permafrost Extended Abstracts, D.L. Kane and K.M. Hinkel (eds). Institute of Northern Engineering, University of Alaska, Fairbanks:125-130.
Bockheim, J.G., I.B. Campbell and M. McLeod, 2008c. Use of soil chronosequences for testing the existence of high-water-level lakes in the McMurdo Dry Valleys, Antarctica. Catena, 74:144-152.
Bockheim, J.G., M.R. Prentice and M. McLeod, 2008d. Distribution of glacial deposits, soils and permafrost in Taylor Valley, Antarctica. Arctic, Antarctic and Alpine Res., 40:279-286.
Bockheim, J.G. 2009. Soil mapping in Antarctica. Atlas of Northern Soils. Joint Research Centre of the
European Commission.Bockheim, J.G., M.D. Kurz, S. Adam Soule and A. Burke,
2009. Genesis of active sand-filled polygons in lower and central Beacon Valley, Antarctica. Permafrost and Periglacial Processes, 20: 295-308.
Boelhouwers, J., 2007. Plot- and slope-scale topographic and vegetation control on ground temperature spatial variability: synoptic-scale observations from Marion Island. Programme and Abstracts, SANAP Symposium, 9-10 October, p. 36.
Boelhouwers, J., I. Meiklejohn, S. Holness and D. Hedding, 2008. Chapter 4: Geology, geomorphology and climate change. In The Prince Edward Islands, Land-Sea Interactions in a Changing Ecosystem, S.L. Chown and P.W. Froneman, (eds). Stellenbosch University Press, p.65-96.
Bonnaventure, P.P., I. Gartner-Roer, A. Liljedahl, S. Hachem and A. Abramov, 2009. Report from the International Permafrost Association: the Permafrost Young Researchers Network (PYRN). Permafrost and Periglacial Processes, 20: 417-419.
Brown, J., 2006. Role and Response of Permafrost on a Warming Planet. Second International Conference on Arctic Planning II, November 10-12, 2005. Copenhagen, Denmark (CD).
Brown, J. and H.H. Christiansen, 2006. Report of the International Permafrost Association. Permafrost and Periglacial Processes, 17: 377-379.
Brown, J., H.H. Christiansen and H-W. Hubberten, 2008a. Report from the International Permafrost Association: Ninth International Conference on Permafrost and IPA Council Meetings. Permafrost and Periglacial Processes, 19: 393-397.
Brown, J., O.J. Ferrians Jr., J.A. Heginbottom and E.S. Melnikov, 1998. Revised February 2001. Circum-Arctic map of permafrost and ground-ice conditions. Boulder, CO: National Snow and Ice Data Center/World Data Center for Glaciology. Digital Media.
Brown, J., H. French and G. Cheng, 2008b. The International Permafrost Association: 1983-2008. In Ninth International Conference on Permafrost, D.L. Kane and K.M. Hinkel (eds). Institute of Northern Engineering, University of Alaska, Fairbanks 1:199-204.
Brown, J. and V.E. Romanovsky, 2008. Report from the International Permafrost Association: State of
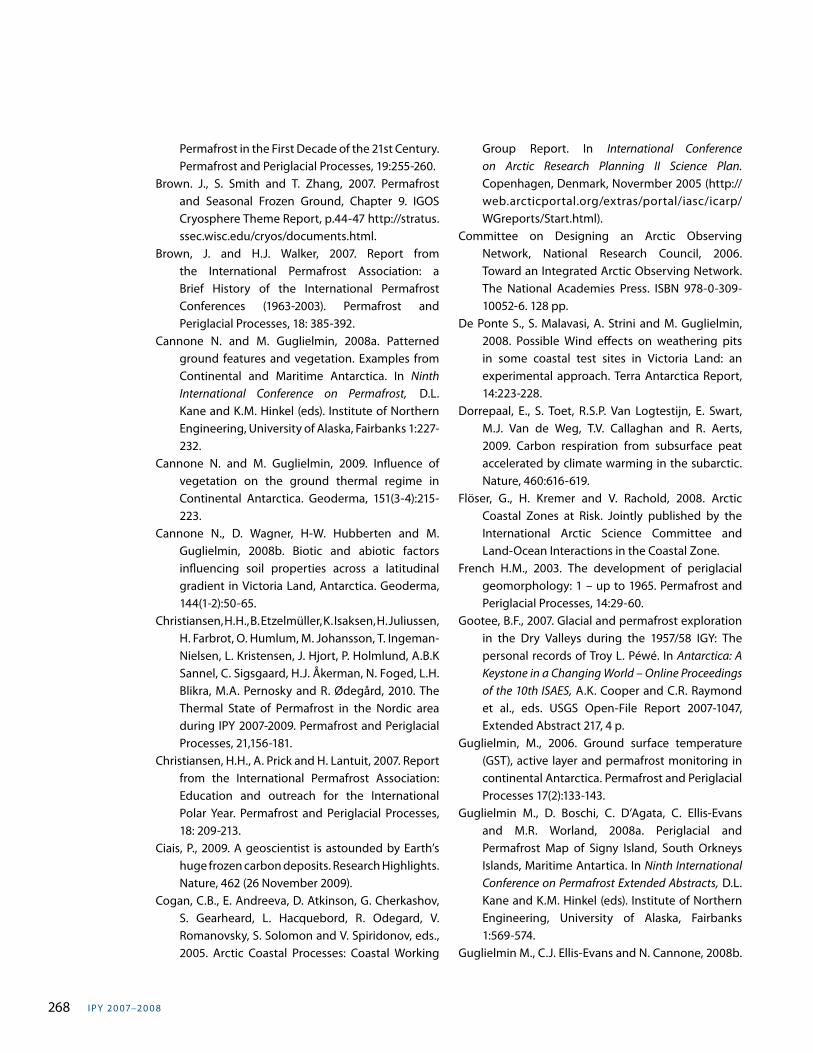
I PY 20 07–20 0 8268
Permafrost in the First Decade of the 21st Century. Permafrost and Periglacial Processes, 19:255-260.
Brown. J., S. Smith and T. Zhang, 2007. Permafrost and Seasonal Frozen Ground, Chapter 9. IGOS Cryosphere Theme Report, p.44-47 http://stratus.ssec.wisc.edu/cryos/documents.html.
Brown, J. and H.J. Walker, 2007. Report from the International Permafrost Association: a Brief History of the International Permafrost Conferences (1963-2003). Permafrost and Periglacial Processes, 18: 385-392.
Cannone N. and M. Guglielmin, 2008a. Patterned ground features and vegetation. Examples from Continental and Maritime Antarctica. In Ninth International Conference on Permafrost, D.L. Kane and K.M. Hinkel (eds). Institute of Northern Engineering, University of Alaska, Fairbanks 1:227-232.
Cannone N. and M. Guglielmin, 2009. Influence of vegetation on the ground thermal regime in Continental Antarctica. Geoderma, 151(3-4):215-223.
Cannone N., D. Wagner, H-W. Hubberten and M. Guglielmin, 2008b. Biotic and abiotic factors influencing soil properties across a latitudinal gradient in Victoria Land, Antarctica. Geoderma, 144(1-2):50-65.
Christiansen, H.H., B. Etzelmüller, K. Isaksen, H. Juliussen, H. Farbrot, O. Humlum, M. Johansson, T. Ingeman-Nielsen, L. Kristensen, J. Hjort, P. Holmlund, A.B.K Sannel, C. Sigsgaard, H.J. Åkerman, N. Foged, L.H. Blikra, M.A. Pernosky and R. Ødegård, 2010. The Thermal State of Permafrost in the Nordic area during IPY 2007-2009. Permafrost and Periglacial Processes, 21,156-181.
Christiansen, H.H., A. Prick and H. Lantuit, 2007. Report from the International Permafrost Association: Education and outreach for the International Polar Year. Permafrost and Periglacial Processes, 18: 209-213.
Ciais, P., 2009. A geoscientist is astounded by Earth’s huge frozen carbon deposits. Research Highlights. Nature, 462 (26 November 2009).
Cogan, C.B., E. Andreeva, D. Atkinson, G. Cherkashov, S. Gearheard, L. Hacquebord, R. Odegard, V. Romanovsky, S. Solomon and V. Spiridonov, eds., 2005. Arctic Coastal Processes: Coastal Working
Group Report. In International Conference on Arctic Research Planning II Science Plan. Copenhagen, Denmark, Novermber 2005 (http://web.arcticportal.org/extras/portal/iasc/icarp/WGreports/Start.html).
Committee on Designing an Arctic Observing Network, National Research Council, 2006. Toward an Integrated Arctic Observing Network. The National Academies Press. ISBN 978-0-309-10052-6. 128 pp.
De Ponte S., S. Malavasi, A. Strini and M. Guglielmin, 2008. Possible Wind effects on weathering pits in some coastal test sites in Victoria Land: an experimental approach. Terra Antarctica Report, 14:223-228.
Dorrepaal, E., S. Toet, R.S.P. Van Logtestijn, E. Swart, M.J. Van de Weg, T.V. Callaghan and R. Aerts, 2009. Carbon respiration from subsurface peat accelerated by climate warming in the subarctic. Nature, 460:616-619.
Flöser, G., H. Kremer and V. Rachold, 2008. Arctic Coastal Zones at Risk. Jointly published by the International Arctic Science Committee and Land-Ocean Interactions in the Coastal Zone.
French H.M., 2003. The development of periglacial geomorphology: 1 – up to 1965. Permafrost and Periglacial Processes, 14:29-60.
Gootee, B.F., 2007. Glacial and permafrost exploration in the Dry Valleys during the 1957/58 IGY: The personal records of Troy L. Péwé. In Antarctica: A Keystone in a Changing World – Online Proceedings of the 10th ISAES, A.K. Cooper and C.R. Raymond et al., eds. USGS Open-File Report 2007-1047, Extended Abstract 217, 4 p.
Guglielmin, M., 2006. Ground surface temperature (GST), active layer and permafrost monitoring in continental Antarctica. Permafrost and Periglacial Processes 17(2):133-143.
Guglielmin M., D. Boschi, C. D’Agata, C. Ellis-Evans and M.R. Worland, 2008a. Periglacial and Permafrost Map of Signy Island, South Orkneys Islands, Maritime Antartica. In Ninth International Conference on Permafrost Extended Abstracts, D.L. Kane and K.M. Hinkel (eds). Institute of Northern Engineering, University of Alaska, Fairbanks 1:569-574.
Guglielmin M., C.J. Ellis-Evans and N. Cannone, 2008b.
s C I e n C e P r o g r a m 269
Active layer thermal regime under different vegetation conditions in permafrost areas. A case study at Signy Island (maritime Antarctica). Geoderma, 144(1-2):73-85.
Hall K., M. Guglielmin and A. Strini, 2008a. Weathering of granite in Antarctica, II: thermal stress at the grain scale. Earth Surface Processes and Landforms, 33(3):475-493.
Hall K., M. Guglielmin and A. Strini, 2008b. Weathering of granite in Antarctica, I: Light penetration in to rock and implications for rock weathering and endolithic communities. Earth Surface Processes and Landforms, 33(2):295-307.
Harris, C., L.U. Arenson, H.H. Christiansen, B. Etzelmüller, R. Frauenfelder, S. Gruber, W. Haeberli, C. Hauck, M. Hölzle, O. Humlum, K. Isaksen, A. Kääb, M.A. Kern-Lütschg, M. Lehning, N. Matsuoka, J.B. Murton, J. Nötzli, M. Phillips, N. Ross, M. Seppälä, S.M. Springman and D. Vonder Mühll, 2009. Permafrost and climate in Europe: Monitoring and modelling thermal, geomorphological and geotechnical responses. Earth Science Reviews, 9(3-4):117-171.
Hauck, C., G. Vieira, S. Gruber, J.J. Blanco and M. Ramos, 2007. Geophysical identification of permafrost in Livingston Island, Maritime Antarctic. Journal of Geophysical Research, Vol. 112, F02S19, doi:10.1029/2006JF000544.
Haussmann, N., M. McGeoch and J. Boelhouwers, 2009. Interactions between a cushion plant (Azorella selago) and surface sediment transport on sub-Antarctic Marion Island. Geomorphology, 107:139-148.
Juliussen, H., H.H. Christiansen, G.S. Strand, S. Iversen, K. Midttømme and J.S. Rønning, in prep. The Norwegian Permafrost Database NORPERM – An IPY legacy. In Ninth International Conference on Permafrost, D.L. Kane and K.M. Hinkel (eds). Institute of Northern Engineering, University of Alaska, Fairbanks Vol. 1 and 2.
Kane, D.L. and K.M. Hinkel, (eds), 2008. Proceedings Ninth International Conference on Permafrost. Fairbanks, vol. 1 and 2. Institute of Northern Engineering, University of Alaska Fairbanks.
Kuhry, P., E. Dorrepaal, G. Hugelius, E.A.G. Schuur and C. Tarnocai, 2010. Potential remobilization of permafrost carbon under future global warming.
Perm. and Periglac. Processes, 208-214.Kuhry, P., C-L. Ping, E.A.G. Schuur, C. Tarnocai and
S. Zimov, 2009. Report from the International Permafrost Association: Carbon pools in permafrost. Permafrost and Periglacial Processes, 20:229-233.
McLeod, M., J.G. Bockheim, M.R. Balks and J. Aislabie, 2007. Soils of Western Wright Valley, Antarctica. In Antarctica: 50 years on the ice. Just the Tip of the Iceberg. Proceedings of the Antarctic Conference held in Wellington 2-6 July 2007: 67.
McLeod M., J.G. Bockheim and M.R. Balks, 2008a: A provisional 1:50 000 scale soil map of the Wright Valley, Antarctica. In Ninth International Conference on Permafrost, D.L. Kane and K.M. Hinkel (eds). Institute of Northern Engineering, University of Alaska, Fairbanks:207-208.
McLeod M., J.G. Bockheim and M. Balks, 2008b. Glacial geomorphology, soil development and permafrost features in central-upper Wright Valley, Antarctica. Geoderma, 144:93-103.
McLeod, M., J.G. Bockheim and M.R. Balks 2008c. A fifth-order reconnaissance soil map of ice- free areas of the Transantarctic Mountains, Antarctica. In Antarctica: A keystone in a Changing World Proceedings of the 10th International Symposium on Antarctic Earth Sciences, Cooper, A.K., P.J. Barrett, H. Stagg, B. Storey, E. Stump, W.Wise and the 10th ISAES editorial team eds. Santa Barbara, California, August 26 to September 1 2007. Washington DC: The National Academy press. USGS OF – 2007-1047, Extended Abstract 116.
Melo, R., 2009. Present-day geomorphological dynamics of Deception Island: spatial analysis of the sector Cerro Caliente - Crater Lake. Ms thesis, Univeristy of Lisbon (in Portuguese).
Mora C., G. Vieira and M. Ramos, in press. Detecção da cobertura de neve na ilha Livingston (Antárctida marítima) com imagens de satélite ASAR. Resultados preliminares. Proceedings of II Iberian Conference of the International Permafrost Association: Periglacial, environments, permafrost and climate variability, J. J. Blanco, M. Ramos and M.A. de Pablo, eds., Colección Obras colectivas, Universidad de Alcalá.
Muller, S.W., 1943. Permafrost or permanently frozen ground and related engineering problems. U.S.
I PY 20 07–20 0 8270
Engineers Office, Strategic Engineering Study, Special Report No. 62, 136 p. (Reprinted in 1947, J.W. Edwards, Ann Arbor, Michigan, 231 p).
Navas A., J. López-Martínez, J. Casas, J. Machín, J.J. Durán, E. Serrano, J.A. Cuchí and S. Mink, 2008. Soil characteristics on varying lithology substract in the South Shetland islands, maritime Antarctica. Geoderma, 144:123-139.
Nel, W., J. Boelhouwers and M. Zilindile, in press. Exploring the temporal scale measurements required to detect climate change in a diurnal frost environment: Observations from sub-Antarctic Marion Island. Geografiska Annaler.
Nelson, F.E., N.I. Shiklomanov, K.M. Hinkel and J. Brown, 2008. Decadal results from the Circumpolar Active Layer Monitoring (CALM) program. In Ninth International Conference on Permafrost, D.L. Kane and K.M. Hinkel (eds). Institute of Northern Engineering, University of Alaska, Fairbanks 2:1273-1280.
O’Neill, T. A. and M.R. Balks 2008. Irreversible damage? Human activity, cumulative impacts and recovery rates of the Antarctic soil environment. In Ninth International Conference on Permafrost, D.L. Kane and K.M. Hinkel (eds). Institute of Northern Engineering, University of Alaska, Fairbanks:229.
Overduin, P.P. and N., Couture eds., 2007. The 6th ACD Workshop, 22-26 October 2006, University of Gronigren, Netherlands. Reports on Polar and Marine Research No. 576, 100 pp.
Overduin P.P. and N. Couture, eds., 2008. The 6th annual Arctic coastal dynamics (ACD) workshop, Oct. 22-26, 2006, Groningen, Netherlands. Berichte zur Polar- und Meeresforschung (Reports on polar and marine research) 576:105.
Raffi, R., B. Stenni, O., Genoni, O. Flora and S. Sega, 2007. Thermal regime, isotopic and morphological characteristics of ice wedges in Northern Victoria Land, Antarctica. 10th International Symposium on Antarctic Earth Sciences, Santa Barbara, California, 26 August to September 1, 2007. Session: The State of Permafrost in a Changing Environment. Oral presentation, USGS OFR- 2007-1047, Extended abstract 204.
Ramos, M. and G. Vieira, 2009. Evaluation of the ground surface enthalpy balance from bedrock shallow borehole temperatures (Livingston
Island, Maritime Antarctic). The Cryosphere, 3: 133-145.
Ramos, M., G. Vieira, S. Gruber, J.J. Blanco, C. Hauck, M.A. Hidalgo, D. Tomé, M. Neves and A. Trindade, 2007. Permafrost and active layer monitoring in the maritime Antarctic: Preliminary results from CALM sites on Livingston and Deception Islands. U.S. Geological Survey and the National Academies; USGS OF-2007-1047, Short Research Paper 070, doi:10.3133/of2007-1047.srp070.
Ramos, M., G. Vieira, J.J. Blanco, S. Gruber, C. Hauck, M.A. Hidalgo and D. Tomé, 2008. Active layer temperature monitoring in two boreholes in Livingston Island, Maritime Antarctic: first results for 2000-2006. Ninth International Conference on Permafrost, D.L. Kane and K.M. Hinkel (eds). Institute of Northern Engineering, University of Alaska, Fairbanks 1463-1467.
Ramos, M., A. Hasler, G. Vieira, C. Hauck and S. Gruber, 2009. Drilling and installations of boreholes for permafrost thermal monitoring on Livingston Island in the Maritime Antarctic. Permafrost and Periglacial Processes, 20:57-64.
Rinke, A., P. Kuhry and K. Dethloff, 2008. Importance of a soil organic layer for Arctic climate: A sensitivity study with an Arctic RCM. Geophys. Res. Lett., 35, L13709, doi:10.1029/2008GL034052.
Rocha, M.J., E. Dutra, R. Tomé, G. Vieira, P. Miranda, M. Fragoso and M. Ramos, 2010. ERA-Interim forced H-TESSEL scheme for modeling ground temperatures for Livingston Island (South Shetlands, Antarctic Peninsula). Proceedings of II Iberian Conference of the International Permafrost Association.
Romanovsky, V., J. Brown, G. Clow, M. Burgess, S. Smith and C. Harris, 2003. The Thermal State of Permafrost: A Contribution to the International Polar Year (Unpublished working draft 10/8/03).
Romanovsky, V.E., D.S. Drozdov, N.G. Oberman, G.V. Malkova, A.L. Kholodov, S.S. Marchenko, N.G. Moskalenko, D.O. Sergeev, N.G. Ukraintseva, A.A. Abramov and A.A. Vasiliev, 2010a. Current Thermal State of Permafrost in Russia. Permafrost and Periglacial Processes, 21, 136-155.
Romanovsky, V.E., S. Gruber, A. Instanes, H. Jin, S.S. Marchenko, S.L. Smith, D. Trombotto and K.M. Walter, 2007. Frozen Ground, Chapter 7 in UNEP
s C I e n C e P r o g r a m 271
(2007.) Global Outlook for Ice and Snow, p. 181-200. United Nations Environment Programme: Nairobi.
Romanovsky, V.E., S.L. Smith and H.H. Christiansen, 2010b. Permafrost thermal state in the polar Northern Hemisphere durig the IPY 2007-2009: a synthesis. Permafrost and Periglacial Processes, 21, 106-116.
Schaefer C., F. Simas, R.J. Gilkes, C. Mathison, L.M. da Costa and M.A. Albuquerque, 2008. Micromorphology and microchemistry of selected Cryosols from maritime Antarctica. Geoderma, 144:104-115.
Schuur, E. A. G, J. Bockheim, J. Canadell, E. Euskirchen, C.B. Field, S.V. Goryachkin, S. Hagemann, P. Kuhry, P. Lafleur, H. Lee, G. Mazhitova, F.E. Nelson, A. Rinke, V. Romanovsky, N. Shiklomanov, C. Tarnocai, S. Venevsky, J.G. Vogel and S.A. Zimov, 2008. Vulnerability of permafrost carbon to climate change: implications for the global carbon cycle. Bioscience, 58:701-714.
Schuur, E. A. G., J.G. Vogel, K.G. Crummer, H. Lee, J.O. Sickman and T.E. Osterkamp, 2009. The impact of permafrost thaw on old carbon release and net carbon exchange from tundra. Nature, 459:556-559.
Serrano E., J. López-Martínez, J.A. Cuchí, J.J. Durán, S. Mink and A. Navas, 2008. Permafrost in the South Shetland islands (maritime Antarctica): spatial distribution pattern NICOP 2008. In Ninth International Conference on Permafrost, D.L. Kane and K.M. Hinkel (eds). Institute of Northern Engineering, University of Alaska, Fairbanks:1621-1625.
Shiklomanov, N.I., F.E. Nelson, D.A. Streletskiy, K.M. Hinkel and J. Brown, 2008. The Circumpolar Active Layer Monitoring (CALM) Program: Data Collection, Management and Dissemination Strategies. In Ninth International Conference on Permafrost, D.L. Kane and K.M. Hinkel (eds). Institute of Northern Engineering, University of Alaska, Fairbanks 2:1647-1652.
Simas, F.N.B., C.E.G.R. Schaefer, V.F. de Melo, M.B.B. Guerra, M. Saunders and R.J. Gilkes, 2006. Clay-sized minerals in permafrost-affected soils (Cryosols) from King George Island, Antarctica. Clays and Clay Minerals, 54:721-736.
Simas, F.N.B., C.E.G.R. Schaefer, M.R. Albuquerque
Filho, M.R., Francelino, E.I. Fernandes Filho and L.M. Costa, 2008. Genesis, properties and classification of Cryosols from Admiralty Bay, Maritime Antarctica. Geoderma, 144:116–122.
Simas, F.N.B., C.E.G.R. Schaefer, V.F. de Melo, M.R. Albuquerque-Filho, R.F.M. Michel, V.V. Pereira, M.R.M. Gomes and L.M. Costa, 2007. Ornithogenic Cryosols from Maritime Antarctica: phosphatization as a soil forming process. Geoderma, 138:191–203.
Smith, S. and J. Brown, 2009. Permafrost: permafrost and seasonally frozen ground: Assessment of the Status of the Development of the Standards for the Terrestrial Essential Climate Variables. Global Terrestrial Observing System, FAO, Rome (www.fao.org/gtos/doc/ECVs/T07/T07.pdf).
Smith, S.L., V.E. Romanovsky, A.G. Lewkowicz, C.R. Burn, M. Allard, G.D. Clow, K. Yoshikawa and J. Throop, 2010. Thermal State of Permafrost in North America – A Contribution to the International Polar Year. Permafrost and Periglacial Processes, 21, 117-135.
Strini A., M. Guglielmin and K. Hall, 2008. Tafoni development in a cryotic environment: an example from Northern Victoria Land, Antarctica. Earth Surface Processes and Landforms, 33:1502-1519.
Tarnocai, C., J. G. Canadell, E. A. G. Schuur, P. Kuhry, G. Mazhitova and S. Zimov, 2009. Soil organic carbon pools in the northern circumpolar permafrost region. Global Biogeochem. Cycles, 23:GB2023, doi:10.1029/2008GB003327.
Trindade, A., 2009. Characteristics of the ground thermal regime in Hurd Peninsula (Livingston Island, Antarctic). Ms thesis, University of Lisbon (in Portuguese).
Trombotto, D. and E. Borzotta, 2009. Indicators of present global warming through changes in active layer-thickness, estimation of thermal difusivity anf geomorphological observations in the Morenas Coloradas rock glacier, Central Andes of Mendoza, Dry Andes, Argentina. Cold Regions Science and Technology, 55: 321-330.
Valcárcel-Díaz M., P. Carrera-Gómez, A. Coronato, F. Castillo-Rodríguez, J. Rabassa and A. Pérez-Alberti, 2006. Cryogenic landforms in the Sierras de Alvear, Fuegian Andes, Subantarctic Argentina. Permafrost and Periglacial Processes, 17:371-376.
I PY 20 07–20 0 8272
Valcárcel-Díaz M., P. Carrera-Gómez, R. Blanco-Chao and A. Pérez-Alberti, 2008. Permafrost occurrence in Southernmost South America (Sierras de Alvear, Tierra del Fuego, Argentina). In Ninth International Conference on Permafrost, D.L. Kane and K.M. Hinkel (eds). Institute of Northern Engineering, University of Alaska, Fairbanks: 1799-1802.
van Everdingen, R. (ed), 1998 revised May 2005. Multi-language glossary of permafrost and related ground-ice terms. Boulder, CO: National Snow and Ice Data Center/World Data Center for Glaciology.
Vieira, G., M. Ramos, S. Gruber, C. Hauck and J. Blanco, 2007. The permafrost environment of northwest Hurd Peninsula (Livingston Island, maritime Antarctic): Preliminary results. U.S. Geological Survey and the National Academies; USGS OF-2007-1047, Extended Abstract 2.
Vieira, G., J. López-Martínez, E. Serrano, M. Ramos, S. Gruber, C. Hauck and J.J. Blanco, 2008. Geomorphological observations of permafrost and ground-ice degradation on Deception and Livingston Islands, Maritime Antarctica NICOP 2008. In Ninth International Conference on Permafrost, D.L. Kane and K.M. Hinkel (eds). Institute of Northern Engineering, University of Alaska, Fairbanks: 1839-1844.
Vieira, G., J. Bockheim, M. Guglielmin, M. Balks, A.A.
Abramov, J. Boelhouwers, N. Cannone, L. Ganzert, D.A. Gilichinsky, S. Goryachkin, J. López-Martínez, I. Meiklejohn, R. Raffi, M. Ramos, C. Schaefer, E. Serrano, F. Simas, R. Sletten and D. Wagner, 2010. Thermal state of Antarctic permafrost and active-layer dynamics: Advances during the International Polar Year 2007–2009. Permafrost and Periglacial Processes, 21:182-197.
Vonder Mühll, D.S., J. Noetzli, J. and I. Roer, 2008. PERMOS-A comprehensive monitoring network of mountain permafrost in the Swiss Alps. In Ninth International Conference on Permafrost, D.L. Kane and K.M. Hinkel (eds). Institute of Northern Engineering, University of Alaska, Fairbanks, 2:1869-1874.
Yoshikawa, K., 2008. Circumpolar permafrost monitoring program. Earth Scientist, 27:14-19.
Zhao, L., Q. Wu, S.S. Marchenko, N. Sharkhuu, Ren Li and Qiang Pang, 2010. Status of permafrost and active layer in Central Asia during the International Polar Year. Permafrost and Periglacial Processes, 198-207.
s C I e n C e P r o g r a m 273
2.8 Earth Structure and Geodynamics at the Poles
Lead Authors:Terry J. Wilson, Karsten Gohl and Jerónimo López-Martínez
Reviewers:Robin Bell, Reinhard Dietrich and Carmen Gaina
PA R T T W O : I P Y S C I E N C E P R O G R A M
The study of Earth structure and geodynamics in polar regions contributes to an improved understanding of processes of global relevance, due to the role of the Arctic and
Antarctic in fields such as geology, oceanography and glaciology, among others. For a better understanding of how global tectonics and sedimentation interact with the Earth system and its changes, it is necessary to have information about the current and past state and relationships of tectonic plates located at high latitudes. Geodynamic, tectonic and sedimentary processes drive the topographic formation and the location of ocean basins and corridors between emergent masses of land. Currents in the polar oceans move along pathways – that have changed through Earth history – with a significant effect on global climate. Subglacial relief features and processes are also connected to the Earth’s structure and geodynamics. Such elements may have impacts on the stability and evolution of the ice sheets and must be considered in climate models. A series of IPY projects have been conducted on this topic, incorporating many research groups and forming examples of multi-national and multi-disciplinary efforts as promoted by IPY. The networks of polar Earth and geodynamics observatories have been significantly improved during IPY; technical advances have occurred and valuable experience of conducting research and collecting data in remote areas and in extreme conditions has been acquired. Scientific results are starting to emerge, as noted below, and more results will appear after processing the great quantity of new data collected during the IPY period of observations. The scope of scientific results will grow
thanks to future continuity of measurements in the observing networks, data sharing and international cooperation. Following the IPY spirit, projects in this field have incorporated new and young researchers and have made a significant effort on education and outreach activities.
Geodynamic studies, subglacial environments and evolution of ice sheets Geodynamic processes act at the base of polar ice sheets, in some cases affecting ice flow and subglacial drainage. The knowledge of such processes, jointly with features at the base of the polar ice sheets, is needed for a better understanding of the status and changes of the polar ice masses. Geodynamic observations using seismic, magnetic, gravity and ice-penetrating radar data, together with satellite imagery and geological observations, were conducted before and during IPY in several locations. The West Antarctic Rift System was studied as an example of a tectonic system that may be connected to the subglacial drainage and especially to the fast-flowing glaciers that drain the West Antarctic Ice Sheet, with implications for ice sheet stability (Fricker et al., 2007). The IPY project Antarctica’s Gamburtsev Province (AGAP) explored the more than 1200 km long and 3000 m high subglacial Gamburtsev Mountains, located in East Antarctica and discovered by the Russians in 1957 during the International Geophysical Year. This project includes seven nations - U.S.A., U.K., Germany, China, Canada, Australia and Japan - and is a good example of
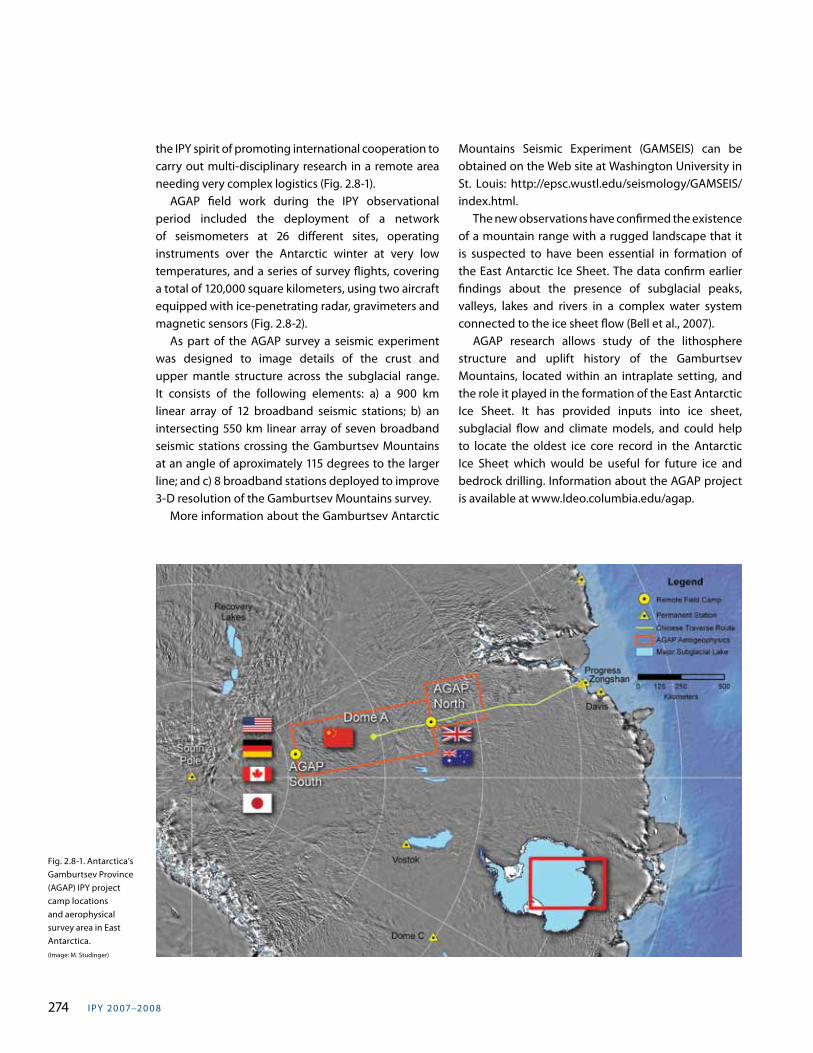
I PY 20 07–20 0 8274
the IPY spirit of promoting international cooperation to carry out multi-disciplinary research in a remote area needing very complex logistics (Fig. 2.8-1). AGAP field work during the IPY observational period included the deployment of a network of seismometers at 26 different sites, operating instruments over the Antarctic winter at very low temperatures, and a series of survey flights, covering a total of 120,000 square kilometers, using two aircraft equipped with ice-penetrating radar, gravimeters and magnetic sensors (Fig. 2.8-2). As part of the AGAP survey a seismic experiment was designed to image details of the crust and upper mantle structure across the subglacial range. It consists of the following elements: a) a 900 km linear array of 12 broadband seismic stations; b) an intersecting 550 km linear array of seven broadband seismic stations crossing the Gamburtsev Mountains at an angle of aproximately 115 degrees to the larger line; and c) 8 broadband stations deployed to improve 3-D resolution of the Gamburtsev Mountains survey. More information about the Gamburtsev Antarctic
Mountains Seismic Experiment (GAMSEIS) can be obtained on the Web site at Washington University in St. Louis: http://epsc.wustl.edu/seismology/GAMSEIS/index.html. The new observations have confirmed the existence of a mountain range with a rugged landscape that it is suspected to have been essential in formation of the East Antarctic Ice Sheet. The data confirm earlier findings about the presence of subglacial peaks, valleys, lakes and rivers in a complex water system connected to the ice sheet flow (Bell et al., 2007). AGAP research allows study of the lithosphere structure and uplift history of the Gamburtsev Mountains, located within an intraplate setting, and the role it played in the formation of the East Antarctic Ice Sheet. It has provided inputs into ice sheet, subglacial flow and climate models, and could help to locate the oldest ice core record in the Antarctic Ice Sheet which would be useful for future ice and bedrock drilling. Information about the AGAP project is available at www.ldeo.columbia.edu/agap.
Fig. 2.8-1. Antarctica’s Gamburtsev Province (AGAP) IPY project camp locations and aerophysical survey area in East Antarctica.(Image: M. Studinger)
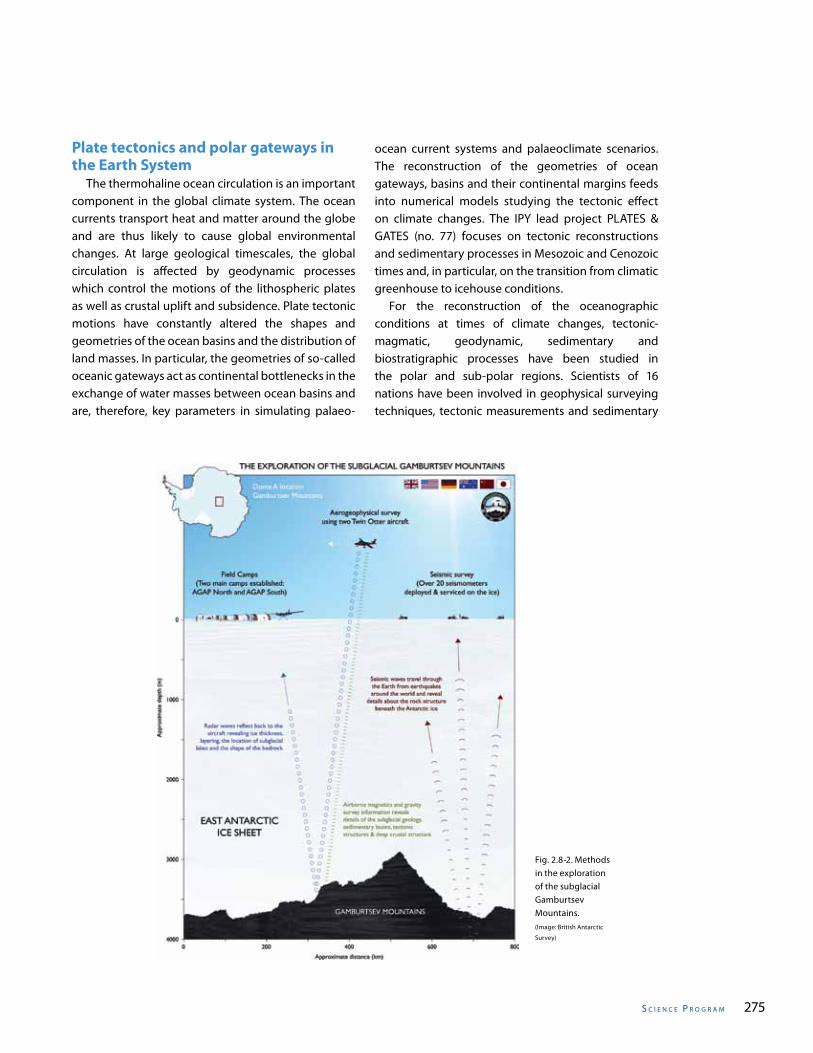
s C I e n C e P r o g r a m 275
Plate tectonics and polar gateways in the Earth System The thermohaline ocean circulation is an important component in the global climate system. The ocean currents transport heat and matter around the globe and are thus likely to cause global environmental changes. At large geological timescales, the global circulation is affected by geodynamic processes which control the motions of the lithospheric plates as well as crustal uplift and subsidence. Plate tectonic motions have constantly altered the shapes and geometries of the ocean basins and the distribution of land masses. In particular, the geometries of so-called oceanic gateways act as continental bottlenecks in the exchange of water masses between ocean basins and are, therefore, key parameters in simulating palaeo-
ocean current systems and palaeoclimate scenarios. The reconstruction of the geometries of ocean gateways, basins and their continental margins feeds into numerical models studying the tectonic effect on climate changes. The IPY lead project PLATES & GATES (no. 77) focuses on tectonic reconstructions and sedimentary processes in Mesozoic and Cenozoic times and, in particular, on the transition from climatic greenhouse to icehouse conditions. For the reconstruction of the oceanographic conditions at times of climate changes, tectonic-magmatic, geodynamic, sedimentary and biostratigraphic processes have been studied in the polar and sub-polar regions. Scientists of 16 nations have been involved in geophysical surveying techniques, tectonic measurements and sedimentary
Fig. 2.8-2. Methods in the exploration of the subglacial Gamburtsev Mountains.(Image: British Antarctic
Survey)
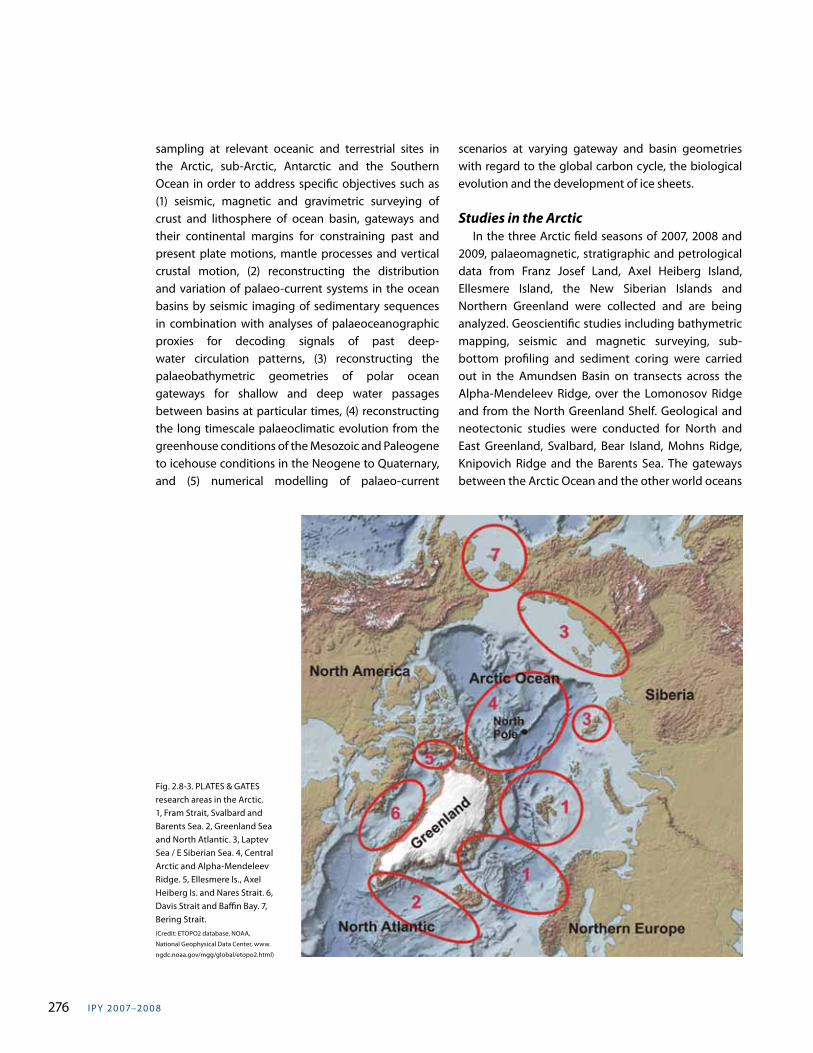
I PY 20 07–20 0 8276
sampling at relevant oceanic and terrestrial sites in the Arctic, sub-Arctic, Antarctic and the Southern Ocean in order to address specific objectives such as (1) seismic, magnetic and gravimetric surveying of crust and lithosphere of ocean basin, gateways and their continental margins for constraining past and present plate motions, mantle processes and vertical crustal motion, (2) reconstructing the distribution and variation of palaeo-current systems in the ocean basins by seismic imaging of sedimentary sequences in combination with analyses of palaeoceanographic proxies for decoding signals of past deep-water circulation patterns, (3) reconstructing the palaeobathymetric geometries of polar ocean gateways for shallow and deep water passages between basins at particular times, (4) reconstructing the long timescale palaeoclimatic evolution from the greenhouse conditions of the Mesozoic and Paleogene to icehouse conditions in the Neogene to Quaternary, and (5) numerical modelling of palaeo-current
scenarios at varying gateway and basin geometries with regard to the global carbon cycle, the biological evolution and the development of ice sheets.
Studies in the Arctic In the three Arctic field seasons of 2007, 2008 and 2009, palaeomagnetic, stratigraphic and petrological data from Franz Josef Land, Axel Heiberg Island, Ellesmere Island, the New Siberian Islands and Northern Greenland were collected and are being analyzed. Geoscientific studies including bathymetric mapping, seismic and magnetic surveying, sub-bottom profiling and sediment coring were carried out in the Amundsen Basin on transects across the Alpha-Mendeleev Ridge, over the Lomonosov Ridge and from the North Greenland Shelf. Geological and neotectonic studies were conducted for North and East Greenland, Svalbard, Bear Island, Mohns Ridge, Knipovich Ridge and the Barents Sea. The gateways between the Arctic Ocean and the other world oceans
Fig. 2.8-3. PLATES & GATES research areas in the Arctic. 1, Fram Strait, Svalbard and Barents Sea. 2, Greenland Sea and North Atlantic. 3, Laptev Sea / E Siberian Sea. 4, Central Arctic and Alpha-Mendeleev Ridge. 5, Ellesmere Is., Axel Heiberg Is. and Nares Strait. 6, Davis Strait and Baffin Bay. 7, Bering Strait.(Credit: ETOPO2 database, NOAA,
National Geophysical Data Center, www.
ngdc.noaa.gov/mgg/global/etopo2.html)
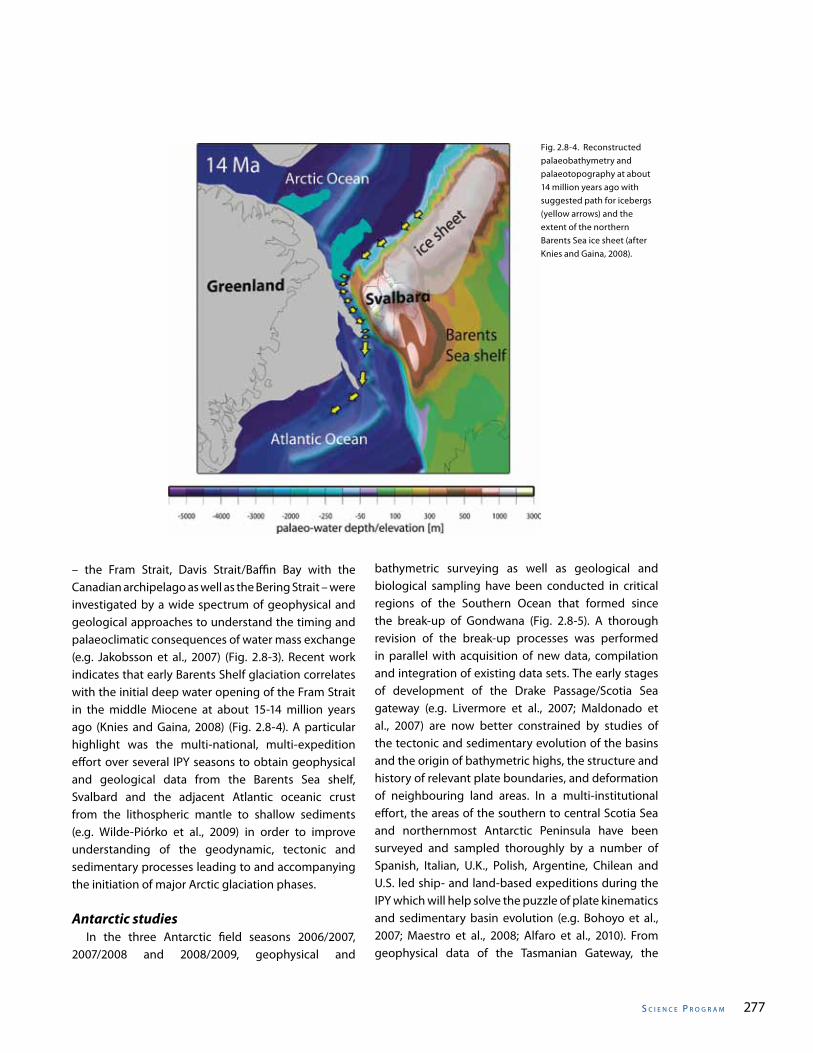
s C I e n C e P r o g r a m 277
– the Fram Strait, Davis Strait/Baffin Bay with the Canadian archipelago as well as the Bering Strait – were investigated by a wide spectrum of geophysical and geological approaches to understand the timing and palaeoclimatic consequences of water mass exchange (e.g. Jakobsson et al., 2007) (Fig. 2.8-3). Recent work indicates that early Barents Shelf glaciation correlates with the initial deep water opening of the Fram Strait in the middle Miocene at about 15-14 million years ago (Knies and Gaina, 2008) (Fig. 2.8-4). A particular highlight was the multi-national, multi-expedition effort over several IPY seasons to obtain geophysical and geological data from the Barents Sea shelf, Svalbard and the adjacent Atlantic oceanic crust from the lithospheric mantle to shallow sediments (e.g. Wilde-Piórko et al., 2009) in order to improve understanding of the geodynamic, tectonic and sedimentary processes leading to and accompanying the initiation of major Arctic glaciation phases.
Antarctic studies In the three Antarctic field seasons 2006/2007, 2007/2008 and 2008/2009, geophysical and
bathymetric surveying as well as geological and biological sampling have been conducted in critical regions of the Southern Ocean that formed since the break-up of Gondwana (Fig. 2.8-5). A thorough revision of the break-up processes was performed in parallel with acquisition of new data, compilation and integration of existing data sets. The early stages of development of the Drake Passage/Scotia Sea gateway (e.g. Livermore et al., 2007; Maldonado et al., 2007) are now better constrained by studies of the tectonic and sedimentary evolution of the basins and the origin of bathymetric highs, the structure and history of relevant plate boundaries, and deformation of neighbouring land areas. In a multi-institutional effort, the areas of the southern to central Scotia Sea and northernmost Antarctic Peninsula have been surveyed and sampled thoroughly by a number of Spanish, Italian, U.K., Polish, Argentine, Chilean and U.S. led ship- and land-based expeditions during the IPY which will help solve the puzzle of plate kinematics and sedimentary basin evolution (e.g. Bohoyo et al., 2007; Maestro et al., 2008; Alfaro et al., 2010). From geophysical data of the Tasmanian Gateway, the
Fig. 2.8-4. Reconstructed palaeobathymetry and palaeotopography at about 14 million years ago with suggested path for icebergs (yellow arrows) and the extent of the northern Barents Sea ice sheet (after Knies and Gaina, 2008).
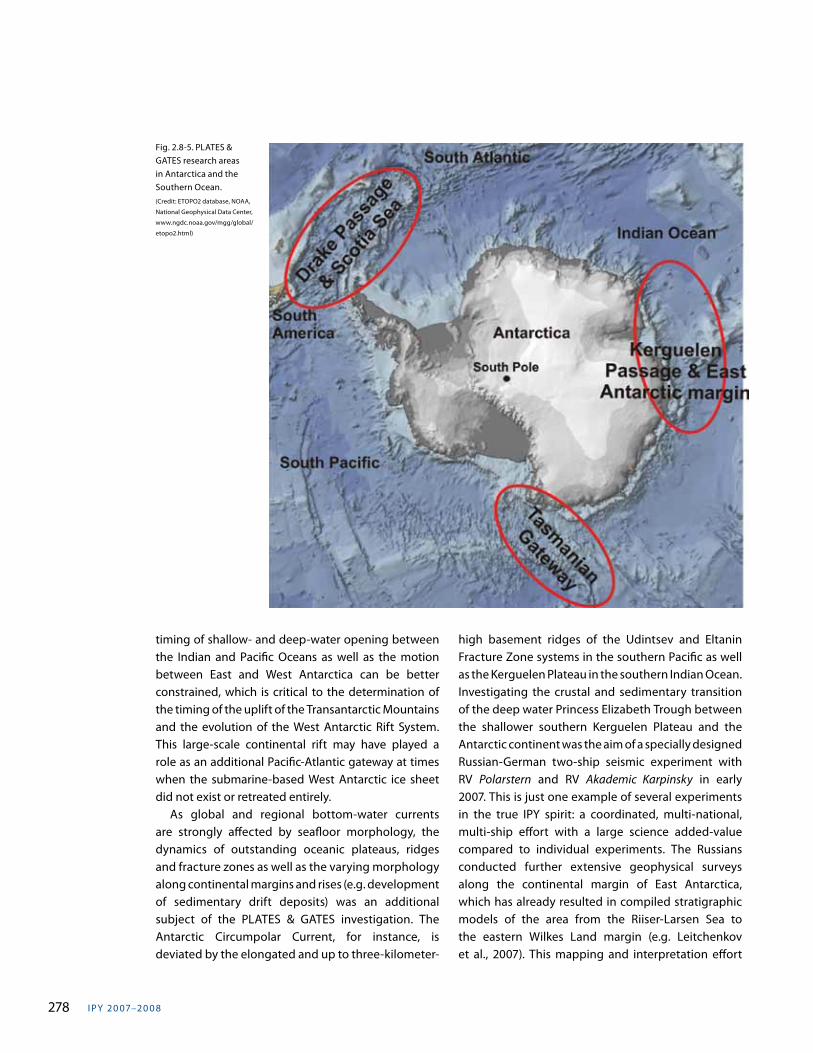
I PY 20 07–20 0 8278
timing of shallow- and deep-water opening between the Indian and Pacific Oceans as well as the motion between East and West Antarctica can be better constrained, which is critical to the determination of the timing of the uplift of the Transantarctic Mountains and the evolution of the West Antarctic Rift System. This large-scale continental rift may have played a role as an additional Pacific-Atlantic gateway at times when the submarine-based West Antarctic ice sheet did not exist or retreated entirely. As global and regional bottom-water currents are strongly affected by seafloor morphology, the dynamics of outstanding oceanic plateaus, ridges and fracture zones as well as the varying morphology along continental margins and rises (e.g. development of sedimentary drift deposits) was an additional subject of the PLATES & GATES investigation. The Antarctic Circumpolar Current, for instance, is deviated by the elongated and up to three-kilometer-
high basement ridges of the Udintsev and Eltanin Fracture Zone systems in the southern Pacific as well as the Kerguelen Plateau in the southern Indian Ocean. Investigating the crustal and sedimentary transition of the deep water Princess Elizabeth Trough between the shallower southern Kerguelen Plateau and the Antarctic continent was the aim of a specially designed Russian-German two-ship seismic experiment with RV Polarstern and RV Akademic Karpinsky in early 2007. This is just one example of several experiments in the true IPY spirit: a coordinated, multi-national, multi-ship effort with a large science added-value compared to individual experiments. The Russians conducted further extensive geophysical surveys along the continental margin of East Antarctica, which has already resulted in compiled stratigraphic models of the area from the Riiser-Larsen Sea to the eastern Wilkes Land margin (e.g. Leitchenkov et al., 2007). This mapping and interpretation effort
Fig. 2.8-5. PLATES & GATES research areas in Antarctica and the Southern Ocean.(Credit: ETOPO2 database, NOAA,
National Geophysical Data Center,
www.ngdc.noaa.gov/mgg/global/
etopo2.html)
s C I e n C e P r o g r a m 279
contributes significantly to the New Tectonic Map of Antarctica (Grikurov and Leitchenkov, in press) as part of the IPY PLATES & GATES project. The information on this map, the characterisation of the Antarctic continent-ocean transitions (e.g. Gohl, 2008) and recent regional stratigraphic grids will be compiled in two follow-up, post-IPY projects Circum-Antarctic Stratigraphy and Paleobathymetry (CASP) and Antarctic Paleotopographic Maps (ANTScape). The generation of higher-resolution palaeobathymetric and palaeotopographic grids is a key condition for realistic simulations of palaeo-ocean currents. Within the PLATES & GATES project, Cenozoic and Mesozoic climate reconstructions are performed using a variety of Earth system models designed to evaluate the effect of ocean gateways and basins on palaeo-circulation patterns, the global carbon cycle and nature of polar ice-sheet development. These experiments include sensitivity runs incorporating new palaeobathymetric reconstructions arising from the new data acquisition described above. The results from these experiments are compared with other model simulations, which include different forcing factors such as atmospheric greenhouse gases and mountain uplift to determine the relative importance of palaeogeography on the evolution of polar and global climates over long geological timescales.
An international effort PLATES & GATES was set up as a closely knit network project, consisting of 33 individual projects with 46 ex-peditions, of which 26 expeditions were land-based, 27 were ship-based and 7 were conducted as com-bined marine-land expeditions. The split between Arctic/sub-Arctic and Antarctic/Southern Ocean expe-ditions is almost even. The following 16 nations with a total of about 60 scientists, technicians and students were active in funded polar expeditions for this proj-ect: Argentina, Chile, Denmark, Germany, Finland, Italy, Japan, New Zealand, Norway, Poland, Russia, Spain, Sweden, U.K., Ukraine and U.S.A.. At least two expeditions were conducted by Chile, Germany, Italy, Norway, Poland, Russia, Spain, Sweden and U.S.A. A summary of all funded PLATES & GATES projects and expeditions can be accessed at www.international-polar-year.de/Plates-and-Gates.28.0.html. Although the tectonic evolution of the polar
ocean basins and their continental margins has been investigated over the last 40 years in various individual projects, PLATES & GATES is the first coordinated effort to bring together the relevant geoscientific disciplines with the ultimate objective to understand the tectonic and sedimentary processes leading to ocean gateway developments. Also new is the approach to involve the numerical palaeoclimate modelling community, as they are the ones which translate the resulting basin and margin bathymetries and topographies into their dynamic model geometries. The challenge will be to compile this vast amount of data and results from the individual PLATES & GATES projects for more realistic dynamic palaeobathymetric and palaeotopographic grids of geological epochs which were relevant for major events in the Earth’s climate history. At this stage, most collected data and samples are still being analyzed, models are being built and first publi-cations are being written. First initial results were pre-sented at the IPY Open Science Conference 2010 in Oslo. With the abundance of the large variety of data and samples, it will take several years to unify models and describe the processes of polar gateway and basin for-mation and their effects on long-term climate change.
Polar Earth Observing Networks in International Polar Year A dearth of geophysical observations in the polar regions has long been recognized, particularly from sites remote from permanent research stations or inhabited sites. Given the intensive global attention and accelerating research efforts focused on understanding ice sheet behaviour in response to climate change, the establishment of geophysical observing networks during IPY was particularly timely. Fundamental objectives of many of the projects involved in the IPY Polar Earth Observing Network (POLENET) program are focused on measuring solid-earth phenomena that provide information on ice mass change and on controls on ice sheet evolution and dynamics. Predictions of the response of the ice sheets to changing global climate, including how ice mass will change, their modes of collapse and the rapidity of resultant sea-level rise, are crucial to planning for our changing environment. Robust predictions require systems-scale observations over
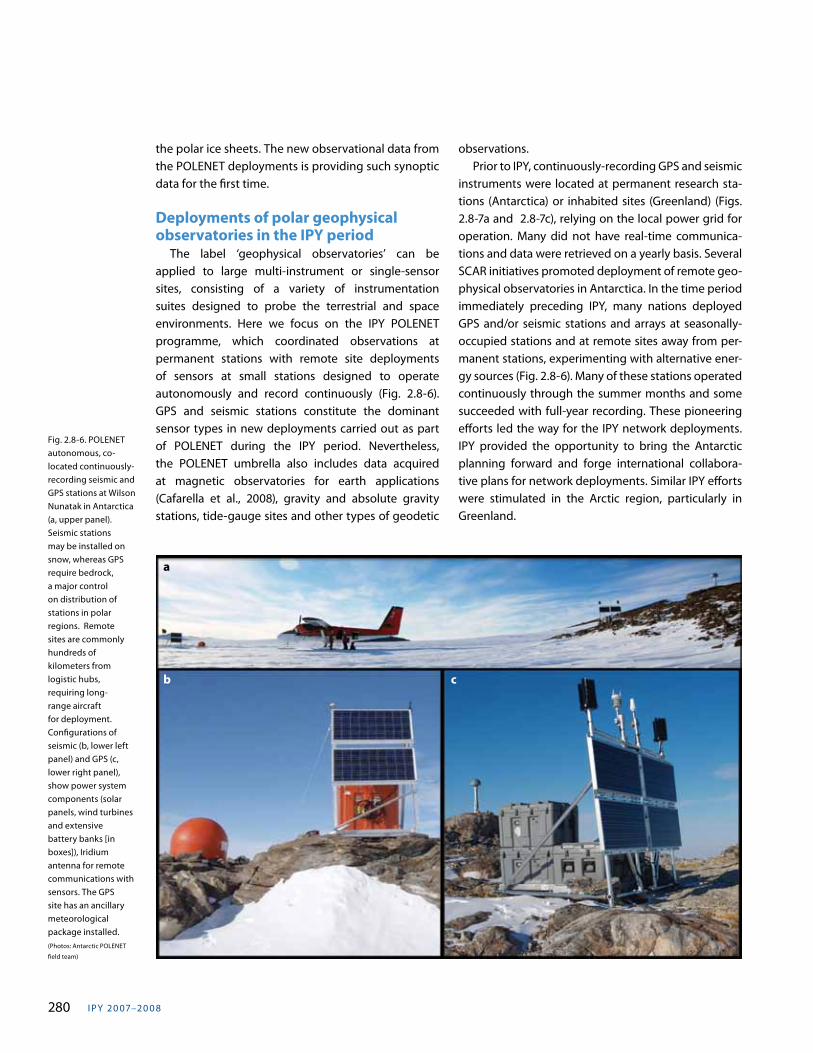
I PY 20 07–20 0 8280
the polar ice sheets. The new observational data from the POLENET deployments is providing such synoptic data for the first time.
Deployments of polar geophysical observatories in the IPY period The label ‘geophysical observatories’ can be applied to large multi-instrument or single-sensor sites, consisting of a variety of instrumentation suites designed to probe the terrestrial and space environments. Here we focus on the IPY POLENET programme, which coordinated observations at permanent stations with remote site deployments of sensors at small stations designed to operate autonomously and record continuously (Fig. 2.8-6). GPS and seismic stations constitute the dominant sensor types in new deployments carried out as part of POLENET during the IPY period. Nevertheless, the POLENET umbrella also includes data acquired at magnetic observatories for earth applications (Cafarella et al., 2008), gravity and absolute gravity stations, tide-gauge sites and other types of geodetic
observations. Prior to IPY, continuously-recording GPS and seismic instruments were located at permanent research sta-tions (Antarctica) or inhabited sites (Greenland) (Figs. 2.8-7a and 2.8-7c), relying on the local power grid for operation. Many did not have real-time communica-tions and data were retrieved on a yearly basis. Several SCAR initiatives promoted deployment of remote geo-physical observatories in Antarctica. In the time period immediately preceding IPY, many nations deployed GPS and/or seismic stations and arrays at seasonally-occupied stations and at remote sites away from per-manent stations, experimenting with alternative ener-gy sources (Fig. 2.8-6). Many of these stations operated continuously through the summer months and some succeeded with full-year recording. These pioneering efforts led the way for the IPY network deployments. IPY provided the opportunity to bring the Antarctic planning forward and forge international collabora-tive plans for network deployments. Similar IPY efforts were stimulated in the Arctic region, particularly in Greenland.
Fig. 2.8-6. POLENET autonomous, co-located continuously-recording seismic and GPS stations at Wilson Nunatak in Antarctica (a, upper panel). Seismic stations may be installed on snow, whereas GPS require bedrock, a major control on distribution of stations in polar regions. Remote sites are commonly hundreds of kilometers from logistic hubs, requiring long-range aircraft for deployment. Configurations of seismic (b, lower left panel) and GPS (c, lower right panel), show power system components (solar panels, wind turbines and extensive battery banks [in boxes]), Iridium antenna for remote communications with sensors. The GPS site has an ancillary meteorological package installed.(Photos: Antarctic POLENET
field team)
a
b c
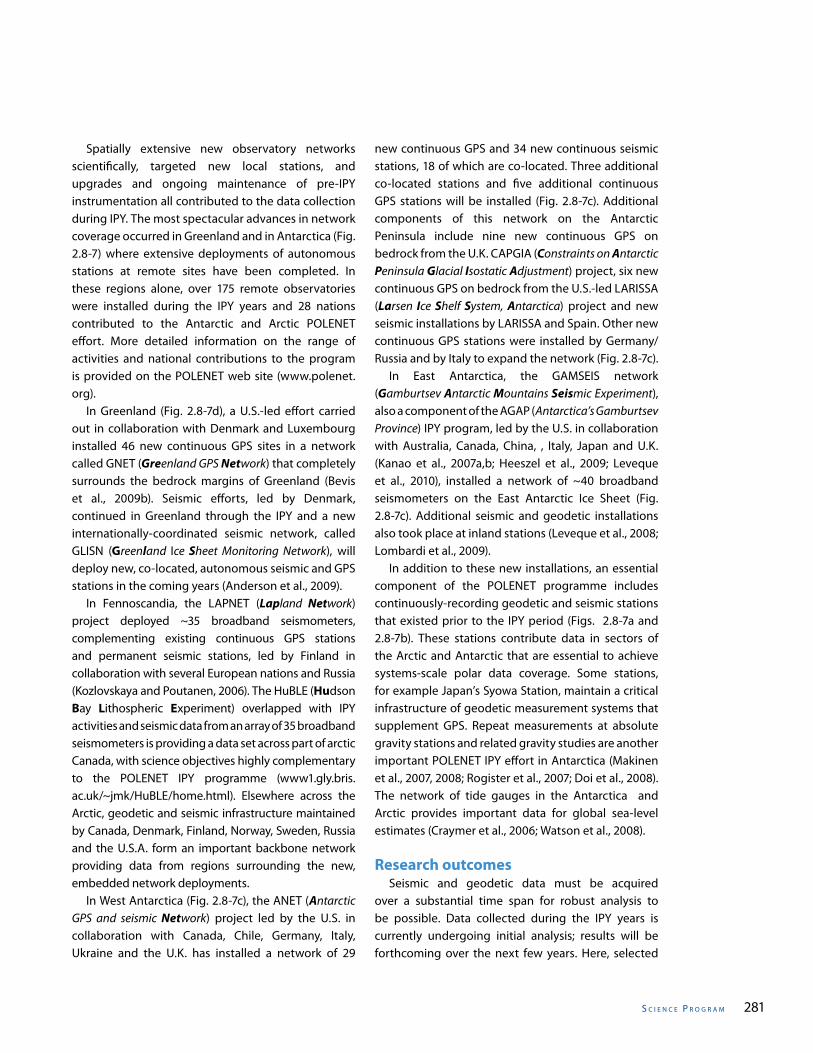
s C I e n C e P r o g r a m 281
Spatially extensive new observatory networks scientifically, targeted new local stations, and upgrades and ongoing maintenance of pre-IPY instrumentation all contributed to the data collection during IPY. The most spectacular advances in network coverage occurred in Greenland and in Antarctica (Fig. 2.8-7) where extensive deployments of autonomous stations at remote sites have been completed. In these regions alone, over 175 remote observatories were installed during the IPY years and 28 nations contributed to the Antarctic and Arctic POLENET effort. More detailed information on the range of activities and national contributions to the program is provided on the POLENET web site (www.polenet.org). In Greenland (Fig. 2.8-7d), a U.S.-led effort carried out in collaboration with Denmark and Luxembourg installed 46 new continuous GPS sites in a network called GNET (Greenland GPS Network) that completely surrounds the bedrock margins of Greenland (Bevis et al., 2009b). Seismic efforts, led by Denmark, continued in Greenland through the IPY and a new internationally-coordinated seismic network, called GLISN (Greenland Ice Sheet Monitoring Network), will deploy new, co-located, autonomous seismic and GPS stations in the coming years (Anderson et al., 2009). In Fennoscandia, the LAPNET (Lapland Network) project deployed ~35 broadband seismometers, complementing existing continuous GPS stations and permanent seismic stations, led by Finland in collaboration with several European nations and Russia (Kozlovskaya and Poutanen, 2006). The HuBLE (Hudson Bay Lithospheric Experiment) overlapped with IPY activities and seismic data from an array of 35 broadband seismometers is providing a data set across part of arctic Canada, with science objectives highly complementary to the POLENET IPY programme (www1.gly.bris.ac.uk/~jmk/HuBLE/home.html). Elsewhere across the Arctic, geodetic and seismic infrastructure maintained by Canada, Denmark, Finland, Norway, Sweden, Russia and the U.S.A. form an important backbone network providing data from regions surrounding the new, embedded network deployments. In West Antarctica (Fig. 2.8-7c), the ANET (Antarctic GPS and seismic Network) project led by the U.S. in collaboration with Canada, Chile, Germany, Italy, Ukraine and the U.K. has installed a network of 29
new continuous GPS and 34 new continuous seismic stations, 18 of which are co-located. Three additional co-located stations and five additional continuous GPS stations will be installed (Fig. 2.8-7c). Additional components of this network on the Antarctic Peninsula include nine new continuous GPS on bedrock from the U.K. CAPGIA (Constraints on Antarctic Peninsula Glacial Isostatic Adjustment) project, six new continuous GPS on bedrock from the U.S.-led LARISSA (Larsen Ice Shelf System, Antarctica) project and new seismic installations by LARISSA and Spain. Other new continuous GPS stations were installed by Germany/Russia and by Italy to expand the network (Fig. 2.8-7c). In East Antarctica, the GAMSEIS network (Gamburtsev Antarctic Mountains Seismic Experiment), also a component of the AGAP (Antarctica’s Gamburtsev Province) IPY program, led by the U.S. in collaboration with Australia, Canada, China, , Italy, Japan and U.K. (Kanao et al., 2007a,b; Heeszel et al., 2009; Leveque et al., 2010), installed a network of ~40 broadband seismometers on the East Antarctic Ice Sheet (Fig. 2.8-7c). Additional seismic and geodetic installations also took place at inland stations (Leveque et al., 2008; Lombardi et al., 2009). In addition to these new installations, an essential component of the POLENET programme includes continuously-recording geodetic and seismic stations that existed prior to the IPY period (Figs. 2.8-7a and 2.8-7b). These stations contribute data in sectors of the Arctic and Antarctic that are essential to achieve systems-scale polar data coverage. Some stations, for example Japan’s Syowa Station, maintain a critical infrastructure of geodetic measurement systems that supplement GPS. Repeat measurements at absolute gravity stations and related gravity studies are another important POLENET IPY effort in Antarctica (Makinen et al., 2007, 2008; Rogister et al., 2007; Doi et al., 2008). The network of tide gauges in the Antarctica and Arctic provides important data for global sea-level estimates (Craymer et al., 2006; Watson et al., 2008).
Research outcomes Seismic and geodetic data must be acquired over a substantial time span for robust analysis to be possible. Data collected during the IPY years is currently undergoing initial analysis; results will be forthcoming over the next few years. Here, selected
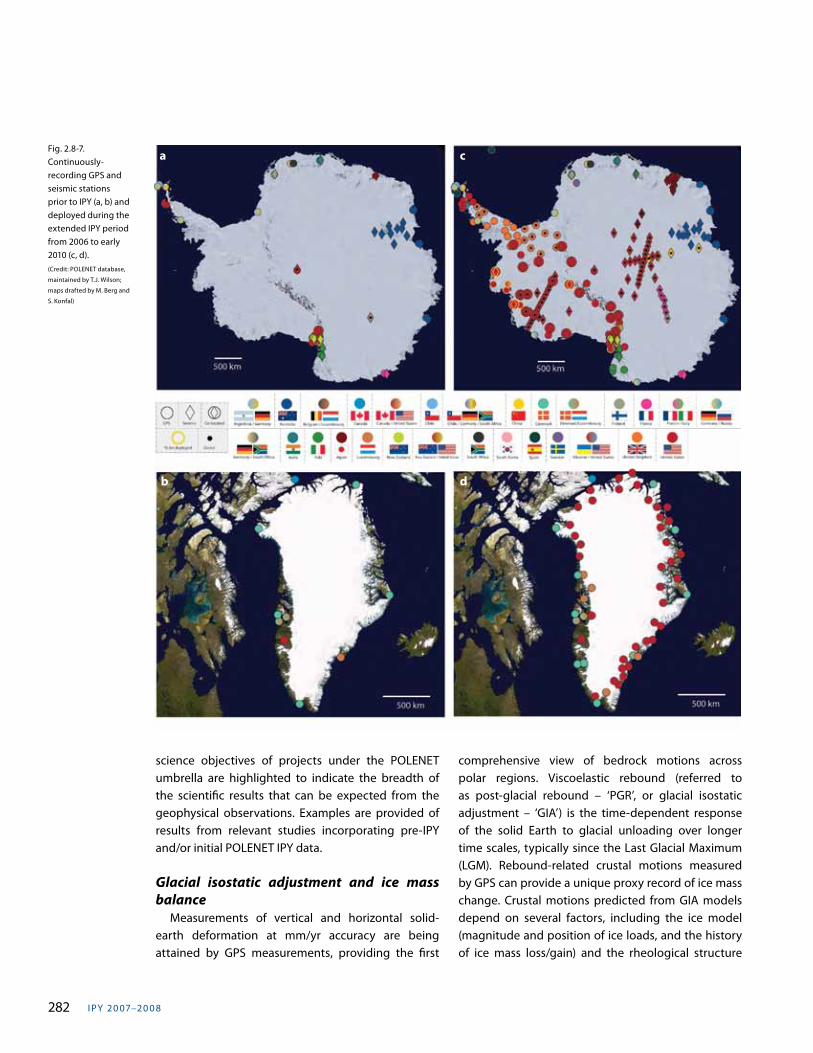
I PY 20 07–20 0 8282
Fig. 2.8-7. Continuously-recording GPS and seismic stations prior to IPY (a, b) and deployed during the extended IPY period from 2006 to early 2010 (c, d). (Credit: POLENET database,
maintained by T.J. Wilson;
maps drafted by M. Berg and
S. Konfal)
science objectives of projects under the POLENET umbrella are highlighted to indicate the breadth of the scientific results that can be expected from the geophysical observations. Examples are provided of results from relevant studies incorporating pre-IPY and/or initial POLENET IPY data.
Glacial isostatic adjustment and ice mass balance Measurements of vertical and horizontal solid-earth deformation at mm/yr accuracy are being attained by GPS measurements, providing the first
comprehensive view of bedrock motions across polar regions. Viscoelastic rebound (referred to as post-glacial rebound – ‘PGR’, or glacial isostatic adjustment – ‘GIA’) is the time-dependent response of the solid Earth to glacial unloading over longer time scales, typically since the Last Glacial Maximum (LGM). Rebound-related crustal motions measured by GPS can provide a unique proxy record of ice mass change. Crustal motions predicted from GIA models depend on several factors, including the ice model (magnitude and position of ice loads, and the history of ice mass loss/gain) and the rheological structure
a
b
c
d
s C I e n C e P r o g r a m 283
of the Earth. The patterns of uplift documented by GPS measurements can document the positions of major ice loads (Sella et al., 2007). Mantle viscosity and the thickness and elastic rigidity of the lithosphere, control the magnitudes and time scales for isostatic response to glacial loading and unloading. These earth properties, and their variation, can be inferred from studies of seismic velocity and attenuation. Hence, by simultaneously measuring crustal motions using GPS and by gaining higher-resolution data on the thickness and rheology of the crust and mantle from seismological studies, the POLENET observational programme will make an unprecedented leap in our ability to model GIA in Antarctica and Greenland. The first tests of glacial isostatic adjustment models for Antarctica and Greenland based on GPS-derived vertical crustal motions mainly show that GIA model predictions do not match measured rates (Ohzono et al., 2006; Mancini et al., 2007; Khan et al., 2008; Willis et al., 2008c; Bevis et al., 2009a). This emphasizes the need for improved ice and earth models, and for ‘GPS-tuned’ GIA modeling. Satellite-based monitoring provides one means of obtaining data on modern ice mass balance for entire ice sheets, and ongoing analyses of both altimetry and time-variable gravity data indicate mass loss from the Greenland and Antarctic ice sheets that appears to be accelerating (Rignot et al., 2008; Chen et al., 2009; Velicogna, 2009). Uncertainties in both types of measurements, however, are mainly due to ‘contamination’ by vertical displacement of the bedrock beneath the ice sheets due to ‘rebound’, and a poorly constrained ‘correction’ must be applied to remove this component in order to derive ice mass change (Alley et al., 2007). POLENET observing networks were designed to directly measure solid earth phenomena, including ‘rebound’, and provide the first synoptic ground-based observations across the Greenland and Antarctic ice sheets. The new observations will thus greatly reduce the sources of uncertainties in satellite-derived measurements. For example, GPS data from Enderby Land, Antarctica, has shown that an apparent region of positive ice mass change, which could be interpreted as increasing ice mass, cannot be ascribed to incorrectly modeled vertical crustal motion due to GIA (Tregoning et al., 2009). POLENET GPS measurements will thus complement the orbital data
sets to measure ice mass change to an unprecedented level of detail and accuracy. Earth’s response to any very recent changes in ice mass, including rapidly accelerating ice loss over decades, will be largely elastic. Outlet glaciers in southeast Greenland showing accelerated flow speeds and rapid ice discharge in the current decade produced a detectable increase in uplift in the time series of a nearby continuous GPS station, recording a rapid elastic response of the crust (Khan et al., 2007). The new array of continuous GPS stations in both Greenland and Antarctica ensure that any such elastic signals will be recorded and, using seismological constraints on regional elastic structure and any independent data on ice mass change, we will be able to calibrate the relationship between ice mass change and crustal deflection. This geodetic measurement of earth’s elastic response will provide a new way to recognize and measure periodic or accelerating ice mass loss.
Ice dynamics An understanding of the ‘solid Earth’ processes that influence ice sheet dynamics is essential for predicting the future behavior and stability of the polar ice sheets. Coupled ice-sheet climate models require estimates of heat flow and sediment thickness at the base of the ice sheet, which can ‘lubricate’ the ice-rock interface. Since these parameters cannot be measured directly in Antarctica, seismic images provide a ‘remote sensing’ method to obtain information that is vital to understanding ice sheet stability. Scientists will use seismological investigations, integrated with results from the geodetic studies, to provide first-order constraints on geological/tectonic parameters important for understanding ice sheet dynamics. New seismic data will be used to develop high-resolution seismic images that will constrain lithospheric viscosity and thermal structure as well as basal heat flow. High heat flow could produce sub-ice water, lowering bed friction, and may lead to the formation of subglacial lakes. Tomographic images of West Antarctica show the entire region is characterized by slow upper mantle velocities suggestive of high heat flow and thin lithosphere, but resolution is too poor for detailed correlation of low velocity regions with tectonic and glacial features.
I PY 20 07–20 0 8284
Seismic imaging can also be used to map the presence of sedimentary substrate, bedrock topography and structure, all of which can significantly influence ice flow. A variety of evidence suggests that thick sedimentary deposits may be critical to the formation of fast-moving ice streams, yet the distribution and thickness of sediments beneath the ice sheets is poorly known. Important constraints on ice sheet dynamics can be obtained from glacier seismicity, including insight into the flow of glaciers (e.g. Danesi et al., 2007). Glacial earthquakes of longer period provide critical information about processes associated with calving at ice margins and at the base of glacial systems (Wiens et al., 2008; Nettles and Ekstrom, 2010).
Deep Earth structure and evolution The resolution of deep seismic structure using data from pre-IPY permanent seismic stations was on the order of 500-1000 km across most of Antarctica, but the new array of seismic sensors will improve this resolution by orders of magnitude, to produce seismic images at scales of interest to tectonic studies. For example, mantle structure associated with rifting, mountain uplift and with potential rising mantle plumes can now be resolved (e.g. Lawrence et al., 2006; Watson et al., 2006; Reusch et al., 2008; Gupta et al., 2009). In addition to improving detail of deep seismic structure beneath Antarctica, Greenland and other Arctic regions, the new seismic data will contribute significantly to global tomographic models of the Earth’s interior, which suffer from undersampling around the poles, particularly in the southern hemisphere. The polar regions provide a unique vantage point for studying the structure and improving understanding of the evolution of the Earth’s inner core. Only seismic phases traveling along polar paths can map seismic anisotropy in the core, generally aligned parallel to Earth’s rotation axis, which may be due to convection patterns in the core (Leykam et al., 2010). New studies will provide insights into core dynamics with implications for the earth’s magnetic field.
Plate tectonics, intraplate deformation and magmatism, and tectonic evolution GPS and seismology are primary tools for resolving neotectonic deformation between and within plates. The pattern of steady horizontal motion of the bedrock of the continents will be better resolved by the spatially distributed continuous GPS measurements and this information, combined with new knowledge of the location and magnitude of earthquakes from the deployment of seismic stations, will show any active deformation and elucidate the relationships between ice mass loads, GIA, crustal stresses and seismicity (e.g. Chung, 2002; Reading, 2007). GPS studies using pre- and early-IPY continuous, quasi-continuous and campaign data have indicated rigid behaviour of the Antarctic plate (e.g. Ohzono et al., 2006; Casula et al., 2007; Capra et al., 2008; Jiang et al., 2009). In contrast, tectonic crustal motion is clearly resolved by GPS in the Bransfield Strait and Scotia Arc from GPS results (Dietrich et al., 2004; Smalley et al., 2007). Very small residual horizontal motions remain after rigid plate motion is removed in the Transantarctic Mountains region, suggesting rifting processes may be inactive (Casula et al., 2007; Capra et al., 2008) and/or that horizontal motions may be largely driven by glacial isostatic adjustment (Willis, 2008b). Available data from long-term, continuously-recording seismic stations indicate that continental Greenland and Antarctica are characterized by a low level of seismicity (Gregersen, 1989; Kaminuma, 2000; Reading, 2007), with the exception of the tectonically active Scotia Arc region, (Fig. 2.8-8). Temporary seismic arrays have shown that regional seismicity is present in the continental interior and around the continental margins in Antarctica, and can be attributed to active structures and plates mobility (e.g. Reading, 2007). Earthquakes go undetected in Antarctica and improved seismic station distribution will reveal seismicity pat-terns in increasing detail. Deployment of hydroacous-tic arrays on the ocean floor is improving monitoring of seismicity associated with Bransfield Strait and Sco-tia Arc neotectonics (Dziak et al., 2007, 2010). Seismic methods also provide a way to map ancient orogenic fabrics developed during assembly of supercontinents, including the Antarctic core of the Gondwana super-continent (e.g. Reading, 2006b; Barklage et al., 2009)
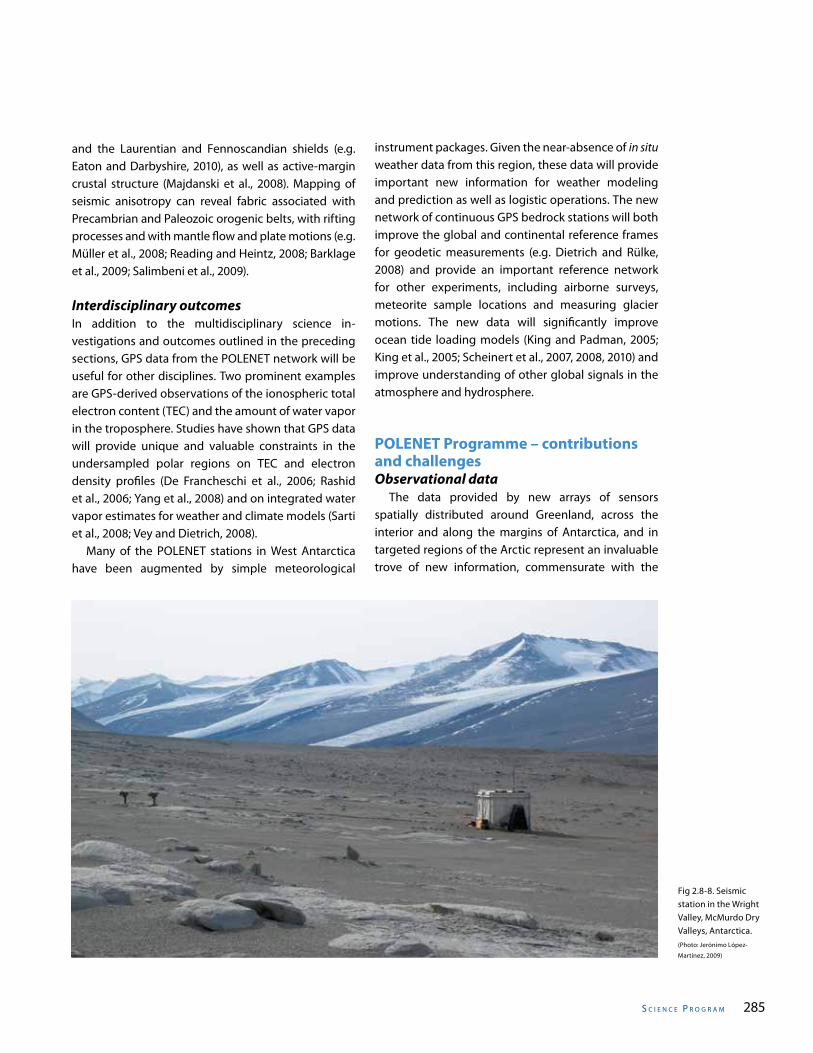
s C I e n C e P r o g r a m 285
and the Laurentian and Fennoscandian shields (e.g. Eaton and Darbyshire, 2010), as well as active-margin crustal structure (Majdanski et al., 2008). Mapping of seismic anisotropy can reveal fabric associated with Precambrian and Paleozoic orogenic belts, with rifting processes and with mantle flow and plate motions (e.g. Müller et al., 2008; Reading and Heintz, 2008; Barklage et al., 2009; Salimbeni et al., 2009).
Interdisciplinary outcomesIn addition to the multidisciplinary science in-vestigations and outcomes outlined in the preceding sections, GPS data from the POLENET network will be useful for other disciplines. Two prominent examples are GPS-derived observations of the ionospheric total electron content (TEC) and the amount of water vapor in the troposphere. Studies have shown that GPS data will provide unique and valuable constraints in the undersampled polar regions on TEC and electron density profiles (De Francheschi et al., 2006; Rashid et al., 2006; Yang et al., 2008) and on integrated water vapor estimates for weather and climate models (Sarti et al., 2008; Vey and Dietrich, 2008). Many of the POLENET stations in West Antarctica have been augmented by simple meteorological
instrument packages. Given the near-absence of in situ weather data from this region, these data will provide important new information for weather modeling and prediction as well as logistic operations. The new network of continuous GPS bedrock stations will both improve the global and continental reference frames for geodetic measurements (e.g. Dietrich and Rülke, 2008) and provide an important reference network for other experiments, including airborne surveys, meteorite sample locations and measuring glacier motions. The new data will significantly improve ocean tide loading models (King and Padman, 2005; King et al., 2005; Scheinert et al., 2007, 2008, 2010) and improve understanding of other global signals in the atmosphere and hydrosphere.
POLENET Programme – contributions and challengesObservational data The data provided by new arrays of sensors spatially distributed around Greenland, across the interior and along the margins of Antarctica, and in targeted regions of the Arctic represent an invaluable trove of new information, commensurate with the
Fig 2.8-8. Seismic station in the Wright Valley, McMurdo Dry Valleys, Antarctica.(Photo: Jerónimo López-
Martínez, 2009)
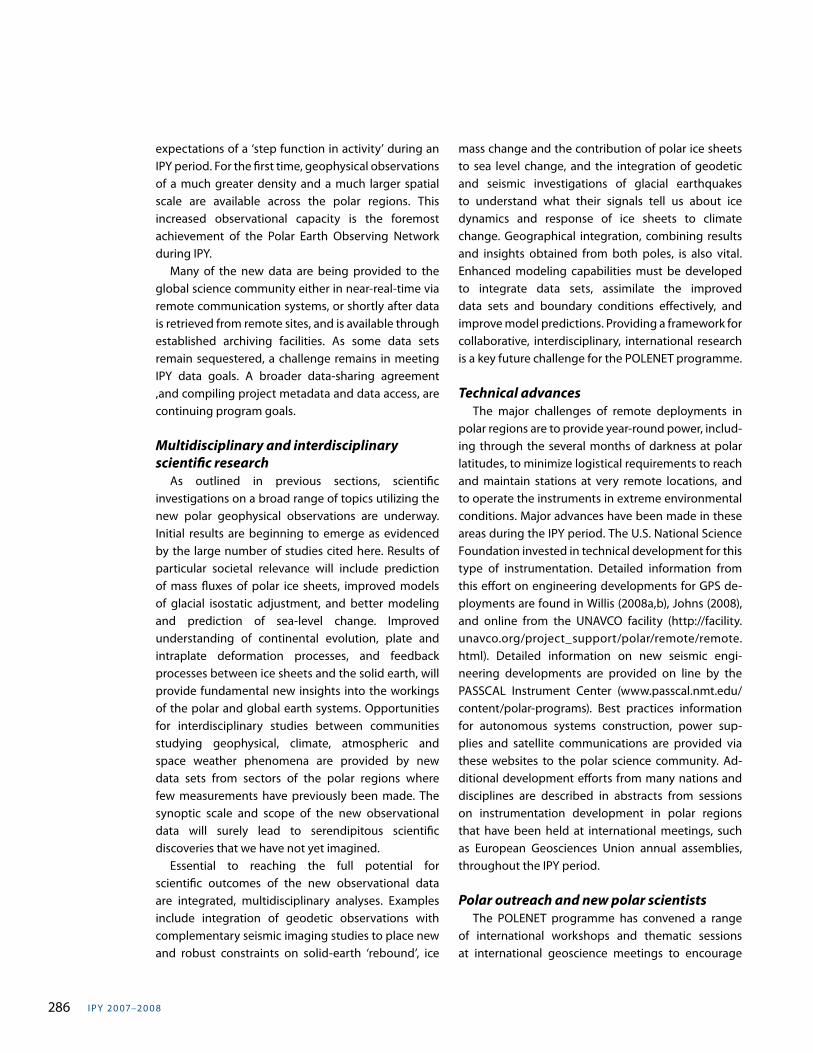
I PY 20 07–20 0 8286
expectations of a ‘step function in activity’ during an IPY period. For the first time, geophysical observations of a much greater density and a much larger spatial scale are available across the polar regions. This increased observational capacity is the foremost achievement of the Polar Earth Observing Network during IPY. Many of the new data are being provided to the global science community either in near-real-time via remote communication systems, or shortly after data is retrieved from remote sites, and is available through established archiving facilities. As some data sets remain sequestered, a challenge remains in meeting IPY data goals. A broader data-sharing agreement ,and compiling project metadata and data access, are continuing program goals.
Multidisciplinary and interdisciplinary scientific research As outlined in previous sections, scientific investigations on a broad range of topics utilizing the new polar geophysical observations are underway. Initial results are beginning to emerge as evidenced by the large number of studies cited here. Results of particular societal relevance will include prediction of mass fluxes of polar ice sheets, improved models of glacial isostatic adjustment, and better modeling and prediction of sea-level change. Improved understanding of continental evolution, plate and intraplate deformation processes, and feedback processes between ice sheets and the solid earth, will provide fundamental new insights into the workings of the polar and global earth systems. Opportunities for interdisciplinary studies between communities studying geophysical, climate, atmospheric and space weather phenomena are provided by new data sets from sectors of the polar regions where few measurements have previously been made. The synoptic scale and scope of the new observational data will surely lead to serendipitous scientific discoveries that we have not yet imagined. Essential to reaching the full potential for scientific outcomes of the new observational data are integrated, multidisciplinary analyses. Examples include integration of geodetic observations with complementary seismic imaging studies to place new and robust constraints on solid-earth ‘rebound’, ice
mass change and the contribution of polar ice sheets to sea level change, and the integration of geodetic and seismic investigations of glacial earthquakes to understand what their signals tell us about ice dynamics and response of ice sheets to climate change. Geographical integration, combining results and insights obtained from both poles, is also vital. Enhanced modeling capabilities must be developed to integrate data sets, assimilate the improved data sets and boundary conditions effectively, and improve model predictions. Providing a framework for collaborative, interdisciplinary, international research is a key future challenge for the POLENET programme.
Technical advances The major challenges of remote deploy ments in polar regions are to provide year-round power, includ-ing through the several months of darkness at polar latitudes, to minimize logistical requirements to reach and maintain stations at very remote locations, and to operate the instruments in extreme environmental conditions. Major advances have been made in these areas during the IPY period. The U.S. National Science Foundation invested in technical development for this type of instrumentation. Detailed information from this effort on engineering developments for GPS de-ployments are found in Willis (2008a,b), Johns (2008), and online from the UNAVCO facility (http://facility.unavco.org/project_support/polar/remote/remote.html). Detailed information on new seismic engi-neering developments are provided on line by the PASSCAL Instrument Center (www.passcal.nmt.edu/content/polar-programs). Best practices information for autonomous systems construction, power sup-plies and satellite communications are provided via these websites to the polar science community. Ad-ditional development efforts from many nations and disciplines are described in abstracts from sessions on instrumentation development in polar regions that have been held at international meetings, such as European Geosciences Union annual assemblies, throughout the IPY period.
Polar outreach and new polar scientists The POLENET programme has convened a range of international workshops and thematic sessions at international geoscience meetings to encourage
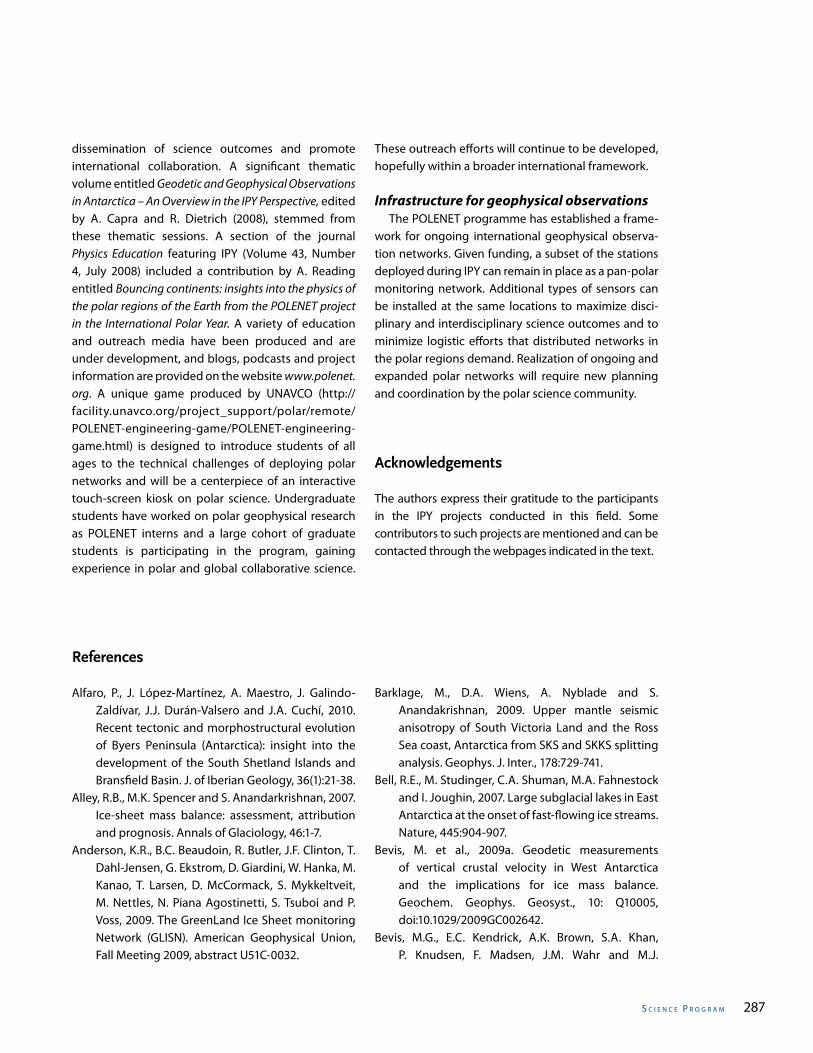
s C I e n C e P r o g r a m 287
dissemination of science outcomes and promote international collaboration. A significant thematic volume entitled Geodetic and Geophysical Observations in Antarctica – An Overview in the IPY Perspective, edited by A. Capra and R. Dietrich (2008), stemmed from these thematic sessions. A section of the journal Physics Education featuring IPY (Volume 43, Number 4, July 2008) included a contribution by A. Reading entitled Bouncing continents: insights into the physics of the polar regions of the Earth from the POLENET project in the International Polar Year. A variety of education and outreach media have been produced and are under development, and blogs, podcasts and project information are provided on the website www.polenet.org. A unique game produced by UNAVCO (http://facility.unavco.org/project_support/polar/remote/POLENET-engineering-game/POLENET-engineering-game.html) is designed to introduce students of all ages to the technical challenges of deploying polar networks and will be a centerpiece of an interactive touch-screen kiosk on polar science. Undergraduate students have worked on polar geophysical research as POLENET interns and a large cohort of graduate students is participating in the program, gaining experience in polar and global collaborative science.
References
Alfaro, P., J. López-Martínez, A. Maestro, J. Galindo-Zaldívar, J.J. Durán-Valsero and J.A. Cuchí, 2010. Recent tectonic and morphostructural evolution of Byers Peninsula (Antarctica): insight into the development of the South Shetland Islands and Bransfield Basin. J. of Iberian Geology, 36(1):21-38.
Alley, R.B., M.K. Spencer and S. Anandarkrishnan, 2007. Ice-sheet mass balance: assessment, attribution and prognosis. Annals of Glaciology, 46:1-7.
Anderson, K.R., B.C. Beaudoin, R. Butler, J.F. Clinton, T. Dahl-Jensen, G. Ekstrom, D. Giardini, W. Hanka, M. Kanao, T. Larsen, D. McCormack, S. Mykkeltveit, M. Nettles, N. Piana Agostinetti, S. Tsuboi and P. Voss, 2009. The GreenLand Ice Sheet monitoring Network (GLISN). American Geophysical Union, Fall Meeting 2009, abstract U51C-0032.
Barklage, M., D.A. Wiens, A. Nyblade and S. Anandakrishnan, 2009. Upper mantle seismic anisotropy of South Victoria Land and the Ross Sea coast, Antarctica from SKS and SKKS splitting analysis. Geophys. J. Inter., 178:729-741.
Bell, R.E., M. Studinger, C.A. Shuman, M.A. Fahnestock and I. Joughin, 2007. Large subglacial lakes in East Antarctica at the onset of fast-flowing ice streams. Nature, 445:904-907.
Bevis, M. et al., 2009a. Geodetic measurements of vertical crustal velocity in West Antarctica and the implications for ice mass balance. Geochem. Geophys. Geosyst., 10: Q10005, doi:10.1029/2009GC002642.
Bevis, M.G., E.C. Kendrick, A.K. Brown, S.A. Khan, P. Knudsen, F. Madsen, J.M. Wahr and M.J.
These outreach efforts will continue to be developed, hopefully within a broader international framework.
Infrastructure for geophysical observations The POLENET programme has established a frame-work for ongoing international geophysical observa-tion networks. Given funding, a subset of the stations deployed during IPY can remain in place as a pan-polar monitoring network. Additional types of sensors can be installed at the same locations to maximize disci-plinary and interdisciplinary science outcomes and to minimize logistic efforts that distributed networks in the polar regions demand. Realization of ongoing and expanded polar networks will require new planning and coordination by the polar science community.
Acknowledgements
The authors express their gratitude to the participants in the IPY projects conducted in this field. Some contributors to such projects are mentioned and can be contacted through the webpages indicated in the text.
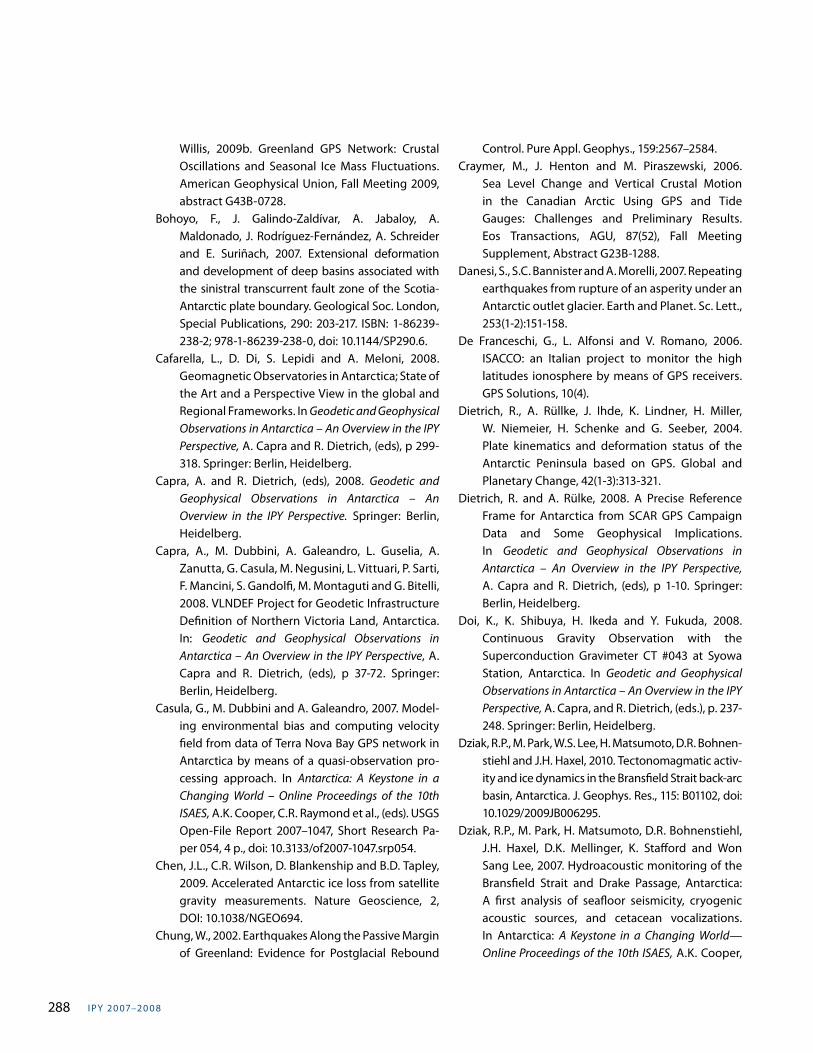
I PY 20 07–20 0 8288
Willis, 2009b. Greenland GPS Network: Crustal Oscillations and Seasonal Ice Mass Fluctuations. American Geophysical Union, Fall Meeting 2009, abstract G43B-0728.
Bohoyo, F., J. Galindo-Zaldívar, A. Jabaloy, A. Maldonado, J. Rodríguez-Fernández, A. Schreider and E. Suriñach, 2007. Extensional deformation and development of deep basins associated with the sinistral transcurrent fault zone of the Scotia-Antarctic plate boundary. Geological Soc. London, Special Publications, 290: 203-217. ISBN: 1-86239-238-2; 978-1-86239-238-0, doi: 10.1144/SP290.6.
Cafarella, L., D. Di, S. Lepidi and A. Meloni, 2008. Geomagnetic Observatories in Antarctica; State of the Art and a Perspective View in the global and Regional Frameworks. In Geodetic and Geophysical Observations in Antarctica – An Overview in the IPY Perspective, A. Capra and R. Dietrich, (eds), p 299-318. Springer: Berlin, Heidelberg.
Capra, A. and R. Dietrich, (eds), 2008. Geodetic and Geophysical Observations in Antarctica – An Overview in the IPY Perspective. Springer: Berlin, Heidelberg.
Capra, A., M. Dubbini, A. Galeandro, L. Guselia, A. Zanutta, G. Casula, M. Negusini, L. Vittuari, P. Sarti, F. Mancini, S. Gandolfi, M. Montaguti and G. Bitelli, 2008. VLNDEF Project for Geodetic Infrastructure Definition of Northern Victoria Land, Antarctica. In: Geodetic and Geophysical Observations in Antarctica – An Overview in the IPY Perspective, A. Capra and R. Dietrich, (eds), p 37-72. Springer: Berlin, Heidelberg.
Casula, G., M. Dubbini and A. Galeandro, 2007. Model-ing environmental bias and computing velocity field from data of Terra Nova Bay GPS network in Antarctica by means of a quasi-observation pro-cessing approach. In Antarctica: A Keystone in a Changing World – Online Proceedings of the 10th ISAES, A.K. Cooper, C.R. Raymond et al., (eds). USGS Open-File Report 2007–1047, Short Research Pa-per 054, 4 p., doi: 10.3133/of2007-1047.srp054.
Chen, J.L., C.R. Wilson, D. Blankenship and B.D. Tapley, 2009. Accelerated Antarctic ice loss from satellite gravity measurements. Nature Geoscience, 2, DOI: 10.1038/NGEO694.
Chung, W., 2002. Earthquakes Along the Passive Margin of Greenland: Evidence for Postglacial Rebound
Control. Pure Appl. Geophys., 159:2567–2584.Craymer, M., J. Henton and M. Piraszewski, 2006.
Sea Level Change and Vertical Crustal Motion in the Canadian Arctic Using GPS and Tide Gauges: Challenges and Preliminary Results. Eos Transactions, AGU, 87(52), Fall Meeting Supplement, Abstract G23B-1288.
Danesi, S., S.C. Bannister and A. Morelli, 2007. Repeating earthquakes from rupture of an asperity under an Antarctic outlet glacier. Earth and Planet. Sc. Lett., 253(1-2):151-158.
De Franceschi, G., L. Alfonsi and V. Romano, 2006. ISACCO: an Italian project to monitor the high latitudes ionosphere by means of GPS receivers. GPS Solutions, 10(4).
Dietrich, R., A. Rüllke, J. Ihde, K. Lindner, H. Miller, W. Niemeier, H. Schenke and G. Seeber, 2004. Plate kinematics and deformation status of the Antarctic Peninsula based on GPS. Global and Planetary Change, 42(1-3):313-321.
Dietrich, R. and A. Rülke, 2008. A Precise Reference Frame for Antarctica from SCAR GPS Campaign Data and Some Geophysical Implications. In Geodetic and Geophysical Observations in Antarctica – An Overview in the IPY Perspective, A. Capra and R. Dietrich, (eds), p 1-10. Springer: Berlin, Heidelberg.
Doi, K., K. Shibuya, H. Ikeda and Y. Fukuda, 2008. Continuous Gravity Observation with the Superconduction Gravimeter CT #043 at Syowa Station, Antarctica. In Geodetic and Geophysical Observations in Antarctica – An Overview in the IPY Perspective, A. Capra, and R. Dietrich, (eds.), p. 237-248. Springer: Berlin, Heidelberg.
Dziak, R.P., M. Park, W.S. Lee, H. Matsumoto, D.R. Bohnen-stiehl and J.H. Haxel, 2010. Tectonomagmatic activ-ity and ice dynamics in the Bransfield Strait back-arc basin, Antarctica. J. Geophys. Res., 115: B01102, doi: 10.1029/2009JB006295.
Dziak, R.P., M. Park, H. Matsumoto, D.R. Bohnenstiehl, J.H. Haxel, D.K. Mellinger, K. Stafford and Won Sang Lee, 2007. Hydroacoustic monitoring of the Bransfield Strait and Drake Passage, Antarctica: A first analysis of seafloor seismicity, cryogenic acoustic sources, and cetacean vocalizations. In Antarctica: A Keystone in a Changing World—Online Proceedings of the 10th ISAES, A.K. Cooper,
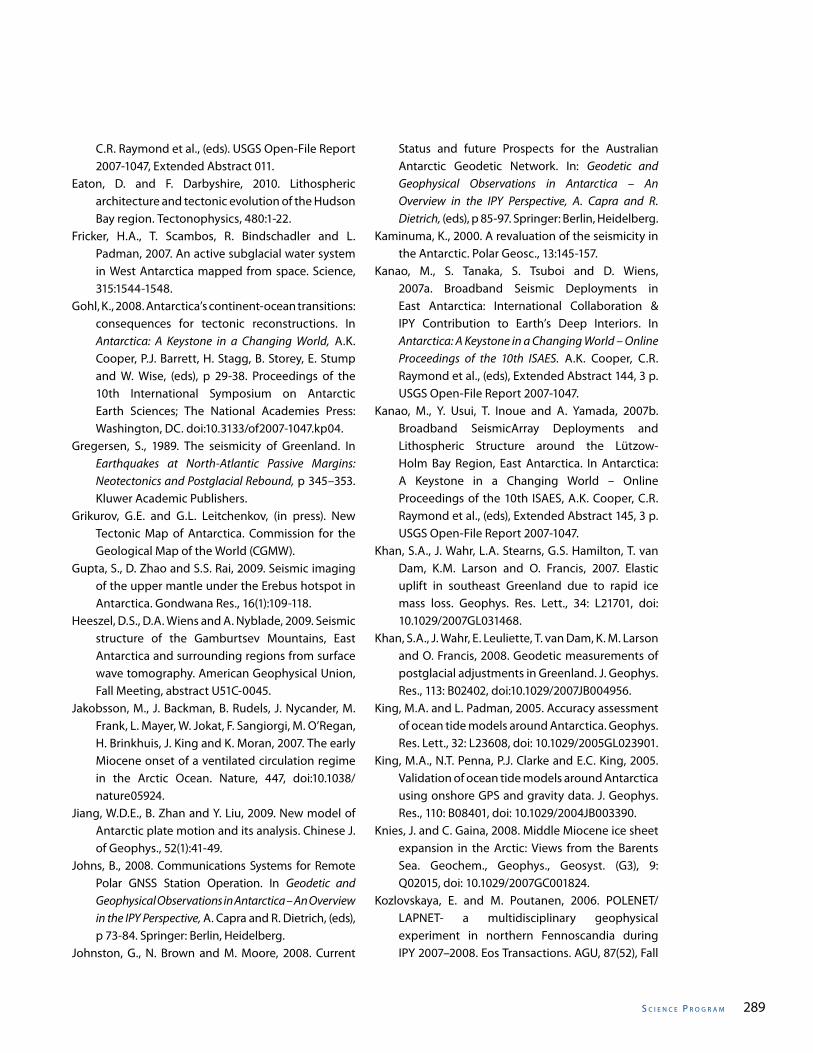
s C I e n C e P r o g r a m 289
C.R. Raymond et al., (eds). USGS Open-File Report 2007-1047, Extended Abstract 011.
Eaton, D. and F. Darbyshire, 2010. Lithospheric architecture and tectonic evolution of the Hudson Bay region. Tectonophysics, 480:1-22.
Fricker, H.A., T. Scambos, R. Bindschadler and L. Padman, 2007. An active subglacial water system in West Antarctica mapped from space. Science, 315:1544-1548.
Gohl, K., 2008. Antarctica’s continent-ocean transitions: consequences for tectonic reconstructions. In Antarctica: A Keystone in a Changing World, A.K. Cooper, P.J. Barrett, H. Stagg, B. Storey, E. Stump and W. Wise, (eds), p 29-38. Proceedings of the 10th International Symposium on Antarctic Earth Sciences; The National Academies Press: Washington, DC. doi:10.3133/of2007-1047.kp04.
Gregersen, S., 1989. The seismicity of Greenland. In Earthquakes at North-Atlantic Passive Margins: Neotectonics and Postglacial Rebound, p 345–353. Kluwer Academic Publishers.
Grikurov, G.E. and G.L. Leitchenkov, (in press). New Tectonic Map of Antarctica. Commission for the Geological Map of the World (CGMW).
Gupta, S., D. Zhao and S.S. Rai, 2009. Seismic imaging of the upper mantle under the Erebus hotspot in Antarctica. Gondwana Res., 16(1):109-118.
Heeszel, D.S., D.A. Wiens and A. Nyblade, 2009. Seismic structure of the Gamburtsev Mountains, East Antarctica and surrounding regions from surface wave tomography. American Geophysical Union, Fall Meeting, abstract U51C-0045.
Jakobsson, M., J. Backman, B. Rudels, J. Nycander, M. Frank, L. Mayer, W. Jokat, F. Sangiorgi, M. O’Regan, H. Brinkhuis, J. King and K. Moran, 2007. The early Miocene onset of a ventilated circulation regime in the Arctic Ocean. Nature, 447, doi:10.1038/nature05924.
Jiang, W.D.E., B. Zhan and Y. Liu, 2009. New model of Antarctic plate motion and its analysis. Chinese J. of Geophys., 52(1):41-49.
Johns, B., 2008. Communications Systems for Remote Polar GNSS Station Operation. In Geodetic and Geophysical Observations in Antarctica – An Overview in the IPY Perspective, A. Capra and R. Dietrich, (eds), p 73-84. Springer: Berlin, Heidelberg.
Johnston, G., N. Brown and M. Moore, 2008. Current
Status and future Prospects for the Australian Antarctic Geodetic Network. In: Geodetic and Geophysical Observations in Antarctica – An Overview in the IPY Perspective, A. Capra and R. Dietrich, (eds), p 85-97. Springer: Berlin, Heidelberg.
Kaminuma, K., 2000. A revaluation of the seismicity in the Antarctic. Polar Geosc., 13:145-157.
Kanao, M., S. Tanaka, S. Tsuboi and D. Wiens, 2007a. Broadband Seismic Deployments in East Antarctica: International Collaboration & IPY Contribution to Earth’s Deep Interiors. In Antarctica: A Keystone in a Changing World – Online Proceedings of the 10th ISAES. A.K. Cooper, C.R. Raymond et al., (eds), Extended Abstract 144, 3 p. USGS Open-File Report 2007-1047.
Kanao, M., Y. Usui, T. Inoue and A. Yamada, 2007b. Broadband SeismicArray Deployments and Lithospheric Structure around the Lützow-Holm Bay Region, East Antarctica. In Antarctica: A Keystone in a Changing World – Online Proceedings of the 10th ISAES, A.K. Cooper, C.R. Raymond et al., (eds), Extended Abstract 145, 3 p. USGS Open-File Report 2007-1047.
Khan, S.A., J. Wahr, L.A. Stearns, G.S. Hamilton, T. van Dam, K.M. Larson and O. Francis, 2007. Elastic uplift in southeast Greenland due to rapid ice mass loss. Geophys. Res. Lett., 34: L21701, doi: 10.1029/2007GL031468.
Khan, S.A., J. Wahr, E. Leuliette, T. van Dam, K. M. Larson and O. Francis, 2008. Geodetic measurements of postglacial adjustments in Greenland. J. Geophys. Res., 113: B02402, doi:10.1029/2007JB004956.
King, M.A. and L. Padman, 2005. Accuracy assessment of ocean tide models around Antarctica. Geophys. Res. Lett., 32: L23608, doi: 10.1029/2005GL023901.
King, M.A., N.T. Penna, P.J. Clarke and E.C. King, 2005. Validation of ocean tide models around Antarctica using onshore GPS and gravity data. J. Geophys. Res., 110: B08401, doi: 10.1029/2004JB003390.
Knies, J. and C. Gaina, 2008. Middle Miocene ice sheet expansion in the Arctic: Views from the Barents Sea. Geochem., Geophys., Geosyst. (G3), 9: Q02015, doi: 10.1029/2007GC001824.
Kozlovskaya, E. and M. Poutanen, 2006. POLENET/LAPNET- a multidisciplinary geophysical experiment in northern Fennoscandia during IPY 2007–2008. Eos Transactions. AGU, 87(52), Fall
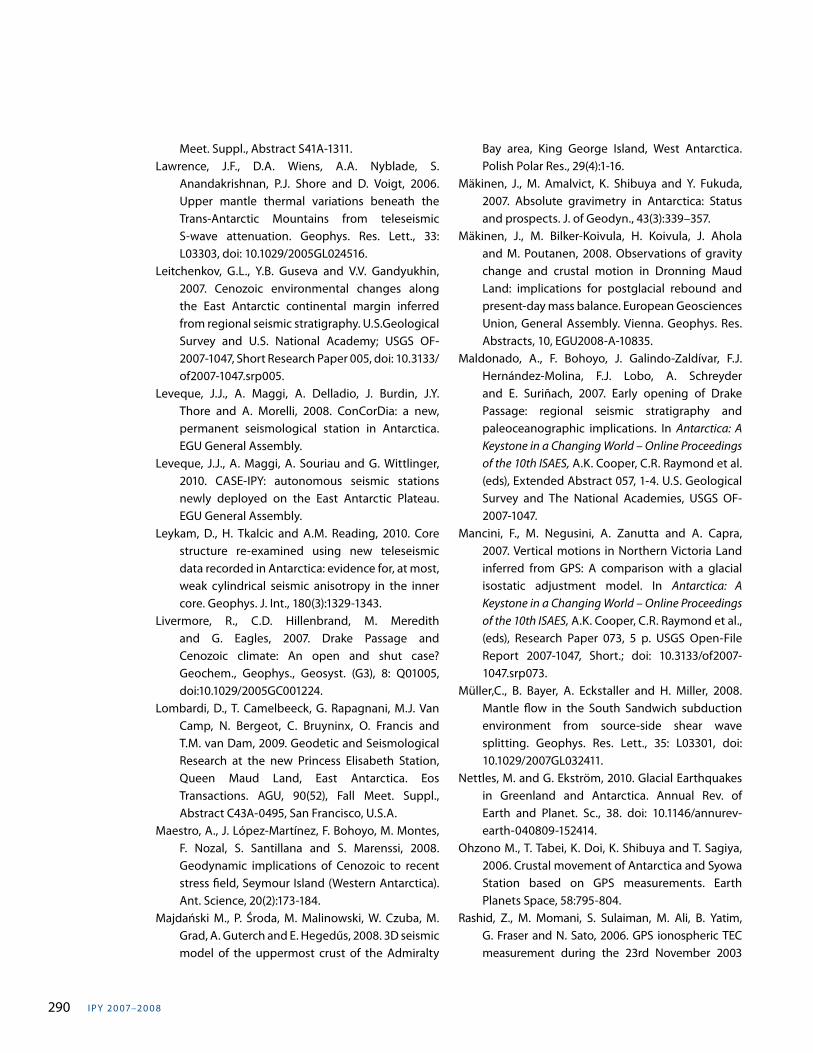
I PY 20 07–20 0 8290
Meet. Suppl., Abstract S41A-1311.Lawrence, J.F., D.A. Wiens, A.A. Nyblade, S.
Anandakrishnan, P.J. Shore and D. Voigt, 2006. Upper mantle thermal variations beneath the Trans-Antarctic Mountains from teleseismic S-wave attenuation. Geophys. Res. Lett., 33: L03303, doi: 10.1029/2005GL024516.
Leitchenkov, G.L., Y.B. Guseva and V.V. Gandyukhin, 2007. Cenozoic environmental changes along the East Antarctic continental margin inferred from regional seismic stratigraphy. U.S.Geological Survey and U.S. National Academy; USGS OF-2007-1047, Short Research Paper 005, doi: 10.3133/of2007-1047.srp005.
Leveque, J.J., A. Maggi, A. Delladio, J. Burdin, J.Y. Thore and A. Morelli, 2008. ConCorDia: a new, permanent seismological station in Antarctica. EGU General Assembly.
Leveque, J.J., A. Maggi, A. Souriau and G. Wittlinger, 2010. CASE-IPY: autonomous seismic stations newly deployed on the East Antarctic Plateau. EGU General Assembly.
Leykam, D., H. Tkalcic and A.M. Reading, 2010. Core structure re-examined using new teleseismic data recorded in Antarctica: evidence for, at most, weak cylindrical seismic anisotropy in the inner core. Geophys. J. Int., 180(3):1329-1343.
Livermore, R., C.D. Hillenbrand, M. Meredith and G. Eagles, 2007. Drake Passage and Cenozoic climate: An open and shut case? Geochem., Geophys., Geosyst. (G3), 8: Q01005, doi:10.1029/2005GC001224.
Lombardi, D., T. Camelbeeck, G. Rapagnani, M.J. Van Camp, N. Bergeot, C. Bruyninx, O. Francis and T.M. van Dam, 2009. Geodetic and Seismological Research at the new Princess Elisabeth Station, Queen Maud Land, East Antarctica. Eos Transactions. AGU, 90(52), Fall Meet. Suppl., Abstract C43A-0495, San Francisco, U.S.A.
Maestro, A., J. López-Martínez, F. Bohoyo, M. Montes, F. Nozal, S. Santillana and S. Marenssi, 2008. Geodynamic implications of Cenozoic to recent stress field, Seymour Island (Western Antarctica). Ant. Science, 20(2):173-184.
Majdański M., P. Środa, M. Malinowski, W. Czuba, M. Grad, A. Guterch and E. Hegedűs, 2008. 3D seismic model of the uppermost crust of the Admiralty
Bay area, King George Island, West Antarctica. Polish Polar Res., 29(4):1-16.
Mäkinen, J., M. Amalvict, K. Shibuya and Y. Fukuda, 2007. Absolute gravimetry in Antarctica: Status and prospects. J. of Geodyn., 43(3):339–357.
Mäkinen, J., M. Bilker-Koivula, H. Koivula, J. Ahola and M. Poutanen, 2008. Observations of gravity change and crustal motion in Dronning Maud Land: implications for postglacial rebound and present-day mass balance. European Geosciences Union, General Assembly. Vienna. Geophys. Res. Abstracts, 10, EGU2008-A-10835.
Maldonado, A., F. Bohoyo, J. Galindo-Zaldívar, F.J. Hernández-Molina, F.J. Lobo, A. Schreyder and E. Suriñach, 2007. Early opening of Drake Passage: regional seismic stratigraphy and paleoceanographic implications. In Antarctica: A Keystone in a Changing World – Online Proceedings of the 10th ISAES, A.K. Cooper, C.R. Raymond et al. (eds), Extended Abstract 057, 1-4. U.S. Geological Survey and The National Academies, USGS OF-2007-1047.
Mancini, F., M. Negusini, A. Zanutta and A. Capra, 2007. Vertical motions in Northern Victoria Land inferred from GPS: A comparison with a glacial isostatic adjustment model. In Antarctica: A Keystone in a Changing World – Online Proceedings of the 10th ISAES, A.K. Cooper, C.R. Raymond et al., (eds), Research Paper 073, 5 p. USGS Open-File Report 2007-1047, Short.; doi: 10.3133/of2007-1047.srp073.
Müller,C., B. Bayer, A. Eckstaller and H. Miller, 2008. Mantle flow in the South Sandwich subduction environment from source-side shear wave splitting. Geophys. Res. Lett., 35: L03301, doi: 10.1029/2007GL032411.
Nettles, M. and G. Ekström, 2010. Glacial Earthquakes in Greenland and Antarctica. Annual Rev. of Earth and Planet. Sc., 38. doi: 10.1146/annurev-earth-040809-152414.
Ohzono M., T. Tabei, K. Doi, K. Shibuya and T. Sagiya, 2006. Crustal movement of Antarctica and Syowa Station based on GPS measurements. Earth Planets Space, 58:795-804.
Rashid, Z., M. Momani, S. Sulaiman, M. Ali, B. Yatim, G. Fraser and N. Sato, 2006. GPS ionospheric TEC measurement during the 23rd November 2003
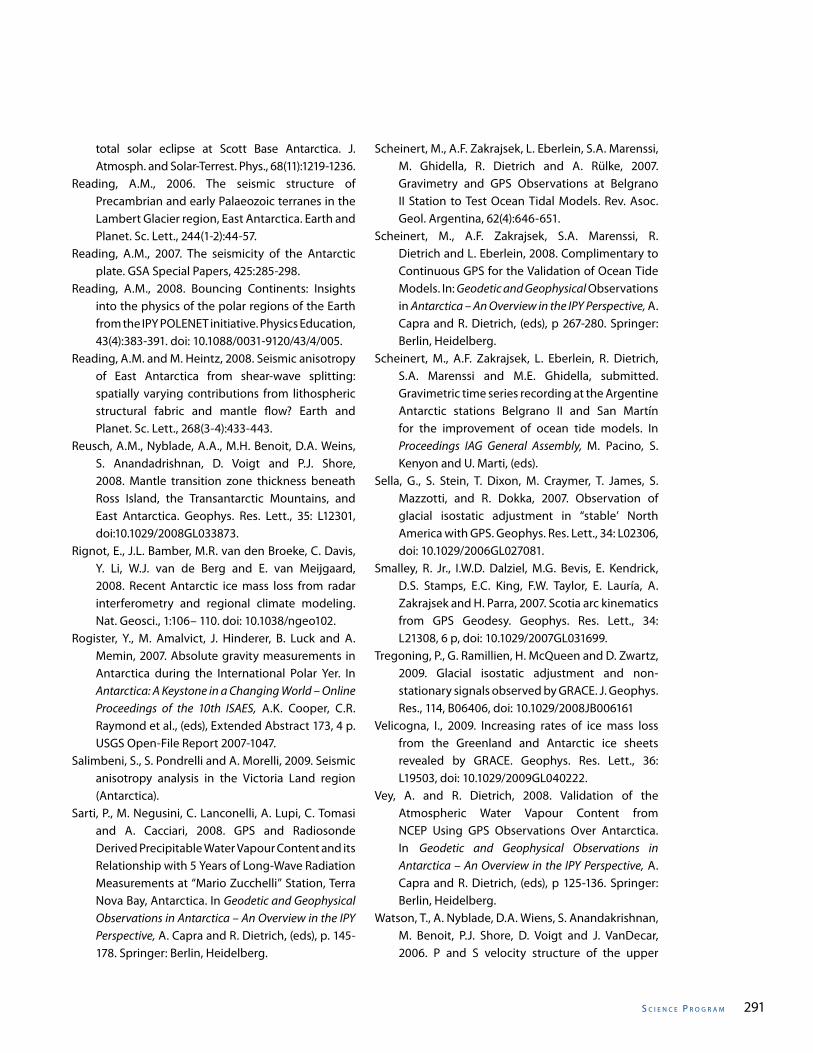
s C I e n C e P r o g r a m 291
total solar eclipse at Scott Base Antarctica. J. Atmosph. and Solar-Terrest. Phys., 68(11):1219-1236.
Reading, A.M., 2006. The seismic structure of Precambrian and early Palaeozoic terranes in the Lambert Glacier region, East Antarctica. Earth and Planet. Sc. Lett., 244(1-2):44-57.
Reading, A.M., 2007. The seismicity of the Antarctic plate. GSA Special Papers, 425:285-298.
Reading, A.M., 2008. Bouncing Continents: Insights into the physics of the polar regions of the Earth from the IPY POLENET initiative. Physics Education, 43(4):383-391. doi: 10.1088/0031-9120/43/4/005.
Reading, A.M. and M. Heintz, 2008. Seismic anisotropy of East Antarctica from shear-wave splitting: spatially varying contributions from lithospheric structural fabric and mantle flow? Earth and Planet. Sc. Lett., 268(3-4):433-443.
Reusch, A.M., Nyblade, A.A., M.H. Benoit, D.A. Weins, S. Anandadrishnan, D. Voigt and P.J. Shore, 2008. Mantle transition zone thickness beneath Ross Island, the Transantarctic Mountains, and East Antarctica. Geophys. Res. Lett., 35: L12301, doi:10.1029/2008GL033873.
Rignot, E., J.L. Bamber, M.R. van den Broeke, C. Davis, Y. Li, W.J. van de Berg and E. van Meijgaard, 2008. Recent Antarctic ice mass loss from radar interferometry and regional climate modeling. Nat. Geosci., 1:106– 110. doi: 10.1038/ngeo102.
Rogister, Y., M. Amalvict, J. Hinderer, B. Luck and A. Memin, 2007. Absolute gravity measurements in Antarctica during the International Polar Yer. In Antarctica: A Keystone in a Changing World – Online Proceedings of the 10th ISAES, A.K. Cooper, C.R. Raymond et al., (eds), Extended Abstract 173, 4 p. USGS Open-File Report 2007-1047.
Salimbeni, S., S. Pondrelli and A. Morelli, 2009. Seismic anisotropy analysis in the Victoria Land region (Antarctica).
Sarti, P., M. Negusini, C. Lanconelli, A. Lupi, C. Tomasi and A. Cacciari, 2008. GPS and Radiosonde Derived Precipitable Water Vapour Content and its Relationship with 5 Years of Long-Wave Radiation Measurements at “Mario Zucchelli” Station, Terra Nova Bay, Antarctica. In Geodetic and Geophysical Observations in Antarctica – An Overview in the IPY Perspective, A. Capra and R. Dietrich, (eds), p. 145-178. Springer: Berlin, Heidelberg.
Scheinert, M., A.F. Zakrajsek, L. Eberlein, S.A. Marenssi, M. Ghidella, R. Dietrich and A. Rülke, 2007. Gravimetry and GPS Observations at Belgrano II Station to Test Ocean Tidal Models. Rev. Asoc. Geol. Argentina, 62(4):646-651.
Scheinert, M., A.F. Zakrajsek, S.A. Marenssi, R. Dietrich and L. Eberlein, 2008. Complimentary to Continuous GPS for the Validation of Ocean Tide Models. In: Geodetic and Geophysical Observations in Antarctica – An Overview in the IPY Perspective, A. Capra and R. Dietrich, (eds), p 267-280. Springer: Berlin, Heidelberg.
Scheinert, M., A.F. Zakrajsek, L. Eberlein, R. Dietrich, S.A. Marenssi and M.E. Ghidella, submitted. Gravimetric time series recording at the Argentine Antarctic stations Belgrano II and San Martín for the improvement of ocean tide models. In Proceedings IAG General Assembly, M. Pacino, S. Kenyon and U. Marti, (eds).
Sella, G., S. Stein, T. Dixon, M. Craymer, T. James, S. Mazzotti, and R. Dokka, 2007. Observation of glacial isostatic adjustment in “stable’ North America with GPS. Geophys. Res. Lett., 34: L02306, doi: 10.1029/2006GL027081.
Smalley, R. Jr., I.W.D. Dalziel, M.G. Bevis, E. Kendrick, D.S. Stamps, E.C. King, F.W. Taylor, E. Lauría, A. Zakrajsek and H. Parra, 2007. Scotia arc kinematics from GPS Geodesy. Geophys. Res. Lett., 34: L21308, 6 p, doi: 10.1029/2007GL031699.
Tregoning, P., G. Ramillien, H. McQueen and D. Zwartz, 2009. Glacial isostatic adjustment and non-stationary signals observed by GRACE. J. Geophys. Res., 114, B06406, doi: 10.1029/2008JB006161
Velicogna, I., 2009. Increasing rates of ice mass loss from the Greenland and Antarctic ice sheets revealed by GRACE. Geophys. Res. Lett., 36: L19503, doi: 10.1029/2009GL040222.
Vey, A. and R. Dietrich, 2008. Validation of the Atmospheric Water Vapour Content from NCEP Using GPS Observations Over Antarctica. In Geodetic and Geophysical Observations in Antarctica – An Overview in the IPY Perspective, A. Capra and R. Dietrich, (eds), p 125-136. Springer: Berlin, Heidelberg.
Watson, T., A. Nyblade, D.A. Wiens, S. Anandakrishnan, M. Benoit, P.J. Shore, D. Voigt and J. VanDecar, 2006. P and S velocity structure of the upper
I PY 20 07–20 0 8292
mantle beneath the Transantarctic Mountains, East Antarctic craton, and Ross Sea from travel time tomography. Geochem. Geophys. Geosyst., 7: Q07005, doi: 10.1029/2005GC001238.
Watson, C., R. Handsworth and H. Brolsma, 2008. Tide Gauges in the Antarctic and sub-Antarctic: Instrumentation and Calibration Issues from an Australian Perspective. In Geodetic and Geophysical Observations in Antarctica – An Overview in the IPY Perspective, A. Capra and R. Dietrich, (eds), p 249-266. Springer-Verlag Berlin Heidelberg,
Wiens, D.A., S. Anandakrishnan, J.P. Winberry and M.A. King, 2008. Simultaneous teleseismic and geodetic observations of the stick–slip motion of an Antarctic ice stream. Nature, 453:770-774. doi: 10.1038/nature06990.
Wilde-Piórko, M., M. Grad, P. Wiejacz and J. Schweitzer, 2009. HSPB seismic broadband station in Southern Spitsbergen: First results on crustal and mantle structure from receiver functions and SKS splitting. Polish Polar Res., 30:301-316, doi:
10.4202/ppres.2009.16.Willis, M.J., 2008a. Technologies to Operate Year-
Round Remote Global Navigation Satellite System (GNSS) Stations in Extreme Environments. In Geodetic and Geophysical Observations in Antarctica – An Overview in the IPY Perspective, A. Capra and R. Dietrich, (eds), p 11-36. Springer: Berlin, Heidelberg.
Willis, M.J., 2008b. Crustal motion in the Antarctic interior from a decade of global positioning system measurements. Dissertation, The Ohio State University, 251 p.
Willis, M.J., T.J. Wilson and T.S. James, 2008c. GPS-Constrained Glacial Isostatic Adjustment Models for West Antarctica: Implications for Ice Sheet Mass Balance Measurements. American Geophysical Union, Fall Meeting, Abstract G31A-0642.
Yang, M., Z. Wang, E. Dongchen and C. Hongtao, 2008. Research of Polar TEC fluctuations and polar patches during magnetic storm using GPS. Chinese J. Geophys., 51(1):17-24.
s C I e n C e P r o g r a m 293
2.9 Polar Terrestrial Ecology and Biodiversity
Lead Authors: Kjell Danell and Terry Callaghan
Contributing Authors: Gilles Gauthier, Mike Gill, Ad H.L. Huiskes, Takeshi Naganuma, Gareth Phoenix, Leslie Tamppari, Donald A. Walker and Mathew Williams
Reviewer: David Hik
PA R T T W O : I P Y S C I E N C E P R O G R A M
Introduction The land masses beyond the polar circles are vast; they are often remote, uninhabited and experience harsh climatic and physical environments. Because of these characteristics, polar ecological and biological research and observation are generally under-represented compared with such research and observation in more populated and benign environments. Past international campaigns have sought to document the biodiversity and ecological processes of terrestrial ecosystems and the previous polar years together with the International Biological Programme of 1967–1974 (Bliss et al., 1981) provided major advances in our understanding and a significant legacy in new generations of researchers and international collaborations. However, the Polar Region research has remained rather esoteric and relatively unconnected with global issues. Within the past 20 years, this has changed: the Polar Regions have attracted world-wide attention because impacts of UV-B radiation, contaminants and particu-larly climate change are profound there. The compre-hensive Arctic Climate Impact Assessment (ACIA, 2005) documented the major ecological changes occurring in the Arctic and showed how some of these changes, the biospheric feedbacks, were likely to influence the global climate system. Since then, a similar assessment for the Antarctic has also provided compelling evi-dence of major climate impacts on the Antarctic terres-trial biota (Turner et al., 2009; Chapter 5.2). It is now clear that the Arctic and the Antarctic Pen-insula are warming at approximately twice the general planetary rate and that many impacts are already af-fecting biodiversity and ecosystem processes, some of which are likely to have global consequences. Interna-
tional Polar Year 2007–2008 was therefore, organised at a critical time. The international science community mobilised during this period to document changes, understand its causes, provide baselines against which future changes can be measured, predict future changes and assess prospective global influence of some of these changes. Altogether, 30 international project consortia on polar biology and ecology were formally endorsed by the IPY Joint Committee. Each project is described in Table 2.9-1, which gives information on title, status, geographic area studied, number of nations, partners and participants involved. For this chapter we con-tacted all team leaders in order to receive updated information on their activities. Seven projects oper-ated both in the Arctic and the Antarctic; 19 projects operated only in the Arctic and most of these had a cir-cumpolar perspective; three projects operated only in the Antarctic (one project did not receive funding). All projects were international (ranging from three to 27 participating nations), which means that the activities involved several nations with a short history in polar research. Some of the larger consortia had up to 150 participants, but some projects used only a handful of scientists. Many IPY projects were multidisciplinary and engaged climatologists, molecular biologists, soil biologists, plant and animal ecologists, modellers and experts on GIS and remote sensing. Some of the proj-ects had socio-economic aspects as well. A common denominator for most of the research under IPY ter-restrial projects was the impact of climate change. At this time, many of the projects are still process-ing their data following fieldwork, so that results and publications are likely to continue for the foreseeable
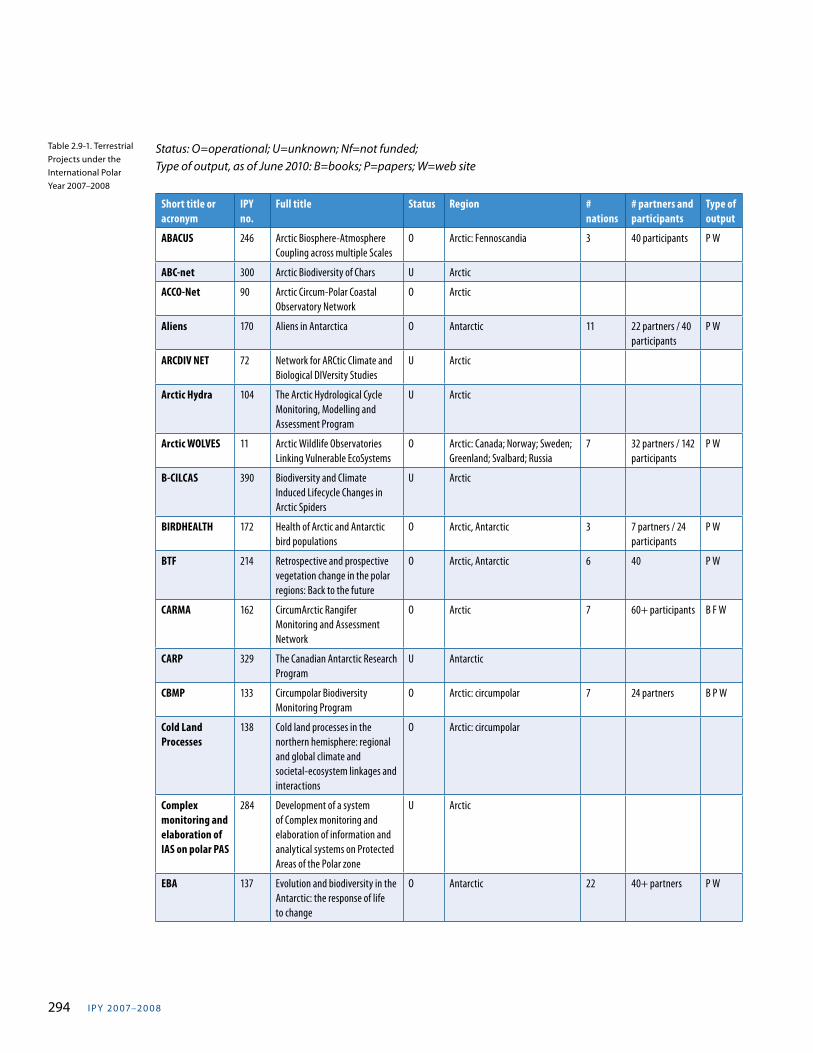
I PY 20 07–20 0 8294
Status: O=operational; U=unknown; Nf=not funded;Type of output, as of June 2010: B=books; P=papers; W=web site
Short title or acronym
IPY no.
Full title Status Region # nations
# partners and participants
Type of output
ABACUS 246 Arctic Biosphere-Atmosphere Coupling across multiple Scales
O Arctic: Fennoscandia 3 40 participants P W
ABC-net 300 Arctic Biodiversity of Chars U Arctic
ACCO-Net 90 Arctic Circum-Polar Coastal Observatory Network
O Arctic
Aliens 170 Aliens in Antarctica O Antarctic 11 22 partners / 40 participants
P W
ARCDIV NET 72 Network for ARCtic Climate and Biological DIVersity Studies
U Arctic
Arctic Hydra 104 The Arctic Hydrological Cycle Monitoring, Modelling and Assessment Program
U Arctic
Arctic WOLVES 11 Arctic Wildlife Observatories Linking Vulnerable EcoSystems
O Arctic: Canada; Norway; Sweden; Greenland; Svalbard; Russia
7 32 partners / 142 participants
P W
B-CILCAS 390 Biodiversity and Climate Induced Lifecycle Changes in Arctic Spiders
U Arctic
BIRDHEALTH 172 Health of Arctic and Antarctic bird populations
O Arctic, Antarctic 3 7 partners / 24 participants
P W
BTF 214 Retrospective and prospective vegetation change in the polar regions: Back to the future
O Arctic, Antarctic 6 40 P W
CARMA 162 CircumArctic Rangifer Monitoring and Assessment Network
O Arctic 7 60+ participants B F W
CARP 329 The Canadian Antarctic Research Program
U Antarctic
CBMP 133 Circumpolar Biodiversity Monitoring Program
O Arctic: circumpolar 7 24 partners B P W
Cold Land Processes
138 Cold land processes in the northern hemisphere: regional and global climate and societal-ecosystem linkages and interactions
O Arctic: circumpolar
Complex monitoring and elaboration of IAS on polar PAS
284 Development of a system of Complex monitoring and elaboration of information and analytical systems on Protected Areas of the Polar zone
U Arctic
EBA 137 Evolution and biodiversity in the Antarctic: the response of life to change
O Antarctic 22 40+ partners P W
Table 2.9-1. Terrestrial Projects under the International Polar Year 2007–2008
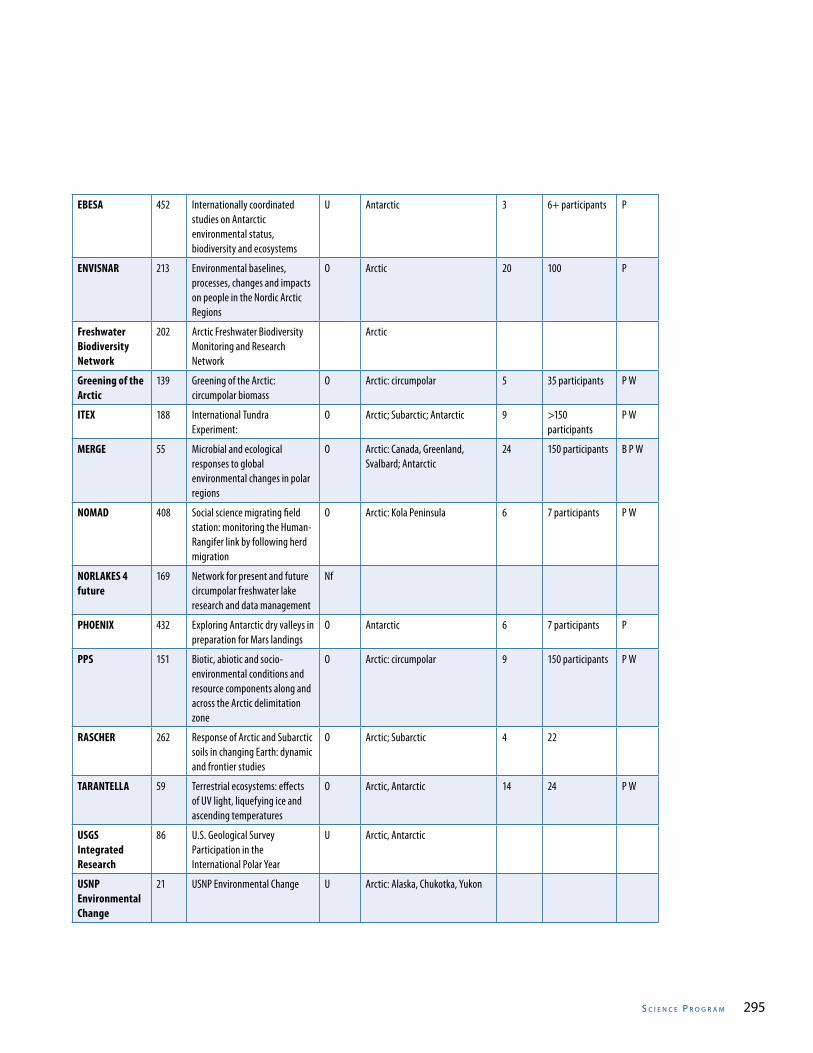
s C I e n C e P r o g r a m 295
EBESA 452 Internationally coordinated studies on Antarctic environmental status, biodiversity and ecosystems
U Antarctic 3 6+ participants P
ENVISNAR 213 Environmental baselines, processes, changes and impacts on people in the Nordic Arctic Regions
O Arctic 20 100 P
Freshwater Biodiversity Network
202 Arctic Freshwater Biodiversity Monitoring and Research Network
Arctic
Greening of the Arctic
139 Greening of the Arctic: circumpolar biomass
O Arctic: circumpolar 5 35 participants P W
ITEX 188 International Tundra Experiment:
O Arctic; Subarctic; Antarctic 9 >150 participants
P W
MERGE 55 Microbial and ecological responses to global environmental changes in polar regions
O Arctic: Canada, Greenland, Svalbard; Antarctic
24 150 participants B P W
NOMAD 408 Social science migrating field station: monitoring the Human-Rangifer link by following herd migration
O Arctic: Kola Peninsula 6 7 participants P W
NORLAKES 4 future
169 Network for present and future circumpolar freshwater lake research and data management
Nf
PHOENIX 432 Exploring Antarctic dry valleys in preparation for Mars landings
O Antarctic 6 7 participants P
PPS 151 Biotic, abiotic and socio-environmental conditions and resource components along and across the Arctic delimitation zone
O Arctic: circumpolar 9 150 participants P W
RASCHER 262 Response of Arctic and Subarctic soils in changing Earth: dynamic and frontier studies
O Arctic; Subarctic 4 22
TARANTELLA 59 Terrestrial ecosystems: effects of UV light, liquefying ice and ascending temperatures
O Arctic, Antarctic 14 24 P W
USGS Integrated Research
86 U.S. Geological Survey Participation in the International Polar Year
U Arctic, Antarctic
USNP Environmental Change
21 USNP Environmental Change U Arctic: Alaska, Chukotka, Yukon
I PY 20 07–20 0 8296
future. For this reason, the present chapter serves to document activities and early results rather than at-tempting a full synthesis of the data collected. Fur-ther, we are aware that the recent recognition of the global significance of the Arctic biota and ecological processes has stimulated a surge in research and ob-servation activities that are not affiliated with IPY; we do not attempt to review these studies, some of which have been recently summarized (Post et al., 2009). As most of the IPY projects focus on a certain aspect of change in ecosystem structure and/or function, we structure our paper along a timeline, that is, establish-ing current baselines against which future changes can be measured, documenting past changes, recent changes, and assessing the likely future changes and the impacts they may have within and outside the polar regions. Finally, we address some critical gaps in our understanding and discuss how the legacy of IPY may help reduce these uncertainties.
Establishing current baselines Several IPY terrestrial projects sought to monitor biodiversity in terrestrial, freshwater and marine ecosystems across the circumpolar Arctic. For example, the Circumpolar Biodiversity Monitoring Program (CBMP, IPY no. 133; Chapter 3.9) is a part of the Arctic Council’s CAFF (Conservation of Arctic Flora and Fauna) Working Group. Its aim is to coordinate pan-Arctic biodiversity monitoring, data management and reporting through the development of integrated, ecosystem-based monitoring plans, coordinated, Web-based data management products and targeted reporting tools (e.g. development of biodiversity indicators and indices). CBMP activities within IPY have developed, in coordination with other partners, monitoring frameworks for marine mammals and seabirds and contributed to the development of ecosystem-based, pan-Arctic biodiversity monitoring plans (marine and freshwater) bringing together a multitude of monitoring networks into a coordinated, pan-arctic monitoring effort. It has also contributed to an application for funding by SCANNET (Circum-Arctic Network of Terrestrial Field Bases) to extend the biodiversity monitoring plans to terrestrial ecosystems. A distributed, interoperable Web-based system for accessing and displaying current arctic
biodiversity information has already been developed and a range of products is available. One aspect of biodiversity documentation that has been notoriously difficult is that of microbial diversity and our baseline information has been poor compared with other taxa. MERGE (Microbial and Ecological Responses to Global Environmental Changes in Polar Regions, no. 55) is a large IPY consortium that has used recently developed technology to make major advances in understanding microbial diversity and function in both Polar Regions. MERGE discovered Polar microorganisms with surprising diversity, essential ecological functions and environmental roles as global warming sentinels. MERGE has resulted in a major leap forward in our understanding of the microbial diversity of polar ecosystems and has contributed fundamental insights into Arctic habitats, their communities and climate impacts. Some of the most striking microbial communities were found in the perennial cold springs in the Canadian High Arctic. Grey-coloured microbial streamers form during winter in snow-covered regions but disappear during the Arctic summer. The streamers were uniquely dominated by sulfur-oxidizing species of the genus Thiomicrospira (Fig. 2.9-1). This finding broadens our knowledge of the physico-chemical limits for life on Earth. The IPY project “The Phoenix Mars Polar Lander and Antarctic Analog Studies” (no. 432) had a component focused on the Antarctic Dry Valley Soil/Ice History and Habitability. It investigated life in an extreme environment by deploying an interdisciplinary team and using recently developed technologies including those used on the Phoenix Mars Lander. This effort not only produced new findings about Antarctica, but also provided a unique opportunity to do comparative planetology. For the first time high- and low- elevation valleys (University Valley and Taylor Valley, respectively) were sampled in depth with samples acquired and analyzed for soil mineralogy, soil solution chemistry, soil pedogenic processes, and total and live biomass, with complementary analyses performed for soil water availability and local environmental conditions. Due to the discovery of perchlorate (ClO4) on Mars by the Phoenix spacecraft, this chemical was searched for in the Dry Valley samples and unexpectedly high levels were found. These were correlated to nitrate,
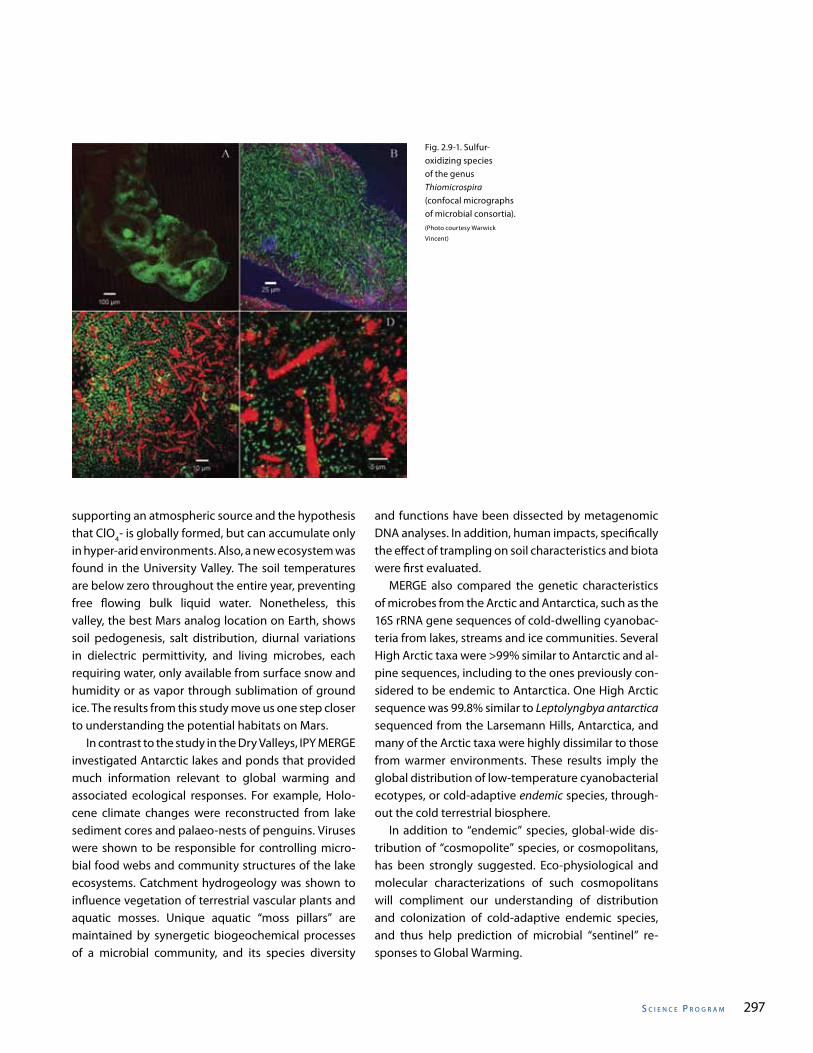
s C I e n C e P r o g r a m 297
supporting an atmospheric source and the hypothesis that ClO4- is globally formed, but can accumulate only in hyper-arid environments. Also, a new ecosystem was found in the University Valley. The soil temperatures are below zero throughout the entire year, preventing free flowing bulk liquid water. Nonetheless, this valley, the best Mars analog location on Earth, shows soil pedogenesis, salt distribution, diurnal variations in dielectric permittivity, and living microbes, each requiring water, only available from surface snow and humidity or as vapor through sublimation of ground ice. The results from this study move us one step closer to understanding the potential habitats on Mars. In contrast to the study in the Dry Valleys, IPY MERGE investigated Antarctic lakes and ponds that provided much information relevant to global warming and associated ecological responses. For example, Holo-cene climate changes were reconstructed from lake sediment cores and palaeo-nests of penguins. Viruses were shown to be responsible for controlling micro-bial food webs and community structures of the lake ecosystems. Catchment hydrogeology was shown to influence vegetation of terrestrial vascular plants and aquatic mosses. Unique aquatic “moss pillars” are maintained by synergetic biogeochemical processes of a microbial community, and its species diversity
and functions have been dissected by metagenomic DNA analyses. In addition, human impacts, specifically the effect of trampling on soil characteristics and biota were first evaluated. MERGE also compared the genetic characteristics of microbes from the Arctic and Antarctica, such as the 16S rRNA gene sequences of cold-dwelling cyanobac-teria from lakes, streams and ice communities. Several High Arctic taxa were >99% similar to Antarctic and al-pine sequences, including to the ones previously con-sidered to be endemic to Antarctica. One High Arctic sequence was 99.8% similar to Leptolyngbya antarctica sequenced from the Larsemann Hills, Antarctica, and many of the Arctic taxa were highly dissimilar to those from warmer environments. These results imply the global distribution of low-temperature cyanobacterial ecotypes, or cold-adaptive endemic species, through-out the cold terrestrial biosphere. In addition to “endemic” species, global-wide dis-tribution of “cosmopolite” species, or cosmopolitans, has been strongly suggested. Eco-physiological and molecular characterizations of such cosmopolitans will compliment our understanding of distribution and colonization of cold-adaptive endemic species, and thus help prediction of microbial “sentinel” re-sponses to Global Warming.
Fig. 2.9-1. Sulfur-oxidizing species of the genus Thiomicrospira (confocal micrographs of microbial consortia). (Photo courtesy Warwick
Vincent)
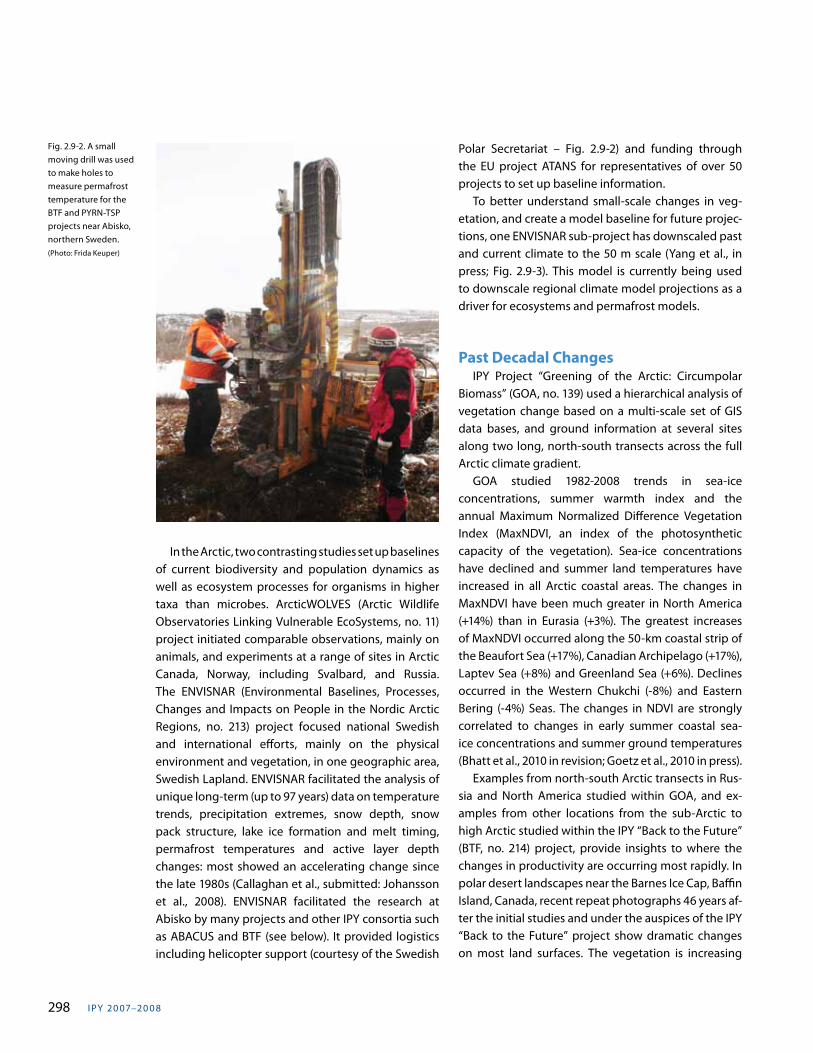
I PY 20 07–20 0 8298
In the Arctic, two contrasting studies set up baselines of current biodiversity and population dynamics as well as ecosystem processes for organisms in higher taxa than microbes. ArcticWOLVES (Arctic Wildlife Observatories Linking Vulnerable EcoSystems, no. 11) project initiated comparable observations, mainly on animals, and experiments at a range of sites in Arctic Canada, Norway, including Svalbard, and Russia. The ENVISNAR (Environmental Baselines, Processes, Changes and Impacts on People in the Nordic Arctic Regions, no. 213) project focused national Swedish and international efforts, mainly on the physical environment and vegetation, in one geographic area, Swedish Lapland. ENVISNAR facilitated the analysis of unique long-term (up to 97 years) data on temperature trends, precipitation extremes, snow depth, snow pack structure, lake ice formation and melt timing, permafrost temperatures and active layer depth changes: most showed an accelerating change since the late 1980s (Callaghan et al., submitted: Johansson et al., 2008). ENVISNAR facilitated the research at Abisko by many projects and other IPY consortia such as ABACUS and BTF (see below). It provided logistics including helicopter support (courtesy of the Swedish
Fig. 2.9-2. A small moving drill was used to make holes to measure permafrost temperature for the BTF and PYRN-TSP projects near Abisko, northern Sweden. (Photo: Frida Keuper)
Polar Secretariat – Fig. 2.9-2) and funding through the EU project ATANS for representatives of over 50 projects to set up baseline information. To better understand small-scale changes in veg-etation, and create a model baseline for future projec-tions, one ENVISNAR sub-project has downscaled past and current climate to the 50 m scale (Yang et al., in press; Fig. 2.9-3). This model is currently being used to downscale regional climate model projections as a driver for ecosystems and permafrost models.
Past Decadal Changes IPY Project “Greening of the Arctic: Circumpolar Biomass” (GOA, no. 139) used a hierarchical analysis of vegetation change based on a multi-scale set of GIS data bases, and ground information at several sites along two long, north-south transects across the full Arctic climate gradient. GOA studied 1982-2008 trends in sea-ice concentrations, summer warmth index and the annual Maximum Normalized Difference Vegetation Index (MaxNDVI, an index of the photosynthetic capacity of the vegetation). Sea-ice concentrations have declined and summer land temperatures have increased in all Arctic coastal areas. The changes in MaxNDVI have been much greater in North America (+14%) than in Eurasia (+3%). The greatest increases of MaxNDVI occurred along the 50-km coastal strip of the Beaufort Sea (+17%), Canadian Archipelago (+17%), Laptev Sea (+8%) and Greenland Sea (+6%). Declines occurred in the Western Chukchi (-8%) and Eastern Bering (-4%) Seas. The changes in NDVI are strongly correlated to changes in early summer coastal sea-ice concentrations and summer ground temperatures (Bhatt et al., 2010 in revision; Goetz et al., 2010 in press). Examples from north-south Arctic transects in Rus-sia and North America studied within GOA, and ex-amples from other locations from the sub-Arctic to high Arctic studied within the IPY “Back to the Future” (BTF, no. 214) project, provide insights to where the changes in productivity are occurring most rapidly. In polar desert landscapes near the Barnes Ice Cap, Baffin Island, Canada, recent repeat photographs 46 years af-ter the initial studies and under the auspices of the IPY “Back to the Future” project show dramatic changes on most land surfaces. The vegetation is increasing
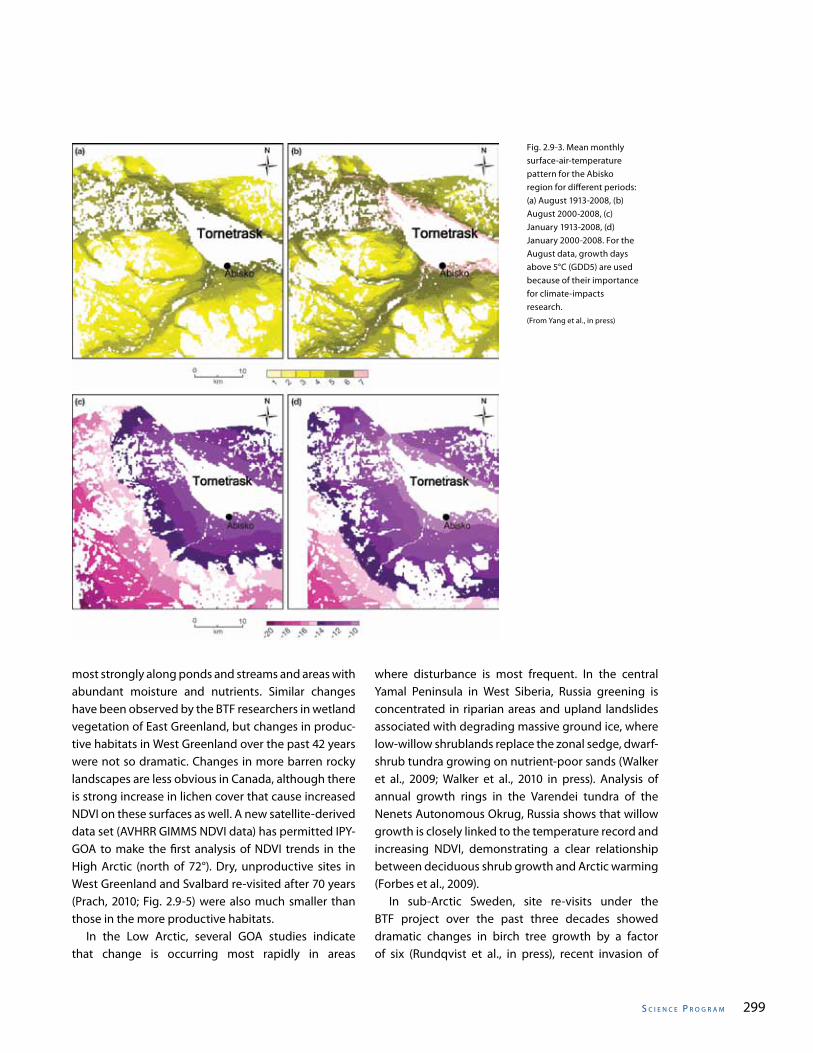
s C I e n C e P r o g r a m 299
Fig. 2.9-3. Mean monthly surface-air-temperature pattern for the Abisko region for different periods: (a) August 1913-2008, (b) August 2000-2008, (c) January 1913-2008, (d) January 2000-2008. For the August data, growth days above 5°C (GDD5) are used because of their importance for climate-impacts research. (From Yang et al., in press)
most strongly along ponds and streams and areas with abundant moisture and nutrients. Similar changes have been observed by the BTF researchers in wetland vegetation of East Greenland, but changes in produc-tive habitats in West Greenland over the past 42 years were not so dramatic. Changes in more barren rocky landscapes are less obvious in Canada, although there is strong increase in lichen cover that cause increased NDVI on these surfaces as well. A new satellite-derived data set (AVHRR GIMMS NDVI data) has permitted IPY-GOA to make the first analysis of NDVI trends in the High Arctic (north of 72°). Dry, unproductive sites in West Greenland and Svalbard re-visited after 70 years (Prach, 2010; Fig. 2.9-5) were also much smaller than those in the more productive habitats. In the Low Arctic, several GOA studies indicate that change is occurring most rapidly in areas
where disturbance is most frequent. In the central Yamal Peninsula in West Siberia, Russia greening is concentrated in riparian areas and upland landslides associated with degrading massive ground ice, where low-willow shrublands replace the zonal sedge, dwarf-shrub tundra growing on nutrient-poor sands (Walker et al., 2009; Walker et al., 2010 in press). Analysis of annual growth rings in the Varendei tundra of the Nenets Autonomous Okrug, Russia shows that willow growth is closely linked to the temperature record and increasing NDVI, demonstrating a clear relationship between deciduous shrub growth and Arctic warming (Forbes et al., 2009). In sub-Arctic Sweden, site re-visits under the BTF project over the past three decades showed dramatic changes in birch tree growth by a factor of six (Rundqvist et al., in press), recent invasion of
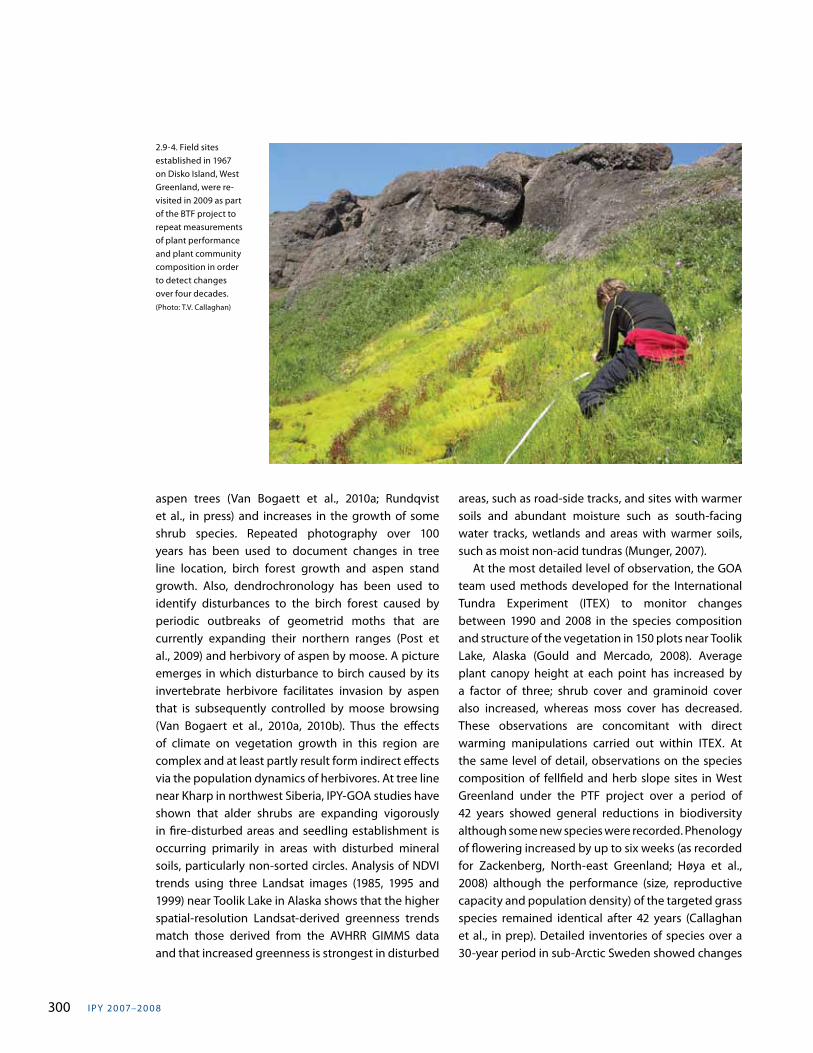
I PY 20 07–20 0 8300
aspen trees (Van Bogaett et al., 2010a; Rundqvist et al., in press) and increases in the growth of some shrub species. Repeated photography over 100 years has been used to document changes in tree line location, birch forest growth and aspen stand growth. Also, dendrochronology has been used to identify disturbances to the birch forest caused by periodic outbreaks of geometrid moths that are currently expanding their northern ranges (Post et al., 2009) and herbivory of aspen by moose. A picture emerges in which disturbance to birch caused by its invertebrate herbivore facilitates invasion by aspen that is subsequently controlled by moose browsing (Van Bogaert et al., 2010a, 2010b). Thus the effects of climate on vegetation growth in this region are complex and at least partly result form indirect effects via the population dynamics of herbivores. At tree line near Kharp in northwest Siberia, IPY-GOA studies have shown that alder shrubs are expanding vigorously in fire-disturbed areas and seedling establishment is occurring primarily in areas with disturbed mineral soils, particularly non-sorted circles. Analysis of NDVI trends using three Landsat images (1985, 1995 and 1999) near Toolik Lake in Alaska shows that the higher spatial-resolution Landsat-derived greenness trends match those derived from the AVHRR GIMMS data and that increased greenness is strongest in disturbed
areas, such as road-side tracks, and sites with warmer soils and abundant moisture such as south-facing water tracks, wetlands and areas with warmer soils, such as moist non-acid tundras (Munger, 2007). At the most detailed level of observation, the GOA team used methods developed for the International Tundra Experiment (ITEX) to monitor changes between 1990 and 2008 in the species composition and structure of the vegetation in 150 plots near Toolik Lake, Alaska (Gould and Mercado, 2008). Average plant canopy height at each point has increased by a factor of three; shrub cover and graminoid cover also increased, whereas moss cover has decreased. These observations are concomitant with direct warming manipulations carried out within ITEX. At the same level of detail, observations on the species composition of fellfield and herb slope sites in West Greenland under the PTF project over a period of 42 years showed general reductions in biodiversity although some new species were recorded. Phenology of flowering increased by up to six weeks (as recorded for Zackenberg, North-east Greenland; Høya et al., 2008) although the performance (size, reproductive capacity and population density) of the targeted grass species remained identical after 42 years (Callaghan et al., in prep). Detailed inventories of species over a 30-year period in sub-Arctic Sweden showed changes
2.9-4. Field sites established in 1967 on Disko Island, West Greenland, were re-visited in 2009 as part of the BTF project to repeat measurements of plant performance and plant community composition in order to detect changes over four decades. (Photo: T.V. Callaghan)
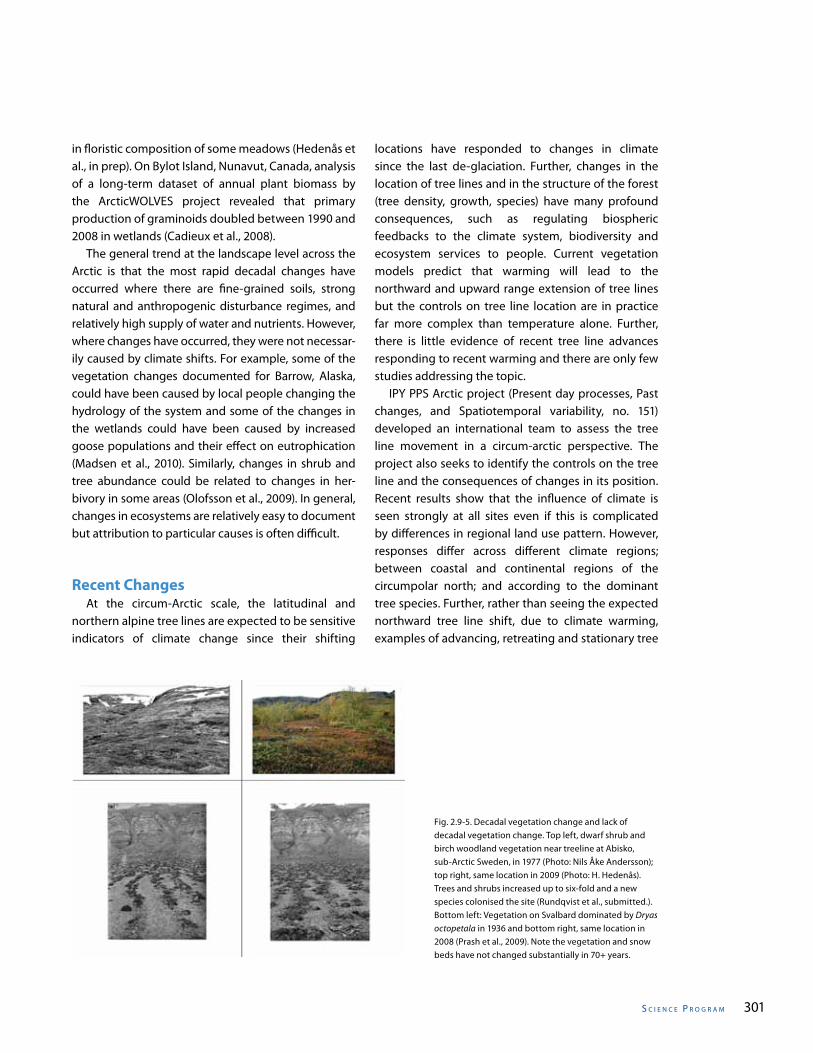
s C I e n C e P r o g r a m 301
in floristic composition of some meadows (Hedenås et al., in prep). On Bylot Island, Nunavut, Canada, analysis of a long-term dataset of annual plant biomass by the ArcticWOLVES project revealed that primary production of graminoids doubled between 1990 and 2008 in wetlands (Cadieux et al., 2008). The general trend at the landscape level across the Arctic is that the most rapid decadal changes have occurred where there are fine-grained soils, strong natural and anthropogenic disturbance regimes, and relatively high supply of water and nutrients. However, where changes have occurred, they were not necessar-ily caused by climate shifts. For example, some of the vegetation changes documented for Barrow, Alaska, could have been caused by local people changing the hydrology of the system and some of the changes in the wetlands could have been caused by increased goose populations and their effect on eutrophication (Madsen et al., 2010). Similarly, changes in shrub and tree abundance could be related to changes in her-bivory in some areas (Olofsson et al., 2009). In general, changes in ecosystems are relatively easy to document but attribution to particular causes is often difficult.
Recent Changes At the circum-Arctic scale, the latitudinal and northern alpine tree lines are expected to be sensitive indicators of climate change since their shifting
locations have responded to changes in climate since the last de-glaciation. Further, changes in the location of tree lines and in the structure of the forest (tree density, growth, species) have many profound consequences, such as regulating biospheric feedbacks to the climate system, biodiversity and ecosystem services to people. Current vegetation models predict that warming will lead to the northward and upward range extension of tree lines but the controls on tree line location are in practice far more complex than temperature alone. Further, there is little evidence of recent tree line advances responding to recent warming and there are only few studies addressing the topic. IPY PPS Arctic project (Present day processes, Past changes, and Spatiotemporal variability, no. 151) developed an international team to assess the tree line movement in a circum-arctic perspective. The project also seeks to identify the controls on the tree line and the consequences of changes in its position. Recent results show that the influence of climate is seen strongly at all sites even if this is complicated by differences in regional land use pattern. However, responses differ across different climate regions; between coastal and continental regions of the circumpolar north; and according to the dominant tree species. Further, rather than seeing the expected northward tree line shift, due to climate warming, examples of advancing, retreating and stationary tree
Fig. 2.9-5. Decadal vegetation change and lack of decadal vegetation change. Top left, dwarf shrub and birch woodland vegetation near treeline at Abisko, sub-Arctic Sweden, in 1977 (Photo: Nils Åke Andersson); top right, same location in 2009 (Photo: H. Hedenås). Trees and shrubs increased up to six-fold and a new species colonised the site (Rundqvist et al., submitted.). Bottom left: Vegetation on Svalbard dominated by Dryas octopetala in 1936 and bottom right, same location in 2008 (Prash et al., 2009). Note the vegetation and snow beds have not changed substantially in 70+ years.
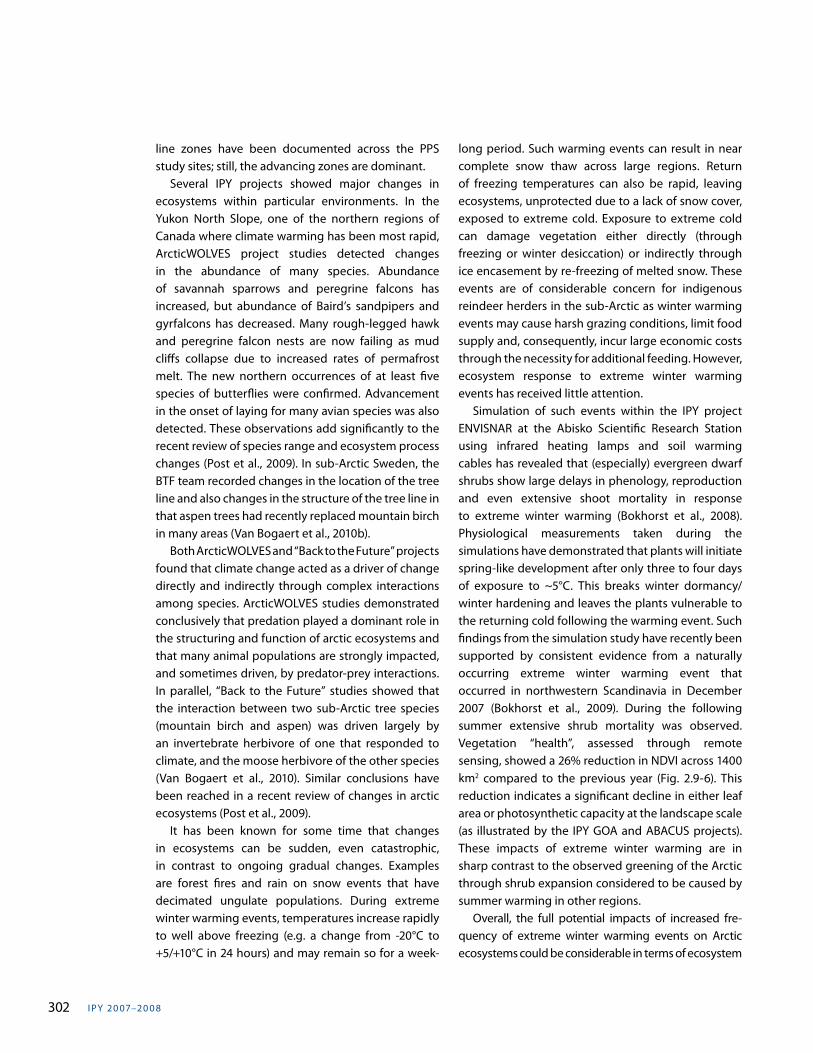
I PY 20 07–20 0 8302
line zones have been documented across the PPS study sites; still, the advancing zones are dominant. Several IPY projects showed major changes in ecosystems within particular environments. In the Yukon North Slope, one of the northern regions of Canada where climate warming has been most rapid, ArcticWOLVES project studies detected changes in the abundance of many species. Abundance of savannah sparrows and peregrine falcons has increased, but abundance of Baird’s sandpipers and gyrfalcons has decreased. Many rough-legged hawk and peregrine falcon nests are now failing as mud cliffs collapse due to increased rates of permafrost melt. The new northern occurrences of at least five species of butterflies were confirmed. Advancement in the onset of laying for many avian species was also detected. These observations add significantly to the recent review of species range and ecosystem process changes (Post et al., 2009). In sub-Arctic Sweden, the BTF team recorded changes in the location of the tree line and also changes in the structure of the tree line in that aspen trees had recently replaced mountain birch in many areas (Van Bogaert et al., 2010b). Both ArcticWOLVES and “Back to the Future” projects found that climate change acted as a driver of change directly and indirectly through complex interactions among species. ArcticWOLVES studies demonstrated conclusively that predation played a dominant role in the structuring and function of arctic ecosystems and that many animal populations are strongly impacted, and sometimes driven, by predator-prey interactions. In parallel, “Back to the Future” studies showed that the interaction between two sub-Arctic tree species (mountain birch and aspen) was driven largely by an invertebrate herbivore of one that responded to climate, and the moose herbivore of the other species (Van Bogaert et al., 2010). Similar conclusions have been reached in a recent review of changes in arctic ecosystems (Post et al., 2009). It has been known for some time that changes in ecosystems can be sudden, even catastrophic, in contrast to ongoing gradual changes. Examples are forest fires and rain on snow events that have decimated ungulate populations. During extreme winter warming events, temperatures increase rapidly to well above freezing (e.g. a change from -20°C to +5/+10°C in 24 hours) and may remain so for a week-
long period. Such warming events can result in near complete snow thaw across large regions. Return of freezing temperatures can also be rapid, leaving ecosystems, unprotected due to a lack of snow cover, exposed to extreme cold. Exposure to extreme cold can damage vegetation either directly (through freezing or winter desiccation) or indirectly through ice encasement by re-freezing of melted snow. These events are of considerable concern for indigenous reindeer herders in the sub-Arctic as winter warming events may cause harsh grazing conditions, limit food supply and, consequently, incur large economic costs through the necessity for additional feeding. However, ecosystem response to extreme winter warming events has received little attention. Simulation of such events within the IPY project ENVISNAR at the Abisko Scientific Research Station using infrared heating lamps and soil warming cables has revealed that (especially) evergreen dwarf shrubs show large delays in phenology, reproduction and even extensive shoot mortality in response to extreme winter warming (Bokhorst et al., 2008). Physiological measurements taken during the simulations have demonstrated that plants will initiate spring-like development after only three to four days of exposure to ~5°C. This breaks winter dormancy/winter hardening and leaves the plants vulnerable to the returning cold following the warming event. Such findings from the simulation study have recently been supported by consistent evidence from a naturally occurring extreme winter warming event that occurred in northwestern Scandinavia in December 2007 (Bokhorst et al., 2009). During the following summer extensive shrub mortality was observed. Vegetation “health”, assessed through remote sensing, showed a 26% reduction in NDVI across 1400 km2 compared to the previous year (Fig. 2.9-6). This reduction indicates a significant decline in either leaf area or photosynthetic capacity at the landscape scale (as illustrated by the IPY GOA and ABACUS projects). These impacts of extreme winter warming are in sharp contrast to the observed greening of the Arctic through shrub expansion considered to be caused by summer warming in other regions. Overall, the full potential impacts of increased fre-quency of extreme winter warming events on Arctic ecosystems could be considerable in terms of ecosystem
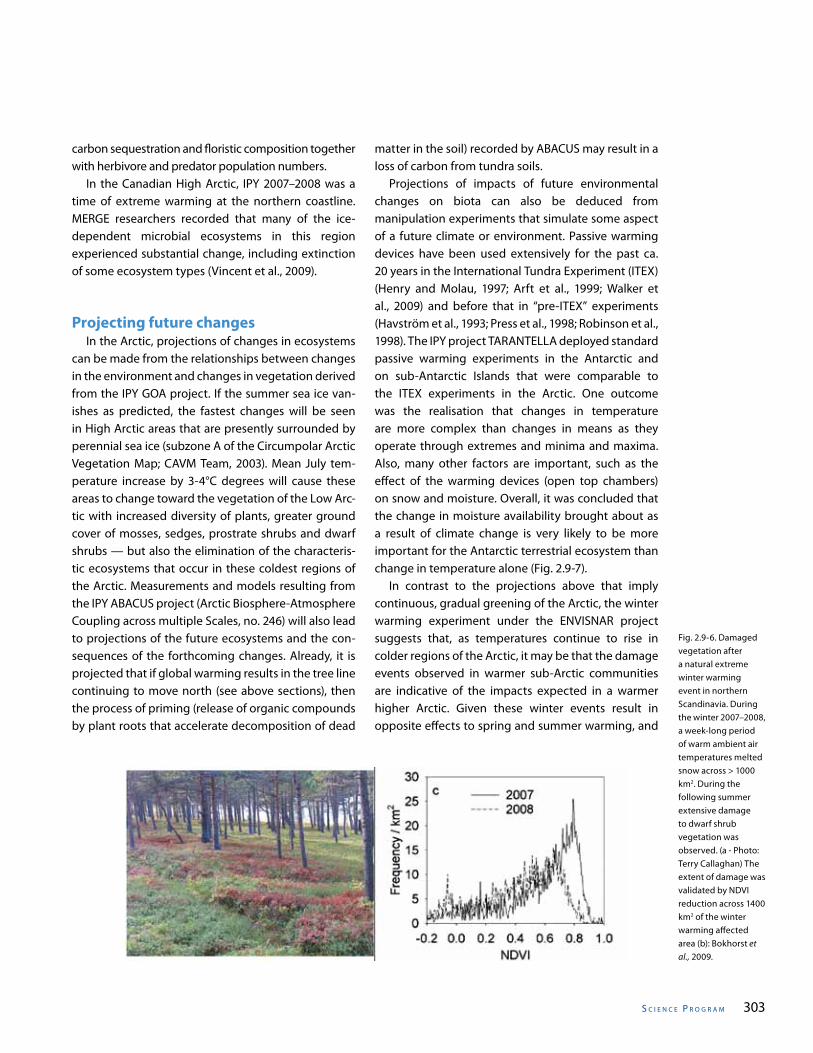
s C I e n C e P r o g r a m 303
carbon sequestration and floristic composition together with herbivore and predator population numbers. In the Canadian High Arctic, IPY 2007–2008 was a time of extreme warming at the northern coastline. MERGE researchers recorded that many of the ice-dependent microbial ecosystems in this region experienced substantial change, including extinction of some ecosystem types (Vincent et al., 2009).
Projecting future changes In the Arctic, projections of changes in ecosystems can be made from the relationships between changes in the environment and changes in vegetation derived from the IPY GOA project. If the summer sea ice van-ishes as predicted, the fastest changes will be seen in High Arctic areas that are presently surrounded by perennial sea ice (subzone A of the Circumpolar Arctic Vegetation Map; CAVM Team, 2003). Mean July tem-perature increase by 3-4°C degrees will cause these areas to change toward the vegetation of the Low Arc-tic with increased diversity of plants, greater ground cover of mosses, sedges, prostrate shrubs and dwarf shrubs — but also the elimination of the characteris-tic ecosystems that occur in these coldest regions of the Arctic. Measurements and models resulting from the IPY ABACUS project (Arctic Biosphere-Atmosphere Coupling across multiple Scales, no. 246) will also lead to projections of the future ecosystems and the con-sequences of the forthcoming changes. Already, it is projected that if global warming results in the tree line continuing to move north (see above sections), then the process of priming (release of organic compounds by plant roots that accelerate decomposition of dead
matter in the soil) recorded by ABACUS may result in a loss of carbon from tundra soils. Projections of impacts of future environmental changes on biota can also be deduced from manipulation experiments that simulate some aspect of a future climate or environment. Passive warming devices have been used extensively for the past ca. 20 years in the International Tundra Experiment (ITEX) (Henry and Molau, 1997; Arft et al., 1999; Walker et al., 2009) and before that in “pre-ITEX” experiments (Havström et al., 1993; Press et al., 1998; Robinson et al., 1998). The IPY project TARANTELLA deployed standard passive warming experiments in the Antarctic and on sub-Antarctic Islands that were comparable to the ITEX experiments in the Arctic. One outcome was the realisation that changes in temperature are more complex than changes in means as they operate through extremes and minima and maxima. Also, many other factors are important, such as the effect of the warming devices (open top chambers) on snow and moisture. Overall, it was concluded that the change in moisture availability brought about as a result of climate change is very likely to be more important for the Antarctic terrestrial ecosystem than change in temperature alone (Fig. 2.9-7). In contrast to the projections above that imply continuous, gradual greening of the Arctic, the winter warming experiment under the ENVISNAR project suggests that, as temperatures continue to rise in colder regions of the Arctic, it may be that the damage events observed in warmer sub-Arctic communities are indicative of the impacts expected in a warmer higher Arctic. Given these winter events result in opposite effects to spring and summer warming, and
Fig. 2.9-6. Damaged vegetation after a natural extreme winter warming event in northern Scandinavia. During the winter 2007–2008, a week-long period of warm ambient air temperatures melted snow across > 1000 km2. During the following summer extensive damage to dwarf shrub vegetation was observed. (a - Photo: Terry Callaghan) The extent of damage was validated by NDVI reduction across 1400 km2 of the winter warming affected area (b): Bokhorst et al., 2009.
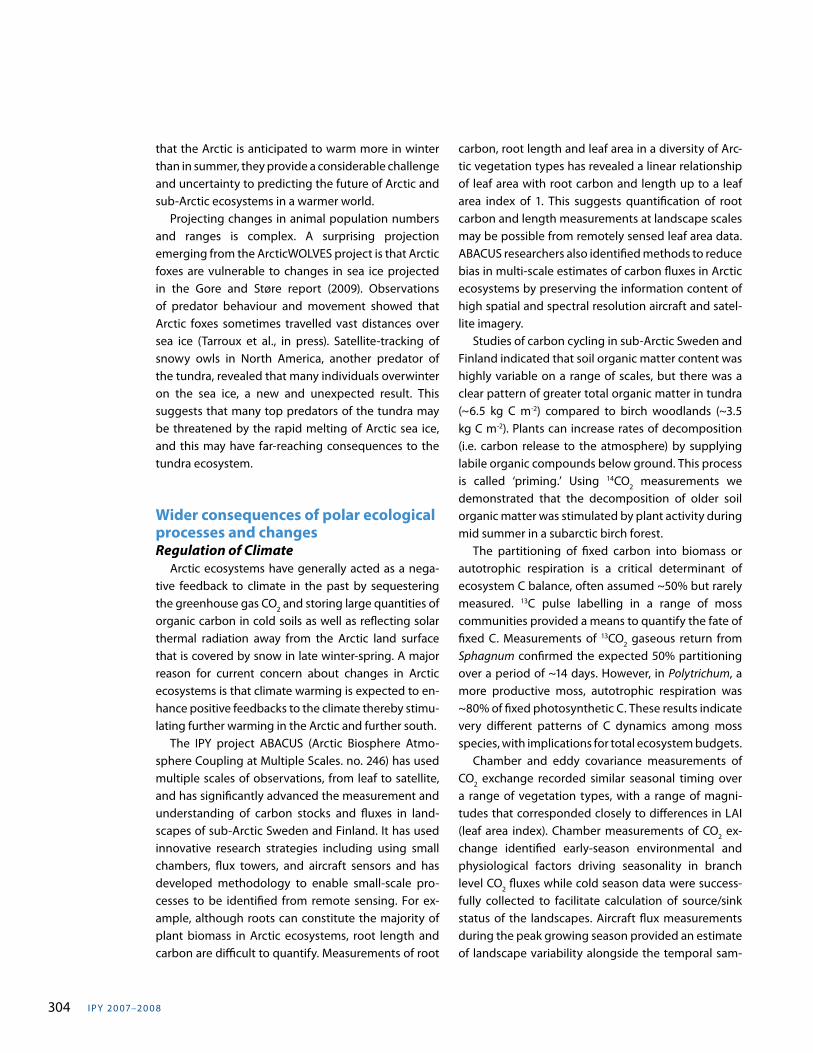
I PY 20 07–20 0 8304
that the Arctic is anticipated to warm more in winter than in summer, they provide a considerable challenge and uncertainty to predicting the future of Arctic and sub-Arctic ecosystems in a warmer world. Projecting changes in animal population numbers and ranges is complex. A surprising projection emerging from the ArcticWOLVES project is that Arctic foxes are vulnerable to changes in sea ice projected in the Gore and Støre report (2009). Observations of predator behaviour and movement showed that Arctic foxes sometimes travelled vast distances over sea ice (Tarroux et al., in press). Satellite-tracking of snowy owls in North America, another predator of the tundra, revealed that many individuals overwinter on the sea ice, a new and unexpected result. This suggests that many top predators of the tundra may be threatened by the rapid melting of Arctic sea ice, and this may have far-reaching consequences to the tundra ecosystem.
Wider consequences of polar ecological processes and changesRegulation of Climate Arctic ecosystems have generally acted as a nega-tive feedback to climate in the past by sequestering the greenhouse gas CO2 and storing large quantities of organic carbon in cold soils as well as reflecting solar thermal radiation away from the Arctic land surface that is covered by snow in late winter-spring. A major reason for current concern about changes in Arctic ecosystems is that climate warming is expected to en-hance positive feedbacks to the climate thereby stimu-lating further warming in the Arctic and further south. The IPY project ABACUS (Arctic Biosphere Atmo-sphere Coupling at Multiple Scales. no. 246) has used multiple scales of observations, from leaf to satellite, and has significantly advanced the measurement and understanding of carbon stocks and fluxes in land-scapes of sub-Arctic Sweden and Finland. It has used innovative research strategies including using small chambers, flux towers, and aircraft sensors and has developed methodology to enable small-scale pro-cesses to be identified from remote sensing. For ex-ample, although roots can constitute the majority of plant biomass in Arctic ecosystems, root length and carbon are difficult to quantify. Measurements of root
carbon, root length and leaf area in a diversity of Arc-tic vegetation types has revealed a linear relationship of leaf area with root carbon and length up to a leaf area index of 1. This suggests quantification of root carbon and length measurements at landscape scales may be possible from remotely sensed leaf area data. ABACUS researchers also identified methods to reduce bias in multi-scale estimates of carbon fluxes in Arctic ecosystems by preserving the information content of high spatial and spectral resolution aircraft and satel-lite imagery. Studies of carbon cycling in sub-Arctic Sweden and Finland indicated that soil organic matter content was highly variable on a range of scales, but there was a clear pattern of greater total organic matter in tundra (~6.5 kg C m-2) compared to birch woodlands (~3.5 kg C m-2). Plants can increase rates of decomposition (i.e. carbon release to the atmosphere) by supplying labile organic compounds below ground. This process is called ‘priming.’ Using 14CO2 measurements we demonstrated that the decomposition of older soil organic matter was stimulated by plant activity during mid summer in a subarctic birch forest. The partitioning of fixed carbon into biomass or autotrophic respiration is a critical determinant of ecosystem C balance, often assumed ~50% but rarely measured. 13C pulse labelling in a range of moss communities provided a means to quantify the fate of fixed C. Measurements of 13CO2 gaseous return from Sphagnum confirmed the expected 50% partitioning over a period of ~14 days. However, in Polytrichum, a more productive moss, autotrophic respiration was ~80% of fixed photosynthetic C. These results indicate very different patterns of C dynamics among moss species, with implications for total ecosystem budgets. Chamber and eddy covariance measurements of CO2 exchange recorded similar seasonal timing over a range of vegetation types, with a range of magni-tudes that corresponded closely to differences in LAI (leaf area index). Chamber measurements of CO2 ex-change identified early-season environmental and physiological factors driving seasonality in branch level CO2 fluxes while cold season data were success-fully collected to facilitate calculation of source/sink status of the landscapes. Aircraft flux measurements during the peak growing season provided an estimate of landscape variability alongside the temporal sam-
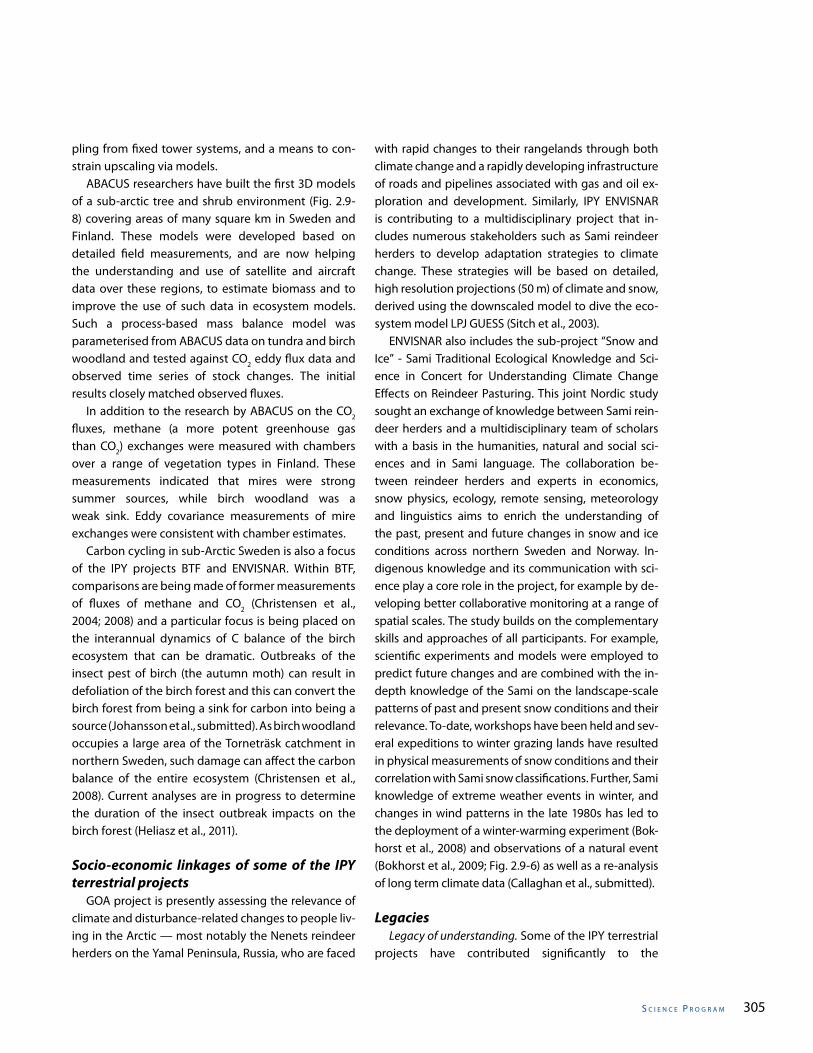
s C I e n C e P r o g r a m 305
pling from fixed tower systems, and a means to con-strain upscaling via models. ABACUS researchers have built the first 3D models of a sub-arctic tree and shrub environment (Fig. 2.9-8) covering areas of many square km in Sweden and Finland. These models were developed based on detailed field measurements, and are now helping the understanding and use of satellite and aircraft data over these regions, to estimate biomass and to improve the use of such data in ecosystem models. Such a process-based mass balance model was parameterised from ABACUS data on tundra and birch woodland and tested against CO2 eddy flux data and observed time series of stock changes. The initial results closely matched observed fluxes. In addition to the research by ABACUS on the CO2 fluxes, methane (a more potent greenhouse gas than CO2) exchanges were measured with chambers over a range of vegetation types in Finland. These measurements indicated that mires were strong summer sources, while birch woodland was a weak sink. Eddy covariance measurements of mire exchanges were consistent with chamber estimates. Carbon cycling in sub-Arctic Sweden is also a focus of the IPY projects BTF and ENVISNAR. Within BTF, comparisons are being made of former measurements of fluxes of methane and CO2 (Christensen et al., 2004; 2008) and a particular focus is being placed on the interannual dynamics of C balance of the birch ecosystem that can be dramatic. Outbreaks of the insect pest of birch (the autumn moth) can result in defoliation of the birch forest and this can convert the birch forest from being a sink for carbon into being a source (Johansson et al., submitted). As birch woodland occupies a large area of the Torneträsk catchment in northern Sweden, such damage can affect the carbon balance of the entire ecosystem (Christensen et al., 2008). Current analyses are in progress to determine the duration of the insect outbreak impacts on the birch forest (Heliasz et al., 2011).
Socio-economic linkages of some of the IPY terrestrial projects GOA project is presently assessing the relevance of climate and disturbance-related changes to people liv-ing in the Arctic — most notably the Nenets reindeer herders on the Yamal Peninsula, Russia, who are faced
with rapid changes to their rangelands through both climate change and a rapidly developing infrastructure of roads and pipelines associated with gas and oil ex-ploration and development. Similarly, IPY ENVISNAR is contributing to a multidisciplinary project that in-cludes numerous stakeholders such as Sami reindeer herders to develop adaptation strategies to climate change. These strategies will be based on detailed, high resolution projections (50 m) of climate and snow, derived using the downscaled model to dive the eco-system model LPJ GUESS (Sitch et al., 2003). ENVISNAR also includes the sub-project “Snow and Ice” - Sami Traditional Ecological Knowledge and Sci-ence in Concert for Understanding Climate Change Effects on Reindeer Pasturing. This joint Nordic study sought an exchange of knowledge between Sami rein-deer herders and a multidisciplinary team of scholars with a basis in the humanities, natural and social sci-ences and in Sami language. The collaboration be-tween reindeer herders and experts in economics, snow physics, ecology, remote sensing, meteorology and linguistics aims to enrich the understanding of the past, present and future changes in snow and ice conditions across northern Sweden and Norway. In-digenous knowledge and its communication with sci-ence play a core role in the project, for example by de-veloping better collaborative monitoring at a range of spatial scales. The study builds on the complementary skills and approaches of all participants. For example, scientific experiments and models were employed to predict future changes and are combined with the in-depth knowledge of the Sami on the landscape-scale patterns of past and present snow conditions and their relevance. To-date, workshops have been held and sev-eral expeditions to winter grazing lands have resulted in physical measurements of snow conditions and their correlation with Sami snow classifications. Further, Sami knowledge of extreme weather events in winter, and changes in wind patterns in the late 1980s has led to the deployment of a winter-warming experiment (Bok-horst et al., 2008) and observations of a natural event (Bokhorst et al., 2009; Fig. 2.9-6) as well as a re-analysis of long term climate data (Callaghan et al., submitted).
Legacies Legacy of understanding. Some of the IPY terrestrial projects have contributed significantly to the
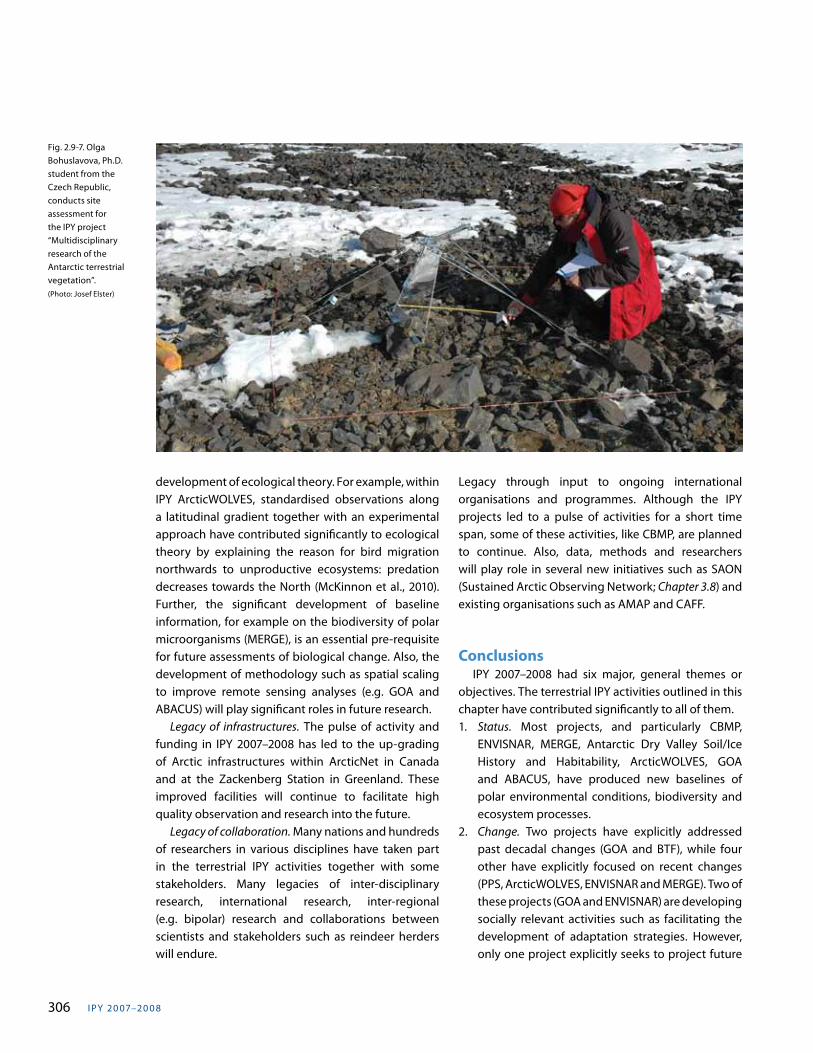
I PY 20 07–20 0 8306
development of ecological theory. For example, within IPY ArcticWOLVES, standardised observations along a latitudinal gradient together with an experimental approach have contributed significantly to ecological theory by explaining the reason for bird migration northwards to unproductive ecosystems: predation decreases towards the North (McKinnon et al., 2010). Further, the significant development of baseline information, for example on the biodiversity of polar microorganisms (MERGE), is an essential pre-requisite for future assessments of biological change. Also, the development of methodology such as spatial scaling to improve remote sensing analyses (e.g. GOA and ABACUS) will play significant roles in future research. Legacy of infrastructures. The pulse of activity and funding in IPY 2007–2008 has led to the up-grading of Arctic infrastructures within ArcticNet in Canada and at the Zackenberg Station in Greenland. These improved facilities will continue to facilitate high quality observation and research into the future. Legacy of collaboration. Many nations and hundreds of researchers in various disciplines have taken part in the terrestrial IPY activities together with some stakeholders. Many legacies of inter-disciplinary research, international research, inter-regional (e.g. bipolar) research and collaborations between scientists and stakeholders such as reindeer herders will endure.
Legacy through input to ongoing international organisations and programmes. Although the IPY projects led to a pulse of activities for a short time span, some of these activities, like CBMP, are planned to continue. Also, data, methods and researchers will play role in several new initiatives such as SAON (Sustained Arctic Observing Network; Chapter 3.8) and existing organisations such as AMAP and CAFF.
Conclusions IPY 2007–2008 had six major, general themes or objectives. The terrestrial IPY activities outlined in this chapter have contributed significantly to all of them.1. Status. Most projects, and particularly CBMP,
ENVISNAR, MERGE, Antarctic Dry Valley Soil/Ice History and Habitability, ArcticWOLVES, GOA and ABACUS, have produced new baselines of polar environmental conditions, biodiversity and ecosystem processes.
2. Change. Two projects have explicitly addressed past decadal changes (GOA and BTF), while four other have explicitly focused on recent changes (PPS, ArcticWOLVES, ENVISNAR and MERGE). Two of these projects (GOA and ENVISNAR) are developing socially relevant activities such as facilitating the development of adaptation strategies. However, only one project explicitly seeks to project future
Fig. 2.9-7. Olga Bohuslavova, Ph.D. student from the Czech Republic, conducts site assessment for the IPY project “Multidisciplinary research of the Antarctic terrestrial vegetation”. (Photo: Josef Elster)
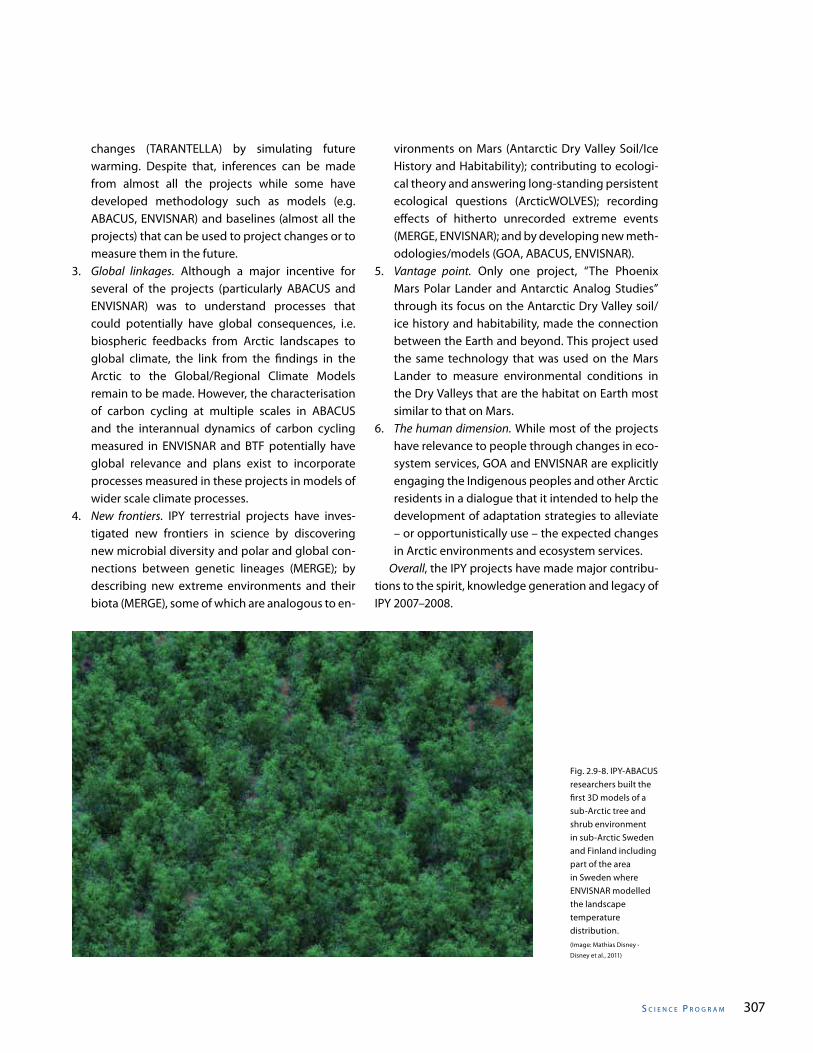
s C I e n C e P r o g r a m 307
changes (TARANTELLA) by simulating future warming. Despite that, inferences can be made from almost all the projects while some have developed methodology such as models (e.g. ABACUS, ENVISNAR) and baselines (almost all the projects) that can be used to project changes or to measure them in the future.
3. Global linkages. Although a major incentive for several of the projects (particularly ABACUS and ENVISNAR) was to understand processes that could potentially have global consequences, i.e. biospheric feedbacks from Arctic landscapes to global climate, the link from the findings in the Arctic to the Global/Regional Climate Models remain to be made. However, the characterisation of carbon cycling at multiple scales in ABACUS and the interannual dynamics of carbon cycling measured in ENVISNAR and BTF potentially have global relevance and plans exist to incorporate processes measured in these projects in models of wider scale climate processes.
4. New frontiers. IPY terrestrial projects have inves-tigated new frontiers in science by discovering new microbial diversity and polar and global con-nections between genetic lineages (MERGE); by describing new extreme environments and their biota (MERGE), some of which are analogous to en-
vironments on Mars (Antarctic Dry Valley Soil/Ice History and Habitability); contributing to ecologi-cal theory and answering long-standing persistent ecological questions (ArcticWOLVES); recording effects of hitherto unrecorded extreme events (MERGE, ENVISNAR); and by developing new meth-odologies/models (GOA, ABACUS, ENVISNAR).
5. Vantage point. Only one project, “The Phoenix Mars Polar Lander and Antarctic Analog Studies” through its focus on the Antarctic Dry Valley soil/ice history and habitability, made the connection between the Earth and beyond. This project used the same technology that was used on the Mars Lander to measure environmental conditions in the Dry Valleys that are the habitat on Earth most similar to that on Mars.
6. The human dimension. While most of the projects have relevance to people through changes in eco-system services, GOA and ENVISNAR are explicitly engaging the Indigenous peoples and other Arctic residents in a dialogue that it intended to help the development of adaptation strategies to alleviate – or opportunistically use – the expected changes in Arctic environments and ecosystem services.
Overall, the IPY projects have made major contribu-tions to the spirit, knowledge generation and legacy of IPY 2007–2008.
Fig. 2.9-8. IPY-ABACUS researchers built the first 3D models of a sub-Arctic tree and shrub environment in sub-Arctic Sweden and Finland including part of the area in Sweden where ENVISNAR modelled the landscape temperature distribution.(Image: Mathias Disney -
Disney et al., 2011)
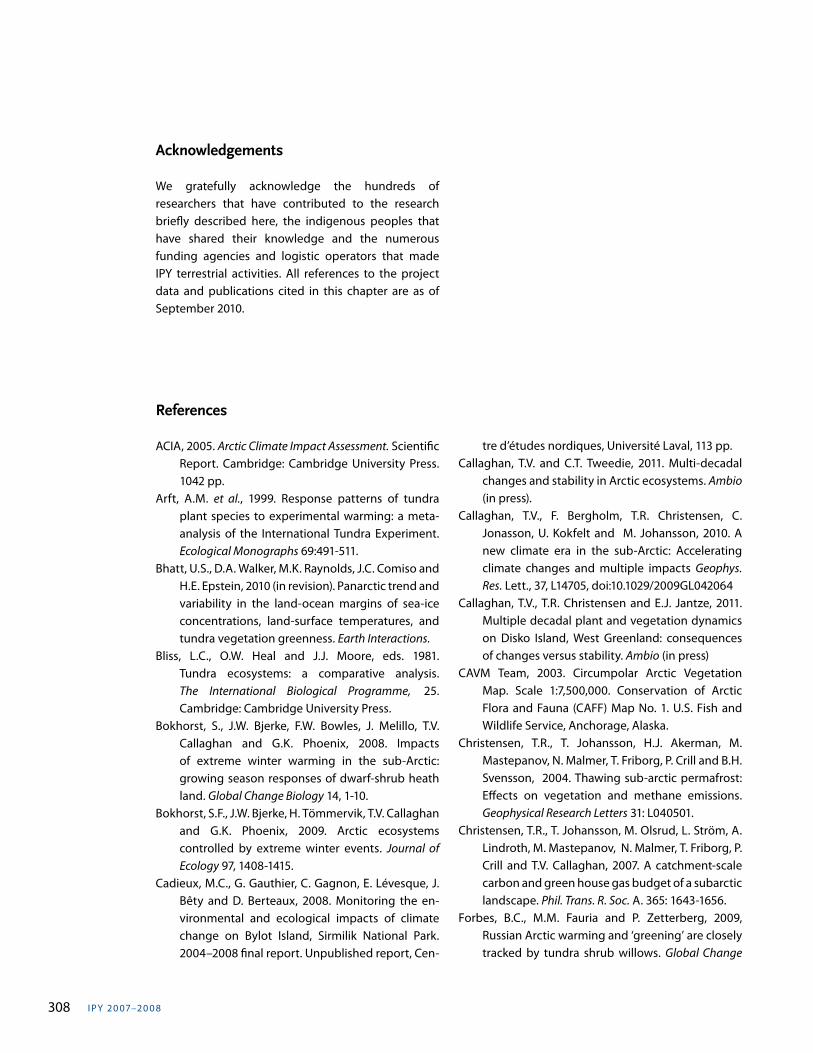
I PY 20 07–20 0 8308
Acknowledgements
We gratefully acknowledge the hundreds of researchers that have contributed to the research briefly described here, the indigenous peoples that have shared their knowledge and the numerous funding agencies and logistic operators that made IPY terrestrial activities. All references to the project data and publications cited in this chapter are as of September 2010.
References
ACIA, 2005. Arctic Climate Impact Assessment. Scientific Report. Cambridge: Cambridge University Press. 1042 pp.
Arft, A.M. et al., 1999. Response patterns of tundra plant species to experimental warming: a meta-analysis of the International Tundra Experiment. Ecological Monographs 69:491-511.
Bhatt, U.S., D.A. Walker, M.K. Raynolds, J.C. Comiso and H.E. Epstein, 2010 (in revision). Panarctic trend and variability in the land-ocean margins of sea-ice concentrations, land-surface temperatures, and tundra vegetation greenness. Earth Interactions.
Bliss, L.C., O.W. Heal and J.J. Moore, eds. 1981. Tundra ecosystems: a comparative analysis. The International Biological Programme, 25. Cambridge: Cambridge University Press.
Bokhorst, S., J.W. Bjerke, F.W. Bowles, J. Melillo, T.V. Callaghan and G.K. Phoenix, 2008. Impacts of extreme winter warming in the sub-Arctic: growing season responses of dwarf-shrub heath land. Global Change Biology 14, 1-10.
Bokhorst, S.F., J.W. Bjerke, H. Tömmervik, T.V. Callaghan and G.K. Phoenix, 2009. Arctic ecosystems controlled by extreme winter events. Journal of Ecology 97, 1408-1415.
Cadieux, M.C., G. Gauthier, C. Gagnon, E. Lévesque, J. Bêty and D. Berteaux, 2008. Monitoring the en-vironmental and ecological impacts of climate change on Bylot Island, Sirmilik National Park. 2004–2008 final report. Unpublished report, Cen-
tre d’études nordiques, Université Laval, 113 pp. Callaghan, T.V. and C.T. Tweedie, 2011. Multi-decadal
changes and stability in Arctic ecosystems. Ambio (in press).
Callaghan, T.V., F. Bergholm, T.R. Christensen, C. Jonasson, U. Kokfelt and M. Johansson, 2010. A new climate era in the sub-Arctic: Accelerating climate changes and multiple impacts Geophys. Res. Lett., 37, L14705, doi:10.1029/2009GL042064
Callaghan, T.V., T.R. Christensen and E.J. Jantze, 2011. Multiple decadal plant and vegetation dynamics on Disko Island, West Greenland: consequences of changes versus stability. Ambio (in press)
CAVM Team, 2003. Circumpolar Arctic Vegetation Map. Scale 1:7,500,000. Conservation of Arctic Flora and Fauna (CAFF) Map No. 1. U.S. Fish and Wildlife Service, Anchorage, Alaska.
Christensen, T.R., T. Johansson, H.J. Akerman, M. Mastepanov, N. Malmer, T. Friborg, P. Crill and B.H. Svensson, 2004. Thawing sub-arctic permafrost: Effects on vegetation and methane emissions. Geophysical Research Letters 31: L040501.
Christensen, T.R., T. Johansson, M. Olsrud, L. Ström, A. Lindroth, M. Mastepanov, N. Malmer, T. Friborg, P. Crill and T.V. Callaghan, 2007. A catchment-scale carbon and green house gas budget of a subarctic landscape. Phil. Trans. R. Soc. A. 365: 1643-1656.
Forbes, B.C., M.M. Fauria and P. Zetterberg, 2009, Russian Arctic warming and ‘greening’ are closely tracked by tundra shrub willows. Global Change
s C I e n C e P r o g r a m 309
Biology, p. doi: 10.1111/j.1365-2486.2009.02047.Gould, W.A. , J.A. Mercado-Díaz, 2008. Twenty year
record of vegetation change from long-term plots in Alaskan tundra. Eos Trans. AGU, 89(53), Fall Meet. Suppl., Abstract C11C-0524.
Goetz, S.J., H.E. Epstein, F. Achard, D. Alcaraz, U.S. Bhatt, A. Bunn, J.C. Comiso, M. Hansen, G.J. Jia, J.O. Kaplan, H. Lischke, A. Lloyd, D.A. Walker and Q. Yu, 2010 (in press). Vegetation productivity and disturbance changes across arctic northern Eurasia: Satellite observations and simulation modelling. In Eurasian Arctic Land Cover and Land Use in a Changing Climate. G. Gutman, P. Groisman and A. Reissell, eds. Heidelberg: Springer.
Gore, A. and J.G. Støre, eds. 2009. Melting Ice. Report presented at COP XV, Copenhagen, December 2009.
Havström, M., T.V. Callaghan and S. Jonasson, 1993. Differential growth responses of Cassiope tetragona, an arctic dwarf shrub, to environmental perturbations among three contrasting high- and sub-arctic sites. Oikos 66: 389-402.
Henry, G.H.R., U. Molau, 1997. Tundra plants and cli-mate change: the International Tundra Experi-ment (ITEX). Global Change Biology 3: 1-9.
Hedenås, H., C. Jonasson and T.V. Callaghan, 2011. Changes and homeostasis in alpine and sub-alpine vegetation – a three decade perspective. Ambio (in press).
Heliasz, M., T. Johansson, A. Lindroth, M. Mölder, M. Mastepanov, T. Friborg, T.V. Callaghan and T.R. Christensen, 2011, Quantification of C uptake in subarctic birch forest after setback by an extreme insect outbreak, Geophys. Res. Lett., 38, L01704, doi:10.1029/2010GL044733.
Høye, T.T., E. Post, H. Meltofte, N.M. Schmidt and M.C. Forchhammer, 2007. Rapid advancement of spring in the High Arctic. Current Biology 17, R449-R451.
IPCC, 2007. Climate Change 2007. The Physical Science Basis. Contribution of Working Group I to the Fourth Assessment. Report of the Intergorvernmental Panel on Climate Change. [S. Solomon, D. Qin, M. Manning, Z. Chen, M. Marquis, K.B. Averyt, M. Tignor and H.L. Miller (eds.)]. Cambridge: Cambridge University Press.
Johansson, M., H.J. Åkerman, C. Jonasson, T.R. Christensen and T.V. Callaghan, M. Johansson,
H.J. Åkerman, C. Jonasson, T.R. Christensen, T.V. Callaghan, 2008. Increasing Permafrost Temperatures in Subarctic Sweden. In Ninth International Conference on Permafrost. D.L. Kane and K.M. Hinkel, eds. Institute of Northern Engineering, University of Alaska Fairbanks, Vol. I, pp.851-856.
Kounaves, S.P., S.T. Stroble, R.M. Anderson, Q. Moore, D.C. Catling, S. Douglas, C. P. McKay, D.W. Ming, P.H. Smith, L.K. Tamppari, A.P. Zent, 2010. Discovery of natural perchlorate in the Antarctic Dry Valleys and its global implications., Environ. Sci. & Tech., doi:10.1021/es9033606 (In press)
McKinnon, L., P.A. Smith, E. Nol, J.L. Martin, F.I. Doyle, K.F. Abraham, H.G. Gilchrist, R.I.G. Morrison and J. Bêty, 2010. Lower predation risk for migratory birds at high latitudes. Science 327:326-327.
Olofsson, J., L. Oksanen, T. Callaghan, P.E. Hulme, T. Oksanen and O. Suominen, 2009. Herbivores inhibit climate-driven shrub expansion on the tundra. Global Change Biology 15, 2681-2693.
Post, E., M.C. Forchhammer, S. Bret-Harte, T.V. Callaghan, T.R. Christensen, B. Elberling, A.D. Fox, O. Gilg, D.S. Hik, R.A. Ims, E. Jeppesen, D.R. Klein, J. Madsen, A.D. McGuire, S. Rysgaard, D.E. Schindler, I. Stirling, M.P. Tamstorf, N.J.C. Tyler, R. van der Wal, J. Welker, P.A. Wookey, N.M. Schmidt and P. Aastrup, 2009. Ecological dynamics across the Arctic associated with recent climate change. Science 325, 1355 -1358.
Prach, K., J. Kosnar, J. Klimesova and M. Hais, 2010. High Arctic vegetation after 70 years: a repeated analysis from Svalbard. Polar Biology. 33:635-639
Press, M. C, T.V. Callaghan and J.A. Lee, 1998b. How will European Arctic ecosystems respond to projected global environmental change? Ambio 27:306-311
Riseth, J.Å., H. Tømmervik, E. Helander-Renvall, V. Poh-jola, N.T. Labba, N. Labba, E.A. Niia, H. Kuhmunen, A. Schanche, C. Jonasson, C. Johansson, L.E. Sarri, J.W. Bjerke, E. Malnes and T.V Callaghan submit-ted (2010) “Snow and Ice” Sami TEK and Science in concert for understanding climate change effects on reindeer pasturing. Polar Record. doi:10.1017/S0032247410000434
Robinson, C.H., P.A. Wookey, J.A. Lee, T.V. Callaghan and M.C. Press, 1998. Plant community responses to simulated environmental change at a high
I PY 20 07–20 0 8310
arctic polar semi-desert. Ecology 79: 856-866. Rundqvist, S., H. Hedenås, A. Sandström, U. Emanuels-
son, H. Eriksson, C. Jonasson and T.V. Callaghan. 2011. Tree and shrub layer expansion over the past 34 years at the tree-line in Abisko, sub-Arctic. Ambio (in press).
Sitch, S., B. Smith, I.C. Prentice et al., 2003. Evaluation of ecosystem dynamics, plant geography and ter-restrial carbon cycling in the LPJ dynamic global vegetation model. Global Change Biology 9: 161-
Tarroux, A., D. Berteaux and J. Bêty, 2010 Northern nomads: ability for extensive movements in adult arctic foxes. Polar Biology (in press).
Turner, J., R.A. Bindschadler, P. Convey, G. Di Prisco, E. Fahrbach, J. Gutt, D.A. Hodgson, P.A. Mayewski and Summerhayes, C.P. 2009. Antarctic Climate Change and the Environment. SCAR, Cambridge.
Van Bogaert, R., C. Jonasson, M. De Dapper and T.V. Callaghan, 2009. Competitive interaction between aspen and birch moderated by invertebrate and vertebrate herbivores and climate warming. Plant Ecology and Diversity vol 2 (3), 221–232.
Van Bogaert R. , C. Jonasson, M. De Dapper and T.V. Callaghan, 2010. Range expansion of thermophilic aspen (Populus tremula L.) in the Swedish Subarctic. Arctic, Antarctic and Alpine Research 42, 362-375.
Van Bogaert, R., K. Haneca, J. Hoogesteger, C. Jonasson, M. De Dapper and T.V. Callaghan, 2010. A century of tree line changes in sub-Arctic Sweden show local and regional variability and only a minor role of 20th Century climate warming. Journal of Biogeography. Doi: 10.111/j.1365-
2699.2010.02453.xVincent, W.F., L.G. Whyte, C. Lovejoy, C.W. Greer, I.
Laurion, C.A. Suttle, J. Corbeil and D.R. Mueller, 2009. Arctic microbial ecosystems and impacts of extreme warming during the International Polar Year. Polar Science 3: 171-180, doi:10.1016/j.polar.2009.05.004
Walker, D.A., B.C. Forbes, M.O. Leibman, H.E. Epstein, U.S. Bhatt, J.C. Comiso, D.S. Drozdov, A.A. Gubarkov, G.J. Jia, E. Karlejaärvi, J.O. Kaplan, V. Khumutov, G.P. Kofinas, T. Kumpula, P. Kuss, N.G. Moskalenko, M.K. Raynolds, V.E. Romanovsky, F. Stammler and Q. Yu, 2010 (in press). Cumulative effects of rapid land-cover and land-use changes on the Yamal Peninsula, Russia. In Eurasian Arctic Land Cover and Land Use in a Changing Climate. G. Gutman, P. Groismann and A. Reissel, eds. Heidelberg: Springer.
Walker, D.A., M.O. Leibman, H.E. Epstein, B.C. Forbes, U.S. Bhatt, M.K. Raynolds, J.C. Comiso, A.A. Gubar-kov, A.V. Khomutov, G.J. Jia, E. Kaarlejärvi, J.O. Kaplan, T. Kumpula, J.P. Kuss, G. Matyshak, N.G. Moskalenko, P. Orekhov, V.E. Romanovsky, N.K. Ukraientseva and Q. Yu, 2009. Spatial and tempo-ral patterns of greenness on the Yamal Peninsula, Russia: Interactions of ecological and social factors affecting Arctic NDVI. Environmental Research Let-ters. 4, doi:10.1088/1748-9326/1084/1084/045004.
Yang, Z., E. Hanna and T.V. Callaghan (in press). Scale integration of driving forces behind temperature variation over complex terrain - modeling surface air temperature at 50 metres’ resolution around Abisko, Swedish Lapland. Geografiske Annaler
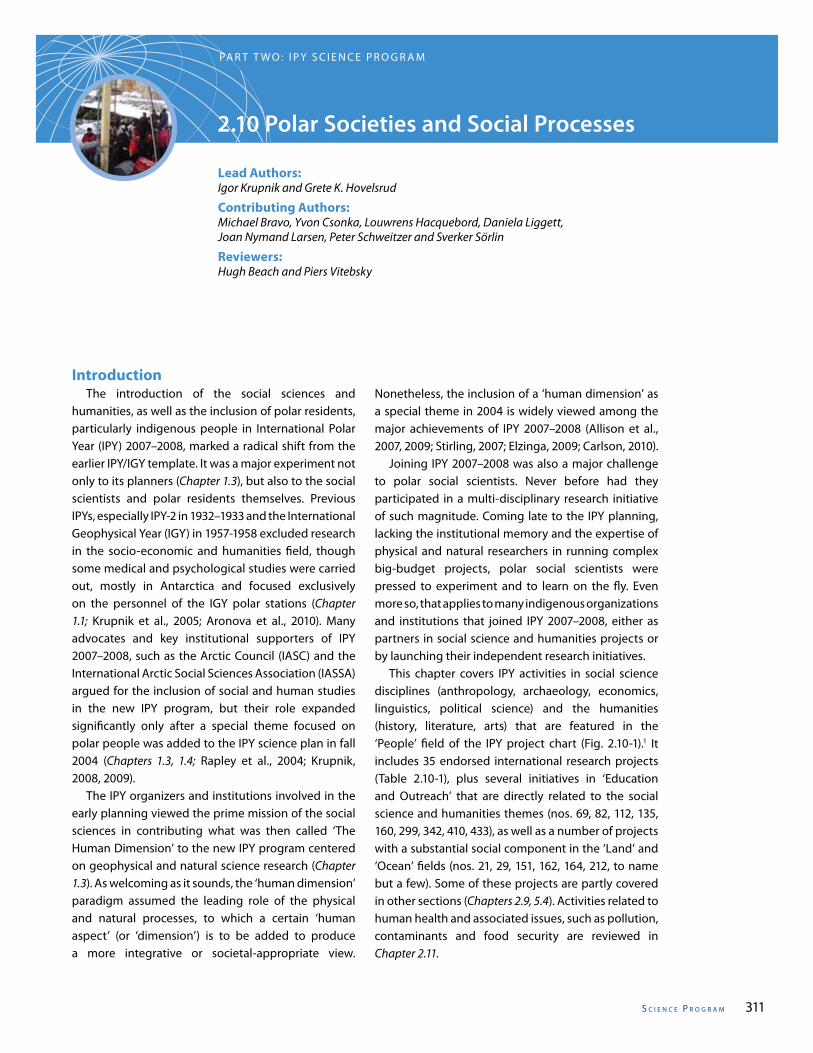
s C I e n C e P r o g r a m 311
2.10 Polar Societies and Social Processes
Lead Authors:Igor Krupnik and Grete K. Hovelsrud
Contributing Authors:Michael Bravo, Yvon Csonka, Louwrens Hacquebord, Daniela Liggett, Joan Nymand Larsen, Peter Schweitzer and Sverker Sörlin
Reviewers:Hugh Beach and Piers Vitebsky
PA R T T W O : I P Y S C I E N C E P R O G R A M
Introduction The introduction of the social sciences and humanities, as well as the inclusion of polar residents, particularly indigenous people in International Polar Year (IPY) 2007–2008, marked a radical shift from the earlier IPY/IGY template. It was a major experiment not only to its planners (Chapter 1.3), but also to the social scientists and polar residents themselves. Previous IPYs, especially IPY-2 in 1932–1933 and the International Geophysical Year (IGY) in 1957-1958 excluded research in the socio-economic and humanities field, though some medical and psychological studies were carried out, mostly in Antarctica and focused exclusively on the personnel of the IGY polar stations (Chapter 1.1; Krupnik et al., 2005; Aronova et al., 2010). Many advocates and key institutional supporters of IPY 2007–2008, such as the Arctic Council (IASC) and the International Arctic Social Sciences Association (IASSA) argued for the inclusion of social and human studies in the new IPY program, but their role expanded significantly only after a special theme focused on polar people was added to the IPY science plan in fall 2004 (Chapters 1.3, 1.4; Rapley et al., 2004; Krupnik, 2008, 2009). The IPY organizers and institutions involved in the early planning viewed the prime mission of the social sciences in contributing what was then called ‘The Human Dimension’ to the new IPY program centered on geophysical and natural science research (Chapter 1.3). As welcoming as it sounds, the ‘human dimension’ paradigm assumed the leading role of the physical and natural processes, to which a certain ‘human aspect’ (or ‘dimension’) is to be added to produce a more integrative or societal-appropriate view.
Nonetheless, the inclusion of a ‘human dimen sion’ as a special theme in 2004 is widely viewed among the major achievements of IPY 2007–2008 (Allison et al., 2007, 2009; Stirling, 2007; Elzinga, 2009; Carlson, 2010). Joining IPY 2007–2008 was also a major challenge to polar social scientists. Never before had they participated in a multi-disciplinary research initiative of such magnitude. Coming late to the IPY planning, lacking the institutional memory and the expertise of physical and natural researchers in running complex big-budget projects, polar social scientists were pressed to experiment and to learn on the fly. Even more so, that applies to many indigenous organizations and institutions that joined IPY 2007–2008, either as partners in social science and humanities projects or by launching their independent research initiatives. This chapter covers IPY activities in social science disciplines (anthropology, archaeology, economics, linguistics, political science) and the humanities (history, literature, arts) that are featured in the ‘People’ field of the IPY project chart (Fig. 2.10-1).1 It includes 35 endorsed international research projects (Table 2.10-1), plus several initiatives in ‘Education and Outreach’ that are directly related to the social science and humanities themes (nos. 69, 82, 112, 135, 160, 299, 342, 410, 433), as well as a number of projects with a substantial social component in the ‘Land’ and ‘Ocean’ fields (nos. 21, 29, 151, 162, 164, 212, to name but a few). Some of these projects are partly covered in other sections (Chapters 2.9, 5.4). Activities related to human health and associated issues, such as pollution, contaminants and food security are reviewed in Chapter 2.11.
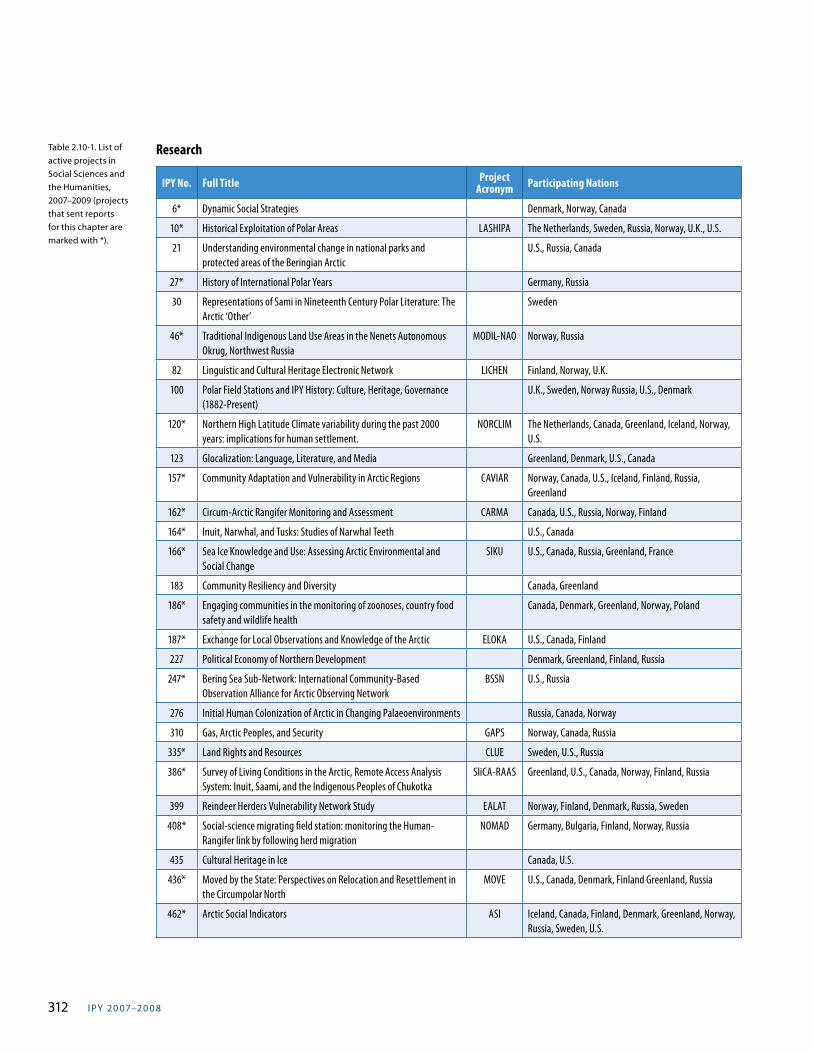
I PY 20 07–20 0 8312
Research
IPY No. Full Title Project Acronym Participating Nations
6* Dynamic Social Strategies Denmark, Norway, Canada
10* Historical Exploitation of Polar Areas LASHIPA The Netherlands, Sweden, Russia, Norway, U.K., U.S.
21 Understanding environmental change in national parks and protected areas of the Beringian Arctic
U.S., Russia, Canada
27* History of International Polar Years Germany, Russia
30 Representations of Sami in Nineteenth Century Polar Literature: The Arctic ‘Other’
Sweden
46* Traditional Indigenous Land Use Areas in the Nenets Autonomous Okrug, Northwest Russia
MODIL-NAO Norway, Russia
82 Linguistic and Cultural Heritage Electronic Network LICHEN Finland, Norway, U.K.
100 Polar Field Stations and IPY History: Culture, Heritage, Governance (1882-Present)
U.K., Sweden, Norway Russia, U.S., Denmark
120* Northern High Latitude Climate variability during the past 2000 years: implications for human settlement.
NORCLIM The Netherlands, Canada, Greenland, Iceland, Norway, U.S.
123 Glocalization: Language, Literature, and Media Greenland, Denmark, U.S., Canada
157* Community Adaptation and Vulnerability in Arctic Regions CAVIAR Norway, Canada, U.S., Iceland, Finland, Russia, Greenland
162* Circum-Arctic Rangifer Monitoring and Assessment CARMA Canada, U.S., Russia, Norway, Finland
164* Inuit, Narwhal, and Tusks: Studies of Narwhal Teeth U.S., Canada
166* Sea Ice Knowledge and Use: Assessing Arctic Environmental and Social Change
SIKU U.S., Canada, Russia, Greenland, France
183 Community Resiliency and Diversity Canada, Greenland
186* Engaging communities in the monitoring of zoonoses, country food safety and wildlife health
Canada, Denmark, Greenland, Norway, Poland
187* Exchange for Local Observations and Knowledge of the Arctic ELOKA U.S., Canada, Finland
227 Political Economy of Northern Development Denmark, Greenland, Finland, Russia
247* Bering Sea Sub-Network: International Community-Based Observation Alliance for Arctic Observing Network
BSSN U.S., Russia
276 Initial Human Colonization of Arctic in Changing Palaeoenvironments Russia, Canada, Norway
310 Gas, Arctic Peoples, and Security GAPS Norway, Canada, Russia
335* Land Rights and Resources CLUE Sweden, U.S., Russia
386* Survey of Living Conditions in the Arctic, Remote Access Analysis System: Inuit, Saami, and the Indigenous Peoples of Chukotka
SliCA-RAAS Greenland, U.S., Canada, Norway, Finland, Russia
399 Reindeer Herders Vulnerability Network Study EALAT Norway, Finland, Denmark, Russia, Sweden
408* Social-science migrating field station: monitoring the Human-Rangifer link by following herd migration
NOMAD Germany, Bulgaria, Finland, Norway, Russia
435 Cultural Heritage in Ice Canada, U.S.
436* Moved by the State: Perspectives on Relocation and Resettlement in the Circumpolar North
MOVE U.S., Canada, Denmark, Finland Greenland, Russia
462* Arctic Social Indicators ASI Iceland, Canada, Finland, Denmark, Greenland, Norway, Russia, Sweden, U.S.
Table 2.10-1. List of active projects in Social Sciences and the Humanities, 2007–2009 (projects that sent reports for this chapter are marked with *).
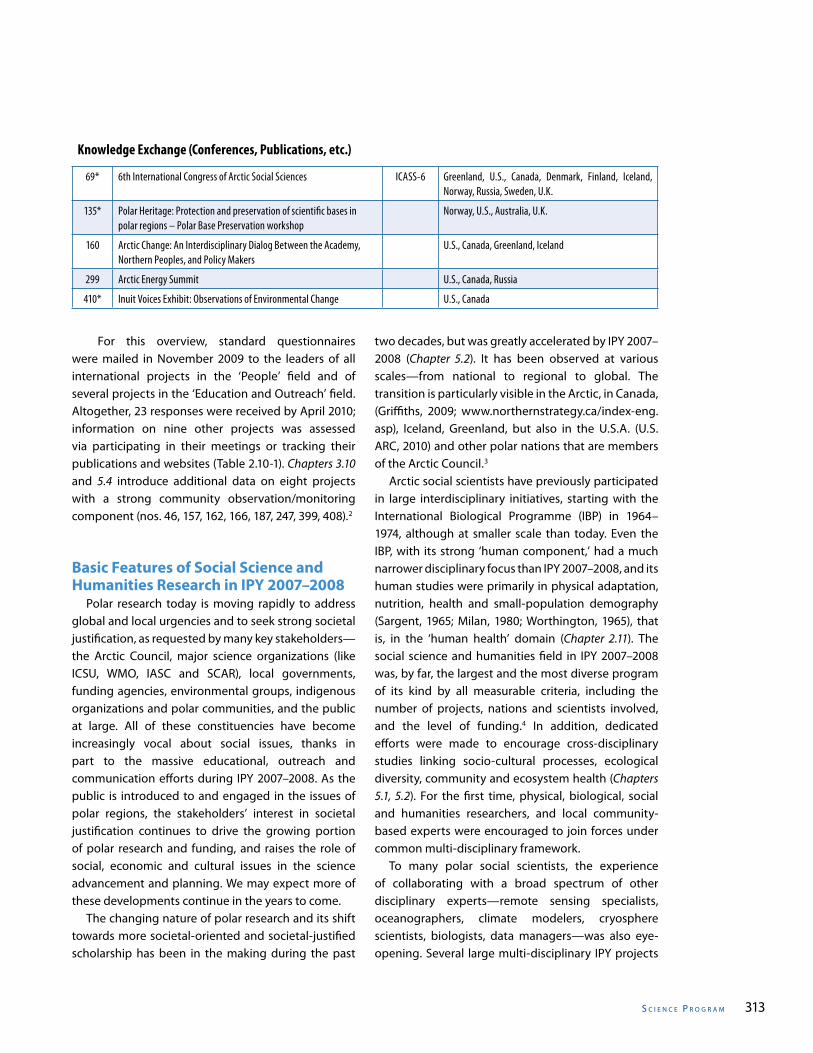
s C I e n C e P r o g r a m 313
Knowledge Exchange (Conferences, Publications, etc.)
69* 6th International Congress of Arctic Social Sciences ICASS-6 Greenland, U.S., Canada, Denmark, Finland, Iceland, Norway, Russia, Sweden, U.K.
135* Polar Heritage: Protection and preservation of scientific bases in polar regions – Polar Base Preservation workshop
Norway, U.S., Australia, U.K.
160 Arctic Change: An Interdisciplinary Dialog Between the Academy, Northern Peoples, and Policy Makers
U.S., Canada, Greenland, Iceland
299 Arctic Energy Summit U.S., Canada, Russia
410* Inuit Voices Exhibit: Observations of Environmental Change U.S., Canada
For this overview, standard questionnaires were mailed in November 2009 to the leaders of all international projects in the ‘People’ field and of several projects in the ‘Education and Outreach’ field. Altogether, 23 responses were received by April 2010; information on nine other projects was assessed via participating in their meetings or tracking their publications and websites (Table 2.10-1). Chapters 3.10 and 5.4 introduce additional data on eight projects with a strong community observation/monitoring component (nos. 46, 157, 162, 166, 187, 247, 399, 408).2
Basic Features of Social Science and Humanities Research in IPY 2007–2008 Polar research today is moving rapidly to address global and local urgencies and to seek strong societal justification, as requested by many key stakeholders—the Arctic Council, major science organizations (like ICSU, WMO, IASC and SCAR), local governments, funding agencies, environmental groups, indigenous organizations and polar communities, and the public at large. All of these constituencies have become increasingly vocal about social issues, thanks in part to the massive educational, outreach and communication efforts during IPY 2007–2008. As the public is introduced to and engaged in the issues of polar regions, the stakeholders’ interest in societal justification continues to drive the growing portion of polar research and funding, and raises the role of social, economic and cultural issues in the science advancement and planning. We may expect more of these developments continue in the years to come. The changing nature of polar research and its shift towards more societal-oriented and societal-justified scholarship has been in the making during the past
two decades, but was greatly accelerated by IPY 2007–2008 (Chapter 5.2). It has been observed at various scales—from national to regional to global. The transition is particularly visible in the Arctic, in Canada, (Griffiths, 2009; www.northernstrategy.ca/index-eng.asp), Iceland, Greenland, but also in the U.S.A. (U.S. ARC, 2010) and other polar nations that are members of the Arctic Council.3
Arctic social scientists have previously participated in large interdisciplinary initiatives, starting with the International Biological Programme (IBP) in 1964–1974, although at smaller scale than today. Even the IBP, with its strong ‘human component,’ had a much narrower disciplinary focus than IPY 2007–2008, and its human studies were primarily in physical adaptation, nutrition, health and small-population demography (Sargent, 1965; Milan, 1980; Worthington, 1965), that is, in the ‘human health’ domain (Chapter 2.11). The social science and humanities field in IPY 2007–2008 was, by far, the largest and the most diverse program of its kind by all measurable criteria, including the number of projects, nations and scientists involved, and the level of funding.4 In addition, dedicated efforts were made to encourage cross-disciplinary studies linking socio-cultural processes, ecological diversity, community and ecosystem health (Chapters 5.1, 5.2). For the first time, physical, biological, social and humanities researchers, and local community-based experts were encouraged to join forces under common multi-disciplinary framework. To many polar social scientists, the experience of collaborating with a broad spectrum of other disciplinary experts—remote sensing specialists, oceanographers, climate modelers, cryosphere scientists, biologists, data managers—was also eye-opening. Several large multi-disciplinary IPY projects
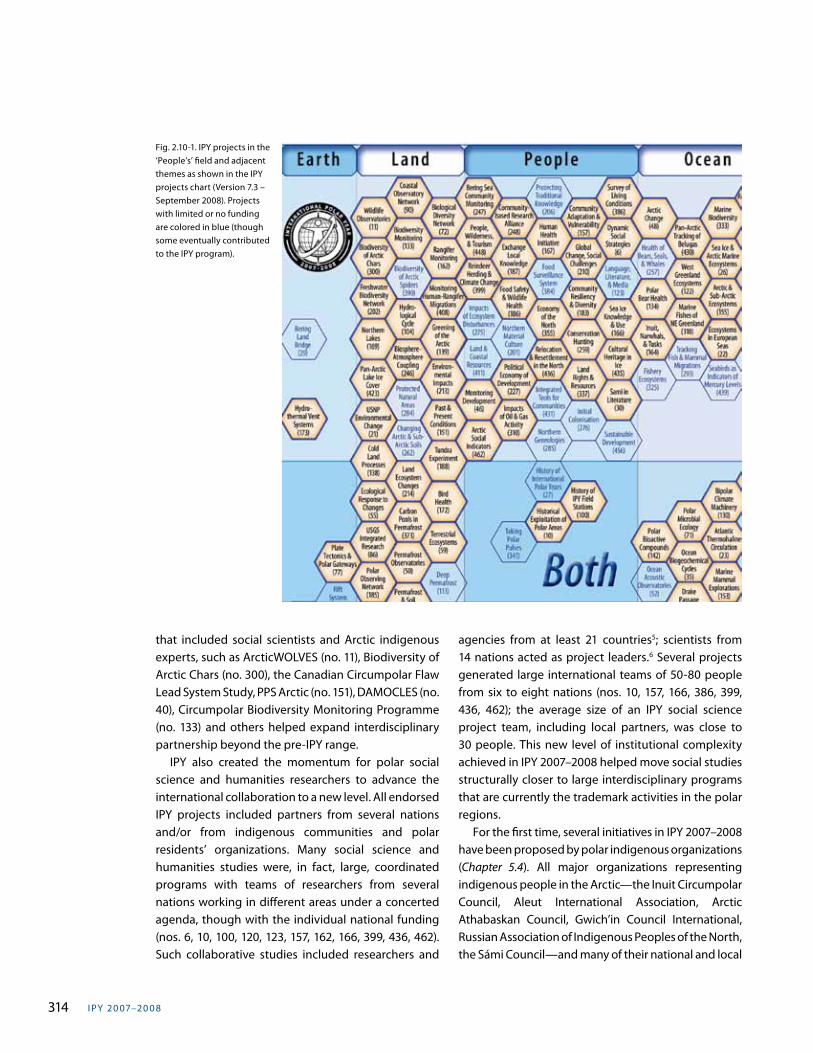
I PY 20 07–20 0 8314
Fig. 2.10-1. IPY projects in the ‘People’s’ field and adjacent themes as shown in the IPY projects chart (Version 7.3 – September 2008). Projects with limited or no funding are colored in blue (though some eventually contributed to the IPY program).
that included social scientists and Arctic indigenous experts, such as ArcticWOLVES (no. 11), Biodiversity of Arctic Chars (no. 300), the Canadian Circumpolar Flaw Lead System Study, PPS Arctic (no. 151), DAMOCLES (no. 40), Circumpolar Biodiversity Monitoring Programme (no. 133) and others helped expand interdisciplinary partnership beyond the pre-IPY range. IPY also created the momentum for polar social science and humanities researchers to advance the international collaboration to a new level. All endorsed IPY projects included partners from several nations and/or from indigenous communities and polar residents’ organizations. Many social science and humanities studies were, in fact, large, coordinated programs with teams of researchers from several nations working in different areas under a concerted agenda, though with the individual national funding (nos. 6, 10, 100, 120, 123, 157, 162, 166, 399, 436, 462). Such collaborative studies included researchers and
agencies from at least 21 countries5; scientists from 14 nations acted as project leaders.6 Several projects generated large international teams of 50-80 people from six to eight nations (nos. 10, 157, 166, 386, 399, 436, 462); the average size of an IPY social science project team, including local partners, was close to 30 people. This new level of institutional complexity achieved in IPY 2007–2008 helped move social studies structurally closer to large interdisciplinary programs that are currently the trademark activities in the polar regions. For the first time, several initiatives in IPY 2007–2008 have been proposed by polar indigenous organizations (Chapter 5.4). All major organizations representing indigenous people in the Arctic—the Inuit Circumpolar Council, Aleut International Association, Arctic Athabaskan Council, Gwich’in Council International, Russian Association of Indigenous Peoples of the North, the Sámi Council—and many of their national and local
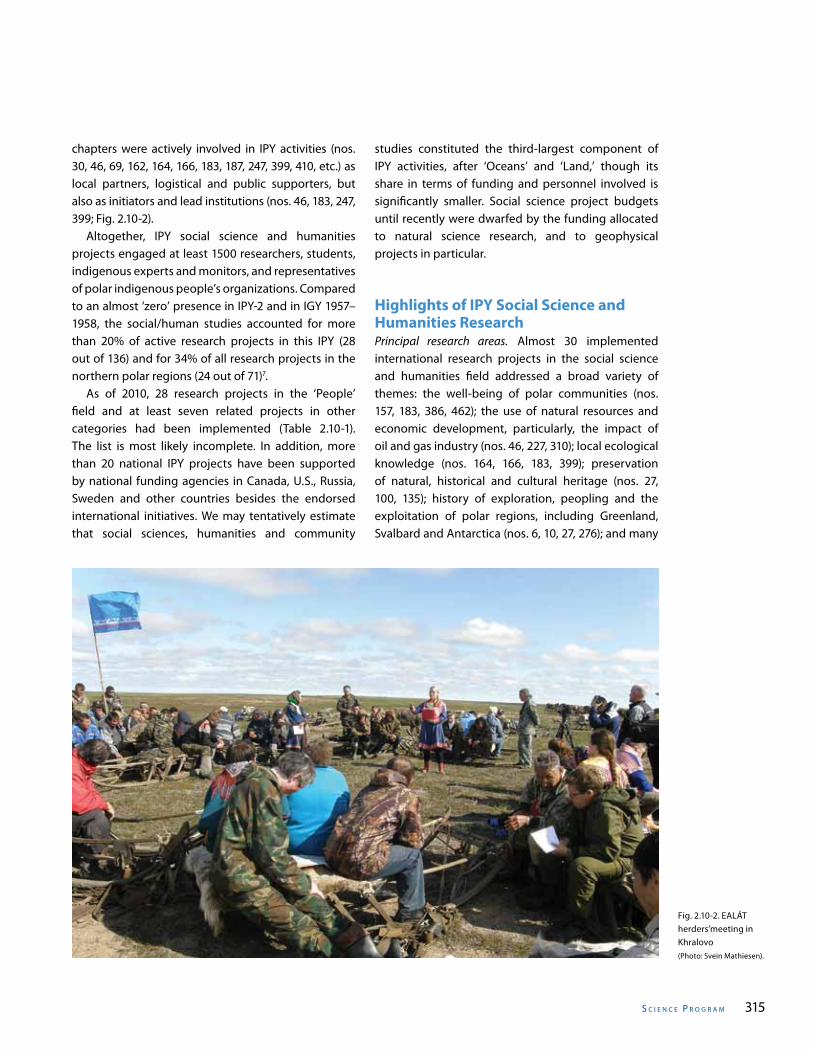
s C I e n C e P r o g r a m 315
chapters were actively involved in IPY activities (nos. 30, 46, 69, 162, 164, 166, 183, 187, 247, 399, 410, etc.) as local partners, logistical and public supporters, but also as initiators and lead institutions (nos. 46, 183, 247, 399; Fig. 2.10-2). Altogether, IPY social science and humanities projects engaged at least 1500 researchers, students, indigenous experts and monitors, and representatives of polar indigenous people’s organizations. Compared to an almost ‘zero’ presence in IPY-2 and in IGY 1957–1958, the social/human studies accounted for more than 20% of active research projects in this IPY (28 out of 136) and for 34% of all research projects in the northern polar regions (24 out of 71)7. As of 2010, 28 research projects in the ‘People’ field and at least seven related projects in other categories had been implemented (Table 2.10-1). The list is most likely incomplete. In addition, more than 20 national IPY projects have been supported by national funding agencies in Canada, U.S., Russia, Sweden and other countries besides the endorsed international initiatives. We may tentatively estimate that social sciences, humanities and community
studies constituted the third-largest component of IPY activities, after ‘Oceans’ and ‘Land,’ though its share in terms of funding and personnel involved is significantly smaller. Social science project budgets until recently were dwarfed by the funding allocated to natural science research, and to geophysical projects in particular.
Highlights of IPY Social Science and Humanities Research Principal research areas. Almost 30 implemented international research projects in the social science and humanities field addressed a broad variety of themes: the well-being of polar communities (nos. 157, 183, 386, 462); the use of natural resources and economic development, particularly, the impact of oil and gas industry (nos. 46, 227, 310); local ecological knowledge (nos. 164, 166, 183, 399); preservation of natural, historical and cultural heritage (nos. 27, 100, 135); history of exploration, peopling and the exploitation of polar regions, including Greenland, Svalbard and Antarctica (nos. 6, 10, 27, 276); and many
Fig. 2.10-2. EALÁT herders’meeting in Khralovo (Photo: Svein Mathiesen).
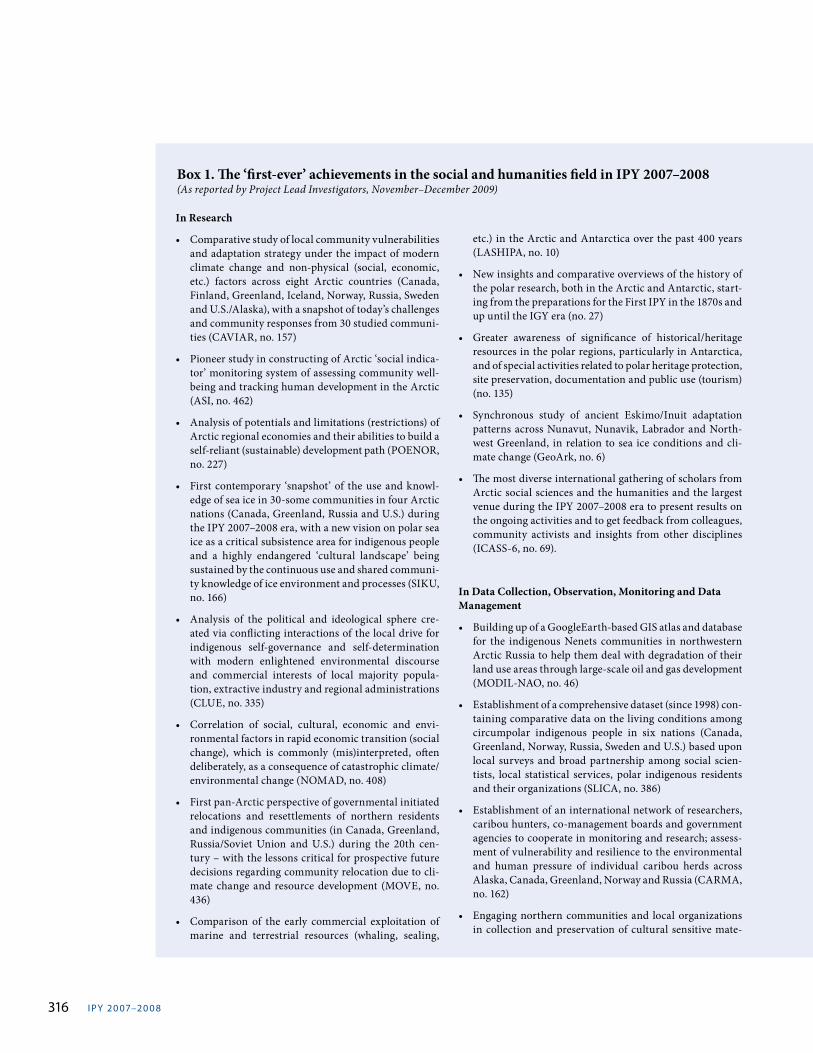
I PY 20 07–20 0 8316
In Research
• Comparative study of local community vulnerabilities and adaptation strategy under the impact of modern climate change and non-physical (social, economic, etc.) factors across eight Arctic countries (Canada, Finland, Greenland, Iceland, Norway, Russia, Sweden and U.S./Alaska), with a snapshot of today’s challenges and community responses from 30 studied communi-ties (CAVIAR, no. 157)
• Pioneer study in constructing of Arctic ‘social indica-tor’ monitoring system of assessing community well-being and tracking human development in the Arctic (ASI, no. 462)
• Analysis of potentials and limitations (restrictions) of Arctic regional economies and their abilities to build a self-reliant (sustainable) development path (POENOR, no. 227)
• First contemporary ‘snapshot’ of the use and knowl-edge of sea ice in 30-some communities in four Arctic nations (Canada, Greenland, Russia and U.S.) during the IPY 2007–2008 era, with a new vision on polar sea ice as a critical subsistence area for indigenous people and a highly endangered ‘cultural landscape’ being sustained by the continuous use and shared communi-ty knowledge of ice environment and processes (SIKU, no. 166)
• Analysis of the political and ideological sphere cre-ated via conflicting interactions of the local drive for indigenous self-governance and self-determination with modern enlightened environmental discourse and commercial interests of local majority popula-tion, extractive industry and regional administrations (CLUE, no. 335)
• Correlation of social, cultural, economic and envi-ronmental factors in rapid economic transition (social change), which is commonly (mis)interpreted, often deliberately, as a consequence of catastrophic climate/environmental change (NOMAD, no. 408)
• First pan-Arctic perspective of governmental initiated relocations and resettlements of northern residents and indigenous communities (in Canada, Greenland, Russia/Soviet Union and U.S.) during the 20th cen-tury – with the lessons critical for prospective future decisions regarding community relocation due to cli-mate change and resource development (MOVE, no. 436)
• Comparison of the early commercial exploitation of marine and terrestrial resources (whaling, sealing,
Box 1. The ‘first-ever’ achievements in the social and humanities field in IPY 2007–2008 (As reported by Project Lead Investigators, November–December 2009)
etc.) in the Arctic and Antarctica over the past 400 years (LASHIPA, no. 10)
• New insights and comparative overviews of the history of the polar research, both in the Arctic and Antarctic, start-ing from the preparations for the First IPY in the 1870s and up until the IGY era (no. 27)
• Greater awareness of significance of historical/heritage resources in the polar regions, particularly in Antarctica, and of special activities related to polar heritage protection, site preservation, documentation and public use (tourism) (no. 135)
• Synchronous study of ancient Eskimo/Inuit adaptation patterns across Nunavut, Nunavik, Labrador and North-west Greenland, in relation to sea ice conditions and cli-mate change (GeoArk, no. 6)
• The most diverse international gathering of scholars from Arctic social sciences and the humanities and the largest venue during the IPY 2007–2008 era to present results on the ongoing activities and to get feedback from colleagues, community activists and insights from other disciplines (ICASS-6, no. 69).
In Data Collection, Observation, Monitoring and Data Management
• Building up of a GoogleEarth-based GIS atlas and database for the indigenous Nenets communities in northwestern Arctic Russia to help them deal with degradation of their land use areas through large-scale oil and gas development (MODIL-NAO, no. 46)
• Establishment of a comprehensive dataset (since 1998) con-taining comparative data on the living conditions among circumpolar indigenous people in six nations (Canada, Greenland, Norway, Russia, Sweden and U.S.) based upon local surveys and broad partnership among social scien-tists, local statistical services, polar indigenous residents and their organizations (SLICA, no. 386)
• Establishment of an international network of researchers, caribou hunters, co-management boards and government agencies to cooperate in monitoring and research; assess-ment of vulnerability and resilience to the environmental and human pressure of individual caribou herds across Alaska, Canada, Greenland, Norway and Russia (CARMA, no. 162)
• Engaging northern communities and local organizations in collection and preservation of cultural sensitive mate-
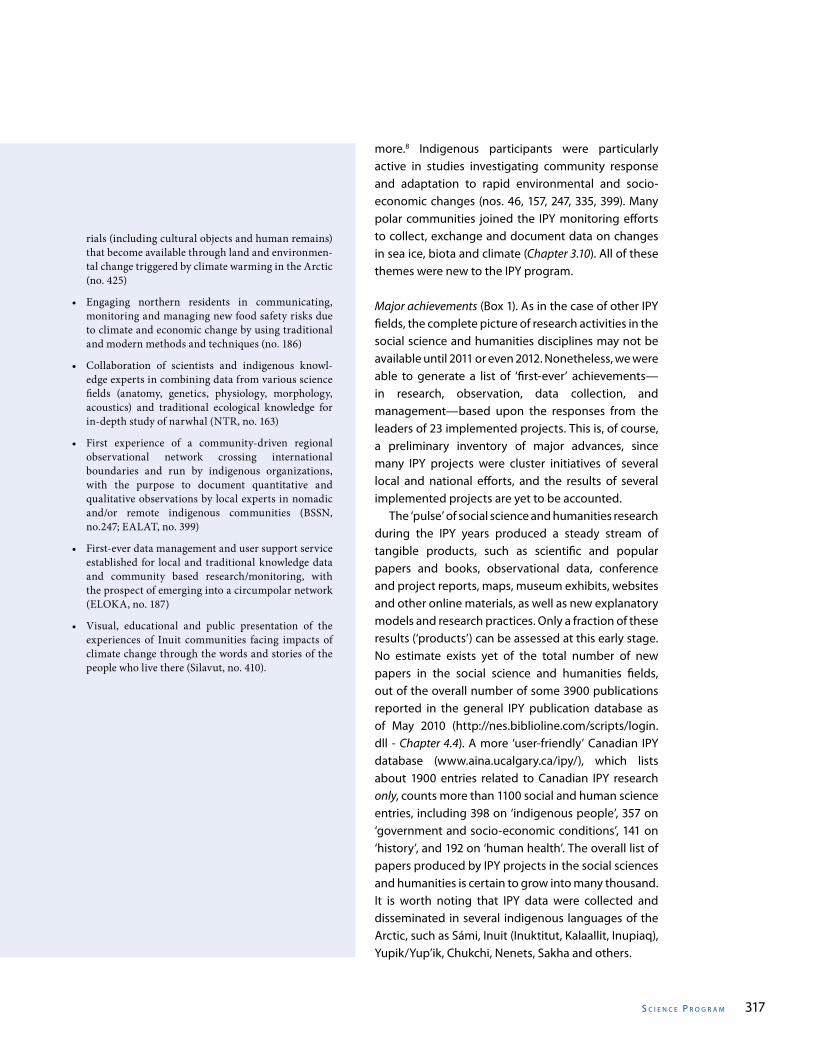
s C I e n C e P r o g r a m 317
more.8 Indigenous participants were particularly active in studies investigating community response and adaptation to rapid environmental and socio-economic changes (nos. 46, 157, 247, 335, 399). Many polar communities joined the IPY monitoring efforts to collect, exchange and document data on changes in sea ice, biota and climate (Chapter 3.10). All of these themes were new to the IPY program.
Major achievements (Box 1). As in the case of other IPY fields, the complete picture of research activities in the social science and humanities disciplines may not be available until 2011 or even 2012. Nonetheless, we were able to generate a list of ‘first-ever’ achievements—in research, observation, data collection, and management—based upon the responses from the leaders of 23 implemented projects. This is, of course, a preliminary inventory of major advances, since many IPY projects were cluster initiatives of several local and national efforts, and the results of several implemented projects are yet to be accounted. The ‘pulse’ of social science and humanities research during the IPY years produced a steady stream of tangible products, such as scientific and popular papers and books, observational data, conference and project reports, maps, museum exhibits, websites and other online materials, as well as new explanatory models and research practices. Only a fraction of these results (‘products’) can be assessed at this early stage. No estimate exists yet of the total number of new papers in the social science and humanities fields, out of the overall number of some 3900 publications reported in the general IPY publication database as of May 2010 (http://nes.biblioline.com/scripts/login.dll - Chapter 4.4). A more ‘user-friendly’ Canadian IPY database (www.aina.ucalgary.ca/ipy/), which lists about 1900 entries related to Canadian IPY research only, counts more than 1100 social and human science entries, including 398 on ‘indigenous people’, 357 on ‘government and socio-economic conditions’, 141 on ‘history’, and 192 on ‘human health’. The overall list of papers produced by IPY projects in the social sciences and humanities is certain to grow into many thousand. It is worth noting that IPY data were collected and disseminated in several indigenous languages of the Arctic, such as Sámi, Inuit (Inuktitut, Kalaallit, Inupiaq), Yupik/Yup’ik, Chukchi, Nenets, Sakha and others.
rials (including cultural objects and human remains) that become available through land and environmen-tal change triggered by climate warming in the Arctic (no. 425)
• Engaging northern residents in communicating, monitoring and managing new food safety risks due to climate and economic change by using traditional and modern methods and techniques (no. 186)
• Collaboration of scientists and indigenous knowl-edge experts in combining data from various science fields (anatomy, genetics, physiology, morphology, acoustics) and traditional ecological knowledge for in-depth study of narwhal (NTR, no. 163)
• First experience of a community-driven regional observational network crossing international boundaries and run by indigenous organizations, with the purpose to document quantitative and qualitative observations by local experts in nomadic and/or remote indigenous communities (BSSN, no.247; EALAT, no. 399)
• First-ever data management and user support service established for local and traditional knowledge data and community based research/monitoring, with the prospect of emerging into a circumpolar network (ELOKA, no. 187)
• Visual, educational and public presentation of the experiences of Inuit communities facing impacts of climate change through the words and stories of the people who live there (Silavut, no. 410).
I PY 20 07–20 0 8318
The field of the social sciences and humanities generated by far the largest share of the first books produced by the IPY 2007–2008 programs. As of this writing (summer 2010), at least twelve volumes based upon nine IPY projects in the social science and humanities field were already published or are in press (Barr and Chaplin, 2008 – no. 135; Barr and Lüedecke, 2010 – no. 27; Fienup-Riordan and Rearden, 2010 – no. 166; Hovelsrud and Smit, 2010 – no. 157; Krupnik et al., 2009, 2011 – no. 166; Launius et al., 2010 – no. 27; Larsen et al., 2010 – no. 462; Oskal et al., 2009 – no. 399; Shadian and Tennberg, 2009 – no. 100; Stuckenberger, 2007 – no. 160; Winther, 2010 – no. 227). Several more books are in submission and preparation. In addition, several reprints of the early IPY sources, collections on IPY history and polar research heritage were produced (Andreev et al., 2007; Arnestad Foote, 2009; Barr and Chaplin, 2008; Tromholt, 2007; Vairo et al., 2007a,b). By 2012, the publication ‘imprint’ of IPY social science and humanities research will be even more visible and will include several special journal issues and heritage materials produced for participating polar communities, now in preparation.
From ‘local’ to ‘polar.’ During IPY, seven projects (nos. 157, 162, 166, 227, 399, 436, 462) included new coordinated research and data collection in four or more Arctic nations. Four projects, CAVIAR (no. 157), CARMA (no. 162), EALÁT (no. 399) and MOVE (no. 436), aspired to produce pan-Arctic overviews of local community adaptation and vulnerability; subsistence caribou hunting; status of reindeer herders’ knowledge; and the role of governmental policies in community resettlement and relocations, respectively. These projects, together with other large initiatives were critical in moving the social science and humanities field from local and regional to the ‘circumpolar’ level, as a result of IPY. Two new ‘pan-Arctic’ IPY projects – Community Adaptation and Vulnerability in the Arctic Region (CAVIAR, no. 157) and Arctic Social Indicators (ASI, no. 462) – were particularly instrumental in this transformation. The CAVIAR project was aimed at testing a new research and modelling approach to assess Arctic populations’ vulnerability and adaptability via studies in 26 communities in Canada, U.S. (Alaska), Greenland, Iceland, Norway, Sweden,
Finland and Russia (Chapter 3.10; Hovelsrud and Smit, 2010). The main outcome was a new vision of the Arctic peoples’ resilience to environmental stress as a ‘two-way’ process that depends as much (or more) on the strength of the community internal networks (social, cultural, institutional, economic, etc.) as on the intensity of the environmental signal (Fig. 2.10-3). As the CAVIAR case studies illustrate (and as social scientists have been arguing for years), the projected impact of change should be first assessed at the local community level rather than from the top-down, large-scale climate change scenarios that simulate certain temperature, ice, or seasonal shifts. In the pre-IPY impact assessment, including the IPCC Reports, the latter approach was viewed as a standard pathway to complex environmental impact modeling (Smit and Wandel, 2006; Krupnik, 2010). The ASI project aspired to develop a set of thoroughly calibrated indicators, via data mining and expert assessment, to evaluate the status of socio-cultural well-being of Arctic population at the community, local and regional level. Here, again, more general national indices used by UNESCO and other major international agencies, such as per capita gross domestic product or the overall level of literacy (http://unstats.un.org/unsd/demographic/products/socind/default.htm) have been successfully substituted by more locally-nuanced tools to assess community well-being, as a result of IPY research (Larsen et al., 2010; Table 2.10-2). It remains to be seen whether a community-based (‘bottom-up’) approach will become standard in the post-IPY studies.
The Power of Multiple Perspectives. This notion used by one of the IPY socio-cultural teams (Huntington et al., 2010) led to a new way of IPY data collection and will impact the future synthesis of IPY-generated materi-als. As has been long recognized by researchers, each process or phenomenon should be viewed from sev-eral perspectives, coming from different disciplines and/or groups of stakeholders. In physical and natural studies, bringing several disciplines to inter-disciplin-ary inquiry is most often aimed at grasping more el-ements and linkages in the complex natural systems. In social science research, this approach is rather as-sociated with the use of radically different types of knowledge that have independent origins and basic principles, like those coming from the science and the
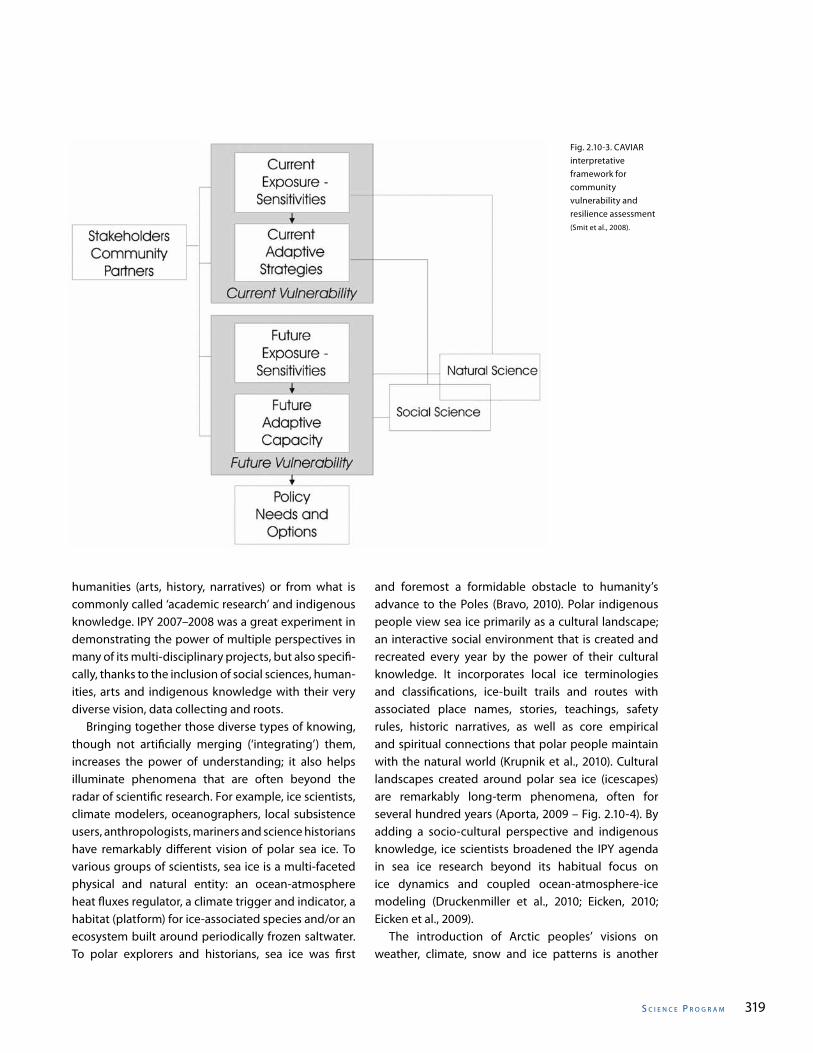
s C I e n C e P r o g r a m 319
Fig. 2.10-3. CAVIAR interpretative framework for community vulnerability and resilience assessment (Smit et al., 2008).
humanities (arts, history, narratives) or from what is commonly called ‘academic research’ and indigenous knowledge. IPY 2007–2008 was a great experiment in demonstrating the power of multiple perspectives in many of its multi-disciplinary projects, but also specifi-cally, thanks to the inclusion of social sciences, human-ities, arts and indigenous knowledge with their very diverse vision, data collecting and roots. Bringing together those diverse types of knowing, though not artificially merging (‘integrating’) them, increases the power of understanding; it also helps illuminate phenomena that are often beyond the radar of scientific research. For example, ice scientists, climate modelers, oceanographers, local subsistence users, anthropologists, mariners and science historians have remarkably different vision of polar sea ice. To various groups of scientists, sea ice is a multi-faceted physical and natural entity: an ocean-atmosphere heat fluxes regulator, a climate trigger and indicator, a habitat (platform) for ice-associated species and/or an ecosystem built around periodically frozen saltwater. To polar explorers and historians, sea ice was first
and foremost a formidable obstacle to humanity’s advance to the Poles (Bravo, 2010). Polar indigenous people view sea ice primarily as a cultural landscape; an interactive social environment that is created and recreated every year by the power of their cultural knowledge. It incorporates local ice terminologies and classifications, ice-built trails and routes with associated place names, stories, teachings, safety rules, historic narratives, as well as core empirical and spiritual connections that polar people maintain with the natural world (Krupnik et al., 2010). Cultural landscapes created around polar sea ice (icescapes) are remarkably long-term phenomena, often for several hundred years (Aporta, 2009 – Fig. 2.10-4). By adding a socio-cultural perspective and indigenous knowledge, ice scientists broadened the IPY agenda in sea ice research beyond its habitual focus on ice dynamics and coupled ocean-atmosphere-ice modeling (Druckenmiller et al., 2010; Eicken, 2010; Eicken et al., 2009). The introduction of Arctic peoples’ visions on weather, climate, snow and ice patterns is another
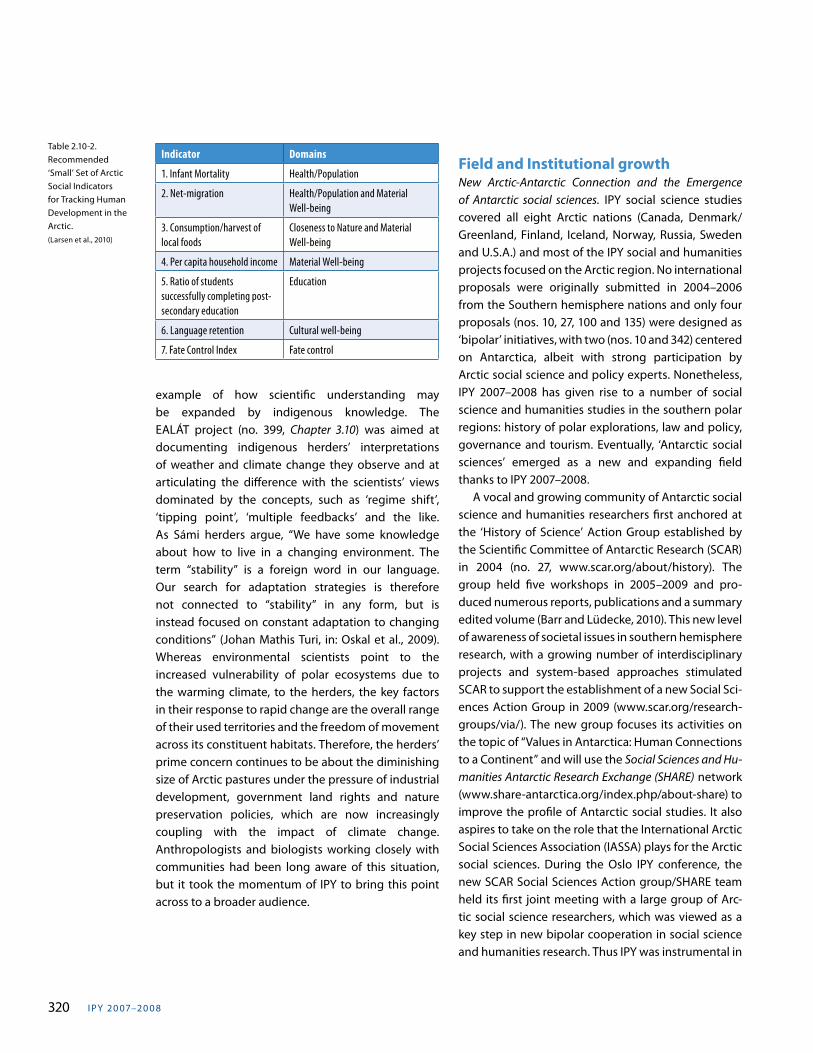
I PY 20 07–20 0 8320
example of how scientific understanding may be expanded by indigenous knowledge. The EALÁT project (no. 399, Chapter 3.10) was aimed at documenting indigenous herders’ interpretations of weather and climate change they observe and at articulating the difference with the scientists’ views dominated by the concepts, such as ‘regime shift’, ‘tipping point’, ‘multiple feedbacks’ and the like. As Sámi herders argue, “We have some knowledge about how to live in a changing environment. The term “stability” is a foreign word in our language. Our search for adaptation strategies is therefore not connected to “stability” in any form, but is instead focused on constant adaptation to changing conditions” (Johan Mathis Turi, in: Oskal et al., 2009). Whereas environmental scientists point to the increased vulnerability of polar ecosystems due to the warming climate, to the herders, the key factors in their response to rapid change are the overall range of their used territories and the freedom of movement across its constituent habitats. Therefore, the herders’ prime concern continues to be about the diminishing size of Arctic pastures under the pressure of industrial development, government land rights and nature preservation policies, which are now increasingly coupling with the impact of climate change. Anthropologists and biologists working closely with communities had been long aware of this situation, but it took the momentum of IPY to bring this point across to a broader audience.
Indicator Domains
1. Infant Mortality Health/Population
2. Net-migration Health/Population and Material Well-being
3. Consumption/harvest of local foods
Closeness to Nature and Material Well-being
4. Per capita household income Material Well-being
5. Ratio of students successfully completing post-secondary education
Education
6. Language retention Cultural well-being
7. Fate Control Index Fate control
Table 2.10-2. Recommended ‘Small’ Set of Arctic Social Indicators for Tracking Human Development in the Arctic. (Larsen et al., 2010)
Field and Institutional growthNew Arctic-Antarctic Connection and the Emergence of Antarctic social sciences. IPY social science studies covered all eight Arctic nations (Canada, Denmark/Greenland, Finland, Iceland, Norway, Russia, Sweden and U.S.A.) and most of the IPY social and humanities projects focused on the Arctic region. No international proposals were originally submitted in 2004–2006 from the Southern hemisphere nations and only four proposals (nos. 10, 27, 100 and 135) were designed as ‘bipolar’ initiatives, with two (nos. 10 and 342) centered on Antarctica, albeit with strong participation by Arctic social science and policy experts. Nonetheless, IPY 2007–2008 has given rise to a number of social science and humanities studies in the southern polar regions: history of polar explorations, law and policy, governance and tourism. Eventually, ‘Antarctic social sciences’ emerged as a new and expanding field thanks to IPY 2007–2008. A vocal and growing community of Antarctic social science and humanities researchers first anchored at the ‘History of Science’ Action Group established by the Scientific Committee of Antarctic Research (SCAR) in 2004 (no. 27, www.scar.org/about/history). The group held five workshops in 2005–2009 and pro-duced numerous reports, publications and a summary edited volume (Barr and Lüdecke, 2010). This new level of awareness of societal issues in southern hemisphere research, with a growing number of interdisciplinary projects and system-based approaches stimulated SCAR to support the establishment of a new Social Sci-ences Action Group in 2009 (www.scar.org/research-groups/via/). The new group focuses its activities on the topic of “Values in Antarctica: Human Connections to a Continent” and will use the Social Sciences and Hu-manities Antarctic Research Exchange (SHARE) network (www.share-antarctica.org/index.php/about-share) to improve the profile of Antarctic social studies. It also aspires to take on the role that the International Arctic Social Sciences Association (IASSA) plays for the Arctic social sciences. During the Oslo IPY conference, the new SCAR Social Sciences Action group/SHARE team held its first joint meeting with a large group of Arc-tic social science researchers, which was viewed as a key step in new bipolar cooperation in social science and humanities research. Thus IPY was instrumental in
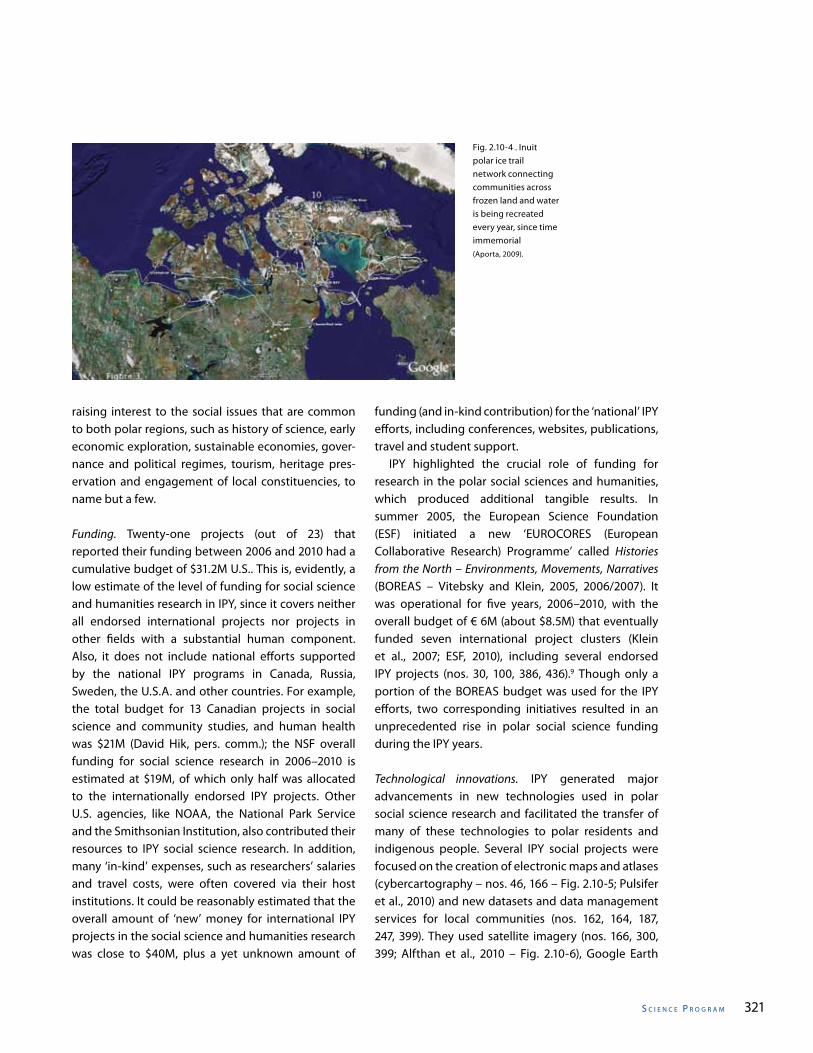
s C I e n C e P r o g r a m 321
Fig. 2.10-4 . Inuit polar ice trail network connecting communities across frozen land and water is being recreated every year, since time immemorial (Aporta, 2009).
raising interest to the social issues that are common to both polar regions, such as history of science, early economic exploration, sustainable economies, gover-nance and political regimes, tourism, heritage pres-ervation and engagement of local constituencies, to name but a few.
Funding. Twenty-one projects (out of 23) that reported their funding between 2006 and 2010 had a cumulative budget of $31.2M U.S.. This is, evidently, a low estimate of the level of funding for social science and humanities research in IPY, since it covers neither all endorsed international projects nor projects in other fields with a substantial human component. Also, it does not include national efforts supported by the national IPY programs in Canada, Russia, Sweden, the U.S.A. and other countries. For example, the total budget for 13 Canadian projects in social science and community studies, and human health was $21M (David Hik, pers. comm.); the NSF overall funding for social science research in 2006–2010 is estimated at $19M, of which only half was allocated to the internationally endorsed IPY projects. Other U.S. agencies, like NOAA, the National Park Service and the Smithsonian Institution, also contributed their resources to IPY social science research. In addition, many ‘in-kind’ expenses, such as researchers’ salaries and travel costs, were often covered via their host institutions. It could be reasonably estimated that the overall amount of ‘new’ money for international IPY projects in the social science and humanities research was close to $40M, plus a yet unknown amount of
funding (and in-kind contribution) for the ‘national’ IPY efforts, including conferences, websites, publications, travel and student support. IPY highlighted the crucial role of funding for research in the polar social sciences and humanities, which produced additional tangible results. In summer 2005, the European Science Foundation (ESF) initiated a new ‘EUROCORES (European Collaborative Research) Programme’ called Histories from the North – Environments, Movements, Narratives (BOREAS – Vitebsky and Klein, 2005, 2006/2007). It was operational for five years, 2006–2010, with the overall budget of € 6M (about $8.5M) that eventually funded seven international project clusters (Klein et al., 2007; ESF, 2010), including several endorsed IPY projects (nos. 30, 100, 386, 436).9 Though only a portion of the BOREAS budget was used for the IPY efforts, two corresponding initiatives resulted in an unprecedented rise in polar social science funding during the IPY years.
Technological innovations. IPY generated major advancements in new technologies used in polar social science research and facilitated the transfer of many of these technologies to polar residents and indigenous people. Several IPY social projects were focused on the creation of electronic maps and atlases (cybercartography – nos. 46, 166 – Fig. 2.10-5; Pulsifer et al., 2010) and new datasets and data management services for local communities (nos. 162, 164, 187, 247, 399). They used satellite imagery (nos. 166, 300, 399; Alfthan et al., 2010 – Fig. 2.10-6), Google Earth
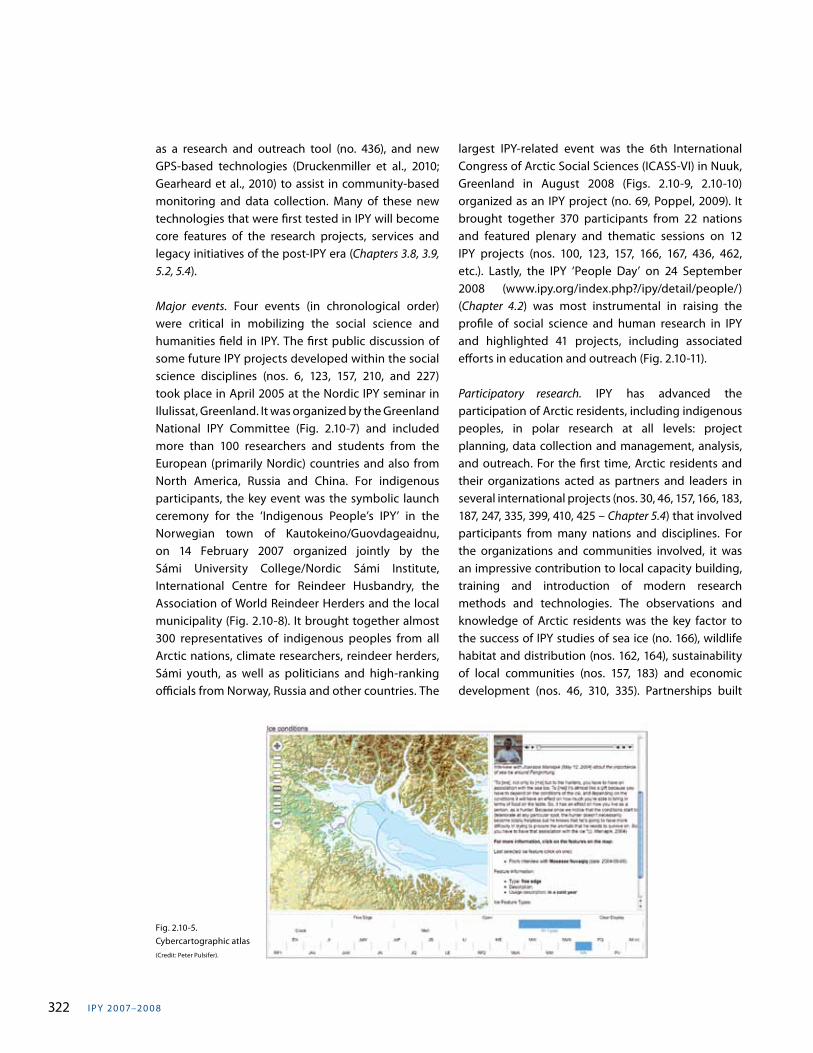
I PY 20 07–20 0 8322
as a research and outreach tool (no. 436), and new GPS-based technologies (Druckenmiller et al., 2010; Gearheard et al., 2010) to assist in community-based monitoring and data collection. Many of these new technologies that were first tested in IPY will become core features of the research projects, services and legacy initiatives of the post-IPY era (Chapters 3.8, 3.9, 5.2, 5.4).
Major events. Four events (in chronological order) were critical in mobilizing the social science and humanities field in IPY. The first public discussion of some future IPY projects developed within the social science disciplines (nos. 6, 123, 157, 210, and 227) took place in April 2005 at the Nordic IPY seminar in Ilulissat, Greenland. It was organized by the Greenland National IPY Committee (Fig. 2.10-7) and included more than 100 researchers and students from the European (primarily Nordic) countries and also from North America, Russia and China. For indigenous participants, the key event was the symbolic launch ceremony for the ‘Indigenous People’s IPY’ in the Norwegian town of Kautokeino/Guovdageaidnu, on 14 February 2007 organized jointly by the Sámi University College/Nordic Sámi Institute, International Centre for Reindeer Husbandry, the Association of World Reindeer Herders and the local municipality (Fig. 2.10-8). It brought together almost 300 representatives of indigenous peoples from all Arctic nations, climate researchers, reindeer herders, Sámi youth, as well as politicians and high-ranking officials from Norway, Russia and other countries. The
largest IPY-related event was the 6th International Congress of Arctic Social Sciences (ICASS-VI) in Nuuk, Greenland in August 2008 (Figs. 2.10-9, 2.10-10) organized as an IPY project (no. 69, Poppel, 2009). It brought together 370 participants from 22 nations and featured plenary and thematic sessions on 12 IPY projects (nos. 100, 123, 157, 166, 167, 436, 462, etc.). Lastly, the IPY ‘People Day’ on 24 September 2008 (www.ipy.org/index.php?/ipy/detail/people/) (Chapter 4.2) was most instrumental in raising the profile of social science and human research in IPY and highlighted 41 projects, including associated efforts in education and outreach (Fig. 2.10-11).
Participatory research. IPY has advanced the participation of Arctic residents, including indigenous peoples, in polar research at all levels: project planning, data collection and management, analysis, and outreach. For the first time, Arctic residents and their organizations acted as partners and leaders in several international projects (nos. 30, 46, 157, 166, 183, 187, 247, 335, 399, 410, 425 – Chapter 5.4) that involved participants from many nations and disciplines. For the organizations and communities involved, it was an impressive contribution to local capacity building, training and introduction of modern research methods and technologies. The observations and knowledge of Arctic residents was the key factor to the success of IPY studies of sea ice (no. 166), wildlife habitat and distribution (nos. 162, 164), sustainability of local communities (nos. 157, 183) and economic development (nos. 46, 310, 335). Partnerships built
Fig. 2.10-5. Cybercartographic atlas (Credit: Peter Pulsifer).
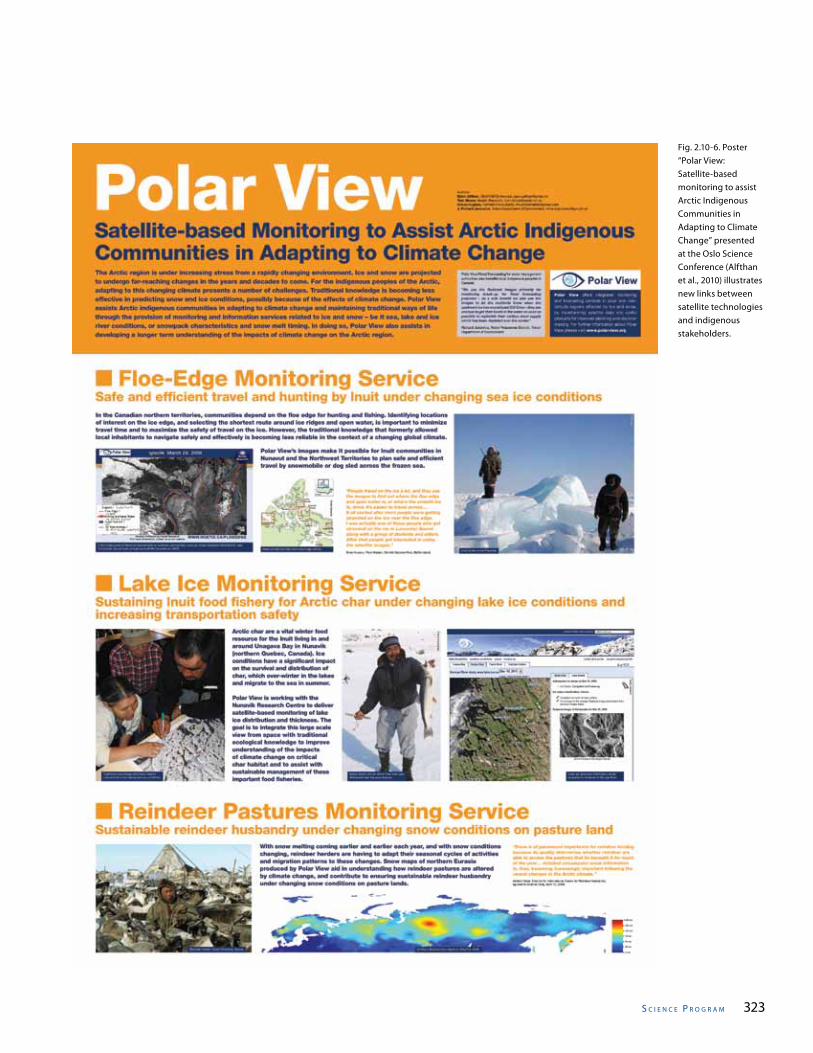
s C I e n C e P r o g r a m 323
Fig. 2.10-6. Poster “Polar View: Satellite-based monitoring to assist Arctic Indigenous Communities in Adapting to Climate Change” presented at the Oslo Science Conference (Alfthan et al., 2010) illustrates new links between satellite technologies and indigenous stakeholders.
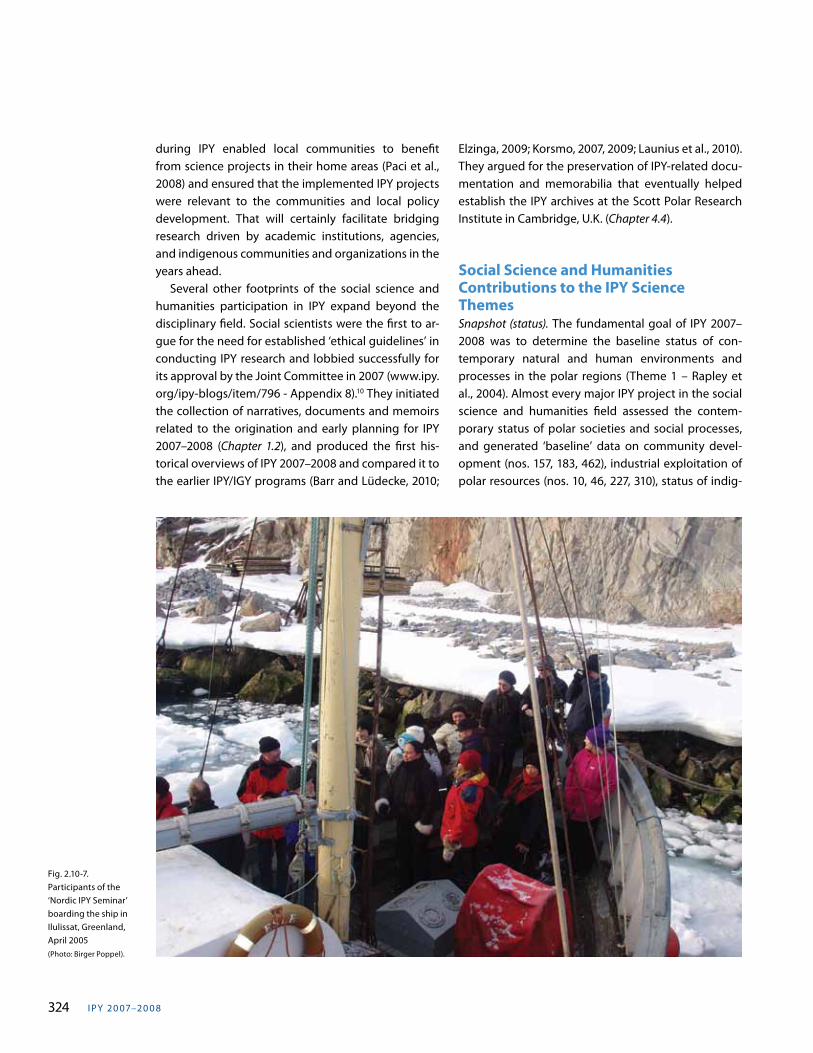
I PY 20 07–20 0 8324
during IPY enabled local communities to benefit from science projects in their home areas (Paci et al., 2008) and ensured that the implemented IPY projects were relevant to the communities and local policy development. That will certainly facilitate bridging research driven by academic institutions, agencies, and indigenous communities and organizations in the years ahead. Several other footprints of the social science and humanities participation in IPY expand beyond the disciplinary field. Social scientists were the first to ar-gue for the need for established ‘ethical guidelines’ in conducting IPY research and lobbied successfully for its approval by the Joint Committee in 2007 (www.ipy.org/ipy-blogs/item/796 - Appendix 8).10 They initiated the collection of narratives, documents and memoirs related to the origination and early planning for IPY 2007–2008 (Chapter 1.2), and produced the first his-torical overviews of IPY 2007–2008 and compared it to the earlier IPY/IGY programs (Barr and Lüdecke, 2010;
Fig. 2.10-7. Participants of the ‘Nordic IPY Seminar’ boarding the ship in Ilulissat, Greenland, April 2005 (Photo: Birger Poppel).
Elzinga, 2009; Korsmo, 2007, 2009; Launius et al., 2010). They argued for the preservation of IPY-related docu-mentation and memorabilia that eventually helped establish the IPY archives at the Scott Polar Research Institute in Cambridge, U.K. (Chapter 4.4).
Social Science and Humanities Contributions to the IPY Science ThemesSnapshot (status). The fundamental goal of IPY 2007–2008 was to determine the baseline status of con-temporary natural and human environments and processes in the polar regions (Theme 1 – Rapley et al., 2004). Almost every major IPY project in the social science and humanities field assessed the contem-porary status of polar societies and social processes, and generated ‘baseline’ data on community devel-opment (nos. 157, 183, 462), industrial exploitation of polar resources (nos. 10, 46, 227, 310), status of indig-
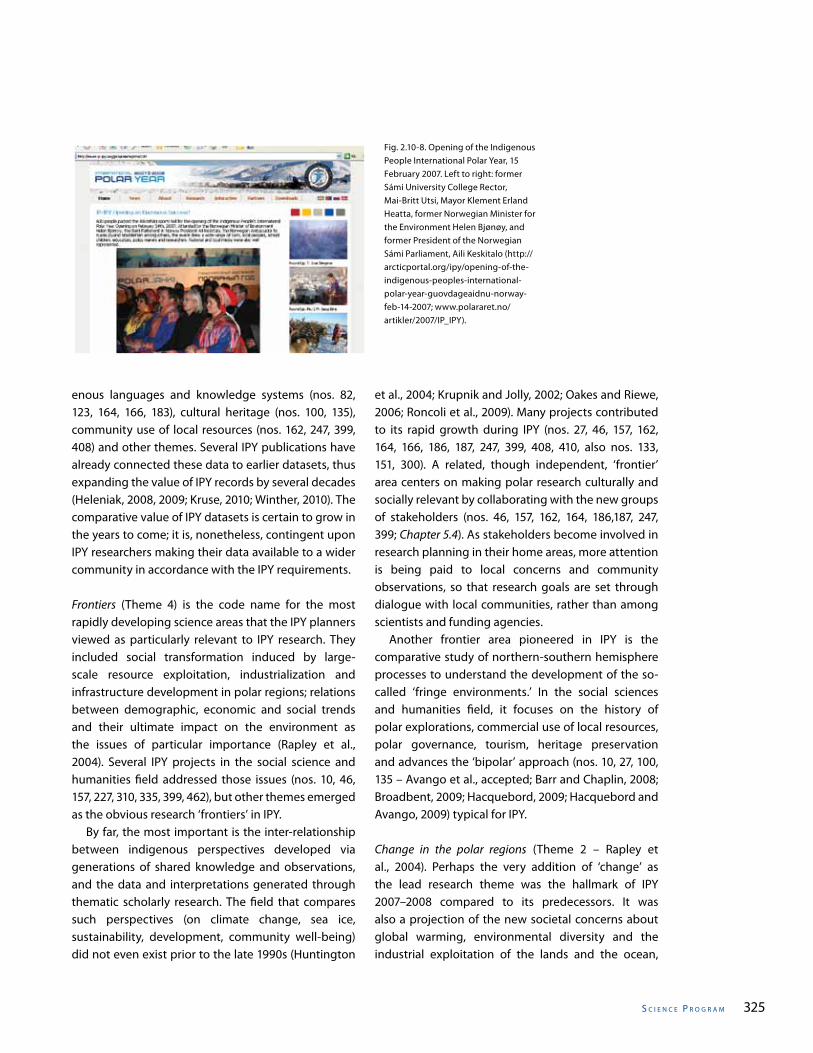
s C I e n C e P r o g r a m 325
Fig. 2.10-8. Opening of the Indigenous People International Polar Year, 15 February 2007. Left to right: former Sámi University College Rector, Mai-Britt Utsi, Mayor Klement Erland Heatta, former Norwegian Minister for the Environment Helen Bjønøy, and former President of the Norwegian Sámi Parliament, Aili Keskitalo (http://arcticportal.org/ipy/opening-of-the-indigenous-peoples-international-polar-year-guovdageaidnu-norway-feb-14-2007; www.polararet.no/artikler/2007/IP_IPY).
enous languages and knowledge systems (nos. 82, 123, 164, 166, 183), cultural heritage (nos. 100, 135), community use of local resources (nos. 162, 247, 399, 408) and other themes. Several IPY publications have already connected these data to earlier datasets, thus expanding the value of IPY records by several decades (Heleniak, 2008, 2009; Kruse, 2010; Winther, 2010). The comparative value of IPY datasets is certain to grow in the years to come; it is, nonetheless, contingent upon IPY researchers making their data available to a wider community in accordance with the IPY requirements.
Frontiers (Theme 4) is the code name for the most rapidly developing science areas that the IPY planners viewed as particularly relevant to IPY research. They included social transformation induced by large-scale resource exploitation, industrialization and infrastructure development in polar regions; relations between demographic, economic and social trends and their ultimate impact on the environment as the issues of particular importance (Rapley et al., 2004). Several IPY projects in the social science and humanities field addressed those issues (nos. 10, 46, 157, 227, 310, 335, 399, 462), but other themes emerged as the obvious research ‘frontiers’ in IPY. By far, the most important is the inter-relationship between indigenous perspectives developed via generations of shared knowledge and observations, and the data and interpretations generated through thematic scholarly research. The field that compares such perspectives (on climate change, sea ice, sustainability, development, community well-being) did not even exist prior to the late 1990s (Huntington
et al., 2004; Krupnik and Jolly, 2002; Oakes and Riewe, 2006; Roncoli et al., 2009). Many projects contributed to its rapid growth during IPY (nos. 27, 46, 157, 162, 164, 166, 186, 187, 247, 399, 408, 410, also nos. 133, 151, 300). A related, though independent, ‘frontier’ area centers on making polar research culturally and socially relevant by collaborating with the new groups of stakeholders (nos. 46, 157, 162, 164, 186,187, 247, 399; Chapter 5.4). As stakeholders become involved in research planning in their home areas, more attention is being paid to local concerns and community observations, so that research goals are set through dialogue with local communities, rather than among scientists and funding agencies. Another frontier area pioneered in IPY is the comparative study of northern-southern hemisphere processes to understand the development of the so-called ‘fringe environments.’ In the social sciences and humanities field, it focuses on the history of polar explorations, commercial use of local resources, polar governance, tourism, heritage preservation and advances the ‘bipolar’ approach (nos. 10, 27, 100, 135 – Avango et al., accepted; Barr and Chaplin, 2008; Broadbent, 2009; Hacquebord, 2009; Hacquebord and Avango, 2009) typical for IPY.
Change in the polar regions (Theme 2 – Rapley et al., 2004). Perhaps the very addition of ‘change’ as the lead research theme was the hallmark of IPY 2007–2008 compared to its predecessors. It was also a projection of the new societal concerns about global warming, environmental diversity and the industrial exploitation of the lands and the ocean,
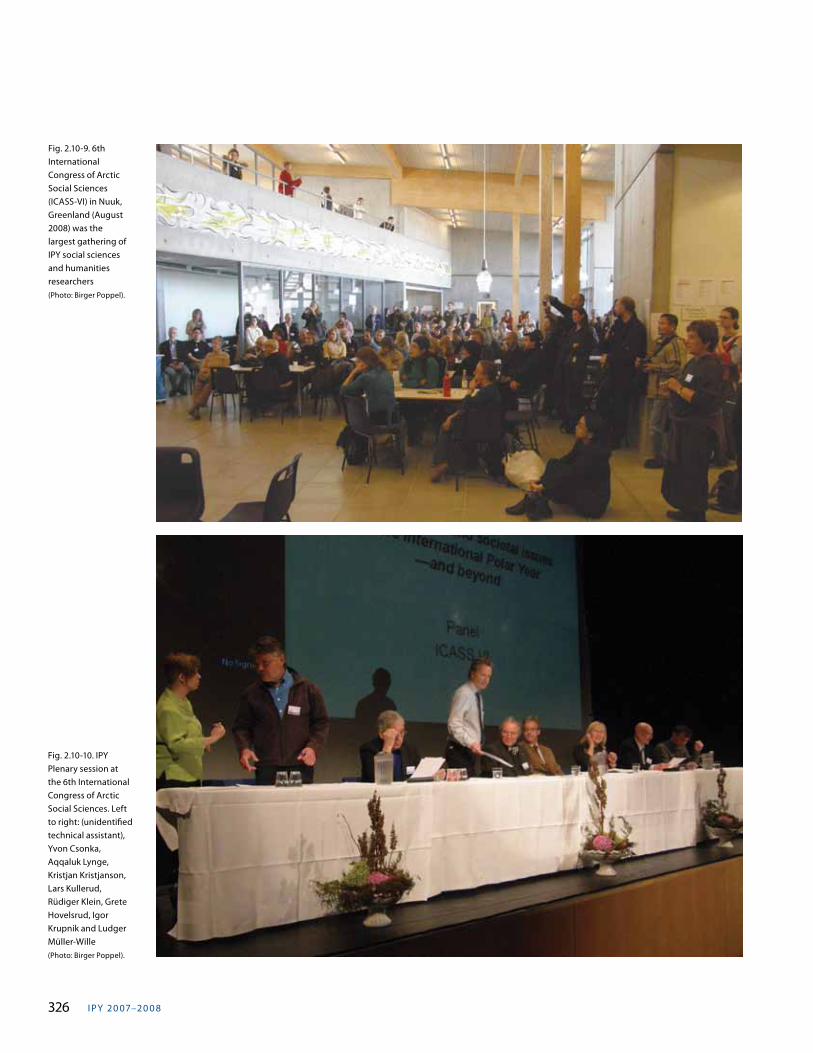
I PY 20 07–20 0 8326
Fig. 2.10-9. 6th International Congress of Arctic Social Sciences (ICASS-VI) in Nuuk, Greenland (August 2008) was the largest gathering of IPY social sciences and humanities researchers (Photo: Birger Poppel).
Fig. 2.10-10. IPY Plenary session at the 6th International Congress of Arctic Social Sciences. Left to right: (unidentified technical assistant), Yvon Csonka, Aqqaluk Lynge, Kristjan Kristjanson, Lars Kullerud, Rüdiger Klein, Grete Hovelsrud, Igor Krupnik and Ludger Müller-Wille (Photo: Birger Poppel).
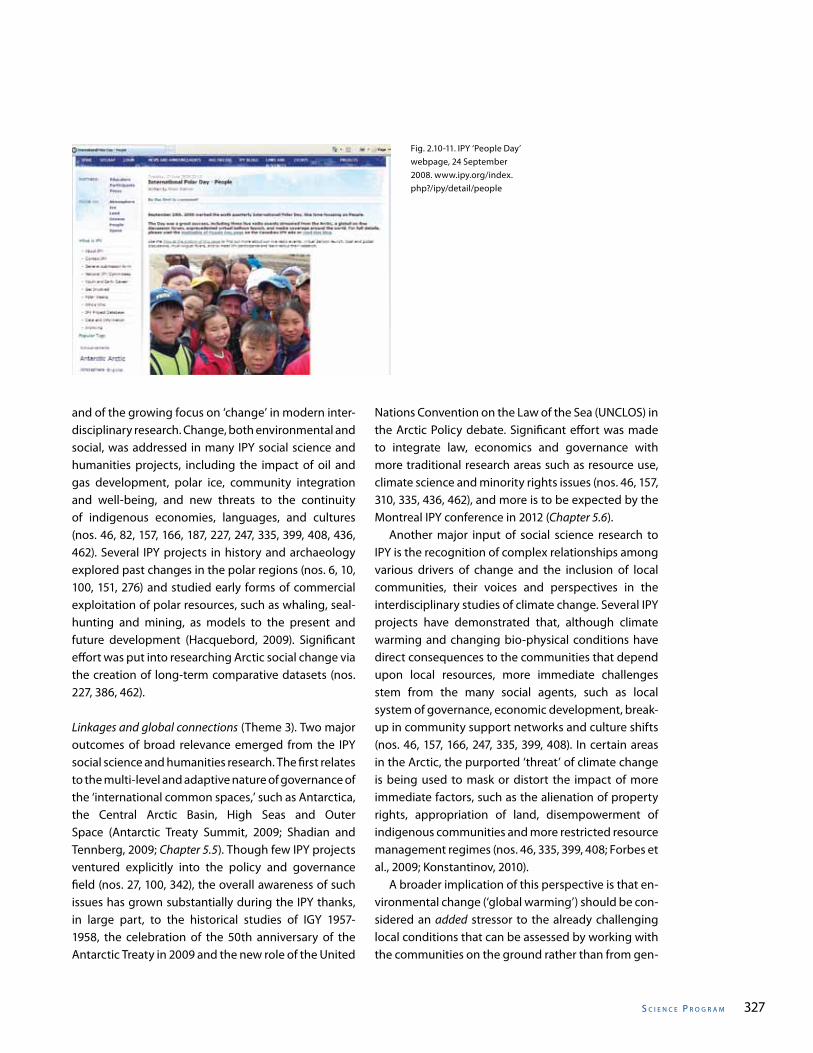
s C I e n C e P r o g r a m 327
Fig. 2.10-11. IPY ‘People Day’ webpage, 24 September 2008. www.ipy.org/index.php?/ipy/detail/people
and of the growing focus on ‘change’ in modern inter-disciplinary research. Change, both environmental and social, was addressed in many IPY social science and humanities projects, including the impact of oil and gas development, polar ice, community integration and well-being, and new threats to the continuity of indigenous economies, languages, and cultures (nos. 46, 82, 157, 166, 187, 227, 247, 335, 399, 408, 436, 462). Several IPY projects in history and archaeology explored past changes in the polar regions (nos. 6, 10, 100, 151, 276) and studied early forms of commercial exploitation of polar resources, such as whaling, seal-hunting and mining, as models to the present and future development (Hacquebord, 2009). Significant effort was put into researching Arctic social change via the creation of long-term comparative datasets (nos. 227, 386, 462).
Linkages and global connections (Theme 3). Two major outcomes of broad relevance emerged from the IPY social science and humanities research. The first relates to the multi-level and adaptive nature of governance of the ‘international common spaces,’ such as Antarctica, the Central Arctic Basin, High Seas and Outer Space (Antarctic Treaty Summit, 2009; Shadian and Tennberg, 2009; Chapter 5.5). Though few IPY projects ventured explicitly into the policy and governance field (nos. 27, 100, 342), the overall awareness of such issues has grown substantially during the IPY thanks, in large part, to the historical studies of IGY 1957-1958, the celebration of the 50th anniversary of the Antarctic Treaty in 2009 and the new role of the United
Nations Convention on the Law of the Sea (UNCLOS) in the Arctic Policy debate. Significant effort was made to integrate law, economics and governance with more traditional research areas such as resource use, climate science and minority rights issues (nos. 46, 157, 310, 335, 436, 462), and more is to be expected by the Montreal IPY conference in 2012 (Chapter 5.6). Another major input of social science research to IPY is the recognition of complex relationships among various drivers of change and the inclusion of local communities, their voices and perspectives in the interdisciplinary studies of climate change. Several IPY projects have demonstrated that, although climate warming and changing bio-physical conditions have direct consequences to the communities that depend upon local resources, more immediate challenges stem from the many social agents, such as local system of governance, economic development, break-up in community support networks and culture shifts (nos. 46, 157, 166, 247, 335, 399, 408). In certain areas in the Arctic, the purported ‘threat’ of climate change is being used to mask or distort the impact of more immediate factors, such as the alienation of property rights, appropriation of land, disempowerment of indigenous communities and more restricted resource management regimes (nos. 46, 335, 399, 408; Forbes et al., 2009; Konstantinov, 2010). A broader implication of this perspective is that en-vironmental change (‘global warming’) should be con-sidered an added stressor to the already challenging local conditions that can be assessed by working with the communities on the ground rather than from gen-
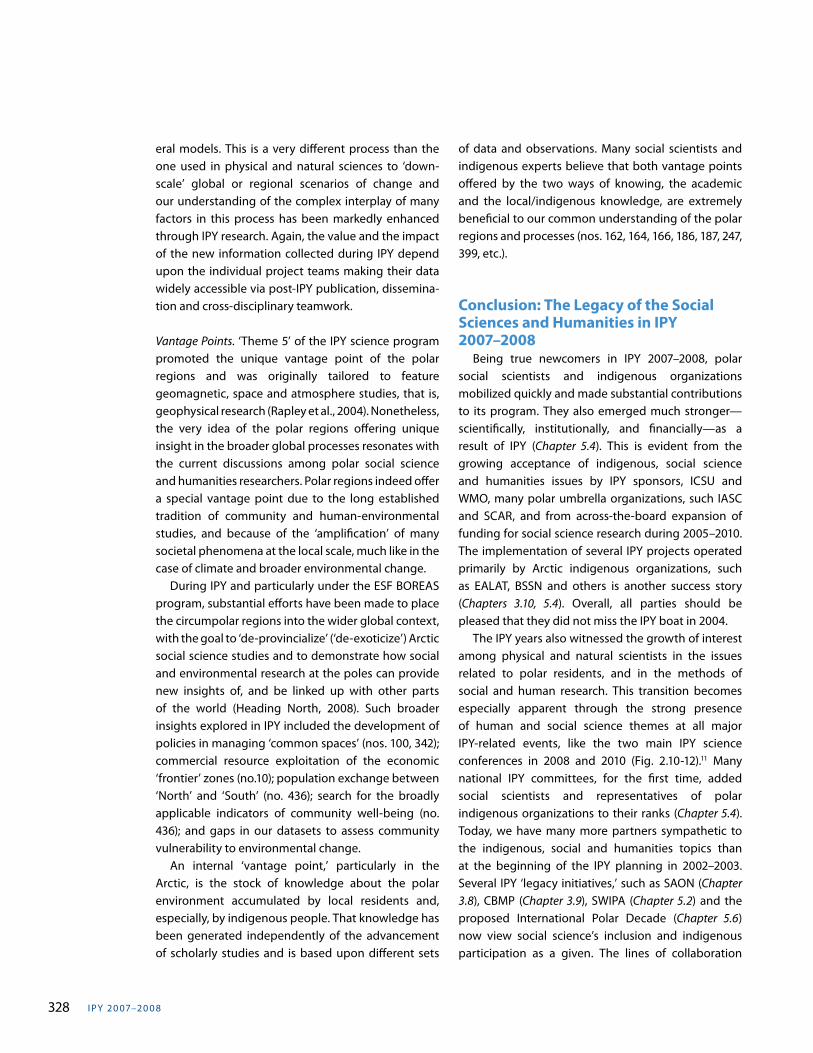
I PY 20 07–20 0 8328
eral models. This is a very different process than the one used in physical and natural sciences to ‘down-scale’ global or regional scenarios of change and our understanding of the complex interplay of many factors in this process has been markedly enhanced through IPY research. Again, the value and the impact of the new information collected during IPY depend upon the individual project teams making their data widely accessible via post-IPY publication, dissemina-tion and cross-disciplinary teamwork.
Vantage Points. ‘Theme 5’ of the IPY science program promoted the unique vantage point of the polar regions and was originally tailored to feature geomagnetic, space and atmosphere studies, that is, geophysical research (Rapley et al., 2004). Nonetheless, the very idea of the polar regions offering unique insight in the broader global processes resonates with the current discussions among polar social science and humanities researchers. Polar regions indeed offer a special vantage point due to the long established tradition of community and human-environmental studies, and because of the ‘amplification’ of many societal phenomena at the local scale, much like in the case of climate and broader environmental change. During IPY and particularly under the ESF BOREAS program, substantial efforts have been made to place the circumpolar regions into the wider global context, with the goal to ‘de-provincialize’ (‘de-exoticize’) Arctic social science studies and to demonstrate how social and environmental research at the poles can provide new insights of, and be linked up with other parts of the world (Heading North, 2008). Such broader insights explored in IPY included the development of policies in managing ‘common spaces’ (nos. 100, 342); commercial resource exploitation of the economic ‘frontier’ zones (no.10); population exchange between ‘North’ and ‘South’ (no. 436); search for the broadly applicable indicators of community well-being (no. 436); and gaps in our datasets to assess community vulnerability to environmental change. An internal ‘vantage point,’ particularly in the Arctic, is the stock of knowledge about the polar environment accumulated by local residents and, especially, by indigenous people. That knowledge has been generated independently of the advancement of scholarly studies and is based upon different sets
of data and observations. Many social scientists and indigenous experts believe that both vantage points offered by the two ways of knowing, the academic and the local/indigenous knowledge, are extremely beneficial to our common understanding of the polar regions and processes (nos. 162, 164, 166, 186, 187, 247, 399, etc.).
Conclusion: The Legacy of the Social Sciences and Humanities in IPY 2007–2008 Being true newcomers in IPY 2007–2008, polar social scientists and indigenous organizations mobilized quickly and made substantial contributions to its program. They also emerged much stronger—scientifically, institutionally, and financially—as a result of IPY (Chapter 5.4). This is evident from the growing acceptance of indigenous, social science and humanities issues by IPY sponsors, ICSU and WMO, many polar umbrella organizations, such IASC and SCAR, and from across-the-board expansion of funding for social science research during 2005–2010. The implementation of several IPY projects operated primarily by Arctic indigenous organizations, such as EALAT, BSSN and others is another success story (Chapters 3.10, 5.4). Overall, all parties should be pleased that they did not miss the IPY boat in 2004. The IPY years also witnessed the growth of interest among physical and natural scientists in the issues related to polar residents, and in the methods of social and human research. This transition becomes especially apparent through the strong presence of human and social science themes at all major IPY-related events, like the two main IPY science conferences in 2008 and 2010 (Fig. 2.10-12).11 Many national IPY committees, for the first time, added social scientists and representatives of polar indigenous organizations to their ranks (Chapter 5.4). Today, we have many more partners sympathetic to the indigenous, social and humanities topics than at the beginning of the IPY planning in 2002–2003. Several IPY ‘legacy initiatives,’ such as SAON (Chapter 3.8), CBMP (Chapter 3.9), SWIPA (Chapter 5.2) and the proposed International Polar Decade (Chapter 5.6) now view social science’s inclusion and indigenous participation as a given. The lines of collaboration
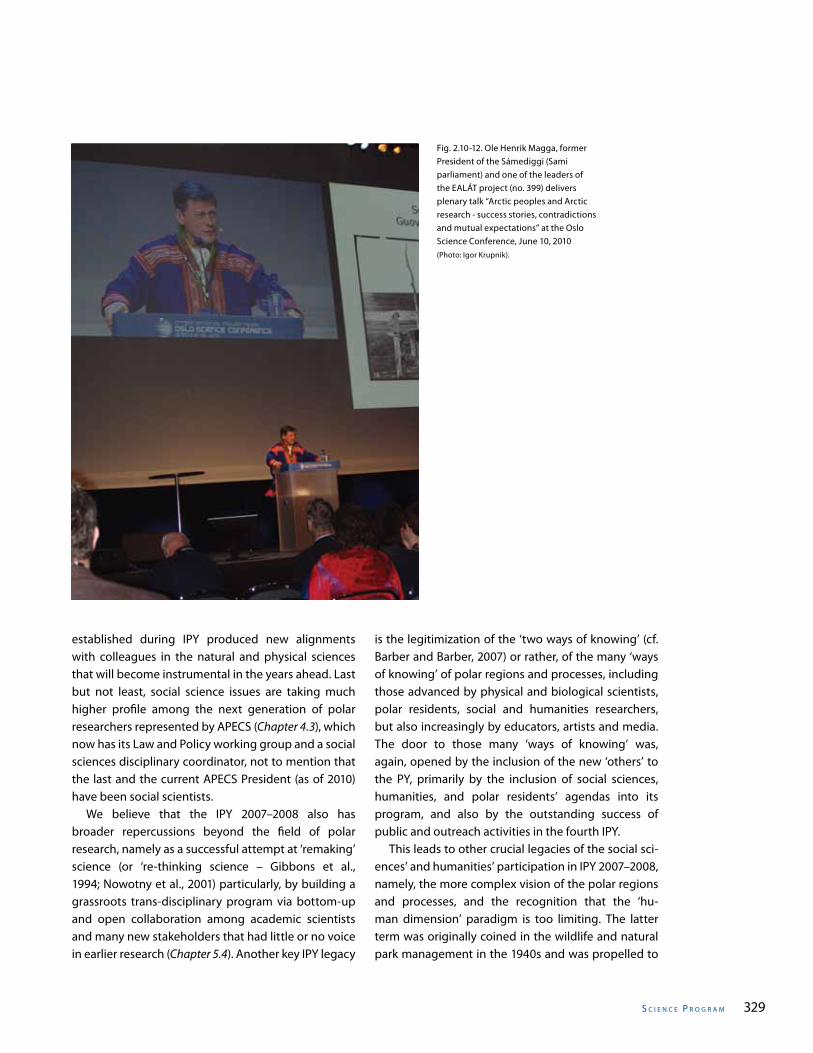
s C I e n C e P r o g r a m 329
Fig. 2.10-12. Ole Henrik Magga, former President of the Sámediggi (Sami parliament) and one of the leaders of the EALÁT project (no. 399) delivers plenary talk “Arctic peoples and Arctic research - success stories, contradictions and mutual expectations” at the Oslo Science Conference, June 10, 2010(Photo: Igor Krupnik).
established during IPY produced new alignments with colleagues in the natural and physical sciences that will become instrumental in the years ahead. Last but not least, social science issues are taking much higher profile among the next generation of polar researchers represented by APECS (Chapter 4.3), which now has its Law and Policy working group and a social sciences disciplinary coordinator, not to mention that the last and the current APECS President (as of 2010)have been social scientists. We believe that the IPY 2007–2008 also has broader repercussions beyond the field of polar research, namely as a successful attempt at ‘remaking’ science (or ‘re-thinking science – Gibbons et al., 1994; Nowotny et al., 2001) particularly, by building a grassroots trans-disciplinary program via bottom-up and open collaboration among academic scientists and many new stakeholders that had little or no voice in earlier research (Chapter 5.4). Another key IPY legacy
is the legitimization of the ‘two ways of knowing’ (cf. Barber and Barber, 2007) or rather, of the many ‘ways of knowing’ of polar regions and processes, including those advanced by physical and biological scientists, polar residents, social and humanities researchers, but also increasingly by educators, artists and media. The door to those many ‘ways of knowing’ was, again, opened by the inclusion of the new ‘others’ to the PY, primarily by the inclusion of social sciences, humanities, and polar residents’ agendas into its program, and also by the outstanding success of public and outreach activities in the fourth IPY. This leads to other crucial legacies of the social sci-ences’ and humanities’ participation in IPY 2007–2008, namely, the more complex vision of the polar regions and processes, and the recognition that the ‘hu-man dimension’ paradigm is too limiting. The latter term was originally coined in the wildlife and natural park management in the 1940s and was propelled to
I PY 20 07–20 0 8330
popularity during the 1980s (Manfredo, 1989; Stern et al., 1992). It has been applied broadly in the past two decades in the studies of environmental and climate change, resource management, ecosystem dynam-ics, wildlife monitoring and even broader areas, such as geoengineering, urban planning or adaptation to natural catastrophes.12 In most of these applications, it has been viewed primarily as a tool in top-down ‘impact assessment’ (mitigation) approach, with little relation to local communities and actual socio-cultural development on the ground. The inclusion of social sciences and the humanities to the IPY program intro-
Acknowledgements
We are grateful to the leaders of 23 social science and humanities projects in IPY 2007–2008 who shared information on their activities for this overview. Special thanks go to our colleagues in IPY, Björn Alfthan, Claudio Aporta, Birger Poppel and Svein Mathiesen for kindly supplying illustrations to this chapter, and to Hugh Beach and Piers Vitebsky, who offered valuable comments as external reviewers.
References
AHDR (Arctic Human Development Report), 2004. N. Einarsson, J. Nymand Larsen, A. Nilsson and O.R. Young, (eds). Stefansson Arctic Institute: Akureyri.
Alfthan, B., T. Hirose, S. Hughes and J.R. Janowicz, 2010. Satellite-Based Monitoring to Assist Arctic Indigenous Communities to Adapt to Climate Change. Abstract IPY Oslo Science Conference.
Allison, I., M. Béland, K. Alverson, R. Bell, D. Carlson, P. Cutler, K. Danell, C. Ellis-Evans, E. Fahrbach, G. Hovelsrud, J. Huber, V. Kotlyakov, I. Krupnik, J. López-Martínez, T. Mohr, H. Ödmark H., D. Qin, V. Rachold, C. Rapley, O. Rogne, E. Sarukhanian, C. Summerhayes and T. Yamanouchi, 2009. The State of Polar Research. A Statement from the International Council for Science/World Meteorological Organization Joint Committee for the International Polar Year 2007–2008. World Meteorological Organization: Geneva.
Allison, I., M. Béland , K. Alverson, R. Bell, D. Carlson, K. Danell, C. Ellis-Evans, E. Fahrbach, E. Fanta, Y. Fujii, G. Gilbertson, L. Goldfarb, G. Hovelsrud-Broda, J. Huber, V. Kotlyakov, I. Krupnik, J. López-Martínez, T. Mohr, D. Qin, V. Rachold, C. Rapley, O. Rogne, E.
duced the complexity of processes going at the local scale or, at the very least, demonstrated the limitation of the dominant top-down scenarios in complex en-vironmental modelling. It strengthened the value of comparative perspectives, other ways of knowing, and new voices in what may eventually emerge as the new (post)-IPY ‘inter-disciplinarity’ (Chapters 5.1, 5.2, 5.4). The IPY momentum has been extremely helpful in putting it to work, bridging disciplines and fields as so often and long advocated. It will be for future gen-erations to judge whether these approaches will have a lasting impact on polar science.
s C I e n C e P r o g r a m 331
Drucknemiller, M.L., H. Eicken, J.C. George and L. Brower, 2010. Assessing the Shorefast Ice: Iñupiat Whaling Trails off Barrow, Alaska. In SIKU: Knowing Our Ice. Documenting Inuit Sea Ice Knowledge and Use, I. Krupnik, C. Aporta, S. Gearheard, G.J. Laidler and L. Kielsen Holm, (eds), p 203-228. Springer: Dorderecht, Heidelberg.
Eicken, H., 2010. Indigenous Knowledge and Sea Ice Science: What Can We Learn from Indigenous Ice Users. In SIKU: Knowing Our Ice. Documenting Inuit Sea Ice Knowledge and Use, I. Krupnik, C. Aporta, S. Gearheard, G.L. Laidler and L. Kielsen Holm, (eds), P 357-376. Springer: Dorderecht, Heidelberg.
Eicken, H., A. L. Lovecraft and M.L. Druckenmiller, 2009. Sea-ice system services: A framework to help identify and meet information needs relevant for Arctic observing networks. Arctic, 62(2):119-136.
Elzinga, A. 2009. Through the lens of the polar years: changing characteristics of polar research in his-torical perspective. Polar Record, 45(235):313–336.
ESF, 2010.. Histories from the North – environments, movements, narratives (BOREAS). Final Report, 22 p. European Science Foundation: Strasbourg.
Forbes, B.C., F. Stammler, T. Kumpulac, N. Meschtyb, A. Pajunena and E. Kaarlejärvi, 2009. High resilience in the Yamal-Nenets social– ecological system, West Siberian Arctic, Russia. Proceedings of the Na-tional Academy of Sciences, 106(52):22041-22048.
Gearheard, S., G. Aipellee and K. O’Keefe, 2010. The Igliniit Project: Combining Inuit Knowledge and Geomatics Engineering to Develop a New Observation Tool for Hunters. In SIKU: Knowing Our Ice. Documenting Inuit Sea Ice Knowledge and Use, I. Krupnik, C. Aporta, S. Gearheard, G.J. Laidler and L. Kielsen Holm, (eds), p181-202. Springer: Dordrecht, Heidelberg.
Gibbons, M., C. Limoges, S. Schwartzman, H. Nowotny, M. Trow and P. Scott, 1994. The New Production of Knowledge: The Dynamics of Science and Research in Contemporary Societies. London: SAGE.
Griffiths, F., 2009. Towards a Canadian Arctic Strategy. Canadian International Council 1 www.onlinecic.org/research/foreignpol/towardsaca~2.
Hacquebord, L., 2009. Back to the Future. The Past, Present and Future of Resource Development in a Changing Arctic. Journal of Northern Studies, 2:7-21.
Hacquebord, L. and D. Avango, 2009. Settlements
Sarukhanian, C. Summerhayes and C. Xiao, 2007. The Scope of Science for the International Polar Year 2007–2008. WMO/TD-No.1364, 79 p. World Meteorological Organization: Geneva.
Antarctic Treaty Summit, 2009. Antarctic Treaty Sum-mit: Science-Policy Interactions in International Governance. International Conference. Wash-ington, DC: Smithsonian Institution, November 30-December 2 – www.atsummit50.aq
Aporta, C., 2009. The trail as home: Inuit and their pan-Arctic network of routes. Human Ecology, 37(2):131–146.
Aronova, E., K.S. Baker and N. Oreskes,2010. Big Sci-ence and Big Data in Biology: From the Interna-tional Geophysical Year through the International Biological Program to the Long Term Ecological Research (LTER) Network, 1957–Present. Historical Studies in the Natural Sciences, 40(2): 183-224.
Avango, D. et al., accepted. Between markets and geo-politics: natural resource exploitation on Spitsbergen (Svalbard), from 1600 to the present day. Polar Record.
Barber, D. and D. Barber, 2007. Two Ways of Knowing: merging science and traditional knowledge during the fourth International Polar Year. Winnipeg: University of Manitoba Press.
Barr, S. and P. Chaplin, (eds), 2008. Historical Polar Bases – Preservation and Management. ICOMOS: Monuments and Sites XVIII.
Barr, S. and C. Luedecke, (eds), 2010. The History of the International Polar Years (IPYs). Springer: Dordrech.
Bravo, M.T., 2010. Epilogue: The Humanism of Sea Ice. In SIKU: Knowing Our Ice. Documenting Inuit Sea Ice Knowledge and Use, I. Krupnik, C. Aporta, S. Gearheard, G.L. Laidler and L. Kielsen Holm, (eds), p 445–452. Springer: Dorderecht, Heidelberg.
Broadbent, N., 2009. From Ballooning in the Arctic to 10,000-Foot Runways in Antarctic: Lessons from Historic Archaeology. In Smithsonian at the Poles. Contributions to International Polar Year Science, I. Krupnik, M.A. Lang and S.E. Miller, (eds), p 49-60. Smithsonian Institution: Washington, D.C.
Carlson, D., 2010. Why Do We Have a 4th IPY? In: The History of the International Polar Years (IPYs), S. Barr and C. Lüdecke, (eds.) p299-312. Springer Heidelberg, Dordrecht, London, New York.
I PY 20 07–20 0 8332
in an Arctic Resource Frontier Region. Arctic Anthropology, 46(1-2):25-39.
Heading North, 2008. Heading North, Heading South: Arctic Social-sciences research in a global dia-logue. Workshop announcement, BOREAS EURO-CORES Programme, www.esf.org/activities/euro-cores/running-programmes/boreas/events.html
Heleniak, T., 2008. Changing Settlement Patterns across the Russian North at the Turn of the Millennium. In Russia’s Northern Regions on the Edge: Communities, industries and populations from Murmansk to Magadan, M. Tykkylainen and V. Rautio, (eds). Kikimora Publications: Helsinki.
Heleniak, T., 2009. Growth Poles and Ghost Towns in the Russian Far North. In Russia and the North. E. Wilson Rowe, (ed), p 129-162. University of Ottawa Press: Ottawa.
Hovelsrud, G.K. and B. Smit, (eds), 2010. Community Adaptation and Vulnerability in the Arctic Regions. Springer: Dordrecht.
Hovelsrud, G.K. and J. Helgeson, 2006. IPY 2007–2008 and the Social Sciences: A Preliminary Analysis. Northern Notes, Summer 2006:7–10, www.iassa.gl/newsletter/news06_1.pdf.
Hovelsrud, G.K. and I. Krupnik. 2006. IPY 2007–08 and Social/Human Sciences: An Update. Arctic, 59(3):341–348.
Hughes, D.R. and F.A. Milan, 1980. Introduction. In The Human Biology of Circumpolar Populations, Milan, F.A. (ed), p 1-11. International Biological Programme, 21. Cambridge University Press: Cambridge.
Huntington, H.P., S. Gearhearn and L. Kielsen Holm, 2010. The Power of Multiple Perspectives: Behind the Scenes of the Siku-Inuit-Hila Project. In SIKU: Knowing Our Ice. Documenting Inuit Sea Ice Knowl-edge and Use I. Krupnik, C. Aporta, S. Gearheard, G.L. Laidler and L. Kielsen Holm, (eds), p 257-274. Springer: Dorderecht, Heidelberg.
Huntington, H.P., T.V. Callaghan, S. Fox Gearheard and I. Krupnik, 2004. Matching traditional and scientific observations to detect environmental change: a discussion on arctic terrestrial ecosystems. Ambio, 33(7): 18-23.
Klein, R., R. Tuomaala and P. Vitebsky, (eds), 2007. His-tories from the North: Environments, Movements, Narratives (BOREAS). European Science Founda-
tion: Strasbourg.Konstantinov, Y., 2010. Socioeconomic Life of Climate
Change: Extensivity in Reindeer Husbandry in Relation to Synergies between Social and Climate Change (Kola Peninsula). Acta Borealia, 27(1):44–65.
Korsmo, F.L., 2007. The Genesis of the International Geophysical Year. Physics Today, 60(7):38–43.
Korsmo, F.L., 2009. The Policy Process and the International Geophysical Year, 1957–1958. In Smithsonian at the Poles. Contributions to International Polar Year Science, I. Krupnik, M.A. Lang and S.E. Miller, (eds), p 23-33. Smithsonian Institution Scholarly Press: Washington, DC.
Krupnik, I., 2010. The ‘Year’ That Changed How We View the North. In Community Adaptation and Vulnerability in the Arctic Regions, G.K. Hoveslrud and B. Smit, (eds) p v-viii. Springer: Dordrecht.
Krupnik, I., 2009. IPY 2007–2008: A Science Breakthrough and a Blink of an Eye. Northern Notes, 30 (spring-summer2009): 10–13, www.iassa.gl/newsletter/news09_1.pdf
Krupnik, I., 2008. IPY 2007–2008 and Social Sciences: A Challenge of Fifty Years. Plenary paper presented at 6th International Congress of Arctic Social Sciences (ICASS-6) www.svs.is/IASSA/Igor%20PlenaryFin_March%202009_InclFig.pdf.
Krupnik, I., 2006. IPY 2007–2008: Nine Months and Counting. Northern Notes, Summer 2006: 3 –7, www.iassa.gl/newsletter/news06_1.pdf.
Krupnik, I., C. Aporta, S. Gearheard, G.L. Laidler and L. Kielsen Holm, (eds), 2010. SIKU: Knowing Our Ice. Documenting Inuit Sea Ice Knowledge and Use. Springer: Dorderecht, Heidelberg.
Krupnik, I., M. Bravo, Y. Csonka, G. Hovelsrude-Broda, L. Müller-Wille, B. Poppel, P. Schweitzer and S. Sörlin, 2005. Social Sciences and Humanities in the International Polar Year 2007–2008: An Integrating Mission. Arctic, 58(1): 89–95.
Krupnik, I. and D. Jolly, (eds), 2002. The Earth Is Faster Now: Indigenous Observations of Arctic Environmental Change. ARCUS: Fairbanks..
Kruse, J., 2010. Sustainability from a local point of view: Alaska’s North Slope and Oil Development. In The Political Economy of Northern Regional Development. G. Winther, (ed), v 1, p 41-54. Archus: TemaNord.
Larsen, J., P. Schweitzer and G. Fondahl, 2010. Arctic
s C I e n C e P r o g r a m 333
Social Indicators. Arhus: TemaNord.Launius, R.D., J.R. Fleming and D.H. DeVorkin, (eds),
2010. Globalizing Polar Science: Reconsidering the International Polar and Geophysical Years. Palgrave Studies in the History of Science and Technology. New York: Palgrave Macmillan.
Manfredo, M.J., 1989. Human Dimensions of Wildlife Management. Wildlife Society Bulletin, 17:447 –449.
Milan, F.A., (ed), 1980. The Human Biology of Circum-polar Populations. International Biological Pro-gramme, 21. Cambridge University Press: Cam-bridge.
Nowotny, H., P. Scott and M. Gibbons, 2001. Re-think-ing Science: Knowledge and the Public in the Age of Uncertainty. Polity Press and Blackwell Publish-ers: Oxford.
Oakes, J. and R. Riewe, (eds), 2006. Climate Change: Linking Traditional and Scientific Knowledge. Aboriginal Issues Press: Winnipeg.
Oskal, A., J.M. Turi, S.D. Mathiesen and P. Burgess, 2009. EALÁT. Reindeer Herders’ Voice: Reindeer herding, traditional knowledge and adaptation to climate change and grazing lands. Report no. 2. International Centre for Reindeer Husbandry: Kautokeino.
Paci, C., A. Hodgkins, S. Katz, J. Braden, M. Bravo, R.A. Gal, C. Jardine, M. Nuttall, J. Erasmus and S. Daniel, 2008. Northern Science and Research. Post-secondary Perspectives in the Northwest Territories. Journal of Northern Studies, 1-2.
Poppel, B., 2009. The Sixth International Congress of Arctic Social Sciences, ICASS VI – Nuuk. Arctic Social Sciences – Prospects for the International Polar Year 2007–2008 Era and Beyond. Northern Notes, 30 (spring-summer): 8–10, www.iassa.gl/newsletter/news09_1.pdf.
Pulsifer, P.L., G.J. Laidler, D.R.F. Taylor and A. Hayes, 2010. Creating an Online Cybercartographic Atlas of Inuit Sea Ice Knowledge and Use. In SIKU: Knowing Our Ice. Documenting Inuit Sea Ice Knowledge and Use, I. Krupnik, C. Aporta, S. Gearheard, G.J. Laidler and L. Kielsen Holm, (eds), p 229-255. Springer: Dorderecht, Heidelberg.
Rapley, C., R. Bell, I. Allison, R. Bindschadler, G. Casassa, S. Chown, G. Duhaime, V. Kotlyakov, M. Kuhn, O. Orheim, P.Ch. Pandey, H. Petersen, H. Schalke, W. Janoschek, E. Sarukhanian and Zh. Zhang, 2004.
A Framework for the International Polar Year 2007–2008. Produced by the ICSU IPY 2007–2008 Planning Group. 57 p. ICSU: Paris.http://classic.ipy.org/development/framework/framework.pdf.
Roncoli, C., T. Crane and B. Orlove, 2009. Fielding Climate Change in Cultural Anthropology. In Anthropology and Climate Change. From Encounters to Actions, S.A. Crate and M. Nuttall, (eds), p 87-115. Left Coast Press: Walnut Creek.
Sargent, F., 1965. The International Biological Program. International Journal of Biometeorology, 9(2):101-102.
Shadian, J.M. and M. Tennberg, (eds), 2009. Legacies and Change in Polar Sciences. Historical, Legal, and Political Reflections on the International Polar Year. Ashgate Publishing: Farnham.
Smit, B., G. Hovelsrud and J. Wandel, 2008. CAVIAR – Community Adaptation and Vulnerability in Arctic Regions. Framework document for the International Polar Year Consortium. Department of Geography, University of Guelph Occasional Paper 28.
Smit, B. and J. Wandel, 2006. Adaptation, adaptive capacity and vulnerability. Global Environmental Change, 16:282-292.
Stern, P.C., O.R. Young and D. Druckman, (eds), 1992. Global Environmental Change. Understand-ing the Human Dimensions. National Research Council, Committee on the Human Dimensions of Global Change. National Academy Press, Wash-ington, D.C.
Stirling, G.C., 2007. International Scientific Collabo-ration: International Years of Science and the Launch of the International Polar Year 2007–2008. OECD Global Science Forum, www.oecd.org/dataoecd/49/40/39516014.pdf.
Stuckenberger, N.A., (ed), 2007. Thin Ice. Inuit Traditions within a Changing Environment. Exhibit Catalog. University Press of New England: Hanover and London.
Tromholt. S., 1885. Under Nordlysets Straaler. Skildring-er fra Lallernes Land. Kjøbehnavn: F. Hegel & Søn (reprint 2007, Nordisk Samisk Institutt).
U.S. ARC, 2010. U.S. States Arctic Research Commission. Goals and Objectives for Arctic Research 2009–2010. Report for the U.S. Arctic Research Program Plan. Washington, DC. www.arctic.gov/
I PY 20 07–20 0 8334
Vairo, C., R. Capdevila, V. Aldazabal and P. Pereyra, 2007a. Antarctica Argentina Cultural Heritage. Museums, sites and shelters of Argentina. Zagier & Urruty Publication: Ushuaia.
Vairo, C., G. May and H. Molina Pico, 2007b. Antarctica Historic Whaling Settlements. Zagier & Urruty Publications: Ushuaia.
Vitebsky, P. and R. Klein. 2006/2007. ESF EUROCORES programme BOREAS (Histories from the North: environments, movements, narratives) up and running, Northern Notes (IASSA Newsletter), fall/
winter, 5-12.Vitebsky, P. and R. Klein, 2005. BOREAS: a humanities
and social sciences-based, multinational research programme on the circumpolar North, Northern Notes (IASSA Newsletter), spring/summer,3-5.
Winther, G., (ed), 2010. The Political Economy of North-ern Regional Development. Archus: TemaNord, v 1, 521.
Worthington, E.B., 1965. The International Biological Programme. Nature, 208(5007):223-226.
Notes1 The field of the social science and humanities research in IPY has been covered in earlier overviews (Hoveslrud and Krupnik, 2006;
Krupnik, 2008, 2009; Hovelsrud and Helgeson, 2006) and at several meetings, particularly at the 6th International Congress of Arctic Social Sciences (ICASS-6) in Nuuk in 2008.
2 Additional information can be found on the websites and in publications generated by individual projects.3 For example, the newly released U.S. Arctic Research agenda (2010) features ‘Indigenous Languages, Cultures, and Identities’ (also
‘Arctic Human Health’) among its five central themes. 4 Unlike their colleagues in physical and natural sciences, polar social researchers and indigenous organizations had little experience
in running major international projects that crossed the boundaries of several Arctic nations and covered large sections of the circumpolar zone. The Study of the Living Conditions in the Arctic (SLICA), started in 1998 and completed as IPY project (no. 386), was the only coordinated international social survey in six Arctic nations (Canada, Greenland, Norway, Russia, Sweden and the U.S.) prior to IPY 2007–2008.
5 The nations most active in IPY social research, both in terms of internationally coordinated projects and their participants, were Canada, Norway, U.S.A., Denmark/Greenland, Iceland, Russia and Sweden, with the substantial participation by scientists from Germany, U.K., Finland and the Netherlands. Individual researchers from Bulgaria, Estonia, France, Poland, Australia, Argentina and New Zealand were active in certain projects. Little or no social research was, reportedly, conducted during IPY 2007–2008 in China, Korea, Japan, India, Chile, Belgium, Portugal, Spain, Switzerland and other nations with substantial IPY activities in other fields.
6 Bulgaria, Canada, Denmark/Greenland, Finland, Germany, Iceland, the Netherlands, Norway, Sweden, Russia, United Kingdom, and U.S.A.
7 The overall number of endorsed international projects associated with the social sciences and the humanities at the onset of IPY was around 60 (Hovelsrud and Krupnik, 2006), including 16 projects in ‘Education and Outreach.’ Overall, those 60 proposals made an amazingly high score of about 28% of the total IPY effort. The ‘full proposal’ database (http://classic.ipy.org) featured a total of 83 proposals under the listing of ‘People,’ of which 54 can be reasonably attributed to the social and humanities field.
8 See earlier analysis of a larger sample of endorsed IPY projects in Hovelsrud and Krupnik (2006), Hovelsrud and Helgeson (2006) and Krupnik (2006, 2008, 2009).
9 Funding for BOREAS was coordinated by the European Science Foundation and came as contributions from Canada, Denmark, Estonia, Finland, Iceland, Norway, Poland, Sweden and the U.S.A. Associated project partners were based in Belgium, France, Germany, Russia, Switzerland and the U.K. Though the overall amount of funding may look modest to the natural scientists, it was the biggest program ever funded for humanities research in the Arctic.
10 The discussion about a special statement on ‘ethical guidelines’ for IPY research to be issued by the Joint Committee was started at the JC-3 meeting in Cambridge in April 2006 and continued at the JC-4 and JC-5 meetings (in September 2006 and 2007, respectively). A draft of the ‘Ethical guidelines’ for IPY research was prepared by Igor Krupnik in November 2006; it was finally approved by the JC and posted on the main IPY website in May 2007 (Appendix 8).
11 The IPY Conference in St. Petersburg (2008) featured a special theme, “People and Resources at the Poles,” with eight sessions on social/human projects in IPY 2007–2008 that included more than 100 oral and poster presentations (www.scar-iasc-ipy2008.org/). The Oslo Science Conference in June 2010, similarly had a special theme titled “Human Dimensions of Change: Health, Society and Resources” with six thematic areas featuring more than 350 presentations (http://ipy-osc.no/theme/4).
12 Recent Google search for ‘Human dimensions’ generates about 5.5 M references (May 2010)
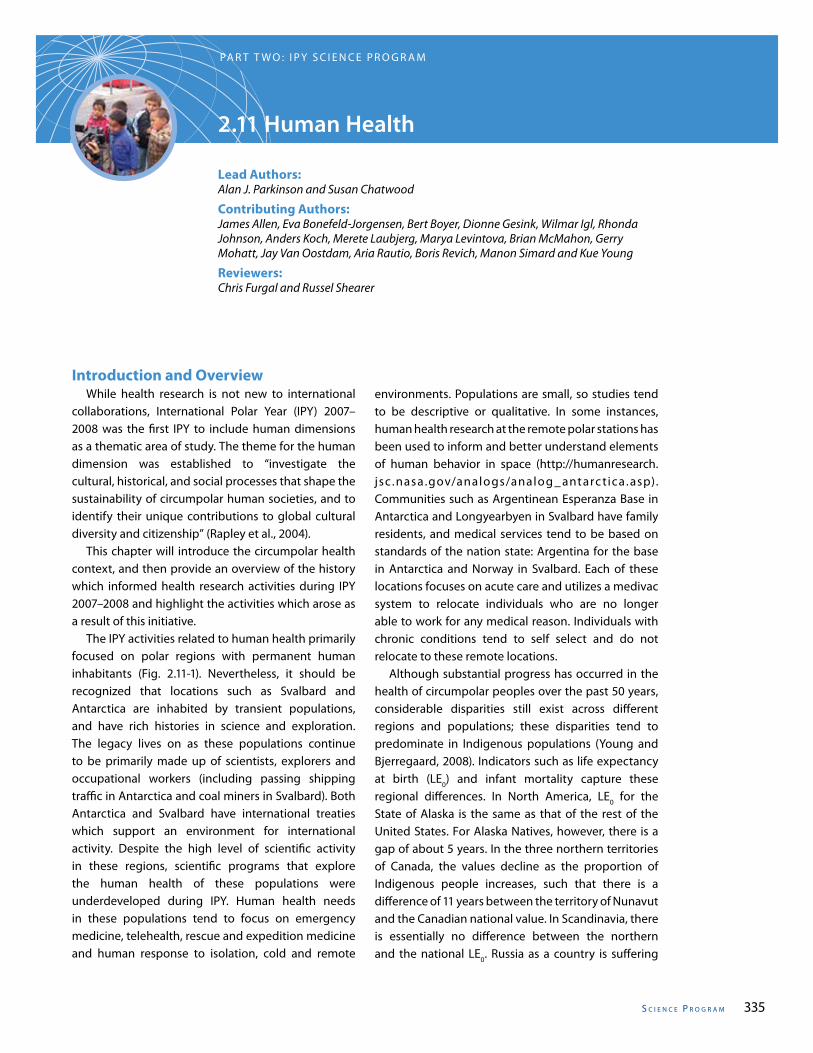
s C I e n C e P r o g r a m 335
2.11 Human Health
Lead Authors:Alan J. Parkinson and Susan Chatwood
Contributing Authors:James Allen, Eva Bonefeld-Jorgensen, Bert Boyer, Dionne Gesink, Wilmar Igl, Rhonda Johnson, Anders Koch, Merete Laubjerg, Marya Levintova, Brian McMahon, Gerry Mohatt, Jay Van Oostdam, Aria Rautio, Boris Revich, Manon Simard and Kue Young
Reviewers:Chris Furgal and Russel Shearer
PA R T T W O : I P Y S C I E N C E P R O G R A M
Introduction and Overview While health research is not new to international collaborations, International Polar Year (IPY) 2007–2008 was the first IPY to include human dimensions as a thematic area of study. The theme for the human dimension was established to “investigate the cultural, historical, and social processes that shape the sustainability of circumpolar human societies, and to identify their unique contributions to global cultural diversity and citizenship” (Rapley et al., 2004). This chapter will introduce the circumpolar health context, and then provide an overview of the history which informed health research activities during IPY 2007–2008 and highlight the activities which arose as a result of this initiative. The IPY activities related to human health primarily focused on polar regions with permanent human inhabitants (Fig. 2.11-1). Nevertheless, it should be recognized that locations such as Svalbard and Antarctica are inhabited by transient populations, and have rich histories in science and exploration. The legacy lives on as these populations continue to be primarily made up of scientists, explorers and occupational workers (including passing shipping traffic in Antarctica and coal miners in Svalbard). Both Antarctica and Svalbard have international treaties which support an environment for international activity. Despite the high level of scientific activity in these regions, scientific programs that explore the human health of these populations were underdeveloped during IPY. Human health needs in these populations tend to focus on emergency medicine, telehealth, rescue and expedition medicine and human response to isolation, cold and remote
environments. Populations are small, so studies tend to be descriptive or qualitative. In some instances, human health research at the remote polar stations has been used to inform and better understand elements of human behavior in space (http://humanresearch.jsc .nasa.gov/analogs/analog _ antarc tica . asp). Communities such as Argentinean Esperanza Base in Antarctica and Longyearbyen in Svalbard have family residents, and medical services tend to be based on standards of the nation state: Argentina for the base in Antarctica and Norway in Svalbard. Each of these locations focuses on acute care and utilizes a medivac system to relocate individuals who are no longer able to work for any medical reason. Individuals with chronic conditions tend to self select and do not relocate to these remote locations. Although substantial progress has occurred in the health of circumpolar peoples over the past 50 years, considerable disparities still exist across different regions and populations; these disparities tend to predominate in Indigenous populations (Young and Bjerregaard, 2008). Indicators such as life expectancy at birth (LE0) and infant mortality capture these regional differences. In North America, LE0 for the State of Alaska is the same as that of the rest of the United States. For Alaska Natives, however, there is a gap of about 5 years. In the three northern territories of Canada, the values decline as the proportion of Indigenous people increases, such that there is a difference of 11 years between the territory of Nunavut and the Canadian national value. In Scandinavia, there is essentially no difference between the northern and the national LE0. Russia as a country is suffering
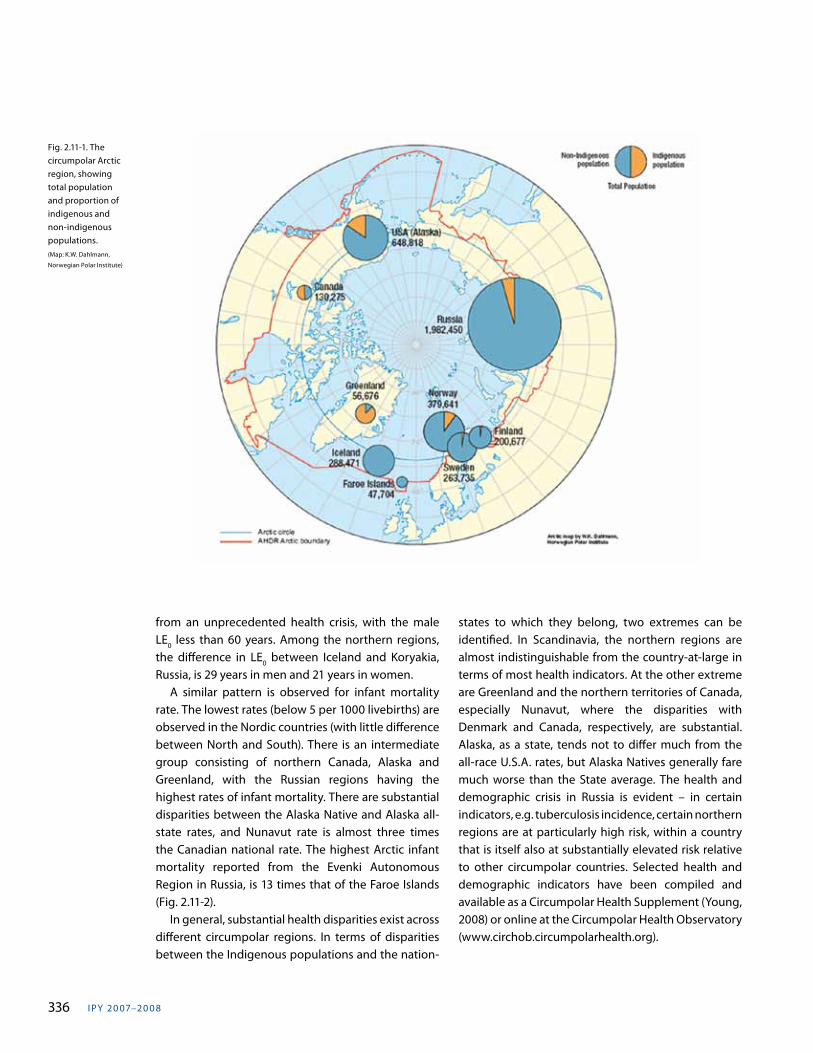
I PY 20 07–20 0 8336
from an unprecedented health crisis, with the male LE0 less than 60 years. Among the northern regions, the difference in LE0 between Iceland and Koryakia, Russia, is 29 years in men and 21 years in women. A similar pattern is observed for infant mortality rate. The lowest rates (below 5 per 1000 livebirths) are observed in the Nordic countries (with little difference between North and South). There is an intermediate group consisting of northern Canada, Alaska and Greenland, with the Russian regions having the highest rates of infant mortality. There are substantial disparities between the Alaska Native and Alaska all-state rates, and Nunavut rate is almost three times the Canadian national rate. The highest Arctic infant mortality reported from the Evenki Autonomous Region in Russia, is 13 times that of the Faroe Islands (Fig. 2.11-2). In general, substantial health disparities exist across different circumpolar regions. In terms of disparities between the Indigenous populations and the nation-
states to which they belong, two extremes can be identified. In Scandinavia, the northern regions are almost indistinguishable from the country-at-large in terms of most health indicators. At the other extreme are Greenland and the northern territories of Canada, especially Nunavut, where the disparities with Denmark and Canada, respectively, are substantial. Alaska, as a state, tends not to differ much from the all-race U.S.A. rates, but Alaska Natives generally fare much worse than the State average. The health and demographic crisis in Russia is evident – in certain indicators, e.g. tuberculosis incidence, certain northern regions are at particularly high risk, within a country that is itself also at substantially elevated risk relative to other circumpolar countries. Selected health and demographic indicators have been compiled and available as a Circumpolar Health Supplement (Young, 2008) or online at the Circumpolar Health Observatory (www.circhob.circumpolarhealth.org).
Fig. 2.11-1. The circumpolar Arctic region, showing total population and proportion of indigenous and non-indigenous populations. (Map: K.W. Dahlmann,
Norwegian Polar Institute)
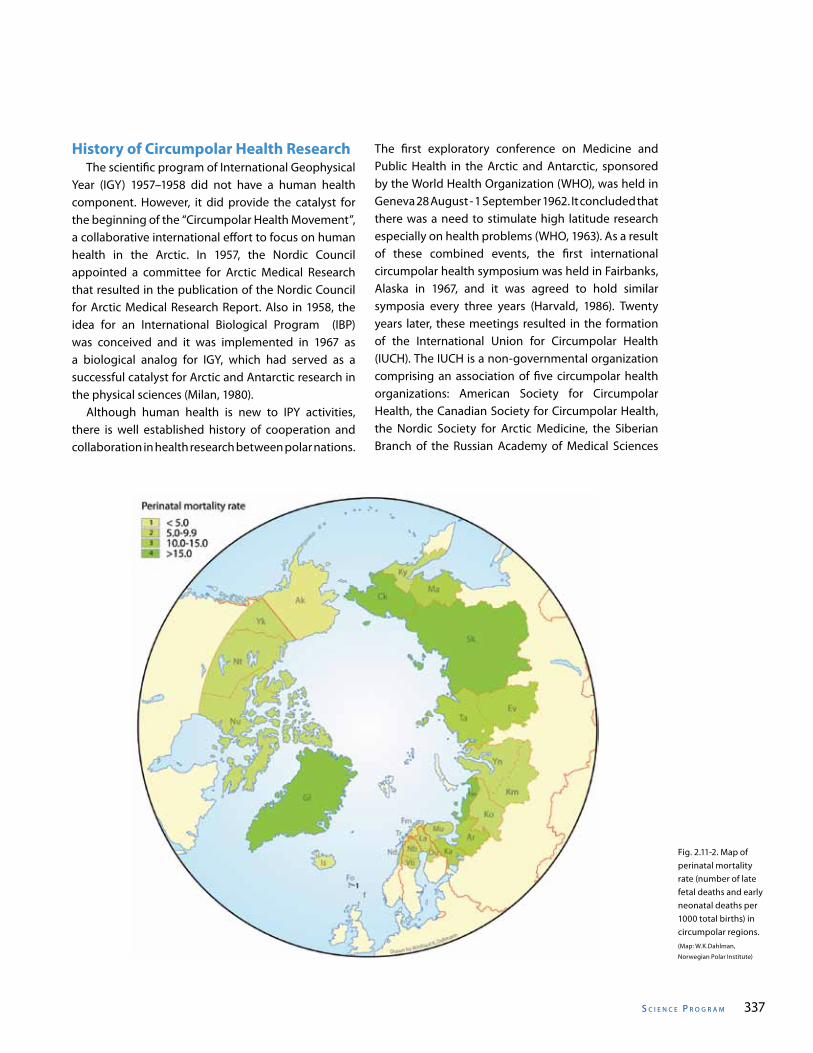
s C I e n C e P r o g r a m 337
History of Circumpolar Health Research The scientific program of International Geophysical Year (IGY) 1957–1958 did not have a human health component. However, it did provide the catalyst for the beginning of the “Circumpolar Health Movement”, a collaborative international effort to focus on human health in the Arctic. In 1957, the Nordic Council appointed a committee for Arctic Medical Research that resulted in the publication of the Nordic Council for Arctic Medical Research Report. Also in 1958, the idea for an International Biological Program (IBP)was conceived and it was implemented in 1967 as a biological analog for IGY, which had served as a successful catalyst for Arctic and Antarctic research in the physical sciences (Milan, 1980). Although human health is new to IPY activities, there is well established history of cooperation and collaboration in health research between polar nations.
Fig. 2.11-2. Map of perinatal mortality rate (number of late fetal deaths and early neonatal deaths per 1000 total births) in circumpolar regions. (Map: W.K.Dahlman,
Norwegian Polar Institute)
The first exploratory conference on Medicine and Public Health in the Arctic and Antarctic, sponsored by the World Health Organization (WHO), was held in Geneva 28 August - 1 September 1962. It concluded that there was a need to stimulate high latitude research especially on health problems (WHO, 1963). As a result of these combined events, the first international circumpolar health symposium was held in Fairbanks, Alaska in 1967, and it was agreed to hold similar symposia every three years (Harvald, 1986). Twenty years later, these meetings resulted in the formation of the International Union for Circumpolar Health (IUCH). The IUCH is a non-governmental organization comprising an association of five circumpolar health organizations: American Society for Circumpolar Health, the Canadian Society for Circumpolar Health, the Nordic Society for Arctic Medicine, the Siberian Branch of the Russian Academy of Medical Sciences
I PY 20 07–20 0 8338
and the Danish Greenlandic Society for Circumpolar Health. The IUCH promotes circumpolar collaboration and cooperation through the activities of its working groups in various fields of health and medicine (www.iuch.net ). Outreach and communication are provided through the publication of the International Journal of Circumpolar Health and the hosting of the triennial International Congress on Circumpolar Health http://icch2009.circumpolarhealth.org/ . The success of the IPY health activities can be attrib-uted to the development of mechanisms for commu-nication, contributions of existing polar organizations engaged in health research and the dedication of indi-viduals through the circumpolar regions.
IPY and the Arctic Human Health Initiative Within the Arctic Council, it was recognized that IPY 2007–2008 represented a unique opportunity to further stimulate cooperation and coordination on Arctic health research and increase the awareness and visibility of Arctic regions, and an opportunity to expand cooperation on human health. The Arctic Human Health Initiative (AHHI, IPY no. 167) was a U.S.-led Arctic Council IPY coordinating project that aimed to build and expand on existing Arctic Council and International Union for Circumpolar Health’s human health research activities. The project aimed to link researchers with potential international collaborators and to serve as a focal point for human health research, education, outreach, and communication activities during IPY. The overall goal of the AHHI was to increase awareness and visibility of human health concerns of Arctic peoples, foster human health research, and promote health strategies that will improve health and well being of all Arctic residents. Proposed activities to be recognized through the initiative included: • Expanding research networks that will enhance
surveillance and monitoring of health issues of concern to Arctic peoples, and increase collaboration and coordination of human health research;
• Fostering research that will examine the health impact of anthropogenic pollution, rapid modernization and economic development, climate variability, infectious and chronic diseases,
intentional and unintentional injuries; • Promoting education, outreach and communication
that will focus public and political attention on Arctic health issues, using a variety of publications, printed and electronic reports from scientific conferences, symposia and workshops targeting researchers, students, communities and policy makers;
• Promoting the translation of research into health policy and community action including implementation of prevention strategies and health promotion; and
• Promoting synergy and strategic direction of Arctic human health research and health promotion.
As of 31 March 2009, the official end of IPY, AHHI represented a total of 38 proposals, including 21 individual Expressions of Intent (EoI), nine full proposals (FP) and ten national initiatives (NI), submitted from lead investigators from the U.S., Canada, Greenland, Norway Finland, Sweden and the Russian Federation (Table 2.11-1). The AHHI currently monitors the progress of 28 individual active human health projects in the following thematic areas: Health Network expansion (5), Infectious Disease Research (6); Environmental Health Research (7); Behavioral and Mental Health Research (3); and Outreach Education and Communication (5). While some projects have been completed in 2008–2009, others will continue beyond IPY. Individual project details can be viewed at: www.arctichealth.org. The AHHI proved to be an effective exercise in identifying and featuring health research activities during IPY. The information was shared via websites, circumpolar health supplements, congress presentations and within peer reviewed journals. The positioning of the project within the Arctic Council also allowed for information to be shared at the level of the Sustainable Development Working Group. The sharing of activities and projects raised the profile of health research and highlighted the need within Arctic Council for there to be ongoing access to research findings and experts engaged in circumpolar health research. To this end, strengths of the AHHI were identified and formalized through the development of the Arctic Human Health Expert Group, a government appointed advisory to the Sustainable Development Working Group (Parkinson, 2010a,b).
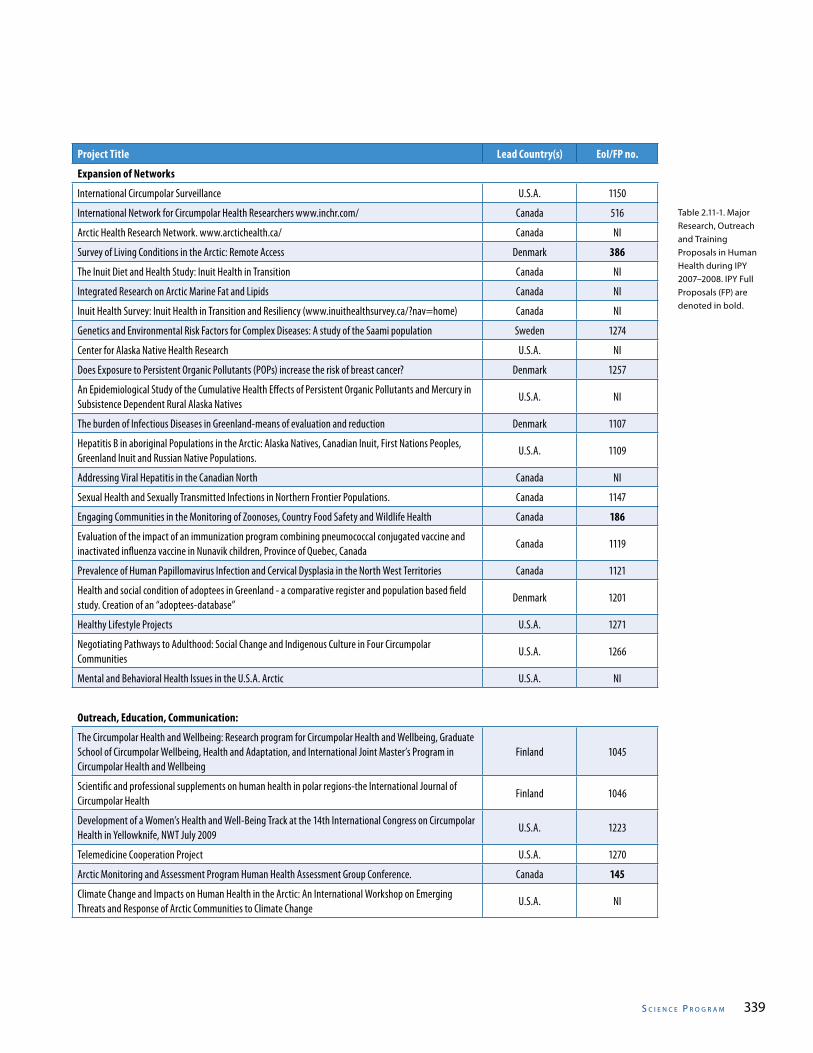
s C I e n C e P r o g r a m 339
Project Title Lead Country(s) EoI/FP no.
Expansion of Networks
International Circumpolar Surveillance U.S.A. 1150
International Network for Circumpolar Health Researchers www.inchr.com/ Canada 516
Arctic Health Research Network. www.arctichealth.ca/ Canada NI
Survey of Living Conditions in the Arctic: Remote Access Denmark 386
The Inuit Diet and Health Study: Inuit Health in Transition Canada NI
Integrated Research on Arctic Marine Fat and Lipids Canada NI
Inuit Health Survey: Inuit Health in Transition and Resiliency (www.inuithealthsurvey.ca/?nav=home) Canada NI
Genetics and Environmental Risk Factors for Complex Diseases: A study of the Saami population Sweden 1274
Center for Alaska Native Health Research U.S.A. NI
Does Exposure to Persistent Organic Pollutants (POPs) increase the risk of breast cancer? Denmark 1257
An Epidemiological Study of the Cumulative Health Effects of Persistent Organic Pollutants and Mercury in Subsistence Dependent Rural Alaska Natives
U.S.A. NI
The burden of Infectious Diseases in Greenland-means of evaluation and reduction Denmark 1107
Hepatitis B in aboriginal Populations in the Arctic: Alaska Natives, Canadian Inuit, First Nations Peoples, Greenland Inuit and Russian Native Populations.
U.S.A. 1109
Addressing Viral Hepatitis in the Canadian North Canada NI
Sexual Health and Sexually Transmitted Infections in Northern Frontier Populations. Canada 1147
Engaging Communities in the Monitoring of Zoonoses, Country Food Safety and Wildlife Health Canada 186
Evaluation of the impact of an immunization program combining pneumococcal conjugated vaccine and inactivated influenza vaccine in Nunavik children, Province of Quebec, Canada
Canada 1119
Prevalence of Human Papillomavirus Infection and Cervical Dysplasia in the North West Territories Canada 1121
Health and social condition of adoptees in Greenland - a comparative register and population based field study. Creation of an “adoptees-database”
Denmark 1201
Healthy Lifestyle Projects U.S.A. 1271
Negotiating Pathways to Adulthood: Social Change and Indigenous Culture in Four Circumpolar Communities
U.S.A. 1266
Mental and Behavioral Health Issues in the U.S.A. Arctic U.S.A. NI
Table 2.11-1. Major Research, Outreach and Training Proposals in Human Health during IPY 2007–2008. IPY Full Proposals (FP) are denoted in bold.
Outreach, Education, Communication:
The Circumpolar Health and Wellbeing: Research program for Circumpolar Health and Wellbeing, Graduate School of Circumpolar Wellbeing, Health and Adaptation, and International Joint Master’s Program in Circumpolar Health and Wellbeing
Finland 1045
Scientific and professional supplements on human health in polar regions-the International Journal of Circumpolar Health
Finland 1046
Development of a Women’s Health and Well-Being Track at the 14th International Congress on Circumpolar Health in Yellowknife, NWT July 2009
U.S.A. 1223
Telemedicine Cooperation Project U.S.A. 1270
Arctic Monitoring and Assessment Program Human Health Assessment Group Conference. Canada 145
Climate Change and Impacts on Human Health in the Arctic: An International Workshop on Emerging Threats and Response of Arctic Communities to Climate Change
U.S.A. NI
I PY 20 07–20 0 8340
Research Infrastructure and the Expansion of Networks While various networks exist to coordinate circumpolar health researchers, how circumpolar health research is organized varies from country to country. Some countries have established polar institutes and support special polar research programs focused on population health, whereas other regions do not have a central health program and health researchers have to compete with other specialists for program funds (Hanne, 2009). Over the IPY years, as a result of increases in research activities, both networks supporting individual researchers and infrastructure to support circumpolar research programs have been enhanced and developed. During the preparation and implementation of IPY 2007–2008, circumpolar countries have made substantial progress in expanding health research institutes. In Greenland, the Greenland Institute for Circumpolar Health Research was established in Nuuk in 2008. In Canada, the Institute for Circumpolar Health Research in Yellowknife, NWT and the Arctic Health Research Network – Yukon and Qaujigiartiit/ Arctic Health Research Network NU, in Iqaluit, Nunavut were established. Health research capacity was also built at the Labrador Institute via infrastructure enhancements and the establishment of a faculty position in community health and humanities in partnership with the Memorial University in Newfoundland and Labrador. The Centre for Arctic Medicine’s Thule Institute, University of Oulu, Finland (http://arctichealth.oulu.fi) has a developed research program related to Circumpolar Health and Wellbeing. Activities are focused on environmental health and adaptation; population health and health care; societal and individual wellbeing, and cultural aspects of health and wellbeing. Research projects are supported by the Finnish Academy and the European Union. In the U.S.A., circumpolar health research infra-
structure has been expanded at the University of Alas-ka, Anchorage through development and support of a new graduate program in public health (MPH) focused on northern and circumpolar health issues (http://health.uaa.alaska.edu/mph/index.htm) and in the re-organization of Alaska’s existing Institute for Circum-polar Health Studies (www.ichs.uaa.alaska.edu). The establishment and development of institutes can be facilitated by northern-based leadership, a vision for health research and the engagement of key partners and stakeholders (Chatwood and Young, 2010). Proximity of these institutes to the peoples and governments allow for efficiencies in public health research including access to policy-makers, partnerships with community-based organizations and opportunities to design research projects of relevance to their regions while considering the circumpolar context.
Connecting people in circumpolar regions During IPY 2007–2008, the core participants were self-organizing groups of researchers, their parent organizations, existing bodies with a role in polar regions research and monitoring, and consortia of such bodies. Increased activities created synergies and the development of new networks. The International Union for Circumpolar Health (www.iuch.net) has served as an ongoing network where the numerous circumpolar societies can meet and work on initiatives that support research development, networking and dissemination of health information. To this end the main activity of the IUCH has been the International Congress on Circumpolar Health, which is held in circumpolar regions every three years (see below). The IUCH also has working groups which provide a mechanism for networking in specific thematic areas. IPY saw the establishment of the International Net-
Canadian training, communications and outreach projects
The Inuit Cohort: A Community of Research Practice Across Canada www.ciet.org/en/documents/projects_cycles/2007102165919.asp
Canada NI
Healthy Foods North NWT www.hlthss.gov.nt.ca/sites/healthy_foods_north/default.htm Canada NI
Pan-Arctic Interactive Communications Health Project www.naho.ca/inuit/wellnessTV/index.php Canada NI
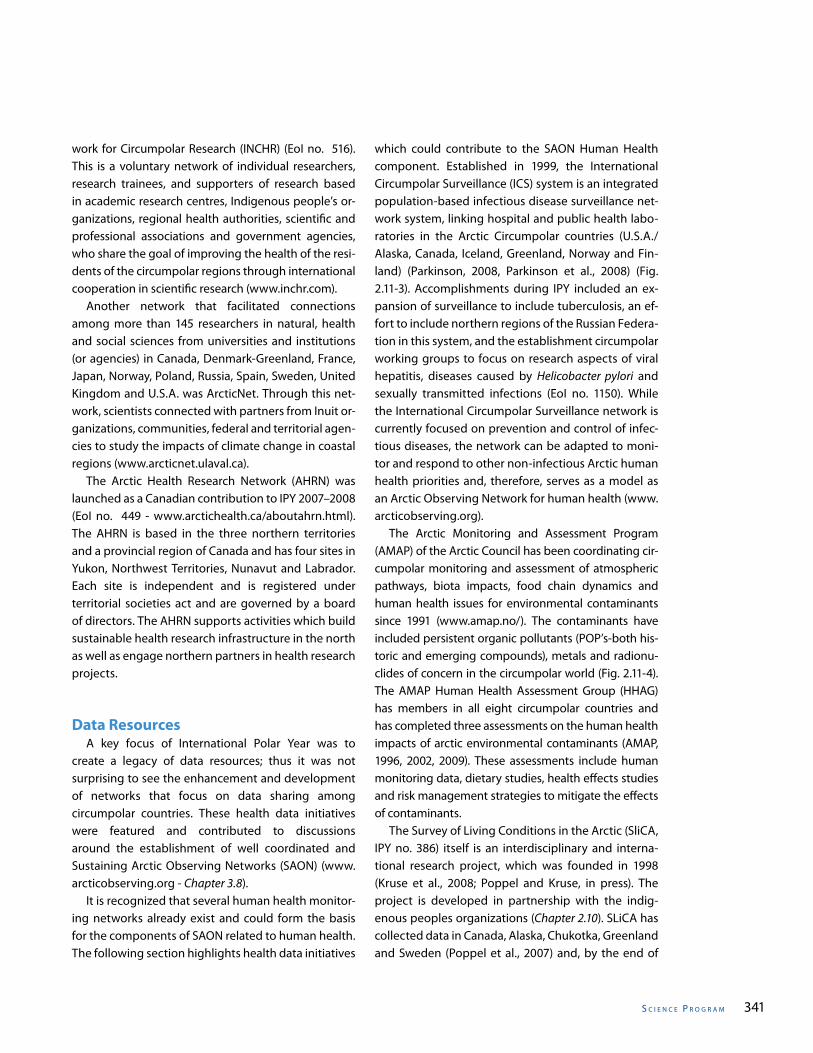
s C I e n C e P r o g r a m 341
work for Circumpolar Research (INCHR) (EoI no. 516). This is a voluntary network of individual researchers, research trainees, and supporters of research based in academic research centres, Indigenous people’s or-ganizations, regional health authorities, scientific and professional associations and government agencies, who share the goal of improving the health of the resi-dents of the circumpolar regions through international cooperation in scientific research (www.inchr.com). Another network that facilitated connections among more than 145 researchers in natural, health and social sciences from universities and institutions (or agencies) in Canada, Denmark-Greenland, France, Japan, Norway, Poland, Russia, Spain, Sweden, United Kingdom and U.S.A. was ArcticNet. Through this net-work, scientists connected with partners from Inuit or-ganizations, communities, federal and territorial agen-cies to study the impacts of climate change in coastal regions (www.arcticnet.ulaval.ca). The Arctic Health Research Network (AHRN) was launched as a Canadian contribution to IPY 2007–2008 (EoI no. 449 - www.arctichealth.ca/aboutahrn.html). The AHRN is based in the three northern territories and a provincial region of Canada and has four sites in Yukon, Northwest Territories, Nunavut and Labrador. Each site is independent and is registered under territorial societies act and are governed by a board of directors. The AHRN supports activities which build sustainable health research infrastructure in the north as well as engage northern partners in health research projects.
Data Resources A key focus of International Polar Year was to create a legacy of data resources; thus it was not surprising to see the enhancement and development of networks that focus on data sharing among circumpolar countries. These health data initiatives were featured and contributed to discussions around the establishment of well coordinated and Sustaining Arctic Observing Networks (SAON) (www.arcticobserving.org - Chapter 3.8). It is recognized that several human health monitor-ing networks already exist and could form the basis for the components of SAON related to human health. The following section highlights health data initiatives
which could contribute to the SAON Human Health component. Established in 1999, the International Circumpolar Surveillance (ICS) system is an integrated population-based infectious disease surveillance net-work system, linking hospital and public health labo-ratories in the Arctic Circumpolar countries (U.S.A./Alaska, Canada, Iceland, Greenland, Norway and Fin-land) (Parkinson, 2008, Parkinson et al., 2008) (Fig. 2.11-3). Accomplishments during IPY included an ex-pansion of surveillance to include tuberculosis, an ef-fort to include northern regions of the Russian Federa-tion in this system, and the establishment circumpolar working groups to focus on research aspects of viral hepatitis, diseases caused by Helicobacter pylori and sexually transmitted infections (EoI no. 1150). While the International Circumpolar Surveillance network is currently focused on prevention and control of infec-tious diseases, the network can be adapted to moni-tor and respond to other non-infectious Arctic human health priorities and, therefore, serves as a model as an Arctic Observing Network for human health (www.arcticobserving.org). The Arctic Monitoring and Assessment Program (AMAP) of the Arctic Council has been coordinating cir-cumpolar monitoring and assessment of atmospheric pathways, biota impacts, food chain dynamics and human health issues for environmental contaminants since 1991 (www.amap.no/). The contaminants have included persistent organic pollutants (POP’s-both his-toric and emerging compounds), metals and radionu-clides of concern in the circumpolar world (Fig. 2.11-4). The AMAP Human Health Assessment Group (HHAG) has members in all eight circumpolar countries and has completed three assessments on the human health impacts of arctic environmental contaminants (AMAP, 1996, 2002, 2009). These assessments include human monitoring data, dietary studies, health effects studies and risk management strategies to mitigate the effects of contaminants. The Survey of Living Conditions in the Arctic (SliCA, IPY no. 386) itself is an interdisciplinary and interna-tional research project, which was founded in 1998 (Kruse et al., 2008; Poppel and Kruse, in press). The project is developed in partnership with the indig-enous peoples organizations (Chapter 2.10). SLiCA has collected data in Canada, Alaska, Chukotka, Greenland and Sweden (Poppel et al., 2007) and, by the end of
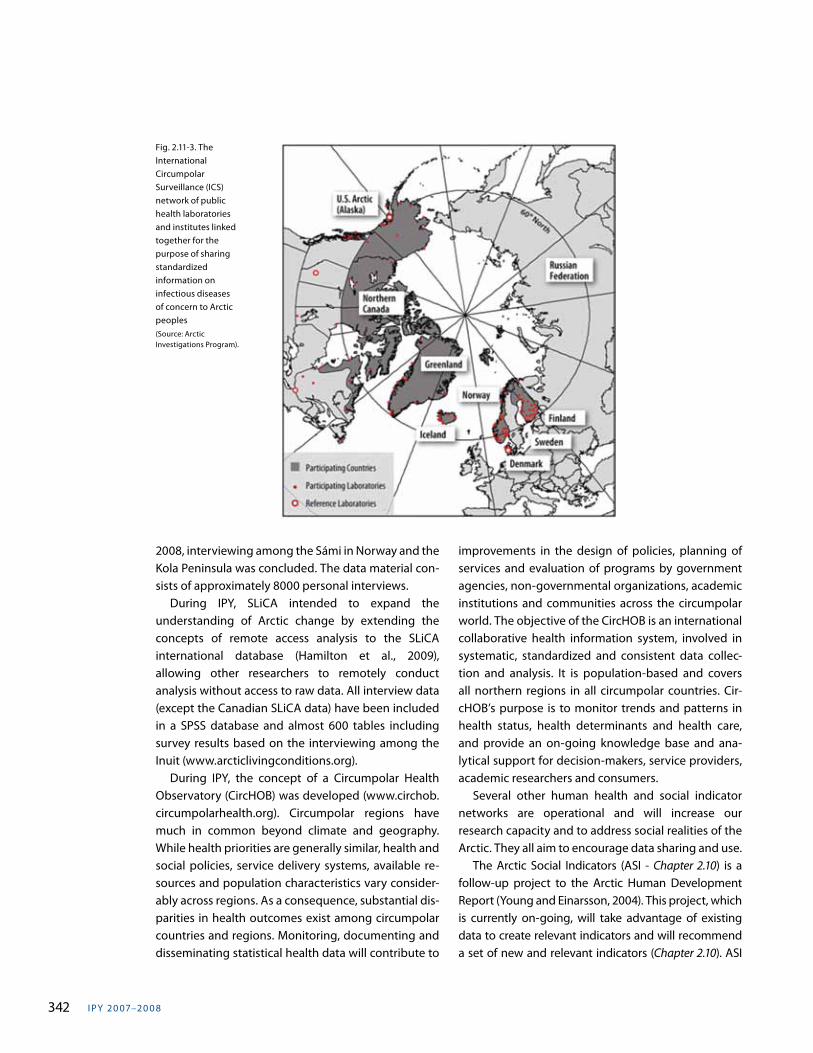
I PY 20 07–20 0 8342
2008, interviewing among the Sámi in Norway and the Kola Peninsula was concluded. The data material con-sists of approximately 8000 personal interviews. During IPY, SLiCA intended to expand the understanding of Arctic change by extending the concepts of remote access analysis to the SLiCA international database (Hamilton et al., 2009), allowing other researchers to remotely conduct analysis without access to raw data. All interview data (except the Canadian SLiCA data) have been included in a SPSS database and almost 600 tables including survey results based on the interviewing among the Inuit (www.arcticlivingconditions.org). During IPY, the concept of a Circumpolar Health Observatory (CircHOB) was developed (www.circhob.circumpolarhealth.org). Circumpolar regions have much in common beyond climate and geography. While health priorities are generally similar, health and social policies, service delivery systems, available re-sources and population characteristics vary consider-ably across regions. As a consequence, substantial dis-parities in health outcomes exist among circumpolar countries and regions. Monitoring, documenting and disseminating statistical health data will contribute to
Fig. 2.11-3. The International Circumpolar Surveillance (ICS) network of public health laboratories and institutes linked together for the purpose of sharing standardized information on infectious diseases of concern to Arctic peoples (Source: Arctic Investigations Program).
improvements in the design of policies, planning of services and evaluation of programs by government agencies, non-governmental organizations, academic institutions and communities across the circumpolar world. The objective of the CircHOB is an international collaborative health information system, involved in systematic, standardized and consistent data collec-tion and analysis. It is population-based and covers all northern regions in all circumpolar countries. Cir-cHOB’s purpose is to monitor trends and patterns in health status, health determinants and health care, and provide an on-going knowledge base and ana-lytical support for decision-makers, service providers, academic researchers and consumers. Several other human health and social indicator networks are operational and will increase our research capacity and to address social realities of the Arctic. They all aim to encourage data sharing and use. The Arctic Social Indicators (ASI - Chapter 2.10) is a follow-up project to the Arctic Human Development Report (Young and Einarsson, 2004). This project, which is currently on-going, will take advantage of existing data to create relevant indicators and will recommend a set of new and relevant indicators (Chapter 2.10). ASI
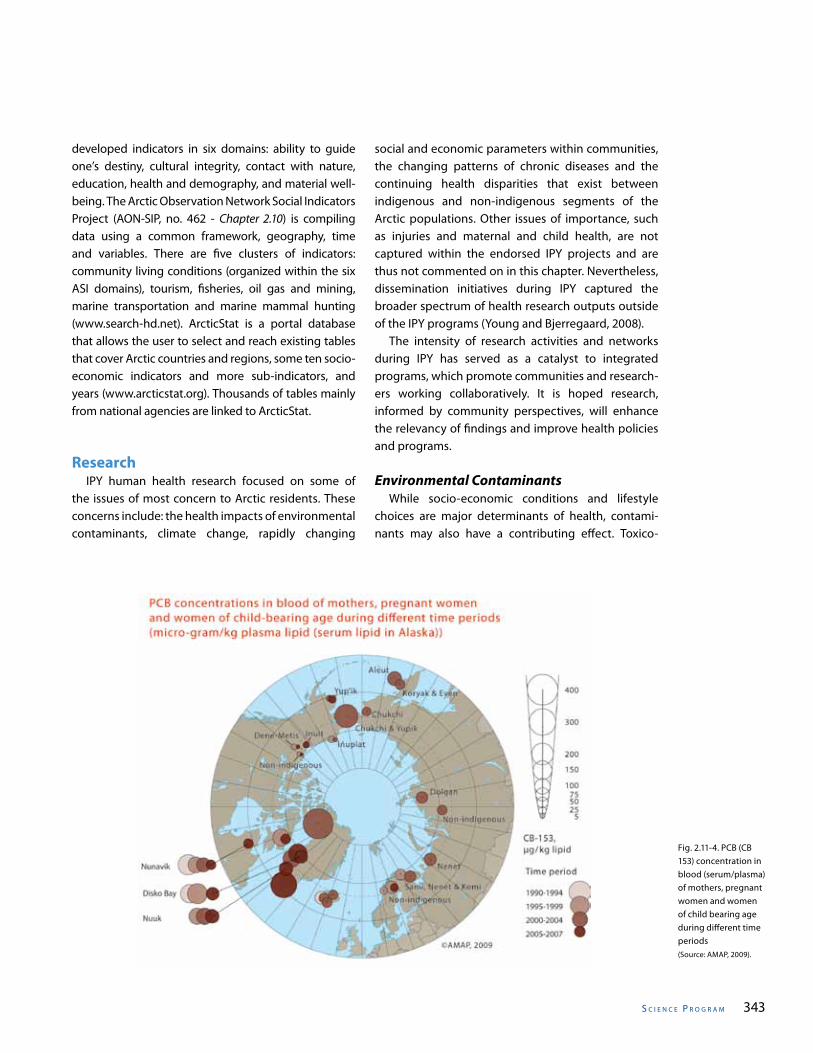
s C I e n C e P r o g r a m 343
developed indicators in six domains: ability to guide one’s destiny, cultural integrity, contact with nature, education, health and demography, and material well-being. The Arctic Observation Network Social Indicators Project (AON-SIP, no. 462 - Chapter 2.10) is compiling data using a common framework, geography, time and variables. There are five clusters of indicators: community living conditions (organized within the six ASI domains), tourism, fisheries, oil gas and mining, marine transportation and marine mammal hunting (www.search-hd.net). ArcticStat is a portal database that allows the user to select and reach existing tables that cover Arctic countries and regions, some ten socio-economic indicators and more sub-indicators, and years (www.arcticstat.org). Thousands of tables mainly from national agencies are linked to ArcticStat.
Research IPY human health research focused on some of the issues of most concern to Arctic residents. These concerns include: the health impacts of environmental contaminants, climate change, rapidly changing
social and economic parameters within communities, the changing patterns of chronic diseases and the continuing health disparities that exist between indigenous and non-indigenous segments of the Arctic populations. Other issues of importance, such as injuries and maternal and child health, are not captured within the endorsed IPY projects and are thus not commented on in this chapter. Nevertheless, dissemination initiatives during IPY captured the broader spectrum of health research outputs outside of the IPY programs (Young and Bjerregaard, 2008). The intensity of research activities and networks during IPY has served as a catalyst to integrated programs, which promote communities and research-ers working collaboratively. It is hoped research, informed by community perspectives, will enhance the relevancy of findings and improve health policies and programs.
Environmental Contaminants While socio-economic conditions and lifestyle choices are major determinants of health, contami-nants may also have a contributing effect. Toxico-
Fig. 2.11-4. PCB (CB 153) concentration in blood (serum/plasma) of mothers, pregnant women and women of child bearing age during different time periods (Source: AMAP, 2009).
I PY 20 07–20 0 8344
logical studies show that contaminant levels found in some parts of the Arctic have the potential for ad-verse health effects in people. Epidemiological studies looking at Arctic residents directly provide evidence for subtle immunological cardiovascular and repro-ductive effects due to contaminants in some Arctic populations (AMAP, 2009). If climate change is associ-ated with rising salmon and human levels of POPs and mercury it would provide data to further support re-duction of POPs and mercury production and release, and efforts to reduce global warming. Another study led by researchers at the Center for Arctic Environ-mental Medicine, School of Public Health, University of Aarhus, Denmark examined the risk of the develop-ment of breast cancer in Greenlandic Inuit women fol-lowing exposure to persistent organic pollutants (EoI no. 1257). Blood levels of POPs in women with breast cancer will be compared to controls with respect to age and lifestyle. The bio-effects of POP levels on hor-mone receptor function will also be examined (Bone-feld-Jorgensen, 2010).
Infectious Diseases A continuing major health disparity is the increased morbidity and mortality due to infectious diseases seen among indigenous populations when compared to the non-indigenous populations of the Arctic. These disparities can be resolved with greater understanding of their causes through research, focused efforts at treatment and prevention. Hepatitis B infection occurs at high and endemic rates in Arctic populations. For example research has shown that 3-5% of individuals residing in the Cana-dian North, 5-14% of Inuit in Greenland and 3-10% of Alaska Native people in Western Alaska are infected with hepatitis B virus (HBV) and likely, if left untreated, 10-25% will develop liver cancer or die of cirrhosis. Re-searchers from the U.S., Canada, Greenland, Denmark and the Russian Federation have formed a Circumpo-lar Viral Hepatitis Working Group and are conducting studies to determine the epidemiology of chronic HBV in Aboriginal populations (EoI no. 1109). The study monitors patients to determine disease progression, examine demographic characteristics associated with disease outcome, examine environmental factors as-sociated with disease outcome, including contami-nants in the environment and subsistence foods, ex-
amine co-factors such as alcohol intake, obesity and metabolic syndrome, and examine viral characteris-tics, such as genotype and viral loads and mutations that could affect disease outcome. This study allows the identification of barriers to vaccination, the devel-opment of registries for research and clinical manage-ment, the development of criteria to identify poten-tial treatment candidates, monitoring of treatment outcome, and the examination of the role of factors, such as demographics, viral genotype, and environ-mental factors in treatment outcome. Already, this re-search group has identified a new HBV sub-genotype (B6), which is only found in indigenous populations of Alaska, Canada, and Greenland (Sakamoto et al., 2007) and assisted Greenland in the investigation of an out-break of hepatitis D superinfection in adolescents with chronic HBV in a community in Greenland (Borresen et al., 2010). In addition this working group has been instrumental in encouraging the Greenland govern-ment to adopt universal childhood hepatitis B vacci-nation in Greenland. Similarly reported rates of sexually transmitted infections (STIs) are disparately high among indigenous populations of the Arctic (Gesink-Law et al., 2008). Research in Canada, U.S.A. and Greenland (EoI no. 1147), aimed at building capacity to examine individual, social and environmental factors that influence perceptions of sexual health and sexually transmitted infections, is being conducted by researchers and communities using participatory methods (Gesink et al., 2010; Rink et al., 2009). The aims include a description of the basic epidemiology of sexual health and STIs and to identify communities at risk and targets for capacity-building and interventions. Preliminary results indicate that Mycoplasma genitalium is as prevalent as Chlamydia trachomatis in Greenland, and that social and cultural norms around sexual health communication, trust, drinking and sex appear to influence individual sexual behaviours and risk for STIs. Based on this research, the National Science Foundation has granted U.S., Canadian, Greenlandic and Danish researchers new funds to explore community based participatory methods in Greenland and develop a social intervention focusing on sexual health communication with families and relationships. Canadian researchers are examining the potential
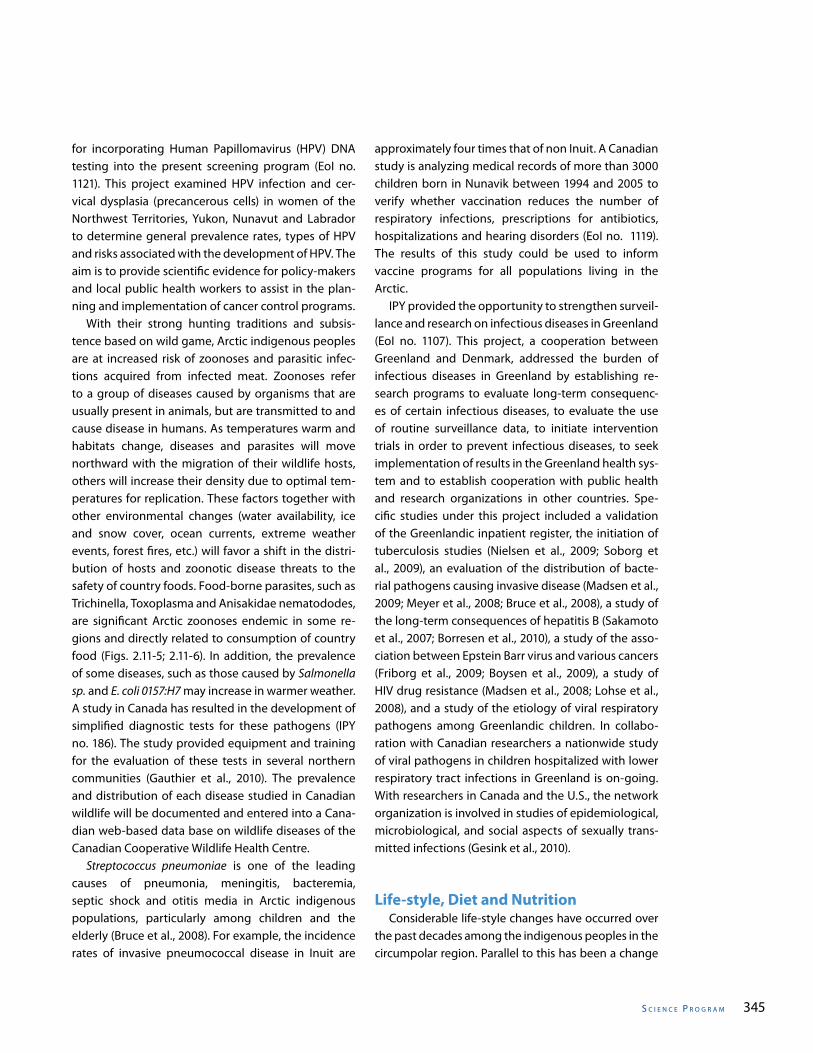
s C I e n C e P r o g r a m 345
for incorporating Human Papillomavirus (HPV) DNA testing into the present screening program (EoI no. 1121). This project examined HPV infection and cer-vical dysplasia (precancerous cells) in women of the Northwest Territories, Yukon, Nunavut and Labrador to determine general prevalence rates, types of HPV and risks associated with the development of HPV. The aim is to provide scientific evidence for policy-makers and local public health workers to assist in the plan-ning and implementation of cancer control programs. With their strong hunting traditions and subsis-tence based on wild game, Arctic indigenous peoples are at increased risk of zoonoses and parasitic infec-tions acquired from infected meat. Zoonoses refer to a group of diseases caused by organisms that are usually present in animals, but are transmitted to and cause disease in humans. As temperatures warm and habitats change, diseases and parasites will move northward with the migration of their wildlife hosts, others will increase their density due to optimal tem-peratures for replication. These factors together with other environmental changes (water availability, ice and snow cover, ocean currents, extreme weather events, forest fires, etc.) will favor a shift in the distri-bution of hosts and zoonotic disease threats to the safety of country foods. Food-borne parasites, such as Trichinella, Toxoplasma and Anisakidae nematododes, are significant Arctic zoonoses endemic in some re-gions and directly related to consumption of country food (Figs. 2.11-5; 2.11-6). In addition, the prevalence of some diseases, such as those caused by Salmonella sp. and E. coli 0157:H7 may increase in warmer weather. A study in Canada has resulted in the development of simplified diagnostic tests for these pathogens (IPY no. 186). The study provided equipment and training for the evaluation of these tests in several northern communities (Gauthier et al., 2010). The prevalence and distribution of each disease studied in Canadian wildlife will be documented and entered into a Cana-dian web-based data base on wildlife diseases of the Canadian Cooperative Wildlife Health Centre. Streptococcus pneumoniae is one of the leading causes of pneumonia, meningitis, bacteremia, septic shock and otitis media in Arctic indigenous populations, particularly among children and the elderly (Bruce et al., 2008). For example, the incidence rates of invasive pneumococcal disease in Inuit are
approximately four times that of non Inuit. A Canadian study is analyzing medical records of more than 3000 children born in Nunavik between 1994 and 2005 to verify whether vaccination reduces the number of respiratory infections, prescriptions for antibiotics, hospitalizations and hearing disorders (EoI no. 1119). The results of this study could be used to inform vaccine programs for all populations living in the Arctic. IPY provided the opportunity to strengthen surveil-lance and research on infectious diseases in Greenland (EoI no. 1107). This project, a cooperation between Greenland and Denmark, addressed the burden of infectious diseases in Greenland by establishing re-search programs to evaluate long-term consequenc-es of certain infectious diseases, to evaluate the use of routine surveillance data, to initiate intervention trials in order to prevent infectious diseases, to seek implementation of results in the Greenland health sys-tem and to establish cooperation with public health and research organizations in other countries. Spe-cific studies under this project included a validation of the Greenlandic inpatient register, the initiation of tuberculosis studies (Nielsen et al., 2009; Soborg et al., 2009), an evaluation of the distribution of bacte-rial pathogens causing invasive disease (Madsen et al., 2009; Meyer et al., 2008; Bruce et al., 2008), a study of the long-term consequences of hepatitis B (Sakamoto et al., 2007; Borresen et al., 2010), a study of the asso-ciation between Epstein Barr virus and various cancers (Friborg et al., 2009; Boysen et al., 2009), a study of HIV drug resistance (Madsen et al., 2008; Lohse et al., 2008), and a study of the etiology of viral respiratory pathogens among Greenlandic children. In collabo-ration with Canadian researchers a nationwide study of viral pathogens in children hospitalized with lower respiratory tract infections in Greenland is on-going. With researchers in Canada and the U.S., the network organization is involved in studies of epidemiological, microbiological, and social aspects of sexually trans-mitted infections (Gesink et al., 2010).
Life-style, Diet and Nutrition Considerable life-style changes have occurred over the past decades among the indigenous peoples in the circumpolar region. Parallel to this has been a change
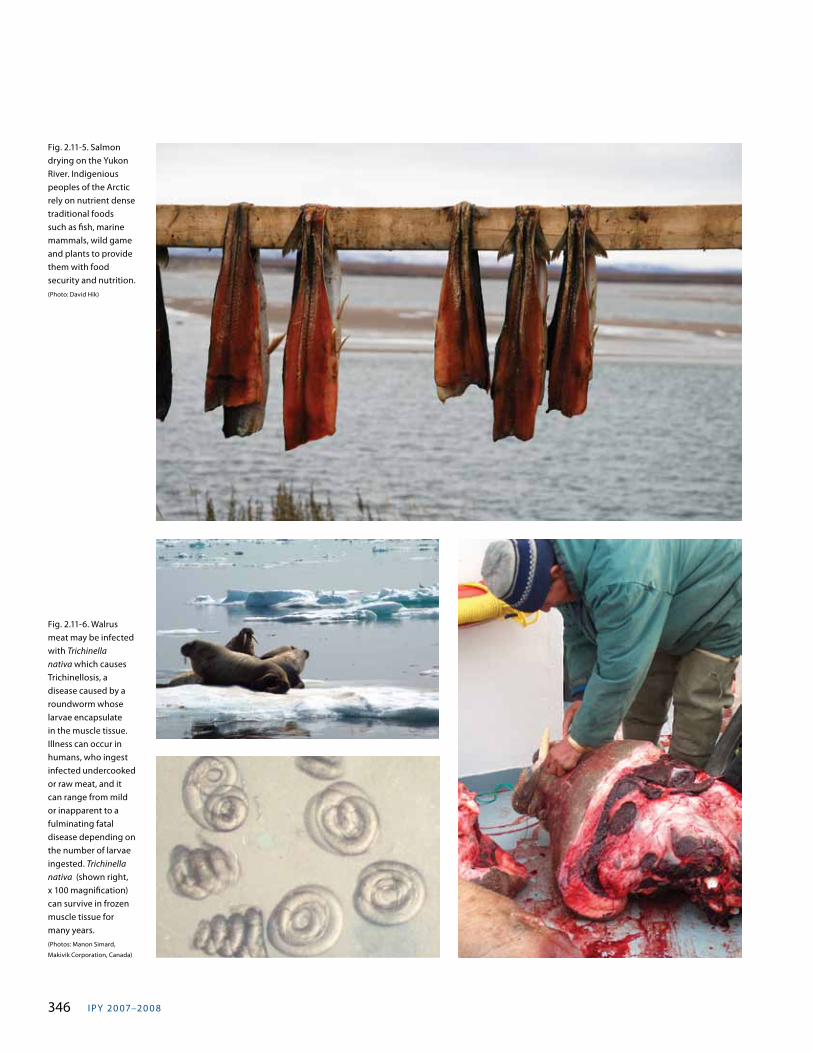
I PY 20 07–20 0 8346
Fig. 2.11-5. Salmon drying on the Yukon River. Indigenious peoples of the Arctic rely on nutrient dense traditional foods such as fish, marine mammals, wild game and plants to provide them with food security and nutrition. (Photo: David Hik)
Fig. 2.11-6. Walrus meat may be infected with Trichinella nativa which causes Trichinellosis, a disease caused by a roundworm whose larvae encapsulate in the muscle tissue. Illness can occur in humans, who ingest infected undercooked or raw meat, and it can range from mild or inapparent to a fulminating fatal disease depending on the number of larvae ingested. Trichinella nativa (shown right, x 100 magnification)can survive in frozen muscle tissue for many years.(Photos: Manon Simard,
Makivik Corporation, Canada)
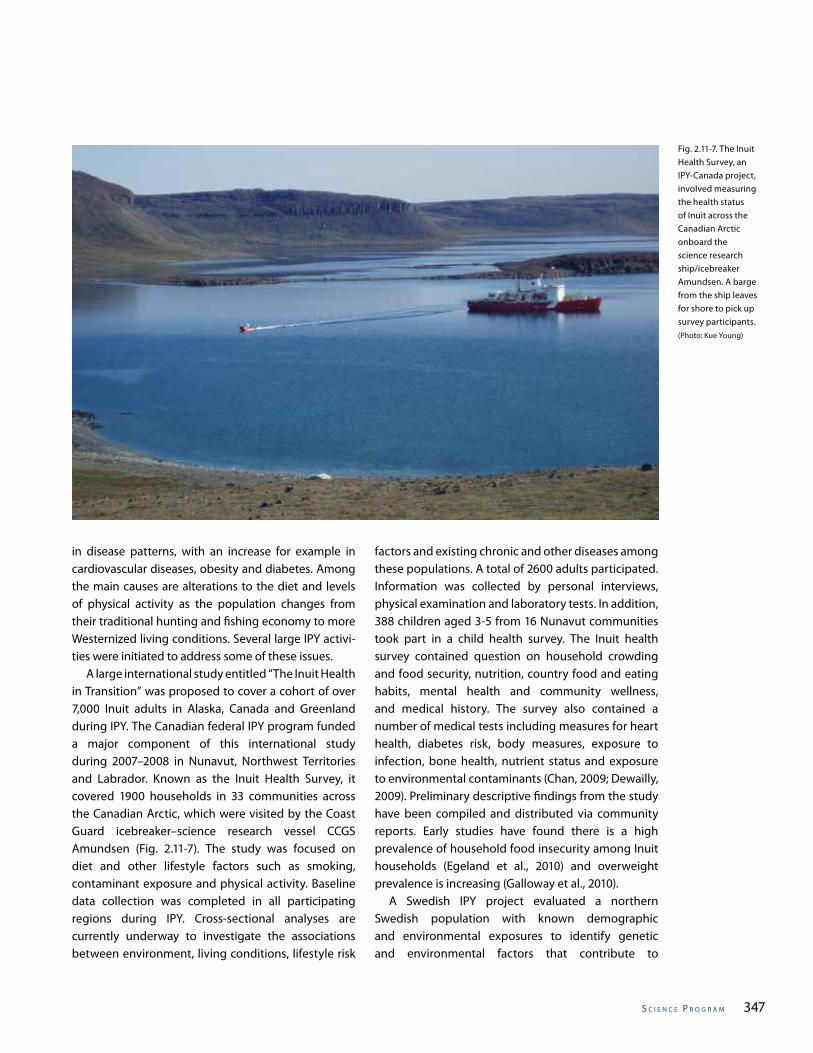
s C I e n C e P r o g r a m 347
in disease patterns, with an increase for example in cardiovascular diseases, obesity and diabetes. Among the main causes are alterations to the diet and levels of physical activity as the population changes from their traditional hunting and fishing economy to more Westernized living conditions. Several large IPY activi-ties were initiated to address some of these issues. A large international study entitled “The Inuit Health in Transition” was proposed to cover a cohort of over 7,000 Inuit adults in Alaska, Canada and Greenland during IPY. The Canadian federal IPY program funded a major component of this international study during 2007–2008 in Nunavut, Northwest Territories and Labrador. Known as the Inuit Health Survey, it covered 1900 households in 33 communities across the Canadian Arctic, which were visited by the Coast Guard icebreaker–science research vessel CCGS Amundsen (Fig. 2.11-7). The study was focused on diet and other lifestyle factors such as smoking, contaminant exposure and physical activity. Baseline data collection was completed in all participating regions during IPY. Cross-sectional analyses are currently underway to investigate the associations between environment, living conditions, lifestyle risk
factors and existing chronic and other diseases among these populations. A total of 2600 adults participated. Information was collected by personal interviews, physical examination and laboratory tests. In addition, 388 children aged 3-5 from 16 Nunavut communities took part in a child health survey. The Inuit health survey contained question on household crowding and food security, nutrition, country food and eating habits, mental health and community wellness, and medical history. The survey also contained a number of medical tests including measures for heart health, diabetes risk, body measures, exposure to infection, bone health, nutrient status and exposure to environmental contaminants (Chan, 2009; Dewailly, 2009). Preliminary descriptive findings from the study have been compiled and distributed via community reports. Early studies have found there is a high prevalence of household food insecurity among Inuit households (Egeland et al., 2010) and overweight prevalence is increasing (Galloway et al., 2010). A Swedish IPY project evaluated a northern Swedish population with known demographic and environmental exposures to identify genetic and environmental factors that contribute to
Fig. 2.11-7. The Inuit Health Survey, an IPY-Canada project, involved measuring the health status of Inuit across the Canadian Arctic onboard the science research ship/icebreaker Amundsen. A barge from the ship leaves for shore to pick up survey participants. (Photo: Kue Young)
I PY 20 07–20 0 8348
health status (EoI no. 1274). In this study, cross-population comparisons are used to study genetic and environmental risk factors among populations with widely differing origins and environments. The study measures a broad spectrum of environmental (e.g. diet, physical activity and daylight exposure) and genetic (e.g. single-nucleotide polymorphisms) factors with potential relevance for health risk. A comprehensive set of health indicators and diagnoses of cardiovascular, orthopedic and metabolic diseases has been collected. In particular, the state-of-the-art laboratory analysis of blood lipids comprising several hundreds of lipid species will give unique insights into the human metabolism under extreme living conditions. Studies of rural populations can make substantial contributions to basic research to understand environmental and genetic determinants of disease. The European Special Population Network (EUROSPAN) provides a platform combining studies of rural populations from different parts of Europe to leverage these for collaboration with large international consortia (Igl et al., 2010). In the U.S., the Center for Alaska Native Health Research (CANHR) at the University of Alaska, Fairbanks used the IPY momentum to build a collaborative research presence in Alaska Native communities, focusing on prevention and reduction of health disparities by seeking new knowledge through basic and applied research that can ultimately be applied to understand, prevent and reduce health disparities in indigenous communities (Mohatt et al., 2007) (http://canhr.uaf.edu/). The Center studies behavioral, dietary and genetic risk and protective factors related to obesity diabetes and cardiovascular disease risk in Alaska Natives of Southwestern Alaska. CANHR includes studies related to substance abuse and suicide prevention, the development of novel dietary biomarkers, contaminants and the safety of substance foods, stress and gene by environment interactions, and nutrition research. All CANHR studies employ community-based participatory research approaches.
Behavioural and Mental Health Behavioural and mental health disorders are common worldwide and circumpolar regions are not exempt from this burden. Contemporary dynamics
of rapid social change have dramatically affected the political, cultural and economic systems of circumpolar indigenous people. Depression and suicide have been highlighted as significant issues in northern regions. (Levintova et al., 2010). During IPY, there were a number of research projects which explored behavioral and mental health, and the relationships between outcomes and environmental factors. The Inuit Health Survey collected information on mental and community wellness. Findings provide information on the burden of mental illness and also evaluate social support and other determinants of resiliency and self-reported health (Egeland, 2009). In Nunavik a cohort study was carried out that focused on exposure to environmental contaminants and child behaviour. The study also explored the impact of lifestyle factors, such as smoking, alcohol and drug abuse during pregnancy, on multiple domains of child development and behaviour (Muckle, 2009). Two CANHR affiliated studies focus on behavioural health research. This U.S.-led study examined social change and indigenous culture in five circumpolar communities by exploring responses to rapid social transition through the life experiences of circumpolar youth (EoI no. 1266). This study is completing over 100 youth life history interviews from Alaska Inupiat, Alaska Yup’ik, Canadian Inuit and Sámi and Siberian Eveny communities. The project team identified shared and divergent stressors and patterns of resilience in the transition to adulthood across these different circumpolar settings (Fig. 2.11-8). Elluam Tungiinun -“Toward wellness”- is a culturally-based preventive intervention to reduce suicide risk and co-morbid underage drinking among Alaska Native Yup’ik Eskimo youth. This five-year community based participatory research prevention trial will enroll 239 youth ages 12 through18 in five rural remote Yup’ik communities and test effectiveness post-intervention using a randomized dynamic wait list control design. This study represents the next stage in a 15-year community-based participatory research process with Alaska Native people (Allen et al., 2009). A Danish study examined the health and social condition of adoptees in Greenland. Greenland has a significant number of adoptees and the number of children placed at institution is large (EoI no. 1201). The study explored how adoption and collective
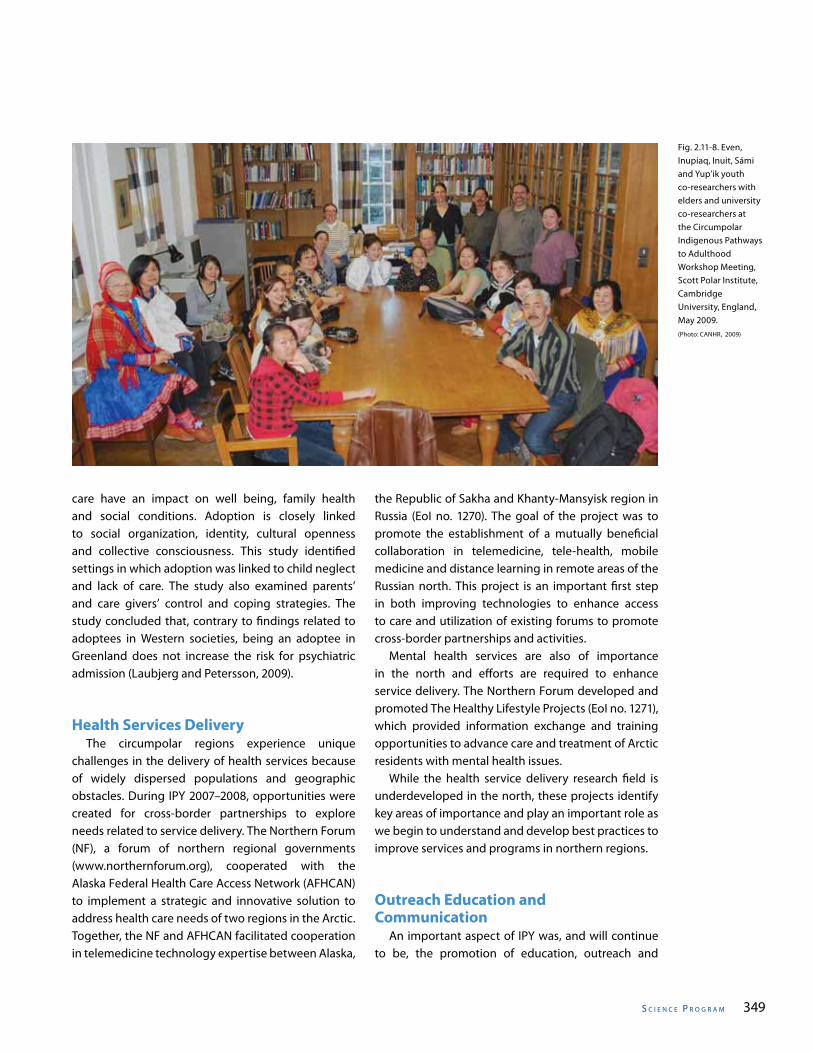
s C I e n C e P r o g r a m 349
care have an impact on well being, family health and social conditions. Adoption is closely linked to social organization, identity, cultural openness and collective consciousness. This study identified settings in which adoption was linked to child neglect and lack of care. The study also examined parents’ and care givers’ control and coping strategies. The study concluded that, contrary to findings related to adoptees in Western societies, being an adoptee in Greenland does not increase the risk for psychiatric admission (Laubjerg and Petersson, 2009).
Health Services Delivery The circumpolar regions experience unique challenges in the delivery of health services because of widely dispersed populations and geographic obstacles. During IPY 2007–2008, opportunities were created for cross-border partnerships to explore needs related to service delivery. The Northern Forum (NF), a forum of northern regional governments (www.northernforum.org), cooperated with the Alaska Federal Health Care Access Network (AFHCAN) to implement a strategic and innovative solution to address health care needs of two regions in the Arctic. Together, the NF and AFHCAN facilitated cooperation in telemedicine technology expertise between Alaska,
Fig. 2.11-8. Even, Inupiaq, Inuit, Sámi and Yup’ik youth co-researchers with elders and university co-researchers at the Circumpolar Indigenous Pathways to Adulthood Workshop Meeting, Scott Polar Institute, Cambridge University, England, May 2009.(Photo: CANHR, 2009)
the Republic of Sakha and Khanty-Mansyisk region in Russia (EoI no. 1270). The goal of the project was to promote the establishment of a mutually beneficial collaboration in telemedicine, tele-health, mobile medicine and distance learning in remote areas of the Russian north. This project is an important first step in both improving technologies to enhance access to care and utilization of existing forums to promote cross-border partnerships and activities. Mental health services are also of importance in the north and efforts are required to enhance service delivery. The Northern Forum developed and promoted The Healthy Lifestyle Projects (EoI no. 1271), which provided information exchange and training opportunities to advance care and treatment of Arctic residents with mental health issues. While the health service delivery research field is underdeveloped in the north, these projects identify key areas of importance and play an important role as we begin to understand and develop best practices to improve services and programs in northern regions.
Outreach Education and Communication An important aspect of IPY was, and will continue to be, the promotion of education, outreach and
I PY 20 07–20 0 8350
communication, which will focus public and political attention on Arctic health issues; increase dialogue between researchers, policy-makers and communities; increase distribution of scientific information to scientists and the public through conferences, symposia, workshops and a variety of electronic and printed media; increase community involvement in research activities; and foster a “new” generation of Arctic health scientists.
Symposia and Workshops IPY was highlighted by the occurrence of the 13th International Congress on Circumpolar Health held in Novosibirsk, Russian Federation, 12-16 June 2006, the “Gateway to the International Polar Year” for the circumpolar health community. This congress was put on by IUCH and brought together circumpolar health care professionals, workers, researchers, policy-makers and indigenous community members. The meeting presented a forum for discussion on their respective visions and priorities for human health activities for IPY and beyond. These discussions resulted in recommendations that emphasized the role of communities in research planning, research activities and the translation of research findings into actions that would benefit the health and wellbeing of Arctic communities (ICCH13, 2007). The Women’s Health Working Group of the IUCH was reactivated at that congress in June 2006 (EoI no. 1223). Participants identified at least four areas of mutual interest, including, but not limited to: 1) perinatal health systems and challenges, 2) infectious disease, particularly HPV and new vaccine; 3) interpersonal violence prevention and 4) health communication and health literacy. At the end of IPY, the 14th International Congress on Circumpolar Health was held in Yellowknife, North-west Territories, Canada, 12-16 July 2009. The theme of the congress recognized the end of the Polar Year and spoke to Securing the IPY Legacy: From Research to Action. While results from much of the research conducted over IPY are still pending, the congress program contained a broad cross section of present-ers, sessions and preliminary results from IPY. The ses-sions allowed for complementary perspectives of re-searchers, clinicians, community representatives and governments on numerous topics that impact public health, health services delivery, the research process
and Indigenous wellness in our circumpolar regions. Presentations demonstrated instances where research findings are applied in numerous settings, with uptake by clinicians, community organizations and govern-ments. Presentations also recognized the contribu-tions of numerous stakeholders through the research process with a particular focus on community engage-ment and participatory methods (ICCH14, 2010). IPY also provided the opportunity to conduct a number of workshops that brought together researchers from circumpolar countries on topics such as the human health impacts of climate change, environmental contaminants and developing a prevention research strategy for behavioral and mental health. The Arctic, like most other parts of the world, has warmed substantially over the last few decades. The impacts of climate change on the health of Arctic residents will vary depending on such factors as age, socioeconomic status, life-style, culture, location and capacity of the local health care infrastructures to adapt. It is likely that the most vulnerable will be those living close to the land in remote communities and those already facing health related challenges (Berner and Furgal, 2005). Climate change workshops were convened in Anchorage, Alaska as part of the 2008 Alaska Forum on the Environment (www.akforum.com), in Moscow, May 2008 and in Arkhangelsk, June 2009, all organized by UNDP, WHP and UNEP. These meetings recommended that action be taken on the human health recommendations put forward by Chapter 15 of the ACIA Report, and in the report by the United Nations and the Russian Federation “Impact of Global Climate Change on Human Health in the Russian Arctic” (Parkinson and Berner, 2008; Parkinson, 2010c; Revich, 2008, 2010). A joint AMAP and Northern Contaminants Program (NCP) symposium was held in Iqaluit, Nunavut, Cana-da 10-12 June 2009 (IPY no. 145). At this meeting, the third NCP and AMAP Human Health Assessments re-ports on environmental contaminants were released and the results were discussed (AMAP, 2009; CACHAR, 2009). The symposium demonstrated that the overall management of contaminants issue in the Arctic by all partners has been effective in reducing the health risks to northern populations from environmental
s C I e n C e P r o g r a m 351
contaminants. While the results indicate that there are declines in many contaminants in several Arctic Regions, there are still indications that there may be subtle health effects (cardiovascular, immunological) due to contaminants in some Arctic populations. The symposium reemphasized the importance of bio-monitoring of persistent organic pollutants and met-als to track international protocols, biomonitoring of emerging contaminants, quality control of laboratory methods, health effects research and dietary choice, risk perception and risk communication. The Fogarty International Center at the National Institutes of Health (NIH), together with the U.S. Arctic Research Commission (USARC) and other NIH institutes and CDC, organized a strategy setting conference on the Behavioral and Mental Health Research in the Arctic in Anchorage, AK on 2-3 June 2009. The purpose of this meeting was to develop a U.S. Arctic Human Health Research Strategy that will advise the Interagency Arctic Research Policy Committee (IARPC) on the development of a Arctic Human Health Research Plan. This meeting engaged Arctic health stakeholders including U.S. government, scientific and tribal community leaders and international scientists in behavioural and mental health with discussions of current knowledge and gaps in research, with a particular focus on improving our understanding of the risk factors for and barriers to reduce suicide and other behavioral and mental health ailments among Arctic populations. The conference outcome will be a strategy plan that will include specific goals and methods, as well as discussion of potential future research and research training activities on behavioral and mental health in the Arctic (Levintova et al., 2010).
Electronic and Print MediaDissemination in Scientific Community While the activities of the polar years focused on study implementation and data collection, analysis and dissemination of findings will be ongoing for years to come. During IPY, a number of summary and synthesis documents were created. The International Journal of Circumpolar Health (www.ijch.fi) produced a series of Circumpolar Health Supplements on topics of general interest and related to IPY themes (EoI no. 1046). To date, seven supplements have been
published as contributions to the IPY: (1) Anthropology and Health of Indigenous Peoples of Northern Russia (Kozlov et al., 2007); (2) Diet and Contaminants in Greenland (Hansen et al., 2008); (3) Circumpolar Health Indicators (Young, 2008); (4) International Circumpolar Surveillance: Prevention and Control of Infectious Diseases (Zulz et al., 2009); (5) Behavioral and Mental Health Research in the Arctic: Strategy Setting Meeting (Levintova et al., 2010); and (6) The Arctic Human health Initiative (Parkinson, 2010b); (7) Proceedings of the 14th International Congress on Circumpolar Health (ICCH14 2010). The International Network for Circumpolar Health Research produced a book, Health Transitions in Arctic Populations (Young and Bjerregaard, 2008) with contri-butions from 23 scientists and health care practitioners from all the Arctic countries. It synthesized existing knowledge on the health status of all the circumpolar regions and populations, with specific focus on the in-digenous Sámi, Dene and Inuit people, their determi-nants, and strategies for improving their health.
Multi-media and knowledge sharing The Arctic Human Health Initiative facilitated the development of the Arctic Health website www.arctichealth.org as a central source for information on diverse aspects of the Arctic environment and the health of northern peoples. The site gives access to health information from hundreds of local, state, national and international agencies, as well as from professional societies and universities. In addition, the Arctic Health Publications Database, (currently more than 96,000 records), provides access to Arctic-specific articles, out of print publications and information from special collections held in the Alaska Medical Library. During IPY, a concept for a circumpolar health por-tal was developed (www.circumpolarhealth.org). This project is exploring the feasibility of a coordinated venue to capture and promote the activities of circum-polar health organizations and initiatives. The web-site also incorporates Facebook and Twitter, and has dedicated channels for You Tube iPod casts and Flickr. These mechanisms allow for storage and access of photos, audio files and video. These tools are especially valuable to share information and outputs related to youth driven and participatory research projects. In addition to web-based media, radio and TV still
I PY 20 07–20 0 8352
play an important role in the sharing of information with circumpolar residents. A series of three live TV call-in shows on Inuit wellness was developed under the umbrella of the Pan-Arctic Interactive Communications Health Project. TV programs were produced and focused on the current health issues of importance to Inuit, including: (1) Inuit men’s health and wellness, (2) Inuit maternal care, and (3) Inuit youth and coping. Each show was moderated and featured panel discussions about programs and research with community representatives and physicians, video vignettes and interactions with the studio audience, Skype, phone and e-mail participants. The television broadcasts reached a wide audience by airing on networks in Canada and Alaska. This project was an innovative, multi-dimensional, collaborative health communication project that raised both interest and awareness about complex health conditions in the North, and stimulated community dialogue and potential for both local and regional collaborative action. On-going evidence-based resources for health education and community action developed through this program were assembled and archived in digital format (www.naho.ca/inuit/e/TVseries) to increase accessibility for otherwise isolated individuals and remote communities.
Education and Training Initiatives Education and training in the “discipline” of circumpolar health is as varied and broad as the number of topics related to human health, which are explored in circumpolar regions. Thus education and training activities through the polar years have tended to be cross-cutting and integrated in research programs. Activities have included the support of graduate students and training of community partners. Many health research initiatives now employ community-based participatory methods in which training in research methods, data collection and dissemination practices are integral components of the methodology. Examples of community participation have been demonstrated in programs, such as the Inuit Health Survey, Healthy Foods North project and the Inuit Cohort, an education initiative to promote graduate education for Inuit. All of these initiatives are important as research methods are improved to
incorporate academic and community perspectives. The evaluation of the The Pan-Arctic Inuit Wellness TV Series project provides specific lessons to build a strong foundation of community-professional-academic partnership (Johnson et al., 2009). In addition, the Centre for Arctic Medicine, Thule Institute, University of Oulu, Finland (http://arctichealth.oulu.fi) has a program dedicated to circumpolar health (EoI no. 1045). It is delivered in close collaboration with the University of the Arctic (www.uarctic.org). The program offers both PhD and Master’s programs in the field of health and well being in the circumpolar regions. The International Master’s program started in autumn 2008 with 14 students from Canada, United Kingdom, Finland, Russia and Australia. Other partners involved in providing courses towards the degree program include, the Center for Health Education (Nuuk, Greenland), Luleå University of Technology (Luleå, Sweden), Northern Medical State University (Arkhangeslsk, Russia), Pomor State University (Arkhangelsk, Russia), NORUT Social Science Research Ltd (Tromso, Norway), University of Lapland (Rovaniemi, Finland), University of Manitoba (Winnipeg, Canada) and University of Southern Denmark, (Esbjerg, Denmark) as well as the Cross Border University of Barents area. The Centre for Arctic Medicine is collaborating with the University of Alaska Anchorage MPH program and others to off the first Summer Institute in Circumpolar Health Research in Copenhagen in May 2010 (http://sichr.circumpolarhealth.org).
Securing the Legacy of IPY 2007-2009 The aim of IPY activities was to harness the resources and intellect across the circumpolar regions and leave a legacy of data, observing sites, facilities and systems to support on-going polar research and monitoring, and to provide value to future generations. (Rapley et al., 2004). During IPY, it was evident that health research productivity increased and many collaborative research projects were started because of national interest and the availability of new funding programs dedicated to human health research. Other projects were possible because agencies and organizations redirected resources and in-kind support to ensure the success of this human health initiative. Through
s C I e n C e P r o g r a m 353
these activities networks grew, infrastructure was built, health research institutes were established, training opportunities were provided, data projects were initiated and mechanisms to improve knowledge dissemination were supported and developed. Unique features of health research included the engagement of community and end user stakeholders in the research process to optimize relevancy and uptake of findings. A number of networks, policies and best practices to enhance research impacts have been developed and leave elements of frameworks for best practices in circumpolar health research. The legacy for health research lies in the mechanisms and framework, which support the interconnectivity from polar communities to the international forums of decision-makers. It is through these initiatives from community-based networks, to SAON-coordinated projects, to Arctic Council advisories, circumpolar institutes and their affiliated networks of stakeholders and partners that value for future generations will be secured. On-going critical development of and support for these initiatives must be secured throughout the circumpolar regions. A broad informed base will ensure ongoing uptake and analysis of data to the highest standard as well as ensuring dissemination of findings so best practices may inform the development of government policies and clinical guidelines which influence health and well being. It is the networks and institutes, which support these connections, that will combine perspectives and knowledge bases required to address the complexities of the polar environments, the multifaceted nature of health determinants, and will ultimately inform solutions to promote health across the polar regions.
Acknowledgements
Centers for Disease Control and Prevention, Arctic Investigations Program, Anchorage, Alaska; The University of Alaska, Anchorage, U.S.A.; The University of Alaska, Fairbanks, U.S.A.; Alaska Pacific University, Anchorage, U.S.A.; The National Institutes of Health, International Relations, Fogarty International Center, Bethesda, U.S.A.; The National Institutes of Health, National Library of Medicine, Bethesda, U.S.A.; The U.S. State Department, Office of Oceans Affairs, Bureau of Oceans and International Environmental and Scientific Affairs, Washington DC., U.S.A.; University of Victoria, British Columbia, Canada; Environmental Health Surveillance Division, Health Canada, Ottawa, Ontario, Canada; Russian Association of Indigenous Peoples of the North (RAIPON), Moscow, Russian Federation; Gwitch’n Council International; Inuit Circumpolar Conference; Aleut International Association ; Northern Forum, Secretariat, Anchorage, U.S.A.; Department of Otolaryngology, Head and Neck Surgery Rigshospitalet University Hospital of Copenhagen, Denmark; Department of Public Health and General Medicine, University of Oulu, Finland; Center for International Health, University of Tromso, Norway; Office of the Medical Officer of Health, Nuuk, Greenland; National Public Health Laboratory, Oulu, Finland; Indian and Northern Affairs Canada; Government of Canada; Canadian IPY Secretariat; Health Canada; Government of the Northwest Territories; CIHR Team in Circumpolar Health; International Union for Circumpolar Health; International Network for Circumpolar Health Research; Alaska Native Tribal Health Consortium, Anchorage, Alaska, U.S.A.; Department of Medicine, Health Sciences Center, Manitoba, Canada; Department of Public Health Sciences, Faculty of Medicine University of Toronto, Canada; Department of Epidemiology Research, Statens Serum Institute, Copenhagen, Denmark; Institute of Developmental Physiology, Russian Academy of Education, Moscow Russian Federation; Institute for Circumpolar Health Research, Institute of Physiology SB RAMS, Novosibirsk, Russian Federation; Tromsø University, Institute of Community Medicine, Tromsø, Norway; Centre for Arctic Medicine, Thule Institute, Oulu, Finland; Inuit Tapariit Kanatami, Ottawa, Canada; Arctic Net.
I PY 20 07–20 0 8354
References
Allen, J., G.V. Mohatt, C.C. Fok, D. Henry and People Awakening team, 2009. Suicide Prevention as a community development process: Understanding circumpolar youth suicide prevention through community level outcomes. Int. J. Circumpolar Health, Special Issue; Occurrence and prevention of suicides in circumpolar areas, 68:274-291.
AMAP, Arctic Monitoring and Assessment Program Report. Arctic Pollution, 2009. Oslo, Norway, ISBN: 978-82-7971-050-9,p 37-64.
AMAP, Arctic Monitoring and Assessment Program Report. Arctic Pollution, 2002. Oslo, Norway, ISBN: 82-7971-015-9, p 77-96.
AMAP, Arctic Monitoring and Assessment Program Report. Arctic Pollution Issues, 1998. Oslo, Norway, p 775-837.
Berner, J. and C. Furgal, 2005. Human Health. In Impacts of a Warming Arctic: Arctic Climate Impact Assessment Scientific Report, C. Symon, L. Arris and B. Healt, (eds), p 863-906. Cambridge University Press: Cambridge (NY).
Bonefeld-Jorgensen, E., 2010. Dioxin-like activity in the blood of Greenlandic Inuit and Danish women: a pilot study. Int. J. Circumpolar Health, 69(2):109-212.
Borresen, M.L., O.R. Olsen, K. Ladefoged, B.J. McMa-hon, H. Krarup and A. Koch, 2010. Hepatitis D outbreak in a HBV hyper endemic settlement in Greenland. J. Viral Hepatitis, 17(3): 162-70.
Boysen. T., M. Mohammadi, M. Melbye, S. Hamilton-Dutoit, B. Vainer, A.V. Hansen, J. Wohlfahrt and J. Friborg, 2009. EBV-associated gastric carcinoma in high- and low-incidence areas for nasopharyngeal carcinoma. Br. J. Cancer, 101(3):530-3.
Bruce, M.G., S.L. Deeks, T. Zulz, D. Bruden, C. Navarro, M. Lovegren, L. Jette, K. Kristinsson, G. Sigmundsdottir, K.B. Jensen, O. Lovoll, J.P. Nuorti, E. Herva, A. Nystedt, A. Sjostedt, A. Koch, T.W. Hennessey and A.J. Parkinson, 2008. International Circumpolar Surveillance for invasive pneumococcal disease, 1999-2005. Emerg. Infect. Dis. J., 14(1): 25-33.
CACHAR, 2009. Canadian Arctic Contaminants and Health Assessment Report. Indian and Northern Affairs, Canada.
Chan, L., 2009. Northern Contaminants Program Synopsis of Research Report 2008-09. Assessment of contaminants and dietary nutrient interactions in the Inuit Health Survey Nunavut, Nunatsiavut, Inuvialuit. Indian and Northern Affairs, Canada.
Chatwood, S. and K. Young, 2010. A new approach to health research in Canada. Canadian J. Public Health, 101(1):25-27.
Dewailly, E., 2009. Northern Contaminants Program Synopsis of Research Report 2008-09. Contaminant exposure and emergence of cardiovascular diseases in the Inuit. Indian and Northern Affairs, Canada.
Egeland, G., 2009. Northern Contaminants Program Synopsis of Research Report 2008-09. Indian and Northern Affairs, Canada. Nunatsiavut Inuit Health Survey: “Kanuivit?”
Egeland G. and the Inuvialuit Steering Committee, 2010. Inuit Health Survey 2007–2008. Inuvialuit Settlement Region.
Egeland, G., A. Pacey, C. Zirong and I. Sobol, 2010. Food insecurity among Inuit preschoolers: Nunavut Inuit Child Health Survey, 2007–2008 Can. Med. Assoc. J., February 23, 2010, 182(3) 243-248.
Friborg, J., A. Koch, P. Garred, J. Freeland, A. Andersen and M. Melbye, 2009. Mannose-binding lectin genotypes and susceptibility to Epstein-Barr virus infection in infancy. Clinical and Vaccine Immunology, 2009.
Galloway, T., T.K. Young and G. Egeland, 2010. Emerging obesity among preschool-aged Canadian Inuit children. Int. J. of Circumpolar Health, 69(2).
Gauthier, M., M. Simard and B. Blais, 2010. Prevalence of Escherichia coli O157:H7 and Salmonella in traditional meats derived from game animals in Nunavik. Rural and Remote Health, 10(2): 1329.
Gesink, D., E. Rink, R. Montgomery-Anderson, G. Mulvad and A. Koch, 2010. Developing a culturally competent and socially relevant sexual health survey with an urban Arctic community. Int. J. Circumpolar Health, 69(1):25-37.
Gesink-Law, D., E. Rink, G. Mulvad and A. Koch, 2008. Sexual health and sexually transmitted infections in the North American Arctic. Emerg. Infect. Diseases, 14(1):4-9.
s C I e n C e P r o g r a m 355
Hamilton, L., P. Bjerregaard and B. Poppel, 2009. Health and Population. In Arctic Social Indicators – A follow-up to the Arctic Human Development Report, J. Nymand Larsen, P. Schweitzer and G. Fondahl, (eds.), www.svs.is/ASI/Report%20C h a p t e r s / N o v e m b e r % 2 0 2 0 0 9 /A S I % 2 0 _pr%C3%B3f%C3%B6rk_1-80.pdf.
Hanne, K.P., 2009. The Arctic: A Model for Science Cooperation in Northern Exposure: Peoples, Powers and Prospects in Canada’s North, Institute for Research on Public Policy.
Hansen, J.C., B. Deuche and J.O. Odland, 2008. Dietary Transitions and Contaminants in the Arctic: emphasis on Greenland. Oulu: Circumpolar Health Supplements, (2).
Harvald, B., 1986. The International Collaboration on Circumpolar Health. Arctic Med. Res., 42-48.
ICCH14, 2010. Proceedings of the 14th International Congress on Circumpolar Health, Circumpolar Health Supplements, (7).
ICCH13, 2007. Proceedings of the 13th International Congress on Circumpolar Health. Alaska Medicine. Supplement, 42(2).
Igl, W., A. Johansson, G. Zaboli, A. Ameur, I. Jonasson and U. Gyllensten, 2010. Northern Sweden Population Health Study (NSPHS). Rural and Remote Health, 10(2): 1363.
Johnson, R., R. Morales and D. Leavitt, 2009. Final Evaluation Report: Pan Arctic Inuit Wellness TV Series. For Inuit Tuttarvingat of the National Aboriginal Health Association (NAHO). Anchorage, AK.
Kozlov, A., G. Vershubsky and M. Kozlova, 2007. Indigenous Peoples of Northern Russia: Anthropology and Health. Oulu: Circumpolar Health Supplements (1).
Kruse J., B. Poppel, L. Abryutina, G. Duhaime, S. Martin, M. Poppel, M. Kruse, E.Ward, P. Cochran and V. Hanna, 2008. Survey of living conditions in the Arctic (SliCA). In Barometers of Quality of Life Around the Globe How are We Doing?, V. Møller, D. Huschka and A.C. Michalos, (eds), www.springerlink.com/content/978-1-4020-8685-4.
Laubjerg, M. and B. Petersson, 2010. Greenlandic adoptees’ psychiatric inpatient contact. A
comparative register-based study. Scandinavian Journal of Public Health, 38:64–70.
Levintova, M., W.I. Zapol and E. Engmann, 2010. Behavioral and Mental Health Research in the Arctic: Strategy Setting Meeting. Oulu: Circumpolar Health Supplements, (5).
Lohse, N., K. Ladefoged and N. Obel, 2008. Implementation and effectiveness of antiretroviral therapy in Greenland. Emerg. Infect. Dis. J., 14(1):56-9.
Madsen, R.G., K. Ladefoged, J.J. Kjærgaard, P.S. Andersen and C. Clemmesen, 2009. Endocarditis in Greenland with special reference to endocarditis caused by Streptococcus pneumoniae. Inter. J. of Circumpolar Health, 68(4):347-53.
Madsen, T.V., N. Lohse, E.S. Jensen, N. Obel, K. Ladefoged, J. Gerstoft, A.B. Petersen, C. Nielsen and L.B. Jørgensen, 2008. Short communication: high prevalence of drug-resistant human immunodeficiency virus type 1 in treatment-naive patients in Greenland. AIDS Res. Hum. Retroviruses, 24:1073-7.
Meyer, A., K. Ladefoged, P. Poulsen and A. Koch, 2008. Population based survey of invasive bacterial diseases in Greenland 1995-2004. Emerg. Infect. Dis., 8(14):76-79.
Milan, F.A. 1968. The International Study of the Eskimos. J. Arctic Institute of North America, 21(3):23-26.
Mohatt, G.V., J. Klejka, B.B. Boyer, B.R. Luick, C. Lardon, R. Plaetke, C. Wolsko, S.E. Hopkins, M. Dondanville, J. Herron, E. Ruppert, A. Bersamin, E.M. Orr and the CANHR Research Team, 2007. The Center for Alaska Native Health Research Study: A community-based participatory research study of obesity and chronic disease-related protective and risk factors. Inter. J. of Circumpolar Health, 66(1):8-18.
Muckle G., 2009. Northern Contaminants Program Synopsis of Research Report 2008-09. Nunavik cohort study on exposureto environmental contaminants and child development. Indian and Northern Affairs, Canada.
Nielsen, N., T. Skifte, M. Andersson, J. Wohlfahrt, B. Søborg, A. Koch, M. Melbye and K. Ladefoged, 2010. Both high and low levels of serum vitamin
I PY 20 07–20 0 8356
D are associated with tuberculosis: A case-control study in Greenland. Br. J. Nutrition 104(10: 1487-91.
Parkinson, A.J., 2010a. Improving Human Health in the Arctic: The Expanding Role of the Arctic Council’s Sustainable Development Working Group. Int. J. Circumpolar Health, 69(3): 304-13.
Parkinson, A.J., 2010b. The Arctic Human Health Initiative. Oulu: Circumpolar Health Supplements, (6). www.ijch.fi/CHS/CHS_2010(6).pdf
Parkinson A.J., 2010c. Sustainable Development, Climate Change and Human Health in the Arctic. Int. J. Circumpolar Health, 69(1):99-105.
Parkinson, A.J., 2008. The International Polar Year: An opportunity to focus on Infectious diseases in Arctic regions. Emerg. Infect. Dis. J., 14(1):1-3.
Parkinson, A.J. and J. Berner, 2009. Climate Change and Impact on Human Health in the Arctic: An International Workshop on Emerging Threats and the Response of Arctic Communities to Climate Change in the Arctic. Int. J. Circumpolar Health, 68(1):88-95.
Parkinson, A.J., M.G. Bruce and T. Zulz, 2008. International Circumpolar Surveillance, an Arctic network for surveillance of infectious diseases. Emerg. Infect. Dis. J., 14(1):18-24.
Poppel, B. and J Kruse, in press. The importance of a mixed cash- and harvest herding based economy to living in the Arctic – an analysis based on Survey of Living Conditions in the Arctic (SLiCA). In Quality of Life in the New Millenium: Advances in Quality-of-Life Studies, Theory and Research, V. Møller and D. Huscka, (eds), Social Indicators Research Series. Springer Verlag.
Poppel, B., J. Kruse, G. Duhaime and L. Abryutina, 2007. SLiCA Results. Anchorage: Institute of Social and Economic Research, University of Alaska Anchorage.www.arcticlivingconditions.org).
Rapley, C. et al., 2004. A Framework for the International Polar Year 2007–2008. Produced by the ICSU IPY 2007–2008 Planning Group. Paris: ICSU. www.icsu.org/Gestion/img/ICSU_DOC_DOWNLOAD/562_DD_FILE_IPY_web_version.pdf.
Revich. B., 2010. Climate warming and health effects of extreme temperature episodes in Yakutsk East Siberia. Rural and Remote Health 10(2): 1338.
Revich, B., 2008. Climate Change alters human health in Russia. Studies on Russian Economic Development,
19(3):311-317.Rink, E., D. Gesink-Law, R. Montgomery-Andersen,
G. Mulvad and A. Koch, 2009. The practical application of community based participatory research in Greenland: Initial experiences of the Greenland sexual health study. Int. J. Circumpolar Health, 68(4):405-413.
Sakamoto, T., Y. Tanaka, J. Simonetti , C. Osiowy, M.L. Borresen, A. Koch, F. Kubanov, M. Sugiyama, G.Y. Minuk, B.J. McMahon and M. Mizokami, 2007. Classification of hepatitis B virus genotype B into two major forms based on characterization of a novel subgenotype in the Arctic indigenous populations. J. Infect. Dis., 196:1487-92.
Søborg, B., A. Koch, V.O. Thomsen, K. Ladefoged, M. Andersson, J. Wohlfahrt, M. Melbye and A.B. Andersen, 2010. Ongoing tuberculosis transmission among children in Greenland. Thorax, 36(4): 878-84
Søborg, B., M. Ruhwald, M.L. Hetland, S. Jacobsen, A.B. Andersen, N. Milman, V.O. Thomsen, D.V. Jensen, A. Koch, J. Wohlfahrt and P. Ravn, 2009. Comparison of Screening Procedures for M.tuberculosis Infection among Patients with Inflammatory Diseases. Journal of Rheumatology, 36:9; doi:10.3899/jrheum.081292.
WHO, 1963. Conference on Medicine and Public Health in the Arctic and Antarctic. Wld. Hlth. Org. Tech. Rep. Ser., 253. World Health Organization: Geneva.
Young, T.K., 2008. Circumpolar Health Indicators: Sources, Data, Maps. Oulu. Circumpolar Health Supplements, (3) www.ijch.fi/CHS/CHS%202008(3).pdf.
Young, K.T. and P. Bjerregaard, 2008. Health Transitions in Arctic Populations. University of Toronto Press: Toronto.
Young, O.R. and N. Einarsson, 2004. A Human Development Agenda for the Arctic: Major Findings and Emerging Issues. LA, Young OR editors. In The Arctic Human Development Report, p 229-242. Young OR editors, Steffansson Arctic Institute: Akureyi, Iceland.
Zultz, T., M.G. Bruce and A.J. Parkinson, 2009. Interna-tional Circumpolar Surveillance: Prevention and Control of Infectious Diseases: 1999-2008. Oulu: Circumpolar Health Supplements, (4).