stylet penetration of cacopsylla pyri; an electrical penetration graph (epg) study
TRANSCRIPT

Journal of Insect Physiology 57 (2011) 1407–1419
Contents lists available at ScienceDirect
Journal of Insect Physiology
journal homepage: www.elsevier .com/ locate/ j insphys
Stylet penetration of Cacopsylla pyri; an electrical penetration graph (EPG) study
Stefano Civolani a,⇑, Marilena Leis a, Gilberto Grandi a, Elisa Garzo b, Edison Pasqualini c, Stefano Musacchi d,Milvia Chicca a, Giuseppe Castaldelli a, Remigio Rossi a, W. Freddy Tjallingii e
a Department of Biology and Evolution, University of Ferrara, via L. Borsari 46, 44100 Ferrara, Italyb Instituto de Ciencias Agrarias, Centro de Ciencias Medioambientales, CSIC Serrano 115bis, 28006 Madrid, Spainc Department of Agroenvironmental Sciences and Technologies, University of Bologna, via G. Fanin 44, 40127 Bologna, Italyd Department of Fruit Tree and Woody Plant Science, University of Bologna, via G. Fanin 46, 40127 Bologna, Italye Laboratory of Entomology – Wageningen University/EPG Systems, Droevendaalsesteeg 1, 6708 PB Wageningen, The Netherlands
a r t i c l e i n f o
Article history:Received 11 March 2011Received in revised form 8 July 2011Accepted 12 July 2011Available online 23 July 2011
Keywords:Insect–plant interactionsPear psyllaSternorrhynchaPyrus communisStylet penetration
0022-1910/$ - see front matter � 2011 Elsevier Ltd. Adoi:10.1016/j.jinsphys.2011.07.008
⇑ Corresponding author. Tel.: +39 532 455956; fax:E-mail address: [email protected] (S. Civola
a b s t r a c t
Detailed information on plant penetration activities by pear psylla Cacopsylla pyri L. (Hemiptera Psyllidae)is essential to study phytoplasma transmission of ‘‘Candidatus Phytoplasma pyri’’ responsible of peardecline disease (PD) and to trace and evaluate resistant traits in new pear tree selections for advancedbreeding programs. The electrical penetration graph technique or (full) EPG may relevantly contributeto this knowledge. C. pyri EPG waveforms were characterized on basis of amplitude, frequency, voltagelevel, and electrical origin. Additionally, stylet tracks and the putative location of stylet tips in the planttissue were histologically related to EPG waveforms by light and transmission electron microscopy obser-vations after stylectomy. More than one waveform occurred in the same tissue: PA, PB, PC1 and PC2 wereall detected in the mesophyll, and PE1 and PE2 were both recorded in the phloem. Waveform PE1 wasalways preceded by transient waveform PD, as previously described in other psyllids. Interestingly, nobrief intracellular punctures (potential drop waveforms) were observed during plant penetration, oppo-site of what is usually recorded in aphids and other Sternorrhyncha.
� 2011 Elsevier Ltd. All rights reserved.
1. Introduction
European pear psylla Cacopsylla pyri L. (Hemiptera Psyllidae) isone of the most important new pests of pear, Pyrus communis L., inItaly and Europe. C. pyri damages include necrosis of leaf and fruittissues as well as honeydew excretion causing sooty mould, whichreduces the market value of pears. In addition, C. pyri is a vector of‘‘Candidatus Phytoplasma pyri’’ (Seemüller and Schneider, 2004)responsible for pear decline (PD) disease that reduces tree vigorand sometimes causes tree death. This phytoplasma belongs tothe apple proliferation group that includes several important fruittree phytoplasmas, such as apple proliferation (AP) disease andEuropean stone fruit yellows (ESFY) in temperate European regions(Seemüller et al., 1998). Here C. pyri and C. pyricola Förster havebeen reported as vectors of PD on pear (Davis et al., 1992; Carraroet al., 2001; Garcia-Chapa et al., 2005), while C. melanoneura (För-ster) and C. picta (Förster) are the vectors of ‘‘Candidatus Phytoplas-ma mali’’ responsible for AP (Jarausch et al., 2007; Tedeschi andAlma, 2007). C. pruni (Scopoli) is a vector of ‘‘Candidatus Phytoplas-ma prunorum’’ inducing ESFY on Prunus (Fialová et al., 2007;Sauvion et al., 2007).
ll rights reserved.
+39 532 249761.ni).
The success and efficiency of phytoplasma transmission de-pends on phytoplasma–plant–vector relationships. In trees, thephytoplasmas are localized at low concentrations inside functionalphloem elements. In pear, the colonization by PD phytoplasma fol-lows a seasonal pattern: the phytoplasma disappears from theaboveground parts during winter, with complete inactivation ofsieve tubes, and survives in roots from where they re-colonizetrunk and branches the following spring (Schaper and Seemüller,1982; Seemüller et al., 1984; Errea et al., 2002).
Phytoplasmas are transmitted in a persistent-propagative man-ner. They are ingested by the vectors during feeding from infectedplants and they need to replicate in the vector for transmission.After crossing the midgut epithelium, they replicate in the insecthemolymph and reach the salivary glands, from where they are ex-pelled during feeding in the phloem tissue of another plant: thecomplete cycle requires 15–30 days (Tedeschi and Alma, 2007).
A good knowledge of insect–plant interactions is necessary totrace and evaluate resistant traits for tree selection in plant breedingprograms. Also, detailed information on stylet penetration activitiesare essential to study phytoplasma transmission, as shown for virustransmission by aphids (Prado and Tjallingii, 1994; Martin et al.,1997) and leafhoppers (Stafford and Walker, 2009).
Regardless of the role of external olfactory and gustatory stimulibefore and during early insect–plant contacts, it is likely that

Fig. 1. Compressed view of all EPG waveforms by Cacopsylla pyri in EPG signals. X axis, 2 h in total; Y axis, output voltage (volt) from the EPG amplifier, arbitrary scale (exceptfor 0 V). The scale is arbitrary because it depends on the insect/input resistance ratio, the applied plant voltage, and the gain.
1408 S. Civolani et al. / Journal of Insect Physiology 57 (2011) 1407–1419
internal plant chemicals play a crucial role in reaching xylem,phloem or other tissues during ingestion by the pest, and thereforein the transmission of phytoplasmas and other pathogens. Manyaphids rarely discriminate between host and non-host plantsbefore stylet penetration. Although in C. pyricola plant stimuli per-ceived before stylet penetration may be important in host discrim-ination (Ullman and McLean, 1986, 1988a,b; Horton and Krysian,1991), the general hemipteran anatomy suggests the many precib-arial gustatory chemoreceptors are stimulated during plant sapingestion. Further studies are required to describe in detail thesechemoreceptors in psyllids and to identify their role and that ofcontact chemoreceptors on the labium and tarsi.
In host plant selection behavior by psyllids, the probing phase isprobably the most relevant to understand the mechanisms of hostchoice: however, data are still scarce and plant cues involved inhost acceptance have not yet been determined (Horton andKrysian, 1991).
Probing stylet penetration behavior by piercing–sucking in-sects has been studied by electronic monitoring, first introducedby McLean and Kinsey (1964) and later improved by Tjallingii(1978, 1985a,b; 1988, 2006) using modified electronic circuitry.The signal, called the electrical penetration graph (EPG) reflectsstylet tip positions in plant tissues as well as insect activities suchas stylet penetration, salivation and ingestion. The signal withvoltages from electrical resistance (R) fluctuations only is indi-cated as the R-EPG, whereas the signal with voltages from both,R and electromotive force (emf) fluctuations are called ‘‘full-EPG’’, from now on referred as (full) EPG or simply EPG (Tjallingii,2000; Tjallingii et al., 2010). In C. pyricola, early studies by R-EPGand light microscope (LM) images concerned relations betweenprobing sites and salivary sheaths (Ullman and McLean1988a,b). However, the sub-optimal R-EPG and low resolutionLM provided ambiguous results and speculative correlations.Although some general conclusions were correct, the evidenceprovided was insufficient to show salivation and ingestion fromcells or tissues by the pear psyllid. In other hemipterans, inges-tion from plant cells or tissues could only be shown by EPG asso-ciated with transmission electron microscopy (TEM) (Spiller et al.,1985; Kimmins, 1986; Tjallingii and Hogen Esch, 1993; Lett et al.,2001), as well as by results from honeydew clocks and virustransmission experiments (Prado and Tjallingii, 1994; Martinet al., 1997). Recently, EPGs were reported from a different psyllidspecies, the Asian citrus psyllid, Diaphorina citri Kuwayama(Bonani et al., 2010). Although the (full) EPG method used wassuitable, the main waveforms were correlated only with LMimages of salivary sheath termini in plant tissues: therefore thewaveforms were interpreted according to their similarity withthose of other Sternorrhyncha (aphids and whiteflies). However,a clear improvement over waveform was that correlations werebased on evidence from the acquisition of phloem-restricted bac-teria during the occurrence of specific waveforms (Bonani et al.,2010).
Our aim was to investigate plant penetration and feedingbehavior of C. pyri in detail, by describing these activities in termsof better correlated (full) EPG waveforms. Stylectomy during wave-forms was followed by LM and TEM, to correlate EPG waveformswith tip positions. These data could be useful for future studieson localization of tissue resistance in different pear genotypes.
2. Materials and methods
2.1. Insects and plants
Nymphs and adult winter and summer forms of C. pyri were col-lected in a commercial pear orchard in Emilia-Romagna (NorthernItaly). Insects were kept on small potted pear trees, cultivar Bartlett(William) in a climate room at 23 �C and 16L:8D photoperiod. Aftertwo weeks, experiments were carried out on young potted trees ofthe same cultivar Bartlett (William), which is susceptible to C. pyri.
2.2. Electrical penetration graph (EPG) recording
Stylet penetration was recorded using a 4-channel version DCEPG system (type Giga-4, Wageningen University, The Nether-lands) developed by Tjallingii (1988, 2000). Before recording, adultpsyllids (actively flying and jumping) were chilled in a glass tube ina freezer for 1–2 min, with no important effects on their subse-quent behavior. For wiring, the insects were handled by a vacuumneedle under a stereomicroscope, and a gold wire electrode (length2 cm; diameter 20 lm) was glued to the dorsal mesothorax, be-tween the wings, with silver glue (Pelco Colloidal Silver Liquid,Ted Pella Inc. Redding, California). Nymphs were not chilled but di-rectly applied to the vacuum needle by a small brush. Each insectwas connected to one of the primary amplifier inputs (1 GX inputresistance) before access to a pear leaf. The plant, the insects andthe amplifiers were placed inside a Faraday cage shielding the set-up from external noise sources. Temperature during all experi-ments was 20–22 �C.
To store EPG signals onto the computer hard disk, an A/D con-verter board (KPCI-3102, Keithley Instruments, Cleveland, Ohio,USA) was used at 100 Hz and, mediated by PROBE 3.0 software(Wageningen University). Recordings lasted eight hours. Signalanalysis used the same software. To characterize and discriminatewaveforms, signals from 22 adult winter forms, 14 adult summerforms and 27 nymphs were analyzed. The measurement criteriawere similar to waveform characterizations used in aphid EPGs(Tjallingii, 1988): (1) the relative amplitude, i.e. minimum to max-imum voltage deflection in proportion to the waveform with max-imum amplitude, (2) the frequency or repetition rate (3) thevoltage level and (4) the main electrical origin, either resistance(R) or electromotive force (emf). To estimate the main frequencyin regular waveforms the fast Fourier transform (FFT) tool ofPROBE 3.0 was used, providing an auto power spectrum of a givensample. The main electrical origin of each waveform could be de-

Table 1Summary of main characteristics and correlations of C. pyri EPG waveforms, compared to those of other sucking insects.
EPGwaveform
Characteristics Correlation waveform Occurrence in other insect
Relativeamplitude (%)
Frequency(Hz)
Voltagelevela
Main electricoriginb�
Tissue location ofstylet tips
Evidence Activity Insect Label Reference
Np – – Non probing + All sucking insectsPseudo
waveform– – Surface + Walking and external
salivationNot described but common in mostother insects
PA 100 Variable E R/emf Start penetration (+) Sheath salivation and styletpenetration
Very similar to aphids A Tjallingii, 1988
PB 100 0.1–0.3 E R/emf Start penetration (+) Sheath salivation and styletpenetration
Very similar to aphids B Tjallingii, 1988
PC1 20 13 E emf Parenchyma (+) Sheath salivation Diaphorina citriCirculifer tenellusNilaparvata lugens
CCN2
Bonani et al., 2010Stafford andWalker, 2009Seo et al., 2009
PC2 5 Variable E emf Vascular parenchyma (+) Unknown No other insectsPD ?? Variable E emf Sieve element – Transition to PE1 Diaphorina citri D Bonani et al., 2010PE1 5 4–8 I emf Sieve element (+) Phloem salivation Diaphorina citri
Circulifer tenellusE1D2
Bonani et al., 2010Stafford andWalker, 2009
PE2 5 4–8 I emf Sieve element (+) Phloem ingestion Diaphorina citriCirculifer tenellusNilaparvata lugens
E2D3N4-b
Bonani et al., 2010Stafford andWalker, 2009Seo et al., 2009
PG 50–75 5–71.4–2
E R Xylem vesselPericyclic fiber
+(�) Xylem active ingestion Diaphorina citriAll aphidsCicadulina mbilaCirculifer tenellusHomalodisca spp.Bucephalogonia xanthophisNilaparvata lugens
GG2CCXcN5
Bonani et al., 2010Spiller et al., 1990Lett et al., 2001Stafford andWalker, 2009Dugravot et al.,2008Miranda et al., 2009Seo et al., 2009
a E = extracellular; I = intracellular.b emf = electromotive force; R = resistance.
S.Civolaniet
al./Journalof
InsectPhysiology
57(2011)
1407–1419
1409

Fig. 2. Details of C. pyri waveforms, with amplitude in volt (v) and time in seconds (s). (a) Waveform PA and PB, after non probing (Np); (b) waveform PB, phase 1 and 2; (c)waveform PC1; (d) waveform PC2; (e) waveform PD in PC1-PD-PE1 sequence; (f) waveform PE1; (g) waveform PE2, showing a voltage drop (arrow); (h) waveform PG.
Fig. 3. Details of C. pyri waveforms PC1 and PC1–PC2 overlap (top), and PC2 and transition of PC2 to PC1 (bottom).
1410 S. Civolani et al. / Journal of Insect Physiology 57 (2011) 1407–1419
rived by changing the plant voltage during recording, achieving anegative, positive, or zero voltage output of the EPG signal, as de-scribed for aphids (Tjallingii, 2000).
After waveform characterization, waveform sequences werepresented in diagrams for each C. pyri form studied (see Bonaniet al., 2010). Considering the psyllid waveform labels used by

S. Civolani et al. / Journal of Insect Physiology 57 (2011) 1407–1419 1411
Bonani et al. (2010), we decided to add a ‘‘P’’ (for Psyllid) to alllabels, similar to the ‘‘N’’ proposed by Seo et al. (2009) for Nilaparv-ata lugens (Stål), because the similarity of psyllid waveforms tothose of aphids does not necessarily imply similar correlations.
2.3. Full and R-EPG recording
A recently developed bimodal EPG system (Kindt et al., 2006;Tjallingii et al., 2010) allowed simultaneous recording of the R-EPG and the (full) EPG. This system is an optimized version ofthe original (amplitude modulation based) McLean and Kinsey(1964) monitor, sensitive only to R-components. With bimodalEPG system the two signals (of adults only) could be comparedand the (main) electrical origin of each waveform could be derived.
2.4. Stylectomy and microscopy
During recording of PC1, PC2, PG and PE1–PE2 waveforms,probing was terminated by stylectomy (Unwin, 1978), i.e. styletamputation by an RF microcautery device (‘Zapper’, M. Thorpe, Up-ton NY). About 0.25 cm2 of the leaf tissue containing the styletstump was dissected and processed for TEM. The tissue was fixedfor 2 h at 4 �C in 2% glutaraldehyde solution, buffered at pH 7.2with 0.1 M sodium cacodylate. The specimens were rinsed andkept for 12–15 h in 0.1 M cacodylate buffer containing 5% sucroseand 0.05% CaCl2 and then postfixed for 2 h at 4 �C in 1% osmiumtetroxide solution in the same cacodylate buffer. They were dehy-drated in a graded series of ethanol, briefly transferred throughpropylene oxide and embedded in Epon–Araldite mixture.
Final embedding and polymerization occurred in polyethylenecontainers at 60 �C for 2 days. Semi-thin sections (1 lm) of eachsample were prepared using an ultramicrotome (Ultracut-E, Reic-hert-Jung, Austria). Semi-thin sections were stained with AzureA-methylene blue mixture and observed by a light microscope(Eclipse E200, Nikon, Japan) to identify the salivary sheath. Onceidentified the salivary sheath, ultrathin sections of the sample wereprepared (70–80 nm) and mounted on grids. The ultrathin sections
Fig. 4. Details of C. pyri waveforms, with amplitude in volt (v) and time in seconds (
were contrasted with saturated uranyl acetate followed by lead cit-rate solution (Reynolds, 1963) and examined by a transmissionelectron microscope (TEM) (H 800, Hitachi, Japan). For each samplethe procedure was repeated until the stylet tips and/or the end ofthe salivary sheath was identified.
3. Results
3.1. pyri EPG waveform characterization
On pear plants, adult winter and summer forms, and nymphs ofC. pyri produced (in different occurrence and duration) eight dis-tinct EPG waveforms (Fig. 1, Table 1), labeled PA–PG (Psyllid wave-form A–G) in accordance to their general order of appearanceduring recordings.
After plant access, C. pyri first showed a period of base line ornon-probing (Np), maintained for up to about 10 min during whichonly small and short signals frequently occurred (Figs. 1 and 2a).The signals were probably caused by electrical contacts of tarsalclaws scratching on the leaf surface, and have no reproducibleamplitude and frequency. The subsequent real EPG waveformscan then be described as follows.
3.1.1. Waveform PAStart of penetration is mostly dominated by a series of high
amplitude peaks between the 0 V level and the highest value ofall other waveforms in the recordings (Fig. 2a). This high amplitudeis defined as 100% on the relative amplitude scale (Table 1). How-ever, sometimes the initial PA amplitude is smaller than the nextamplitude of waveform PB (see Fig. 6b, lowest trace). Since wave-form PA is the first appearing waveform, it represents the first elec-trical contact between the insect mouthparts and the plant tissue,and is similar to EPGs of other homopterans. PA generally lasts forabout 10 s and is followed by the second waveform, PB, sometimesafter a typical drop of the signal voltage.
s): PE1 (top), PE1–PE2 superimposed (middle), PE2 with voltage drop (bottom).

Tabl
e2
Dat
aof
C.py
riEP
Gw
avef
orm
sof
duri
ngan
8-ho
urac
cess
peri
odto
Pyru
sco
mm
unis
:pe
rcen
tage
ofin
sect
spr
oduc
ing
the
wav
efor
m,a
vera
ge±
SEnu
mbe
rof
wav
efor
mev
ents
,wav
efor
mdu
rati
onpe
rin
sect
(min
),du
rati
onof
each
wav
efor
mev
ent
(min
).V
alue
rang
esar
ein
dica
ted
wit
hin
brac
kets
.
EPG
wav
efor
mA
dult
s–
win
ter
form
(N=
22)
Adu
lts
–su
mm
erfo
rm(N
=14
)N
ymph
s(N
=27
)
%of
inse
cts
Mea
nn
um
ber
ofw
avef
orm
even
ts
Mea
nw
avef
orm
dura
tion
per
inse
ct
Mea
ndu
rati
onof
each
wav
efor
mev
ent
%of
inse
cts
Mea
nn
um
ber
ofw
avef
orm
even
ts
Mea
nw
avef
orm
dura
tion
per
inse
ct
Mea
ndu
rati
onof
each
wav
efor
mev
ent
%of
inse
cts
Mea
nn
um
ber
ofw
avef
orm
even
ts
Mea
nw
avef
orm
dura
tion
per
inse
ct
Mea
ndu
rati
onof
each
wav
efor
mev
ent
Np
100
11.2
±1.
7(3
–39)
146.
1±
22.2
(7.7
–339
.4)
19.7
±4.
6(1
.7–8
4.9)
100
15.4
±3.
4(1
–41)
186.
1±
23.9
(7.9
–309
.8)
17.4
±3.
8(5
.4–4
8.6)
100
7.7
±1.
1(2
–20)
177.
6±
26.2
(5.4
–477
.9)
41.8
±11
.9(1
.8–2
38.9
)PC
110
014
.6±
2.1
(3–4
1)13
1.1
±16
.1(2
1.9–
351.
7)10
.6±
1.4
(4.0
–36.
7)10
021
.8±
2.9
(7–4
6)12
7.7
±9.
2(3
7.1–
270.
1)6.
1±
0.8
(2.6
–15.
0)10
011
.8±
1.3
(1–2
3)15
0.2
±16
.9(2
.1–3
29.7
)14
.2±
1.9
(2.1
–49.
5)PC
277
4.8
±1.
3(0
–26)
81.9
±17
.5(1
.8–2
50.9
)14
.4±
2.3
(1.9
–32.
7)64
1.8
±0.
6(0
–7)
13.8
±6.
9(1
.5–6
6.1)
3.9
±0.
9(1
.5–9
.4)
180.
2±
0.1
(0–1
)14
.2±
7.4
(1.2
–42.
5)14
.2±
7.4
(1.2
–42.
5)PD
451.
5±
0.5
(0–8
)5.
0±
3.9
(0.3
–40.
4)0.
9±
0.6
(0.1
–6.7
)93
6.2
±1.
4(0
–15)
1.5
±0.
3(0
.1–3
.7)
0.3
±0.
0(0
.1–0
.7)
854.
3±
0.8
(0–1
8)1.
6±
0.3
(0.2
–5.3
)0.
3±
0.0
(0.2
–0.5
)PE
145
1.5
±0.
4(0
–7)
10.4
±3.
3(1
.6–3
2.7)
3.4
±0.
8(0
.7–8
.4)
936.
3±
1.5
(0–1
5)46
.4±
15.1
(0.7
–197
.2)
5.3
±1.
0(0
.7–1
4.1)
854.
2±
0.8
(0–1
8)16
.0±
3.0
(1.2
–53.
6)4.
1±
0.8
(0.6
–13.
0)PE
232
0.6
±0.
2(0
–4)
23.1
±16
.7(0
.2–1
23.1
)20
.4±
17.1
(0.2
–123
.0)
781.
9±
0.5
(0–7
)87
.0±
33.7
(3.8
–336
.9)
49.0
±29
.2(3
.8–3
36.4
)70
1.4
±0.
4(0
–8)
157.
3±
26.2
(2.5
–390
.2)
116.
1±
24.0
(2.5
–390
.2)
PG95
2.45
±0.
3(0
–6)
130.
9±
20.5
(29.
1–33
2.4)
49.3
±4.
4(1
4.5–
83.1
)57
1.0
±0.
3(0
–3)
77.4
±26
.6(8
.0–2
09.2
)38
.6±
10.2
(4.0
–89.
1)48
0.8
±0.
2(0
–4)
49.4
±7.
4(1
.6–9
6.8)
36.3
±5.
5(1
.6–6
9.8)
1412 S. Civolani et al. / Journal of Insect Physiology 57 (2011) 1407–1419
3.1.2. Waveform PBWaveform PB also shows high amplitude, up to 100% but
decreasing over time. Waveform PB consists of two phases: thefirst one is a series of slow high PB waves, immediately followingwaveform PA. The second phase is characterized by a high fre-quency of about 12 Hz and a duration of a few seconds, untilthe next high PB wave. In the second phase a series of high PBwaves appear at a frequency of about 0.1–0.3 Hz, repeated every5–10 s (Fig. 2b).
3.1.3. Waveform PC (2 waveforms: PC1 and PC2)Waveform PC1 is similar to the second PB phase, starting dur-
ing the PB intervals and later continued without the high PB waveinterruptions. In C. pyri, waveform PC1 lasted longer than anyother waveform we observed. PC1 has a high frequency of about10–15 Hz and its relative amplitude is only about 20% of PA orPB (Fig. 2c). The R component in the PC1 signal is small, as shownby the unchanged amplitude at the 0 V adjustment trace inFig. 5b, as well as from the R-EPG trace of the dual mode amplifier(Fig. 6c, upper trace). Consequently, the emf component predom-inates in C. pyri waveform PC (Figs. 2, 3, and 6c, lower trace).Waveform PC1 is followed by waveforms PC2 or PG (rarely PD)in the adult winter forms. In the adult summer forms and innymphs PC1 is followed by a sequence PD-PE1 or PD-PE1–PE2and rarely by PG or PC2 (Fig. 10). Occasionally, waveform PC1 isshown with a reduced frequency of about 5 Hz, but then it is un-clear whether it belongs to PC1, PC2, or represents an overlap ofthe two waveforms (Fig. 3). The data concerning the mean wave-form duration per insect of waveform PC1 (including brief periodsof waveform PA and PB) are reported in Table 2.
Waveform PC2 always showed positive or negative sawtooth-like spikes, some of which ‘‘crested’’ (i.e. with fast repeatedspikes) and appearing at irregular intervals (Fig. 2d), so that noclear repetition rate could be established. The waveform ampli-tude was similar to PC1. Waveform PC2 followed either waveformPC1 (Fig. 3) or PG and was common in the adult winter forms, lessfrequent in summer forms and rare in nymphs (Fig. 10). The dataconcerning the mean waveform duration per insect of PC2 are re-ported in Table 2.
3.1.4. Waveform PDWaveform PD is a brief (about 20 sec) transition phase be-
tween PC1 and PE1/PE2 (Fig 10), characterized by a shift to a low-er voltage level (Fig. 2e). Waveform PD starts with number ofpositive waves of decreasing amplitude, sometimes crested. Thelow voltage level at the end of waveform is at the same level ofthe following waveforms PE1 and PE2.
3.1.5. Waveform PE1Waveform PE1 (Fig. 2f) always preceded by waveform PD, has
a stereotypical shape characterized by low amplitude upwardspikes at a regular frequency of 4–8 Hz and a low voltage level(see PD). A waveform PE1 period can be followed by either PC1or PE2 and frequently alternates with PE2 (Figs. 4 and 10). Duringthe 8 h recordings, PE1 rarely appeared in the adult winter form,was more frequent in the summer form but it was especially com-mon in nymphs. Table 2 reports both the mean waveform dura-tion per insect and the mean number of waveform events.
3.1.6. Waveform PE2Waveform PE2 is always preceded by PE1 (Fig. 10) and
although its shape is highly variable, it generally exhibits sharpdownward spikes at 4–8 Hz at low amplitude (Fig. 2g). Typicalfeatures of this waveform are the periodical interruptions by volt-age drops of about 0.5 s and also its frequent alternation withwaveform PE1 (Fig. 4). Similar to PE1, waveform PE2 was rare in

Fig. 5. Assessment of the R and emf components contribution to each waveform by different plant voltage adjustments; positive (+), zero (0) and negative (�); amplitude involt (v) and time in seconds (s). (a) Waveform PA–PB; (b) waveform PC1; (c) waveform PC2; (d) waveform PD; (e) waveform PE1; (f) waveform PE2; (g) waveform PG.
S. Civolani et al. / Journal of Insect Physiology 57 (2011) 1407–1419 1413
the adult winter form, was more frequent in the adult summerform and was common in nymphs (Table 2).
Waveform PE1 and PE2 often appeared at the same time, thuscreating superimposed waveforms with less prominent upwardand/or downward spikes (Fig. 4).
3.1.7. Waveform PGWaveform PG is preceded by PC1, it has a relative amplitude of
about 50–75% and a main frequency of about 5–7 Hz. The ratherregular negative spikes (Fig. 2h) may be more pronounced onceevery few oscillations, when plant voltage is adjusted towards low-er values (Fig. 5g). During 8 h recordings the mean waveform dura-tion per insect was very high in the adult winter form, and lower inthe summer form and in nymphs (for details see Table 2).
3.2. Impact of changing the plant voltage adjustments on C. pyriwaveforms
In Fig. 5 the respective waveforms are shown at positive, zeroand negative levels of the output voltage (the recorded signal).
The PA and PB waveforms (Fig. 5a) show a similar signal for the po-sitive (+) and 0 V adjustments: only the latter amplitude is smaller.The 0 V signal reflects the emf component and in the positiveadjustment the amplitude increase is due to the superimposed R-component, which apparently maintains the same features. TheseR-component features, however, are inverted in the negative ad-justed signal and therefore the superimposed signal looks com-pletely different. The R-components largely compensate and(depending on the magnitude of the applied negative voltage)may even overcome the emf component thus resulting in a nega-tive signal (Fig. 5a, right trace). Waveform PC1 shows only slightlyreduced amplitude at 0 V, indicating a major emf component(Fig. 5b). During negative (�) adjustment the signal looks identicalto the other two adjustment voltages: this demonstrates a pre-dominant emf-component, even stronger than those of PA andPB. Waveform PC2 shows both emf and R-components (Fig. 5c):the R-component, together with the emf one, increases the sawtooth-like spikes during positive plant voltage adjustments (bothcomponents are positive). However, during negative adjustmentsthe R-components are negative: they counteract the positive
1414 S. Civolani et al. / Journal of Insect Physiology 57 (2011) 1407–1419
emf-components and therefore the spikes become scarcely visible.For waveform PD (Fig. 5d), the traces similarly suggest R andemf-components, whereas for PE1, PE2 and PG (Fig. 5e–g), theadjustments effects are only small, indicating a strong emf-compo-nent. During the 0 V and negative adjustment in PG, some addi-tional negative spikes (every 3–5 spikes) appear (Fig. 5g). Duringpositive voltage adjustment these additional spikes are apparentlycompensated by concurrent positive R-component spikes, whichattenuate the spike size differences.
3.3. Dual mode EPG recording
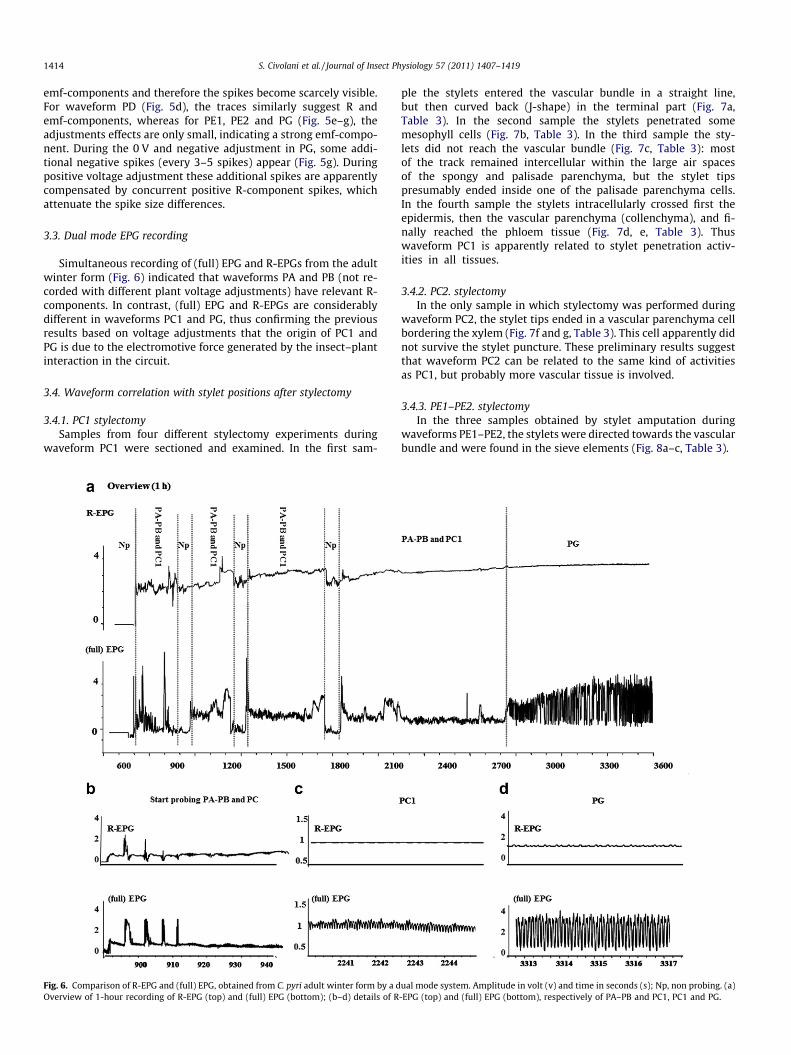
Simultaneous recording of (full) EPG and R-EPGs from the adultwinter form (Fig. 6) indicated that waveforms PA and PB (not re-corded with different plant voltage adjustments) have relevant R-components. In contrast, (full) EPG and R-EPGs are considerablydifferent in waveforms PC1 and PG, thus confirming the previousresults based on voltage adjustments that the origin of PC1 andPG is due to the electromotive force generated by the insect–plantinteraction in the circuit.
3.4. Waveform correlation with stylet positions after stylectomy
3.4.1. PC1 stylectomySamples from four different stylectomy experiments during
waveform PC1 were sectioned and examined. In the first sam-
Fig. 6. Comparison of R-EPG and (full) EPG, obtained from C. pyri adult winter form by a dOverview of 1-hour recording of R-EPG (top) and (full) EPG (bottom); (b–d) details of R
ple the stylets entered the vascular bundle in a straight line,but then curved back (J-shape) in the terminal part (Fig. 7a,Table 3). In the second sample the stylets penetrated somemesophyll cells (Fig. 7b, Table 3). In the third sample the sty-lets did not reach the vascular bundle (Fig. 7c, Table 3): mostof the track remained intercellular within the large air spacesof the spongy and palisade parenchyma, but the stylet tipspresumably ended inside one of the palisade parenchyma cells.In the fourth sample the stylets intracellularly crossed first theepidermis, then the vascular parenchyma (collenchyma), and fi-nally reached the phloem tissue (Fig. 7d, e, Table 3). Thuswaveform PC1 is apparently related to stylet penetration activ-ities in all tissues.
3.4.2. PC2. stylectomyIn the only sample in which stylectomy was performed during
waveform PC2, the stylet tips ended in a vascular parenchyma cellbordering the xylem (Fig. 7f and g, Table 3). This cell apparently didnot survive the stylet puncture. These preliminary results suggestthat waveform PC2 can be related to the same kind of activitiesas PC1, but probably more vascular tissue is involved.
3.4.3. PE1–PE2. stylectomyIn the three samples obtained by stylet amputation during
waveforms PE1–PE2, the stylets were directed towards the vascularbundle and were found in the sieve elements (Fig. 8a–c, Table 3).
ual mode system. Amplitude in volt (v) and time in seconds (s); Np, non probing. (a)-EPG (top) and (full) EPG (bottom), respectively of PA–PB and PC1, PC1 and PG.

Fig. 7. Stylet tracks of C. pyri in plant tissues after stylectomy during waveform PC1 (a–e) and PC2 (f–g). (a) Longitudinal LM section showing the stylet entering the vascularbundle; (b) longitudinal TEM section showing the stylet penetrating mesophyll cells; Is, intercellular space, Pp, palisade parenchyma cell, Ss; salivary sheath; (c) TEM crosssection showing the stylet (white arrow) and salivary sheath (Ss) crossing a palisade parenchyma cell (Pp); Cw, cell wall; (d) TEM cross section showing the mandibular (Md)and the maxillary (Mx) stylets (white arrow), with salivary sheath (Ss), crossing a group of phloem companion cells (Cc); Se, sieve element; (e) TEM cross section showing thestylets (white arrow) with salivary sheath (Ss) crossing a sieve element (Se); Cw, cell wall; Ppr, P protein; (f, g) TEM cross sections of stylet tip (white arrow) ending in the samevascular parenchyma cell (Vp) with degenerating cell content; Ch, chloroplast; Is, intercellular space; Ss, salivary sheath; Xv, xylem vessel; only one stylet tip is visible in Fig. 7g.
S. Civolani et al. / Journal of Insect Physiology 57 (2011) 1407–1419 1415
3.4.4. PG stylectomyIn both samples obtained after stylectomy during waveform PG,
the stylets were directed towards the vascular bundle. The firstsample clearly showed stylet tips inside a xylem vessel (Fig. 9a,b, Table 3): although the final sections of this sample were notclearly visible. In the second sample the stylet tips also ended in-side a xylem vessel after having crossed several phloem cells (sieve
elements and companion cells) and completely filled them withgelling sheath material (Fig. 9c–e, Table 3).
4. Discussion and conclusions
Generally, C. pyri EPGs showed obvious similarities to aphidEPGs (Tjallingii, 1978, 1985a,b, 1988; Kimmins and Tjallingii,

Tabl
e3
Sum
mar
yof
plan
tti
ssue
scr
osse
dby
C.py
rist
ylet
trac
ksaf
ter
styl
ecto
my
duri
ngdi
ffer
ent
EPG
wav
efor
ms.
SB,s
tyle
tbu
ndle
;ST
,sty
let
tips
.
Styl
ecto
my
Tiss
ue
wit
hst
ylet
part
sin
TEM
/LM
Sam
ple
Wav
efor
mEp
ider
mis
Mes
oph
yll
Vas
cula
rpa
ren
chym
aPh
loem
pare
nch
yma
Phlo
emsi
eve
elem
ent
Xyl
em
1PC
1SB
SBSB
––
–2
PC1
SBSB
––
––
3PC
1SB
SBSB
––
–4
PC1
SBSB
SBSB
––
5PC
2SB
SBST
––
–6
PE1–
PE2
SBSB
SBSB
ST–
7PE
1–PE
2SB
SBSB
SBST
–8
PE1–
PE2
SBSB
SBSB
ST–
9PG
SBSB
SB–
–ST
10PG
SBSB
SBSB
SBST
Fig. 8. Stylets of C. pyri in plant tissues after stylectomy during waveform PE1–PE2.LM cross sections. (a) Subterminal part of the stylets (black arrow) between a sieveelement (Se) and a xylem vessel (Xv); Ss, salivary sheath; (b, c) subterminal parts ofthe stylets (black arrow) inside a sieve element (Se); Ss, salivary sheath; Xv, xylemvessel.
1416 S. Civolani et al. / Journal of Insect Physiology 57 (2011) 1407–1419
1985). Comparing C. pyri EPGs with those of other Sternorrhyncha(aphids, whiteflies and mealybugs) five main differences emerged.First, the short potential drop (pd) waveforms, frequently observed

Fig. 9. Stylets of C. pyri in plant tissues after stylectomy during waveform PG with stylets inside xylem vessels. TEM cross sections. (a) Subterminal part of the stylets (whitearrow) inside a xylem vessel (Xv); Ss, salivary sheath; (b) terminal part of the stylets (black arrow) inside a xylem vessel (Xv); (c) fragments of the stylet tips (black arrow)inside a xylem vessel (Xv); Ss, salivary sheath; (d, e) Consecutive sections showing fragments of the stylet tips (black arrows) inside xylem vessels (Xv); Ss, salivary sheath;the dashed circle outlines the empty spaces previously occupied by the stylets.
Fig. 10. Typical sequences of events related to C. pyri stylet penetration in plant tissue for adult winter forms (left), adult summer forms (center), nymphs (right). Values nearthe arrows indicate the likelihood of each event.
S. Civolani et al. / Journal of Insect Physiology 57 (2011) 1407–1419 1417

1418 S. Civolani et al. / Journal of Insect Physiology 57 (2011) 1407–1419
in EPGs of aphids (Tjallingii, 1985b; Tjallingii and Hogen Esch,1993), in the mealybugs Phenacoccus manihoti (Calatayud et al.,1994) and Planococcus citri (Cid and Fereres, 2010) and less fre-quently in the whiteflies Bemisia tabaci (Jiang et al., 1999; Jiangand Walker, 2003) and Trialeurodes vaporariorum (Janssen et al.,1989; Lei et al., 1998), are absent in C. pyri. The absence of shortpotential drops was also found in EPG of the psyllid D. citri (Bonaniet al., 2010), and is typical of Auchenorrhyncha, such as South Afri-can maize leafhopper Cicadulina mbila Naudè (Lett et al., 2001), theBeet leafhopper Circulifer tenellus (Baker) and the Brown plant hop-per N. lugens (Kimmins, 1989; Seo et al., 2009).
The second difference involves intracellular stylet penetration,which occurs through any cell type in C. pyri. In C. pyricola similarintracellular stylet tracks were also reported (Ullman and McLean,1988a,b), but not in D. citri (Bonani et al., 2010). Both research in-volved LM techniques only. In Auchenorrhyncha alternating inter-and intracellular stylet tracks were also observed by TEM (Lettet al., 2001). Our TEM images obtained after stylectomy duringwaveform PC1 showed stylet tracks across parenchyma cells, sug-gesting that waveform PC1 is correlated with salivary sheath secre-tion and stylet penetration through the mesophyll. Thus, PC1seems to reflect pathway activities, similar to the waveform C ofD. citri (Bonani et al., 2010) and waveform C of leafhopper C. tenel-lus (Stafford and Walker, 2009), and to the waveform N2 of leaf-hopper N. lugens (Seo et al., 2009) (Table 1). All these insects arebigger and stronger than aphids and whiteflies and this may ex-plain their more vigorous and faster access to the phloem. Wave-forms PA, PB, and PC1 cannot be separated in distinct periodsand therefore in EPG analysis it seems wise to gather them all asPC, or pathway phase. The third difference concerns waveformPC2, which has no other Sternorrhyncha equivalent and has notbeen reported in D. citri (Bonani et al., 2010). Waveform PC2mainly appear in winter forms of C. pyri, followed or alternatedwith waveform PC1. Similarly to PC1, PC2 seems mainly relatedto pathway activities, involving parenchyma and perhaps the prox-imity of the vascular bundles. However, it is still unclear what dif-ferent activities waveform PC2 reflects; therefore the differencebetween PC1 and PC2, and the possibility to gather PC2 with wave-forms PA, PB, and PC1 need further studies.
The fourth difference concerns waveform PD, which is similar towaveform D in D. citri (Bonani et al., 2010) and has no equivalent inother Sternorrhyncha groups. This waveform reflects the initialactivities in phloem sieve elements and is always followed bywaveform PE1: it could represent a transition phase from theextracellular pathway to the intracellular phloem phase.
Waveforms PE1 and PE2 showed a sustained low voltage level,indicating an intracellular stylet tip position inside a living cell.These data, together with histological indications of the stylet trackinside a phloem sieve element, strongly suggest the involvement ofboth waveforms in phloem salivation and ingestion, as also sug-gested for D. citri, where an association of these waveforms withthe acquisition of bacteria from sieve elements was found (Bonaniet al., 2010).
The final difference is a general one: unlike aphids (Tjallingiiand Hogen Esch, 1993), many vascular cells close to the stylet tipswere completely damaged and filled with gelling saliva, thus bothmandibular and maxillary stylets seem involved in C. pyri cellpunctures.
Waveform PG was apparently related to the position of stylettips in xylem vessels in at least one sample, similar to what de-tected for waveform G in D. citri (Bonani et al., 2010). This wave-form, as well as waveform G in aphids (Spiller et al., 1990) andwhiteflies (Janssen et al., 1989), has a frequency of 5–7 Hz and highemf amplitude, likely reflecting cibarial pump activity during ac-tive ingestion (Dugravot et al., 2008). Similar waveforms have also
been observed in some Auchenorrhyncha, that is the leafhopper C.mbila on maize (Lett et al., 2001), in which waveform 2 was iden-tified as related to active ingestion, and the sharpshooters Homa-lodisca spp. and Bucephalogonia xanthophis (Berg). In Homalodiscaspp. the waveform C represents active ingestion from xylem(Dugravot et al., 2008), while in B. xanthophis the waveform Xc rep-resents the contact of stylets with xylem vessels (Miranda et al.,2009). In all cases the waveform patterns are similar to waveformPG in C. pyri. Based on all the above data, waveform PG is verylikely related to xylem ingestion.
The flat R-EPG waveforms PC1, PC2 and PG appear very similarto those observed by R-EPG in C. pyricola: in this case they were allinterpreted as involved in ingestion, without clear experimentalevidence (Ullman and McLean 1988a, 1988b).
Generally, our results allow to establish or infer correlations ofC. pyri waveforms with the stylet tip positions in specific plant tis-sues or cells (inter- and intracellular). However, the correlation ofwaveforms with penetration activities (e. g. saliva secretion, pas-sive or active ingestion, mechanical penetration activities) remainsspeculative. Moreover, since more than one waveform is associatedto the same tissue (for example PA, PB, PC1 and PC2 were all re-lated to the mesophyll, and PE1 and PE2 to the phloem), the differ-ences among waveforms should be further investigated.Nevertheless, the present data of waveform identification andcharacterization, together with those obtained by Bonani et al.(2010), could be applied in future studies on localization of tissueresistance in pear genotypes.
Acknowledgements
This study was part of the project PRIA – Ricerche sul pero final-izzate alla riduzione dell’impatto ambientale e alla valorizzazionedella qualità (Research on pear to reduce environmental impactand to increase production quality) and of the project Innovapero(Management and crop innovations for high-quality pear produc-tion, Italy). Funds for the research were provided by MiPAF (Minis-tero delle Politiche Agricole e Forestali, Italian Ministry forAgriculture and Forestry) and by AGER (Fondazioni per la ricercaagroalimentare, Foundations for agricultural and food research,Italy). Special thanks are also due to Donatella Mares, Professorof Plant Ultrastructure at the University of Ferrara (Ferrara, Italy)for valuable suggestions in interpreting the ultrastructural data.
References
Bonani, J.P., Fereres, A., Garzo, E., Miranda, M.P., Appezzato-Da-Gloria, B., Lopes,J.R.S., 2010. Characterization of electrical penetration graphs of the Asian citruspsyllid, Diaphorina citri, in sweet orange seedlings. Entomologia Experimentaliset Applicata 134, 35–49.
Calatayud, P.A., Rahbé, Y., Tjallingii, W.F., Tertuliano, M., Le Rü, B., 1994. Electricallyrecorded feeding behaviour of cassava mealybug on host and non-host plants.Entomologia Experimentalis et Applicata 72, 219–232.
Carraro, L., Loi, N., Ermacora, N., 2001. The life cycle of pear decline phytoplasma inthe vector Cacopsylla pyri. Journal of Plant Pathology 83, 87–90.
Cid, M., Fereres, A., 2010. Characterization of the probing and feeding behavior ofPlanococcus citri (Hemiptera: Pseudococcidae) on grapevine. Annals of theEntomological Society of America 103, 404–417.
Davis, D.L., Guise, C.M., Clark, M.F., Adams, A.N., 1992. Parry’s disease of pears issimilar to pear decline and is associated with mycoplasma-like organismstransmitted by Cacopsylla pyricola. Plant Pathology 41, 195–203.
Dugravot, S., Backus, E.A., Reardon, B.J., Miller, T.A., 2008. Correlations of cibarialmuscle activities of Homalodisca spp, sharpshooters (Hemiptera: Cicadellidae)with EPG ingestion waveform and excretion. Journal of Insect Physiology 54,1467–1478.
Errea, P., Aguelo, V., Hormaza, J.I., 2002. Seasonal variations in detection andtransmission of pear decline phytoplasma. Journal of Phytopathology 150, 439–443.
Fialová, R., Navrátil, M., Lauterer, P., Navrkalová, V., 2007. ‘‘Candidatus Phytoplasmaprunorum’’: the phytoplasma infection of Cacopsylla pruni from apricotorchards and from overwintering habitats in Moravia (Czech Republic).Bulletin of Insectology 60, 183–184.

S. Civolani et al. / Journal of Insect Physiology 57 (2011) 1407–1419 1419
Garcia-Chapa, M., Sabaté, J., Lavina, A., Battle, A., 2005. Role of Cacopsylla pyri in theepidemiology of pear decline in Spain. European Journal of Plant Pathology 111,9–17.
Horton, D.R., Krysian, J.L., 1991. Host acceptance behavior of pear psylla(Homoptera: Psyllidae) affected by plant species, host deprivation,habituation, and eggload. Annals of Entomological Society of America 84,612–627.
Janssen, J.A.M., Tjallingii, W.F., van Lenteren, J.C., 1989. Electrical recording andultrastructure of stylet penetration by the greenhouse whitefly. EntomologiaExperimentalis et Applicata 52, 69–81.
Jarausch, B., Fuchs, A., Schwind, N., Krczal, G., Jarausch, W., 2007. Cacopsylla picta asmost important vector for ‘‘Candidatus Phytoplasma mali’’ in Germany andneighbouring regions. Bulletin of Insectology 60, 189–190.
Jiang, Y.X., Lei, H., Collar, J.L., Martin, B., Muñiz, M., Fereres, A., 1999. Probing andfeeding behavior of two distinct biotypes of Bemisia tabaci (Homoptera:Aleyrodidae) on tomato plants. Journal of Economic Entomology 92, 357–366.
Jiang, Y.X., Walker, G.P., 2003. Electrical penetration graphs of the nymphal stage ofBemisia argentifolii. Entomologia Experimentalis et Applicata 109, 101–111.
Kimmins, F.M., 1986. Ultrastructure of the stylet pathway of Brevicoryne brassicae inhost plant tissue, Brassica oleracea. Entomologia Experimentalis et Applicata 41,238–290.
Kimmins, F.M., 1989. Electrical penetration graphs from Nilaparvata lugens onresistant and susceptible rice varieties. Entomologia Experimentalis etApplicata 50, 69–79.
Kimmins, F.M., Tjallingii, W.F., 1985. Ultrastructure of sieve element penetration byaphid stylets during electrical recording. Entomologia Experimentalis etApplicata 39, 135–141.
Kindt, F., Joosten, N.N., Tjallingii, W.F., 2006. Electrical penetration graphs of thripsrevised: combining DC- and AC-EPG signals. Journal of Insect Physiology 52, 1–10.
Lei, H., Tjallingii, W.F., van Lenteren, J.C., 1998. Probing and feeding characteristicsof the greenhouse whitefly in association with host-plant acceptance andwhitefly strains. Entomologia Experimentalis et Applicata 88, 73–80.
Lett, M.J., Granier, M., Grondin, M., Turpin, P., Molinaro, F., Chiroleu, F.,Peterschmitt, M., Reynaud, B., 2001. Electrical penetration graphs fromCicadulina mbila on maize, the fine structure of its stylet pathways andconsequences for virus transmission efficiency. Entomologia Experimentaliset Applicata 101, 93–109.
Martin, B., Collar, J.L., Tjallingii, W.F., Fereres, A., 1997. Intracellular ingestion andsalivation by aphids may cause the acquisition and inoculation of non-persistently transmitted plant viruses. Journal of General Virology 78, 2701–2705.
McLean, D.L., Kinsey, M.G., 1964. A technique for electronically recording aphidfeeding and salivation. Nature 202, 1358–1359.
Miranda, M.P., Fereres, A., Appezzato-da-Gloria, B., Lopes, J.R.S., 2009.Characterization of electrical penetration graphs of Bucephalogonia xanthophis,a vector of Xylella fastidiosa in citrus. Entomologia Experimentalis et Applicata130, 35–46.
Prado, E., Tjallingii, W.F., 1994. Aphid activities during sieve element punctures.Entomologia Experimentalis et Applicata 72, 157–165.
Reynolds, E.S., 1963. The use of lead citrate at high pH as electron-opaque stain inelectron microscopy. The Journal of Cell Biology 17, 208–212.
Sauvion, N., Lachenaud, O., Genson, G., Rasplus, J.Y., Labonne, G., 2007. Are thereseveral biotypes of Cacopsylla pruni ? Bulletin of Insectology 60, 185–186.
Schaper, U., Seemüller, E., 1982. Condition of the phloem and the persistence ofmycoplasma-like organism associated with apple proliferation and peardecline. Phytopathology 72, 736–742.
Seemüller, E., Schaper, U., Zimbelmann, F., 1984. Seasonal variation in thecolonization patterns of mycoplasma like organisms associated with appleproliferation and pear decline. Journal of Plant Disease Protection 91, 371–392.
Seemüller, E., Marcone, C., Lauer, U., Ragozzino, A., Göschl, M., 1998. Current statusof molecular classification of the phytoplasmas. Journal of Plant Pathology 80,3–26.
Seemüller, E., Schneider, B., 2004. Taxonomic description of ‘‘CandidatusPhytoplasma mali’’ sp. nov., ‘‘Candidatus Phytoplasma pyri’’ sp. nov., and‘‘Candidatus Phytoplasma prunorum’’ sp. nov., the casual agents of appleproliferation, pear decline and European stone fruit yellows, respectively.International Journal of Systematic and Evolutionary Microbiology 54, 1231–1240.
Seo, B.Y., Kwon, Y.H., Young, J.K., Kim, G.H., 2009. Electrical penetration graphicwaveforms in relation to the actual positions of the stylet tips of Nilaparvatalugens in rice tissue. Journal of Asia-Pacific Entomology 12, 89–95.
Spiller, N.J., Kimmins, F.M., Llewellyn, M., 1985. Fine structure of aphid styletpathways and its use in host plant resistance studies. EntomologiaExperimentalis et Applicata 38, 293–295.
Spiller, N.J., Koenders, L., Tjallingii, W.F., 1990. Xylem ingestion by aphids – astrategy for maintaining water balance. Entomologia Experimentalis etApplicata 55, 101–104.
Stafford, C.A., Walker, G.P., 2009. Characterization and correlation of DC electricalpenetration graph waveform with feeding behaviour of beet leafhopper,Circulifer tenellus. Entomologia Experimentalis et Applicata 130, 113–129.
Tedeschi, R., Alma, A., 2007. ‘‘Candidatus Phytoplasma mali’’: the current situation ofinsect vectors in northwestern Italy. Bulletin of Insectology 60, 187–188.
Tjallingii, W.F., 1978. Electronic recording of penetration behaviour by aphids.Entomologia Experimentalis et Applicata 24, 521–530.
Tjallingii, W.F., 1985a. Electrical nature of recorded signals during stylet penetrationby aphids. Entomologia Experimentalis et Applicata 38, 177–186.
Tjallingii, W.F., 1985b. Membrane potentials as an indication for plant cellpenetration by aphid stylets. Entomologia Experimentalis et Applicata 38,187–193.
Tjallingii, W.F., 1988. Electronic recording of stylet penetration activities. In: Minks,A.K., Harrewijn, P. (Eds.), Aphids, their biology, natural enemies and control, vol.2B. Elsevier, Amsterdam, pp. 95–108.
Tjallingii, W.F., 2000. Comparison of AC and DC system for electronic monitoring ofstylet penetration activities by homopterans. In: Walker, G.P., Backus, E.A.(Eds.), Principle and applications of electronic monitoring and other techniquesin the study of homopteran feeding behaviour. Thomas Say Publications inEntomology. Entomological Society of America, Lanham, Maryland, pp. 41–69.
Tjallingii, W.F., 2006. Salivary secretions by aphids interacting with proteins ofphloem wound responses. Journal of Experimental Botany 57, 739–745.
Tjallingii, W.F., Hogen Esch, T.H., 1993. Fine structure of aphid stylet routes in planttissues in correlation with EPG signals. Physiological Entomology 18, 317–328.
Tjallingii, W.F., Garzo, E., Fereres, A., 2010. New structure in cell puncture activitiesby aphid stylets: a dual-mode EPG study. Entomologia Experimentalis etApplicata 135, 193–207.
Ullman, D.E., McLean, D.L., 1986. Anterior alimentary canal of the pear psylla, Psyllapyricola Foerster (Homoptera: Psyllidae). Journal of Morphology 189, 89–98.
Ullman, D.E., McLean, D.L., 1988a. Feeding behaviour of the winter-form pear psylla,Psylla pyricola Foerster (Homoptera: Psyllidae), on reproductive and transitoryhost plants. Environmental Entomology 17, 675–678.
Ullman, D.E., McLean, D.L., 1988b. The probing behaviour of the summer-form pearpsylla. Entomologia Experimentalis et Applicata 47, 115–125.
Unwin, F.M., 1978. A versatile high frequency microcautery. PhysiologicalEntomology 3, 71–73.