seismic noise characteristics at the romanian broadband seismic network
TRANSCRIPT

This article was downloaded by: [Bogdan Grecu]On: 26 June 2012, At: 13:11Publisher: Taylor & FrancisInforma Ltd Registered in England and Wales Registered Number: 1072954 Registeredoffice: Mortimer House, 37-41 Mortimer Street, London W1T 3JH, UK
Journal of Earthquake EngineeringPublication details, including instructions for authors andsubscription information:http://www.tandfonline.com/loi/ueqe20
Seismic Noise Characteristics at theRomanian Broadband Seismic NetworkBogdan Grecu a , Cristian Neagoe a & Dragos Tataru aa National Institute for Earth Physics, Magurele, Romania
Available online: 26 Jun 2012
To cite this article: Bogdan Grecu, Cristian Neagoe & Dragos Tataru (2012): Seismic NoiseCharacteristics at the Romanian Broadband Seismic Network, Journal of Earthquake Engineering,16:5, 644-661
To link to this article: http://dx.doi.org/10.1080/13632469.2011.642931
PLEASE SCROLL DOWN FOR ARTICLE
Full terms and conditions of use: http://www.tandfonline.com/page/terms-and-conditions
This article may be used for research, teaching, and private study purposes. Anysubstantial or systematic reproduction, redistribution, reselling, loan, sub-licensing,systematic supply, or distribution in any form to anyone is expressly forbidden.
The publisher does not give any warranty express or implied or make any representationthat the contents will be complete or accurate or up to date. The accuracy of anyinstructions, formulae, and drug doses should be independently verified with primarysources. The publisher shall not be liable for any loss, actions, claims, proceedings,demand, or costs or damages whatsoever or howsoever caused arising directly orindirectly in connection with or arising out of the use of this material.

Journal of Earthquake Engineering, 16:644–661, 2012Copyright © A. S. Elnashai & N. N. AmbraseysISSN: 1363-2469 print / 1559-808X onlineDOI: 10.1080/13632469.2011.642931
Seismic Noise Characteristics at the RomanianBroadband Seismic Network
BOGDAN GRECU, CRISTIAN NEAGOE, andDRAGOS TATARU
National Institute for Earth Physics, Magurele, Romania
The noise level of the Romanian broadband stations operating since 2006 has been studied in orderto identify the variations in background seismic noise as a function of time of day, season, and partic-ular conditions at the stations. Power spectral densities and their corresponding probability densityfunctions are used in this paper to characterize the background seismic noise. At high frequencies(> 1 Hz), seismic noise seems to have cultural origin, since significant variations (up to 55 dB)between daytime and nighttime noise levels are observed at almost all of the stations. However,this variability appears not to influence the detection capabilities of the Romanian Seismic Networkin case of intermediate-depth earthquakes and earthquakes with magnitude over 3.0. For smallermagnitude events (Mw < 3), we showed that the number of stations detecting an event decreasesduring daytime. We studied the seasonal variation of the seismic noise for primary and secondarymicroseisms (with emphasize for the latter) and we demonstrated that the noise levels are higher inwinter than in summer. We also observed a shift of the double-frequency peak from lower periods insummer to longer periods in winter. The polarization analysis indicated that the main sources of sec-ondary microseisms for stations close to the Black Sea are coming from the Black Sea, while for theothers the main sources are found in the Mediterranean Sea and Atlantic Ocean. Finally, the analysisof the probability density functions for stations located in different geologic conditions has pointedout that the noise level is higher for stations sited on softer formations than those sited on hard rocks.
Keywords Background Seismic Noise; Probability Density Functions; Cultural Noise;Microseisms; Diurnal Variations; Seasonal Variations
1. Introduction
The main function of the Romanian Seismic Network (RSN) is to monitor the seismicactivity occurring on the Romanian territory and to provide high-quality data for source,Earth structure, microzonation, and seismic hazard studies and for data exchange withinternational seismic data centers. At the first stage (1980–1982), the RSN consisted of14 short period telemetered stations and was primarily designed to survey the Vranceaseismic region, characterized by the occurrence of the earthquakes at intermediate depths(between 60 and 220 km) within an unusual narrow focal volume located at the CarpathianArc Bend. This subcrustal activity is very intense and is characterized by the occurrenceof 2–5 strong earthquakes (M ≥ 7) per century (Oncescu et al., 1999). These earthquakesrepresent the main threat for the Romanian territory and caused a lot of damages and loss oflives during the centuries. In the mid 1990’s, four more telemetered stations were installed
Received 18 July 2011; accepted 16 November 2011.Address correspondence to Bogdan Grecu, National Institute for Earth Physics, Magurele, Romania 077125;
E-mail: [email protected]
644
Dow
nloa
ded
by [
Bog
dan
Gre
cu]
at 1
3:11
26
June
201
2
Noise Characteristics at the Romanian Seismic Stations 645
in the Western part of Romania to survey the Banat region, characterized by a relativelyintense crustal seismic activity.
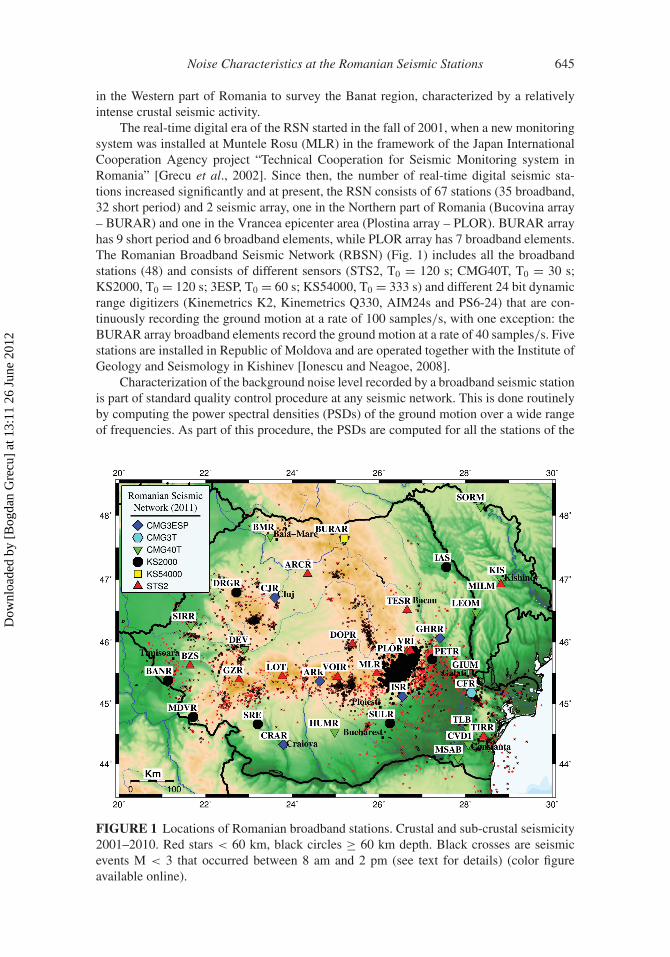
The real-time digital era of the RSN started in the fall of 2001, when a new monitoringsystem was installed at Muntele Rosu (MLR) in the framework of the Japan InternationalCooperation Agency project “Technical Cooperation for Seismic Monitoring system inRomania” [Grecu et al., 2002]. Since then, the number of real-time digital seismic sta-tions increased significantly and at present, the RSN consists of 67 stations (35 broadband,32 short period) and 2 seismic array, one in the Northern part of Romania (Bucovina array– BURAR) and one in the Vrancea epicenter area (Plostina array – PLOR). BURAR arrayhas 9 short period and 6 broadband elements, while PLOR array has 7 broadband elements.The Romanian Broadband Seismic Network (RBSN) (Fig. 1) includes all the broadbandstations (48) and consists of different sensors (STS2, T0 = 120 s; CMG40T, T0 = 30 s;KS2000, T0 = 120 s; 3ESP, T0 = 60 s; KS54000, T0 = 333 s) and different 24 bit dynamicrange digitizers (Kinemetrics K2, Kinemetrics Q330, AIM24s and PS6-24) that are con-tinuously recording the ground motion at a rate of 100 samples/s, with one exception: theBURAR array broadband elements record the ground motion at a rate of 40 samples/s. Fivestations are installed in Republic of Moldova and are operated together with the Institute ofGeology and Seismology in Kishinev [Ionescu and Neagoe, 2008].
Characterization of the background noise level recorded by a broadband seismic stationis part of standard quality control procedure at any seismic network. This is done routinelyby computing the power spectral densities (PSDs) of the ground motion over a wide rangeof frequencies. As part of this procedure, the PSDs are computed for all the stations of the
FIGURE 1 Locations of Romanian broadband stations. Crustal and sub-crustal seismicity2001–2010. Red stars < 60 km, black circles ≥ 60 km depth. Black crosses are seismicevents M < 3 that occurred between 8 am and 2 pm (see text for details) (color figureavailable online).
Dow
nloa
ded
by [
Bog
dan
Gre
cu]
at 1
3:11
26
June
201
2

646 B. Grecu, C. Neagoe, and D. Tataru
RBSN using the PASSCAL Quick Look eXtra (PQLX) software package [McNamara andBoaz, 2005]. A statistical approach of the PSDs provides the probability density functions(PDFs) that prove to be a useful tool for monitoring the network performance and to eval-uate the seismic noise level at a given station. The noise level of the different Romanianbroadband stations is analyzed in different frequency bands as a function of time of day,season, and particular conditions at the stations.
2. Data and Method
In order to determine the characteristics of the ambient seismic noise at the Romanianbroadband stations, we have selected data recorded between January 2006 and December2010. Since the development of the RBSN to its present-day configuration was a pro-cess that took place over several years, the data availability differs from station to station.In 2006, only 10 broadband stations were available in real-time, while most of the stationswere installed towards the end of 2008 and beginning of 2009. All the data used in this studywas gathered in a database together with the transfer function of the sensors, and the instru-ment response was removed automatically within PQLX software to obtain accelerations.
To calculate the ambient seismic background noise, we applied the method ofMcNamara and Buland [2004]. According to this work, the entire available dataset isdivided into one hour-long continuous time segments that are overlapping by 50%. ThePSD is computed for each time segment and for each channel, frequency distributions areconstructed by accumulating the individual PSDs in the following manner: (1) binningperiods in 1/8 octave intervals; and (2) binning power in 1 dB intervals. The PDF is thenconstructed normalizing each frequency distribution bin by the total number of PSDs. Moredetails on the PSD and PDF calculation can be found in McNamara and Buland [2004].The results of the analysis are processed and plotted for direct comparison with Peterson’s[1993] low and high new noise models (NLNM and NHNM). This approach has the advan-tage that it does not need a preliminary examination of the data for earthquakes, transientsignals, or instrumental glitches. These signals are generally low-probability occurrencesand do not contaminate high-probability seismic noise observed in the PDFs [McNamaraand Buland, 2004] and thus they are included in the PSD computations.
3. Results and Discussion
Power density functions were calculated for each component of each RBSN station. Severalstatistics (min, max, mean, median, mode, etc.) can be used to illustrate the distribution ofobservations. McNamara and Buland [2004] showed that the PDF mode corresponds tothe highest probability noise level for a given station. However, this curve is often affectedby system transients or, at higher frequencies, displays jumps that are related to the diurnalvariations in cultural noise, and the comparison of the noise level at different stations is thusmore difficult. In order to make the comparison between stations easier, Diaz et al. [2010]chose to use the median curves, as they produce smoother results and are less affected bythe presence of outliers.
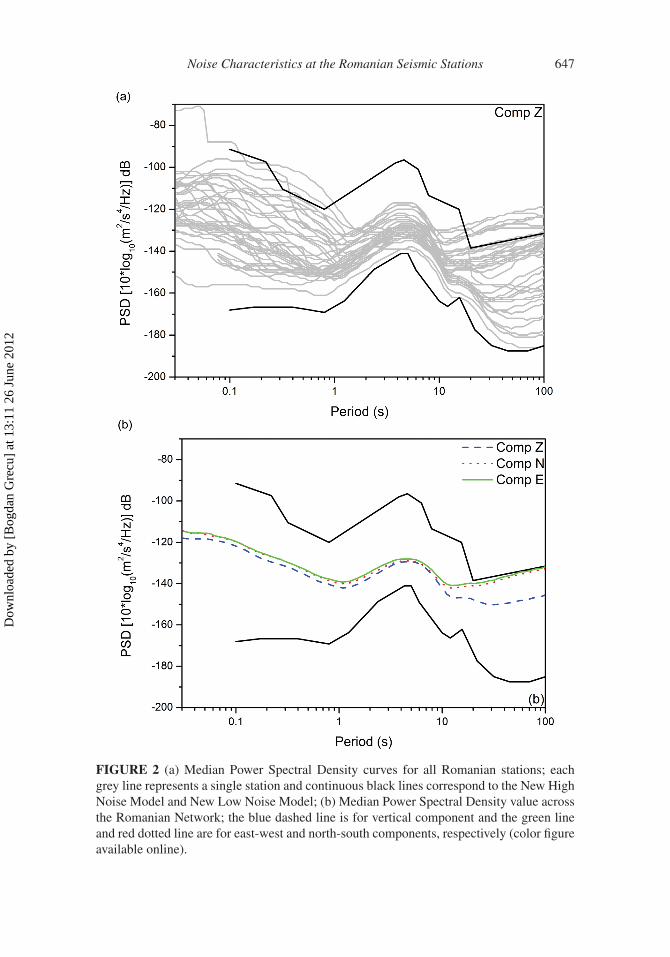
To get an idea on how well the RBSN network performs, we computed the mediancurve for each component of each station and for the whole dataset available for eachstation. Figure 2a shows the results for the vertical components.
The dynamic range of the vertical components of the RBSN data extends from approx-imately −180 dB (T > 40 s) to −90 dB (T < 0.033 s). The lowest difference in noise levels,reaching 20–25 dB, is observed for periods between 2 and 10 s. This domain correspondsto the secondary microseism band where the noise level is related mainly to the energy
Dow
nloa
ded
by [
Bog
dan
Gre
cu]
at 1
3:11
26
June
201
2
Noise Characteristics at the Romanian Seismic Stations 647
FIGURE 2 (a) Median Power Spectral Density curves for all Romanian stations; eachgrey line represents a single station and continuous black lines correspond to the New HighNoise Model and New Low Noise Model; (b) Median Power Spectral Density value acrossthe Romanian Network; the blue dashed line is for vertical component and the green lineand red dotted line are for east-west and north-south components, respectively (color figureavailable online).
Dow
nloa
ded
by [
Bog
dan
Gre
cu]
at 1
3:11
26
June
201
2

648 B. Grecu, C. Neagoe, and D. Tataru
released by oceanic waves [Stutzmann et al., 2000]. For the primary microseism band(10–20 s), an increase of the difference in the noise levels can be observed from 20 dBat T∼10 s to 30 dB at T∼20 s. For periods longer than 20 s, the difference in noise lev-els increases again significantly, reaching 70 dB at T∼100 s. For seven stations (BANR,BMR, GHRR, MDVR, PLOR5, SULR, SRE) the noise level of the vertical componentlays 3–12 dB above NHNM. For periods shorter than 2 s and up to 30 Hz (0.033 s), thepower of the vertical components ranges between −160 dB and −90 dB, except for stationCVD1 whose power level reaches −70 dB at 30 Hz. The larger variation of the noise levelat higher frequencies is not surprising as in this domain the noise is mainly generated byanthropic activities and exhibits diurnal variations. For stations CVD1, CRAR, and GIUM,the median curves exceed NHNM for frequencies in the range 1–4.5 Hz. This behavioris well explained by the position of the stations with respect to urbanized and industrial-ized areas. Thus, the last two stations are located in the city of Craiova (CRAR) and in thevicinity of the city of Galati (GIUM) (two of the largest and highly industrialized cities inRomania), while station CVD1 is located near Cernavoda Nuclear Power Plant.
The horizontal components are usually noisier than the vertical component. At longperiods, the tilting effects are responsible for an increase of the noise level up to 30 dBabove the noise level of the vertical component [Bormann, 2002]. This behavior is observedalso at RBSN stations. Figure 2b shows the PSD median curves for the three componentsacross the RBSN network. We note that the difference between vertical and horizontalcomponents is less than 2 dB for periods shorter than 8 s. The difference increases towardslonger periods and reaches 13 dB at T∼100 s.
It is well known that background seismic noise has different sources. At high fre-quencies (>1Hz), seismic noise, referred to as cultural noise, is mainly associated withthe coupling of man and man-made machinery (power plants, factories, highways, etc.)energy into the Earth. The cultural noise level is different from site to site depending on thesource and the distance to the source. This kind of noise shows important diurnal variations[McNamara and Buland, 2004; Marzorati and Bindi, 2006; Sheen et al., 2009; Diaz et al.,2010] that are related to human activities during the days and nights. To investigate thediurnal variations we selected two stations (CFR and GHRR) and a PDF median was com-puted for each hour of the day over one month (August 2010). Figure 3 shows the variationin the PDF median as a function of hour of the day at the two stations. The CFR stationhas median power variations on the order of 55 dB at frequencies between 1 and 20 Hzthroughout the day. The GHRR station shows weaker power variations of 40 dB. However,the maximum value of the difference between daytime and nighttime noise level for eachfrequency reaches 13 dB at station CFR and 23 dB at station GHRR and is found around20 Hz for both stations. In Fig. 3, we can also see quite clearly an increase of the noiselevel during the daylight hours at both stations.
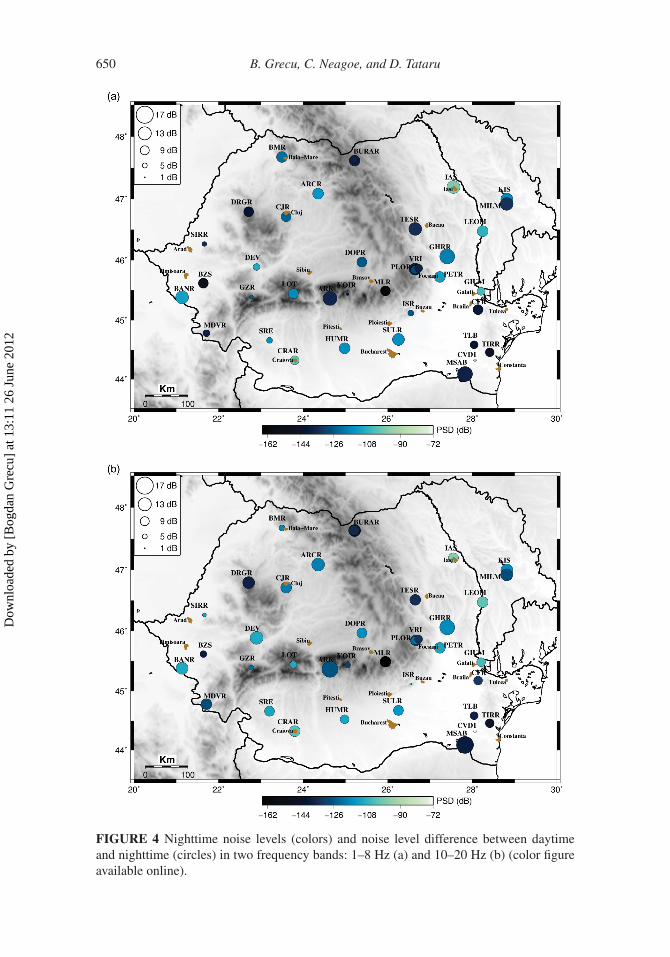
To better illustrate this feature and to have an image of the distribution of the diurnalvariations, we computed the PDF median for vertical components in two frequency bands,1–8 Hz and 10–20 Hz, respectively, for daytime (10–14 h) and nighttime (0–4 h) andover the whole period of functioning of each station. We computed then the differencebetween daytime noise level and nighttime noise level for each frequency and we usedfor representation the maximum of this difference. For each site we represented a circlecolored according to the nighttime median power level, while the size of the circle indi-cates the noise level differences between daytime and nighttime (Fig. 4). As expected, theresults show variations far from homogeneous. The smallest difference between daytimeand nighttime noise levels is 2 dB and is observed at station ISR in the frequency band10–20 Hz. The same station has noise power variations of 6 dB in the low frequency band.However, the nighttime noise level is higher between 10 and 20 Hz (−104 dB) than between
Dow
nloa
ded
by [
Bog
dan
Gre
cu]
at 1
3:11
26
June
201
2

Noise Characteristics at the Romanian Seismic Stations 649
FIGURE 3 Diurnal variations for the vertical component of the stations CFR (a) andGHRR (b) (color figure available online).
1 and 8 Hz (−126 dB). The station CVD1 is another station with low diurnal variations(3 dB) and is observed for both frequency bands. For this station, the noise level during thenighttime reaches −93 dB in the frequency band 1–8 Hz and −72 db in the frequency band10–20 Hz. CVD1 is sited within the Cernavoda Nuclear Power Plant area and therefore, thisunusual high noise level and the small difference between day and night noise levels aremost likely due to the location of the station. Station MSAB exhibits the largest power vari-ation (17 dB) in the frequency band 10–20 Hz (at approximately 14.9 Hz), while a lowerpower variation (−15 dB) is observed in the low-frequency band (1–8 Hz). The installationof this station inside the courtyard of the Sfantul Andrei Monastery explains the increaseof the noise during the daylight hours. However, MSAB shows a relatively low nighttimenoise level (−137 dB and −139 dB for the frequency bands 1–8 Hz and 10–20 Hz, respec-tively). Another station that shows large diurnal variations in both frequency bands (14 dB
Dow
nloa
ded
by [
Bog
dan
Gre
cu]
at 1
3:11
26
June
201
2
650 B. Grecu, C. Neagoe, and D. Tataru
FIGURE 4 Nighttime noise levels (colors) and noise level difference between daytimeand nighttime (circles) in two frequency bands: 1–8 Hz (a) and 10–20 Hz (b) (color figureavailable online).
Dow
nloa
ded
by [
Bog
dan
Gre
cu]
at 1
3:11
26
June
201
2

Noise Characteristics at the Romanian Seismic Stations 651
for the low-frequency band and 16 dB for the high-frequency band) is ARR station. Thisstation is located on very hard rock (crystalline rock), close to the Vidraru dam where theanthropic activity is high during the day. However, the station shows a relatively low night-time noise level (−136 dB in the frequency band 1–8 Hz and −127 dB in the frequencyband 10–20 Hz). It is interesting to note that for some stations (e.g., BMR, BZS, HUMR,IAS, ISR, LOT, SULR) the noise power variations are much larger (2 even 3 times) in thelow-frequency band than in the high-frequency band. On the other hand, several stations(e.g., ARCR, CRAR, DEV, DRGR, SRE) exhibit larger diurnal variations in the frequencyband 10–20 Hz. It is also worth noting that the difference between daytime and nighttimenoise levels is larger than 8 dB for several stations (e.g., ARR, BURAR, BZS, DRGR,MLR, PLOR, TESR) located on hard rock, but with a nighttime noise level relatively low,varying from −134 dB at TESR to −162 dB at MLR. Marzorati and Bindi [2006] per-formed a synthetic test for estimating the spatial variability of the detection thresholds ofthe network deployed in north central Italy and showed that during the day hours the areacorresponding to the smallest detection thresholds is smaller than during the night hours.In order to see the possible effect of the diurnal variations on the location capabilities ofthe RSN, we investigate the location history of the RSN for the last decade together withthe number of stations that were used in the location process. We performed this analysisfor two time intervals: the first, between 2001 and 2005 (hereinafter referred as to Period1), when the local earthquake location process was performed using mainly the real-timetelemetered stations (18) and the second, between 2006 and 2010 (hereinafter referred asto Period 2), when the number of real-time digital stations (both short period and broadband) increased and reached 69 at the end of 2010. Figure 5 shows the number of eventsas a function of time of day in four cases: (a) intermediate-depth events (H ≥ 60 km); (b)crustal events (H < 60 km); (c) all events with Mw ≥ 3; and (d) all events with Mw < 3.The histograms correspond to the number of events, while the lines (black line for Period1 and red line for Period 2) correspond to the average number of stations that were used forevent location. Figure 5 also shows that the number of events that occurred during Period2 increased in comparison with the number of events that occurred during Period 1. In thesame time, the average number of stations reporting the events is larger for Period 2 thanfor Period 1. The number of events having intermediate depths (H ≥ 60 km) has a quasi-uniform distribution overall for Period 1, while for Period 2 it slightly increases during thenight hours (Fig. 5a). However, the number of stations shows a random distribution in bothcases. On the other hand, when considering Period 2, the number of events having crustaldepths (H < 60 km) increases significantly between 8 am and 2 pm, while the numberof stations drops to less than 5 for the same time interval (Fig. 5b). This behavior is alsoobserved for Period 1, but at a smaller scale. The distribution of the events with Mw ≥3 (Fig. 5c) and the number of stations show no clear dependence on time of day. On theother hand, Fig. 5d shows that most of the events with Mw < 3 occur between 8 am and2 pm and the number of stations reporting the events drops in the same time interval. Thisanalysis indicates that most of the events occurring during the day hours have small mag-nitudes (Mw < 3) and crustal depths (H < 60 km) and approximately 60% of these eventshave most likely artificial origin. The distribution of these events presented in Fig. 1 showsseveral areas with clusters of events spread on the Romanian territory. Most of these areascorrespond to well-known quarries and it should also be stressed out that all the explo-sions are prohibited in Romania during night hours. Seismic energy of the small artificialevents that occur between 8 am and 2 pm attenuates rapidly within the distance of tens ofkilometers and therefore is recorded by stations located close to the epicenters, and thusthe number of stations decreases during daytime when the large number of small eventsoccurs. Our analysis also suggests that there is no clear evidence of the influence of the
Dow
nloa
ded
by [
Bog
dan
Gre
cu]
at 1
3:11
26
June
201
2

FIG
UR
E5
Num
ber
ofev
ents
(his
togr
ams)
dete
cted
byR
SNst
atio
nsan
dth
eav
erag
enu
mbe
rof
stat
ions
repo
rtin
gth
eev
ents
(bla
cklin
efo
rPe
riod
1an
dre
dlin
efo
rPe
riod
2)fo
r:(a
)in
term
edia
te-d
epth
even
ts(H
≥60
km);
(b)
crus
tale
vent
s(H
<60
km);
(c)
even
tsw
ithM
w≥
3;an
d(d
)ev
ents
with
Mw
<3
(col
orfig
ure
avai
labl
eon
line)
.
652
Dow
nloa
ded
by [
Bog
dan
Gre
cu]
at 1
3:11
26
June
201
2

Noise Characteristics at the Romanian Seismic Stations 653
diurnal noise variations on the location capabilities of the RSN for events with magnitudelarger than three and for intermediate-depth earthquakes.
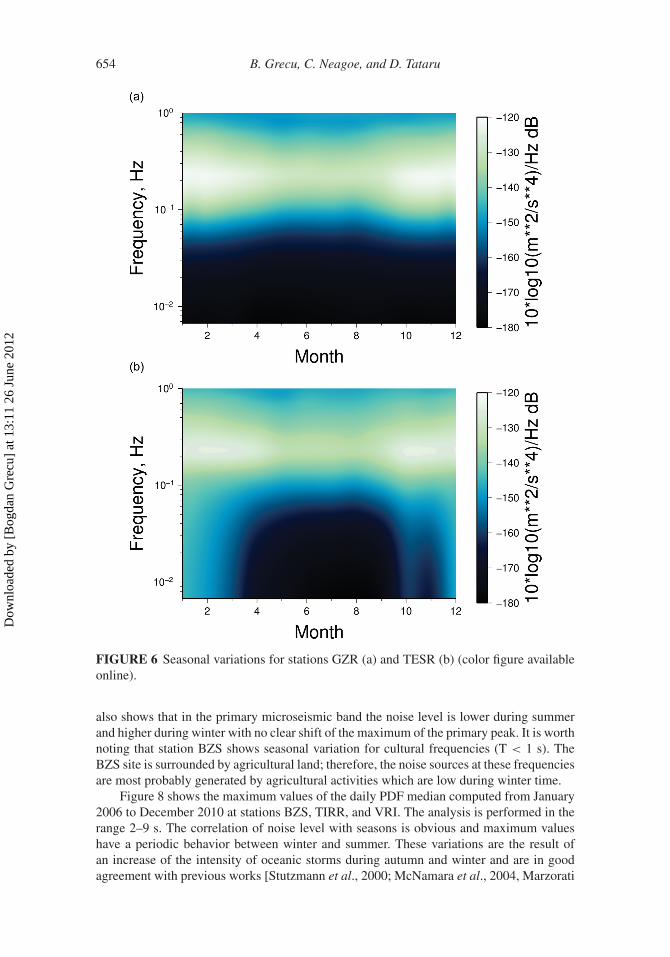
In the microseismic band (0.05 – 0.5 Hz), seismic noise spectrum is characterizedby two dominant peaks that are easily recognizable at broadband stations worldwide. Thesmaller amplitude peak, known as primary or single-frequency peak, occurs in the 0.05– 0.1 Hz frequency band and is generated by the interaction between oceanic waves andshallow seafloor. This interaction converts the energy of oceanic waves into elastic Rayleighwaves [Hasselmann, 1963]. The strongest peak is known as secondary or double-frequencypeak (DFP) and is observed in the 0.1 – 0.5 Hz frequency range. This peak is generated bytwo oceanic waves of similar period travelling in opposite directions. When these wavesmeet, they generate standing gravity waves of half of the period of the ocean waves andcouple energy into elastic waves through a nonlinear mechanism [Longuet-Higgens, 1950].In recent years, many studies have outlined the direct link between the origin of the noisein the microseismic band and its seasonal variability [Stutzmann et al., 2000; McNamaraet al., 2004, Marzorati et al., 2006; Gerstoft and Tanimoto, 2007; Sheen et al., 2009;Stutzmann et al., 2009; Diaz et al., 2010]. To verify the influence of the seasons on thebackground seismic noise at RBSN stations, we computed a PDF and its statistical medianfor each month of the year 2010. Figure 6 is a plot of the seasonal variation at two stations,Gura Zlata (GZR) and Tescani (TESR), respectively. For the frequency range 0.1–1 Hz theseasonal variability of noise is evident, with the noise power increasing during the coldermonths. This behavior is found at all RBSN stations. For frequencies smaller than 0.1 Hzwe can observe at station TESR an important increase of the noise level of about 40 dB dur-ing the winter. This pattern is observed only at 8 stations (ARCR, ARR, PLOR, PLOR1,PLOR2, PLOR3, TESR, and VOIR) and is related to the poor thermal insulation of thesensor. Diaz et al. [2010] found the same behavior at several stations of the IberArray net-work, with the lower noise levels corresponding to the warmer periods and the higher levelscorresponding to the colder periods. They also showed experimentally that after the properinsulation of the sensor the higher noise level disappeared.
To outline the dependency of the noise level on the season we selected three stations(Buzias – BZS, Targusor – TIRR, Vrincioaia – VRI) for which we have more than five yearsof continuous data and we computed the median of the PSD for three months intervals,from December 2006 to November 2010. We considered the months of December, January,and February as winter months, March, April, and May as spring months, June, July, andAugust as summer months, and September, October, and November as fall months. Forall three stations the seasonal variations are clearly seen in the primary and secondarymicroseismic bands (Fig. 7). For stations BZS and VRI the noise power levels are lowestduring summer and highest during winter, while during spring and fall the noise level isvery similar and in-between the first two. We also note that the maximum of the DFP shiftsfrom smaller periods (∼ 4.5 s) in the summer to higher periods (∼7 s) in the winter. Forstation TIRR, the lowest noise level is found during summer while the highest power levelis reached during winter only for two winter periods: December 2006 to February 2007(for T > 4 s) and December 2009 to February 2010. The DFP of TIRR station is flatter andbroader than for BZS and VRI stations and has its maximum at T ∼ 2.2 s. Bromirsky et al.[2005] observed the splitting of the DFP into two peaks, one at short periods (SPDF) andone at long periods (LPDF). According to this work, the SPDF microseisms are generatedby rapid shift of local winds and by nearby storms while LPDF microseisms are generatedin near coastal areas and depend on how the waves generated by distant storms hit thecoastline. The TIRR station is close to the Black Sea and the broader peak suggests that thelocal shoreline of the Black Sea is the dominant source region for DFP microseisms. This isalso confirmed by the noise polarization analysis performed later at TIRR station. Figure 7
Dow
nloa
ded
by [
Bog
dan
Gre
cu]
at 1
3:11
26
June
201
2
654 B. Grecu, C. Neagoe, and D. Tataru
FIGURE 6 Seasonal variations for stations GZR (a) and TESR (b) (color figure availableonline).
also shows that in the primary microseismic band the noise level is lower during summerand higher during winter with no clear shift of the maximum of the primary peak. It is worthnoting that station BZS shows seasonal variation for cultural frequencies (T < 1 s). TheBZS site is surrounded by agricultural land; therefore, the noise sources at these frequenciesare most probably generated by agricultural activities which are low during winter time.
Figure 8 shows the maximum values of the daily PDF median computed from January2006 to December 2010 at stations BZS, TIRR, and VRI. The analysis is performed in therange 2–9 s. The correlation of noise level with seasons is obvious and maximum valueshave a periodic behavior between winter and summer. These variations are the result ofan increase of the intensity of oceanic storms during autumn and winter and are in goodagreement with previous works [Stutzmann et al., 2000; McNamara et al., 2004, Marzorati
Dow
nloa
ded
by [
Bog
dan
Gre
cu]
at 1
3:11
26
June
201
2
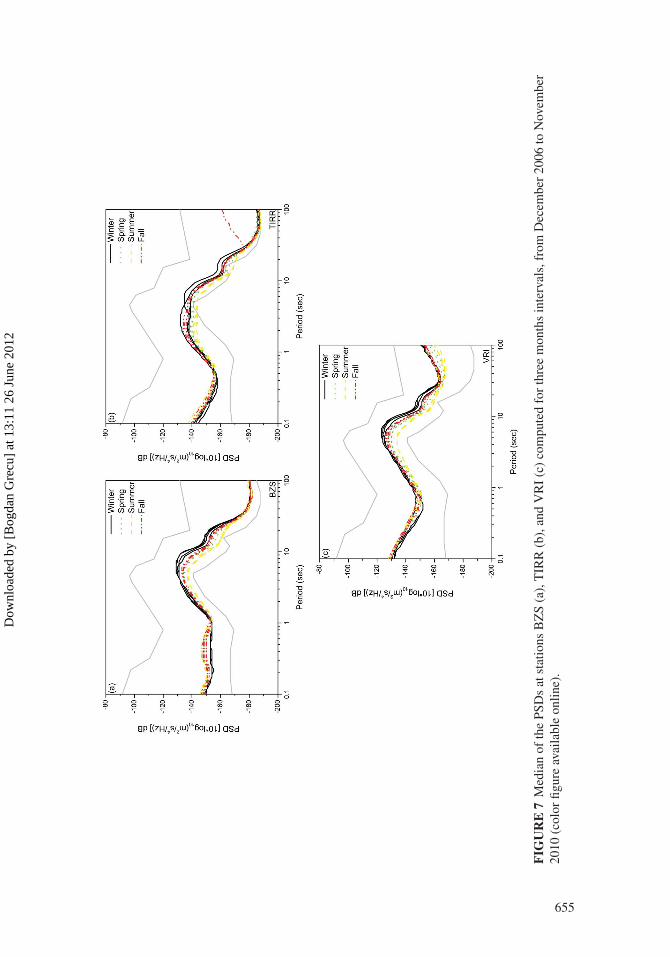
FIG
UR
E7
Med
ian
ofth
ePS
Ds
atst
atio
nsB
ZS
(a),
TIR
R(b
),an
dV
RI
(c)
com
pute
dfo
rth
ree
mon
ths
inte
rval
s,fr
omD
ecem
ber
2006
toN
ovem
ber
2010
(col
orfig
ure
avai
labl
eon
line)
.
655
Dow
nloa
ded
by [
Bog
dan
Gre
cu]
at 1
3:11
26
June
201
2

656 B. Grecu, C. Neagoe, and D. Tataru
FIGURE 8 Maximum values of PDF median in the range 2-9 s for station BZS (red dots),TIRR (blue squares), and VRI (green triangles) (color figure available online).
et al., 2006]. Figure 8 also indicates that the lowest noise level is observed at TIRR stationand which is the result of the stronger attenuation of the SPDF microseisms than the LPDFmicroseisms [Bromirski et al., 2005].
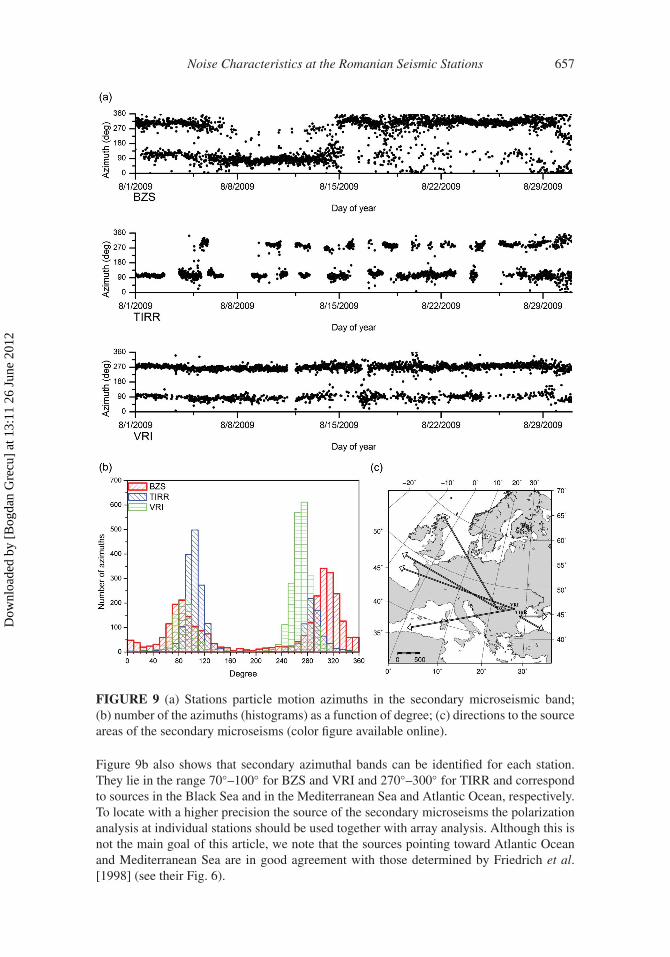
Recent studies [Schulte-Pelkum et al., 2004; Chevrot et al., 2007; Stutzmann et al.,2009] showed that is possible to constrain the incoming direction of microseisms at a par-ticular station by polarization analysis of seismic noise. We performed this analysis forBZS, TIRR, and VRI stations. We selected the continuous records from August 1–31,2009 and we band-passed the waveforms in the frequency range 0.1–0.5 Hz. For polar-ization analysis we used a time domain covariance method [Jurkevics, 1988; Earle, 1999]and the particle motion was estimated in intervals of 15 min [Schulte-Pelkum et al., 2004].The results are presented in Figs. 9a, b, and c: Fig. 9a shows the station particle motionazimuths in the secondary microseismic band, the histograms in Fig. 9b correspond to thenumber of azimuths as a function of degree and Fig. 9c shows the main directions of thesource areas of secondary microseisms. The azimuth measurements show a higher amountof scatter for BZS than for TIRR and VRI (Fig. 9a). However, for all three stations, thedistribution of the azimuths is not random. They concentrate in different main azimuthalbands that vary from station to station. For stations BZS, TIRR, and VRI this band rangesfrom 300◦–330◦, 90◦–120◦, and 260◦–290◦, respectively (Fig. 9 b) (we considered the mainazimuthal band the three highest bars in the histograms). These source azimuths are thenplotted at the station location in Fig. 9c. We can observe that for BZS and VRI they pointtoward Atlantic Ocean and Mediterranean Sea, while for TIRR the main source indicatethe Black Sea. It is interesting to note the absence of azimuths from the Mediterranean Seaat BZS station. At this stage, it is difficult to explain the phenomenon and further studiesshould be performed. However, we suppose that this is related to some attenuation featuresthat occur on the path between the noise source in Mediterranean Sea and BZS station.
Dow
nloa
ded
by [
Bog
dan
Gre
cu]
at 1
3:11
26
June
201
2
Noise Characteristics at the Romanian Seismic Stations 657
FIGURE 9 (a) Stations particle motion azimuths in the secondary microseismic band;(b) number of the azimuths (histograms) as a function of degree; (c) directions to the sourceareas of the secondary microseisms (color figure available online).
Figure 9b also shows that secondary azimuthal bands can be identified for each station.They lie in the range 70◦–100◦ for BZS and VRI and 270◦–300◦ for TIRR and correspondto sources in the Black Sea and in the Mediterranean Sea and Atlantic Ocean, respectively.To locate with a higher precision the source of the secondary microseisms the polarizationanalysis at individual stations should be used together with array analysis. Although this isnot the main goal of this article, we note that the sources pointing toward Atlantic Oceanand Mediterranean Sea are in good agreement with those determined by Friedrich et al.[1998] (see their Fig. 6).
Dow
nloa
ded
by [
Bog
dan
Gre
cu]
at 1
3:11
26
June
201
2

658 B. Grecu, C. Neagoe, and D. Tataru
FIGURE 10 PDF median noise levels mapped across the Romanian territory in twofrequency bands: 1–20 Hz (a) and 0.05–1 Hz (b) (color figure available online).
Dow
nloa
ded
by [
Bog
dan
Gre
cu]
at 1
3:11
26
June
201
2
Noise Characteristics at the Romanian Seismic Stations 659
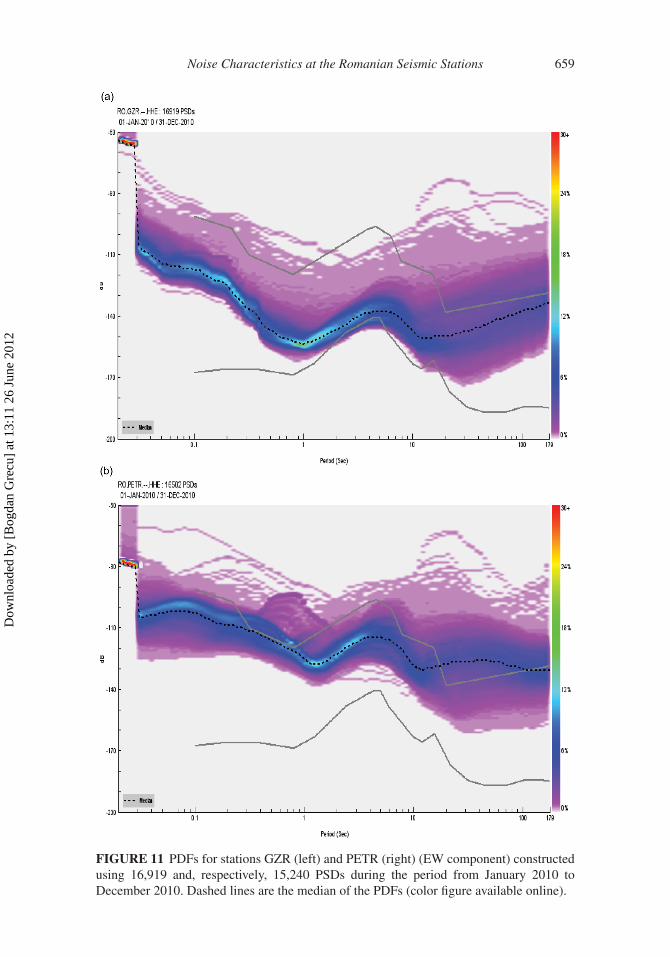
FIGURE 11 PDFs for stations GZR (left) and PETR (right) (EW component) constructedusing 16,919 and, respectively, 15,240 PSDs during the period from January 2010 toDecember 2010. Dashed lines are the median of the PDFs (color figure available online).
Dow
nloa
ded
by [
Bog
dan
Gre
cu]
at 1
3:11
26
June
201
2

660 B. Grecu, C. Neagoe, and D. Tataru
Finally, we investigated the variation of the noise level as a function of site conditionand geographic position. For each site, we computed a PDF median of the maximum ofthe horizontal components and we interpolated its maximum determined in the frequencybands 0.05–1 Hz and 1–20 Hz (Fig. 10). We can observe that in both cases the stationswith higher noise levels are located in the eastern and southern part of Romania. Thesestations are either close to the cities (e.g., IAS, CRAR) or they are situated on sediments ofwhich thickness varies from several kilometers in the Eastern Carpathians foredeep (e.g.,PETR, GHRR) to several hundreds of meters in the Moesian platform (e.g., ISR, HUMR,SRE). For the frequency range 1–20 Hz, the lower background seismic noise is observed atstations located in the Carpathian Orogen (e.g., ARR, BURAR, BZS, DRGR, GZR, LOT,MLR, PLOR, VOIR). Most of the stations in western Romania show relatively low noisepower levels, except for station BANR and DEV. BANR is located on thick sediments(∼1.3 km) while DEV lies on a thin sedimentary layer but close to the city of Deva. Allstations in south-eastern part (CFR, CVD1, MSAB, TLB, TIRR) show low noise powers,except for station CVD1 which has the highest noise level of all stations (Fig. 11a). The spe-cial place (the area of the Cernavoda Nuclear Power Plant) where this station is sited couldexplain easily this peculiar high noise level. Of these stations, only MSAB is installed onthin Quaternary and Tertiary deposits (∼50 m) that overlay older Mesozoic and Paleozoicformations (∼2000 m thickness), all others being installed on well consolidated rocks. Forthe frequency range 0.05–1 Hz, all the stations in the central and western part of Romaniashow low noise levels ( larger than −125 dB), except for station BANR. Low noise lev-els are also observable for stations in south-eastern part of Romania (Fig. 10b). To betterillustrate the difference between the noise level recorded on hard rocks and noise levelrecorded on soft deposits, we compared the PDF of two stations located on different geo-logic conditions (Fig. 11). Station GZR, located in the Southern Carpathians on very hardrocks (granites), shows lower noise levels than station PETR, that is located in the FocsaniDepression on very thick Neogene (∼ 8 km) sediments. Similar features are observed forall stations having the same geological conditions as the two investigated stations.
4. Conclusions
A study of the characteristics of the background seismic noise at the Romanian broadbandstations has been performed by means of PSDs and their PDFs [McNamara and Buland,2004]. We showed that, in the frequency range 1–20 Hz, most of the stations exhibit importantpower variations during daytime and nighttime. However, these diurnal variations seemto have little influence on the detection capabilities of the RSN for intermediate-depthearthquakes and events with magnitude over 3.0. In the microseismic band, importantseasonal variations were observed. For most of the stations, the noise level is the lowest insummer and increases during winter. The polarization analysis performed for three stationsshowed that at station located close to the Black Sea (TIRR) the main source of the secondarymicroseisms originates from the Black Sea, while for the two stations located farther fromthe Black Sea (BZS and VRI) the secondary microseisms are generated in the MediterraneanSea and Atlantic Ocean. In order to locate more precisely the sources of the microseisms,future work should be dedicated to performing array analysis. Finally, we showed thatstations sited on softer formations exhibit higher noise levels than those on hard rocks.
Acknowledgments
This work was supported by CNCSIS-UEFISCDI, project number PN II-RU 120/2010.Most of the figures were created using Generic Mapping Tool (GMT) [Wessel and Smith,1998] software package. Figure 11 was created using PQLX [McNamara and Boaz,
Dow
nloa
ded
by [
Bog
dan
Gre
cu]
at 1
3:11
26
June
201
2
Noise Characteristics at the Romanian Seismic Stations 661
2005] software. We are grateful to the reviewer whose suggestions and critical remarkssignificantly improved the quality of the article.
References
Bormann, P., Ed. [2002] New Manual of Seismological Observatory Practice,GeoForschungsZentrum Potsdam, Potsdam, Germany.
Bromirski, P. D., Duennebier, F. K., and Stephen, R. A. [2005] “Mid-ocean microseisms,”Geochemistry Geophysics Geosystems 6(4), 1–19.
Chevrot, S., Sylvander, M., Benahmed, S., Ponsolles, C., Lefevre, J. M., and Paradis, D. [2007]“Source locations of secondary microseisms in Western Europe: Evidence for both coastal andpelagic sources,” Journal of Geophysical Research, 112, doi 10.1029/2007JB005059.
Diaz, J., Villasenor, A., Morales, J., Pazos, A., Cordoba, D., Pulgar, J., Garcia-Lobon, J. L., Harnafi,M., Carbonell, R., Gallart, J., and TopoIberia Seismic Working Group [2010] “Background noisecharacteristics at the IberArray broadband seismic network,” Bulletin of Seismological Society ofAmerica 100(2), 618–628.
Earle, P. S. [1999] “Polarization of the Earth’s teleseismic wavefield,” Geophysical JournalInternational 139, 1–8.
Friedrich, A., Kruger, F., and Klinge, K. [1998] “Ocean-generatedmicroseismic noise located withthe Grafenberg array,” Journal of Seismology 2, 47–64.
Gerstoft, P. and Tanimoto, T. [2007] “A year of microseisms in southern California,” GeophysicalResearch Letters 34, doi 10.1029/2007GL031091.
Grecu, B., Ghica, D., Popa, M., Rizescu, M., and Ionescu, C. [2002] “Earthquake monitoring by theSeismic Network of the National Institute for Earth Physics,” Revue Roumaine de Géophysique46, 47–57.
Hasselmann, K. [1963] “A statistical analysis of the generation of micro-seisms,” Reviews ofGeophysics 1, 177–209.
Ionescu, C. and Neagoe, C. [2008] “Romanian Seismic Network development,” Acta Geodaetica etGeophysica Hungarica 43(2), 145–152.
Jurkevics, A. [1988] “Polarization analysis of three-component array data,” Bulletin of SeismologicalSociety of America 78, 1725–1743.
Longuet-Higgens, M. S. [1950] “A theory of the origin of microseisms,” Philosophical Transactionsof the Royal Society 243, 1–35.
McNamara, D. E. and Buland, R. P. [2004] “Ambient noise levels in the Continental United States,”Bulletin of Seismological Society of America 94(4), 15717–15727.
McNamara, D. E. and Boaz, R.I. [2005] “Seismic noise analysis system, power spectral density prob-ability density function: Stand-alone software package,” in U. S. Geological Survey Open FileReport, 2005–1438, Washington, D.C.
Marzorati, S. and Bindi, D. [2006] “Ambient noise levels in north central Italy,” GeochemistryGeophysics Geosystems, doi 10.1029/2006GC001256.
Oncescu, M.-C., Marza, V. I., Rizescu, M., and Popa, M. [1999] “The Romanian earthquake cata-logue between 1984–1997,” in Vrancea earthquakes: tectonics, hazard and risk mitigation, ed. F.Wenzel, D. Lungo, and O. Novack ( Kluwer Academic Publishers, Dordrecht), pp. 43–47.
Peterson, J. [1993] “Observations and modeling of background seismic noise,” in U.S. GeologicalSurvey Open-File Report 93–322, Albuquerque, New Mexico.
Schulte-Pelkum, V., Earle, P. S. and Vernon, F. L. [2004] “Strong directivity of ocean-generatedseismic noise,” Geochemistry Geophysics Geosystems 5(3), 10.1029/2003GC000520.
Sheen, D.-H., Shin, J. S., and Kang, T.-S. [2009] “Seismic noise level variation in South Korea,”Geosciences Journal 13(2), 183–190.
Stutzmann, E., Roult, G., and Astiz, L. [2000] “GEOSCOPE station noise levels,” Bulletin ofSeismological Society of America 90(3), 690–701.
Stutzmann, E., Schimmel, M., Patau, G., and Maggi A. [2009] “Global climate imprint on seismicnoise,” Geochemistry Geophysics Geosystems 10(11), doi 10.1029/2007GC002619.
Wessel, P. and Smith, W. H. F. [1998] “New, improved version of the Generic Mapping Toolsreleased,” EOS Transactions of the American Geophysical Union 79, 579.
Dow
nloa
ded
by [
Bog
dan
Gre
cu]
at 1
3:11
26
June
201
2