tensile strength of wet granula materials
TRANSCRIPT

ELSEVIER Powder T~hnology 91 (1997) 83-93 L
Tensile strength of wet granular materials
Patrice Pierrat, Hugo S. Caram * Chemical Engineering Department. Lehigh University. Bethlehem, PA 18015. USA
Received 8 August 1994; revised 19 December 1995
Abstract
The dimensionless tensile strength (rdla of wet granular materials with saturation levels in the plateau region of the pendular state was correlated with the void fraction of the agglomerate. The correlation fitted well with experimental measurements carried out on glass beads of diameter 93/.tin and with literature data. and was an improvement over the traditional Rumpf model. The tensile strength at other saturations could be easily derived from the proposed correlation. The effects of bed height in the tester cell, liquid saturation levels in the agglomerate, chemical additives and non.uniformity of the packing of the powder mass were also investigated.
Keywords: Characterization: Wet solids: Tensile strength
1. Introduction
Tensile strength is an important parameter in powder char- acterization. It can also be combined with the yield locus of a wet granular material to characterize its flow properties. The tensile strength of wet powders can be measured direclly by moans of testing apparatuses available on the market I I= 7], However, it would be of considerable interest to predict its value from easyotoomeasure parameters such as void fraco tion, particle size, etc. A simple model is introduced and compared with tensile strength measurements on wet glass beads. Finally, a new correlation is proposed, allowing for the calculation of the tensile strength of any wet granular material.
2. Adhesion force due to a liquid bridge
. . . . .
Fig,, I, Liquid bridgu bonding two monosiz~d parUcl~s,
concave menisci develop at the surface of the agglomerate. In the pendular state, the maximum tensile force transmitted by a liquid bridge bonding two monosized spherical particles of diameter d and separated by a distance a (Fig. ! ) consists of two components. The first, F~, is due to the surface tension of the liquid at the liquid-particle contact line and is given in dimensionless form as
2. I. Forces acting in a liquid bridge
The interaction between the liquid and the solid in wet granular materials depends on the amount of liquid present. A small quantity of liquid causes liquid bridges to form between the particles of the agglomerate. This state is called the 'pendular state'. By increasing the amount of liquid, the 'funicular state' is obtained where both liquid bridges and pores filled with liquid are present. The 'capillary state' is reached when all the pores are filled with the liquid and
= ,rr sin 0 sin( 0 + 8) ( 1 ) ad
where 0 is the filling angle, and a and 8 are the surface tension and contact angle, respectively, of the wetting liquid.
The second, F~, is due to the curvature of the liquid bridge which creates a pressure difference across the surface:
a-d=1r~ 2 ] ~r* (2)
* Corresponding author, with
0032-5910/9"//$17.00 © 1997 Published by Elsevier Science S.A. All rights reserved Pll $0032-5910 ( 96 ) 03 ! 79-8
g4 P. Pierm¢. If.S. Carom I Po,~der Technology 91 (1997) 83-93
h* h sin0 rl - ~ m - - ~ - + ~ " [sin(0+ ~) - 1] (3)
r~'=rt ( l - c o s 0) +aid d'= 2 cos(0+ B) (4)
where h* and r* are the two dimensionless radii of curvature of the liquid br id~ when ~ e n as arcs of a circle. The exact v a l ~ of the radii of curvature h and rl can be obtained by solving numerically the Laplace Young equation for the sur- face shape, However, Heady and Cahn [ 8] compared the rigorous solution with the one based on the circle approxi- mation and showed that the error was very small in practice.
The total dimensionless force is the sum of the two components:
[ F--A*'ad ¢rsin 0 sin(0+ 6) + - . ~ - (5)
Combining Eqs. (3), (4) and (5). one can see that the dimensionless bonding force is only a function of the contact and filling angles and the dimensionless separation distance. The filling angle is determined by the moisture content x,, defined as the ratio of the mass of liquid to the mass of dry particles. It is given by the following relation:
(6) m~,. V,,,ip,~ "r~ ~16 P.,I 1, 2 ~ P,,,I
where k is the mean number of contact points per particle or the mean coordination number, Vh.~ is the volume of the liquid bridge, and/~,q and P~,t are the liquid and panicle densities, respectively. Tbe~ arc several models, reviewed by Mebrotra and Sastry 19 ], for the calculation of the liquid bridge volume, Pietsch and Rumpf [ 10] gave the following expression, assuming r~ to be a constant:
Ir :+ (r? +h*):] rr cos(O÷#)
tosS(0+ r :(ri' +h*) 3
x Ices (O+ ' ) sin(O+') ( 2 - O-/~)]
I - 2~ (2 +cos O)( I -cos O): (7)
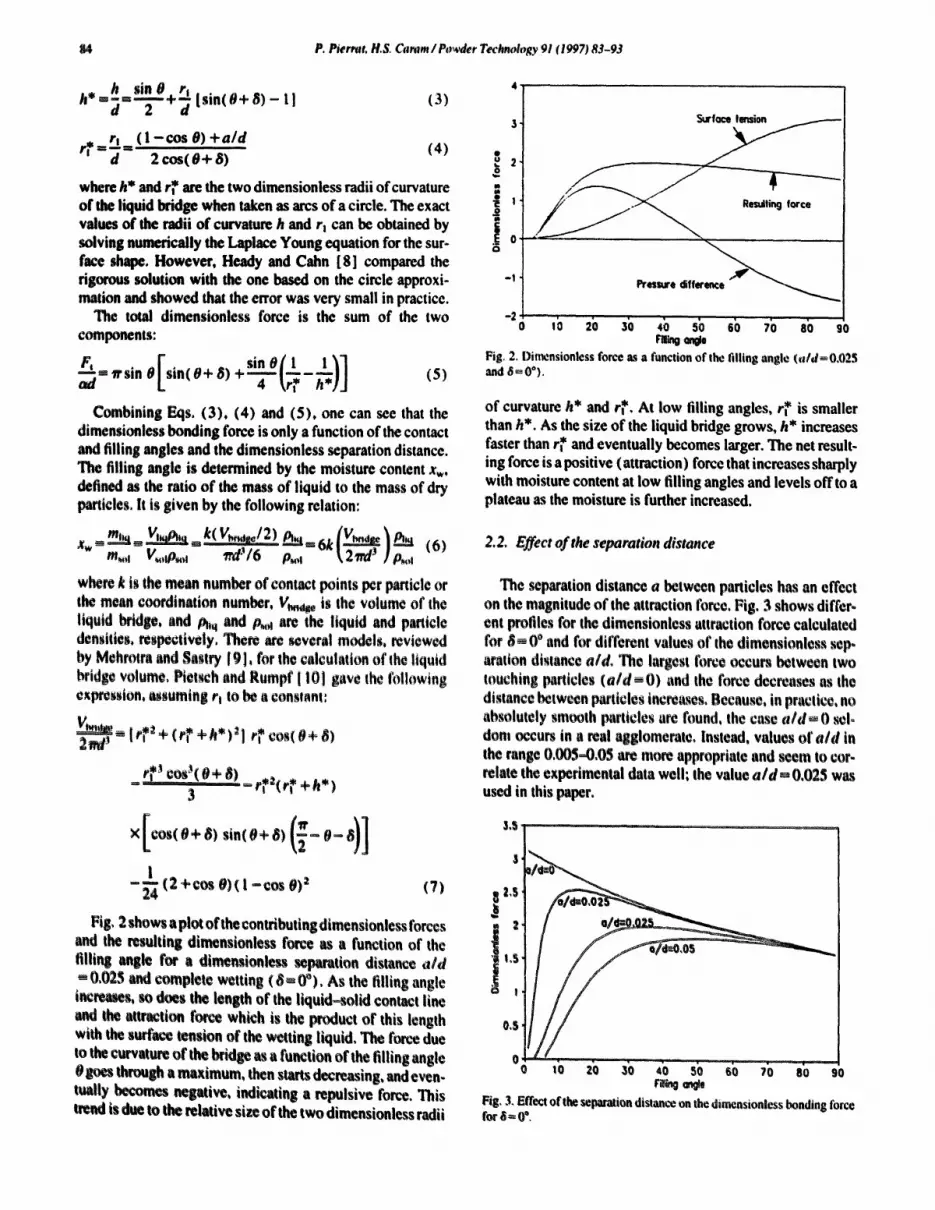
Fig, 2 shows a plot ofthe contributing dimensionless forces and the resulting dimensionless force as a function of the filling angle foe a dimensionless separation distance aid - 0,02S and complete wetting (~-0°) , As the filling angle i~reases, so ~ the length of the liquid-solid contact line and the auraction force which is the product of this length with the surface tension of the wetting liquid, The force due to the curvature ofthe bridge as a function ofthe filling angle OBoes through a maximum, then starts decreasing, and even- really becomes negative, indicating a repulsive force, This trend is due to the relative size of the two dimensionless radii
4
o 3 $ u r ~
• | / .
o
-1 Pressure differ
-2o ,b sb d) fi) ab so ra~ ~ ,
Fig. 2. Dimensionless force as a function of the filling anglo (~dd ~ 0,025 and ,S-, 0°).
of curvature h* and r*, At low filling angles, r~ is smaller than h*. As the size of the liquid bridge grows, h* increases faster than r* and eventually becomes larger. The net result- ing force is a positive (attraction) force that increases sharply with moisture content at low filling angles and levels off to a plateau as the moisture is further increased.
2.2, Effect of the separation distance
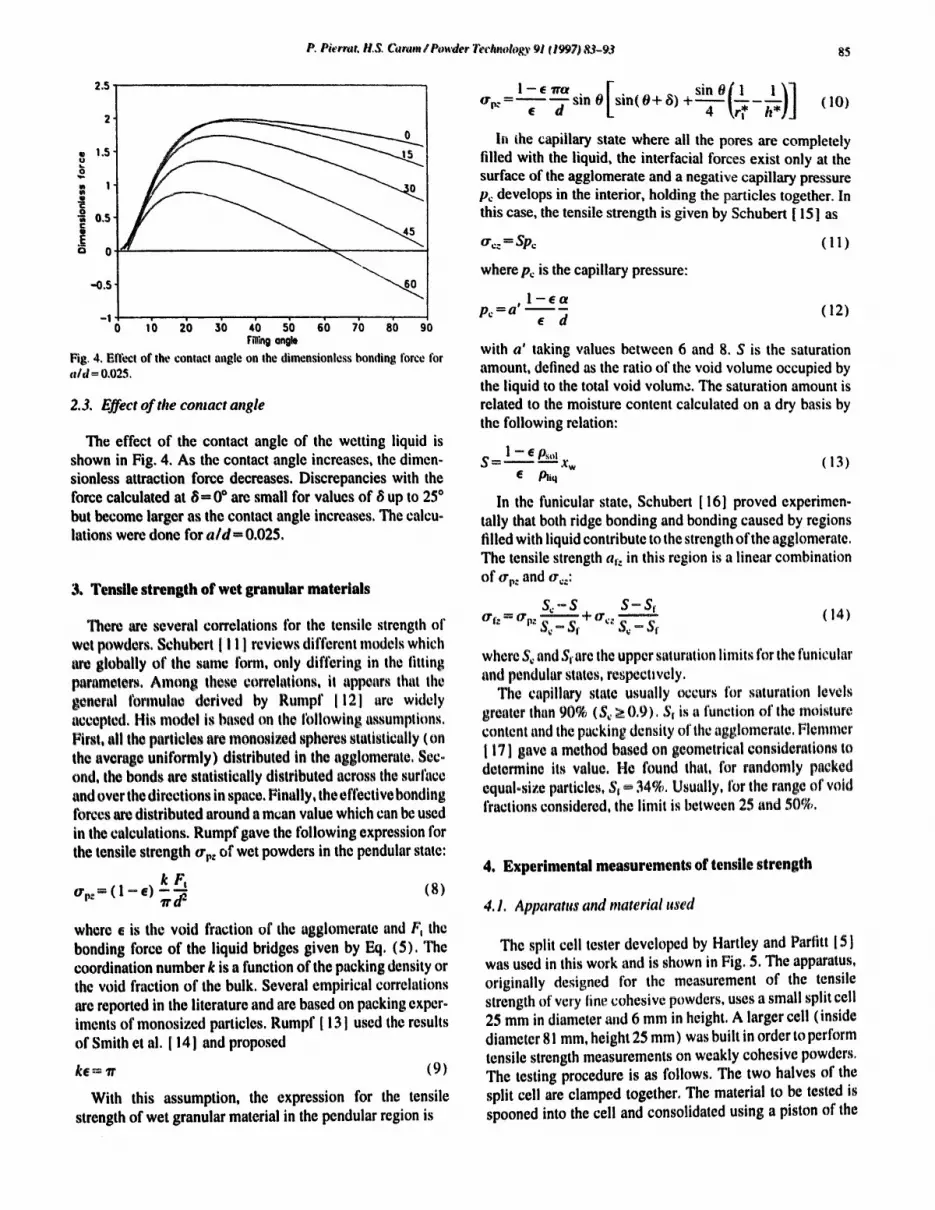
The separation distance a between particles has an effect on the magnitude of the attraction force. Fig. 3 shows differ,. ant profiles for the dimensionless attraction force calculated for 6 - 0 ~ and for different values of the dimensionless sep- aration distance aid, The largest force occurs between two touching particles ( a i d - O ) and the force decreases as the distance between particles increases, Because, in practice, no absolutely smooth particles are found, the case a i d - 0 sale dent occurs in a real agglomerate. Instead, values of aid in the range 0,005~0,05 are more appropriate and seem to cor- relate the experimental data well; the value a id m 0,025 was used in this paper.
3
Z,S
! I,$
!
0,$
0 9 10 20 30 40 50 60 70 80 SO
m~ an~e Fig, 3, Effect of the separation distance on the dimensionless bonding force for ~ 0 ~ .
P, Pierrat. tI, S, Carom/Powder lYehnology 91 ¢ ! ~ ? ) 83-93 85
2.5
g
0.5
Q 0
-0,5
- I
0
45
0 ,'0 2i) 3i) 4i) sb sb 7~ 8o 90 Fgling angle
Fig, 4. Bfl~cl of the contacl angle on the dimensionless bonding force for a i d ~ 0,025.
2.3. Effect of the comact angle
The effect of the contact angle of the wetting liquid is shown in Fig. 4. As the contact angle increases, the dimen- sionless attraction force decreases. Discrepancies with the force calculated at 6 - 0 * are small for values of 8 up to 25* but become larger as the contact angle increases. The calcu- lations were done for a/d-- 0.025.
3. Tensile strength o f wet granular materials
There are several correlations Ibr the tensile strength of wet powders. Schubert [ I I ] reviews different models which are globally of the same tbrm, only differing in the fitting parameters, Among these correlations, it appears that tl~e general ibnnulae derived by Rumpf 1121 arc widely accepted, His model is based on the lollowing assumptions. First, all the particles ar~ monosized spheres statistically (on the average uniformly) distributed in the agglomerate. Sec- ond, the bonds are statistically distributed across the surlhce and over the directions in space. Finally, the effective bonding forces are distributed around a mean value which can be used in the calculations. Rumpf gave the tbllowing expression for the tensile strength O'p~ of wet powders in the pendular state:
kF, o'p:== ( l - ¢) - ~ (8)
where E is the void fraction of the agglomerate and F~ the bonding force of the liquid bridges given by Eq. (5). The coordination number k is a function of the packing density or the void fraction of the bulk. Several empirical correlations are reported in the literature and are based on packing exper- iments of monosized particles. Rumpf [ 131 used the results of Smith et al. [ 141 and proposed
ke='n' (9)
With this assumption, the expression for the tensile strength of wet granular material in the pendular region is
1 - ¢ "t'ra [ sin 0 ( ~ / ~ ) ] °'r~ = ~ - -d sin 0 sin( 0 + ~) + - - -~ - (10)
In the capillary state where all the pores are completely filled with the liquid, the interracial forces exist only at the surface of the agglomerate and a negative capillary pressure p, develops in the interior, holding the particles together. In this case, the tensile strength is given by Schubert [ 15] as
o'c:=Spc ( I I )
where pc is the capillary pressure:
pc =a ' ~ - (12) ,~ d
with a ° taking values between 6 and 8. S is the saturation amount, defined as the ratio of the void volume occupied by the liquid to the total void volume. The saturation amount is related to the moisture content calculated on a dry basis by the following relation:
1 - ¢ P,~,,I S = ~ m x w (13)
Pliq
In the funicular state, Schubert [16] proved experimen- tally that both ridge bonding and bonding caused by regions filled with liquid contribute to the strength of the agglomerate. The tensile strength at: in this region is a linear combination of ~rp: and o'~;
S~ - S S - St' o',,~, = O'p~ S~ - S----~ + o',,; S~ - St ( ! 4)
where S~ and St are the upper saturation limits for tile funicular and pendular states, respecttvely.
The capillary state usually occurs for saturation levels greater than 90% (S~ > 0.9). St is a function of the moisture content and the packing density of tile agglomerate. Flemmer [ 17] gave a method based on geometrical considerations to determine its value. He found that, for randomly packed equal-size particles, St ~ 34%. Usually. Ibr the range of void h'actions considered, the limit is between 25 and 50%.
4, Experimental measurements of tensile strength
4. !, Apparatus and material used
The split cell tester developed by Hartley and Parfitt [5] was used in this work and is shown in Fig. 5. The apparatus, originally designed for the measurement of the tensile strength of very line cohesive powders, uses a small split cell 25 mm in diameter and 6 mm in height. A larger cell (inside diameter 81 mm, height 25 mm) was built in order to perform tensile strength measurements on weakly cohesive powders. The testing procedure is as follows. The two halves of the split cell are clamped together. The material to be tested is spooned into the cell and consolidated using a piston of the

86 P. Picrrat. H$. Cams / Powder Technology 91 (1997) 83-93
1200 ~
, . ,oooltitt !
+ I t 400 1 1
O S IS 25 $ IS 25 S IS 25 S IS 25 S IS 2S
Rig+ 5. Patti, tensile strength t.~tter: A+ split cell: B+ clamp; C. positioning Fig. 6+ Measured tensile strength as a function of the bed height in the cell clamps: D, fixed base; E. movable base; F and i. ball bearings; G. inchworm (saturation - !2% and e- 0,438), ~,-,~1~o.-: H. force transducer.
Table I Smfa,'e tension of the w+tttng liquids
Wetting sohnion Renex Aquashed SLS Zoflyl Water Surface lenslon (N/m) 0+020 0.032 0.0347 0,0384 0.072
same diameter as the inside diameter of the cell. Some twists are applied to the piston so the particles can rearrange and reorientate themselves, breaking any air pockets that could be present in the bulk. Once the a l l is filled, it is fastened on the split b m and the clamp is removed. The translator is turned on, pulling the half of the bah that is posting on ball beings. The force needed to fracture the sample is measu~ by a f~t~e tranMucer and ~orded+ The tensile s~ngth is obtained by calculating the ratio of the fracture force to the ~He~fional area of the sample in the cell. Experiments were ~trried out on glass beads of average diameter 93 l+m with a density of 2 , ~ gtcm ~, The ~ p l e s were tested at different moisture contents corresponding to different sara+ ration levels in the pendul~ region and wetted with water and different surfactants, The suffactants used with their surface tensions in solution with water are given in Table I. The cont~t angles ofthe solutions with the glass beads were taken to be equal to zero+
,~.2. react o/ tke bed keieht
Schubert [ l I 1, who conducted some tensile strength meas- urements on wet powders with a split~ell apparatus of his own design, found that the height of the bed in the cell affects the value of the measured tensile strength. He stated that the elongation of ~ material responiible for the tensile resis+ lance in ~ vicinity of the slit in the plate decreases towards the top surface of the material where the ~ is smaller. Tberefot~ an i t g ~ in the height of the sample d~s not contribute to the fracture force that must be applied, but t, nly iac~,~Bes the ¢wou-sectional area, leading to a smaller tens,le force per unit area. He recommended that several measme-
ments should be performed at different sample heights, extrapolating to zero height to determine the actual tensile strength. Zero height corresponds to the location where the fracture initiates before propagating upwards through the bed. Fig. 6 shows the measured values of the tensile strength of glass beads wetted with different solutions as a function of the height of the bed in the cell. The experiments were carried out on samples at a saturation of 12% and with a void fraction of 0.438. Eight measurements were performed for each ofthe five bed heights considered and the recorded tensile forces were averaged and divided by the fracture plane area to give the tensile strength. The horizontal bars represent the average values and the veNi¢~l bars indicate the 95% confidence inter. vats, Contrary to Schubert's observations, the tensile strength did not increase as the bed height decreased except for sam~ pies wetted with the Renex (ICI Surfactants, Wilmington, DE) solution+ For water and the Aquashed (Chemlink, AUi+ son Park, PA) solution, the tensile strength seemed to decrease with the bed height. The SLS (SAP Bulk Chemicals, Saint Louis, Me) and Zonyl (Dupont, Wilmington, DE) solutions exhibited constant values. For samples wetted with Zonyl, measurements could not be done at bed heights less than I0 mm because the recorded tensile force was too small and very inconsistent. Overall, reproducibility of the meas- urements was good since the 95% confidence interval was no more than 10% of the average value. As a general trend, if one measurement at one bed height is disregarded for each sample wetted with the five different solutions, the tensile strength seems to be constant, indicating that it does not vary with the bed height. Consequently, extrapolation to zero height should not be necessary and measurements at one selected bed height should be sufficient to determine the ten- sile strength of the powder investigated. As shown later, the results obtained here are also supported by the measurements of the tensile strength of samples with mixed void fractions. In the later experiments, tests were performed on samples with a compacted bed height of 20 mm.
P. Pierrot, H,S, Cumm / Pmt~ler Technoh~gy 91 (199"/)83-93 87
Table 2 Comparison of the ratios of tensile strengths and surface tensions
Wetting Water Zonyl Renex Aquasht.nl SLS solution
o ' : ~ (N/m 2) 1007.6 229.4 467.4 496.0 531.2 er: ~,J o'.~ w,I,.,~ I 0.228 0A64 0.492 0.527 et~lo~,a~ I 0.278 0.444 0.482 0.533
4.3. Effect of additives on the tensile strength
Since the tensile strength is not a function of the bed height, the average tensile strength o'.~ a,, for each wetting liquid was calculated from all the measurements at different heights. In order to verify the proportionality of the tensile strength to the surface tension of the wetting liquid, the computed aver- age values o'~ ~ot were divided by the average value of the tensile strength o" z ~,,,t~ of the powder wetted with water and compared with the ratio of the surface tension of the wetting liquid, ef~,,~, to that of water, awat,,. The results are given in Table 2. As expected from Eq. (10), the results show the proportionality between the tensile strength and the surface tension of the wetting liquid since the calculated ratios are almost identical and the discrepancies within experimental e r r o r .
4.4. Effect of saturation on the tensile strength
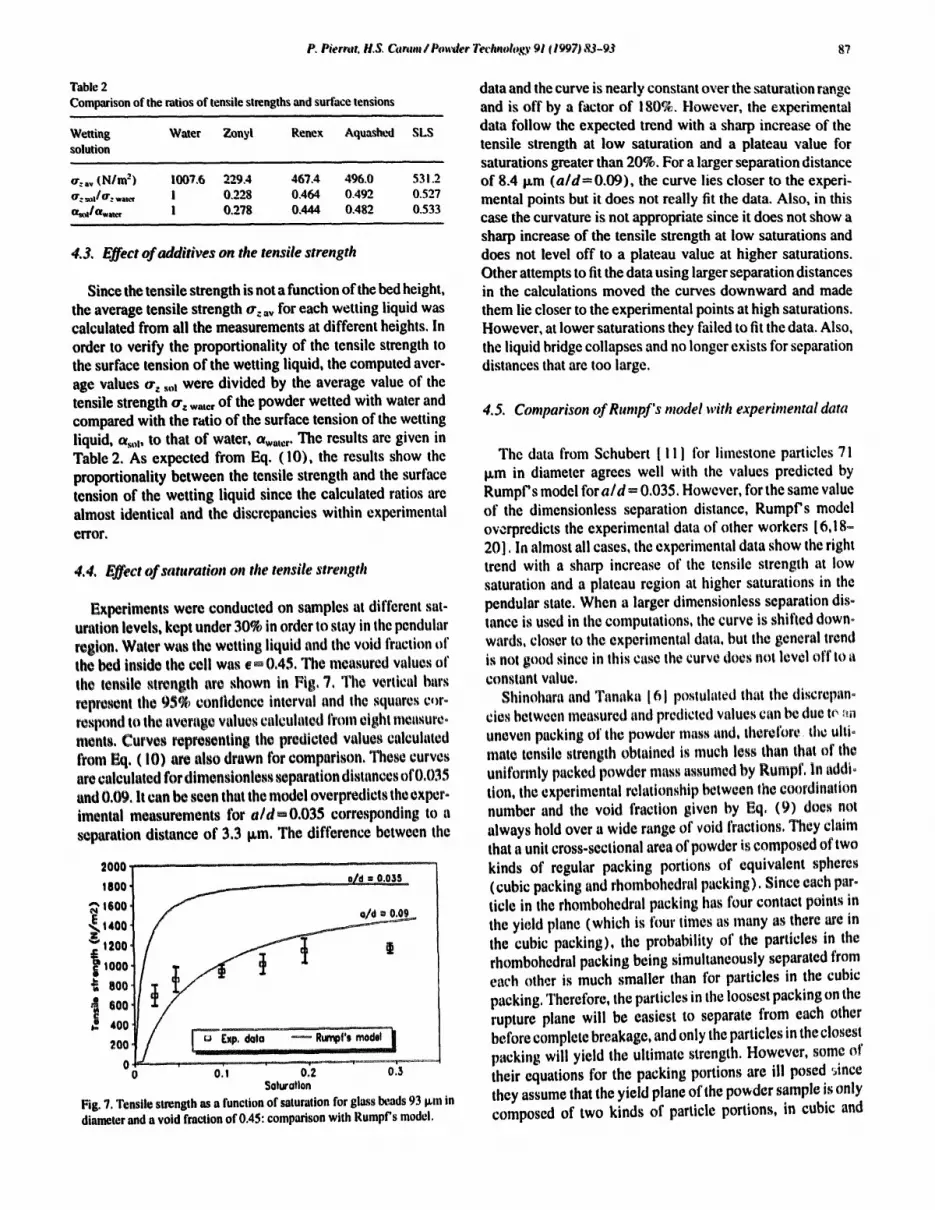
Experiments were conducted on samples at different sat- uration levels, kept under 30% in order to stay in the pendular region, Water was the wetting liquid and the void fraction of the bed inside the cell was e ~ 0.45. The measured values of the tensile strength are shown in Fig, 7. The vertical bars represent the 95% conlidenee interval and the squares c,)r- respond to the average values calculated from eight measure- meats, Curves representing the predicted values calculated from Eq. (I0) are also drawn for comparison. These curves are calculated for dimensionless separation distances of 0.035 and 0.09. It can be seen that the model overpredicts the exper- imental measurements for ald-O.035 corresponding to a separation distance of 3.3 p,m. The difference between the
2000 ]
1800
~' t6oo
~,ooo-~
_ _ o/'d = 0.03S
|
i: i I o . . . . . .
o 0.! 0.2 0.5 $olurotlon
Fig. 7. Tensile strength as a function of saturation for glass beads 93 pan in diameter and a void fraction of 0.45: comparison with Rumpf's model.
data and the curve is nearly constant over the saturation range and is off by a factor of 180%. However, the experimental data follow the expected trend with a sharp increase of the tensile strength at low saturation and a plateau value for saturations greater than 20%. For a larger separation distance of 8.4 p.m (aid= 0.09), the curve lies closer to the experi- mental points but it does not really fit the data. Also, in this case the curvature is not appropriate since it does not show a sharp increase of the tensile strength at low saturations and does not level off to a plateau value at higher saturations. Other attempts to fit the data using larger separation distances in the calculations moved the curves downward and made them lie closer to the experimental points at high saturations. However, at lower saturations they failed to fit the data. Also, the liquid bridge collapses and no longer exists for separation distances that are too large.
4.5. Comparison of Rumpf's model with experimental data
The data from Schubert [ I ! i for limestone particles 71 p,m in diameter agrees well with the values predicted by Rumpf's model for aid-0.035. However, for the same value of the dimensionless separation distance, Rumpf's model overpredicts the experimental data of other workers [6,18- 20]. In almost all cases, the experimental data show the right trend with a sharp increase of the tensile strength at low saturation and a plateau region at higher saturations in the pendular state. When a larger dimensionless separation dis- tance is used in the computations, the curve is shifted down- wards, closer to the experimental data, but the general trend is not good since in this case the curve does not level off to a constant value.
Shinohara and Tanaka 161 postulated that the discrepano ties between measured and predicted values can be due t~ ~m uneven packing of the powder mass and, therefore the ultio mate tensile strength obtained is much less than that of the uniformly packed powder mass assumed by Rumpf, In addle tion, the. experimental relationship between the coordination number and the void fraction given by Eq. (9) does not always hold over a wide range of void fractions. They claim that a unit cross.sectional area of powder is composed of two kinds of regular packing portions of equivalent spheres (cubic packing and rhombohedral packing). Since each par- ticle in the rhombohedral packing has four contact points in the yield plane (which is tk)ur times as many as there me in the cubic packing), the probability of the particles in the rhombohedral packing being simultaneously separated from each other is much smaller than for particles in the cubic packing. Therefore, the particles in the loosest packing on the rupture plane will be easiest to separate from each other before complete breakage, and only the particles in the closest packing will yield the ultimate strength. However, some of their equations for the packing portions are ill posed ~ince they assume that the yield plane of the po~der sample is only composed of two kinds of particle portions, in cubic and
88 P. Pierm~, H.S, Caram I Powder Tec~logy 91 (1997) 83-93
dtombohedral pacing, R~ and R, respectively, but the sum of t ~ c a l c u ~ portions, Rc + R~, is not equal to unity.
4.6. F_~ec¢ of ~ packing density on the tensile strength
The effect of the packing density or the void fraction of the powder mass on the tensile strength was investigated. We
Eq. (8) here:
iF,
From Eqs. (3 ) - (7) and (9), we find
a, a/d. x., e) ( t 5 )
However, the dimensionless separation distance aid is a constant and the contact angle 6 can be assumed constant for a given liquid in contact with a given surface. Therefore, for a given moisture con~nt x,, F, lad or F¢ is only a function of e. However, the dependence on e is very small since achange in the void fraction will only affect the coordination number or the number of liquid I~,dges in con~ t with each panicle according to Bqi. (9). This will slighdy modify the size of the liquid bridge and barely affects the resulting attraction force. This is shown in Table 3 where the dimensionless attraction force is calculated at different void fractions. Therefore, F~ c a n be taken as constant and Eq. (8) can be rewritten as follows:
~ ~-"~ K (16) e
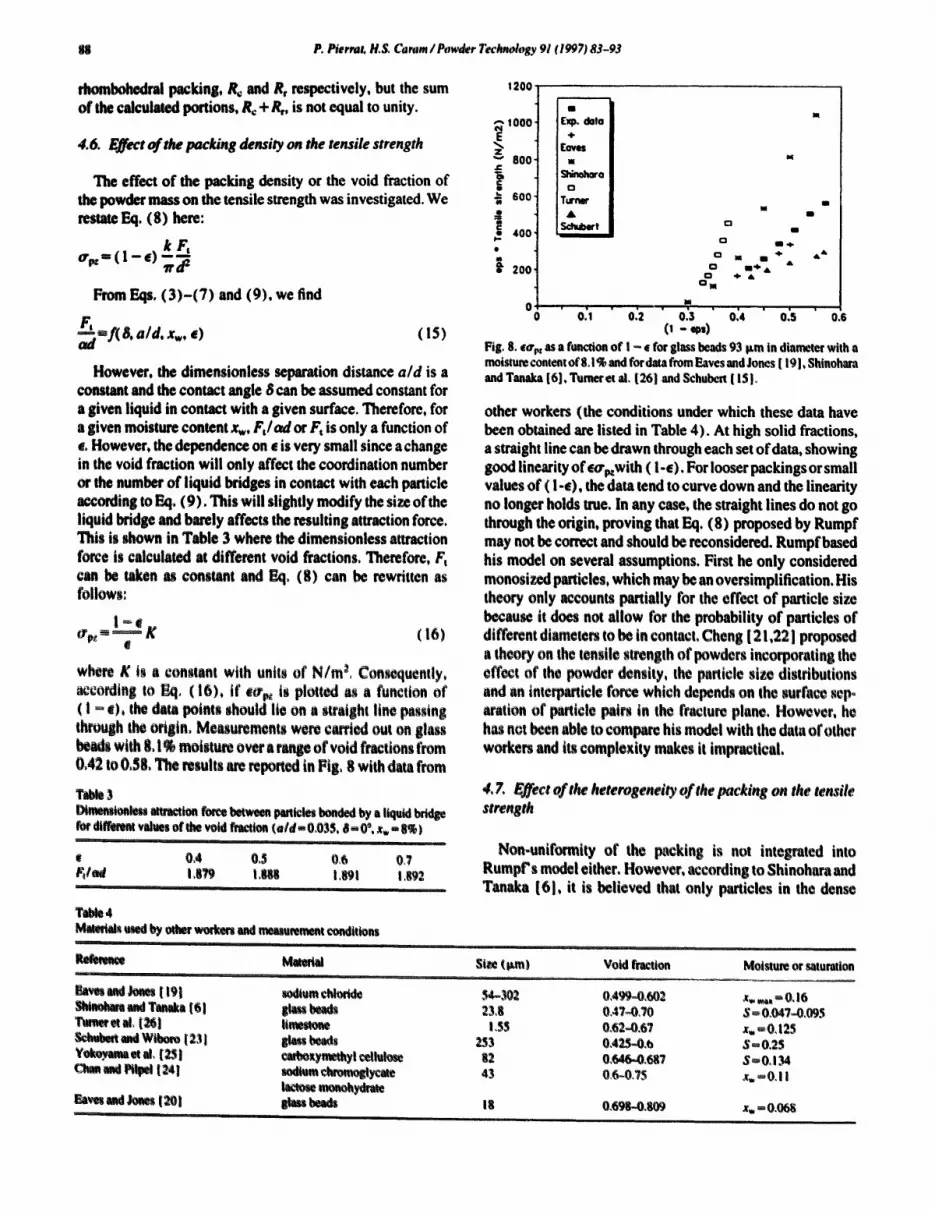
where K i~ a constant with unite of N/m ~, Consequently, ~cordin~ to ~1. (16), if ~o~ is plotted as a function of ( I ~ e)0 the data points should lie on a straight line passing through the origin, Measurements were c m t ~ out on 81ass beads with 8, 1% moisture over a range of void fractions from 0,42 to 0,58. The results are reported in Fig, 8 with data from
Table 3 I)tmeMtoMe~ ~'i ict ioa force between panicles bonded by a liquid bridge for d t ~ t v~lues of the void ff~tion ( a ld - 0,035. ~ - 0 ~. x , - 8% )
e 0.4 0,5 0 6 0,7 ~tet4 1.8~ t .8~ 1.891 1,892
1~)1e4 .sed I~ other workers ~ me~remem ~ l t U o M
1200
~ 1o0o
"" 800' i.,
-- 600 i
; ! m
2004
IB
E~p. data +
Eaves m
ShinoMra 0
T u r n e r
SchUbert r-1
C3
O m I I C3 R - b d L
1:3 + A Q I m
IB
I + +
A
I l l lib
dk &
Im
° o ' o ' , ' o '2 ' ' o.'4 ' o :s ' o.6 0 - ~ , )
Fig. 8. ,arp: as a function of I - • for glass beads 93 p.m in diameter with a moisture contain of 8. ! % and for data from Eaves and Jones [ 19 !, Shtnohara and Tanaka 16], Turner et ai. [261 and Schubert [ 151.
other workers (the conditions under which these data have been obtained are listed in Table 4). At high solid fractions, a straight line can be drawn through each set of data, showing good lineadty of eor~with ( i -e). For looser packings or small values of ( I-e), the data tend to curve down and the iinearity no longer holds true. In any case, the straight lines do not go through the origin, proving that Eq. (8) proposed by Rumpf may not be correct and should be reconsidered. Rumpfbased his model on several assumptions. First he only considered monosized particles, which may be an oversimplification. His theory only accounts partially for the effect of particle size because it does not allow for the probability of particles of different diameters to be in contact. Chang [ 21,22 ] proposed a theory on the tensile strength of powders incorporating the eff~t of the powder density, the particle size distributions a ~ an interparticle force which depends on the surface sap° aration of particle pairs in the fracture plane, However, he ha~s n~t been able to compare his model with the data ofother workers and its complexity makes it impractical.
4. Z £ffect of the heterogeneity of dle packing on the tensile s(rength
Non~unifomdty of the packing is not integrated into Rumpf's model either. However, according to Shinohara and Tanaka [61, it is believed that only particles in the dense
Rettlen~ Malarial $ I~ (tun) Void fraction Moisture or saturation
kve~ ~ Joael [ 191 so~um chloride ~ 3 0 2 0,499`0,602 x , ~ - 0 . 1 6 ~ ; m 4 Temka 161 j l ~ be~ 23.8 0.4?`0.70 S- 0~047`0.095 Tmwer et ~!. (26] llmeeloM 1.55 0.62-0.67 x, ~ 0.125
~ Wtboeo [ 23 ] ~ beads ~3 0A25`0.b $- 0.2S Yekoymmet eL [~ l ¢abo~mwtkyl cellulose 82 0~6~/6~.687 S-0.134 CIm mid PtlFel ( 24 | wdlum ~m~,t~e~e 43 0,6~.75 x. ~ O. I I
~ e moe~yclr~e ISavet ~ ~ I~ l ~ ~ 18 0.08-0.809 x,, - O.06S
P. Pierrat, H,S, Caram / Powder Technology 91 f1997j ~3-93 89
Table 5 Tensile strength of heterogeneously packed samples with an overall void fraction of 0.52
Test no, I 2 • bottom (7 mm) 0.43 0A6
top ( 13 mm) 0.57 0.55 overall I[20 ram) 0.52 0.52
3 0.49 0.54 0.52
4 0.52 0.52 0.52
Tensile strength (N/m'-) 728.5 568.8 690.7 665.5
Table 6 Measured tensile forces ( in gram-force) for the heterogeneously packed samples and the 7 mm samples
Void fraction at bottom of cell 0.43 0.46 0.49 0.52
Heterogeneous sample (7 mm+ 13 ram) 120,3 ?mm sample 74.2 Ratio (%) 61,7
93.9 114, ! 108.7 56.8 49,7 41.4 60.5 43.6 38. I
packing are responsible for the tensile strength of a powder. Experiments were performed in order to determine the tensile strength of heterogeneously packed samples. The bottom part of the cell was packed at different void fractions (0.43, 0.46, 0.49 and 0.52) over a height of 7 mm and the rest of the cell was filled with more powder in order to reach a total bed height of 20 mm and an overall void fraction of 0.52. The results are given in Table 5. It can be seen that the measured tensile strengths are different for each test even though the overall void fraction in the cell is the same. The value of the tensile strength is the highest for test I with the densest pack- ing in the bottom of the cell. Except for test 2, the tensile strengths of the heterogeneously packed samples are higher than those of the homogeneously packed one. This shows that the tensile strength of a material depends on how the material is packed.
Next, eXl~riments were conducted on s~tmples with void fractions of 0.43, 0.46, 0,49 and 0.52 with a bed height cff 7 ram. The tensile force needed to split the cell was recorded and compared with that required to break the heterogeneously packed samples in order to determine the contribution of the dense fraction to the tensile force. The ratio of the tensile force of the 7 mm sample to that of the heterogeneously packed one was also calculated. The results are shown in Table 6. The calculated ratios show that the dense packing fraction makes a large contribution to the tensile force and the highest ratio is for the highest packing. Table 6 also shows that the force needed to separate the cell is always greater for the heterogeneously packed sample with a bed height of 20 mm than for the 7 mm sample. This supports the fact that, contrary to Schubert's statement, the material in the upper part of the cell also contributes to the strength of the powder. Therefore, as mentioned earlier, it is reasonable to assume that the tensile strength dot:~ not vary with the bed height and that extrapolation to zero height is not necessary.
Finally, assuming that the tensile strength of the hetero- geneously packed sample is a linear function of the tensile strengths of the two portions, the tensile strength was calcu- lated from the tensile strengths measured in homogeneously
Table 7 Measured and calculated tensile strengths (in N/m") for heterogeneously packed samples
• rest no. I 2 3 4 Calculated 713,0 683.5 688.0 655.5 Measured 728.5 568.8 690.7 665.5
packed samples, taking into account the respective sizes of the two portions in the fracture plane. Our measurements, which were performed on glass beads with a moisture content of 8. 1%, are reported in Fig. 8. They were fit by the following relation:
e~rl, ~ ~ 2477( ! - e) - 843 (17)
The above relation allows for the calculation of ~rl~ at the required values of e. The calculated values are compared with those measured experimentally and the results are given in Table 7. Except for test 2, the calculated and measured values of the tensile strength match. This indicates that the tensile strength of a heterogeneously packed sample is a linear come bination of the tensile strengths of the different portions preso ent in the sample. This is not in agreement with the statement of Shinohara and Tanaka who claimed that only the densest packed fraction contributed to the ultimate tensile strength.
[;. Universal correlation
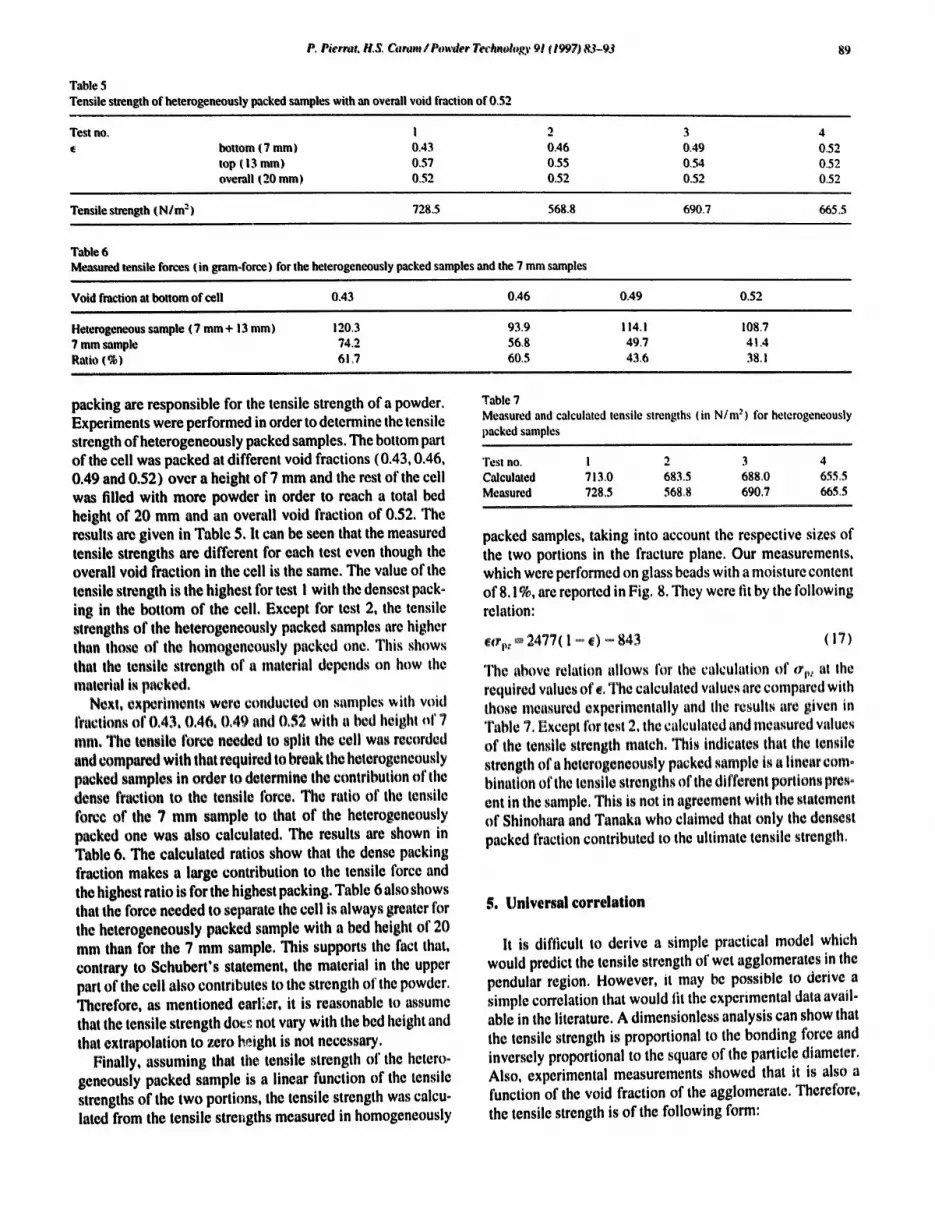
It is difficult to derive a simple practical model which would predict the tensile strength of wet agglomerates in the pendular region. However, it may be possible to derive a simple correlation that would tit the experimental data avail- able in the literature. A dimensionless analysis can show that the tensile strength is proportional to the bonding force and inversely proportional to the square of the particle diameter. Also, experimental measurements showed that it is also a function of the void fraction of the agglomerate. Therefore, the tensile strength is of the following form:
P. Pierrat, H,£ C*aram/Powder T ~ o g y 91 (1997)&~-93
~ 1.s lob,. ~ 1.4
1.2 m
1
I0"1 - ' 0,$
0.4
°o oJ~ oJ= oJs o;2' o;s oJs oJ7 o~'a oJt Void fraction
l~g. 9. ~ o n l ~ tensile smm~h ua/das a run.ion ohhe void ~r~ion ~e for diffemtN powders with saturation in the p t~e~_,_, region of the p e a d ~ sfl~.
o'p; ~f(e) -~ (18)
Using Eq. (15).
-d r ( ~. aid, x., e) (19)
or, for the dimensionless tensile strength or*.
~. .~_m~.f( 8, a/d. x., ~) (20)
For a given wetting liquid, the contact angle B is constant. a/d is also constant and therefore o'* depends only on x~ and e Moreover, in the plateau region of the pendular state, the tensile strength and, therefore, o'* do not vary when the moisture content is changed, Consequently, in the plateau region of the pendul&r state, o'* is only a function of ¢,
Data from different workers (see Table 4 for references, material ch~teristics and ~ e n t conditions) were col lec~ and ~ri~dla was plotted as a function of e for pow- ders with saturation amounts in the plateau region of the pendular slate as shown in Fig. 9. The data were fit by the following relation:
~ , . ~_e~, 7.80( l - e) ~o~ (21)
Eqs. (g) and (9), derived from Rumpf's model, can be combined together to give
I - e F~
Table 3 indi~tes that for a moisture content corresponding to the plateau region of the penduler state, the attraction force F, is given by
F! ~ l.gad ( 23 )
for a dimensionless sepm'ation distance ald: 0.035 and is independent of the void fraction of the agglomerate.
The dimensionless tensile strength is then
ord 1 - e --== 1.9 ' (24) ¢1 •
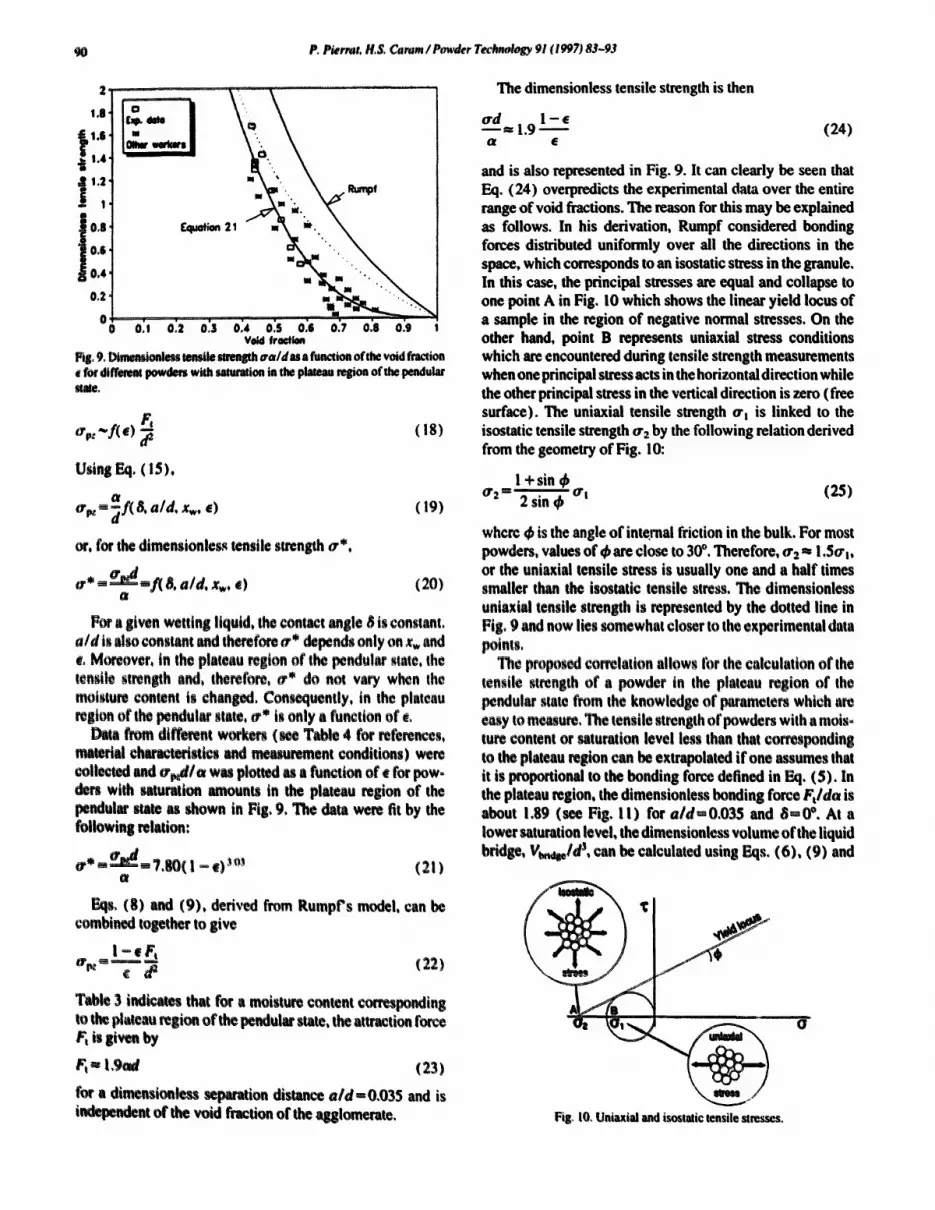
and is also represented in Fig. 9. It can clearly be seen that Eq. (24) overpredicts the experimental data over the entire range of void fractions. The reason for this may be explained as follows. In his derivation, Rumpf considered bonding forces distributed uniformly over all the directions in the space, which corresponds to an isostatic stress in the granule. In this case, the principal stresses are equal and collapse to ore point A in Fig. 10 which shows the linear yield locus of a sample in the region of negative normal stresses. On the other hand, point B represents uniaxial stress conditions which are encountered during tensile strength measurements when one principal stress acts in the horizontal direction while the other principal stress in the vertical direction is zero (free surface). The uniaxial tensile strength o't is linked to the isostatic tensile strength or 2 by the following relation derived from the geometry of Fig. I0:
I + sin or: = 2 sin ~ or, (25)
where ~ is the angle of internal friction in the bulk. For most powders, values of 4,are close to 30 °. Therefore, ¢r2 m 1.50",, or the uniaxial tensile stress is usually one and a half times smaller than the isoslatic tensile stress. The dimensionless uniaxial tensile strength is represented by the dotted line in Fig. 9 and now lies somewhat closer to the experimental data points.
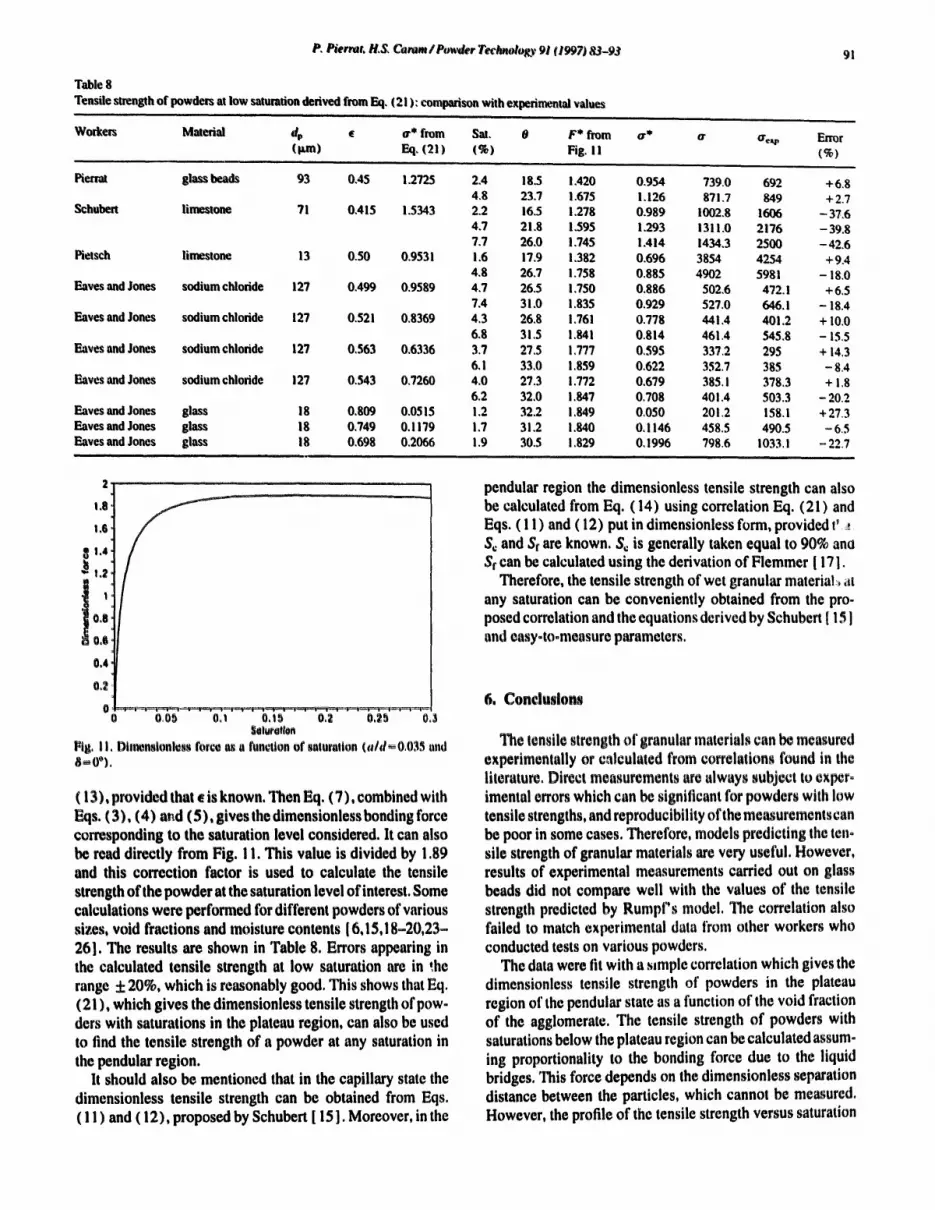
The proposed conelation allows Ibr the calculation of the tensile strength of a powder in the plateau region of the pendular slate from the knowledge of parameters which are easy to measure, The tensile strength of powders with a mois° turn content or saturation level less than that corresponding to the plateau region can be extrapolated if one assumes that it is proportional to the bonding force defined in Eq. (5). In the plateau region, the dimensionless bonding force Ft/da is about !.89 (see Fig. II) for a/riB0.035 and BB0 °. At a lower saturation level, the dimensionless volume ofthe liquid bridge, Vbnd_~ld ~, can be calculated using Eqs. (6), (9) and
Fig, I0. Uniaxial and isostatic tensile stresses.
P, Pierrot. H,S, Carom l Powcler Teclmololo, 91 fl997) 83-93
Table 8 Tensile strength of powders at low saturation derived from Eq, (21): comparison with experimental values
91
Workers Material dp • at* from Sat, 0 F* from ~r* a~ orcq, En~ (pro) F,q, (21) (%) Fig. I I (%)
Pietrat glass beads 93 0.45 1.2725 2.4 18.5 I A20 0.954 739.0 692 + 6.8 4.8 23.7 1.675 !. 126 871.7 849 + 2.7
Schubert lime.stone 71 0.415 1.5343 2.2 16.5 1.278 0.989 1002.8 1606 - 37.6 4.7 21.8 1.595 1.293 1311.0 2176 - 39.8 7.7 26.0 1.745 I AI4 1434.3 2500 - 42.6
Pietsch limestone 13 0.50 0,9531 1.6 17.9 i.382 0.696 3854 4254 + 9.4 4.8 26.7 1.758 0.885 4902 5981 - 18.0
Eaves and Jones sodium chloride 127 0.499 0.9589 4.7 26.5 i.750 0.886 502,6 472. I + 6.5 7.4 31.0 1.835 0.929 527.0 646. I - 18.4
Eaves and Jones sodium chloride 127 0.521 0.8369 4.3 26.8 !.761 0.778 441.4 401.2 + 10.0 6.8 31,5 !.841 0.814 461,4 545.8 - 15.5
Eaves and Jones sodium chloride 127 0.563 0.6336 3.7 27.5 1,777 0.595 337.2 295 + 14.3 6, I 33.0 1.859 0.622 352.7 385 - 8,4
Eaves and Jones sodium chloride 127 0.543 0.7260 4.0 27.3 1.772 0.679 385. I 378.3 + 1.8 6.2 32.0 1.847 0.708 401.4 503.3 - 20,2
Eaves and Jones glass 18 0,809 0.0515 1,2 32.2 1.849 0,050 201.2 158. i + 27.3 Eaves and Jones glass 18 0.749 0.1179 1.7 31.2 1.840 0.1146 458.5 490.5 - 6.5 Eaves and Jones glass 18 0,698 0.2066 i .9 30.5 ! .829 0,1996 798,6 i 033. I - 22.7
1.8
1,6
$1.4 1.2
I'1 0.8
0o6
0'4 L
0 0,05 O,I 0,1[} 0,3 O,2b 0,3 $o|ufdt|otl
Fig, II, Dil~nsionlcss force as a functton of saturation (atd~O,O3A and ,S-0').
(13), provided that ¢ is known. Then Eq. (7), combined with Eqs. ( 3 ), (4) a~.d (5), gives the dimensionless bonding force corresponding to the saturation level considered. It can also be read directly from Fig. I I. This value is divided by 1.89 and this correction factor is used to calculate the tensile strength of the powder at the saturation level of interest. Some calculations were performed for different powders of various sizes, void fractions and moisture contents [6,15,18m20,23-. 26]. The results are shown in Table 8. Errors appearing in the calculated tensile strength at low saturation arc in ;he range .6 20%, which is reasonably good. This shows that Eq. (21 ), which gives the dimensionless tensile strength of pow- ders with saturations in the plateau region, can also be used to find the tensile strength of a powder at any saturation in the pendular region.
It should also be mentioned that in the capillary state the dimensionless tensile strength can be obtained from Eqs. ( I 1 ) and (12), proposed by Schubert [ 15]. Moreover, in the
pendular region the dimensionless tensile strength can also be calculated from Eq. (14) using correlation Eq. (21) and Eqs. ( 11 ) and (12) put in dimensionless form, provided t'.~ $,: and Sr are known. $,: is generally taken equal to 90% ann Sf can be calculated using the derivation of Flemmer { 17].
Therefore, the tensile strength of wet granular material~ at any saturation can be conveniently obtained from the pro- posed correlation and the equations derived by Schubert [ 15 ] and easy-to.measure parameters.
6, Conclusions
The tensile strength of granular materials can be measured experimentally or calculated from correlations found in the literature. Direct measurements are always subject to cxpcro imental errors which can be significant for powders with low tensile strengths, and reproducibility oftbe measurements can be poor in some cases. Therefore, models predicting the teno sile strength of granular materials are very useful. However, results of experimental measurements carried out on glass beads did not compare well with the values of the tensile strength predicted by Rumpf's model. The correlation also failed to match experimental data from other workers who conducted tests on various powders.
The data were lit with a s~mple correlation which gives the dimensionless tensile strength of powders in the plateau region of the pendular state as a function of the void fraction of the agglomerate. The tensile strength of powders with saturations below the plateau region can be calculated assume ing proportionality to the bonding force due to the liquid bridges. This force depends on the dimensionless separation distance between the particles, which cannot be measured. However, the profile of the tensile strength versus saturation

P. ~ r rm , IL$, Caram / Powder Techm~ogy 91 ~1997) 83-P3
suggests that a id = 0.035. In the funicular state the tensile mength can also be determi~..d from Eq. (21 ), provided that the c a p i l ~ pressure and the transition saturation Sf between the pendular and the funicular state are known. However. the value of S~ cannot always be computed accurately because the transition between the pendular and the funicular state is not always clearly defined. This is particularly true for poly- dispersed powders,
The tensile strength of a wet gran~ar ~ d i~ is a strong function of the pacing density. Local differences in the void fraction affect the strength of the material and the densest ~ i o n in ~ agglomerate contributes the most to its strength. The scatter of the ~ in Fig. 9 shows that, for a given value of the void fraction, there is a large variation in the COtTesponding tensile strength. The packing density of the material must be measured accurately in order to minimize the uncertainty when using the correlation, Void fraction measurements are easy to perform, and it was found that for wet glass beads the measurements were reproducible and the experimental error is usually small.
Eq. (21) gives the tensile strength of powders wetted with liquid with zero coneact angle. For contact angles less than 200-30 °. the proposed correlation is believed to give reason- ably accurate results. However, for hydrophobic particles the bonding force is greatly reduced and the ~ l a d o n will over- predict the actual value of the tensile strength.
The correlation for the tensile strength requires knowledge of the particle diameter, the surface tension of the wetting liquid and the void fraction of the agglomerate. In the case of polydispcn~d powdef~, a clear choi~ of average particle diameter is not yet available and more data are needed to evaluate the correlation, Efforts [21,22] to integrate the effe~¢t of the p~rticle si~e distribution in a model have yielded complicated correlations not yet supported by egperiments,
?, LdN o f ~ m b o b
¢1 d'
d
F,
h* k K mt~ ~lt~ d P~ rt
S
septr~tion distance - ~ t o 8 particle diameter force due to curvature of liquid bridge force dee to surface tension resulting force radius of curvature of liquid bridge dimensionless radius of curvature of liquid bridge me~m coordination number constant in Bq, (16) mass of l iqu~ mass of dpj particle ¢ap i l l ~ pressure radius of c~a tu re of liquid bridge dimensionless radius of curvature of liquid bridge saturation saturation at transition between funicular and ~apillery states
Sf
Xw
saturation at transition between pendular and funicular states volume of liquid volume of dry particle moisture content
Greek letters
ot surface tension contact angle
• volume void fraction 0 filling angle p~,¢ liquid density p,,,, particle density o* dimensionless tensile strength o.~z tensile strength in capillary state o.~: tensile strength in funicular state o.p: tensile strength in pendular state o.~ uniaxial tensile strength o'2 isostatic tensile strength
angle of internal friction
Acknowledgements
Support from New York State Electric and Gas and the Petroleum Research Fund is gratefully acknowledged.
References
t11
121
HI
[Sl
[6l [7]
lSl [91
[iOl I l l ] 112l
1131 I141
IISI I161 ll?l [181
1191
J.G~ I)awe~, ~ M~,~s R~s~ K, tab~ tt~s~ Rep. ,t6, HM$O, London, 19~2. H.$. Ei~n~, G. FoU and T,W Taylor, 3~dlnr O,,Rr, Su~jm~,Ac#ivily. V,i. 2, 19¢i0, pp. 378-382~ G. 111ou~eau and T.W. Taylor, ~ Mine,, Re.,. Estab, Re,~. ReF 197, HM$O, London, 1%2, MD. Adtlon, R. Farley and F.H.K VMenltn, J SoL Instrum., 41 (1964) 763-7~, P.A. Hettley and G.D. Pm~tt, J. Phys. E.: ScL Instmm., 17 (1984) 347-349, K. Shlnoh~ oM T. Tanaka, J. Cbem. F, ng. Jpn., 8 (1975) 4~0° 5, Yano, fl, Shlnuni~e, K, Hayash|da and M, Arakawa, P~c, Sprin~ Meet, Soc, Power Teci~nol. Jim,, 1979, p, ?8, R.B. Heady and J.W. Cahn, Metatt. T~ms., I (1970) 185-189. V.P. Mehmtm and KoV.$. Sast~y, Pointer Tecbnol., 25 (1980) 203- 214. W,B, Ptet~h and H, Rumpf, Chem. Ing, Trek, 39 (1967) 885~893, H. Schubext, Powder Tcclmol., I I (1975) 107-119. fl. Rumpf, in W.A. Kl~pper led. ), At~t~lomemtion, Inlerscience, New Yod~ 1962, p. 379. H. Rumpf, Chem. le~l~ Tectr. 30 (1958) 144. W.O. Smith, P.D. Foote and P.F. Busan8, Phys. Rev.. 34 (1929) 127 I- 1274, H, Schulx~t, Chem~ Ing. Teck., 45 (1973) 396-401. H, Schubert, TkesL~, University of Karlsmhe, Germany, 1972. C.L. Flemmer, PowderTcclmol., 66 ( 1991 ) 191-194. W, Pietsch, E. HoHman and H. Rumpf, Ind. Eng. Chem. Pr4~d. Res. Dev,. 8 (1%9) 58-62. 1", Eaves and T,M Jones, J, Pkare¢ Set.. 61 (1972) 256-261.

P, Piern~l, I£S, Car~lm / Po~ler Technology 91 (1997) 83-93 93
[20] T. Eaves and T.M, Jones, J, Pharm, Sci,, 61 (1972) M2-348, [21] D,C.H. Chang, Chem, Eng, Sci., 23 (1968) 1405-1420. [221 D.C,H. Chang, J. Adhe,~ion. 2 (1970) 82-92, [23] H. Schubert and W, Wibom, Chem, Ing, Tech.. 42 (1970) 541-
545.
[24] S.Y. Chart and N. Pilpel, J. Phann. Pharmacol., 35 ( 1983~ 477-481. [ 25 ] T, Yokoyama, K, Fujii and T, Yokoyama, Powder Technol,, 32 ( 1982 )
55-62, [26] G,A. Turner, M. Balasubmmanian and L, Otten, Powder Tecimo[.. 15
(1976) 97-105.