determination of young’s modulus, fracture energy and tensile strength of refractories by inverse...
TRANSCRIPT

Engineering Fracture Mechanics 116 (2014) 228–236
Contents lists available at ScienceDirect
Engineering Fracture Mechanics
journal homepage: www.elsevier .com/locate /engfracmech
Determination of Young’s modulus, fracture energy and tensilestrength of refractories by inverse estimation of a wedgesplitting procedure
0013-7944/$ - see front matter � 2013 Elsevier Ltd. All rights reserved.http://dx.doi.org/10.1016/j.engfracmech.2013.11.010
⇑ Corresponding author. Tel.: +43 38424023236.E-mail address: [email protected] (S. Jin).
Shengli Jin ⇑, Dietmar Gruber, Harald HarmuthChair of Ceramics, Montanuniversität Leoben, A-8700 Leoben, Austria
a r t i c l e i n f o
Article history:Received 9 April 2013Received in revised form 5 July 2013Accepted 4 November 2013
Keywords:Inverse estimationWedge splitting testStrain softeningFracture energyRefractories
a b s t r a c t
The wedge splitting test according to Tschegg provides a technique to characterize the frac-ture behavior of ordinary ceramic refractory materials. By fitting the data from finite ele-ment simulation to the results of the wedge splitting test, Young’s modulus andparameters describing the failure behavior under Mode I conditions can be inversely esti-mated through an adaptive nonlinear least-squares algorithm. The results show Young’smodulus is accurately identified as well as the tensile strength and total specific fractureenergy when a trilinear strain softening law is employed. The inversely estimated param-eters from three experimental curves of the same material at room temperature are veryconsistent as well as the values of thermal stress resistance parameter R and characteristiclength lch. The method developed enables the identification of the total specific fractureenergy, tensile strength and Young’s modulus with numerically robust method in therelatively short time from a single wedge splitting procedure.
� 2013 Elsevier Ltd. All rights reserved.
1. Introduction
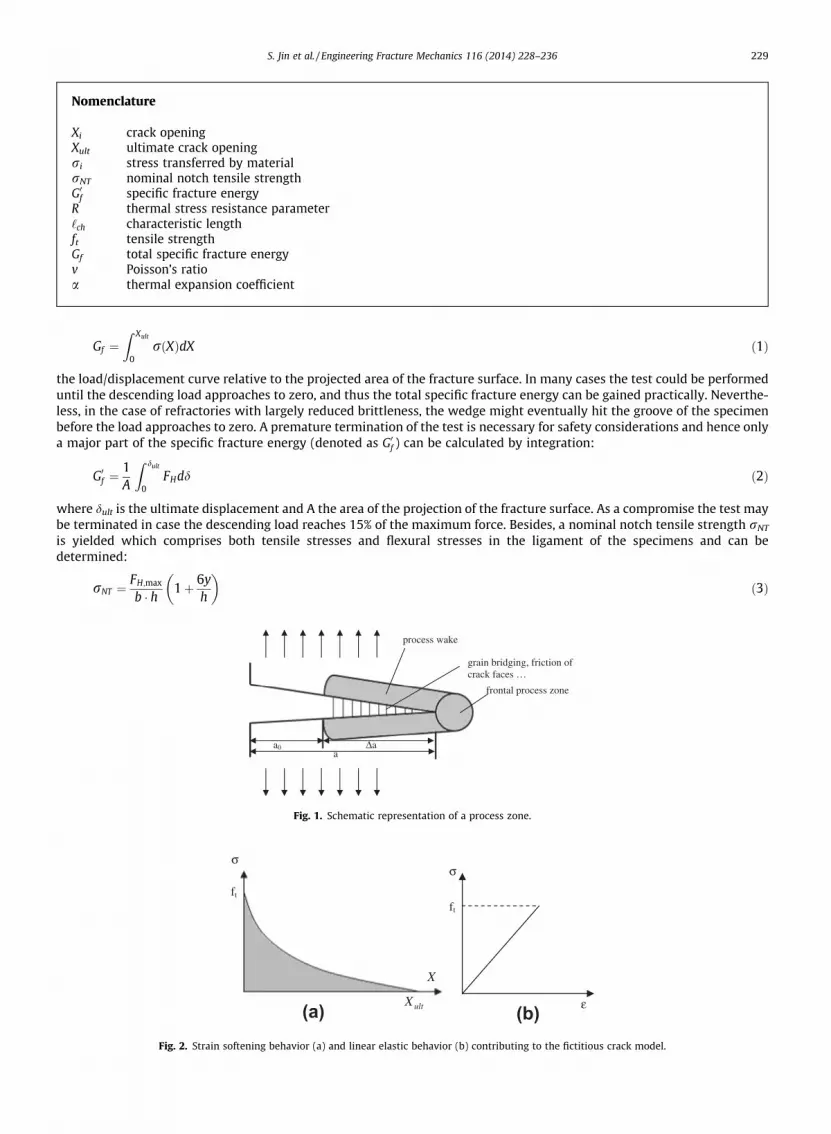
Considerable deviations from pure linear elastic fracture mechanics have to be expected when the process zone size (thelength of the process wake Da plus the size of the frontal process zone, see Fig. 1) is not negligibly small relative to the cracklength or the specimen size [1–4]. This might be the case for materials showing a considerable size of the structural elements(e.g. large grains) relative to the size of the whole part and not behaving totally brittle. Examples are common building mate-rials (especially concrete and mortar) and refractories. For those cases a material model allowing numerical treatment ofcrack propagation is desirable. For this purpose the fictitious crack model according to Hillerborg was already introduced30 years ago and especially applied for concrete [1,2]. It assumes a strain softening behavior characterized by a monoto-nously decreasing stress transferred between the crack faces until an ultimate crack opening of Xult is achieved (Fig. 2a),whereas a normally linear stress/strain relation is applied in the uncracked region (Fig. 2b). As Eq. (1) shows, the area belowthe strain softening curve is equal to the total specific fracture energy Gf.
The wedge splitting test according to Tschegg [5,6] is suitable for the determination of the specific fracture energy ofrefractories by favoring stable crack propagation in specimens with sufficiently large dimension [7]. The detailed descriptionof the wedge splitting test and its applications are available in Refs. [8–12], and here only the schematic representation ofthis test is shown in Fig. 3a. Out of this test, a load/displacement curve can be registered (Fig. 3b) and the specific fractureenergy can be further obtained by calculating the area under:
Nomenclature
Xi crack openingXult ultimate crack openingri stress transferred by materialrNT nominal notch tensile strengthG0f specific fracture energyR thermal stress resistance parameter‘ch characteristic lengthft tensile strengthGf total specific fracture energyv Poisson’s ratioa thermal expansion coefficient
S. Jin et al. / Engineering Fracture Mechanics 116 (2014) 228–236 229
Gf ¼Z Xult
0rðXÞdX ð1Þ
the load/displacement curve relative to the projected area of the fracture surface. In many cases the test could be performeduntil the descending load approaches to zero, and thus the total specific fracture energy can be gained practically. Neverthe-less, in the case of refractories with largely reduced brittleness, the wedge might eventually hit the groove of the specimenbefore the load approaches to zero. A premature termination of the test is necessary for safety considerations and hence onlya major part of the specific fracture energy (denoted as G0f ) can be calculated by integration:
G0f ¼1A
Z dult
0FHdd ð2Þ
where dult is the ultimate displacement and A the area of the projection of the fracture surface. As a compromise the test maybe terminated in case the descending load reaches 15% of the maximum force. Besides, a nominal notch tensile strength rNT
is yielded which comprises both tensile stresses and flexural stresses in the ligament of the specimens and can bedetermined:
rNT ¼FH;max
b � h 1þ 6yh
� �ð3Þ
a a0 Δa
process wake
frontal process zone
grain bridging, friction of crack faces …
Fig. 1. Schematic representation of a process zone.
ft
σσ
ft
ε(a) (b)ultX
X
Fig. 2. Strain softening behavior (a) and linear elastic behavior (b) contributing to the fictitious crack model.

(a) (b)
0 0.5 1.0 1.5 2.0 2.5 3.0 3.5
100
200
300
400
500
600
700
800
0
Vertical displacement /mm
Verti
cal f
orce
/N
FV,max
0.15FV,maxG’f
FV-vertical load, FH-horizontal load, FV,max-maximum vertical load, FH,max-maximum horizontal load, δ-loadpoint displacement, 1-wedge, 2-rolls, 3-load transmission pieces, 4-starter notch, 5-side groove, 6-linear support
Fig. 3. Schematic representation of the wedge splitting test (a) and a typical load/displacement curve (b) [8–12].
230 S. Jin et al. / Engineering Fracture Mechanics 116 (2014) 228–236
where b and h are the width and height of the fracture surface area, respectively, and y is the vertical distance of the centre ofgravity of the fracture surface from the horizontal force. Direct determination of the tensile strength ft is not possible fromthe wedge splitting test out of several reasons. These are the actions of the notch, the additional flexural load and the sizeeffect which tends to reduce the apparent strength with rising specimen size due to increasing brittleness.
To define the total specific fracture energy and tensile strength, an inverse estimation procedure could be applied for theidentification from the wedge splitting test results. Pioneer work was performed by Hillerborg [13], and Roelfstra [14] pub-lished similar studies later, in which an optimization procedure was established to fit the experimental and predicted load/displacement curves from FEM (finite element method) simulation of 3-point bending tests with a bilinear strain softeninglaw. However, the fitting was not really satisfying especially for the area near the peaks of the curves and similar phenomenawere observed in the work of Kim where the same inverse estimation strategy was used for the wedge splitting test [15],probably because the optimization unfortunately fell into a local minimum. In order to avoid the risk of local minima an evo-lutionary algorithm was employed and extended for the optimization during the inverse determination of a strain softeninglaw [16]. However, this optimization method did not show high efficiency and an extreme long computation time wasneeded for one optimization.
Several analytical models or approaches for the wedge splitting test of concrete and mortar were proposed which caninversely calculate the strain softening curves rather efficiently, for instances, hinge model and back analysis [17–23]. A com-mon character of them is the inverse analysis has to be performed step by step according to elastic and different stages ofstrain softening behavior. Consequently the interactions among the modulus of elasticity, tensile strength and fracture en-ergy might be ignored or inhibited. Frequently, a weighting function was also demanded in order to reach a better local andglobal fitting on the experimental curves [24]. Besides, the optimization algorithms used could not exhibit favorable conver-gence by using the common least squares approach and thus a specific error norm or peculiar convergence tolerance has tobe adopted [20,25]. In the refractory field, trials also have been done to inversely determine Young’s modulus E as well as thetensile strength and fracture energy from the wedge splitting test [26]. The FEM simulations of the wedge splitting test wereperformed in terms of a strain softening model according to Hordijk [27], and the displacement of the descending branch at50% of Fmax was chosen as a significant feature accounting for the shape of the load/displacement curve. Three nonlinear for-mulas were thus established to numerically describe the relations of fracture mechanical properties of refractories. By a min-imization technique, the tensile strength, specific fracture energy and Young’s modulus have been inversely estimated.
In the present paper a more general approach is shown to inversely identify the tensile strength, the total specific fractureenergy and Young’s modulus of refractories from wedge splitting test results. By this approach, a pre-analysis of Young’smodulus from the experimental curve is not necessary, and the definition of the stress/strain softening type can be easilydone in the commercial code ABAQUS [28]. Moreover, the conventional least-squares norm is employed for the minimizationof the difference between experimental and predicted data. The load/displacement curves of a magnesia-chromite materialdetermined by the wedge splitting test at room temperature are used for a sensitivity investigation of number and values offracture mechanical properties. The final inverse estimation results of fracture mechanical properties are provided andcompared to experimental results.
2. Mathematical procedure
An inverse estimation procedure usually can be realized by minimizing the objective function through searching a betterparameter vector. Frequently, the objective function f(x) is given as the sum-of-squares as follows:
f ðxÞ ¼ 12
WðxÞT WðxÞ ¼ 12
Xn
i¼1
wiðxÞ2 ð4Þ

S. Jin et al. / Engineering Fracture Mechanics 116 (2014) 228–236 231
WðxÞ ¼ ðw1ðxÞ;w2ðxÞ;w3ðxÞ; . . . ;wnðxÞÞT ð5Þ
x ¼ ðx1; x2; x3; . . . ; xpÞT ð6Þ
where W(x) is the residual vector, n is the number of its components, x is the parameter vector, and p is the number ofparameters.
Several algorithms such as Gauss–Newton and Levenberg–Marquardt methods were developed to solve the least-squaresproblems and well applied for inverse estimation [29–31]. NL2SOL, an adaptive nonlinear least-squares algorithm, is morepromising in dealing with large residue problems i.e. least-squares problems where the residuals do not tend to zero withincreasing number of iterations [32,33]. In this algorithm, the increment of x for iteration is determined customarily by
Dx ¼ �H�1g ð7Þ
Here g is the gradient of f(x) defined as
g ¼ JT W ð8Þ
where J is the Jacobian matrix of W(x). H is defined according to following two equations:
H ¼ JT J ð9Þ
H ¼ JT J þXn
i¼1
wiðxÞr2wiðxÞ ð10Þ
Eq. (9) represents the Gauss–Newton model (abbreviated as G) and Eq. (10) the augmented model (denoted as S) which addi-tionally includes the Hessian matrix r2wi(x).
The choice of the model is decided by evaluating the decrease of the actual function result relative to its predicted value ateach iteration and this strategy can promote the fast convergence even the starting guesses are poor.
3. Models and inverse procedure
A two-dimensional and symmetrical model comprising one half of the specimen and the wedge as well as one transmis-sion piece was built according to the test configuration and specimen geometry (Fig. 4a). Strain softening behavior was as-signed to quadrilateral cohesive elements with linear interpolation scheme arranged along the ligament area which was1.5 mm wide (shaded area in Fig. 4b) and had a projected fracture surface of 65 � 63 mm2. Linear elastic behavior was as-sumed to the bulk of the material and the load transmission pieces with quadrilateral elements interpolated by linearscheme. The modeling of the wedge splitting test process was performed via the commercial code ABAQUS. Two executablefiles were written in Python language in order to extract data from ABAQUS .odb file as well as discretize the experimentaldata. The open source code DAKOTA in which the algorithm NL2SOL has been implemented was used to integrate all thecomponents of the minimization procedure [34]. The numerical process is shown in Fig. 4b.
(a) (b)
1
3
2
1-roller,2-load transmission piece, 3-ligament area, 4-linear elastic part of specimen
4
50 mm
100
mm
22 m
m66
mm
1.5 mm
Start
Initially guess the parameters
FEM simulation through ABAQUS
Obtain the vertical load/displacement curve from ABAQUS .obd file
Calculate residual according to Eq.4
Discretize the vertical load/displacement curve from the experiment
no
yesEnd
New
par
amet
ers
retu
rned
ba
sed
on N
L2SO
L
Establish FEM model of the wedge splitting test and define the strain softening law
Convergence criteria (default) [33]
Fig. 4. Two-dimensional and symmetrical model for the wedge splitting test (a) and the flowchart of the numerical process (b).

232 S. Jin et al. / Engineering Fracture Mechanics 116 (2014) 228–236
4. Sensitivity investigation
A magnesia-chromite material (56.5 wt% MgO, 25.5 wt% Cr2O3) was chosen for the wedge splitting test at room temper-ature. Three specimens were prepared according to the above mentioned geometry and load/displacement curves were re-corded. Two hundred equally spaced data points were extracted from each experimental curve, which were believed tocontain sufficient information of the original load/displacement curve. For the sensitivity investigation, only one curvewas adopted and six cases of parameters were designed for the evaluation as seen in Table 1. In the case of an odd numberin the first column Young’s modulus was one of the parameters identified. On the other hand, in the cases with even numberYoung’s modulus was measured by Resonance Frequency and Damping Analyzer (RFDA, IMCE in Belgium) at room temper-ature, which is 81 GPa. The corresponding type of strain softening laws also can be seen in the last column.
Fig. 5 shows an example of the convergence and alternative numerical models during the minimization. Herein the rel-ative residual was defined as the difference between the previous and the current residual results divided by the previousresidual value [33]. G–S in the figure means that during the iteration the Gauss–Newton model was tried first and a switchwas then made to the augmented model. S–G and G–S–G have analogous meanings. Clearly the residual decreased dramat-ically during the first 3 iterations and the relative residuals were close to 1. Afterwards, the residual values changed slightlyand consequently the relative residual decreased by a power of ten. The Gauss–Newton model was chosen primarily untilthe relative residual was 0.0015, and then the augmented model was chosen to enhance the convergence where the relativeresidual was increased to 0.004. Afterwards, the switch between G and S models was more frequently among the 7–10thiterations. The minimization procedure was automatically terminated when the relative residual was less than 10�6, anda further decrease of the residual was not possible by this method.
The final residuals and number of function evaluations were used to compare the convergence capacity of the inverseestimation. The number of function evaluations is the number of calls to calculate the objective function f(x), which includesthose used for the evaluation of Eq. (2). As can be seen from Fig. 6 if more than four parameters are evaluated the residual isonly the seventh part of that in the case with two parameters. In contrast, the number of function evaluations increases onlyby a factor of two or three. Usually, a typical computation time was around 0.5 h for each case.
The influences of Young’s modulus on the identified results for the total specific fracture energy Gf and the tensilestrength ft were analyzed as well. Figs. 7 and 8 show normalized values for Gf, ft and E. In the case of Gf and ft they are ob-tained by dividing the actual value by the maximum occurring in the test series, and for E the measured Young’s modulus byRFDA is the reference value. The values attributive to the dots in Figs. 7 and 8 indicate the number of evaluated parameters. Itis shown that Gf did not receive significant impact from the variation of Young’s modulus. Nevertheless, the normalized ft
varied from 0.83 to 1. Because the strategy is to minimize the difference of two curves and Gf is the specific area underthe curve, Gf did not vary too much although Young’s modulus changed. Only cases containing 4, 6 and 7 evaluated
Table 1Testing designs for sensitivity investigation.
Number of parameters Evaluated parameters Curve type
2 ft, Gf Linear3 ft, Gf, E Linear4 ft, r1, X1, Xult Bilinear5 ft, r1, X1, Xult, E Bilinear6 ft, r1, r2, X1, X2, Xult Trilinear7 ft, r1, r2, X1, X2, Xult, E Trilinear
1.E-07
1.E-06
1.E-05
1.E-04
1.E-03
1.E-02
1.E-01
1.E+00
0 1 2 3 4 5 6 7 8 9 10 11 12 131.E+02
1.E+03
1.E+04
1.E+05
1.E+06G G G
G
G
S
G-S
SS-G
G-S-G
G
G
Iterations
Res
idua
l /N
2
Rel
ativ
e re
sidu
al
Fig. 5. Convergence and alternative numerical models during one complete minimization process.

0
5
10
15
20
25
30
35
40
0 1 2 3 4 5 6 7 8
Number of parametersN
umbe
r of f
unct
ion
eval
uatio
ns
0
1000
2000
3000
4000
5000
6000
7000
8000
Res
idua
l /N
2
Fig. 6. Sensitivity of the residual and number of function evaluations to the number of parameters.
0.95
0.96
0.97
0.98
0.99
1.00
0.9 1.0 1.1 1.2Normalized E [1]
Nor
mal
ized
frac
ture
ene
rgy
[1]
3
57
2
4
6
Fig. 7. Sensitivity of the total specific fracture energy to Young’s modulus.
0.80
0.84
0.88
0.92
0.96
1.00
0.9 1.0 1.1 1.2
Normalized E [1]
Nor
mal
ized
tens
ile s
treng
th [1
]
3
5
7
2
46
Fig. 8. Sensitivity of the tensile strength to Young’s modulus.
S. Jin et al. / Engineering Fracture Mechanics 116 (2014) 228–236 233
parameters exhibited very similar values. Frequently, thermal stress resistance parameter R and characteristic length lch
(proportional to the R0 0 0 0 parameter and inversely proportional to a brittleness number) were used to assess the resistanceof refractories to crack initiation and propagation due to thermal shock [12,35]. These two values can be calculated utilizingthe results from the wedge splitting test, Poisson’s ratio (v) and thermal expansion coefficient (a). Fig. 9 depicts the influenceof the number of parameters on R and lch. The maximum values of R and lch were used as denominators for the normalization.Similar to Fig. 8, the application of 4, 6 and 7 evaluated parameters resulted in nearly the same values of R and lch. Althoughfor 6 and 7 evaluated parameters lower residuals occurred, confident results for the characterization of thermal stress resis-tance can be obtained by a bilinear strain softening law when the Young’s modulus was determined by RFDA. In the case that

0.4
0.5
0.6
0.7
0.8
0.9
1.0
1.1
0 1 2 3 4 5 6 7 8Number of parameters
0.4
0.5
0.6
0.7
0.8
0.9
1.0
1.1
E
fR t
αν )1( −= 2
t
fch f
EGl =
Nor
mal
ized
ch [
1]
Nor
mal
ized
[1
]
Fig. 9. Sensitivity of the thermal stress resistance parameter R and characteristic length lch to the number of parameters.
234 S. Jin et al. / Engineering Fracture Mechanics 116 (2014) 228–236
Young’s modulus is not available, a trilinear strain softening law can be used to determine Young’s modulus, the tensilestrength and the total fracture energy accurately.
5. Results
Four parameters as shown in Table 1 were used for the inverse estimation of 3 experimental curves. Curves 2 and 3 wereshifted several millimeters in order to be better distinguished. Fig. 10 shows the good agreement and the residuals betweenthe experimental and simulated curves. Here an example was provided to show the identified parameters of bilinear strainsoftening law from Curve 1: ft = 5.50 MPa, r1 = 2.93 MPa, X1 = 22.2 lm, Xult = 80.0 lm. Table 2 lists the calculated and inver-sely estimated parameters from the 3 experimental curves and their standard deviations. It is shown that the mean value of ft
equaled 5.5 MPa while that of rNT was 8.9 MPa. A difference between rNT and ft is expected due to not only the flexural load-ing component in rNT but also the size effect. It is commonly recognized that the nominal tensile strength increases withdecreasing structural size in the quasi-brittle materials especially in the presence of notches or cracks [36–38]. Several gen-eral laws comprising the structural sizes and characteristic length (or brittleness number) were developed to describe thesize effect on the nominal tensile strength in the last decades [39–42]. Especially, a formula of the ratio rNT/ft dependentof the brittleness number was given in the case of wedge splitting test according to Tschegg, and this ratio decreased withincreasing brittleness number [26]. In the case of concrete or mortar with large brittleness, the difference between thenominal notch tensile strength and the tensile strength is expected to decrease.
As seen in Table 2, the mean value of G0f was equal to 151 N m�1 and that of Gf 177 N m�1 which was 17% higher than theformer. This difference between G0f and Gf is reasonable because G0f was calculated up to a fixed level of the residual load inlaboratory as mentioned early. Also, R and lch were calculated from the above determined parameters respectively and listedin Table 2. The mean value of R derived from the measurement was 8.3 K and that from the inverse estimation only 5.2 K.Evidently difference between the values of lch derived from the inverse estimation and the measurement can be observed.Normally the characteristic length is based on a tensile strength and therefore the value calculated by the results of the
0
100
200
300
400
500
600
700
800
900
1000
0.0 0.5 1.0 1.5 2.0 2.5 3.0
Vertical displacement /mm
Verti
cal f
orce
/N
ExperimentalSimulated
Curve 1 Curve 2 Curve 3
Curve Residual /N2
1 10682 41433 5375
Fig. 10. Experimental and simulated vertical load/displacement curves from the wedge splitting test.

Table 2Experimentally obtained and inversely estimated parameters for 3 load/displacement curves at room temperature.
Curve 1 Curve 2 Curve 3 Mean value Standard deviation
Experimental Nominal notch tensile strength, rNT/MPa 8.7 8.9 9.0 8.9 0.1Specific fracture energy, G0f =N m�1 152 157 145 151 5
R/K 8.2 8.4 8.5 8.3 0.1lch/mm 163 161 145 156 8
Inverse estimation Tensile strength, ft/MPa 5.5 5.7 5.3 5.5 0.2Total specific fracture energy, Gf/N m�1 178 182 172 177 4R/K 5.2 5.4 5.0 5.2 0.2lch/mm 477 453 495 475 17
S. Jin et al. / Engineering Fracture Mechanics 116 (2014) 228–236 235
proposed method is preferred. In other words, the real lch value was underestimated by 3 times if lch was calculated from theexperimentally determined parameters. This is largely influenced by the fact that the nominal notch tensile strength is con-siderably larger than the identified tensile strength. Additionally, the inverse estimation results showed comparatively smalldeviations for the three curves although their residuals were apparently different (Fig. 10). A strong robustness of thisinverse estimation procedure can be expected for the wedge splitting test.
6. Conclusions
A computational procedure has been successfully applied for the wedge splitting test in order to inversely estimate notonly strain softening law under Mode I failure but also Young’s modulus of ordinary refractory ceramic materials. The inverseestimation results from three experimental curves of one material show the good agreement. The tensile strength largelydiffers from the nominal notch tensile strength, which means that this inverse evaluation procedure is very necessary todo if the strength should be assessed. The difference in the specific fracture energy is by far smaller. In the case of Table 2,G0f is 85% of Gf, but rNT is 162% of ft. It is worthy to comment that this general inverse estimation procedure is easily handledand may be implemented into other research fields where the inverse estimation is needed.
Acknowledgements
Financial support by the Austrian Federal Government and the Styrian Provincial Government (ÖsterreichischeForschungsförderungsgesellschaft and Steirische Wirtschaftsförderungsgesellschaft) within the K2 Competence Centreon Integrated Research in Materials, Processing and Product Engineering (MCL Leoben) in the framework of the AustrianCOMET Competence Centre Programme is gratefully acknowledged.
References
[1] Hillerborg A, Modeer M, Petersson PE. Analysis of crack formation and crack growth in concrete by means of fracture mechanics and finite elements.Cem Concr Res 1976;6:773–82.
[2] Hillerborg A. Analysis of one single crack. In: Wittmann FH, editor. Fracture mechanics of concrete. Amsterdam: Elsevier; 1983. p. 223–49.[3] Harmuth H, Tschegg EK. Fracture mechanical characterization of ordinary ceramic refractory materials. Veitsch-Radex Rundschau 1984:465–80.[4] Sakai M. Fracture mechanics of refractory materials. Taikabutsu Overseas 1988;8:4–12.[5] Tschegg EK. Testing device and appropriate specimen shapes for tests to measure fracture values. Austrian Patent AT 390328 B, registered; 1986 [in
German].[6] Tschegg EK. New equipments for fracture tests on concrete. Mater Test 1991;33:338–42.[7] Harmuth H. Stability of crack propagation associated with fracture energy determined by wedge splitting specimen. Theor Appl Fract Mech
1995;23:103–8.[8] Harmuth H, Rieder KA, Krobath M, Tschegg EK. Investigation of the nonlinear fracture behavior of ordinary ceramic refractory materials. Mater Sci
Engng A 1996;214:53–61.[9] Harmuth H, Tschegg EK. A fracture mechanics approach for the development of refractory materials with reduced brittleness. Fatigue Fract Engng
Mater Struct 1997;20(11):1585–603.[10] Rieder KA, Tschegg EK, Harmuth H. Notch sensitivity of ordinary ceramic refractory materials. J Mater Sci Lett 1998;17:675–8.[11] Tschegg EK, Fendt KT, Manhart Ch, Harmuth H. Uniaxial and biaxial fracture behaviour of refractory materials. Eng Fract Mech 2009;76:2249–59.[12] Harmuth H, Bradt RC. Investigation of refractory brittleness by fracture mechanical and fractographic methods. Interceram (Refract Man) 2010:6–10.[13] Hillerborg A. The theoretical basis of a method to determine the fracture energy Gf of concrete. Mater Struct 1985;18(106):291–6.[14] Roelfstra PE, Wittmann FH. Numerical method to link strain softening with failure of concrete. In: Wittmann FH, editor. Fracture toughness and
fracture energy of concrete. Amsterdam: Elsevier; 1986. p. 163–75.[15] Kim J, Lee Y, Yi S. Fracture characteristics of concrete at early ages. Cem Concr Res 2004;34:507–19.[16] Slowik V, Villmann B, Bretschneider N, Villmann T. Computational aspects of inverse analyses for determining softening curves of concrete. Comput
Methods Appl Mech Engng 2006;195:7223–36.[17] Abdalla HM, Karihaloo BL. A method for constructing the bilinear tension softening diagram of concrete corresponding to its true fracture energy. Mag
Concr Res 2004;10:597–604.[18] Löfgren I, Stang H, Olesen JF. Fracture properties of FRC determined through inverse analysis of wedge splitting and three-point bending tests. J Adv
Concr Technol 2005;3:423–34.[19] Walter R, Østergaard L, Olesen JF, Stang H. Wedge splitting test for a steel–concrete interface. Eng Fract Mech 2005;72:2565–83.[20] Skocek J, Stang H. Inverse analysis of the wedge-splitting test. Eng Fract Mech 2008;75:3173–88.[21] Nanakorn P, Horii H. Back analysis of tension-softening relationship of concrete. J Mater Concr Struct Pavements, JSCE 1996;544:265–75.

236 S. Jin et al. / Engineering Fracture Mechanics 116 (2014) 228–236
[22] Kitsutaka Y. Fracture parameters by polylinear tension-softening analysis. J Engng Mech 1997;123:444–50.[23] Ishiguro S. Experiments and analyses of fracture properties of grouting mortars. In: Proceedings of fracture mechanics of concrete and concrete
structures – new trends in fracture. Catania: Taylor & Francis; 2007. p. 293–8.[24] Sousa J, Gettu R. Determining the tensile stress-crack opening curve of concrete by inverse analysis. J Engng Mech 2006;132:141–8.[25] Que NS, Tin-Loi F. Numerical evaluation of cohesive fracture parameters from a wedge splitting test. Eng Fract Mech 2002;69:1269–86.[26] Auer T, Harmuth H. Numerical simulation of a fracture test for brittle disordered materials. In: Gdoutos EE, editor. Fracture of nano and engineering
materials and structures. Proceedings of the 16th European conference of fracture, Alexandroupolis; 2006. p. 591–2.[27] Hordijk DA. Local approach to fatigue of concrete. Meinema, Delft, Netherlands; 1991.[28] ABAQUS Analysis user’s manual release 6.9; 2009.[29] Lei F, Szeri AZ. Inverse analysis of constitutive models: biological soft tissues. J Biomech 2007;40:936–40.[30] Kwon SH, Zhao Z, Shah SP. Effect of specimen size on fracture energy and softening curve of concrete: Part II. Inverse analysis and softening curve. Cem
Concr Res 2008;38:1061–9.[31] Boisse P, Gasser A, Rousseau J. Computations of refractory lining structures under thermal loadings. Adv Engng Softw 2002;33:487–96.[32] Dennis JE, Gay DM, Welsch RE. An adaptive nonlinear least squares algorithm. ACM Trans Math Softw 1981;7:348–68.[33] Dennis JE, Gay DM, Welsch RE. Algorithm 573:NL2SOL-an adaptive nonlinear least squares algorithm. ACM Trans Math Softw 1981;7:369–83.[34] DAKOTA, User’s Manual, Version 5.2, Unlimited Release, November 30; 2011.[35] Hasselman DPH. Thermal stress resistance parameters for brittle refractory ceramics: a compendium. Ceram Bull 1970;12:1033–7.[36] Leicester RH. Effect of size on the strength of structures. CSIRO Div Build Res Paper, CSIRO, Melboume 1973;71:1–13.[37] Carpinteri A. Fractal nature of material microstructure and size effects on apparent mechanical properties. Mech Mater 1994;18:89–101.[38] Ishiguro S. Evaluation of fracture properties of concrete using wedge splitting test method. J Soc Mater Sci Japan 2003;52:1043–8.[39] Carpinteri A, Chiaia B, Ferro G. Size effects on nominal tensile strength of concrete structures: multifractality of material ligaments and dimensional
transition from order to disorder. Mater Struct 1995;28:311–7.[40] Bazant ZP, Pfeiffer PA. Determination of fracture energy from size effect and brittleness number. ACI Mater J 1987;84:463–80.[41] Carpinteri A, Puzzi S. Self-similarity in concrete fracture: size-scale effects and transition between different collapse mechanisms. Int J Fract
2008;154:167–75.[42] Karihaloo BL, Abdalla HM, Xiao QZ. Deterministic size effect in the strength of cracked concrete structures. Cem Concr Res 2006;36:171–88.