forming crystalline polymer-nano interphase structures for high-modulus and high- tensile/strength...
TRANSCRIPT
Full Paper
Forming Crystalline Polymer-Nano InterphaseStructures for High-Modulus and High-Tensile/Strength Composite Fibers
Jiangsha Meng, Yiying Zhang, Kenan Song, Marilyn L. Minus*
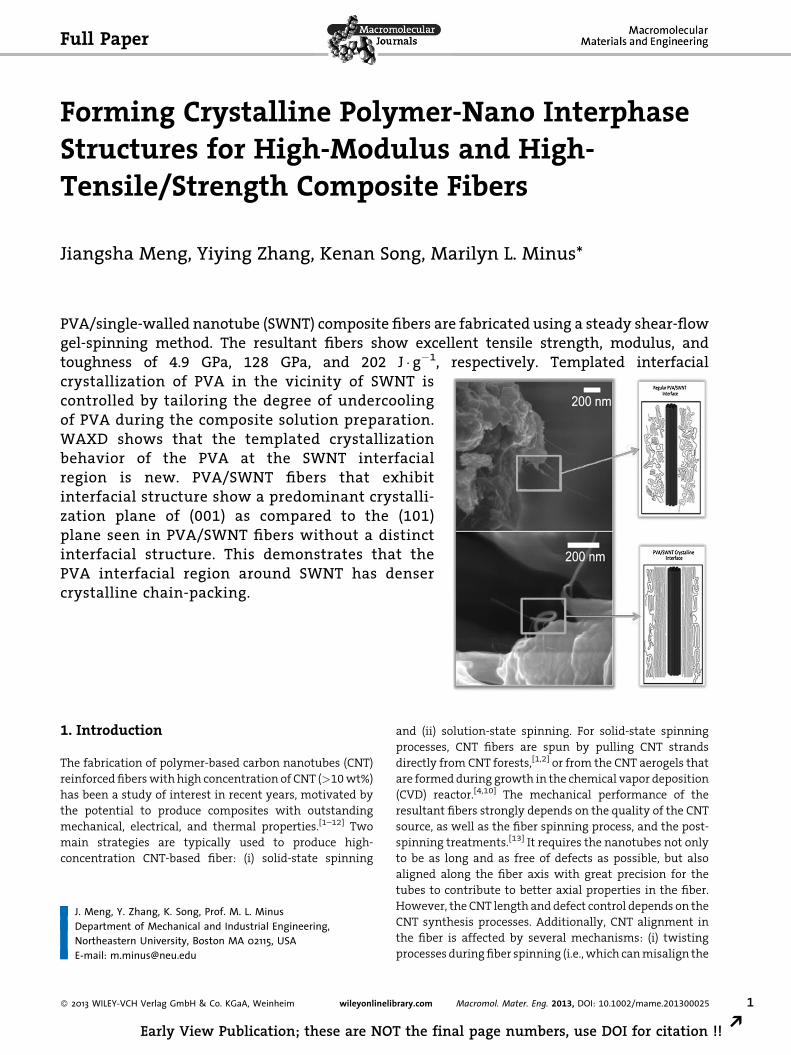
PVA/single-walled nanotube (SWNT) composite fibers are fabricated using a steady shear-flowgel-spinning method. The resultant fibers show excellent tensile strength, modulus, andtoughness of 4.9 GPa, 128 GPa, and 202 J � g�1, respectively. Templated interfacial
crystallization of PVA in the vicinity of SWNT iscontrolled by tailoring the degree of undercoolingof PVA during the composite solution preparation.WAXD shows that the templated crystallizationbehavior of the PVA at the SWNT interfacialregion is new. PVA/SWNT fibers that exhibitinterfacial structure show a predominant crystalli-zation plane of (001) as compared to the (101)plane seen in PVA/SWNT fibers without a distinctinterfacial structure. This demonstrates that thePVA interfacial region around SWNT has densercrystalline chain-packing.J. Meng, Y. Zhang, K. Song, Prof. M. L. MinusDepartment of Mechanical and Industrial Engineering,Northeastern University, Boston MA 02115, USAE-mail: [email protected]
� 2013 WILEY-VCH Verlag GmbH & Co. KGaA, Weinheim wileyonlinelibrary.com
Early View Publication; these are NOT the fin
lution-state spinning. For solid-state spinning
1. IntroductionThe fabrication of polymer-based carbon nanotubes (CNT)
reinforced fiberswith high concentration of CNT (>10wt%)
has been a study of interest in recent years, motivated by
the potential to produce composites with outstanding
mechanical, electrical, and thermal properties.[1–12] Two
main strategies are typically used to produce high-
concentration CNT-based fiber: (i) solid-state spinning
and (ii) so
processes, CNT fibers are spun by pulling CNT strands
directly from CNT forests,[1,2] or from the CNT aerogels that
are formed during growth in the chemical vapor deposition
(CVD) reactor.[4,10] The mechanical performance of the
resultant fibers strongly depends on the quality of the CNT
source, as well as the fiber spinning process, and the post-
spinning treatments.[13] It requires the nanotubes not only
to be as long and as free of defects as possible, but also
aligned along the fiber axis with great precision for the
tubes to contribute to better axial properties in the fiber.
However, the CNT length and defect control depends on the
CNT synthesis processes. Additionally, CNT alignment in
the fiber is affected by several mechanisms: (i) twisting
processes duringfiber spinning (i.e.,which canmisalign the
Macromol. Mater. Eng. 2013, DOI: 10.1002/mame.201300025 1
al page numbers, use DOI for citation !! R
www.mme-journal.de
J. Meng et al.
2
REa
CNT by introducing a twisting angle with respect to the
fiber axis); and (ii) post-spinning treatments such as
densification, used to increase the contact area between
CNT (i.e., improves the load transfer). Such post-processing
treatments may also misalign the CNT due to unevenly
distributed densification as well as the introduction of
different-sized vacancies between CNT. It has been shown
that the theoretical Young’s modulus of the fiber can
decrease to approximately 80% of its magnitudewith even
a minor change in the degree of orientation (global CNT
alignment of �58) of the CNT with respect to the fiber
axis.[14] Therefore, the quality of the CNT source as well
as the spinning and post-spinning processes need to be
well-controlled in order to improve the fiber mechanical
properties.
The second strategy for processing high-concentration
polymer/CNT composites uses the solution-state spinning
method. In this case, CNT are first dispersed into solvents
or polymer solutions and the composite dopes are
subsequently spun into fibers.[3,5,12,15] The mechanical
performance of the resultant fibers will depend on several
factors including the dispersion of CNT, alignment of
CNT, the CNT length, and the polymer/CNT interfacial
strength.[16] If the dispersion quality of CNT is not well-
controlled, CNT tend to entangle and result in misalign-
ment and/or poor interaction with polymer matrix in the
composite fiber. In addition, preservation of CNT length
in the fiber is also important to reduce defects which
will occur at the CNT ends and result in premature fiber
failure.
In situations where CNT dispersions are prepared
utilizing polymer solutions, the CNT bundles are exfoliated
and the bundle reformation can be prevented by the
presence of the polymer chains which adsorb to the CNT.
The adsorption of the polymer to the CNT may lead to the
formation of an interphase structure between polymer and
CNT. The interphase is considered to be the major factor
of maximizing the mechanical contribution from CNT
due to its ability to provide load transfer from polymer
matrix to CNT.[17]
Crystallization processes provide a mechanism for
the formation of the polymer interfacial structure on
CNT. It has been shown that CNT can act as a nucleating
agent for polymer crystallization,[18–20] and the crystalline
polymer/CNT interface has been observed for various
polymers.[14,21–23] This interfacial polymer crystallization
on CNT improves the polymer/CNT binding energy,
which could lead to better load transfer from polymer
matrices to CNT upon stretching.[24]
Poly(vinyl) alcohol (PVA) is a commonly used polymer
to produce CNT reinforced composite fibers.[3,5,12,25–29]
The first continuous fibers with high concentration of
CNT were produced in PVA solution, where the single-
walled nanotubes (SWNT) suspension was injected into
Macromol. Mater. Eng. 2013, DOI
� 2013 WILEY-VCH Verlag Gmb
rly View Publication; these are NOT the final pag
a rotating PVA flow to produce SWNT fibers (>60 wt% of
SWNT) with Young’s modulus of 15 GPa and tensile
strength of 0.15 GPa.[12] A few years later, the spinning
process was refined and much better SWNT fibers was
achieved with average Young’s modulus of 244 GPa
and average tensile strength of 2.9 GPa.[3,5] It should be
noted that these high tensile modulus and strength
properties (244 and 2.9 GPa, respectively) correspond to
fibers with very small diameter (�1.4mm). As the diameter
increased the properties of PVA/SWNT fibers were found
to decrease. Fibers with diameters 10mm or higher
exhibited average modulus and tensile strength below
30 and 500 MPa, respectively.[3] The composite fibers
produced and discussed in this work have diameters of
�10mm. In addition to the composite property trends for
PVA/SWNT fibers, it has also been reported that the PVA
has the ability to form an extended-chain crystalline
interface on SWNT.[22] Resultant PVA/SWNT composite
fibers (with �1 wt% SWNT loading) which exhibit this
extended-chain morphology, show great improvement in
mechanical performance.[14]
In this work, the PVA/SWNT composite fibers were
produced using a steady shear-flow apparatus. Crystalli-
zation temperature was controlled during the composite
solution preparation to facilitate the polymer interfacial
crystal growth in the vicinity of the SWNT. The shear-
flow during spinning and fiber hot-drawing were
used to promote high orientation of the PVA and
SWNT. The composite fibers exhibited oriented inter-
facial structure which resulted in high mechanical
performance with maximum Young’s modulus, tensile
strength, and toughness of 128 GPa, 4.9 GPa, and
202 J � g�1, respectively.
2. Experimental Section
2.1. Materials
PVA (molecular weight 325 000 g �mol�1, Mowiol 235) was
obtained from Kuraray America Incorporation. SWNT (purity
>90 wt%, ash <1.5 wt%) was obtained from Cheaptubes
Incorporation. Dimethyl sulfoxide (DMSO) was purchased from
Sigma-Aldrich and used as received.
2.2. Solution Preparation
SWNTwas dispersed in DMSO solvent (at a concentration of 21mg
ofSWNTmL�1ofDMSO)usingabathsonicator (FS30manufactured
by Fisher Scientific) for a period of 48 h. After sonication, the PVA
powder and additional DMSO solvent were added into the
dispersion to achieve a final PVA concentration of 5 wt% in DMSO
and SWNT concentration of 10wt%with respect to solid content of
PVA in the solution. The mixture was subsequently heated and
homogenized (T10 ULTRA-TURRAXmanufactured by IKA) for 20 h
: 10.1002/mame.201300025
H & Co. KGaA, Weinheim www.MaterialsViews.com
e numbers, use DOI for citation !!
Forming Crystalline Polymer-Nano Interphase Structures . . .
www.mme-journal.de
in order to further disperse SWNT and completely dissolve all PVA.
Two different solution batches were prepared by using separate
heat treatments during homogenization: (i) the first batch of
solution (S-A) was homogenized under a constant hot plate
temperatureof120 8C;and(ii) thesecondbatchofsolution(S-B)was
homogenized using a hot plate temperature 160 8C for the first 2 h
and subsequently cooled down to 120 8C. The change in tempera-
ture used for the S-B solution induced PVA crystallization during
homogenization.
2.3. SWNT Dispersions
The nanotube dispersions were studied by electron microscopy in
order to determine the length distribution of the SWNT after
sonication.Diluted droplets of thedispersionsweredried on silicon
and imaged by means of scanning electron microscopy (SEM).
Imageswere analyzed using the software package Image J (version
1.44o). It was found that after 48 h of bath sonication the SWNT
length varied considerably. The average SWNT length distribution
based on more than 100 measurements of distinct tubes was
1.5�1.1mm.[32] This experimental length value is used in
conjunction with the theoretical analysis of the mechanical
properties for the PVA/SWNT composite fibers produced in this
work.
2.4. Fiber Preparation
Rotation of a cylindrical stir-bar in a flat bottom flask (gap size
between the cylinder and flask was 10 mm) was used to create
shear-flow. The rotation speed of the stir-bar ranged from50 to 100
RPM.Amethanol spinningbathwasusedandmaintainedat5–8 8C
Table 1. Processing parameters for PVA control and PVA/SWNT fiber
Fabrication Parameters/drawing conditions
sonication time [h]
temperature [8C]
homogenization time [h]
hot plate temperature [8C]
shear flow spinning needle gauge/diameter [mm]
gelation temperature [8C]
syringe push speed [mL � s–1]take-up speed [rpm]
hot drawing process as-spun draw ratio
coagulation time [h]
drawing temperatures [8C] 1st sta
2nd st
draw ratio 1st sta
2nd st
Macromol. Mater. Eng. 2013, DO
� 2013 WILEY-VCH Verlag Gmwww.MaterialsViews.com
Early View Publication; these are NO
for the purpose of gelation. By using a glass syringe (Thermo
ScientificHPLC 100mL), the PVA/SWNT solutionswere injected at a
speedof10mL � s�1 througha22-gaugeblunt tipneedle into thecold
methanol subjected to shear flow. The as-spun fibers were further
immersed in cold methanol for 1 h before being drawn on the hot
plate. Twohot-drawing stageswereusedat temperatures of 90and
160 8C, respectively. The drawn fibers were subsequently cut into
specimens for tensile tests. The spun fibers from the S-A and S-B
solutions are referred to as F-A and F-B fibers, respectively. The
specific gel-spinning and hot-drawing parameters used for the F-A
and F/B composite fibers are listed in Table 1.
2.5. Sample Characterization
Scanning electron microscopy was performed on Supra-25
(operating voltage 5 kV, manufactured by Zeiss). SEM samples
were placed on carbon tape and sputter coated with platinum for
imaging.Tensile testswereperformedusingadynamicmechanical
analyzer G2-RSA model (manufactured by TA Instruments) using
gauge length of 10mmand strain rate of 0.05mm � s�1.Wide-angle
X-ray diffraction (WAXD) patterns were obtained on multi-
filament bundles using Rigaku MicroMax-002 Microfocus X-ray
Generator (operating voltage at 45 kV, current at 0.66 mA, Cu Ka,
l¼0.1541 nm) manufactured by Rigaku Americas Corporation.
3. Results and Discussion
SEM micrographs of the fractured ends of the F-A and F-B
composite fibers are shown in Figure 1. For F-A fibers
(Figure 1a and b), no interfacial coating of PVA is observed
s.
F-A F-B Control fibers
48 48 –
50 50
20 20 PVA was dissolved by
mechanically stirring
on 120 8C hot plate
To: 120 Tf: 120
22/0.394 22/0.394 22/0.394
5–8 5–8
10 10 10
50 50
1.3 1.3 1.3
1 1
ge 90 90 90
age 160 160
ge 5.0 4.6 9.0
age 2.2 2.1
I: 10.1002/mame.201300025
bH & Co. KGaA, Weinheim 3
T the final page numbers, use DOI for citation !! R
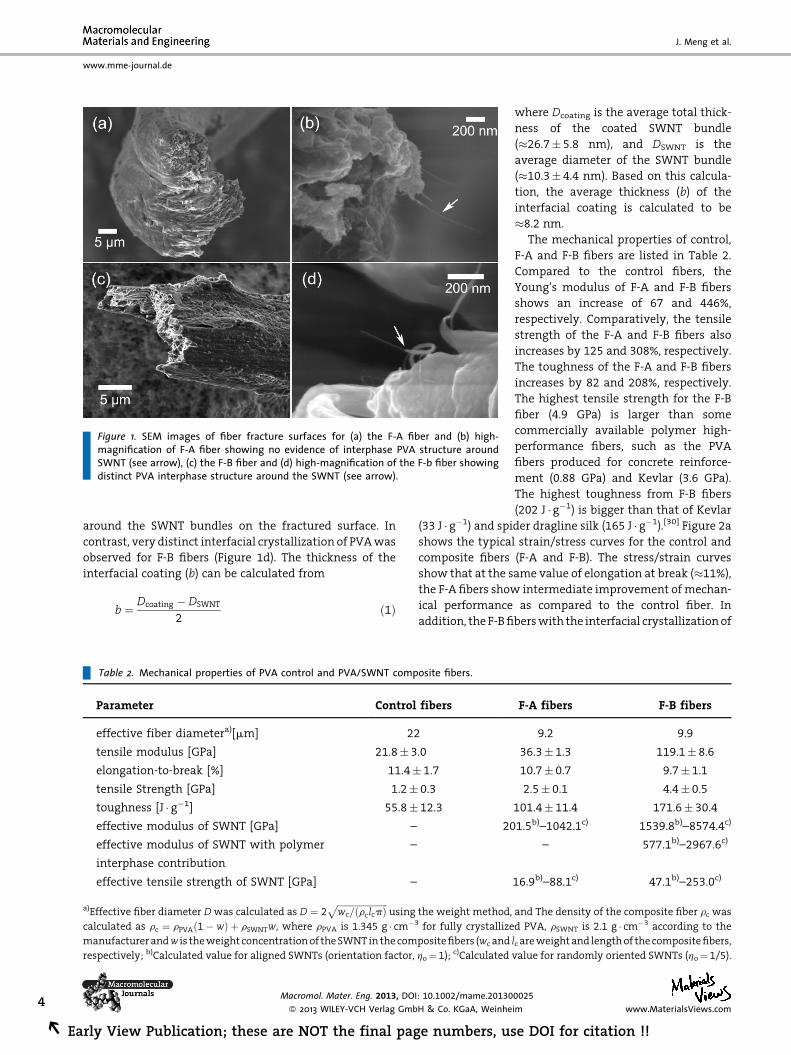
Figure 1. SEM images of fiber fracture surfaces for (a) the F-A fiber and (b) high-magnification of F-A fiber showing no evidence of interphase PVA structure aroundSWNT (see arrow), (c) the F-B fiber and (d) high-magnification of the F-b fiber showingdistinct PVA interphase structure around the SWNT (see arrow).
www.mme-journal.de
J. Meng et al.
4
REa
around the SWNT bundles on the fractured surface. In
contrast, very distinct interfacial crystallization of PVAwas
observed for F-B fibers (Figure 1d). The thickness of the
interfacial coating (b) can be calculated from
Tab
Par
eff
ten
elo
ten
tou
eff
eff
int
eff
a)Effec
calcul
manu
respec
rly V
b ¼ Dcoating � DSWNT
2ð1Þ
le 2. Mechanical properties of PVA control and PVA/SWNT composite fibers.
ameter Control fibers
ective fiber diametera)[mm] 22
sile modulus [GPa] 21.8� 3.0
ngation-to-break [%] 11.4� 1.7
sile Strength [GPa] 1.2� 0.3
ghness [J � g�1] 55.8� 12.3
ective modulus of SWNT [GPa] – 20
ective modulus of SWNT with polymer
erphase contribution
–
ective tensile strength of SWNT [GPa] –
tive fiber diameter Dwas calculated as D ¼ 2ffiffiffiffiffiffiffiffiffiffiffiffiffiffiffiffiffiffiffiffiffiffiffiwc=ðrclcpÞ
pusing the weight method,
ated as rc ¼ rPVAð1� wÞ þ rSWNTw, where rPVA is 1.345 g � cm�3 for fully crystallize
facturer andw is theweightconcentrationof theSWNTin thecompositefibers (wc and
tively; b)Calculated value for aligned SWNTs (orientation factor, ho¼1); c)Calculated
Macromol. Mater. Eng. 2013, DOI: 10.1002/mame.20130
� 2013 WILEY-VCH Verlag GmbH & Co. KGaA, Weinhe
iew Publication; these are NOT the final page numbers, us
where Dcoating is the average total thick-
ness of the coated SWNT bundle
(�26.7� 5.8 nm), and DSWNT is the
average diameter of the SWNT bundle
(�10.3� 4.4 nm). Based on this calcula-
tion, the average thickness (b) of the
interfacial coating is calculated to be
�8.2 nm.
The mechanical properties of control,
F-A and F-B fibers are listed in Table 2.
Compared to the control fibers, the
Young’s modulus of F-A and F-B fibers
shows an increase of 67 and 446%,
respectively. Comparatively, the tensile
strength of the F-A and F-B fibers also
increases by 125 and 308%, respectively.
The toughness of the F-A and F-B fibers
increases by 82 and 208%, respectively.
The highest tensile strength for the F-B
fiber (4.9 GPa) is larger than some
commercially available polymer high-
performance fibers, such as the PVA
fibers produced for concrete reinforce-
ment (0.88 GPa) and Kevlar (3.6 GPa).
The highest toughness from F-B fibers
(202 J � g�1) is bigger than that of Kevlar
(33 J � g�1) and spider dragline silk (165 J � g�1).[30] Figure 2a
shows the typical strain/stress curves for the control and
composite fibers (F-A and F-B). The stress/strain curves
show that at the same value of elongation at break (�11%),
the F-A fibers show intermediate improvement ofmechan-
ical performance as compared to the control fiber. In
addition, the F-Bfiberswith the interfacial crystallizationof
F-A fibers F-B fibers
9.2 9.9
36.3� 1.3 119.1� 8.6
10.7� 0.7 9.7� 1.1
2.5� 0.1 4.4� 0.5
101.4� 11.4 171.6� 30.4
1.5b)–1042.1c) 1539.8b)–8574.4c)
– 577.1b)–2967.6c)
16.9b)–88.1c) 47.1b)–253.0c)
and The density of the composite fiber rc was
d PVA, rSWNT is 2.1 g � cm�3 according to the
lc areweightand lengthof the compositefibers,
value for randomly oriented SWNTs (ho¼1/5).
0025
im www.MaterialsViews.com
e DOI for citation !!
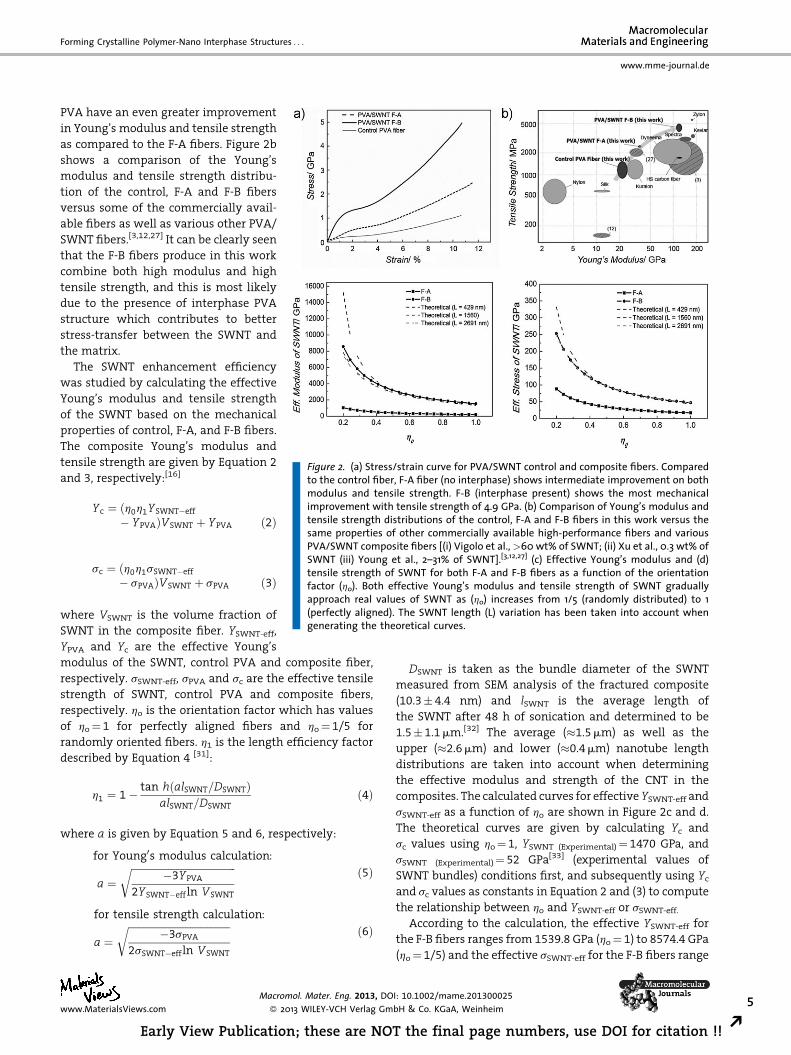
Figure 2. (a) Stress/strain curve for PVA/SWNT control and composite fibers. Comparedto the control fiber, F-A fiber (no interphase) shows intermediate improvement on both
Forming Crystalline Polymer-Nano Interphase Structures . . .
www.mme-journal.de
PVA have an even greater improvement
in Young’s modulus and tensile strength
as compared to the F-A fibers. Figure 2b
shows a comparison of the Young’s
modulus and tensile strength distribu-
tion of the control, F-A and F-B fibers
versus some of the commercially avail-
able fibers as well as various other PVA/
SWNT fibers.[3,12,27] It can be clearly seen
that the F-B fibers produce in this work
combine both high modulus and high
tensile strength, and this is most likely
due to the presence of interphase PVA
structure which contributes to better
stress-transfer between the SWNT and
the matrix.
The SWNT enhancement efficiency
was studied by calculating the effective
Young’s modulus and tensile strength
of the SWNT based on the mechanical
properties of control, F-A, and F-B fibers.
The composite Young’s modulus and
tensile strength are given by Equation 2
and 3, respectively:[16]
modulus and tensile strength. F-B (interphase present) shows the most mechanicalimprovement with tensile strength of 4.9 GPa. (b) Comparison of Young’s modulus andtensile strength distributions of the control, F-A and F-B fibers in this work versus thesame properties of other commercially available high-performance fibers and variousPVA/SWNT composite fibers [(i) Vigolo et al.,>60 wt% of SWNT; (ii) Xu et al., 0.3 wt% ofSWNT (iii) Young et al., 2–31% of SWNT].[3,12,27] (c) Effective Young’s modulus and (d)tensile strength of SWNT for both F-A and F-B fibers as a function of the orientationfactor (ho). Both effective Young’s modulus and tensile strength of SWNT graduallyapproach real values of SWNT as (ho) increases from 1/5 (randomly distributed) to 1
www.M
Yc ¼ ðh0h1YSWNT�eff
� YPVAÞVSWNT þ YPVA ð2Þ
sc ¼ ðh0h1sSWNT�eff
� sPVAÞVSWNT þ sPVA ð3Þ
(perfectly aligned). The SWNT length (L) variation has been taken into account whengenerating the theoretical curves.
where VSWNT is the volume fraction of
SWNT in the composite fiber. YSWNT-eff,
YPVA and Yc are the effective Young’s
modulus of the SWNT, control PVA and composite fiber,
respectively. sSWNT-eff, sPVA and sc are the effective tensile
strength of SWNT, control PVA and composite fibers,
respectively. ho is the orientation factor which has values
of ho¼ 1 for perfectly aligned fibers and ho¼ 1/5 for
randomly oriented fibers. h1 is the length efficiency factor
described by Equation 4 [31]:
h1 ¼ 1� tan hðalSWNT=DSWNTÞalSWNT=DSWNT
ð4Þ
where a is given by Equation 5 and 6, respectively:
for Young0s modulus calculation:
a ¼ffiffiffiffiffiffiffiffiffiffiffiffiffiffiffiffiffiffiffiffiffiffiffiffiffiffiffiffiffiffiffiffiffiffiffiffiffiffiffiffiffiffi�3YPVA
2YSWNT�effln VSWNT
r ð5Þ
for tensile strength calculation:
a ¼ffiffiffiffiffiffiffiffiffiffiffiffiffiffiffiffiffiffiffiffiffiffiffiffiffiffiffiffiffiffiffiffiffiffiffiffiffiffiffiffiffi�3sPVA
2sSWNT�effln VSWNT
r ð6Þ
Macromol. Mater. Eng. 2013, DO
� 2013 WILEY-VCH Verlag GmaterialsViews.com
Early View Publication; these are NO
DSWNT is taken as the bundle diameter of the SWNT
measured from SEM analysis of the fractured composite
(10.3� 4.4 nm) and lSWNT is the average length of
the SWNT after 48 h of sonication and determined to be
1.5� 1.1mm.[32] The average (�1.5mm) as well as the
upper (�2.6mm) and lower (�0.4mm) nanotube length
distributions are taken into account when determining
the effective modulus and strength of the CNT in the
composites. The calculated curves for effective YSWNT-eff and
sSWNT-eff as a function of ho are shown in Figure 2c and d.
The theoretical curves are given by calculating Yc and
sc values using ho¼ 1, YSWNT (Experimental)¼ 1470 GPa, and
sSWNT (Experimental)¼ 52 GPa[33] (experimental values of
SWNT bundles) conditions first, and subsequently using Ycand sc values as constants in Equation 2 and (3) to compute
the relationship between ho and YSWNT-eff or sSWNT-eff.
According to the calculation, the effective YSWNT-eff for
the F-B fibers ranges from 1539.8 GPa (ho¼ 1) to 8574.4 GPa
(ho¼ 1/5) and the effective sSWNT-eff for the F-B fibers range
I: 10.1002/mame.201300025
bH & Co. KGaA, Weinheim 5
T the final page numbers, use DOI for citation !! R
www.mme-journal.de
J. Meng et al.
6
REa
from 47.1 GPa (ho¼ 1) to 253.0 GPa (ho¼ 1/5). These results
suggest that as the orientation factor changes from1/5 to 1,
the calculated values approach the real properties of SWNT
(as mentioned), which have been experimentally and
theoretically determined.[33–37]
Since the fibers are spun under shear-flow and subse-
quently drawn, the SWNT in the fiber systems will tend
to be more aligned than randomly distributed. Therefore,
recognizing that a certain degree of disorientation of SWNT
will remain in the composite fiber, the minimum effective
Young’s modulus and tensile strength of the SWNT for F-B
fibers are 1539.8 and 47.1 GPa, respectively. By comparing
these values with the same analysis for the F-A fibers, the
effectiveYSWNT-eff and sSWNT-eff values of F-Bfibers are 664%
higher and 179% higher, respectively. This result confirms
that by inducing interfacial crystallization of PVA during
fiber processing, a stronger PVA/SWNT interphasehas been
created, and subsequently better load transfer from the
PVA matrix to SWNT has been achieved.
Based on this theoretical analysis using Equation 2, 4, 5,
and6, thepredictedeffectivemodulusvalueatho¼ 1 for the
SWNT in theF-B is ratherhigh. Typically, bothexperimental
andtheoretical SWNTmodulusvaluesof1TPaorgreaterare
associated with individual single-wall nanotubes as
opposed to bundles/ropes. In this work the PVA/SWNT
fibers contain SWNT bundles of �10 nm in diameter, and
the predicted and measured modulus values reported for
SWNT bundles are usually only a few hundred giga-
pascals.[33,42,43] For the F-A fibers where there is no
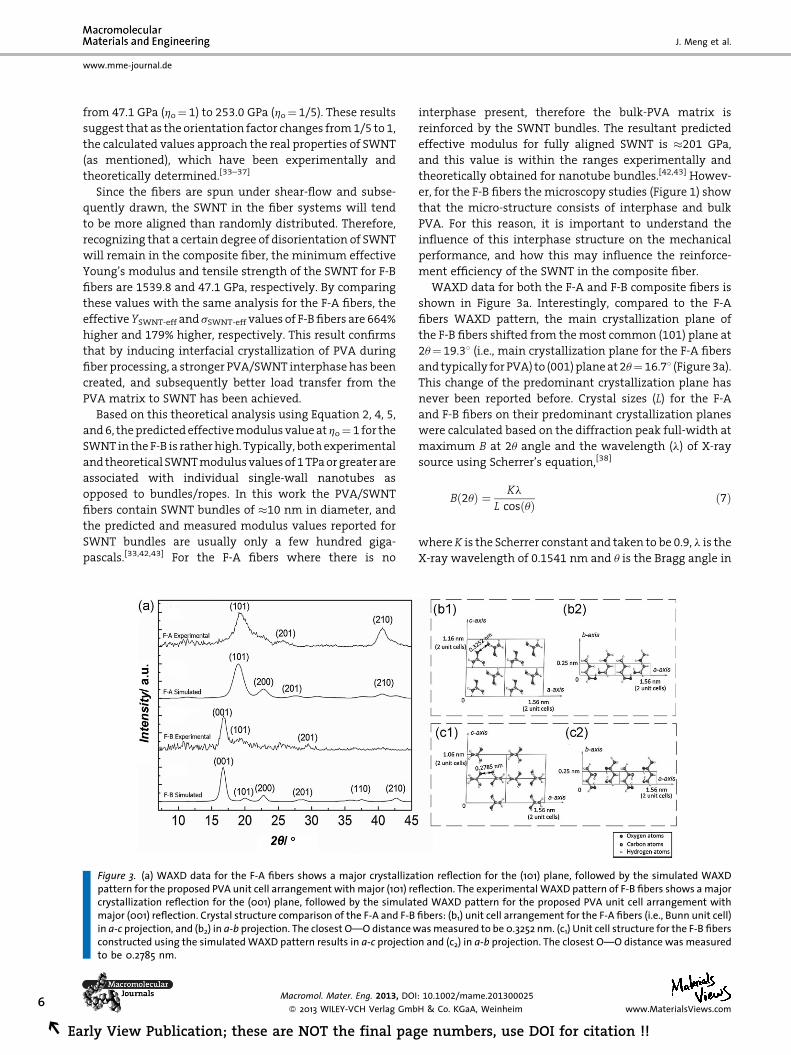
Figure 3. (a) WAXD data for the F-A fibers shows a major crystallizapattern for the proposed PVA unit cell arrangement withmajor (101) recrystallization reflection for the (001) plane, followed by the simulatmajor (001) reflection. Crystal structure comparison of the F-A and F-Bin a-c projection, and (b2) in a-b projection. The closest O—Odistancewconstructed using the simulatedWAXD pattern results in a-c projectioto be 0.2785 nm.
Macromol. Mater. Eng. 2013, DOI
� 2013 WILEY-VCH Verlag Gmb
rly View Publication; these are NOT the final pag
interphase present, therefore the bulk-PVA matrix is
reinforced by the SWNT bundles. The resultant predicted
effective modulus for fully aligned SWNT is �201 GPa,
and this value is within the ranges experimentally and
theoretically obtained for nanotube bundles.[42,43] Howev-
er, for the F-B fibers themicroscopy studies (Figure 1) show
that the micro-structure consists of interphase and bulk
PVA. For this reason, it is important to understand the
influence of this interphase structure on the mechanical
performance, and how this may influence the reinforce-
ment efficiency of the SWNT in the composite fiber.
WAXD data for both the F-A and F-B composite fibers is
shown in Figure 3a. Interestingly, compared to the F-A
fibers WAXD pattern, the main crystallization plane of
the F-B fibers shifted from themost common (101) plane at
2u¼ 19.38 (i.e., main crystallization plane for the F-A fibers
and typically forPVA) to (001)planeat2u¼ 16.78 (Figure3a).This change of the predominant crystallization plane has
never been reported before. Crystal sizes (L) for the F-A
and F-B fibers on their predominant crystallization planes
were calculated based on the diffraction peak full-width at
maximum B at 2u angle and the wavelength (l) of X-ray
source using Scherrer’s equation,[38]
tion reflflectioned WAfibers:asmen and (
: 10.100
H & Co
e nu
Bð2uÞ ¼ KlL cosðuÞ ð7Þ
whereK is the Scherrer constant and taken to be 0.9, l is the
X-ray wavelength of 0.1541 nm and u is the Bragg angle in
ection for the (101) plane, followed by the simulated WAXD. The experimental WAXD pattern of F-B fibers shows amajorXD pattern for the proposed PVA unit cell arrangement with(b1) unit cell arrangement for the F-A fibers (i.e., Bunn unit cell)asured to be 0.3252 nm. (c1) Unit cell structure for the F-B fibersc2) in a-b projection. The closest O—O distance was measured
2/mame.201300025
. KGaA, Weinheim www.MaterialsViews.com
mbers, use DOI for citation !!
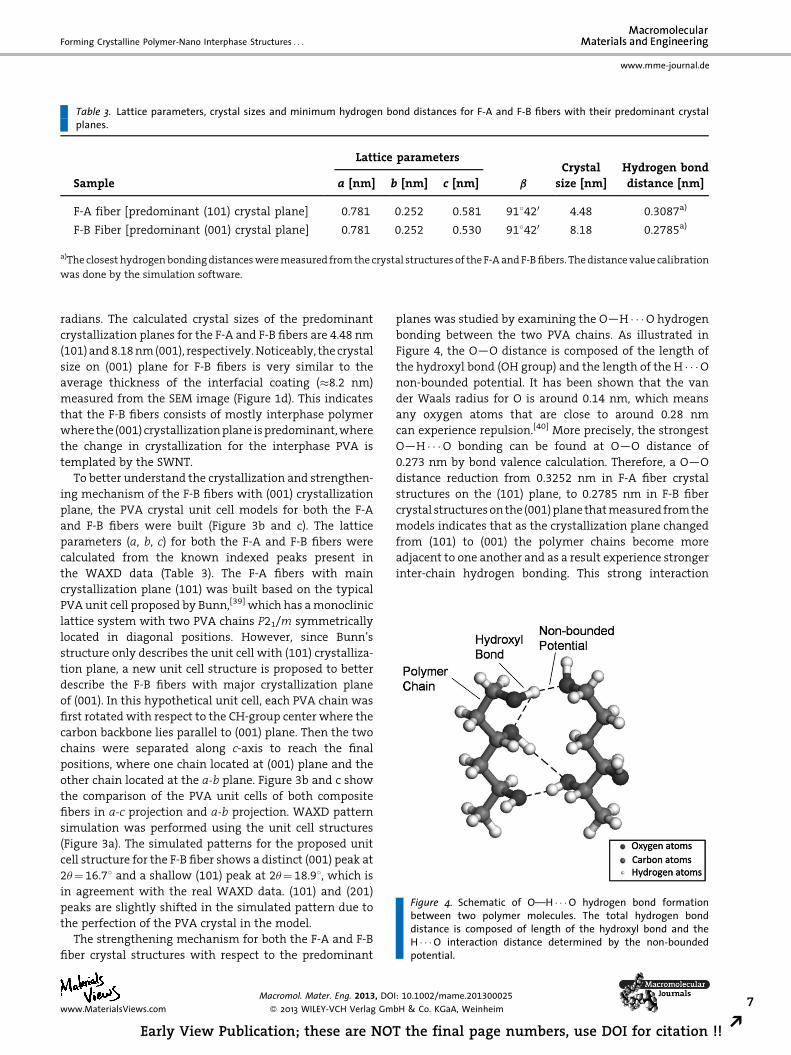
Table 3. Lattice parameters, crystal sizes and minimum hydrogen bond distances for F-A and F-B fibers with their predominant crystalplanes.
Sample
Lattice parameters
b
Crystal
size [nm]
Hydrogen bond
distance [nm]a [nm] b [nm] c [nm]
F-A fiber [predominant (101) crystal plane] 0.781 0.252 0.581 918420 4.48 0.3087a)
F-B Fiber [predominant (001) crystal plane] 0.781 0.252 0.530 918420 8.18 0.2785a)
a)The closest hydrogenbondingdistancesweremeasured fromthe crystal structures of theF-A andF-Bfibers. Thedistancevalue calibration
was done by the simulation software.
Figure 4. Schematic of O—H � � �O hydrogen bond formationbetween two polymer molecules. The total hydrogen bonddistance is composed of length of the hydroxyl bond and theH � � �O interaction distance determined by the non-boundedpotential.
Forming Crystalline Polymer-Nano Interphase Structures . . .
www.mme-journal.de
radians. The calculated crystal sizes of the predominant
crystallization planes for the F-A and F-B fibers are 4.48 nm
(101)and8.18nm(001), respectively.Noticeably, thecrystal
size on (001) plane for F-B fibers is very similar to the
average thickness of the interfacial coating (�8.2 nm)
measured from the SEM image (Figure 1d). This indicates
that the F-B fibers consists of mostly interphase polymer
where the (001) crystallizationplane ispredominant,where
the change in crystallization for the interphase PVA is
templated by the SWNT.
To better understand the crystallization and strengthen-
ing mechanism of the F-B fibers with (001) crystallization
plane, the PVA crystal unit cell models for both the F-A
and F-B fibers were built (Figure 3b and c). The lattice
parameters (a, b, c) for both the F-A and F-B fibers were
calculated from the known indexed peaks present in
the WAXD data (Table 3). The F-A fibers with main
crystallization plane (101) was built based on the typical
PVA unit cell proposed by Bunn,[39] which has amonoclinic
lattice system with two PVA chains P21/m symmetrically
located in diagonal positions. However, since Bunn’s
structure only describes the unit cell with (101) crystalliza-
tion plane, a new unit cell structure is proposed to better
describe the F-B fibers with major crystallization plane
of (001). In this hypothetical unit cell, each PVA chain was
first rotated with respect to the CH-group center where the
carbon backbone lies parallel to (001) plane. Then the two
chains were separated along c-axis to reach the final
positions, where one chain located at (001) plane and the
other chain located at the a-b plane. Figure 3b and c show
the comparison of the PVA unit cells of both composite
fibers in a-c projection and a-b projection. WAXD pattern
simulation was performed using the unit cell structures
(Figure 3a). The simulated patterns for the proposed unit
cell structure for the F-B fiber shows a distinct (001) peak at
2u¼ 16.78 and a shallow (101) peak at 2u¼ 18.98, which is
in agreement with the real WAXD data. (101) and (201)
peaks are slightly shifted in the simulated pattern due to
the perfection of the PVA crystal in the model.
The strengthening mechanism for both the F-A and F-B
fiber crystal structures with respect to the predominant
Macromol. Mater. Eng. 2013, DO
� 2013 WILEY-VCH Verlag Gmwww.MaterialsViews.com
Early View Publication; these are NO
planes was studied by examining the O—H � � �O hydrogen
bonding between the two PVA chains. As illustrated in
Figure 4, the O—O distance is composed of the length of
the hydroxyl bond (OH group) and the length of the H � � �Onon-bounded potential. It has been shown that the van
der Waals radius for O is around 0.14 nm, which means
any oxygen atoms that are close to around 0.28 nm
can experience repulsion.[40] More precisely, the strongest
O—H � � �O bonding can be found at O—O distance of
0.273 nm by bond valence calculation. Therefore, a O—O
distance reduction from 0.3252 nm in F-A fiber crystal
structures on the (101) plane, to 0.2785 nm in F-B fiber
crystal structuresonthe (001)plane thatmeasured fromthe
models indicates that as the crystallization plane changed
from (101) to (001) the polymer chains become more
adjacent to one another and as a result experience stronger
inter-chain hydrogen bonding. This strong interaction
I: 10.1002/mame.201300025
bH & Co. KGaA, Weinheim 7
T the final page numbers, use DOI for citation !! R
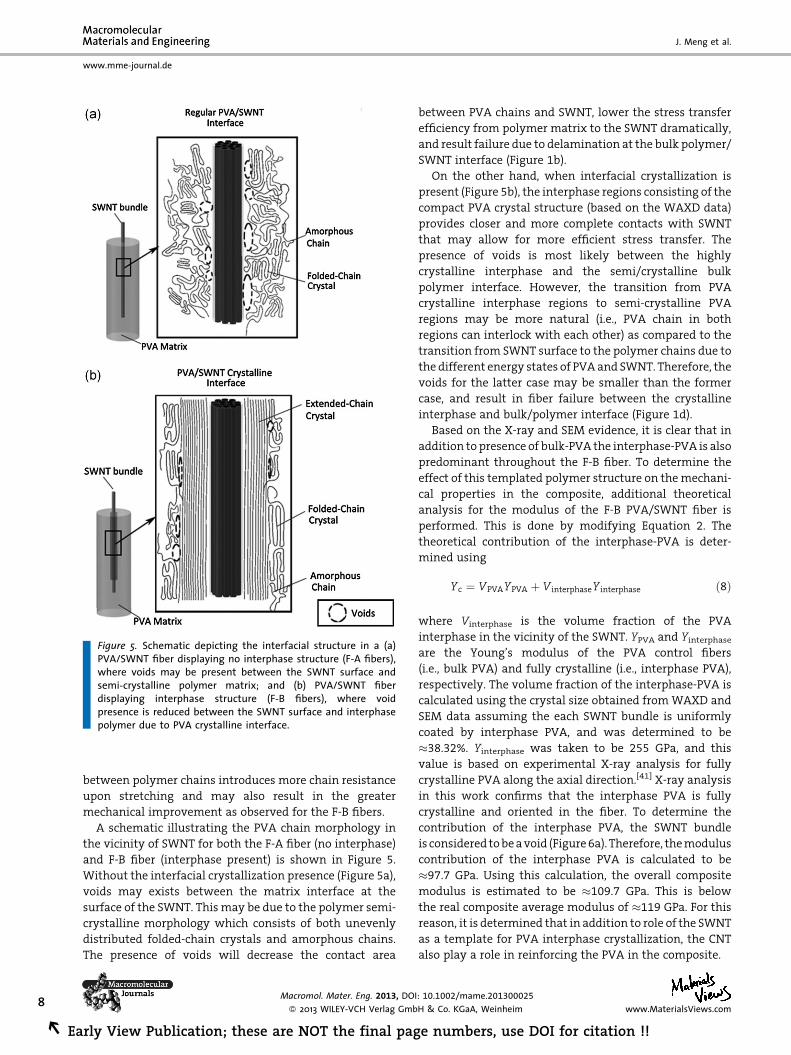
Figure 5. Schematic depicting the interfacial structure in a (a)PVA/SWNT fiber displaying no interphase structure (F-A fibers),where voids may be present between the SWNT surface andsemi-crystalline polymer matrix; and (b) PVA/SWNT fiberdisplaying interphase structure (F-B fibers), where voidpresence is reduced between the SWNT surface and interphasepolymer due to PVA crystalline interface.
www.mme-journal.de
J. Meng et al.
8
REa
between polymer chains introduces more chain resistance
upon stretching and may also result in the greater
mechanical improvement as observed for the F-B fibers.
A schematic illustrating the PVA chain morphology in
the vicinity of SWNT for both the F-A fiber (no interphase)
and F-B fiber (interphase present) is shown in Figure 5.
Without the interfacial crystallization presence (Figure 5a),
voids may exists between the matrix interface at the
surface of the SWNT. This may be due to the polymer semi-
crystalline morphology which consists of both unevenly
distributed folded-chain crystals and amorphous chains.
The presence of voids will decrease the contact area
Macromol. Mater. Eng. 2013, DOI
� 2013 WILEY-VCH Verlag Gmb
rly View Publication; these are NOT the final pag
between PVA chains and SWNT, lower the stress transfer
efficiency from polymer matrix to the SWNT dramatically,
and result failure due to delamination at the bulk polymer/
SWNT interface (Figure 1b).
On the other hand, when interfacial crystallization is
present (Figure 5b), the interphase regions consisting of the
compact PVA crystal structure (based on the WAXD data)
provides closer and more complete contacts with SWNT
that may allow for more efficient stress transfer. The
presence of voids is most likely between the highly
crystalline interphase and the semi/crystalline bulk
polymer interface. However, the transition from PVA
crystalline interphase regions to semi-crystalline PVA
regions may be more natural (i.e., PVA chain in both
regions can interlock with each other) as compared to the
transition from SWNT surface to the polymer chains due to
the different energy states of PVAand SWNT. Therefore, the
voids for the latter case may be smaller than the former
case, and result in fiber failure between the crystalline
interphase and bulk/polymer interface (Figure 1d).
Based on the X-ray and SEM evidence, it is clear that in
addition to presence of bulk-PVA the interphase-PVA is also
predominant throughout the F-B fiber. To determine the
effect of this templated polymer structure on themechani-
cal properties in the composite, additional theoretical
analysis for the modulus of the F-B PVA/SWNT fiber is
performed. This is done by modifying Equation 2. The
theoretical contribution of the interphase-PVA is deter-
mined using
: 10.100
H & Co
e nu
Yc ¼ VPVAYPVA þ V interphaseY interphase ð8Þ
where Vinterphase is the volume fraction of the PVA
interphase in the vicinity of the SWNT. YPVA and Yinterphaseare the Young’s modulus of the PVA control fibers
(i.e., bulk PVA) and fully crystalline (i.e., interphase PVA),
respectively. The volume fraction of the interphase-PVA is
calculated using the crystal size obtained fromWAXD and
SEM data assuming the each SWNT bundle is uniformly
coated by interphase PVA, and was determined to be
�38.32%. Yinterphase was taken to be 255 GPa, and this
value is based on experimental X-ray analysis for fully
crystalline PVA along the axial direction.[41] X-ray analysis
in this work confirms that the interphase PVA is fully
crystalline and oriented in the fiber. To determine the
contribution of the interphase PVA, the SWNT bundle
is considered tobeavoid (Figure6a). Therefore, themodulus
contribution of the interphase PVA is calculated to be
�97.7 GPa. Using this calculation, the overall composite
modulus is estimated to be �109.7 GPa. This is below
the real composite average modulus of �119 GPa. For this
reason, it is determined that in addition to role of the SWNT
as a template for PVA interphase crystallization, the CNT
also play a role in reinforcing the PVA in the composite.
2/mame.201300025
. KGaA, Weinheim www.MaterialsViews.com
mbers, use DOI for citation !!
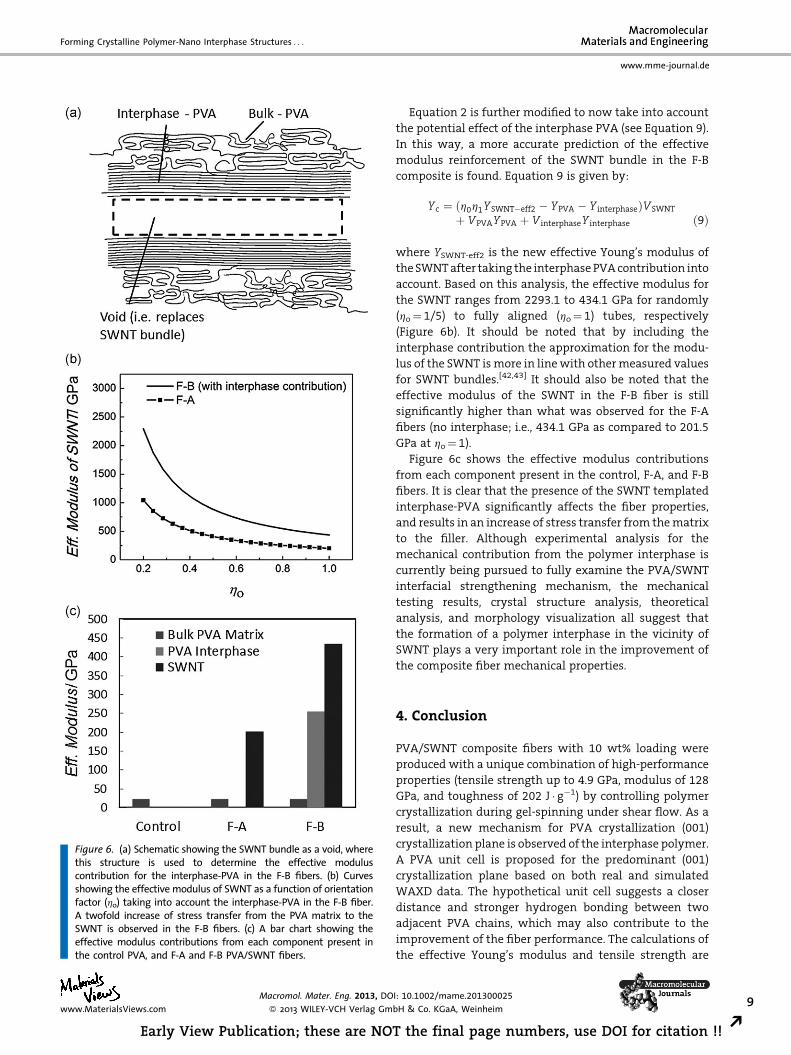
Figure 6. (a) Schematic showing the SWNT bundle as a void, wherethis structure is used to determine the effective moduluscontribution for the interphase-PVA in the F-B fibers. (b) Curvesshowing the effective modulus of SWNT as a function of orientationfactor (ho) taking into account the interphase-PVA in the F-B fiber.A twofold increase of stress transfer from the PVA matrix to theSWNT is observed in the F-B fibers. (c) A bar chart showing theeffective modulus contributions from each component present inthe control PVA, and F-A and F-B PVA/SWNT fibers.
Forming Crystalline Polymer-Nano Interphase Structures . . .
www.mme-journal.de
Macromol. Mater. Eng. 2013, DO
� 2013 WILEY-VCH Verlag Gmwww.MaterialsViews.com
Early View Publication; these are NO
Equation 2 is further modified to now take into account
the potential effect of the interphase PVA (see Equation 9).
In this way, a more accurate prediction of the effective
modulus reinforcement of the SWNT bundle in the F-B
composite is found. Equation 9 is given by:
I: 10.10
bH & Co
T the
Yc ¼ ðh0h1YSWNT�eff2 � YPVA � Y interphaseÞVSWNT
þ VPVAYPVA þ V interphaseY interphase ð9Þ
where YSWNT-eff2 is the new effective Young’s modulus of
the SWNTafter taking the interphase PVAcontribution into
account. Based on this analysis, the effective modulus for
the SWNT ranges from 2293.1 to 434.1 GPa for randomly
(ho¼ 1/5) to fully aligned (ho¼ 1) tubes, respectively
(Figure 6b). It should be noted that by including the
interphase contribution the approximation for the modu-
lus of the SWNT ismore in linewith othermeasured values
for SWNT bundles.[42,43] It should also be noted that the
effective modulus of the SWNT in the F-B fiber is still
significantly higher than what was observed for the F-A
fibers (no interphase; i.e., 434.1 GPa as compared to 201.5
GPa at ho¼ 1).
Figure 6c shows the effective modulus contributions
from each component present in the control, F-A, and F-B
fibers. It is clear that the presence of the SWNT templated
interphase-PVA significantly affects the fiber properties,
and results in an increase of stress transfer from thematrix
to the filler. Although experimental analysis for the
mechanical contribution from the polymer interphase is
currently being pursued to fully examine the PVA/SWNT
interfacial strengthening mechanism, the mechanical
testing results, crystal structure analysis, theoretical
analysis, and morphology visualization all suggest that
the formation of a polymer interphase in the vicinity of
SWNT plays a very important role in the improvement of
the composite fiber mechanical properties.
4. Conclusion
PVA/SWNT composite fibers with 10 wt% loading were
produced with a unique combination of high-performance
properties (tensile strength up to 4.9 GPa, modulus of 128
GPa, and toughness of 202 J � g�1) by controlling polymer
crystallization during gel-spinning under shear flow. As a
result, a new mechanism for PVA crystallization (001)
crystallization plane is observed of the interphase polymer.
A PVA unit cell is proposed for the predominant (001)
crystallization plane based on both real and simulated
WAXD data. The hypothetical unit cell suggests a closer
distance and stronger hydrogen bonding between two
adjacent PVA chains, which may also contribute to the
improvement of the fiber performance. The calculations of
the effective Young’s modulus and tensile strength are
02/mame.201300025
. KGaA, Weinheim 9
final page numbers, use DOI for citation !! R
www.mme-journal.de
J. Meng et al.
10
REa
much larger for the PVA/SWNT fibers which exhibit
interphase structure. Creation of the polymer interphase
region is a key component for improving stress-transfer,
where this clearly observed in the F-B fibers as compared to
the F-A (no interphase) fibers.
Acknowledgements: The authors thank the Air Force Office ofScientific Research (AFOSR FA 9950-11-1-0153) for financialsupport of this research work.
Received: January 22, 2013; Revised: March 29, 2013; Publishedonline: DOI: 10.1002/mame.201300025
Keywords: carbon nanotubes; fibers; interfaces; nanocomposites;poly(vinyl alcohol)
[1] M. Zhang, K. R. Atkinson, R. H. Baughman, Science 2004, 306,1358.
[2] X. B. Zhang, K. L. Jiang, C. Teng, P. Liu, L. Zhang, J. Kong, T. H.Zhang, Q. Q. Li, S. S. Fan, Adv. Mater. 2006, 18, 1505.
[3] K. Young, F. M. Blighe, J. J. Vilatela, A. H. Windle, I. A. Kinloch,L. B. Deng, R. J. Young, J. N. Coleman, ACS Nano 2010, 4, 6989.
[4] L. Y. Li, I. A. Kinloch, A. H. Windle, Science 2004, 304, 276.[5] J. M. Razal, J. N. Coleman, E. Munoz, B. Lund, Y. Gogotsi, H. Ye,
S. Collins, A. B. Dalton, R. H. Baughman, Adv. Funct. Mater.2007, 17, 2918.
[6] K. Liu, Y. H. Sun, R. F. Zhou, H. Y. Zhu, J. P. Wang, L. Liu, S. S. Fan,K. L. Jiang, Nanotechnology 2010, 21, 045708.
[7] A. B. Dalton, S. Collins, J. Razal, E. Munoz, V. H. Ebron, B. G.Kim, J. N. Coleman, J. P. Ferraris, R. H. Baughman, J. Mater.Chem. 2004, 14, 1.
[8] X. H. Zhong, Y. L. Li, Y. K. Liu, X. H. Qiao, Y. Feng, J. Liang, J. Jin, L.Zhu, F. Hou, J. Y. Li, Adv. Mater. 2010, 22, 692.
[9] S. Boncel, R. M. Sundaram, A. H. Windle, K. Koziol, ACS Nano2011, 5, 9339.
[10] K. Koziol, J. Vilatela, A. Moisala, M. Motta, P. Cunniff,M. Sennett, A. Windle, Science 2007, 318, 1892.
[11] C. D. Tran, S. Lucas, D. G. Phillips, L. K. Randeniya, R. H.Baughman, T. Tran-Cong, Nanotechnology 2011, 22, 145302.
[12] B. Vigolo, A. Penicaud, C. Coulon, C. Sauder, R. Pailler, C. Journet,P. Bernier, P. Poulin, Science 2000, 290, 1331.
[13] T. W. Chou, L. M. Gao, E. T. Thostenson, Z. G. Zhang, J. H. Byun,Compos. Sci. Technol. 2010, 70, 1.
[14] M. L. Minus, H. G. Chae, S. Kumar, Macromol. Chem. Phys.2009, 210, 1799.
Macromol. Mater. Eng. 2013, DO
� 2013 WILEY-VCH Verlag Gmb
rly View Publication; these are NOT the final pag
[15] A. B. Dalton, S. Collins, E. Munoz, J. M. Razal, V. H. Ebron, J. P.Ferraris, J. N. Coleman, B. G. Kim, R. H. Baughman, Nature2003, 423, 703.
[16] J. N. Coleman, U. Khan, W. J. Blau, Y. K. Gun’ko, Carbon 2006,44, 1624.
[17] J. N. Coleman, M. Cadek, R. Blake, V. Nicolosi, K. P. Ryan,C. Belton, A. Fonseca, J. B. Nagy, Y. K. Gun’ko, W. J. Blau, Adv.Funct. Mater. 2004, 14, 791.
[18] K. P. Ryan, M. Cadek, A. Drury, M. Ruether, W. J. Blau, J. N.Coleman, Fuller. Nanotub. Carbon Nanostruct. 2005, 13, 431.
[19] C. Y. Li, L. Y. Li, W. W. Cai, S. L. Kodjie, Adv. Mater. 2005, 17,1198.
[20] K. P. Ryan, S. M. Lipson, A. Drury, M. Cadek, M. Ruether, S. M.O’Flaherty, V. Barron, B. McCarthy, H. J. Byrne, W. J. Blau,Chem. Phys. Lett. 2004, 391, 329.
[21] H. G. Chae, M. L. Minus, S. Kumar, Polymer 2006, 47, 3494.[22] M. L. Minus, H. G. Chae, S. Kumar, Polymer 2006, 47, 3705.[23] S. Kanagaraj, F. R. Varanda, T. V. Zhil’tsova, M. S. A. Oliveira,
J. A. O. Sim̌es, Compos. Sci. Technol. 2007, 67, 3071.[24] J. N. Coleman, M. S. Ferreira, Appl. Phys. Lett. 2004, 84, 798.[25] W. Liu, X. H. Zhang, G. Xu, P. D. Bradford, X. Wang, H. B. Zhao,
Y. Y. Zhang, Q. X. Jia, F. G. Yuan, Q.W. Li, Carbon 2011, 49, 4786.[26] M. Naebe, T. Lin, W. Tian, L. M. Dai, X. G. Wang,
Nanotechnology 2007, 18, 225605.[27] X. Xu, A. J. Uddin, K. Aoki, Y. Gotoh, T. Saito, M. Yumura,
Carbon 2010, 48, 1977.[28] L. B. Deng, S. J. Eichhorn, C. C. Kao, R. J. Young,ACS Appl. Mater.
Interfaces 2011, 3, 433.[29] K. K. H. Wong, M. Zinke-Allmang, J. L. Hutter, S. Hrapovic, J. H.
T. Luong, W. Wan, Carbon 2009, 47, 2571.[30] F. Vollrath, B. Madsen, Z. Z. Shao, Proc. R. Soc. Lond. Ser. B Biol.
Sci. 2001, 268, 2339.[31] G. P. Carman, K. L. Reifsnider, Compos. Sci. Technol. 1992, 43,
137.[32] Y. Zhang, M. L. Minus, Conference Presentation at ACS Spring
Meeting 2012, PMSE (429).[33] M. F. Yu, B. S. Files, S. Arepalli, R. S. Ruoff, Phys. Rev. Lett. 2000,
84, 5552.[34] M. M. J. Treacy, T. W. Ebbesen, J. M. Gibson, Nature 1996, 381,
678.[35] T. Natsuki, K. Tantrakarn, M. Endo, Carbon 2004, 42, 39.[36] R. S. Ruoff, D. Qian, W. K. Liu, C. R. Phys. 2003, 4, 993.[37] T. Belytschko, S. P. Xiao, G. C. Schatz, R. S. Ruoff, Phys. Rev. B
2002, 65, 235430.[38] P. Scherrer, Nachr. Ges. Wiss. G€ottingen 1918, 26, 98.[39] C. W. Bunn, Nature 1948, 161, 929.[40] I. D. Brown, Acta Crystallogr. A 1976, 32, 24.[41] I. Sakurada, T. Ito, K. Nakamae, J. Polym. Sci. C 1966, 15, 75.[42] C. H. Ke, M. Zheng, I. T. Bae, J. Appl. Phys. 2010, 107, 104305.[43] J. P. Lu, Phys. Rev. Lett. 1997, 79, 1297.
I: 10.1002/mame.201300025
H & Co. KGaA, Weinheim www.MaterialsViews.com
e numbers, use DOI for citation !!