selection of representative shear modulus reduction and
TRANSCRIPT
ORIGINAL PAPER
Selection of representative shear modulus reductionand damping curves for rock, gravel and sand sitesfrom the KiK-Net downhole array
P. Anbazhagan1,2 • Athul Prabhakaran1 • H. Madhura1 •
Sayed S. R. Moustafa2,3 • Nassir S. N. Al-Arifi2
Received: 25 July 2015 / Accepted: 31 May 2017 / Published online: 22 June 2017� Springer Science+Business Media B.V. 2017
Abstract Representative computation of ground response parameters requires accurate
information about nonlinear dynamic behavior of the soil column, commonly incorporated
in site response analysis through shear modulus reduction and damping curves which are
functions of the strain level. Most site response studies are carried out by considering a set
of existing shear modulus and damping curves, without knowing its suitability for the
in situ soil type. In this study, an attempt has been made to identify suitable shear modulus
and damping curves for soil grouped into different classes viz. sand, gravel and rock. Soil
profiles of sites having surface and bedrock motion recordings are selected from the KiK-
Net downhole array database and equivalent linear and total stress nonlinear site response
analysis has been carried out by varying the shear modulus and damping curves for
different sites. Estimated surface response spectra for each set of shear modulus and
damping curves are compared with the observed response spectra at each site, and a
detailed analysis is made to find out which set of curves gives a best match with the
recorded data. Based on this study, representative property curves for rock, gravel and sand
are suggested, which could be used for further site response studies in the region. This
study shows that only a set of shear modulus and damping curves ensure a compatible
spectrum with the recorded data from the KiK-Net downhole array sites, among the many
available shear modulus and damping curves in the literature.
Electronic supplementary material The online version of this article (doi:10.1007/s11069-017-2944-x)contains supplementary material, which is available to authorized users.
& P. [email protected]
1 Department of Civil Engineering, Indian Institute of Science, Bangalore, India
2 Faculty of Science, Geology and Geophysics Department, King Saud University, Riyadh,Saudi Arabia
3 Seismology Department, National Research Institute of Astronomy and Geophysics (NRIAG),Cairo 11421, Egypt
123
Nat Hazards (2017) 88:1741–1768DOI 10.1007/s11069-017-2944-x

Keywords Soil dynamics � Shear modulus and damping curves � Siteresponse � DEEPSOIL � KiK-Net
1 Introduction
The modification of seismic waves as it propagates through soil stratum is a well-observed
and documented issue since over a century (Milne 1898). Local site effects play a crucial
role in focusing the energy density of the ground motions to a range of frequencies, that
often proves destructive to many structures. Apart from the ground shaking hazard alone,
these effects also trigger hazards due to the ground shaking, including the cyclic mobility
and flow liquefaction hazards. (Kramer 1996). Evident with the destruction caused in the
1987 Mexico City earthquake, where long-period structures founded on soft lacustrine soil
suffered intense damages (Seed et al. 1987). Site effects were studied extensively for many
earthquakes such as the Loma Prieta earthquake (Seed and Sun 1989), 1995 Kobe earth-
quake, 2001 Bhuj Earthquake, 2010 Canterbury earthquake and the recent Nepal earth-
quake (Moss et al. 2015; Mugnier et al. 2011). The estimation of the in situ dynamic
properties of soil deposits is of prime importance in studying the response of structures
founded on such sites.
The incorporation of site effects, in studying the earthquake response of structures, has
been done through amplification factors in existing literature (Choi and Stewart 2005;
Boore and Atkinson 2008) integrated into various ground motion prediction equations
(Boore et al. 2014 (NGA WEST GMPEs Project) and in various code provisions (BSSC
2001; CEN 2004) as functions of the 30 m average shear wave velocity (Vs30). For several
important projects, site-specific data could also be used to perform detailed site response
analysis for the site, where the wave propagation equation is solved for a site condition and
a ground motion. Among the methods, for large-scale projects, site response analysis is
often used to estimate the ground motion characteristics at the surface of the strata, after
the seismic waves pass through the deposit, as it can physically model aspects of the wave
propagation problem unlike the other empirical studies, including effective stress models,
pore water pressure generation and dissipation models. In actual practice, only the one-
dimensional (1D) wave propagation equation is usually solved as evident with the exis-
tence of various site response software viz. Shake91, DEEPSOIL, EERA, STRATA. Even
though site response study and amplification estimation essential most of modern codes,
site response studies are started in India after Bhuj earthquake 2001 and then several
researchers carried out ground response analysis for many cities in India. Govindaraju et al.
(2004) and Shukla and Choudhury (2012) for Gujarat; Mahajan et al. (2007) for Dehradun;
Boominathan et al. (2008) for Chennai; Mohanty et al. (2007) and Kamatchi et al. (2008)
for Delhi; Anbazhagan and Sitharam (2008) for Bengaluru, Govindaraju and Bhattacharya
(2008) for Kolkata region, Raghu Kanth et al. (2009) for Guwahati, and Kumar et al.
(2012) for Lucknow, Uttar Pradesh. Mahajan et al. (2007) preformed 50 MASW surveys at
different locations across the Dehradun and performed site response analyses yielding
amplifications of peak ground acceleration (PGA) ranging from 1 to 4 in different parts of
the city. Anbazhagan and Sitharam (2008) performed the site response analysis in Ben-
galuru region and performed one-dimensional site response analyses obtaining amplifi-
cation factors varying from 1 to 4 in the PGA. Boominathan et al. (2008) performed the
ground response analyses for Chennai city and reported amplification factors between 4
1742 Nat Hazards (2017) 88:1741–1768
123
and 6. Govindaraju and Bhattacharya (2008) performed the site response analysis based on
the equivalent linear approach for the city of Kolkata. More than 100 boreholes collected
from various agencies to understand the subsoil lithology variation for the city of Kolkata.
Ground response analysis for these soil columns by Govindaraju and Bhattacharya (2008)
showed amplification factors were in between 4.4 and 4.8. Kamatchi et al. (2008) per-
formed site-specific analysis of Delhi region and reported the amplifications of the sites
between 2.02 and 3.3. Hanumantha Rao and Ramana (2009) carried out response studies
for sites in Delhi, using synthetic motions and the corresponding acceleration response
spectrum at four different site classes (Site class A, B, C and D) as per IBC (2009).
Phanikanth et al. (2011) carried out response studies of the typical sites in Mumbai
considering 3 sites varying up to rock depth resulting in amplification factors varying from
1.07 to 3.35. Similar studies were performed by Shukla and Choudhury (2012) carried out
response studies of the four ports (Kandla, Mundra, Hazira and Dahej) sites in Gujarat
using three synthetic time histories. Kumar et al. (2012) carried out site response studies
for different locations in Lucknow city. Response parameters at ground surface were
estimated by nonlinear site response analysis considering multiple input ground motions
given at very dense soil layer having Vs of 760 ± 60 m/s at 29 locations, and the authors
found that amplification factors are in the range of 3.5–5.54 in the northern parts of the
city. However, the successful application of such site response study in specific cases is
essentially dependent on the incorporation of the representative soil properties in the
response analyses (Seed et al. 1986; Bradley 2011; Thompson et al. 2012) and the cali-
bration of the program used in the analysis.
In this respect, downhole arrays provide a valuable comparison tool in assessing the
capability of such programs and the assumptions used in implementing them. Downhole
arrays contain a pair of seismograms with which they are usually coupled and triggered in
the event of earthquakes. Various studies have been undertaken at vertical downhole array
sites to obtain the in situ soil conditions through system identification (Elgamal et al. 1995;
Pecker 1995; Glaser 1995, 2006; Elgamal et al. 1996; Assimaki and Steidl 2007; Assimaki
et al. 2006), in evaluating the dynamic behavior of the soil (Zeghal et al. 1995; Zeghal and
Elgamal 1994; Zorapapel and Vucetic 1994; Zeghal et al. 1996; Assimaki et al.
2008a, b, 2011; Glaser and Baise 2000; Chang et al. 1996) and for studying the effec-
tiveness of various computational models of site response (Kwok et al. 2008; Seed and
Idriss 1970; Idriss and Seed 1970; Johnson and Silva 1981; Shearer and Orcutt 1987).
Elgamal et al. (2001) provides detailed insight into the various downhole arrays operating
over the world and the various practices of system identification for obtaining measures of
site amplification for such deposits. Bradley (2011) proposed a framework to assess the
validity of the computational models used to compute seismic site response underlining the
common sources of uncertainty in estimating the response, including uncertainties asso-
ciated with the site characterization, constitutive model parameter estimation, constitutive
model selection and computational model methodology. This was underlined in Thompson
et al. (2012), where extensive linear site response analysis was performed using low-
amplitude ground motion on the sites in the KiK-Net (Kiban-Kyoshin Network) array,
delineating 16 profiles, where the assumptions of one-dimensional SH (horizontally
polarized shear wave) propagation assumptions are valid and the deposit could be modeled
without assuming three-dimensional effects. These profiles were further used by Kakla-
manos et al. (2015) in comparing equivalent linear and nonlinear total stress site response
models where a heavy dependence was observed in the assumed modulus reduction and
damping curves. Kaklamanos et al. (2013) identified the critical parameters affecting the
bias and variability of the site response analysis using strong motion data.
Nat Hazards (2017) 88:1741–1768 1743
123
Since the behavior of soil during dynamic loading is a nonlinear function of numerous
exogenous variables including stress history, soil strata, etc., which are not ascertained
before the response, the most common method to study the soil response is assuming that
the tip of the stress–strain path the soil undertakes follows an established modulus
reduction curve and the associated increase in hysteretic damping with shear strain to
follow another specified curve. Therefore, the representative dynamic shear modulus
degradation and damping ratio behavior with strain are required for accurate computation
of ground response parameters, which are incorporated through the equivalent shear
modulus and damping curves in site response analysis. The main objective of the study is
to identify suitable shear modulus reduction and damping curves for sand, rock and gravel
soil sites, through parametric investigations considering pairs of bedrock and surface
recorded ground motion data with the respective soil profiles from the Kiban-Kyoshin
Network. Soil profiles of sites having pairs of surface and bedrock motion recording are
selected from the Kiban-Kyoshin Network (KiK-Net, http://www.kyoshin.bosai.go.jp/),
and detailed equivalent linear and nonlinear site response analysis has been performed with
the rock recorded earthquake ground motion data as input, which removes the possibility of
mixing site effects with the other source and path effects, and the response spectrum is
evaluated for each site by parametrically varying the modulus reduction and damping
curves for the sites.
The evaluated surface response for each set of shear modulus and damping curves is
compared with the recorded data at the surface. Comparison is mainly concentrated to
identify the best match in the residual between the observed and calculated response
spectra to quantify the misfit. Based on the results of the analysis with real ground motion
data and available borelog details, appropriate curves for a particular soil class are sug-
gested. Shear modulus and damping curves suggested for different soil columns in this
study may be useful for estimating representative ground response parameters at sites
where no site-specific shear modulus and damping curves are available in the Japanese
sites.
2 Site and ground motion selection from the KiK-Net database
The soil profiles analyzed are obtained from the Kiban-Kyoshin network (KiK-Net, K-Net,
http://www.kyoshin.bosai.go.jp/). The KiK-Net and K-Net arrays were commissioned in
1996, operated by the National Research Institute for Earth Science and Disaster
Prevention (NIED) in the aftermath of the 1995 Kobe earthquake. The array consists of
more than 1000 observation stations of which 700 have downhole and surface high-quality
seismographs, which form the KiK-Net array. At these respective sites, surface-source
downhole receiver logging is performed to obtain the shear wave velocities at the
respective sites, along with the information regarding the major type of soil at each depth
and its period of its origin. Pairs of acceleration time histories for the both horizontal
components at the site are collected from the KiK-Net database for each of the profiles
selected. The processing of ground motions is done using the methodology developed in
Dawood et al. (2016) using a high-pass fourth-order acausal butterworth filter implemented
as per Boore and Bommer (2005) through the Boore Fortran Programs (TSSP). The corner
frequencies are selected from the flatfile, through the procedure developed from Dawood
et al. (2016) obtained from the corresponding NEES flatfile for all the KiK-Net sites.
1744 Nat Hazards (2017) 88:1741–1768
123
2.1 Selection of shear wave velocity profiles
Thompson et al. (2012) extensively studied the KiK-Net downhole arrays and used 100
sites with 4862 ground motions recorded from 1573 earthquakes, filtering them to an
accelerations less than 0.1 g at the surface, to identify 16 locations where the conditions of
one-dimensional horizontally polarized shear wave propagation (1D SH) and 1D site
response analysis hold, terming these sites, for low intraevent variability and good fit to the
1D SH assumptions (LG). Apart from these 16 identified profiles, Thompson et al. (2012)
also identified 53 sites, which had low interevent variability, but a poor fit to the 1D SH
wave propagation assumption (LP), for low intraevent variability and poor fit to the 1D SH
wave propagation assumption, stating that these profiles required nonlinear modeling, and
care had to be taken to identify the source of heterogeneity. From the 100 profiles men-
tioned in
Thompson et al. (2012), profiles containing predominantly sand or gravel lying over
rock are selected in indentifying the best shear modulus reduction and damping curves
from a family of commonly used curves, which could be used for further site response
studies in the region.
For predominant rock profiles, categorized as LG, 15 and 10 pairs of acceleration time
histories are used, respectively, for the IWTH27 and IWTH08 profiles. For the rock LP
sites, 5 pairs of low-amplitude ground motion are used, respectively, for IWTH05 and
FKSH18 for calibration and 10 pairs of records are used each, for site response analysis. In
the case of predominant gravel profiles, FKSH11, TCGH12, TKCH08, 10 records are
selected each for the site response analysis, and in case of sand, 10 pairs of ground motions
are selected each for KSRH05, FKSH08, TCGH15, respectively. Summary of all sites
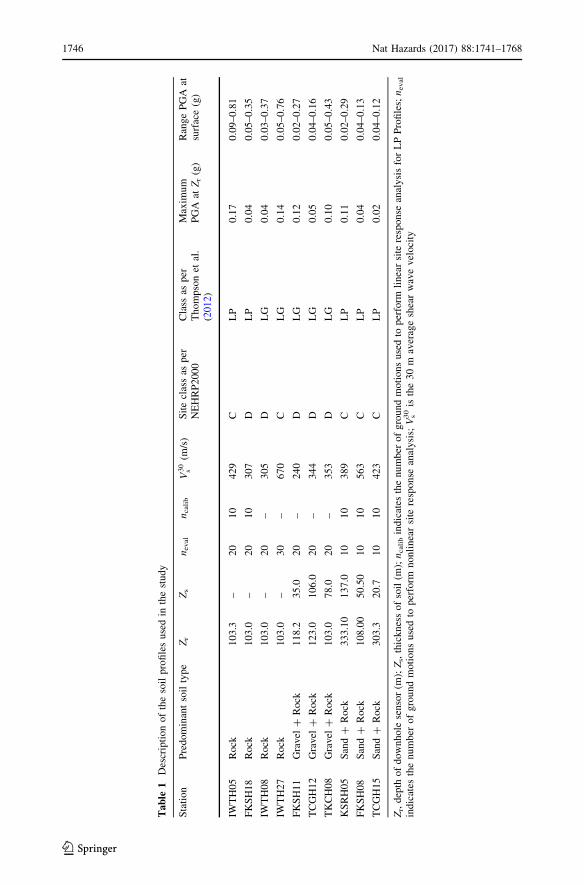
considered and ground motions selected is given in Table 1.
In this study, it has been assumed that the source of misfit to the 1D SH wave propa-
gation assumption is the soil heterogeneity and shear wave velocity structure. Though the
shear wave velocity structure for the KiK-Net sites is obtained by downhole logging and
peak picking to obtain travel times, which are not subjected to a large degree of uncer-
tainty, in this study, we assume that the shear wave velocity structure for such sites is
inaccurate. Thompson et al. (2012) note this and compared the results of Vs profiles
estimated through spectral analysis of surface waves and from the KiK-Net database and
observed differences in the shear wave velocity structure at the vicinity of the profiles.
To address this issue, detailed linear site response analysis has been carried out at the LP
sites, through Monte Carlo simulations varying the shear wave velocity structure of the
site, with low-amplitude ground motions (PGA * 0.005 g), recorded in the downhole
sensor. On obtaining the ground motion response spectrum at the top of the deposit for
each of the simulated shear wave velocity sites, the Pearson’s correlations coefficient (R2)
is used to compare the geometric mean of the calculated and observed response spectra at
the surface of the deposit. The profiles are ranked according to their correlation coefficients
and the velocity profile which is most similar to the seed profile as obtained from the KiK-
Net database is studied further. The variation of small strain damping with depth is a major
factor in linear site response analysis, and various authors (Park and Hashash 2005) have
provided different methodologies to obtain estimates of small strain damping profile of the
site. To obtain estimates of the small strain damping, the profile obtained from the Monte
Carlo simulations is studied further and the small strain damping has been varied in each
layer of the deposit. The seed value of the small strain damping is provided as the average
Nat Hazards (2017) 88:1741–1768 1745
123
Table
1Descriptionofthesoilprofilesusedin
thestudy
Station
Predominantsoiltype
Zr
Zs
neval
ncalib
V30
s(m
/s)
Siteclassas
per
NEHRP2000
Class
asper
Thompsonet
al.
(2012)
Maxim
um
PGA
atZr(g)
RangePGA
atsurface(g)
IWTH05
Rock
103.3
–20
10
429
CLP
0.17
0.09–0.81
FKSH18
Rock
103.0
–20
10
307
DLP
0.04
0.05–0.35
IWTH08
Rock
103.0
–20
–305
DLG
0.04
0.03–0.37
IWTH27
Rock
103.0
–30
–670
CLG
0.14
0.05–0.76
FKSH11
Gravel
?Rock
118.2
35.0
20
–240
DLG
0.12
0.02–0.27
TCGH12
Gravel
?Rock
123.0
106.0
20
–344
DLG
0.05
0.04–0.16
TKCH08
Gravel
?Rock
103.0
78.0
20
–353
DLG
0.10
0.05–0.43
KSRH05
Sand?
Rock
333.10
137.0
10
10
389
CLP
0.11
0.02–0.29
FKSH08
Sand?
Rock
108.00
50.50
10
10
563
CLP
0.04
0.04–0.13
TCGH15
Sand?
Rock
303.3
20.7
10
10
423
CLP
0.02
0.04–0.12
Zr,depth
ofdownhole
sensor(m
);Zs,thicknessofsoil(m
);ncalibindicates
thenumber
ofgroundmotionsusedto
perform
linearsite
response
analysisforLPProfiles;neval
indicates
thenumber
ofgroundmotionsusedto
perform
nonlinearsite
response
analysis;Vs30isthe30m
averageshearwavevelocity
1746 Nat Hazards (2017) 88:1741–1768
123
small strain damping value for the respective profile as provided by Kaklamanos et al.
(2013).
The shear wave velocity profiles are identified from the mentioned 16 LG sites and
calibrated 53 LP sites for identifying the corresponding shearmodulus reduction and damping
curves which fit the model the best, in comparison with the surface recorded time histories.
Rock profiles are identified in these sites amounting to predominantly rock sites among the 16
sites identified as having low interevent variability and a good fit to the 1D SH wave prop-
agation assumptions (LG) and 3 sites among the 53 identified as having low interevent
variability between ground motion records and a poor fit to 1D SH wave propagation
assumptions (LP) as studied by Thompson et al. (2012). For the gravel soil class, 3 profiles are
selected from the 16 LG identified profiles, and for the sand soil class, 4 profiles are selected
from the 53 LP sites. Summary of the profiles selected with the class is provided in Table 1.
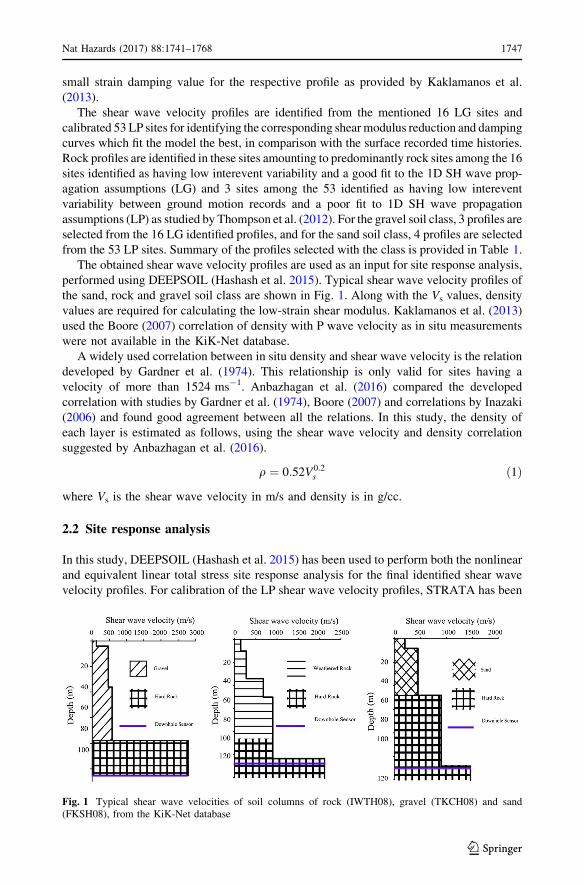
The obtained shear wave velocity profiles are used as an input for site response analysis,
performed using DEEPSOIL (Hashash et al. 2015). Typical shear wave velocity profiles of
the sand, rock and gravel soil class are shown in Fig. 1. Along with the Vs values, density
values are required for calculating the low-strain shear modulus. Kaklamanos et al. (2013)
used the Boore (2007) correlation of density with P wave velocity as in situ measurements
were not available in the KiK-Net database.
A widely used correlation between in situ density and shear wave velocity is the relation
developed by Gardner et al. (1974). This relationship is only valid for sites having a
velocity of more than 1524 ms-1. Anbazhagan et al. (2016) compared the developed
correlation with studies by Gardner et al. (1974), Boore (2007) and correlations by Inazaki
(2006) and found good agreement between all the relations. In this study, the density of
each layer is estimated as follows, using the shear wave velocity and density correlation
suggested by Anbazhagan et al. (2016).
q ¼ 0:52V0:2s ð1Þ
where Vs is the shear wave velocity in m/s and density is in g/cc.
2.2 Site response analysis
In this study, DEEPSOIL (Hashash et al. 2015) has been used to perform both the nonlinear
and equivalent linear total stress site response analysis for the final identified shear wave
velocity profiles. For calibration of the LP shear wave velocity profiles, STRATA has been
Fig. 1 Typical shear wave velocities of soil columns of rock (IWTH08), gravel (TKCH08) and sand(FKSH08), from the KiK-Net database
Nat Hazards (2017) 88:1741–1768 1747
123
used to perform the Monte Carlo trials and linear site response analysis using low-am-
plitude ground motions. DEEPSOIL discretizes the entire 1D soil column into lumped
multidegree of freedom elements with individual model parameters. The nonlinear
behavior of soil is captured through the pressure-dependent hyperbolic model for the
backbone curve, developed by Konder and Zelasko (1963), modified by Matasovic (1993).
The unloading and reloading formulations are based on the extended Masing rules
(Hashash et al. 2015), and the within boundary condition is used at the depth of the
downhole sensor.
The shear modulus reduction and damping curves were used to fit the modified
hyperbolic model using the MRDF-UIUC procedure developed by Phillips and Hashash
(2009). Many authors including Hashash et al. (2010) and Stewart and Kwok (2009) have
proposed modifications to the hyperbolic relationship to obtain reasonable estimates of
shear strength post-fitting the model. Groholski et al. (2015) proposes a generalized
quadratic/hyperbolic strength controlled model to address this issue, and the module has
been implemented in DEEPSOIL. In this study, the formulation by Hashash et al. (2010) is
used to obtain estimates of shear strength. Since, in downhole arrays, the static shear
strength is not known beforehand, correlations between the shear wave velocity and
undrained shear strength suggested by Dickenson (1994) are used. Frequency-independent
Rayleigh damping is used to model the small strain damping as suggested by Phillips and
Hashash (2009). Dependence of overburden pressure on the behavior of the modulus
reduction curve and small strain damping is modeled through two coefficients in
DEEPSOIL.
Pairs of input ground motion has been given at recorded depths of the downhole sensor.
As information on water table is unavailable, pore water effects are not considered and
total stress analysis is carried out. Geometric mean of the pair of response spectra obtained
at the surface from the analyses was compared with that obtained from recorded motion.
The residuals of spectral acceleration for the ith ground motion were calculated between
0.02 and 0.6 s as,
dðTÞi ¼ ln Sa Tð Þð Þirecorded� ln Sa Tð Þð Þipredicted ð2Þ
The bias, i.e., mean (li) and standard deviation (ri) of the residuals, was used to
quantify the fits between multiple shear modulus reduction and damping curves within a
soil class. A residuals plot is used for quantitative estimate of the applicability of the
model, as the model with residual having zero mean and less standard deviation is more
compatible. The set of shear modulus reduction and damping curves which provided the
least values of mean and standard deviations across multiple ground motions were selected
as the best-fit selection for that particular soil class.
3 Summary of shear modulus reduction and damping curves
Over the years, several researchers have presented the variation of shear modulus and
damping ratio values with shear strain for different materials. Of the several available
modulus reduction and damping curves available for different soil types from existing
literature, a set of curves are popularly used in the site response analysis. Widely used
shear modulus and damping curves were developed by Seed and Idriss (1970), EPRI
(1993), Vucetic and Dobry (1991), Darendeli (2001), Ishibashi and Zhang (1993), Seed
1748 Nat Hazards (2017) 88:1741–1768
123
et al. (1986), Sun et al. (1988) and Rollins et al. (1998) for representing the dynamic
behavior of the soil column.
For shallow profiles, certain shear modulus reduction and damping curves have been
widely used in the literature as they required simple input parameters to be used in the site
response analysis. In case of deeper profiles, Hardin and Drnevich (1972), Kokusho (1980)
and several other researchers recognized the effect of confining pressure on dynamic soil
properties as the most significant for granular profiles. Hashash and Park (2001) used the
measured results of Laird and Stokoe (1993) and Seed and Idriss (1970) and from the
computational model of Ishibashi and Zhang (1993) to study the dependence of overburden
pressure on the dynamic soil properties and observed that the Laird and Stokoe measured
curves were the most appropriate for calibration of their nonlinear pressure-dependent
hyperbolic soil model used in DEEPSOIL. Hashash and Park (2001) also studied the
influence of confining pressure on the 1D site response analysis noting the differences in
the response of the pressure-independent and pressure-dependent nonlinear hyperbolic soil
models for soil columns of 100, 500 and 1000 m depth, and it was reported that the
differences in the pressure-independent and pressure-dependent models were similar for
the 100 m soil column and the pressure-dependent model shows larger amplitudes for
shorter periods. Though it was reported that the differences in the models were significant
even for the 100 m soil column by Hashash and Park (2001), we have adopted the pres-
sure-independent model as the former curves reported in the literature viz. Seed and Idriss
(1970) do not have specific information on the effect of confining pressure on the modulus
reduction and damping properties. Zhang et al. (2005) highlighted that strain (c), mean
effective confining stress (r0m), soil type and plasticity index (PI) are the most important
factors that affect the ratio of shear modulus (G/Gmax). Other factors which affects the G/
Gmax curve but appear to be less important include the frequency of loading, number of
loading cycles, over-consolidation ratio, void ratio, degree of saturation and grain char-
acteristics (Darendeli 2001; Zhang et al. 2005). The most important factors that affect
damping ratio (n) are strain (c), r0m, soil type and PI, frequency of loading, and number of
loading cycles. With the increase of r0m, n tends to decrease for all strain amplitudes.
In the absence of the site-specific shear modulus reduction and damping ratio variation
with shear strain, site response studies are carried out by considering a well-known set of
curves for the same broad soil class. Over the years, several researchers have used these
curves for site response studies. Hanumantharao and Ramana (2008) carried out studies to
find dynamic properties of Delhi soil through cyclic triaxial tests. Kamatchi et al. (2008)
used Vucetic and Dobry (1991) curves for site-specific analysis of the Delhi region. The
Seed and Idriss (1970) average curve for sand was used by Anbazhagan et al. (2010) for the
microzonation of Bangalore. During the seismic hazard assessment of Chennai city,
Boominathan et al. (2008) used Sun et al. (1988), Seed and Idriss (1970) and Idriss (1990)
curves for clay and sand, respectively, and the Schnabel (1973) curve of the rock and
carried out ground response analysis on 38 representative sites. Shukla and Choudhury
(2012) studied site-specific responses of port sites in Gujarat and used Sun et al. (1988) and
Vucetic and Dobry (1991) curves for clay, Seed and Idriss (1970) average, Seed et al.
(1986) and Idriss (1990) upper curves for silty sand and the Roblee and Chiou (2004) curve
for silty sandy gravel. Govindaraju and Bhattacharya (2012) used the Vucetic and Dobry
(1991) curves for response studies in Kolkata region. Kumar et al. (2012) carried out
response studies of deep sites in the Indo-Gangetic basin considering the curves from Sun
et al. (1988) for clay and Seed and Idriss (1970) for sand. Karastathis et al. (2010) used
EPRI (1993) for evaluation of nonlinear site response in Greece. Hartzell et al. (2004) also
Nat Hazards (2017) 88:1741–1768 1749
123
used EPRI (1993) sand and rock curves for sand and Vucetic and Dobry (1991) curves for
clay while studying the nonlinear effects in Seattle area.
In actual site conditions, soils exist as a mixture of gravels, sands, silts and clays. It is
hence imperative to understand the performance of such soils under dynamic loading.
Various researchers have attempted to study the performance of such soils during dynamic
loading, including Hanumantharao and Ramana (2008), Okur and Ansal (2007), Lee and
Sheu (2007), Wang and Kuwano (1999) and Yamada et al. (2008a). Hanumantharao and
Ramana (2008) performed tests using various mixtures of Yamuna sand and non-plastic
fines. Different proportions of fines (15, 30 and 50%) were mixed with clean Yamuna
sands to obtain the soil mixtures available in different parts of the Delhi to study the
response of soil without plastic fines, and it was observed that the modulus reduction and
damping curves obtained were similar to the Seed and Idriss (1970) lower bound curve.
Okur and Ansal (2007) studied samples from Turkey post the 1999 Kocaeli Earthquake
which contained ML, MH, CL and CH soil types and confirmed that PI was the governing
factor in both the modulus reduction and damping curves as explained by Vucetic and
Dobry (1991) and developed semi-empirical correlations to study the dynamic properties
of such soils.
The dataset used by Rollins et al. (1998) consisted of both poorly graded clean gravels
and gravelly sands, with few well-graded gravels, viz. GP, SP and SW of the USCS
classification system. The mean values reported in the gravel curve are 10–30% lower than
the Seed and Idriss (1970) curves with a slight overlap. Due to the similarity in the curves,
additional tests were performed to study the behavior of both gravelly sands and sandy
gravels, which are commonly observed in field conditions. Evans and Zhou (1995) sum-
marizes the specimen procedure, and it is seen that on increasing gravel content, there is
only a slight increase in the normalized shear modulus, which pushes the 60% gravel curve
further into the sand range.
For cohesive soils containing larger amounts of sand content, Yamada et al. (2008a)
performed a series of cylindrical torsional simple shear tests to study the performance of
soils with a wide range of grain sizes and plasticities. Marine clays were mixed with silica
sands at various proportions to study the dynamic response of soils. With increase in fines
content, measured through the equivalent plasticity index (IP*), the behavior of sand-clay
mixtures changes from that of clays to that of sands as fines decreases. Given the value of
equivalent plasticity index, where IP* = IP * R, where IP is the plasticity index and R refers
to a reduction factor as defined by Yamada et al. (2008b), a table is developed from which
the standard modulus reduction and damping curves could be obtained for various types of
soil. Wang and Kuwano (1999) studied the response of 4 types of clay–sand mixtures using
low-plastic soils. Marine clay from the Tokyo bay was mixed with amounts of Toyoura
sand to obtain various proportions of clay–sand mixtures.
Several generic shear modulus reduction and damping curves also exist in the literature
for a wider range of soil classes including Darendeli (2001), Roblee and Chiou (2004),
Andrus et al. (2003), Menq (2003), Kishida et al. (2009), Yamada et al. (2008a), Zhang
et al. (2005). These curves often require various parameters which are usually not obtained
in downhole arrays, without in situ soil testing and though extensively used in various
studies and have not been considered in this study. As clay behavior is significantly
dependent on PI, there has been large scatter in the dynamic properties of clay (Anderson
and Richart 1976) and the clayey soil class is also not considered presently for study.
Very limited guidelines are available for benchmarking the selection of a set of shear
modulus and damping for the site response study where prior investigations into the
dynamic soil properties are not done. This will raise serious issues in representing the soil
1750 Nat Hazards (2017) 88:1741–1768
123
behavior while carrying out response analyses. It would also be very helpful if there were a
set of modulus reduction and the damping curves for different soil types, which could
represent the soil behavior fairly accurately in the absence of parameters other than
effective confining pressure (sand) and plasticity index (clay). Over the years, researchers
in the Geotechnical field have presented a variation of shear modulus and damping ratio
with shear strain for several materials. Available shear modulus and damping curves are
collected from the literature for soil classes studied viz. sand, gravel and rock. Parametric
studies were carried out considering sites with rock and surface recorded earthquake data
to identify suitable curves. Available modulus and damping curves for different soil class
are summarized here.
3.1 Selection of shear modulus reduction and damping curves for graveland rock
Study of shear modulus reduction and damping ratio with strain of different soils was
started much earlier, but for gravel and rock samples, studies were started after 1984.
Results of the first study of rock samples were published by Seed et al. (1984, 1986) from
large diameter (=300 mm) cyclic triaxial shear tests on four rock-fill darn materials
(Rollins et al. 1998). Rollins et al. (1998) summarized the shear modulus and damping of
gravel from Iida et al. (1984), Seed et al. (1986), Shamoto et al. (1986), Hatanaka et al.
(1988), Hynes (1988), Shibuya et al. (1990), Goto et al. (1992, 1994), Yasuda and Mat-
sumoto (1993, 1994), Kokusho and Tanaka (1994), Konno et al. (1994), Souto et al.
(1994), Hatanaka and Uchida (1995) and presented best-fit curves for shear modulus
reduction and damping relationships with strain and further highlighted the factors
affecting shear modulus and damping ratio. The shear moduli and damping characteristics
of the gravel were determined from the hysteretic stress–strain relationships determined by
cyclic undrained triaxial tests (Rollins et al. 1998).
3.1.1 Selection of curves for rock sites
Very limited modulus reduction and damping curves exist for rock as noted by Stewart
et al. (2014). EPRI (1993) provide confinement-dependent curves for studying the non-
linear behavior of rocks during dynamic loading. Other modulus reduction curves include
the pressure-independent one provided by Schnabel (1973) and the pressure-dependent
Choi (2008) class of curves. Equivalent linear and nonlinear site response analysis for
predominantly rock profiles is studied with the three aforementioned curves. Figure 2
shows the modulus reduction and damping curves used in the current analysis for rock
profiles. In the analyses, 10 pairs of ground motions are used for the site response analyses
of LP rock sites IWTH05, FKSH18 and the LG rock site IWTH08, whereas 15 pairs are
considered from the IWTH27 LG rock site. Five pairs of low-amplitude ground motions
(PGA * 0.005 g) are used to calibrate the shear wave velocity structure of the LP rock
profiles IWTH05 and FKSH18.
Plots of typical response spectra obtained from the analysis and observed response
spectrum at the surface are shown in Fig. 3a for LP profile FKSH18 and Fig. 3b for LG
profile IWTH27. The residuals of response spectra are shown in Fig. 4, indicating that
among the 3 curves used for rock, the pressure-dependent EPRI (1993) curves provide the
least bias. The mean and standard deviation of all the profiles and ground motions con-
sidered in the analysis are provided as an electronic supplementary material (refer
Table ET1). The Choi (2008) curves significantly underpredict the response at the studied
Nat Hazards (2017) 88:1741–1768 1751
123

period range, and the Schnabel et al. (1972) curve provides higher residuals than the EPRI
(1993) curves. The bias in the profiles for all sites is shown in Fig. 5. The box plots show
the relative differences between the three different modulus reduction and damping curves
used in the analyses and the difference between equivalent linear and nonlinear site
response methodologies. Between the three curves used in the analysis viz. Schnabel et al.
(1972) curve, the Choi (2008) curve and the EPRI (1993) curves, the EPRI (1993) curve
0
0.2
0.4
0.6
0.8
1
0.0001 0.001 0.01 0.1
G/G
max
Shear strain (%)
Schnabel (1973)
EPRI (1993) (0-6 m)
EPRI (1993) (6-15 m)
EPRI (1993) (15-36 m)
EPRI (1993) (36-75 m)
EPRI (1993) (75-150 m)
EPRI (1993) (150-300 m)
Choi (2008) (180 KPa)
Choi (2008) (475 KPa)
Choi (2008) (890 KPa)
0
10
20
30
40
0.0001 0.001 0.01 0.1
Dam
ping
ratio
(%)
Shear strain (%)
Schnabel (1973) EPRI (1993) (0-6 m)
EPRI (1993) (6-15 m) EPRI (1993) (15-36 m)
EPRI (1993) (36 - 75 m) EPRI (1993) (75 - 150 m)
EPRI (1993) (150-300 m) Choi (2008) (180 KPa)
Choi (2008) (475 KPa) Choi (2008) (890 KPa)
(a)
(b)
Fig. 2 Variation of shear modulus (a) and damping (b) with shear strain for rock
1752 Nat Hazards (2017) 88:1741–1768
123
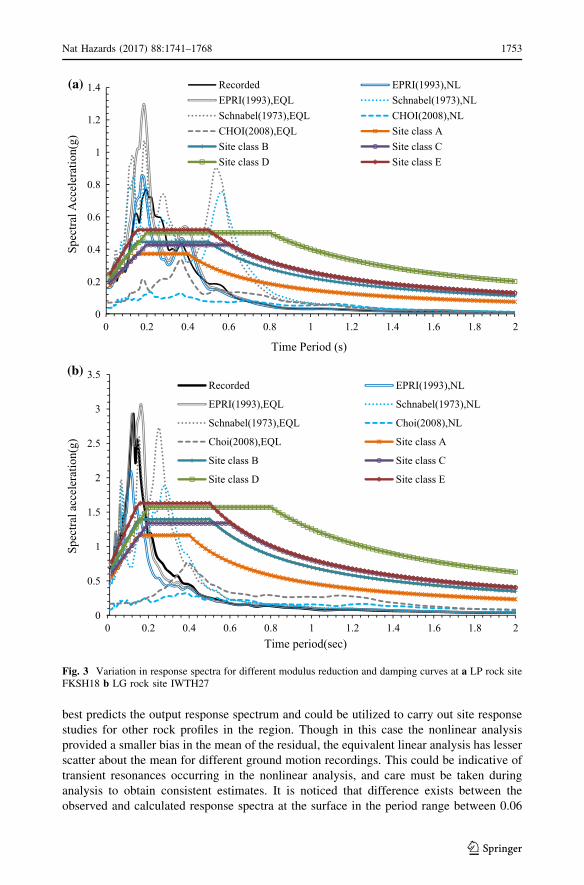
best predicts the output response spectrum and could be utilized to carry out site response
studies for other rock profiles in the region. Though in this case the nonlinear analysis
provided a smaller bias in the mean of the residual, the equivalent linear analysis has lesser
scatter about the mean for different ground motion recordings. This could be indicative of
transient resonances occurring in the nonlinear analysis, and care must be taken during
analysis to obtain consistent estimates. It is noticed that difference exists between the
observed and calculated response spectra at the surface in the period range between 0.06
0
0.2
0.4
0.6
0.8
1
1.2
1.4(a)
(b)
0 0.2 0.4 0.6 0.8 1 1.2 1.4 1.6 1.8 2
Spec
tral A
ccel
erat
ion(
g)
Time Period (s)
Recorded EPRI(1993),NLEPRI(1993),EQL Schnabel(1973),NLSchnabel(1973),EQL CHOI(2008),NLCHOI(2008),EQL Site class ASite class B Site class CSite class D Site class E
0
0.5
1
1.5
2
2.5
3
3.5
0 0.2 0.4 0.6 0.8 1 1.2 1.4 1.6 1.8 2
Spec
tral a
ccel
erat
ion(
g)
Time period(sec)
Recorded EPRI(1993),NL
EPRI(1993),EQL Schnabel(1973),NL
Schnabel(1973),EQL Choi(2008),NL
Choi(2008),EQL Site class A
Site class B Site class C
Site class D Site class E
Fig. 3 Variation in response spectra for different modulus reduction and damping curves at a LP rock siteFKSH18 b LG rock site IWTH27
Nat Hazards (2017) 88:1741–1768 1753
123
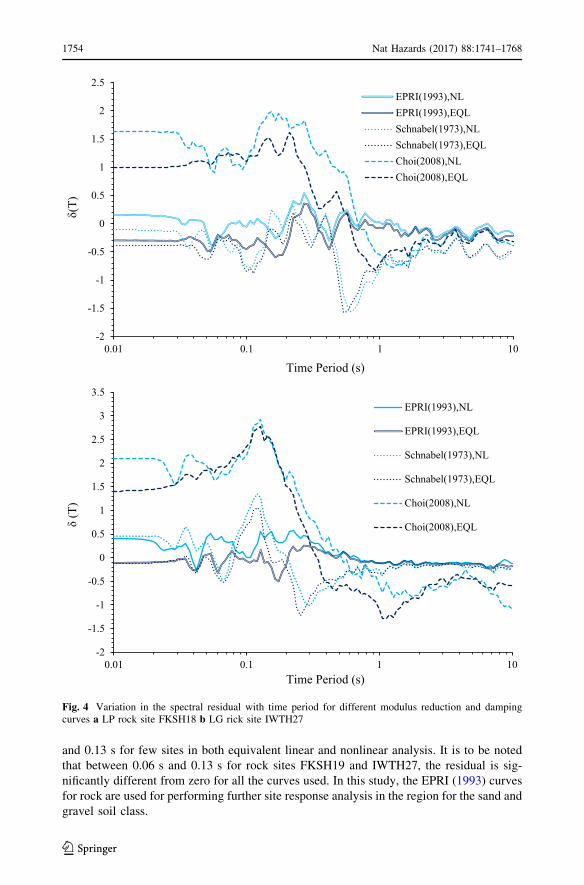
and 0.13 s for few sites in both equivalent linear and nonlinear analysis. It is to be noted
that between 0.06 s and 0.13 s for rock sites FKSH19 and IWTH27, the residual is sig-
nificantly different from zero for all the curves used. In this study, the EPRI (1993) curves
for rock are used for performing further site response analysis in the region for the sand and
gravel soil class.
-2
-1.5
-1
-0.5
0
0.5
1
1.5
2
2.5
0.01 0.1 1 10
δ(T)
Time Period (s)
EPRI(1993),NLEPRI(1993),EQLSchnabel(1973),NLSchnabel(1973),EQLChoi(2008),NLChoi(2008),EQL
-2
-1.5
-1
-0.5
0
0.5
1
1.5
2
2.5
3
3.5
0.01 0.1 1 10
δ(T
)
Time Period (s)
EPRI(1993),NL
EPRI(1993),EQL
Schnabel(1973),NL
Schnabel(1973),EQL
Choi(2008),NL
Choi(2008),EQL
Fig. 4 Variation in the spectral residual with time period for different modulus reduction and dampingcurves a LP rock site FKSH18 b LG rick site IWTH27
1754 Nat Hazards (2017) 88:1741–1768
123
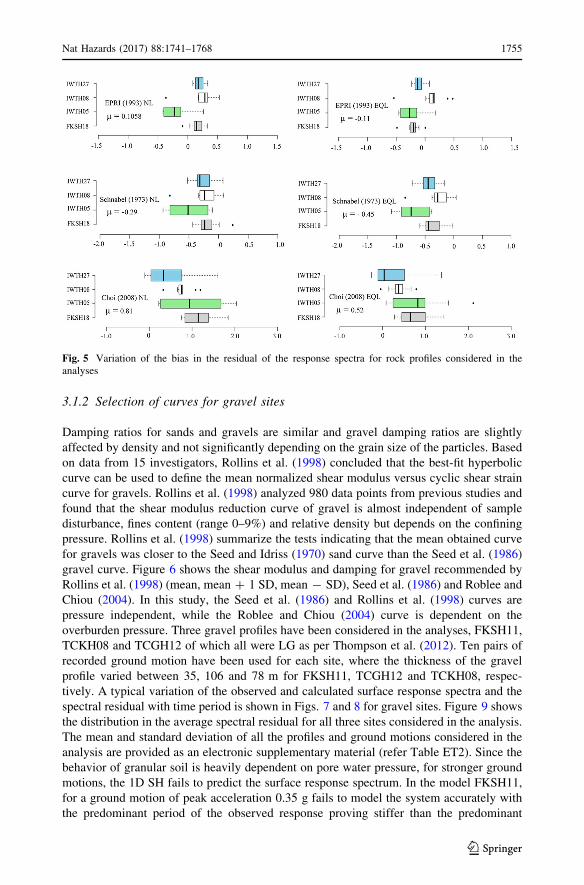
3.1.2 Selection of curves for gravel sites
Damping ratios for sands and gravels are similar and gravel damping ratios are slightly
affected by density and not significantly depending on the grain size of the particles. Based
on data from 15 investigators, Rollins et al. (1998) concluded that the best-fit hyperbolic
curve can be used to define the mean normalized shear modulus versus cyclic shear strain
curve for gravels. Rollins et al. (1998) analyzed 980 data points from previous studies and
found that the shear modulus reduction curve of gravel is almost independent of sample
disturbance, fines content (range 0–9%) and relative density but depends on the confining
pressure. Rollins et al. (1998) summarize the tests indicating that the mean obtained curve
for gravels was closer to the Seed and Idriss (1970) sand curve than the Seed et al. (1986)
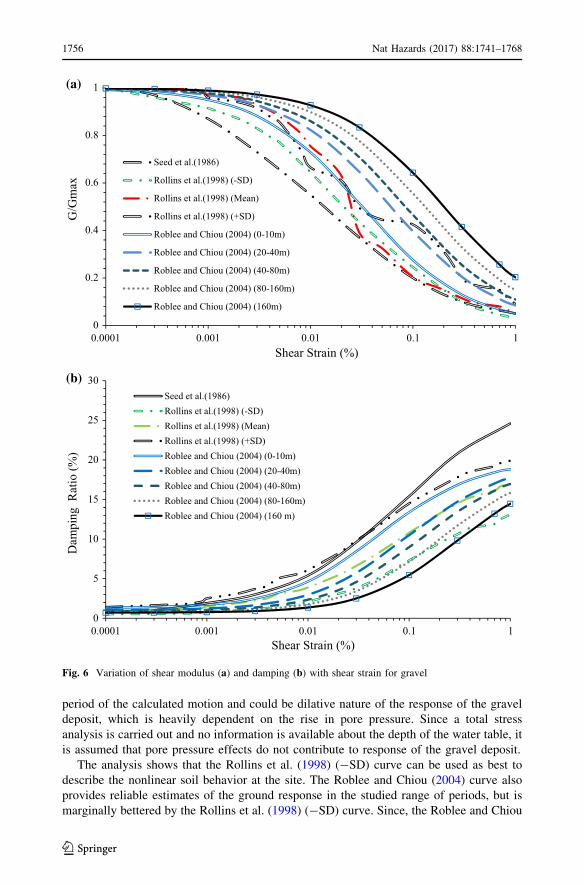
gravel curve. Figure 6 shows the shear modulus and damping for gravel recommended by
Rollins et al. (1998) (mean, mean ? 1 SD, mean - SD), Seed et al. (1986) and Roblee and
Chiou (2004). In this study, the Seed et al. (1986) and Rollins et al. (1998) curves are
pressure independent, while the Roblee and Chiou (2004) curve is dependent on the
overburden pressure. Three gravel profiles have been considered in the analyses, FKSH11,
TCKH08 and TCGH12 of which all were LG as per Thompson et al. (2012). Ten pairs of
recorded ground motion have been used for each site, where the thickness of the gravel
profile varied between 35, 106 and 78 m for FKSH11, TCGH12 and TCKH08, respec-
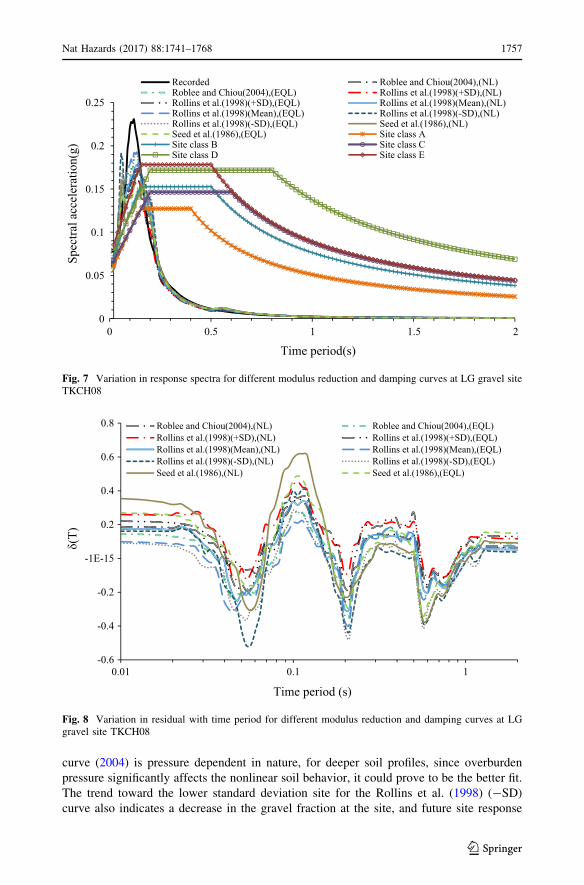
tively. A typical variation of the observed and calculated surface response spectra and the
spectral residual with time period is shown in Figs. 7 and 8 for gravel sites. Figure 9 shows
the distribution in the average spectral residual for all three sites considered in the analysis.
The mean and standard deviation of all the profiles and ground motions considered in the
analysis are provided as an electronic supplementary material (refer Table ET2). Since the
behavior of granular soil is heavily dependent on pore water pressure, for stronger ground
motions, the 1D SH fails to predict the surface response spectrum. In the model FKSH11,
for a ground motion of peak acceleration 0.35 g fails to model the system accurately with
the predominant period of the observed response proving stiffer than the predominant
Fig. 5 Variation of the bias in the residual of the response spectra for rock profiles considered in theanalyses
Nat Hazards (2017) 88:1741–1768 1755
123
period of the calculated motion and could be dilative nature of the response of the gravel
deposit, which is heavily dependent on the rise in pore pressure. Since a total stress
analysis is carried out and no information is available about the depth of the water table, it
is assumed that pore pressure effects do not contribute to response of the gravel deposit.
The analysis shows that the Rollins et al. (1998) (-SD) curve can be used as best to
describe the nonlinear soil behavior at the site. The Roblee and Chiou (2004) curve also
provides reliable estimates of the ground response in the studied range of periods, but is
marginally bettered by the Rollins et al. (1998) (-SD) curve. Since, the Roblee and Chiou
0
0.2
0.4
0.6
0.8
1
0.0001 0.001 0.01 0.1 1
G/G
max
Shear Strain (%)
Seed et al.(1986)
Rollins et al.(1998) (-SD)
Rollins et al.(1998) (Mean)
Rollins et al.(1998) (+SD)
Roblee and Chiou (2004) (0-10m)
Roblee and Chiou (2004) (20-40m)
Roblee and Chiou (2004) (40-80m)
Roblee and Chiou (2004) (80-160m)
Roblee and Chiou (2004) (160m)
0
5
10
15
20
25
30
0.0001 0.001 0.01 0.1 1
Dam
ping
Rat
io (%
)
Shear Strain (%)
Seed et al.(1986)Rollins et al.(1998) (-SD)Rollins et al.(1998) (Mean)Rollins et al.(1998) (+SD)Roblee and Chiou (2004) (0-10m)Roblee and Chiou (2004) (20-40m)Roblee and Chiou (2004) (40-80m)Roblee and Chiou (2004) (80-160m)Roblee and Chiou (2004) (160 m)
(a)
(b)
Fig. 6 Variation of shear modulus (a) and damping (b) with shear strain for gravel
1756 Nat Hazards (2017) 88:1741–1768
123
curve (2004) is pressure dependent in nature, for deeper soil profiles, since overburden
pressure significantly affects the nonlinear soil behavior, it could prove to be the better fit.
The trend toward the lower standard deviation site for the Rollins et al. (1998) (-SD)
curve also indicates a decrease in the gravel fraction at the site, and future site response
0
0.05
0.1
0.15
0.2
0.25
0 0.5 1 1.5 2
Spec
tral a
ccel
erat
ion(
g)
Time period(s)
Recorded Roblee and Chiou(2004),(NL)Roblee and Chiou(2004),(EQL) Rollins et al.(1998)(+SD),(NL)Rollins et al.(1998)(+SD),(EQL) Rollins et al.(1998)(Mean),(NL)Rollins et al.(1998)(Mean),(EQL) Rollins et al.(1998)(-SD),(NL)Rollins et al.(1998)(-SD),(EQL) Seed et al.(1986),(NL)Seed et al.(1986),(EQL) Site class ASite class B Site class CSite class D Site class E
Fig. 7 Variation in response spectra for different modulus reduction and damping curves at LG gravel siteTKCH08
-0.6
-0.4
-0.2
-1E-15
0.2
0.4
0.6
0.8
0.01 0.1 1
δ(T)
Time period (s)
Roblee and Chiou(2004),(NL) Roblee and Chiou(2004),(EQL)Rollins et al.(1998)(+SD),(NL) Rollins et al.(1998)(+SD),(EQL)Rollins et al.(1998)(Mean),(NL) Rollins et al.(1998)(Mean),(EQL)Rollins et al.(1998)(-SD),(NL) Rollins et al.(1998)(-SD),(EQL)Seed et al.(1986),(NL) Seed et al.(1986),(EQL)
Fig. 8 Variation in residual with time period for different modulus reduction and damping curves at LGgravel site TKCH08
Nat Hazards (2017) 88:1741–1768 1757
123
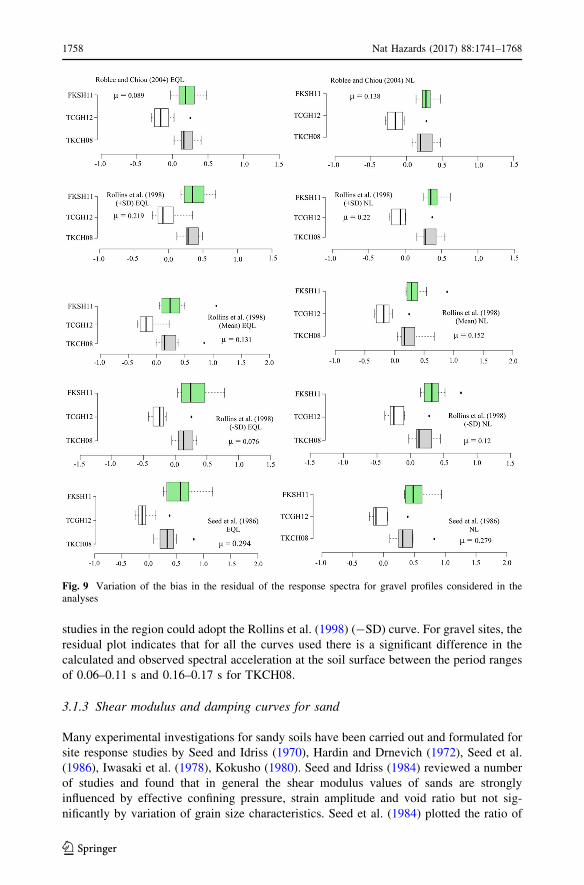
studies in the region could adopt the Rollins et al. (1998) (-SD) curve. For gravel sites, the
residual plot indicates that for all the curves used there is a significant difference in the
calculated and observed spectral acceleration at the soil surface between the period ranges
of 0.06–0.11 s and 0.16–0.17 s for TKCH08.
3.1.3 Shear modulus and damping curves for sand
Many experimental investigations for sandy soils have been carried out and formulated for
site response studies by Seed and Idriss (1970), Hardin and Drnevich (1972), Seed et al.
(1986), Iwasaki et al. (1978), Kokusho (1980). Seed and Idriss (1984) reviewed a number
of studies and found that in general the shear modulus values of sands are strongly
influenced by effective confining pressure, strain amplitude and void ratio but not sig-
nificantly by variation of grain size characteristics. Seed et al. (1984) plotted the ratio of
Fig. 9 Variation of the bias in the residual of the response spectra for gravel profiles considered in theanalyses
1758 Nat Hazards (2017) 88:1741–1768
123
modulus at shear strain c to modulus at shear strain 10-4 % from the Hardin and Drnevich
(1972) relationship to obtain a band of results and noted that the results fall within a narrow
range. Many other investigators found results in the same general range (Iwasaki et al.
1978; Kokusho 1980; Prakash and Puri 1981).
The damping ratio is slightly affected by grain size characteristics, degree of saturation,
void ratio, lateral earth pressure coefficient, angle of internal friction and number of stress
cycles, which was highlighted by Seed et al. (1986) based on studies shown by Hardin and
Drnevich (1972), Seed and Idriss (1970) and others. Electric Power Research Institute
(EPRI 1993) presented a set of depth-dependent generic modulus reduction and damping
curves for cohesionless soils accommodating the effect of confining pressure. Developed in
the aftermath of the 1989 Loma Prieta earthquake, data from three earthquakes were
considered in formulating these curves viz. the 1979 Coyote Lake Earthquake, the 1989
Loma Prieta earthquake and the 1984 Morgan Hill Earthquake. Revisions were made post
the Northridge 1994 earthquake when it was realized that the initially developed EPRI
curves underpredicted the response. Hence, from the peninsular range, data were complied
and the EPRI standard curves were revised. These curves were based on laboratory testing
of undisturbed samples obtained at different depths from three reference Gilroy sites. The
laboratory tests conducted for modulus reduction curves were resonant column and tor-
sional shear (RCTS) and pulse setting tests.
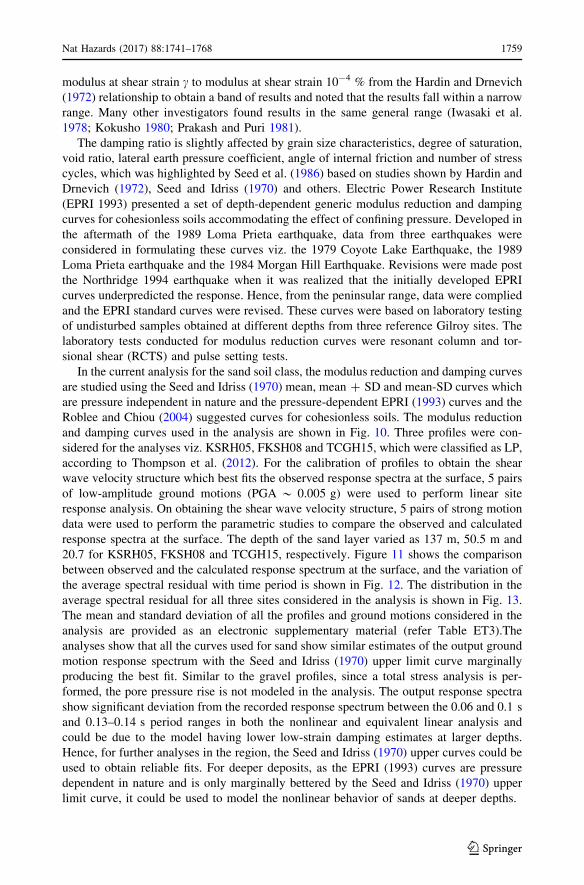
In the current analysis for the sand soil class, the modulus reduction and damping curves
are studied using the Seed and Idriss (1970) mean, mean ? SD and mean-SD curves which
are pressure independent in nature and the pressure-dependent EPRI (1993) curves and the
Roblee and Chiou (2004) suggested curves for cohesionless soils. The modulus reduction
and damping curves used in the analysis are shown in Fig. 10. Three profiles were con-
sidered for the analyses viz. KSRH05, FKSH08 and TCGH15, which were classified as LP,
according to Thompson et al. (2012). For the calibration of profiles to obtain the shear
wave velocity structure which best fits the observed response spectra at the surface, 5 pairs
of low-amplitude ground motions (PGA * 0.005 g) were used to perform linear site
response analysis. On obtaining the shear wave velocity structure, 5 pairs of strong motion
data were used to perform the parametric studies to compare the observed and calculated
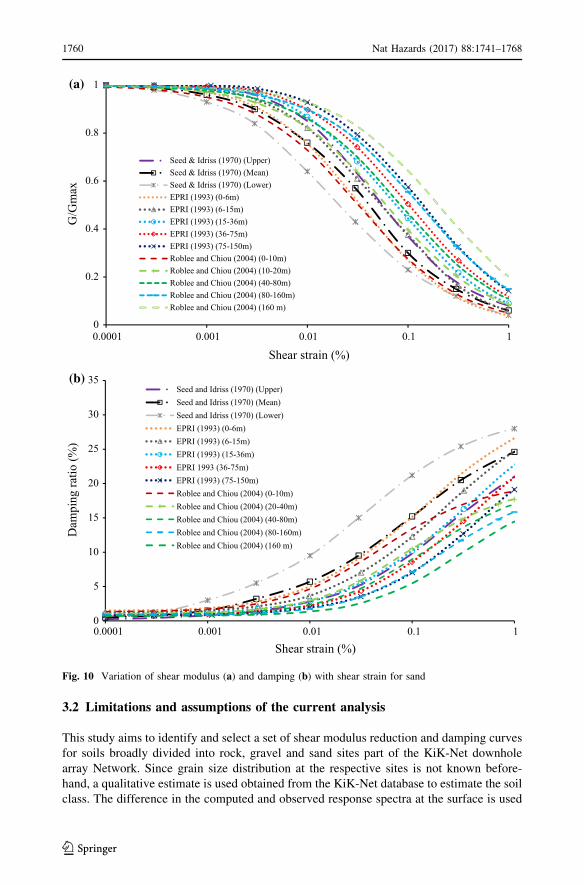
response spectra at the surface. The depth of the sand layer varied as 137 m, 50.5 m and
20.7 for KSRH05, FKSH08 and TCGH15, respectively. Figure 11 shows the comparison
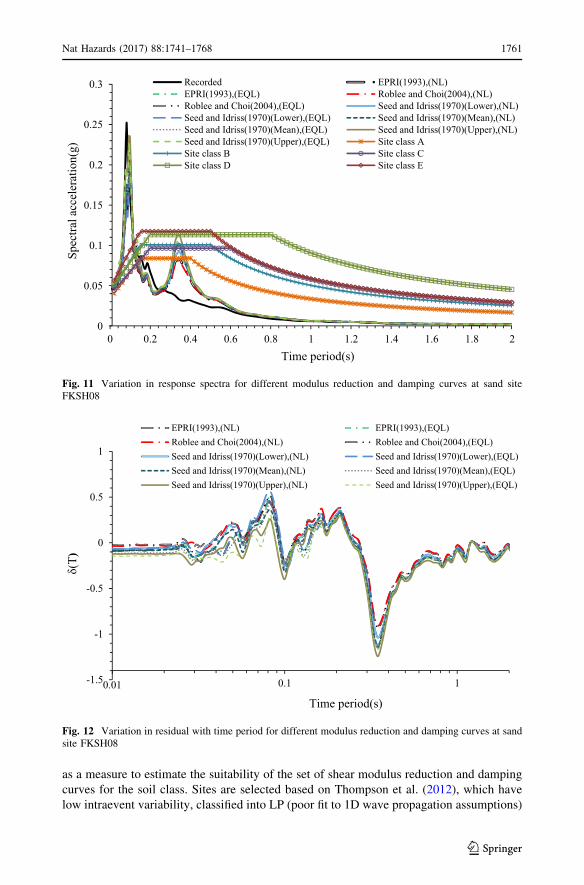
between observed and the calculated response spectrum at the surface, and the variation of
the average spectral residual with time period is shown in Fig. 12. The distribution in the
average spectral residual for all three sites considered in the analysis is shown in Fig. 13.
The mean and standard deviation of all the profiles and ground motions considered in the
analysis are provided as an electronic supplementary material (refer Table ET3).The
analyses show that all the curves used for sand show similar estimates of the output ground
motion response spectrum with the Seed and Idriss (1970) upper limit curve marginally
producing the best fit. Similar to the gravel profiles, since a total stress analysis is per-
formed, the pore pressure rise is not modeled in the analysis. The output response spectra
show significant deviation from the recorded response spectrum between the 0.06 and 0.1 s
and 0.13–0.14 s period ranges in both the nonlinear and equivalent linear analysis and
could be due to the model having lower low-strain damping estimates at larger depths.
Hence, for further analyses in the region, the Seed and Idriss (1970) upper curves could be
used to obtain reliable fits. For deeper deposits, as the EPRI (1993) curves are pressure
dependent in nature and is only marginally bettered by the Seed and Idriss (1970) upper
limit curve, it could be used to model the nonlinear behavior of sands at deeper depths.
Nat Hazards (2017) 88:1741–1768 1759
123
3.2 Limitations and assumptions of the current analysis
This study aims to identify and select a set of shear modulus reduction and damping curves
for soils broadly divided into rock, gravel and sand sites part of the KiK-Net downhole
array Network. Since grain size distribution at the respective sites is not known before-
hand, a qualitative estimate is used obtained from the KiK-Net database to estimate the soil
class. The difference in the computed and observed response spectra at the surface is used
0
0.2
0.4
0.6
0.8
1
0.0001 0.001 0.01 0.1 1
G/G
max
Shear strain (%)
Seed & Idriss (1970) (Upper)Seed & Idriss (1970) (Mean)Seed & Idriss (1970) (Lower)EPRI (1993) (0-6m)EPRI (1993) (6-15m)EPRI (1993) (15-36m)EPRI (1993) (36-75m)EPRI (1993) (75-150m)Roblee and Chiou (2004) (0-10m)Roblee and Chiou (2004) (10-20m)Roblee and Chiou (2004) (40-80m)Roblee and Chiou (2004) (80-160m)Roblee and Chiou (2004) (160 m)
0
5
10
15
20
25
30
35
0.0001 0.001 0.01 0.1 1
Dam
ping
ratio
(%)
Shear strain (%)
Seed and Idriss (1970) (Upper)Seed and Idriss (1970) (Mean)Seed and Idriss (1970) (Lower)EPRI (1993) (0-6m)EPRI (1993) (6-15m)EPRI (1993) (15-36m)EPRI 1993 (36-75m)EPRI (1993) (75-150m)Roblee and Chiou (2004) (0-10m)Roblee and Chiou (2004) (20-40m)Roblee and Chiou (2004) (40-80m)Roblee and Chiou (2004) (80-160m)Roblee and Chiou (2004) (160 m)
(a)
(b)
Fig. 10 Variation of shear modulus (a) and damping (b) with shear strain for sand
1760 Nat Hazards (2017) 88:1741–1768
123
as a measure to estimate the suitability of the set of shear modulus reduction and damping
curves for the soil class. Sites are selected based on Thompson et al. (2012), which have
low intraevent variability, classified into LP (poor fit to 1D wave propagation assumptions)
0
0.05
0.1
0.15
0.2
0.25
0.3
0 0.2 0.4 0.6 0.8 1 1.2 1.4 1.6 1.8 2
Spec
tral a
ccel
erat
ion(
g)
Time period(s)
Recorded EPRI(1993),(NL)EPRI(1993),(EQL) Roblee and Choi(2004),(NL)Roblee and Choi(2004),(EQL) Seed and Idriss(1970)(Lower),(NL)Seed and Idriss(1970)(Lower),(EQL) Seed and Idriss(1970)(Mean),(NL)Seed and Idriss(1970)(Mean),(EQL) Seed and Idriss(1970)(Upper),(NL)Seed and Idriss(1970)(Upper),(EQL) Site class ASite class B Site class CSite class D Site class E
Fig. 11 Variation in response spectra for different modulus reduction and damping curves at sand siteFKSH08
-1.5
-1
-0.5
0
0.5
1
0.01 0.1 1
δ(T)
Time period(s)
EPRI(1993),(NL) EPRI(1993),(EQL)Roblee and Choi(2004),(NL) Roblee and Choi(2004),(EQL)Seed and Idriss(1970)(Lower),(NL) Seed and Idriss(1970)(Lower),(EQL)Seed and Idriss(1970)(Mean),(NL) Seed and Idriss(1970)(Mean),(EQL)Seed and Idriss(1970)(Upper),(NL) Seed and Idriss(1970)(Upper),(EQL)
Fig. 12 Variation in residual with time period for different modulus reduction and damping curves at sandsite FKSH08
Nat Hazards (2017) 88:1741–1768 1761
123

and LG (good fit to the 1D wave propagation assumptions). For sites labeled as LP, non-
vertical incidence is not assumed as a source of error and the error is attributed to dif-
ferences in the shear wave velocity and small strain damping ratio of the profile. Initial
estimates of the in situ small strain damping ratio are obtained from Kaklamanos et al.
(2013), and a Monte Carlo simulation is performed varying the shear wave velocity profile
structure of the site to perform a linear 1D site response analysis. Once the shear wave
velocity profile of the site is estimated, the sites are further used to perform the site
response analysis using the proposed set of shear modulus reduction and damping curves.
Several generic shear modulus reduction and damping curves exist in the literature,
which require additional parameters which are difficult to obtain for a soil deposit without
sampling, and hence among many such curves existing in the literature, few are selected
and compared to estimate which set of curves would produce the best fit. Assumptions of
Fig. 13 Variation of the bias in the residual of the response spectra for sand profiles considered in theanalyses
1762 Nat Hazards (2017) 88:1741–1768
123
1D horizontally polarized shear wave propagation assuming vertical incidence are used in
the analysis, and ground motions are filtered using Boore and Bommer (2005), with the
corner frequencies selected from Dawood et al. (2016). Limitations of the analysis involves
the use of results only for Japanese sites, data are entirely from the Japanese seismo-
tectonic regime and when being used for other site, care must to be taken. It is also noted
that these curves should not be used as a replacement for available existing data at sites and
can only be used as an initial estimate to predict the surface response spectra, through a site
response analysis in the absence of additional information about the soil deposit.
4 Conclusions
In this study, suitable shear modulus reduction and damping ratio curves for different soil
types are identified by the parametric site response studies. Three sand column profiles,
three gravel profiles and four rock profiles are taken from the KiK-Net downhole array
database along with the recorded ground motion from the uphole and downhole sensors for
the corresponding sites. The sites which showed low interevent variability were selected in
accordance with earlier studies. For sites which were not a good fit to the one-dimensional
wave propagation assumptions, Monte Carlo simulations were carried out, varying the
shear wave velocity structure of the site to perform linear site response analysis with low-
amplitude ground motion. With the profiles obtained, nonlinear total stress site response
analysis was carried out using strong motion data, giving the rock recorded ground motion
as input to the obtained shear wave velocity structure. The modulus reduction and damping
curves were taken from the literature and varied in the deposit for different soil classes
grouped as gravel, rock and sand. Response spectrum at the surface is arrived from each
trial and compared with the observed surface record, and the fits are compared using the
average spectral residual between 0.02 and 0.6 s. Shear modulus and damping curves given
by Seed and Idriss (1970) upper limit can be used to predict reliable response parameters in
sandy soil sites. Shear modulus and damping curve of Rollins et al. (1998) (-SD) give the
most accurate match for sites with dominant gravel layers. Shear modulus reduction and
damping curves for rock are very limited, and the curves given by EPRI (1993) are found
to be more appropriate than the other two curves in the literature. These findings may be
further improved when a large number of profiles are analyzed. The recommended shear
modulus reduction and damping curves for close matching of several profiles is considered
as the suitable curve of the soil class and is recommended for site response analysis of
similar soil column where such curves are unavailable sites. Equivalent linear analysis
provided lower scatter in the range of the estimates means of the residuals than nonlinear
analysis, which could be due to transient resonances and thus care must be taken in the
development of profiles for nonlinear analysis. Certain profiles showed changes in the
predominant period of the soil column, indicating that pore pressure rise and effective
stress behavior significantly affects the performance of gravels and sands.
Acknowledgements The authors wish to thank the Kyoshin Net Strong Motion Network of Japan forproviding an excellent earthquake database and valuable feedback for conducting this research. The authorsextend their sincere appreciation to the Deanship of Scientific Research at King Saud University for itsfunding for this Prolific Research Group (PRG-1436-06).
Nat Hazards (2017) 88:1741–1768 1763
123
References
Anbazhagan P, Sitharam TG (2008) Seismic microzonation of Bangalore’. J Earth Syst Sci117(S2):833–852
Anbazhagan P, Thingbaijam KKS, Nath SK, Narendara Kumar JN, Sitharam TG (2010) Multi-criteriaseismic hazard evaluation for Bangalore city, India. J Asian Earth Sci 38:186–198
Anbazhagan P, Uday A, Moustafa SR, Al-Arifi SN (2016) Correlation of densities with shear wavevelocities and SPT N values. J Geophys Eng 13:320
Anderson DG, Richart FE Jr (1976) Effects of straining on shear modulus of clays’. J Geotech Eng DivASCE 102(9):975–987
Andrus RD, Zhang J, Ellis BS, Juang CH (2003) Guide for estimating the dynamic properties of SouthCarolina soils for ground response analysis. Report No. FHWA-SC-03-07, South Carolina Departmentof Transportation, Columbia, S.C
Assimaki D, Steidl J (2007) Inverse analysis of weak and strong motion borehole array data from the Mw7.0Sanriku-Minami earthquake’. Soil Dyn Earthq Eng 27:73–92
Assimaki D, Steidl J, Liu PC (2006) Attenuation and velocity structure for site response analyses viadownhole seismogram inversion. Pure appl Geophys 163:81–118
Assimaki D, Li W, Steidl JH, Tsuda K (2008a) Site amplification and attenuation via downhole arrayseismogram inversion: a comparative study of the 2003 Miyagi-Oki aftershock sequence. Bull SeismolSoc Am 98:301–330
Assimaki D, Li W, Schmedes J, Steidl J (2008b) Quantifying nonlinearity susceptibility via site-responsemodeling uncertainty at three sites in the Los Angeles Basin. Bull Seismol Soc Am 98:2364–2390
Assimaki D, Li W, Kalos A (2011) A wavelet-based seismogram inversion algorithm for the in situcharacterization of nonlinear soil behavior. Pure appl Geophys 168(10):1669–1691
Boominathan A, Dodagoudar GR, Suganthi A, Maheswari RU (2008) Seismic hazard assessment of Chennaicity considering local site effects’. J Earth Syst Sci 117(S2):853–863
Boore DM (2007) Some thoughts on relating density to velocity. 12 p. http://daveboore.com/dave_notes.php. Accessed June 2016
Boore DM, Atkinson GM (2008) Ground-motion prediction equations for the average horizontal componentof PGA, PGV, and 5%-damped PSA at spectral periods between 0.1 s and 10.0 s’. Earthq Spectra24(1):99–138
Boore DM, Bommer JJ (2005) Processing of strong-motion accelerograms: needs, options and conse-quences’. Soil Dyn Earthq Eng 25:93–115
Boore DM, Stewart JP, Seyhan E, Atkinson GM (2014) NGA-West2 equations for predicting responsespectral accelerations for shallow crustal earthquakes’. Earthq Spectra 30:1057–1086
Bradley BA (2011) A framework for validation of seismic response analyses using seismometer arrayrecordings’. Soil Dyn Earthq Eng 31:512–520
Building Seismic Safety Council (BSSC) (2001) NEHRP recommended provisions for seismic regulationsfor new buildings and other structures, 2000 edition, part 1—provisions, part 2—commentary, ReportNos. FEMA-368 and FEMA-369, Federal Emergency Management Agency, Washington, DC
Comite Europeen de Normalisation (CEN) (2004) Eurocode 8, design of structures for earthquake resis-tance. Part 5: foundations, retaining structures and geotechnical aspects, EN 1998-5, Brussels, Belgium
Chang CY, Mok CMW, Tang HT (1996) Inference of dynamic shear modulus from lotung downhole data.J Geotech Eng ASCE 122(8):657–665
Choi WK (2008) Dynamic properties of ash-flow tuffs. Ph.D. thesis, Department of Civil Engineering,University of Texas, Austin, Texas
Choi Y, Stewart JP (2005) Nonlinear site amplification as function of 30 m shear wave velocity. EarthqSpectra 21(1):1–30
Darendeli MB (2001) Development of a new family of normalized modulus reduction and material dampingcurves. Ph.D. dissertation, University of Texas at Austin, Austin, Texas
Dawood HM, Rodriguez-Marek Adrian, Bayless J, Goulet C, Thompson E (2016) A flatfile for the KiK-netdatabase processed using an automated protocol’. Earthq Spectra 32(2):1281–1302
Dickenson SE (1994) Dynamic response of soft and deep cohesive soils during the loma prieta earthquake ofOctober 17, 1989. Ph.D. thesis, Department of Civil and Environmental Engineering, University ofCalifornia, Berkeley, CA
Electric Power Research Institute (EPRI) (1993) Guidelines for Site specific ground motions, Palo Alto,California, November, TR-102293
Elgamal AW, Zeghal M, Tang HT, Stepp JC (1995) Lotung downhole array I: evaluation of site dynamicproperties’. J Geotech Eng 121(4):350–362
1764 Nat Hazards (2017) 88:1741–1768
123
Elgamal AW, Zeghal M, Parra E (1996) Liquefaction of reclaimed island in Kobe, Japan. J Geotech EngASCE 122(1):39–49
Elgamal A, Lai T, Yang Z, He L (2001) Dynamic soil properties, seismic downhole arrays and applicationsin practice. In: International conferences on recent advances in geotechnical earthquake engineeringand soil dynamics, Paper No. 6
Evans MD, Zhou S (1995) Liquefaction behavior ofsand-gravel composites. J Geotech Eng ASCE121(3):287–298
Gardner GHF, Gardner LW, Gregory AR (1974) Formation velocity and density—the diagnostic basics forstratigraphic traps’. Geophysics 39:770–780
Glaser S (1995) System identification and its application to estimating soil properties. J Geotech Eng121(7):553–560
Glaser SD (2006) Downhole seismic arrays and system identification of soil response. In: Proceedings of the4th international conference of earthquake engineering, Taipei, Taiwan
Glaser SD, Baise LG (2000) System identification estimation of soil properties at the lotung site’. Soil DynEarthq Eng 19:521–531
Goto S, Suzuki Y, Nishio S, Ohoka H (1992) Mechanical properties of undisturbed Tone river gravelobtained by in situ freezing method. Soils Found Tokyo Jpn 32(3):15–25
Goto S, Nisho S, Yoshimi Y (1994) Dynamic properties of gravels sampled by ground freezing. Groundfailures under seismic conditions, ASCE GSP no. 44, pp 141–157
Govindaraju L, Bhattacharya S (2008) Site response studies for seismic hazard analysis of Kolkata city. In:Proceedings of the 12th international conference of international association for computer methods andadvances in geomechanics (IACMAG), Oct 1–6, Goa, pp 2899–2907
Govindaraju L, Bhattacharya S (2012) ‘‘Site-specific earthquake response study for hazard assessment inKolkata city, India. Nat Hazards 61(3):943–965
Govindaraju L, Ramana GV, HanumanthaRao C, Sitharam TG (2004) Site-specific ground response anal-ysis. Curr Sci 87(10):1354–1362
Groholski DR, Hashash YMA, Musgrove M, Harmon J, Kim B (2015) Evaluation of 1-D non-linear siteresponse analysis using a general quadratic/hyperbolic strength-controlled constitutive model. In: 6thinternational conference on earthquake geotechnical engineering 1–4 November 2015 Christchurch,New Zealand
Hanumantha Rao C, Ramana GV (2009) Site specific ground response analyses at Delhi, India. EJGE, 16http://www.ejge.com/2009/Ppr0936/Ppr0936.pdf. Accessed 26 Dec 2014
Hanumantharao C, Ramana GV (2008) Dynamic soil properties for microzonation of Delhi, India. J EarthSyst Sci 117(S2):719–730
Hardin BO, Drnevich VP (1972) Shear modulus and damping in soils: design equations and curves. SoilMech Found Div ASCE 98(7):667–692
Hartzell S, Bonilla LF, Williams RA (2004) Prediction of nonlinear soil effects. Bull Seismol Soc Am94(5):1609–1629
Hashash YMA, Park D (2001) Non-linear one-dimensional seismic ground motion propagation in theMississippi embayment. Eng Geol 62(1–3):185–206
Hashash YMA, Phillips C, Groholski DR (2010) Recent advances in non-linear site response analysis. In:Proceedings of the 5th international conference on recent advances in geotechnical earthquake engi-neering and soil dynamics, San Diego, California
Hashash YMA, Musgrove MI, Harmon JA, Groholski DR, Phillips CA, Park D (2015) DEEPSOIL 6.1, usermanual. Board of Trustees of University of Illinois at Urbana-Champaign, Urbana
Hatanaka M, Uchida A (1995) Effects of test methods on the cyclic deformation characteristics of highquality undisturbed gravel samples. In: Static and dynamic properties of gravelly soils, GeotechnicalSpecial Publication No. 56, ASCE, Reston, Va. pp 136–161
Hatanaka M, Suzuki Y, Kawasaki T, Endo M (1988) Cyclic undrained shear properties of high qualityundisturbed Tokyo gravel. Soils Found 28(4):57–68
Hynes ME (1988) Pore water pressure generation characteristics of gravels under undrained cyclic loadings,Ph.D. dissertation, University of California, Berkeley, California
IBC (2009) International building code, 5th edn. International Code Council: Inc, Falls ChurchIdriss IM (1990) Response of soft soil sites during earthquakes. In: Duncan JM (ed) Proceedings in H.
Bolton seed memorial symposium, vol 2, pp 273–290Idriss IM, Seed HB (1970) Seismic response of soil deposits. J Soil Mech Found Div Proc ASCE 96:9–103Iida R, Matsumoto N, Yasuda N, Watanabe K, Sakaino N, Ohno K (1984) Large-scale tests for measuring
dynamic shear moduli and damping ratios of rockfill materials, sixteenth joint meeting. Japan Panel onWind and Seismic Effects, Washington
Nat Hazards (2017) 88:1741–1768 1765
123
Inazaki T (2006) Relationship between S-wave velocities and geotechnical properties of alluvial sedimentsIn: Proceedings of 19th annual symposium on application of geophysics to engineering and envi-ronmental problems (SAGEEP2006) pp 1296–303
Ishibashi I, Zhang X (1993) Unified dynamic shear moduli and damping ratios of sand and clay. Soils Found33(1):182–191
Iwasaki T, Tatsuoka F, Takagi Y (1978) Shear moduli of sands under cyclic torsional shear loading. SoilsFound 18(1):39–56
Johnson LR, Silva W (1981) The effects of unconsolidated sediments upon the ground motion during localearthquakes. Bull Seismol Soc Am 71:127–142
Kaklamanos J, Bradley BA, Thompson EM, Baise LG (2013) Critical parameters affecting bias and vari-ability in site response analyses using KiK-net downhole array data. Bull Seismol Soc Am103:1733–1749
Kaklamanos J, Baise LG, Thompson EM, Dorfmann L (2015) Comparison of 1D linear, equivalent-linear,and nonlinear site response models at six KiK-net validation sites. Soil Dyn Earthq Eng 69:207–219
Kamatchi P, Ramana GV, Nagpal AK, Lakshmanan N (2008) Site-specific analysis of delhi region forscenario earthquakes. In: Proceedings of the 14th world conference on earthquake engineering, Bei-jing, October pp 12–17
Karastathis VK, Papadopoulos GA, Novikova T, Roumelioti Z, Karmis P, Tsombos P (2010) Prediction andevaluation of nonlinear site response with potentially liquefiable layers in the area of Nafplion(Peloponnesus, Greece) for a repeat of historical earthquakes. Nat Hazards Earth Syst Sci10(11):2281–2304
Kishida T, Boulanger R, Abrahamson N, Wehling T, Driller M (2009) Regression models for dynamicproperties of highly organic soils. J Geotech Geoenviron Eng ASCE 135(4):533–543
Kokusho T (1980) Cyclic triaxial test of dynamic soil properties for wide strain range’. Soils Found20:45–60
Kokusho T, Tanaka Y (1994) Dynamic properties of gravel layers investigated by in situ freezing sampling.In: Ground failures under seismic conditions, Geotechnical Special Publication No. 44, ASCE, Reston,Va. pp 121–140
Konder RL, Zelasko JS (1963) A hyperbolic stress-strain formulation for sands. In: Proceedings of 2nd PanAmerican conference on soil mechanics and foundation engineering, Brazil, pp 289–324
Konno T, Hatanaka M, Ishihara K, Ibe Y, Iizuka S (1994) Gravelly soil properties evaluation by large scalein situ cyclic shear tests. In: Ground failures under seismic conditions, Geotechnical Special Publi-cation No. 44, ASCE, Reston, Va. pp 177–200
Kramer SL (1996) Geotechnical earthquake engineering. Prentice Hall, Upper Saddle River, p 653Kumar A, Anbazhagan P, Sitharam TG (2012) Site specific ground response study of deep Indo-Gangetic
basin using representative regional ground motion. Geo-Congress, State of art and practise inGeotechnical Engineering, Oakland California, Paper No. 1065, pp 1888–1897
Kwok AOL, Stewart JP, Hashash YMA (2008) Nonlinear ground-response analysis of Turkey flat shallowstiff-soil site to strong ground motion. Bull Seismol Soc Am 98(1):331–343
Laird JP, Stokoe KH (1993) Dynamic properties of remolded and undisturbed soil samples tested at highconfining pressures. Geotechnical Engineering Report GR93-6, Electrical Power Research Institute
Lee CJ, Sheu SF (2007) The stiffness degradation and damping ratio evolution of Taipei silty clay undercyclic straining’. Soil Dyn Earthq Eng 27:730–740
Mahajan AK, Sporry RJ, Champati Ray PK, Ranjan R, Slob S, Van WC (2007) Methodology for site-response studies using multi-channel analysis of surface wave technique in Dehradun city’. Curr Sci92(7):945–955
Matasovic N (1993) Seismic response of composite horizontally-layered soil deposits. Ph.D. thesis,University of California, Los Angeles
Menq FY (2003) Dynamic properties of sandy and gravelly soils. Ph.D. thesis, Department of CivilEngineering, University of Texas, Austin, TX
Milne J (1898) Seismology, 1st edn. Kegan Paul, Trench, Truber, LondonMohanty WK, Walling MY, Nath SK, Pal I (2007) First order seismic microzonation of Delhi, India using
geographic information system (GIS). Nat Hazards 40(2):245–260Moss RES, Thompson EM, Kieffer DS, Tiwari B, Hashash YMA, Acharya I, Adhikari B, Assimaki D,
Clahan KB, Collins BD (2015) Geotechnical effects of the 2015 Mw 7.8 Gorkha, Nepal, earthquakeand aftershocks. Seismol Res Lett 86(6):1514–1523
Mugnier JL, Huyghe P, Gajurel AP, Upreti BN, Jouanne F (2011) Seismites in the Kathmandu basin andseismic hazard in central Himalaya’. Tectonophysics 509:33–49
Okur DV, Ansal A (2007) Stiffness degradation of natural fine grained soils during cyclic loading. Soil DynEarthq Eng 27:843–854
1766 Nat Hazards (2017) 88:1741–1768
123
Park D, Hashash Y (2005) Evaluation of seismic site factors in the Mississippi embayment. II. Probabilisticseismic hazard analysis with nonlinear site effects. Soil Dyn Earthq Eng 25:145–156
Pecker A (1995) Validation of small strain properties from recorded weak seismic motions. Soil Dyn EarthqEng 14(6):399–408
Phanikanth VS, Deepankar Choudhury, Reddy GR (2011) Equivalent-linear seismic ground responseanalysis of some typical sites in Mumbai. Geotech Geol Eng Int J 29(6):1109–1126
Phillips C, Hashash YM (2009) Damping formulation for nonlinear 1D site response analyses. Soil DynEarthq Eng 29(7):1143–1158
Prakash S, Puri VK (1981) Dynamic properties of soils from in-situ tests. Geotech Eng Div ASCE107(7):943–964
Raghu Kanth STG, Dixit J, Dash SK (2009) Estimation of site amplification factors for Guwahati City. IGC,Guntur
Roblee C, Chiou B (2004) A proposed geoindex model for design selection of non-linear properties for siteresponse analyses. In: International workshop on uncertainties in nonlinear soil properties and theirimpact on modeling dynamic soil response, PEER Headquarters, UC Berkeley
Rollins K, Evans M, Diehl N, III W (1998) Shear modulus and damping relationships for gravels. J GeotechGeoenviron Eng 124(5):396–405
Schnabel PB (1973) Effects of local geology and distance from source on earthquake ground motions. Ph.D.thesis, University of California, Berkeley
Schnabel PB, Lysmer J, Seed HB (1972) SHAKE—a computer program for earthquake response analysis ofhorizontally layered soils. Report No. EERC-72/12, University of California, Berkeley
Seed HB, Idriss IM (1970) Soil moduli and damping factors for dynamic response analyses. TechnicalReport EERRC-70-10, University of California, Berkeley
Seed HB, Idriss IM (1984) Ground motions and soil liquefaction during earthquake. Earthquake EngineeringResearch Institute, Berkeley
Seed HB, Sun JH (1989) Implication of site effects in the Mexico City earthquake of September 19, 1985 forearthquake-resistance-design criteria in the San Francisco Bay Area of California. Report No. UCB/EERC-89/03, University of California, Berkeley, California
Seed HB, Wong RT, Idriss IM, Tokimatsu K (1984) Moduli and damping factors for dynamic analyses ofcohesionless soils. Report No. EERC 84-14, Earthquake Engineering Research Center, University ofCalifornia, Berkeley, California
Seed H, Wong R, Idriss I, Tokimatsu K (1986) Moduli and damping factors for dynamic analyses ofcohesionless soils. J Geotech Eng 112(11):1016–1032
Seed HB, Romo MP, Sun JJ, Lysmer J (1987) Relationships between soil conditions and earthquake groundmotions in Mexico City in the earthquake of september 19, 1985. Report No. UCB/EERC-87/15,Earthquake Engineering Research Center, College of Engineering, University of California, Berkeley,CA
Shamoto Y, Nishio S, Baba K (1986) Cyclic stress strain behaviour and liquefaction strength of diluvialgravels utilizing freezing sampling, symposium on deformation and strength characteristics and testingmethods of coarse grained granular materials. JSSMFE, Tokyo, Japan, pp 89–94
Shearer PM, Orcutt JA (1987) Surface and near-surface effects on seismic-waves—theory and boreholeseismometer results’. Bull Seismol Soc Am 77:1168–1196
Shibuya S, Kong XJ, Tatsuoka E (1990) Deformation characteristics of gravels subjected to monotonic andcyclic loadings. In: Proceedings of the 8th Japan earthquake engineering symposium, 1, pp 771–776
Shukla J, Choudhury D (2012) Seismic hazard and site-specific ground motion for typical ports of Gujarat.Nat Hazards 60:541–565
Souto A, Hartikainen J, Ozudogru K (1994) Measurement of dynamic parameters of road pavementmaterials by the bender element and resonant column tests. Geotechnique 44(3):519–526
Stewart J, Kwok A.(2009) Nonlinear seismic ground response analysis: protocols and verification againstarray data. PEER Annual Meet in San Francisco, Present 84
Stewart J, Afshari K, Hashash YMA (2014) Guidelines for perfoming hazard consistent one dimensionalground response analysis for ground motion prediction. PEER Report
Sun JI, Golesorkhi R, Seed HB (1988) Dynamic moduli and damping ratios for cohesive soils. EERC ReportNo. UCB/EERC-88/15
Thompson EM, Baise LG, Tanaka Y, Kayen RE (2012) A taxonomy of site response complexity. Soil DynEarthq Eng 41:32–43
Vucetic M, Dobry R (1991) Effect of soil plasticity on cyclic response. J Geotech Eng 117(1):89–107Wang GX, Kuwano J (1999) Modeling of strain dependency of shear modulus and damping of clayey sand.
Soil Dyn Earthq Eng 18(6):463–471
Nat Hazards (2017) 88:1741–1768 1767
123

Yamada S, Hyodo M, Orense R, Dinesh SV, Hyodo T (2008a) Strain-dependent dynamic properties ofremoulded sand-clay mixtures. J Geotech Geoenviron Eng 134(7):972–981
Yamada S, Hyodo M, Orense R, Dinesh SV (2008b) Initial shear modulus of remolded sand-clay mixtures.J Geotech Geoenviron Eng 134(7):960–971
Yasuda N, Matsumoto N (1993) Dynamic deformation characteristics of sand and rockfill materials. CanGeotech J 30:747–757
Yasuda N, Matsumoto N (1994) Comparisons of deformation characteristics of rockfill materials usingmonotonic and cyclic loading laboratory tests and in situ tests. Can Geotech J 31(2):162–174
Zeghal M, Elgamal AW (1994) Analysis of site liquefaction using earthquake records. J Geotech Eng ASCE120(6):996–1017
Zeghal M, Elgamal AW, Tang HT, Stepp JC (1995) Lotung downhole array: evaluation of soil nonlinearproperties. J Geotech Eng ASCE 121(4):363–378
Zeghal M, Elgamal AW, Parra E (1996) Identification and modeling of earthquake ground response II: siteliquefaction. Soil Dyn Earthq Eng 15(8):523–547
Zhang J, Andrus R, Juang C (2005) Normalized shear modulus and material damping ratio relationships.J Geotech Geoenviron Eng ASCE 131:453–464
Zorapapel GT, Vucetic M (1994) The effect of pore-pressure on ground motion. Earthq Spectra10(2):403–438
1768 Nat Hazards (2017) 88:1741–1768
123