direct shear and direct simple shear tests - university of
TRANSCRIPT
Univers
ity of
Cap
e Tow
n
Direct Shear and Direct Simple Shear Tests:
A Comparative Study of the Strength Parameters and
their Dependence on Moisture and Fines Contents
By:
Zainab Babalola
A thesis submitted to the University of Cape Town in partial fulfilment of therequirement for the degree of Master of Science in Engineering
Faculty of Engineering and Built Environment
Department of Civil Engineering
January 2016
Supervisor: Dr Denis Kalumba Co Supervisor: Faridah Chebet
The copyright of this thesis vests in the author. No quotation from it or information derived from it is to be published without full acknowledgement of the source. The thesis is to be used for private study or non-commercial research purposes only.
Published by the University of Cape Town (UCT) in terms of the non-exclusive license granted to UCT by the author.
Univers
ity of
Cap
e Tow
n

Page iiZainab Babalola /University of Cape Town
DECLARATION
1. I know that plagiarism is wrong. Plagiarism is to use another’s work and pretend that it is
one’s own.
2. I have used the Harvard convention for citation and referencing. Each significant contribution
to and quotation in this thesis from the work or works of other people has been attributed and has
been cited and referenced.
3. This thesis is my own work.
4. I have not allowed and will not allow anyone to copy my work with the intention of passing it
as his or her own.
Zainab Babalola
BBLZAI001
Date: 29/01/2016
Signature Removed
Page iiiZainab Babalola /University of Cape Town
Dedicated to:
Saheed Babalola
For his endless love and support.
Page ivZainab Babalola /University of Cape Town
Acknowledgement
I would like to express my profound gratitude to God the Almighty, for the blessings and
protection. The opportunity to study for this master’s degree as given by Dr Denis Kalumba who
willingly agreed to supervise me. Words are not enough to describe my appreciation for him.
Sincere gratitude goes to him for the guidance, commitment, willingness to help on even the
most minor issues and constructive criticism during the execution of this work. Thank you Denis
for motivating me and guiding me all the way through. I am also grateful for the excellent
contribution from my co-supervisor, Ms Faridah Chebet.
I acknowledge the assistance received from University of Cape Town Civil Engineering staff,
particularly the Geotechnical laboratory manager, Mr Noor Hassen. Special thanks also goes to
laboratory assistants, Elvino Witbooi, Hector Zwelixolile Mafungwa and Charles May, for their
support at all times. I would also like to make a special mention of Charles Nicholas, the
Principal Technical officer, who manufactured the hand compactor used in the study and who
was always ready to help me in difficult times during my experiments.
I am grateful to Franki Africa for providing me access to their office. I am particularly thankful
to Dr Nicol Chang for his support while executing my pile design.
A big thank you to my geotechnical research group colleagues: Joan Ongondia, Vincent Oderah,
Dennis Kiptoo, Johnny Oriokot, Byron Mawer, Samuel Jjukko, Angela Lekea, Sam Wagener,
Dercio Chim Jin, Lita Noluthshungu, Paul Wanyama, Sanelisiwe Buthelezi, Vuyiseka
Mapangwana, and Laxmee Sobhee for their friendship, moral support and constructive
discussion.
I would like to express my heartfelt gratitude to my husband, Saheed Babalola, for his financial
and moral support. There are no words to describe my love for you, thank you sweetheart for
always being there for me. Special words of utmost recognition are towards my sons, brothers,
sisters and other family members for their love, patience, moral support and prayers. Thank you
everyone and God bless you all.
Zainab Babalola
BBLZAI001
Page vZainab Babalola /University of Cape Town
Abstract
Shear strength of soil is characterized by cohesion, angle of internal friction and dilatation. The
first two parameters mentioned primarily define the soil’s ability to resist shear stress under
specified load. These parameters can be determined by tests conducted either in the laboratory or
the field for use in design of geotechnical structures. Some of the tests in the laboratory to
determine the shear strength of soil, include triaxial, ring shear, torsional shear, direct shear and
direct simple shear.
Direct shear test is the most widely used geotechnical shear device due to its simplicity,
however, the test suffers from stress inhomogeneity. Direct simple shear apparatus was
developed because of the shortcomings in the direct shear test. In these two tests, different
shearing conditions are applied to soil samples. For the direct shear test, shearing occurs at a
predetermined center of the specimen which may not be the weakest plane of the soil while in
direct simple shear, the entire specimen distorts without the formation of single shearing surface.
The mode of shearing established in the direct simple shear device is similar to that which occurs
around the shaft of a pile. In contrast to the extensive geotechnical application of direct shear
test, limited information exists on direct simple shear test. This thesis endeavours to establish the
relationship between the two tests by undertaking extensive testing to obtain a better
understanding of direct simple shear test as used for testing local soils and to determine a
correlation with the results from direct shear tests.
A series of shear tests were undertaken on Klipheuwel sand, Kaolin clay and composite of the
sand and clay using universal shear device. The soils were mixed with water in percentages of 5,
10, 15, 20 and 25%, and the composite with clay percentages of 10, 25, 50 and 75%, to
investigate the impact of water and clay on the shear parameters determined from the two tests.
The results showed that direct shear test gives higher shear strength when compared to direct
simple shear test under the same soil condition. The addition of water, and clay, generally
reduced the internal friction angle of sand for both tests. Furthermore, increase in cohesion was
observed with the addition of water to Kaolin clay for the direct simple shear test and the reverse
was true in the direct shear test. The correlation factors developed in this study for the direct
simple shear test could be used to refine the results from the direct shear test.
Page viZainab Babalola /University of Cape Town
Table of Content
Declaration …………………………………………………………………………….…….......ii
Acknowledgement……………………………………………………………………….……....iv
Abstract…………… ……………………………………………………………………..……....v
Table of Content…………………………………………………………………………..……..vi
List of Figures………………………………………………………………………………..…...x
List of Tables…………………………………………………………………………………...xiv
Acronyms and Annotations …………………………………………………………......…….xvi
1.0 Introduction……………………...…………………………………………………….....1
1.1 Background to the study…………………………………………………………..1
1.2 Relevance of the Study…………………………………………………………....2
1.3 Research objectives………………………………………………………...……...3
1.4 Scope and limitation………………………………………………………………3
1.5 Thesis overview…………………………………………………………………...3
2.0 Literature Review………………………………………………………………….….....4
2.1 Introduction…………………………………………………………………….….4
2.2 Shear strength of soils……………………...……………………………………...4
2.2.1 Mohr-Coulomb theory ……………………………………………….…...5
2.2.2 Mohr-Coulomb failure criterion…….…………………………………….6
2.3 Measurement of shear strength………………………….………………………...9
2.3.1 Torsional shear test ……………………….……………………………….9
2.3.2 Triaxial test…………………………………………………………….....10
2.3.3 Ring shear test …………………………………………………………....14
2.3.4 Direct shear ……………………………………………………………....16
2.3.5 Direct simple shear test…………………………………..……………….19
2.4 Summary of shearing methods…………………………………………...............23
2.5 Previous studies …………………………………………..……………………24
2.5.1 A study on the effects of relative density on friction angle using the
direct shear test ………………...…………………..………………...…24
Page viiZainab Babalola /University of Cape Town
2.5.2 A study of the effects of particle size on friction angle using
the direct shear test………………………………..…………..………….27
2.5.3 The study of the effects of relative density on shear strength
parameters using the direct simple shear test……………………..……...30
2.5.4 A study of the effects of clay and moisture content for clay-sand
mixtures using direct shear test……………….………..…………..….…37
2.5.5 A study of the effect of test quantity on shear strength parameters
using direct simple shear test………………………………………..…. .39
2.5.6 Comparing results between direct shear test and direct simple shear
Test…………………………………………………………………..…..43
2.6 Conclusion……...………………………………………………………….…….47
3.0 Research Materials and Methodology………………………………………...............48
3.1 Introduction.……...……………………………………………….…………......48
3.2 Research materials……………………....…………………………………….....48
3.2.1 Klipheuwel Sand………………………………………………………...48
3.2.2 Kaolin……………………………………..…………………………..….48
3.3 Soil classification tests…………………………………………………….….….49
3.4 Test equipment………………………………………………………………..….52
3.5 Sample preparation for direct shear test and direct simple shear test………..…..54
3.5.1 Sample Preparation for direct shear test………..…………………..……55
3.5.1.1 Pure soil (Klipheuwel sand and Kaoiln clay)……..………..……55
3.5.1.2 Sand-clay composite……………………………………....……..56
3.5.1.3 Pure soil with varying moisture content ………………..…….....57
3.5.2 Sample preparation for direct simple shear test..………………...………58
3.5.2.1 Pure soil (Klipheuwel sand and Kaoiln clay)…………..………..58
3.5.2.2 Sand-clay composite…………………………………..…………59
3.5.2.3 Pure soil with varying moisture content …………...……..…….60
3.5.3 Direct shear device setup……………………………………………..….61
3.5.4 Direct simple shear device setup…………………………………...….....62
3.6 Test procedure………………………………........................................................62
3.6.1 Procedure for direct shear test…………………………………….…...…62
Page viiiZainab Babalola /University of Cape Town
3.6.2 Procedure for direct simple shear test…………………………………..64
3.7 Testing schedule………………………………………………………………...66
3.8 Repeatability of the data………………………………………………………...72
3.9 Bulk / dry density …………………………………………………...…………..74
3.10 Quality Control ………………….………………………………………….…..75
3.11 Data processing………………………………...………………………………..75
4 .0 Results, Analysis and Discussion……………………………………………………...77
4.1 Introduction…………………………………………………………………......77
4.2 Shear stress - horizontal displacement relationship…………………..…………77
4.2.1 Sand only…………………………………………………......................77
4.2.2 Sand at varying moisture content……………….………………………78
4.2.3 Sand and clay …………………………………………...…….………...81
4.2.4 Kaolin clay ………………………………………...………….………...83
4.2.5 Kaolin clay at varying moisture content ……………………..................83
4.3 Shear stress - normal stress relationship ……………………………….……….86
4.3.1 Sand only ……………………………………………………….……....87
4.3.2 Sand at varying moisture content……………………………..…..…….88
4.3.3 Sand and clay …………………………………………………….……..90
4.3.4 Kaolin clay…………………………………………................................92
4.3.5 Kaolin clay at varying moisture content ………………………….…….93
4.4 Correlation factor…………………………………………………………..……95
5.0 Practical Applications…….………………………………………………………..…..100
5.1 Introduction………………………………………………………………….....100
5.2 The proposed design ……………………………………………………….…100
5.3 Design Example………………………………………………………………..100
5.3.1 Soil parameters ………………………………………………. ……….102
5.3.2 Design analysis using angle of internal friction from direct shear test...104
5.3.3 Design analysis using angle of internal friction from direct
simple shear test………………………………………………….….…105
6.0 Conclusions and Recommendation………………………………………………......107
6.1 Introduction…….……………………………………………………………....107
Page ixZainab Babalola /University of Cape Town
6.2 Summary of the findings……….……………………………………………….107
6.3 Recommendations………………………………………....................................108
7.0 References
8.0 Appendices
Page xZainab Babalola /University of Cape Town
List of Figures
Figure 1.1 Example of shear failure in soils………………………………….………….....…1
Figure 2.1 Failure surface and shear resistance……………………………………………….5
Figure 2.2 Mohr-Coulomb failure criterion and failure envelope ……………………………7
Figure 2.3 Mohr circles of different soil elements ………………………..………………….7
Figure 2.4 Mohr circles for different stress condition………………………………………...8
Figure 2.5 Mohr circles for total stress and effective stress condition……...….……………..8
Figure 2.6 Schematic diagram of the torsional shear testing system………......……………10
Figure 2.7 Triaxial Cell with Associated Hydraulic Loading System………....……………11
Figure 2.8 Fully Automated Triaxial Load Frame …………………………...…..................11
Figure 2.9 Generalised specimen response during shear for a normally-consolidated clay...13
Figure 2.10 Cohesive specimen post-shear showing failure plane……………...………...….13
Figure 2.11 Schematic of ring shear test shearing mechanism………………......…………..14
Figure 2.12 Typical graphs from ring shear test …………………………………………......15
Figure 2.13 Shear box apparatus ………………………………………………………..........16
Figure 2.14 Direct shear apparatus (manual)……………………………………………........17
Figure 2.15 Shear box test …………………………………………………………………...17
Figure 2.16 Typical deformation results from a direct shear test on loose and dense
cohensionless soil specimen………………………………….………….….…...18
Figure 2.17 Cambridge direct simple shear testing cubical sample…….…………….….…...19
Figure 2.18 Principle of the direct simple shear test ………………………………….….......20
Figure 2.19 Stability of slope …………………………………………………………...…....21
Figure 2.20 Cyclic loading of gravity base structure…….……………………………...........21
Figure 2.21 NGI pile design method, static and cyclic testing of remoulded and
undisturbed soil……..………………………………………………………...….22
Figure 2.22 Typical graphs on direct simple shear test……………………………….……...22
Figure 2.23 Relationship between shear box scale effect and footing scale effect…………...26
Figure 2.24 Results of direct shear test on Tergha sand……………………………..….…….39
Figure 2.25 Shear Stress and Volumetric Strain Variations at Different Normal Stresses…...31
Figure 2.26 Mohr-Culomb failure criteria (Effect of Normal Stress)………………….……..32
Page xiZainab Babalola /University of Cape Town
Figure 2.27 Influence of normal stress on shear stiffness …………………………………....32
Figure 2.28 Shear stress and volumetric strain variations (50kPa)……………………..…….33
Figure 2.29 Shear stress and volumetric strain variations (200kPa)……………………....….34
Figure 2.30 Shear stress and volumetric strain variations (300kPa)…………………………..34
Figure 2.31 Mohr-Coulomb Failure Criteria (Effect of Relative Density) ………………......35
Figure 2.32 Influence of moisture content on angle of internal friction and cohesion …...….38
Figure 2.33 Influence of clay content on cohesion and internal angle of friction ……………39
Figure 2.34 Peak values of loose sand shear strength parameters……………………………40
Figure 2.35 Peak shearing stress versus horizontal displacement………………….………...41
Figure 2.36 Characteristic angle of internal friction versus test quantity……………….........41
Figure 2.37 Characteristic cohesion versus test quantity ……………………………….……42
Figure 2.38 Shear strength and stiffness data for direct simple shear test and direct shear
test in Ariake clay……………………….………………………………………45
Figure 2.39 Shear strength and stiffness data for direct simple shear test and direct
shear test in Drammen clay…………..………………………………….…….....46
Figure 3.1 Klipheuwel sand and Kaolin…………….…………………………….…............49
Figure 3.2 Particle grading curve for Klipheuwel sand. ……………………………..….……50
Figure 3.3 Standard proctor curves for Klipheuwel sand ……….……………………...……..51
Figure 3.4 Standard proctor curves for kaolin clay ……………………………………..….…51
Figure 3.5 Conversion of ShearTrac-II (DS) for direct shear to ShearTrac-II-DSS for direct
simple shear (Geocomp, 2015)…………………………….………………..….....53
Figure 3.6 Simple shear arms …………………………………..……………………….….. 54
Figure 3.7 Hand compactor ……………………………………...……………………….….55
Figure 3.8 Moist sample preparation Klipheuwel and Kaolin……...……………………… 58
Figure 3.9 Sample ready for testing…………………………………………………………59
Figure 3.10 Direct shear test setup ………………………………………………………….....61
Figure 3.11 Shear control window ………………………………………………………….....63
Figure 3.12 Samples of direct shear test specimen after …………………………………………64
Figure 3.13 Direct simple shear software window with different setting tabs …..………...…....64
Figure 3.14 Sample of direct simple shear test specimen after test …………………….….…...65
Figure 3.15 Repeatable results for three samples tested at 50kPa dst….……………………..73
Page xiiZainab Babalola /University of Cape Town
Figure 3.16 Repeatable results for three samples tested at 50kPa dsst…………….....………73
Figure 3.17 Summary of research methodology…………………………………….………..76
Figure 4.1 Direct shear and direct simple shear test results for
Klipheuwel sand only……………………………………....................…………78
Figure 4.2 Shear stress versus horizontal displacement for Klipheuwel sand with
different Percentages of moisture content for direct shear and direct
simple shear tests……..………………………………………………...………..79
Figure 4.3 Shear stress versus horizontal displacement for Klipheuwel sand and
Kaolin clay at different a concentrations of Kaolin clay for direct shear and
direct simple shear tests……………………………………………….……...….81
Figure 4.4 Shear stress versus horizontal displacement for Kaolin clay……..…….………..83
Figure 4.5 Shear stress versus horizontal displacement for Kaolin clay with
different percentage of moisture content for direct and simple shear tests.….….84
Figure 4.6 Relationship between the maximum shear stress and normal applied pressure
for Klipheuwel sand (direct shear test and direct simple shear test)……….……88
Figure 4.7 Relationship between the maximum shear stress and normal applied
pressure for Klipheuwel sand with varying moisture content
(direct shear test and direct simple shear test)………………………..………….89
Figure 4.8 Relationship between the maximum shear stress and normal applied pressure
for Klipheuwel sand and kaolin (direct shear test and direct simple shear
test)…………………………………………………………………….…….......91
Figure 4.9 Relationship between the maximum shear stress and normal applied pressure
for kaolin clay (direct shear test and direct simple shear test)…………..…….…92
Figure 4.10 Relationship between the maximum shear stress and normal applied pressure
f.or kaolin clay at varying moisture content (direct shear test and direct
simple shear test)………………………………………………………...………93
Figure 4.11 Relationship of angle of internal friction between direct shear test result and
direct simple shear test result……………………………………………..……...96
Figure 5.1 The old and the proposed new bridge side by side………...…………………..101
Figure 5.2 Pile capacity…………………………………………………………..….……102
Figure 5.3 Pile parameters (direct shear test)………………………………………...…...104
Page xiiiZainab Babalola /University of Cape Town
Figure 5.4 Pile parameters (direct simple shear test)…………………………….….……105
Page xivZainab Babalola /University of Cape Town
List of Tables
Table 2.1 Summary of sample preparation techniques in the direct shear box
testing program…………………………………………………………………..25
Table 2.2 Direct shear box testing results using the constant volume shear strength….......27
Table2.3 Granular properties of sample ……………………………………………...…...28
Table 2.4 Shear Strength Parameters (Effect of Relative Density)……………………...…35
Table 3.1 Experiment Conducted for Soil Classification………………………………......49
Table 3.2 Summary of the results obtained from the classification tests for Kaolin
And Klipheuwel sand……………………………………...........................…….52
Table 3.3 Code terminology … ……………………………………………........................66
Table 3.4 Direct shear test on Klipheuwel sand and clay…………………..........................67
Table 3.5 Direct simple shear test on Klipheuwel sand and clay……………………..........70
Table 3.6 Repeatability results…………………………………………………………......73
Table 3.7 The densities achieved during the preparation of test specimens…………..........74
Table 4.1 Peak shear stress for Klipheuwel sand with different percentage of
moisture content……………………………………………....………………….80
Table 4.2 Peak shear stress for Klipheuwel sand with different concentration of
Kaolin clay…………………...…………………………………………………..82
Table 4.3 Peak shear stress for Kaolin clay with different percentage of moisture content..86
Table 4.4 Shear strength parameters (friction angle and cohesion) obtained from direct
shear test and direct simple shear from Klipheuwel sand with varying
moisture content …………………………………………………………………90
Table 4.5 Shear strength parameters (friction angle and cohesion) obtained from direct
shear test and direct simple shear from Klipheuwel sand and Kaolin clay with
different clay concentration……...........................................................................92
Table 4.6 Shear strength parameters (friction angle and cohesion) obtained from direct
shear test and direct simple shear from Kaolin clay with varying moisture
content……………………………………………………………………….….95
Table 4.7 Percentage difference of angle of internal friction for all the
soil samples…………………………………………………......………………98
Page xvZainab Babalola /University of Cape Town
Table 5.1 Parameters for design of pile in cohensionless soils …………………………..103
Table 5.2 Design calculations results………………………………………… .................106
Page xviZainab Babalola /University of Cape Town
Acronyms and Annotations
ASCE American Society of Civil Engineers
ASTM American Society for Testing and Materials
BS British standards
Cc Coefficient of curvature
Cu Coefficient of uniformity
DS Direct shear
DSS Direct simple shear
FOS Factor of safety
OMC Optimum Moisture Content
NGI Norwegian geotechnical institute
UCT University of Cape Town
USCS Unified Soil Classification System
c Cohesion of soil (kPa)
D50 Mean grain size
N Normal applied load (kN)
ϕ Angle of internal friction
ρ Density
Page 1Zainab Babalola /University of Cape Town
1.0 INTRODUCTION
1.1 Background to the study
Failure of soil may cause collapse of structures resulting in loss of lives as well as economic and
financial damages. Soil failure and the associated problems are generally termed geotechnical
stability problems. Most geotechnical instability problems are associated with shear failure.
Shear strength is therefore one of the most important properties for design of engineering
structures and also one of the most difficult to evaluate (Nagendra et al., 2013). The shear
strength of soils is a necessary aspect in many foundation problems such as the bearing capacity
of shallow foundations and piles, stability of the slopes of dams and embankments, and lateral
earth pressure on retaining walls (Das, 1983). The safety of geotechnical structures depends on
the strength properties of soil and therefore a proper understanding of soil strength parameters is
essential in ensuring safe designs. Soil is strong in compression but weak in shear and tension,
thus the strength of any soil under compression load is defined by its resistance to shearing
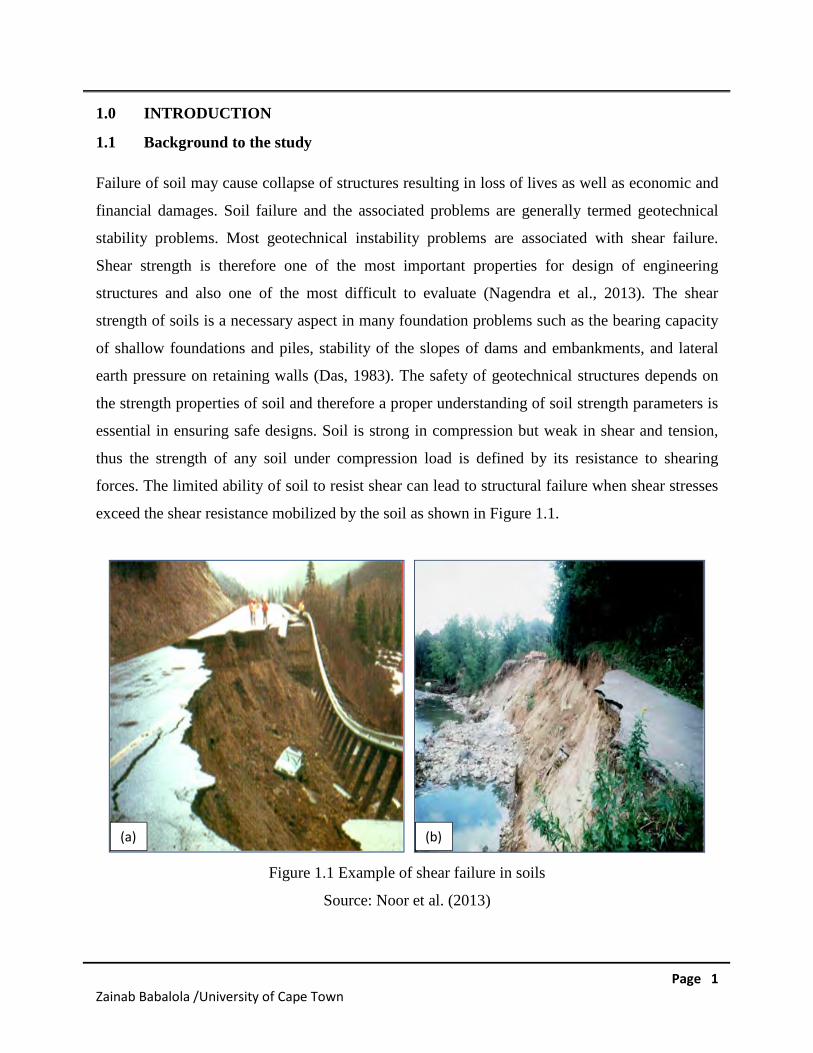
forces. The limited ability of soil to resist shear can lead to structural failure when shear stresses
exceed the shear resistance mobilized by the soil as shown in Figure 1.1.
Figure 1.1 Example of shear failure in soils
Source: Noor et al. (2013)
(b)(a)
Page 2Zainab Babalola /University of Cape Town
In order to determine the parameters that govern shear strength, namely angle of internal friction
and cohesion, laboratory tests or field tests are conducted. Laboratory shear testing has become
an integral part of many soil investigations as a way to determine the shear strength parameters
of a soil (Hanzawa et al., 2007). Many types and variations of laboratory shear tests have been
developed and in most of these tests the rates of deformation are controlled and the resulting
loads are measured. Field tests such as cone penetration test and vane shear test are very
common in engineering projects. But, stress-strain relationships can not be measured directly.
Laboratory tests are mostly of academic interest and the accuracy of this test is sufficient for
practical purposes. The tests employed in the laboratory include ring shear, torsional shear,
triaxial, direct shear and simple shear. Shear parameters derived from either field or laboratory
test are used for design purposes. Direct shear test is a simple and relatively cheap method for
determining the soil shear strength parameters. The apparatus is easy to use, the test is fast to
perform, and the output data can be relatively easily processed to obtain the necessary
parameters. Therefore the direct shear apparatuses are widely applied in engineering practice and
for research purposes (Amsiejus et al., 2013). However, direct simple shear test is a relatively
new improvement of direct shear test (Siti et al., 2015). Both devices apply shear directly to the
soil specimen. This study investigated the relationship between the results generated from direct
shear and direct simple shear test using South Africa soils.
1.2 Relevance of study
Direct simple shear test is not popular in practise (Dinesh, 2010). Information concerning direct
simple shear test as compared to direct shear test is necessary to enhance its adaptability for
shear testing of soils. Kjellman (1951) reported that the direct simple shear testing gave results
that were closer to those deduced from back analysis of some field failures than the results of
other shear test. Direct simple shear was found to have better results, when compared to other
shear tests. It was anticipated therefore that a better understanding of measurement of shear
strength parameters would be realized, when the results generated from direct shear test is
compared to direct simple shear test.
Page 3Zainab Babalola /University of Cape Town
1.3 Research objectives
The main objective of this study was to compare soil strength parameters determined using direct
shear and direct simple shear test apparatuses. The specific objectives were;
(1) To evaluate the effect of moisture content on shear strength parameters of sand and clay.
(2) To determine the effect of fine content on shear strength parameters of sand in both the direct
shear test and the simple shear test.
(3) To compare the overall shear test results obtained from direct shear test and direct simple
shear test.
1.4 Scope and limitations
The research conducted herein involved the investigation of shear strength parameters of soil as
obtained using both direct shear and direct simple shear device, and to determine the relationship
between the results as well as the benefits of their inclusion in the design of structures. The shear
tests conducted were limited to these two tests, and no other shear tests included in the research.
The investigation only considered two soils, Klipheuwel sand and Kaolin clay sourced locally.
1.5 Thesis overview
This thesis initially provides an introductory overview which includes the background,
relevance, justification and objectives of the study. In order to provide additional background on
the concepts of shear strength in soils, chapter 2 explores the literature review of different
apparatus used for measuring shear strength. This is followed by the previous studies on direct
shear test and direct simple shear test. The mechanical properties of the test materials, sample
preparation, equipment and the details of the experimental procedure for both direct shear test
and direct simple shear test are given in Chapter 3. All the results, their analysis and discussion
are presented in Chapter 4. Results using both the direct shear test and direct simple shear test
were compared and correlation factors are detailed. Chapter 5 looks at an example of the
engineering application of the results generated from this study. Finally, the conclusion and
recommendations for application and further research are given in Chapter 6.
Page 4Zainab Babalola /University of Cape Town
2.0 LITERATURE REVIEW
2.1 Introduction
The object of laboratory shear testing is to study the behaviour of a given soil under conditions
similar to those encountered in the field and to establish those parameters that describe this
behaviour in a set of constitutive equations. In a laboratory shear test, the specimen is intended
and generally assumed to represent a single point in a soil medium. Separate measurements are
often made for the soil phase, the water phase and, sometimes, the air phase of the specimen in
order to relate its contribution to the strength of the mass. This chapter explores the history of
different laboratory shear tests and reviews previous studies that are related to this study.
2.2 Shear strength of soil
In most of the problems in soils engineering, such as those concerning the foundations of
structures, earthwork engineering, etc., the soil mass has to withstand shearing stresses. The
shearing stresses tend to displace a part of soil relative to the rest of the soil mass. The capacity
of the soil to resist shearing stresses is referred to as shear strength. It can be explained further as
the maximum value of shear stress that can be mobilised within a soil mass. If this value is
equalled by the shear stress on any plane or a surface, the failure will occur in the soil because of
the movement of a portion of the soil mass along that particular plane or surface. In this instance
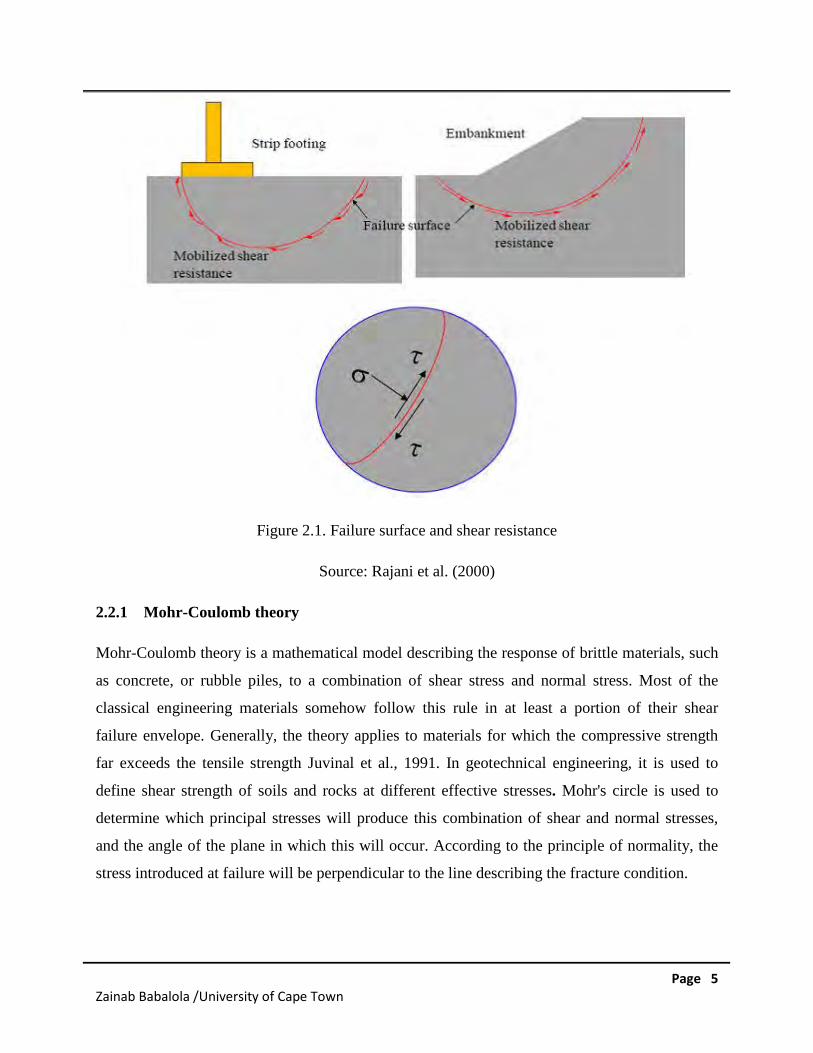
the soil has failed in shear. At the failure surface, shear stress reaches the shear strength (τ) of the
soil, and sliding between the particles takes place as illustrated in Figure 2.1. Slopes of all kinds,
such as hills or mountains, banks of canals or rivers, man-made cuts and fills, etc., remain stable
only if the shear strength of the material of which they are composed is adequate.
Page 5Zainab Babalola /University of Cape Town
Figure 2.1. Failure surface and shear resistance
Source: Rajani et al. (2000)
2.2.1 Mohr-Coulomb theory
Mohr-Coulomb theory is a mathematical model describing the response of brittle materials, such
as concrete, or rubble piles, to a combination of shear stress and normal stress. Most of the
classical engineering materials somehow follow this rule in at least a portion of their shear
failure envelope. Generally, the theory applies to materials for which the compressive strength
far exceeds the tensile strength Juvinal et al., 1991. In geotechnical engineering, it is used to
define shear strength of soils and rocks at different effective stresses. Mohr's circle is used to
determine which principal stresses will produce this combination of shear and normal stresses,
and the angle of the plane in which this will occur. According to the principle of normality, the
stress introduced at failure will be perpendicular to the line describing the fracture condition.
Page 6Zainab Babalola /University of Cape Town
2.2.2. Mohr-Coulomb Failure Criterion
Mohr (1900) presented a theory for rupture in materials that contended that a material fails
because of a critical combination of normal stress and shearing stress, and not from either
maximum normal or shear stress alone. Thus, the functional relationship between normal stress
and shear stress on a failure plane can be expressed in the following form:
τ = f (σ)……………………… (2.1)
The failure envelope defined is generally a curved line. For most soil mechanics
problems, it is sufficient to approximate the shear stress on the failure plane as a linear function
of the normal stress (Coulomb, 1776). This linear function can be written as:
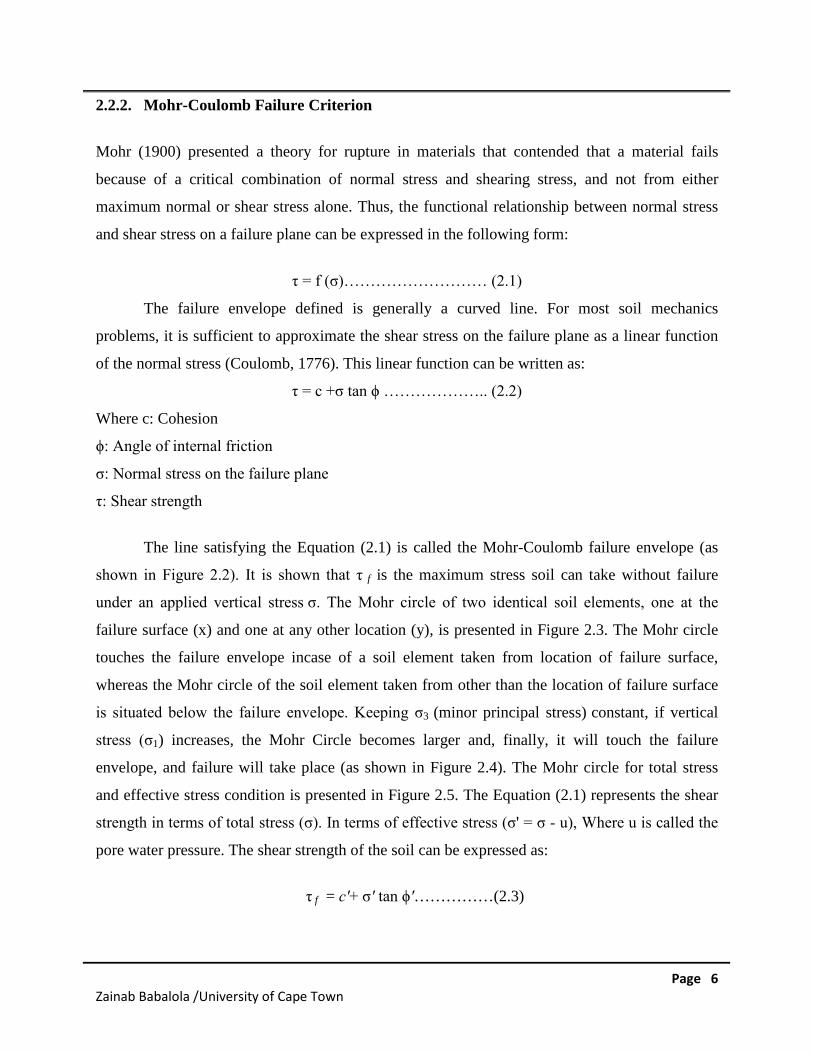
τ = c +σ tan ϕ ……………….. (2.2)
Where c: Cohesion
ϕ: Angle of internal friction
σ: Normal stress on the failure plane
τ: Shear strength
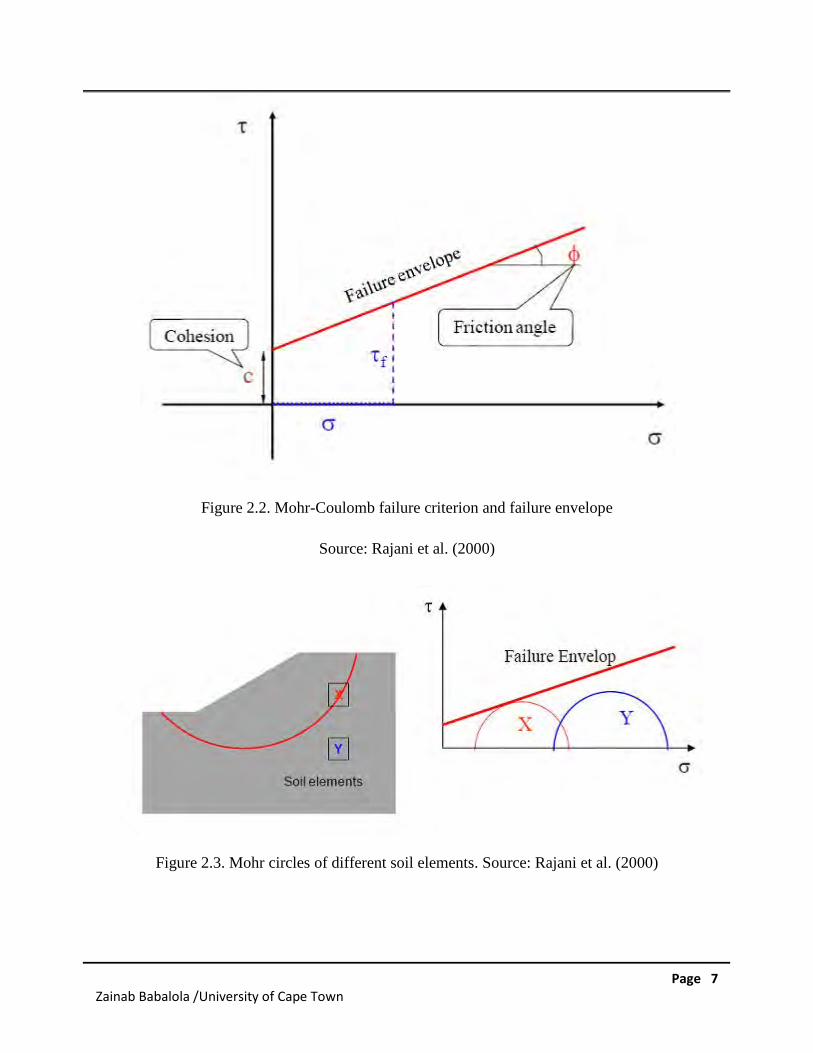
The line satisfying the Equation (2.1) is called the Mohr-Coulomb failure envelope (as
shown in Figure 2.2). It is shown that τ f is the maximum stress soil can take without failure
under an applied vertical stress σ. The Mohr circle of two identical soil elements, one at the
failure surface (x) and one at any other location (y), is presented in Figure 2.3. The Mohr circle
touches the failure envelope incase of a soil element taken from location of failure surface,
whereas the Mohr circle of the soil element taken from other than the location of failure surface
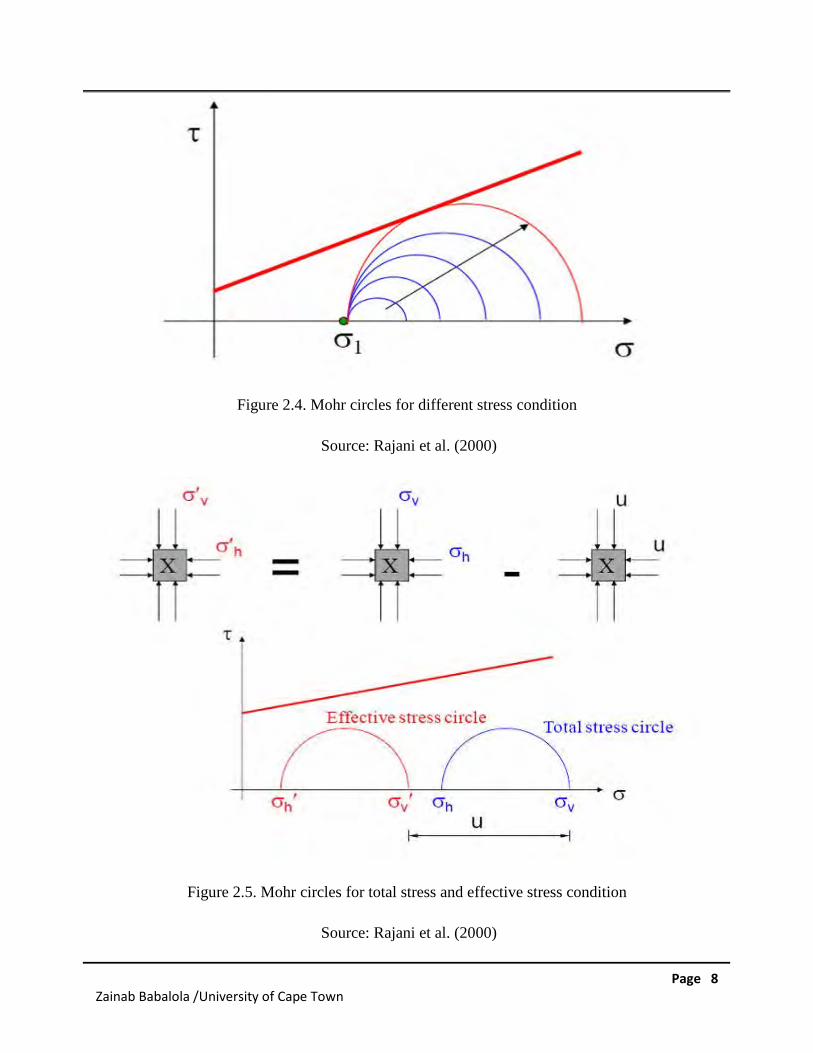
is situated below the failure envelope. Keeping σ3 (minor principal stress) constant, if vertical
stress (σ1) increases, the Mohr Circle becomes larger and, finally, it will touch the failure
envelope, and failure will take place (as shown in Figure 2.4). The Mohr circle for total stress
and effective stress condition is presented in Figure 2.5. The Equation (2.1) represents the shear
strength in terms of total stress (σ). In terms of effective stress (σ' = σ - u), Where u is called the
pore water pressure. The shear strength of the soil can be expressed as:
τ f = c′+ σ′ tan ϕ′……………(2.3)
Page 7Zainab Babalola /University of Cape Town
Figure 2.2. Mohr-Coulomb failure criterion and failure envelope
Source: Rajani et al. (2000)
Figure 2.3. Mohr circles of different soil elements. Source: Rajani et al. (2000)
Page 8Zainab Babalola /University of Cape Town
Figure 2.4. Mohr circles for different stress condition
Source: Rajani et al. (2000)
Figure 2.5. Mohr circles for total stress and effective stress condition
Source: Rajani et al. (2000)
Page 9Zainab Babalola /University of Cape Town
2.3 Measurement of shear strength
Many types and variations of shear tests have been developed to measure shear strength of soils.
In most of these tests the rate of deformation is controlled and the resulting loads are measured.
In some tests, total stress parameters are determined while in others effective stress strength
parameters are obtained.
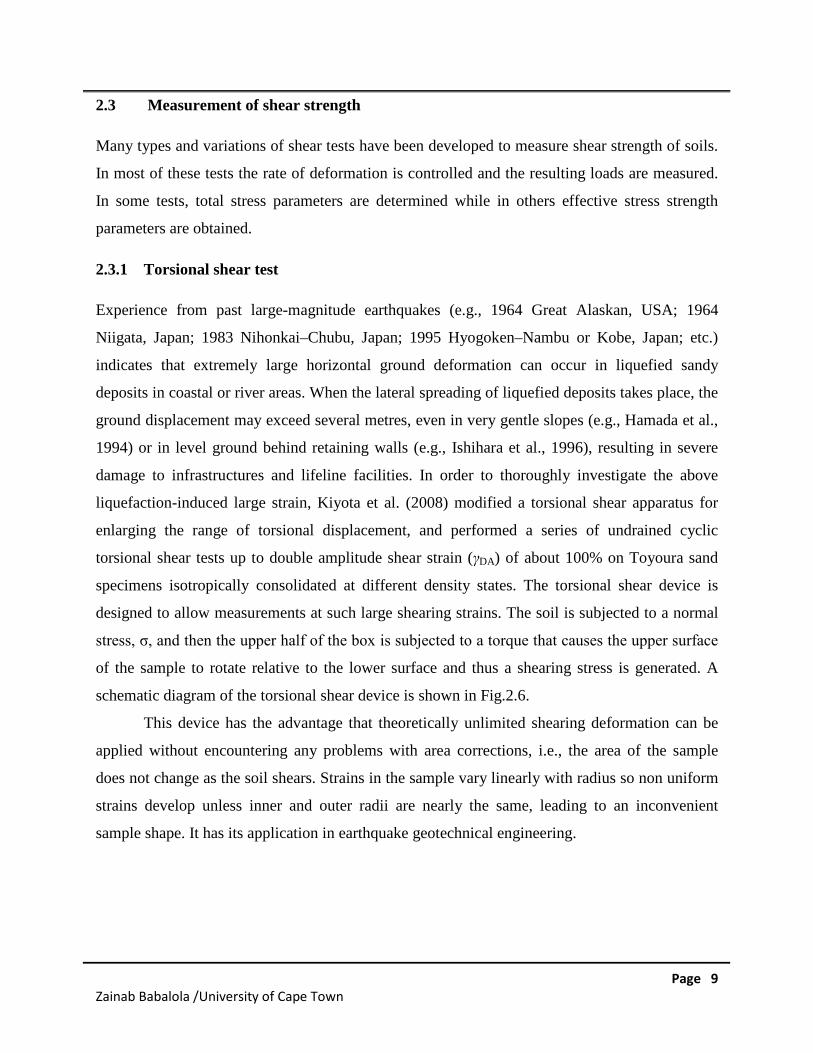
2.3.1 Torsional shear test
Experience from past large-magnitude earthquakes (e.g., 1964 Great Alaskan, USA; 1964
Niigata, Japan; 1983 Nihonkai–Chubu, Japan; 1995 Hyogoken–Nambu or Kobe, Japan; etc.)
indicates that extremely large horizontal ground deformation can occur in liquefied sandy
deposits in coastal or river areas. When the lateral spreading of liquefied deposits takes place, the
ground displacement may exceed several metres, even in very gentle slopes (e.g., Hamada et al.,
1994) or in level ground behind retaining walls (e.g., Ishihara et al., 1996), resulting in severe
damage to infrastructures and lifeline facilities. In order to thoroughly investigate the above
liquefaction-induced large strain, Kiyota et al. (2008) modified a torsional shear apparatus for
enlarging the range of torsional displacement, and performed a series of undrained cyclic
torsional shear tests up to double amplitude shear strain (γDA) of about 100% on Toyoura sand
specimens isotropically consolidated at different density states. The torsional shear device is
designed to allow measurements at such large shearing strains. The soil is subjected to a normal
stress, σ, and then the upper half of the box is subjected to a torque that causes the upper surface
of the sample to rotate relative to the lower surface and thus a shearing stress is generated. A
schematic diagram of the torsional shear device is shown in Fig.2.6.
This device has the advantage that theoretically unlimited shearing deformation can be
applied without encountering any problems with area corrections, i.e., the area of the sample
does not change as the soil shears. Strains in the sample vary linearly with radius so non uniform
strains develop unless inner and outer radii are nearly the same, leading to an inconvenient
sample shape. It has its application in earthquake geotechnical engineering.
Page 10Zainab Babalola /University of Cape Town
Fig. 2.6 Schematic diagram of the torsional shear testing system
Source: Nakagawa (1995)
2.3.2 Triaxial test
The triaxial test was developed by Casagrande in an attempt to overcome some of the serious
disadvantages of direct shear test (Braja Das, 2012). These disadvantages include uncontrolled
rotation of principal planes and stresses, the failure plane is forced to be horizontal and
uncontrolled drainage. The triaxial shear device evolved over a period of years. Early devices
with many of the characteristics of current triaxial devices were originated by Buisman (1924)
and Hveem (1934) according to Endersby (1950), but the first device that resembled modern
equipment was developed in the early 1930s by Casagrande at Harvard. A consensus developed
during the late 1930s that the triaxial device was superior to the direct shear device and that view
tends to persist today (Jiunnren Lai, 2004).
At Imperial College, London, Bishop and Henkel (1953) developed the so-called ‘self-
compensating mercury control apparatus’ for applying cell pressure. Pressure comes from a
column of mercury, and the unit weight of mercury is about 13.546 grams/ml at 20° Celsius. So
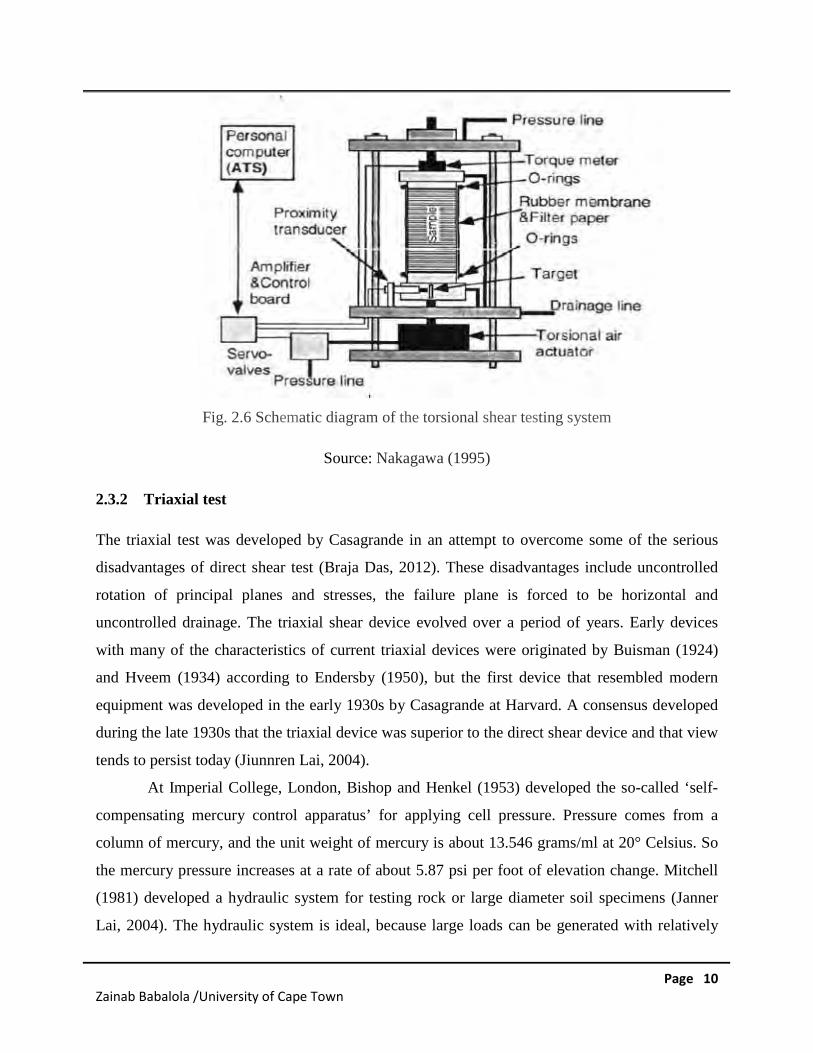
the mercury pressure increases at a rate of about 5.87 psi per foot of elevation change. Mitchell
(1981) developed a hydraulic system for testing rock or large diameter soil specimens (Janner
Lai, 2004). The hydraulic system is ideal, because large loads can be generated with relatively
Page 11Zainab Babalola /University of Cape Town
compact apparatus. The usual procedure is to use a single hydraulic cylinder, a high-pressure
pump, and a set of metering valves. The valves can be computer-controlled so loads can be
applied at any reasonable rate, and cyclic loadings are easily achieved. The hydraulic system is
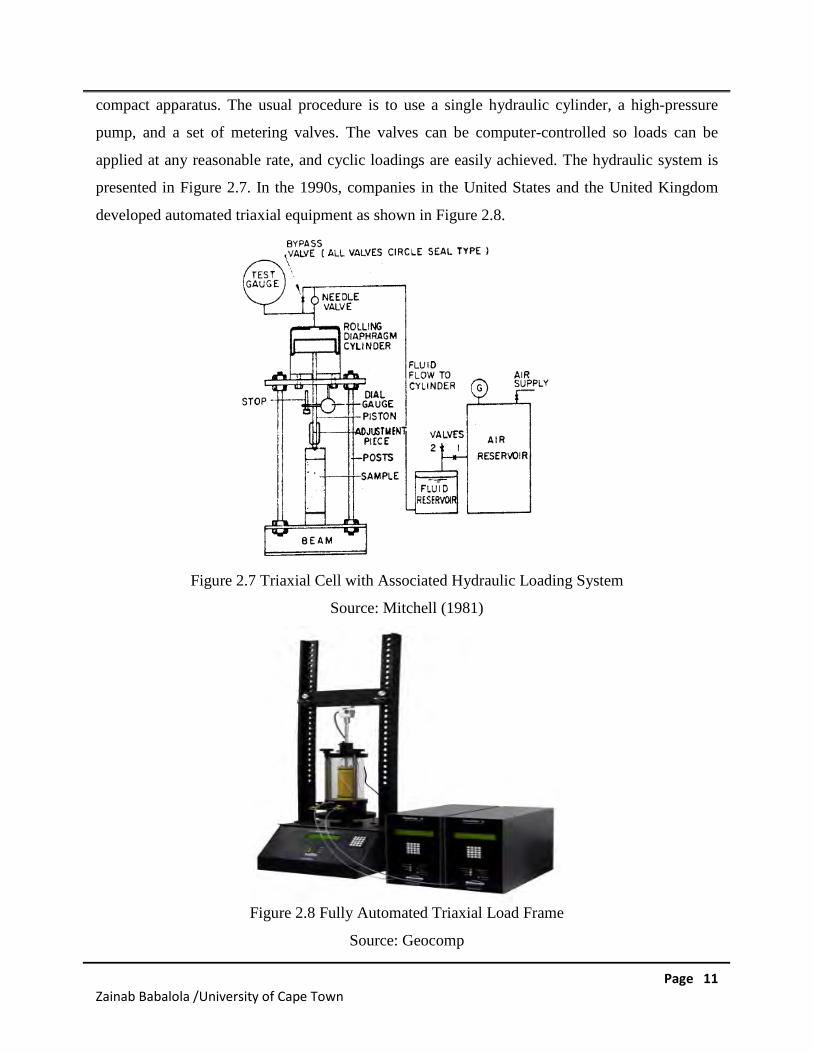
presented in Figure 2.7. In the 1990s, companies in the United States and the United Kingdom
developed automated triaxial equipment as shown in Figure 2.8.
Figure 2.7 Triaxial Cell with Associated Hydraulic Loading System
Source: Mitchell (1981)
Figure 2.8 Fully Automated Triaxial Load Frame
Source: Geocomp
Page 12Zainab Babalola /University of Cape Town
The fully automated shear apparatus programme the conduct of triaxial stress path tests on soils
and soft rocks. This system operates by means of software, which automates all the stages
involved in the test. This system also allows specifications of all steps required to perform a
triaxial stress path test along any stress path test possible in a triaxial cell, including the ability to
specify changes.
The test is called triaxial because the three principal stresses are assumed to be known
and controlled. The three types of triaxial tests can be listed as follows: unconsolidated-
undrained test (UU or Q) test; consolidated-undrained (CU or R) test and consolidated-drained
(CD or S) test. The information, such as the shear strength parameters and the cohesion that is
obtained from the triaxial test can be used to check the safety and predict the behaviours of long-
term stability of slopes and earth fills and earth-retaining structures. The analysis carried out in
terms of total stress obtained from an undrained test can be used to investigate the initial stability
of the foundation of a structure or embankment on saturated clay. Alternatively, the analysis can
also be used to determine the initial stability of an open cut or sheet piled excavation made in
clay and the stability against the bottom heave of a deep excavation in clay. The triaxial test has
the ability to control the drainage conditions so as to allow for different types of test (drained and
undrained conditions) and measure pore pressure Moreover, stability of relatively impervious
rolled field can be investigated using the test Shawntiku, 2011. The shear strength parameters
determined using triaxial test are more accurate than those obtained from shear box test because
it allows soil to be sheared to failure along its natural weakest plane Shawntiku, 2011.
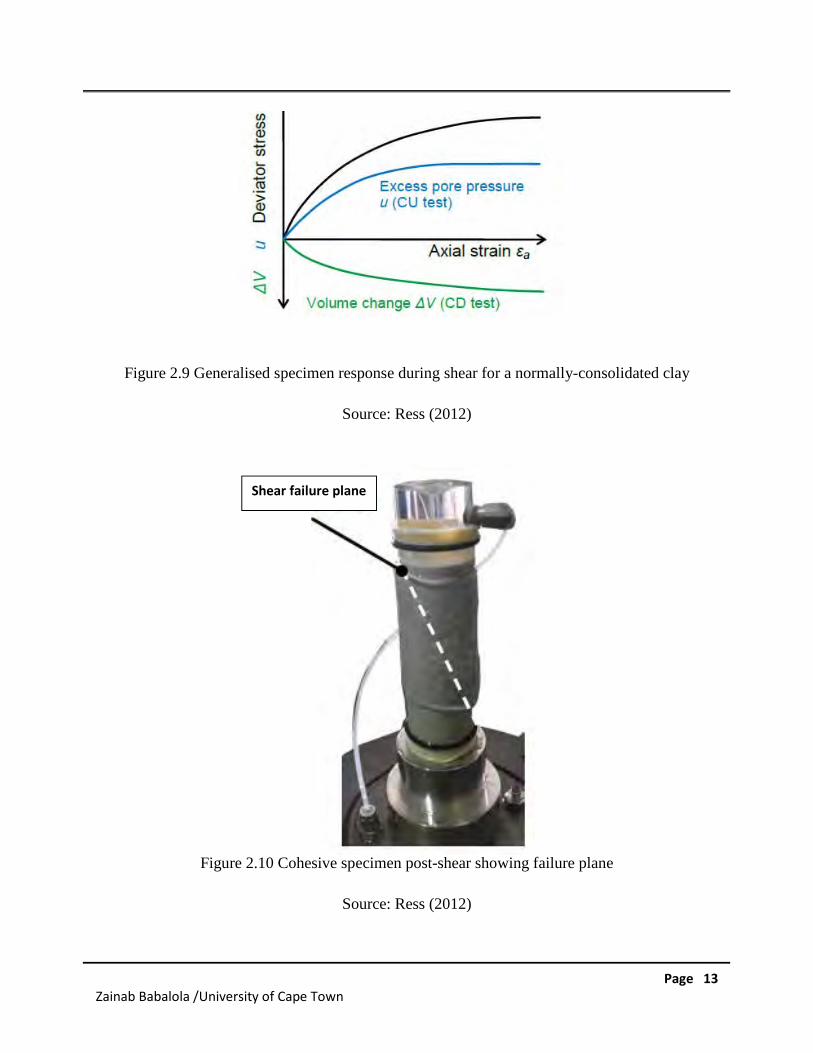
The triaxial test apparatus is elaborate, bulky and costly, the drained test takes place over
a longer period in comparison with a direct shear test. A generalised response for normally
consolidated clay is presented in Figure 2.9. This includes the excess pore pressure generated
during a CU test, and an observed specimen volume change during a CD test. Figure 2.10
displays a cohesive specimen after completion of the shear stage, with the plane of failure
highlighted (i.e. the plane in which the majority of shear strain occurs).
Page 13Zainab Babalola /University of Cape Town
Figure 2.9 Generalised specimen response during shear for a normally-consolidated clay
Source: Ress (2012)
Figure 2.10 Cohesive specimen post-shear showing failure plane
Source: Ress (2012)
Shear failure plane
Page 14Zainab Babalola /University of Cape Town
2.3.3 Ring shear test
A number of different forms of the ring shear apparatus have been developed, examples are:
Hvorslev (1936 and 1939), La Gatta (1970), Bishop et a1. (1971) and Bromhead (1979). However,
the Bromhead (1979) ring shear apparatus is becoming more widely used because of cost and ease
of operation. Bromhead and Curtis (1983) showed that this apparatus yields results that are in
agreement with those obtained using the more sophisticated apparatus developed by the
Norwegian Geotechnical Institute and Imperial College (Bishop et al., 1971).
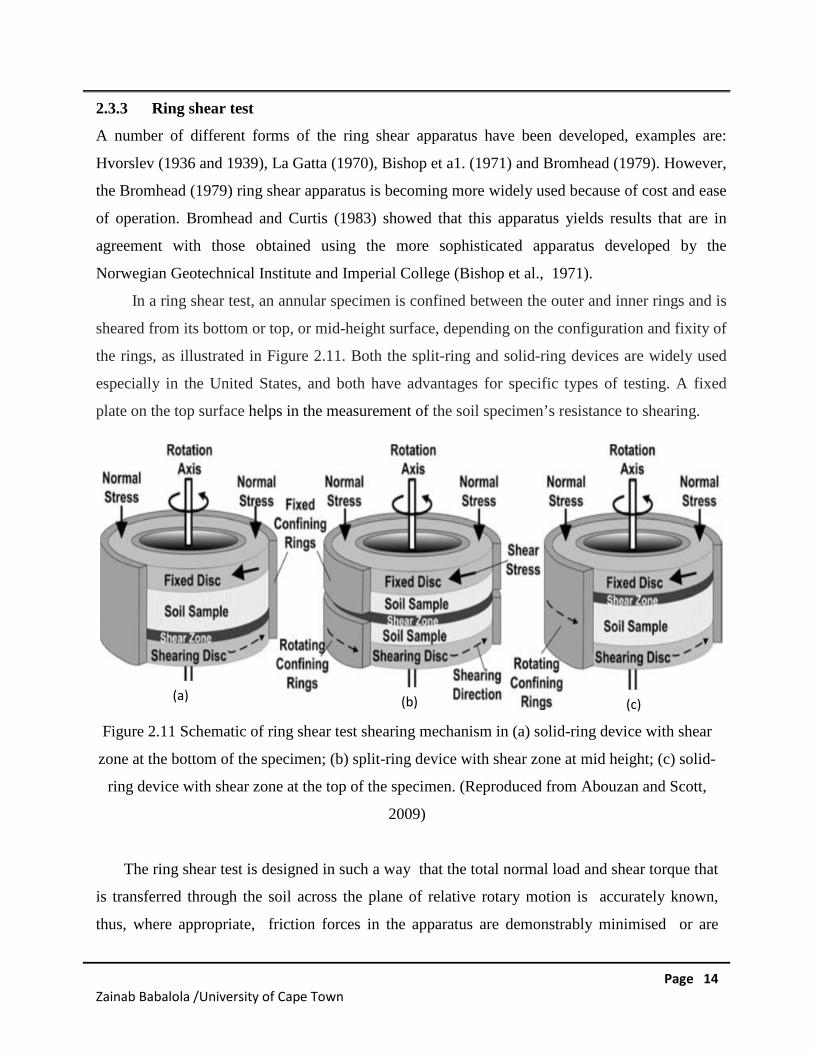
In a ring shear test, an annular specimen is confined between the outer and inner rings and is
sheared from its bottom or top, or mid-height surface, depending on the configuration and fixity of
the rings, as illustrated in Figure 2.11. Both the split-ring and solid-ring devices are widely used
especially in the United States, and both have advantages for specific types of testing. A fixed
plate on the top surface helps in the measurement of the soil specimen’s resistance to shearing.
Figure 2.11 Schematic of ring shear test shearing mechanism in (a) solid-ring device with shear
zone at the bottom of the specimen; (b) split-ring device with shear zone at mid height; (c) solid-
ring device with shear zone at the top of the specimen. (Reproduced from Abouzan and Scott,
2009)
The ring shear test is designed in such a way that the total normal load and shear torque that
is transferred through the soil across the plane of relative rotary motion is accurately known,
thus, where appropriate, friction forces in the apparatus are demonstrably minimised or are
(a) (b) (c)
Page 15Zainab Babalola /University of Cape Town
measured (Bishop et al., 1971). The ring shear test provides many advantages for measuring the
large displacement shear resistance of sands. These include the ability to shear a sample
uninterrupted to virtually unlimited displacement; ability to apply known shear stresses on a
horizontal (depositional) shearing plane; the ability to continuously rotate (although
uncontrolled) principal stress directions; the ability to consolidate a specimen prior to shear and
the ability to accurately track volume changes because changes occur only in one dimension. The
cross-sectional area of the shear plane remains unchanged during shearing and the geometry of
the test specimen remains unchanged during shearing. In a ring shear test as opposed to the
specimen in triaxial test where shape changes from rectangular to nearly an ovoid.
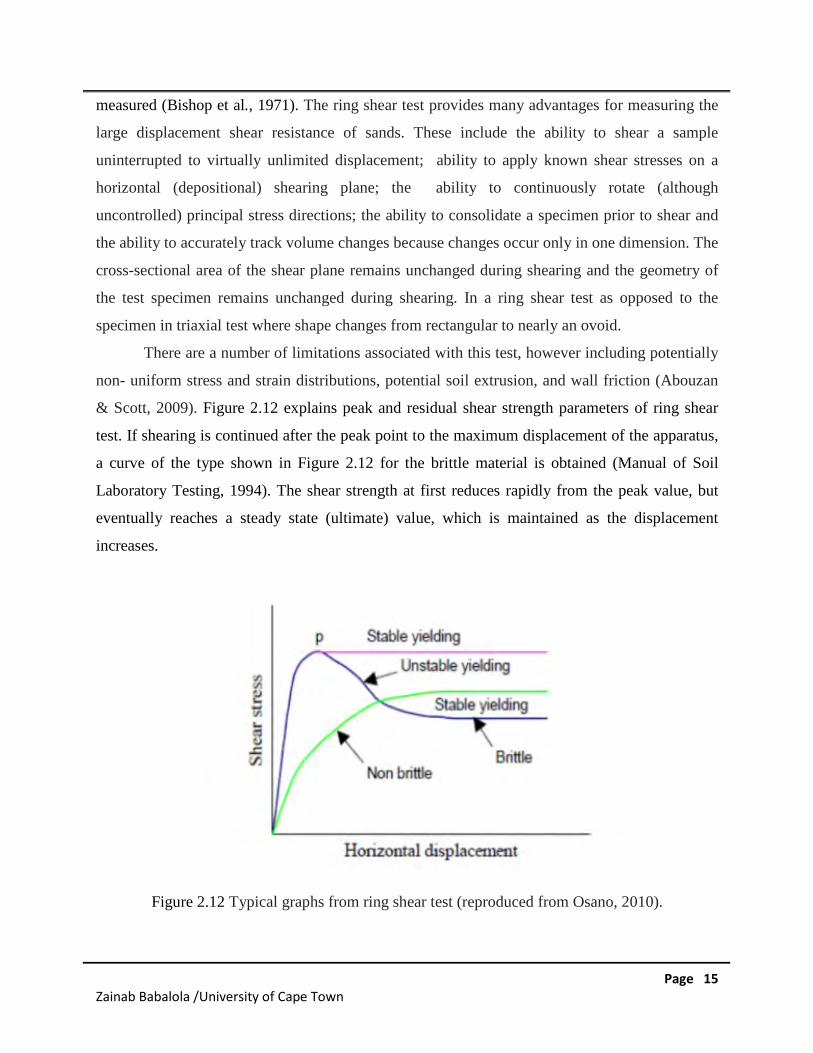
There are a number of limitations associated with this test, however including potentially
non- uniform stress and strain distributions, potential soil extrusion, and wall friction (Abouzan
& Scott, 2009). Figure 2.12 explains peak and residual shear strength parameters of ring shear
test. If shearing is continued after the peak point to the maximum displacement of the apparatus,
a curve of the type shown in Figure 2.12 for the brittle material is obtained (Manual of Soil
Laboratory Testing, 1994). The shear strength at first reduces rapidly from the peak value, but
eventually reaches a steady state (ultimate) value, which is maintained as the displacement
increases.
Figure 2.12 Typical graphs from ring shear test (reproduced from Osano, 2010).
Page 16Zainab Babalola /University of Cape Town
2.3.4 Direct shear test
This is the oldest and simplest type of a laboratory shear test. The direct shear box test is a
conceptually simple test that apparently was used for soil testing as early as 1776 by Coulomb
(Lambe & Whitman, 1969) and was featured prominently by French engineer Alexandre Collin
in 1846 (Skempton, 1984). In Britain, Bell (1915) made the earliest measurements and
constructed a device which was to be the prototype for subsequent developments of the shear
box. Bell was the first to carry out and publish practical results of shear tests on various types of
soils (Skempton, 1958). A modern shear box was designed by Casagrande at Harvard (USA) in
1932. A constant rate of the displacement machine that applies the 'strain control' principle using
a fixed speed motor, was developed in 1946 (Matthew, 2000). Bishop (1946) introduced the
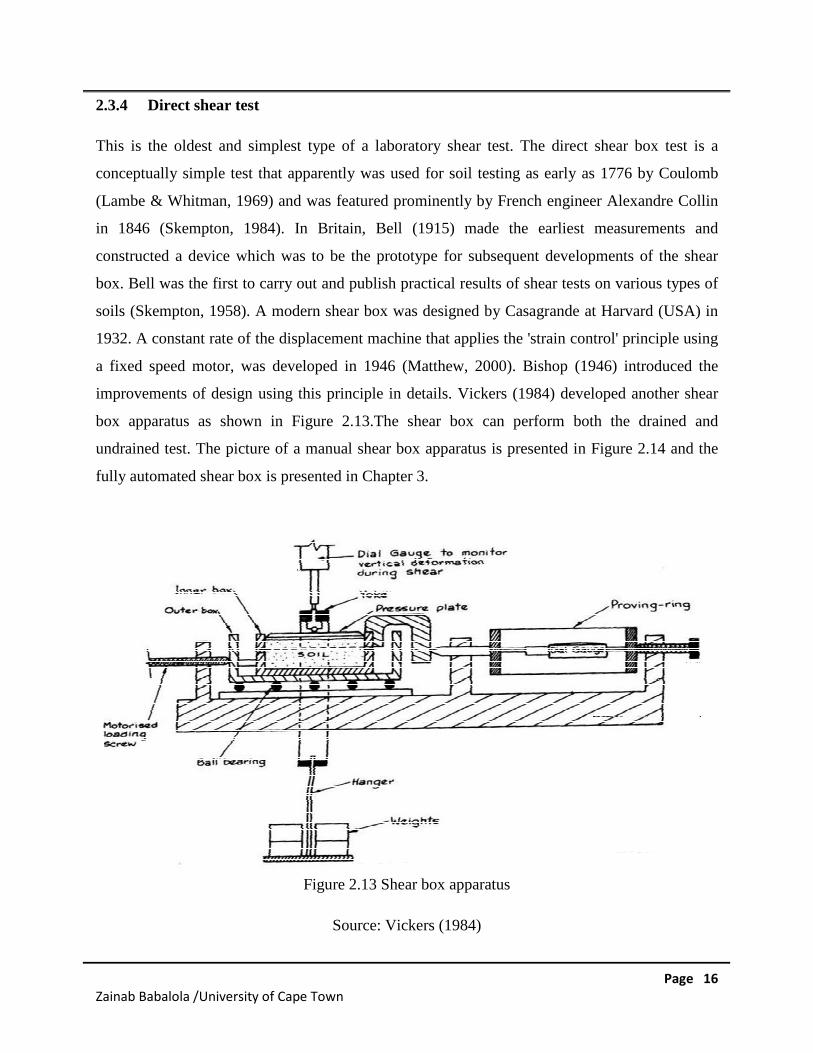
improvements of design using this principle in details. Vickers (1984) developed another shear
box apparatus as shown in Figure 2.13.The shear box can perform both the drained and
undrained test. The picture of a manual shear box apparatus is presented in Figure 2.14 and the
fully automated shear box is presented in Chapter 3.
Figure 2.13 Shear box apparatus
Source: Vickers (1984)
Page 17Zainab Babalola /University of Cape Town
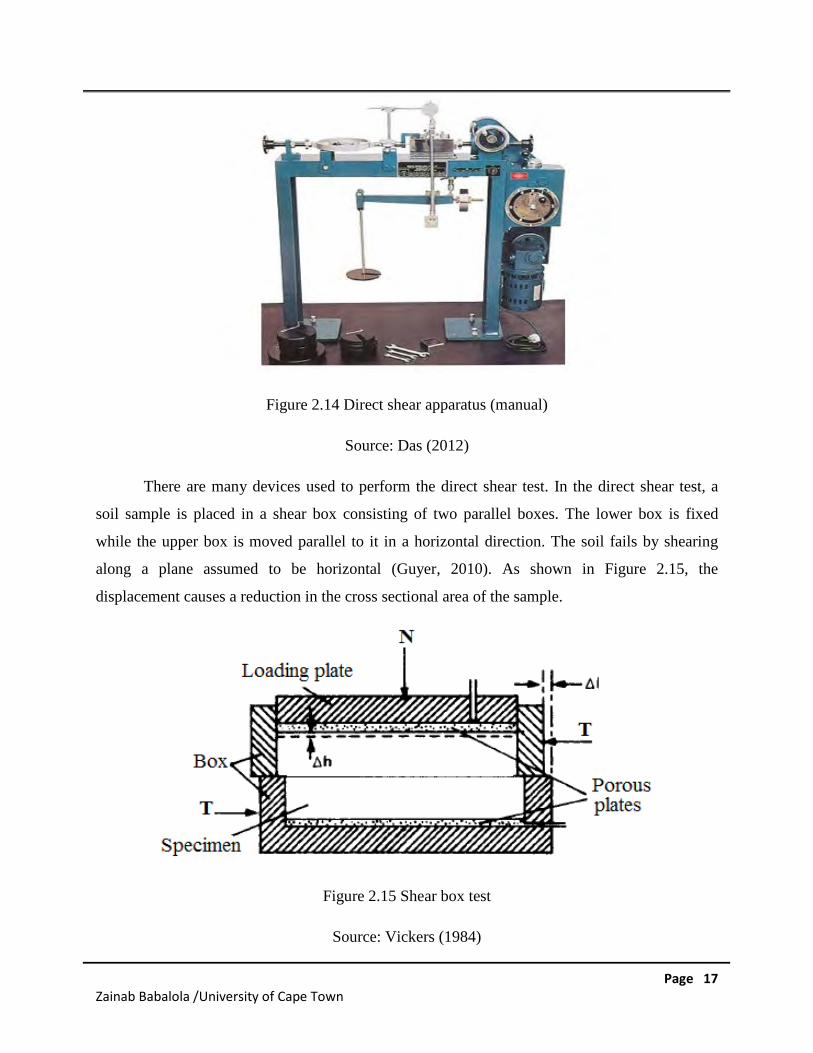
Figure 2.14 Direct shear apparatus (manual)
Source: Das (2012)
There are many devices used to perform the direct shear test. In the direct shear test, a
soil sample is placed in a shear box consisting of two parallel boxes. The lower box is fixed
while the upper box is moved parallel to it in a horizontal direction. The soil fails by shearing
along a plane assumed to be horizontal (Guyer, 2010). As shown in Figure 2.15, the
displacement causes a reduction in the cross sectional area of the sample.
Figure 2.15 Shear box test
Source: Vickers (1984)
Page 18Zainab Babalola /University of Cape Town
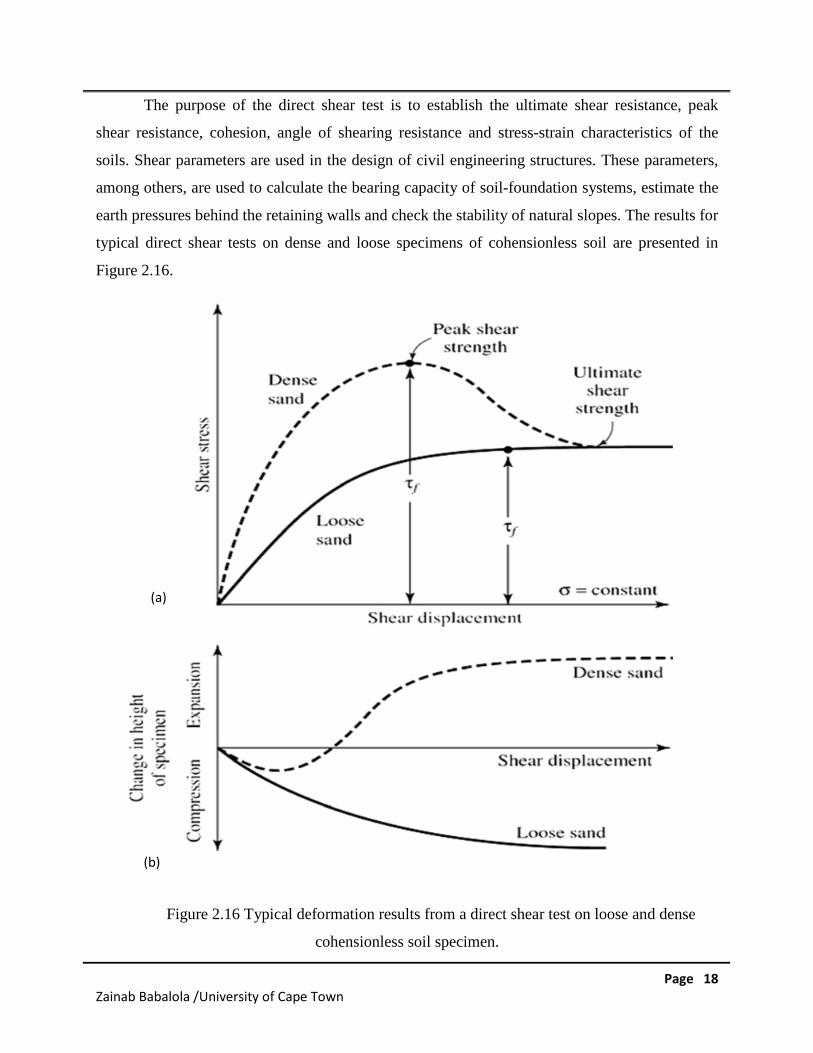
The purpose of the direct shear test is to establish the ultimate shear resistance, peak
shear resistance, cohesion, angle of shearing resistance and stress-strain characteristics of the
soils. Shear parameters are used in the design of civil engineering structures. These parameters,
among others, are used to calculate the bearing capacity of soil-foundation systems, estimate the
earth pressures behind the retaining walls and check the stability of natural slopes. The results for
typical direct shear tests on dense and loose specimens of cohensionless soil are presented in
Figure 2.16.
Figure 2.16 Typical deformation results from a direct shear test on loose and dense
cohensionless soil specimen.
(a)
(b)
Page 19Zainab Babalola /University of Cape Town
The peak shear strength and ultimate shear strength points are marked. Depending on the
material density and normal stress level, the peak may be well defined or it may coincide with
the residual condition. In all cases, the vertical displacement should be constant at the residual
condition.
The advantage of the direct shear test over other shear tests is seen in the simplicity of the
setup and the equipment used, and the ability to test under differing saturation, drainage, and
consolidation conditions. There is a sample non-uniform stress and strain distribution. The
vertical compressive load applied on the top is not completely transferred to the sample. The
actual distribution of a normal load on a shear plane is unknown in the test and it cannot be
perform under the constant volume condition (Amsiejus et al., 2013).
2.2.5 Direct simple shear test
In 1936, the Swedish Geotechnical Institute (SGI) built the first direct simple shear device
that was able to uniformly deform a soil specimen in pure shear (Kjellam, 1951). This device
confined specimens using a rubber membrane and aluminium rings. There have been many
additional direct simple shear devices built since then.
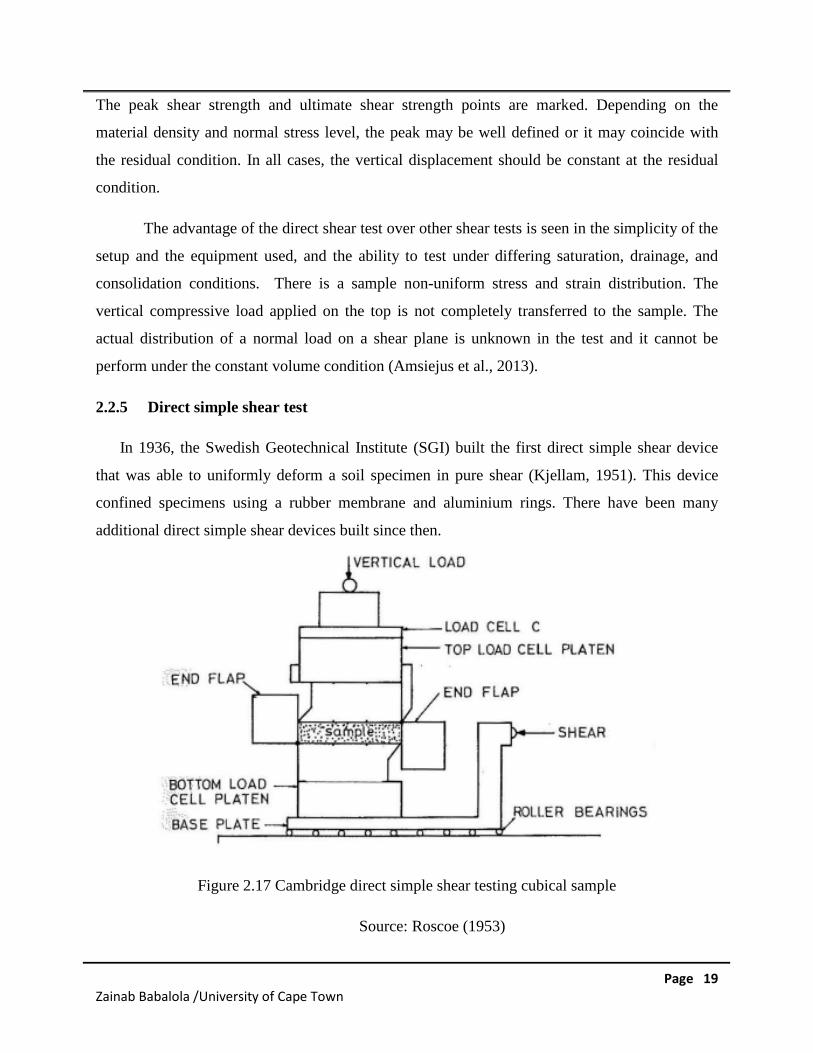
Figure 2.17 Cambridge direct simple shear testing cubical sample
Source: Roscoe (1953)
Page 20Zainab Babalola /University of Cape Town
A device that used a square box for sand specimens, was designed at the University of
Cambridge in 1953 (Figure 2.17). In the 1960s the Norwegian Geotechnical Institute (NGI)
created a device that was able to strain in simple shear after vertical loading while using a rubber
membrane reinforced with a wound wire encased by the rubber membrane (DeGroot et al, 1992).
Data acquisition and control systems became relatively inexpensive in the 1990s, and
several companies in the U.S. and the United Kingdom developed automated triaxial, direct
simple shear, consolidation, and cyclic equipment. These companies sell direct simple shear
equipment exclusively with stacked rings to avoid the high costs of wire-reinforced membranes.
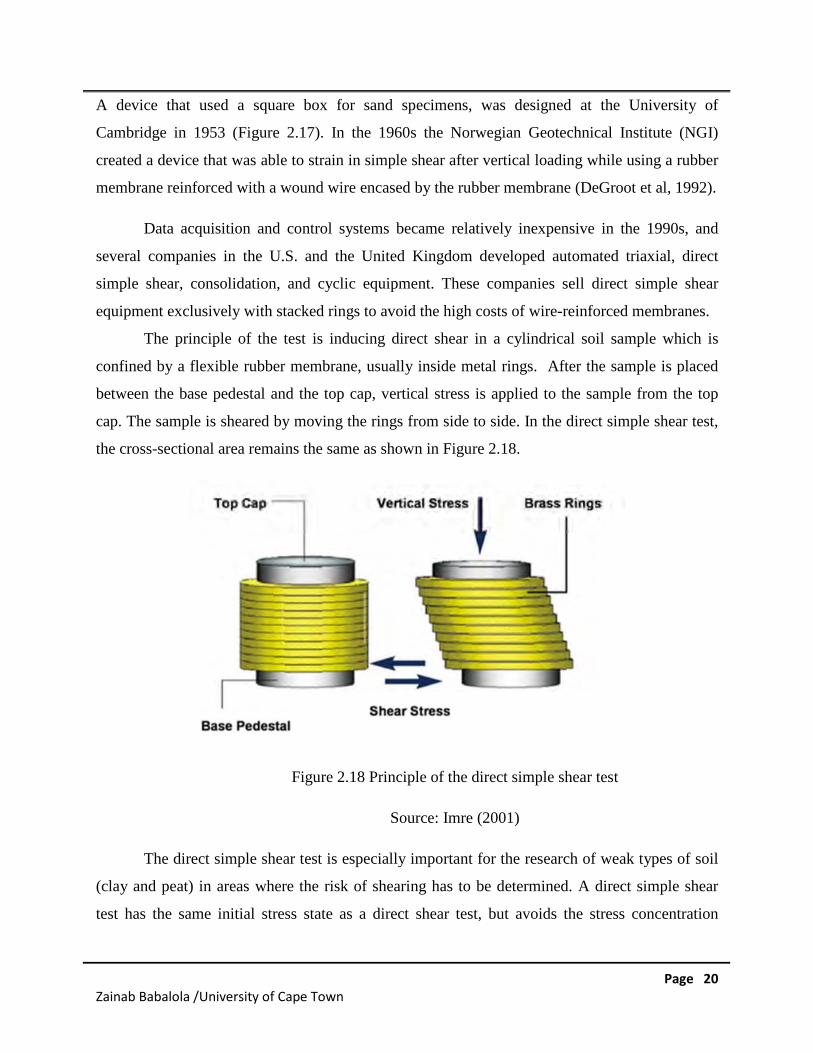
The principle of the test is inducing direct shear in a cylindrical soil sample which is
confined by a flexible rubber membrane, usually inside metal rings. After the sample is placed
between the base pedestal and the top cap, vertical stress is applied to the sample from the top
cap. The sample is sheared by moving the rings from side to side. In the direct simple shear test,
the cross-sectional area remains the same as shown in Figure 2.18.
Figure 2.18 Principle of the direct simple shear test
Source: Imre (2001)
The direct simple shear test is especially important for the research of weak types of soil
(clay and peat) in areas where the risk of shearing has to be determined. A direct simple shear
test has the same initial stress state as a direct shear test, but avoids the stress concentration
Page 21Zainab Babalola /University of Cape Town
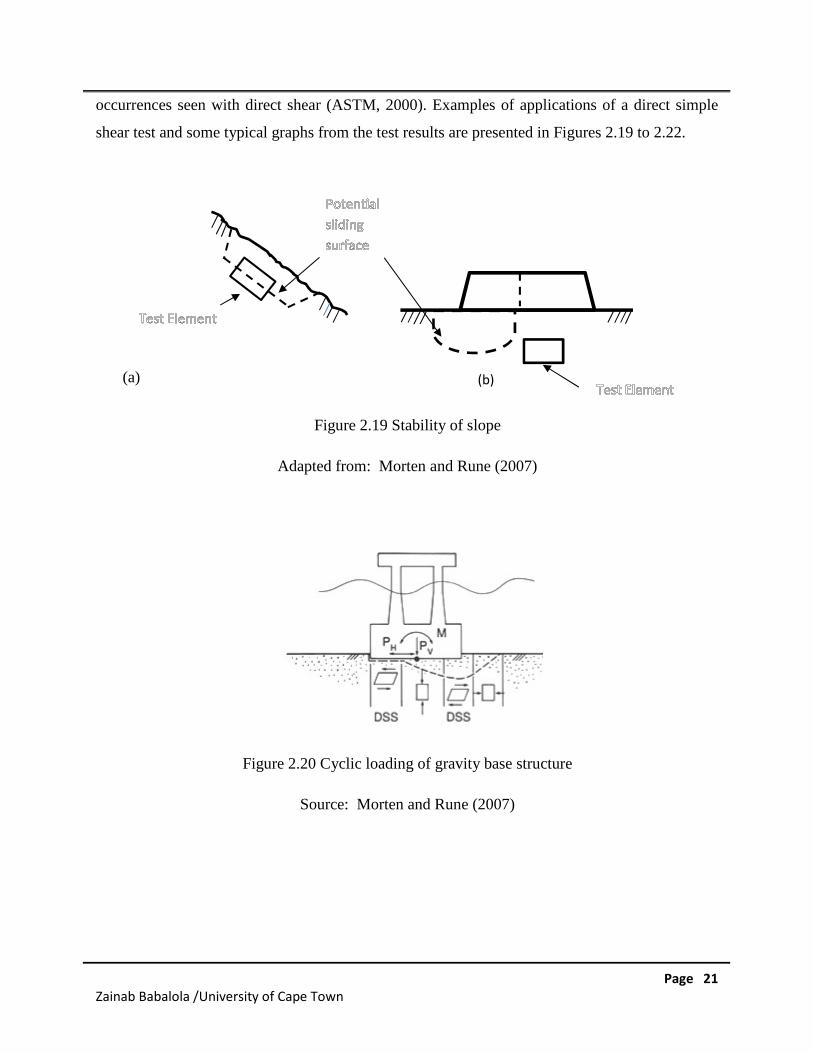
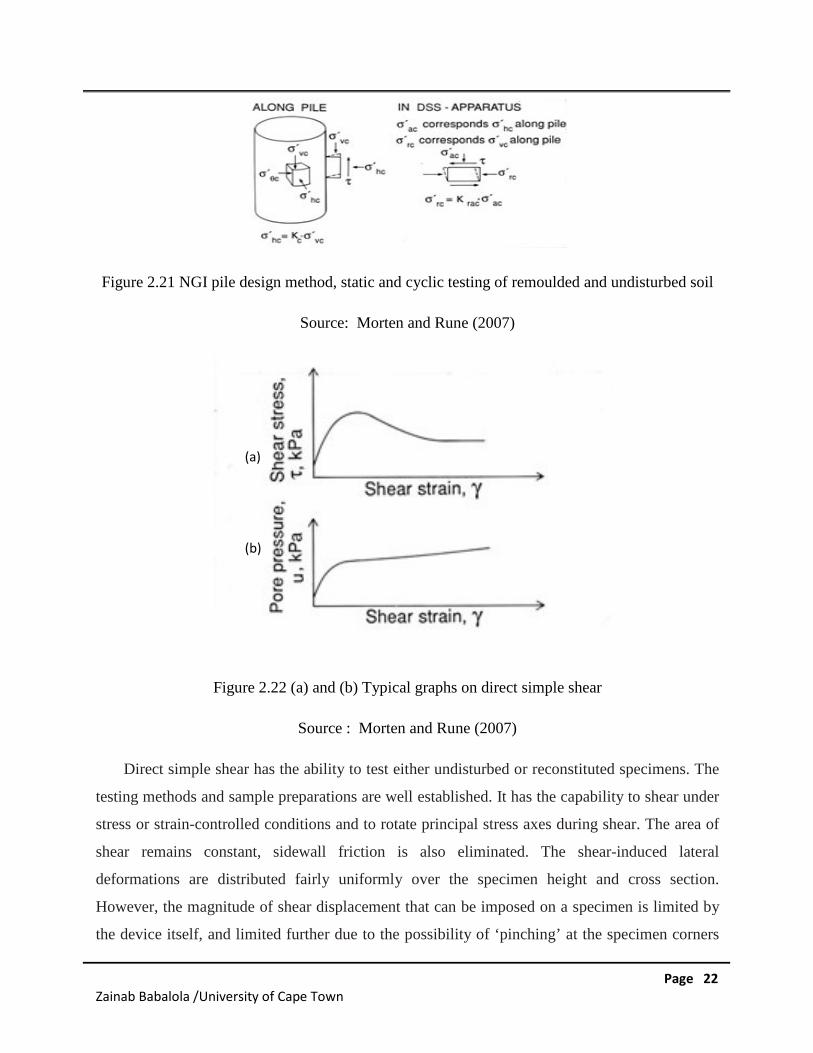
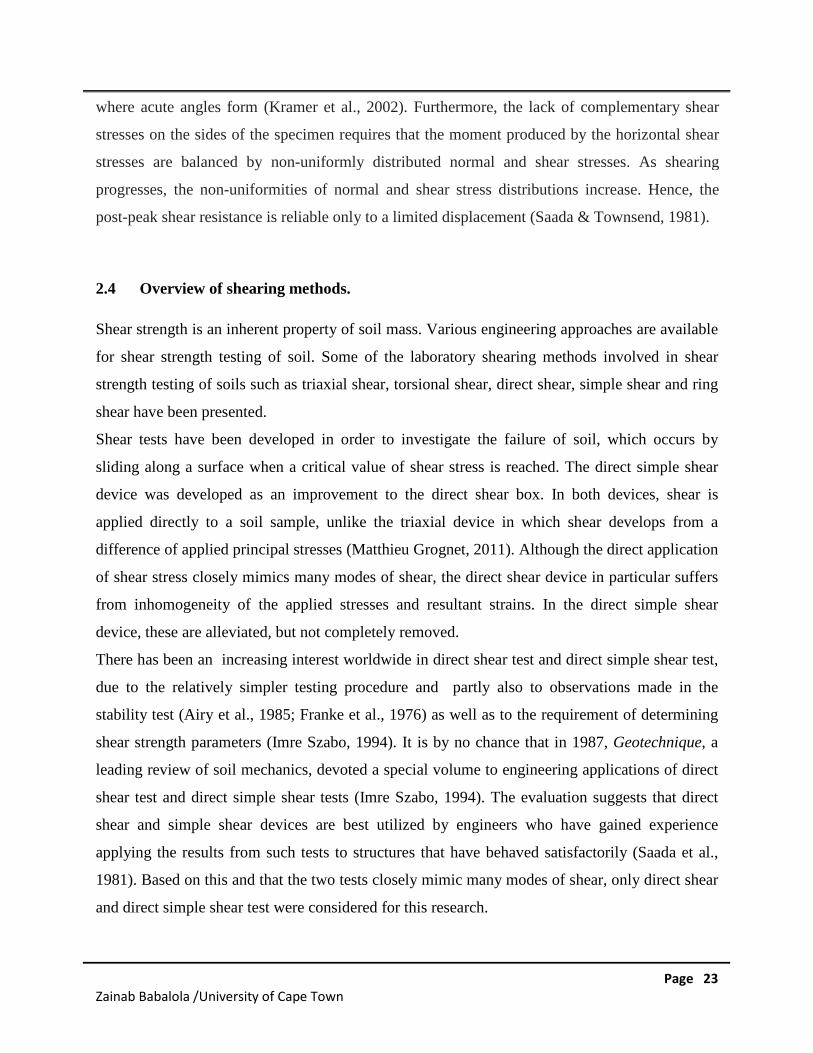
occurrences seen with direct shear (ASTM, 2000). Examples of applications of a direct simple
shear test and some typical graphs from the test results are presented in Figures 2.19 to 2.22.
Figure 2.19 Stability of slope
Adapted from: Morten and Rune (2007)
Figure 2.20 Cyclic loading of gravity base structure
Source: Morten and Rune (2007)
(a) (b)
Page 22Zainab Babalola /University of Cape Town
Figure 2.21 NGI pile design method, static and cyclic testing of remoulded and undisturbed soil
Source: Morten and Rune (2007)
Figure 2.22 (a) and (b) Typical graphs on direct simple shear
Source : Morten and Rune (2007)
Direct simple shear has the ability to test either undisturbed or reconstituted specimens. The
testing methods and sample preparations are well established. It has the capability to shear under
stress or strain-controlled conditions and to rotate principal stress axes during shear. The area of
shear remains constant, sidewall friction is also eliminated. The shear-induced lateral
deformations are distributed fairly uniformly over the specimen height and cross section.
However, the magnitude of shear displacement that can be imposed on a specimen is limited by
the device itself, and limited further due to the possibility of ‘pinching’ at the specimen corners
(a)
(b)
Page 23Zainab Babalola /University of Cape Town
where acute angles form (Kramer et al., 2002). Furthermore, the lack of complementary shear
stresses on the sides of the specimen requires that the moment produced by the horizontal shear
stresses are balanced by non-uniformly distributed normal and shear stresses. As shearing
progresses, the non-uniformities of normal and shear stress distributions increase. Hence, the
post-peak shear resistance is reliable only to a limited displacement (Saada & Townsend, 1981).
2.4 Overview of shearing methods.
Shear strength is an inherent property of soil mass. Various engineering approaches are available
for shear strength testing of soil. Some of the laboratory shearing methods involved in shear
strength testing of soils such as triaxial shear, torsional shear, direct shear, simple shear and ring
shear have been presented.
Shear tests have been developed in order to investigate the failure of soil, which occurs by
sliding along a surface when a critical value of shear stress is reached. The direct simple shear
device was developed as an improvement to the direct shear box. In both devices, shear is
applied directly to a soil sample, unlike the triaxial device in which shear develops from a
difference of applied principal stresses (Matthieu Grognet, 2011). Although the direct application
of shear stress closely mimics many modes of shear, the direct shear device in particular suffers
from inhomogeneity of the applied stresses and resultant strains. In the direct simple shear
device, these are alleviated, but not completely removed.
There has been an increasing interest worldwide in direct shear test and direct simple shear test,
due to the relatively simpler testing procedure and partly also to observations made in the
stability test (Airy et al., 1985; Franke et al., 1976) as well as to the requirement of determining
shear strength parameters (Imre Szabo, 1994). It is by no chance that in 1987, Geotechnique, a
leading review of soil mechanics, devoted a special volume to engineering applications of direct
shear test and direct simple shear tests (Imre Szabo, 1994). The evaluation suggests that direct
shear and simple shear devices are best utilized by engineers who have gained experience
applying the results from such tests to structures that have behaved satisfactorily (Saada et al.,
1981). Based on this and that the two tests closely mimic many modes of shear, only direct shear
and direct simple shear test were considered for this research.
Page 24Zainab Babalola /University of Cape Town
2.5 Previous studies on direct shear test and direct simple shear test
2.5.1 Effects of relative density on friction angle using the direct shear test
Amy and Alan (2006) performed a study on specimen size and scale effects on direct shear box
tests of sands. Five sands with different properties were tested in three square shear boxes of
varying sizes (60 mm, 101.6 mm, and 304.8mm), each at three relative densities dense, medium,
and loose. Three of the sands were clean sands with significantly different values of D50.The
other two sands were natural sands found in the Connecticut Valley and McLean, Virginia.
The sands used in this investigation were characterised using specific gravity, maximum
and minimum density, grain-size, and two dimensional (2D) image analysis tests. Direct shear
box tests were performed on each soil in general accordance with ASTM D 3080-90. According
to ASTM D 3080-90, the direct shear box test has several particle-sizes to box-size requirements
when preparing specimens for testing.
Three different size shear boxes were used, the first square shear box had a width of 60
mm and a depth of 26.4 mm (aspect ratio, H/L=0.44). The samples were sheared at a constant
rate of 0.25 mm/min, which is consistent with the standard rate for drained tests on sands. Tests
were conducted in a water bath with the sample completely submerged to ensure that the samples
had no cohesion. This was identical to the testing protocol of the surface footing tests. The
thickness of the 60 mm shear box did not meet the ASTM minimum criteria of six times the
maximum particle diameter, or 30 mm (maximum particle size was 5 mm), for the Winter Sand
or Gravel Pack #3. The second square shear box had a width of 101.6 mm and a total depth of
40.64 mm (H/L=0.40). In the two smaller boxes, five tests were performed for each density with
five increasing normal stresses (38, 68, 95,122, and 150 kPa), using a dead-weight system. The
third square shear box had a width of 304.8 mm and a depth of 177.8 mm (H/L=0.58). Five shear
tests were performed for each density at five varying normal stresses (69, 103, 138, 172, and 207
kPa) for each relative density. These normal stresses in the larger box are slightly different from
the normal stresses used in the two smaller boxes because the hydraulic arm of the 304.8 mm
shear box could not apply a normal stress less than 69 kPa.
Two sands were prepared by moist compaction, two sands were prepared by dry
pluviation and the Gravel Pack was prepared by dry compaction. The Summary of sample
preparation techniques is presented in Table 2.1. The specimens in the two small shear boxes
Page 25Zainab Babalola /University of Cape Town
were pluviated using a stationary pluviator with a constant fall height of 36.8 cm. This height
was chosen because a large range of relative densities could be achieved with this fall height (25
to 100 %), constant relative densities were achieved at one particular angle and mesh setting, and
the relative density was consistent throughout the thickness of the sample specimen. This fall
height was 14 and 9 times greater than the shear box thickness respectively.
Table 2.1 Summary of sample preparation techniques in the direct shear box testing programme.
Box Size (mm)
Sand Type 60 101.6 304.8
Brown Mortar Moist Compaction Moist Compaction Moist Compaction
Winter Moist Compaction Moist Compaction Moist Compaction
Ottawa Stationary Pluviator Stationary Pluviator Traveling Pluviator
Morie Stationary Pluviator Stationary Pluviator Traveling Pluviator
Gp#3 Dry Compaction Dry Compaction Dry Compaction
In most tests, the failure envelope went through zero because the tests were run under
saturated conditions. However, in some of the dense well-graded specimens, the failure envelope
showed some amount of cohesion (c=1.5 to 20 KPa). The friction angles were calculated
accordingly. It is recognised that a failure envelope may show curvature, depending on relative
density over a large range of normal stresses.
However, within the stress range used in these tests, the Mohr-Coulomb (M-C) failure
envelope was reasonably linear. The friction angle was obtained by linear regression. Friction
angles were obtained as a function of the shear stresses at the end of each test. The vertical
displacement results were checked to make sure a constant volume state (no additional vertical
displacement) had been reached, and at this point of no volume change the friction angles were
obtained.
Five sands with different properties were tested in three square shear boxes of varying
sizes, each at three densities: 1.96, 1.65, and 1.41 Mg/m3. The friction angle was seen to increase
Page 26Zainab Babalola /University of Cape Town
with increasing relative density in each of the three boxes. The constant volume (residual)
friction angle decreased or remained constant, with increasing box size dependent on the type of
sand and the relative density. The results show that loose specimens (1.41Mg/m3), as well as
dense specimens (1.96 Mg/m3) were affected by box size. The friction angles of the well-graded
angular natural sands and the angular poorly graded manufactured gravel pack, GP#3, were most
affected by specimen size. The constant volume friction angle of the Ottawa Sand, which was the
most rounded and uniform sand, was only slightly affected by specimen size.
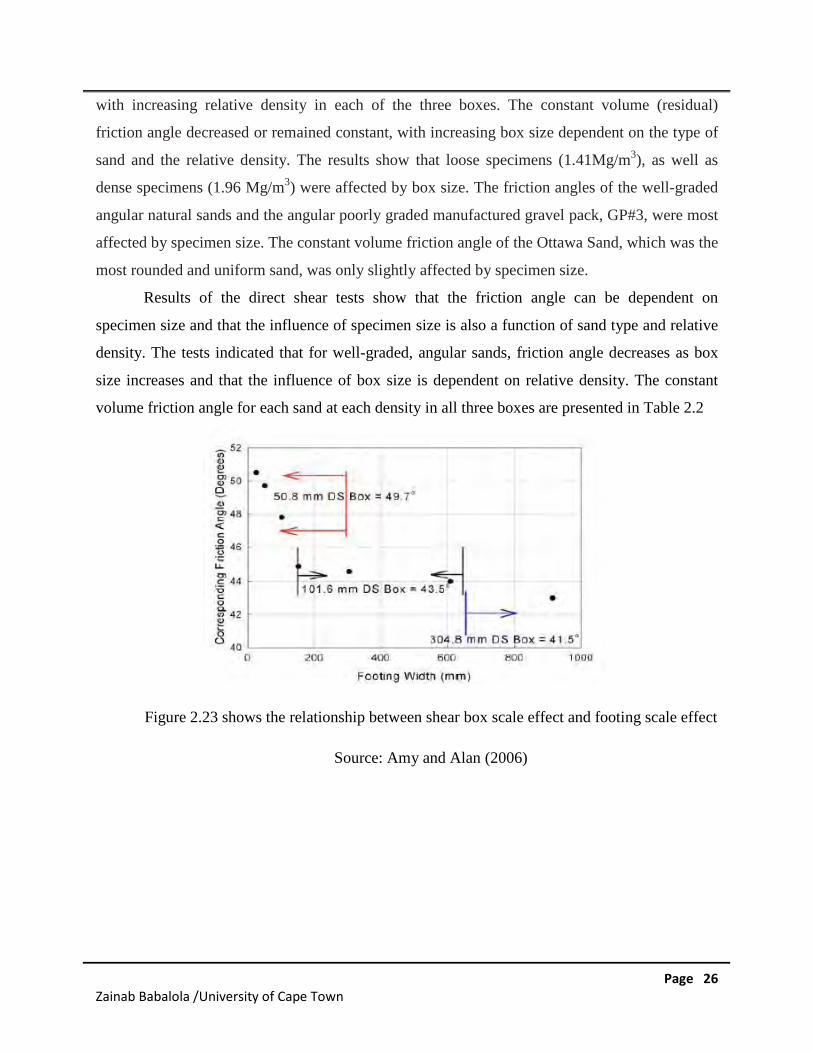
Results of the direct shear tests show that the friction angle can be dependent on
specimen size and that the influence of specimen size is also a function of sand type and relative
density. The tests indicated that for well-graded, angular sands, friction angle decreases as box
size increases and that the influence of box size is dependent on relative density. The constant
volume friction angle for each sand at each density in all three boxes are presented in Table 2.2
Figure 2.23 shows the relationship between shear box scale effect and footing scale effect
Source: Amy and Alan (2006)
Page 27Zainab Babalola /University of Cape Town
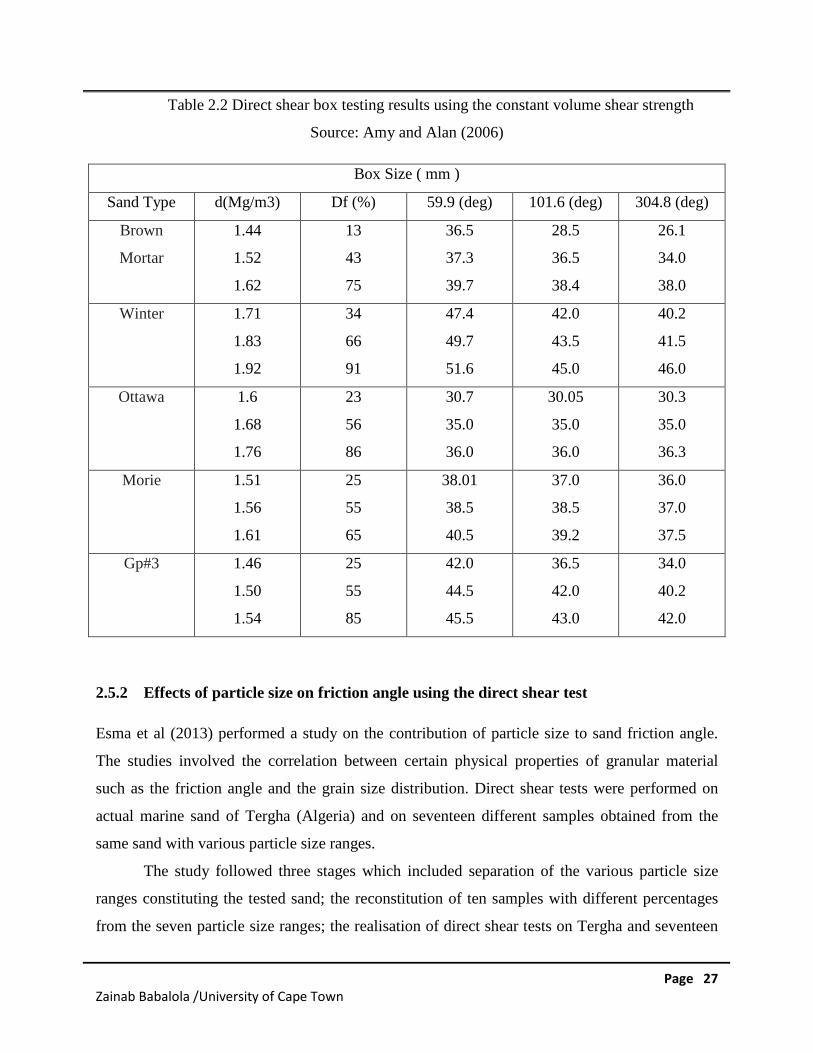
Table 2.2 Direct shear box testing results using the constant volume shear strength
Source: Amy and Alan (2006)
Box Size ( mm )
Sand Type d(Mg/m3) Df (%) 59.9 (deg) 101.6 (deg) 304.8 (deg)
Brown
Mortar
1.44
1.52
1.62
13
43
75
36.5
37.3
39.7
28.5
36.5
38.4
26.1
34.0
38.0
Winter 1.71
1.83
1.92
34
66
91
47.4
49.7
51.6
42.0
43.5
45.0
40.2
41.5
46.0
Ottawa 1.6
1.68
1.76
23
56
86
30.7
35.0
36.0
30.05
35.0
36.0
30.3
35.0
36.3
Morie 1.51
1.56
1.61
25
55
65
38.01
38.5
40.5
37.0
38.5
39.2
36.0
37.0
37.5
Gp#3 1.46
1.50
1.54
25
55
85
42.0
44.5
45.5
36.5
42.0
43.0
34.0
40.2
42.0
2.5.2 Effects of particle size on friction angle using the direct shear test
Esma et al (2013) performed a study on the contribution of particle size to sand friction angle.
The studies involved the correlation between certain physical properties of granular material
such as the friction angle and the grain size distribution. Direct shear tests were performed on
actual marine sand of Tergha (Algeria) and on seventeen different samples obtained from the
same sand with various particle size ranges.
The study followed three stages which included separation of the various particle size
ranges constituting the tested sand; the reconstitution of ten samples with different percentages
from the seven particle size ranges; the realisation of direct shear tests on Tergha and seventeen
Page 28Zainab Babalola /University of Cape Town
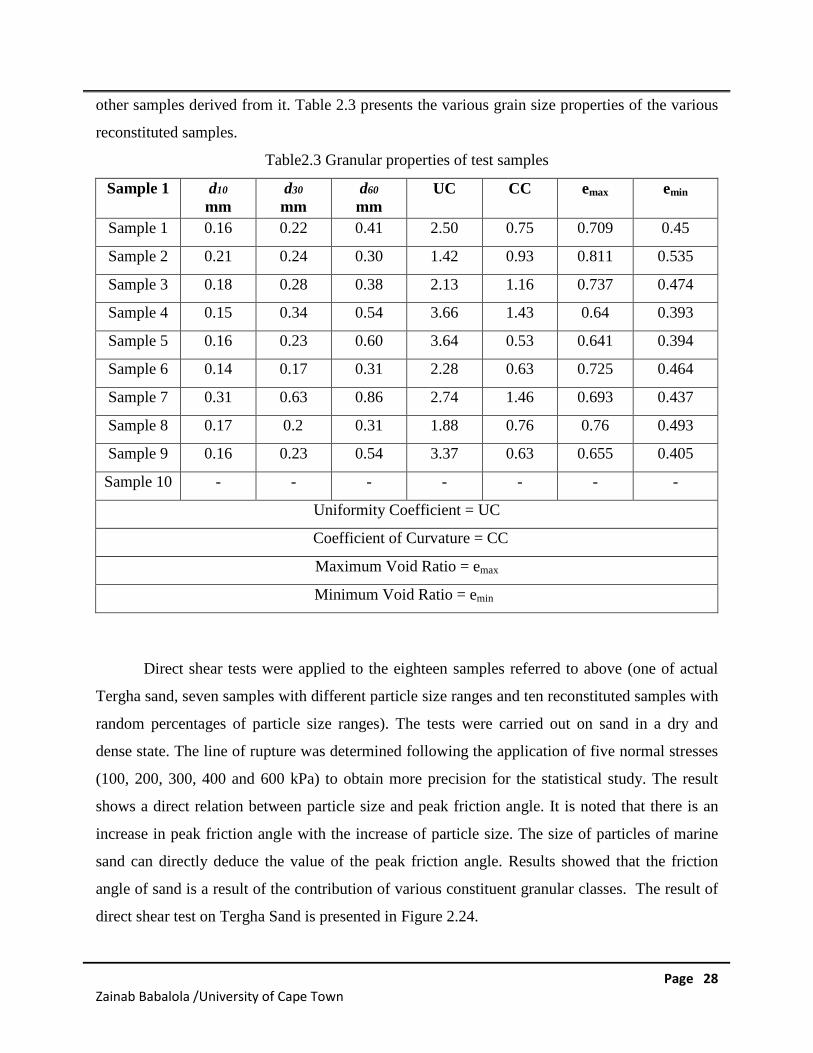
other samples derived from it. Table 2.3 presents the various grain size properties of the various
reconstituted samples.
Table2.3 Granular properties of test samples
Sample 1 d10
mmd30
mmd60
mmUC CC emax emin
Sample 1 0.16 0.22 0.41 2.50 0.75 0.709 0.45
Sample 2 0.21 0.24 0.30 1.42 0.93 0.811 0.535
Sample 3 0.18 0.28 0.38 2.13 1.16 0.737 0.474
Sample 4 0.15 0.34 0.54 3.66 1.43 0.64 0.393
Sample 5 0.16 0.23 0.60 3.64 0.53 0.641 0.394
Sample 6 0.14 0.17 0.31 2.28 0.63 0.725 0.464
Sample 7 0.31 0.63 0.86 2.74 1.46 0.693 0.437
Sample 8 0.17 0.2 0.31 1.88 0.76 0.76 0.493
Sample 9 0.16 0.23 0.54 3.37 0.63 0.655 0.405
Sample 10 - - - - - - -
Uniformity Coefficient = UC
Coefficient of Curvature = CC
Maximum Void Ratio = emax
Minimum Void Ratio = emin
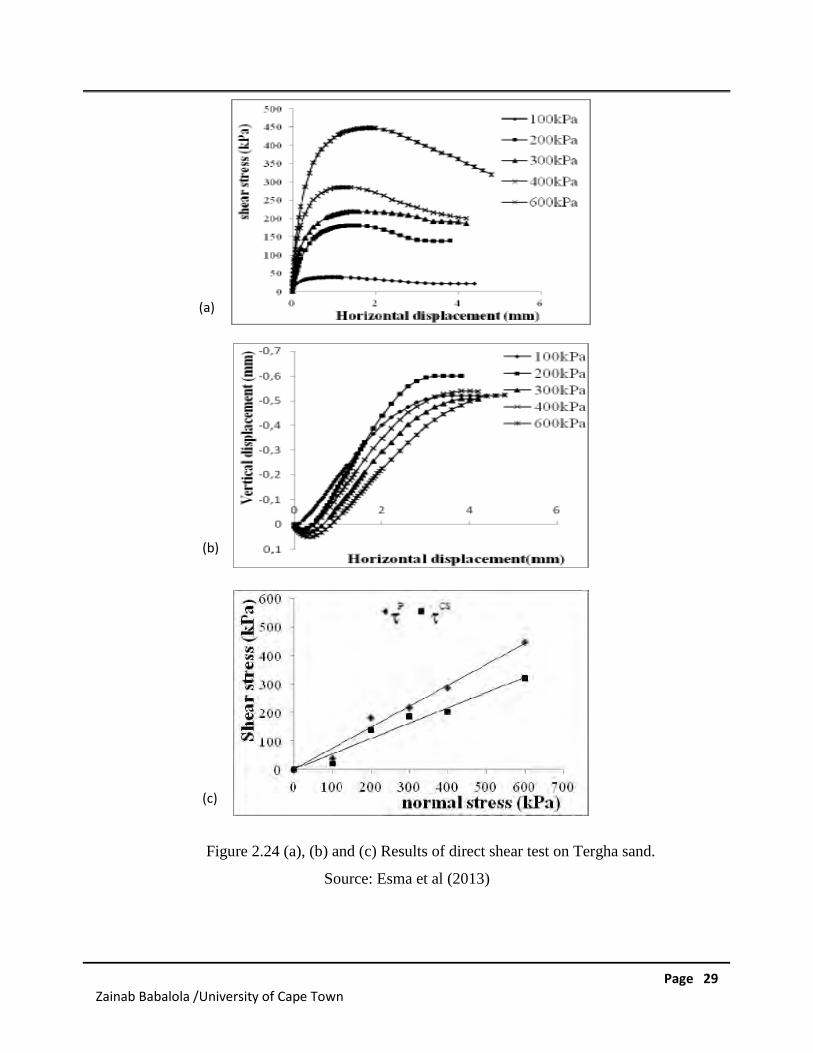
Direct shear tests were applied to the eighteen samples referred to above (one of actual
Tergha sand, seven samples with different particle size ranges and ten reconstituted samples with
random percentages of particle size ranges). The tests were carried out on sand in a dry and
dense state. The line of rupture was determined following the application of five normal stresses
(100, 200, 300, 400 and 600 kPa) to obtain more precision for the statistical study. The result
shows a direct relation between particle size and peak friction angle. It is noted that there is an
increase in peak friction angle with the increase of particle size. The size of particles of marine
sand can directly deduce the value of the peak friction angle. Results showed that the friction
angle of sand is a result of the contribution of various constituent granular classes. The result of
direct shear test on Tergha Sand is presented in Figure 2.24.
Page 29Zainab Babalola /University of Cape Town
(c)
Figure 2.24 (a), (b) and (c) Results of direct shear test on Tergha sand.
Source: Esma et al (2013)
(c)
(b)
(a)
Page 30Zainab Babalola /University of Cape Town
2.5.3 Effects of relative density on shear strength parameters using direct simple shear
test
Sivadass and Lee (2008) performed a direct simple shear testing on residual soils with high silt
content. These residual soils are the products of the insitu weathering of rocks due to the warm
and wet climate of Malaysia. Malaysia’s residual soils are composite soils of sand, silt and clay
in varying proportions that depend on the geological setting of the soil. Because a general soil
element in the ground can may experience varying directions and magnitudes of principal
stresses, it becomes important to study the behaviour of soil samples in the laboratory under
stress conditions in which a rotation of the principal axis can occur. Direct simple shear
apparatus enables soil specimens to be tested in conditions in which the major principal stress
axis rotates during shear while the specimen is kept under a condition of plane strain.
The soil used in the study was obtained from a construction site at the Universiti Tenaga
Nasional (UNITEN) campus that is close to Putrajaya, the new government administrative centre
of Malaysia. It consists of about 74% silt, 17% clay, 9% sand and no gravels. The specific
gravity was 2.66. The maximum dry density obtained was 1.72 Mg/m3 at optimum moisture
content of 17.6%. The minimum dry density obtained was 0.93 Mg/m3. A conventional direct
simple shear apparatus has been modified to be a computer-controlled testing system. This
simple shear apparatus has three major components, namely, sample assembly, vertical loading
system and horizontal loading system.
The soil samples used in the experiments were oven-dried and sieved to remove any
particles larger than 2 mm. The reconstituted soil specimens were prepared by pouring a
predetermined quantity of dried residual soils into the rubber membrane which was encased in a
stack of metal washers at a constant height in order to achieve uniform density in each sample. A
circular platen with a dimension of 70 mm was used in this study. The standard dry density used
in the tests was about 1.05 Mg/m3 – 1.42 Mg/m3. Gentle tappings were applied to the external
body of the metal washers to minimise voids. Each soil sample was then saturated. A
consolidation clamp had to be installed carefully, without causing disturbances to the sample
prepared earlier. The applied normal stress in the tests varied from 50 kPa to 300 kPa. Upon
completion of the primary consolidation, the sample was sheared at the rate of 0.24 mm/minute
up to a maximum horizontal strain of 16%. The data acquisition and testing procedures were
performed by using a computer software.
Page 31Zainab Babalola /University of Cape Town
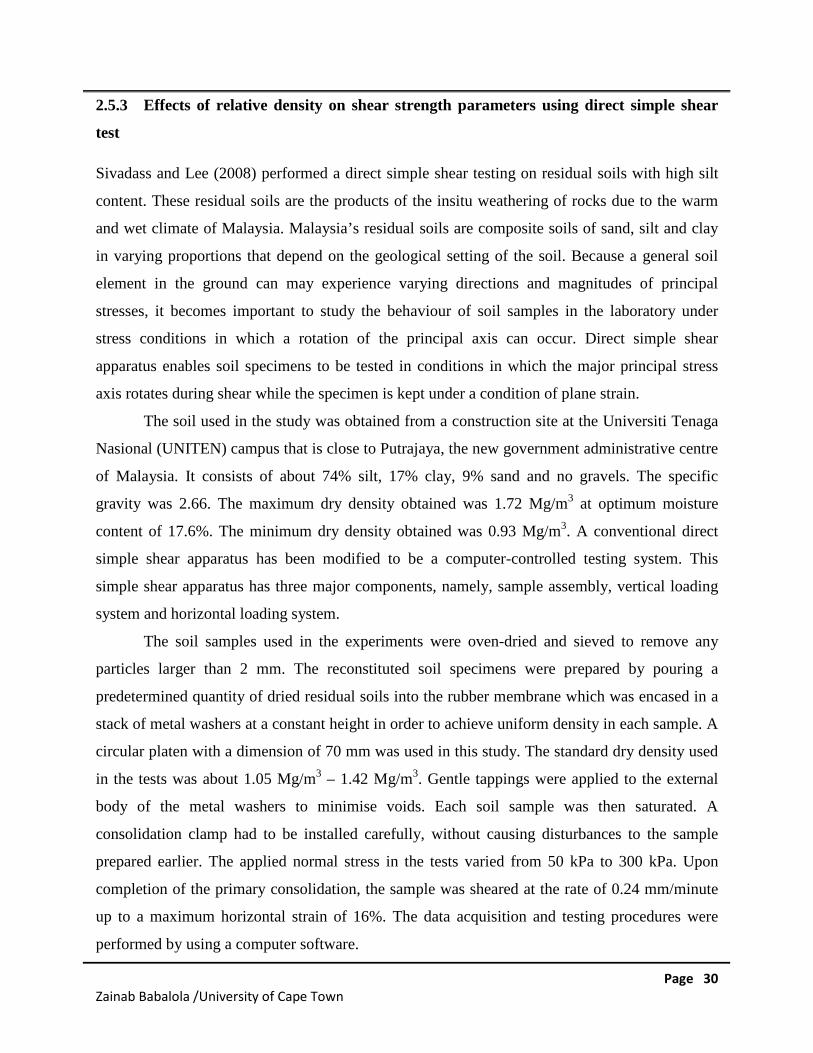
The results obtained for the respective circular soil samples (70 mm sample size) under
different normal stresses were analysed to obtain the required shear strength parameters. It is
observed that the shear stress increases as the normal stress increase as shown in figure 2.25.
Shearing resistance in soils is the result of another across the contact area that increases as the
normal force increases by Terzaghi and Peck (1967). The Hvorslev theory emphasised that an
increase in effective stress will increase the particle-to-particle contact force, thus increasing the
frictional resistance. During drained tests an increase in effective stress decreases the volume,
thus increases the amount of interlocking. The volume change behaviour was always contractive
to failure, even at higher normal stresses. The mechanism responsible for this volume change is
the tendency of the soil particles to rearrange themselves during shear due to the expulsion of
water. The amount of volume reduction was due to the compressibility of the loose silt.
Figure 2.25 (a) and (b) Shear stress and volumetric strain variations at different normal stresses
Source: Sivadass and Lee (2008)
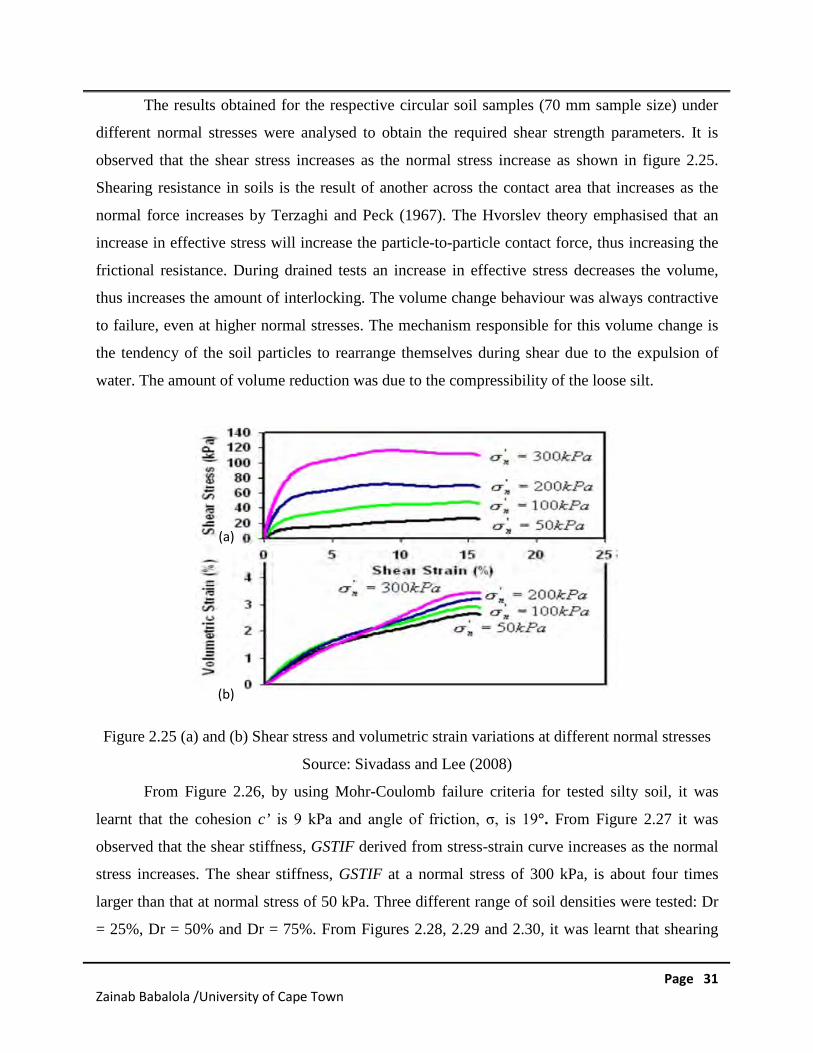
From Figure 2.26, by using Mohr-Coulomb failure criteria for tested silty soil, it was
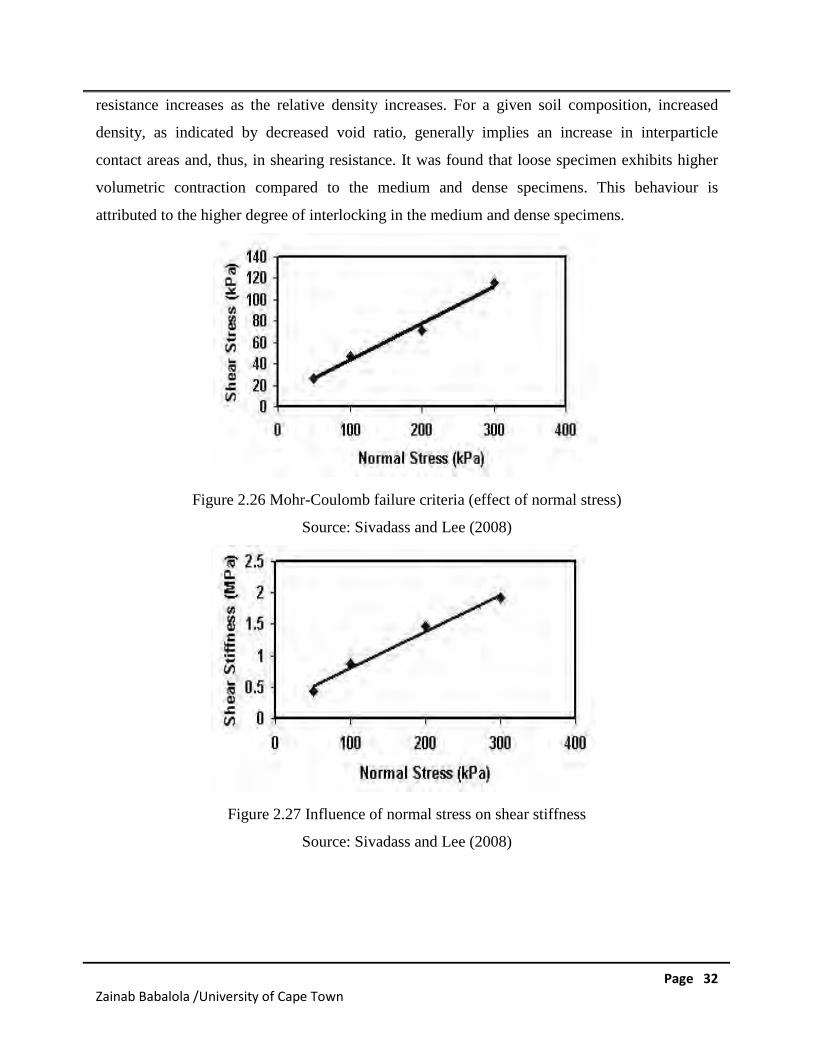
learnt that the cohesion c’ is 9 kPa and angle of friction, σ, is 19°. From Figure 2.27 it was
observed that the shear stiffness, GSTIF derived from stress-strain curve increases as the normal
stress increases. The shear stiffness, GSTIF at a normal stress of 300 kPa, is about four times
larger than that at normal stress of 50 kPa. Three different range of soil densities were tested: Dr
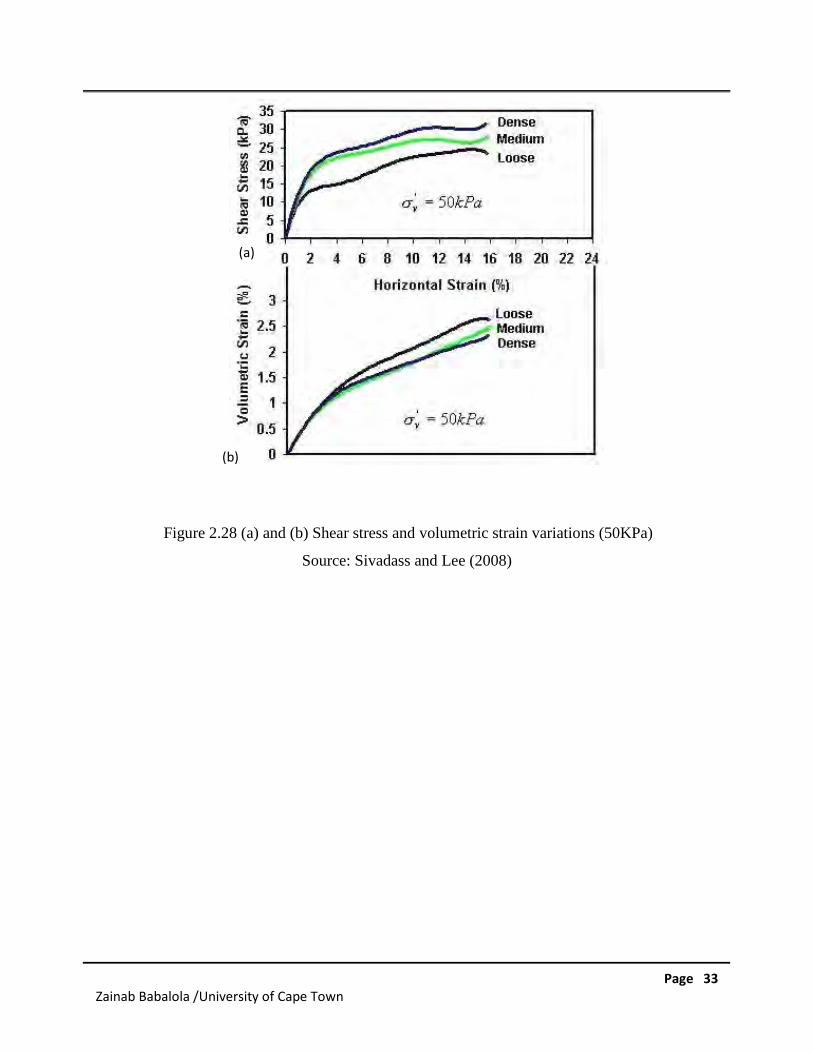
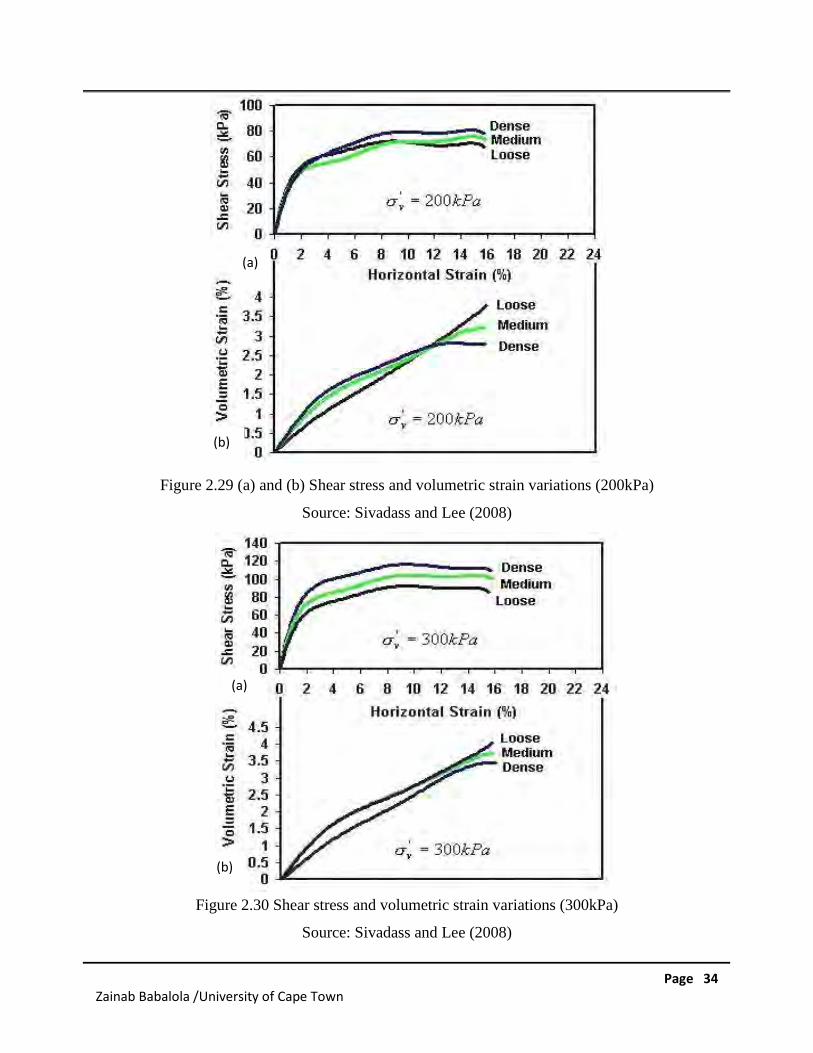
= 25%, Dr = 50% and Dr = 75%. From Figures 2.28, 2.29 and 2.30, it was learnt that shearing
(a)
(b)
Page 32Zainab Babalola /University of Cape Town
resistance increases as the relative density increases. For a given soil composition, increased
density, as indicated by decreased void ratio, generally implies an increase in interparticle
contact areas and, thus, in shearing resistance. It was found that loose specimen exhibits higher
volumetric contraction compared to the medium and dense specimens. This behaviour is
attributed to the higher degree of interlocking in the medium and dense specimens.
Figure 2.26 Mohr-Coulomb failure criteria (effect of normal stress)
Source: Sivadass and Lee (2008)
Figure 2.27 Influence of normal stress on shear stiffness
Source: Sivadass and Lee (2008)
Page 33Zainab Babalola /University of Cape Town
Figure 2.28 (a) and (b) Shear stress and volumetric strain variations (50KPa)
Source: Sivadass and Lee (2008)
(a)
(b)
Page 34Zainab Babalola /University of Cape Town
Figure 2.29 (a) and (b) Shear stress and volumetric strain variations (200kPa)
Source: Sivadass and Lee (2008)
Figure 2.30 Shear stress and volumetric strain variations (300kPa)
Source: Sivadass and Lee (2008)
(a)
(b)
(a)
(b)
Page 35Zainab Babalola /University of Cape Town
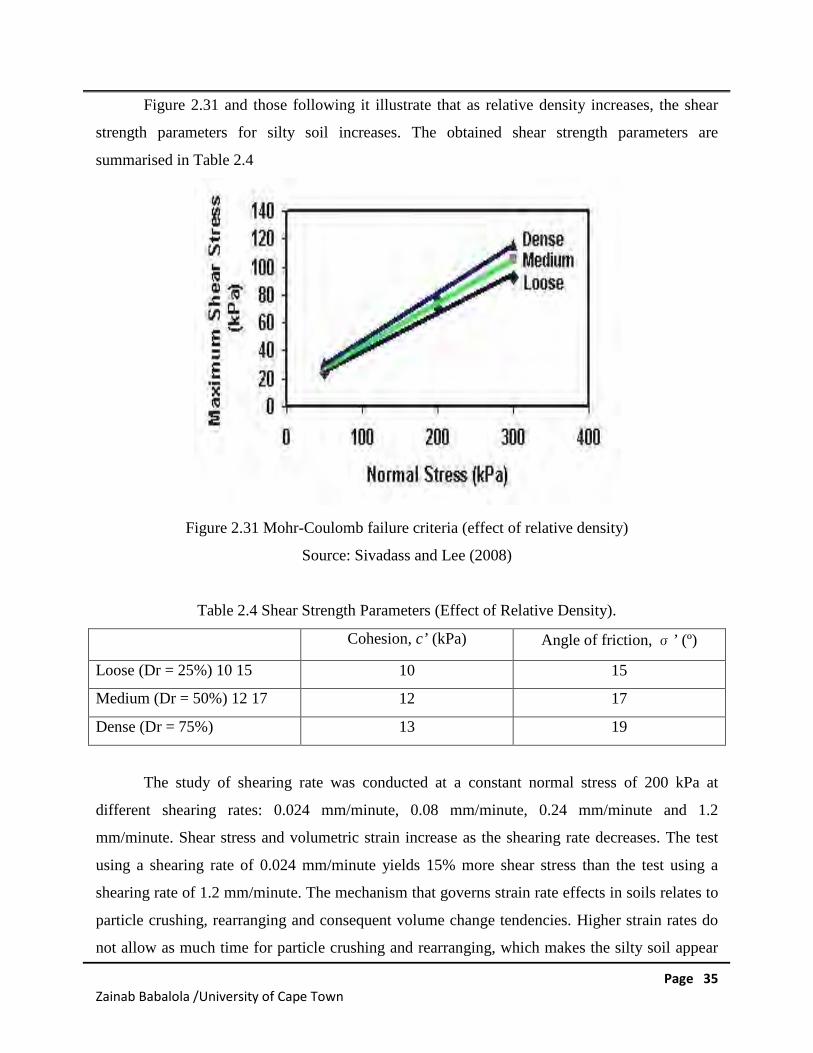
Figure 2.31 and those following it illustrate that as relative density increases, the shear
strength parameters for silty soil increases. The obtained shear strength parameters are
summarised in Table 2.4
Figure 2.31 Mohr-Coulomb failure criteria (effect of relative density)
Source: Sivadass and Lee (2008)
Table 2.4 Shear Strength Parameters (Effect of Relative Density).
Cohesion, c’ (kPa) Angle of friction, σ’ (º)
Loose (Dr = 25%) 10 15 10 15
Medium (Dr = 50%) 12 17 12 17
Dense (Dr = 75%) 13 19
The study of shearing rate was conducted at a constant normal stress of 200 kPa at
different shearing rates: 0.024 mm/minute, 0.08 mm/minute, 0.24 mm/minute and 1.2
mm/minute. Shear stress and volumetric strain increase as the shearing rate decreases. The test
using a shearing rate of 0.024 mm/minute yields 15% more shear stress than the test using a
shearing rate of 1.2 mm/minute. The mechanism that governs strain rate effects in soils relates to
particle crushing, rearranging and consequent volume change tendencies. Higher strain rates do
not allow as much time for particle crushing and rearranging, which makes the silty soil appear
Page 36Zainab Babalola /University of Cape Town
less compressive. A shearing rate of 1.2 mm/minute used in the test yields the highest shear
stiffness among the applied shearing rates.
It can be observed that the shear stress decreases as the over-consolidation ratio increases.
For all soil samples, the residual shear strength was attained after large displacements. However,
for soil sample with over-consolidation greater than 3, the tendency for the soil to exhibit dilating
behaviour increases with increasing over-consolidation. This behaviour arises because soil
particles must take up a suitable arrangement of packing corresponding to critical void ratio
before continued shearing can take place. As the particles are initially more densely packed than
the critical void ratio, some loosening will have to occur before steady shear can take place. A
loosening of the packing requires an increase in void ratio and this corresponds to an increase in
the overall volume (dilation).
The effect of an over-consolidation ratio was more significant on soil samples, which
were initially consolidated at vertical stress, 100kPa. As long as the isotropic stress remains
below the pre-consolidation pressure, when the stress state on a soil was increased, the
deformation should be much less than if the soil were normally consolidated. A highly over-
consolidated soil, therefore, should experience less strain than a normally consolidated soil under
similar loading conditions. The amount of elastic strain under a given shear increment is
controlled by the shear stiffness. As soils that are lightly over-consolidated to normally over-
consolidate rarely experience purely elastic deformation, the effect of shear stiffness is much
more noticeable in the highly over-consolidated soils.
It is found that for the Malaysian residual soil with high silt content, the shear stiffness derived
from stress-strain curve increases as the normal stress increases. Loose specimen exhibits higher
volumetric contraction compared to the medium and dense specimens. This behaviour is
attributed to the higher degree of interlocking in the medium and dense specimens. As relative
density increases, the shear strength parameter for silty soil increases. Shear stress and
volumetric strain increase as the shearing rate decreases. Shear stress decreases as the over-
consolidation ratio increases and, for all soil samples, the residual shear strength was attained
after large displacements.
Page 37Zainab Babalola /University of Cape Town
2.5.4 Effects of clay and moisture content for clay-sand mixtures using direct shear test
Muawia Dafalla (2013) investigated the effects of clay and moisture content on direct shear tests
for clay-sand mixtures. The clay soil was brought from Al-Qatif town in the Eastern Province of
Saudi Arabia. The sand material used is typical fine-grained sand used in construction in the
country. Characterisation tests were carried out for Al-Qatif clay and the sand material.
Classification tests included gradation, liquid limit, and plastic limit tests. The clay material was
found to have a high liquid limit and plastic limit and classified within a CH group in accordance
with the Unifed Soil Classification System. The fine-grained sand and several sand clay mixtures
were investigated for compaction properties. Standard compaction tests were carried out in
accordance with ASTM D 698 to establish the compaction characteristics of sand-clay mixtures.
The bentonite and the sand was obtained from Riyadh city.
The direct shear test was performed in accordance with ASTM standard D 3080 for 15 clay-sand
mixture samples grouped in sets of three so as to allow for variations in moisture content and
clay content. The shearing rate is between 1.2 to 1.3mm/min. All samples were prepared at the
maximum dry density as obtained in a standard compaction tests. The moisture range considered
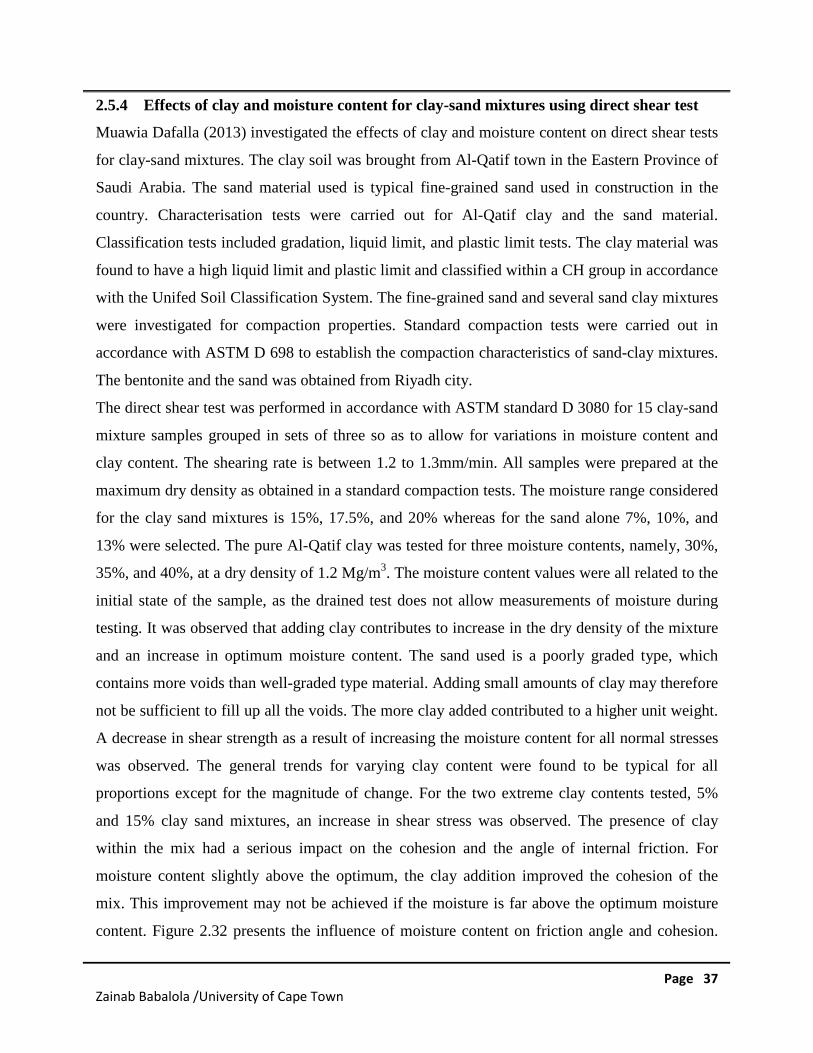
for the clay sand mixtures is 15%, 17.5%, and 20% whereas for the sand alone 7%, 10%, and
13% were selected. The pure Al-Qatif clay was tested for three moisture contents, namely, 30%,
35%, and 40%, at a dry density of 1.2 Mg/m3. The moisture content values were all related to the
initial state of the sample, as the drained test does not allow measurements of moisture during
testing. It was observed that adding clay contributes to increase in the dry density of the mixture
and an increase in optimum moisture content. The sand used is a poorly graded type, which
contains more voids than well-graded type material. Adding small amounts of clay may therefore
not be sufficient to fill up all the voids. The more clay added contributed to a higher unit weight.
A decrease in shear strength as a result of increasing the moisture content for all normal stresses
was observed. The general trends for varying clay content were found to be typical for all
proportions except for the magnitude of change. For the two extreme clay contents tested, 5%
and 15% clay sand mixtures, an increase in shear stress was observed. The presence of clay
within the mix had a serious impact on the cohesion and the angle of internal friction. For
moisture content slightly above the optimum, the clay addition improved the cohesion of the
mix. This improvement may not be achieved if the moisture is far above the optimum moisture
content. Figure 2.32 presents the influence of moisture content on friction angle and cohesion.
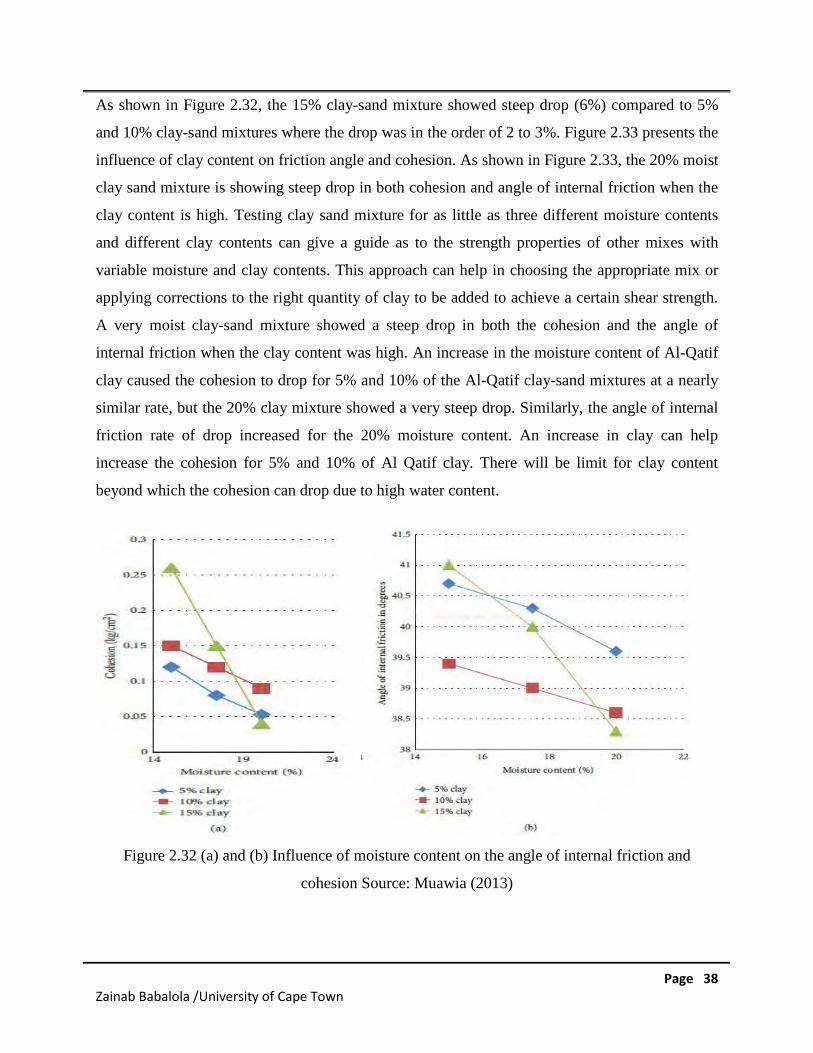
Page 38Zainab Babalola /University of Cape Town
As shown in Figure 2.32, the 15% clay-sand mixture showed steep drop (6%) compared to 5%
and 10% clay-sand mixtures where the drop was in the order of 2 to 3%. Figure 2.33 presents the
influence of clay content on friction angle and cohesion. As shown in Figure 2.33, the 20% moist
clay sand mixture is showing steep drop in both cohesion and angle of internal friction when the
clay content is high. Testing clay sand mixture for as little as three different moisture contents
and different clay contents can give a guide as to the strength properties of other mixes with
variable moisture and clay contents. This approach can help in choosing the appropriate mix or
applying corrections to the right quantity of clay to be added to achieve a certain shear strength.
A very moist clay-sand mixture showed a steep drop in both the cohesion and the angle of
internal friction when the clay content was high. An increase in the moisture content of Al-Qatif
clay caused the cohesion to drop for 5% and 10% of the Al-Qatif clay-sand mixtures at a nearly
similar rate, but the 20% clay mixture showed a very steep drop. Similarly, the angle of internal
friction rate of drop increased for the 20% moisture content. An increase in clay can help
increase the cohesion for 5% and 10% of Al Qatif clay. There will be limit for clay content
beyond which the cohesion can drop due to high water content.
Figure 2.32 (a) and (b) Influence of moisture content on the angle of internal friction and
cohesion Source: Muawia (2013)
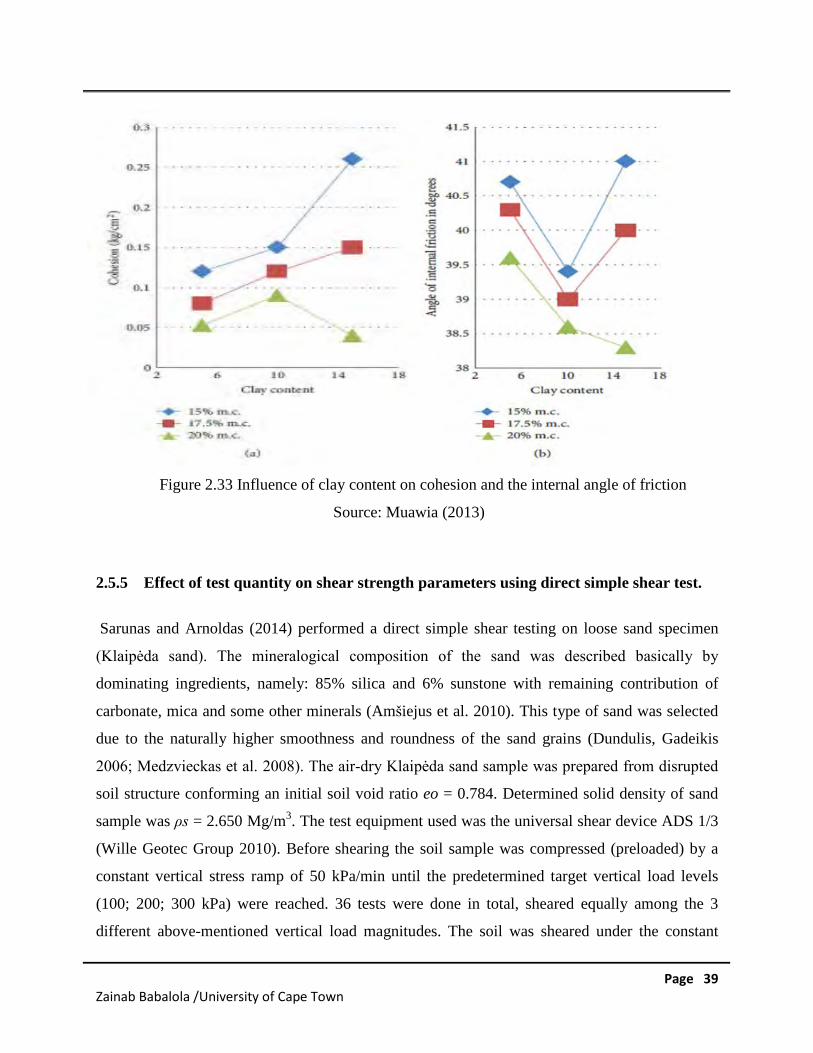
Page 39Zainab Babalola /University of Cape Town
Figure 2.33 Influence of clay content on cohesion and the internal angle of friction
Source: Muawia (2013)
2.5.5 Effect of test quantity on shear strength parameters using direct simple shear test.
Sarunas and Arnoldas (2014) performed a direct simple shear testing on loose sand specimen
(Klaipėda sand). The mineralogical composition of the sand was described basically by
dominating ingredients, namely: 85% silica and 6% sunstone with remaining contribution of
carbonate, mica and some other minerals (Amšiejus et al. 2010). This type of sand was selected
due to the naturally higher smoothness and roundness of the sand grains (Dundulis, Gadeikis
2006; Medzvieckas et al. 2008). The air-dry Klaipėda sand sample was prepared from disrupted
soil structure conforming an initial soil void ratio eo = 0.784. Determined solid density of sand
sample was ρs = 2.650 Mg/m3. The test equipment used was the universal shear device ADS 1/3
(Wille Geotec Group 2010). Before shearing the soil sample was compressed (preloaded) by a
constant vertical stress ramp of 50 kPa/min until the predetermined target vertical load levels
(100; 200; 300 kPa) were reached. 36 tests were done in total, sheared equally among the 3
different above-mentioned vertical load magnitudes. The soil was sheared under the constant
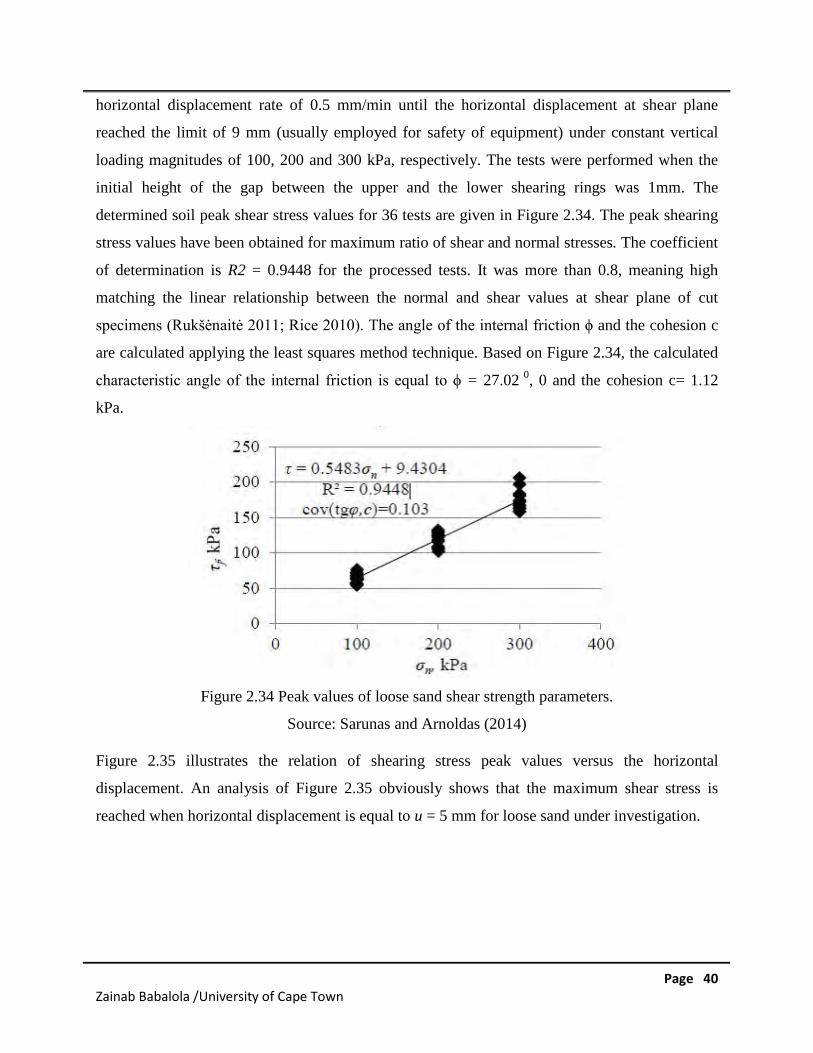
Page 40Zainab Babalola /University of Cape Town
horizontal displacement rate of 0.5 mm/min until the horizontal displacement at shear plane
reached the limit of 9 mm (usually employed for safety of equipment) under constant vertical
loading magnitudes of 100, 200 and 300 kPa, respectively. The tests were performed when the
initial height of the gap between the upper and the lower shearing rings was 1mm. The
determined soil peak shear stress values for 36 tests are given in Figure 2.34. The peak shearing
stress values have been obtained for maximum ratio of shear and normal stresses. The coefficient
of determination is R2 = 0.9448 for the processed tests. It was more than 0.8, meaning high
matching the linear relationship between the normal and shear values at shear plane of cut
specimens (Rukšėnaitė 2011; Rice 2010). The angle of the internal friction ϕ and the cohesion c
are calculated applying the least squares method technique. Based on Figure 2.34, the calculated
characteristic angle of the internal friction is equal to ϕ = 27.02 0, 0 and the cohesion c= 1.12
kPa.
Figure 2.34 Peak values of loose sand shear strength parameters.
Source: Sarunas and Arnoldas (2014)
Figure 2.35 illustrates the relation of shearing stress peak values versus the horizontal
displacement. An analysis of Figure 2.35 obviously shows that the maximum shear stress is
reached when horizontal displacement is equal to u = 5 mm for loose sand under investigation.
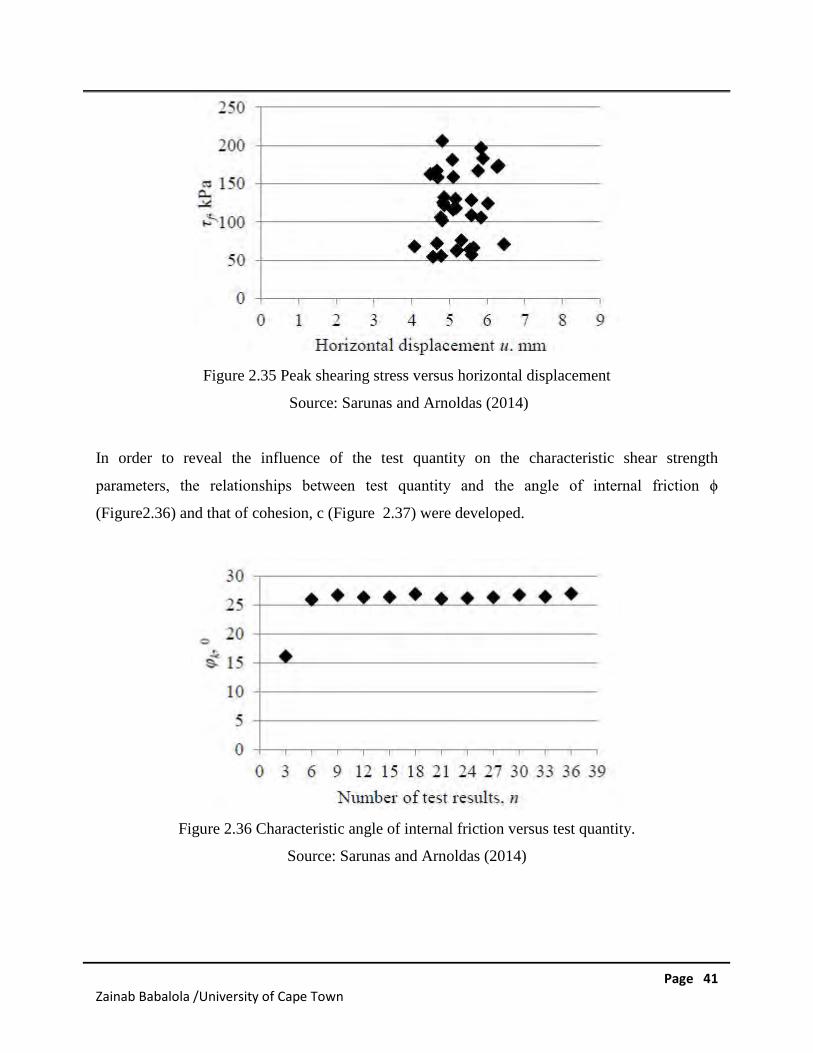
Page 41Zainab Babalola /University of Cape Town
Figure 2.35 Peak shearing stress versus horizontal displacement
Source: Sarunas and Arnoldas (2014)
In order to reveal the influence of the test quantity on the characteristic shear strength
parameters, the relationships between test quantity and the angle of internal friction ϕ
(Figure2.36) and that of cohesion, c (Figure 2.37) were developed.
Figure 2.36 Characteristic angle of internal friction versus test quantity.
Source: Sarunas and Arnoldas (2014)
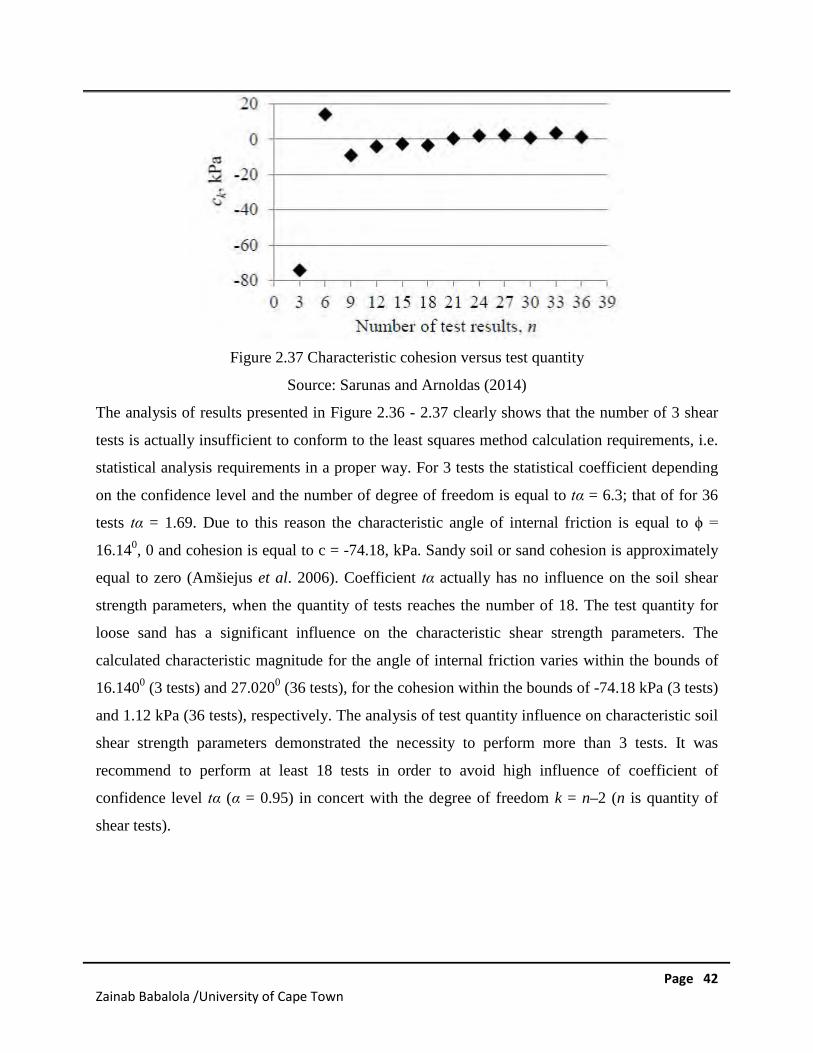
Page 42Zainab Babalola /University of Cape Town
Figure 2.37 Characteristic cohesion versus test quantity
Source: Sarunas and Arnoldas (2014)
The analysis of results presented in Figure 2.36 - 2.37 clearly shows that the number of 3 shear
tests is actually insufficient to conform to the least squares method calculation requirements, i.e.
statistical analysis requirements in a proper way. For 3 tests the statistical coefficient depending
on the confidence level and the number of degree of freedom is equal to tα = 6.3; that of for 36
tests tα = 1.69. Due to this reason the characteristic angle of internal friction is equal to ϕ =
16.140, 0 and cohesion is equal to c = -74.18, kPa. Sandy soil or sand cohesion is approximately
equal to zero (Amšiejus et al. 2006). Coefficient tα actually has no influence on the soil shear
strength parameters, when the quantity of tests reaches the number of 18. The test quantity for
loose sand has a significant influence on the characteristic shear strength parameters. The
calculated characteristic magnitude for the angle of internal friction varies within the bounds of
16.1400 (3 tests) and 27.0200 (36 tests), for the cohesion within the bounds of -74.18 kPa (3 tests)
and 1.12 kPa (36 tests), respectively. The analysis of test quantity influence on characteristic soil
shear strength parameters demonstrated the necessity to perform more than 3 tests. It was
recommend to perform at least 18 tests in order to avoid high influence of coefficient of
confidence level tα (α = 0.95) in concert with the degree of freedom k = n–2 (n is quantity of
shear tests).
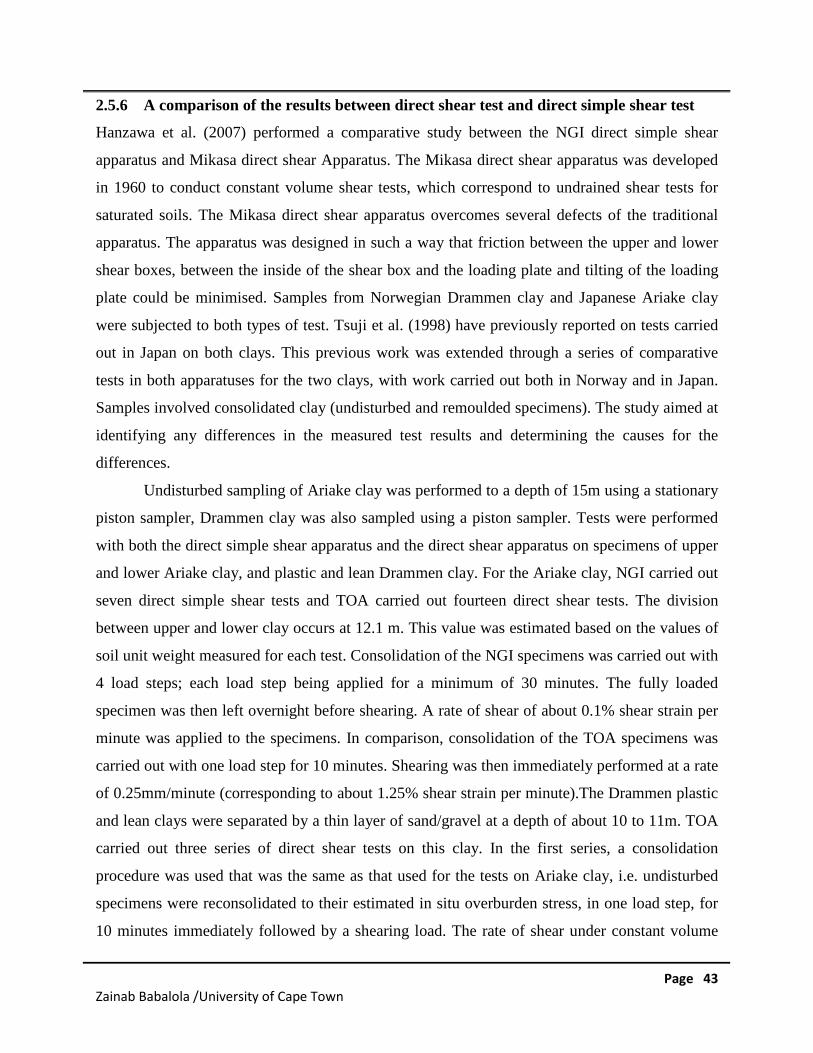
Page 43Zainab Babalola /University of Cape Town
2.5.6 A comparison of the results between direct shear test and direct simple shear test
Hanzawa et al. (2007) performed a comparative study between the NGI direct simple shear
apparatus and Mikasa direct shear Apparatus. The Mikasa direct shear apparatus was developed
in 1960 to conduct constant volume shear tests, which correspond to undrained shear tests for
saturated soils. The Mikasa direct shear apparatus overcomes several defects of the traditional
apparatus. The apparatus was designed in such a way that friction between the upper and lower
shear boxes, between the inside of the shear box and the loading plate and tilting of the loading
plate could be minimised. Samples from Norwegian Drammen clay and Japanese Ariake clay
were subjected to both types of test. Tsuji et al. (1998) have previously reported on tests carried
out in Japan on both clays. This previous work was extended through a series of comparative
tests in both apparatuses for the two clays, with work carried out both in Norway and in Japan.
Samples involved consolidated clay (undisturbed and remoulded specimens). The study aimed at
identifying any differences in the measured test results and determining the causes for the
differences.
Undisturbed sampling of Ariake clay was performed to a depth of 15m using a stationary
piston sampler, Drammen clay was also sampled using a piston sampler. Tests were performed
with both the direct simple shear apparatus and the direct shear apparatus on specimens of upper
and lower Ariake clay, and plastic and lean Drammen clay. For the Ariake clay, NGI carried out
seven direct simple shear tests and TOA carried out fourteen direct shear tests. The division
between upper and lower clay occurs at 12.1 m. This value was estimated based on the values of
soil unit weight measured for each test. Consolidation of the NGI specimens was carried out with
4 load steps; each load step being applied for a minimum of 30 minutes. The fully loaded
specimen was then left overnight before shearing. A rate of shear of about 0.1% shear strain per
minute was applied to the specimens. In comparison, consolidation of the TOA specimens was
carried out with one load step for 10 minutes. Shearing was then immediately performed at a rate
of 0.25mm/minute (corresponding to about 1.25% shear strain per minute).The Drammen plastic
and lean clays were separated by a thin layer of sand/gravel at a depth of about 10 to 11m. TOA
carried out three series of direct shear tests on this clay. In the first series, a consolidation
procedure was used that was the same as that used for the tests on Ariake clay, i.e. undisturbed
specimens were reconsolidated to their estimated in situ overburden stress, in one load step, for
10 minutes immediately followed by a shearing load. The rate of shear under constant volume
Page 44Zainab Babalola /University of Cape Town
conditions was 0.25mm/minute. Fifteen tests were carried out in this way on samples from
depths ranging from 6m to 19m. In the second series of TOA tests, the trimmings from the
samples taken from depths from 6m to 9m (i.e. plastic Drammen clay) were remoulded and then
consolidated to a vertical effective stress of 392 kPa for one day, using the NGI procedure. On
the following day the specimens were unloaded corresponding to a predetermined OCR. The rate
of shearing under constant volume conditions of 0.1mm/minute (about 0.5% shear strain per
minute) was used. Seven tests were carried out in this way, at laboratory OCR values between 1
and 40. In the third TOA series of DST tests, undisturbed samples of plastic Drammen clay were
used, from depths of 6 m, 7 m and 8 m at OCR values of 1, 3 and 10 respectively. The
consolidation procedure and the rate of shearing were the same as those described for the second
TOA series of tests. No additional direct simple shear tests were performed by NGI on Drammen
clay for this programme. Rather, use was made of previous tests performed on Drammen clay for
a number of research projects. A selection of twelve tests was gathered from these projects,
corresponding to the tests performed by TOA. In six of these tests (on both plastic and lean
Drammen clay) the specimens were consolidated to in situ stresses using 4 load steps, over one
day, with shear testing performed on the following day.Procedures of sample extrusion and
preparation were similar. Average strain rate varied between 0.004 and 0.08 % per minute. In a
further six tests specimens of plastic Drammen clay were first consolidated up to a maximum
stress of 400kPa for one day, followed by unloading on the second day to a vertical stress
corresponding to a predetermined OCR, with shear testing on the third day at a standard strain
rate of about 0.08% per minute. Test results from the direct simple shear test and direct shear test
on Ariake clay are shown in Figure 2.38. It is clear that the peak failure strengths from a direct
simple shear test were significantly lower than for the direct shear test. The contribution of
several factors to the observed differences in strength included: sample disturbance, different
consolidation time (less significant), and rate of testing and shearing mechanism.
Many techniques are available for the assessment of sample quality. A disturbance index
was used to evaluate sample disturbance. It was observed, that the differences in the disturbance
index between the direct simple shear test and the direct shear test do not clearly echo the
differences in shear strength exhibited in the soil samples. However, variations in the testing
procedures will mask the effect of disturbance.
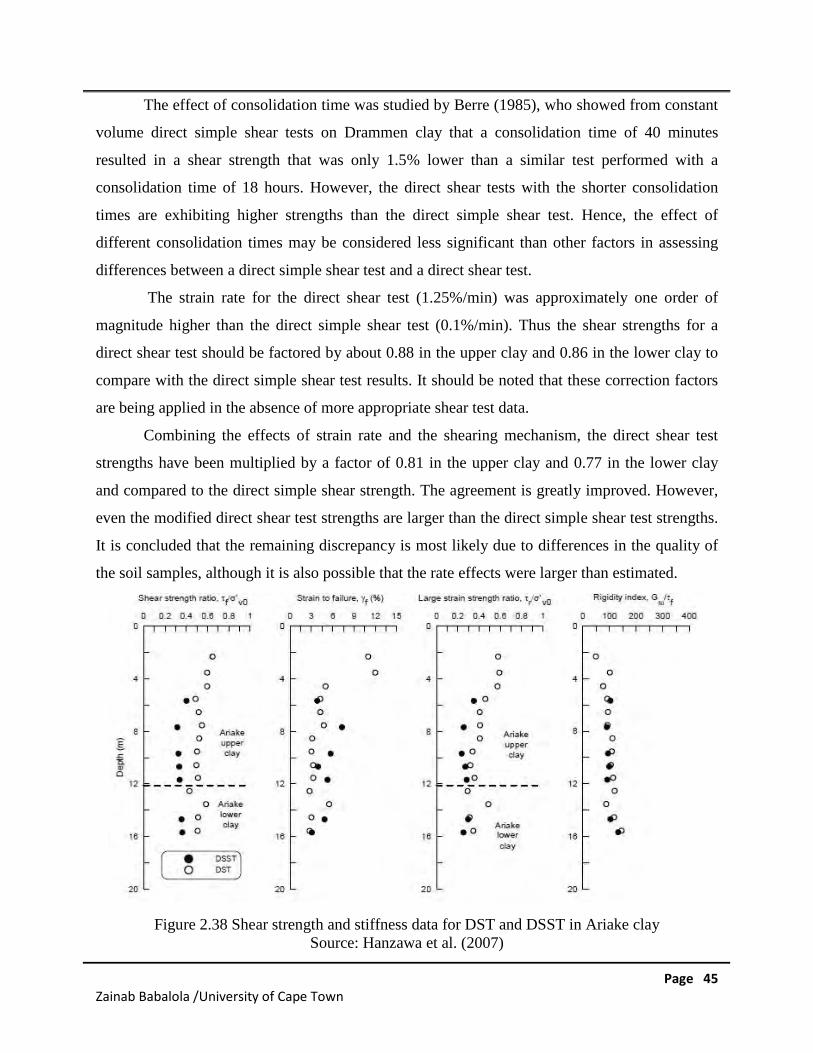
Page 45Zainab Babalola /University of Cape Town
The effect of consolidation time was studied by Berre (1985), who showed from constant
volume direct simple shear tests on Drammen clay that a consolidation time of 40 minutes
resulted in a shear strength that was only 1.5% lower than a similar test performed with a
consolidation time of 18 hours. However, the direct shear tests with the shorter consolidation
times are exhibiting higher strengths than the direct simple shear test. Hence, the effect of
different consolidation times may be considered less significant than other factors in assessing
differences between a direct simple shear test and a direct shear test.
The strain rate for the direct shear test (1.25%/min) was approximately one order of
magnitude higher than the direct simple shear test (0.1%/min). Thus the shear strengths for a
direct shear test should be factored by about 0.88 in the upper clay and 0.86 in the lower clay to
compare with the direct simple shear test results. It should be noted that these correction factors
are being applied in the absence of more appropriate shear test data.
Combining the effects of strain rate and the shearing mechanism, the direct shear test
strengths have been multiplied by a factor of 0.81 in the upper clay and 0.77 in the lower clay
and compared to the direct simple shear strength. The agreement is greatly improved. However,
even the modified direct shear test strengths are larger than the direct simple shear test strengths.
It is concluded that the remaining discrepancy is most likely due to differences in the quality of
the soil samples, although it is also possible that the rate effects were larger than estimated.
Figure 2.38 Shear strength and stiffness data for DST and DSST in Ariake claySource: Hanzawa et al. (2007)
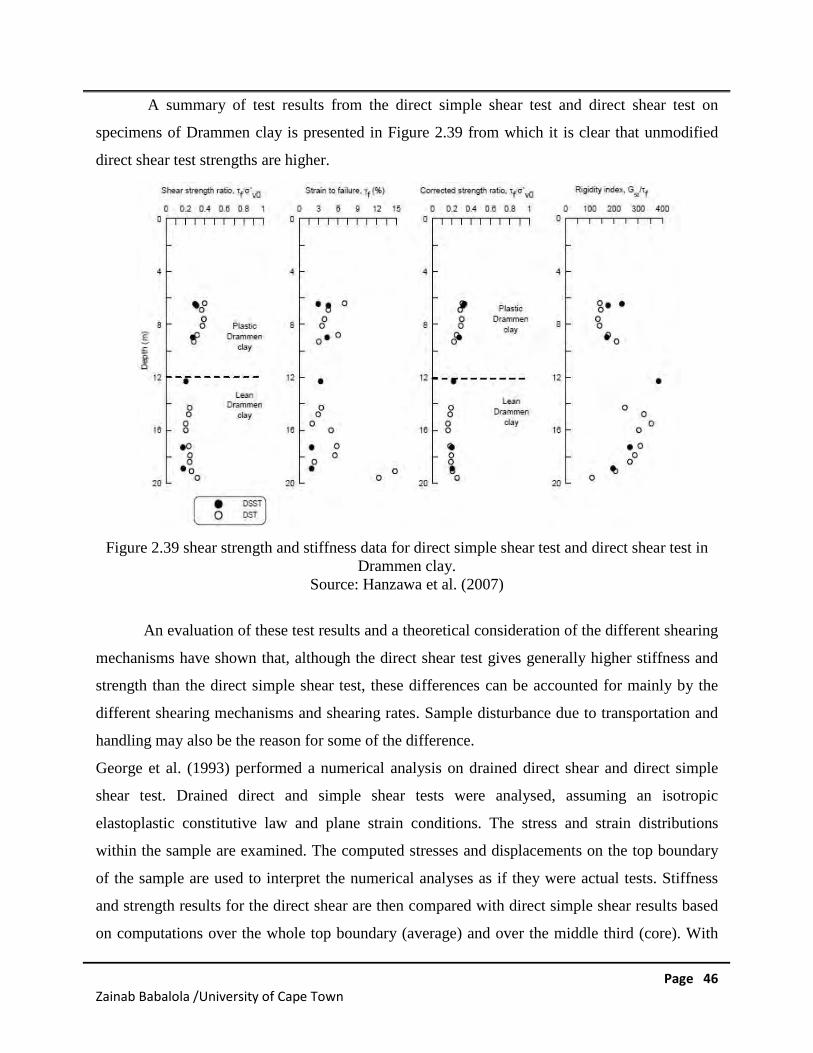
Page 46Zainab Babalola /University of Cape Town
A summary of test results from the direct simple shear test and direct shear test on
specimens of Drammen clay is presented in Figure 2.39 from which it is clear that unmodified
direct shear test strengths are higher.
Figure 2.39 shear strength and stiffness data for direct simple shear test and direct shear test inDrammen clay.
Source: Hanzawa et al. (2007)
An evaluation of these test results and a theoretical consideration of the different shearing
mechanisms have shown that, although the direct shear test gives generally higher stiffness and
strength than the direct simple shear test, these differences can be accounted for mainly by the
different shearing mechanisms and shearing rates. Sample disturbance due to transportation and
handling may also be the reason for some of the difference.
George et al. (1993) performed a numerical analysis on drained direct shear and direct simple
shear test. Drained direct and simple shear tests were analysed, assuming an isotropic
elastoplastic constitutive law and plane strain conditions. The stress and strain distributions
within the sample are examined. The computed stresses and displacements on the top boundary
of the sample are used to interpret the numerical analyses as if they were actual tests. Stiffness
and strength results for the direct shear are then compared with direct simple shear results based
on computations over the whole top boundary (average) and over the middle third (core). With
Page 47Zainab Babalola /University of Cape Town
the ideal simple shear as a reference state, direct simple shear results based on average
measurements underestimate initial stiffness and peak strength by as much as 20%, while core
measurements give a better but not perfect agreement. Direct shear tests overestimated the initial
stiffness and, in most cases, the peak strength by as much as 7.5%. Stress and strain distribution
in the direct simple shear test becomes highly non-uniform as peak conditions are approached.
2.6 Conclusion
It is clear that specimen size and particle size influence friction angle of sand. From previous
studies, the shear strength parameters increase as the relative density increases for silty soil. The
amount of moisture content and clay content influence the angle of internal friction and cohesion
for clay-sand mixture. The test quantity for loose sand has influence on the shear strength
parameters. A direct shear test gives higher strength and stiffness than does the direct simple
shear test by Hanzawa et al (2007). Direct shear tests overestimated the initial stiffness and, in
most cases, the peak strength by as much as 7.5% by George et al (1993), when compared with
the direct simple shear test.
Studies conducted in the past have given limited attention to direct simple shear tests as
the majority conducted have employed direct shear tests which are favoured by many
geotechnical engineers because of their simplicity. In some cases, direct shear test may be the
only feasible type of shear test available. The question arises as to how direct shear test data can
be related to the results obtained from direct simple shear tests. This is of interest because the
design procedures for many problems are based on direct shear tests, but soil response often
bears more resemblance to direct simple shear. More knowledge is required to establish the
relationship between the results generated from a direct shear test and a direct simple shear test,
in order to also develop a correlation factor between the results from the two tests.
Page 48Zainab Babalola /University of Cape Town
3.0 RESEARCH MATERIALS AND METHODOLOGY
3.1 Introduction
This chapter details the methodology followed to achieve the specific objectives of the study.
The test materials, the soil classification tests method, the testing schedule and experimental
procedures are discussed. To maintain consistency direct shear and direct simple shear tests were
carried out on identical soil specimens with the same normal loads.
3.2 Test materials and equipment
The soil samples procured for the tests were Kliphuewel sand and Kaolin. The equipment
employed for the direct shear and direct simple shear laboratory tests was the ShearTrac-II
supplied by the Geocomp cooperation.
3.2.1 Klipheuwel sand
Klipheuwel sand is reddish-brown in colour with a natural moisture content of 2.63%. It was
sourced from Cape Town, South Africa and classified by Kalumba (1998) according to the
Unified Soil Classification System as a well-graded sand with little fines and particles that are
angular in shape. This sand was selected due to local availability and its significant presence in
Cape Town. It was clean and easy to work with, thus making it possible for the results to be
repeatable.
3.2.2 Kaolin
Kaolin is an example of a typical soft soils. On this basis, it was selected for this research in
order to compare the results obtained under similar conditions with Klipheuwel sand. In addition,
it was consistent and easily controllable, which enabled repeatability of results. The kaolin clay
material used in this research is extracted and supplied locally in Cape Town.
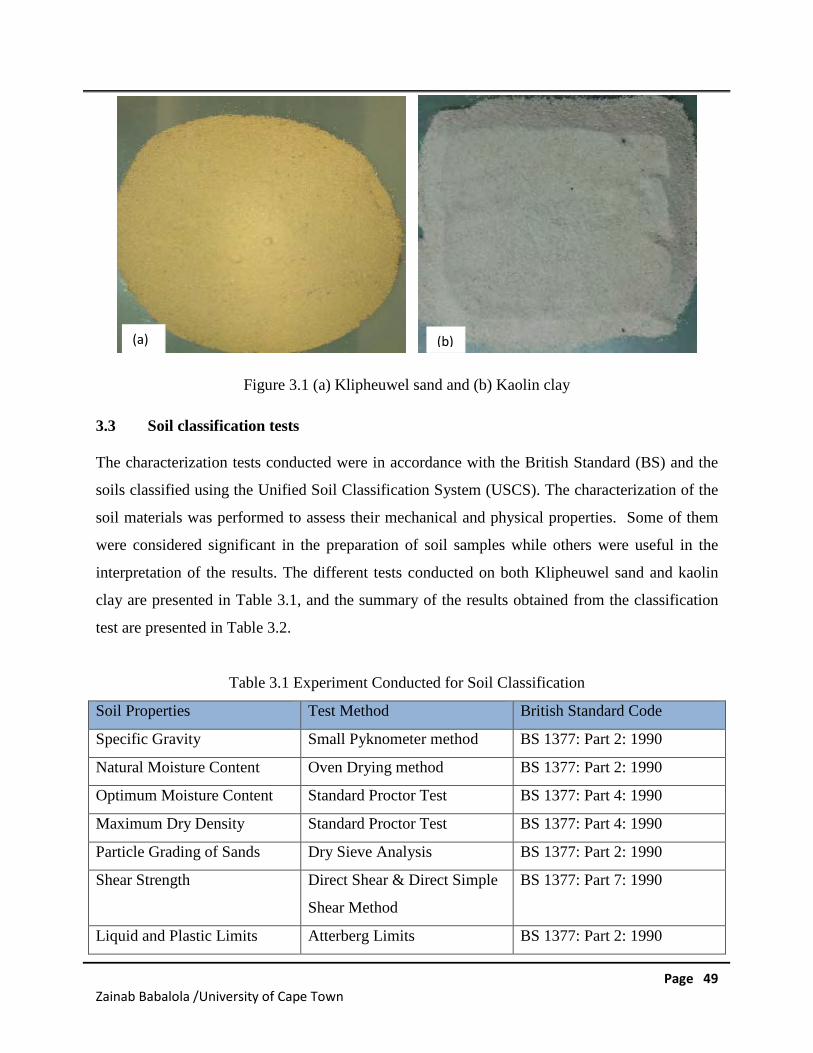
Page 49Zainab Babalola /University of Cape Town
Figure 3.1 (a) Klipheuwel sand and (b) Kaolin clay
3.3 Soil classification tests
The characterization tests conducted were in accordance with the British Standard (BS) and the
soils classified using the Unified Soil Classification System (USCS). The characterization of the
soil materials was performed to assess their mechanical and physical properties. Some of them
were considered significant in the preparation of soil samples while others were useful in the
interpretation of the results. The different tests conducted on both Klipheuwel sand and kaolin
clay are presented in Table 3.1, and the summary of the results obtained from the classification
test are presented in Table 3.2.
Table 3.1 Experiment Conducted for Soil Classification
Soil Properties Test Method British Standard Code
Specific Gravity Small Pyknometer method BS 1377: Part 2: 1990
Natural Moisture Content Oven Drying method BS 1377: Part 2: 1990
Optimum Moisture Content Standard Proctor Test BS 1377: Part 4: 1990
Maximum Dry Density Standard Proctor Test BS 1377: Part 4: 1990
Particle Grading of Sands Dry Sieve Analysis BS 1377: Part 2: 1990
Shear Strength Direct Shear & Direct Simple
Shear Method
BS 1377: Part 7: 1990
Liquid and Plastic Limits Atterberg Limits BS 1377: Part 2: 1990
(a) (b)
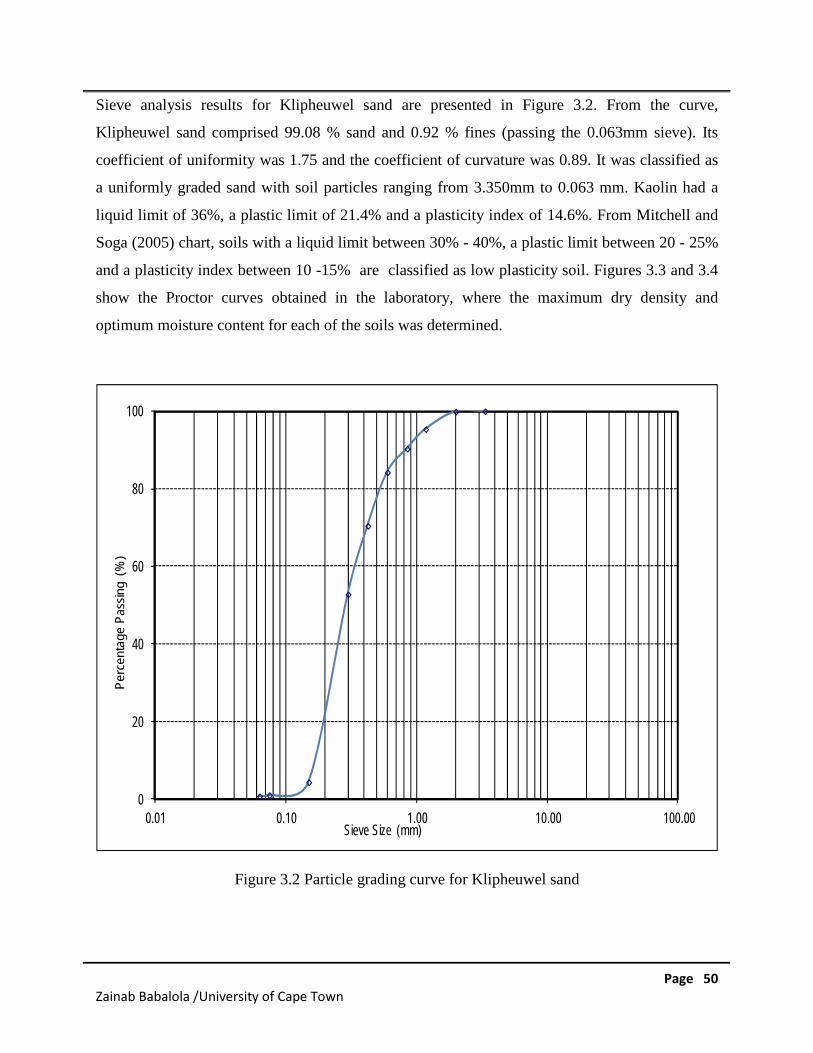
Page 50Zainab Babalola /University of Cape Town
Sieve analysis results for Klipheuwel sand are presented in Figure 3.2. From the curve,
Klipheuwel sand comprised 99.08 % sand and 0.92 % fines (passing the 0.063mm sieve). Its
coefficient of uniformity was 1.75 and the coefficient of curvature was 0.89. It was classified as
a uniformly graded sand with soil particles ranging from 3.350mm to 0.063 mm. Kaolin had a
liquid limit of 36%, a plastic limit of 21.4% and a plasticity index of 14.6%. From Mitchell and
Soga (2005) chart, soils with a liquid limit between 30% - 40%, a plastic limit between 20 - 25%
and a plasticity index between 10 -15% are classified as low plasticity soil. Figures 3.3 and 3.4
show the Proctor curves obtained in the laboratory, where the maximum dry density and
optimum moisture content for each of the soils was determined.
0
20
40
60
80
100
0.01 0.10 1.00 10.00 100.00
Pe
rcen
tag
eP
ass
ing
(%)
Sieve Size (mm)
Figure 3.2 Particle grading curve for Klipheuwel sand
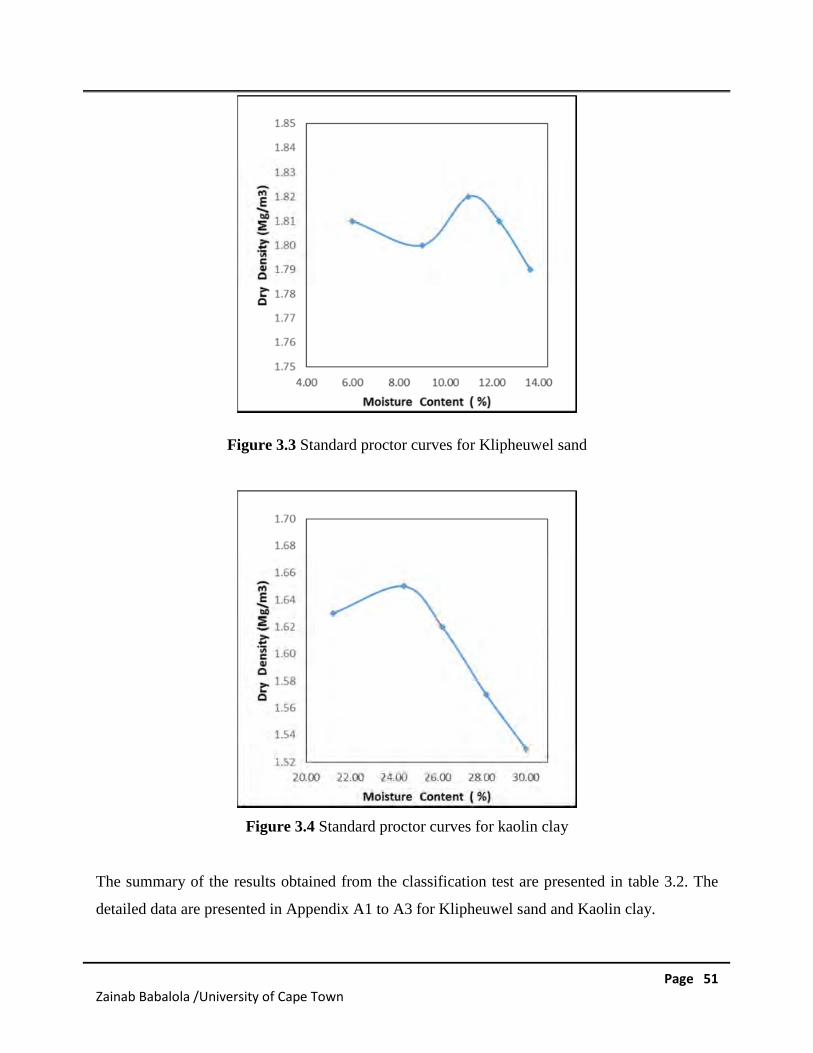
Page 51Zainab Babalola /University of Cape Town
Figure 3.3 Standard proctor curves for Klipheuwel sand
Figure 3.4 Standard proctor curves for kaolin clay
The summary of the results obtained from the classification test are presented in table 3.2. The
detailed data are presented in Appendix A1 to A3 for Klipheuwel sand and Kaolin clay.
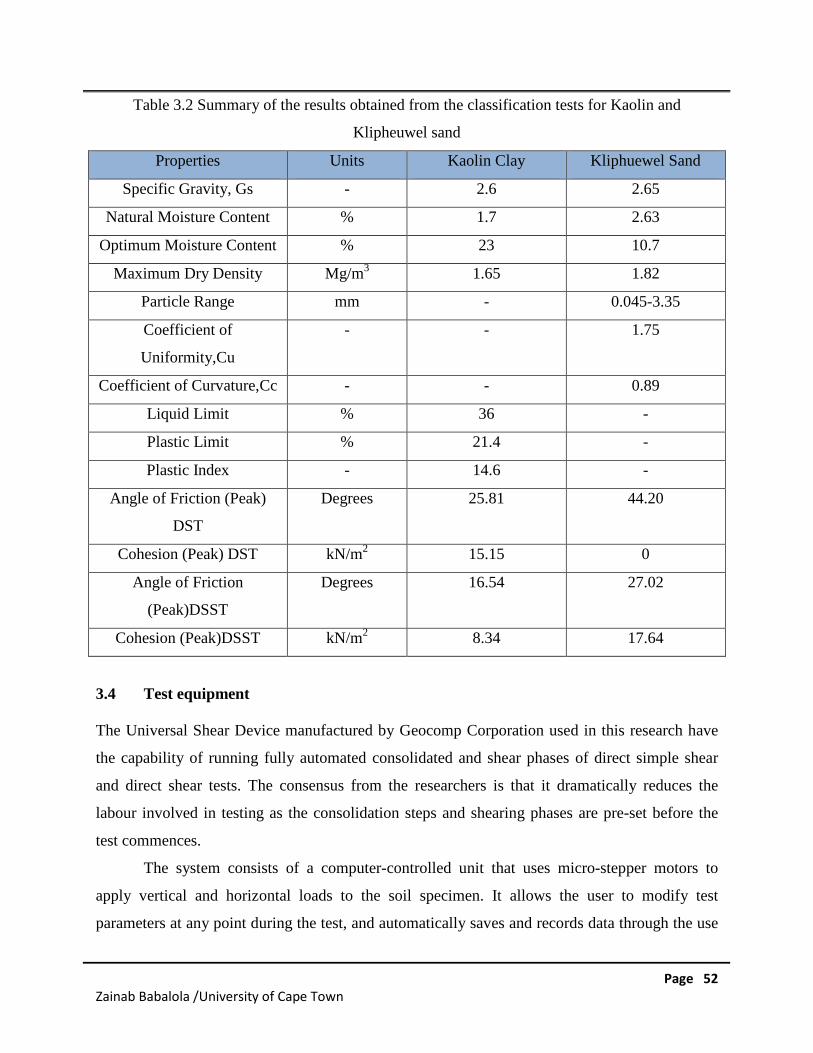
Page 52Zainab Babalola /University of Cape Town
Table 3.2 Summary of the results obtained from the classification tests for Kaolin and
Klipheuwel sand
Properties Units Kaolin Clay Kliphuewel Sand
Specific Gravity, Gs - 2.6 2.65
Natural Moisture Content % 1.7 2.63
Optimum Moisture Content % 23 10.7
Maximum Dry Density Mg/m3 1.65 1.82
Particle Range mm - 0.045-3.35
Coefficient of
Uniformity,Cu
- - 1.75
Coefficient of Curvature,Cc - - 0.89
Liquid Limit % 36 -
Plastic Limit % 21.4 -
Plastic Index - 14.6 -
Angle of Friction (Peak)
DST
Degrees 25.81 44.20
Cohesion (Peak) DST kN/m2 15.15 0
Angle of Friction
(Peak)DSST
Degrees 16.54 27.02
Cohesion (Peak)DSST kN/m2 8.34 17.64
3.4 Test equipment
The Universal Shear Device manufactured by Geocomp Corporation used in this research have
the capability of running fully automated consolidated and shear phases of direct simple shear
and direct shear tests. The consensus from the researchers is that it dramatically reduces the
labour involved in testing as the consolidation steps and shearing phases are pre-set before the
test commences.
The system consists of a computer-controlled unit that uses micro-stepper motors to
apply vertical and horizontal loads to the soil specimen. It allows the user to modify test
parameters at any point during the test, and automatically saves and records data through the use
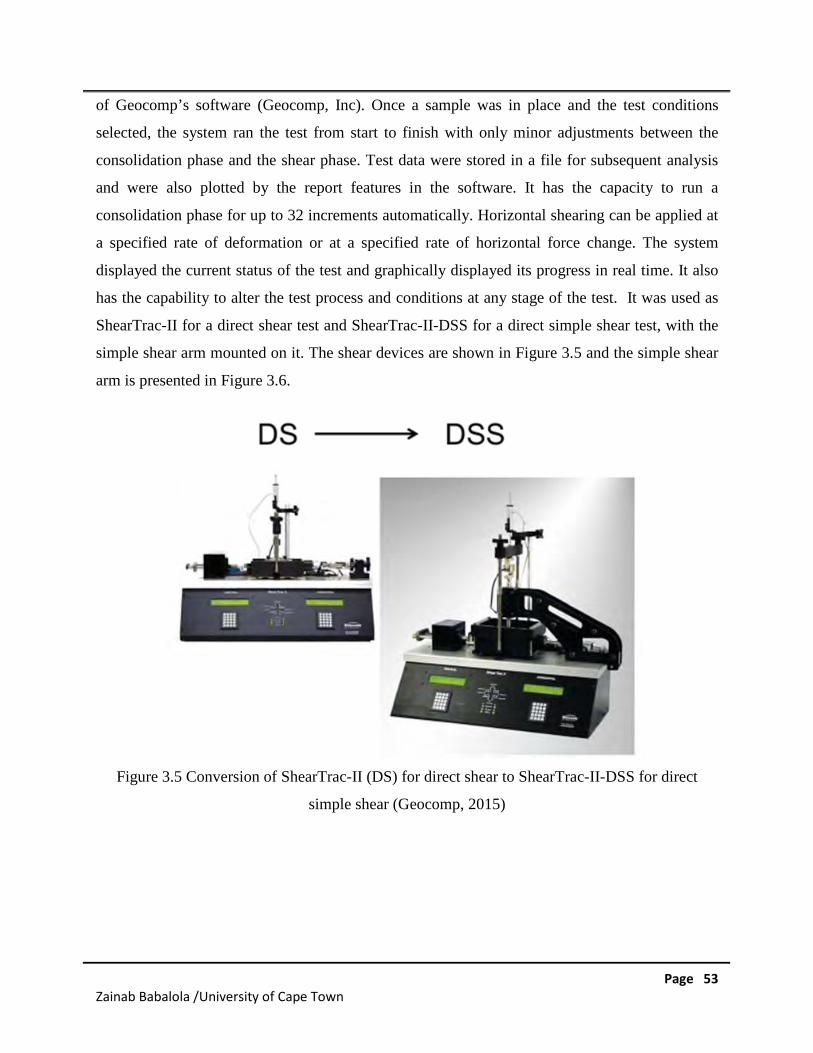
Page 53Zainab Babalola /University of Cape Town
of Geocomp’s software (Geocomp, Inc). Once a sample was in place and the test conditions
selected, the system ran the test from start to finish with only minor adjustments between the
consolidation phase and the shear phase. Test data were stored in a file for subsequent analysis
and were also plotted by the report features in the software. It has the capacity to run a
consolidation phase for up to 32 increments automatically. Horizontal shearing can be applied at
a specified rate of deformation or at a specified rate of horizontal force change. The system
displayed the current status of the test and graphically displayed its progress in real time. It also
has the capability to alter the test process and conditions at any stage of the test. It was used as
ShearTrac-II for a direct shear test and ShearTrac-II-DSS for a direct simple shear test, with the
simple shear arm mounted on it. The shear devices are shown in Figure 3.5 and the simple shear
arm is presented in Figure 3.6.
Figure 3.5 Conversion of ShearTrac-II (DS) for direct shear to ShearTrac-II-DSS for direct
simple shear (Geocomp, 2015)
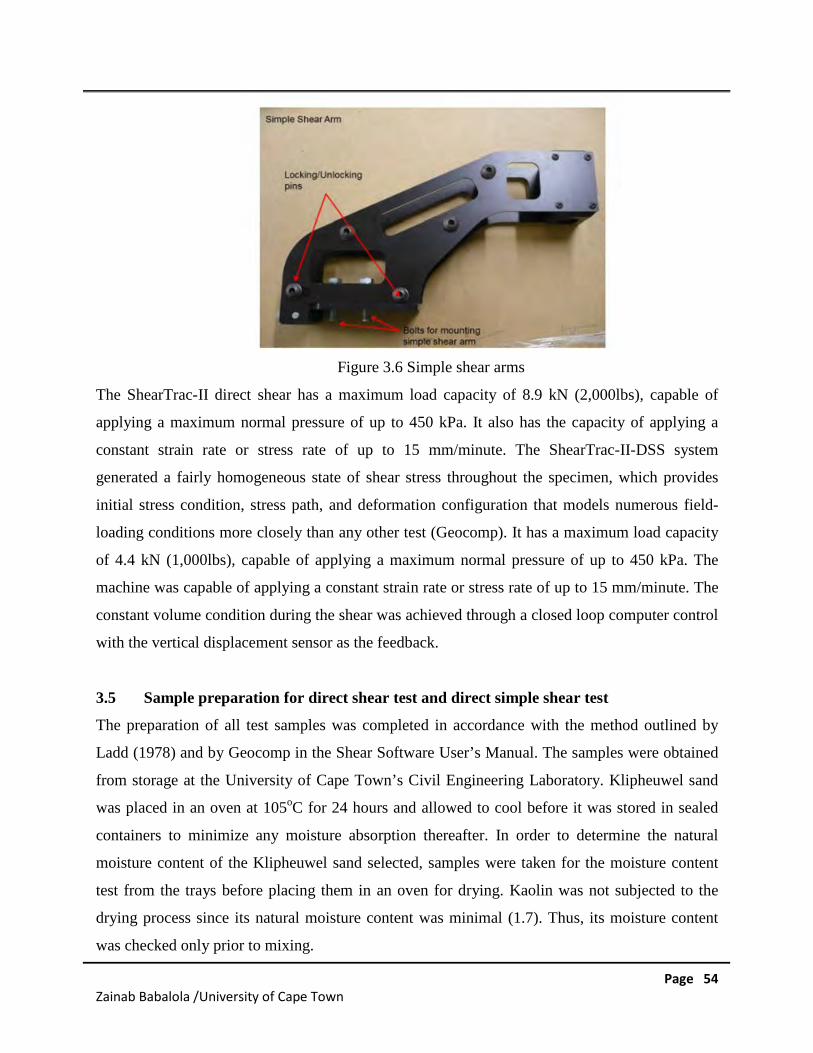
Page 54Zainab Babalola /University of Cape Town
Figure 3.6 Simple shear arms
The ShearTrac-II direct shear has a maximum load capacity of 8.9 kN (2,000lbs), capable of
applying a maximum normal pressure of up to 450 kPa. It also has the capacity of applying a
constant strain rate or stress rate of up to 15 mm/minute. The ShearTrac-II-DSS system
generated a fairly homogeneous state of shear stress throughout the specimen, which provides
initial stress condition, stress path, and deformation configuration that models numerous field-
loading conditions more closely than any other test (Geocomp). It has a maximum load capacity
of 4.4 kN (1,000lbs), capable of applying a maximum normal pressure of up to 450 kPa. The
machine was capable of applying a constant strain rate or stress rate of up to 15 mm/minute. The
constant volume condition during the shear was achieved through a closed loop computer control
with the vertical displacement sensor as the feedback.
3.5 Sample preparation for direct shear test and direct simple shear test
The preparation of all test samples was completed in accordance with the method outlined by
Ladd (1978) and by Geocomp in the Shear Software User’s Manual. The samples were obtained
from storage at the University of Cape Town’s Civil Engineering Laboratory. Klipheuwel sand
was placed in an oven at 105oC for 24 hours and allowed to cool before it was stored in sealed
containers to minimize any moisture absorption thereafter. In order to determine the natural
moisture content of the Klipheuwel sand selected, samples were taken for the moisture content
test from the trays before placing them in an oven for drying. Kaolin was not subjected to the
drying process since its natural moisture content was minimal (1.7). Thus, its moisture content
was checked only prior to mixing.
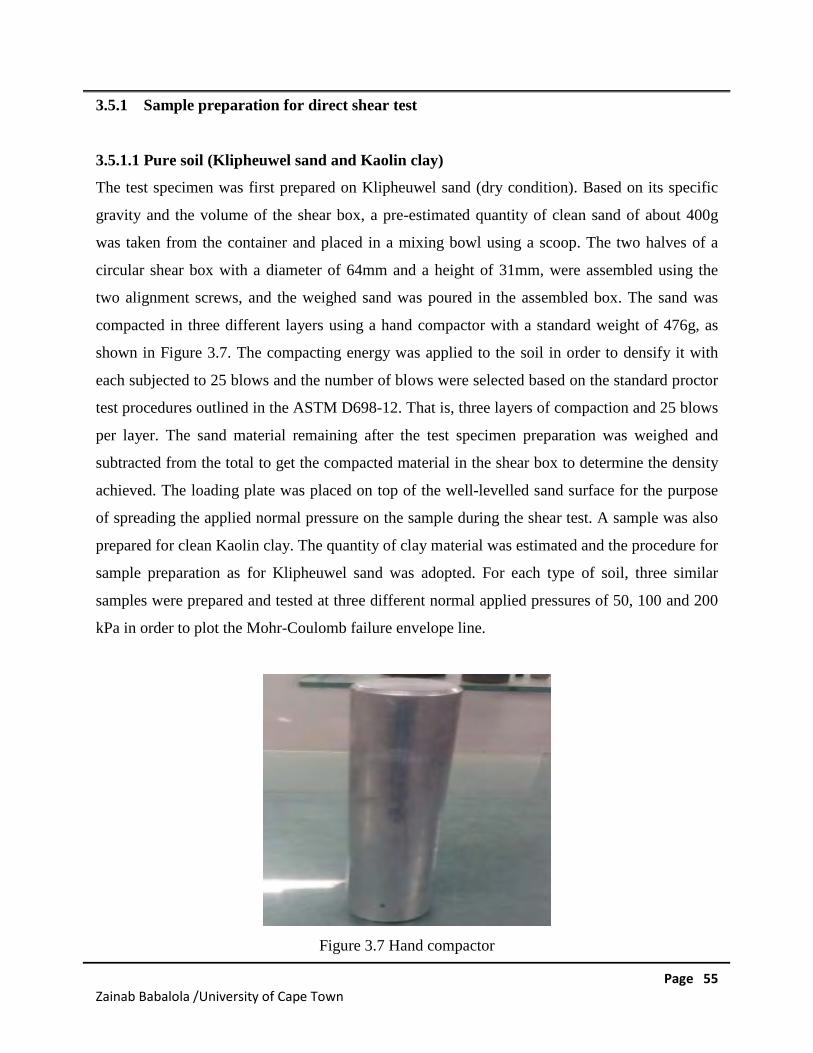
Page 55Zainab Babalola /University of Cape Town
3.5.1 Sample preparation for direct shear test
3.5.1.1 Pure soil (Klipheuwel sand and Kaolin clay)
The test specimen was first prepared on Klipheuwel sand (dry condition). Based on its specific
gravity and the volume of the shear box, a pre-estimated quantity of clean sand of about 400g
was taken from the container and placed in a mixing bowl using a scoop. The two halves of a
circular shear box with a diameter of 64mm and a height of 31mm, were assembled using the
two alignment screws, and the weighed sand was poured in the assembled box. The sand was
compacted in three different layers using a hand compactor with a standard weight of 476g, as
shown in Figure 3.7. The compacting energy was applied to the soil in order to densify it with
each subjected to 25 blows and the number of blows were selected based on the standard proctor
test procedures outlined in the ASTM D698-12. That is, three layers of compaction and 25 blows
per layer. The sand material remaining after the test specimen preparation was weighed and
subtracted from the total to get the compacted material in the shear box to determine the density
achieved. The loading plate was placed on top of the well-levelled sand surface for the purpose
of spreading the applied normal pressure on the sample during the shear test. A sample was also
prepared for clean Kaolin clay. The quantity of clay material was estimated and the procedure for
sample preparation as for Klipheuwel sand was adopted. For each type of soil, three similar
samples were prepared and tested at three different normal applied pressures of 50, 100 and 200
kPa in order to plot the Mohr-Coulomb failure envelope line.
Figure 3.7 Hand compactor
Page 56Zainab Babalola /University of Cape Town
3.5.1.2 Sand-clay composite
Samples were also prepared at composite conditions corresponding to optimum moisture content
for both Klipheuwel sand and Kaolin clay. The amount of water added was determined by the
individual standard Proctor tests, carried out as per the clay concentration. It was crucial to
compute the quantities required for the mixing before the sample of any mixture was prepared.
Equation (3.1), below, was thus adopted during the preparation of the mixture;
Wc= χ.Wcsc ……………………………………………… (3.1)
Where
Wc: the weight of clay; χ: the concentration of clay in the mixture Wcsc: the weight of clay sand composite
The concentrations of clay considered in this study were 10, 25, 50 and 75 % by dry weight.
Each percentage of clay content was considered independently during sample preparation. The
quantity of clay to be combined with sand was predetermined before mixing. Therefore, the
concentration of 10% clay by dry mass was first considered with the Klipheuwel sand. The total
quantity of sand to fill the shear box was estimated following the similar procedure used in pure
soil calculations and 10% clay by dry mass of that sand was computed using equation (3.1). The
weight of sand equivalent to clay was replaced by the weight of clay. After all the calculations
were completed, the quantity of sand, clay and water to be used was taken and weighed using an
electronic scale, after which they were thoroughly mixed in a mixing bowl using a scoop to
obtain a well-mixed sample. Mixing was done for a predetermined period of five minutes, after
which the material was placed in the shear box.
The two halves of a circular shear box were assembled on a table using the alignment screws and
the clay sand composite was carefully transferred into the box in layers. The clay-sand composite
was compacted in three layers to ensure that all the material in shear box received the same
energy. Each layer was compacted using the similar equipment used in the preparation of the
pure soil sample and received the same number of blows equal to 25.The volume of the
specimen in the shear box was determined and consequently its mass and then the density
achieved was calculated. Calculations based on 10% clay content were repeated for 25, 50 and
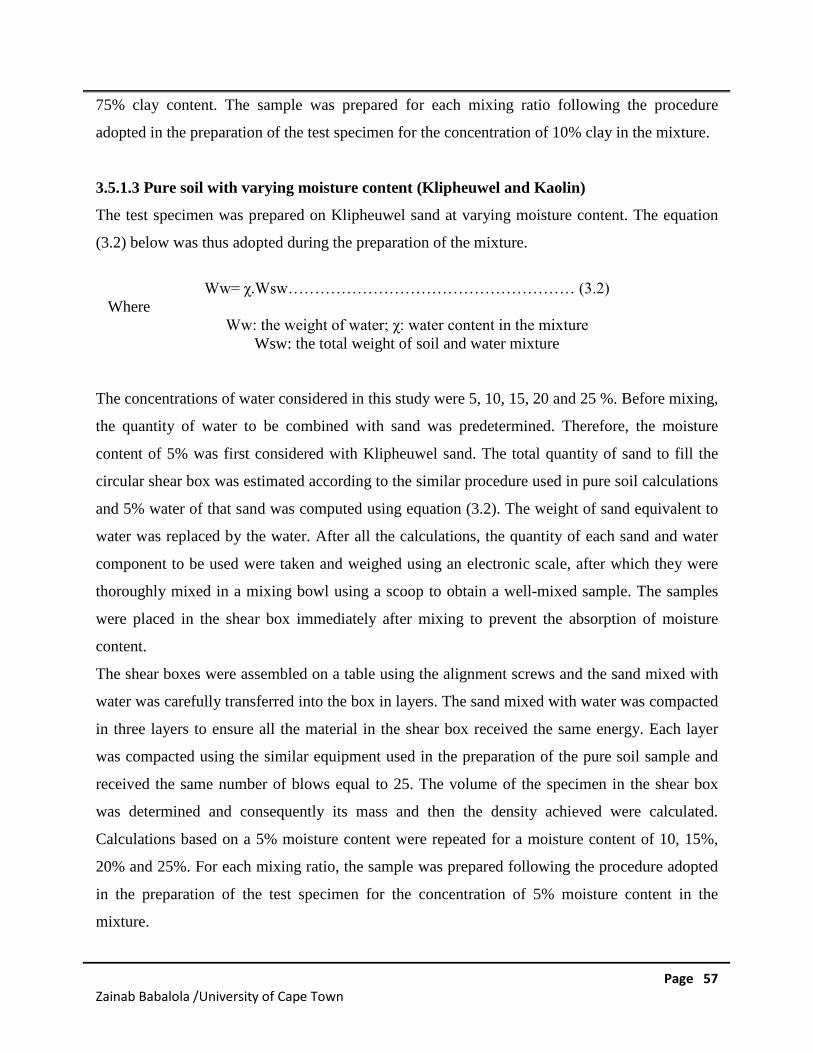
Page 57Zainab Babalola /University of Cape Town
75% clay content. The sample was prepared for each mixing ratio following the procedure
adopted in the preparation of the test specimen for the concentration of 10% clay in the mixture.
3.5.1.3 Pure soil with varying moisture content (Klipheuwel and Kaolin)
The test specimen was prepared on Klipheuwel sand at varying moisture content. The equation
(3.2) below was thus adopted during the preparation of the mixture.
Ww= χ.Wsw……………………………………………… (3.2) Where
Ww: the weight of water; χ: water content in the mixture Wsw: the total weight of soil and water mixture
The concentrations of water considered in this study were 5, 10, 15, 20 and 25 %. Before mixing,
the quantity of water to be combined with sand was predetermined. Therefore, the moisture
content of 5% was first considered with Klipheuwel sand. The total quantity of sand to fill the
circular shear box was estimated according to the similar procedure used in pure soil calculations
and 5% water of that sand was computed using equation (3.2). The weight of sand equivalent to
water was replaced by the water. After all the calculations, the quantity of each sand and water
component to be used were taken and weighed using an electronic scale, after which they were
thoroughly mixed in a mixing bowl using a scoop to obtain a well-mixed sample. The samples
were placed in the shear box immediately after mixing to prevent the absorption of moisture
content.
The shear boxes were assembled on a table using the alignment screws and the sand mixed with
water was carefully transferred into the box in layers. The sand mixed with water was compacted
in three layers to ensure all the material in the shear box received the same energy. Each layer
was compacted using the similar equipment used in the preparation of the pure soil sample and
received the same number of blows equal to 25. The volume of the specimen in the shear box
was determined and consequently its mass and then the density achieved were calculated.
Calculations based on a 5% moisture content were repeated for a moisture content of 10, 15%,
20% and 25%. For each mixing ratio, the sample was prepared following the procedure adopted
in the preparation of the test specimen for the concentration of 5% moisture content in the
mixture.
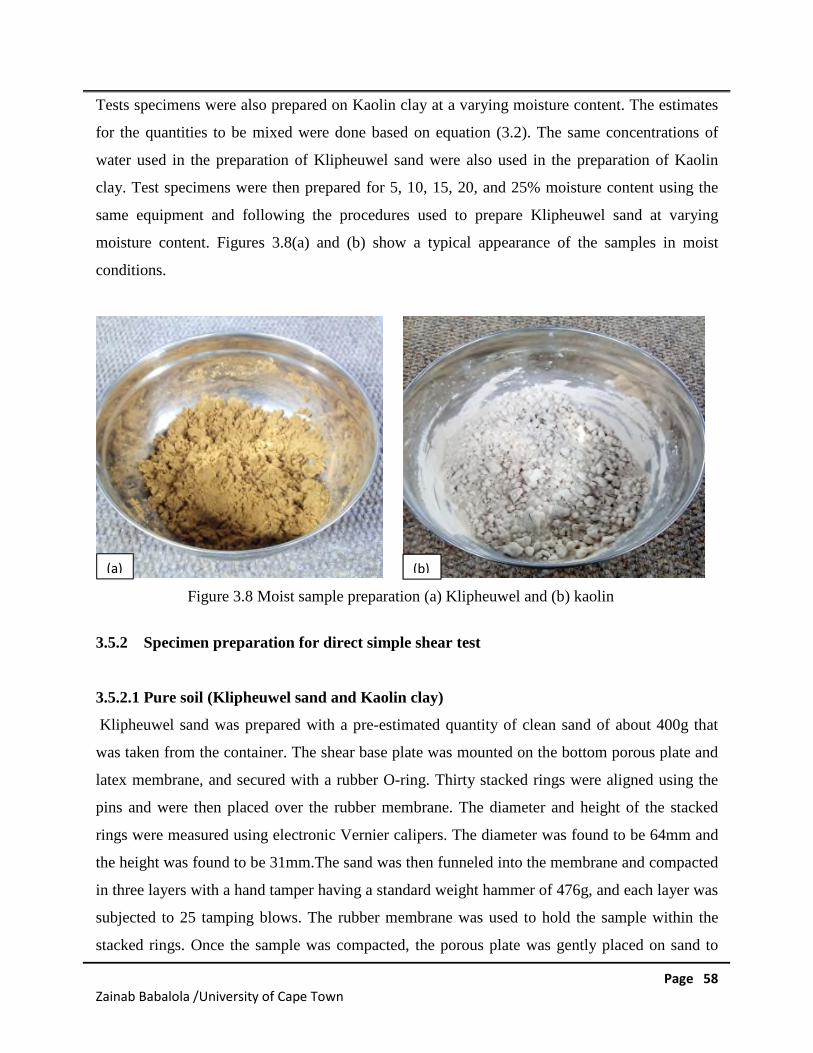
Page 58Zainab Babalola /University of Cape Town
Tests specimens were also prepared on Kaolin clay at a varying moisture content. The estimates
for the quantities to be mixed were done based on equation (3.2). The same concentrations of
water used in the preparation of Klipheuwel sand were also used in the preparation of Kaolin
clay. Test specimens were then prepared for 5, 10, 15, 20, and 25% moisture content using the
same equipment and following the procedures used to prepare Klipheuwel sand at varying
moisture content. Figures 3.8(a) and (b) show a typical appearance of the samples in moist
conditions.
Figure 3.8 Moist sample preparation (a) Klipheuwel and (b) kaolin
3.5.2 Specimen preparation for direct simple shear test
3.5.2.1 Pure soil (Klipheuwel sand and Kaolin clay)
Klipheuwel sand was prepared with a pre-estimated quantity of clean sand of about 400g that
was taken from the container. The shear base plate was mounted on the bottom porous plate and
latex membrane, and secured with a rubber O-ring. Thirty stacked rings were aligned using the
pins and were then placed over the rubber membrane. The diameter and height of the stacked
rings were measured using electronic Vernier calipers. The diameter was found to be 64mm and
the height was found to be 31mm.The sand was then funneled into the membrane and compacted
in three layers with a hand tamper having a standard weight hammer of 476g, and each layer was
subjected to 25 tamping blows. The rubber membrane was used to hold the sample within the
stacked rings. Once the sample was compacted, the porous plate was gently placed on sand to
(a) (b)
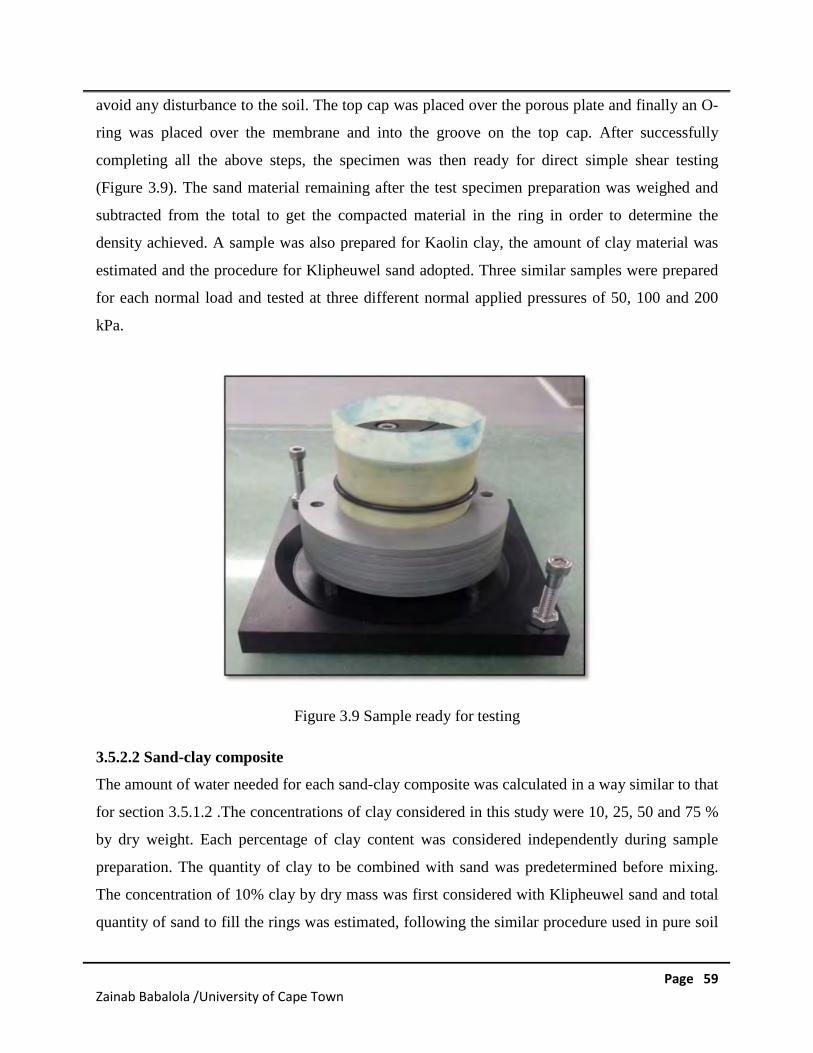
Page 59Zainab Babalola /University of Cape Town
avoid any disturbance to the soil. The top cap was placed over the porous plate and finally an O-
ring was placed over the membrane and into the groove on the top cap. After successfully
completing all the above steps, the specimen was then ready for direct simple shear testing
(Figure 3.9). The sand material remaining after the test specimen preparation was weighed and
subtracted from the total to get the compacted material in the ring in order to determine the
density achieved. A sample was also prepared for Kaolin clay, the amount of clay material was
estimated and the procedure for Klipheuwel sand adopted. Three similar samples were prepared
for each normal load and tested at three different normal applied pressures of 50, 100 and 200
kPa.
Figure 3.9 Sample ready for testing
3.5.2.2 Sand-clay composite
The amount of water needed for each sand-clay composite was calculated in a way similar to that
for section 3.5.1.2 .The concentrations of clay considered in this study were 10, 25, 50 and 75 %
by dry weight. Each percentage of clay content was considered independently during sample
preparation. The quantity of clay to be combined with sand was predetermined before mixing.
The concentration of 10% clay by dry mass was first considered with Klipheuwel sand and total
quantity of sand to fill the rings was estimated, following the similar procedure used in pure soil
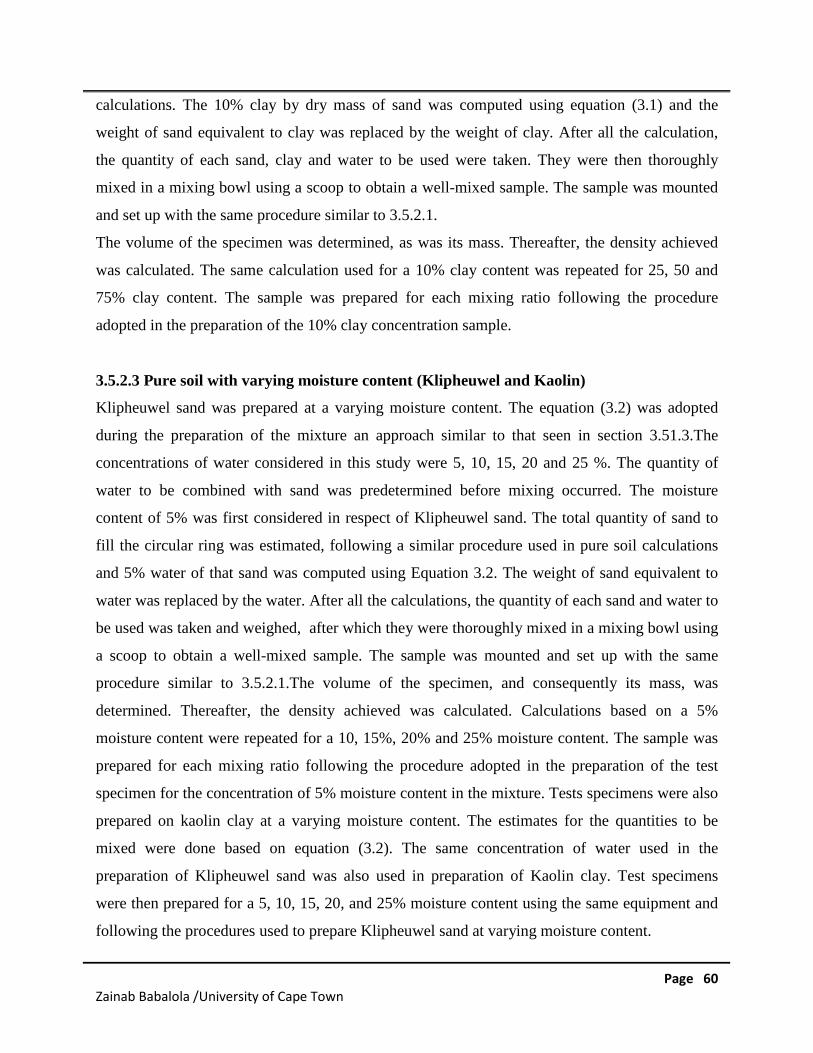
Page 60Zainab Babalola /University of Cape Town
calculations. The 10% clay by dry mass of sand was computed using equation (3.1) and the
weight of sand equivalent to clay was replaced by the weight of clay. After all the calculation,
the quantity of each sand, clay and water to be used were taken. They were then thoroughly
mixed in a mixing bowl using a scoop to obtain a well-mixed sample. The sample was mounted
and set up with the same procedure similar to 3.5.2.1.
The volume of the specimen was determined, as was its mass. Thereafter, the density achieved
was calculated. The same calculation used for a 10% clay content was repeated for 25, 50 and
75% clay content. The sample was prepared for each mixing ratio following the procedure
adopted in the preparation of the 10% clay concentration sample.
3.5.2.3 Pure soil with varying moisture content (Klipheuwel and Kaolin)
Klipheuwel sand was prepared at a varying moisture content. The equation (3.2) was adopted
during the preparation of the mixture an approach similar to that seen in section 3.51.3.The
concentrations of water considered in this study were 5, 10, 15, 20 and 25 %. The quantity of
water to be combined with sand was predetermined before mixing occurred. The moisture
content of 5% was first considered in respect of Klipheuwel sand. The total quantity of sand to
fill the circular ring was estimated, following a similar procedure used in pure soil calculations
and 5% water of that sand was computed using Equation 3.2. The weight of sand equivalent to
water was replaced by the water. After all the calculations, the quantity of each sand and water to
be used was taken and weighed, after which they were thoroughly mixed in a mixing bowl using
a scoop to obtain a well-mixed sample. The sample was mounted and set up with the same
procedure similar to 3.5.2.1.The volume of the specimen, and consequently its mass, was
determined. Thereafter, the density achieved was calculated. Calculations based on a 5%
moisture content were repeated for a 10, 15%, 20% and 25% moisture content. The sample was
prepared for each mixing ratio following the procedure adopted in the preparation of the test
specimen for the concentration of 5% moisture content in the mixture. Tests specimens were also
prepared on kaolin clay at a varying moisture content. The estimates for the quantities to be
mixed were done based on equation (3.2). The same concentration of water used in the
preparation of Klipheuwel sand was also used in preparation of Kaolin clay. Test specimens
were then prepared for a 5, 10, 15, 20, and 25% moisture content using the same equipment and
following the procedures used to prepare Klipheuwel sand at varying moisture content.
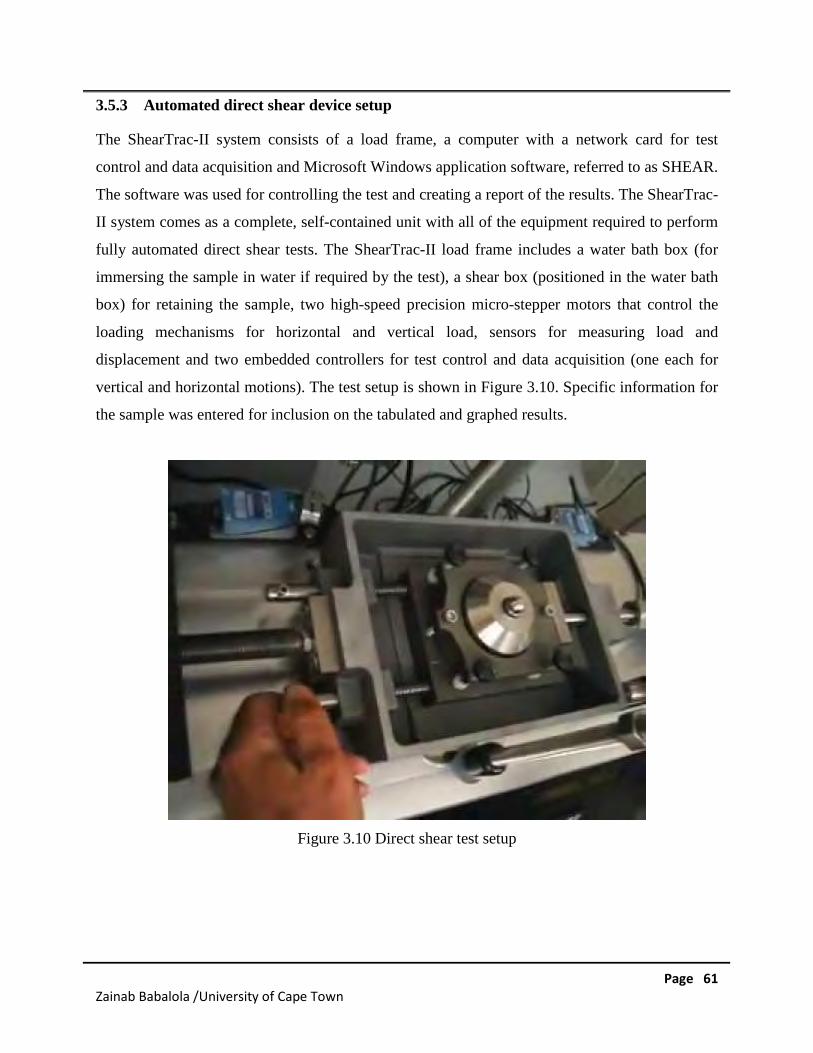
Page 61Zainab Babalola /University of Cape Town
3.5.3 Automated direct shear device setup
The ShearTrac-II system consists of a load frame, a computer with a network card for test
control and data acquisition and Microsoft Windows application software, referred to as SHEAR.
The software was used for controlling the test and creating a report of the results. The ShearTrac-
II system comes as a complete, self-contained unit with all of the equipment required to perform
fully automated direct shear tests. The ShearTrac-II load frame includes a water bath box (for
immersing the sample in water if required by the test), a shear box (positioned in the water bath
box) for retaining the sample, two high-speed precision micro-stepper motors that control the
loading mechanisms for horizontal and vertical load, sensors for measuring load and
displacement and two embedded controllers for test control and data acquisition (one each for
vertical and horizontal motions). The test setup is shown in Figure 3.10. Specific information for
the sample was entered for inclusion on the tabulated and graphed results.
Figure 3.10 Direct shear test setup
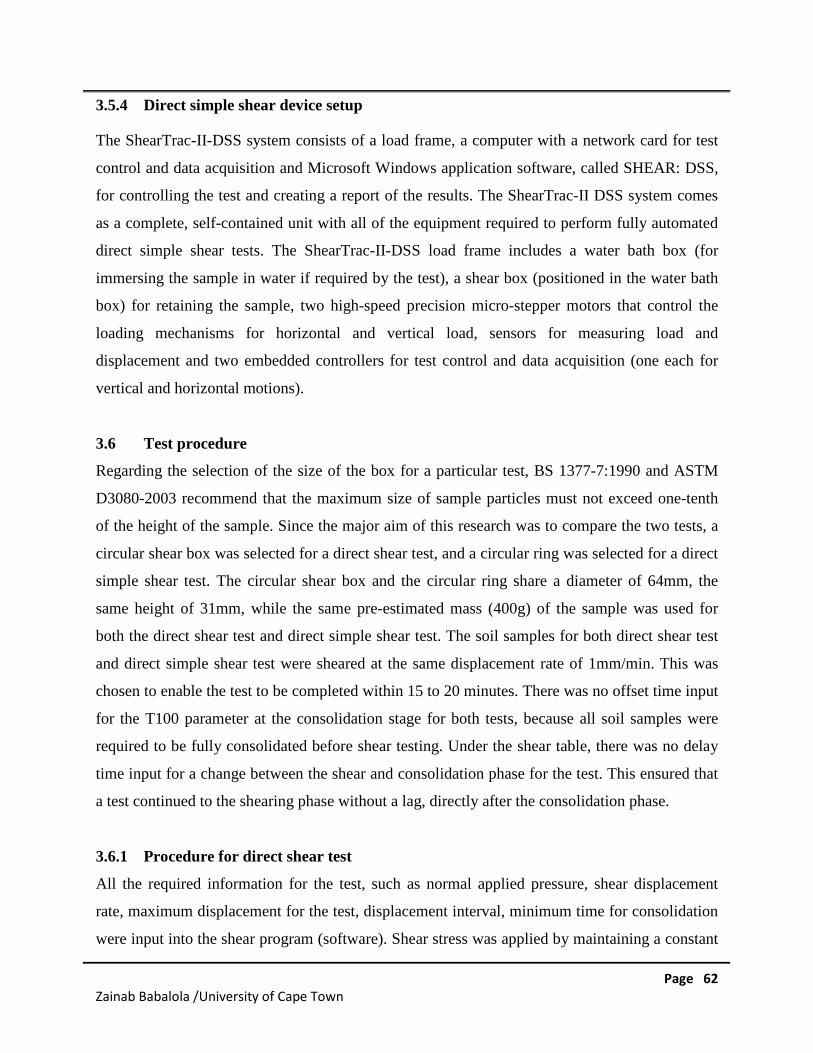
Page 62Zainab Babalola /University of Cape Town
3.5.4 Direct simple shear device setup
The ShearTrac-II-DSS system consists of a load frame, a computer with a network card for test
control and data acquisition and Microsoft Windows application software, called SHEAR: DSS,
for controlling the test and creating a report of the results. The ShearTrac-II DSS system comes
as a complete, self-contained unit with all of the equipment required to perform fully automated
direct simple shear tests. The ShearTrac-II-DSS load frame includes a water bath box (for
immersing the sample in water if required by the test), a shear box (positioned in the water bath
box) for retaining the sample, two high-speed precision micro-stepper motors that control the
loading mechanisms for horizontal and vertical load, sensors for measuring load and
displacement and two embedded controllers for test control and data acquisition (one each for
vertical and horizontal motions).
3.6 Test procedure
Regarding the selection of the size of the box for a particular test, BS 1377-7:1990 and ASTM
D3080-2003 recommend that the maximum size of sample particles must not exceed one-tenth
of the height of the sample. Since the major aim of this research was to compare the two tests, a
circular shear box was selected for a direct shear test, and a circular ring was selected for a direct
simple shear test. The circular shear box and the circular ring share a diameter of 64mm, the
same height of 31mm, while the same pre-estimated mass (400g) of the sample was used for
both the direct shear test and direct simple shear test. The soil samples for both direct shear test
and direct simple shear test were sheared at the same displacement rate of 1mm/min. This was
chosen to enable the test to be completed within 15 to 20 minutes. There was no offset time input
for the T100 parameter at the consolidation stage for both tests, because all soil samples were
required to be fully consolidated before shear testing. Under the shear table, there was no delay
time input for a change between the shear and consolidation phase for the test. This ensured that
a test continued to the shearing phase without a lag, directly after the consolidation phase.
3.6.1 Procedure for direct shear test
All the required information for the test, such as normal applied pressure, shear displacement
rate, maximum displacement for the test, displacement interval, minimum time for consolidation
were input into the shear program (software). Shear stress was applied by maintaining a constant
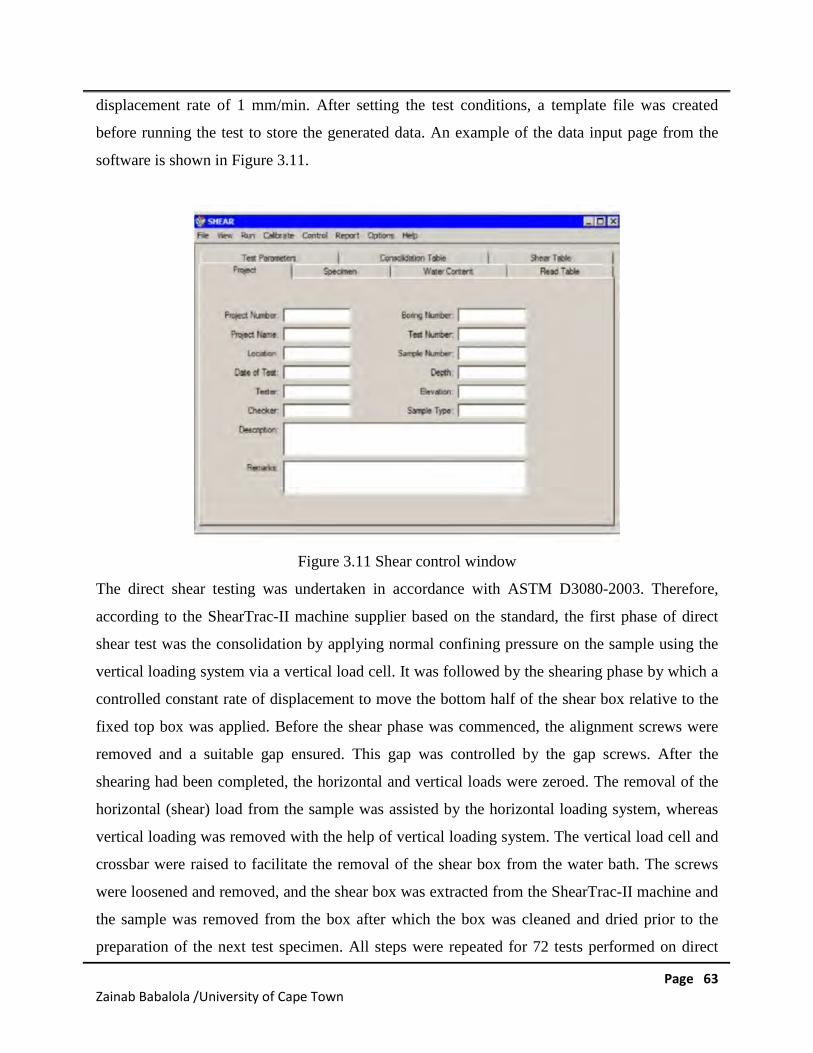
Page 63Zainab Babalola /University of Cape Town
displacement rate of 1 mm/min. After setting the test conditions, a template file was created
before running the test to store the generated data. An example of the data input page from the
software is shown in Figure 3.11.
Figure 3.11 Shear control window
The direct shear testing was undertaken in accordance with ASTM D3080-2003. Therefore,
according to the ShearTrac-II machine supplier based on the standard, the first phase of direct
shear test was the consolidation by applying normal confining pressure on the sample using the
vertical loading system via a vertical load cell. It was followed by the shearing phase by which a
controlled constant rate of displacement to move the bottom half of the shear box relative to the
fixed top box was applied. Before the shear phase was commenced, the alignment screws were
removed and a suitable gap ensured. This gap was controlled by the gap screws. After the
shearing had been completed, the horizontal and vertical loads were zeroed. The removal of the
horizontal (shear) load from the sample was assisted by the horizontal loading system, whereas
vertical loading was removed with the help of vertical loading system. The vertical load cell and
crossbar were raised to facilitate the removal of the shear box from the water bath. The screws
were loosened and removed, and the shear box was extracted from the ShearTrac-II machine and
the sample was removed from the box after which the box was cleaned and dried prior to the
preparation of the next test specimen. All steps were repeated for 72 tests performed on direct
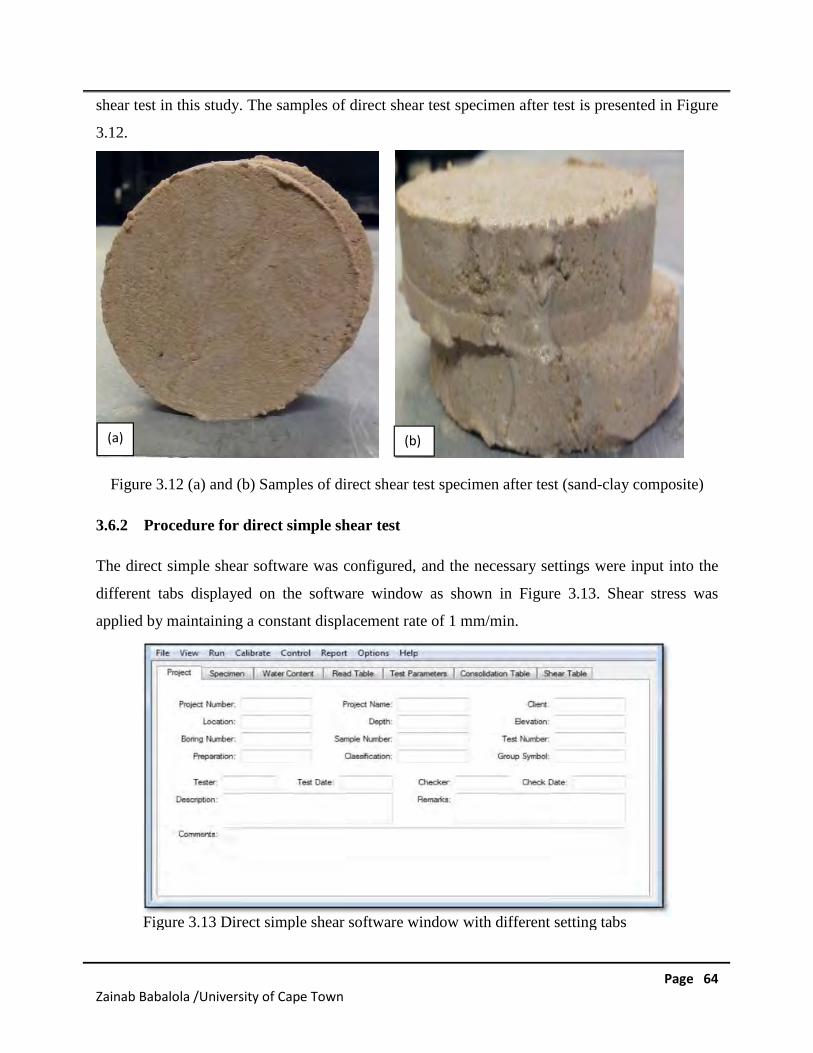
Page 64Zainab Babalola /University of Cape Town
shear test in this study. The samples of direct shear test specimen after test is presented in Figure
3.12.
Figure 3.12 (a) and (b) Samples of direct shear test specimen after test (sand-clay composite)
3.6.2 Procedure for direct simple shear test
The direct simple shear software was configured, and the necessary settings were input into the
different tabs displayed on the software window as shown in Figure 3.13. Shear stress was
applied by maintaining a constant displacement rate of 1 mm/min.
(a)(a) (b)
Figure 3.13 Direct simple shear software window with different setting tabs
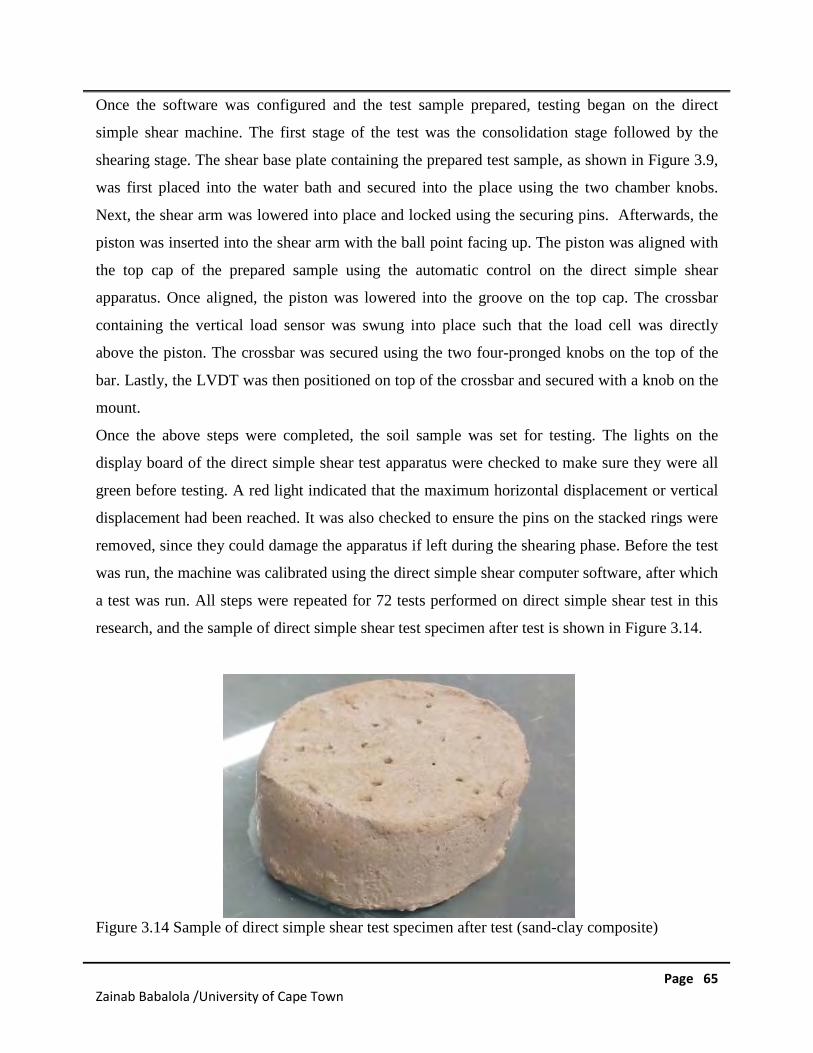
Page 65Zainab Babalola /University of Cape Town
Once the software was configured and the test sample prepared, testing began on the direct
simple shear machine. The first stage of the test was the consolidation stage followed by the
shearing stage. The shear base plate containing the prepared test sample, as shown in Figure 3.9,
was first placed into the water bath and secured into the place using the two chamber knobs.
Next, the shear arm was lowered into place and locked using the securing pins. Afterwards, the
piston was inserted into the shear arm with the ball point facing up. The piston was aligned with
the top cap of the prepared sample using the automatic control on the direct simple shear
apparatus. Once aligned, the piston was lowered into the groove on the top cap. The crossbar
containing the vertical load sensor was swung into place such that the load cell was directly
above the piston. The crossbar was secured using the two four-pronged knobs on the top of the
bar. Lastly, the LVDT was then positioned on top of the crossbar and secured with a knob on the
mount.
Once the above steps were completed, the soil sample was set for testing. The lights on the
display board of the direct simple shear test apparatus were checked to make sure they were all
green before testing. A red light indicated that the maximum horizontal displacement or vertical
displacement had been reached. It was also checked to ensure the pins on the stacked rings were
removed, since they could damage the apparatus if left during the shearing phase. Before the test
was run, the machine was calibrated using the direct simple shear computer software, after which
a test was run. All steps were repeated for 72 tests performed on direct simple shear test in this
research, and the sample of direct simple shear test specimen after test is shown in Figure 3.14.
Figure 3.14 Sample of direct simple shear test specimen after test (sand-clay composite)
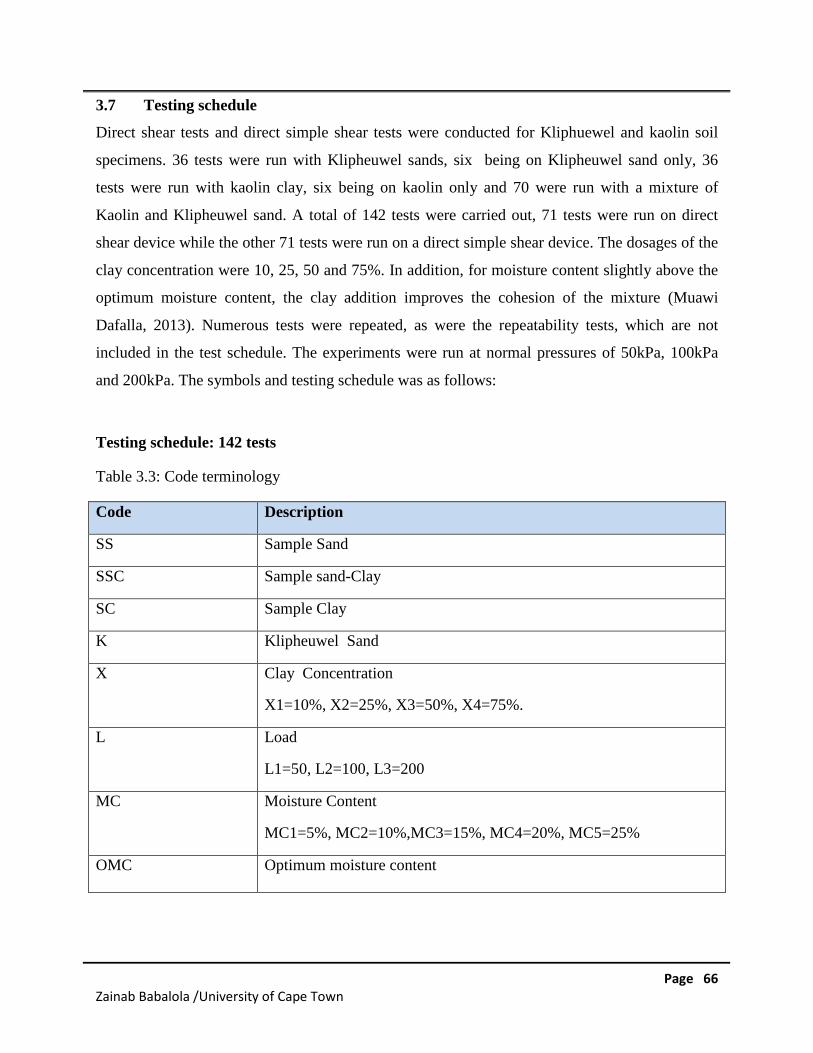
Page 66Zainab Babalola /University of Cape Town
3.7 Testing schedule
Direct shear tests and direct simple shear tests were conducted for Kliphuewel and kaolin soil
specimens. 36 tests were run with Klipheuwel sands, six being on Klipheuwel sand only, 36
tests were run with kaolin clay, six being on kaolin only and 70 were run with a mixture of
Kaolin and Klipheuwel sand. A total of 142 tests were carried out, 71 tests were run on direct
shear device while the other 71 tests were run on a direct simple shear device. The dosages of the
clay concentration were 10, 25, 50 and 75%. In addition, for moisture content slightly above the
optimum moisture content, the clay addition improves the cohesion of the mixture (Muawi
Dafalla, 2013). Numerous tests were repeated, as were the repeatability tests, which are not
included in the test schedule. The experiments were run at normal pressures of 50kPa, 100kPa
and 200kPa. The symbols and testing schedule was as follows:
Testing schedule: 142 tests
Table 3.3: Code terminology
Code Description
SS Sample Sand
SSC Sample sand-Clay
SC Sample Clay
K Klipheuwel Sand
X Clay Concentration
X1=10%, X2=25%, X3=50%, X4=75%.
L Load
L1=50, L2=100, L3=200
MC Moisture Content
MC1=5%, MC2=10%,MC3=15%, MC4=20%, MC5=25%
OMC Optimum moisture content
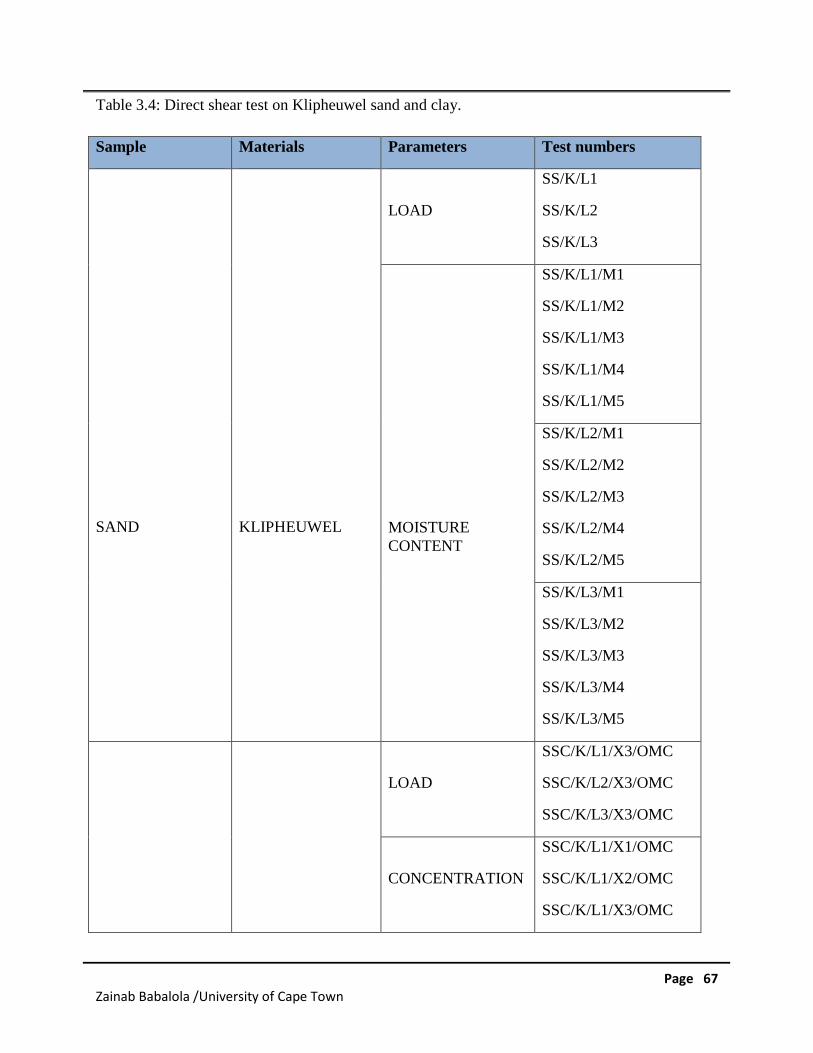
Page 67Zainab Babalola /University of Cape Town
Table 3.4: Direct shear test on Klipheuwel sand and clay.
Sample Materials Parameters Test numbers
SAND KLIPHEUWEL
LOAD
SS/K/L1
SS/K/L2
SS/K/L3
MOISTURECONTENT
SS/K/L1/M1
SS/K/L1/M2
SS/K/L1/M3
SS/K/L1/M4
SS/K/L1/M5
SS/K/L2/M1
SS/K/L2/M2
SS/K/L2/M3
SS/K/L2/M4
SS/K/L2/M5
SS/K/L3/M1
SS/K/L3/M2
SS/K/L3/M3
SS/K/L3/M4
SS/K/L3/M5
LOAD
SSC/K/L1/X3/OMC
SSC/K/L2/X3/OMC
SSC/K/L3/X3/OMC
CONCENTRATION
SSC/K/L1/X1/OMC
SSC/K/L1/X2/OMC
SSC/K/L1/X3/OMC
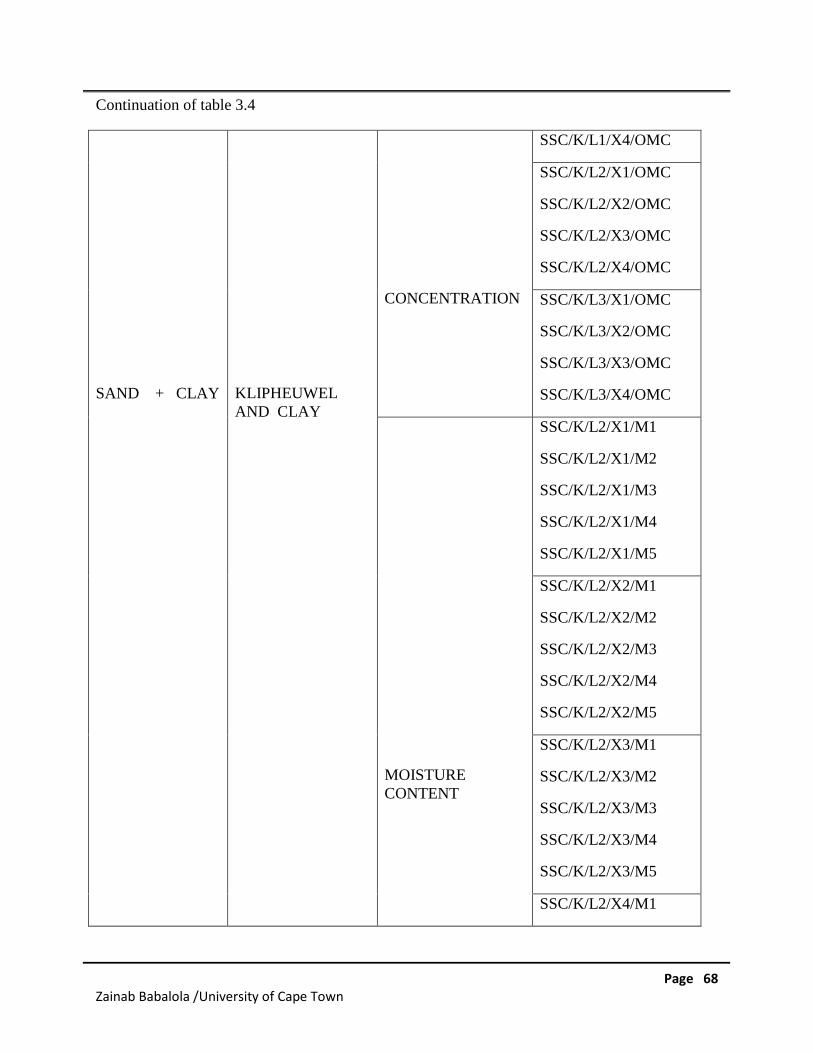
Page 68Zainab Babalola /University of Cape Town
Continuation of table 3.4
SAND + CLAY KLIPHEUWELAND CLAY
CONCENTRATION
SSC/K/L1/X4/OMC
SSC/K/L2/X1/OMC
SSC/K/L2/X2/OMC
SSC/K/L2/X3/OMC
SSC/K/L2/X4/OMC
SSC/K/L3/X1/OMC
SSC/K/L3/X2/OMC
SSC/K/L3/X3/OMC
SSC/K/L3/X4/OMC
MOISTURECONTENT
SSC/K/L2/X1/M1
SSC/K/L2/X1/M2
SSC/K/L2/X1/M3
SSC/K/L2/X1/M4
SSC/K/L2/X1/M5
SSC/K/L2/X2/M1
SSC/K/L2/X2/M2
SSC/K/L2/X2/M3
SSC/K/L2/X2/M4
SSC/K/L2/X2/M5
SSC/K/L2/X3/M1
SSC/K/L2/X3/M2
SSC/K/L2/X3/M3
SSC/K/L2/X3/M4
SSC/K/L2/X3/M5
SSC/K/L2/X4/M1
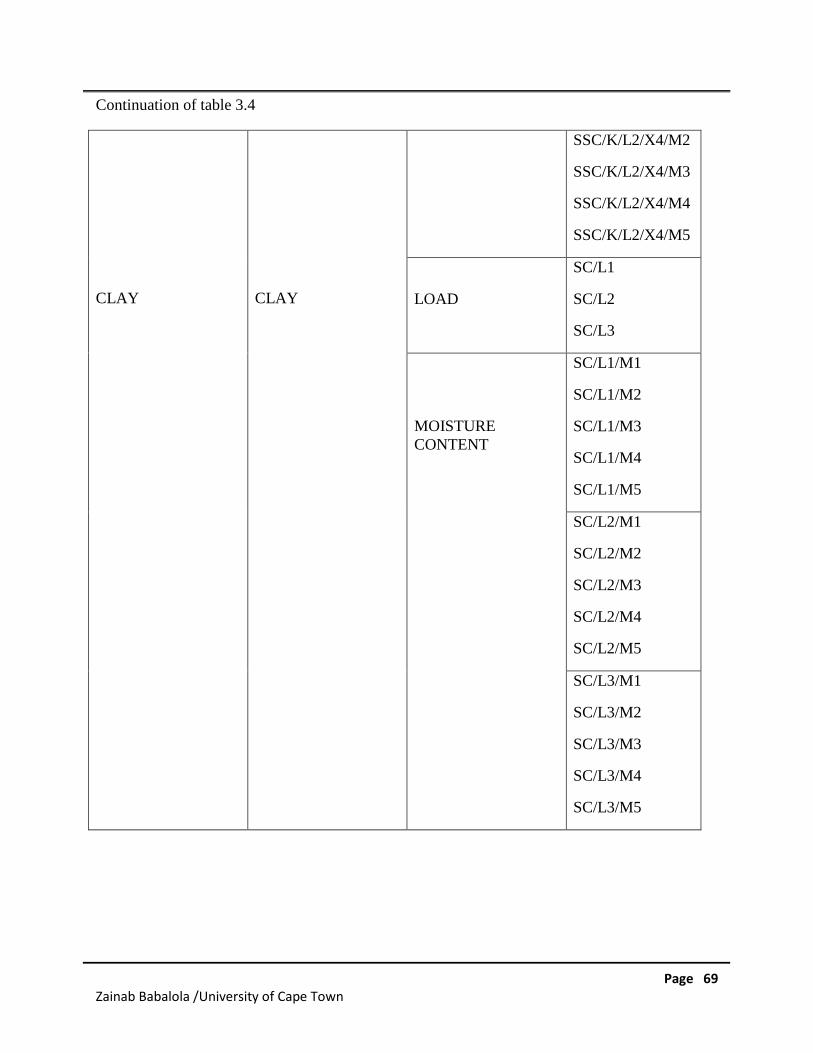
Page 69Zainab Babalola /University of Cape Town
Continuation of table 3.4
CLAY CLAY
SSC/K/L2/X4/M2
SSC/K/L2/X4/M3
SSC/K/L2/X4/M4
SSC/K/L2/X4/M5
LOAD
SC/L1
SC/L2
SC/L3
MOISTURECONTENT
SC/L1/M1
SC/L1/M2
SC/L1/M3
SC/L1/M4
SC/L1/M5
SC/L2/M1
SC/L2/M2
SC/L2/M3
SC/L2/M4
SC/L2/M5
SC/L3/M1
SC/L3/M2
SC/L3/M3
SC/L3/M4
SC/L3/M5
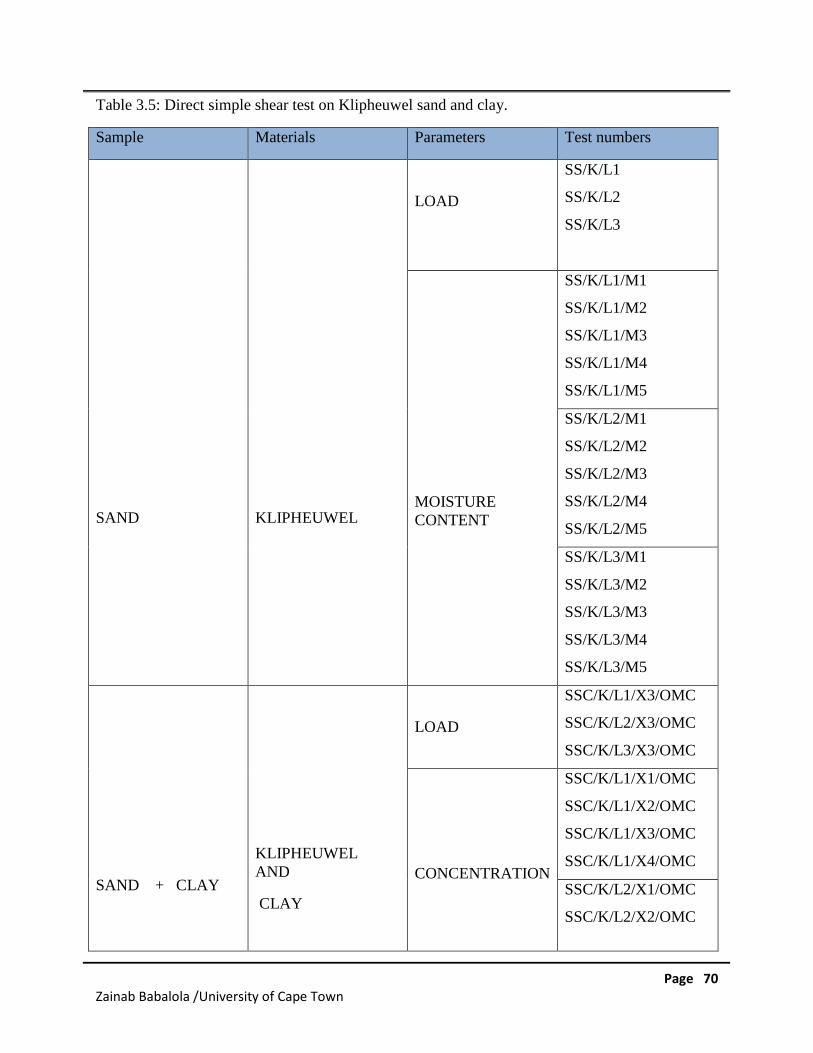
Page 70Zainab Babalola /University of Cape Town
Table 3.5: Direct simple shear test on Klipheuwel sand and clay.
Sample Materials Parameters Test numbers
SAND KLIPHEUWEL
LOAD
SS/K/L1
SS/K/L2
SS/K/L3
MOISTURECONTENT
SS/K/L1/M1
SS/K/L1/M2
SS/K/L1/M3
SS/K/L1/M4
SS/K/L1/M5
SS/K/L2/M1
SS/K/L2/M2
SS/K/L2/M3
SS/K/L2/M4
SS/K/L2/M5
SS/K/L3/M1
SS/K/L3/M2
SS/K/L3/M3
SS/K/L3/M4
SS/K/L3/M5
SAND + CLAY
KLIPHEUWELAND
CLAY
LOAD
SSC/K/L1/X3/OMC
SSC/K/L2/X3/OMC
SSC/K/L3/X3/OMC
CONCENTRATION
SSC/K/L1/X1/OMC
SSC/K/L1/X2/OMC
SSC/K/L1/X3/OMC
SSC/K/L1/X4/OMC
SSC/K/L2/X1/OMC
SSC/K/L2/X2/OMC
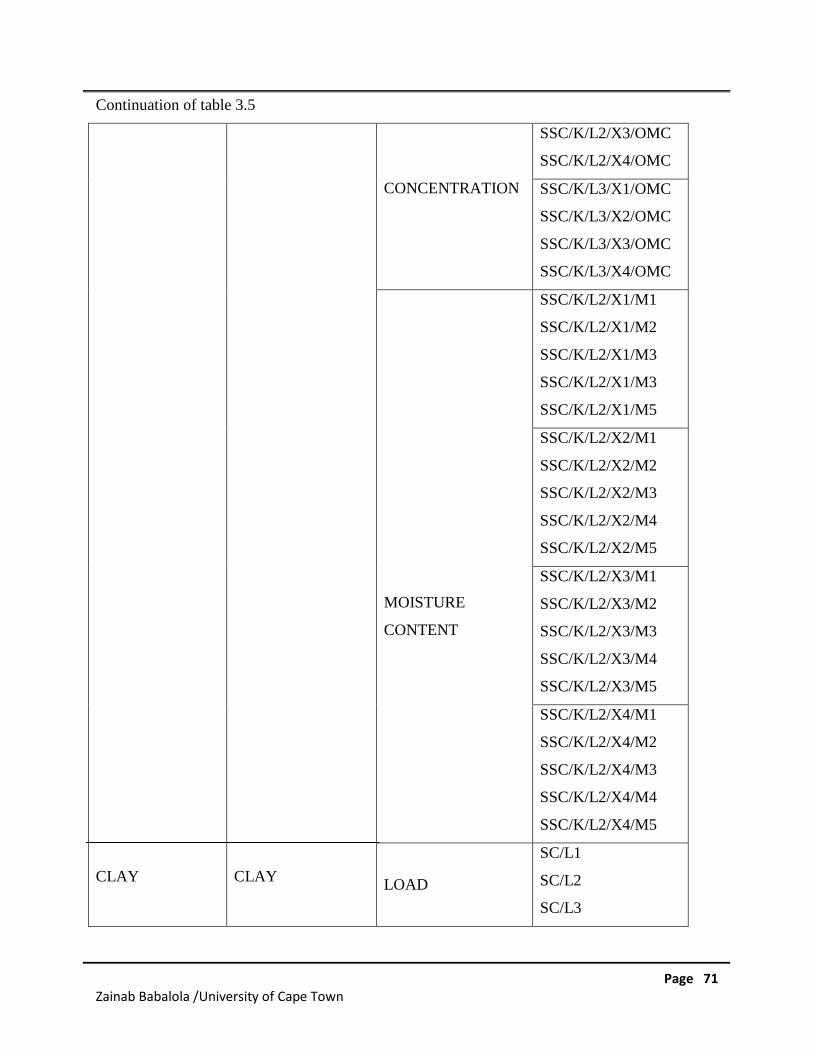
Page 71Zainab Babalola /University of Cape Town
Continuation of table 3.5
CLAY CLAY
CONCENTRATION
SSC/K/L2/X3/OMC
SSC/K/L2/X4/OMC
SSC/K/L3/X1/OMC
SSC/K/L3/X2/OMC
SSC/K/L3/X3/OMC
SSC/K/L3/X4/OMC
MOISTURE
CONTENT
SSC/K/L2/X1/M1
SSC/K/L2/X1/M2
SSC/K/L2/X1/M3
SSC/K/L2/X1/M3
SSC/K/L2/X1/M5
SSC/K/L2/X2/M1
SSC/K/L2/X2/M2
SSC/K/L2/X2/M3
SSC/K/L2/X2/M4
SSC/K/L2/X2/M5
SSC/K/L2/X3/M1
SSC/K/L2/X3/M2
SSC/K/L2/X3/M3
SSC/K/L2/X3/M4
SSC/K/L2/X3/M5
SSC/K/L2/X4/M1
SSC/K/L2/X4/M2
SSC/K/L2/X4/M3
SSC/K/L2/X4/M4
SSC/K/L2/X4/M5
LOAD
SC/L1
SC/L2
SC/L3
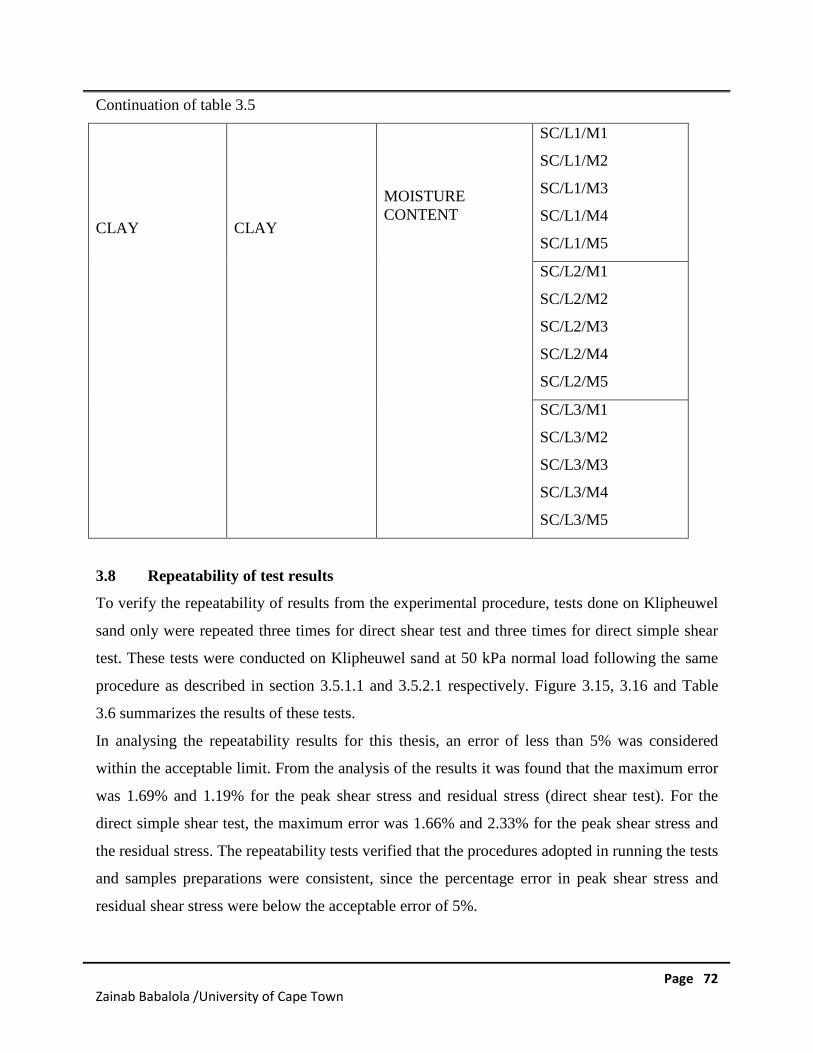
Page 72Zainab Babalola /University of Cape Town
Continuation of table 3.5
CLAY CLAY
MOISTURECONTENT
SC/L1/M1
SC/L1/M2
SC/L1/M3
SC/L1/M4
SC/L1/M5
SC/L2/M1
SC/L2/M2
SC/L2/M3
SC/L2/M4
SC/L2/M5
SC/L3/M1
SC/L3/M2
SC/L3/M3
SC/L3/M4
SC/L3/M5
3.8 Repeatability of test results
To verify the repeatability of results from the experimental procedure, tests done on Klipheuwel
sand only were repeated three times for direct shear test and three times for direct simple shear
test. These tests were conducted on Klipheuwel sand at 50 kPa normal load following the same
procedure as described in section 3.5.1.1 and 3.5.2.1 respectively. Figure 3.15, 3.16 and Table
3.6 summarizes the results of these tests.
In analysing the repeatability results for this thesis, an error of less than 5% was considered
within the acceptable limit. From the analysis of the results it was found that the maximum error
was 1.69% and 1.19% for the peak shear stress and residual stress (direct shear test). For the
direct simple shear test, the maximum error was 1.66% and 2.33% for the peak shear stress and
the residual stress. The repeatability tests verified that the procedures adopted in running the tests
and samples preparations were consistent, since the percentage error in peak shear stress and
residual shear stress were below the acceptable error of 5%.
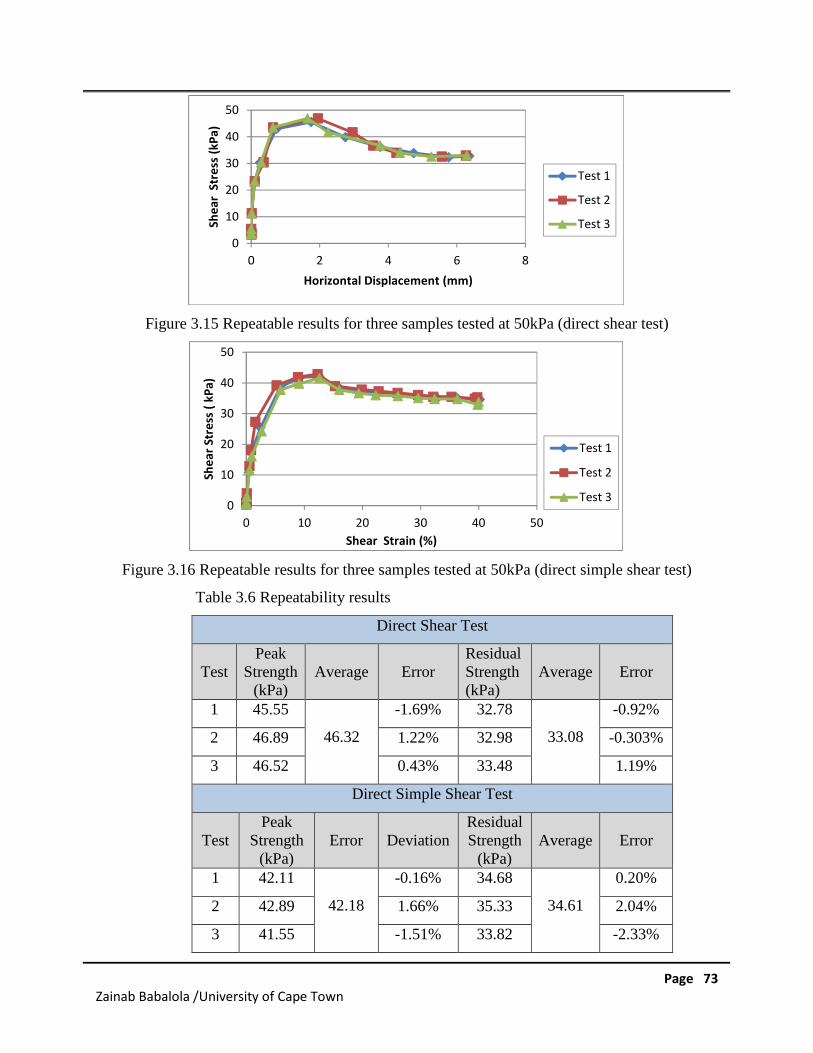
Page 73Zainab Babalola /University of Cape Town
Figure 3.15 Repeatable results for three samples tested at 50kPa (direct shear test)
Figure 3.16 Repeatable results for three samples tested at 50kPa (direct simple shear test)
Table 3.6 Repeatability results
Direct Shear Test
TestPeak
Strength(kPa)
Average ErrorResidualStrength(kPa)
Average Error
1 45.55
46.32
-1.69% 32.78
33.08
-0.92%
2 46.89 1.22% 32.98 -0.303%
3 46.52 0.43% 33.48 1.19%
Direct Simple Shear Test
TestPeak
Strength(kPa)
Error DeviationResidualStrength
(kPa)Average Error
1 42.11
42.18
-0.16% 34.68
34.61
0.20%
2 42.89 1.66% 35.33 2.04%
3 41.55 -1.51% 33.82 -2.33%
0
10
20
30
40
50
0 2 4 6 8
She
arSt
ress
(kP
a)
Horizontal Displacement (mm)
Test 1
Test 2
Test 3
0
10
20
30
40
50
0 10 20 30 40 50
She
arSt
ress
(kP
a)
Shear Strain (%)
Test 1
Test 2
Test 3
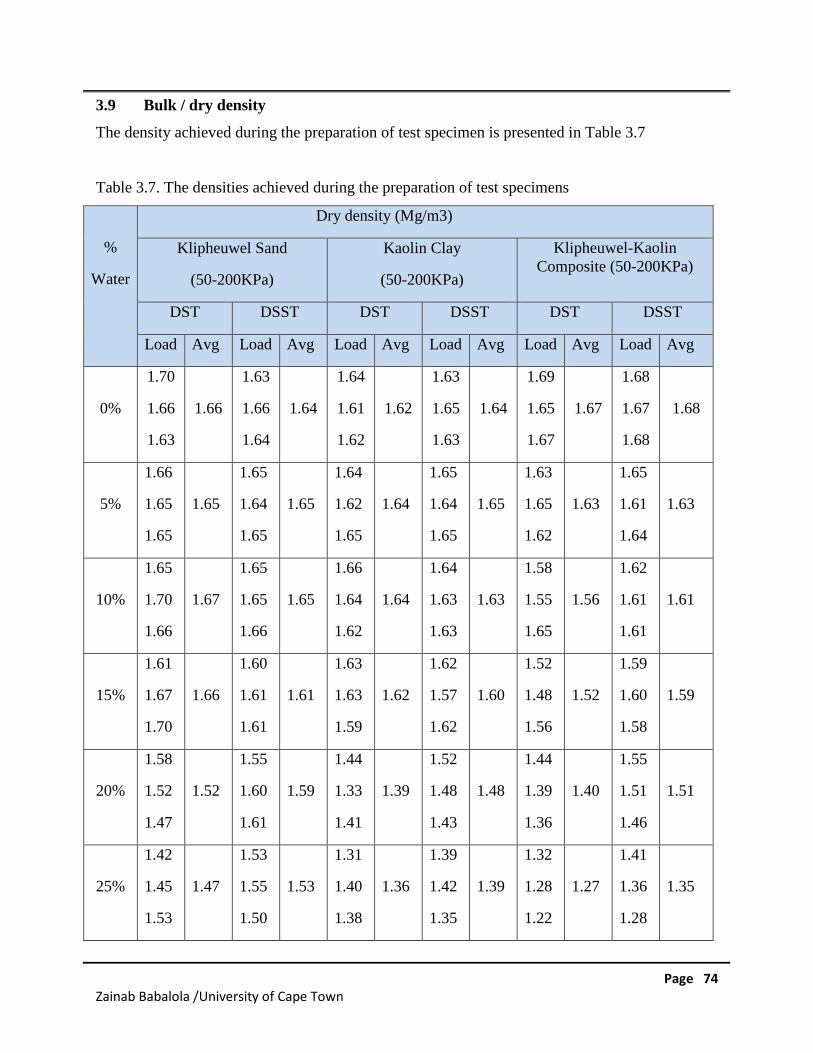
Page 74Zainab Babalola /University of Cape Town
3.9 Bulk / dry density
The density achieved during the preparation of test specimen is presented in Table 3.7
Table 3.7. The densities achieved during the preparation of test specimens
%
Water
Dry density (Mg/m3)
Klipheuwel Sand
(50-200KPa)
Kaolin Clay
(50-200KPa)
Klipheuwel-KaolinComposite (50-200KPa)
DST DSST DST DSST DST DSST
Load Avg Load Avg Load Avg Load Avg Load Avg Load Avg
0%
1.70
1.66
1.63
1.66
1.63
1.66
1.64
1.64
1.64
1.61
1.62
1.62
1.63
1.65
1.63
1.64
1.69
1.65
1.67
1.67
1.68
1.67
1.68
1.68
5%
1.66
1.65
1.65
1.65
1.65
1.64
1.65
1.65
1.64
1.62
1.65
1.64
1.65
1.64
1.65
1.65
1.63
1.65
1.62
1.63
1.65
1.61
1.64
1.63
10%
1.65
1.70
1.66
1.67
1.65
1.65
1.66
1.65
1.66
1.64
1.62
1.64
1.64
1.63
1.63
1.63
1.58
1.55
1.65
1.56
1.62
1.61
1.61
1.61
15%
1.61
1.67
1.70
1.66
1.60
1.61
1.61
1.61
1.63
1.63
1.59
1.62
1.62
1.57
1.62
1.60
1.52
1.48
1.56
1.52
1.59
1.60
1.58
1.59
20%
1.58
1.52
1.47
1.52
1.55
1.60
1.61
1.59
1.44
1.33
1.41
1.39
1.52
1.48
1.43
1.48
1.44
1.39
1.36
1.40
1.55
1.51
1.46
1.51
25%
1.42
1.45
1.53
1.47
1.53
1.55
1.50
1.53
1.31
1.40
1.38
1.36
1.39
1.42
1.35
1.39
1.32
1.28
1.22
1.27
1.41
1.36
1.28
1.35
Page 75Zainab Babalola /University of Cape Town
3.10 Quality control
To ensure that all tests were performed up to standard, several factors were taken into
consideration as detailed below:
1. No soil sample or composite was reused once tested.
2. All equipment was cleaned and checked for any defects when soil samples were tested.
3. All samples were properly weighed using calibrated weighing scales and prepared prior
to testing.
4. Mixing clay with sand was properly done with a scoop to ensure a homogenous random
mixing. Water was added in small amounts to ensure balanced water absorption
between clay and sand
5. The number of drops needed to compress the soil was kept unchanged for every sample
and the height from which the hand compactor was dropped to compress the soil was
maintained constant.
3.11 Data processing
All data were processed by ShearTrac-II universal shear device software. After the completion
of the test, the data from the created template file in the form of tables and figures were
downloaded and the results from tables such as shear stresses, vertical and horizontal
displacements were transferred into excel sheets and the new graphs of shear stress versus
horizontal displacement were plotted. In order to determine the internal friction angle and
cohesion from the raw data, first the peak shear stress for each test run was recorded. A straight-
line graph of peak shear stress versus the corresponding normal pressure used for that particular
test was then drawn for normal pressures of 50kPa, 100kPa and 200kPa. A line of best fit was
generated and the gradient and Y-intercept values were determined from the equation. The
arctangent of the gradient value was then calculated to obtain the internal friction angle. The Y-
intercept of the equation of the line of best fit corresponded to the apparent cohesion value.
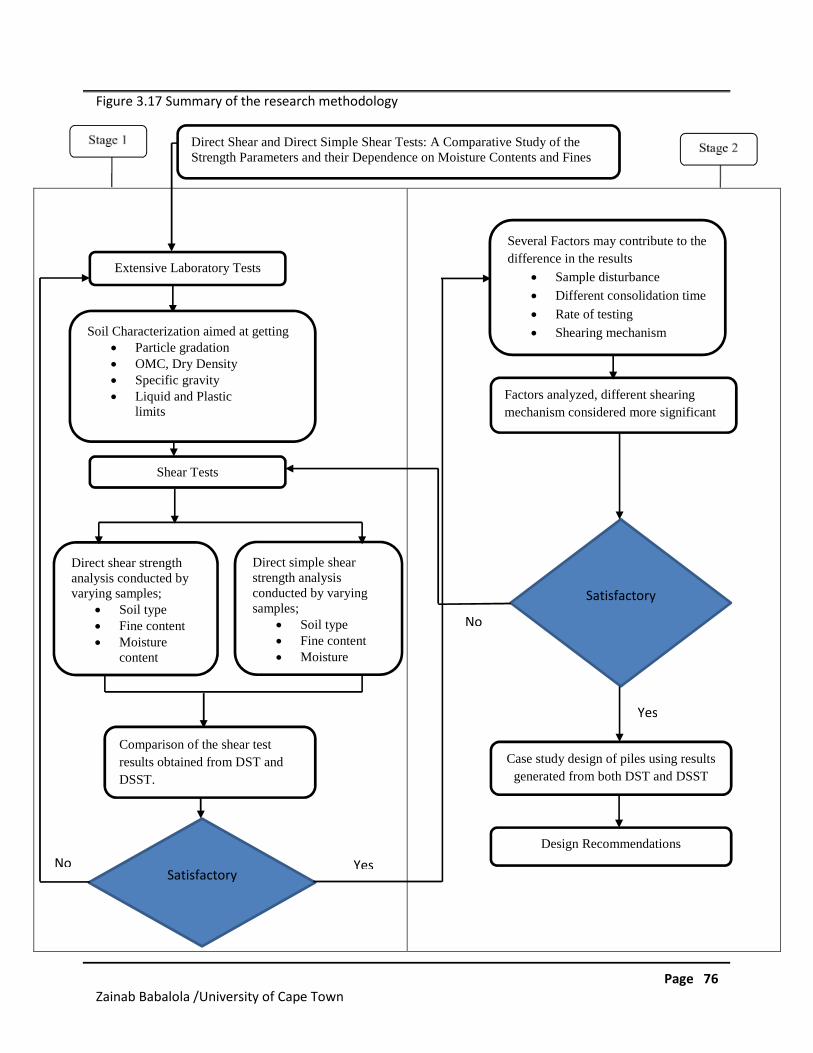
Page 76Zainab Babalola /University of Cape Town
RESULTS, ANALYSIS AND DISCUSSIONS
Direct shear strengthanalysis conducted byvarying samples;
• Soil type• Fine content• Moisture
content
Direct simple shearstrength analysisconducted by varyingsamples;
• Soil type• Fine content• Moisture
Factors analyzed, different shearing
mechanism considered more significant
Satisfactory
Design Recommendations
Satisfactory
Extensive Laboratory Tests
Soil Characterization aimed at getting• Particle gradation• OMC, Dry Density• Specific gravity• Liquid and Plastic
limits
Shear Tests
Several Factors may contribute to the
difference in the results
• Sample disturbance
• Different consolidation time
• Rate of testing
• Shearing mechanism
Case study design of piles using results
generated from both DST and DSST
Comparison of the shear test
results obtained from DST and
DSST.
No
No Yes
Yes
Figure 3.17 Summary of the research methodology
Direct Shear and Direct Simple Shear Tests: A Comparative Study of theStrength Parameters and their Dependence on Moisture Contents and FinesSimple Shear Tests: A Comparative Study of the Strength Parameters and
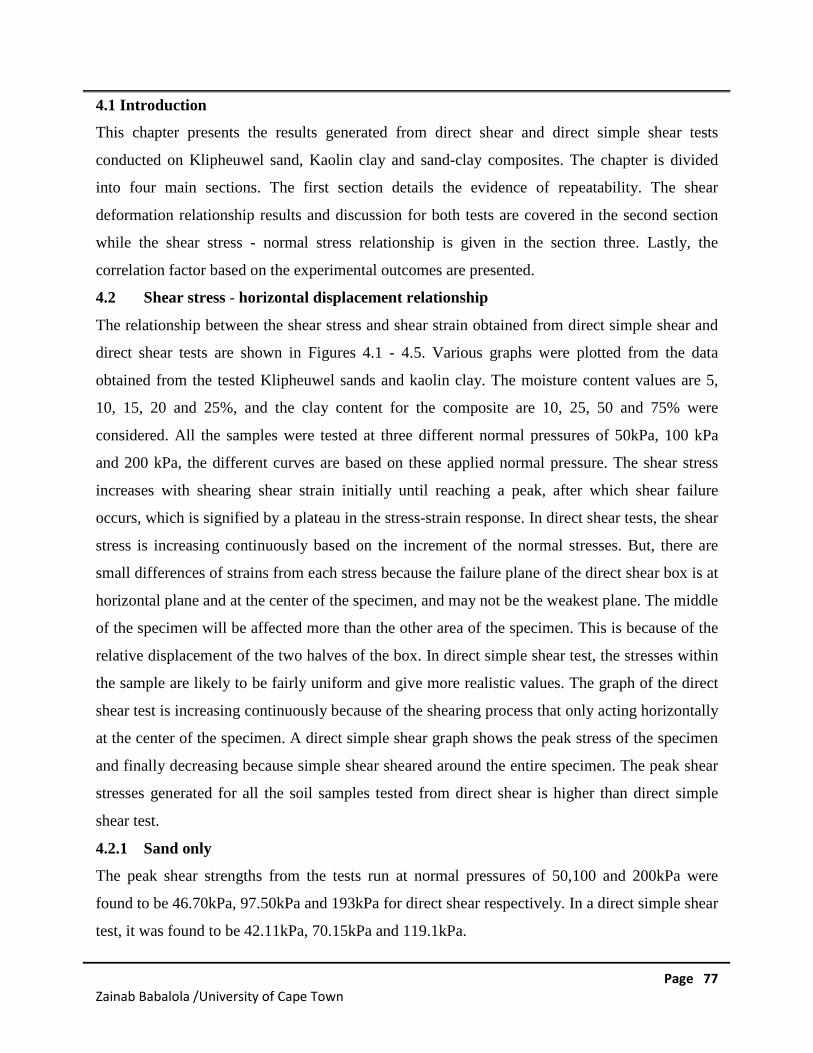
Page 77Zainab Babalola /University of Cape Town
4.1 Introduction
This chapter presents the results generated from direct shear and direct simple shear tests
conducted on Klipheuwel sand, Kaolin clay and sand-clay composites. The chapter is divided
into four main sections. The first section details the evidence of repeatability. The shear
deformation relationship results and discussion for both tests are covered in the second section
while the shear stress - normal stress relationship is given in the section three. Lastly, the
correlation factor based on the experimental outcomes are presented.
4.2 Shear stress - horizontal displacement relationship
The relationship between the shear stress and shear strain obtained from direct simple shear and
direct shear tests are shown in Figures 4.1 - 4.5. Various graphs were plotted from the data
obtained from the tested Klipheuwel sands and kaolin clay. The moisture content values are 5,
10, 15, 20 and 25%, and the clay content for the composite are 10, 25, 50 and 75% were
considered. All the samples were tested at three different normal pressures of 50kPa, 100 kPa
and 200 kPa, the different curves are based on these applied normal pressure. The shear stress
increases with shearing shear strain initially until reaching a peak, after which shear failure
occurs, which is signified by a plateau in the stress-strain response. In direct shear tests, the shear
stress is increasing continuously based on the increment of the normal stresses. But, there are
small differences of strains from each stress because the failure plane of the direct shear box is at
horizontal plane and at the center of the specimen, and may not be the weakest plane. The middle
of the specimen will be affected more than the other area of the specimen. This is because of the
relative displacement of the two halves of the box. In direct simple shear test, the stresses within
the sample are likely to be fairly uniform and give more realistic values. The graph of the direct
shear test is increasing continuously because of the shearing process that only acting horizontally
at the center of the specimen. A direct simple shear graph shows the peak stress of the specimen
and finally decreasing because simple shear sheared around the entire specimen. The peak shear
stresses generated for all the soil samples tested from direct shear is higher than direct simple
shear test.
4.2.1 Sand only
The peak shear strengths from the tests run at normal pressures of 50,100 and 200kPa were
found to be 46.70kPa, 97.50kPa and 193kPa for direct shear respectively. In a direct simple shear
test, it was found to be 42.11kPa, 70.15kPa and 119.1kPa.
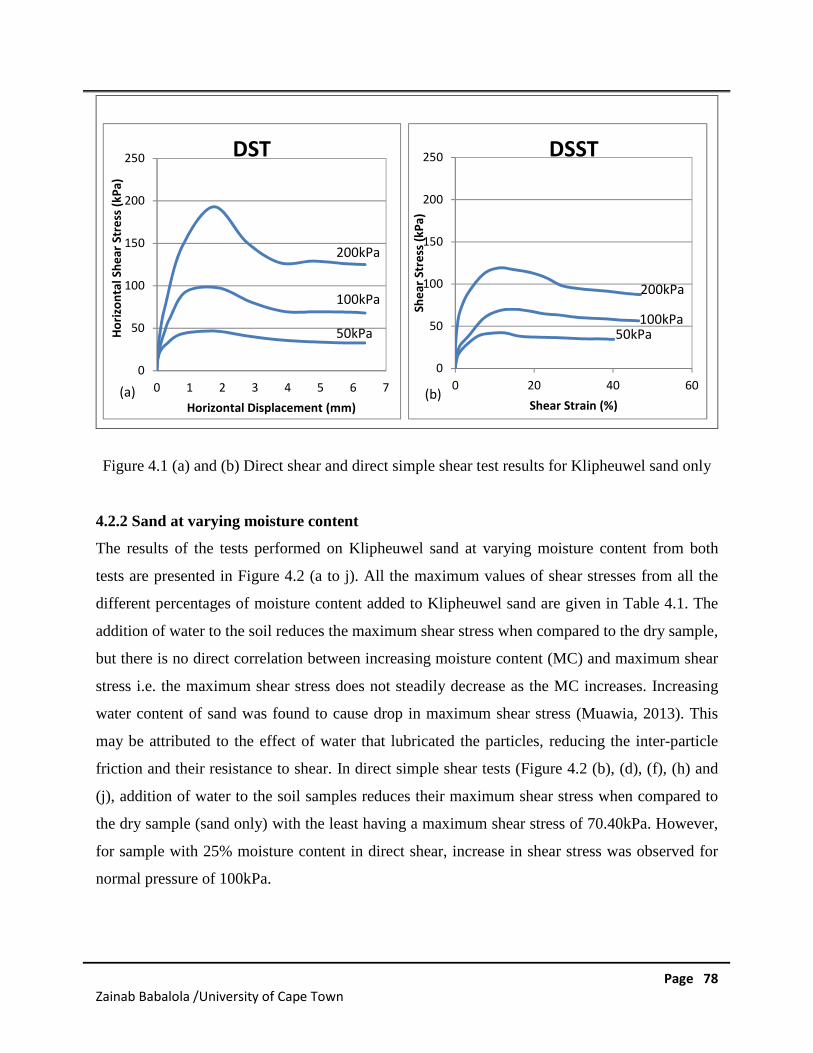
Page 78Zainab Babalola /University of Cape Town
Figure 4.1 (a) and (b) Direct shear and direct simple shear test results for Klipheuwel sand only
4.2.2 Sand at varying moisture content
The results of the tests performed on Klipheuwel sand at varying moisture content from both
tests are presented in Figure 4.2 (a to j). All the maximum values of shear stresses from all the
different percentages of moisture content added to Klipheuwel sand are given in Table 4.1. The
addition of water to the soil reduces the maximum shear stress when compared to the dry sample,
but there is no direct correlation between increasing moisture content (MC) and maximum shear
stress i.e. the maximum shear stress does not steadily decrease as the MC increases. Increasing
water content of sand was found to cause drop in maximum shear stress (Muawia, 2013). This
may be attributed to the effect of water that lubricated the particles, reducing the inter-particle
friction and their resistance to shear. In direct simple shear tests (Figure 4.2 (b), (d), (f), (h) and
(j), addition of water to the soil samples reduces their maximum shear stress when compared to
the dry sample (sand only) with the least having a maximum shear stress of 70.40kPa. However,
for sample with 25% moisture content in direct shear, increase in shear stress was observed for
normal pressure of 100kPa.
0
50
100
150
200
250
0 1 2 3 4 5 6 7
Ho
rizo
nta
lSh
ear
Stre
ss(k
Pa)
Horizontal Displacement (mm)
DST
200kPa
100kPa
50kPa
(a)
0
50
100
150
200
250
0 20 40 60
She
arSt
ress
(kP
a)Shear Strain (%)
DSST
200kPa
100kPa50kPa
(b)
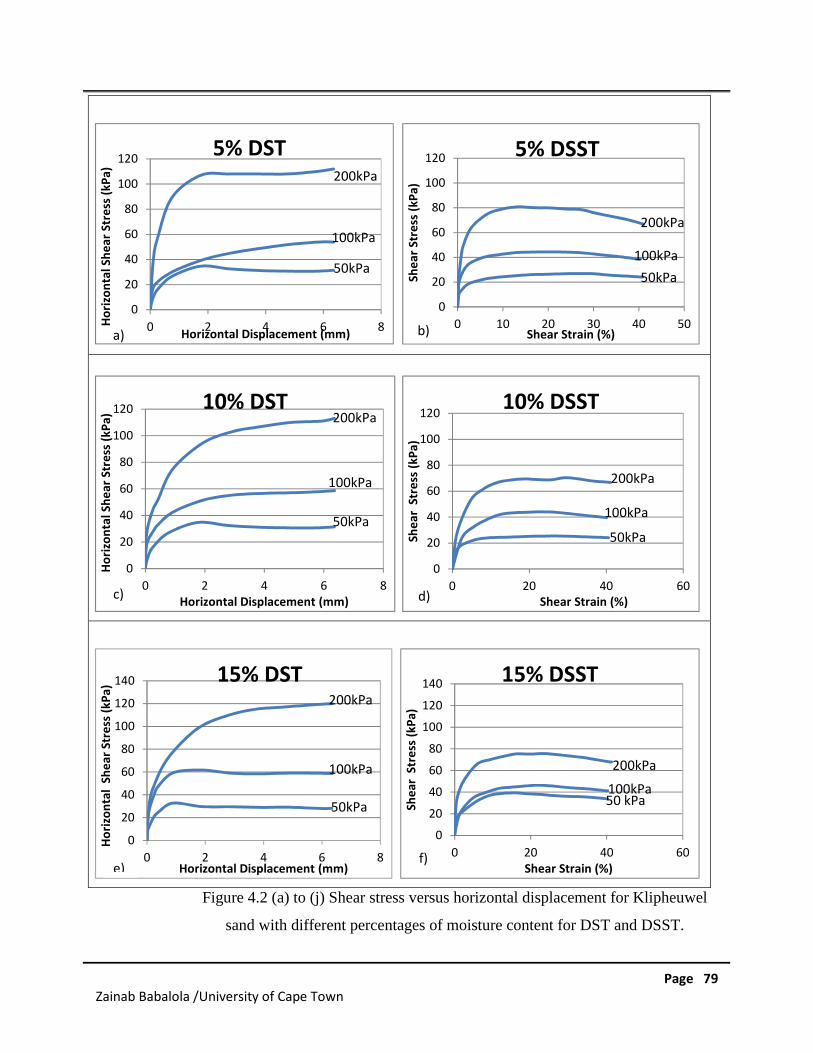
Page 79Zainab Babalola /University of Cape Town
Figure 4.2 (a) to (j) Shear stress versus horizontal displacement for Klipheuwel
sand with different percentages of moisture content for DST and DSST.
0
20
40
60
80
100
120
0 2 4 6 8Ho
rizo
nta
lSh
ear
Stre
ss(k
Pa)
Horizontal Displacement (mm)
5% DST200kPa
100kPa
50kPa
a)
0
20
40
60
80
100
120
0 10 20 30 40 50
She
arSt
ress
(kP
a)
Shear Strain (%)
5% DSST
200kPa
100kPa
50kPa
b)
0
20
40
60
80
100
120
0 2 4 6 8
Ho
rizo
nta
lSh
ear
Stre
ss(k
Pa)
Horizontal Displacement (mm)
10% DST200kPa
100kPa
50kPa
0
20
40
60
80
100
120
0 20 40 60
She
arSt
ress
(kP
a)
Shear Strain (%)
10% DSST
200kPa
100kPa
50kPa
d)
0
20
40
60
80
100
120
140
0 2 4 6 8
Ho
rizo
nta
lSh
ear
Stre
ss(k
Pa)
Horizontal Displacement (mm)
15% DST200kPa
100kPa
50kPa
0
20
40
60
80
100
120
140
0 20 40 60
She
arSt
ress
(kP
a)
Shear Strain (%)
15% DSST
200kPa
100kPa50 kPa
f)e)
c)
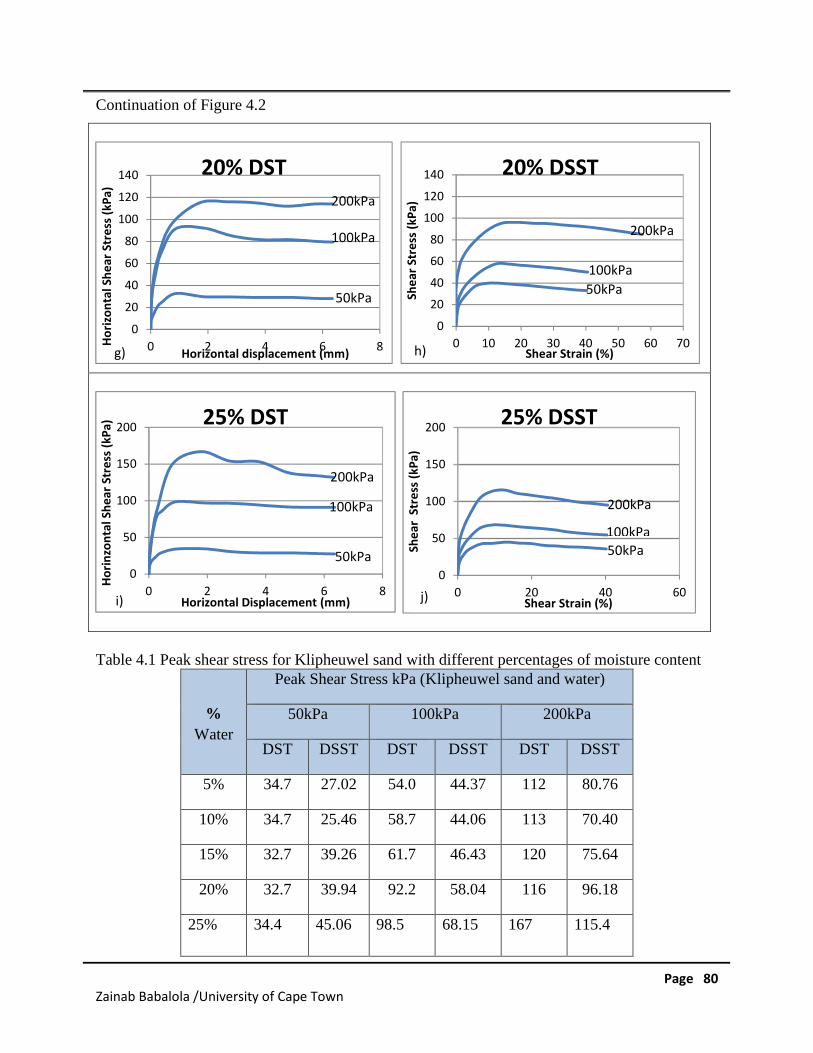
Page 80Zainab Babalola /University of Cape Town
Continuation of Figure 4.2
Table 4.1 Peak shear stress for Klipheuwel sand with different percentages of moisture content
%
Water
Peak Shear Stress kPa (Klipheuwel sand and water)
50kPa 100kPa 200kPa
DST DSST DST DSST DST DSST
5% 34.7 27.02 54.0 44.37 112 80.76
10% 34.7 25.46 58.7 44.06 113 70.40
15% 32.7 39.26 61.7 46.43 120 75.64
20% 32.7 39.94 92.2 58.04 116 96.18
25% 34.4 45.06 98.5 68.15 167 115.4
0
20
40
60
80
100
120
140
0 2 4 6 8Ho
rizo
nta
lSh
ear
Stre
ss(k
Pa)
Horizontal displacement (mm)
20% DST
200kPa
100kPa
50kPa
g)
0
20
40
60
80
100
120
140
0 10 20 30 40 50 60 70
She
arSt
ress
(kP
a)
Shear Strain (%)
20% DSST
200kPa
100kPa
50kPa
h)
0
50
100
150
200
0 2 4 6 8
Ho
rin
zon
talS
he
arSt
ress
(kP
a)
Horizontal Displacement (mm)
25% DST
200kPa
100kPa
50kPa
i)
0
50
100
150
200
0 20 40 60
She
arSt
ress
(kP
a)
Shear Strain (%)
25% DSST
200kPa
100kPa
50kPa
j)
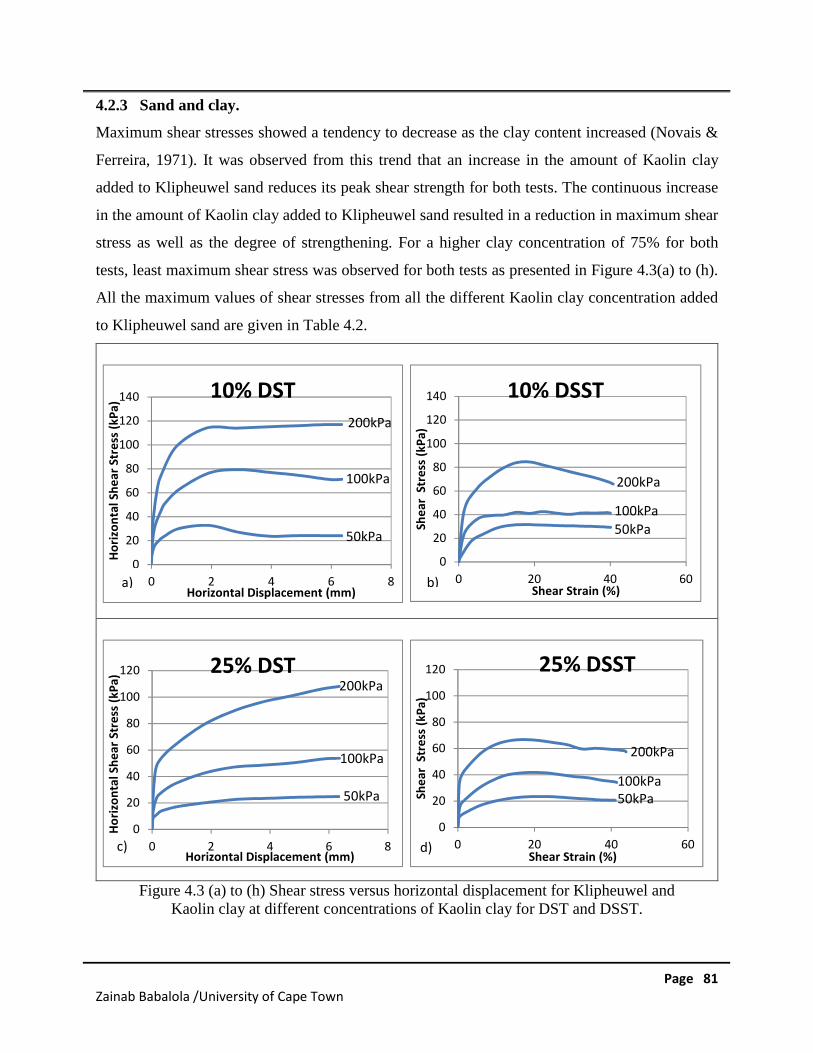
Page 81Zainab Babalola /University of Cape Town
4.2.3 Sand and clay.
Maximum shear stresses showed a tendency to decrease as the clay content increased (Novais &
Ferreira, 1971). It was observed from this trend that an increase in the amount of Kaolin clay
added to Klipheuwel sand reduces its peak shear strength for both tests. The continuous increase
in the amount of Kaolin clay added to Klipheuwel sand resulted in a reduction in maximum shear
stress as well as the degree of strengthening. For a higher clay concentration of 75% for both
tests, least maximum shear stress was observed for both tests as presented in Figure 4.3(a) to (h).
All the maximum values of shear stresses from all the different Kaolin clay concentration added
to Klipheuwel sand are given in Table 4.2.
Figure 4.3 (a) to (h) Shear stress versus horizontal displacement for Klipheuwel andKaolin clay at different concentrations of Kaolin clay for DST and DSST.
0
20
40
60
80
100
120
140
0 2 4 6 8
Ho
rizo
nta
lSh
ear
Stre
ss(k
Pa)
Horizontal Displacement (mm)
10% DST200kPa
100kPa
50kPa
0
20
40
60
80
100
120
140
0 20 40 60
She
arSt
ress
(kP
a)
Shear Strain (%)
10% DSST
200kPa
100kPa
50kPa
0
20
40
60
80
100
120
0 2 4 6 8
Ho
rizo
nta
lSh
ear
Stre
ss(k
Pa)
Horizontal Displacement (mm)
25% DST200kPa
100kPa
50kPa
c)
0
20
40
60
80
100
120
0 20 40 60
She
arSt
ress
(kP
a)
Shear Strain (%)
25% DSST
200kPa
100kPa50kPa
d)
a) b)
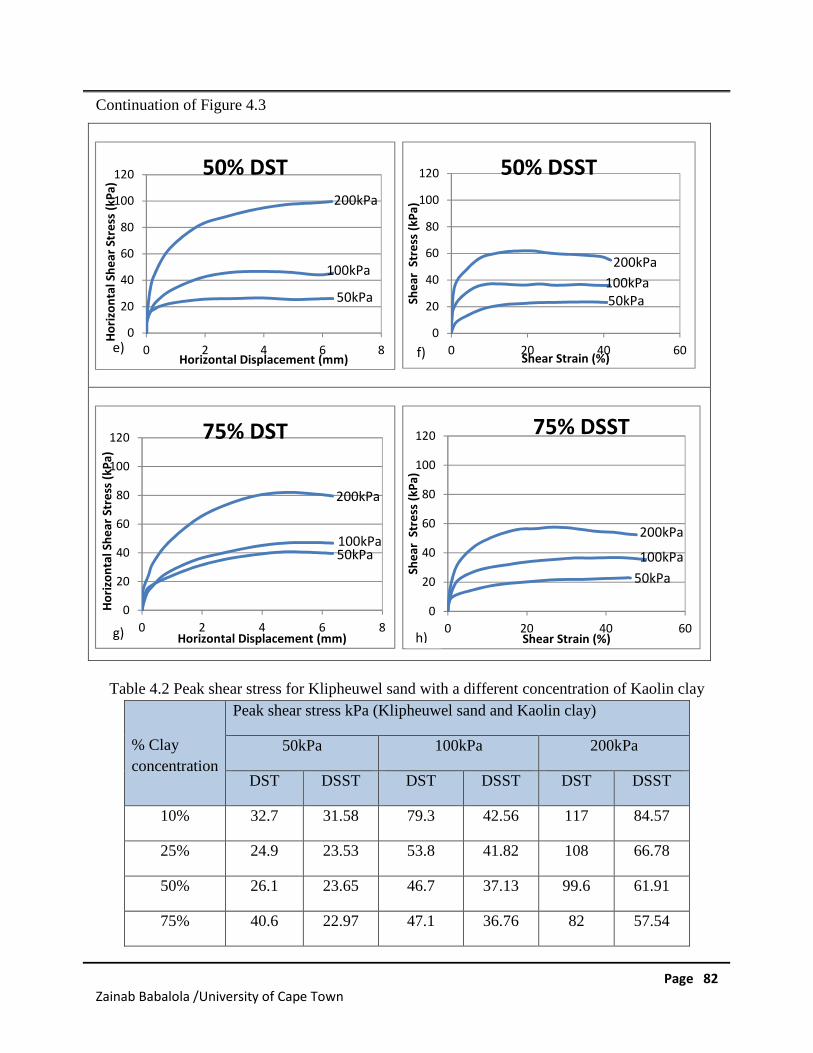
Page 82Zainab Babalola /University of Cape Town
Continuation of Figure 4.3
Table 4.2 Peak shear stress for Klipheuwel sand with a different concentration of Kaolin clay
% Clay
concentration
Peak shear stress kPa (Klipheuwel sand and Kaolin clay)
50kPa 100kPa 200kPa
DST DSST DST DSST DST DSST
10% 32.7 31.58 79.3 42.56 117 84.57
25% 24.9 23.53 53.8 41.82 108 66.78
50% 26.1 23.65 46.7 37.13 99.6 61.91
75% 40.6 22.97 47.1 36.76 82 57.54
0
20
40
60
80
100
120
0 2 4 6 8
Ho
rizo
nta
lSh
ear
Stre
ss(k
Pa)
Horizontal Displacement (mm)
50% DST
200kPa
50kPa
e)
100kPa
0
20
40
60
80
100
120
0 20 40 60
She
arSt
ress
(kP
a)
Shear Strain (%)
50% DSST
50kPa100kPa
200kPa
f)
0
20
40
60
80
100
120
0 2 4 6 8
Ho
rizo
nta
lSh
ear
Stre
ss(k
Pa)
Horizontal Displacement (mm)
75% DST
200kPa
100kPa50kPa
g)
0
20
40
60
80
100
120
0 20 40 60
She
arSt
ress
(kP
a)
Shear Strain (%)
75% DSST
200kPa
100kPa
50kPa
h)
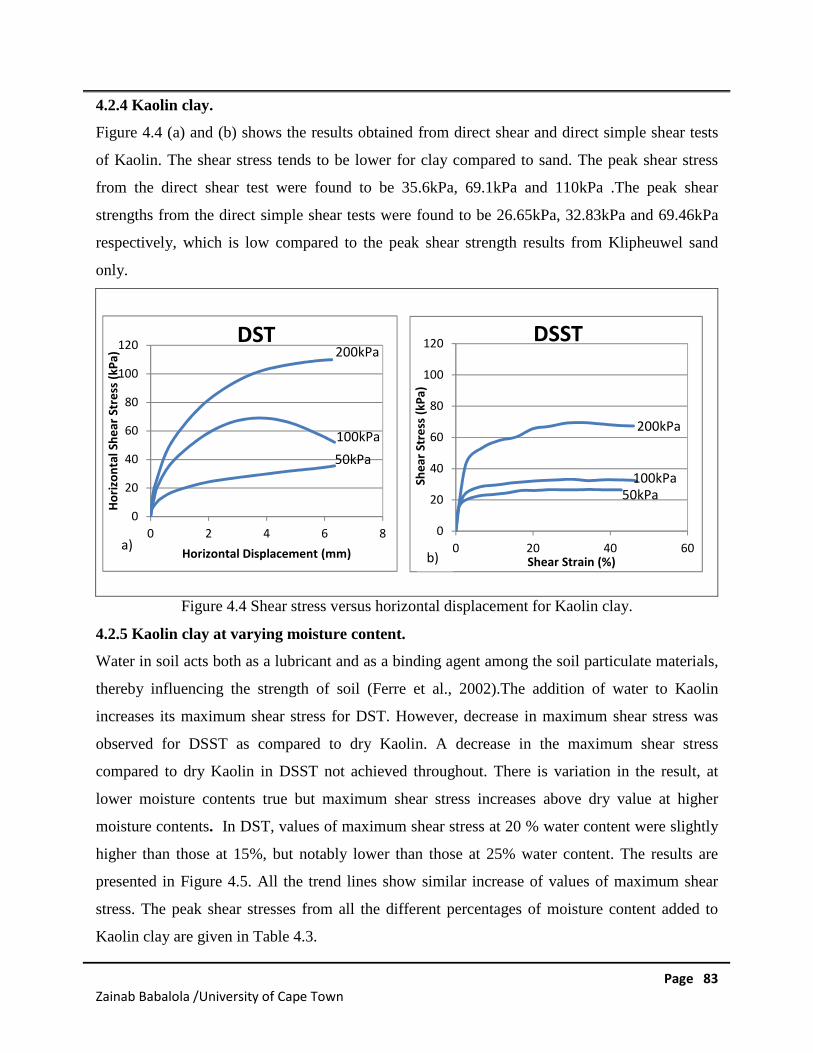
Page 83Zainab Babalola /University of Cape Town
4.2.4 Kaolin clay.
Figure 4.4 (a) and (b) shows the results obtained from direct shear and direct simple shear tests
of Kaolin. The shear stress tends to be lower for clay compared to sand. The peak shear stress
from the direct shear test were found to be 35.6kPa, 69.1kPa and 110kPa .The peak shear
strengths from the direct simple shear tests were found to be 26.65kPa, 32.83kPa and 69.46kPa
respectively, which is low compared to the peak shear strength results from Klipheuwel sand
only.
Figure 4.4 Shear stress versus horizontal displacement for Kaolin clay.
4.2.5 Kaolin clay at varying moisture content.
Water in soil acts both as a lubricant and as a binding agent among the soil particulate materials,
thereby influencing the strength of soil (Ferre et al., 2002).The addition of water to Kaolin
increases its maximum shear stress for DST. However, decrease in maximum shear stress was
observed for DSST as compared to dry Kaolin. A decrease in the maximum shear stress
compared to dry Kaolin in DSST not achieved throughout. There is variation in the result, at
lower moisture contents true but maximum shear stress increases above dry value at higher
moisture contents. In DST, values of maximum shear stress at 20 % water content were slightly
higher than those at 15%, but notably lower than those at 25% water content. The results are
presented in Figure 4.5. All the trend lines show similar increase of values of maximum shear
stress. The peak shear stresses from all the different percentages of moisture content added to
Kaolin clay are given in Table 4.3.
0
20
40
60
80
100
120
0 20 40 60
She
arSt
ress
(kP
a)
Shear Strain (%)
DSST
200kPa
100kPa50kPa
0
20
40
60
80
100
120
0 2 4 6 8
Ho
rizo
nta
lSh
ear
Stre
ss(k
Pa)
Horizontal Displacement (mm)
DST200kPa
100kPa
50kPa
a)b)
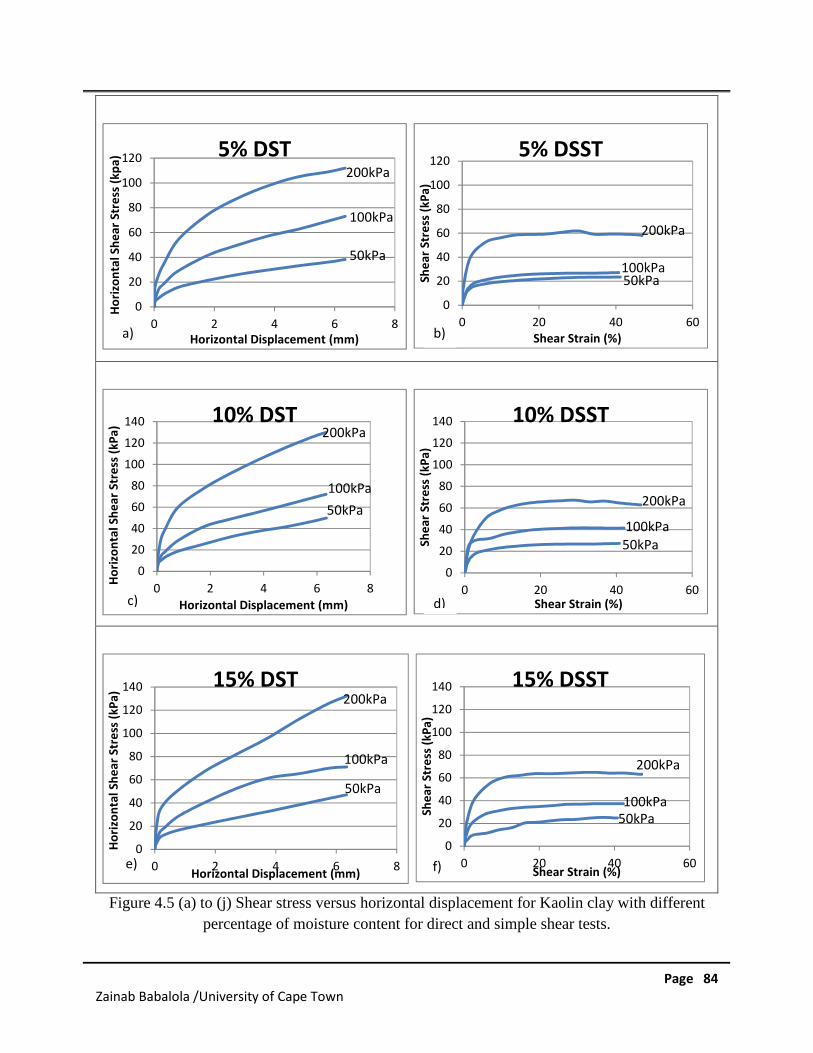
Page 84Zainab Babalola /University of Cape Town
Figure 4.5 (a) to (j) Shear stress versus horizontal displacement for Kaolin clay with different
percentage of moisture content for direct and simple shear tests.
0
20
40
60
80
100
120
0 2 4 6 8
Ho
rizo
nta
lSh
ear
Stre
ss(k
pa)
Horizontal Displacement (mm)
5% DST200kPa
100kPa
50kPa
0
20
40
60
80
100
120
0 20 40 60
She
arSt
ress
(kP
a)
Shear Strain (%)
5% DSST
200kPa
100kPa50kPa
0
20
40
60
80
100
120
140
0 2 4 6 8
Ho
rizo
nta
lSh
ear
Stre
ss(k
Pa)
Horizontal Displacement (mm)
10% DST
50kPa
100kPa
200kPa
c)
0
20
40
60
80
100
120
140
0 20 40 60
She
arSt
ress
(kP
a)
Shear Strain (%)
10% DSST
200kPa
100kPa50kPa
0
20
40
60
80
100
120
140
0 2 4 6 8
Ho
rizo
nta
lSh
ear
Stre
ss(k
Pa)
Horizontal Displacement (mm)
15% DST200kPa
50kPa
100kPa
e)
0
20
40
60
80
100
120
140
0 20 40 60
She
arSt
ress
(kP
a)
Shear Strain (%)
15% DSST
200kPa
100kPa50kPa
f)
a) b)
d)
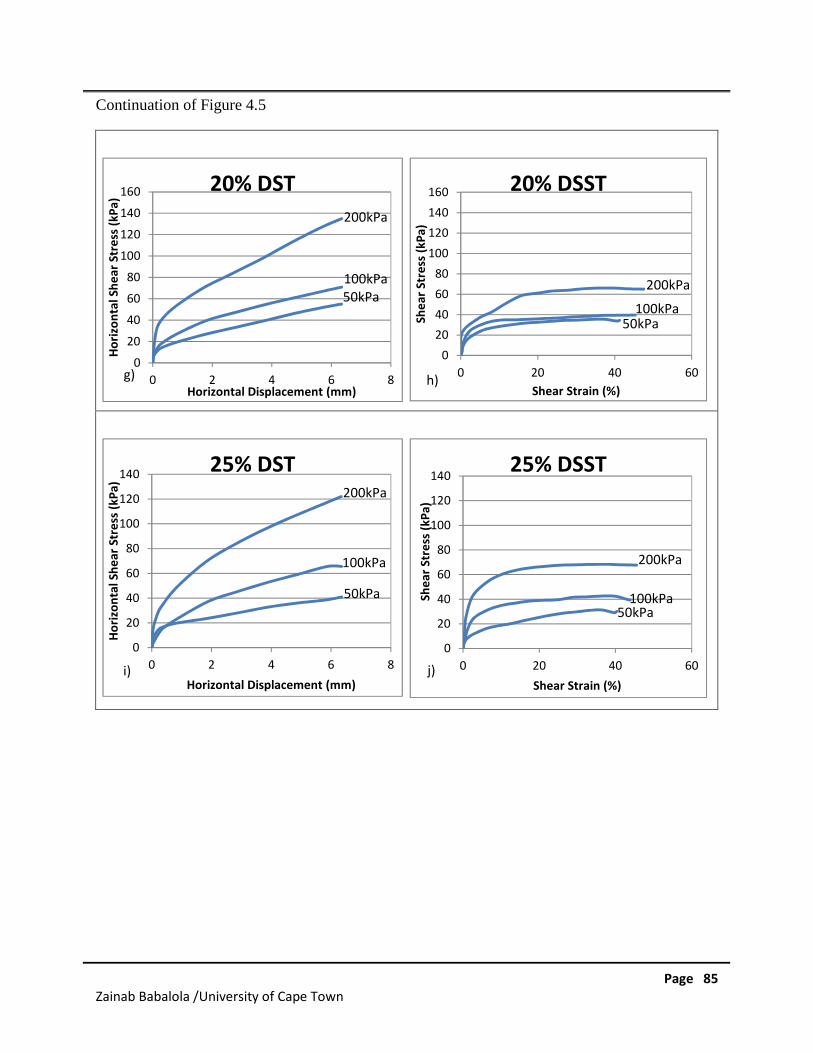
Page 85Zainab Babalola /University of Cape Town
Continuation of Figure 4.5
0
20
40
60
80
100
120
140
160
0 2 4 6 8
Ho
rizo
nta
lSh
ear
Stre
ss(k
Pa)
Horizontal Displacement (mm)
20% DST
200kPa
100kPa50kPa
g)
0
20
40
60
80
100
120
140
160
0 20 40 60
She
arSt
ress
(kP
a)
Shear Strain (%)
20% DSST
200kPa
100kPa50kPa
0
20
40
60
80
100
120
140
0 2 4 6 8
Ho
rizo
nta
lSh
ear
Stre
ss(k
Pa)
Horizontal Displacement (mm)
25% DST200kPa
100kPa
50kPa
0
20
40
60
80
100
120
140
0 20 40 60
She
arSt
ress
(kP
a)
Shear Strain (%)
25% DSST
200kPa
100kPa50kPa
j)
h)
i)
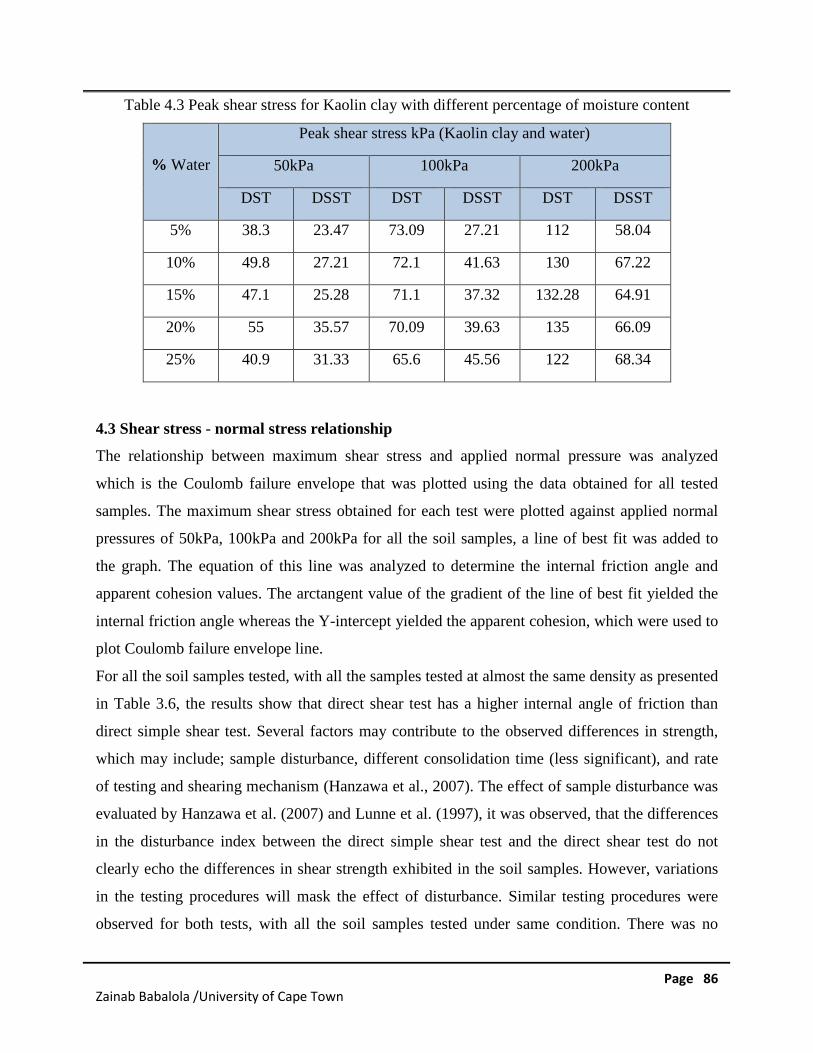
Page 86Zainab Babalola /University of Cape Town
Table 4.3 Peak shear stress for Kaolin clay with different percentage of moisture content
% Water
Peak shear stress kPa (Kaolin clay and water)
50kPa 100kPa 200kPa
DST DSST DST DSST DST DSST
5% 38.3 23.47 73.09 27.21 112 58.04
10% 49.8 27.21 72.1 41.63 130 67.22
15% 47.1 25.28 71.1 37.32 132.28 64.91
20% 55 35.57 70.09 39.63 135 66.09
25% 40.9 31.33 65.6 45.56 122 68.34
4.3 Shear stress - normal stress relationship
The relationship between maximum shear stress and applied normal pressure was analyzed
which is the Coulomb failure envelope that was plotted using the data obtained for all tested
samples. The maximum shear stress obtained for each test were plotted against applied normal
pressures of 50kPa, 100kPa and 200kPa for all the soil samples, a line of best fit was added to
the graph. The equation of this line was analyzed to determine the internal friction angle and
apparent cohesion values. The arctangent value of the gradient of the line of best fit yielded the
internal friction angle whereas the Y-intercept yielded the apparent cohesion, which were used to
plot Coulomb failure envelope line.
For all the soil samples tested, with all the samples tested at almost the same density as presented
in Table 3.6, the results show that direct shear test has a higher internal angle of friction than
direct simple shear test. Several factors may contribute to the observed differences in strength,
which may include; sample disturbance, different consolidation time (less significant), and rate
of testing and shearing mechanism (Hanzawa et al., 2007). The effect of sample disturbance was
evaluated by Hanzawa et al. (2007) and Lunne et al. (1997), it was observed, that the differences
in the disturbance index between the direct simple shear test and the direct shear test do not
clearly echo the differences in shear strength exhibited in the soil samples. However, variations
in the testing procedures will mask the effect of disturbance. Similar testing procedures were
observed for both tests, with all the soil samples tested under same condition. There was no
Page 87Zainab Babalola /University of Cape Town
offset time input for the T100 parameter at the consolidation stage for both tests, because all soil
samples were required to be fully consolidated before shear testing. The effect of consolidation
time was studied by Berre (1985), who concluded that consolidation time is less significant in
assessing differences between direct shear and direct simple shear tests. The soil samples for
both direct shear test and direct simple shear test were sheared at the same displacement rate of
1mm/min. Similar results were obtained by Hanzawa et al. (2007) and Ohta et al. (1985), it was
concluded that the differences between direct simple shear and direct shear tests can be attributed
to different shearing mechanisms. In a direct shear test, the circular box is split horizontally into
halves. Normal force on the specimen is applied from the top of the shear box. Shear force is
applied by moving one half of the box relative to the other to cause failure in the soil specimen.
The shear force is applied in equal increments until the specimen fails. The failure occurs along
the plane of split of the shear box. The change in the height of the specimen (and thus the volume
change of the specimen) was observed after the test. In a direct simple shear test, during the
shearing phase of the test, the circular rings surrounding the test sample are forced to slide apart,
thereby subjecting the soil sample to a shearing force. After a soil sample was tested, it was
observed that the rings undergo maximum displacement at the bottom of the stack of rings, and
that this deformation was reduced towards the top of the stack. This is a result of the shearing
mechanism of the direct simple shear test machine and also the specimen height remains the
same after the test. A soil sample is constrained against any vertical movement by a force that is
transmitted through a piston which presses against the top of the soil sample. In a direct shear,
the distribution of normal and shearing stresses during the test are not uniform. Failure of the soil
occurs progressively from the edges towards the center of the sample.
4.3.1 Sand only.
The internal friction angle obtained from a direct shear test is 44.20º and cohesion is zero, while
the internal friction angle obtained from a direct simple shear test is 27.02º with an apparent
cohesion of 17.64. The density of sample tested for a direct shear test is 1.66 Mg/m3 while the
density of samples tested for a direct simple shear test is 1.64 Mg/m3. Figure 4.6 represent the
Coulomb failure envelopes for Klipheuwel sand for both a direct shear test and a direct simple
shear test.
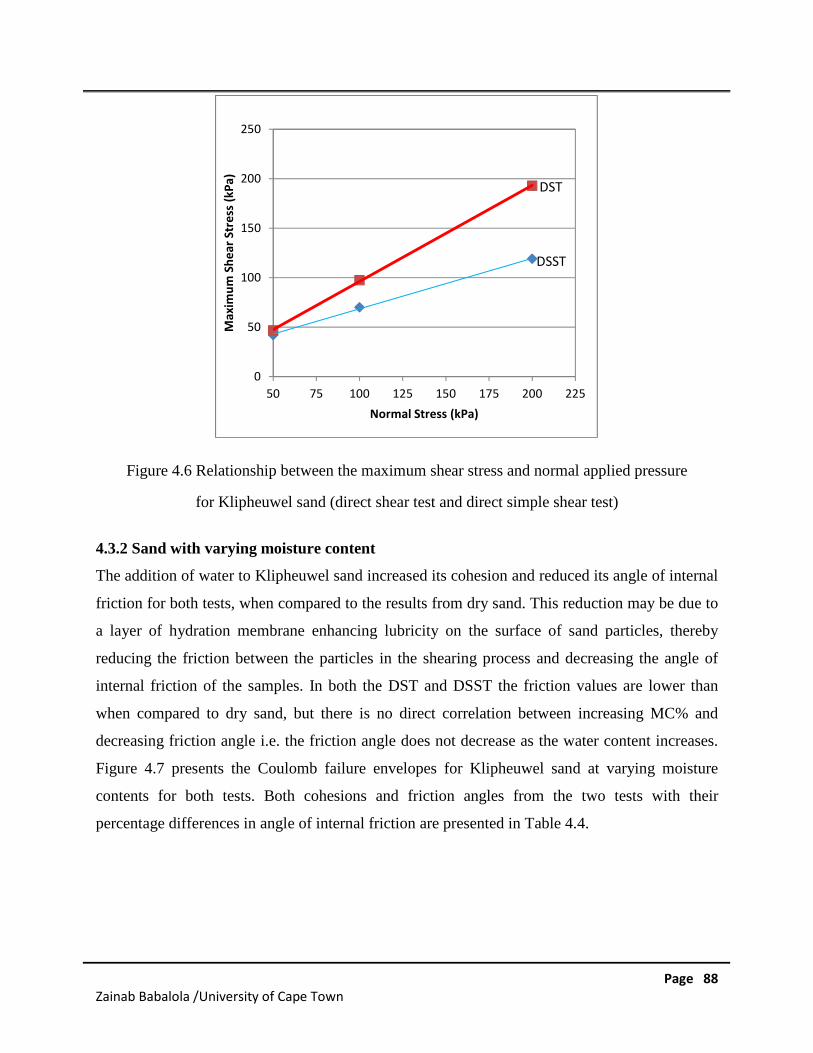
Page 88Zainab Babalola /University of Cape Town
Figure 4.6 Relationship between the maximum shear stress and normal applied pressure
for Klipheuwel sand (direct shear test and direct simple shear test)
4.3.2 Sand with varying moisture content
The addition of water to Klipheuwel sand increased its cohesion and reduced its angle of internal
friction for both tests, when compared to the results from dry sand. This reduction may be due to
a layer of hydration membrane enhancing lubricity on the surface of sand particles, thereby
reducing the friction between the particles in the shearing process and decreasing the angle of
internal friction of the samples. In both the DST and DSST the friction values are lower than
when compared to dry sand, but there is no direct correlation between increasing MC% and
decreasing friction angle i.e. the friction angle does not decrease as the water content increases.
Figure 4.7 presents the Coulomb failure envelopes for Klipheuwel sand at varying moisture
contents for both tests. Both cohesions and friction angles from the two tests with their
percentage differences in angle of internal friction are presented in Table 4.4.
0
50
100
150
200
250
50 75 100 125 150 175 200 225
Max
imu
mSh
ear
Stre
ss(k
Pa)
Normal Stress (kPa)
DST
DSST
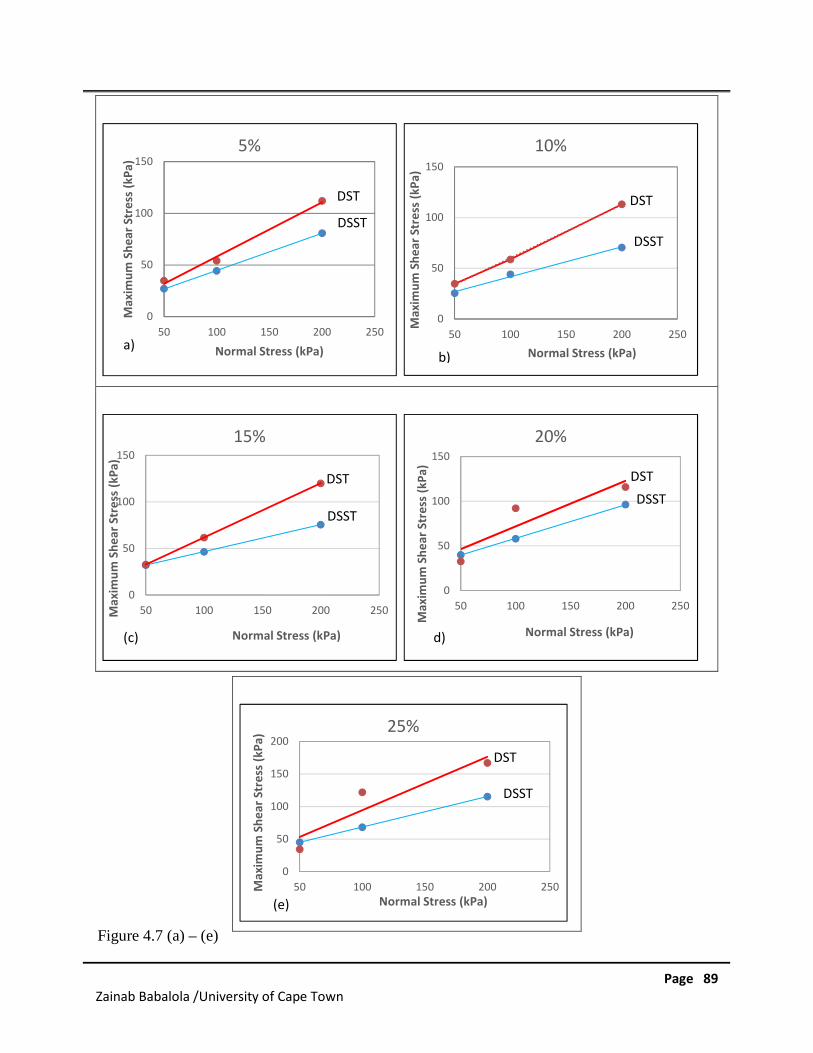
Page 89Zainab Babalola /University of Cape Town
Figure 4.7 (a) – (e)
0
50
100
150
50 100 150 200 250
Max
imu
mSh
ear
Stre
ss(k
Pa)
Normal Stress (kPa)
5%
DST
DSST
0
50
100
150
50 100 150 200 250
Max
imu
mSh
ear
Stre
ss(k
Pa)
Normal Stress (kPa)
10%
DST
DSST
0
50
100
150
50 100 150 200 250Max
imu
mSh
ear
Stre
ss(k
Pa)
Normal Stress (kPa)
15%
DST
DSST
0
50
100
150
50 100 150 200 250
Max
imu
mSh
ear
Stre
ss(k
Pa)
Normal Stress (kPa)
20%
DST
DSST
0
50
100
150
200
50 100 150 200 250Max
imu
mSh
ear
Stre
ss(k
Pa)
Normal Stress (kPa)
25%
DST
DSST
(e)
a)b)
(c) d)
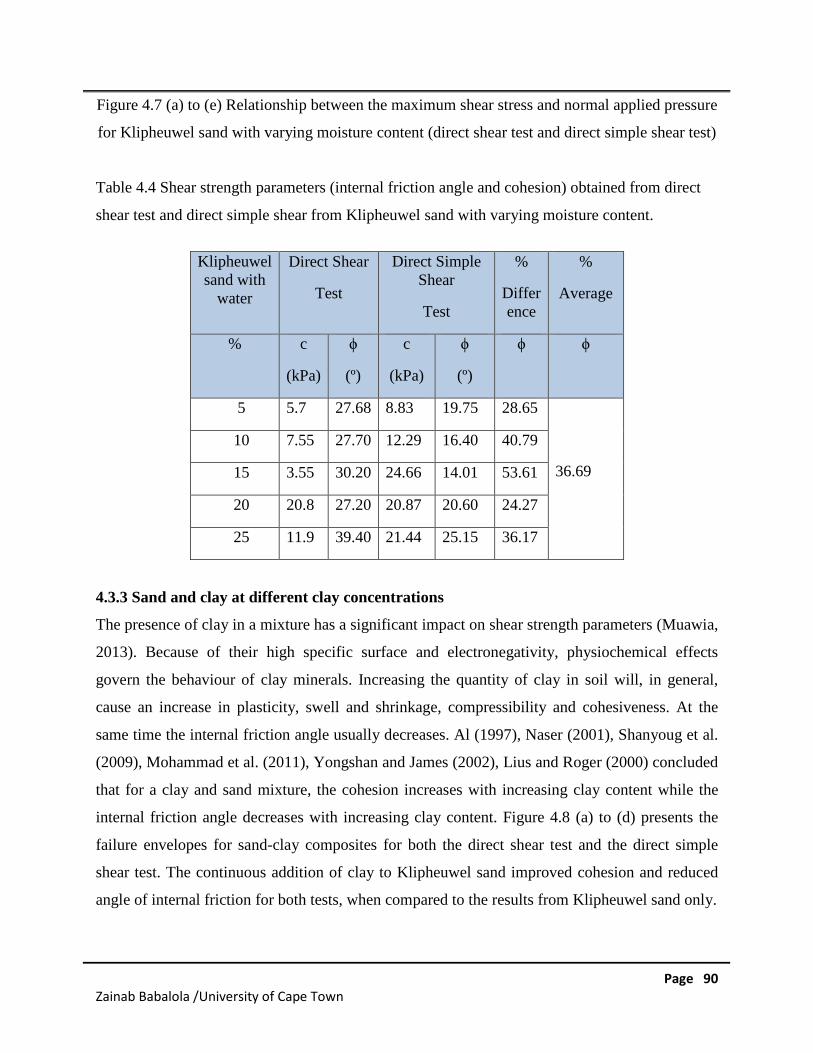
Page 90Zainab Babalola /University of Cape Town
Figure 4.7 (a) to (e) Relationship between the maximum shear stress and normal applied pressure
for Klipheuwel sand with varying moisture content (direct shear test and direct simple shear test)
Table 4.4 Shear strength parameters (internal friction angle and cohesion) obtained from direct
shear test and direct simple shear from Klipheuwel sand with varying moisture content.
Klipheuwelsand with
water
Direct Shear
Test
Direct SimpleShear
Test
%
Difference
%
Average
% c
(kPa)
ϕ
(º)
c
(kPa)
ϕ
(º)
ϕ ϕ
5 5.7 27.68 8.83 19.75 28.65
36.69
10 7.55 27.70 12.29 16.40 40.79
15 3.55 30.20 24.66 14.01 53.61
20 20.8 27.20 20.87 20.60 24.27
25 11.9 39.40 21.44 25.15 36.17
4.3.3 Sand and clay at different clay concentrations
The presence of clay in a mixture has a significant impact on shear strength parameters (Muawia,
2013). Because of their high specific surface and electronegativity, physiochemical effects
govern the behaviour of clay minerals. Increasing the quantity of clay in soil will, in general,
cause an increase in plasticity, swell and shrinkage, compressibility and cohesiveness. At the
same time the internal friction angle usually decreases. Al (1997), Naser (2001), Shanyoug et al.
(2009), Mohammad et al. (2011), Yongshan and James (2002), Lius and Roger (2000) concluded
that for a clay and sand mixture, the cohesion increases with increasing clay content while the
internal friction angle decreases with increasing clay content. Figure 4.8 (a) to (d) presents the
failure envelopes for sand-clay composites for both the direct shear test and the direct simple
shear test. The continuous addition of clay to Klipheuwel sand improved cohesion and reduced
angle of internal friction for both tests, when compared to the results from Klipheuwel sand only.
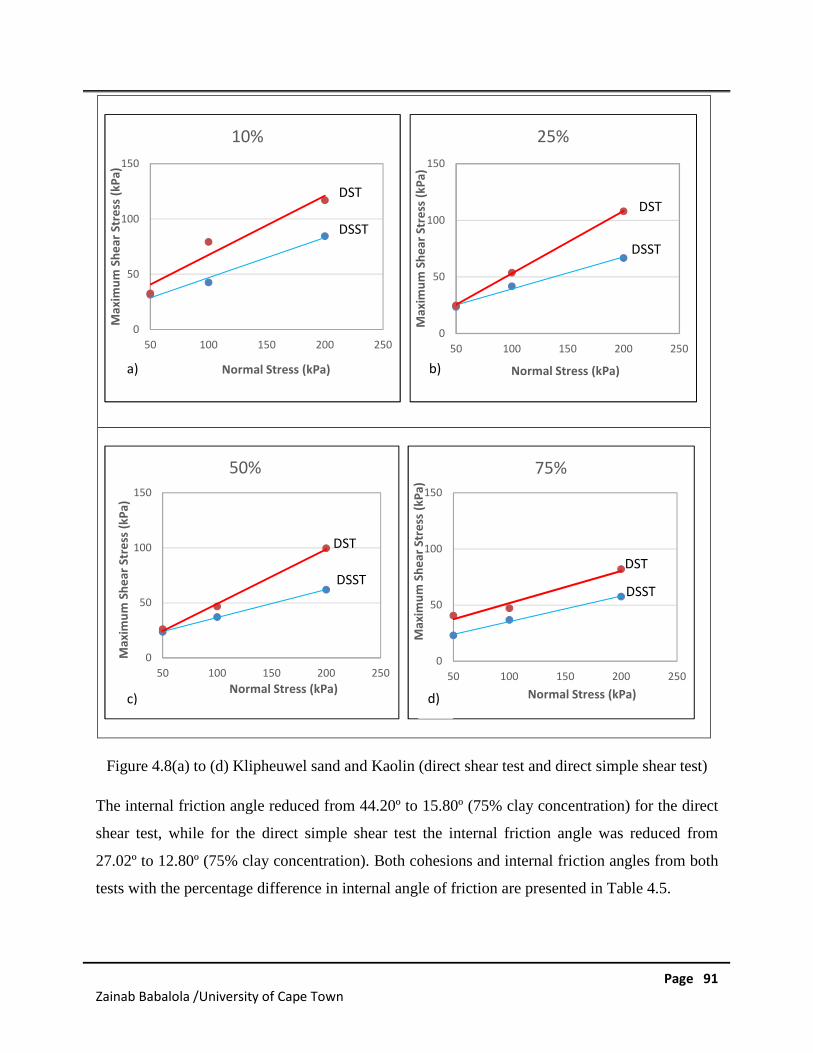
Page 91Zainab Babalola /University of Cape Town
Figure 4.8(a) to (d) Klipheuwel sand and Kaolin (direct shear test and direct simple shear test)
The internal friction angle reduced from 44.20º to 15.80º (75% clay concentration) for the direct
shear test, while for the direct simple shear test the internal friction angle was reduced from
27.02º to 12.80º (75% clay concentration). Both cohesions and internal friction angles from both
tests with the percentage difference in internal angle of friction are presented in Table 4.5.
0
50
100
150
50 100 150 200 250
Max
imu
mSh
ear
Stre
ss(k
Pa)
Normal Stress (kPa)
10%
DST
DSST
a)
0
50
100
150
50 100 150 200 250
Max
imu
mSh
ear
Stre
ss(k
Pa)
Normal Stress (kPa)
25%
DST
DSST
0
50
100
150
50 100 150 200 250
Max
imu
mSh
ear
Stre
ss(k
Pa)
Normal Stress (kPa)
50%
DST
DSST
0
50
100
150
50 100 150 200 250
Max
imu
mSh
ear
Stre
ss(k
Pa)
Normal Stress (kPa)
75%
DST
DSST
d)
b)
c)
Page 92Zainab Babalola /University of Cape Town
Table 4.5: Shear strength parameters (internal friction angle and cohesion) obtained from both
tests on Klipheuwel sand and kaolin clay with a different clay concentration.
Klipheuwelsand with
Kaolin clay Direct Shear Test Direct Simple Shear Test
%
Difference
%
Average
%
Clay
c
(kPa)
ϕ
(º)
c
(kPa)
ϕ
(º)
ϕ ϕ
10 13.85 28.17 10.75 19.94 29.2
34.0525 16.22 28.01 11.05 15.79 45.38
50 18.44 26.36 11.33 14.25 45.94
75 23.15 15.18 12.58 12.80 15.68
4.3.4 Kaolin clay.
The internal friction angle obtained from the direct shear test is 25.81º and cohesion is 15.15,
while the internal friction angle obtained from the direct simple shear test is 16.5 º and an
apparent cohesion of 8.34. The density of the sample tested for the direct shear test is 1.62
Mg/m3, while the density of samples tested for the direct simple shear test is 1.64 Mg/m3. Figure
4.9 represents the failure envelopes for Kaolin clay for both the direct shear test and the direct
simple shear test.
Figure 4.9 Relationship between the maximum shear stress and normal applied pressurefor Kaolin clay (direct shear test and direct simple shear test)
0
20
40
60
80
100
120
50 75 100 125 150 175 200 225 250
Max
imu
mSh
ear
Stre
ss(k
Pa)
Normal Stress (kPa)
DSST
DST
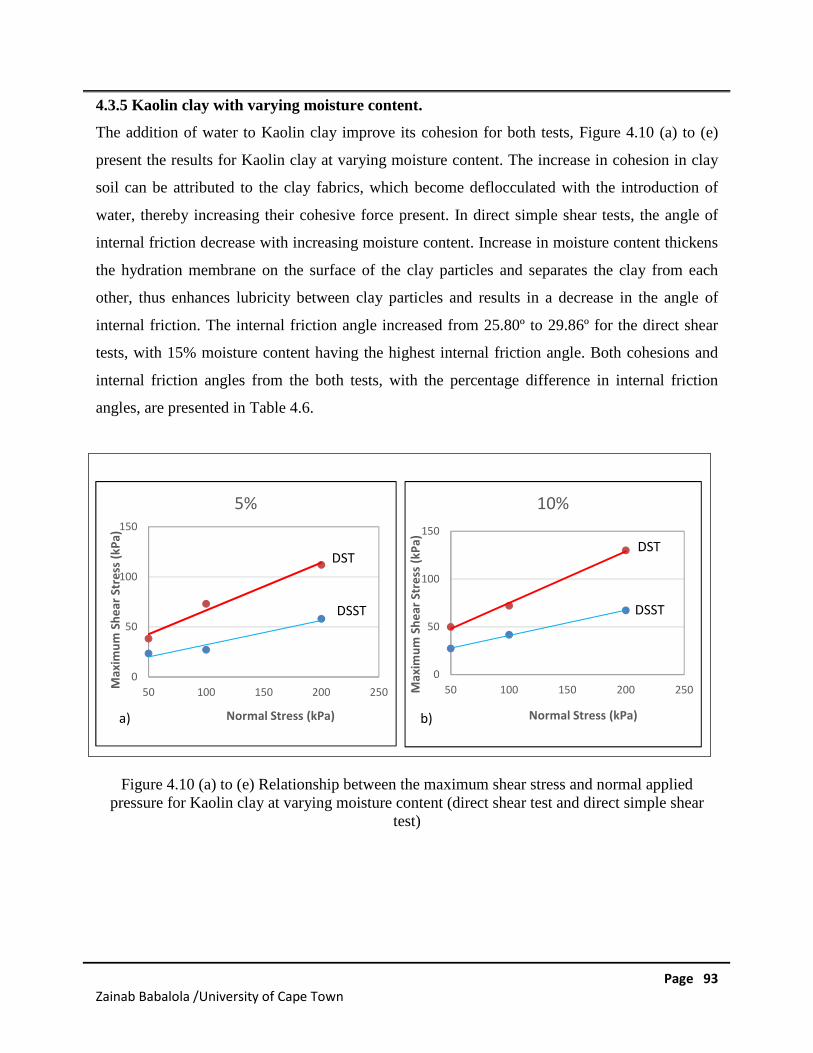
Page 93Zainab Babalola /University of Cape Town
4.3.5 Kaolin clay with varying moisture content.
The addition of water to Kaolin clay improve its cohesion for both tests, Figure 4.10 (a) to (e)
present the results for Kaolin clay at varying moisture content. The increase in cohesion in clay
soil can be attributed to the clay fabrics, which become deflocculated with the introduction of
water, thereby increasing their cohesive force present. In direct simple shear tests, the angle of
internal friction decrease with increasing moisture content. Increase in moisture content thickens
the hydration membrane on the surface of the clay particles and separates the clay from each
other, thus enhances lubricity between clay particles and results in a decrease in the angle of
internal friction. The internal friction angle increased from 25.80º to 29.86º for the direct shear
tests, with 15% moisture content having the highest internal friction angle. Both cohesions and
internal friction angles from the both tests, with the percentage difference in internal friction
angles, are presented in Table 4.6.
Figure 4.10 (a) to (e) Relationship between the maximum shear stress and normal appliedpressure for Kaolin clay at varying moisture content (direct shear test and direct simple shear
test)
0
50
100
150
50 100 150 200 250
Max
imu
mSh
ear
Stre
ss(k
Pa)
Normal Stress (kPa)
5%
DST
DSST
0
50
100
150
50 100 150 200 250Max
imu
mSh
ear
Stre
ss(k
Pa)
Normal Stress (kPa)
10%
DST
DSST
a) b)
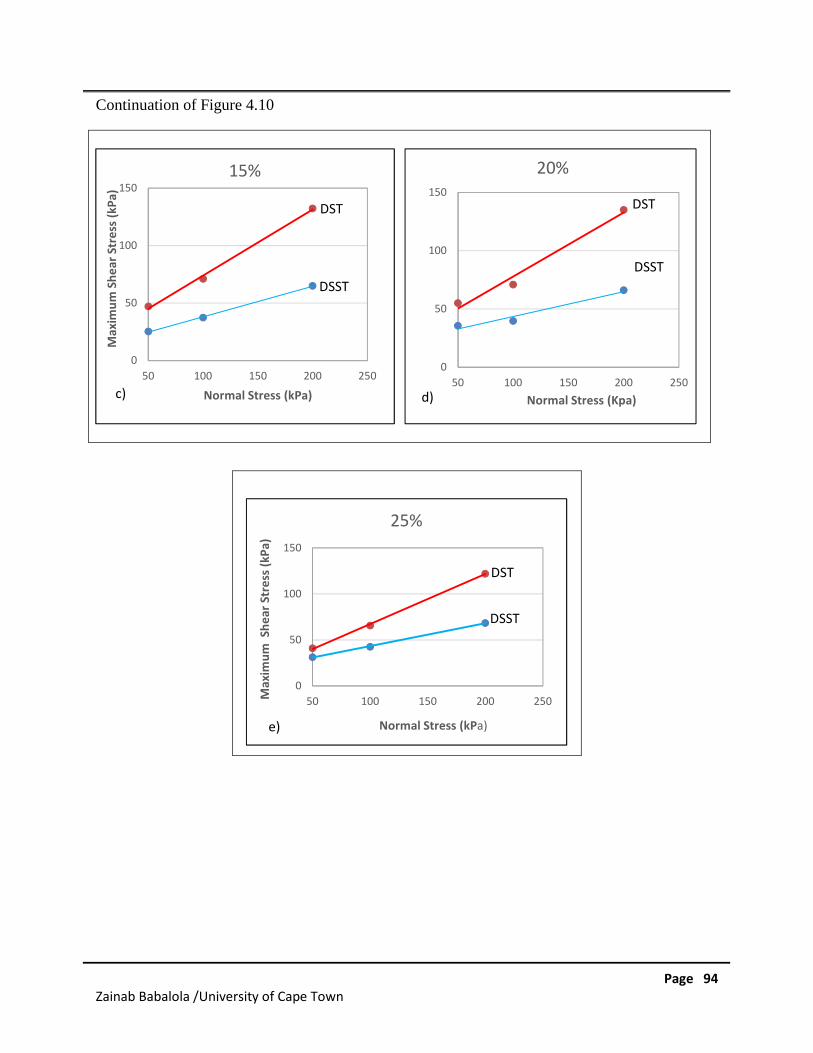
Page 94Zainab Babalola /University of Cape Town
Continuation of Figure 4.10
0
50
100
150
50 100 150 200 250
Max
imu
mSh
ear
Stre
ss(k
Pa)
Normal Stress (kPa)
15%
DST
DSST
c)
0
50
100
150
50 100 150 200 250
Normal Stress (Kpa)
20%
DST
DSST
0
50
100
150
50 100 150 200 250Max
imu
mSh
ear
Stre
ss(k
Pa)
Normal Stress (kPa)
25%
DST
DSST
e)
d)
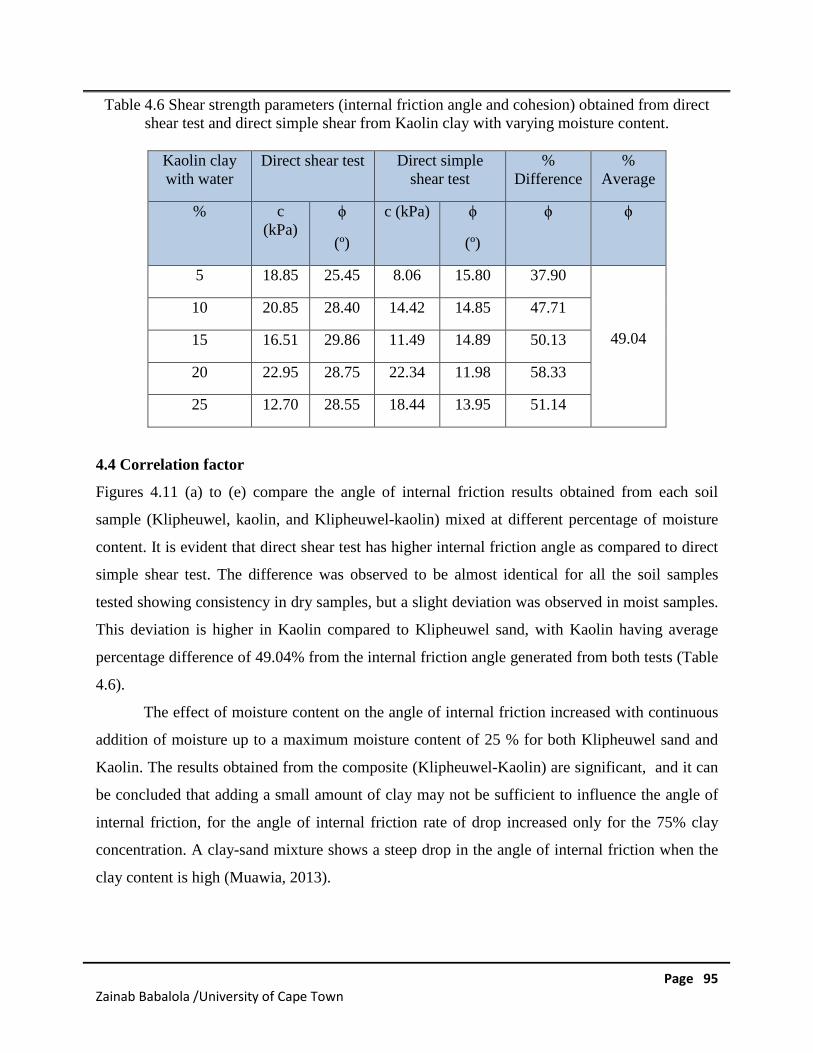
Page 95Zainab Babalola /University of Cape Town
Table 4.6 Shear strength parameters (internal friction angle and cohesion) obtained from directshear test and direct simple shear from Kaolin clay with varying moisture content.
Kaolin claywith water
Direct shear test Direct simpleshear test
%Difference
%Average
% c(kPa)
ϕ
(º)
c (kPa) ϕ
(º)
ϕ ϕ
5 18.85 25.45 8.06 15.80 37.90
49.04
10 20.85 28.40 14.42 14.85 47.71
15 16.51 29.86 11.49 14.89 50.13
20 22.95 28.75 22.34 11.98 58.33
25 12.70 28.55 18.44 13.95 51.14
4.4 Correlation factor
Figures 4.11 (a) to (e) compare the angle of internal friction results obtained from each soil
sample (Klipheuwel, kaolin, and Klipheuwel-kaolin) mixed at different percentage of moisture
content. It is evident that direct shear test has higher internal friction angle as compared to direct
simple shear test. The difference was observed to be almost identical for all the soil samples
tested showing consistency in dry samples, but a slight deviation was observed in moist samples.
This deviation is higher in Kaolin compared to Klipheuwel sand, with Kaolin having average
percentage difference of 49.04% from the internal friction angle generated from both tests (Table
4.6).
The effect of moisture content on the angle of internal friction increased with continuous
addition of moisture up to a maximum moisture content of 25 % for both Klipheuwel sand and
Kaolin. The results obtained from the composite (Klipheuwel-Kaolin) are significant, and it can
be concluded that adding a small amount of clay may not be sufficient to influence the angle of
internal friction, for the angle of internal friction rate of drop increased only for the 75% clay
concentration. A clay-sand mixture shows a steep drop in the angle of internal friction when the
clay content is high (Muawia, 2013).
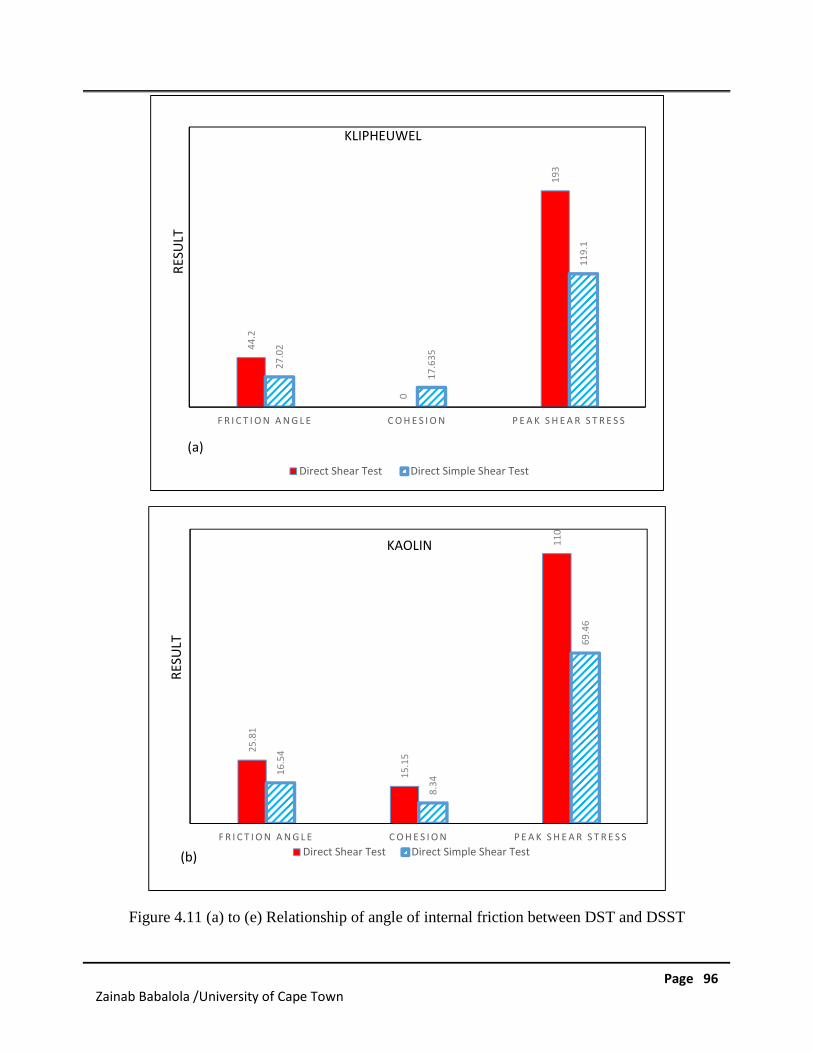
Page 96Zainab Babalola /University of Cape Town
Figure 4.11 (a) to (e) Relationship of angle of internal friction between DST and DSST
44
.2
0
19
3
27
.02
17
.63
5
11
9.1
F R I C T I O N A N G L E C O H E S I O N P E A K S H E A R S T R E S S
Direct Shear Test Direct Simple Shear Test
KLIPHEUWEL
RES
ULT
25
.81
15
.15
11
0
16
.54
8.3
4
69
.46
F R I C T I O N A N G L E C O H E S I O N P E A K S H E A R S T R E S S
Direct Shear Test Direct Simple Shear Test
KAOLIN
RES
ULT
(a)
(b)
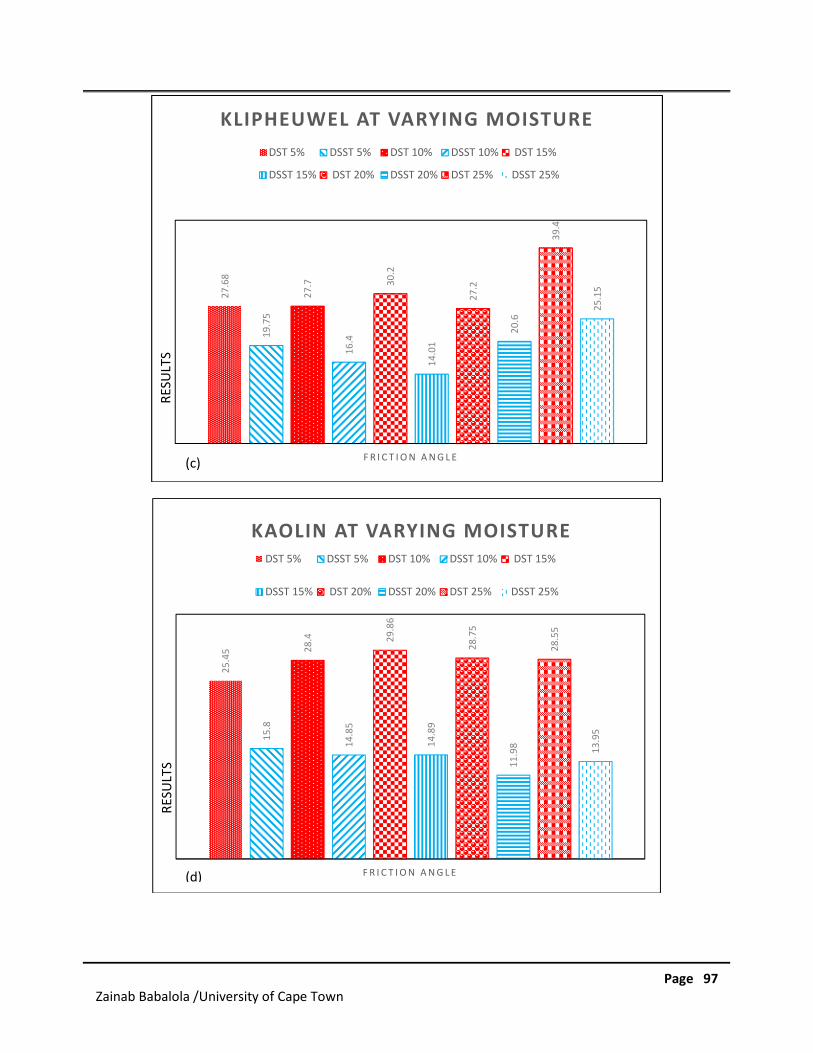
Page 97Zainab Babalola /University of Cape Town
27
.68
19
.75
27
.7
16
.4
30
.2
14
.01
27
.2
20
.6
39
.4
25
.15
F R I C T I O N A N G L E
KLIPHEUWEL AT VARYING MOISTURE
DST 5% DSST 5% DST 10% DSST 10% DST 15%
DSST 15% DST 20% DSST 20% DST 25% DSST 25%R
ESU
LTS
25
.45
15
.8
28
.4
14
.85
29
.86
14
.89
28
.75
11
.98
28
.55
13
.95
F R I C T I O N A N G L E
KAOLIN AT VARYING MOISTUREDST 5% DSST 5% DST 10% DSST 10% DST 15%
DSST 15% DST 20% DSST 20% DST 25% DSST 25%
RES
ULT
S
(c)
(d)
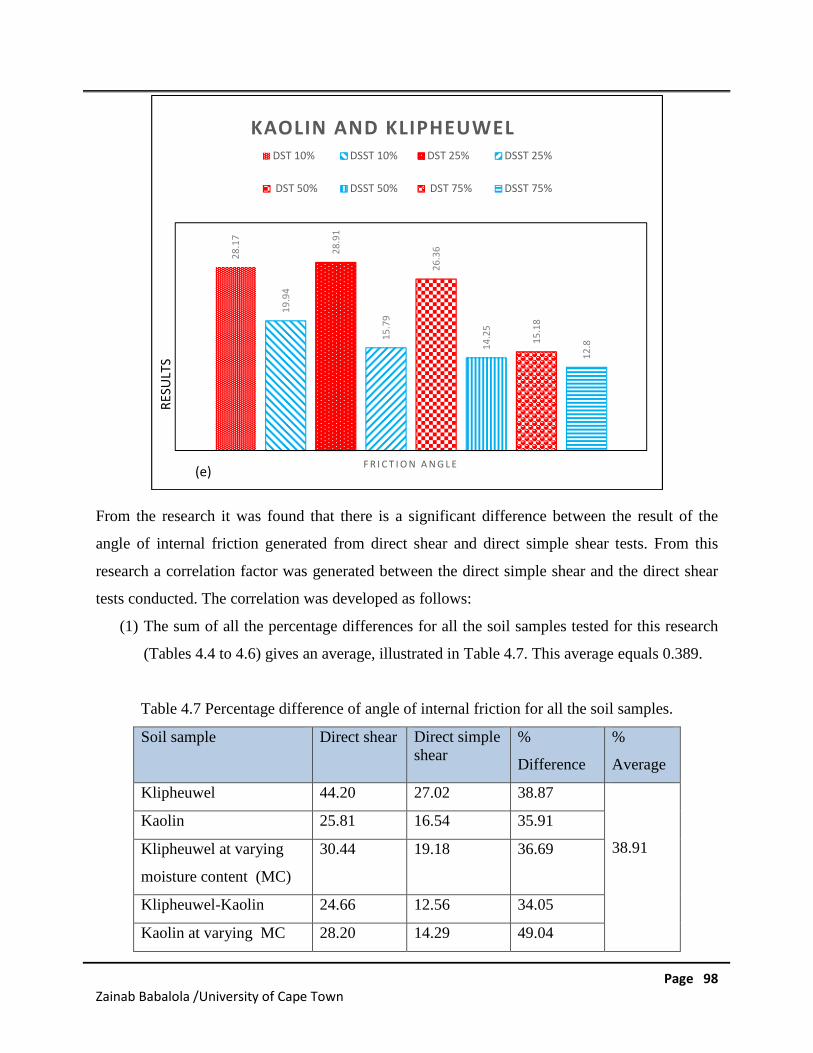
Page 98Zainab Babalola /University of Cape Town
From the research it was found that there is a significant difference between the result of the
angle of internal friction generated from direct shear and direct simple shear tests. From this
research a correlation factor was generated between the direct simple shear and the direct shear
tests conducted. The correlation was developed as follows:
(1) The sum of all the percentage differences for all the soil samples tested for this research
(Tables 4.4 to 4.6) gives an average, illustrated in Table 4.7. This average equals 0.389.
Table 4.7 Percentage difference of angle of internal friction for all the soil samples.
Soil sample Direct shear Direct simpleshear
%
Difference
%
Average
Klipheuwel 44.20 27.02 38.87
38.91
Kaolin 25.81 16.54 35.91
Klipheuwel at varying
moisture content (MC)
30.44 19.18 36.69
Klipheuwel-Kaolin 24.66 12.56 34.05
Kaolin at varying MC 28.20 14.29 49.04
28
.17
19
.94
28
.91
15
.79
26
.36
14
.25
15
.18
12
.8
F R I C T I O N A N G L E
KAOLIN AND KLIPHEUWELDST 10% DSST 10% DST 25% DSST 25%
DST 50% DSST 50% DST 75% DSST 75%
RES
ULT
S
(e)
Page 99Zainab Babalola /University of Cape Town
(2) To derive the angle of internal friction for direct simple shear test (DSST) for any of the
soil sample, the constant (0.389) is multiplied by its angle of internal friction for direct
shear test (DST).
(3) The result derived above is then subtracted from the angle of internal friction from the
same direct shear test.
The relationship can be estimated as follows:
Dst ϕ – 0.389Dst ϕ = Dsst ϕ
Where Dst = direct shear test
Dsst= direct simple shear test.
ϕ =Angle of internal friction
Page 100Zainab Babalola /University of Cape Town
5.0 PRACTICAL APPLICATIONS
5.1 Introduction.
The angle of internal friction and cohesion are among the important parameters contributing to
the shear strength in a soil, and are used in design of structures. To limit deformations within
tolerable limits, a suitable factor of safety is generally applied to soil structures so that the shear
stress in the soil does not exceed a certain proportion of its maximum shear strength. This
chapter discusses the application of the results generated from this study and presents a basic
design example.
5.2 The proposed design
The extensive application of both shear tests depends on the mode of shear of the soil underlying
proposed site. The behavior of soils adjacent to a pile can be closely reproduced by direct simple
shear, since it allows for the rotation of principal stresses. The mode of shearing established in
the simple shear device is similar to that which occurs around the shaft of a pile (Jose Fernando
et al., 2002). It is on this basis that a pile design was chosen to explain the relevance of this
study. The angle of internal friction from direct shear and direct simple shear for Klipheuwel
sand was used to design a pile and the results were analyzed.
Piles are structural members that transmit the super structure loads to deep soil layers. They are
preferred to be used as a foundation type when shallow foundations are not practical option for
the purposes of safety and reliability of a project. Piles and pile foundations have been in use
since prehistoric times (Shamsher, 1990).The Roman wooden piles are classic example for this.
Today piles can be made of wood, concrete or steel. Piles are classified according to three
different ways, namely nature of load support, construction method and material composition. If
the piles do not reach a hard stratum, their load carrying capacity is derived partly from end
bearing and partly from the skin friction; these piles are called friction piles. Piles that derive
most of their load from placement hard rock or very dense sand or gravelly material are referred
to as end bearing piles. Displacement piles are those piles, which displace the soil radially and
vertically during driving. Timber and concrete piles are classified base on their material
composition.
5.3 Design example
An existing box girder bridge comprises of a 2 lane road. The length of the existing bridge was
1892m and consists of 41 spans ranging from 37-60m. During the construction time, concrete
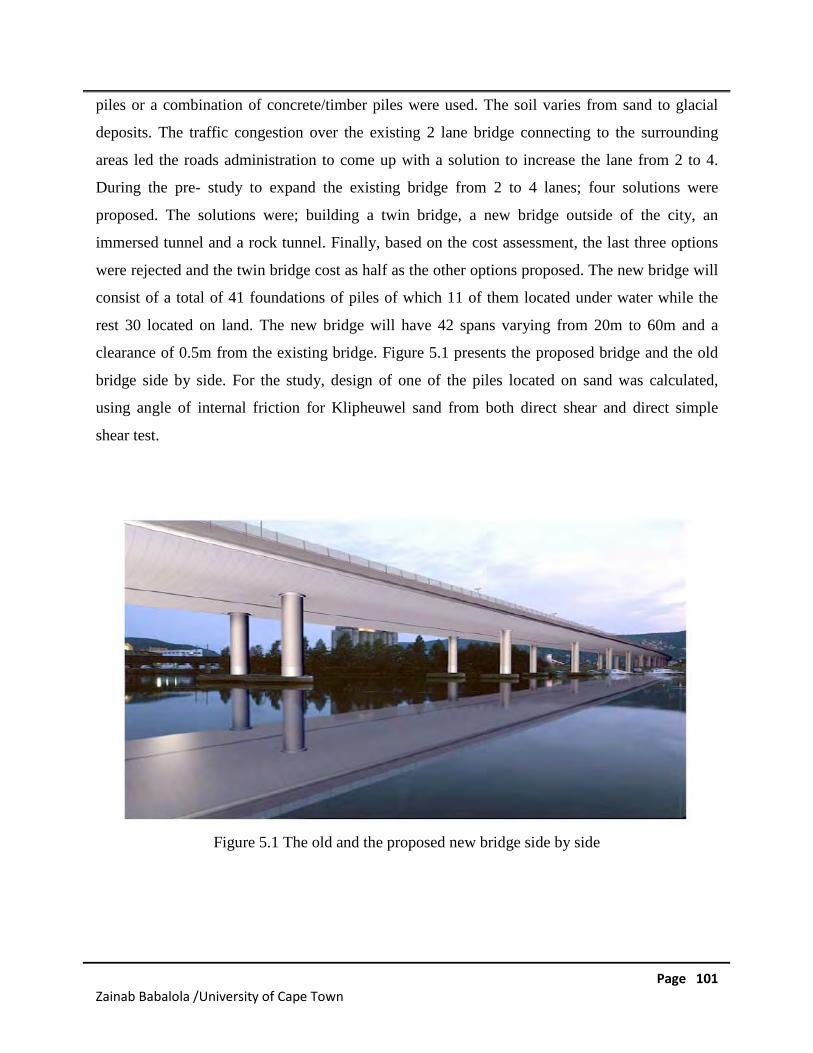
Page 101Zainab Babalola /University of Cape Town
piles or a combination of concrete/timber piles were used. The soil varies from sand to glacial
deposits. The traffic congestion over the existing 2 lane bridge connecting to the surrounding
areas led the roads administration to come up with a solution to increase the lane from 2 to 4.
During the pre- study to expand the existing bridge from 2 to 4 lanes; four solutions were
proposed. The solutions were; building a twin bridge, a new bridge outside of the city, an
immersed tunnel and a rock tunnel. Finally, based on the cost assessment, the last three options
were rejected and the twin bridge cost as half as the other options proposed. The new bridge will
consist of a total of 41 foundations of piles of which 11 of them located under water while the
rest 30 located on land. The new bridge will have 42 spans varying from 20m to 60m and a
clearance of 0.5m from the existing bridge. Figure 5.1 presents the proposed bridge and the old
bridge side by side. For the study, design of one of the piles located on sand was calculated,
using angle of internal friction for Klipheuwel sand from both direct shear and direct simple
shear test.
Figure 5.1 The old and the proposed new bridge side by side
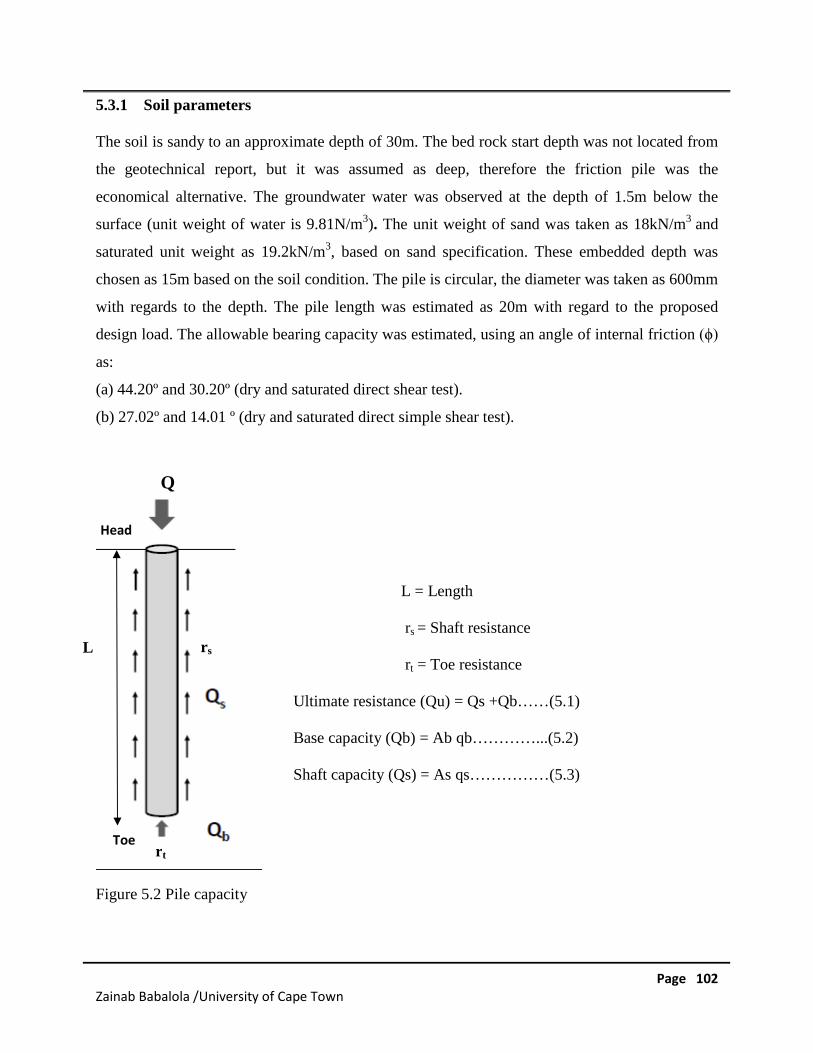
Page 102Zainab Babalola /University of Cape Town
5.3.1 Soil parameters
The soil is sandy to an approximate depth of 30m. The bed rock start depth was not located from
the geotechnical report, but it was assumed as deep, therefore the friction pile was the
economical alternative. The groundwater water was observed at the depth of 1.5m below the
surface (unit weight of water is 9.81N/m3). The unit weight of sand was taken as 18kN/m3 and
saturated unit weight as 19.2kN/m3, based on sand specification. These embedded depth was
chosen as 15m based on the soil condition. The pile is circular, the diameter was taken as 600mm
with regards to the depth. The pile length was estimated as 20m with regard to the proposed
design load. The allowable bearing capacity was estimated, using an angle of internal friction (ϕ)
as:
(a) 44.20º and 30.20º (dry and saturated direct shear test).
(b) 27.02º and 14.01 º (dry and saturated direct simple shear test).
L = Length
rs = Shaft resistance
rt = Toe resistance
Ultimate resistance (Qu) = Qs +Qb……(5.1)
Base capacity (Qb) = Ab qb…………...(5.2)
Shaft capacity (Qs) = As qs……………(5.3)
Figure 5.2 Pile capacity
L
Q
rs
Head
Toert
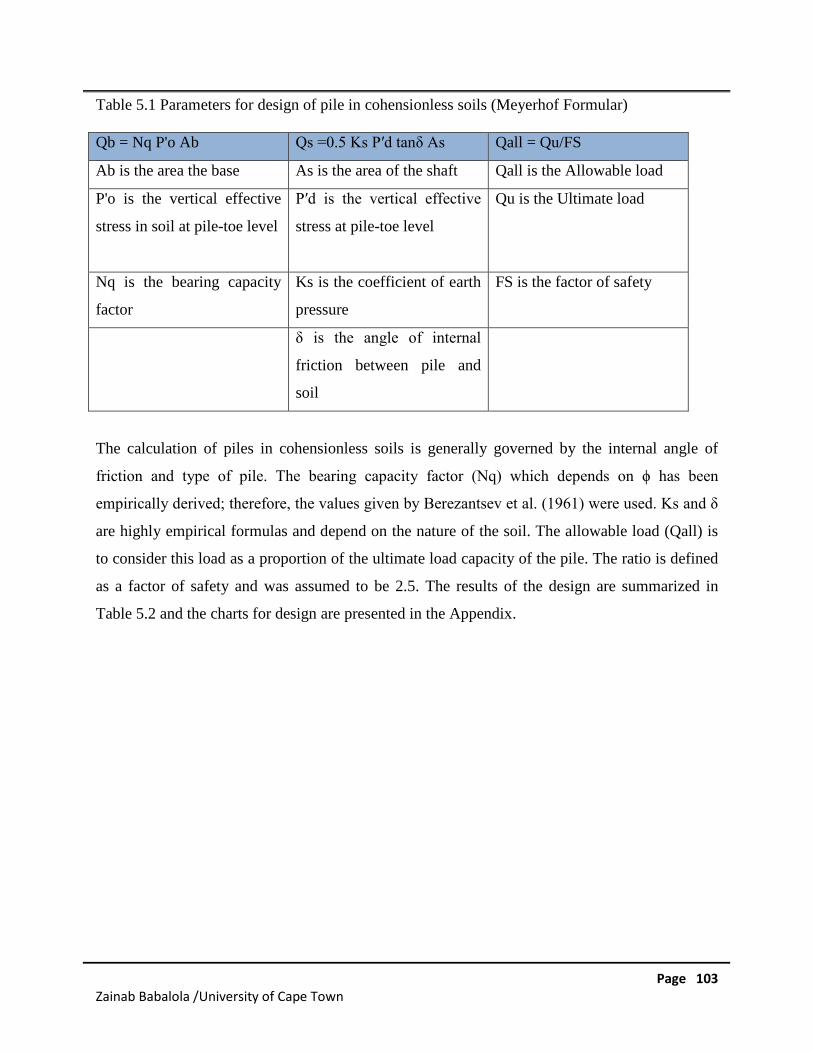
Page 103Zainab Babalola /University of Cape Town
Table 5.1 Parameters for design of pile in cohensionless soils (Meyerhof Formular)
Qb = Nq P'o Ab Qs =0.5 Ks P′d tanδ As Qall = Qu/FS
Ab is the area the base As is the area of the shaft Qall is the Allowable load
P'o is the vertical effective
stress in soil at pile-toe level
P′d is the vertical effective
stress at pile-toe level
Qu is the Ultimate load
Nq is the bearing capacity
factor
Ks is the coefficient of earth
pressure
FS is the factor of safety
δ is the angle of internal
friction between pile and
soil
The calculation of piles in cohensionless soils is generally governed by the internal angle of
friction and type of pile. The bearing capacity factor (Nq) which depends on ϕ has been
empirically derived; therefore, the values given by Berezantsev et al. (1961) were used. Ks and δ
are highly empirical formulas and depend on the nature of the soil. The allowable load (Qall) is
to consider this load as a proportion of the ultimate load capacity of the pile. The ratio is defined
as a factor of safety and was assumed to be 2.5. The results of the design are summarized in
Table 5.2 and the charts for design are presented in the Appendix.
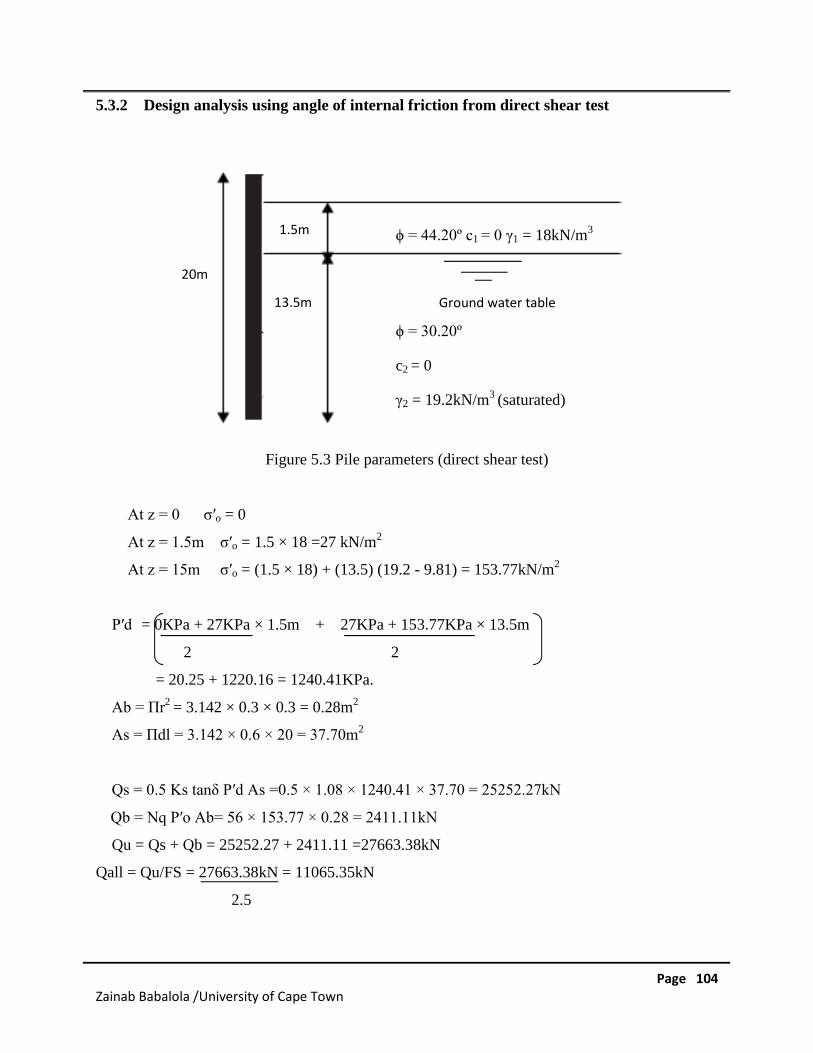
Page 104Zainab Babalola /University of Cape Town
5.3.2 Design analysis using angle of internal friction from direct shear test
Figure 5.3 Pile parameters (direct shear test)
At z = 0 σ′o = 0
At z = 1.5m σ′o = 1.5 × 18 =27 kN/m2
At z = 15m σ′o = (1.5 × 18) + (13.5) (19.2 - 9.81) = 153.77kN/m2
P′d = 0KPa + 27KPa × 1.5m + 27KPa + 153.77KPa × 13.5m
2 2
= 20.25 + 1220.16 = 1240.41KPa.
Ab = Πr2 = 3.142 × 0.3 × 0.3 = 0.28m2
As = Πdl = 3.142 × 0.6 × 20 = 37.70m2
Qs = 0.5 Ks tanδ P′d As =0.5 × 1.08 × 1240.41 × 37.70 = 25252.27kN
Qb = Nq P′o Ab= 56 × 153.77 × 0.28 = 2411.11kN
Qu = Qs + Qb = 25252.27 + 2411.11 =27663.38kN
Qall = Qu/FS = 27663.38kN = 11065.35kN
2.5
1.5m
13.5m
20m
Ground water table
ϕ = 30.20º
c2 = 0
γ2 = 19.2kN/m3 (saturated)
ϕ = 44.20º c1 = 0 γ1 = 18kN/m3
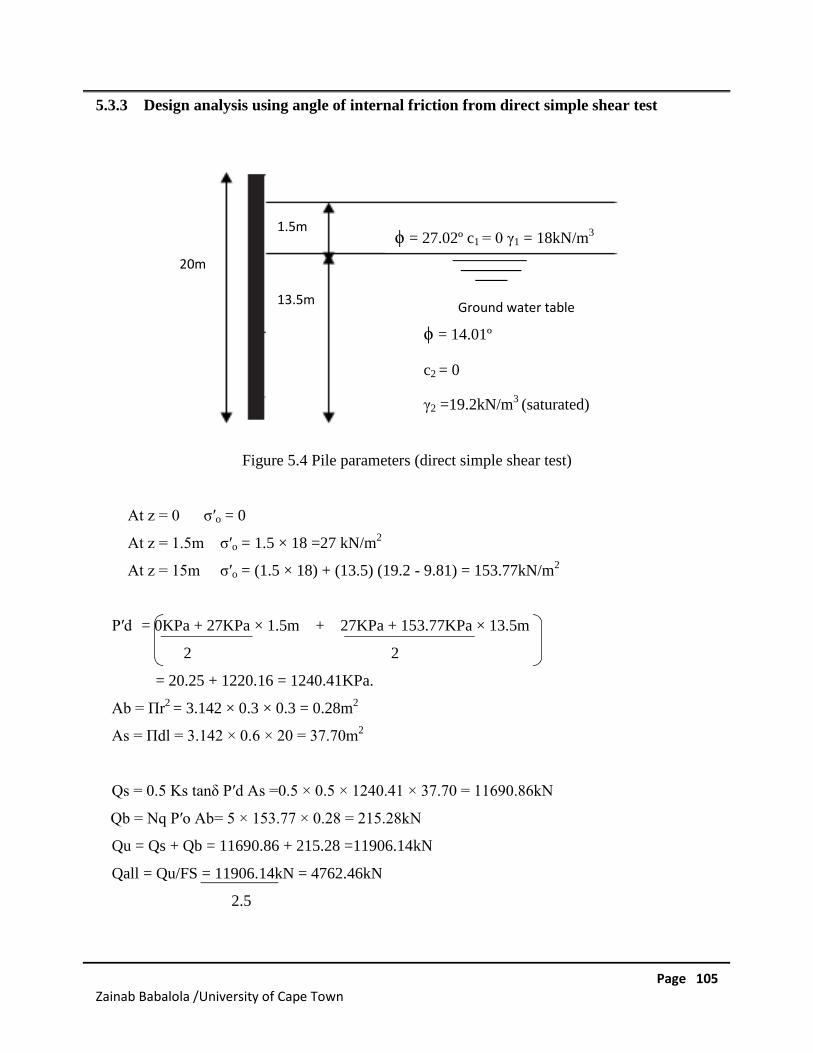
Page 105Zainab Babalola /University of Cape Town
5.3.3 Design analysis using angle of internal friction from direct simple shear test
Figure 5.4 Pile parameters (direct simple shear test)
At z = 0 σ′o = 0
At z = 1.5m σ′o = 1.5 × 18 =27 kN/m2
At z = 15m σ′o = (1.5 × 18) + (13.5) (19.2 - 9.81) = 153.77kN/m2
P′d = 0KPa + 27KPa × 1.5m + 27KPa + 153.77KPa × 13.5m
2 2
= 20.25 + 1220.16 = 1240.41KPa.
Ab = Πr2 = 3.142 × 0.3 × 0.3 = 0.28m2
As = Πdl = 3.142 × 0.6 × 20 = 37.70m2
Qs = 0.5 Ks tanδ P′d As =0.5 × 0.5 × 1240.41 × 37.70 = 11690.86kN
Qb = Nq P′o Ab= 5 × 153.77 × 0.28 = 215.28kN
Qu = Qs + Qb = 11690.86 + 215.28 =11906.14kN
Qall = Qu/FS = 11906.14kN = 4762.46kN
2.5
20m
1.5m
13.5mGround water table
ϕ = 14.01º
c2 = 0
γ2 =19.2kN/m3 (saturated)
ϕ = 27.02º c1 = 0 γ1 = 18kN/m3
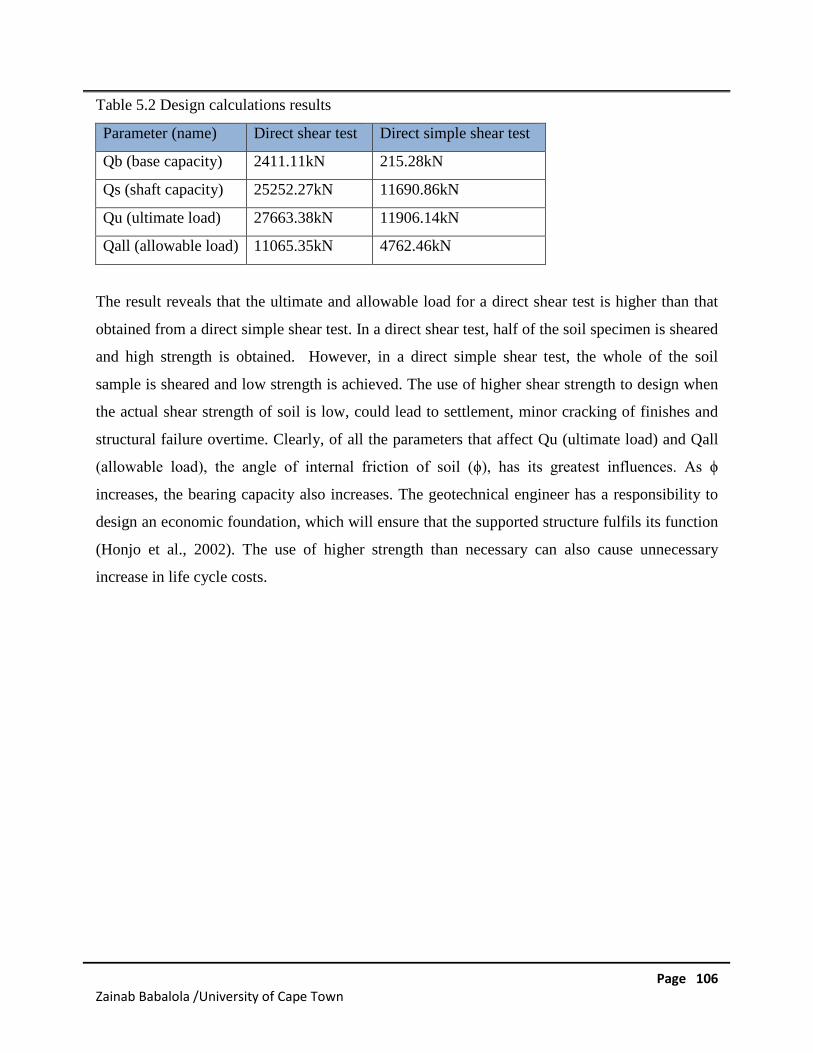
Page 106Zainab Babalola /University of Cape Town
Table 5.2 Design calculations results
Parameter (name) Direct shear test Direct simple shear test
Qb (base capacity) 2411.11kN 215.28kN
Qs (shaft capacity) 25252.27kN 11690.86kN
Qu (ultimate load) 27663.38kN 11906.14kN
Qall (allowable load) 11065.35kN 4762.46kN
The result reveals that the ultimate and allowable load for a direct shear test is higher than that
obtained from a direct simple shear test. In a direct shear test, half of the soil specimen is sheared
and high strength is obtained. However, in a direct simple shear test, the whole of the soil
sample is sheared and low strength is achieved. The use of higher shear strength to design when
the actual shear strength of soil is low, could lead to settlement, minor cracking of finishes and
structural failure overtime. Clearly, of all the parameters that affect Qu (ultimate load) and Qall
(allowable load), the angle of internal friction of soil (ϕ), has its greatest influences. As ϕ
increases, the bearing capacity also increases. The geotechnical engineer has a responsibility to
design an economic foundation, which will ensure that the supported structure fulfils its function
(Honjo et al., 2002). The use of higher strength than necessary can also cause unnecessary
increase in life cycle costs.
Page 107Zainab Babalola /University of Cape Town
6.0 CONCLUSIONS AND RECOMMENDATIONS.
6.1 Introduction
This study investigated the difference in the test results between direct shear test and direct
simple shear test using Klipheuwel sand, Kaolin clay and some composites of Klipheuwel sand
with Kaolin clay at varying moisture contents. Klipheuwel sand is a common source of fill
material used in the construction of road embankments. The study was conducted to establish a
relationship between the results. Klipheuwel sand and Kaolin clay were mixed with water in
various percentages of 5, 10, 15, 20 and 25%, and composites of the sand and clay were tested
using Universal Shear Trac-ll. The summary of the findings as well as recommendations are
given in the following sections.
6.2 Summary of the findings
Based on the findings of this study the following can be concluded.
• The addition of water to Klipheuwel sand reduced the internal friction angle for both
direct shear and direct simple shear tests.
• The addition of water to Kaolin clay improved the internal friction angle for direct shear
test and reduced the internal friction angle for direct simple shear test.
• An increase in water content by 20% for Klipheuwel sand resulted in a 39% reduction in
shear strength for direct shear test and a 25% reduction in shear strength for the direct
simple shear test.
• An increase in water content by 15% for Kaolin resulted in a 16% increase in shear
strength for the direct shear test and a 10% reduction in shear strength for the direct
simple shear test.
• An increase in cohesion was observed with the addition of water to Kaolin clay for the
direct simple shear test.
• The addition of Kaolin clay to Klipheuwel sand reduced the internal friction angle in
both the direct shear and the direct simple shear tests.
• An increase in clay content by 50% for Klipheuwel sand resulted in a 40% reduction in
shear strength for the direct shear test and a 48% reduction in shear strength for the direct
simple shear test.
Page 108Zainab Babalola /University of Cape Town
• The direct shear test gives higher shear strength values compared to the direct simple
shear test for the tests conducted in this study.
6.3 Recommendations.
• Research has shown the difference in results between direct shear and direct simple shear
can be attributed to their different mode of shear. Further investigations into their
shearing mechanism are required to further refine the correlation generated between the
results from the two tests.
• The tamping blows could not be kept near constant with every sample since they were
done manually. For consistency, it is recommended that a specially designed drop weight
that is able to fall from a constant height, be used to compress test samples.
• Investigations using a wider variety of soils to develop a correlation factor for a broader
range of soils on which the direct shear and direct simple shear tests is undertaken in
geotechnical engineering.
Page 109Zainab Babalola /University of Cape Town
7.0 REFERENCES
Airey, D.W. and Wood, D., 1984. Discussion on: Specimen Size Effect in Simple Shear Test.
Journal of Geotechnical Engineering Division, ASCE Vol. 110, No.3, pp 439-442.
Airey, D. W. and Wood, D.M., 1987. An Evaluation of Direct Simple Shear Tests on Clay,
Geotechnique, Vol. 37, No.1, pp 25-35.
Amsiejus, J., Dirgeliene, N., Norkus, A. and Skuodis, S., 2013. Comparison of Sandy Soil
Shear Strength Parameters obtained by various Construction Direct Shear Apparatuses.
Archives of Civil and Mechanical Engineering, Vol. 14, pp 327-334.
Amy, B. C. and Alan, J. L., 2006. Specimen Size and Scale Effects of Direct Shear Box Tests of
Sands. Geotechnical Testing Journal, Vol. 29, No. 6, pp 1-10.
Arthur, J. R. and Dunstan, T., 1988. The Engineering Application of Direct and Simple Shear
Testing. Sixth Geotechnique Symposium, Geotechnique 38, No. 1, pp 139-154.
ASTM D422. 2007. Standard Test method for Particle Size Analysis of Soils. ASTM
International, West Conshohocken, PA, USA.
ASTM D3080. 2011. Standard Test Method for Direct Shear Test of Soils under Consolidated
Drained Conditions. ASTM International, West Conshohocken, PA, USA.
ASTM D854. 2010. Standard Test Methods for Specific Gravity of Soil Solids by Water
Pycnometer. ASTM International, West Conshohocken, PA, USA.
ASTM D2216. 2010. Standard Test Methods for Laboratory Determination of Moisture Content
of Soil and Rock by Mass. ASTM International, West Conshohocken, PA, USA.
ASTM D1557-12. 2012. Standard Test Methods for Laboratory Compaction Characteristics of
Soil using Modified Effort. ASTM International, West Conshohocken, PA, USA.
ASTM, 2003. Standard Test Methods for Liquid Limit, Plastic Limit, and Plasticity Index of
Soils. Annual Book of ASTM Standards, Vol. 04.08, pp. 582–595. American Society for
Testing and Materials, West Conshohocken, PA, USA.
Bareither, C. A., Benson, C.H. and Edil, T.B., 2008. Comparison of Shear Strength of Sand
Backfills measured in Small-Scale and Large- Scale Direct Shear Tests. Canadian
Geotechnical Journal, Vol. 45, pp 1224–1236.
Bardet, J. P., 1997. Experimental Soil Mechanics, Prentice-Hall, Inc, United States.
Bayoglu, E., 1995. Shear Strength and Compressibility Behavior of Sand-Clay Mixtures, M.S.
Thesis, Middle East Technical University, Turkey
Page 110Zainab Babalola /University of Cape Town
Baxter, C., Bradshaw, A., Ochoa, L. and Hankou, R., 2010. Direct simple shear Test Results
Using Wire-Reinforced Membrane and Stacked Rings. ASCE Journals, pp 600-614.
Berre, T. and Bjerrum, L., 1973. Shear Strength of Normally Consolidated Clays. Geotechnical
Testing Journal, Vol.14, pp 327-334.
Borin, D.L., 1973. The Behaviour of Saturated Kaolin in the Simple Shear Apparatus. PhD
thesis, University of Cambridge.
Bishop, A. W., 1971. The Influence of Progressive Failure on the Method of Stability Analysis;
Géotechnique; Vol. 21, No. 2, pp 47-59.
Bishop, A. W., Green, G. E., Garga, V. K., Anderson, A., Brown, J. D., 1971. New Rings Shear
Apparatus and its Application to the Measurement of Residual Strength. Géotechnique; Vol.
21, No. 4, pp 310-318.
Braja, M.D., 2007. Foundamentals of Geotechnical Engineering. Third Edition.
Braja, M.D., 2007. Principles of Foundation Engineering. Seventh Edition.
Bromhead, E. N. The stability of slopes. Blackie Academic & Professional, Glasgow, UK, 1992.
Bromhead, E. N., Dixon, N., 1986. The field Residual Strength of London Clay and its
Correlation with Laboratory Measurements, especially Ring Shear Tests. Géotechnique; Vol.
36, No. 3, pp 1- 14.
Budhu, M., 1984. Nonuniformities Imposed by Simple Shear Apparatus. Canadian Geotechnical
Journal, Vol.21 No.1, pp 125-137.
Castellanos, B.A. and Brandon, T.L, 2013. A Comparison between the Shear Strength Measured
with Direct Shear and Triaxial Devices on Undisturbed and Remolded Soils. Proceedings of
the 18th International Conference on Soil Mechanics and Geotechnical Engineering, Paris.
Cerato, B.A. and Lutenegger, A.J., 2006. Specimen Size and Scale Effects of Direct Shear Box
Tests of Sands. Geotechnical Testing Journal, Vol. 29, No 6, pp 507–516
Cernica, J. N., 1995. Geotechnical Engineering: Soil Mechanics, John Wiley & Sons, Inc, United
States.
Craig, R. F., 1997. Soil Mechanics, Sixth Edition, Spon Press, London.
Craig, R.F., 2004.Soil Mechanics. Seventh Edition.
Das, M. B., 1983. Advanced Soil Mechanics, Hemisphere Publishing Corp., McGraw Hill,
London.
Page 111Zainab Babalola /University of Cape Town
Degroot, D.J. and John, T.G., 1996. Undrained Multidirectional Direct Simple Shear Behaviour
of Cohesive Soils. Journal of Geotechnical Engineering, Vol.122, No 2.
Dyvik, R., Berre, T., Lacasse, S. and Raadim, B. 1987. Comparison of Truly Undrained and
Constant Volume Direct Simple Shear Tests. Geotechnique, Vol. 37, pp 3-10.
Esma, M. k, Mourad, M., and Nabil, A., 2011. Contribution of Particles Size Ranges to Sand
Friction. Engineering, Technology & Applied Science Research Vol. 3, No. 4, pp 497-50.
George, T.D. and David, M.P., 1993. Numerical Analysis of Drained Direct Shear and Direct
Simple Shear Test. Journal of Geotechnical Engineering, Vol. 119, No. 12, pp 1870-1892
Guyer, J.P., 2010. Introduction to Laboratory Testing of Soils. Lecture notes.
Hanzawa, H., Fukaya, T. and Suzuki, K., 1990.Evaluation of Engineering Properties for an
Ariake Clay. Soils and Foundations, Vol. 30, No 4, pp 11-24.
Hanzawa, H., Nutt, N., Lunne, T., Tang, Y. and Long, M., 2007. A Comparative Study between
the NGI Direct Simple Shear Apparatus and the Mikasa Direct Shear Apparatus. Japanese
Geotechnical Society, Soils and Foundations, Vol. 47, No 1, pp 47-58.
Imre, S., 1994. Up-To-Date Means of Shear Strength Tests Comparison between Simple and
Direct Shear. Periodica Politechnical SER. Civil ENG. Vol. 38, No. 1, pp. 109-126.
Jewell, R.A., 1988. Direct Shear Test on Sand. A Soil Mechanics Report.
Jiunnren, L. and Roy, E. O., 2004. Types of Laboratory Apparatus for Shear Testing of Soils. A
summary report.
John, T.G. and Amy V. G., 2009. Geotechnical Laboratory Measurements for Engineers.
John, T.G., 2011. Characterization of Reconsistuted Low Plasticity Silt. Master thesis submitted
to the Massachussets Institute of Technology.
Karsten, T., Christian, G. and Joachim T., 2006. Shear Strength Parameters from Direct Shear
Tests – Influencing Factors and their Significance. The Geological Society of London, Vol.
10, pp. 484-496.
Lambe, T.W., 1951. Soil Testing for Engineers, John Wiley, New York.
Landva, A., 1966. Direct Simple Shear Tests on a Norwegian Quick Clay, Geotechnique, Vol.16
No.1, pp 1-20.
Li-chang, W., Wei, L. and Shi-juan, G., 2014. Effect of Moisture Content, Void Ration and
Compacted Sand Content on Remoulded Clay. Chinese Journal of Geotechnical Engineering,
Vol.2, pp 3314 -3327.
Page 112Zainab Babalola /University of Cape Town
Lin, C.P., 2012. Shear Strength of Soils. Lecture notes at National Chiao Tung University.
Kjellman, W., 1951. Testing the Shear Strength of Clay in Sweden. Geotechnique, Vol.2, No.
3, pp 225-235.
Matthieu, G., 2011. The Boundary Conditions in Direct Simple Shear Tests, Development for
Peat Testing at Low Vertical Stress. Master thesis submitted to Deflt University of
Technology.
Mehmet, S.O., 2008. Shear Strength Behavior of Sand- Clay Mixtures. A thesis submitted to the
graduate school of natural and applied sciences of Middle East technical university.
Muawia, A. D., 2012. Effects of Clay and Moisture Content on Direct Shear Tests for Clay-Sand
Mixtures. Advances in Materials Science and Engineering.
Osano, S.N., 2012. Direct Shear Box and Ring Shear Test Comparison: Why does Internal Angle
of Friction vary? Journal of Engineering Indian Centre for Advanced Scientific and
Technological Research (Icastor), Vol. 5, No. 2, 77 – 93.
Paul, W.M., 1985. A Review of Undrained Shear Strength in Direct Simple Shear Test. Journal
of Japanese Geotechnical Society, Vol. 25, No. 3, pp 64-72.
Primesh, J., 2014. Direct Simple Shear Tests on Soil-Plastic (Polythene) Waste Composites.
Undergraduate thesis submitted to the University of Cape Town.
Rahnenma, A., Habibagahi, G. and Ghahramani, A., 2003. A New Simple Shear Apparatus for
Testing Unsaturated Soil. Iranian Journal of Science and Technology, Vol. 27, No 1, pp 73 –
80.
Saada, A.S. and Townsend, F.C, 1981. State of the Art: Laboratory Strength Testing of Soils.
ASTM Spec. Tech. Publ., No. 740, pp 7-77.
Sarunus, S. and Arnoldas, N., 2014. Influence of Test Quantity on Loose Sand Shearing Strength
Parameters. Proceedings of the International Conference on Innovative Materials, Structures
and Technologies, pp 10-28.
Sean, R., 2012. Introduction to Triaxial Testing. Lecture Note.
Seth, M., 2011. Comparison of Direct Simple Shear Confinement Methods on Clay and Silt
Specimens. Master thesis submitted to the University of Rhode Island.
Sivadass, T. and Lee, C., 2008. Simple Shear Testing of Residual Soils with High Silt Content.
International Conference on Construction and Building Technology, Vol. 38, pp 469-484.
Page 113Zainab Babalola /University of Cape Town
Sofian, M. A., 2004. Direct Shear Testing. Doctoral thesis submitted to University of Sumatera
Utara.
Takada, N., 1993. Mikasa's Direct Shear Apparatus, Test Procedures and Results. Geotechnical
Testing Journal, Vol. 16, No 3, pp 314-322.
Tanaka, H., Sharma, P., Tsuchida, T. and Tanaka, M., 1996. Comparative Study on Sample
Quality Using Several Different Types of Samplers. Soils and Foundations, Vol.36, No 2, pp
67 -68.
Terzaghi, K. and Peck, R.B., 1967. Soil Mechanics in Engineering Practice. Second Edition.
Tsuji, K., Tang, Y.X. and Lunne, T., 1998. A comparative Study on Shear Strength of Marine
Clays by Direct Shear and Direct Simple shear test. Journal of Geotechnical Engineering,
JSCE, pp 275 – 285.
Tomoyo, N. and Stephen, F., 2008. Direct Shear Testing of a Marginal Material Using a Large
Shear Box. Geotechnical Testing Journal, Vol. 31, No. 5, pp 1-11.
Touahmia, M., 2014. Shear Strength of Soils. Lecture Note.
Vucetic, M. and Lacasse, S., 1982. Specimen Size Effect in Simple Shear Test. Journal of
Geotechnical Engineering, pp 1567-1585.
Wright, D.K., Gilbert, P.A. and Saada, A.S., 1978. Shear Devices for Determining Dynamic Soil
Properties. Proc. Spec. Conf. Earthquake Engineering and Soil Dynamics, ASCE, Pasadena,
2, pp 1056-1075.
Wroth, C.P., 1984. The Interpretation of In situ Soil Tests. 24th Rankine Lecture. Geotechnique,
Vol. 34, No. 4, pp 449-489.
Wroth, C.P., 1987.The Behaviour of Normally Consolidated Clay as Observed in Undrained
Direct Shear Tests. Geotechnique 37, No.1, pp 37-43.
Page 114Zainab Babalola /University of Cape Town
8.0 APPENDIX
Zainab Babalola /University of Cape Town
Direct Shear and Direct Simple Shear Tests:
A Comparative Study of the Strength Parameters and
their Dependence on Moisture and Fines Contents
By:
ZAINAB BABALOLA
SUPERVISED BY DR DENIS KALUMBACO-SUPERVISED BY FARIDAH CHEBET
REPORT OF REVISIONS
University of Cape TownDepartment of Civil Engineering
April 2016
Page 1Zainab Babalola /University of Cape Town
TABLE OF CONTENTS
1. General…………………………………………………………………………2
1.1 Minor Typographical Errors and Minor Changes ……………………………2
1.2 Review of Specific Chapters/Sections………………………………………..5
1.2.1 Title of the study……………………………………………………………5
1.2.2 Chapter 1……………………………………………………………………5
1.2.3 Chapter 2……………………………………………………………………6
1.2.4 Chapter 3……………………………………………………………………7
1.2.5 Chapter 4……………………………………………………………………9
1.3 References ……………………………………………………………………9
2. Final Comments………………………………………………………………..14
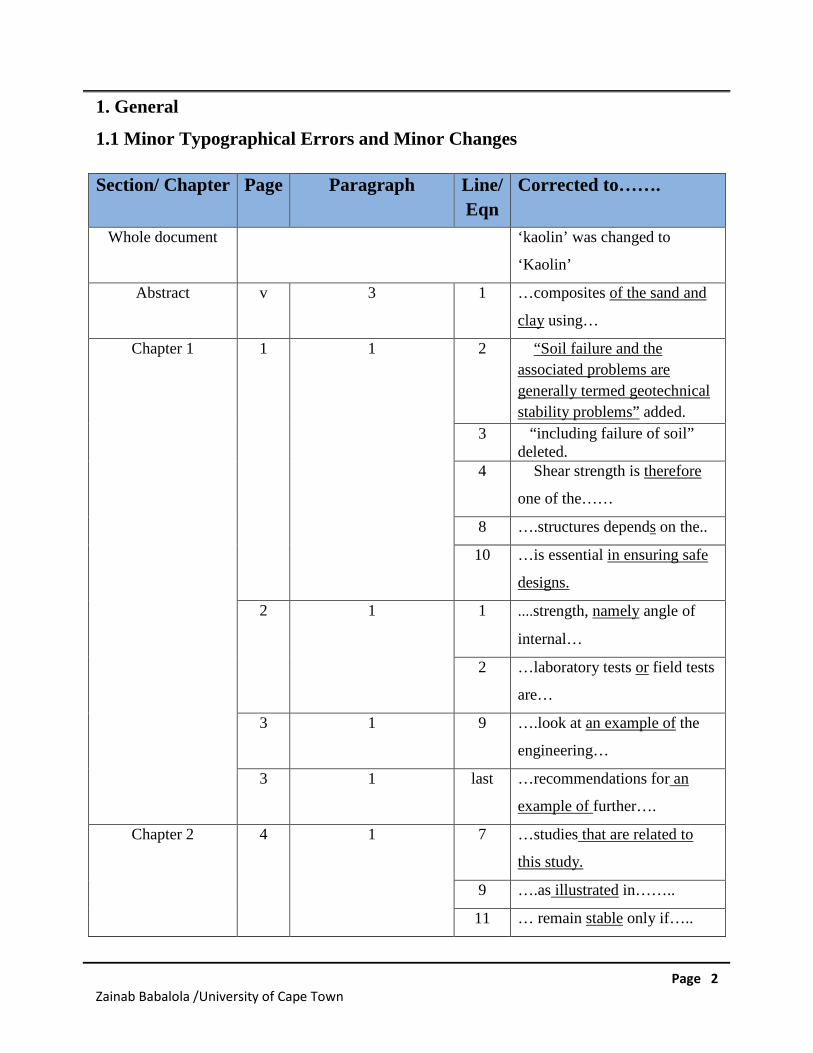
Page 2Zainab Babalola /University of Cape Town
1. General
1.1 Minor Typographical Errors and Minor Changes
Section/ Chapter Page Paragraph Line/
Eqn
Corrected to…….
Whole document ‘kaolin’ was changed to
‘Kaolin’
Abstract v 3 1 …composites of the sand and
clay using…
Chapter 1 1 1 2 “Soil failure and the
associated problems are
generally termed geotechnical
stability problems” added.
3 “including failure of soil”deleted.
4 Shear strength is therefore
one of the……
8 ….structures depends on the..
10 …is essential in ensuring safe
designs.
2 1 1 ....strength, namely angle of
internal…
2 …laboratory tests or field tests
are…
3 1 9 ….look at an example of the
engineering…
3 1 last …recommendations for an
example of further….
Chapter 2 4 1 7 …studies that are related to
this study.
9 ….as illustrated in……..
11 … remain stable only if…..
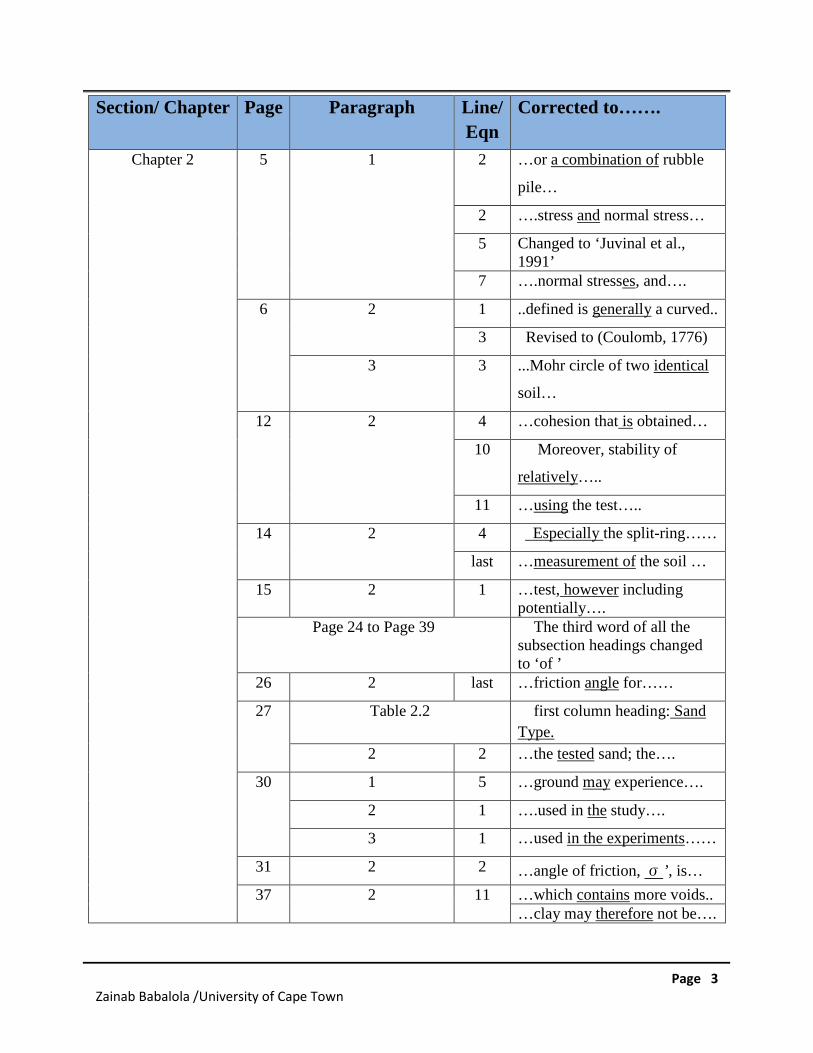
Page 3Zainab Babalola /University of Cape Town
Section/ Chapter Page Paragraph Line/
Eqn
Corrected to…….
Chapter 2 5 1 2 …or a combination of rubble
pile…
2 ….stress and normal stress…
5 Changed to ‘Juvinal et al.,1991’
7 ….normal stresses, and….
6 2 1 ..defined is generally a curved..
3 Revised to (Coulomb, 1776)
3 3 ...Mohr circle of two identical
soil…
12 2 4 …cohesion that is obtained…
10 Moreover, stability of
relatively…..
11 …using the test…..
14 2 4 Especially the split-ring……
last …measurement of the soil …
15 2 1 …test, however includingpotentially….
Page 24 to Page 39 The third word of all thesubsection headings changedto ‘of ’
26 2 last …friction angle for……
27 Table 2.2 first column heading: Sand
Type.
2 2 …the tested sand; the….
30 1 5 …ground may experience….
2 1 ….used in the study….
3 1 …used in the experiments……
31 2 2 …angle of friction, σ’, is…
37 2 11 …which contains more voids..…clay may therefore not be….
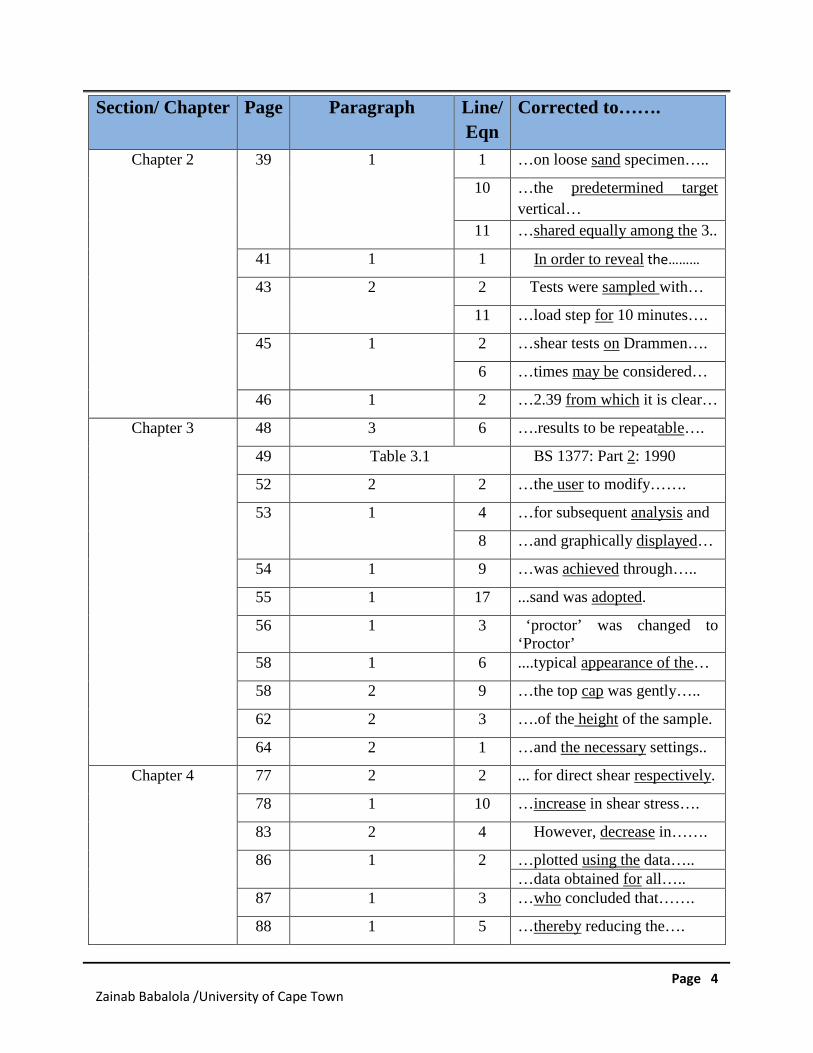
Page 4Zainab Babalola /University of Cape Town
Section/ Chapter Page Paragraph Line/
Eqn
Corrected to…….
Chapter 2 39 1 1 …on loose sand specimen…..
10 …the predetermined target
vertical…
11 …shared equally among the 3..
41 1 1 In order to reveal the………
43 2 2 Tests were sampled with…
11 …load step for 10 minutes….
45 1 2 …shear tests on Drammen….
6 …times may be considered…
46 1 2 …2.39 from which it is clear…
Chapter 3 48 3 6 ….results to be repeatable….
49 Table 3.1 BS 1377: Part 2: 1990
52 2 2 …the user to modify…….
53 1 4 …for subsequent analysis and
8 …and graphically displayed…
54 1 9 …was achieved through…..
55 1 17 ...sand was adopted.
56 1 3 ‘proctor’ was changed to‘Proctor’
58 1 6 ....typical appearance of the…
58 2 9 …the top cap was gently…..
62 2 3 ….of the height of the sample.
64 2 1 …and the necessary settings..
Chapter 4 77 2 2 ... for direct shear respectively.
78 1 10 …increase in shear stress….
83 2 4 However, decrease in…….
86 1 2 …plotted using the data…..…data obtained for all…..
87 1 3 …who concluded that…….
88 1 5 …thereby reducing the….
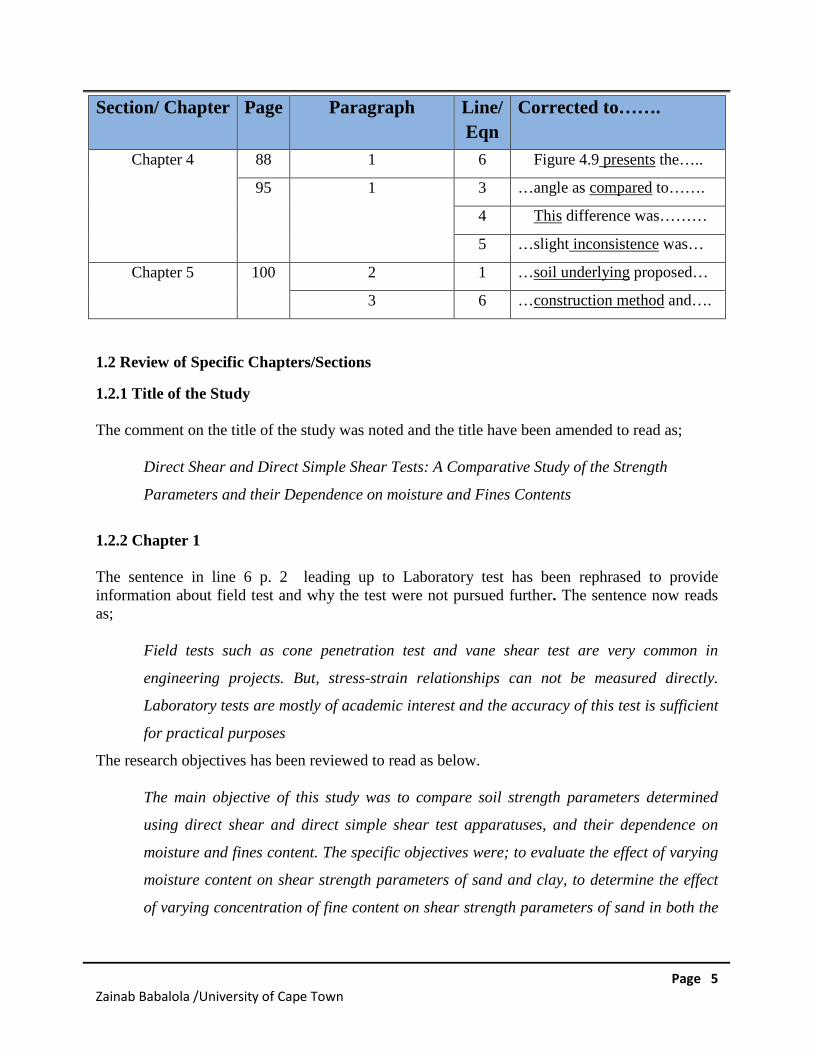
Page 5Zainab Babalola /University of Cape Town
Section/ Chapter Page Paragraph Line/
Eqn
Corrected to…….
Chapter 4 88 1 6 Figure 4.9 presents the…..
95 1 3 …angle as compared to…….
4 This difference was………
5 …slight inconsistence was…
Chapter 5 100 2 1 …soil underlying proposed…
3 6 …construction method and….
1.2 Review of Specific Chapters/Sections
1.2.1 Title of the Study
The comment on the title of the study was noted and the title have been amended to read as;
Direct Shear and Direct Simple Shear Tests: A Comparative Study of the Strength
Parameters and their Dependence on moisture and Fines Contents
1.2.2 Chapter 1
The sentence in line 6 p. 2 leading up to Laboratory test has been rephrased to provideinformation about field test and why the test were not pursued further. The sentence now readsas;
Field tests such as cone penetration test and vane shear test are very common in
engineering projects. But, stress-strain relationships can not be measured directly.
Laboratory tests are mostly of academic interest and the accuracy of this test is sufficient
for practical purposes
The research objectives has been reviewed to read as below.
The main objective of this study was to compare soil strength parameters determined
using direct shear and direct simple shear test apparatuses, and their dependence on
moisture and fines content. The specific objectives were; to evaluate the effect of varying
moisture content on shear strength parameters of sand and clay, to determine the effect
of varying concentration of fine content on shear strength parameters of sand in both the
Page 6Zainab Babalola /University of Cape Town
direct shear test and the simple shear test, and to compare the overall shear test results
obtained from direct shear test and direct simple shear.
Section 1.4 has been added to discuss the scope and limitations of the study. It reads as;
The research conducted herein involved the investigation of shear strength parameters of
soil as obtained using both direct shear and direct simple shear device, and to determine
the relationship between the results as well as the benefits of their inclusion in the design
of structures. The shear tests conducted were limited to these two tests, and no other
shear tests included in the research. The investigation only considered two soils,
Klipheuwel sand and Kaolin clay sourced locally.
1.2.3 Chapter 2
The last sentence of section 2.3.1 has been rephrased to read as;
It has its application in earthquake geotechnical engineering
The sentence in line 11 p. 12 has been deleted so that the paragraph read as;
The triaxial test has the ability to control the drainage conditions so as to allow for
different types of test (drained and undrained conditions) and measure pore pressure.
Moreover, stability of relatively impervious rolled field can be investigated using the test
Shawntiku, 2011. The shear strength parameters determined using triaxial test are more
accurate than those obtained from shear box test because it allows soil to be sheared to
failure along its natural weakest plane Shawntiku, 2011.
The last sentence of section 2.3.3 has been modified to read as:
The cross-sectional area of the shear plane remains unchanged during shearing and the
geometry of the test specimen remains unchanged during shearing. In a ring shear test as
opposed to the specimen in triaxial test where shape changes from rectangular to nearly
an ovoid.
The Table 2.3 has been reproduced for better appearance and readability as shown below.
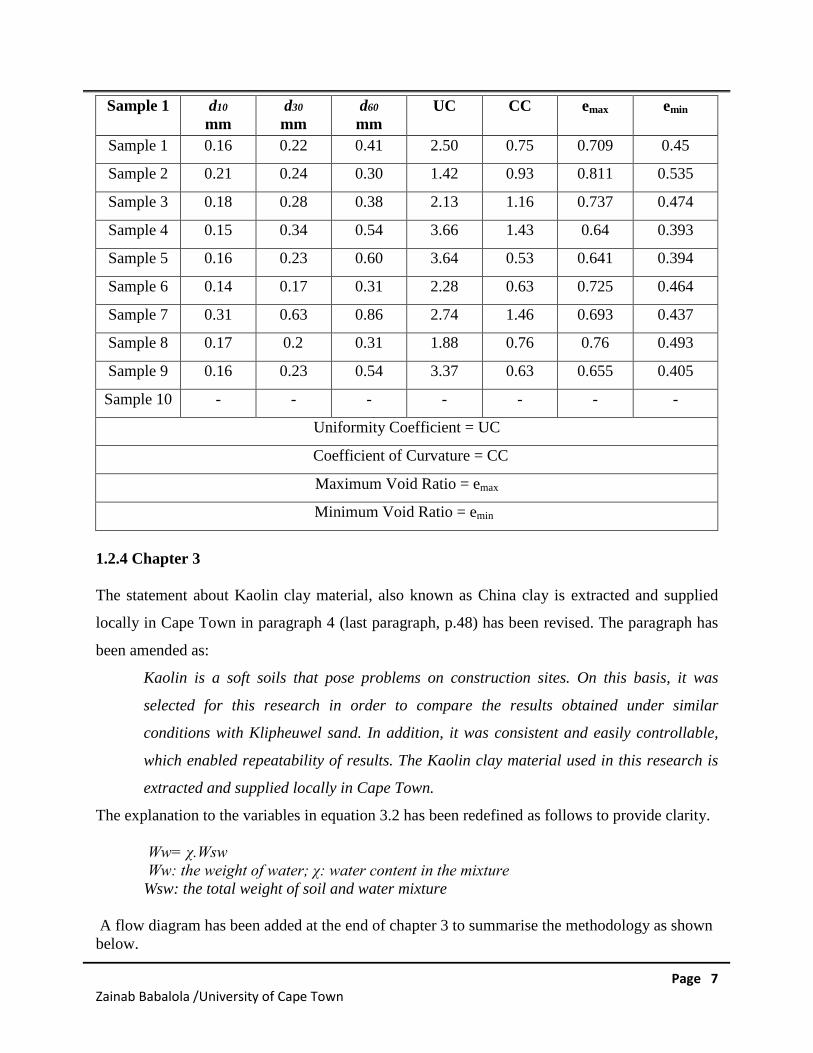
Page 7Zainab Babalola /University of Cape Town
Sample 1 d10
mmd30
mmd60
mmUC CC emax emin
Sample 1 0.16 0.22 0.41 2.50 0.75 0.709 0.45
Sample 2 0.21 0.24 0.30 1.42 0.93 0.811 0.535
Sample 3 0.18 0.28 0.38 2.13 1.16 0.737 0.474
Sample 4 0.15 0.34 0.54 3.66 1.43 0.64 0.393
Sample 5 0.16 0.23 0.60 3.64 0.53 0.641 0.394
Sample 6 0.14 0.17 0.31 2.28 0.63 0.725 0.464
Sample 7 0.31 0.63 0.86 2.74 1.46 0.693 0.437
Sample 8 0.17 0.2 0.31 1.88 0.76 0.76 0.493
Sample 9 0.16 0.23 0.54 3.37 0.63 0.655 0.405
Sample 10 - - - - - - -
Uniformity Coefficient = UC
Coefficient of Curvature = CC
Maximum Void Ratio = emax
Minimum Void Ratio = emin
1.2.4 Chapter 3
The statement about Kaolin clay material, also known as China clay is extracted and supplied
locally in Cape Town in paragraph 4 (last paragraph, p.48) has been revised. The paragraph has
been amended as:
Kaolin is a soft soils that pose problems on construction sites. On this basis, it was
selected for this research in order to compare the results obtained under similar
conditions with Klipheuwel sand. In addition, it was consistent and easily controllable,
which enabled repeatability of results. The Kaolin clay material used in this research is
extracted and supplied locally in Cape Town.
The explanation to the variables in equation 3.2 has been redefined as follows to provide clarity.
Ww= χ.Wsw Ww: the weight of water; χ: water content in the mixture
Wsw: the total weight of soil and water mixture
A flow diagram has been added at the end of chapter 3 to summarise the methodology as shownbelow.
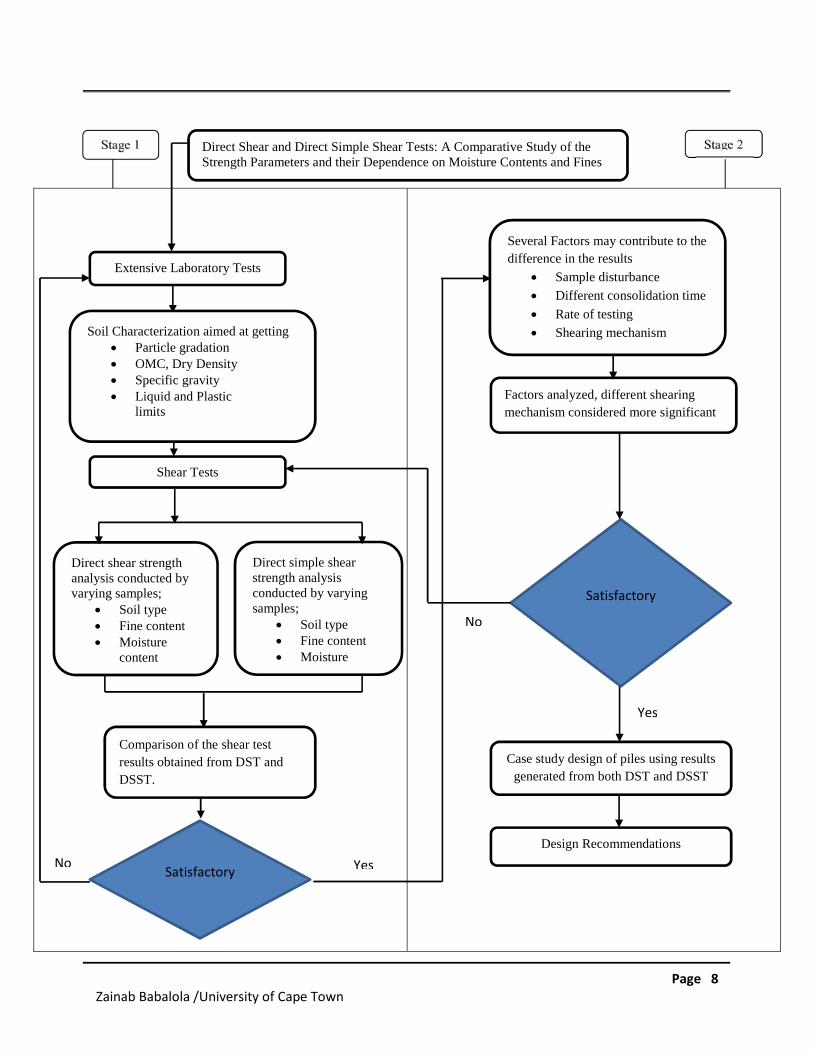
Page 8Zainab Babalola /University of Cape Town
Direct shear strengthanalysis conducted byvarying samples;
• Soil type• Fine content• Moisture
content
Direct simple shearstrength analysisconducted by varyingsamples;
• Soil type• Fine content• Moisture
Factors analyzed, different shearing
mechanism considered more significant
Satisfactory
Design Recommendations
Extensive Laboratory Tests
Soil Characterization aimed at getting• Particle gradation• OMC, Dry Density• Specific gravity• Liquid and Plastic
limits
Shear Tests
Several Factors may contribute to the
difference in the results
• Sample disturbance
• Different consolidation time
• Rate of testing
• Shearing mechanism
Case study design of piles using results
generated from both DST and DSST
Comparison of the shear test
results obtained from DST and
DSST.
No
No Yes
Yes
Direct Shear and Direct Simple Shear Tests: A Comparative Study of theStrength Parameters and their Dependence on Moisture Contents and Fines
Satisfactory
Page 9Zainab Babalola /University of Cape Town
1.2.5 Chapter 4
The explanation for the reduction in maximum shear stress with increased moisture content has
been amended, such that it reads:
The addition of water to the soil reduces the maximum shear stress when compared to the
dry sample, but there is no direct correlation between increasing moisture content (MC)
and maximum shear stress i.e. the maximum shear stress does not steadily decrease as
the MC increases.
The statement about the decrease in maximum shear stress for DSST has compared to dry Kaolin
in paragraph 2 (page 84) has been revised. It reads as;
The addition of water to Kaolin increases its maximum shear stress for DST. However,
decrease in maximum shear stress was observed for DSST as compared to dry Kaolin. A
decrease in the maximum shear stress compared to dry Kaolin in DSST not achieved
throughout. There is variation in the result, at lower moisture contents true but maximum
shear stress increases above dry value at higher moisture contents.
Regarding the effect of water content on strength parameter of sand in paragraph 1 (page 89) has
been reviewed to read as below.
In both the DST and DSST the friction values are lower than when compared to dry
sand, but there is no direct correlation between increasing MC% and decreasing friction
angle i.e. the friction angle does not decrease as the water content increases.
1.3 References
All references were updated as follows:
Airey, D.W. and Wood, D., 1984. Discussion on: Specimen Size Effect in Simple Shear Test.
Journal of Geotechnical Engineering Division, ASCE Vol. 110, No.3, pp 439-442.
Airey, D. W. and Wood, D.M., 1987. An Evaluation of Direct Simple Shear Tests on Clay,
Geotechnique, Vol. 37, No.1, pp 25-35.
Amsiejus, J., Dirgeliene, N., Norkus, A. and Skuodis, S., 2013. Comparison of Sandy Soil
Shear Strength Parameters obtained by various Construction Direct Shear Apparatuses.
Archives of Civil and Mechanical Engineering, Vol. 14, pp 327-334.
Amy, B. C. and Alan, J. L., 2006. Specimen Size and Scale Effects of Direct Shear Box Tests of
Page 10Zainab Babalola /University of Cape Town
Sands. Geotechnical Testing Journal, Vol. 29, No. 6, pp 1-10.
Arthur, J. R. and Dunstan, T., 1988. The Engineering Application of Direct and Simple Shear
Testing. Sixth Geotechnique Symposium, Geotechnique 38, No. 1, pp 139-154.
ASTM D422. 2007. Standard Test method for Particle Size Analysis of Soils. ASTM
International, West Conshohocken, PA, USA.
ASTM D3080. 2011. Standard Test Method for Direct Shear Test of Soils under Consolidated
Drained Conditions. ASTM International, West Conshohocken, PA, USA.
ASTM D854. 2010. Standard Test Methods for Specific Gravity of Soil Solids by Water
Pycnometer. ASTM International, West Conshohocken, PA, USA.
ASTM D2216. 2010. Standard Test Methods for Laboratory Determination of Moisture Content
of Soil and Rock by Mass. ASTM International, West Conshohocken, PA, USA.
ASTM D1557-12. 2012. Standard Test Methods for Laboratory Compaction Characteristics of
Soil using Modified Effort. ASTM International, West Conshohocken, PA, USA.
ASTM, 2003. Standard Test Methods for Liquid Limit, Plastic Limit, and Plasticity Index of
Soils. Annual Book of ASTM Standards, Vol. 04.08, pp. 582–595. American Society for
Testing and Materials, West Conshohocken, PA, USA.
Bareither, C. A., Benson, C.H. and Edil, T.B., 2008. Comparison of Shear Strength of Sand
Backfills measured in Small-Scale and Large- Scale Direct Shear Tests. Canadian
Geotechnical Journal, Vol. 45, pp 1224–1236.
Bardet, J. P., 1997. Experimental Soil Mechanics, Prentice-Hall, Inc, United States.
Bayoglu, E., 1995. Shear Strength and Compressibility Behavior of Sand-Clay Mixtures, M.S.
Thesis, Middle East Technical University, Turkey
Baxter, C., Bradshaw, A., Ochoa, L. and Hankou, R., 2010. Direct simple shear Test Results
Using Wire-Reinforced Membrane and Stacked Rings. ASCE Journals, pp 600-614.
Berre, T. and Bjerrum, L., 1973. Shear Strength of Normally Consolidated Clays. Geotechnical
Testing Journal, Vol.14, pp 327-334.
Borin, D.L., 1973. The Behaviour of Saturated Kaolin in the Simple Shear Apparatus. PhD
thesis, University of Cambridge.
Bishop, A. W., 1971. The Influence of Progressive Failure on the Method of Stability Analysis;
Géotechnique; Vol. 21, No. 2, pp 47-59.
Bishop, A. W., Green, G. E., Garga, V. K., Anderson, A., Brown, J. D., 1971. New Rings Shear
Page 11Zainab Babalola /University of Cape Town
Apparatus and its Application to the Measurement of Residual Strength. Géotechnique; Vol.
21, No. 4, pp 310-318.
Braja, M.D., 2007. Foundamentals of Geotechnical Engineering. Third Edition.
Braja, M.D., 2007. Principles of Foundation Engineering. Seventh Edition.
Bromhead, E. N. The stability of slopes. Blackie Academic & Professional, Glasgow, UK, 1992.
Bromhead, E. N., Dixon, N., 1986. The field Residual Strength of London Clay and its
Correlation with Laboratory Measurements, especially Ring Shear Tests. Géotechnique; Vol.
36, No. 3, pp 1- 14.
Budhu, M., 1984. Nonuniformities Imposed by Simple Shear Apparatus. Canadian Geotechnical
Journal, Vol.21 No.1, pp 125-137.
Castellanos, B.A. and Brandon, T.L, 2013. A Comparison between the Shear Strength Measured
with Direct Shear and Triaxial Devices on Undisturbed and Remolded Soils. Proceedings of
the 18th International Conference on Soil Mechanics and Geotechnical Engineering, Paris.
Cerato, B.A. and Lutenegger, A.J., 2006. Specimen Size and Scale Effects of Direct Shear Box
Tests of Sands. Geotechnical Testing Journal, Vol. 29, No 6, pp 507–516
Cernica, J. N., 1995. Geotechnical Engineering: Soil Mechanics, John Wiley & Sons, Inc, United
States.
Craig, R. F., 1997. Soil Mechanics, Sixth Edition, Spon Press, London.
Craig, R.F., 2004.Soil Mechanics. Seventh Edition.
Das, M. B., 1983. Advanced Soil Mechanics, Hemisphere Publishing Corp., McGraw Hill,
London.
Degroot, D.J. and John, T.G., 1996. Undrained Multidirectional Direct Simple Shear Behaviour
of Cohesive Soils. Journal of Geotechnical Engineering, Vol.122, No 2.
Dyvik, R., Berre, T., Lacasse, S. and Raadim, B. 1987. Comparison of Truly Undrained and
Constant Volume Direct Simple Shear Tests. Geotechnique, Vol. 37, pp 3-10.
Esma, M. k, Mourad, M., and Nabil, A., 2011. Contribution of Particles Size Ranges to Sand
Friction. Engineering, Technology & Applied Science Research Vol. 3, No. 4, pp 497-50.
George, T.D. and David, M.P., 1993. Numerical Analysis of Drained Direct Shear and Direct
Simple Shear Test. Journal of Geotechnical Engineering, Vol. 119, No. 12, pp 1870-1892
Guyer, J.P., 2010. Introduction to Laboratory Testing of Soils. Lecture notes.
Hanzawa, H., Fukaya, T. and Suzuki, K., 1990.Evaluation of Engineering Properties for an
Page 12Zainab Babalola /University of Cape Town
Ariake Clay. Soils and Foundations, Vol. 30, No 4, pp 11-24.
Hanzawa, H., Nutt, N., Lunne, T., Tang, Y. and Long, M., 2007. A Comparative Study between
the NGI Direct Simple Shear Apparatus and the Mikasa Direct Shear Apparatus. Japanese
Geotechnical Society, Soils and Foundations, Vol. 47, No 1, pp 47-58.
Imre, S., 1994. Up-To-Date Means of Shear Strength Tests Comparison between Simple and
Direct Shear. Periodica Politechnical SER. Civil ENG. Vol. 38, No. 1, pp. 109-126.
Jewell, R.A., 1988. Direct Shear Test on Sand. A Soil Mechanics Report.
Jiunnren, L. and Roy, E. O., 2004. Types of Laboratory Apparatus for Shear Testing of Soils. A
summary report.
John, T.G. and Amy V. G., 2009. Geotechnical Laboratory Measurements for Engineers.
John, T.G., 2011. Characterization of Reconsistuted Low Plasticity Silt. Master thesis submitted
to the Massachussets Institute of Technology.
Karsten, T., Christian, G. and Joachim T., 2006. Shear Strength Parameters from Direct Shear
Tests – Influencing Factors and their Significance. The Geological Society of London, Vol.
10, pp. 484-496.
Lambe, T.W., 1951. Soil Testing for Engineers, John Wiley, New York.
Landva, A., 1966. Direct Simple Shear Tests on a Norwegian Quick Clay, Geotechnique, Vol.16
No.1, pp 1-20.
Li-chang, W., Wei, L. and Shi-juan, G., 2014. Effect of Moisture Content, Void Ration and
Compacted Sand Content on Remoulded Clay. Chinese Journal of Geotechnical Engineering,
Vol.2, pp 3314 -3327.
Lin, C.P., 2012. Shear Strength of Soils. Lecture notes at National Chiao Tung University.
Kjellman, W., 1951. Testing the Shear Strength of Clay in Sweden. Geotechnique, Vol.2, No.
3, pp 225-235.
Matthieu, G., 2011. The Boundary Conditions in Direct Simple Shear Tests, Development for
Peat Testing at Low Vertical Stress. Master thesis submitted to Deflt University of
Technology.
Mehmet, S.O., 2008. Shear Strength Behavior of Sand- Clay Mixtures. A thesis submitted to the
graduate school of natural and applied sciences of Middle East technical university.
Muawia, A. D., 2012. Effects of Clay and Moisture Content on Direct Shear Tests for Clay-Sand
Mixtures. Advances in Materials Science and Engineering.
Page 13Zainab Babalola /University of Cape Town
Osano, S.N., 2012. Direct Shear Box and Ring Shear Test Comparison: Why does Internal Angle
of Friction vary? Journal of Engineering Indian Centre for Advanced Scientific and
Technological Research (Icastor), Vol. 5, No. 2, 77 – 93.
Paul, W.M., 1985. A Review of Undrained Shear Strength in Direct Simple Shear Test. Journal
of Japanese Geotechnical Society, Vol. 25, No. 3, pp 64-72.
Primesh, J., 2014. Direct Simple Shear Tests on Soil-Plastic (Polythene) Waste Composites.
Undergraduate thesis submitted to the University of Cape Town.
Rahnenma, A., Habibagahi, G. and Ghahramani, A., 2003. A New Simple Shear Apparatus for
Testing Unsaturated Soil. Iranian Journal of Science and Technology, Vol. 27, No 1, pp 73 –
80.
Saada, A.S. and Townsend, F.C, 1981. State of the Art: Laboratory Strength Testing of Soils.
ASTM Spec. Tech. Publ., No. 740, pp 7-77.
Sarunus, S. and Arnoldas, N., 2014. Influence of Test Quantity on Loose Sand Shearing Strength
Parameters. Proceedings of the International Conference on Innovative Materials, Structures
and Technologies, pp 10-28.
Sean, R., 2012. Introduction to Triaxial Testing. Lecture Note.
Seth, M., 2011. Comparison of Direct Simple Shear Confinement Methods on Clay and Silt
Specimens. Master thesis submitted to the University of Rhode Island.
Sivadass, T. and Lee, C., 2008. Simple Shear Testing of Residual Soils with High Silt Content.
International Conference on Construction and Building Technology, Vol. 38, pp 469-484.
Sofian, M. A., 2004. Direct Shear Testing. Doctoral thesis submitted to University of Sumatera
Utara.
Takada, N., 1993. Mikasa's Direct Shear Apparatus, Test Procedures and Results. Geotechnical
Testing Journal, Vol. 16, No 3, pp 314-322.
Tanaka, H., Sharma, P., Tsuchida, T. and Tanaka, M., 1996. Comparative Study on Sample
Quality Using Several Different Types of Samplers. Soils and Foundations, Vol.36, No 2, pp
67 -68.
Terzaghi, K. and Peck, R.B., 1967. Soil Mechanics in Engineering Practice. Second Edition.
Tsuji, K., Tang, Y.X. and Lunne, T., 1998. A comparative Study on Shear Strength of Marine
Clays by Direct Shear and Direct Simple shear test. Journal of Geotechnical Engineering,
JSCE, pp 275 – 285.
Page 14Zainab Babalola /University of Cape Town
Tomoyo, N. and Stephen, F., 2008. Direct Shear Testing of a Marginal Material Using a Large
Shear Box. Geotechnical Testing Journal, Vol. 31, No. 5, pp 1-11.
Touahmia, M., 2014. Shear Strength of Soils. Lecture Note.
Vucetic, M. and Lacasse, S., 1982. Specimen Size Effect in Simple Shear Test. Journal of
Geotechnical Engineering, pp 1567-1585.
Wright, D.K., Gilbert, P.A. and Saada, A.S., 1978. Shear Devices for Determining Dynamic Soil
Properties. Proc. Spec. Conf. Earthquake Engineering and Soil Dynamics, ASCE, Pasadena,
2, pp 1056-1075.
Wroth, C.P., 1984. The Interpretation of In situ Soil Tests. 24th Rankine Lecture. Geotechnique,
Vol. 34, No. 4, pp 449-489.
Wroth, C.P., 1987.The Behaviour of Normally Consolidated Clay as Observed in Undrained
Direct Shear Tests. Geotechnique 37, No.1, pp 37-43.
2. Final Comments
I am grateful for the insightful comments made by the external examiners. The shear strength of
soil is important for design of engineering structures. Therefore, accurate and reliable tests are
required to determine the strength parameters. The comparison between direct shear and direct
simple shear tests is a good topic that needs further dedicated studies. Nevertheless, I hope that
the information availed herein will be of help to researchers and any practicing engineer.
Signed:
Date: April 2016
Page 15Zainab Babalola /University of Cape Town
APPENDIX A. Characterization tests results
A.1 Natural water content
A.2 Determination of particle size distribution
A.3 Determination of the specific gravity
APPENDIX B. Shear Test Results
B.1 Klipheuwel sand and Kaolin at varying moisture content.
APPENDIX C. Design Charts
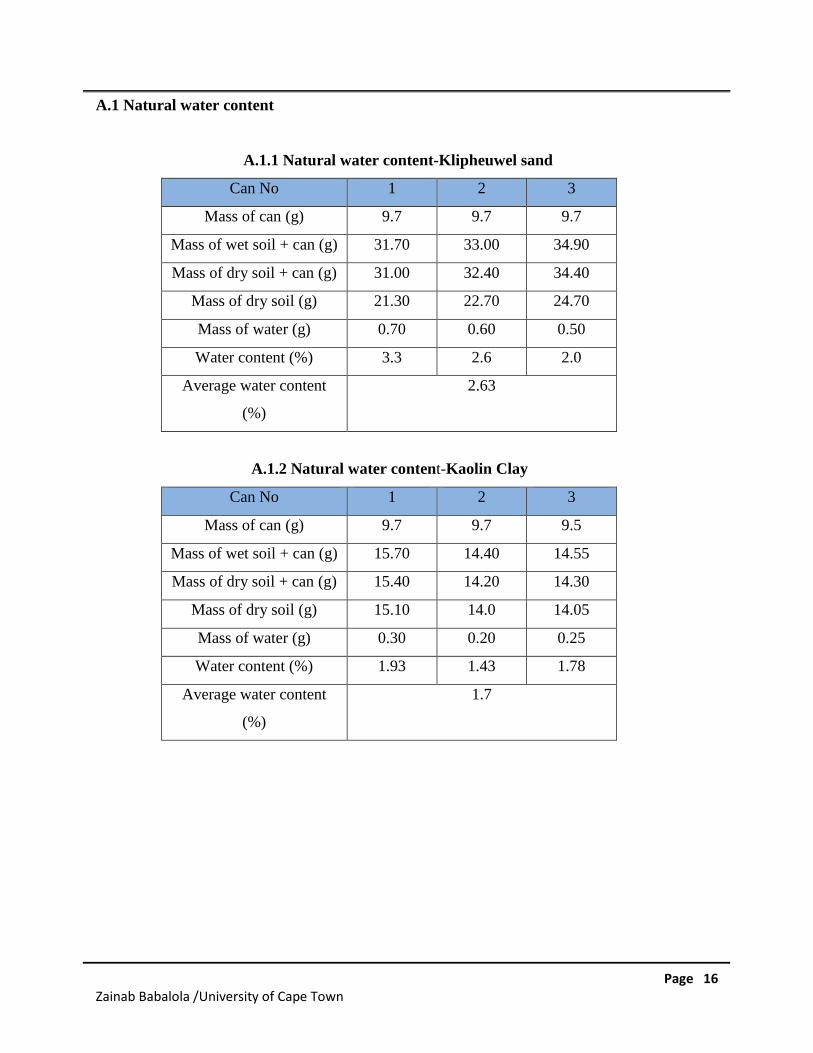
Page 16Zainab Babalola /University of Cape Town
A.1 Natural water content
A.1.1 Natural water content-Klipheuwel sand
Can No 1 2 3
Mass of can (g) 9.7 9.7 9.7
Mass of wet soil + can (g) 31.70 33.00 34.90
Mass of dry soil + can (g) 31.00 32.40 34.40
Mass of dry soil (g) 21.30 22.70 24.70
Mass of water (g) 0.70 0.60 0.50
Water content (%) 3.3 2.6 2.0
Average water content
(%)
2.63
A.1.2 Natural water content-Kaolin Clay
Can No 1 2 3
Mass of can (g) 9.7 9.7 9.5
Mass of wet soil + can (g) 15.70 14.40 14.55
Mass of dry soil + can (g) 15.40 14.20 14.30
Mass of dry soil (g) 15.10 14.0 14.05
Mass of water (g) 0.30 0.20 0.25
Water content (%) 1.93 1.43 1.78
Average water content
(%)
1.7
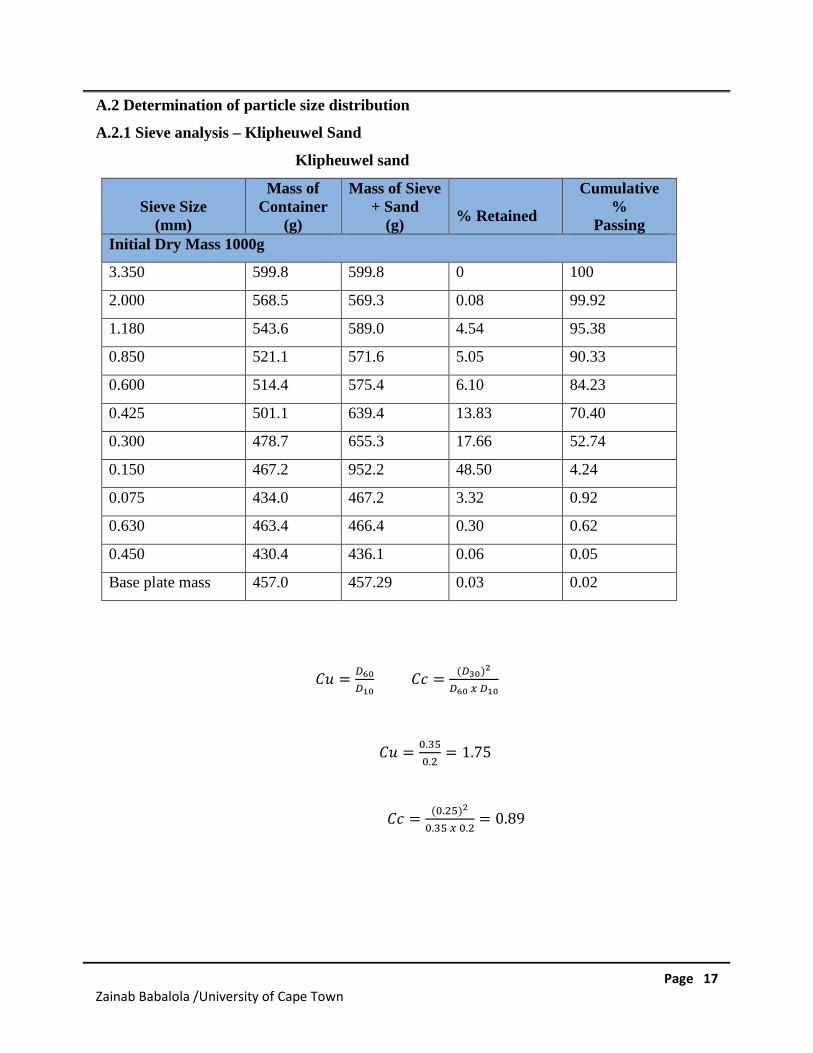
Page 17Zainab Babalola /University of Cape Town
A.2 Determination of particle size distribution
A.2.1 Sieve analysis – Klipheuwel Sand
Klipheuwel sand
Sieve Size(mm)
Mass ofContainer
(g)
Mass of Sieve+ Sand
(g)% Retained
Cumulative%
PassingInitial Dry Mass 1000g
3.350 599.8 599.8 0 100
2.000 568.5 569.3 0.08 99.92
1.180 543.6 589.0 4.54 95.38
0.850 521.1 571.6 5.05 90.33
0.600 514.4 575.4 6.10 84.23
0.425 501.1 639.4 13.83 70.40
0.300 478.7 655.3 17.66 52.74
0.150 467.2 952.2 48.50 4.24
0.075 434.0 467.2 3.32 0.92
0.630 463.4 466.4 0.30 0.62
0.450 430.4 436.1 0.06 0.05
Base plate mass 457.0 457.29 0.03 0.02
� � =� � �
� � �� � =
( � � � )�
� � � � � � �
� � =� . � �
� . �= 1.75
� � =(� . � � )�
� . � � � � . �= 0.89
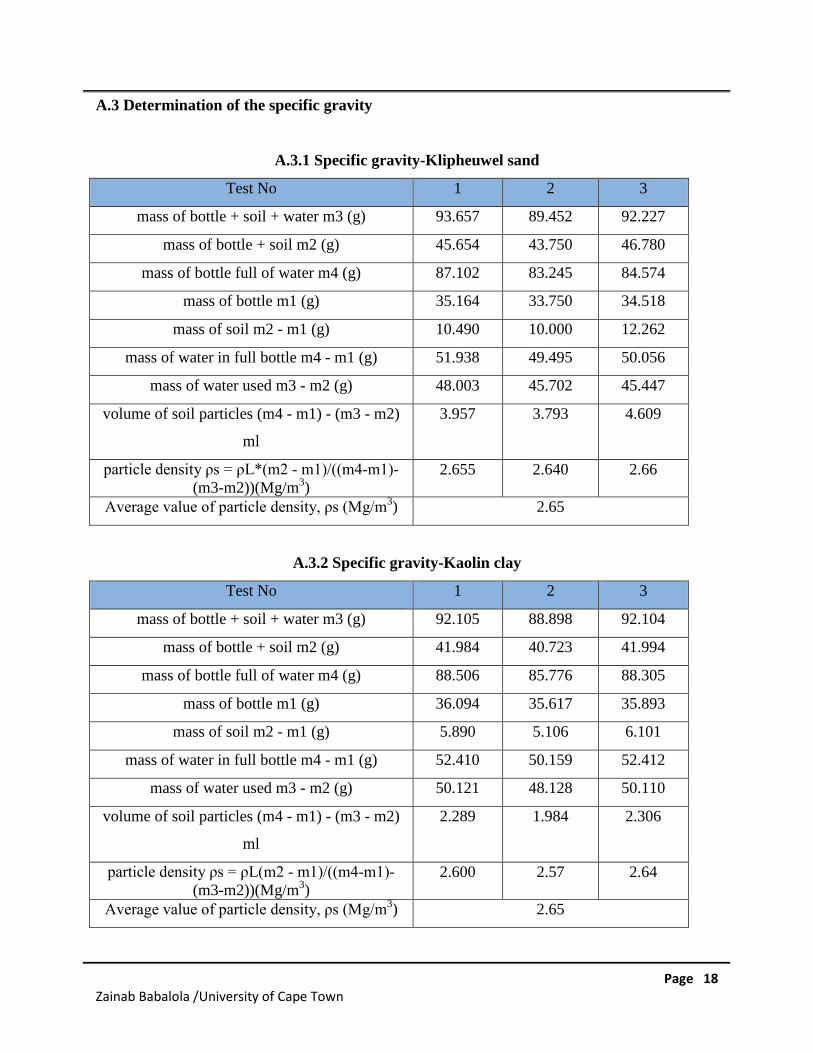
Page 18Zainab Babalola /University of Cape Town
A.3 Determination of the specific gravity
A.3.1 Specific gravity-Klipheuwel sand
Test No 1 2 3
mass of bottle + soil + water m3 (g) 93.657 89.452 92.227
mass of bottle + soil m2 (g) 45.654 43.750 46.780
mass of bottle full of water m4 (g) 87.102 83.245 84.574
mass of bottle m1 (g) 35.164 33.750 34.518
mass of soil m2 - m1 (g) 10.490 10.000 12.262
mass of water in full bottle m4 - m1 (g) 51.938 49.495 50.056
mass of water used m3 - m2 (g) 48.003 45.702 45.447
volume of soil particles (m4 - m1) - (m3 - m2)
ml
3.957 3.793 4.609
particle density ρs = ρL*(m2 - m1)/((m4-m1)-(m3-m2))(Mg/m3)
2.655 2.640 2.66
Average value of particle density, ρs (Mg/m3) 2.65
A.3.2 Specific gravity-Kaolin clay
Test No 1 2 3
mass of bottle + soil + water m3 (g) 92.105 88.898 92.104
mass of bottle + soil m2 (g) 41.984 40.723 41.994
mass of bottle full of water m4 (g) 88.506 85.776 88.305
mass of bottle m1 (g) 36.094 35.617 35.893
mass of soil m2 - m1 (g) 5.890 5.106 6.101
mass of water in full bottle m4 - m1 (g) 52.410 50.159 52.412
mass of water used m3 - m2 (g) 50.121 48.128 50.110
volume of soil particles (m4 - m1) - (m3 - m2)
ml
2.289 1.984 2.306
particle density ρs = ρL(m2 - m1)/((m4-m1)-(m3-m2))(Mg/m3)
2.600 2.57 2.64
Average value of particle density, ρs (Mg/m3) 2.65
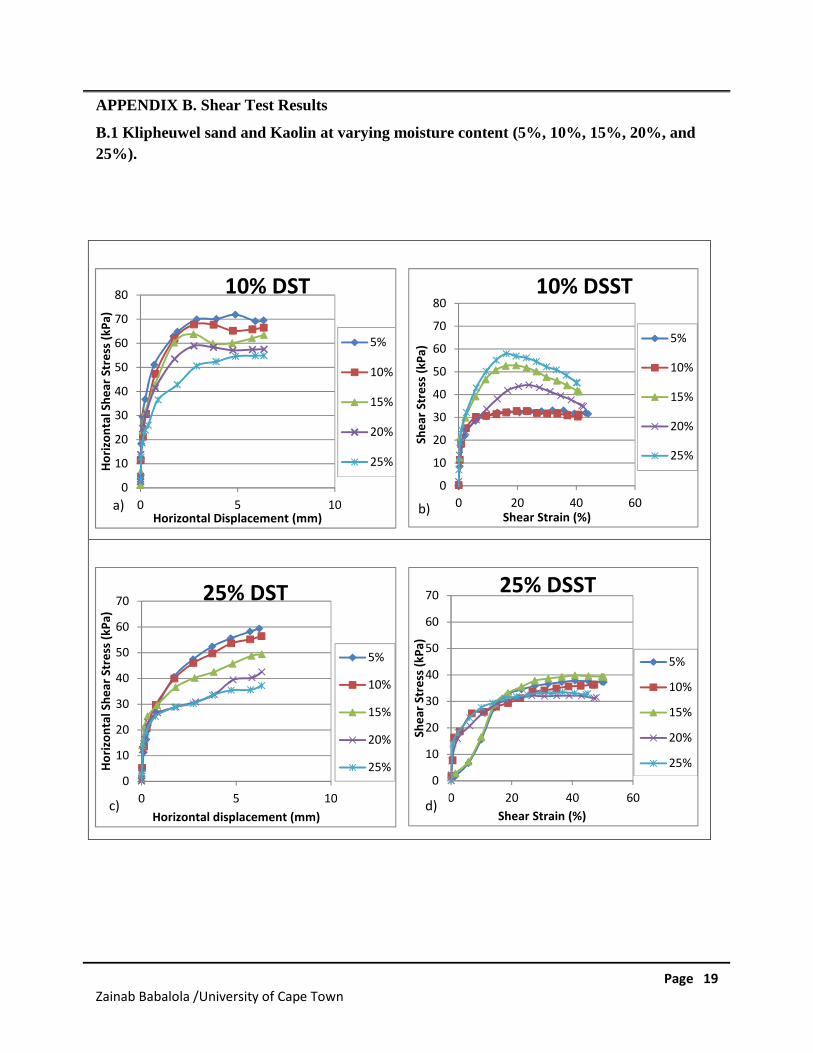
Page 19Zainab Babalola /University of Cape Town
APPENDIX B. Shear Test Results
B.1 Klipheuwel sand and Kaolin at varying moisture content (5%, 10%, 15%, 20%, and
25%).
0
10
20
30
40
50
60
70
80
0 5 10
Ho
rizo
nta
lSh
ear
Stre
ss(k
Pa)
Horizontal Displacement (mm)
10% DST
5%
10%
15%
20%
25%
a)
0
10
20
30
40
50
60
70
80
0 20 40 60
She
arSt
ress
(kP
a)
Shear Strain (%)
10% DSST
5%
10%
15%
20%
25%
b)
0
10
20
30
40
50
60
70
0 5 10
Ho
rizo
nta
lSh
ear
Stre
ss(k
Pa)
Horizontal displacement (mm)
25% DST
5%
10%
15%
20%
25%0
10
20
30
40
50
60
70
0 20 40 60
She
arSt
ress
(kP
a)
Shear Strain (%)
25% DSST
5%
10%
15%
20%
25%
c) d)
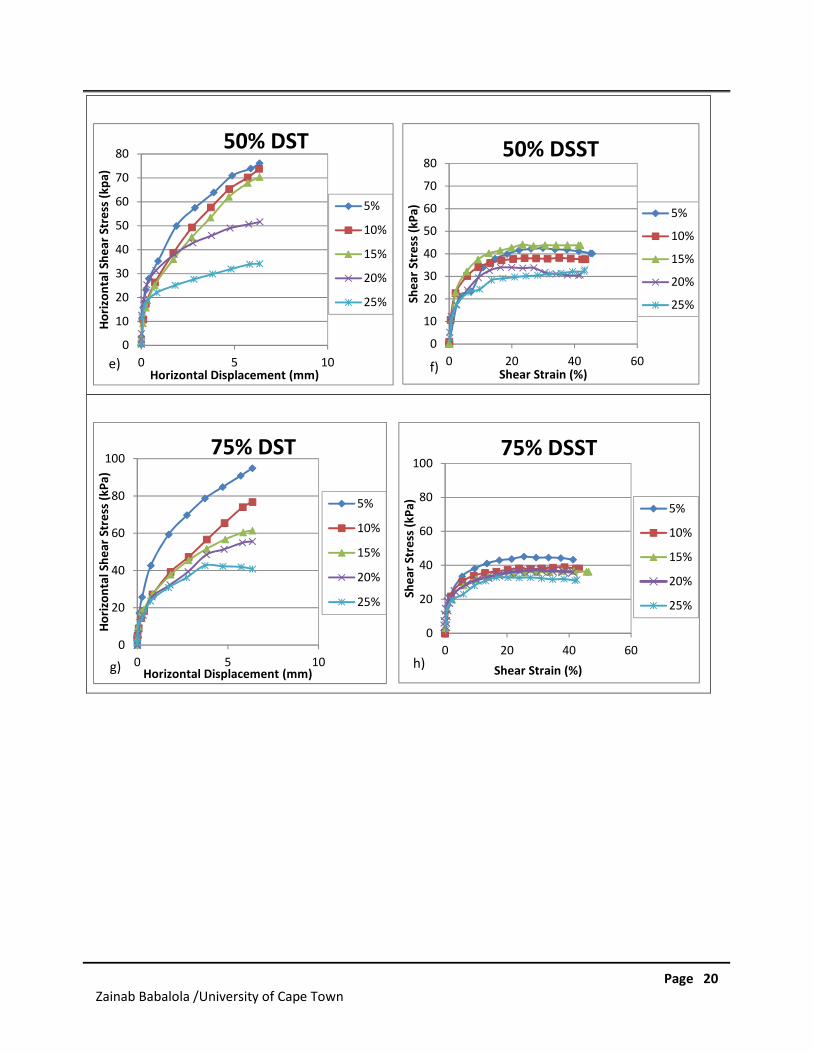
Page 20Zainab Babalola /University of Cape Town
0
10
20
30
40
50
60
70
80
0 5 10
Ho
rizo
nta
lSh
ear
Stre
ss(k
pa)
Horizontal Displacement (mm)
50% DST
5%
10%
15%
20%
25%
0
10
20
30
40
50
60
70
80
0 20 40 60
She
arSt
ress
(kP
a)
Shear Strain (%)
50% DSST
5%
10%
15%
20%
25%
f)
0
20
40
60
80
100
0 5 10
Ho
rizo
nta
lSh
ear
Stre
ss(k
Pa)
Horizontal Displacement (mm)
75% DST
5%
10%
15%
20%
25%
g)
0
20
40
60
80
100
0 20 40 60
She
arSt
ress
(kP
a)
Shear Strain (%)
75% DSST
5%
10%
15%
20%
25%
h)
e)
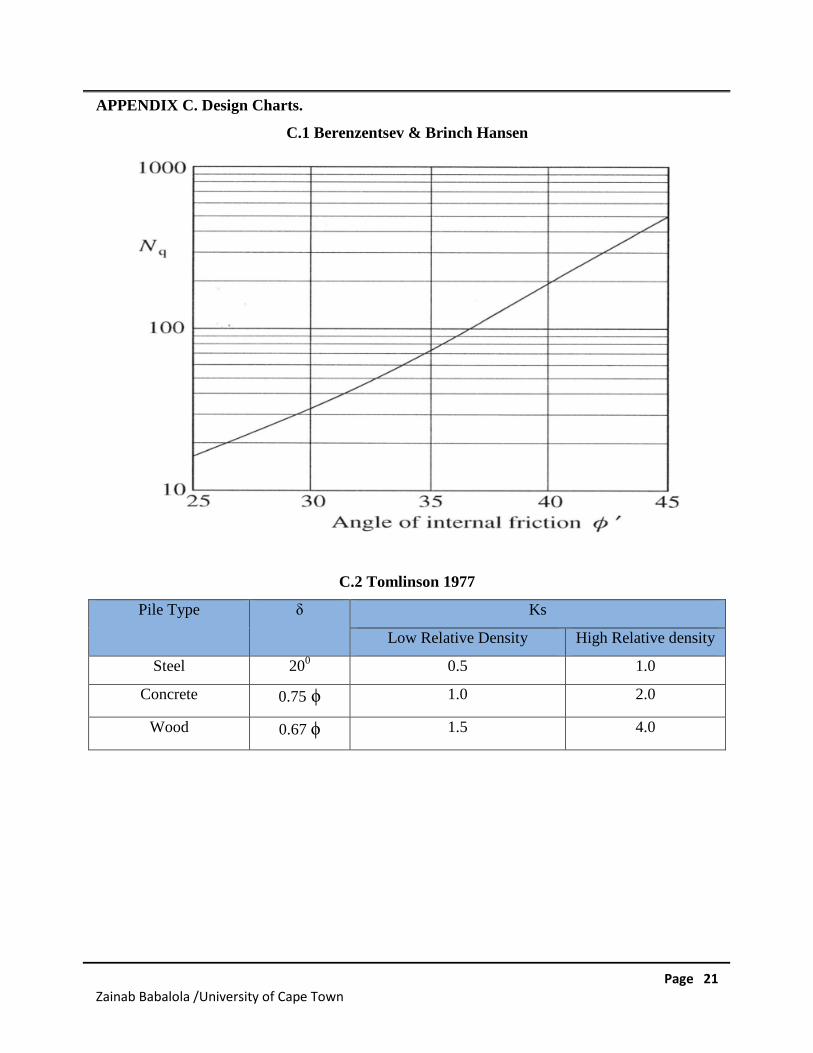
Page 21Zainab Babalola /University of Cape Town
APPENDIX C. Design Charts.
C.1 Berenzentsev & Brinch Hansen
C.2 Tomlinson 1977
Pile Type δ Ks
Low Relative Density High Relative density
Steel 200 0.5 1.0
Concrete 0.75 ϕ 1.0 2.0
Wood 0.67 ϕ 1.5 4.0
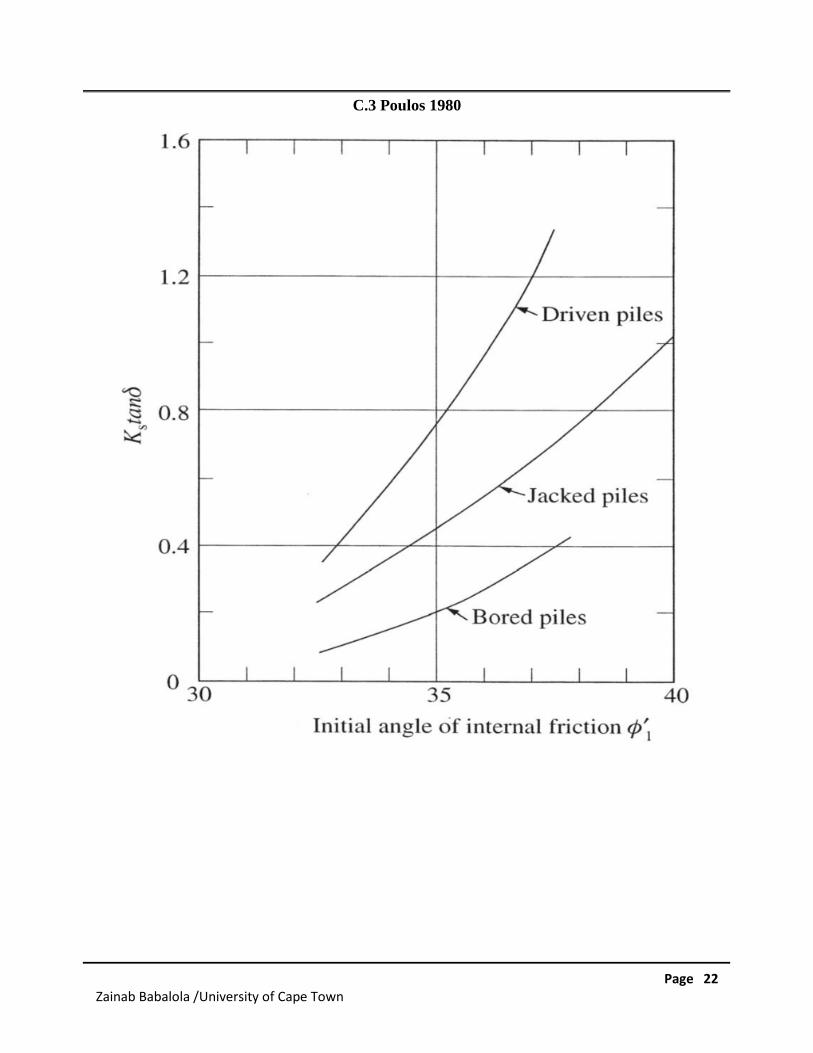
Page 22Zainab Babalola /University of Cape Town
C.3 Poulos 1980