direct shear tests of filled and unfilled joints
TRANSCRIPT
119
THE NASLIDEN PROJECT -
DIRECT SHEAR TESTS OF FILLED AND UNFILLED JOINTS
by
Bengt Ludvig Diy of Rock Mechanics University of Lulea S - 951 87 LULEASWEDEN
ABSTRACT
Joints froni the Nasliden mine have been tested in a small field shear box and in a large shear rig. The large shear rig is described in detail, and its ability to test joints with an area of 600 cm2 at a maximum normal stress of up to 20 MPa is emphasized.
The stiffness and shear strength of the discontinuities in the Nasliden mine is presented. The values estimated at direct shear tests are compared with results from in situ measurements and tests on drillcores. The results show that the hi situ measurements give lower values for the shear resistance than the direct shear tests. Estimation of the normal stiffness for joints in drill cores gave much higher stiffness than the estimations in the shear rig.
INTRODUCTION
The tests, which are presented in this paper, were performed during the first stage in the Nasliden Project, Ludvig1>2. The test results have been applied as in put data in the mathematical models for analysing the stability of the mine. A serie of joints was tested in a large shear rig. The direct shear tests have been supplemented with mapping of the joint sets and the joints roughness in the mine, Stephansson^»^. Before the description of the experimental work is a brief review given of the principles for estimation of the strength and stiffness properties of joints in rock.
Normal deformation in joints
When the blocks on each side of a rough joint surface are placed lightly together the entire contact force is sustained at limited number of . contact points. With increasing normal load, the point contacts are enlarge be elaseic deformation and crushing. The maximum closure, Vmo , is less than the thickhess of the joint, e.
GoodmAn^ showed emperically that a relationship satisfying, these conditions is a hyperbola. The deformation in joints under normal load is controlled by both geometric and strength properties of the joint surface, Swan^.
120
♦Normal stiffness in joints is determined by either measuring axial displacement over a joint in a core or measuring the normal displacement close to the joint in shear boxes, Swan^ and Rosso?.
Shear deformations in joints
The aim with the shear test is to estimate the shear strength in joints under different normal stresses. One method is to do axial tests on cores with an inclined joint. Through measuring both the axial and the lateral displacement, it is possible to estimate the shear properties of the joint.
Another method is direct shear testing in a shear box. The great difference between the axial compression test and the direct shear test is that in the first method the normal stress increases until the shearing in the joint start, while during direct shear test the normal stress can be controlled during the test, Rosso?.
The most common stress deformation mode in direct shear tests are tests with constant normal stress on the joint surface.V /'
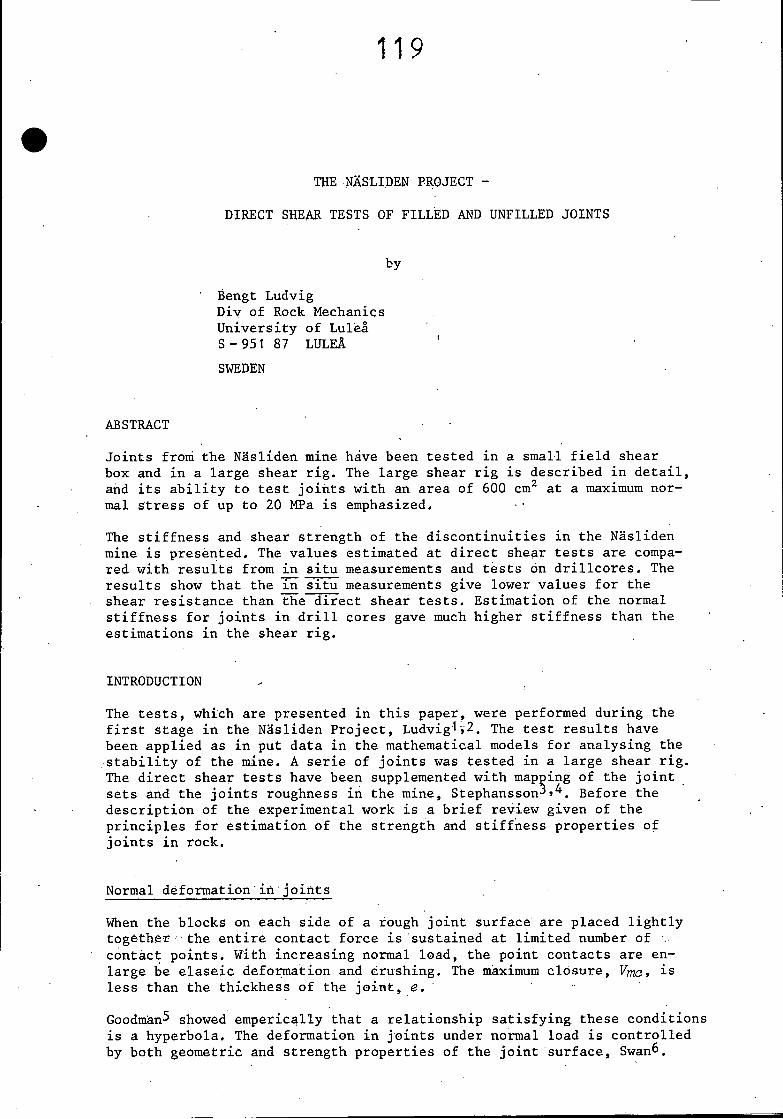
•v The shear displacement versus shear stress curve for a test of rough joints under constant normal stress can be divided into three parts; elastic, peak and plastic, Fig 1. Smooth joints have no clear peak shear strength.
I r o u ^ n jOnrvL
S m o o t h loint
SHEAR C H iP L A v C E M E n T , U
Fig 1 Shear stress versus shear displacement for a rough and asmooth joint.
The slope of the curve for the elastic region is called shear stiffness, ks. Barton^ has showed that the shear stiffness displays a strong scale effect. A greater test area gives smaller shear stiffness for the same type of joint.
Ajonts shear strength, as defined by the peak value, dependes on the joint's roughness and the strength of the asperities. For low values of normal stress the blocks are free to move apart, dilatate", and ride over
121
«
the asperities. In this case it is mainly the roughness controlling the peak shear strength, Fecker^. If the blocks are confined, shearing is possible only if the asperities are sheared off.
The roughness of the joints is defined with an angle, dilatation angle, eZfl. The dilatation angle can be estimated in situ by measuring profiles along the joints or by measuring joints orientation in steps with different length, RengerslO. Bartonl1 showed that the dilatation angle decreases when the ration between normal stress and the compressive strength of the joint surface (JCS) increases. The compressive strength of joints surfaces are estimated with Schmidt hammer.
The plastic part of the curve for shear displacement versus shear stress is called residual shear strength. A more correct designation is ultimate shear strength, as defined by Krahn and Morgensternl2. An important characteristic of the residual strength for soils is that it is independent of the original state. The residual strength is the same for a soil whether the soil is disturbed or not. However, for rock discontinuities the large displecement shearing resistance is dependent upon the original roughness of the discontinuity.
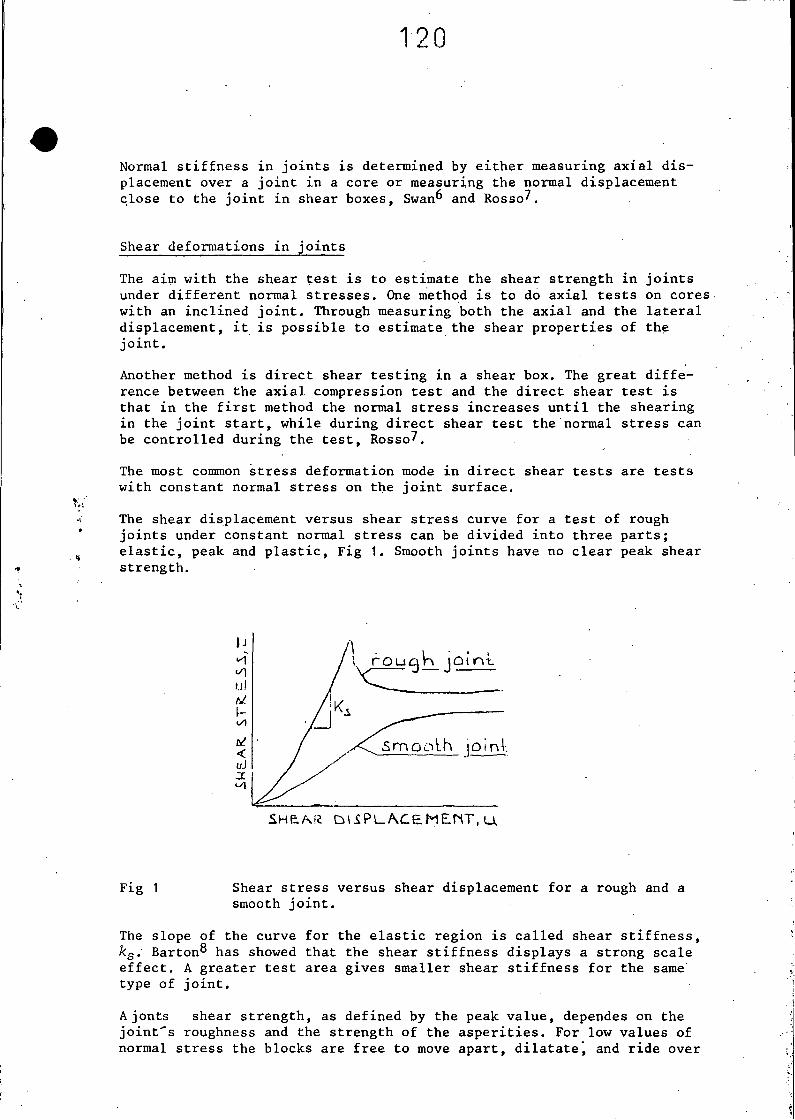
The most common way to estimate the peak friction angle, (pp, and the ultimate friction angle, <j>w , are by means of shear tests under successively increasing value of normal stress, Fig 2A.
llJa
hu<UJ
■SKPACL IM A P L.A'. tLHE N T , U.
N
Fig 2
AMOCLKA.L, i'T P. E S 5 <r
BCharacteristics of joints.A. Shear displacement versus shear stress.B. Normal stress versus shear stress, with definition of
peak friction angle, <f>p, and ultimate friction angle,^U'
Plotting of peak shear resistance and ultimate shear resistance versus normal stress defines the friction angles <pp and <j>u of the joint.
The peak shear friction angle, (f>p, is the sum of the basic friction angle, <J>£, and the dilatation angle, , of the joint, Barton 13.
It has been customary to use Mohr-Coulomb's linear relation to calculate
122
the peak shear strength.
Xp = C + an • tan <j>p
However, the curve for normal stress versus shear stress is flattens out which gives a lower friction angle for higher normal stress.
Empirical equation of shear strength
B a r t o n 13 has formulated an empirical relationship for peak shear strength of joints.
T =.an tan [JRC log1Q (^-) + cf̂ ]
where T = peak shear strength in MPaOn = normal stress in MPaJRC = joint roughness coefficientJCS = joint wall compressive strength in MPa<j)£ = basic friction angle
The joint wall compressive strength is estimated with Schmidt hammer and the basic friction angle is obtained from residual shear tests on flat unweathercd rock surfaces.
Joint roughness values, JRC, is estimated by comparing the joint's roughness with ten examples of profiles for JRC value range from 0 to 20..Tse and Cruden15 have shown a clear correlation between mathematical surface characteristics and Barton's JRC value.
EXPERIMENTAL WORK
Experimental equipment
Results from shear tests are strongly dependent on the sampling method, experimental equipment and the sixe of the tested joints.
The simplest shear test is the tilt test, Barton and Choubey1̂ . Shear strength is estimated under low normal stress on small joint areas. S c h n e i d e r 16 used plaster cast print of rock joints, during shear tests in a stiff servo-controlled shear machine. In his experiments the bottom block is longer than the upper block, so the nominal tested joint area is therefore constant during the shearing.
Shear tests in a field shear box
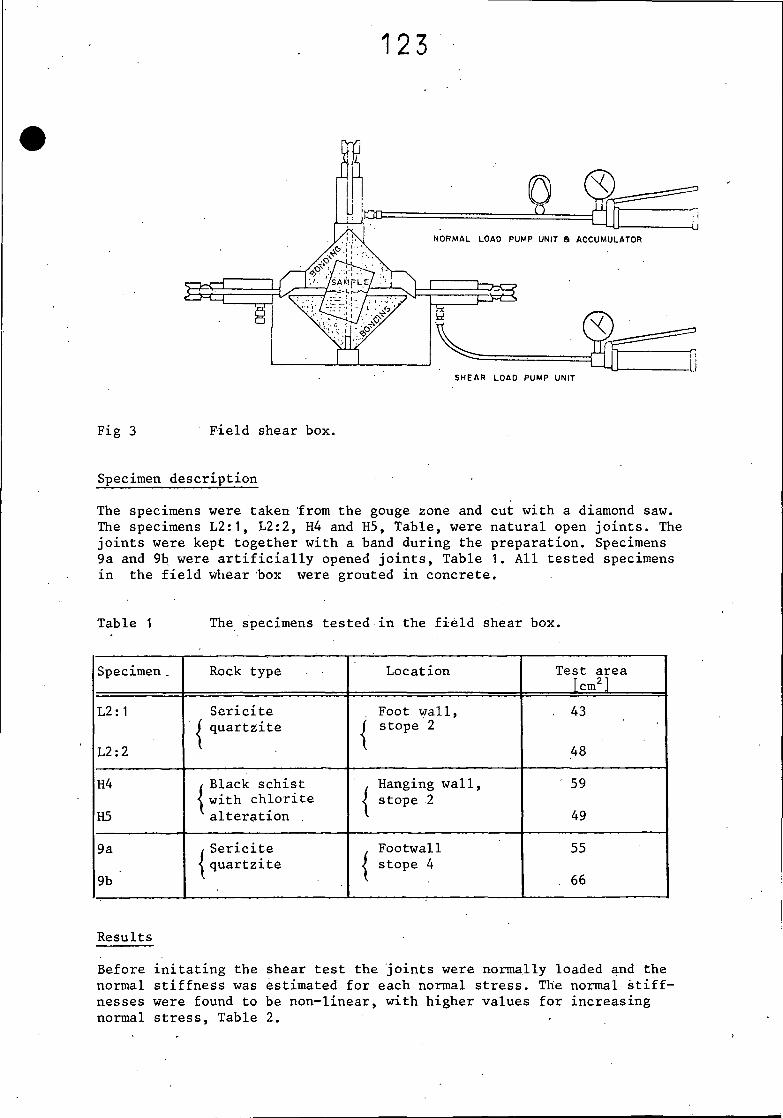
The field shear box has been made by Robertson Research International Limited, Hoek17. The maximum test area is 115 x 125 mm and the maximum load is 50 kN, which gives normal stresses of up to approximately 3.5 MPa. Lateral and vertical movements were measured with dial gauges,Fig 3.
123
NORMAL LOAD PUMP UNIT 8 ACCUMULATOR
SAMPLE,
SH EA R LOAD PUMP UN IT
Fig 3 Field shear box.
Specimen description
The specimens were taken from the gouge zone and cut with a diamond saw. The specimens L2:'1, L2:2, H4 and H5, Table, were natural open joints. The joints were kept together with a band during the preparation. Specimens 9a and 9b were artificially opened joints, Table 1. All tested specimens in the field whear box were grouted in concrete.
Table 1 The specimens tested in the field shear box.
Specimen . Rock type Location Test area [cm2]
L2: 1 Sericite Foot wall, , 43( quartzite j stope 2
L2:2 I \ 48
H4 / Black schist . Hanging wall, 59< with chlorite < stope 2
H5 alteration . I 49
9a /Sericite . Footwall 55< quartzite i stope 4
9b I I 66
Results
Before initating the shear test the joints were normally loaded and thenormal stiffness was estimated for each normal stress. The normal stiffnesses were found to be non-linear, with higher values for increasingnormal stress, Table 2. •
124
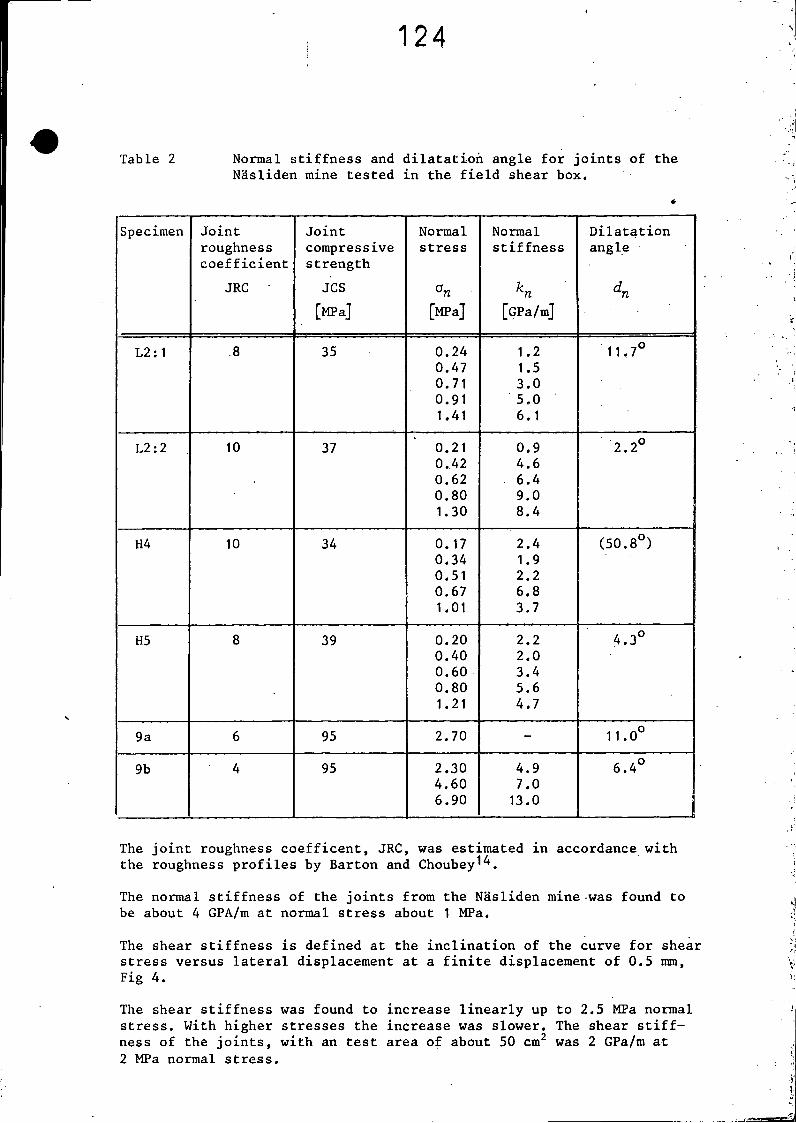
Table 2 Normal stiffness and dilatation angle for joints of theNdsliden mine tested in the field shear box.
Specimen Jointroughnesscoefficient
JRC
JointcompressivestrengthJCS[MPa]
Nonna 1 stress
°n[MPa]
Normalstiffness
K[GPa/m]
Dilatationangle
dn
L2:1 .8 35 0.24 1.2 11.7°0.47 1.50.71 3.00.91 5.01.41 6.1
L2:2 10 37 0.21 0.9 2.2°0.42 4.60.62 • 6.40.80 9.01.30 8.4
H4 10 34 0.17 2.4 (50.8°)0.34 1.90.51 2.20.67 6.81.01 3.7
H5 8 39 0.20 2.2 4.3°0.40 2.00.60 3.40.80 5.61.21 4.7
9a 6 95 2.70 - 11.0°
9b 4 95 2.304.606.90
4.97.013.0
6.4°
.. ..
The joint roughness coefficent, JRC, was estimated in accordance with the roughness profiles by Barton and Choubey^.
The normal stiffness of the joints from the Nasliden mine was found to be about 4 GPA/m at normal stress about 1 MPa.
The shear stiffness is defined at the inclination of the curve for shear stress versus lateral displacement at a finite displacement of 0.5 mm, Fig 4.
The shear stiffness was found to increase linearly up to 2.5 MPa normal stress. With higher stresses the increase was slower. The shear stiffness of the joints, with an test area of about 50 cm2 was 2 GPa/m at 2 MPa normal stress.
125
2
2 4Normal s t r e s s [MPa]
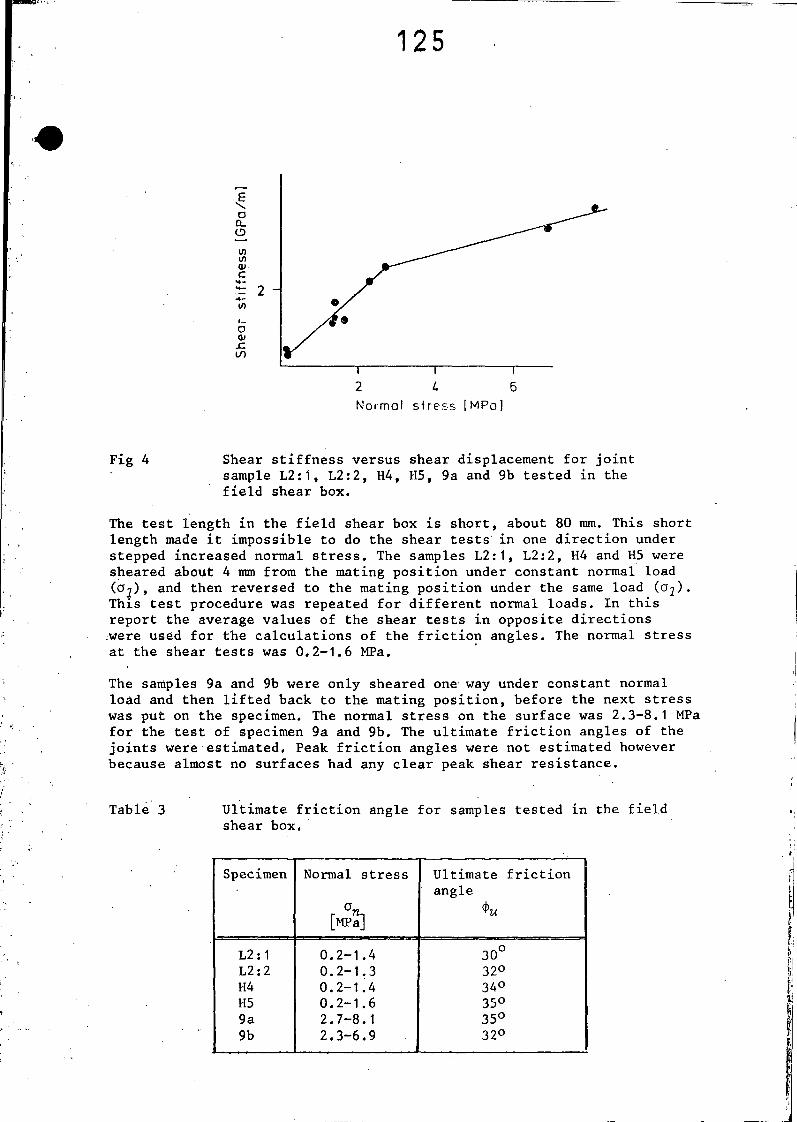
Fig 4 Shear stiffness versus shear displacement for jointsample L2:1, L2:2, H4, H5, 9a and 9b tested in the field shear box.
The test length in the field shear box is short, about 80 mm. This short length made it impossible to do the shear tests in one direction under stepped increased normal stress. The samples L2:1, L2:2, H4 and H5 were sheared about 4 mm from the mating position under constant normal load (Oj), and then reversed to the mating position under the same load (a^). This test procedure was repeated for different normal loads. In this report the average values of the shear tests in opposite directions were used for the calculations of the friction angles. The normal stress at the shear tests was 0.2-1.6 MPa.
The samples 9a and 9b were only sheared one way under constant normal load and then lifted back to the mating position, before the next stress was put on the specimen. The normal stress on the surface was 2.3-8.1 MPa for the test of specimen 9a and 9b. The ultimate friction angles of the joints were estimated. Peak friction angles were not estimated however because almost no surfaces had any clear peak shear resistance.
Table 3 Ultimate friction angle for samples tested in the fieldshear box.
I
I
_____ i
Specimen Normal stress
r °ni [MPa]
Ultimate friction angle
L2:1 0.2-1.4 30°L2:2 0.2-1.3 32°H4 0.2-1.4 34°H5 0.2-1.6 35°9a 2.7-8.1 35°9b 2.3-6.9 32°
126
»
The proportionally lower friction angle values for joints taken from the foot wall (L2:1, L2:2) depends on the fact that these joints were smoother and contained more joint filling material.
The joints in specimen 9a and 9b were smoother than the others. However,the compressive strength of the joints surface in specimen 9a and 9b was high which gave a high value of the ultimate shear friction angle.
The dilatation angles of the joints is defined as the angle between lateral displacement, Au, and vertical displacement, Au, at the peak shear stress. As these tests had no clear peak shear stress, the dilatation angle was determined for lateral displacement of 0.5 mm. The dilatation angles were found to vary between 2° and 12°.
Shear tests in a large shear rig
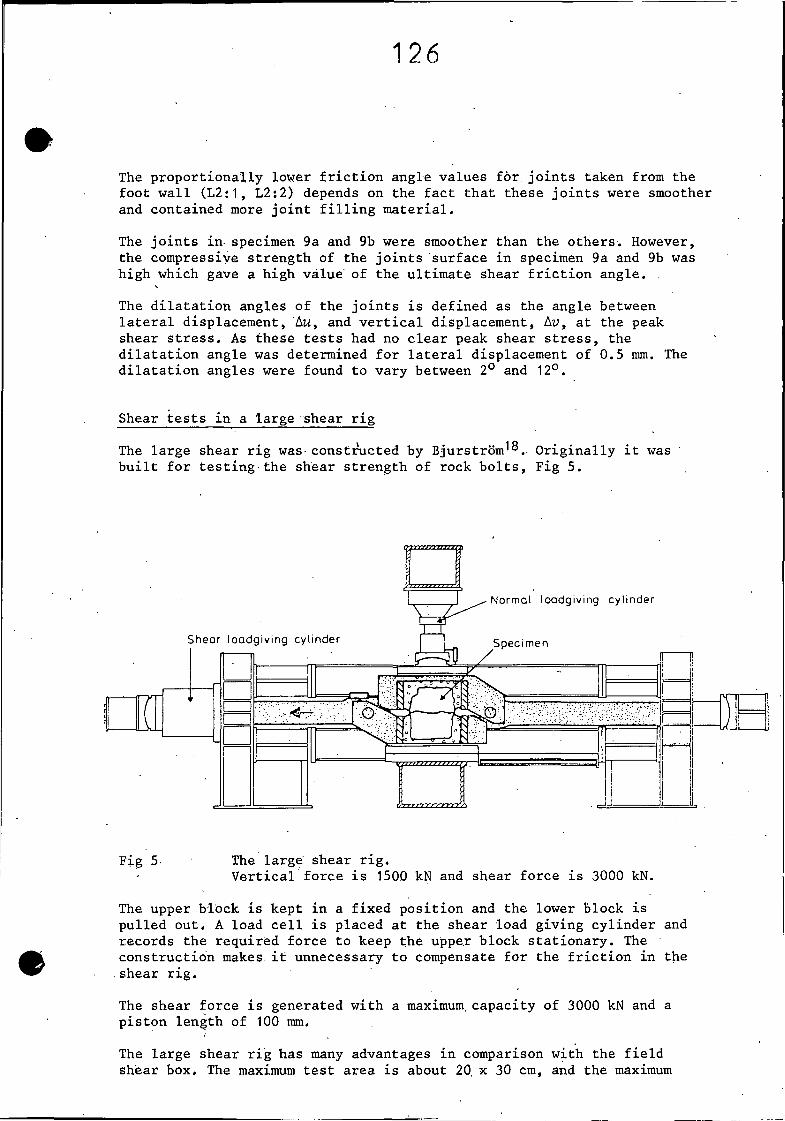
The large shear rig was- constructed by BjurstronJ®. Originally it wasbuilt for testing the shear strength of rock bolts, Fig 5.
N o r m o l lo a d g iv in g c y l in d e r
S h e a r lo a d g i v i n g c y l in d e r S p e c im e n
Fig 5 The large shear rig.Vertical force is 1500 kN and shear force is 3000 kN.
The upper block is kept in a fixed position and the lower block is pulled out. A load cell is placed at the shear load giving cylinder and records the required force to keep the upper block stationary. The construction makes, it unnecessary to compensate for the friction in the shear rig.
The shear force is generated with a maximum, capacity of 3000 kN and a piston length of 100 mm.
The large shear rig has many advantages in comparison with the field shear box. The maximum test area is about 20. x 30 cm, and the maximum
127
normal load is 1500 kN, which gives a normal stress on the joint surface of 25 MPa, Normal load is generated by a reversable hydraulic cylinder. The load' is measured with a load cell between the cylinder and the top of the upper box, Fig 5,
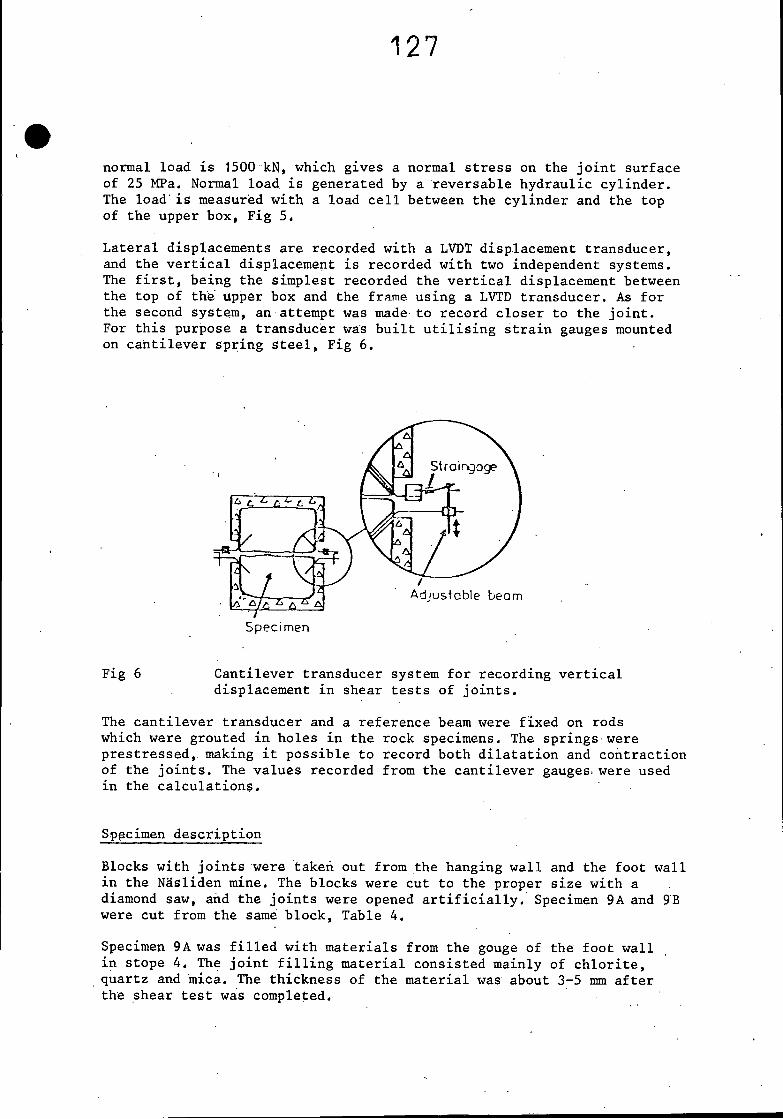
Lateral displacements are recorded with a LVDT displacement transducer, and the vertical displacement is recorded with two independent systems. The first, being the simplest recorded the vertical displacement between the top of the upper box and the frame using a LVTD transducer. As for the second system, an attempt was made to record closer to the joint.For this purpose a transducer was built utilising strain gauges mounted on cantilever spring steel, Fig 6.
Adjustab le beam
Specimen
Fig 6 Cantilever transducer system for recording verticaldisplacement in shear tests of joints.
The cantilever transducer and a reference beam were fixed on rods which were grouted in holes in the rock specimens. The springs were prestressed, making it possible to record both dilatation and contraction of the joints. The values recorded from the cantilever gauges, were used in the calculations.
Specimen description
Blocks with joints were taken out from the hanging wall and the foot wall in the Nasliden mine. The blocks were cut to the proper size with a diamond saw, and the joints were opened artificially. Specimen 9A and 9B were cut from the same block, Table 4.
Specimen 9A was filled with materials from the gouge of the foot wall in stope 4. The joint filling material consisted mainly of chlorite, quartz and mica. The thickness of the material was about 3-5 mm after the shear test was completed.
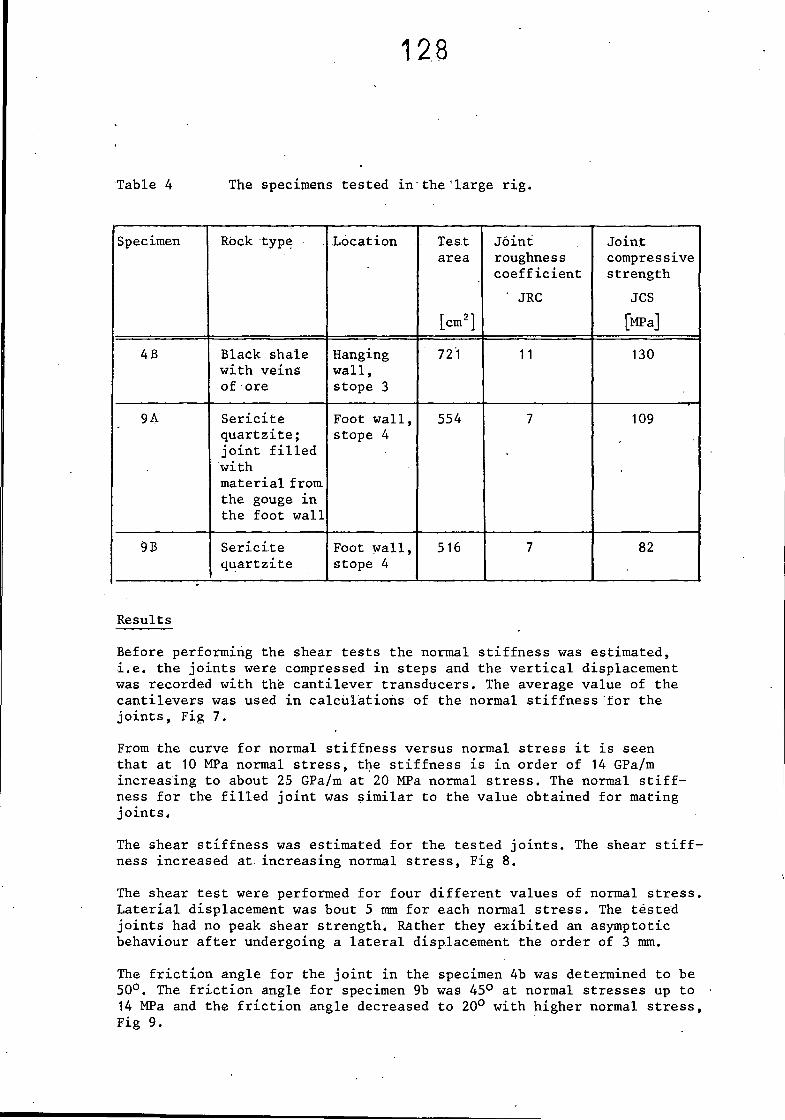
Table 4 The specimens tested in"the "Targe rig.
Specimen Rock type Location Testarea
[cm2]
Jointroughnesscoefficient' JRC
Jointcompressivestrength
JCS[MPa]
4 B Black shale with veins of ore
Hanging wall, stope 3
721 11 130
9 A Sericite quartzite; joint filled withmaterial from, the gouge in the foot wall
Foot wall, stope 4
554 7 109
9B Sericitequartzite
Foot wall, stope 4
516 7 82
Results
Before performing the shear tests the normal stiffness was estimated, i.e. the joints were compressed in steps and the vertical displacement was recorded with the cantilever transducers. The average value of the cantilevers was used in calculations of the normal stiffness "for the joints, Fig 7.
From the curve for normal stiffness versus normal stress it is seen that at 10 MPa normal stress, the stiffness is in order of 14 GPa/m increasing to about 25 GPa/m at 20 MPa normal stress. The normal stiffness for the filled joint was similar to the value obtained for mating joints.
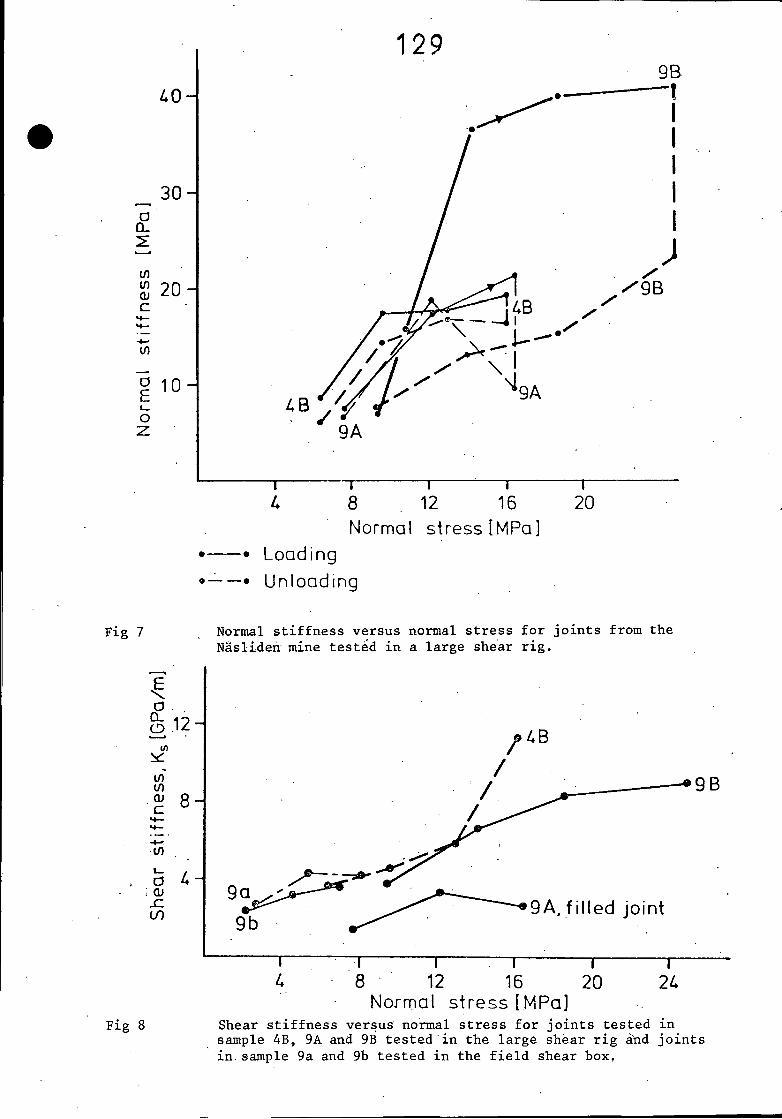
The shear stiffness was estimated for the tested joints. The shear stiffness increased at. increasing normal stress, Fig 8.
The shear test were performed for four different values of normal stress. Laterial displacement was bout 5 mm for each normal stress. The tested joints had no peak shear strength. Rather they exibited an asymptotic behaviour after undergoing a lateral displacement the order of 3 mm.
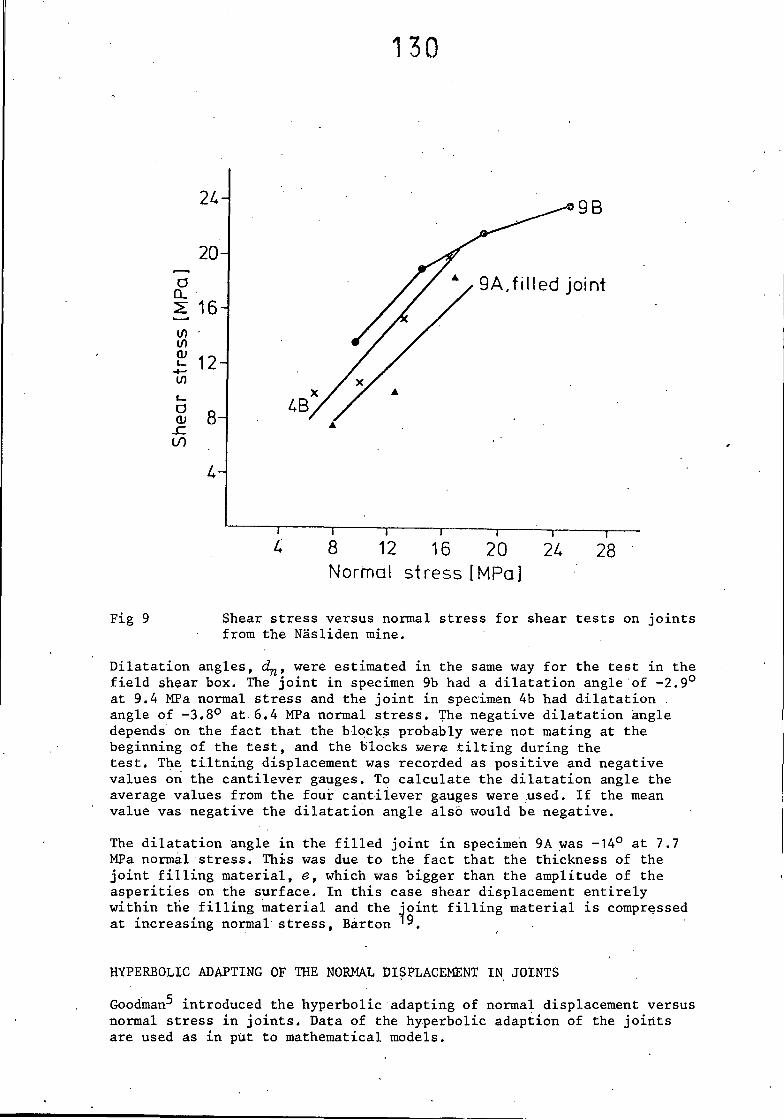
The friction angle for the joint in the specimen 4b was determined to be 50°. The friction angle for specimen 9b was 45° at normal stresses up to 14 MPa and the friction angle decreased to 20° with higher normal stress, Fig 9.
1299B
3 0 -oQ_5:
(Z)% 20 - cH—M—
o9A
8 12 16 20Normal stress [MPa]
Loading• -— • Unloading
Fig 7 Normal stiffness versus normal stress for joints from the Nasliden mine tested in a large shear rig.
5O0 .12 -
V)
ihV)o;c9 B
a<ujCCO
9a9 A, f i l led jo in t
Normal s tress [MPa]Fig 8 Shear stiffness versus normal stress for joints tested in
sample 4B, 9A and 9B tested in the large shear rig and joints in.sample 9a and 9b tested in the field shear box.
130
9B
20 -
9A,f i l led joint^ 16-
LO
8 12 16 20 Normal s tress [MPa]
Fig 9 Shear stress versus normal stress for shear tests on jointsfrom the Nasliden mine.
Dilatation angles, were estimated in the same way for the test in the field shear box. The joint in specimen 9b had a dilatation angle of -2.9° at 9.4 MPa normal stress and the joint in specimen 4b had dilatation . angle of -3.8° at 6.4 MPa normal stress. The negative dilatation angle depends on the fact that the blocks probably were not mating at the beginning of the test, and the blocks were tilting during the test. The tiltning displacement was recorded as positive and negative values on the cantilever gauges. To calculate the dilatation angle the average values from the four cantilever gauges were used. If the mean value vas negative the dilatation angle also would be negative.
The dilatation angle in the filled joint in specimen 9A was -14° at 7.7 MPa normal stress. This was due to the fact that the thickness of the joint filling material, e, which was bigger than the amplitude of the asperities on the surface. In this case shear displacement entirely within the filling material and the joint filling material is compressed at increasing normal stress, Barton '9,
HYPERBOLIC ADAPTING OF THE NORMAL DISPLACEMENT IN JOINTS
Goodman-* introduced the hyperbolic adapting of normal displacement versus normal stress in joints. Data of the hyperbolic adaption of the joints are used as in put to mathematical models.
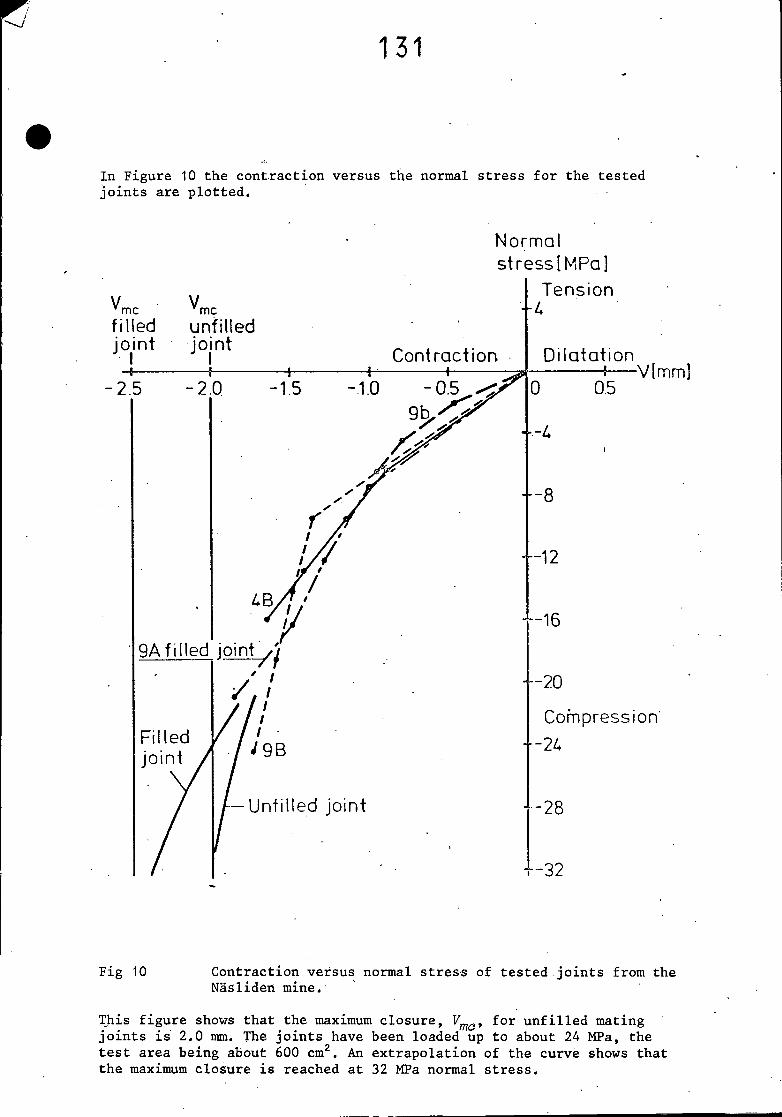
In Figure 10 the contraction versus the normal stress for the tested joints are plotted.
Normal stress [MPa]
Tension* me mef i l led unfilled jo in t jo in t D ilatat ionContraction
H Vlmm]0.5-0.5- 2.0 - 1.0-2.5
--8
-16
9A fi l ied j o i n t l y
— 20
Compression — 2 UFilled
jo in t
— Unfilled jo in t -28
Fig 10 Contraction versus normal stress of tested joints from theNasliden mine.
This figure shows that the maximum closure, Vma, for unfilled mating joints is 2.0 mm. The joints have been loaded up to about 24 MPa, the test area being about 600 cm2. An extrapolation of the curve shows that the maximum closure is reached at 32 MPa normal stress.
132
A check'was carried out to see if the measured values for contraction in the joints fitted the relationship
v = a + b In a
where a, b are constantsa is normal stress in MPaV is joint closure in mm
The correlation factor was found to be 0.973 for a = 0.0573 mm andb = 0.5672 mm. As shown by Swan^ theoretically b is a measure.of the joint's roughness, which has a direct influence on the normal stiffness.
Relation between the roughness Of the joints and the normal stiffness
The normal stiffness of joint is controlled by strength properties and three topografic properties, namely the number of asperities of any given height, the shape of the asperities and the frequency of occurance of such asperities, Swan^.
It is known that there is a linear relation between normal stress, a, and normal stiffness, kn , i.e.
a =bk n
where b = 0,5672 mm
Measurements on small surfaces from the Nasliden mine have shown that:
s = 10 • b
where s is the standard deviation of the asperity peak distribution. An application of this to the 2?-value for the joints described in this paper gives the joint's asperity peak distribution to be 5.6 mm. This seems to be realistic for those joints comprising the rock's schistocity planes.
Visual judgement of the joint roughness gave values of the joint roughness coefficient, JRC, for large specimens such as; 9A, 9B=7 and 4a = 11, which indicate rough joint surfaces.
IN SITU DETERMINATION OF DILATATION ANGLE IN THE NASLIDEN MINE
Measurements of the joint's roughness have been made in stope 2 and 4.The roughness was measured along horizontal and vertical profiles of the walls of the stopes.
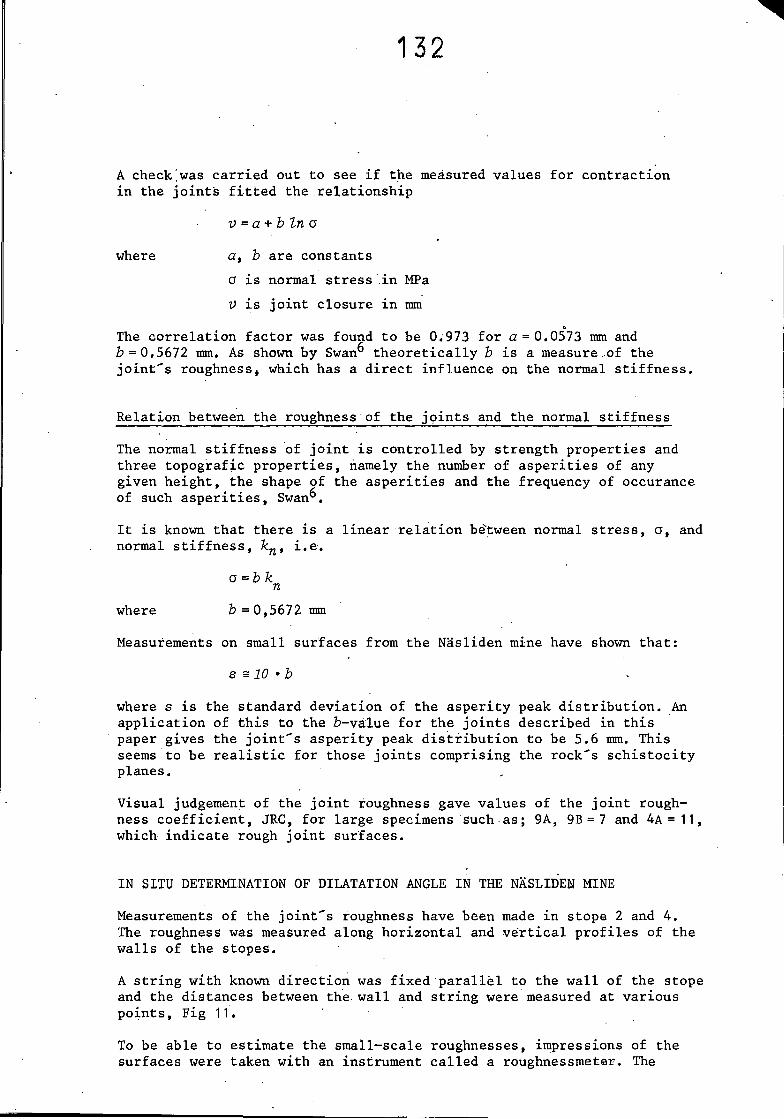
A string with known direction was fixed parallel to the wall of the stope and the distances between the wall and string were measured at various points, Fig 11.
To be able to estimate the small-scale roughnesses, impressions of the surfaces were taken with an instrument called a roughnessmeter. The
133
Ruler Roughnessmeter
DistanceReferencestr ing
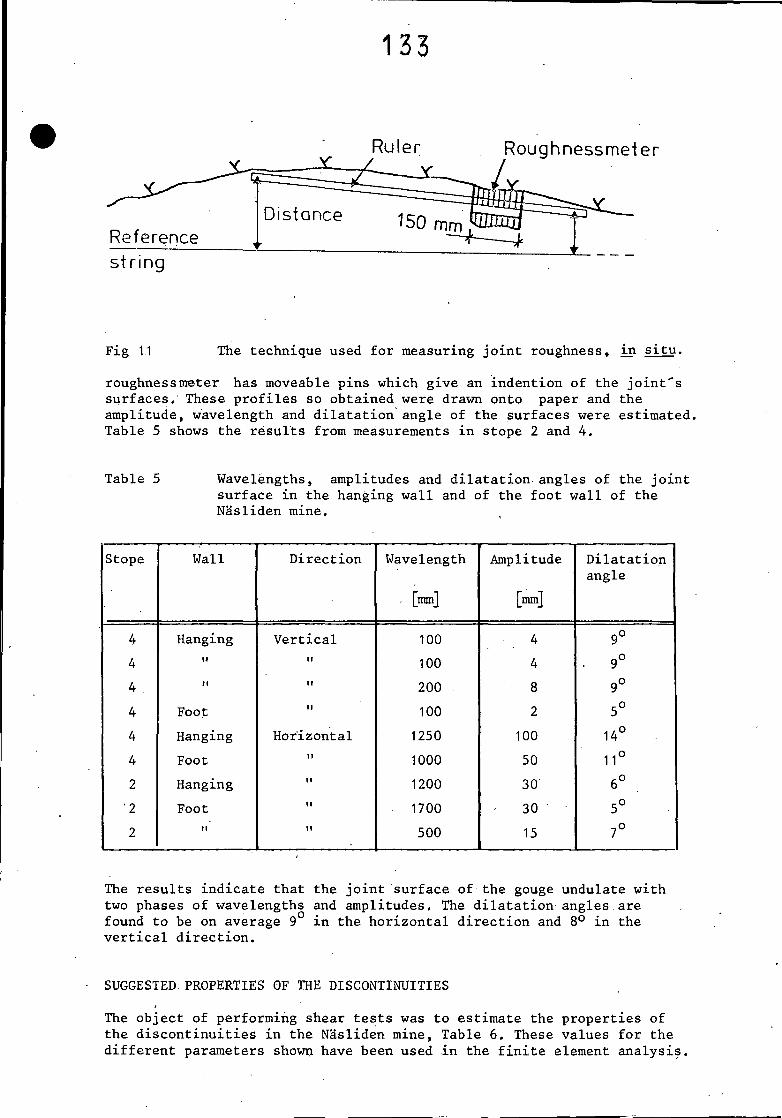
Fig 11 The technique used for measuring joint roughness, in situ.
roughnessmeter has moveable pins which give an indention of the joint's surfaces. These profiles so obtained were drawn onto paper and the amplitude, wavelength and dilatation angle of the surfaces were estimated. Table 5 shows the results from measurements in stope 2 and 4.
Table 5 Wavelengths, amplitudes and dilatation angles of the jointsurface in the hanging wall and of the foot wall of the Nasliden mine.
Stope Wall Direction Wavelength
. [mm]
Amplitude
[mm]
Dilatationangle
4 Hanging Vertical 100 4 9°4 II " 100 4 ■ 9°4 . II II 200 8 9°4 Foot 11 100 2 5°4 Hanging Horizontal 1250 100 14°4 Foot II 1000 50 11°2 Hanging II 1200 30 6° .2 Foot 11 1700 30 5°2 II II 500 15 7°
The results indicate that the joint surface of the gouge undulate with two phases of wavelengths and amplitudes. The dilatation angles.are found to be on average 9 in the horizontal direction and 8° in the vertical direction.
SUGGESTED PROPERTIES OF THE DISCONTINUITIES
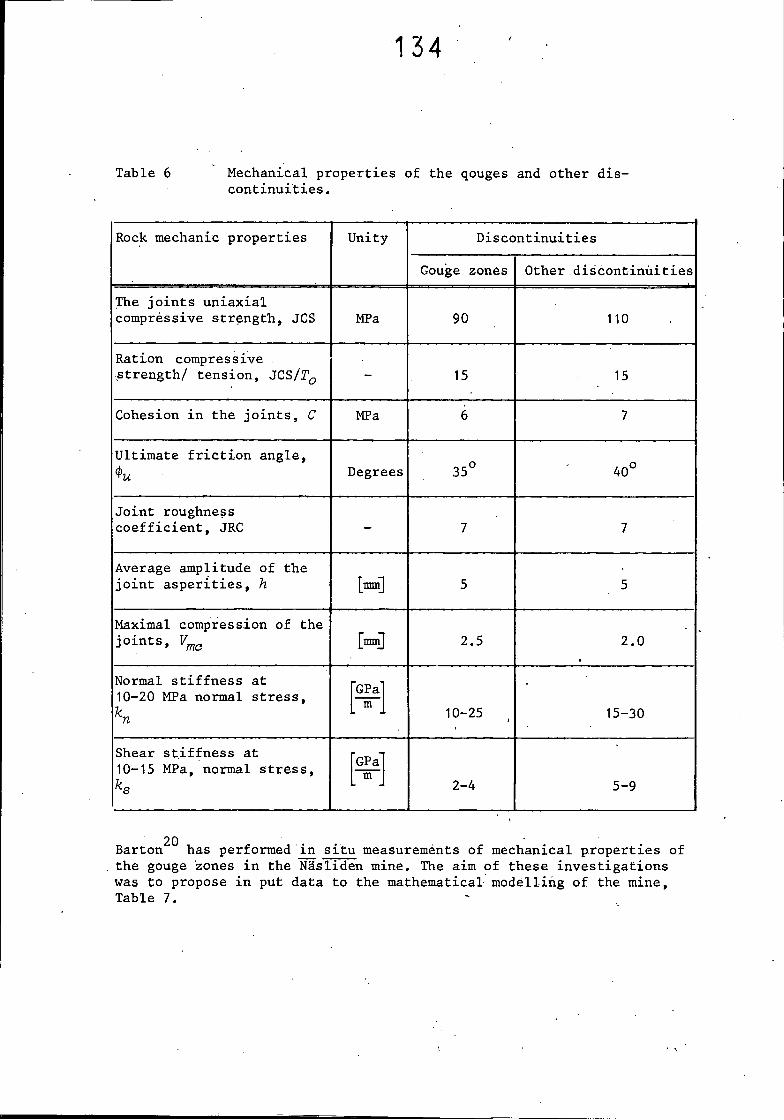
The object of performing shear tests was to estimate the properties of the discontinuities in the Nasliden mine, Table 6. These values for the different parameters shown have been used in the finite element analysis.
134
Table 6 Mechanical properties of the qouges and other discontinuities.
Rock mechanic properties Unity Discontinuities
Gouge zones Other discontinuities
The joints uniaxial compressive strength, JCS MPa 90 110
Ration compressive ■strength/ tension, JCS/TQ - 15 15
Cohesion in the joints, C MPa 6 7
Ultimate friction angle,Degrees 35° ■C' o o
Joint roughness coefficient, JRC - 7 7
Average amplitude of the joint asperities, h [mm] 5 5
Maximal compression of the joints, Vmo [mm] 2.5 2.0
Normal stiffness at 10-20 MPa normal stress,kn
GPam 10-25 15-30
Shear stiffness at 10-15 MPa, normal stress,ks
tdp4 a o
2-4 5-9
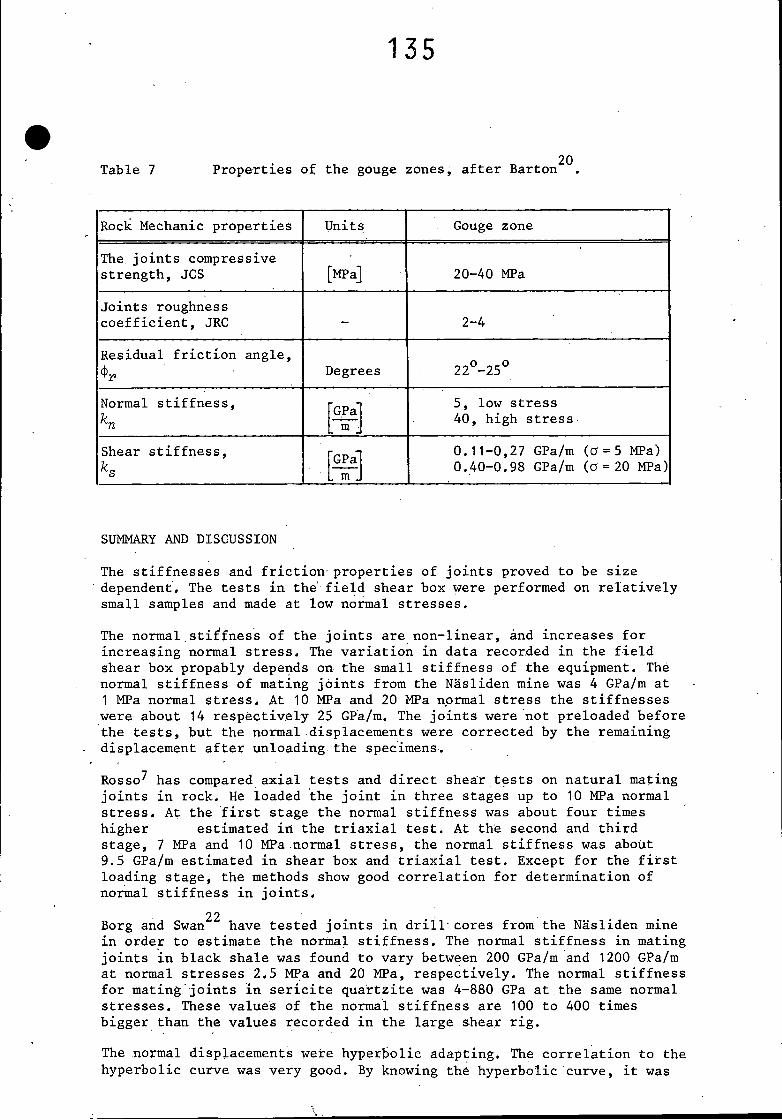
Barton has performed iji situ measurements of mechanical properties of the gouge zones in the Nasliden mine. The aim of these investigations was to propose in put data to the mathematical modelling of the mine, Table 7. ' .
135
Table 7 Properties of the gouge zones, after Barton
Rock Mechanic properties Units Gouge zone
The joints compressive strength, JCS [MPa] 20-40 MPa
Joints roughness coefficient, JRC - 2-4
Residual friction angle,' Degrees 22°-25°
Normal stiffness,kn
5, low stress 40, high stress
Shear stiffness,ks
GPa] . m J
0. 11-0,27 GPa/m (a = 5 MPa) 0.40-0.98 GPa/m (a=20 MPa)
SUMMARY AND DISCUSSION
The stiffnesses and friction- properties of joints proved to be size dependent. The tests in the' field shear box were performed on relatively small samples and made at low normal stresses.
The normal stiffness of the joints are non-linear, and increases for increasing normal stress. The variation in data recorded in the field shear box propably depends on the small stiffness of the equipment. The normal stiffness of mating joints from the Nasliden mine was 4 GPa/m at 1 MPa normal stress. At 10 MPa and 20 MPa normal stress the stiffnesses were about 14 respectively 25 GPa/m. The joints were not preloaded before the tests, but the normal displacements were corrected by the remaining displacement after unloading the specimens.
Rosso^ has compared axial tests and direct shear tests on natural mating joints in rock. He loaded the joint in three stages up to 10 MPa normal stress. At the first stage the normal stiffness was about four times higher estimated in the triaxial test. At the second and thirdstage, 7 MPa and 10 MPa normal stress, the normal stiffness was abotit9.5 GPa/m estimated in shear box and triaxial test. Except for the first loading stage, the methods show good correlation for determination of normal stiffness in joints.
22 . .Borg and Swan have tested joints m drill cores from the Nasliden minein order to estimate the normal stiffness. The normal stiffness in mating joints in black shale was found to vary between 200 GPa/m and 1200 GPa/m at normal stresses 2.5 MPa and 20 MPa, respectively. The normal stiffness for mating joints in sericite quartzite was 4-880 GPa at the same normal stresses. These values of the normal stiffness are 100 to 400 times bigger than the values recorded in the large shear rig.
The normal displacements were hyperbolic adapting. The correlation to the hyperbolic curve was very good. By knowing the hyperbolic curve, it was
\
136
possible to calcilate the asperity peak distribution, which was5.6 mm.
8Barton has shown that the shear stiffness decreases when the test area increases. The results presented in this paper show a good conformity between shear stiffness of small test areas (50 cm2) and big test areas (600 cm2) for mating joints. However, the shear stiffness is extremely dependent on the normal stress. For.mating joints the shear stiffness at 2 MPa and 20 MPa normal stress are about 2 GPa/m respectively 10 GPa/m. The filled joints have lower shear stiffness.
The results from the estimations of ultimate friction angle in the field shear box and in the large shear rig were different. The natural open joints from the gouge had friction .angle of 30°-35 , when tested in the field shear box. No joints of this type were tested in the large shear rig.
From block number 9 small and large specimens were cut out. The specimens tested in the field shear box had friction angle of 32°-35° and specimens tested in the large shear rig had a friction angle of 45°-50° at low normal stress and about 20° at higher stresses.
The visual judgement of the joint roughness coefficient, JRC,' gave the values 4-6 for joints in small specimens and 7-11 for joints in large specimens. This can be explained by loacal irregularities and the fact that there are two phases of wave.lengths of the asperities on the joint - surfaces.
The suggested rock mechanical properties of the gouge given in this paper differ from those proposed by Barton^O.. The properties given in this paper are based on direct shear tests. Barton has done empirical calculations after in situ measurements. Barton reached the conclusion that the stiffnesses and the shear resistance of the gouge are lower than these proposed in this paper.
ACKNOWLEDGEMENTS
The author wishes to acknowledge with thanks Prof Ove Stephansson and Dr Graham Swan for helpful advice during the tests and the writing of this paper. Thanks also to Eng Rune Larsson whose assistance at the tests in the large shear rig was of valuable help.
REFERENCES
1 Ludvig, B. The Nasliden project- Report 4 - The gouge zone friction properties. University of Lulea 1977 (in Swedish).
2 Ludvig, B. The Nasliden projece - Report 8 - The discontinuities friction and stiffness properties. University of Lulea 1977 (in Swedish).
3 Stephansson, 0. The Nasliden project - Report 3 - In situ measurements from field course in rock mechanics. University of Lulea 1977 (in Swedish).
Stephansson, 0. The Nasliden project - Report 13 - In situ measurements from field course in rock mechanics. University of Lulea 1978 (in Swedish).
Goodman, R.E. Methods of Geological Engineering in Discontinuous Rocks. West publ. comp. New York 1976.
Swan, G. The Nasliden project - Stiffness and associated joint properties of rock. University of Lulea 1980 (in this volume).
Rosso, R.S. A comparison of Joint.Stiffness Measurements in Direct Shear Triaxiel Compression and In Situ. Int. J. Rock Mech. Min. Sci. and Geomech. Avstr. Vol. 113, pp 167-172.
Barton, N. A model study of rock - joint deformation.Int. J. Rock Mech. and Min. and Science Abstr. V9 n5,1972.
Fecker, E. Hydraulisches.analogen zum Spitzenreibungs- wiederstand auf grossen Kluftflachen. Universitat Karlsruhe, Doktor Dissertation 1977.
Rengers, N. The influence of surface roughness on the friction properties of rock planes. Proc. 2nd Cong. ISRM Belgrade V1, p 1-31.
Barton, N. A relationship between joint roughness and joint Shear strength. Proc. Int. Symp. on Rock Fracture, Nancy (ISRM), paper 1-8, 1971.
Krahn, J. and Morgenstern, N.R. The Ultimate Frictional Resistance of Rock Discontinuities. Int..J. Rock Mech.Sci. and Geomech. Abstr. Vol 16, 1979.
Barton, N. Review of new shear strength criterion for rock joints. Engineering Geology, Elsevier, 7:287-332.
Barton, N; and Choubey, V. The shear strength of rock joints in theory and practice. Rock Mechanics 10, 1-65,1977.
Tse, R. and Cruden, D.M. Estimating Joint Roughness Coefficients. Int J. Rock Mech. Sci. and Abstr. Vol 16, 1979.
Schneider, H.J. Reibungs- und Verformungsverhalten von Trennflacken in Fels. Universitat Karlsruhe, Doktor Dissertation 1975.
Hoek, E. Estimating the stability of excavated slopes in open cast mines. Trans. Inst. Min. Metal1 (sect. A Min. Industry) 79, 1970. A 109-132.
138
18 Bjurstrom, S. Bolted hard jointed rock. Fortifikations- forvaltningen, Forskningsbyran. Rapport nr 121:3, Stockholm 1973 (in Swedish).
19 Barton, N. A review of the Shear Strength of Filled Discontinuities in Rock. Review of a New Shear Criterion for Rock Joints. NGI, publ. nr 105, Oslo 1974.
20 Barton, N. Estimation of in situ joint properties in the Nasliden mine (in this volume).
21 B°rg, T. The Nasliden project - Sensitivity aspects of FEM calculations (in this volume).
22 Borg, T. and Swan, G. The Nasliden project - Report 11 - Proposal for in put values to the linear elastic calculations. University of Lulea 1978 (in Swedish).