comparison of young's modulus of continuous and aligned
TRANSCRIPT
�����������������
Citation: Ribeiro, M.M.; Pinheiro,
M.A.; Rodrigues, J.d.S.; Ramos, R.P.B.;
Corrêa, A.d.C.; Monteiro, S.N.; da
Silva, A.C.R.; Candido, V.S.
Comparison of Young’s Modulus of
Continuous and Aligned
Lignocellulosic Jute and Mallow
Fibers Reinforced Polyester
Composites Determined Both
Experimentally and from Theoretical
Prediction Models. Polymers 2022, 14,
401. https://doi.org/10.3390/
polym14030401
Academic Editor: Changtong Mei
Received: 13 November 2021
Accepted: 29 December 2021
Published: 20 January 2022
Publisher’s Note: MDPI stays neutral
with regard to jurisdictional claims in
published maps and institutional affil-
iations.
Copyright: © 2022 by the authors.
Licensee MDPI, Basel, Switzerland.
This article is an open access article
distributed under the terms and
conditions of the Creative Commons
Attribution (CC BY) license (https://
creativecommons.org/licenses/by/
4.0/).
polymers
Article
Comparison of Young’s Modulus of Continuous and AlignedLignocellulosic Jute and Mallow Fibers Reinforced PolyesterComposites Determined Both Experimentally and fromTheoretical Prediction ModelsMaurício Maia Ribeiro 1, Miriane Alexandrino Pinheiro 1, Jean da Silva Rodrigues 2 ,Roberto Paulo Barbosa Ramos 2, Alessandro de Castro Corrêa 2 , Sérgio Neves Monteiro 3 ,Alisson Clay Rios da Silva 4 and Verônica Scarpini Candido 1,*
1 Engineering of Natural Resources of the Amazon Program, Federal University of Pará—UFPA,Belem 66075-110, Brazil; [email protected] (M.M.R.); [email protected] (M.A.P.)
2 Materials Engineering Program, Federal Institute of Education, Science and Technology of Pará—IFPA,Belem 66093-020, Brazil; [email protected] (J.d.S.R.); [email protected] (R.P.B.R.);[email protected] (A.d.C.C.)
3 Materials Science Program, Military Institute of Engineering—IME, Rio de Janeiro 22290-270, Brazil;[email protected]
4 Materials Science and Engineering Program, Federal University of Pará—UFPA,Ananindeua 67130-660, Brazil; [email protected]
* Correspondence: [email protected]
Abstract: Mechanical properties of composites reinforced with lignocellulosic fibers have beenresearched in recent decades. Jute and mallow fibers are reinforcement alternatives, as they cancontribute to increase the mechanical strength of composite materials. The present work aims topredict the Young’s modulus with application of continuous and aligned lignocellulosic fibers to beapplied as reinforcement in polyester matrix. Fibers were manually separated and then arranged andaligned in the polyester matrix. Composites with addition 5, 15, and 25 vol% jute and mallow fiberswere produced by vacuum-assisted hand lay-up/vaccum-bagging procedure. Samples were testedin tensile and the tensile strength, elasticity modulus, and deformation were determined. Resultsshowed that the intrinsic Young’s modulus of the fibers was set at values around 17.95 and 11.72 GPafor jute and mallow fibers, respectively. Statistical analysis showed that composites reinforced with 15and 25 vol% jute and mallow presented the highest values of tensile strength and Young’s modulus.The incorporation of 25 vol% of jute and mallow fibers increased the matrix Young’s modulus by 534%and 353%, respectively, effectively stiffening the composite material. Prediction models presentedsimilar values for the Young’s modulus, showing that jute and mallow fibers might be used aspotential reinforcement of polymeric matrices
Keywords: natural fiber; tensile properties; micro-mechanics; vacuum-assisted hand lay-up
1. Introduction
Natural lignocellulosic fibers polymer matrix composites have gained interest over thepast few decades because of their availability, biodegradability, renewability, low density,low cost, high specific moduli, and environmentally friendly appeal [1–3]. Indeed, naturalfiber-composite have been studied in past years to assess the possibility of their use in fornon-structural and structural engineering applications [4–6] and knowing the chemical,physical, and mechanical properties of composites contribute to their application in severalareas of engineering [3]. Factors such as exposure to radiation, temperature variation,chemical treatment, as well as fiber size and shape can influence the mechanical propertiesand dynamic mechanical behavior of composites reinforced with lignocellulosic fibers [7–9].
Polymers 2022, 14, 401. https://doi.org/10.3390/polym14030401 https://www.mdpi.com/journal/polymers
Polymers 2022, 14, 401 2 of 16
In study of [10] three types of composites with natural fiber reinforcements wereresearched: composites reinforced with hemp fabric in the 50% fraction and polyurethaneresin matrix, composite reinforced with oak wood particles in polyester resin in six differentdimensions of the particles in the volumetric fraction 25%, and hybrid composites reinforcedwith flax fibers in the volume fraction of 30%, with insertion of oak particulate, in polyestermatrix. Among the different results obtained, the authors concluded that the tensile andrheological behavior depend on the size and disposition of fibers in the composite and onthe type of matrix.
Croccolo et al. [11] used flax fibers in the production of composites in isophthalic(181EN2X) and vinyl ester (VEef220ST) matrices; the specimens were tested in tensile andit was observed that the composites reinforced with 50% of flax fibers in matrix 181EN2Xovercame the pure matrix by 25.4% for tensile strength and 21.5% and for modulus ofelasticity. Composites reinforced with 50% flax fibers in VEef220ST matrix surpassed thepure matrix by 11.2% and 37.7% for tensile strength and modulus of elasticity, respectively.The mechanical strength and rigidity of the composite with isophthalic resin overcame thecomposite with vinyl ester resin. Moreover, the isophthalic resin composites showed goodadhesion between the matrix and the fiber.
Jute fiber and mallow fiber are relatively high-strength natural fibers with promisingresearch and application potential. The work of Monteiro et al. [12] investigated theballistic performance of plain-woven jute fabric-reinforced polyester matrix composites.The composites were produced with up to 30% by volume of fiber and orthophthalicpolyester. Results showed that the composites exhibited ballistic behavior similar to that ofaramid, also used as a component Multilayered Armor System.
Hanamanagouda et al. [13] studied mechanical properties of composites reinforcedwith 5, 10, 15, 20, and 25% by volume of jute fiber. The samples were produced by hotcompression molding technique and then tested in impact, flexural, and tensile strengths.Results show that composites might be used in the manufacture of structural components.
The Izod impact and bend properties of composites reinforced with 10, 20, and 30 vol%of mallow fibers were determined [14]. The composites were molded by compressionmixing aligned fiber and epoxy resin in a steel mold by. Results showed that compositesfabricated with 20 and 30 vol% presented greater reinforcement capacity. Moreover, therewas an interfacial detachment between the fiber and the matrix. The statistical analysisshows that composites reinforced with 30% by volume of mallow fiber presented thebest performance.
It was reported that the polyester matrix composites reinforced with up to 40 vol% ofmallow fabrics show exponential increase in tensile strength and linear increase in Young’smodulus [15].
The determination of tensile properties of manufactured composites are often car-ried out using some simple mathematical prediction models. These models give goodapproximations to predict tensile properties of continuous and uniaxially aligned fibers [1].
A model to calculate the Young’s modulus and tensile properties of 3D printed carbon-fiber-reinforced nylon matrix composite was presented by [16]. This model was elaboratedfrom experimental data. The carbon fibers were aligned in the 0◦ direction in relation tothe load applied in the tensile test. All samples tested exceeded the value of the Young’smodulus of the pure matrix of 0.92 GPa. In the proposed model, the mixing rule wasconverted so that the volumetric fraction was replaced by a percentage of the total area ofcarbon fibers.
There have been numbers of estimate models to predict mechanics properties ofcomposites. The Rule-of-Mixture model (ROM) corresponds to the case when the appliedload causes equal strains in the phases. The volume fraction of each phase is the principalelement for pondering and determining the Young’s modulus of the composite. The ROMis considered an upper bound for the true elastic modulus [17]. The accuracy of this modelis highly questionable because it cannot reflect the detailed constituent geometry and thedispersion structure among other features [18,19].
Polymers 2022, 14, 401 3 of 16
In the present work, the main prediction models are presented, starting with theROM and followed by other theoretical prediction models. For comparison, experimentalinvestigation was used to study the Young’s modulus of jute fiber- and mallow fiber-reinforced polyester composites incorporated with different fiber volume fraction. Forthe first time, a theoretical modeling of the Young’s modulus using six different types ofmathematical models is presented. Furthermore, for the first time, an ample statisticalanalysis of the mechanical properties of polyester matrix composites reinforced with juteand mallow fibers is carried out.
2. Materials and Methods2.1. Materials
The unsaturated terephthalate-based polyester resin (Arazyn AZ 1.0 #34) of averageviscosity and the catalyst methyl-ethyl-ketone peroxide (MEK), PERMEC D-45, both sup-plied by Ara Química SA (São Paulo, Brazil), were used as the composite matrix. Thepolyester resin was mixed with 1.0 wt.% of catalytic hardener. The jute (Corchorus capsularis)and mallow (Urena lobata) natural lignocellulosic fiber used in this investigation weresupplied by the “Companhia Têxtil de Castanhal do Pará” in the north region of Brazil.The fibers were manually separated and cut in lengths of 300 mm.
Table 1 shows the chemical composition of jute and mallow fibers.
Table 1. Chemical composition of natural fibers.
Fiber Type Cellulose(%)
Hemicellulose(%)
Lignin(wt.%)
Wax(%) References
Jute 50–72 12–20 8–13 0.5 [20–23]Mallow 56–72 27–29 10–12 0.6 [24]
2.2. Fiber Characterization2.2.1. Scanning Electron Microscope (SEM)
The surface of the fiber was observed using a scanning electron microscope (Tescan-Vega 3,Brno, Czech Republic) equipped with a 5-kV field emission electron source.
2.2.2. Diameter and Density Determination
The fiber diameter was measured in a Carl Zeiss, model Stemi 508, camera AXIO-CAM105 Color optical microscope (Carl Zeiss, Berlin, Germany) at 3 different positions alongthe axis of each fiber [4]. Fifty jute and mallow fibers average diameter were determined.
The density of the jute and mallow fibers were measured by the pycnometer methodin an analytical balance with 0.0001 g of precision [25].
2.2.3. Tensile Tests
The determination of the mechanical properties of the fibers was done by tensile test.The preparation of the specimen was performed according to ASTM C1557 [26]. Before thetensile test, the fibers were attached to 90 m/g2 paper using epoxy adhesive. The tensiletests were performed in an EMIC DL 10,000 (Instron, São José dos Pinhais, Paraná, Brazil)universal testing machine. Tensile tests were carried out on specimens with 40-mm gagelength using the displacement control at a rate of 0.2 mm/min. For each type of fiber,50 tests were performed, and the fibers were tested as received [27]. The cross-section of thefibers was considered circular, and their areas were used to calculate the tensile strength.
2.3. Composites Preparation
The jute and mallow fibers were accommodated continuous and aligned in a 300-mm-longmold (Figure 1a). Composites were produced by vacuum-assisted hand lay-up/vacuum-bagging procedure, stacking dry fiber ply layers onto a planar glass base to form a laminate.Resin was applied to the dry plies after hand lay-up, and then, the amount of resin needed
Polymers 2022, 14, 401 4 of 16
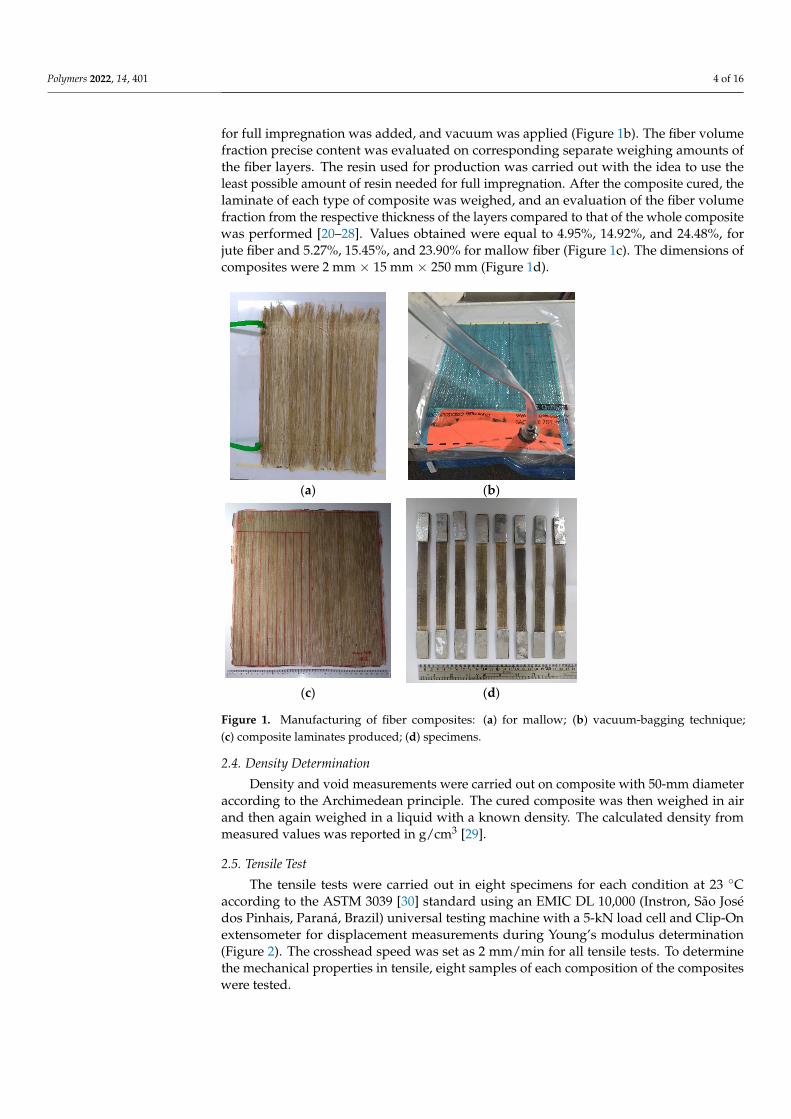
for full impregnation was added, and vacuum was applied (Figure 1b). The fiber volumefraction precise content was evaluated on corresponding separate weighing amounts ofthe fiber layers. The resin used for production was carried out with the idea to use theleast possible amount of resin needed for full impregnation. After the composite cured, thelaminate of each type of composite was weighed, and an evaluation of the fiber volumefraction from the respective thickness of the layers compared to that of the whole compositewas performed [20–28]. Values obtained were equal to 4.95%, 14.92%, and 24.48%, forjute fiber and 5.27%, 15.45%, and 23.90% for mallow fiber (Figure 1c). The dimensions ofcomposites were 2 mm × 15 mm × 250 mm (Figure 1d).
Polymers 2022, 14, x FOR PEER REVIEW 4 of 17
2.3. Composites Preparation The jute and mallow fibers were accommodated continuous and aligned in a 300-
mm-long mold (Figure 1a). Composites were produced by vacuum-assisted hand lay-up/vacuum-bagging procedure, stacking dry fiber ply layers onto a planar glass base to form a laminate. Resin was applied to the dry plies after hand lay-up, and then, the amount of resin needed for full impregnation was added, and vacuum was applied (Figure 1b). The fiber volume fraction precise content was evaluated on corresponding separate weighing amounts of the fiber layers. The resin used for production was carried out with the idea to use the least possible amount of resin needed for full impregnation. After the composite cured, the laminate of each type of composite was weighed, and an evaluation of the fiber volume fraction from the respective thickness of the layers compared to that of the whole composite was performed [20–28]. Values obtained were equal to 4.95%, 14.92%, and 24.48%, for jute fiber and 5.27%, 15.45%, and 23.90% for mallow fiber (Figure 1c). The dimensions of composites were 2 mm × 15 mm × 250 mm (Figure 1d).
(a) (b)
(c) (d)
Figure 1. Manufacturing of fiber composites: (a) for mallow; (b) vacuum-bagging technique; (c) composite laminates produced; (d) specimens.
2.4. Density Determination Density and void measurements were carried out on composite with 50-mm
diameter according to the Archimedean principle. The cured composite was then weighed in air and then again weighed in a liquid with a known density. The calculated density from measured values was reported in g/cm3 [29].
2.5. Tensile Test The tensile tests were carried out in eight specimens for each condition at 23 °C
according to the ASTM 3039 [30] standard using an EMIC DL 10,000 (Instron, São José dos Pinhais, Paraná, Brazil) universal testing machine with a 5-kN load cell and Clip-On
Figure 1. Manufacturing of fiber composites: (a) for mallow; (b) vacuum-bagging technique;(c) composite laminates produced; (d) specimens.
2.4. Density Determination
Density and void measurements were carried out on composite with 50-mm diameteraccording to the Archimedean principle. The cured composite was then weighed in airand then again weighed in a liquid with a known density. The calculated density frommeasured values was reported in g/cm3 [29].
2.5. Tensile Test
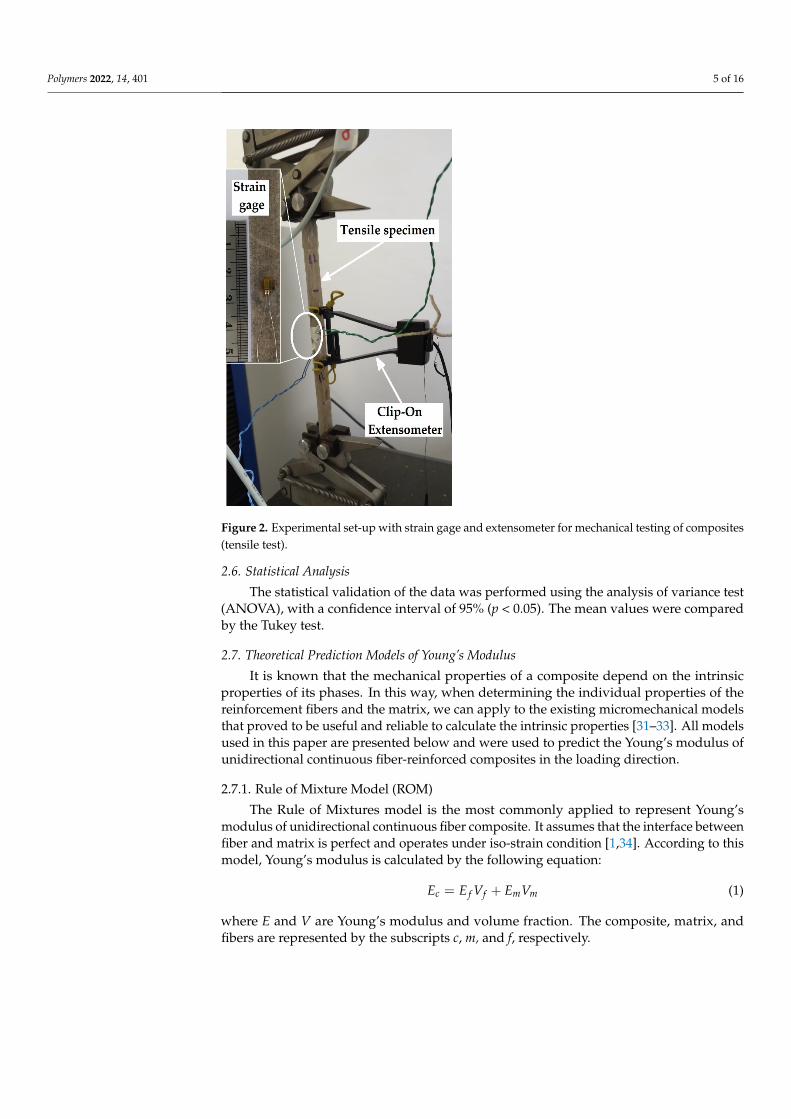
The tensile tests were carried out in eight specimens for each condition at 23 ◦Caccording to the ASTM 3039 [30] standard using an EMIC DL 10,000 (Instron, São Josédos Pinhais, Paraná, Brazil) universal testing machine with a 5-kN load cell and Clip-Onextensometer for displacement measurements during Young’s modulus determination(Figure 2). The crosshead speed was set as 2 mm/min for all tensile tests. To determinethe mechanical properties in tensile, eight samples of each composition of the compositeswere tested.
Polymers 2022, 14, 401 5 of 16
Polymers 2022, 14, x FOR PEER REVIEW 5 of 17
extensometer for displacement measurements during Young’s modulus determination (Figure 2). The crosshead speed was set as 2 mm/min for all tensile tests. To determine the mechanical properties in tensile, eight samples of each composition of the composites were tested.
Figure 2. Experimental set-up with strain gage and extensometer for mechanical testing of composites (tensile test).
2.6. Statistical Analysis The statistical validation of the data was performed using the analysis of variance
test (ANOVA), with a confidence interval of 95% (p < 0.05). The mean values were compared by the Tukey test.
2.7. Theoretical Prediction Models of Young’s Modulus It is known that the mechanical properties of a composite depend on the intrinsic
properties of its phases. In this way, when determining the individual properties of the reinforcement fibers and the matrix, we can apply to the existing micromechanical models that proved to be useful and reliable to calculate the intrinsic properties [31–33]. All models used in this paper are presented below and were used to predict the Young’s modulus of unidirectional continuous fiber-reinforced composites in the loading direction.
2.7.1. Rule of Mixture Model (ROM) The Rule of Mixtures model is the most commonly applied to represent Young’s
modulus of unidirectional continuous fiber composite. It assumes that the interface between fiber and matrix is perfect and operates under iso-strain condition [1,34]. According to this model, Young’s modulus is calculated by the following equation: = + (1)
where E and V are Young’s modulus and volume fraction. The composite, matrix, and fibers are represented by the subscripts c, m, and f, respectively.
Figure 2. Experimental set-up with strain gage and extensometer for mechanical testing of composites(tensile test).
2.6. Statistical Analysis
The statistical validation of the data was performed using the analysis of variance test(ANOVA), with a confidence interval of 95% (p < 0.05). The mean values were comparedby the Tukey test.
2.7. Theoretical Prediction Models of Young’s Modulus
It is known that the mechanical properties of a composite depend on the intrinsicproperties of its phases. In this way, when determining the individual properties of thereinforcement fibers and the matrix, we can apply to the existing micromechanical modelsthat proved to be useful and reliable to calculate the intrinsic properties [31–33]. All modelsused in this paper are presented below and were used to predict the Young’s modulus ofunidirectional continuous fiber-reinforced composites in the loading direction.
2.7.1. Rule of Mixture Model (ROM)
The Rule of Mixtures model is the most commonly applied to represent Young’smodulus of unidirectional continuous fiber composite. It assumes that the interface betweenfiber and matrix is perfect and operates under iso-strain condition [1,34]. According to thismodel, Young’s modulus is calculated by the following equation:
Ec = E f Vf + EmVm (1)
where E and V are Young’s modulus and volume fraction. The composite, matrix, andfibers are represented by the subscripts c, m, and f, respectively.
Polymers 2022, 14, 401 6 of 16
2.7.2. Al-Quresh’s Model
Al-Quresh’s model is based on a combination of dispersed phases composed of fibersand particulates [35,36]. As such, by considering the principle of additivity, the equation ofthe rule of mixtures becomes:
Ec = βE f Vf + λEmVm + γEpVp (2)
The factor β is associated with reinforcement efficiency in the case of parallel fibersand considered to have a value 1. The factor λ concerns the efficiency of the interfacialbond of the fiber by the matrix; in this paper, the value 1 was considered. The particulate isrepresented by the subscripts p, which is not considered in the present research.
2.7.3. Madsen’s Model
In the Madsen’s model, the effect of porosity on the stiffness of plant fiber compositesis demonstrated to be well simulated by including the factor (1 − Vv)2 in the ROM. Themodel assumes axial loading of the fibers as well as elastic stress transfer between matrixand fibers. The exponent 2 was considered in this paper. This value is denoted as theporosity efficiency exponent, where the author, in a broad range of plant fiber compositesystems, found that n = 2 generally gives a good fit to the experimental data [37,38], usingthe following equation:
Ec = (η0.ηl .E f Vf + EmVm)(1 − Vv)2 (3)
The η0 is fiber orientation efficiency factor and is calculated for some typical fiberorientation distributions. In case of unidirectional and loaded along fibers, it is equal to 1.
The factor ηl is fiber length efficiency factor for composites with fiber aspect ratiosabove 50; in the case of the composites presented in this paper, it was set equal to 1.
The void volume fraction needs to be calculated using the following equation:
Vv = 1 −m f /ρ f +
(mc − m f
)/ρm
mc/ρc(4)
where ρf, ρm, and ρc are density of fiber, matrix, and composite, respectively. They werecalculated from experimental data. Just like mf, mm, and mc are mass of fiber, matrix, andcomposite, respectively, they were determined experimentally. The porosity is representedby the subscript v.
2.7.4. Shah’s Model
The modified ROM, which takes into account the effect of fiber obliquity in twistedyarn reinforcements, is given by Equation (5). This model proposed a twist angle at theyarn surface α where a single plant fiber is similar to a twisted yarn composite. Single plantfibers are a lignin-hemicellulose matrix reinforced by cellulose fibrils where the microfibrilsare at an angle to the vertical axis [39]; the model is represented by:
Ec = (cos2 ∝ .ηl .ηd.E f Vf + EmVm)(1 − Vv)2 (5)
where α is twist angle at the yarn surface and, in this paper, has a value of 18◦.The ηd is distribution efficiency factor and reinforcement orientation, and it is assumed
that ηd is unity. The factor ηl is the fiber length efficiency factor for composites with fiberaspect ratios above 50, as is the case for the composites presented in this paper, which wereset equal to 1.
2.7.5. Halpin-Tsai Model
Halpin and Tsai developed a semi-empirical model for the prediction and determi-nation of the Young’s modulus of continuous fiber-reinforced composites aligned [40,41].
Polymers 2022, 14, 401 7 of 16
This model has been widely used among the prediction models for Young’s moduli incomposite materials [1,42]:
Ec = Em
(1 + ζηVf
1 − ηVf
)(6)
where the constants η and ζ are given by:
η =
E fEm
− 1E fEm
+ ζ
(7)
ζ =
(2ld
)(8)
such that ζ is a shape fitting parameter. The variables l and d are the length of the fiber inthe direction of the load and diameter of fiber, respectively [1].
2.7.6. Nielsen’s Model
Landel and Nielsen [43] modified the Halpin-Tsai model by assuming a factor toaccount for the fiber arrangement as well as fiber content, ψ, to enable prediction as givenby the following equations:
Ec = Em
(1 + ζηVf
1 − ηψVf
)(9)
and
ψ = 1 +(
1 −∅max
∅2max
).Vf (10)
where ∅max is the maximum fiber packing fraction. In this paper, the fiber arrangement forrandom packing of fibers was adopted: 0.82 [44].
3. Results and Discussion3.1. Fiber Characterization
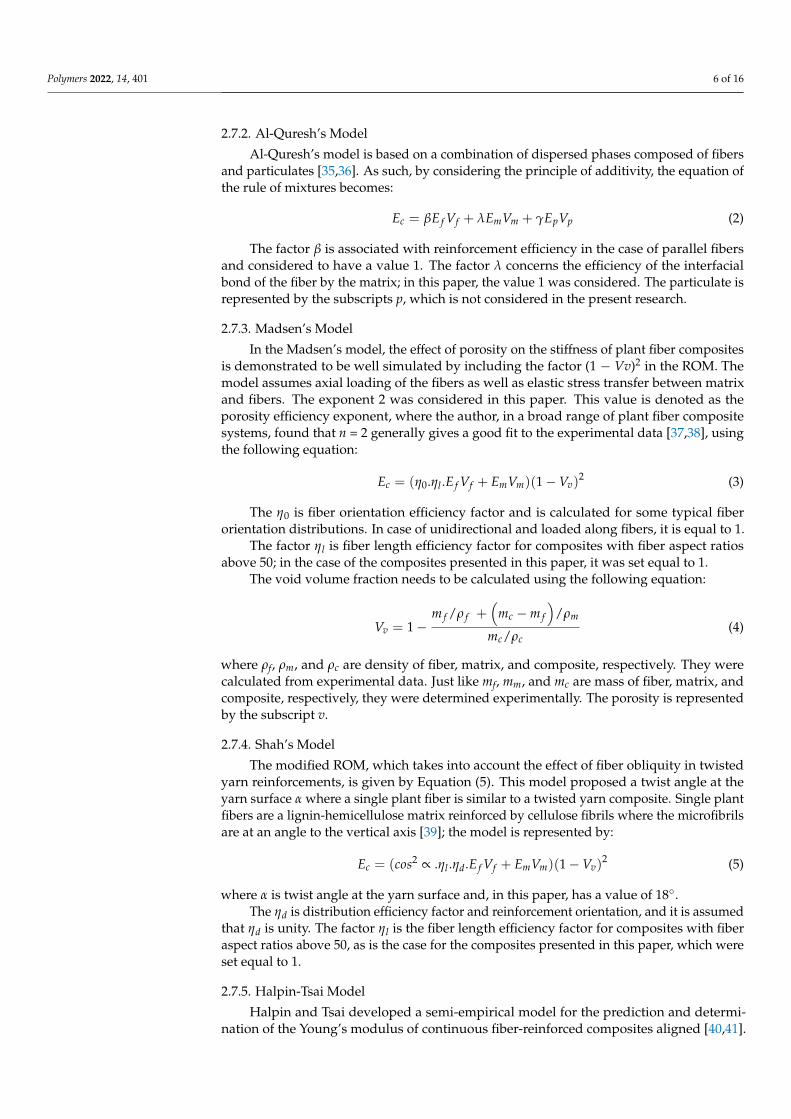
SEM images of the jute and mallow fibers cross section are shown in Figure 3. It canbe seen that it presents structures similar to those of other NFLs [4–6], with a lumen in thecenter and a structure that has an almost circular shape.
Polymers 2022, 14, x FOR PEER REVIEW 7 of 17
= (6)
where the constants η and are given by:
= (7)
= (8)
such that is a shape fitting parameter. The variables l and d are the length of the fiber in the direction of the load and diameter of fiber, respectively [1].
2.7.6. Nielsen’s Model Landel and Nielsen [43] modified the Halpin-Tsai model by assuming a factor to
account for the fiber arrangement as well as fiber content, ψ, to enable prediction as given by the following equations: = (9)
and = 1 + ∅ ∅ . (10)
where ∅max is the maximum fiber packing fraction. In this paper, the fiber arrangement for random packing of fibers was adopted: 0.82 [44].
3. Results and Discussion 3.1. Fiber Characterization
SEM images of the jute and mallow fibers cross section are shown in Figure 3. It can be seen that it presents structures similar to those of other NFLs [4–6], with a lumen in the center and a structure that has an almost circular shape.
(a) (b)
Figure 3. Scanning electron microscopy of fibers: (a) jute fiber; (b) mallow fiber. Magnification of 2.5.
Figure 4 shows optical microscopy of elementary fibers, where the values of the measurements of the diameters of the jute (Figure 4a) and mallow fibers (Figure 4b) are
Figure 3. Scanning electron microscopy of fibers: (a) jute fiber; (b) mallow fiber. Magnification of 2.5.
Polymers 2022, 14, 401 8 of 16
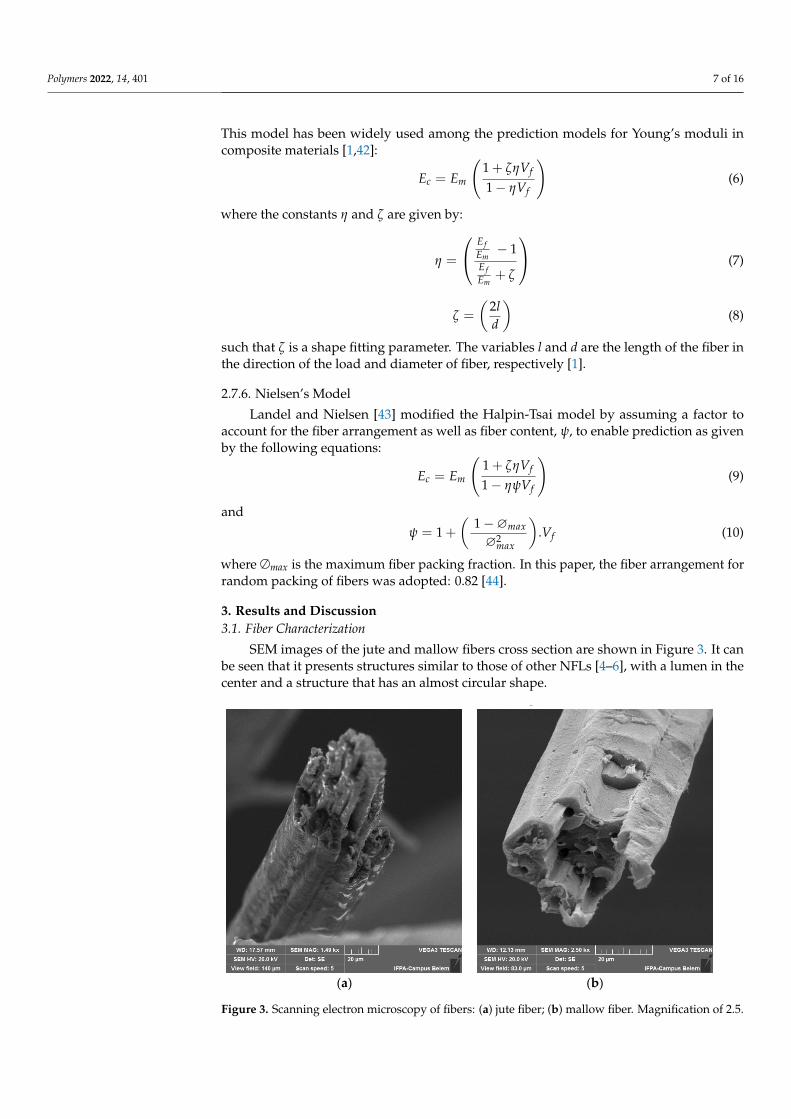
Figure 4 shows optical microscopy of elementary fibers, where the values of themeasurements of the diameters of the jute (Figure 4a) and mallow fibers (Figure 4b) arehighlighted. Table 2 shows the average diameter, density, and mechanical properties of juteand mallow fibers.
Polymers 2022, 14, x FOR PEER REVIEW 8 of 17
highlighted. Table 2 shows the average diameter, density, and mechanical properties of jute and mallow fibers.
(a) (b)
Figure 4. Optical microscopy showing specifics diameters: (a) for jute fiber and (b) mallow fiber.
Table 2. Properties and result of tensile tests of samples fiber.
Fiber Average Diameter
(μm) Density (g/cm3)
Tensile Strength (MPa)
Total Strain (mm/mm)
Young’s Modulus (GPa)
Jute Fiber 78.00 ± 15.57 1.482 ± 0.055 380.87 ± 89.32 0.0292 ± 0.012 17.955 ± 6.57 Mallow
Fiber 79.74 ± 18.15 1.148 ± 0.068 446.80 ± 104.47 0.0722 ± 0.030 11.725 ± 4.09
Jute and mallow fibers had an average diameter of 78.00 ± 15.57 μm and 79.74 ± 18.15 μm and density of 1.482 ± 0.055 g/cm3 and 1.148 ± 0.068 g/cm3, respectively. The average ultimate tensile strength was 380.87 ± 89.32 MPa and 446.80 ± 104.47 MPa, and Young’s modulus was found to be 17.955 ± 6.57 GPa and 11.725 ± 4.09 GPa, respectively. Table 2 also shows that total strains were found to be 0.0292 ± 0.012 mm/mm and 0.0722 ± 0.030 mm/mm for the jute and mallow fibers, respectively.
One should notice that these experimental values are similar to those of jute fibers from the literature as shown in [45], where the presented density was 1.46 (g/cm3), tensile strength 393–800 (MPa), Young’s modulus 10–30 (GPa), and elongation 1.5–1.8 (%), and similarly for mallow fibers, [46]’s study presented a density of 1.37 (g/cm3), tensile strength of 160 (MPa), Young’s modulus of 17.4 (GPa), and elongation of 5.2 (%). The data provided in Table 1 were used in the prediction models to calculate the theoretical Young’s modulus.
3.2. Mechanical Properties of Composites Table 3 presents the properties of jute and mallow fiber-reinforced composites. In this
table, it might be seen that composite densities increase with the incorporation of jute and mallow fibers. It is also observed that the densities of the composites do not exceed the density value of the neat polyester matrix. The result of void volume fraction in Table 3 revealed that the manufacturing process of composites materials vacuum-assisted hand lay-up is a very effective method to prepare the composites.
Figure 4. Optical microscopy showing specifics diameters: (a) for jute fiber and (b) mallow fiber.
Table 2. Properties and result of tensile tests of samples fiber.
Fiber Average Diameter(µm)
Density(g/cm3)
Tensile Strength(MPa)
Total Strain(mm/mm)
Young’s Modulus(GPa)
Jute Fiber 78.00 ± 15.57 1.482 ± 0.055 380.87 ± 89.32 0.0292 ± 0.012 17.955 ± 6.57
MallowFiber 79.74 ± 18.15 1.148 ± 0.068 446.80 ± 104.47 0.0722 ± 0.030 11.725 ± 4.09
Jute and mallow fibers had an average diameter of 78.00± 15.57µm and 79.74 ± 18.15 µmand density of 1.482 ± 0.055 g/cm3 and 1.148 ± 0.068 g/cm3, respectively. The aver-age ultimate tensile strength was 380.87 ± 89.32 MPa and 446.80 ± 104.47 MPa, andYoung’s modulus was found to be 17.955 ± 6.57 GPa and 11.725 ± 4.09 GPa, respec-tively. Table 2 also shows that total strains were found to be 0.0292 ± 0.012 mm/mm and0.0722 ± 0.030 mm/mm for the jute and mallow fibers, respectively.
One should notice that these experimental values are similar to those of jute fibersfrom the literature as shown in [45], where the presented density was 1.46 (g/cm3), tensilestrength 393–800 (MPa), Young’s modulus 10–30 (GPa), and elongation 1.5–1.8 (%), andsimilarly for mallow fibers, [46]’s study presented a density of 1.37 (g/cm3), tensile strengthof 160 (MPa), Young’s modulus of 17.4 (GPa), and elongation of 5.2 (%). The data providedin Table 1 were used in the prediction models to calculate the theoretical Young’s modulus.
3.2. Mechanical Properties of Composites
Table 3 presents the properties of jute and mallow fiber-reinforced composites. In thistable, it might be seen that composite densities increase with the incorporation of jute andmallow fibers. It is also observed that the densities of the composites do not exceed thedensity value of the neat polyester matrix. The result of void volume fraction in Table 3revealed that the manufacturing process of composites materials vacuum-assisted handlay-up is a very effective method to prepare the composites.
Polymers 2022, 14, 401 9 of 16
Table 3. Properties of samples of fiber polyester composites.
Composite ManufacturingCondition Description Fiber Volume Fraction
(%)Void Volume Fraction
(%)Density(g/cm3)
Neat Polyester Matrix Hand lay-up method PM * 0 NA ** 1.249 ± 0.0310
Polyester/Jute fiber(0◦ unidirectional) Vacuum-assisted
hand lay-up/vacuum-baggingmethod
J5% 5 19.58 1.115 ± 0.0115J15% 15 10.34 1.154 ± 0.0136J25% 25 10.76 1.172 ± 0.0055
Polyester/Mallow fiber(0◦ unidirectional)
M5% 5 12.60 1.097 ± 0.0037M15% 15 9.70 1.112 ± 0.0136M25% 25 3.91 1.176 ± 0.0162
* PM polyester matrix; ** NA not applicable.
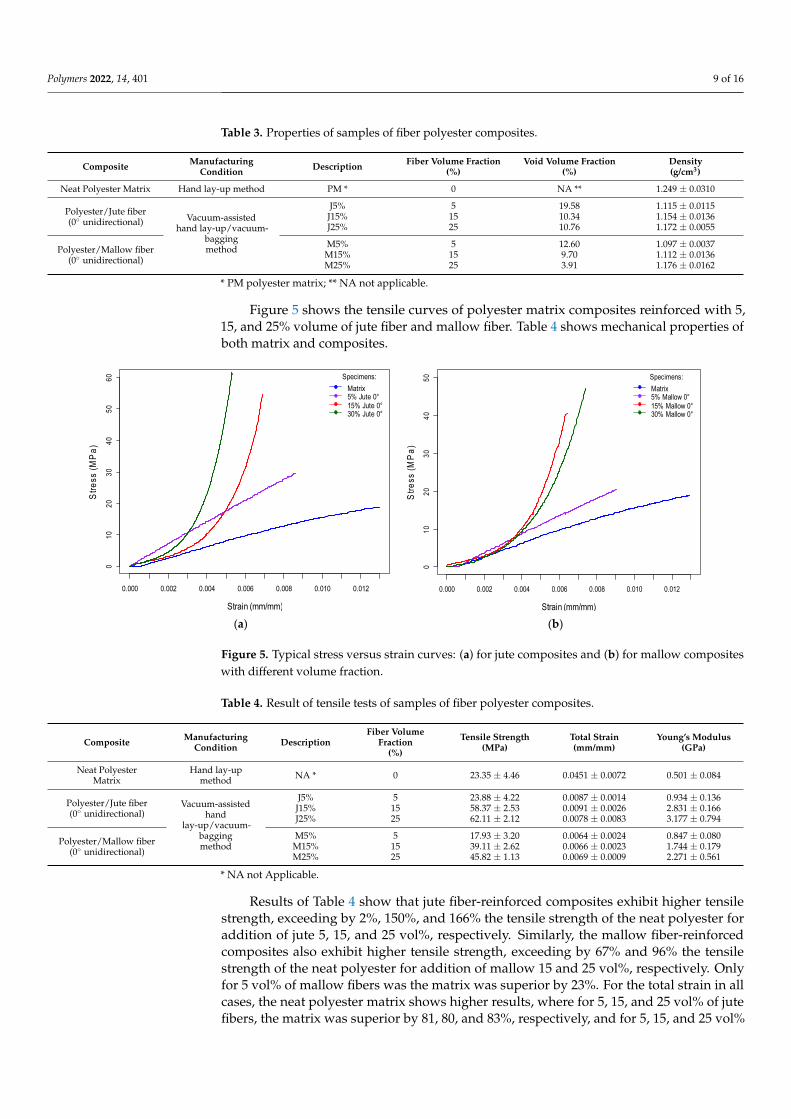
Figure 5 shows the tensile curves of polyester matrix composites reinforced with 5,15, and 25% volume of jute fiber and mallow fiber. Table 4 shows mechanical properties ofboth matrix and composites.
Polymers 2022, 14, x FOR PEER REVIEW 9 of 17
Table 3. Properties of samples of fiber polyester composites.
Composite Manufacturing
Condition Description Fiber Volume
Fraction (%)
Void Volume Fraction
(%)
Density (g/cm3)
Neat Polyester Matrix Hand lay-up method
PM * 0 NA ** 1.249 ± 0.0310
Polyester/Jute fiber (0° unidirectional) Vacuum-assisted
hand lay-up/vacuum-
bagging method
J5% 5 19.58 1.115 ± 0.0115 J15% 15 10.34 1.154 ± 0.0136 J25% 25 10.76 1.172 ± 0.0055
Polyester/Mallow fiber (0° unidirectional)
M5% 5 12.60 1.097 ± 0.0037 M15% 15 9.70 1.112 ± 0.0136 M25% 25 3.91 1.176 ± 0.0162
* PM polyester matrix; ** NA not applicable.
Figure 5 shows the tensile curves of polyester matrix composites reinforced with 5, 15, and 25% volume of jute fiber and mallow fiber. Table 4 shows mechanical properties of both matrix and composites.
(a) (b)
Figure 5. Typical stress versus strain curves: (a) for jute composites and (b) for mallow composites with different volume fraction.
Table 4. Result of tensile tests of samples of fiber polyester composites.
Composite Manufacturing Condition
Description Fiber Volume
Fraction (%)
Tensile Strength
(MPa)
Total Strain (mm/mm)
Young’s Modulus (GPa)
Neat Polyester Matrix
Hand lay-up method NA * 0 23.35 ± 4.46 0.0451 ± 0.0072 0.501 ± 0.084
Polyester/Jute fiber (0° unidirectional) Vacuum-assisted
hand lay-up/vacuum-
bagging method
J5% 5 23.88 ± 4.22 0.0087 ± 0.0014 0.934 ± 0.136 J15% 15 58.37 ± 2.53 0.0091 ± 0.0026 2.831 ± 0.166 J25% 25 62.11 ± 2.12 0.0078 ± 0.0083 3.177 ± 0.794
Polyester/Mallow fiber (0° unidirectional)
M5% 5 17.93 ± 3.20 0.0064 ± 0.0024 0.847 ± 0.080 M15% 15 39.11 ± 2.62 0.0066 ± 0.0023 1.744 ± 0.179 M25% 25 45.82 ± 1.13 0.0069 ± 0.0009 2.271 ± 0.561
* NA not Applicable.
Strain (mm/mm)
Stre
ss (M
Pa)
0.000 0.002 0.004 0.006 0.008 0.010 0.012
010
2030
4050
60 Specimens:Matrix5% Jute 0°15% Jute 0°30% Jute 0°
Strain (mm/mm)
Stre
ss (M
Pa)
0.000 0.002 0.004 0.006 0.008 0.010 0.012
010
2030
4050 Specimens:
Matrix5% Mallow 0°15% Mallow 0°30% Mallow 0°
Figure 5. Typical stress versus strain curves: (a) for jute composites and (b) for mallow compositeswith different volume fraction.
Table 4. Result of tensile tests of samples of fiber polyester composites.
Composite ManufacturingCondition Description
Fiber VolumeFraction
(%)
Tensile Strength(MPa)
Total Strain(mm/mm)
Young’s Modulus(GPa)
Neat PolyesterMatrix
Hand lay-upmethod NA * 0 23.35 ± 4.46 0.0451 ± 0.0072 0.501 ± 0.084
Polyester/Jute fiber(0◦ unidirectional)
Vacuum-assistedhand
lay-up/vacuum-baggingmethod
J5% 5 23.88 ± 4.22 0.0087 ± 0.0014 0.934 ± 0.136J15% 15 58.37 ± 2.53 0.0091 ± 0.0026 2.831 ± 0.166J25% 25 62.11 ± 2.12 0.0078 ± 0.0083 3.177 ± 0.794
Polyester/Mallow fiber(0◦ unidirectional)
M5% 5 17.93 ± 3.20 0.0064 ± 0.0024 0.847 ± 0.080M15% 15 39.11 ± 2.62 0.0066 ± 0.0023 1.744 ± 0.179M25% 25 45.82 ± 1.13 0.0069 ± 0.0009 2.271 ± 0.561
* NA not Applicable.
Results of Table 4 show that jute fiber-reinforced composites exhibit higher tensilestrength, exceeding by 2%, 150%, and 166% the tensile strength of the neat polyester foraddition of jute 5, 15, and 25 vol%, respectively. Similarly, the mallow fiber-reinforcedcomposites also exhibit higher tensile strength, exceeding by 67% and 96% the tensilestrength of the neat polyester for addition of mallow 15 and 25 vol%, respectively. Onlyfor 5 vol% of mallow fibers was the matrix was superior by 23%. For the total strain in allcases, the neat polyester matrix shows higher results, where for 5, 15, and 25 vol% of jutefibers, the matrix was superior by 81, 80, and 83%, respectively, and for 5, 15, and 25 vol%
Polymers 2022, 14, 401 10 of 16
of mallow fibers, the matrix was superior by 86, 85, and 85%, respectively. Similar resultswere obtained by [47].
Consequently, under this condition, the Young’s modulus for the 5, 15, and 25 vol%jute fiber-reinforced composites exhibit the highest values, exceeding by 86, 465, and 534%the stiffness of the neat polyester. Similarly, the Young’s modulus for the 5, 15, and 25 vol%mallow fiber-reinforced composites also exhibit the highest values, exceeding by 69, 248,and 353% the stiffness of the neat polyester, respectively.
3.3. Statistical Analysis
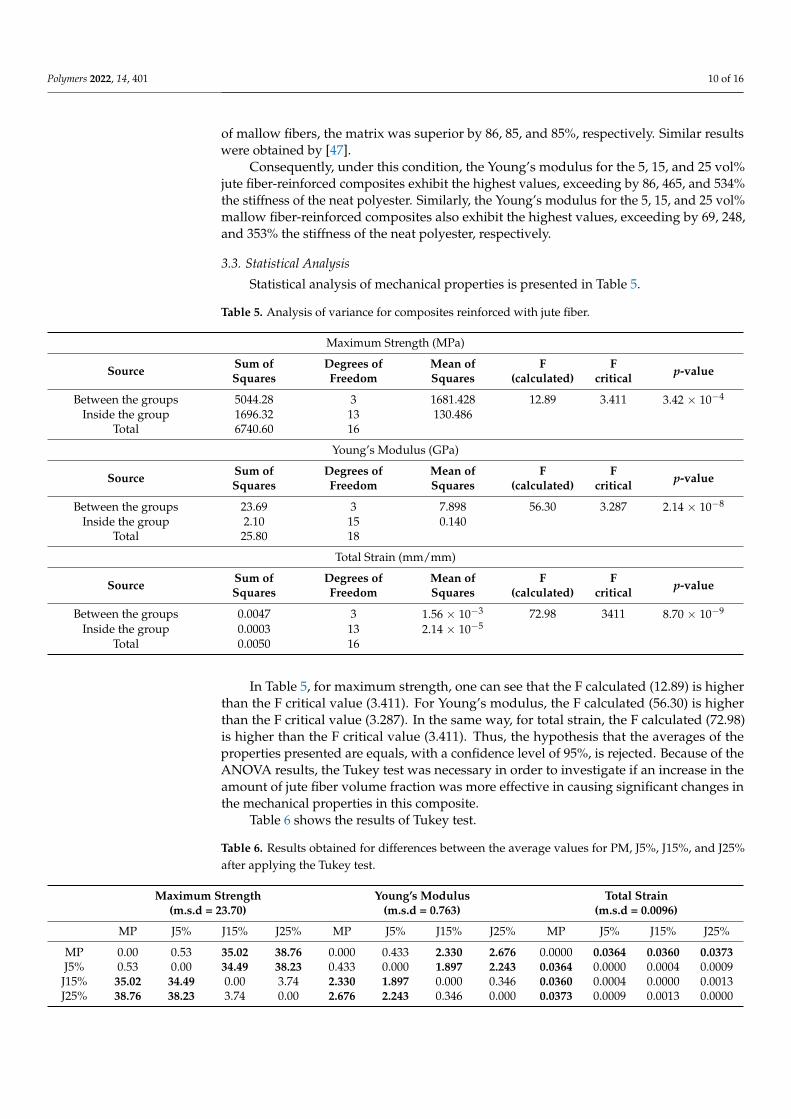
Statistical analysis of mechanical properties is presented in Table 5.
Table 5. Analysis of variance for composites reinforced with jute fiber.
Maximum Strength (MPa)
Source Sum ofSquares
Degrees ofFreedom
Mean ofSquares
F(calculated)
Fcritical p-value
Between the groups 5044.28 3 1681.428 12.89 3.411 3.42 × 10⁻⁴
Inside the group 1696.32 13 130.486Total 6740.60 16
Young’s Modulus (GPa)
Source Sum ofSquares
Degrees ofFreedom
Mean ofSquares
F(calculated)
Fcritical p-value
Between the groups 23.69 3 7.898 56.30 3.287 2.14 × 10⁻⁸
Inside the group 2.10 15 0.140Total 25.80 18
Total Strain (mm/mm)
Source Sum ofSquares
Degrees ofFreedom
Mean ofSquares
F(calculated)
Fcritical p-value
Between the groups 0.0047 3 1.56 × 10⁻³ 72.98 3411 8.70 × 10⁻⁹
Inside the group 0.0003 13 2.14 × 10⁻⁵
Total 0.0050 16
In Table 5, for maximum strength, one can see that the F calculated (12.89) is higherthan the F critical value (3.411). For Young’s modulus, the F calculated (56.30) is higherthan the F critical value (3.287). In the same way, for total strain, the F calculated (72.98)is higher than the F critical value (3.411). Thus, the hypothesis that the averages of theproperties presented are equals, with a confidence level of 95%, is rejected. Because of theANOVA results, the Tukey test was necessary in order to investigate if an increase in theamount of jute fiber volume fraction was more effective in causing significant changes inthe mechanical properties in this composite.
Table 6 shows the results of Tukey test.
Table 6. Results obtained for differences between the average values for PM, J5%, J15%, and J25%after applying the Tukey test.
Maximum Strength(m.s.d = 23.70)
Young’s Modulus(m.s.d = 0.763)
Total Strain(m.s.d = 0.0096)
MP J5% J15% J25% MP J5% J15% J25% MP J5% J15% J25%
MP 0.00 0.53 35.02 38.76 0.000 0.433 2.330 2.676 0.0000 0.0364 0.0360 0.0373J5% 0.53 0.00 34.49 38.23 0.433 0.000 1.897 2.243 0.0364 0.0000 0.0004 0.0009
J15% 35.02 34.49 0.00 3.74 2.330 1.897 0.000 0.346 0.0360 0.0004 0.0000 0.0013J25% 38.76 38.23 3.74 0.00 2.676 2.243 0.346 0.000 0.0373 0.0009 0.0013 0.0000
Polymers 2022, 14, 401 11 of 16
The minimum significant difference (m.s.d) is a value that can discriminate whichtreatment shows difference in its average values. Once the difference between the averagevalues of groups, compared two by two, is higher than the m.s.d value, this pair is consid-ered to be different. The m.s.d for maximum strength was calculated as 23.70, the m.s.d forYoung’s modulus was calculated as 0.763, and for total strain, it was 0.0096.
Thus, it might be seen that the inclusion of continuous and aligned of jute fiber inpolyester resin was essential to cause changes in mechanical properties. The J15% andJ25% composites have indeed the highest tensile strength and Young’s modulus, whicheffectively stiffened the material.
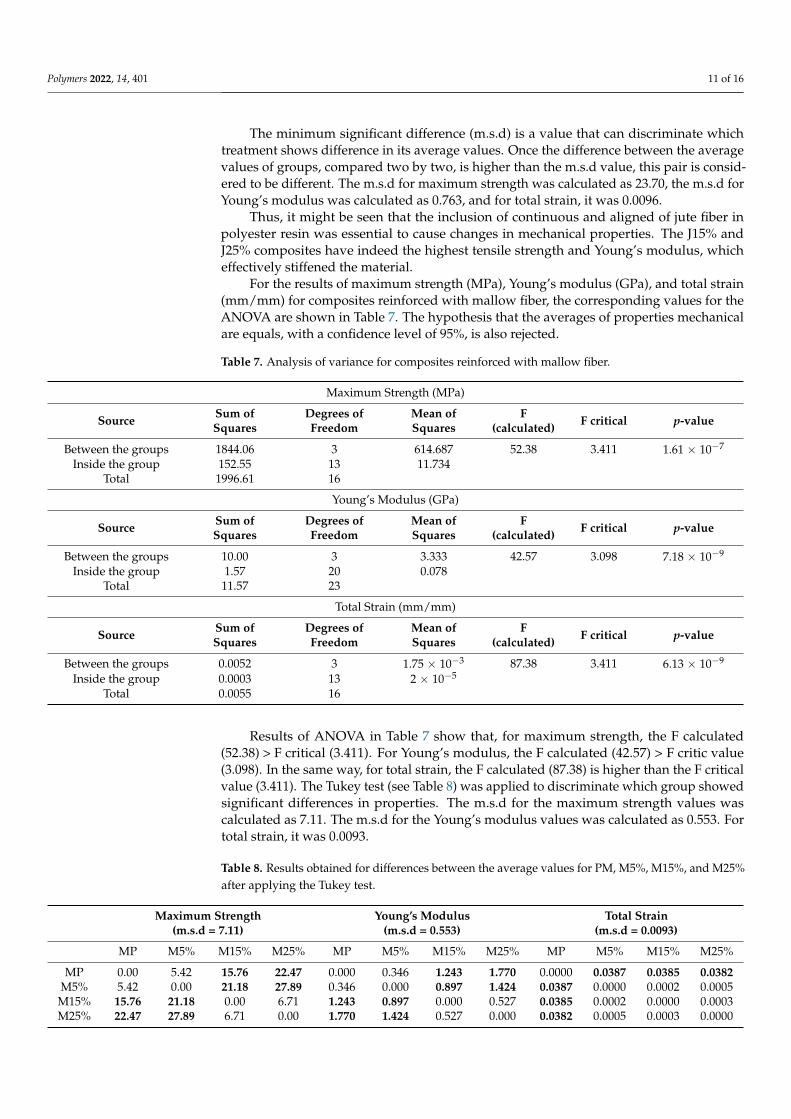
For the results of maximum strength (MPa), Young’s modulus (GPa), and total strain(mm/mm) for composites reinforced with mallow fiber, the corresponding values for theANOVA are shown in Table 7. The hypothesis that the averages of properties mechanicalare equals, with a confidence level of 95%, is also rejected.
Table 7. Analysis of variance for composites reinforced with mallow fiber.
Maximum Strength (MPa)
Source Sum ofSquares
Degrees ofFreedom
Mean ofSquares
F(calculated) F critical p-value
Between the groups 1844.06 3 614.687 52.38 3.411 1.61 × 10⁻⁷
Inside the group 152.55 13 11.734Total 1996.61 16
Young’s Modulus (GPa)
Source Sum ofSquares
Degrees ofFreedom
Mean ofSquares
F(calculated) F critical p-value
Between the groups 10.00 3 3.333 42.57 3.098 7.18 × 10⁻⁹
Inside the group 1.57 20 0.078Total 11.57 23
Total Strain (mm/mm)
Source Sum ofSquares
Degrees ofFreedom
Mean ofSquares
F(calculated) F critical p-value
Between the groups 0.0052 3 1.75 × 10⁻³ 87.38 3.411 6.13 × 10⁻⁹
Inside the group 0.0003 13 2 × 10⁻⁵
Total 0.0055 16
Results of ANOVA in Table 7 show that, for maximum strength, the F calculated(52.38) > F critical (3.411). For Young’s modulus, the F calculated (42.57) > F critic value(3.098). In the same way, for total strain, the F calculated (87.38) is higher than the F criticalvalue (3.411). The Tukey test (see Table 8) was applied to discriminate which group showedsignificant differences in properties. The m.s.d for the maximum strength values wascalculated as 7.11. The m.s.d for the Young’s modulus values was calculated as 0.553. Fortotal strain, it was 0.0093.
Table 8. Results obtained for differences between the average values for PM, M5%, M15%, and M25%after applying the Tukey test.
Maximum Strength(m.s.d = 7.11)
Young’s Modulus(m.s.d = 0.553)
Total Strain(m.s.d = 0.0093)
MP M5% M15% M25% MP M5% M15% M25% MP M5% M15% M25%
MP 0.00 5.42 15.76 22.47 0.000 0.346 1.243 1.770 0.0000 0.0387 0.0385 0.0382M5% 5.42 0.00 21.18 27.89 0.346 0.000 0.897 1.424 0.0387 0.0000 0.0002 0.0005
M15% 15.76 21.18 0.00 6.71 1.243 0.897 0.000 0.527 0.0385 0.0002 0.0000 0.0003M25% 22.47 27.89 6.71 0.00 1.770 1.424 0.527 0.000 0.0382 0.0005 0.0003 0.0000
Polymers 2022, 14, 401 12 of 16
M15% and M25% composites group, with 95% confidence level, exhibit the highest ten-sile strength and Young’s modulus. Thus, it might be seen that the inclusion of continuousand aligned mallow fiber in polyester resin caused changes in mechanical properties. Onthe other hand, no significant difference was found in the values of mechanical resistancebetween M5% composite and neat polyester matrix.
3.4. Theoretical Prediction Models of Young’s Modulus
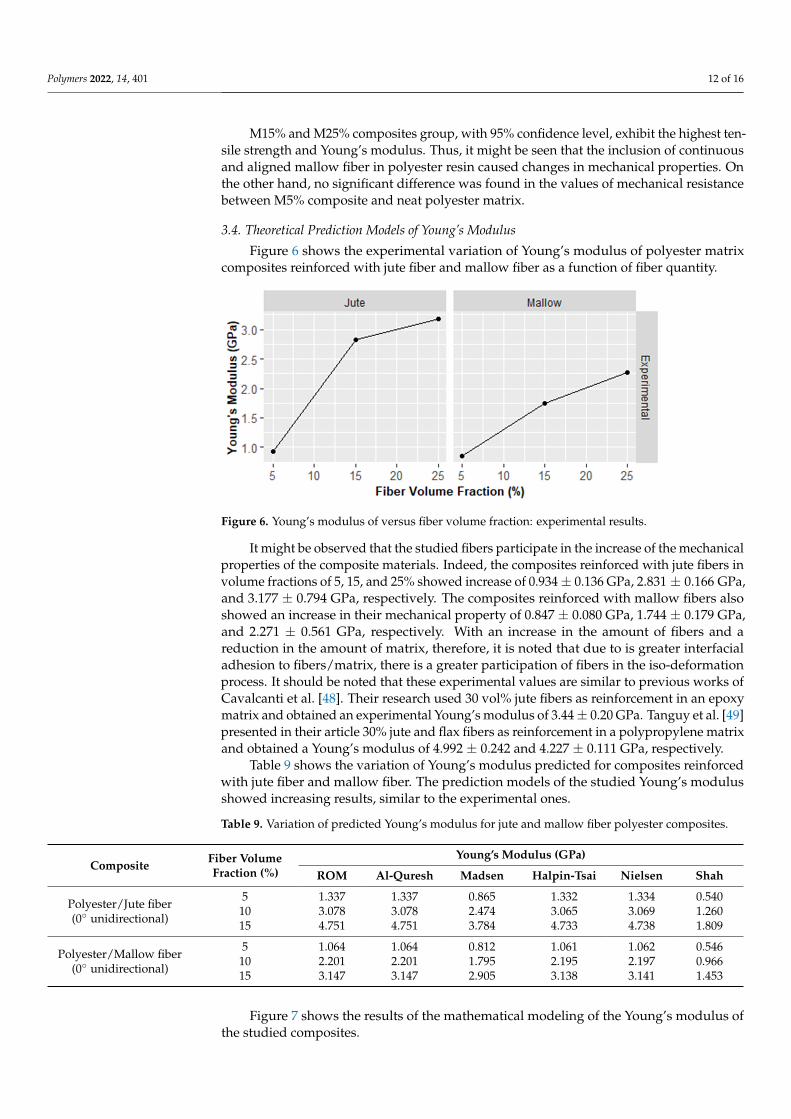
Figure 6 shows the experimental variation of Young’s modulus of polyester matrixcomposites reinforced with jute fiber and mallow fiber as a function of fiber quantity.
Polymers 2022, 14, x FOR PEER REVIEW 12 of 17
Table 8. Results obtained for differences between the average values for PM, M5%, M15%, and M25% after applying the Tukey test.
Maximum Strength
(m.s.d = 7.11) Young’s Modulus
(m.s.d = 0.553) Total Strain
(m.s.d = 0.0093) MP M5% M15% M25% MP M5% M15% M25% MP M5% M15% M25%
MP 0.00 5.42 15.76 22.47 0.000 0.346 1.243 1.770 0.0000 0.0387 0.0385 0.0382 M5% 5.42 0.00 21.18 27.89 0.346 0.000 0.897 1.424 0.0387 0.0000 0.0002 0.0005 M15% 15.76 21.18 0.00 6.71 1.243 0.897 0.000 0.527 0.0385 0.0002 0.0000 0.0003 M25% 22.47 27.89 6.71 0.00 1.770 1.424 0.527 0.000 0.0382 0.0005 0.0003 0.0000
M15% and M25% composites group, with 95% confidence level, exhibit the highest tensile strength and Young’s modulus. Thus, it might be seen that the inclusion of continuous and aligned mallow fiber in polyester resin caused changes in mechanical properties. On the other hand, no significant difference was found in the values of mechanical resistance between M5% composite and neat polyester matrix.
3.4. Theoretical Prediction Models of Young’s Modulus Figure 6 shows the experimental variation of Young’s modulus of polyester matrix
composites reinforced with jute fiber and mallow fiber as a function of fiber quantity.
Figure 6. Young’s modulus of versus fiber volume fraction: experimental results.
It might be observed that the studied fibers participate in the increase of the mechanical properties of the composite materials. Indeed, the composites reinforced with jute fibers in volume fractions of 5, 15, and 25% showed increase of 0.934 ± 0.136 GPa, 2.831 ± 0.166 GPa, and 3.177 ± 0.794 GPa, respectively. The composites reinforced with mallow fibers also showed an increase in their mechanical property of 0.847 ± 0.080 GPa, 1.744 ± 0.179 GPa, and 2.271 ± 0.561 GPa, respectively. With an increase in the amount of fibers and a reduction in the amount of matrix, therefore, it is noted that due to is greater interfacial adhesion to fibers/matrix, there is a greater participation of fibers in the iso-deformation process. It should be noted that these experimental values are similar to previous works of Cavalcanti et al. [48]. Their research used 30 vol% jute fibers as reinforcement in an epoxy matrix and obtained an experimental Young’s modulus of 3.44 ± 0.20 GPa. Tanguy et al. [49] presented in their article 30% jute and flax fibers as reinforcement in a polypropylene matrix and obtained a Young’s modulus of 4.992 ± 0.242 and 4.227 ± 0.111 GPa, respectively.
Table 9 shows the variation of Young’s modulus predicted for composites reinforced with jute fiber and mallow fiber. The prediction models of the studied Young’s modulus showed increasing results, similar to the experimental ones.
Figure 6. Young’s modulus of versus fiber volume fraction: experimental results.
It might be observed that the studied fibers participate in the increase of the mechanicalproperties of the composite materials. Indeed, the composites reinforced with jute fibers involume fractions of 5, 15, and 25% showed increase of 0.934 ± 0.136 GPa, 2.831 ± 0.166 GPa,and 3.177 ± 0.794 GPa, respectively. The composites reinforced with mallow fibers alsoshowed an increase in their mechanical property of 0.847 ± 0.080 GPa, 1.744 ± 0.179 GPa,and 2.271 ± 0.561 GPa, respectively. With an increase in the amount of fibers and areduction in the amount of matrix, therefore, it is noted that due to is greater interfacialadhesion to fibers/matrix, there is a greater participation of fibers in the iso-deformationprocess. It should be noted that these experimental values are similar to previous works ofCavalcanti et al. [48]. Their research used 30 vol% jute fibers as reinforcement in an epoxymatrix and obtained an experimental Young’s modulus of 3.44 ± 0.20 GPa. Tanguy et al. [49]presented in their article 30% jute and flax fibers as reinforcement in a polypropylene matrixand obtained a Young’s modulus of 4.992 ± 0.242 and 4.227 ± 0.111 GPa, respectively.
Table 9 shows the variation of Young’s modulus predicted for composites reinforcedwith jute fiber and mallow fiber. The prediction models of the studied Young’s modulusshowed increasing results, similar to the experimental ones.
Table 9. Variation of predicted Young’s modulus for jute and mallow fiber polyester composites.
Composite Fiber VolumeFraction (%)
Young’s Modulus (GPa)
ROM Al-Quresh Madsen Halpin-Tsai Nielsen Shah
Polyester/Jute fiber(0◦ unidirectional)
5 1.337 1.337 0.865 1.332 1.334 0.54010 3.078 3.078 2.474 3.065 3.069 1.26015 4.751 4.751 3.784 4.733 4.738 1.809
Polyester/Mallow fiber(0◦ unidirectional)
5 1.064 1.064 0.812 1.061 1.062 0.54610 2.201 2.201 1.795 2.195 2.197 0.96615 3.147 3.147 2.905 3.138 3.141 1.453
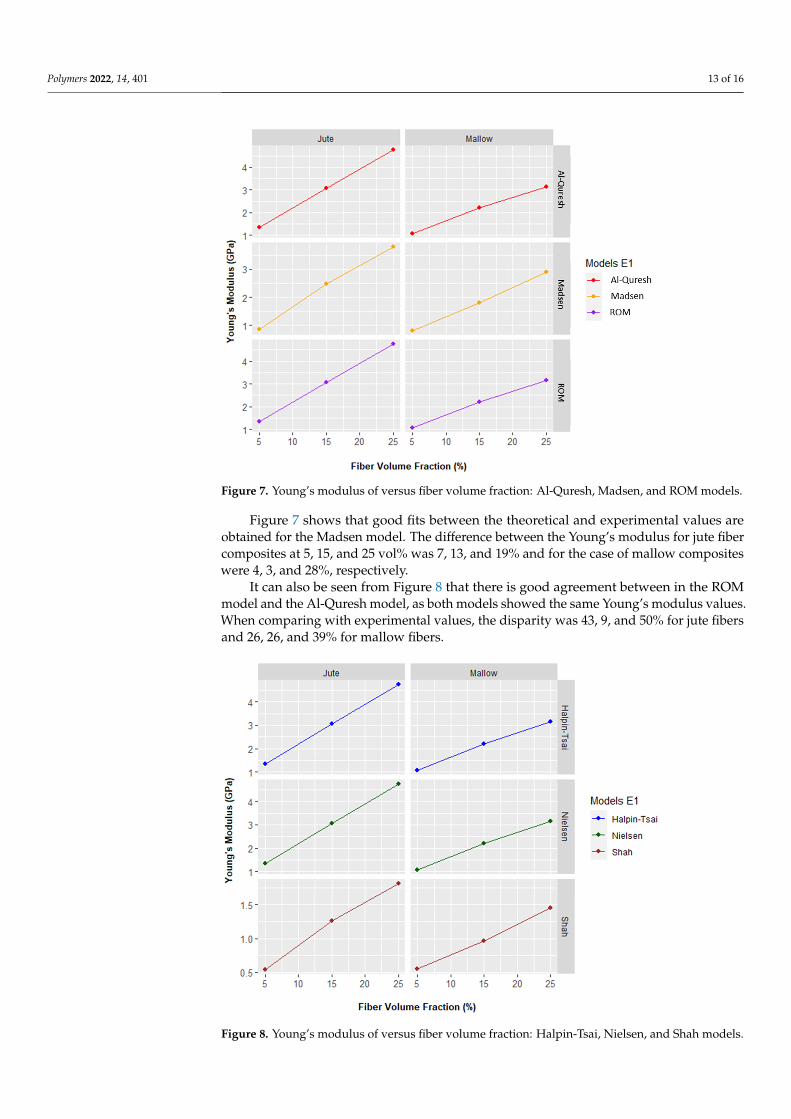
Figure 7 shows the results of the mathematical modeling of the Young’s modulus ofthe studied composites.
Polymers 2022, 14, 401 13 of 16
Polymers 2022, 14, x FOR PEER REVIEW 13 of 17
Table 9. Variation of predicted Young’s modulus for jute and mallow fiber polyester composites.
Composite Fiber Volume Fraction (%)
Young’s Modulus (GPa) ROM Al-Quresh Madsen Halpin-Tsai Nielsen Shah
Polyester/Jute fiber (0° unidirectional)
5 1.337 1.337 0.865 1.332 1.334 0.540 10 3.078 3.078 2.474 3.065 3.069 1.260 15 4.751 4.751 3.784 4.733 4.738 1.809
Polyester/Mallow fiber (0° unidirectional)
5 1.064 1.064 0.812 1.061 1.062 0.546 10 2.201 2.201 1.795 2.195 2.197 0.966 15 3.147 3.147 2.905 3.138 3.141 1.453
Figure 7 shows the results of the mathematical modeling of the Young’s modulus of the studied composites.
Figure 7. Young’s modulus of versus fiber volume fraction: Al-Quresh, Madsen, and ROM models.
Figure 7 shows that good fits between the theoretical and experimental values are obtained for the Madsen model. The difference between the Young’s modulus for jute fiber composites at 5, 15, and 25 vol% was 7, 13, and 19% and for the case of mallow composites were 4, 3, and 28%, respectively.
It can also be seen from Figure 8 that there is good agreement between in the ROM model and the Al-Quresh model, as both models showed the same Young’s modulus values. When comparing with experimental values, the disparity was 43, 9, and 50% for jute fibers and 26, 26, and 39% for mallow fibers.
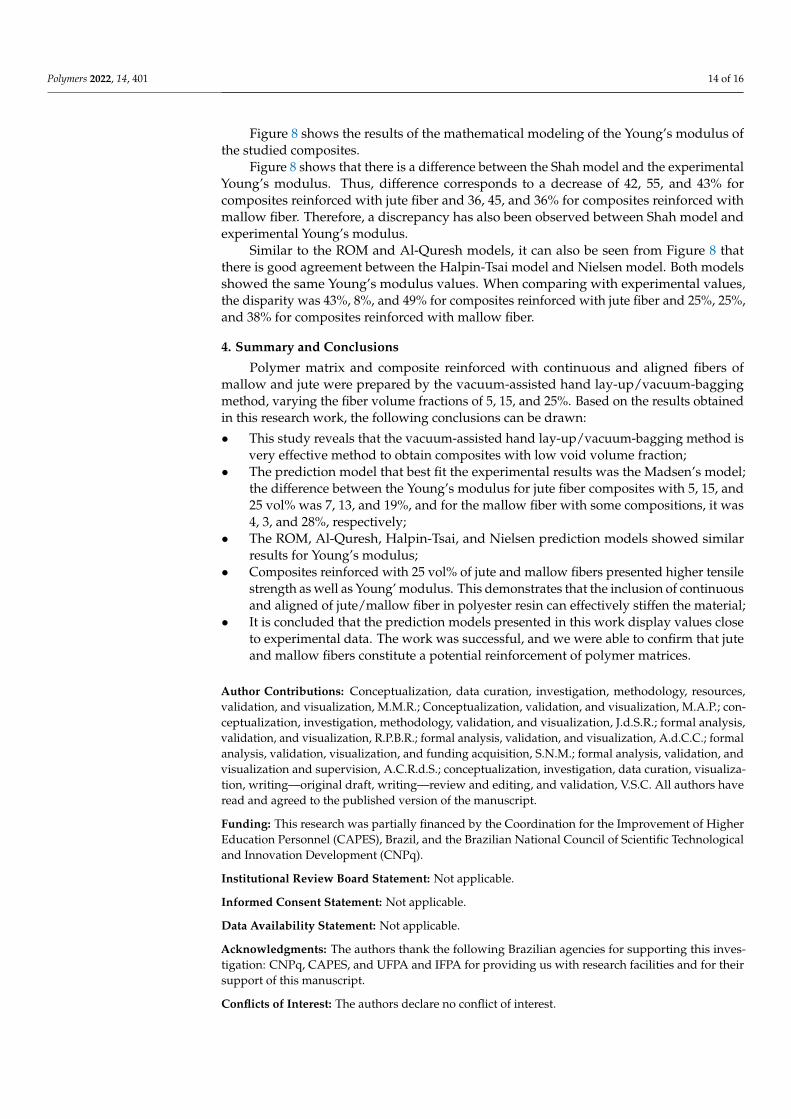
Figure 8 shows the results of the mathematical modeling of the Young’s modulus of the studied composites.
Figure 7. Young’s modulus of versus fiber volume fraction: Al-Quresh, Madsen, and ROM models.
Figure 7 shows that good fits between the theoretical and experimental values areobtained for the Madsen model. The difference between the Young’s modulus for jute fibercomposites at 5, 15, and 25 vol% was 7, 13, and 19% and for the case of mallow compositeswere 4, 3, and 28%, respectively.
It can also be seen from Figure 8 that there is good agreement between in the ROMmodel and the Al-Quresh model, as both models showed the same Young’s modulus values.When comparing with experimental values, the disparity was 43, 9, and 50% for jute fibersand 26, 26, and 39% for mallow fibers.
Polymers 2022, 14, x FOR PEER REVIEW 14 of 17
Figure 8. Young’s modulus of versus fiber volume fraction: Halpin-Tsai, Nielsen, and Shah models.
Figure 8 shows that there is a difference between the Shah model and the experimental Young’s modulus. Thus, difference corresponds to a decrease of 42, 55, and 43% for composites reinforced with jute fiber and 36, 45, and 36% for composites reinforced with mallow fiber. Therefore, a discrepancy has also been observed between Shah model and experimental Young’s modulus.
Similar to the ROM and Al-Quresh models, it can also be seen from Figure 8 that there is good agreement between the Halpin-Tsai model and Nielsen model. Both models showed the same Young’s modulus values. When comparing with experimental values, the disparity was 43%, 8%, and 49% for composites reinforced with jute fiber and 25%, 25%, and 38% for composites reinforced with mallow fiber.
4. Summary and Conclusions Polymer matrix and composite reinforced with continuous and aligned fibers of
mallow and jute were prepared by the vacuum-assisted hand lay-up/vacuum-bagging method, varying the fiber volume fractions of 5, 15, and 25%. Based on the results obtained in this research work, the following conclusions can be drawn: • This study reveals that the vacuum-assisted hand lay-up/vacuum-bagging method is
very effective method to obtain composites with low void volume fraction; • The prediction model that best fit the experimental results was the Madsen’s model;
the difference between the Young’s modulus for jute fiber composites with 5, 15, and 25 vol% was 7, 13, and 19%, and for the mallow fiber with some compositions, it was 4, 3, and 28%, respectively;
• The ROM, Al-Quresh, Halpin-Tsai, and Nielsen prediction models showed similar results for Young’s modulus;
Figure 8. Young’s modulus of versus fiber volume fraction: Halpin-Tsai, Nielsen, and Shah models.
Polymers 2022, 14, 401 14 of 16
Figure 8 shows the results of the mathematical modeling of the Young’s modulus ofthe studied composites.
Figure 8 shows that there is a difference between the Shah model and the experimentalYoung’s modulus. Thus, difference corresponds to a decrease of 42, 55, and 43% forcomposites reinforced with jute fiber and 36, 45, and 36% for composites reinforced withmallow fiber. Therefore, a discrepancy has also been observed between Shah model andexperimental Young’s modulus.
Similar to the ROM and Al-Quresh models, it can also be seen from Figure 8 thatthere is good agreement between the Halpin-Tsai model and Nielsen model. Both modelsshowed the same Young’s modulus values. When comparing with experimental values,the disparity was 43%, 8%, and 49% for composites reinforced with jute fiber and 25%, 25%,and 38% for composites reinforced with mallow fiber.
4. Summary and Conclusions
Polymer matrix and composite reinforced with continuous and aligned fibers ofmallow and jute were prepared by the vacuum-assisted hand lay-up/vacuum-baggingmethod, varying the fiber volume fractions of 5, 15, and 25%. Based on the results obtainedin this research work, the following conclusions can be drawn:
• This study reveals that the vacuum-assisted hand lay-up/vacuum-bagging method isvery effective method to obtain composites with low void volume fraction;
• The prediction model that best fit the experimental results was the Madsen’s model;the difference between the Young’s modulus for jute fiber composites with 5, 15, and25 vol% was 7, 13, and 19%, and for the mallow fiber with some compositions, it was4, 3, and 28%, respectively;
• The ROM, Al-Quresh, Halpin-Tsai, and Nielsen prediction models showed similarresults for Young’s modulus;
• Composites reinforced with 25 vol% of jute and mallow fibers presented higher tensilestrength as well as Young’ modulus. This demonstrates that the inclusion of continuousand aligned of jute/mallow fiber in polyester resin can effectively stiffen the material;
• It is concluded that the prediction models presented in this work display values closeto experimental data. The work was successful, and we were able to confirm that juteand mallow fibers constitute a potential reinforcement of polymer matrices.
Author Contributions: Conceptualization, data curation, investigation, methodology, resources,validation, and visualization, M.M.R.; Conceptualization, validation, and visualization, M.A.P.; con-ceptualization, investigation, methodology, validation, and visualization, J.d.S.R.; formal analysis,validation, and visualization, R.P.B.R.; formal analysis, validation, and visualization, A.d.C.C.; formalanalysis, validation, visualization, and funding acquisition, S.N.M.; formal analysis, validation, andvisualization and supervision, A.C.R.d.S.; conceptualization, investigation, data curation, visualiza-tion, writing—original draft, writing—review and editing, and validation, V.S.C. All authors haveread and agreed to the published version of the manuscript.
Funding: This research was partially financed by the Coordination for the Improvement of HigherEducation Personnel (CAPES), Brazil, and the Brazilian National Council of Scientific Technologicaland Innovation Development (CNPq).
Institutional Review Board Statement: Not applicable.
Informed Consent Statement: Not applicable.
Data Availability Statement: Not applicable.
Acknowledgments: The authors thank the following Brazilian agencies for supporting this inves-tigation: CNPq, CAPES, and UFPA and IFPA for providing us with research facilities and for theirsupport of this manuscript.
Conflicts of Interest: The authors declare no conflict of interest.
Polymers 2022, 14, 401 15 of 16
References1. Efendy, M.G.A.; Pickering, K.L. Comparison of strength and Young’s modulus of aligned discontinuous fibre PLA composites
obtained experimentally and from theoretical prediction. Compos. Struct. 2019, 208, 566–573. [CrossRef]2. Filho, E.G.O.; Luz, F.S.; Fujiyama, R.T.; Silva, A.C.R.; Candido, V.S.; Monteiro, S.N. Effect of chemical treatment and length of
Raffia fiber (Raphia vinifera) on mechanical stiffening of polyester composites. Polymers 2020, 12, 2899. [CrossRef] [PubMed]3. Sinha, A.K.; Narang, H.K.; Bhattacharya, S. Mechanical properties of natural fibre polymer composites. J. Polym. Eng. 2017,
37, 879–895. [CrossRef]4. Pinheiro, M.A.; Gomes, L.G.; da Silva, A.C.R.; Candido, V.S.; Reis, R.H.M.; Monteiro, S.N. Guaruman: A natural amazonian fibers
with potential for polymer composite reinforcement. Mater. Res. 2019, 22, 1–8. [CrossRef]5. Souza, A.T.; Junio, R.F.P.; Neuba, L.M.; Candido, V.S.; da Silva, A.C.R.; Azevedo, A.R.G.; Monteiro, S.N.; Nascimento, L.F.C.
Caranan Fiber from Mauritiella armata Palm Tree as Novel Reinforcement for Epoxy Composites. Polymers 2020, 12, 2037.[CrossRef] [PubMed]
6. Cunha, J.S.C.; Nascimento, L.F.C.; da Luz, F.S.; Monteiro, S.N.; Lemos, M.F.; da Silva, C.G.; Simonassi, N.T. Physical andMechanical Characterization of Titica Vine (Heteropsis flexuosa) Incorporated Epoxy Matrix Composites. Polymers 2021, 13, 4079.[CrossRef] [PubMed]
7. Negawo, T.A.; Polat, Y.; Akgul, Y.; Kilic, A.; Jawaid, M. Mechanical and dynamic mechanical thermal properties of ensetefiber/woven glass fiber fabric hybrid composites. Compos. Struct. 2021, 259, 113221. [CrossRef]
8. Ashok, R.B.; Srinivasa, C.V.; Basavaraju, B. Dynamic mechanical properties of natural fiber composites—A review. Adv ComposHybrid Mater. 2019, 2, 586–607. [CrossRef]
9. Azwa, Z.N.; Yousif, B.F.; Manalo, A.C.; Karunasena, W. A review on the degradability of polymeric composites based on naturalfibres. Mater. Des. 2013, 47, 424–442. [CrossRef]
10. Stanciu, M.D.; Draghicescu, H.T.; Tamas, F.; Terciu, O.M. Mechanical and rheological behaviour of composites reinforced withnatural fiber. Polymers 2020, 12, 1402. [CrossRef]
11. Croccolo, D.; de Agostinis, M.; Fini, S.; Liverani, A.; Marinelli, N.; Nissini, E.; Olmi, G. Mechanical characteristics of twoenvironmentally friendly resins reinforced with flax fibers. J. Mech. Eng. 2015, 61, 227–236. [CrossRef]
12. Monteiro, S.N.; Pereira, A.C.; Ferreira, C.L.; Pereira Júnior, E.; Weber, R.P.; Assis, F.S. Performance of Plain Woven Jute Fabric-Reinforced Polyester Matrix Composite in Multilayered Ballistic System. Polymers 2018, 10, 230. [CrossRef] [PubMed]
13. Hanamanagouda; Keerthi Gowda, B.S.; Easwara Prasad, G.L.; Velmurugan, R. Mechanical properties of raw jute polyestercomposite. Int. J. Fiber. Text. Res. 2016, 6, 20–24.
14. Costa, U.O.; Nascimento, L.F.C.; Garcia, J.M.; Bezerra, W.B.A.; Monteiro, S.N. Evaluation of Izod impact and bend properties ofepoxy composites reinforced with mallow fibers. J. Mater. Res. Technol. 2020, 9, 373–382. [CrossRef]
15. Moraes, Y.M.; Ribeiro, C.G.D.; Ferreira, C.L.; Lima, E.S.; Margem, J.I.; Nascimento, L.F.C.; Monteiro, S.N. Mechanical behavior ofmallow fabric reinforced polyester matrix composites. J. Mater. Res. Technol. 2018, 7, 515–519. [CrossRef]
16. Deng, K.; Nejadkhaki, H.K.; Pasquali, F.M.; Amaria, A.P.; Armstrong, J.N.; Hall, J.F. Rule of mixture to determine elasticmodulus and tensile strength of 3D printed carbon fiber reinforced nylon. In Proceedings of the ASME 2019 InternationalDesign Engineering Technical Conferences & Computers and Information in Engineering Conference, Anahein, CA, USA, 18–21August 2019.
17. Hill, R.A. Self-consistent mechanics of composite materials. J. Mech. Phys. Solids 1965, 13, 213–222. [CrossRef]18. Cho, J.R.; Ha, D.Y. Averaging and finite-element discretization approaches in the numerical analysis of functionally graded
materials. Mater. Sci. Eng. A 2001, 302, 187–196. [CrossRef]19. Tan, J.F.; Jia, Y.J.; Li, L.X. A series-parallel mixture model to predict the overall property of particle reinforced composites. Compos.
Struct. 2006, 150, 219–225. [CrossRef]20. Rohit, K.; Dixit, S. A review—future aspect of natural fiber reinforced composite. Polym. Renew. Resour. 2016, 7, 43–60. [CrossRef]21. Ramesh, M.; Palanikumar, K.; Reddy, K.H. Plant fibre based bio-composites: Sustainable and renewable green materials. Renew.
Sustain. Energy Rev. 2017, 79, 558–584. [CrossRef]22. Bourmaud, A.; Beaugrand, J.; Shah, D.U.; Placet, V.; Baley, C. Towards the design of high-performance plant fibre composites.
Prog. Mater. Sci. 2018, 97, 347–408. [CrossRef]23. Mahesh, V.; Joladarashi, S.; Kulkarni, S.M. An experimental investigation on low-velocity impact response of novel jute/rubber
flexible bio-composite. Compos. Struct. 2019, 225, 111190. [CrossRef]24. Cunha, J.S.C.; Oliveira Neto, H.E.; Giacon, V.M.; Manzato, L.; Silva, C.G. Study of mechanical and thermal properties of Amazon
fibers on the polymeric biocomposites: Mallow and Tucum. Fibers Polym. 2021, 22, 3203–3211.25. Omrani, E.; Menezes, P.L.; Rohatgi, P.K. State of the art on tribological behavior of polymer matrix composites reinforced with
natural fibers in the green materials world. Eng. Sci. Technol. Int. J. 2016, 19, 717–736. [CrossRef]26. ASTM C1557-20; Standard Test Method for Tensile Strength and Young’s Modulus of Fibers. ASTM International: West
Conshohocken, PA, USA, 2017.27. Fidelis, M.E.A.; Pereira, T.V.C.; Gomes, O.F.M.; Silva, F.A.; Filho, R.D.T. The effect of fiber morphology on the tensile strength of
natural fibers. J. Mater. Res. Technol. 2013, 2, 149–157. [CrossRef]28. Fragassa, C.; Pavlovic, A.; Santulli, C. Mechanical and impact characterization of flax and basalt fibre vinylester composites and
their hybrids. Compos. Part B 2018, 137, 247–259. [CrossRef]
Polymers 2022, 14, 401 16 of 16
29. Rodrigues, J.; Sousa, J.A.; Fujiyama, R.T. Polymeric composites reinforced with natural fibers from Amazon manufactured byinfusion. Matéria 2015, 20, 946–960. (In Portuguese)
30. ASTM D3039/D3039M-17; Standard Test Method for Tensile Properties of Polymer Matrix Composite Materials. ASTM Interna-tional: West Conshohocken, PA, USA, 2017.
31. Li, Y.; Pickering, K.L.; Farrell, R.L. Determination of interfacial shear strength of white rot fungi treated hemp fibre reinforcedpolypropylene. Compos. Sci. Technol. 2009, 69, 1165–1171. [CrossRef]
32. Chihaoui, B.; Parareda, F.S.; Tarrés, Q.; Espinach, F.X.; Boufi, S.; Aguilar, M.D. Effect of the Fiber Treatment on the Stiffness ofDate Palm Fiber Reinforced PP Composites: Macro and Micromechanical Evaluation of the Young’s Modulus. Polymers 2020,12, 1693. [CrossRef]
33. Ku, H.; Wang, H.; Pattarachaiyakoop, N.; Trada, M. A review on the tensile properties of natural fiber reinforced polymercomposites. Compos. B Eng. 2011, 42, 856–873. [CrossRef]
34. Mendonça, P.T.R. Composite Materials and Sandwich Structures: Design and Analysis, 2nd ed.; Orsa Maggiore: Florianópolis, SC,Brazil, 2019.
35. Al-Qureshi, H.A.; Stael, G.C. Modified rule of mixture for natural fiber composites. In Proceedings of the 16th Canadian Congressof Applied Mechanics—CANCAM-97, Laval, QC, Canada, 1–5 June 1997.
36. Casaril, A.; Gomes, E.R.; Soares, M.R.; Fredel, M.C.; Al-Qureshi, H.A. Micromechanical analysis of composites with short fibersand particles. Materia 2007, 12, 408–419. (In Portuguese)
37. Madsen, B. Properties of Plant Fibre Yarn Polymer Composites—An Experimental Study. Ph.D. Thesis, Technical University ofDenmark, Department of Civil Engineering, Kongens Lyngby, Denmark, 2004; 206p.
38. Madsen, B.; Thygesen, A.; Lilholt, H. Plant fibre composites—Porosity and stiffness. Compos. Sci. Technol. 2009, 69, 1057–1069.[CrossRef]
39. Shah, D.U.; Schubel, P.J.; Clifford, M.J. Modelling the effect of yarn twist on the tensile strength of unidirectional plant fibre yarncomposites. J. Compos. Mater. 2013, 47, 425–436. [CrossRef]
40. Halpin, J.C. Effects of Environmental Factors on Composite Materials; DTIC Document 1969; Technical Rept. Aug-Dec 67; DefenseTechnical Information Center: Fort Belvoir, VA, USA, 1969.
41. Facca, A.G.; Kortschot, M.T.; Yan, N. Predicting the elastic modulus of natural fibre reinforced thermoplastics. Compos. A Appl.Sci. Manuf. 2006, 37, 1660–1671. [CrossRef]
42. Fu, S.Y.; Feng, X.Q.; Lauke, B.; Mai, Y.W. Effects of particle size, particle/matrix interface adhesion and particle loading onmechanical properties of particulate-polymer composites. Compos. Part B 2008, 39, 933–961. [CrossRef]
43. Landel, R.F.; Nielsen, L.E. Mechanical Properties of Polymers and Composites; CRC Press: Boca Raton, FL, USA, 1993.44. Li, Y.; Mai, Y.-W.; Ye, L. Sisal fibre and its composites: A review of recent developments. Compos. Sci. Technol. 2000, 60, 2037–2055.
[CrossRef]45. David, D.B.; Hota, V.S.; Rao, G. Critical review of recent publications on use of natural composites in infrastructure. Compos. Part
A Appl. Sci. Manuf. 2012, 43, 1419–1429.46. Nascimento, L.F.C.; Monteiro, S.N.; Louro, L.H.L.; Luz, F.S.; Santos, J.L.; Braga, F.O.; Marçal, R.L.S.B. Charpy impact test of epoxi
composites reiforced with untreated and mercerized mallow fibers. J. Miner. Met. Mater. Soc. 2018, 7, 2052–2057.47. Cai, D.; Zhou, G.; Wang, X.; Li, C.; Deng, J. Experimental investigation on mechanical properties of unidirectional and woven
fabric glass/epoxy composites under off-axis tensile loading. Polym. Test. 2017, 58, 142–152. [CrossRef]48. Cavalcanti, D.K.K.; Banea, M.D.; Neto, J.S.S.; Lima, R.A.A.; da Silva, L.F.M.; Carbas, R.J.C. Mechanical characterization of
intralaminar natural fibre-reinforced hybrid composites. Compos. Part B 2019, 175, 107149. [CrossRef]49. Tanguy, M.; Bourmaud, A.; Beaugrand, J.; Gaudry, T.; Baley, C. Polypropylene reinforcement with flax or jute fibre; Influence of
microstructure and constituent’s properties on the performance of composite. Compos. Part B 2018, 139, 64–74. [CrossRef]