early age tensile and compressive strength of concrete – impact on predictions for anchor pull-out...
TRANSCRIPT
Curtin University is a trademark of Curtin University of Technology
CRICOS Provider Code 00301J
Dr Natalie Lloyd, Senior Lecturer
Andrew Barraclough, PhD Research Candidate
Early Age Tensile & Compressive
Concrete Strength – Impact on anchor pull-out prediction
October 2013

Tensile Anchoring Lateral Tensile Anchoring
Concrete
Load resistance model of an anchor
system in a precast panel
Complimentary Reinforcement Supplementary Reinforcement

• The mechanical interlock of the steel anchors
predisposes a concrete element to a tensile failure
mechanism
• Lifting before 3 days is necessary for prefabricators
• Concrete is more sensitive to tensile failure than
shear failure
• Pure shear failure is hard to create without the
influence of tension

Foot anchor concrete cone Safe Working Load at various concrete strengths
SWL limited by steel

Variables
Anchor embedment
Panel thickness
Distance to the 4 edges
Anchor spacing
Concrete strength

Test data is a collation of results from 4 sources
Used compression tests and cast-in insert pull-out test
as the benchmark comparison
Evaluation of concrete strength tests
- in-direct tensile (splitting)
- uniaxial direct tensile
- compression (cored and moulded)
Application benchmark
Test benchmark

Early age testing compared to the ACI capacity model
77 1.63 – 3.79 2.49 0.4
n, number of Tests Test / Predicted
Range
Average
Test/Predicted
Standard
Deviation
Test/Predicted

AS3600 – Characteristic Uniaxial tensile strength from compressive
𝑓𝑐𝑡′ = 0.36 𝑓𝑐
′
𝑓𝑐𝑡 = 0.9 𝑓𝑐𝑡.𝑠𝑝
Direct tensile strength from compressive strength (Darwin 1996)
AS3600 – Uniaxial tensile strength from splitting test
fct = gt × wc × 𝑓𝑐′
𝑔𝑡 = 0.0069
𝑤𝑐 = Unit Weight of Concrete (kg/m3)
𝑓𝑐𝑡.𝑠𝑝 = 𝑀𝑒𝑎𝑠𝑢𝑟𝑒𝑑 𝑠𝑝𝑙𝑖𝑡𝑡𝑖𝑛𝑔 𝑡𝑒𝑛𝑠𝑖𝑙𝑒 𝑠𝑡𝑟𝑒𝑛𝑔𝑡 𝑜𝑓
𝑐𝑜𝑛𝑐𝑟𝑒𝑡𝑒, 𝑎𝑠 𝑝𝑒𝑟 𝐴𝑆1012.10 𝑆𝑝𝑙𝑖𝑡𝑡𝑖𝑛𝑔 𝑇𝑒𝑠𝑡

Compression
• Moulded cylinder, ø100mm
• Cored cylinders, ø69mm and ø110mm
Tension
• In-direct splitting, moulded ø150mm
• Uniaxial direct, moulded ø100mm notched
Tension in application
• Cast-in foot anchor, 50mm hef
All tested at 1, 2, 3, 7, 21 and 28 days, using 20MPa and
40MPa concrete design strength
Cast-in
Direct
Splitting
Cored

Concentric alignment is easy to achieve
Non confined specimens. Shrinkage cracks
influence crack propagation
Connection to tensile specimens has been made
easier with the development of epoxy paste
Setup method and time reduces the risk of
adding non-test related cracks (i.e. cores)

• Standard 100mm dia. x 200mm plastic capped cylinders
• Naturally cured (10-25 degrees C)
• Prepared in accordance with AS1012.8
• De-moulded at time of test
• Notched cylinders size: 60mm dia. & 30mm length, 5mm taper
• Compression and tension cylinders stored together
• Compression and tension cylinders poured from the same concrete batch

Un-notched 40MPa tensile result Un-notched 32MPa tensile result

a) Cracks formed at the onset of extension & bridging
b) Throated cylinders typical fracture
a) b)

Typical fracture surface

10
15
20
25
30
35
40
45
50
1 3 7 28
Mean
Co
mp
ressiv
e S
tren
gth
, f c
m (
MP
a)
Time (Days)
Compressive Strength Gain Comparison - Cored v Moulded
Moulded Cylinders
Cored Series1 Panel 1
Cored Series 1 Panel 2
Cored Series 2 Panel 1
Cored Series 2 Panel 2
Cored Series 3 Panel 1
Cored Series 3 Panel 2
20MPa f’c
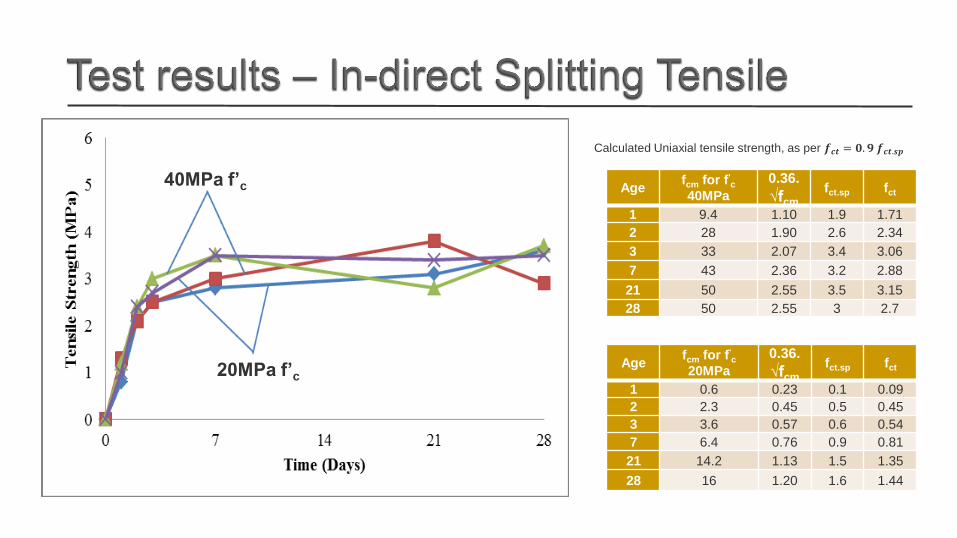
40MPa f’c Age fcm for f'
c
40MPa
0.36.
√fcm fct.sp fct
1 9.4 1.10 1.9 1.71
2 28 1.90 2.6 2.34
3 33 2.07 3.4 3.06
7 43 2.36 3.2 2.88
21 50 2.55 3.5 3.15
28 50 2.55 3 2.7
Age fcm for f'
c
20MPa
0.36.
√fcm fct.sp fct
1 0.6 0.23 0.1 0.09
2 2.3 0.45 0.5 0.45
3 3.6 0.57 0.6 0.54
7 6.4 0.76 0.9 0.81
21 14.2 1.13 1.5 1.35
28 16 1.20 1.6 1.44
Calculated Uniaxial tensile strength, as per 𝒇𝒄𝒕 = 𝟎. 𝟗 𝒇𝒄𝒕.𝒔𝒑

Age fcm for f'c 40MPa
A
0.36.√fcm
B
gt.√(wc . fcm)
C
fct
1 15.83 1.43 1.35 1.13
2 27.83 1.90 1.78 1.20
3 31.17 2.01 1.89 1.37
7 42.90 2.36 2.21 1.33
21 46.13 2.45 2.30 1.37
Age fcm for f'c 20MPa
A
0.36.√fcm
B
gt . √(wc . fcm)
C
fct
1 3.13 0.64 0.60 0.57
2 7.00 0.95 0.89 0.63
3 10.00 1.14 1.07 0.78
7 14.93 1.39 1.31 1.37
21 21.63 1.67 1.57 1.33
Calculated fct values compared
against tested fct values
A - Characteristic Uniaxial tensile
strength (AS3600) 𝑓𝑐𝑡′ = 0.36 𝑓𝑐
′
B - Direct tensile strength to
compressive strength (Darwin 1996)
fct = gt × wc × 𝑓𝑐′
𝑁𝑜𝑡𝑒: 𝑓𝑐𝑚 𝑢𝑠𝑒𝑑 𝑖𝑛 𝑙𝑖𝑒𝑢 𝑜𝑓 𝑓𝑐′
C – Tested direct tensile strength

0
1
2
3
0 5 10 15 20 25
Ten
sile S
tren
gth
, M
Pa
Concrete Age, Days
Indirect vs Direct Tensile Strength
40MPa Direct Tension 40MPa Split Test

0
10
20
30
40
50
60
0 5 10 15 20 25
Ten
sile
Pu
ll-o
ut
Lo
ad
(k
N)
Days
40𝑀𝑃𝑎 𝑃𝑟𝑒𝑑𝑖𝑐𝑡𝑒𝑑
40𝑀𝑃𝑎 𝑇𝑒𝑠𝑡 𝐴𝑐𝑡𝑢𝑎𝑙
20𝑀𝑃𝑎 𝑇𝑒𝑠𝑡 𝐴𝑐𝑡𝑢𝑎𝑙 20𝑀𝑃𝑎 𝑃𝑟𝑒𝑑𝑖𝑐𝑡𝑒𝑑
Comparison of calculated versus the mean actual pull-out ultimate
load for a hef of 50mm in a 20MPa and 40MPa f’c

Appreciation of the influences that affect concrete strength
Use reliable and repeatable test specimens
Mechanical interlock and adhesion of the course aggregate plays a part in the
early development of tensile capacity
CCD method is conservative enough to be robust

Further extensive direct tensile tests are required to establish a model for
direct tensile strength gain
Correlation to fracture mechanics parameters would assist further
understanding, mainly Fracture Energy and Modulus of Elasticity
Further research on tensile strength gain will be:
- Effects of different concrete mixes in tension
- Effects of temperature controlled curing
- The fracture size effect
- Non-linear FEA modeling
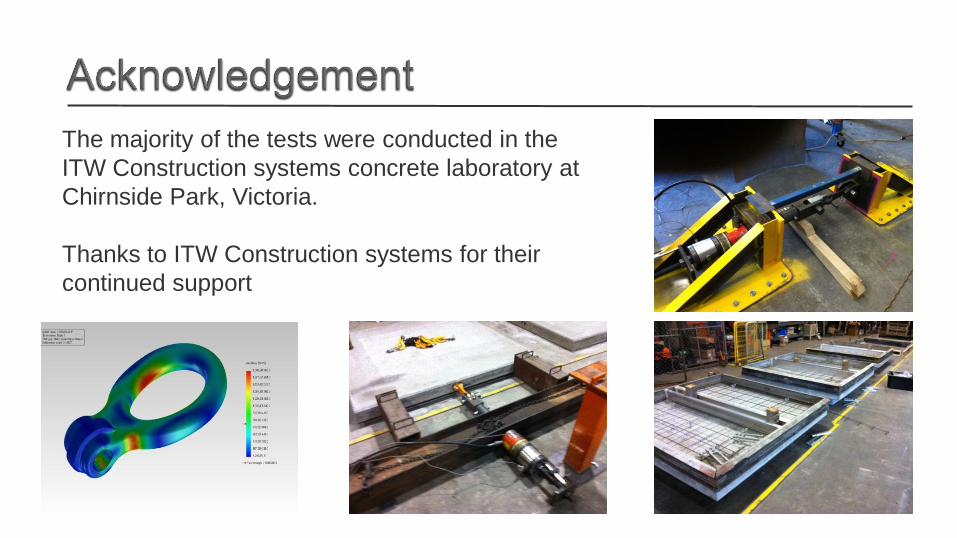
The majority of the tests were conducted in the
ITW Construction systems concrete laboratory at
Chirnside Park, Victoria.
Thanks to ITW Construction systems for their
continued support