gas potential of proterozoic and phanerozoic shales from the nw himalaya, india: inferences from...
TRANSCRIPT

Gas potential of Proterozoic and Phanerozoic shales from the NWHimalaya, India: Inferences from pyrolysis
Devleena Mani a,⁎, D.J. Patil a, A.M. Dayal a, S. Kavitha a, Mateen Hafiz b, Naveen Hakhoo b, G.M. Bhat b
a CSIR-National Geophysical Research Institute, Hyderabad, Indiab Institute of Energy Research and Training (IERT) and Department of Geology, University of Jammu, Jammu & Kashmir, India
a b s t r a c ta r t i c l e i n f o
Article history:
Received 26 December 2013
Received in revised form 10 April 2014
Accepted 10 April 2014
Available online 24 April 2014
Keywords:
Himalaya
Shale
Shale gas
Organic matter
Rock Eval
Organic richness and kerogen properties of sixty-seven shales, obtained from the outcrops and underground
mines of Jammu, Kashmir and Ladakh regions of Northwest Himalaya, India, have been studied to evaluate
their gas generation potential using Rock Eval pyrolysis. Ranging in age from the Proterozoic to Tertiary, organic
matter content and characteristics of the carbonaceous and coaly shales vary widely, indicating that sedimentary
and burial history significantly affected the preservation and maturation of organic components in rocks.
The total organic carbon (TOC) content ranges from 0.01 to 1.2% in the Permian–Jurassic and Paleozoic–Tertiary
shales of Ladakh to as high as 32.5% in the Eocene shales/coaly shales from Jammu. The thermo-labile hydrocar-
bons (S1) and those from cracking of kerogen (S2), released from the pyrolysis of Eocene Subathu shales, are ob-
served to be high (from 0.1 to 2.6 and from 0.5 to 15.5 mg HC/g rock, respectively). Rock Eval thermal maturity
parameters, indicated by Tmax (temperature at highest yield of S2; N490 °C) and calculated vitrinite reflectance
(1.5 to 3.7 Ro %), suggest a post-mature, dry gas stage for the hydrocarbon generation. Based on hydrogen
index (HI) and Tmax correlations, organic matter in the Subathu shales is characterized by a late metagenetic
gas prone Type III kerogen and a fair to excellent gas potential is exhibited by these shales.
The interbedded shale units in the Proterozoic Sirban Limestone Formation, occurring as an isolated inlier in
Jammu, show TOC values from 0.1 to 1.4% with quite low S1, S2 and HI values. Thermal maturity of shales
within the stromatolitic Sirban succession indicates a post-mature and/or already spent hydrocarbon
stage. The Plio-Pleistocene carbonaceous clays, lignites and mudstones from the Lower Karewa Group of
Kashmir basin are organically rich with TOC content ranging from 5.86 to 29.4%. A thermally immature,
Type II/Type III kerogen is indicated by the HI (109 to 278 mg HC/g TOC) and Tmax (399 to 427 °C) plots
of the Karewa samples. The exposed Lower Triassic Black shales from the Permian–Triassic boundary sec-
tions in Kashmir are comparatively lean in organic matter, with TOC values ranging from 0.18 to 0.93%,
whereas the Permian–Jurassic and Paleozoic–Tertiary shales from Ladakh have a TOC content ranging
from 0.01 to 1.22%. The pyrolyzable organic carbon is b0.1% and the residual organic carbon contributes sig-
nificantly to the TOC content of these shales. The other Rock Eval parameters (S1, S2, HI) are quite low and
indicate a poor source potential. Themajority of shales from the Tethys and Trans Himalayan regions appear
to have undergone metamorphism and exhumation of organic carbon associated with the Himalayan
orogeny.
© 2013 Published by Elsevier B.V.
1. Introduction
The significant amount of natural gas trapped in organic-rich, fine
grained sedimentary shale rocks has emerged as an unconventional
energy resource in recent times globally (Boyer et al., 2006). Shale
gas, primarily methane, is generated in place from the buried organic
matter within the sediments under influence of heat and pressure.
The shale acts as a source as well as reservoir where the generated gas
remains stored within the intra- and inter-particle mineral pores and
organopores (Loucks et al., 2012; Ross and Bustin, 2009); natural frac-
tures in the shale, or adsorbed onto the organic matter (Boyer et al.,
2006). Advanced exploration technologies such as horizontal drilling
and hydraulic fracturing have allowed access to large volumes of shale
gas that were earlier uneconomical to produce (EIA, 2013; Horsfield
and Schulz, 2012; USGS, 2012). Shale gas technology has been largely
pioneered in the United States of America and the gas production
from several plays such as the Barnett, Haynesville, Fayetteville,
Woodford, and Marcellus offer an answer to the growing demand of
clean energy.
Ahead of drilling and production, shale gas plays spur a closer look at
shale rocks in terms of its organic matter distribution, richness and
International Journal of Coal Geology 128–129 (2014) 81–95
⁎ Corresponding author.
E-mail address: [email protected] (D. Mani).
http://dx.doi.org/10.1016/j.coal.2014.04.007
0166-5162/© 2013 Published by Elsevier B.V.
Contents lists available at ScienceDirect
International Journal of Coal Geology
j ourna l homepage: www.e lsev ie r .com/ locate / i j coa lgeo

properties that contribute largely to the gas generation potential, evalu-
ation of energy resource and delineation of target horizons (Boyer et al.,
2006). Compositional characteristics of organic matter provide useful
insights onto the variations in depositional environments that prevailed
during sedimentation (Romero and Philip, 2012). Geochemical attri-
butes of sedimentary organic matter such as the TOC content, kerogen
type and thermalmaturity are important parameters for the assessment
of gas shale potential toward hydrocarbon generation (Horsfield and
Schulz, 2012; Jarvie et al., 2007; Romero and Philip, 2012). Open system
pyrolysis of shales using Rock Eval is one of the basic organic geochem-
ical methods for characterization of the sedimentary organic matter.
The pyrolysis technique is based on the steady heating of rock samples
so that the total evolved hydrocarbons can bemonitored as a function of
temperature (Behar et al., 2001; Espitalie et al., 1987; Lafargue et al.,
1998). Released hydrocarbons and the carbon di and mono oxides gen-
erated from the organic/mineral sources aremonitored byflame ioniza-
tion (FID) and infrared (IR) detectors, respectively (Behar et al., 2001;
Lafargue et al., 1998).
For the Indian subcontinent, about 63 trillion cubic feet of recover-
able shale gas has been estimated from the sedimentary basins of Cam-
bay, Krishna–Godavari, Cauvery and Damodar Valley (DGH, 2013; Klett
et al., 2012). Among other frontier basins, those of theHimalayan region
appear prospective for the hydrocarbon resources (Bhattacharya and
Chandra, 1979; DGH, 2013). The Himalayan Foreland basin has no sig-
nificant oil and gas shows, however; owing to favorable geological con-
ditions for hydrocarbon generation and entrapment, it is considered
prospective. The Karewa and Spiti–Zanskar basins are categorized po-
tentially prospective due to their analogy with similar hydrocarbon
producing basins of the world (DGH, 2013; Jokhan Ram, 2005). The Hi-
malayan orogeny has been associatedwith the continental collision and
active tectonic prevails in the region (Molnar, 1986; Powell and
Conaghan, 1973). Plate junctions and major tectonic features have
been related to some of the largest oil and gas fields of the world
(Bullard, 1973; Nair et al., 1979). Studies have revealed that the level
of organic metamorphism in Himalayan foreland basins is favorable
for the occurrence of mainly thermo-catalytic gaseous hydrocarbons
(Bhattacharya and Chandra, 1979; Verma et al., 2006). The exploratory
knowledge, specifically for shale gas, in the tectonically active Himala-
yan region is in the knowledge building stage due to the constraints of
complex structure and tectonics of the fold and thrust belts and
logistics.
In the present work, organic geochemical characterization of shales
from Jammu, Kashmir and Ladakh regions of Northwest Himalaya has
been carried out using Rock Eval pyrolysis. Sixty-seven Proterozoic and
Phanerozoic shales were collected from the outcrops and underground
mines, which are physiographically located within the Outer, Tethys
and Trans Himalaya (Fig. 1). The sampled areas include the Cenozoic
Foothills belt of Outer Himalaya, comprising of the Eocene Subathu and
interbedded shales of Proterozoic Sirban Formations, carbonaceous
clays, mudstones and lignites of Karewa Group and the Black shales of
Permian–Triassic boundary sections of Kashmir basin along with the
Permian–Jurassic shales from the Zanskar basin of Tethyan Himalaya
and the Paleozoic–Tertiary shales from the Indus–Shyok and Karakoram
zones of Ladakh, Trans Himalaya (Figs. 1–4). Organic richness and kero-
gen properties of the varied age shales studied here provide useful in-
sights onto the abundance, distribution and thermal maturation of
Fig. 1. Geological map of Himalaya showing the different tectonic features along with the present study regions of Jammu, Kashmir and Ladakh.
Modified after Sorkhabi and Macfarlane (1999).
82 D. Mani et al. / International Journal of Coal Geology 128–129 (2014) 81–95

organic matter for the evaluation of its gas generation potential. The re-
sults obtained are interpreted in light of the sedimentary and burial his-
tory of the sampled strata located in different tectonic zones of the
Himalaya, which might have influenced the geological preservation
and maturation of sedimentary organic matter and accordingly, their
gas generation potential.
Fig. 2. Geological map of Jammu region showing the sample collection points for the Subathu and Sirban shales.
Modified after Hakhoo et al. (2011).
Fig. 3. Outline map of Kashmir basin showing the sample collection points for the Permian/Triassic shales and Karewa sediments.
Modified after Bhat (1989).
83D. Mani et al. / International Journal of Coal Geology 128–129 (2014) 81–95
2. Geologic setting and stratigraphy of studied areas
The Himalaya is the youngest and highest mountain range in the
world. The closing and subduction of the Tethyan Ocean between
India and Asia during Paleozoic, followed by collision of the two con-
tinents resulted in the rise of theHimalaya and a variety of deformation-
al structures and collision induced lithologies (Yin and Harrison,
2000). Fig. 1 illustrates the various tectonic elements of Himalaya
(Sorkhabi and Macfarlane, 1999). From south to north, there exist
six tectono-stratigraphic/tectono-geomorphic zones: the Outer
(Sub) Himalaya, the Lesser (Lower) Himalaya, the Higher (Great)
Himalaya, the Tethys (Tibetan) Himalaya, the Indus Suture Zone
and the Trans-Himalaya (Gansser, 1964). The arcuate Himalayan
belt stretches uninterruptedly for about 2500 km from west to east.
The frontier basins of Himalaya have thick sedimentary successions
and range in age from the Proterozoic to Pleistocene.
2.1. Outer Himalaya Zone
Forming the southernmost zone, the Outer Himalaya consists of
about 10 km thick Cenozoic sedimentary pile, predominantly continen-
tal molasses, ranging in age from Paleocene to Upper Pleistocene
(Thakur, 1993). Its northern boundary is limited by the Main Boundary
Thrust (MBT), which separates the Cenozoic belt from the pre-Tertiary
Lesser Himalayan strata (Fig. 1). To the south, the topographic break
against the alluvial plains of Ganga basin is expressed as a fault called
the Himalayan Foot Hill Fault (HFF) or the Main Frontal Thrust (MFT).
The Cenozoic sedimentary units of the Outer Himalaya are located in
four different tectonic settings: the Foot Hill belt, the Potwar Plateau
of Pakistan, the Ganga Basin and the Late Cenozoic Intermontane basins
(Thakur, 1993). Stratigraphically, the Tertiary Foot Hill belt in Jammu
has been divided into three principal groups: the Subathu Group, the
Murree (Dharamsala) Group, and the Siwalik Group (Karunakaran
and Ranga Rao, 1979; Table 1-1).
2.1.1. Eocene Subathu Formation, Jammu
Subathu Group and its equivalents occur north of the Siwalik Group,
as tectonically influenced outcrops extending from Potwar eastwards
through Jammu, Himachal Pradesh, Garhwal and Kumaun to their east-
ern limit in Nepal (Thakur, 1993). It consists of olive to dark green shales
interbedded with nummulitic limestone beds, carbonaceous shales and
coal seams. It is considered as source rock for the hydrocarbons in the
Himalayan Foreland basin in analogy with the adjoining petroliferous
Kohat–Potwar basin of Pakistan (DGH, 2013).
In the Jammu hills, the Subathu Group rocks occur as discontinu-
ous outcrops in three structural belts. From south to north these are:
1) Kalakot region, mainly around Kalakot, Metka, Mahogala, Riasi,
2) near Satra, south of Main Boundary Thrust and 3) near Mandi in
Himachal Pradesh (Fig. 2). In Jammu & Kashmir, the thickness varies
from about 80 to 100 m. The outcrops of Subathu Group in Kalakot,
Jammu consist of olive green shales with a thickness of about 80 m,
juxtaposed against the Sirban limestone Formation. The sequence
begins with coaly shales and coals of paralic origin becoming marine
upwards with olive green foraminiferal shales and lenticular lime-
stones (Thakur, 1993). Rich and diverse vertebrate fauna of Eocene
age, with a predominance of mammalian fossils, has been recovered
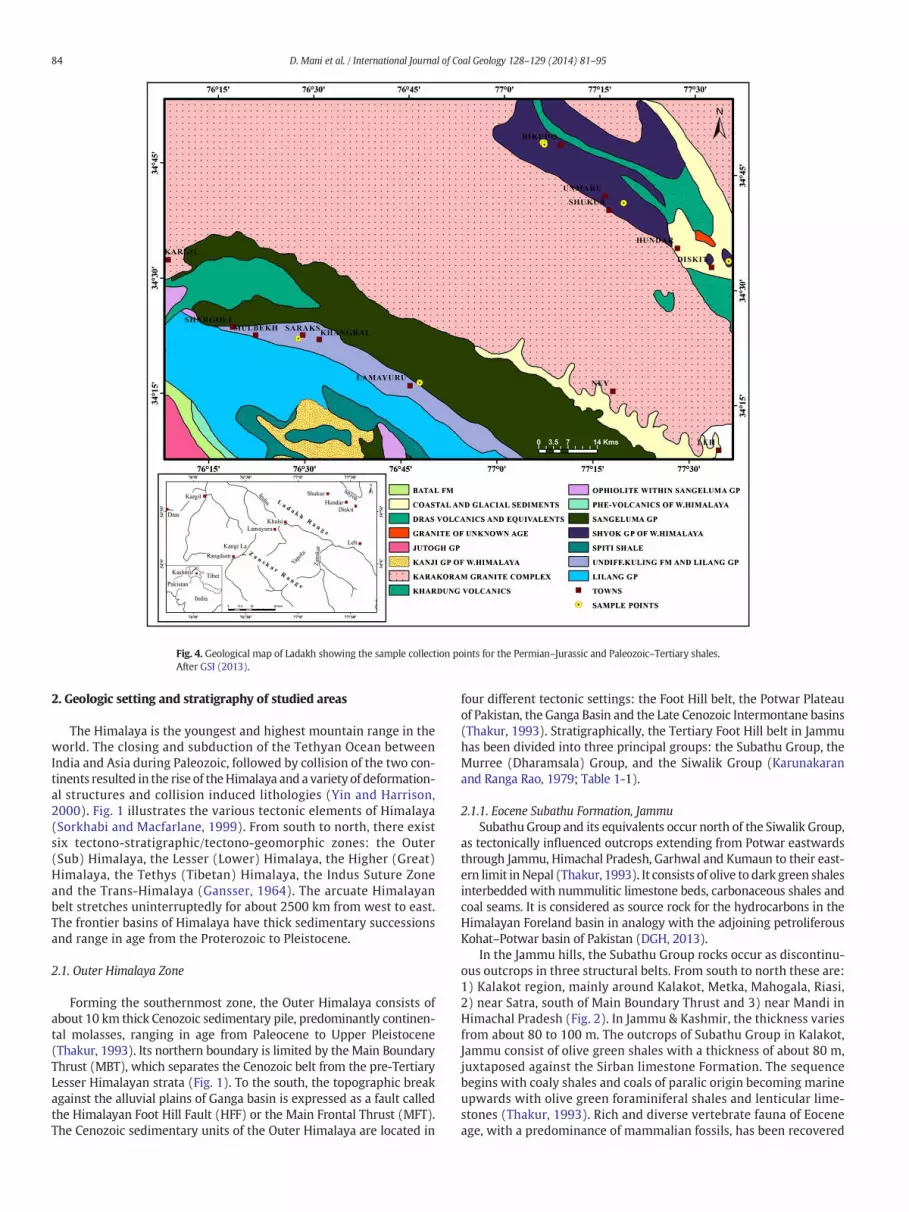
Fig. 4. Geological map of Ladakh showing the sample collection points for the Permian–Jurassic and Paleozoic–Tertiary shales.
After GSI (2013).
84 D. Mani et al. / International Journal of Coal Geology 128–129 (2014) 81–95

Table 1
Generalized stratigraphy of theCenozoics of Jammu Foot Hills-1; Karewa Beds, Kashmir-2; P/T section, Guryul Ravine-3; Tethyan Zone, Zanskar-4; Indus–Tsangpo Suture Zone, Ladakh-5.
After, Gansser (1964), Sweet (1970), and Thakur (1993) (not to scale).
85
D.M
aniet
al./
Intern
atio
nalJou
rnalofCoalGeology
128–129(2014)81–95

from the Subathu sediments in the Kalakot area (Kumar and Sahni,
1985).
Significant palynological changes attributed to the variation in depo-
sitional environment from marine to fresh water is observed in the
Subathu sediments of Jammu and Dagshai sediments of the Simla
Hills, Himachal Pradesh (Sahni et al., 1983). Three main facies within
the Subathu Group have been identified, which suggest strandline con-
ditions characterized by transgressive and regressive phases, beginning
with subsidence and transgressive epicontinental sea followed by uplift
and shallowing of the basin, finally further uplift of the region to com-
plete withdrawal of the sea. These facies are the black-gray facies at
the base, overlain by the green facies and the red facies on the top, re-
spectively (Sahni et al., 1983; Thakur, 1993).
The Subathu Group is overlain by the Murree Group, and the later is
juxtaposed against the Siwalik Group along the Main Boundary Thrust
(=Reasi thrust in Jammu region) (Klootwijk et al., 1986).
2.1.2. Proterozoic Sirban Formation, Jammu
In the Jammu Sub-Himalaya, the Proterozoic Sirban Limestone
represents an allochthonous unit that crops out as detached inliers
(viz. (i) Dandili–Devigarh, (ii) Kalakot–Mahogala, (iii) Reasi and
(iv) Dhansal–Sawalkot (Lophri) inliers) toward the south of the MBT
(Fig. 2; Table 1-1; Craig et al., 2013; Hakhoo et al., 2011). The Sirban
Limestone succession consists of thickly bedded, highly jointed, hard,
and dark to light gray (silicified) dolostone, limestone characterized
by microbial mats and stromatolites interbedded with thin chert and
shale beds (up to about 10 m thick) and occasional 15–20 cm thick oo-
litic limestone and tempestite (storm deposit) beds (Craig et al., 2013).
The inliers occur in a belt about 80 km long and about 8–20 kmwide. In
the Reasi Inlier, the Sirban Formation is juxtaposed against the Tertiary
sedimentary successions of the Subathu- and the Murree Groups in the
northern part and against the Siwalik Group in the south (Klootwijk
et al., 1986).
2.1.3. Cenozoic Karewa Formation, Kashmir
The intermontane Kashmir basin, in NWHimalaya is a northwestly–
southeastly elongated depression, which is filled with about 1300 m of
weakly consolidated fluvio-lacustrine sediments of Plio-Pliestocene
age known as Karewas (Fig. 3). It has been divided into two broad
lithologic units (Table 1-2). The Lower Karewas are characterized
by mud-stones, unconsolidated sandstones, lignite layers, and con-
glomerate horizons. The Upper Karewas are laminated claystones,
sandstones and some conglomeratic layers and are devoid of lignites
(Kotila, 1990; Roy, 1975).
2.1.4. Permian–Triassic Section, Kashmir
The Permian–Triassic (P/T) boundary deposits are well exposed at
several sections in Kashmir like the Guryul Ravine, Barus, Pahalgam
etc. (Fig. 3). At Guryul Ravine section, the recognizable boundary is
the contact between the Zewan and Khunamuh Formations, which co-
incides with the regression level of Late Permian and Transgression
level of the Early Triassic (Table 1-3; Kapoor, 1996). It is marked by a
plane where maximum group of Permian biota disappeared and
new elements of Triassic nature appeared (Kapoor, 1996). The Zewan
Formation consists of carbonates, sandy shales, shales and calcareous
sandstones. The Formation is richly fossiliferous with bryozoans,
gastropods, foraminifera, conodonts etc. The succeeding Lower Triassic
Khunamuh Formation is characterized by alterations of limestones and
shales (Kapoor, 1996). Occurrence of the benthic mollusks suggests a
baythal environment. The stratigraphic sequence of Permo-Triassic
rocks is more than 300 m at Barus Spur and consists of calcareous and
carbonaceous shales, limestones, pebbly horizons and sandstones. Ex-
posures of boundary section at Pahlgam are much thicker and sandier
(Brookfield et al., 2003; Gupta and Brookfield, 1986).
2.2. Tethys Himalaya Zone
Themain belt of the Tethys Himalaya Zone lies in between the Indus
Tsangpo Suture and the Higher Himalaya Zone (Fig. 1; Thakur, 1993). In
the NW Himalaya, the well developed sequence of Tethyan Zone is ex-
posed in northern Kumaun, Malla Johar, Spiti and Zanskar regions
(Fig. 1). It comprises of over 10 km thick sequence of rocks, which are
predominantly fossiliferous and range in age from the Late Precambrian
to Cretaceous or Lower Eocene. To the north, the Tethyan sequence is
separated from the Indus Suture Zone by a south hading thrust, called
the Zanskar Thrust; and to the south, the sequence overlies the Central
Crystalline of the Higher Himalaya along a tectonic contact designated
as the Tethyan Thrust. The sedimentary sequence represents the de-
posits of the earlier Southern Tethys sea over the north facing Indian
margin (Thakur, 1993).
2.2.1. Permian–Jurassic Kulling Formation & Lilang Group, Zanskar
The Tethyan Himalaya Zone occupies 70 km wide belt in the
Zanskar mountains of Ladakh. The Zanskar sequence forms a gigantic
synclinorium called the Zanskar synclinorium showing a northwest
closure. The Late Precambrian to Lower Eocene sequence (c. 15 km
thick) here has two distinct facies in Mesozoic — the shallow shelf and
the deeper basin to slope facies. The Spongtong Klippe of the ophiolitic
rocks occurs in the core of synclinorium. It overlies theMesozoic units of
the Zanskar Tethys, thus representing their southward tectonic trans-
port from the root zone (Thakur, 1993). Stratigraphically, the Zone
has been divided into the Southern, Northern and Eastern Zanskar
(Thakur, 1993).
The Southern Zanskar includes the Late Precambrian to the Lower
Eocene sequence of the Southern part of the Zanskar Synclinorium
located between the Zanskar Valley and the mountain passes of the
Chalung La, Kangi La and Spanboth (Fig. 4). The principal strati-
graphic units are shown in Table 1-4. Overlying the volcanics of
Lower Permian, the Kulling Formation comprises of the sandstone,
shale and limestone with thickness ranging from 30 to 55 m
(Fig. 4; Table 1-4; Thakur, 1993). The Kulling Formation is succeeded
by 1000m thick sequence of dominantly carbonates described as Lilang
Group (Table 1-4; Thakur, 1993). The Northern Zanskar unit comprises
of the Zanskar Carbonates, Shilakong Formation, Lamayuru Formation,
Linghset Limestone and Kong Slate from north to south. The area of
Zanskar mountains lying east of the Zankar river and west of Nimaling
Range has been referred as Eastern Zanskar (Thakur, 1993). A tectonic
unit Tso–Morari Crystalline domal structure is an important unit in
the Eastern Zanskar.
2.3. Trans Himalaya
The Trans Himalaya is located north of the Tethys Himalaya Zone
and it includes the Indus and Shyok sutures and Karakoram Zone
(Fig. 1; Thakur, 1993). The Indus Suture Thrust (IST) separates the
largely south dipping Indus Suture rock unit from the shelf facies Tethys
Himalaya sequence and the Karakoram Thrust (KT) demarcates a
boundary between the Shyok Suture and the Karakoram Zone (Fuchs,
1977, 1984; Thakur, 1993).
2.3.1. Paleozoic–Tertiary Shyok Group, Nubra–Shyok Valley
The Ladakh region shows a well exposed cross-section of the Indus
Tsangpo Suture Zone (ITSZ). The ITSZ represents the boundary between
the Indian plate and the Karakoram–Tibet block of the Eurasian plate
(Thakur and Misra, 1984). Locally, it is referred to as the Indus Suture
Zone in Ladakh. The Indus Tsangpo Suture is divided into Indus and
Shyok sutures. The principal tectonostratigraphic units in the western
part of the Indus Suture, west of Leh and Shyok Suture Zone in the
Nubra–Shyok region have been described in Table 1-5. The Lamayuru
Formation (Lower Triassic to Middle Jurassic) appears to be an accreted
unit to the suture (Thakur, 1993). It has an average thickness of 3000 m
86 D. Mani et al. / International Journal of Coal Geology 128–129 (2014) 81–95

and consists of the shale, siltstone and graded sandstone. The Dras For-
mation constitutes the volcanics of the Late Jurassic to Early Cretaceous
age. The Cretaceous Nindam Formation consists of alternating thinly
and thickly bedded sandstone, siltstone and shale togetherwith bedded
tuffs and has an average thickness of 3000m. The Indus Formation con-
sists of thickly interbedded succession of predominantly conglomerate,
sandstone, siltstone and shale together with subordinate calcareous
shale and limestone. The entire sequence of the Indus Formation ranges
from the Lower Cretaceous to the Oligocene with shallow marine to a
near shore continental environment of the deposition (Thakur, 1993).
The main tectonostratigraphic units of the Shyok Suture Zone in the
Nubra–Shyok region are the Khalsar Formation, the Shyok Volcanics,
Saltoro Andesites, Hundri Formation, the Nubra ophioloitic malange
and the Saltoro Molasse (Table 1-5; Juyal, 2006). These rock formations
do not show a regular stratigraphic sequence but occur as silvers of
mélange (Thakur, 1993). The Karakoram metasedimentaries occur as
tectonic slices within the Shyok Suture Zone (Table 1-5; Fig. 4).
3. Field study and sample collection
A total of sixty-seven samples were collected from the underground
mines and the outcrops of Jammu, Kashmir and Ladakh regions of
Northwest Himalaya, India (Fig. 1). Samples collected from the subsur-
face mines were un-weathered and intact. When sampling the out-
crops, care was taken to collect the fresh, consolidated shales having
least signs of weathering by hammering out about ameter of outer por-
tion of the horizons. Area wise description of the sampling horizons is
mentioned below.
3.1. Jammu region
A total of twenty-nine shales/coaly shales and few coals belonging
to the Eocene Subathuwere collected from the interbedded shale ho-
rizons of underground mines in coal fields of Kalakot, Kotla and
Mahogla and outcrops at Salal, Kanthan and Kalimitti areas of Jammu
(Table 2; Fig. 2). Point samples of shales from different horizons and
the coal samples lying below the shaleswere collected.Where possible,
samples were collected at an approximate spacing of about 0.5 to 1.5m,
representing the vertical section of mines. Carbonaceous and coaly
shales were collected from the Subathu outcrops in Salal and Kanthan,
whereas the coaly shales at regular spacing of approximately 1 m
were sampled from a hillock at Kalimitti.
Three interbedded shale samples from the Proterozoic Sirban
Formation were collected from a thrust bound sliver (c. 40 m thick)
from the Tattapani area of Kalakot–Mahogala Inlier (Fig. 2).
3.2. Kashmir Region
The carbonaceous clays and lignites of the Karewa Group were
sampled from the Nichahom area of Baramulla District (Fig. 3). The
Nichahom section exposes the thickest lignites of the Hirpur Forma-
tion of Lower Karewas. The lignites occur in the Dubjan Member of
Hirpur Formation. Five carbonaceous samples were collected from
the different horizons of lignites exposed near the bottom portion
of a cliff wall for the study.
A total of sixteen Black Shales from the Permian–Triassic boundary
exposures at the Guryul Ravine section, 3 kmnorth of Barus, and Kathsu
village, Pahlgam in Kashmir basin were collected (Fig. 3). At Guryul
Ravine section, about nine shales from approximately spacing of about
0.5 to 1 m were samples, while seven point samples were collected
from the Barus and Pahlgam area.
3.3. Ladakh region
The Permian Jurassic shales from the Indus Suture Zone (ISZ) of
the Zanskar region were sampled for the study. The shales were
collected from the region between Kargil and Leh, around Lamayuru
and Saraks (Fig. 4). The Permian–Jurassic shales belong to the Undiffer-
entiated Kulling Group and Lilang Group of the Northwest Himalaya.
The Paleozoic–Tertiary shales were collected from the Shyok Suture
Zone (SSZ) of the Nubra–Shyok Valley, Northern Ladakh around the
villages of Shukur, Hunder and Diskit (Fig. 4). The shales belong to the
Shyok Group of Northwestern Himalaya. A total of fourteen samples
were collected from the exposed Formations in the ISZ and SSZ of
Ladakh–Karakoram zones.
4. Analytical procedure
4.1. Rock Eval pyrolysis
Rock Eval pyrolysis is used to estimate the petroleum potential of
rock samples by open system cracking of organic matter according to
a programmed temperature pattern. The complete process takes place
in the two ovens, pyrolysis and oxidation (combustion), respectively
of Rock Eval pyrolyzer. Pyrolysis proceeds with an initial isothermal
temperature program of 300 °C in an inert atmosphere of nitrogen.
The final temperature is set at 650 °C with a rise of 25 °C per minute.
The pyrolyzed hydrocarbons aremonitored by a flame ionization detec-
tor (FID), forming the so-called peaks S1 (thermovaporized free hydro-
carbons) and S2 (pyrolysis products from cracking of organic matter).
The method is completed by combustion of the residual rock recovered
after pyrolysis up to 850 °C, under artificial air (N2/O2). During pyrolysis
and combustion, releasedCOandCO2 aremonitored on line bymeans of
an infra-red cell. This complementary data acquisition enables determi-
nation of the organic and mineral carbon content of samples, labeled
TOC and MinC, respectively. The Tmax value is a maturity parameter
and corresponds to the temperature at whichmaximum amount of hy-
drocarbons are released from the thermal degradation of kerogen, i.e.;
the temperature atwhich S2 peak reaches itsmaximum. Among various
calculated parameters of Rock Eval, the hydrocarbon potential or hydro-
gen index, (HI) is defined by 100 × S2/TOC. The oxygen index, (OI) is
defined as 100× S3/TOC,where S3 is the CO2 released during the pyrol-
ysis. These indices help in defining kerogen types and maturation. The
experimental temperatures are set considerably higher than those
found naturally in the subsurface, so that appreciable reaction for the
generation of hydrocarbons can occur in a reasonably short time and
amount of generated hydrocarbons relative to the total potential of
the source rock can be estimated (Nuñez-Betelu and Baceta, 1994). De-
tails on Rock Eval functioning, parameters acquired, and interpretive
guidelines have been discussed by several workers (Espitalie et al.,
1987; Peters, 1986; Peters and Cassa, 1994).
4.2. Methodology
The shale sampleswere washedwithMilliQ water, air dried at room
temperature and powdered homogenously. The pyrolysis of shales was
carried out using the Rock Eval 6 pyrolyzer, Turbo version (Vinci Tech-
nologies). After obtaining a stable signal for the detectors, the instru-
ment was calibrated in standard mode using the IFP standard, 160,000
(Tmax = 416 °C; S2 = 12.43). The samples were weighed in pre-
oxidized crucibles depending upon the organic matter content
(~50–70mg of shale; and 8–15mg of coaly shale). The shale samples
were run under analysis mode using the bulk rock method and basic
cycle of Rock Eval 6 and the data was reported on dry weight basis.
5. Results
The important parameters obtained from the pyrolysis of shales
using Rock Eval 6 are given in Table 2. The Eocene shales/coaly shales
and coals collected from the underground mines of Kalakot, Kotla and
Mahogala, and outcrops of Salal, Kanthan and Kalimitti areas of
Jammu show quite high Total Organic Carbon (TOC) content ranging
87D. Mani et al. / International Journal of Coal Geology 128–129 (2014) 81–95

Table 2
Rock Eval pyrolysis results of samples from Jammu, Kashmir and Ladakh, Northwest Himalaya, India.
S no. Sample ID Type S1a S2a PIa Tmaxa S3a PC (%)a RC (%)a TOC (%)a HIa OIa VRo %a
Subathu Formation, Jammu
Bergoa Coal Mine, Kalakot
1 E-S-BK-1 Coaly shale 2.66 15.54 0.15 502 0.09 1.54 28.86 30.4 51 0 1.9
2 E-S-BK-2 Coaly shale 1.03 13.21 0.07 498 0.17 1.20 23.36 24.56 54 1 1.8
3 E-S-BK-3 Carb. shale 0.06 2.25 0.03 512 0.07 0.20 6.46 6.66 34 1 2.1
4 E-S-BK-4 Carb. shale 0.05 0.83 0.06 542 0.12 0.09 4.34 4.43 19 3 2.6
Chakkar Coal Mine, Kotla
5 E-S-CK-1 Coal 0.23 33.76 0.01 484 0.1 2.87 45.68 48.55 70 0 1.6
6 E-S-CK-2 Carb. shale 0.19 1.63 0.11 496 0.02 0.16 5.61 5.77 28 0 1.8
7 E-S-CK-3 Carb. shale 0.09 0.94 0.09 501 0.01 0.10 4.39 4.49 21 0 1.9
8 E-S-CK-4 Carb. shale 0.06 0.94 0.06 504 0 0.09 4.37 4.46 21 0 1.9
9 E-S-CK-5 Carb. shale 0.49 1.07 0.32 499 0.02 0.14 4.62 4.76 22 0 1.8
10 E-S-CK-6 Carb. shale 0.11 0.51 0.18 502 0.01 0.05 3.22 3.27 16 0 1.9
11 E-S-CK-7 Carb. shale 0.06 0.88 0.06 494 0.01 0.09 4.07 4.16 21 0 1.7
Mahogla Coal Mine, Mahogla
12 E-S-MM-1 Coal 0.34 71.62 – 488 0.48 6.09 57.44 63.53 113 1 1.6
13 E-S-MM-2 Carb. Shale 0.13 2.26 0.05 518 0.05 0.20 6.73 6.93 33 1 2.2
14 E-S-MM-3 Coal 0.25 27.35 0.01 496 0.38 2.43 51.28 53.71 51 1 1.8
15 E-S-MM-4 Carb. shale 0.05 2.51 0.02 535 0.04 0.23 10.49 10.72 23 0 2.5
16 E-S-MM-5 Carb. shale 0.21 6.57 0.03 495 0.06 0.60 13.90 14.50 45 0 1.8
17 E-S-MM-6 Carb. shale 0.33 6.50 0.05 499 0.11 0.59 10.81 11.40 57 1 1.8
18 E-S-MM-7 Carb. shale 0.05 0.63 0.07 517 0.02 0.06 2.36 2.42 26 1 2.1
19 E-S-MM-8 Carb. shale 0.12 7.72 0.01 498 0.05 0.68 13.27 13.95 55 0 1.8
20 E-S-MM-9 Carb. shale 0.15 2.50 0.06 515 0.06 0.23 7.73 7.96 31 1 2.1
Salal
21 E-S-S-1 coal 0.60 20.62 0.03 537 0.53 1.89 76.00 77.89 26 1 2.5
22 E-S-S-2 Coaly shale 0.14 3.40 0.04 587 0.99 0.43 30.34 30.77 11 3 3.4
Kanthan
23 E-S-K-1 Coaly shale 0.17 0.68 0.2 606 5.65 0.49 27.48 27.97 2 20 3.7
Kalimitti
24 E-S-KM-1 Coaly shale 0.11 3.65 0.03 602 2.87 0.65 30.90 31.55 12 9 3.7
25 E-S-KM-2 Coaly shale 0.36 4.41 0.07 573 0.26 0.52 29.41 29.93 15 1 3.2
26 E-S-KM-3 Coaly shale 0.14 3.05 0.05 570 0.14 0.31 21.15 21.46 14 1 3.1
27 E-S-KM-4 Coaly shale 0.29 3.91 0.07 600 1.05 0.56 31.90 32.46 12 3 3.6
28 E-S-KM-5 Coaly shale 0.08 1.09 0.07 598 0.54 0.21 13.04 13.25 8 4 3.6
29 E-S-KM-6 Coal 0.21 3.38 0.06 597 11.71 1.06 38.60 39.66 9 30 3.6
Sirban Formation, Jammu
Tattapani
30 P-S-TP-1 Calc. shale 0.01 0.00 0.99 322 0.08 0.00 0.05 0.05 0 160 –
31 P-S-TP-2 Carb. shale 0.20 0.06 0.76 533 0.38 0.04 0.87 0.91 7 42 –
32 P-S-TP-3 Carb. shale 0.03 0.10 0.21 527 0.43 0.03 1.33 1.36 7 32 –
Permian–Triassic Boundary, Kashmir
Guryul Ravine
33 PT-GR-1 Black shale 0.03 0.03 0.52 335 0.14 0.01 0.17 0.18 17 78 –
34 PT-GR-2 Black shale 0.03 0.04 0.39 344 0.02 0.01 0.19 0.20 20 10 –
35 PT-GR-3 Black shale 0.02 0.03 0.32 342 0.09 0.01 0.28 0.29 10 31 –
36 PT-GR-4 Black shale 0.02 0.01 0.67 336 0.04 0.01 0.23 0.24 4 17 –
37 PT-GR-5 Black shale 0.00 0.00 – – 0.08 0.00 0.19 0.19 0 42 –
38 PT-GR-6 Black shale 0.00 0.00 – 345 0.06 0.00 0.28 0.28 0 21 –
39 PT-GR-7 Black shale 0.00 0.00 – 523 0.29 0.01 0.69 0.70 0 41 –
40 PT-GR-8 Black shale 0.00 0.00 – – 0.24 0.01 0.19 0.20 0 120 –
41 PT-GR-9 Black shale 0.00 0.00 – 360 0.61 0.02 0.71 0.73 0 84 –
Barus
42 PT-BS-1 Black shale 0.00 0.00 – – 0.83 0.03 0.90 0.93 0 89 –
43 PT-BS-2 Black shale 0.00 0.00 – – 0.19 0.01 0.77 0.78 0 24 –
44 PT-BS-3 Black shale 0.00 0.00 – – 0.33 0.01 0.92 0.93 0 35 –
45 PT-BS-4 Black shale 0.26 0.00 – – 0.24 0.03 0.83 0.86 0 28 –
Kathsu, Pahlgam
46 PT-KP-1 Black shale 0.00 0.00 – – 0.34 0.01 0.42 0.43 0 79 –
47 PT-KP-2 Black shale 0.00 0.00 – – 0.24 0.01 0.39 0.40 0 60 –
48 PT-KP-3 Black shale 0.00 0.00 – – 0.29 0.01 0.30 0.31 0 94 –
Karewa sediments, Kashmir
Nichahom
49 PP-K-1 Carb. clay 0.25 9.53 0.03 424 4.23 1.05 4.81 5.86 163 72 0.5
50 PP-K-2 Shaly lignite 3.40 48.05 0.07 399 19.74 5.45 22.10 27.55 174 72 0.0
51 PP-K-3 Shaly lignite 10.25 81.69 0.11 402 18.54 8.64 20.71 29.35 278 63 0.1
52 PP-K-4 Carb. clay 0.79 21.44 0.04 419 15.42 2.67 14.13 16.80 128 92 0.4
53 PP-K-5 Shaly lignite/mudstone 1.84 28.50 0.06 407 25.81 3.91 22.26 26.17 109 99 0.2
Kulling–Lilang GRP, Ladakh
Lamayuru
54 PJ-L-1 Silty, Calc. shale 0.89 0.05 0.95 – 0 0.08 0.08 0.16 31 0 –
55 PJ-L-2 Silty, Calc. shale 0.00 0.00 – – 0.01 0.00 0.08 0.08 0 12 –
Kulling–Lilang GRP, Ladakh
88 D. Mani et al. / International Journal of Coal Geology 128–129 (2014) 81–95

from3.2 to 77.8%. Frequency distribution diagramof the TOC (%) (Fig. 5)
indicates the organic richness of the Subathu shales. The S1 values range
from 0.01 to 2.6 mg HC/g rock (milligram hydrocarbon/g of rock)
(Table 2). S2 shows an elevated value ranging from 0.51 to
71.62 mg HC/g rock. The HI ranges between 2 and 113 mg HC/g
TOC, where as the oxygen index (OI) for all studied samples is low
(b30 mg HC/g CO2). A modified van Krevelen diagram (van Krevelen,
1961) (Fig. 6) indicates that organic matter is characterized by Type III
kerogen. The Tmax of the shale samples ranges from 490 to 515 °C sug-
gesting an over mature phase for the hydrocarbons (Fig. 7). The coals
and coaly shales have TOC content N30%, and Tmax above 550 °C sug-
gesting high levels of maturity as compared to the carbonaceous shales
(Table 2; Fig. 7). The organicmatter inmajority of Subathu samples con-
sists of Type III kerogen and has generation potential for the gaseous hy-
drocarbons (Fig. 8). Rock Eval vitrinite reflectance, calculated using the
Tmax data of Subathu samples (0.018 × Tmax− 7.16; Jarvie and Lundell,
1991), ranges from 1.5 to 3.7 Ro % (Table 2). It indicates an overmature,
dry gas stage. The ratio of S1 to TOC vs depth has been used to deter-
mine the interval at which a source rock begins to expel oil. In general,
ratios between 0.1 and 0.2 have been suggested for oil generation by
Smith (1994). The S1/TOC values for the Subathu shales are in the
range of 0.01 to 0.04, except for one sample where it is 0.1. The values
well below 0.1 indicate that these shales could generate gas (Hunt,
1996). The relationship of S2 and TOC has been used to define the po-
tential of source rocks (Shalaby et al., 2012). S2 vs TOC plots show the
source rock properties of Subathu sediments to vary widely with an
overall expression of fair to excellent potential (Fig. 9).
The interbedded shale units in the Proterozoic Sirban limestone
Formation from Tattapani, Jammu show an average TOC of ~1%
(Table 2). However; all the other Rock Eval parameters such as S1,
S2, and HI are quite low for these shales. The carbonaceous clays
and lignites from the Karewa Formation, Nichahom are rich in organic
matter with the TOC content up to 29.4%. HI values are comparatively
high, ranging between 109 and 278 mg HC/g TOC. The organic matter
in majority of samples contains mixed Type II/Type III kerogen
(Fig. 10) The Tmax ranges between 399 and 27 °C suggesting an im-
mature phase for the hydrocarbon generation (Fig. 11).
The shales from the Permian–Triassic boundary in Kashmir are
lean in organic matter with TOC values of b1% (Table 2). At Guryul
Ravine section, the TOC content is between 0.1 and 0.7%; where as
those of Barus spur are between 0.7 and 0.9%. The samples from
Kathsu, Pahalgam show the TOC values between 0.3 and 0.4%. The HI
values for these shales are extremely low (Fig. 10). The Permian–Jurassic
and Paleozoic–Tertiary shales from Ladakh–Karakoram zones show
quite low TOC content of b0.5%; except for two samples where the
TOC is 1.12 and 1.22% (Table 2). The other pyrolysis parameters such
as S1, S2, HI are very low for these shales.
6. Discussion
In general, the organic content and thermal maturity of the
Proterozoic–Phanerozoic Himalayan shales observed using the Rock
Eval pyrolysis vary widely, depending upon the quality and quantity
of preserved sedimentary organic matter and geological settings. The
TOC content is quite high in the younger sediments such as the Subathu
shales of Eocene age and Plio-Pleistocene Karewas, as compared to the
Proterozoic and Paleozoic–Mesozoic shales of Kashmir and Ladakh, re-
spectively, which possess very low organic content. An overall low to
moderate HI values is observed in all the samples. Oxygen index varies
widely with quite low values in the Eocene shales as compared to the
samples fromother regions. Immature to high levels of thermalmatura-
tion characterizes the sediments, with the dominance of Type III kero-
gen in samples with significant TOC content.
Regionally, the organic matter in Subathu shales from Jammu is
characterized by organic rich; gas prone, Type III kerogen and the source
rock potential varies from fair to excellent (Figs. 5–9). The calculated
Rock Eval vitrinite reflectance varies between 1.5 and 3.7 Ro %
(Table 2), suggesting the post-mature, dry gas stage (Hunt, 1991).
Overall, the HI is low, however; the Subathu shales from Mahogla
and Kotla coal fields have comparatively higher values. Accordingly,
the thermal maturity of shales from these areas is also low as compared
to the Subathu shales from other places of Jammu. Usually, the prolific
gas–shale systems are usually characterized by high organic richness
of N3% TOC and HI values greater than 350 mg HC/g TOC (Slatt and
Table 2 (continued)
S no. Sample ID Type S1a S2a PIa Tmaxa S3a PC (%)a RC (%)a TOC (%)a HIa OIa VRo %a
Lamayuru
56 PJ-L-3 Dark gray shale 0.01 0.00 – – 0.2 0.01 1.11 1.12 0 18 –
57 PJ-L-4 Dark gray shale 0.00 0.00 – – 0.13 0.01 1.21 1.22 0 11 –
Shyok GRP, Ladakh
Shukur
58 PT-L-1 Light gray shale 0.00 0.00 1 – 0.01 0.00 0.01 0.01 0 100 –
59 PT-L-2 Calc. light gray shale 0.00 0.00 1 – 0.01 0.00 0.02 0.02 0 50 –
60 PT-L-3 Light gray shale 0.00 0.00 0.95 342 0.01 0.00 0.04 0.04 0 25 –
61 PT-L-4 Light gray shale 0.00 0.00 0.75 341 0.02 0.00 0.04 0.04 0 50 –
62 PT-L-5 Calc.,light gray shale 0.01 0.01 0.39 348 0.07 0.01 0.13 0.14 7 50 –
63 PT-L-6 Calc. light gray shale 0.01 0.01 0.52 350 0.07 0.01 0.27 0.28 4 25 –
64 PT-L-7 Calc. light gray shale 0.06 0.01 0.87 332 0.06 0.01 0.07 0.08 12 75 –
65 PT-L-8 Calc.light gray shale 0.14 0.00 1 334 0.07 0.01 0.04 0.05 0 140 –
66 PT-L-9 Calc.light gray shale 0.00 0.00 1 – 0.05 0.00 0.28 0.28 0 18 –
67 PT-L-10 Calc.light gray shale 0.00 0.00 0 – 0.06 0.00 0.06 0.06 0 100 –
S1& S2 = mgHC/g rock; Production Index, PI = S1 / (S1 + S2); Tmax = °C; S3 = mg CO2/g rock; PC = pyrolyzable organic carbon; RC = residual organic carbon;HI = mgHC/g TOC;
OI = mg CO2/g TOC; calculated vitrinite reflectance VRo % = 0.018 × Tmax − 7.16, Carb. = carbonaceous, Calc.= calcareous.a Units.
Fig. 5. Frequency distribution diagram of the TOC (%) content in Subathu shales, Jammu.
89D. Mani et al. / International Journal of Coal Geology 128–129 (2014) 81–95

Rodriguez, 2012). These values are greater than the threshold values
typical of gas generation from conventional gas-prone source rocks
and similar to the characteristics typical of Type II kerogen-rich, oil-
prone source rocks (Slatt and Rodriguez, 2012). Nevertheless, recent
studies have indicated that there might be an additional dry gas charge
for some types of organic-rich shales, subsequent to regular primary
Fig. 6. Modified van Krevelen diagram indicating the kerogen type for the Subathu shales, Jammu.
Fig. 7. HI versus Tmax plot indicating the thermal maturity of kerogen in the Subathu shales, Jammu.
90 D. Mani et al. / International Journal of Coal Geology 128–129 (2014) 81–95

and secondary decomposition reactions at geologic temperatures well
in excess of 200 °C (Ro N2.0%) (Mahlstedt and Horsfield, 2012).
The organic rich sediments of Subathu Groupmight act as source for
the late metagenetic gaseous hydrocarbons. The sapropelic and humic
type of organic matter in Subathu indicates degree of metamorphism
higher than the last stage of oil generation (Karunakaran and Ranga
Rao, 1979). Small quantities of the flaky, semi anthracite coal has been
reported in the lowest part of the sequence (Karunakaran and Ranga
Rao, 1979). Although having being subjected to low grade metamor-
phism, a high carbon ratio with respect to hydrogen of associated coal
is exhibited by the Eocene sediments (Karunakaran and Ranga Rao,
1979). Pyrolysis results show high values for the residual carbons
(Table 2). Due to tectonic deformations and subsequent thermal matu-
ration, a highly mature stage of late gas generation is expected of these
sediments, particularly when moving from base to the top of the
sequence.
Depositional environment, apart from initial organic matter
structure and precursor biota, have a significant role in generation
of such metagenetic late gas plays. Facies analysis of the outcrops
of Subathu Group shows that in the southern areas represented by
the Kalakot, Jammu and north of Kalka, Himachal Pradesh, conditions
of deposition changed from paralic to shallow marine and that marine
conditions existed from Lower to Middle Eocene (Karunakaran and
Ranga Rao, 1979). Beginning with the Upper Eocene, the rest of se-
quence was found to be continental in character (Karunakaran and
Ranga Rao, 1979). The thickness of the Subathu in these areas range
from 200 to 600 m. Sufficient thickness of organic rich strata, usually
greater than 65m, is necessary criteria in evaluation of a shale gas pros-
pect (Slatt and Rodriguez, 2012). Compared to south, in the areas to the
north of Kalakot, shallow marine conditions alternated with the non
marine conditions due to repeated transgression and regressions of
the sea (Karunakaran and Ranga Rao, 1979). The thickness here is
estimated to be of the order of 2000 m (Karunakaran and Ranga Rao,
1979). The quantitative petrological investigations suggest that these
coals are vitrinite rich, with low concentrations of inertinite and rare oc-
currences of liptinite (Singh and Singh, 1995). The Subathu sedi-
ments show features characteristic of an open sea deposit (shelf
mud, tidal flats and sand bars), partly with hyper saline and reducing
conditions with fine sediment laminae (Singh and Singh, 1995; Singh
and Srivastava, 2011; Singh et al., 2000). Late gas potential has been
associated with heterogeneous admixtures or structures in terrestri-
ally influenced, in some cases marine Type III and Type II/III coals and
shales (Mahlstedt and Horsfield, 2012).
Stratigraphic equivalents of Subathu, the Lower Dharamsala For-
mation of Himachal Pradesh, indicated gas shows during exploratory
drilling (DGH, 2013; Karunakaran and Ranga Rao, 1979). The gases of
Jwalamukhi and Nurpur wells are methane rich with low nitrogen
concentration and are dry and thermogenic in nature (C2+ b2%)
(Mittal et al., 2006). Carbon isotopic composition of methane from
these wells suggest a deep over mature source for the gases (δ13C1
~−32.0‰) (Mittal et al., 2006). In the Foot Hills of the Outer Himalaya,
the Tertiary belt has large thickness and is folded into long anticlinal
structures forming suitable traps for the entrapment of gaseous hydro-
carbons. Of this large thickness, the lower-most section comprising of
the Subathu Group has marine origin (Kurien and Rajarajan, 1979).
X-Ray diffraction studies on outcropping Subathu shales from the
Jammu area have shown the lithology to have high quartz to clay
content with almost no carbonate content (Mateen et al., 2013, per-
sonal communication). Major oxides, SiO2, Al2O3 and CaO are repre-
sentative of the main mineral phases namely quartz, clays and
carbonate, respectively. High Si/Al ratios indicate quartz-rich miner-
alogy, where as low Si/Al ratio is typically clay-rich. The fracability of
shale is an important concern for the development of plays and is
governed largely by the mineralogy (Ross and Bustin, 2009). With
high brittleness, the response of quartz rich Subathu shale to fracking
appears to be encouraging based on the preliminary lithological studies
(Mateen et al., 2013, personal communication). Estimations on expelled
and retained gas can be made, taking into account the generation po-
tential, source rock thickness and extent, along with the porosity and
permeability parameters for the Subathu shales.
The two of three interbedded shale samples collected from the
Proterozoic Sirban Limestone Formation from Tattapani, Jammu
show a TOC content of 0.91 and 1.36%. However; the HI values for
these samples is very low (b7 mg HC/g TOC). The low TOC (0.05%)
for one sample indicates the degradation of organic matter, probably
due to oxidation. The OI for the sample is quite high (160 mg CO2/g
TOC), indicating that weathering influenced the preservation of or-
ganic matter. Oxidation removes hydrogen and adds oxygen to the
kerogen, and, therefore, HI values are usually lower and OI values
higher for outcrop samples than for fresh core samples (Tissot and
Welte, 1984). The Tmax values of the shales with TOC content from
1 to 1.36% show a highly mature stage for the hydrocarbon genera-
tion. The Sirban Limestone extends westwards to the oil producing
Potwar basin in Northeast Pakistan and on basis of lithological simi-
larity it has been correlated with the outcrops to the NW in the Salt
Range and the Muzzafarabad–Punch sector (Sirban Limestone) in
Pakistan; to the NE in Dharamshala (Dharamkot Limestone); and in
Shimla (Tundapather Limestone) in Himachal Pradesh, northern India
(Bhat et al., 2009; 2012). Although the Proterozoic sediments have
been considered less suitable for oil and gas exploration; the hydrocar-
bon potential of theNeoproterozoic petroleum systems has been prom-
ising globally (Craig et al., 2013; Hakhoo et al., 2011; Jokhan Ram,
2012). In Indian subcontinent, the recent discovery of liquid hydrocar-
bons from Baghewala-1 in the Terminal Proterozoic (Vendian) and
Lower Paleozoic (Cambrian) sequences has opened up a new explora-
tion frontier for Cambrian–Infracambrian sequences (Ojha, 2012;
Jokhan Ram, 2012). The Baghewala-1 oil has been reported to be geo-
chemically similar to another heavy oil from the Infracambrian Salt
Fig. 8. HI vs TOC (%) plot indicating the gas prone source potential of Subathu shales,
Jammu.
Fig. 9. Source rock characteristics as interpreted by the relationship between the remain-
ing hydrocarbon potential (S2) and TOC (wt.%) for the Subathu shales from Jammu.
91D. Mani et al. / International Journal of Coal Geology 128–129 (2014) 81–95

Fig. 10. Modified van Krevelen diagram (HI vs OI) indicating the kerogen type of Karewa sediments from the Kashmir basin.
Fig. 11. HI versus Tmax plot for the carbonaceous sediments from the Lower Karewa, Nichahom section, Kashmir.
92 D. Mani et al. / International Journal of Coal Geology 128–129 (2014) 81–95
Range Series in the nearby Karampur-1 well in Pakistan and to oils de-
rived from carbonate–evaporite facies of the Infracambrian Huqf Group
about 2000 km to the southwest in the Eastern Flank province of south-
ern Oman (Dutta et al., 2013; Peters et al., 1995). The organic richness
and thermal maturity of the shales, as indicated by the pyrolysis data
and the presence of diverse biota dominated by various cyanobacteria,
microbial stromatolites and acritarchs (Bhat et al., 2009; Craig et al.,
2013; Raha and Sastry, 1982) in the Sirban Limestone succession
makes it a potential hydrocarbon source. The shale units between the
Sirban Limestones may possibly act as a source for gaseous hydrocar-
bons. However; the present-day high level of thermal maturity of the
shales (Tmax = 566–572 °C) also suggest a possibility that the source
may already be in a spent hydrocarbon stage.
The Plio-Pleistocene carbonaceous clays, dark mudstones and lig-
nites from Nichahom, Kashmir basin show varied range of high TOC
content (5.86–29.35%). The samples are characterized by high HI
(109–278 mg HC/g TOC) and OI (63–99 mg HC/g CO2) indicating a
lower maturity for these sediments. Modified van Krevelen diagram
(HI vs OI) for the Karewa sediments suggest that the organic matter
is characterized by mixed Type II/III kerogen (Fig. 10). An immature
stage for hydrocarbon generation is also indicated by their HI vs Tmax
plot (Fig. 11). The Karewa lignites are characterized by low percentage
of fixed carbon and high moisture content. The average of proximate
content in Karewa lignites are: Ash = 40.56%; Volatile matter =
27.04%; Moisture = 16.26%; Fixed Carbon = 16.14% (Bhat, 1989).
Due to immature level of kerogen in the present samples under consid-
eration, further geochemical and kinetic investigations on the Karewa
sediments from different regions of Kashmir are required to infer its
source potential.
The Permian–Triassic Black Shales from Kashmir have a TOC con-
tent of b1%. Majority of samples from the Guryul Ravine section are
organically lean with TOC ranging from 0.1 to 0.2%. However; two
samples (P/T-GR-7 & P/T-GR-9) have TOC content of 0.7%, indicating
characteristics of a fair source potential. These samples represent the
Lower Triassic Black Shales of Guryul Ravine P/T boundary section.
The shale samples from the Barus area have comparatively higher TOC
(0.78–0.98%); where as that of Pahlgam range from 0.31 to 0.4%. How-
ever, a commonality of the Rock Eval parameters S1, S2 being zero, a
low HI (4–20 mg HC/g TOC), and a high OI (10–120 mg HC/g CO2)
may be indicative of the weathering or metamorphic influences upon
these samples. Organic metamorphism, induced by heat (maximum
paleotemperature) and pressure, modifies the organic matter locked
in the sedimentary matrix as well as the mobile products, leading to
paraffinic oils and condensates, then to dry gas and pyrobitumens,
and finally to graphitization under severe conditions (Staplin, 1969).
The P/T sections have been reported to be metamorphosed, with abun-
dant chloritoid, indicating the sub-greenschist facies (Brookfield et al.,
2003). The TOC content obtained during pyrolysis is the sumof pyrolyz-
able and oxidative carbon present in the sample. Here, in samples
where organic content is high, the pyrolyzable carbon is b0.1%, indicat-
ing the TOC value to be derived almost entirely from the residual car-
bon. The low TOC content may also be attributed to the inherently
low organic matter deposition, as indicated by the lack of organic rich
laminae and pyrite precipitates, which generally are common in anoxic
environments (Brookfield et al., 2003; Srivastava and Singh, 1984).
With an overall low TOC, the HI, OI correlations thus, possibly indicate
altered/reworked organic matter content (Fig. 10).
The organic matter in the Permian–Jurassic and Paleozoic–Tertiary
shales from the Ladakh–Karakoram region shows low to negligible
TOC content (b0.2%). The Permian–Jurassic shales were sampled from
the Indus Suture Zone, around Saraks and Lamayuru (Fig. 4). However;
two samples (P/J-L-3 and P/J-L-4) show comparatively higher TOC con-
tent of 1.12 and 1.22%, respectively (Table 2). The Paleozoic–Tertiary
shales collected from Shyok Suture Zone around Shukur, Hunder and
Diskit areas of Nubra–Shyok Valley show quite low TOC content, rang-
ing from 0.05 to 0.33% (Fig. 4; Table 2). Other Rock Eval parameters
such as S1, S2, and HI for the Permian–Jurassic as well as Paleozoic–
Tertiary shales are low to negligible, leading to an unreliable Tmax and
a paucity in typing of kerogen and its maturation assessment toward
gas generation. Post-depositional thermal alterations leading to organic
metamorphism (Price et al., 1999) and exhumation of buried organic
carbon could possibly account for the loss of TOC content from the sed-
imentary strata. The pyrolyzable carbon for the two Permian–Jurassic
shales from IST is zero and the net TOC is contributed by the residual
carbon only (Table 2). Examining the bulk organic carbon isotope and
rank data in South Africa shales, McKirdy and Powell (1974) have
shown that post-depositional thermal alteration may account for the
anomalously heavy reduced carbon and the maturation of the kerogen
beyond a rank equivalent to 91 to 93% carbon resulting in marked en-
richment of the residual organic matter.
Contact metamorphism of organic material leads to elevated
vitrinite reflectance (%Ro), loss of TOC, increased aromatization and
changes in carbon isotope compositions (δ13C) of the residual organic
material toward the contact (Aarnes et al., 2010 and references therein).
Organic metamorphism of these shales is supported by the fact that
about 30% of the shales from Tethys and Trans Himalaya have TOC con-
tent N0.5% and reaching up to a maximum of 1.2% with high residual
carbon values. These values indicate a fair to good source rock potential.
However; the maturity assessments using the van Krevelen diagram
here reflect the present-day generation potential and not the
original source rock generation potential. Similarly, the original
TOC, (TOCO) differs from the present day TOC content (TOCP)
(TOCP/0.64 = TOCO; Jarvie and Lundell, 1991) and is generally
higher that present day observations.
Loss of hydrogen with increasing organic maturation is widely
evident (Tissot and Welte, 1984). The maturity of organic matter af-
fects the HI and hydrocarbon generation of the samples, decreasing
both. Loss of TOC is also attributed to the exhumation of buried
organic matter due to a tectonic activity. Beck et al. (1995) have pro-
vided evidence that the timing of early Himalayan thrusting and ex-
humation of bulk organic carbon (Corg) (kerogen, bitumen, and
mobile hydrocarbons including methane) from neo-Tethyan strata
above the north Indian shelf coincides with and is quantitatively
compatible with the rapid decrease of δ13Ccarb near the Paleocene–
Eocene boundary.
It has been demonstrated that oxidative weathering of organic mat-
ter in black slates is a fast process with substantial decrease of organic
matter occurring within only some decades to a century, rather than
over geological time spans (Fischer et al., 2007). The depositional
history of sediments in Himalaya has been controlled by the major tec-
tonic elements and the intensity of geological activity is reflected in the
progressive changes in the composition of organic matter in highly
sheared Himalayan shales (Brookfield and Andrews-Speed, 1984).
Occurrence of numerous slate exposures in the Himalaya, particularly
in the Tethys, Higher and Trans Himalaya (Thakur, 1993) indicate the
intense level of tectonically induced metamorphism and oxidation of
the originally deposited organic rich sedimentary strata.
The geology of Himalaya is represented by several phases of tectonic
and deformational events and the rocks in Himalayan basins have been
deposited under highly variable conditions. The Lesser, Higher and Te-
thys Himalaya belonged to the northern part of the Indian plate; and
the Trans Himalaya that includes the Indus and Shyok sutures and the
Karakoram Zone constituted the southern part of the Asian plate
(Thakur, 1993). The Lesser Himalaya sequence, dominantly of Precam-
brian to Lower Cambrian age, represents the northerly extension of an
intracratonic basin of the Peninsular India; and the Higher Himalaya
rocks have come from the mid-crustal level, whose cover of upper
crust has been largely eroded away and deposited in the Tertiary fore-
land basin (Thakur, 1993). The Tethys Himalaya sequence of fossilifer-
ous Cambrian to Cretaceous and Early Cretaceous and Early Eocene
was deposited along the north-facing Indian margin. The Indus and
Shyok sutures are the byproduct of an active margin that was located
93D. Mani et al. / International Journal of Coal Geology 128–129 (2014) 81–95

along the southernmargin of the Asian plate. Trans Himalayamagmatic
arc of Ladakh and Kohistan and a major part of the Karakoram pluton
were produced on the active margin above a subduction zone
(Thakur, 1993). The Karakoram metamorphic complex and the
Karakoram Supergroup represent the basement and the sedimentary
cover respectively of the south facingmargin of the Tibet–Karakoram
Block. The principal intracrustal thrusts, like MBT, MCT, IST, andMKT
and the Himalayan metamorphism and leucogranites were generated
as a result of collision between the two plates. Early Miocene uplift
post-Himalayan collision produced the foreland basin, south of Lesser
Himalaya in which the Tertiary Subathu sediments were deposited
(Thakur, 1993). This is reflected by the organic geochemistry of the
Subathu sediments of Outer Himalaya, which are younger and compar-
atively less mature than the Proterozoic and Paleozoic–Mesozoic suc-
cessions of Outer, Tethyan and Trans Himalaya, respectively and show
the presence of volatile hydrocarbon components (S1) and elevated
HI values.
7. Conclusion
The Rock Eval pyrolysis data of the Proterozoic and Phanerozoic
shales from Himalayan region is varied, ranging from excellent to very
good to poor. From the present pyrolysis observations, it can be inferred
that:
• Organically-rich,marine Subathu shales of the Tertiary Foot Hill belt in
theOuter Himalayan regions of Jammu could act as source for the gas-
eous hydrocarbons and have promising gas potential.
The organic matter in the Subathu shales is characterized by high
TOC content and Type III kerogen.
• The calculated Rock Eval vitrinite reflectance suggests highly mature
kerogen, derived from heterogeneous mixed marine and terrestrial
organic matter with various amounts of higher land plant material,
whichmight be crucial for thedevelopment of a high late gas potential
for the Subathu shales.
• The Lower Karewa sediments are organically rich with mixed Type
II/III kerogen. Due to lower levels of thermal maturity on samples
under consideration, further organic geochemical and kinetic in-
vestigations are required on immature samples their source poten-
tial.
• The organic matter characteristics of other Formations, namely
Proterozoic Sirban Formation of Jammu, Permian–Triassic section
of Kashmir and the Paleozoic–Mesozoic–Tertiary shales from La-
dakh–Karakoram zones, are not encouraging and/or insufficient
to describe their hydrocarbon generation potential.
• The deposition and preservation organic matter in these shales has
been influenced bymetamorphism and exhumation of organic car-
bon, inseparably linked with the evolution of the Himalaya which
involved multiple phases of tectonic deformations.
• The knowledge of the distribution, facies, and thickness of the
Subathu Group shale put together with petro-physical and litho-
logic properties and stratigraphic heterogeneity due to faults and
fractures would provide criteria for precise defining of the gas
shale horizons.
Acknowledgments
The authors acknowledge the Oil Industry Development Board (4/5/
2009-OIDB), New Delhi for providing financial aid in setting up of the
laboratory. Director, NGRI is acknowledged for permitting the publica-
tion of this work. Naveen Hakhoo gratefully acknowledges the senior
research fellowship from CSIR-India. Prof. Brian Horsfield, GFZ, is
acknowledged for the constructive scientific discussions.
References
Aarnes, I., Svensen, H., Connolly, J.A.D., Podladchikov, Y.Y., 2010. How contact metamor-phism can trigger global climate changes: modeling gas generation around igneoussills in sedimentary basins. Geochim. Cosmochim. Acta 74, 7179–7195.
Beck, R.A., Burbank, D.W., Sercombe,W.J., Olson, T.L., Khan, A.M., 1995. Organic carbon ex-humation and global warming during the early Himalayan collision. Geology 23,387–390.
Behar, F., Beaumont, V., Penteado, H.L., De, B., 2001. Rock-Eval 6 Technology: Perfor-mances and Developments Oil & Gas Science and Technology — Rev. IFP. 56 (2),111–134.
Bhat, D.K., 1989. Lithostratigraphy of Karewa Group, Kashmir Valley, India and a criticalreview of its fossil records. Geol. Surv. India Mem. 22, 85p.
Bhat, G.M., Ram, Ghara, Koul, S., 2009. Potential for oil and gas in the Proterozoic carbon-ates (Sirban Limestone) of Jammu, Northern India. Geol. Soc. Lond., Spec. Publ. 326,245–254.
Bhat, G.M., Craig, J., Hafiz, M., Hakhoo, N., Thurow, J.W., Thusu, B., Cozzi, A., 2012. Geologyand hydrocarbon potential of Neoproterozoic–Cambrian Basins in Asia: an introduc-tion. In: Bhat, G.M., Craig, J., Thurow, J.W., Thusu, B., Cozzi, A. (Eds.), Geology and hy-drocarbon potential of Neoproterozoic–Cambrian Basins in Asia. Geological Society,London, Special Publications, 366, pp. 1–17.
Bhattacharya, S.N., Chandra, K., 1979. Geochemical investigations for petroleum explora-tion in the Himalayan region. Geological survey of India, miscellaneous publicationsno. 41, part V, 217–232. In Proceeding of Himalayan Geology Seminar, 13–17 Sep-tember, New Delhi.
Boyer, C., Keischnick, J., Lewis, R.E., 2006. Producing gas from its source. Oil Field Rev. 36, 49.Brookfield, M.E., Andrews-Speed, C.P., 1984. Sedimentology, petrography and tectonic
significance of the shelf, flysch and molasse clastic deposits across the Indus SutureZone, Ladakh, NW India. Sediment. Geol. 40, 249–286.
Brookfield, M.E., Twitchett, R.J., Goodings, C., 2003. Palaeo-environments of the Permian–Triassic transition sections in Kashmir, India. Palaeogeogr. Palaeoclimatol. Palaeoecol.198, 353–371.
Bullard, E.C., 1973. Overview of plate tectonics. In: Fisher, A.G., Judson, S. (Eds.), Petroleumand Global Tectonics. Geology, 2. Princeton University Press, pp. 591–595.
Craig, J., Biffi, U., Galimberti, R.F., Ghori, K.A.R., Gorter, J.D., Hakhoo, N., Le Heron, D.P.,Thurowe, J., Vecoli, M., 2013. The palaeobiology and geochemistry of Precambrian hy-drocarbon source rocks. Mar. Pet. Geol. 40, 1–47.
DGH, 2013. Directorate General of Hydrocarbons, India. www.dghindia.org (Retrievedfrom).
Dutta, S., Bhattacharya, S., Raju, S.V., 2013. Biomarker signatures from Neoproterozoic–Early Cambrian oil, western India. Org. Geochem. 56, 68–80.
EIA, 2013. United States Energy Information Administration. http://www.eia.gov/energy_in_brief/article/about_shale_gas.cfm (Retrieved from).
Espitalie, J., Marquis, F., Sage, L., 1987. Organic geochemistry of the Paris Basin. In: Brooks,J., Glennie, K. (Eds.), Petroleum Geology of North West Europe, Graham and Totman,London, pp. 71–86.
Fischer, C., Karius, V., Thiel, V., 2007. Organic matter in black slate shows oxidative degra-dation within only a few decades. J. Sediment. Geol. 77 (5), 355–365.
Fuchs, G., 1977. Traverse of Zanskar from the Indus to the Valley of Kashmir — A Prelim-inary Note. pp. 219–229 (Retrieved from www.geologie.ac.at Jahrb. Geol. B.-A. B and120, Heft 2 S).
Fuchs, G., 1984. Note on the geology of the Markha–Nimaling area in Ladakh India. Geol.Jahrb. 129, 403–437.
Gansser, A., 1964. Geology of the Himalayas. Wiley-Interscience, London (289 pp.).GSI, 2013. Geological Survey of India, Geological Map of Himalaya, (1:1 million).Gupta, V.J., Brookfield, M.E., 1986. Preliminary observations on a possibly complete
Permian–Triassic boundary section at Pahlgam, Kashmir, India. Newslett. Stratigr.17, 29–35.
Hakhoo, N., Bhat, G.M., Koul, S., Craig, J., Thusu, B., 2011. Potential Proterozoic PetroleumSystem, Northwest Himalayan Thrust Belt, Jammu (India). Abstracts AAPG Interna-tional Conference & Exhibition, Milan, Italy pp. 23–26.
Horsfield, B., Schulz, H.M., 2012. Shale gas exploration and exploitation. Mar. Pet. Geol. 31(1), 1–2.
Hunt, J.M., 1991. Generation of gas and oil from coal and other terrestrial organic matter.Org. Geochem. 17 (6), 673–680.
Hunt, J.M., 1996. PetroleumGeology andGeochemistry.W. H. Freeman and Company, SanFrancisco (617 pp.).
Jarvie, D.M., Lundell, L.L., 1991. Hydrocarbon Generation Modeling of Naturally and Arti-ficially Matured Barnett Shale, Ft. Worth Basin, Texas, Southwest Regional Geochem-istry Meeting, Sept. 8–9, 1991, The Woodlands, Texas, 1991.
Jarvie, D.M., Hill, J.R., Ruble, T.E., Pollastro, R.M., 2007. Unconventional shale–gas systems:the Mississippian Barnett Shale of north-central Texas as one model for thermogenicshale–gas assessment. AAPG Bull. 91 (4), 475–499.
Juyal, K.P., 2006. Foraminiferal biostratigraphy of the Early Cretaceous Hundiri Formation,lower Shyok area, eastern Karakoram, India. Curr. Sci. 91, 8.
Kapoor, H.M., 1996. The Guryul Ravine section, candidate of the global stratotypeand point (GSSP) of the Permian–Triassic boundary (PTB). In: Yin, H. (Ed.), ThePaleozoic–Mesozoic Boundary. Candidates of the Global Stratotype Section andPoint of the Permian–Triassic Boundary. China University of Geosciences Press,Wuhan, pp. 99–110.
Karunakaran, C., Ranga Rao, A., 1979. Status of exploration for hydrocarbon in the Hima-layan Region — contributions to stratigraphy and structure. Geological survey ofIndia, miscellaneous publications no. 41, part V, 1–6, 6. Proceeding of Himalayan Ge-ology Seminar, 13–17 September, New Delhi.
Klett, T.R., Schenk, C.J., Wandrey, C.J., Brownfield, Michael, Charpentier, R.R., Cook, T.,Gautier, D.L., Pollastro, R.M., 2012. Assessment of Potential Shale Gas Resources of
94 D. Mani et al. / International Journal of Coal Geology 128–129 (2014) 81–95

the Bombay, Cauvery, and Krishna–Godavari Provinces, India, 2011: U.S. GeologicalSurvey Fact Sheet 2011-3131 (2 pp.).
Klootwijk, C.T., Sharma, M.L., Gergan, J., Shah, S.K., Gupta, B.K., 1986. Rotational overthrusting of the northwestern Himalaya: further palaeomagnetic evidence from theRiasi thrust sheet, Jammu foothills, India. Earth Planet. Sci. Lett. 80 (3–4), 375–393.
Kotila, B.S., 1990. Large mammals from the Plio-Pleistocene of Kashmir IntermontaneBasin, India, with reference to their status in magnetic polarity time scale. Eiszeit.Gegenw. 40, 38–52 (Hannover).
Kumar, K., Sahni, S., 1985. Eocene mammals from the Upper Subathu Group, KashmirHimalaya, India. J. Vertebr. Paleontol. 5, 153–168.
Kurien, T.K., Rajarajan, K., 1979. The possibility of locating oil field in Jammu–Kashmirpart of the outer Himalaya. Geological survey of India, miscellaneous publicationsno. 41, part V, 65–80. Proceeding of Himalayan Geology Seminar, 13–17 September,New Delhi.
Lafargue, E., Marquis, F., Pillot, D., 1998. Rock-Eval 6 Applications in Hydrocarbon Explo-ration, Production, and Soil Contamination Studies, 53, 4, Juillet-Août 1998, IFP.
Loucks, R.G., Reed, R.M., Ruppel, Stephen C., Hammes, U., 2012. Spectrum of pore typesand networks in mudrocks and a descriptive classification for matrix-relatedmudrock pores. AAPG Bull. 96 (6), 1071–1098.
Mahlstedt, N., Horsfield, B., 2012. Metagenetic methane generation in gas shales I. Screen-ing protocols using immature samples. Mar. Pet. Geol. 31, 27–42.
McKirdy, D.M., Powell, T.G., 1974. Metamorphic Alteration of Carbon Isotopic Composi-tion in Ancient Sedimentary Organic Matter: New Evidence from the Precambrianand Cambrian of Australia. Record 1974/040. Bureau of Mineral Resources, Geologyand Geophysics, Canberra.
Mittal, A.K., Pandey, H.C., Singh, R.R., 2006. Geochemistry of gas seeps from surface showsand wells of the Himalayan Foreland Basin. Proceedings of 6th International Confer-ence & Exposition on Petroleum Geophysics Kolkatta, pp. 235–291.
Molnar, P., 1986. The geologic history and structure of the Himalaya. Am. Sci. 74, 144–154.Nair, N.G.K., Gaur, V.K., Khattri, K.N., Sinvhal, H., 1979. Plate junctions and hydrocarbon
accumulations in the Indian region. Geological survey of India, miscellaneous publica-tions no. 41, part V, 277–286. Proceeding of Himalayan Geology Seminar, 13–17 Sep-tember, New Delhi.
Nuñez-Betelu, L., Baceta, J., 1994. Basics and application of Rock-Eval/TOC pyrolysis. AnExample from the Uppermost Paleocene/Lowermost Eocene in the Basque Basin,Western Pyrenees. , 46. MUNIBE (Ciencias Naturales - Natur Zientziak), SanSebastian, pp. 43–62 (ISSN 0214-7688).
Ojha, P.S., 2012. Precambrian sedimentary basins of India: an appraisal of their petroleumpotential. Geol. Soc. Lond. Spec. Publ. vol. 366. http://dx.doi.org/10.1144/sp366.11.
Peters, K.E., 1986. Guidelines for evaluating petroleum source rock using programmed py-rolysis. Am. Assoc. Pet. Geol. Bull. 70, 318–329.
Peters, K.E., Cassa, M.R., 1994. Applied source rock geochemistry. In: Magoon, L.B.,Dow, W.G. (Eds.), The petroleum system from source to trap AAPG. Memoirs,60, pp. 93–120.
Peters, K.E., Clark, M.E., Das Gupta, U.E., McCaffrey, M.A., Lee, C.Y., 1995. Recognition of anInfracambrian source rock based on biomarkers in the Baghewala-1 Oil, India. AAPGBull. 79 (10), 1481–1493.
Powell, C.M., Conaghan, P.J., 1973. Plate tectonics and Himalayas. Earth Planet. Sci. Lett.20, 1–12.
Price, L.C., Pawlewicz, M., Daws, T., 1999. Organic metamorphism in the California petro-leum basins chapter A—Rock-Eval and vitrinite reflectance. U.S. Geol. Surv. Bull.(2174-A) 42 p.
Raha, P.K., Sastry, M.V.A., 1982. Stromatolites and Precambrian stratigraphy in India. Pre-cambrian Res. 18, 293–318.
Jokhan, Ram, 2005. Hydrocarbon exploration in onland frontier basins of India: perspec-tive and challenges. J. Palaeontol. Soc. India 50 (1), 1–16.
Jokhan, Ram, 2012. Neoproterozoic successions in peninsular India and their hydrocarbonprospectivity. Geol. Soc. Lond. Spec. Publ. vol. 366. http://dx.doi.org/10.1144/sp366.4.
Romero, A.M., Philip, R.P., 2012. Organic geochemistry of the Woodford Shale, southeast-ern Oklahoma: how variable can shales be? AAPG Bull. 96 (3), 493–517.
Ross, D.J.K., Bustin, R.M., 2009. The importance of shale composition and pore structureupon gas storage potential of shale gas reservoirs. Original research article. Mar.Pet. Geol. 26 (6), 916–927.
Roy, D.K., 1975. Stratigraphy and paleontology of the Karewa Group of Kashmir. Geol.Surv. India Misc. Publ. 24, 204–221.
Sahni, A., Bhatia, S.B., Kumar, K., 1983. Faunal evidence for thewithdrawal of the Tethys inthe Lesser Himalaya, Northwest India. Bull. Soc. Paleontol. Ital. 22, 77–86.
Shalaby, M.R., Hakimi, M.H., Abdullah, W.H., 2012. Organic geochemical characteristicsand interpreted depositional environment of the Khatatba Formation, northernWestern Desert, Egypt. AAPG Bull. 96 (11), 2019–2036.
Singh, M.P., Singh, G.P., 1995. Petrological evolution of the Paleogene coal deposits ofJammu, Jammu & Kashmir, India. Int. J. Coal Geol. 27, 171–191.
Singh, B.P., Srivastava, A.K., 2011. Storm activities during the Sedimentation of Late Paleo-cene–Middle Eocene Subathu Formation, Western Himalayan Foreland Basin. J. Geol.Soc. India 77, 130–136.
Singh, B.R., Andotra, D.S., Kumar, R., 2000. Provenance of the lower Tertiary mudrocks inthe Jammu Sub-Himalayan Zone, Jammu and Kashmir State (India), NW Himalayaand its tectonic implications. Geosci. J. 4 (1), 1–9.
Slatt, R.M., Rodriguez, N.D., 2012. Comparative sequence stratigraphy and organicgeochemistry of gas shales: commonality or coincidence? J. Nat. Gas Sci. Eng. 8,68–84.
Smith, J.T., 1994. Petroleum system logic as an exploration tool in a frontier setting. In:Magoon, L.B., McKay, J.F. (Eds.), Geochemistry and Chemistry of Oil Shales.American Chemical Society, Washington, DC, pp. 235–248.
Sorkhabi, R.B., Macfarlane, A., 1999. Himalaya and Tibet: mountain roots to mountaintops. Geol. Soc. Am. Spec. Pap. 328, 1–7.
Srivastava, R.A.K., Singh, T., 1984. Bio-diagenetic textures from the Permo-Triassic calcar-eous facies of Kashmir Himalaya. Current Trends in Geology, 5, Sedimentary Geologyof the Himalaya pp. 197–201.
Staplin, F.L., 1969. Sedimentary organic matter, organic metamorphism, and oil and gasoccurrence. Bull. Can. Petrol. Geol. 17 (1), 47–66.
Sweet, W.C., 1970. Permian and Triassic conodonts from a section at Guryul Ravine,Vihi district, Kashmir. Paleontological Contributions, Paper. , 49. The Universityof Kansas.
Thakur, V.C., 1993. Geology of Western Himalaya. Physics and Chemistry of Earth. vol. 19.Pergamon Press, U.K.
Thakur, V.C., Misra, D.K., 1984. Tectonic framework of the Indus and Shyok suture zonesin eastern Ladakh, northwest Himalaya. Tectonophysics 101, 207–220.
Tissot, B., Welte, D.H., 1984. Petroleum Formation and Occurrence, 2nd ed. SpringerVerlag, Heidelberg p. 679.
USGS, 2012. United States Geological Survey. http://pubs.usgs.gov/fs/2011/3131/pdf/fs2011-3131.pdf (Retrieved from).
van Krevelen, D.W., 1961. Coal: Typology–Chemistry–Physics–Constitution. Elsevier Sci-ence, Amsterdam (514 pp.).
Verma, N.K., Ranjan, V., Kumar, J., 2006. Imprints of Mesozoic–Paleozoic strata and Eocenecarbonates in J&K sub-Himalaya: potential rocks for hydrocarbon exploration. Pro-ceedings of 6th International Conference & Exposition on Petroleum Geophysics Kol-kata, pp. 55–60.
Yin, A., Harrison, T.M., 2000. Geologic evolution of the Himalayan–Tibetan orogen. Annu.Rev. Earth Planet. Sci. 28, 211–280.
95D. Mani et al. / International Journal of Coal Geology 128–129 (2014) 81–95