assessing the ecological dominance of phanerozoic marine invertebrates
TRANSCRIPT

Copyright � 2006, SEPM (Society for Sedimentary Geology) 0883-1351/06/0021-0431/$3.00
PALAIOS, 2006, v. 21, p. 431–441
Research Article
DOI: 10.2110/palo.2005.P05-017R
ASSESSING THE ECOLOGICAL DOMINANCE OF PHANEROZOIC MARINE INVERTEBRATES
MATTHEW E. CLAPHAM,1* DAVID J. BOTTJER,1 CATHERINE M. POWERS,1 NICOLE BONUSO,2 MARGARET L. FRAISER,3
PEDRO J. MARENCO,1 STEPHEN Q. DORNBOS,3 and SARA B. PRUSS4
1 Department of Earth Sciences, University of Southern California, Los Angeles, California 90089-0740, USA; 2 Department of Geological Sciences, California StateUniversity, Fullerton, California 92834, USA; 3 Department of Geosciences, University of Wisconsin-Milwaukee, Milwaukee, Wisconsin 53201-0413, USA;
4 Department of Organismic and Evolutionary Biology, Harvard University, 26 Oxford Street, Cambridge, Massachusetts 02138, USAe-mail: [email protected]
ABSTRACT
Ecological studies have revealed that the functional roles of dominantspecies in modern communities are often more important than over-all diversity in governing community composition and functioning.Despite this recognition that abundance and diversity data are bothrequired for a complete understanding of ecological processes, manypaleoecological studies focus on presence-absence data, possibly be-cause of concerns regarding the taphonomic fidelity of time-averagedfossil accumulations. However, the abundance of organisms in shellbeds has been shown to provide a fairly accurate record of the livingcommunity, suggesting that the benefits of relative-abundance datashould be reconsidered. Recognition of ecologically dominant speciesin local fossil assemblages should be based on counts of relative abun-dance and assessment of ecological role. Ecological dominance atlarger spatial or temporal scales can be quantified using the meanrank order of a clade and the proportion of assemblages where theclade is present, providing unbiased, quantitative values for measur-ing the ecological importance of a clade. Their utility has been testedwith three case studies encompassing a range of geographic and tax-onomic scales, using a database of 1221 Ordovician–Paleogene quan-titative fossil collections. The dominance metrics for rhynchonelli-form brachiopods, bivalves, and gastropods broadly parallel anec-dotal trends, even including some more detailed patterns documentedby regional studies. An examination of substrate preferences for bra-chiopod and bivalve orders confirms the abundance of infaunal bi-valves in siliciclastics and epifaunal bivalves in carbonates, but it alsoreveals intriguing patterns regarding substrate preferences amongrhynchonelliform brachiopod orders. The final case study analyzedchanges in dominance between early Mesozoic fossil assemblagesfrom Tethys and Panthalassa, documenting significant geographicdifferences in the ecological importance of rhynchonelliform bra-chiopods and bivalves. These large-scale dominance patterns oftenapproximately matched those inferred from diversity trends; how-ever, there are also times when dominance was decoupled from di-versity, indicating that further investigation of ecological dominancewill provide additional insights into ecological influences on the Phan-erozoic history of life.
‘‘Are most species simply passengers in ecosystems that are runbasically by a few dominants?’’ (Worm and Duffy, 2003, p. 631)
INTRODUCTION
The maintenance of community structure and functioning is not sharedequally among all members of a community. A few species, typically themost abundant members, are ‘‘ecological dominants’’ that play a crucialrole in governing energy flow and providing habitat space for other or-
* Corresponding author.1 www.sepm.org/archive/index.html
ganisms (Power et al., 1996). Most species, however, are so-called weakinteractors that individually exert a minimal effect on community func-tioning and whose presence or absence has no direct impact on the abun-dance of other species in the community (Berlow, 1999). Ecologists nowrecognize that, although diversity (the number of species present) mayinfluence ecosystem functioning through complementarity and increasedresource-use efficiency (van Ruijven and Berendse, 2005) or the emergenteffects of many weak interactors that reduce population variability andpromote community stability (Berlow, 1999; Neutel et al., 2002), theidentity and functional role of a few dominant species are often equallyor even more important in controlling energy flow, trophic structure, andspecies composition (Grime, 1997; Symstad et al., 1998; Downing andLeibold, 2002; Smith and Knapp, 2003; Smith et al., 2004). Becausespecies often adopt similar responses to environmental conditions andplay complementary roles in nutrient cycling and other community pro-cesses, the relationship between species richness diversity and the varietyof functional groups that actually govern community processes is notalways linear, suggesting that diversity alone may not be an accuratepredictor of ecosystem functioning (Dıaz and Cabido, 2001). The loss ofa single dominant species or functional group can reduce productivityand disrupt trophic energy flow, ultimately leading to significant changesin the abundance of other organisms and substantial reorganizations ofcommunity structure through trophic cascades, cascading extinctions, andcatastrophic regime shifts (Pace et al., 1999; Scheffer and Carpenter,2003; Worm and Duffy, 2003). These results stress the importance ofassessing both diversity and ecological dominance in community studies,and they imply that consideration of species richness alone will provideonly a partial description of the ecological processes operating to structurecommunities and paleocommunities.
Ecologically dominant species in modern communities can be classi-fied as: (1) competitively dominant species; (2) keystone species; or (3)ecosystem engineers, on the basis of the manner in which they influencecommunity structure. Competitive dominants are species that are highlyabundant within a community because of adaptations that confer superiorcompetitive ability or result in better adaptation to local environmentalconditions (Bruno et al., 2003). For example, mussels are highly abundantcompetitive dominants in regions of the intertidal zone because they arebetter adapted to thrive in high-energy conditions and can displace otherlarge sessile species such as barnacles and macroalgae (Bruno et al.,2003). Although competitive dominants may sometimes directly excludeother organisms through competition, their high abundance more oftensimply signals a better adaptation to local conditions. Keystone speciesare taxa that also have a large impact on the community; in contrast tocompetitive dominants, their effect is much greater than predicted fromtheir abundance (Power et al., 1996). The effects of keystone species arealso often indirect, acting on lower levels of the food web through trophiccascades (Pace et al., 1999). Predatory starfish are classic keystone pred-ators in intertidal communities; by selectively preying upon competitivelydominant mussels, they alter community structure, fostering a greaterdiversity of primary sessile benthic species (Paine, 1969; Power et al.,
432 PALAIOSCLAPHAM ET AL.
1996). Ecosystem engineers are organisms that directly or indirectly alterthe physical environment, affecting resource availability for other mem-bers of the community (Jones et al., 1994). Like keystone species, eco-system engineers often (but not always) have a disproportionately largerimportance than their low abundance would suggest. A familiar ecosys-tem engineer is the beaver, which transforms forests into wetlands throughits dam-building activities, modifying large areas of habitat and affectingnutrient cycling, water quality, and local species composition (Jones etal., 1994). Similarly, burrowing infauna have long been recognized in thepaleontological literature as ecosystem engineers (Levinton, 1995); byaltering substrate consistency and sediment biogeochemistry (e.g.,Rhoads and Young, 1970; Lohrer et al., 2004), they exclude sessile epi-fauna and may have contributed to long-term faunal changes (e.g., Thay-er, 1979, 1983; Sepkoski et al., 1991; Bottjer et al., 2000).
In contrast to the extensive research by ecologists on characterizingthe nature of ecological dominance and identifying dominant species orclades, widespread analysis of abundance data has been a relatively latearrival in paleoecological research, despite recognition that dominanceand diversity effects in paleocommunities are not necessarily correlated(McKinney et al., 1998; Droser et al., 2000). Relative-abundance dataenjoyed widespread use during the 1960s and 1970s in delineating fossilassemblages and evaluating trophic and community change (Ziegler etal., 1968; Walker and Laporte, 1970; Watkins, 1973; Levinton and Bam-bach, 1975; Walker and Alberstadt, 1975; Titus and Cameron, 1976).Later recognition of the severity of taphonomic biases potentially intro-duced by spatial mixing and time averaging (Fursich, 1978; Fursich andAberhan, 1990; Kidwell, 1993; Kidwell and Flessa, 1996), however, waslikely a major factor contributing to increased reticence associated withattributing ecological or biological significance to relative-abundance datain level-bottom assemblages. Could relative abundance within a fossilcollection have any real ecological meaning if that assemblage is a mix-ture of several to many successive generations possibly contaminatedwith exotic species introduced through physical transport? Subsequenttaphonomic studies have suggested that the answer to this question is aqualified yes. Some fossil assemblages do in fact provide a mostly ac-curate snapshot of the rank-order structure of the living community (Kid-well, 2001, 2002). These results have begun to prompt paleoecologists toreevaluate the benefits of relative-abundance data and studies of ecolog-ical dominance. Despite taphonomic biases that may invalidate someanalyses derived from modern communities and partially obscure syn-ecological relationships, greater incorporation of relative-abundance datainto a paleoecological research program and explicit consideration of eco-logical dominance will supplement diversity data and better constrain ourunderstanding of the ecological influences on the Phanerozoic history oflife.
This research has three key goals. (1) To identify a set of criteria thathave been used as proxies for assessing ecological dominance in the fossilrecord, recognizing that certain ecological methods of assessing domi-nance in modern communities may not apply to the fossil record and thatfossil assemblages may provide ways to measure dominance not availablein modern settings. (2) To generate metrics for assessing ecological dom-inance in fossil assemblages from quantitative literature data, and to testthe viability of the dominance values with three case studies. (3) Topropose a methodology for assessing dominance and encourage research-ers to continue collecting relative-abundance data and explicitly assessecological dominance, and to consider what underlying biotic and abioticfactors might have influenced trends in dominant invertebrate groups.
ASSESSING LOCAL ECOLOGICAL DOMINANCE
Ecologists have defined a number of specific criteria for assessing eco-logical dominance in modern communities through studies of keystonespecies, ecosystem engineers, and competitive dominants. But given thesignificant differences between fossil assemblages and modern commu-nities, especially those arising from taphonomic effects, some of these
criteria will not be applicable to studies of ancient counterparts. For ex-ample, identification of keystone species, recognized in modern com-munities by their strong interaction strength and disproportionate effecton community structure, typically requires exclusion experiments to de-termine their effects conclusively (Power et al., 1996). Comparative stud-ies of communities with or without the purported keystone species pro-vide the primary evidence in paleoecological studies but are often con-founded by changes in other variables (Power et al., 1996). The problemsinherent to comparative studies are exacerbated by time averaging infossil assemblages and the inability to directly measure interactionstrength of fossil species. Ecosystem engineering, like keystone species,has not often been explicitly addressed in fossil assemblages, but unlikekeystones the broad role of fossil ecosystem engineers can be identified.Just as modern corals act as ecosystem engineers by building a rigid reefframework that provides habitat space for many associated species (Joneset al., 1994), frame builders in fossil reefs can also be identified as eco-system engineers. More subtle examples of engineering, such as the mod-ern periwinkle Littorina, which alters community composition by bull-dozing sediments from hard substrates (Jones et al., 1994), may not beapparent in the fossil record. The role of ecosystem engineers is never-theless important, however, and should be incorporated in paleoecologicalcriteria for dominance. The identity of competitive dominants in fossilassemblages is considerably easier to assess, based on the high abundanceof dominant species in a community. Given the ecological importance ofabundant species in controlling community composition and structure(Power et al., 1996; Smith and Knapp, 2003; Smith et al., 2004), countsof relative abundance within a fossil assemblage will provide the mostunequivocal indication of ecological dominance and a measure that isbroadly comparable to assessments of dominance in ecological studies.
A survey of paleoecological literature reveals that four methods, rang-ing from more qualitative to more quantitative, have been used to assessecological dominance in fossil assemblages. The simplest of these is theuse of distinctive biofacies named for a particular taxon, such as graptolitefacies or bryomol deposits, to indicate qualitative numerical dominanceof that group (e.g., Titus and Cameron, 1976; Taylor and Allison, 1998).Although this method may provide a rapid initial assessment of large-scale abundance trends, especially for groups such as bryozoans that aredifficult to identify and count, the lack of precise abundance counts andpotential taphonomic biases mean that the distinctive biofacies proxy can-not be used for detailed paleoecological studies.
A more quantitative approach to assessing ecological dominance adoptsa field-based scoring system to describe the most abundant componentof shell beds (Allmon and Knight, 1993; Li and Droser, 1997, 1999;Fraiser and Bottjer, 2004). One such approach considers a clade to bedominant if it comprises at least 60% of the total number of individualsin a single bed based on a semiquantitative visual inspection (Fraiser andBottjer, 2004). The shell-bed proxy improves upon the distinctive bio-facies approach by considering single shell beds, thus allowing potentialtaphonomic biases to be addressed. However, the proxy provides only alow level of ecological precision by not providing detailed abundancecounts and considering only higher-level taxonomic groups. This lack ofspecies- or genus-level abundance information masks fine-scale com-munity changes and hinders detailed paleoecological analysis.
Abundance in reef settings may be difficult to assess because the struc-ture and functioning of reef ecosystems are controlled primarily by vol-umetrically large, but numerically rare, functionally important ecosystemengineers such as framework constructors, bafflers, and binders (Fager-strom, 1988). Dominance in reef facies should be recognized throughquantification of biovolume and direct assessment of the ecological roleof taxa in those reefs (e.g., Kissling and Lineback, 1967; Weidlich andFlugel, 1995; Fagerstrom and Weidlich, 1999). For example, scleractiniancorals are ecologically dominant because they physically create theframework of modern reefs; they are fundamentally important ecosystemengineers and constitute a large proportion of community biomass (Fa-gerstrom, 1988; Jones et al., 1994). Although constructors often play the

PALAIOS 433ASSESSING ECOLOGICAL DOMINANCE
most important role in reef ecosystems, members of the baffler and binderguilds may also be dominant organisms, especially when constructors areabsent or less important volumetrically (Cuffey, 1977; Fagerstrom, 1988).This suggests that a group may be ecologically dominant if it is volu-metrically abundant and either makes significant contributions to oneguild or plays accessory roles in several guilds within a reef.
For level-bottom assemblages, direct counts of the abundance of spe-cies within a single shell bed provide a proxy for ecological dominancethat is analogous to assessments of competitive dominance in moderncommunities (Ziegler et al., 1968; Titus and Cameron, 1976; Miller, 1989;Schubert and Bottjer, 1995; Patzkowsky and Holland, 1999; Bonuso etal., 2002; Boyer et al., 2004). Abundant organisms represent dominantspecies that are responsible for controlling community composition andfunctioning in modern communities (Power et al., 1996) and likely playeda similar crucial role in many paleocommunities. In addition, samplingfrom thin, individual shell accumulations allows incorporation of simpletaphonomic field criteria (e.g., Kidwell and Holland, 1991; Fursich, 1995)to remove most deposits that are excessively time averaged, amalgam-ated, and/or spatially mixed. For these reasons, relative abundance is themost refined proxy for ecological dominance, allowing precise assessmentof the identity and role of ecologically dominant species and the impor-tance of subordinate but potentially significant taxa.
As with all proxies and paleoecological studies, relative abundance canassess only the ecological dominance of shelly taxa. Soft-bodied organ-isms are the most abundant component of many modern marine com-munities (e.g., Mayer and Piepenburg, 1996; Gutt et al., 1999), and likelywere similarly dominant in ancient communities (Valentine, 1969), yettheir abundance cannot be quantitatively compared to the shelly fauna ina collection. Another possible complication is the potentially high abun-dance within an assemblage of opportunistic species. These undergo in-termittent explosive population bursts but are usually absent or rare anddo not interact with most members of the community (Levinton, 1970).Therefore, the most abundant dominant species may be overwhelmedduring time averaging by the remains of short-lived blooms of opportun-ists (Fursich and Aberhan, 1990), resulting in an erroneous estimate ofecological dominance. This may be a particular problem in depositionalsettings where abiotic stress is more frequent or severe such as thosefrom nearshore environments like shoreface, lagoonal, or estuarine de-posits. Another complication is the abundance of smaller taxa, which haveshorter generation times and may therefore be overrepresented in deathassemblages, skewing assessment of true ecological dominance (Vermeijand Herbert, 2004). Counts of relative abundance are also difficult toapply to taxa that molt or become disarticulated easily after death (e.g.,trilobites and crinoids). Point counting of specimens on bedding surfacesmay be able to assess the volumetric or biomass dominance of suchorganisms (e.g., Watkins, 1991), but hard-part abundance may not cor-relate well with soft-part biomass and with an individual’s ecologicalimportance. However, despite these caveats there is generally good cor-relation between life and death assemblages in most normal marine en-vironments (Kidwell, 2001), suggesting that rank order and relative abun-dance may indeed provide a reasonable, broad indication of original eco-logical dominance.
Although counting individuals is more time intensive than field scoringof dominance in shell beds, substantial added ecological precision isgained from species- or genus-level analysis of the entire fossil assem-blage, including problematic taxa such as bryozoans and crinoids, andideally counting at least 300–400 individuals (Chang, 1967) from repli-cate samples (Bennington, 2003). Exclusion of bryozoans and crinoidsfrom many Paleozoic collections, where they are commonly the secondor third most abundant group, would artificially raise the rank order ofall groups that are less abundant. Analysis of the complete fossil assem-blage also allows size data and trophic and guild information to be in-corporated. Trophic analysis (Stanton and Dodd, 1976) provides furtherecological information, because the relative importance of epifaunal andinfaunal organisms and suspension and deposit feeders can be assessed
(e.g., Schubert and Bottjer, 1995). The combination of species counts withsize and guild information makes relative abundance the most sensitiveproxy for dominance, yielding precise ecological inferences comparableto those obtained in studies of modern communities. Ideally, each studyshould include these four pieces of information: (1) counts of relativeabundance, (2) size-frequency data, (3) ecological niche, and (4) a lith-ofacies description in order to quantify local dominance and interpret theorganisms’ habitat.
QUANTIFYING ECOLOGICAL DOMINANCE
The four proxies detailed above vary from qualitative and more im-precise (e.g., distinctive biofacies proxy) to more quantitative and focused(e.g., relative abundance proxy), providing different levels of data quality.Taxonomic diversity, because it is not necessarily correlated to a group’sabundance and ecological importance (McKinney et al., 1998; Dıaz andCabido, 2001; Stromberg, 2005), should not be used as a proxy for eco-logical dominance (although both types of data should be collected andthey may sometimes be correlated). In order to compare the ecologicaldominance of different clades it is necessary to develop reproducible,unbiased quantitative metrics using numerical data (relative abundanceproxy) that: (1) assess ecological dominance at the genus or species levelwithin a local assemblage (local dominance); and (2) extrapolate frommany assemblages to quantify ecological dominance at larger temporal,spatial, or phylogenetic levels (regional dominance).
Identification of the dominant clade in a local assemblage (i.e., a fossilcollection obtained from sampling of a single shell bed exposed in oneoutcrop) is based on counts of the number of individuals (or estimationof their biomass) and calculation of relative abundance from those data.Local dominance is calculated from counts of all fossils, although cladesthat comprise less than 5% of the local assemblage should be excludedfrom the final analysis. Excluding rare clades is a common and simplesolution often adopted in paleoecological studies, and it has an empiricalbasis, given the statistical margin of error in most paleoecological sam-pling regimes. Theoretically it seems unlikely that such a rare clade couldhave significant ecological effects (excluding keystone species, whichcannot be identified in paleoecological studies). However, it would alsobe useful to quantify ecological dominance at larger scales in order tocompare the importance of different clades across an environmental tran-sect, in different basins, or between different time intervals.
Assessment of regional dominance requires creation of scale-indepen-dent quantitative metrics that can be extrapolated from a set of measuresof local dominance. There are two intuitive approaches to developing aregional dominance metric, utilizing either the mean percent abundanceof a clade (class, order, genus) from many local assemblages or the meanrank order of a clade from a series of fossil collections. Use of meanrank order has three benefits. First, it is a metric that is simple and in-tuitive, and it has been used previously in small-scale studies (e.g., Bairdand Brett, 1983). Second, rank order is relatively robust to taphonomicalteration (Kidwell, 2001), but relative abundance may be more variable.Finally, rank order may be a more ecologically meaningful measure ofdominance, because the most abundant group (rank order 1) has the great-est ecological importance regardless of its actual proportional abundance.
The degree of regional dominance by a clade depends not only on itsmean rank order but also on the number of fossil assemblages in whichit occurs (e.g., Patzkowsky and Holland, 1999). Clearly a group that wasabundant only in a small number of collections (reflecting a limited en-vironmental or geographic range) was not as dominant as one that waspresent in many local assemblages. From this, one can conclude that aregional dominance metric must include two criteria: a rank-order abun-dance coefficient, measuring the mean rank order of the clade, and abreadth-of-distribution coefficient, measuring the proportion of collec-tions in which that clade was present (i.e., in which it comprised at least5% of the assemblage). The consideration of both rank-order abundanceand breadth of distribution as contributors to regional dominance is a

434 PALAIOSCLAPHAM ET AL.
major benefit of this approach when compared to simple measurement ofa clade’s mean percent abundance. The two variables enable recognitionof changes in dominance either from an increase in average local domi-nance or from an increase in the number of collections where a clade ispresent. For example, a clade may become more dominant by increasingits mean rank-order abundance from 2 to 1.5, whereas a different clademay become more dominant by increasing the proportion of collectionsin which it is present from 0.25 to 0.50. The nature of their dominancewould clearly be quite different, reflecting influences such as changes inthe competitive interactions among groups at a local scale or the breadthof a clade’s environmental tolerances.
APPLYING THE DOMINANCE METRICS: CASE STUDIES
Three case studies were conducted in order to test the dominance met-rics and demonstrate their widespread utility at a variety of temporal,environmental, and spatial scales (provided that enough data are availablefor comparisons): (1) the global dominance histories of rhynchonelliformbrachiopods, bivalves, and gastropods, (2) a comparison of the dominancehistories of rhynchonelliform brachiopod and bivalve orders in siliciclas-tic and carbonate settings, and (3) biogeographic changes in dominancebetween Tethys and eastern Panthalassa in the early Mesozoic. Theseexamples were chosen because they represent well-known paleoecologi-cal transitions (e.g., Gould and Calloway, 1980), incorporate easily fos-silizable groups that were likely to be reported in all faunal lists, andillustrate the wide applicability of the metric to global and regional stud-ies.
Quantitative fossil-assemblage data from the Paleobiology Database(www.pbdb.org), supplemented by other literature references, was usedto calculate the dominance metrics. Only those assemblages with a spatialscale of ‘‘small collection’’ or ‘‘outcrop’’ and a temporal scale of ‘‘bed’’or ‘‘group of beds’’ in the PBDB were utilized for this study. Althoughmany of these collections likely do not meet the strict taphonomic re-quirements for paleoecological studies, the thickness and taphonomy ofsampled beds are not described in most literature sources. The spatial andtemporal restriction should filter the most egregious examples of regionalcollections or assemblages from an entire member or formation. Onlythose collections that appeared to include the entire fauna (in some casesit may be difficult to assess, but obviously brachiopod-only lists, for ex-ample, were excluded) and only those lists containing more than 100individuals were utilized. The resulting database includes 1221 local as-semblages from the Ordovician–Paleogene (see Supplementary Data1).There are no quality assemblages from the Cambrian and only two fromthe Neogene.
Because of the small number of collections in some time intervals, thedata are not yet ideal for studies of ecological dominance. Collectionsare overwhelmingly located in North America and/or Europe (Fig. 1),biased strongly toward either carbonate or siliciclastic lithologies in manyintervals (Fig. 2), and may not provide an equal sampling of all environ-mental settings (Fig. 2). Assessment of ecological dominance at a globalscale must sample local assemblages from all lithologies and depositionalenvironments, and, most importantly, incorporate data from all geograph-ic realms—not just North America and Europe—for the time interval ofinterest, in order to avoid bias from a single dataset. In addition, manycollections (especially in the Paleozoic) do not provide quantitative es-timates of the abundance of important groups such as bryozoans. Nev-ertheless, the Paleobiology Database data are the only available relative-abundance data and will be sufficient, but not ideal, for this pilot study.Caveats in the assessment of ecological dominance resulting from thebiased nature of the data are discussed below, and imply that furthercollection of abundance counts is of paramount importance.
Global Dominance Histories of Brachiopods, Bivalves,and Gastropods
The taxonomic and ecological transition between rhynchonelliformbrachiopods and molluscs (bivalves and gastropods) was one of the more
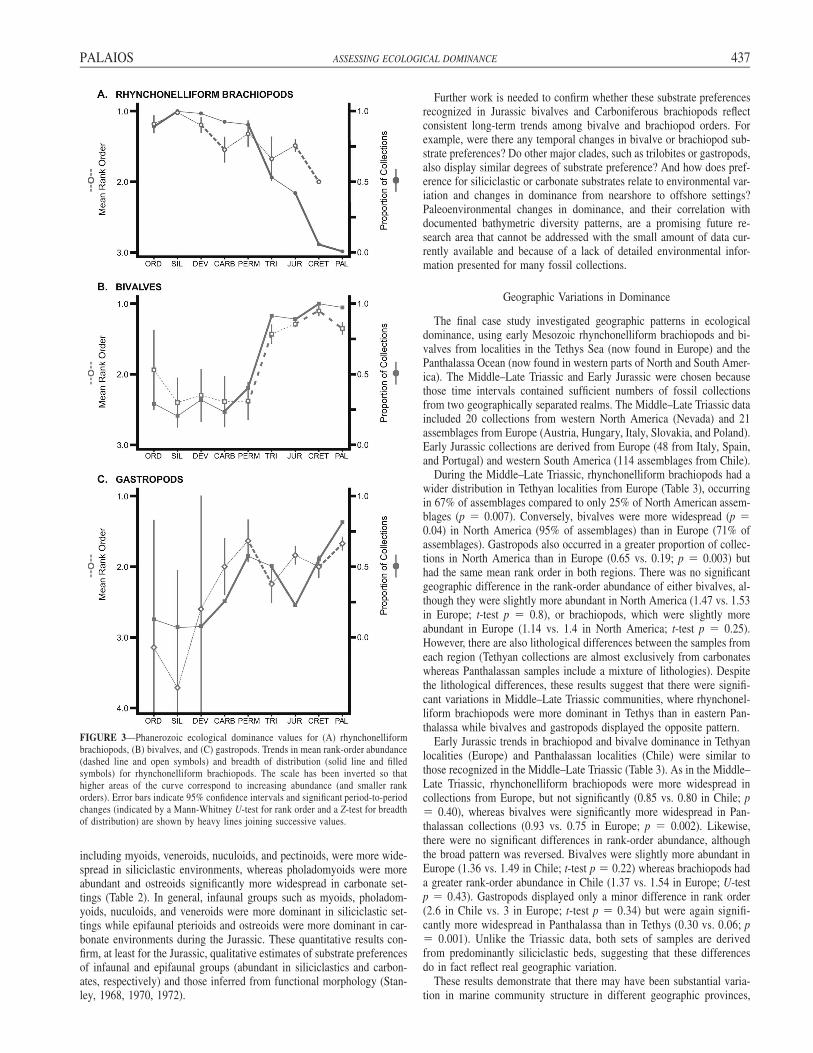
important biotic events in marine ecosystems. The nature of this transitionhas largely been addressed using diversity measures (Gould and Callo-way, 1980; Sepkoski, 1996), supplemented by regional studies of relativeabundance (e.g., Phelps, 2004). There have been many studies docu-menting the dominant clade in local areas and in selected time intervals(Watkins, 1973; Aberhan, 1994; Patzkowsky and Holland, 1999) and, asa result, the generalization that brachiopods were most abundant in thePaleozoic and molluscs in the post-Paleozoic is widely accepted. How-ever, no previous studies have synthesized these separate works into aquantitative dominance history for the entire Phanerozoic. Quantitativereconstruction of the mean rank-order abundance and breadth of distri-bution for rhynchonelliform brachiopods, bivalves, and gastropods (Fig.3) shows that brachiopods were most dominant during the Paleozoic andmolluscs most dominant in the post-Paleozoic, confirming at this broadscale the anecdotal trends described previously in the literature. However,the transition was not as abrupt as assumed from diversity data, and thereappear to be considerably more nuances during the Permian–Cretaceousinterval, even at the coarse temporal scale utilized in this analysis.
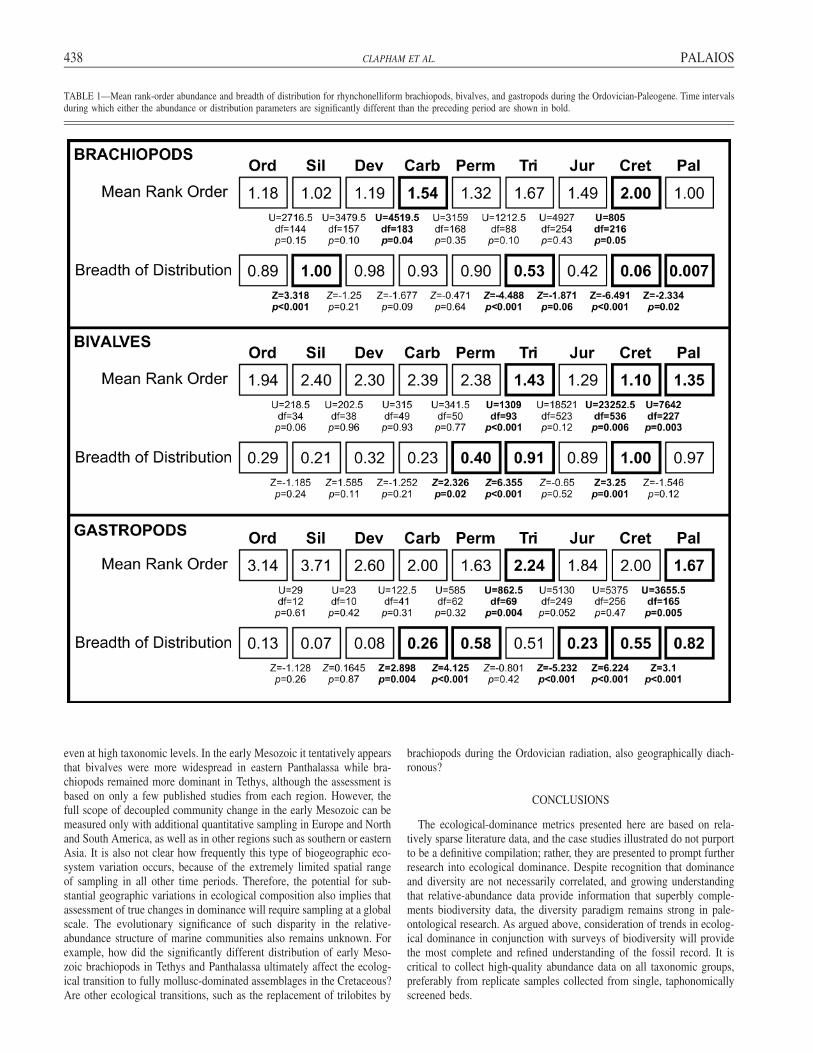
The mean rank-order abundance of rhynchonelliform brachiopods fromthe Ordovician–Devonian varied between 1.0 and 1.2 (Fig. 3A), with nomeaningful difference between the time intervals (Table 1). Brachiopodrank-order abundance decreased significantly from the Devonian to theCarboniferous, to a mean rank order of 1.54 (Mann-Whitney U-test, p �0.04), confirming the local pattern documented by Phelps (2004). Abun-dance then remained constant at the period level through the Jurassic,although there were substantial short-term variations not recognized inthis dataset (e.g., Early Triassic recovery interval; Fraiser and Bottjer,2005), declining significantly to a mean rank-order of 2 in the Cretaceous(p � 0.05). Brachiopods are present in only one Paleogene collection,precluding calculation of the mean rank order. Rhynchonelliform bra-chiopods were found in 83% to 100% of Paleozoic collections, with sig-nificant period-to-period change in breadth of distribution only occurringfrom the Ordovician to Silurian (Z-test, p � 0.001). There were alsosignificant decreases in the proportion of collections containing rhyncho-nelliform brachiopods (Fig. 3A), from the Permian to Triassic (0.90 to0.53; p � 0.001), Jurassic to Cretaceous (0.42 to 0.06; p � 0.001), andCretaceous to Paleogene (0.06 to 0.007; p � 0.02).
Bivalves were much less abundant than brachiopods throughout thePaleozoic (Table 1), with a mean rank order of 1.9 to 2.4 (Fig. 3B) butdisplayed no significant temporal trends. Abundance increased from thePermian to the Triassic (mean rank order from 2.38 to 1.43; p � 0.001),when bivalves and rhynchonelliform brachiopods had similar mean rank-order abundances (1.43 vs. 1.67; Mann-Whitney U � 1770, df � 115,p � 0.31). Bivalves increased in abundance significantly from the Juras-sic to the Cretaceous (rank order 1.29 to 1.1; p � 0.006) but were lessabundant in the Paleogene (rank order 1.35; p � 0.003). Bivalve breadthof distribution widened in three significant steps (Fig. 3B): during theCarboniferous–Permian (0.23 to 0.40; p � 0.04), Permian–Triassic (0.40to 0.91; p � 0.001), and Jurassic–Cretaceous (0.89 to 1; p � 0.001)transitions.
The only statistically significant transitions in the abundance of gas-tropods were from the Permian to Triassic (rank-order abundance de-clined from 1.63 to 2.24; p � 0.004) and between the Cretaceous andPaleogene, when the rank-order changed from 2 to 1.67 (p � 0.005;Table 1). Gastropod rank-order abundance gradually decreased throughthe Phanerozoic (Fig. 3C), but sample size of gastropods, especially inearly Paleozoic assemblages, was extremely small (gastropods were onlypresent in 5 to 7 assemblages in the Ordovician–Devonian). Most of themajor shifts in gastropod dominance were instead accommodated by in-creases in the proportion of collections in which gastropods are found,first from 0.08 in the Devonian to 0.26 in the Carboniferous (p � 0.004).Subsequent shifts occurred between the Carboniferous and Permian (0.26to 0.67; p � 0.001), between the Triassic and Jurassic (0.51 to 0.23; p� 0.001), the Jurassic and Cretaceous (0.23 to 0.55; p � 0.001), andthe Cretaceous to Paleogene (0.55 to 0.82; p � 0.001).

PALAIOS 435ASSESSING ECOLOGICAL DOMINANCE
FIGURE 1—Paleogeographic maps showing the spatial distribution of sampled fossil assemblages in each time interval. Base maps are modified from Scotese (2002).
436 PALAIOSCLAPHAM ET AL.
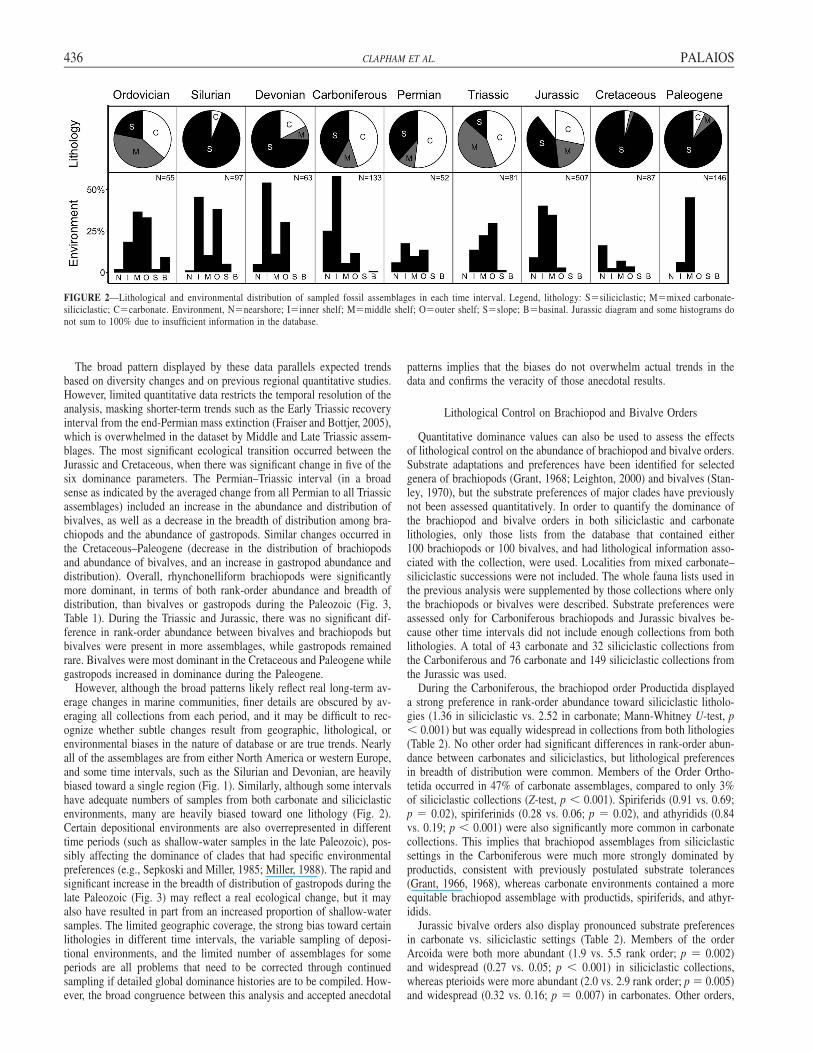
FIGURE 2—Lithological and environmental distribution of sampled fossil assemblages in each time interval. Legend, lithology: S�siliciclastic; M�mixed carbonate-siliciclastic; C�carbonate. Environment, N�nearshore; I�inner shelf; M�middle shelf; O�outer shelf; S�slope; B�basinal. Jurassic diagram and some histograms donot sum to 100% due to insufficient information in the database.
The broad pattern displayed by these data parallels expected trendsbased on diversity changes and on previous regional quantitative studies.However, limited quantitative data restricts the temporal resolution of theanalysis, masking shorter-term trends such as the Early Triassic recoveryinterval from the end-Permian mass extinction (Fraiser and Bottjer, 2005),which is overwhelmed in the dataset by Middle and Late Triassic assem-blages. The most significant ecological transition occurred between theJurassic and Cretaceous, when there was significant change in five of thesix dominance parameters. The Permian–Triassic interval (in a broadsense as indicated by the averaged change from all Permian to all Triassicassemblages) included an increase in the abundance and distribution ofbivalves, as well as a decrease in the breadth of distribution among bra-chiopods and the abundance of gastropods. Similar changes occurred inthe Cretaceous–Paleogene (decrease in the distribution of brachiopodsand abundance of bivalves, and an increase in gastropod abundance anddistribution). Overall, rhynchonelliform brachiopods were significantlymore dominant, in terms of both rank-order abundance and breadth ofdistribution, than bivalves or gastropods during the Paleozoic (Fig. 3,Table 1). During the Triassic and Jurassic, there was no significant dif-ference in rank-order abundance between bivalves and brachiopods butbivalves were present in more assemblages, while gastropods remainedrare. Bivalves were most dominant in the Cretaceous and Paleogene whilegastropods increased in dominance during the Paleogene.
However, although the broad patterns likely reflect real long-term av-erage changes in marine communities, finer details are obscured by av-eraging all collections from each period, and it may be difficult to rec-ognize whether subtle changes result from geographic, lithological, orenvironmental biases in the nature of database or are true trends. Nearlyall of the assemblages are from either North America or western Europe,and some time intervals, such as the Silurian and Devonian, are heavilybiased toward a single region (Fig. 1). Similarly, although some intervalshave adequate numbers of samples from both carbonate and siliciclasticenvironments, many are heavily biased toward one lithology (Fig. 2).Certain depositional environments are also overrepresented in differenttime periods (such as shallow-water samples in the late Paleozoic), pos-sibly affecting the dominance of clades that had specific environmentalpreferences (e.g., Sepkoski and Miller, 1985; Miller, 1988). The rapid andsignificant increase in the breadth of distribution of gastropods during thelate Paleozoic (Fig. 3) may reflect a real ecological change, but it mayalso have resulted in part from an increased proportion of shallow-watersamples. The limited geographic coverage, the strong bias toward certainlithologies in different time intervals, the variable sampling of deposi-tional environments, and the limited number of assemblages for someperiods are all problems that need to be corrected through continuedsampling if detailed global dominance histories are to be compiled. How-ever, the broad congruence between this analysis and accepted anecdotal
patterns implies that the biases do not overwhelm actual trends in thedata and confirms the veracity of those anecdotal results.
Lithological Control on Brachiopod and Bivalve Orders
Quantitative dominance values can also be used to assess the effectsof lithological control on the abundance of brachiopod and bivalve orders.Substrate adaptations and preferences have been identified for selectedgenera of brachiopods (Grant, 1968; Leighton, 2000) and bivalves (Stan-ley, 1970), but the substrate preferences of major clades have previouslynot been assessed quantitatively. In order to quantify the dominance ofthe brachiopod and bivalve orders in both siliciclastic and carbonatelithologies, only those lists from the database that contained either100 brachiopods or 100 bivalves, and had lithological information asso-ciated with the collection, were used. Localities from mixed carbonate–siliciclastic successions were not included. The whole fauna lists used inthe previous analysis were supplemented by those collections where onlythe brachiopods or bivalves were described. Substrate preferences wereassessed only for Carboniferous brachiopods and Jurassic bivalves be-cause other time intervals did not include enough collections from bothlithologies. A total of 43 carbonate and 32 siliciclastic collections fromthe Carboniferous and 76 carbonate and 149 siliciclastic collections fromthe Jurassic was used.
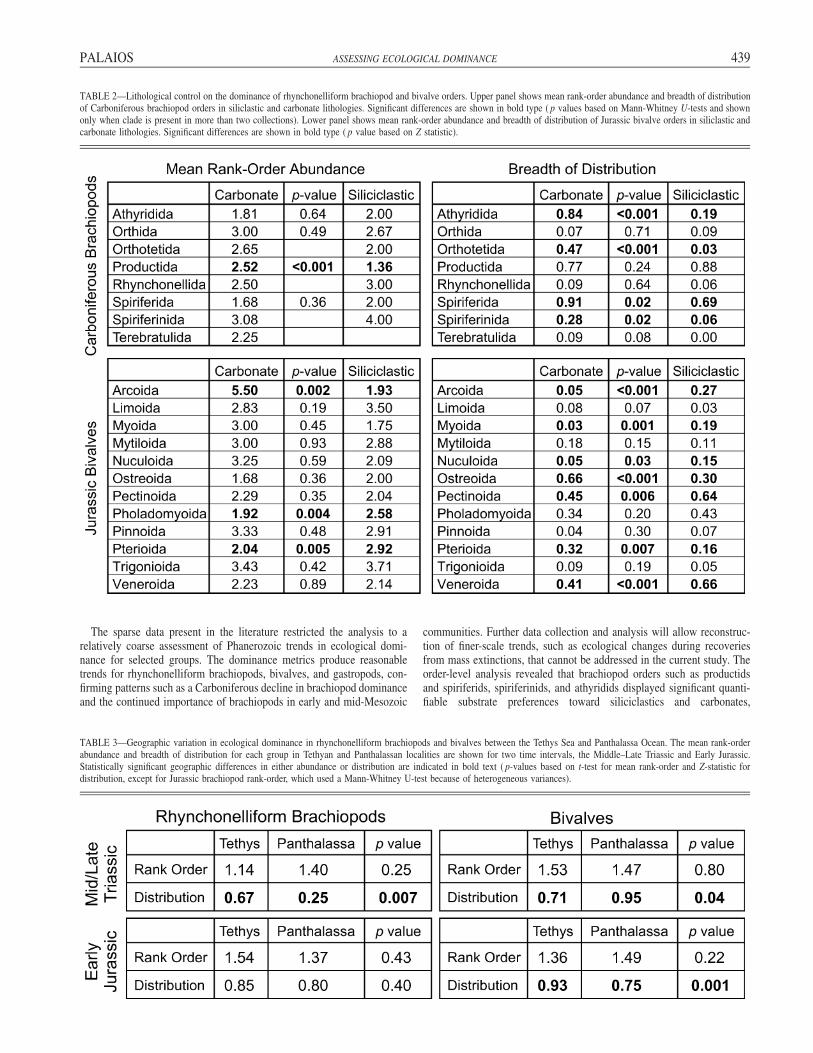
During the Carboniferous, the brachiopod order Productida displayeda strong preference in rank-order abundance toward siliciclastic litholo-gies (1.36 in siliciclastic vs. 2.52 in carbonate; Mann-Whitney U-test, p� 0.001) but was equally widespread in collections from both lithologies(Table 2). No other order had significant differences in rank-order abun-dance between carbonates and siliciclastics, but lithological preferencesin breadth of distribution were common. Members of the Order Ortho-tetida occurred in 47% of carbonate assemblages, compared to only 3%of siliciclastic collections (Z-test, p � 0.001). Spiriferids (0.91 vs. 0.69;p � 0.02), spiriferinids (0.28 vs. 0.06; p � 0.02), and athyridids (0.84vs. 0.19; p � 0.001) were also significantly more common in carbonatecollections. This implies that brachiopod assemblages from siliciclasticsettings in the Carboniferous were much more strongly dominated byproductids, consistent with previously postulated substrate tolerances(Grant, 1966, 1968), whereas carbonate environments contained a moreequitable brachiopod assemblage with productids, spiriferids, and athyr-idids.
Jurassic bivalve orders also display pronounced substrate preferencesin carbonate vs. siliciclastic settings (Table 2). Members of the orderArcoida were both more abundant (1.9 vs. 5.5 rank order; p � 0.002)and widespread (0.27 vs. 0.05; p � 0.001) in siliciclastic collections,whereas pterioids were more abundant (2.0 vs. 2.9 rank order; p � 0.005)and widespread (0.32 vs. 0.16; p � 0.007) in carbonates. Other orders,
PALAIOS 437ASSESSING ECOLOGICAL DOMINANCE
FIGURE 3—Phanerozoic ecological dominance values for (A) rhynchonelliformbrachiopods, (B) bivalves, and (C) gastropods. Trends in mean rank-order abundance(dashed line and open symbols) and breadth of distribution (solid line and filledsymbols) for rhynchonelliform brachiopods. The scale has been inverted so thathigher areas of the curve correspond to increasing abundance (and smaller rankorders). Error bars indicate 95% confidence intervals and significant period-to-periodchanges (indicated by a Mann-Whitney U-test for rank order and a Z-test for breadthof distribution) are shown by heavy lines joining successive values.
including myoids, veneroids, nuculoids, and pectinoids, were more wide-spread in siliciclastic environments, whereas pholadomyoids were moreabundant and ostreoids significantly more widespread in carbonate set-tings (Table 2). In general, infaunal groups such as myoids, pholadom-yoids, nuculoids, and veneroids were more dominant in siliciclastic set-tings while epifaunal pterioids and ostreoids were more dominant in car-bonate environments during the Jurassic. These quantitative results con-firm, at least for the Jurassic, qualitative estimates of substrate preferencesof infaunal and epifaunal groups (abundant in siliciclastics and carbon-ates, respectively) and those inferred from functional morphology (Stan-ley, 1968, 1970, 1972).
Further work is needed to confirm whether these substrate preferencesrecognized in Jurassic bivalves and Carboniferous brachiopods reflectconsistent long-term trends among bivalve and brachiopod orders. Forexample, were there any temporal changes in bivalve or brachiopod sub-strate preferences? Do other major clades, such as trilobites or gastropods,also display similar degrees of substrate preference? And how does pref-erence for siliciclastic or carbonate substrates relate to environmental var-iation and changes in dominance from nearshore to offshore settings?Paleoenvironmental changes in dominance, and their correlation withdocumented bathymetric diversity patterns, are a promising future re-search area that cannot be addressed with the small amount of data cur-rently available and because of a lack of detailed environmental infor-mation presented for many fossil collections.
Geographic Variations in Dominance
The final case study investigated geographic patterns in ecologicaldominance, using early Mesozoic rhynchonelliform brachiopods and bi-valves from localities in the Tethys Sea (now found in Europe) and thePanthalassa Ocean (now found in western parts of North and South Amer-ica). The Middle–Late Triassic and Early Jurassic were chosen becausethose time intervals contained sufficient numbers of fossil collectionsfrom two geographically separated realms. The Middle–Late Triassic dataincluded 20 collections from western North America (Nevada) and 21assemblages from Europe (Austria, Hungary, Italy, Slovakia, and Poland).Early Jurassic collections are derived from Europe (48 from Italy, Spain,and Portugal) and western South America (114 assemblages from Chile).
During the Middle–Late Triassic, rhynchonelliform brachiopods had awider distribution in Tethyan localities from Europe (Table 3), occurringin 67% of assemblages compared to only 25% of North American assem-blages (p � 0.007). Conversely, bivalves were more widespread (p �0.04) in North America (95% of assemblages) than in Europe (71% ofassemblages). Gastropods also occurred in a greater proportion of collec-tions in North America than in Europe (0.65 vs. 0.19; p � 0.003) buthad the same mean rank order in both regions. There was no significantgeographic difference in the rank-order abundance of either bivalves, al-though they were slightly more abundant in North America (1.47 vs. 1.53in Europe; t-test p � 0.8), or brachiopods, which were slightly moreabundant in Europe (1.14 vs. 1.4 in North America; t-test p � 0.25).However, there are also lithological differences between the samples fromeach region (Tethyan collections are almost exclusively from carbonateswhereas Panthalassan samples include a mixture of lithologies). Despitethe lithological differences, these results suggest that there were signifi-cant variations in Middle–Late Triassic communities, where rhynchonel-liform brachiopods were more dominant in Tethys than in eastern Pan-thalassa while bivalves and gastropods displayed the opposite pattern.
Early Jurassic trends in brachiopod and bivalve dominance in Tethyanlocalities (Europe) and Panthalassan localities (Chile) were similar tothose recognized in the Middle–Late Triassic (Table 3). As in the Middle–Late Triassic, rhynchonelliform brachiopods were more widespread incollections from Europe, but not significantly (0.85 vs. 0.80 in Chile; p� 0.40), whereas bivalves were significantly more widespread in Pan-thalassan collections (0.93 vs. 0.75 in Europe; p � 0.002). Likewise,there were no significant differences in rank-order abundance, althoughthe broad pattern was reversed. Bivalves were slightly more abundant inEurope (1.36 vs. 1.49 in Chile; t-test p � 0.22) whereas brachiopods hada greater rank-order abundance in Chile (1.37 vs. 1.54 in Europe; U-testp � 0.43). Gastropods displayed only a minor difference in rank order(2.6 in Chile vs. 3 in Europe; t-test p � 0.34) but were again signifi-cantly more widespread in Panthalassa than in Tethys (0.30 vs. 0.06; p� 0.001). Unlike the Triassic data, both sets of samples are derivedfrom predominantly siliciclastic beds, suggesting that these differencesdo in fact reflect real geographic variation.
These results demonstrate that there may have been substantial varia-tion in marine community structure in different geographic provinces,
438 PALAIOSCLAPHAM ET AL.
TABLE 1—Mean rank-order abundance and breadth of distribution for rhynchonelliform brachiopods, bivalves, and gastropods during the Ordovician-Paleogene. Time intervalsduring which either the abundance or distribution parameters are significantly different than the preceding period are shown in bold.
even at high taxonomic levels. In the early Mesozoic it tentatively appearsthat bivalves were more widespread in eastern Panthalassa while bra-chiopods remained more dominant in Tethys, although the assessment isbased on only a few published studies from each region. However, thefull scope of decoupled community change in the early Mesozoic can bemeasured only with additional quantitative sampling in Europe and Northand South America, as well as in other regions such as southern or easternAsia. It is also not clear how frequently this type of biogeographic eco-system variation occurs, because of the extremely limited spatial rangeof sampling in all other time periods. Therefore, the potential for sub-stantial geographic variations in ecological composition also implies thatassessment of true changes in dominance will require sampling at a globalscale. The evolutionary significance of such disparity in the relative-abundance structure of marine communities also remains unknown. Forexample, how did the significantly different distribution of early Meso-zoic brachiopods in Tethys and Panthalassa ultimately affect the ecolog-ical transition to fully mollusc-dominated assemblages in the Cretaceous?Are other ecological transitions, such as the replacement of trilobites by
brachiopods during the Ordovician radiation, also geographically diach-ronous?
CONCLUSIONS
The ecological-dominance metrics presented here are based on rela-tively sparse literature data, and the case studies illustrated do not purportto be a definitive compilation; rather, they are presented to prompt furtherresearch into ecological dominance. Despite recognition that dominanceand diversity are not necessarily correlated, and growing understandingthat relative-abundance data provide information that superbly comple-ments biodiversity data, the diversity paradigm remains strong in pale-ontological research. As argued above, consideration of trends in ecolog-ical dominance in conjunction with surveys of biodiversity will providethe most complete and refined understanding of the fossil record. It iscritical to collect high-quality abundance data on all taxonomic groups,preferably from replicate samples collected from single, taphonomicallyscreened beds.
PALAIOS 439ASSESSING ECOLOGICAL DOMINANCE
TABLE 2—Lithological control on the dominance of rhynchonelliform brachiopod and bivalve orders. Upper panel shows mean rank-order abundance and breadth of distributionof Carboniferous brachiopod orders in siliclastic and carbonate lithologies. Significant differences are shown in bold type ( p values based on Mann-Whitney U-tests and shownonly when clade is present in more than two collections). Lower panel shows mean rank-order abundance and breadth of distribution of Jurassic bivalve orders in siliclastic andcarbonate lithologies. Significant differences are shown in bold type ( p value based on Z statistic).
TABLE 3—Geographic variation in ecological dominance in rhynchonelliform brachiopods and bivalves between the Tethys Sea and Panthalassa Ocean. The mean rank-orderabundance and breadth of distribution for each group in Tethyan and Panthalassan localities are shown for two time intervals, the Middle–Late Triassic and Early Jurassic.Statistically significant geographic differences in either abundance or distribution are indicated in bold text ( p-values based on t-test for mean rank-order and Z-statistic fordistribution, except for Jurassic brachiopod rank-order, which used a Mann-Whitney U-test because of heterogeneous variances).
The sparse data present in the literature restricted the analysis to arelatively coarse assessment of Phanerozoic trends in ecological domi-nance for selected groups. The dominance metrics produce reasonabletrends for rhynchonelliform brachiopods, bivalves, and gastropods, con-firming patterns such as a Carboniferous decline in brachiopod dominanceand the continued importance of brachiopods in early and mid-Mesozoic
communities. Further data collection and analysis will allow reconstruc-tion of finer-scale trends, such as ecological changes during recoveriesfrom mass extinctions, that cannot be addressed in the current study. Theorder-level analysis revealed that brachiopod orders such as productidsand spiriferids, spiriferinids, and athyridids displayed significant quanti-fiable substrate preferences toward siliciclastics and carbonates,
440 PALAIOSCLAPHAM ET AL.
respectively, whereas the substrate preferences of Jurassic bivalves werebroadly correlated with an infaunal or epifaunal life habit. Finally, therewere substantial ecological differences at the class level between earlyMesozoic Tethyan and Panthalassan assemblages, suggesting that geo-graphic differences in ecological dominance may be significant at certaintimes.
These case studies show that the dominance metrics can be used, withsufficient data, to answer questions at a variety of scales about majorecological transitions, such as the spatial or environmental context ofchanges in ecological dominance. It can also be used to quantify theecological severity of mass extinctions (e.g., Droser et al., 2000; McGheeet al., 2004) or the nature of ecological change associated with boundariesbetween ecological-evolutionary units. Detailed quantification of changesin ecological dominance at finer taxonomic scales, over shorter timeintervals, linked to depositional environment, and coupled with well-documented diversity trends will help to unravel the complex, interrelatedeffects of extinctions, environment, and ecology in the Phanerozoic his-tory of life.
ACKNOWLEDGMENTS
Reviews from R. Bambach, B. Bennington, K. Flessa, A. Miller, T.Olszewski, and M. Patzkowsky on this and an earlier version of thismanuscript provided valuable input in developing our quantitative ap-proach to assessing dominance. This is Paleobiology Database publication#42.
REFERENCES
ABERHAN, M., 1994, Guild-structure and evolution of Mesozoic benthic shelf com-munities: PALAIOS, v. 9, p. 516–545.
ALLMON, W.D., and KNIGHT, J.L., 1993, Paleoecological significance of a turritellinegastropod-dominated assemblage in the Cretaceous of South Carolina: Journal ofPaleontology, v. 67, p. 355–360.
BAIRD, G.C., and BRETT, C.E., 1983, Regional variation and paleontology of twocoral beds in the Middle Devonian Hamilton Group of western New York: Journalof Paleontology, v. 57, p. 417–446.
BENNINGTON, J.B., 2003, Transcending patchiness in the comparative analysis of pa-leocommunities: A test case from the Upper Cretaceous of New Jersey: PALAIOS,v. 18, p. 22–33.
BERLOW, E.L., 1999, Strong effects of weak interactions in ecological communities:Nature, v. 398, p. 330–334.
BONUSO, N., NEWTON, C.R., BROWER, J.C., and IVANY, L.C., 2002, Statistical testingof community patterns: Uppermost Hamilton Group, Middle Devonian (New YorkState: USA): Palaeogeography, Palaeoclimatology, Palaeoecology, v. 185, p. 1–24.
BOTTJER, D.J., HAGADORN, J.W., and DORNBOS, S.Q., 2000, The Cambrian substraterevolution: GSA Today, v. 10,9, p. 1–7.
BOYER, D.L., BOTTJER, D.J., and DROSER, M.L., 2004, Ecological signature of LowerTriassic shell beds of the western United States: PALAIOS, v. 19, p. 372–380.
BRUNO, J.F., STACHOWICZ, J.J., and BERTNESS, M.D., 2003, Inclusion of facilitation intoecological theory: Trends in Ecology and Evolution, v. 18, p. 119–125.
CHANG, Y.-M., 1967, Accuracy of fossil percentage estimation: Journal of Paleon-tology, v. 41, p. 500–502.
CUFFEY, R.J., 1977, Bryozoan contributions to reefs and bioherms through geologictime, in Frost, S.H., Weiss, M.P., and Saunders, J.B., eds., Reefs and RelatedCarbonates—Ecology and Sedimentology: American Association of PetroleumGeologists Studies in Geology, p. 181–194.
DıAZ, S., and CABIDO, M., 2001, Vive la difference: Plant functional diversity mattersto ecosystem processes: Trends in Ecology and Evolution, v. 16, p. 646–655.
DOWNING, A.L., and LEIBOLD, M.A., 2002, Ecosystem consequences of species rich-ness and composition in pond food webs: Nature, v. 416, p. 837–841.
DROSER, M.L., BOTTJER, D.J., SHEEHAN, P.M., and MCGHEE, G.R., JR., 2000, Decou-pling of taxonomic and ecologic severity of Phanerozoic marine mass extinctions:Geology, v. 28, p. 675–678.
FAGERSTROM, J.A., 1988, A structural model for reef communities: PALAIOS, v. 3,p. 217–220.
FAGERSTROM, J.A., and WEIDLICH, O., 1999, Strengths and weaknesses of the reefguild concept and quantitative data: application to the upper Capitan-massive com-munity (Permian), Guadalupe Mountains, New Mexico–Texas: Facies, v. 40, p.131–156.
FRAISER, M., and BOTTJER, D.J., 2004, The non-actualistic Early Triassic gastropod
fauna: a case study of the Lower Triassic Sinbad Limestone Member: PALAIOS,v. 19, p. 259–275.
FRAISER, M.L., and BOTTJER, D.J., 2005, Restructuring in benthic level-bottom shal-low marine communities due to prolonged environmental stress following the end-Permian mass extinction: Comptes Rendus Paleovol, v. 4, p. 515–523.
FURSICH, F.T., 1978, The influence of faunal condensation and mixing on the pres-ervation of fossil benthic communities: Lethaia, v. 11, p. 243–250.
FURSICH, F.T., 1995, Shell concentrations: Eclogae Geologicae Helvetiae, v. 88, p.643–655.
FURSICH, F.T., and ABERHAN, M., 1990, Significance of time-averaging for paleocom-munity analysis: Lethaia, v. 23, p. 143–152.
GOULD, S.J., and CALLOWAY, C.B., 1980, Clams and brachiopods—Ships that pass inthe night: Paleobiology, v. 6, p. 383–396.
GRANT, R.E., 1966, Spine arrangement and life habits of the productoid brachiopodWaagenoconcha: Journal of Paleontology, v. 40, p. 1063–1069.
GRANT, R.E., 1968, Structural adaptation in two Permian brachiopod genera, SaltRange, West Pakistan: Journal of Paleontology, v. 42, p. 1–32.
GRIME, J.P., 1997, Biodiversity and ecosystem function: The debate deepens: Science,v. 277, p. 1260–1261.
GUTT, J., HELSEN, E., ARNTZ, W., and BUSCHMANN, A., 1999, Biodiversity and com-munity structure of the mega-epibenthos in the Magellan region (South America):Scientia Marina, v. 63, p. 155–170.
JONES, C.G., LAWTON, J.H., and SHACHAK, M., 1994, Organisms as ecosystem engi-neers: Oikos, v. 69, p. 373–386.
KIDWELL, S.M., 1993, Patterns of time-averaging in the shallow marine fossil record,in Kidwell, S.M., and Behrensmeyer, A.K., eds., Taphonomic Approaches to TimeResolution in Fossil Assemblages, Short Courses in Paleontology 6: Knoxville,The Paleontological Society, p. 275–300.
KIDWELL, S.M., 2001, Preservation of species abundance in marine death assem-blages: Science, v. 294, p. 1091–1094.
KIDWELL, S.M., 2002, Time-averaged molluscan death assemblages: Palimpsests ofrichness, snapshots of abundance: Geology, v. 30, p. 803–806.
KIDWELL, S.M., and FLESSA, K.W., 1996, The quality of the fossil record: Populations,species, and communities: Annual Review of Earth and Planetary Sciences, v. 24,p. 433–464.
KIDWELL, S.M., and HOLLAND, S.M., 1991, Field description of coarse bioclastic fab-rics: PALAIOS, v. 6, p. 426–434.
KISSLING, D.L., and LINEBACK, J.A., 1967, Paleoecological analysis of corals andstromatoporoids in a Devonian biostrome, Falls of the Ohio, Kentucky-Indiana:Geological Society of America Bulletin, v. 78, p. 157–174.
LEIGHTON, L.R., 2000, Environmental distribution of spinose brachiopods from theDevonian of New York: Test of the soft-substrate hypothesis: PALAIOS, v. 15,p. 184–193.
LEVINTON, J., 1970, Paleoecological significance of opportunistic species: Lethaia, v.3, p. 69–78.
LEVINTON, J., 1995, Bioturbators as ecosystem engineers: control of the sedimentfabric, inter-individual interactions, and material fluxes, in Jones, C.G., and Law-ton, J.H., eds., Linking Species & Ecosystems: New York, Chapman and Hall, p.29–36.
LEVINTON, J.S., and BAMBACH, R.K., 1975, A comparative study of Silurian and recentdeposit-feeding bivalve communities: Paleobiology, v. 1, p. 97–124.
LI, X., and DROSER, M.L., 1997, Nature and distribution of Cambrian shell concen-trations: Evidence from the Basin and Range Province of the Western UnitedStates (California, Nevada, and Utah): PALAIOS, v. 12, p. 111–126.
LI, X., and DROSER, M.L., 1999, Lower and Middle Ordovician shell beds from theBasin and Range Province of the Western United States (California, Nevada, andUtah): PALAIOS, v. 14, p. 215–233.
LOHRER, A.M., THRUSH, S.F., and GIBBS, M.M., 2004, Bioturbators enhance ecosystemfunction through complex biogeochemical interactions: Nature, v. 431, p. 1092–1095.
MAYER, M., and PIEPENBURG, D., 1996, Epibenthic community patterns on the con-tinental slope off East Greenland at 75� N: Marine Ecology Progress Series, v.143, p. 151–164.
MCGHEE, G.R., JR., SHEEHAN, P.M., BOTTJER, D.J., and DROSER, M.L., 2004, Ecologicalranking of Phanerozoic biodiversity crises: Ecological and taxonomic severitiesare decoupled: Palaeogeography, Palaeoclimatology, Palaeoecology, v. 211, p.289–297.
MCKINNEY, F.K., LIDGARD, S., SEPKOSKI, J.J., JR., and TAYLOR, P.D., 1998, Decoupledtemporal patterns of evolution and ecology in two post-Paleozoic clades: Science,v. 281, p. 807–809.
MILLER, A.I., 1988, Spatio-temporal transitions in Paleozoic Bivalvia: An analysisof North American fossil assemblages: Historical Biology, v. 1, p. 251–273.
MILLER, A.I., 1989, Spatio-temporal transitions in Paleozoic Bivalvia: A field com-parison of Upper Ordovician and upper Paleozoic bivalve-dominated fossil assem-blages: Historical Biology, v. 2, p. 227–260.

PALAIOS 441ASSESSING ECOLOGICAL DOMINANCE
NEUTEL, A.-M., HEESTERBEEK, J.A.P., and DE RUITER, P.C., 2002, Stability in real foodwebs: Weak links in long loops: Science, v. 296, p. 1120–1123.
PACE, M.L., COLE, J.J., CARPENTER, S.R., and KITCHELL, J.F., 1999, Trophic cascadesrevealed in diverse ecosystems: Trends in Ecology and Evolution, v. 14, p. 483–488.
PAINE, R.T., 1969, A note on trophic complexity and community stability: AmericanNaturalist, v. 103, p. 91–93.
PATZKOWSKY, M.E., and HOLLAND, S.M., 1999, Biofacies replacement in a sequencestratigraphic framework: Middle and Upper Ordovician of the Nashville Dome,Tennessee, USA: PALAIOS, v. 14, p. 301–323.
PHELPS, W.T., 2004, Ecologic changes associated with the Late Devonian mass ex-tinction: evidence from field and laboratory studies of limestones from the GreatBasin region of the western United States (abstract): GSA Abstracts with Pro-grams, v. 36, p. 177.
POWER, M.E., TILMAN, D., ESTES, J.A., MENGE, B.A., BOND, W.J., MILLS, L.S., DAILY,G., CASTILLA, J.C., LUBCHENCO, J., and PAINE, R.T., 1996, Challenges in the questfor keystones: BioScience, v. 46, p. 609–620.
RHOADS, D.C., and YOUNG, D.K., 1970, The influence of deposit-feeding organismson sediment stability and community trophic structure: Journal of Marine Re-search, v. 28, p. 150–178.
SCHEFFER, M., and CARPENTER, S.R., 2003, Catastrophic regime shifts in ecosystems:Linking theory to observation: Trends in Ecology and Evolution, v. 18, p. 648–656.
SCHUBERT, J.K., and BOTTJER, D.J., 1995, Aftermath of the Permian-Triassic massextinction event: paleoecology of Lower Triassic carbonates in the western USA:Palaeogeography, Palaeoclimatology, Palaeoecology, v. 116, p. 1–39.
SCOTESE, C.R., 2002, www.scotese.com (PALEOMAP website), date accessed: May2005.
SEPKOSKI, J.J., JR., 1996, Competition in macroevolution: The double wedge revisited,in Jablonski, D., Erwin, D.H., and Lipps, J.H., eds., Evolutionary Paleobiology:Chicago, University of Chicago Press, p. 211–255.
SEPKOSKI, J.J., JR., BAMBACH, R.K., and DROSER, M.L., 1991, Secular changes in Phan-erozoic event bedding and the biological overprint: in Einsele, G., Ricbien, W.,and Seilacher, A., eds., Cycles and Events in Stratigraphy: New York, Springer,p. 298–313.
SEPKOSKI, J.J., JR., and MILLER, A.I., 1985, Evolutionary faunas and the distributionof Paleozoic benthic communities in space and time, in Valentine, J.W., ed., Phan-erozoic Diversity Patterns: Princeton, New Jersey, Princeton University Press, p.153–190.
SMITH, M.D., and KNAPP, A.K., 2003, Dominant species maintain ecosystem functionwith non-random species loss: Ecology Letters, v. 6, p. 509–517.
SMITH, M.D., WILCOX, J.C., KELLY, T., and KNAPP, A.K., 2004, Dominance not rich-ness determines invasibility of tallgrass prairie: Oikos, v. 106, p. 253–262.
STANLEY, S.M., 1968, Post-Paleozoic adaptive radiation of infaunal bivalve mol-luscs—A consequence of mantle fusion and siphon formation: Journal of Pale-ontology, v. 42, p. 214–229.
STANLEY, S.M., 1970, Relation of shell form to life habits of the Bivalvia (Mollusca):Geological Society of America Memoir, v. 125, p. 269 p.
STANLEY, S.M., 1972, Functional morphology and evolution of byssally attachedbivalve mollusks: Journal of Paleontology, v. 46, p. 165–211.
STANTON, R.J., and DODD, J.R., 1976, The application of trophic structure of fossilcommunities in paleoenvironmental reconstruction: Lethaia, v. 9, p. 327–342.
STROMBERG, C.A.E., 2005, Decoupled taxonomic radiation and ecological expansionof open-habitat grasses in the Cenozoic of North America: Proceedings of theNational Academy of Sciences, USA, v. 102, p. 11,980–11,984.
SYMSTAD, A.J., TILMAN, D., WILLSON, J., and KNOPS, J.M.H., 1998, Species loss andecosystem functioning: Effects of species identity and community composition:Oikos, v. 81, p. 389–397.
TAYLOR, P.D., and ALLISON, P.A., 1998, Bryozoan carbonate through time and space:Geology, v. 26, p. 459–462.
THAYER, C.W., 1979, Biological bulldozers and the evolution of marine benthic com-munities: Science, v. 203, p. 458–461.
THAYER, C.W., 1983, Sediment-mediated biological disturbance and the evolution ofmarine benthos, in Tevesz, M.J.S., and McCall, P.L., eds., Biotic Interactions inRecent and Fossil Benthic Communities: New York, Plenum Press, p. 479–625.
TITUS, R., and CAMERON, B., 1976, Fossil communities of the lower Trenton Group(Middle Ordovician) of central and northwestern New York State: Journal of Pa-leontology, v. 50, p. 1209–1225.
VALENTINE, J.W., 1969, Patterns of taxonomic and ecological structure of the shelfbenthos during Phanerozoic time: Palaeontology, v. 12, p. 684–709.
VAN RUIJVEN, J., and BERENDSE, F., 2005, Diversity-productivity relationships: Initialeffects, long-term patterns, and underlying mechanisms: Proceedings of the Na-tional Academy of Sciences, USA, v. 102, p. 695–700.
VERMEIJ, G.J., and HERBERT, G.S., 2004, Measuring relative abundance in fossil andliving assemblages: Paleobiology, v. 30, p. 1–4.
WALKER, K.R., and ALBERSTADT, L.P., 1975, Ecological succession as an aspect ofstructure in fossil communities: Paleobiology, v. 1, p. 238–257.
WALKER, K.R., and LAPORTE, L.F., 1970, Congruent fossil communities from Ordo-vician and Devonian carbonates of New York: Journal of Paleontology, v. 44, p.928–944.
WATKINS, R., 1973, Carboniferous faunal associations and stratigraphy, Shasta Coun-ty, northern California: American Association of Petroleum Geologists Bulletin,v. 57, p. 1743–1764.
WATKINS, R., 1991, Guild structure and tiering in a high-diversity Silurian commu-nity, Milwaukee County, Wisconsin: PALAIOS, v. 6, p. 465–478.
WEIDLICH, O., and FLUGEL, H.W., 1995, Upper Permian (Murghabian) rugose coralsfrom Oman (Ba’id Area, Saih Hatat): community structure and contributions toreefbuilding processes: Facies, v. 33, p. 229–264.
WORM, B., and DUFFY, J.E., 2003, Biodiversity, productivity, and stability in realfood webs: Trends in Ecology and Evolution, v. 18, p. 628–632.
ZIEGLER, A.M., COCKS, L.R.M., and BAMBACH, R.K., 1968, The composition andstructure of Lower Silurian marine communities: Lethaia, v. 1, p. 1–27.
ACCEPTED MARCH 30, 2006