a 56 million year rhythm in north american sedimentation during the phanerozoic
TRANSCRIPT
Earth and Planetary Science Letters xxx (2011) xxx–xxx
EPSL-10736; No of Pages 7
Contents lists available at ScienceDirect
Earth and Planetary Science Letters
j ourna l homepage: www.e lsev ie r.com/ locate /eps l
A 56 million year rhythm in North American sedimentation during the Phanerozoic
Stephen R. Meyers ⁎, Shanan E. PetersDepartment of Geoscience, 1215 W. Dayton Street, University of Wisconsin-Madison, Madison, WI 53706, USA
⁎ Corresponding author. Tel.: +1 608 890 2574; fax:E-mail address: [email protected] (S.R. Me
0012-821X/$ – see front matter © 2010 Elsevier B.V. Adoi:10.1016/j.epsl.2010.12.044
Please cite this article as: Meyers, S.R., PeterPlanet. Sci. Lett. (2011), doi:10.1016/j.epsl.
a b s t r a c t
a r t i c l e i n f oArticle history:Received 20 August 2010Received in revised form 14 December 2010Accepted 20 December 2010Available online xxxx
Edited by P. DeMenocal
Keywords:macrostratigraphycyclostratigraphysedimentationspectral analysisbiologic diversity
Long-term (N10 Myr) fluctuations in climate, sea-level and sedimentation have been documented in thestratigraphic record, but the lack of well-constrained data series has made it difficult to rigorously evaluatecyclic (periodic or quasi-periodic) changes at this scale. Here we utilize a new compilation of the coveragearea of sedimentary rocks in North America to investigate the dominant modes (“orders”) of stratigraphicvariability, and to evaluate potential long-period cyclic changes in sedimentation on the continent during thePhanerozoic. Our analysis resolves two principal temporal modes of variability: (1) a strongly sinusoidalmode with a periodicity of 56 Myr+/−3 Myr, and (2) a longer-term Phanerozoic mode (the “M-curve”,linked to the Wilson cycle), which is indistinguishable from a stochastic autoregressive process. The newlyidentified 56 Myr cycle in sedimentation delineates most of the cratonic sequences that have previously beenidentified qualitatively in North America, but here we propose a quantitative redefinition that includes ninedistinct units and two mega-sequences. The timing of the 56 Myr beat in sedimentation is consistent with anorogenic oscillator source or an oscillatory dynamic in mantle convection, and its tempo is statistically similarto a known rhythm in number of marine animal genera in the global fossil record. Thus, the identification of asignificant periodic signal in the sedimentary record of North America provides new evidence for animportant tectonic- and/or mantle-scale cyclic process that links both large-scale biological evolution andphysical environmental change.
+1 608 262 0693.yers).
ll rights reserved.
s, S.E., A 56 million year rhythm in North Am2010.12.044
© 2010 Elsevier B.V. All rights reserved.
1. Introduction
Rhythmic changes in climate, sea-level and sedimentation are aprominent feature of the Neogene, fundamentally linked to interac-tions between orbital-insolation and cryosphere dynamics (Clarket al., 1999; Hays et al., 1976; Lisiecki, 2010; Zachos et al., 2001).Although longer-term (N10 Myr) fluctuations in climate, sea-leveland sedimentation are known to occur (Haq et al., 1987; Kominz,1995; Miller et al., 2005; Vail et al., 1977), the lack of well-constrained, high-resolution data on the character and extent ofsedimentary rocks has prevented rigorous quantitative analysis oftheir cyclic temporal variability. In this study, we utilize the totalcoverage area of sedimentary strata, derived by macrostratigraphicanalysis of the rock record of North America (Peters, 2006), to (1)extract the dominant modes (“orders”) of stratigraphic variability,and (2) evaluate potential long-period cyclic changes in sedimenta-tion during the Phanerozoic. This continent-scale record reflects boththe production and preservation of sediments, factors that aregoverned by large-scale crustal deformation, mantle-controlleddynamic topography, global eustatic sea-level, and climate (Miall,1997). Our novel approach to this research problem integratesemerging macrostratigraphic and cyclostratigraphic methods to
provide a robust quantitative foundation for evaluation of thestratigraphic record.
2. Material and methods
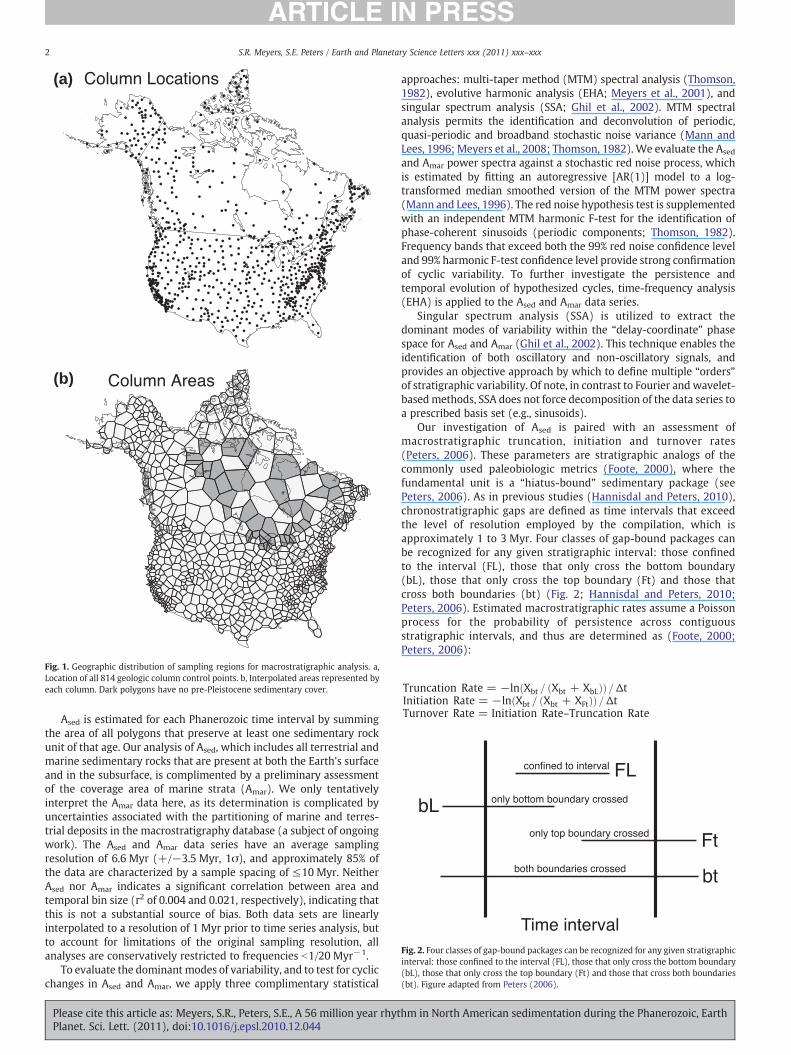
A comprehensive macrostratigraphic database (Peters and Heim,2010) consisting of 18,815 sedimentary rock units from 814geographic locations in North America (Fig. 1) is used to estimatetotal sediment coverage area (Ased), primarily based upon publishedcorrelation charts for the United States (Childs, 1985; Salvador, 1985)and Canada (Douglas, 1970). The database (accessible at http://macrostrat.geology.wisc.edu) includes most known rock units fromboth the surface and subsurface, and utilizes stage boundary agesfrom the most recent International Stratigraphic Chart (InternationalCommission on Stratigraphy; http://www.stratigraphy.org/upload/ISChart2009.pdf). To determine the areal extents of sedimentary rockunits, a Dirichlet tessellation (Fig. 1b) around each of the 814stratigraphic column control points (Fig. 1a) is calculated using theDelaunay triangulation function in the ‘deldir’ package for R(R development core team, 2006). The spacing of columns and theresultant areas generally reflect the complexity of the geologicalrecord of that region, with continental margins having, on average, acloser packing of columns than the sediment-covered continentalinterior. In the absence of data to the contrary, we presume that theareal extent of rock units that occur in one column but not in anadjacent column extends half-way between the two.
erican sedimentation during the Phanerozoic, Earth
(a)
(b)
Fig. 1. Geographic distribution of sampling regions for macrostratigraphic analysis. a,Location of all 814 geologic column control points. b, Interpolated areas represented byeach column. Dark polygons have no pre-Pleistocene sedimentary cover.
Fig. 2. Four classes of gap-bound packages can be recognized for any given stratigraphicinterval: those confined to the interval (FL), those that only cross the bottom boundary(bL), those that only cross the top boundary (Ft) and those that cross both boundaries(bt). Figure adapted from Peters (2006).
2 S.R. Meyers, S.E. Peters / Earth and Planetary Science Letters xxx (2011) xxx–xxx
Ased is estimated for each Phanerozoic time interval by summingthe area of all polygons that preserve at least one sedimentary rockunit of that age. Our analysis of Ased, which includes all terrestrial andmarine sedimentary rocks that are present at both the Earth's surfaceand in the subsurface, is complimented by a preliminary assessmentof the coverage area of marine strata (Amar). We only tentativelyinterpret the Amar data here, as its determination is complicated byuncertainties associated with the partitioning of marine and terres-trial deposits in the macrostratigraphy database (a subject of ongoingwork). The Ased and Amar data series have an average samplingresolution of 6.6 Myr (+/−3.5 Myr, 1σ), and approximately 85% ofthe data are characterized by a sample spacing of ≤10 Myr. NeitherAsed nor Amar indicates a significant correlation between area andtemporal bin size (r2 of 0.004 and 0.021, respectively), indicating thatthis is not a substantial source of bias. Both data sets are linearlyinterpolated to a resolution of 1 Myr prior to time series analysis, butto account for limitations of the original sampling resolution, allanalyses are conservatively restricted to frequencies b1/20 Myr−1.
To evaluate the dominant modes of variability, and to test for cyclicchanges in Ased and Amar, we apply three complimentary statistical
Please cite this article as: Meyers, S.R., Peters, S.E., A 56 million year rhytPlanet. Sci. Lett. (2011), doi:10.1016/j.epsl.2010.12.044
approaches: multi-taper method (MTM) spectral analysis (Thomson,1982), evolutive harmonic analysis (EHA; Meyers et al., 2001), andsingular spectrum analysis (SSA; Ghil et al., 2002). MTM spectralanalysis permits the identification and deconvolution of periodic,quasi-periodic and broadband stochastic noise variance (Mann andLees, 1996; Meyers et al., 2008; Thomson, 1982). We evaluate the Ased
and Amar power spectra against a stochastic red noise process, whichis estimated by fitting an autoregressive [AR(1)] model to a log-transformed median smoothed version of the MTM power spectra(Mann and Lees, 1996). The red noise hypothesis test is supplementedwith an independent MTM harmonic F-test for the identification ofphase-coherent sinusoids (periodic components; Thomson, 1982).Frequency bands that exceed both the 99% red noise confidence leveland 99% harmonic F-test confidence level provide strong confirmationof cyclic variability. To further investigate the persistence andtemporal evolution of hypothesized cycles, time-frequency analysis(EHA) is applied to the Ased and Amar data series.
Singular spectrum analysis (SSA) is utilized to extract thedominant modes of variability within the “delay-coordinate” phasespace for Ased and Amar (Ghil et al., 2002). This technique enables theidentification of both oscillatory and non-oscillatory signals, andprovides an objective approach by which to define multiple “orders”of stratigraphic variability. Of note, in contrast to Fourier and wavelet-basedmethods, SSA does not force decomposition of the data series toa prescribed basis set (e.g., sinusoids).
Our investigation of Ased is paired with an assessment ofmacrostratigraphic truncation, initiation and turnover rates(Peters, 2006). These parameters are stratigraphic analogs of thecommonly used paleobiologic metrics (Foote, 2000), where thefundamental unit is a “hiatus-bound” sedimentary package (seePeters, 2006). As in previous studies (Hannisdal and Peters, 2010),chronostratigraphic gaps are defined as time intervals that exceedthe level of resolution employed by the compilation, which isapproximately 1 to 3 Myr. Four classes of gap-bound packages canbe recognized for any given stratigraphic interval: those confinedto the interval (FL), those that only cross the bottom boundary(bL), those that only cross the top boundary (Ft) and those thatcross both boundaries (bt) (Fig. 2; Hannisdal and Peters, 2010;Peters, 2006). Estimated macrostratigraphic rates assume a Poissonprocess for the probability of persistence across contiguousstratigraphic intervals, and thus are determined as (Foote, 2000;Peters, 2006):
Truncation Rate = −ln Xbt = Xbt + XbLð Þð Þ=ΔtInitiation Rate = −ln Xbt = Xbt + XFtð Þð Þ=ΔtTurnover Rate = Initiation Rate–Truncation Rate
hm in North American sedimentation during the Phanerozoic, Earth
3S.R. Meyers, S.E. Peters / Earth and Planetary Science Letters xxx (2011) xxx–xxx
where Δt=time interval, Xbt=number of gap bound packagesthat cross both the lower and upper time interval boundaries,XbL=number of gap bound packages that only cross the lower timeinterval boundary, XFt=number of gap bound packages that onlycross the upper time interval boundary.
3. Results
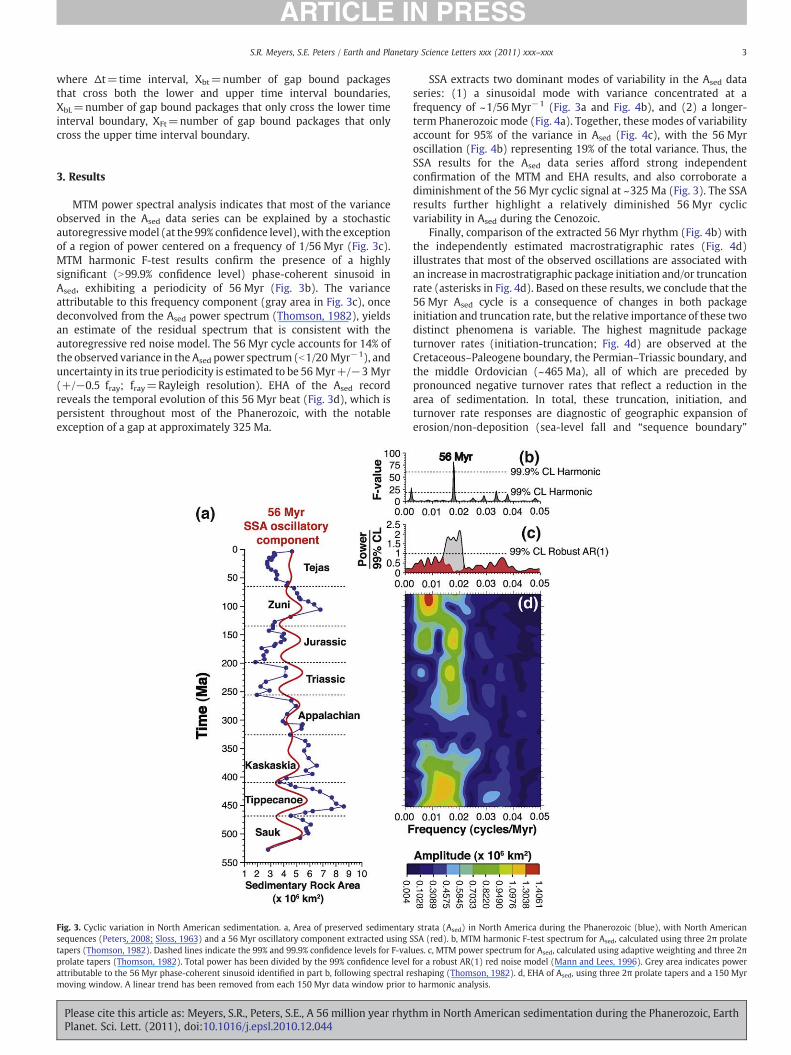
MTM power spectral analysis indicates that most of the varianceobserved in the Ased data series can be explained by a stochasticautoregressivemodel (at the 99% confidence level),with the exceptionof a region of power centered on a frequency of 1/56 Myr (Fig. 3c).MTM harmonic F-test results confirm the presence of a highlysignificant (N99.9% confidence level) phase-coherent sinusoid inAsed, exhibiting a periodicity of 56 Myr (Fig. 3b). The varianceattributable to this frequency component (gray area in Fig. 3c), oncedeconvolved from the Ased power spectrum (Thomson, 1982), yieldsan estimate of the residual spectrum that is consistent with theautoregressive red noise model. The 56 Myr cycle accounts for 14% ofthe observed variance in the Ased power spectrum (b1/20 Myr−1), anduncertainty in its true periodicity is estimated to be 56 Myr+/−3 Myr(+/−0.5 fray; fray=Rayleigh resolution). EHA of the Ased recordreveals the temporal evolution of this 56 Myr beat (Fig. 3d), which ispersistent throughout most of the Phanerozoic, with the notableexception of a gap at approximately 325 Ma.
Fig. 3. Cyclic variation in North American sedimentation. a, Area of preserved sedimentarsequences (Peters, 2008; Sloss, 1963) and a 56 Myr oscillatory component extracted using Stapers (Thomson, 1982). Dashed lines indicate the 99% and 99.9% confidence levels for F-valprolate tapers (Thomson, 1982). Total power has been divided by the 99% confidence levelattributable to the 56 Myr phase-coherent sinusoid identified in part b, following spectral removing window. A linear trend has been removed from each 150 Myr data window prior t
Please cite this article as: Meyers, S.R., Peters, S.E., A 56 million year rhytPlanet. Sci. Lett. (2011), doi:10.1016/j.epsl.2010.12.044
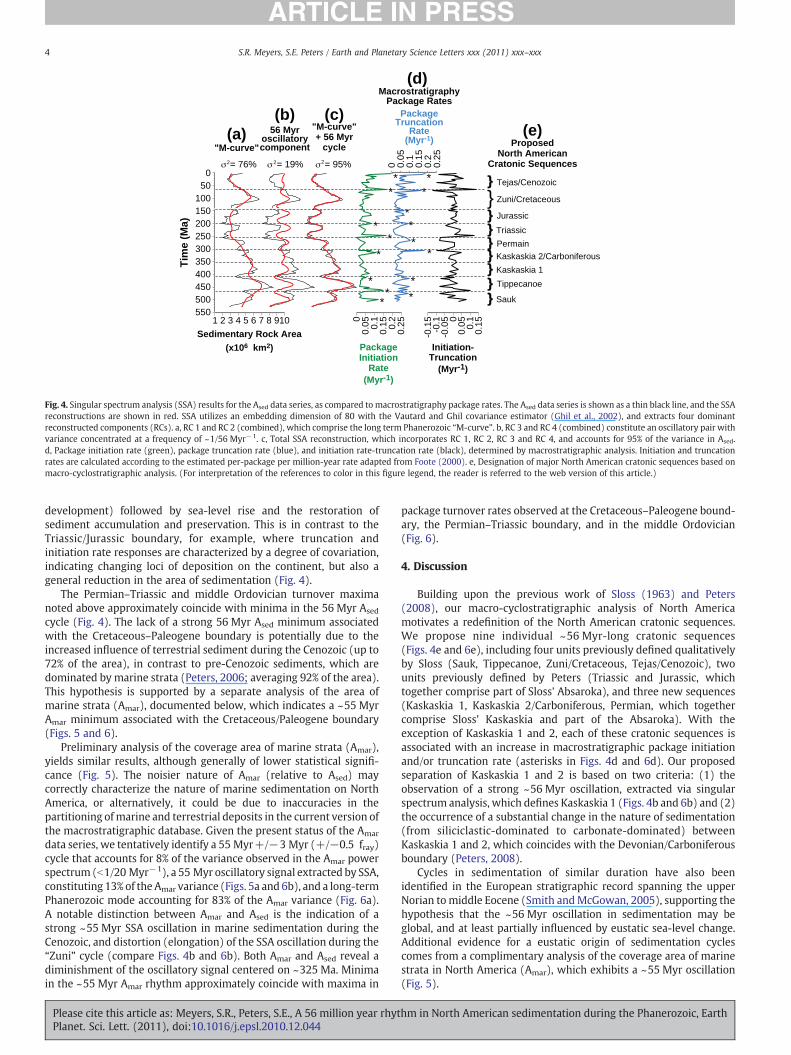
SSA extracts two dominant modes of variability in the Ased dataseries: (1) a sinusoidal mode with variance concentrated at afrequency of ~1/56 Myr−1 (Fig. 3a and Fig. 4b), and (2) a longer-term Phanerozoic mode (Fig. 4a). Together, these modes of variabilityaccount for 95% of the variance in Ased (Fig. 4c), with the 56 Myroscillation (Fig. 4b) representing 19% of the total variance. Thus, theSSA results for the Ased data series afford strong independentconfirmation of the MTM and EHA results, and also corroborate adiminishment of the 56 Myr cyclic signal at ~325 Ma (Fig. 3). The SSAresults further highlight a relatively diminished 56 Myr cyclicvariability in Ased during the Cenozoic.
Finally, comparison of the extracted 56 Myr rhythm (Fig. 4b) withthe independently estimated macrostratigraphic rates (Fig. 4d)illustrates that most of the observed oscillations are associated withan increase inmacrostratigraphic package initiation and/or truncationrate (asterisks in Fig. 4d). Based on these results, we conclude that the56 Myr Ased cycle is a consequence of changes in both packageinitiation and truncation rate, but the relative importance of these twodistinct phenomena is variable. The highest magnitude packageturnover rates (initiation-truncation; Fig. 4d) are observed at theCretaceous–Paleogene boundary, the Permian–Triassic boundary, andthe middle Ordovician (~465 Ma), all of which are preceded bypronounced negative turnover rates that reflect a reduction in thearea of sedimentation. In total, these truncation, initiation, andturnover rate responses are diagnostic of geographic expansion oferosion/non-deposition (sea-level fall and “sequence boundary”
y strata (Ased) in North America during the Phanerozoic (blue), with North AmericanSA (red). b, MTM harmonic F-test spectrum for Ased, calculated using three 2π prolateues. c, MTM power spectrum for Ased, calculated using adaptive weighting and three 2πfor a robust AR(1) red noise model (Mann and Lees, 1996). Grey area indicates powershaping (Thomson, 1982). d, EHA of Ased, using three 2π prolate tapers and a 150 Myro harmonic analysis.
hm in North American sedimentation during the Phanerozoic, Earth
(Myr-1)
*
**
*
*
**
**
*
**
**
*
= 19% = 76% = 95%
550500450400350300250200150100500
1 2 3 4 5 6 7 8 910
Tim
e (M
a)
Sedimentary Rock Area
(a)(b)
Zuni/Cretaceous
Permain
Kaskaskia 1
Tippecanoe
}
} Sauk
Triassic
Jurassic
}}}
}
Tejas/Cenozoic}
56 Myroscillatorycomponent
(c)"M-curve"+ 56 Myr
cycle"M-curve"
(x106 km2)
ProposedNorth American
Cratonic Sequences
(e)
}Kaskaskia 2/Carboniferous}
00.
05 0.1
0.15 0.
20.
250 0.
050.
10.
150.
20.
25
(d)Macrostratigraphy
Package Rates
-0.1
5-0
.1-0
.05 0
0.05 0.
10.
15
*
2 2 2
(Myr-1)
PackageInitiation
Rate
Initiation-Truncation
(Myr-1)
PackageTruncation
Rate
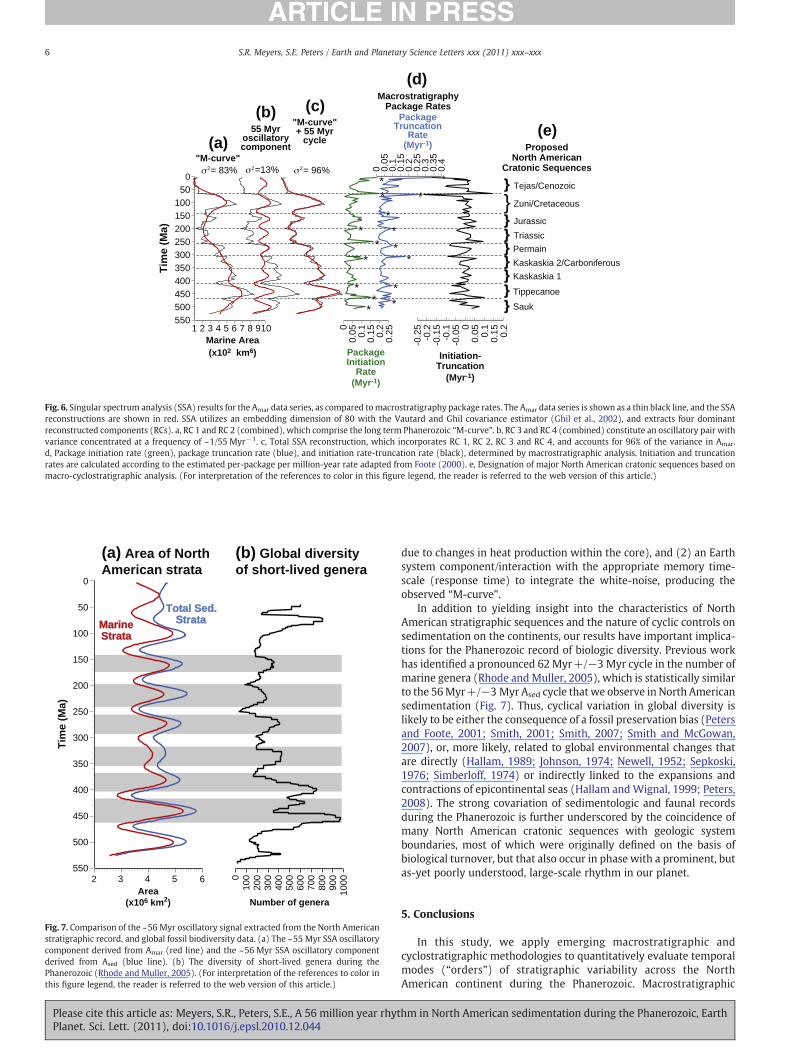
Fig. 4. Singular spectrum analysis (SSA) results for the Ased data series, as compared to macrostratigraphy package rates. The Ased data series is shown as a thin black line, and the SSAreconstructions are shown in red. SSA utilizes an embedding dimension of 80 with the Vautard and Ghil covariance estimator (Ghil et al., 2002), and extracts four dominantreconstructed components (RCs). a, RC 1 and RC 2 (combined), which comprise the long term Phanerozoic “M-curve”. b, RC 3 and RC 4 (combined) constitute an oscillatory pair withvariance concentrated at a frequency of ~1/56 Myr−1. c, Total SSA reconstruction, which incorporates RC 1, RC 2, RC 3 and RC 4, and accounts for 95% of the variance in Ased.d, Package initiation rate (green), package truncation rate (blue), and initiation rate-truncation rate (black), determined by macrostratigraphic analysis. Initiation and truncationrates are calculated according to the estimated per-package per million-year rate adapted from Foote (2000). e, Designation of major North American cratonic sequences based onmacro-cyclostratigraphic analysis. (For interpretation of the references to color in this figure legend, the reader is referred to the web version of this article.)
4 S.R. Meyers, S.E. Peters / Earth and Planetary Science Letters xxx (2011) xxx–xxx
development) followed by sea-level rise and the restoration ofsediment accumulation and preservation. This is in contrast to theTriassic/Jurassic boundary, for example, where truncation andinitiation rate responses are characterized by a degree of covariation,indicating changing loci of deposition on the continent, but also ageneral reduction in the area of sedimentation (Fig. 4).
The Permian–Triassic and middle Ordovician turnover maximanoted above approximately coincide with minima in the 56 Myr Ased
cycle (Fig. 4). The lack of a strong 56 Myr Ased minimum associatedwith the Cretaceous–Paleogene boundary is potentially due to theincreased influence of terrestrial sediment during the Cenozoic (up to72% of the area), in contrast to pre-Cenozoic sediments, which aredominated by marine strata (Peters, 2006; averaging 92% of the area).This hypothesis is supported by a separate analysis of the area ofmarine strata (Amar), documented below, which indicates a ~55 MyrAmar minimum associated with the Cretaceous/Paleogene boundary(Figs. 5 and 6).
Preliminary analysis of the coverage area of marine strata (Amar),yields similar results, although generally of lower statistical signifi-cance (Fig. 5). The noisier nature of Amar (relative to Ased) maycorrectly characterize the nature of marine sedimentation on NorthAmerica, or alternatively, it could be due to inaccuracies in thepartitioning ofmarine and terrestrial deposits in the current version ofthe macrostratigraphic database. Given the present status of the Amar
data series, we tentatively identify a 55 Myr+/−3 Myr (+/−0.5 fray)cycle that accounts for 8% of the variance observed in the Amar powerspectrum (b1/20 Myr−1), a 55 Myr oscillatory signal extracted by SSA,constituting 13% of the Amar variance (Figs. 5a and 6b), and a long-termPhanerozoic mode accounting for 83% of the Amar variance (Fig. 6a).A notable distinction between Amar and Ased is the indication of astrong ~55 Myr SSA oscillation in marine sedimentation during theCenozoic, and distortion (elongation) of the SSA oscillation during the“Zuni” cycle (compare Figs. 4b and 6b). Both Amar and Ased reveal adiminishment of the oscillatory signal centered on ~325 Ma. Minimain the ~55 Myr Amar rhythm approximately coincide with maxima in
Please cite this article as: Meyers, S.R., Peters, S.E., A 56 million year rhytPlanet. Sci. Lett. (2011), doi:10.1016/j.epsl.2010.12.044
package turnover rates observed at the Cretaceous–Paleogene bound-ary, the Permian–Triassic boundary, and in the middle Ordovician(Fig. 6).
4. Discussion
Building upon the previous work of Sloss (1963) and Peters(2008), our macro-cyclostratigraphic analysis of North Americamotivates a redefinition of the North American cratonic sequences.We propose nine individual ~56 Myr-long cratonic sequences(Figs. 4e and 6e), including four units previously defined qualitativelyby Sloss (Sauk, Tippecanoe, Zuni/Cretaceous, Tejas/Cenozoic), twounits previously defined by Peters (Triassic and Jurassic, whichtogether comprise part of Sloss' Absaroka), and three new sequences(Kaskaskia 1, Kaskaskia 2/Carboniferous, Permian, which togethercomprise Sloss' Kaskaskia and part of the Absaroka). With theexception of Kaskaskia 1 and 2, each of these cratonic sequences isassociated with an increase in macrostratigraphic package initiationand/or truncation rate (asterisks in Figs. 4d and 6d). Our proposedseparation of Kaskaskia 1 and 2 is based on two criteria: (1) theobservation of a strong ~56 Myr oscillation, extracted via singularspectrum analysis, which defines Kaskaskia 1 (Figs. 4b and 6b) and (2)the occurrence of a substantial change in the nature of sedimentation(from siliciclastic-dominated to carbonate-dominated) betweenKaskaskia 1 and 2, which coincides with the Devonian/Carboniferousboundary (Peters, 2008).
Cycles in sedimentation of similar duration have also beenidentified in the European stratigraphic record spanning the upperNorian tomiddle Eocene (Smith andMcGowan, 2005), supporting thehypothesis that the ~56 Myr oscillation in sedimentation may beglobal, and at least partially influenced by eustatic sea-level change.Additional evidence for a eustatic origin of sedimentation cyclescomes from a complimentary analysis of the coverage area of marinestrata in North America (Amar), which exhibits a ~55 Myr oscillation(Fig. 5).
hm in North American sedimentation during the Phanerozoic, Earth
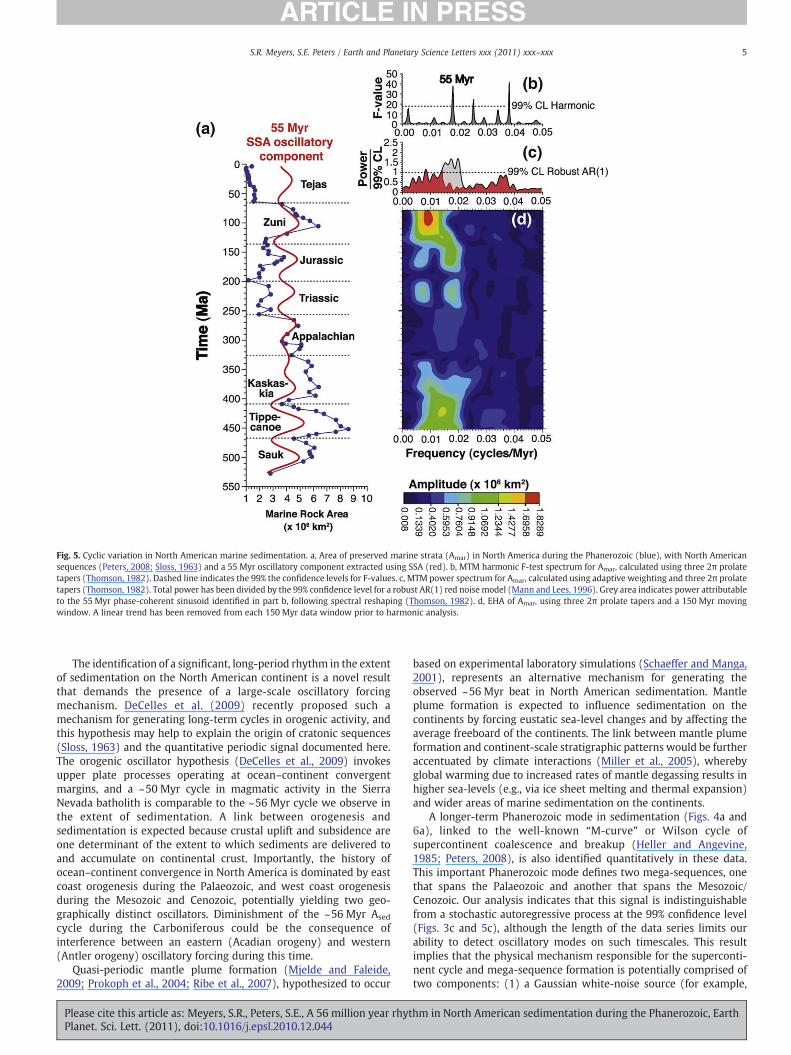
Fig. 5. Cyclic variation in North American marine sedimentation. a, Area of preserved marine strata (Amar) in North America during the Phanerozoic (blue), with North Americansequences (Peters, 2008; Sloss, 1963) and a 55 Myr oscillatory component extracted using SSA (red). b, MTM harmonic F-test spectrum for Amar, calculated using three 2π prolatetapers (Thomson, 1982). Dashed line indicates the 99% the confidence levels for F-values. c, MTM power spectrum for Amar, calculated using adaptive weighting and three 2π prolatetapers (Thomson, 1982). Total power has been divided by the 99% confidence level for a robust AR(1) red noise model (Mann and Lees, 1996). Grey area indicates power attributableto the 55 Myr phase-coherent sinusoid identified in part b, following spectral reshaping (Thomson, 1982). d, EHA of Amar, using three 2π prolate tapers and a 150 Myr movingwindow. A linear trend has been removed from each 150 Myr data window prior to harmonic analysis.
5S.R. Meyers, S.E. Peters / Earth and Planetary Science Letters xxx (2011) xxx–xxx
The identification of a significant, long-period rhythm in the extentof sedimentation on the North American continent is a novel resultthat demands the presence of a large-scale oscillatory forcingmechanism. DeCelles et al. (2009) recently proposed such amechanism for generating long-term cycles in orogenic activity, andthis hypothesis may help to explain the origin of cratonic sequences(Sloss, 1963) and the quantitative periodic signal documented here.The orogenic oscillator hypothesis (DeCelles et al., 2009) invokesupper plate processes operating at ocean–continent convergentmargins, and a ~50 Myr cycle in magmatic activity in the SierraNevada batholith is comparable to the ~56 Myr cycle we observe inthe extent of sedimentation. A link between orogenesis andsedimentation is expected because crustal uplift and subsidence areone determinant of the extent to which sediments are delivered toand accumulate on continental crust. Importantly, the history ofocean–continent convergence in North America is dominated by eastcoast orogenesis during the Palaeozoic, and west coast orogenesisduring the Mesozoic and Cenozoic, potentially yielding two geo-graphically distinct oscillators. Diminishment of the ~56 Myr Ased
cycle during the Carboniferous could be the consequence ofinterference between an eastern (Acadian orogeny) and western(Antler orogeny) oscillatory forcing during this time.
Quasi-periodic mantle plume formation (Mjelde and Faleide,2009; Prokoph et al., 2004; Ribe et al., 2007), hypothesized to occur
Please cite this article as: Meyers, S.R., Peters, S.E., A 56 million year rhytPlanet. Sci. Lett. (2011), doi:10.1016/j.epsl.2010.12.044
based on experimental laboratory simulations (Schaeffer and Manga,2001), represents an alternative mechanism for generating theobserved ~56 Myr beat in North American sedimentation. Mantleplume formation is expected to influence sedimentation on thecontinents by forcing eustatic sea-level changes and by affecting theaverage freeboard of the continents. The link between mantle plumeformation and continent-scale stratigraphic patterns would be furtheraccentuated by climate interactions (Miller et al., 2005), wherebyglobal warming due to increased rates of mantle degassing results inhigher sea-levels (e.g., via ice sheet melting and thermal expansion)and wider areas of marine sedimentation on the continents.
A longer-term Phanerozoic mode in sedimentation (Figs. 4a and6a), linked to the well-known “M-curve” or Wilson cycle ofsupercontinent coalescence and breakup (Heller and Angevine,1985; Peters, 2008), is also identified quantitatively in these data.This important Phanerozoic mode defines two mega-sequences, onethat spans the Palaeozoic and another that spans the Mesozoic/Cenozoic. Our analysis indicates that this signal is indistinguishablefrom a stochastic autoregressive process at the 99% confidence level(Figs. 3c and 5c), although the length of the data series limits ourability to detect oscillatory modes on such timescales. This resultimplies that the physical mechanism responsible for the superconti-nent cycle and mega-sequence formation is potentially comprised oftwo components: (1) a Gaussian white-noise source (for example,
hm in North American sedimentation during the Phanerozoic, Earth
****
***
**
**
* **
*
55050045040035030025020015010050
0
1 2 3 4 5 6 7 8 910
Tim
e (M
a)
Marine Area
(a)
(b)
Zuni/Cretaceous
Permain
Kaskaskia 1
Tippecanoe
}
} Sauk
Triassic
Jurassic
}}}
}
Tejas/Cenozoic}
55 Myroscillatorycomponent
(c)"M-curve"+ 55 Myr
cycle
"M-curve"
(x102 km6)
ProposedNorth American
Cratonic Sequences
(e)
}Kaskaskia 2/Carboniferous}
00.
05 0.1
0.15 0.2
0.25
0 0.05
0.1
0.15
0.2
0.25
0.3
0.35
0.4
(d)Macrostratigraphy
Package Rates
=13% = 83% = 96%
-0.2
5-0
.2-0
.15
-0.1
-0.0
5 00.
05 0.1
0.15 0.2
*
2 2 2
PackageTruncation
Rate(Myr-1)
PackageInitiation
Rate(Myr-1) (Myr-1)
Initiation-Truncation
Fig. 6. Singular spectrum analysis (SSA) results for the Amar data series, as compared tomacrostratigraphy package rates. The Amar data series is shown as a thin black line, and the SSAreconstructions are shown in red. SSA utilizes an embedding dimension of 80 with the Vautard and Ghil covariance estimator (Ghil et al., 2002), and extracts four dominantreconstructed components (RCs). a, RC 1 and RC 2 (combined), which comprise the long term Phanerozoic “M-curve”. b, RC 3 and RC 4 (combined) constitute an oscillatory pair withvariance concentrated at a frequency of ~1/55 Myr−1. c, Total SSA reconstruction, which incorporates RC 1, RC 2, RC 3 and RC 4, and accounts for 96% of the variance in Amar.d, Package initiation rate (green), package truncation rate (blue), and initiation rate-truncation rate (black), determined by macrostratigraphic analysis. Initiation and truncationrates are calculated according to the estimated per-package per million-year rate adapted from Foote (2000). e, Designation of major North American cratonic sequences based onmacro-cyclostratigraphic analysis. (For interpretation of the references to color in this figure legend, the reader is referred to the web version of this article.)
550
500
450
400
350
300
250
200
150
100
50
0
2 3 4 5 6
Tim
e (M
a)
Area
MarineStrata
Total Sed.Strata
(x106 km2)
010
020
030
040
050
060
070
080
090
010
00
Number of genera
(a) Area of NorthAmerican strata
(b) Global diversityof short-lived genera
Fig. 7. Comparison of the ~56 Myr oscillatory signal extracted from the North Americanstratigraphic record, and global fossil biodiversity data. (a) The ~55 Myr SSA oscillatorycomponent derived from Amar (red line) and the ~56 Myr SSA oscillatory componentderived from Ased (blue line). (b) The diversity of short-lived genera during thePhanerozoic (Rhode and Muller, 2005). (For interpretation of the references to color inthis figure legend, the reader is referred to the web version of this article.)
6 S.R. Meyers, S.E. Peters / Earth and Planetary Science Letters xxx (2011) xxx–xxx
Please cite this article as: Meyers, S.R., Peters, S.E., A 56 million year rhytPlanet. Sci. Lett. (2011), doi:10.1016/j.epsl.2010.12.044
due to changes in heat production within the core), and (2) an Earthsystem component/interaction with the appropriate memory time-scale (response time) to integrate the white-noise, producing theobserved “M-curve”.
In addition to yielding insight into the characteristics of NorthAmerican stratigraphic sequences and the nature of cyclic controls onsedimentation on the continents, our results have important implica-tions for the Phanerozoic record of biologic diversity. Previous workhas identified a pronounced 62 Myr+/−3 Myr cycle in the number ofmarine genera (Rhode and Muller, 2005), which is statistically similarto the 56Myr+/−3 Myr Ased cycle that we observe in North Americansedimentation (Fig. 7). Thus, cyclical variation in global diversity islikely to be either the consequence of a fossil preservation bias (Petersand Foote, 2001; Smith, 2001; Smith, 2007; Smith and McGowan,2007), or, more likely, related to global environmental changes thatare directly (Hallam, 1989; Johnson, 1974; Newell, 1952; Sepkoski,1976; Simberloff, 1974) or indirectly linked to the expansions andcontractions of epicontinental seas (Hallam andWignal, 1999; Peters,2008). The strong covariation of sedimentologic and faunal recordsduring the Phanerozoic is further underscored by the coincidence ofmany North American cratonic sequences with geologic systemboundaries, most of which were originally defined on the basis ofbiological turnover, but that also occur in phase with a prominent, butas-yet poorly understood, large-scale rhythm in our planet.
5. Conclusions
In this study, we apply emerging macrostratigraphic andcyclostratigraphic methodologies to quantitatively evaluate temporalmodes (“orders”) of stratigraphic variability across the NorthAmerican continent during the Phanerozoic. Macrostratigraphic
hm in North American sedimentation during the Phanerozoic, Earth
7S.R. Meyers, S.E. Peters / Earth and Planetary Science Letters xxx (2011) xxx–xxx
analysis provides an estimate of the total coverage area ofsedimentary strata (surface and subsurface), as well as quantitativemeasures of the underlying processes that generate the observedstratigraphy (rates of initiation and termination of sedimentarypackages). Quantitative cyclostratigraphic methods provide theopportunity to objectively identify stratigraphic “orders” in themacrostratigraphic data, and permit the deconvolution of determin-istic sinusoidal modes from stochastic variability.
Analysis of the total coverage area of sedimentary strata(terrestrial+marine) identifies two prominent modes: (1) a stronglysinusoidal mode with a periodicity of 56 Myr+/−3 Myr, and (2) alonger-term Phanerozoic mode (the “M-curve” or Wilson cycle),which is indistinguishable from a stochastic autoregressive process.Similar temporal modes are obtained from an analysis of the coveragearea of marine sedimentary strata during the Phanerozoic. Basedon these results we propose a quantitative redefinition of theNorth American cratonic sequences, with nine distinct units(Sauk, Tippecanoe, Kaskaskia 1, Kaskaskia 2/Carboniferous, Permian,Triassic, Jurassic, Zuni/Cretaceous, and Tejas/Cenozoic) and twomega-sequences (Palaeozoic and Mesozoic/Cenozoic).
The ~56 Myr beat in North American sedimentation is statisticallysimilar to a known rhythm in number of marine animal genera in theglobal fossil record, indicating either a fossil preservation bias thatimpacts observed biodiversity, or an intimate linkage between sea-level and environmental conditions that influence biodiversity. Thesource of this ~56 Myr rhythm remains uncertain, but it mustultimately derive from a tectonic- and/or mantle-scale cyclic process.Importantly, these results suggest a unified oscillatory mechanismthat links North American cratonic sequences, geodynamics, andchanges in observed biologic diversity, throughout the Phanerozoic.
Acknowledgments
This research was partially funded by National Science Foundationgrants to SEP (NSF EAR 0819931) and SRM (NSF EAR 1003603). Wethank Nereo Preto, GrahamWeedon, and Peggy Delaney for providingvery helpful reviews and editorial comments on the manuscript.
Appendix A. Supplementary data
Supplementary data to this article can be found online atdoi:10.1016/j.epsl.2010.12.044.
The Supplementary data are available in two separate EXCEL files.The first is designated as "Electronic Appendix 1" and containsMacrostratigraphic data for total sedimentary strata. The second isdesignated as "Electronic Appendix 2" and contains Marcrostrati-graphic data for marine sedimentary strata.
References
Childs, O.E., 1985. Correlation of stratigraphic units of North America; COSUNA. AAPGBull. 69, 173–180.
Clark, P.U., Alley, R.B., Pollard, D., 1999. Northern Hemisphere Ice-sheet influences onglobal climate change. Science 286, 1104–1111.
DeCelles, P.G., Ducea, M.N., Kapp, P., Zandt, G., 2009. Cyclicity in Cordilleran orogenicsystems. Nat. Geosci. 2, 251–257.
Douglas, R.J.W., 1970. Geology and economic minerals of Canada. Economic GeologyReport No. 1. Geological Survey of Canada, Ottawa.
Foote, M., 2000. Origination and extinction components of taxonomic diversity: generalproblems. Paleobiology 4, 74–102.
Ghil, M., Allen, M.R., Dettinger, M.D., Ide, K., Kondrashov, D., Mann, M.E., Robertson, A.W., Saunders, A., Tian, Y., Varadi, F., Yiou, P., 2002. Advanced spectral methods forclimatic times series. Rev. Geophys. 40 1-1–1-41.
Please cite this article as: Meyers, S.R., Peters, S.E., A 56 million year rhytPlanet. Sci. Lett. (2011), doi:10.1016/j.epsl.2010.12.044
Hallam, A., 1989. The case for sea-level change as a dominant casual factor in massextinction. Proc. R. Soc. Lond. B 325, 437–455.
Hallam, A., Wignal, P.B., 1999. Mass extinction and sea-level changes. Earth Sci. Rev. 48,217–250.
Hannisdal, B., Peters, S.E., 2010. On the relationship between macrostratigraphy andgeological processes: quantitative information capture and sampling robustness. J.Geol. 118 (2), 111–130.
Haq, B.U., Hardenbol, J., Vail, P., 1987. Chronology of fluctuating sea levels since theTriassic. Science 235, 1156–1167.
Hays, J.D., Imbrie, J., Shackleton, N.J., 1976. Variations in the Earth's orbit: pacemaker ofthe ice ages. Science 194, 1121–1132.
Heller, P.L., Angevine, C.L., 1985. Sea-level cycles during the growth of Atlantic-typeoceans. Earth Planet. Sci. Lett. 75, 417–426.
Johnson, J.G., 1974. Extinction of perched faunas. Geology 2, 479–482.Kominz, M.A., 1995. Thermally subsiding basins and the effect of sediments with
application to the Cambro-Ordovician Great Basin sequence, western U.S. BasinRes. 7, 221–233.
Lisiecki, L.E., 2010. Links between eccentricity forcing and the 100,000-year glacialcycle. Nat. Geosci. 3, 349–352.
Mann, M.E., Lees, J.M., 1996. Robust estimation of background noise and signaldetection in climatic time series. Climate Change 33, 409–445.
Meyers, S., Sageman, B., Hinnov, L., 2001. Integrated quantitative stratigraphy of TheCenomanian–Turonian bridge creek limestone member using evolutive harmonicanalysis and stratigraphic modeling. J. Sed. Res. 71, 627–643.
Meyers, S.R., Sageman, B.B., Pagani, M., 2008. Resolving Milankovitch: consideration ofsignal and noise. Am. J. Sci. 308, 770–786.
Miall, A.D., 1997. The Geology of Stratigraphic Sequences. Springer-Verlag, Berlin.433 pp.
Miller, K.G., Kominz, M.A., Browning, J.V., Wright, J.D., Mountain, G.S., Katz, M.E.,Sugarman, P.J., Cramer, B.S., Christie-Blick, N., Pekar, S.F., 2005. The PhanerozoicRecord of Global Sea-Level Change. Science 310, 1293–1298.
Mjelde, R., Faleide, J.I., 2009. Variation of Icelandic andHawaiianmagmatism: evidence forco-pulsation of mantle plumes? Mar. Geophys. Res. 30, 61–72. doi:10.1007/s11001-009-9066-0.
Newell, N.D., 1952. Periodicity of invertebrate evolution. J. Paleontol. 26, 371–385.Peters, S.E., 2006. Macrostratigraphy of North America. J. Geol. 114, 391–412.Peters, S.E., 2008. Macrostratigraphy and its promise for paleobiology. Paleontol. Soc.
Pap. 14, 205–231.Peters, S.E., Foote, M., 2001. Biodiversity in the Phanerozoic: a reinterpretation.
Paleobiology 27, 583–601.Peters, S.E., Heim, N.A., 2010. The geological completeness of paleontological sampling
in North America. Paleobiology 36, 61–79.Prokoph, A., Ernst, R.E., Buchan, K.L., 2004. Time-series analysis of large igneous
provinces: 3500 Ma to present. J. Geol. 112, 1–22.R development core team, 2006. R: a language and environment for statistical computing,
R Foundation for Statistical Computing, Vienna, Austria. http://www.R-project.org2006 URL.
Rhode, R.A., Muller, R.A., 2005. Cycles in fossil diversity. Nature 434, 208–210.Ribe, N., Davaille, A., Christensen, U., 2007. Fluid dynamics of mantle plumes. In: Ritter,
J., Christensen, U. (Eds.), Mantle Plumes: A Multidisciplinary Approach. Springer,Berlin. pp. 1–48.
Salvador, A., 1985. Chronostratigraphic and geochronometric scales in COSUNAstratigraphic correlation charts of the United States. AAPG Bull. 69, 181–189.
Schaeffer, N., Manga, M., 2001. Interaction of rising and sinking mantle plumes.Geophys. Res. Lett. 28, 455–458.
Sepkoski Jr., J.J., 1976. Species diversity in the Phanerozoic: species-area effects.Paleobiology 2, 298–303.
Simberloff, D.S., 1974. Permo-Triassic extinctions: effects of area on biotic equilibrium.J. Geol. 82, 267–274.
Sloss, L.L., 1963. Sequences in the cratonic interior of North America. Geologic Soc. Am.Bull. 74, 93–113.
Smith, A.B., 2001. Large-scale heterogeneity of the fossil record: implications forPhanerozoic biodiversity studies. Philos. Trans R. Soc. Lond. B 356, 351–367.
Smith, A.B., 2007. Marine diversity through the Phanerozoic: problems and prospects. J.Geol. Soc. 164, 731–745.
Smith, A.B., McGowan, A.J., 2005. Cyclicity in the fossil record mirrors rock outcrop area.Biol. Lett. 1, 443–445.
Smith, A.B., McGowan, A.J., 2007. The shape of the Phanerozoic diversity curve. Howmuch can be predicted from the sedimentary rock record of Western Europe?Palaeontology 50, 1–10.
Thomson, D.J., 1982. Spectrum estimation and harmonic analysis:. IEEE Proc. 70,1055–1096.
Vail, P.R.,Mitchum Jr., R.M., Todd, R.G.,Widmier, J.M., Thompson III, S., Sangree, J.B., Bubb, J.N., Hatlelid, W.G., 1977. Seismic stratigraphy and global changes of sea level. In:Payton, C.E. (Ed.), Seismic Stratigraphy—Applications to Hydrocarbon Exploration:American Association Petroleum Geologists Memoir, 26, pp. 49–212.
Zachos, J., Pagani, M., Sloan, L., Thomas, E., Billups, K., 2001. Trends, rhythms, andaberrations in global climate 65 Ma to present. Science 292, 686–693.
hm in North American sedimentation during the Phanerozoic, Earth