crustacean disparity through the phanerozoic: comparing morphological and stratigraphic data
TRANSCRIPT

Biological Journal of the Linnean Society (1998), 65: 455–500. With 10 figures
Article ID: bj980255
Crustacean disparity through the Phanerozoic:comparing morphological and stratigraphic data
MATTHEW A. WILLS∗
Department of Earth Sciences, The University of Bristol, Wills Memorial Building, QueensRoad, Bristol BS8 1RJ
Received 2 February 1998; accepted for publication 20 June 1998
Crustaceans have been an important component of marine diversity and biomass sincethe earliest Phanerozoic. With a relatively well-documented fossil record, they providean excellent subject for a continuous study of disparity (≈bodyplan variety) from theCambrian to the Recent. A data base of 135 morphological characters forms the basisfor cladistic and morphospace studies at the ordinal and sub-ordinal level. Gross cladistictopology is: (Eumalacostraca+Hoplocarida vs Maxillopoda) vs Phyllopoda (paraphyletic).Each of these groups is of approximately equal disparity, and occupies a distinct regionof the morphospace plot. A few problematical fossils (e.g. Waptia and Odaraia) fall closeto the base of the tree. Comparison of the cladogram with stratigraphic range dataindicates the location of probable ghost lineages, and randomization procedures providea statistical test of the goodness of fit of a given set of stratigraphic ranges to a giventree topology. Disparity indices are calculated at series and stage intervals. Observedrange data indicate that Cambrian disparity was approximately one third its presentlevel. The Earliest Ordovician saw a marked decrease, with an increase and subsequentplateau through rest of the period. Increases through the Silurian and Devoniancorresponded to the radiation of branchiopods, cephalocarids, and latterly the Eu-malacostraca and Hoplocarida. By the end of the Carboniferous, observed disparity hadreached over four fifths of Recent levels, and the remaining history of the group saw agradual but slightly irregular increase up until the end of the Tertiary. Indices of disparityincorporating ghost lineages exhibit less marked peaks and troughs, with fewer perturbationsoverall. Cladistically-implied disparity in the Lower Cambrian is estimated at threequarters of that in the Recent. Rarefaction is used to compare actual levels of disparityat each time interval with the mean for a similar number of taxa selected randomlyfrom the list of all realized bodyplans. Most intervals preserved a range of forms moredisparate than the mean of random samples drawn from the pool of all the taxaconsidered. From the Triassic to the Recent this difference was intermittently significant.Once occupied, extremes of morphospace tend not to fall vacant again.
1998 The Linnean Society of London
ADDITIONAL KEYWORDS:—morphospace – problematica – stratigraphic congruence– ghost ranges – Gap Excess Ratio – Cambrian explosion.
Present address: Oxford University Museum of Natural History, Parks Road, Oxford OX1 3PW.E-mail: [email protected]
4550024–4066/98/120455+46 $30.00/0 1998 The Linnean Society of London
M. A. WILLS456
CONTENTS
Introduction . . . . . . . . . . . . . . . . . . . . . . . 456Principal issues in crustacean evolution . . . . . . . . . . . . . . 457Types of data . . . . . . . . . . . . . . . . . . . . . . 459
The uses of stratigraphic data in phylogeny reconstruction . . . . . . 459Identifying ghost ranges . . . . . . . . . . . . . . . . . 460
Methods . . . . . . . . . . . . . . . . . . . . . . . . 461Stratigraphic data . . . . . . . . . . . . . . . . . . . 461The morphological data base . . . . . . . . . . . . . . . . 461Cladistic analysis . . . . . . . . . . . . . . . . . . . . 463Assessing the degree of stratigraphic congruence . . . . . . . . . 464Phenetic analysis . . . . . . . . . . . . . . . . . . . . 467
Results and discussion . . . . . . . . . . . . . . . . . . . 472Phylogeny . . . . . . . . . . . . . . . . . . . . . . 472Completeness of the fossil record and stratigraphic congruence . . . . . 473Crustacean morphospace . . . . . . . . . . . . . . . . . 475The disparity of major groups . . . . . . . . . . . . . . . 476Overall patterns of disparity and morphological variance through time . . 478Disparity and the occupation of morphospace through time . . . . . . 479The differential occupation of morphospace . . . . . . . . . . . 486‘Mass extinctions’, diversity, disparity and sampling . . . . . . . . 490Morphological variety profiles in trilobites . . . . . . . . . . . 491Implications for the Cambrian ‘explosion’ . . . . . . . . . . . 493
Conclusions . . . . . . . . . . . . . . . . . . . . . . . 493Acknowledgements . . . . . . . . . . . . . . . . . . . . 495References . . . . . . . . . . . . . . . . . . . . . . . 495
INTRODUCTION
Recent studies of disparity (as distinct from diversity) have demonstrated howsome large clades have diversified into morphospace, and thereby come to definenew bodyplans. This has had considerable impact on our understanding of severalevolutionary radiations, most notably the Cambrian. Some studies have comparedthe Cambrian fauna with the Recent (e.g. Wills, Briggs & Fortey, 1994, 1998; Wills,1998b), while others have examined the fortunes of particular clades through aportion of the Phanerozoic (e.g. Foote, 1989, 1991a,b, 1992b, 1994). The presentstudy traces the disparity of a highly diverse and important clade (the crustaceans)from the Cambrian to the Recent, making comparisons at series and stage intervals.
The crustaceans exhibit enormous plasticity of form, having evolved manydistinctive bodyplans since their origins (Schram, 1982; Briggs, 1992). The segmentedbody and serially homologous appendages provide great scope for variety (as inarthropods more generally), although there appear to be limitations on what canand cannot be a functioning arrangement of parts. Homoplasy within the clade ishigh, and many characters have conflicting distributions (Schram, 1978, 1986).There may also be superficial similarities in overall form and function for distantly-related taxa in similar habitats (Schram, 1982). Crustaceans have a reasonably goodfossil record throughout the Phanerozoic (Briggs, Weedon & Whyte, 1993; Whatley,Siveter & Boomer, 1993), making them well-suited to a longitudinal study ofdisparity. They also preserve a large number of morphological characters, permittingmeaningful comparisons with the living fauna.
Direct comparisons of phylogenetic and stratigraphic data have underpinned a

CRUSTACEAN DISPARITY THROUGH TIME 457
number of important recent studies (Huelsenbeck, 1994; Benton, 1995). Several ofthese have assayed large numbers of cladograms statistically to address broad-scalequestions (e.g. Has palaeontological knowledge improved with research time? Arephylogenies for some higher taxa more congruent with the fossil record than others?Is there a difference in ‘goodness of fit’ for trees based on morphology versus thosederived from sequence data?). Similar approaches can be used to deduce the locationsof probable ghost lineages for particular groups in detail. This may further informour understanding of a clade’s radiation and dispersal in morphospace throughtime.
PRINCIPAL ISSUES IN CRUSTACEAN EVOLUTION
Diagnosing the Crustacea as a group is problematical, but Schram (1986) identifieda number of features typical of most taxa. Similarly, Wills et al. (1995, 1998) foundthe clade to be well supported, but observed that many characters reverse withinthe group. Where lateral eyes are present, these are usually free or pedunculatebeneath the carapace. The second appendages are usually differentiated as sensoryantennae, followed by gnathobasic mandibles. The outer rami of the trunk ap-pendages are organized around a longitudinal rachis, and a pair of mobile appendagesare usually present on the telson. All pass through a nauplius or egg nauplius stagein ontogeny. The cephalon of the adult comprises five post-acronal segments [fewerin some fossils that have hitherto been excluded from the subphylum for this reason(e.g. Muller & Walossek, 1986)]. In contrast, molecular work (e.g. Adoette & Philippe,1993; Averof & Akam, 1995) raises the possibility of a paraphyletic Crustacea, withthe Hexapoda derived from their midst (see also Carpenter, 1906; Sharov, 1966).
Relationships within the group have been discussed in detail elsewhere (Wills,1998a). The following issues are significant in considerations of crustacean evolutionand disparity:
(1) Gross topology. The first thorough, parsimony-based analysis of crustaceansubclasses and orders (Schram, 1986) resolved the non-phyllocarid Malacostraca(Eumalacostraca and Hoplocarida) as sister group to a Maxillopoda/Phyllopodadichotomy, with the remipedes basal to all other taxa. Brusca & Brusca (1990), bycontrast, placed all the Malacostraca as sister-group to the Maxillopoda, succeededby the Branchiopoda, Cephalocarida and Remipedia in pectinate succession. Morerecent, molecular studies (e.g. Abele et al., 1992; Spears & Abele, 1998) even castdoubt on the monophyly of these component clades. Character conflict is such thatany conceivable cladogram will necessitate accepting a large amount of homoplasy.Moreover, all published phylogenies imply extensive ghost ranges.
(2) Integrity of the Maxillopoda. The Branchiura, Cirripedia, Copepoda and My-stacocarida were united as the ‘Copepodoidea’ by Beklemischev (1952, 1969), andthe ‘Maxillopoda’ by Dahl (1956, 1963) (see also Bowman & Abele, 1982; Boxshall& Huys, 1989; Grygier, 1983; Muller, 1985; Muller & Walossek, 1988; Newman,Zullo & Withers, 1969; Newman, 1983). The Ostracoda are usually consideredmembers of this group (e.g. Siewing, 1960; Schram, 1986), as are the Tantulocarida(Grygier, 1987). Several recent morphological (e.g. Wilson, 1992) and molecularstudies (e.g. Abele et al. 1992) have cast doubt on the monophyly of the group,

M. A. WILLS458
implying that the maxillopods have been tenuously united by a small number ofplesiomorphic features.
(3) Status of the Phyllocarida and ‘Phyllopoda’. Phyllocarids have traditionally beenclassified together with the Eumalacostraca and Hoplocarida in the Malacostraca(Claus, 1888; Metschnikov, 1968). Schram (1986) preferred to place them with theCephalocarida and Branchiopoda in the class Phyllopoda. Few characters unite thephyllocarids themselves, particularly if one includes the canadaspidids (Briggs, 1978,1992). The thorax and part of the abdomen are enclosed within a bivalved carapace.The thoracic limbs have lost all ambulatory function, and serve for respiration,feeding and brood protection (Dahl, 1976). Several primitive features are evidentin their embryology (Manton, 1934), and in the long, tubular nature of the heart.
(4) Primitive groups and the ‘urcrustacean’. Much recent carcinological theory has beenunderpinned by attempts to determine the most plesiomorphic crustacean bodyplan.Three extant groups have attracted most attention in this context. The Cephalocarida(Sanders, 1963; Hessler & Newman, 1975; Hessler, 1992) are elongate forms withphyllopodous appendages on the first nine of 19 trunk somites. The carapace-lessAnostraca (Calman, 1909; Zimmer, 1926–27; Tiegs & Manton, 1958; Fryer, 1992)have 20 or more trunk somites, of which numbers 11 to 19 bear phyllopods.The more recently-discovered Remipedia (Yager, 1981; Schram, 1983; Schram &Emerson, 1986) have as many as 32 podous trunk somites behind a cephalonwith several raptorial mouth parts. The ventrolaterally-directed trunk limbs arehomonomous, biramous and oar-like. Common to all these taxa is a relativelyelongate trunk, with little appendage differentiation. The remipedes lack all trunktagmosis. Importantly, none of these groups are among the oldest supposed crustaceanfossils (phyllocarids, ostracods and cirripedes), implying appreciable ghost ranges.All previous work on arthropod phylogeny by the author (e.g. Briggs, Fortey &Wills, 1992; Wills et al., 1994, 1995, 1998) has placed the remipedes at the base ofthe crustacean clade. The extant Nectiopoda and fossil Enantiopoda are thereforeused to root the analyses here (Schram, 1986). Several authors (Hessler & Newman,1975; Schram, 1982; Fryer, 1992) removed the supposed apomorphies from thegroup that they believed most primitive in order to derive a hypothetical ancestor(urcrustacean). Only Fryer’s model (Fryer, 1992) has a differentiated abdomen.
(5) The significance of problematic fossil taxa. A number of fossil taxa, particularly thosefrom the Cambrian, defy easy assignment to any established crustacean subclass.Others lack the traditionally diagnostic cephalic segmentation for the entire group.Exquisitely preserved, phosphatized specimens from the Upper Cambrian Orstenfauna of Sweden have attracted considerable attention. Controversy centres aroundwhether these fossils are simply larval ‘flotsam’ of uncertain affinities (Schram, 1986)or earliest representatives of the Anostraca (Rehbachiella: Walossek, 1993), Copepoda(Skara: Muller, 1985; Muller & Walossek, 1988), Thecostraca (Bredocaris: Muller &Walossek, 1988), and the stem lineage leading to all the crustaceans (Martinssonia:Muller & Walossek, 1986). Other anomalous taxa are documented from the BurgessShale. Waptia is a slender, bivalved form, with possible affinities to the branchiopods(Briggs, 1983; but see Briggs et al., 1992). Odaraia (Briggs, 1981) is bivalved, with25–30 trunk somites each bearing biramous appendages. It shares derived characterswith both the branchiopods (Briggs, 1981; Briggs et al., 1992) and phyllocarids(Walcott, 1912; Henriksen, 1928; Wills et al., 1994, 1995), but also has many

CRUSTACEAN DISPARITY THROUGH TIME 459
highly plesiomorphic attributes (Briggs, 1981). Similarities between the bivalvedCanadaspidida (Canadaspis and Perspicaris) and the phyllocarids have been noted bynumerous workers (Novozhilov, 1960; Walcott, 1912; Raymond, 1920; Henriksen,1928; Schram, 1986). However, their position remains controversial (Dahl, 1983,1984; Bergstom, 1992), much depending on the interpretation of limb morphology(Briggs, 1992). Lepidocaris from the Middle Devonian Rhynie Chert has been alliedwith the anostracan branchiopods (Scourfield, 1926; Sanders, 1963; Walossek, 1993)and the brachypodans (Schram, 1986).
TYPES OF DATA
The present study sought to compare two independent sources of data: (1) thedistribution of morphological character states across extant and extinct taxa, and(2) data on the first appearances of taxa in the fossil record. These two classes ofinformation are independent. Character data (1) have two applications: (1) theyform the basis for estimates of phenetic proximity and morphological disparity; (2)in conjunction with hypotheses about character polarity (from outgroup comparisonor ontogeny), character data can be used to infer phylogeny.
The uses of stratigraphic data in phylogeny reconstruction
Attitudes to the use of stratigraphic data in phylogeny reconstruction varyconsiderably ( Janvier, 1984; Hallam, 1988). At one extreme, stratopheneticistsderive morphological clusters (i.e. metaspecies; Smith, 1994) at numerous successivetime intervals, and then join the most similar clusters in adjacent intervals to directlymap out an evolutionary tree along the time axis (or up the stratigraphic column)(e.g. Gingerich, 1979; Fordham, 1986). At the other extreme are cladists (seePatterson, 1981) who (if they incorporate data from fossils at all) consider thestratigraphic distribution of taxa an irrelevance. The middle ground is occupied byworkers who variously utilize stratigraphic data in a cladistic context. Four approacheshave recently received most attention:
Polarizing charactersThis rests on the assumption that the oldest known character states are the most
plesiomorphic, and requires a virtually complete fossil record for the groups ofinterest. A more conservative (‘fine tuning’) example of this approach is providedby Fortey & Owens (1990).
StratocladisticsThe order in which groups appear in time (and therefore in the fossil record)
should correlate with the order of cladistic branching. An irreversible charactercoding the relative timing of group origins in the record is analysed alongside themorphological data, thereby adding a ‘stratigraphic debt’ to the total tree length(Fisher, 1994). The method selects the shortest tree or trees overall (which mightdiffer from the most parsimonious tree(s) based solely on an analysis of morphology).
M. A. WILLS460
A B C D
A B C DT
ime
or s
trat
igra
phy
Observed ranges + Cladogram = > Ghost ranges
A B C D
Tim
e or
str
atig
raph
y
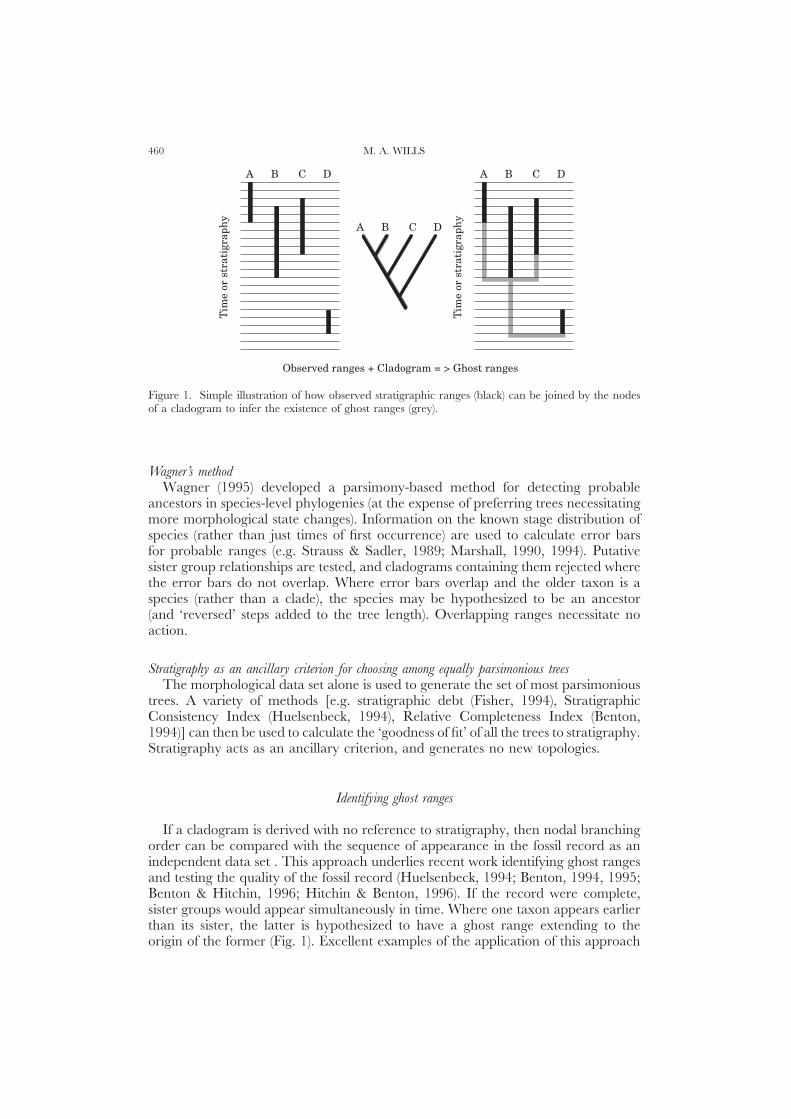
Figure 1. Simple illustration of how observed stratigraphic ranges (black) can be joined by the nodesof a cladogram to infer the existence of ghost ranges (grey).
Wagner’s methodWagner (1995) developed a parsimony-based method for detecting probable
ancestors in species-level phylogenies (at the expense of preferring trees necessitatingmore morphological state changes). Information on the known stage distribution ofspecies (rather than just times of first occurrence) are used to calculate error barsfor probable ranges (e.g. Strauss & Sadler, 1989; Marshall, 1990, 1994). Putativesister group relationships are tested, and cladograms containing them rejected wherethe error bars do not overlap. Where error bars overlap and the older taxon is aspecies (rather than a clade), the species may be hypothesized to be an ancestor(and ‘reversed’ steps added to the tree length). Overlapping ranges necessitate noaction.
Stratigraphy as an ancillary criterion for choosing among equally parsimonious treesThe morphological data set alone is used to generate the set of most parsimonious
trees. A variety of methods [e.g. stratigraphic debt (Fisher, 1994), StratigraphicConsistency Index (Huelsenbeck, 1994), Relative Completeness Index (Benton,1994)] can then be used to calculate the ‘goodness of fit’ of all the trees to stratigraphy.Stratigraphy acts as an ancillary criterion, and generates no new topologies.
Identifying ghost ranges
If a cladogram is derived with no reference to stratigraphy, then nodal branchingorder can be compared with the sequence of appearance in the fossil record as anindependent data set . This approach underlies recent work identifying ghost rangesand testing the quality of the fossil record (Huelsenbeck, 1994; Benton, 1994, 1995;Benton & Hitchin, 1996; Hitchin & Benton, 1996). If the record were complete,sister groups would appear simultaneously in time. Where one taxon appears earlierthan its sister, the latter is hypothesized to have a ghost range extending to theorigin of the former (Fig. 1). Excellent examples of the application of this approach

CRUSTACEAN DISPARITY THROUGH TIME 461
are provided by Glenner et al. (1995) (cirripede evolution), and Dunlop & Selden(1998) (the phylogeny of fossil chelicerates).
Such methods make several assumptions, including: (1) taxa are monophyletic;(2) the cladogram is correct and (3) there is no significant anagenesis within taxa.The first is a more general assumption of the cladistic method, and subject to thesame strictures. The second is axiomatic, and can only be substantiated under themost controlled conditions (never when dealing with fossils). The third assumptionis more problematic. It requires that taxa first appear in the record with all theirdiagnostic features, which may be an oversimplification (Shultz, 1994). Evidencesuggests that most morphological change is associated with cladogenesis as discreteevents, punctuated by periods of stasis or equilibrium (Gould & Eldredge, 1977).However, it is possible for groups to diverge with little or no immediate changes inmorphology, differences gradually accumulating in one or both lineages over time.Hence, early fossil representatives of a taxon might not be recognizable as such. Ifa cladogram is assumed to be correct, comparison with the fossil record can set alower bound for the origin of bodyplan morphologies. This pushes the inferredhistory of lineages back as far as the fossil record and cladogram will justify.Importantly, this is not an absolute lower bound, since the fossil record of sistertaxa need not extend back to their actual cladogenesis. One can never be sure onehas found the oldest fossils of a given group.
METHODS
Stratigraphic data
The fossil record of crustaceans is far from uniform. Despite their abundancethroughout the Phanerozoic, the records of several groups are erratic. A few heavily-mineralized taxa (e.g. decapods and ostracods) account for the majority of fossilspecimens and species. However, most crustacean taxa are ‘soft-bodied’ and knownfrom rare, temporally and environmentally-scattered Konservat Lagerstatten (Se-ilacher, 1990). There are fewer marine-derived Lagerstatten after the mid-Palaeozoic,and these are correspondingly less important as sources of information. Such‘taphonomic windows’ alone cannot yield a complete picture of evolution at thegenus or species level, neither can they provide a continuous record of the temporalpattern of diversity or environmental distribution. Moreover, there are no simplemetrics by which to correct for such preservational biases. A study of bodyplandisparity through time is a more realistic proposition. The fossil records of bodyplans,like those of higher taxa, are less susceptible to variations in the quality of preservationor the completeness of the fossil record. Range data have been taken primarily fromBriggs et al. (1993) and Whatley et al. (1993).
The morphological data base
TaxaThe intention is to define a morphospace from a representative sample of
crustacean bodyplan variety (see analagous studies for all arthropods; Briggs et al.,

M. A. WILLS462
1992, 1993; Wills et al., 1994, 1998). One exemplar was coded from each crustaceanorder (and suborders in some cases), according to the classification scheme of Schram(1986). Using his taxonomy ensured adequate coverage of crustacean morphologicalvariety (most of Schram’s orders are recognized as subclasses, orders or subordersby most other workers). Where the relationships of taxa within these groupings wasuncontested, a primitive or basal representative was coded, and where no suchconsensus existed, genera with a ‘representative’ or less specialized morphology wereused.
It would be impracticable to code all of the genera observed at each horizon.Some orders would be represented by numerous exemplars, others by just singlespecies (which would potentially bias a morphospace study by emphasizing smallervariations in the more richly sampled group). Moreover, coding many of the oldestfossils (which can be fragmentary but unambiguous exemplars of their orders) wouldnecessitate the incorporation of large amounts of missing data.
Although many Cambrian taxa are are known only from fragmentary specimens(often lacking appendages), most of those coded in the present data base have beendescribed in considerable detail. There are five genera from the Burgess Shale. TheCanadaspididae (Canadaspis and Perspicaris) have been monographed (Briggs, 1977,1978, 1992), and the position they occupy in morphospace is well constrained(despite some mobility on cladograms) Odaraia has been described in similar detail(Briggs, 1981) [older treatments are provided by Størmer (1944) and Rolfe (1959)],while work on Waptia (Briggs, 1977) has not been superseded in over 20 years(examination of the specimens confirms that some details are obscured, withsome consequent missing data). Many workers believe that Priscansermarinus was apedunculate barnacle (e.g. Collins & Rudkin, 1981; Schram, 1982; Hessler et al.,1982), although Briggs (1983) expresses some misgivings. The remaining taxa havebeen described from exquisitely-preserved phosphatized material. Martinssonia (Muller& Walossek, 1986), Skara (Muller, 1985), Bredocaris (Muller & Walossek, 1988) andRehbachiella (Walossek, 1993) from the Upper Cambrian ‘Orsten’ fauna have all beenexhastively monographed from SEM studies. Dala (Muller, 1983) has also beendescribed in considerable detail, although the anterior appendages are unknown,and its entry includes some missing data. Hesslandona and Vestrogothia have beenscored from detailed descriptions (Muller, 1979, 1982), and are coded separately fromthe ostracods (the Cambrian phosphatocopine ‘ostracods’ and the Myodocopida/Podocopida do not resolve as a clade, and other ‘ostracod’ taxa known only fromcarapaces have not been included).
Some fossil genera have invited more than one interpretation. In some cases,coding according to alternative reconstructions can result in different resolutions incladograms (Schram & Hof, 1998). [Inevitably, it is also possible that preconceptionsabout relationships have biassed the interpretations of specimens (Gould, 1989)].Alternative interpretations of Canadaspis are offered by Dahl (1984) and Xianguang& Bergstrom (1997). Nahecaris (an archaeostracan) has been coded from the in-terpretation and reconstruction of Bergstrom et al. (1987). Tesnusocaris (an enantiopod)is coded from interpretations by Schram (1983) and Schram & Emerson (1986,1991), rather than the earlier work of Brooks (1955) (who compared the fossilprincipally with cephalocarids and branchiopods). Whether or not the du-plosegmentation hypothesis of Emerson & Schram (1990) is adopted has no con-sequence for coding the present character set.

CRUSTACEAN DISPARITY THROUGH TIME 463
CharactersDetermining homologies for a group as large and plastic as the Crustacea is
highly problematic (Schram, 1986). Many of the specific issues encountered inconstructing and analysing a morphological data base have been considered elsewhere(Wills, 1998a). Most discussions of crustacean phylogeny emphasize tagmosis patterns,numbers of appendages, the numbers of podomeres in the rami of these appendages,and the morphological specialization of limbs (e.g. Hessler & Newman, 1975; Cisne,1982; Hessler et al., 1982; Wilson, 1992; Ito, 1989). Detailed comparisons ofappendage morphology are often pivotal in attempts to determine the affinities ofenigmatic fossil taxa (e.g. Scourfield, 1926; Briggs, 1992; Muller, 1983). Particularemphasis has been placed on the condition of the first five (cephalic) limbs. Severalimportant fossils express markedly different head appendage morphologies from anymodern crustacean, and in a few cases have fewer cephalic appendages than theirmodern counterparts. Some authors (e.g. Muller & Walossek, 1986) consider thesedifferences sufficient to exclude some fossil taxa from the crustacean crown group.The present data base codes the morphology of all five anterior appendagesindependently (cf. Wills et al., 1994, 1995, 1998 for all arthropods). The first fourpost-maxillary appendages have also been coded, a number intended to capturemost of the variation observed in anterior trunk appendage morphology throughoutthe crustaceans. The resulting data base is composed of 135 characters coded for62 taxa. A character matrix and a list of characters and codings can be downloadedfrom http://palaeo.gly.bris.ac.uk/personnel/Wills/data.html.
Cladistic analysis
A thorough cladistic treatment of a similar morphological data base is providedby Wills (1998a), and the reader is referred to that source for a full discussion ofordering and weighting procedures. In summary, however, characters relating tonumbers of podomeres, tagmata and other organs have been ordered (consideringthem as internested sets of synapomorphies), while characters relating to numbersof podomeres (often with very large numbers of states) have also been ranged(downweighted such that transitions between extreme states add a length of 1 to thecladogram). The second to fourth thoracopods (appendages 7–9) are homonomousin most entomostracans, but variously modified for trophic functions in manyeumalacostracans. In order to preserve informative variation in the latter group[while avoiding the pitfalls of duplicating data (serial homologies) and ‘overweighting’for other groups] characters relating to appendages 7–9 have been scaled to a thirdof the weight for other characters (using a base weight of 1000). For a summary ofthe treatment of each character, see the PAUP file at the above web site.
PAUP 3.1.1 (Swofford, 1993) was used to find the most parsimonious trees, usingsimple, closest, and 500 random additions of taxa followed by TBR branch swapping.The resulting networks were pulled down with the remipedes (Enantiopoda andNectiopoda). As discussed above, remipedes have consistently emerged as the mostbasal crustaceans in all analyses of the arthropod clade by the author (e.g. Briggs etal., 1992; Wills et al., 1994, 1995, 1998. See also Emerson & Schram, 1998; Schram,1982; Zrzavy, Hypsa & Vlaskova, 1998). The object here is to infer phylogenywithin the crustaceans (not the position of the crustaceans within the arthropods).Continuing uncertainty over the identity of the crustacean sister group (compare

M. A. WILLS464
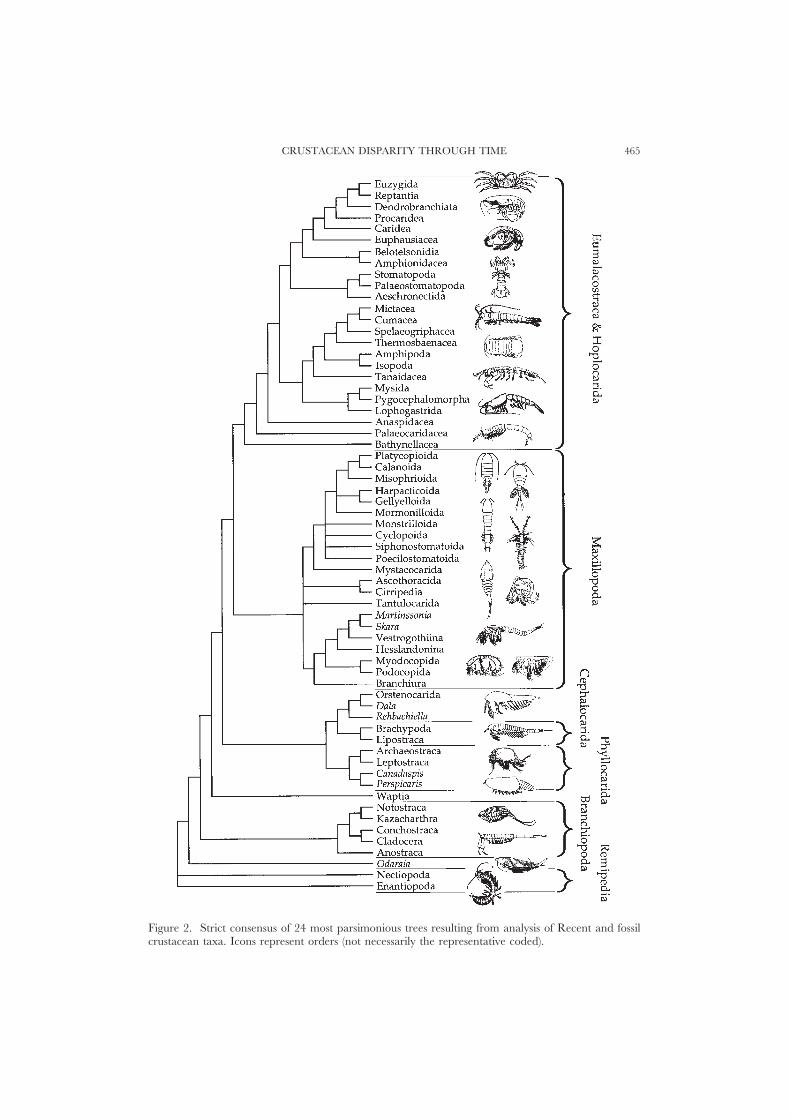
Emerson & Schram, 1998; Spears & Abele, 1998; Wheeler, 1998; Wills et al., 1998;Zrzavy et al., 1998) means a remipede rooting is considered the most reliable wayto polarize characters within the rest of the crustacean clade. All of the shortesttrees from the PAUP runs were saved, and a strict consensus derived (Fig. 2).
Assessing the degree of stratigraphic congruence
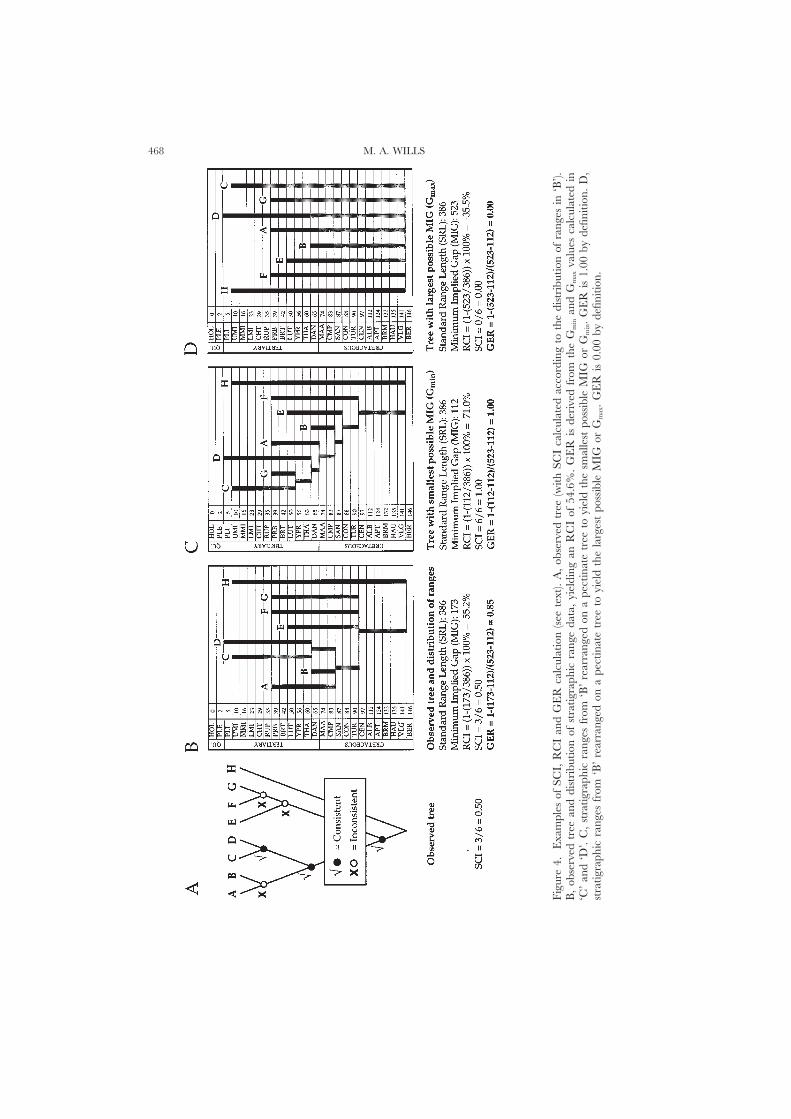
The strict consensus of the most parsimonious cladograms (24) has been plottedagainst the fossil record, revealing extensive ghost ranges (Fig. 3). This naturallybegs the question of how extensive the ghost ranges are, and how well the cladisticbranching order matches the order of appearance of the fossils. Two indices forassessing ‘gappiness’ and the ‘goodness of fit’ of cladograms to the fossil record arein common use: the Relative Completeness Index (RCI) of Benton (1994) and theStratigraphic Consistency Index (SCI) of Huelsenbeck (1994). A third, the GapExcess Ratio (GER) is briefly discussed here.
The Relative Completeness IndexThe RCI is calculated as 1, minus the sum of all ghost ranges (the Minimum
Implied Gap or MIG) over the sum of all observed ranges (the Standard RangeLength or SRL), multiplied by 100% (Fig. 4B). However, the distribution of observedstratigraphic ranges for any given set of taxa determines an upper and lower boundfor the possible amount of ghost range. For example, if all taxa originate at the sametime, the maximum and minimum ghost range will both be zero. If half of the taxaoriginate in the Recent and half in the Cambrian, then the minimum ghost rangewill be the length of the Phanerozoic (one link connecting the two groups). Themaximum ghost range in this situation will be equal to the minimum ghost range,times the number of Recent taxa. Tree balance further constrains the distributionof possible RCI values (Siddall, 1996).
The Stratigraphic Consistency IndexThe SCI expresses the number of nodes in the cladogram that are consistent
(have an older or equally old sister group) as a fraction of the total number of nodes(Fig. 4A). However, this measure is particularly sensitive to the location of the oldesttaxa (Hitchin & Benton, 1996). For example, if the branching order from the baseto the tip of a pectinate cladogram matches the order of appearance of the taxa inthe record, then the SCI will be at its maximum (1.0). If just the basalmost and oneof the uppermost taxa are swapped, SCI collapses to its minimum (0.0). This is trueeven if the implied ghost ranges throughout the cladogram are very small (nodesare either consistent or inconsistent).
The Gap Excess RatioWhile the SCI merely provides an index of the proportion of consistent nodes in
a tree, the RCI conflates a measure of the extent of implied ghost ranges with theextent of observed ranges. Benton et al. (1998) demonstrated that this is a desirableproperty of the RCI when attempting to assess the completeness of the fossil record.However, it does mean that the RCI is not a pure index of stratigraphic congruenceper se. A new index that expresses just the proportion of the total ghost range
CRUSTACEAN DISPARITY THROUGH TIME 465
Figure 2. Strict consensus of 24 most parsimonious trees resulting from analysis of Recent and fossilcrustacean taxa. Icons represent orders (not necessarily the representative coded).

M. A. WILLS466
Figure 3. Observed ranges (black) and cladistically-implied ghost ranges (grey) for Recent and fossilcrustacean taxa.

CRUSTACEAN DISPARITY THROUGH TIME 467
necessitated by the constraints of a cladogram is the Gap Excess Ratio (GER) (Fig. 4) (Wills,1998c). This is given by:
(1) GER=1−(MIG−Gmin)/(Gmax−Gmin)
MIG is the ‘Minimum Implied Gap’ as calculated for the RCI. Gmin is the ‘MinimumGap’ (the minimum possible sum of ghost ranges for any given distribution oforigination dates). The Minimum Gap is observed in a completely pectinate tree,with taxa ordered from youngest to oldest, crown to base (Fig. 4C). More simply,Gmin is given by the difference in origination times between the oldest taxon andthe youngest taxon. Gmax is the ‘Maximum Gap’, the maximum possible sum ofghost ranges for a given distribution of origination dates. This is given by the sumof the differences in origination times between the oldest taxon and every othertaxon (Fig. 4D).
GER values range from 0.00 (the worst possible fit, when MIG is equal to Gmax)to 1.00 (the best possible fit, when MIG equals Gmin). GER values of 1.00 arepossible even for point occurrences of fossils, which will yield large and negativeRCI indices. The GER scores over the SCI and RCI since it enables the comparisonof stratigraphic congruence for cladograms referenced to different distributions ofrange data. However, like the RCI and SCI, the GER provides no control for thetheoretical constraints of tree balance.
Randomization testsNone of the indices discussed above provide tests of stratigraphic congruence.
They merely describe aspects of congruence, but in a manner that prevents directcomparison with other trees (although the GER is the most suitable for this purpose).Randomization tests determine whether congruence is significantly better thanexpected by chance, controlling for differences in tree size, shape, and the distributionof range data. The resulting scores are independent of context, and can becompared readily between trees. They operate by randomly permuting the observedstratigraphic range data across taxa a large number of times (e.g. 1000), whileholding cladogram topology constant (Huelsenbeck, 1994). RCI, SCI and GERvalues are recalculated for each randomization, yielding a distribution for eachindex. The percentage of randomized values worse than or equal to that derivedfrom the original data provides a measure of the uncertainty that a given congruenceindex is better than random. If this percentage is small (say, 5%), then the fit of thecladogram to stratigraphy is significantly better than would be expected by chance.A program for testing RCI, SCI and GER values in this manner given one or morePAUP, MacClade (Maddison & Maddison, 1992) or user-typed tree files and rangedata is available from http://palaeo.gly.bris.ac.uk/personnel/Wills/Gho2.html.
Phenetic analysis
Principal coordinates and other ordination methodsThe cladistic analysis uses a mixture of character types (ordered and unordered
multistate, variously weighted and ranged). The intention was to analyse the samedata phenetically in an analogous manner. This is not possible with straightforward
M. A. WILLS468
Figu
re4.
Exa
mpl
esof
SCI,
RC
Ian
dG
ER
calc
ulat
ion
(see
text
).A
,obs
erve
dtr
ee(w
ithSC
Ica
lcul
ated
acco
rdin
gto
the
dist
ribu
tion
ofra
nges
in‘B
’).B
,ob
serv
edtr
eean
ddi
stri
butio
nof
stra
tigra
phic
rang
eda
ta,
yiel
ding
anR
CI
of54
.6%
.G
ER
isde
rive
dfr
omth
eG
min
and
Gm
axva
lues
calc
ulat
edin
‘C’
and
‘D’.
C,
stra
tigra
phic
rang
esfr
om‘B
’re
arra
nged
ona
pect
inat
etr
eeto
yiel
dth
esm
alle
stpo
ssib
leM
IGor
Gm
in.
GE
Ris
1.00
byde
finiti
on.
D,
stra
tigra
phic
rang
esfr
om‘B
’re
arra
nged
ona
pect
inat
etr
eeto
yiel
dth
ela
rges
tpo
ssib
leM
IGor
Gm
ax.
GE
Ris
0.00
byde
finiti
on.

CRUSTACEAN DISPARITY THROUGH TIME 469
factor analysis. Simple principal components analysis (PCA) derives either a co-variance or correlation matrix between variables, and then extracts componentscores for taxa on each new axis by scaling them in proportion to either thecorresponding eigenvectors, or to unity. The net effect is that all variables (characters)must be treated as continuous (ordered) (e.g. Briggs et al., 1992). Wills et al. (1994)described a method for unordering and weighting characters that overcomes thisproblem by recoding the matrix. However, this procedure is a little time-consuming,and the data base must be recoded every time a change is made to the weights orthe characters and the taxa included (impractical if one wishes to investigate theeffects of different treatments of the data). An alternative approach (particularly ifone is not interested in the contribution of each character to each abstracted axis)is the use of principal coordinates analysis (PCO). PCO extracts axes of greatestvariance from any matrix of inter-taxon distances (or similarities). A PCO ofEuclidean distances yields the same configuration of points as a principal componentsanalysis (PCA) (using a covariance matrix, and scaling components to their cor-responding eigenvectors). However, if the distance matrix is not Euclidean, a greateror lesser amount of distortion (in the form of negative eigenvectors and associatedaxes that cannot be interpreted) usually results. Unfortunately, most procedures thatderive Euclidean distance matrices treat all characters identically (either ordered orunordered), while methods that allow the use of mixed character types yieldnon-Euclidean distances [these are suitable for producing dendritic clusterings(phenograms), but not as the basis for morphospace plots]. Gower’s (1966) generalizedsimilarity coefficient utilizes mixtures of ordered and unordered characters, but thecontributions of each character to each inter-taxon distance are simply averaged,and the matrices are not Euclidean. The solution implemented here was to use anapproach similar to that of Gower to derive a more flexible, generalized Euclideandistance coefficient. For this study, three types of characters were recognized: (1)unordered multistate, (2) ordered, and (3) ranged. For a given comparison betweentwo taxa (i and j), unordered characters contribute a univariate distance of 1.00 inall cases where states do not match, and zero where states do match. Orderedcharacters contribute a univariate distance equal to the difference in their numericalscores. Ranged characters contribute a univariate distance equal to the differencein their numerical scores, expressed as a fraction of the maximum and minimumscores for that character. All of the univariate distances are squared, and the squareddistances added. The square root of this sum provides a Generalized EuclideanDistance metric (GED) suitable for PCO ordination. Characters can be weightedby duplicating them in the calculation.
If i and j are two taxa in the data matrix, and k is the data for the kth variableor character, then Xik is the datum for the kth character of taxon i. GED will thenbe given by:
(2) GEDij=JRkWijkSijk2
where Wijk is an integer (usually 1), indicating the character weight, and Sijk is thecharacter distance for the comparison. The formula for Sijk depends on the charactertype.
For unordered multistate characters, Sijk=0 for matches, and 1 for mismatches.
For ordered characters, Sijk=Xik−Xjk .

M. A. WILLS470
Figu
re5.
Prin
cipa
lcoo
rdin
ates
anal
ysis
offo
ssil
and
Rec
ent
arth
ropo
ds.T
axa
have
been
plot
ted
with
resp
ect
toth
efir
stth
ree
coor
dina
tes
(thir
dax
isin
and
out
ofpa
ge),
whi
chto
geth
eren
com
pass
75%
ofth
eva
rian
cein
the
data
set.
CRUSTACEAN DISPARITY THROUGH TIME 471
For ranged characters, Sijk=Xik–Xjkrange (k)
.
Where a character matrix contains missing entries (common in cladistics), somevalues of Sijk (the univariate distances) cannot be calculated because data for i or jor both is absent. Where the proportion of missing data is relatively small, theseincalculable Sijk values can be assigned weighted ‘mean’ values, based on thecalculable Sijk values. A weighted mean fractional univariate distance for the calculablecomparisons (Sjjk) is given by:
(3) Sijk=RSijkWijk
RS(ijk)maxWijk
S(ijk)max values are equal to 1 for unordered and ranged characters, and equal tothe range of k for ordered characters. ‘Missing’ Sijk values in equation (2) are thengiven by Sijk.S(ijk)max.
A Macintosh program (‘Matrix’) to derive triangular GED matrices suitable forreading into the statistical package MVSP (Kovach, 1990) is available from http://palaeo.gly.bris.ac.uk/personnel/Wills/Mat.html.
A generalized Euclidean distance matrix was calculated from the cladistic dataset, and ordinated using the PCO procedure of MVSP (Kovach, 1990). The first51 of the resulting 63 coordinate axes had positive eigenvalues, leaving less than2% of the total variance in the data associated with uninterpretable axes. Distortionwas therefore trivial. Taxa have been plotted with respect to the first three principalcoordinates (Fig. 5), which encompass approximately 75% of the variation in thedata. Taxa have also been joined by a minimal-spanning tree (MST) (Gower &Ross, 1969; Rohlf, 1973) based on the same GER matrix. The MST is useful forvisualising the location of taxa in all dimensions, given that only the first three canbe plotted on paper.
Indices of morphological variationFour indices of morphological variety were calculated. The first 13 coordinate
axes (in this case encompassing 90% of the total variance) were used to calculateproducts of ranges and variances, and all the axes with positive eigenvalues (herethe first 51) were used to calculate sums of ranges and variances. Wills et al. (1994)discussed the relative merits of these as indices of disparity. Variances are mostappropriate for determining the average dissimilarity between forms, and arerelatively insensitive to differences in sample sizes (but are influenced by in-consistencies in taxomomic practice). The total extent of bodyplan variation (disparity)and the filling of extremes of morphospace is best assessed using range-basedmeasures. As discussed in the next section, smaller samples will tend to define asmaller range than larger samples, but these differences are pertinent to a study ofbodyplan diversification. Range-based indices are therefore more appropriate asdisparity indices, and the sum of the ranges is preferred (see Wills et al., 1994).
The four indices were first calculated for each stratigraphic series (Cambrian toCarboniferous and Tertiary) and stage (Permian to Cretaceous) for lineages actuallyknown from the fossil record. This included lineages known from fossils above and
M. A. WILLS472
below the interval in question. For convenience, this is referred to hereafter as the‘observed’ disparity.
The four indices were then recalculated, this time for observed lineages plus thoseinferred from the cladogram. This is designated the ‘implied’ disparity for simplicity.In instances where a clade with a ghost range (a) opposed a single taxon or cladewith an older first occurrence (b), the member of ‘a’ phenetically closest to anymember of ‘b’ was used to represent clade ‘a’ throughout its ghost range. This is aconservative approach (though not the only one possible), including ghost taxaclosest to regions of morphospace known to be occupied.
There is an inherent and unavoidable asymmetry in the use of ghost ranges, sincethey can only ever extend the ranges of taxa back in time. Sister groups must derivesimultaneously, but can (and very probably do) go extinct independently. Othermethods for extending taxon ranges forward in time mostly require a species-levelphylogeny. Even if a satisfactory probabilistic method could be devised to extendconfidence intervals above and below known ordinal ranges, cladograms could stillbe invoked to extend the ranges of sister taxa downwards, but not upwards.
Morphological rarefactionAll other things being equal, a larger sample of taxa will (on average) occupy a
greater range in morphospace than a smaller one. Foote (1992a) and Wills et al.(1994) describe methods for randomly resampling (rarefying) data sets so as tominimize these effects. Two questions are addressed here. (1) To what extent is theapparent difference in the disparity (sum of ranges) of crustacean groups a functionof the number of constituent taxa? (2) Is the disparity of crustaceans at eachstratigraphic stage more or less than would be expected for a similar number ofsuborders drawn from the list of all realized bodyplans? All runs were based on1000 resamplings, with approximate confidence intervals calculated according toFoote (1992a). A Macintosh program for morphological rarefaction is available viahttp://palaeo.gly.bris.ac.uk/personnel/Wills/Rar.html.
RESULTS AND DISCUSSION
Phylogeny
Crustacean phylogeny and the relationships of problematic taxa are discussed insome detail by Wills (1998a). However, several issues merit comment here.
(1) Gross topology. Parsimony analysis yielded 24 trees (CI=0.269; RI=0.715;RC=0.197). The strict consensus (Fig. 2) conforms precisely to neither Schram’s(1986) model, nor to that of Brusca & Brusca (1990), but incorporates elementsof both. The Eumalacostraca and Hoplocarida are highly derived rather thanemerging basally (contra Schram, 1986). However, the phyllocarids dissociatefrom the Eumalacostraca and Hoplocarida, falling within a basal, paraphyleticseries of phyllopod and ‘Orsten’ groups. A clade including all the maxillopodsemerges as sister group to the eumalacostracans and hoplocarids [rather thanopposing the Phyllopoda (Schram, 1986)].
(2) The Maxillopoda (including the Ostracoda and Tantulocarida, but including

CRUSTACEAN DISPARITY THROUGH TIME 473
Skara and Martinssonia) resolve as a clade. They are supported by the presenceof 11 post-maxillary body segments, and six somites in the thorax (Dahl, 1956),each bearing an appendage. The abdomen is apodous. Trunk endopods tendto be composed of three podomeres.
(3) Phyllocarids (including the Canadaspidida) oppose a clade of Brachypoda [Ce-phalocarida and Lepidocaris (Schram, 1986)] plus the Orsten Rehbachiella, Bredocarisand Dala. This entire clade opposes the Eumalacostraca/Hoplocarida andMaxillopoda. The other major ‘phyllopod’ group (the Branchiopoda) forms aclade lower in the tree.
(4) Primitive groups. Anostracans resolve low in the tree, while the cephalocaridsresolve somewhat higher.
(5) In addition to the problematica discussed above, the location of Waptia betweenthe phyllocarid/cephalocarid and branchiopod clades is notable. Odaraia resolvesbasally above the remipedes, and is clearly highly plesiomorphic.
(6) Within the Eumalacostraca/Hoplocarida, the Syncarida are paraphyletic andbasal. The Peracarida resolve as a clade (cf. Watling, 1983), within which theshrimp-like mysids oppose all other taxa. The Eucarida and the Belotelsonideatogether comprise a clade in opposition to the Hoplocarida. The hoplocaridsare usually considered to be the sister group of the Eumalacostraca (Schram,1969; Bowman & Abele, 1982; Kunze, 1983; Dahl, 1983; Hessler, 1983; Spears& Abele, 1998), and are placed in a separate subclass by Schram (1986). Forcingthis alternative resolution for the hoplocarids (Schram, 1969) (using MacClade),adds 1.7% to the total tree length, but 3.2% to the eumalacostracan/hoplocaridportion alone. [The weighting procedure makes it difficult to equate thesepercentages directly with unit numbers of state changes. However, the weightedlength of the entire most parsimonious trees is 602533, and that with thehoplocarids moved is 612949. The minimum possible weighted length is 166002,and the minimum unweighted length 272 (135 characters, some of them withlarge numbers of alternative states). The addition to tree length resulting frommoving the hoplocarids is therefore equivalent to: (602533/166002)×272×1.7%=17 unit state changes. However, it should also be notedthat the cost of the move if all characters are weighted to unity from the outsetis zero.] The more derived location for the hoplocarids resolved here finds somesupport from other morphological and total evidence approaches (including datafrom 18S and 28S rDNA) (Wheeler, 1998).
Completeness of the fossil record and stratigraphic congruence
RCI values for the 24 fundamental trees are all low (from −8.28 to −15.53;negative values indicate that there is more ghost range than observed range).However, GER values are between 0.61 and 0.58 indicating that while the fossilrecord may be relatively poor, the fit of the most parsimonious trees to the rangedata (measured in terms of ghost ranges) is reasonably good. Moreover, none of1000 permuted range assignments produced RCI or GER values equal to or betterthan this, indicating that the extent of ghost ranges is very significantly less thanexpected at random. SCI values for the fundamentals ranged from 0.46 to 0.43,indicating that the majority of their nodes are stratigraphically inconsistent. However,considering just the Eumalacostraca/Hoplocarida, it will be seen that some of the

M. A. WILLS474
oldest taxa (e.g. Reptantia, Spelaeogriphacea) are amongst the most derived in theirconstituent subclades (leading to low SCI values regardless of the consistency of therest of the tree). It is unsurprising, therefore, that the SCI from the original datadoes not differ significantly from the random permutations (Hitchin & Benton,1996).
The phylogeny of Schram (1986) (containing an almost identical set of taxa) wasalso tested for congruence, with similar results. All indices were comparable to thoseobserved above (RCI=−16.02, GER=0.57, SCI=0.40), with none of the 1000randomized trees having a better RCI or GER (a highly significant result). Again,the deviation of the SCI value from the random distribution was insignificant.
Congruence in the Eumalacostraca and HoplocaridaCongruence was recalculated for just the eumalacostracan/hoplocarid portion of
the tree (24 taxa). Despite a more complete fossil record than the tree as a whole(RCI=8.08), the GER was markedly poorer (0.06) and the SCI slightly poorer(0.41). RCI, GER and SCI significances based on 1000 permuted range reassignmentswere extremely poor (99% of these randomized assignments yielded better RCI andGER values than the original data). It is useful to consider why congruence withinthis portion of the tree should be so low.
The most obvious explanation would be a wildly inaccurate cladogram. Inthis context, it is interesting to look at the goodness of fit for some alternativeeumalacostracan/hoplocarid trees [phylogenetic ideas have been remarkably staticthroughout most of the twentieth century (Schram, 1981)]. The only other cladogramof the whole group based on a parsimony analysis of morphological characters(Schram, 1986) had a lower RCI (1.73) and SCI (0.27), but a slightly higher GER(0.13). None of these values deviated significantly from random. The ‘traditional’model (illustrated by Schram, 1981) had a much better RCI (28.60) and SCI (0.42)but a poor GER (0.12), with none of the indices being significant. Trees for theperacarids alone also failed to yield congruence values deviating significantly fromrandom [Fryer (1965), RCI=55.49, SCI=0.40, GER=0.03; Pires (1987), RCI=34.74, SCI=0.50, GER=0.02; Watling (1981), RCI=53.13, SCI=0.40, GER=0.09]. While it is possible that all the published trees are hopelessly inaccurate, thisseems unlikely.
A second possible explanation would be a severely patchy fossil record. Apartfrom the taxa restricted exclusively to the Recent, most eumalacostracan andhoplocarid orders arose in a relatively short time interval from the Late Devonianto the Early Carboniferous. The majority of eumalacostracan bodyplans (as evidencedby their contribution to total disparity) appear to have been deployed in a rapidradiation (Schram, 1981). Fossil collecting over the last hundred years has donelittle to change this picture. It is thought unlikely that the group would remain staticfor 350 million years or more, before radiating again in several parallel lineagesnear the Recent. Hence, it seems probable that several apparently solely Recentgroups have (in reality) a long history. This is almost certainly true of the Ther-mosbaenacea (Schram, 1986), where trans-Atlantic links of closely-related moderntaxa (Stock, 1976, 1982; Stock & Langley, 1981) strongly suggest the breakup of anancient group with a Tethyan biogeography (Maguire, 1965).
This still begs the question of why no fossils have been found. Probable sister taxain similar environments can have hundreds of millions of years between their earliest

CRUSTACEAN DISPARITY THROUGH TIME 475
fossil occurrences (e.g. Isopoda and Amphipoda, Euzygida and Reptantia, Mysidaceaand Pygocephalomorpha). Therefore, limited exposure of suitable sediments isunlikely to be the explanation.
Fortey, Briggs & Wills (1995, 1997) consider cladogenesis in lineages of a smallsize as a possible explanation for the lack of Precambrian fossils and the apparentlyexplosive radiation of the arthropods and Metazoa en masse in the Cambrian. Thishypothesis requires an external trigger for size increase in numerous parallel lineages.While the Cambrian may be a special case in the fossil record of the history of life(Gould, 1991), it is difficult to envisage a similar explanation for the appearance ofseveral Recent eumalacostracan groups.
A plausible reason why some groups left no fossils is that numbers of individuals(and species) have always been low. The Procarididea, for example, are representedby just a single living species (Procaris ascensionis), discovered relatively recently in theAscension Islands (Chase & Manning, 1972), and known only from two otherlocailities in Hawaii. Similarly, the Mictacea are known from just two extant speciesin two families; one deep sea form (Hirsutia bathyalis) described from just twospecimens (Sanders, Hessler & Garner, 1985), the other (Mictocaris halope) moreplentiful, and endemic to marine caves in Bermuda (Bowman & Illiffe, 1985).The order Amphionidacea contains just one living species (Amphionides reynaudii;Williamson, 1973), ubiquitous but uncommonly reported from depths of around2000 m or more. [The absence of euphausiacians in the fossil record is moreperplexing. Modern forms range in length from about 4 cm to 15 cm, and krill canreach densities in excess of 1000 animals/m3 of sea water. Several authors (e.g. Dzik& Jazdzewski, 1978; Schram, 1981) have forwarded candidate fossils, but none ofthese is particularly convincing (Schram, 1986)]. From this perspective, congruencefor the Eumalacostraca has deteriorated with the discovery of new living taxa inthe last hundred years, and the situation may get worse before it improves. However,since many of the Recent orders are ‘morphological intermediates’, and have sistergroups with an ancient fossil record, it seems unlikely that the pattern of disparitythrough time will be radically changed by new fossil discoveries.
Another possibility is that some taxa are ancestral to others, with relatively recentgroups being derived from the midst of those with a longer heritage. Clearly,paraphyly in some taxa would make the cladistic treatment of the data (and theghost range approach) problematic. While this possibility cannot be excluded, allthe eumalacostracan and hoplocarid orders are considered clades, and there arefew evolutionary systematic scenarios that propose the derivation of one order fromanother (Schram, 1982, 1986; but see discussion by Dahl, 1992). Again, however,the paraphyly of several lineages (though devastating to apparent congruence values)need only have a slight to moderate effect on disparity profiles. The profiles calculatedsolely from the observed fossil lineages are consistent with the worst-case scenarioin which the majority of orders are paraphyletic.
In fact, none of these explanations is mutually exclusive, and the reality maycombine elements of all of them.
Crustacean morphospace
Although not clusters in the strict sense, three broad groupings can be recognizedin the PCO plot (Fig. 5) (compare with the cladogram; Fig. 2). (1) The right-hand

M. A. WILLS476
region contains predominantly maxillopods, and several other taxa (Orsten forms)with an abbreviated series of trunk appendages. At the extreme right of themaxillopod grouping are the ostracods, Martinssonia and Skara. More centrally,the copepods cluster tightly, along with the mystacocarid, thecostracans and thetantulocarid. To the left are the Orsten Bredocaris and Dala. (2) The upper left regionof the morphospace contains predominantly ‘phyllopodous’ taxa (those with ‘leaf-like’ appendages). The remipedes join the branchiopods on the far left, with thecanadaspidids on the far right. Most of the taxa thought to exemplify the ancestralcondition by various authors (Remipedia, Cephalocarida, Anostraca) plot in thisregion of the graph. (3) The mid to lower left region is occupied by Malacostracans.These extend perpendicular to the main axis (the first coordinate) defined by thephyllopods and maxillopods.
Morphology within the Eumalacostraca/Hoplocarida ranges from the en-tomostracan-like Bathynellacea and Thermosbaenacea, to the caridoid Eukyphida,Dendrobranchiata and Reptantia. The Peracarida (all joined by the MST) includessome taxa (e.g. Thermosbaenacea) morphologically proximate to the primitivesyncarids, and others (e.g. Mysidacea) showing striking convergence with the caridoideucarids. This is particularly noteworthy; even though the character matrix doesnot code for overall form and ‘shape’, taxa with grossly similar bodyplans plotproximally in the morphospace. This implies congruence between disparity measuredin terms of discrete character data and that derived from analyses of overall shape.
Phenetic proximity does not necessarily imply a close phylogenetic relationship(compare Fig. 5 with Fig. 2). The Leptostraca and Archaeostraca (phyllocarids) arephenetically closest to the Eumalacostraca, although they resolve some distancefrom them on the cladogram. Phenetic convergence may explain the desire to classifythe Phyllocarida with the Hoplocarida and Eumalacostraca (Malacostraca) (Claus,1888; Metschnikov, 1868). By the same token, close phylogenetic proximity neednot imply that taxa are immediately adjacent in morphospace. Although theLeptostraca/Archaeostraca and the Canadaspidida form a clade, the canadaspididsare phenetically removed from the other phyllocarids (Fig. 5). By contrast, pheneticdistinctiveness (in the form of autapomorphies) may explain why the Hoplocaridaare usually regarded as a separate taxon from the Eumalacostraca.
The disparity of major groups
The disparity of several major crustacean groups (not all of them clades) measuredas the sum of ranges on the first 13 principal components is illustrated (Fig. 6A).The phyllopods are the most disparate group, but are not a clade. The Malacostracaemerge as the most disparate clade, closely followed by the Maxillopoda andBranchiopoda. [The use of the product of ranges on the first 13 axes gives a similarresult, while the incorporation of all components captures more variation within thePhyllocarida (corresponding to a level of disparity between the Eumalacostraca andMaxillopoda – not illustrated)]. The groups illustrated are not of an equal size(Malacostraca are represented by 24 taxa and Maxillopoda by 21, while there arejust four phyllocarids), and the effects of these differences were investigated withrarefaction. Figure 6B shows the results of 1000 bootstrappings (resamplings withreplacement) of four taxa (the number of phyllocarids) from the larger groups. Upperand lower 95% intervals are calculated according to Foote (1992a). The overall

CRUSTACEAN DISPARITY THROUGH TIME 477
Figure 6. Disparity (sum of ranges on first 13 principal coordinates) for several large crustacean cladesand other groups. A, disparity of all taxa in group. B, mean disparity of four taxa bootstrapped fromeach group (1000 samples, with upper and lower 95% confidence intervals).
trends are similar to those emerging in Figure 6A, but the branchiopods aremarginally the most disparate clade.
The five branchiopods display a wide range of bodyplan designs (e.g. comparethe abbreviate trunk and non-phyllopodous appendages of carnivorous cladoceranswith the long trunk and numerous phyllopods of the notostracans). While the

M. A. WILLS478
Notostraca, Kazacharthra, Conchostraca and Anostraca all plot in the top left,phyllopodous region of Figure 5, the Cladocera resolve closer to the maxillopods,and are joined to the tantulocarid by the MST. Within the Malacostraca, theperacarids represent a relatively disparate assemblage [ranging from entomostracan-like thermosbaenaceans, through rather myriapod-like isopods (woodlice) to shrimp-like mysids]. The Eucarida (crabs, lobsters, crayfish, some ‘shrimps’) are moretightly constrained (Schram, 1986). Within the maxillopods, the copepods (althoughrepresented by ten suborders) constitute a very tight cluster, and accordingly havea relatively low disparity (regardless of the measure used, the number of componentsincorporated, or control for sample size differences). The phyllocarids, by contrast,are represented by just four taxa (not all of them of subordinal status) yet subtenda mean bootsrapped amount of morphospace exceeding the eucarids, peracaridsand copepods.
Overall patterns of disparity and morphological variance through time
Sums and products of rangesSums and products of ranges provide the most appropriate indices of disparity,
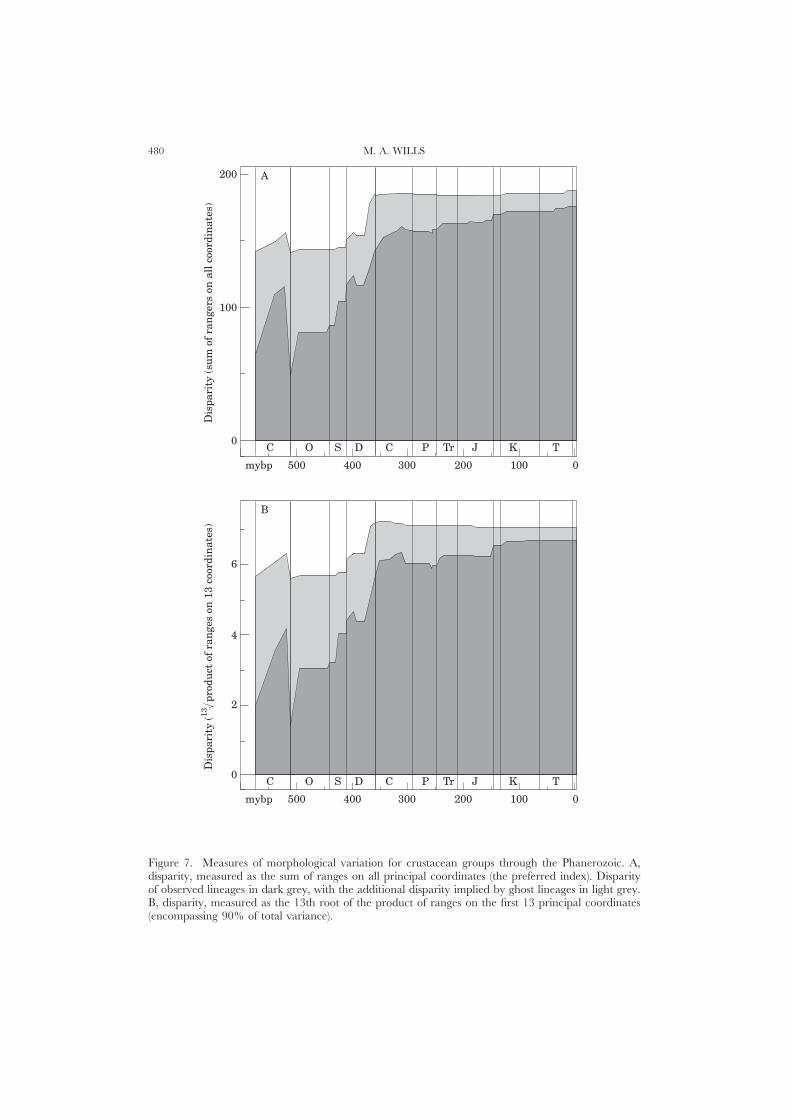
and the sum of ranges is preferred (Wills et al., 1994). However, both indices yieldsimilar profiles through time (Fig. 7A,B). The sums and products of ranges forobserved lineages in the Lower Cambrian are 34% and 28% respectively of thecorresponding Recent values. Sums and products of ranges for observed plus inferredlineages are markedly higher (76% and 80% respectively). Hence, even conservativeestimates show the first crustacean fossils to have been widely separated in morph-ospace, and to have occupied perhaps one third of the Recent hypervolume.Observed disparity increases dramatically through the Cambrian (the range sum inthe Merioneth reaches 62% of the Recent, and the range product 59%). Implieddisparity also peaks, but much less markedly than observed disparity. The earliestOrdovician sees a drop to the lowest observed levels at any time, while the drop inimplied disparity is much more modest. The rest of the period sees little change.Observed and implied profiles show the same pattern through the Silurian andDevonian, with increases in the mid Silurian, early and late Devonian (althoughincreases in observed levels are more pronounced than those in implied levels).Impied disparity reaches its maximum by the beginning of the Carboniferous, andshows little change threafter. Observed disparity shows a gradual increase betweenthe Carboniferous and Recent, though with some perturbations (more marked forthe product of ranges). Notable increases occur in the early Triassic, and at thebeginning of the Cretaceous.
Sums and products of variancesVariances are most appropriate for measuring the average dissimilarity amongst
taxa (Foote, 1992b), rather than the absolute extent of bodyplan variety (disparity).If the distribution of taxa in morphospace were always random, the sum of variancesshould be largely independent of sample size differences. Similarly, if taxa appearedand disappeared randomly in morphospace through time, sums of variances shouldremain approximately constant. This is not so for crustacean morphospace.
The observed sum of variances (Fig. 7C) shows irregular growth to a Devonian

CRUSTACEAN DISPARITY THROUGH TIME 479
peak, then a crash with more moderate oscillation about the mean from theCarboniferous to the Recent. The implied sum of variances (Fig. 7C) shows farmore shallow growth into the Devonian, a more modest drop into the Carboniferous,and shallow growth thereafter. The corresponding patterns for products of variancesare rather different (Fig. 7D). The observed variance product shows dramatic andirregular growth from the Cambrian to the Devonian, and slight variation about aconstant high level thereafter. The curve is similar to those for the observed sumsand products of variances (disparity). The implied variance product starts muchhigher than the observed variance product, reaches a modest peak in the Devonian,and broadly tracks the observed variance product from the Carboniferous to theRecent.
Identical sums of variances can result from very different distributions of varianceson successive coordinates (e.g. 3+2+1=6 and 2+2+2=6). However, where alarge proportion of the total variance sum is invested in a small number of coordinates,the product will always be less than if the total variance were more evenly-distributedover successive coordinates (3×2×1=6: 2×2×2=8). All coordinates contributeequally to variance products (regardless of the variance they encompass), while theycontribute to variance sums roughly in proportion to the corresponding eigenvalues.In the first half of the Phanerozoic, variance sums for observed lineages are higherthan variance products because more of the variation is expressed on earliercoordinates. Similarly, the marked Devonian peak in observed variance sums (butnot variance products) indicates a probable increase in variance predominantly onthe earlier, more important coordinates. Sums and products of ranges tend not tobehave in this manner, since successive coordinates are derived so as to encompasssuccessively smaller portions of the total variance, with no reference to the range(which can remain stable or increase on later coordinates).
Small sample sizes make it difficult to conclude much from the marked fluctuationsof variance from the Cambrian to the Ordovician. The radiation of the branchiopodsthrough the Silurian and the base of the Devonian is responsible for a markedincrease in variance-based indices, and the greatest average dissimilarity amongsttaxa occurs during the Devonian.
Disparity and the occupation of morphospace through time
The following discussion is limited to range-based indices of morphologicalvariation (the preferred indices of disparity rather than the average dissimilaritybetween forms). As noted above, sums and products of ranges both yield similardisparity profiles (Fig. 7A,B).
CambrianThe oldest, well-described crustacean fossils that appear in the Lower Cambrian
are phosphatocopines and canadaspidids (Fig. 8A). These have markedly dissimilarmorphologies, and while they do not delimit the extremes of crustacean bodyplanvariation on all axes, they define a sum of ranges one third of the Recent level.The appearance of several Burgess fossils (Waptia and Odaraia) proximate to thebranchiopod region of the plot serves to increase observed disparity by over 70%
M. A. WILLS480
0
mybp
Dis
pari
ty (
13 p
rodu
ct o
f ra
nge
s on
13
coor
din
ates
)
6
4
2
400 200300 100500
C O S D C P Tr J K T
0
B
0
mybp
Dis
pari
ty (
sum
of
ran
gers
on
all
coo
rdin
ates
)
200
100
400 200300 100500
C O S D C P Tr J K T
0
A
Figure 7. Measures of morphological variation for crustacean groups through the Phanerozoic. A,disparity, measured as the sum of ranges on all principal coordinates (the preferred index). Disparityof observed lineages in dark grey, with the additional disparity implied by ghost lineages in light grey.B, disparity, measured as the 13th root of the product of ranges on the first 13 principal coordinates(encompassing 90% of total variance).

CRUSTACEAN DISPARITY THROUGH TIME 481
mybp
Dis
pari
ty (
13 p
rodu
ct o
f ra
nge
rs o
n 1
3 co
ordi
nat
es)
3.5
2.5
1.5
400 200300 100500
C O S D C P Tr J K T
0
D
60
mybp
Dis
pari
ty (
sum
of
vari
ance
on
all
coo
rdin
ates
) 160
100
400 200300 100500
C O S D C P Tr J K T
0
C
140
120
80
Figure 7—contd. C, average dissimilarity between forms measured as the sum of variances on allprincipal coordinates. D, average dissimilarity between forms measured as the 13th root of the productof variances on the first 13 principal coordinates. Disparity of (Χ) observed lineages and (Β) observedlineages plus ghost lineages.
in the middle Cambrian . The Upper Cambrian Orsten fauna contains taxa closeto the maxillopod (Bredocaris, Dala) and ostracod (Skara, Martinssonia) morphologies,continuing to increase observed disparity to the end of the Cambrian.

M. A. WILLS482
Figure 8. Representative ‘time slice’ plots of crustacean morphospace. Compare with Fig. 5. Firstthree principal coordinates are illustrated. Third coordinate is at right angles to the plane of the page,filled symbols are positive, open symbols are negative (arbitrary). Black symbols represent taxa with arange extending through the stage illustrated. Dark grey symbols represent taxa with a ghost range.Light grey symbols represent taxa extinct at the stage illustrated. A, Lower Cambrian (Caerfai). B,End Ordovician (Ashgill). C, End Devonian (Famennian). D, End Carboniferous (Gzelian). E, EndJurassic (Tithonian). F, End Tertiary (Pliocene).

CRUSTACEAN DISPARITY THROUGH TIME 483
Figure 8—contd.
M. A. WILLS484
The cladogram implies that most major clades (e.g. Remipedia, Branchiopoda,Phyllocarida, Ostracoda, Eumalacostraca, Copepoda to Thecostraca, Dala to Ce-phalocarida), as well as the genera Waptia and Odaraia, must have been representedeven in the Lower Cambrian. Implied disparity approaches 76% of the Recentlevel. The implied peak toward the end of the Cambrian is far less pronouncedthan the observed peak, since some of the previously inferred lineages now appearin the record. Nonetheless, implied disparity reaches 83% of its present level.
Since only well-described fossils are coded from the Cambrian, the indices ofCambrian disparity may be conservative. Numerous Cambrian fossils known onlyfrom carapaces have been assigned to the phyllocarids and ostracods, but theirstatus is highly contentious (Schram, 1986) (Cambrian ‘phyllocarids’ may actuallyhave greater affinities with thylacocephalans). For this reason, the Cambrian portionof Figure 7 should be viewed with some caution.
Ordovician/SilurianThe end of the Cambrian saw the demise of the canadaspidids and all of the
Orsten genera. The earliest Ordovician is therefore marked by a decrease inobserved disparity to a level below that in the earliest Cambrian, supported onlyby archaeostracans and cirripedes (Fig. 8B). An increase in observed disparity inthe Arenig was maintained throughout the Ordovician. The Silurian saw theappearance of myodocopine ostracods (close to the podocopines, and therefore withlittle effect) and the anostracan branchiopods [colonizing a more peripheral regionof morphospace (upper left in Fig. 5)], bringing observed disparity to over half itsRecent level. Numbers of observed taxa are small throughout the Cambrian, Or-dovician and Silurian, and the extinction of a few lineages has more influence onabsolute levels of disparity than at later times. Several regions of morphospace areoccupied by single taxa, and their extinction causes the collapse of a large portionof the envelope. The denser occupation later in time means that several taxa orlineages need to become extinct to achieve a comparable effect.
Implied disparity (unlike observed disparity) does not exhibit a catastrophic dropfrom the Cambrian to the beginning of the Ordovician, and maintains a level similarto that in the Lower Cambrian throughout the Ordovician and Silurian. Again, theinferred presence of several major lineages (Remipedia, Eumalacostraca, Ce-phalocarida, Copepoda to Tantulocarida) serves to keep the morphospace envelopeopen.
DevonianThe appearance of conchostracan branchiopods at the beginning of the Devonian
restores observed disparity to Middle Cambrian levels. The brief appearance in theLokhovian of the phyllopodous Lepidocaris (Rhynie Chert) (Scourfield, 1926) in asimilar location sees another slight disparity increase. The next marked change(Famennian) corresponds to the appearance of the first eumalacostracans, thereptantians and palaeostomatopods (Fig. 8C). Reptantians are a highly-derivedgroup of eumalacostracans (Fig. 2), and plot far from the entomostracan region ofmorphospace (Fig. 5) (on a remote terminal of the MST). Their appearance representsa significant morphological innovation (implying the existence of numerous ghostlineages for taxa that appear later). The palaeostomatopods are hoplocarids, oftenregarded as a sister group to the Eumalacostraca (Schram, 1986), but resolved here
CRUSTACEAN DISPARITY THROUGH TIME 485
as a sister group to the Eucarida plus the Belotelsonidea (Fig. 2). Disparity accordinglyrises to its highest level so far.
The pattern of implied disparity is similar to the observed pattern, only displacedvertically. The sum of ranges reaches 95% of its Recent level by the end of theDevonian (Famennian), bolstered by ghost lineages for most eucarid and all syncaridorders, and a diverse branchiopod clade. Peracarids are represented by just a singlelineage.
Carboniferous/PermianImportant eumalacostracan lineages appear in the fossil record through to the
middle Carboniferous: the Belotelsonidea, Spelaeogriphacea and Py-gocephalomorpha (Tournaisian), the Aeschronectida, Paleocaridacea and Tanai-dacea (Visean), and the Cumacea (Bashkovian). Together with the appearance ofthe Enantiopoda (remipedes) these contribute to a mid Carboniferous peak. Theextinction of the Enantiopoda and Belotelsonidea by the Kasimovian results in adecrease in observed disparity, despite the emergence of the notostracan branchiopods(Fig. 8D). There is little change in disparity throughout the Permian. A small wobblefrom the Ufimian to the Tatarian corresponds to the extinction of the Palaeocaridaceaand the subsequent emergence of the Leptostraca.
Implied disparity (sum of ranges) reaches Recent levels by the beginning of theCarboniferous. The Eumalacostaraca are densely sampled throughout, with just twoorders yet to appear. There is little change throughout the Carboniferous andPermian (or even up to the Recent).
Triassic-TertiaryThe extinction of the Pygocephalomorpha results in a barely perceptible decline
in observed disparity at the start of the Triassic, followed by a larger rise in theAnisian and Carnian caused by the appearance of the anaspidaceans and thekazacharthran branchiopods. There is no subsequent change until the Jurassic(Toarcian), with the appearance of the Euzygida and the later demise of thekazacharthrans. The first records of the Caridacea and Mysidacea in the Callovianhave little effect on disparity at the end of the Jurassic (Fig. 8E). A much morepronounced increase at the start of the Cretaceous corresponds to the appearanceof the cladoceran branchiopods. The first fossil copepod (a parasitic siphonostomatoid)in the Aptian has little effect, as it plots within the relatively densely-occupied‘maxillipod’ region of morphospace. Similar considerations apply to the first ascot-horacican (cirripedes are present from the Middle Cambrian). The only remainingevents are the appearance of the amphipods and anostracan branchiopods in thePriabonian, and the harpacticoid and monstrilloid copepods in the Langhian (Fig.8F), none of which markedly influence disparity levels.
Implied disparity shows virtually no change throughout this period. The radiationof the morphologically constrained copepods (and by inference, the mystacocaridsand tantulocarids) is registered, but of little overall significance.
RecentSeveral morphologically rather distinct groups have no fossil record, among them
the Amphionidacea, Thermosbaenacea, Bathynellacea, Mystacocarida, Tan-tulocarida, Branchiura, Brachypoda and Nectiopoda. These contribute to a largeincrease in disparity from the Pleistocene to the Recent.

M. A. WILLS486
The differential occupation of morphospace
Realized bodyplansThe PCO plot (Fig. 5) illustrates something that will be obvious to any carcinologist:
while the crustaceans are a highly plastic group, there are large regions of morphospacethat are not currently, and (from all the fossil evidence) never have been occupied.Schram (1984) demonstrated this for eumalacostracans by a simple consideration ofjust three parameters (the development of the cephalothoracic shield, the developmentof a brood pouch, and the biramy or uniramy of the thoracopods). Considering thecrustaceans as a whole, no taxon has ever combined a fused cephalothorax with (forexample) phyllopodous limbs or an elongate, homonomous trunk. Similarly, manyspecializations and unique tagmoses of the appendages occur solely within the Ma-lacostraca. A discussion of the reasons for these limitations is beyond the scope of thisstudy, although functional morphological and mechanical constraints may almostcertainly be invoked (e.g. a remipede-like animal would be hydrodynamically inept ifencumbered with a large, bivalved, cephalothoracic shield).
Morphological rarefactionAlthough the distribution of all taxa (extant and fossil) in morphospace dem-
onstrates a pattern that is clearly significantly different from random, we may stillask whether the disparity of taxa at any given time was significantly different froma similarly-sized random sample drawn from the universe of all realized bodyplans?In other words (for example), are the 17 orders that existed in the Moscovian moreor less disparate (on average) than seventeen orders chosen randomly from the listof all the orders that existed? This question was addressed by producing rarefactioncurves of all four measures of morphological variation (sums and products of rangesand variances) at sample sizes between two and one less than the total number ofsuborders coded. Results for sums of ranges on all coordinate axes are illustrated(Fig. 9). Values from the randomly-selected taxa are plotted as lines (mean valueswith upper and lower 5% confidence intervals). The disparity of the taxa actuallyobserved at each stage is plotted as open circles and the disparity of observed pluscladistically implied taxa is plotted as triangles. Only a small number of points lieoutside the 90% confidence limits. Values for observed plus implied taxa are clusteredtowards higher sample sizes, and are slightly closer to the mean on average.
For clarity, the difference between the average randomized values and the actualvalues for each stage are plotted against time (Fig. 10), with upper and lower 5%confidence intervals also indicated. Four graphs show the sum of ranges for bothobserved taxa (Fig. 10A,B) and implied taxa (Fig. 10C,D), on all coordinates (Fig.10A,C) and on just the first 13 coordinates (Fig. 10B,D). All except six of the timeslices (within the Cambrian, the first half of the Silurian, and the Recent), haveobserved values (Fig. 10A,B) exceeding the mean for samples of a similar numberof taxa. A similar pattern applies to the sum of implied ranges on all coordinates(Fig. 10C). The sum of implied ranges on just the first 13 coordinates (Fig. 10D)has many more values below the mean through the Carboniferous, Permian,Cretaceous and Tertiary. Three of the graphs (B,C,D) have disparity levels belowthe upper 95% confidence interval, while the sum of observed ranges on allcoordinates (Fig. 10A) has some values exceeding the upper interval from the Triassicto the Recent. In no cases do values fall below the lower interval (and therefore inno cases is disparity significanly less than predicted at random).

CRUSTACEAN DISPARITY THROUGH TIME 487
Figure 9. Rarefaction analysis of crustacean disparity. Disparity is calculated as the sum of ranges onall coordinates. Rarefaction curves have been produced from 1000 random draws (without replacement)of taxa at each sample size. The mean values, with 95% confidence intervals, are indicated as lines.Data for lineages observed at each stage are plotted as circles. Data for implied lineages (includingthe observed ones) are plotted as triangles. Most stratigraphic intervals contain an array of taxa thatare more disparate than the average of a similar number drawn randomly from the list of all realizedorders. The pattern through time is investigated in more detail in Fig. 10.
We would not expect animals to appear and disappear in morphospace purely atrandom. In reality, new bodyplans arise by phyletic branching, and a clade diversifiesby the incremental acquisition of apomorphies along its branches. Cladograms usuallyreveal sequences of morphologies ‘intermediate’ between common ancestors and themost phenetically-derived terminals (or those supported by the largest numbers ofnodes). Therefore, taxa would be expected to appear in morphospace closer (on av-erage) to regions already occupied than predicted by a random model (provided tem-poral resolution was sufficient). Similarly, the early evolution of a group should becharacterized by the colonization of morphospace progressively further from the com-mon ancestor, whether in several directions or just one. Extinctions might be expectedto deselect groups of related taxa, rather than picking off branches from the tree atrandom. Both of these effects will tend to make disparity at any given time less thanthat for a corresponding random scatter of points. Hence, the observation of greaterdisparity at most intervals than at random is surprising, and the fact that some of thesedifferences are significant is even more surprising.
The Cambrian has rather lower disparity than expected at random, but notsignificantly so. Hence, although just a few Cambrian taxa circumscribe an ap-preciable fraction of Recent disparity (Fig. 7A), this is not inconsistent with therandom appearance of forms. The fact that Cambrian levels are among the lowestalso suggests more of a Markovian progression through morphospace than at other
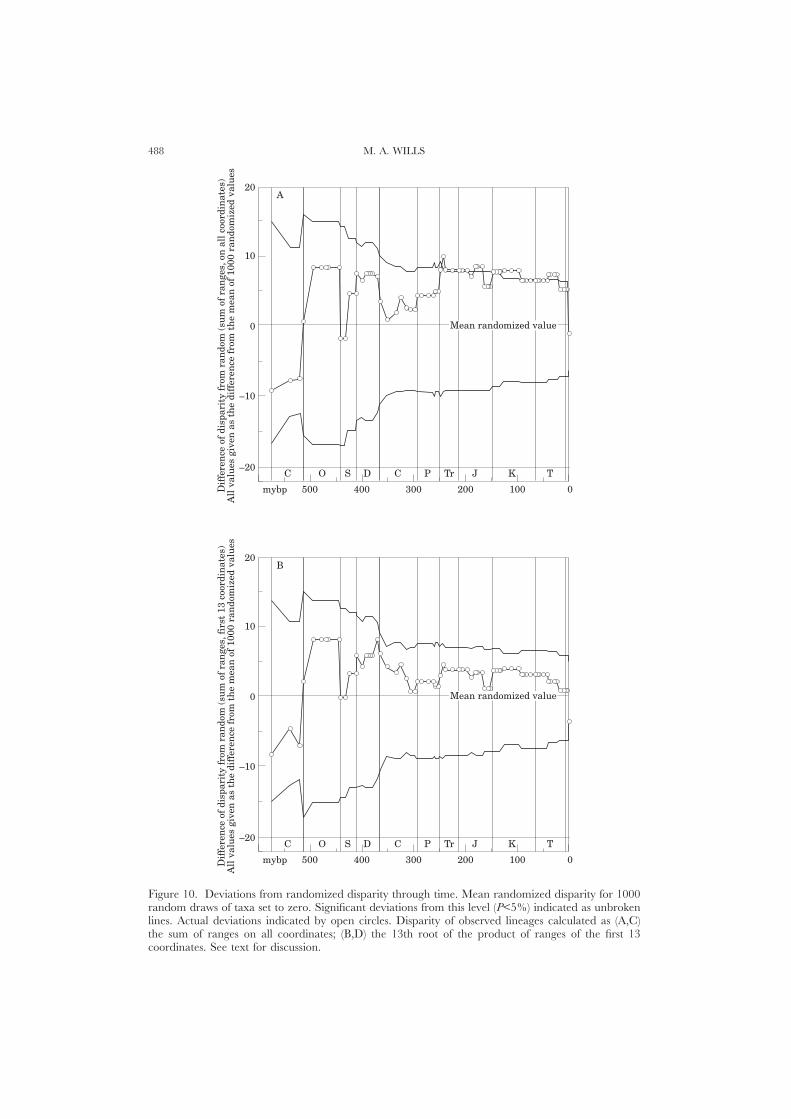
M. A. WILLS488
20
–20
mybpDif
fere
nce
of
disp
arit
y fr
om r
ando
m (
sum
of
ran
ges,
fir
st 1
3 co
ordi
nat
es)
All
val
ues
giv
en a
s th
e di
ffer
ence
fro
m t
he
mea
n o
f 10
00 r
ando
miz
ed v
alu
es
10
0
–10
400 200300 100500
C O S D C P Tr J K T
0
Mean randomized value
B
20
–20
mybpDif
fere
nce
of
disp
arit
y fr
om r
ando
m (
sum
of
ran
ges,
on
all
coo
rdin
ates
)A
ll v
alu
es g
iven
as
the
diff
eren
ce f
rom
th
e m
ean
of
1000
ran
dom
ized
val
ues
10
0
–10
400 200300 100500
C O S D C P Tr J K T
0
Mean randomized value
A
Figure 10. Deviations from randomized disparity through time. Mean randomized disparity for 1000random draws of taxa set to zero. Significant deviations from this level (P<5%) indicated as unbrokenlines. Actual deviations indicated by open circles. Disparity of observed lineages calculated as (A,C)the sum of ranges on all coordinates; (B,D) the 13th root of the product of ranges of the first 13coordinates. See text for discussion.

CRUSTACEAN DISPARITY THROUGH TIME 489
20
–20
mybp
10
0
–10
400 200300 100500
C O S D C P Tr J K T
0
D
20
–20
mybpDif
fere
nce
of
disp
arit
y fr
om r
ando
m (
sum
of
ran
ges
on a
ll c
oord
inat
es)
All
val
ues
giv
en a
s th
e di
ffer
ence
fro
m t
he
mea
n o
f 10
00 r
ando
miz
ed v
alu
es
10
0
–10
400 200300 100500
C O S D C P Tr J K T
0
Mean randomized value
C
Dif
fere
nce
of
disp
arit
y fr
om r
ando
m (
sum
of
ran
ges,
fir
st 1
3 co
ordi
nat
es)
All
val
ues
giv
en a
s th
e di
ffer
ence
fro
m t
he
mea
n o
f 10
00 r
ando
miz
ed v
alu
es
times. These observations, though dampening the extreme ‘explosive’ model (Gould,1989, 1991), still attest to a markedly scattered initial record for the Crustacea, andsome implications of this are discussed later.

M. A. WILLS490
An Ordovician peak in observed levels (Fig. 10A,B) contrasts with near-randomimplied levels (Fig. 10C,D). Numbers of observed taxa through the Ordovician arelow, but many of the cladistically-implied lineages are close to the morphology ofobserved ones. Another peak in the Devonian (greatest for the implied differences, Fig.10C,D) marks the radiation of the branchiopods and cephalocarids. The appearanceof the highly-derived reptantian eumalacostracans in the record at the end of theDevonian sees the highest overall observed level on the first 13 coordinates (Fig. 10B)(and the one closest to being significant). The cladogram implies the appearance ofnumerous other (morphologically relatively similar) eumalacostracan lineages at thistime, which reduces the difference from random in implied disparity (Fig. 10C,D).Implied disparity shows a gradual increase through the Carboniferous and Permian,and in Fig. 10C (all coordinates) reaches levels on the border of significance throughthe Triassic, Jurassic and early Cretaceous. Most major clades contain many modernorders with lineages or ghost lineages extending back to the Triassic, with the exceptionof the maxillopods. The implied radiation of this latter group (including the mor-phologically rather conservative copepods, Fig. 6) in the Aptian sees implied disparitylevels decrease closer to the random level. Towards the Recent, the appearance ofseveral ghost lineages (and many observed lineages) close to regions of morphospacealready occupied sees a decrease in disparity to levels well below the mean average.
In general, the graphs based on just the first 13 coordinates (Fig. 10B,D) showless deviation from random than the corresponding graphs based on all positivecoordinates (Fig. 10A,C). This suggests that the spread of taxa on many of the latercoordinates is more eccentric than on the earlier ones. While the first few coordinatesappear to differentiate between the major clades, later coordinates probably pullout differences within these groups (lower portions of the overall variance). This inturn suggests that the radiation within crustacean clades may differ more fromrandom than the radiation of the clades themselves. It is also noteworthy that thepattern of observed disparity calculated on all coordinates differs most from thatcalculated on just the first 13 coordinates in the period Triassic to Recent (whereall coordinates imply greater and often significant deviation from random). Thisinterval sees the appearance of many important new morphologies within theEumalacostraca and Maxillopoda. The corresponding period of greatest differencefor implied (closer to the truth?) disparity lies from the Carboniferous to the Recent,and is undoubtedly driven initially by the radiation of the Eumalacostraca.
‘Mass extinctions’, diversity, disparity and sampling
With the exception of the event at the end of the Cambrian, levels of disparityare undiminished at times with significantly-elevated extinction rates. The end-Permian, end-Triassic and end-Cretaceous events cause no changes in the sums andproducts of ranges, while the end Ordovician sees an increase. Disparity increasesdramatically from the late Devonian to the early Carboniferous.
The differential effects of mass extinctions on ‘diversity’ at various levels in thetaxonomic hierarchy are well-documented (Raup & Sepkoski, 1986; see also Smith &Jeffery, 1998, for a consideration of some ecological factors influencing clade sur-vivorship). Species and genera may be wiped out with relative ease, but extinguishinga family means knocking out perhaps tens or even hundreds of genera, and the demise

CRUSTACEAN DISPARITY THROUGH TIME 491
of an order implies the loss of many families. In general, as we increase the hierarchicallevel of the taxa we study, perturbations in taxic diversity decrease.
Disparity (or bodyplan variety) is undoubtedly more closely tied to numbers ofhigher taxa (orders, classes etc.) than to numbers of species (Gould, 1989), but thereare serious dangers in simply equating the two (Briggs et al., 1992). Moderncoelacanths and xiphosurans, for example, are lone representatives of what wereonce vastly more diverse higher taxa and bodyplan designs. In effect, just a fewgenera ‘hold the fort’, bolstering the disparity of the larger groups that containthem. To this extent, the demise of either of these ‘living fossils’ would be of greatersignificance than the extinction of (for example), a genus of gobies or three generaof spiders. Similarly, some crustacean orders are monogeneric (e.g. Amphionidacea,Procarididea) while others contain hundreds or thousands of genera (e.g. Isopoda,Reptantia). This is why variance-based indices of morphological variation areconsidered less informative for the present purposes; rare and eccentric bodyplanscan be lost with very little change in the indices, and the absolute magnitude ofchange will depend on the extent of taxonomic splitting.
A worthwhile exercise (and one, no doubt, destined for further study) would beto investigate crustacean disparity by sampling below the ordinal and sub-ordinallevels. It is quite possible, however, that this would yield patterns of range sums andproducts broadly similar to those outlined here. Some regions of the morphospacewould be much more densely occupied than they are in the present analysis (whichmight have some implications for the orientation of the cloud of points along thecoordinate axes, and variances along those axes). However, in terms of the characterset used here, further taxonomic splitting would reveal few additional combinationsof states, and therefore do little to change the overall distribution of occupied regionswithin the space. Sums and products of ranges (the preferred indices of disparity)would be expected to change little, while sums and products of variances would bemore influenced by the differential clustering of points (Foote, 1992b).
Morphological variety profiles in trilobites
The most prominent examples of studies similar to this are found within a series ofpapers on trilobites by Foote (1989, 1990, 1991a, 1992b, 1993). The trilobites aremarkedly less disparate overall than the crustaceans (Wills et al., 1998a), and are a cladeof much lower rank [the Crustacea oppose the Arachnomorpha, and this latter cladecontains not only the trilobites but also the chelicerates and many other Burgess‘problematica’ (Wills et al., 1998b)]. Species and specimens were selected in a rathermore ‘haphazard’ fashion than here. Most of Foote’s investigations focussed on theaverage dissimilarity between forms (variance) rather than the range of morphospaceoccupied, and in some cases, ‘outliers’ were arbitrarily ignored (Foote, 1991a,b). Adirect comparison with disparity (as defined here for the Crustacea) is not straight-forward. Moreover, the data used by Foote differed quantitatively and qualitativelyfrom those employed here. Differences in the morphology of the cranidium alone wereused to define a trilobite morphospace, rather than attempting to capture mor-phological variation in the whole body. Instead of a suite of discrete morphologicalcharacters, cranidial outlines were projected into two dimensions, and described by aseries of harmonic coefficients from a Fourier transform (Foote, 1989). Shape variationin a single, conservative feature was then used as a proxy for differences in overall
M. A. WILLS492
bodyplanmorphology[abigassumption,butonewhichprobablyhas somebasis (Foote,1989, 1991a)]. Despite the differences in approach, some interesting observations arisefrom a comparison of patterns of morphological variety in the two studies.
The sum of variances on all axes for all trilobites was about one third of its maximumin the first Cambrian time-slice (Foote, 1993). Visual inspection of the ordinationssuggests that the sums of ranges (at least on the first two principal components) may havebeen ina similar ratio. Trilobites, like crustaceans, appear tohave been morphologicallyrather diverse early in their recorded history. The variance sum is seen to decreaselater in the Cambrian, but reached its all-time maximum in the latter half of theOrdovician. Illustrations suggest that the sum of ranges probably peaked at the sametime. Sums of variances for crustaceans were also at higher levels through the Ordo-vician. The early histories for the two groups therefore appear to be quite similar.Thereafter, however, the patterns differ markedly.
Trilobites maintained a fairly dispersed but much more rarefied distributionthrough the Silurian and Devonian, but sums of variances (and sums of ranges)significantly decreased. By contrast, crustaceans showed an increase to an all time-high on all indices by the end of the Devonian (except the sum of variances, whichpeaked in the early and mid Devonian). The early Carboniferous saw a markedcrash in variance sums for trilobites, and by the end of the period the group occupieda very restricted pocket of morphospace (certainly a smaller sum of ranges than inthe Cambrian). The last trilobites died out at the end of the Permian. Disparity (thesum of ranges) for crustaceans continued to increase steeply until the Moscovian(86% of the Recent), with just a slight overall upward trend from the end of theCarboniferous to the end of the Tertiary. [The filling in of morphological in-termediates during the Carboniferous caused the sum of variances to decrease to alevel around that in the Ordovician (where it stayed until the Recent)].
Hence, the Silurian to Carboniferous demise of trilobite disparity coincided witha major phase of disparity increase for the Crustacea. It is tempting to speculatethat the phenomena may be linked. Ecological competition is difficult to demonstratein the living fauna, and much more so in the fossil record (Benton, 1996). Trilobites,like crustaceans, exploited a variety of habitats and niches. However, the majoritywere benthic, either crawling over the sediment or burrowing through surface layers.Most of these were probably scavengers or direct deposit feeders, while a few mayhave been active predators, ambushing prey from a partially buried hiding place(Bergstrom, 1973). Some genera may also have suspension fed. Most benthic trilobiteswere a few centimeters long, although some reached 60 cm or more. A few trilobitesunder 1cm were planktonic. Crustaceans exploited most of the same habitats evenin the Cambrian, but benthic scavengers, deposit feeders and predators seem onlyto have taken off with the radiation of the Eumalacostraca in the late Devonianand Carboniferous (corresponding with the rapid decline in trilobite disparity). Thefirst eumalacostracans were almost certainly active walkers rather than swimmers(Manton, 1953; Dahl, 1992), and the differentiation of the thorax and abdomen islikely to have been associated with an epibenthic mode of life (Calman, 1909).
It may also be significant that the diversity of eurypterid (‘water-scorpion’) familiesincreased from the mid Ordovician to a Silurian peak, and then declined markedlyin the Devonian (Selden, 1993). Eurypterids appear to have used a variety of feedingstrategies, although most were rapacious carnivores. One might speculate tentativelyon the possibility of competition between eurypterids and the reptant decapods andhoplocarids.
CRUSTACEAN DISPARITY THROUGH TIME 493
Briggs, Fortey & Clarkson (1988) noted some complementarity in the genericdiversity curves for Eurypterids and fish, with fish diversity peaking in the lateDevonian. The rise of gnathostomes (the fish group most ‘adaptively comparable’with the predaceous eurypterids) coincided with the onset of eurypterid decline inthe Silurian-early Devonian. However, the decline in eurypterids was not com-plemented by an increase in fishes, but rather paralleled by a similar decline (Briggs,1985). Briggs et al. (1988) concluded that there is little evidence to support thehypothesis of competitive interaction between these two groups, and cautionedagainst an uncritical reading of the fossil record in this way.
Implications for the Cambrian ‘explosion’
Even though disparity of the earliest Cambrian crustacean fossils is indistinguishablefrom a similarly-sized random sample (Fig. 10), this is remarkable. Even if functionaland developmental constraints took effect early in the history of a group, initial di-versification should refelct a progressive exploration of morphospace, rather than anapparently simultaneous colonization of several extremes. Such drift could originateanywhere within the space, centrally, peripherally (the remipedes, and all other groupsconsidered plesiomorphic, plot in the top left of Fig. 5), or somewhere in between.Since the earliest fossils are as disparate (on average) as a similar number of ordinal-level bauplane picked randomly from the list of all those realized (i.e. Lower Cambrianfossils are widely scattered in morphospace), this strongly suggests that the earliestdiversification of the group is not recorded here. This may be either because the eventwas explosive (and the fossil record samples the result on too coarse a time interval topick it up), or because significant cladogenesis took place in the Precambrian (althoughthis is not evident in the fossil record). Fortey, Briggs & Wills (1995, 1997) discussedthe latter possibility for all arthropods, and all Metazoa, proposing a Precambrianhistory of cladogenesis in animals too small to be fossilized. As discussed above, thiswould require the roughly simultaneous triggering of size increase in many lineages bysome (presumably external) factor. Support for this idea comes from the observationthat many phyla have minute (<1 mm) sister groups or basal representatives. Recentrate studies in several molecules (haemoglobin, NADH dehydrogenase subunit 1, 18SrRNA, ATPase 6, cytochrome c and cytochrome c oxidase subunits I and II) implydivergence times for all phyla in excess of 1200 million years before present (Wray etal., 1996). A more conservative molecular estimate (Ayala, Rzhetsky & Ayala, 1998)dates the protostome/deuterostome split to about 670 million years, still implying aPrecambrian history for modern animal groups of 120 million years or more. Therelatively low levels of disparity through the Cambrian are, perhaps, even more surprisinggiven claims about the inordinately disparate morphologies of animals from the BurgessShale, Chengjiang and Peary Land faunas (Gould, 1989, 1991).
CONCLUSIONS
(1) Historically, palaeontologists have utilized two sources of data for inferringphylogeny; morphological and stratigraphic. Stratigraphic data have usuallybeen ignored by most cladists, who deduce phylogeny from the distribution of

M. A. WILLS494
character states alone. Recently a variety of techniques have been devised thatutilize stratigraphic congruence within the optimality criteria for cladogramselection. Alternatively, morphological and stratigraphic information can beconsidered independently, allowing robust phylogenies to identify ghost rangesand gaps in the fossil record. Randomization procedures offer a significance testof the ‘goodness of fit’ of these two types of data.
(2) Cladistic and appropriate morphospace methods can be applied in parallel todata sets of discrete morphological characters.
(3) The cladogram for crustaceans does not conform precisely to any previously pub-lished tree for the clade (Schram, 1986; Brusca & Brusca, 1990). Malacostracans(sans phyllocarids) constitute a sister group to maxillopods. Phyllopod taxa resolveas a paraphyletic series of sister groups in opposition to this clade (interspersed with‘Orsten’ genera). The putatively ancestral forms, branchiopods (Fryer, 1992) andcephalocarids (Hessler & Newman, 1975) fall low in the tree. The hoplocarids areprobably not the sister group of the eumalacostracans (Schram, 1969), but are mostparsimoniously interpreted in association with the eucarids. The peracarids forma clade, but the syncarids are a paraphyletic taxon, united by symplesiomorphicfeatures. The cladogram implies the existence of significantly shorter ghost rangesthan obtained from a random permutation of stratigraphic data over the entiretree. However, stratigraphic congruence within the Eumalacostraca is significantlyworse than random using both the tree presented here, and published alternatives.Oneof several possibleexplanations for this is theabsenceof fossilsbecausenumbersof individuals have always been small (living examples of several lineages have onlybeen discovered relatively recently).
(4) Three broad ‘clusters’ emerge from the morphospace plot, echoing the structureof the cladogram. The first comprises the maxillopods and ‘Orsten’ taxa (with theexception of Rehbachiella). The second contains the malacostracans, leptostracansand archaeostracans. The third encompasses several taxa believed to be close tothe ancestral crustracean morphology (Remipedia, Cephalocarida, Branchiopoda)plus the Canadaspidida, Odaraia and Waptia. Remipedes (used to root the clado-gram) lie at one extreme of the MST, and in a far corner of the plot. There must havebeen a strongly directional component to the early exploration of morphospace,irrespective of precisely where the ancestor lay. Malacostracans extend along thesecond coordinate, from the more entomostracan-like syncarids and ther-mosbaenaceans, to the typically caridoid reptantians, eukyphids, and dendro-branchiates at the tips of the MST. Several regions of the overall morphospaceremain conspicuously unoccupied. However, there are few obvious discontinuitiesin those regions that are occupied (i.e. there are many intermediate forms).
(5) The maxillopods and eumalacostracans show a comparable disparity (sum ofranges) overall, while the phyllopods (paraphyletic) are slightly more disparate.The branchiopods are almost as disparate as the maxillopods, although only fivebranchiopod exemplars were coded, compared with 21 maxillopods. Correctingfor sample size differences, the branchiopods, maxillopods and eumalacostracansall have a comparable disparity.
(6) In the Lower Cambrian, the levels of disparity for observed fossil lineages wereabout a third of their present value (using range-based measures). Observeddisparity increased throughout the Cambrian but after a marked slump in theTremadocian, stabilized to a level similar to the Lower Cambrian thoughoutthe rest of the Ordovician. Increases through the Silurian register the appearance
CRUSTACEAN DISPARITY THROUGH TIME 495
of ostracods and the anostracans. The Devonian witnessed two marked increaseswith the diversification of branchiopods and eumalacostracans. Disparity attainedabout 85% of Recent levels by the base of the Permian, and showed a gradualincrease to 94% by the Pleistocene. Values incorporating ghost lineages exhibithigher initial levels, with less marked peaks and troughs and fewer perturbationsoverall. Levels of disparity are not significantly diminished at most times of massextinction (with the exception of the end Cambrian). Most time intervals containan assemblage of orders with a disparity exceeding the mean for a similarly-sized random sample. However, this difference is only significant in the absenceof ghost ranges, intermittently from the Triassic to the mid Tertiary.
ACKNOWLEDGEMENTS
My thanks to R.A. Fortey and F. R. Schram for comments that enabled me tosubstantially improve this paper. M.J. Benton, D.E.G. Briggs, D.H. Erwin, P.J.Wagner, R.P. Higgins, M. Foote and M.-H. Trivella also offered constructivecriticism. Particular thanks to P.H.A. Sneath for inspiring me to experiment.Phylogenetic data were compiled during the tenure of a Smithsonian PostdoctoralFellowship, and the analyses were undertaken with funding from the LeverhulmeTrust (Grant F/182/AK).
REFERENCES
Abele LG, Spears T. 1998. Crustacean phylogeny inferred from 18s rDNA. In: Fortey RA, ThomasR, eds. Arthropod relationships. London: Chapman & Hall, 169–188.
Abele LG, Spears T, Kim W, Applegate M. 1992. Phylogeny of selected maxillopodan and othercrustacean taxa based on 18S ribosomal nucleotide sequences: a preliminary analysis. Acta Zoologica73: 373–382.
Adouette A, Philippe H. 1993. The major lines of metazoan evolution, summary of traditionalevidence and lessons from ribosomal RNA analysis. In: Pichon Y, ed. Comparative molecular neurobiology.Basel: Birkhauser Verlag, 1–30.
Averof M, Akam M. 1995. Insect–crustacean relationships: insights from comparative developementaland molecular studies. Philosophical Transactions of the Royal Society London Series B347: 293–303.
Ayala FJ, Rzhetsky A, Ayala FJ. 1998. Origin of the metazoan phyla: molecular clocks confirmpaleontological estimates. Proceedings of the National Academy of Sciences 95: 606–611.
Beklemischev VN. 1952. Osnovy sraviteljnoi anatomii bespozvonocnych. 2nd ed. Moscow: Nauka.Beklemischev VN. 1969. Principles of Comparative Anatomy of Invertebrates. Vol. 1. Edinburgh: Oliver &
Boyd. (translation of 3rd (1964) ed. by MacLennan JM).Benton MJ. 1994. Palaeontological data and indentifying mass extinctions. Trends in Ecology and
Evolution 9: 181–185.Benton MJ. 1995. Testing the time axis of phylogenies. Philosophical Transactions of the Royal Society
B349: 5–10.Benton MJ. 1996. On the nonprevalence of competitive replacement in the evolution of tetrapods.
In: Jablonski D, Erwin DH, Lipps JH, eds. Evolutionary Paleobiology. Chicago: University of ChicagoPress, 185–210.
Benton MJ, Hitchin R. 1996. Testing the quality of the fossil record by groups and by majorhabitats. Historical Biology 12: 111–157.
Benton MJ, Hitchin R, Wills MA. 1998. Assessing congruence between cladistic and stratigraphicdata. Systematic Zoology (in press).
Bergstrom J. 1973. Organization, life and systematics of trilobites. Fossils and Strata 1: 1–63.Bergstrom J. 1991. Metazoan evolution around the Precambrian-Cambrian transition. In: Simonetta

M. A. WILLS496
AM, Conway Morris S, eds. The early evolution of Metazoa and the significance of problematic taxa.Cambridge: Cambridge University Press, 25–34.
Bergstrom J. 1992. The oldest arthropods and the origin of the Crustacea. Acta Zoologica 73: 287–291.Bergstrom J, Briggs DEG, Dahl E, Rolfe WDI, Sturmer W. 1987. Nahecaris stuertzi, a phyllocarid
crustacean frrom the Lower Devonian Hunsruck Slate. Palaontologische Zeitschrift 61: 273–298.Bowman TE, Abele LG. 1982. Classification of the Recent Crustacea. In: Abele LG, ed. The biology
of Crustacea. Vol. 1. New York: Academic Press, 1–27.Bowman TE, Iliffe TM. 1985. Mictocaris halope, a new unusual peracaridan crustacean from marine
caves in Bermuda. Journal of Crustacean Biology 5: 58–73.Boxshall GA, Huys R. 1989. New tantulocarid, Stygotantulus stocki, parasitic on harpacticoid copepods,
with an analysis of the phylogenetic relationships within the Maxillopoda. Journal of Crustacean Biology9: 126–140.
Briggs DEG. 1977. Bivalved arthropods from the Cambrian Burgess Shale of British Columbia.Palaeontology 20: 595–621.
Briggs DEG. 1978. The morphology, mode of life, and affinities of Canadaspis perfecta (Crustacea:Phyllocarida), Middle Cambrian, Burgess Shale, British Columbia. Philosophical Transactions of theRoyal Society of London B 281: 439–487.
Briggs DEG. 1981. The arthropod Odaraia alata Walcott, Middle Cambrian, Burgess Shale, BritishColumbia. Transactions of the Royal Society of London B 291: 541–585.
Briggs DEG. 1983. Affinities and early evolution of the Crustacea: the evidence of the Cambrianfossils. In: Schram FR, ed. Crustacean phylogeny. Rotterdam: A.A. Balkema, 1–22.
Briggs DEG. 1985. Gigantism in Palaeozoic arthropods. Special Papers in Palaeontology 33: 157.Briggs DEG. 1992. Phylogenetic significance of the Burgess Shale crustacean Canadaspis. Acta Zoologica
73: 293–300.Briggs DEG, Fortey RA, Clarkson ENK. 1988. Extinction and the fossil record of arthropods. In:
Larwood GP, ed. Extinction and survival in the fossil record. Oxford: Clarendon Press, 57–65.Briggs DEG, Fortey RA, Wills MA. 1992. Morphological disparity in the Cambrian. Science 256:
1670–1673.Briggs DEG, Fortey RA, Wills MA. 1993. How big was the Cambrian explosion? A taxonomic
and morphologic comparison of Cambrian and Recent arthropods. In: Lees DR, Edwards D, eds.Evolutionary patterns and processes. London: Linnean Society Symposium Series, Linnean Society ofLondon, 33–44.
Briggs DEG, Weedon MJ, Whyte MA. 1993. Arthropoda (Crustacea excluding Ostracoda). In:Benton MJ, ed. The fossil record 2. London: Chapman & Hall, 321–342.
Brooks HK. 1955. A crustacean from the Tesnus formation of Texas. Journal of Paleontology 29:252–256.
Brusca RC, Brusca GJ. 1990. Invertebrates. Massachusetts: Sinauer.Calman WT. 1909. Crustacea. In: Lankester R, ed. Treatise on zoology VII (Appendiculata) (fascicule 3).
London: Adam & Black, 1–346.Carpenter GH. 1906. Notes on the segmentation and phylogeny of the Arthropoda, with an account
of the maxillae in Polyxenus lagurus. Quarterly Journal of the Microscopical Society 49: 469–491.Chase FA, Manning RB. 1972. Two new caridean shrimps, one representing a new family, from
marine pools on Ascension Island. Smithsonian Contributions in Zoology 131: 1–18.Cisne JL. 1982. Origin of the Crustacea. In: Abele LG, ed. The biology of the Crustacea, Vol. 1. Systematics,
the fossil record and biogeography. New York: Academic Press, 65–92.Claus C. 1888. Uber den Organismus der Nebaliden und die systematische Stellung der Leptostraken.
Arbeiteten aus dem Zoologischen Institut der Universitat Wien 6: 1–108.Collins DH. 1981. Priscancermerianus barnetti, a probable lepadomorph barnacle from the Middle
Cambrian Burgess Shale of British Columbia. Journal of Paleontology 55: 1006–1015.Dahl E. 1956. Some crustacean relationships. In: Wingstrand, ed. Bertil Hanstrom, zoological papers in
honour of his sixty-fifth birthday, November 20th, 1956. Sweden: Lund Zoological Institute, 138–147.Dahl E. 1963. Main evolutionary lines among recent Crustacea. In: Whittington HB, Rolfe WDI,
eds. Phylogeny and evolution of crustacea. Massachusetts: Cambridge, Museum of Comparative Zoology,1–15.
Dahl E. 1976. Structural plans as functional models exemplified by the Crustacea Malacostraca.Zoologica Scripta 5: 163–166.
Dahl E. 1983. Malacostracan phylogeny and evolution. In: Schram FR, ed. Crustacean issues. Vol. 1.(crustacean phylogeny). Rotterdam: Balkema, 189–212.
CRUSTACEAN DISPARITY THROUGH TIME 497
Dahl E. 1984. The subclass Phyllocarida (Crustacea) and the status of some early fossils; a neontologist’sview. Videnskabelige Meddelelser fra Dansk naturhistorisk Forening 145: 61–76.
Dahl E. 1991. Crustacea Phyllopoda and Malacostraca, a reappraisal of cephalic dorsal shield andfold systems. Philosophical Transactions of the Royal Society B334: 1–26.
Dahl E. 1992. Aspects of malacostracan evolution. Acta Zoologica 73: 339–346.Dunlop JA, Selden PA. 1998. The early history and phylogeny of the chelicerates. In: Fortey RA,
Thomas R, eds. Arthropod relationships. London: Chapman & Hall, 221–235.Dzik J, Jazzewski K. 1978. The euphausiid species of the Antarctic region. Polskie Archiwum Hydrobiologii
25: 589–605.Emerson MJ, Schram FR. 1990. The origin of crustacean biramous appendages and the evolution
of Arthropoda. Science 250: 667–669.Emerson MJ, Schram FR. 1998. Theories, patterns and reality: game plan for arthropod phylogeny.
In: Fortey RA, Thomas R, eds. Arthropod relationships. London: Chapman & Hall, 67–86.Fisher DC. 1994. Stratocladistics: morphological and temporal patterns and their relation to phylo-
genetic process. In: Grande L, Rieppel O, eds. Interpreting the hierarchy of nature. San Diego: AcademicPress, 113–171.
Foote M. 1989. Perimeter-based Fourier analysis: A new morphometric method applied to the trilobitecranidium. Journal of Palaeontology 63: 880–885.
Foote M. 1990. Nearest-neighbor analysis of trilobite morphospace. Systematic Zoology 39: 371–382.Foote M. 1991a. Morphologic patterns of diversification: examples from trilobites. Palaeontology 34:
461–485.Foote M. 1991b. Morphological and taxonomic diversity in a clade’s history: the blastoid record and
stochastic simulations. Contributions from the Museum of Paleontology, the University of Michigan 286(6):101–140.
Foote M. 1992a. Rarefaction analysis of morphological and taxonomic diversity. Paleobiology 18:17–29.
Foote M. 1992b. Paleozoic record of morphological diversity in blastozoan echinoderms. Proceedingsof the National Academy of Science, USA 89: 7325–7329.
Foote M. 1993. Discordance and concordance between morphological and taxonomic diversity.Paleobiology 19: 185–204.
Foote M. 1994. Morphological disparity in Ordovician-Devonian crinoids and the early saturationof morphological space. Paleobiology 20: 320–344.
Fordham BG. 1986. Miocene-Pleistocene planktic foraminifers from D.S.D.P. sites 208 and 77, andclassification of Cenozoic species. Evolutionary Monographs 6: 1–200.
Fortey RA, Owens RM. 1990. Trilobites. In: McNamara KJ, ed. Evolutionary trends. Tucson: Universityof Arizona Press. 121–142
Fortey RA, Briggs DEG, Wills MA. 1995. The Cambrian evolutionary ‘explosion’: decouplingcladogenesis from morphological disparity. Biological Journal of the Linnean Society 57: 13–33.
Fortey RA, Briggs DEG, Wills MA. 1997. The Cambrian evolutionary ‘explosion’ recalibrated.Bioessays 19: 429–434.
Fryer G. 1965. Studies on the functional morphology and feeding mechanisms of Monodella argentariiStella (Crustacea: Thermosbaenacea). Transactions of the Royal Society of Edinburgh 66: 49–90.
Fryer G. 1992. The origin of the Crustacea. Acta Zoologica 73: 273–286.Gingerich PD. 1979. The stratigraphic approach to phylogeny reconstruction in vertebrate pa-
leontology. In: Cracraft J, Eldredge N, ed. Phylogenetic analysis and pelaeontology. New York: ColumbiaUniversity Press, 41–77.
Glenner H, Grygier MJ, Høeg JT, Jensen PG, Schram FR. 1995. Cladistic analysis of theCirripedia Thoracia. Zoological Journal of the Linnean Society 114: 365–404.
Gould SJ. 1989. Wonderful life: the Burgess Shale and the nature of history. New York: W.W. Norton.Gould SJ. 1991. The disparity of the Burgess Shale arthropod fauna and the limits of cladistic analysis:
why we must strive to quantify morphospace. Paleobiology 17: 411–423.Gould SJ, Eldredge N. 1977. Punctuated equilibria: the tempo and mode of evolution reconsidered.
Paleobiology 3: 115–151.Gower JC. 1966. Some distance properties of latent root and vector methods used in multivariate
analysis. Biometrika 53: 325–338.Gower JC, Ross GJS. 1969. Minimum spanning trees and single-linkage cluster analysis. Applied
Statistics 18: 54–64.Grygier MJ. 1983. Ascothoracida and the unity of the Maxillopoda. In: Schram FR, ed. Crustacean
issues. Vol. 1. (crustacean phylogeny). Rotterdam: Balkema, 73–104.

M. A. WILLS498
Grygier MJ. 1987. Nauplii, antennular ontogeny, and the position of the Ascothoracida within theMaxillopoda. Journal of Crustacean Biology 7: 87–104.
Hallam A. 1988. The contribution of palaeontology to systematics and evolution. In: HawksworthDL, ed. Prospects in systematics. Oxford: Clarendon Press, 128–147.
Hauser DL, Presch W. 1991. The effect of ordered characters on phylogenetic reconstruction.Cladistics 7: 243–265.
Henriksen KL. 1928. Critical notes on some Cambrian arthropods described by Charles D. Walcott.Videnskabelige Meddeleser fra Dansk naturhistorisk Forening 86: 1–20.
Hessler RR. 1983. A defence of the caridoid facies: wherein the early evolution of the Eumalacostracais discussed. In: Schram FR, ed. Crustacean issues. Vol. 1. (crustacean phylogeny). Rotterdam: Balkema,145–164.
Hessler RR. 1992. Reflections on the phylogenetic position of the Cephalocarida. Acta Zoologica 73:315–316.
Hessler RR, Newman WA. 1975. A trilobitomorph origin for the Crustacea. Fossils and Strata 4:437–459.
Hessler RR, Marcotte BM, Newman WA, Maddocks RF. 1982. Evolution within the Crustacea.In: Abele LG, ed. The Biology of Crustacea. New York: Academic Press, 150–234.
Hitchin R, Benton MJ. 1996. Associating stratigraphy and cladistics: cross-testing of three indicesthat assess the quality of the fossil record. Paleobiology 23: 20–32.
Huelsenbeck JP. 1994. Comparing the stratigraphic record to estimates of phylogeny. Paleobiology20: 470–483.
Ito T. 1989. Origin of the limb basis in copepod limbs, with reference to remipedian and cephalocaridlimbs. Journal of Crustacean Biology 9: 85–103.
Janvier P. 1984. Cladistics: theory, purpose and evolutionary implications. In: Pollard JW, ed.Evolutionary theory: paths into the future. Chichester: Wiley, 39–75.
Kovach WL. 1990. Multi-variate statistical package, version 2.0. Computer program distributed by KovachComputing Services, 85 Nant-y-Felin, Pentraeth, Isle of Anglesey, LL75 8UY Wales, U.K.
Kunze JC. 1983. Stomatopoda and the evolution of the Hoplocarida. In: Schram FR, ed. Crustaceanissues. Vol. 1. (crustacean phylogeny). Rotterdam: Balkema, 165–188.
Maddison WP, Maddison DR. 1992. MacClade, version 3.01. Sunderland, Massachusetts: Sinauer.Maguire B. 1965. Monodella taxana, and extension of the range of the crustacean order Thermosbaenacea
to the Western hemisphere. Crustaceana 9: 149–154.Manton SM. 1934. On the embryology of Nebalia bipes. Philosophical Transactions of the Royal Society
London Series B 223: 168–238.Manton SM. 1953. Locomotory habits and the evolution of the large arthropodan groups. Symposia
of the Society for Experimental Biology 7: 339–376.Marshall CR. 1990. Confidence intervals on stratigraphic ranges. Paleobiology 16: 1–10.Marshall CR. 1994. Confidence intervals on stratigraphic ranges: partial relaxation of the assumption
of randomly-distributed fossil horizons. Paleobiology 20: 459–469.Metschnikov E. 1868. The history of the development of Nebalia. Zapiski Imperatorskoi Akademii Nauk,
St.-Petersburg 13: 1–48.Mikulik DG. 1990. The arthropod fossil record: biologic and taphonomic controls. In: Mikulik DG,
ed. Arthropod paleobiology, short courses in paleontology 3. Knoxville: The Paleontological Society, 1–23.Muller KJ. 1979. Phosphatocopine ostracodes with preserved appendages from the Upper Cambrian
of Sweden. Lethaia 12: 1–27.Muller KJ. 1982. Hesslandona unisulcata sp. nov. with phosphatised appendages from the Upper
Cambrian ‘Orsten’ of Sweden. In: Bate RH, Robinson E, Sheppard LM, eds. Fossil and Recentostracods. Chichester: Ellis Horwood, 276–304.
Muller KJ. 1983. Crustacea with preserved soft parts from the Upper Cambrian of Sweden. Lethaia16: 93–109.
Muller KJ. 1985. Skaracarida, a new order of Crustacea from the Upper Cambrian of Vastergotland.Fossils and Strata 17: 1–65.
Muller KJ, Walossek D. 1986. Martinssonia elongata. gen. et sp.n., a crustacean-like euarthropod fromthe Upper Cambrian ‘Orsten’ of Sweden. Zoologica Scripta 15: 73–92.
Muller KJ, Walossek D. 1988. External morphology and larval development of the Upper Cambrianmaxillopod Bredocaris admirabilis. Fossils and Strata 23: 1–69.
Newman WA. 1983. Origin of the Maxillopoda; urmalacostracan ontogeny and progenesis. In:Schram FR, ed. Crustacean phylogeny. Rotterdam: Balkema, 105–119.

CRUSTACEAN DISPARITY THROUGH TIME 499
Newman WA, Zullo VA, Withers TH. 1969. Cirripedia. In: Moore RC, ed. Treatise on invertebratepaleontology Part R, Arthropoda, Vol. 4. Lawrence: Geological Society of America and the Universityof Kansas, R206–R295.
Novozhilov NI. 1960. Podklass Pseudocrustacea. In: Orlov Yu A, ed. Osnovy paleontologii, Arthropoda.Trilobitomorpha and Crustacea. Moscow: Nedra, 199.
Patterson C. 1981. Significance of fossils in determining evolutionary relationships. Annual Review ofEcology and Systematics. 12: 195–223.
Pimentel RA, Riggins R. 1987. The nature of cladistic data. Cladistics 3: 201–209.Pires AMS. 1987. Potiicoara brasiliensis—a new genus and species of Splelaeogriphacea (Crustacea,
Peracarida) from Brazil with a phylognetic analysis of the Peracarida. Journal of Natural History 21:225–238.
Raup DM, Sepkoski Jr. JJ. 1986. Periodic extinction of families and genera. Science 231: 833–836.Raymond PE. 1920. The appendages, anatomy and relationships of Trilobites. Memoirs of the Connecticut
Academy of Arts and Sciences 7: 1–169.Rohlf FJ. 1973. Algorithm 76: Hierarchical clustering using the minimum spanning tree. Computer
Journal 16: 93–95.Rolfe WDI. 1969. Phyllocarida. In: Moore RC, ed. Treatise on Invertebrate Paleontology Part R, Arthropoda,
Vol. 4. Kansas: University of Kansas Press, 296–331.Sanders HL. 1963. Significance of the Cephalocarida. In: Whittington HB, Rolfe WDI, eds. Phylogeny
and evolution of Crustacea. Massachusetts: Museum of Comparative Zoology, 163–175.Sanders HL, Hessler RR, Garner SP. 1985. Hirsutia bathyalis, a new unusual deep-sea benthic
peracaridan crustacean from the tropical Atlantic. Journal of Crustacean Biology 1: 30–57.Schram FR. 1969. Polyphyly in the Eumalacostraca? Crustaceana 16: 243–250.Schram FR. 1978. Arthropods, a convergent phenomenon. Fieldiana Geology 39: 61–108.Schram FR. 1981. On the classification of the Eumalacostraca. Journal of Crustacean Biology 1: 1–10.Schram FR. 1982. The fossil record and evolution of the Crustacea. In: Abele LG, ed. The Biology of
Crustacea. New York: Academic Press, 93–147.Schram FR. 1983. Remipedia and crustacean phylogeny. In: Schram FR, ed. Crustacean issues. Vol. 1.
(crustacean phylogeny). Rotterdam: Balkema, 23–28.Schram FR. 1984. Relationships within the eumalacostracan Crustacea. Transactions of the San Diego
Society of Natural History 20: 301–312.Schram FR. 1986. Crustacea. Oxford: Oxford University Press.Schram FR, Emerson MJ. 1986. The great Tesnus fossil expedition of 1985. Environment Southwest
515: 16–21.Schram FR, Emerson MJ. 1991. Arthropod pattern theory: a new approach to arthropod phylogeny.
Memoirs of the Queensland Museum 31: 1–18.Schram FR, Hof C. 1998. Fossils and the interrelationships of major crustacean groups. In:
Edgecombe GE, ed. Arthropod fossils and phylogeny. New York: Columbia University Press, 233–302.Scourfield DJ. 1926. On a new type of crustacean from the Old Red Sandstone—Lepidocaris rhyniensis.
Philosophical Transactions of the Royal Society London Series B214: 153–187.Seilacher A. 1990. Taphonomy of fossil-largerstatten. In: Briggs DEG, Crowther PR, eds. Palaeobiology,
a synthesis. Oxford: Blackwell, 266–270.Selden PA. 1993. Arthropoda (Aglaspidida, Pycnogonida and Chelicerata). In: Benton MJ, ed. The
fossil record 2. London: Chapman & Hall, 297–320.Sharov AG. 1966. Basic Arthropodan Stock. New York: Pergamon.Shultz JW. 1994. The limits of stratigraphic evidence in assessing phylogenetic hypotheses of Recent
arachnids. Journal of Arachnology 22: 169–172.Siddall ME. 1996. Stratigraphic consistency and the shape of things. Systematic Biology 45: 111–115.Siewing R. 1960. Neuere ergebnisse der verwandtschaftsforschung bei den crustaceen. wis-
senschaftliche zeitschrift der Universitat Rostock, Reihe. Mathematik-Naturwissenschaften 9: 343–358.Smith AB. 1994. Systematics and the fossil record: documenting evolutionary patterns. Oxford: Blackwell.Smith AB, Jeffery CH. 1998. Selectivity of extinction among sea urchins at the end of the Cretaceous
period. Nature 392: 69–71.Spears T, Abele LG. 1998. Crustacean phylogeny inferred from 18S rDNA. In: Fortey RA, Thomas
R, eds. Arthropod relationships. London: Chapman & Hall, 169–187.Stock JH. 1976. A new genus and two new species of the crustacean order Thermosbaenacea from
the West Indies. Bijdragen tot de Dierkunde 46: 47–70.Stock JH. 1982. The influence of hadziid Amphipoda on the occurrence and distribution of
M. A. WILLS500
Thermosbaenacea and cyclopod Copepoda in the West Indies. Polskie Archiwum Hydrobiologii 29:275–282.
Stock JH, Langley G. 1981. The generic status and distribution of Monodella texana, the only knownNorth American thermosbaenacean. Proceedings of the Biological Society of Washington 94: 569–578.
Størmer L. 1944. On the relationships and phylogeny of fossil and Recent Arachnomorpha. Skrifterutgitt av det Norske Vidensk Academi i Oslo 5: 1–158.
Strauss D, Sadler PM. 1989. Classical confidence intervals and Bayesian probability estimates forends of local taxon ranges. Mathematical Geology 21: 411–427.
Swofford DL. 1993. PAUP: Phylogenetic Analysis Using Parsimony, Version 3.1.1. Computer programdistributed by the Smithsonian Institution, Washington D.C.
Tiegs OW, Manton SM. 1958. The evolution of the Arthropoda. Biological Reviews of the CambridgePhilosophical Society 33: 255–337.
Wagner PJ. 1995. Stratigraphic tests of cladistic hypotheses. Paleobiology 21: 153–178.Walcott CD. 1912. Middle Cambrian Branchiopoda, Malacostraca, Trilobita and Merostomata.
Cambrian geology and paleontology, II. Smithsonian Miscellaneous Collections 57: 109–144.Walossek D. 1993. The Upper Cambran Rehbachiella and the phylogeny of the Branchiopoda and
Crustacea. Fossils and Strata 32: 1–202.Watling L. 1981. An alternative phylogeny of peracarid crustaceans. Journal of Crustacean Biology 1:
201–210.Watling L. 1983. Peracaridan disunity and its bearing on eumalacostracan phylogeny with a
redefinition of eumalacostracan superorders. In: Schram FR, ed. Crustacean issues. Vol. 1. (crustaceanphylogeny). Rotterdam: Balkema, 213–228.
Whatley RC, Siveter DJ, Boomer ID. 1993. Arthropoda (Crustacea: Ostracoda). In: Benton MJ,ed. The fossil record 2. London: Chapman & Hall, 343–357.
Wheeler WC. 1998. Sampling, groundplans, total evidence and the systematics of arthropods. In:Fortey RA, Thomas R, eds. Arthropod relationships. London: Chapman & Hall, 87–96.
Williamson DI. 1973. Amphionides reynaudii, representative of a proposed new order of eucaridanMalacostraca. Crustacean 25: 35–50.
Wills MA. 1998a. A phylogeny of Recent and fossil Crustacea derived from morphological characters.In: Fortey RA, Thomas R, eds. Arthropod relationships. London: Chapman & Hall, 189–209.
Wills MA. 1998b. Cambrian and Recent disparity: the picture from priapulids. Paleobiology 24:177–199.
Wills MA. 1998c. The goodness of fit between phylogeny and stratigraphy: randomization tests andthe gap excess ratio. Systematic Zoology (in press).
Wills MA, Briggs DEG, Fortey RA. 1994. Disparity as an evolutionary index: a comparison ofCambrian and Recent arthropods. Paleobiology 20: 93–130.
Wills MA, Briggs DEG, Fortey RA. 1998. Evolutionary correlates of arthropod tagmosis: scrambledlegs. In: Fortey RA, Thomas R, eds. Arthropod relationships. London: Chapman & Hall, 57–65.
Wills MA, Briggs DEG, Fortey RA, Wilkinson M. 1995. The significance of fossils in understandingarthropod evolution. Verhandlungen der Deutschen Zoologischen Gesellschaft 57: 13–33.
Wills MA, Briggs DEG, Fortey RA, Wilkinson M, Sneath PHA. 1998. An arthropod phylogenybased on fossil and Recent taxa. In: Edgecombe GE, ed. Arthropod fossils and phylogeny. New York:Columbia University Press (in press).
Wilson GDF. 1992. Computerized analysis of crustacean relationships. Acta Zoologica 73: 383–389.Wray GA, Levinton JS, Shapiro LH. 1996. Molecular evidence for deep pre-Cambrian divergences
among metazoan phyla. Science 274: 568–573.Xianguang H, Bergstrom J. 1997. Arthropods of the Lower Cambrian Chengjiang fauna, southwest
China. Fossils & Strata 45: 1–116.Yager J. 1981. Remipedia. A new class of Crustacea from a marine cave in the Bahamas. Journal of
Crustacean Biology 1: 328–333.Zimmer C. 1904. Amphionides valvidae. Zool. Anz. 28: 225–228.Zimmer C. 1926–27. Crustacea=krebse allgemeine einleitung in die naturgeschichte der Crustacea.
In: Kukenthal WK, Krumbach T, eds. Handbuch der Zoologie. Vol. III, No. 1. Berlin: de Gruyter.Zrzavy J, Hypsa V, Vlaskova M. 1998. Arthropod phylogeny: taxonomic congruence, total evidence
and conditional combination approaches to morphological and molecular data sets. In: Fortey RA,Thomas R, eds. Arthropod relationships. London: Chapman & Hall, 97–107.