wet spinning of porous polyacrylonitrile fibers
TRANSCRIPT
,WET SPINNING OF POROUS POLYACRYLONITRILE FIBERS
AND AFFECT ON FIBER OXIDATION/
by
William Finley ,,speer 11 Jr.
Thesis submitted to the Graduate Faculty of the
Virginia Polytechnic Institute and State University
in partial fulfillment of the requirements for the degree of
MASTER OF SCIENCE
APPROVED:
George B"! Wills
in
Chemical Engineering
Arthur L. Fricke, Chairman
H. A.
May, 1974
Blacksburg, Virginia
Thomas C. Ward
ACKNOWLEDGEMENTS
The author thanks , Associate Professor of
Chemical Engineering at Virginia Polytechnic Institute and State
University, for his assistance and suggestions.
A special thanks to personnel of Celanese Fibers Company for
their encouragement and allowing me the time to pursue the work to-
wards this degree. I am also very grateful for their financial aid
and the use of their equipment.
Finally, I want to thank my wife and children for their patience
and understanding along with my parents for providing me with the
desire and sense of direction necessary to successfully obtain an
education.
ii
TABLE OF CONTENTS
Chapter
ACKNOWLEDGEMENTS .
LIST OF FIGURES ..
LIST OF TABLES .
I. INTRODUCTION
II. LITERATURE REVIEW.
Introduction to Graphite Fibers.
Polyacrylonitrile Fiber Production
Production of Porous PAN Fibers.
Porosity Measurement • .
Oxidation of PAN . • •
Interpretation of Stress-Strain Behavior ,
III. EXPERIMENTAL . •
Plan of Experimentation.
Procedures .
Results.
IV. DISCUSSION
Objective and Approach
Safety .
Spinning Procedures and Equipment.
Denier Measurements.
Tensile Properties •
Fiber Diameter and Porosity.
iii
. .
. . .
. . . . . .
ii
v
vi
1
3
. . . . 3
6
9
10
13
15
19
19
. . . . 22
33
. 43
43
43
44
46
. . . . 47
. . . . 51
TABLE OF CONTENTS (continued)
Chapter
Thermogravimetric Analysis . 55
Recommendations ... 58
V. CONCLUSIONS .. 71
VI. SUMMARY. . 63
VII. LITERATURE CITED . 65
VIII. APPENDIX . 67
Data Tables .. 67
Sample Calculations. 67
Safety Data .•...• 76
Method for Determining Concentration of PAN in PAN/DMF Spinning Dope. . . . . . . . 76
Procedure for Measuring Density of PAN/DMF Dope. 77
Derivation of Spinning Drawdown Ratio. . . 81
Procedure for Determining Concentration of DMF in DMF/Water Solutions. . • • . . . . . . 82
Calibration of Zenith Metering Pump. 85
Materials. 89
Apparatus .. 90
IX. VITA . • • • . 101
iv
Figure
1
2
3
4
5
6
7
LIST OF FIGURES
Typical Stress-Strain Curve for Relaxed PAN Fiber ..
Effect of Stretching Ratio on Unrelaxed Yarn Tenacity . • . • . . • . • • . • . . .
Effect of Stretching Ratio on Relaxed Yard Tenacity.
Stretching Ratio versus Relaxed Yarn Elongation.
Mercury Instrusion Pressure-Volume Curve . . . .
Penetrated Volume at 5000 PSI versus Calculated Void Fraction for Samples 1-8 .......•..
Percentage Weight Loss as a Function of Exposure Time in Heated Argon Atmosphere •.......•
8 Stress-Strain Curves of Yarn Before and After Relaxation . . . .
9 Effect of Air Flow Rate on Weight Loss during TGA Analysis at 230°C. . • . . . .
10 Loss of Solvent During Dope Filtration •
11 Density versus Concentration of PAN/DMF Spinning Dope . . . . . . . . . . . . . . . . . . • .
12 Refractive Index versus Concentration of DMF/Water Solutions. . . . . . . . . . ....•
13 Zenith Pump Delivery Rate at Various Speeds (RPM) ..
14 Schematic Layout of Spinning and Stretching Apparatus ....
15 Spinneret Assembly .
16 Spinneret Hole Configuration and Dimensions.
17 Assembly View of Zenith Dope Pump.
18 Drawing of Filtration Apparatus •..
v
16
37
38
39
40
41
42
52
57
78
80
84
88
94
95
96
97
99
LIST OF TABLES
Table
I. Well-Known Manufactures of PAN Fibers and Spinning Process Used .•.
II. Spinning Conditions Explored During Study .•
III. Results Derived from Weight, Length, and Diameter
IV.
v.
VI.
VII.
VIII.
IX.
x. XI.
XII.
Measurements . . . .
Physical Properties of Wet Spun Samples.
Comparison of Deniers Obtained by Weighing versus Vibrascope Measurement . . . . . • • . • • . .
Some Comparative Mechanical Properties of Experimental and Commercial Wet Spun PAN Fibers.
Data on Fiber Dimensions
Porosimetry Data • .
TGA Data Using Air
TGA Data Using Argon •
Calibration Data for Refractometer
Zenith Dope Pump Calibration Data.
vi
7
27
35
36
48
49
68
69
70
71
83
87
I. INTRODUCTION
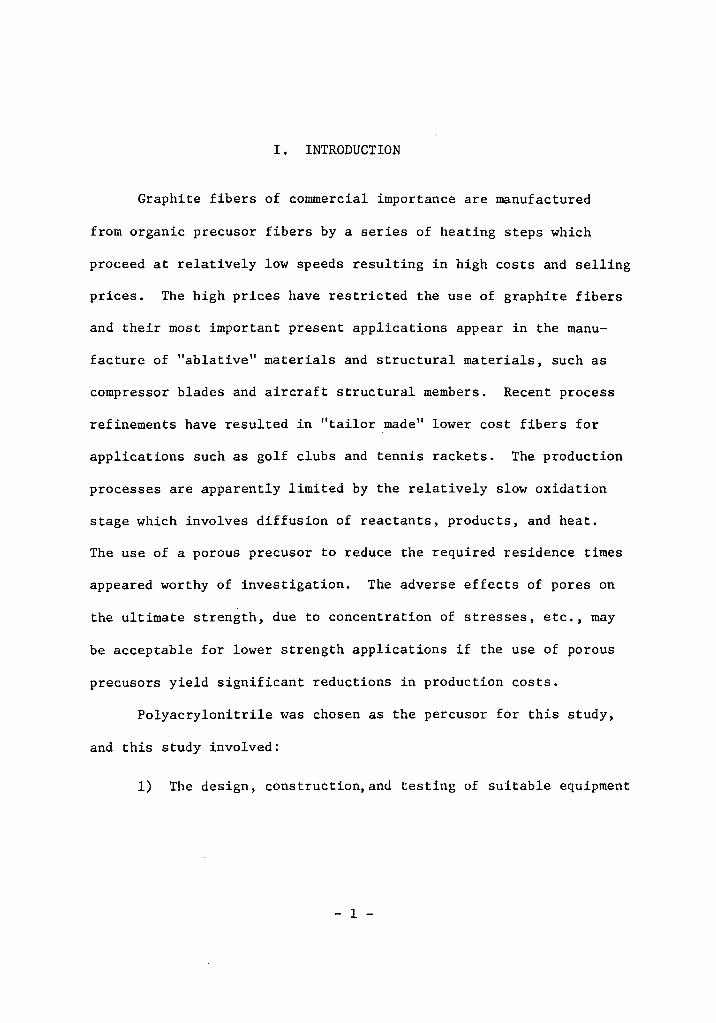
Graphite fibers of commercial importance are manufactured
from organic precusor fibers by a series of heating steps which
proceed at relatively low speeds resulting in high costs and selling
prices. The high prices have restricted the use of graphite fibers
and their most important present applications appear in the manu-
facture of "ablative" materials and structural materials, such as
compressor blades and aircraft structural members. Recent process
refinements have resulted in "tailor made" lower cost fibers for
applications such as golf clubs and tennis rackets. The production
processes are apparently limited by the relatively slow oxidation
stage which involves diffusion of reactants, products, and heat.
The use of a porous precusor to reduce the required residence times
appeared worthy of investigation. The adverse effects of pores on
the ultimate strength, due to concentration of stresses, etc., may
be acceptable for lower strength applications if the use of porous
precusors yield significant reductions in production costs.
Polyacrylonitrile was chosen as the percusor for this study,
and this study involved:
1) The design, construction,and testing of suitable equipment
- 1 -
- 2 -
for production of porous PAN fibers.
2) Fiber properties were measured to ensure the apparatus
reasonably duplicated commercial processes.
3) Porosity of the fibers was measured and the effect on oxi-
dation of the fibers was examined using thermogravimetric analysis.
II. LITERATURE REVIEW
Information pertaining to this study is presented here.
Introduction to Graphite Fibers
The production of graphite material involves several chemical
and physical changes during successive exposure to higher tempera-
tures. The stages of the process are generally referred to as oxi-
dation, carbonization, and graphitization. Graphite material is a
relatively recent development and manufactures are not prepared to
disclose production techniques for obvious reasons; hence, the
following brief process description is given as a general guide only.
Precusors. Several raw materials have been used, including
polyacrylonitrile (PAN), rayon, and pitch. The most notable pro-
gress has been made using PAN precusors. The following description
applies directly to PAN, but processes for other precusors are simi-
lar, in general, except for the specific reactions and tensioning.
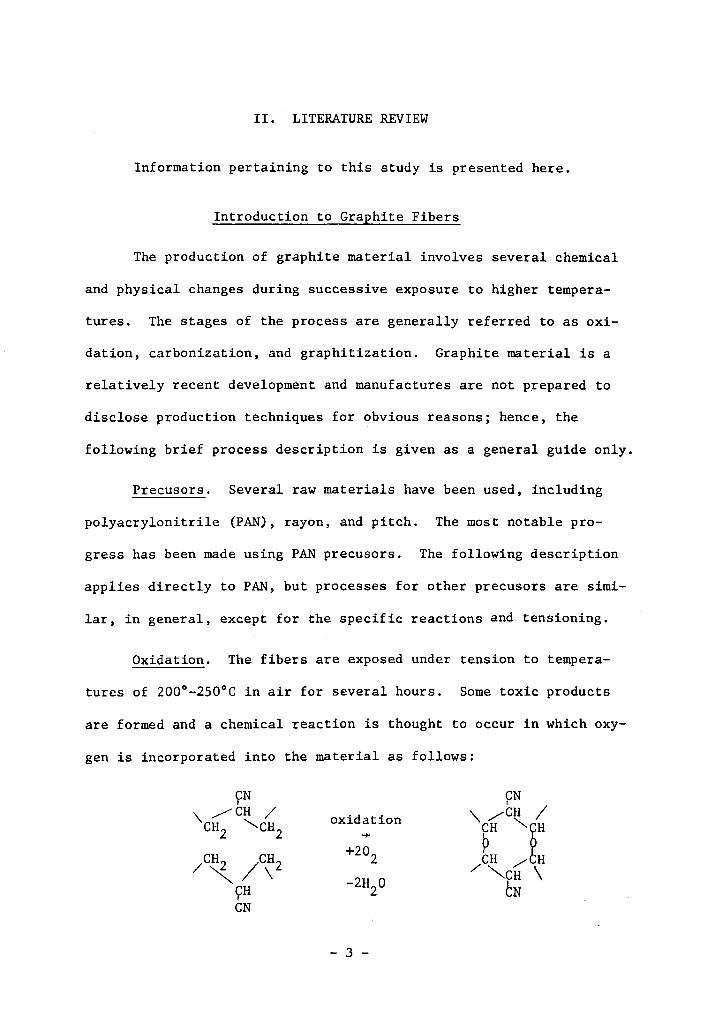
Oxidation. The fibers are exposed under tension to tempera-
tures of 200°-250°C in air for several hours. Some toxic products
are formed and a chemical reaction is thought to occur in which oxy-
gen is incorporated into the material as follows:
yN CN I
/CH / oxidation '\/CH I '\CH "-CH
~H "r 2 2 -+
+202 /c~ /c~2 CH / H
-2H 0 / ""-cH \ yH 2 tN CN
- 3 -
- 4 -
The work of Watt(!) showed a significant improvement in the final
modulus of graphite fibers if tension were applied during oxidation.
It was postulated that the tension prevents shrinkage and preserves
the molecular orientation along the fiber axis, allowing greater
intermolecular bonding. A black shiny fiber results from oxi-
dation.
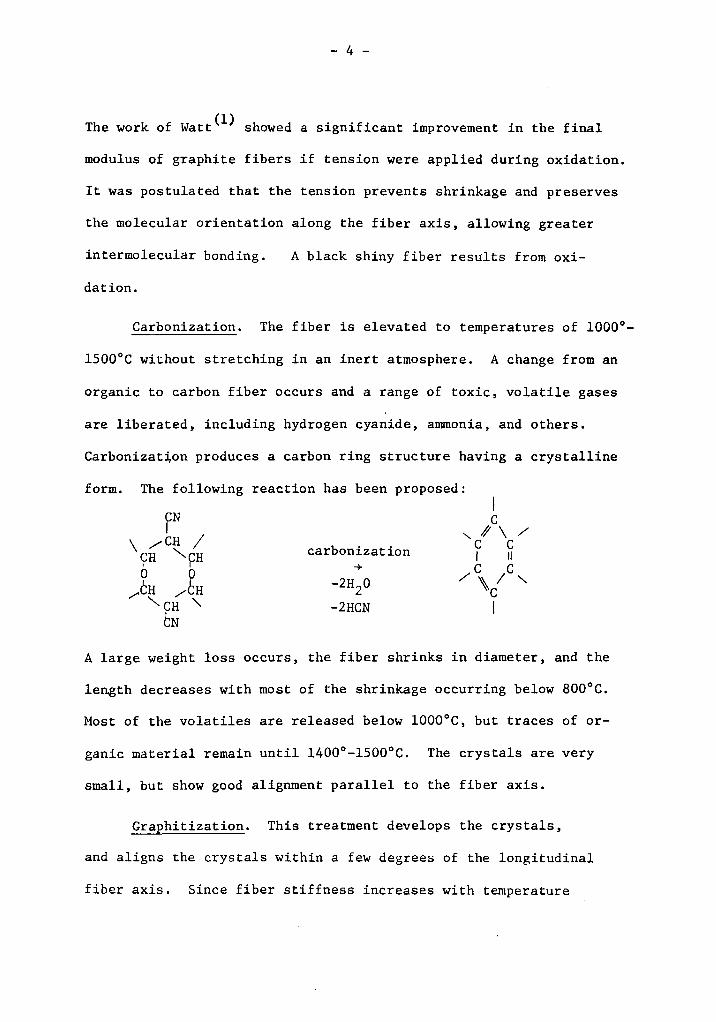
Carbonization. The fiber is elevated to temperatures of 1000°-
1500°C without stretching in an inert atmosphere. A change from an
organic to carbon fiber occurs and a range of toxic, volatile gases
are liberated, including hydrogen cyanide, ammonia, and others.
Carbonizat~on produces a carbon ring structure having a crystalline
form. The following reaction has been proposed:
carbonization -+
I c " ~ \ / c c
I II c c
/\I '-c I
A large weight loss occurs, the fiber shrinks in diameter, and the
length decreases with most of the shrinkage occurring below 800°C.
Most of the volatiles are released below 1000°C, but traces of or-
ganic material remain until 1400°-1500°C. The crystals are very
small, but show good alignment parallel to the fiber axis.
Graphitization. This treatment develops the crystals,
and aligns the crystals within a few degrees of the longitudinal
fiber axis. Since fiber stiffness increases with temperature
- 5 -
and maximum tensile strength occurs in fibers treated at about 1500°C,
some material is not graphitized but sold as a very high strength
product with moderately high modulus. The loss of elasticity at
higher temperatures produces very high modulus materials, even though
the tensile strength actually decreases for fibers treated at higher
temperatures. The fiber is heat treated at temperatures ranging
from 1600 to 3000°C in electrically heated graphite furnaces to
graphitize it. A major requirement during graphitization is the com-
plete exclusion of air, since minor amounts of air cause significant
deterioration of product properties. Argon gas is usually used for
the inert atmosphere. The heating rates could be much higher than
those used in oxidation or carbonization, since no volatiles are re-
moved and the graphite structure develops quickly.
The production rates appear to be limited by the ability of
the reactants to diffuse through the fiber structure and the rates
at which the products and heat are released. Watt(l) states that
the oxidation stage appears to be diffusion controlled. Most commer-
cial products and successful research work use precusors of fine
filaments (1-3 denier) while larger diameter precusor fibers require
longer heat treatment exposure. Ezekiel (2) reported great difficulty
in oxidizing large quantities of fiber due to the dissipation of the
heat of reaction.
The long processing time is a key factor in the relatively
high cost of graphite fibers. Efforts to obtain faster conversion
- 6 -
rates have been carried out by doping PAN precusors with metal ad-
ditives. The use of a precusor having a porous structure to increase
the conversion rates would also appear worthy of investigation. The
use of a porous structure is certainly debatable since work such
as that by Johnson(J) concludes that the tensile strength of PAN
based graphite fibers is largely controlled by the presence of dis-
crete flaws. The failures were associated with voids and other in-
eluded structures which, in most cases, were close to or on the sur-
face. However, the presence of pores appears necessary for rapid
diffusion of reactants and products in large fibers and there is
probably a compromise between the physical properties and cost. It
appears reasonable that the controlled introduction of small pores
could produce significant savings in processing costs while yielding
a product with useful and acceptable properties.
Polyacrylonitrile Fiber Production
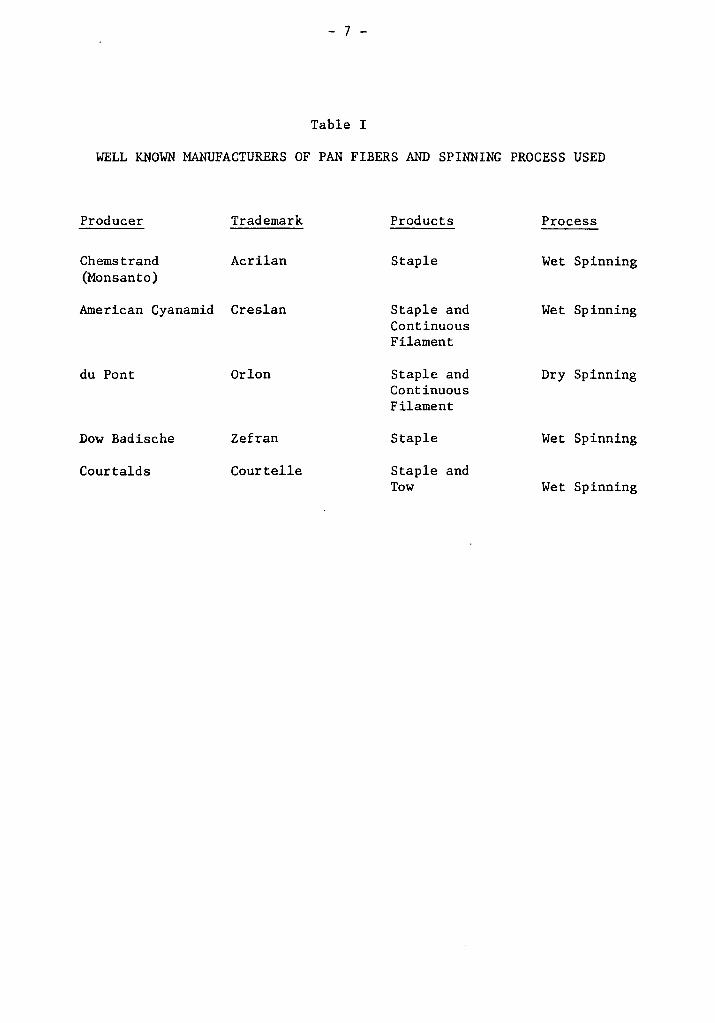
Both the wet and dry spinning processes are used commercially
today, while the use of melt spinning has received some minor atten-
tion in the research laboratories. A list of some well known PAN
fibers is shown in Table I, along with the production method thought
to be used.
Solvents used to dissolve the PAN include dimethylformamide,
dimethyl sulfoxide, dimethyl acetamide, and ethylene carbonate.
Sometimes oxalic or phosphoric acid is added in small quantities (1%)
- 7 -
Table I
WELL KNOWN MANUFACTURERS OF PAN FIBERS AND SPINNING PROCESS USED
Producer Trademark Products Process
Chemstrand Acrilan Staple Wet Spinning (Monsanto)
American Cyanamid Creslan Staple and Wet Spinning Continuous Filament
du Pont Orlon Staple and Dry Spinning Continuous Filament
Dow Badische Zefran Staple Wet Spinning
Courtalds Courtelle Staple and Tow Wet Spinning
- 8 -
to the spinning dope as heat stabilizers to prevent discoloration
during the preparation of the dope.
Dry spinning, in which the solvent is DMF, is done with cabi-
net temperatures of 220-250°C and take up speeds of 100-300 meters
per minute. Stretching and relaxation are usually done in batch
operations at elev~ted temperatures. The wet spinning operations
are usually done at lower production rates. The process involves
spinning, stretching, washing, and drying as a continuous operation.
Coagulants used, when DMF is the solvent, include water, glycerol,
and aqueous salt solutions such as calcium chloride.
Fiber consisting of 100% PAN, referred to as homopolymer yarn,
has only a small amount of thermoplasticity which adversely affects
the stretching and crimping operations. A certain amount of another
monomer such as vinyl acetate, acrylates, methacrylates, etc. is
usually copolymerized to break up the highly oriented structure and
give some degree of thermoplasticity. The copolymers also aid in
dyeing and affect the heat and solvent resistance of the fibers.
Yarn containing at least 85% by weight of the acrylonitrile units
(-CH2-~H-) is termed acrylic, while modacrylics is the term applied
CN to yarn containing between 35% but not more than 85% by weight of the
acrylonitrile units.
- 9 -
Production of Porous PAN Fibers
The wet spinning of PAN fibers involves the extrusion of dope
into a coagulation bath where the polymer is precipitated due to
diffusion of the nonsolvent and solvent. Literature indicates that
a gelled polymer structure is formed, characterized by a network of
pores or voids of varying size, depending on the particular bath
composition, residence time, and temperature. Drying of the gelled
structure, usually with heated rollers, causes the collapse of the
pores. The production of porous fibers using general wet spinning
techniques while avoiding compressive pressures after coagulation
appeared worthy of investigation. Various other methods which were
comparatively difficult were reviewed. Briefly, these are as
follows:
1) Dry spinning a polymer mixture of PAN and cellulose
acetate followed by acetone extraction of the CA. Calculations
using the technique of Crowley(4) indicated that DMF would dissolve
CA. Experiments confirmed the solubility of CA in DMF and the in-
solubility of PAN in acetone.
2) Phase separation spinning of a PAN and caprolactam mixture
followed by a water wash to extract the caprolactam or PAN, urea,
and dimethyl sulfoxide followed by a butanol wash. Several recent (5 6 7) theses ' ' have explored the use of phase separation spinning
and all have concluded that a porous structure is produced.
- 10 -
3) Wet spinning using ligroin in the coagulation bath. A
patent(S) discloses the use of a mixture of ligroin fractions and
methanol used as the coagulation bath for a PAN and DMF spinning
dope. The ligroindiffuses into the porous structure and is later
removed by exposure to temperatures above its boiling point. It
was postulated that the ligroin aided in preserving the porous
network.
Various articles indicated that the amount and size of the pores
was significantly affected by the conditions and composition of the
coagulation bath. Fibers having a harsh hand or very opaque were
reportedly(9) produced when the bath conditions were varied.
Porosity Measurement
The pore volume was measured using a porosimeter and the re-
sults were compared to calculated values. ·(7) Nelson has reviewed
the use of the mercury intrusion porosimeter to measure pore size
and pore size distribution. Although the equipment appeared to
have some limited capabilities, it was thought to be useful in gain-
ing some insight as to size and size distribution of the pores. His
recommendations for improving the accuracy were followed, including
the use of the smallest penetrometer covering the range of volume
changes and elimination of readings below atmospheric pressure.
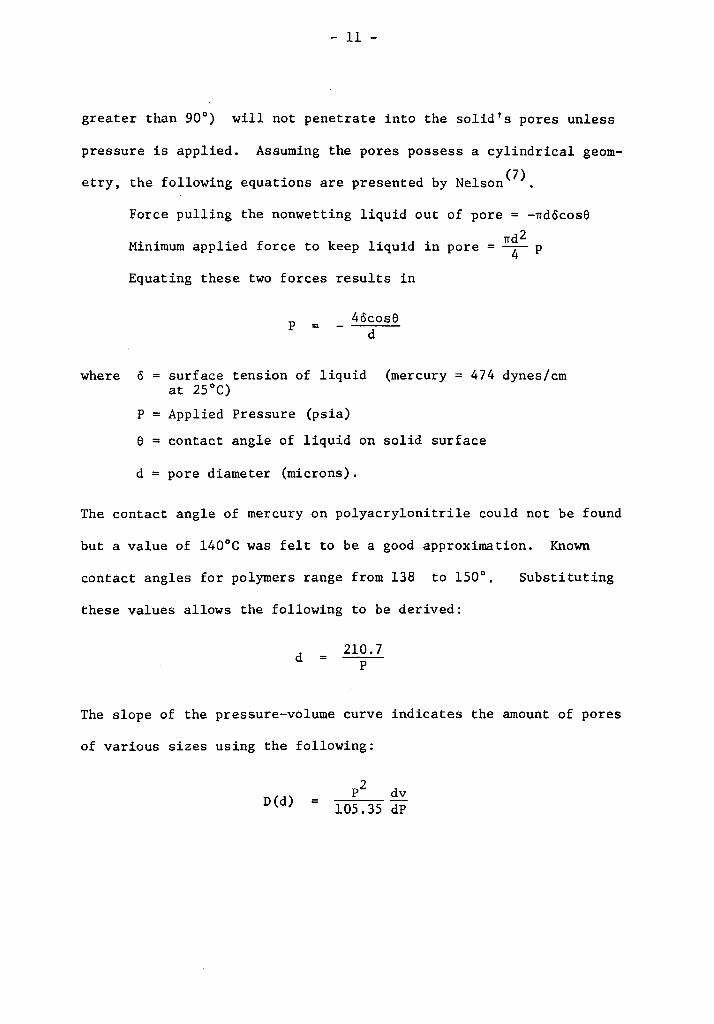
The porosimetry technique is based on the fact that a liquid
that does not wet a solid's surface (liquids with contact angles of
- 11 -
greater than 90°) will not penetrate into the solid's pores unless
pressure is applied. Assuming the pores possess a cylindrical geom-
etry, the following equations are presented by Nelson(7).
where
Force pulling the nonwetting liquid out
Minimum applied force to keep liquid in
Equating these two forces results in
0
p =
p = 4ocose d
surface tension of liquid (mercury at 25°C) Applied Pressure (psia)
of pore = -ndocose nd2 pore = - 4- p
474 dynes/cm
e = contact angle of liquid on solid surface
d = pore diameter (microns).
The contact angle of mercury on polyacrylonitrile could not be found
but a value of 140°C was felt to be a good approximation. Known
contact angles for polymers range from 138 to 150°.
these values allows the following to be derived:
d = 210.7 p
Substituting
The slope of the pressure-volume curve indicates the amount of pores
of various sizes using the following:
D(d) P2 dv 105.35 dP
- 12 -
where D(d) = pore size distribution function
dv/dp slope of pressure-volume curve.
The compressibility of the fibers along with noncylindrical
pore shapes are two possible sources of error. If these errors
occur, the values should be at least of the correct order of magni-
tude and the shape of the size distribution should still be valid.
The void fraction was also calculated based on the measurements
of fiber denier and fiber diameter as done by both Andrade(6) and
Nelson(]). The accuracy of this calculation is dependent on using
correct values for density of void free PAN and the "true" diameter.
Cross-sections of the fibers revealed a slightly crenulated and non-
round shape. The problem of determining an average fiber diameter
was encountered by Jones and Duncan(lS) when the measurement was
attempted for highly crenulated graphite fibers having the character-
istic cross-section of the rayon precusor. They demonstrated fairly
good agreement and a linear relationship between the average mea-
sured "apparent" diameter, obtained by optical measurement of the
fiber width, and the true "equivalent" diamete.r, measured by calcula-
tions based on weights of cross-sectional photographs taken at a
magnification of 1500X. For the purpose of this study, it was con-
sidered adequate to measure the width of the fibers at several
points along the fiber length to obtain an average diameter. No
values could be found for the density of void free PAN. Dry spun
PAN fibers are thought to have only small pore volumes and density
- 13 -
figures of 1.18 gr/cm3 are given(20). Therefore, a density of 1.20
3 gr/cm was used in the calculations and, due to the uncertainty of
this value, the numbers for void fraction are intended to illustrate
trends and should, otherwise, be used cautiously.
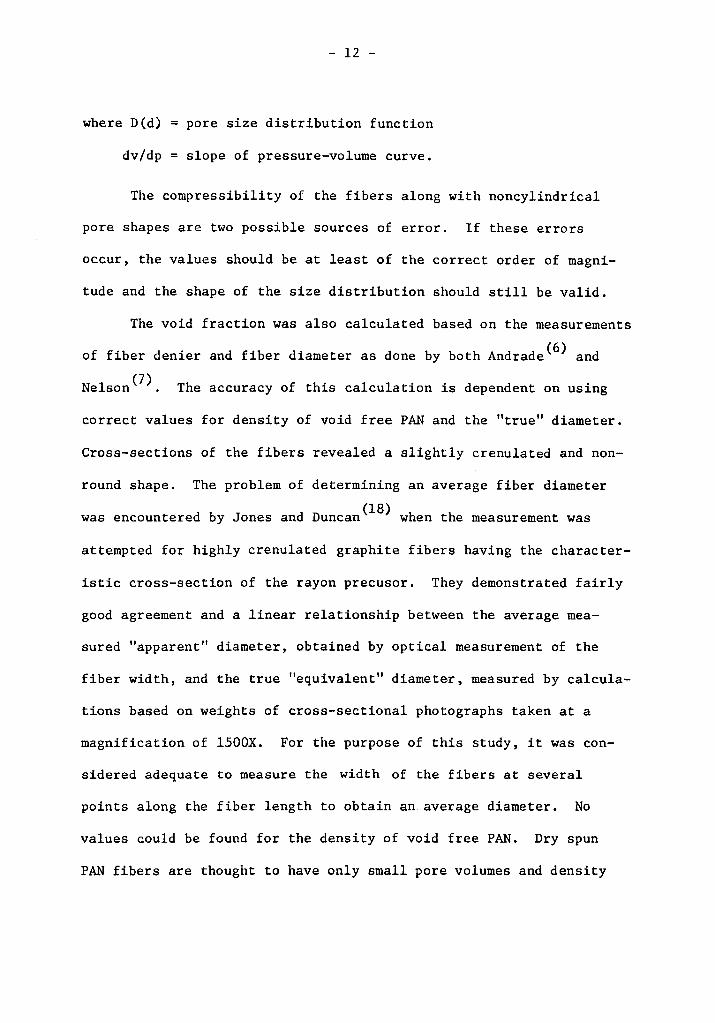
Oxidation of PAN
Oxidation is the term now applied to the first stage of
graphitization since the most important change is thought to be
incorporation of oxygen linkages between PAN molecules. Watt(l)
has reviewed the literature and presents several possible reactions
of PAN occurring at temperatures of 200-250°C in an air atmosphere.
Some are presented as follows:
A.
CH2 CH2 1cH2
CH2 CH2 B. /'\/\ '-:1\1\
CH CH CH CH I I I I CN CN CN CN
CH2 CH2 CH2 /'\/\!\ CH CH I I c. CN CN
\/CH /CH cH2 j"-cH21' cH2
CN CN
-2H 2
-2HCN -+
I CH C CH
I \2 I~ I\ 2 c c II I c ~--N-= 'N
CH2 CH2 CH2 CH2 CH2 l\/'\l'\1\1 c c c f I I I c c c c
/ ~N/ ~/ ~N/ ~
CH2 CH2 CH2 /\I'\ I\ CH CH I I c c
\/I\ /I\ CH2 CH2 CH2
CN CN
- 14 -
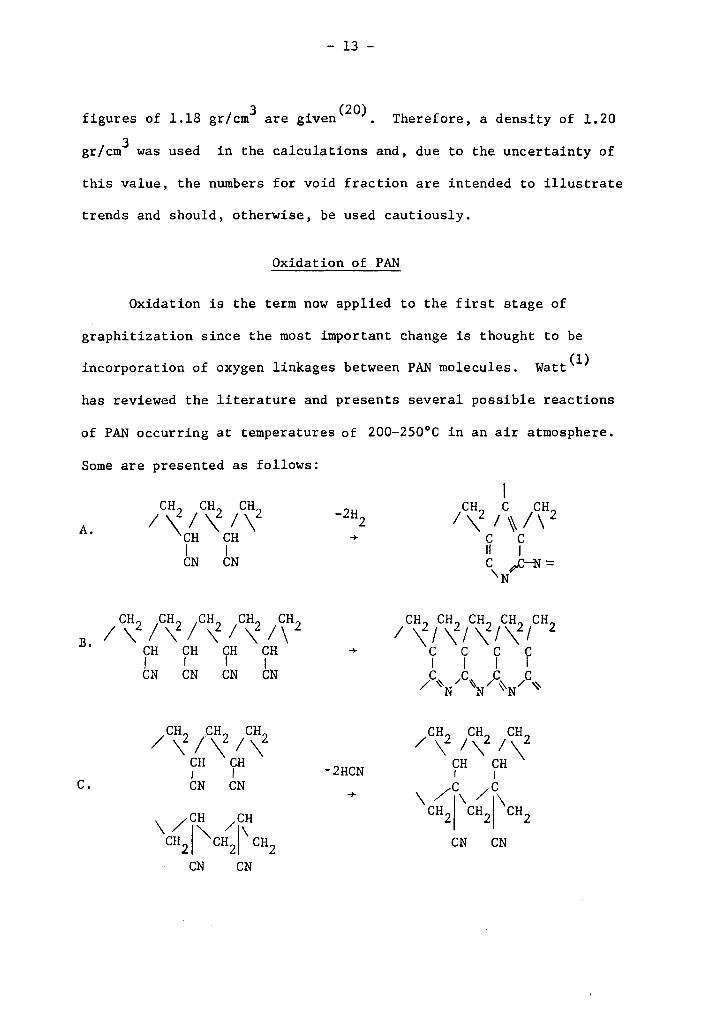
D. -+
The polyacrylonitrile molecule has an atactic stereo arrangement
which results in a noncrystalline fiber. The relatively large
shrinkage upon heating can be explained to a large degree by the
non-crystallinity. Watt concluded that many possible reactions can
occur on heating PAN with or without the participation of oxygen
and the different reactions proceed simultaneously but are dependent
on the spatial arrangement of the reacting groups. Therefore, a key
factor is that the extent to which any reaction will occur is govern-
ed by the approach distance of reacting groups, i.e., because of the
atacticity of the molecular chains, a number of reactions are pos-
sible.
Watt did not review all of the possible reactions but mentions
that measurements have shown HCN, NH3 , and water are evolved when
PAN is heated in air at temperatures of 200°-220°C. The carbon
content of the fibers was found to increase after oxidation which
indicates that the production of gaseous byproducts must be signifi-
cant to offset the reduction in carbon content (by weight) resulting
from the incorporation of oxygen according to equation D.
- 15 -
Weights were hung on the fibers to produce various len~th
changes. The modulus of the graphite fibers appeared to increase with
the increase in length of the fibers during oxidation. Watt con-
eluded that the increased modulus values were due to the fact that
the tension results in better orientation of the molecules resulting
in a product with greater cross-linked orientation and higher strength
along the fiber axis. The degree of cross linking and product pro-
perties will therefore be dependent on the ability of oxygen to dif-
fuse throughout the fiber's structure.
The rate at which the reactants and byproducts are transferred
into and out of the fiber structure will be subject to the dif-
fusivity coefficient, pore size, and any boundary layer effects
that exist.
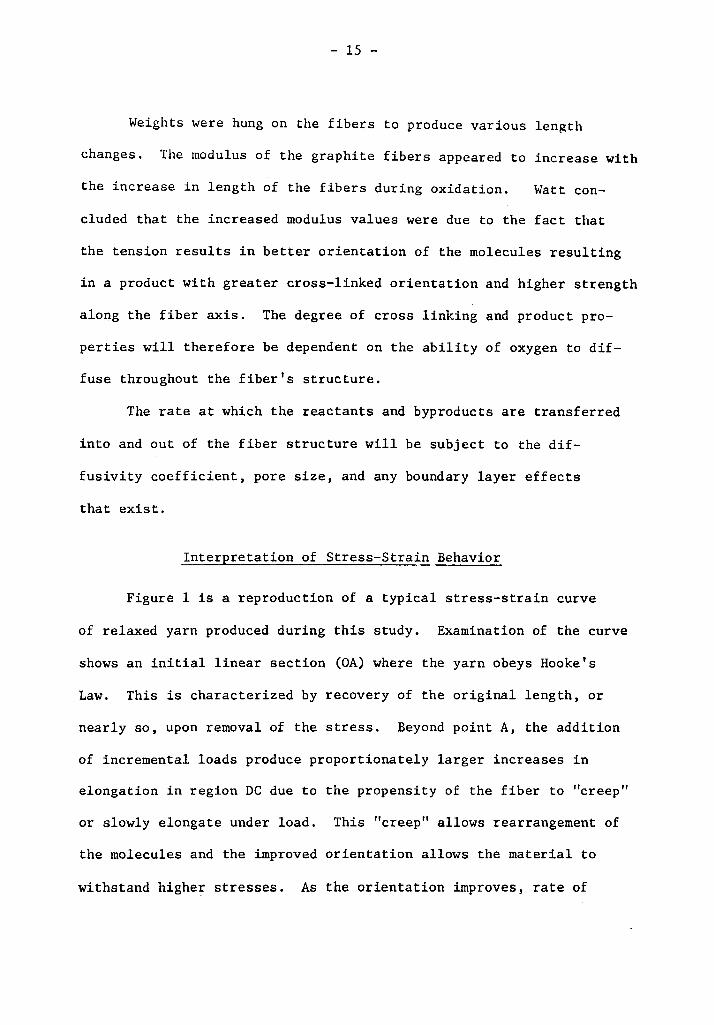
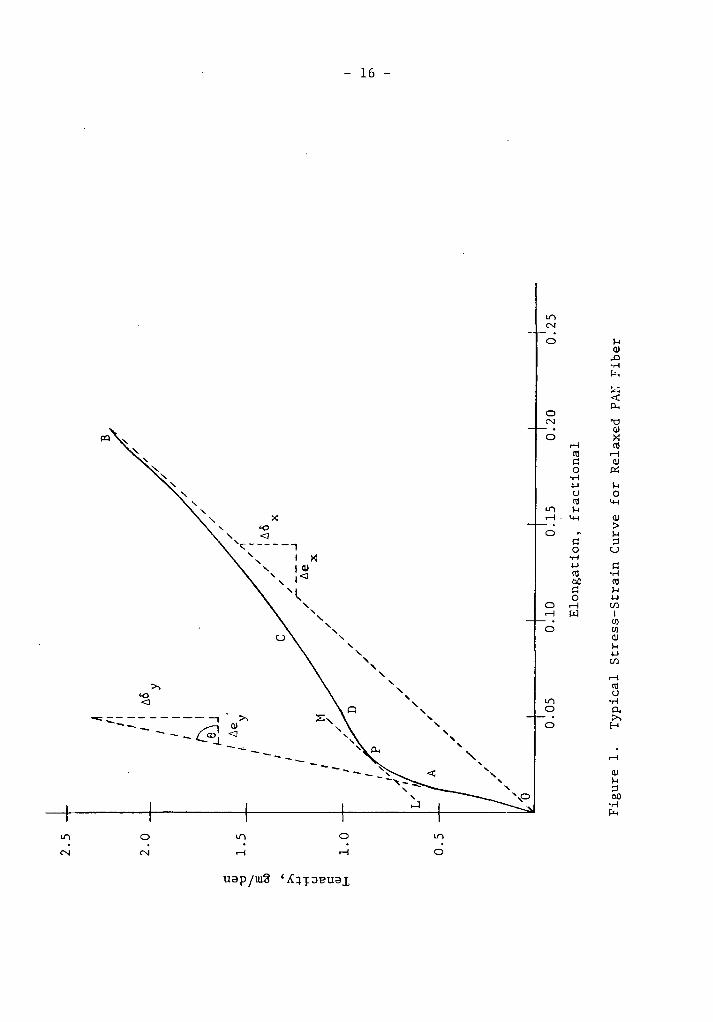
Interpretation of Stress-Strain Behavior
Figure 1 is a reproduction of a typical stress-strain curve
of relaxed yarn produced during this study. Examination of the curve
shows an initial linear section (OA) where the yarn obeys Hooke's
Law. This is characterized by recovery of the original length, or
nearly so, upon removal of the stress. Beyond point A, the addition
of incremental loads produce proportionately larger increases in
elongation in region DC due to the propensity of the fiber to "creep"
or slowly elongate under load. This "creep" allows rearrangement of
the molecules and the improved orientation allows the material to
withstand higher stresses. As the orientation improves, rate of
i::::
QJ
"'O -s bO
:>...
.j.J
"M u C1I
i::::
QJ
E-t
2.5
2.0
1.5
1. 0
0.5
I I I I I I
I I I I I /
A
I I I I
I I
I I
I I I
I I
I I
[ejJ
I ,. /
ti.e y / /
/ /
/).0 y / /
/ /
/
0:0
5
/ /
/ /
/ /
/ /
A //
I
/ /
/ /
/
/ :M
/
I X
/
I ,,
----
..J
/ ti.e
/
x
0:10
0:
15 /
~
~
I'
~
'/
B
'l 0:2
0
Elo
ng
atio
n,
fracti
on
al
0.25
Fig
ure
1.
Ty
pic
al S
tress
-Str
ain
Cur
ve
for
Rel
axed
P
M:
Fib
er
f--'
0\
- 17 -
elongation decreases. This "creep" region is, therefore, followed
by a stiffening region CB where additional loads cause smaller
changes in elongation until break occurs. Quantitative analysis
of the curves was done using the following definitions:
Tenacity. Tenacity at break, point B
Elongation. Elongation at break, point B
Initial Young's Modulus or Elastic Modulus. Ratio of change
in stress to change in strain within the elastic limit of the mate-
rial. The modulus is, therefore, equal to tan e or 60 /6e where y y
e is expressed as a fraction of the original length. Elastic fibers y
are characterized by low modulus values while high modulus values
indicate a stiff nonflexible material.
Secant Modulus. Ratio of change in stress to change in strain
between two points, particularly the points of zero stress and break-
. (14) ing stress . The secant modulus is therefore equal to 66 /6e x x
where e is expressed as a fraction of the original specimen length. x When the breaking values are used, the secant modulus is often re-
£erred to as the average stiffness, which is easily calculated by
dividing the breaking tenacity by the breaking elongation.
Yield Point or Proportional Limit. Point which locates the
region between Hookean behavior and "creep" behavior. It is the
point at which the tangent to the curve is parallel to the line
joining the origin and break point(lS). This is shown in Figure 1
as point P and the tangent is line LM.
- 18 -
Yield Stress. Tenacity at point P.
Yield Strain. Elongation at point P.
III. EXPERIMENTAL
This section contains a plan of experimentation, a description
of the procedures used, and the results obtained for this investiga-
tion.
Plan of Experimentation
This study was undertaken using the following plan of experi-
mentation.
Equipment Design, Construction.and Testing. Initial efforts
were expended on utilizing the spinning equipment used by Williams(S)
in his thesis work and built in the Chemical Engineering shop at
Virginia Polytechnic Institute and State University. After modifi-
cations were made to the equipment for a wet spinning operation, it
became evident that the piston assembly and drive mechanism could
not produce sufficient or consistent dope pressures to ensure uni-
form fiber properties. The variable speed at which the piston moved
through the bored cylinder was further aggravated by the small quan-
tities of dope used since the piston was especially unstable near
the end of the stroke.
Spinning equipment more suitable for extrusion of small quan-
tities of PAN was designed and fabricated at the Celco Plant of the
Celanese Fibers Company where the author is an employee. The spin-
ning unit consisted of a stainless steel cylindrical dope reservoir
to which variable pressures could be applied using a cylinder of
- 19 -
- 20 -
nitrogen with a pressure regulator. The dope consisting of PAN
dissolved in DMF was forced to a Zenith metering pump which provides
accurate dope flow rates using an interlocking gear displacement
mechanism. The metering pump supplied dope to a four-hole spinneret
which was partially immersed in a coagulation bath of dimethylforma-
mide and water. The yarn was taken up on a powered feed roll.
The stretching unit was positioned next to the spinning unit to
allow continuous extrusion and stretching operations. After wrapping
four times around the feed roll, the yarn was passed through a
boiling water bath and collected on a take-up roll. The yarn was
manually guided onto the take-up roll to build a fairly uniform
package.
Electrical heating tapes and hotplates were used to maintain
the desired temperatures of the coagulation bath, stretching bath,
and the dope prior to extrusion. Temperatures of the dope and baths
were monitored with thermocouples or thermometers and readings were
made periodically.
Fiber Spinning, Stretching, and Sample Collection. The pro-
perties of fibers are known to be highly dependent on the extent to
which the dope is filtered prior to extrusion. The dope was, there-
fore, filtered extensively prior to its use in the spinning appara-
tus. (9 10 11 12) The literature ' ' ' revealed the use of many different
dope compositions and the conditions chosen to remain constant
throughout the spinning trials were an extrusion dope temperature
- 21 -
of 50°C and a dope composition of 17% PAN and 83% DMF by weight.
The coagulation bath temperature and composition were varied to
determine the effect on fiber properties, porosity, and stability.
Two levels of stretching ratio were examined to determine the effect
on fiber properties and porosity.
The fiber samples were collected on cardboard rolls slipped
over the take-up roll. A chrome plated pigtail was used to guide
the yarn onto the roll. After sufficient yarn was collected, the
cardboard roll was removed and another one inserted for collection
at different operating conditions.
Fiber Physical Testing. Denier of the four filament yarn was
obtained by weighing known lengths. Measurement of fiber breaking
tenacity and elongation were made using an Instron Tensile
Tester. The rate of elongation was adjusted to 60% of the initial . (13) specimen length per minute as recommended . Adjustments were
also made to obtain the break point at 50-85% of the full scale
reading. The specimen gage length was 16.7 cm. Samples were con-
ditioned at 65% RH and 70°F prior to physical testing, which is
the recommended ASTM standard.
Fiber Structure. The pore volume was measured using a mer-
cury intrusion porosimeter and the results were compared with cal-
culated values based on fiber diameter, denier, and the pore-free
density of PAN. Some fibers were cut with a sharp razor blade to
allow examination of the cross-section configuration.
- 22 -
Oxidation of PAN. The effect of pore volume on the oxidation
of PAN was examined using thermogravimetric analysis. Approximately
10 mg of selected samples were cut into short pieces and placed in a
du Pont Model 950 thermogravimetric analyzer for 200 minutes at a con-
stant temperature of 225°C. The weight change was monitored in
an atmosphere of air or argon. The rate of weight loss was used to
indicate the effect of pore volume on the rate at which reactants
and products could diffuse through the fiber structure.
Procedures
Dope Preparation. An appropriate amount of refrigerated (15°C)
N,N-Dimethylformamide was added to a tared glass jar. Knowing the
amount of DMF, sufficient polyacrylonitrile powder was added to the
glass jar to yield a solution of 17% PAN by weight. Sample size
varied from 50 grams to 400 grams. The PAN powder was preheated to
100°C in a capped jar. These temperatures were found to reduce the
formation of lumps and reduce mixing time. The jar was then placed
in a high speed laboratory shaker for 15 minutes, heated to 60°C
for two hours, and placed on a slowly rotating tumbler overnight.
The contents, after mixing, became viscous and had a brown color.
Undissolved matter could be seen in the viscous dope indicating the
obvious need for filtration.
Dope Filtration. The dope was placed in a 1-1/2" diameter
cylinder and pressurized using a nitrogen cylinder with a pressure
regulator. The dope was forced through various filter media by
- 23 -
increasing the pressure to a maximum of 160 psi and collected in a
clean glass jar. The dope was recycled four times using progressive-
ly more retentive filter media. The four stages included a 25 x 100
mesh wire cloth with a rating of 100 microns, 40 x 150 mesh wire
cloth with a rating of 60 microns, one layer of fiber filter paper
with a layer of cotton sheeting on each side, and three layers of
cotton batting with a layer of cotton sheeting on each sid·e. The
filtration was done at room temperature and the filtered dope was
crystal clear but a slight yellow-greenish tint remained. The
equipment was cleaned with 100% DMF between batches. An analysis of
the particulate matter removed from the dope indicated that 60% by
weight was organic while the remainder was inorganic material. The
ashing of the filtered material was done at 575°C for three hours
in a muffle furnace and indicated that most of the material was pro-
bably undissolved PAN. Measurements of the concentration of PAN in
the dope were, therefore, made on each sample prior to spinning, even
though these measurements revealed only very minor amounts of PAN
remained undissolved.
Equipment Start-up. Prior to spinning, a small sample of
dope was analyzed gravimetrically to determine the concentration of
PAN. This procedure is detailed in the Appendix.
The hotplate used to boil the water in the stretching bath was
turned up to maximum output, once the tray was filled with distilled
water. An aluminum cover was used to reduce the heatup time. The
- 24 -
heating tape surrounding the glass tray, which served as the coagula-
tion bath, was then activated and an on/off controller was used to
maintain the desired temperature. The coagulation solution was
either freshly made or reused from earlier trials. The concentra-
tion was measured using a Bausch and Lomb refractometer. The use
of refractive index to measure concentration was found to be very
accurate and the procedure and calibration curve is detailed in
the Appendix.
The filtered dope was poured into the reservoir and pressur-
ized to approximately 50 psi. The Zenith metering pump was turned
on and the speed adjusted to give the desired rpm and associated
dope flow rate. The dope pressure in the transfer line between the
pump and spinneret was visually monitored and the pressure on the
dope reservoir was varied to maintain the same pump inlet and outlet
pressures.
The dope was allowed to flow from the spinneret until bubble
free dope formed on the surface. The spinneret was then lowered
into the coagulation bath and the feed and takeup rolls were started
at the desired speed. Fibers began to form as soon as the spinneret
contacted the bath. Using gloves, the fibers were collected and
pulled through the bath while rollers were placed on top of the yarn
bundle. The yarn end was then manipulated over the feed roll and
feed roll guides which allowed the yarn to wrap the feed roll four
times without overlapping. The yarn was then passed to the takeup
roll and the stretching bath cover removed. The yarn was then
- 25 -
placed under two rollers attached to a ring stand which were then
lowered into the boiling water. The takeup roll speed was slightly
greater than the feed roll speed and the yarn had enough flexibility
so that no difficulty was encountered during the entire threading
operation.
A check of all temperatures and speeds was made to ensure
proper operating conditions.
Sample and Data Collection. The Zenith metering pump speed
was checked using a low speed hand tachometer. The feed roll and
takeup roll speeds {rpm) were indicated on the control units, which
were previously calibrated with a moderate speed hand tachometer.
All speeds and temperatures were easily maintained but were period-
ically recorded between sample collections.
Once the apparatus was threaded and all operating conditions
recorded, a cardboard roll was placed over the end of the takeup
roll. The yarn, while being wound on the uncovered portion of the
takeup roll, was then manually guided onto the cardboard roll using
a pigtail. After several layers were collected on the cardboard roll,
the yarn was guided back onto the uncovered portion. The fibers
leading on and off the cardboard roll were cut with a wooden knife.
The cardboard roll was then removed while running by applying pres-
sure to the inside of the cardboard roll which extended past the end
of the solid aluminum takeup roll. After the sample was collected,
all operating conditions were re-recorded.
- 26 -
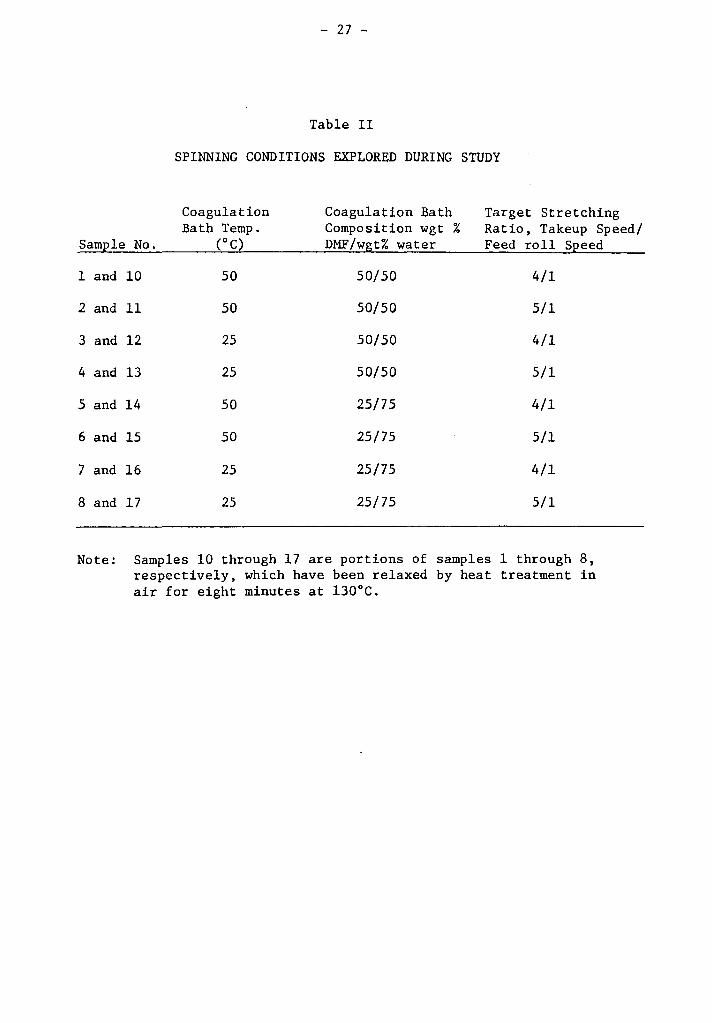
Table II shows the eight operating conditions for which
samples were tested. Part of the sample was removed from the card-
board roll and wound into a hank. The hank was loosely hung on a
bar and placed in a forced convection oven for eight minutes at
130°C. The hank of relaxed and a hank of unrelaxed yarn was placed
in a conditioned atmosphere overnight for testing the next day.
Shut-down Procedures. After all samples were collected, the
metering pump was turned off and the reservoir pressure released by
closing off the nitrogen cylinder and opening a relief valve slowly.
The feed roll, heaters, and takeup roll were turned off. The spin-
neret was raised out of the bath and the coagulating mixture was
syphoned out of the tray through a standard funnel with filter paper
and collected in a large jar for reuse.
The reservoir, pump, spinneret assembly, and all tubing were
disassembled and cleaned in DMF, if the equipment was not to be re-
used shortly.
Concentrations and Temperatures. The extrusion dope tempera-
ture was maintained at 50°C. After initial trial and error, the
variac setting of 90 was found to properly control the voltage to the
heating tape which surrounded the tubing supplying the spinneret.
The dope temperature did not vary more than+ 1°C as measured with
the thermocouple. A cover was placed over the stretching bath to
maintain temperatures closer to 100°C. The cover was
left in place as long as possible and replaced whenever the
- 27 -
Table II
SPINNING CONDITIONS EXPLORED DURING STUDY
Coagulation Coagulation Bath Target Stretching Bath Temp. Composition wgt % Ratio, Takeup Speed/
SamEle No. (oC) DMF/wgt% water Feed roll s2eed
1 and 10 50 50/50 4/1
2 and 11 50 50/50 5/1
3 and 12 25 50/50 4/1
4 and 13 25 50/50 5/1
5 and 14 50 25/75 4/1
6 and 15 50 25/75 5/1
7 and 16 25 25/75 4/1
8 and 17 25 25/75 5/1
Note: Samples 10 through 17 are portions of samples 1 through 8, respectively, which have been relaxed by heat treatment in air for eight minutes at 130°C.
- 28 -
temperature began dropping significantly. The arrangement, although
cumbersome, allowed temperatures of 94°-97°C to be maintained.
A constant temperature controller was used to maintain the
coagulation bath temperature. The first samples were collected at
50°C and the temperature was then lowered to 27°C without stopping
the e~trusion by turning off the controller and simultaneously drain-
ing the bath and adding additional cooled coagulant. To ensure a
constant temperature, approximately five minutes were allowed before
sampling was continued. Measurements showed no significant increase
in the level of DMF in the bath since relatively small quantities
of dope were extruded.
Fiber-Physical Testing. Total denier of the four filament yarn
was obtained by measuring the weight of 90 cm lengths and the average
denier per filament was calculated. Measurement of fiber
tenacity and percent elongation at break was obtained using an
Instron Tensile Tester with an attached recorder. The area compen-
sation accessory was utilized to allow the direct readout of grams/
denier instead of load in grams. The Instron unit was used with a
gage length of 16.7 cm., crosshead speed of 10 cm per minute, and a
chart speed of 50 cm per minute. The chart speed of 50 cm/min. was
found to yield acceptable slopes of the stress-strain curves. As
pointed out by Andrade( 6), it is recommended that the chart speed
be such that the initial slope correspond to a 45° angle for the
most accurate moduli measurements. The crosshead speed was used to
- 29 -
give a rate of extension equal to 60% of the initial specimen length
per minute as recommended(lJ). The load selector switch was varied
for full scale reading of 2.0 to 4.0 grams per denier for the yarn
produced at stretching ratios of about 4:1 and 5:1 respectively.
This was done to maintain the reading at 50-85% of the full scale.
The samples were maintained overnight in a conditioned room
at 70°F and 65% RH prior to testing. These are standard ASTM con-
ditions for textile testing.
The fibers were composed of four filaments and, to obtain an
indication of the variability between individual filaments, the
denier per filament was measured using a vibrascope. The vibrascope
is described by Kaswell (l4) and is based upon the principle that the
weight per unit length of a completely flexible string can be cal-
culated from its lateral frequency vibration characteristics, its
length, and the applied tension. The relationship is as follows:
denier =
The denier is in grams per 9000 meters, T is tension in grams force,
£ is the effective fiber length in centimeters, and f is the resonant
frequency in cycles per second. The fiber is vibrated transversely
and a variable oscillator is used to adjust the frequency so that
the harmonic modes are established.
- 30 -
Porosity Measurement. A mercury intrusion porosimeter was
used to gain some insight into the size and distribution of pores.
The equipment ·has been adequately described by Nelson( 7). A pene-
trometer was used having a maximum scale range of 0.02 cm3 due to
the small sample size. As recommended by Nelson, the filling pro-
cedure was modified so that the mercury level reads zero at atmos-
pheric pressure to eliminate volume changes due to filling voids be-
tween the fibers. The procedure used to operate the Aminco porosim-
eter is found in the Aminco-Winslow-Porosimeter Instruction Manual
No. 597<l9). Porosity measurements were made of unrelaxed samples
only (Numbers 1 to 8), since the relaxed fibers were expected to
have lower void fractions and less porosity. Twenty two readings
were taken on each sample tested.
The pore volume was also calculated using the measured fiber
diameter and a theoretical density for void free PAN. The fiber
diameter was measured at three points along each of the four fila-
ments in the fiber for a total of 12 measurements. The width of the
filaments was measured using a Leitz microscope at a magnification
of 500 X, obtained with a 50X objective and a lOX Filar micrometer
eyepiece. The focus was adjusted until both sides were distinctly
outlined. The hairline in the eyepiece was moved across the fiber
outline and the change in dial readings was used as the fiber diam-
eter. The eyepiece was calibrated using a standard calibration grid
with spacings of 100 microns. The calibration revealed that 5.64
- 31 -
divisions on the eyepiece was equivalent to 600 microns. Therefore,
one division was equivalent to 17.7 microns. The dial markings re-
fined one division to 100 subdivisions, which were read directly.
It was therefore possible to obtain readings to within approximately
0.2 microns. The filament denier was calculated by dividing the
total denier by four, thereby resulting in an average denier per
filament. A value for the void free density of PAN could not be
found. 3 Polyacronitrile fibers have a density of 1.17 to 1.18 gr/cm •
Therefore a value of 1.20 gr/cm3 was used in the calculation. The
absolute ~alues for the void fractions must be used cautiously.
A sample of dry spun yarn was obtained for comparative purposes.
The yarn end contained 383 filaments averaging 1.76 dpf. The yarn
was thought to be dry spun, since many filaments had a trilobal
cross-section and only round cross-sections are thought to be pro-
duced by wet spinning processes. The filament diameter was measured
to be 16.8 microns, which is much smaller than all other samples
evaluated.
Thermogravimetric Analysis. A du Pont Model 950 Thermogravi-
metric Analyzer was used to observe the weight loss of fiber samples
on exposure to temperatures of 220°-230°C for several hours. If the
oxidation process is diffusion controlled, it was thought that the
rate of weight loss would correlate with the amount of pores, pore
size, or pore size distribution. The basic procedures are shown in
the TGA instruction manual; however, some special procedures had to
be developed due to the nature of the fiber samples.
- 32 -
A platinum-rhodium sample pan was used which is roughly cylin-
drical with a diameter of 3/16" and a length of 3/8" hung from its
side and having open ends. Sample weights could range from one to
60 mg. A small weight loss was expected (1-5% by weight), so a
sample size of about 10 mg was chosen to allow more accurate weight
readings from the chart paper. It was also found that larger amounts
of samples resulted in tight packing of the sample pan which may
affect the gas flows and the subsequent weight loss readings. There-
fore the variation in sample size was minimized also.
The fibers were cut into 1/4" lengths using a sharp razor blade
to minimize the introduction of significant amounts of surface area
at the ends of the fibers. This also facilitated the loading of
the sample pan.
The fiber was heated isothermally and the sample temperature
was checked periodically by switching from the time to temperature
mode. All temperatures were within 220-230°C indicating adequate
isothermal operation. The thermocouple used to measure the tempera-
ture near the sample pan was carefully adjusted to within 1 mm to
ensure accurate measurement. The target temperature was set and
equilibration allowed to occur, which required 5-10 minutes, before
the weight recording was started.
Exposure time was 200 minutes for all but one of the five
selected samples. The sample weight was continuously recorded with
time and the weight loss calculated. The equipment has the capability
- 33 -
of being adjusted for greater sensitivity of weight loss, but the
calibration procedures indicated some electronic instability and
this option was not used.
The sample can be heated in a vacuum or a purged gas atmos-
phere. The samples were first run in air at carefully measured
flow rates. The flow rates were measured using two rotameters in
series to ensure accurate readings. Different air flow rates had a
major influence on the sample temperature and readjustment was neces-
sary at various air flow rates. As discussed later, the weight loss
was significantly affected by the air flow rate. Samples were run
under an atmosphere of argon gas to eliminate any data variability
which may be due to competing reactions. Without the oxidation re-
action, the weight loss should result from the evolution of pyroly-
sis byproducts such as HCN, NH3 , and water. It was felt that signif-
icant increases in weight loss rates, due to evolution of these by-
products, should indicate that the mass transfer rate was greater
and increased transfer rates of oxygen into the fiber could be pro-
jected.
Results
The tensile testing indicated the yarn had physical properties
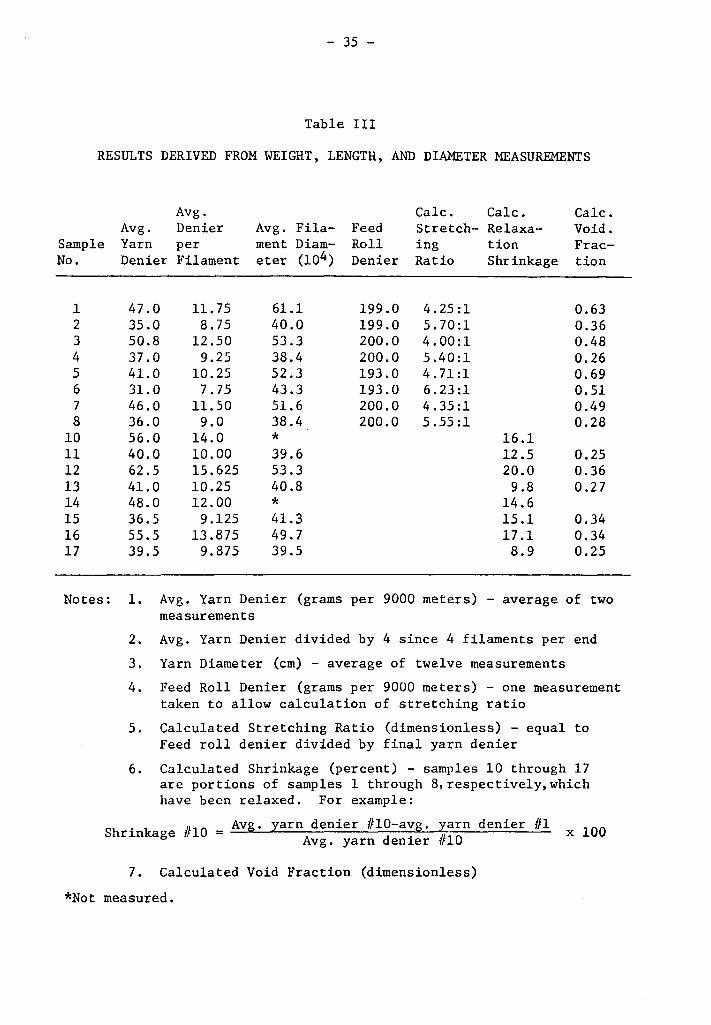
similar to that of commercially available products. Table III shows
the denier and diameter of the fibers and filaments along with cal-
culated values of stretching ratio, shrinkage during relaxation, and
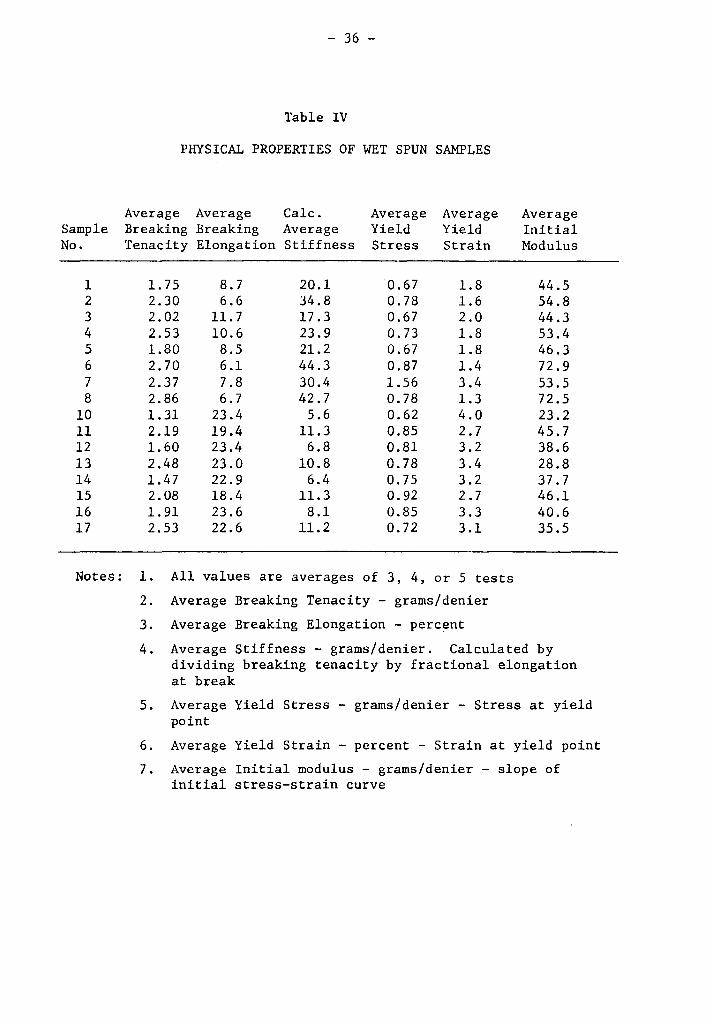
void fraction. Table IV lists the physical properties of tenacity,
- 34 -
elongation, average stiffness, yield tenacity, yield elongation, and
initial modulus.
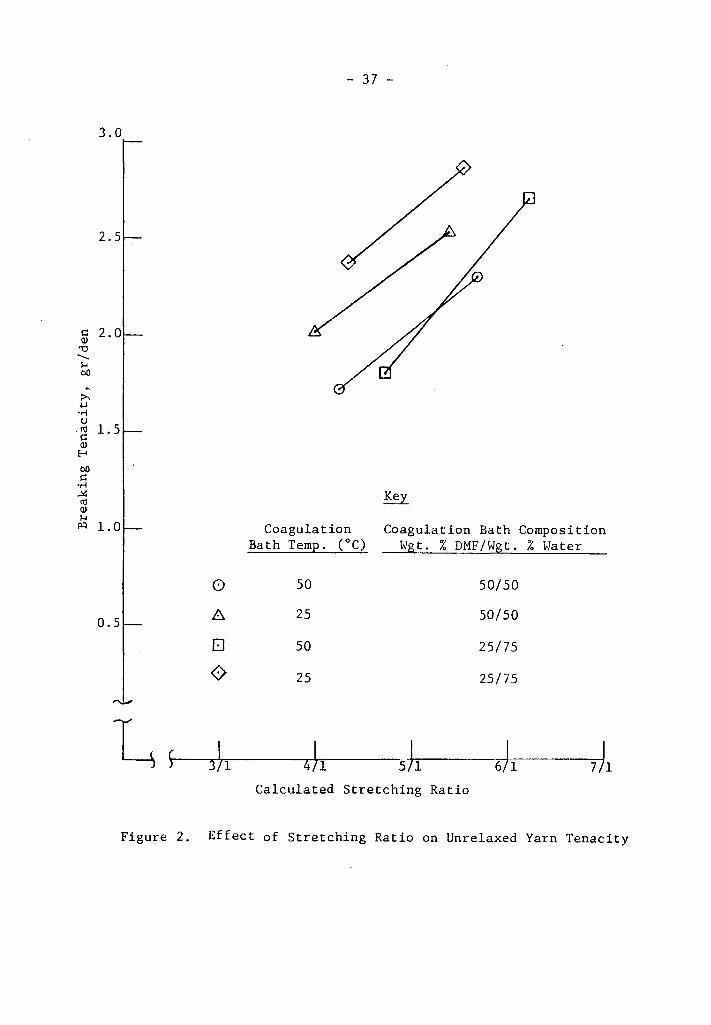
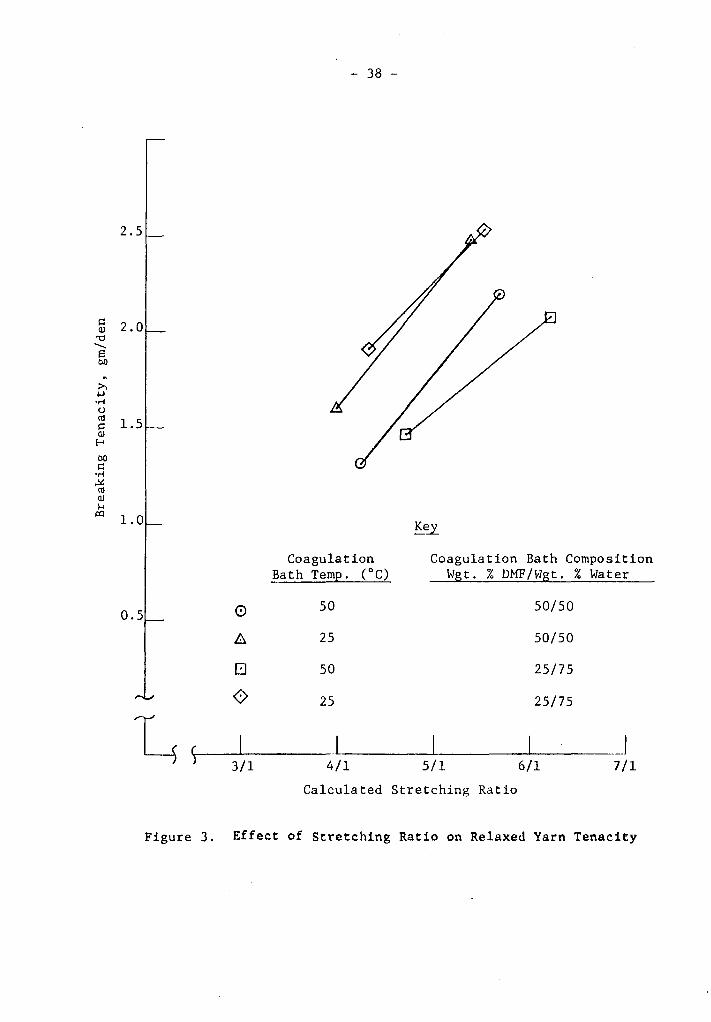
Figure 2 shows the tenacity as a function of calculated stretch
ratio for the unrelaxed fibers while Figure 3 shows the same for the
relaxed fibers. The effect of calculated stretch ratio on elongation
of relaxed yarn is seen in Figure 4.
The results of porosimeter measurements are shown in Figure 5
which indicates the relationship between pressure and penetrated
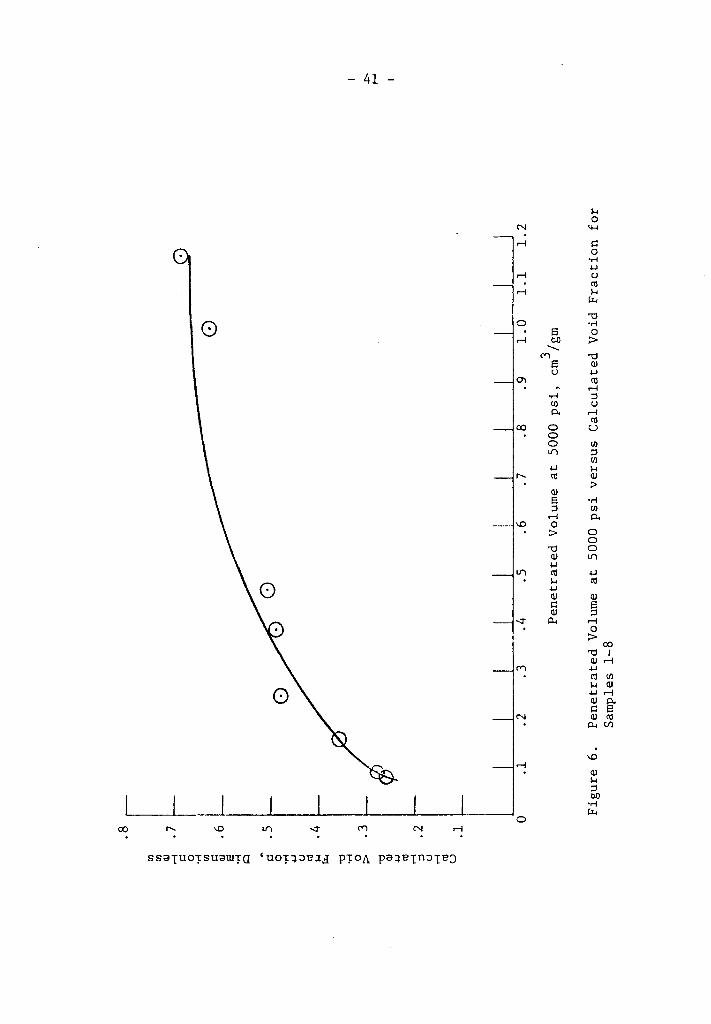
volume. Figure 6 shows the correlation between maximum penetrated
volume and the calculated void fraction.
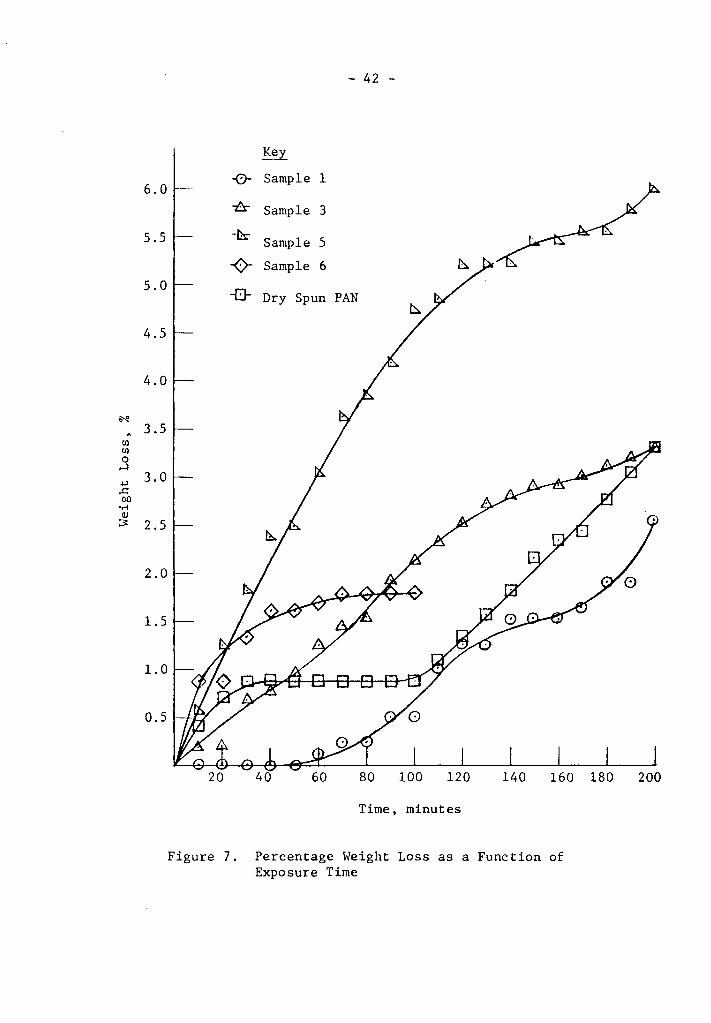
Percent weight loss as a function of time is illustrated in
Figure 7 for samples exposed to temperatures of 220°-230°C in an
argon atmosphere.
- 35 -
Table III
RESULTS DERIVED FROM WEIGHT, LENGTH, AND DIAMETER MEASUREMENTS
Sample No.
1 2 3 4 5 6 7 8
10 11 12 13 14 15 16 17
Notes:
Avg. Cale. Cale. Cale. Avg. Denier Avg. Fila- Feed Stretch- Relaxa- Void. Yarn per ment Diam- Roll ing tion Frac-Denier Filament eter (104) Denier Ratio Shrinkage tion
47.0 11. 75 61.1 199.0 4.25:1 0.63 35.0 8.75 40.0 199.0 5.70:1 0.36 50.8 12.50 53.3 200.0 4.00:1 0.48 37.0 9.25 38.4 200.0 5.40:1 0.26 41.0 10.25 52.3 193.0 4.71:1 0.69 31. 0 7.75 43.3 193.0 6.23:1 0.51 46.0 11.50 51.6 200.0 4.35:1 0.49 36.0 9.0 38.4 200.0 5.55:1 0.28 56.0 14.0 * 16.1 40.0 10.00 39.6 12.5 0.25 62.5 15.625 53.3 20.0 0.36 41.0 10.25 40.8 9.8 0 .2 7 48.0 12.00 * 14.6 36.5 9.125 41.3 15.1 0.34 55.5 13.875 49.7 17.1 0.34 39.5 9.875 39.5 8.9 0.25
1. Avg. Yarn Denier (grams per 9000 meters) - average of two measurements
2. 3. 4.
5.
6.
Avg. Yarn Denier divided by 4 since 4 filaments per end Yarn Diameter (cm) - average of twelve measurements Feed Roll Denier (grams per 9000 meters) - one measurement taken to allow calculation of stretching ratio Calculated Stretching Ratio (dimensionless) - equal to Feed roll denier divided by final yarn denier Calculated Shrinkage (percent) - samples 10 through 17 are portions of samples 1 through 8,respectively,which have been relaxed. For example:
Sh . k #lO Avg. yarn denier #10-avg. yarn denier #1 x lOO rin age = Avg. yarn denier #10
7. Calculated Void Fraction (dimensionless)
*Not measured.
Sample No.
1 2 3 4 5 6 7 8
10 11 12 13 14 15 16 17
- 36 -
Table IV
PHYSICAL PROPERTIES OF WET SPUN SAMPLES
Average Average Cale. Breaking Breaking Average Tenacity Elongation Stiffness
1. 75 2.30 2.02 2.53 1.80 2. 70 2.37 2.86 1.31 2.19 1.60 2.48 1.47 2.08 1. 91 2.53
8.7 6.6
11. 7 10.6
8.5 6.1 7.8 6.7
23.4 19.4 23.4 23.0 22.9 18.4 23.6 22.6
20.l 34.8 17.3 23.9 21.2 44.3 30.4 42.7 5.6
11.3 6.8
10.8 6.4
11.3 8.1
11.2
Average Average Yield Yield Stress Strain
0.67 0.78 0.67 0.73 0.67 0.87 1.56 0.78 0.62 0.85 0.81 0. 78. 0.75 0.92 0.85 0.72
1.8 1.6 2.0 1.8 1.8 1.4 3.4 1.3 4.0 2.7 3.2 3.4 3.2 2.7 3.3 3.1
Average Initial Modulus
44.5 54.8 44.3 53.4 46.3 72.9 53.5 72.5 23.2 45.7 38.6 28.8 37.7 46.1 40.6 35.5
Notes: 1. All values are averages of 3, 4, or 5 tests 2. Average Breaking Tenacity - grams/denier 3. Average Breaking Elongation - percent
4. Average Stiffness - grams/denier. Calculated by dividing breaking tenacity by fractional elongation at break
5. Average Yield Stress - grams/denier - Stress at yield point
6. Average Yield Strain - percent - Strain at yield point 7. Average Initial modulus - grams/denier - slope of
initial stress-strain curve
3.0
2.5
i:: 2.0 Q)
'"O -M bO ~
:>... .._, "M u ·~ 1. 5
Q) E-t bO i::
"M ~ Cll Q) M
P'.l 1.0
0.5
0
8
EJ ()
- 37 -
Coagulation Bath Temp. (°C)
50
25
50
25
Coagulation Bath Composition Wgt. % DMF/Wgt. % Water
50/50
50/50
25/75
25/75
Calculated Stretching Ratio
Figure 2. Effect of Stretching Ratio on Unrelaxed Yarn Tenacity
2.5
~ 2.0 -a -s b()
~
:>. +J •r-i ()
~ 1.5 Q)
E-< b() ~
•r-i ~
Cl! Q) H
i:Q 1.0
0.5
~
0 8.
El
0
~ 3/1
- 38 -
Key
Coagulation Coagulation Bath Composition Bath Temp. (oC) Wgt. % DMF /Wgt. % Water
50 50/50
25 50/50
50 25/75
25 25/75
I _J 4/1 5/1 6/1 7/1
Calculated Stretching Ratio
Figure 3. Effect of Stretching Ratio on Relaxed Yarn Tenacity
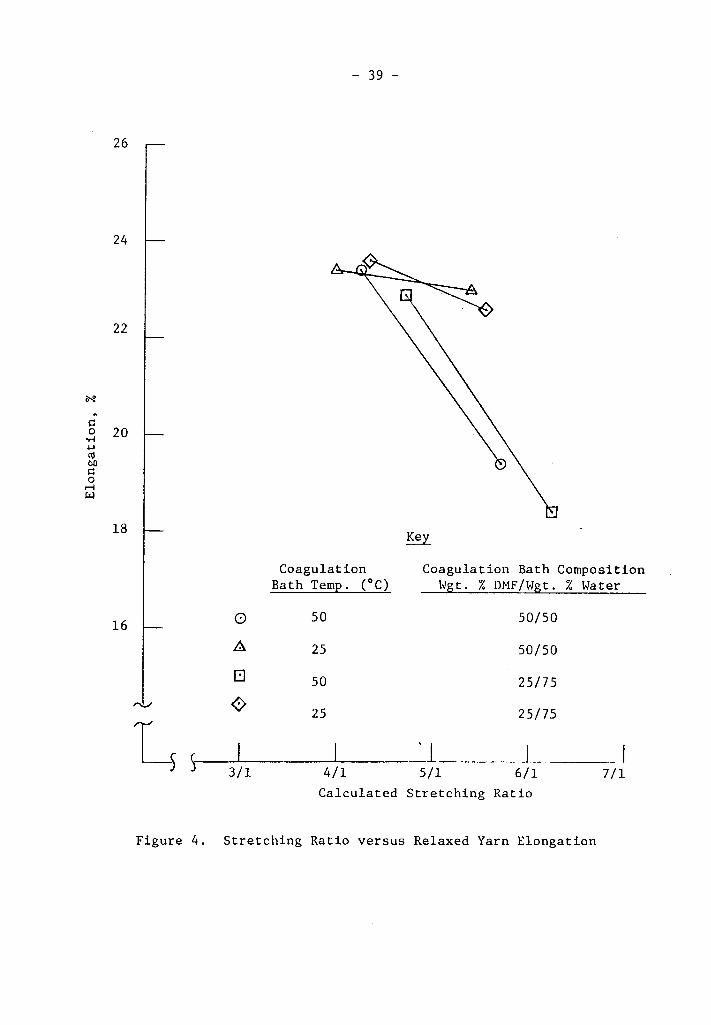
- 39 -
26
24
22
N ~
i:: 0 20 -M .µ ro 00 i:: 0
r-i w
18 Key
Coagulation Coagulation Bath Composition Bath Temp. (oC) Wgt. % DMF/Wgt. % Water
16 0 so SO/SO
A 2S 50/SO
El so 2S/7S ~ ~ 2S/75 2S
Ls ) , I __ J -- I
3/1 4/1 5/1 6/1 7/1 Calculated Stretching Ratio
Figure 4. Stretching Ratio versus Relaxed Yarn Elongation
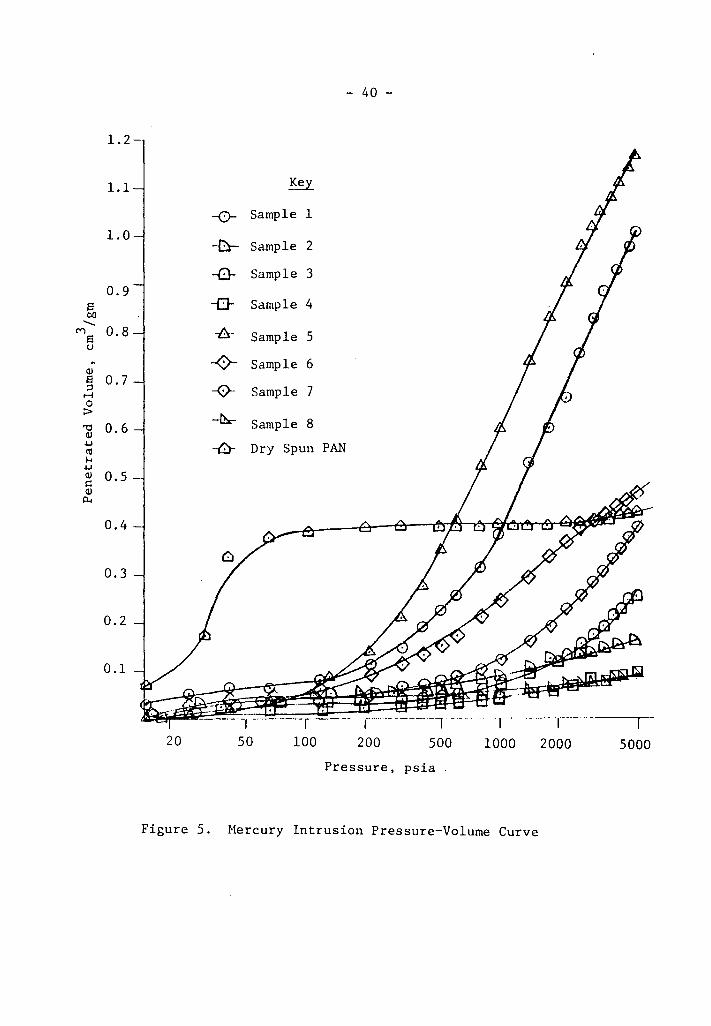
- 40 -
1.2
1.1 Key
-0-- Sample 1
1.0 -tr- Sample 2
-0- Sample 3 0.9
8 -0- Sample 4 00 -("") 0.8 -fr Sample 5 8 (.)
~ -0- Sample 6 QJ 8 0.7 ::l --0- Sample 7 ~ 0 :>
-~ "t:J 0.6 Sample 8 QJ
-1..J -D- Dry Spun PAN al .....
-1..J QJ 0.5 ~ QJ
P-t
0.4
0.3
0.2
0.1
r-··· ··· -----, -- -- ·r- ---·-1--20 50 100 200 500 1000 2000 5000
Pressure, psia
Figure 5. Mercury Intrusion Pressure-Volume Curve
U)
U) Q)
,.-j
i::
0 .,.;
.81
.7 r-
U) i::
Q) e .,.;
0
.6
i::~
• 5
0 .,.;
.i..J ()
113 ""'
.4
i:...
"O
.,.; g
.3
"O
Q)
.i..J 113
,.
-j
:I
()
,.-j
co u
.2
.1 0
.1
.2
.3
0
.4
.5
. 6
.7
.8
.9
1.0
1
.1
1.2
Pen
etra
ted
Vol
ume
at 5
000
psi
, cm
3 /gm
Fig
ure
6.
Pen
etra
ted
Vol
ume
at 5
000
psi
ver
sus
Cal
cula
ted
Voi
d F
ract
ion
for
Sa
mpl
es 1
-8
~
I-'
N
Cl) Cl) 0
.....:1 .jJ
..c: OD
•ri QJ ~
- 42 -
Key
-0- Sample 1 6.0 -
-fr Sample 3
5.5 -t!r Sample 5
-<>- Sample 6 5.0 -El- Dry Spun PAN
4.5
4.0
3.5
3.0
2.5
2.0
1.5
1.0
0.5
20 60 80 100 120 140 160 180
Time, minutes
Figure 7. Percentage Weight Loss as a Function of Exposure Time
200
IV. DISCUSSION
The following are comments concerning the logic, procedures,
and equipment used in this investigation. The results are discussed
along with recommendations for further study.
Objective and Approach
A significant part of the high cost for graphite material is
the long processing time. It is felt that the carbonization and oxi-
dation stages restrict the production rate and are limited by diffu-
sion of oxygen and volatile reaction products along with adequate heat
dis~ipation. The controlled introduction of small pores appeared a
worthwhile technique for increasing the mass transfer rates and dis-
sipation of heat.
The literature indicated that the wet spinning operation pro-
duces a porous fiber during the coagulation step and the pores are
eliminated to a great extent during the following steps of stretching,
relaxation, and drying. The objective of this study was then to
determine if mild operating conditions could preserve this network
of pores. The yarn was then analyzed to determine if significant
changes could be detected in the oxidation rate using thermogravi-
metric analysis.
Safety
The solvent, N-N dimethylformamide, was used cautiously and
gloves were used whenever contact was necessary. When samples
- 43 -
- 44 -
containing the solvent were dryed, vacuum ovens were used to prevent
explosive buildup of the vapors or leakage of toxic byproducts. No
smoking was permitted in areas where vapors could exist. The nitrogen
cylinder was securely fastened to the wall and normal caution was
used when handling hot solutions. Safety glasses were worn whenever
the spinning equipment or analyzing apparatus was used.
Spinning Procedures and Equipment
The use of heated PAN powder and cooled DMF was found to reduce
the tendency of lump formation upon mixing and decreased the time re-
quired for dissolution. No information was supplied with the PAN
powder, except that the intrinsic viscosity was 2.18. Many various
constants for the Mark-Howwink equation could be found in the liter-
ature. Using K = 197.0 x 10⁻⁵ and a= 0.625(9) a number average
molecular weight of 74,000 was calculated. No constants for the
weight average molecular weight could be found which yielded a value
within the recommended molecular weight range for those constants.
For estimating purposes, one set of constants with a maximum recom-
mended average molecular weight of 90,000 yielded a value of ~ =
196,000. This information indicates the molecular weight may have been on
the high side but the spinnability of PAN has been reported(l 7) to
be good at ~ = 150,000-200,000 for narrowly dispersed PAN fractions.
The dope solutions were not colorless liquids as reported( 9)
but rather discolored and contained many multi-colored particles.
The discoloration was thought to be degradation, perhaps, and the
- 45 -
mixing temperatures were therefore held low at 60°C. Small amounts
of oxalic or phosphoric acid are added to PAN dopes as heat stabil-
izers to prevent discoloration(l 2). One sample was prepared with
1.4% by weight of oxalic acid and less discoloration resulted. How-
ever, this did not appear to be of major importance for this study
and the use of heat stabilizers was not pursued. The particles which
were removed during filtration were ashed and data indicated 40% by
weight was inorganic material thought to be salts and metals.
The filtering equipment worked well, but required a lot of
time when larger samples of approximately 500 grams were filtered.
~he spinning and stretching apparatus worked smoothly and the small
amount of fibers produced, did not significantly change the coagula-
tion bath composition. No coalescence of filaments in the yarn was
found.
When the cover was removed from the boiling water bath, the
temperature began dropping slowly from about 98°C. About two samples
could be collected before the temperature dropped to around 94°C, at
which time the bath was recovered and the temperature brought back
to 98°C. The maximum stretching ratio was found to be near six for
these conditions. The yarn would usually break at one of the rollers
used to guide the yarn through the bath. Higher stretching ratios
are felt to be possible, if a higher stretching bath temperature is
used. To test this, a piece of stretched yarn was dipped in a beaker
of glycerol at 150°C and then quickly stretched by pulling. The yarn
easily stretched another 200-300% and indeed the yarn only needed to
- 46 -
be held in the vapors to be stretched. Glycerol has been reportedly(9)
used at 165°C for the stretching bath with stretching ratios of 15:1
resulting. Higher stretching temperatures should offer significant
improvements in yarn tenacity and especially elongation. The use of
glycerol would be suitable for laboratory work but would probably
require recovery on a large scale. Higher extrusion speeds or larger
deniers may require modifying the apparatus to provide longer coagula-
tion and stretching baths for increased residence time.
The method used to collect samples was adequate; however, an
automated takeup unit would make the operation much more convenient.
The yarn did not stick to the cardboard rolls and was easily removed.
The use of a refractometer to measure the coagulation bath composi-
tion was reliable, accurate, and very convenient.
Denier Measurement
The four filament yarn deniers obtained in this study, i.e.,
31.0-62.5, are in the commercially useful range. Of course, various
deniers could be.made by adjusting the drawdown ratio, dope concen-
tration,dope temperature, or the spinneret hole size. The denier
accuracy was probably± 1.0 gram since a milligram Mettler Balance
was used to weigh 90 cm lengths which weighed no more than 0.007
grams.
The deniers of the four individual filaments in the yarn were
checked on two samples with a vibrascope to determine the variability
of the denier per filament (dpf). A comparison between the calculated
- 47 -
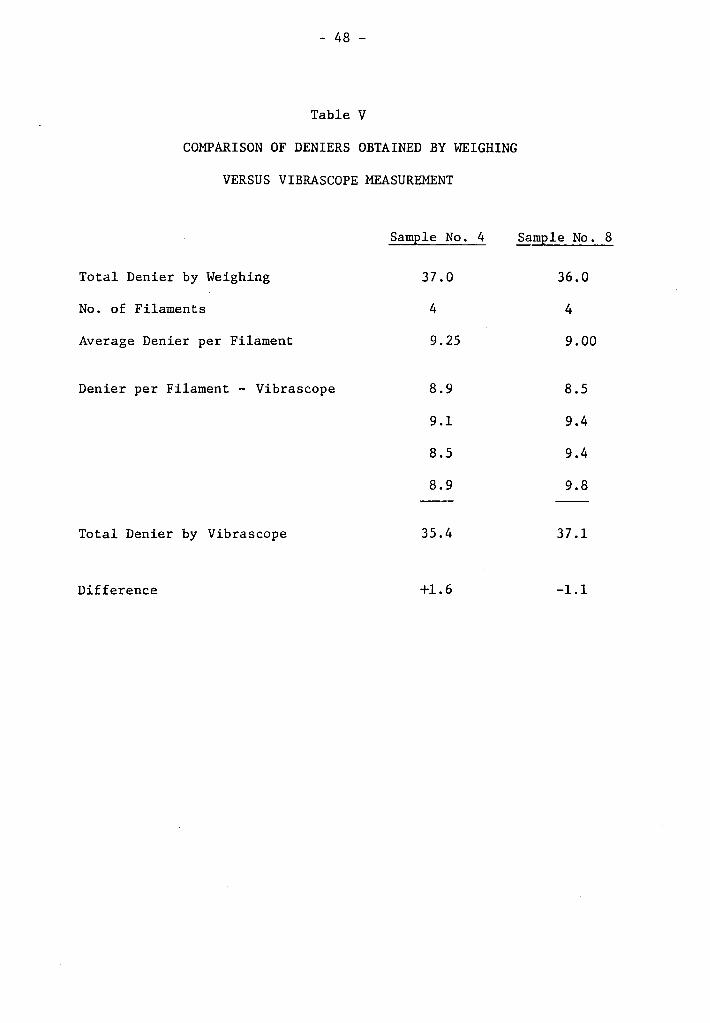
average dpf and the values obtained with the vibrascope is shown in
Table V. The maximum variability of dpf was found to be 1.3 gr/denier,
which indicates a moderate amount of variability for sample 8. The
other sample showed a range of 0.6 dpf. The sharp break point during
tensile testing which occurred for all samples, indicates that no
filaments were extremely abnormal in size and all had similar phys-
ical properties.
Tensile Properties
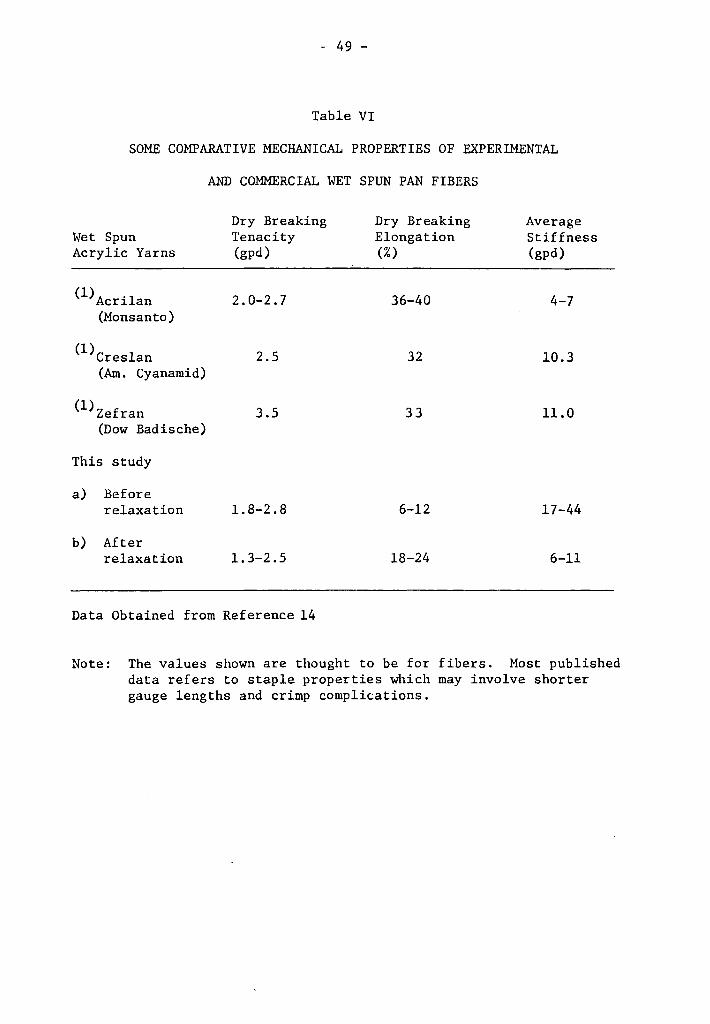
Table VI compares some of the physical fiber properties with a
few of the commercially available fibers. The values shown in the
table indicate that the properties of yarn made in this study were
similar to commercially available wet spun yarn except for slightly
greater stiffness, resulting in lower break elongations and higher
initial moduli. It is felt that the use of higher stretching bath
temperatures could result in matching and even surpassing those of
commercially available wet spun yarns.
Breaking Tenacity. The relaxation operation reduced the tenac-
ity of every sample. The higher tenacity yarns were generally less
affected by the same high temperature exposure. This could be caused
by the higher tenacity yarn having a more oriented molecular struc-
ture, requiring greater quantities of thermal energy to break down.
The percent shrinkage due to the relaxation stage was based on denier
changes and revealed that the high tenacity yarns shrank only 1/2-3/4
as much as the lower tenacity yarns. This, again, indicates the
- 48 -
Table V
COMPARISON OF DENIERS OBTAINED BY WEIGHING
VERSUS VIBRASCOPE MEASUREMENT
Sample No. 4
Total Denier by Weighing 37.0
No. of Filaments 4
Average Denier per Filament 9.25
Denier per Filament - Vibrascope 8.9
9.1
8.5
8.9
Total Denier by Vibrascope 35.4
Difference +1.6
Sample No. 8
36.0
4
9.00
8.5
9.4
9.4
9.8
37.1
-1.l
- 49 -
Table VI
SOME COMPARATIVE MECHANICAL PROPERTIES OF EXPERIMENTAL
AND COMMERCIAL WET SPUN PAN FIBERS
Dry Breaking Dry Breaking Average Wet Spun Tenacity Elongation Stiffness Acrylic Yarns (gpd) (%) (gpd)
(l) Acrilan 2.0-2.7 36-40 4-7 (Monsanto)
(l)Creslan 2.5 32 10.3 (Am. Cyanamid)
(l)Zefran 3.5 33 11.0 (Dow Badische)
This study
a) Before relaxation 1.8-2. 8 6-12 17-44
b) After relaxation 1. 3-2. 5 18-24 6-11
Data Obtained from Reference 14
Note: The values shown are thought to be for fibers. Most published data refers to staple properties which may involve shorter gauge lengths and crimp complications.
- 50 -
greater retention of the oriented structure during relaxation for the
higher tenacity yarns.
Figures 2 and 3 show the tenacity as a function of calculated
stretching ratio. As expected, increasing the stretching ratio
resulted in larger tenacity values in every case. The parallel slopes
indicate that, for samples produced with the same coagulation bath
composition, the changes in stretching ratio have a consistent and
repeatable effect on tenacity. The tenacity of yarns produced with
the same coagulation composition was higher at the lower temperature
in every case.
Breaking Elongation. The elongation of unrelaxed yarn did not
correlate with any of the operating conditions. It is felt that this
may be due in part to the stretching bath temperatures used. Figure
3 shows the relationship between elongation and stretching ratio for
relaxed yarns. In all cases, the breaking elongation decreased with
higher stretching ratios. This is in agreement with the concept that
higher stretching ratios result in greater orientation along the
fiber axis. Therefore, the molecules are less coiled, resulting in
less extension at various stress levels. The effect of the relaxa-
tion operation on elongation can be seen by the range of percent
elongation before relaxation of 6-11% compared to an elongation range
of 18-23% after relaxation. Shrinkage due to relaxation ranged from
8.9-20.0%, which shows that the operation allows disorientation of
molecules to occur; thereby increasing the elongation at break and
decreasing the tenacity at break.
- 51 -
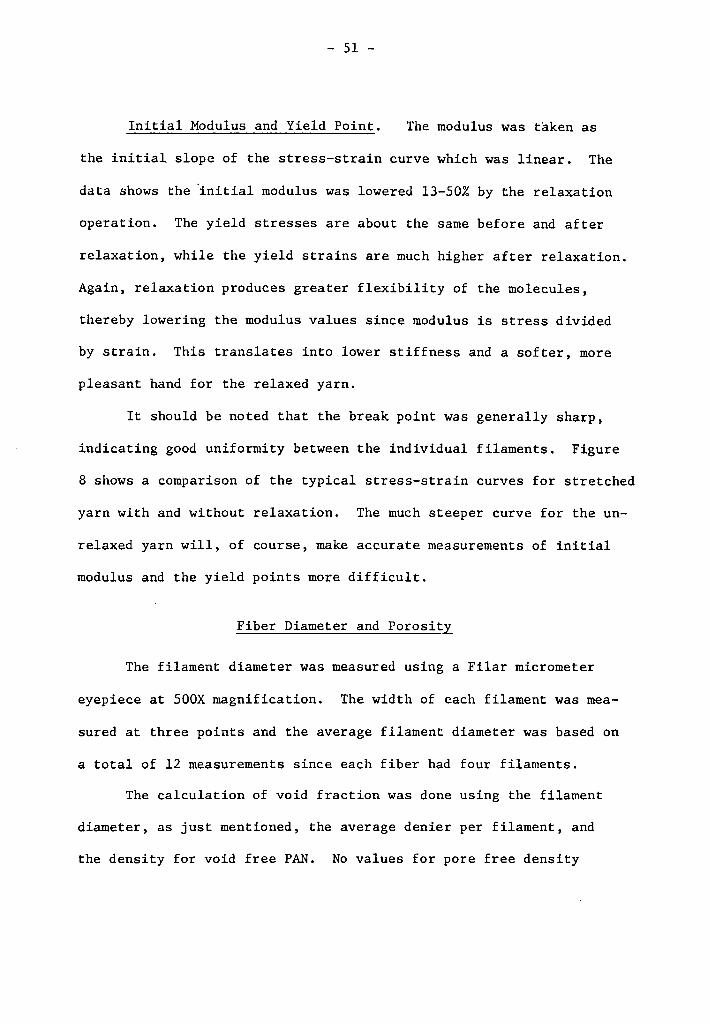
Initial Modulus and Yield Point. The modulus was taken as
the initial slope of the stress-strain curve which was linear. The
data shows the 'initial modulus was lowered 13-50% by the relaxation
operation. The yield stresses are about the same before and after
relaxation, while the yield strains are much higher after relaxation.
Again, relaxation produces greater flexibility of the molecules,
thereby lowering the modulus values since modulus is stress divided
by strain. This translates into lower stiffness and a softer, more
pleasant hand for the relaxed yarn.
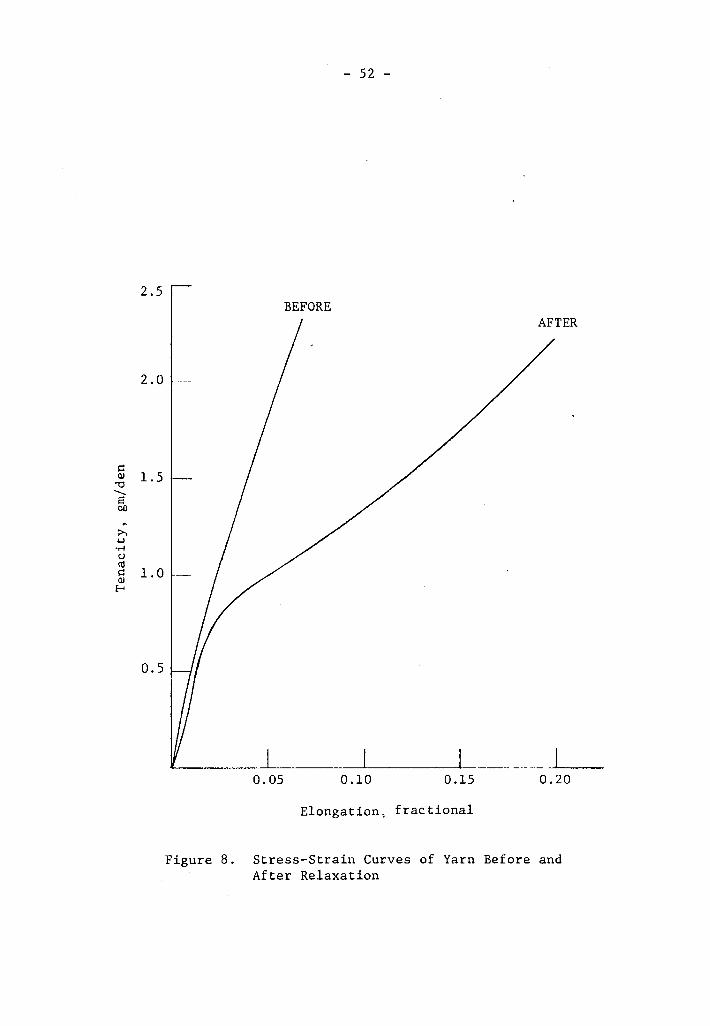
It should be noted that the break point was generally sharp,
indicating good uniformity between the individual filaments. Figure
8 shows a comparison of the typical stress-strain curves for stretched
yarn with and without relaxation. The much steeper curve for the un-
relaxed yarn will, of course, make accurate measurements of initial
modulus and the yield points more difficult.
Fiber Diameter and Porosity
The filament diameter was measured using a Filar micrometer
eyepiece at 500X magnification. The width of each filament was mea-
sured at three points and the average filament diameter was based on
a total of 12 measurements since each fiber had four filaments.
The calculation of void fraction was done using the filament
diameter, as just mentioned, the average denier per filament, and
the density for void free PAN. No values for pore free density
2.5
2.0
i:: QJ 1.5
'O -s 00
;>.. ~ ·r-i u (1j i:: 1.0 QJ
E-<
0.5
- 52 -
BEFORE
0.05 0.10 0.15 0.20
Elongation, fractional
Figure 8. Stress-Strain Curves of Yarn Before and After Relaxation
- 53 -
3 could be found so an arbitrary value of 1.20 gr/cm was used. This
is slightly higher than the value of 1.18 gr/cm3 which was found as
the density of dry spun polyacrylonitrile. It is stressed, therefore,
that the values presented for void fraction are intended to illus-
trate a trend and that the actual values are of little significance.
Values for void fraction shown in Table III clearly demon-
strates that relaxation tends to reduce the pore volume. This is
in agreement with earlier data which shows that relaxation causes
shrinkage along the fiber length and increased denier. The shrink-
age apparently coincides with total or partial collapse of the pores.
Another trend indicated by the data in Table III is that the
most porous structures are formed at coagulation bath temperatures
of 50°C compared with those at 25°C. In every case the yarn which
was processed at higher stretching ratios had less pore volume.
Overall, the fibers produced with a 25/75 DMF/water coagulation bath
composition had greater pore volume than those using a 50/50 DMF/
water composition. These trends would indicate that lower concen-
trations of solvent in the coagulation bath results in faster dif-
fusion of the solvent from the fiber, creating more void structures.
Higher temperatures would also appear to cause faster and less uni-
form diffusion of the solvent from the fiber and faster diffusion
of nonsolvent into the fiber structure, resulting in a porous struc-
ture.
- 54 -
Figure 6 shows a surprisingly good correlation between the
calculated void fraction and the penetrated volume obtained with the
porosimeter. Therefore, the previous statements would also apply to
the porosimetry data. The agreement between the two porosity mea-
surements would indicate that the porous structure existed throughout
the fiber and was not confined to the fiber surface. If pores existed
only at the surface, it is doubtful that the relative calculated void
fractions would cor.relate well with the porosimetry data.
The penetrated volume in Figure 5 indicates the relative amounts
of pores while the applied pressure indicates the pore size using
the equation:
diameter in microns ~ 210.7
applied pressure in psia
The pore size at the maximum pressure of 5000 psia is 0.042
microns. The shape of the pressure-volume curve indicates relative
amounts of the various sized pores, since a steep slope indicates a
large penetrated volume occurring for small changes in pressure,
while flat slopes indicate the absence of any appreciable amounts
of pores of that size. The curves would indicate that no significant
amount of pores with diameters greater than 0.042 microns exist in
samples 2, 4, or 8. Samples 3 and 7 show some volume of pores
with diameters between approximately 0.04 and 0.2 microns. Sample 6
appears to have pores ranging in diameter from 0.04 to 0.4 microns.
- 55 -
Samples 1 and 5 have pores having diameters from 0.04 to 1.0 microns.
The sample of dry spun polyacrylonitrile showed a large amount of
large pores around 7 microns in diameter with very few, if any,
smaller pores. Since these filaments were much smaller in diameter,
it was reasoned that the initial slope of the curve was due to mer-
cury filling between the fibers and not the pores. If the initial
slope is neglected, the dry spun sample shows essentially no pore
volume down to diameters of 0.042 microns. This was confirmed by
a small calculated void fraction of 0.26.
No pore size distribution was calculated, since there were
evidently smaller pores and the curves of V vs. ·p did not reach a
slope of zero. It is essential to obtain a leveling off of the
curve to allow the curve to be normalized and relative fractions cal-
culated for a distribution. Indeed, there could be a considerable
amount of smaller pores remaining in the sample but equipment cap-
able of exerting more than 5000 psi would be needed to force the
mercury into them for measurement.
Thermogravimetric Analysis
TGA analysis began with the examination of PAN weight loss
under standard oxidation conditions reportedly used in the manu-
facture of graphite fibers, i.e., air at 220-230°C. Samples of
dry spun yarn, supplied by Celanese, were exposed to these conditions
using air flow rates of 2 CFH and 4 CFH which correspond to linear
- 56 -
velocities of 1.6 and 3.2 in/sec through the 7/8" diameter furnace
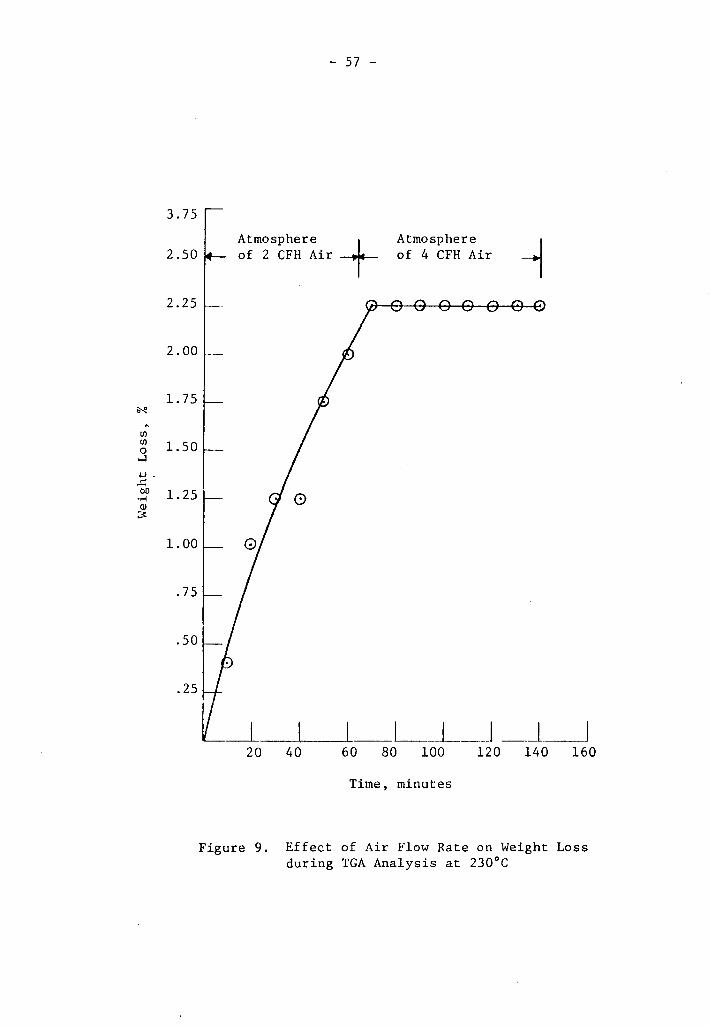
tube. Figure 9 shows the percentage weight loss as a function of
time for a sample exposed at 230°C in a flow rate of 2 CFH of air
for 70 minutes, after which the air flow rate was increased to 4 CFH
and the temperature readjusted quickly back to 230°C for 70 minutes
of exposure. As can be seen, the sample did not lose any weight at
the higher air flow rates after an appreciable loss at the lower
flow rates. The following reasons may account for the lack of weight
loss:
1. The difference between the thermocouple reading and
actual sample temperature increases at higher flow rates. The
sample temperature may have actually been below 200°C where no
appreciable reactions and therefore, no weight loss are thought to
occur.
2. The oxidation rate is increased significantly at the
higher air flow rates, and increase in weight due to incorporation
of oxygen is equal to the weight loss due to pyrolysis.
It is felt that the drop in sample temperature is the most
probable cause, since the oxidation reaction rate is thought to be
relatively slow and an air velocity of 1.6 in/sec should be more
than enough to replenish the oxygen at the surface. The boundary
layer thickness is not thought to be of major significance.
To eliminate the possibility that the oxidation may be ex-
tremely sensitive to air flow rates, it was decided to use an inert
3.75
2.50
2.25
2.00
1. 75 ~
UJ UJ 1.50 0
.....l µ, ..c bO 1.25 ..... QI ~
1.00
.75
.50
.25
-
- 57 -
Atmosphere + of 2 CFH Air
Atmosphere of 4 CFH Air
~~-~__._-~ ___ L_J_I J 20 40 60 80 100 120 140 160
Time, minutes
Figure 9. Effect of Air Flow Rate on Weight Loss during TGA Analysis at 230°C
- 58 -
atmosphere and examine the weight loss rate of the pyrolysis reactions
which result in products such as HCN, NH3 , water, etc. It was reason-
ed that, if pores cause higher weight losses or loss rates with pyrol-
ysis reactions, it would be logical to assume that higher oxygen
transfer rates into the fiber should also be obtained during oxida-
tion.
High purity argon was used and Figure 7 shows the resulting
percentage weight loss as a function of time. The porosimetry mea-
surements and calculated void fractions do not correlate very well
with the maximum weight loss after 200 minutes of exposure. The %
weight loss rates (slope of curves) are variable and show no strong
correlation with porosity. However, the most porous fiber (sample 5)
did show both a much higher weight loss and a higher sustained loss
rate. Sample 1, which was thought also to have a large pore volume,
showed, unexpectedly, the lowest weight loss. Sample 3 had a rela-
tively high weight loss. Some of the descrepancy in the data may
be due to the existance and amount of very small pores which could
not be measured with the porosimeter. It would have been much
better to run duplicate samples, but the lack of additional sample
made this impossible.
Recommendations
The following is a list of recommendations for equipment mod-
ifications and procedures for use in further studies.
- 59 -
Further Studies. The most immediate further study recommen<led
is the more thorough analysis of the effect of pore size, distribu-
tion, and quantity on the oxidation of PAN. It is imperative that
the reliability and repetitiveness of the TGA analysis be established.
Once precision of TGA analysis has been determined, additional samples
should be produced for porosity and oxidation analysis. If consistent
results indicate improvements of the magnitude shown by sample 5, it
would then be extremely worthwhile to further evaluate samples through
the carbonization and graphitization stages. Further evaluation will
require much more additional equipment to handle large enough fiber
samples for physical testing, etc. It may be more expedient to have
industrial firms, who are in the graphite business, evaluate any yarn
produced in large enough quantities.
It is also recommended that the use of a density gradient column
be investigated for obtaining accurate "apparent" densities of the
produced fibers. This has been used to measure the density of graph-
ite fibers( 2l) with both high accuracy and precision. The measure-
ment of fiber density along with fiber diameter will allow pore
volume to be determined quickly and accurately.
If porous fibers are to of fer improvements in processing
rates, it is important to obtain indications of the effect of pore
size and quantity on the physical properties of the graphite pro-
duct. This should be done as soon as repetitive thermogravimetric
results show it is warranted.
- 60 -
Equipment and Procedure Modifications. The only significant
problem associated with existing equipment is the maintenance of a
consistent stretching bath temperature. It is recommended that an
oil bath be used around the stretching bath to ensure high enough
heat transfer to maintain a constant bath temperature.
The use of glycerol in the stretching bath should be investi-
gated. It is felt that major improvement in the fiber strength and
flexibility will result if stretching temperatures up to 150°C ~re
examined. This will, of course, necessitate an additional washing
or extraction step to remove the glycerol, if the yarn is to be
examined on the TGA.
The design and construction of a winder to build uniform
packages on the takeup roll would make the sample collection much
easier.
V. CONCLUSIONS
PAN fibers were produced using the wet spinning process and
analyzed for physical properties and porosity. The affect of por-
osity on the oxidation rate of PAN was examined. The results of
this study led to the following conclusions:
1. The equipment, constructed for this study, produces fibers
having physical properties comparable with commercial PAN fibers.
2. Deniers as well as diameters of the fibers made varied
inversely with stretching ratio.
3. Relaxation of the yarn (exposure to temperatures of l30°C)
resulted in:
a) increase of fiber elongation
b) decrease of fiber tenacity
c) shrinkage of fiber length, the amount of
shrinkage varying indirectly with unrelaxed tenacity
d) reduction of pore volume
e) little change in yield point tenacity
f) increases in yield point elongation
g) reduction of the average initial modulus
h) reduction of the average stiffness value
4. The four filaments comprising the fiber were of uniform
size and have similar physical properties.
5. The breaking tenacity varies directly with stretching
ratio.
- 61 -
- 62 -
6. Elongation varies inversely with stretching ratio.
7. The amount of pore volume in the fibers increased with
higher coagulation bath temperatures and lower solvent concentra-
tions in the bath.
8. Porosimetry measurements show good correlation with cal-
culated values of the pore volume. The amount of pores and the
pore size vary greatly between samples produced under different
extrusion and stretching conditions.
9. The smallest measurable pore size was 0~044 microns, but
significant quantities of smaller pores may exist in the fibers.
10. Pore size and size distribution may have a significant
impact on the rate of PAN fiber oxidation.
VI. SUMMARY
The first objective of this study was to design, build, and
test an apparatus for making porous polyacrylonitrile fibers. An
effort was then made to determine the effect of a porous structure
on the oxidation rate of PAN fibers. Increases in oxidation rates
may significantly increase the production rates of the graphite
process resulting in lower cost to the purchaser and wider uses
of graphite fibers.
The wet spinning process was evaluated for porous PAN fiber
production. A large range of fiber properties could be obtained
by varying the stretching ratio and exposure to elevated tempera-
tures. Analysis indicates that fibers containing significant quan-
tities of pores, can be produced under suitable coagulation bath
conditions. The quantity of pores increased when a low amount of
stretching was applied and the yarn was not allowed to relax at
elevated temperatures. Even under these conditions it is thought
that sufficient orientation of the PAN molecules may exist in the
fibers to yield graphite yarn properties which are acceptable for
some lower strength applications.
The effect of pore volume on oxidation rate was examined
assuming that increased weight loss rate during pyrolysis in the
absence of air would indicate proportional increases in oxidation
rate. The weight loss rates appeared highly variable and did not
correlate directly with pore volume. The limit of precision of the
- 64 -
TGA analyzer is thought to contribute to the inconsistency of the
results, while the existence of pores, too small to be measured,
may also be a factor.
VII. LITERATURE CITED
1. Watt, W. and W. Johnson: "The Effect of Length Changes During the Oxidation of Polyacrylonitrile Fibers on the Young's Modulus of Carbon Fibers", High Temperature Resistance Fibers from Organic Polymers, (J. Preston, Editor), Interscience, New York, N.Y., 1969.
2. Ezekiel, H.: "High Strength, High.Modulus Graphite Fibers: The Preparation from Acrylic Yarn Precusors", AFML-TR-69-167, October, 1969.
3. Johnson, J. W.: "Factors Affecting the Tensile Strength of Carbon-Graphite Fibers", High Temperature Resistant Fibers from Organic Polymers, (J. Preston, Editor), Interscience, New York, N.Y., 1969.
4. Crowley, J. D. , G. S. Teague, Jr. , and J. W. Lowe, Jr. : "A Three Dimensional Approach to Solubility: Part. II", Journal of Paint Technology, Vol. 39, No. 504, January, 1967.
5. Williams, M.C.: "Properties and Characteristics of Polypropy-lene Fibers Spun by the Phase-Separation Technique", M.S. Thesis, Virginia Polytechnic Institute and State University, Department of Chemical Engineering, 1971.
6. Andrade, C. A.: "Phase Separation Spinning of Polypropylene Fibers", M.S. Thesis, Virginia Polytechnic Institute and State University, Department of Chemical Engineering, 1972.
7. Nelson, D. E.: "Phase Separation Spinning of Porous Polypro-pylene Hollow Fibers", M.S. Thesis, Virginia Polytechnic Institute and State University, Department of Chemical Engineering, 1974.
8. Knudsen, J. D. (to Monsanto Company), U.S. Patent 3,551,547, 1967.
9. Mark, M. F., S. M. Atlas, and E. Cernia: "Han-Made Fibers, Science and Technology", Vol. 3, Interscience, New York, N.Y., 1968.
10. Alexander, A. R.: "Man Made Fiber Processing", Noyes Develop-ment Corporation, Park Ridge, N.J., 1966.
11. Moncrieff, R. W.: "Man Made Fibers", Fifth Edition, Wiley-Interscience, New York, N.Y., 1970.
- 65 -
- 66 -
12. Sittig, M: "Acrylic and Vinyl Fibers", Noyes Data Corp., Park Ridge, N.J., 1972.
13. American Society for Testing Materials, ASTM-D 2101-64T, Revised 1964.
14. Kaswell, E. R.: "Wellington Sears Handbook of Industrial Textiles", Wellington Sears Co., New York, N.J., 1963.
15. Booth, J.E.: "Principles of Textile Testing", Chemical Publishing Co., New York, N.Y., 1961.
16. Sax, N. I.: "Dangerous Properties of Industrial Materials", Second Edition, Reinhold Publishing Corp., New York, N.Y., 1963.
17. Miller, M. L.: "The Structure of Polymers", p. 100. Reinhold Publishing Corp., New York, N.Y., 1968.
18. Jones, B. F. and R. G. Duncan: "The Effect of Fiber Diameter on the Mechanical Properties of Graphite Fibers Manufactured from Polyacrylonitrile and Rayon", Journal of Materials Science, No. 6, 1971.
19. Aminco-Winslow Porosimeter Cat. No. 5-7107, Instruction No. 597. American Instrument Co., Inc., Silver Spring, Md.
20. Textile World, "Man Made Fiber Chart, 1972", McGraw-Hill Pub. Co., Inc., New York, N.Y., 1972.
21. Walker, D. A. and W. H. Gloor: "Fiber and Yarn Density Deter-mination", AFML-TR-68-74, July, 1968.
- 67 -
VIII. APPENDIX
The appendix contains information which would be required to
reproduce the results of this investigation. A few procedures are
detailed along with a complete listing of materials and equipment
used in this study.
Data Tables
Th~s section contains the data obtained during the investiga-
tion. Table VII contains the fiber diameters from optical measure-
ments while Table VIII includes the penetrated volumes obtained
using the porosimeter. Tables IX and X contains the weight measure-
ments resulting from the thermogravimetric analysis.
Sample Calculations
These are examples of calculations made during this investi-
gation.
Drawdown Ratio. This ratio is defined and derived later.
All samples were extruded using a dope concentration of 17.1% by
weight at 50°C. Figure 11 shows a dope density of 0.961 gr/cm3
under these conditions. The spinneret holes are circular with an
average diameter of 118 microns. Table III shows the total denier
at the feed roll was usually 200 and the average denier per fila-
ment was therefore SO. The drawdown under these conditions was
calculated as
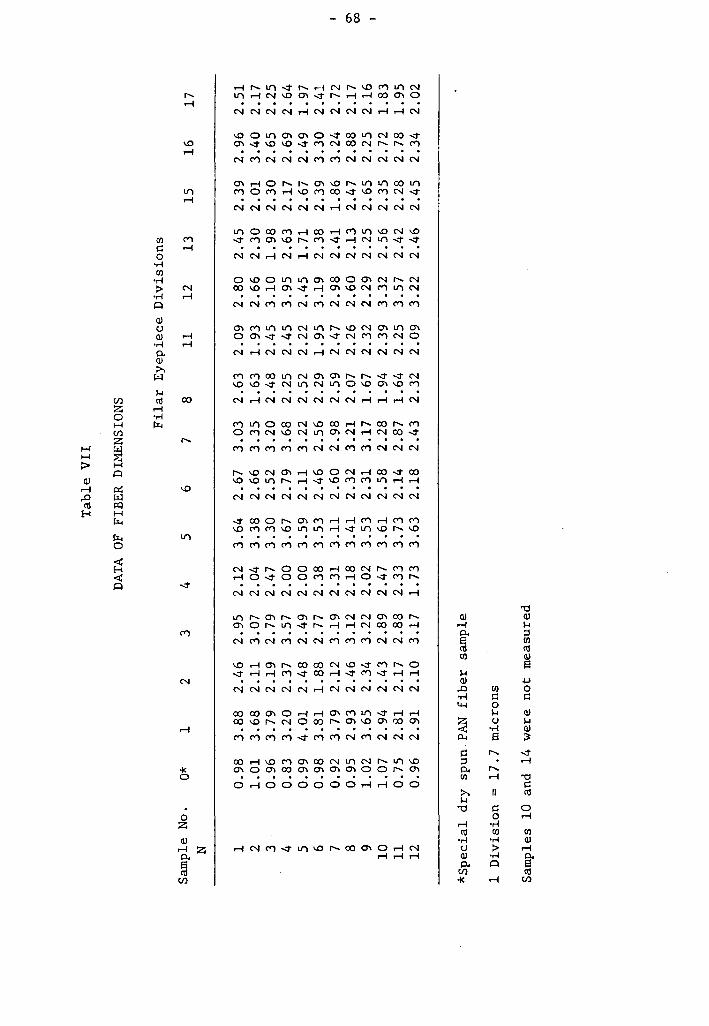
Tab
le V
II
DATA
OF
FIBE
R DI
MEN
SION
S
Fil
ar E
yepi
ece
Div
isio
ns
Sam
ple
No.
O*
1
2 3
4 5
6 7
8 11
12
13
15
16
17
N
1 0.
98
3.88
2.
46
2.95
2.
12
3.64
2.
67
3.03
2.
63
2.09
2.
80
2.45
2.
39
2.96
2.
51
2 1.
01
3.68
2.
11
3.07
2.
04
3.38
2.
66
3.35
1.
63
1.93
2.
66
2.30
2.
01
3.40
2.
17
3 0.
96
3.79
2.
19
2.79
2.
47
3.30
2.
52
3.20
2.
48
2.45
3.
10
1. 98
2.
30
2.65
2.
25
4 0.
83
3.20
2.
37
3.57
2.
00
3.67
2.
79
3.68
2.
25
2.45
3.
95
2.63
2.
17
2.69
2.
64
5 0.
99
4.01
2.
48
2.49
2.
00
3.59
2.
11
3.22
2.
52
2.22
2.
45
1. 71
2.
67
2.49
1.
97
6 0.
98
3.81
1.
88
2. 77
2.
38
3.53
2.
46
2.56
2.
29
1.95
3.
19
2.38
2.
39
3.30
2.
41
7 0.
92
3. 79
2.
12
3.19
2.
31
3.11
2.
60
2.98
2.
59
2.47
2.
98
2.41
1.
86
3.24
2.
72
8 0.
95
2.93
2.
46
3.12
2.
18
3.41
2.
32
3.21
2.
07
2.26
2.
60
2.13
2.
47
2.88
2.
17
°' 00 9
1.02
3.
65
2.34
3.
22
2.02
3.
53
2.31
3.
17
1.67
2.
32
2.29
2.
25
2.65
2.
25
2.16
10
1.
07
2.94
2.
43
2.89
2.
47
3.61
2.
58
2.28
1.
94
2.39
3.
32
2.56
2.
35
2.72
1.
83
11
0. 75
2.
81
2.17
2.
88
2.33
3.
73
2.14
2.
87
1.64
2.
25
3.57
2.
42
2.28
2.
78
1.95
12
0.
96
2.91
2.
10
3.17
1.
73
3.63
2.
18
2.43
2.
32
2.09
3.
22
2.46
2.
45
2.34
2.
02
*Spe
cial
dry
spu
n.PA
N f
iber
sa
mpl
e
1 D
ivis
ion
= 1
7.7
mic
rons
Sam
ples
10
and
14 w
ere
not
mea
sure
d
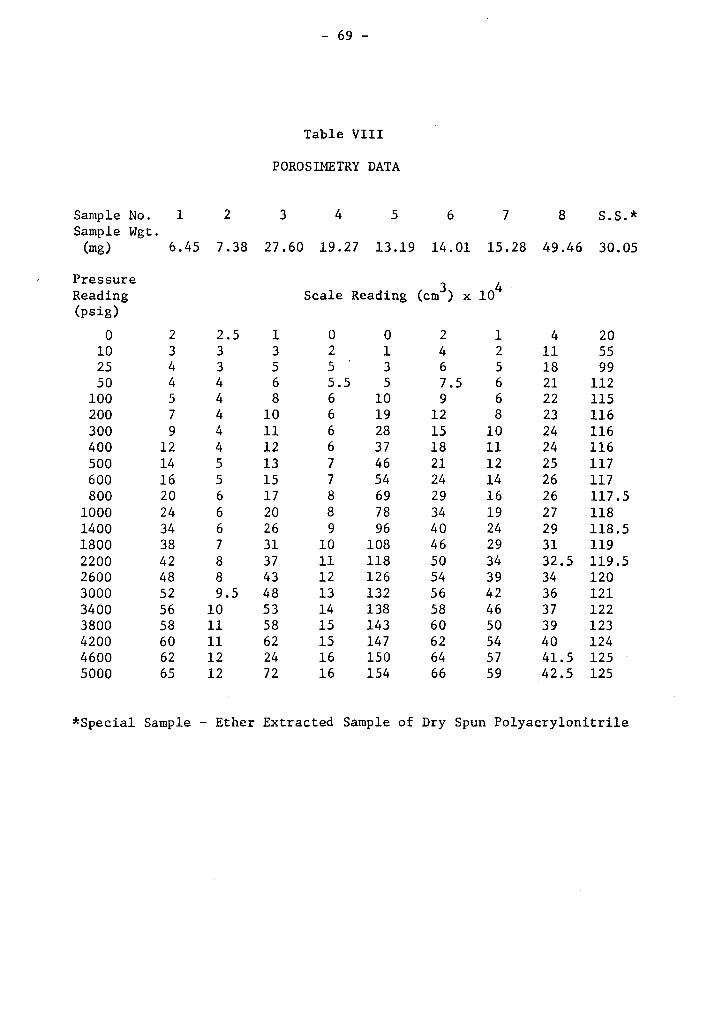
- 69 -
Table VIII
POROSIMETRY DATA
Sample No. 1 2 3 4 5 6 7 8 S.S.* Sample Wgt.
(mg) 6.45 7.38 27.60 19.27 13.19 14.01 15.28 49.46 30.05
Pressure 3 x 10⁴ Reading Scale Reading (cm ) (psig)
0 2 2.5 1 0 0 2 1 4 20 10 3 3 3 2 1 4 2 11 55 25 4 3 5 5 3 6 5 18 99 50 4 4 6 5.5 5 7.5 6 21 112
100 5 4 8 6 10 9 6 22 115 200 7 4 10 6 19 12 8 23 116 300 9 4 11 6 28 15 10 24 116 400 12 4 12 6 37 18 11 24 116 500 14 5 13 7 46 21 12 25 117 600 16 5 15 7 54 24 14 26 117 800 20 6 17 8 69 29 16 26 117.5
1000 24 6 20 8 78 34 19 27 118 1400 34 6 26 9 96 40 24 29 118.5 1800 38 7 31 10 108 46 29 31 119 2200 42 8 37 11 118 so 34 32.5 119.5 2600 48 8 43 12 126 54 39 34 120 3000 52 9.5 48 13 132 56 42 36 121 3400 56 10 53 14 138 58 46 37 122 3800 58 11 58 15 143 60 50 39 123 4200 60 11 62 15 147 62 54 40 124 4600 62 12 24 16 150 64 57 41.5 125 5000 65 12 72 16 154 66 59 42.5 125
*Special Sample - Ether Extracted Sample of Dry Spun Polyacrylonitrile
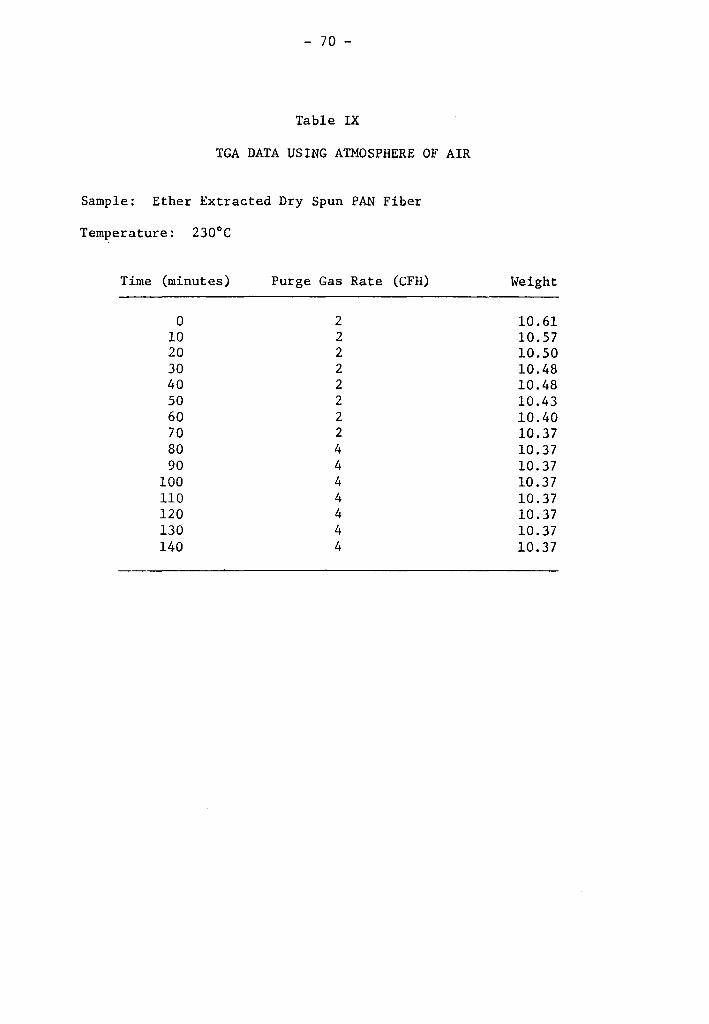
- 70 -
Table IX
TGA DATA USING ATMOSPHERE OF AIR
Sample: Ether Extracted Dry Spun PAN Fiber
Temperature: 230°C
Time (minutes) Purge Gas Rate (CFH)
0 2 10 2 20 2 30 2 40 2 50 2 60 2 70 2 80 4 90 4
100 4 110 4 120 4 130 4 140 4
Weight
10.61 10.57 10.50 10.48 10.48 10.43 10.40 10.37 10.37 10.37 10.37 10.37 10.37 10.37 10.37
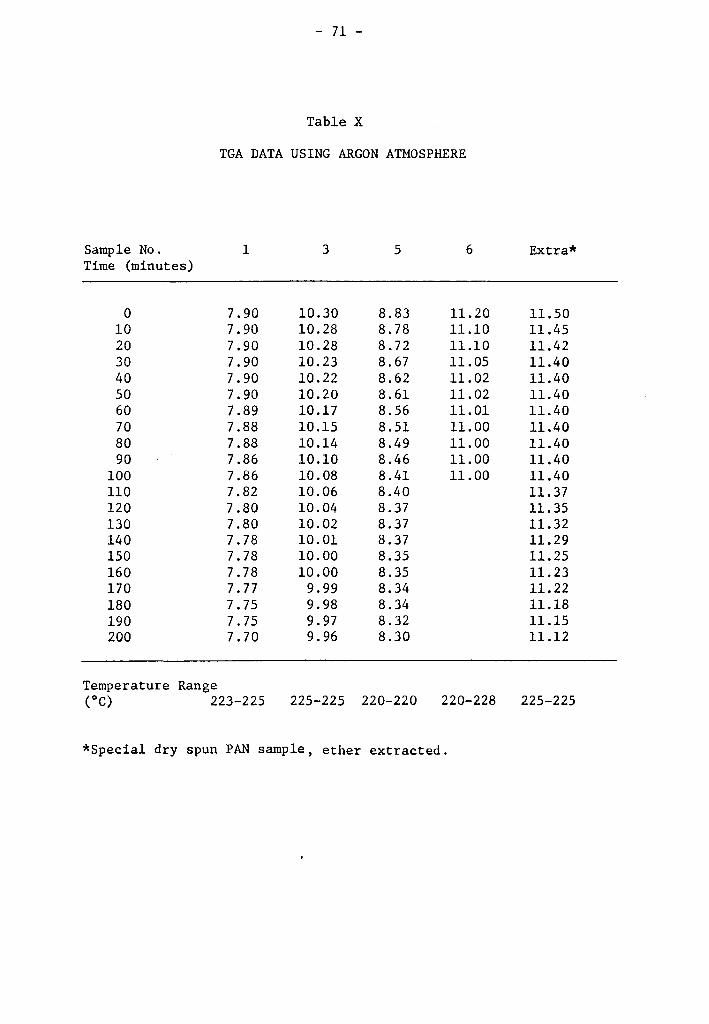
- 71 -
Table X
TGA DATA USING ARGON ATMOSPHERE
Sample No. 1 3 5 6 Extra* Time (minutes)
0 7.90 10.30 8.83 11.20 11.50 10 7.90 10.28 8.78 11.10 11.45 20 7.90 10.28 8.72 11.10 11.42 30 7.90 10.23 8.67 11.05 11.40 40 7.90 10.22 8.62 11.02 11.40 50 7.90 10.20 8.61 11.02 11.40 60 7.89 10.17 8.56 11.01 11.40 70 7.88 10.15 8.51 11.00 11.40 80 7.88 10.14 8.49 11.00 11.40 90 7.86 10.10 8.46 11.00 11.40
100 7.86 10.08 8.41 11.00 11.40 110 7.82 10.06 8.40 11.37 120 7.80 10.04 8.37 11.35 130 7.80 10.02 8.37 11.32 140 7.78 10.01 8.37 11.29 150 7.78 10.00 8.35 11.25 160 7.78 10.00 8.35 11.23 170 7. 77 9.99 8.34 11.22 180 7.75 9.98 8.34 11.18 190 7.75 9.97 8.32 11.15 200 7.70 9.96 8.30 11.12
Temperature Range (oC) 223-225 225-225 220-220 220-228 225-225
*Special dry spun PAN sample, ether extracted.
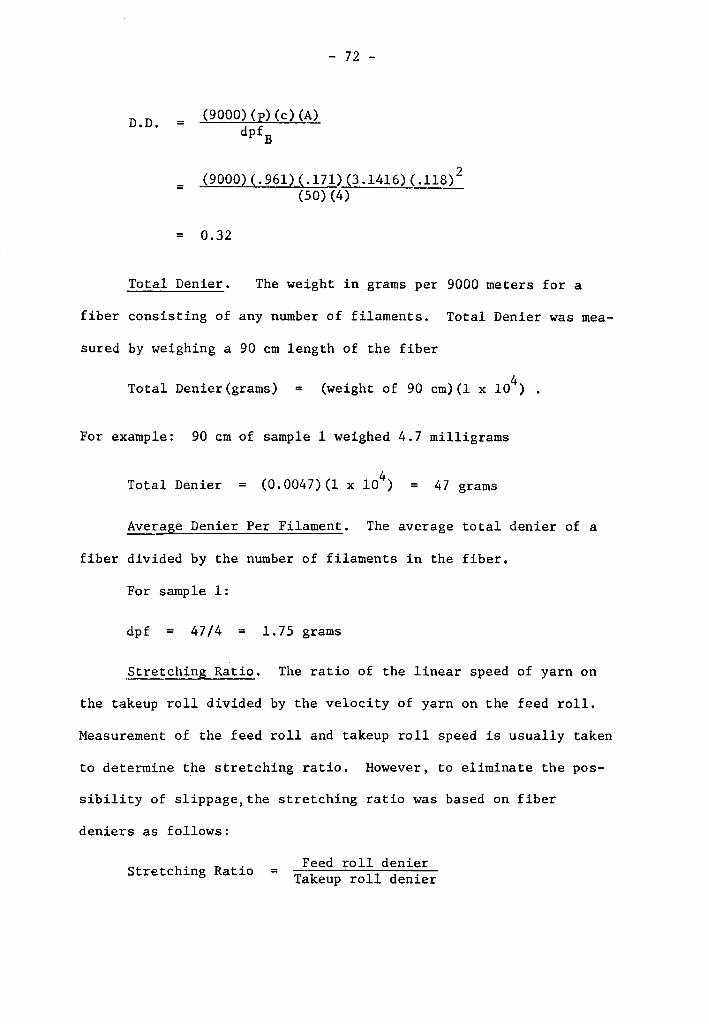
- 72 -
D.D. (9000)(p){c)(A) dpfB
(9000)(.961)(.171)(3.1416)(.118) 2 (50)(4)
0.32
Total Denier. The weight in grams per 9000 meters for a
fiber consisting of any number of filaments. Total Denier was mea-
sured by weighing a 90 cm length of the fiber
Total Denier{grams) = (weight of 90 cm){l x 104)
For example: 90 cm of sample 1 weighed 4.7 milligrams
Total Denier (0.0047)(1 x 10⁴) = 47 grams
Average Denier Per Filament. The average total denier of a
fiber divided by the number of filaments in the fiber.
For sample 1:
dpf 47/4 = 1.75 grams
Stretching Ratio. The ratio of the linear speed of yarn on
the takeup roll divided by the velocity of yarn on the feed roll.
Measurement of the feed roll and takeup roll speed is usually taken
to determine the stretching ratio. However, to eliminate the pos-
sibility of slippage,the stretching ratio was based on fiber
deniers as follows:
Stretching Ratio Feed roll denier = Takeup roll denier
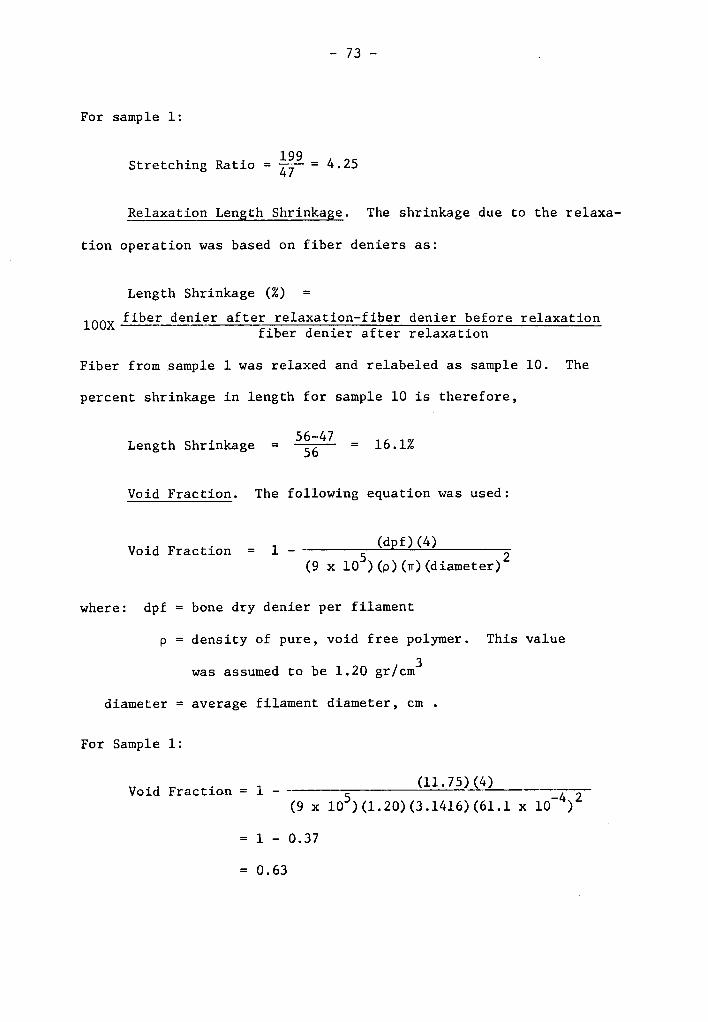
- 73 -
For sample 1:
199 Stretching Ratio = ~ = 4.25
Relaxation Length Shrinkage. The shrinkage due to the relaxa-
tion operation was based on fiber deniers as:
Length Shrinkage (%) = lOOX fiber denier after relaxation-fiber denier before relaxation
fiber denier after relaxation
Fiber from sample 1 was relaxed and relabeled as sample 10. The
percent shrinkage in length for sample 10 is therefore,
Length Shrinkage = 56-47 56 16.1%
Void Fraction. The following equation was used:
Void Fraction 1 - (dpf)(4) (9 x 10⁵)(p)(n)(diameter) 2
where: dpf = bone dry denier per filament
p density of pure, void free polymer. This value
3 was assumed to be 1.20 gr/cm
diameter = average filament diameter, cm
For Sample 1:
Void Fraction 1 (11. 75) (4)
(9 x 10⁵)(1.20)(3.1416)(61.1 x 10⁻⁴) 2
1 - 0.37
= 0.63
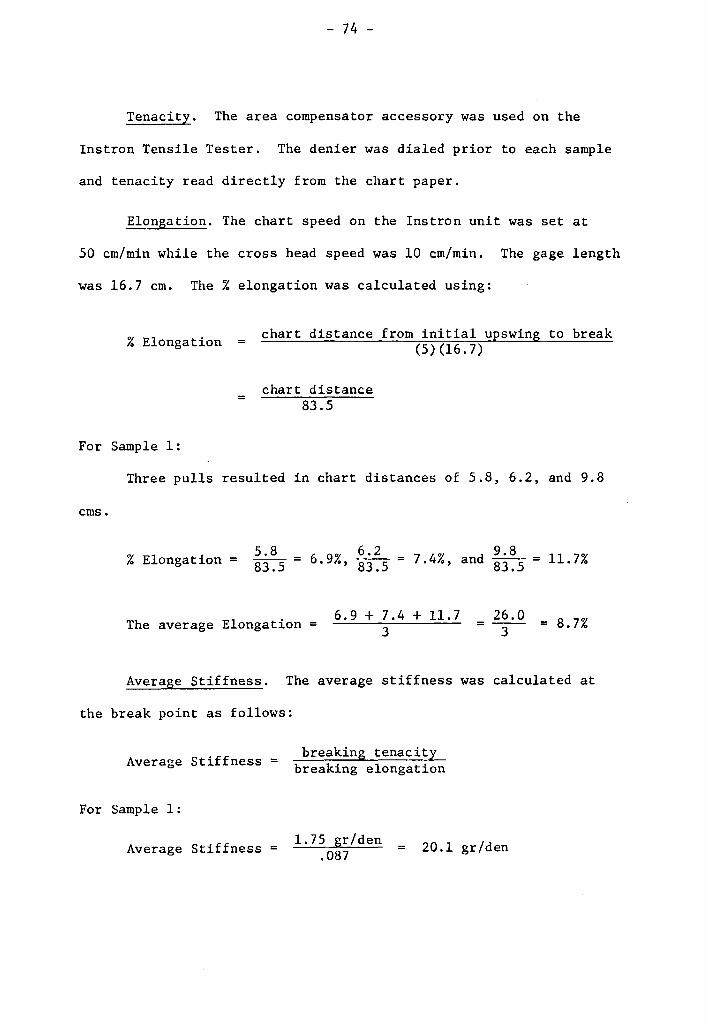
- 74 -
Tenacity. The area compensator accessory was used on the
Instron Tensile Tester. The denier was dialed prior to each sample
and tenacity read directly from the chart paper.
Elongation. The chart speed on the Instron unit was set at
50 cm/min while the cross head speed was 10 cm/min. The gage length
was 16.7 cm. The% elongation was calculated using:
% Elongation
=
chart distance from initial upswing to break (5)(16.7)
chart distance 83.5
For Sample 1:
ems.
Three pulls resulted in chart distances of 5.8, 6.2, and 9.8
% Elongation= ~j~5 = 6.9%, ;j:5 = 7.4%, and ~j~5 = 11.7%
The average Elongation 6. 9 + 7 .4 + 11. 7 3
= 26.0 = 8.7% 3
Average Stiffness. The average stiffness was calculated at
the break point as follows:
Average Stiffness =
For Sample 1:
Average Stiffness
breaking tenacity breaking elongation
1. 75 gr/den .087 = 20.1 gr/den
- 75 -
Average Yield Stress. Read directly from chart paper since
accessory was used which compensated for the denier dialed in prior
to testing.
Average Yield Strain. Calculated in a manner similar to elonga-
tion except the chart distance was measured from the initial
upswing to the yield point.
For Sample 1:
Three pulls resulted in chart distances of 1.4, 1.5 and 1.6 ems.
% Elongation to Yield ~j:5 = 1.7%, ~j:5 = 1.8%, ~j~5 = 1.9%
The average yield strain = 1.7+1.8+1.9 3
534 = 1.8%
Initial Modulus. The initial modulus was calculated as the
initial linear slope of the stress strain curve.
Initial Modulus (dgr ) en = change in tenacity
fractional elongation
Weight Loss. TGA analysis of sample 1 indicated:
initial weight
weight at 100 minutes
percent weight loss
= 7. 90 mg
7.80 mg
7.90 - 7.86 7.90 x 100 0.51%
- 76 -
Safety Data
The solvent, N-N dimethylformamide, is moderately toxic and
has a threshold limit value of 20 ppm(l6). The material fortunately
has the relatively high boiling point of 153°C and is generally non-
corrosive. Adsorption through the skin may be harmful, so gloves
were worn whenever contact was necessary. The explosive limits for
DMF are: L.E.L. = 2.2% and U.E.L. = 15.2% by volume at 100°C.
Determination of PAN Concentration in PAN/DMF Dope
The following procedure was used to determine the percentage
by weight of PAN in PAN/DMF dope.
1. A cleaned dish is heated at 200°C for one hour.
2. The dish is placed in a dessicator with dry sodium
silicate crystals for 30 minutes.
3. Weigh dish to nearest 0.0001 grams and weight is recorded
as weight A.
4. Approximately 3 grams of filtered dope are added to the
dish which is then reweighed to the nearest 0.0001 grams. Weight
is recorded as weight B.
5. Dish is placed in a vacuum oven for two hours at 200°C.
6. Place dish in dessicator for 30 minutes.
7. Reweigh dish to nearest 0.0001 grams and record as weight
c.
Calculation: weight % PAN = weight C - weight A weight B - weight A x 100
- 77 -
Notes:
1. Drying time was determined by changes in results with one,
two and three hours of drying time. Larger quantities of dope will
require longer drying time.
2. Tongs should be used whenever dish is handled.
3. Figure 10 shows the concentration of dope before and after
filtration. The results indicated that the concentration of PAN in-
creased approximately 0.2 weight percent during filtration since a
closed system was not used.
Determination of PAN/DMF Dope Density
Procedure used is as follows:
1. Place jar of dope in a 25°C constant temperature bath
for two hours.
2. A 25 ml graduated cylinder (subdivisions of 0.2 ml) was
washed and dried in a vacuum oven at 100°C for one hour.
3. The cylinder was placed in a dessicator containing dry
sodium silicate crystals for 30 minutes.
4. The cylinder was weighed to nearest 0.0001 grams and
the weight recorded as A.
5. Slowly pour approximately 18-20 ml of cooled filtered dope
into the graduated cylinder. Use caution in pouring since air is
entrapped if done too quickly. If air bubbles exist, the sample
must be discarded.
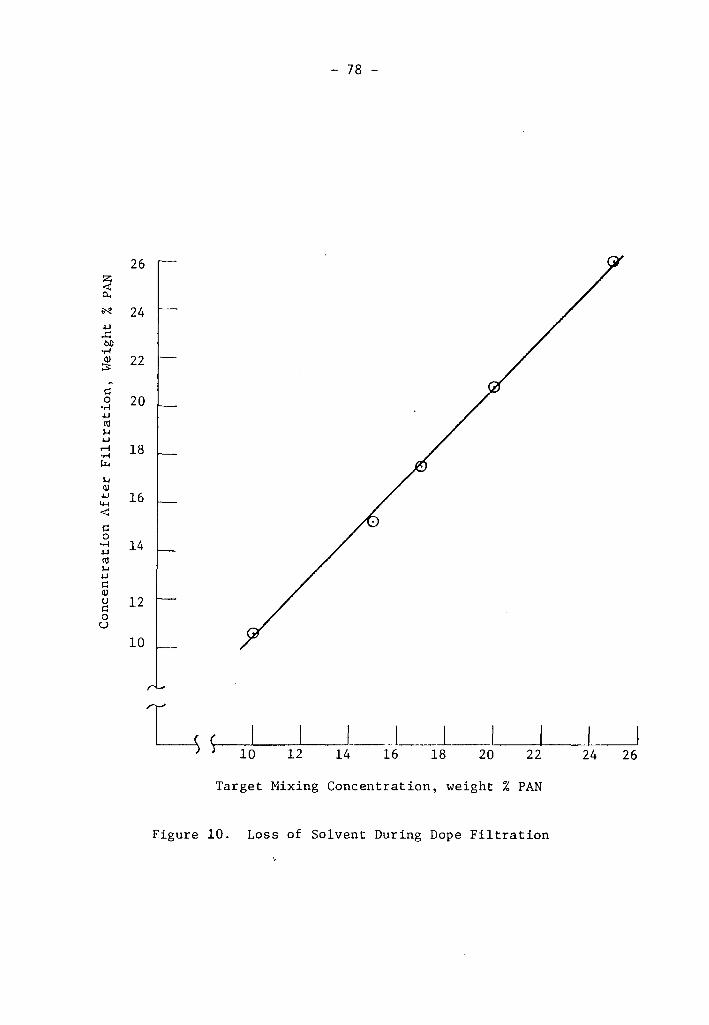
- 78 -
26 ~ 11..
~ 24 w
...c:: bO
·r-4 Q) 22 :::::: ~
t:: 0 20 ·r-4 w C1l H w
.-l 18 •rl µ,. ,... Q) w 16 t+..< <r:: t:: 0
·r-4 14 w C1l ,... w t:: Q) u 12 t:: 0 u
10
G )-_.________._____, 10 12 14
_l __ l __ ~, ~~-~ 16 18 20 22 24 26
Target Mixing Concentration, weight % PAN
Figure 10. Loss of Solvent During Dope Filtration
- 79 -
6. Immediately read the volume of dope to the nearest 0.1 ml
and record as volume A.
7. Reweigh the filled cylinder quickly to the nearest 0.0001
grams and note as weight B.
8. Place the cylinder in an oven at 50°C + 1°C for 30 minutes.
9. Remove cylinder and quickly observe volume and reweigh.
Record as volume B and weight C.
Calculation: Density at 27°C (gr/cc) weight B - weight A volume A
Notes:
known.
Density at 50°C (gr/cc) weight C - weight A volume B
1. Is is presumed that the initial concentration of dope is
2. Due to the high boiling point of DMF, only minute quan-
tities of DMF were lost during the heating at 50°C. For example,
the concentration at 25°C was measured gravimetrically to be 15.10%
and calculated to be 15.11% due to a loss of 0.0163 grams, which
was assumed to be solvent only, during the heating period.
Therefore concentration was assumed constant.
3. Tongs should be used to handle all apparatus.
A plot of density as a function of concentration is shown in
Figure 11.
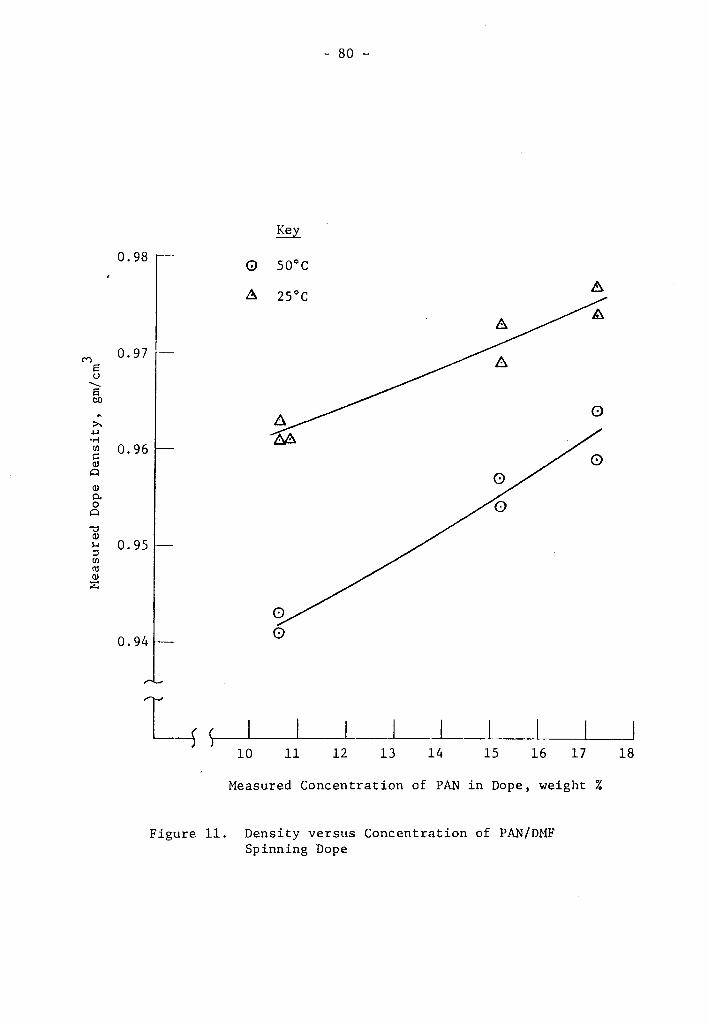
("')
e u -e 00 ~
;:.,, .µ ·.-l U) ~ Q)
Q
Q) p. 0
Q
"d Q) !--< ;:l (/) C'il Q)
::<:
- 80 -
0.98 Q 50°C
A
0.97 -
0.96
0.95
0.94
G \,._-c-~_L ___ L___..__I -'---L-----L---J
10 11 12 13 14 15 16 17 18
Measured Concentration of PAN in Dope, weight %
Figure 11. Density versus Concentration of PAN/DMF Spinning Dope
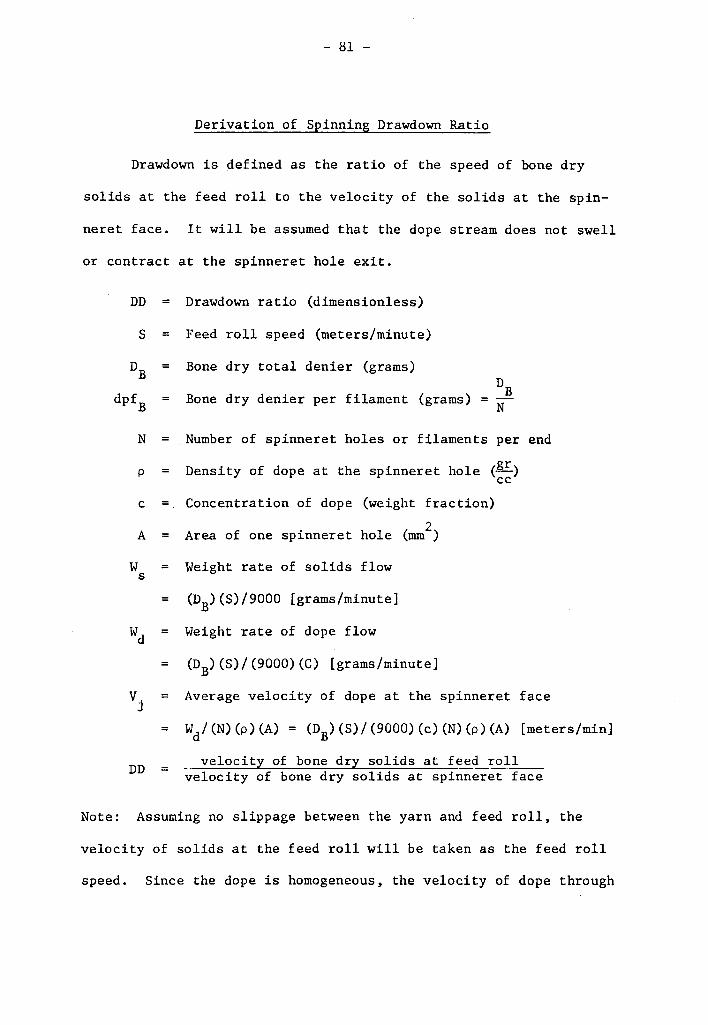
- 81 -
Derivation of Spinning Drawdown Ratio
Drawdown is defined as the ratio of the speed of bone dry
solids at the feed roll to the velocity of the solids at the spin-
neret face. It will be assumed that the dope stream does not swell
or contract at the spinneret hole exit.
DD = Drawdown ratio (dimensionless)
S Feed roll speed (meters/minute)
N
p
c
A
w = s
wd
v. J
=
DD
Bone dry total denier (grams)
Bone dry denier per filament (grams)
Number of spinneret holes or filaments per end
Density of dope at the spinneret hole (liE..) cc Concentration of dope (weight fraction)
Area of one spinneret hole (mm2)
Weight rate of solids flow
(DB)(S)/9000 [grams/minute]
Weight rate of dope flow
(DB) (S) I (9000) (C) [grams/minute]
Average velocity of dope at the spinneret
Wd/(N)(p)(A) = (DB)(S)/{9000)(c)(N)(p)(A)
face
[meters/min]
velocity of bone dry solids at feed rol_l~velocity of bone dry solids at spinneret face
Note: Assuming no slippage between the yarn and feed roll, the
velocity of solids at the feed roll will be taken as the feed roll
speed. Since the dope is homogeneous, the velocity of dope through
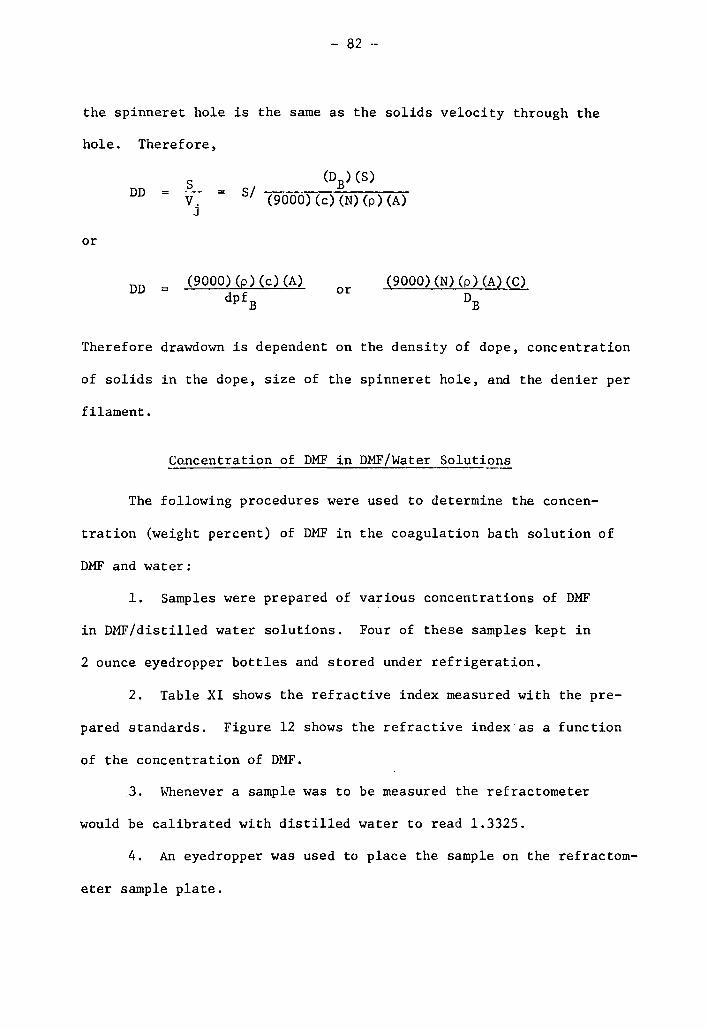
- 82 ·-
the spinneret hole is the same as the solids velocity through the
hole. Therefore,
DD
or
DD =
s v. =
(DB) (S)
S/ (9000) (c) (N) (p) (A) J
(9000) (p) (c) (A) dpf B
or (9000)(N)(p)(A)(C) DB
Therefore drawdown is dependent on the density of dope, concentration
of solids in the dope, size of the spinneret hole, and the denier per
filament.
Co,ncentration of DMF in DMF/Water Solutions
The following procedures were used to determine the concen-
tration (weight percent) of DMF in the coagulation bath solution of
DMF and water:
1. Samples were prepared of various concentrations of DMF
in DMF/distilled water solutions. Four of these samples kept in
2 ounce eyedropper bottles and stored under refrigeration.
2. Table XI shows the refractive index measured with the pre-
pared standards. Figure 12 shows the refractive index as a function
of the concentration of DMF.
3. Whenever a sample was to be measured the refractometer
would be calibrated with distilled water to read 1.3325.
4. An eyedropper was used to place the sample on the refractom-
eter sample plate.
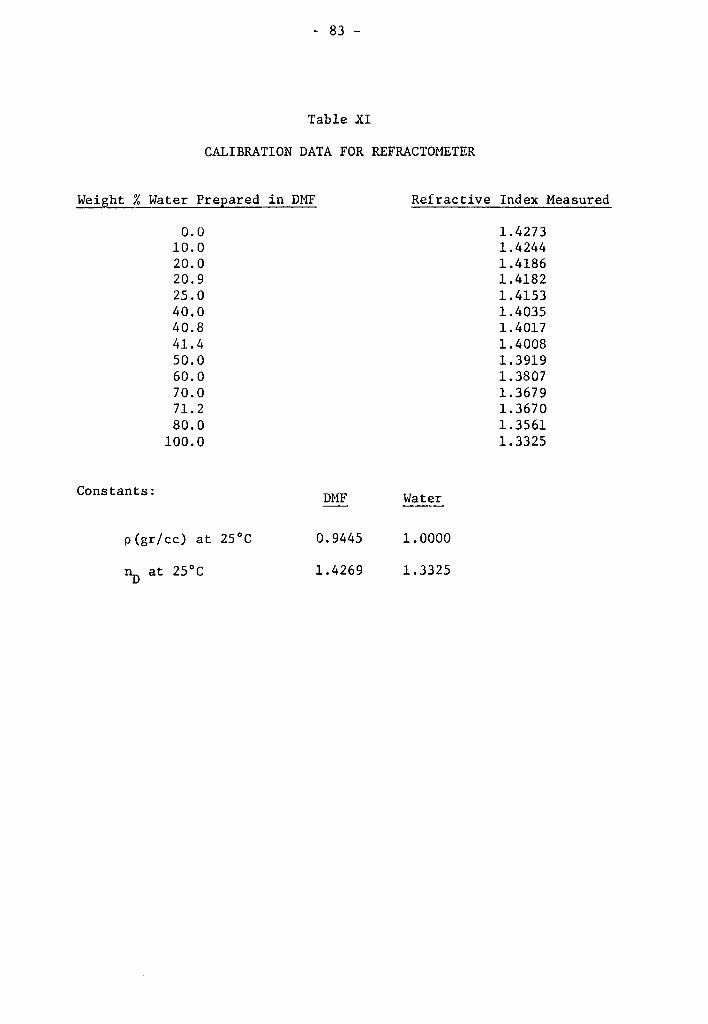
- 83 -
Table XI
CALIBRATION DATA FOR REFRACTOMETER
Weight % Water Prepared in DMF
Constants:
o.o 10.0 20.0 20.9 25.0 40.0 40.8 41.4 50.0 60.0 70.0 71. 2 80.0
100.0
p(gr/cc) at 25°C
~ at 25°C
DMF
0.9445
1.4269
Refractive Index Measured
Water
1.0000
1.3325
1.4273 1.4244 1.4186 1.4182 1.4153 1.4035 1.4017 1.4008 1.3919 1.3807 1.3679 1. 3670 1.3561 1.3325
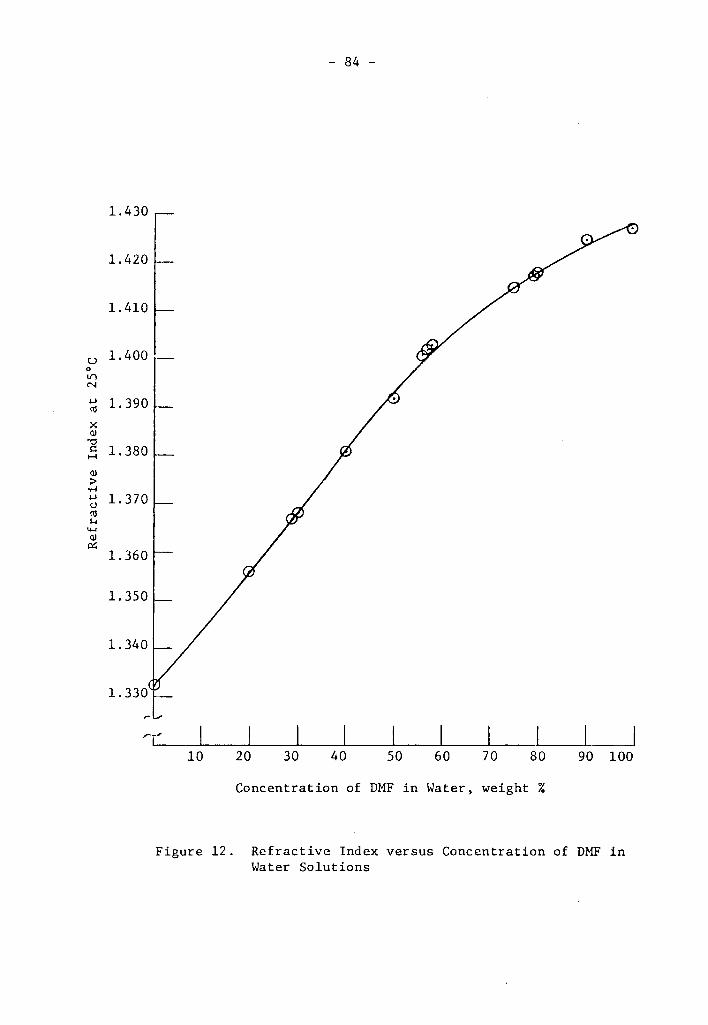
u 0 lJ") N
~
Cll
x Q)
"O ~
H
Q) :>
·r-l ~ (.) Cll ,...
4-< Q)
0::
- 84 -
1.430
1.420
1.410
1.400 -
1.390
1.380
1. 370
1.360
1.350
1.340
1.330
....-( 10 20 30 40 50 60 70 80 90 100
Concentration of DMF in Water, weight %
Figure 12. Refractive Index versus Concentration of DMF in Water Solutions
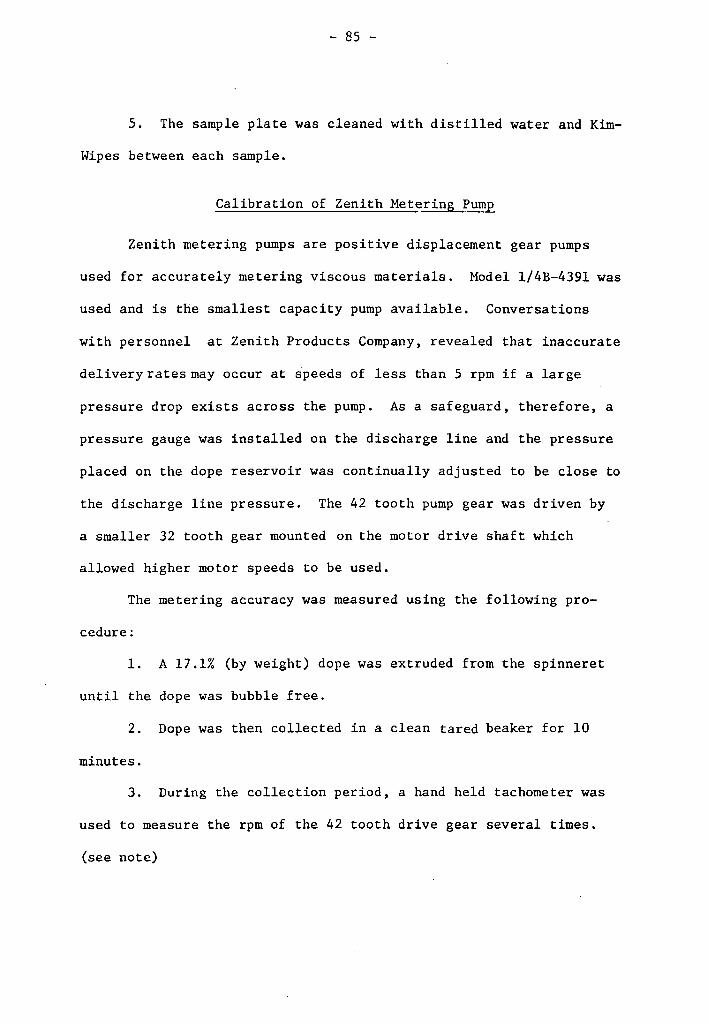
- 85 -
5. The sample plate was cleaned with distilled water and Kim-
Wipes between each sample.
Calibration of Zenith Metering Pump
Zenith metering pumps are positive displacement gear pumps
used for accurately metering viscous materials. Model l/4B-4391 was
used and is the smallest capacity pump available. Conversations
with personnel at Zenith Products Company, revealed that inaccurate
deliveryratesmay occur at speeds of less than 5 rpm if a large
pressure drop exists across the pump. As a safeguard, therefore, a
pressure gauge was installed on the discharge line and the pressure
placed on the dope reservoir was continually adjusted to be close to
the discharge line pressure. The 42 tooth pump gear was driven by
a smaller 32 tooth gear mounted on the motor drive shaft which
allowed higher motor speeds to be used.
The metering accuracy was measured using the following pro-
cedure:
1. A 17.1% (by weight) dope was extruded from the spinneret
until the dope was bubble free.
2. Dope was then collected in a clean tared beaker for 10
minutes.
3. During the collection period, a hand held tachometer was
used to measure the rpm of the 42 tooth drive gear several times.
(see note)
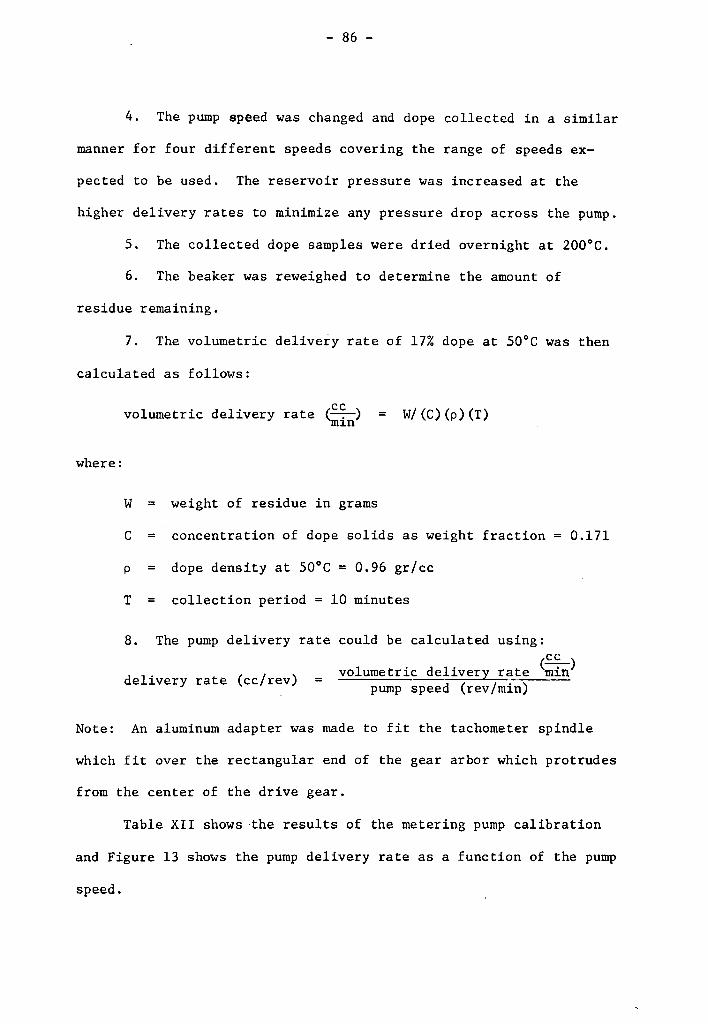
- 86 -
4. The pump speed was changed and dope collected in a similar
manner for four different speeds covering the range of speeds ex-
pected to be used. The reservoir pressure was increased at the
higher delivery rates to minimize any pressure drop across the pump.
5. The collected dope samples were dried overnight at 200°C.
6. The beaker was reweighed to determine the amount of
residue remaining.
7. The volumetric delivery rate of 17% dope at 50°C was then
calculated as follows:
where:
cc volumetric delivery rate (~.~) = W/(C)(p)(T) min
W weight of residue in grams
C = concentration of dope solids as weight fraction
p = dope density at 50°C = 0.96 gr/cc
T = collection period = 10 minutes
8. The pump delivery rate could be calculated using:
0.171
cc __ volumetric delivery rate (min) delivery rate (cc/rev) pump speed (rev/min)
Note: An aluminum adapter was made to fit the tachometer spindle
which fit over the rectangular end of the gear arbor which protrudes
from the center of the drive gear.
Table XII shows the results of the metering pump calibration
and Figure 13 shows the pump delivery rate as a function of the pump
speed.
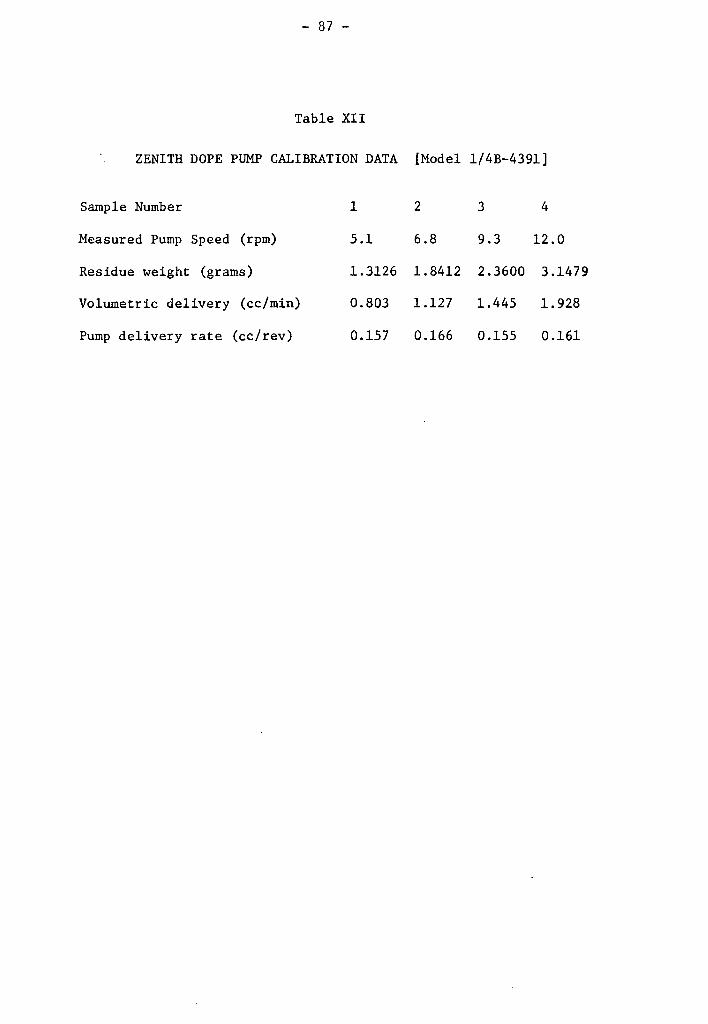
- 87 -
Table XII
ZENITH DOPE PUMP CALIBRATION DATA (Model l/4B-4391]
Sample Number 1 2 3 4
Measured Pump Speed (rpm) 5.1 6.8 9.3 12.0
Residue weight (grams) 1.3126 1.8412 2.3600 3.1479
Volumetric delivery (cc/min) 0.803 1.127 1.445 1. 928
Pump delivery rate (cc/rev) 0.157 0.166 0.155 0.161
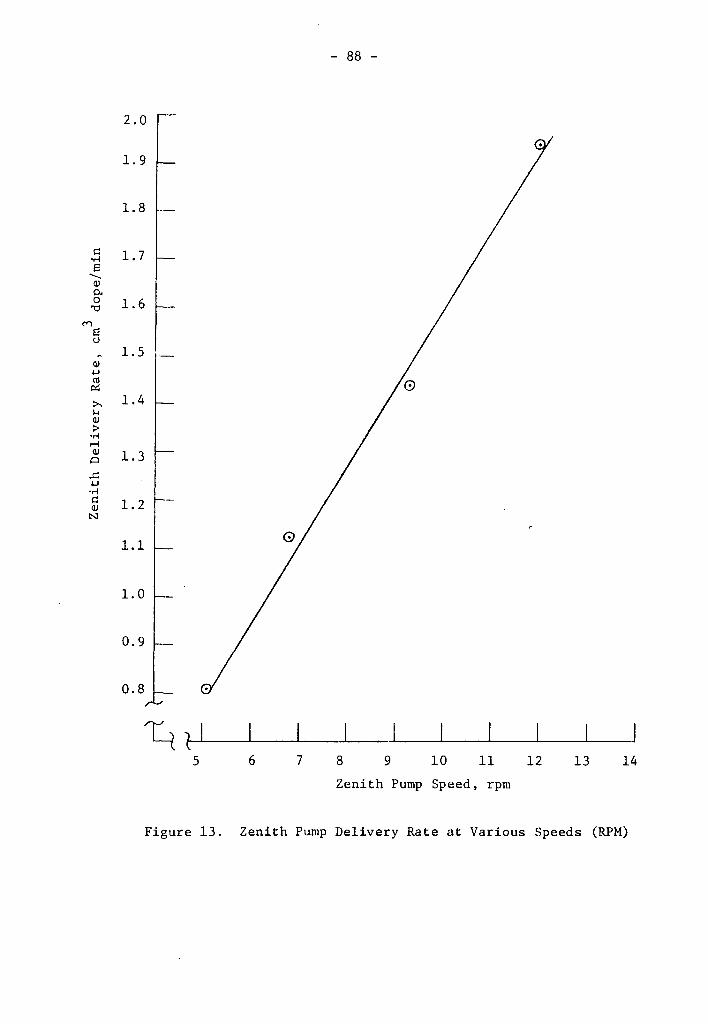
- 88 -
2.0
1. 9
1.8 --
1. 7
1.6
1.5
1.4
1.3
1. 2
1.1
1. 0
0.9
0.8
~ 1,__,_l~-~~-~I -~~-~ 5 6 7 8 9 10 11 12 13 14
Zenith Pump Speed, rpm
Figure 13. Zenith Pump Delivery Rate at Various Speeds (RPM)
- 89 -
Materials
Materials used in this project are as follows:
N,N-Dirnethyl Forrnamide. Reagent Grade. Purchased from Fisher
Scientific Company, Fair Lawn, New Jersey. Catalog Number D-119.
Used as solvent for polyacrylonitrile powder.
Polyacrylonitrile Powder. Two pounds of PAN polymer powder.
Intrinsic viscosity of 2.18. Donated by Celanese Research Company,
Sununit, New Jersey. Used for extrusion into fibers.
Polyacrylonitrile Fiber. One cone of PAN Homopolymer Yarn.
Donated by Celanese Research Company, Summit, New Jersey. Used to
establish and compare oxidation conditions on thermogravimetric
analyzer.
Nitrogen. Oil pumped. Minimum purity is 99.7 weight percent.
Supplied by Industrial Gas, Bluefield, West Virginia. Used to pres-
surize dope reservoir.
Washer. Hard gray fiber washer. Purchased from Penn Fiber
and Specialty Company, Philadelphia, Pennsylvania. Used to seal
spinneret assembly and discarded after use.
Micromesh Screen. Micronic rating of 10. 304 stainless
steel. Purchased from Kressilk Products, Inc., Elmsford, New York.
Used as final filter in spinneret assembly and discarded after use.
Filters, A. 25 x 100 mesh wire cloth and 40 x 150 mesh wire
cloth with micronic ratings of 100 and 60 respectively. Plain Dutch
- 90 - '
Weave. 304 stainless steel. Purchased from National-Standard Com-
pany, Corbin, Kentucky. Used as first and second stage filtering
media respectively.
Filters, B. ED-349-48 filter paper. Composed of compressed
wood fibers. Purchased from Eaton Dikeman Company, Mt. Holly
Springs, Pennsylvania. Used as third stage filter media.
Filters, C. Cotton Batting. Trade name CCE-30. Purchased
from Barhardt Manufacturing Company, Charlotte, North Carolina.
Used as fourth stage filter media.
Filters, D. Cotton, sheeting. 4 ounce. Purchased from
Lamport's Company, Cleveland, Ohio. Used on each side of filter
paper or cotton batting to secure the filtering media.
Apparatus
The apparati used in this project are described as follows:
Constant Speed Control Unit with Motor. Model 4420. 120
volts range 0-3000 rpm. Supplied by Cole Parmer Instrument and
Equipment Company, Chicago, Illinois. One unit was used as the
feed roll drive and another unit for takeup roll drive.
Motor. Model B-2420C-40L. One sixth h.p., 73 inch pounds
torque, 2.6-52 rpm. Manufactured by B&B Motor Control Corporation,
New York, New York. Used to drive Zenith Metering Pump.
Controller. Model SA12. Obtained from B&B Motor Control
Corporation, New York, New York. Used to control motor speed for
- 91 -
Zenith pump drive.
Heating Tape. Electrothermal Heating Tape. 120 v. Used to
heat dope in discharge line from Zenith pump.
Variac. Powerstat voltage regulator, type 3PN116, 0-140
volts. Manufactured by Superior Electric Company, Inc., Bristol,
Connecticut. Used to control voltage to dope line heating tape.
Galvanometer. Model 9B. Manufactured by Technique Associates,
Division of West Instrument Corporation, Schiller Park, Indiana.
Used with thermocouple to read dope temperature just prior to spin-
neret.
Thermocouple. Copper-Constantain, Manufactured by Marlin
Manufacturing Corporation, Cleveland, Ohio. Used to measure dope
temperature just prior to spinneret.
Glass Trays. 7" x 11" x 211 deep, Model 411 with two quart
capacity. Manufactured by Anchor Hocking Ovenware Company. One
used as coagulation bath and another for stretching bath.
Constant Temperature Controller. Model AC-505. Temperature
range = 38°-288°C. 120 volts. Copper-constantain thermocouple
included. Manufactured by Blue M Electric Company, Blue Island,
Illinois. Used to measure temperature of coagulation bath and
control the heating tape surrounding the bath.
Heating Cord. Cal-cord 400. Flexible. Temperature limit
400°C. Rating of 120 watts, 120 volts. Manufactured by Glas-Col.
Used to heat coagulation bath.
- 92 -
Tachometers, Hand, A. Range 0-1000 rpm with 0.2 rpm sub-
divisions. Distributed by Hasler-Tel Company, Inc., New York,
New York. Used to check the rotational speeds of feed roll and
takeup roll.
Tachometers, Hand, B. Range 0-100 rpm with 0.05 rpm sub-
divisions. Distributed by Hasler-Tel Company, Inc., New York,
New York. Used to check the rotational speed of Zenith ~etering
Pump.
Guides and Rollers. Various configurations. Aluminum oxide
composition. Purchased from Heany Industries, Scottsville, New
York. Used to guide yarn through baths and onto feed roll.
Metering Pump. Model l/4B-4391. All wetted parts 440-C
stainless steel. 42 tooth drive gear. Speed range 0-250 rpm.
Purchased from Zenith Products Company, West Newton, Massachusetts.
Used to pump and meter dope from the reservoir to the spinneret.
Mercury Intrusion Porosimeter. Aminco-Winslow Catalog Number
5-7107. Manufactured by American Instrument Company, Silver Spring,
Maryland. Property of the Metals and Ceramics Engineering Depart-
ment, Virginia Polytechnic Institute and State University. Used to
measure the pore size and distribution of selected fiber samples.
Thermogravimetric Analyzer. Model 950. Manufactured by E. I.
du Pont de Nemours and Company, Instrument Products Division, Wilm-
ington, Delaware. Property of Chemical Engineering Department,
Virginia Polytechnic Institute and State University. Used for
- 93 -
thermal analysis of selected fiber samples.
Spinning and Stretching Apparatus. Figure 14 shows the overall
layout of the spinning and stretching units. The spinning unit con-
sisted of the dope reservoir, pump drive motor, metering pump, and
spinneret support mounted on a 30" x 30" slab of l" thick
pressed particle board. Sufficient space remained on the slab to
place the galvanometer used to read the dope temperature thermo-
couple, the coagulation bath temperature controller, and the variace
used to control the heating tape for dope temperature control.
Figure 15 is an exploded view of the spinneret assembly and Figure 16
shows the dimensions of the spinneret holes. The spinneret contained
four holes having a diameter of approximately 0.005". Figure 17 is
an exploded view of the Zenith Metering Pump.
The stretching unit consisted of two motor supports, supports
for the feed roll guides, and supports for rollers used to guide
the yarn through the bath mounted on a 30" x 30" slab of l" thick
pressed particle board. A hotplate having a 12 inch square heating
surface was used to heat the water.
The feed roll and takeup roll were controlled with constant
speed control units. The feed roll and takeup roll were both 1 1/2"
dia. x 6" long cylinders made of aluminum and machined to fit on
the drive shaft of the constant speed motors.
Dope was poured into the reservoir and forced to the Zenith
metering pump by pressurizing the reservoir with nitrogen. A
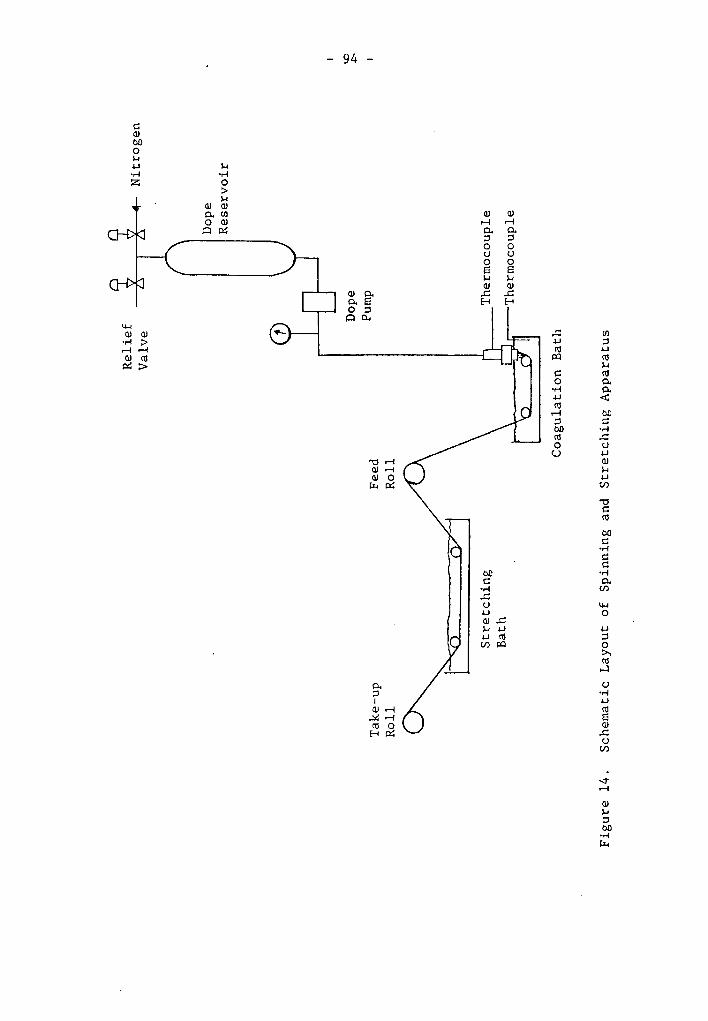
Tak
e-up
R
oll
Feed
R
oll
Rel
ief
Val
ve D
ope
Pum
p
Nit
roge
n
Dop
e R
eser
voir
Str
etch
ing
B
ath
l T
herm
ocou
ple
The
rmoc
oupl
e
Coa
gula
tion
Bat
h
Fig
ure
14.
Sch
emat
ic L
ayou
t of
S
pinn
ing
and
Str
etch
ing
App
arat
us
\0
.i::-.
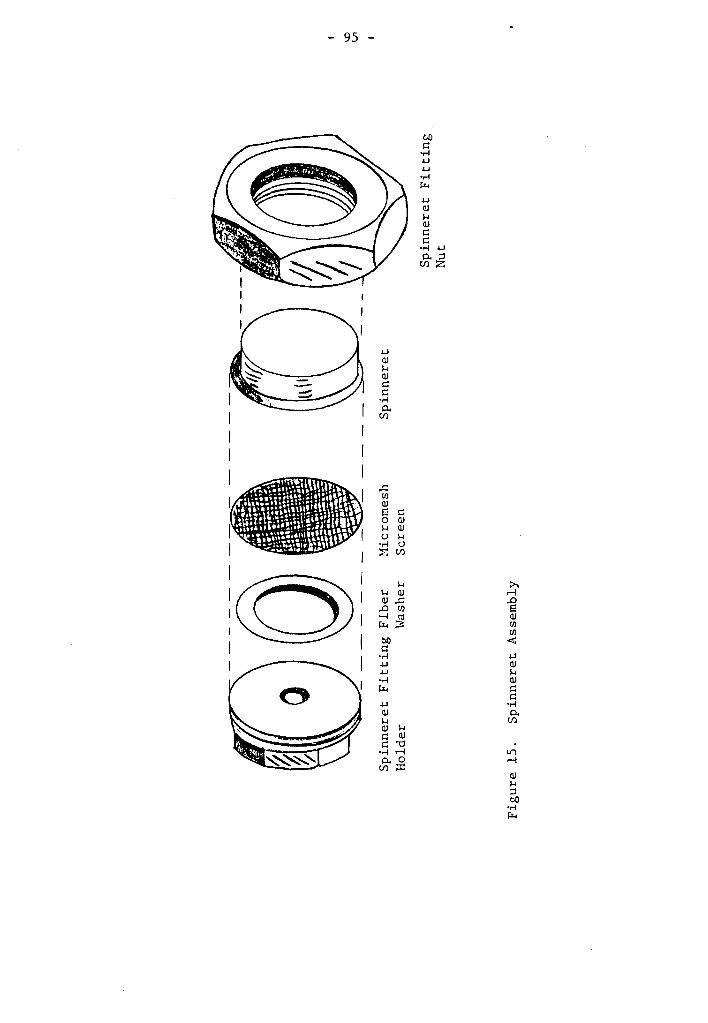
Spi
nner
et F
itti
ng
Fib
er
Hol
der
Was
her
Fig
ure
15.
Spi
nner
et A
ssem
bly
Mic
rom
esh
Scr
een
Spi
nner
et
Spi
nner
et F
itti
ng
N
ut
l.D
Vl
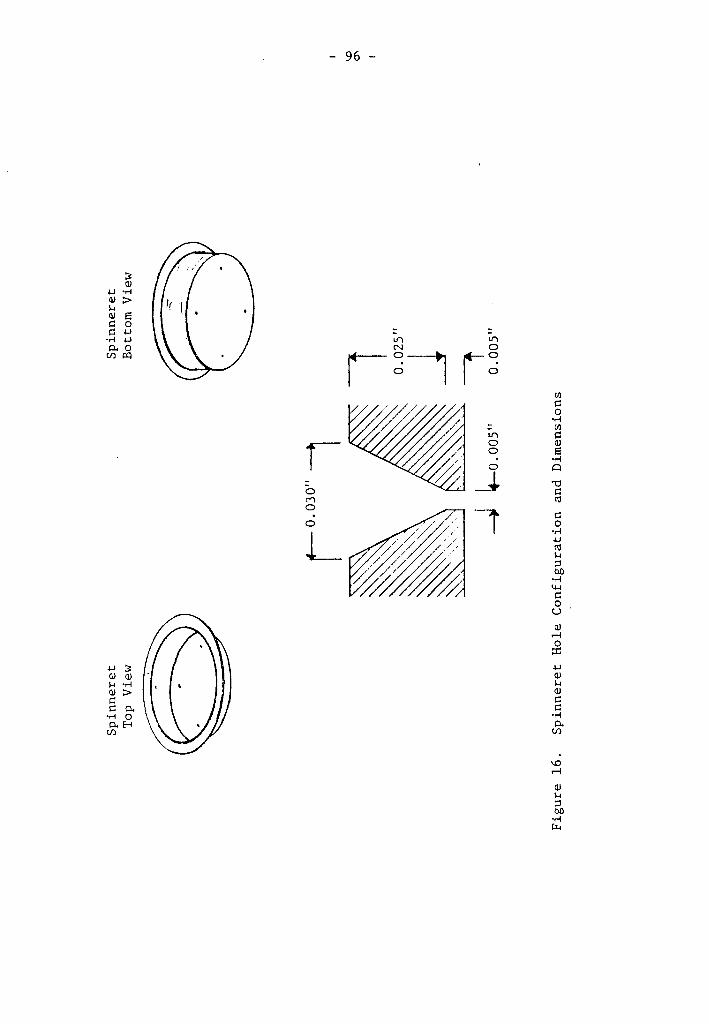
Spi
nner
et
Top
Vie
w
10.
030"
I 1.-o. 00
5"
Fig
ure
16.
Spi
nner
et H
ole
Con
figu
rati
on a
nd D
imen
sion
s
Spi
nner
et
Bot
tom
Vie
w
T 0.00
5"
\.0 "'
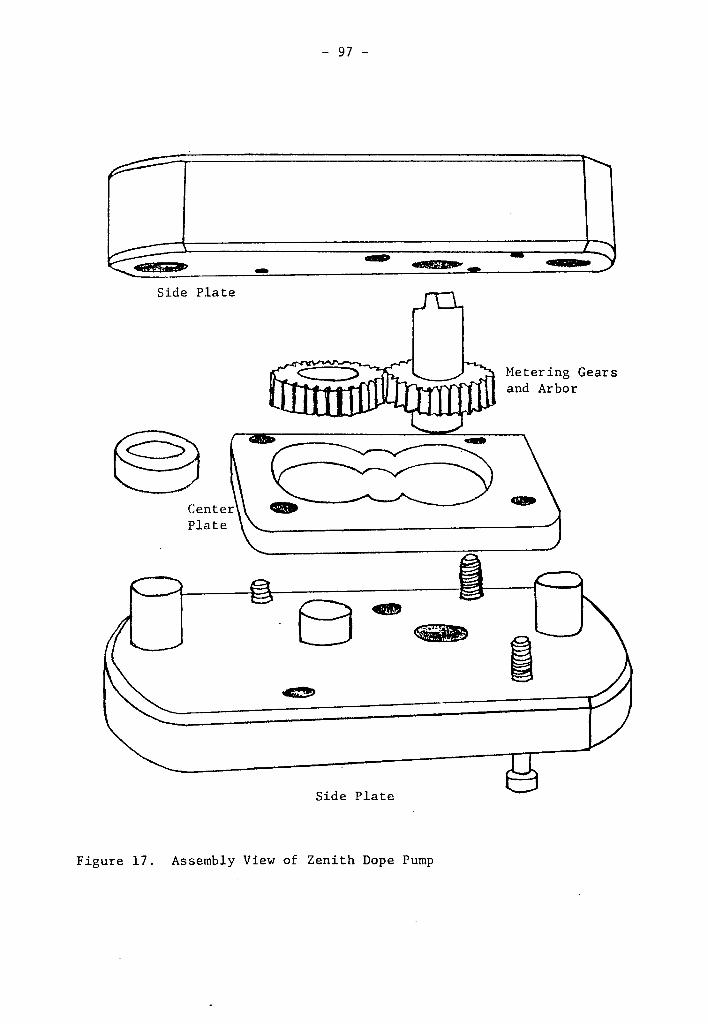
.---::::...... r--
~ ~.,,.
Side Plate
Center Plate
-- 97 -
~ -
Side Plate
Figure 17. Assembly View of Zenith Dope Pump
, ... _ ..... - )
Metering Gears and Arbor
- 98 -
regulator was used to adjust the pressure from the nitrogen supply
cylinder. As recommended by the manufacturer, the pressure on the
dope reservoir was adjusted to match the dope pressure in the dis-
charge line to ensure accurate metering rates. From the pump, dope
flowed to the spinneret and extruded into the coagulation bath. The
solidified fibers traveled under two rollers in the coagulation bath
and was wound around the variable speed feed roll. The yarn was
wrapped four times around the feed roll to ensure no slippage. For
each wrap, the yarn would contact approximately 3/4 of the feed roll
circumference and then pass through offset back guides which would
prevent the parallel wraps from overlapping. This arrangement en-
sured constant yarn speed from the coagulation bath and prevented
slippage when the takeup roll speed was changed.
After the feed roll, the yarn passed to the takeup roll at the
far end of the stretching bath. Rollers were placed on stainless
steel rods to guide the yarn through the boiling water. High draw
ratios could be achieved only when these rollers were loose and
easily rotated. The elevation of the feed roll and takeup roll was
adjusted to minimize the amount of contact between the yarn and
rollers. The yarn would break frequently unless the yarn contacted
less than 1/4 of the roller circumference.
Filtering Apparatus. Figure 18 shows the filter assembly.
Dope was forced, using nitrogen, through various filter media held
by the filter assembly. The filter media was cut into 1 1/2"
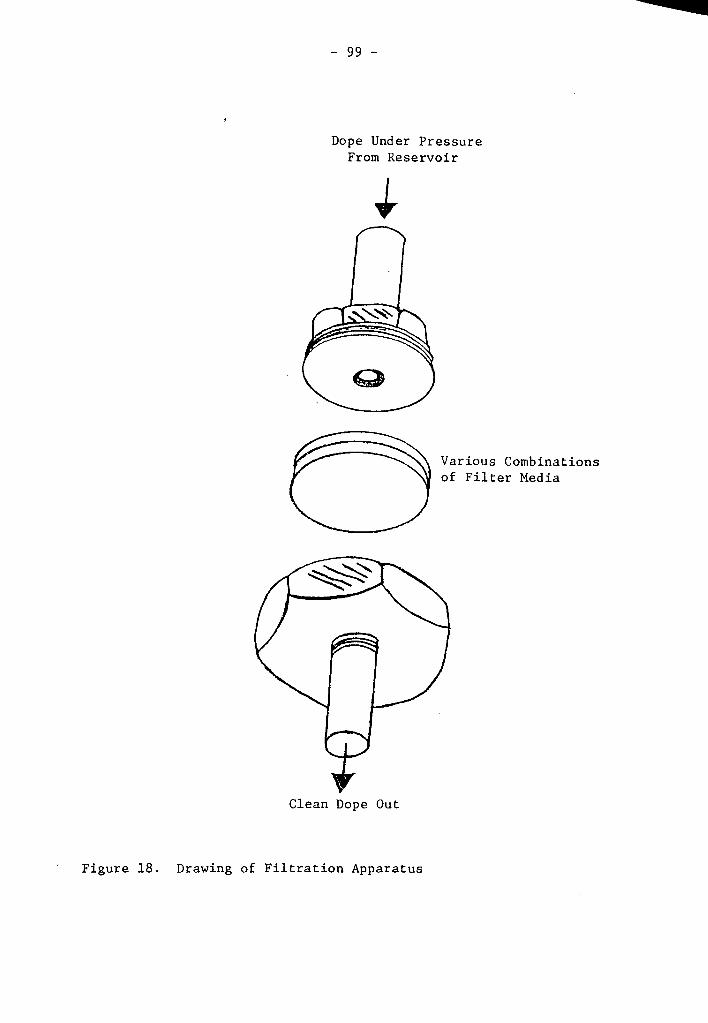
- 99 -
Dope Under Pressure From Reservoir
Clean Dope Out
Figure 18. Drawing of Filtration Apparatus
Various Combinations of Filter Media
a
- 100 -
' . diameter circles and held in place by screwing the bottom and top
pieces together,

The vita has been removed from the scanned document
WET SPINNING OF POROUS POLYACRYLONITRILE FIBERS
AND AFFECT ON FIBER OXIDATION
by
William Finley Speer, Jr.
(ABSTRACT)
A spinning apparatus was built to investigate the wet spinning
technique for production of porous polyacrylonitrile fibers. Di-
methylformamide was used as the solvent and a 17% by weight dope was
extruded through a spinneret having four 118 micron diameter holes.
It was found that porous fibers could be produced with reason-
able physical properties. Fiber porosity was increased with lower
solvent concentration in the precipitation bath and higher bath tern-
peratures. The fibers were particularly porous when low stretch-
ing ratios were used and the yarn was not allowed to relax during
exposure to elevated temperatures. PAN fibers are stretched to im-
prove the molecular orientation along the fiber axis while relaxa-
tion is generally used to improve the elastic properties. It
appears that processing conditions can be changed to yield fibers
with adequate properties for handling but with greater pore volume.
Pore volume does not appear to be directly correlated with
the oxidation rate of the fibers. Experimental fibers containing
pores did show generally a faster initial weight loss rate but some
inconsistencies were found. The sample with greatest measured pore
volume had a substantially higher weight loss and percentage weight
loss rate than other experimental fibers and a commercial dry spun
fiber. The effect of operating conditions on fiber properties and
porosity were found to be in agreement with the literature.
It was recommended that the precision of the Thermogravimetric
Analysis, for fibrous sample, be determined to provide some explana-
tion perhaps of the inconsistencies found during the oxidation ex-
perimentation.