performances of chitosan grafted onto surface of polyacrylonitrile functionalized through amination...
TRANSCRIPT
S1
Supporting information
for
Performances of Chitosan Grafted onto Surface
of Polyacrylonitrile Functionalized
through Amination Reactions
Vasilica Popescu a*
, Emil Ioan Muresan b
a, * “Gheorghe Asachi” Technical University, Faculty of Textiles, Leather Engineering and
Industrial Management, 29 Blvd. Mangeron, TEX 1 Building, Iasi-700050, Romania;
b “Gheorghe Asachi” Technical University, Faculty of Chemical Engineering and Environment
Management, 73 Blvd. Mangeron, Iasi 700050, Romania; [email protected]
Corresponding author: [email protected]; tel.: +40 (0)726371108
S2
S1. Characterization of Dyestuffs and Polymers (PAN and CS)
S2. FTIR Analysis
S2.1.Spectral Subtraction Method
S2.2.Frequencies Characteristic of Untreated PAN Fiber
S2.3.Results of Spectral Subtraction for Grafted Samples
S3. SEM Analysis
S4. Nitrogen (N) Content
S5. Yellowness Index and Color Measurements
S6. Tensile strength
S7. Fastness properties
S3
S1. Characterization of Dyestuffs and Polymers (PAN and CS)
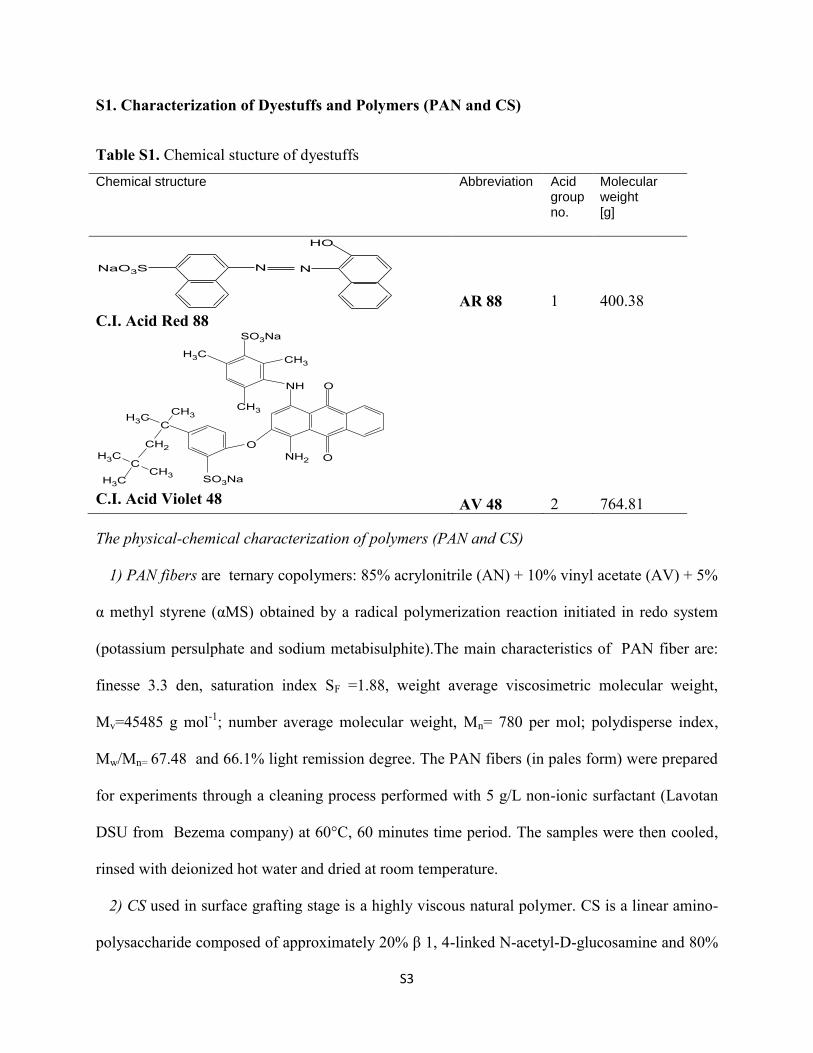
Table S1. Chemical stucture of dyestuffs
Chemical structure Abbreviation Acid group no.
Molecular weight [g]
C.I. Acid Red 88
AR 88
1
400.38
C.I. Acid Violet 48
AV 48
2
764.81
The physical-chemical characterization of polymers (PAN and CS)
1) PAN fibers are ternary copolymers: 85% acrylonitrile (AN) + 10% vinyl acetate (AV) + 5%
α methyl styrene (αMS) obtained by a radical polymerization reaction initiated in redo system
(potassium persulphate and sodium metabisulphite).The main characteristics of PAN fiber are:
finesse 3.3 den, saturation index SF =1.88, weight average viscosimetric molecular weight,
Mv=45485 g mol-1
; number average molecular weight, Mn= 780 per mol; polydisperse index,
Mw/Mn= 67.48 and 66.1% light remission degree. The PAN fibers (in pales form) were prepared
for experiments through a cleaning process performed with 5 g/L non-ionic surfactant (Lavotan
DSU from Bezema company) at 60°C, 60 minutes time period. The samples were then cooled,
rinsed with deionized hot water and dried at room temperature.
2) CS used in surface grafting stage is a highly viscous natural polymer. CS is a linear amino-
polysaccharide composed of approximately 20% β 1, 4-linked N-acetyl-D-glucosamine and 80%
S4
β 1, 4-linked D-glucosamine. The amine groups from CS have a pKa in the range of 6.2 ÷6.8,
such that the material acts as a cationic polyelectrolyte under acidic conditions.
The characteristics of CS are: degree of deacetylation, DD =78%, average molecular weight,
Mw=409,100 g mol-1
; number average molecular weight, Mn= 189,900 g mol-1
; z average
molecular weight, Mz=110,500 g mol-1
, Mw/Mn= 2.154, number average mean square radius, Rn
=49.2, radius weighted average mean square, Rw = 67.0, z average mean square radius,
Rz=108.4.
Through the solubilization of CS in 2% acetic acid solution (at room temperature) many NH2
groups were transformed in ionic groups (as NH+
3 -OOC-CH3).
S2. FTIR Analysis
S2.1. Spectral Subtraction Method
In order to perform the spectral subtraction, it was necessary that, prior to the
collection/recording of those spectra, to subtract the spectra afferent to the working medium (air)
and to ATR crystal. In processing the recorded spectra, the following operations were carried
out: atmosphere correction (CO2, water), straight line generation (for frequence range 2400-
2300, for CO2) smoothing (with the value of smoothing point of 9 for less denticulated
spectra, and higher than 9 for those very denticulated), baseline correction (concave Rubberband
algoritm), normalization, final smoothing and saving in %transmittance, as Galactic type spectra.
In order to obtain precise results, an exact spectra overlapping and linearization were necessary,
as well as and a correspondence of data points to the same x-values (equidistance and the same
resolution (4 cm-1
)) . For spectra linearization, other two baseline corrections with polyline
algorithm (one manually and one automatically performed by the software) were carried out.
S5
Other utilized algorithms (standard normal variate correction and detrending) permitted the
correction of drifted baseline and removing offset and tilting of spectra.
The mathematical equation (eq.S2) and the parameters used in the spectral subtraction are:
Asample spectrum - F x A reference spectrum = result (S2)
where: Asample are the absorbances of analized sample; A reference spectrum are the absorbances of the
sprectrum afferent to reference sample; F= scalar factor; the intensities of the reference sample
are scaled by the scaling factor in advance, by the software. Practically, F is indicated by the
software from the comparison between degree of the concentration/absorbance of known
components located both in the spectrum of the analyzed sample and in the reference spectrum.
In this paper, the scalar factor was 1, and during the subtraction operation we took into account
the entire spectra (within the range 4000-600cm-1
wavenumbers, with a number of points equal to
1764, XYPE =1 , YTYPE=128 and data spacing of 1,9288157685762901).
In order to highlight the absorbance bands given by each functionalization treatment, the
spectrum corresponding to untreated PAN was subtracted from that of the functionalized sample.
The absorbance bands due to the grafting treatment were calculated as the difference between the
intensities of the spectrum of the grafted sample (grafted on a certain functionalized support) and
the intensities of the spectrum of the same functionalized sample (the scalar factor was 1, too).
When the result of the subtraction had higher values (positive values), it meant that the
absorbance intensities of the analyzed sample were bigger than those of the reference sample.
When the reference sample had higher values of the absorbance intensity (or other additional
bands) than the analyzed sample, bands located below the zero line (negative values) appeared
on the difference spectrum.
S6
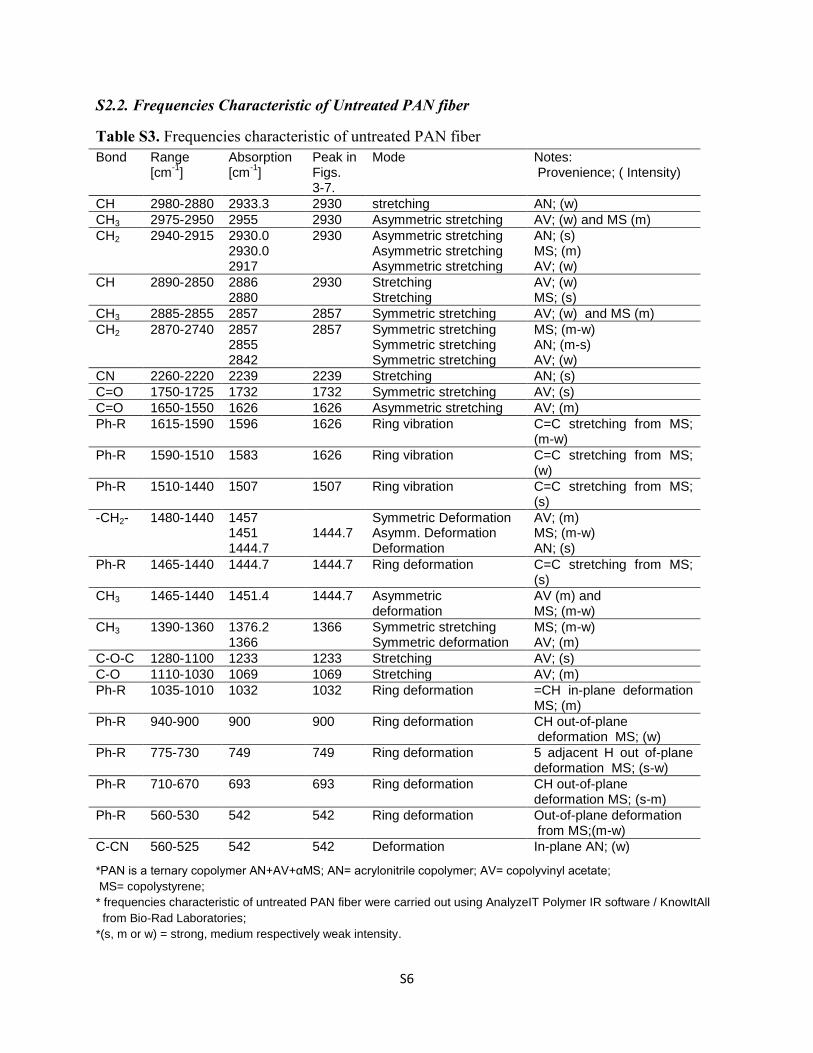
S2.2. Frequencies Characteristic of Untreated PAN fiber
Table S3. Frequencies characteristic of untreated PAN fiber
*PAN is a ternary copolymer AN+AV+αMS; AN= acrylonitrile copolymer; AV= copolyvinyl acetate;
MS= copolystyrene;
* frequencies characteristic of untreated PAN fiber were carried out using AnalyzeIT Polymer IR software / KnowItAll
from Bio-Rad Laboratories;
*(s, m or w) = strong, medium respectively weak intensity.
Bond Range [cm
-1]
Absorption [cm
-1]
Peak in Figs. 3-7.
Mode Notes: Provenience; ( Intensity)
CH 2980-2880 2933.3 2930 stretching AN; (w)
CH3 2975-2950 2955 2930 Asymmetric stretching AV; (w) and MS (m)
CH2 2940-2915 2930.0 2930.0 2917
2930 Asymmetric stretching Asymmetric stretching Asymmetric stretching
AN; (s) MS; (m) AV; (w)
CH 2890-2850 2886 2880
2930
Stretching Stretching
AV; (w) MS; (s)
CH3 2885-2855 2857 2857 Symmetric stretching AV; (w) and MS (m)
CH2 2870-2740 2857 2855 2842
2857 Symmetric stretching Symmetric stretching Symmetric stretching
MS; (m-w) AN; (m-s) AV; (w)
CN 2260-2220 2239 2239 Stretching AN; (s)
C=O 1750-1725 1732 1732 Symmetric stretching AV; (s)
C=O 1650-1550 1626 1626 Asymmetric stretching AV; (m)
Ph-R 1615-1590 1596 1626 Ring vibration C=C stretching from MS; (m-w)
Ph-R 1590-1510 1583 1626 Ring vibration C=C stretching from MS; (w)
Ph-R 1510-1440 1507 1507 Ring vibration C=C stretching from MS; (s)
-CH2- 1480-1440 1457 1451 1444.7
1444.7
Symmetric Deformation Asymm. Deformation Deformation
AV; (m) MS; (m-w) AN; (s)
Ph-R 1465-1440 1444.7 1444.7 Ring deformation C=C stretching from MS; (s)
CH3 1465-1440 1451.4 1444.7 Asymmetric deformation
AV (m) and MS; (m-w)
CH3 1390-1360 1376.2 1366
1366 Symmetric stretching Symmetric deformation
MS; (m-w) AV; (m)
C-O-C 1280-1100 1233 1233 Stretching AV; (s)
C-O 1110-1030 1069 1069 Stretching AV; (m)
Ph-R 1035-1010 1032 1032 Ring deformation =CH in-plane deformation MS; (m)
Ph-R 940-900 900 900 Ring deformation CH out-of-plane deformation MS; (w)
Ph-R 775-730 749 749 Ring deformation 5 adjacent H out of-plane deformation MS; (s-w)
Ph-R 710-670 693 693 Ring deformation CH out-of-plane deformation MS; (s-m)
Ph-R 560-530 542 542 Ring deformation Out-of-plane deformation from MS;(m-w)
C-CN 560-525 542 542 Deformation In-plane AN; (w)
S7
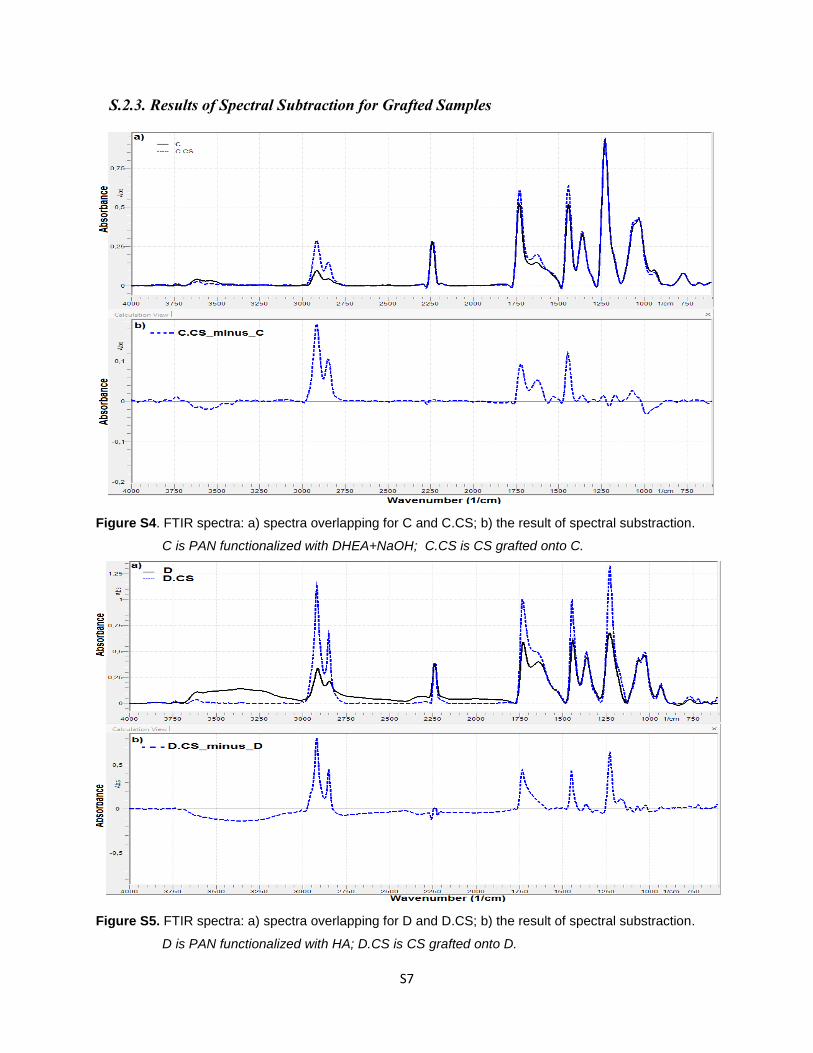
S.2.3. Results of Spectral Subtraction for Grafted Samples
Figure S4. FTIR spectra: a) spectra overlapping for C and C.CS; b) the result of spectral substraction.
C is PAN functionalized with DHEA+NaOH; C.CS is CS grafted onto C.
Figure S5. FTIR spectra: a) spectra overlapping for D and D.CS; b) the result of spectral substraction.
D is PAN functionalized with HA; D.CS is CS grafted onto D.
S8
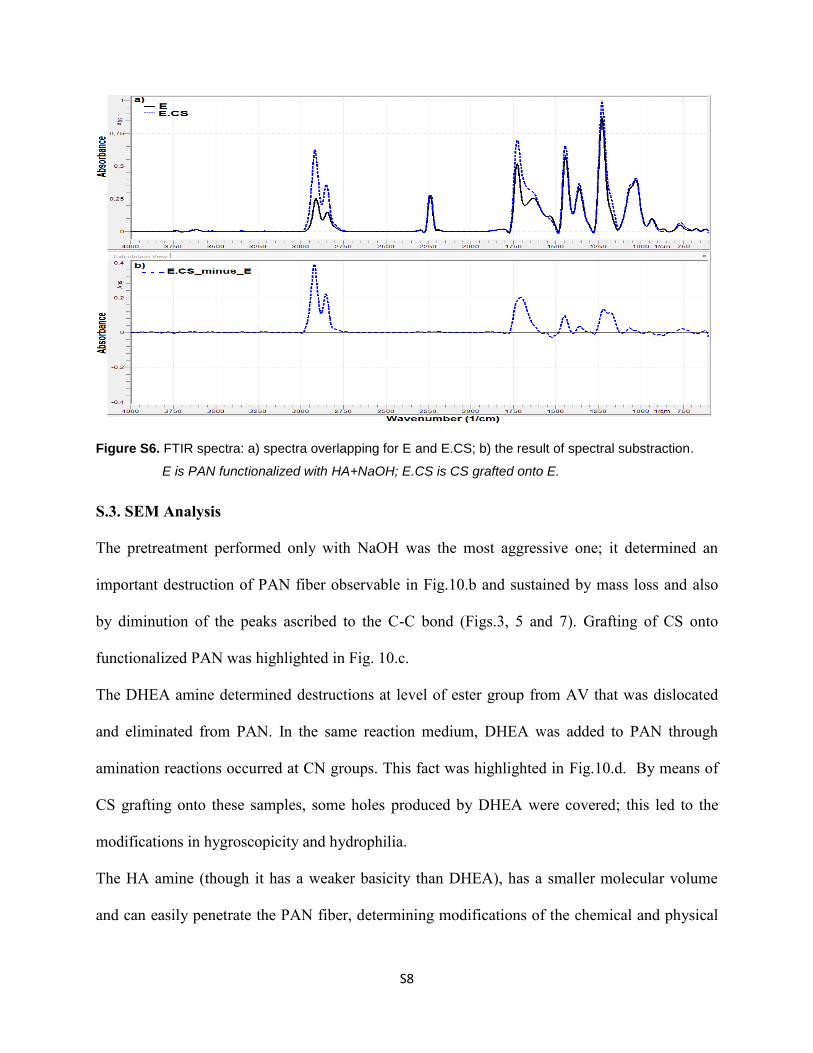
Figure S6. FTIR spectra: a) spectra overlapping for E and E.CS; b) the result of spectral substraction.
E is PAN functionalized with HA+NaOH; E.CS is CS grafted onto E.
S.3. SEM Analysis
The pretreatment performed only with NaOH was the most aggressive one; it determined an
important destruction of PAN fiber observable in Fig.10.b and sustained by mass loss and also
by diminution of the peaks ascribed to the C-C bond (Figs.3, 5 and 7). Grafting of CS onto
functionalized PAN was highlighted in Fig. 10.c.
The DHEA amine determined destructions at level of ester group from AV that was dislocated
and eliminated from PAN. In the same reaction medium, DHEA was added to PAN through
amination reactions occurred at CN groups. This fact was highlighted in Fig.10.d. By means of
CS grafting onto these samples, some holes produced by DHEA were covered; this led to the
modifications in hygroscopicity and hydrophilia.
The HA amine (though it has a weaker basicity than DHEA), has a smaller molecular volume
and can easily penetrate the PAN fiber, determining modifications of the chemical and physical
S9
structure. Fig.10.h shows the presence of small pores as proof of the modification of physical
structure through functionalization with HA. In grafting stage, CS binds through etheric bonds to
functionalized sample and the surface appearance of fiber from Fig. 10.i proves the accumulation
of CS.
HA + NaOH mixture acted according to the mechanism presented in Fig.1; in the first stage, the
saponifications of acetate groups, respectively hydrolysis of CN groups took place. The newly
formed COOH groups (from CN) served as supports for addition of nucleophile HA agent, from
an N-acylation reaction. The aspect on fiber’ surface was characterized by the presence of
numerous white spots that are almost uniformly distributed (Fig.10.j). Fig. 10.k shows that CS is
stretched almost uniformly, like a thin film, on the surface of functionalized fiber and it covers
some of the pores created through saponification. This process determined a smaller accessibility
than in the case of PAN functionalized with HA and grafted with CS.
S4. Nitrogen (N) Content
For the pretreatment DHEA±NaOH or HA±NaOH systems, even if chemical modifications
occurred, no modification of %N was noticed, since each CN group from the initial sample was
transformed in an amide group or a group of hydroxamic acid type (which have each one N atom
in their molecule, the same as the CN group from the initial AN). In the NaOH case, the smaller
%N values led to the supposition that NaOH determined the generation of carboxylic groups
which have no N in their molecule. It is known that the CN group was transformed in carboxylic
group via amide group; the fact that at120 minutes, the %N slightly increased, can be explained
by the existence of some amide groups still unconverted into carboxylic groups. Therefore, at
120 minutes a mixture of carboxylic and amide groups can be found.
S10
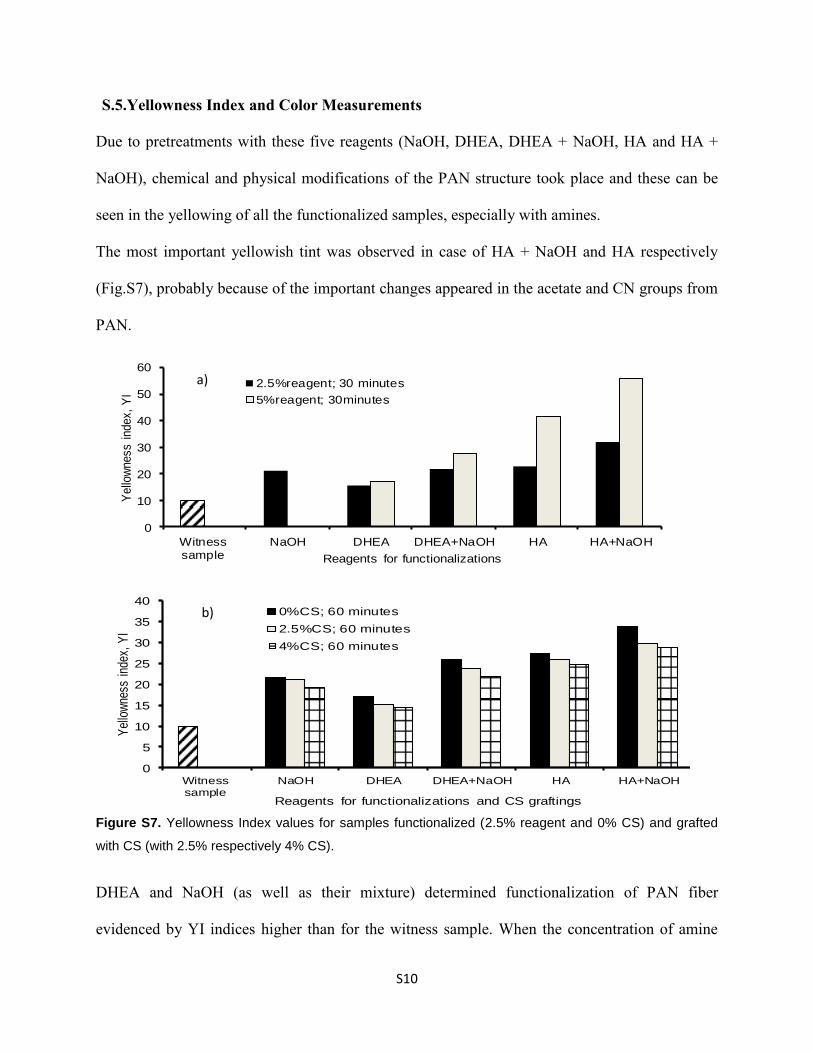
S.5.Yellowness Index and Color Measurements
Due to pretreatments with these five reagents (NaOH, DHEA, DHEA + NaOH, HA and HA +
NaOH), chemical and physical modifications of the PAN structure took place and these can be
seen in the yellowing of all the functionalized samples, especially with amines.
The most important yellowish tint was observed in case of HA + NaOH and HA respectively
(Fig.S7), probably because of the important changes appeared in the acetate and CN groups from
PAN.
0
10
20
30
40
50
60
Witnesssample
NaOH DHEA DHEA+NaOH HA HA+NaOH
Yello
wness i
ndex,
YI
Reagents for functionalizations
2.5%reagent; 30 minutes
5%reagent; 30minutes
0
5
10
15
20
25
30
35
40
Witnesssample
NaOH DHEA DHEA+NaOH HA HA+NaOH
Yel
low
ness
ind
ex,
YI
Reagents for functionalizations and CS graftings
0%CS; 60 minutes
2.5%CS; 60 minutes
4%CS; 60 minutes
Figure S7. Yellowness Index values for samples functionalized (2.5% reagent and 0% CS) and grafted
with CS (with 2.5% respectively 4% CS).
DHEA and NaOH (as well as their mixture) determined functionalization of PAN fiber
evidenced by YI indices higher than for the witness sample. When the concentration of amine
a)
b)
S11
was doubled at 5% (Fig.S7.a), an increase in YI appeared because of the intensification of
chemical and physical transformations in functionalized PAN. These changes were significant in
the cases of aminations with HA+NaOH and HA and insignificant in other cases, whence the
hypothesis that HA (although being a weak base) could cause serious chemical changes to the
acrylic fiber.
CS grafted onto functionalized PAN determined a decrease of YI, probably because CS was
stretched like a film over functionalized fibers (Fig.S7.b).The increase in concentration of CS
used for grafting (from 2.5 to 4%) determined the decrease of YI in case of all tested samples.
Even if it is an amine (but a weak and colorless amine in the solved form), CS diminished the
yellowish tint acquired through functionalization for all the tested systems. By covering every
functionalized sample with a colorless film (CS), the chromatic parameters (a* and b*), as well
as the lightness (L*) were modified. In fact, a decrease of the chromatic parameter (b*) and an
increase of lightness (L*) occurred, resulting in YI diminution. These variations were also
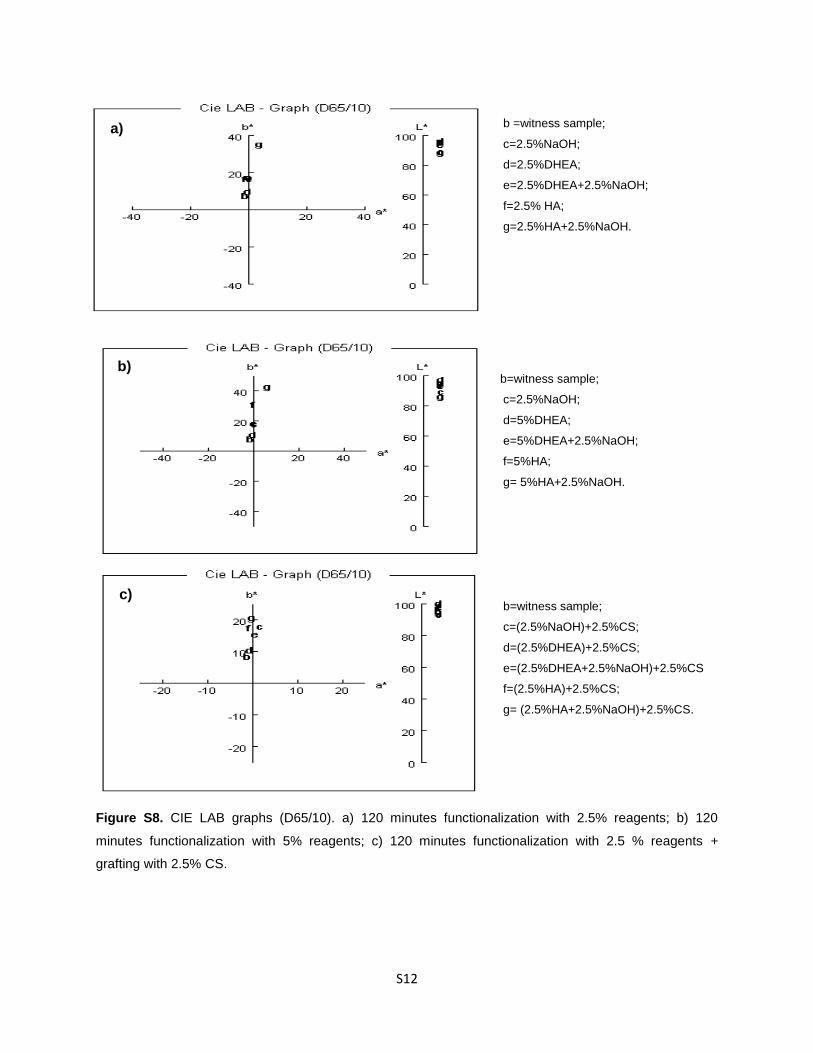
validated by CIE Lab graphics (Fig.S8) realized by using both daylight and a standard
illuminant, D65/10°.
Fig.S8.a shows that through pretreatments realized with 2.5 % reagents, for 120 minutes, all
samples get a yellow tint, having the chromatic parameter b*>0. The most noticeable yellowing
was produced by the HA+NaOH mixture which has b*=37.116 (abbreviated with g from
figure). By doubling the reagents concentration to 5% (Fig.S8.b), the sample yellowish tint
intensified (especially for samples abbreviated with g, f and e; for example, sample g got b*=
41.673).
CS grafted onto any functionalized PAN resulted in a significant decrease of yellowing; for
example, the same sample g, got b*= 21.080 (Fig.S8.c).
S12
b =witness sample;
c=2.5%NaOH;
d=2.5%DHEA;
e=2.5%DHEA+2.5%NaOH;
f=2.5% HA;
g=2.5%HA+2.5%NaOH.
b=witness sample;
c=2.5%NaOH;
d=5%DHEA;
e=5%DHEA+2.5%NaOH;
f=5%HA;
g= 5%HA+2.5%NaOH.
b=witness sample;
c=(2.5%NaOH)+2.5%CS;
d=(2.5%DHEA)+2.5%CS;
e=(2.5%DHEA+2.5%NaOH)+2.5%CS
f=(2.5%HA)+2.5%CS;
g= (2.5%HA+2.5%NaOH)+2.5%CS.
Figure S8. CIE LAB graphs (D65/10). a) 120 minutes functionalization with 2.5% reagents; b) 120
minutes functionalization with 5% reagents; c) 120 minutes functionalization with 2.5 % reagents +
grafting with 2.5% CS.
a)
c)
b)
S13
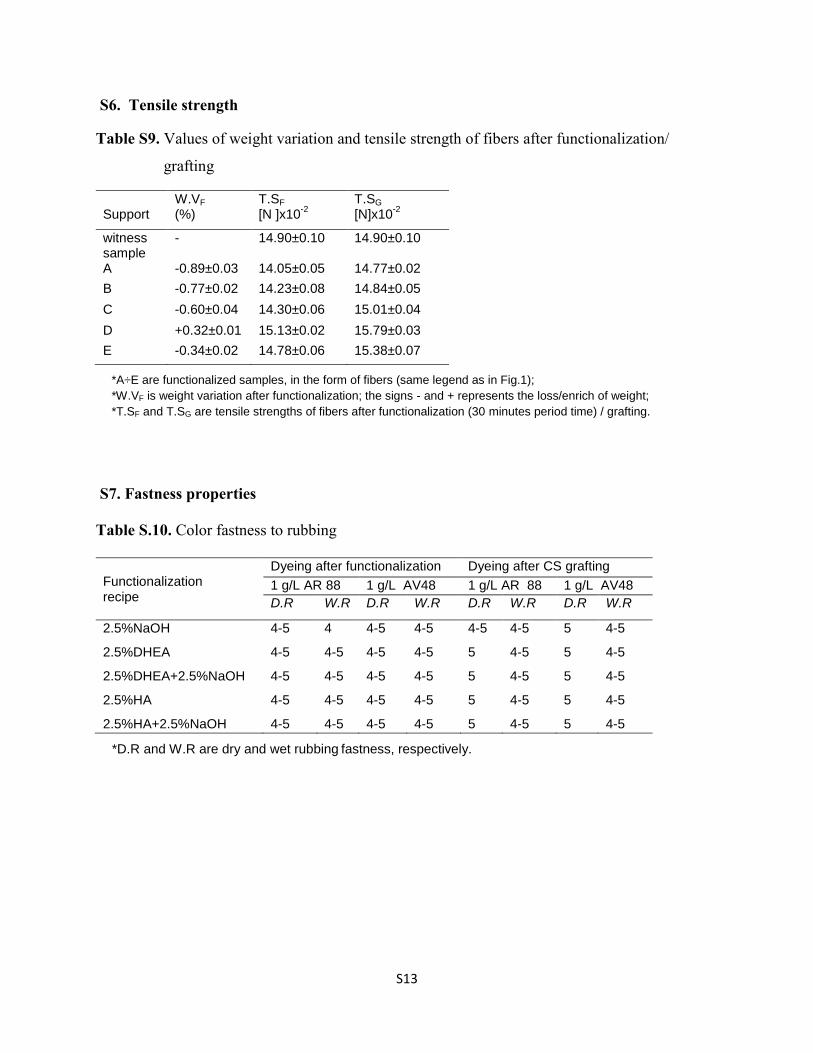
S6. Tensile strength
Table S9. Values of weight variation and tensile strength of fibers after functionalization/
grafting
*A÷E are functionalized samples, in the form of fibers (same legend as in Fig.1);
*W.VF is weight variation after functionalization; the signs - and + represents the loss/enrich of weight;
*T.SF and T.SG are tensile strengths of fibers after functionalization (30 minutes period time) / grafting.
S7. Fastness properties
Table S.10. Color fastness to rubbing
Functionalization recipe
Dyeing after functionalization Dyeing after CS grafting
1 g/L AR 88 1 g/L AV48 1 g/L AR 88 1 g/L AV48
D.R W.R D.R W.R D.R W.R D.R W.R
2.5%NaOH 4-5 4 4-5 4-5 4-5 4-5 5 4-5
2.5%DHEA 4-5 4-5 4-5 4-5 5 4-5 5 4-5
2.5%DHEA+2.5%NaOH 4-5 4-5 4-5 4-5 5 4-5 5 4-5
2.5%HA 4-5 4-5 4-5 4-5 5 4-5 5 4-5
2.5%HA+2.5%NaOH 4-5 4-5 4-5 4-5 5 4-5 5 4-5
*D.R and W.R are dry and wet rubbing fastness, respectively.
Support
W.VF (%)
T.SF [N ]x10
-2 T.SG [N]x10
-2
witness sample
- 14.90±0.10 14.90±0.10
A -0.89±0.03 14.05±0.05 14.77±0.02
B -0.77±0.02 14.23±0.08 14.84±0.05
C -0.60±0.04 14.30±0.06 15.01±0.04
D +0.32±0.01 15.13±0.02 15.79±0.03
E -0.34±0.02 14.78±0.06 15.38±0.07