analysis of formaldehyde preservatives in wet
TRANSCRIPT
Indonesia Chimica Acta Adriani, et.al. p-ISSN 2085-014X Vol.11. No.1, June 2018 e-ISSN 2655-6049
1
ANALYSIS OF FORMALDEHYDE PRESERVATIVES IN WET ANCHOVY
(Stolephorus Sp.) FROM TRADITIONAL MARKETS IN MAKASSAR CITY,
SOUTH SULAWESI
Adriani1*, Abd. Karim1, Seniwati Dali1
1Department of Chemistry, Faculty of Mathematics and Natural Sciences, University of
Hasanuddin Jl. Perintis Kemerdekaan Km. 10 Makassar 90245
Abstrak. Pengawet makanan merupakan bahan sangat penting dalam peningkatan kualitas dan
produksi makanan olahan yang dapat memperpanjang umur simpan makanan tersebut. Namun demikian terdapat berbagai macam pengawet dan diantaranya pengawet yang tidak diperbolehkan
seperti formaldehida . Penelitian ini bertujuan untuk mengetahui kandungan bahan pengawet
formaldehida pada ikan teri (stolephorus sp.) basah dari pasar tradisional Kota Makassar Sulawesi Selatan. Bahan pengawet formaldehida diidentifikasi dengan melalui uji kualitatif dan kuantitatif.
Uji kualitatif formalin menggunakan pereaksi Schryver dengan menggunakan metode analisis
Spektrofotometer UV-Vis. Hasil analisis kualitatif menunjukkan bahwa semua sampel ikan teri basah mengandung formaldehida, dengan nilai konsentrasi Sampel dari Pasar Daya A; Pasar Daya
B; Pasar Daya C berturut-turut 0,2702ppm; 0,1307ppm; 0,0871ppm, Pasar Antang A; Pasar
Antang B; Pasar Aantang C berturut-turut 0,1612ppm; 0,2223ppm; 0,1525ppm, Pasar Pa’baeng-
baeng A; Pasar Pa’baeng-baeng B; Pasar Pa’baeng-baeng C berturut-turut 0,1918ppm; 0,0087ppm; 0,2877ppm, Pasar Terong A; Pasar Terong B; Pasar Terong C; berturut-turut
0,1394ppm; 0,1961ppm; 0,0043. Kadar formaldehida terendah terdapat pada Pasar Terong C
dengan kadar 0,0087ppm dan kadar formaldehida tertinggi terdapat pada Pasar Pa’baeng-baeng C dengan kadar 0,2877ppm.
Kata Kunci : Formaldehida, Pengawet, Pereaksi Schryver, Spektrofotometer Uv-Vis
Abstract. Food preservatives are very important ingredients in improving the quality and
production of processed foods. However there are various presenvatives and such preservatives
such as formaldehide are not allowed. This study aims to determine the content of preservatives in fresh anchovy (stolephorus sp.) from the traditional market of Makassar City South Sulawesi.
Formaldehyde preservatives is identified by qualitative and quantitative test, qualitative
formaldehyde was tested using Schryver reagent using UV-Vis Spectrophotometer analysis method. The result of qualitative analysis showed that all samples contained formaldehyde, with
the concentration value of 0.2702ppm; 0.1307ppm; 0.0871ppm in Daya Market A; Daya Market
B; Daya Market C samples, respectively. The content of 0.1612ppm; 0.2223ppm; 0,1525ppm in
Antang Market A; Antang Market B; Antang Market C samples, respectively. The content of 0,1918ppm;0,0087ppm; 0.2877ppm in Terong Market A; Terong Market B; Terong Market C,
samples, respectively and the content of 0.1394ppm; 0.1961ppm; 0,0043, in Pa’baeng-baeng
Market A; Pa’baeng-baeng Market B; Pa’baeng-baeng Market C samples, respectively. The lowest formaldehyde level was found in Terong Market C with level of 0.0087ppm and the
highest formaldehyde level was in Pa’baeng-baeng Market C with the level of 0.2877ppm.
Keywords : Formaldehyde, Preservatives, Schryver Reagent, UV-Vis Spectrophotometer
Indonesia Chimica Acta Adriani, et.al. p-ISSN 2085-014X Vol.11. No.1, June 2018 e-ISSN 2655-6049
2
INTRODUCTION1
Fresh anchovy is one of the fish that
has a high protein content, which is 68.7
g/100g of fresh dried anchovy and 42
g/100g of salted dried anchovy.
Anchovy protein contains a number of
essential amino acids, namely amino
acids that cannot be formed in the body,
but must come from food. The most
prominent essential amino acids in
anchovy are isoleucine, leucine, lysine
and valine. Besides containing essential
amino acids, anchovies are also rich in
non-essential amino acids. The
prominent non-essential amino acids in
anchovy are glutamic acid and aspartic
acid, each of which reaches 1,439 and
966 mg / 100g of fresh anchovy. Other
nutrients that are very meaningful from
anchovy are minerals, calcium,
phosphorus and iron (Sastra, 2008).
Fresh fish has the characteristics of
being easily damaged and easily rot so it
needs to be preserved. Preservation
which is commonly used by the
community is by cooling, drying and
adding certain substances. Substances
added to fish can be either natural or
artificial substances. Based on the
Minister of Health Regulation No.1168
/MENKES/PER/X/1999 the additional
ingredients allowed for food are NaCl
salt, sodiumtripolyphosphate (STPP),
granulated sugar, sodium nitrite, sodium
lactate, sodium acetate, and compounds
(potassium nitrate, calcium nitrate ,
sodium nitrate). People generally do not
use these substances for fear of changing
the taste of the ingredients to be
preserved. They choose prohibited
1Corresponding author:
synthetic preservatives such as
formaldehyde, because prices are
relatively cheap, easy to obtain and their
use does not require special expertise.
The principle of preservation is to
maintain fish as long as possible by
inhibiting or stopping the activity of
decomposing microorganisms.
Preservation of fish will cause changes
in the characteristics of fresh fish, both
smell, taste, shape, and texture of the
meat (Sutarni, 2013).
Formaldehyde that enters the body
in amounts of 1.5 mg to 14 mg per day
or in 0.1 ppm solution can be tolerated,
if it exceeds the threshold it can cause
interference with the organs and systems
of the human body. The resulting
consequences can occur in a short or
short term and in the long term, through
inhalation, direct contact or ingestion
(Hastuti, 2010).
Wulan (2015) analyzed
formaldehyde from 10 meatball samples
by Uv-Vis spectrophotometer with
Schryver reagents in Panakukkang
District and the results were identified as
many as 4 meatball samples which
showed positive results with different
levels of 0.357 μg/g, 0.285 μg/g, 1.504
μg/g and 1.070 μg/g. Faradillah et al
(2014) identified formaldehyde using a
Uv-Vis spectrophotometer with Nash
reagents on meatballs sold in Padang
City. The results showed that 20 out of
42 (47.6%) samples taken from traders
of meatball carts, meatball stalls, and
restaurants contained formaldehyde.
Putri et al. (2016) tested the
formaldehyde content by Uv-Vis

Indonesia Chimica Acta Adriani, et.al. p-ISSN 2085-014X Vol.11. No.1, June 2018 e-ISSN 2655-6049
3
spectrophotometer with Schiff reagents
on papaya (carica papaya L.) and
pineapple (ananas comosus L.) fruit sold
in the Raden Fatah State Islamic
University Palembang and showed that
all samples were tested containing
formaldehyde with levels of 0.0007ppm
and 0.0025ppm.
Abdullah (2013) has tested the
content of formaldehyde by
spectrophotometer with Scrhyver
reagent on salted anchovy from the
Market of Tuesday, Central and Galael
of Gorontalo City and shows that the
sample contains formaldehyde. Analysis
of formaldehyde content by Uv-
Vis spectrophotometer with Nash
reagent on sunu fish from the Traditional
Makassar Market by Riana (2015) also
showed the presence of formaldehyde in
the samples analyzed. Based on the
previous description of the abuse of
formaldehyde from various types of
food, a study was conducted on the
analysis of formalidehyde preservatives
carried out on wet anchovy from the
Traditional Market of Makassar City.
MATERIAL AND METHOD
Instruments
The instrument used are label paper,
stationery, destilator, pumpkin distillate,
100 mL volumetric flask, 50 mL and 10
mL, UV-Vis spectrophotometer, and
glassware commonly used in
laboratories.
Materials,
The materials used were samples of
wet anchovy, 85% phosphoric acid
(H3PO4), concentrated hydrochloric acid
(HCl), Potassium Ferrisianide (III)
(K3Fe(CN)6), phenylhydrazine, aquades,
37% formaldehyde, filter paper.
Methods
1. Sampling technique
Wet anchovy is taken from 4
different locations, namely 3 samples
from Traditional Eggplant, Pa'baeng-
baeng, Antang and Daya markets. Wet
anchovy samples taken from each trader
of wet anchovy are packed in containers
such as dry plastic. Plastic containers are
coded. After that, samples of wet
anchovy are taken from the sampling site
to be carried out in the laboratory testing
stage.
2. Formaldehyde Analysis
Qualitative Test of Formaldehyde
Compounds in Wet Anchovy
Samples with Schryver Reagents
Twelve different samples of wet
anchovy were mashed, each weighed as
much as 30 g, then the sample was put
into a distillation flask and added 200mL
of distilled water. Then acidified with
85% phosphoric acid solution of 10mL.
The solution is slowly distilled piped, put
into a test tube and added Schryver
reagent (2mL phenylhydrazine
hydrochloride 1%, 5 mL concentrated
HCl and 1mL K3Fe(CN)6). The solution
will turn red if it contains formaldehyde
in the sample (Riana, 2015).
3. Quantitative Test of
Formaldehyde Levels on Wet
Anchovy Samples with
Spectrophotometric Methods
Making the mother liquor and
standard, Formaldehyde 37% with
different concentrations. Then the
solution is put into a test tube that has
been labeled, added Schryver reagent
which is 1% phenylhydrazine
hydrochloride as much as 2 mL, 5 mL
concentrated HCl and 1mL K3Fe(CN)6 at
Indonesia Chimica Acta Adriani, et.al. p-ISSN 2085-014X Vol.11. No.1, June 2018 e-ISSN 2655-6049
4
each different concentration, Samples
that are positive in qualitative testing,
measured the absorbance with
spectrophotometer at a wavelength of
518 nm (Riana, 2015).
4. Determination of Calibration
Curves
Making 1000 mL Formalin 1000 ppm
Formalin solution 37% pipetted as
much as 2.70 mL into a 1000 mL
volumetric flask, added with distilled
water, diluted to reach the boundary
mark, homogenized.
Making 100 mL Formalin 10 ppm
Standard Solution 1000 ppm
formalin mother liquor pipetted as much
as 5 mL into a 50 mL volumetric flask,
added with aquades, diluted to the
boundary mark, homogenized.
Making 10 mL Formalin Standard
Solution 0.2 ppm, 0.4 ppm, 0.8 ppm,
0.16 ppm and 0.32 ppm
The 10 ppm formalin standard
solution is piped as much as 0.1 mL, 0.2
mL, 0.4 mL, 0.8 mL and 1.6 mL into a
10 mL volumetric flask, added with
distilled water, diluted to the boundary
mark, homogenized. Then each standard
series solution is piped as much as 10 mL
into a test tube, Scrhyver reagent is
added, which is phenylhydrazine
hydrochloride 1% as much as 2 mL, 5
mL concentrated HCl and 1 mL
K3Fe(CN)6. Then the absorbance is
measured.
Making a blank solution
Aquadest solution pipetted as much
as 10 mL into a test tube, added Schryver
reagent namely phenylhydrazine HCl
1% as much as 2 mL, 5 mL concentrated
HCl and 1 mL K3Fe(CN)6. Then the
absorbance is measured.
EXPERIMENTAL RESULT
Qualitative Test Results for
Formaldehyde Preservatives with
Schryver reagents
Qualitative analysis of
formaldehyde in wet anchovy samples
can use several methods such as Nash
reagent method, chromatoprat acid
reagent method and Schryver reagent
method (Suryadi et al, 2008). According
to Schryver (1910) identification of
formaldehyde by using the Schryver
reagent method can be done by adding a
solution of 2 mL fennilhydrazine
hydrochloride solution, 1% potassium
ferricianide solution of 1 mL, 5 mL
concentrated hydrochloric acid into
10 mL of the material which will tested
where if the food is tested. If react with
formaldehyde will change color from
colorless to bright red then its absorption
is measured at a wavelength of 518 nm.
The results of the qualitative analysis of
formaldehyde with Schryver reagent on
wet samples of anchovy (Stolephorus
sp.) From the Makassar Traditional
Market can be seen in Table 1.
Indonesia Chimica Acta Adriani, et.al. p-ISSN 2085-014X Vol.11. No.1, June 2018 e-ISSN 2655-6049
5
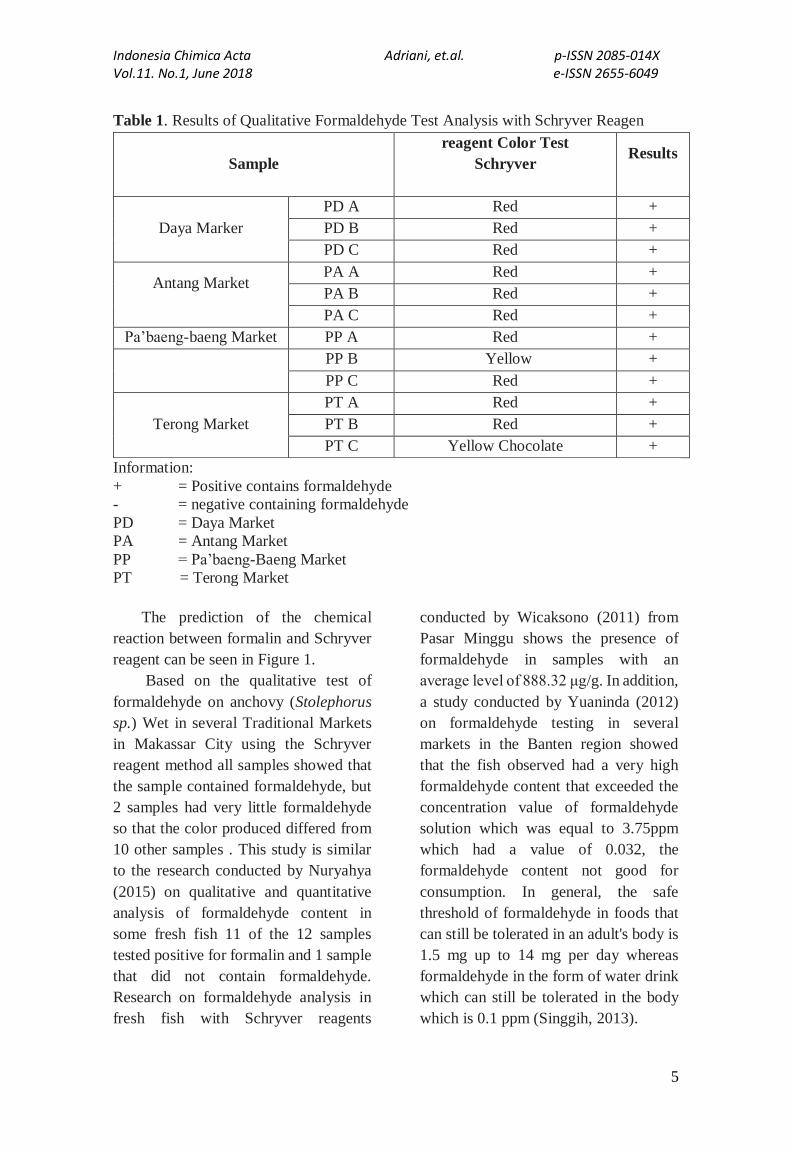
Table 1. Results of Qualitative Formaldehyde Test Analysis with Schryver Reagen
Sample
reagent Color Test
Schryver
Results
Daya Marker
PD A Red +
PD B Red +
PD C Red +
Antang Market
PA A Red +
PA B Red +
PA C Red +
Pa’baeng-baeng Market PP A Red +
PP B Yellow +
PP C Red +
Terong Market
PT A Red +
PT B Red +
PT C Yellow Chocolate +
Information:
+ = Positive contains formaldehyde
- = negative containing formaldehyde
PD = Daya Market
PA = Antang Market
PP = Pa’baeng-Baeng Market
PT = Terong Market
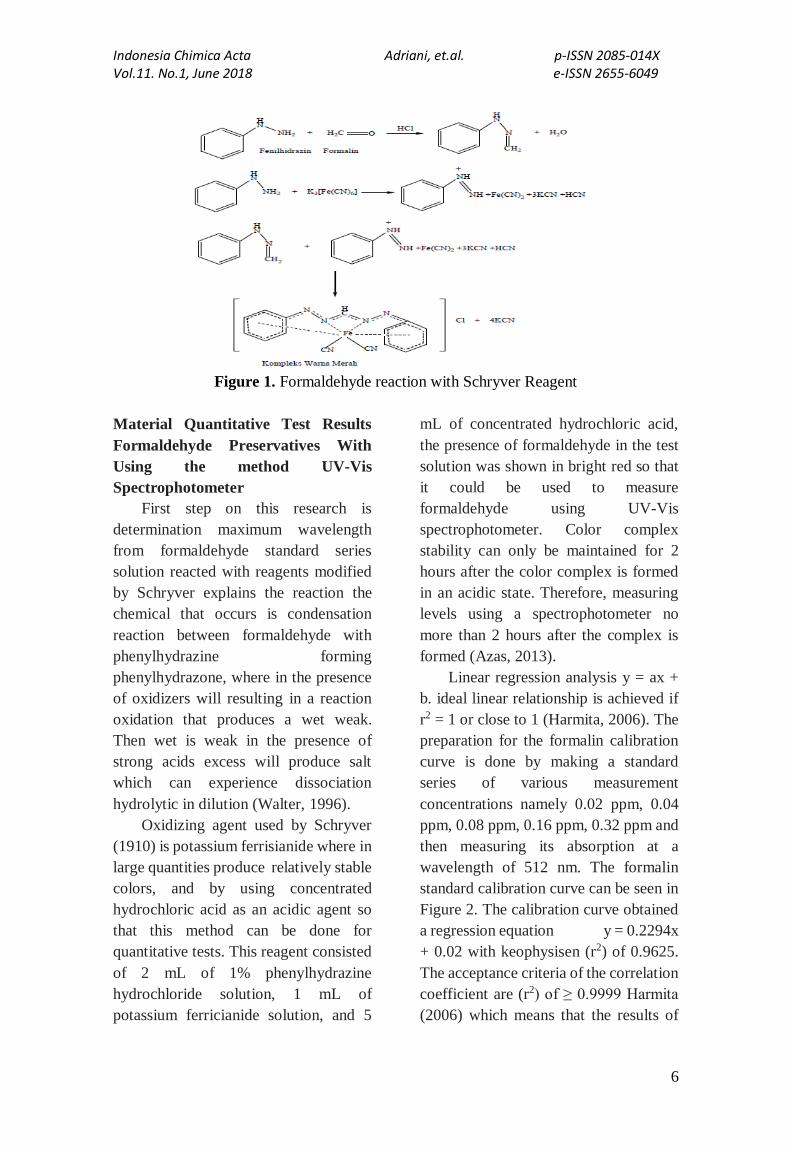
The prediction of the chemical
reaction between formalin and Schryver
reagent can be seen in Figure 1.
Based on the qualitative test of
formaldehyde on anchovy (Stolephorus
sp.) Wet in several Traditional Markets
in Makassar City using the Schryver
reagent method all samples showed that
the sample contained formaldehyde, but
2 samples had very little formaldehyde
so that the color produced differed from
10 other samples . This study is similar
to the research conducted by Nuryahya
(2015) on qualitative and quantitative
analysis of formaldehyde content in
some fresh fish 11 of the 12 samples
tested positive for formalin and 1 sample
that did not contain formaldehyde.
Research on formaldehyde analysis in
fresh fish with Schryver reagents
conducted by Wicaksono (2011) from
Pasar Minggu shows the presence of
formaldehyde in samples with an
average level of 888.32 μg/g. In addition,
a study conducted by Yuaninda (2012)
on formaldehyde testing in several
markets in the Banten region showed
that the fish observed had a very high
formaldehyde content that exceeded the
concentration value of formaldehyde
solution which was equal to 3.75ppm
which had a value of 0.032, the
formaldehyde content not good for
consumption. In general, the safe
threshold of formaldehyde in foods that
can still be tolerated in an adult's body is
1.5 mg up to 14 mg per day whereas
formaldehyde in the form of water drink
which can still be tolerated in the body
which is 0.1 ppm (Singgih, 2013).
Indonesia Chimica Acta Adriani, et.al. p-ISSN 2085-014X Vol.11. No.1, June 2018 e-ISSN 2655-6049
6
Figure 1. Formaldehyde reaction with Schryver Reagent
Material Quantitative Test Results
Formaldehyde Preservatives With
Using the method UV-Vis
Spectrophotometer
First step on this research is
determination maximum wavelength
from formaldehyde standard series
solution reacted with reagents modified
by Schryver explains the reaction the
chemical that occurs is condensation
reaction between formaldehyde with
phenylhydrazine forming
phenylhydrazone, where in the presence
of oxidizers will resulting in a reaction
oxidation that produces a wet weak.
Then wet is weak in the presence of
strong acids excess will produce salt
which can experience dissociation
hydrolytic in dilution (Walter, 1996).
Oxidizing agent used by Schryver
(1910) is potassium ferrisianide where in
large quantities produce relatively stable
colors, and by using concentrated
hydrochloric acid as an acidic agent so
that this method can be done for
quantitative tests. This reagent consisted
of 2 mL of 1% phenylhydrazine
hydrochloride solution, 1 mL of
potassium ferricianide solution, and 5
mL of concentrated hydrochloric acid,
the presence of formaldehyde in the test
solution was shown in bright red so that
it could be used to measure
formaldehyde using UV-Vis
spectrophotometer. Color complex
stability can only be maintained for 2
hours after the color complex is formed
in an acidic state. Therefore, measuring
levels using a spectrophotometer no
more than 2 hours after the complex is
formed (Azas, 2013).
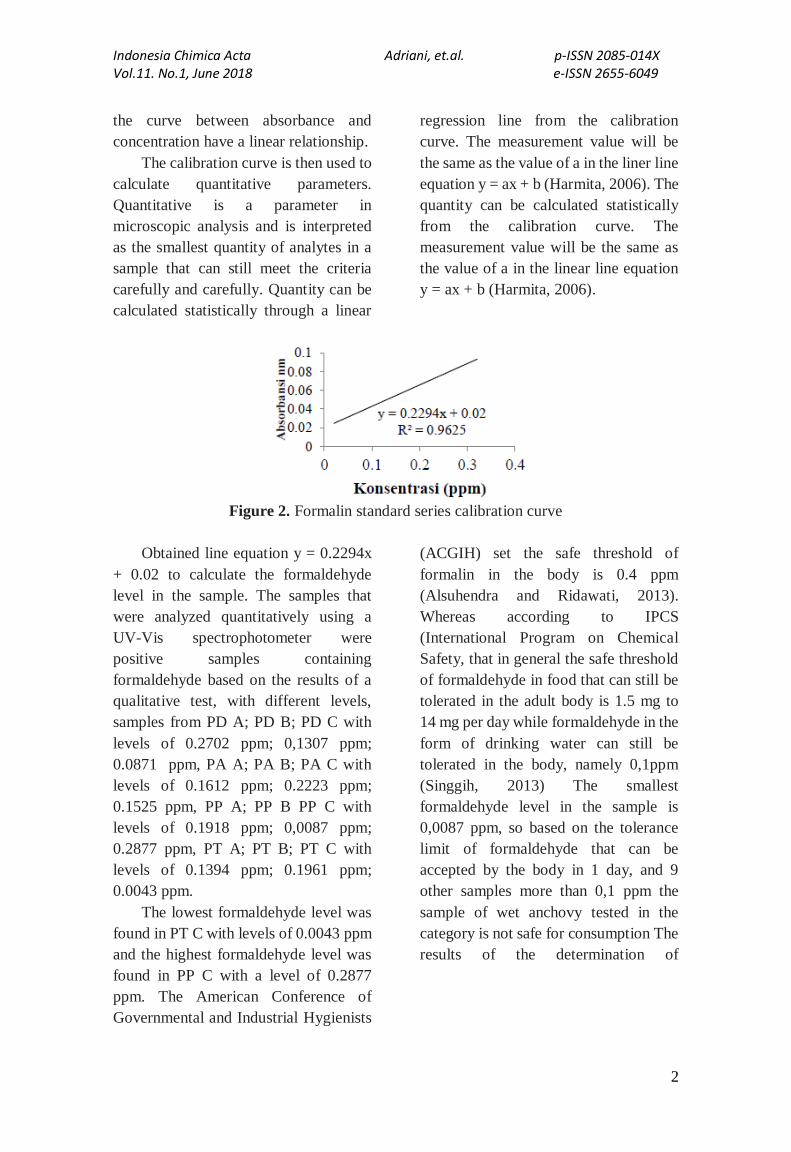
Linear regression analysis y = ax +
b. ideal linear relationship is achieved if
r2 = 1 or close to 1 (Harmita, 2006). The
preparation for the formalin calibration
curve is done by making a standard
series of various measurement
concentrations namely 0.02 ppm, 0.04
ppm, 0.08 ppm, 0.16 ppm, 0.32 ppm and
then measuring its absorption at a
wavelength of 512 nm. The formalin
standard calibration curve can be seen in
Figure 2. The calibration curve obtained
a regression equation y = 0.2294x
+ 0.02 with keophysisen (r2) of 0.9625.
The acceptance criteria of the correlation
coefficient are (r2) of ≥ 0.9999 Harmita
(2006) which means that the results of
Indonesia Chimica Acta Adriani, et.al. p-ISSN 2085-014X Vol.11. No.1, June 2018 e-ISSN 2655-6049
2
the curve between absorbance and
concentration have a linear relationship.
The calibration curve is then used to
calculate quantitative parameters.
Quantitative is a parameter in
microscopic analysis and is interpreted
as the smallest quantity of analytes in a
sample that can still meet the criteria
carefully and carefully. Quantity can be
calculated statistically through a linear
regression line from the calibration
curve. The measurement value will be
the same as the value of a in the liner line
equation y = ax + b (Harmita, 2006). The
quantity can be calculated statistically
from the calibration curve. The
measurement value will be the same as
the value of a in the linear line equation
y = ax + b (Harmita, 2006).
Figure 2. Formalin standard series calibration curve
Obtained line equation y = 0.2294x
+ 0.02 to calculate the formaldehyde
level in the sample. The samples that
were analyzed quantitatively using a
UV-Vis spectrophotometer were
positive samples containing
formaldehyde based on the results of a
qualitative test, with different levels,
samples from PD A; PD B; PD C with
levels of 0.2702 ppm; 0,1307 ppm;
0.0871 ppm, PA A; PA B; PA C with
levels of 0.1612 ppm; 0.2223 ppm;
0.1525 ppm, PP A; PP B PP C with
levels of 0.1918 ppm; 0,0087 ppm;
0.2877 ppm, PT A; PT B; PT C with
levels of 0.1394 ppm; 0.1961 ppm;
0.0043 ppm.
The lowest formaldehyde level was
found in PT C with levels of 0.0043 ppm
and the highest formaldehyde level was
found in PP C with a level of 0.2877
ppm. The American Conference of
Governmental and Industrial Hygienists
(ACGIH) set the safe threshold of
formalin in the body is 0.4 ppm
(Alsuhendra and Ridawati, 2013).
Whereas according to IPCS
(International Program on Chemical
Safety, that in general the safe threshold
of formaldehyde in food that can still be
tolerated in the adult body is 1.5 mg to
14 mg per day while formaldehyde in the
form of drinking water can still be
tolerated in the body, namely 0,1ppm
(Singgih, 2013) The smallest
formaldehyde level in the sample is
0,0087 ppm, so based on the tolerance
limit of formaldehyde that can be
accepted by the body in 1 day, and 9
other samples more than 0,1 ppm the
sample of wet anchovy tested in the
category is not safe for consumption The
results of the determination of
Indonesia Chimica Acta Adriani, et.al. p-ISSN 2085-014X Vol.11. No.1, June 2018 e-ISSN 2655-6049
2
formaldehyde levels in all samples can
be seen in Figure 3.
Figure 3. Graph analysis of formaldehyde levels in wet anchovy samples
CONCLUSION
Based on the results of the study it can
be concluded that the wet anchovy sold in
the Makassar Traditional Market with a
qualitative test analysis of all samples of
wet anchovy positively contains
formaldehyde. The lowest level of
formaldehyde is found in Terong Market
sample C with a concentration of 0.0087
ppm. the highest body and formalin levels
were found in Pa'baeng-baeng Market,
sample C with a level of 0.2877 ppm, not
safe for consumption.
REFERENCES
Abdullah, S., 2013, Qualitative Test of
Formalin content in Salted Fish sold in
Central Market of Gorontalo City,
unpublished Skipsi, Faculty of
Mathematics and Natural Sciences,
Gorontalo State University.
Afrianto, E., and E. Liviawaty., 1991, Fish
Preservation and Processing, Kanisius,
Yogyakarta.
Allport, N.L., 1951, Colorimetric Analysis,
Hall Chapman, New York.
Alsuhendra and Ridawati, 2013, Toxic In
Food, Bandung: PT. Teen Rosdakarya.
Aryati, E.E., Wulan, A., and Darmayanti,
S., 2014, Benefits of Fresh Anchovy
(Stolephorus Sp) on Bone and Dental
Growth, Journal of Odontodental, 1
(2): 52-58.
Astawan, and Made., 2006, Getting to
Know Formalin and Its Risks, Penebar
Swadaya, Jakarta.
Azas, Q.S., 2013, Analysis of Borax Levels
in Dates Fruit Circulating in Tanah
Abang Market Using UV-Vis
Spectrophotometer, Thesis not
Published, Pharmacy Study Program,
Faculty of Medicine and Health
Sciences, Syarif Hidayatullah State
Islamic University, Jakarta.
Borgstrom, G., and Paris, C.D., 1965. The
Regional Development of Fisheries
and Fish Processing, Fish as Food,
Academic Press, New York.
Cahyanto, 2008, Spectrophotometer
Review. Xains Info, http: // xains
info.blogspot.com/ 2008/08 / review-
spectrophotometer. html (online),
accessed on February 22, 2017.
Constantinides, 1988, Applied numerical
methods with Personal Computers,
MC Grawhill Book Company, New
York.
Indonesia Chimica Acta Adriani, et.al. p-ISSN 2085-014X Vol.11. No.1, June 2018 e-ISSN 2655-6049
3
Day, R.A and Underwood, A.L., 1999,
Analysis of Quantitative Chemistry,
Erlangga, Jakarta.
Indonesian Ministry of Health, 1995,
Indonesian Pharmacopoeia, Edition
IV, Jakarta.
Dwiari, S. R., 2008, Food Technology,
Ministry of National Education,
Jakarta.
Eka, R., 2013, Secrets of Knowing
Dangerous Foods, Titik Media
Publisher, Jakarta.
Endah, I., Saraswati, T.R., and Nurani.,
2013, Effects of Formalin, Diazepam
and Alcoholic Beverages on Feed
Consumption, Drinking and Mus
Musculus Body Weight, Journal of
Science and Mathematics, 17 (3): 141-
144.
Fadli, R.A., Ibrahim, M.N., and
Sadirmantara, M.S, 2016, Analysis of
Formalin Preservative Substances in
Terasi Traded in Kendari Traditional
Market, Food Science and Technology
Journal, 1 (1): 73-78.
Faradilah., Alioes, Y., and Elmatris., 2014,
Identification of Formaldehyde in
Meatballs sold in several Places in the
City of Padang, Andalas Health
Journal, 3 (2): 2301-7406.
Hadi, A., 2009, Spectrophotometry, Tjah
Kimai, Semarang State University,
Semarang.
Harjono, Y., 2006, Healthy Living Healthy
Eating, Kompas, Jakarta.
Harmita., 2006, Quantitative Analysis of
Raw Materials and Pharmaceutical
Preparations, Pharmacy Department of
FMIPA Universitas Indonesia,
Jakarta.
Hastuti, S, 2010, Qualitative and
Quantitative Analysis of
Formaldehyde in Salted Fish in
Madura, Journal of Agrointek, 4 (2):
132-137.
Horwitz, W., 1970, Official Method of
Analysis of Official Analytical
Chemist, Fifteenth Edition,
Washington DC.
Hutomo, M., Burhanuddin, A. Djamali,
and Martosewojo S., 1987, Anchovy
Resources in Indonesia, Oceanology
Research and Development Center
LIPI, Jakarta.
Khopkar, 1990, Basic Concepts of
Analytical Chemistry, UI Press,
Jakarta.
Kuswan, U.S., 2011, Optimization of
Scryver Reagent and Its Application to
Formaldehyde Analysis in Intestine
and Chicken Liver Samples by
Spectropometry, Thesis Not
Published, Pharmacy Study Program,
Faculty of Mathematics and Natural
Sciences, University of Indonesia,
Depok.
Mayrita, 2010, Optimizing the Utilization
of Anchovy in Banten Bay, Bogor
(IDN), Unpublished Thesis, Fisheries
and Marine Sciences, Bogor
Agricultural Institute.
Nuryahya, R.A., 2015, Qualitative and
Quantitative Test of Formalin Levels
in Fresh Fish, Jurnal Perikanan, 4 (2);
1-30.
Minister Regulation, 1999, Food
Additives, Regulation of the Minister
of Health of the Republic of Indonesia
number 1168 / Menkes / Per / X / 1999,
Jakarta.
Putri, DA, Pane, ER, and Khasianturi, V.,
2016, Test for Formalin in Papaya
(Carica Papaya L.) and Pineapple Fruit
(Ananas Comosus L.) which are sold
in Palembang's Uin Raden Fatah
Environment with Spectrophotometry
Method, Journal Biota, 2 (1): 76-81.
Riana, 2015, Formalin Content and Salt
Content in Sunu Asin Fish from
Makassar, South Sulawesi Traditional
Markets, Unpublished Thesis,
Veterinary Medicine, FK, Hasanuddin
University.
Roth, J., 1988, Pharmaceutical Chemistry,
Ellishorwood, Singapore.
Schryver, S.B., 1910, The Photochemical
Formation of Formaldehyde in Green
Plants, Procroy Soc Series, London.
Singgih, H, 2013, Formalin Test, ELTEK
Polytechnic Negri Malang Journal, 11
(1), 11-17.
Sumarauw, W., Fatimawali., And
Yudistira, A., 2013, Identification and
Determination of Benzoic Acid Levels
Indonesia Chimica Acta Adriani, et.al. p-ISSN 2085-014X Vol.11. No.1, June 2018 e-ISSN 2655-6049
4
in Soy Sauce Circulating in the City of
Manado, Pharmaceutical Scientific
Journal, 2 (1): 2302-2493.
Surawidjaja, 1994, Calibration Matrix for
Determination of Component
Concentration in Mixed Solutions,
FMIPA, Yogyakarta.
Suryadi H., Kurniadi M., and Melanie Y.,
2010, Formalin Analysis in Fresh Fish
and Shrimp Samples from Muara
Angke Market, Pharmaceutical
Science Magazine, 7 (3): 16-31.
Suryadi, H., Mansur, U and Christine, N.,
2008, Optimization of Schryver
Reagents for Formalin Identification
in Candy Samples, XVI Scientific
Congress of the Indonesian Pharmacy
Bachelor Association, Yogyakarta.
Suryana A. 1993. Impact of the Use of
Preservatives on Food and Its
Supervision, Diponegoro University,
Semarang.
Sutarni, 2013, Factors Affecting the
Preservation of Salted Teri Fish in
Labuhan Maringgai District, East
Lampung Regency. Pharmaceutical
Scientific Journal, 7 (1): 20-24.
Syafitri M., 2007, Management of Export
Fish Production at PT. Tridaya
Eramina Bahari Muara Baru Jakarta,
Unpublished Thesis, Bogor (IDN),
Department of Fisheries Resource
Utilization. Faculty of Fisheries and
Marine Sciences, Bogor Agricultural
University.
Theines, C.H., and Haley, T.J., 1955,
Clinical Toxicology, 3rd Edition, Lea
& Febiger, Philadelphia.
Wicaksono, S.S., 2011, Formalin Analysis
in Fresh Fish and Shrimp with
Schryver Reagent, Thesis Not
Published, Pharmacy Study Program,
Faculty of Mathematics and Natural
Sciences, University of Indonesia,
Depok.
Widodo, J., 2006, Effect of Formalin on
Body Systems, Center for
Biotechnology Development,
Muhammadiyah University, Malang.
Winarno F.G., 2004, Food Safety Volume
1, M-Brio Press, Bogor.
Wulan, S.R.S., 2015, Identification of
Formalin in Meatballs from Meatball
Traders in Panakukkang District,
Makassar City, Thesis not Published,
Veterinary Medicine Program, FK,
Hasanuddin University, Makassar.
Yuaninda, A., 2014, Qualitative and
Quantitative Test of Formalin Levels
in Fresh Fish, Jurnal Perikanan, 6 (3);
6-11.
Minister Regulation, 1999, Food
Additives, Regulation of the Minister
of Health of the Republic of Indonesia
number 1168 / Menkes / Per / X / 1999,
Jakarta.