sands, diss, 20170619 - escholarship
TRANSCRIPT
UNIVERSITY OF CALIFORNIA
Los Angeles
Managing Astronomy Research Data:
Data Practices in the Sloan Digital Sky Survey and
Large Synoptic Survey Telescope Projects
A dissertation submitted in partial satisfaction
of the requirements for the degree
Doctor of Philosophy in Information Studies
by
Ashley Elizabeth Sands
2017

© Copyright by
Ashley Elizabeth Sands
2017
ii
ABSTRACT OF THE DISSERTATION
Managing Astronomy Research Data:
Data Practices in the Sloan Digital Sky Survey and
Large Synoptic Survey Telescope Projects
by
Ashley Elizabeth Sands
Doctor of Philosophy in Information Studies
University of California, Los Angeles, 2017
Professor Christine L. Borgman, Chair
Ground-based astronomy sky surveys are massive, decades-long investments in scientific data
collection. Stakeholders expect these datasets to retain scientific value well beyond the lifetime
of the sky survey. However, the necessary investments in knowledge infrastructures for
managing sky survey data are not yet in place to ensure the long-term management and
exploitation of these scientific data. How are sky survey data perceived and managed, by whom,
and what are the implications for the infrastructures necessary to sustain the long-term value of
data? This dissertation used semi-structured interviews, document analysis, and ethnographic
fieldwork to explain how perspectives on data management differ among the stakeholder
populations of two major sky surveys: the Sloan Digital Sky Survey (SDSS) and the Large
Synoptic Survey Telescope (LSST). Perspectives on sky survey data cluster into two categories:
iii
“data as a process” is where data are perceived in terms of the practices and contexts surrounding
data production; and “data as a product” is where data are perceived as objective representations
of reality, divorced from their production context. Analysis reveals these different perspectives
result from stakeholders’ differing data management responsibilities throughout the research life
cycle, as reflected through their professional role, career stage, and level of astronomy education.
These results were used to construct a data management life cycle model for ground-based
astronomy sky surveys. Stakeholders involved in day-to-day construction, operations, and
processing activities perceive data as a process because they are intimately familiar with how the
data are produced. In contrast, sky survey leaders perceive data as a product due to their roles as
liaisons to external stakeholders. During the proposal stage, leaders must present the data as
objective and accurate to secure financial support; during data release, leaders must attract
researchers to trust the data for scientific use. The tendency of sky survey leaders to regard data
as a product leads them, and other stakeholders, to undervalue workforces, funding, and the other
knowledge infrastructures necessary to sustain the value of scientific data. Planning for long-
term data management must include stakeholders who view data as a process as well as those
who view data as a product.
iv
The dissertation of Ashley Elizabeth Sands is approved.
Jonathan Furner
Beverly P. Lynch
Sharon Traweek
Christine L. Borgman, Committee Chair
University of California, Los Angeles
2017

v
For Mom and Father
vi
TableofContents
ListofFigures............................................................................................................................................................xi
ListofTables............................................................................................................................................................xii
Acknowledgements..............................................................................................................................................xiii
Vita................................................................................................................................................................................xv
1Introduction............................................................................................................................................................1
1.1ScientificDataRevolution....................................................................................................................11.1.1Data-intensivesciences.....................................................................................................................................31.1.2Data-intensiveastronomy................................................................................................................................5
1.2MotivationforthisStudy.......................................................................................................................72LiteratureReview.................................................................................................................................................9
2.1ScientificResearchData......................................................................................................................102.1.1Knowledgeinfrastructures...........................................................................................................................122.1.2Astronomyskysurveydata..........................................................................................................................14
2.2ScientificResearchDataManagement...........................................................................................162.2.1Lifecycles.............................................................................................................................................................172.2.2Sustainability......................................................................................................................................................21
2.3ScientificResearchDataManagementWorkforces...................................................................262.3.1Professionaldatapractices...........................................................................................................................282.3.2Datamanagementexpertise.........................................................................................................................33
2.4AstronomySkySurveyKnowledgeInfrastructures...................................................................362.4.1 USspace-andground-basedastronomy................................................................................................412.4.2 The Sloan Digital Sky Survey........................................................................................................................442.4.3 The Large Synoptic Survey Telescope........................................................................................................462.4.4 Individual and small-group astronomy projects.......................................................................................48
3 Research Methods................................................................................................................................................50
3.1 Research Questions..................................................................................................................................503.1.1Whatareastronomyresearchdata?.........................................................................................................513.1.2Whatisdatamanagementinastronomy?..............................................................................................523.1.3Whatexpertiseisappliedtothemanagementofdata?...................................................................523.1.4Howdoesdatamanagementdifferbetweenpopulations?............................................................53
3.2 Data Collection..........................................................................................................................................533.2.1 Study populations................................................................................................................................................553.2.1.1SloanDigitalSkySurveyteam...............................................................................................................................573.2.1.2LargeSynopticSurveyTelescopeteam.............................................................................................................583.2.1.3SloanDigitalSkySurveydataend-users...........................................................................................................60
vii
3.2.2Semi-structuredinterviews..........................................................................................................................613.2.2.1Primaryinstitutionalaffiliation............................................................................................................................653.2.2.2Yearofinterview.........................................................................................................................................................653.2.2.3Careerstage...................................................................................................................................................................663.2.2.4Levelofastronomyeducation...............................................................................................................................673.2.2.5Currentworkforce......................................................................................................................................................683.2.2.6RoleinSDSSandLSST..............................................................................................................................................693.2.2.7Theorists.........................................................................................................................................................................69
3.2.3Ethnography........................................................................................................................................................703.2.4Documentanalysis...........................................................................................................................................73
3.3ValidityandReliability........................................................................................................................763.4Analysis.....................................................................................................................................................773.5EthicalStandards...................................................................................................................................79
4 Results......................................................................................................................................................................82
4.1RQ1Results:WhatareScientificAstronomyData?...................................................................834.1.1 RQ1 documentation results..............................................................................................................................85
4.1.1.1 SDSS data in documents.............................................................................................................................................85v Levelsofdataprocessing.......................................................................................................................................87v Relationshipsbetweendataproducts..............................................................................................................88v PublicavailabilityofSDSSdata............................................................................................................................88
4.1.1.2 LSST data in documents.............................................................................................................................................90v Levelsofdataprocessing.......................................................................................................................................91v Relationshipbetweendataproductsanddatamanagementtasks.....................................................92v PublicavailabilityofLSSTdata............................................................................................................................93
4.1.2 RQ1 interview results........................................................................................................................................944.1.2.2Howresponseswereelicited.................................................................................................................................94
v SDSSandLSSTteammembers.............................................................................................................................95v SDSSdataend-users.................................................................................................................................................95
4.1.2.3SDSSteam.......................................................................................................................................................................97v Content...........................................................................................................................................................................97v State.................................................................................................................................................................................98v Use....................................................................................................................................................................................98v Format............................................................................................................................................................................99v Source.............................................................................................................................................................................99v Evidence.......................................................................................................................................................................100v Contentandstate.....................................................................................................................................................100v Format,content,andstate...................................................................................................................................100v Content,state,andsource....................................................................................................................................101v Stateandformat.......................................................................................................................................................101v Stateandsource.......................................................................................................................................................101
4.1.2.4LSSTteam.....................................................................................................................................................................102v Content.........................................................................................................................................................................102v State...............................................................................................................................................................................102v Use..................................................................................................................................................................................103v Format..........................................................................................................................................................................103v Source...........................................................................................................................................................................104v Evidence.......................................................................................................................................................................104v Contentandstate.....................................................................................................................................................104v Format,content,andstate...................................................................................................................................105v Content,state,andsource....................................................................................................................................105v Stateandformat.......................................................................................................................................................105
viii
v Stateandsource.......................................................................................................................................................1064.1.2.5SDSSdataend-users................................................................................................................................................106
v Content.........................................................................................................................................................................106v State...............................................................................................................................................................................106v Use..................................................................................................................................................................................107v Format..........................................................................................................................................................................108v Source...........................................................................................................................................................................108v Evidence.......................................................................................................................................................................108v Contentandstate.....................................................................................................................................................109v Format,content,andstate...................................................................................................................................109v Content,state,andsource....................................................................................................................................109v Stateandformat.......................................................................................................................................................109v Stateandsource.......................................................................................................................................................110
4.1.3 RQ1 ethnography results................................................................................................................................1104.1.3.1 SDSS data in ethnography.......................................................................................................................................1104.1.3.2 LSST data in ethnography........................................................................................................................................113
4.1.4RQ1resultssummary....................................................................................................................................1144.2RQ2Results:WhatisDataManagementinAstronomy?.......................................................121
4.2.1 RQ2 documentation results............................................................................................................................1214.2.1.1 SDSS data management in documents.................................................................................................................121
v Datacollection...........................................................................................................................................................122v Datastorage,processingandtransfer............................................................................................................123v Long-termservingandarchiving......................................................................................................................124
4.2.1.2 LSST data management in documents.................................................................................................................125v Datamanagementinfundingproposals........................................................................................................126v Datamanagementinpresentations.................................................................................................................126v Datamanagementinthepublicwebsite.......................................................................................................128v Datamanagementinpolicydocuments.........................................................................................................129
4.2.2 RQ2 interview results......................................................................................................................................1304.2.2.1SDSSteam.....................................................................................................................................................................131
v SDSSteamdatacollection....................................................................................................................................131v SDSSteamdatastorage,processing,andtransfer....................................................................................132v SDSSteamlong-termservingandarchiving................................................................................................134
4.2.2.2LSSTteam.....................................................................................................................................................................135v LSSTteamdatacollection....................................................................................................................................135v LSSTteamdatastorage,processing,andtransfer.....................................................................................136v LSSTteamlong-termservingandarchiving................................................................................................136
4.2.2.3SDSSdataend-users................................................................................................................................................137v SDSSend-usersdatacollection..........................................................................................................................138v SDSSend-usersdatastorage,processing,andtransfer..........................................................................139v SDSSend-userslong-termservingandarchiving.....................................................................................140
4.2.3 RQ2 ethnography results................................................................................................................................1434.2.3.1SDSSdatamanagementinethnography.........................................................................................................1444.2.3.2LSSTdatamanagementinethnography.........................................................................................................145
4.2.4RQ2resultssummary....................................................................................................................................1484.3RQ3Results:WhatExpertiseisAppliedtotheManagementofData?.............................150
4.3.1 RQ3 documentation results............................................................................................................................1514.3.1.1 SDSS data management expertise in documents..............................................................................................151
v Continualexpertiseandlearning......................................................................................................................151v Data-intensiveexpertise.......................................................................................................................................152v Helpdesk.....................................................................................................................................................................153
4.3.1.2 LSST data management expertise in documents..............................................................................................154v Softwareengineeringknowledge.....................................................................................................................155
ix
v Bigdataexpertise....................................................................................................................................................155v Breadthinastronomyexpertise........................................................................................................................156
4.3.2RQ3interviewresults...................................................................................................................................1564.3.2.1SDSSteamexpertise................................................................................................................................................157
v Datacollection...........................................................................................................................................................158v Datastorage,processing,andtransfer...........................................................................................................158v Long-termservingandarchiving......................................................................................................................160
4.3.2.2LSSTteamexpertise................................................................................................................................................161v Datacollection...........................................................................................................................................................161v Datastorage,processing,andtransfer...........................................................................................................162v Long-termservingandarchiving......................................................................................................................163
4.3.2.3SDSSend-usersexpertise......................................................................................................................................164v Datacollection...........................................................................................................................................................165v Datastorage,processing,andtransfer...........................................................................................................165v Long-termservingandarchiving......................................................................................................................166
4.3.3RQ3ethnographyresults.............................................................................................................................1664.3.3.1SDSSexpertiseinethnography...........................................................................................................................1674.3.3.2LSSTexpertiseinethnography...........................................................................................................................169
4.3.4RQ3resultssummary....................................................................................................................................1704.4RQ4Results:HowDoesDataManagementDifferBetweenPopulations?.......................1724.4.1Primaryinstitutionalaffiliation................................................................................................................1744.4.2Yearofinterview.............................................................................................................................................1754.4.3Careerstage.......................................................................................................................................................1764.4.4Levelofastronomyeducation...................................................................................................................1774.4.5Currentworkforce..........................................................................................................................................1784.4.6RoleinSDSSandLSST..................................................................................................................................1784.4.7Theorists.............................................................................................................................................................1794.4.8Summary.............................................................................................................................................................179
5 Discussion...........................................................................................................................................................181
5.1SummaryofResults...........................................................................................................................1815.1.1Whatareastronomyresearchdata?.......................................................................................................1825.1.2Whatisdatamanagementinastronomy?............................................................................................1835.1.3Whatexpertiseisappliedtothemanagementofdata?.................................................................1835.1.4Howdoesdatamanagementdifferbetweenpopulations?..........................................................184
5.2DiscussionofFindings......................................................................................................................1855.2.1Astronomyresearchdata............................................................................................................................1885.2.2Astronomydatamanagement...................................................................................................................1905.2.3Datamanagementexpertise.......................................................................................................................1985.2.4Howdatamanagementdiffersbetweenpopulations.....................................................................2065.2.4.1ProfessionalRole.......................................................................................................................................................207
v Teammembersanddataend-users................................................................................................................207v SDSSandLSSTleadership....................................................................................................................................210v SDSSlibraryworkforces.......................................................................................................................................212
5.2.4.2Careerstage.................................................................................................................................................................214v Skysurveyparticipationstagesbycareerstage........................................................................................214v Skysurveyparticipationincentivesbycareerstage................................................................................217
5.2.4.3Levelofastronomyeducation.............................................................................................................................2185.2.5ModelofSkySurveyDataManagement................................................................................................2205.2.5.2DataasaProduct......................................................................................................................................................2225.2.5.1DataManagementLifeCycle................................................................................................................................223
x
5.2.6SkySurveyDataManagementModelExplanationandSignificance........................................2245.2.6.1DataasaProcess.......................................................................................................................................................2245.2.6.2DataasaProduct......................................................................................................................................................225
v Proposal;R&D...........................................................................................................................................................226v DataRelease...............................................................................................................................................................227
5.2.6.3AstronomyKnowledgeInfrastructures..........................................................................................................2286 Conclusion...........................................................................................................................................................230
6.1DifficultiesSustainingSkySurveyExpertise.............................................................................2326.1.1Datamanagementexpertiserewardstructures................................................................................2336.1.2Datamanagementasinvisiblework.......................................................................................................2376.1.3Astronomyskysurveyleadership...........................................................................................................240
6.2DifficultiesSustainingDigitalInfrastructures..........................................................................2446.3Limitations............................................................................................................................................2526.4FutureWork.........................................................................................................................................2536.5ClosingRemarks.................................................................................................................................254
AppendixI:SloanDigitalSkySurveyTimeline......................................................................................257
AppendixII:LargeSynopticSurveyTelescopeTimeline..................................................................258
AppendixIII:IntervieweeDemographics................................................................................................259
AppendixIV:InterviewConsentForm......................................................................................................262
AppendixV:InterviewDeedofGiftForm................................................................................................265
References..............................................................................................................................................................266
xi
ListofFiguresFigure 1 Research data life cycle model developed by (Wallis et al., 2008) to analyze a NSF
Science and Technology Center ............................................................................................ 19Figure 2 Data Conservancy Stack Model for Data Management. Adapted from (Choudhury,
2013); published in (Sands et al., 2014). .............................................................................. 31Figure 3 Workforce knowledge breadth and depth illustrated with the letters T and Pi. Figure by
Jake VanderPlas, reprinted with author’s permission (2014a, 2014b). ................................ 34Figure 4 Adaptation of “Relationships between Publications, Objects, Observations and the
corresponding major actors in the curating process and their activities” (Accomazzi & Dave, 2011, p. 3). .................................................................................................................. 37
Figure 5 Adaptation of the NASA data processing levels. Table modified from NASA (Committee on NASA Astronomy Science Centers, & National Research Council, 2007, p. 12; “Data Processing Levels for EOSDIS Data Products - NASA Science,” 2010). ........... 42
Figure 6 The three LSST data levels (“Data products | LSST public website,” 2015; Juric, 2014, sec. 4) .................................................................................................................................... 92
Figure 7 Sky Survey Data Stages ................................................................................................ 150Figure 8 The Distributed Nature of the Expertise Necessary to Develop the LSST Data
Management Software Stack (Juric, 2014, p. 16; Kantor, 2014, p. 12). ............................. 154Figure 9 IWGDD Digital Data Life Cycle Model (2009, p. B3) ................................................ 194Figure 10 Sky survey participant career stages over time .......................................................... 215Figure 11 Sky Survey Data Management Life Cycle model ...................................................... 220Figure 12 Traditional end of funding for sky survey projects .................................................... 246
xii
ListofTablesTable 1 Comparison of the scale and goals of the SDSS and LSST Projects ............................... 47Table 2 Relationship between research questions, study populations, and research methods ..... 54Table 3 Number of interviewees in each of the three study populations ...................................... 56Table 4 Interviewees organized by role in SDSS and LSST (See also Table 11) ........................ 57Table 5 Number of interviewees in each of the three study populations ...................................... 64Table 6 Interviewees organized by primary affiliation ................................................................. 65Table 7 Interviewees organized by year of interview ................................................................... 66Table 8 Interviewees organized by career stage ........................................................................... 67Table 9 Interviewees organized by level of astronomy education ................................................ 68Table 10 Interviewees organized by workforce ............................................................................ 69Table 11 Interviewees organized by role in SDSS and LSST (See also Table 4) ........................ 69Table 12 Interviewees organized by participation in theoretical work ......................................... 70Table 13 Author’s sustained interactions with study populations ................................................ 71Table 14 Detailed parameter information on the 15 key informants ............................................ 73Table 15 The kinds of SDSS and LSST documents and writing styles ........................................ 75Table 16 Research questions and associated codes ...................................................................... 79Table 17 Emergent “Data Characteristics” subcodes ................................................................... 84Table 18 Manner in which SDSS and LSST team interviewee data definition responses were
elicited ................................................................................................................................... 95Table 19 Example source-list for SDSS end-user article-based interviews ................................. 96Table 20 SDSS long-term scientific data archive: Library task distribution .............................. 112Table 21 Emergent “Data Characteristics” subcodes ................................................................. 117Table 22 Emergent categorization from analysis of the “Data Characteristics” code from all three
research methods ................................................................................................................. 120Table 23 SDSS end-user responses to “Could you locate the data for this [table/graphic/image]?”
............................................................................................................................................. 141Table 24 Temporal stages in which experience and expertise were discussed ........................... 171Table 25 Demographic parameters used in study population sampling design .......................... 173Table 26 Comparison of temporal stages between research questions ....................................... 191Table 27 Comparison of the ways data were described in SDSS and LSST documentation ..... 211
xiii
Acknowledgements
I was able to write this dissertation and earn my PhD due to the support of my family,
friends, teachers, and colleagues. Thank you to my advisor, Christine Borgman, who has
provided the motivation and incentive to ensure I become the best possible version of myself.
Thank you to Sharon Traweek, for your sincerity in mentoring. Thank you to Jonathan Furner for
supporting my work since I arrived at UCLA in 2009. Finally, thank you to Beverly Lynch for
your guidance on my committee and devotion to the importance of libraries and librarians for
decades.
Thank you to my parents, Tom and Patty, who have never failed to support my passions.
To my sister, Lindsey Smith-Sands, who helped me laugh through all the ups and downs. To
Lynn Swartz Dodd, for pointing me toward Information Studies, and Bruce Zuckerman for
providing me opportunities when I needed them most. Thank you to my friends for staying by
my side even while I disappeared to complete my degree. Thank you to Katie, Sarah, Michelle,
Alex, Joel, Rachel, Melissa, Hilary, Kat, Carole, Joanie, Terry, and particularly to Dimi, who
never doubted my ability to succeed.
Thank you to all the members of the UCLA Center for Knowledge Infrastructures during
my tenure; you have been my colleagues and friends. These collaborators include Rebekah
Cummings, Milena Golshan, Rachel Mandell, Jaklyn Nunga, Irene Pasquetto, Bernie Randles,
Lizzy Rolando, and Jillian Wallis. Particular appreciation goes to Peter T. Darch who has gone
above and beyond as my friend, collaborator, and mentor.
I appreciate the time and commitment of our team advisory board. The thoughtful
considerations of these successful astronomers have catalyzed our analysis over the years:
xiv
George Djorgovski, Alyssa Goodman, and Alexander Szalay. This research was conducted under
approval of the UCLA Institutional Review Board, Study Protocol ID# 10-000909.
Thank you to the Alfred P. Sloan Foundation and the National Science Foundation for
supporting the full tenure of this research. The generous support included (A) the National
Science Foundation (“Data Conservancy” OCI0830976, S. Choudhury, PI, Johns Hopkins
University) and (2) (“Knowledge & Data Transfer: the Formation of a New Workforce” #
1145888. C.L. Borgman, PI; S. Traweek, Co-PI) and (B) the Alfred P. Sloan Foundation (3)
(“The Transformation of Knowledge, Culture, and Practice in Data-Driven Science: A
Knowledge Infrastructures Perspective” # 20113194. C.L. Borgman, PI; S. Traweek, Co-PI) and
(4) “If Data Sharing is the Answer, What is the Question?” # 201514001 C.L. Borgman, PI).
Thank you particularly to Joshua Greenberg who generously supported our UCLA team
research, and who believed in me as a team member and as an individual.
xv
Vita EDUCATION University of California, Los Angeles September 2009-June 2011
MLIS, Master of Library and Information Science Advisor: Jonathan Furner University of Southern California August 2003-May 2007
BA, Bachelor of Arts, Magna Cum Laude Double Major: Religion and Classics
JOURNAL ARTICLES Borgman, C. L., Golshan, M. S., Sands, A. E., Wallis, J. C., Cummings, R. L., Darch, P. T., &
Randles, B. M. (2016). Data Management in the Long Tail: Science, Software, and Service. International Journal of Digital Curation, 11(1), 128–149. https://doi.org/10.2218/ijdc.v11i1.428
Borgman, C. L., Darch, P. T., Sands, A. E., Pasquetto, I. V., Golshan, M. S., Wallis, J. C., &
Traweek, S. (2015). Knowledge infrastructures in science: data, diversity, and digital libraries. International Journal on Digital Libraries, 16(3-4), 207–227. http://doi.org/10.1007/s00799-015-0157-z
Darch, P. T., Borgman, C. L., Traweek, S., Cummings, R. L., Wallis, J. C., & Sands, A. E.
(2015). What lies beneath?: Knowledge infrastructures in the subseafloor biosphere and beyond. International Journal on Digital Libraries, 16(1), 1–17. http://doi.org/10.1007/s00799-015-0137-3
Sands, A. E., Borgman, C. L., Traweek, S., & Wynholds, L. A. (2014). We’re Working On It:
Transferring the Sloan Digital Sky Survey from Laboratory to Library. International Journal of Digital Curation, 9(2), 98–110. http://doi.org/10.2218/ijdc.v9i2.336
Sands, A. E. (2012). Scholarly Publication and WAC: The Need for a Critical Response.
Archaeologies, 8(1), 12–17. http://doi.org/10.1007/s11759-012-9196-x REFEREED CONFERENCE PAPERS Darch, P. T., & Sands, A. E. (2017). Uncertainty About the Long-Term: Digital Libraries,
Astronomy Data, and Open Source Software. In 2017 IEEE/ACM Joint Conference on Digital Libraries (JCDL). Toronto, Canada.
Borgman, C. L., Darch, P. T., Sands, A. E., & Golshan, M. S. (2016). The Durability and
Fragility of Knowledge Infrastructures: Lessons Learned from Astronomy. In Proceedings of the 79th Association for Information Science and Technology Annual Meeting (Vol. 53). Copenhagen: ASIS&T. https://arxiv.org/abs/1611.00055
xvi
Pasquetto, I. V., Sands, A. E., Darch, P. T., & Borgman, C. L. (2016). Open Data in Scientific
Settings: From Policy to Practice. In Proceedings of the 2016 CHI Conference on Human Factors in Computing Systems (pp. 1585–1596). New York, NY, USA: ACM. http://doi.org/10.1145/2858036.2858543
Borgman, C. L., Golshan, M. S., Sands, A. E., Wallis, J. C., Cummings, R. L., & Randles, B. M.
(2016). Data Management in the Long Tail: Social and Technical Opportunities. Presented at the 11th International Digital Curation Conference, Amsterdam. Tied Runner-Up for Best Research Paper.
Pasquetto, I. V., Sands, A. E., & Borgman, C. L. (2015). Exploring Openness in Data and
Science: What is “Open,” to Whom, When, and Why? In Proceedings of the Association for Information Science and Technology (Vol. 52, pp. 1–2). St. Louis, MO. http://doi.org/10.1002/pra2.2015.1450520100141
Darch, P. T., & Sands, A. E. (2015). Beyond Big or Little Science: Understanding Data
Lifecycles in Astronomy and the Deep Subseafloor Biosphere. In Proceedings of the iConference 2015, Newport Beach, CA. http://hdl.handle.net/2142/73655
Borgman, C. L., Darch, P. T., Sands, A. E., Wallis, J. C., & Traweek, S. (2014). The ups and downs of knowledge infrastructures in science: Implications for data management. In 2014 IEEE/ACM Joint Conference on Digital Libraries (JCDL) (pp. 257–266). http://doi.org/10.1109/JCDL.2014.6970177
Wynholds, L. A., Wallis, J. C., Borgman, C. L., Sands, A. E., & Traweek, S. (2012). Data, Data
Use, and Scientific Inquiry: Two Case Studies of Data Practices. In Proceedings of the 12th ACM/IEEE-CS Joint Conference on Digital Libraries (pp. 19–22). New York, NY, USA: Association for Computing Machinery. http://doi.org/10.1145/2232817.2232822
PROFESSIONAL EXPERIENCE Senior Program Officer, Institute of Museum and Library Services Fall 2016-Present Graduate Student Researcher, UCLA Fall 2011-2016 Research Associate, West Semitic Research Project & InscriptiFact Fall 2007-2011 Research Assistant, USC Archaeology Research Center Fall 2003-2011 HONORS AND AWARDS Co-author to successful $1.4M Alfred P. Sloan Foundation grant 2015 UCLA Information Studies Hal Borko Fellowship / Dean’s Scholar 2015 Doctoral Colloquium Invited Participant, iConference 2015 10th IEEE International Conference on e-Science Student Sponsorship 2014 Special Libraries Association Southern California Karen Sternheim Scholarship 2010 USC Phi Beta Kappa Undergraduate Recognition Award 2007 USC Provost Undergraduate Research Symposium Awards 2007
1
1IntroductionInterviewer: “You're an astronomer by training, right?” Interviewee: “Yeah, but I don't really do any astronomy, I haven't done for years now, I'm basically just doing data-intensive science and providing access to astronomical data” (Staff Scientist, 2014). Innovative data collection methods, tools, and technologies are enabling qualitative
changes to scientific research, including the ability to ask new kinds of research questions (W. L.
Anderson, 2004; Borgman, 2015; Borne, 2013; Goble & De Roure, 2009; Goodman & Wong,
2009; Kitchin, 2014; McCray, 2014; National Science Board (U.S.), 2005). The changes in
modern science have been interpreted in various ways. Some argue the large quantities of data
have enabled a “Fourth Paradigm” (Borne, 2013, p. 407; Hey, Tansley, & Tolle, 2009b). Others
assert we have entered an era of “e-science” (Bell, Hey, & Szalay, 2009, p. 1298), or “big data”
(Galison & Hevly, 1992a; Gitelman & Jackson, 2013; Price, 1963; R. W. Smith, 1992;
Weinberg, 1961), in which scientists can ask new scientific questions that can only be
investigated by, “analyzing hundreds of billions of data points” (Mayer-Schonberger & Cukier,
2013, p. 11).
1.1ScientificDataRevolution
Scientists in each generation have declared “the dawning of a new age” (Bowker, 2005,
p. 12), and academics have often referenced information overload (Blair, 2010; Kitchin, 2014).
The size of electronic datasets continue to increase since the “start of modern science” (Kitchin,
2014, p. 67), the early nineteenth century (Bowker, 2005, p. 6), the 1960s (Mayer-Schonberger
& Cukier, 2013, p. 9), the 1990s (Ray, 2014a), and the new millennium (Gitelman & Jackson,
2013). Technological advances have contributed to concerns over data management; however,
2
the current period is uniquely transformational for scientific data management and sharing
because of both technological and cultural changes in research data.
Ann Blair (2010) explains that eras of information overload—such as the modern “data
deluge”—come about only when technological and societal factors occur simultaneously.
Describing the heightened respect for the printed word during the Renaissance, she cites not only
the technological innovation of “printing and the availability of paper,” but also the change in
social perspective to “a newly invigorated info-lust that sought to gather and manage as much
information as possible” (Blair, 2010, p. 6). A combination of shifts in societal thinking and
modern technology, has similarly culminated in the current attention to data management and
sharing in the sciences (CODATA-ICSTI Task Group on Data Citation Standards Practices,
2013; Joint Information Systems Committee (JISC) & Coalition for Networked Information
(CNI), 2015; Michener et al., 2011; Miller, 2012; Treloar, 2014). One modern shift is the
growing interest in research data (Ray, 2014a) and our society’s fascination with “big data.”
boyd and Crawford confirm the newly emphasized importance of data-intensive research,
asserting that “Big Data not only refers to very large data sets and the tools and procedures used
to manipulate and analyze them, but also to a computational turn in thought and research” (2011,
p. 3).
Another modern shift in information priorities is parallels the information overload
experienced during the Renaissance. One impetus for that shift was recognizing that current
practices ultimately lost ancient information, producing a subsequent desire to prevent further
loss (Blair, 2010, p. 12,64). Technology development within data-intensive sciences is only one
factor for the surge of attention paid to data management, sharing, and preservation. Given the
modern speed of digital technology development, both scholars and citizens alike are losing
3
information that was not migrated forward through successive generations of hardware and
software. Most individuals in 2017 have experienced the inability to access data, photos, or other
kinds of important information because they were saved to outdated disks or hard drives. Some
even evangelize that our future will result in a “Digital Dark Age” (Bollacker, 2010; Neuman,
2015). To combat the potential for loss, and to ensure data are available for data-intensive
scientific reuse, a worldwide movement of funding bodies and governments are pushing for data
management planning and publicly available scientific journal articles.
Respect for and concerted retention of information during the Renaissance was not an
inevitable result of the invention of the printing press; it only occurred due to the simultaneous
social agreements about the importance of the information (Blair, 2010). Similarly, the recent
turn towards the importance of sharing and preserving scientific research data was not an
inevitable consequence of the emergence of large datasets and data-intensive sciences. Only
through the current and continued cultural focus on data will scientific data continue to be
actively shared and preserved.
1.1.1Data-intensivesciences
Data-intensive sciences are those in which the collected data are of a scale beyond the
other resources available to researchers (Burns, Vogelstein, & Szalay, 2014; Schroeder & Meyer,
2012). Technological advances have enabled data-intensive sciences. Throughout recent decades,
leading to the modern era of data-driven science, “a number of transformative effects took place:
computational power grew exponentially; devices were networked together; …data became ever
more indexical and machine-readable; and data storage expanded and became distributed”
(Kitchin, 2014, p. 81).
4
The scale of collected data in data-intensive sciences may be enormous in terms of
volume, variety, velocity, value, and veracity (Critchlow & Van Dam, 2013; Ekbia et al., 2015;
Hey, 2015; Kitchin, 2014; Laney, 2001). These large-scale datasets may be combined from
multiple sources, enabling investigation of complex research questions The combination of
discrete datasets may be a complex exercise, but it is essential to actualizing powerful big data
networks (boyd & Crawford, 2012; Gitelman & Jackson, 2013; Kitchin, 2014; Kitching et al.,
2013; Van de Sompel, 2013). While all observational sciences rely on data, data-intensive
sciences notably investigate questions that can only be answered through the use and
combination of large quantities of data.
In the data-intensive sciences, disciplinary boundaries are often crossed as research
questions and necessary tools require a sizeable number of collaborators and kinds of expertise:
“It is no longer the case that knowledge held in a particular discipline is enough to carry out
scientific work” (Bowker, 2005, p. 123). This kind of cross-disciplinary scientific research is
described as a “synthesis of information technology and science that enables challenges on
previously unimaginable scales to be tackled” in which science is “collaborative, networked, and
data-driven” (Bell et al., 2009, p. 1298).
The drastic increase in data volume and scale has become standard in many scientific
research communities, generating a qualitatively different kind of scientific investigation
(Mayer-Schonberger & Cukier, 2013). In these research communities, data are more likely to be
generated directly from instruments rather than gathered by hand. For example, in the
environmental sciences, data collection has accelerated due to embedded sensor networks
(Borgman, Wallis, & Enyedy, 2007; Estrin, Michener, & Bonito, 2003; McNally, Mackenzie,
Hui, & Tomomitsu, 2012). High Energy Physics (HEP) is widely considered the academic field
5
generating the highest data volume, and HEP experiments are among the most financially
expensive and labor-intensive scientific experiments. Construction of the Large Hadron Collider
in Geneva for instance cost over 2.5 billion euros (“Large Hadron Collider (LHC),” 2015). In
astronomy, international collaborations collect hundreds of terabytes of data and are now
planning petabyte-scale data collection projects (“Large Synoptic Survey Telescope: Home,”
2016; “Sloan Digital Sky Survey: Home,” 2016).
One consequence of modern scientific data collection is that quick and easy data
accumulation requires greater processing and analysis (Borne, 2013; Hey, Tansley, & Tolle,
2009a; Szalay, 2011). The preparation, cleaning, and reduction components of research can be
considered aspects of the broader concept of data management, and “only now is the range of
problems in dealing with data becoming apparent” (Borgman, 2015, p. 32).
The relationship between data and journal articles has also evolved (Borgman, 2007;
Levine, 2014). Databases and other scientific datasets are now often considered valuable beyond
their initial research use and viewed as an academic deliverable in their own right (Bowker,
2005; Mayer-Schonberger & Cukier, 2013). The Human Genome Project and astronomy sky
surveys are examples of scientific investigations in which the creation of a database can be an
end product of a scientific endeavor. Accelerated data collection in data-intensive sciences now
outpaces the evolution of data management practices and the workforce necessary to maintain
these voluminous datasets.
1.1.2Data-intensiveastronomy
Astronomy is one field transformed by big science and data-intensive research methods.
Formerly a discipline of individual investigators using private telescopes, (Bowker, 2005;
Mayer-Schonberger & Cukier, 2013) modern “big science” astronomy (Borne, 2013; N. Gray,
6
Carozzi, & Woan, 2012; R. W. Smith, 1992) requires collaborative efforts to design, build, and
maintain innovative telescope facilities (Bicarregui et al., 2013; Flannery et al., 2009). One of the
oldest disciplines in the world, data-intensive astronomy is an example of a discipline changing
from data-poverty to data-wealth (Sawyer, 2008). This wave of data-intensive science in
astronomy broadens data use beyond those initially involved in data collection: “Astronomical
research now goes beyond the paradigm of the original scientific team consuming only the
observational data for which they proposed” (Thomas et al., 2014, p. 352). The current
“revolution in data availability” (Kitching et al., 2013, pp. 381–382) increases the number of
people with access to data.
While sky surveys are not new and observational star catalogs have been generated for
millennia, modern sky surveys are a qualitatively different kind of data collection. The Hubble
Space Telescope (Zimmerman, 2008), and the Sloan Digital Sky Survey (SDSS) became gold
standards for data sharing and reuse in astronomy. These collaborations released their survey
data in annual intervals, using a short proprietary period to clean the data prior to release. SDSS
collaboration members confidently released the data, because the project collected more
information than could possibly be analyzed by the team members alone (Borgman, 2015).
SDSS thus serves as an example of the changing nature of data collection, which has
revolutionized data sharing by making data catalogs and databases available to and useable by
those not initially involved in data collection.
Astronomy is an excellent venue in which to study data-intensive science. Astronomers
have arguably made the furthest strides toward an integrated, online sharing of research
publications and data (refer to Chapter 2 Literature Review). Collectively astronomy is a
computationally advanced field in regards to data management, sharing, and reuse best practices;
7
however, long-term data access necessitates further development. The technical and workforce
data management infrastructures available to large telescopes and missions are currently
unavailable to smaller telescopes, satellites, and other instruments. While many astronomers are
moving toward computational analysis of shared datasets, some professionals closely analyzing
smaller scale phenomena push back on resource investments into data sharing.
1.2MotivationforthisStudy
How are astronomy data managed, for what purposes, and who does the work to sustain
scientific astronomy data usability and meet data-intensive science objectives? The current
approach to these questions will influence future scientific discovery (boyd & Crawford, 2012).
Multiple factors, however, complicate managing the scientific usefulness of data.
Different stakeholders hold diverging understandings of key terms and components of the
scientific process (Gall, 1976; Mol, 2002), and the boundaries and definitions of data exist within
locally construed contexts (Latour, 1987, 1993; Latour & Woolgar, 1986; Rijcke & Beaulieu,
2014). Most policy makers and funding agencies now agree that research data should be made
publicly available (Directorate of Mathematical and Physical Sciences Division of Astronomical
Sciences (AST), 2010; Holdren, 2013; National Institute of Health, 2003; National Science
Foundation, 2010b). Data management, access, and archiving are challenging and expensive
undertakings however (Kitchin, 2014), especially given the dearth of highly skilled and well-
trained workforces vital for building and maintaining data management infrastructures
(Hedstrom et al., 2015, p. 73). No one-size-fits-all policy exists, nor would one enable effective
data management across disciplines, projects, or even between individuals in a single team
(Darch et al., 2015).
8
Empirical studies that investigate data-intensive knowledge infrastructures are necessary
to understand how, when, and by whom data can be managed (Bowker, 2005; Kitchin, 2014).
The UCLA Center for Knowledge Infrastructures (CKI) investigates the human and physical
infrastructures in scientific data management (“UCLA Center for Knowledge Infrastructures:
Home,” 2016). The CKI team currently conducts research funded by the Alfred P. Sloan
Foundation, and this dissertation research is one component of the grant-funded research. This
dissertation presents an empirical examination of astronomer data practices to investigate how
various stakeholders understand what data are, how they are managed, and who does the work.
An astronomy dataset is “incomprehensible and hence useless unless there is a detailed
and clear description of how and when it was gathered, and how the derived data was produced”
(J. Gray, Szalay, Thakar, Stoughton, & vandenBerg, 2002, p. 5). This dissertation analysis
reveals the data infrastructures necessary to support data management for reuse, because while
“it is easy enough to develop a potentially revolutionary technology; it is extremely hard to
implement it—and even harder to maintain it” (Bowker, 2005, p. 115). Similar to Blair’s analysis
of the Renaissance however, data-intensive sciences will not flourish solely upon technological
advances. In addition, sustainable infrastructures and workforces must be socially prioritized to
enable a truly scientific data revolution.
9
2LiteratureReview
For decades, scholars have observed and analyzed how scientists shape their scientific
data practices (Galison, 1997; Latour & Woolgar, 1979; Merton, 1973; Shapin & Shaffer, 1985;
Traweek, 1988). The information science field has tackled the meanings of data, information,
documents, knowledge, and similar concepts (Borgman, 1999; Buckland, 1991, 1997; Carlson &
Anderson, 2007). The library community has standardized the management of journals, articles,
and books to improve search and retrieval for patrons. Despite these efforts, the meaning of the
term “data” does not have a universally agreed upon or standardized definition (Borgman, 2015;
Parsons & Fox, 2013), nor has the scientific research process been found to be neatly bound with
a finite beginning or end (Latour & Woolgar, 1979). Considering the scientific research process
outspans a single researcher in breadth and longevity, competing notions emerge concerning
what data are, what is needed to manage data, and who is best equipped to take on the challenge.
These considerations allow a potentially broad array of stakeholders to define needs and assign
roles.
Multiple types of stakeholders in research data and research data management activities
engage at differing degrees. Data management stakeholders include scientists, researchers,
research staff, institutions, funders, policy makers, future data re-users, and more (Hahn, Lowry,
Lynch, & Shulenberger, 2009; Research Information Network, 2008; Swan & Brown, 2008).
The faculty, staff, and students conducting investigations as individuals or teams are closest to
the research data. The centers, departments, libraries, and universities supporting the work are
also stakeholders of effective research. Funding bodies at any scale are stakeholders in the
success of the research they support. Policy makers both influence and are influenced by large
research agendas, as well as individual research projects. Finally, the government, education
10
systems, and private individuals are stakeholders in research that may be funded from their tax
dollars and could influence their lives. These varied local and global stakeholders in academic
research may prioritize data management goals differently (Borgman, 2013; Edwards, 2010;
Leonelli, 2013; Sands, Borgman, Traweek, & Wynholds, 2014; Treloar, 2014). The myriad of
stakeholder interests in data-intensive academic research necessitates further analysis to unpack
diverse motivations and perspectives.
2.1ScientificResearchData
Modern science is built upon a model of inquiry in which conclusions require supporting
evidence; data collection and analysis are integral to this model. Despite widely accepted
scientific methods, a universally recognized definition of data remains elusive (Borgman, 2012a;
Consultative Committee for Space Data Systems, 2002, 2012; Renear, Sacchi, & Wickett, 2010;
Rosenberg, 2013). Indeed, “data is a complex notion, and one that is not well understood even by
the parties creating and using them” (Borgman, Wallis, & Mayernik, 2012, p. 517).
One commonly cited definition of data comes from the Open Archival Information
System (OAIS) Reference Model. The OAIS defines data as:
“A reinterpretable representation of information in a formalized manner suitable for communication, interpretation, or processing. Examples of data include a sequence of bits, a table of numbers, the characters on a page, the recording of sounds made by a person speaking, or a moon rock specimen” (Consultative Committee for Space Data Systems, 2012, pp. 1–10).
In the OAIS definition, data are representations of information, independent of the media in
which the data are embedded. The OAIS definition is purposefully broad and includes digital
files, electronic files, written records, and scientific specimens. However, each scientific
community may have further boundaries for what counts as data within their field. Borgman
defines data as “representations of observation, objects, or other entities used as evidence of
11
phenomena for the purposes of research or scholarship” (2015, p. 28). These overarching
definitions of scientific data offer each community a broad context they can amend to provide a
more specific definition. For the purposes of this dissertation, data are defined by the OAIS
Reference Model as “…reinterpretable representation[s] of information in a formalized
manner…” (Consultative Committee for Space Data Systems, 2012, pp. 1–10).
Data require additional contextual information to enable future scientific use (Borgman,
2015). Karasti and Baker (2008) distinguish between the management of data and scholarly
publications, because a large amount of contextual information must be retained and
management activities must take place for data to remain usable beyond the timeframe of the
initial project. Often this contextual information is recorded in the form of documentation or
metadata. While colloquially referred to as ‘data about data,’ metadata can be as difficult to
define as data itself. Mayernik defines metadata by referring to, “documentation, descriptions,
and annotations created and used to manage, discover, access, use, share, and preserve
informational resources” (2011, p. 28). Some refer to the metadata as just as essential as the data
(Levine, 2014). It can prove difficult to define metadata and data because these concepts are
fluid; the same piece of information could be data to a user in one context and metadata to
another user (Borgman et al., 2012).
The National Information Standards Organization (NISO) definition of metadata is used
for the purposes of this dissertation. NISO defines metadata as, “structured information that
describes, explains, locates, or otherwise makes it easier to retrieve, use, or manage an
information resource” (National Information Standards Organization, 2004, p. 1). The NISO
definition of metadata applies to this dissertation research, because it stresses the importance of
metadata for facilitating data reuse. In terms of scientific research data, the importance of
12
metadata is that it provides the context to enable data discoverability and usability into the
future; the more metadata that is available, the larger the potential user community (Bowker,
2005).
2.1.1Knowledgeinfrastructures
Research indicates that what counts as data varies by discipline and even by individual
researcher (Borgman, 2012a; Borgman et al., 2007; Renear et al., 2010). As Latour and other
scholars discuss, scientific research is a complex social and technical practice; “the construction
of facts and machines is a collective process” (1987, p. 29). Even “factual” information is only
useful within its context, and therefore even facts are constructs and not inherent truths. Borgman
explains, “even the most concrete metrics, such as temperature, height, and geo-spatial location,
are human inventions” (Borgman, 2015, p. 26). However, scientists may build external user trust
in established resources by presenting those resources as a black box. Latour explains that a
black box was termed by cyberneticians and is used, “whenever a piece of machinery or a set of
commands is too complex… they draw a little box about which they need to know nothing but
its input and output” (1987, pp. 2–3).
Research contexts can be referred to as knowledge infrastructures. Knowledge
infrastructures are defined as “robust networks of people, artifacts, and institutions that generate,
share, and maintain specific knowledge about the human and natural worlds” (Edwards, 2010, p.
17). According to Bowker, no data can emerge free of infrastructure: “Acts of committing to
record (such as writing a scientific paper) do not occur in isolation; they are embedded within a
range of practices (technical, formal, social)…” (Bowker, 2005, p. 7). Data are generated within
knowledge infrastructures, including “people, places, documents, and technologies,” and
13
continue to require infrastructures to retain meaning throughout the lifetime of the data (Ribes &
Jackson, 2013, p. 147).
Infrastructures may exist at a variety of scales. For example, while the World Wide Web
is an international phenomenon that many researchers rely upon for collaboration, others may
instead use local intranets to collaborate. While some scientific investigations require decades of
planning and execution, others are conceived of and completed within months. Ribes and Finholt
(2009) address potential existing tensions between infrastructures at different scales and
timelines through the premise of The Long Now Foundation (The Long Now Foundation, est.
01996). They refer to “The Long Now” as a way “to understand that participants seek to
simultaneously address” infrastructures with goals in the short-, medium-, and long-term (Ribes
& Finholt, 2009, p. 375).
The complexities, local variation, and temporal qualities of knowledge infrastructures
complicate what and how infrastructures should be built, particularly in dynamic contexts of
ever-changing scientific technologies (Bell et al., 2009; Borgman, 2007, 2015; Darch & Sands,
2017; Edwards et al., 2013; Van de Sompel, 2013). Infrastructures, data, and their contexts are
all dynamic and interdependent (Borgman, 2015; Gitelman & Jackson, 2013; Ribes & Jackson,
2013; Star & Ruhleder, 1996); this interrelatedness further complicates policy-setting initiatives
(Borgman, 2015).
While policy reports provide summary information for the evolving field, they are
professional recommendations as opposed to empirical findings. These landmark reports are
useful in terms of general professional advice (Association of Research Libraries, 2009, 2009;
Atkins et al., 2011; Hahn et al., 2009; Joint Leadership Group of the National Digital
Stewardship Alliance, 2013; Lyon, 2007; National Science Board (U.S.), 2005; Swan & Brown,
14
2008). However, the reports are limited by their generalities and necessitate complementary
empirical studies focused on the intricacies of scientific data practices. This dissertation
contributes empirical analysis of scientific data practices, while augmenting “policy level reports
on e-Science, cyberinfrastructure and data curation…” (Karasti, Baker, & Halkola, 2006, p. 323).
Only through understanding specific knowledge infrastructures can data management policies be
determined and deployed (National Science Board (U.S.), 2005).
2.1.2Astronomyskysurveydata
Astronomy is a millennia-old discipline in which data were initially gathered by hand,
then data collection advanced through photography, and now data are amassed digitally (Munns,
2012). In the late twentieth century, astronomy made the evolution from photographic to
electronic data collection and then transitioned to born-digital (McCray, 2014, p. 4). This
dissertation research is focused on data management practices for data that are born digital, the
scope of which does not include the digitization of photographic plates.
Astronomy sky surveys are a “systematic, controlled, and repeatable” method to study the
sky (Borne, 2013, p. 413). They are often referred to as a data-intensive inquiries because these
surveys often gather enough uniform data that astronomers can ask statistical questions of the
data, creating tremendous potential for new discoveries (Borne, 2013, p. 413). Sky surveys
include, “uniform calibrations and well-engineered pipelines for the production of a
comprehensive set of quality-controlled data products” (Borne, 2013, p. 413). The specific
surveys studied in this dissertation research are detailed in section 2.4 Astronomy Sky Survey
Knowledge Infrastructures.
Until the 1930s, astronomers collected data limited to the visible wavelengths of the
electromagnetic spectrum. The visible band is the narrow section of light humans can see. Since
15
the mid 20th century, astronomers began studying the sky using additional wavelengths (National
Aeronautics and Space Administration, Science Mission Directorate, 2010). Astronomers now
can collect data of the gamma ray, X-ray, ultraviolet, microwave, infrared, and radio
wavelengths (R. C. Smith, 1995). While data are collected differently based on wavelength,
properly managed data can be integrated and analyzed across the electromagnetic spectrum.
Astronomy research is often roughly divided between observational and theoretical work.
Telescopes and other devices gather observational data. Conversely, theoretical data are
generally computer simulations. This study primarily focuses on self-identified observational
astronomers, as opposed to theorists. Additionally, this dissertation focuses on astronomers,
whose work is largely contained within the portion of the electromagnetic spectrum from
ultraviolet through near infrared, including the visible wavelengths.
Some astronomy data have been reused for hundreds of years (N. Gray et al., 2012, p. 9).
Astronomy has a long tradition of “dependence on data collected by others as well as data
collected in the past. They have a well-developed culture of sharing” (W. L. Anderson, 2004, p.
194; McCray, 2000). Modern astronomy data are more standardized than data in many other
disciplines, though require contextual information for reuse (Accomazzi, Derriere, Biemesderfer,
& Gray, 2012). Particularly in astronomy, “data are inseparable from the software code used to
clean, reduce, and analyze them” (Borgman, 2015, p. 106).
This dissertation examines the data practices of a limited number of astronomy research
projects within one subfield; it does not cover data practices of the entire discipline. Here the
focus is on observational astronomy data collected in digital form through optical, ground-based
sky surveys. Space historian Robert Zimmerman notes astronomy data has always captured the
public’s imagination,
16
“Though the optical wavelengths form only a small part of the tapestry astronomers use to try to understand what is going on in the heavens, to all humans the optical wavelengths give us a direct window into those phenomena” (2008, p. 179).
2.2ScientificResearchDataManagement
Data management is also far from a unified concept (Wallis, 2012). Many attempts to
define data management involve non-exhaustive lists of its possible components. For example, a
National Academy of Sciences (NAS) study clustered together terms related to data management
practices: “Information management, data management, data stewardship, data governance, and
digital archiving are related terms used to describe processes and activities that overlap with
curation” (Hedstrom et al., 2015, p. 13). The NAS study employs the Data Management
International definition of data management: “the development and execution of architectures,
policies, and practices and procedures that properly manage the full data lifecycle needs of an
enterprise…” (“About Us | DAMA,” 2015; Hedstrom et al., 2015, p. 13).
A similarly broad definition of data management is used for the purposes of this
dissertation: data management is an umbrella term encompassing actions taken on data aimed at
enabling scientific progress. The enumerations of data management actions may vary based on
institutional and individual motivations. In the short- and medium-term, data are managed for
scientific research; in the long-term, reasons for data management include permitting future
scientific reuse or ensuring replicable studies.
As an overarching term used in this study, data management includes activities involving
the collection, organization, analysis, release, storage, archiving, preservation, and curation of
research data. Each of these additional terms also have different meanings between communities
(Abrams, Cruse, & Kunze, 2009; Choudhury, Palmer, Baker, & DiLauro, 2013; Digital Curation
17
Centre, 2005; Walters & Skinner, 2011). While converging on similar issues, many stakeholders
hold different meanings for each of these terms, sometimes employing discrete definitions, and
other times muddling the concepts.
Data remain challenging to manage, curate, preserve, and reuse (Parsons & Berman,
2013). The current physical size of data overextends existing infrastructures, which prevents
scientists from properly creating, accessing, storing, curating, and preserving data for the long-
term. As the role of scientific research data has expanded in recent years to include the data-
intensive sciences, the motivation for focused data curation and preservation has also broadened.
Indeed, “…the development of digital technologies has radically changed our ability to manage,
structure, process, analyse, share and reuse data, especially those born digital” (Kitchin, 2014, p.
46). Data management throughout the full research process may require dedicated funding to
support the necessary technical and human infrastructures.
2.2.1Lifecycles
One reason a universal definition of data and data management are difficult to achieve is
because the conceptions cover many incremental steps within the research life cycle. Data and
metadata are active, fluid parts of scientific research, often as much process as product (Edwards,
Mayernik, Batcheller, Bowker, & Borgman, 2011). Data are mutable depending on context,
“over time and space as they flow through interconnected but different socio-cultural contexts
each with their own conceptual frameworks and value systems” (Bates, Goodale, & Lin, 2015, p.
14).
The path of data through the scientific process is often discussed in terms of a data life
cycle. The process of scientific research can also be discussed as a research life cycle. Research
data life cycles, as used in the literature of archives, libraries, digital libraries, and records
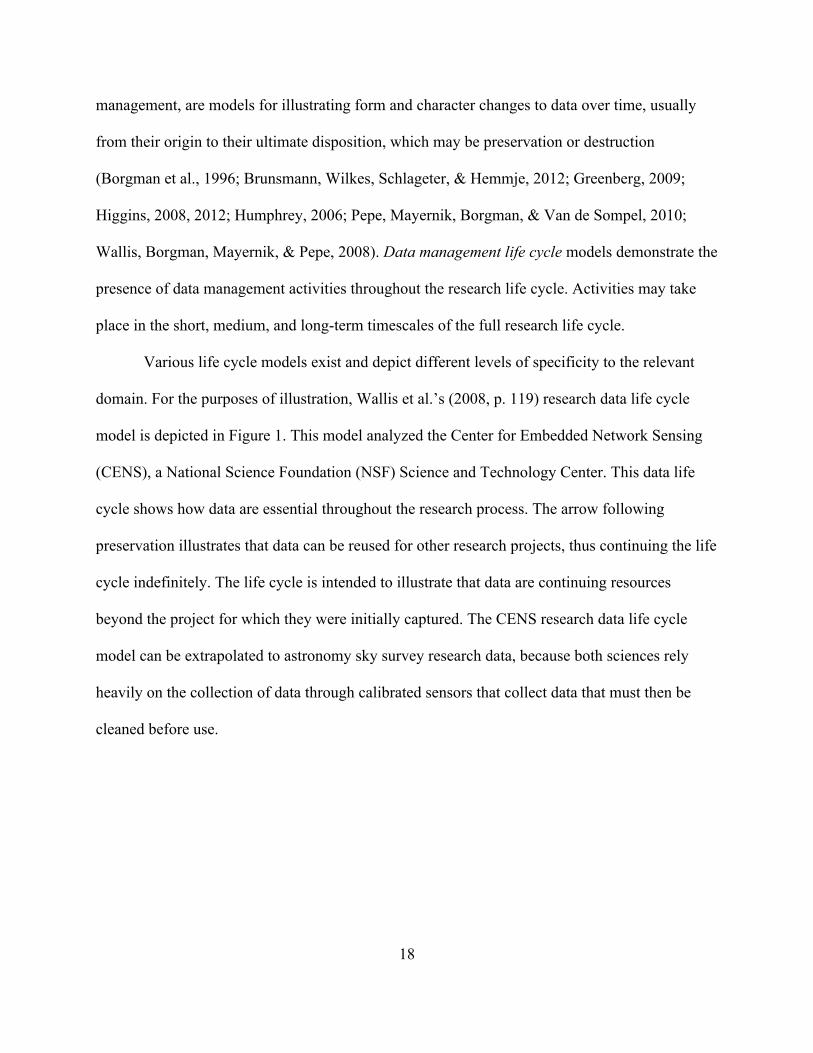
18
management, are models for illustrating form and character changes to data over time, usually
from their origin to their ultimate disposition, which may be preservation or destruction
(Borgman et al., 1996; Brunsmann, Wilkes, Schlageter, & Hemmje, 2012; Greenberg, 2009;
Higgins, 2008, 2012; Humphrey, 2006; Pepe, Mayernik, Borgman, & Van de Sompel, 2010;
Wallis, Borgman, Mayernik, & Pepe, 2008). Data management life cycle models demonstrate the
presence of data management activities throughout the research life cycle. Activities may take
place in the short, medium, and long-term timescales of the full research life cycle.
Various life cycle models exist and depict different levels of specificity to the relevant
domain. For the purposes of illustration, Wallis et al.’s (2008, p. 119) research data life cycle
model is depicted in Figure 1. This model analyzed the Center for Embedded Network Sensing
(CENS), a National Science Foundation (NSF) Science and Technology Center. This data life
cycle shows how data are essential throughout the research process. The arrow following
preservation illustrates that data can be reused for other research projects, thus continuing the life
cycle indefinitely. The life cycle is intended to illustrate that data are continuing resources
beyond the project for which they were initially captured. The CENS research data life cycle
model can be extrapolated to astronomy sky survey research data, because both sciences rely
heavily on the collection of data through calibrated sensors that collect data that must then be
cleaned before use.
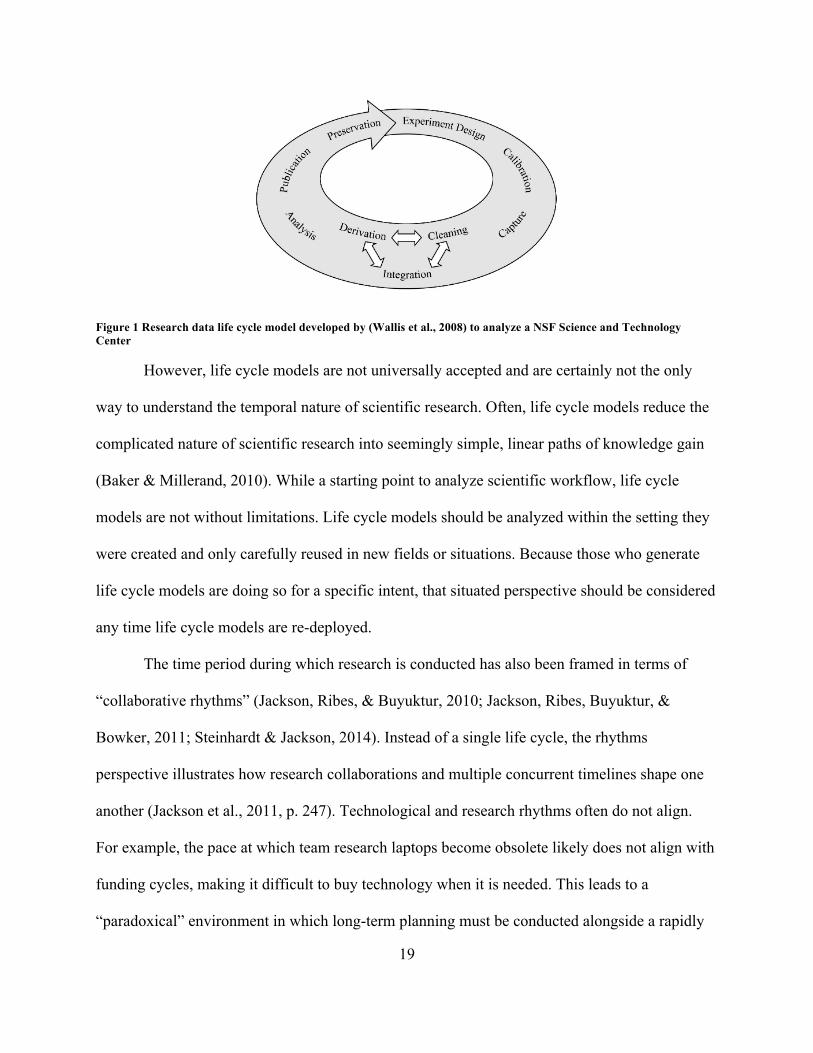
19
Figure 1 Research data life cycle model developed by (Wallis et al., 2008) to analyze a NSF Science and Technology Center
However, life cycle models are not universally accepted and are certainly not the only
way to understand the temporal nature of scientific research. Often, life cycle models reduce the
complicated nature of scientific research into seemingly simple, linear paths of knowledge gain
(Baker & Millerand, 2010). While a starting point to analyze scientific workflow, life cycle
models are not without limitations. Life cycle models should be analyzed within the setting they
were created and only carefully reused in new fields or situations. Because those who generate
life cycle models are doing so for a specific intent, that situated perspective should be considered
any time life cycle models are re-deployed.
The time period during which research is conducted has also been framed in terms of
“collaborative rhythms” (Jackson, Ribes, & Buyuktur, 2010; Jackson, Ribes, Buyuktur, &
Bowker, 2011; Steinhardt & Jackson, 2014). Instead of a single life cycle, the rhythms
perspective illustrates how research collaborations and multiple concurrent timelines shape one
another (Jackson et al., 2011, p. 247). Technological and research rhythms often do not align.
For example, the pace at which team research laptops become obsolete likely does not align with
funding cycles, making it difficult to buy technology when it is needed. This leads to a
“paradoxical” environment in which long-term planning must be conducted alongside a rapidly
20
changing information technology environment (Ribes & Finholt, 2009, p. 376). Another
simultaneous rhythm are workforce career paths: “The ritual has been repeated thousands of
times, but no single practical or material element endures the years: students graduate to faculty,
instruments become outdated or imprecise, even buckets wear out” (Ribes & Jackson, 2013, p.
156). Given the many changes that occur through the full life of a dataset, life cycle models and
rhythms analysis can help understand the many temporal factors influencing the research life
cycle.
Effective data management aimed at enabling future data reuse is complex, locally
contingent, and requires reliable workforces and funding. Data management stakeholders often
use research life cycle models to plan long-term projects, starting as early as possible in the
research process (Atkins et al., 2011; Carlson & Anderson, 2007; Corrall, 2012; Lee, 2009). Ball
explains the use of data management life cycle models in that they “provide a structure for
considering the many operations that will need to be performed on a data record throughout its
life. Many curatorial actions can be made considerably easier if they have been prepared for in
advance…” (Ball, 2012, p. 3). Beyond immediate scientific use, if data are to remain
scientifically valuable to unknown users in the future, they must be managed effectively through
the full course of the research life cycle (Abrams et al., 2009; Sands et al., 2014). Earlier
planning in the research life cycle for long-term data management increases the likelihood that
the efforts will be successful (Research Information Network, 2008, p. 9).
Astronomy data management nominally refers to all actions taken on data over the course
of the broadly construed research process. Data management, given this inclusive definition of
the research life cycle, begins in the research planning stages and may never have a definite
conclusion (Rots, Winkelman, Paltani, & DeLuca, 2002, p. 172). The ultimate goal of astronomy
21
data management is to further the scientific goals of the discipline; however, each stage and each
stakeholder may have other pressing goals in the near, medium, and long-term.
2.2.2Sustainability
The life cycle model shows that data may require long-term management beyond data
collection, processing, analysis, and publication. Long-term data management is often referred to
as data stewardship. Baker and Yarmey (2009) refer to data stewardship as a collection of data
curation activities taking place within an infrastructure with the goal of research data care.
Conversely, the OAIS reference model fails to mention the word steward or stewardship
anywhere in the 135-page document (Consultative Committee for Space Data Systems, 2012). In
other sources, stewardship is used as another umbrella term for data management (Borgman,
2015; Data and Visualization Task Force, 2011; Joint Leadership Group of the National Digital
Stewardship Alliance, 2013; Parsons & Fox, 2013; Research Information Network, 2008). For
the purposes of this dissertation, data stewardship is the facet of data management work
undertaken to enable the potential future reuse of data, beyond that of immediate scientific
returns.
Data stewardship is one component of ensuring the sustainability of scientific research
data. Scientific research data sustainability is also a complex notion lacking a unified definition.
Eschenfelder and Shankar (2016) identify and compare multiple sustainability frameworks
developed for institutions required to continue the access and preservation of research data.
Indices are available for institutions to analyze their available knowledge infrastructures to
determine their data sustainability “grade” throughout multiple categories (Australian National
Data Service (ANDS), 2017; Crowston & Qin, 2011; Sallans & Lake, 2014). For the purposes of
this dissertation, data sustainability refers to notions of reliability in the knowledge
22
infrastructures supporting access to, and preservation of, scientific research data. While not all
data will require sustainable infrastructures, the data deemed worthy of long-term management
do necessitate ongoing support.
Scientific communities, funding bodies, and the general public expect research endeavors
to have broad success given the large financial investments and human labor. The High Energy
Physics (HEP) community participated in a global self-study examining, “long-term data
analysis as a way to maximise the scientific return for investment in large-scale accelerator
facilities” (Study Group for Data Preservation and Long Term Analysis in High Energy Physics,
2012, p. 6). The report indicates data preservation in HEP requires “urgent action” (Study Group
for Data Preservation and Long Term Analysis in High Energy Physics, 2012, p. 6). Similarly,
the International Astronomical Union (IAU) adopted a resolution in 2003 stating:
“data obtained at major astronomical facilities should…be placed in an archive where they may be accessed via the internet by all research astronomers. As far as possible, the data should be accompanied by appropriate metadata and other information to tools [sic] to make them scientifically valuable” (XXVth General Assembly of the International Astronomical Union, 2003).
Policymakers and funders have begun to implement data management requirements,
often intended to promote data sharing. Beginning in 2011, the NSF-mandated data management
plans as a component of all new grant proposals. In February 2013, the United States Executive
Office of the President, Office of Science and Technology Policy, released a memorandum
requiring large federal agencies to ensure federally funded scientific research data are made
available to the “public, industry, and the scientific community” (Holdren, 2013, p. 1). In
addition to data, many universities and academic researchers are shifting toward open access
publication of scientific results (Office of Scholarly Communication, University of California,
2013a, 2013b; Provost & EVP - Academic Affairs, 2015). Some university libraries are
23
developing data management departments, and some universities are establishing data
management and data science education tracks within existing departments or as new programs
(Thompson, Mayernik, Palmer, Allard, & Tenopir, 2015; Varvel Jr., Bammerlin, & Palmer,
2012; Weber, Palmer, & Chao, 2012).
Arguments for data sharing as a collective good indicate that data release can reduce
replication of effort while enabling scientific verification and reproducibility. Data sharing is
especially heralded as important when data are collected using public funds; “Right now,
taxpayer-funded research is probably generating data that is not being fully utilized… we may
waste money on the same research or miss opportunities to reuse existing data for new inquiries”
(Levine, 2014, p. 134). Data sharing also enables scientific advancement in the form of data
“amplification,” in which the combination of discrete datasets results in information larger than
the sum of the parts (Kitchin, 2014). Funding agencies, universities, and researchers alike largely
agree that data management, sharing, and preservation benefit both individual scientific outputs
and global scientific progress. However, questions remain: what kind of data management must
take place, when, and by whom, to enable future scientists to make use of preserved data?
Sustainable infrastructures can be expensive and require consistent funding over time.
There remains an “Availability-Usability Gap” between the aspirations of funding agencies and
the reality of how research data can and are managed under current infrastructures (Levine, 2014,
p. 129). Funding agencies may expect long-term data management to take place by individuals
and teams who lack sustainable infrastructures. Not only can the technological and workforce
costs be high for long-term data management, but also the costs for data management are often
placed on those who will not reap the benefits. The unclear nature of who pays and who benefits
from long-term scientific data management raise questions of which stakeholders should be
24
responsible for the time spent and costs incurred. Data managers may find themselves wondering
what level of effort should be given to data of uncertain long-term value (N. Gray et al., 2012).
Economies of scale, like “Moore’s Law” help, but they do not negate the expense of
long-term data management (Blair, 2010; Kitchin, 2014). Long-term data management activities
can be time consuming, and do not always result in immediate scientific returns. Making data
available requires technological and human infrastructure, which are both “precondition[s] to
meaningful access and reuse…” (Berman & Cerf, 2013, p. 341; Edwards et al., 2013; Hine,
2006). Other research communities could serve as examples. For instance, “…it may be
informative to consider NSF processes for managing large facilities as a way of better
understanding the issues involved in developing policy to manage long-lived digital data
collections” (National Science Board (U.S.), 2005, p. 40). The Inter-university Consortium for
Political and Social Research is a consortium that has worked together since the 1960s to sustain
social science research data (Regents of the University of Michigan, 2016). The ICPSR seeks to
ensure, “leadership and training in data access, curation, and methods of analysis for the social
science research community” (Regents of the University of Michigan, 2016).
In the era of data-driven science, increased importance is placed on data with long-term
value since it can be combined with multiple sources (National Science Board (U.S.), 2005, p.
13). Data management throughout the full research life cycle is necessary to ensure future data
can be reused, however the specific tasks entailed in data management may differ by setting. In
all contexts, however, data management requires human and technical resources (Levine, 2014,
p. 136). Despite mounting pressure from funding agencies and policy makers, little consensus
exists regarding what, when, how, and how long data should be managed (Borgman, 2015).
Policies and procedures are necessary to determine whether or not data will retain long-term
25
value and therefore necessitate long-term management (Blair, 2010; Bowker, 2005; National
Science Board (U.S.), 2005; Research Information Network, 2008).
Data context is required for datasets to retain their scientific usability (Research
Information Network, 2008, p. 10). Data sharing is not a simple endeavor, as data are inherently
removed from their surrounding contexts when shared and reused (Borgman, 2015; Bowker,
2005; Edwards, 2010; Edwards et al., 2013). For example, data sharing and subsequent reuse are
challenging in that reusers must trust choices made by others during data collection. Software
and other kinds of information may need to accompany datasets to enable reuse (Bowker, 2005;
Edwards, 2010; Edwards et al., 2013), which may present additional management challenges (N.
Gray et al., 2012, p. 7). Metadata and other documentation may be created to mitigate the
contextual shift, but these activities also require investment in resources. Given these
complexities, long-term data management to enable future discovery and reuse can be considered
a “grand challenge” (Ray, 2014a, p. 2).
A number of valid reasons exist why researchers may choose to not share data. While
some scientific collaborations choose to release their data, resulting in scientific advances, data
sharing is not inherently “good” (Kitchin, 2014, p. 62). Scholars may still be actively using a
dataset and fear that other researchers could “scoop” their research findings by publishing first
(Borgman, 2015). Researchers often lack the time and expertise necessary to make data useful to
others, and the creator may not even envision the future uses of their data since the data may not
have been created with the intent of reuse (Borgman, 2012a, 2015; Fecher, Friesike, & Hebing,
2015; Kratz & Strasser, 2015; Mayernik, 2011; Wallis, 2012; Wallis, Rolando, & Borgman,
2013). Today, like in fourth-century Athens, there remains the “fear that written words, in
26
circulating beyond the author’s control, were more readily misunderstood and misused than
words spoken to an interlocutor” (Blair, 2010, p. 14).
2.3ScientificResearchDataManagementWorkforces
Sustainable data infrastructures require investments in technology and workforces. As
data-driven sciences continue to emerge, it concurrently necessitates “an accompanying surge in
the advancement of digital curation, and therefore in the digital curation workforce” (Hedstrom
et al., 2015, p. 9). Data management expertise is important; “Without such support, there is the
danger that data will be created in unusable forms, managed inappropriately, or stored
ineffectively” (Research Information Network, 2008, p. 13). Workforces are an essential
component of the management of research data, since a solely technological solution does not
exist to ensure research data management (Baker & Millerand, 2010; Borgman, 2015; Ray,
2014a).
However, identifying relevant workforces for data management and sustainability is also
complex. Regardless of the precise definition, research data management workforces are critical
to the support of data-intensive science and yet policy makers and many researchers decry a gap
in the quality and quantity of data management professionals available for modern science
(Kitchin, 2014; Ray, 2014a). For the purposes of this dissertation, the scientific research data
workforce encompasses those that are tasked with managing, stewarding, sustaining, serving,
storing, archiving, curating, or preserving scientific research data; and the expertise and
experience are the existing knowledgebase the workforces bring to these tasks (Sands et al.,
2014).
It is unclear whether new workforces will bring these data management skills to research
collaborations, or whether existing stakeholders will be trained in data-intensive science data
27
management (National Science Board (U.S.), 2005). Whether data curation is conducted by data
specialists, or by domain experts, expertise must be shared:
“Digital curation specialists will need some knowledge of the disciplines and domains in which the digital information they curate will be used. Without some familiarity with the problems to be addressed, the goals to be pursued, as well as the customary methods, nomenclature, and practices of the fields in which the digital information assets are used, curators will not be able to make good decisions as they manage and enhance those assets for current and future use. Similarly, those who conduct curatorial activities as only a small part of their work, will need some study and command of the knowledge and skills of digital curation, regardless of how well they are educated in their own domains” (Hedstrom et al., 2015, p. 63).
For collaborations as large and complex as astronomy sky surveys, it is impossible for
one person to be an expert on the details of the full data life cycle (Borgman, 2015). Data must
be managed well across the life cycle, which requires overlapping expertise as data move
through a distributed workforce and across time. Action or inaction at any point in the life cycle
could reduce the ability for data to be reused in the future. For example, the work done by
content creators, early in the life cycle may impact the future usability of a dataset as much as the
actions of a data manager at the end of the life cycle (National Digital Stewardship Alliance of
the Library of Congress, 2013).
A sustainable workforce is necessary at multiple scales, both within individual projects as
well as across the larger field of data-intensive sciences (National Science Board (U.S.), 2005, p.
38). The Research Information Network report explicitly states that to ensure “…arrangements
for their stewardship are sustainable—not least [by] the training and supply of a cadre of
specialist curation personal. Otherwise there is the danger of loss or damage to valuable data”
(2008, p. 14). Depending on the context, a sustainable workforce may require the same staff
working on a project over the long-term. Alternatively, continuity may mean clearly defined
28
handoff and coordination procedures are in place. Regardless, a sustainable workforce is
necessary to ensure data remain supported over time.
2.3.1Professionaldatapractices
Management of scientific data involves a large number of data practices. Just as data
management, sustainability, and other terms have multiple meanings between stakeholders, so do
terms describing the data management workforce. The data management workforce in the
information science (IS) community have been referred to as research technologists (Lyon,
2007), data scientists (National Science Board (U.S.), 2005; van der Graaf & Waaijers, 2011), e-
science professionals (Stanton et al., 2011), and data curators (Higgins, 2008). Some of these
examples reflect generic roles in scientific data curation and others are specific to university-
based academic settings. Data science programs appear with greater frequency in colleges and
universities. In 2015, nearly 100 universities offered programs in “data science” including
bachelors, masters, graduate certificates, and PhDs (Borgman, Darch, Sands, Pasquetto, &
Golshan, 2015; Sands et al., 2014). However, not all of these roles refer to data management
practice for science as described in this dissertation. Most of these programs are geared to
business, many of the scientific programs were focused in the biological sciences, and only three
IS departments included data science programs. While a number of IS departments offered
individual courses in data management, these curricula generally focused on professional
practices for work at the end of the life cycle, including data curation, preservation, and
stewardship (Lyon, 2007; Mayernik et al., 2013; Ray, 2014b). Rarely is data management taught
explicitly within graduate programs in the sciences (Mossink, Bijsterbosch, & Nortier, 2013;
National Health and Medical Research Council, 2007). While most educators concur with an
increased need for data managers in all fields, agreed upon definitions of these workforces and
29
established career paths are lacking (Manyika et al., 2013; Mayer-Schonberger & Cukier, 2013;
M. A. Nielsen, 2012).
Some argue that research library staff in particular should have a role in scientific data
management, because libraries have already established infrastructures for the management of
research publications (Choudhury, 2010; Levine, 2014; H. J. Nielsen & Hjørland, 2014; Tenopir,
Birch, & Allard, 2012). However, exactly how libraries can manage data-intensive scientific data
without a re-skilling of the workforce is undetermined (Borgman, 2015; Sands et al., 2014;
Sands, Darch, Borgman, Golshan, & Traweek, In Progress). Due to the long-lived nature of
university libraries, it is reasonable to consider them as sustainable institutions for research data
management (Corrall, 2012; Data and Visualization Task Force, 2011; Heidorn, 2011; Hey &
Hey, 2006). Unfortunately, the expertise necessary to manage literary resources does not
necessarily translate to the management of research data (Borgman, 2015; Heidorn, 2011; Sands
et al., 2014).
Several professional practice frameworks elucidate the knowledge and expertise
necessary for the data management workforce (Choudhury, 2013; Engelhardt, Strathmann, &
McCadden, 2012; Hedstrom, 2012; Hedstrom et al., 2015; Y. Kim, Addom, & Stanton, 2011;
Swan & Brown, 2008). These frameworks, while varied by goals and structure, each attempt to
illustrate the array of traits required for scientific data managers. The frameworks categorize into
lists of knowledge and expertise, without ordering their individual value. For example, Swan and
Brown differentiate data management personnel expertise between three categories: subject
knowledge, technical skills, and people skills (2008); Engelhardt, et al. differentiate these lists of
skills between technical expertise, information science, and subject knowledge (2012, p. 4).
While these examples are helpful to recognize the broad range of knowledge and expertise
30
exhibited in data management, they often blur the specific skills and individuals involved in the
data workforce. These data management personnel frameworks cluster together an array of
careers, education, experience, expertise, and life cycle stages. The amount of domain
knowledge required for data management at different life cycle stages appears to vary by
context.
Initial studies of astronomy data practices indicated that those managing data require
domain knowledge to ensure data are useable (W. L. Anderson, 2004; Sands et al., 2014).
Astronomy communities tend to embrace information technology knowledge; however,
astronomers are rarely formally trained in computer science and software engineering (N. Gray
et al., 2012). Data management experience without formal training can lead to technologically
successful short-term collaborations that require further education for managing data in the long-
term (N. Gray et al., 2012). Information Studies (IS) analyses of the knowledge and expertise
required for data management are often based on evidence gathered from interviews with
professionals in the field, evaluation of job descriptions, and internship experiences (J. Kim,
Warga, & Moen, 2013; Y. Kim et al., 2011; Pryor & Donnelly, 2009). However, these
frameworks tend to ignore the data management practices of the scientists themselves, focusing
on an IS-based workforce. Further domain-based case studies are necessary to delineate
specifically the specializations and roles professionals play in data management (Renear et al.,
2010, p. 4).The Data Conservancy employs the data-driven Stack Model for Data management
(Figure 2) to distinguish data management practices (Sayeed Choudhury on Data Stack Model,
2012). The Data Conservancy is an university-based collaboration addressing research data
management (“Data Conservancy,” 2014). The model is an example of a professional practice
framework that provides definitions for components of data management (Choudhury, 2013;
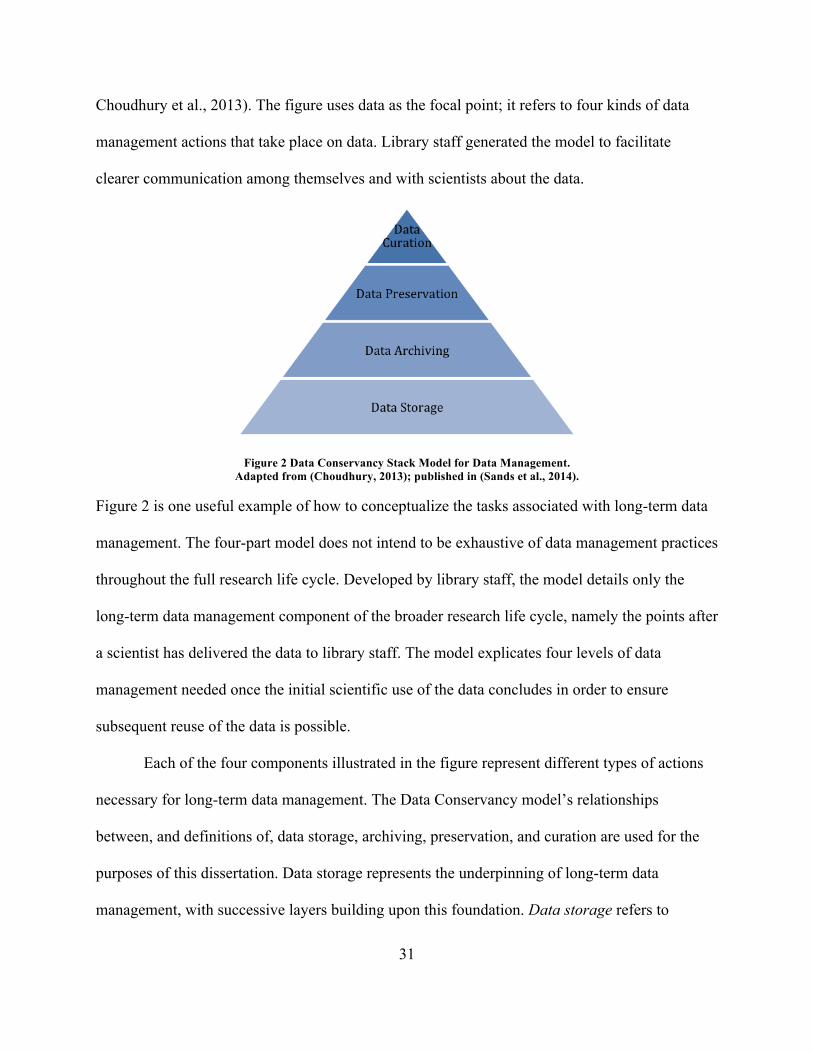
31
Choudhury et al., 2013). The figure uses data as the focal point; it refers to four kinds of data
management actions that take place on data. Library staff generated the model to facilitate
clearer communication among themselves and with scientists about the data.
Figure 2 Data Conservancy Stack Model for Data Management. Adapted from (Choudhury, 2013); published in (Sands et al., 2014).
Figure 2 is one useful example of how to conceptualize the tasks associated with long-term data
management. The four-part model does not intend to be exhaustive of data management practices
throughout the full research life cycle. Developed by library staff, the model details only the
long-term data management component of the broader research life cycle, namely the points after
a scientist has delivered the data to library staff. The model explicates four levels of data
management needed once the initial scientific use of the data concludes in order to ensure
subsequent reuse of the data is possible.
Each of the four components illustrated in the figure represent different types of actions
necessary for long-term data management. The Data Conservancy model’s relationships
between, and definitions of, data storage, archiving, preservation, and curation are used for the
purposes of this dissertation. Data storage represents the underpinning of long-term data
management, with successive layers building upon this foundation. Data storage refers to
32
ensuring the security, back up, and potential restoration of digital data bits (Choudhury et al.,
2013). Data storage can be a critical component to data management both during and after the
initial scientific use of the data.
The term archive is often used in its noun form, referring to archives as institutions or
archivists as information managers. The oft-cited OAIS reference model consistently uses the
term archive in the noun form. An archive is: “an organization that intends to preserve
information for access and use by a Designated Community” (Consultative Committee for Space
Data Systems, 2012). In this dissertation, however, the verb form “to archive” is used to describe
the act of archiving information. Data managers are archiving data when they act in ways
enabling data to be searched for and retrieved in the future. Given the Data Conservancy model,
once data are stored properly, archiving can include adding unique and persistent identifiers to
data, enabling reliable data findability for indeterminate future retrieval (Choudhury et al.,
2013).Data preservation practices are those that ensure data are maintained in the long-term. In
the Data Conservancy model, preservation activities ensure archived data are physically
conserved into the future. Preservation activities may include, “maintaining information,
independently understandable by a designated community, and with evidence supporting its
authenticity, over the long term” (Consultative Committee for Space Data Systems, 2012, pp. 1–
13). Data preservation includes the actions needed to secure information over the course of time,
which often includes preemptive hardware and software migration and other technical updates.
Data curation is the highest-level long-term data management activity in the Data
Conservancy model. Once data are stored, archived, and preserved, data curation activities are
performed in accordance with given institutional capacities and priorities. Data curation is an
aspect of data management which includes adding value to extant data “through documentation,
33
standardization, migration to new formats” and is critical to effective data reuse (Borgman et al.,
2012, p. 486). While some employ data curation as an umbrella term for data management
(Abrams et al., 2009; Henry, 2012, p. 1), data curation can be distinguished from other data
management activities by noting that, “what distinguishes curation from these other fields is its
emphasis on enhancing the value of information assets for current and future use and its attention
to the repurposing and reuse of information, both within and beyond the context in which it was
first created or collected” (Hedstrom et al., 2015, p. 13).
2.3.2Datamanagementexpertise
The kinds of experience and expertise necessary to support research data management,
much like the definition of research data management, are not agreed upon. As the scale of data
swells, the qualitative nature of data education must also adapt; “today’s graduate students need
formal training in areas beyond their central discipline: they need to know some data
management, computational concepts and statistical techniques” (Szalay & Gray, 2006, p. 413).
Rita Colwell (former Director of the NSF) describes the needed domain experts as “T-shaped”
individuals whose knowledge is both “broad and deep” (Benderly, 2008; Colwell, 2009;
Committee on Enhancing the Master’s Degree in the Natural Sciences, Board on Higher
Education and Workforce, Policy and Global Affairs, & National Research Council, 2008).
Others in business and academia describe more specifically the need for expertise
strength in two fields, namely domain knowledge and technical skills. Scientific domain
knowledge, which for this dissertation is astronomy, is the knowledge obtained through higher
education in a specific field of study. Technical expertise, or computational skills, alternatively
can be acquired in multiple ways and various levels. Computer science knowledge is that
obtained through a higher education degree in computer science. Other times, computational
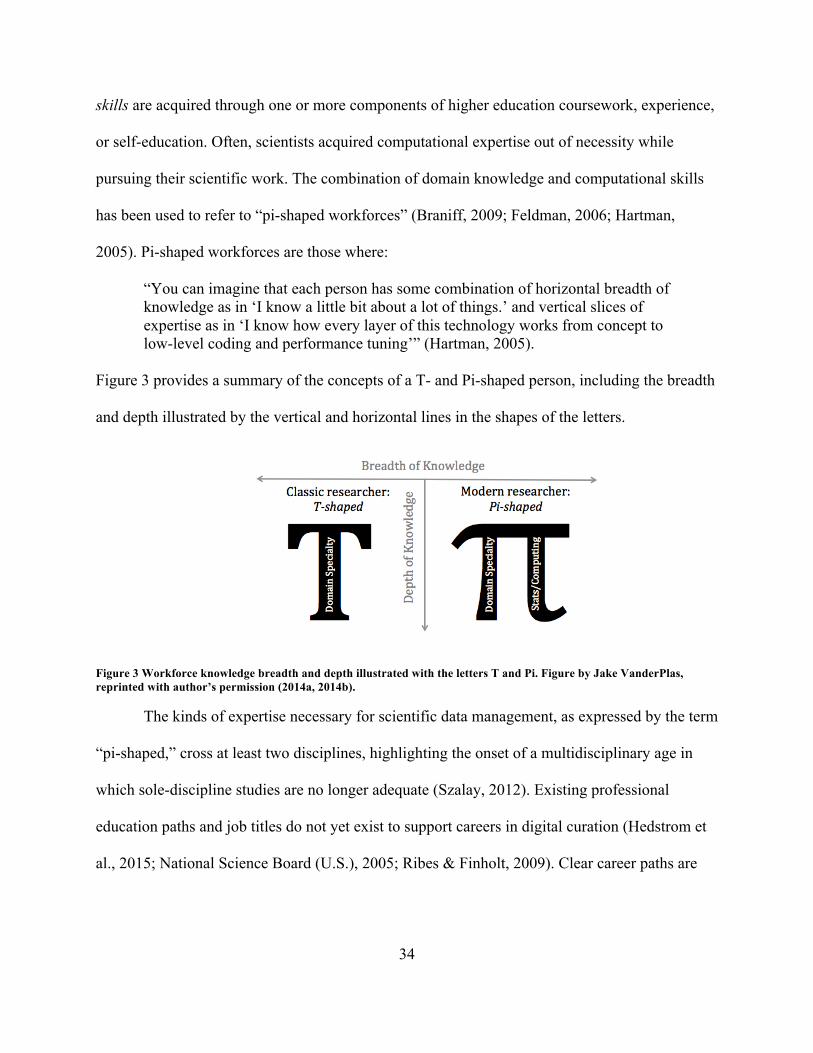
34
skills are acquired through one or more components of higher education coursework, experience,
or self-education. Often, scientists acquired computational expertise out of necessity while
pursuing their scientific work. The combination of domain knowledge and computational skills
has been used to refer to “pi-shaped workforces” (Braniff, 2009; Feldman, 2006; Hartman,
2005). Pi-shaped workforces are those where:
“You can imagine that each person has some combination of horizontal breadth of knowledge as in ‘I know a little bit about a lot of things.’ and vertical slices of expertise as in ‘I know how every layer of this technology works from concept to low-level coding and performance tuning’” (Hartman, 2005).
Figure 3 provides a summary of the concepts of a T- and Pi-shaped person, including the breadth
and depth illustrated by the vertical and horizontal lines in the shapes of the letters.
Figure 3 Workforce knowledge breadth and depth illustrated with the letters T and Pi. Figure by Jake VanderPlas, reprinted with author’s permission (2014a, 2014b).
The kinds of expertise necessary for scientific data management, as expressed by the term
“pi-shaped,” cross at least two disciplines, highlighting the onset of a multidisciplinary age in
which sole-discipline studies are no longer adequate (Szalay, 2012). Existing professional
education paths and job titles do not yet exist to support careers in digital curation (Hedstrom et
al., 2015; National Science Board (U.S.), 2005; Ribes & Finholt, 2009). Clear career paths are
35
needed to increase professional opportunities for individuals with “pi-shaped” expertise
(Bowker, 2005; Hedstrom et al., 2015).
While deep knowledge in two domains is said to be increasingly necessary for data-
driven science, these experts may or may not be compensated accordingly for their dual
expertise. For example, modern scientific collaborations require experts from different
disciplines, yet universities remain organized to reward individuals publishing within single,
established disciplines (Bowker, 2005, p. 125; Hedstrom et al., 2015). While the expertise is
necessary for sky surveys, there remains a paradox between the disparate reward structures for
instrument builders, software developers, and data managers, compared to those who perform
scientific research with the resulting data (Ribes & Finholt, 2009).
Sky surveys in astronomy are an example of big science (Galison & Hevly, 1992b), in
which more than half of the project funding and person-time may be devoted to data collection,
cleaning, and management. Those who perform this data management work often require
expertise in astronomy as well as computational skills. Sky survey data managers may have the
expertise and desire to publish scientific journal articles, without the time to pursue those tasks.
While writing and publishing scientific journal articles is generally the most important measure
by which academic tenure and promotion decisions are determined, data management work often
detracts from writing time (Levine, 2014; Ribes & Finholt, 2009; Star & Ruhleder, 1996). Given
that infrastructure work detracts from the writing and publication of journal articles, data
managers may find it difficult to be competitive for tenure-track academic careers.
Formal education and career paths for data management are still emerging; currently
scientific collaborations manage data through a variety of methods. Data management work is
often a part of infrastructure building and maintenance (Borgman, 2000, 2015) and may become
36
“invisible” (Paisley, 1980; Shapin, 1989). Invisible work most closely related to knowledge
infrastructures and data management is that in which, “Work may become expected, part of the
background, and invisible by virtue of routine (and social status). If one looked, one could
literally see the work being done – but the taken for granted status means that it is functionally
invisible” (Star & Strauss, 1999, p. 20). System administrators, long-term data managers,
software engineers, and others involved in the daily maintenance of existing infrastructures,
whose continued availability is taken for granted, may be performing invisible work (Borgman,
2015; Bowker & Star, 1999; Ribes & Finholt, 2009; Ribes & Jackson, 2013; Star & Strauss,
1999). Despite perceptions, “infrastructural development and maintenance requires work, a
relatively stable technology, and communication” (Bowker, 2005, p. 114).
2.4AstronomySkySurveyKnowledgeInfrastructures
As defined in 2.1.1 Knowledge infrastructures, knowledge infrastructures are “robust
networks of people, artifacts, and institutions that generate, share, and maintain specific
knowledge about the human and natural worlds” (Edwards, 2010, p. 17). Astronomy has some of
the most established human and technical infrastructures of any scientific field. International
tools are generally built within the discipline by domain experts (Kurtz et al., 2005). In addition
to tools, human infrastructures are important to the functioning of astronomy. Accomazzi and
Dave (2011) explain the interactions of large, existing infrastructure projects (See Figure 4). In
their assessment, future astronomy goals include the interoperability of astronomical objects
(celestial objects), observations (the data), and publications (scholarly communication). Figure 4
begins to elucidate an emerging web of astronomy resources. The Virtual Astronomical
Observatory (VAO) is central to multiple resources and tools (Accomazzi & Dave, 2011;
Budavari, 2010; Djorgovski & Williams, 2005; Hanisch, 2013). NED and SIMBAD, as well as
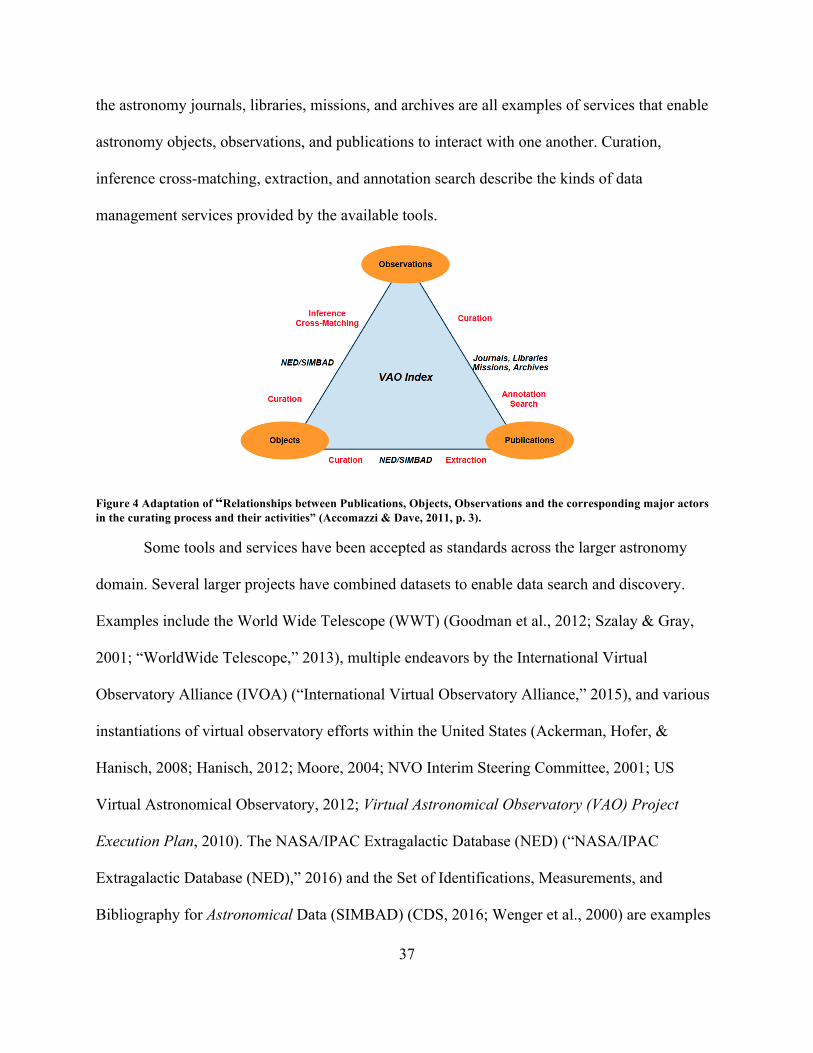
37
the astronomy journals, libraries, missions, and archives are all examples of services that enable
astronomy objects, observations, and publications to interact with one another. Curation,
inference cross-matching, extraction, and annotation search describe the kinds of data
management services provided by the available tools.
Figure 4 Adaptation of “Relationships between Publications, Objects, Observations and the corresponding major actors in the curating process and their activities” (Accomazzi & Dave, 2011, p. 3).
Some tools and services have been accepted as standards across the larger astronomy
domain. Several larger projects have combined datasets to enable data search and discovery.
Examples include the World Wide Telescope (WWT) (Goodman et al., 2012; Szalay & Gray,
2001; “WorldWide Telescope,” 2013), multiple endeavors by the International Virtual
Observatory Alliance (IVOA) (“International Virtual Observatory Alliance,” 2015), and various
instantiations of virtual observatory efforts within the United States (Ackerman, Hofer, &
Hanisch, 2008; Hanisch, 2012; Moore, 2004; NVO Interim Steering Committee, 2001; US
Virtual Astronomical Observatory, 2012; Virtual Astronomical Observatory (VAO) Project
Execution Plan, 2010). The NASA/IPAC Extragalactic Database (NED) (“NASA/IPAC
Extragalactic Database (NED),” 2016) and the Set of Identifications, Measurements, and
Bibliography for Astronomical Data (SIMBAD) (CDS, 2016; Wenger et al., 2000) are examples
38
of federated databases enabling simplified search and retrieval of information about astronomical
objects.
In terms of scholarly communication, astronomers extensively and consistently rely on
the Astrophysics Data System (ADS) for bibliographic records and document access (Accomazzi
et al., 2015; Accomazzi, Grant, Eichhorn, Kurtz, & Murray, 1996; Henneken et al., 2010;
Henneken, Kurtz, & Accomazzi, 2011; Kurtz et al., 1999; McKiernan, 2001). The ADS
“provides easy on-line access to journal abstracts and articles, maintains a digital library and data
catalogs, and provides access to archival data” (Accomazzi, 2011; Hasan, Hanisch, &
Bredekamp, 2000, p. 136). ADS has served the astronomy community with a bibliographic
database for over 20 years, and in 2010 began including the service of linking data to
publications (Henneken & Thompson, 2013). Similarly, the community broadly uses the pre-
print document archive service “arXiv” (Cornell University, 2016; Ginsparg, 2011). arXiv is
used by thousands of astronomers internationally (Henneken et al., 2007; Kurtz et al., 2007).
Additional projects are still considering tools for data in addition to existing tools for
publications (Norris et al., 2006, p. 5).
From the outside, astronomy infrastructure appears solidly in place in the form of the
many projects, tools, and services described above. However, astronomers continue pursuing
better scholarly infrastructure dimensions and attempting to resolve problems that remain
unaddressed by existing tools and services, including the automating some existing processes.
Some infrastructures are more fragile than others (Borgman, Darch, Sands, & Golshan, 2016).
Accordingly, much infrastructure work remains necessary to create a truly seamless astronomy
environment (Accomazzi, Henneken, Erdmann, & Rots, 2012; Crosas, 2013; Goodman, 2009;
Goodman & Wong, 2009; Norris et al., 2006).
39
The scientific community works together to, “coordinate conventions, types of data
(images, time series, spectra etc.), and a basic lexicon…” (Hasan et al., 2000, p. 133). Most
notably, astronomy data standardization includes international use of the Flexible Image
Transport System (FITS) file format (Hanisch et al., 2001). FITS has been the agreed upon file
format for over forty years and proved itself as a powerful standard within the discipline,
enabling data interoperability and reuse. However, some argue the format is now showing its
age, and the community should seek to adapt or replace the standard to face the “new challenges
for the 21st century” (Thomas et al., 2014, p. 354). The SDSS and LSST projects emerged from
within this environment where standardization enabled huge interoperability gains, but in which
the community continues to push boundaries.
Long a grievance of instrument builders and laboratory technicians (Blair, 2010; Shapin,
1989), a reward-structure hierarchy persists in scientific research, even when one component is
agreed to be critical to the success of the other. Ribes and Finholt state, “The implicit hierarchy
places scientific research first, followed by deployment of new analytic tools and resources, and
trailed by maintenance work” (2009, p. 388). In many scientific fields, team members are
rewarded for time spent building shared infrastructures by being allowed access to resulting data
during the proprietary period. Proprietary periods, also referred to in some communities as
embargos, are time periods with which investigators are able “to control their data before
releasing [the data]” (Borgman, 2015, p. 12). Proprietary periods enable team members the
chance to publish findings first, before the data are released to outside investigators who have not
invested time into the project.
While some data management and infrastructure building may be rewarded through
journal article citations, the data citation model is also not agreed upon (Altman, Borgman,
40
Crosas, & Martone, 2015; Altman & Crosas, 2013; Borgman, 2012b; CODATA-ICSTI Task
Group on Data Citation Standards Practices, 2013; Crosas, Carpenter, Shotton, & Borgman,
2013; National Academies of Science. US CODATA and the Board on Research Data and
Information, in collaboration with CODATA-ICSTI Task Group on Data Citation Standards and
Practices, 2012; Uhlir, 2012). Multiple genres of journal articles can also complicate data
citation.
The astronomy community uses these three different kinds of journal articles to alert
colleagues to new information, contribute details for data and instrument reuse, and provide a
way to reference instruments or data within the confines of traditional bibliographic references.
Common among scientific communities are “science papers.” Science papers are journal articles
that describe the methods and analysis that enabled scientific discoveries. Astronomers in
particular may also publish “instrument papers.” Instrument papers provide detailed information
about instruments such as telescopes, detectors, cameras, and other data collection materials.
End-user scientists may need the information provided in these papers to guide their use of the
resultant data. The third kind of astronomy journal article is a “data paper” or “data release”
article. Data papers describe in detail a set of data, often as it is released for public use. The
SDSS provides data release articles for each official public release. The data paper provides
context and processing information to assist users in understanding the benefits and limitations
of the data. Authorship and citation in each kind of paper are important ways stakeholders derive
credit for their work on scientific and infrastructure-building collaborations.
Scientists, engineers, instrument builders, and other infrastructure engineers earn credit
for their work through authorship and citations to each of these three kinds of journal articles.
Most scientific communities are familiar with the citation of science papers. However, the
41
astronomy community will also cite the instrument papers and data papers to reference useful
resources. These citations benefit the careers of the authors and provide feedback to funding
agencies regarding how much use are coming from the projects, instruments, and datasets they
fund. Individual collaborations define their own criteria for authorship for each type of journal
article.
2.4.1 USspace-andground-basedastronomy
The United States’ National Aeronautics and Space Administration (NASA) funds
astronomy missions in which the telescope and instruments are physically located in space, while
other agencies fund missions where the telescope is located on earth. Therefore, data practices of
astronomers are differentiated between space-based (generally NASA-operated) missions, and
ground-based (generally NSF, multi-university, and donor-funded) operations. NASA missions
have well-formed data management practices and human resource infrastructures. NASA data
are collected, processed, and archived at specific locations among a dedicated workforce
(Committee on NASA Astronomy Science Centers, & National Research Council, 2007). For
example, Hubble Space Telescope data are processed and archived at the Mikulski Archive for
Space Telescopes (MAST) in Baltimore, Maryland (R. L. White et al., 2009). A dedicated, full-
time staff of dozens of astronomers and computer scientists manage the Hubble data from
collection, analysis, archiving, and preservation. The dedicated staff manages the Hubble data to
ensure their scientific usability. Astronomy data are complex and differ between telescopes and
even among instruments on a single telescope. The long-term MAST archive is important for
Hubble data because of the dedicated, long-term archive staff who can perform consistent
management over time, leading to a stable dataset (Zimmerman, 2008, pp. 166–167).
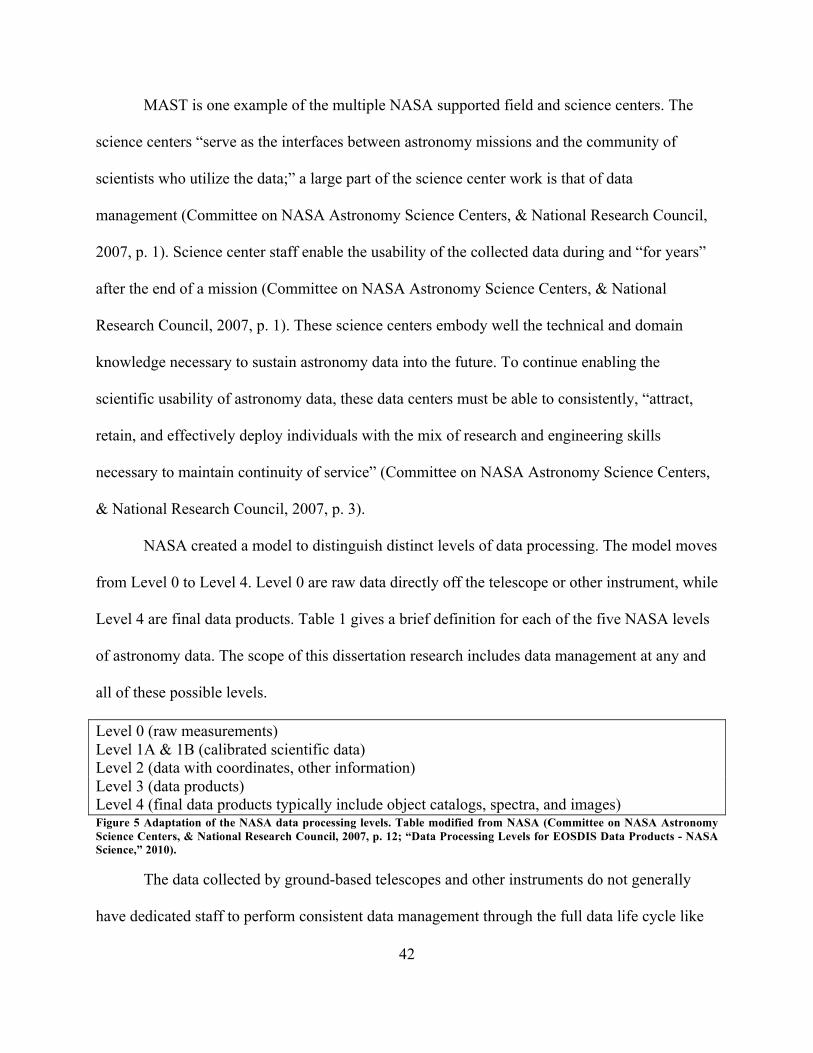
42
MAST is one example of the multiple NASA supported field and science centers. The
science centers “serve as the interfaces between astronomy missions and the community of
scientists who utilize the data;” a large part of the science center work is that of data
management (Committee on NASA Astronomy Science Centers, & National Research Council,
2007, p. 1). Science center staff enable the usability of the collected data during and “for years”
after the end of a mission (Committee on NASA Astronomy Science Centers, & National
Research Council, 2007, p. 1). These science centers embody well the technical and domain
knowledge necessary to sustain astronomy data into the future. To continue enabling the
scientific usability of astronomy data, these data centers must be able to consistently, “attract,
retain, and effectively deploy individuals with the mix of research and engineering skills
necessary to maintain continuity of service” (Committee on NASA Astronomy Science Centers,
& National Research Council, 2007, p. 3).
NASA created a model to distinguish distinct levels of data processing. The model moves
from Level 0 to Level 4. Level 0 are raw data directly off the telescope or other instrument, while
Level 4 are final data products. Table 1 gives a brief definition for each of the five NASA levels
of astronomy data. The scope of this dissertation research includes data management at any and
all of these possible levels.
Level 0 (raw measurements) Level 1A & 1B (calibrated scientific data) Level 2 (data with coordinates, other information) Level 3 (data products) Level 4 (final data products typically include object catalogs, spectra, and images) Figure 5 Adaptation of the NASA data processing levels. Table modified from NASA (Committee on NASA Astronomy Science Centers, & National Research Council, 2007, p. 12; “Data Processing Levels for EOSDIS Data Products - NASA Science,” 2010).
The data collected by ground-based telescopes and other instruments do not generally
have dedicated staff to perform consistent data management through the full data life cycle like
43
is available at the NASA science centers. Many ground-based telescopes follow a sole-researcher
model for data management. Many telescopes designed for individual and small groups of
scientists may have a different, single astronomer collecting data each night and require these
individuals to manage the data they collect. These astronomers are managing their data for their
own use and are expected to manage the data through the entirety of the data life cycle.
Other ground-based data are collected through sky survey teams, not individuals. Unlike
individual investigator-driven research, sky surveys result in uniformly captured data. The same
team collects the data over the course of the survey instead of data being collected by a different
scientist each night. The data management activities are generally split between team members
with different kinds of expertise. In projects involving a sole astronomer, that researcher
manages data through the whole life cycle; in contrast, sky survey data are managed by different
sets of team members at different stages in the life cycle. A more specialized workforce develops
in sky surveys, as team members manage data at different junctures in the life cycle, aiming to
support data use by a whole community beyond their own scientific needs.
This dissertation research investigates astronomy data practices among the population of
team members and data end-users of modern astronomy sky survey data. More specifically, the
three study populations are those involved in The Sloan Digital Sky Survey (SDSS) project
collaboration, the Large Synoptic Survey Telescope (LSST) project collaboration, and individual
astronomers who make use of SDSS data. The SDSS and the LSST projects are both ground-
based, optical sky surveys, and are each at different stages in their research life cycles. Individual
astronomers in this study may work alone or in small groups using SDSS data. The next three
subsections provide background on each of the three study populations. Chapter
44
3 Research Methods describes how the study populations were operationalized and the study
sampling methods.
2.4.2 The Sloan Digital Sky Survey
The Sloan Digital Sky Survey (SDSS) (“Sloan Digital Sky Survey: Home,” 2016)
produces a significant astronomy dataset in terms of its scope, quality, public access, and extent
of uses and users. The survey covered over a quarter of the night sky with high quality
photometric and spectroscopic imaging. The first phase of the SDSS project (SDSS I) ran from
2000 to 2005, the second (SDSS II) from 2005 to 2008, and subsequent SDSS projects continue
today; SDSS IV began taking data during Summer 2014. The final data release of the SDSS I
and II project collaboration occurred in June 2009 (Abazajian et al., 2009). A timeline of the
SDSS project is included in Appendix I. This dissertation examines the SDSS I and II phases of
data management. SDSS was the first astronomy ground-based survey to ensure prompt public
release of data, and many current collaborative telescope projects now emulate SDSS data
practices. Indeed, "By altering the traditional interactions between a telescope, its data and
communities of astronomers, Sloan … is indeed a legacy to be celebrated" (Kennicutt Jr, 2007,
p. 489).
SDSS data are consulted millions of times each month; in April 2014, the SDSS
SkyServer (the online public SDSS database) was visited more than four million times (SDSS
Collaboration, 2014). SDSS data are some of the most used astronomy data, arguably second
only to the Hubble Space Telescope (Borne et al., 2009; Hand, 2009; Kennicutt Jr, 2007;
Reichhardt, 2006; Singh et al., 2006). Because the SDSS data are publicly available, project
collaborators, external individuals, international scientists, and the general public alike can use
SDSS data for educational purposes and scientific research.
45
While often referred to as ‘the data,’ the SDSS I and II dataset is a complex aggregation
of materials representing multiple elements of the international project. Generally speaking, the
SDSS includes four kinds of data 1) a photometric catalog, 2) spectroscopic catalog, 3) images,
and 4) spectra (Szalay, Kunszt, Thakar, & Gray, 1999, p. 3). Specifically, the SDSS I and II
Long-Term Scientific Data Archive (the SDSS Archive) is comprised of four related datasets: (1)
the Data Archive Server (DAS) contains the processed flat image files; (2) the Catalog Archive
Server (CAS) contains multiple releases of the image and spectroscopy SQL [Structured Query
Language] database; (3) the Software includes the code generated for the data collection, data
processing, database creation, user interfaces, and the SDSS website; and (4) the Raw Data are
the unprocessed data as received from the scientific instruments. In total, the SDSS I and II
archive forms a collection between 100 and 200 terabytes (Astrophysical Research Consortium,
2008).
The SDSS collaboration manages SDSS data for use by the team and countless others.
This process can prove difficult, because one cannot predict all potential future users and uses of
a dataset (Huang et al., 1995). SDSS astronomers and computer scientists spent more than a
decade planning for data collection to ensure standardized, consistent data products over time
(Huang et al., 1995; Szalay et al., 1999; Szalay, Kunszt, Thakar, Gray, & Slutz, 2000). Data
management for the sky survey involves a number of steps beginning with the collection of raw
data by the instruments. The SDSS data were then processed through the software pipeline.
Astronomy processing pipelines are specific collections of algorithms and software designed to
calibrate, process, and derive information from raw digital data produced by scientific
instruments, which result in intelligible images, spectra, and catalogs.
Construction of the processing pipeline was a critical aspect of the entire SDSS project.
46
The pipeline software accounted for approximately 25% of the entire survey’s total “cost and
effort” (J. Gray, Slutz, et al., 2002, p. 2). Following pipeline processing, the SDSS data were
then made publicly available as flat files (DAS) and a Structured Query Language (SQL)
database (CAS). The construction and maintenance of the SQL database was a large software
project of its own due to the vast size, amount, and complexity of the SDSS dataset (J. Gray,
Slutz, et al., 2002; Szalay et al., 1999, p. 5). Now that the SDSS I and II collaboration no longer
collects new data, the data management considerations focus on the continued ability to serve
and preserve the data as a valuable resource to astronomers around the world.
2.4.3 The Large Synoptic Survey Telescope
The Large Synoptic Survey Telescope (LSST) is an international astronomy project
currently under construction. Planning for the LSST began in the late 1990s (Tyson, 1998),
enabling project recognition in time for the 2000 Astronomy Decadal Survey (Astronomy and
Astrophysics Survey Committee, 2001). The LSST collaboration now plans for data collection to
begin approximately 2020 (“LSST project schedule,” 2015). By the time of the 2010 Decadal
Survey, the LSST was chosen as the single most important astronomy project in terms of funding
and time investment for the current decade (Committee for a Decadal Survey of Astronomy and
Astrophysics; National Research Council, 2010). A timeline of the LSST project is included as
Appendix 2. Astronomers estimate that the LSST will have an even larger impact on the
astronomy community than the SDSS, in part because of the larger scale of research data
expected to be collected (Ivezić et al., 2007).
The LSST survey plans to cover more of the night sky and provide better imaging than
the SDSS project achieved due to continued advances in technology (See Table 1). Additionally,
the LSST project will acquire more data, which will address a larger number of scientific
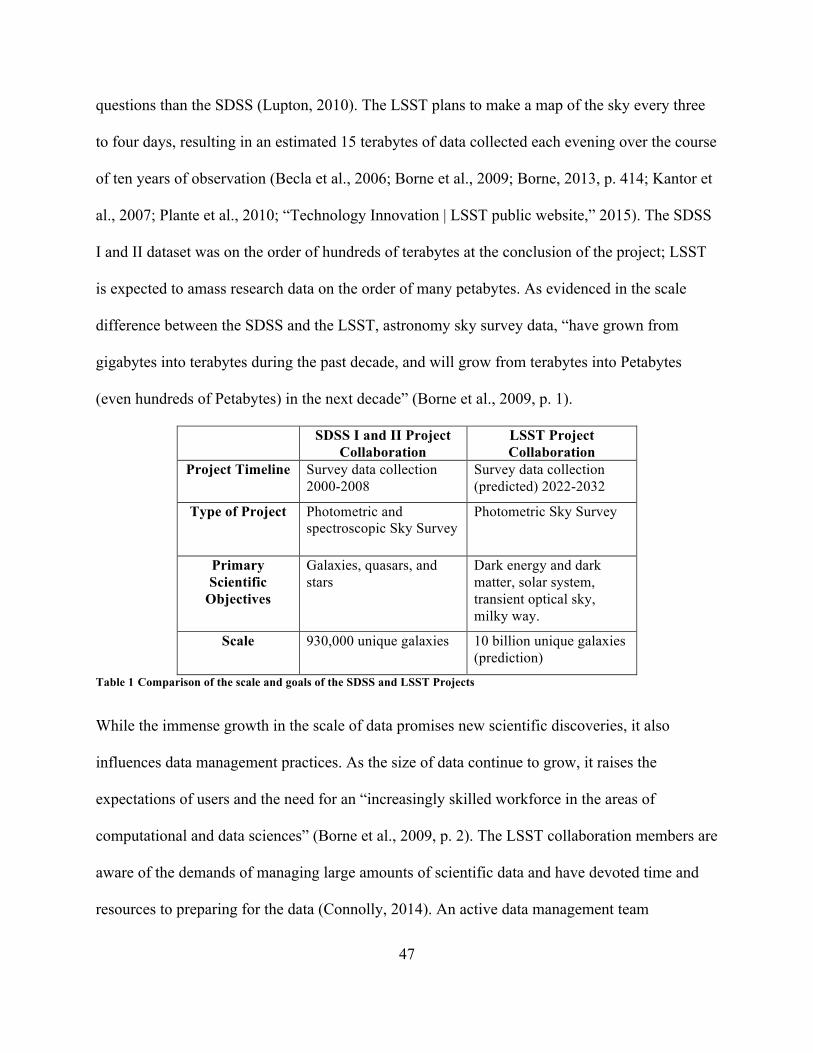
47
questions than the SDSS (Lupton, 2010). The LSST plans to make a map of the sky every three
to four days, resulting in an estimated 15 terabytes of data collected each evening over the course
of ten years of observation (Becla et al., 2006; Borne et al., 2009; Borne, 2013, p. 414; Kantor et
al., 2007; Plante et al., 2010; “Technology Innovation | LSST public website,” 2015). The SDSS
I and II dataset was on the order of hundreds of terabytes at the conclusion of the project; LSST
is expected to amass research data on the order of many petabytes. As evidenced in the scale
difference between the SDSS and the LSST, astronomy sky survey data, “have grown from
gigabytes into terabytes during the past decade, and will grow from terabytes into Petabytes
(even hundreds of Petabytes) in the next decade” (Borne et al., 2009, p. 1).
SDSS I and II Project Collaboration
LSST Project Collaboration
Project Timeline Survey data collection 2000-2008
Survey data collection (predicted) 2022-2032
Type of Project Photometric and spectroscopic Sky Survey
Photometric Sky Survey
Primary Scientific
Objectives
Galaxies, quasars, and stars
Dark energy and dark matter, solar system, transient optical sky, milky way.
Scale 930,000 unique galaxies 10 billion unique galaxies (prediction)
Table 1 Comparison of the scale and goals of the SDSS and LSST Projects
While the immense growth in the scale of data promises new scientific discoveries, it also
influences data management practices. As the size of data continue to grow, it raises the
expectations of users and the need for an “increasingly skilled workforce in the areas of
computational and data sciences” (Borne et al., 2009, p. 2). The LSST collaboration members are
aware of the demands of managing large amounts of scientific data and have devoted time and
resources to preparing for the data (Connolly, 2014). An active data management team
48
collaborates across six institutions to build the software necessary to manage the impending
LSST data deluge (“Data management | LSST public website,” 2015; “LSST Data Management
Wiki,” 2015).
2.4.4 Individual and small-group astronomy projects
Large sky surveys have significantly shaped research practices in astronomy. However,
meaningful astronomy research is still conducted individually or by small groups. In addition to
those directly involved in the SDSS and LSST collaborations, many independent astronomers
make use of publicly available survey data.
Despite the large size of the SDSS and LSST collaborations, individuals or small teams
of faculty accomplish most astronomy research. The individuals and small teams considered in
this dissertation obtained astronomy research datasets in part or whole from sky surveys,
particularly the SDSS. Depending on the research question, these teams may use only SDSS
data, SDSS data alongside data from other sky surveys, or may collect their own data from new
photometric or spectroscopic observations. Subsequently, data from across the electromagnetic
spectrum are combined and analyzed to generate derived data. In this dissertation, derived data
in astronomy are defined as copies of an original dataset that have been re-processed by one or
more end-users.
The growing number of astronomy tools and infrastructures, as well as the presence of
large sky surveys, suggests that astronomy data and therefore data management practices are
largely homogenous. However, the management practices of individual and small groups differ
from large project data management, and are mainly heterogeneous among one another (Darch &
Sands, 2015; Sands, Borgman, Wynholds, & Traweek, 2012). These highly processed derived
data are rarely provided long-term archiving, whereas the SDSS and LSST projects planned for

49
data sharing from the beginning of project development (Norris et al., 2006, p. 7).
50
3 Research Methods
This dissertation emerged from the author’s five-year collaboration in the UCLA Center
for Knowledge Infrastructures (CKI), funded by the National Science Foundation and the Alfred
P. Sloan Foundation. This dissertation addresses integral questions to the CKI’s grant-funded
research, as well as key outcomes. Within the scope of the CKI work, this dissertation research
pursues four specific research questions (RQs) among three study populations. The study
benefits from the coordination of three complementary research methods. The primary source of
data for this dissertation is semi-structured interviews. Over five years (2011-2015), the author
conducted more than 100 interviews with astronomy community members. All of those
interviews were transcribed and are part of the UCLA CKI dataset. Given the specific
operationalization of the three study populations, 80 interviews were used to represent the three
study populations for this dissertation. Ethnographic methods and document analysis were used
to prepare for, support, and explain the interview findings. Further details on the analytical
relationships between the methods are now presented.
3.1 Research Questions
This dissertation examines stakeholder perspectives of the data practices employed by
sky survey team members and data end-users. The study focuses on scientific research data; data
management tasks; the knowledge, expertise, and experience required; the workforce
responsible; and how data management activities differ between astronomy populations.
The fourth research question in this study is: How does data management differ between
populations? To address this question, the first three successive research questions had to be
examined. The expertise involved in astronomy data management was examined prior to
51
investigating how astronomy data management differs between populations. To analyze the
required expertise for data management, data management had to be understood first. Finally, to
analyze what data management is, data itself had to be scoped. The four research questions for
this dissertation successively build on one another and cumulate to the fourth question.
1. What are astronomy research data?
2. What is data management in astronomy?
3. What expertise is applied to the management of data?
4. How does data management differ between populations?
These research questions focus on revealing how data management differs between populations.
While stakeholder understandings of data, data management, and expertise openly differ, the
reasons for these differences are unclear.
3.1.1Whatareastronomyresearchdata?
Data can mean different things to different people (Borgman et al., 2012) and therefore a
single definition is impossible (Parsons & Fox, 2013). This study sought to understand how these
differences surface among the SDSS and LSST study populations, and what the implications are
for scientific research and data management infrastructures. Astronomy research data were
nominally defined in section 2.1 Scientific Research Data as “…reinterpretable representation[s]
of information in a formalized manner…” (Consultative Committee for Space Data Systems,
2012, pp. 1–10). Astronomy research data were operationalized for this dissertation to include
digital information developed for, or exploited by, the SDSS, the LSST, and SDSS data end-
users. The term data was intentionally operationalized broadly, to ensure information considered
data to some but not all stakeholders remained within the scope of the investigation.
52
3.1.2Whatisdatamanagementinastronomy?
To reveal how stakeholders discussed data management, data interpretations were
analyzed. Data management was defined nominally as an umbrella term referring to actions
taken on data aimed at enabling scientific progress (refer back to 2.2 Scientific Research Data
Management). Data management was operationalized to include all activities related to planning,
collecting, processing, documenting, analyzing, sharing, and maintaining SDSS and LSST data
as defined in the previous subsection. Data management included tasks throughout the full data
life cycle, including storage, archiving, preservation, curation, and other undertakings for data
analysis in the short- and medium-term and data stewardship in the long-term. The broad
definition was critical to ensure potential outlying perspectives were included during analysis.
3.1.3Whatexpertiseisappliedtothemanagementofdata?
Necessary data management expertise was interpreted by analyzing how interviewees
expressed data management tasks. The scientific research data workforce was defined nominally
as to encompass all individuals tasked with managing, stewarding, sustaining, serving, storing,
archiving, curating, or preserving scientific research data, whereas expertise and experience are
the existing knowledge the workforce bring to these tasks (Sands et al., 2014). These terms were
operationalized broadly to avoid unduly restricting study participant interpretations. The data
management workforce was operationalized to include all individuals who either self-identify, or
are identified by others, as affiliated with the management of the SDSS and LSST data (see
operationalized definitions of data and data management in previous sub-sections). Experience
and expertise were operationalized as any formal or informal education, skill, and knowledge
that informed or managed the SDSS and LSST data.
53
3.1.4Howdoesdatamanagementdifferbetweenpopulations?
Finally, the ways interviewees described data, and therefore data management, and the
expertise needed to manage data was analyzed based on seven demographic variables gathered
for each interviewee. The perspectives revealed in the first three cumulative research questions
informed analysis of the fourth question. Findings operationally were grouped according to the
seven demographic characteristics of interviewees recorded for this study, discussed in detail in
section 3.2.2 Semi-structured interviews.
3.2 Data Collection
This study was conducted using three qualitative research methods: semi-structured interviews,
ethnographic fieldwork, and document analysis. Table 2 shows the relationship between the
research questions (described and operationalized 3.1 Research Questions), the three study
populations and interviewee demographics, and the three research methods, which are detailed in
the following section. The table also provides a visual of the Results chapter.
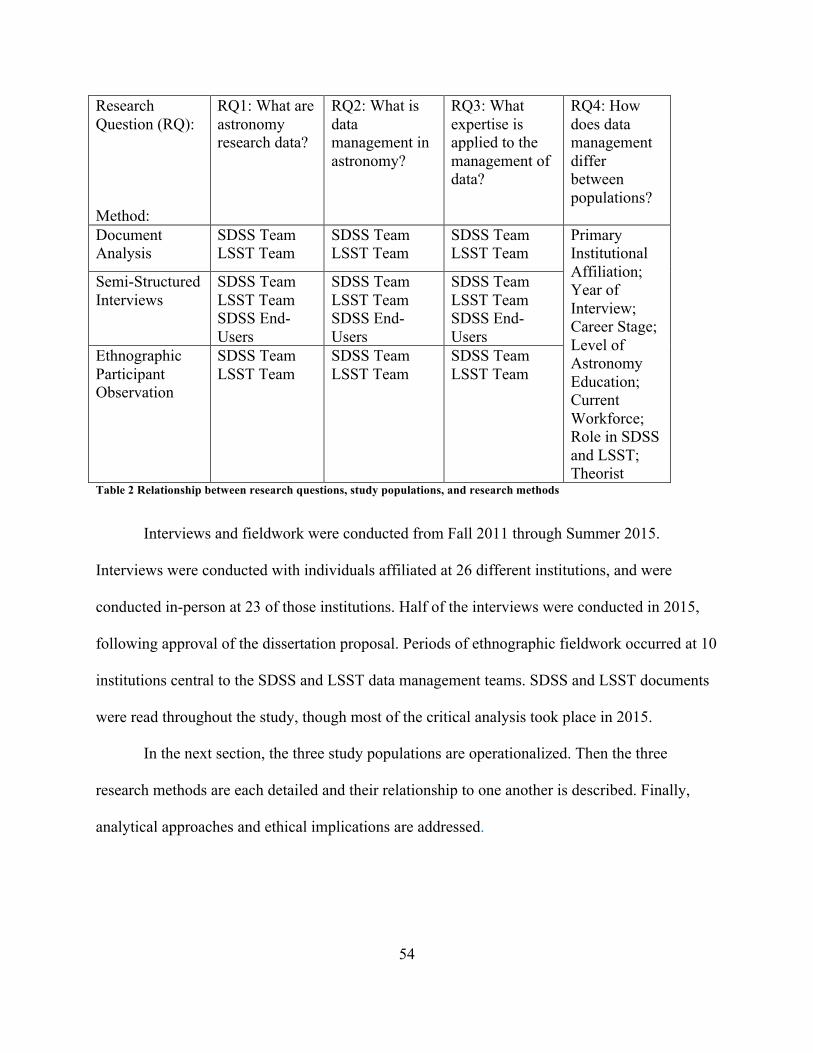
54
Research Question (RQ): Method:
RQ1: What are astronomy research data?
RQ2: What is data management in astronomy?
RQ3: What expertise is applied to the management of data?
RQ4: How does data management differ between populations?
Document Analysis
SDSS Team LSST Team
SDSS Team LSST Team
SDSS Team LSST Team
Primary Institutional Affiliation; Year of Interview; Career Stage; Level of Astronomy Education; Current Workforce; Role in SDSS and LSST; Theorist
Semi-Structured Interviews
SDSS Team LSST Team SDSS End-Users
SDSS Team LSST Team SDSS End-Users
SDSS Team LSST Team SDSS End-Users
Ethnographic Participant Observation
SDSS Team LSST Team
SDSS Team LSST Team
SDSS Team LSST Team
Table 2 Relationship between research questions, study populations, and research methods
Interviews and fieldwork were conducted from Fall 2011 through Summer 2015.
Interviews were conducted with individuals affiliated at 26 different institutions, and were
conducted in-person at 23 of those institutions. Half of the interviews were conducted in 2015,
following approval of the dissertation proposal. Periods of ethnographic fieldwork occurred at 10
institutions central to the SDSS and LSST data management teams. SDSS and LSST documents
were read throughout the study, though most of the critical analysis took place in 2015.
In the next section, the three study populations are operationalized. Then the three
research methods are each detailed and their relationship to one another is described. Finally,
analytical approaches and ethical implications are addressed.
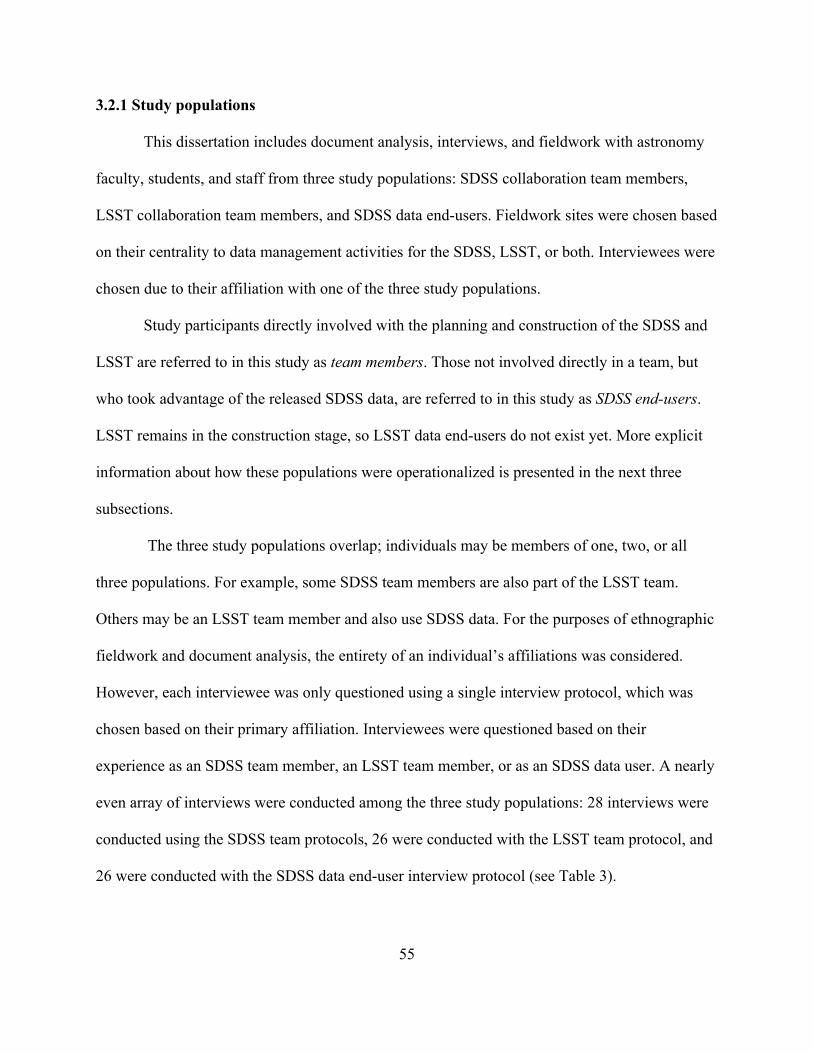
55
3.2.1 Study populations
This dissertation includes document analysis, interviews, and fieldwork with astronomy
faculty, students, and staff from three study populations: SDSS collaboration team members,
LSST collaboration team members, and SDSS data end-users. Fieldwork sites were chosen based
on their centrality to data management activities for the SDSS, LSST, or both. Interviewees were
chosen due to their affiliation with one of the three study populations.
Study participants directly involved with the planning and construction of the SDSS and
LSST are referred to in this study as team members. Those not involved directly in a team, but
who took advantage of the released SDSS data, are referred to in this study as SDSS end-users.
LSST remains in the construction stage, so LSST data end-users do not exist yet. More explicit
information about how these populations were operationalized is presented in the next three
subsections.
The three study populations overlap; individuals may be members of one, two, or all
three populations. For example, some SDSS team members are also part of the LSST team.
Others may be an LSST team member and also use SDSS data. For the purposes of ethnographic
fieldwork and document analysis, the entirety of an individual’s affiliations was considered.
However, each interviewee was only questioned using a single interview protocol, which was
chosen based on their primary affiliation. Interviewees were questioned based on their
experience as an SDSS team member, an LSST team member, or as an SDSS data user. A nearly
even array of interviews were conducted among the three study populations: 28 interviews were
conducted using the SDSS team protocols, 26 were conducted with the LSST team protocol, and
26 were conducted with the SDSS data end-user interview protocol (see Table 3).
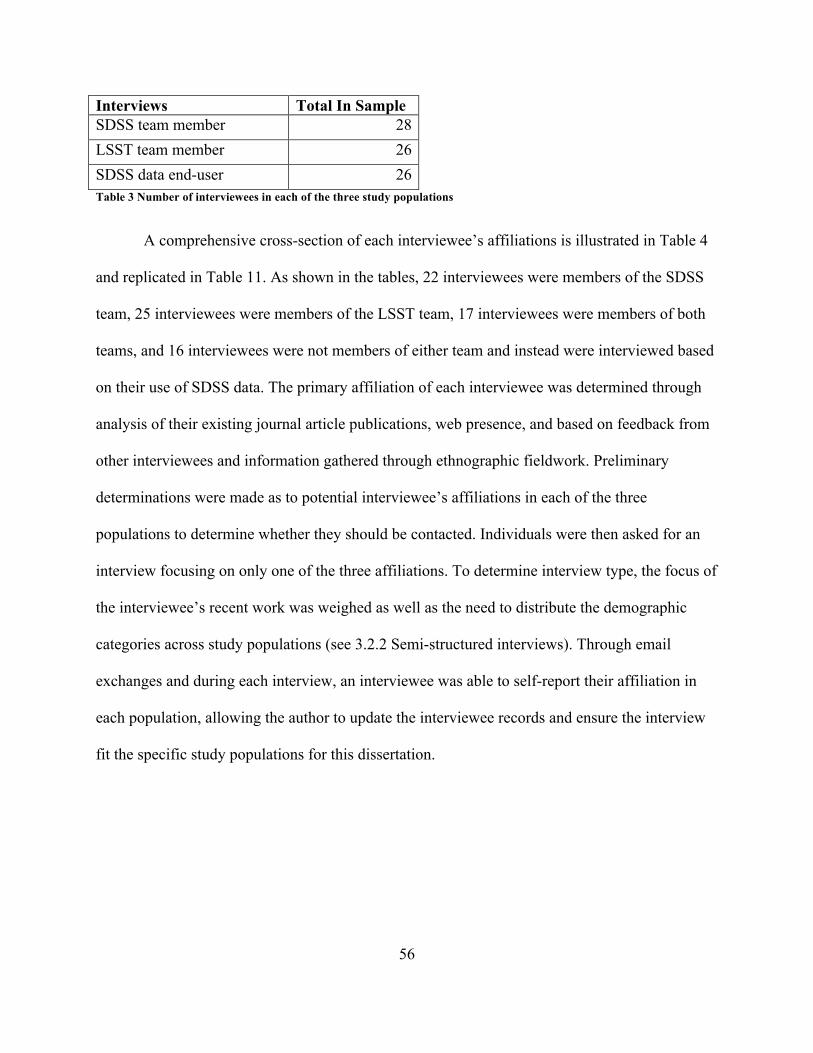
56
Interviews Total In Sample SDSS team member 28
LSST team member 26
SDSS data end-user 26 Table 3 Number of interviewees in each of the three study populations
A comprehensive cross-section of each interviewee’s affiliations is illustrated in Table 4
and replicated in Table 11. As shown in the tables, 22 interviewees were members of the SDSS
team, 25 interviewees were members of the LSST team, 17 interviewees were members of both
teams, and 16 interviewees were not members of either team and instead were interviewed based
on their use of SDSS data. The primary affiliation of each interviewee was determined through
analysis of their existing journal article publications, web presence, and based on feedback from
other interviewees and information gathered through ethnographic fieldwork. Preliminary
determinations were made as to potential interviewee’s affiliations in each of the three
populations to determine whether they should be contacted. Individuals were then asked for an
interview focusing on only one of the three affiliations. To determine interview type, the focus of
the interviewee’s recent work was weighed as well as the need to distribute the demographic
categories across study populations (see 3.2.2 Semi-structured interviews). Through email
exchanges and during each interview, an interviewee was able to self-report their affiliation in
each population, allowing the author to update the interviewee records and ensure the interview
fit the specific study populations for this dissertation.
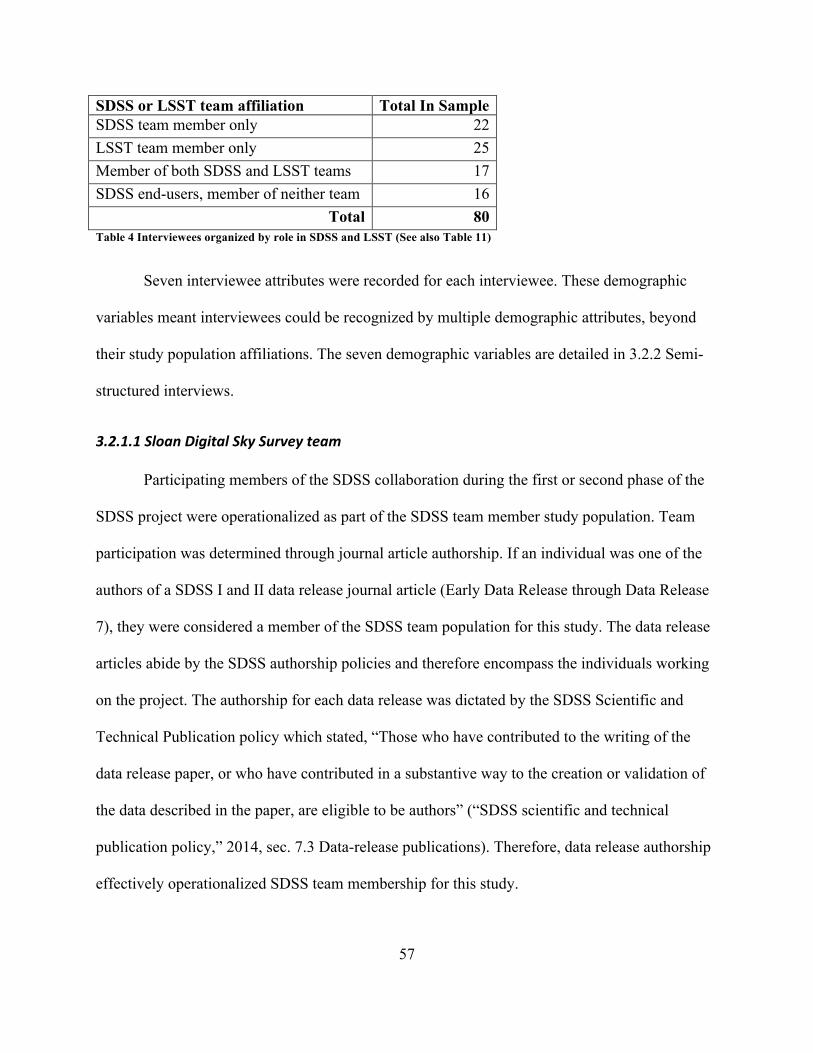
57
SDSS or LSST team affiliation Total In Sample SDSS team member only 22
LSST team member only 25
Member of both SDSS and LSST teams 17
SDSS end-users, member of neither team 16
Total 80 Table 4 Interviewees organized by role in SDSS and LSST (See also Table 11)
Seven interviewee attributes were recorded for each interviewee. These demographic
variables meant interviewees could be recognized by multiple demographic attributes, beyond
their study population affiliations. The seven demographic variables are detailed in 3.2.2 Semi-
structured interviews.
3.2.1.1SloanDigitalSkySurveyteam
Participating members of the SDSS collaboration during the first or second phase of the
SDSS project were operationalized as part of the SDSS team member study population. Team
participation was determined through journal article authorship. If an individual was one of the
authors of a SDSS I and II data release journal article (Early Data Release through Data Release
7), they were considered a member of the SDSS team population for this study. The data release
articles abide by the SDSS authorship policies and therefore encompass the individuals working
on the project. The authorship for each data release was dictated by the SDSS Scientific and
Technical Publication policy which stated, “Those who have contributed to the writing of the
data release paper, or who have contributed in a substantive way to the creation or validation of
the data described in the paper, are eligible to be authors” (“SDSS scientific and technical
publication policy,” 2014, sec. 7.3 Data-release publications). Therefore, data release authorship
effectively operationalized SDSS team membership for this study.
58
Prior to visiting an institution for this dissertation work, the author emailed every person
at the institution who qualified as a study participant to request an interview. This recruitment
method was effective and not overwhelming due to the level of interviewee willingness to
participate in the study. Many potential interviewees did not respond to two e-mail attempts to
schedule an interview, while others were unable to find a mutually agreeable time to meet.
Participation in interviews was solely at the discretion of the interviewee.
Two protocols were used for the SDSS team interviews. Most interviews were conducted
using the UCLA CKI “Phase1” interview protocol. In December 2013, eight SDSS team
interviews were conducted using a modified version of the “Phase1” protocol, which included
greater focus on the later stages of the SDSS I and II data life cycle. As the interviews were
semi-structured, the protocols were modified to pertain specifically to each individual’s role in
the collaboration(s). Questions were related to data management, curation, and preservation of
the SDSS data as a resource for the astronomy community.
3.2.1.2LargeSynopticSurveyTelescopeteam
LSST team interviews for this dissertation parallel research conducted by other UCLA
CKI team members. Peter T. Darch, also of the UCLA CKI, similarly interviewed other LSST
team members regarding their data practices. There are six primary LSST data management
(DM) construction sites, Darch and the author each focused on fieldwork and interviews at three
of the six sites. Therefore, the LSST team interviews for this dissertation were conducted with
interviewees from half of the primary LSST DM institutions in the United States.
Potential research subjects were considered members of the LSST team if they were an
author on LSST: from Science Drivers to Reference Design and Anticipated Data Products
(Version 4.0) (Ivezić et al., 2014) or LSST Science Book (Version 2.0) (LSST Science
59
Collaboration et al., 2009). LSST team members consistently described these two documents as
essential blueprints to the project.
Authorship for the “Science Drivers” paper included individuals who had contributed to
LSST design and development and are largely paid members of the team. However, there were
many other individuals who were not paid members of the LSST team, but instead contributed
their time and expertise to LSST as a member of an LSST Science Collaboration (“Science
collaborations | LSST Corporation,” 2015). These individuals collaborated in the writing of the
LSST “Science Book” and continue to plan for future scientific cases made possible by the
LSST. Science Collaboration members are not directly paid through LSST funding; they are paid
through their primary institutions and volunteer their time to LSST to help shape the anticipated
scientific work. Therefore, both paid team members and scientific collaboration members were
included broadly in the LSST team study population, operationalized by authorship on either or
both of the aforementioned documents. As with the SDSS, while every potential interviewee at
all visited sites were contacted, each individual had the choice to participate in the study.
Interviewees who joined the LSST team too recently to be included as authors on either
the Science Drivers or Science Book documents were not considered eligible as interviewees for
this dissertation. However, the author may have interviewed these new team members for the
broader UCLA CKI investigations. While these interviews were not included in the
operationalized dataset for this dissertation, the interviews have been transcribed and made
available to the UCLA CKI team for further examination.
LSST interviews were conducted using the UCLA CKI “LSST1” interview protocol.
While having emerged from existing UCLA CKI team protocols, modifications were required to
reflect LSST’s early life cycle stage. Questions were related to the design and construction of
60
data management infrastructures for LSST, the workforces involved in these activities, the nature
of the expected data, and the influence of the collaboration and the larger astronomy field.
3.2.1.3SloanDigitalSkySurveydataend-users
SDSS data end-users are the third study population, which includes astronomers at all
career stages who (co-)authored a journal article using SDSS data. Specifically, the interviewee
must have authored a journal article available on arXiv.org that referenced SDSS in the article
title or abstract. arXiv is a widely used pre-print archiving service for the physics and astronomy
community (Cornell University, 2016). Prior to visiting each institution, the author investigated
potential interviewees by searching arXiv for articles with “SDSS” or “Sloan Digital Sky
Survey” in either the title or the abstract, published in the preceding couple of years, and having
at least one author affiliated with the institution. Only articles published recently were chosen,
because authors tend to change institutions and forget details of the research process over time.
Prior to each trip, relevant authors were emailed requesting an interview, which included
mention of the pre-identified journal article.
This sampling method had two limitations. First, the sample was limited to institutions in
Southern California, or the institutions (or nearby institutions) already scheduled for SDSS or
LSST team research. However, strong project funding (see Acknowledgements) enabled
considerable travel, which permitted interviews at 23 institutions. Second, as stated with the
other study populations, the method was limited due to interviewee willingness to participate.
Many interviewees did not respond to two e-mail attempts to schedule an interview, while others
were unable to find a mutually available time to meet.
The SDSS end-user interviews were conducted using the UCLA CKI “Follow the Data”
interview protocol. Follow the Data interview questions inquired about data management
61
practices used by the interviewee as an individual or among their small research group. The
interview protocol is effective in identifying specific data sources, types, and uses (Sands et al.,
2012). The protocol allows the interviewer to use the publication (co-) authored by the
interviewee as a lens to identify data uses leading into and out of the journal article. The article
was chosen prior to the interview session, and the interviewer performed a close reading of the
text to identify authors, data sources, links to data, and other relevant characteristics. This
background research enabled rich interviews that addressed questions pre-identified during the
close reading of the text. These interviews facilitated exploration of how small-scale research
projects employing SDSS data compare and contrast to the data management activities involved
in the large-scale SDSS and LSST collaborations.
3.2.2Semi-structuredinterviews
Interviews included questions adapted from existing UCLA CKI protocols to engage
researchers on their data practices, perspectives on data management, curation, and preservation
activities, and perceptions of data management knowledge and expertise needs. Semi-structured
interviews balance the rigidity of structured interviews, while enabling more focus than
unstructured interviews like oral histories. Interviews were conducted with a protocol, including
mostly open-ended, but also strategically pointed, questions. The specific protocol used for each
interview was addressed in 3.2.1 Study populations.
Often, interviewees addressed themes before the protocol question about that theme were
asked. In these cases, the interviewer adjusted the protocol question sequence accordingly. When
themes were addressed already, the interview question was often omitted. Alternatively, some
interviewees addressed themes that were not in the protocol. In these cases, the interviewer could
choose to encourage the line of thinking by asking more specific questions if relevant, or return
62
to the predetermined questions. Semi-structured interviews therefore allowed the interviewer to
focus on data management topics, while enabling interviewees to focus on the aspects of the
topic they found most important. The semi-structured interviews enabled analytical comparisons
between all interviewees, and across multiple sites and kinds of expertise.
Interviewees were chosen through a nonprobability sampling method referred to as Quota
Sampling (Babbie, 2007, pp. 185–187), with a reliance on subject availability and voluntary
participation. Quota sampling was used in this study to ensure a broad mix of demographic
participation. As a field research project, quota sampling is an excellent method to compare and
contrast informant perspectives across multiple parameters (Babbie, 2007, pp. 185–186). A
matrix was created to ensure study participants held a breadth of the following parameters:
institutional affiliation, career stage, level of astronomy education, current workforce, association
with theoretical astronomy, and most importantly affiliation with the SDSS team, LSST team,
and SDSS data use. The interviews also occurred over five years. These seven parameters were
chosen because they were hypothesized to be factors relevant to the primary research question:
How does data management differ between populations? From preliminary interviews, these
demographics were chosen as sources of distinction between individuals and their data
management practices. Demographics largely were determined through institutional website
searches before each interview and confirmed during each interview.
The operationalization of the SDSS team, LSST team, and SDSS end-users was largely
detailed in the previous section on study populations. Potential interviewees were determined by
geographic location, authorship in designated journal articles, and willingness to participate in
the study. Toward the end of data collection in 2015, interviewees were targeted more strictly to
ensure the demographic variables were covered evenly. For example, to ensure they were well
63
represented in the sample, graduate students were sought out specifically to participate in the
study in 2015. All but one of the study interviews were conducted in-person; one was conducted
via Skype.
Data collection took place from 2011 to 2015 and later interviews and coding responded
to the themes that emerged from earlier work. For example, the research questions used in this
dissertation were developed by the author in 2013 and formalized in 2014. The third research
question seeks to understand the expertise necessary for data management. However, questions
addressing experience and expertise were not explicit in earlier interview protocols because the
author developed the line of questioning from ongoing complementary UCLA CKI research. The
author added questions aimed toward eliciting the interviewee’s educational and experiential
backgrounds, as well as how they are training the next generation to work with sky surveys.
While experience and expertise were one of many lines of inquiry for the UCLA CKI, their
prominence in this dissertation led to an increased focus on related interview questions as the
years passed.
This dissertation research amassed 80 semi-structured interviews. The corpus is
composed of 28 interviews with SDSS team members, 26 with LSST team members, and 26
with SDSS data end-users. Interviews ranged from 20 minutes to three hours, with most lasting
about one hour and thirty minutes. Thirty-one of the 80 interviews were conducted prior to the
dissertation proposal (24 by the author), under the auspices of the UCLA CKI grant-funded
research (see Table 5). Two UCLA CKI team members conducted seven of the interviews
included in the study: David S. Fearon, Jr. (four) and Christine L. Borgman (three). The
company Scribie confidentially transcribed the interviews. The transcripts were audio-verified by
the UCLA CKI team, usually the author. Milena S. Golshan of the UCLA CKI also assisted with
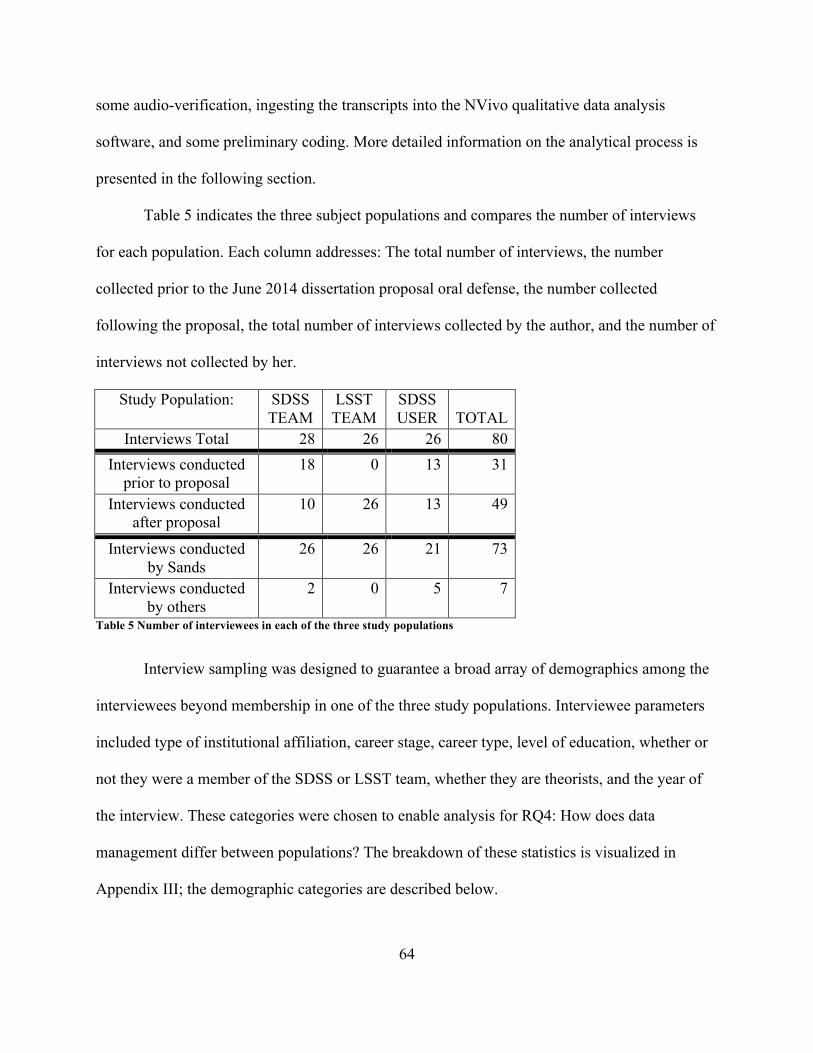
64
some audio-verification, ingesting the transcripts into the NVivo qualitative data analysis
software, and some preliminary coding. More detailed information on the analytical process is
presented in the following section.
Table 5 indicates the three subject populations and compares the number of interviews
for each population. Each column addresses: The total number of interviews, the number
collected prior to the June 2014 dissertation proposal oral defense, the number collected
following the proposal, the total number of interviews collected by the author, and the number of
interviews not collected by her.
Study Population: SDSS TEAM
LSST TEAM
SDSS USER
TOTAL
Interviews Total 28 26 26 80 Interviews conducted
prior to proposal 18 0 13 31
Interviews conducted after proposal
10 26 13 49
Interviews conducted by Sands
26 26 21 73
Interviews conducted by others
2 0 5 7
Table 5 Number of interviewees in each of the three study populations
Interview sampling was designed to guarantee a broad array of demographics among the
interviewees beyond membership in one of the three study populations. Interviewee parameters
included type of institutional affiliation, career stage, career type, level of education, whether or
not they were a member of the SDSS or LSST team, whether they are theorists, and the year of
the interview. These categories were chosen to enable analysis for RQ4: How does data
management differ between populations? The breakdown of these statistics is visualized in
Appendix III; the demographic categories are described below.
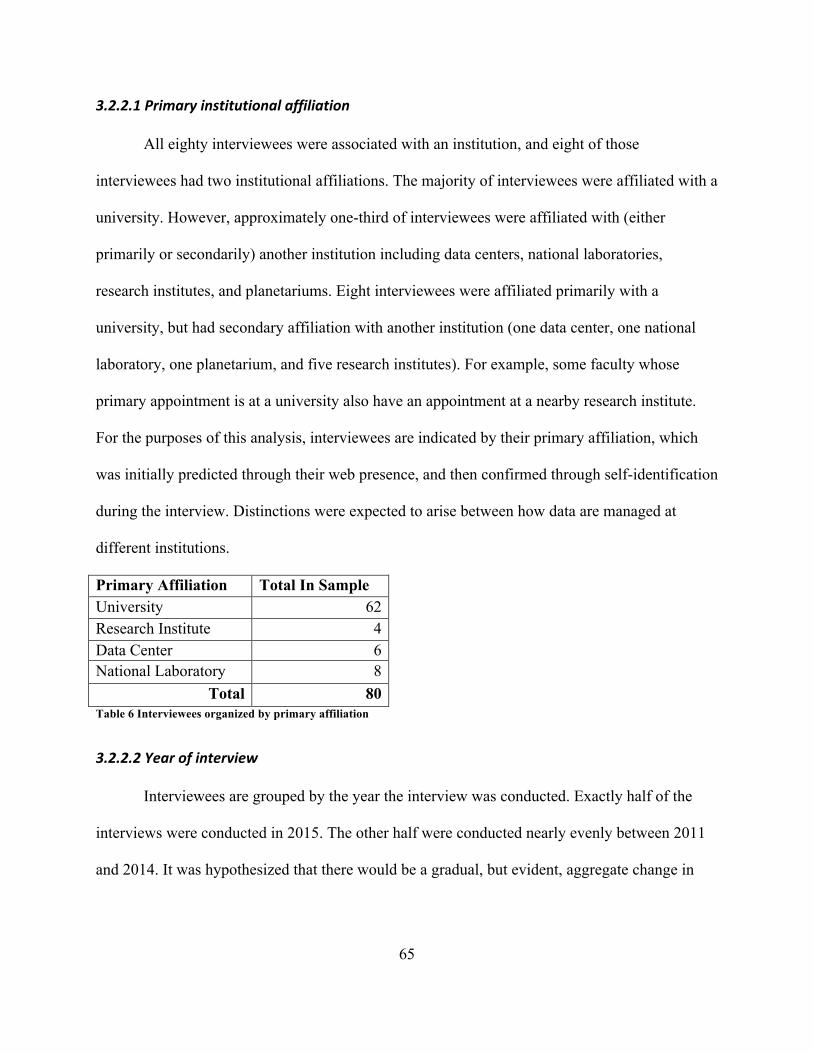
65
3.2.2.1Primaryinstitutionalaffiliation
All eighty interviewees were associated with an institution, and eight of those
interviewees had two institutional affiliations. The majority of interviewees were affiliated with a
university. However, approximately one-third of interviewees were affiliated with (either
primarily or secondarily) another institution including data centers, national laboratories,
research institutes, and planetariums. Eight interviewees were affiliated primarily with a
university, but had secondary affiliation with another institution (one data center, one national
laboratory, one planetarium, and five research institutes). For example, some faculty whose
primary appointment is at a university also have an appointment at a nearby research institute.
For the purposes of this analysis, interviewees are indicated by their primary affiliation, which
was initially predicted through their web presence, and then confirmed through self-identification
during the interview. Distinctions were expected to arise between how data are managed at
different institutions.
Primary Affiliation Total In Sample University 62 Research Institute 4 Data Center 6 National Laboratory 8
Total 80 Table 6 Interviewees organized by primary affiliation
3.2.2.2Yearofinterview
Interviewees are grouped by the year the interview was conducted. Exactly half of the
interviews were conducted in 2015. The other half were conducted nearly evenly between 2011
and 2014. It was hypothesized that there would be a gradual, but evident, aggregate change in
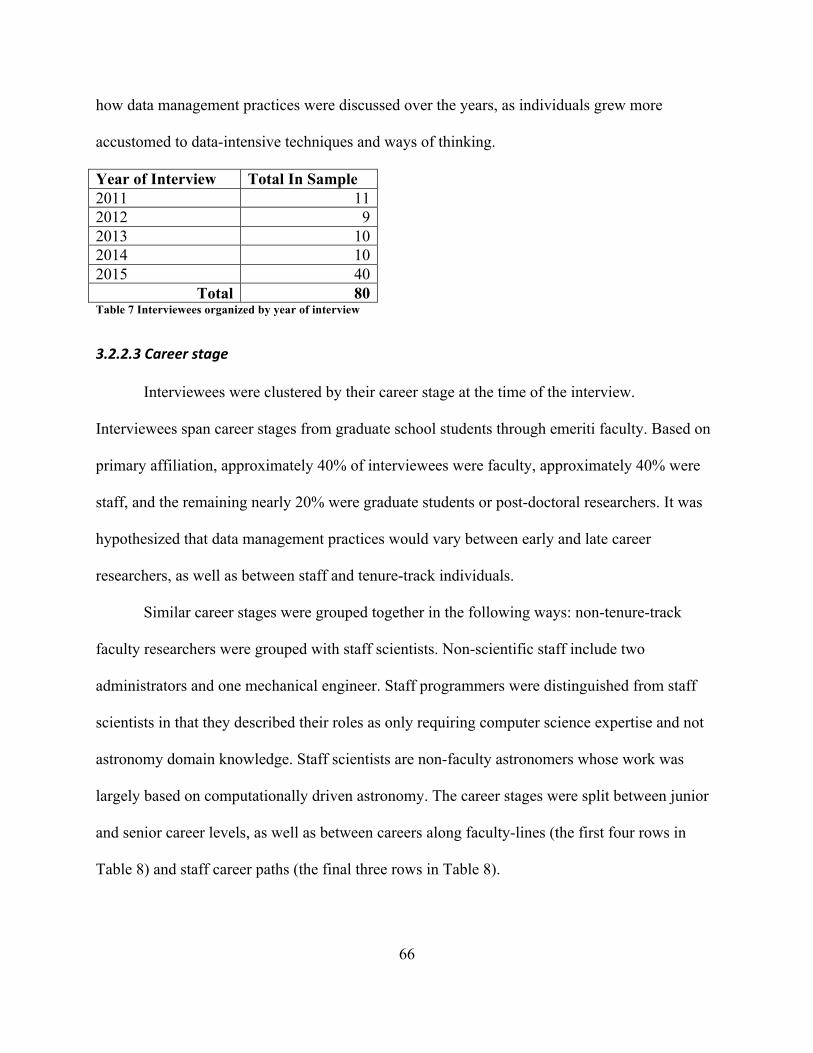
66
how data management practices were discussed over the years, as individuals grew more
accustomed to data-intensive techniques and ways of thinking.
Year of Interview Total In Sample 2011 11 2012 9 2013 10 2014 10 2015 40
Total 80 Table 7 Interviewees organized by year of interview
3.2.2.3Careerstage
Interviewees were clustered by their career stage at the time of the interview.
Interviewees span career stages from graduate school students through emeriti faculty. Based on
primary affiliation, approximately 40% of interviewees were faculty, approximately 40% were
staff, and the remaining nearly 20% were graduate students or post-doctoral researchers. It was
hypothesized that data management practices would vary between early and late career
researchers, as well as between staff and tenure-track individuals.
Similar career stages were grouped together in the following ways: non-tenure-track
faculty researchers were grouped with staff scientists. Non-scientific staff include two
administrators and one mechanical engineer. Staff programmers were distinguished from staff
scientists in that they described their roles as only requiring computer science expertise and not
astronomy domain knowledge. Staff scientists are non-faculty astronomers whose work was
largely based on computationally driven astronomy. The career stages were split between junior
and senior career levels, as well as between careers along faculty-lines (the first four rows in
Table 8) and staff career paths (the final three rows in Table 8).
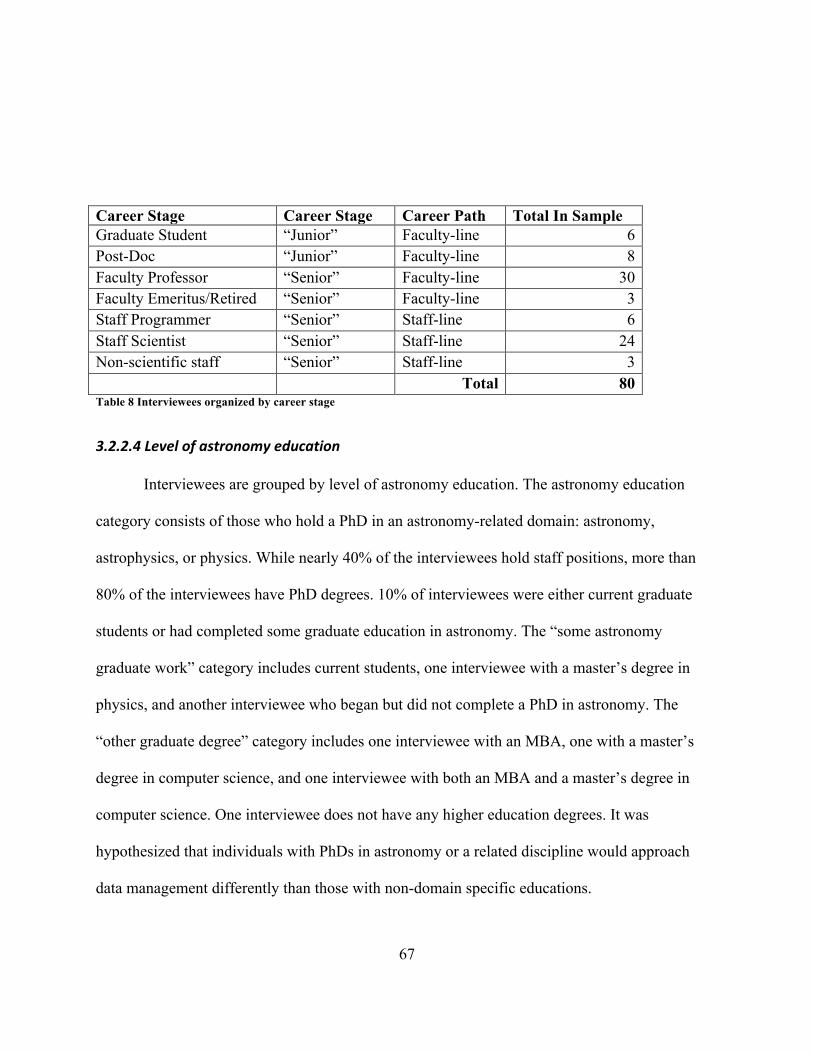
67
Career Stage Career Stage Career Path Total In Sample Graduate Student “Junior” Faculty-line 6 Post-Doc “Junior” Faculty-line 8 Faculty Professor “Senior” Faculty-line 30 Faculty Emeritus/Retired “Senior” Faculty-line 3 Staff Programmer “Senior” Staff-line 6 Staff Scientist “Senior” Staff-line 24 Non-scientific staff “Senior” Staff-line 3 Total 80 Table 8 Interviewees organized by career stage
3.2.2.4Levelofastronomyeducation
Interviewees are grouped by level of astronomy education. The astronomy education
category consists of those who hold a PhD in an astronomy-related domain: astronomy,
astrophysics, or physics. While nearly 40% of the interviewees hold staff positions, more than
80% of the interviewees have PhD degrees. 10% of interviewees were either current graduate
students or had completed some graduate education in astronomy. The “some astronomy
graduate work” category includes current students, one interviewee with a master’s degree in
physics, and another interviewee who began but did not complete a PhD in astronomy. The
“other graduate degree” category includes one interviewee with an MBA, one with a master’s
degree in computer science, and one interviewee with both an MBA and a master’s degree in
computer science. One interviewee does not have any higher education degrees. It was
hypothesized that individuals with PhDs in astronomy or a related discipline would approach
data management differently than those with non-domain specific educations.
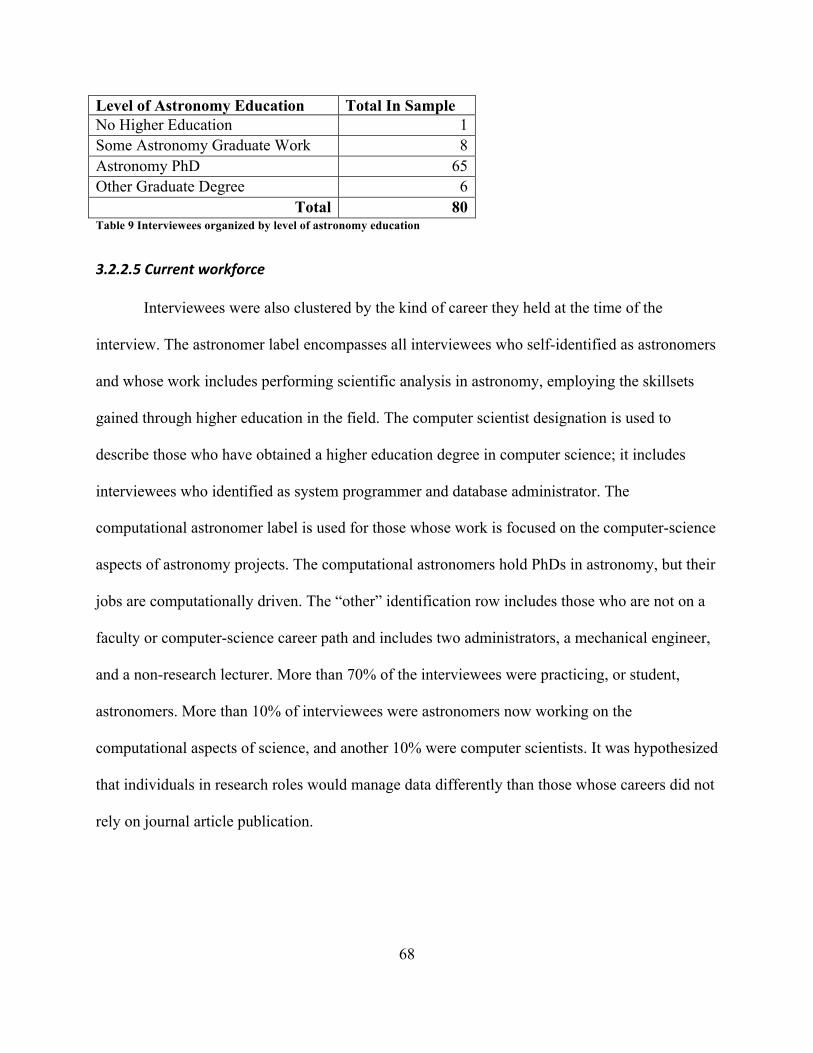
68
Level of Astronomy Education Total In Sample No Higher Education 1 Some Astronomy Graduate Work 8 Astronomy PhD 65 Other Graduate Degree 6
Total 80 Table 9 Interviewees organized by level of astronomy education
3.2.2.5Currentworkforce
Interviewees were also clustered by the kind of career they held at the time of the
interview. The astronomer label encompasses all interviewees who self-identified as astronomers
and whose work includes performing scientific analysis in astronomy, employing the skillsets
gained through higher education in the field. The computer scientist designation is used to
describe those who have obtained a higher education degree in computer science; it includes
interviewees who identified as system programmer and database administrator. The
computational astronomer label is used for those whose work is focused on the computer-science
aspects of astronomy projects. The computational astronomers hold PhDs in astronomy, but their
jobs are computationally driven. The “other” identification row includes those who are not on a
faculty or computer-science career path and includes two administrators, a mechanical engineer,
and a non-research lecturer. More than 70% of the interviewees were practicing, or student,
astronomers. More than 10% of interviewees were astronomers now working on the
computational aspects of science, and another 10% were computer scientists. It was hypothesized
that individuals in research roles would manage data differently than those whose careers did not
rely on journal article publication.
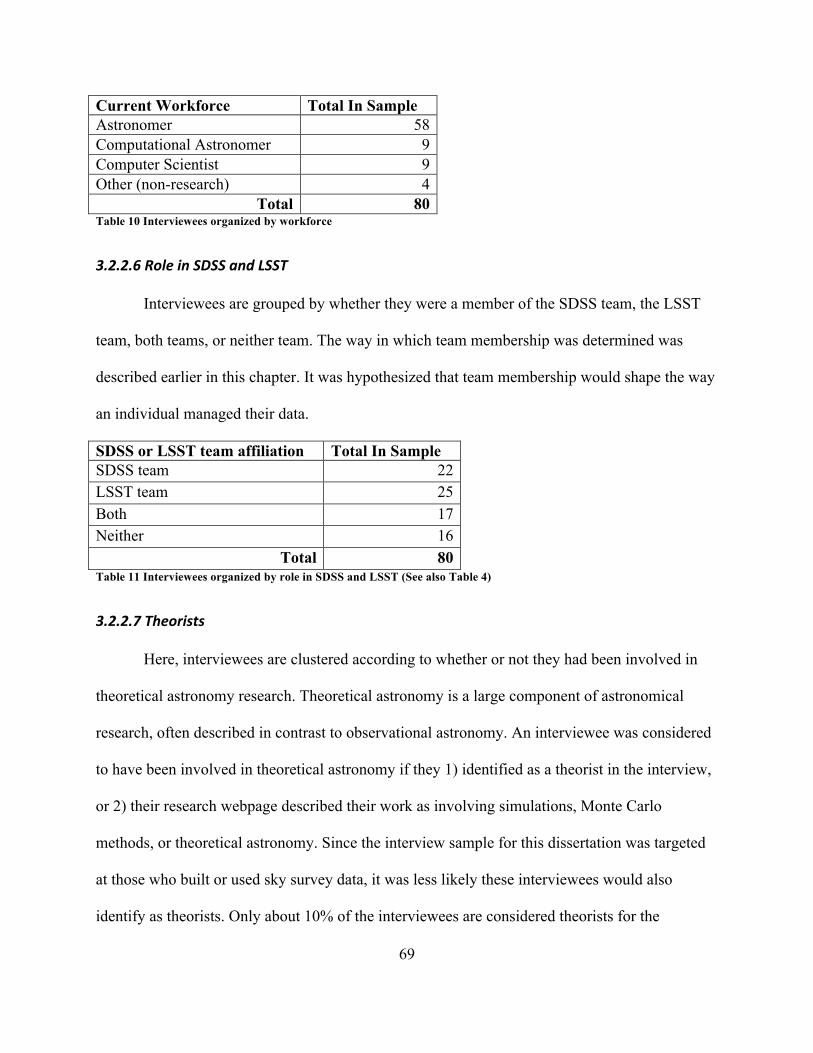
69
Current Workforce Total In Sample Astronomer 58 Computational Astronomer 9 Computer Scientist 9 Other (non-research) 4
Total 80 Table 10 Interviewees organized by workforce
3.2.2.6RoleinSDSSandLSST
Interviewees are grouped by whether they were a member of the SDSS team, the LSST
team, both teams, or neither team. The way in which team membership was determined was
described earlier in this chapter. It was hypothesized that team membership would shape the way
an individual managed their data.
SDSS or LSST team affiliation Total In Sample SDSS team 22 LSST team 25 Both 17 Neither 16
Total 80 Table 11 Interviewees organized by role in SDSS and LSST (See also Table 4)
3.2.2.7Theorists
Here, interviewees are clustered according to whether or not they had been involved in
theoretical astronomy research. Theoretical astronomy is a large component of astronomical
research, often described in contrast to observational astronomy. An interviewee was considered
to have been involved in theoretical astronomy if they 1) identified as a theorist in the interview,
or 2) their research webpage described their work as involving simulations, Monte Carlo
methods, or theoretical astronomy. Since the interview sample for this dissertation was targeted
at those who built or used sky survey data, it was less likely these interviewees would also
identify as theorists. Only about 10% of the interviewees are considered theorists for the
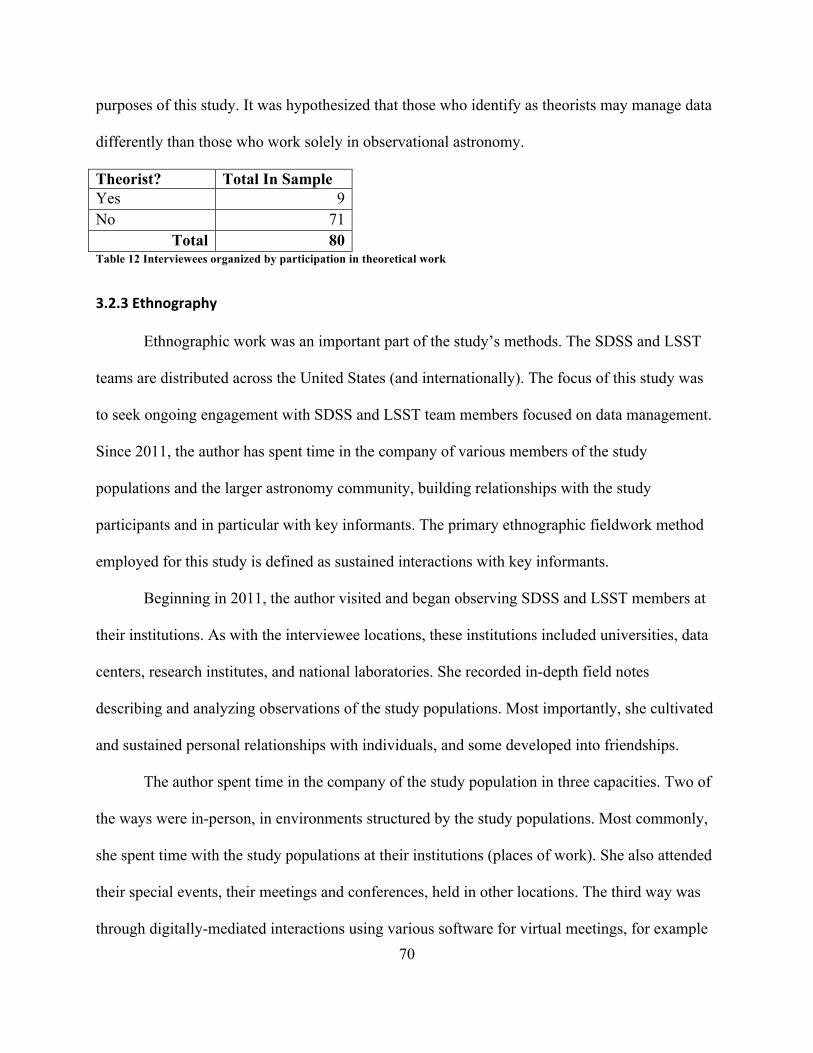
70
purposes of this study. It was hypothesized that those who identify as theorists may manage data
differently than those who work solely in observational astronomy.
Theorist? Total In Sample Yes 9 No 71
Total 80 Table 12 Interviewees organized by participation in theoretical work
3.2.3Ethnography
Ethnographic work was an important part of the study’s methods. The SDSS and LSST
teams are distributed across the United States (and internationally). The focus of this study was
to seek ongoing engagement with SDSS and LSST team members focused on data management.
Since 2011, the author has spent time in the company of various members of the study
populations and the larger astronomy community, building relationships with the study
participants and in particular with key informants. The primary ethnographic fieldwork method
employed for this study is defined as sustained interactions with key informants.
Beginning in 2011, the author visited and began observing SDSS and LSST members at
their institutions. As with the interviewee locations, these institutions included universities, data
centers, research institutes, and national laboratories. She recorded in-depth field notes
describing and analyzing observations of the study populations. Most importantly, she cultivated
and sustained personal relationships with individuals, and some developed into friendships.
The author spent time in the company of the study population in three capacities. Two of
the ways were in-person, in environments structured by the study populations. Most commonly,
she spent time with the study populations at their institutions (places of work). She also attended
their special events, their meetings and conferences, held in other locations. The third way was
through digitally-mediated interactions using various software for virtual meetings, for example
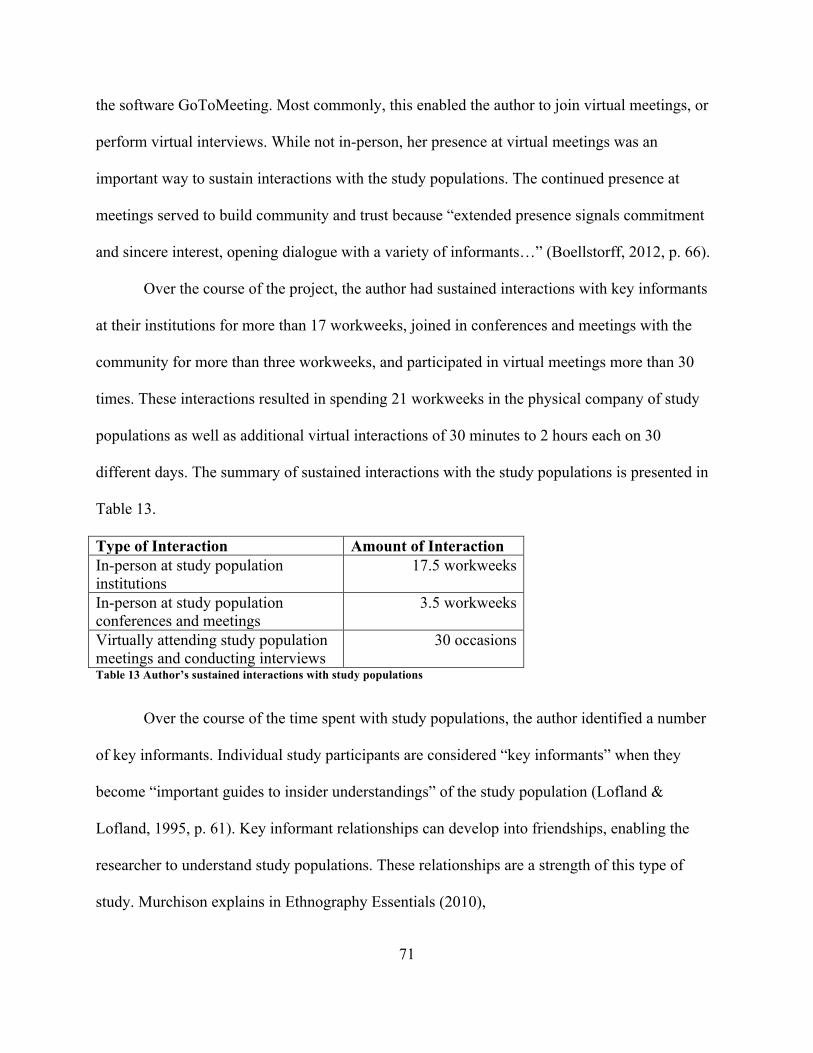
71
the software GoToMeeting. Most commonly, this enabled the author to join virtual meetings, or
perform virtual interviews. While not in-person, her presence at virtual meetings was an
important way to sustain interactions with the study populations. The continued presence at
meetings served to build community and trust because “extended presence signals commitment
and sincere interest, opening dialogue with a variety of informants…” (Boellstorff, 2012, p. 66).
Over the course of the project, the author had sustained interactions with key informants
at their institutions for more than 17 workweeks, joined in conferences and meetings with the
community for more than three workweeks, and participated in virtual meetings more than 30
times. These interactions resulted in spending 21 workweeks in the physical company of study
populations as well as additional virtual interactions of 30 minutes to 2 hours each on 30
different days. The summary of sustained interactions with the study populations is presented in
Table 13.
Type of Interaction Amount of Interaction In-person at study population institutions
17.5 workweeks
In-person at study population conferences and meetings
3.5 workweeks
Virtually attending study population meetings and conducting interviews
30 occasions
Table 13 Author’s sustained interactions with study populations
Over the course of the time spent with study populations, the author identified a number
of key informants. Individual study participants are considered “key informants” when they
become “important guides to insider understandings” of the study population (Lofland &
Lofland, 1995, p. 61). Key informant relationships can develop into friendships, enabling the
researcher to understand study populations. These relationships are a strength of this type of
study. Murchison explains in Ethnography Essentials (2010),
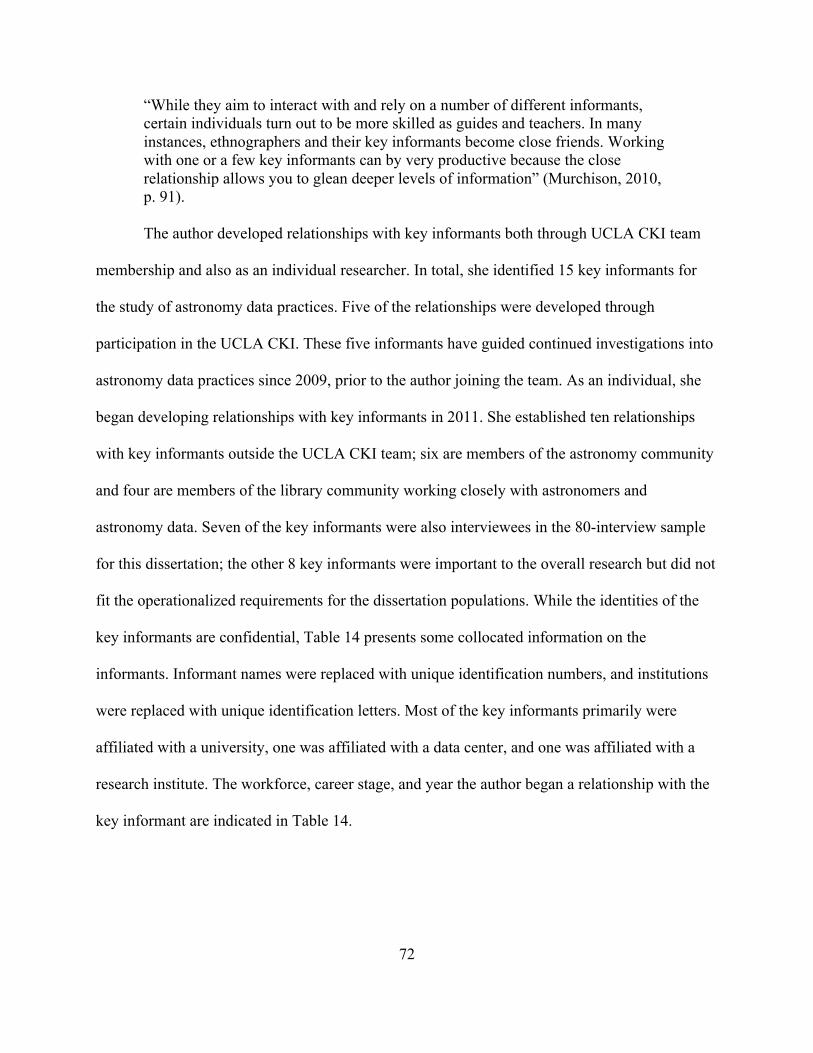
72
“While they aim to interact with and rely on a number of different informants, certain individuals turn out to be more skilled as guides and teachers. In many instances, ethnographers and their key informants become close friends. Working with one or a few key informants can by very productive because the close relationship allows you to glean deeper levels of information” (Murchison, 2010, p. 91).
The author developed relationships with key informants both through UCLA CKI team
membership and also as an individual researcher. In total, she identified 15 key informants for
the study of astronomy data practices. Five of the relationships were developed through
participation in the UCLA CKI. These five informants have guided continued investigations into
astronomy data practices since 2009, prior to the author joining the team. As an individual, she
began developing relationships with key informants in 2011. She established ten relationships
with key informants outside the UCLA CKI team; six are members of the astronomy community
and four are members of the library community working closely with astronomers and
astronomy data. Seven of the key informants were also interviewees in the 80-interview sample
for this dissertation; the other 8 key informants were important to the overall research but did not
fit the operationalized requirements for the dissertation populations. While the identities of the
key informants are confidential, Table 14 presents some collocated information on the
informants. Informant names were replaced with unique identification numbers, and institutions
were replaced with unique identification letters. Most of the key informants primarily were
affiliated with a university, one was affiliated with a data center, and one was affiliated with a
research institute. The workforce, career stage, and year the author began a relationship with the
key informant are indicated in Table 14.
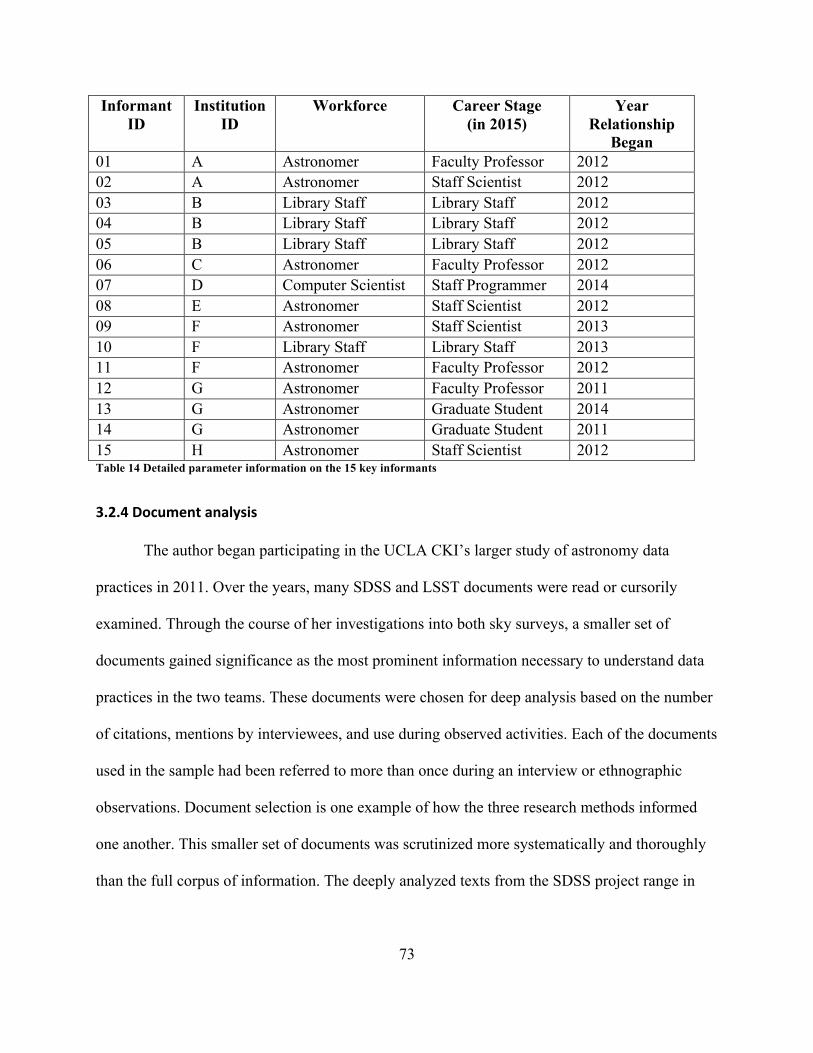
73
Informant ID
Institution ID
Workforce Career Stage (in 2015)
Year Relationship
Began 01 A Astronomer Faculty Professor 2012 02 A Astronomer Staff Scientist 2012 03 B Library Staff Library Staff 2012 04 B Library Staff Library Staff 2012 05 B Library Staff Library Staff 2012 06 C Astronomer Faculty Professor 2012 07 D Computer Scientist Staff Programmer 2014 08 E Astronomer Staff Scientist 2012 09 F Astronomer Staff Scientist 2013 10 F Library Staff Library Staff 2013 11 F Astronomer Faculty Professor 2012 12 G Astronomer Faculty Professor 2011 13 G Astronomer Graduate Student 2014 14 G Astronomer Graduate Student 2011 15 H Astronomer Staff Scientist 2012 Table 14 Detailed parameter information on the 15 key informants
3.2.4Documentanalysis
The author began participating in the UCLA CKI’s larger study of astronomy data
practices in 2011. Over the years, many SDSS and LSST documents were read or cursorily
examined. Through the course of her investigations into both sky surveys, a smaller set of
documents gained significance as the most prominent information necessary to understand data
practices in the two teams. These documents were chosen for deep analysis based on the number
of citations, mentions by interviewees, and use during observed activities. Each of the documents
used in the sample had been referred to more than once during an interview or ethnographic
observations. Document selection is one example of how the three research methods informed
one another. This smaller set of documents was scrutinized more systematically and thoroughly
than the full corpus of information. The deeply analyzed texts from the SDSS project range in
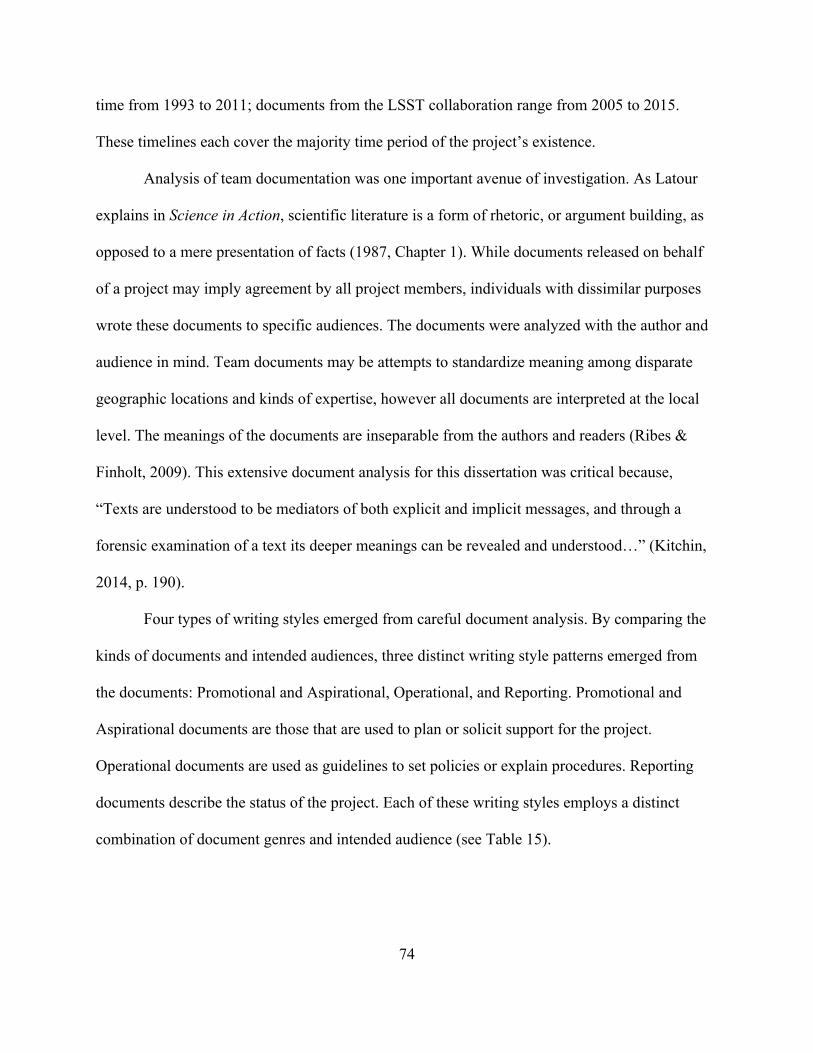
74
time from 1993 to 2011; documents from the LSST collaboration range from 2005 to 2015.
These timelines each cover the majority time period of the project’s existence.
Analysis of team documentation was one important avenue of investigation. As Latour
explains in Science in Action, scientific literature is a form of rhetoric, or argument building, as
opposed to a mere presentation of facts (1987, Chapter 1). While documents released on behalf
of a project may imply agreement by all project members, individuals with dissimilar purposes
wrote these documents to specific audiences. The documents were analyzed with the author and
audience in mind. Team documents may be attempts to standardize meaning among disparate
geographic locations and kinds of expertise, however all documents are interpreted at the local
level. The meanings of the documents are inseparable from the authors and readers (Ribes &
Finholt, 2009). This extensive document analysis for this dissertation was critical because,
“Texts are understood to be mediators of both explicit and implicit messages, and through a
forensic examination of a text its deeper meanings can be revealed and understood…” (Kitchin,
2014, p. 190).
Four types of writing styles emerged from careful document analysis. By comparing the
kinds of documents and intended audiences, three distinct writing style patterns emerged from
the documents: Promotional and Aspirational, Operational, and Reporting. Promotional and
Aspirational documents are those that are used to plan or solicit support for the project.
Operational documents are used as guidelines to set policies or explain procedures. Reporting
documents describe the status of the project. Each of these writing styles employs a distinct
combination of document genres and intended audience (see Table 15).
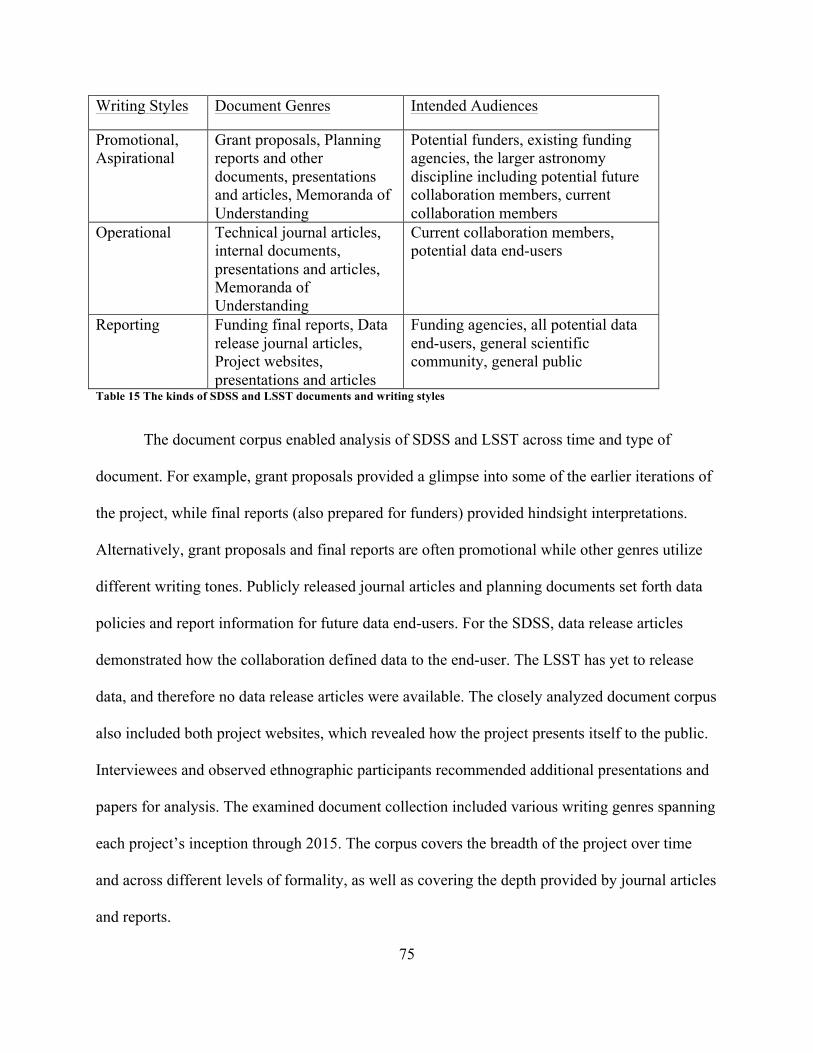
75
Writing Styles Document Genres Intended Audiences
Promotional, Aspirational
Grant proposals, Planning reports and other documents, presentations and articles, Memoranda of Understanding
Potential funders, existing funding agencies, the larger astronomy discipline including potential future collaboration members, current collaboration members
Operational Technical journal articles, internal documents, presentations and articles, Memoranda of Understanding
Current collaboration members, potential data end-users
Reporting Funding final reports, Data release journal articles, Project websites, presentations and articles
Funding agencies, all potential data end-users, general scientific community, general public
Table 15 The kinds of SDSS and LSST documents and writing styles
The document corpus enabled analysis of SDSS and LSST across time and type of
document. For example, grant proposals provided a glimpse into some of the earlier iterations of
the project, while final reports (also prepared for funders) provided hindsight interpretations.
Alternatively, grant proposals and final reports are often promotional while other genres utilize
different writing tones. Publicly released journal articles and planning documents set forth data
policies and report information for future data end-users. For the SDSS, data release articles
demonstrated how the collaboration defined data to the end-user. The LSST has yet to release
data, and therefore no data release articles were available. The closely analyzed document corpus
also included both project websites, which revealed how the project presents itself to the public.
Interviewees and observed ethnographic participants recommended additional presentations and
papers for analysis. The examined document collection included various writing genres spanning
each project’s inception through 2015. The corpus covers the breadth of the project over time
and across different levels of formality, as well as covering the depth provided by journal articles
and reports.
76
3.3ValidityandReliability
Interviews encompassed the largest amount of time devoted to data collection and
analysis. However, document analysis and ethnographic methods were complementary, often
used to support and frame the interview findings over the course of this multi-year study. For
example, sustained interactions with key informants were critical to identifying important team
documents for deeper analysis, as described above. Often, interviews were used to understand
the context surrounding the documents and unearth their underlying meaning. The three methods
were used to validate each other, often providing more nuance or context to the information
obtained by the other methods.
As described earlier, the interview protocols used in this study were modified from those
used by the UCLA CKI longitudinal work. The consistency of interview protocols over time is a
strength of the UCLA CKI team research. This dissertation is included in the CKI’s longitudinal,
cross-disciplinary study of knowledge infrastructures and scientific data practices. The strength
of the longitudinal team research means that many interview questions and protocol themes were
generated before the team began specifically researching the astronomy community in 2009.
Ethnography and document analysis were important methods to support the interviews and to
ensure the details specific to astronomy research were revealed. These additional methods also
helped create context and dimension to assist in performing and analyzing the interviews. In turn,
the interviews provided entrée to relationships with study populations, some who evolved into
key informants. The three methods informed one another, over time, in the study planning,
execution, and analysis.
The qualitative nature of this three-method study provides a high level of validity to its
findings. The research methods were chosen to “follow the best of all guides, scientists
77
themselves” (Latour, 1987, p. 21). The ability for the author to visit 23 different institutions,
while participating in sustained conversations with key informants over years strengthens the
validity of the work. Indeed, “’Being there’ is a powerful technique for gaining insights into the
nature of human affairs in all their rich complexity,” showing the high level of validity obtained
through fieldwork in this study (Babbie, 2007, pp. 313–314).
The use of three methods to qualify the findings of each other method increased the level
of validity in the study. The time spent “on the ground” performing in-person interviews and
ethnography also increased the quality of the study. However, the research was weaker in
reliability due to the personal nature of these methods (Babbie, 2007, p. 314). For example,
interviewee and informant opinions may change over the course of time and due to experience,
as cultures are in flux and not stagnant (Babbie, 2007, p. 230; Murchison, 2010, p. 11). This
study combatted threats to reliability by conducting complementary document analysis,
interviews, and sustained interactions with key informants. These three methods were
specifically used over the course of years to prevent drawing conclusions from only a “snapshot”
in the timeline of the projects or from interactions with one individual. The interviewee
demographic matrix was developed to ensure a single perspective was not prioritized over other
voices. The use of ethnography further broadened the number of perspectives examined for the
study. The document analysis was also conducted with a critical perspective, ensuring the
motivations of the authors were considered. Each of the three research methods were used to
certify a broad array of perspectives were included in this study, over a period of years, and with
careful consideration of the potential biases and motivations of the participants.
3.4Analysis
The collected transcripts, interview notes, ethnographic field notes, and the document
78
corpus were analyzed based on this dissertation’s research questions. These materials were coded
using the “UCLA Data Conservancy Data Practices Interview Code Book.” The UCLA CKI
created the codebook through an iterative process beginning in 2006. The codebook was adapted
as needed based on emerging themes, under the principles of grounded theory (Clarke, 2005;
Glaser & Strauss, 1967; Star, 1999). The continued use of the codebook, beyond that of this
dissertation, will benefit the UCLA CKI’s longitudinal analysis of scientific data practices across
disciplines.
NVivo 10 qualitative analysis software was used for all collected materials, which were
coded using the full codebook. Passages ranged from requiring no relevant codes, one code, and
sometimes a handful of codes were relevant for the same passage. The resulting NVivo coding
file remains available and in use by the UCLA CKI team to support future research.
For the analysis of each research question, findings were drawn based on identified
themes in the NVivo software, according to the codebook. The author’s coding process informed
the shape of the results of this dissertation, whether or not a specific passage was captured
specifically for each research question. The analysis of each of the research questions was
focused on a single code from the codebook. The three codes used in this study (one for each of
the cumulative research questions, see Table 16), were from the UCLA CKI codebook and best
reflected each research question. Each code provided more than 200 pages of relevant interview
passages, observational and interview field notes, as well as passages from documentation. The
author printed the pages of relevant materials for each code. Through iterative reading and
analysis of the passages, subcodes were identified within each research question. The iterative
coding of interviews, field notes, and documents resulted in the “interpretive template”
(Parmiggiani, Monteiro, & Hepsø, 2015) detailed in Table 16. The table presents each research
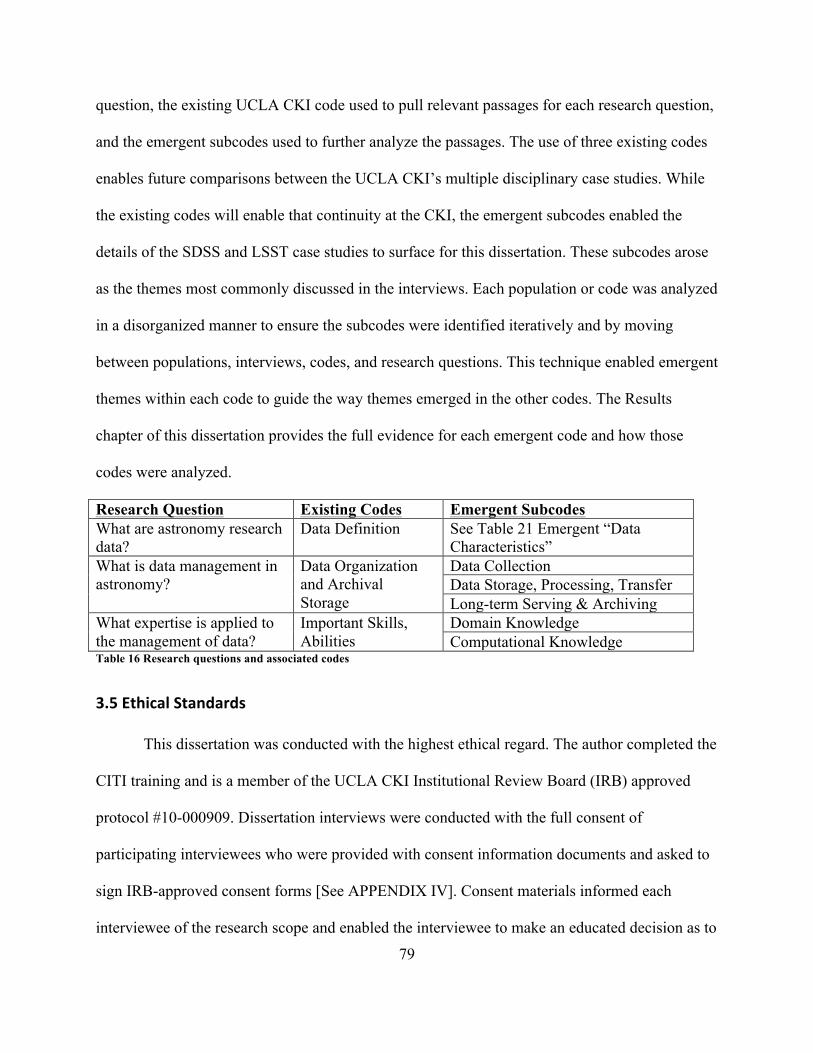
79
question, the existing UCLA CKI code used to pull relevant passages for each research question,
and the emergent subcodes used to further analyze the passages. The use of three existing codes
enables future comparisons between the UCLA CKI’s multiple disciplinary case studies. While
the existing codes will enable that continuity at the CKI, the emergent subcodes enabled the
details of the SDSS and LSST case studies to surface for this dissertation. These subcodes arose
as the themes most commonly discussed in the interviews. Each population or code was analyzed
in a disorganized manner to ensure the subcodes were identified iteratively and by moving
between populations, interviews, codes, and research questions. This technique enabled emergent
themes within each code to guide the way themes emerged in the other codes. The Results
chapter of this dissertation provides the full evidence for each emergent code and how those
codes were analyzed.
Research Question Existing Codes Emergent Subcodes What are astronomy research data?
Data Definition See Table 21 Emergent “Data Characteristics”
What is data management in astronomy?
Data Organization and Archival Storage
Data Collection Data Storage, Processing, Transfer Long-term Serving & Archiving
What expertise is applied to the management of data?
Important Skills, Abilities
Domain Knowledge Computational Knowledge
Table 16 Research questions and associated codes
3.5EthicalStandards
This dissertation was conducted with the highest ethical regard. The author completed the
CITI training and is a member of the UCLA CKI Institutional Review Board (IRB) approved
protocol #10-000909. Dissertation interviews were conducted with the full consent of
participating interviewees who were provided with consent information documents and asked to
sign IRB-approved consent forms [See APPENDIX IV]. Consent materials informed each
interviewee of the research scope and enabled the interviewee to make an educated decision as to
80
whether or not to opt-in to the study. In addition to the consent materials, an IRB-approved Deed
of Gift form [See APPENDIX IV] was used for all recorded interviews. The Deed of Gift
document was signed by the interviewee and ensures the audio recording and transcription can
be used and retained by the interviewer and the UCLA CKI research team into the future.
Interviewees had the right to complete each form as they felt comfortable, and the right to
end participation in the study at any time. The privileges of the individual continue to be
respected. Interviewees were asked always and never coerced to participate. Many potential
interviewees never responded to two email requests for an interview. For example, for a long
research trip in late winter 2015, the author contacted 59 potential interviewees before arriving at
the destination institutions. These 59 contacts resulted in 29 interviews, revealing a 49% success
rate. For this period in 2015, less than half of contacted individuals agreed and were able to find
the time to be interviewed for this study. Choices to ignore a second e-mail interview request and
requests not to be interviewed were always honored.
Interviewees were not quoted by name in this document nor in subsequent publications.
While full anonymity is impossible due to the nature of in-person interviews (Babbie, 2007, pp.
64–65; Lofland & Lofland, 1995, pp. 43–44), all efforts continue to be made to maintain the
confidentiality of interviewees under approval of the UCLA CKI IRB-approved study (National
Commission for the Protection of Human Subjects of Biomedical and Behavioral Research,
1978; UCLA Office of Research Administration, 2015).
Study participants are ensured confidentiality. When gender-based pronouns are used to
reference interviewees in this document, the genders have been randomly assigned to each
interviewee. For the purposes of confidentiality, all interviewees have been assigned surname
pseudonyms within this dissertation. The surname pseudonyms were randomly assigned to each
81
interviewee from the United States’ most common surnames according to the US Census (US
Census Bureau, 2014). When an interview is quoted, a citation is included. The citation
references the interviewee’s pseudonym, the career stage of the interviewee at the time of the
interview (see 3.2.2.3 Career stage), and the year of the interview (see 3.2.2.2 Year of interview).
For example, the following citation: (Reyes, Graduate Student, 2014) would reference an
interview with participant Reyes who was a graduate student at the time of the interview in 2014.
82
4 Results
The Sloan Digital Sky Survey (SDSS) and Large Synoptic Survey Telescope (LSST)
collaborations are large, modern sky surveys. The SDSS was conceived in the late 1980s, and
SDSS I and II operations ran from 2005-2008. At the time of this writing, the SDSS I and II data
have been collected, the SDSS III has completed operations, and the SDSS IV is collecting data.
The first presentation about what is now called the Large Synoptic Survey Telescope (LSST)
was given in 1998, ten years after the organization known today as SDSS was established. LSST
commenced construction in 2014, and the team anticipates beginning data collection in 2022.
Often referred to as the next generation of SDSS, considerable personnel and institutional
overlap exist between the two projects. Some scientists whose careers grew with the SDSS now
occupy LSST leadership roles. However, LSST will be conducted at a scale beyond the original
SDSS in terms of survey years, project cost, data volume, and scientific aims.
The objective of this dissertation research is to garner further knowledge about how data
management differs between these sky survey populations through accumulating research
questions. Research Question 1 (RQ1) examines how data are understood by SDSS and LSST
team members and end-users. The successive research questions then build on this foundation.
Given how study participants understand data, RQ2 examines how these participants
comprehend what it means to manage those data. Given how data management is interpreted,
RQ3 next examines what kinds of expertise are viewed as necessary for data management. The
findings for RQ1 to RQ3 are presented here in the Results chapter based on three factors:
research question, research method, and study population. In terms of research method,
document analysis results are presented first, semi-structured interview results second,
ethnography findings third. Study populations are described first by SDSS team members, then
83
LSST team members, and finally by SDSS data end-users. RQ4 clearly examines the different
understandings of data between study participants given the seven individual demographic
variables in the study (refer back to 3.2.2 Semi-structured interviews for an explanation of each
demographic variable). RQ4 builds on the combination of the first three questions and is
presented by the seven demographic variables in the study population matrix. The results are
now presented sequentially by research question.
4.1RQ1Results:WhatareScientificAstronomyData?
The first research question asks: “What are scientific astronomy data?” These results
explore the three study populations (SDSS team members, LSST team members, and SDSS data
end-users) and how individuals within each population define astronomy data. After fully coding
the documents, interview transcripts, and field notes, the passages coded with “Data Definition”
were extracted from the NVivo qualitative coding software for further scrutiny. The “Data
Definition” code is intended to capture notions of how astronomy data, broadly construed, are
interpreted and defined.
After close examination of the extracted passages from all three methods, patterns of how
data were discussed emerged. These patterns were indicated with descriptive “subcodes.” Table
17 presents the subcodes and indicates the method from which each subcode emerged. An “x” in
the table indicates the perspective emerged from evidence using that research method.
Statements made specifically about the SDSS or LSST are indicated as such.
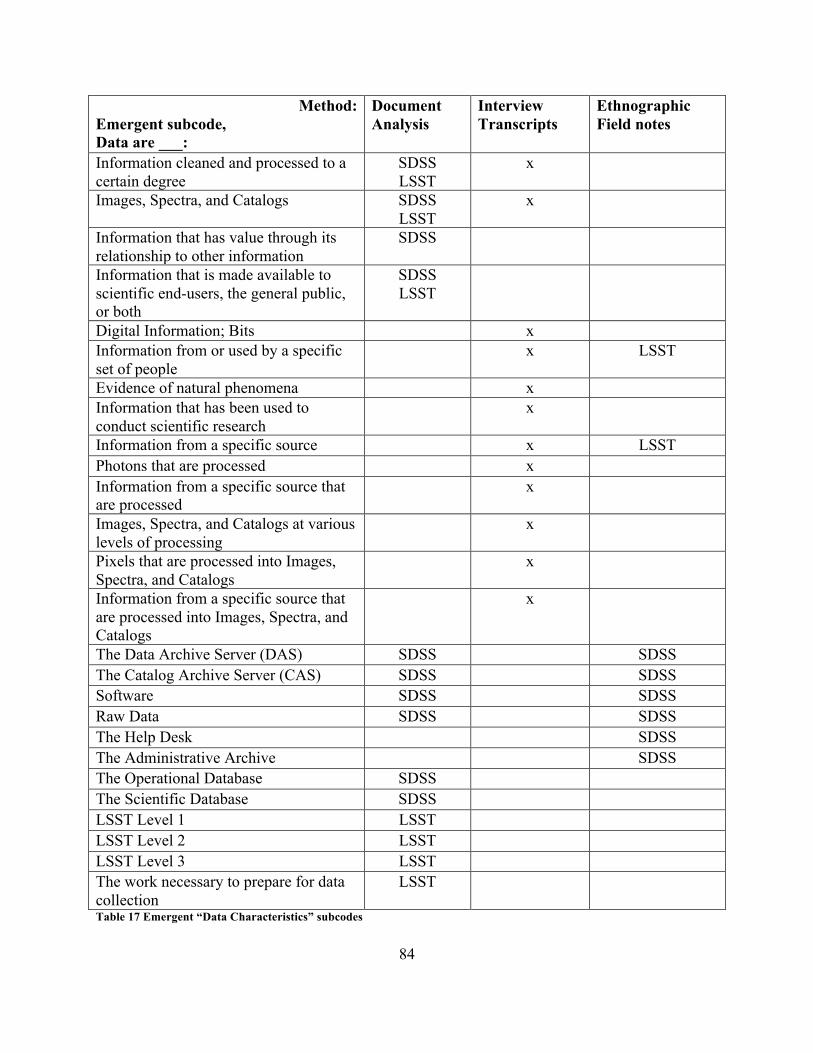
84
Method: Emergent subcode, Data are ___:
Document Analysis
Interview Transcripts
Ethnographic Field notes
Information cleaned and processed to a certain degree
SDSS LSST
x
Images, Spectra, and Catalogs SDSS LSST
x
Information that has value through its relationship to other information
SDSS
Information that is made available to scientific end-users, the general public, or both
SDSS LSST
Digital Information; Bits x Information from or used by a specific set of people
x LSST
Evidence of natural phenomena x Information that has been used to conduct scientific research
x
Information from a specific source x LSST Photons that are processed x Information from a specific source that are processed
x
Images, Spectra, and Catalogs at various levels of processing
x
Pixels that are processed into Images, Spectra, and Catalogs
x
Information from a specific source that are processed into Images, Spectra, and Catalogs
x
The Data Archive Server (DAS) SDSS SDSS The Catalog Archive Server (CAS) SDSS SDSS Software SDSS SDSS Raw Data SDSS SDSS The Help Desk SDSS The Administrative Archive SDSS The Operational Database SDSS The Scientific Database SDSS LSST Level 1 LSST LSST Level 2 LSST LSST Level 3 LSST The work necessary to prepare for data collection
LSST
Table 17 Emergent “Data Characteristics” subcodes
85
Table 17 provides a glimpse of the 26 ways data were described between each of the
three research methods used in this study. Next, the specific results that revealed these 26
subcodes are presented: first from the documents, then the interviews, and finally from the
ethnographic observations. Analysis and refinement of these emergent subcodes is presented at
the conclusion of the RQ1 findings (see 4.1.4 RQ1 results summary).
4.1.1 RQ1 documentation results
The following results reveal how data were described within SDSS and LSST project
documentation. Documents closely examined for the SDSS project range in time from 1993-
2011; documents from the LSST collaboration range from 2005-2015. These intervals cover the
majority of each project’s duration (see APPENDIX I and APPENDIX II for succinct timelines
of each project). The Methods chapter provides a more detailed description of the document
corpus.
4.1.1.1 SDSS data in documents
SDSS documentation analysis reveals how the boundaries and definitions of the SDSS
data changed over time. While presentations and conference proceedings are the most common
documents to explicitly define SDSS data, a number of genres also discuss the boundaries of the
data. “The SDSS data” are referred to in a number of ways: “database” (Abazajian et al., 2003;
Gunn & Knapp, 1993), “data bank” (Margon, 1998), “data products” (Astrophysical Research
Consortium, 2008; Boroski, 2007; Kent, 1994; York et al., 2000), “data sets” (Szalay et al.,
1999), “data archive” (Astrophysical Research Consortium, 2008; Stoughton et al., 2002; Yanny,
2011), “the data” (Kron, Gunn, Weinberg, Boroski, & Evans, 2008; Xiang, 2008), “the SDSS
Archive” (Szalay et al., 2000), and “science archive” (Astrophysical Research Consortium, 2000,
86
2005; Brunner et al., 1996; Kunszt, Szalay, Csabai, & Thakar, 2000). The terms data base (sic)
and data bank (sic) are only used through the first couple of data releases; the term data archive
continues to be used often over the course of the project. While SDSS data are repeatedly
referenced in different documents, the described boundaries of the data archive differ. Individual
documents referred to the SDSS data as though there were an agreed-upon definition, but close
analysis reveals the boundaries differed through time and by author. Overall, the most common
way SDSS data were described in project documents was based on their content, which includes:
images (photometric data), spectra (spectroscopic data), and catalogs (object attributes derived
from the images and spectra).
By the time SDSS I and II data collection neared completion, plans were already
underway to ensure the data could be archived and served into the near future. Multiple
institutions were chosen to manage the SDSS data following data collection. Planning meetings
between the SDSS leadership, represented by the Astrophysical Research Consortium, and the
chosen astronomy departments and university libraries resulted in Memoranda of Understanding
(MOUs). Each MOU included the Appendix “SDSS Long-Term Scientific Data Archive.” The
Appendix “summarizes the SDSS data products that will be maintained in the long-term
scientific data archive” (Astrophysical Research Consortium, 2008). After multiple years of
planning, the documents were signed near the end of 2008, and the participating institutions
archived and served the SDSS data from January 2009-December 2013. By the end of SDSS data
collection in 2008, “the SDSS data” were defined in the MOUs as consisting of the: Data
Archive Server (DAS), Catalog Archive Server (CAS), Survey Software, and Raw Data. While
the MOUs and Appendix appear to indicate a shared understanding of the boundaries of the
SDSS dataset, analysis of the implementation of these agreements revealed divergent
87
understandings. See 4.1.3.1 SDSS data in ethnography for observational findings explaining how
these MOU documents were interpreted and implemented in practice.
In addition to describing data as images, spectra, and catalogs, or based on the contents of
the “SDSS Long-Term Scientific Data Archive,” three additional ways of describing the data
emerged from the document corpus: the level of data processing, the relationships between data
products, and the internal and external divisions of data.
v Levelsofdataprocessing
The phrase “levels of data processing” is used here to refer to the ways and extent by
which astronomy data are processed. A number of software pipelines processed SDSS data to
ensure the raw data from the detectors were calibrated and smoothed, and the artifacts from the
detector, also referred to as systematics, were cleaned. Documents often refer to data in terms of
the level of data processing, most commonly in policy papers and presentations. The processed,
cleaned data were circulated through formal data releases, and some data were processed further
by end-users into other derived data products (Kron, Gunn, Strauss, Boroski, & Evans, 2005).
For many, the data release was the point at which data were considered “processed” as opposed
to “raw.” These documents refer to data in terms of multiple levels of data processing. SDSS
documents describe the importance of retaining copies of the data at each point along the
continuum of data processing: “The data should be retained as a full data set of all pixels on the
sky as well as in reduced data sets for later analysis and distribution” (Astrophysical Research
Consortium, 2000).
88
v Relationshipsbetweendataproducts
SDSS database builders authored documents regarding the importance of retaining
relationships between datasets. SDSS data releases include both flat files and a relational
database. Builders explained the importance of capturing both types of files: “The success of the
archive depends on capturing the spatial nature of this large-scale scientific data” (Szalay et al.,
1999, p. 4). The SDSS science archive is described not as a stand-alone data product, but in
relation to other aspects of the project. Data here are described by their relationships to other
information, including other data and the tools and services that enable community access and
retrieval. The relationships between images, spectra, and catalogs are related inextricably to
other data, information sources, and tools that enable the scientific usefulness of the data.
v PublicavailabilityofSDSSdata
Prior to data collection, collaboration documents used the terms SDSS Archive or data to
encompass all information throughout the lifetime of the project, from the internal data necessary
to build and run the survey, through the final data products as delivered to external end-users.
For example, Huang et al. (1995) described the importance of the data archive for internal
collaborators in terms of the “development and testing of software algorithms; quality analysis
on both the raw and processed data; selection of spectroscopic targets from the photometric
catalogs; and scientific analysis…” (1995, sec. Abstract). Documents written early in the
collaboration clarified the difference between, but noted the importance of both the data used to
run the survey, and the data released for scientific end-use. After data collection was completed,
the term “science archive” referred only to the data available to end-users, and stopped including
the data used in survey operations. After the first few data releases, the operational database, the
89
information necessary for survey operations, was no longer referred to as a part of the science
archive.
The Principles of Operation policy documents (released in 2000 for SDSS I and 2005 for
SDSS II) purport to present a formalized and mutual definition of the science archive. According
to these documents, the science archive encompasses all SDSS data and information necessary
for scientific results, which was acknowledged as the main product of the survey (Astrophysical
Research Consortium, 2005, sec. 1.3). Data base (sic) or data bank (sic) may refer to information
for survey operations or end-user data; however, data products, data archive, and science archive
are consistently used only to describe information intended for scientific end-use. In these later
documents, data are described as information used in scientific research, and not the data used to
operate the survey itself.
Some SDSS information was designated for internal project use, while other information
was intended for external end-users. Documents authored by upper SDSS administrators
characterize SDSS data by distinguishing information used within the team from data released to
the end-user community. The public release of SDSS data was an important milestone in project
development, as it ensured continued funding support and support from the end-user community.
Richard Kron, et al. (2008) describes the SDSS data as consisting of “object catalogs, imaging
data, and spectra,” but goes on to note these data are, “all available through the SDSS web site
http://www.sdss.org, along with detailed documentation and powerful search tools” (Kron et al.,
2008, p. 2). Thus, these authors describe the SDSS dataset as information available to a broad
range of scientists. Data use was contingent on the SDSS team’s ability to make the data public,
accessible, and retrievable: “The data are publicly available in searchable databases and flat
90
files…” (Kron et al., 2005, p. 1). Here, only the information destined for end-users are
considered data, while internal, operational information are not considered data.
4.1.1.2 LSST data in documents
LSST documents and presentations note that the project will have produced the most
data-voluminous optical survey in history when the ten-year operations are completed (now
expected to commence in 2022). According to a presentation by the LSST Project Scientist for
Data Management, the data will be the most important outcome of the project: “the ultimate
deliverable of LSST is not the telescope, nor the instruments; it is the fully reduced data. All
science will be [sic] come from survey catalogs and images” (Juric, 2014, sec. 2). LSST staff
refer to “fully reduced” data as data that has completed its processing by the LSST team and is
ready for end-users. Juric’s statement references the most common way data were described in
documents, as scientific products: images, spectra, and catalogs. Through different authors and
document genres, the project employs grandiose language to describe the size and quality of the
expected data, software tools, and infrastructures to support data collection, processing, and
analysis.
LSST document analysis reveals documents representing different genres define the
boundaries of “the LSST data” differently. LSST data have been referred to as a “data set”
(National Science Foundation, 2005; Pike, Stein, Szalay, & Tyson, 2001), “data” (Becla et al.,
2005; Ivezić et al., 2011), and a “database” (Kantor et al., 2007; National Science Foundation,
2012); however, LSST data are most commonly referred to as “data products” (Becla et al.,
2006; Freemon & Kantor, 2013; Juric et al., 2013; LSST Science Collaboration et al., 2009;
National Science Foundation, 2010a). In addition to referring to data as images, spectra, and
catalogs, three themes emerged summarizing the ways LSST documents reference LSST data.
91
First, similar to the SDSS documents, the data are referred to by the level of data processing.
Next, documents, and in particular the LSST website, refer to data, according to the work
required to prepare the data for scientific end-use. Finally, documents written to interact with
funding agencies often refer to data in terms of the level of public availability.
v Levelsofdataprocessing
The LSST Data Processing Plan references three distinct levels of LSST data; Figure 6
presents the 2015 website description of these three levels (“Data products | LSST public
website,” 2015; Juric, 2014, sec. 4). Level 1 data products are often called alerts, and provide
recent event notifications. The current intention is to distribute these alerts world-wide within 60
seconds of each event (Juric, 2014, sec. 4). Level 2 data will be disseminated online in data
releases, similar to the way SDSS data were collected and made available. These data will be
released to LSST membership countries and institutions on an approximate annual basis. While
not referencing data per se, LSST’s Level 3 tier designates an infrastructure available for end-
users to engage in scientific investigations using LSST data. For example, software, APIs, and
computing time will be made available to assist LSST data end-users in processing and analyzing
LSST data. These three levels are distinct from the NASA data levels (as detailed earlier in 2.4.1
US space- and ground-based astronomy), and detail instead the manner in which LSST
specifically will make its data and resources available.
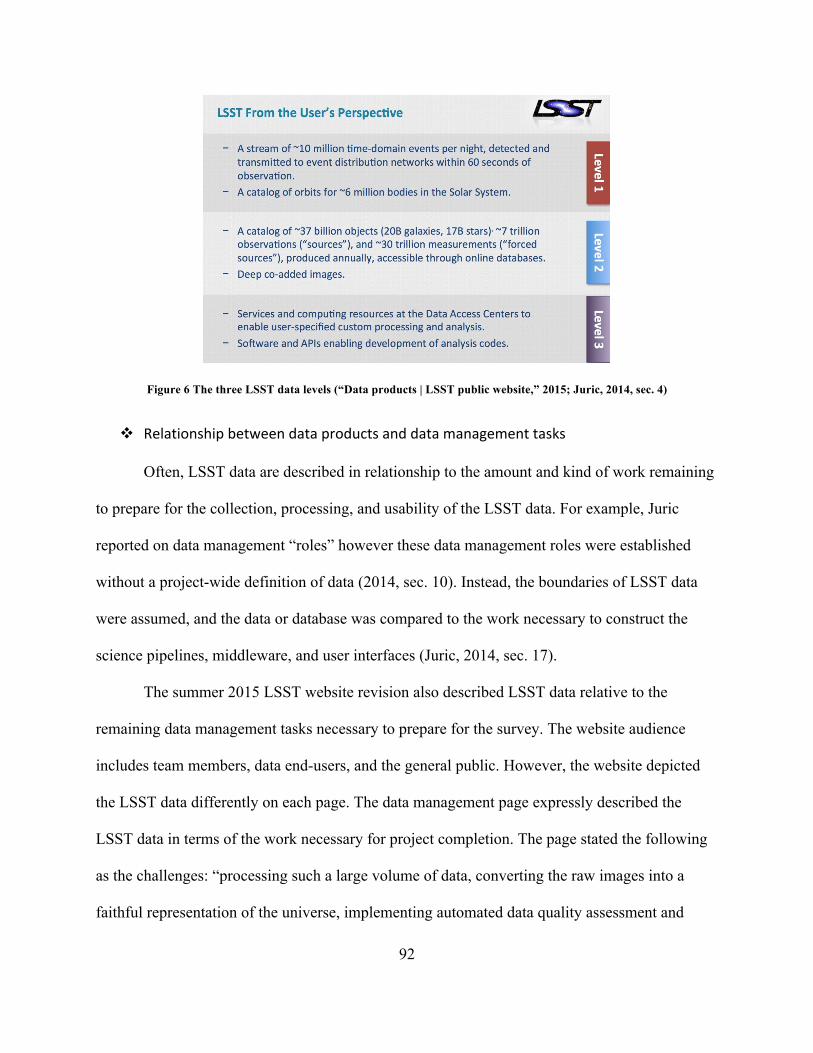
92
Figure 6 The three LSST data levels (“Data products | LSST public website,” 2015; Juric, 2014, sec. 4)
v Relationshipbetweendataproductsanddatamanagementtasks
Often, LSST data are described in relationship to the amount and kind of work remaining
to prepare for the collection, processing, and usability of the LSST data. For example, Juric
reported on data management “roles” however these data management roles were established
without a project-wide definition of data (2014, sec. 10). Instead, the boundaries of LSST data
were assumed, and the data or database was compared to the work necessary to construct the
science pipelines, middleware, and user interfaces (Juric, 2014, sec. 17).
The summer 2015 LSST website revision also described LSST data relative to the
remaining data management tasks necessary to prepare for the survey. The website audience
includes team members, data end-users, and the general public. However, the website depicted
the LSST data differently on each page. The data management page expressly described the
LSST data in terms of the work necessary for project completion. The page stated the following
as the challenges: “processing such a large volume of data, converting the raw images into a
faithful representation of the universe, implementing automated data quality assessment and
93
automated discovery of moving or transient sources, and archiving the results in useful form for
a broad community of users…” (“Data management | LSST public website,” 2015). The website
goes into extensive detail on the data itself in five separate pages, describing the same data
products using slightly different language on each page (“Data management system requirements
| LSST public website,” 2015; “Data products | LSST public website,” 2015; “Petascale R&D
challenges | LSST public website,” 2015; “Pipelines | LSST public website,” 2015; “Technology
Innovation | LSST public website,” 2015). Consistently, the LSST presentations and website
refer to the data in terms of the work still required to collect, manage, and use the data.
v PublicavailabilityofLSSTdata
LSST NSF grant proposals describe the importance of LSST data in terms of the
international benefit to science (National Science Foundation, 2005, 2010a, 2012, 2014a). In
these documents, data are construed by their accessibility to astronomers and the public. In 2005,
LSST acquired an 11-million-dollar planning grant from the NSF. In the application, the
collaboration promised to “produce the largest non-proprietary data set in the world” (National
Science Foundation, 2005). The grant proposal refers to data in terms of its accessibility and
potential for broad scientific impact.
The tools created by the LSST collaboration aim to benefit astronomical work well
beyond that of project members. The 2010 proposal explains, “In addition, the [larger
astronomy] community will see significant technical overlap between the LSST and the needs of
other imaging systems and software under development in the national security arena” (National
Science Foundation, 2010a). In addition to pedagogical training of the next generation of
scientists and public education resources, the proposals indicate the development of tools to
ensure the scientific and public accessibility of LSST data (National Science Foundation, 2005).
94
These NSF proposals stress the importance of data access by stating “the broader impacts of the
LSST will be profound, as scientists, the public, and schoolchildren around the world will have
ready access to the data” (National Science Foundation, 2005, 2010a). The 2012 NSF proposal
pinpoints LSST’s mission to broadly benefit astronomy by explaining that the data management
system is being developed open source (National Science Foundation, 2012). The writing
focused strategically on LSST’s public, broader impacts to enable the LSST to attract and retain
funders from the United States and around the world.
4.1.2 RQ1 interview results
Analysis of eighty semi-structured interviews generated the following results for the first
research question. As a component of each interview, interviewees specified their definition of
astronomy data. Interview results for RQ1 - What are astronomy research data? - are presented
from each study population.
4.1.2.2Howresponseswereelicited
All interviewees discussed how they understood astronomy data. However, their
descriptions were evoked in one of three ways. Twenty-five interviewees defined data indirectly
over the course of the interview, doing so without a specific prompt or question from the
interviewer. These freely expressed definitions are important because they emerged organically,
thus reducing the potential bias of the interviewer through the wording of the question. When
interviewees did not define data to the satisfaction of the interviewer, interviewees were
explicitly asked for a definition. Thirty-three interviewees were directly asked to define
astronomy data. Twenty-three end-user interviewees were interviewed using the “Follow the
Data” protocol, and their understanding of data emerged from direct questioning about the
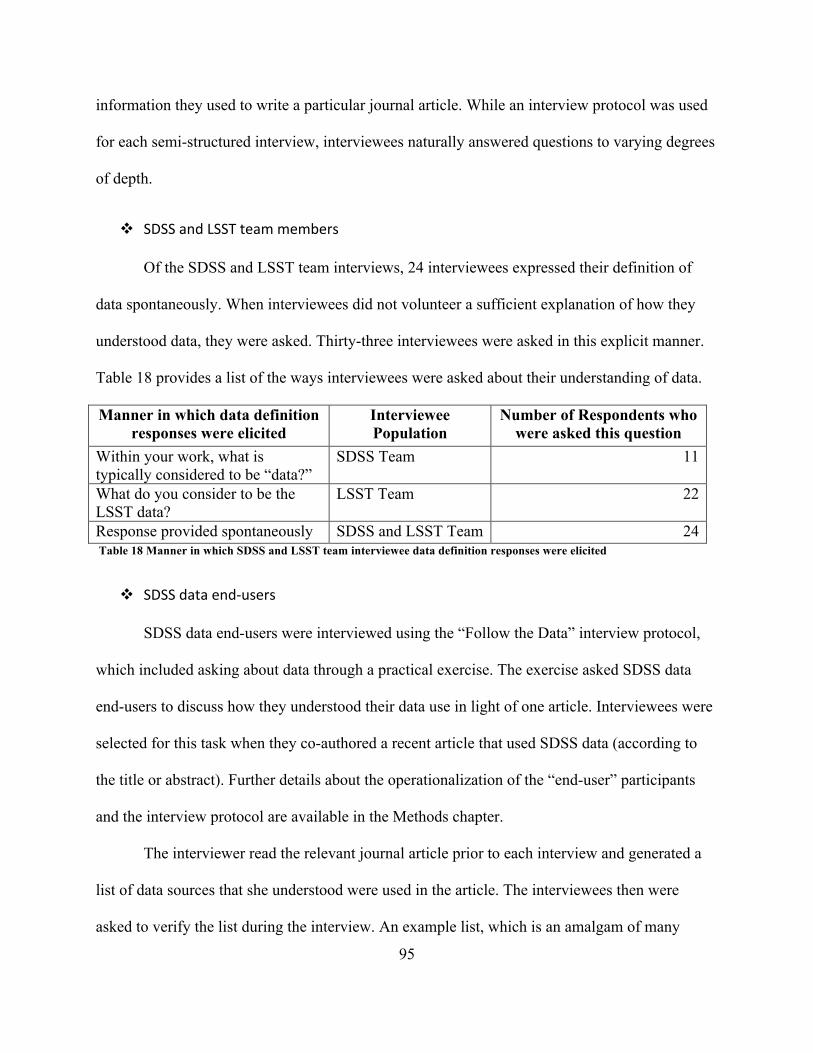
95
information they used to write a particular journal article. While an interview protocol was used
for each semi-structured interview, interviewees naturally answered questions to varying degrees
of depth.
v SDSSandLSSTteammembers
Of the SDSS and LSST team interviews, 24 interviewees expressed their definition of
data spontaneously. When interviewees did not volunteer a sufficient explanation of how they
understood data, they were asked. Thirty-three interviewees were asked in this explicit manner.
Table 18 provides a list of the ways interviewees were asked about their understanding of data.
Manner in which data definition responses were elicited
Interviewee Population
Number of Respondents who were asked this question
Within your work, what is typically considered to be “data?”
SDSS Team 11
What do you consider to be the LSST data?
LSST Team 22
Response provided spontaneously SDSS and LSST Team 24 Table 18 Manner in which SDSS and LSST team interviewee data definition responses were elicited
v SDSSdataend-users
SDSS data end-users were interviewed using the “Follow the Data” interview protocol,
which included asking about data through a practical exercise. The exercise asked SDSS data
end-users to discuss how they understood their data use in light of one article. Interviewees were
selected for this task when they co-authored a recent article that used SDSS data (according to
the title or abstract). Further details about the operationalization of the “end-user” participants
and the interview protocol are available in the Methods chapter.
The interviewer read the relevant journal article prior to each interview and generated a
list of data sources that she understood were used in the article. The interviewees then were
asked to verify the list during the interview. An example list, which is an amalgam of many
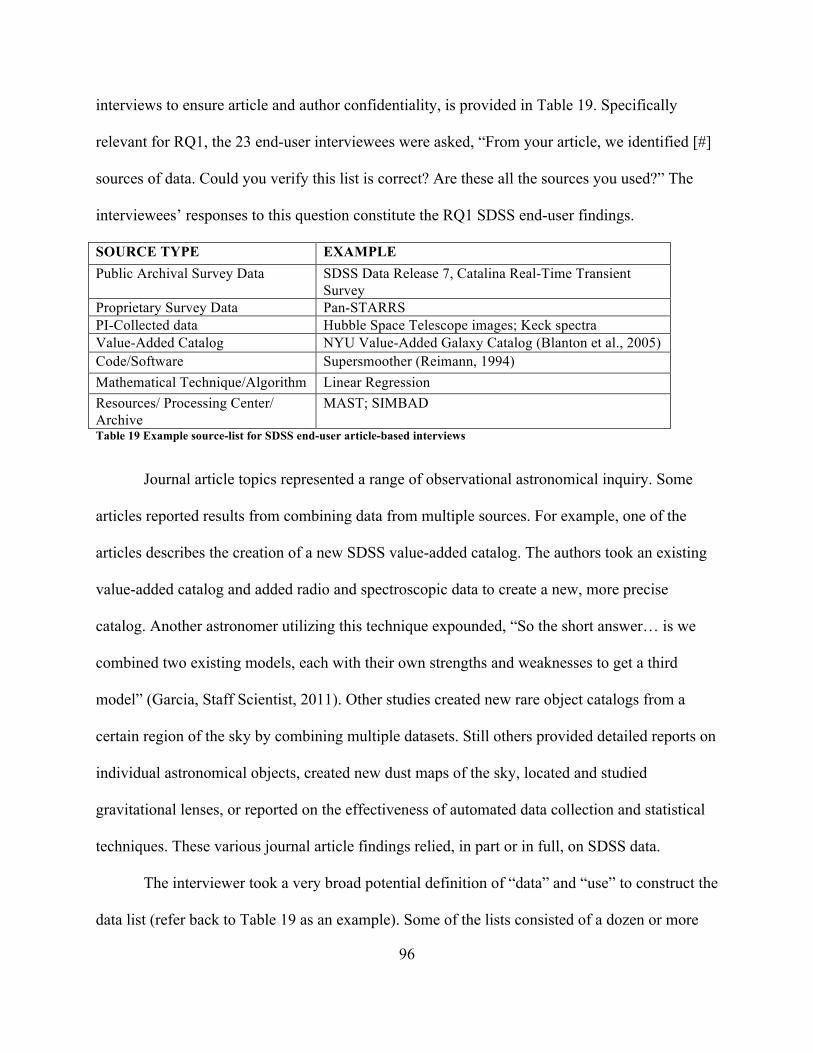
96
interviews to ensure article and author confidentiality, is provided in Table 19. Specifically
relevant for RQ1, the 23 end-user interviewees were asked, “From your article, we identified [#]
sources of data. Could you verify this list is correct? Are these all the sources you used?” The
interviewees’ responses to this question constitute the RQ1 SDSS end-user findings.
SOURCE TYPE EXAMPLE Public Archival Survey Data SDSS Data Release 7, Catalina Real-Time Transient
Survey Proprietary Survey Data Pan-STARRS PI-Collected data Hubble Space Telescope images; Keck spectra Value-Added Catalog NYU Value-Added Galaxy Catalog (Blanton et al., 2005) Code/Software Supersmoother (Reimann, 1994) Mathematical Technique/Algorithm Linear Regression Resources/ Processing Center/ Archive
MAST; SIMBAD
Table 19 Example source-list for SDSS end-user article-based interviews
Journal article topics represented a range of observational astronomical inquiry. Some
articles reported results from combining data from multiple sources. For example, one of the
articles describes the creation of a new SDSS value-added catalog. The authors took an existing
value-added catalog and added radio and spectroscopic data to create a new, more precise
catalog. Another astronomer utilizing this technique expounded, “So the short answer… is we
combined two existing models, each with their own strengths and weaknesses to get a third
model” (Garcia, Staff Scientist, 2011). Other studies created new rare object catalogs from a
certain region of the sky by combining multiple datasets. Still others provided detailed reports on
individual astronomical objects, created new dust maps of the sky, located and studied
gravitational lenses, or reported on the effectiveness of automated data collection and statistical
techniques. These various journal article findings relied, in part or in full, on SDSS data.
The interviewer took a very broad potential definition of “data” and “use” to construct the
data list (refer back to Table 19 as an example). Some of the lists consisted of a dozen or more
97
potential sources. While the interviewer brought a very broadly construed source-list to the
interview, only three interviewees chose to make changes. Wilson clarified that the Monte Carlo
(simulation) listed on the source list should be identified as a “technique” instead of data. He
explained, “It’s not a data source, but instead it’s actually just a mathematical technique that was
used…” (Wilson, Graduate Student, 2015). Rodriguez wanted to clarify that the Supersmoother
was software and not data, and another listed source was an analysis method instead of data
(Rodriguez, Professor, 2011). Lee referred to SDSS data as different from the other kinds of data
used in his journal article. He stated, “Yeah, so we used Sloan to select objects, but we couldn't
do the science we wanted to with the Sloan data. So, for us, Sloan is a finder” (Lee, Post-Doc,
2013). The other 20 interviewees confirmed the data source lists as identified by the interviewer.
4.1.2.3SDSSteam
The following findings present the different ways SDSS team interviewees defined data
during the interviews. As described in the introduction to the RQ1 Results, the following results
summarize the findings culled from the code “Data Definition,” and are organized by emergent
subcode. Within each subsection, the number of interviewees who described data in that way are
noted, and a representative set of quotes illustrate the meaning of the emergent subcode.
v Content
Six interviewees, questioned using SDSS interview protocols, discussed astronomy data
in terms of the content of the data. These individuals discussed astronomy data as encompassing
images, spectra, and catalogs. For example, James described the data she uses in her research:
“So, definitely, for me it is essential to have the spectra. Surveys… they are great, because they
will have the images and everything. But for me without spectra it's tough” (James, Professor,
98
2015). Flores explained data similarly as involving, “…all photographic and spectra. Spectra is
photographic, but it's photographs of spectrum” (Flores, Staff Engineer, 2015). Lopez described
collecting data from various sources and then generating catalogs from those images and spectra
(Lopez, Professor 2013). Each of these six interviewees described astronomy data as images,
spectra, and catalogs.
v State
Six interviewees from the SDSS team interviews described data in relation to the current
state of the data, specifically in terms of the levels of data processing. Martin explained that in
order to prepare data for scientific analysis, data must first undergo numerous processing stages
(Martin, Staff Scientist, 2012). Clark mentioned multiple levels of data, including an early stage
when the instruments are run without “expecting to get science out,” raw data, and transformed
data (Clark, Research Programmer, 2013). Brooks described how NASA science centers ideally
archive data at each of the multiple levels of processing. He explained, “So, yes, [NASA science
centers] they're doing a great job. … So they preserve the raw data from the space craft and then
these high level data products” (Brooks, Professor, 2015). These interviewees all spoke about
data by focusing on the extent of processing.
v Use
Four SDSS team members described data in terms of its scientific usability. These
interviewees described data in terms of its potential usefulness for specific inquiries. For
example, one interviewee described data in the context of its use in publications. When asked
about the data from a recent publication, he explained, “The actual data are online. … The paper
doesn't have any data actually. It has a bunch of words and a few pictures and a table of numbers
99
or two, but the data is far too large” (Thomas, Professor, 2012). Gray described data in terms of
precision, which he based on his current project. He explained, “I want to write the papers for
those two things before we have any data. I want to take the simulations, treat them as if the real
data, and I want to publish a paper based on that” (Gray, Professor, 2015). Gray defines data as
information that is useful to his scientific work, whether the data are simulated or observations.
These interviewees distinguish their data based on the scientific objective for which the data are
being used.
v Format
Two SDSS interviewees referred to data in terms of its digital nature. For example, Harris
used the term data “loosely,” when he explained, “Data to me is anything with numbers…”
(Harris, Staff Scientist, 2013). Gonzalez also described data as any information obtained from
scientific instruments. He elaborated, “The analog of the digital converter that brings us a file, so
that we call data. And so, it could be pixels, it could be quantities that derive from the pixels, that
would be data too” (Gonzalez, Professor, 2013). These interviewees referenced data by
describing aspects of data as digital information.
v Source
One SDSS team interviewee described data as anything from a specific project’s
instruments. Walker described the SDSS data as information involved in the SDSS “project
history,” or as the information generated by the SDSS project (Walker, Project Manager, 2013).
This interviewee referred to data as information from a specific source or group of people.
100
v Evidence
Two SDSS team members described data as evidence of phenomena. Cooper
characterized data as, “any inferred quantity from the sky or from a simulation” (Cooper,
Professor, 2015). Anderson differentiated between data and understanding, in which data are
information collected about the universe (Anderson, Emeritus Professor, 2012). These
interviewees labeled data as evidence of the natural world.
v Contentandstate
Two interviewees described data based on both its content and its state. In other words,
these interviewees discussed images, spectra, and catalogs based on their level of data
processing. Wilson described raw data as images or spectra processed into usable data, which are
then reduced into data products (for example, catalogs) (Wilson, Graduate Student, 2011). Carter
agreed, stating that within her work data are, “photometric measurements or catalogs and
spectral files” (Carter, Professor, 2015). She then immediately proceeded to discuss the
differences between what he defines as data compared to raw and unreduced data and “machine
readable tables of published, inferred values in papers” (Carter, Professor, 2015). Both of these
interviewees discussed data in terms of images, spectra, and catalogs processed to a certain
extent.
v Format,content,andstate
Robinson began discussing data as digital information processed into images, spectra,
and catalogs. Robinson distinguished between images and spectra: “So for the images, it's like a
digital picture of the sky… for the spectroscopy, it's sort of like a one dimensional digital picture.
You have to actually do some processing to get it there… But it all ends up in digital form…”
101
(Robinson, Staff Scientist, 2013). Robinson thus provides a complex explanation of data by
referencing it as digital information processed into images, spectra, and catalogs.
v Content,state,andsource
Moore described SDSS data as information that comes from the SDSS instruments,
requires a lot of processing, and then turns into images, spectra, and catalogs that could be
processed even further. She described SDSS data as anything from the SDSS camera: “[We]
very much designed the Sloan codes to do no harm to the data, to extract almost everything that
came off the cameras” (Moore, Staff Scientist, 2012). Moore goes into great detail about the data
processing pipelines and concludes the information from the SDSS cameras and spectrographs
ultimately results in images, spectra, and catalogs.
v Stateandformat
No SDSS interviewees described data based on State or Format.
v Stateandsource
One SDSS interviewee described data based on the source of the information and its level
of processing. She described SDSS data as information “obtained by observers in the New
Mexico Observatory” that was then “sent to [the SDSS data center] in a FITS file” (Lewis,
Research Programmer, 2013). She then discussed in detail the processing that takes place once
the SDSS information arrived at the data center. Lewis described SDSS data as information
collected by the SDSS instruments and processed by the SDSS team.
102
4.1.2.4LSSTteam
The following are the different ways LSST team members defined data. As described in
the RQ1 Results introduction, the following results summarize the findings from the code “Data
Definition,” and are organized by emergent subcode. Within each subsection, the number of
LSST team interviewees who described data in each way are noted, and a representative set of
quotes illustrate the meaning of the emergent subcode.
v Content
Six LSST team member interviewees described data in terms of its content, specifically
as images, spectra, and catalogs. When asked about data within his work, Thomas explained the
nature of astronomy data succinctly: “…We have the images of the sky, we have the catalogs
derived from those images, we have spectra, and then we have all the metadata that come with
that…” (Thomas, Professor, 2015). When asked what he considers to be the LSST data, another
interviewee answered, “…I don't know, were you looking for catalogs, images I can just say that.
[chuckle] I was going to just describe everything in the catalogs” (Baker, Graduate Student,
2014). Each of these interviewees discussed data in terms of its content, by describing data as
images, spectra, and catalogs.
v State
Four interviewees from the LSST team described data in terms of data processing levels.
Three of these interviewees were directly involved in the technical development of the LSST
data management system over multiple years. Kelly, a computer scientist and long-time member
of LSST described the future project data by mentioning the alerts and data releases, two of the
three LSST data levels. He described the first two LSST levels by saying, “I mean because
103
there's two different types of processing. …one's the alert production stuff, which is nightly. And
then the data release processing stuff… and since we do that every year, there's gonna be some
time to improve everything” (Kelly, Research Programmer, 2015). Rivera explained data are
processed information by revealing, “So for me, data, usually it's sort of a processed version”
(Rivera, Professor, 2015). These interviewees each described astronomy data by referencing the
different levels of data processing.
v Use
One interviewee described data in terms of its uses for scientific research. Sanchez
described data in terms of its use as a pedagogical tool. She explained, “So we came up and did a
lot of work with her students and all the research there and using all of the Sloan data for that”
(Sanchez, Lecturer, 2014). Sanchez described data in relationship to its use teaching future
scientists.
v Format
Three LSST team member interviewees described data in terms of its digital materiality.
For example, Nelson described data in terms of its digital “binary” nature (Nelson, Staff
Scientist, 2014). When asked if what is considered LSST data has changed over time, an LSST
team leader answered, “We never defined it. That's a very interesting question. We talked many,
many times about LSST data, but we never defined the term. I think most people would think of
pixel values in LSST images, plus everything you derive from those pixel values…” (Martinez,
Professor, 2011). Phillips agreed, noting, “At a more fundamental level of course is the LSST
pixels” (Phillips, Staff Scientist, 2015). These interviewees each discussed the digital nature of
data, whether stored in binary or as pixels.
104
v Source
Four LSST team members described data in terms of the data’s origin. Two interviewees
described the data source in terms of the distinction between simulated data and observational
data. Diaz described how the LSST uses simulated data as input for the data management team
processing. He believes that the simulated data are “real data” even though they are not “from
the sky” because the LSST team is using them (Diaz, Research Programmer, 2015). He also
explained the LSST is using data from previous surveys in addition to simulated data, including
the SDSS Data Release Seven “Stripe 82” data. King described LSST data as simulations, while
in the future the LSST data will be information from the LSST camera (King, Research
Programmer, 2014). These interviewees describe LSST data by referring to the project that
created or uses the data, whether simulated or observational.
v Evidence
One LSST team member described data as evidence of a phenomenon. Bailey illustrated
this in her broad response by saying the LSST data are, “Basically, any information they derive
about the external world. … All of that is the data” (Bailey, Staff Scientist, 2015).
v Contentandstate
Three interviewees described data as extensively processed images, spectra, and catalogs.
For example, Adams explained astronomy data are catalogs and images, but the kind of research
question determines the necessary processing level for the scientist to work with the data
(Adams, Staff Scientist, 2014). Scott was asked, “From your perspective, what are the LSST
data?” He explained that while he generally uses processed data, he is eager to begin using the
LSST Level 1 data: “So for most applications other than that I would be looking at [a] more
105
processed version. I think this is the only one where I foresee myself actually want[ing] to look
at the raw images or doing something with that” (Scott, Post-Doc, 2014). Lee explained that the
LSST data for him is “the calibrated images and DM-produced object and source catalogs,” but
acknowledged other researchers may want to analyze the data at different levels of processing
(Lee, Post Doc, 2013). These interviewees each described data as images, spectra, and catalogs
available at different levels of processing.
v Format,content,andstate
Two interviewees described data based on its digital nature, content, and state of
processing. When asked how he understood astronomy data, Murphy was surprised by the
question and responded, “That's a very metaphysical question - a bunch of ones and zeros”
(Murphy, Professor, 2015). Murphy goes on to explain that LSST data are information from the
telescope, processed into images, spectra, and catalogs. Stewart similarly described data as pixels
processed through a few stages and result in catalogs. These interviewees discussed data in terms
of its digital nature, its extent of processing, and its content as images, spectra, and catalogs.
v Content,state,andsource
No LSST team member interviewees described data based on content, state, and source.
v Stateandformat
One LSST team member described data based on the state of processing and format as
digital information. When asked what she considered to be data, she explained, “…the primary
data would be the photons that come in. ...Because there'll be so much of it, like with all of these
things, I would hope that the pipeline data would do the trick. But the raw data, or the 1.5 data,
or how you do, all that stuff...” (Reed, Staff Scientist, 2015).
106
v Stateandsource
No LSST team member described data based on the state of processing and its source.
4.1.2.5SDSSdataend-users
The SDSS end-user interviews corroborated how data were described in the SDSS and
LSST team interviews by discussing the data they used in a particular journal article. The
number of SDSS end-user interviewees who described data in each way is presented below.
v Content
Nine interviewees described data by referencing its content: astronomical images,
spectra, and catalogs. Morris explained, “What kind of data I use? Imaging data. So, anything
that is measured from astronomy images. And then spectroscopic data. So, things that are
measured from spectroscopic measurements. Those are the two main data sets” (Morris,
Professor, 2015). Johnson agreed by noting, “So in [the] case of say, digital sky surveys, data
would be tables in the database and images…” (Johnson, Professor, 2011). More specifically,
Smith described how she begins using SDSS catalog data and then adds spectral information to
create the dataset for a journal article. She explained, “Now I have that catalog then I go to Sloan
database… and I compiled the radio properties as a subset of the columns in this catalog. And
also the database, the individual spectrum…” (Smith, Post-Doc, 2011). These interviewees
described the data they used in their journal article by referencing the information as images,
spectra, and catalogs.
v State
While SDSS and LSST team members frequently discussed data in terms of the level of
data processing, only three SDSS data end-user interviewees discussed data by state or level of
107
processing. These three interviewees disagreed as to whether the level of processing creates a
distinction between “data” and “data products.” Collins considered data products, which have
been highly processed, as distinct from other kinds of data (Collins, Professor, 2015). Edwards
did not distinguish between data and data products, and instead described data as information
along a path of processing. He explained, “Anything from the raw image on a detector, up
through something derived, like a sensitivity limit, is usually considered data. Brightnesses,
spectra, all these things are considered data” (Edwards, Post-Doc, 2015).
v Use
Five SDSS data end-user interviewees described data in terms of scientific use. End-user
interviewees often discussed data in terms of primary or parent datasets in comparison to
secondary or follow-up datasets. These data end-user interviewees described data in relationship
to other research information. The interviewees referred to the dataset that they used to begin an
investigation as the parent or primary dataset; secondary datasets were those they added to the
primary dataset for analysis. For example, White explained a quasar catalog was the parent
sample in his study: “Okay. The first of three, so the SDSS quasar catalog DR8, all of those were
things that existed. That’s the parent sample” (White, Staff Scientist, 2012). He went on to
explain that he calls other data added to the catalog ancillary data. Similarly, Ward began his
study with an interesting discovery from one particular dataset. He then referred to all other data
he used as follow-up data, including SDSS data he was able to download (Ward, Professor,
2015). Jackson referred to his data as primary and secondary (Jackson, Staff Scientist, 2012).
These interviewees all described data by referencing the priority of the data in a specific analysis.
108
v Format
Three SDSS data end-users described data in terms of its digital medium. One computer
science researcher explained that she did not cite the data source in his publication because the
particulars of the astronomy data he used in his study were not important. She explained the
decision: “This is a lame excuse, but from the computer science point of view... Yeah, it's bits;
it's zeros and ones that you have there…. In hindsight, that's true, that's where they got the
images was Sloan” (Hill, Professor, 2015). Williams described astronomy data as photons, “But
the data will be the number of photons that are associated with physical source. That would be
the primary thing” (Williams, Staff Scientist, 2011). These three interviewees described data by
referring to characteristics of its digital form.
v Source
Three SDSS data end-users described data in terms of where, or by whom, the data had
originated. For example, one interviewee working in a technical capacity for the SDSS project
referred to data as “whatever [the SDSS leaders] tell me that needs to be saved” (Bennett, Staff
Scientist, 2015). Mitchell referred to datasets by the name of the survey that initially collected
the data (Mitchell, Graduate Student, 2015). These interviewees referenced data in terms of the
project or instrument that collected the data.
v Evidence
Only one SDSS data end-user described data in terms of its evidentiary value for
scientific research. When asked, “So, in your work, what do you consider to be data?” Nguyen
responded, “Effectively, everything that has relation to reality” (Nguyen, Professor, 2015). This
category may have only been referred to once in the end-user interviews because these
109
interviews were focused on data from a specific journal article. Since concrete options for data
were discussed, end-user interviewees may have been less inclined to describe data generically,
as evidence of phenomena.
v Contentandstate
No SDSS data end-user interviewees described data based on its content as images,
spectra, and catalogs alongside its nature as processed information.
v Format,content,andstate
No SDSS data end-users described data based on its format as digital information, its
content as images, spectra, and catalogs, and its state as processed information.
v Content,state,andsource
Two SDSS data end-user interviewees discussed data based on its content, state, and
source. For example, Lee went into detail about the different levels of data processing he uses for
his research, “…what I actually mean by data is the higher, reduced, processed, end science
product,” also noting the content are images, spectra, and catalogs coming from specific project
sources (Lee, Staff Scientist, 2015). Similarly, Wood, described data in terms of images, spectra,
and catalogs from specific sources, “anything I get from the telescope…[which]…go through
several steps to what we call data reduction, where you go from this raw off-the-telescope kind
of information down to something that you want to analyze” (Wood, Professor, 2015).
v Stateandformat
One SDSS data end-user described data based on its state of processing and its format as
digital information. Rogers explained, “Datasets, we preserve the core bits of information, all the
110
telemetry data that comes off of the telescopes… Those are just like save the bits… For that
initial data off the telescope” (Rogers, Professor, 2015). Rogers described data as digital bits
directly from an instrument or digital bits processed to different degrees.
v Stateandsource
No SDSS data end-users described data based on its level of processing and its origin
from a specific set of instruments or collaboration.
4.1.3 RQ1 ethnography results
Ethnographic observations revealed nuance to stakeholder understandings of data in both
the SDSS and the LSST. Fieldwork following the SDSS I and II data collection and release
revealed the different ways stakeholders interpret the boundaries of the dataset. Fieldwork with
LSST team members revealed different interpretations as to whether or not LSST data existed
during the construction phase of the project.
4.1.3.1 SDSS data in ethnography
In 2008, the SDSS I and II completed data collection and distributed the final data release
for those phases. As those initial phases of the project ended, the SDSS collaborators knew the
SDSS data retained great value to the astronomy community. SDSS leaders determined plans
were necessary to ensure the data were archived and served following the fiscal close of the
SDSS I and II. On behalf of the SDSS collaboration, the Astrophysical Research Consortium
(ARC), signed Memoranda of Understanding (MOUs) with four different institutions to continue
managing the SDSS I and II data for five years from January 1, 2009-December 31, 2013. Two
of the MOUs were signed with institutions already involved in the collaboration; the other two
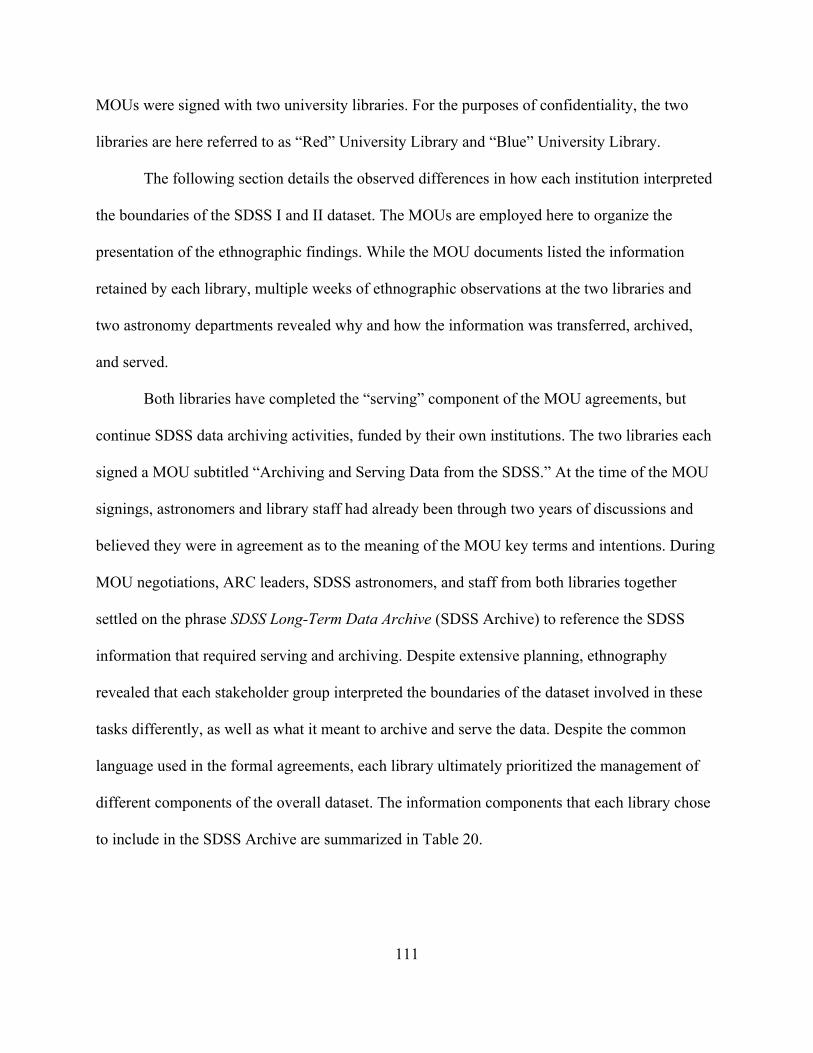
111
MOUs were signed with two university libraries. For the purposes of confidentiality, the two
libraries are here referred to as “Red” University Library and “Blue” University Library.
The following section details the observed differences in how each institution interpreted
the boundaries of the SDSS I and II dataset. The MOUs are employed here to organize the
presentation of the ethnographic findings. While the MOU documents listed the information
retained by each library, multiple weeks of ethnographic observations at the two libraries and
two astronomy departments revealed why and how the information was transferred, archived,
and served.
Both libraries have completed the “serving” component of the MOU agreements, but
continue SDSS data archiving activities, funded by their own institutions. The two libraries each
signed a MOU subtitled “Archiving and Serving Data from the SDSS.” At the time of the MOU
signings, astronomers and library staff had already been through two years of discussions and
believed they were in agreement as to the meaning of the MOU key terms and intentions. During
MOU negotiations, ARC leaders, SDSS astronomers, and staff from both libraries together
settled on the phrase SDSS Long-Term Data Archive (SDSS Archive) to reference the SDSS
information that required serving and archiving. Despite extensive planning, ethnography
revealed that each stakeholder group interpreted the boundaries of the dataset involved in these
tasks differently, as well as what it meant to archive and serve the data. Despite the common
language used in the formal agreements, each library ultimately prioritized the management of
different components of the overall dataset. The information components that each library chose
to include in the SDSS Archive are summarized in Table 20.
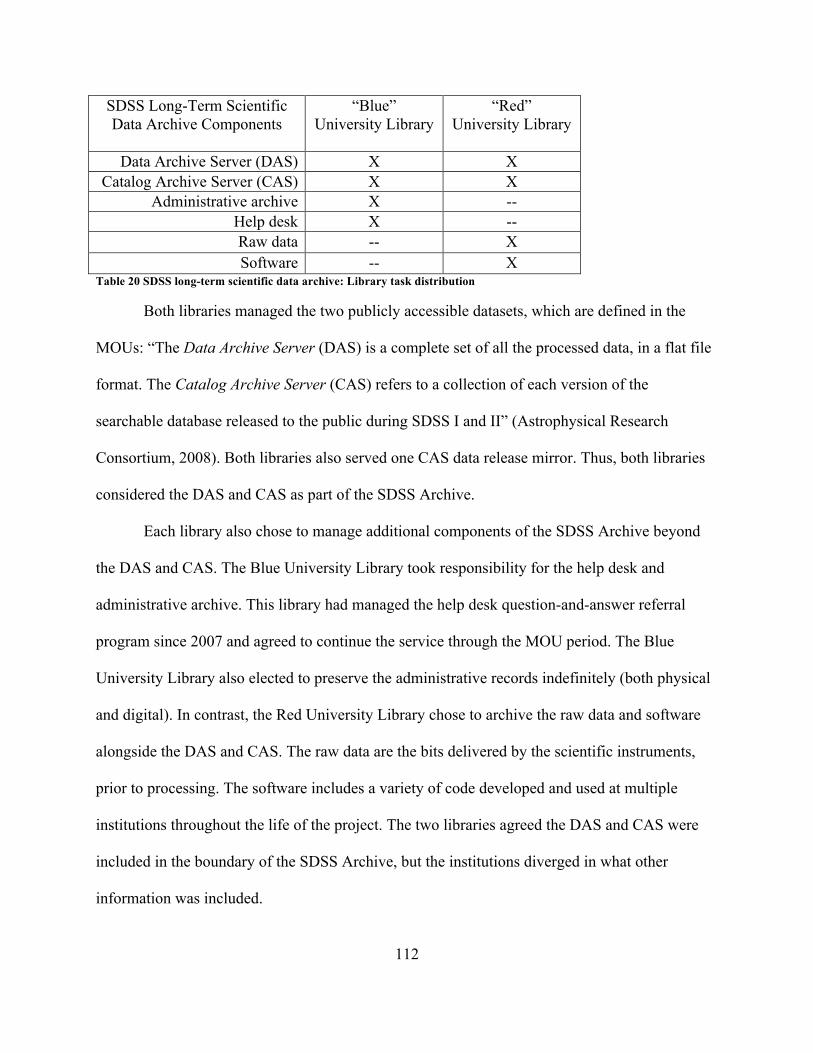
112
SDSS Long-Term Scientific Data Archive Components
“Blue” University Library
“Red” University Library
Data Archive Server (DAS) X X
Catalog Archive Server (CAS) X X Administrative archive X --
Help desk X -- Raw data -- X Software -- X
Table 20 SDSS long-term scientific data archive: Library task distribution
Both libraries managed the two publicly accessible datasets, which are defined in the
MOUs: “The Data Archive Server (DAS) is a complete set of all the processed data, in a flat file
format. The Catalog Archive Server (CAS) refers to a collection of each version of the
searchable database released to the public during SDSS I and II” (Astrophysical Research
Consortium, 2008). Both libraries also served one CAS data release mirror. Thus, both libraries
considered the DAS and CAS as part of the SDSS Archive.
Each library also chose to manage additional components of the SDSS Archive beyond
the DAS and CAS. The Blue University Library took responsibility for the help desk and
administrative archive. This library had managed the help desk question-and-answer referral
program since 2007 and agreed to continue the service through the MOU period. The Blue
University Library also elected to preserve the administrative records indefinitely (both physical
and digital). In contrast, the Red University Library chose to archive the raw data and software
alongside the DAS and CAS. The raw data are the bits delivered by the scientific instruments,
prior to processing. The software includes a variety of code developed and used at multiple
institutions throughout the life of the project. The two libraries agreed the DAS and CAS were
included in the boundary of the SDSS Archive, but the institutions diverged in what other
information was included.
113
Two years of discussions by stakeholders resulted in the MOU agreements. However, as
time passed, differing expectations about the scope of the SDSS Archive grew apparent. The
boundaries of the SDSS data therefore are not inherent to the dataset. The boundaries of the
SDSS Archive are instead emergent based on the perspectives of different stakeholders. These
differing perspectives, and thus the divergent understandings of the boundaries of the SDSS
Archive, resulted from the differences in the existing infrastructures of each institution, including
institutional interests, affordances, and constraints.
4.1.3.2 LSST data in ethnography
LSST community members disagree as to whether LSST data exists during the
construction phase of the project. Five study participants believed LSST does not have data as of
the time of discussion because the LSST instruments have not begun collecting data. For
example, when asked about LSST data, some participants noted that they do not consider
simulated data to be “real” data and thus LSST data do not exist yet. However, eight participants
noted the simulations the LSST team generates and uses for data management planning should
be considered LSST data. For example, Diaz described how the LSST uses simulated data as
input for the data management team processing. He explained that he believes simulated data are
“real data” even though they are not “from the sky” (Diaz, Research Programmer, 2015). He also
explained the LSST uses data from other previous surveys in addition to simulated data.
Thirteen LSST team members discussed whether or not simulated data are included as
LSST data. Eight team members interpreted data generated or used by LSST team members
(whether simulated or from a previous survey), to be part of LSST’s data. Alternatively, five
individuals noted LSST data do not yet exist, and only the information collected by the LSST
instruments should be considered LSST data.
114
During observations at one of the primary LSST data management institutions, the author
observed a presentation by LSST server managers. The presentation included a list of the folders
on the LSST servers, each folder containing materials for use in LSST construction. The folders
were:
-Data Challenge data -Image Simulation (Imsim) Data -Data from other surveys: -Pan-STARRS 6.2 TB -Calypso -SDSS 3.5 TB -Stripe82, 11 TB -All Sky Camera Data -Other
The folders’ location on the LSST server in 2015 implies that the LSST team employs
these sets of information. The information within these server folders is information created by
the LSST collaboration (Data Challenge Data, and ImSim Data), as well as data collected by
other surveys but applied to LSST development. Notably, there are two sets of SDSS data stored
and used for LSST: 3.5 TB of “SDSS” data and 11 TB of a specific subset of SDSS data from
the “Stripe82” segment of the sky. While there are arguably no LSST data, because the
instruments especially engineered for the project have not begun collecting data, there are
multiple datasets (both created especially for the project, or borrowed from other projects)
already being used for LSST.
4.1.4RQ1resultssummary
Each of the three research methods demonstrated SDSS and LSST data could be
interpreted in multiple ways, by different people, and over time. Table 17 indicates the 26 ways
data are described by the document authors, interviewees, and observed participants. The
evidence for each of the 26 ways data were described was just presented by research method.
115
Document authors described data in 14 ways, interviewees in 12 ways, and observations revealed
eight ways data were described.
While there is some consistency between research methods, there are also a number of
ways data were described that are reflected in only one or two of the three research methods.
This fact highlights the strength of this dissertation study and its ability to capture many
perspectives by employing all three methods. If only one method, for example interviews, was
used in this study, the official perspectives represented in SDSS and LSST team documents
would have been missed. If only document analysis had occurred, then the less-formal
perspectives of interviewees would not have emerged. Each method validates the findings of the
other methods, while also increasing the reliability of the findings in that the quantity of methods
ensured a broad array of perspectives were included in the study.
As already noted, Table 17 demonstrates the full array of subcodes that emerged from the
ways data were defined in the documents, interview transcripts, and ethnographic field-notes.
Once this full list was generated, the contents were analyzed, and thematic patterns between
subcodes became apparent. Perspectives from any of the three research methods were then
combined into broader emergent themes.
Table 21 visualizes the result of analyzing and grouping like-items from the list of 26
ways data were described (refer back to Table 17). Some interviews and observations revealed
data described as information collected by a certain instrument or employed by a certain group of
people. These notions of data are related to the process, the where and when, of data collection.
Alternatively, others described data as the product of that data collection, as the bits or raw data.
Similarly, a number of interviewees described data as a specific kind of information that must be
processed through some or many stages of handling. Others went into greater detail and
116
described the processing stages and the information more precisely: They described data as
photons, from a specific source, as images, spectra, and catalogs, or as pixels. These study
participants each highlighted the nature of the information being processed. Since each of these
interpretations highlighted the processed nature of the information, over the type of information,
they were grouped together under a refined subcode of processing. In opposition to the way data
were described as an active state of processing, others described data as the result of an action, or
as a product. For example, data were frequently described in the documents and interviews as
images, spectra, and catalogs. In this way, data were described as the resulting products of
processing actions. Some interviewees and documents described data as information used in the
process of scientific research. Others identified data as the results of that scientific research, as
scientific evidence from a specific journal article, or as the derived data resulting from said
research.
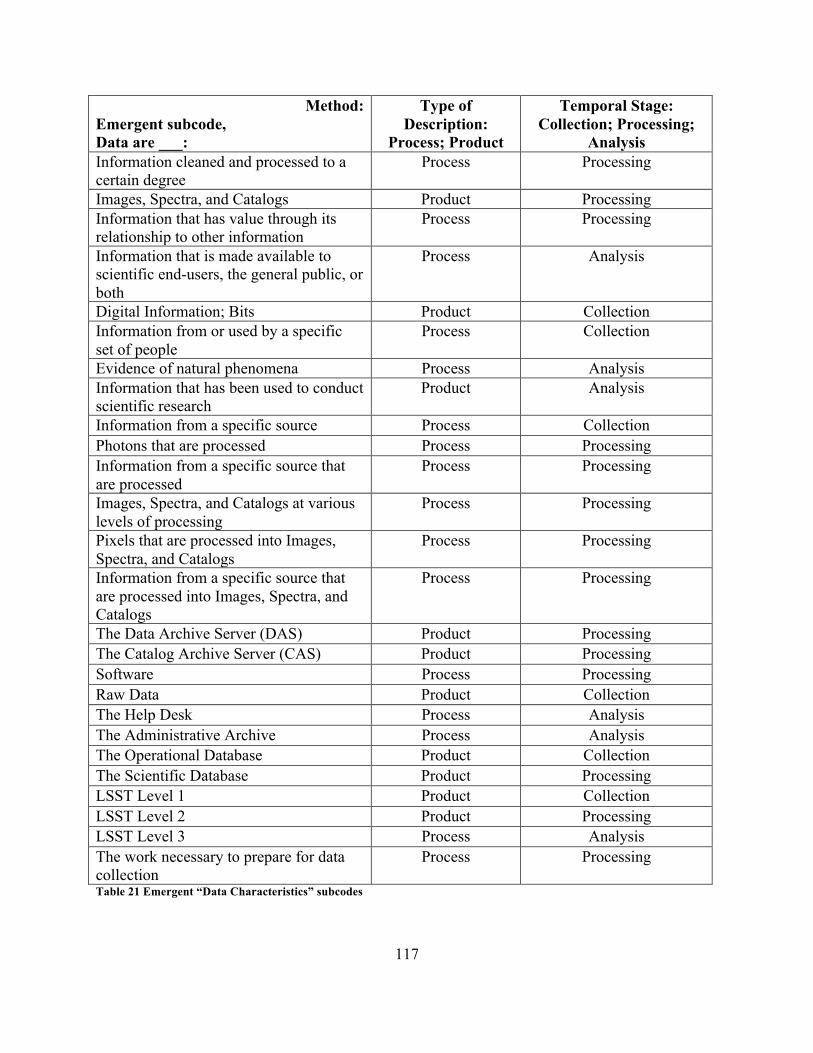
117
Method: Emergent subcode, Data are ___:
Type of Description:
Process; Product
Temporal Stage: Collection; Processing;
Analysis Information cleaned and processed to a certain degree
Process Processing
Images, Spectra, and Catalogs Product Processing Information that has value through its relationship to other information
Process Processing
Information that is made available to scientific end-users, the general public, or both
Process Analysis
Digital Information; Bits Product Collection Information from or used by a specific set of people
Process Collection
Evidence of natural phenomena Process Analysis Information that has been used to conduct scientific research
Product Analysis
Information from a specific source Process Collection Photons that are processed Process Processing Information from a specific source that are processed
Process Processing
Images, Spectra, and Catalogs at various levels of processing
Process Processing
Pixels that are processed into Images, Spectra, and Catalogs
Process Processing
Information from a specific source that are processed into Images, Spectra, and Catalogs
Process Processing
The Data Archive Server (DAS) Product Processing The Catalog Archive Server (CAS) Product Processing Software Process Processing Raw Data Product Collection The Help Desk Process Analysis The Administrative Archive Process Analysis The Operational Database Product Collection The Scientific Database Product Processing LSST Level 1 Product Collection LSST Level 2 Product Processing LSST Level 3 Process Analysis The work necessary to prepare for data collection
Process Processing
Table 21 Emergent “Data Characteristics” subcodes
118
Through extensive, iterative analysis of the documents, interview transcripts, and
ethnographic field-notes, two variables emerged and provide an exhaustive and mutually
exclusive demonstration of the different ways data were described. For example, during the
iterative data analysis, a potential scale emerged relative to whether information was identified as
data based on the extent of information processing. However, while increased processing aligns
with increased potential for scientific use for many study participants, others find non-processed
information the most scientifically usable, as they prefer to process data themselves. Therefore,
the scale logic did not hold. In addition, while the scale was exhaustive, the categories within did
not prove mutually exclusive.
Thus, the long list of ways data were described in Table 17 can be collapsed into
definitions of data that describe a process and those that describe a product (presented in Table
21). Three temporal data stages were used for the purposes of presenting the results, data
collection, data processing, and data analysis. However the stages are not intended to be discrete,
and in reality, are overlapping and indistinct. Table 22 provides an alternate illustration of the
information presented in Table 21, by aligning the initial emergent subcodes with the emergent
dimensions of process versus product, across time. Note that each of the definitions encompasses
either process or product. When each of the 26 ways data were described in all three research
methods are clustered with like kinds, it results in the exhaustive and mutually exclusive
categorization presented in Table 22.
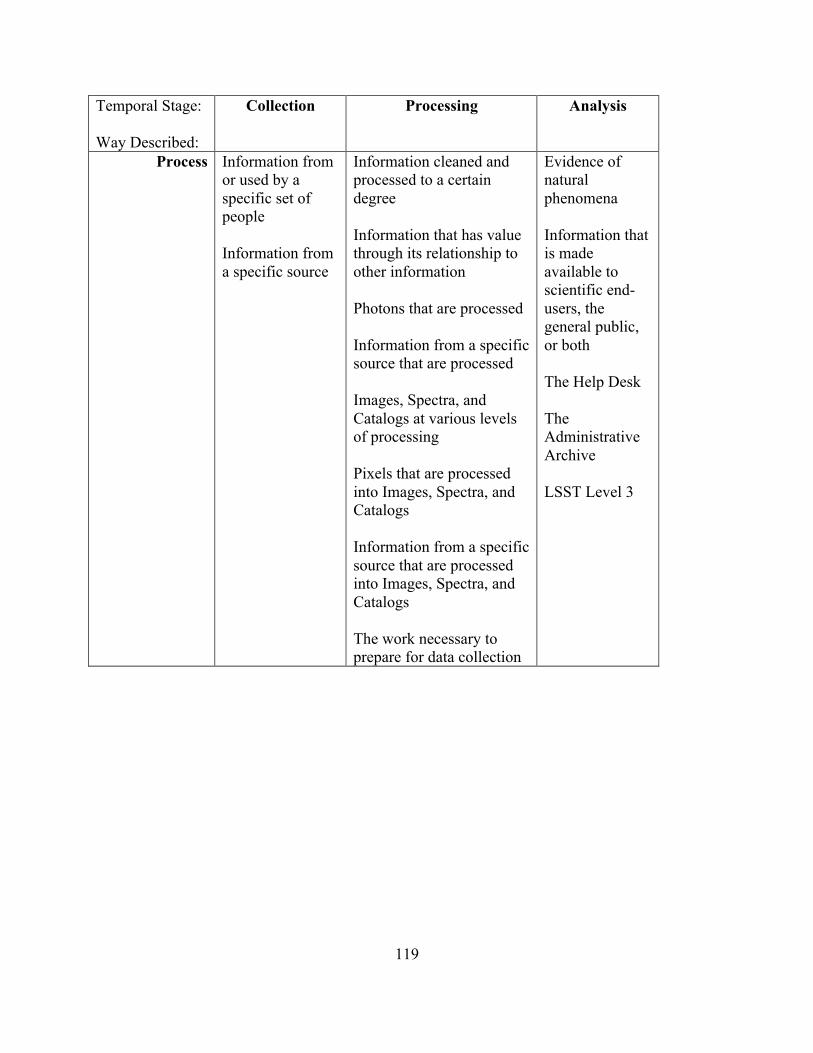
119
Temporal Stage: Way Described:
Collection Processing Analysis
Process Information from or used by a specific set of people Information from a specific source
Information cleaned and processed to a certain degree Information that has value through its relationship to other information Photons that are processed Information from a specific source that are processed Images, Spectra, and Catalogs at various levels of processing Pixels that are processed into Images, Spectra, and Catalogs Information from a specific source that are processed into Images, Spectra, and Catalogs The work necessary to prepare for data collection
Evidence of natural phenomena Information that is made available to scientific end-users, the general public, or both The Help Desk The Administrative Archive LSST Level 3
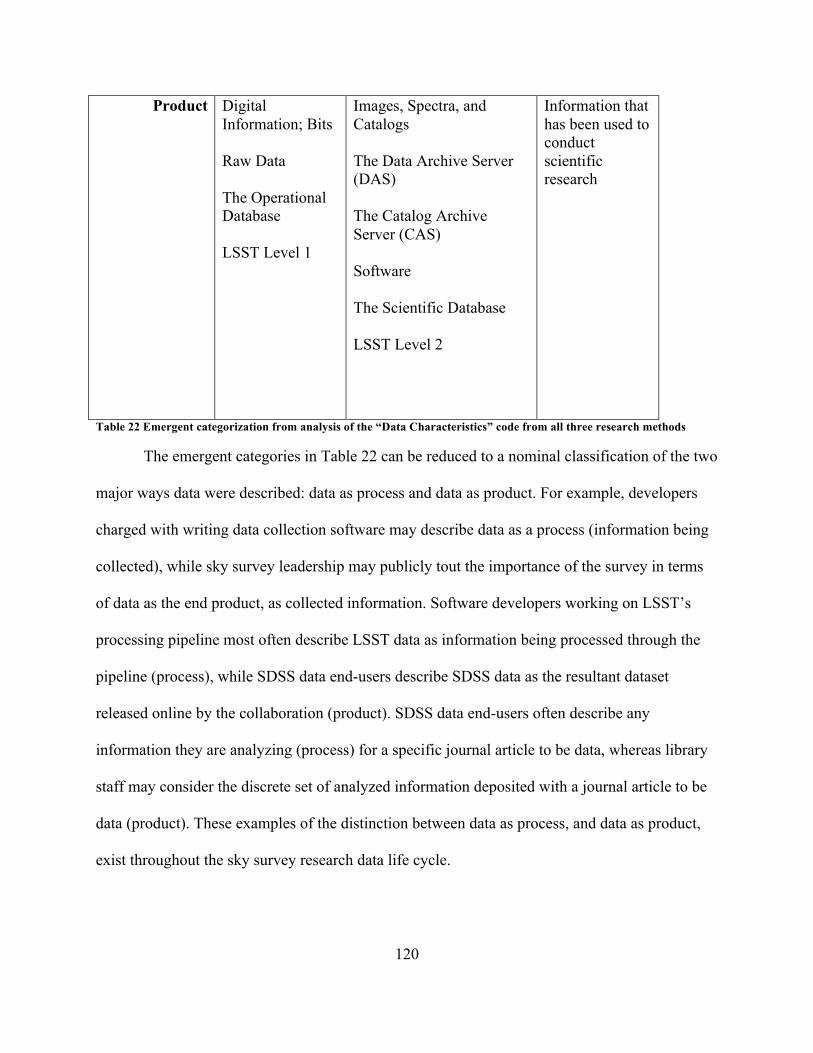
120
Product Digital Information; Bits Raw Data The Operational Database LSST Level 1
Images, Spectra, and Catalogs The Data Archive Server (DAS) The Catalog Archive Server (CAS) Software The Scientific Database LSST Level 2
Information that has been used to conduct scientific research
Table 22 Emergent categorization from analysis of the “Data Characteristics” code from all three research methods
The emergent categories in Table 22 can be reduced to a nominal classification of the two
major ways data were described: data as process and data as product. For example, developers
charged with writing data collection software may describe data as a process (information being
collected), while sky survey leadership may publicly tout the importance of the survey in terms
of data as the end product, as collected information. Software developers working on LSST’s
processing pipeline most often describe LSST data as information being processed through the
pipeline (process), while SDSS data end-users describe SDSS data as the resultant dataset
released online by the collaboration (product). SDSS data end-users often describe any
information they are analyzing (process) for a specific journal article to be data, whereas library
staff may consider the discrete set of analyzed information deposited with a journal article to be
data (product). These examples of the distinction between data as process, and data as product,
exist throughout the sky survey research data life cycle.
121
4.2RQ2Results:WhatisDataManagementinAstronomy?
The following are the results for the second research question (RQ2): What is data
management in astronomy? As presented in the RQ1 results, data were interpreted different
ways, at different times, by different stakeholders. The boundaries of the SDSS and the LSST
data were described in multiple ways over the course of the projects. Data were described as
either a process or a product, and were described differently across the life cycle (refer back to
Table 22).
As described in the Methods chapter, the documents, interview transcripts, and field
notes were all coded as part of the analysis for this study. For RQ2, data were extracted for
analysis from the code “Data Organization and Archival Storage.” The code encompasses
passages related to questions of what it means to manage data in astronomy. Passages were
coded and analyzed from the three research methods and three study populations.
4.2.1 RQ2 documentation results
The SDSS and the LSST projects each generated multiple document genres. Particularly
relevant to RQ2 are the policy documents, which often refer to data management tasks. The
following subsections describe data management interpretations based on SDSS documents and
then LSST documents.
4.2.1.1 SDSS data management in documents
SDSS data management is a complex endeavor that permeates the decades-long project.
Many formal and informal documents list the tasks involved in SDSS data management. While
the specific data management priorities differed across project stages, the temporal way data
122
management was described in the SDSS team documents was divided into three rough periods:
data collection; data storage, processing, and transfer; and long-term serving and archiving.
v Datacollection
The SDSS data acquisition software collects and provides initial data testing. First, data
are analyzed for continuing operations and then for end-user science. Early documents describe
both an “operational archive” and a “science archive,” reflecting these two different data uses.
The operational archive “is the central collection of scientific and bookkeeping data used to run
the survey” (York et al., 2000, p. 1585). As described in the RQ1 findings, the operational
archive is referred to as part of the SDSS data through the first few data releases, and then is no
longer referenced in relationship to SDSS data.
As both a photometric and spectroscopic survey, the SDSS first identifies objects through
photometry and then collects spectra of objects. The photometric data are collected, processed,
and analyzed to determine which spectroscopic data should be collected (Margon, 1998, p. 6;
Szalay et al., 2000, p. 5). Photometric data must be processed quickly to ensure that the best
spectra data collection choices are made. Data are processed through a complicated set of
software pipelines to prepare for scientific use. The pipelines perform operations such as
“astrometric calibration… and detect and measure the brightnesses, positions, and shapes of
objects” (Abazajian et al., 2009, p. 545). Margon described the time-sensitive nature of the work
as placing, “severe demands on the complex software pipeline that acquires the data, performs
image recognition, classification, astrometry, and precision, calibrated photometry, followed by
target selection for a myriad of different scientific project” (Margon, 1998, p. 3). Spectra are then
collected and processed through the pipeline for further calibration and to extract measurements
123
(York et al., 2000, p. 1585). Once ready, the operational database is migrated into the science
database for end-user retrieval and use (Lupton, 2002; York et al., 2000).
v Datastorage,processingandtransfer
SDSS data maintenance required faculty and staff efforts at multiple institutions across
the country. For example, the SDSS data management tasks at just one of the institutions
included, “Operating system upgrades, Security patches, Corrupt file detection/recovery, Disk or
controller replacements, System performance monitoring, Machine replacements” (Boroski,
2007, p. 12). This task list reveals that in addition to working with the processing pipeline
specific to SDSS data, team members also needed to perform general digital maintenance
activities necessary for the continued processing, management, and serving of any kind of digital
information.
The SDSS II Project Execution Plan (PEP) provides the most detailed information for
SDSS data management tasks (Kron, 2008). The purpose of the PEP document is “the cost,
schedule, product goals, management structure, education and public outreach, metrics, and other
aspects of the project” (Kron, 2008, sec. Preface). While prepared for the NSF, the document
reflects on the project as a whole. The Principles of Operation documents also contain relevant
information describing data management, but they only provide simple lists of SDSS team
positions alongside short descriptions (1989, 2000, 2005). Instead, the NSF PEP goes into
significant detail on the team positions and tasks; the information relevant to data management is
organized into two sections: “Data Processing” and “Data Distribution.” The Work Breakdown
Structure is also further organized into six subsections: “Survey Management, Survey
Operations, New Development, ARC Corporate Support, Education and Public Outreach, and
Management Reserve” (Kron, 2008, p. 15). The PEP document reflects the extensive amount and
124
kinds of work considered aspects of processing, managing, and serving the SDSS data.
Once collected and ready for processing, data were sent from Apache Point Observatory
to the data center, which conducted the SDSS I and II data processing. In the early days of SDSS
data collection, the data were too large to be transferred online. Instead, magnetic tapes were
mailed to the data center for processing by an express courier service (Margon, 1998, p. 6).
Technology improved over the first few years of the survey, enabling data delivery directly from
the observatory to the data center, first through a microwave Internet link and then through a
high-speed Internet connection.
v Long-termservingandarchiving
As they planned the survey, the SDSS collaboration knew that the resulting data would
be important to the astronomy community in the long-term. In 2000, SDSS team members
described their data management work as needing to be useful “for the next several decades”
(Szalay et al., 2000, p. 3). The data necessitated being recorded, organized, and distributed in a
sufficient and sustainable manner for long-term use. They went on to explain, “This long-
lifetime presents design and legacy problems. The design of the SDSS archival system must
allow the archive to grow beyond the actual completion of the survey” (Szalay et al., 2000, p. 3).
Therefore, once collected and processed, the data required “a carefully defined schema and
metadata” to ensure scientific usability into the future (Szalay et al., 2000, p. 3).
SDSS team members realized that timely serving was not enough to enable the SDSS
data to remain relevant and scientifically usable into the future. The team did begin to consider
long-term data management prior to the end of data collection; however, no long-term plans
were mentioned in the earlier texts that alluded to the expectation that the data would be valuable
for decades. For example, in 2007 the project manager presented only “preliminary thoughts” on
125
the long-term data management needs of the SDSS: recognizing the importance of both
“required (format conversion; platform migration) and ‘value-added’ (errata, bug fixes,
annotations)” data management activities (Boroski, 2007, p. 17). By 2011, SDSS data serving
and archiving had already begun and the descriptions were more concrete. A presentation by
Brian Yanny regarding care of the SDSS Archive explained the SDSS data must be “preserved in
a readable, understandable format for long periods of time…” which includes, “long term store
copies” and “active working copies” of the data (Yanny, 2011). He went on to explain the
uniquely long-lived value of SDSS data is precisely one of the difficulties of managing the data
because of the changes that can occur to the timeline of the project. He said, “The life
expectancy of data can be decades or centuries, making the technical aspects of data preservation
and dissemination an interesting challenge. Methods and practices are evolving continuously…”
(Yanny, 2011).
4.2.1.2 LSST data management in documents
The LSST collaboration provides a corpus of documentation outlining data management
requirements. In particular, internal policy documents describe data management activities and
responsibilities. The hierarchy of these internal policy documents is important because despite
careful change control, there can be inconsistencies between documents and distributed authors.
An LSST team leader described the LSST System Science Requirements Document (2011) as
“like our constitution. That's the highest-level document from which we derive all other
documents. That describes what we want to accomplish with LSST” (Martinez, Professor, 2011).
In 2014, the LSST project completed the design and development phase of funding and
began construction. While the SDSS data management practices were presented in previous
126
subsections in terms of each of the data management stages, LSST results presented here are
arranged by type of document because LSST is early in the research life cycle.
v Datamanagementinfundingproposals
The LSST NSF funding proposal abstracts briefly describe the work necessary to
complete LSST project goals. The 2012 proposal abstract lists task priorities. Two of the main
priorities are directly related to data management, and include creating the complicated
simulations and software pipelines. Specifically, the proposal abstract notes the priorities as:
“Developing improved algorithms for data… hardware and software prototyping and system
simulations… innovative, large-scale database techniques… [and a] general-purpose data and
algorithm-parallel framework…” (National Science Foundation, 2012). LSST expects to collect
a huge volume of data, which requires the construction of new facilities, dedicated hardware,
highly expert staff, and newly created software. Two years later, the 2014 NSF grant proposal
abstract emphasized how the project plans to push the boundaries of computational capabilities.
A massive effort is required due to the expected data volume, most important, the creation of a
new, “sophisticated” data management software system (National Science Foundation, 2014a).
v Datamanagementinpresentations
Two internal 2014 presentations detailed data management requirements, summarizing
the extensive software systems and algorithms into bullet points. For example, the LSST Data
Management “Principal Responsibilities” (Kantor, 2014, p. 2) or “Roles” (Juric, 2014, p. 10)
were listed as:
“1) Archive Raw Data: Receive the incoming stream of images that the Camera system generates to archive the raw images 2) Process to Data Products: Detect and alert on transient events within one
127
minute of visit acquisition. Approximately once per year create and archive a Data Release, a static self-consistent collection of data products generated from all survey data taken from the date of survey initiation to the cutoff date for the Data Release. 3) Publish: Make all LSST data available through an interface that uses community-accepted standards, and facilitate user data analysis and production of user-defined data products at Data Access Centers (DACs) and external sites.” LSST data management work was also described in terms of necessary LSST software
features. The data management team is working on creating the LSST Software Stack. The stack
is described as including “(science pipelines, middleware, database, user interfaces)” (Juric,
2014, p. 17). Data management team leaders viewed the team’s ultimate tasks as creating tools to
archive, process, and publish the data.
The LSST project is sometimes considered so similar to the SDSS project, that the only
difference will be data volume (Ivezić et al., 2011, p. 20; LSST Science Collaboration et al.,
2009, p. 15). The expected data volume creates hurdles for the data management team to
overcome. While serving the LSST data, the collaboration expects the high volume to influence
their ability to serve the data. While the SDSS collaboration kept all data releases actively
available to the public, the LSST only plans to retain the two most recent releases on “fast
storage and with catalogs loaded into the database…Older releases will be archived to mass
storage (tape)” (Juric et al., 2013, p. 52). Each consecutive data release will include the entirety
of the preceding LSST data, however the datasets are reprocessed with each new release,
resulting in non-identical data between releases.
In addition to the volume of data, LSST data management tasks are also difficult because
of the speed by which the data will need to be released (Becla et al., 2005). For example, the
Level 1 alerts need to be made available within 60 seconds of data capture. The Level 2 data also
needs to be made available to international partners as quickly as it can be collected and
128
processed. Despite challenges presented by data volume and speed, as of 2014, the most pressing
problem was considered to be that of “insufficient documentation” for the work already
accomplished (Juric, 2014, p. 22).
The System Capabilities section of the Systems Requirements Document itself includes
five main subcategories. Three of the five categories are related to data management. These
include Data Collection, Data Products & Processing, and Data Archiving and Services (Claver
& LSST Systems Engineering Integrated Product Team, 2015, p. 14). The document indicates
the need for data curation planning, though it does not provide details and instead merely
indicates “The LSST Observatory shall develop a data curation plan” (Claver & LSST Systems
Engineering Integrated Product Team, 2015, p. 29).
v Datamanagementinthepublicwebsite
According to the LSST Data Management Website, the data management team is tasked
with the challenge of, “Processing such a large volume of data, converting the raw images into a
faithful representation of the universe, implementing automated data quality assessment and
automated discovery… and archiving the results in useful form for a broad community of users”
(“Data management | LSST public website,” 2015). The webpage details how the system is
broken into three architectural layers: the infrastructure layer, middleware layer, and an
applications layer (“Data management | LSST public website,” 2015). Importantly, a number of
pipelines (nightly, data release, calibration, and more) require development to process collected
information into usable data for scientific investigation.
The Data Products website (“Data products | LSST public website,” 2015) detailed the
tasks required of the LSST data management team in terms of managing the immediate, Level 1
data as well as the fully processed Level 2 data:
129
“1) Process the incoming stream of images generated by the camera system during observing to generate and archive the nightly data products: • Raw science images • Catalog of variable sources • Transient alerts. 2) Periodically process accumulated nightly data products to: • Generate co-added images of several types • Optimally measure the properties of fainter objects • Perform astrometric and photometric calibration of the full survey object catalog • Classify objects based on both their static properties and time-dependent
behavior” (“Data products | LSST public website,” 2015).
v Datamanagementinpolicydocuments
Internal LSST policy documents describe the goals and requirements of the LSST data
management system in great detail. These documents provide the most extensive data
management explanations and appear to have no limitation on document length like most other
document genres. The Science Book (2009) explains the LSST data management component of
the project by detailing the Level 1 and Level 2 data production, where “production” means, “a
group of pipelines that together carry out a large-scale DMS function” (LSST Science
Collaboration et al., 2009, p. 39).
The Science Book also describes the planned transit of the data after collection. Data will
be captured at the Summit and quickly moved to the base facility in Chile. Next, dedicated fibers
will transfer the data from Chile to the archive center in the United States. The archive center is
described as, “a super-computing-class data center with high reliability and availability. This is
where the data will undergo complete processing and re-processing and permanent storage. It is
also the main repository feeding the distribution of LSST data to the community…” and will
provide a help desk and other end-user support (LSST Science Collaboration et al., 2009, p. 37).
The Science Book also describes the potential plans for long-term data because the data
are expected to be scientifically important for decades. Similar to the SDSS documents at the
130
same point in the project, LSST documents also note that the collaboration recognizes the data
will be long-lived, but do not yet specify plans for long-term data management. The Science
Book explains, “The LSST will archive all observatory-generated data products during its entire
10-year survey…. The longer-term curation plan for the LSST data beyond the survey period is
not determined, but it is recognized as a serious concern” (LSST Science Collaboration et al.,
2009, p. 45).
4.2.2 RQ2 interview results
All 80 interviews in this study were coded using the full codebook as discussed in the
Methods chapter. Following completion of coding for all interviews, passages coded with “Data
organization and archival storage” were collocated and retrieved. The results from this code fell
into three major categories. Interviewees spoke about data collection; data storage, processing,
and transfer; and long-term serving and archiving. Within each study population, results are
provided at the three data management stages. First, results from the SDSS team are presented,
then the LSST team, and finally SDSS data end-users.
Responses coded with “Data organization and archival storage” arose from questions on
the official interview protocols and also from information voluntarily offered by interviewees.
Often, the specifics regarding the data management work conducted by SDSS and LSST team
members was revealed through narratives describing the path of data through the project life
cycle. More specifically, some interview questions proved particularly helpful in enabling
interviewees to discuss data management. For example, the protocols included questions for
interviewees about their data management and analysis tools. SDSS team member interviewees
were asked to tell a data narrative, “Could you walk us through some of the steps from collecting
datasets from a database to analysis?” SDSS team members were also asked, “What happened to
131
your data at the end of your last project?” LSST arguably does not have data yet, so interviewees
were instead asked to describe the planned data management policies for the project. LSST team
members were also asked to explain their personal data and information storage and management
strategies. One particularly useful question for the LSST team members was: “What is your
process – from data collection and analysis design, to archiving?” SDSS data end-users were
walked through a practical exercise regarding the data they recently used in one of their
published journal articles. SDSS data end-user interviewees were asked, “Where does the data
used for this paper reside? Where is it stored and accessed?” Interviewees were then asked to
locate a specific dataset used in that journal article. End-users were asked to explain aloud their
short- and long-term data management techniques as they located the data during the interview.
Interviewees from all three populations were asked how they keep track of multiple versions or
states of their research data.
4.2.2.1SDSSteam
The SDSS collaboration began collecting scientific data in 1997. Data are collected from
the telescope and instrumentation at Apache Point in New Mexico. Once collected, data are
processed through complicated pipelines, which include data cleaning and calibration, prior to
being released to the public. The SDSS I and II data were released through eight official data
releases, each documented with a data release journal article. The three SDSS team member data
management phases are presented below.
v SDSSteamdatacollection
Most SDSS team member interviewees described the SDSS data path as beginning after
data had already been collected. Only two interviewees in this study population discussed data
132
collection directly. Moore recalled having written some of the data collection and immediate
processing software. However, she is not sure where that information is today and regrets that
the code is currently unavailable (Moore, Staff Scientist, 2012). Taylor discussed how team
members wrote software at the mountain to help determine, in near real-time, whether the data
were being successfully collected. She noted that once the software was activated, it improved
data collection efficiency (Taylor, Emeritus Professor, 2012).
Two SDSS team members explained the data path from the mountaintop to the data
processing center. When the data arrived at the data processing center, a team of computer
scientists and astronomers then managed the information. Robinson explained there was a small
team at the data center who were, “… trained in computer science, who would do the nightly
data processing... And if there was… something they didn't know how to deal with, something
that required a scientist intervention, then they would come to me (Robinson, Staff Scientist,
2013). Another interviewee described the path of the data more specifically after it arrived at the
data center. She described how data arrived as standardized FITS files, and then the DAS experts
would process the data into flat files using Linux. The data were then given to the SQL Server
database experts for processing to prepare for data release (Lewis, Research Programmer, 2013).
These interviewees described how the SDSS data were collected by one team on the
mountaintop, and then transferred to the data center facility where two teams of computer
scientists processed the data while relying on astronomer support.
v SDSSteamdatastorage,processing,andtransfer
After SDSS data were collected and initially processed for operations, they were
processed further, stored, and made available to external data end-users. Clark explained that
data management was a tough job that included the work of multiple departments at the data
133
center. She explained, “So, this issue of maintenance, support, operations…one of the reasons for
having a software infrastructure group involved--that was not just the scientists--was to provide
that kind of sustainability and long-term provision of software and support” (Clark, Research
Programmer, 2013). The data management work at the data center included computer science
experts as well as astronomy domain experts.
During this dissertation study, five local, unofficial copies of the SDSS I and II data were
discovered at various institutions in the United States. Ethnographic work also revealed
unofficial copies in the United Kingdom and Brazil. The author predicts there are more
unofficial copies of the SDSS dataset, including several other copies worldwide. These copies
are used for both project-level and personal-level work. Some copies were used to test and refine
tools that were later re-integrated into the project itself. For example, at one SDSS-affiliated
university astronomy department, long-term work on the data processing and data management
algorithms required testing with the data itself. Taylor agreed that the SDSS project team
members required access to copies of the SDSS data to test the tools that they were constructing
for the project. She explained, “…we made a deal with them that we would keep a copy of the
reduced data here and use it to tweak up the pipeline and fix the problems” (Taylor, Emeritus
Professor, 2012). In addition to using local data copies to test project-level processes,
astronomers often also tested tools for their own personal scientific inquiries on these local
datasets, “So, we had a copy of it here and we did, actually, a fair amount of our science on the
copy here” (Taylor, Emeritus Professor, 2012).
Many interviewees applaud the SDSS data distribution system. While other systems were
initially tested, the resultant tool, SkyServer, is considered one of the major SDSS
accomplishments. An administrator on the SDSS team praised the SkyServer system as a fast
134
and impressive data collection process for end-users (Walker, Project Manager, 2013). Lewis
noted that end-users could access data through multiple systems including CasJobs and
SkyServer. Since there was a lot of demand, and multiple ways to access the data, the data center
needed to maintain and serve multiple copies at any given time.
In hindsight, SDSS collaboration members indicated that they did not budget enough
money for data storage. However, they explained that as the project timeline stretched, storage
costs continued to decrease, and the budget resolved itself. Despite some concerns with data
storage, all data releases were retained and serviced as individual datasets even when newer
versions were released.
v SDSSteamlong-termservingandarchiving
Following initial data release, SDSS data were maintained and continually served to the
public over the course of the eight-year survey and beyond. Clark explained the data processing
center retains the datasets at multiple data processing stages on tape even though phases I and II
of the project were completed. She said, “We keep copies of the transformed data and then we
keep copies of the raw data for significant data sets…. So we archive... Keep everything
basically on tape... (Clark, Research Programmer, 2013).
The SDSS I and II data were archived and served by four institutions for the five years
following the end of SDSS I and II data collection (see also 4.1.3.1 SDSS data in ethnography).
Each institution signed a MOU, dictating the data serving and archiving work they would
complete over the course of the five-year agreement period (2009-2013). After 2013, the four
institutions that signed MOUs have retained a version of the dataset.
135
4.2.2.2LSSTteam
The LSST team plans to begin collecting data in 2020. As of this writing, the team
members are actively working on the construction phase of the project. Data management staff,
primarily at universities, are currently focused on writing components of the processing pipeline
software. Data center technical staff are preparing the hardware and software for massive data
volumes.
v LSSTteamdatacollection
LSST data will be collected on the mountain at Cerro Pachón, Chile and then travel
through fiber networks to the data processing center in the United States. King described the
beginning of the path, “They get fiber off the mountain to the bottom of the mountain, and then I
think there's some fiber networks across the ocean. There'll be multiple data repositories…where
they serve the data to the world” (King, Research Programmer, 2014). King is not concerned
about the data volume and its impact on the ability for the data to transfer from Chile to the
United States. She explained, “You basically throw more hardware at it …It's not gonna be easy,
but we know how to do it. There's things we don't know how to do, that worry me” (King,
Research Programmer, 2014). King explained that while the task of transferring large amounts of
LSST data across continents may appear daunting, it is a task that basically requires funding
instead of new, creative solutions.
Howard explained that data will leave the mountain as a data stream, “We don't do
catalogues. We just send out a stream of data. And it's up to them to organize it…” (Howard,
Professor, 2015). Data will arrive at the processing center, and the data center staff will store,
process, and reduce the data (Cox, Project Manager, 2015). Diaz explained that once the data
arrive at the processing center the difficult data management tasks begin. A major investment is
136
necessary to keep an environment that’s stable and reliable for the LSST data over time.
v LSSTteamdatastorage,processing,andtransfer
As of this writing, the LSST data management team is developing the software and
infrastructures necessary to process, manage, and release LSST data. Given the long-term nature
of the project, Martinez explained that the systems are now being designed to enable changes
over time. He detailed that the LSST team is making sure they continue “designing a system to
be flexible enough that you can just switch from one storage to the other….agnostic” (Martinez,
Professor, 2011). Indeed, the project team members likely will not begin collecting data until
2020, and therefore expect major changes in computing technology before data collection ends,
or even before it begins.
When asked to describe the LSST data management team’s responsibilities, Wright
responded by listing many assigned tasks. In summary, all of these activities can be considered
part of the data processing pipeline: “…what the data management team is all about, is working
on making the pipeline for telescope to internet release” (Wright, Graduate Student, 2014). As
Wright described, the LSST data management team as in charge of the tasks that will process
and prepare LSST data for scientific usability.
v LSSTteamlong-termservingandarchiving
Three interviewees tried to predict the LSST data long-term plans. Hernandez is unclear
of the official long-term plans for the LSST data, however she does believe SDSS lessons
learned are going to shape LSST. She explained the relationship, “A lot of the people who were
involved in LSST were SDSS people, a lot of the institutions for example are similar and so I
would imagine that lessons learned from SDSS are moving on in the course of LSST…”
137
(Hernandez, Post-Doc, 2012). In addition to noting the similarity in individuals and institutions
between the two projects, Hernandez also noted an ideal way to manage the data. She noted that
the best archive environment would be the Mikulski Archive for Space Telescopes (MAST),
however she knows that MAST itself is only available for space-based (NASA) data and not
LSST data, which is ground-based.
Cox is an administrator at the data center and thus is concerned with providing the
hardware and computing power necessary for LSST. However, she acknowledges that the
specific needs will change over time. Cox discussed factors, including the long period of time
and finite resources, which can impact how to make data available to LSST end-users. From the
perspective of the LSST team, it is unclear how many of the intermediate processing levels will
be stored, for how long, and in what medium. She explained that data processing levels might
each need to be stored differently based on the amount and kind of user demand. She explained,
“... How much you keep? Storing data is expensive. …‘It takes me this much to process it. So
that’s fast. It’s inexpensive.’ …And then you have to do like, ‘How many times do I access the
data?’ This cost comparison” (Cox, Project Manager, 2015). Some materials may be stored on
fast disc, some on slow disc, and some on tape. In the long-term, LSST storage and serving
conditions are unclear. While data center staff have chosen to assume that Moore’s Law will
work in their favor over time, it is unclear to what extent exactly the “law” will continue to
benefit the project.
4.2.2.3SDSSdataend-users
The following subsections present data management descriptions by the SDSS data end-
user interviewees. The following includes results from individual, small, and medium-sized
collaborative projects undertaken by interviewees.
138
v SDSSend-usersdatacollection
Interviewees described collecting data in multiple ways; even data from the same source
could be collected in different manners. The kind and amount of data particularly influenced data
collection methods. For example, data volume determined whether an interviewee would hand
collect individual data, download some data, or query a database to download large amounts of
information.
Many interviewees described downloading large amounts of SDSS data from SkyServer
or CasJobs, and then relying on that local copy of the data for further analysis or queries. For
example, Jones explained that he created datasets linking SDSS and other datasets together
(value-added catalogs). Since generating those catalogs, he has not gone back to the original
SDSS dataset, “…having produced these value-added catalogs, we’re more extracting stuff from
those catalogs rather than going back to the actual raw data themselves” (Jones, Professor, 2011).
While some interviewees now rely on writing Structured Query Language (SQL) to query
databases, Carter managed to collect data without using SQL. Instead, she uses the survey
databases in a different way, picking specific objects one at a time, instead of querying a large
dataset. She explained how he collects sky survey data: “So I’m still operating in this weird,
bizarro land where I just focus on a subset of the Sloan dataset as if it were a classical telescope”
(Carter, Professor, 2015).
Sky survey data end-users collect data using multiple methods. End-users query the sky
survey resource using multiple tools, and then may download the data for future reuse. Some
data end-users rely on their knowledge of SQL to obtain data, while others rely on the sky survey
to have created non-SQL based data retrieval tools.
139
v SDSSend-usersdatastorage,processing,andtransfer
Five interviewees mentioned using Dropbox, or a similar kind of storage software, as a
helpful data management tool for both individual and collaborative projects. Some enjoyed the
feature that Dropbox essentially generates backups across computers, others appreciated that
they can work on the same documents from different machines, and still others relied on it for
version control among collaborators.
Three interviewees discussed data management based on data processing stages. Garcia
explained that each stage in a processing pipeline creates new copies of data. A large amount of
storage space is required if copies are retained at each processing stage. White explained that it is
simply not possible to retain all his data at each level of data processing. He explained that he
decides to retain an intermediate level of data only if the next processing step cannot be reversed.
As data are processed through various stages, interviewees must determine whether and how to
manage divergent copies.
Interviewees discussed managing data for their research projects in one of four ways.
Seven SDSS data end-users described their data management as involving folder structure
organization on their personal computer. For example, when asked to explain how he organized
his data, Nguyen responded, “Organize? Well, just try to keep them in different directories, I
guess” (Nguyen, Professor, 2015). Next, four interviewees described how they use the
Interactive Data Language (IDL) database structure to organize data on their personal computers.
For example, Rodriguez uses IDL to organize and analyze FITS files (Rodriguez, Professor,
2011). Three interviewees explained they are unable to manage their research data on a personal
computer, and instead require local workstations to provide the storage space and memory
necessary for scientific data storage and analysis. One interviewee’s office was full of monitor-
140
less computers and he used these computers as nodes for his data work (White, Staff Scientist,
2012). Five interviewees described relying on a shared server to manage and analyze their
scientific data. Garcia used the university computer cluster to process data for his work. Evans
explained that it is only during the final stage of journal article data analysis and writing that she
is able to work with data on her local computer. The rest of her data analysis requires
infrastructure on the scale of server farms (Evans, Post-Doc, 2015). SDSS data end-user
interviewees indeed described four different ways they store data used for scientific analysis:
through folder structures, IDL, local workstations, or shared servers.
v SDSSend-userslong-termservingandarchiving
This section presents how interviewees managed their project data at the end of a project.
As described in the methods, each end-user interviewee was questioned using the “Follow the
Data” interview protocol, which asked about their data management practices through the full
research process of a single journal article. The interviewees in this study generally defined the
end of a project as coinciding with journal article publication.
Twenty-five interviewees were asked to locate the data behind a specific figure in their
recent journal article. Specifically, the interview protocol asked, “Could you locate the data for
this [table/graphic/image]?” Of the 25 interviewees, there were seven kinds of responses to the
question, organized into four categories (Table 23). The four categories of responses were 1) I
have the data (n=12), 2) someone else has the data, but I do not (n=16), 3) the data are available,
but in an earlier level of processing, (n=3) and 4) the data are not available (n=1). Six
interviewees responded by using more than one of the categories. Five of those interviewees
responded with more than one category because the reason that they did not have a copy of the
data was that the data were not important enough to retain. The sixth interviewee offered two
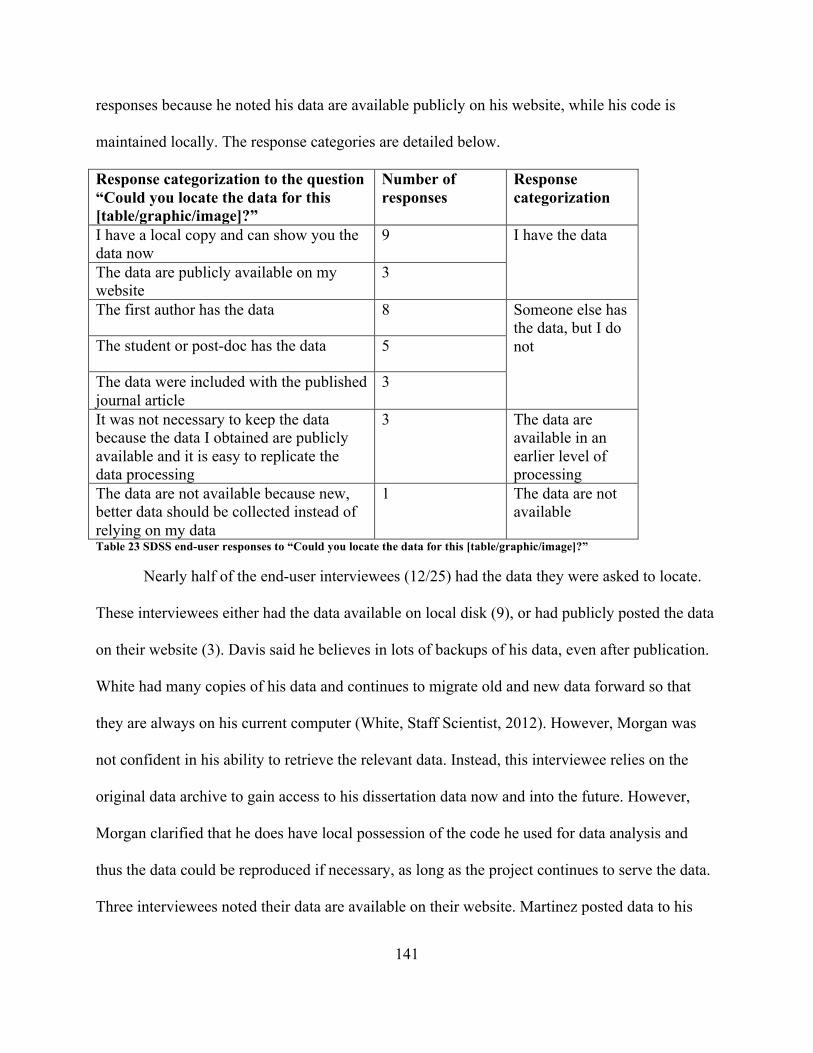
141
responses because he noted his data are available publicly on his website, while his code is
maintained locally. The response categories are detailed below.
Response categorization to the question “Could you locate the data for this [table/graphic/image]?”
Number of responses
Response categorization
I have a local copy and can show you the data now
9 I have the data
The data are publicly available on my website
3
The first author has the data 8 Someone else has the data, but I do not The student or post-doc has the data 5
The data were included with the published journal article
3
It was not necessary to keep the data because the data I obtained are publicly available and it is easy to replicate the data processing
3 The data are available in an earlier level of processing
The data are not available because new, better data should be collected instead of relying on my data
1 The data are not available
Table 23 SDSS end-user responses to “Could you locate the data for this [table/graphic/image]?”
Nearly half of the end-user interviewees (12/25) had the data they were asked to locate.
These interviewees either had the data available on local disk (9), or had publicly posted the data
on their website (3). Davis said he believes in lots of backups of his data, even after publication.
White had many copies of his data and continues to migrate old and new data forward so that
they are always on his current computer (White, Staff Scientist, 2012). However, Morgan was
not confident in his ability to retrieve the relevant data. Instead, this interviewee relies on the
original data archive to gain access to his dissertation data now and into the future. However,
Morgan clarified that he does have local possession of the code he used for data analysis and
thus the data could be reproduced if necessary, as long as the project continues to serve the data.
Three interviewees noted their data are available on their website. Martinez posted data to his
142
website when his journal article was published. In fact, he posts data on his website not only for
other users, but also for himself. He explained, “when I do additional analysis, I want to be dead
certain that I’m using the same thing we’ve made available to other people” (Martinez,
Professor, 2014). These interviewees each have possession of the data they used in the journal
article discussed in their interview.
Roughly half (12/25) of the interviewees noted that they do not have the data, but that a
co-author of the study has the data used in the journal article. When interviewees noted someone
else had the data, they referred to one of two people: the first author of the article (8), or the
graduate student or post doc who collaborated on the project (5). One of the interviewees noted
the person with the data was both their student and the first author of the paper. Some
interviewees felt it was the first author’s responsibility to have the data and did not think about
data disposition beyond that assumption. Johnson said, “Well, there is probably a folder
[student/first author name] has somewhere… Well no, they actually have to go ask [student/first
author name]” (Johnson, Professor, 2011). Williams indicated that during some collaborative
research projects, co-authors with different interests might manage the datasets most relevant to
their specialty. Wilson, a graduate student, was directly asked who generally managed research
data. He responded that students usually were designated as data managers, “Well, these around
here, that's fallen to the students...” (Wilson, Graduate Student, 2011). However, he explained
that student data management was not an official policy and instead an ad hoc tendency. Morgan
laughed during the interview when he realized he did not have access to the data that contributed
to a journal article and that it could affect the reproducibility of his study (Morgan, Post-Doc,
2015).
143
Three interviewees noted that they do not have the final data products that led to journal
article publication. However, they noted the original data remains available publicly and it would
not take very much time to transform the available data into the data product they used for
journal article analysis. For example, Bennett mentioned that not all code needs to be kept,
because some is easy to replicate (Bennett, Staff Scientist, 2015). These three interviewees did
not have access to the data used for their journal article. However, they believed that they could
re-create their processing steps by using the original data, which remains publicly available.
Finally, one interviewee stated that he did not retain his data because he believed that the
particular dataset was unimportant. Wood explained, “… if you talk to somebody who works on
galaxies or something… they would never use data from two decades ago. They would be like,
‘Why would I do that? I'll just go to the telescope and get another spectrum…’" (Wood,
Professor, 2015). This interviewee admitted to no longer having the data, however he argued that
a potential data reuser should instead collect their own data using newer, and thus more
sophisticated, instruments.
4.2.3 RQ2 ethnography results
In both the SDSS and LSST observational findings, academics from different disciplines
worked together, and in both projects culture clashes were found. The SDSS I and II project has
completed data collection when the author of this dissertation began observing the collaboration.
SDSS ethnography results reveal how the term “archive” was understood and used multiple ways
by members of the SDSS collaboration. LSST observations for this dissertation were conducted
at the close of the research and development and start of the construction stage of the project.
LSST ethnography results reveal the joining of divergent cultures influenced how data
management was interpreted.
144
4.2.3.1SDSSdatamanagementinethnography
When the author began observing SDSS in Spring 2012, the project had already
transferred operations from SDSS II to SDSS III. However, the SDSS I and II data continued to
be managed and served to the public. From the author’s perspective, the time following data
collection could be referred to as the archival period. However, the term “archive” held various
meanings for members of the SDSS collaboration.
In Summer 2012, four years after SDSS I and II data collection was completed, the
author had a confusing conversation with Taylor, an SDSS team member and leader. When
asked about the long-term plans and data archiving for the SDSS, Taylor referred to the SDSS I
and II dataset as the “science archive” (see also 4.2.1.1 SDSS data management in documents).
When pushed to describe the long-term management plans and practices for the data, Taylor
noted that multiple universities “have copies.” While referring to the SDSS science archive,
Taylor had no conception of the meaning of the term “archive” as defined in this dissertation and
related to data management, preservation, and curation. The same ambiguity of the term occurred
with another important SDSS team member at the same institution. Once the author and
Anderson reached consensus on the subject, Anderson stated that there was no need for
preservation or archiving. He explained, "We put it up on the web, so it's good, it's done"
(Anderson, Emeritus Professor, 2012). Even though these SDSS team members and leaders
committed more than a decade of their lives to the SDSS project, they were unclear of the
meaning of “archive” beyond that of the SDSS “science archive,” and once pressed found little
need for long-term data management.
Alternatively, there remains much pressure on the SDSS collaboration to ensure the data
are served and preserved in the long-term. As presented in RQ2 section SDSS end-users long-
145
term serving and archiving, the most conscientious data end-users explained that while they save
and backup their SDSS data retrieval queries, as well as the intermediate and final data products
from their analysis, they do not feel a need to save the data initially retrieved from the SDSS
server. End-users are not managing copies of the SDSS data used for their science because they
assume the data will remain consistently available from the SDSS collaboration. SDSS team
members need to serve and preserve the SDSS data because end-users rely on that data to remain
available for the reproducibility of their science.
Luckily, many other SDSS team members have considered and prioritized long-term
management of SDSS data and understand the importance of data preservation. While SDSS
leaders admit they considered long-term management later than they should have, steps were
taken to archive and serve the SDSS data prior to the end of project funding (refer back to 4.1.3.1
SDSS data in ethnography).
4.2.3.2LSSTdatamanagementinethnography
LSST data management systems are currently under development: the project is under
construction, having completed the research and development phase of the work. The LSST
project as a whole, including telescope, camera, data management system, and operations, is a
more than one billion dollar enterprise. Given the complexity and expense of the project, funding
bodies require data management software construction to occur on time and within budget. The
NSF in particular requires extensive planning and reporting to ensure progress.
Most university-based astronomers have never participated in a project the size of LSST,
which has led to a clash of cultures. On one side are PhD astronomers who generally work in
small or medium collaborations, and have never worked on a project at LSST’s scale. The
majority of those employed by LSST for data management have PhDs in astronomy and are
146
located at a university, and as such are more accustomed to the university-based research
environment, which is in sharp contrast to NSF requirements for strong reporting to ensure the
continued success of the software development project.
Many informants described their struggle between moving from an university
environment to a highly regulated NSF culture when they began working on LSST. One
individual was a team member of SDSS and then an early member of LSST. He described
working with LSST leadership to determine, “how do we design the code in a pseudo-
professional way?” (Campbell, Professor, 2015). He explained that much early data management
work during research and development involved attending classes on professional programming.
He explained how important, and yet frustrating, it was to be forced to learn a whole new way to
write software. As astronomers, he and his colleagues generally wrote code well enough to
accomplish a certain task, and then moved on. However, he understood that with a large
collaboration and thousands of potential end-users, the software would have to be created in a
more deliberate way. He described more specifically that this LSST project period was spent
learning how to build data management software as programmers instead of as astronomers:
“Yeah, that involved training us on a lot of new tools, stuff that we had certainly never thought
about having to do in academia” (Campbell, Professor, 2015).
The astronomer described above was frustrated by having to learn all new tools and
techniques for writing code. At another LSST institution, during construction, different software
writing cultures frustrated other LSST team members. Many of the LSST team members have
degrees in computer science and the team as a whole was happy to follow professional software
writing guidelines. They agreed with the importance of professional software techniques, even
147
though the detailed manner in which the Agile software method was deployed by LSST was
difficult to implement across institutions.
Multiple institutions had difficulty reconciling what they saw as two competing cultures:
that of professional software writing and that of the NSF reporting system. “Earned value” is a
term often heard at the LSST data management (DM) leadership meetings. The NSF requires
that software engineering work time is carefully recorded and short- and long-term goals are well
managed. While seemingly simple at first, the devil is in the details of the extensive spreadsheet
system LSST DM leadership uses to track team performance for the NSF. An informant
explained the earned value language from the NSF could sometimes even be in direct contrast to
the Agile professional software engineering system. He explained that Agile enables a software
engineering team to learn how productive their unit is over time, and then to measure and predict
production accordingly. They went on to explain the Agile method is the “antithesis” of the
earned value model that the NSF requires.
The LSST DM leadership specifically tries to shield software writers from the NSF and
earned value language, instead leaving those worries to the leadership team. Despite these
attempts, the discrete cultures of the NSF earned value and the Agile software engineering
system do influence the way software writers go about their work. Each of the institutions
studied for this dissertation found that adapting to working within these two divergent cultures
remained difficult. When specifically asked, one informant noted that the reasons a person may
want to work on an academic project do not align with the way LSST needs to be managed for
the NSF. He explained, “People don't come into academia for the money right? Typically it's for
other perks, …the opportunity to be involved with something kind of grand... [But] at this point
feels like we’re trying to check off boxes for bureaucrats” (ethnographic fieldnotes, 2015). Over
148
the course of the observations, each institution began to more successfully grapple with these
competing cultures.
4.2.4RQ2resultssummary
A number of perspectives emerged for what it means to manage astronomy data. The
SDSS team documents parsed data management into three stages: Data Collection; Data Storage,
Processing, and Transfer; and Long-Term Serving and Archiving. LSST documents did not
describe data management in this kind of temporal fashion because the project is early in the full
project life cycle. Since a temporal pattern across LSST documents did not emerge, these results
were presented by document genre. Different LSST document authors described data
management in terms of the remaining work to prepare for data collection, lists of tasks and
responsibilities, or difficulties associated with the volume of the data and the speed with which it
will need to be made available. The interviewees in all three populations described data across
three rough temporal periods: Data Collection; Data Storage, Processing, and Transfer; and
Long-Term Serving and Archiving. These three stages were the same across the large SDSS and
LSST team projects, as well as the small- and medium-sized projects described by SDSS data
end-user interviewees. The RQ2 ethnography findings illustrated nuance to these larger
categorizations. SDSS ethnography findings showed the term “archive” held many meanings
across the SDSS collaboration, and therefore there were different understandings of what long-
term data management entailed. LSST ethnography revealed different data management working
traditions, which split along professional programming and university settings. While many
university employees had never worked in large, dictated collaborations, the NSF requires
precise recordkeeping to ensure LSST remains a good steward of federal funds. Each of the three
149
research methods elicited complementary understandings of the temporal and nuanced nature of
astronomy data management in the study populations.
Through close analysis and the combination of the three research methods, a descriptive
model emerged showing the stages of sky survey data management over the course of a project.
The RQ2 findings demonstrate that astronomy sky survey data management takes place over the
course of a set of stages. As outlined in the presentation of the results, six data management
stages emerged from the document and interview results from both the SDSS and LSST team
members and the SDSS data end-users. Figure 7 illustrates the Sky Survey Data Stages that
emerged from combining the temporal and nuanced ethnography findings with the document and
interview results. Sky survey data are shown to originate with the sky survey team after project
proposal, construction, and data collection. Data are then processed, documented, and released to
potential end-users. The team members manage the data in the long-term, however “long-term”
is defined locally. Once data are released, end-users can employ the data in their planned
research. This end-user work often requires further data cleaning and processing, analysis,
writing, and publication of findings. The derived data are sometimes then documented and
released to other potential end-users, which begins the cycle anew. More often however, end-
users do not provide long-term data management for derived data, as detailed in 4.2.2.3 SDSS
end-users long-term serving and archiving.
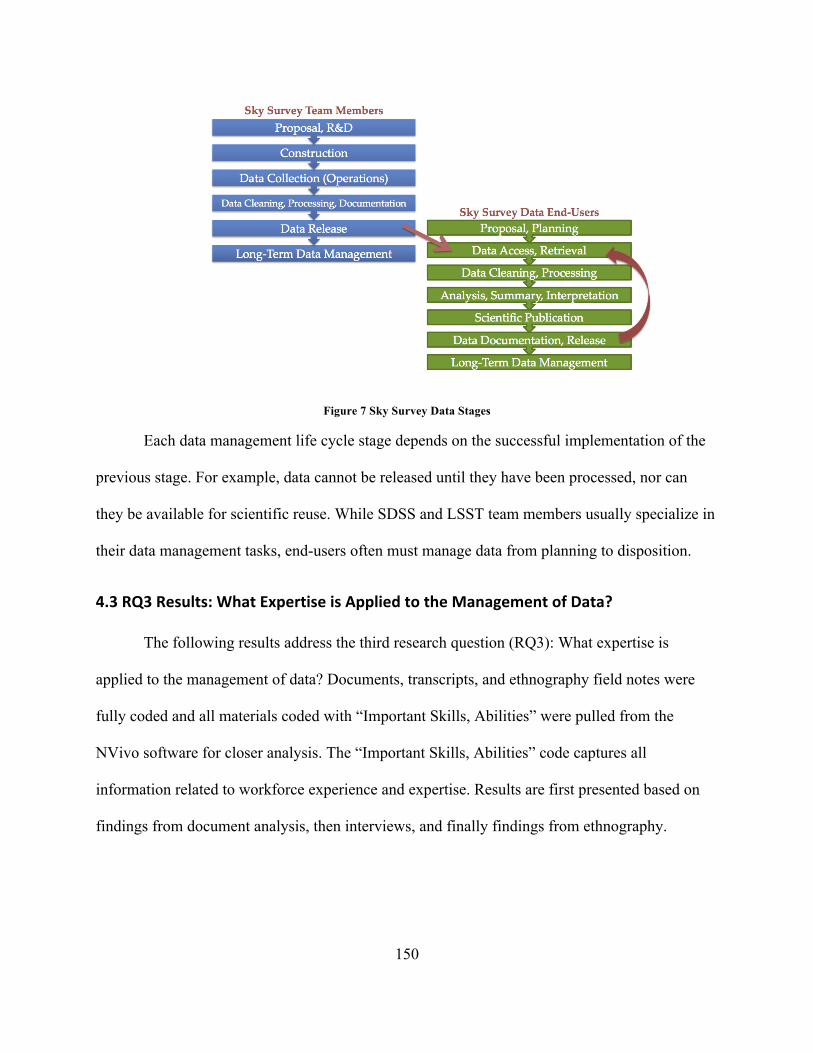
150
Figure 7 Sky Survey Data Stages
Each data management life cycle stage depends on the successful implementation of the
previous stage. For example, data cannot be released until they have been processed, nor can
they be available for scientific reuse. While SDSS and LSST team members usually specialize in
their data management tasks, end-users often must manage data from planning to disposition.
4.3RQ3Results:WhatExpertiseisAppliedtotheManagementofData?
The following results address the third research question (RQ3): What expertise is
applied to the management of data? Documents, transcripts, and ethnography field notes were
fully coded and all materials coded with “Important Skills, Abilities” were pulled from the
NVivo software for closer analysis. The “Important Skills, Abilities” code captures all
information related to workforce experience and expertise. Results are first presented based on
findings from document analysis, then interviews, and finally findings from ethnography.
151
4.3.1 RQ3 documentation results
The following are the findings from documents coded “Important Skills, Abilities.”
SDSS documentation results are presented first followed by LSST documentation results.
4.3.1.1 SDSS data management expertise in documents
SDSS is often described as a pioneering project because lessons learned have influenced
subsequent astronomy sky surveys. Team members describe a range of expertise they developed
from working on the SDSS that they now apply to new projects, including the Dark Energy
Survey (Yanny, 2011, p. 20). However at the time of SDSS I and II, a number of lessons were
yet to be learned and a number of new kinds of expertise were not yet developed in the
astronomy sky survey community.
v Continualexpertiseandlearning
The formal SDSS hierarchy reflects the breadth of expertise necessary for the
collaboration to succeed. The following kinds of positions are within the SDSS leadership
hierarchy: Astrophysical Research Consortium Board, Advisory Council, Advisory Council
Executive Committee, Advisory Council, Chair, Director, Project Scientist, Project Manager,
Spokesperson, Collaboration Council, Project Teams, Management Committee (Astrophysical
Research Consortium, 1989, 2000, 2005). The NSF Project Execution Plan (PEP) reveals further
kinds of expertise embodied throughout discrete components of the larger SDSS project. Of
particular relevance to data management are Survey Operations, Data Processing, and Data
Distribution. In the PEP, each of these components is broken down into a long list of required
tasks and kinds of expertise. For example, the plan disambiguates “Survey Operations” into four
152
different components: Observing Systems, Observatory Operations, Data Processing, and Data
Distribution (Kron, 2008, p. 4).
By the early days of operations, the SDSS collaboration was aware that a breadth of
astronomy, physics, and computer science expertise was necessary to collect and analyze the
SDSS data successfully (Szalay et al., 2000, p. 2). A SDSS team member explained that an
important lesson learned from the SDSS was to ensure depth of expertise by not allowing one
individual to be the only expert along a critical path. He clearly explained,
“Avoid single points of failure. OK, so this is totally obvious, but there are subtler aspects. If one person is allowed to become essential it implies that it’s proved impossible to find someone else who could fill their role. In consequence, if they are on the critical path, and problems arise, it’s hard to add resources to solve the problem” (Lupton, 2002, p. 9). However, despite the large number of team members and implemented hierarchy, SDSS
team members acknowledged there was no way all potentially necessary expertise could be
present at once within the collaboration. The SDSS made provisions to enable the team
membership, and therefore range of expertise on hand, to grow over time. In particular, when an
individual possesses a scientific expertise the collaboration currently lacks, there are ways to add
that individual to the relevant parts of the project (Astrophysical Research Consortium, 2005, p.
11).
v Data-intensiveexpertise
SDSS data were collected and made available at such a relatively high volume and scale
that it was beyond most astronomers’ expertise to manage (Margon, 1998, p. 6). At the time, the
SDSS collaboration was aware that working with these data volumes was primarily limited by
their data management learning curve. Margon explained, “All SDSS data will be entirely public,
153
on a schedule limited only by our (chiefly human) resources needed to process and calibrate this
very large volume of information” (1998, p. 6).
The SDSS collaboration soon discovered it would not just be the SDSS team members,
but also the data end-users, who would require new expertise to work with these volumes of data.
Some SDSS team member leaders explained, “In this era, astronomers will have to be just as
familiar with mining data as with observing on telescopes” (Szalay et al., 2000, p. 2). Early in the
SDSS data collection, team members recognized that many potential end-user scientists held
little expertise working with big data (Szalay et al., 2000, p. 9). Given the level of expertise
generally necessary to analyze large volumes of data, the SDSS team members who developed
the data access mechanisms were highly successful at creating a way for end-users to search,
retrieve, and use SDSS data.
v Helpdesk
Despite the SDSS collaboration’s extensive data management tools and quality
documentation, a help desk remains necessary to assist end-users. End-users ask a variety of
scientific questions about SDSS data. Some of these questions require the end-user to understand
the methodological details of how the SDSS team collected and processed the SDSS data.
Indeed, “In many cases… Users often require support from SDSS personnel with expertise in the
relevant parts of the pipeline to properly interpret the files provided; a helpdesk supported by the
experts is essential” (Neilsen Jr. & Stoughton, 2006, p. 3). The importance of the help desk
illustrates that the SDSS team members who built the infrastructure possess expertise beyond
what can be recorded. For some science questions, team member expertise may prove essential.
However, an individual, even one highly involved in the collection and processing of SDSS data,
cannot answer all help desk questions. Full knowledge of the data requires a team.
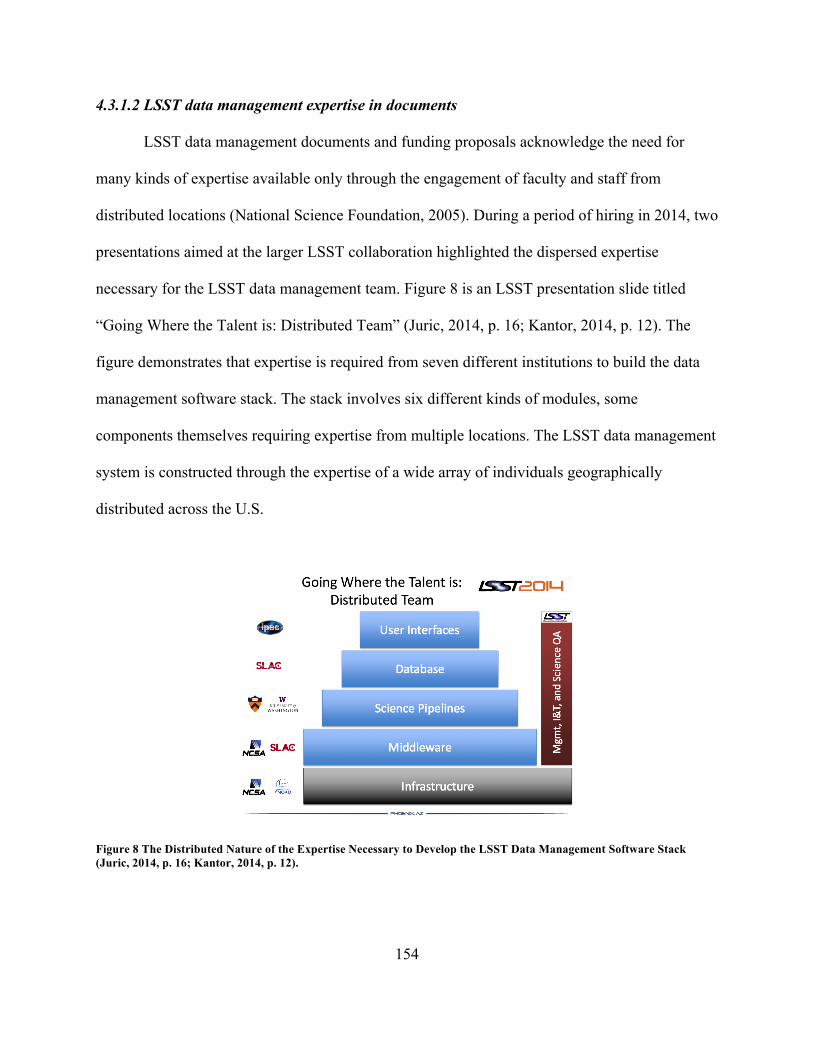
154
4.3.1.2 LSST data management expertise in documents
LSST data management documents and funding proposals acknowledge the need for
many kinds of expertise available only through the engagement of faculty and staff from
distributed locations (National Science Foundation, 2005). During a period of hiring in 2014, two
presentations aimed at the larger LSST collaboration highlighted the dispersed expertise
necessary for the LSST data management team. Figure 8 is an LSST presentation slide titled
“Going Where the Talent is: Distributed Team” (Juric, 2014, p. 16; Kantor, 2014, p. 12). The
figure demonstrates that expertise is required from seven different institutions to build the data
management software stack. The stack involves six different kinds of modules, some
components themselves requiring expertise from multiple locations. The LSST data management
system is constructed through the expertise of a wide array of individuals geographically
distributed across the U.S.
Figure 8 The Distributed Nature of the Expertise Necessary to Develop the LSST Data Management Software Stack (Juric, 2014, p. 16; Kantor, 2014, p. 12).
155
v Softwareengineeringknowledge
Mario Juric, LSST Data Management Project Scientist, explained why the project
requires building a new software stack, as opposed to amending existing software to LSST
specifications. He included six reasons for new code, including the need for “running efficiently
at scale,” and the need for the code to be agnostic and flexible over its predicted 25 years of use
(Juric, 2014, p. 19).
LSST team members refer to the project as one that requires collaborators to push the
limits of computational capabilities. The Technology Innovation page on the LSST website
explains, “The role of the experimental scientist increasingly is as inventor of ambitious new
searches and new algorithms. Novel theories of nature are tested through searching for predicted
statistical relationships across big databases” (“Technology Innovation | LSST public website,”
2015). The expertise necessary to build software from scratch is more extensive than that of
modifying existing software. LSST thus requires software engineers who write ambitiously, and
not just make adaptations to existing software.
v Bigdataexpertise
LSST data will be used for a broad range of scientific inquiries. Many of these
investigations will not require experience working with big data; however, many will need the
expertise necessary to analyze large datasets. Similar to SDSS, LSST is expected to enable
breakthroughs in scientific research beyond known fields of inquiry (Ivezić et al., 2011, p. 28).
To ensure LSST data will be used to their full potential, data management team members and
data end-users will need to become familiar with big data analytical techniques and the data
management necessities involved in utilizing big data. The LSST collaboration must face “Data
Mining Challenges” (Ivezić et al., 2011, p. 20), and the collaboration has begun working with
156
experts outside astronomy including machine learning and statistics. Partnering with experts in
data mining, statistics, and machine learning will likely enable more and different scientific uses
of the LSST data.
v Breadthinastronomyexpertise
LSST is expected to contribute to the scientific goals of a broad range of astronomy
inquiry. Due to the expansiveness of the field, it is not possible for the LSST team to possess
high levels of expertise for every relevant avenue of astronomical investigation. Therefore, in
addition to those paid through LSST funding to build LSST infrastructure, a cadre of scientists
are preparing for LSST data by providing feedback to the systems under construction. Referred
to as members of the “science collaborations,” many scientists donate their time to specify their
scientific needs to the LSST community. The Science Book (2009) required significant
analytical efforts from many members of the science collaborations. As of 2011, “eleven science
collaborations have been established by the project in core science areas. As of the time of this
contribution, there are over 250 participants in these collaborations, mostly from LSST member
institutions” (Ivezić et al., 2011, p. 30). The role of the science collaborations and their members
is vital to LSST because the project requires such a vast breadth of expertise.
4.3.2RQ3interviewresults
The following results address the expertise necessary to manage astronomy data that
emerged from the interviews. Results are presented first from the SDSS team, next from the
LSST team, and finally from the SDSS data end-uses. Together, the SDSS team, LSST team, and
SDSS end-users proceed through the three broad sky survey data stages as revealed in the RQ2
157
results: data collection; data storage, processing and transfer; and long-term serving and
archiving (refer back to 4.2.2 RQ2 interview results).
As already noted, the following interview findings are those that resulted from analysis of
the interview transcript passages coded as “Important Skills, Abilities.” A few interview
questions led to particularly illustrative responses. The LSST team member interview protocol,
in particular, emphasized questions about experience and expertise. For example, two questions
asked interviewees to consider the experience and expertise that has particularly benefitted their
success in the field: “What experience/education/expertise do you think you in particular bring to
LSST?” and “Are there skills or knowledge you gained from a different project that are
particularly useful for LSST work?” While experience and expertise were not brought up as
explicitly in other protocols, the experience and expertise necessary for data management work
emerged from all interviews. For example, follow-up questions were often used to ask
interviewees to delve further into how they were able to accomplish data management tasks.
These follow-up questions often revealed the kinds of experience and expertise the interviewee
identified as important to their data management work. The expertise necessary for data
management at each of the temporal stages that emerged from RQ2 findings are now presented,
beginning with the SDSS team interviews.
4.3.2.1SDSSteamexpertise
At the time of writing, the SDSS I and II had already reached the long-term serving and
archiving project life cycle stage. Each of the results below thus addresses stages in the life of the
SDSS data that have already occurred or begun.
158
v Datacollection
The expertise specifically necessary for SDSS team data collection was rarely discussed
in the interviews, most likely because interviews were conducted years after the SDSS I and II
had completed data collection. This also speaks to the kind of expertise necessary for data
collection, in that it was largely outside the scope of the expertise generally germane to this
study’s populations. Interviewees were chosen for this study based on their relationship to SDSS
data management efforts. Generally speaking, the individuals collecting data on the mountain are
not the same individuals as those processing information at the data center or preparing the data
for release. Once SDSS construction and commissioning were completed, an operations crew
distinct from the data management individuals interviewed for this study, managed the data at
the point of data collection.
However, there can be crossover between the individuals and teams writing the data
processing software and those writing the “mountain-top software” (Moore, Staff Scientist,
2012). While interviewed long after data collection was stabilized, Moore explained that
sometimes the hardware and software on the mountain required management. For example, she
wrote some of the mountaintop software, and sometimes returned when problems arose or
updates were required (Moore, Staff Scientist, 2012). Largely outside of the scope of the study
populations, data management software was, and continues to be, modified for data collection.
v Datastorage,processing,andtransfer
Three interviewees noted the importance of choosing an appropriate institution for the
SDSS data center. They agreed the final SDSS choice was appropriate because it is a large
institution with complementary and redundant expertise across staff. Hall explained the data
center’s extensive previous experience with large volumes of physics data made it an excellent
159
institution to manage SDSS data. A team member at the data center explained that their staff
have, “…expertise in dealing with large datasets. So that's one of the connections between
particle physics and astronomy, was the so-called data processing, taking…large amounts of
data…and turning it into something useful [for] scientists…” (Hall, Staff Scientist, 2013).
Despite the data center’s experience primarily being in physics, and not specifically in
astronomy, the institution had experience managing large datasets, which was the greater SDSS
need.
Two interviewees spoke about the expertise surrounding the hardware needed to serve the
SDSS data. Both interviewees referenced how SDSS required an external group to perform bulk
data distribution. Brown explained they sent SDSS data releases to a team with the expertise to
run large volumes of available hardware, “…then everybody else used to download from there,
because they had... a lot of space to have, to hold our data, and also they had fast pipes to hook
major centers in the world” (Brown, Staff Scientist, 2014). In addition to the hardware and
bandwidth available for bulk data movement, SDSS team members relied on the external team
because that team held expertise, which the SDSS team members did not necessarily possess.
One SDSS team member explained that stable technical experience and expertise are not
available just anywhere, “Like we have a just a superb sys admin and a really nice machine
room, but it's not the sort of thing you would take a $50 million survey and say, ‘We're relying
on this infrastructure’” (Watson, Professor, 2015).
Two SDSS team members spoke to the importance of the SDSS software writers’ ability
to self-teach and learn quickly. They explained that data-intensive astronomy was an actively
changing environment, and required individuals who could adapt accordingly. Martin explained
what he looks for in job candidates: “Because it’s changing so fast and our environment is
160
cutting edge in many ways… that nobody has the full spectrum [of expertise], but we try to find
people who can learn fast and have some background” (Martin, Staff Scientist, 2012). SDSS
team members needed to be able to learn quickly and remain up-to-date with ever-adapting
technologies.
v Long-termservingandarchiving
SDSS did not plan for the long-term serving and archiving of the data in the early days of
the project. One reason that they did not plan early on is the team members did not initially
possess the long-term archival expertise needed for long-lived data management. Brooks
explained, “…whenever we talk about data archives, it always comes up that to properly archive
data, you need expertise… Astronomers, like physicists, we tend to believe we can just figure it
all out ourselves…. I don't think it crossed our mind that there's people we could just call…”
(Brooks, Professor, 2015). The SDSS did work with two university libraries to add long-term
data management expertise to the project (Refer back to 4.1.3.1 SDSS data in ethnography). One
SDSS team member in a leadership position discussed how collaborating with two university
libraries during the SDSS archival phase brought important expertise to the team. He explained
that the libraries taught the SDSS team to focus on the “long-term mindset,” adding metadata and
documentation, migrating to new formats, gathering documents, and the libraries “probably
pushed us to more than we would’ve ourselves” (Robinson, Staff Scientist, 2013). While library
expertise on the collaboration benefitted SDSS according to this interviewee, three different
SDSS team members noted SDSS continued to lack archival expertise present in the NASA
science centers. An SDSS leader noted a NASA science center could have easily archived the
SDSS data because of their existing expertise. Another SDSS leader noted the NASA science
centers are reliable because the data archiving expertise is located in one place, which
161
encourages experts to remain in careers that build and exploit their expertise over time. Bell
explained that one particular NASA science center is a great example of the confluence of
expertise,
“'Cause they have staff who know how to do all these things…. Yeah, it can even be hard to hire that expertise, because someone who's good at that, what are we gonna do? Tell them to move to Hawaii for three years so you can do this, and then you'll have no job at the end? Whereas, [NASA science center], you know it will still be there in 20 years” (Bell, Professor, 2015).
In addition to noting the expertise available at the NASA science centers, two SDSS team
members described how the SDSS team lacked the archival expertise necessary to
accommodate long-term data serving and archiving.
4.3.2.2LSSTteamexpertise
LSST is currently in the construction phase of the project. Operations will likely not
begin for another five years after this writing, with the end of data collection ten years further
off. While data collection has not begun on the mountaintop, the LSST project data management
team has team members at six primary institutions employing various skills to prepare for data
collection.
v Datacollection
Similar to SDSS, most of the interviewees for this study do not describe their expertise as
residing in the data collection stage. No LSST interviewees spoke about data management on the
mountain or at the point of data collection. Therefore, no evidence was provided from these
study populations for the kinds of expertise needed for LSST data collection.
162
v Datastorage,processing,andtransfer
Four interviewees spoke about the expertise necessary to develop LSST data processing
and management software. While data collection will not likely begin until 2020 (as of the time
of this dissertation writing), the data management teams are heavily invested in developing the
infrastructures necessary to support data processing. One SDSS leader explained that it will be
important to maintain the expertise of those team members who are currently building the
software pipelines. Martinez explained that while specifics cannot be predicted, the team knows
LSST software will require updates and maintenance throughout operations, and so it is
important to retain the expertise of those who initially built the software. He explained,
“And the way to understand such a complex system is often related to doing complex simulations. So we cannot let our simulations team go after first light, we'll have to keep them…. And then with data management, too, once you learn how your data actually look like as opposed to what you thought they would look like. You need at least [a] few years to recode your pipelines and to make them good again and then you need to maintain them for a few years” (Martinez, Professor, 2014).
While some kinds of expertise must be retained over the course of the LSST project, some are
necessary only at specific points in the project. Martinez continued to explain that the kinds of
personnel needed for data management can differ between stages, “… you want slightly more
science-y people to define what the project is supposed to deliver. …in construction then you
need people who are better at, for example, coding, who are better at programming…the profile
changed over the time…” (Martinez, Professor, 2014). While different kinds of expertise prove
more important at each LSST stage, past experience on the project remains important in each
stage to retain continuity.
Nelson explained that expertise is important for writing LSST software, but so is working
in a supportive environment of colleagues. He explained, “I'm not, ya know, formally trained in
163
software engineering. Everything that I have learned has been through experience…. And so
having a community... Having an interaction around the solution I think just produces a better
solution, in general” (Nelson, Staff Scientist, 2014). While Nelson was not formally trained in
software engineering, he finds that working alongside his teammates allows them all to succeed
in their work.
Four interviewees discussed the kinds of technical expertise necessary for LSST data
center staff. Staff expertise at the data center is often different than the expertise needed at the
universities developing the software pipelines. The data center is where the data will be stored,
processed, and made available to end-users. One interviewee at the data center listed off the
kinds of experience needed for data management work there: Storage systems, workflow
managing, processing of the data, storage and retrieving data to some extent, networking,
administration of systems, security of systems (Diaz, Research Programmer, 2015). Given the
breadth of expertise and experience needed in the data center, that team requires staff with
expertise in computing, software, and networking, as opposed to experts in astronomy domain
knowledge. Another data center interviewee explained the data center team members are
intended to be more technical experts so the astronomers do not have to gain computer science
expertise on top of their domain knowledge. The LSST team members working at the data center
seek to provide the technical expertise to enable the LSST team to successfully manage their
astronomy data.
v Long-termservingandarchiving
As noted in the RQ2 results, interviewees provided very few perspectives for the long-
term serving and archiving of LSST data. Three individuals predicted what kind of management
might prove necessary in the long-term (refer back to the section on LSST team long-term
164
serving and archiving). However, no one noted the expertise necessary for long-term data
management. Future social science research into LSST should investigate how long-term serving
and archiving of the data is being planned, what the expectations are for data management, and
what kinds of expertise are predicted to be necessary.
4.3.2.3SDSSend-usersexpertise
SDSS data end-users are able to obtain sky survey data once team members make the
data available to the public. At a different scale, data end-users also manage their data first
through data collection, then data storage, processing and transfer, and finally through the extent
to which they offer long-term serving or archiving (refer back to 4.2.2.3 SDSS data end-users).
The expertise necessary for these three stages, within the context of data end-users, is expressed
below. Jackson outlined a distinction between large sky surveys, and end-user research projects.
He explained that in terms of expertise, when he works on an end-user project he requires the
data management expertise for all stages of the research project. He explained,
“But it tends to be that I'm a one-man factory and I do from start to finish. At least for this work, because I made the data...There's too much data and there aren't enough of us to... specialize on particular areas. So, you need to be able to do a bit of everything. So, it tends to be you... So, therefore, it becomes slightly more efficient to be vertical” (Jackson, Staff Scientist, 2012).
Given that individuals or small teams need to possess all of the data management
expertise necessary for their work (while the SDSS and LSST team members can rely on
specific deep dives in expertise spread over a larger team), it is reasonable that sometimes
end-user scientists may require outsourcing for portions of their work.
165
v Datacollection
Five SDSS data end-users discussed the expertise necessary to obtain SDSS data from the
collaboration. Three interviewees discussed the importance of knowing SQL as a necessary
skillset for easy data retrieval. One interviewee noted that while SQL may not have been an
expertise necessary for astronomers in the past, it has now become a critical skill. He explained
that learning coding languages and how to use databases are important for asking new research
questions, “You're not restricted by the options someone gave you on a pull-down menu, but you
can just do anything that you can express in Python” (Bell, Professor, 2015). Another
interviewee explained that, given the volume of data he works with, he often must employ his
system administrator knowledge, which “was one of the engineering skills, that I learned as a
grad student [in astronomy]. Was how to be sys[tem] admin[istrator] for my own machine”
(Campbell, Professor, 2015). These interviewees explained that successfully accessing and
retrieving data from the SDSS interface could require technical knowledge in managing
hardware and software.
v Datastorage,processing,andtransfer
Three interviewees discussed the importance of having experience writing software to
manage SDSS data during analysis. These interviewees mentioned specific programming
languages, while also noting the preferred language may change over time. Not only does it take
time to learn a new language, but also it may require rewriting existing code an end-user may
rely on for multiple projects. A young faculty member explained why he continues to write in the
script he first learned in graduate school instead of learning Python or another modern language:
“And while in principle I should switch, it's so much work for me that I doubt I will ever do
that…. Well, I mean I lose everything. So. You have to really start again” (Rogers, Professor,
166
2015). These interviewees noted they need software writing expertise to process and analyze
their data, and that it can be difficult to find the time to continue learning and adopting new
languages as they change in popularity over the course of their careers.
v Long-termservingandarchiving
No interviewees discussed the expertise necessary to manage personal research data in
the long-term. RQ2 results presented the range of ways data are maintained following the
publication of a journal article. Data may be organized on personal computers or institutional
servers, and the media may be migrated forward over time, the data may be posted to a website,
or simply forgotten. None of the ways end-users discussed data management after publication
reflected on skills or expertise. Aside from recognizing the importance of media migration, no
activities or kinds of expertise were noted in the long-term management of end-user data.
4.3.3RQ3ethnographyresults
As of this writing, SDSS I and II operations are complete, while the LSST construction
phase is ongoing. As the two projects are both sky surveys, and have overlapping leadership,
many team members expect the LSST to benefit from lessons learned during SDSS. One
important lesson learned by SDSS team members is that software engineering for a sky survey
project is an intensive exercise that requires extensive dedicated resources. While the time and
labor of many individuals has shown necessary to successfully generate sky survey software
infrastructure, astronomy is a typical academic discipline in which rewards and promotions are
determined largely by scientific journal article authorship, and not teamwork that results in
infrastructure. The SDSS, and now the LSST, must grapple with how to reward staff members
who have astronomy PhDs, but cannot spend time writing personal scientific papers while they
167
build sky survey infrastructures that benefit the discipline as a whole. As LSST seeks a full
environment of team members with astronomy domain knowledge and computational skills, the
leadership must consider how to reward this workforce in a way to retain the experience and
expertise needed for LSST to succeed into the next decade.
4.3.3.1SDSSexpertiseinethnography
SDSS team members learned a number of lessons that individuals have applied to
subsequent astronomy surveys. Despite having to learn through trial and error, SDSS is today
considered a great success.
Visionary leaders are often cited as critical components of the SDSS data management
end-user services (Finkbeiner, 2010). While it is not advised to expect faculty to build software
systems in their spare time, a handful of such visionary SDSS team members did just that and
enabled the project’s success. However, ethnographic work illustrates it was not just these
individual visionaries, but a team-wide shared desire for project success that enabled SDSS to
persevere through multiple waves of potential budget failures over the years. LSST staff now
emphasize that new team members must have a sense of teamwork and a shared drive for the
successful work of LSST as a whole.
While they may or may not have realized it at the time, the visionaries and others who
dedicated time to building the SDSS data management infrastructure sacrificed much for the
good of the project and the domain as a whole. The PhD astronomers who dedicated their time
and expertise to infrastructure building were unable to spend that time researching and writing
scientific journal articles. For established faculty, the time spent on infrastructure was likely not
problematic. However, junior astronomers’ careers may have suffered due to spending time on
infrastructure instead of publishable scientific research. Since the academic tenure track is
168
designed to reward journal articles, and that is at odds with the SDSS’ need to produce
infrastructure, individual careers have suffered for the good of the project.
Study participants brought up the “scientist’s dilemma” regularly across the five years of
fieldwork for this dissertation. Not new to SDSS or LSST, “the scientist dilemma occurs
whenever highly-skilled, scientifically motivated people are needed for support work”
(Kleinman et al., 2008, sec. 5). Much technical support work is necessary for sky surveys,
however this infrastructure work can derail an individual’s chances at a tenure-track faculty
position. A limited number of faculty were noted as having “beat” the system; they achieved
faculty positions even after spending extensive time on infrastructure projects. However, most
individuals who spent time building infrastructure now have staff-level, rather than faculty-level
careers. Since their interviews, the two study participants most vocally unhappy with their staff-
level positions have since left academia for industry. Luckily, the majority of these staff
informants explained that they were happy with staff-level, infrastructure building positions
because they enjoyed working with software as much as, or more, than doing basic astronomy
research.
While many astronomers may have first realized the reward structure problem with
SDSS, the scientist’s dilemma still shapes astronomy collaboration involvement. Some will
speak to whoever will listen about the improperly placed incentives in infrastructure-building
projects like SDSS and LSST (Finkbeiner, 2001). These large collaborations require individuals
with domain and software-writing expertise, but career disincentives can prevent projects from
finding excellent astronomy software engineers who are also interested in pursuing tenure-track
careers.
169
4.3.3.2LSSTexpertiseinethnography
As of 2016, the LSST Data Management team remained in the process of hiring to full
capacity. The leaders work strategically, trying to hire well for the large amount of work still
necessary and spanning multiple US institutions. The leader at one primary LSST data
management institution seeks to create an “environment” of expertise for LSST work, beyond
that of merely a group of individuals who can perform data management tasks. The team leader
explained a rich environment is necessary to keep operations proceeding smoothly. He continued
to explain that even though the LSST project spent the past few years in research and
development, they are now in construction and soon astronomers and the general public will
expect a system that provides data in a technically mature way. Instead of hiring a set of
individuals, his focus is on hiring a sustainable team with large amounts of overlapping
experience, to ensure a high-level end-user product.
At another primary LSST data management institution, the team leader also described
intentionally hiring a team of experts who overlap and complement one another’s expertise, as
opposed to hiring individuals. He explained that while he wants to hire the extraordinary kind of
person that cannot be duplicated, that would leave the group open to a single point of failure.
From his experience working on SDSS, he learned that instead of relying on a small number of
extraordinary individuals, the collaboration’s knowledge should be spread among team members.
The knowledge of products and processes, big and small, should be distributed across many team
members as it reduces the potential for failure in the case of team member loss. While continuing
to hire extremely bright and experienced team members, multiple branches of the LSST data
management team have noted that it is the team, as a whole, that will ensure success of the
project, and not extraordinarily intelligent and devoted individuals. While SDSS may have relied
170
on visionary individuals, LSST has learned from that experience, and instead is trying to
generate a workforce that includes a meshwork of teamwork, skills, and expertise.
4.3.4RQ3resultssummary
The RQ3 findings from the documents, interviews, and ethnography in this study
complement one another. Each of the three methods revealed the importance of both astronomy
domain knowledge and data-intensive, technical experience for successful astronomy sky survey
data management. SDSS documents revealed astronomy and data-intensive experience as team
traits that can always be improved upon by adding more team members, as well as something
that requires the long-term commitment of individuals to retain institutional memory and survey-
specific knowledge through the life of the project. LSST documentation discussed the necessity
of a distributed team to ensure the range of experience and expertise necessary for project
success. LSST documents also discussed the importance of team members encompassing both a
depth of software engineering knowledge as well as a breadth in astronomy domain knowledge.
RQ3 interview results confirmed the temporal phases that emerged from the RQ2
document and interview results. Not only do interviewees in this study discuss data management
in terms of three distinct temporal stages, the interviewees also discuss data management
expertise in terms of these three stages. However, each study population focused on only one or
two of the three stages (see Table 24). SDSS team members did not discuss data collection,
instead focusing on data storage, processing, and transfer as well as long-term serving and
archiving. In comparison, LSST team members only focused on the second of those three stages,
while the SDSS data end-users failed to focus on the third stage. While all three populations
discussed the experience and expertise necessary for data storage, processing, and transfer, only
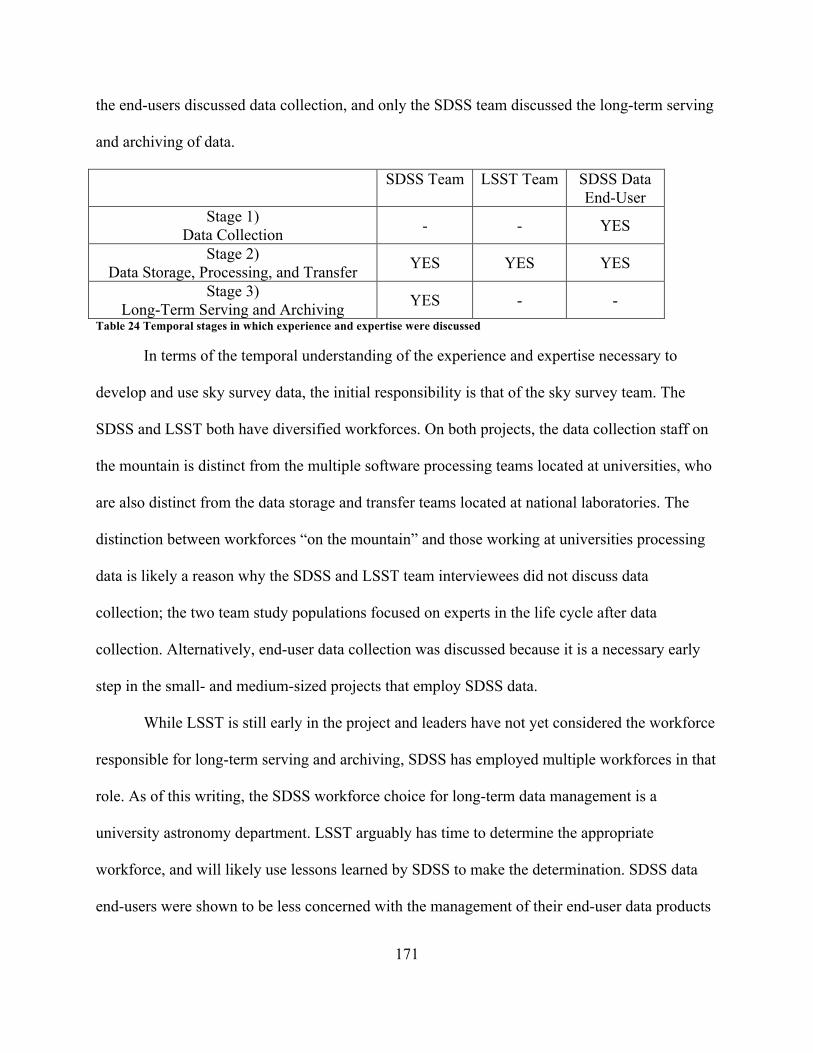
171
the end-users discussed data collection, and only the SDSS team discussed the long-term serving
and archiving of data.
SDSS Team LSST Team SDSS Data End-User
Stage 1) Data Collection - - YES
Stage 2) Data Storage, Processing, and Transfer YES YES YES
Stage 3) Long-Term Serving and Archiving YES - -
Table 24 Temporal stages in which experience and expertise were discussed
In terms of the temporal understanding of the experience and expertise necessary to
develop and use sky survey data, the initial responsibility is that of the sky survey team. The
SDSS and LSST both have diversified workforces. On both projects, the data collection staff on
the mountain is distinct from the multiple software processing teams located at universities, who
are also distinct from the data storage and transfer teams located at national laboratories. The
distinction between workforces “on the mountain” and those working at universities processing
data is likely a reason why the SDSS and LSST team interviewees did not discuss data
collection; the two team study populations focused on experts in the life cycle after data
collection. Alternatively, end-user data collection was discussed because it is a necessary early
step in the small- and medium-sized projects that employ SDSS data.
While LSST is still early in the project and leaders have not yet considered the workforce
responsible for long-term serving and archiving, SDSS has employed multiple workforces in that
role. As of this writing, the SDSS workforce choice for long-term data management is a
university astronomy department. LSST arguably has time to determine the appropriate
workforce, and will likely use lessons learned by SDSS to make the determination. SDSS data
end-users were shown to be less concerned with the management of their end-user data products
172
in the RQ2 results. This lack of concern explains why the end-users did not focus on expressing
long-term serving and archiving experience and expertise.
The RQ3 ethnography findings add further dimension to the documentation and interview
findings. The ethnography findings revealed the SDSS team initially relied on visionary leaders
for success, but learned that teamwork among a diverse collaboration proved more sustainable.
LSST collaboration members learned this lesson in expertise sustainability from the SDSS
project and described wanting to build a full “environment” of experts for the project. However,
both projects are faced with problems ensuring successful career paths in academia for staff who
focus time and effort on building infrastructure for the sky surveys.
4.4RQ4Results:HowDoesDataManagementDifferBetweenPopulations?
As described in the Methods chapter, the interview population sample was developed to
enable cross-comparisons between population demographics. Understanding participant
perspectives across demographic dimensions reveals how data management differs between
populations. Seven demographic dimensions were chosen because they were hypothesized to
influence data management. Variety was ensured through interviewee institutional affiliation,
career stage, level of astronomy education, current workforce, role in SDSS and LSST, and
participation in theoretical research. Interviews were conducted over a five-year period. The
seven demographic parameters are recapped in Table 25; refer back to the Methods chapter for
operationalization of the demographic variables.
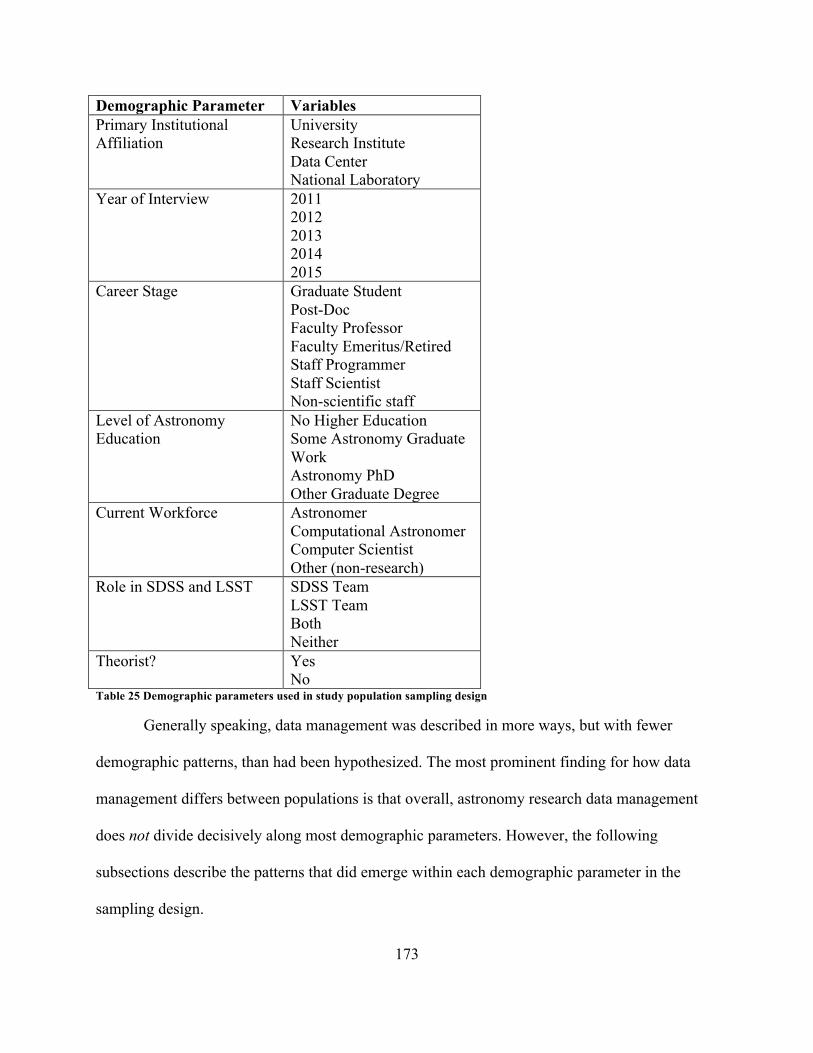
173
Demographic Parameter Variables Primary Institutional Affiliation
University Research Institute Data Center National Laboratory
Year of Interview 2011 2012 2013 2014 2015
Career Stage
Graduate Student Post-Doc Faculty Professor Faculty Emeritus/Retired Staff Programmer Staff Scientist Non-scientific staff
Level of Astronomy Education
No Higher Education Some Astronomy Graduate Work Astronomy PhD Other Graduate Degree
Current Workforce Astronomer Computational Astronomer Computer Scientist Other (non-research)
Role in SDSS and LSST SDSS Team LSST Team Both Neither
Theorist? Yes No
Table 25 Demographic parameters used in study population sampling design
Generally speaking, data management was described in more ways, but with fewer
demographic patterns, than had been hypothesized. The most prominent finding for how data
management differs between populations is that overall, astronomy research data management
does not divide decisively along most demographic parameters. However, the following
subsections describe the patterns that did emerge within each demographic parameter in the
sampling design.
174
4.4.1Primaryinstitutionalaffiliation
Interviewee responses are grouped by the primary institutional affiliation of the
interviewee. The majority of interviewees (nearly 80%) were affiliated with a university. More
than 20% of interviewees were affiliated primarily with a research institute, data center, or
national laboratory (refer back to Table 6).
Institutional affiliation is a factor in determining how interviewees discussed data. Refer
back to Table 22 for a breakdown of the ways data were described. University employees and
research institute staff were highly likely to discuss data in terms of content, the product of data
processing. Alternatively, no one from a data center or national laboratory described data based
on its content as images, spectra, and catalogs. Instead, national laboratory staff were most likely
to describe data in terms of level of processing. These findings confirm that those who are most
likely to be working on scientific research are more likely to think of data as scientific content,
whereas those who are most likely to be working on building data infrastructures for others to
use are more focused on data as information that is processed through those infrastructures.
Individuals who use data for research thus consider data in terms of its resultant scientific nature
and less its nature as developing information; indeed, only individuals at a university described
data in terms of its evidentiary value. Individuals who are not using data for immediate scientific
research instead focus on the process of preparing data. These findings align with types of
careers, and therefore the way data are used and managed, in each institution.
These results demonstrate the amount and kind of interaction individuals had with data
influenced the way that they spoke about data. Individuals working at Data Centers and National
Laboratories were more likely to work with data on a daily basis, often for building sky survey
infrastructures, and thus were more likely to describe data in terms of its state or level of data
175
processing. These interviewees outside universities were not faculty members and were less
likely to be concerned, for example, with the content (images, spectra, and catalogs), or the
analytical uses of the data for publishing journal articles. Instead, those working infrastructures
were most likely to refer to data in a manner resonating with the interactions they had with data,
generally through pipeline development and data processing. Furthermore, LSST interviewees at
data centers only described data in terms of the level of processing. Thus, primary institutional
affiliation proved a distinguishing factor between data management perspectives. However, the
explanation relates more to the types of careers interviewees at each kind of institution held,
rather than to the type of institution per se. The institutions point more to the distinctions
between interviewees affiliated with tenure-track research careers, than those who build
infrastructures and do not rely on research publications for career advancement.
4.4.2Yearofinterview
Interviewees are grouped by the year the interview was conducted. Exactly half (n=40) of
the interviews were conducted in 2015. The other forty interviews were conducted at a rate of
about ten interviews each year from 2011-2014 (refer back to Table 7). No patterns emerged to
differentiate the ways interviewees described data based on the year of the interview. Instead,
data and data management were described differently based on an individuals’ type of data work,
and not the year they were asked to describe their data work. A strong pattern may not have
emerged because there were three different interview protocols, and they were not evenly used
over the five years of the study. For example, more SDSS team members were interviewed early
in the study, while LSST team members were only interviewed in 2014 and 2015. SDSS data
end-users were largely interviewed in sets either early or later in the study duration. More LSST
team members were interviewed in 2015 (during LSST construction) than at any other time. This
176
may be a reason why data as processing was discussed considerably more in 2015 than in any
other year. The year of the interview was not a factor in how data were interpreted, but instead
served as a tool to recognize the extent to which active LSST team members understood data in
terms of processing.
4.4.3Careerstage
Interviewees are organized by their career stage at the time of the interview.
Approximately 40% of interviewees were faculty, approximately 40% were staff, and the
remaining nearly 20% of interviewees were graduate students or post-doctoral researchers (refer
back to Table 8). Interviewees and ethnographic participants across career stages explained that
students and post-docs are most likely to spend time manipulating, analyzing, and managing
data. Faculty generally have less time to interact regularly with data, and instead coordinate
research projects with younger scholars who work with the data to produce initial results.
According to interviews and ethnography, students were much more likely to perform data
calibration, management, and analysis regularly. Accordingly, faculty members were most likely
to note that they were “behind” in learning the latest scientific software languages. Aside from a
few who have made concerted efforts to learn new languages, most later career astronomers
described using the programming language they learned in graduate school over their entire
careers. Only later career staff scientists and emeritus faculty described data in terms of its
evidentiary value. Younger scholars tended to work directly with data, while later scholars
tended to coordinate research, which may explain why only late career interviewees discussed
data theoretically, in terms of evidentiary value.
Faculty had the broadest number of ways of describing data management. More
specifically, those interviewees whose careers do not rely on writing scientific papers were more
177
likely to describe data as a process. Indeed, staff scientists were most likely to describe data in
terms of its state than any other way. Interviewees actively engaged in academic research leading
to journal articles were more likely to describe data as astronomical products: images, spectra,
and catalogs. Thus, the extent to which an interviewee regularly interacts with data, and whether
that is in a context of “doing science” or in managing data for others, influenced the way data
management was discussed.
Only later career professors and staff described data based on format, as digital
information. This may be because these individuals began their careers using analog data, and
thus make the distinction when discussing astronomy data. Additionally, there was a clear split
between those who described data in terms of source or origin. Faculty never described data
based on its source (i.e., the SDSS telescope or the MAST archive). Instead, this language was
used by early career individuals (students and post docs) or staff working on sky survey teams.
These differences show that early and late career individuals consider data differently in terms of
format and origin.
4.4.4Levelofastronomyeducation
Interviewees are grouped according to their level of astronomy education. Astronomy
education here refers to a PhD in an astronomy-related field, which includes astronomy,
astrophysics, or physics. While nearly 40% of the interviewees held staff positions, more than
80% of the interviewees held astronomy-related PhDs (Refer back to Table 9). Interviewees with
astronomy PhD degrees described data in many ways, though more than half described data in
one of only two ways: either by its state (level of data processing) or by the content of the data
(images, spectra, and catalogs). These two manners were also the most common ways data were
described over all.
178
Those with computer science or other higher degrees never described data in terms of
astronomy content (images, spectra, and catalogs) and never described data in terms of its
scientific research use (for example, in relationship to a journal article). Indeed, only two
interviewees of the 15 who lacked a PhD in an astronomy-related field discussed data in terms of
its astronomical content.
4.4.5Currentworkforce
Interviewee responses are clustered by the kind of career the interviewee held at the time
of the interview (refer back to Table 10). There are no evident patterns in the way interviewees
described data when organized by current workforce. Similar to the other demographic
dimensions, the two most common ways to describe data management were consistently the
most common across all four workforces. The state of the data (level of data processing) and the
content of the data (images, spectra, and catalogs) remain the most common ways to describe
data management, regardless of current workforce. The type of institution for which the
interviewee worked, described earlier, provides a clearer distinction between perspectives than
does the current workforce.
4.4.6RoleinSDSSandLSST
The ways interviewees described astronomy data are grouped by whether the interviewee
was a member of the SDSS team, the LSST team, both teams, or neither team (refer back to
Table 11). Team membership (astronomer, computational astronomer, computer scientist, and
other) is operationalized in the Methods chapter. Surprisingly, few patterns emerged in terms of
how data management was described by team membership. Computational astronomers were
more likely to describe data in terms of processing than any other way. Computer scientists never
179
described data in terms of its use for science or its evidentiary value. These two patterns were
predictable based on the kinds of data work performed in each role.
As across the other demographic variables, state (level of data processing) and content
(images, spectra, and catalogs) were the most common ways data were described across all team
affiliation categories. SDSS-only team members were slightly more likely to refer to data in
terms of the source of the data (generally by referring to data as any information from the SDSS
telescope and instruments). SDSS end-users were most likely to discuss data based on content
rather than state.
4.4.7Theorists
The interviewee responses regarding the definition of data are clustered according to
whether or not an interviewee has been involved in theoretical research. Since the interview
sample included individuals who built or used sky survey data, it was less likely that they would
identify as theorists. Only about 10% of the interviewees are considered theorists for the purpose
of this study (refer back to Table 12). Interviewees affiliated with theoretical research were very
likely to describe data in terms of the state (level of data processing) of the data, which is
consistent with non-theorists and across the other demographics already described. However, a
larger percentage of theorists described data in terms of its digital medium than other
demographic categories. Surprisingly, only one of the nine theorists described data in terms of its
evidentiary value.
4.4.8Summary
The interview sample includes an array of interviewees across seven different
demographic dimensions. Surprisingly, most of these dimensions did not produce strongly
180
discernable distinctions in the ways interviewees described data management. The primary
institutional affiliation of the interviewee proved to be the most useful way to distinguish
interviewee perspectives, largely because it drew out the distinction between faculty and staff.
However, examination of career stage unearthed the biggest distinctions between the amount and
type of an individual’s direct interaction with data. Finally, while interviewees with computer
sciences degrees and astronomy degrees often described data in terms of its state (level of
processing), astronomy PhDs were more likely to describe data in terms of its content (images,
spectra, and catalogs), while computer science degree holders described data in terms of its
origin (specific astronomical instrument) or digital nature.
Document analysis and ethnography confirmed the strong interview findings of these
distinctions between interviewee demographic perspectives. For example, documents confirmed
the types of tasks that experts with different educational backgrounds, and at different
institutions, undertook. Ethnography confirmed the extent to which students and post-docs
directly managed research data, as opposed to faculty who often worked on managerial tasks.
Taken together, the demographic distinctions clearly expressed through the interviewee
responses are confirmed and explained in each section above through contextual information
provided by document analysis and ethnography.
181
5 Discussion
The Sloan Digital Sky Survey (SDSS) and the Large Synoptic Survey Telescope (LSST)
are two large, innovative astronomy sky surveys. The SDSS I and II completed operations in
2008, while LSST is predicted to begin data collection in 2020. The two projects were conceived
more than a decade apart and LSST endeavors to proceed with an even greater scale of data
collection, data volume, and necessary expertise. The ultimate goal of each collaboration is to
advance scientific understanding by generating and making available astronomy data. The data
are then retrieved by end-users for scientific analysis, ultimately benefitting the field as a whole.
The Discussion ultimately reveals that SDSS and LSST stakeholders define data through
local, limited perspectives. Stakeholder perspectives on what it means to manage data, and the
kind of expertise needed for data management are each colored by these diverging perspectives
of what data are. Data management best practices for ground-based, astronomy sky surveys have
not fully developed because individual stakeholders necessarily have these limited perspectives
on what is involved in managing data.
The Conclusion accepts that astronomy stakeholders have local, limited perspectives on
data, data management, and data management expertise. Accepting those diverse perspectives,
the Conclusion chapter looks to the future, addressing what can be done to develop and
strengthen the ground-based astronomy sky survey workforces and other infrastructures
necessary to manage data for the full research data life cycle.
5.1SummaryofResults
This dissertation is the result of a five-year qualitative study of the data practices of sky
survey astronomers. The central question is: How does data management differ between
182
stakeholders, and to what end? To address how data management differs, the study first
examined how the populations understand what astronomy research data are, then what
astronomy data management entails, and finally what experience and expertise are applied to the
management of astronomy data. Progressing through these successive research questions, the
study sheds light on how and why data management differs between populations.
A corpus of project documents, a diverse interview set, and weeks of ethnographic field
notes were collected and iteratively analyzed. Specifically, 80 semi-structured interviews, 21
workweeks of ethnography, and extensive document analysis were conducted. Data were
assembled through qualitative coding software and analyzed to address each research question.
The interviewee dataset matrix was developed to ensure participant breadth across seven
characteristics (refer back to 3.2.2 Semi-structured interviews). These characteristics were
Primary Affiliation, Year of Interview, Career Stage, Level of Astronomy Education, Current
Workforce, Role in SDSS and LSST, and whether the stakeholder was a Theorist.
Astronomy data stakeholder perspectives were found to differ regarding what data are,
which influenced stakeholder understandings of data management. The remainder of this
subsection advances through the four progressive research questions, ultimately revealing that
data management differs based on stakeholder professional role, career stage, and level of
astronomy education.
5.1.1Whatareastronomyresearchdata?
Stakeholders in this dissertation study describe SDSS and LSST data as either a process
or a product. Data descriptions were tied to the ways individuals interacted with data. The
distinction between process and product emerged through cross-analysis of the three study
populations and the three research methods. Data were described across a temporal spectrum, for
183
example as information being collected, collected information, information being processed,
processed information, information being analyzed, or analyzed information. This empirical
confirmation that different SDSS and LSST stakeholders hold differing interpretations of what
SDSS and LSST data are can serve as a critical communication tool in facilitating cross-
stakeholder discussions by acknowledging the differing perspectives of what data management
entails.
5.1.2Whatisdatamanagementinastronomy?
As reflected in Figure 7, sky survey data management was described chronologically,
beginning with data management work conducted by the sky survey team, leading up to and data
release, and beyond. Data management work is then conducted by scientific data end-users. Sky
survey teams are responsible for the way the sky survey data are managed in the long-term, and
sky survey data end-users are responsible for any long-term management of their resultant data
products.
5.1.3Whatexpertiseisappliedtothemanagementofdata?
Documents, interviews, and ethnographic observations revealed stakeholder perspectives
on the expertise necessary for data management, which also were expressed by study participants
with the same temporal stages that emerged in descriptions of data management (Figure 7). The
expertise necessary to manage SDSS and LSST data was described as a mix of astronomy
domain knowledge and computational skillsets. The necessary experiences and expertise were
described in relation to the temporal research life cycle period that the skills and knowledge were
deployed. Beyond individuals possessing experience and expertise, the SDSS and LSST team
members highlighted the importance of developing collaborative teams with overlapping and
184
complementary knowledgebases and skillsets. The importance of in-project experience and
expertise retention throughout the full research life cycle was stressed also. SDSS data end-users
usually lacked the resources to compile a stratified team and instead must rely on individual
skillsets for success in their research projects, albeit at a smaller scale.
5.1.4Howdoesdatamanagementdifferbetweenpopulations?
Stakeholder perspectives on data management differ between populations based on
professional role, career stage, and level of astronomy education. The primary institutional
affiliation of the interviewee was the most distinguishing demographic, which revealed differing
interviewee perspectives based on professional role. Individuals working at a university or
research center were more likely to discuss data in terms of its content, which is a product of data
processing that can be used for scientific research. They were more likely to be reliant on
publishing scientific research papers for career advancement, and they described data
management based on their relationships to data as information deployed for scientific research.
Alternatively, data center and national laboratory staff were much less likely to describe data in
terms of content, and were also less likely to have tenure-track-seeking career paths. Instead,
these individuals at national laboratories were much more likely to discuss data as information
that requires processing. The description of data as information requiring processing aligns with
SDSS and LSST communities, because many SDSS and LSST processing pipelines staff are
employed at national laboratories. Data management also varies between populations based on
career-stage. Young tenure-track academics rarely participated in long-term infrastructure
building. Young scholars instead focused on collecting and publishing short-term research results
to further their careers. Very senior academics also rarely participated in these long-term projects
early on, because they could fail to see new data by their career ends. As a consequence, much
185
infrastructure work was conducted by mid-career, tenure-track academics and staff members of
all professional stages whose careers are not dependent on the “publish or perish” mantra.
Finally, data management differs based on the level of astronomy education the stakeholder has
earned. The extent to which a stakeholder has computer science expertise and astronomy domain
knowledge determined the stratified role they played in the sky survey.
5.2DiscussionofFindings
This dissertation focused on examining SDSS and LSST data management
infrastructures. These knowledge infrastructures were analyzed through the study’s research
questions in terms of the data, data management practices, and workforces associated with SDSS
and LSST. This study developed as a unique piece of inquiry from the UCLA Center for
Knowledge Infrastructures (CKI). The author developed the specific research aims and
questions, and the findings presented here are a distinct component of the larger UCLA CKI
investigations. This dissertation is the result of the author’s iterative analysis, firmly planted in
the tradition of Grounded Theory (Glaser & Strauss, 1967). To reduce the potential for biased
interpretations, the themes discussed in this dissertation emerged through iterative reading and
coding of the documents, interview transcripts, and ethnographic field notes. Interviews, field
notes, and documents were coded iteratively using the UCLA CKI codebook, throughout the
course of data collection, culminating in dedicated, immersive coding in Fall 2015. By repetitive
reading, analyzing, and coding, trends emerged from the data. For research questions one, two,
and three (RQ1-RQ3), one code was selected and closely analyzed. RQ4 was analyzed based on
the accumulated findings from the first three research questions and according to the seven
participant demographic variables used in this study. The research questions for this study are as
follows:
186
1. What are astronomy research data?
2. What is data management in astronomy?
3. What expertise is applied to the management of data?
4. How does data management differ between populations?
This study was designed ultimately to understand RQ4: How does data management
differ between populations? To ask this question, the first three RQs were employed to
deconstruct the variables and to reveal the underlying assumptions present in the research
question. The three questions built on one another to answer ultimately how data management
diverges between populations.
The SDSS and LSST projects both exhibit complex knowledge infrastructures that
emerged from decades of project development and hundreds of collaborators. The term
knowledge infrastructures is used in this study to refer to “robust networks of people, artifacts,
and institutions that generate, share, and maintain specific knowledge about the human and
natural worlds” (Edwards, 2010, p. 17). The SDSS and LSST each arose from within existing
infrastructures while shaping simultaneously these existing and new infrastructures. Each project
has, or is, constructing a mirror, telescope, and data collection site. The mountaintop facilities
can be considered ecologies of infrastructures in their own right (Star & Ruhleder, 1996). At the
same time, these two projects fit within the existing larger social, political, and technical
infrastructures at hand for scientific investigation as a whole. These infrastructures are found at
multiple overlapping scales or collaborative rhythms (Jackson et al., 2011, p. 247). Study
participants are affiliated with universities, data centers, research institutes, and national
laboratories; each institution both exists within and is its own knowledge infrastructure.
187
While distinct projects, each at different temporal stages, the SDSS and LSST
infrastructures are interconnected in multiple ways. The first connection is through the
workforce. More than 20% of this study’s interviewee population has been team members of
both the SDSS and LSST (see Table 4). Many SDSS leaders, especially those who were students
and post-docs during the period of SDSS data collection, now hold leadership positions within
LSST: “A lot of the people who were involved in LSST were SDSS people, a lot of the
institutions for example are similar…” (Hernandez, Post-Doc, 2012). The workforce carry-over
and the international trust placed on SDSS data are reasons many of the same policies and
practices were transferred from the successful SDSS project to LSST.
The SDSS and LSST projects also overlap through data. As noted in section 4.2.3.2
LSST data management in ethnography, SDSS data are used in LSST development. The LSST
data center has copies of some subsets of the SDSS data. The center holds 3.5 terabytes of
“SDSS” data and 11 terabytes of “Stripe82” data (the SDSS data from a specific portion of the
night sky). LSST team members use the SDSS datasets, alongside simulated data developed by
the LSST team, to test new calibrations and pipeline processes during LSST data management
software construction. The SDSS and LSST projects are intricately connected to one another as
both individuals and datasets pass from one project to another. The LSST has chosen largely to
follow the path of SDSS in terms of the data collection and release plans, varying in scale but not
quality.
While infrastructures and scientific technologies are constantly evolving (Bell et al.,
2009; Borgman, 2007, 2015; Edwards et al., 2013; Van de Sompel, 2013), infrastructures emerge
from within an existing context (Bowker, 2005; Ribes & Jackson, 2013). LSST would not be the
project it is today without the existence and success of the SDSS. The value of the SDSS data
188
evolves beyond the SDSS itself, through its use in the next generation of sky survey
development. SDSS data are used in LSST development generating a use case beyond that of the
traditional end-user.
5.2.1Astronomyresearchdata
To understand how data management differs between stakeholders, this study first
investigated how stakeholders understand data. This study is an empirical examination of
narrowly defined communities to understand their perceptions of data; it does not attempt to
provide a definition of data that can be all things to all people. Instead, this dissertation confirms
that similar to ‘beauty being in the eye of the beholder,’ stakeholders perceive data differently
based on their institutional affiliation, career stage, and level of astronomy-related education.
Given the different stakeholder perspectives in this study, SDSS and LSST data can be
understood as multiple sides of a faceted diamond.
SDSS and LSST stakeholders described and defined data as a process or product,
contingent upon the point at which the stakeholder works along the research data life cycle.
Depending on how a study stakeholder interacts with relevant infrastructure, collaboration, and
dataset, their perspective on the importance and priorities of the SDSS and LSST data differ. The
way data are understood in these sky surveys is locally contingent (boyd & Crawford, 2012;
Gitelman & Jackson, 2013).
SDSS and LSST stakeholders’ differing backgrounds and experiences shaped their
perspectives on data, data management, and data management expertise. Computer science
experts more often discussed data in terms of bits, because that meaning is consonant with their
experiences. Interpreting data as bits also reflects a computer scientist’s career, as discussing
images, spectra, and catalogs would not support career advancement in the field of computer
189
science. This understanding of data is very different from how SDSS end-users described data as
images, spectra, and catalogs, or as information used for scientific research. These discrete
meanings of data resonate with the prior experiences, current work, and future uses of data for
each stakeholder.
SDSS and LSST stakeholders also often differed according to their role in the research
data life cycle (refer back to 4.1.4 RQ1 results summary). The categorization emerged because of
the distributed nature of the teams and the diverse necessary expertise applicable in these large
sky surveys. As noted in the Results (refer back to 4.2.1.2 LSST data management in
documents), the LSST documentation often referred to data based on the amount and kind of
data management activities necessary to produce and prepare the data for use. For example,
whether or not stakeholders believe LSST data exist (refer back to 4.1.3.2 LSST data in
ethnography) is reflected by data management roles in the project. Interviewees who engaged in
simulation activities for the data management team believe LSST data exist within the
simulations. Diaz believes simulated data are “real data” even though they are not “from the sky”
(Diaz, Research Programmer, 2015). Alternatively, a future LSST end-user who is not involved
with building of the LSST simulations and data management system had the opposite
perspective. She does not believe LSST data exist yet and said, “There isn't data yet, it's all
simulation…. I don't believe in the fake universe” (Evans, Post-Doc, 2015). Diaz is a
programmer developing the simulations via hands-on work for the LSST data management team;
Evans is a researcher who hopes to one-day use LSST data. For the potential future end-user,
LSST data do not exist yet, because there is no data for her to conduct her scientific research. For
the LSST employed researcher on the data management team, simulation data are real LSST
data, because he is currently using that data for the LSST project. This example illustrates the
190
dissertation’s finding that stakeholder perceptions of data are determined by their roles and
interactions with data in the project. SDSS and LSST stakeholders include distributed and
specialized workforces who hold diverging perspectives on data.
Data definitions are locally contingent and should only be re-deployed in other contexts
carefully. This dissertation’s results confirm that even highly regarded, broad data definitions are
far from universal (Borgman, 2015; Consultative Committee for Space Data Systems, 2012; Fox
& Harris, 2013; National Research Council, 1999; Renear et al., 2010). These findings reaffirm
that data exist within a contextual setting (Latour, 1987, 1993; Latour & Woolgar, 1986; Rijcke
& Beaulieu, 2014). This dissertation’s demonstration of stakeholder perspectives varying across
process and product can serve as a starting point for cross-disciplinary conversations when a
shared understanding of astronomy data remains illusory (Borgman, 2012a; Consultative
Committee for Space Data Systems, 2002, 2012; Renear et al., 2010; Rosenberg, 2013).
5.2.2Astronomydatamanagement
Data management is a major undertaking in data-intensive sciences, including the SDSS
and LSST projects. SDSS pipeline development and implementation was estimated at 25% of
project personnel time and resource expenses (J. Gray, Slutz, et al., 2002, p. 2). Years later, the
LSST budget dictates more than half of operations costs will go toward data management
(National Science Foundation, 2014b). Previous research has also found that data-intensive
projects like sky surveys usually devote a huge percentage of project time and resources to data
management (Borne, 2013; Hey et al., 2009a; Szalay, 2011). The popular media often repeats the
idea that 50%-80% of a data scientist’s work is spent cleaning data (Lohr, 2014). Given the
massive financial and labor costs devoted to the processing and management of data in data-
driven sciences, it is unsurprising that many SDSS and LSST stakeholders discuss data based on
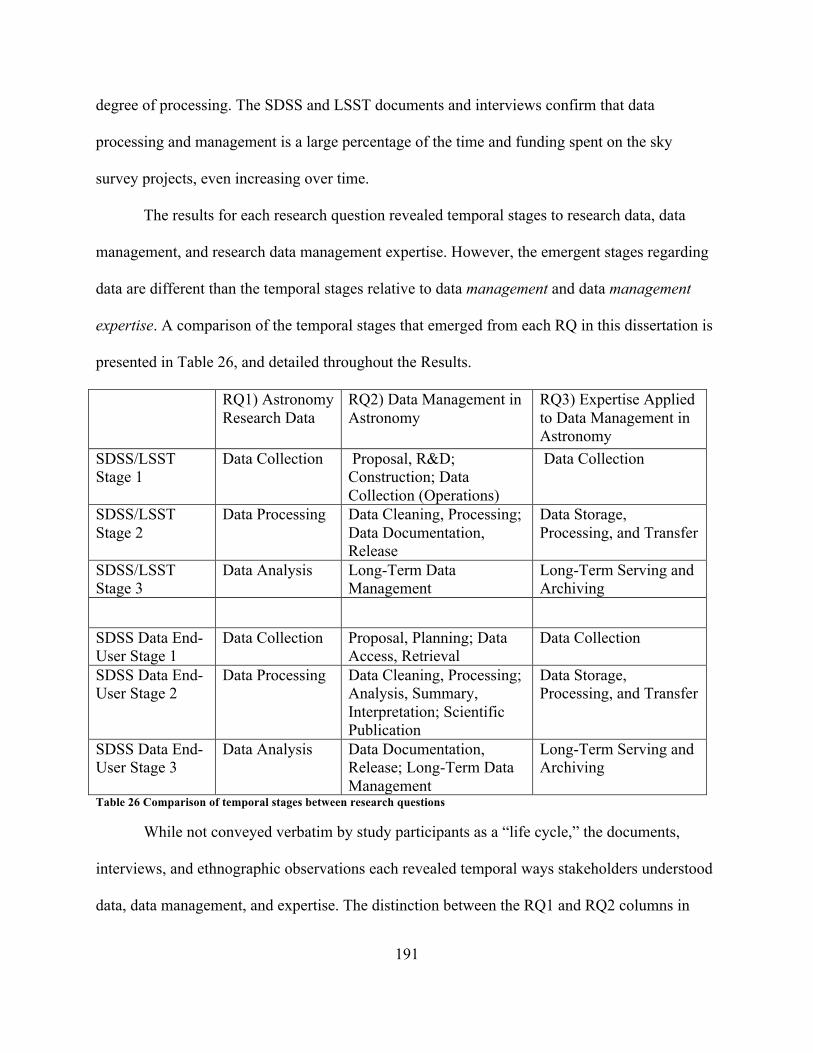
191
degree of processing. The SDSS and LSST documents and interviews confirm that data
processing and management is a large percentage of the time and funding spent on the sky
survey projects, even increasing over time.
The results for each research question revealed temporal stages to research data, data
management, and research data management expertise. However, the emergent stages regarding
data are different than the temporal stages relative to data management and data management
expertise. A comparison of the temporal stages that emerged from each RQ in this dissertation is
presented in Table 26, and detailed throughout the Results.
RQ1) Astronomy Research Data
RQ2) Data Management in Astronomy
RQ3) Expertise Applied to Data Management in Astronomy
SDSS/LSST Stage 1
Data Collection Proposal, R&D; Construction; Data Collection (Operations)
Data Collection
SDSS/LSST Stage 2
Data Processing Data Cleaning, Processing; Data Documentation, Release
Data Storage, Processing, and Transfer
SDSS/LSST Stage 3
Data Analysis Long-Term Data Management
Long-Term Serving and Archiving
SDSS Data End-User Stage 1
Data Collection Proposal, Planning; Data Access, Retrieval
Data Collection
SDSS Data End-User Stage 2
Data Processing Data Cleaning, Processing; Analysis, Summary, Interpretation; Scientific Publication
Data Storage, Processing, and Transfer
SDSS Data End-User Stage 3
Data Analysis Data Documentation, Release; Long-Term Data Management
Long-Term Serving and Archiving
Table 26 Comparison of temporal stages between research questions
While not conveyed verbatim by study participants as a “life cycle,” the documents,
interviews, and ethnographic observations each revealed temporal ways stakeholders understood
data, data management, and expertise. The distinction between the RQ1 and RQ2 columns in
192
Table 26 demonstrates stakeholders in this study understand the astronomy research data life
cycle and the astronomy research data management life cycles as occurring in different temporal
stages. While the data life cycle was considered complete after analysis, stakeholders articulated
the importance of data management beyond an initial analytical need.
Stakeholders also expressed a distinction between the temporal nature of data and the
temporal nature of data management. Data are discussed as a completed product or as an ongoing
process. When stakeholders thought of data, data were considered information for an immediate
concern. When asked to consider data management, stakeholders expressed data as information
for immediate and also potential future concerns. These findings demonstrate that the language
used for discussing research data has temporal implications for data management. For
stakeholders to consider data use beyond the immediate need, appropriate language must indicate
the importance and potential future uses of data. The way stakeholders defined data directly
shaped their perceptions for what could or should be involved in data management.
The distinction is essential, because many still conflate research data and research data
management life cycles. A number of life cycle models have been published; some provide a
complicated, universal scientific research data life cycle (Higgins, 2008), while others try to
reflect only a small research community (Wallis et al., 2008). Each of these models reflect a
starting point when research ideas are conceived, and most point to an “indefinite end” in which
data may be reused for perpetual analysis, re-starting the life cycle (Rots et al., 2002, p. 172).
Ultimately, each data management life cycle reflects the concerns the authors found important.
The DCC Curation Lifecycle Model describes itself as a “high-level overview of the
stages required for successful curation and preservation of data…” (Higgins, 2008, p. 137).
According to the original publication, the model is intended as only a data management life
193
cycle. However, the DCC Lifecycle is often re-deployed for many other aims, including as a full
research life cycle, a data life cycle, and the original data management life cycle. Wallis et al.’s
“Life cycle of CENS data” model from the same year is also only intended to reflect the data life
cycle of a specific community (Wallis et al., 2008). Subsequent uses of these specific models,
however, often fail to recognize the difference between a data life cycle and a data management
life cycle (Pepe, Mayernik, Borgman, & Van de Sompel, 2009). The conflation of information
existence and the tasks necessary to manage that information can derail collaborative efforts. The
Swiss University Conference (SUC) presents “Data Life-Cycle steps and corresponding roles,”
which allows the reader to recognize that a data life cycle is not the same as a data management
life cycle (Blumer & Burgi, 2015). The Interagency Working Group on Digital Data (IWGDD)
also clearly understood the distinction between a data (product) life cycle and a data management
(process) life cycle (2009). In the IWGDD life cycle (Figure 9), different kinds of temporal
stages are indicated through the use of multiple rings. One ring (Document, Organize, Protect,
Access) indicates the stage of “Data Management Functions” (2009). The other ring indicates the
data life cycle (Plan, Create, Keep, Disposition). While officially titled as a data life cycle model,
the model incorporates both “Life Cycle Functions for Digital Data” and “Data Management
Functions for Scientific and Technical Data” (2009, pp. B3-5). The stakeholders in this
dissertation study understood data and data management with distinct temporal stages, just as the
IWGDD discovered.
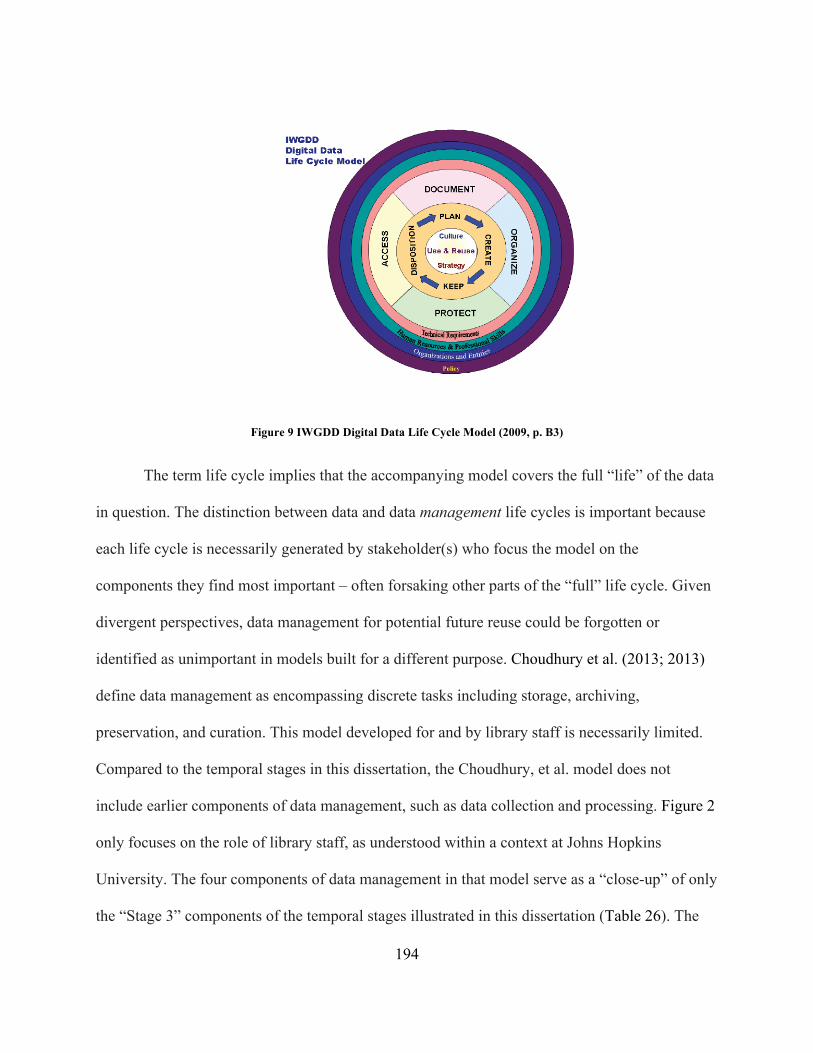
194
Figure 9 IWGDD Digital Data Life Cycle Model (2009, p. B3)
The term life cycle implies that the accompanying model covers the full “life” of the data
in question. The distinction between data and data management life cycles is important because
each life cycle is necessarily generated by stakeholder(s) who focus the model on the
components they find most important – often forsaking other parts of the “full” life cycle. Given
divergent perspectives, data management for potential future reuse could be forgotten or
identified as unimportant in models built for a different purpose. Choudhury et al. (2013; 2013)
define data management as encompassing discrete tasks including storage, archiving,
preservation, and curation. This model developed for and by library staff is necessarily limited.
Compared to the temporal stages in this dissertation, the Choudhury, et al. model does not
include earlier components of data management, such as data collection and processing. Figure 2
only focuses on the role of library staff, as understood within a context at Johns Hopkins
University. The four components of data management in that model serve as a “close-up” of only
the “Stage 3” components of the temporal stages illustrated in this dissertation (Table 26). The
195
stakeholders’ perspectives strongly shape the development of the life cycle models. This
dissertation examined the perspectives of the sky survey stakeholders, primarily focusing on the
domain scientists. The Choudhury, et al. model instead focuses on the tasks of the libraries. Still
others instead focus on the astronomy curation work performed by data center staff, splitting
discussion and acknowledgement of these tasks by workforce (Norris et al., 2006, p. 4). Helpful
for their immediate audiences, these segmented models are reminders that multiple kinds of
workforces may be charged with discrete components of scientific data management, so a single
individual may not be aware of the full life cycle. As data management work and expertise
increasingly becomes stratified in data-intensive “big data” projects, more work is necessary to
reconcile disparate perspectives. Generating a definition of data management that encompasses
the full longevity of scientific work remains tedious, because data management practices differ
between disciplines, stakeholders, and across the life of the data.
At the time of writing, the data collected by the SDSS Phase I and II collaboration remain
highly valuable for scientific research, and the LSST data are predicted to be at least as highly
valued. Taken together, SDSS data generated by all four project phases have been used in over
6500 peer-reviewed journal articles, which have been cited more than 300,000 times (ADS,
2016; SDSS Collaboration, 2016). In 2015, including only the English language portions, the
SDSS website had more than 63 million hits (SDSS Collaboration, 2014). One interviewee
clearly explained the importance of the SDSS data: “So I use Sloan as a finding chart. … So I
use it every day” (Wilson, Graduate Student, 2011). New journal articles continue to be
published utilizing the multiple SDSS data releases. The “overwhelming majority” of science
papers employing SDSS data have been written by end-users unaffiliated with the formal project
(SDSS Collaboration, 2016).
196
Despite the extensive, daily use of SDSS data by astronomers worldwide, the SDSS
collaboration is no different than most scientific projects. It is funded through a series of
successive short-term grants, with specific beginning and end dates. SDSS collaborators believe
that the SDSS data will remain important for decades, or possibly hundreds of years (Margon,
1998; Yanny, 2011). The close of funding for LSST is more than a decade away, although the
LSST collaboration expects the data will be scientifically useful for far longer (2014, NSF
Proposal). SDSS data end-users’ long-term management of data products range from neglect to
long-term storage and serving services. The heterogeneous extent to which individual end-users
maintain their data confirms the indefinite and often unpredictable “end” to scientific research
data (Rots et al., 2002).
At each stage of the research life cycle, collaborations must prioritize different parts of
the larger project to realize short and medium-term goals. To ensure future access however, the
long-term view also warrants consideration, even at the early stages of the research life cycle.
Ribes and Finholt (2009) employ “The Long Now” metaphor to reflect on how projects must
manage competing priorities for the short-, medium-, and long-term benefit of the project. The
SDSS and LSST are sky surveys with multi-decade histories, including expectations for the data
to remain valuable for one or more decades into the future (N. Gray et al., 2012); “The Long
Now” is a considerable period for these astronomy sky surveys. A particular difficulty for long-
term projects is that while funding is provided for shorter timespans, the data are expected to be
scientifically relevant for decades. The SDSS and LSST are among scientific data projects that
are “…intended to persist for decades, but whose financial support comes in increments of
years” (Ribes & Finholt, 2009, p. 383). Funding is necessary to continue serving the SDSS and
LSST data because data accessibility requires technological and human infrastructure, which are
197
both “precondition[s] to meaningful access and reuse…” (Berman & Cerf, 2013, p. 341;
Edwards et al., 2013; Hine, 2006). The temporal misalignment of funding structures and funding
needs is an example of differences in collaborative rhythms (Jackson et al., 2010, 2011;
Steinhardt & Jackson, 2014).
In 2016, an SDSS team member and leader explained that the current SDSS I and II data
management objective is to provide sufficient data management continuity to ensure SDSS data
usability for an additional 15 years. Instead of promising naively to maintain the data forever, the
team believes this finite timeline will permit other astronomy infrastructures to grow and
additional telescopes to begin operations. By the end of that 15-year period, SDSS team
members expect the SDSS dataset could then be integrated into a newer, larger astronomy
project. For example, by 2030 or 2032, LSST infrastructures will likely be so strong that
ingesting the full final SDSS Data Release would be a trivial exercise. However, continuous care
for the SDSS data over the intervening 15 years requires committed resources and is not a trivial
exercise (Borgman, 2015; Bowker, 2005; N. Gray et al., 2012; Parsons & Berman, 2013; Ray,
2014a). The data will require a commitment of sustained funding, workforce expertise, and
physical infrastructures; in fact, this long-term data management to enable future use can be
considered a “grand challenge” (Ray, 2014a, p. 2). In effect, the data will require knowledge
infrastructures be developed with the short, medium, and long-term management needs of the
data in mind. While enabling scientific use of the SDSS data consistently over the long-term is a
data management goal, the project struggles to retain that kind of continuity amid funding
models providing only short- and medium-term options. While these stakeholders would prefer
to be able to generate long-term infrastructures, funding patterns and the regular lifetimes of
198
physical and human infrastructures prevent long-lived knowledge infrastructures for scientific
data.
Some stakeholders believe that long-term data management is an integral component to
the data life cycle; others are indifferent to managing data beyond its primary use. The data
distinction that emerged from this study centers on data as process versus data as product.
Stakeholders viewing data as a product, and the research life cycle as a data life cycle, may not
focus on potential future uses. In contrast, stakeholders who view data as a process, and the
research life cycle in terms of data management, may prioritize long-term efforts. Both
perspectives are accurate and have meaning for the stakeholder; however only one prioritizes the
long-term data management of information for potential future secondary uses.
5.2.3Datamanagementexpertise
The workforces involved in astronomy sky surveys may be the most important
component of knowledge infrastructures: human infrastructure. Skilled workforces are essential
to the success of the SDSS and LSST, because each project is an extremely complicated
endeavor requiring geographically distributed individuals and teams to collaborate over years
and even decades.
Study stakeholders described expertise for the SDSS and LSST similarly to the way they
spoke about data and data management. Just like data and data management, analytical expertise
was revealed according to stages in the data management life cycle. Data management expertise
was discussed based on the necessary data management work across points in the data life cycle.
The data management activities and the expertise required to perform those activities are
interrelated. Martinez, a leader in both SDSS and LSST, described two types of data
management work in the LSST project: one with a known solution and one without a known
199
solution. The known solution may be difficult to manage, but a solution exists and the task can
be accomplished with rigorous work. Alternatively, because LSST plans include pushing data-
intensive boundaries, a number of tasks need to be accomplished that have no known solution.
Martinez explained, “So the actual data transfer is not a big deal. Even storing the data is not big
deal… The big deal is to actually touch each bit of that data, to process the data and then to do
something intelligent with it” (Martinez, Professor, 2014). Given that there remain unknown
challenges in these sky surveys, the SDSS and LSST leadership realize that their teams can
always use additional and complementary kinds of expertise. Questions remain unsolved, such as
how to process and analyze the 15 terabytes of data that will be collected each day once the
LSST survey begins.
The LSST and SDSS workforces must be adaptive. It is not always clear what will prove
to be the best mixture of experience and expertise, and expertise composition will depend on the
individual roles played in the larger survey. In both the SDSS and LSST, data centers require
individuals and teams of computer science experts. However, Martinez explained that personnel
needs change over the course of the project, “… you want slightly more science-y people to
define what the project is supposed to deliver. But once you go into construction then you need
people who are better at, for example, coding…” (Martinez, Professor, 2014). The ratio of
computer science experts to astronomy domain researchers on the sky survey teams remains
fluid as the projects cycle through stages including planning, construction, operations, and
archiving and serving data.
Debate continues as how best to educate and develop a career path for the kinds of
expertise necessary for SDSS and LSST data management team members, who require both
domain expertise and computational knowledge. These specialists are essential to the success of
200
modern sky surveys, and yet their job titles remain unclear and educational and career paths are
unstandardized. Attempts to identify the critical data management workforce competencies
needed result in lists of kinds of expertise (Choudhury, 2013; Engelhardt et al., 2012; Hedstrom,
2012; Hedstrom et al., 2015; Y. Kim et al., 2011; Swan & Brown, 2008). This dissertation does
not endeavor to compile yet another list of the expertise needed for SDSS and LSST
participation, as it would likely be outdated by the time of publication. These lists of typical
examples of data, data management, or expertise are often unhelpful (Borgman, 2015, p. 28) as
highly technical jobs and careers are in flux and adapt quickly. As Martin explained, sky survey
team members need the ability to adapt to change, without knowing what that change will entail,
“…Yeah, I mean the tools keep changing. Projects, long term projects have the disadvantage that they have to sort of come up with design plans or other standards like what languages to use and things like that and what's the effect if we're going to stick with them… So, because the context will change in the next 10 years significantly... We really have to essentially keep that in mind and prepare for this transition. It's not clear what's going to be the main solution, but it's clear that it's going to change” (Martin, Staff Scientist, 2012).
The lack of an existing educational or career path for astronomy data management experts is a
symptom of the quickly changing and adapting skillsets projects like the SDSS and LSST
require.
The documents, interviews, and ethnography observations analyzed for this dissertation
provide two expansive areas that stakeholders revealed as critical for SDSS and LSST data
management work. Astronomy domain knowledge and computational literacy were consistently
described as essential kinds of expertise for SDSS and LSST data management workforces.
However, instead of providing long lists of skillsets, stakeholders noted that it was more
important that data managers are able to learn new skills than that they necessarily already
possess a particular set of expertise at a given time. Martin went on to explain, “Because it's
201
changing so fast and our environment is cutting edge in many ways… nobody has the full
spectrum, but we try to find people who can learn fast…” (Martin, Staff Scientist, 2012). The
ability to continue learning domain and computational skills, as well as the ability to work as a
team with other experts, were seen as the strongest kinds of workforce expertise for SDSS and
LSST data managers.
The kind of data management expertise revealed in this dissertation resonates with the
concept of “pi-shaped” expertise. Pi-shaped experts are members of a workforce who have a
shallow breadth of general knowledge and extensive knowledge of two domains (Braniff, 2009;
Feldman, 2006; Hartman, 2005; Szalay, 2012). In terms of SDSS and LSST data management,
the two deep domains are astronomy knowledge and computational knowledge. The inclusion of
astronomy and computational sciences into the required expertise, such as with pi-shaped
experts, is one way of indicating astronomy sky surveys are data-intensive sciences.
The scale and distribution of work in these data-driven projects is more extensive than
many fields. A single individual cannot be an expert in all aspects of the full SDSS or LSST
research life cycle (Borgman, 2015). Instead collaboration members must develop trust between
institutions and individuals (Committee on NASA Astronomy Science Centers, & National
Research Council, 2007; Kitching et al., 2013; Research Information Network, 2008). Without
respected connections between each institution in the project, neither SDSS nor LSST could
operate at scale. Systemic trust, which requires leadership traits and the ability to contribute
respectfully, is essential to these data-intensive collaborations.
Interviewees for this dissertation bemoaned a dearth of long-term data management
workforce expertise. This finding aligns with Hedstrom et al.’s (2015) detection that highly
skilled and well-trained workforces necessary to build and maintain data management
202
infrastructures are lacking. Noting the dearth of highly skilled workforce members, participants
instead sought a full “environment” of expertise. In the three study populations, stakeholders
minimized project reliance on individuals and instead focused on developing teams with
overlapping skillsets. Ribes and Finholt noted concerns over holes in expertise when explaining
that, “…in the face of short-term funding, CI [cyberinfrastructure] projects will attempt to
transition to facilities by forming alliances with the persistent institutions of science in their
domain fields” (2009, p. 394). In astronomy, facilities more persistent than the SDSS or LSST
collaborations are the NASA science centers (Committee on NASA Astronomy Science Centers,
& National Research Council, 2007).
The NASA science centers possess the centralized expertise for management through the
full life cycle of astronomy data. In 2015, Professor Bell explained that another astronomy
collaboration he participates in had secured a long-term solution for access and preservation of
their dataset. He explained the difficulties in securing that kind of long-term data expertise,
“Yeah, it can even be hard to hire that expertise, because someone who's good at that, what are
we gonna do? Tell them to move to Hawaii for three years so you can do this, and then you'll
have no job at the end?” (Bell, Professor, 2015). Data collected under the auspices of Bell’s
project will be managed at one of the NASA science centers, which provides continuity of
knowledge infrastructures and workforces to support long-term data management. Dr. Bell
explained his relief that a NASA science center accepted their project data. He understands that
finding stable data management expertise is challenging and especially difficult to secure for
smaller projects where data were collected outside the context of a larger mission.
The NASA science centers themselves were built for NASA-funded investigations,
which are primarily space-based endeavors. The SDSS and LSST are largely funded from the
203
NSF and private funders, and are ground-based projects, therefore outside of the mission of the
NASA science centers. SDSS team members did once propose that their data be included in a
NASA science center, however the proposal was denied due to the science center’s space-based
mission (Gonzalez, Professor, 2013).
Study participants from the three study populations consistently referred to the NASA
science centers as the prime example of a stable environment of expertise. MAST, for example,
employs dedicated, full-time staff to manage the Hubble telescope data through the full life of
the data (Zimmerman, 2008, pp. 166–167). The physical and human infrastructures exist within a
single geographic location and provide data management for large, long-term NASA missions
(Committee on NASA Astronomy Science Centers, & National Research Council, 2007, p. 3).
MAST and other NASA science centers specifically work to “serve as the interfaces between
astronomy missions and the community of scientists who utilize the data” (Committee on NASA
Astronomy Science Centers, & National Research Council, 2007, p. 1). As noted in this
dissertation, sky survey team members and data end-users often have different understandings of
data and data management. Also confirmed in this dissertation, expertise generally is divided
based on the stage of the project, so few people have a full understanding of how data are
processed through the full life cycle (Borgman, 2015). Similar to MAST, a persistent team able
to liaise between these two communities and experts throughout the project could be a strong
asset to the SDSS and LSST projects.
The long-term, overlapping expertise at NASA science center institutions is the envy of
many participants in this study. While devoted individuals may have ensured the SDSS project
survived tumultuous times (Finkbeiner, 2010), it was the widespread commitment of team
members that ensured SDSS project success overall. SDSS survived potential terminations of
204
funding, often thanks to the efforts of individuals who went above and beyond their assigned
duties (Finkbeiner, 2010).
In hindsight, SDSS leaders confirmed that the project worked more smoothly when
expertise and information were spread across team members. LSST team members noted that
they value this SDSS lesson and are instead building a set of staff with complementary strengths
and overlapping skillsets. While SDSS may have relied on visionary individuals, the LSST is
relying on a web of teamwork, skills, and expertise. Compelling leadership forged SDSS
success, and LSST leadership agrees that relying on individuals would leave their project open to
points of failure (Moore, Staff Scientist, 2015).
SDSS and LSST are data-intensive scientific projects that require infrastructures beyond
the scale of individual researchers (Burns et al., 2014; National Science Board (U.S.), 2005;
Schroeder & Meyer, 2012). These human investments are essential to the success of data-
intensive science. Data management and data recombination is fundamental to seeing through
the potential power of the relational, or networked, nature of big data (boyd & Crawford, 2012;
Gitelman & Jackson, 2013, p. 8; Kitchin, 2014, p. 1; Kitching et al., 2013, p. 382; Van de
Sompel, 2013).
This dissertation confirms that data management aimed at enabling future data reuse is
complex, depends on local circumstances, and requires consistent workforces and funding. These
requirements suggest that ideally SDSS and LSST data management occur within an
environment similar to a NASA science center. However, the NASA science centers themselves
have missions to manage only space-based, NASA-funded projects. Most study participants
recognize that the high level of data security supplied through NASA science center
infrastructures is prohibitively expensive and unlikely for ground-based projects like the SDSS
205
or LSST. Ground-based projects have different funders, different funding models, and exist
within different scientific cultures than that of space-based missions.
The NSF is a major funding agency for ground-based astronomers. While many projects
are funded through short-term grants, the NSF also has longer-term funding, including that for
facilities. Perhaps the facilities funding model, combined with the NASA science center
workforce model, could be used to sustain NSF-funded data, that like the SDSS and LSST are
determined to be “long-lived digital data collections” (National Science Board (U.S.), 2005, p.
40). Despite the cost differences, diverging missions, and cultural dissimilarities, the NASA
science centers currently remain the best practice for long-term astronomy data management,
whether ground- or space-based.
The preceding sections described how the three cumulating research questions for this
dissertation built on one another and analyzed how the findings compare to existing literature.
First, the study sought to understand how participants understood sky survey data. The data were
understood as differing along temporal stages and as either a process or product. This data model
directly revealed how study participants understood data management. Data management was
described in temporal stages that reflect the work necessary to collect, process, and release the
data. In turn, the expertise needed to participate in the sky survey projects was described based
on the data management activities needed for each of these data management temporal stages.
SDSS and LSST stakeholders described data, data management, and data management expertise
based on the activities performed during the course of the project, all influenced by individuals’
perspectives on data. These findings provide the foundation to answer the fourth research
question: How does data management differ between populations?
206
5.2.4Howdatamanagementdiffersbetweenpopulations
This dissertation investigated what are data, data management, and data management
expertise to whom, when, and why these differences matter. A wide variety of SDSS and LSST
team members and end-users reflections were presented in the findings. Study participants were
chosen to reflect a matrix of kinds of expertise and experience. These characteristics were
Primary Affiliation, Year of Interview, Career Stage, Level of Astronomy Education, Current
Workforce, Role in SDSS and LSST, and whether the stakeholder was a Theorist. These seven
variables were chosen to generate a demographically varied set of interviewees. Workforce
demographics of the study population are listed in Table 10 and roles in SDSS and LSST are
listed in Table 4. The study was designed specifically with this population variety to enable
critical analysis of the factors that influence stakeholder perceptions.
As described in the previous subsections, SDSS and LSST stakeholders hold differing
perspectives of what data are, and therefore what data management is and what data management
expertise are necessary. These findings resonate with earlier work that describes how discrete
perspectives across individuals can make up a coherent, larger workforce. Annemarie Mol shows
how stakeholders in a Dutch university hospital define atherosclerosis differently based on their
day-to-day work and their specific role in combating the disease (Mol, 2002). The results are
also reminiscent of John Gall’s metaphor for ship-building:
“Now if you go down to Hampton Roads or any other shipyard and look around for a shipbuilder, you will be disappointed. You will find—in abundance—welders, carpenters, foremen, engineers and many other specialists, but no shipbuilders. True, the company executives may call themselves shipbuilders, but if you observe them at their work, you will see that it really consists of writing contracts, planning budgets and other administrative activities. Clearly, they are not in any concrete sense building ships” (Gall, 1976).
207
Just as shipyard employees describe their day-to-day tasks, so too do the SDSS and LSST
stakeholders describe data management from their day-to-day perspectives. Software developers
working on SDSS and LSST describe their work as writing software to build pipelines, not as
building a sky survey. Similar to Gall’s company executives, the SDSS and LSST leaders are the
most likely to describe their work in terms of developing sky surveys. However, each
stakeholder’s perspective on data and data management is most closely influenced by the daily
work they do for the project. Despite differing descriptions among team members,
atherosclerosis is treated and ships are built. The SDSS was and the LSST likely will be highly
successful sky surveys. The remainder of this section first describes specifically how stakeholder
perspectives varied in this dissertation study. Next, these findings are coalesced into a ground-
based sky survey model of data management. Further elucidation of the model and its
implications close the Discussion.
5.2.4.1ProfessionalRole
Analyses of the professional roles stakeholders play in the sky survey data management
life cycle revealed distinctions between the perspectives on data and data management. The
following sub-sections discuss distinctions between team members and data end-users, SDSS
and LSST team leaders, and SDSS library workforces.
v Teammembersanddataend-users
A sharp contrast in how data, data management, and expertise were described emerged
between individuals building infrastructure and those using resultant data for scientific research.
Three study populations were chosen for this study: SDSS team members, LSST team members,
and SDSS data end-users. Differences were predicted between these three populations. However,
208
it was surprising how similar members of the two teams were to one another and how sharply
they differed from the SDSS end-users.
The clearest example of the data management differences between team members and
data end-users is the way they share and manage data in the long-term. Sky survey team
members manage the SDSS and LSST data as part of the official project. The team then releases
the project data and end-users retrieve said data. Often, end-users manipulate their copy of the
project data by then combining it with other datasets or running it through additional processing
pipelines. Additional processing by the end-user results in derived datasets. However, these
derived datasets are rarely released or managed as consistently as the originally collected sky
survey data.
Long-term data management includes ensuring data integrity, preventing cyber attacks,
updating software, and performing hardware migrations over time. Most sky survey team
members agree that data management activities are important for the team to perform, and the
SDSS and LSST both promised their funding agencies that the data would remain available to
end-users. In 2011, Brian Yanny spoke about the long-term care of the SDSS data by saying the
data must be “preserved in a readable, understandable format for long periods of time…” which
includes, “long term store copies” and “active working copies” of the data (Yanny, 2011).
However, most end-users do not carefully perform these long-term data management activities
on their derived datasets. This result parallels previous studies that demonstrate highly processed,
derived datasets of individual and small group research projects are rarely provided long-term
management (Norris et al., 2006, p. 7).
There are a number of reasons why astronomy data end-users treat their collected data
differently than the collaboration treats its data. Many of these motivations resonate with other
209
studies of why scientists do or do not share or archive their data. First, astronomy data, like all
scientific data, are “incomprehensible and hence useless unless there is a detailed and clear
description” of the provenance of the data (J. Gray, Szalay, et al., 2002, p. 5). Data sharing and
long-term management are challenging and expensive undertakings, and can impact decisions
throughout the project timeline (Abrams et al., 2009; Kitchin, 2014; Sands et al., 2014).
Therefore, a project or individual must actively decide to provide a set of resources and expertise
to ensure data are productively shared and managed in the long-term.
Data management to enable future reuse by a team or as an individual can also prove
daunting, because all potential future users and uses of a dataset cannot be predicted (Borgman,
2012a, 2015; Fecher et al., 2015; Kratz & Strasser, 2015; Mayernik, 2011; Wallis, 2012; Wallis
et al., 2013). Many end-user astronomers may not have the expertise or capacity to manage
derived data as effectively as a large team could maintain sky survey data. While an individual
manages data through the whole life cycle in the scope of end-user data projects, a more
specialized workforce develops in sky surveys.
End-users may not consider their derived data as valuable enough to warrant data
management efforts in the medium and long-term. Instead of managing their derived data, many
blindly rely on sky survey projects to ensure the originally collected data are preserved and
remain accessible over time. Others believe their data that is at least partially derived from SDSS
data does not have value and therefore do not consider long-term data management activities.
These astronomers do not perceive future data reuse value, because the derived data used for a
research project could be easily or quickly re-derived from the original project dataset. Or, the
end-user considers their derived data to only be of fleeting value, expecting the data or findings
to be quickly supplanted by the next wave of technology. These findings resonate with earlier
210
studies that show researchers often lack the resources necessary to make data useful for sharing,
data may not have been created with the intent of reuse, and they may not be able to imagine
future uses of their data (Borgman, 2012a, 2015; Fecher et al., 2015; Kratz & Strasser, 2015;
Mayernik, 2011; Wallis, 2012; Wallis et al., 2013).
The preceding were the reasons provided by data end-users explaining why they do not
provide long-term management for their derived datasets. However, those reasons rely on the sky
survey team itself ensuring the durability and accessibility of the originally collected data in the
long-term. The reasons also assume that the data they use is exactly the same as the original sky
survey data. While most of the data management labor takes place before data are released to
end-users, the infrastructure work continues after data have been released. A large amount of
“invisible work” takes place to ensure data remain available to users. Therefore, data end-users
rely on a misnomer: the sky survey team will perpetually manage the original datasets.
v SDSSandLSSTleadership
The voices expressed by SDSS and LSST leadership in documentation are distinct from
the broader set of voices that emerged from team member interviews. SDSS documentation
describes the SDSS data, or science archive, several ways over time: as images, spectra and
catalogs, by level of data processing, as related to other information, as related to the public
availability of information, or specifically based on the component parts. LSST data, data
products, or the scientific database, were described in terms of images, spectra, and catalogs, the
level of data processing, according to the work still required to prepare the data for use, the
extent to which the data are public, and as one of the three levels of project data. A comparison
of these differences is below in Table 27, and the documentation results are further
contextualized with the three research methods in Table 17.
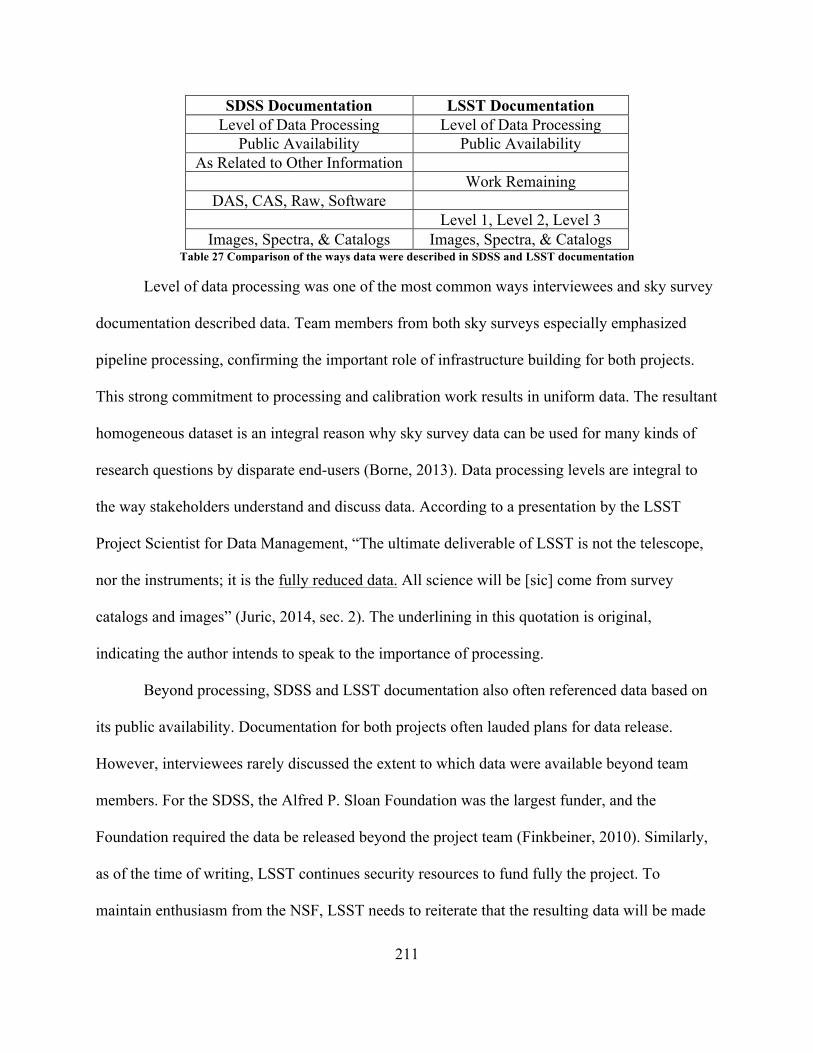
211
SDSS Documentation LSST Documentation Level of Data Processing Level of Data Processing
Public Availability Public Availability As Related to Other Information
Work Remaining DAS, CAS, Raw, Software
Level 1, Level 2, Level 3 Images, Spectra, & Catalogs Images, Spectra, & Catalogs
Table 27 Comparison of the ways data were described in SDSS and LSST documentation
Level of data processing was one of the most common ways interviewees and sky survey
documentation described data. Team members from both sky surveys especially emphasized
pipeline processing, confirming the important role of infrastructure building for both projects.
This strong commitment to processing and calibration work results in uniform data. The resultant
homogeneous dataset is an integral reason why sky survey data can be used for many kinds of
research questions by disparate end-users (Borne, 2013). Data processing levels are integral to
the way stakeholders understand and discuss data. According to a presentation by the LSST
Project Scientist for Data Management, “The ultimate deliverable of LSST is not the telescope,
nor the instruments; it is the fully reduced data. All science will be [sic] come from survey
catalogs and images” (Juric, 2014, sec. 2). The underlining in this quotation is original,
indicating the author intends to speak to the importance of processing.
Beyond processing, SDSS and LSST documentation also often referenced data based on
its public availability. Documentation for both projects often lauded plans for data release.
However, interviewees rarely discussed the extent to which data were available beyond team
members. For the SDSS, the Alfred P. Sloan Foundation was the largest funder, and the
Foundation required the data be released beyond the project team (Finkbeiner, 2010). Similarly,
as of the time of writing, LSST continues security resources to fund fully the project. To
maintain enthusiasm from the NSF, LSST needs to reiterate that the resulting data will be made
212
available to all United States taxpayers. LSST leadership can use documents to convince funding
agencies that the project is worth fully funding. While leadership focused on data availability in
documentation, most sky survey team members minimized data release importance, because
their interviews for this dissertation were not part of a larger agenda to securing funding. Instead,
interviewees more often spoke about their work cleaning data, and therefore data were often
discussed based on that level of processing.
v SDSSlibraryworkforces
The results also revealed important distinctions between the ways SDSS data were
discussed by the astronomers and the library staff involved in archiving and serving the SDSS
data from 2009-2013. As presented in the Results section 4.1.3.1 SDSS data in ethnography, two
university libraries agreed to archive and serve the SDSS data for a five-year period. From 2007-
2009, the stakeholders met with one another to draft and sign Memoranda of Understanding
(MOU). While MOUs generally help interdisciplinary communities define roles and
responsibilities (Research Information Network, 2008; Shankar, 2010), disparate perspectives
remained during the archiving and serving of the SDSS data. The libraries executed the task
differently from one another based on the infrastructures at their disposal, including each existing
workforce (Borgman et al., 2012). Earlier studies (Carusi et al., 2010; Edwards et al., 2011;
Olson & Olson, 2000) note it is essential for collaborators to develop shared understandings. The
SDSS long-term data management experiences from 2009-2013 reveal the communication
difficulties that can occur when shared understandings are not generated and re-established over
time.
During ethnographic observations and interviews from 2012-2015, staff at both libraries
described their participation in the SDSS project as successful. The libraries each felt positive
213
about the collaborative project because each gained experience managing scientific data, as well
as providing a service to the SDSS astronomy community. A number of astronomers involved
with the SDSS however, did not see the library collaborations as productive uses of funds.
Astronomers and library staff held misaligned goals and expectations, despite years of
planning, because the libraries and the SDSS leadership perceived the data and the data
management tasks differently. It is foreseeable that the meaning of data, and what it meant to
manage data, would be multiple and local (Hedstrom et al., 2015; Lynch, 2013; Star & Ruhleder,
1996; Walters & Skinner, 2011). For example, Ribes and Jackson (2013) also discovered that the
boundaries change depending on the lens by which a research subject considers data. In the
context of their study, the boundaries of the “stream data archive” were malleable based on how
far an interviewee was prodded to think about their data. They explained,
“When asked, ‘Where is the stream data archive?,” a researcher will first insistently direct us to a public online page with an embedded web service. But thereafter, with only a little further prodding from the interviewer, the database becomes multimedia: it is digital; it is paper and pen; it is water…. The archive’s borders stretch to a receding horizon that include the pen and paper field sheets backfilled for years, a cold room of samples, and the uncaptured experience of scientists and technicians entrusted with the production of the archive” (Ribes & Jackson, 2013, pp. 164–165). While the variety of perspectives on data could have been predicted because of particular
workforces involved, the astronomers and library staff believed they had developed shared
understandings from the years spent collaborating in the development of the MOU documents
prior to the data management work beginning. Despite faithful attempts to generate shared
meanings of SDSS data, each library and the SDSS astronomers held divergent understandings
of what were the SDSS data and what it meant to archive and serve the data.
For example, one of the libraries focused on carefully transferring and preserving the
SDSS bits. In hindsight, the astronomers can now explain that they had been more concerned
214
with the serving portion of “archiving and serving.” The library staff were interpreting the SDSS
data in terms of the bits that had been generated. The astronomers, as domain experts, interpreted
the SDSS data in terms of its potential usefulness and scientific value. While the library staff
successfully managed the bits, the astronomers actually wanted the data managed to ensure
scientific use. This dissertation reveals the SDSS astronomers and participating library staff held
misaligned data management expectations. This finding validates earlier studies where the
definition of data is only seemingly shared among stakeholders (Borgman, 2012a, 2015;
Borgman et al., 2012; Consultative Committee for Space Data Systems, 2002, 2012; Cronin,
2013).
5.2.4.2Careerstage
Interviewee relationships to the SDSS and LSST sky surveys differed by career stage
(Career stage demographics for this study are listed in Table 8).
v Skysurveyparticipationstagesbycareerstage
Career stage was often referenced as a reason to join, or not join, an infrastructure-
building project. The SDSS and LSST projects were both envisaged by academic scientists.
These academic scientists set in motion the sky survey projects, which were conducted largely
by team members, and which were then used by a wide range of end-users. A basic timeline of
when team members joined the SDSS and LSST projects is presented in Figure 10.
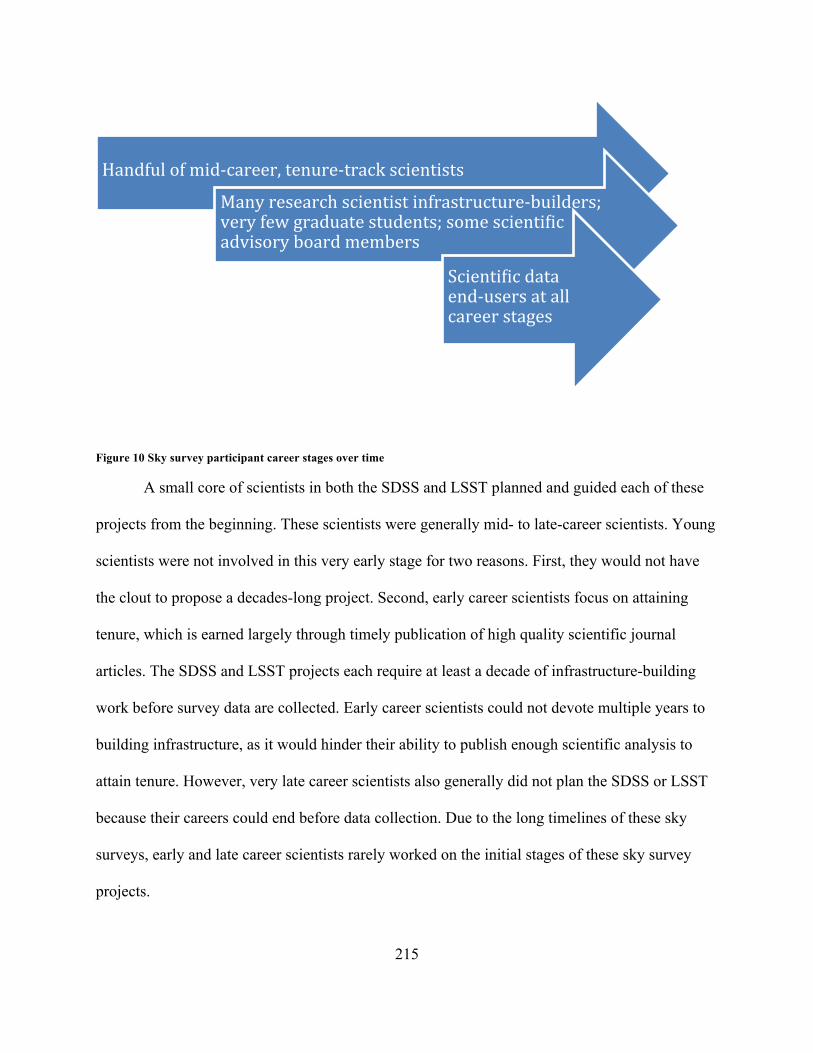
215
Figure 10 Sky survey participant career stages over time
A small core of scientists in both the SDSS and LSST planned and guided each of these
projects from the beginning. These scientists were generally mid- to late-career scientists. Young
scientists were not involved in this very early stage for two reasons. First, they would not have
the clout to propose a decades-long project. Second, early career scientists focus on attaining
tenure, which is earned largely through timely publication of high quality scientific journal
articles. The SDSS and LSST projects each require at least a decade of infrastructure-building
work before survey data are collected. Early career scientists could not devote multiple years to
building infrastructure, as it would hinder their ability to publish enough scientific analysis to
attain tenure. However, very late career scientists also generally did not plan the SDSS or LSST
because their careers could end before data collection. Due to the long timelines of these sky
surveys, early and late career scientists rarely worked on the initial stages of these sky survey
projects.
Handfulofmid-career,tenure-trackscientists
Manyresearchscientistinfrastructure-builders;veryfewgraduatestudents;somescienti_icadvisoryboardmembers
Scienti_icdataend-usersatallcareerstages
216
Large teams are involved in the project as a whole during the research and development,
construction, and operations stages of the SDSS and LSST projects. This workforce is larger for
LSST than SDSS, because the scale of the project is much larger. The team members involved
are generally employed in research scientist career tracks independent of scholarly journal article
publications requirements. Years passed before SDSS data were collected, and more than a
decade will pass before LSST data are collected. Without new data, team members have been
unable to use their expertise in the projects to analyze new data and publish scientific journal
articles. Similarly, graduate students are highly unlikely to be involved with infrastructure-
building, particularly in the early stages of a sky survey project, because they need to ensure data
are collected and usable within a timeframe that allows for analysis and writing of theses and
dissertations.
Alternatively, LSST has motivated a large number of scientists to participate in project
planning and construction, even before data are collected. Scientists participate in working
groups that can influence how the survey will be conducted. In 2016, team members in the nine
active Science Collaboration working groups each provide scientific case studies related to their
ongoing research interests to influence the survey cadence. Survey cadence describes how data
will be collected; discrete data collection patterns better support different kinds of science. These
scientists contribute time and effort to working groups before the LSST data are collected,
because they may be able to influence the project to prioritize their astronomy specialization.
Collaboration members may also gain a better understanding of the data prior to its public
release, speeding up their ability to use collected data once they are made available.
Finally, the majority SDSS or LSST associates are data end-users. These data end-users
include the scientists and team members. Joining these team and working group members are
217
hundreds to thousands of individuals who deploy the data for scientific research as end-users.
Given the long period over which sky surveys are conducted, persons at different career stages
participate in sky surveys in numerous ways and at distinct times.
v Skysurveyparticipationincentivesbycareerstage
There are incentives for future data end-users to join the SDSS or LSST collaboration
years or decades before data become available. First, these academics can help drive how the
project is planned and built, they can advocate for the project to enable better data collection for
their research questions. However, while scientists involved in a sky survey early can influence o
how the project is made, the investment may not pay off for possibly decades. While it may
require a long-term time investment, these scientists have intimate knowledge of the data and
metadata before they are made public. The intricacies of born-digital sky survey data are vast;
after it has been released, new end-users will have a steep learning curve before they can use the
data for scientific analysis effectively. Interviewee Gray, an LSST Science Collaboration
member, explained why it is worth committing time to the LSST prior to data collection, “… you
could say, ‘…here's what we expect the measurement to be’ …when you get the real data, and
you find it's something else, then you have to explain why. So you've already done the
machinery, right?” (Gray, Professor, 2015). The SDSS had only a short proprietary period, and
the LSST plans to effectively have no proprietary period. Those who have dedicated time to
infrastructure building will benefit from having deep knowledge of the data before public
release. While there may not be a specific proprietary period, those familiar with the project can
begin using the data immediately, whereas newcomers must first become acquainted with the
dataset. For many scientists in mid-career, the benefits of helping form the research directives
218
and developing pre-release familiarity with the dataset, provide great incentive for dedicating
time to building sky surveys like SDSS and LSST.
Younger scientists generally cannot devote time to a project that is not yet collecting
data, and instead benefit from the rich trove of sky survey data that are publicly released.
However, while they benefit from data availability, they must wait until after release to learn the
intricacies of the data, how data collection decisions were made, and the other factors that
influenced how the data were collected and processed.
Scientists involved in sky survey development must invest resources for many years prior
to collection and use of the data, although they have the opportunity to optimize the data for their
interests and are ready to analyze the data immediately upon its availability. Young scientists
may not have the time to devote resources into the building of the project, but eventually benefit
from an abundant cache of data. Sky survey projects may require decades of planning and
construction before scientific data are generated and released, and therefore the career stages of
survey participants follow very clear patterns in SDSS and LSST.
5.2.4.3Levelofastronomyeducation
While distinctions between sky survey team members and data end-users were predicted
by the research design, the strength of the distinction was stronger than expected. The differences
are particularly surprising because the majority of interviewees (73/80) hold, or are pursuing, a
PhD in astronomy (refer back to Table 9). While astronomy expertise is indispensable, the SDSS
and LSST also require team members outside the traditional astronomy curriculum expertise. For
example, some LSST team members have computer science degrees, not astronomy degrees.
Broad expertise is important at each stage of the project. For example, the LSST data center
requires more computer science experts and fewer astronomy domain experts during project
219
construction. Martinez explained, “But once you go into construction then you need people who
are better at, for example, coding, who are better at programming…” (Martinez, Professor,
2014). This LSST expertise pattern is expected to change once data are collected and more
domain experts are needed to ensure the project moves forward scientifically.
More than half of this dissertation study’s astronomy PhD degree-holders described data
in only two ways: by the state (level of data processing), or by the content of the data (images,
spectra, and catalogs). Alternatively, study participants with computer science degrees never
described data in terms of the content of images, spectra, and catalogs. While astronomy PhD-
holders often described data based on its scientific use, computer science degree holders never
referenced data based on its scientific use. More specifically, interviewees employed at
universities were most likely to describe data based on its content.
University employed study participants share with astronomy-related PhDs a likelihood
to be in jobs requiring they work with data for their own scientific research (as opposed to
working with data to build infrastructure for others to use). Interviewees focused on writing
scientific journal articles (largely those with astronomy-related PhDs and working in university
settings), data were understood in terms of their content as astronomical images, spectra, and
catalogs.
Alternatively, those with computer science degrees were most likely to describe data in
terms of the digital medium or project source. When data were described in terms of its digital
nature, they were describing data based on its medium. For example, they referred to data as bits,
or zeros and ones. These computer scientists considered astronomy data as computational
information to be managed. Similarly, examples of data described by source would include when
individuals referenced data by describing its project or instrument of origin. For example, data
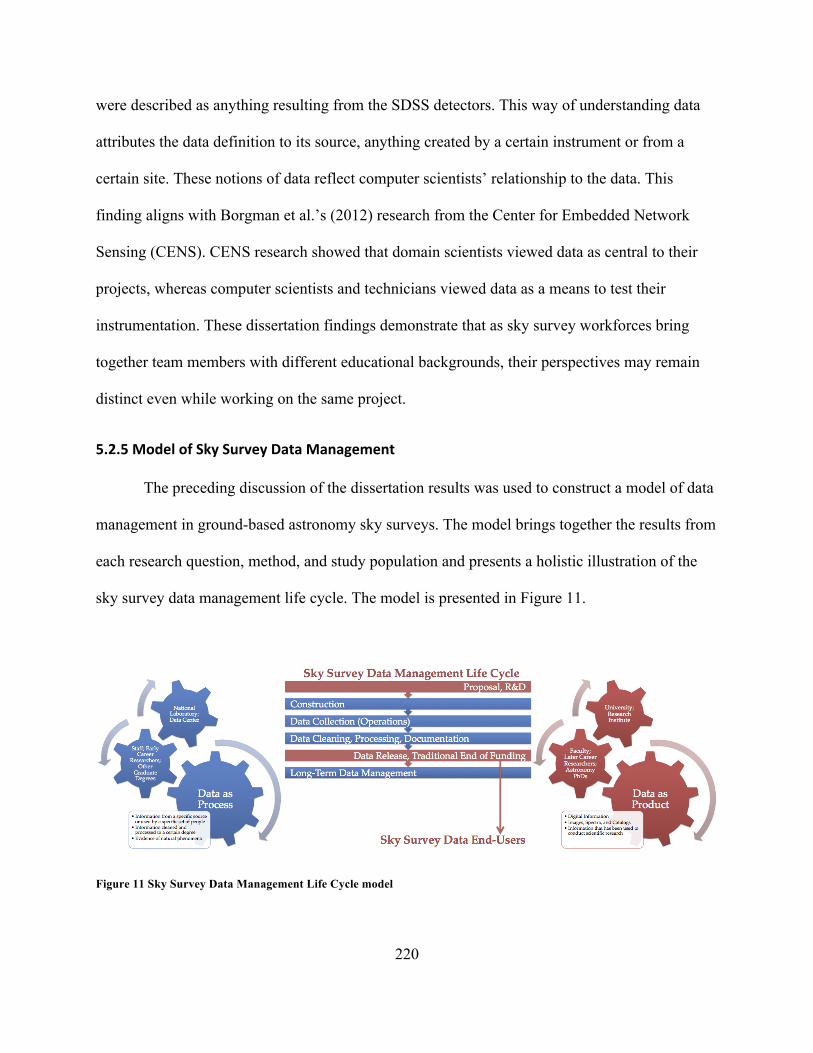
220
were described as anything resulting from the SDSS detectors. This way of understanding data
attributes the data definition to its source, anything created by a certain instrument or from a
certain site. These notions of data reflect computer scientists’ relationship to the data. This
finding aligns with Borgman et al.’s (2012) research from the Center for Embedded Network
Sensing (CENS). CENS research showed that domain scientists viewed data as central to their
projects, whereas computer scientists and technicians viewed data as a means to test their
instrumentation. These dissertation findings demonstrate that as sky survey workforces bring
together team members with different educational backgrounds, their perspectives may remain
distinct even while working on the same project.
5.2.5ModelofSkySurveyDataManagement
The preceding discussion of the dissertation results was used to construct a model of data
management in ground-based astronomy sky surveys. The model brings together the results from
each research question, method, and study population and presents a holistic illustration of the
sky survey data management life cycle. The model is presented in Figure 11.
Figure 11 Sky Survey Data Management Life Cycle model
221
As detailed in the Results chapter and in the preceding sections of the Discussion chapter,
perspectives on sky survey data, data management, and data management expertise differed
based on a stakeholder’s professional role in the sky survey, their career stage, and their level of
astronomy education. These differences in stakeholder perceptions are illustrated in the cogs on
the left and right of the figure, and the sky survey data management life cycle is presented at the
center of the model.
5.2.5.1DataasaProcess
The left side of the model represents stakeholders who view data as a process. Data
perspectives were clustered into this classification when data were identified as information
undergoing a process or when data were perceived in terms of the practices and contexts
surrounding data production. The 15 ways data as a process emerged from documents,
interviewees, and ethnographic participants was presented in Table 22. These perspectives
include references to data as information cleaned and processed to a certain degree and
information that has value through its relationship to other information.
Staff working at national laboratories or data centers usually described data as a process.
These stakeholders likely described data as a process because their day-to-day interactions with
the sky survey project involved hands-on SDSS data processing (or for LSST stakeholders,
hands-on development of the procedures by which the data will be processed). These
stakeholders, including graduate students, post-docs, and team members without astronomy-
related PhD degrees, are often referred to as pi-shaped experts (refer back to section 2.3.2 Data
management expertise). These individuals’ careers do not rely on the ‘publish or perish’ mantra
of scientific research because they are in staff positions, are early career, or their expertise is in
business or computer science instead of within astronomy.
222
5.2.5.2DataasaProduct
The right side of the model reflects the perspectives of stakeholders who view data as a
product. There are 11 ways data as a product emerged from documents, interviewees, and
ethnographic participants, which was presented in Table 22. These perspectives include
references to data as digital information or bits, or data as images, spectra, and catalogs. These
perspectives on data were more likely to reference the nature of the data specifically as
astronomical information. In these examples, data were perceived as objective representations of
reality, divorced from their context of production.
Stakeholders who perceived data as a product were more likely to have tenure-track
careers and work in a university or a research center. These stakeholders were usually faculty,
had completed their PhD degrees, and those degrees were in astronomy or a related field. These
stakeholders were more likely to describe data as a product because of the nature of their
interactions with data. As revealed in section 4.2.2.3 SDSS data end-users, students and post-
docs are more likely to work in the data collection and cleaning phases of research, while faculty
are more likely to focus their time on the research management, analysis, and writing phases of
the research process. Faculty view data as a product, because their daily tasks center on the
analysis of information, as opposed to the activities involved in collecting and preparing data for
analysis. Faculty participation in the processing of data has waned, and they instead employ data
for scientific analysis once it is already processed. These distinctions between data as a process
and data as a product are further summarized in section 4.1.4 RQ1 results summary and will be
discussed in more depth in section 5.2.6 Sky Survey Data Management Model Explanation and
Significance.
223
5.2.5.1DataManagementLifeCycle
The center of the model illustrates the research data management life cycle for sky
surveys. The model begins with proposal writing and R&D work, which are generally completed
by tenure-track, mid-career faculty stakeholders who view data as a product (sky survey
participation by career stage is further detailed in 5.2.4.2 Career stage). These stakeholders
develop the project vision and begin the sky survey life cycle. Essential to this stage is
convincing funders and future team members of the importance of the project and the value of
the eventually collected data.
After faculty leaders have sustained funder buy-in and recruited a starting staff, the bulk
of the data management life cycle is then carried out by those staff who view data as a process.
These steps in the sky survey life cycle include construction, data collection or operations, and
data cleaning, processing, and documentation. Non-tenure-track staff who see data as a process
are the bulk of those who participate in the sky survey at this point in the life cycle.
At distinct points in the sky survey life cycle, data are prepared and released for end-
users. Sky survey leaders, who describe data as the product being released, are those who
publicize the formal data releases. These sky survey leaders must convince external astronomers
that the data are valuable for scientific use. Similar to their work securing funding, sky survey
leaders must recruit data end-users for the project to be successful.
The final data release marks the end of data collection and is traditionally the end of sky
survey funding. Following the close of operations, any steps toward long-term data management
take place. These long-term data management actions take place by staff who view data as a
process. However, the extent to which long-term data management occurs depends on initial
planning by sky survey leadership, who view data as a product. The model thus compares
224
stakeholder perspectives on data within the data management life cycle. The following sub-
section explains the model and why it is important.
5.2.6SkySurveyDataManagementModelExplanationandSignificance
The Sky Survey Data Management Life Cycle model presented in Figure 11 illustrates
the ways disparate sky survey stakeholder data perceptions intersect with points in the data
management life cycle. These different perspectives can be explained through multiple
stakeholder demographic variables, including the stakeholder’s relationship to the data at
different points in the life cycle, their role in building infrastructure or writing scientific journal
articles, and their engagement with stakeholders external to the sky survey (including funders
and potential data end-users). The reason some stakeholders viewed data as a process, while
others viewed it as a product, is thus explained by the life cycle.
5.2.6.1DataasaProcess
One explanation for why perspectives on data diverged across stakeholders is the extent
to which a stakeholder is involved directly with managing sky survey data, as identified in
previous studies (Gall, 1976, 2002; Mol, 2002; Orphanides, 2017). As revealed in section 4.4.3
Career stage, early career tenure-track stakeholders, including students and post-docs, as well as
sky survey staff, are more likely to work with data closely. Alternatively, astronomy faculty are
more likely to manage or oversee data collection and processing. This proximity to the daily,
hands-on, work involved in data management influences perspectives on data and data
management.
Early career stakeholders and staff viewed data as a process, within context, because of
their close relationship to the many practices involved in preparing data before release. These
225
stakeholders are intimately familiar with the labor, infrastructures, relationships, and decisions
that went into collecting and preparing the data for release. Having participated in these
processes, staff members know of any weaknesses in the data and understand the decisions that
went into developing the data management workflows. As Latour explained, these staff see data
as “science in the making” (1987). Far from each datum being an objective truth, these staff
engaged in meetings where specific decision-making developed the processing software, which
cleans and calibrates collected data, in one way versus another. They directly witnessed how the
individuals making up the sky survey team influenced how the data are processed. For example,
their work removing instrument artifacts from images demonstrates the imperfect nature of
scientific data collection and processing. To these staff team members, sky survey data are not a
perfectly clean Latourian black box (1987), they instead have viewed deep into the work
processes that collected and processed the data. Staff hold essential roles and perspectives in sky
surveys because they embody how data are processed through the life cycle.
5.2.6.2DataasaProduct
Stakeholders who expressed a perception of data as a product also developed their
perspectives because of their roles in the sky survey life cycle. Mid-career, tenure-track faculty
are generally the instigators of complex sky surveys, as revealed in section 5.2.4.2 Career stage
and Figure 10. Tenure-track positions within universities and data centers enable faculty to
manage the larger scientific goals while students and staff directly collect and process data.
These faculty generally control decisive points in the sky survey: they have constructed the
funding proposals as well as the framing of each data release. Faculty sky-survey leaders hold
essential roles in the sky survey because their visions and the manner in which they explain the
project to external stakeholders are essential factors in the success of the project overall.
226
v Proposal;R&D
Tenure-track faculty, including sky survey leaders, often describe data as a product,
because it is in the project’s best interest to do so. This dissertation model reveals that two points
in particular when faculty are intimately involved in the sky survey process (Proposal, R&D and
Data Release), necessitate that these faculty perceive and express data as a product.
The mid-career, tenure-track faculty who begin sky surveys express data as a product
through funding proposals, journal articles, and presentations, because the ability to gain project
funding and community buy-in likely require that perspective. Limited funds are available for the
astronomy community; the process of obtaining funding from public or private sources is
intensely competitive. Developing the trust of funders is an essential component of securing
funding for a sky survey. In proposals, sky survey leaders present the data they plan to collect as
objective information that will be useful for scientific advancement.
These faculty demonstrate certainty to funders, because highlighting the contingent
nature of data could undermine their message and instead demonstrate that the project team does
not have the capacity or expertise to generate an excellent dataset. SDSS was able to secure
multiple grants from the Alfred P. Sloan Foundation, as well as other funders, in part due to their
ability to persuade funders of the efficacy of the dataset they were to produce. LSST leaders have
been generating funds planning to total more than one billion dollars; the NSF and other funders
would be less likely to invest these large sums of money in stakeholders who describe their
future data as locally contingent. LSST was rated first in the 2010 Decadal Survey (Committee
for a Decadal Survey of Astronomy and Astrophysics; National Research Council, 2010)
partially because of the ability of the leaders to describe the future dataset as objectively valuable
scientific data products. Indeed, LSST proposals to the NSF declare that the resulting data will
227
benefit not only astronomers, but that, “the broader impacts of the LSST will be profound, as
scientists, the public, and schoolchildren around the world will have ready access to the data”
(National Science Foundation, 2005, 2010a).
While all astronomers and funders are aware that science takes place within a context,
bringing that information to the forefront of an application would likely instill concern of
inadequate planning. Instead, SDSS and LSST leaders described the project and future data as
objective, scientifically-sound images, spectra, and catalogs.
v DataRelease
The other period in the sky survey life cycle in which faculty play a pivotal role is the
point of data release. The collected and processed data are presented as a formal release, in
which a single data release journal article can purportedly provide all the information necessary
for successful use of the dataset. These staff thus understand data as “ready-made science”
(Latour, 1987). This black box view of the data at the time of release may be essential to gaining
the trust of the broader astronomy community. As described in section 2.2.2 Sustainability, end-
users must trust sky survey team members for the choices made during data collection and
processing.
SDSS is considered a success in many ways, including because the broader astronomy
community highly trusts and frequently uses the data. As noted in section 4.1.1.1 SDSS data in
documents, the public release of SDSS data was an important milestone in project development
as it ensured continued support from funders and the end-user community. Trust in the data
product by external end-users is essential; sky survey leaders have incentives to present data as
spotless, objective sources of scientific truth. If these leaders were to present sky survey data as a
contingent process, astronomers could be less likely to trust the end product. While all
228
astronomers are aware to some extent that data are made in a context, bringing that subjective,
contingent information to the forefront of a data release could cause doubt in the scientific
community. To be accepted, the data must be recognized as objective information with truth-
value and thereby useful for scientific research. If the broader community does not trust the data
for use, then the sky survey will ultimately be a failed project.
5.2.6.3AstronomyKnowledgeInfrastructures
The perspectives of data as a process or a product, as illustrated throughout the life cycle
in the data management model, reflect the larger knowledge infrastructures within which these
sky surveys are embedded (Edwards, 2010; Jackson et al., 2011; Star & Ruhleder, 1996). These
findings indicate sky survey leaders likely must perceive and relate data as a product in order for
the sky survey to be successful.
Sky surveys are embedded within larger infrastructures, including the highly competitive
funding apparatus that leaves no room for a nuanced view of information as a process. Faculty
must persuade themselves, funders, and the larger astronomy field of the objective nature of their
projects’ data releases. This need for sky survey leaders to convince external stakeholders of the
value of the data means that leaders often directly influence external stakeholders to perceive the
data as a product. This dissertation model thus reveals that funding agencies and the broader
astronomy community are taught to understand sky survey data results as a product.
The necessity of presenting astronomy data as a black box to further project success has
implications for long-term data management. As data are always presented as a product to
funders and to the broader astronomy field, the processes necessary to prepare and manage data
in the short-, medium-, and long-term are often invisible to anyone outside of the project. Indeed,
the metaphorical black box conceals the intricacies involved in the work. This invisibility can
229
contribute to funders and the external astronomy community not being aware of the challenges
and highly specialized expertise necessary for data collection, processing, and long-term
management because these details are always hidden under the black box.
Funders may not appreciate the infrastructures and workforce necessary to truly manage
the value of data in the long-term, because they are not involved in the day-to-day processes and
are only ever presented data as a product. SDSS collaborators believe SDSS data will remain
important for decades, or possibly hundreds of years (Margon, 1998; Yanny, 2011). However,
presenting data as a product whenever communicating with external stakeholders, such as
funders, may dissuade these agencies from devoting sufficient resources to ensuring data are
available beyond data collection and the traditional end of funding.
The broader knowledge infrastructures at play in astronomy today, including the methods
to acquire funding, the manner in which to recruit and sustain a workforce, and the ways to
garner the trust of fellow astronomers have caused sky survey leaders to present sky survey data
as a product. While internal staff understand the process and expertise involved in sky survey
data management, these details are not made explicit to the external community because of the
way these funding infrastructures and community practices have evolved. It is because of these
infrastructures that leaders present data as a product, which can prevent funders and the broader
community from fully understanding the process and expertise necessary to sustain data into the
long-term. The Conclusion chapter provides a more nuanced examination of the implications of
this black-boxing of scientific data for long-term infrastructures and the workforces involved in
data management.
230
6 Conclusion
“I define getting, understanding, and characterizing the astrophysical objects in data as a scientific task… [But,] if you ask the average member of the AAS, the American Astronomical Society, they'll say, ‘…He hasn't done any science in years,’ because I haven't done any science, in that sense, in years….” (Staff Scientist, 2012). A new era of scientific data collection and analysis is underway. The wave of data-
intensive research promises to propel scientific knowledge gains by enabling the collection and
combination of data at a scale and complexity never before possible. However, strong data
management knowledge infrastructures must be in place to enable the discoveries promised by
data-intensive science. Digital data must be managed properly throughout the research data life
cycle to retain the efficacy of the information bytes as well as the contextual metadata,
documentation, and relationships to other information. Astronomy sky survey data, like other
scientific data, are “incomprehensible and hence useless” without accompanying contextual
information about how data were collected, processed, and curated (J. Gray, Szalay, et al., 2002,
p. 5).
While the sky survey data management model revealed in this dissertation (Figure 11)
demonstrates the importance of framing data as a product to gain the trust of the community,
data are also understood as a process by the stakeholders intimately involved in collection and
processing. A single gap in the life cycle can prevent data from being retained and reused into
the future (Borgman, 2015), and therefore data must be considered as a process when planning
for long-term data management. Only through sustainable workforces and digital infrastructures
can research data appropriately be used, recombined, and reanalyzed in the age of data-intensive
science.
231
The following subsections conclude this dissertation. The first subsection discusses the
factors that prevent sustainable workforces and expertise in the SDSS and LSST. Many study
participants expressed the workforce conundrum as a point of angst in their career development.
Many SDSS and LSST sky survey team members felt under-rewarded for their essential
contributions to these sky survey projects. Astronomy sky survey leaders are encouraged to
consider the career path desires of current and future team members. In particular, sky survey
leaders are encouraged to respect and find non-financial ways to reward team members, even
when their work may initially seem “invisible.” This section is intended to increase awareness of
the disparate reward structures available to highly educated staff involved in SDSS and LSST
infrastructure work. Sky survey staff are not rewarded based on the essential nature of their
skillsets for project success, and these misaligned rewards structures reveal a point of weakness
for the sustainability of long-term sky survey projects.
Second, factors that inhibit long-term sky survey infrastructures are examined. Funding
bodies and other policy makers are encouraged to consider the importance of providing funding
for data management beyond the end of data collection. As revealed in this dissertation’s sky
survey data management model (Figure 11), funders and policy makers inherently are provided
only the data as a product perspective. Funders are thus not given all perspectives of what data
are. The presentation of data as a product, which can black box the infrastructures necessary to
sustain the value of data, may partially explain why sky survey funding ends before long-term
data management begins. Perspectives on data will always vary to some extent; stakeholders
should focus on what can be done to translate between when stakeholders see data as a process,
and when data is seen as a product, to construct collaboratively long-term infrastructures. The
232
dissertation concludes with a discussion of the limitations of this study and a glimpse at future
work.
6.1DifficultiesSustainingSkySurveyExpertise
This dissertation highlighted the workforces and activities required for effective sky
survey data management across the research life cycle. Recent astronomy sky surveys, including
the SDSS and LSST, are examples of data-intensive scientific investigations. The term data-
intensive science refers to the data collection, processing, and analysis in which scientific
questions are investigated by, “analyzing hundreds of billions of data points” (Mayer-
Schonberger & Cukier, 2013, p. 11). Often referred to as a new era of science, the implications
for data management based on these quantitative differences in the scale of data collection must
be addressed. Data-intensive sciences may require new data practices, including more resources
for data cleaning and analysis rather than data collection (Borne, 2013; Hey et al., 2009a; Szalay,
2011). These changes may require a highly adaptable workforce. As this dissertation revealed, an
essential factor in the success of these projects is that of securing qualified, sustainable
workforces.
The data management workforces essential to the success of the SDSS and LSST projects
require expertise in both astronomy and in computational techniques. These “pi-shaped” experts
have proven essential to the functioning of the SDSS and LSST (refer back to Figure 3). While
demand remains for pi-shaped experts to work on the LSST data management team, these
experts are in short supply (Kitchin, 2014; Ray, 2014a). Reasons for the dearth in trained experts
are the poor incentives that dissuade astronomy students from pursuing pi-shaped careers.
Tenure-track careers are at odds with infrastructure-building activities. One senior scientist often
233
explains to her students that decisions to work on scientific software will damage their potential
tenure-track career opportunities,
“The real problem though is that I can't take a good graduate student honestly and tell them they ought to work on this stuff [scientific software] because they're not going to have a career. If they want to end up at a major university then they should not become… software… they shouldn't specialize in that. So that's why I think it needs... That's I think the real change that if it were a respected part of the community…” (Moore, Staff Scientist, 2012). The conundrum remains and shapes the future of astronomy sky surveys and many other
data-intensive research fields: The expertise needed for data management is that of pi-shaped
staff who are experts in astronomy and the computational sciences. However, individuals
pursuing computational work are unable to publish scientific articles concurrently, which
remains essential for acquiring competitive tenure-track career opportunities. In the data
management model revealed in this dissertation study, tenure-track stakeholders and staff
stakeholders are shown to have distinct responsibilities in the data management life cycle, as
well as distinct perspectives on data (Figure 11). The following subsections discuss this
conundrum, its implications for the future of astronomy sky surveys, and how sky survey leaders
can reflect on these findings.
6.1.1Datamanagementexpertiserewardstructures
One reason it is difficult for astronomy sky surveys to maintain data in the long-term, is
because existing workforce reward structures encourage discontinuity. Multiple factors may
prevent a single data team from continuously managing SDSS or LSST data in the short,
medium, and long-term. One obvious notion is that the workforce of a multi-decade project will
include retirements, but there are other nuanced reasons why individuals are dissuaded from
managing data in the long-term. For example, data managers usually desire job security beyond
234
that of the 3-5 year funding cycle. The rhythms of collaborative funding (Jackson et al., 2010)
are often shorter than the length of long-term projects, which creates uncertainty, and are much
shorter than the full career of an individual. The finitely funded SDSS and LSST projects must
also attempt to hire strong data management workforces. However, the inherently short-term
nature of individual projects can be detrimental to the career and work-life balance of a data
manager. Professor Bell confirmed that NASA science centers fulfill the requirements for data
management continuity because, “… you know it will still be there in 20 years, and someone can
go get a job there and have the confidence they have a future at the institution” (Bell, Professor,
2015). However, as discussed in section 5.2.3 Data management expertise, the strong data
management career options at NASA science centers are not available for ground-based
astronomy investigators.
As with most disciplines, staff technologist positions in astronomy are less lucrative than
faculty research positions and are often funded on short-term grants that lack long-term stability.
These staff are not provided as many resources (such as post-docs or students) and are generally
not as well respected in the discipline, despite often having the same education and experience as
their faculty peers. Due to this hierarchy, time spent performing tasks such as documentation and
software programming is often viewed as distractions from performing the “science” necessary
for faculty advancement.
While a sustainable data management workforce is essential for the success of data-
intensive sciences (National Science Board (U.S.), 2005; Research Information Network, 2008),
many interviewees for this dissertation felt their expertise was under-appreciated. Many
interviewees in non-tenure track jobs wanted to share their frustration at their difficulty obtaining
tenure-track careers. Despite holding PhDs in astronomy or computer science and contributing
235
essential expertise to the sky survey, they felt their work and compensation were relegated to that
of untrained support staff. One reason for this discrepancy is that most university and academic
systems are built to prioritize rewarding scientific analysis, as quantified through journal article
publications. Time spent generating infrastructures—including building tools and performing
data management tasks—has been considered a detriment to time spent “doing science” and
writing journal articles (Levine, 2014; Ribes & Finholt, 2009; Star & Ruhleder, 1996). While
many SDSS and LSST infrastructure building staff members enjoy their work, some feel
participating in the sky survey team has stunted their careers. While SDSS and LSST could not
collect or release data without the tireless efforts of these team members, the data management
work is not rewarded as highly as those who perform scientific investigations from that resulting
data (Ribes & Finholt, 2009).
The SDSS team interviewees in this dissertation were usually heavily invested members
of the collaboration. Some had committed years to writing data management software and
performing other team duties for SDSS. Following the conclusion of SDSS I and II, many of
these team members went on to contribute their distinctive expertise to newer projects like the
Dark Energy Survey (DES), the Hyper Suprime-Cam on the Subaru Telescope, and the LSST.
While some SDSS team members have participated in both infrastructure building and scientific
research projects using the SDSS data, many have not found the resources to actually use the
SDSS data for their own research. One senior team member acknowledged that SDSS relied on
individuals who were willing to forgo their science, and therefore their career goals, for the good
of the project (Perez, Emeritus Scientist, 2013).
Data management careers, in astronomy as well as other disciplines, lack an established
and accepted educational path and workforce structure (Hedstrom et al., 2015; National Science
236
Board (U.S.), 2005; Ribes & Finholt, 2009). The development of clear career trajectories could
increase professional opportunities for highly skilled, pi-shaped academics (Bowker, 2005;
Hedstrom et al., 2015). Robert Lupton, a leader in both SDSS and LSST, explained that current
reward structures in universities and astronomy do not properly support essential infrastructure-
building work – whether that work is with hardware or software. Lupton also exposed that
current workforce incentives are unsustainable. Specifically, Lupton suggested that new projects
should learn from SDSS:
“Find some way to reward people working on the project. In SDSS we did this by promising them early access to the data via a proprietary period. Not only is this impossible for publically funded projects, but it doesn’t really work very well. One problem is that the promise of data in the distant future doesn’t help a post-doc much; another is that the community (at least in the US) doesn’t value work on the technical aspects of a large project. …My personal belief is that the only long term way out of this is to integrate instrumentation (hardware and software) into the astronomy career path, much the way that the high-energy physicists appear to have done (at least from the outside)” (Lupton, 2002, p. 10).
While modern scientific collaborations require experts from complementary disciplines,
universities remain structured to support best those whose expertise fits within a single discipline
(Bowker, 2005, p. 125; Hedstrom et al., 2015).
A reward structure hierarchy is not a novel scientific investigation phenomenon (Blair,
2010; Shapin, 1989). However, the highly educated, pi-shaped team members from this study
seem to expect a stronger set of rewards from the university environment. It has never been
expected that all, or even most, astronomy PhD-holders will gain employment in a university
faculty position. According to statistics from the American Institute of Physics, only
approximately 10% of those who receive a PhD in Astronomy or Astrophysics in the US will go
on to hold full-time, tenure-track faculty jobs (Ivie, Ephraim, & White, 2009; Mulvey &
Nicholson, 2014; Nicholson & Mulvey, 2011; S. White, Ivie, Ephraim, & Anderson, 2010). The
237
PhD-holding pay scale is even lower at universities than in private industry or in government
work (G. Anderson & Mulvey, 2012; Mulvey & Pold, 2014). Despite the fact that only a small
percentage of US-based astronomy PhD-recipients are known to go on to tenure-track faculty
careers, many interviewees in this dissertation study expected a better-rewarded career for
themselves because of their in-demand, pi-shaped expertise.
6.1.2Datamanagementasinvisiblework
As revealed in this dissertation, sky survey data management work is often hidden under
the metaphorical black box when data are presented to external stakeholders. Further black
boxing of long-term data management needs occurs through interviewees noting their reliance on
Moore’s Law for the success of SDSS, LSST, or their personal research. By referencing Moore’s
Law, these interviewees are saying that as time passes, data management costs become smaller.
However, while data storage costs have continued to decrease over time, storage is only one
component of data management. According to the Data Conservancy (Figure 2), data storage is a
basic long-term data management activity, but it may be the least expensive component of the
four activities (Choudhury, 2013; Choudhury et al., 2013).
Human labor and other resources are required to ensure data are managed over time.
Long-lived data must be migrated through successive software and hardware iterations. Beyond
migration, data must also be continuously checked for bit rot and other technical errors. To
maintain the value of scientific data, documentation and other curatorial services must also be
performed. While essential, data maintenance work can become invisible; as an infrastructure
becomes more ubiquitous, it also becomes less apparent (Borgman, 2000). The long-term sky
survey data management work may be considered invisible work as it becomes routine
(Borgman, 2015; Bowker, 2005; Daniels, 1987; Ribes & Finholt, 2009; Ribes & Jackson, 2013;
238
Star & Strauss, 1999). The work becomes invisible when performed well, and often is only
brought to the forefront of attention when problems arise. As revealed in this dissertation’s data
management model (Figure 11), long-term data management activities partially are invisible,
because data are presented to external stakeholders as a product instead of a process. With data
always appearing as a black box, the practices and workforces necessary for long-term data
management have become invisible. Professor Bell complained that many stakeholders fail to
realize the costs associated with enabling astronomy data access and preservation. He
sarcastically exclaimed, “Kind of tragic, things do cost money. People are like, "Why didn't you
do it?" "Well, it costs money." This isn't a gigabyte dataset that you put on your home page”
(Bell, 2015).
Some interviewees in this dissertation study were oblivious to the technical and human
resource expenses associated with ensuring availability and usability of SDSS data over time.
One astronomy professor and former member of the SDSS Board of Governors believed long-
term data management was not something the SDSS collaboration ever needed to consider.
When asked about the plans for the longer-term care of the SDSS data that facilitate data-
intensive discoveries, he responded, “Well, I think we made an agreement with NSF that all data
would become public after blank length of time and that basically took care of it” (Anderson,
Emeritus Professor, 2012). While acknowledging the need for a “permanent archive,” Anderson
did not have a sense of data preservation costs or the need for an accessible, actively served copy
of the data. He continued,
“I mean, what we did is we made it all public. And that was our obligation and it was to our interest to do so. … Once we made it public, it's public. So you know, Lincoln wrote the Gettysburg Address, he didn't have to archive that for all time. But people liked it; they could collect it and put it in their drawer. [laughter] Because it's just bits. In other words, if this is public, then anybody can collect all
239
those bits and do with them what they want” (Anderson, Emeritus Professor, 2012).
Professor Anderson assumed that releasing the SDSS data inherently meant that valuable data
would be saved. However, this assumption has proven false, and instead digital data require
continuous, intentional management by experts to remain preserved and usable over time
(Borgman, 2000; Hedstrom et al., 2015). As a senior scholar with a naïve understanding of data
management efforts, Professor Anderson’s perspective provides a clear example of how work
becomes invisible. Despite some SDSS leadership misperceptions, these short, medium, and
long-term data management tasks require sustainable physical and human infrastructures
(Bowker, 2005, p. 114).
Ignorance of the invisible work necessary to ensure long-term maintenance may be one
reason for the under-valuing of data management work and the common lack of planning and
budgeting foresight for long-term data management. As demonstrated in Figure 10 Sky survey
participant career stage, sky survey leadership is largely separated by career stage. Results also
confirmed that as astronomers become more senior, they are increasingly involved in the
management of students and post-docs, who are then the ones directly analyzing datasets, which
resonates with Wallis’ findings of the roles of students and post-docs at the Center for Embedded
Networked Sensing. A temporal expertise gap results: those most familiar with current data
management practices are too early in their careers to be sky survey leaders; at the same time,
current sky survey leaders may have dated understandings of the effort required to manage sky
survey data.
However, ignorance of the labor required for long-term data management can be
combatted. As shown in this dissertation’s data management model, acknowledgement of the
labor involved in data management is a result of the broader infrastructures surrounding sky
240
surveys. Sky survey leaders, funders, and the other workforces surrounding these sky surveys
(including Dean and Provost-level leaders at universities) must acknowledge the divide in
perspectives between staff who work directly with data and later career faculty who manage data
collection and analysis. Ongoing acknowledgement of the differences between data as a process
and data as a product, coupled with efforts by leaders to understand the resources needed to
properly manage data, are necessary steps to making data management work visible. Long-term
data management requires funding, hardware and software, and an expert workforce. The SDSS
and LSST are large-scale projects and require high levels of what may currently be invisible
infrastructure work in design and development, maintenance, infrastructure construction, and
system administration.
6.1.3Astronomyskysurveyleadership
Many essential SDSS and LSST team members are “pi-shaped” experts. Pi-shaped
experts in terms of the SDSS and LSST possess a high degree of expertise in both astronomy and
computational science. Data-intensive sciences often require expertise that crosses these
disciplinary boundaries (Bell et al., 2009; Bowker, 2005; Szalay, 2012). The specific nature of
asking new research questions, which can only be answered by the combination of multiple
datasets, is the hallmark of data-intensive sciences and what necessitates inter-disciplinary
expertise. Pi-shaped sky survey team members are recruited and hired because of their extensive
expertise that generally includes a PhD in astronomy or a related discipline. However, LSST has
not been able to easily attract and retain the needed pi-shaped team members for open data
management positions.
While many potential recruits may desire to be part of the fast-moving and forward-
thinking LSST team, the downsides to joining an infrastructure-building team member persist.
241
As just described, working as a SDSS or LSST infrastructure-building team member will likely
hinder future career opportunities. However, the repercussions of this conundrum can be
reduced. First, SDSS and LSST leadership must inform potential team members honestly of the
ways participation in the SDSS or LSST could hurt their chances at obtaining tenure-track
faculty positions. Second, existing sky survey students, post-docs, and staff should be treated
respectfully, regardless of their hierarchical position on the sky survey team. While some team
members made a concerted choice to join an infrastructure team, because they enjoy the work,
others described unintentionally landing in an unwanted position. Given the university hiring and
promotion climate, individuals who want to pursue tenure-track faculty careers should not be
encouraged to join infrastructure-building projects. As described earlier, interviewee Moore is
forthright with her students about the ways infrastructure work detracts from time that could be
spent writing scientific papers.
Most interviewees drew a sharp line between infrastructure building, and “doing
science.” In this dissertation’s data management model, this distinction is that all work taking
place on behalf of the sky survey is infrastructure work, while analysis of its resulting datasets is
scientific work. Some SDSS team members have remained so busy with SDSS and other
emerging infrastructure projects that they never found time to use SDSS data for their own
personal scientific research projects. Current LSST team members are generally granted 20% of
their work schedule for “science time.” However, many have not actually used the allotted time
for personal science because of the extensive time demands of the LSST infrastructure building
team. For example, staff scientist Stewart explained that while he is granted science time as part
of his LSST job, the time is taken up by LSST priorities, and he has yet to use that time to further
his own scientific interests (Stewart, Staff Scientist, 2015). The practical nature of developing
242
sky survey infrastructures often prevents PhD astronomers from continuing their scientific
research projects and nearly always prevents them from attaining tenure-track faculty careers. In
the long-term, sky survey team leaders could use their academic influence to help shape reward
structures to support better the pi-shaped expertise they need for sky survey collaboration
success. In the meantime, sky survey leaders should be honest with current and future students,
post-docs, and staff about the career repercussions that result from choosing paths in astronomy
infrastructure building and data management.
Despite the hierarchical organizational structures in SDSS and LSST, all sky survey team
members should be treated with respect, and their contributions should be acknowledged. Some
SDSS and LSST team members noted they felt their service to their sky survey project was not
treated with due respect. For example, Campbell explained how different sky survey projects
demonstrate different levels of career support for their staff. He explained how in one sky
survey, he felt supported by the faculty involved but in another he felt, “that the people kind of in
the trenches doing the work were not getting that kind of credit or that kind of exposure”
(Campbell, Professor, 2015). He went on to explain that existing reward structures do not
encourage staff to join and remain in sky survey projects and suggested, “the trick is to keep
these people on, you've got to reward them somehow. Not just monetarily, but their career.
…you need to support the people working for you, and it's tough to do on these big projects”
(Campbell, Professor, 2015). Campbell and others feel they require more support from SDSS or
LSST leaders to support their careers while they spend years supplying their expertise to working
on essential infrastructures. One reason team members may feel their work is disregarded is
because they are performing invisible work. SDSS and LSST leaders will benefit their projects
243
by appreciating all team members, preventing essential work from becoming invisible and
particularly under-rewarded.
Respecting the contributions of all team members is important for the individuals
involved, as well as the overall team confidence. Morale is important for SDSS and LSST,
because the projects can span a decade or more and require geographically disparate teams to
coordinate with and trust one another. High staff turnover can hinder project timelines and
ultimate project success. When team members leave, they take with them the institutional
knowledge and relationships necessary for project continuity. Two interviewees for this
dissertation have since left the SDSS and LSST collaborations and moved to industry careers.
They chose to leave academia, because they not only were unable to obtain faculty tenure-track
careers, and they felt SDSS or LSST leadership undervalued their infrastructure contributions to
the project.
Team members are essential to the SDSS and LSST collaborations. Sky survey team
members must work for up to a decade before end-users can employ the resulting data for
scientific articles. While some team members will also use the resultant data for scientific
analysis, many will find themselves too busy with infrastructure to pursue that end goal. While
SDSS and LSST datasets cannot be collected, processed, and released without the work of many
infrastructure team members, these contributions are often overlooked. However, team members
must feel appreciated and supported in their sky survey work for the project to retain continuous
expertise. Disrespect in each project hierarchy will reduce the supply of willing highly qualified,
pi-shaped available to sky survey teams even further.
This dissertation has opened the black box of long-term data management, demonstrating
the essential roles and perspectives of the staff who manage data across the research life cycle. A
244
dearth in the number of pi-shaped experts in data-intensive science remains at least partially
because the academic reward-structure is at odds with supporting these new, essential experts
(Kitchin, 2014; Ray, 2014a). Sky survey stakeholders should work together to determine and
establish career paths and best practices that can reward and support sky survey staff in ways
comparable to the essential skills they bring to the team. For example, this study has shown that
even when LSST staff are presented with 20% time for their own scientific work, staff tend to
find themselves too busy to use the time for anything other than their regular infrastructure-
building duties. Different models could incentivize these essential pi-shaped staff to remain in
sky surveys and academia instead of losing these talented individuals to industry. Perhaps teams
could be constructed in a way that scientific sabbaticals can be offered without stalling
infrastructure development. Perhaps sky survey projects at different stages of development could
share proprietary data access among one another. In this way, the astronomy community could
work together to support the retention of crucial staff. Specific models could be built into
funding requests to support the intellectual and scientific pursuits of the staff that are crucial for
infrastructure building, but who are not currently appropriately rewarded to the extent that their
expertise is necessary. Perhaps business or industry leaders who specialize in incentives and
workforce development should be consulted to intentionally develop a stronger astronomy
workforce ecosystem that supports sky survey staff.
6.2DifficultiesSustainingDigitalInfrastructures
As shown in this dissertation, sky survey data management stakeholders are diverse and
distributed, each with their own set of understandings for what data management entails. This
dissertation has served to collect, analyze, and provide suggestions for data management best
practices based on the holistic perspective obtained by conducting this study and presented in
245
Figure 11. Data management in the short, medium, and long-term requires monetary resources,
sustainable workforces, and sustained infrastructural commitments.
The SDSS and LSST projects represent incredible feats of cross-disciplinary
collaboration. As shown in the Results chapter, the SDSS compiled a dataset considered by the
worldwide astronomy community as a gold standard to calibrate other datasets. Some end-user
study participants went further to note that their research relies daily on SDSS data. The
thousands of published scholarly articles employing SDSS data further confirm the authority and
quality of SDSS data, which influences research well beyond that of the members of the initial
collaboration. LSST is well on its way to becoming just as critical. Jointly, these two ground-
based, astronomy projects have a successful history of data collection, processing, and release.
However, despite these undeniably successful undertakings, a major impediment prevents these
datasets from being sources of information into the future.
The “Availability-Usability Gap” has emerged from the SDSS and LSST communities,
illustrating the differences between funder mandated data management plans and the actual
accessibility of data given current infrastructures (Levine, 2014, p. 129). Funding agencies and
policy makers should hold community forums in consideration of long-term data funding for
prominent datasets. SDSS and LSST have operated on multiple grants of two to ten years in
length (refer back to 4.1.1 RQ1 documentation results). Each individual award provided funds to
support a distinct portion of the research life cycle. However, there remains a vulnerability to the
sustainability of these quality datasets. Appropriately funded during data planning, collection,
processing, and release, budgeted financial support for long-term data management remains rare.
This dissertation revealed the research life cycle for SDSS and LSST (refer back to Figure 7).
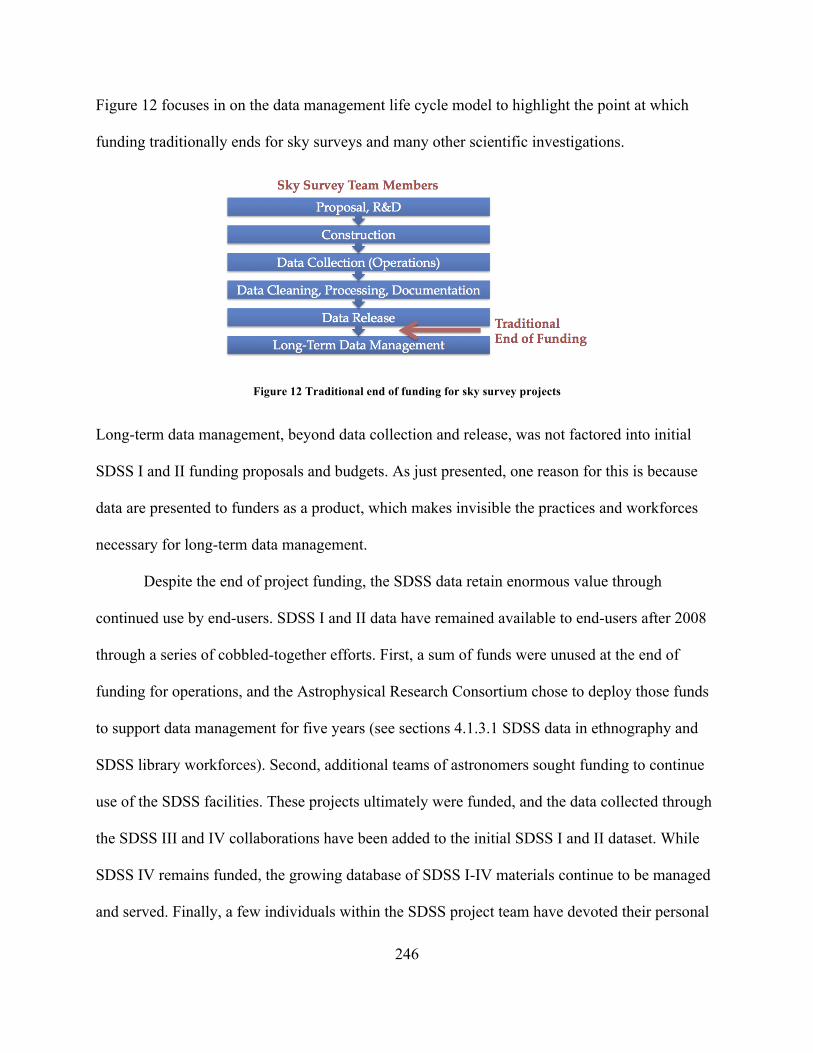
246
Figure 12 focuses in on the data management life cycle model to highlight the point at which
funding traditionally ends for sky surveys and many other scientific investigations.
Figure 12 Traditional end of funding for sky survey projects
Long-term data management, beyond data collection and release, was not factored into initial
SDSS I and II funding proposals and budgets. As just presented, one reason for this is because
data are presented to funders as a product, which makes invisible the practices and workforces
necessary for long-term data management.
Despite the end of project funding, the SDSS data retain enormous value through
continued use by end-users. SDSS I and II data have remained available to end-users after 2008
through a series of cobbled-together efforts. First, a sum of funds were unused at the end of
funding for operations, and the Astrophysical Research Consortium chose to deploy those funds
to support data management for five years (see sections 4.1.3.1 SDSS data in ethnography and
SDSS library workforces). Second, additional teams of astronomers sought funding to continue
use of the SDSS facilities. These projects ultimately were funded, and the data collected through
the SDSS III and IV collaborations have been added to the initial SDSS I and II dataset. While
SDSS IV remains funded, the growing database of SDSS I-IV materials continue to be managed
and served. Finally, a few individuals within the SDSS project team have devoted their personal
247
resources to ensure the SDSS I and II data are preserved into the near future. However, each of
the three ways SDSS data have remained archived and served from 2009 to now have been
serendipitous, were not strategically planned for, and could have crumbled at any point. Indeed,
these three interim solutions are fragile, temporary infrastructures (Borgman et al., 2016).
Instead, durable infrastructures are necessary to support SDSS data management. Data
management for LSST data has also not been considered beyond the end of operations. LSST
staff even noted that they are unable to plan for long-term data management, citing how funders
have scoped their current project funding to focus solely on construction. SDSS data are highly
used, years after the end of their operations. LSST data are expected to be the same, and LSST
documents have asserted the extensive lifetime expected of the data (refer back to 4.1.1.2 LSST
data in documents). However, there is a stark gap in data management infrastructure planning
and action for the long-term.
As illustrated in Figure 12, traditional agency funding ends prior to activities focused on
the long-term archiving and serving of data. Table 26 shows that SDSS and LSST stakeholders
life cycle stages interpretation depend on whether the discussion is focused on data, data
management, or data management expertise. Interviewees discussed a longer, more nuanced life
cycle when discussing data management, while long-term data management was largely ignored
when discussing data. This dissertation has demonstrated that stakeholder conversations must
explicitly focus on data management beyond initial use, referencing data as a process and not as
a product. Without explicit redirection of planning toward future reuse, astronomy project
planning is destined to end with “data analysis” and initial journal article publication as found in
this dissertation study’s RQ1 conversations (refer back to Table 26). Funding agencies and sky
248
survey leadership must continue to re-focus project planning discussions toward future data reuse
for data-intensive advances to occur.
Sustainable funding is essential because archiving and serving require knowledge
infrastructures. Data management before, during, and beyond data collection are active
processes. Data require hardware and software upgrades and migrations and bit rot analysis, to
name a few of the actions necessary for digital information bit management. However, this
dissertation demonstrates that data are more than only bits of information to be digitally stored;
data must also be retained as scientific evidence that can be used for research (refer back to 4.1.4
RQ1 results summary). Active data curation is necessary to develop and maintain relationships
between data at distinct processing levels, and between data and other kinds of information
including documentation and metadata. Finally, for data to remain usable, the information must
be served actively, which includes a host of other system administration and help desk tasks.
While a dark archive may prove cheaper and ensure preservation, that decision limits access.
This dissertation study data management model specifically has shown that SDSS and
LSST data are not just bits, but also evidence for scientific use, and require serving as well as
archiving. Continuous acts of data management require funding, and without them digital data
can become unreadable quickly (Borgman, 2015). Sustainable archiving and serving of scientific
data requires ongoing investments in the knowledge infrastructures and workforces surrounding
these collaborations. These ongoing investments currently do not exist however for ground-based
astronomy projects, which are funded through individual grants a few years at a time and cease
when data collection is complete.
Federal and private funding may have prioritized the SDSS and LSST projects, because
their proposals indicated the enormous future potential in future decades of data-intensive
249
scientific uses and reuses of their data. Traditional funding models effectively support astronomy
when the field is scoped by individual investigators using private telescopes (Bowker, 2005;
Mayer-Schonberger & Cukier, 2013). However, collaborative efforts like SDSS and LSST
require shared telescope facilities, which may also impact the funding models and infrastructures
appropriate for that work. Traditional funding models do not support the invisible labor required
to enable data availability beyond operations, while the promises of future data-intensive
achievement require that data remain available beyond the period of a single project (Burns et
al., 2014; Schroeder & Meyer, 2012). When funding ceases upon data collection completion, or
even shortly thereafter, the research community is unable to realize the full potential of these
multi-million and billion dollar scientific investments.
End-users will be unable to continue using SDSS or LSST data if the data are not
continuously archived and served. As described in 4.2.2.3 SDSS data end-users, SDSS data end-
users rely on continued access to SDSS data, and do not retain copies of the data because they
expect always easily to re-attain the data through the collaboration website. While some
pervasive infrastructures were effectively adapted to modern “big science” approaches to
astronomy research, the prompt end of funding following data collection remains a problem for
the community, inhibiting advances from data-intensive science.
While many funding agencies encourage the development of data management plans and
enabling data access (Directorate of Mathematical and Physical Sciences Division of
Astronomical Sciences (AST), 2010; Holdren, 2013; National Institute of Health, 2003; National
Science Foundation, 2010b), the infrastructures to support these expectations do not exist yet in
ground-based astronomy community. Despite funding proposal promises to facilitate scientific
findings beyond data collection, SDSS, LSST, and other similar projects are unable to fulfill
250
those promises because long-term astronomy and funding infrastructures do not exist to support
such work. As noted in Figure 12, financial support decisively falls off after data collection is
complete, and community infrastructures like NASA science centers do not exist in ground-
based astronomy.
LSST data undeniably will be used highly beyond the end of the ten-year survey.
However, the haphazard ways SDSS data were maintained after survey close cannot serve as
data management solutions for LSST. Instead, funding and personnel must be dedicated early to
ensure the archiving and serving of LSST data until the point at which the community itself
decides the data no longer require maintenance. Judging by the impact of the SDSS data on the
astronomy community, LSST data are expected to remain an important part of astronomy
research for a decade or more beyond data collection. The scientific community, rather than the
common three-to-five year funding model, should determine when datasets are no longer
archived and served.
Some disciplines have largely resolved the funding gap problem for data management
beyond the close of data collection grants. For example, the Inter-University Consortium for
Political and Social Research (ICPSR) established shared infrastructures to support social
science research data. While the NSF largely funds projects through short-term grants, like those
supporting LSST, NSF also has longer-term, large “facilities” funding models (National Science
Board (U.S.), 2005). Even space-based, NASA-funded astronomy research data are distributed to
NASA science centers following the end of a mission (Committee on NASA Astronomy Science
Centers, & National Research Council, 2007). Those communities have established
infrastructures to archive and serve important data following the end of funding for the
individual created projects. Each of those solutions is discipline specific. ICPSR uses a paid
251
membership model to manage shared data. NASA science centers rely on continued favorable
performance reporting and congressional appropriations. However, in ground-based astronomy,
there is no established infrastructure by which a project can hand-off its data for expert archiving
and serving beyond individual project funding.
Ground-based projects like the SDSS and LSST are prioritized for funding in part
because the data be collected and used in the short-term, and then the data are expected to be
reused and combined in many ways into the future to serve important components of data-driven
research. However, SDSS and LSST leaders and funding agencies are failing to recognize the
chasm disconnecting data collected through project funding and reuse after project close.
Anderson was a senior SDSS leader, and yet his understanding of archiving and serving SDSS
data falls far short of the necessary steps to enable data-intensive science: "We put it up on the
web, so it's good, it's done" (Anderson, Emeritus Professor, 2012).
Systemic change in ground-based astronomy funding rhythms is necessary to ensure data
remain usable following data collection, enabling the promises of data-driven research. However,
this change requires the development of knowledge infrastructures available at the end of the
project life cycle to support data management. Thus, the current sky survey data management
model revealed in this dissertation study must be amended by stakeholders to include the
funding, infrastructures, and workforces necessary for long-term data management for data-
intensive reuse. As the social sciences and NASA-funded projects have established these bridges
for their communities, a center(s) may be required to house the knowledge infrastructures
necessary to support ground-based astronomy data beyond the end of project funding.
The sustainability model that will work best for ground-based astronomy is not yet clear.
Funding agencies should work alongside scientists to determine the best path forward to bridge
252
the gap in support for ground-based astronomy research data. Stakeholders will need to
determine the kinds of workforces and technical infrastructures necessary to sustain data, which
data are determined to have long-term value, what length of time datasets require management,
and other pressing details. These determinations must arise from within the community, and be
aided by funders who invested in the long-term impact of their investments. This necessary field-
wide work is urgent; as time passes, data become increasingly vulnerable to bit rot and other
forms of mismanagement.
6.3Limitations
This dissertation does not attempt to discuss data management expertise across all of
science, or even the full discipline of astronomy. The intended population was that of modern,
ground-based optical sky survey team members and end-users. In practice, the study populations
were the SDSS and LSST data management team members, as well as end-users of SDSS data.
SDSS and LSST are not the only sky surveys in astronomy, but are arguably some of the best
funded and most respected. The same workforce stratification within these two teams may not be
reasonably expected in other surveys.
This dissertation is also limited by the length and intensity of the study. While a five-year
study involving interviews and observations provides a strong set of data, increasing the
longitudinal nature of the study, as well as increasing the depth of investigation, could vastly
improve the study of these projects. Ideally, the number of study years would be increased to
ensure observations of the full life of a sky survey. Long-term, fully immersive ethnographic
participant observation fieldwork, as identified by the anthropology community, would provide a
stronger set of evidence for the ways workforces interact with one another across time and place.
Alternatively, the internal validity of this dissertation may be influenced by the years-long nature
253
of the study. Maturation of study participants can have an effect on findings as “people are
continually growing and changing” (Babbie, 2007, p. 230). To lessen the impact of maturation
on this study, all documents, transcripts, and observations include indications of the year they
took place. Year of interview was also a demographic factor in interview analysis.
Finally, this study was limited by study population self-selection. Observations and
interviews were not conducted with individuals who were disinterested in study participation for
any reason. Some potential for study bias is present, however, the right for a study participant to
opt-in is critical to the ethical nature of the study and cannot, and will not, be rescinded.
6.4FutureWork
Given the abundance of interviews conducted for this dissertation, and the fact that only a
portion of the vast materials were exposed within this document, further analyses should be
conducted with the 80 interview transcripts. The transcripts remain protected under the UCLA
IRB, and the UCLA CKI team members should continue to investigate these findings.
First, data collection for the current case studies should continue to increase the
longitudinal nature of the study and the potential for more thorough analysis. The UCLA CKI
has investigated SDSS since 2009; LSST has only been studied since 2014. The CKI should at
minimum continue to study LSST to obtain comparable depths of understanding for both
astronomy sky survey projects. Ideally, LSST will continue to be studied through the transition
from construction to commissioning and further as funding allows.
The interviews conducted for this study were distributed and diverse. Interviewees were
affiliated with 26 institutions, and clustered based on seven demographic variables. However,
while the coverage was broad, study analysis could have improved by also including specific
stakeholder institutions as an interviewee variable. For example, preliminary analysis indicates
254
collaborative differences between team members at each LSST data management institution.
Future work includes coordinating with fellow team members at the UCLA CKI to analyze the
consistencies and differences between SDSS and LSST stakeholders at different institutions.
Astronomy data are not the only kinds of information integral to astronomy research.
Important contextual information may include the software that has processed, or is necessary to
analyze, the data (Borgman, 2015; N. Gray et al., 2012; Howison & Bullard, 2016). Software
revealed itself during analysis as an important information type for astronomy research.
However, it quickly became difficult to discover the boundaries between data and software.
Further research is needed to understand the role that data, software, and other kinds of
information play in astronomy sky surveys.
Finally, further research is necessary to understand the way sky survey team members are
rewarded and how their educations and careers progress. Pi-shaped stakeholders, who are experts
at astronomy as well as software engineering and infrastructure building, hold an essential
knowledgebase for sky survey growth. However, study participants expressed displeasure that
infrastructure work is often “invisible” and rarely results in tenure-track faculty careers. At the
same time, sky survey participants noted difficulty finding the data management experts needed
for their projects. Highly skilled individuals are poorly rewarded, even though they are in high
demand. Further research should be conducted to gather more evidence about the current reward
structures and their implications for successful research data management now and into the
future.
6.5ClosingRemarks
As discussed in the Introduction chapter, information preservation during the
Renaissance was not an inherent result of the printing press and only occurred because society
255
also specifically acted to respect and preserve information (Blair, 2010, p. 61). Sky survey
leaders, funders, and other policy makers can no longer remain naïve to the notion that data
management requires sustainable resources; while these workforces and infrastructures may
currently be absent, black boxed, or “invisible,” they remain essential to reap the promised
benefits of data-intensive science. Society must once again make a conscious effort to archive
and serve information. While many funders have begun requiring data management plans, a
further social change is also necessary. Funders must also acknowledge the human and physical
infrastructures necessary to accomplish the effective data management they champion for in
these plans. In the era of data-intensive science, data must be managed beyond that of initial use,
because combining and re-combining various datasets in data-intensive research promises to
enhance scientific understanding. These promised insights can only be made if data are managed
beyond data collection; however, data project funding currently ceases at data collection close.
Just as was the case with the printing press in the Renaissance, advances in data-intensive
scientific collection techniques do not inherently beget archived and served datasets of value. It
is only through active decision-making and long-term planning that SDSS and LSST data will
remain available beyond initial use.
The first step in the process of planning for SDSS and LSST long-term legacies is to
accept that stakeholders, including astronomers, computer scientists, librarians, and funders,
have differing perspectives. The next step is to move forward inclusive of these diverse
perspectives, instead of despite them. By recognizing these data management perspectives,
including those of process and product across the full research data life cycle, the strongest
sustainability plans and research infrastructures can be developed and deployed.
256
A consistent, expert workforce with a reliable salary is necessary to ensure the
appropriate long-term management and utility of scientific data (Committee on NASA
Astronomy Science Centers, & National Research Council, 2007; Research Information
Network, 2008). Funding, or a lack thereof, impacts the stability of all knowledge infrastructures,
including the human expertise critical to ensuring data usefulness for years to come (Berman &
Cerf, 2013; Edwards et al., 2013; Hine, 2006). While funding for data collection and scientific
investigation are important, additional funding beyond the point of initial scientific return is
necessary to retain the research efficacy of data over time. For SDSS and LSST data to remain
usable over the long-term, a new funding model and a full environment of sustainable expertise
that bridges the current chasm in the research life cycle are required. These changes may
resemble NSF facilities, NASA science centers, social science consortia like ICPSR, or perhaps a
solution not yet envisioned. It is only once stakeholders acknowledge the true costs of data
management beyond collection (instead of remaining naïve to “invisible” workforces and
currently absent infrastructures) that the SDSS and LSST can contribute fully to the data-
intensive science revolution already underway.
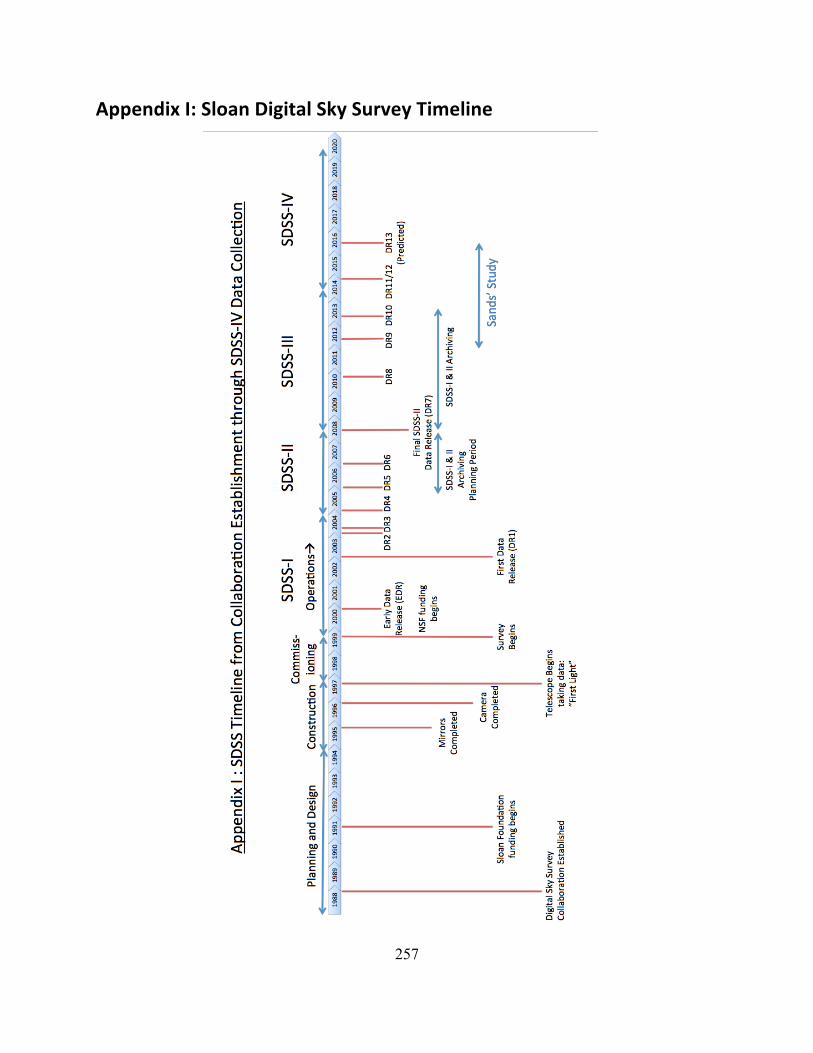
257
AppendixI:SloanDigitalSkySurveyTimeline
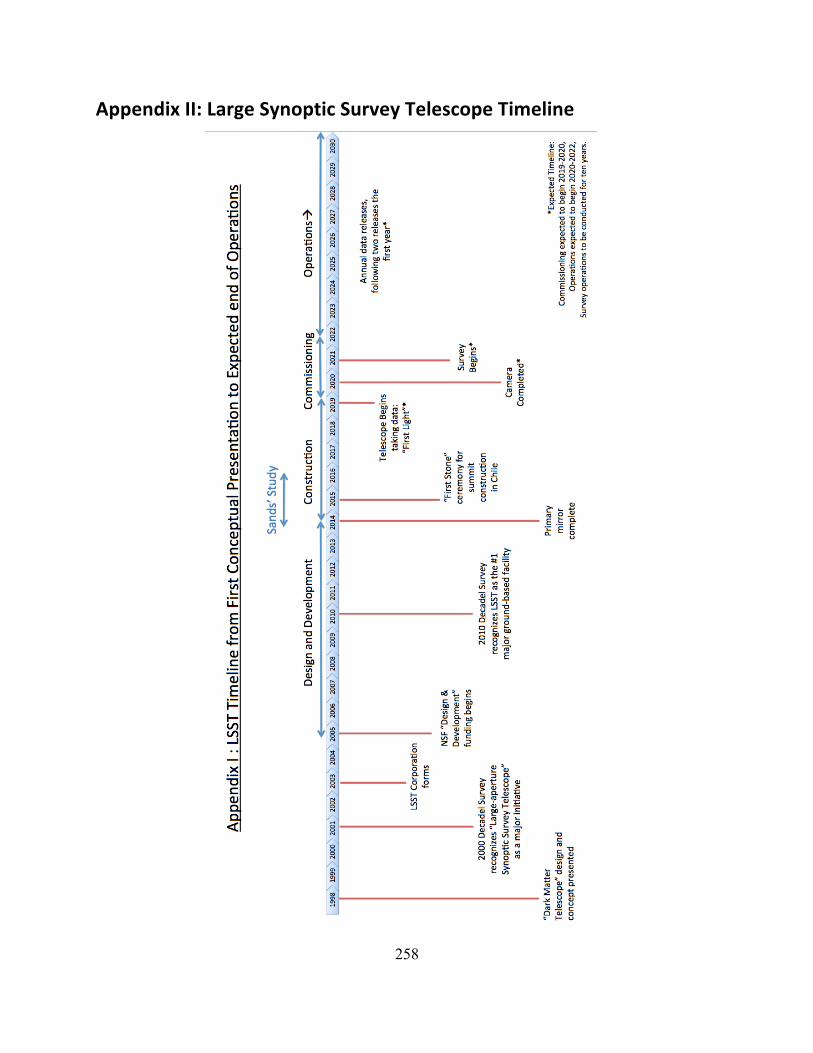
258
AppendixII:LargeSynopticSurveyTelescopeTimeline
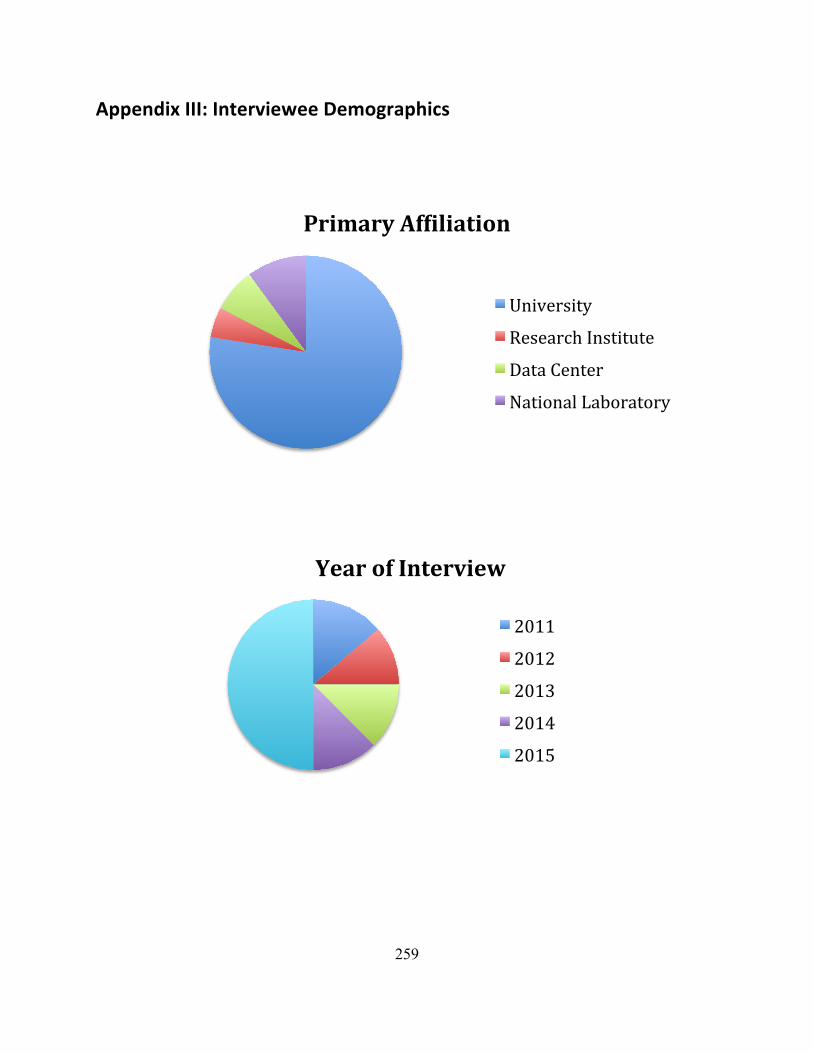
259
AppendixIII:IntervieweeDemographics
PrimaryAfWiliation
University
ResearchInstitute
DataCenter
NationalLaboratory
YearofInterview
2011
2012
2013
2014
2015
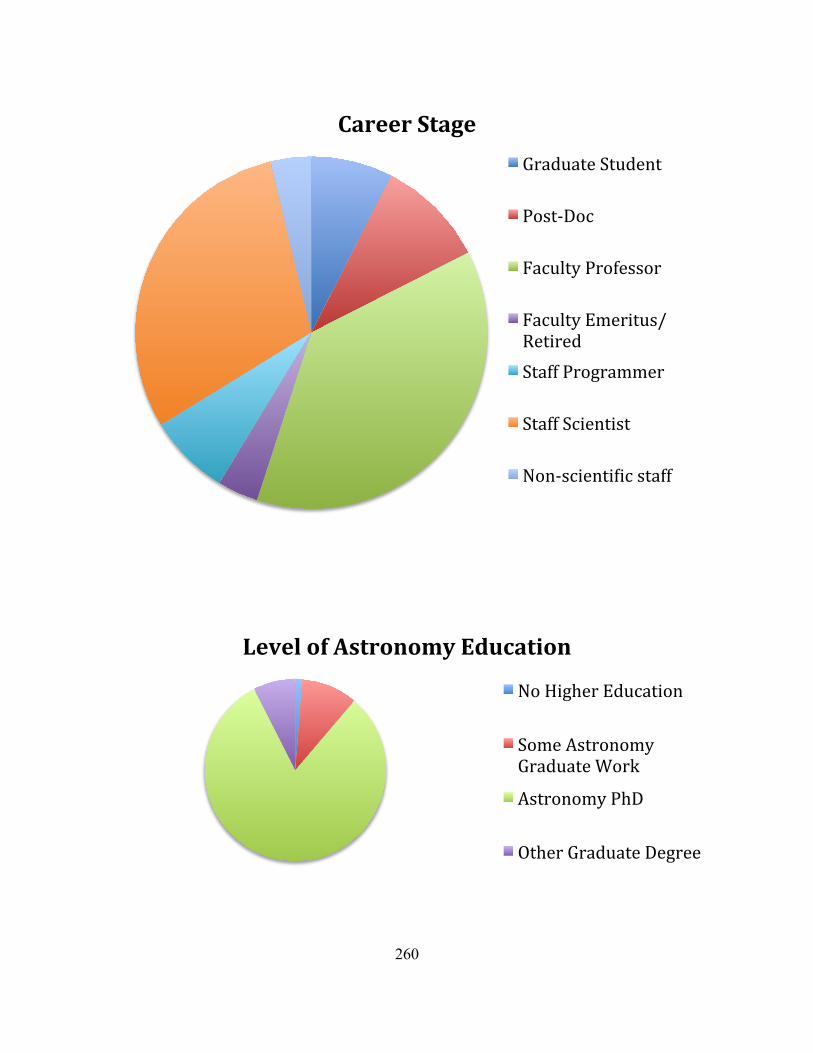
260
CareerStageGraduateStudent
Post-Doc
FacultyProfessor
FacultyEmeritus/RetiredStaffProgrammer
StaffScientist
Non-scienti_icstaff
LevelofAstronomyEducation
NoHigherEducation
SomeAstronomyGraduateWork
AstronomyPhD
OtherGraduateDegree
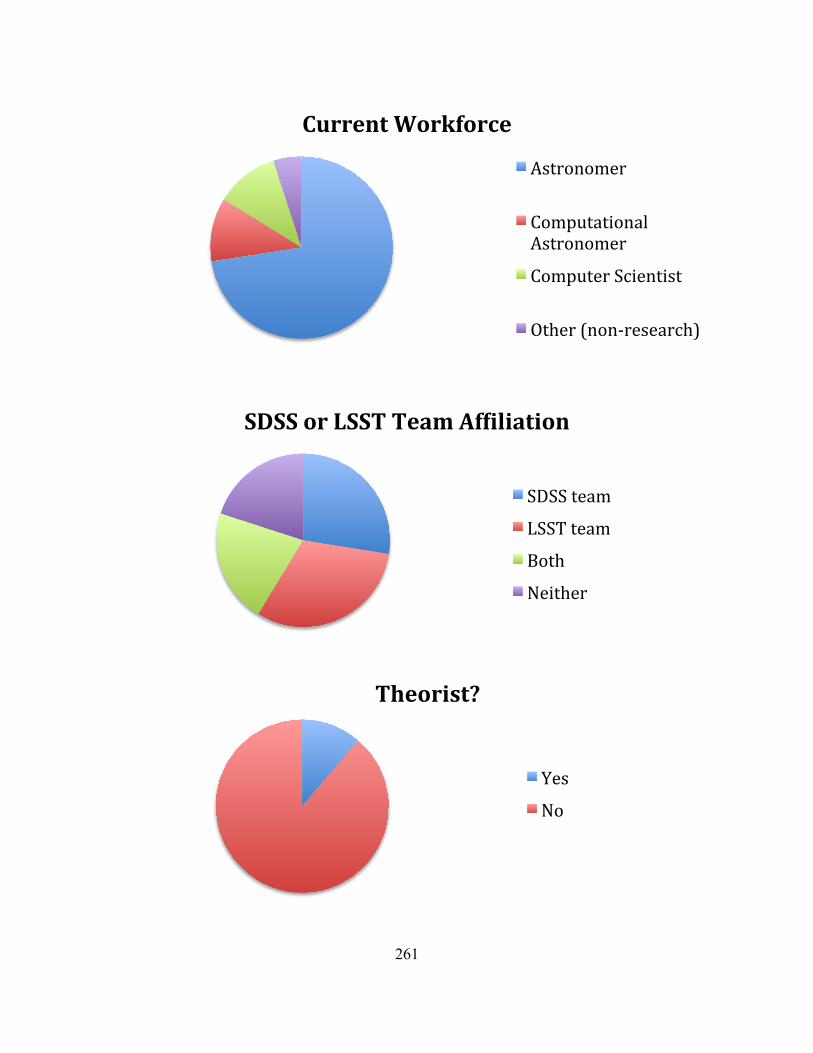
261
CurrentWorkforce
Astronomer
ComputationalAstronomer
ComputerScientist
Other(non-research)
SDSSorLSSTTeamAfWiliation
SDSSteam
LSSTteam
Both
Neither
Theorist?
Yes
No
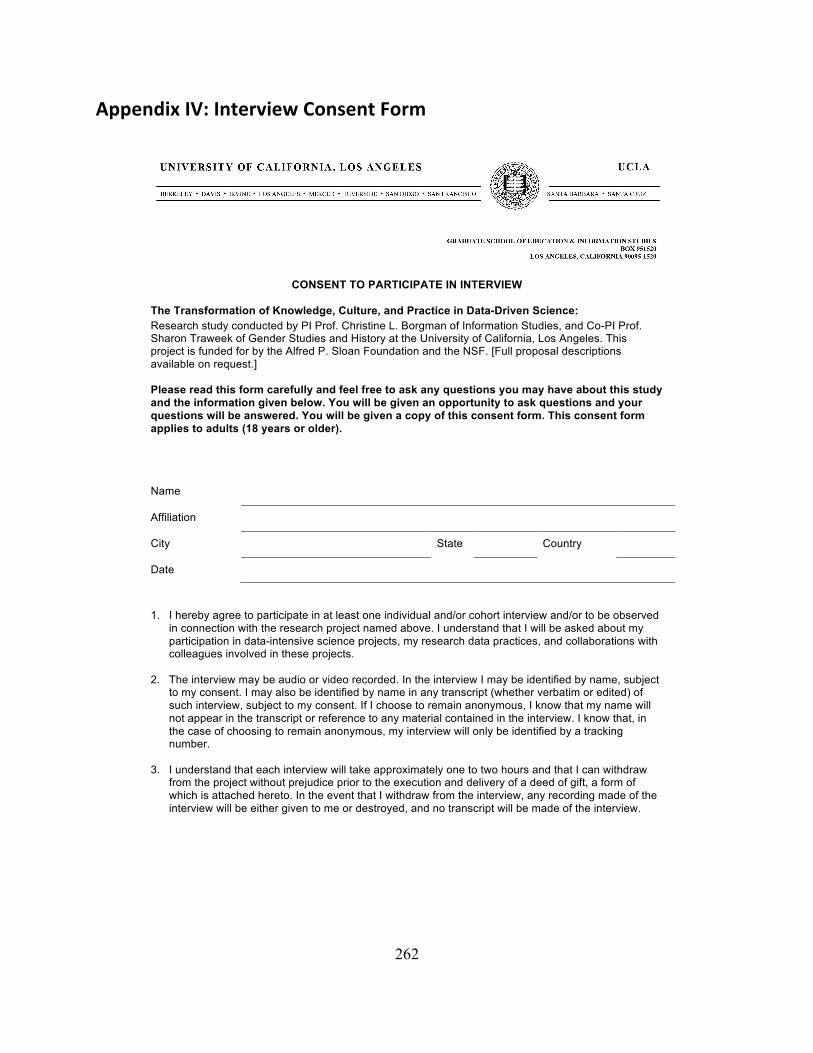
262
AppendixIV:InterviewConsentForm
CONSENT TO PARTICIPATE IN INTERVIEW
The Transformation of Knowledge, Culture, and Practice in Data-Driven Science: Research study conducted by PI Prof. Christine L. Borgman of Information Studies, and Co-PI Prof. Sharon Traweek of Gender Studies and History at the University of California, Los Angeles. This project is funded for by the Alfred P. Sloan Foundation and the NSF. [Full proposal descriptions available on request.] Please read this form carefully and feel free to ask any questions you may have about this study and the information given below. You will be given an opportunity to ask questions and your questions will be answered. You will be given a copy of this consent form. This consent form applies to adults (18 years or older).
Name
Affiliation
City State Country
Date
1. I hereby agree to participate in at least one individual and/or cohort interview and/or to be observed
in connection with the research project named above. I understand that I will be asked about my participation in data-intensive science projects, my research data practices, and collaborations with colleagues involved in these projects.
2. The interview may be audio or video recorded. In the interview I may be identified by name, subject
to my consent. I may also be identified by name in any transcript (whether verbatim or edited) of such interview, subject to my consent. If I choose to remain anonymous, I know that my name will not appear in the transcript or reference to any material contained in the interview. I know that, in the case of choosing to remain anonymous, my interview will only be identified by a tracking number.
3. I understand that each interview will take approximately one to two hours and that I can withdraw
from the project without prejudice prior to the execution and delivery of a deed of gift, a form of which is attached hereto. In the event that I withdraw from the interview, any recording made of the interview will be either given to me or destroyed, and no transcript will be made of the interview.
263
Page 2 of 3
4. Subject to the provisions of paragraph five below, I understand that, upon completion of the interview, the recording and content of the interview belong to PI’s Christine L. Borgman and Sharon Traweek, and that the information in the interview can be used by them in any manner they will determine, including, but not limited to, use by researchers in presentations and publications.
5. (i) No one will use or exercise any rights to the information in the interview prior to the signing of
the deed of gift; (ii) the deed of gift will be submitted to me for my signature at completion of the interview; and (iii) restrictions on the use of the interview can be placed in the deed of gift and will be accepted as amending the researchers’ rights to the content of the interview. I understand that I have the right to review, edit, or erase the recordings of the interview before I sign the deed of gift.
6. Any restrictions as to use of portions of the interview indicated by me will be edited from the final
copy of the transcript. 7. I understand that at the conclusion of this particular study and upon signing the deed of gift, the
recordings and one copy of the transcript will be kept by the principal investigator of this project, Prof. Christine Borgman, Graduate School of Education & Information Sciences at UCLA.
8. If I have questions about the research project or procedures, I know I can contact the principal
investigators of this project:
Prof. Christine Borgman University of California at Los Angeles Graduate School of Education & Information Studies [email protected] (310) 825-6164
Prof. Sharon Traweek Department of Gender Studies University of California at Los Angeles [email protected]
(310) 825-4601
If you wish to ask questions about your rights as a research participant or if you wish to voice any problems or concerns you may have about the study to someone other than the researchers, please call the Office of the Human Research Protection Program at (310) 825-7122 or write to Office for Protection of Research Subjects, UCLA, 11000 Kinross Avenue, Suite 211, Box 951694, Los Angeles, CA 90095-1694.
The content of this informed consent document is drawn from:
Center for the History of Physics, American Institute of Physics:
http://www.aip.org/history http://www.aip.org/history/oral_history/
conducting.html
Indiana University Center for the Study of History and Memory [CSHM]:
http://www.indiana.edu/~cshm/ http://www.indiana.edu/~cshm/informed_consent
264
Page 3 of 3
CONSENT TO PARTICIPATE IN INTERVIEW
Step 1: Check one of the following
___ I agree to be identified by name in any transcript or reference to any information contained in this interview.
____ I wish to remain anonymous in any transcript or reference to any information contained in this interview, and I wish to have my transcript only identified by an internal tracking number.
Step 2: Optional Restrictions
___ I wish to restrict access to recordings and transcripts of this interview to the following kinds of researchers:
___ initial research team conducting the interviews [led by PI’s Borgman & Traweek]
___ university-based researchers _____________________________________
___ others________________________________________________________
These restrictions to recordings and transcripts of this interview are for the following number of years___________
___ I wish to add the following restrictions ____________________________________
___________________________________________________________________
___________________________________________________________________
Ø Interviewee signature _______________________________________________________
Address _____________________________________________________________________
______________________________________________________________________
______________________________________________________________________
Phone number __________________________________________________________________
Consent date ____/____/____ Interviewer signature ________________________________________________________________
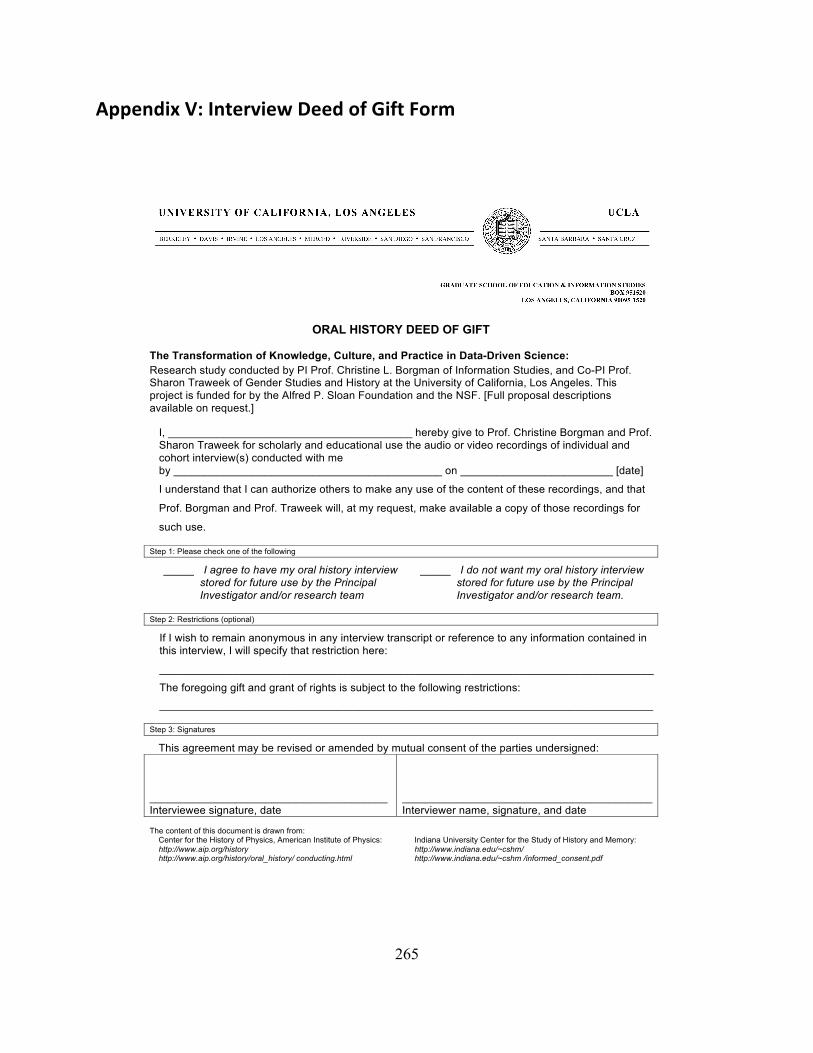
265
AppendixV:InterviewDeedofGiftForm
ORAL HISTORY DEED OF GIFT The Transformation of Knowledge, Culture, and Practice in Data-Driven Science: Research study conducted by PI Prof. Christine L. Borgman of Information Studies, and Co-PI Prof. Sharon Traweek of Gender Studies and History at the University of California, Los Angeles. This project is funded for by the Alfred P. Sloan Foundation and the NSF. [Full proposal descriptions available on request.]
I, ________________________________________ hereby give to Prof. Christine Borgman and Prof. Sharon Traweek for scholarly and educational use the audio or video recordings of individual and cohort interview(s) conducted with me by ____________________________________________ on _________________________ [date]
I understand that I can authorize others to make any use of the content of these recordings, and that
Prof. Borgman and Prof. Traweek will, at my request, make available a copy of those recordings for
such use.
Step 1: Please check one of the following
_____ I agree to have my oral history interview stored for future use by the Principal Investigator and/or research team
_____ I do not want my oral history interview stored for future use by the Principal Investigator and/or research team.
Step 2: Restrictions (optional)
If I wish to remain anonymous in any interview transcript or reference to any information contained in this interview, I will specify that restriction here:
_________________________________________________________________________________
The foregoing gift and grant of rights is subject to the following restrictions: _________________________________________________________________________________________
Step 3: Signatures
This agreement may be revised or amended by mutual consent of the parties undersigned:
_______________________________________ Interviewee signature, date
_________________________________________ Interviewer name, signature, and date
The content of this document is drawn from:
Center for the History of Physics, American Institute of Physics: http://www.aip.org/history http://www.aip.org/history/oral_history/ conducting.html
Indiana University Center for the Study of History and Memory: http://www.indiana.edu/~cshm/ http://www.indiana.edu/~cshm /informed_consent.pdf
266
References Abazajian, K. N., Adelman-McCarthy, J. K., Agüeros, M. A., Allam, S. S., Anderson, S. F.,
Annis, J., … Zucker, D. B. (2003). The first data release of the Sloan Digital Sky Survey.
The Astronomical Journal, 126(4), 2081–2086. https://doi.org/10.1086/378165
Abazajian, K. N., Adelman-McCarthy, J. K., Agüeros, M. A., Allam, S. S., Prieto, C. A., An, D.,
… Zucker, D. B. (2009). The seventh data release of the Sloan Digital Sky Survey. The
Astrophysical Journal Supplement Series, 182(2), 543–558. https://doi.org/10.1088/0067-
0049/182/2/543
About Us | DAMA. (2015, July 12). Retrieved July 13, 2015, from http://dama-dach.org/about-
us/
Abrams, S., Cruse, P., & Kunze, J. (2009). Preservation is not a place. International Journal of
Digital Curation, 4(1), 8–21. https://doi.org/10.2218/ijdc.v4i1.72
Accomazzi, A. (2011). Linking literature and data: Status report and future efforts. In A.
Accomazzi (Ed.), Future Professional Communication in Astronomy II (pp. 135–142).
Springer New York. https://doi.org/10.1007/978-1-4419-8369-5_15
Accomazzi, A., & Dave, R. (2011). Semantic interlinking of resources in the Virtual Observatory
era. Proceedings of Astronomical Data Analysis Software and Systems XX, ASPC 442,
415–424.
Accomazzi, A., Derriere, S., Biemesderfer, C., & Gray, N. (2012). Why don’t we already have
an Integrated Framework for the Publication and Preservation of all Data Products?
Astronomical Society of the Pacific Conference Series, 461, 867–870.
267
Accomazzi, A., Grant, C. S., Eichhorn, G., Kurtz, M. J., & Murray, S. S. (1996). The ADS
Article Service data holdings and access methods. In Astronomical Data Analysis
Software and Systems V, A.S.P. Conference Series (Vol. 101, p. 558).
Accomazzi, A., Henneken, E., Erdmann, C., & Rots, A. (2012). Telescope bibliographies: An
essential component of archival data management and operations. In Proc. SPIE 8448,
Observatory Operations: Strategies, Processes, and Systems IV (Vol. 8448, p. 84480K).
https://doi.org/10.1117/12.927262
Accomazzi, A., Kurtz, M. J., Henneken, E. A., Chyla, R., Luker, J., Grant, C. S., … Murray, S.
S. (2015). ADS: The next generation search platform. In LISA VII: Open Science: At the
Frontiers of Librarianship (Vol. 492, p. 189).
Ackerman, M. S., Hofer, E. C., & Hanisch, R. J. (2008). The National Virtual Observatory. In
Scientific Collaboration on the Internet (p. 135).
ADS. (2016). The SAO/NASA Astrophysics Data System. Retrieved April 11, 2016, from
http://adswww.harvard.edu/
Altman, M., Borgman, C. L., Crosas, M., & Martone, M. (2015). An introduction to the joint
principles for data citation. Bulletin of the American Society for Information Science and
Technology, 41(3), 43–45. https://doi.org/10.1002/bult.2015.1720410313
Altman, M., & Crosas, M. (2013). The Evolution of Data Citation: From Principles to
Implementation. IASSIST Quarterly, 37(Spring), 62.
Anderson, G., & Mulvey, P. (2012). Physics Doctorates Initial Employment: Data from the
Degree Recipient Follow-Up Survey for the Classes of 2009 and 2010. Focus On.
Statistical Research Center of the American Institute of Physics.
268
Anderson, W. L. (2004). Some challenges and issues in managing, and preserving access to,
long-lived collections of digital scientific and technical data. Data Science Journal, 3,
191–201. https://doi.org/10.2481/dsj.3.191
Association of Research Libraries. (2009). The research library’s role in digital repository
services: Final report of the ARL Digital Repository Issues Task Force. Washington, DC:
Association of Research Libraries.
Astronomy and Astrophysics Survey Committee. (2001). Astronomy and astrophysics in the new
millennium. Washington, DC: National Academy of Sciences.
Astrophysical Research Consortium. (1989). Principles of Operation of the Sky Survey Project.
Astrophysical Research Consortium. (2000). Principles of operation for the Sloan Digital Sky
Survey.
Astrophysical Research Consortium. (2005). Principles of operation for the Sloan Digital Sky
Survey II (PoO-II).
Astrophysical Research Consortium. (2008). Appendix. SDSS long-term scientific data archive.
In Memorandum of understanding between X and the Astrophysical Research
Consortium concerning archiving and serving data from the Sloan Digital Sky Survey.
Atkins, D., Dietterich, T., Hey, A. J. G., Baker, S., Feldman, S., Lyon, L., & et al. (2011). Final
report. Advisory Committee for CyberInstrastructure Task Force on Data and
Visualization: National Science Foundation.
Australian National Data Service (ANDS). (2017, January 11). ANDS Guide: Creating a data
management framework. Retrieved from http://www.ands.org.au/guides/creating-a-data-
management-framework
269
Babbie, E. R. (2007). The practice of social research (11th ed.). Belmont, CA: Thomson
Wadsworth.
Baker, K. S., & Millerand, F. (2010). Infrastructuring ecology : challenges in achieving data
sharing. In J. N. Parker, N. Vermeulen, & B. Penders (Eds.), Collaboration in the new life
sciences (pp. 111–138). Farnham, Surrey, England; Burlington, VT: Ashgate.
Baker, K. S., & Yarmey, L. (2009). Data Stewardship: Environmental Data Curation and a Web-
of-Repositories. International Journal of Digital Curation, 4(2), 12–27.
https://doi.org/10.2218/ijdc.v4i2.90
Ball, A. (2012, February 13). Review of Data Management Lifecycle Models. Bath, UK:
University of Bath.
Bates, J., Goodale, P., & Lin, Y. (2015). Data Journeys as an approach for exploring the socio-
cultural shaping of (big) data: The case of climate science in the United Kingdom. In
iConference 2015 Proceedings. iSchools.
https://doi.org/https://www.ideals.illinois.edu/handle/2142/73429
Becla, J., Hanushevsky, A., Nikolaev, S., Abdulla, G., Szalay, A. S., Nieto-Santisteban, M. A.,
… Gray, J. (2006). Designing a multi-petabyte database for LSST. In Proc. SPIE 6270,
Observatory Operations: Strategies, Processes, and Systems (Vol. 6270, p. 62700R–
62700R–8). https://doi.org/10.1117/12.671721
Becla, J., Nikolaev, S., Abdulla, G., Szalay, A. S., Nieto-Santisteban, M., Thakar, A., … Rosing,
W. (2005). LSST data access overview. In Bulletin of the American Astronomical Society
(Vol. 37, p. 1207).
Bell, G., Hey, A. J. G., & Szalay, A. S. (2009). Beyond the Data Deluge (Computer Science).
Science, 323(5919), 1297–1298. https://doi.org/10.1126/science.1170411
270
Benderly, B. L. (2008). Taken for Granted: Fitting the Job Market to a T. Science.
https://doi.org/10.1126/science.caredit.a0800130
Berman, F., & Cerf, V. G. (2013). Who will pay for public access to research data? Science,
341(6146), 616–617. https://doi.org/10.1126/science.1241625
Bicarregui, J., Gray, N., Henderson, R., Jones, R., Lambert, S., & Matthews, B. (2013). Data
Management and Preservation Planning for Big Science. International Journal of Digital
Curation, 8(1), 29–41. https://doi.org/10.2218/ijdc.v8i1.247
Blair, A. M. (2010). Too much to know: managing scholarly information before the modern age.
New Haven [Conn.]: Yale University Press.
Blanton, M. R., Schlegel, D. J., Strauss, M. A., Brinkmann, J., Finkbeiner, D., Fukugita, M., …
Zehavi, I. (2005). New York University Value-Added Galaxy Catalog: A Galaxy Catalog
Based on New Public Surveys. The Astronomical Journal, 129(6), 2562–2578.
https://doi.org/10.1086/429803
Blumer, E., & Burgi, P.-Y. (2015, December). Data Life-Cycle Management Project: SUC P2
2015-2018. Swiss Journal of Information Science (RESSI), 16.
Boellstorff, T. (2012). Ethnography and virtual worlds: A handbook of method. Princeton:
Princeton University Press.
Bollacker, K. D. (2010). Avoiding a Digital Dark Age. American Scientist, 98(2), 106–110.
Borgman, C. L. (1999). What are digital libraries? Competing visions. Information Processing &
Management, 35(3), 227–243. https://doi.org/10.1016/S0306-4573(98)00059-4
Borgman, C. L. (2000). From Gutenberg to the Global Information Infrastructure: Access to
Information in the Networked World. Cambridge, MA: MIT Press.
271
Borgman, C. L. (2007). Scholarship in the Digital Age: Information, Infrastructure, and the
Internet. Cambridge, MA: MIT Press.
Borgman, C. L. (2012a). The conundrum of sharing research data. Journal of the American
Society for Information Science and Technology, 63(6), 1059–1078.
https://doi.org/10.1002/asi.22634
Borgman, C. L. (2012b). Why Are the Attribution and Citation of Scientific Data Important? In
P. F. Uhlir (Ed.), Report from Developing Data Attribution and Citation Practices and
Standards: An International Symposium and Workshop. National Academy of Sciences’
Board on Research Data and Information. (pp. 1–8). Washington, D.C.: The National
Academies Press.
Borgman, C. L. (2013, February). Local or global? Making sense of the data sharing imperative.
British Library, London.
Borgman, C. L. (2015). Big data, little data, no data: Scholarship in the networked world.
Cambridge, MA: MIT Press.
Borgman, C. L., Bates, M. J., Cloonan, M. V., Efthimiadis, E. N., Gilliland-Swetland, A. J.,
Kafai, Y. B., … Maddox, A. B. (1996). Social aspects of digital libraries. Final report to
the National Science Foundation (Background paper for UCLA - National Science
Foundation Workshop).
Borgman, C. L., Darch, P. T., Sands, A. E., & Golshan, M. S. (2016). The durability and fragility
of knowledge infrastructures: Lessons learned from astronomy. In Proceedings of the
Association for Information Science and Technology (Vol. 53, pp. 1–10). ASIS&T.
Retrieved from http://dx.doi.org/10.1002/pra2.2016.14505301057
272
Borgman, C. L., Darch, P. T., Sands, A. E., Pasquetto, I. V., & Golshan, M. S. (2015, April 16).
If Data Sharing is the Answer, What is the Question?: Proposal to the Alfred P. Sloan
Foundation.
Borgman, C. L., Wallis, J. C., & Enyedy, N. (2007). Little science confronts the data deluge:
Habitat ecology, embedded sensor networks, and digital libraries. International Journal
on Digital Libraries, 7(1–2), 17–30. https://doi.org/10.1007/s00799-007-0022-9
Borgman, C. L., Wallis, J. C., & Mayernik, M. S. (2012). Who’s got the data? Interdependencies
in science and technology collaborations. Computer Supported Cooperative Work, 21(6),
485–523. https://doi.org/10.1007/s10606-012-9169-z
Borne, K. D. (2013). Virtual Observatories, Data Mining, and Astroinformatics. In T. D. Oswalt
& H. E. Bond (Eds.), Planets, Stars and Stellar Systems (Vol. 2, pp. 403–443).
Dordrecht: Springer Netherlands. Retrieved from DOI: 10.1007/978-94-007-5618-2_9
Borne, K. D., Jacoby, S., Carney, K., Connolly, A., Eastman, T., Raddick, M. J., … Wallin, J.
(2009). The revolution in astronomy education: Data science for the masses (State of the
Profession Position Paper submitted to the Astro2010 Decadal Survey).
Boroski, B. (2007, November). 5-Year Plan for hosting the SDSS data archive. Presented at the
Advisory Council II Meeting, Chicago O’Hare Hilton.
Bowker, G. C. (2005). Memory Practices in the Sciences. Cambridge, Mass.: MIT Press.
Bowker, G. C., & Star, S. L. (1999). Sorting Things Out: Classification and Its Consequences.
Cambridge, Mass.: The MIT Press.
boyd, danah, & Crawford, K. (2011). Six Provocations for Big Data. In A Decade in Internet
Time: Symposium on the Dynamics of the Internet and Society. Oxford Internet Institute,
University of Oxford.
273
boyd, danah, & Crawford, K. (2012). Critical Questions for Big Data: Provocations for a
cultural, technological, and scholarly phenomenon. Information, Communication &
Society, 15(5), 662–679. https://doi.org/10.1080/1369118X.2012.678878
Braniff, E. (2009, September 4). Hiring and Cultivating a New Kind of Talent: Today’s
Problems Call for Expert Generalists, or “Pi-Shaped” Talent. Advertising Age.
Brunner, R. J., Csabai, I., Szalay, A., Connolly, A. J., Szokoly, G. P., & Ramaiyer, K. (1996).
The Science Archive for the Sloan Digital Sky Survey. In Astronomical Data Analysis
Software and Systems V (Vol. 101, p. 493).
Brunsmann, J., Wilkes, W., Schlageter, G., & Hemmje, M. (2012). State-of-the-art of long-term
preservation in product lifecycle management. International Journal on Digital
Libraries, 12(1), 27–39. https://doi.org/10.1007/s00799-012-0081-4
Buckland, M. K. (1991). Information as thing. Journal of the American Society for Information
Science, 42(5), 351–360. https://doi.org/10.1002/(SICI)1097-
4571(199106)42:5<351::AID-ASI5>3.0.CO;2-3
Buckland, M. K. (1997). What is a “document”? Journal of the American Society for Information
Science, 48(9), 804–809. https://doi.org/10.1002/(SICI)1097-
4571(199709)48:9<804::AID-ASI5>3.0.CO;2-V
Budavari, T. (2010, July). Virtual Observatory technologies. Presented at the Big Data for
Science Workshop, NCSA Summer School 2010.
Burns, R., Vogelstein, J. T., & Szalay, A. S. (2014). From Cosmos to Connectomes: The
Evolution of Data-Intensive Science. Neuron, 83(6), 1249–1252.
https://doi.org/10.1016/j.neuron.2014.08.045
274
Carlson, S., & Anderson, B. (2007). What Are Data? The Many Kinds of Data and Their
Implications for Data Re-Use. Journal of Computer-Mediated Communication, 12(2),
635–651. https://doi.org/10.1111/j.1083-6101.2007.00342.x
Carusi, A., Darch, P. T., Lloyd, S., Jirotka, M., de la Flor, G., Schroeder, R., & Meyer, E. (2010).
Shared Understandings in e-Science Projects: A report from the ‘Embedding e-Science
Applications: Designing and Managing for Usability’ project.
CDS. (2016). SIMBAD Astronomical Database. Retrieved April 11, 2016, from http://simbad.u-
strasbg.fr/simbad/
Choudhury, G. S. (2010, March). The Data Conservancy: A Blueprint for Research Libraries in
the Data Age. Retrieved from https://jscholarship.library.jhu.edu/handle/1774.2/34014
Choudhury, G. S. (2013, August). Open access & data management are do-able through
partnerships. Keynote Lecture presented at the ASERL Summertime Summit: “Liaison
Roles in Open Access & Data Management: Equal Parts Inspiration & Perspiration,”
Georgia Institute of Technology, Klaus Advanced Computing Center. Retrieved from
http://hdl.handle.net/1853/48696
Choudhury, G. S., Palmer, C. L., Baker, K. S., & DiLauro, T. (2013, January). Levels of services
and curation for high functioning data. Poster presented at the International Digital
Curation Conference, Amsterdam.
Clarke, A. (2005). Situational analysis: Grounded theory after the postmodern turn. Thousand
Oaks, Calif.: SAGE Publications, Inc.
Claver, C. F., & LSST Systems Engineering Integrated Product Team. (2015). LSST system
requirements (No. LSE-29).
275
CODATA-ICSTI Task Group on Data Citation Standards Practices. (2013). Out of Cite, Out of
Mind: The Current State of Practice, Policy, and Technology for the Citation of Data.
Data Science Journal, 12, CIDCR1-CIDCR75. https://doi.org/10.2481/dsj.OSOM13-043
Colwell, R. (2009, November). Science Professionals: Master’s Education for a Competitive
World. Presented at the Professional Science Master’s (PSM) Sixth Biennial Meeting,
Washington Court Hotel, Washington, DC.
Committee for a Decadal Survey of Astronomy and Astrophysics; National Research Council.
(2010). New worlds, new horizons in astronomy and astrophysics. Washington, D.C.:
The National Academies Press.
Committee on Enhancing the Master’s Degree in the Natural Sciences, Board on Higher
Education and Workforce, Policy and Global Affairs, & National Research Council.
(2008). Science Professionals: Master’s Education for a Competitive World. Washington,
D.C.: National Academies Press.
Committee on NASA Astronomy Science Centers, & National Research Council. (2007). Portals
to the Universe: The NASA astronomy science centers. Washington, D.C.: National
Academies Press. Retrieved from DOI: 10.17226/11909
Connolly, A. (2014). LSST data management: Prospects for processing and archiving massive
astronomical data sets.
Consultative Committee for Space Data Systems. (2002). Reference model for an Open Archival
Information System (OAIS) (Recommendation for space data system standards No.
CCSDS 650.0-B-1 Blue Book) (pp. 1–9). Washington, D.C.
276
Consultative Committee for Space Data Systems. (2012). Reference model for an Open Archival
Information System (OAIS) (Recommendation for space data system practices No.
CCSDS 650.0-M-2 Magenta Book). Washington, D.C.
Cornell University. (2016). arXiv.org e-Print archive. Retrieved from http://arxiv.org/
Corrall, S. (2012). Roles and responsibilities -- libraries, librarians and data. In G. Pryor (Ed.),
Managing research data (1st ed.). London: Facet Publishing.
Critchlow, T., & Van Dam, K. K. (2013). What Is Data-Intensive Science? In K. K. van Dam
(Ed.), Data-intensive science (pp. 1–13). Boca Raton, Fla.: CRC Press.
Cronin, B. (2013). Thinking about data. Journal of the American Society for Information Science
and Technology, 64(3), 435–436. https://doi.org/10.1002/asi.22928
Crosas, M. (2013). A data sharing story. Journal of EScience Librarianship, 1(3).
https://doi.org/10.7191/jeslib.2012.1020
Crosas, M., Carpenter, T., Shotton, D., & Borgman, C. L. (2013, March 2). Amsterdam
Manifesto on Data Citation Principles. Retrieved from
http://www.force11.org/AmsterdamManifesto
Crowston, K., & Qin, J. (2011). A capability maturity model for scientific data management:
Evidence from the literature. Proceedings of the American Society for Information
Science and Technology, 48(1), 1–9. https://doi.org/10.1002/meet.2011.14504801036
Daniels, A. K. (1987). Invisible Work. Social Problems, 34(5), 403–415.
https://doi.org/10.2307/800538
Darch, P. T., Borgman, C. L., Traweek, S., Cummings, R. L., Wallis, J. C., & Sands, A. E.
(2015). What lies beneath?: Knowledge infrastructures in the subseafloor biosphere and
277
beyond. International Journal on Digital Libraries, 16(1), 61–77.
https://doi.org/10.1007/s00799-015-0137-3
Darch, P. T., & Sands, A. E. (2015). Beyond big or little science: Understanding data lifecycles
in astronomy and the deep subseafloor biosphere. In iConference 2015 Proceedings.
Newport Beach, CA: iSchools. Retrieved from
https://www.ideals.illinois.edu/handle/2142/73655
Darch, P. T., & Sands, A. E. (2017). Uncertainty About the Long-Term: Digital Libraries,
Astronomy Data, and Open Source Software. In 2017 IEEE/ACM Joint Conference on
Digital Libraries (JCDL). Toronto, Canada.
Data and Visualization Task Force. (2011). National Science Foundation Advisory Committee
for Cyberinfrastructure Task Force on Data and Visualization (Final Report).
Data Conservancy: Home. (2014). Retrieved from http://dataconservancy.org/home
Data management | LSST public website. (2015). Retrieved August 15, 2015, from
http://lsst.org/about/dm/
Data management system requirements | LSST public website. (2015). Retrieved August 15,
2015, from http://lsst.org/about/dm/requirements
Data Processing Levels for EOSDIS Data Products - NASA Science. (2010, November 8).
Retrieved August 15, 2015, from http://science.nasa.gov/earth-science/earth-science-
data/data-processing-levels-for-eosdis-data-products/
Data products | LSST public website. (2015). Retrieved August 15, 2015, from
http://lsst.org/about/dm/data-products
278
Digital Curation Centre. (2005). Digital Curation and Preservation: Defining the research
agenda for the next decade (Report of the Warwick Workshop - 7 & 8 November 2005).
Warwick, UK.
Directorate of Mathematical and Physical Sciences Division of Astronomical Sciences (AST).
(2010). Directorate of Mathematical and Physical Sciences Division of Astronomical
Sciences (AST) Advice to PIs on Data Management Plans. National Science Foundation.
Djorgovski, S. G., & Williams, R. (2005). Virtual Observatory: From concept to implementation.
In From Clark Lake to the Long Wavelength Array: Bill Erickson’s Radio Science. ASP
Conference Series (Vol. 345, p. 517).
Edwards, P. N. (2010). A Vast Machine: Computer Models, Climate Data, and the Politics of
Global Warming. Cambridge, MA: The MIT Press.
Edwards, P. N., Jackson, S. J., Chalmers, M. K., Bowker, G. C., Borgman, C. L., Ribes, D., …
Calvert, S. (2013). Knowledge infrastructures: Intellectual frameworks and research
challenges (p. 40). Ann Arbor, MI: University of Michigan. Retrieved from
http://deepblue.lib.umich.edu/handle/2027.42/97552
Edwards, P. N., Mayernik, M. S., Batcheller, A. L., Bowker, G. C., & Borgman, C. L. (2011).
Science Friction: Data, Metadata, and Collaboration. Social Studies of Science, 41(5),
667–690. https://doi.org/10.1177/0306312711413314
Ekbia, H., Mattioli, M., Kouper, I., Arave, G., Ghazinejad, A., Bowman, T., … Sugimoto, C. R.
(2015). Big data, bigger dilemmas: A critical review. Journal of the Association for
Information Science and Technology, 66(8), 1523–1545.
https://doi.org/10.1002/asi.23294
279
Engelhardt, C., Strathmann, S., & McCadden, K. (2012). Report and analysis on the training
needs survey (Education and Culture DG: Lifelong Learning Programme). DigCurV –
Digital Curator Vocational Education Europe.
Eschenfelder, K. R., & Shankar, K. (2016). Designing Sustainable Data Archives: Comparing
Sustainability Frameworks. iSchools. https://doi.org/10.9776/16243
Estrin, D., Michener, W. K., & Bonito, G. (2003). Environmental cyberinfrastructure needs for
distributed sensor networks: A report from a National Science Foundation sponsored
workshop. Scripps Institution of Oceanography, La Jolla, CA.
Fecher, B., Friesike, S., & Hebing, M. (2015). What Drives Academic Data Sharing? PLoS ONE,
10(2), e0118053. https://doi.org/10.1371/journal.pone.0118053
Feldman, S. (2006, October). Summary and Closing. Presented at the Services Science,
Engineering and Management Conference - Education for the 21st Century Conference,
IBM Palisades.
Finkbeiner, A. K. (2001). “Invisible” Astronomers Give Their All to the Sloan. Science,
292(5521), 1472–1475. https://doi.org/10.1126/science.292.5521.1472
Finkbeiner, A. K. (2010). A Grand and Bold Thing: the Extraordinary New Map of the Universe
Ushering in a New Era of Discovery. New York: Free Press.
Flannery, D., Matthews, B., Griffin, T., Bicarregui, J., Gleaves, M., Lerusse, L., … Kleese, K.
(2009). ICAT: Integrating Data Infrastructure for Facilities Based Science. In Fifth IEEE
International Conference on e-Science, 2009. e-Science ’09 (pp. 201–207).
https://doi.org/10.1109/e-Science.2009.36
280
Fox, P., & Harris, R. (2013). ICSU and the Challanges of Data and Information Management for
International Science. Data Science Journal, 12, WDS1-WDS12.
https://doi.org/10.2481/dsj.WDS-001
Freemon, M., & Kantor, J. P. (2013). LSST Data Management Infrastructure Design (No. LDM-
129).
Galison, P. (1997). Image and Logic: A Material Culture of Microphysics. Chicago: University
Of Chicago Press.
Galison, P., & Hevly, B. W. (Eds.). (1992a). Big science: the growth of large-scale research.
Stanford, Calif.: Stanford University Press.
Galison, P., & Hevly, B. W. (1992b). Big Science: The Growth of Large-Scale Research.
Stanford, Calif.: Stanford University Press.
Gall, J. (1976, December 26). Why nothing works the way it’s supposed to. The New York
Times.
Gall, J. (2002). The Systems Bible: The Beginner’s Guide to Systems Large and Small. General
Systemantics Press.
Ginsparg, P. (2011). arXiv at 20. Nature, 476(7359), 145–147. https://doi.org/10.1038/476145a
Gitelman, L., & Jackson, V. (2013). Introduction. In L. Gitelman (Ed.), “Raw Data” Is an
Oxymoron. Cambridge, Massachusetts: The MIT Press.
Glaser, B. G., & Strauss, A. L. (1967). The discovery of grounded theory: Strategies for
qualitative research. Chicago: Aldine Pub. Co.
Goble, C., & De Roure, D. (2009). The impact of workflow tools on data-intensive research. In
A. J. G. Hey, S. Tansley, & K. Tolle (Eds.), The fourth paradigm: Data-intensive
scientific discovery (pp. 137–146). Redmond, WA: Microsoft.
281
Goodman, A. A. (2009, March). Seamless Astronomy. Poster presented at the External Research
Symposium 2009, Microsoft Research.
Goodman, A. A., Fay, J., Muench, A. A., Pepe, A., Udompraseret, P., & Wong, C. (2012).
WorldWide Telescope in research and education. In Astronomical Data Analysis
Software and Systems XXI: November 6-10, 2011, Paris, France. ASP Conference Series
(Vol. 461, pp. 267–270). Astronomical Society of the Pacific.
https://doi.org/https://dash.harvard.edu/handle/1/11688788
Goodman, A. A., & Wong, C. G. (2009). Bringing the night sky closer: Discoveries in the data
deluge. In A. J. G. Hey, S. Tansley, & K. Tolle (Eds.), The fourth paradigm: Data-
intensive scientific discovery (pp. 39–44). Redmond, WA: Microsoft.
Gray, J., Slutz, D., Szalay, A. S., Thakar, A. R., vandenBerg, J., Kunszt, P. Z., … Slutz, D.
(2002). Data mining the SDSS SkyServer database (No. MSR-TR-2002-01) (pp. 189–
210). Microsoft Research.
Gray, J., Szalay, A. S., Thakar, A. R., Stoughton, C., & vandenBerg, J. (2002). Online Scientific
Data Curation, Publication, and Archiving. Cs/0208012.
Gray, N., Carozzi, T. D., & Woan, G. (2012). Managing Research Data in Big Science (This
report was prepared as part of the RDMP strand of the JISC programme Managing
Research Data.). University of Glasgow.
Greenberg, J. (2009). Theoretical considerations of lifecycle modeling: An analysis of the Dryad
repository demonstrating automatic metadata propagation, inheritance, and value system
adoption. Cataloging & Classification Quarterly, 47(3–4), 380–402.
https://doi.org/10.1080/01639370902737547
282
Gunn, J. E., & Knapp, G. R. (1993). The Sloan Digital Sky Survey (Vol. 43, p. 267). Presented at
the Sky Surveys. Protostars to Protogalaxies.
Hahn, K., Lowry, C., Lynch, C., & Shulenberger, D. (2009). The university’s role in the
dissemination of research and scholarship — a call to action (Research on Institutional
Repositories: Articles and Presentations No. 31). Washington, DC: AAU, ARL, CNI, and
NASULGC.
Hand, E. (2009). The world’s top ten telescopes revealed. Nature News.
https://doi.org/10.1038/news.2009.81
Hanisch, R. J. (2012). Science initiatives of the US Virtual Astronomical Observatory. In
Astronomical Data Analysis Software and Systems XXI, Paris, France, 6-10 November,
2011. ASP Conference Series (Vol. 461, p. 271). Astronomical Society of the Pacific.
Hanisch, R. J. (2013, August 12). The future of the Virtual Observatory. Retrieved August 13,
2013, from http://www.usvao.org/2013/08/12/the-future-of-the-virtual-observatory/
Hanisch, R. J., Farris, A., Greisen, E. W., Pence, W. D., Schlesinger, B. M., Teuben, P. J., …
Warnock, A. (2001). Definition of the Flexible Image Transport System (FITS).
Astronomy and Astrophysics, 376(1), 359–380. https://doi.org/10.1051/0004-
6361:20010923
Hartman, P. (2005, October 27). The Art and Science of Being an IT Architect: Are you Pi-
shaped? Retrieved February 7, 2016, from
Hasan, H., Hanisch, R. J., & Bredekamp, J. (2000). NASA’s astrophysics data archives.
Astrophysics and Space Science, 273(1), 131–139.
https://doi.org/10.1023/A:1002620613422
283
Hedstrom, M. (2012, December). Digital data curation - examining needs for digital data
curators. Presented at the Fondazione Rinascimento Digitale International Conference
2012, Florence, Italy.
Hedstrom, M., Dirks, L., Fox, P., Goodchild, M., Joseph, H., Larsen, R., … Title, A. (2015).
Preparing the Workforce for Digital Curation. Washington, D.C.: National Academies
Press.
Heidorn, P. B. (2011). The Emerging Role of Libraries in Data Curation and E-science. Journal
of Library Administration, 51(7–8), 662–672.
https://doi.org/10.1080/01930826.2011.601269
Henneken, E. A., Eichhorn, G., Accomazzi, A., Kurtz, M. J., Grant, C., Thompson, D., …
Murray, S. S. (2010). How the literature is used a view through citation and usage
statistics of the ADS. In H. J. Haubold & A. M. Mathai (Eds.), Proceedings of the Third
UN/ESA/NASA Workshop on the International Heliophysical Year 2007 and Basic Space
Science (pp. 141–147). https://doi.org/10.1007/978-3-642-03325-4_12
Henneken, E. A., Kurtz, M. J., & Accomazzi, A. (2011, June 28). The ADS in the Information
age - impact on discovery.
Henneken, E. A., Kurtz, M. J., Eichhorn, G., Accomazzi, A., Grant, C. S., Thompson, D., …
Warner, S. (2007). E-prints and journal articles in astronomy: A productive co-existence.
Learned Publishing, 20(1), 16–22. https://doi.org/10.1087/095315107779490661
Henneken, E. A., & Thompson, D. (2013). ADS labs: Supporting information discovery in
science education. In Communicating Science: A National Conference on Science
Education and Public Outreach, 2012 (Vol. 473, p. 207). Tucson, AZ: Astronomical
Society of the Pacific.
284
Henry, C. (2012). Introduction. In L. Jahnke, A. D. Asher, & S. D. C. Keralis, The problem of
data. Washington, DC: Council on Library and Information Resources.
Hey, A. J. G. (2015, May). The Fourth Paradigm: Data-Intensive Scientific Discovery, Open
Science and the Cloud. High Energy Seminars at UC Davis presented at the High Energy
Seminars at UC Davis, UC Davis.
Hey, A. J. G., & Hey, J. (2006). e-Science and its implications for the library community.
Library Hi Tech, 24(4), 515–528. https://doi.org/10.1108/07378830610715383
Hey, A. J. G., Tansley, S., & Tolle, K. (Eds.). (2009a). Jim Gray on eScience: A transformed
scientific method. In The fourth paradigm: Data-intensive scientific discovery (pp. xix–
xxxiii). Redmond, WA: Microsoft Research.
Hey, A. J. G., Tansley, S., & Tolle, K. (Eds.). (2009b). The fourth paradigm: Data-intensive
scientific discovery. Redmond, WA: Microsoft Research.
Higgins, S. (2008). The DCC Curation Lifecycle Model. International Journal of Digital
Curation, 3(1), 134–140. https://doi.org/10.2218/ijdc.v3i1.48
Higgins, S. (2012). The lifecycle of data management. In Managing research data (1st ed., p.
224). Facet Publishing.
Hine, C. (Ed.). (2006). New infrastructures for knowledge production: Understanding e-science.
Hershey, PA: Information Science Publishing.
Holdren, J. P. (2013, February 22). Memorandum for the Heads of Executive Departments and
Agencies: Increasing Access to the Results of Federally Funded Scientific Research.
Executive Office of the President, Office of Science and Technology Policy.
Howison, J., & Bullard, J. (2016). Software in the scientific literature: Problems with seeing,
finding, and using software mentioned in the biology literature. Journal of the
285
Association for Information Science and Technology, 67(9), 2137–2155.
https://doi.org/10.1002/asi.23538
Huang, C. H., Munn, J., Yanny, B., Kent, S., Petravick, D., Pordes, R., … Brunner, R. J. (1995).
Object-oriented modeling and design for Sloan Digital Sky Survey retained data (No.
FNAL/C--95/390; CONF-9510286--4). Fermi National Accelerator Lab., Batavia, IL
(United States).
Humphrey, C. (2006). e-Science and the life cycle of research. IASSIST Communiqué.
Interagency Working Group on Digital Data. (2009). Harnessing the power of digital data for
science and society. Washington, D.C.: Report of the Interagency Working Group on
Digital Data to the Committee on Science of the National Science and Technology
Council.
International Virtual Observatory Alliance. (2015). Retrieved from http://www.ivoa.net/
Ivezić, Ž., & LSST Science Council. (2011). LSST system science requirements document,
v.5.2.3 (No. LPM-17).
Ivezić, Ž., Monet, D. G., Bond, N., Jurić, M., Sesar, B., Munn, J. A., … SDSS Collaboration and
LSST Collaboration. (2007). Astrometry with digital sky surveys: From SDSS to LSST.
Proceedings of the International Astronomical Union, 3(S248).
https://doi.org/10.1017/S1743921308020103
Ivezić, Ž., Tyson, J. A., Abel, B., Acosta, E., Allsman, R., AlSayyad, Y., … Collaboration, for
the L. (2011, June 7). LSST: From science drivers to reference design and anticipated
data products (Version 2.0).
286
Ivezić, Ž., Tyson, J. A., Abel, B., Acosta, E., Allsman, R., AlSayyad, Y., … Collaboration, for
the L. (2014, August 26). LSST: From science drivers to reference design and anticipated
data products (Version 4.0).
Ivie, R., Ephraim, A., & White, S. (2009). Astronomy Faculty: Results from the 2008 Survey of
Physics & Astronomy Degree-Granting Departments. Statistical Research Center of the
American Institute of Physics.
Jackson, S. J., Ribes, D., & Buyuktur, A. (2010). Exploring Collaborative Rhythm: Temporal
Flow and Alignment in Collaborative Scientific Work, 1–6.
Jackson, S. J., Ribes, D., Buyuktur, A., & Bowker, G. C. (2011). Collaborative Rhythm:
Temporal Dissonance and Alignment in Collaborative Scientific Work. In Proceedings of
the ACM 2011 Conference on Computer Supported Cooperative Work (pp. 245–254).
New York, NY, USA: ACM. https://doi.org/10.1145/1958824.1958861
Joint Information Systems Committee (JISC), & Coalition for Networked Information (CNI).
(2015). Scholarly communication: The journey towards openness (Conference report:
Jisc CNI meeting 2014: Opening up scholarly communications. 10-11 July 2014, Bristol,
UK). Jisc.
Joint Leadership Group of the National Digital Stewardship Alliance. (2013). 2014 National
Agenda for Digital Stewardship. National Digital Stewardship Alliance (NDSA).
Juric, M. (2014, March). LSST data management: Data products and software stack overview.
Presented at the Joint DES-LSST Workshop, Fermilab.
Juric, M., Lupton, R. H., Axelrod, T., Bosch, J. F., Dubois-Felsmann, G. P., Ivezić, Ž., … Tyson,
J. A. (2013). LSST data products definition document (No. LSST document LSE-163).
287
Kantor, J. P. (2014, August). Introduction to LSST data management. Presented at the LSST
2014 Project and Community Workshop, Phoenix, AZ.
Kantor, J. P., Axelrod, T., Becla, J., Cook, K., Nikolaev, S., Gray, J., … Thakar, A. R. (2007).
Designing for peta-scale in the LSST Database (Vol. 376, p. 3). Presented at the
Astronomical Data Analysis Software and Systems XVI.
Karasti, H., & Baker, K. S. (2008). Digital data practices and the Long Term Ecological
Research program growing global. International Journal of Digital Curation, 3(2), 42–
58. https://doi.org/10.2218/ijdc.v3i2.57
Karasti, H., Baker, K. S., & Halkola, E. (2006). Enriching the notion of data curation in e-
Science: Data managing and information infrastructuring in the Long Term Ecological
Research (LTER) network. Journal of Computer-Supported Cooperative Work, 15(4),
321–358. https://doi.org/10.1007/s10606-006-9023-2
Kennicutt Jr, R. C. (2007). Astronomy: Sloan at five. Nature, 450(7169), 488–489.
https://doi.org/10.1038/450488a
Kent, S. M. (1994). Sloan Digital Sky Survey. In Astronomical Data Analysis Software and
Systems III (Vol. 61, p. 205).
Kim, J., Warga, E., & Moen, W. (2013). Competencies required for digital curation: An analysis
of job advertisements. International Journal of Digital Curation, 8(1), 66–83.
https://doi.org/10.2218/ijdc.v8i1.242
Kim, Y., Addom, B. K., & Stanton, J. M. (2011). Education for eScience professionals:
Integrating data curation and cyberinfrastructure. International Journal of Digital
Curation, 6(1), 125–138. https://doi.org/10.2218/ijdc.v6i1.177
288
Kitchin, R. (2014). The Data Revolution: Big Data, Open Data, Data Infrastructures and Their
Consequences (1st edition). Thousand Oaks, CA: SAGE Publications Ltd.
Kitching, T. D., Mann, R. G., Valkonen, L. E., Holliman, M. S., Hume, A., & Noddle, K. T.
(2013). Data-Intensive Methods in Astronomy. In lcolm Atkinson, R. Baxter, M. Galea,
rk Parsons, P. Brezany, O. Corcho, … D. Snelling (Eds.), The DATA Bonanza (pp. 381–
394). John Wiley & Sons, Inc. Retrieved from DOI:10.1002/9781118540343.ch18
Kleinman, S. J., Gunn, J. E., Boroski, B., Long, D., Snedden, S., Nitta, A., … Jester, S. (2008).
Lessons learned from Sloan Digital Sky Survey operations (Vol. 7016, p. 70160B–
70160B–12). https://doi.org/10.1117/12.789612
Kratz, J. E., & Strasser, C. (2015). Researcher Perspectives on Publication and Peer Review of
Data. PLoS ONE, 10(2), e0117619. https://doi.org/10.1371/journal.pone.0117619
Kron, R. G. (2008). Sloan Digital Sky Survey II Project Execution Plan (Version 1.2).
Kron, R. G., Gunn, J. E., Strauss, M. A., Boroski, W. N., & Evans, M. L. (2005). Final Report to
the Alfred P. Sloan Foundation (No. 99-12–1).
Kron, R. G., Gunn, J. E., Weinberg, D. H., Boroski, W. N., & Evans, M. L. (2008). Final Report
to the Alfred P. Sloan Foundation (No. 2004-3–11).
Kunszt, P. Z., Szalay, A. S., Csabai, I., & Thakar, A. R. (2000). The Indexing of the SDSS
Science Archive. In N. Manset (Ed.), (ADASS 9) Astronomical Data Analysis Software
and Systems IX: proceedings of a meeting held at the Hilton Waikoloa Village, Hawaii,
USA, 3 - 6 October, 1999 (Vol. 216, p. 141). San Francisco, Calif: Astronomical Society
of the Pacific.
Kurtz, M. J., Eichhorn, G., Accomazzi, A., Grant, C., Demleitner, M., & Murray, S. S. (2005).
Worldwide use and impact of the NASA Astrophysics Data System digital library.
289
Journal of the American Society for Information Science and Technology, 56(1), 36–45.
https://doi.org/10.1002/asi.20095
Kurtz, M. J., Eichhorn, G., Accomazzi, A., Grant, C. S., Demleitner, M., & Murray, S. S. (1999).
The NASA ADS Abstract Service and the distributed astronomy digital library. D-Lib
Magazine, 5(11). https://doi.org/10.1045/november99-kurtz
Kurtz, M. J., Eichhorn, G., Henneken, E., Accomazzi, A., Grant, C., Thompson, D., … Murray,
S. (2007). myADS-arXiv: A fully customized, open access virtual journal. In American
Physical Society March Meeting, March 5-9, 2007, abstract #U20.009.
Laney, D. (2001). 3D Data Management: Controlling Data Volume, Velocity and Variety"
(Application Delivery Strategies No. File 949). META Group (Gartner).
Large Hadron Collider (LHC). (2015). Retrieved November 8, 2015, from
http://www.stfc.ac.uk/646.aspx
Large Synoptic Survey Telescope: Home. (2016). Retrieved November 8, 2015, from
http://www.lsst.org/lsst
Latour, B. (1987). Science in action: How to follow scientists and engineers through society.
Cambridge, MA: Harvard University Press.
Latour, B. (1993). We Have Never Been Modern. (C. Porter, Trans.). Cambridge, MA: Harvard
University Press.
Latour, B., & Woolgar, S. (1979). Laboratory Life: The Social Construction of Scientific Facts.
Beverly Hills: Sage Publications.
Latour, B., & Woolgar, S. (1986). Laboratory Life: The Construction of Scientific Facts (2nd
ed.). Princeton, N.J.: Princeton University Press.
290
Lee, C. (2009, December). Overview of DigCCurr matrix of digital curation knowledge and
competencies. Presented at the Fourth meeting of the IDEA (International Data curation
Education Action) Working Group, London, UK.
Leonelli, S. (2013). Global Data for Local Science: Assessing the Scale of Data Infrastructures in
Biological and Biomedical Research. BioSocieties, 8(4), 449–465.
https://doi.org/10.1057/biosoc.2013.23
Levine, M. (2014). Copyright, Open Data, and the Availability-Usability Gap: Challenges,
Opportunities, and Approaches for Libraries. In J. M. Ray, Research Data Management:
Practical Strategies for Information Professionals. West Lafayette: Purdue University
Press.
Lofland, J., & Lofland, L. H. (1995). Analyzing social settings: A guide to qualitative
observation and analysis. Belmont, Calif.: Wadsworth.
Lohr, S. (2014, August 17). For Big-Data Scientists, ‘Janitor Work’ Is Key Hurdle to Insights.
The New York Times.
LSST Data Management Wiki. (2015). [Wiki Site]. Retrieved November 8, 2015, from
https://dev.lsstcorp.org/trac
LSST project schedule. (2015). Retrieved November 8, 2015, from
http://www.lsst.org/about/timeline
LSST Science Collaboration, Abell, P. A., Allison, J., Anderson, S. F., Andrew, J. R., Angel, J.
R. P., … Zhan, H. (2009). LSST Science Book, Version 2.0 (arXiv e-print). Retrieved
from http://arxiv.org/abs/0912.0201
Lupton, R. H. (2002, July). Lessons I Learned from SDSS. Tucson, AZ.
291
Lupton, R. H. (2010, April). Astronomical surveys: From SDSS to LSST. Presented at the
Supercomputing Techniques in Astronomy, Santiago, Chile.
Lynch, C. A. (2013). The Next Generation of Challenges in the Curation of Scholarly Data. In J.
M. Ray (Ed.), Research Data Management: Practical Strategies for Information
Professionals. West Lafayette, IN: Purdue University Press.
Lyon, L. (2007). Dealing with data: Roles, rights, responsibilities, and relationships
(Consultancy Report). Bath, UK: UKOLN.
Manyika, J., Chui, M., Farrell, D., Van Kuiken, S., Groves, P., & Doshi, E. A. (2013). Open
data: Unlocking innovation and performance with liquid information. McKinsey &
Company. Retrieved from
http://www.mckinsey.com/insights/business_technology/open_data_unlocking_innovatio
n_and_performance_with_liquid_information
Margon, B. (1998). The Sloan Digital Sky Survey. Philosophical Transactions of the Royal
Society A.
Mayernik, M. S. (2011, June). Metadata Realities for Cyberinfrastructure: Data Authors as
Metadata Creators (PhD Dissertation). UCLA, Los Angeles, CA. Retrieved from
http://dx.doi.org/10.2139/ssrn.2042653
Mayernik, M. S., DiLauro, T., Duerr, R., Metsger, E., Thessen, A., & Choudhury, G. (2013).
Data Conservancy Provenance, Context, and Lineage Services: Key Components for
Data Preservation and Curation. Data Science Journal, 12(0), 158–171.
https://doi.org/10.2481/dsj.12-039
Mayer-Schonberger, V., & Cukier, K. (2013). Big Data: A Revolution That Will Transform How
We Live, Work, and Think. Boston: Houghton Mifflin Harcourt.
292
McCray, W. P. (2000). Large Telescopes and the Moral Economy of Recent Astronomy. Social
Studies of Science, 30(5), 685–711. https://doi.org/10.1177/030631200030005002
McCray, W. P. (2014). How Astronomers Digitized the Sky. Technology and Culture, 55(4),
908–944. https://doi.org/10.1353/tech.2014.0102
McKiernan, G. (2001). The NASA Astrophysics Data System Abstract Service: Astronomy.
Library Hi Tech News, 18(7). https://doi.org/10.1108/lhtn.2001.23918gaf.003
McNally, R., Mackenzie, A., Hui, A., & Tomomitsu, J. (2012). Understanding the ‘Intensive’ in
‘Data Intensive Research’: Data Flows in Next Generation Sequencing and
Environmental Networked Sensors. International Journal of Digital Curation, 7(1).
https://doi.org/10.2218/ijdc.v7i1.216
Merton, R. K. (1973). The Sociology of Science: Theoretical and Empirical Investigations.
Chicago: University of Chicago Press.
Michener, W., Vieglais, D., Vision, T., Kunze, J., Cruse, P., & Janée, G. (2011). DataONE: Data
Observation Network for Earth - Preserving Data and Enabling Innovation in the
Biological and Environmental Sciences. D-Lib Magazine, 17(1), 3-.
Miller, K. (2012, February 17). 5 Steps to Research Data Readiness | Digital Curation Centre.
Digital Curation Centre. Retrieved from http://www.dcc.ac.uk/news/5-steps-research-
data-readiness
Mol, A. (2002). The body multiple: Ontology in medical practice. Duke University Press.
Moore, R. W. (2004). National Virtual Observatory architecture. In Toward an International
Virtual Observatory (pp. 67–74). Retrieved from http://dx.doi.org/10.1007/10857598_10
Mossink, W., Bijsterbosch, M., & Nortier, J. (2013). European Landscape Study of Research
Data Management (p. 55). Utrecht: SURF Foundation.
293
Mulvey, P., & Nicholson, S. (2014). Astronomy Enrollments and Degrees: Results from the 2012
Survey of Astronomy Enrollments and Degrees. Focus On. Statistical Research Center of
the American Institute of Physics.
Mulvey, P., & Pold, J. (2014). Physics Doctorates Initial Employment: Data from the Degree
Recipient Follow-Up Survey for the Classes of 2011 and 2012. Focus On. Statistical
Research Center of the American Institute of Physics.
Munns, D. P. D. (2012). A single sky: How an international community forged the science of
radio astronomy. The MIT Press.
Murchison, J. M. (2010). Ethnography essentials: Designing, conducting, and presenting your
research (1st ed). San Francisco: Jossey-Bass.
NASA/IPAC Extragalactic Database (NED). (2016). Retrieved October 27, 2015, from
https://ned.ipac.caltech.edu/
National Academies of Science. US CODATA and the Board on Research Data and Information,
in collaboration with CODATA-ICSTI Task Group on Data Citation Standards and
Practices. (2012). Developing Data Attribution and Citation Practices and Standards: An
International Symposium and Workshop. Washington, DC.
National Aeronautics and Space Administration, Science Mission Directorate. (2010).
Introduction to the Electromagnetic Spectrum. Retrieved February 21, 2016, from
http://missionscience.nasa.gov/ems/01_intro.html
National Commission for the Protection of Human Subjects of Biomedical and Behavioral
Research. (1978). Belmont Report: Ethical principles and guidelines for the protection of
human subjects of research. Washington, DC: United States Government Printing Office.
294
National Digital Stewardship Alliance of the Library of Congress. (2013). The NDSA Levels of
Digital Preservation V. 1. Retrieved July 26, 2013, from
http://www.digitalpreservation.gov/ndsa/activities/levels.html
National Health and Medical Research Council. (2007). Australian Code for the Responsible
Conduct of Research (No. 39).
National Information Standards Organization. (2004). Understanding metadata. Bethesda, MD:
NISO Press.
National Institute of Health. (2003). Final NIH Statement on Sharing Research Data (No. NOT-
OD-03-032).
National Research Council. (1999). A Question of Balance: Private Rights and the Public
Interest in Scientific and Technical Databases. Washington, D.C.: National Academies
Press.
National Science Board (U.S.). (2005). Long-Lived Digital Data Collections: Enabling Research
and Education in the 21st Century (No. US NSF-NSB-05-40). Arlington, Virginia:
National Science Foundation.
National Science Foundation. (2005). Award #0551161: The Large Synoptic Survey Telescope
(LSST) for design and development. Retrieved August 14, 2015, from
National Science Foundation. (2010a). Award #1036980: Completion of the design and project
development phases for construction readiness of the Large Synoptic Survey Telescope
(LSST). Retrieved August 14, 2015, from
National Science Foundation. (2010b). NSF Data Management Plans. Washington, D.C.:
National Science Foundation. Retrieved from
http://www.nsf.gov/pubs/policydocs/pappguide/nsf11001/gpg_2.jsp#dmp
295
National Science Foundation. (2012). Award #1227061: The Large Synoptic Survey Telescope
final design phase. Retrieved August 17, 2015, from
National Science Foundation. (2014a). Award #1202910: Construction of the Large Synoptic
Survey Telescope (LSST) under the Major Research Equipment and Facilities
Construction (MREFC) account. Retrieved August 14, 2015, from
National Science Foundation. (2014b). NSF FY 2015 Budget Request to Congress: Major
Research Equipment and Facilities Construction Funding (FY 2015 Budget Request to
Congress).
Neilsen Jr., E. H., & Stoughton, C. (2006). Running the Sloan Digital Sky Survey data archive
server. In Astronomical Data Analysis Software and Systems XVI (Vol. 376, p. 42).
Neuman, S. (2015, February 13). Internet Pioneer Warns Our Era Could Become The “Digital
Dark Ages.” NPR.Org.
Nicholson, S., & Mulvey, P. (2011). Astronomy Enrollments and Degrees: Results from the 2009
& 2010 Surveys of Physics & Astronomy Enrollments and Degrees. Focus On. Statistical
Research Center of the American Institute of Physics.
Nielsen, H. J., & Hjørland, B. (2014). Curating research data: the potential roles of libraries and
information professionals. Journal of Documentation, 70(2), 221–240.
https://doi.org/10.1108/JD-03-2013-0034
Nielsen, M. A. (2011). Reinventing discovery: the new era of networked science. Princeton, N.J.:
Princeton University Press.
Norris, R., Andernach, H., Eichhorn, G., Genova, F., Griffin, E., Hanisch, R. J., … Richards, A.
(2006). Astronomical data management. In Highlights of Astronomy, XXVIth IAU
General Assembly (Vol. 14).
296
NVO Interim Steering Committee. (2001). Toward a National Virtual Observatory: Science
goals, technical challenges, and implementation plan. In R. J. Brunner, S. G. Djorgovski,
& A. S. Szalay (Eds.), Virtual Observatories of the Future (Vol. 225, p. 353).
Astronomical Society of the Pacific.
Office of Scholarly Communication, University of California. (2013a). UC open access policy:
Implementation plan. Retrieved May 15, 2014, from
Office of Scholarly Communication, University of California. (2013b, July 24). Open access
policy for the Academic Senate of the University of California.
Olson, G. M., & Olson, J. S. (2000). Distance matters. Human-Computer Interaction, 15, 139–
178.
Orphanides, A. (2017, March). It’s made of people: designing systems for humans. Opening
Keynote presented at the Code4Lib 2017, Los Angeles, CA.
Paisley, W. J. (1980). Information and work. In B. Dervin & M. J. Voigt (Eds.), Progress in the
Communication Sciences (Vol. 2, pp. 114–165). Norwood, NJ: Ablex.
Parmiggiani, E., Monteiro, E., & Hepsø, V. (2015). The Digital Coral: Infrastructuring
Environmental Monitoring. Computer Supported Cooperative Work (CSCW), 24(5), 423–
460. https://doi.org/10.1007/s10606-015-9233-6
Parsons, M. A., & Berman, F. (2013). The Research Data Alliance: Implementing the
technology, practice and connections of a data infrastructure. Bulletin of the American
Society for Information Science and Technology, 39(6), 33–36.
https://doi.org/10.1002/bult.2013.1720390611
Parsons, M. A., & Fox, P. A. (2013). Is data publication the right metaphor? Data Science
Journal, 12, WDS32-WDS46. https://doi.org/10.2481/dsj.WDS-042
297
Pepe, A., Mayernik, M. S., Borgman, C. L., & Van de Sompel, H. (2009). Technology to
Represent Scientific Practice: Data, Life Cycles, and Value Chains. ArXiv.Org. Retrieved
from http://arxiv.org/abs/0906.2549v1
Pepe, A., Mayernik, M. S., Borgman, C. L., & Van de Sompel, H. (2010). From Artifacts to
Aggregations: Modeling Scientific Life Cycles on the Semantic Web. Journal of the
American Society for Information Science and Technology, 61(3), 567–582.
https://doi.org/10.1002/asi.21263
Petascale R&D challenges | LSST public website. (2015). Retrieved August 16, 2015, from
http://www.lsst.org/about/dm/petascale
Pike, R., Stein, M., Szalay, A. S., & Tyson, T. (2001, February 5). Managing and Mining the
LSST Data Sets. Retrieved from http://www.lsst.org/files/docs/data-challenge.pdf
Pipelines | LSST public website. (2015). Retrieved August 16, 2015, from
http://lsst.org/about/dm/pipelines
Plante, R. L., Greene, G., Hanisch, R. J., McGlynn, T. A., Miller, C. J., Tody, D., & White, R.
(2010). Building archives in the Virtual Observatory era. In N. M. Radziwill & A.
Bridger (Eds.), Proc. SPIE 7740, Software and Cyberinfrastructure for Astronomy (Vol.
7740, p. 77400K–77400K–12). https://doi.org/10.1117/12.857349
Price, D. J. d. S. (1963). Little Science, Big Science. New York, NY, USA: Columbia University
Press.
Provost & EVP - Academic Affairs. (2015). University of California – Presidential Open Access
Policy (No. UC-AA-15-0275).
298
Pryor, G., & Donnelly, M. (2009). Skilling Up to Do Data: Whose Role, Whose Responsibility,
Whose Career? International Journal of Digital Curation, 4(2).
https://doi.org/10.2218/ijdc.v4i2.105
Ray, J. M. (2014a). Introduction. In Research Data Management: Practical Strategies for
Information Professionals. West Lafayette, Ind: Purdue University Press.
Ray, J. M. (Ed.). (2014b). Research Data Management: Practical Strategies for Information
Professionals. West Lafayette, IN: Purdue University Press. Retrieved from
http://www.jstor.org/stable/j.ctt6wq34t
Regents of the University of Michigan. (2016). ICPSR - Inter-university Consortium for Political
and Social Research. Retrieved April 2, 2013, from
http://www.icpsr.umich.edu/icpsrweb/ICPSR/
Reichhardt, T. (2006). Which sites get cited? Nature, 439(7074), 251–251.
https://doi.org/10.1038/439251a
Reimann, J. D. (1994). Frequency estimation using unequally-spaced astronomical data (Ph.D.).
University of California, Berkeley, United States -- California.
Renear, A. H., Sacchi, S., & Wickett, K. M. (2010). Definitions of dataset in the scientific and
technical literature. Proceedings of the American Society for Information Science and
Technology, 47(1), 1–4. https://doi.org/10.1002/meet.14504701240
Research Information Network. (2008, January). Stewardship of digital research data: a
framework of principles and guidelines. Responsibilities of research institutions and
funders, data managers, learned societies and publishers.
Ribes, D., & Finholt, T. A. (2009). The Long Now of Technology Infrastructure: Articulating
Tensions in Development. Journal of the Association for Information Systems, 10(5).
299
Ribes, D., & Jackson, S. J. (2013). Data Bite Man: The Work of Sustaining a Long-Term Study.
In L. Gitelman (Ed.), “Raw Data” Is an Oxymoron (pp. 147–166). Cambridge, MA: The
MIT Press.
Rijcke, S. de, & Beaulieu, A. (2014). Networked Neuroscience: Brain Scans and Visual
Knowing at the Intersection of Atlases and Databases. In C. Coopman, J. Vertesi, M.
Lynch, & S. Woolgar (Eds.), Representation in Scientific Practice Revisited (pp. 131–
152). The MIT Press.
Rosenberg, D. (2013). Data before the Fact. In L. Gitelman (Ed.), “Raw Data” is an Oxymoron
(pp. 15–40). Cambridge MA: MIT Press.
Rots, A. H., Winkelman, S. L., Paltani, S., & DeLuca, E. E. (2002). Chandra data archive
operations. In Proc. SPIE 4844, Observatory Operations to Optimize Scientific Return III
(Vol. 4844, pp. 172–179). https://doi.org/10.1117/12.460662
Sallans, A., & Lake, S. (2014). Data Management Assessment and Planning Tools,. In J. M. Ray,
Research Data Management: Practical Strategies for Information Professionals. West
Lafayette: Purdue University Press.
Sands, A. E., Borgman, C. L., Traweek, S., & Wynholds, L. A. (2014). We’re working on it:
Transferring the Sloan Digital Sky Survey from laboratory to library. International
Journal of Digital Curation, 9(2), 98–110. https://doi.org/10.2218/ijdc.v9i2.336
Sands, A. E., Borgman, C. L., Wynholds, L. A., & Traweek, S. (2012, October). Follow the
data: How astronomers use and reuse data. Poster presented at the ASIS&T 75th Annual
Meeting, Baltimore, MD.
Sands, A. E., Darch, P. T., Borgman, C. L., Golshan, M. S., & Traweek, S. (In Progress). From
Sky to Archive: Long Term Management of Sky Survey Data. JASIST.
300
Sawyer, S. (2008). Data Wealth, Data Poverty, Science and Cyberinfrastructure. Prometheus,
26(4), 355–371. https://doi.org/10.1080/08109020802459348
Sayeed Choudhury on Data Stack Model. (2012). Retrieved from
http://www.youtube.com/watch?v=3MD7KjZF34Y&feature=youtube_gdata_player
Schroeder, R., & Meyer, E. T. (2012). Big Data: What’s New? Presented at the Internet, Politics,
Policy 2012: Big Data, Big Challenges?, Oxford, UK: Oxford Internet Institute,
University of Oxford and the US Social Science Research Council (SSRC).
Science collaborations | LSST Corporation. (2015). Retrieved November 1, 2015, from
https://www.lsstcorporation.org/science-collaborations
SDSS Collaboration. (2014). SkyServer Website Traffic | SDSS. Retrieved November 11, 2014,
from http://skyserver.sdss.org/log/en/traffic/
SDSS Collaboration. (2016, February 3). Science Results | SDSS. Retrieved February 4, 2016,
from http://www.sdss.org/science/
SDSS scientific and technical publication policy. (2014, April 1). Retrieved from
http://classic.sdss.org/policies/pub_policy.html
Shankar, K. (2010). Biological Information and Its Users. In M. J. Bates & M. N. Maack (Eds.),
Encyclopedia of Library and Information Sciences, Third Edition (pp. 615–623). Taylor
& Francis. Retrieved from http://www.tandfonline.com/doi/abs/10.1081/E-ELIS3-
120043747
Shapin, S. (1989). The Invisible Technician. American Scientist, 77(6), 554–563.
Shapin, S., & Shaffer, S. (1985). Leviathan and the Air-Pump: Hobbes, Boyle, and the
Experimental Life. Princeton: Princeton University Press.
301
Singh, V., Gray, J., Thakar, A. R., Szalay, A. S., Raddick, J., Boroski, B., … Yanny, B. (2006).
SkyServer traffic report -- the first five years (TechReport No. MSR-TR-2006-190) (p.
15). Microsoft Research.
Sloan Digital Sky Survey: Home. (2016). Retrieved November 8, 2015, from
http://www.sdss.org/
Smith, R. C. (1995). Observational astrophysics. Cambridge ; New York: Cambridge University
Press.
Smith, R. W. (1992). The Biggest Kind of Big Science: Astronomers and the Space Telescope.
In P. Galison & B. W. Hevly (Eds.), Big science: the growth of large-scale research (pp.
184–211). Stanford, Calif.: Stanford University Press.
Stanton, J. M., Kim, Y., Oakleaf, M., Lankes, R. D., Gandel, P., Cogburn, D., & Liddy, E. D.
(2011). Education for eScience professionals: Job analysis, curriculum guidance, and
program considerations. Journal of Education for Library and Information Science,
52(2), 79–94.
Star, S. L. (1999). The ethnography of infrastructure. American Behavioral Scientist, 43(3), 377–
391.
Star, S. L., & Ruhleder, K. (1996). Steps Toward an Ecology of Infrastructure: Design and
Access for Large Information Spaces. Information Systems Research, 7(1), 111–134.
https://doi.org/10.1287/isre.7.1.111
Star, S. L., & Strauss, A. (1999). Layers of Silence, Arenas of Voice: The Ecology of Visible and
Invisible Work. Computer Supported Cooperative Work (CSCW), 8(1–2), 9–30.
https://doi.org/10.1023/A:1008651105359
302
Steinhardt, S. B., & Jackson, S. J. (2014). Reconciling rhythms: plans and temporal alignment in
collaborative scientific work. In Proceedings of the 17th ACM conference on Computer
supported cooperative work & social computing (pp. 134–145). ACM.
Stoughton, C., Lupton, R. H., Bernardi, M., Blanton, M. R., Burles, S., Castander, F. J., …
Zheng, W. (2002). Sloan Digital Sky Survey: Early data release. The Astronomical
Journal, 123(1), 485–548. https://doi.org/10.1086/324741
Study Group for Data Preservation and Long Term Analysis in High Energy Physics. (2012).
Status report of the DPHEP Study Group: Towards a global effort for sustainable data
preservation in high energy physics (No. DPHEP-2012-001).
Swan, A., & Brown, S. (2008). The skills, role and career structure of data scientists and
curators: An assessment of current practice and future needs (p. 34). Truro, UK: JISC.
Szalay, A. S. (2011). Extreme Data-Intensive Scientific Computing. Computing in Science and
Engineering, 13(6), 34–41. https://doi.org/10.1109/MCSE.2011.74
Szalay, A. S. (2012, May). Scalable Data-Intensive Statistical Computations in Astrophysics.
Presented at the From Data to Knowledge: Machine-Learning with Real-time and
Streaming Applications, University of California, Berkeley.
Szalay, A. S., & Gray, J. (2001). The World-Wide Telescope. Science, 293(5537), 2037–2040.
https://doi.org/10.1126/science.293.5537.2037
Szalay, A. S., & Gray, J. (2006). 2020 Computing: Science in an exponential world. Nature,
440(7083), 413–414. https://doi.org/10.1038/440413a
Szalay, A. S., Kunszt, P. Z., Thakar, A. R., & Gray, J. (1999). Designing and mining multi-
terabyte astronomy archives: The Sloan Digital Sky Survey (Original) (Technical Report
No. MS-TR-99-30).
303
Szalay, A. S., Kunszt, P. Z., Thakar, A. R., Gray, J., & Slutz, D. (2000). The Sloan Digital Sky
Survey and its archive. In Astronomical Data Analysis Software and Systems IX (Vol.
216, p. 405). San Francisco, Calif: Astronomical Society of the Pacific.
Technology Innovation | LSST public website. (2015). Retrieved August 16, 2015, from
http://lsst.org/about/dm/technology
Tenopir, C., Birch, B., & Allard, S. (2012). Academic Libraries and Research Data Services:
Current Practices and Plans for the Future (ACRL White Paper).
The Long Now Foundation. (est. 01996). The Long Now Foundation - Fostering Long-Term
Thinking. Retrieved February 21, 2016, from http://longnow.org/
Thomas, B., Jenness, T., Economou, F., Greenfield, P., Hirst, P., Berry, D. S., … Berriman, G.
B. (2014). Significant Problems in FITS Limit Its Use in Modern Astronomical Research.
In Astronomical Data Analysis Software and Systems XXIII (Vol. 485, p. 351).
Thompson, C. A., Mayernik, M. S., Palmer, C. L., Allard, S., & Tenopir, C. (2015). LIS
Programs and Data Centers: Integrating Expertise.
https://doi.org/https://www.ideals.illinois.edu/handle/2142/73662
Traweek, S. (1988). Beamtimes and Lifetimes: The World of High Energy Physicists (1st
Harvard University Press pbk.). Cambridge, Mass.: Harvard University Press.
Treloar, A. (2014). The Research Data Alliance: globally co-ordinated action against barriers to
data publishing and sharing. Learned Publishing, 27(5), 9–13.
https://doi.org/10.1087/20140503
Tyson, J. A. (1998). Dark matter tomography. In SLAC/DOE Pub. SLAC-R-538 (pp. 89–112).
UCLA Center for Knowledge Infrastructures: Home. (2016). Retrieved from
https://knowledgeinfrastructures.gseis.ucla.edu/
304
UCLA Office of Research Administration. (2015). Office of the UCLA Human Research
Protection Program (OHRPP). Retrieved November 4, 2015, from
http://ora.research.ucla.edu/ohrpp/Pages/OHRPPHome.aspx
Uhlir, P. F. (Ed.). (2012). For Attribution -- Developing Data Attribution and Citation Practices
and Standards: Summary of an International Workshop. Washington, D.C.: The National
Academies Press.
US Census Bureau. (2014, September 15). Frequently Occurring Surnames from the Census
2000. Retrieved November 11, 2015, from
US Virtual Astronomical Observatory. (2012, 2016). VAO Home Page. Retrieved August 17,
2012, from http://www.usvao.org/
Van de Sompel, H. (2013, April). From the Version of Record to a Version of the Record.
Opening Plenary Session presented at the Coalition for Networked Information (CNI)
Spring 2013 Membership Meeting, San Antonio, Texas.
van der Graaf, M., & Waaijers, L. (2011). A Surfboard for Riding the Wave: Towards a four
country action programme on research data (A Knowledge Exchange Report).
VanderPlas, J. (2014a, August). Hacking Academia from Inside and Out. Breakout Session
presented at the O’Reilly SciFOO, Mountain View CA.
VanderPlas, J. (2014b, August 22). Hacking Academia: Data Science and the University.
Retrieved November 6, 2014, from https://jakevdp.github.io/blog/2014/08/22/hacking-
academia/
Varvel Jr., V. E., Bammerlin, E. J., & Palmer, C. L. (2012). Education for data professionals: a
study of current courses and programs. In Proceedings of the 2012 iConference (pp. 527–
529). New York, NY, USA: ACM. https://doi.org/10.1145/2132176.2132275
305
Virtual Astronomical Observatory (VAO) Project Execution Plan. (2010). (Version 1.1).
Wallis, J. C. (2012). The Distribution of Data Management Responsibility within Scientific
Research Groups (Ph.D. Dissertation). University of California, Los Angeles, United
States -- California.
Wallis, J. C., Borgman, C. L., Mayernik, M. S., & Pepe, A. (2008). Moving archival practices
upstream: An exploration of the life cycle of ecological sensing data in collaborative field
research. International Journal of Digital Curation, 3(1), 114–126.
https://doi.org/10.2218/ijdc.v3i1.46
Wallis, J. C., Rolando, E., & Borgman, C. L. (2013). If we share data, will anyone use them?
Data sharing and reuse in the long tail of science and technology. PLoS ONE, 8(7),
e67332. https://doi.org/10.1371/journal.pone.0067332
Walters, T. O., & Skinner, K. (2011). New Roles for New Times: Digital Curation for
Preservation. Washington, D.C.: Association of Research Libraries.
Weber, N. M., Palmer, C. L., & Chao, T. C. (2012). Current Trends and Future Directions in
Data Curation Research and Education. Journal of Web Librarianship, 6(4), 305–320.
https://doi.org/10.1080/19322909.2012.730358
Weinberg, A. M. (1961). Impact of Large-Scale Science on the United States Big science is here
to stay, but we have yet to make the hard financial and educational choices it imposes.
Science, 134(3473), 161–164. https://doi.org/10.1126/science.134.3473.161
Wenger, M., Ochsenbein, F., Egret, D., Dubois, P., Bonnarel, F., Borde, S., … Monier, R.
(2000). The SIMBAD astronomical database: The CDS reference database for
astronomical objects. Astronomy and Astrophysics Supplement Series, 143(1), 9–22.
https://doi.org/10.1051/aas:2000332
306
White, R. L., Accomazzi, A., Berriman, G. B., Fabbiano, G., Madore, B. F., Mazzarella, J. M.,
… Winkelman, S. (2009). The high impact of astronomical data archives. In astro2010:
The Astronomy and Astrophysics Decadal Survey (Vol. 2010, p. 64P).
White, S., Ivie, R., Ephraim, A., & Anderson, G. (2010). The Faculty Job Market in Physics &
Astronomy Departments: Results from the 2008 Survey of Physics & Astronomy Degree-
Granting Departments. Statistical Research Center of the American Institute of Physics.
WorldWide Telescope. (2013). Retrieved April 4, 2013, from
http://www.worldwidetelescope.org/Home.aspx
Xiang, H. X. (2008). Experiences Acquiring and Distributing a Large Scientific Database. In
Second International Conference on Future Generation Communication and Networking
Symposia, 2008. FGCNS ’08 (Vol. 2, pp. 14–19).
https://doi.org/10.1109/FGCNS.2008.69
XXVth General Assembly of the International Astronomical Union. (2003). Public access to
astronomical archives (No. Resolution No. B.1.). Sydney, Australia.
Yanny, B. (2011, May). The Sloan Digital Sky Survey archive.
York, D. G., Adelman, J., Anderson, Jr., J. E., Anderson, S. F., Annis, J., Bahcall, N. A., …
Yasuda, N. (2000). The Sloan Digital Sky Survey: Technical Summary. The
Astronomical Journal, 120(3), 1579–1587. https://doi.org/10.1086/301513
Zimmerman, R. (2008). The Universe in a Mirror: The saga of the Hubble Telescope and the
visionaries who built it. Princeton, N.J.; Woodstock: Princeton University Press.