qt1sb4c8vh_nosplash_8ceb3bd... - escholarship
TRANSCRIPT
LBL-8615 GSRMP-I
UC-66e
Environmental and Economic Effects of Subsidence
V.F. Vets, C.K. Vaughan, and R.C. Harding EDAW. ESA-A Joint Venture of
EDAW, Inc. and Earth Sciences Associates
Palo Alto. California
II
Eeuthermal
L
Subsidence Besearch UUUanagement
May 1979
Earth Sciences Division Lawrence Berkeley Laboratory University of California
Prepared for the US. Department of Energy under Contract W-7405-ENG-48
c
DISCLAIMER
This report was prepared as an account of work sponsored by an agency of the United States Government. Neither the United States Government nor any agency Thereof, nor any of their employees, makes any warranty, express or implied, or assumes any legal liability or responsibility for the accuracy, completeness, or usefulness of any information, apparatus, product, or process disclosed, or represents that its use would not infringe privately owned rights. Reference herein to any specific commercial product, process, or service by trade name, trademark, manufacturer, or otherwise does not necessarily constitute or imply its endorsement, recommendation, or favoring by the United States Government or any agency thereof. The views and opinions of authors expressed herein do not necessarily state or reflect those of the United States Government or any agency thereof.

DISCLAIMER Portions of this document may be illegible in electronic image products. Images are produced from the best available original document.
LEQAL NOTICE
This report was prepared as an account of work sponsored by the United States Government. Neither the United States nor the United States Department of Energy, nor any of their employees, nor any of their contractors, subcontractors, or their employees. makes any warranty, express or implied, or assumes any legal liability or responsibility for the accuracy. completeness or usefulness of MY information, apparatus, product or process disclosed, or represents that its use would not infringe privately owned rights.
Printed in the United States of America Available from
National Technical Information Service U.S. Department of Commerce 5285 Port Royal Road Springfield, VA 22161 Price Code: A l l
Lawrence Berkeley Laboratory Geothermal Subsidence Research Program
Category 4, Project 1
EFFECTS OF SUBSIDENCE - ENVIRONMENTAL AND ECONOMIC
FINAL REPORT
Submitted to:
Lawrence Berkeley Laboratory Berkeley, California
By :
EDAW-ESA - a Joint Venture of EDAW, Inc. and Earth Sciences Associates
Palo Alto, California
i May 1979

n
7
FOREWORD
This final report on the Environmental and Economic Effects of Subsidence concerns the collection of data on actual subsided areas. This research was a part of the on- going Geothermal Subsidence Research Program being conducted by Lawrence Berkeley Laboratory (LBL) of the University of California, under the auspices of the Division of Geothermal Energy of the U . S . Department of Energy. Table i shows the various levels of the total Subsidence program and the role of this research category within it. This project is part of the program element "Characterization of Subsidence."
EDAWeESA, the contractor for this study, performed the work under Purchase Order 300-3902 with approximately twelve man-months of effort. EDAW*ESA is a joint venture of EDAW, Inc., an environmental planning firm, and Earth Sciences Associates, a geotechnical consulting firm. The project manager of this study was Victor F. Viets. The principal environmental and economic investigator was Christopher K. Vaughan. Principal geotechnical investigator was Richard C.
Harding .
of Terry Simkin and technical coordination of John E. Noble. H. A. Todd was Contract Administrator.
At LBL, this project was administered under the direction
iii By
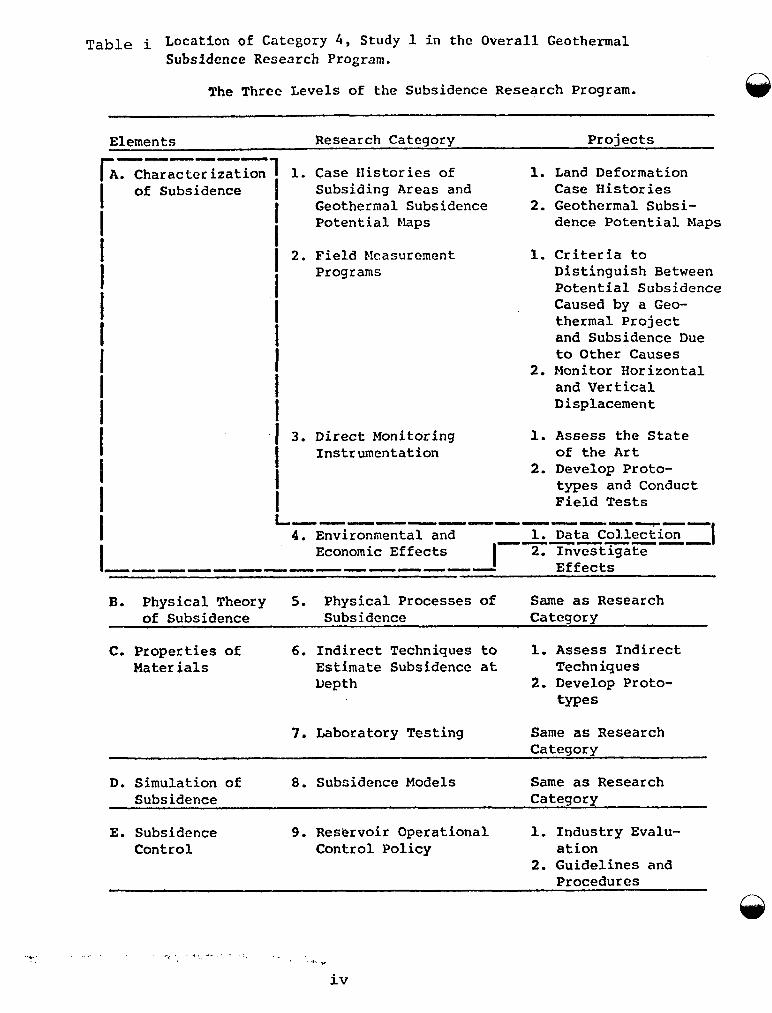
Table i Location of CatCgOry 4 , Study 1 i n the Overall Geothermal Subsidence Research Program.
The Three Levels of the Subsidence Research Program.
Elements Research Category Projects ------ m. Characterization 1 1. Case Histories of I of Subsidence I Subsiding Areas and Case Histories 1. Land Deformation
Geothermal Subsidence 2. Geothermal Subsi- dence Potential Maps I I
2. Field Elcasurcment 1. Criteria to Programs Distinguish Between
Potential Subsidence Caused by a Geo- thermal Project and Subsidence Due to Other Causes
2. Monitor Horizontal and Vertical Displacement
3. Direct Monitoring 1. Assess the State Instrumentation of the A r t
2. Develop Proto- types and Conduct Field Tests
1. Data Col.lection I -------- 4. Environmental and Economic Effects I 2. Investigate
I -------- ------- Effects
B. Physical Theory 5 . Physical Processes of Same as Research of Subsidence Subsidence Category
C. Properties of 6. Indirect Techniques to 1. Assess Indirect Estimate Subsidence at Tec hn iq ue s Depth 2. Develop Proto-
Materials
types
7. Laboratory Testing Same as Research Category
D. Simulation of 8. Subsidence Models Same as Research Subsidence Category
E. Subsidence 9. Reservoir Operational 1. Industry Evalu- Con t r o 1 Control Policy ation
2. Guidelines and Procedures
. li ” ‘ e ’ . . - .. .. . - . . ._* . . .
iv
ENVIRONMENTAL AND ECONOMIC EFFECTS OF SUBSIDENCE
FINAL REPORT
TABLE OF CONTENTS
Page
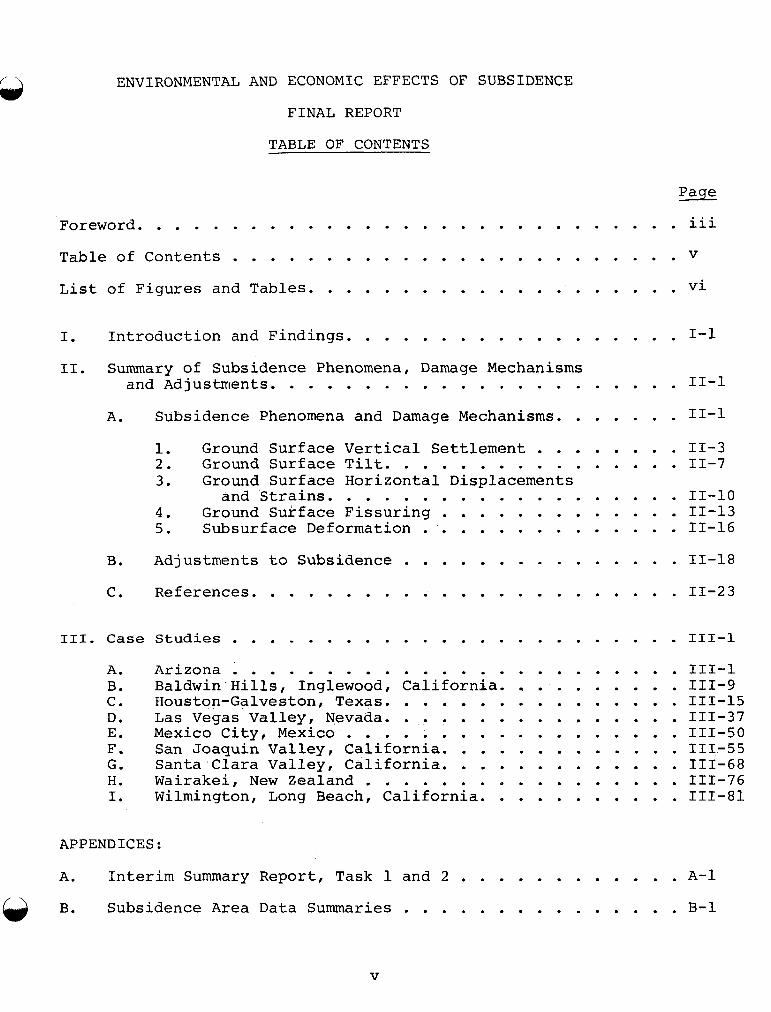
Foreword . . . . . . . . . . . . . . . . . . . . . . . . . . . . . i i i
Table of Contents . . . . . . . . . . . . . . . . . . . . . . . . V
List of Figures and Tables . . . . . . . . . . . . . . . . . . . . Vi
. . . . . . . . . . . . . . . . . . 1-1 I . Introduction and Findings
11 . Summary of Subsidence Phenomena. Damage Mechanisms and Adjustments . . . . . . . . . . . . . . . . . . . . . . 11-1
A . Subsidence Phenomena and Damage Mechanisms . . . . . . . 11-1 1 . Ground Surface Vertical Settlement . . . . . . . . 11-3 2 . Ground Surface Tilt . . . . . . . . . . . . . . . . 11-7 3 . Ground Surface Horizontal Displacements
and Strains . . . . . . . . . . . . . . . . . . . 11-10 4 . Ground Surface Fissuring . . . . . . . . . . . . . 11-13 5 . Subsurface Deformation . . . . . . . . . . . . . . 11-16
B . Adjustments to Subsidence . . . . . . . . . . . . . . . 11-18 C . References . . . . . . . . . . . . . . . . . . . . . . . 11-23
I11 . Case S t u d i e s . . . . . . . . . . . . . . . . . . . . . . . . 111-1
A . B . C . D . E . F . G . H . I .
Arizona . . . . . . . . . . . . . . . . . . . . . . . . 111-1
Houston.Ga1veston. Texas . . . . . . . . . . . . . . . . 111-15 Las Vegas Valley. Nevada . . . . . . . . . . . . . . . . 111-37 Mexico City. Mexico . . . . . . . . . . . . . . . . . . 111-50 San Joaquin Valley. California . . . . . . . . . . . . . 111-55 Santa Clara Valley. California . . . . . . . . . . . . . 111-68 Wairakei. New Zealand . . . . . . . . . . . . . . . . . 111-76 Wilmington. Long Beach. California . . . . . . . . . . . 111-81
Baldwin Hills. Inglewood. California . . . . . . . . . . 111-9
APPENDICES :
V
A . Interim Summary Report. Task 1 and 2 . . . . . . . . . . . . 24-1 B . Subsidence Area Data Summaries . . . . . . . . . . . . . . . . . B-1
List of Figures and Tables
Page
F i guir e s
Figure 1-1
Figure 11-1
Figure 11-2
--
Figure III-A-1
Figure III-A-2
Figure III-A-3
Figure III-B-1
Figure III-B-2
Figure III-C-1
Figure III-C-2
Figure III-C-3
Figure III-C-4
Figure III-C-5
Figure III-C-6
Figure III-C-7
Figure III-C-8
Figure III-D-1
Figu.re I II-D- 2
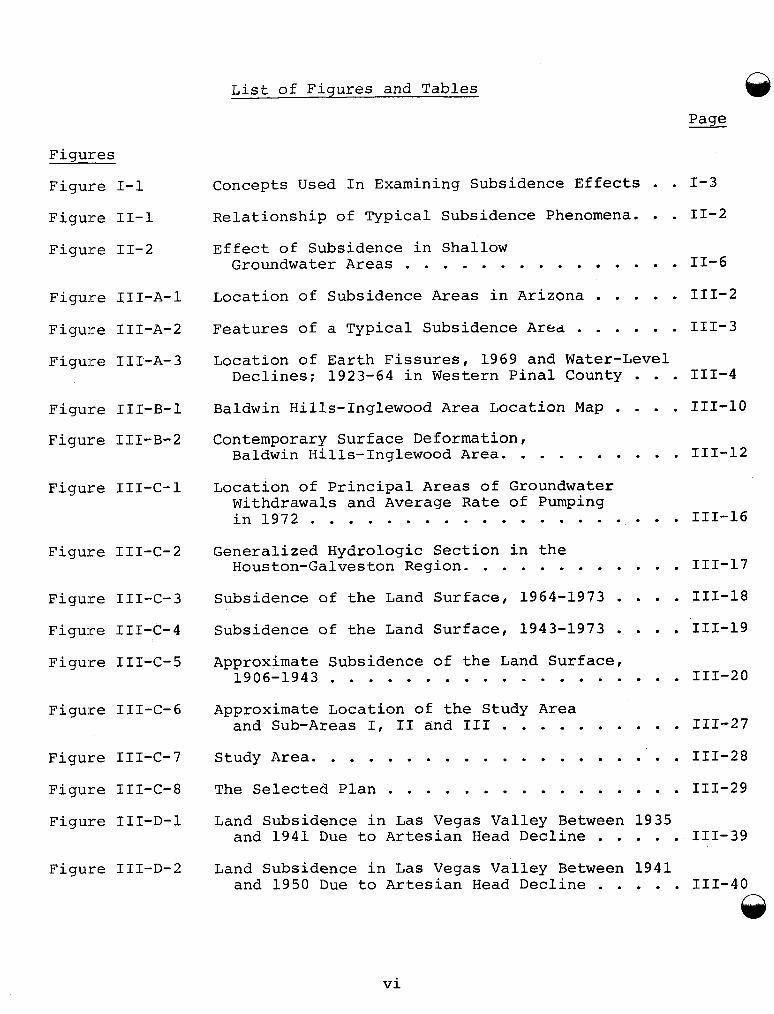
Concepts Used In Examining Subsidence Effects . . 1-3 Relationship of Typical Subsidence Phenomena. . . 11-2 Effect of Subsidence in Shallow Groundwater Areas . . . . . . . . . . . . . . . 11-6
Location of Subsidence Areas in Arizona . . . . . 111-2 Features of a Typical Subsidence Area . I . . . . 111-3 Location of Earth Fissures, 1969 and Water-Level Declines; 1923-64 in Western Pinal County . . . 111-4
Baldwin Hills-Inglewood Area Location Map . . . . 111-10 Contemporary Surface Deformation, Baldwin Hills-Inglewood Area. . . . . . . . . . 111-12
Location of Principal Areas of Groundwater Withdrawals and Average Rate of Pumping in1972. . . . . . . . . . . . . . . . . . . . 111-16
Generalized Hydrologic Section in the Houston-Galveston Region. . . . . . . . . . . . 111-17
Subsidence of the Land Surface, 1964-1973 . . . . 111-18 Subsidence of the Land Surface, 1943-1973 . . . . 111-19 Approximate Subsidence of the Land Surface, 1906-1943 . . . . . . . . . . . . . . . . . . . 111-20
Approximate Location of the Study Area and Sub-Areas I, I1 and I11 . . . . . . . , . . 111-27
Study Area. . . . . . . . . . . . . . . . . . . . 111-28 The Selected Plan . . . . . . . . . . . . . . . . 111-29 Land Subsidence in Las Vegas Valley Between 1935 and 1941 Due to Artesian Head Decline . . . . . 111-39
Land Subsidence in Las Vegas Valley Between 1941 and 1950 Due to Artesian Head Decline . . . . . 111-40
vi
,&) List of Figures and Tables (continued)
Page
Figure III-D-3
Figure III-D-4
Figure III-D-5
Figure III-D-6
Figure III-D-7
Figwe III-F-1
Figure III-F-2
Figure III-F-3
Figure III-F-4
Figure III-F-5
Figure III-G-1
Figure III-H-1
Figure III-H-2
Figure 111-1-1
Figure 111-1-2
Figure 111-1-3
Land Subsidence in Las Vegas Valley Between 1941 and 1950 Due to Artesian Head Decline. . . III-4,1
A Portion of the Hoover Dam Level Net in Las Vegas Valley . . . . . . . . . . . . . . 111-42
Northwest-Southeast Cross Section of Total Land Subsidence in Las Vegas Valley . . . . . . 111-43
Northeast-Southwest Cross Section of Total Land Subsidence in Las Vegas Valley . . . . . . 111-44
John A. Blume Level Lines, Compaction Fault Scarps and Areas of Fissuring . . . . . . . . . 111-45
Pertinent Geographic Features of Central and Southern San Joaquin Valley and Areas Affected by Subsidence. . . . . . . . . . . . . 111-56
Land Subsidence in the San Joaquin Valley, 1926-1970 . . . . . . . * . ., . . . . . . . . . 111-58
Detail of Land Subsidence, 1926-1972, Los Banos-Kettleman City Area . . . . . . . . . 111-59
Detail of Land Subsidence, 1926-1970, Tulare-Wasco Area . . . . . . . . . . . . . . . 111-60
Detail of Land Subsidence, 19.26-1970, Arvin-Maricopa Area . . . . : . . . . . . . . . 111-61
Land Subsidence from 1937 to 1967, Santa Clara Valley, California. . . . . . . . . . . . 111-70
Index Map, Wairakei Subsidence Area, New Zealand . . . . . . . . . . . . . . . . . . 111-77
Total Subsidence at Wairakei, 1964-1974 . . . . . 111-78 L o s Angeles Basin Oil Fields. . . . . . . . . . . 111-82 Total Subsidence, 1926-1967, Wilmington Field . . 111-83 Rebound as a Result of Injection Well Operations . . . . . . . . . . . . . . . . 111-85
vii
List of Figures and Tables (continued)
Page Tab1 e s -- T a b l e i Location of Catalog 4, Study 1, in the Overall
Geothermal Subsidence Research Program. . . . . iv Table 1-1 Summary of Case Study Results . . . . . . . . . . 1-5 Table 11-1 Vertical Subsidence Values for Case Study Areas . 11-3 Table 11-2 Damage from Ground Surface Vertical Settlements
Reported in Case Studies. . . . . . . . . . . . 11-5 Table 11-3 Tilt and Differential Settlement Values for
Case Study Areas. . . . . . . . . . . . . . . . 11-8 Tahle 11-4 Damage from Ground Surface Tilt Reported
in Case Studies . . . . . . . . . . . . . . . . 11-9 Table 11-5 Damage from Differential Settlement
Reported in Case Studies. . . . . . . . . . . . 11-11 Tahle 11-6 The Effect of Subsidence Related Ground Surface
Strains on Engineering Structures . . . . . . . 11-12 Tahle 11-7 Maximum Horizontal Strain Values for
Case Study Areas. . . . . . . . . . . . . . . . 11-14 Table 11-8 Damage from Horizontal Strains Reported in
Case Studies. . . . . . . . . . . . . . . . . 11-15 Tahle 11-9 Damage from Fissuring Reported in the
Case Studies. . . . . . . . . . . . . . . . . . 11-17 Table 11-10 Damage from Subsurface Deformations Reported
in the Case Studies . . . . . . . . . . . . . . 11-19 Tahle 11-11 Classification and Examples of Adjustments to
Subsidence. . . . . . . . . . . . . . . . . . . 11-21 Table 11-12 Adjustments to Subsidence in the Case
Study Areas . . . . . . . . . . . . . . . . . . 11-22 Table III-C-1 Examples of Economic Effects. . . . . . . . . . . 111-22 Table III-C-2 Home Damage by Active Faults in the
1
Houston Area. . . . . . . . . . . . . . . . . . 111-31 Table III-C-3 Summary of Adjustments to Subsidence in the
Houston Area. . . . . . . . . . . . . . . . . . 111-3
@ I. INTRODUCTION AND FINDINGS
The development of geothermal energy sources may result in land deformation, commonly referred to as subsidence, as a result of removal or injection of fluids from or into geo- thermal reservoirs. This potential problem was recognized by the U.S. Department of Energy (previously the Energy Research and Development Administration) which established the Geothermal Subsidence Research Program to study the control or mitigation of subsidence caused by energy develop- ment.
One of the difficulties encountered in planning the geothermal research program was that the nature of the subsidence problem, in terms of the damage and economic loss potentials, had not been clearly defined. It was thought that while unexpected and uncontrolled subsidence might have serious social, economic, and environmental consequences, subsidence occurring under controlled conditions might be acceptable. Reports of economic losses from subsidence due to groundwater development and other causes not related to geothermal develop- ment ranged from nominal to over $100 million at one area. To clarify the issue, this study was planned and conducted to collect data on the actual damages and economic losses that have occurred in subsiding areas and to document some of the specific local responses to subsidence in those areas.
Early in the formulation of this study, it was recognized that budgetary and schedule constraints would limit the analysis to a manageable number of case studies rather than to an analysis of all known subsidence areas. A list of all known subsidence areas was compiled from the available literature, from the International Survey on land subsidence (ISOLS) of the International Association of Hydrologic Sciences, and from interviews with key researchers familiar with many of the subsidence areas. This list of more than 70 areas was then screened to select those subsidence areas which seemed to have the best potential for providing reliable data. The screening process is described in Appendix A . Nine areas were selected for detailed case studies to collect all available data on the environmental and economic effects of the subsidence. Available information from the subsidence areas not selected as case studies was tabulated on Summary Sheets for each area and is included in Appendix B.
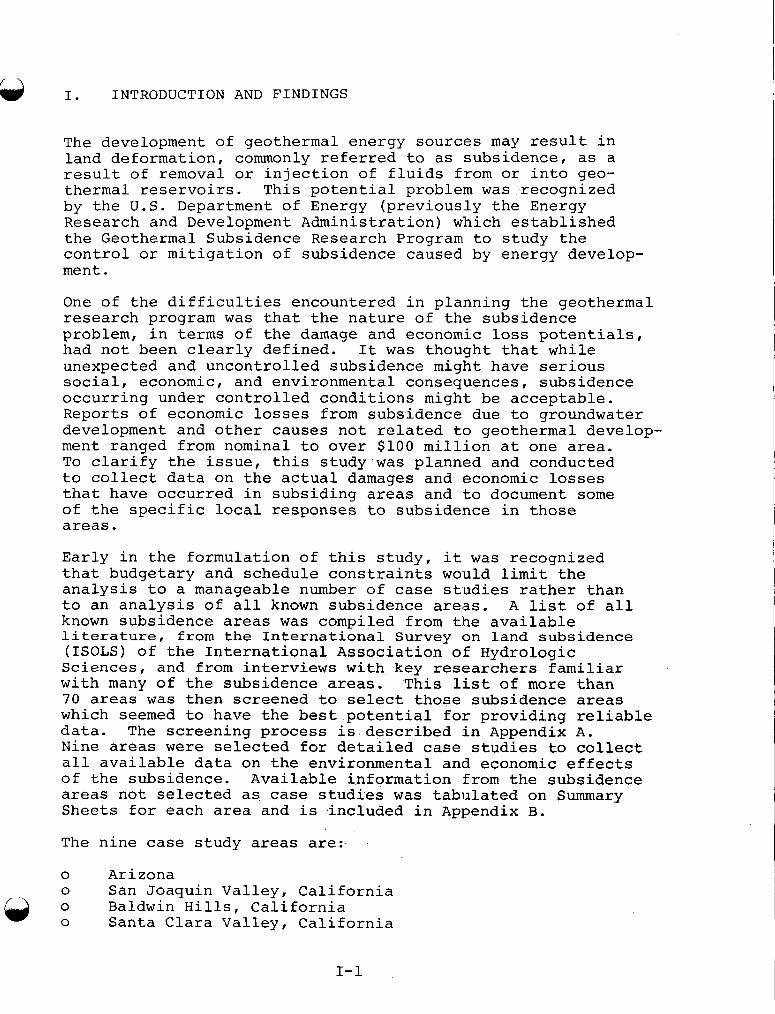
The nine case study areas are:
0 Arizona 0 San Joaquin Valley, California
Baldwin Hills, California Santa Clara Valley, California
1-1
0 Wilmington, California 0 Las Vegas Valley, Nevada 0 Houston-Galveston area, Texas 0 Mexico City, Mexico 0 Wairakei, New Zealand
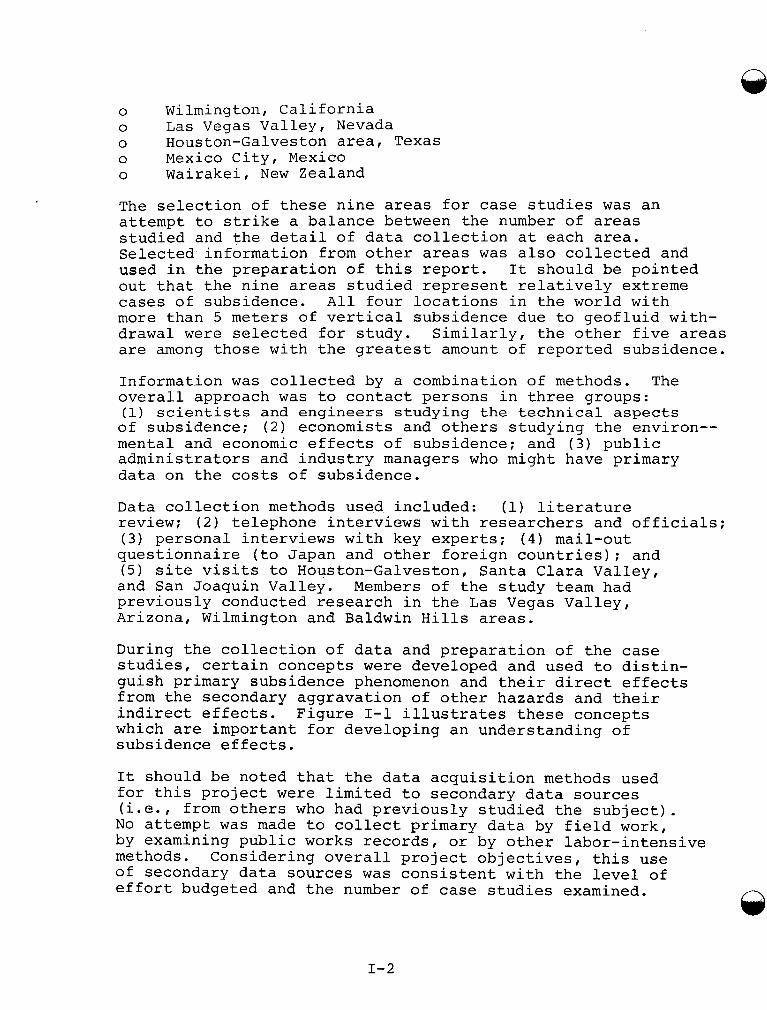
The selection of these nine areas for case studies was an attempt to strike a balance between the number of areas studied and the detail of data collection at each area. Selected information from other areas was also collected and used in the preparation of this report. It should be pointed out that the nine areas studied represent relatively extreme cases of subsidence. All four locations in the world with more than 5 meters of vertical subsidence due to geofluid with- drawal were selected for study. Similarly, the other five areas are among those with the greatest amount of reported subsidence.
Information was collected by a combination of methods. The overall approach was to contact persons in three groups: (1) scientists and engineers studying the technical aspects of subsidence; ( 2 ) economists and others studying the environ-- mental and economic effects of subsidence; and ( 3 ) public administrators and industry managers who might have primary data on the costs of subsidence.
Data collection methods used included: (1) literature review; ( 2 ) telephone interviews with researchers and officials; ( 3 ) personal interviews with key experts; (4) mail-out questionnaire (to Japan and other foreign countries); and (5) site visits to Houston-Galveston, Santa Clara Valley, and San Joaquin Valley. Members of the study team had previously conducted research in the Las Vegas Valley, Arizona, Wilmington and Baldwin Hills areas.
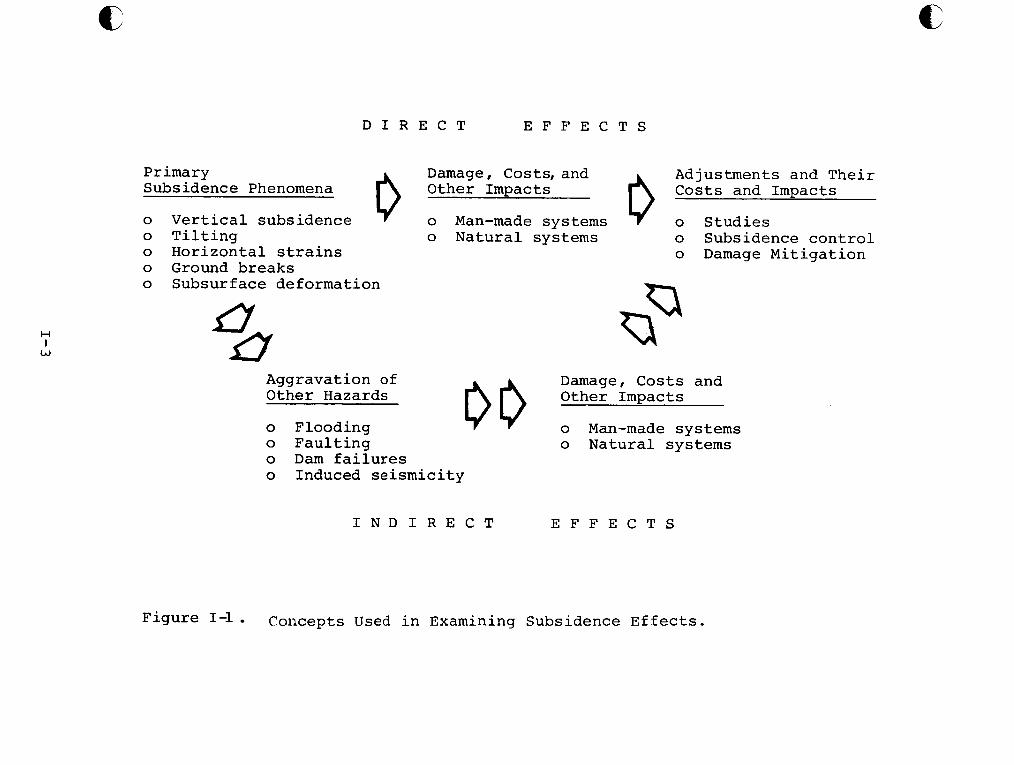
During the collection of data and preparation of the case studies, certain concepts were developed and used to distin- guish primary subsidence phenomenon and their direct effects from the secondary aggravation of other hazards and their indirect effects. Figure 1-1 illustrates these concepts which are important for developing an understanding of subsidence effects.
It should be noted that the data acquisition methods used for this project were limited to secondary data sources (i.e., from others who had previously studied the subject). No attempt was made to collect primary data by field work, by examining public works records, or by other labor-intensive methods. Considering overall project objectives, this use of secondary data sources was consistent with the level of effort budgeted and the number of case studies examined.
1-2
e
H I
W
D I R E C T E F F E C T S
Primary Subsidence Phenomena
o Vertical subsidence o Tilting o Horizontal strains o Ground breaks o Subsurface deformation
Adjustments and Their Costs and Impacts
o Studies o Subsidence control o Damage Mitigation
Damage, Costs,and Other Impacts
o Man-made systems o Natural systems
Damage, Costs and Other Impacts
o Man-made systems o Natural systems
Aggravation of Other Hazards
o Flooding o Faulting o Dam failures o Induced seismicity
I N D I R E C T E F F E C T S
Figure 1-1 Concepts Used in Examining Subsidence Effects.
General Findings
Data collected from the nine case studies illustrates a number of important aspects of subsidence:
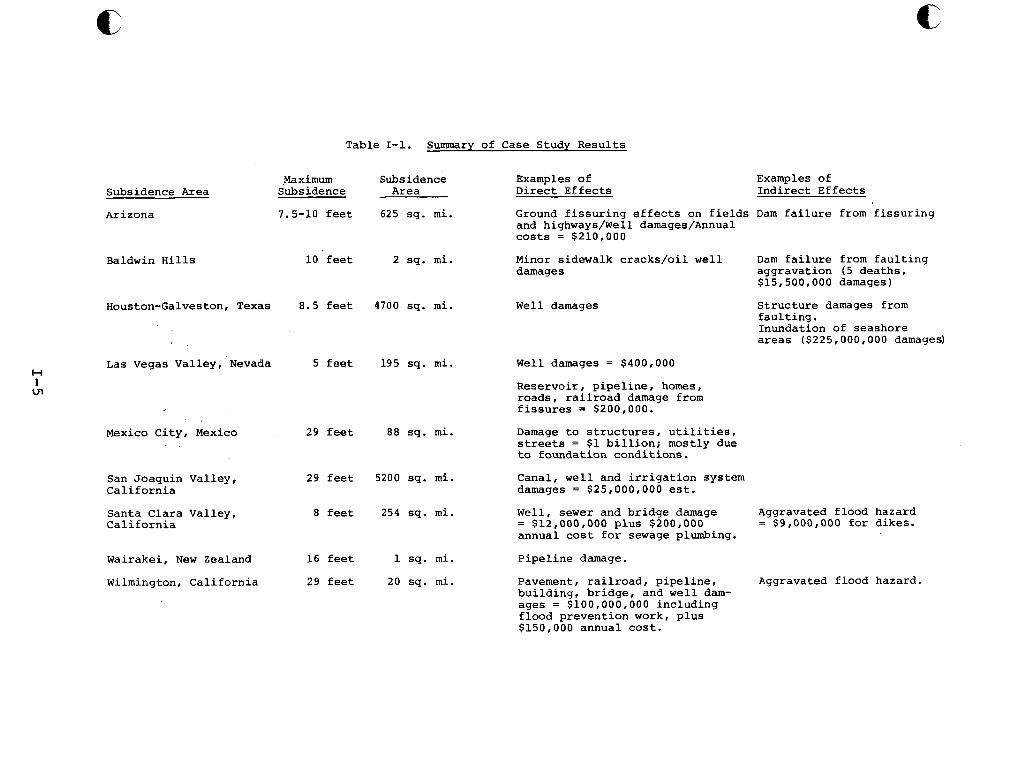
0 Environmental and economic effects directly from primary subsidence phenomena can vary from neglible to severe depending on the nature of the land uses present and the severity of the subsidence phenomena. Table I- 1 illustrates this point and sumiiarizes the data col- lection results. It should be pointed out that the case studies were selected partly because they offer examples of damage. This may give an initial impres- sion that subsidence always causes significant damages and economic losses, but it must be remembered that many of the more than 6 0 subsidence areas not studied in detail reported little or no damage.
0 Indirect effects of subsidence through aggravation of other hazards already present in the area are frequently more severe than the direct effects. Increased flooding from land subsidence was the most common indirect effect observed but aggravation of surface faulting and dam failures were also identified.
0 Subsidence effects, both direct and indirect, are highly site-specific. Each case study area seems to have its own unique set of subsidence-related problems. Because of this site specific nature of the problems, it is generally not possible to use the results of one case study to predict the consequences of subsidence in another area. Additional analysis of the data may reveal similarities among the case studies or generic relationships for common types of land use.
0 Subsidence phenomena such as tilting, horizontal strain, and fissuring of the ground surface appear to be more responsible for damage than the simple vertical subsid- ence of the ground. More analysis of the subsidence areas, however, is necessary to confirm this finding. Rates of surface deformations, such as the rate of horizontal strain accumulation, and the related amounts of natural adjustments to these deformations, such as stress relief mechanisms between structures and the surrounding soil, may also be important but no data or analysis is available for the case studies.
0 The quantity and quality of data collected for all case studies were disappointing. There were several reasons for this:
1-4
c
Table 1-1. Summary of Case Study Results
c
H I
wl
Maximum Subsidence Examples of Subsidence Area Subsidence Area Direct Effects
Arizona 7.5-10 feet 625 sq. mi.
Baldwin Hills 10 feet 2 sq. mi.
Houston-Galveston, Texas 8.5 feet 4100 sq. mi.
Las Vegas Valley, Nevada 5 feet 195 sq. mi.
Mexico City, Mexico 29 feet 88 sq. mi.
San Joaquin Valley, 29 feet 5200 sq. mi. California
Santa Clara Valley, 8 feet 254 sq. mi. California
Wairakei, New Zealand 16 feet 1 sq. mi.
Wilmington, California 29 feet 20 sq. mi.
Examples of Indirect Effects
Ground fissuring effects on fields Dam failure from fissuring and highways/Well damages/Annual costs = $210,000
Minor sidewalk cracks/oil well Dam failure from faulting damages aggravation (5 deaths,
$15,500,000 damages)
Well damages Structure damages from faulting . Inundation of seashore areas ($225,000,000 damages)
Well damages = $400,000
Reservoir, pipeline, homes, roads, railroad damage from fissures = $200,000.
Damage to structures, utilities, streets = $1 billion; mostly due to foundation conditions.
Canal, well and irrigation system damages = $25,000,000 est.
Well, sewer and bridge damage Aggravated flood hazard = $9,000,000 for dikes. = $12,000,000 plus $200,000
annual cost for sewage plumbing.
Pipeline damage.
Pavement, railroad, pipeline, Aggravated flood hazard. building, bridge, and well dam- ages = $100,000,000 including flood prevention work, plus $150,000 annual cost.
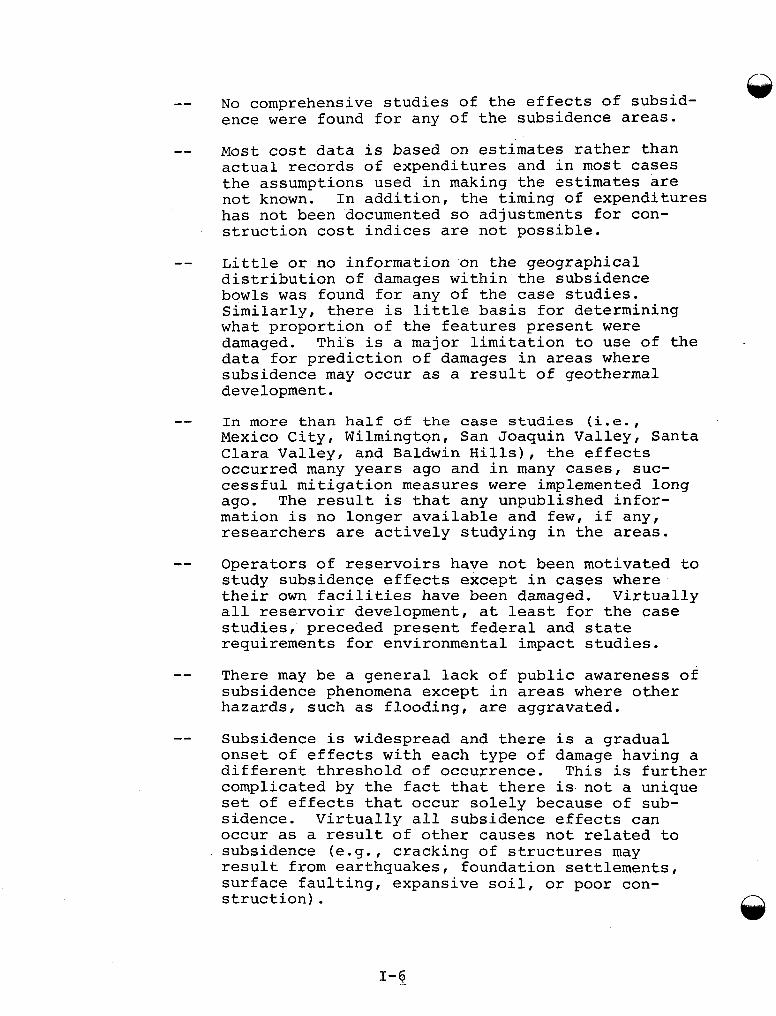
-- No comprehensive studies of the effects of subsid- ence were found for any of the subsidence areas.
-- Most cost data is based on estimates rather than actual records of expenditures and in most cases the assumptions used in making the estimates are not known. In addition, the timing of expenditures has not been documented so adjustments for con- struction cost indices are not possible.
-- Little or no information on the geographical distribution of damages within the subsidence bowls was found for any of the case studies. Similarly, there is little basis for determining what proportion of the features present were damaged. This is a major limitation to use of the data for prediction of damages in areas where subsidence may occur as a result of geothermal development.
-- In more than half of the case studies ( i . e . , Mexico City, Wilrnington, San Joaquin Valley, Santa Clara Valley, and Baldwin Hills), the effects occurred many years ago and in many cases, suc- cessful mitigation measures were implemented long ago. The result is that any unpublished infor- mation is no longer available and few, if any, researchers are actively studying in the areas.
-- Operators of reservoirs have not been motivated to study subsidence effects except in cases where their own facilities have been damaged. Virtually all reservoir development, at least for the case studies, preceded present federal and state requirements for environmental impact studies.
-- There may be a general lack of public awareness of subsidence phenomena except in areas where other hazards, such as flooding, are aggravated.
-- Subsidence is widespread and there is a gradual onset of effects with each type of damage having a different threshold of occurrence. This is further complicated by the fact that there is not a unique set of effects that occur solely because of sub- sidence. Virtually all subsidence effects can occur as a result of other causes not related to subsidence (e.g., cracking of structures may result from earthquakes, foundation settlements, surface faulting, expansive soil, or poor con- struction).
1-6 .._
0 While there is a serious lack of reliable data on actual subsidence effects in the areas studied, it does appear that it is possible to quantitatively predict many types of subsidence effects using conventional engineering techniques to supplement the limited sub- sidence data. The National Coal Board of England has developed a Subsidence Engineers' Handbook which is useful for making predictions and for designing to avoid subsidence damages. The Handbook must be used with caution since it is designed for use with sub- sidence from underground coal mines and not for sub- sidence from geofluid withdrawal but the damage causing mechanisms at the ground surface (e.g., tilting and horizontal strains) are similar in many cases so the results are of considerable value. The Handbook discusses the relationships of ground movement to surface damage, the characteristics of surface damages, and structural precautions for minimizing damage to new and existing structures and pipelines. Additional guidance can be obtained from the Civil Engineering disciplines, particularly those related to soil and foundations engineering, and from a recent publication (1977) entitled Ground Subsidence-by the Institution of Civil Engineers, London. -
Implications for Program Objectives
Considering the overall objectives of the Geothermal Subsid- ence Research Program, these general findings have a number of implications:
0 Subsidence effects, either direct or indirect, are clearly of potential major economic, public safety and environmental importance. Continuation of the Geo- thermal Subsidence Research Program is essential in order to identify and avoid or mitigate adverse effects from future geothermal' development.
0 Presently available data on the known effects o f sub- sidence, including the data from this study, are adequate for developing a checklist of potential effects from future development. However, there is considerable doubt about the adequacy of the available data for use in developing quantitative models for predicting generic or site specific effects of sub- sidence on various types of land uses.
Considering the apparent importance of tilting, hori- zontal strains, ground fissuring and rate of strain accumulation in determining the effects of subsidence, other projects in the Geothermal Subsidence Research
o
1-7
9 Program (e.g., field monitoring, subsidence models, and subsidence potential mapping) should be reviewed to insure that they will have the ability to deal with these phenomena as well as with vertical and horizontal surface movements.
o Additional information on the actual environmental and economic effects in existing subsidence areas could be developed, if needed, at least in the areas where subsidence is continuing. This information, however, would require more costly efforts than those applied to Category 4 , Project 1. The efforts might include: extensive field surveys and mapping of the subsidence bowls and the existing land uses and other environ- mental conditions present in and near the subsiding areas; field reconnaissance and interviews to determine the location and nature of damges that have occurred; and overlay analysis of the subsidence, environmental, and damage data maps to determine cause-effect relation- ships for specific t ypes of facilities.
0 Regardless of which approach is used for subsequent studies of subsidence damage and economic effects, it is important that the social as well as the economic aspects of the problem be addressed. Specific study topics might include:
Effectiveness of institutional means, such as land use controls for avoiding adverse effects.
Methods for translating the results of the Geo- thermal Subsidence Research Program into public policies for controlling reservoir development. This would include definition of possible roles and responsibilities of reservoir developers, local governments and state and federal regulatory agencies.
Methods for presentation of subsidence-related issues to local areas, where development may occur, in ways that will solicit local cooperative participation in problem solving.
Inequities in the distribution of adverse impacts and costs from subsidence versus the distribution of benefits and profits from reservoir develop- ment.
11. SUMMARY OF SUBSIDENCE PHENOMENA, DAMAGE MECHANISMS, AND ADJUSTMENTS
A. Subsidence Phenomena and Damage Mechanisms
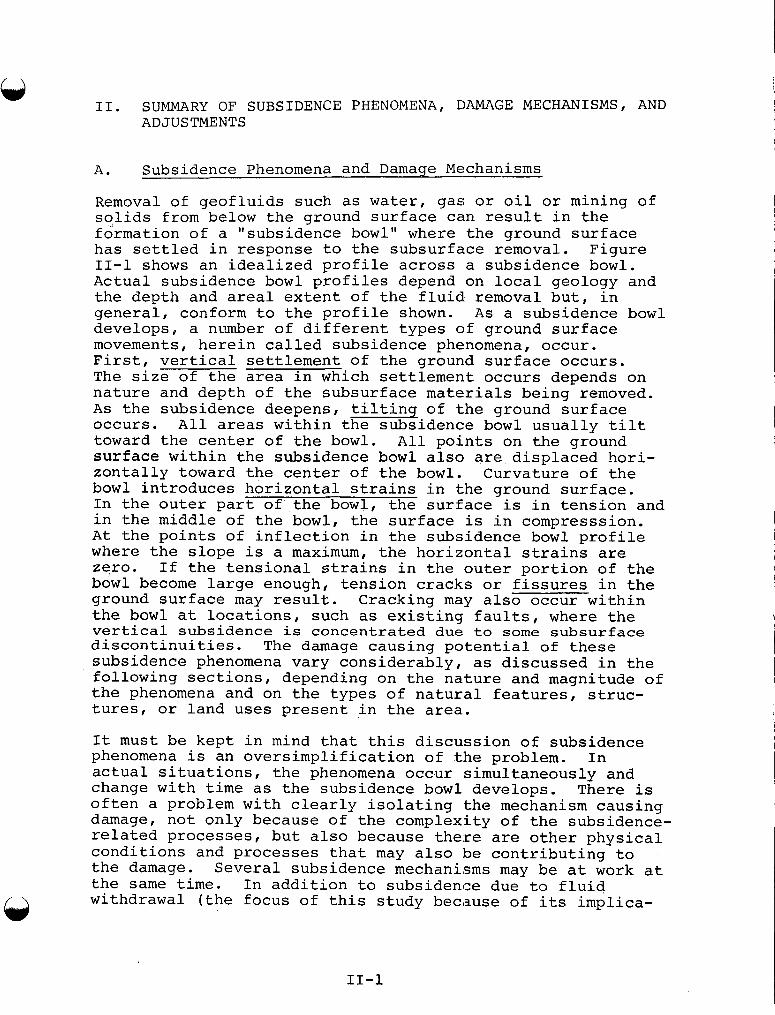
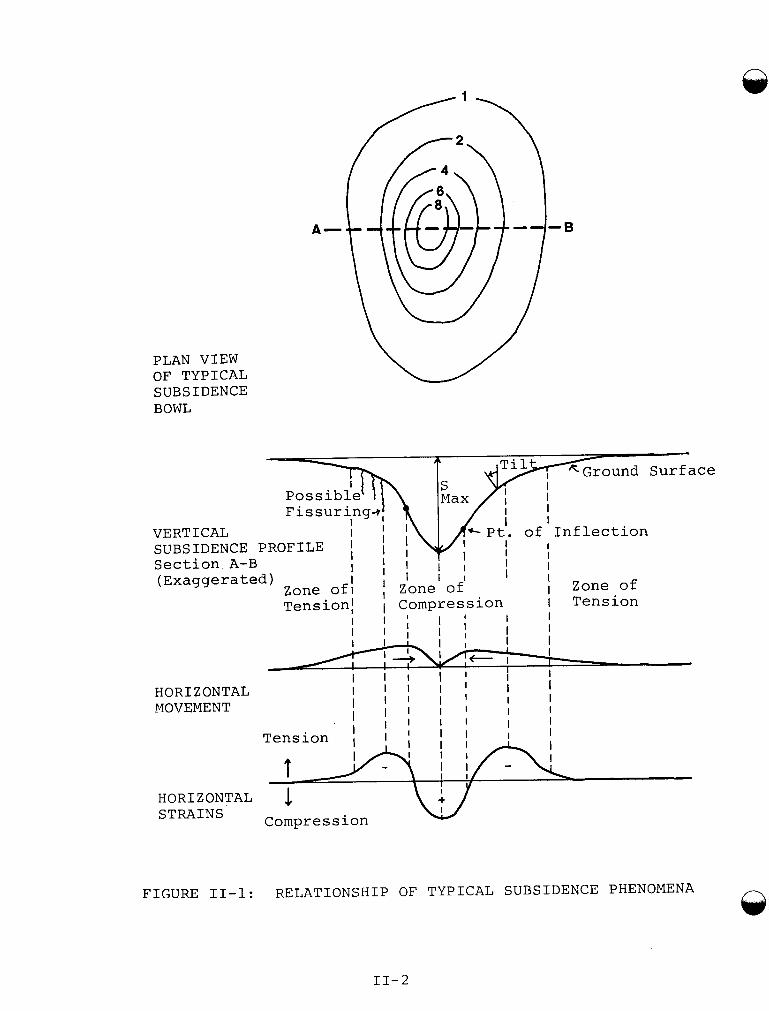
Removal of geofluids such as water, gas or oil or mining of solids from below the ground surface can result in the formation of a "subsidence bowl" where the ground surface has settled in response to the subsurface removal. Figure 11-1 shows an idealized profile across a subsidence bowl. Actual subsidence bowl profiles depend on local geology and the depth and areal extent of the fluid removal but, in general, conform to the profile shown. As a subsidence bowl develops, a number of different types of ground surface movements, herein called subsidence phenomena, occur. First, vertical settlement of the ground surface occurs. The size of the area in which settlement occurs depends on nature and depth of the subsurface materials being removed. As the subsidence deepens, tilting of the ground surface occurs. All areas within the subsidence bowl usually tilt toward the center of the bowl. All points on the ground surface within the subsidence bowl also are displaced hori- zontally toward the center of the bowl. Curvature of the bowl introduces horizontal strains in the ground surface. In the outer part of the bowl, the surface is in tension and in the middle of the bowl, the surface is in compresssion. At the points of inflection in the subsidence bowl profile where the slope is a maximum, the horizontal strains are zqro. If the tensional strains in the outer portion of the bowl become large enough, tension cracks or fissures in the ground surface may result. Cracking may also occur within the bowl at locations, such as existing faults, where the vertical subsidence is concentrated due to some subsurface discontinuities. The damage causing potential of these subsidence phenomena vary considerably, as discussed in the following sections, depending on the nature and magnitude of the phenomena and on the types of natural features, struc- tures, or land uses present in the area.
It must be kept in mind that this discussion of subsidence phenomena is an oversimplification of the problem. In actual situations, the phenomena occur simultaneously and change with time as the subsidence bowl develops. There is often a problem with clearly isolating the mechanism causing damage, not only because of the complexity of the subsidence- related processes, but also because there are other physical conditions and processes that may also be contributing to the damage. Several subsidence mechanisms may be at work at the same time. In addition to subsidence due to fluid withdrawal (the focus of this study because of its implica-
11-1
PLAN VIEW OF TYPICAL SUBSIDENCE BOWL
ound Surface
VERTICAL SUBSIDENCE PR Section A-B (Exaggerated)
HORIZONTAL MOVEMENT
HORIZONTAL STRAINS
I ' I I I
I A i
Tension I
v Compression
1 1 - 2
. . . . .. ..
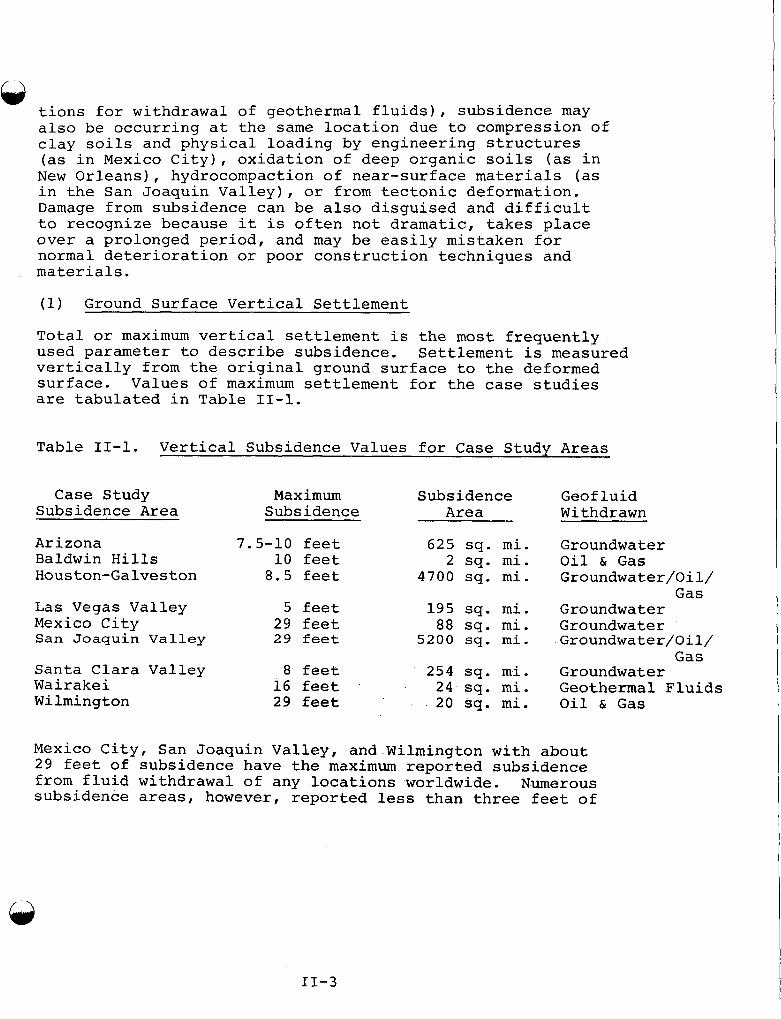
tlons for withdrawa of geothermal fluids), subsidence may also be occurring at the same location due to compression of clay soils and physical loading by engineering structures (as in Mexico City), oxidation of deep organic soils (as in New Orleans), hydrocompaction of near-surface materials (as in the San Joaquin Valley), or from tectonic deformation. Damage from subsidence can be also disguised and difficult to recognize because it is often not dramatic, takes place over a prolonged period, and may be easily mistaken for normal deterioration or poor construction techniques and materials.
(1) Ground Surface Vertical Settlement
Total or maximum vertical settlement is the most frequently used parameter to describe subsidence. Settlement is measured vertically from the original ground surface to the deformed surface. Values of maximum settlement for the case studies are tabulated in Table 11-1.
Table 11-1. Vertical Subsidence Values for Case Study Areas
Case Study Subsidence Area
Arizona Baldwin Hills Houston-Galveston
Las Vegas Valley Mexico City San Joaqu in Valley
Santa Clara Valley Wairakei Wilmington
Maximum Subsidence
Subsidence Area
7.5-10 feet 10 feet
8.5 feet
5 feet 29 feet 29 feet
8 feet 16 feet 29 feet
6 2 5 sq. mi. 2 sq. mi.
4700 sq. mi.
1 9 5 sq. mi. 88 sq. mi.
5200 sq. mi.
254 sq. mi. 24 sq. mi.
. 20 sq. mi.
Geof luid Withdrawn
Groundwater Oil & G a s Groundwater/Oil/
Groundwater Groundwater Groundwater/Oil/
Groundwater Geothermal Fluids Oil & G a s
Gas
Gas
Mexico City, San Joaquin Valley, and Wilmington with about 2 9 feet of subsidence have the maximum reported subsidence from fluid withdrawal of any locations worldwide. Numerous subsidence areas, however, reported less than three feet of
total vertical subsidence. These case study areas, therefore, represent most of the areas of greatest subsidence.
Damage Causing Potential - Vertical Settlements Uniform vertical settlements alone are not usually responsible for damage. Structures are generally not subject to damage from the vertical component of subsidence since a structure resting on the land surface subjected to uniform vertical settlement would maintain its locational relationship to the sinking surface.
However, when vertical settlements occur adjacent to a water body such as a river, lake, or the ocean, the increased risk of flooding in the subsidence bowl can be a serious problem. Permanent inundation of some lands and increased exposure to flooding have resulted from subsidence in Houston-Galveston; Long Beach; Santa Clara Valley; Venice, Italy; Lake Maracaibo, Venezuela; and in several Japanese coastal cities. In these areas the problems of land settlement in relationship to the water bodies far exceed in severity the problems related to other subsidence phenomena. Defense against permanent inundation and hazard of recurrent floods has required major capital investments to construct dikes, levees, pumping stations, and other facilities. Damages from vertical settlements in the case study areas are summarized in Table 11-2.
In addition to increasing flooding potential, vertical settlement can cause difficulties with hydraulic systems such as canals, sewers, and streams which depend on gravity flow and can cause changes in the groundwater levels relative to the ground surface. Changes in hydraulic systems are discussed in the following section which deals with tilting. In shallow groundwater areas, subsidence of the surface can result in apparent rising groundwater levels which disrupt plant growth, interfere with subsurface drainage, and eventu- ally cause surface ponding and disruptions in land use as illustrated in Figure 11-2. These groundwater effects were not reported in the nine case study areas, but have been encountered in other subsidence areas. In some cases, permanent drains and wells with pumping stations may be necessary to avoid adverse effects. In shallow groundwater areas where water tables are perched on subsurface horizontal beds which restrict downward movement of water, a decline in groundwater levels may result if subsidence-induced fissures rupture the water-retarding beds.
A
11-4
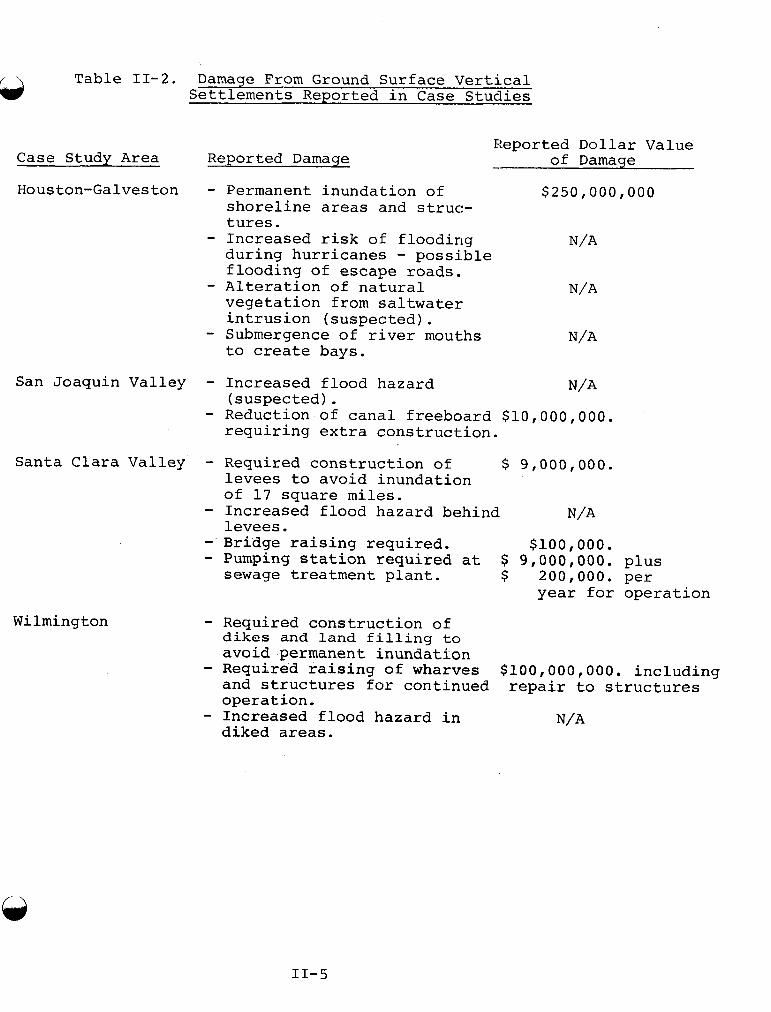
Table 11-2. Damage From Ground Surface Vertical Settlements Reported in Case Studies drs
Case Study Area Reported Damage Reported Dollar Value
of Damage - Houston-Galveston - Permanent inundation of $250,000,000
shoreline areas and struc- tures.
during hurricanes - possible flooding of escape roads.
vegetation from saltwater intrusion (suspected).
- Submergence of river mouths to create bays.
- Increased risk of flooding N/A
N/A
N/A
- Alteration of natural
N/A San Joaquin Valley - Increased flood hazard (suspected) . requiring extra construction.
- Reduction of canal freeboard $10,000,000.
Santa Clara Valley - Required construction of $ 9,000,000. levees to avoid inundation of 17 square miles. - Increased flood hazard behind levees.
N/A
- Bridge raising required. $100,000. - Pumping station required at $ 9,000,000. plus sewage treatment plant. $ 200,000. per
year for operation
Wilmington - Required construction of dikes and land filling to avoid permanent inundation - Required raising of wharves $100,000,000. including and structures for continued repair to structures operation.
- Increased flood hazard in diked areas.
N/A
11-5
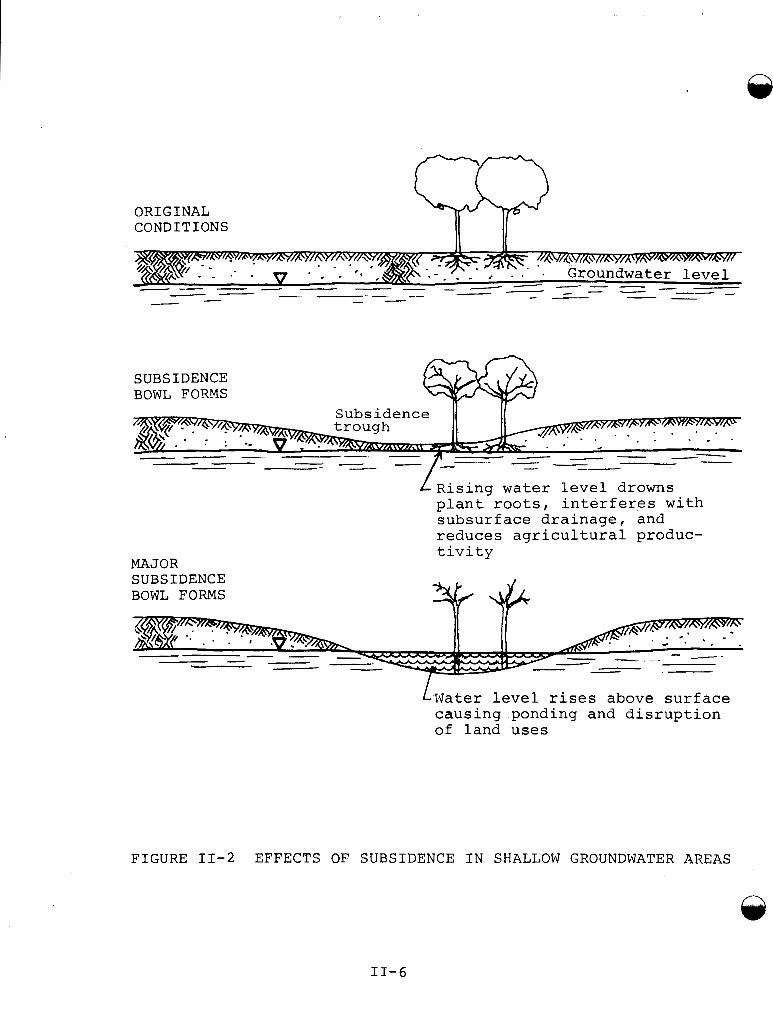
ORIGINAL CONDITIONS
SUBSIDENCE BOWL FORMS
MAJOR SUBSIDENCE BOWL FORMS
L R i s i n g w a t e r l e v e l drowns p l a n t r o o t s , i n t e r f e r e s w i t h s u b s u r f a c e d r a i n a g e , and r educes a g r i c u l t u r a l produc- t i v i t y
LWater l e v e l r ises above s u r f a c e c a u s i n g ponding and d i s r u p t i o n of l and u s e s
FIGURE 11-2 EFFECTS OF SUBSIDENCE IN SHALLOW GROUNDWATER AREAS
11-6
(2) Ground Surface Tilt and Differential Settlement
Tilting of the ground surface toward the center of the subsidence bowl occurs in most parts of the bowl except at the edge of the bowl and in the center where the surface remains in its original orientation. In cases where fluids are withdrawn at a relatively uniform rate over a wide area, as in the San Joaquin Valley, the degree of tilt may be relatively minor or negligible. In other areas with consider- able subsidence over a small area, the tilt may be consider- able. Values of maximum and average tilt for the case studies are tabulated in Table 11-3. These values were calculated from the subsidence profiles in the case study descriptions. The points of maximum tilt are at the points of inflection in the subsidence profiles. Tilting must be considered in two ways when evaluating damage causing poten- tials; rigid-body tilting and differential settlement, depending on the type of structures involved.
Damage Causing Potential-Rigid-Body Tilt%
Tilting of the ground surface may adversely effect tall structures such as tall buildings, silos, smokestacks, and communication towers. The term tilting, as used in this context, refers to uniform or rigid-body tilting without bending deformations within the structure. Adverse effects from rigid-body tilting may include disruption of sensitive machinery, misalignment of elevators in tall buildings, and misalignment of microwave communication beams. Tilts as small as 0.0002 have been reported to affect sensitive machinery but tilts in the range of 0.003-0.005 may be generally acceptable for tall buildings. Reported damages from tilting in the case study areas are tabulated in Table 11-4.
Tilting over considerable horizontal distances can change surface drainage patterns in relatively flat land and can cause changes in river hydrology through alteration of stream gradients which in turn alter natural erosion-sedimen- tation processes and flood carrying capacities. Formation of marshes and ponds may result from disruption of natural surface drainage. Tilting which increases stream gradients will tend to encourage erosion and increase flood carrying capacities while tilting which decreases stream gradients will have the opposite effects. Similarly, tilting can increase or decrease capacities of man-made hydraulic struc- tures such as canals, agricultural drains and sewage collec- tion systems and may require releveling of agricultural fields where flood irrigation is used. reduce the effective height of flood control levees and canal banks requiring costly reconstruction. Because of the
Tilting may also
11-7
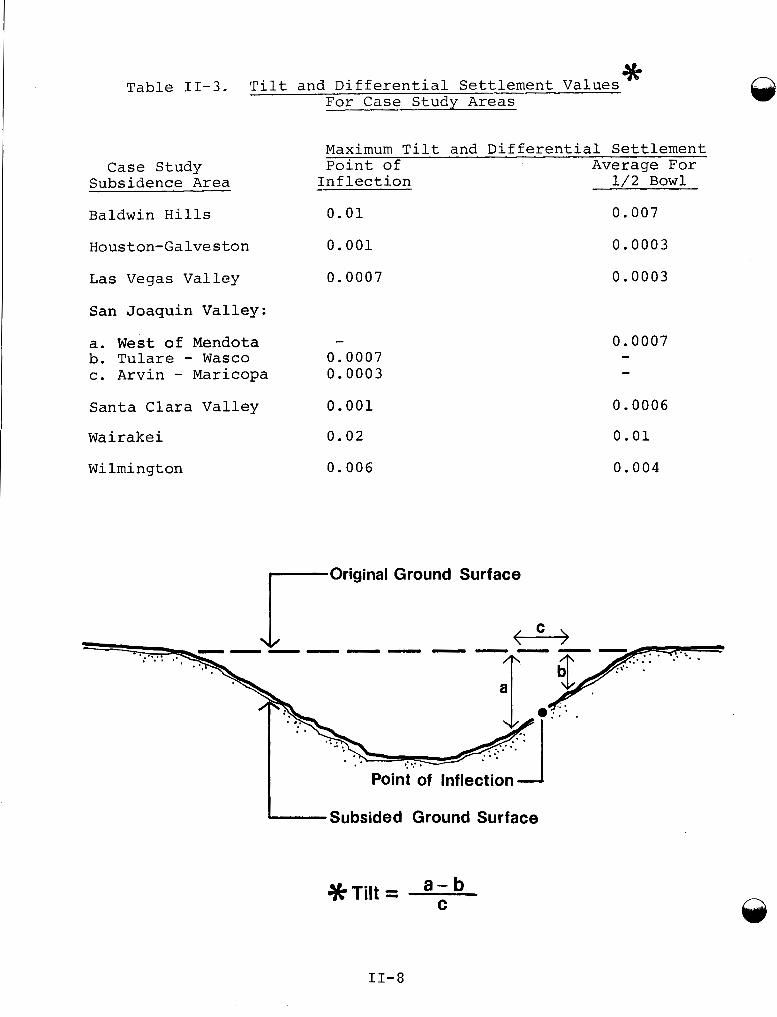
* Table 11-3. Tilt and Differential Settlement Values
For Case Study Areas
Case Study Subsidence Area
Baldwin Hills
Houston-Galveston
Las Vegas Valley
San Joaquin Valley:
a. West of Mendota b. Tulare - Wasco c. Arvin - Maricopa Santa Clara Valley
wairakei
Wilmington
Maximum Tilt and Differential Settlement Point of Average For Inflection 1/2 Bowl
0.01
0.001
0.0007
- 0.0007 0.0003
0 .001
0.02
0.006
0 .007
0 .0003
0 .0003
0.0007 - -
0.0006
0.01
0.004
Ground Surface
Subsided Ground Surface
a- b C
*Tilt =
11-8
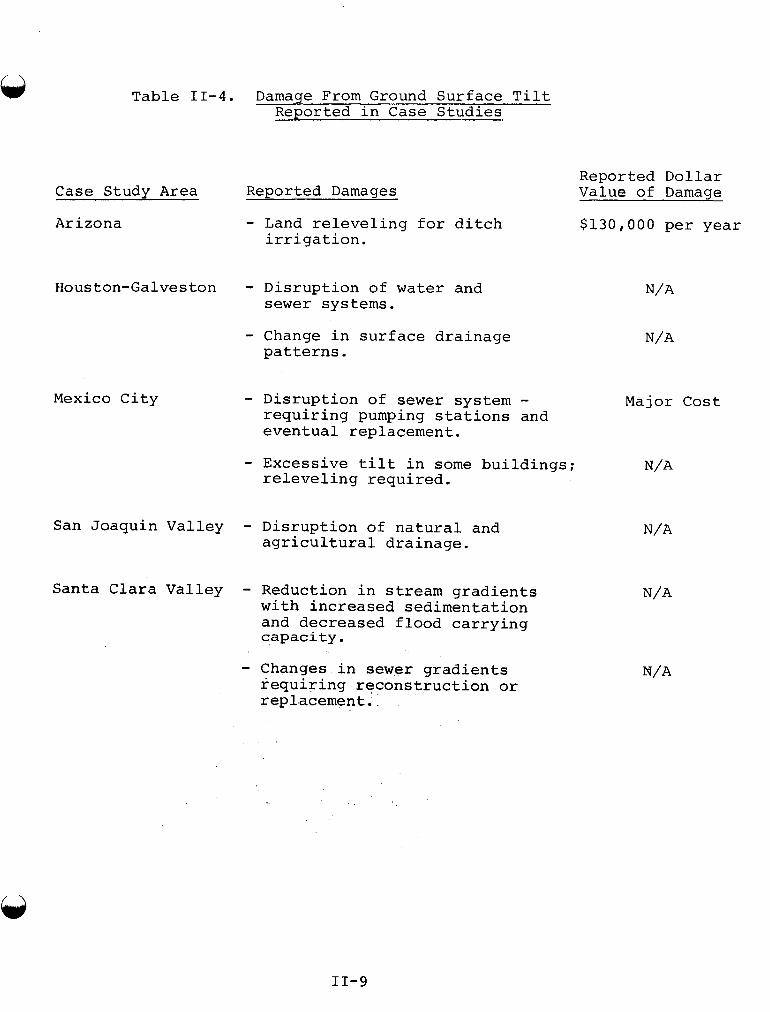
Table 11-4.
Case Study Area
Arizona
Houston-Galveston
Mexico City
San Joaquin Valley
Santa Clara Valley
Damaqe From Ground Surface Tilt Reported in Case Studies
Reported Damages
- Land releveling for ditch irrigation.
- Disruption of water and sewer systems.
- Change in surface drainage patterns.
- Disruption of sewer system - requiring pumping stations and eventual replacement.
- Excessive tilt in some buildings; releveling required.
- Disruption of natural and agricultural drainage.
- Reduction in stream gradients with increased sedimentation and decreased flood carrying capacity .
- Changes in sewer gradients requiring reconstruction or replacement.
Reported Dollar Value of Damaae
$130,000 per year
Major Cost
11-9
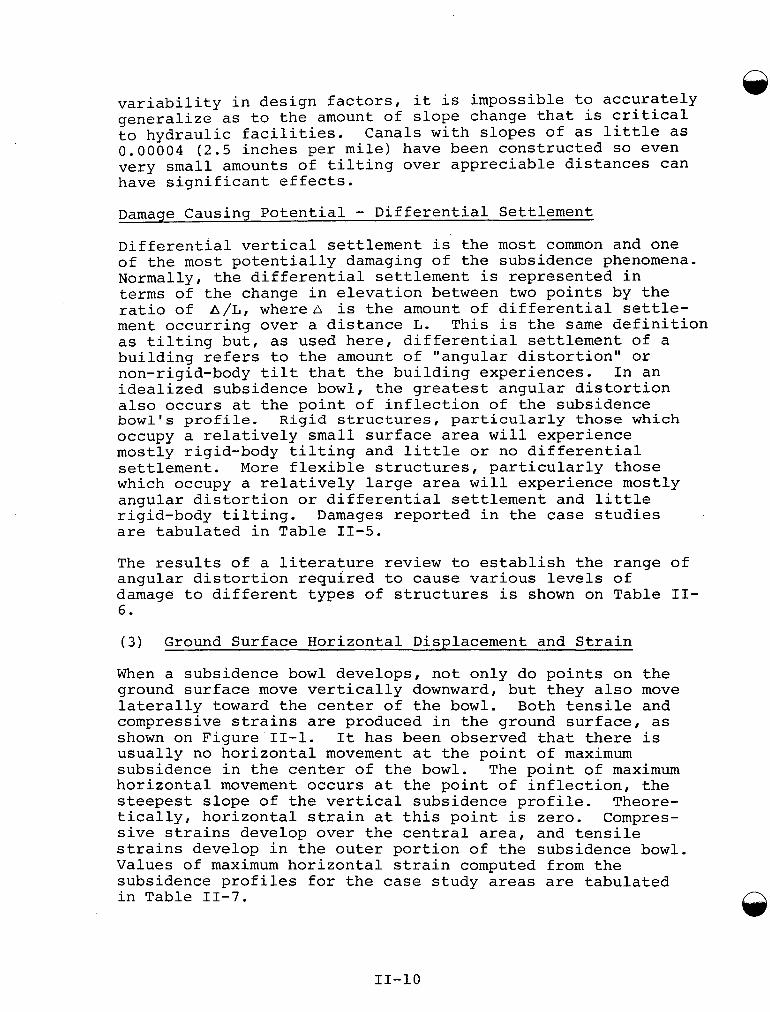
variability in design factors, generalize as to the amount of slope change that is critical to hydraulic facilities. Canals with slopes of as little as 0.00004 (2.5 inches per mile) have been constructed so even very small amounts of tilting over appreciable distances can have significant effects.
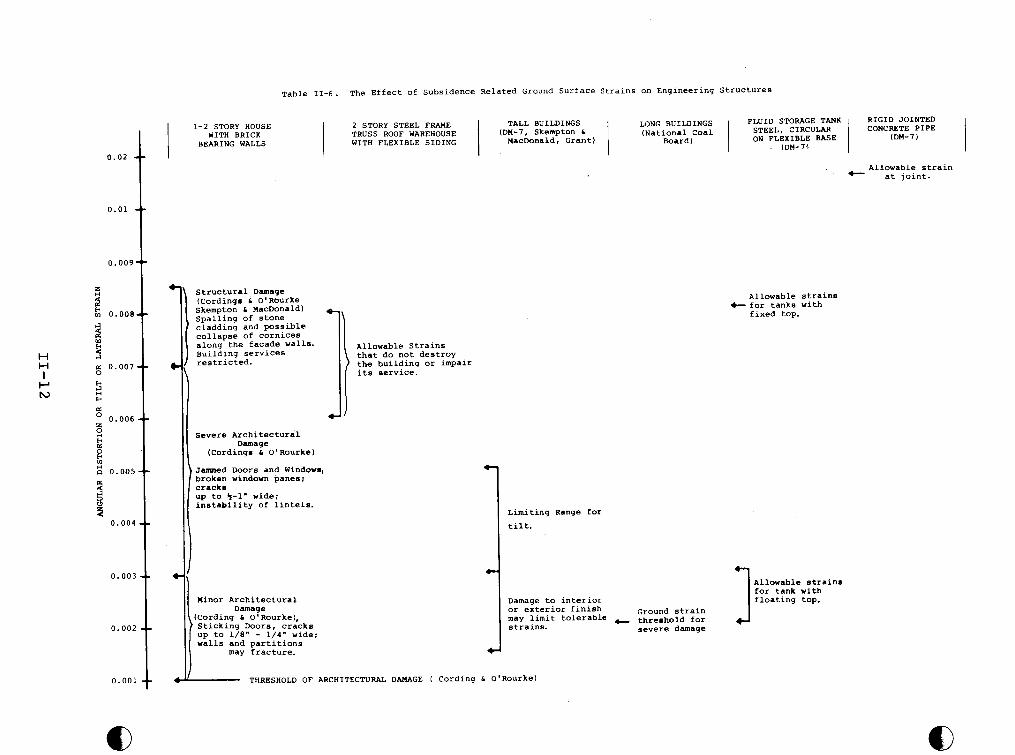
Damage Causing Potential - Differential Settlement Differential vertical settlement is the most common and one of the most potentially damaging of the subsidence phenomena. Normally, the differential settlement is represented in terms of the change in elevation between two points by the ratio of A / L , whereA is the amount of differential settle- ment occurring over a distance L. This is the same definition as tilting but, as used here, differential settlement of a building refers to the amount of "angular distortion" or non-rigid-body tilt that the building experiences. In an idealized subsidence bowl, the greatest angular distortion also occurs at the point of inflection of the subsidence bowl's profile. Rigid structures, particularly those which occupy a relatively small surface area will experience mostly rigid-body tilting and little or no differential settlement. More flexible structures, particularly those which occupy a relatively large area will experience mostly angular distortion or differential settlement and little rigid-body tilting. Damages reported in the case studies are tabulated in Table 11-5.
it is impossible to accurately
The results of a literature review to establish the range of angular distortion required to cause various levels of damage to different types of structures is shown on Table II- 6.
( 3 ) Ground Surface Horizontal Displacement and Strain
When a subsidence bowl develops, not only do points on the ground surface move vertically downward, but they also move laterally toward the center of the bowl. Both tensile and compressive strains are produced in the ground surface, as shown on Figure 11-1. It has been observed that there is usually no horizontal movement at the point of maximum subsidence in the center of the bowl. The point of maximum horizontal movement occurs at the point of inflection, the steepest slope of the vertical subsidence profile. Theore- tically, horizontal strain at this point is zero. Compres- sive strains develop over the central area, and tensile strains develop in the outer portion of the subsidence bowl. Values of maximum horizontal strain computed from the subsidence profiles for the case study areas are tabulated in Table 11-7. A
11-10
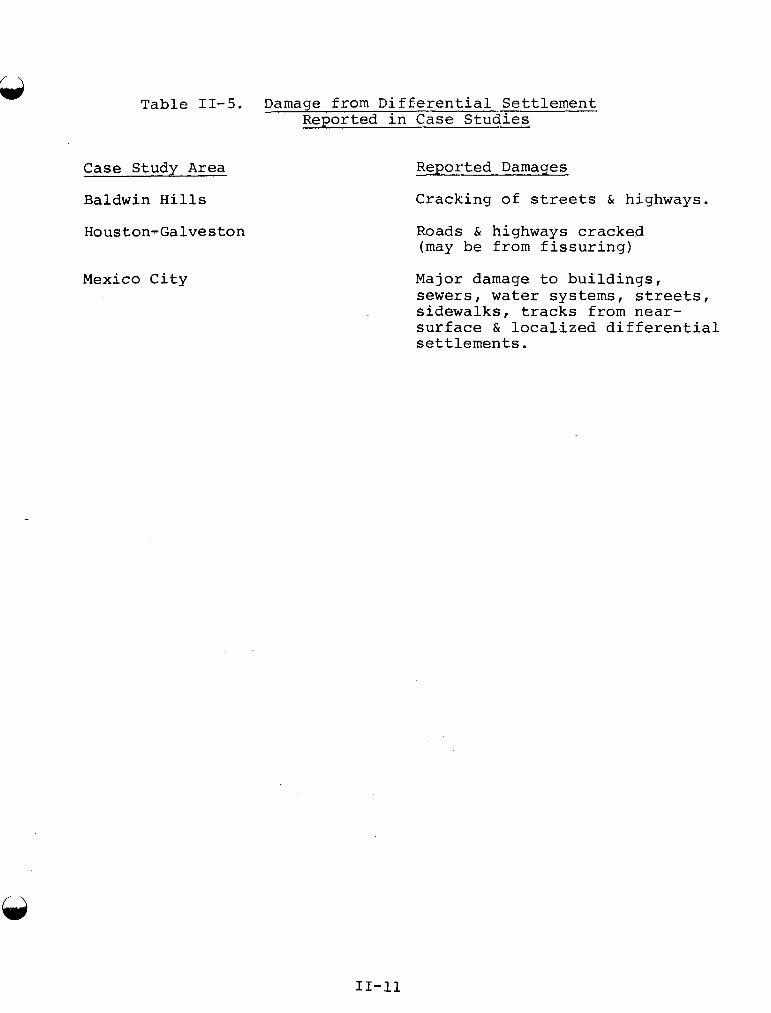
Table 11-5. Damage from Differential Settlement Reported in Case Studies
Case Study Area
Baldwin Hills
Houston-Galveston
Mexico City
Reported Damages
Cracking of streets & highways.
Roads & highways cracked (may be from fissuring)
Major damage to buildings, sewers, water systems, streets, sidewalks, tracks from near- surface & localized differential settlements.
11-11
0.02
STEEL, CIRCULAR ON FLEXIBLE BASE
(DM-7)
1-2 STORY HOUSE 2 STORY STEEL FRAME (DM-7, Skempton c (National Coal WITH BRICK TRUSS ROOF WAREHOUSE I BEARING WALLS WITH FLEXIBLE SIDING Board) nacDonald, Grant)
0.01
(DM-7)
0.00:
R 2 c 0.001
El
H 2 H a 0.00' I P h, CI
El
El
a O 0.001
s
z 0.00
a El
3 8 2
0.00
0.00
0.00
0.00
Table 11-6. The Effect of Subsidence Related Ground Surface Strains on Engineering Structures
c
structural Damage (Cording. s O'ROurke Skempton s MacDonald) Spalling of stone cladding and possible collapse of cornices along the facade walls. Building services restricted.
Severe Architectural Damage
(Cording. c O'Rourke)
Jammed Doors and Windows, broken windown panes: cracks up to f-1" wide; instability of lintels.
Uinor Architectural Damage
(Cording L O'Rourke), Sticking Doors, cracks up to 1/8" - 1/4" wide: walls and partitions
may fracture.
3 Allowable Strains that do not destroy the building or impair its service.
c
- THRESHOLD OF ARCHITECTURAL DAMAGE ( Cording & O'Rourke)
+ Allowable at joint. strain
Allowable strains C for tanks with
fixed top.
Limiting Range for tilt.
Allowable strains for tank with f loating top. 3 Damage to interior
Ground strain or exterior finish may limit tolerable thre,hold for strains. severe damage
Damage Causing Potential - Horizontal Displacement and Strain It has been observed that horizontal strains induced in structures are sometimes less than the ground strains. In assessing the damage-causing potential of horizontal strains, it is therefore important to distinguish between ground strain and the strain transmitted to the structure. Damage from horizontal strains reported in the case studies are tabulated in Table 11-8.
The results of a literature review to establish the levels of horizontal strain that may cause damage are shown on Table 11-6. The total amount of strain that will accumulate in a structure depends not only on the level of strain in the underlying ground surface and the portion that is transferred to the building, but also depends on the length of the building. For instance, a short 20-foot building may be able to absorb 0.2 feet of movement from a compressional strain of 0.001 by distributinq it over the structure. But for a 200-foot long structure subjected to the same strain level, the 0.2 foot shortening might concentrate at some weak point, causing severe damage. For this reason, some investigators feel that the total change in length of a structure is a better indication of damage potential than the level of horizontal strain.
Long, fairly rigid structures such as warehouses, bridges, pipelines, concrete highways, airport runways, and concrete curbs and sidewalks are most sensitive to damage from horizon- tal strain because they accumulate strains over long distan- ces. Service pipe connections to long buildings are particu- larly susceptible to damage. Long structures with flexibility, such as asphalt pavements, or with numerous joints which can absorb strain, such as jointed concrete or clay pipe, are less sensitive to damage. Strains of about 0.0005 can cause slight structural damage while strains of 0.003 to 0.006 can cause severe structural damage. In terms of total change in structure length, changes of up to 0.2 feet may cause only slight damage while length changes of 0.4 feet and more may cause severe damage.
( 4 ) Ground Surface Fissuring
Cracking or fissuring of the ground surface occasionally occurs in the zones of tension within the outer portions of subsidence bowls.
11-13
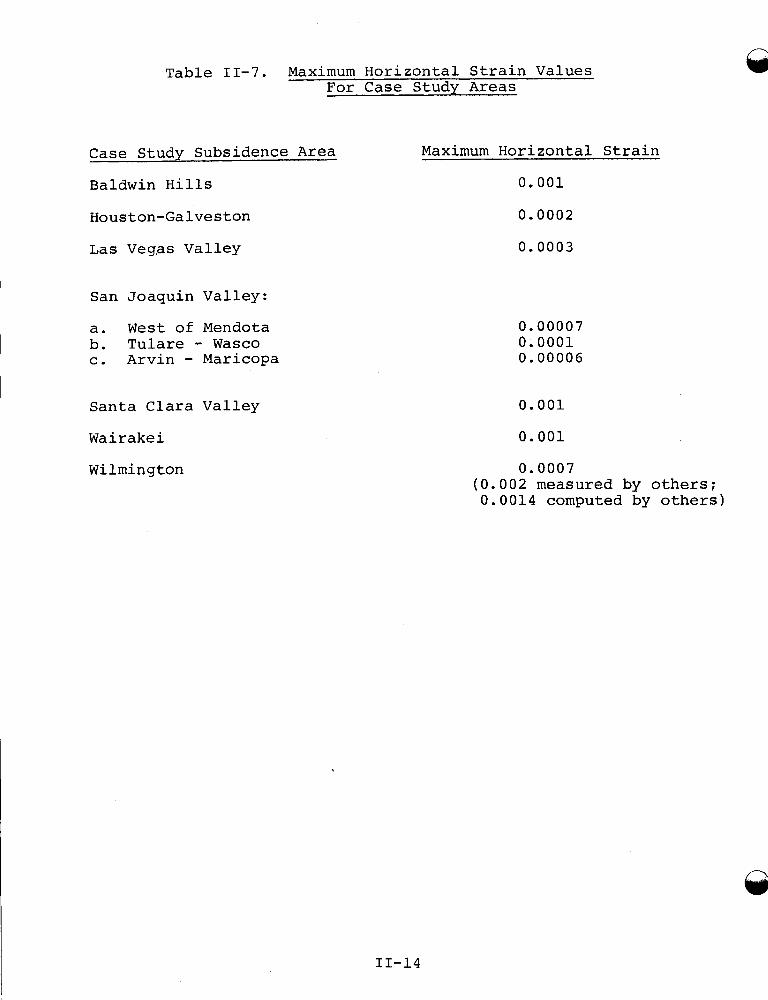
Table 11-7. Maximum Horizontal Strain Values For Case Study Areas
Case Study Subsidence Area Maximum Horizontal Strain
Baldwin Hills 0.001
Houston-Galveston 0.0002
Las Veg.as Valley 0.0003
San Joaquin Valley:
a. West of Mendota b. Tulare - Wasco c. Arvin - Maricopa
0.00007 0.0001 0.00006
Santa Clara Valley
Wairakei
Wilmington
11-14
0.001
0.001
0.0007 (0.002 measured by others; 0.0014 computed by others)
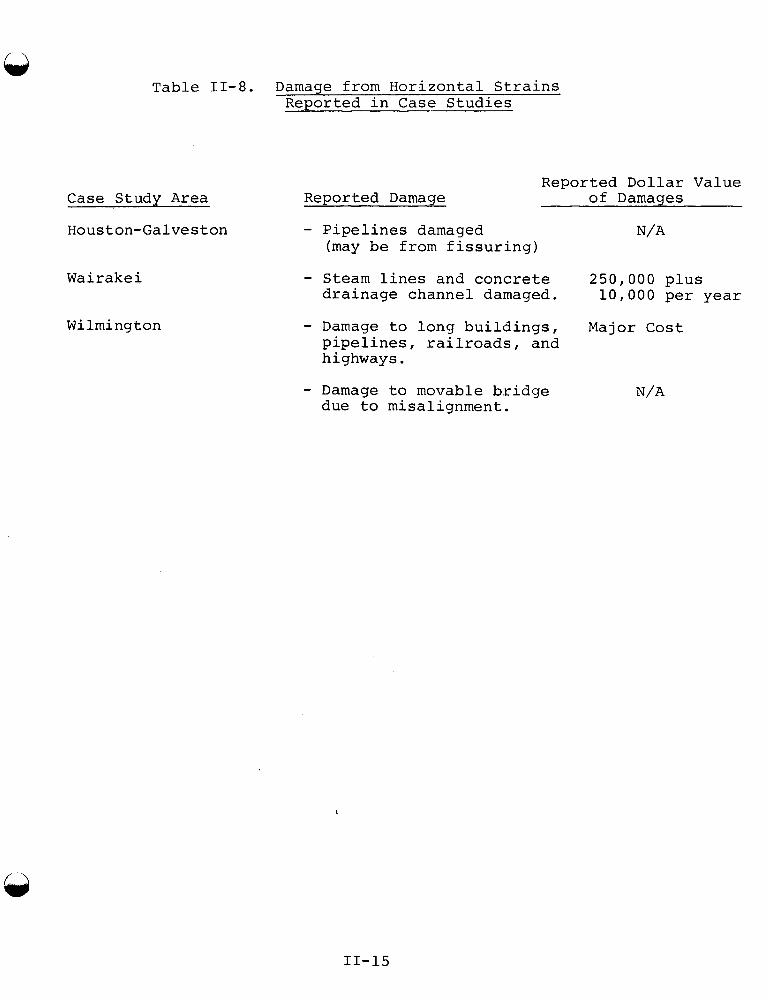
Table 11-8. Damage from Horizontal Strains Reported in Case Studies
Case Study Area
Houston-Galveston
Wairakei
Wilmington
ReDorted Damaae Reported Dollar Value
of Damaaes
- Pipelines damaged (may be from fissuring)
- Steam lines and concrete 250,000 plus drainage channel damaged. 10,000 per year
- Damage to long buildings, Major Cost pipelines, railroads, and highways.
- Damage to movable bridge N/A due to misalignment.
11-15
Depending on the local conditions, these fissures can exceed one kilometer in length but more commonly have lengths of the order of a few hundred meters. Fissures as deep as 10 meters and with widths much less than two centimeters are commonly observed. ably enlarged by erosion, and in fact, this may be the principal hazard associated with them.
In addition to the formation of fissures, fluid withdrawal in several cases has been documented as the cause of reactiva- tion of mo vement on pre-existing faults. When this occurs, it can cause severe differential settlements Over short distances.
Fissures in arid zones are often consider-
Cracks and fissures have been reported at Arizona, Houston- Galveston, Las Vegas, San Joaquin Valley, Mexico City and Wilmington. Differential surface or subsurface movements along pre-existing faults-have been reported in Houston- Galveston, Baldwin Hills, and Wilmington.
Damage-Causing Potential - Fissuring
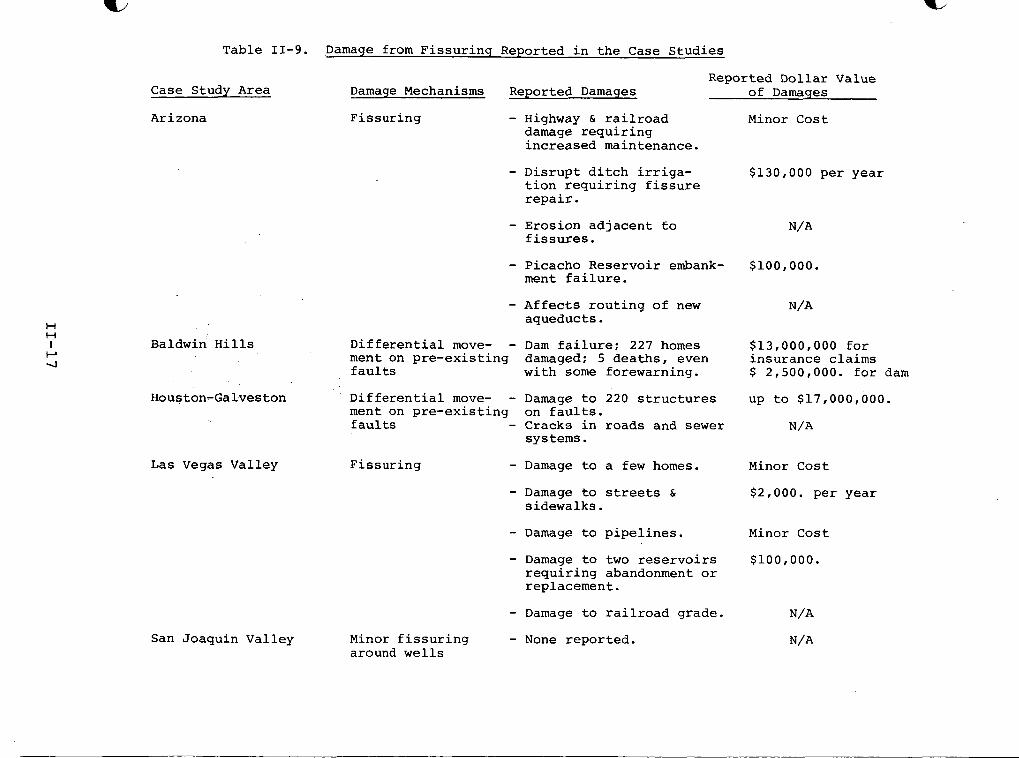
Fissuring disrupts surface and subsurface water flow and drainage and can damage facilities located on the fissure erosion, loss of agricultural productivity and damage to irrigation systems and drains have been reported as a result of fissuring in agricultural areas. Cracking of highways and structures have also been reported from both new fissures and from differential movement along pre-existing faults within subsidence bowls. The most serious damage that may be attributed to ground surface cracking was at Baldwin Hills where differential movement along a pre-existing fault resulted in the failure of a dam and reservoir with major loss of life and property. Clearly, this catastrophic event was unique to the Baldwin Hills subsidence bowl but it serves as a reminder of the potential consequences of unanti- cipated or uncontrolled subsidence phenomena. Fissuring from subsidence has been suggested as the cause of failure of an embankment of Picacho Reservoir in Arizona. In that case, the desert soils have a very low resistance to piping so water retaining structures can be easily undermined and eroded if fissuring occurs to initiate piping.
Damages from fissuring reported in the case studies are tabulated in Table 11-9.
( 5 ) Subsurface Deformation
Both vertical and horizontal deformations of the subsurface materials occur between the zone of fluid withdrawal and
11-16
c
H H
I P 4
Table 11-9. Damage from Fissuring Reported in the Case Studies
Reported Dollar Value Case Study Area Damage Mechanisms Reported Damages of Damages
Arizona Fissuring - Highway & railroad Minor Cost damage requiring increased maintenance.
- Disrupt ditch irriga- $130,000 per year tion requiring fissure repair.
- Erosion adjacent to fissures .
- Picacho Reservoir embank- $100,000. ment failure.
- Affects routing of new aqueducts.
Baldwin Hills Differential move- - Dam failure: 227 homes $13,000,000 for ment on pre-existing damaged: 5 deaths, even insurance claims faults with some forewarning. $ 2,500,000. for dam
ment on pre-existing on faults. Houston-Galveston Differential move- - Damage to 220 structures up to $17,000,000.
faults - Cracks in roads and sewer N/A systems.
Las Vegas Valley Fissuring - Damage to a few homes. Minor Cost
San Joaquin Valley
- Damage to streets & $2,000. per year sidewalks.
- Damage to pipelines. Minor Cost
- Damage to two reservoirs $100,000. requiring abandonment or replacement.
- Damage to railroad grade. N/A
Minor fissuring - None reported. around wells
the ground surface. within the zones of fluid withdrawal due to vertical compac- tion of the geologic formations and within the overlying materials as they subside because of the loss of support. Horizontal movements and strains develop below the surface just as they do at the surface. deformations may be relatively uniform or concentrated along geologic discontinuities and pre-existing faults.
Damage-Causing Potential - Subsurface Deformation The vertical compression and horizontal and vertical shearing of strata at depth can result in serious damage to wells which pass through the zone of deformation. Vertical sub- surface deformation can cause wells and well casings to be compressed and rupture or, if there is not much friction between the well casing and the rock material, subsurface deformation can cause wells to protrude from the ground as the ground surface sinks away from the well head. This mechanism is associated principally with groundwater pro- d u c t i o n and has c a u s e d damage t o wells and well casings in Arizona, the Houston-Galveston region, Las Vegas Valley, Mexico City and in the San Joaquin and Santa Clara'Valleys to name some of the most significant experiences. Damages from subsurface deformation reported in the case studies are tabulated in Table 11-10.
Some damaged wells have been abandoned, others have been repaired at depth, still others that have protruded from the ground have been cut off and the pump replaced at the new ground surface level. New wells in known subsidence areas may be installed with a sleeved casing to compensate for vertical compression along the axis of the casing.
Vertical subsurface deformations occur
These vertical and horizontal
The only notable report of damage from horizontal displace- ment at depth comes from the Wilmington Oil Field at Long Beach where numerous oil wells were sheared off at depth due to horizontal strains and their relief along pre-existing fault planes.
B. Adjustments to Subsidence
With an interest in the full range of possible adjustments to subsidence and the eventual definition of an optimal set of adjustments to subsidence due to geothermal resource development, an effort was made to categorize adjustments that are reported or inferred to have been made in areas experiencing subsidence. The classes of adjustments are as defined by Burton, et. al. (1968) and commonly used by natural hazards investigators (see also Natural Hazards, White, G. F., ed. 1 9 7 4 ) . Examples of the types of adjustments
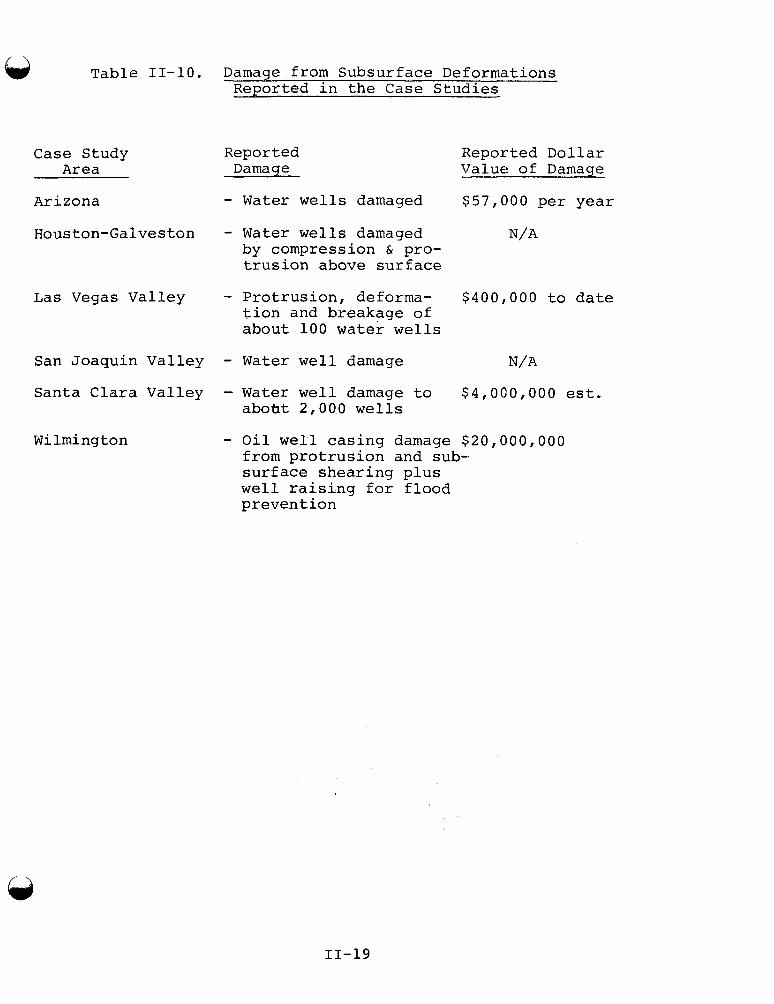
Table 11-10 . Damage from Subsurface Deformations ReDorted i n t h e C a s e S t u d i e s
Case Study A r e a
Arizona
Houston-Galveston
L a s Vegas Va l l ey
San Joaquin Va l l ey
Santa Clara Val ley
Wilmington
Reported Damage
Reported D o l l a r Value of D a m a q e
- Water w e l l s damaged $ 5 7 , 0 0 0 p e r y e a r
- Water w e l l s damaged N/A by compression & pro- t r u s i o n above s u r f a c e
- P r o t r u s i o n , deforma- $ 4 0 0 , 0 0 0 t o date t i o n and breakage of about 1 0 0 water w e l l s
- Water w e l l damage N/A
- Water w e l l damage t o $ 4 , 0 0 0 , 0 0 0 est . abobt 2 , 0 0 0 w e l l s
- O i l w e l l c a s i n g damage $ 2 0 , 0 0 0 , 0 0 0 from p r o t r u s i o n and sub- s u r f a c e s h e a r i n g p l u s w e l l r a i s i n g f o r f l o o d p reven t ion
11-19
to subsidence are listed in Table 11-11. listed are from British practices and have not been reported in the case studies. For additional adjustments to reduce or prevent damage, refer to Ground Subsidence, 1977; Institu- ticn of Civil Engineers, London.
The adjustments practiced in the nine case study subsidence areas are shown in Table 11-12. Subsidence from fluid withdrawal is a 20th century phenomenon, and has occurred in large volumes of groundwater or oil and gas. As a result, subsidence in these areas has been seen as a technological problem. tic of the industrial or post-industrial techno-social stages. social stage are made by government agencies, are capital intensive engineeriog projects and tend to be inflexible. Responses characteristic of the post-industrial techno- social stage tend to be heavily based on scientific study and emphasize the development that may include capital intensive engineering solutions but also may include the development of institutions and laws to govern man's manipula- tion of the environment.
Some of the examples
Most of the adjustments identified are characteris-
Adjustments characteristic of the industrial techno-
For most of the case study areas there has been considerable scientific study of the subsidence and related problem and adjustments have included changes in institutional systems and laws as well as capital-intensive technological solutions. A typical pattern of comprehensive approach to the subsidence problem is far regulation or taxation of groundwater pumping to be implemented at the same time that alternative water resources are offered. This "carrot and stick" solution has been implemented in Houston-Galveston, Mexico City, the Santa Clara Valley, Wilmington, Venice and numerous coastal cities in Japan.
Some of the adjustments identified in the case studies may not be applicable to management of geothermal resource developments. For example, in several cases of subsidence due to groundwater withdrawal, the decision was made to develop alternative water supplies and to curtail groundwater withdrawals. Such a step would be undesirable from the point of view of the reservoir operator.
Other adjustments, however, are suited to geothermal develop- ment and are in practice or under consideration. Specifi- cally, the reinjection of geothermal fluid by injection wells, a process developed and used in oil and gas fields, is an adjustment readily transferrable to geothermal pro; duction. Much like the experience with the Wilmington Oil Field, reinjection of fluid will not only aid in controling subsidence, but may a l so improve production from the field.
@
11-20
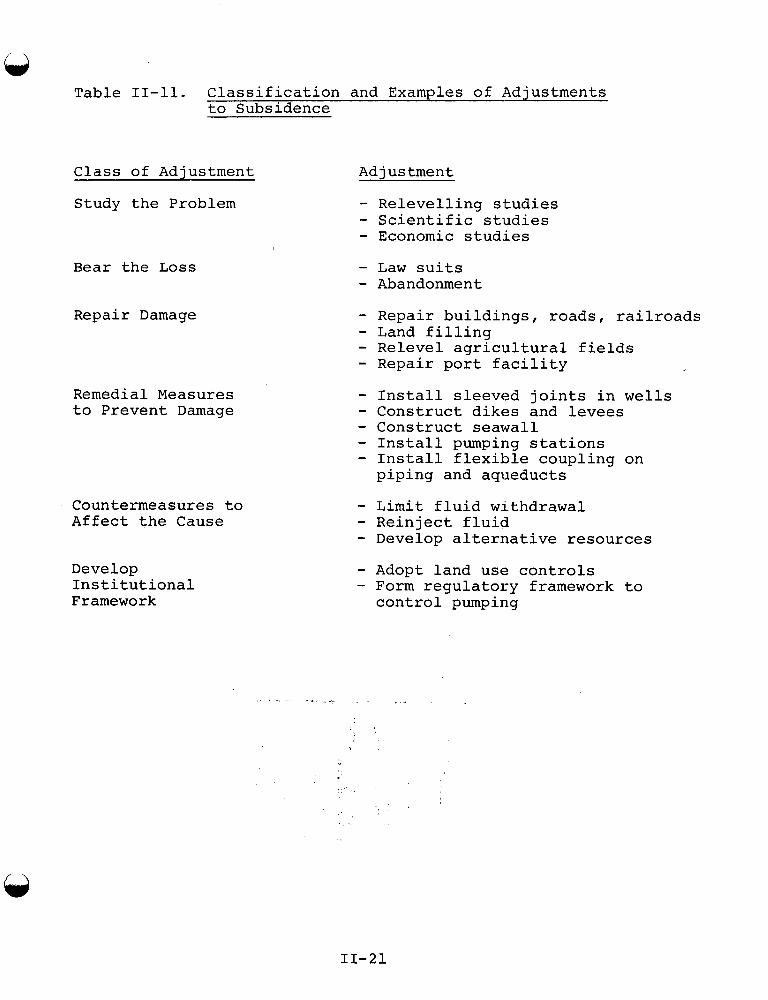
Table 11-11. Classification and Examples of Adjustments to Subsidence
Class of Adjustment Adjustment
Study the Problem
Bear the Loss
Repair Damage
Remedial Measures to Prevent Damage
Countermeasures to Affect the Cause
Develop Institutional Framework
- Relevelling studies - Scientific studies - Economic studies
- Law suits - Abandonment
- Repair buildings, roads, railroads - Land filling - Relevel agricultural fields - Repair port facility - Install sleeved joints in wells - Construct dikes and levees - Construct seawall - Install pumping stations - Install flexible coupling on piping and aqueducts
- Limit fluid withdrawal - Reinject fluid - Develop alternative resources - Adopt land use controls - Form regulatory framework to control pumping
..- . .. I ,. .-. . ., . .
I..
11-21
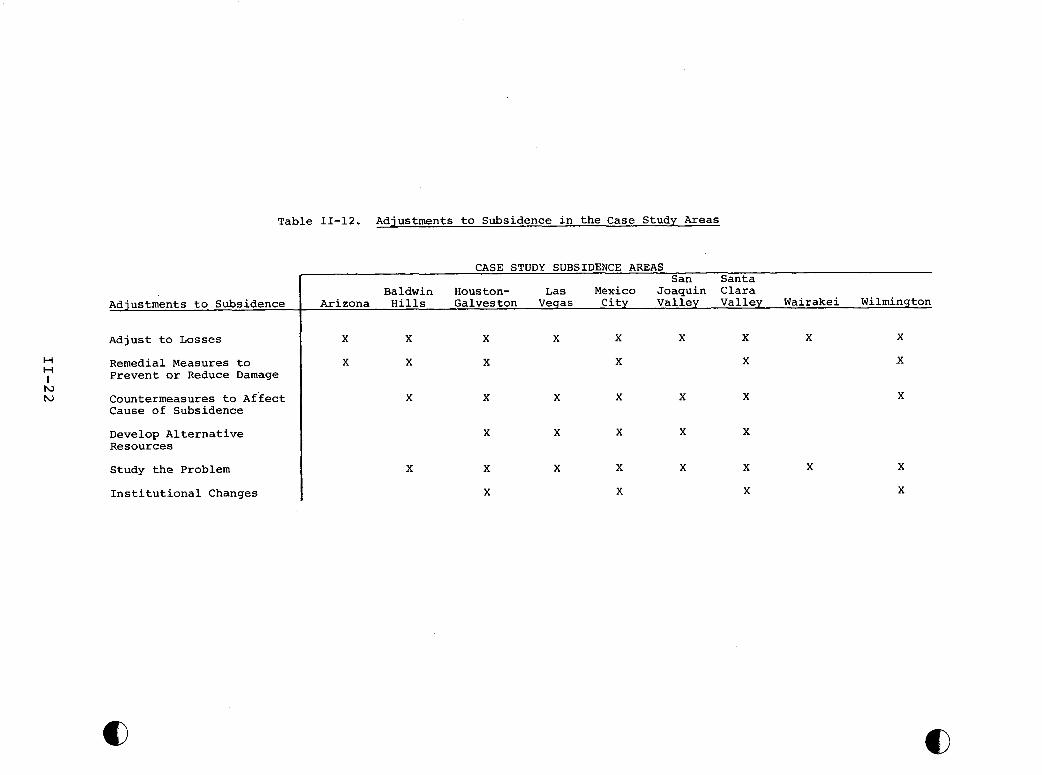
Table 11-12. Adjustments to Subsidence in the Case Study Areas
Adjustments to Subsidence
Adjust to Losses
H H I N h,
San Santa Baldwin Houston- Las Mexico Joaquin Clara
Arizona Hills Galveston Veqas City Valley Valley Wairakei Wilmington
X X X X X X X X X
X X l x Remedial Measures to Prevent or Reduce Damage
X X
X X X X X X Countermeasures to Affect Cause of Subsidence
Develop Alternative Resources
Study the Problem
Institutional Changes I X
X X X X X
X X X X X
X X X
X
X
X
X
X
REFERENCES
Burland, J. B., and C. P. Worth, 1974. Settlement of Buildings and Associated Damage: General Report, Session 5, Conference on Settlement of Structures, Cambridge, England.
G
Burton, Kates and White, 1968. "The Human Ecology of Extreme Geophysical Events", Natural Hazards Research Working Paper No. 1, Department of Geography, University of Chicago.
Carver, E. E., 1969. Model Studies of Differential Compaction: Land Subsidence Proceedings of Tokyo Symposium, LASH/AIHS- UNESCO, Val. 2.
Cording, E. J. and T. D. O'Rourke. Excavation, Ground Movements and Their Influence on Buildings: unpublished. University of Illinois, Urbana, Illinois 61801.
Feld, J., 1965. Tolerance of Structures to Settlement: Journal of Soil Mechanics and Foundation Division, Proceedings of ASCE, p. 555-583.
Grant, R. J., T. Christian and E. H. Vanmarcke, 1974. Differential Settlement of Buildings: Journal of Geotechnical Division, ASCE, V O ~ . 100, NO. GT9, p. 973-991.
Holzer, Thomas L., 1977. Ground Failures in Areas of Subsidence Due to Groundwater Decline in the U.S.A.: Publication No. 121 of the International Association of Hydrological Sciences, Procedures of Anaheim Symposium.
Institution of Civil Engineers, 1977, Ground Subsidence, London.
Kapp, W. A., 1977. The Characteristics of Subsidence Due to Under- ground Coal Mining at Newcastle, New South Wales: Publication No. 121 of International Association of Hydrological Sciences, Procedures of Anaheim Symposium.
Lee, K. L. and 14. E. Strauss. Prediction of Horizontal Movements Due to Subsidence Over Mined Areas.
Polshin, D. E. and R. A. Tokar, 1957. Maximum Allowable Non- uniform Settlement of Structures: 4th International Con- ference on Soil Mechanics and Foundation Engineering, Vol. 1, p. 402-405.
Skempton, A. W. and D. H. MacDonald, 1956. The Allowable Settle- ment of Buildings: Procedures Institute of Civil Engineers, Vol. 5, Part 111, p. 727-784.
Subsidence Engineer's Handbook, 1975. National Coal Board Mining Department, London
United States, Department of the Navy, Bureau of Yards and Docks, 1972. Soil Mechanics, Foundations and Earth Structures: NAVDOCKS Design Manual, DM-7.
11-23
White, G. F. (ed.), 1974. Natural Hazards: New York - Oxford
Wohlrab, Botho, 1969. Effects of Land Subsidences Caused by
University Press.
Mining to the Groundwater and Remedial Measures: Subsidence Proceedings of the Tokyo SyEposium, p. 502-511.
in Land
Yerkes, R. F. and R. 0. Castle. Surface Deformation Associated with Oil and Gas Field Operations in the United States: U. S. Geological Survey, Menlo Park, California 94025, Tokyo Symposium.
11-24
111. CASE STUDIES crs A. ARIZONA
(1) Introduction
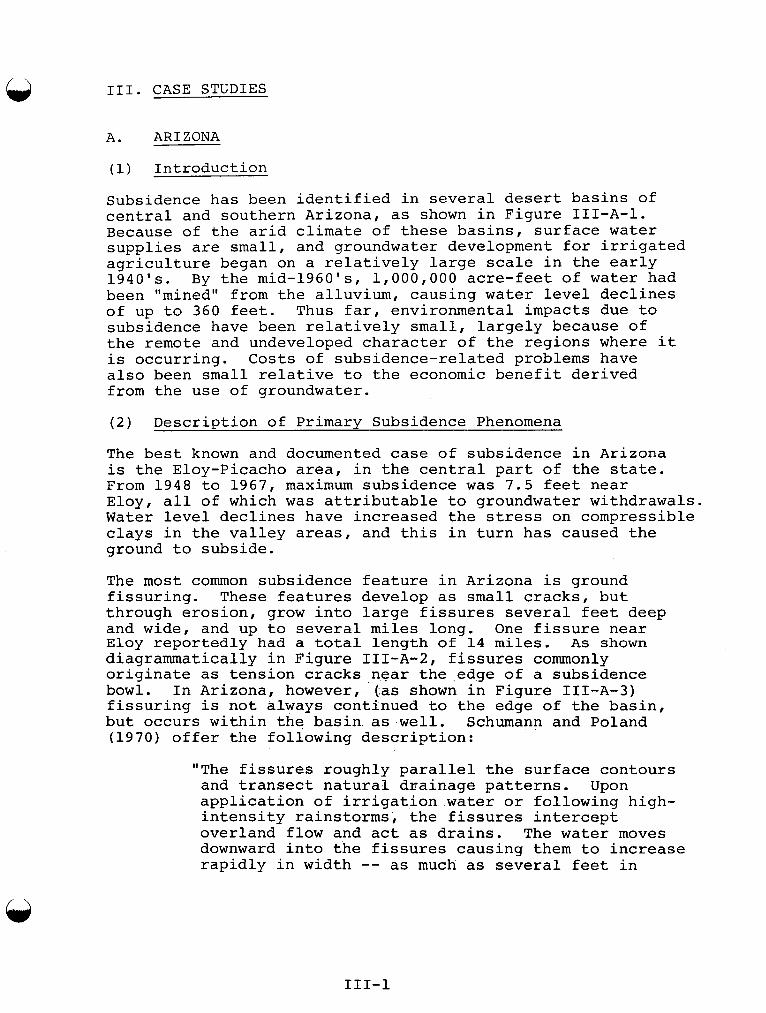
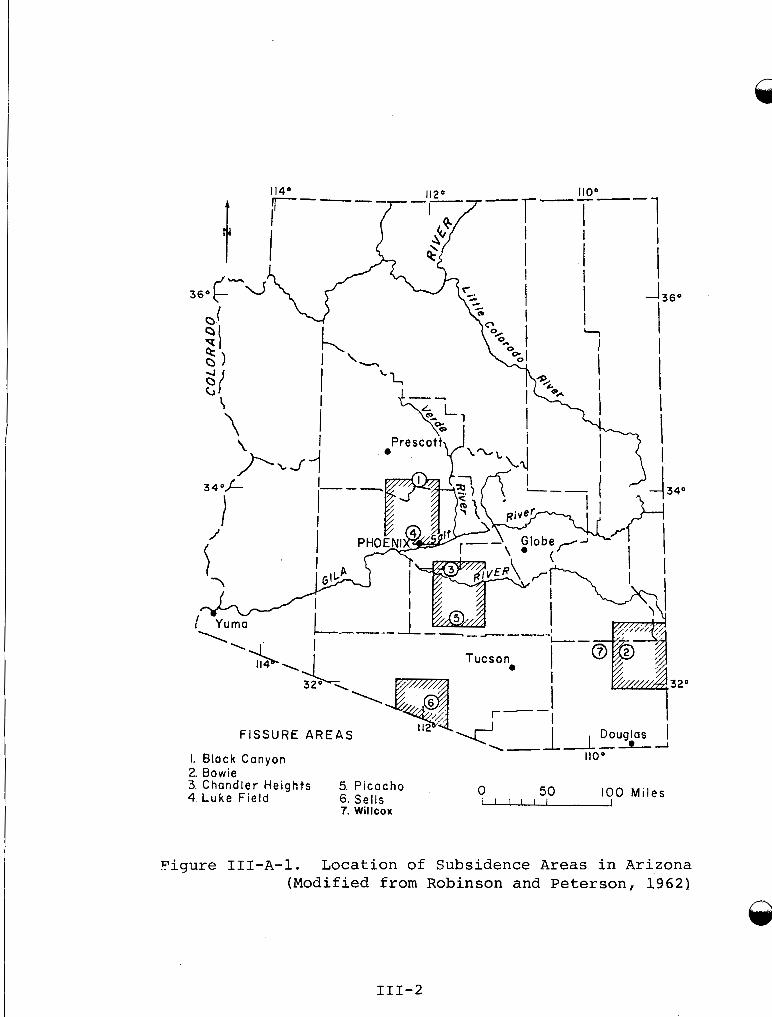
Subsidence has been identified in several desert basins of central and southern Arizona, as shown in Figure 111-A-1. Because of the arid climate of these basins, surface water supplies are small, and groundwater development for irrigated agriculture began on a relatively large scale in the early 1940's. By the mid-l960's, 1,000,000 acre-feet of water had been "mined'' from the alluvium, causing water level declines of up to 360 feet. Thus far, environmental impacts due to subsidence have been relatively small, largely because of the remote and undeveloped character of the regions where it is occurring. Costs of subsidence-related problems have also been small relative to the economic benefit derived from the use of groundwater.
( 2 ) Description of Primary Subsidence Phenomena
The best known and documented case of subsidence in Arizona is the Eloy-Picacho area, in the central part of the state. From 1948 to 1967, maximum subsidence was 7.5 feet near Eloy, all of which was attributable to groundwater withdrawals. Water level declines have increased the stress on compressible clays in the valley areas, and this in turn has caused the ground to subside.
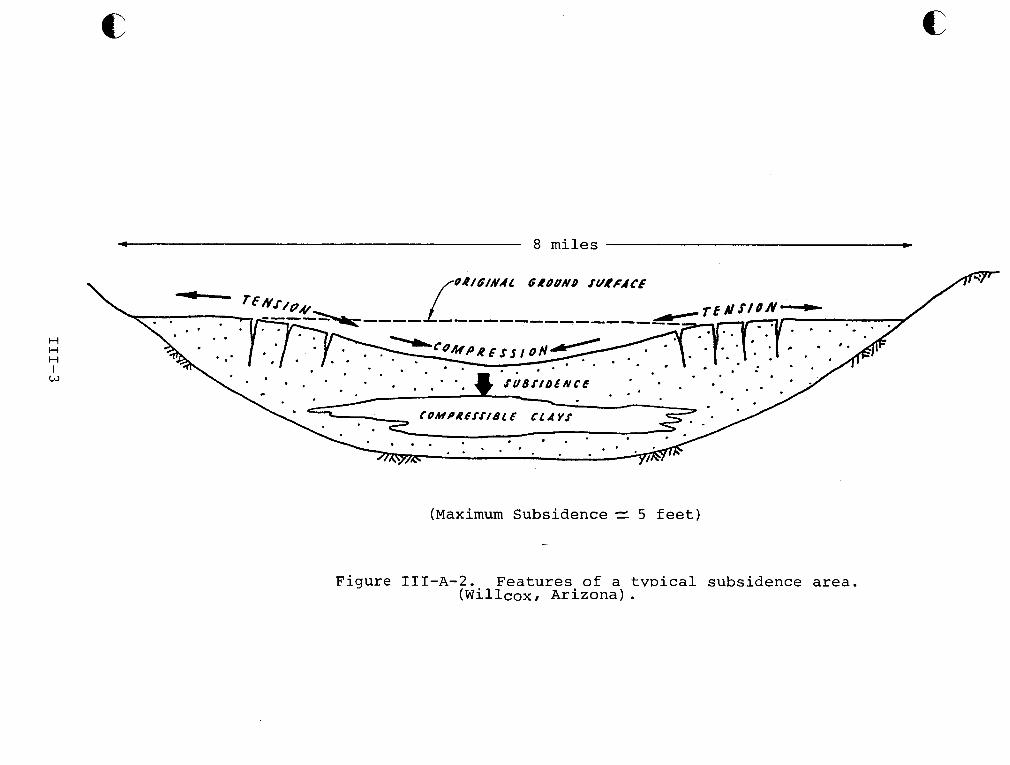
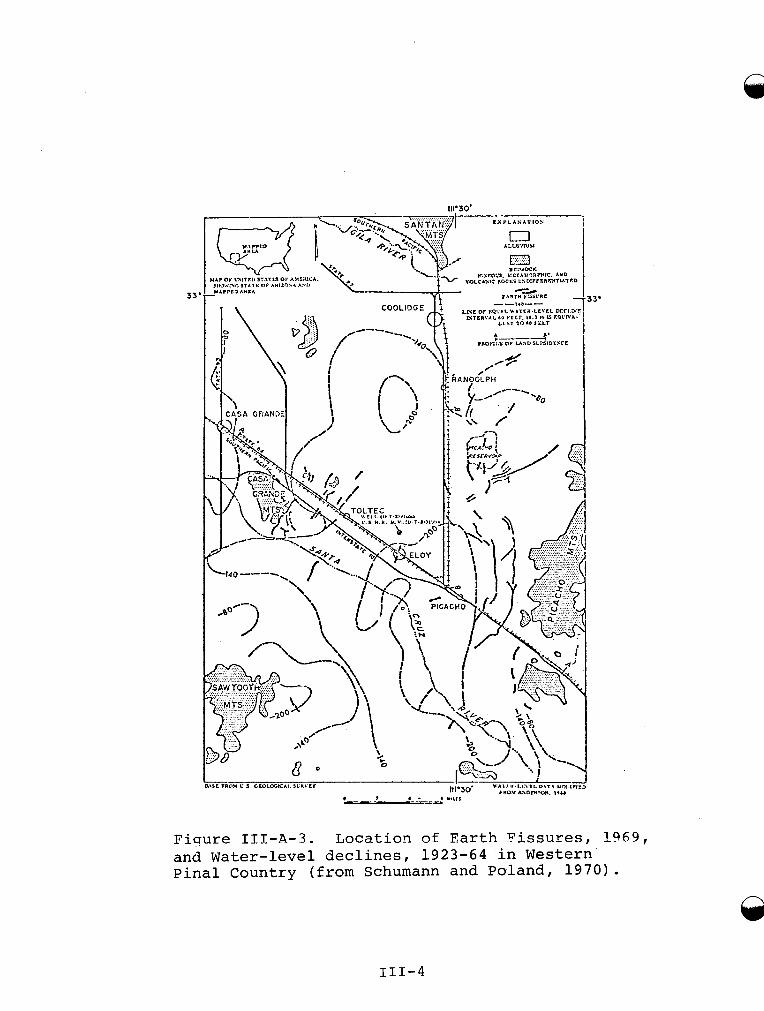
The most common subsidence feature in Arizona is ground fissuring. These features develop as small cracks, but through erosion, grow into large fissures several feet deep and wide, and up to several miles long. One fissure near Eloy reportedly had a total length of 14 miles. As shown diagrammatically in Figure 111-A-2, fissures commonly originate as tension cracks near the edge of a subsidence bowl. In Arizona, however, (as shown in Figure 111-A-3) fissuring is not always continued to the edge of the basin, but occurs within the basin as well. Schumann and Poland (1970) offer the following description:
"The fissures roughly parallel the surface contours and transect natural drainage patterns. Upon application of irrigatlion water or following high- intensity rainstorms, the fissures intercept overland flow and act as drains. The water moves downward into the fissures causing them to increase rapidly in width -- as much as several feet in
111-1
A
36'
2. Bowie 3. Chandler Heights 5. Picacho 0 50 100 Mi les 4. L u k e Fie ld 6. Se l l s I I I I I I
7. Willcox
Figure III-A-1. Location of Subsidence Areas in Arizona (Modified from Robinson and Peterson, 1962)
111-2
..
-1
h
c, a, a, w
in \I a, u
c a, a
-rl rJY .n 5
m E
3
E
-rl X
v
111-3
P-I11
.f .E€
,OE.III
Principal phenomena
places. mainly by erosion of the sides. Gullying often occurs on the upstream side of the fissure. The fissures tend to connect and to form fissure systems that are as much as 8 miles (12.8 km) long" .
The fissures widen partly by slumping but
The trends of many of the fissures roughly conform with linear zones of steep gravity gradients. Most of the steep gravity gradients are adjacent to the mountain masses and may reflect buried fault scarps along the periphery of the subsiding basin. If this is true, the buried fault scarps probably are sites of maximum tensile stress. Thus, the most likely sites for new fissures would be along these zones."
investigators who have been studying subsidence in central Arizona include Thomas L. Holze of the
U.S. Geological Survey, Menlo Park, California; Carl C. Winikka of the Arizona Resources Information System, Phoenix, Arizona; Robert L. Laney of the U . S . Geological Survey, Phoenix, Arizona; Charles McCauley of the Tucson Gas and Electric Company; and Richard L. Meehan of Earth Sciences Associates, Palo Alto, California.
( 3 ) Effects of Primary Subsidence Phenomena
A dish-shaped reduction in ground elevation, several miles in diameter and up to 10 feet maximum depth is a typical natural feature. Cracking and fissuring occur on the periph- ery of the subsidence bowl, and in some cases lead to erosion and minor changes in surface drainage.
Changes in lowland ground elevation might be expected to cause changes i n s u r f a c e hydro logy , and pe rhaps i n c r e a s e t h e risk of flooding in some areas. Whether because the surface drainage adjusts itself rapidly to the changed condition, or because subsidence has not been of great magnitude, or because of the relatively remote character of the subsided areas, this potentially adverse impact does not seem to have occurred in Arizona.
Several impacts on man-made features have been noted. Damage to wells, including damage to casings and pumps, occurs mainly as a result of stresses from the subsiding ground acting on the well casing. Protrusion of well casings from the ground is a tell-tale sign of subsidence. Charles McCauley of the Tucson Gas and Electric Company estimates the annual cost of well repair in Pinal County (site of the most severe subsidence) at $57,250 per year.
111-5
There are no reports of significant damage to houses, commer- cial or industrial structures, or appurtenant services such as pipelines. However, fissure development could have a serious impact in urbanized areas, and could pose a signific- ant cost or feasibility barrier to subdivision development. So far, the absence of these problems is related to the absence of urbanization in subsiding areas.
Earth fissures crossing road and railroad rights-of-way (e.g., Highway 1-10, State Highway 87) have caused continuing maintenance problems, although the cost of the few reported cases of damage has not been great. Given the potentially sudden development of fissures, however, it seems possible that their development beneath high-speed traffic lanes could pose a hazard to traffic. cases of bridge damage.
Both the development of fissures and changes in grade due to subsidence reportedly have caused some impacts on agricultural operations, requiring extra land leveling and crack repair, and affecting ditch irrigation efficiency or feasibility. Mr. McCauley estimates these annual costs in Pinal County at $130,000, but points out that these costs are relatively small in comparison to the benefits obtained from water use.
There are no documented
Although there are no reports of damage to major water conveyance or storage facilities such as canals, aqueducts, flood control dams, or reservoirs, the failure of an embank- ment at the Picacho Reservoir in 1961 was attributed to subsidence. Earth dams and dikes, or earth-lined reservoirs or water conveyance facilities, are extremely sensitive to tensile strains which occur on the edges of subsidence areas and cause ground cracking and fissuring. This is especially true in Arizona, where many local desert soils have a very low resistance to piping, a form of hazardous erosion. The safety of existing earth water conveyance or retaining structures on the edge of subsidence bowls should always be carefully reviewed, and the feasibility of building new earth dams or canals across areas which have been or might be subject to subsidence should be evaluated with this potential hazard in mind. The failure of earth dams as a result of tensile cracking and consequent piping is apt to be sudden and may be catastrophic where downstream areas are populated. In the case of flood control reservoirs which are infrequently filled, cracking could occur without obvious premonitory signs, and the existence of the hazard discovered only after sudden failure of the dam.
Cost data are not available for the reportedly subsidence- induced failure of Picacho Reservoir or of the reported re- routing of the aqueduct. It is probable that the cost is not large in comparison to the benefits obtained from ground- water overdraft. In general, costs associated with subsidence- induced hazards to water conveyance and storage facilities could be of several types, including:
errs
0 The cost of lost opportunity; such as having to avoid siting facilities in certain areas because of the hazard;
0 Extra engineering and construction costs required to build or modify the structure in order to partially or fully negate the hazard;
0 Risk costs associated with unavoidable extra hazards, which cannot be eliminated by design -- essentially the insurance cost associated with the special risks accom- panying subsidence induced ground movements.
( 4 ) Aggravation of Other Hazards
None are known.
( 5 ) Effects of Aggravated Hazards
None are known.
(6) Adjustments to Subsidence
Several adjustments have been employed to mitigate or avoid problems. Others have been considered and rejected, and further measures may have to be employed as subsidence continues.
Investigations of the problem are underway by the Arizona State Highway Department, the Department of Water Resources, the United States Geological Survey and the University of Arizona. These investigations are aimed at identification and monitoring of areas of subsidence and cracking, and development of mitigation measures.
Maintenance and repair of various facilities affected by subsidence, including wells, irrigation systems, roads, etc., is the principal form of response. in 1975 are estimated at some $207,000.in Pinal County (Eloy-Picacho area). These costs were incurred as the result of the withdrawal of about 1,000,000 acre-feet of groundwater, and accordingly amount to about 21 cents per acre-foot of water.
Costs of these adjustments
111-7
Because the current costs in Pinal County are relatively small in comparison to the value of groundwater obtained, there is little incentive to control groundwater use, which is the usual method of controlling subsidence.
(7) Summary of Effects
Available data on the economic effects of subsidence in Arizona are summarized below.
Damages Remedies costs
Cracking and disruption Repair of roads and railroads
Relatively minor
Damage to wells and Repair or $57,250 per year well casings Replace in Pinal Co.
Failure of Picacho Abandonment, Not available Reservoir aqueduct re-
routing
Tilting of fields and Relevelling $130,000 per year irrigation ditches fields and in Pinal Co.
regrading ditches
(8) References
Robinson, G. M. and D. E. Peterson, 1962, Notes on Earth Fissures in Southern Arizona, U.S. Geological Survey Circular 466.
Schumann, H. H. and J. F. Poland, 1970 , Land Subsidence Earth Fissures and Groundwater Withdrawal in South-Central Arizona, U.S.A., Institute of Scientific Hydrology, Proceedings: Reading Symposium on World Water Balance, July, 1970 .
Winikka, C. C. and P. D. Wold, 1976 , Land Subsidence in Central Arizona, Proceedings: Second International Symposium on Land Subsidence, Anaheim, California, December, 1976 .
( 9 ) Persons Contacted
Patricia Paylore, Assistant Director, Office of Arid Lands Studies, University of Arizona, Tucson, Arizona.
111-8
B. BALDWIN HILLS, C A L I F O R N I A /,\
(1) I n t r o d u c t i o n
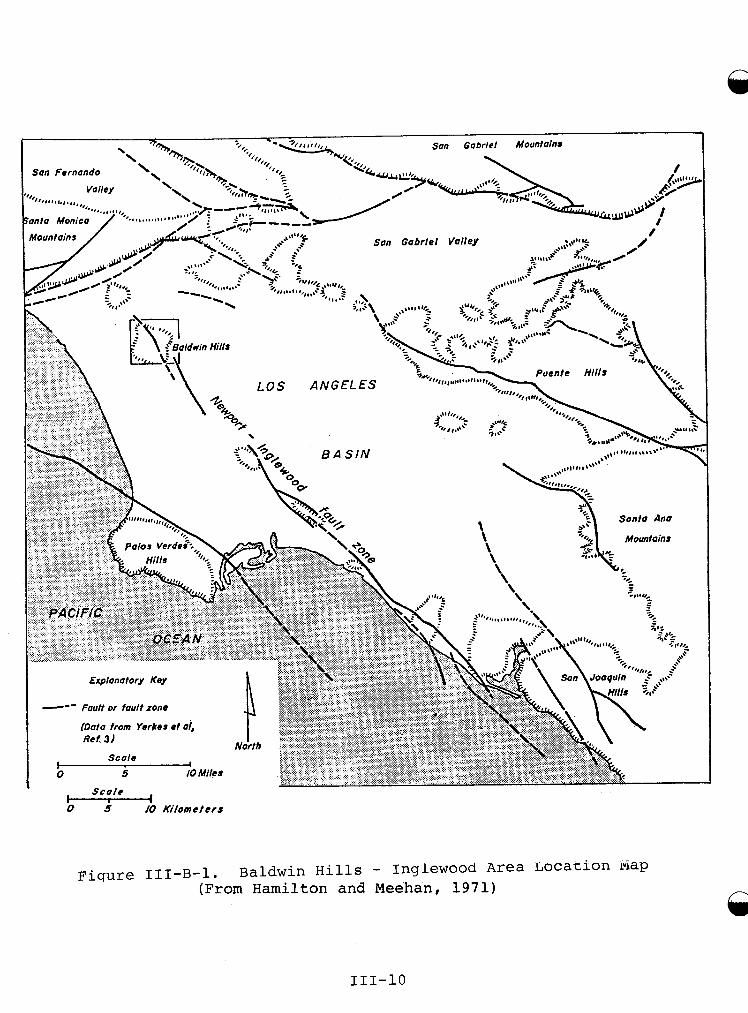
Land s u r f a c e subs idence i n t h e Baldwin H i l l s area of C a l i f o r n i a has occur red as a r e s u l t o f o i l and gas withdrawal from t h e Inglewood O i l F i e l d , d i scovered i n 1 9 2 4 . 'The Baldwin H i l l s , s i t e o f t h e Inglewood O i l F i e l d , form p a r t o f an i n t e r r u p t e d c h a i n of low h i l l s t h a t r ise i n c o n t r a s t t o t h e sur rounding f l a t t e r r a i n of t h e L o s Angeles Basin (F igu re III- B - 1 ) . The primary a n t i c l i n a l f o l d s t r u c t u r e i n t h e h i l l s has been much modified by f a u l t i n g , e s p e c i a l l y by s t r i k e - s l i p and d i p - s l i p d isp lacements a long t h e Newport-Inglewood f a u l t which b i s e c t s them. Other s u b s i d i a r y and a p p a r e n t l y r e l a t e d f a u l t s are a l s o p r e s e n t i n t h e area.
The Inglewood O i l F i e l d occup ies a roughly o v a l area t h a t ex tends d i a g o n a l l y a c r o s s t h e t r e n d of t h e h i l l s a long t h e a x i s of t h e f a u l t e d Inglewood a n t i c l i n e . By 1 9 6 4 , o i l e x t r a c t i o n had caused approximately 1 0 feet of subs idence a t t h e f i e l d . N o s i g n i f i c a n t damage w a s r e p o r t e d from t h e d i r e c t e f f e c t s o f subs idence , b u t numerous ground b reaks occurred . These breaks have r e s u l t e d e i t h e r from s t r a i n s induced by t h e ground subs idence o r by t h e f l u i d i n j e c t i o n which has been conducted t o i n c r e a s e recovery from t h e o i l f i e l d . One of t h e ground b reaks p a s s e s through t h e Baldwin H i l l s Rese rvo i r s i t e and w a s r e s p o n s i b l e f o r f a i l u r e of t h e dam on December 1 4 , 1963. About 250 m i l l i o n g a l l o n s of w a t e r emptied w i t h i n hours and inundated a s q u a r e m i l e o f r e s i d e n c e s w i t h mud and d e b r i s , damaging or d e s t r o y i n g 277 homes and caus ing f i v e dea ths . This case s t u d y i l l u s t r a t e s t h e extreme consequences t h a t can r e s u l t from u n c o n t r o l l e d subs idence - re l a t ed phenomena i n t h e p re sence of a dam and r e s e r v o i r .
( 2 ) D e s c r i p t i o n of Primary Subsidence Phenomena
The Inglewood O i l F i e l d developed r a p i d l y a f t e r i t s d i scove ry i n 1 9 2 4 . I n 1954, S tandard O i l i n i t i a t e d a p i l o t " w a t e r - f l o o d " program of secondary recovery and began f u l l scale o p e r a t i o n s i n 1957. Although " e a r t h c r a c k " ground r u p t u r i n g may n o t have been d e f i n i t e l y observed i n t h e area b e f o r e 1957, t h e e x i s t e n c e of a more widespread and l a r g e r scale form of ground s u r f a c e movement w a s recognized by t h e L o s Angeles Department of Water and Power as e a r l y as 1943. I n any case, t h e Department opened t h e r e s e r v o i r i n 1951. I n 1957, s u r f a c e c rack ing and f a u l t i n g a t a nearby local street i n t e r s e c t i o n w e r e noted. S i x y e a r s l a t e r , t h e dam f a i l u r e occurred .
111-9
Scale I 0 5 10 Kilom et crs
Figure III-B-1. Baldwin Hills - Inglewood Area Locaciorl iviap (From Hamilton and Meehan, 1971)
111-10
Although some observers differ slightly in their interpreta- tion of the pattern, magnitude and history of the deformation, the principal features of the recent ground subsidence and surface rupture have been clearly established (Figure III-B- 2 ) . The origin of deformations has been divided into two distinct categories:
0 Activities associated with operation of the Inglewood Oil Field, including response of reservoir and overburden materials to lowering of fluid pressure, fluid withdrawal, reinjection and related phenomena;
0 Deformation largely or wholly of tectonic origin.
Hamilton and Meehan (1971) conclude that the ground breaks were genetically related to high pressure injection of fluid into the previously faulted and subsidence-stressed subsurface.
( 3 ) Effects of Primary Subsidence Phenomena
While there is evidence of surface cracking and faulting, there have been no reports of significant damage other than to the dam and reservoir (exclusive of flood damage). Winston Tyler, of the City of Los Angeles Attorney's Office, feels that cracking in streets or sidewalks due to ground breakage was probably repaired as part of the normal street maintenance of the city. In any case, the extent or cost of any such damage cannot now be determined, principally because it occurred 15 to 20 years ago. Any data that was available has been made inaccessible by the controversy and litigation procedures that followed the failure of the dam.
( 4 ) Aggravation of Other Hazards
The Baldwin Hills Dam and reservoir were located on a hilltop above a populated area, and are now unused. The surface cracking in the subsidence b o w l clearly increased the risk of dam failure and the hazard to downstream residents and property.
( 5 ) Effects of Aggravated Hazards
In order to determine the cost,of damages incurred as a result of the Baldwin Hills failure, the lawyers most involved in the ensuing litigation were interviewed. These were R. C. Ericson of Chevron who represented the oil companies; Winston Tyler, who represented the insurance carriers and is now with the City of Los Angeles Attorney's Office; and Stephen Powers, who represented the Department of Water and Power. Hamilton and Meehan's 1971 paper in Science a lso contained some damage cost estimates.
111-11
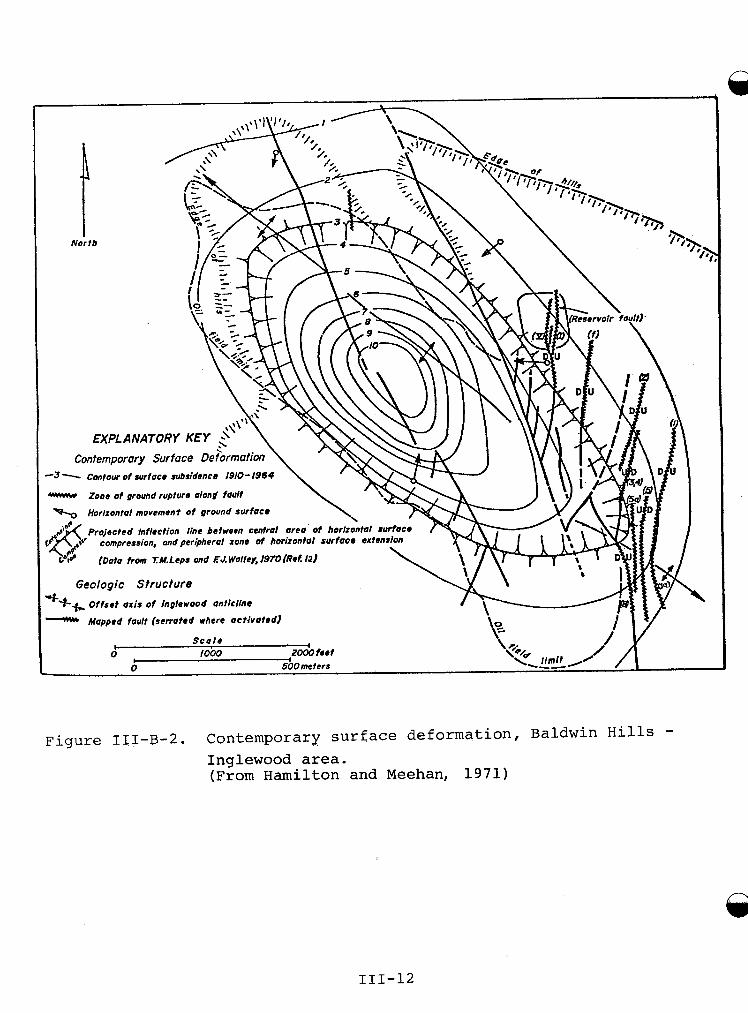
Figure III-B-2. Contemporary surface deformation, Baldwin Hills - Inglewood area. (From Hamilton and Meehan, 1971)
A
111-12
Mr. Ericson stated from memory that total damage costs as a result of the dam failure were $25 million, but that the insurance companies paid out about $14 million. The Depart- ment of Water and Power of the City of Los Angeles, he said, sued the oil companies for $10.5 million, but settled for "15 cents on the dollar." This amount included $750,000 for loss of the reservoir.
69
Hamilton and Meehan ( 1 9 7 1 ) quoted property damage losses of $12 million plus the loss of the reservoir and five deaths. They also mentioned an out-of-court settlement of $3.9 million by the oil companies to the city and its insurers. Winston Tyler estimated $14 million damage.
Steve Powers of the Department of Water and Power stated that total damages were $13,018,000 which was paid to about 3,700 claimants. These included suits involving the five dead, damages to homes and businesses, plus some claims for overtime police and fire protection during the crisis.
( 6 ) Adjustments to Subsidence
No significant adjustments to the subsidence were reported other than the abandonment of the reservoir. The first recognized earth crack occurred in 1957 . Eight more faults were activated from 1 9 5 7 to 1 9 6 3 during the secondary recovery observations. Monthly strain gage readings were taken across a crack in a concrete inspection gallery beneath the reservoir and across the fault, so displacement due to subsidence was well monitored up to the time of the reservoir failure in 1963. Similar monitoring procedures would have been followed in most well-supervised dam sites regardless of subsidence effects, so the incremental costs are probably not applicable, even if they could be obtained.
The Inglewood Oil Field is still in operation, but the damaged reservoir stands empty today and t h e s i t e will probably never be reused.
(7) Summary of Effects
The summary of effects is as follows:
Damage Remedies
Street Cracks Repair (not well documented)
costs
Unknown, but probably minor
Baldwin Hills Abandonment Valued at $2.5 million, Res ervoi r insurance paid $0.75 million
Flood From ' Damages paid to $13+ million Reservoir Failure; 3,700 claimants Five Deaths
111-13
( 8 ) References
Hamilton, H . and R . L . Meehan, 1 9 7 1 , "Ground Rupture i n t h e Baldwin H i l l s " , Sc i ence , Volume 1 7 2 , A p r i l 23, 1971, Pages 333-344.
( 9 ) Persons Contacted
R. C . E r i c son , Chevron, I n c . , San F ranc i sco , C a l i f o r n i a : t e l ephone i n t e r v i e w , February 9 , 1 9 7 8 .
Winston T y l e r , A t to rney , C i t y of L o s Angeles A t t o r n e y ' s O f f i c e , C a l i f o r n i a : t e l ephone i n t e r v i e w .
S teve Powers, A t to rney , L o s Angeles Department o f Water and Power, L o s Angeles , C a l i f o r n i a : t e l ephone i n t e r v i e w .
1 1 1 - 1 4
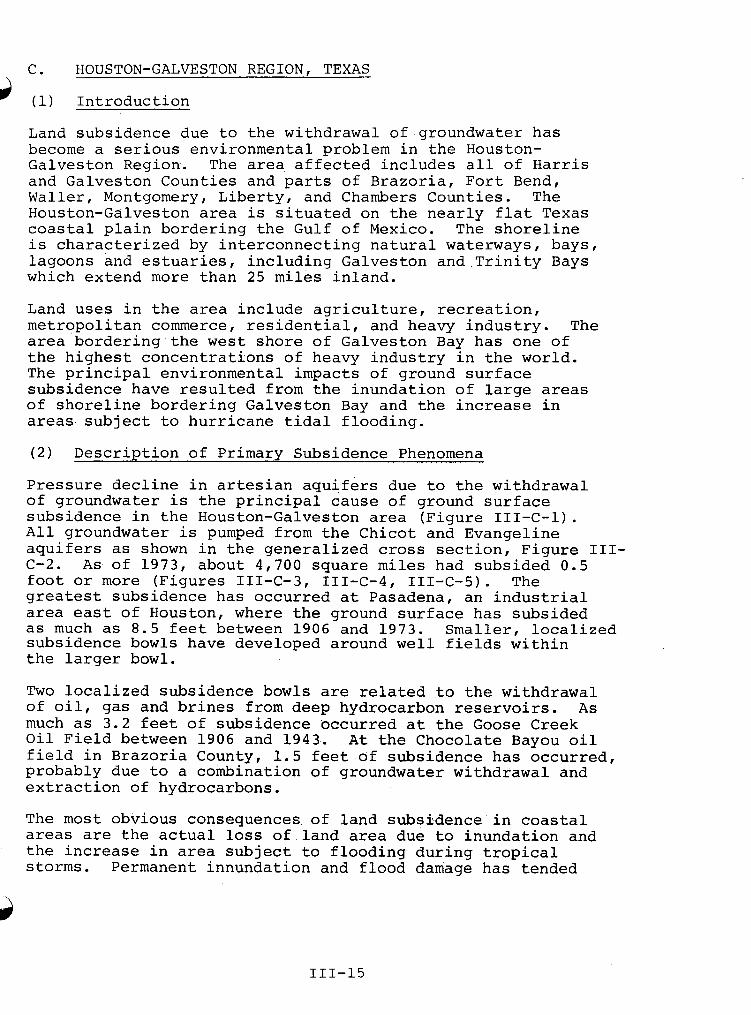
C. HOUSTON-GALVESTON REGION, TEXAS \
(1) Introduction
Land subsidence due to the withdrawal of groundwater has become a serious environmental problem in the Houston- Galveston Region. The area affected includes all of Harris and Galveston Counties and parts of Brazoria, Fort Bend, Waller, Montgomery, Liberty, and Chambers Counties. The Houston-Galveston area is situated on the nearly flat Texas coastal plain bordering the Gulf of Mexico. The shoreline is characterized by interconnecting natural waterways, bays, lagoons and estuaries, including Galveston and Trinity Bays which extend more than 25 miles inland.
Land uses in the area include agriculture, recreation, metropolitan commerce, residential, and heavy industry. The area bordering the west shore of Galveston Bay has one of the highest concentrations of heavy industry in the world. The principal environmental impacts of ground surface subsidence have resulted from the inundation of large areas of shoreline bordering Galveston Bay and the increase in areas subject to hurricane tidal flooding.
( 2 ) Description of Primary Subsidence Phenomena
Pressure decline in artesian aquifers due to the withdrawal of groundwater is the principal cause of ground surface subsidence in the Houston-Galveston area (Figure III-C-1). All groundwater is pumped from the Chicot and Evangeline aquifers as shown in the generalized cross section, Figure III- C-2. As of 1973, about 4,700 square miles had subsided 0.5 foot or more (Figures III-C-3, III-C-4, III-C-5). The greatest subsidence has occurred at Pasadena, an industrial area east of Houston, where the ground surface has subsided as much as 8.5 feet between 1906 and 1973. Smaller, localized subsidence bowls have developed around well fields within the larger bowl.
Two localized subsidence bowls are related to the withdrawal of oil, gas and brines from deep hydrocarbon reservoirs. As much as 3.2 feet of subsidence 'occurred at the Goose Creek Oil Field between 1906 and 1943. At the Chocolate Bayou oil field in Brazoria County, 1.5 feet of subsidence has occurred, probably due to a combination of groundwater withdrawal and extraction of hydrocarbons.
The most obvious consequences of land subsidence in coastal areas are the actual loss of land area due to inundation and the increase in area subject to flooding during tropical storms. Permanent innundation and flood damage has tended
111-15
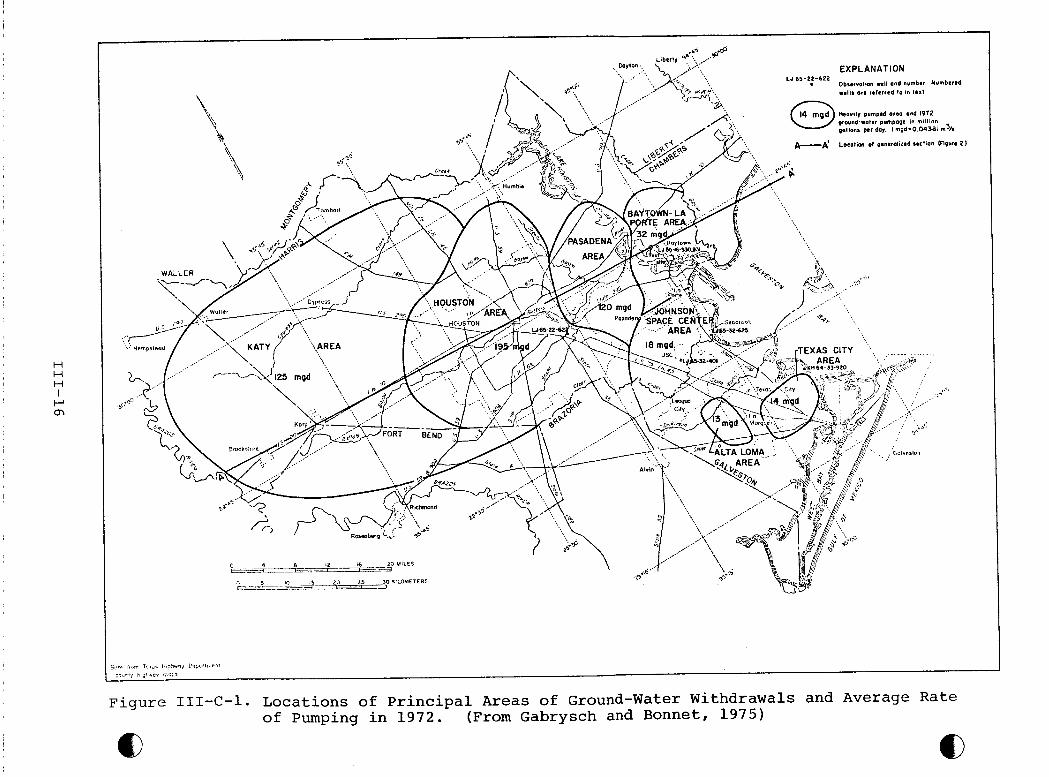
111-16
a) tn rd k
a, 3
4 d
I u I H
H
H
a, k 3
m
-I+ b-l
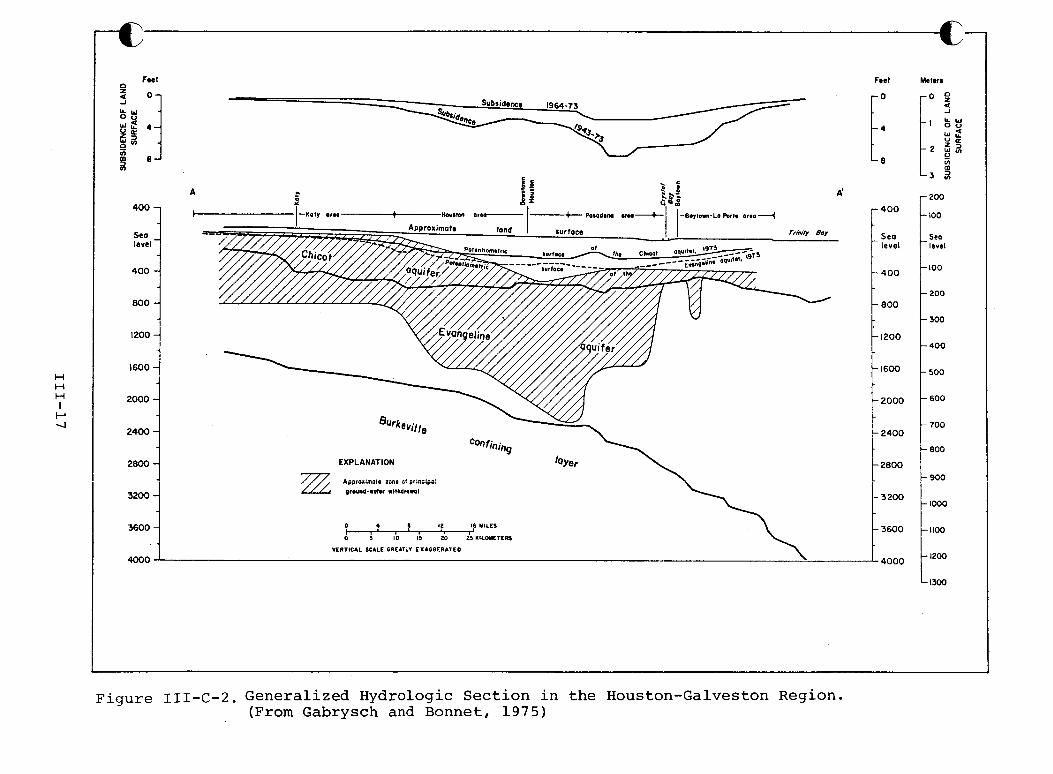
f
111-17
Figure III-C-3. Subsidence of the Lana Surface, 1964-1973. (From Gabrysch and Bonnet, 1975)
111-18
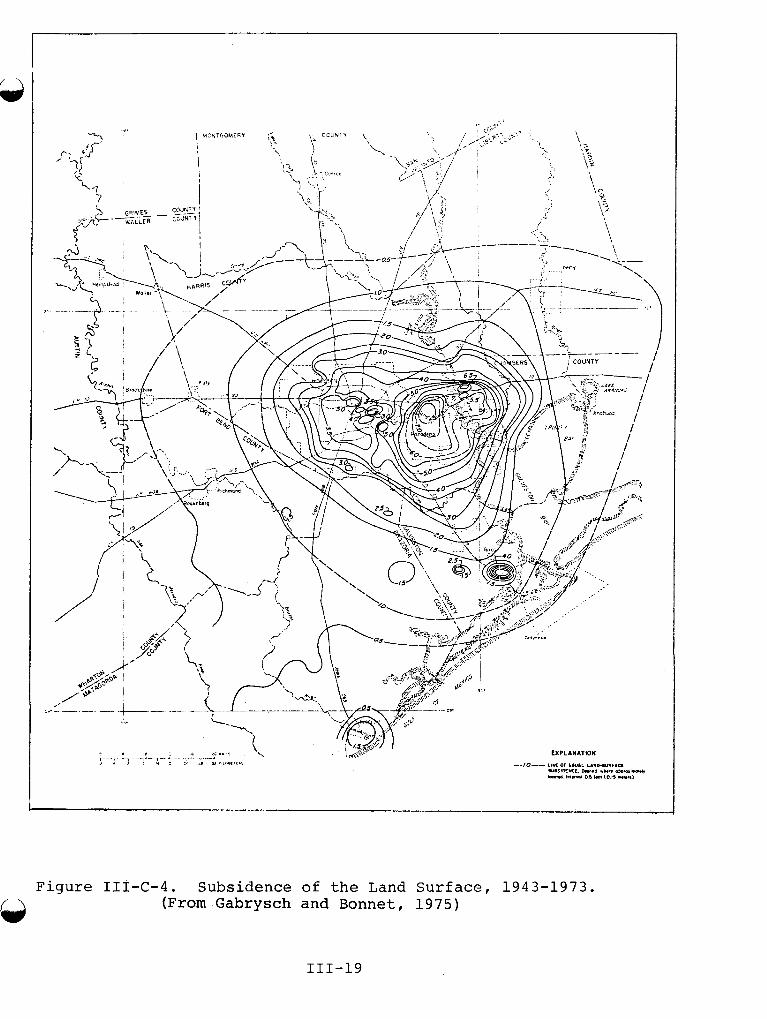
6T-I11
r- I
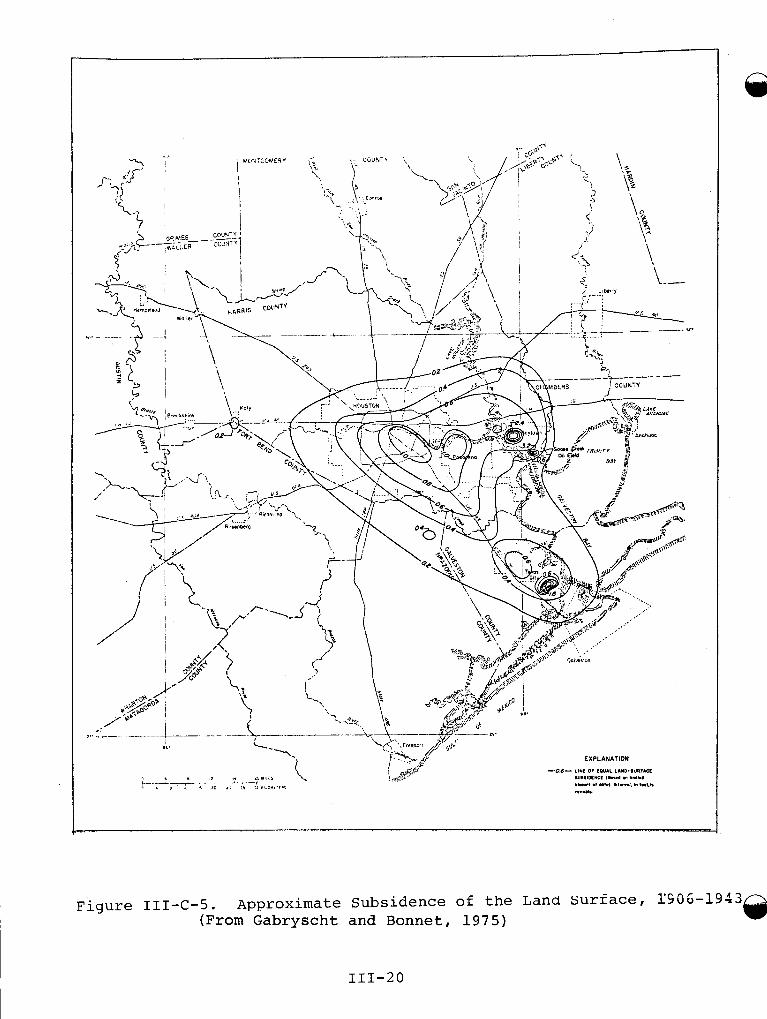
Figure 111-C-5. Approximate Subsidence of the Lana Surface, l'SO6-1913 (From Gabryscht and Bonnet, 1975)
111-20
to overshadow other damages,, but structures also have been damaged by ground cracking and wells have been damaged by subsurface compaction. Tilting of the ground has caused problems in such gravity transport systems as water and sewage systems.
( 3 ) Effects of Primary Subsidence Phenomena
Changes to natural features in the Houston-Galveston region include changes in land slope, stream gradients and stream drainage patterns, with a resultant worsening of drainage problems. At their lower reaches, former river channels such as the San Jacinto River are now baylands.
The most dramatic and costly environmental effect of subsid- ence in the Houston-Galveston Region, however, is the change in land surface elevation with respect to sea level. An increasing amount of land is becoming inundated by salt water, and the area subject to flooding by tidal surge during tropical storms and hurricanes has increased dramatic- ally. This submergence of land has further resulted in the alteration of natural vegetation where salt water has intruded.
Roads and highways in both Harris and Galveston Counties have been cracked and tilted as a result of subsidence. Estimates by both counties of the cost of road repairs due to subsidence appear in Table 111-C-1. Damage to railroads has been reported, but no specific examples or cost estimates were obtained, in this study. No reports of significant damage to aqueduct and irrigation channels were found, but damages to sewage systems have been severe. The extent of damage to small structures, houses or commercial buildings by tilting appears to be slight in comparison to the damage caused by flooding and inundation and by aggravated surface faulting. Except near the waterfront, subsidence is not generally recognized because of its regional nature. The changes in altitudes are not usually abrupt, and subsidence has not caused widespread structural damage. No reports of damage or losses to dams and reservoirs due to subsidence in the region have been found.
There have been few if any reported effects on agricultural fields in the region, even though rice farmers west of Houston and Galveston produce two crops a year using ground- water from the Chicot and Evangeline aquifers. However, wells and well casings have been damaged by the compression of water bearing.strata below the surface and by the protru- sion of wellheads above ground. No estimates of the cost of damage to wells and well casings were found. Pipelines also have been damaged by earth movement in the area, but it is not clear whether this is a result of differential subsid- ence or simply the movement of expansive clay soils, also a
@ problem in the region.
111-21
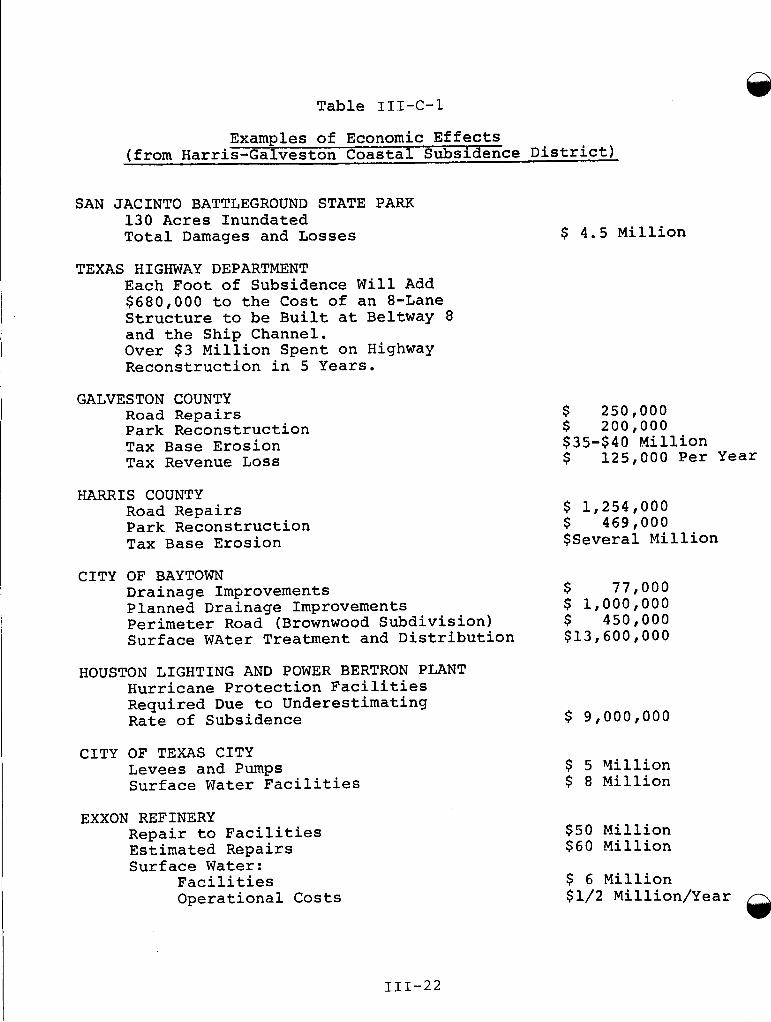
Table III-C-1
Examples of Economic Effects (from Harris-Galveston Coastal Subsidence District)
SAN JACINTO BATTLEGROUND STATE PARK 130 Acres Inundated Total Damages and Losses
TEXAS HIGHWAY DEPARTMENT Each Foot of Subsidence Will Add $680,000 to the Cost of an 8-Lane Structure to be Built at Beltway 8 and the Ship Channel. Over $ 3 Million Spent on Highway Reconstruction in 5 Years.
GALVESTON COUNTY R o a d Repairs Park Reconstruction Tax Base Erosion Tax Revenue Loss
HARRIS COUNTY Road Repairs Park Reconstruction Tax Base Erosion
CITY OF BAYTOWN Drainage Improvements Planned Drainage Improvements Perimeter Road (Brownwood Subdivision) Surface WAter Treatment and Distribution
HOUSTON LIGHTING AND POWER BERTRON PLANT Hurricane Protection Facilities Required Due to Underestimating Rate of Subsidence
CITY OF TEXAS CITY Levees and Pumps Surface Water Facilities
EXXON REFINERY Repair to Facilities Estimated Repairs Surface Water:
Facilities Operational Costs
111-22
$ 4.5 Million
$ 250,000 $ 200,000 $35-$40 Million $ 125,000 Per Year
$ 1,254,000 $ 469,000 $Several bli 1 lion
$ 77,000
$ 450,000 $13,600,000
$ 1,000,000
$ 9,000,000
$ 5 Yillion $ 8 Million
$50 Million $60 Million
$ 6 Million $1/2 Million/Year
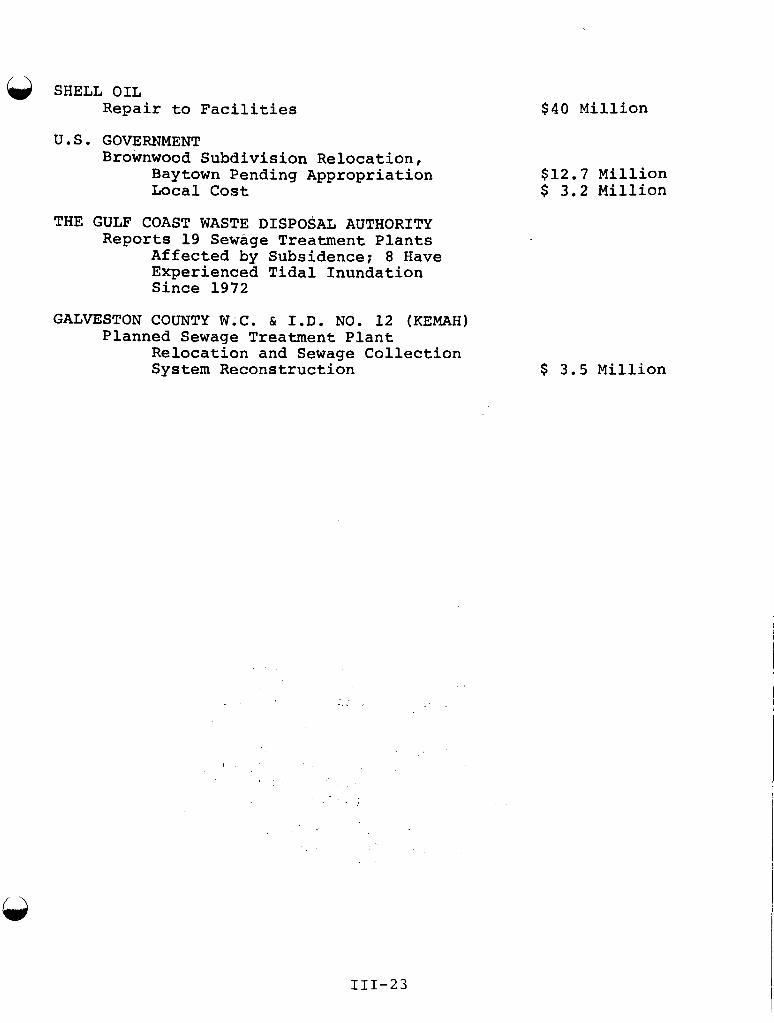
SHELL OIL Repair to Facilities
U. S . GOVERNMENT Brownwood Subdivision Relocation,
Baytown Pending Appropriation Local Cost
$ 4 0 Million
$12.7 Million $ 3.2 Million
THE GULF COAST WASTE DISPOSAL AUTHORITY Reports 19 Sewage Treatment Plants
Affected by Subsidence; 8 Have Experienced Tidal Inundation Since 1972
GALVESTON COUNTY W.C. & I.D. NO. 12 (KEMAH) Planned Sewage Treatment Plant
Relocation and Sewage Collection System Reconstruction $ 3.5 Million
111-23
( 4 ) Aggravation -- of Other Hazards
Hazards aggravated by land subsidence in the area in-clude flooding and surface faulting. prominent effects of subsidence are related coastal elevation with respect to sea level. permanently inundated some shoreline areas, risk of periodic flooding in other areas, an flooding of escape routes from Galveston Is1 next hurricane. .
Houston-Galveston The most to the change in Subsidence has
increased the d will cause and during the
The Harris-Galveston Coastal. Subsidence District's bimonthly newsletter Subsidence Update, September, headline "SUBSIDENCE INCREASES DAMAGE POTENTIAL" with the
1 9 7 7 , supports its
following:
... if storm tides with the same surge height as those generated by Hurricane Carla in 1961 had struck the Galveston Bay in 1 9 7 4 , an additional 7 0 square miles of subsiding land, much of it highly developed, would be flooded by hurricane-surge waters.
... if Carla returned today, she would directly affect at least 50 ,000 more people and cover Interstate 45 in several places not affected in 1 9 6 1 ; thus cutting off escape routes that were usable in 1 9 6 1 .
A massive hurricane will cross Galveston Island, sooner or later. When it does, the Johnson Space Center (elevation 1 5 - 25 feet), the Texas City Refinery Complex (elevation 5-15 feet), many of the industries along the upper Ship Channel (elevation 1 0 - 3 5 feet), and more than 1,000 square miles of land will be under water.
The loss of property from Carla was $350 million; from a major hurricane striking directly at the Galveston Bay area, the cost would be in the billions of dollars.
The public safety implications of subsidence in the Houston- Galveston area are ponderous. Subsidence has seriously increased the potential for loss of lines during a hurricane. Due to subsidence Interstate 45 will be flooded during the next hurricane, effectively cutting off evacuation by automobile and trapping the hapless residents of Galveston with no means of escape. The possibility for catastrophic l o s s of lives, unusual in recent American history, is very real.
111-24
c
Ground rupture as a result of faulting is a major geologic hazard in the Houston-Galveston area, where more than 95 miles of lineaments and fault traces have been mapped. Active faults can cause damage to structures, city streets, interstate highways, railroad tracks, and airport runways The differential movement across the reflection pool at the San Jacinto Monument is a rather spectacular result Of localized subsidence along one of these faults.
Faults in the Texas Coastal Zone are products of natural geologic phenomena and have been explained as resulting from the deposition and differential compaction of thousands of feet of sediments, the upward movement of salt masses to form salt domes, the gulfward creep of the coastal land mass, and the bending of the landmass due to regional tecton- ics. There are clear indications, however, that whatever the origin of these faults, in some cases subsidence from fluid withdrawal has increased fault activity. The faults divide the earth's crust into discrete blocks and, in some cases, act as barriers'between aquifers in one block and those in an adjoining block. If the pressure decline from fluid withdrawal is greater in one block than the other, differential compaction occurs across the blocks resulting in vertical movements on the intervening fault. There has been no seismic activity associated with the active faults in the Texas Coastal Region.
(5) Effects of Aggravated Hazards
Inundation has damaged homes, ferry terminals, shipping docks, parks, roadways, railroads and sewage systems, but data on the cost of subsidence is fragmentary and the subject of debate. Cost information has been gathered for various purposes by the U.S. Army Corps of Engineers (19751, by economists at Texas A&M University (Warren, Jones et. al., 1974, and Jones and Larson, 1975), and by the Harris-Galveston Coastal Subsidence District (1977). According to Frank A. Marshall of McClelland Engineers, Inc., no one has done a comprehensive study of costs. cost analysis should also include an account of the benefits of subsidence. For example, subsidence has made it unneces- sary to dredge the Houston Ship Channel for several years.
The work of John D. Warren, Lonnie Jones, James Larson and others at Texas A&M University was the first systematic effort to estimate costs of subsidence. however, concentrated on limited study areas rather than attempting to estimate all costs due to subsidence through- out the region.
He pointed out that a proper
Their investigations,
In a 1974 study, Warren, Jones, et. al., selected a 300 square mile portion of the Greater Houston-Galveston area. They estimated the costs of subsidence-related damages in
111-25
t h e area as $ 6 0 . 6 7 m i l l i o n i n p r i v a t e damages, $48.76 m i l l i o n i n p r i v a t e p r o p e r t y losses, and $4 m i l l i o n i n p u b l i c p r o p e r t y losses. A s i x - f o o t t i d e i n 1973, which may be expec ted t o occur once eve ry f i v e y e a r s , w a s found r e s p o n s i b l e f o r $53 m i l l i o n of t h i s $113.43 m i l l i o n t o t a l . Balanc ing t h e b e n e f i t s of groundwater u s e a g a i n s t t h e s e costs , t h e y concluded t h a t :
If t h e h i s t o r i c losses e s t i m a t e d i n t h e s t u d y were i n c l u d e d i n t h e cost of groundwater u se , t h e pu rchase of a l l of t h e areas' r e c e n t w a t e r needs (up t o 132 b i l l i o n g a l l o n s a y e a r ) f r o m s u r f a c e w a t e r s o u r c e s would have been j u s t i f i e d .
A subsequen t s tudy by Jones and Larson focused on a 945 s q u a r e m i l e area t h a t has subs ided one f o o t or more s i n c e 1943. Es t imated annual costs i n damage and p r o p e r t y loss exceeded $31.7 m i l l i o n , p r i m a r i l y costs t o r e s i d e n t i a l , commercial and i n d u s t r i a l p r o p e r t y b u t i n c l u d i n g ove r $ .5 m i l l i o n i n p u b l i c costs f o r damage abatement o r r e p a i r t o f a c i l i t i e s . The s t u d y r e v e a l e d h i g h e r i n c i d e n c e , i n t e n s i t y , and costs for w a t e r f r o n t areas. Twelve p e r c e n t of t h e s t u d y area w a s w a t e r f r o n t l and and accounted fo r 45% of t h e costs of subsidence-related damages (Areas I and 11, F i g u r e I I I - C - 6 ) . Jones and Larson a l so d i d a compara t ive a n a l y s i s of t h e costs of groundwater pumping as opposed t o impor t ing s u r f a c e w a t e r t o m e e t area needs. They concluded t h a t t h e impor- t a t i o n of s u r f a c e w a t e r would have been economica l ly j u s t i f i e d f r o m t h e s t a n d p o i n t o f r educ ing costs; t h u s c o n c u r r i n g w i t h t h e r e s u l t s of the ear l ier s t u d y (see F i g u r e I I I - C - 6 ) .
I n 1 9 7 7 , t he Harr i s -Galves ton Coastal Subsidence D i s t r i c t t e s t i f i e d b e f o r e t h e House and Sena te N a t u r a l Resources C o m m i t t e e of t h e 65 th Texas L e g i s l a t u r e and p r e s e n t e d a l i s t of economic effects f o r areas w i t h i n t h e d i s t r i c t (Table III-c-1).
The U.S. Army Corps of Engineers (1975) has r e p o r t e d t h a t houses have been s u b j e c t e d bo th t o permanent and p e r i o d i c f l o o d i n g , m o s t n o t a b l y i n a coastal area which b o r d e r s B u r n e t t , C r y s t a l and Scot t Bays a t Baytown, Texas ( F i g u r e s I I I - C - 7 and III-C-8, " s tudy area" and " s e l e c t e d p l a n " ) . A s a remedy, t h e Corps of Engineers has proposed " . . . t o a c q u i r e and remove ,448 d w e l l i n g s ; evacua te and relocate abou t 1 , 5 5 0 r e s i d e n t s and deed t o t h e c i t y of Baytown t h e 750 acres o f a c q u i r e d l a n d f o r u s e by t h e C i t y as a n a t u r e a r e a or as deemed a p p r o p r i a t e f o r l a n d s v u l n e r a b l e t o r e c u r r e n t t i d a l , h u r r i c a n e , o r r a i n runof f f l o o d i n g . 'I
An a r t i c l e i n t h e Houston Post ( January 23, 1 9 7 7 ) d i s c u s s e s a secondary socioeconomic problem due t o coastal subs idence i n r e s i d e n t i a l areas: t h e loss of homeowners i n s u r a n c e f o r t h e r e s i d e n t s who s t i l l l i v e i n t h e Brownwood S u b d i v i s i o n i n Baywood. R e s i d e n t s of t h e s u b d i v i s i o n f i n d themselves
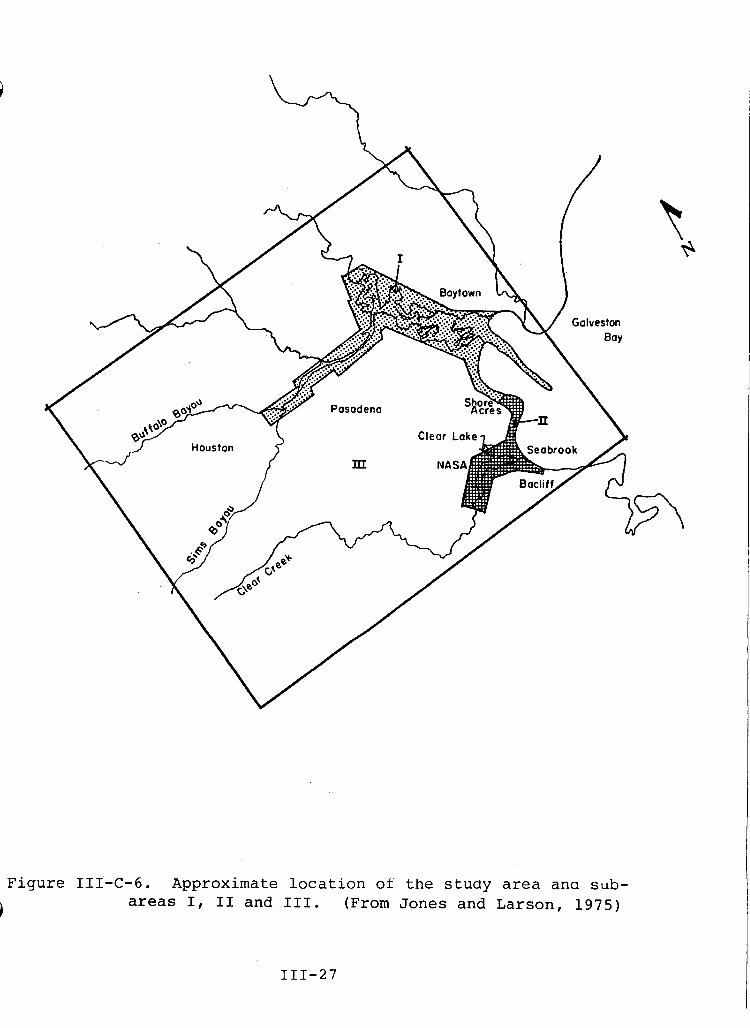
Figure III-C-6. Approximate location of the study area ana s u b - areas I, I1 and 111. (From Jones and Larson, 1975) 63
111-27
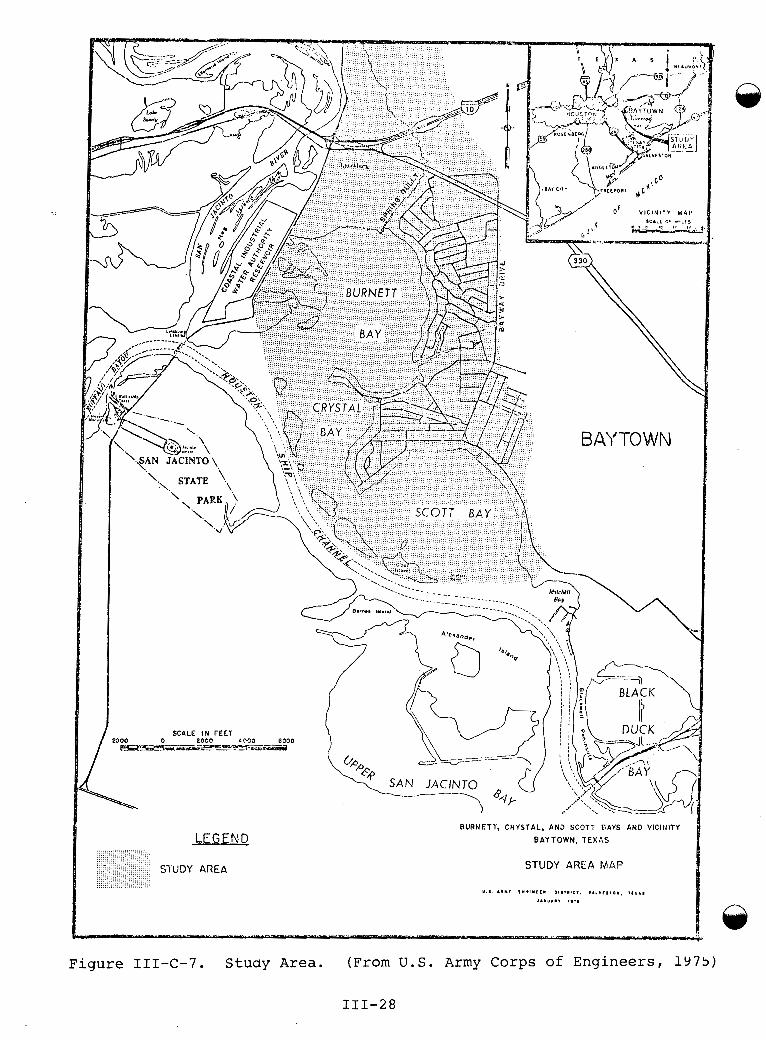
BAYTO W I'd
LEGFND
S1 UDY AREA
BURNETT, CRYSTAL, AND S C O T T BAYS AND VICINITY
BAYTOWN. 1 E X h S
STUDY AREA MAP
Figure 111-C-7. Study Area. (From U.S. Army Corps of Engineers, 1975)
111-28
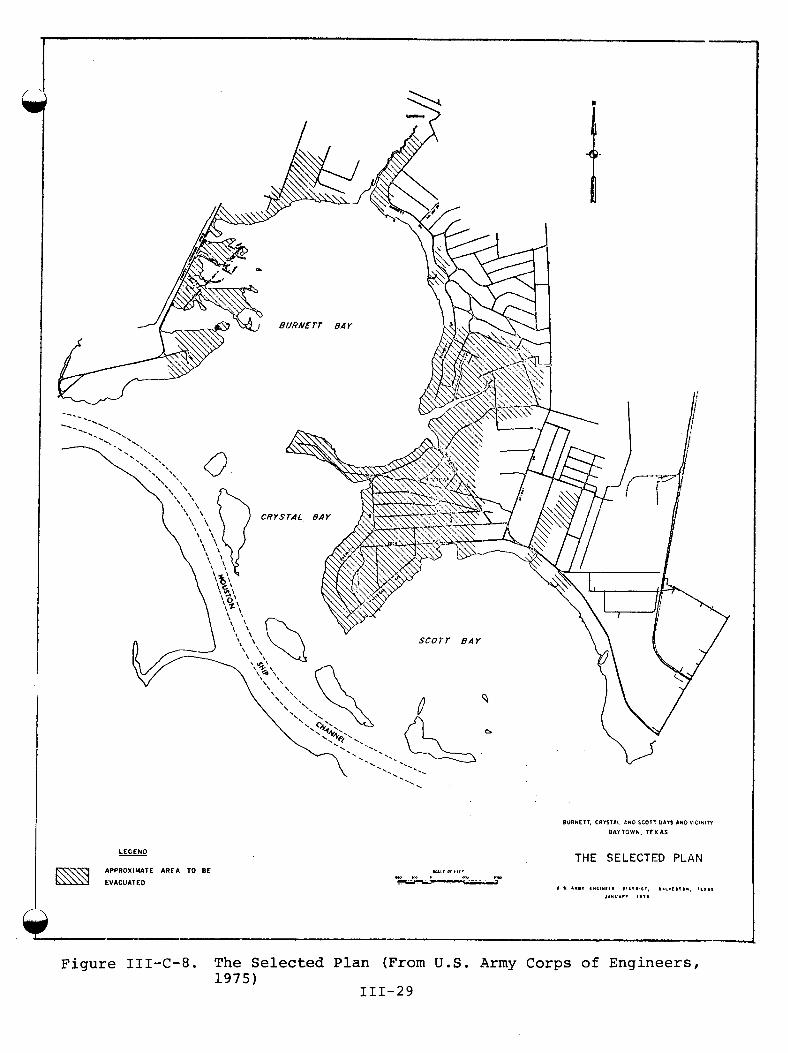
c
LEGEWD
APPROXIUATE A R F A TO BE
EVACUATED
BURNEIT. C8YSIbL AND S C O I T UAVS AND V I C l N l n
EAYTOWN. TEXAS
THE SELECTED PLAN
Figure III-C-8. The Selected Plan (From U . S . Army Corps of Engineers, 1975)
111-29
unable to get homeowners insurance which protects against fire, windstorm, hail, theft, and other risks as insurance companies will no longer write homeowners policies on homes highly susceptible to inundation.
Surface faulting, another environmental hazard aggravated by subsidence, has reportedly caused extensive damage in the Houston-Galveston area. However, no information has been found to indicate what portion of the damage is due to faulting aggravated by subsidence as compared to that due to naturally occurring faulting. The data collected by Jones and Larson (1975) from property owners in the area suggest that structural damages in areas away from the waterfront "...caused an estimated $17 million in costs to residential and commercial property owners", and that "these damages are manifested primarily as cracking, shifting and separation in residential and commercial'structures and attachments such as sewer and water lines."
Kreitler and McKalips (report in preparation) report that a total of 3 4 5 homes in the Houston area are located on active fault traces. Of these, 141 (41%) have experienced major damage (defined as cracks in concrete foundation slabs or cracks in house walls), and 7 0 ( 2 0 % ) have experienced minor damage such as tilting ridgelines of roofs or separation of driveways from house slabs. Their data are summarized in Table III-C-2 for various categories of property values. Assuming minor damage amounts to 25% of the estimated property value of each home and major damage amounts to 5 0 % , the total property damage from surface faulting in the area would amount to roughly three to four million dollars.
( 6 ) Adjustments to Subsidence
A full range of adjustments to subsidence problems has been practiced in the Houston-Galveston area by individual homeowners, homeowners groups, industries, insurance com- panies, and government bodies at the local, state and federal levels. Table III-C-3 is a summary of adjustments to subsidence and flooding practiced in the area.
In their feasibility study for flood damage reduction to residences at Baytown, the Corps of Engineers evaluated several alternative solutions to the flooding problem. These included construction of flood walls, flood proofing existing structures, imposition of zoning regulations, improved flood forecasting and temporary or permanent evacua- tion with relocation assistance.
The recommended plan proposes evacuation of all residents from the projected 50-year flood plain, assistance in their relocation at project expense and removal of the structures from the flood plain. The vacated lands would be deeded to
111-30
A
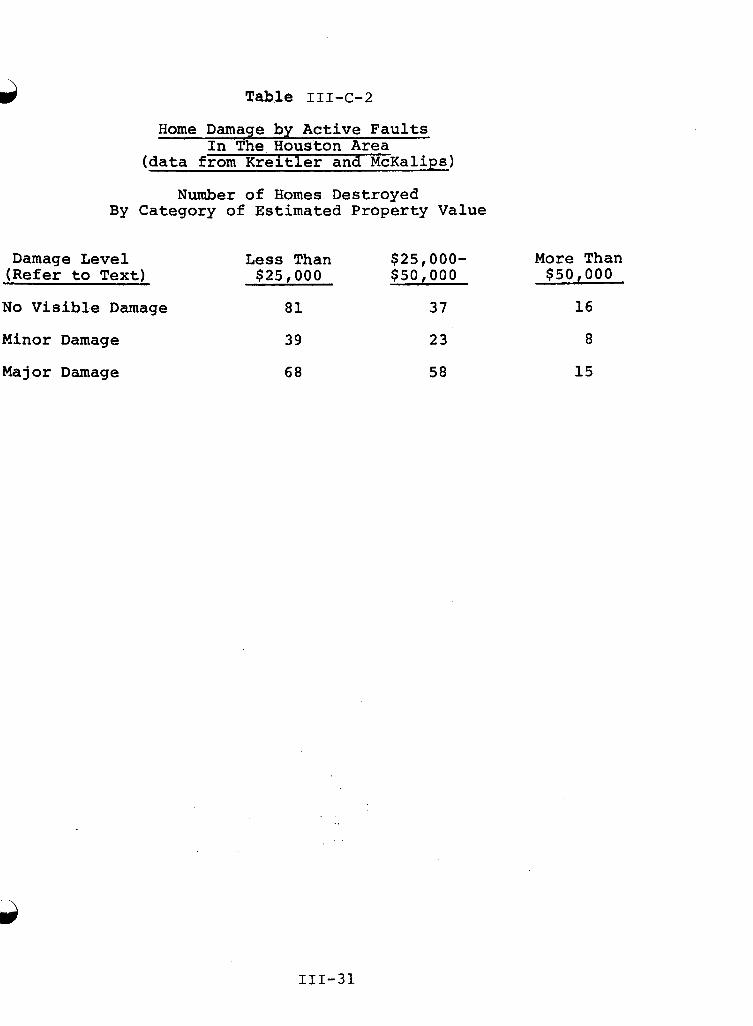
Table 11142-2
Home Damage by Active F a u l t s In The Houston A r e a
(data from Kreitler and McKalips)
Number of H o m e s Des troyed B y Category of Es t imated P r o p e r t y Value
Damage Level L e s s Than $25,000- More Than (Refer to T e x t ) $25 ,000 $50 , 000 $ 5 0 , 0 0 0
N o V i s i b l e Damage 8 1 37 16
Minor Damage 39 23 8
Major Damage 68 58 1 5
111-31
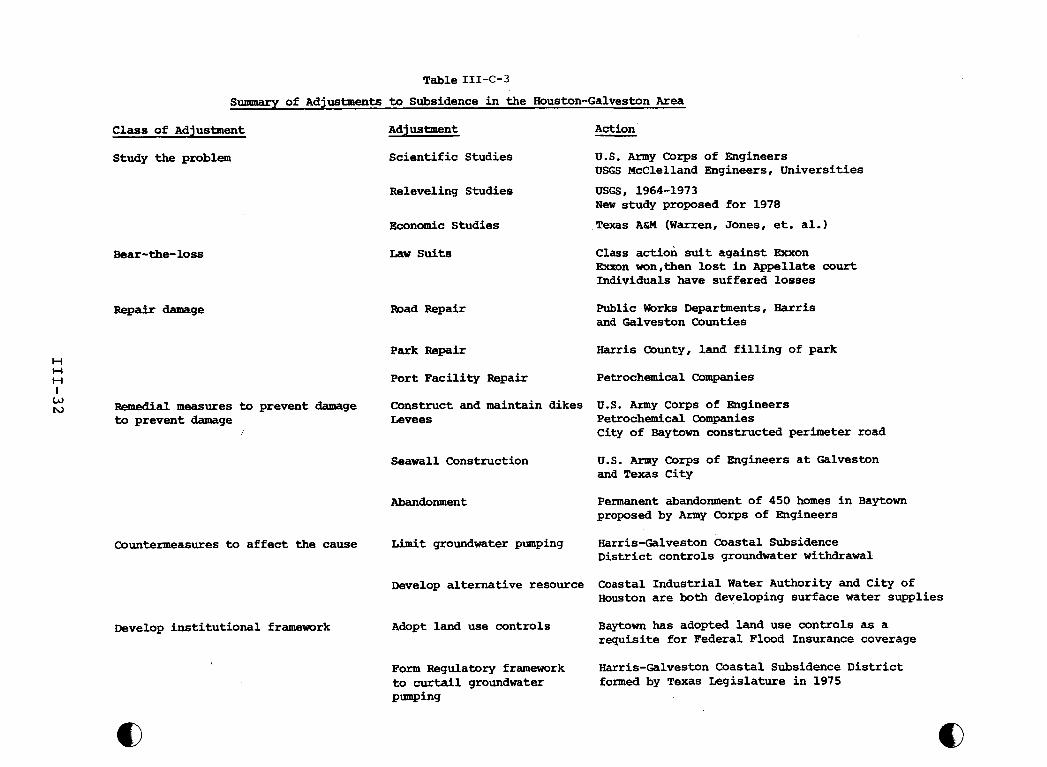
Table 111-C-3
SUmrmary of Adjustments to Subsidence i n the Houston-Galveston Area
Class of Adjustment Adj ustnent Action
Study the problem
Bear-the-loss
Repair damage
Scientific Studies U.S. m y Corps of Engineers USGS McClelland Engineers, Universities
Releveling Studies USGS, 1964-1973 New study proposed for 1978
Economic Studies Texas A&M (Warren, Jones, et. al.)
Law suits
Road Repair
Class action suit against =on Exxon won,then lost in Appellate court Individuals have suffered losses
Public Works Departments, Harris and Galveston Counties
Park Repair Harris County, land filling of park H H H Port Facility Repair Petrochemical Companies
I W N Remedial measures to prevent damage
to prevent damage Levees Petrochemical Companies Construct and maintain dikes U.S. Army Corps of Engineers
/ City of Baytown constructed perimeter road
Seawall Construction U.S. Army Corps of Engineers at Galveston and Texas City
Abandonment Permanent abandonment of 450 homes in Baytown proposed by Army Corps of Engineers
Countermeasures to affect the cause Limit groundwater pumping Harris-Galveston Coastal Subsidence District controls groundwater withdrawal
Develop alternative resource Coastal Industrial Water Authority and City of Houston are both developing surface water supplies
Develop institutional framework Adopt land use controls Baytown has adopted land use controls as a requisite for Federal Flood Insurance coverage
Form Regulatory framework to curtail groundwater
Harris-Galveston Coastal Subsidence District formed by Texas Legislature in 1975
puwing
t) Q
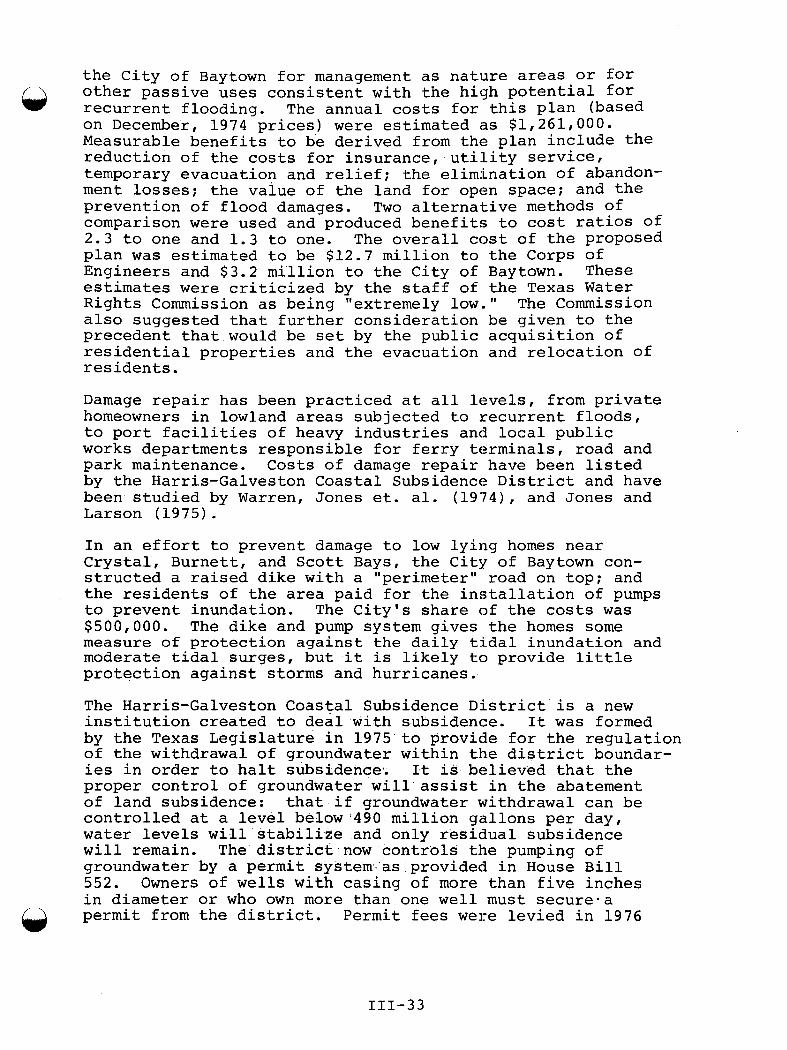
the City of Baytown for management as nature areas or for other passive uses consistent with the high potential for recurrent flooding. The annual costs for this plan (based on December, 1974 prices) were estimated as $1,261,000. Measurable benefits to be derived from the plan include the reduction of the costs for insurance, utility service, temporary evacuation and relief; the elimination of abandon- ment losses: the value of the land for open space; and the prevention of flood damages. Two alternative methods of comparison were used and produced benefits to cost ratios Of 2.3 to one and 1.3 to one. The overall cost of the proposed plan was estimated to be $12.7 million to the Corps of Engineers and $3.2 million to the City of Baytown. These estimates were criticized by the staff of the Texas Water Rights Commission as being "extremely low. 'I The Commission also suggested that further consideration be given to the precedent that would be set by the public acquisition of residential properties and the evacuation and relocation of residents.
@
Damage repair has been practiced at all levels, from private homeowners in lowland areas subjected to recurrent floods, to port facilities of heavy industries and local public works departments responsible for ferry terminals, road and park maintenance. Costs of damage repair have been listed by the Harris-Galveston Coastal Subsidence District and have been studied by Warren, Jones et. al. (1974), and Jones and Larson (1975).
In an effort to prevent damage to low lying homes near Crystal, Burnett, and Scott Bays, the City of Baytown con- structed a raised dike with a "perimeter" road on top; and the residents of the area paid for the installation of pumps to prevent inundation. The City's share of the costs was $500,000. The dike and pump system gives the homes some measure of protection against the daily tidal inundation and moderate tidal surges, but it is likely to provide little protection against storms and hurricanes.
The Harris-Galveston Coastal Subsidence District is a new institution created to deal with subsidence. It was formed by the Texas Legislature in 1975 to provide for the regulation of the withdrawal of groundwater within the district boundar- ies in order to halt subsidence,. It is believed that the proper control of groundwater will assist in the abatement of land subsidence: that if groundwater withdrawal can be controlled at a level below(490 million gallons per day, water levels will stabilize and only residual subsidence will remain. The district now controls the pumping of groundwater by a permit system as provided in House Bill 552. Owners of wells with casing of more than five inches in diameter or who own more than one well must secure-a permit from the district. Permit fees were levied in 1976
111-33
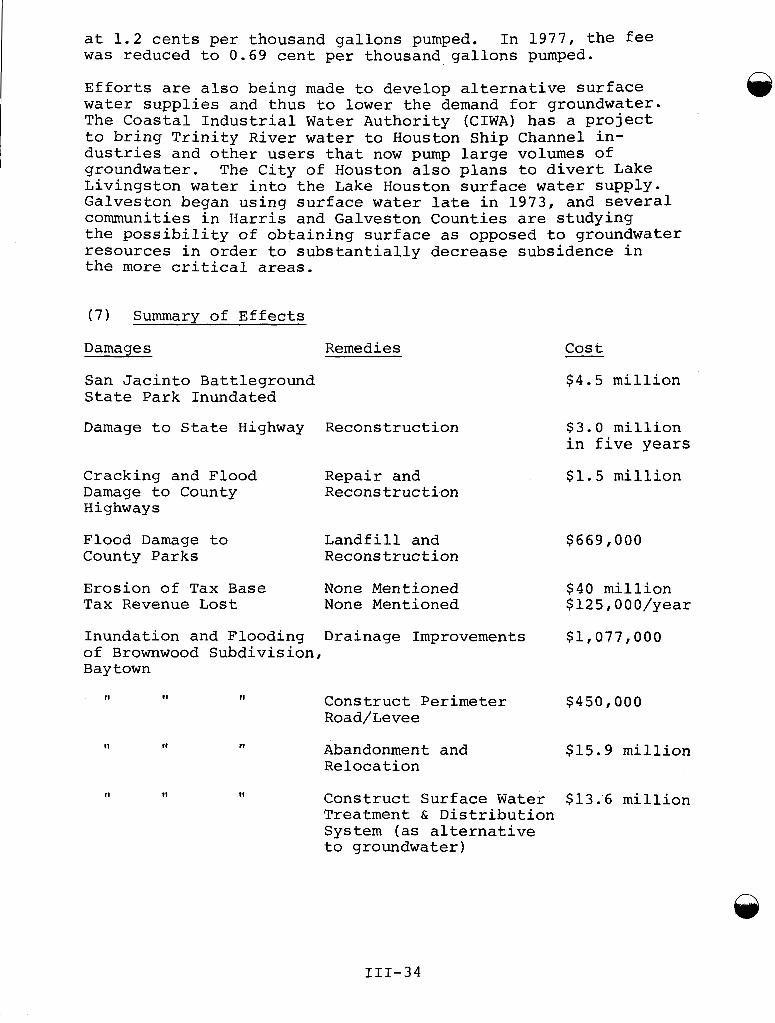
at 1.2 cents per thousand gallons pumped. was reduced to 0.69 cent per thousand gallons pumped.
Efforts are also being made to develop alternative surface water supplies and thus to lower the demand for groundwater. The Coastal Industrial Water Authority (CIWA) has a project to bring Trinity River water to Houston Ship Channel in- dustries and other users that now pump large volumes of groundwater. The City of Houston also plans to divert Lake Livingston water into the Lake Houston surface water supply. Galveston began using surface water late in 1973, and several communities in Harris and Galveston Counties are studying the possibility of obtaining surface as opposed to groundwater resources in order to substantially decrease subsidence in the more critical areas.
In 1977, the fee
(7) Summary of Effects
Damages
San Jacinto Battleground State Park Inundated
cost c__
Remedies
Damage to State Highway Reconstruction
$4.5 million
$3.0 million in five years
Cracking and Flood Repair and $1.5 million Damage to County Reconstruction Highways
Flood Damage to County Parks
Landfill and Reconstruction
Erosion of Tax Base None Mentioned Tax Revenue Lost None Mentioned
$669,000
$40 million $125,00O/year
Inundation and Flooding Drainage Improvements $1,077,000 of Brownwood Subdivision, Baytown
I 1 II II Construct Perimeter $450,000 Road/Levee
II I1 I1 Abandonment and $15.9 million Relocation
II II 11 Construct Surface Water $13.6 million Treatment E, Distribution System (as alternative to groundwater)
111-34
Inundation & Flooding Construct Levees; $5 million of City of Texas City Install Pumps
II I1 I! $8 million Construct Surface Water Facilities
c9 Hurricane Flood Hazard Construct Hurricane $ 4 million to Power Plant Protection Facilities
Subsidence of Inundation Repairs, $110 million at EXXON Refinery Flood Protection
I1 I1 II Develop Surface $6 million Water Facilities $. 5 million/:
Subsidence and Inunda- Repairs, $40 million tion at Shell Refinery Flood Protection
Changed Gradients, Redesign & Reconstruct $3.5 million Inundation of Sewage Collection Facilities, Collection System & Install Pumps. Relocate Treatment Plants Sewage Treatment Plant
( 8 1 References
r
Gabrysch, R. K., and C. W. Bonnet, 1975, Land-Surface Subsidence in the Houston-Galveston Region, Texas Water Development Board Report 188.
Gulf Coast Waste Disposal Authority and Houston-Galveston Area Council, 1976, "Subsidence and Related Effects on Wastewater Collection and Treatment Facilities", Areawide Waste Treat- ment Management Plan for the Greater Houston Area, Activity 14.
Harris-Galveston Coastal Subsidence District, July 1976, District Plan.
Harris-Galveston Coastal Subsidence District, 1977, Testimony Before House and Senate, Natural Resources Committees, 65th Legislature.
Jones, L. L. and J. Larson, 1975, Economic Effects of Land Subsidence Due to Excessive Groundwater Withdrawal in the Texas Gulf Coast Area, Texas A&M University, Texas Water Resource Institute.
Kreitler, C. W., 1976, Lineations and Faults in the Texas Coastal Region, Report of 1nvestigation.No. 85, University of Texas of Austin, Bureau of Economic Geology.
Kreitler & McKalips, Horizontal Electric Resistivity Profiles Across Faults and Lineations, Texas Coastal Zone, University of Texas of Austin, Bureau of Economic Geology (in prepara- tion).
111-35
111-36
Lofgren, Ben E., 1977, Background Studies of Subsidence in the Texas Gulf Coast Reqion, Sacramento, California, U . S . Geological Survey, open - file report.
Spencer, G. W., 1977, "The Fight to Keep Houston From Sinking", Civil Engineering, Volume 47, No. 8.
U.S. Army Corps of Engineers District, Galveston, Texas, 1975, Burnett, Crystal, and Scott Bays and Vicinity, Baytown, Texas Feasibility Report for Flood Damage Reduction, 2 Volumes, Main Report and Appendices.
Warren, J. P. and L. L. Jones, et. al., 1974, Costs of Land Subsidence Due to Groundwater Withdrawal, Texas A&M University, Texas Water Resource Institute.
(9) Persons Contacted
Frank A. Marshall, Engineer, McClelland Engineers, Inc., Houston, Texas: personal interview, January 19, 1978.
Peggy Harwood, Texas General Land Office, Austin, Texas: telephone interview, March 27, 1978.
Ronald J. Neighbors, General Manager, Harris-Galveston. Coastal Subsidence District, Houston, Texas: personal interview, January 13, 1978.
Sid Tanner, Chief, Coastal Navigation, U.S. Army Corps of Engineers, Galveston, Texas: personal interview, January 13, 1978.
Lonnie L. Jones, Professor, Department of Agricultural Economics, Texas A&M University, College Station, Texas: telephone interview, October 10, 1977.
D. LAS VEGAS VALLEY, NEVADA
(1) Introduction
The Las Vegas Valley is a fault-bounded st.ructura1 depression in the basin and range province, which is filled with 4000 feet or more of sediments derived from the surrounding mountains. Approximately 500 square kilometers in the central part of the Valley has subsided up to 1.5 meters, primarily as a result of the withdrawal of large quantities of groundwater. sparse natural vegetation. Land uses in the valley include agriculture, recreation, commercial, residential and open space with open space predominating. The closest major water body is Lake Mead, located several miles to the east.
The region consists of arid desert with
(2)
Levelling and survey data have been available for the area since 1935, when stations were established to record the effects of the filling of Lake Mead. Since that time, the U.S. Bureau of Reclamation, National Geodetic Survey (formerly U.S. Coast and Geodetic Survey), U.S. Geological Survey and the Nevada Highway Department have established additional stations and conducted periodic relevelling surveys. Desert Research Institute in Reno, Nevada has been investigat- ing subsidence in the Las Vegas Valley for over 14 years. Principal investigators have included A. L. Mindling, John A. Blume and Associates, and Ralph Patt. Contributions through other agencies have been made by Jim Harrill and C. T. Malmberg.
Description of Primary Subsidence Phenomena
The
Subsidence was first documented in the area in 1948 by Maxey and Jameson. It has since been determined that three forms of ground surface warping are affecting the area:
0 A regional tilting to the south, believed to be of tectonic origin and considered to have been in progress prior to the filling of Lake Mead, although changes in the rate and direction of tilting may have been trig- gered by the added stress of reservoir filling:
probably related to the elastic strain response of the underlying rocks to the weight of water in Lake Mead:
0 A broad shallow downwarping, centered on Lake Mead,
o A steep localized depression in Las Vegas Valley related to groundwater withdrawals.
Although all three types of surface warping are presently active in the Valley, groundwater withdrawal has caused 90% of the total elevation change.
6d
111-37
Land subsidence from fluid withdrawal results from the compaction of fine-grained sediments due to the increase in effective stress caused by lowering of the artesian head within the groundwater system. Comparison of leveling data from 1935 to 1963, as illustrated in Figures III-D-1 to 111- D-6, graphically illustrates the history of subsidence in this area. The maximum cumulative elevation change was 1.2 meters in 1963, with 1 . 5 meters reported in 1974.
It is interesting to note that the area of maximum subsidence does not coincide with, but lies two to three miles to the east of the major cone of groundwater depression. This is most likely due to an increase in both compressibility and aggregate thickness of fine grained sediments from west to east. Because the valley fill sediments vary laterally from east to west in their compressibility, it has been proposed that the prominent, north trending fault scarps crossing the valley (Figure III-D-7) are related to differential compaction which has been occurring throughout the recent geologic past. The present pumping activities have served to acceler- ate and localize the rate of compaction.
Associated 'effects which have occurred as a r e s u l t of subsid- ence include tilting, ground surface ruptures and subsurface deformation. Tilting of the ground surface has occurred on a regional scale as well as along the margins of the subsid- ence bowl. Ground surface ruptures in the form of cracks and fissures have occurred in Las Vegas Valley as a result of tensile stresses associated with differential subsidence. These fissures begin as small cracks less than an inch wide, but may be widened to several feet across as the result of erosion. Much of the fissuring is in the vicinity of the compaction fault scarps which apparently serve as boundaries along which stress adjustments are made. Fissures and cracks also occur immediately adjacent to some wells where subsidence is intensely localized. To date, there has been no reported seismicity that is known to be related to the subsidence phenomena.
A subsidence effect of considerable economic impact is subsurface deformation. In the Las Vegas Valley, this effect is manifested by the compaction of sedimentary layers at depth and has caused protrusion, deformation, and breakage of well casings, often requiring redrilling or abandonment of wells.
( 3 ) Effects of Primary Subsidence Phenomena
Subsidence has caused damage to many wells, several pipelines, a few houses, numerous roads, two reservoirs and a railroad.
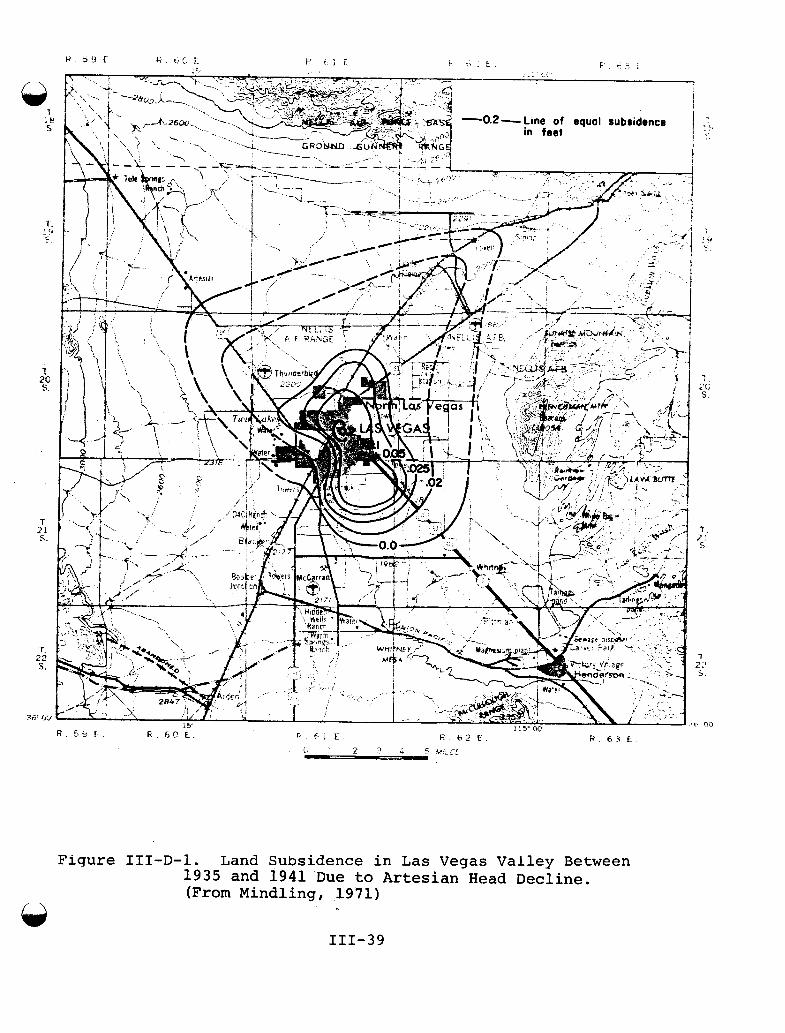
Q ;c. 1
5
I . :'. 5
7 20 S.
T 21 S.
Fiqure III-D-1. Land Subsidence in Las Vegas Valley Between 1935 and 1941 Due to Artesian Head Decline. (From Mindling, 1971)
111-39 63
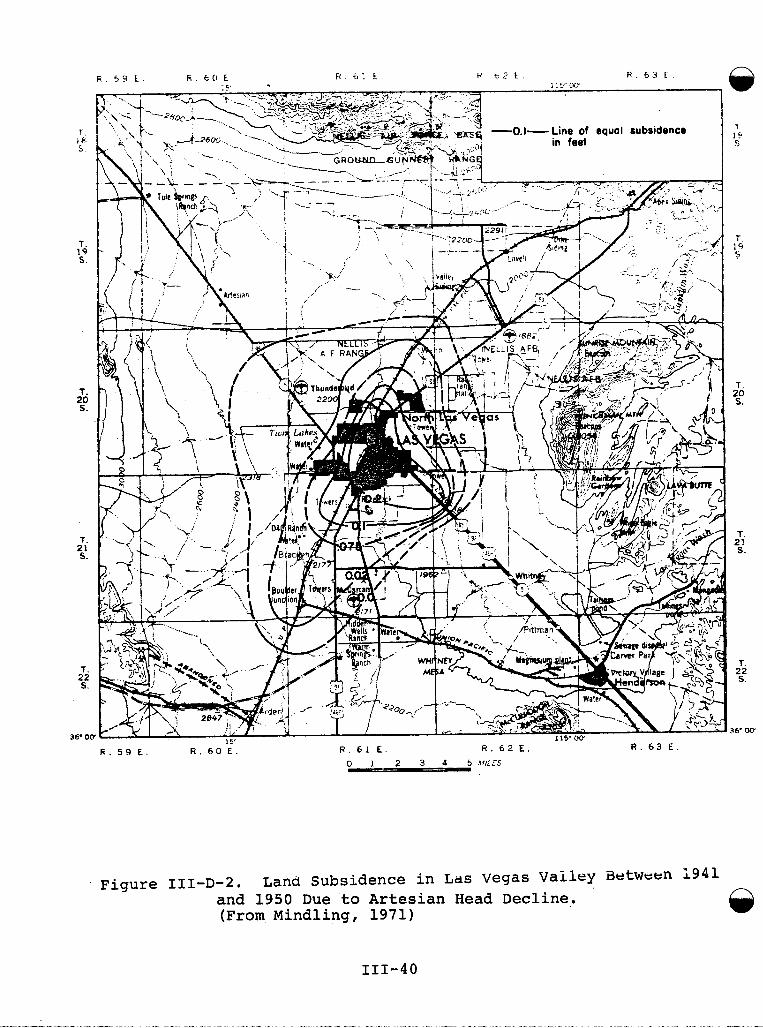
T. 19 S.
1. 20 S.
T. 21 S.
T. 22 S.
36' M R . 6 3 E
13 H. 6 2 E. R . 61 E . R . 5 9 E . R . 6 0 E.
0 I 2 3 4 5 .??!X5 .cL -
Figure III-D-2. Land Subsidence in L a s Vegas Valley aetwtsen 1941 and 1950 Due to Artesian Head Decline. (From Mindling, 1971)
111-40
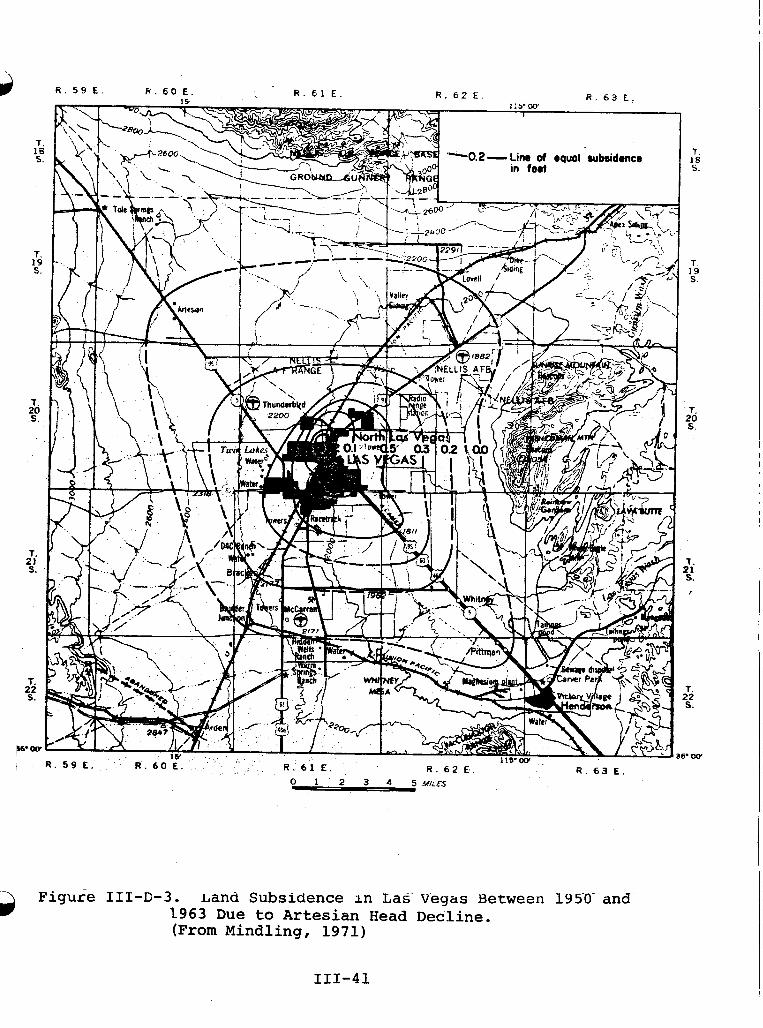
Figure III-E-3. Land Subsidence in Las Vegas Between 1950 and 1963 Due to Artesian Head Decline. (From Mindling, 1971)
111-41
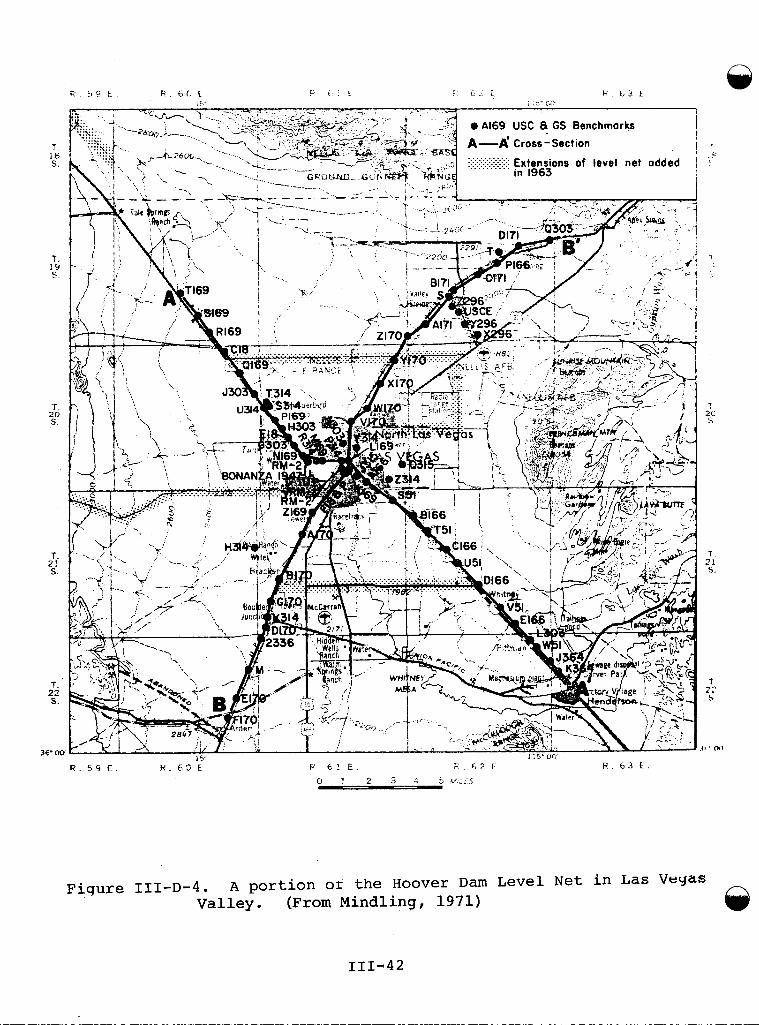
Q R . 6 f > I , c c : t f 6: t E . t 3 t
: . . “-c,<’ .~ E L . ? t
: ’.
R . 5 5 E. R . 6 3 E R . 6 3 E
Fiqure III-D-4. A portion or the Hoover D a m Level Net in L a s Veyas Valley. (From Mindling, 1971)
111-42
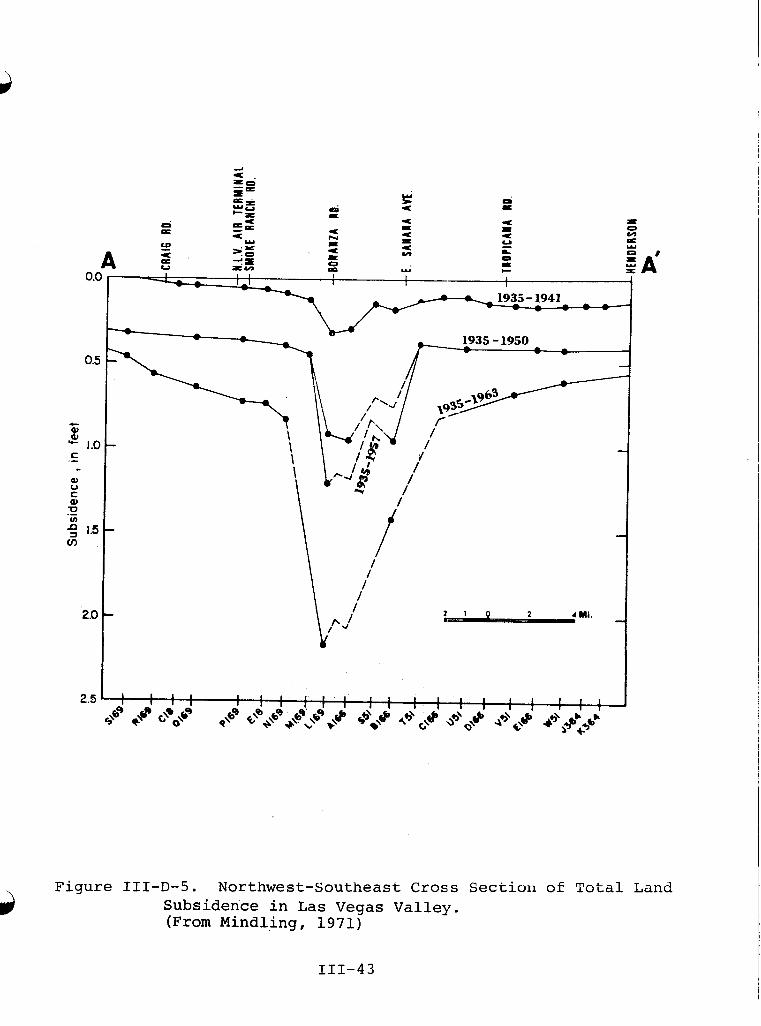
O.(
0.:
% - 1.c C .- .. 0, V C 0, U .- u) 5 1.5 v)
2.0
2.5
U
f /
/
f \
/ 4 /
1 i
= 0 M e W
I A'
Figure III-D-5. Northwest-Southeast Cross Sectioii of Total Land Subsidence in Las Vegas Valley. (From Mindling, 1971)
u 111-43
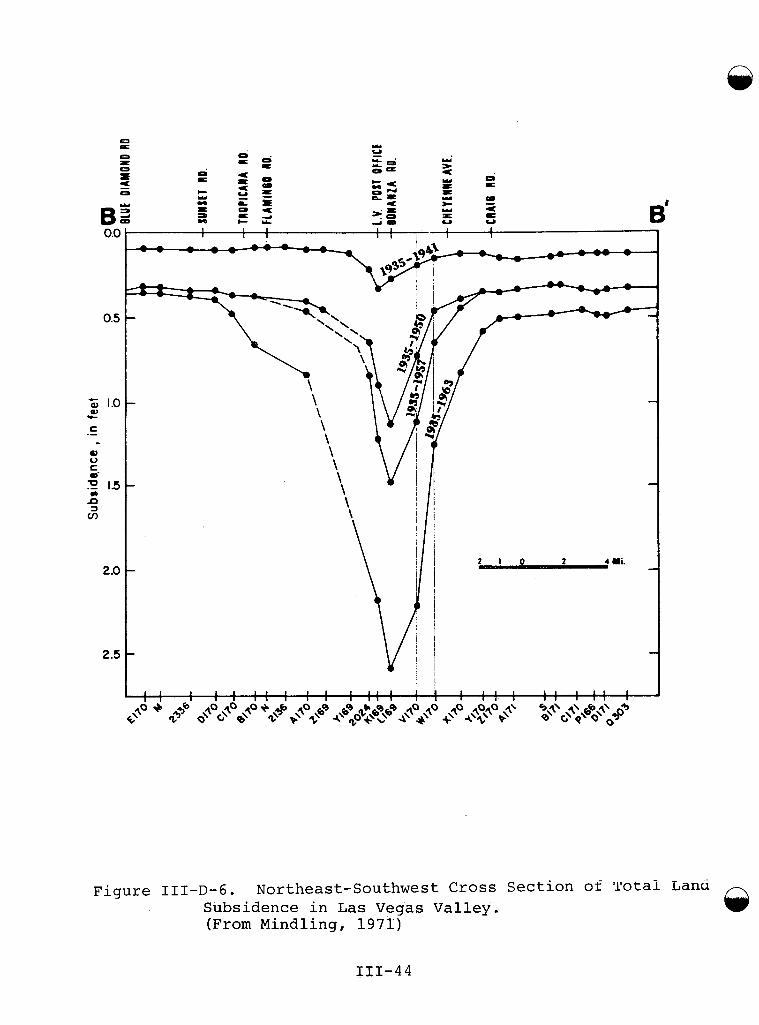
BZ 0.0
0.5
c Q) 1.0 W .c
c .- .. W 0 C ar rn 3 v)
X 15 n
2 .o
2.5
0 c o c
B'
\ \ \
V \ \
1 4 Ni.
Figure III-D-6. Northeast-Southwest Cross Section of 'I'otai Land Subsidence in Las Vegas Valley. (From Mindling, 1971)
JII-44
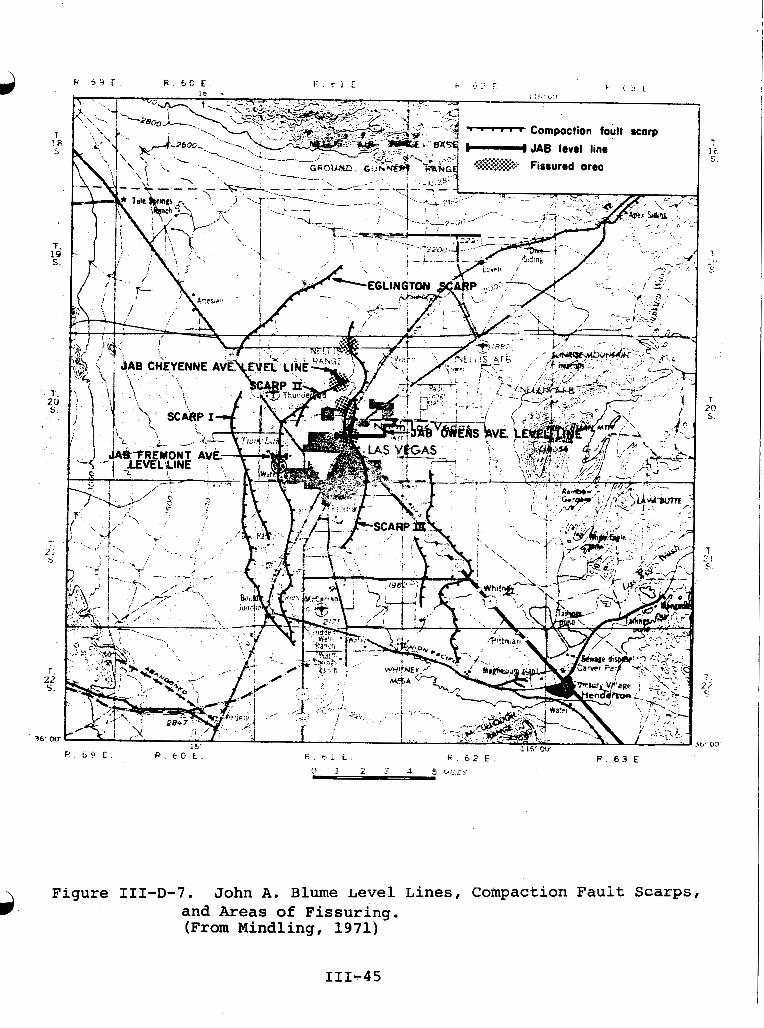
P > e E R . 00 E R . 6 3 E .
Figure III-D-7. John A. Blume Level Lines, Compaction Fault ScaEps, and Areas of Fissuring. (From Mindling, 1971)
0
111-45
Subsurface deformation and ground cracking are the main contributors to significant damage in the area. n
Local well drillers have estimated that approximately 100 wells have been adversely affected by subsidence resulting in a repair/replacement cost in the vicinity of $400,000- Pipeline repairs related to subsidence effects have cost the City of Las Vegas approximately $1,500. Although damage from fissuring has been documented for a few homes, no cost estimates were projected, due to extenuating circumstances involving the cases. At least one home which was severely damaged by fissuring is reported to have been abandoned: it was located within a road right-of-way and was slated to be torn down anyway. The city engineering and road departments of Las Vegas and North Las Vegas spend approximately 2 % of their annual budget, or about $19,000 a year, repairing road damage resulting from subsidence, including fissuring and cracking of roads, sidewalks, and curbs.
Two reservoirs were adversely affected by fissuring to the point of abandonment. One was abandoned for reasons not related to subsidence, and the replacement cost of the other was $100,000. One portion of a railroad grade was repaired after a fissure went through it, but the cost of repair is not known. The total estimated cost of damages described above clearly exceeds $500,000 to date.
( 4 ) Aggravation of Other Hazards
Subsidence has been known to aggravate existing hazards such as flooding in other areas. In the Las Vegas area, periodic flash flooding is a hazard, but subsidence is not known to have significantly affected the pattern of flood prone areas or the frequency and depth of flooding. Conceivably fissuring could affect some of the reservoirs in the area, causing piping (erosion) or possibly failure of the embankment. However, there are no large dams in the valley which would present a significant flooding hazard.
( 5 ) Effects of Aggravated Hazards
None known.
(6) Adjustments to Subsidence
Adjustments to subsidence-related damage have included abandonment.of some wells and relocation of others, in an effort to disperse the area of withdrawal so localized cones of depression can be relieved. Numerous scientific studies have been undertaken to evaluate the cause, extent, and
111-46
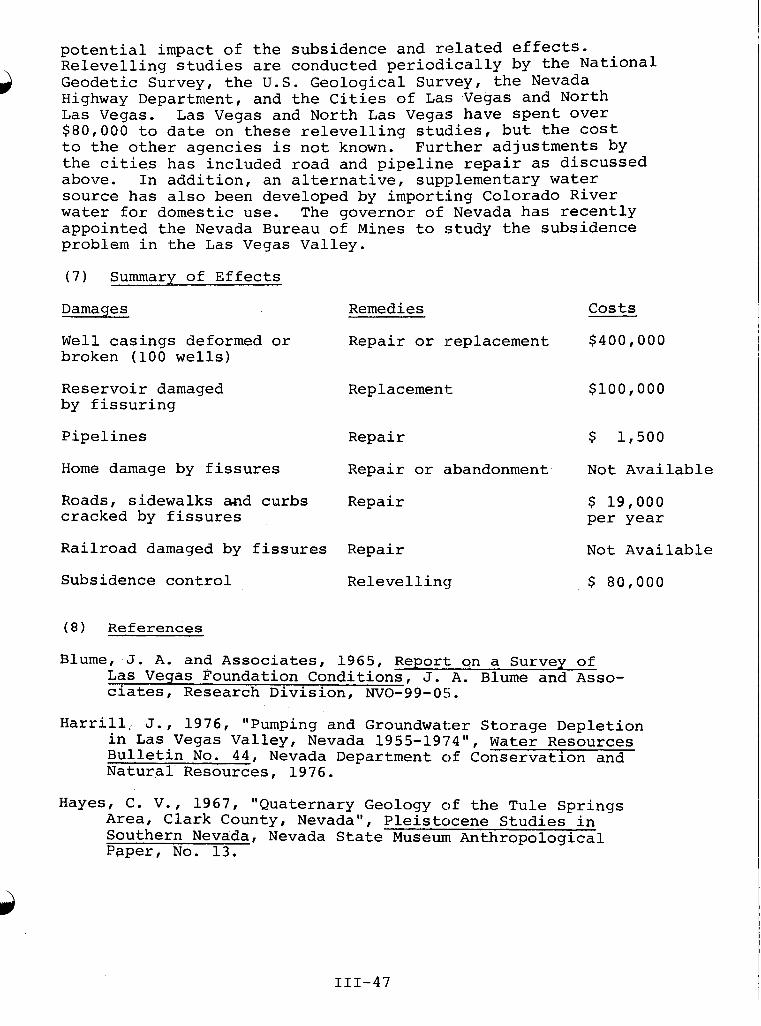
potential impact of the subsidence and related effects. Relevelling studies are conducted periodically by the National Geodetic Survey, the U.S. Geological Survey, the Nevada Highway Department, and the Cities of Las Vegas and North Las Vegas. Las Vegas and North Las Vegas have spent Over $80,000 to date on these relevelling studies, but the cost to the other agencies is not known. Further adjustments by the cities has included road and pipeline repair as discussed above. In addition, an alternative, supplementary water source has also been developed by importing Colorado River water for domestic use. The governor of Nevada has recently appointed the Nevada Bureau of Mines to study the subsidence problem in the Las Vegas Valley.
c3
(7) Summary of Effects
Damaqes Remedies
Well casings deformed or Repair or replacement broken (100 wells)
Reservoir damaged by fissuring
Rep lacemen t
Pipelines Repair
Home damage by fissures Repair or abandonment
Roads, sidewalks and curbs Repair cracked by fissures
Railroad damaged by fissures Repair
Subsidence control Relevelling
costs
$400,000
$100,000
$ 1,500
Not Available
$ 19,000 per year
Not Available
$ 80,000
( 8 ) References
Blume, J. A. and Associates, 1965, Report on a Survey of Las Vegas Foundation Conditions, J. A. Rlume and Asso- ciates, Research Division, NVO-99-05.
Harrill, J., 1976, "Pumping and Groundwater Storage Depletion in Las Vegas Valley, Nevada 1955-1974", Water Resources Bulletin No. 4 4 , Nevada Department of Conservation and Natural Resources, 1976.
Hayes, C. V., 1967, "Quaternary Geology of the Tule Springs Area, Clark County, Nevada", Pleistocene Studies in Southern Nevada, Nevada State Museum Anthropological Paper, No. 13.
111-47
A
Malmberg, G. T., 1961, "A Summary of the Hydrology of the Las Vegas Groundwater Basin, Nevada, with Special Refer- ence to the Available Supply", Natural Resources Bulletin No. 18, Nevada Department of Conservation and Natural Resources.
, "Land Subsidence in Las Vegas Valley, 1935-63", Groundwater Resources Information Series Report 5, U.S. Geological Survey and Nevada Department of Conservation.
Maxey, G. B. and C. H. Jameson, 1948, "Geology and Water Resources of Las Vegas, Pahrump and Indian Springs Valley Clark and Nye Counties, Nevada", Water Resources, Bulletin No. 5, Nevada State Engineering Office.
Mindling, A. L., i971, A Summary of Data Relating to Land Subsidence in Las Vegas Valley, University of Nevada, Desert Research Institute, Center for Water Resources Research.
, 1974, "Effects of Groundwater Withdrawal on 1-15 Freeway in North Las Vegas, Nevada", Project Report Series No. 33, University of Nevada, Desert Research Institute, Center for Water Resources Research.
, 1974, "Potential Stability Problems Relating to Groundwater Conditions and Land Subsidence in the Vicinity of Thomas A. Campbell Reservoir and Pumping Station in La; Vegas, Nevada'', Project Report Series No. 32, University of Nevada, Desert Research Institute, Center for Water Resources Research.
Passmore, G., 1975, Subsidence-Induced Fissures in Las Vegas, Nevada, University of Nevada School Mines Thesis.
(9) Persons Contacted
T. L. Holzer, Geologist, U.S. Geological Survey, Menlo Park, California: personal and telephone interviews, March 8 and 9, 1978.
R. 0. Patt, Research Associate, Desert Research Institute, University of Nevada, .Reno, Nevada: telephone inter- view, March 10, 1978.
Carl Malone, Supervisor of Engineering and Design for the City of Las Vegas, Nevada: telephone interview, March 10, 1978.
A
Kerry Rowe, Engineering Designer for the City of North Las Vegas, California: telephone interview, March 10, 1978.
A. F. Effinger, Owner, Effinger Dril-ling, Las Vegas, Nevada: telephone interview, March 10, 1978.
M. E. McKinney, Owner, McKinney & Sons (well drillers), LaS Vegas, Nevada: telephone interview, March 10, 1978.
111-49
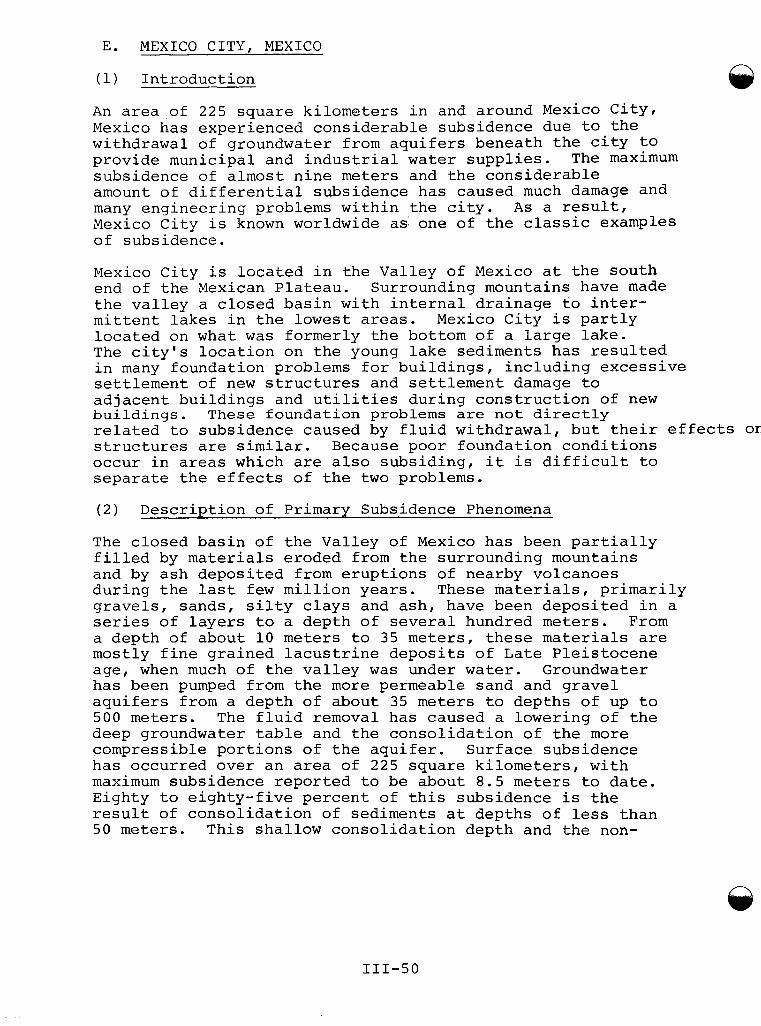
E. MEXICO CITY, MEXICO
(1) Introduction
An area of 225 square kilometers in and around Mexico City, Mexico has experienced considerable subsidence due to the withdrawal of groundwater from aquifers beneath the city to provide municipal and industrial water supplies. subsidence of almost nine meters and the considerable amount of differential subsidence has caused much damage and many engineering problems within the city. A s a result, Mexico City is known worldwide as one of the classic examples of subsidence.
The maximum
Mexico City is located in the Valley of Mexico at the south end of the Mexican Plateau. Surrounding mountains have made the valley a closed basin with internal drainage to inter- mittent lakes in the lowest areas. Mexico City is partly located on what was formerly the bottom of a large lake. The city's location on the young lake sediments has resulted in many foundation problems for buildings, including excessive settlement of new structures and settlement damage to adjacent buildings and utilities during construction of new b u i l d i n g s . These f o u n d a t i o n problems are n o t d i r e c t l y related to subsidence caused by fluid withdrawal, but their effects on structures are similar. Because poor foundation conditions occur in areas which are also subsiding, it is difficult to separate the effects of the two problems.
(2) Description of Primary Subsidence Phenomena
The closed basin of the Valley of Mexico has been partially filled by materials eroded from the surrounding mountains and by ash deposited from eruptions of nearby volcanoes during the last few million years. These materials, primarily gravels, sands, silty clays and ash, have been deposited in a series of layers to a depth of several hundred meters. From a depth of about 10 meters to 3 5 meters, these materials are mostly fine grained lacustrine deposits of Late Pleistocene age, when much of the valley was under water. Groundwater has been pumped from the more permeable sand and gravel aquifers from a depth of about 35 meters to depths of up to 5 0 0 meters. The fluid removal has caused a lowering of the deep groundwater table and the consolidation of the more compressible portions of the aquifer. Surface subsidence has occurred over an area of 2 2 5 square kilometers, with maximum subsidence reported to be about 8.5 meters to date. Eighty to eighty-five percent of this subsidence is the result of consolidation of sediments at depths of less than 5 0 meters. This shallow consolidation depth and the non-
111-50
uniform withdrawal of groundwater over the area has resulted in highly irregular subsidence contours. These irregular contours at Mexico City do not resemble the relatively smooth subsidence bowl contours found where geofluids are withdrawn from much greater depths.
crs Subsidence from fluid withdrawal was first discovered in 1925, although it probably dates back to about 1860 when the first deep well was drilled. Subsidence from normal consoli- dation of the basin sediments is also occurring, but at a much slower rate than that caused by water withdrawal. The maximum rate of surface subisidence due to groundwater extraction reached 45 cm/year in 1951 in the central part of Mexico City. In the early 1950s, a new aqueduct was construc-
~ ted to import water for the supply of Mexico City. Since that time, over-pumping of groundwater has ceased and the water table has stabilized. The rate of subsidence decreased accordingly, but some settlements of the ground surface continue to occur, at a rate which is decreasing with time.
Some ground surface cracking has also resulted from the removal of groundwater. These cracks occurred in areas where the near-surface water table was lowered enough to cause the drying of near-surface clay deposits. Large shrinkage cracks resulted. In some cases, these shrinkage cracks opened as much as a meter at the surface and extended to depths of over 15 meters. The cracks were mostly in undeveloped areas and caused little damage.
( 3 ) Effects of Primary Subsidence Phenomena
Mexico City has experienced extensive damage from subsidence and related phenomena. The most severe damage from subsidence has occurred in the local subsidence bowls around major wells. The abrupt depressions around these wells have destroyed buildings, broken sewers and water supply lines, disturbed streets, sidewalks, and train tracks and in general have been responsible for most of the more obvious and spectacular damage in the city.
More widespread damage has occurred to the sewage systems. Breaks have been reported where differential subsidence occurred, and the surface subsidence has decreased slopes in some of the sewers to the point where pumps have been neces- sary to move sewage water to higher levels in the system. Leaks from cracks in the-sewage systems pose major health problems since groundwater is used for domestic supplies. Approximately 60 kilometers of new sewer main has been constructed at a lower elevation.
111-51
Breaks in the water supply system have also been reported. Broken water mains have been difficult to detect and much water has been lost.
Pile foundations of buildings have also been subject to damage. Friction forces from consolidating materials along the piles have caused piles to sink further into the ground and in some cases have caused differential settlements. Grouting under the piles to i-mprove their bearing capacity enough to overcome the friction forces has been necessary in some cases. In other cases, buildings on shallow founda- tions have been damaged because they were located adjacent to buildings on piles. During shallow subsidence, the pile structures did not subside and emerged slowly from the ground surface, while the adjacent building sank with the ground surface. The resultant differential movement between the two buildings has caused the building on shallow founda- tions to tilt away. Timber sheet piles have been driven into the ground between buildings in this situation to form a slip surface and minimize damage. These relative movements between buildings or between buildings and the adjacent ground have damaged utilities entering the buildings, unless flexible connections have been provided.
Since most of the subsidence occurred from the consolidation of near-surface materials at depths less than 50 meters, the well casings which extended to depths greater than 50 meters did not subside appreciably. The result was that the ground subsided around many of the deeper well casings, leaving them protruding several meters above, the ground surf ace.
(4) Aggravation of Other Hazards
In addition to subsidence phenomena associated with fluid withdrawal, Mexico City is adversely affected by unfavorable foundation conditions. These conditions are not aggravated by the subsidence, but settlement damage arising from them is difficult to separate from that due to subsidence. The clay deposits underlying much of the city are so weak that new buildings experience large total and differential settle- ment unless the buildings receive careful attention to foundation investigation and design. Heavy buildings on raft foundations have experienced settlements of 1.0 to 1.5 meters within a few years when their weight exceeded the critical compressive strength of the clays. Long buildings have suffered considerable differential settlement; and in some storage buildings, relevelling of floors has been required, because handling of merchandise became too difficult.
Buildings on pile foundations have not suffered appreciable settlement, but differential movements between them and adjacent buildings not on piles have damaged the adjacent buildings. These foundation problems have plagued residents of the city since the Aztecs first noticed settlements of their city in 1 3 2 5 . Large buildings from the Seventeenth and Eighteenth Centuries have settled so much that their first floors are now nearly buried below the street level.
( 5 ) Effects of Aggravated Hazards
In spite of the large amount of damage that has occurred in Mexico City, no reliable estimates of economic losses have been made. It has been estimated that the cost of the new sewer system -- roughly 10 billion pesos ( $ 5 0 0 million+) -- represents about 50 percent of the total cost of subsidence. damage in Mexico City. Although foundation problems have been extensive in the city, they have not been attributed to subsidence. The total cost of damage to structures is probably on the order of several hundred million dollars.
Adjustment to Subsidence
The residents have learned to live with these problems and have developed building designs and construction techniques to minimize adverse effects. Advances in the understanding of soil mechanics and foundation design in the last 30 years have also helped reduce damage. Nevertheless, many structures and public works in the city which have experienced foundation settlement damage are within the same areas that are a l so subsiding from fluid withdrawal. This overlap makes it almost impossible to isolate the damage caused by subsidence alone.
Importation of water supplies into the city and prohibition of new wells have succeeded in stopping most of the subsidence.
It is interesting to note that Mexico City has used subsidence phenomena for beneficial uses. has been created outside of town by pumping groundwater to induce a subsidence bowl which was then filled with the pumped water.
A new surface water reservoir
(7) Summary of Effects
Principal effects of subsidence in Mexico City are tabulated below:
111-53
Damage Remedies
Large shrinkage None to date, as cracks cracks are mainly
in undeveloped areas
Breaks and disrup- Build 60 km of tion of sewer new sewer line system
Damage to struc- For new buildings: tures, utilities use improved fdn streets, sidewalks design, flexible
cost
-
Approximately 10 billion pesos (Estimated $500 million at 2Op/$ exchange)
Total probably on the order of several hundred million dollars
and railroad tracks utility connections. For existing structures: repair where possible such as grouting under piles, use of sheet p i l e s , between bui ld- ings, releveling floors, etc.
Deep wells protrude Not known. above ground.
(8) References
Not available.
Ortis, T. S., 1967 , Subsidence in Mexico Cit - in Relation to Groundwater Overdraft, Publication No. 74, International Association of Scientific Hydrological Proceedings, Dubrovnik Symposium.
Vega, G. F., 1975 , Response to the International Survey on Land Subsidence, of the International Association of Hydrological Sciences.
Vega, G. F., 1 9 7 6 , Subsidence in Mexico City, a Histor- ical Review, Publication No. 121, International Association of Hydrological Services, Anaheim Sympo s i um .
Zeevaert, Leonardo, 1973 , Foundation Engineering for Difficult Subsoil Conditions, Van Nostrand Reinhold Co.
( 9 ) Per'sons Contacted
German E. Figueroa Vega, Director of Surface and Underground Water, Valley of Mexico Water Commission: telephone interview.
8
111-54
F. SAN JOAQUIN VALLEY, CALIFORNIA
Introduction
The San Joaquin Valley is a broad alluv,ated trough ma ing up two-thirds of the Central Valley of California. It is about 90 kilometers wide, bordered by the Sierra Nevada on the east and the Coast Ranges on the west. The United States Geological Survey has done extensive work documenting and describing the extent and causes of land subsidence in the San Joaquin Valley of California.
Surface streams from the mountain runoff provide most of the irrigation needs in the northeast part of t.he valley. South of Kings River and throughout the west of the valley, however, natural runoff is inadequate or negligible. Before major canals were built, the valley's western and southern areas were irrigated by thousands of large and deep irrigation wells.
According to Lofgren (1976) three man-induced processes are causing land subsidence in the San Joaquin Valley: the compaction of aquifer systems caused by the. intensive pumping of groundwater; the compaction of moisture-deficient deposits when water is first applied (hydrocompaction); and the extraction of fluids in several oil fields. Figure III-F-1 indicates areas affected by compaction. In the north end of the Valley, farming practices in the delta area of the Sacramento and San Joaquin Rivers have also resulted in subsidence of the land surface. In addition to man-made changes, the slow uplift of the southern and western mountains and very slow settlement of the Valley -- t.ectonic adjustments -- affect ground surface levels.
Approximately half of the area of the Valley has been affected by subsidence, and maximum subsidence exceeds 2.8 meters ( 2 9 feet). Changes have occurred so slowly and uniformly over a broad zrea that the effects of subsidence have gone unnoticed by most residents. In local areas, however, abrupt effects are in evidence.
(2) Description of Primary Subsidence Phenomena
The extraction of deep groundwater has been the principal cause of subsidence in the San Joaquin Valley. The practice of using groundwater for irrigation began during World War I and surged in popularity during and after World War 11. By 1950, more than one quarter of all groundwater pumped for irrigation in the country was used in the San Joaquin Valley. Groundwater overdraft has prevailed in the area since the 1930's, and the decline in water levels has been recognized for a long time. Subsidence has been the cause of increasing concern for some thirty years, raising the height of pumping lifts, causing well casing failures and creating various other problems.
111-55
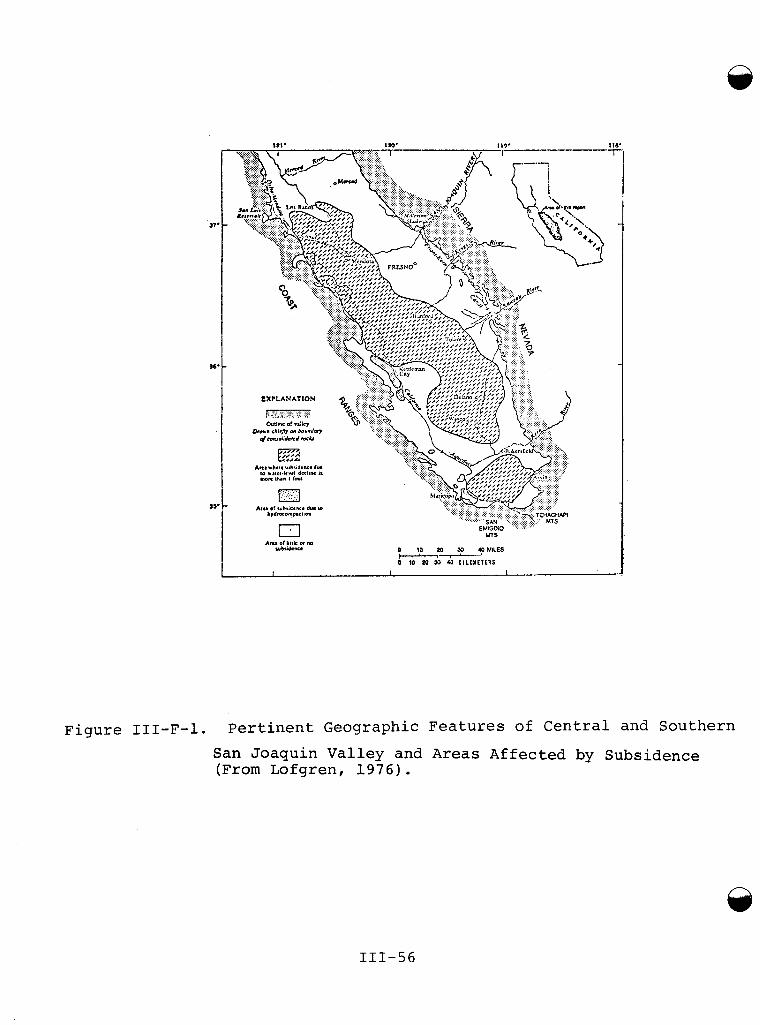
I 1 '7
F i g u r e III-F-~. P e r t i n e n t Geographic F e a t u r e s of C e n t r a l and Southern
San Joaqu in Va l l ey and A r e a s A f f e c t e d by Subsidence (From Lofgren, 1 9 7 6 ) .
111-56
Groundwater pumping increased with the drought of 1976-77 and is likely to remain above the predrought rate, even though the drought ended in early 1978. Farmers, fearing a recurrence of water shortages, are likely to keep those wells that were put into operation during the drought at some minimum level of pumpage in order to be prepared. The effect of this on groundwater levels or subsidence is not now known.
6mJ
Lofgren (1976) described the subsidence as follows:
... there are three centers of major subsidence: (1) a long narrow trough west of Fresno, referred to as the Los Banos-Kettleman City area, with a maximum subsidence of over 8.8 m (29 feet); (2) a central subsidence bowl between Tulare and Wasco with more than 3.6 m (12 feet) of settlement; and ( 3 ) a southern depression south of Bakersfield, commonly referred to as the Arvin-Maricopa area with maximum subsidence of about 2.7 m (9 feet).
Subsidence due to groundwater pumping began in the middle 1920s, but the cumulative volume of subsidence remained small until after World War 11. By 1970... roughly 11.1 x 10³ km (4300 square miles) of farm land had subsided more than 1 foot.
Figures III-F-2 through III-F-5 illustrate the overall subsidence phenomena.
At the U . S . Geological Survey in Sacramento, California, B. E. Lofgren and J. F. Poland have been the principal investigators of the subsidence phenomena since 1955. Both have published several articles and appeared at a number of symposia to discuss their findings. Nikolas P. Prokopovich, a geologist with the U . S . Bureau of Reclamation, has also done extensive work on subsidence in the San Joaquin Valley. The Bureau has planned and constructed several canal projects in the valley that have been affected by subsidence or have had to be designed with subsidence in mind. Mr. Prokopovich has published several articles on the problem since 1968; and he and the Bureau have been attempting since the 1960s to predict ultimate land subsidence, so that new canals could be designed with allowances for eventual subsidence effects.
111-57
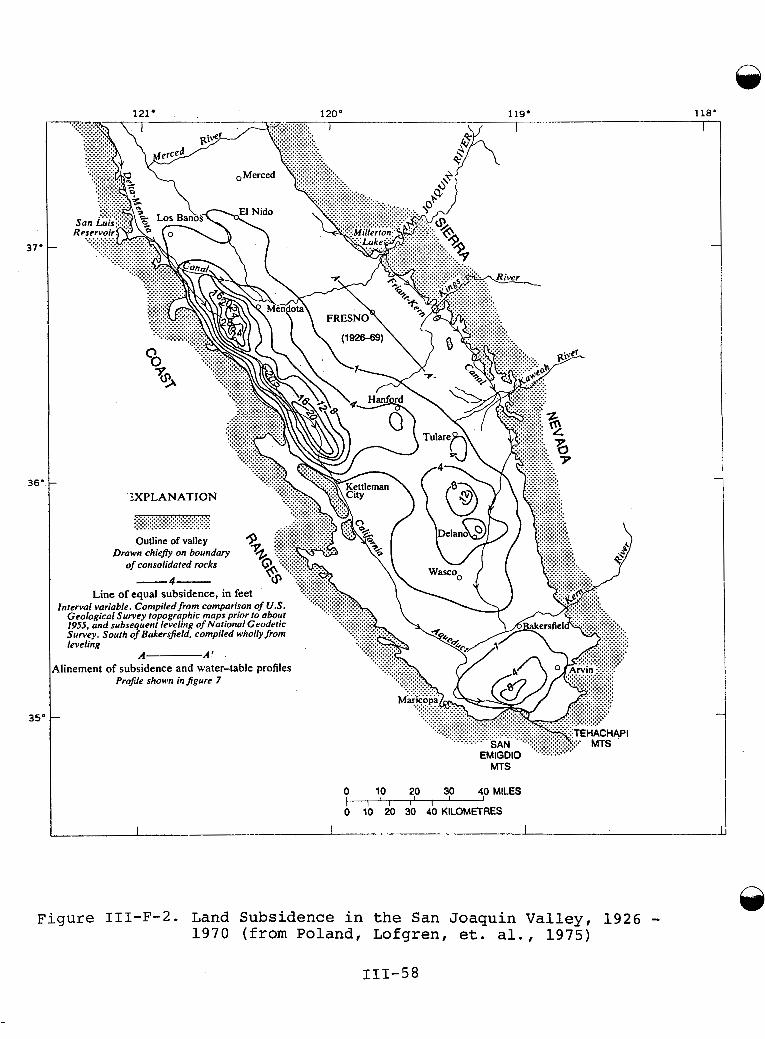
7
121' 120' 119.
0 40 MILES
0 10 20 30 40 KILOMETRES -
I I I
F i gu re III-F-2. Land Subsidence i n t h e San Joaquin V a l l e y , 1 9 2 6 - 1970 (from Poland, Lofgren, e t . a l . , 1975)
111-58
118" T
-
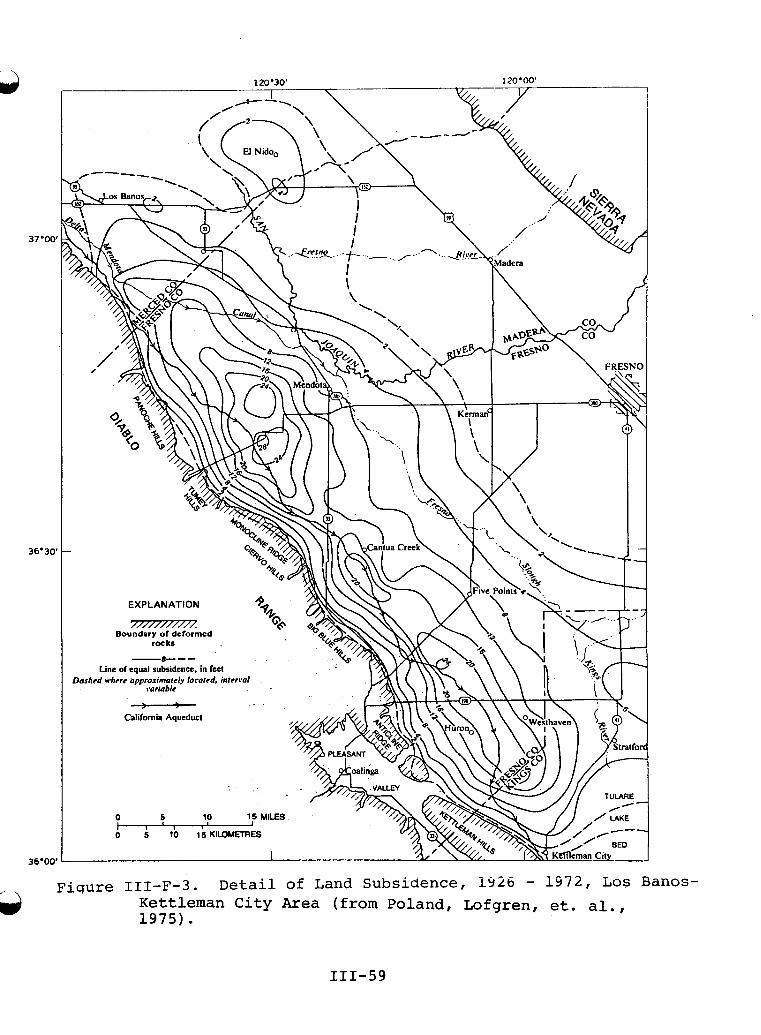
drs
37"OC
36.30
36'00
laden
Fiqure 111-F-3. Kettleman C i t y Area (from Poland, Lofgren, e t . a l . , 1 9 7 5 ) .
Deta i l of Land Subsidence, iY26 - 1472, Los aanos-
111-59
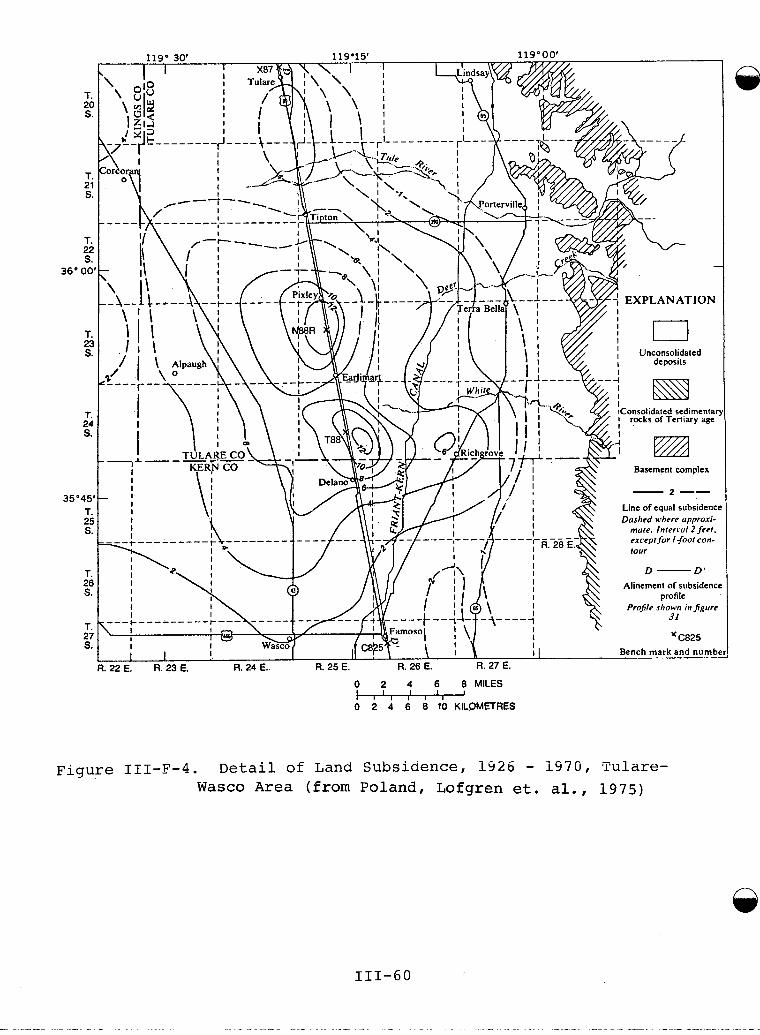
T. 20 S.
T. 21 S.
T. 22 S.
36' 00'
T. 23 S.
1. 24 S.
35'45' T. 25 S.
T. 26 S.
T. 27 S.
Basement complex
- 2 -- Line of equal subsidenc Dushed where upproxi-
mute. I n t e n d 2 ferr. except for lfoot cnn- lour
D -D' Alinement of subsidenc
profile Profile shown in figure
31
' C825
0 2 4 6 8 MILES
0 2 4 6 8 10 KILOMETRES -
Figure 111-F-4. Detail of Land Subsiaence, 1326 - 1570, T u l a r e - Wasco Area (from Poland, Lofgren et. al., 1975)
n
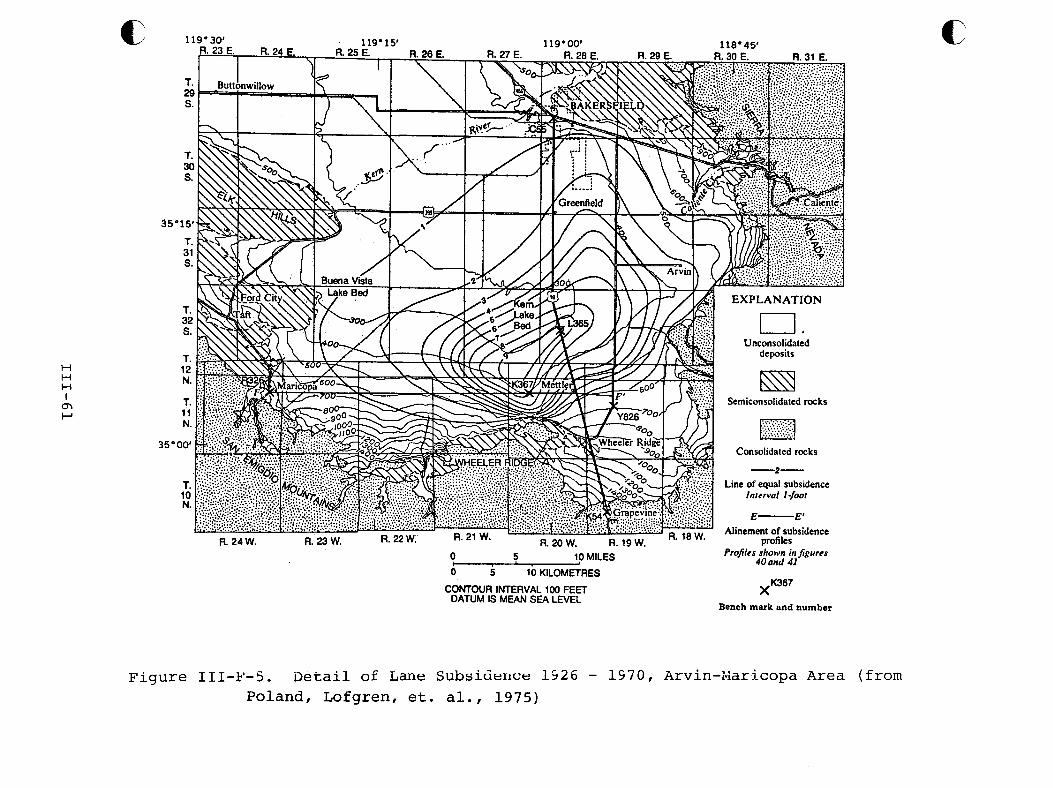
c
H H H I
m P
0 5 10 MILES
b 5 10 KILOMETRES
CONTOUR INTERVAL 100 FEET DATUM IS MEAN SEA LEVEL
Profiles shown in figures 40 and 41
Xm6’ Bench mark and number
F i g u r e III-E’-5. D e t a i l of Lane Subsickrice 1526 - 1370, Arvin-Karicopa A r e a ( f rom Poland, Lofgren, et. a l . , 1 9 7 5 )
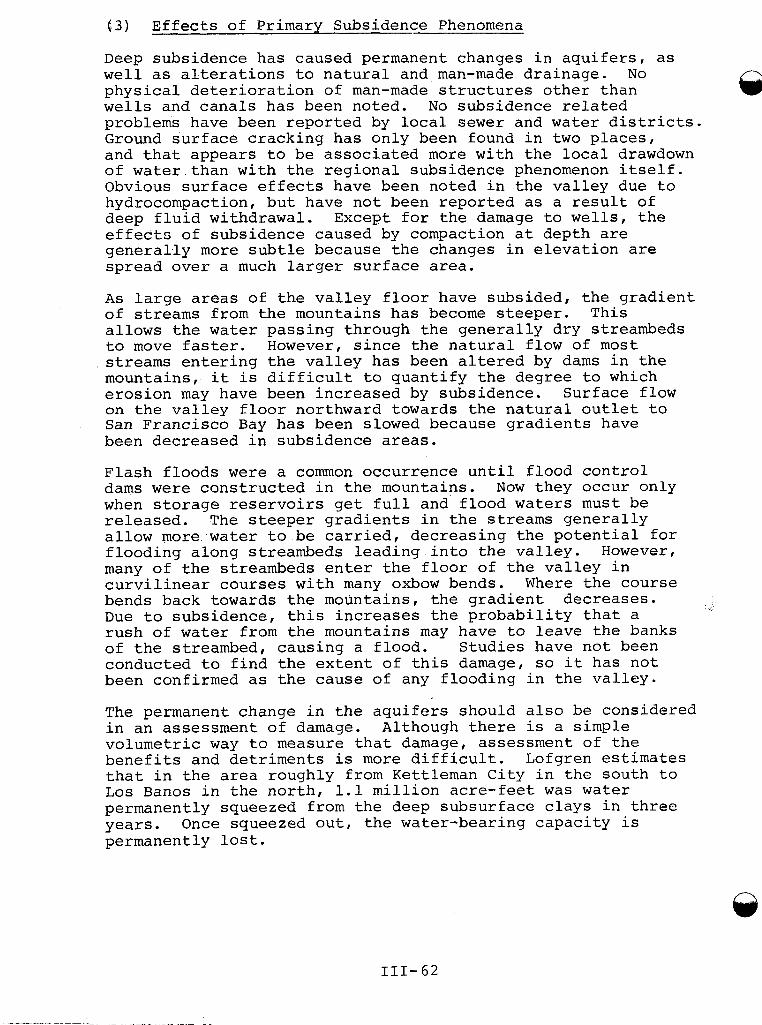
( 3 ) Effects of Primary Subsidence Phenomena
Deep subsidence has caused permanent changes in aquifers, as well as alterations to natural and man-made drainage. No physical deterioration of man-made structures other than wells and canals has been noted. No subsidence related problems have been reported by local sewer and water districts. Ground surface cracking has only been found in two places, and that appears to be associated more with the local drawdown of water than with the regional subsidence phenomenon itself. Obvious surface effects have been noted in the valley due to hydrocompaction, but have not been reported as a result of deep fluid withdrawal. Except for the damage to wells, the effects of subsidence caused by compaction at depth are generally more subtle because the changes in elevation are spread over a much larger surface area.
As large areas of the valley floor have subsided, the gradient of streams from the mountains has become steeper. This allows the water passing through the generally dry streambeds to move faster. However, since the natural flow of most streams entering the valley has been altered by dams in the mountains, it is difficult to quantify the degree to which erosion may have been increased by subsidence. Surface flow on the valley floor northward towards the natural outlet to San Francisco Bay has been slowed because gradients have been decreased in subsidence areas.
Q
Flash floods were a common occurrence until flood control dams were constructed in the mountains. Now they occur only when storage reservoirs get full and flood waters must be released. The steeper gradients in the streams generally allow more water to be carried, decreasing the potential for flooding along streambeds leading into the valley. However, many of the streambeds enter the floor of the valley in curvilinear courses with many oxbow bends. Where the course bends back towards the mountains, the gradient decreases. Due to subsidence, this increases the probability that a rush of water from the mountains may have to leave the banks of the streambed, causing a flood. Studies have not been conducted to find the extent of this damage, so it has not been confirmed as the cause of any flooding in the valley.
The permanent change in the aquifers should also be considered in an assessment of damage. Although there is a simple volumetric way to measure that damage, assessment of the benefits and detriments is more difficult. Lofgren estimates that in the area roughly from Kettleman City in the south to Los Banos in the north, 1.1 million acre-feet was water permanently squeezed from the deep subsurface clays in three years. Once squeezed out, the water-bearing capacity is permanently lost.
111-62
The principal measurable damage to man-made systems in the valley has been to wells, canals and to the aquifers. The effect on canals is best documented by Prokopovich and Hebert (1968). They cite an area along the last 30-40 miles of the Delta-Mendota Canal as a good example of the effects of subsidence phenomena. Subsidence was not taken into consideration during construction of the canal, with the result that bridges, concrete lining, pipe crossings and other structures eventually became partially or completely submerged. On the western side of the San Joaquin Valley, the San Luis Canal was designed and constructed with features which anticipate subsidence effects. Minor subsidence has also been noted in the vicinity of other canals, including the Friant-Kern, the Tehama-Colusa, the Folsom-South, and near the proposed Peripheral Canal. Additional freeboard was designed into the canal planning in order to anticipate subsidence effects. In general, this was adequate to compens- ate for construction andlpost construction subsidence.
Collector drains, which catch water after irrigation, are located on the valley floor and run northward. Subsidence has lowered the gradients in these, reducing their capacity and making them more costly to design and build. Subsidence along the routes of other canals in the central valley is caused by two other phenomena not related to deep water withdrawal: hydrocompaction of near surface soils with the introduction of irrigation: and oxidation of deltaic peat in the delta areas of Sacramento.
Researchers for the U.S. Geological Survey estimate that damage to wells caused by subsidence has bexn the greatest dollar cost of subsidence. However, it is difficult to estimate the number or cost of wells affected. It seems clear that the expected life span of wells was reduced as a consequence of subsidence. During the 1930s and 40s, the expected life span of a well was ten to fifteen years, and when subsidence began to cause damage, many wells were already old. New wells were often drilled in areas where the chances of finding an ample water supply were not as good. Subsidence was- j u s t one additional factor making the investment in a well risky. The Bank of America in Fresno lends money for wells on a five-year note: however, both a farmer and a well industry executive in the area estimate that the average well life is still at least ten years.
On one farm of 120,000 acres, there were about 240 wells. The farm manager estimates that probably 25% of those wells were damaged by deep subsidence. A typical depth is about 2,000 feet. Although, the construction cost of these wells was about $lO/foot when pumping and subsidence were at their peaks, cost of replacement in 1978 would be about $6O/foot. The same farm manager noted that over the years, when
I
111-63
subsidence was causing serious problems with the wells, the quality of water in the wells was improving. Boron, a major problem for San Joaquin Valley irrigation was at a level of about two parts per million in the 1 9 4 0 s , but by 1978 it had gone down to about . 5 parts per million (Wolf, personal communication). A new form of casing that has sleeve joints so that it can accept some vertical movement is now in general use. It costs about $1,000 extra per well.
No study has been made of the complete dollar cost of sub- sidence in the San Joaquin Valley. Poland and Lofgren (1976) estimated the total cost to be $25,000,000. Their estimate came primarily from discussions with the Bureau of Reclamation and the Department of Water Resources of the State of California. They view the cost of well damage and repair as the major item that is difficult to estimate.
The Bureau of Reclamation has made some estimates of cost of damages and preventative measures to the Delta Mendota and San Luis Canals. Twenty-six miles of the Bureau of Reclama- tion's Delta-Mendota Canal have required rehabilitation following damage due to deep subsidence from 1969 to 1978, and the Bureau has had to raise the concrete canal lining and some bridges at a cost of $5 million.
( 4 ) Aggravation of - Other Hazards
As noted earlier, flooding may be accentuated by subsidence along curvilinear streambeds with oxbow bends that turn back towards the mountains. However, this hazard has not been specifically documented. No flood has been attributed to it.
( 5 ) Effects of Aggravated Hazards
None are known.
(6) Adjustments to Subsidence
Efforts to mitigate the subsidence problem have included:
0 Countermeasures to Affect the Cause. The canal and aqueduct system in the San Joaquin Valley has provided an alternative to groundwater pumping by importing surface water to areas of serious overdraft. These waters were not brought in just to stop subsidence, but as a cheaper source of irrigation water. In any case, the effect has been to reduce pumping and subsidence, and to reverse the decline of artesian pressure. Today, much of the overdrawn area is returning to a stable water budget.
111-64
0 Research. U.S. Geological Survey and the Bureau of Reclamation have been studying the causes and effects of subsidence in the area since the 1950s. This work has helped them and others understand the problem. crs
0 Repair. Freeboard has been added to canals where needed. Wells have been replaced or repaired.
0 Planning. The Bureau of Reclamation pioneered efforts to predict subsidence and included subsidence considera- tions in its design of its most recent canals in the valley.
Making use of the experience gained from subsidence problems elsewhere, the Bureau of Reclamation specia1:ly designed certain reaches of the San Luis Canal where subsidence was likely to occur. The cost of these preventive measures was $4.5 million over the cost of construction if no special measures had been taken (Prokopovich, personal communication, 1978).
Beyond the direct cost of subsidence, there is a cost involved in monitoring and studying it. The network of benchmarks that has been used to monitor the progress of subsidence in the valley has been surveyed 12 times. The :1967 survey alone cost $35,000. Overall, between $100,000 and $200,000 has been spent on these surveys. Added to that is the cost of supporting the scientists who have been studying the problem on a full or part-time basis. While there is a great deal of cooperation and collaboration among Federal, State and local agencies regarding subsidence, there is no adopted comprehensive plan of response.
(7) Summary of Effects
Available data on subsidence damage and direct associated costs for 'the San Joaquin Valley are summarized below:
Decreased storage in aquifers
Partial or complete submerg- gence of canals, and associ- ated bridges and pipe crossings
Remedies costs
Increased reliance on Difficult surface supplies to assess
Construct additional $4.5 million freeboard; plan for for San Luis subsidence in new Canal construction
111-65
Damage to wells and well Repair, replacement; casings increased reliance on
surface supplies
Damage to wells and well Use of sleeve joints casings on new wells
Disruption of collector Repair drains; relevel drains, and irrigation fields ditches
Major cost, but no estimates given*
$1000 per well
Unknown
* Poland and Lofgren ( 1 9 7 6 ) estimated total costs $25 ,000 ,000 .
to be about
(8) References -
B. E. Lofgren, 1 9 7 6 , Hydrogeologic Effects of Subsidence, San Joaquin Valley, California, Publication No. 121, International Association of Hydrological Sciences, Proceedings of the Anaheim Symposium.
B. E. Lofgren, 1 9 7 7 , Proceedings of the Eleventh Biennial Conference on Groundwater, California Water Resources Center, University of California, Davis, Report No. 41.
Nikola P. Prokopovich and D. J. Hebert, 1 9 6 8 , "Land Sub- sidence Along the Delta-Mendota Canal, California", Journal, American Water Works Association.
Nikola P. Prokopovich, 1 9 7 3 , "Engineering Geology and the Central Valley Project", Journal American Water Works Association, Volume 65, No. 3.
Nikola P. Prokopovich, 1 9 7 1 , Fourth Asian Regional Confer- ence On Soil Mechanics and Foundation Engineering, Bangkok, Thailand, Bureau of Reclamation, Region 2, California.
Nikola P. Prokopovich, 1 9 7 6 , Quality of Predictions of Land Subsidence Along Delta-Mendota and San Luis Canals in California, U.S.A., Publication No. 121, International Association of Hydrological Sciences, Proceedings of the Anaheim Symposium.
Nikola P. Prokopovich, 1 9 7 8 , "Genetic Classification of Land Subsidence", unpublished preprint.
Nikola P. Prokopovich, 1978, "Prediction of Land Subsidence for Irrigation Canals", unpublished preprint.
111-66
Poland, Lofgren, Ireland and Pugh, 1975, "Land Subsidence in the San Joaquin Valley, California", As of 1972, Geolo- gical Survey Professional Paper 437-H.
(9) Persons Contacted
B. E. Lofgren, U.S. Geological Survey, Sacramento, California: interview, March 13, 1978.
Nikola P. Prokopovich, Bureau of Reclamation, U.S. Department of the Interior, Sacramento, California: interview, March 13-14, 1978.
J. F. Poland, U . S . Geological Survey, Sacramento, California: interview, March 1 3 , 1978.
Frank Lawler, Westlands Water District, Fresno, California: telephone interview, March 15, 1978.
W. T. Geary, Bank of America, Fresno, California: telephone interview, March 15, 1978.
Del Crummey, Peerless Pump Corporation, Fresno, California: telephone interview, March 14, 1978.
Louis Mitchel, Department of Water Resources, Sacramento, California: telephone interview, March 20, 1978.
Bob Johns, Merced County Planning Department, Merced, California: telephone interview, March 10, 1978.
Rudy Clark, Corps of Engineers, Levees Section, Sacramento, California: telephone interview, March 14, 1978.
Joseph Hannon, Department of Transportation, Sacramento, California: interview, March 13, 1978.
Jack Wolf, Griffin Incorporated, Fresno, California: telephone interview, March 15, 1978.
111-67
G. SANTA CLARA VALLEY, CALIFORNIA
(1) Introduction
The Santa Clara Valley, an alluvial plain at the south end of San Francisco Bay exhibits the direct effects of subsidence caused by overdraft of water from a deep confined aquifer. It also exhibits an indirect increase in the flood related hazards due to being a bayshore area.
The Valley is bounded on the southwest by the Santa Cruz Mountains.and on the northeast by the Diablo range. It is a structural trough, with bedrock forming the floor and sides. Fresh water is available from wells that draw on alluvial and bay deposits and underlying deposits of the Santa Clara formation. Deposits have a combined thickness of from 1,000 feet to possibly as much as 2,000 feet, and water wells range from 200 to 1,000 feet in depth. Artesian conditions prevail beneath most of the valley area (Poland and Davis, 1969).
There are several cities in the valley subsidence area, San Jose being the largest, and Alviso the closest to San Francisco Bay. Historically, Alviso was separated from open bay waters by about four miles of low marshland. These low lands, which formed the shore for most of the south end of the bay, had been converted to salt production ponds long before subsidence began.
(2) Description of Primary Subsidence Phenomena
Subsidence in the valley was caused by steadily increasing withdrawal of deep groundwater, primarily for irrigation. According to Roll (19641, little water was pumped before 1900 and only for domestic use. By 1936, irrigation was widespread and most of the valley was being irrigated from groundwater sources.
Land subsidence was first noticed in 1932. A network of benchmarks was established in the valley in 1934; and regular surveys have been conducted by the National Geologic Survey, most recently in 1967. Subsidence ranged from 0.3 to 1.2 meters under San Francisco Bay to 2.4 meters in San Jose during the 33-year period (Poland, 1976).
In 1929, a water conservation district was formed. Dams were constructed on major streams to hold flood waters that had previously flowed into the Bay. These would be slowly released during the dry seasons to percolate into the
@ underground basins. Eight dams were constructed by 1 9 5 2 , with a total storage capacity of 1 5 6 , 9 0 0 acre-feet. The Santa Clara Valley Water Conservation District has also built 48 miles of canals, 14 miles of pipelines, and 5 0 0 acres of percolation ponds.
Nevertheless, the area was not able to meet its water require- ments without continued overpumping of the groundwater basin. Imported water was first delivered to the area by the State of California's South Bay aqueduct in 1 9 6 5 ( R o l l , 1 9 6 7 ) .
The water level recovery has been dramatic. Poland ( 1 9 7 6 ) reported that:
By 1 9 7 5 , the spring high water level at index well 7 R l ... was 3 2 m (104 feet) above that of 1 9 6 7 , and about equal to the level in this well in 1 9 2 5 . This major recovery of artesian head was due to several factors, including increased imports of water, favorable local water supply, decreased pumpage and increased recharge. The most important factor was the increase in imports.
Two major agencies have been investigating causes and solu- tions to the subsidence problem. The subsidence study team of the U . S . Geological Survey in Sacramento, California has been primarily responsible for monitoring the progress of subsidence and identifying the causes. J. F. Poland of that team has been the principal investigator. The Santa Clara Valley Water Conservation District has been responsible for the water conservation and importation measures that have caused the subsidence to virtually cease. A l s o , Santa Clara County has hired a staff geologist to assist the county with groundwater and subsidence problems.
The broad expanse of subsidence in the valley has been well- documented by the U.S. Geological Survey. Figure III-G-1 shows the extent of subsidence measured in feet. The subsid- ence bowl has a volume of 500,000 acre-feet, which represents the amount of water that was squeezed out of deep clays.
( 3 ) Effects of Primary Subsidence Phenomena
There appears to be no direct structural damage to buildings or other structures because the subsidence is essentially uniform over the small area occupied by most structures. Linear construction such'as roads, railroads, pipelines and canals have enough flexibility to bend with the very gradual changes in gradients. However, it is believed that deep subsidence may be a contributing factor to damage to buildings
1 1 1 - 6 9
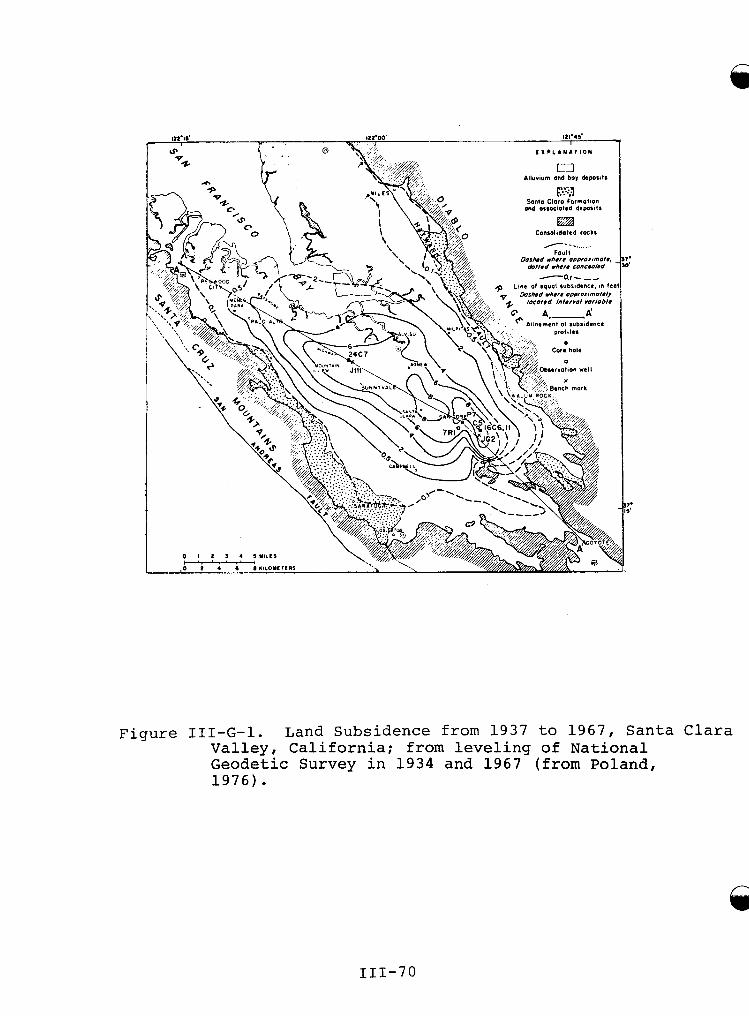
Figure III-G-1. Land Subsidence from 1937 to 1967, Santa Clara Valley, California; from leveling of National Geodetic Survey in 1934 and 1967 (from Poland, 1976).
111-70
in a ten square block area of Santa Clara. Surface settlement due to construction over an old swamp appears to be the primary cause (Berkland, personal communication).
crrs The Santa Clara Valley area has experienced damage to wells, flood drainage systems, the aquifer, and to sewer systems.
The Santa Clara Valley Water Conservation District has had to deal with some difficult flood control problems caused by subsidence as described by Roll (1967). Two major streams, the Guadalupe River and Coyote Creek, and several smaller streams have slowed due to a flattening of the gradient. A serious reduction in carrying capacity has ensued, which has resulted in some cases in a six-foot deep deposit of erosion material in a channel that was originally 8-10 feet deep. When this happens, the flow of water in the channel becomes impeded and flooding occurs in the surrounding areas.
Extensive damage to well casings has also been caused by the subsidence. Some work has been done in the Santa Clara Valley to document the extent of the damage. Poland (1976) estimated that several hundred wells were damaged. Roll (1967) assessed the damage for the Santa Clara Valley Water Conservation District.
Damage to wells occurs as a telescoping action which causes buckling of the casings. Well casings have also been known to protrude at a rate which has required cutting every few years in order to keep the pumps on the floor of the pump house. There are approximately 5,000 wells in the valley, with as estimated one-half of these located in subsidence areas. Water companies estimate the total number of wells damaged as being around 2,000. The cost of repairs is estimated by local agencies and companies at $2,000 per well, of well repair for .the Valley comes to some $ 5 million or more.
~ o l l (1967) reported that subsidence had caused significant problems with sewer systems in the valley, due to a loss in carrying capacity. Storm and sanitary sewers have had to be replaced with larger lines or new lines added, because of the change in grade from land subsidence. There are no exact records of the costs involved, but it has been estimated that they run into many millions of dollars. Two local public works officials were not able to document this problem, but noted that many lines run with the subsidence so that capacity increases. A definite problem was reported at the combined Santa Clara-San Jose Sewage Treatment Plant. The plant requires three pumping stations to move effluent through the plant and into the bay. At least one of those
111-71
would not be needed were it not for subsidence. Construction of that additional pump station cost $8,000,000 to $9,000,000 in 1 9 7 0 and its operation consumes $200,000 worth of electri- city annually.
( 4 ) Aggravation of Other Hazards
The increased flood hazard caused by subsidence is probably the greatest danger and probably the costliest damage caused by subsidence. As previously noted, the channel capacities are decreased by reduced gradients and increased siltation, with the result that channels overflow more quickly and cause flooding.
( 5 ) Effects of Aggravated Hazards
Poland ( 1 9 7 6 ) estimates that about $ 9 million of public expenditures through 1974 for flood control levees along the streams are attributable to subsidence. Most of this has been work done by the Santa Clara Valley Water Conservation District. No disastrous floods have occurred that can be attributed to subsidence. However, there are 17 square miles of land that would be inundated by the bay were it not for the levees. The Leslie Salt Company has about fifty miles of levees in the south bay to protect its salt marsh evaporation ponds which now occupy most of the old lowland and marshes around that end of the Bay (about 45,000 acres). Originally these levees which are located adjacent to the Bay, were about 2.5 to 3 feet high. One company engineer estimates that about 15 miles of the levees have had to be raised several feet to protect against overtopping by the Bay waters. Another 30 miles of levees may have been affected to some extent. The company has made no estimate of the dollar costs of protecting against the increased flood hazard to its ponds (Wilkins, and Walton, personal communica- tion). The Southern Pacific Railroad participated in a $100,000 bridge raising project with the Water Conservation District- in order to move some of its tracks near Alviso out of intermittent flood waters.
( 6 ) Adjustments to Subsidence
Efforts to mitigate subsidence problems have included research to determine the cause of subsidence, measures to halt the subsidence and repair of damage.
The U.S. Geological Survey, and the Santa Clara Valley Water Conservation District have been studying the causes and effects of subsidence since the 1930s. Most of the actual research has been undertaken by the Survey. This work has
n
@ a s s i s t e d t h e D i s t r i c t and t h e S t a t e t o d e s i g n a p p r o p r i a t e measures t o combat t h e problem.
A s no ted ea r l i e r , t h e S a n t a C la ra Va l l ey Water Conse rva t ion D i s t r i c t c o n s t r u c t e d dams and ponds a long s t r e a m s t o c a p t u r e f l o o d water and release it s lowly t o i n c r e a s e t h e amount o f w a t e r p e r c o l a t i n g back i n t o t h e a q u i f e r . These 156,900 a c r e - f e e t of s t o r a g e c a p a c i t y , 4 8 m i l e s of c a n a l s , 1 4 m i l e s o f p i p e l i n e s and 500 acres of p e r c o l a t i o n ponds slowed subs idence by d e c r e a s i n g t h e r a t i o between amount o f water pumped and amount of wa te r r echa rged i n t o t h e a q u i f e r . The t o t a l inves tmen t i n c o n s e r v a t i o n f a c i l i t i e s by 1 9 6 4 w a s i n excess o f $13 m i l l i o n .
The D i s t r i c t a l s o imported w a t e r t o reduce t h e need f o r pumping. I n 1 9 4 0 , San F r a n c i s c o began s e l l i n g s u r f a c e w a t e r from t h e S i e r r a Nevada. Water imported from t h e C e n t r a l V a l l e y th rough t h e South Bay aqueduct f i rs t became a v a i l a b l e i n 1965, and t o t a l impor ts t o San ta Clara County i n c r e a s e d f i v e - f o l d i n t h e t en -yea r p e r i o d from 1964-65 t o 1974-75, from 30,000 t o 1 4 8 , 3 0 0 a c r e - f e e t p e r y e a r (Poland , 1 9 7 6 ) .
To f u r t h e r r educe pumping, San ta Clara p l a c e d a t a x on groundwater i n 1 9 6 4 imposing a s t r o n g d i s i n c e n t i v e t o pump groundwater . According t o Poland ( 1 9 7 6 ) :
I n 1970-71, f o r example, t h e groundwater t a x w a s l e v i e d a t $8 p e r a c r e - f o o t f o r groundwater e x t r a c t e d f o r a g r i c u l t u r a l purposes and a t $ 2 9 p e r a c r e - f o o t f o r groundwater e x t r a c t e d f o r o t h e r u ses . For water d e l i v - ered on t h e s u r f a c e i n l i e u of e x t r a c t i o n t h e cost w a s $10.50 p e r a c r e - f o o t f o r w a t e r used f o r a g r i c u l t u r e and $31.50 p e r a c r e - f o o t f o r water used f o r o t h e r purposes . The economic advantage of u s i n g s u r f a c e w a t e r where a v a i l a b l e i s obvious.
These combined s t r a t e g i e s worked v e r y w e l l . Year ly pumpage of groundwater d e c r e a s e d . f r o m 185,000 acre-feet i n 1960-65 t o 150,000 a c r e - f e e t i n 1 9 7 0 . . Poland judges t h a t t h e increase i n impor ted water w a s t h e m o s t impor t an t of t h e measures t h a t have v i r t u a l l y e l i m i n a t e d subs idence i n t h e San ta C l a r a Va l l ey .
The Water Conse rva t ion D i s t r i c t and t h e L e s l i e S a l t Company c o n t i n u a l l y r e p a i r e d and r a i s e d t h e i r l e v e e s t o compensate f o r t h e i n c r e a s i n g re la t ive h e i g h t o f t h e Bay and t h e d e c r e a s i n g c a r r y i n g c a p a c i t y of ‘stream channe l s . The Sou the rn P a c i f i c R a i l r o a d has had t o raise some t r a c k s and a b r i d g e t o keep t h e t r a c k s o u t of t h e water. Hundreds of w e l l s have been r e p l a c e d o r r e p a i r e d .
111-73
(7) Summary of Effects
Subsidence effects in the Santa Clara Valley include:
Damage Remedies
Several hundred to Repair 2,000 well casings
costs
$2,000 average per well, $4,000,000 total
settlement of sewage Pump sewage through $8,000,000 for treatment plant plant and into dis- pump station,
charge pipes $200,000 per year for pumping energy
Increased flood hazard Dike construction $9,000,000 through from sinking below 1974 bay level Raise railroad bridge $100,000
( 8 ) References
Poland, J. F. and G. I. Davis, 1969, "Land Subsidence Due to Withdrawal of Fluids", Reviews in Engineering Geology 11: Geol. SOC. Amer., Boulder, Colorado.
Roll, R. J., 1967, "Effect of Subsidence on Well Fields", Journal of American Water Works Association, Vol. 59, No. 1, pp. 80-88.
Poland, J. F., 1976, "Land Subsidence Stopped by Artesian-Head Recovery, Santa Clara Valley, California", Land Subsidence Symposium, Publication No. 121 of the International Associ- ation of Hydrological Sciences, Proceedings of the Anaheim Symposium, December, 1976.
(9) Persons Contacted
James Berkland, County Geologist, Santa Clara County, California: telephone interview, March 20, 1978.
Don Uyeda, Senior Civil Engineer, San Jose, California, Department of Public Works: telephone interview, March 20, 1978.
s . M. Crostofand, Director of Public Works, Santa Clara, California: telephone interview and letter correspondence, March 20-21, 1978.
Jack Newby, Soils Engineer, Southern Pacific California: telephone interview, March
Railroad, San Francisco, 10, 1978.
n
111-74
Guy Wilkins, Chief Engineer, Leslie Salt Company, Newark, California: telephone interview, March 21, 1978.
Jim Walton, Leslie Salt Company, in charge of Land Department: telephone interview, March 23, 1978.
111-75
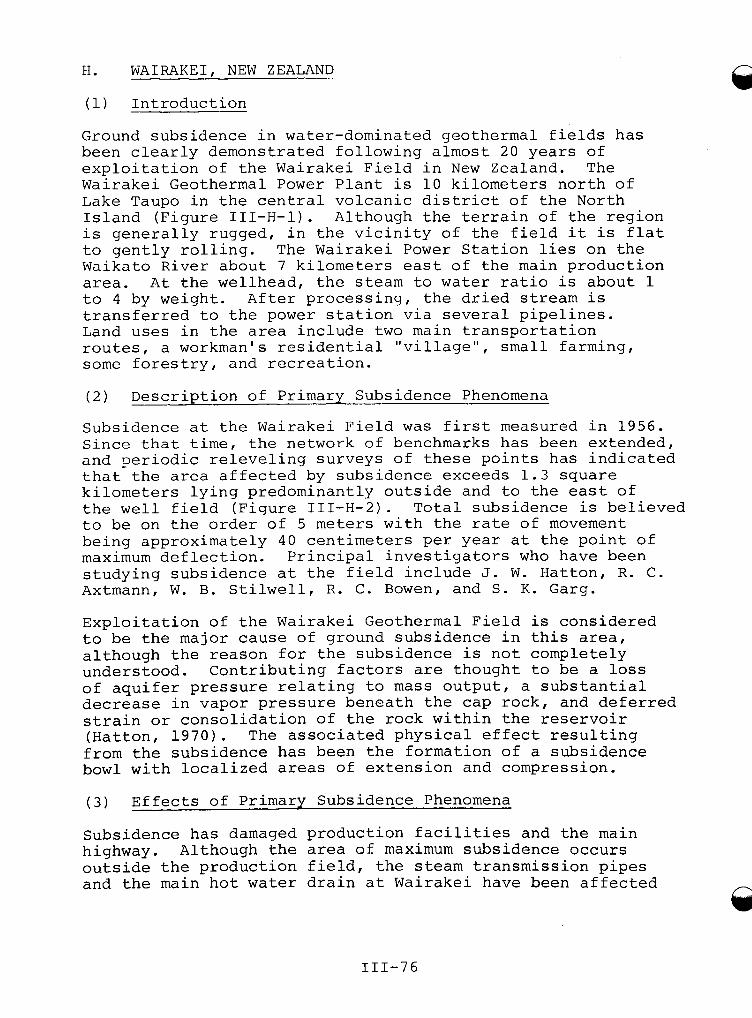
H. WAIRAKEI, NEW ZEALAND
(1) Introduction
Ground subsidence in water-dominated geothermal fields has been clearly demonstrated following almost 20 years of exploitation of the Wairakei Field in New Zealand. The Wairakei Geothermal Power Plant is 10 kilometers north of Lake Taupo in the central volcanic district of the North Island (Figure III-H-1). Although the terrain of the region is generally rugged, in the vicinity of the field it is flat to gently rolling. The Wairakei Power Station lies on the Waikato River about 7 kilometers east of the main production area. At the wellhead, the steam to water ratio is about 1 to 4 by weight. After processing, the dried stream is transferred to the power station via several pipelines. Land uses in the area include two main transportation routes, a workman's residential I'village", small farming, some forestry, and recreation.
(2) Description of Primary Subsidence Phenomena
Subsidence at the Wairakei Field was first measured in 1956. Since that time, the network of benchmarks has been extended, and periodic releveling surveys of these points has indicated that the area affected by subsidence exceeds 1.3 square kilometers lying predominantly outside and to the east of the well field (Figure III-H-2). Total subsidence is believed to be on the order of 5 meters with the rate of movement being approximately 40 centimeters per year at the point of maximum deflection. Principal investigators who have been studying subsidence at the field include J. W. Hatton, R. C. Axtmann, W. B. Stilwell, R. C. Bowen, and S. K. Garg.
Exploitation of the Wairakei Geothermal Field is considered to be the major cause of ground subsidence in this area, although the reason for the subsidence is not completely understood. Contributing factors are thought to be a loss of aquifer pressure relating to mass output, a substantial decrease in vapor pressure beneath the cap rock, and deferred strain or consolidation of the rock within the reservoir (Hatton, 1 9 7 0 ) . The associated physical effect resulting from the subsidence has been the formation of a subsidence bowl with localized areas of extension and compression.
( 3 ) Effects of Primary Subsidence Phenomena
Subsidence has damaged production facilities and the main highway. outside the production field, the steam transmission pipes and the main hot water drain at Wairakei have been affected
Although the area of maximum subsidence occurs
n
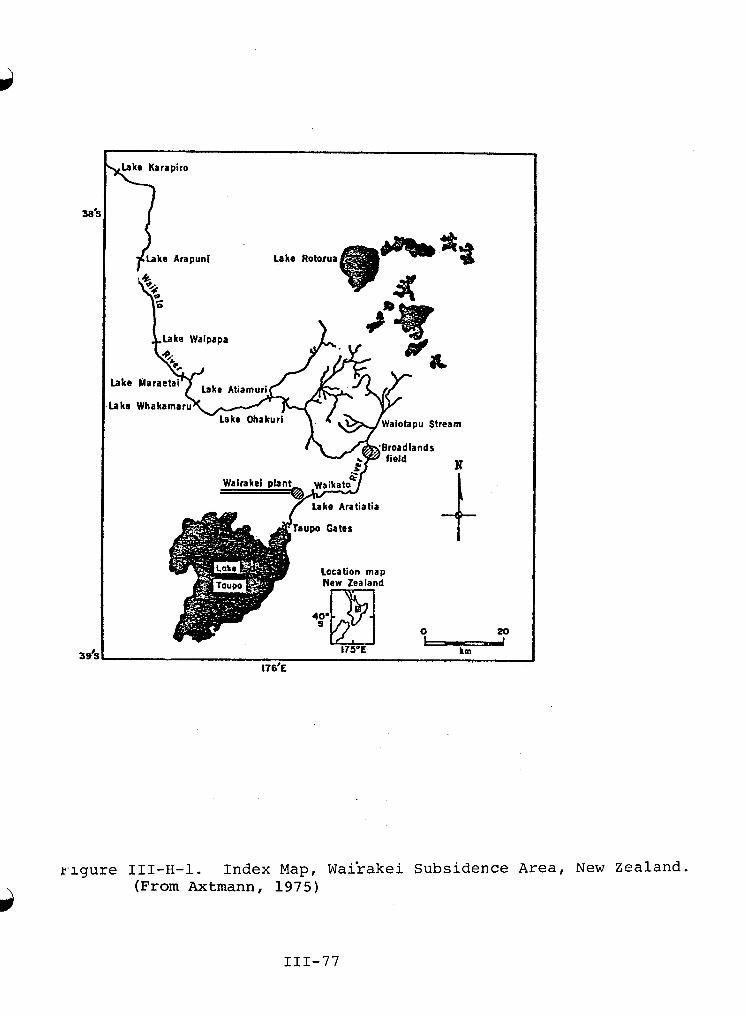
l a k r Karapiro
"I
lake
aka Waiotapu Stream
W h a k a m a r u w ' & l a k e Ohakuri
l a k e Aratiatia
location map New Zealand
175-E
0 zp hm
l76'E
r . i gu re I I I - H - 1 . Index Map, Wai'rakei Subsidence A r e a , N e w zea l and . (From Axtmann, 1975)
111-77
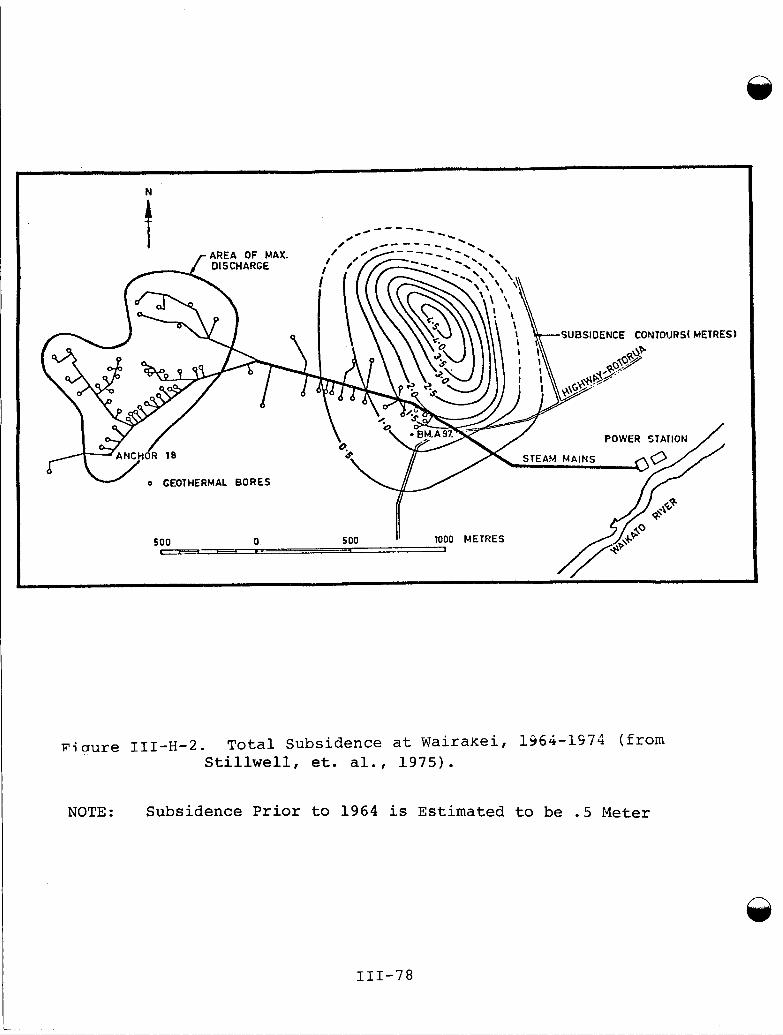
N
4 * - - - - - - 4
SUBSIDENCE CONTOURSI METRES)
o GEOTHERMAL BORES
Fiuure 111-H-2. Total Subsidence at WairaKei, 1964-1974 (from Stillwell, et. al., 1975).
NOTE: Subsidence Prior to 1964 is Estimated to be .5 Meter
111-78
by the ground movement, and modifications have been necessary to accommodate the surface strain. Subsidence along the steam mains has resulted in both compressive and tensile strains, requiring modifications to the steam mains at eight yearly intervals. The pipes are dismantled at joints and sections are added or subtracted as necessary. In some instances, sliding joints have also been ins,talled. Some of the steam mains are no longer at grade and in some cases slope opposite to original grade. As a result, condensate now drains back toward the wells. This could conceivably increase corrosion effects in the long run.
The concrete drainage channel, constructed to carry the hot wastewater from the bores to the river was also cracked by horizontal ground strain, which in turn caused a washout of pumiceous soils.
(4) Aggravation of Other Hazards
No other hazards which might be aggravated by subsidence are known in this area.
(5) Effects of Aggravated Hazards
None are known.
( 6 ) Adjustments to Subsidence
One adjustment to the subsidence has been to study and define it. Since 1 9 5 2 , the checking and expansion of a precise level network has been accomplished through surveying, releveling, and the installation of additional benchmarks. Since 1 9 6 6 , the network has been releveled every three to four years, while local checks on the area of subsidence were made every six months until 1968 and annually through 1 9 7 2 . The costs of these surveys is not known.
Continuing damage to steam mains has been repaired routinely on an annual basis for eight years. Costs range from $2,000 to $10,000 per year, but average closer to $10,000.
Damage to the concrete wastewater channel has been repaired by the installation of a flexible joint. Eroded slopes have ’
been stabilized. Costs of repairs are estimated at $250 ,000 of which half was to repair the washout in erodible pumiceous soils.
Axtmann ( 1 9 7 5 ) reports that a program of reinjection of the hot wastewater is being studied as a possible means of mitigating subsidence, but the feasibility of reinjection and its possible effects on the performance of the reservoir have not yet been documented.
1 1 1 - 7 9
A pilot program for reinjection to control subsidence has been started at the Broadlands Geothermal Field according to recent information from W. B. Stillwell and B. W. Denton at the New Zealand Ministry of Works and Development.
( 7 ) Summary of Effects
Damage Remedies cost
Disruption of steam Repair, remove or add $2,000 to $10,000 transmission pipelines sections as necessary per year
Cracking of drinage Replacement with tele- $250 ,000 channel scopic joint; repair
washout of erodible pumiceous soils
Main Road has subsided None as yet 2m.
None reported
( 8 ) References
Axtmann, R. C., 1 9 7 6 , "Environmental Impact of a Geothermal Power Plant", Science, Volume 1 8 7 , No. 4179.
Hutton, J. W., 1 9 7 0 , "Ground Subsidence of a Geothermal Field During Exploitation", United Nations Symposium on the Development and Utilization of Geothermal Resources, Volume 2, Part 2.
Stillwell, W. B., and W. K. Hall and John Lawai, 1 9 7 5 , Ground Movement in New Zealand Geothermal Fields, Proceedings of the Second United Nations Symposium on Development and Use of Geothermal Resources, San Francisco, California, May 20-29, 1 9 7 5 .
( 9 ) Persons Contacted
Horn, Roland, Department of Geothermal Studies, Stanford University, California, and Department of Theoretical and Applied Mechanics, University of Aukland, New Zealand: telephone interview, March 22 , 1 9 7 8 .
Denton, B. N. and W. B. Stillwell, New Zealand Ministry of Works and Development; Wairakei, D. B. Taupo, New Zealand, telephone conversation, 1 9 7 8 .
111-80
I. WILMINGTON, CALIFORNIA -
(1) Introduction
The Wilmington Oil Field is located near the southwestern margin of the Los Angeles basin, in and near the City of Long Beach (Figure 111-1-1). It is generally agreed that the withdrawal of fluids and gas from the field resulted in the reduction of subsurface pressures in the oil reservoirs causing compaction in the oil zones and subsequent subsidence. The subsidence area once measured 50 square kilometers, and the center of the elliptical, bowl-shaped area has subsided as much as 9 meters (29 feet) since 1926 (Figure 111-1-2). Damage and economic impacts in the area have been extensive due to large amount of subsidence, the problems of flooding, and the highly developed industrial land uses.
(2) Description of Primary Subsidence Phenomena
Appreciable subsidence did not occur until after the oil field development in 1938. During the early war years, the Navy was building a dry dock which entailed a considerable dewatering operation, and subsidence at this time was thought to be caused by the dry dock construction. Major subsidence of up to 122 centimeters (4 feet) by July 1945 showed no decline, however, even after dry dock construction stopped. As reported by the City of Long Beach in - The Subsidence Story (no date):
Some of the earliest studies related the subsiding area to the oil field outline. The consensus of authorities was that the withdrawal of fluids from the oil zones and the consequent loss of underground pressure support enabled the weight of the earth above the oil zones to exert a large downward force and compact the oil forma- tions. The surface then sank in response to the under- ground compaction.
BY 1952, the area reached its maximum subsidence rate of 71 centimeters ( 2 8 inches) per year at the center of the bowl. The vertical subsidence was accompanied by horizontal move- ments amounting to as much as three meters (10 feet) in the area. These horizontal movements were responsible for extensive damage to surface structures, pipelines, and oil well casings.
After 1952, subsidence slowly diminished., Mitigation measures (water injection) began to be effective about 1960, and most of the area had stabilized or was even regaining elevation six years later. The rebounded area now covers ten square
111-81
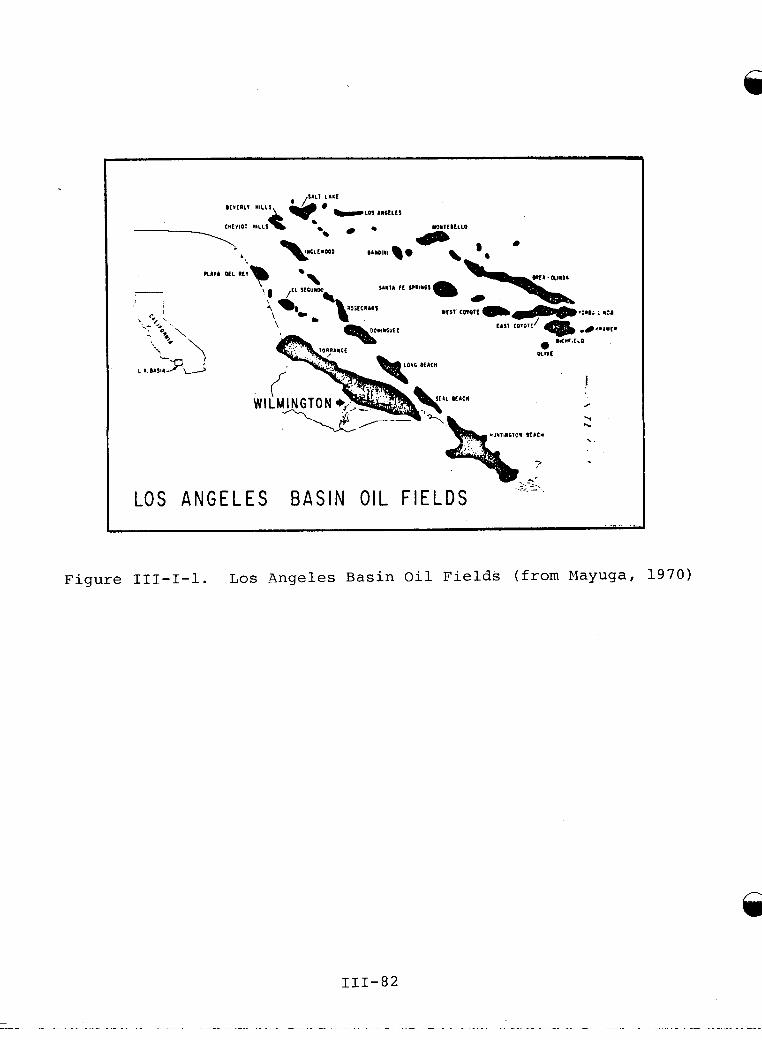
~ _ - - LOS A N G E L E S B A S I N O I L F I E L D S
F i g u r e 111-1-1. L o s Angeles Bas in O i l F i e l d s ( f r o m Mayuga, 1 9 7 0 )
111-82
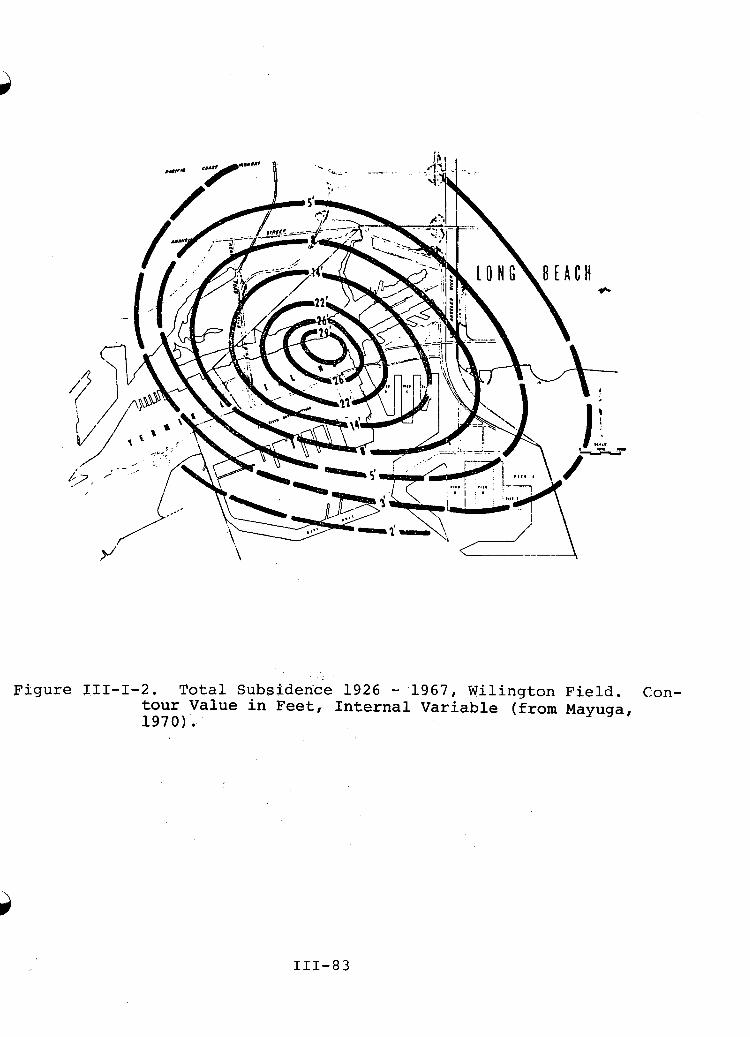
Figure 111-1-2. Total Subsidende 1926 - 1967, Wilington Field. Con- tour Value in Feet, Internal Variable (from Mayuga, 1970).
111-83
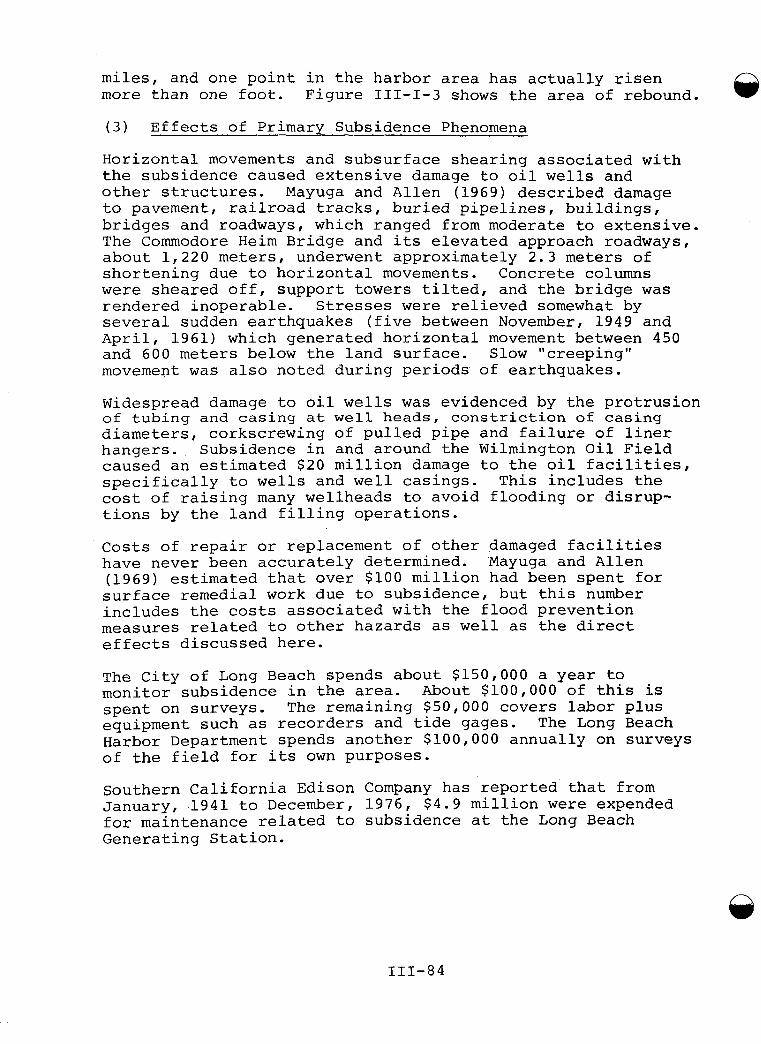
miles, and one point in the harbor area has actually risen more than one foot. Figure 111-1-3 shows the area of rebound.
(3) Effects of Primary Subsidence Phenomena
Horizontal movements and subsurface shearing associated with the subsidence caused extensive damage to oil wells and other structures. Mayuga and Allen (1969) described damage to pavement, railroad tracks, buried pipelines, buildings, bridges and roadways, which ranged from moderate to extensive. The Commodore Heim Bridge and its elevated approach roadways, about 1,220 meters, underwent approximately 2 . 3 meters of shortening due to horizontal movements. Concrete columns were sheared off, support towers tilted, and the bridge was rendered inoperable. Stresses were relieved somewhat by several sudden earthquakes (five between November, 1949 and April, 1961) which generated horizontal movement between 450 and 600 meters below the land surface. Slow "creeping" movement was also noted during periods of earthquakes.
Widespread damage to oil wells was evidenced by the protrusion of tubing and casing at well heads, constriction of casing diameters, corkscrewing of pulled pipe and failure of liner hangers. Subsidence in and around the Wilmington Oil Field caused an estimated $20 million damage to the oil facilities, specifically to wells and well casings. This includes the cost of raising many wellheads to avoid flooding or disrup- tions by the land filling operations.
Costs of repair or replacement of other damaged facilities have never been accurately determined. Mayuga and Allen (1969) estimated that over $100 million had been spent for surface remedial work due to subsidence, but this number includes the costs associated with the flood prevention measures related to other hazards as well as the direct effects discussed here.
The City of Long Beach spends about $150,000 a year to monitor subsidence in the area. About $100,000 of this is spent on surveys. The remaining $50,000 covers labor plus equipment such as recorders and tide gages. Harbor Department spends another $100,000 annually on surveys of the field for its own purposes.
The Long Beach
Southern California Edison Company has reported that from January, 1941 to December, 1976, $4.9 million were expended for maintenance related to subsidence at the Long Beach Generating Station.
111-84
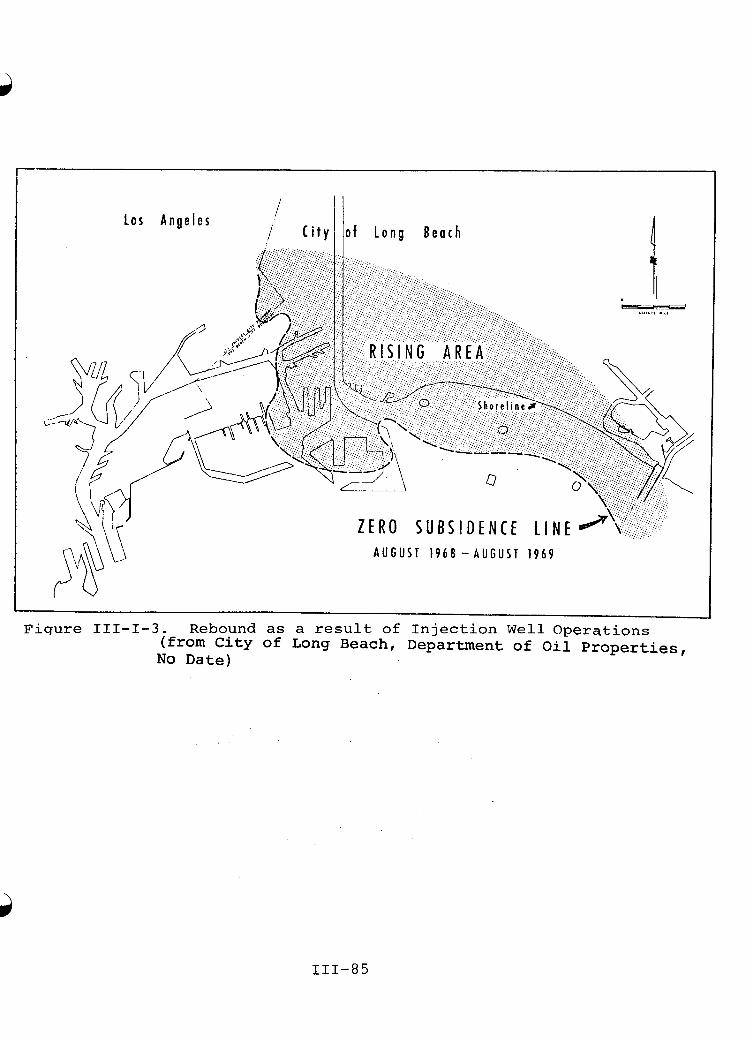
Fiqure 111-1-3. Rebound as a result of Injection Well Operations (from C i t y of Long Beach, Department of O i l Properties, No Date)
111-85
(4) Aggravation of Other Hazards
Flooding from the ocean was the most serious consequence of the subsidence at Wilmington. Most of the harbor area was initially at elevations of only a few meters. Over 1,300 hectares of land subsided below sea level, requiring construc- tion of dikes and filling of land. Wharves and other struc- tures had to be raised to higher elevations or replaced.
(5) Effects of Aggravated Hazards
Flood prevention measures combined with the repair of damaged structures as described in Section 3 resulted in costs amounting to more than $100 million dollars.
There has apparently been no direct correlation of specific earthquake damages caused by the oil withdrawal and subsequent subsidence.,
(6) Adjustments
An extensive reservoir repressurization program was undertaken to halt subsidence. Due to the tremendous geological complex- ity of the oil reservoir structure, coupled with the diverse ownerships, large scale water injection to halt subsidence was feasible only as a cooperative effort or by forming a pool in which all interests would share., The sharing of oil in this manner is called "unitization." It is an involved process, which required special laws and legal agreements in the State of California. If water had been injected without unitization, individual wells would have been flooded out as the water pushed oil to other wells, and many lawsuits would have resulted.
Fluid reinjection has been costly, but it is a cost which cannot be entirely attributed to subsidence control; for although reinjection controls subsidence, it also "doubles production" (over primary recovery rates). The reinjection procedures would, therefore, take place without subsidence. The costs involve an economic benefit as well as an adjustment for subsidence. About 75% of the oil production in 1969 was attributable to the reinjection program.
While damage was extensive at Wilmington, most parties who were damaged were themselves involved in the oil operation and received benefits from the oil production. Reportedly, no lawsuits have been adjudicated to establish liability. The U . S . Navy filed a suit for damages to their shipyard, but settled for an out-of-court financial compromise.
111-86
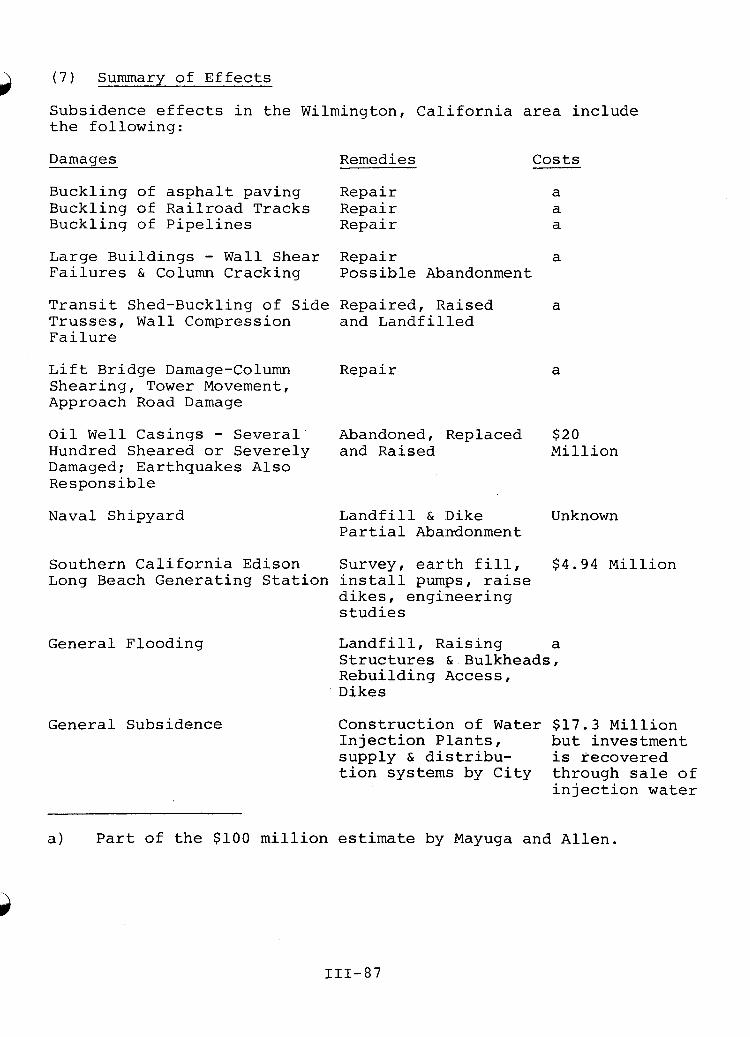
(7) Summary of Effects
Subsidence effects in the Wilmington, California area include the following:
Damages Remedies costs
Buckling of asphalt paving Repair Buckling of Railroad Tracks Repair Buckling of Pipelines Repair
a a a
Large Buildings - Wall Shear Repair a Failures & Column Cracking Possible Abandonment
Transit Shed-Buckling of Side Repaired, Raised a Trusses, Wall Compression and Landfilled Failure
Lift Bridge Damage-Column Repair Shearing, Tower Movement, Approach Road Damage
a
Oil Well Casings - Several Abandoned, Replaced $20 Hundred Sheared or Severely and Raised Mi 11 ion Damaged; Earthquakes Also Responsible
Naval Shipyard Landfill & Dike Unknown Partial Abandonment
Southern California Edison Survey, earth fill, $4.94 Million Long Beach Generating Station install pumps, raise
dikes, engineering studies
General Flooding
General Subsidence
Landfill, Raising a Structures & Bulkheads, Rebuilding Access, Dikes
Construction of Water $17.3 Million Injection Plants, but investment supply & distribu- is recovered tion systems by City through sale of
injection water
a) Part of the $100 million estimate by Mayuga and Allen.
111-87
(8) References
City of Long Beach, no date, The Subsidence Story, Department
Mayuga, M. N. and D. R. Allen, 1970, "Subsidence in the
of Oil Properties, Long Beach, California.
Wilmington Oil Field, Long Beach, California, USA", Land Subsidence, Proceedings of the Tokyo Symposium, 1969, IASH/AIHS-UNESCO, Volume 1, p. 66-79.
Mayuga, M. N., 1970, "Geology and Development of California's Giant - Wilmington Oil Field", Geology of Giant Petro- leum Fields; American Association Petroleum Geology, Mem. 14, p. 158-184.
(9) Persons Contacted
D. R. Allen, Subsidence Engineer, City of Long Beach, Department of Oil Properties: February 9, 1978.
telephone interview, February 14, 1978.
Edison, Rosemead, California: telephDne interview, March 27, 1978.
telephone interview,
Herb Robb, Western Oil and Gas Association, Los Angeles:
Dallas J. Downs, Senior Civil Engineer, Southern California
Earl R. Sample, Southern California Edison Company, Rosemead, California: correspondence April, 1978.
Thomas M. Leps, Consulting Engineer: Interview, Palo Alto, California.
111-88
APPENDIX A
December 15, 1977
Lawrence Berkeley Laboratory Geothermal Subsidence Research Program
Category 4, Project 1 ENVIRONMENTAL AND ECOKOMIC
EFFECTS OF SUBSIDENCE
Interim Summary Report
Task 1. Identify Subsidence Areas Task 2. Develop Methods for Acquiring Information
Submitted to:
Lawrence Berkeley Laboratory Berkeley, California
By:.
EDAW'ESA - A Joint Venture of EDAW, Inc. and Earth Sciences Associates
Palo Alto, California
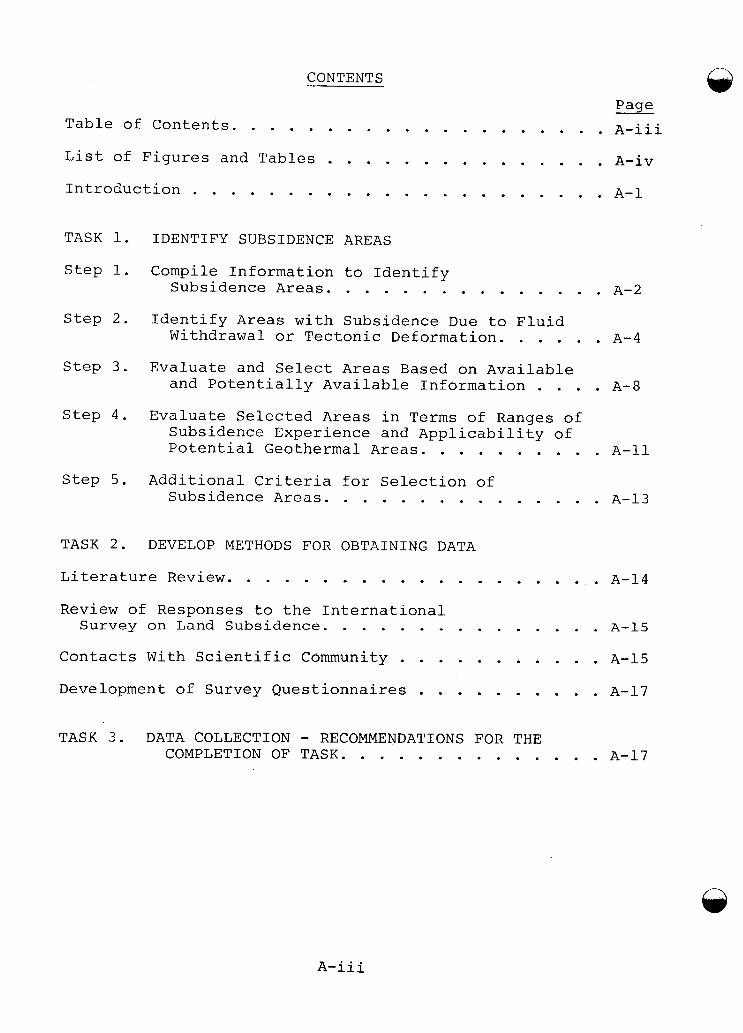
CONTENTS
Page Table of Contents. . . . . . . . . . . . . . . . . . . . A-iii List of Figures and Tables . . . . . . . . . . . . . . . A-iv Introduction . . . . . . . . . . . . . . . . . . . . . . A-1
TASK 1. IDENTIFY SUBSIDENCE AREAS
Step 1. Compile Information to Identify Subsidence Areas. . . . . . . . . . . . . . . A-2
Step 2. Identify Areas with Subsidence Due to Fluid Withdrawal or Tectonic Deformation. . . . . . A-4
Step 3. Evaluate and Select Areas Based on Available and Potentially Available Information . . . . A-8
Step 4. Evaluate Selected Areas in Terms of Ranges of Subsidence Experience and Applicability of Potential Geothermal Areas. . . . . . . . . . A-11
Step 5. Additional Criteria for Selection of Subsidence Areas. . . . . . . . . . . . . . . A-13
TASK 2. DEVELOP METHODS FOR OBTAINING DATA
Literature Review. . . . . . . . . . . . . . . . . . . . A-14 Review of Responses to the International.
Survey on Land Subsidence. . . . . . . . . . . . . . . A-15 Contacts With Scientific Community . . . . . . . . . . . A-15
Development of Survey Questionnaires . . . . . . . . . . A-17
TASK 3 . DATA COLLECTION - RECOIJIMENDATIONS FOR THE COMPLETION OF TASK. . . . . . . . . . . . . . A-17
A-iii
List of Figures and Tables
Figure 1.
Figure 2. Map of Subsidence fireas Caused by Fluid
Subsidence Area Screening Process Diagram
Withdrawal or Tectonic Deformation
Table 1. Areas With Subsidence Due to Other Causes
Page
A- 3
A-6
A- 5
Table 2. (Matrix) Evaluation of Available and Potentially Available Information on Environmental and Economic Effects A- 7
Table 3 . (Matrix) Characteristics of Selected Subsidence Areas A-10
Table 4. Partial List of Persons Contacted A-16
A-iv
INTRODUCTION
The collection of data on the environmental and economic effects of subsidence is Research Category 4, Project 1, of Lawrence Berkeley Laboratory's Geothermal Subsidence Research Program.
This interim summary report documents the work performed to date on Tasks 1 and 2 of this project. The respective purposes of Tasks 1 and 2 are to identify subsidence areas and develop methods for acquiring data on environmental and economic effects of subsidence.
This report evaluates the work completed on Tasks 1 and 2 and recommends steps for the timely and effective completion of Task 3 - "Data Collection".
A- 1
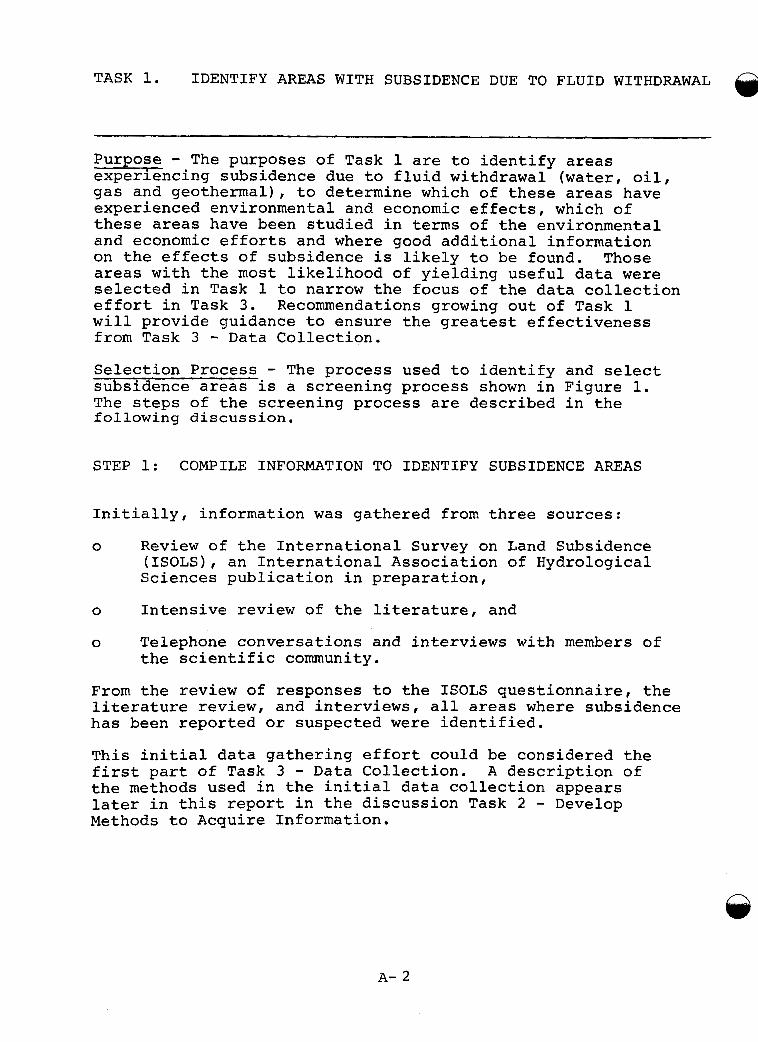
TASK 1. IDENTIFY AREAS WITH SUBSIDENCE DUE TO FLUID WITHDRAWAL
Purpose - The purposes of Task 1 are to identify areas experiencing subsidence due to fluid withdrawal (water, oil, gas and geothermal), to determine which of these areas have experienced environmental and economic effects, which of these areas have been studied in terms of the environmental and economic efforts and where good additional information on the effects of subsidence is likely to be found. Those areas with the most likelihood of yielding useful data were selected in Task 1 to narrow the focus of the data collection effort in Task 3 . Recommendations growing out of Task 1 will provide guidance to ensure the greatest effectiveness from Task 3 - Data Collection. Selection Process - The process used to identify and select subsidence areas is a screening process shown in Figure 1. The steps of the screening process are described in the following discussion.
STEP 1: COMPILE INFORMATION TO IDENTIFY SUBSIDENCE AREAS
Initially, inform-ation was gathered from three sources:
0 Review of the International Survey on Land Subsidence (ISOLS), an International Association of Hydrological Sciences publication in preparation,
0 Intensive review of the literature, and
0 Telephone conversations and interviews with members of the scientific community.
From the review of responses to the ISOLS questionnaire, the literature review, and interviews, all areas where subsidence has been reported or suspected were identified.
This initial data gathering effort could be considered the first part of Task 3 - Data Collection. the methods used in the initial data collection appears later in this report in the discussion Task 2 - Develop Methods to Acquire Information.
A description of
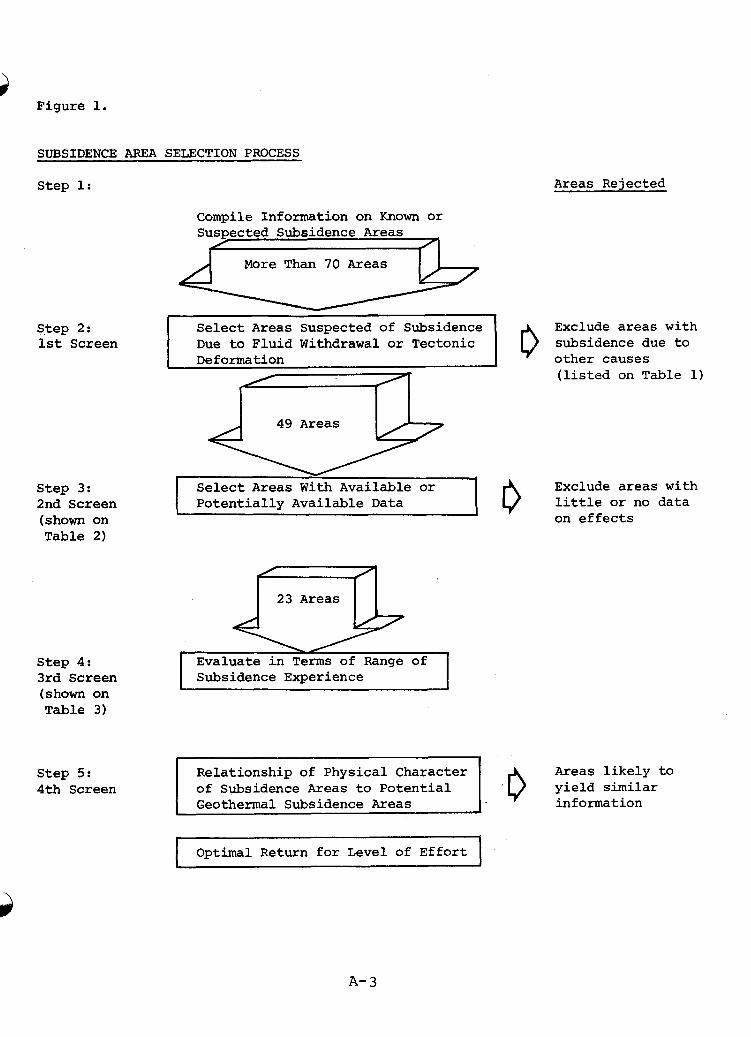
Figure 1. e3
Relationship of Physical Character of Subsidence Areas to Potential Geothermal Subsidence Areas -
SUBSIDENCE AREA SELECTION PROCESS
Areas likely to yield similar information
Step 1:
Compile Information on Known or Suspected Subsidence Areas
Step 2: 1st Screen
Step 3: 2nd Screen (shown on Table 2)
Step 4: 3rd Screen (shown on Table 3)
Step 5 : 4th Screen
More Than 70 Areas
Select Areas Suspected of Subsidence Due to Fluid Withdrawal or Tectonic Deformation
I Select Areas With Available or I Potentially Available Data
23 Areas
Subsidence Experience I
0
Areas Rejected
Exclude areas with subsidence due to other causes (listed on Table 1)
Exclude areas with little or no data on effects
Optimal Return for Level of Effort
A- 3
STEP 2: IDENTIFY AREAS WITH SUBSIDENCE DUE TO FLUID WITHDWWAL OR TECTONIC DEFORMATION
Areas with subsidence due to causes other than fluid with- drawal or tectonic deformation were eliminated from the list of subsidence areas under consideration.
While subsidence has occurred from other causes, subsidence due to fluid withdrawal or tectonic deformation are most similar to subsidence that may be expected from geothermal resource development.
Other causes of subsidence reported in ISOLS are:
Kydrocompaction Loading by Engineering Structures Karst Collapse Salt Solution Mining (coal, iron, salt) Dewatering of Organic Soils Liquifaction
Subsidence areas excluded by the first screen are listed in Table 1.
The areas with suspected subsidence due to fluid withdrawal or tectonic deformation which passed through the first screen are listed on Table 2. The locations of these subsi- dence areas are shown in Figure 2 .
Geothermal Areas - Some areas where geothermal powerplants are in production or testing phases are also listed because it was suspected that subsidence might have occurred at these areas. Our review of the subsidence literature has revealed no information on subsidence for these geothermal fields :
Geysers, California Imperial Valley, California Larderello, Italy Monte Amiata, Italy Cerro .Prieto, Mexico
While it is generally thought that there is potential for subsidence at some of these fields, notably Imperial Valley and Cerro Prieto, we found no reports of actual subsidence and more importantly, no reports of damage from subsidence for these geothermal fields.
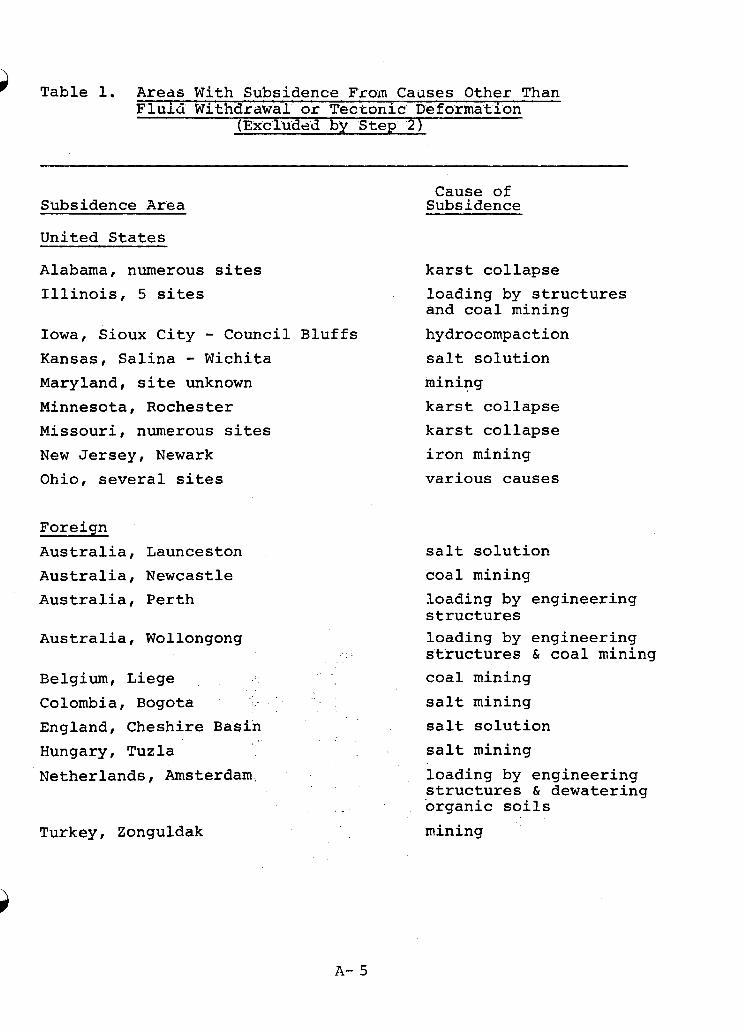
Table 1. Areas With Subsidence From Caclses Other Than F l u i d Withdrawal or Tectonic Deformation
(Excluded by Step 2 )
Subsidence Area
United States
Cause of Subsidence
Alabama, numerous sites Illinois, 5 sites
Iowa, Sioux City - Council Bluffs Kansas, Salina - Wichita Maryland, site unknown Minnesota, Rochester Missouri, numerous sites New Jersey, Newark Ohio, several sites
karst collapse loading by structures and coal mining hydrocompaction salt solution mining karst collapse karst collapse iron mining various causes
Foreiqn Australia, Launceston Australia, Newcastle Australia, Perth
Australia, Wollongong
Belgium, Liege Colombia, Bogota England, Cheshire Basin Hungary, Tuzla
salt solution coal mining loading by engineering structures loading by engineering structures & coal mining coal mining salt mining salt solution salt mining
Netherlands, Amsterdam loading by engineering structures & dewatering organic soils
Turkey, Zonguldak mining
A- 5
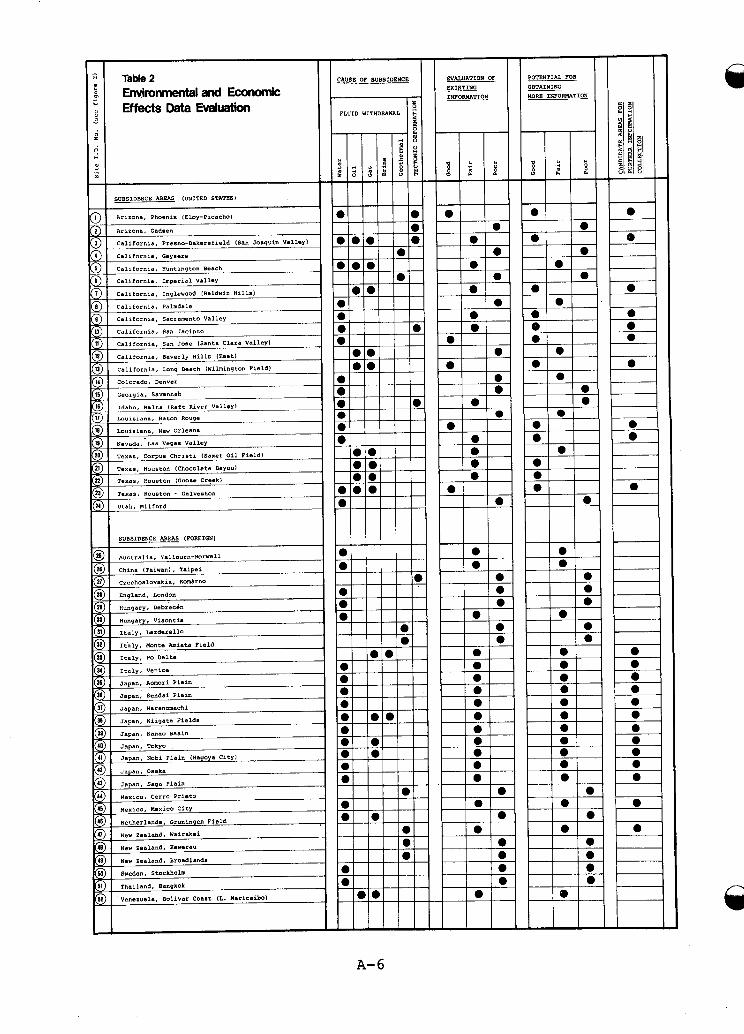
Table2 i EnvimnmentalandEconomic :: EffectsDataEvaluatiOn -
1 I CAUSE OF SUBSIDENCE
FLUID WITHDQAWAL
A- 6
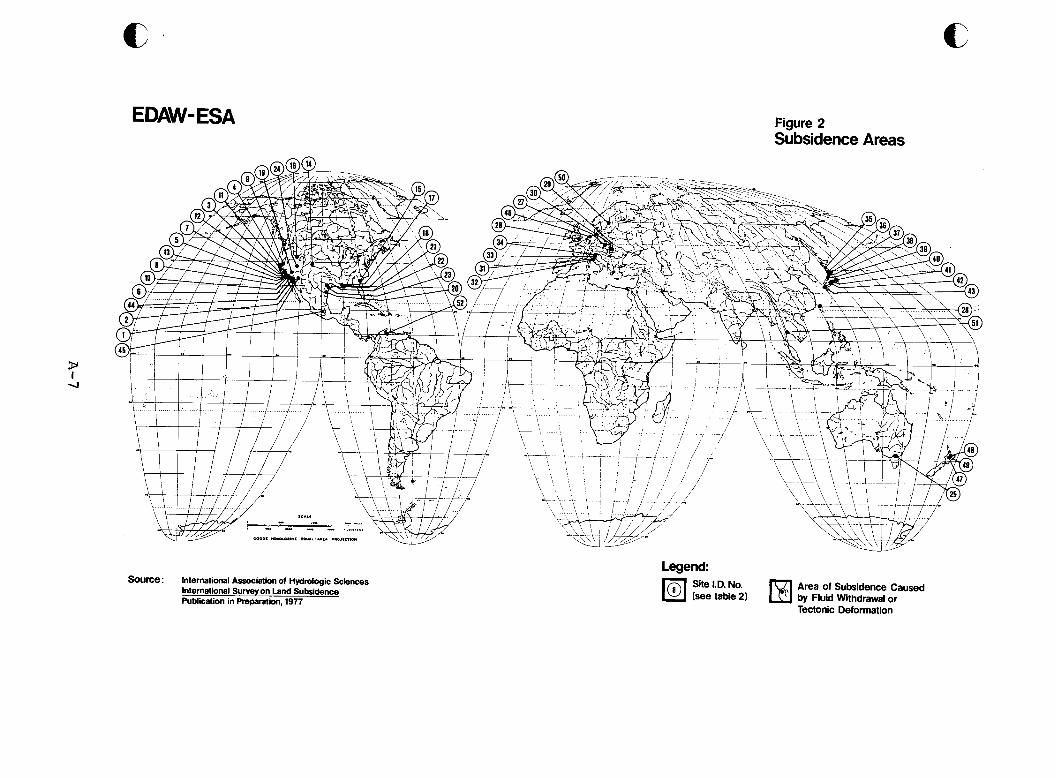
c c EDAW-ESA Figure 2
Subsidence Areas
SOUrCe : International Association of Hydrologic Sciences International Survey on Land Subsidence Publication in Weparation, 1977
Legend Area of Subsidence Caused by Fluid Withdrawal or Tectonic Deformation
For the areas listed on Table 2, the data obtained from the International Survey on Land Subsidence and the review of the literature will be sumarized on individual subsidence area data summary sheets and will be part of the final project report. Attachment 1 to this Interim Summary Report.
An example of the data summary sheet is
STEP 3: POTENTIALLY AVAILABLE INFORMATION
EVALUATE AND SELECT AREAS BASED ON AVAILABLE AND
Available Information - Available information collected from the literature review and review of ISOLS was evaluated and given good, fair, or poor ratings based on the following criteria:
Criteria
Good - : - A study has been done on economic effects; or A well known history of sub- sidence and the costs of damages have been estimated in publications or by respondents to ISOLS.
-
Fair: -
Poor : -
Physical aspects of subsidence have been studied; and Damages and economic impacts are mentioned; but No study of economic effects.
- - -
Subsidence studied, but no mention of damages or costs; or Damages and costs are reported as none.
-
-
Potential For More Information - The potential for obtaining more information was evaluated. as good, fair, or poor, based on the following criteria:
Rating Scale Criteria
Good : - Good contacts with economists. Some aspect of costs already studied.
- -
Fair: -
Poor: - - - - - - -
The available information and the
A variety of adjustments to damage have been identified. In U.S.A. only.
Good contacts with engineer, geologist or hydrologist. Apparent public awareness of problems. Public agencies have probably budgeted for damage repair, rewedial work or countermeasures. In U.S.A. or foreign.
Poor contacts. Language problems. Little or no damage. Little apparent awareness of the problem. In U.S.A. or foreign.
potential to obtain further information were evaluated jointly' and 2 3 areas were identi- fied as worthy of further efforts to collect data. Areas worthy of further data collection efforts are:
United States
Arizona, Phoenix (central Arizona including Eloy-Picacho) California, Fresno-Bakersfield (San Joaquin Valley) California, Inglewood (Baldwin Hills) California, Sacramento Valley California, San Jacinto California, San Jose (Santa Clara Valley) California, Long Beach (Wilmington Oil Field) Louisiana, New Orleans Nevada, Las Vegas Valley Texas, Houston-Galveston (including Goose Creek & Chocolate Bayou)
Foreign
Italy, Po Delta Italy, Venice Japan, (9 areas) Mexico, Mexico City New Zealand, Wairakei
A- 9
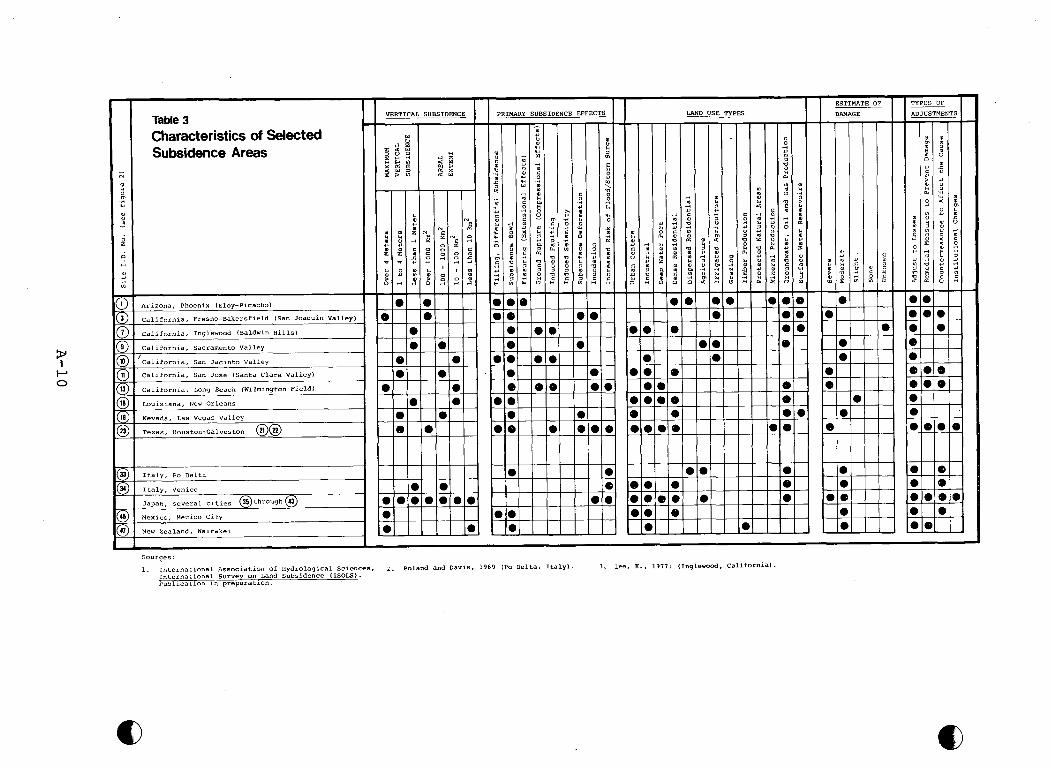
sah"eq3 IB"O??"?T?S"I
sasso? 07 ?snCpv
1
,I I
I I
I I
I I
I .I I
ll
I
II
II
II
II
I
II
II
I
A-10
STEP 4 : EVALUATE SELECTED AREAS IN TERMS OF RANGES OF SUBSIDENCE EXPERIENCE AND APPLICABILITY TO POTENTIAL GEOTHERMAL AREAS
Table 3 shows the extent to which the 23 selected areas represent a variety of experiences with subsidence, especially range of vertical subsidence, types of subsidence effects, types of land uses, level of damages and types of adjustments to subsidence. The characteristics shown on Table 3 are explained below.
Vertical Subsidence
Maximum vertical subsidence and areal extent are values obtained principally from the responses to ISOLS.
Primary Subsidence Effects
Several physical effects have been reported where subsidence has occurred.
Tilting or differential subsidence. Development of a subsidence bowl. Fissuring (tensionial, extensional effects). Ground rupture (compressional effects). Subsurface deformation (well extrusion). Induced faulting. Induced seismicity. Inundation. Increased risk of flood, storm surge.
All of these effects are possible if subsidence should occur at prospective geothermal areas. Identification of these effects as occurring at specific subsidence areas is based upon complete information gained principally from the respon- ses to ISOLS and our review of the literature. Some of the effects are reported to have occurred while others are inferred to have occurred.
Land Use Types
Potential geothermal resources, both hydrothermal and geopres- sured, are located in and among a variety of land uses. For modeling and predictive purposes, it is important to learn what effects subsidence has on human use systems in a variety of land use settings.
The environmental impact assessments for the Hydrothermal and Geopressure Subprograms of ERDA's Geothermal Development
A-1 1
Program were reviewed and the following land uses and features were found in one or more of the potential geothermal resource areas :
Urban Centers Grazing Industrial Timber Production Deep Water Port Dense Residential Mineral Production Dispersed Residential Groundwater, Oil and Gas Production Agriculture Surface Water Reservoirs Irrigated Agriculture
Protected Natural Areas
Land uses reported or inferred to exist in the listed subsi- dence areas are checked in the matrix to indicate the range of land uses represented in the subsidence areas. Choice of subsidence areas for further study based in part on land uses will permit the study of subsidence effects on land uses in potential geothermal resource areas.
Estimate of Damage
An estimate of the severity of damage due to subsidence was requested in the International Survey on Land Subsidence (ISOLS). The estimates of damage shown on the table are generally indicative of the level of damage, but are not comparable from area to area as the estimates are those made by individual respondents to the questionnaire and no common scale of damage was used.
Types of Adjustments
With an interest in the full range of possible adjustments to subsidence and the eventual definition of an optimal set of adjustments to subsidence due to geothermal resource development, an effort was made to categorize adjustments that are reported or inferred to have been made in areas experiencing subsidence. The classes of adjustments are as defined by Burton, Kates and White (1968) "The Human Ecology of Extreme Geophysical Events" and commonly used by natural hazards investigators (see also Natural Hazards, White, G. F., ed. 1974). Examples of the types of adjustments to subsidence are:
Adjustment Class G3 Adjust to Losses:
Remedial Measures to Prevent Damage:
Examples
Repair damage to buildings, roads, railroads, etc.
-
c Abandon property.
c Raise levees.
c Build sea wall.
Flexible coupling on piping, aqueducts.
-
Countermeasures to Affect - Stop/restrict pumping. The Cause:
Find alternate source of resource.
-
- Reinject fluid.
Institutional Changes: - Develop subsidence district.
Develop structure to control groundwater pumping.
-
STEP 5: ADDITIONAL CRITERIA FOR SELECTION OF SUBSIDENCE AREAS
o Applicability of physical character of subsidence areas to potential subsidence from geothermal development.
Allocating work effort to obtain maximum yield of information for the number of sites in timely and cost effective manner.
Specific recommendations for the conduct of the remainder of the project follow’Task 2 summary.
o
. .
A- 13
TASK 2. DEVELOP METHODS FOR OBTAINING DATA
The following methods for obtaining data on the environmental and economic effects of subsidence have been used to date in this project:
o Review of Responses to the International Survey on Land Subsidence (ISOLS)
0 Literature Review
0 Contacts With Active Researchers
The effectiveness of each of these approaches is discussed here.
Literature Review
An intensive literature review was made with the aid of Allan Conrad, and Gloria Smith Haire of Lawrence Berkeley Laboratory's Technical Information Group, which operates the Western Regional Information Service Center. facilities at LBL, computerized literature searches were designed and made of data bases accessed on the RECON System at Oak Ridge National Laboratories:
0 Selected Water Resources Abstracts (WRA).
Using the
o Energy Information Data Base (EDB).
0 Environmental Services Index (ESI).
o Engineering Index (EIX).
Updated additions to the present citations contained in the RECON Data Bases will be provided to EDAWoESA for the duration of the project. be maintained throughout the Geothermal Subsidence Research Program.
Other computerized literature data bases that were scanned for references to environmental and economic effects of subsidence were:
It is recommended that the update service
0 GEOREF;
0 Smithsonian Scientific Information Exchange, Inc. (SSIE), both files in SDC's ORBIT data base; and
0 The National Geothermal Information Resource (GRID) at Lawrence Berkeley Laboratory
Bibliographies reviewed for pertinent publications included:
0 Systems Control, Inc. (1976), The Analysis of Subsidence Associated With Geothermal DeveloDment. Data Bank: and
0 Keith, S. J. (1977), The Impact of Groundwater Develop ment in Arid Lands, University of Arizona; Office of Arid Lands Studies, Tucson, Arizona.
The literature review was performed mostly by reading abstracts and resulted in the identification of a few journal articles, dissertations and monographs which investigate and report on the economic effects of subsidence in central Arizona, the Houston-Galveston and New Orleans areas of the Texas and Louisiana Gulf Coast. Copies of these publications have been ordered, and the authors of the Texas and Louisiana studies have been contacted by telephone.
With the completion of our literature review, we are reason- ably certain that no other studies of the economic effects of subsidence have reached the published literature.
Review of Responses to ISOLS
The EDAWoESA team was fortunate to obtain permission from A. Ivan Johnson to photocopy and use the responses to the International Survey on Land Subsidence prior to publication in a volume by the International Association of Hydrological Sciences. The information available from ISOLS was the principal source of information used to identify and select subsidence areas (Task 1 of this project).
The data requested in ISOLS cover many subsidence parameters. The data on economic effects provided by the respondents tend to be sketchy and incomplete for many areas. Despite these limitations, the information permitted the initial screening and selection of subsidence areas for further data gathering performed as Task 1, and provided nam-es of investi- gators to contact.
Contacts With Scientific Corrmunity
In the planning of this project, this method was believed to be the most effective means of obtaining information on subsidence effects once a rapid review of the literature was performed. community have been made from the outset of the project. Some of the persons contacted to date are listed in Table 4 .
Contacts with various members of the scientific
G
A- 15
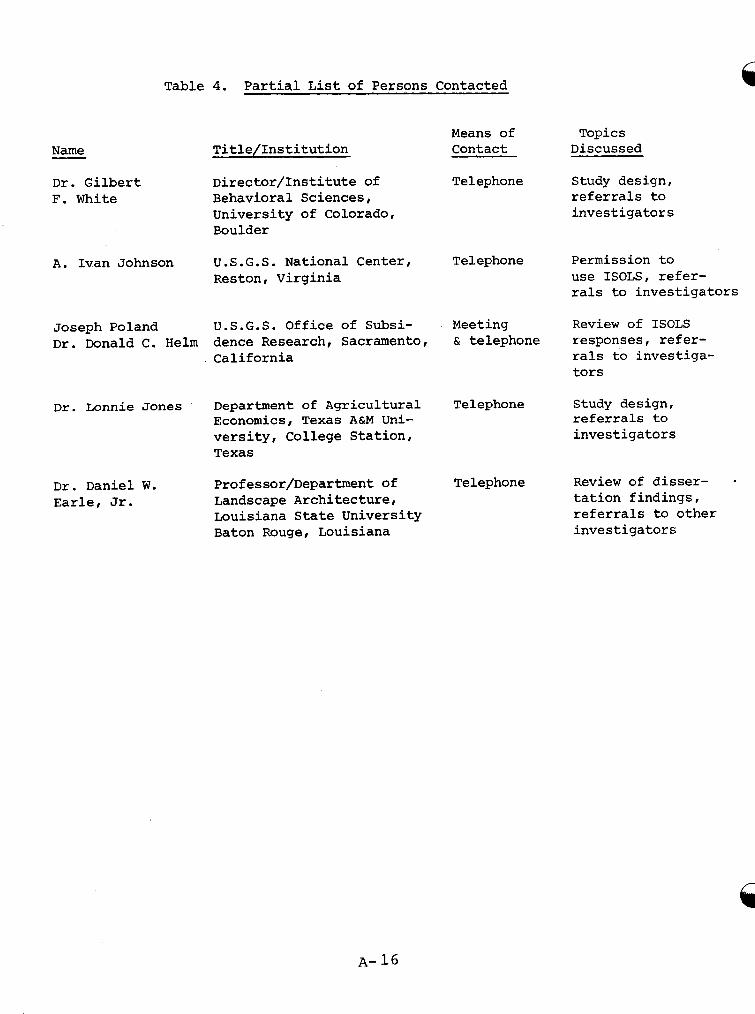
Table
Name
Dr. Gilbert F. White
A. Ivan Johnson
Joseph Poland Dr. Donald C. Helm
Dr. Lonnie Jones
Dr. Daniel W. Earle, Jr.
4. Partial List of Persons Contacted
Title/Institution
Director/Institute of Behavioral Sciences, University of Colorado, Boulder
U.S.G.S. National Center, Reston, Virginia
U.S.G.S. Office of Subsi- dence Research, Sacramento, California
Department of Agricultural Economics, Texas A&M Uni- versity, College Station, Texas
Professor/Department of Landscape Architecture, Louisiana State University Baton Rouge, Louisiana
Means of Contact
Telephone
Telephone
Meeting & telephone
Telephone
Telephone
Topics Discussed
Study design, referrals to investigators
Permission to use ISOLS, refer- rals to investigators
Review of ISOLS responses, refer- rals to investiga- tors
Study design, referrals to investigators
Review of disser- tation findings, referrals to other investigators
A- 16
6d A structured form, Data Acquisition Forn #1 was developed and has been used to ensure the effective acquisition and recordation of information and referrals to other investiga- tors. This form is Attachment 2 to this interim smmary report.
Development of Survey Questionnaires
Some effort has been expended to design questionnaires that could be used on site in a subsidence area to gather primary data from active investigators, public agencies and private industry managers working with subsidence problems. This form is Attachment 3 to this interim summary report.
TASK 3 - DATA COLLECTION Recommendations for the Completion of Task 3 - In actuality, Task 3 - "Data Collection" began at the inception of Category 4 , Project 1, and has been performed concurrently with Tasks 1 and 2. As of now, the data collection effort will be empha- sized for much of the remainder of the project. EDAW.ESA recommends that for the subsidence areas selected in Task 1 the project team seeks additional detailed information on the effects of subsidence as may exist. For these areas within the United States, the team should direct its efforts to making telephone and personal contact with active investi- gators, public agencies and officials, and private industry managers to gather information on subsidence effects and referrals to other potential sources of information.
For those areas outside the United States, EDAW.ESA recommends that it undertake a program of written correspondence to select scientists and officials in Italy, Japan, Mexico and New Zealand.
Other Recommendations fo r Discussion
0 Compile master mailing list of all investigators and establish regular informative mailings.
0 Send notice of interest in effects data with mail-back response cards to all investigators.
0 Contract with literature review services through LEL library.
0 Retain local investigators to compile primary data under our direction.
A- 17
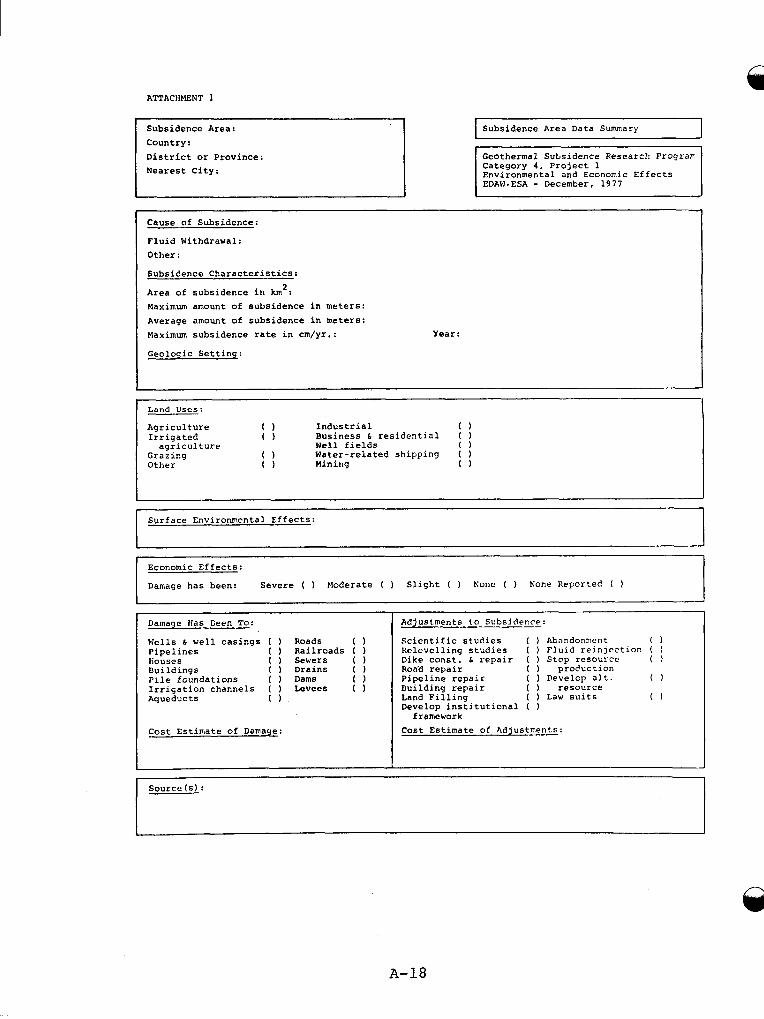
ATTACHMENT 1
- Surface Environmental Effects:
Economic Effects:
Damage has been: Severe ( ) Moderate ( ) Slight ( ) None ( ) Lone Reported. ( )
Subsidence Area: Country : District or Province: Nearest City:
Subsidence Area Data Summary I Geothermal Subsidence Research Prograr Category 4, Project 1 Environmental and Economic Effects
Causeof Subsidence:
Fluid Withdrawal: Other:
Subsidence Characteristics:
Area of subsidence in km': Maximum amount of subsidence in meters: Average amount of subsidence in meters: Maximum subsidence rate in cm/yr. : Year:
Geologic Setting:
Land Uses:
Agriculture 0 Industrial 0 Business & residential ( Well fields 0
Irrigated 0 Grazing Water-related shipping ( 1 Other 0 0
agriculture
Damage Ifas Geen To:
Wells b well casings ( ) Roads 0 Pipelines ( ) Railroads ( ) liouses ( ) Sewers ( ) Bu i Id ings ( ) Drains ( ) Pile foundations [ ) Dams 0 Irrigation channels ( ) Levees ( 1 Aqueducts 0
Cost Estimate of Damage:
Adjustments to Subsidence:
Scicntific studies ( ) Abandonment 0 Relevelling studies ( ) Fluid reinlection ( ) Dike const. 6 repair ( ) Step resourcc ( ) RocTd repair
0 Pipeline repair Duilding repair ( ) resource
Develop institutional ( )
Cost Estimate of hdjustrrents:
( ) proc'uction ( ) Develop alt.
Land Filling ( ) Law suits 0
framework
Source ( s ) :
I I
n
A-18
Subsidence Area:
Country : District or Province: Nearest City:
PuJAications:
-- Investigators:
A-19
ATTACHMENT 2
7s-119 CKV
October 5, 1977
SUBSIDENCE EFFECTS DATA ACQUISITION FORM #1
Telephone Questionnaire
Subsidence area:
Geof luid withdrawn:
~~
1. Person contacted
Name :
Address :
City:
Title :
Institution:
State: Zip : Country:
Telephone: Date : Time :
Referred by:
Responded to A . I. Johnson's Questionnaire: Yes ( ) KO (
2 . Do you know of any environmental or economic effects of subsidence on the surface environment or on human use systems? List.
3 . Do you know of any scientific studies that have been made of subsidence related problems: (Check focus of study)
Subsidence characteristics ( ) Biological/ecological effects (
Surface physical effects ( ) Effects on human use systems ( )
Surface hydrology ( ) Economic costs of subsidence ( )
A-20
4 . List known publications: (Request bibliography by mail) (Author, year, title, publisher, journal)
5. Do you know if any investigators have been studyin? the environmental and economic effects of subsidence?
Name : Title: Institution:
Address : City: State:
Telephone:
Principal research interest:
6. What government bodies have been dealing with subsidence pr ob 1 ems ?
Agency : Address :
Contact person: City:
Telephone number:
State: Zone :
Principal interest/responsibility in subisdence prob1en.s:
7. Any suggestions? Comments.
A - 2 1
ATTACHMENT 3
4 . Environmental Setting
( ) Coastal ( ) Inland ( ) Other unique circumstances (explain)
4
EDAW- ESA 8 / 4 / 7 7
ENVIRONMENTAL & ECONOMIC EFFECTS OF S U B S I D E N C E
Telephone Questionnaire
1. - Respondent
Name : Title:
Address:
City: State : Zone : C o u r . t r y :
Telephone:
Date :
2 . Responded to A. I. Johnson's questionnaire: Yes ( ) No ( )
A
A-22
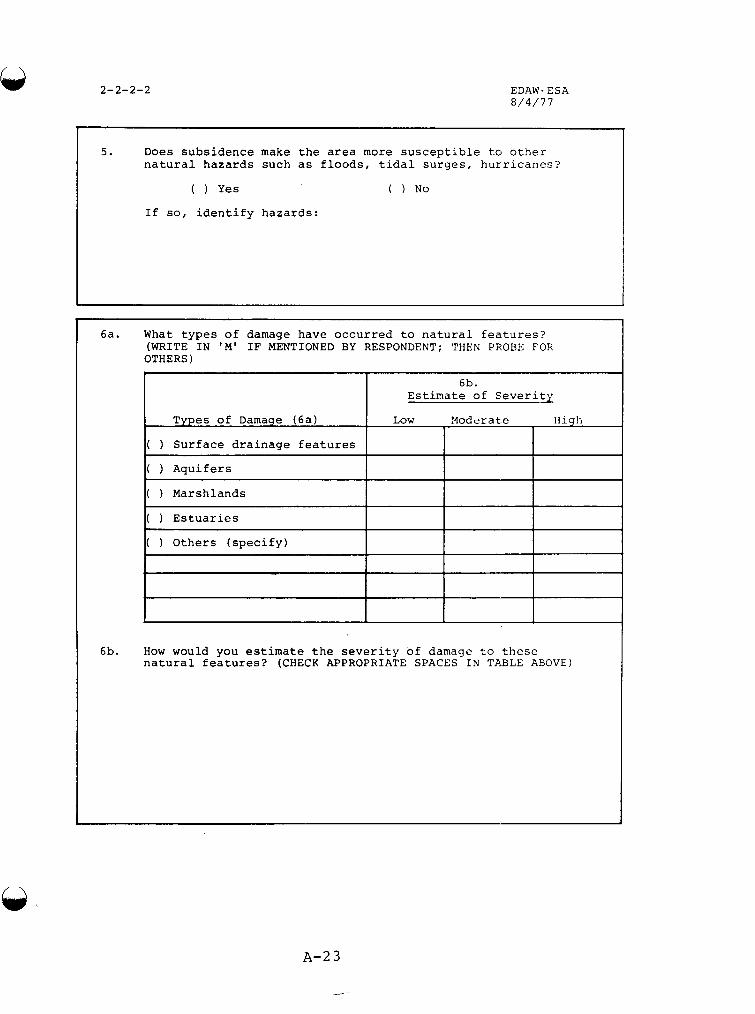
2-2-2-2 EDAW- E S A 8 / 4 / 7 1
5. Does subs idence make t h e a r e a more s u s c e p t i b l e t o o t h e r n a t u r a l haza rds such as f l o o d s , t i d a l s u r g e s , h u r r i c a n e s ?
( 1 Y e s ( ) No
I f so, i d e n t i f y haza rds :
6a. What t y p e s o f damage have occur red t o n a t u r a l f e a t u r e s ? (WRITE I N ' M ' I F MENTIONED BY RESPONDENT: THEN PROBE F O R OTHERS)
6b. Es t ima te of S e v e r i t 2
Types o f Damage ( 6 a ) I Low Xod er a t e H i g h I 1
I ( 1 S u r f a c e d r a i n a g e f e a t u r e s I I 1 ( ) Aqui fe r s
I 1 I
( ) Marshlands
( ) E s t u a r i e s
( 1 Other s ( s p e c i f y ) I 1
6b. How would you estimate t h e s e v e r i t y of damage t o t h e s e n a t u r a l f e a t u r e s ? (CHECK APPROPRIATE SPACES I N TABLE ABOVE)
A - 2 3
_-
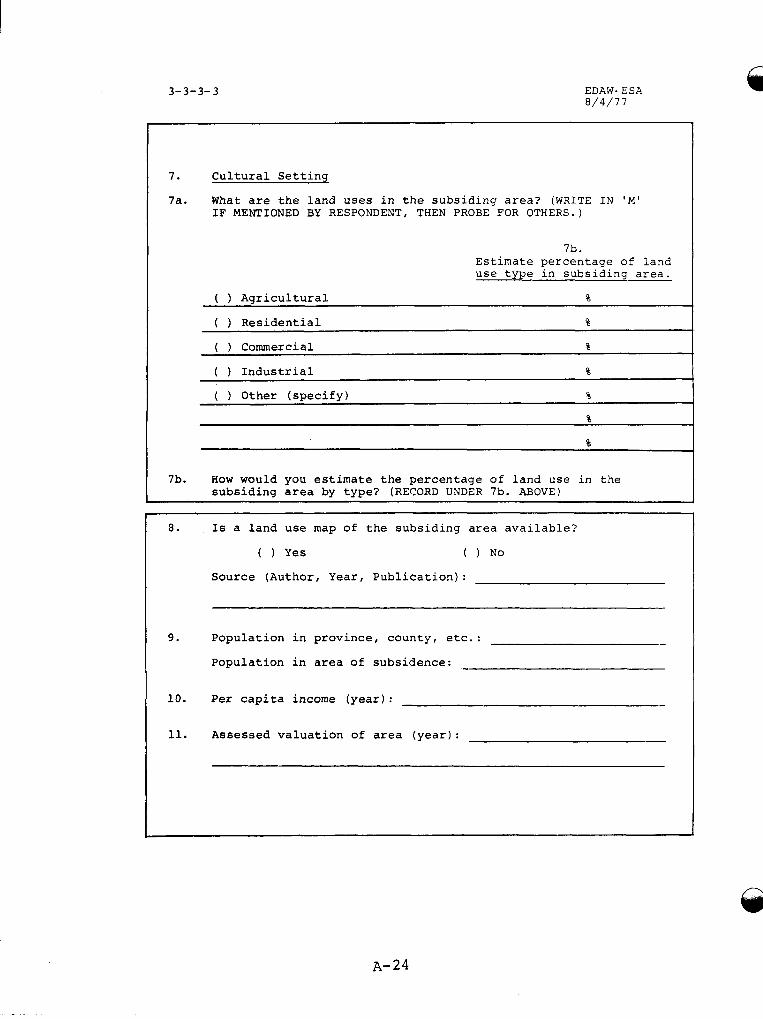
3-3-3- 3 EDAW. ESA 8/4/77
7. Cultural Setting
7a. What are the land uses in the subsiding area? (WRITE IN ‘M IF MENTIONED BY RESPONDENT, THEN PROBE FOR OTHERS.)
7b. Estimate percentage of land ~
( ) Agricultural %
( 1 Residential % ~~~
( ) Commercial %
( ) Industrial %
( ) Other (specify) %
7b. How would you estimate the percentage of land use in the subsiding area by type? (RECORD UNDER 7b. ABOVE)
a.
9.
10.
11.
Is a land use map of the subsiding area available?
( 1 Yes ( 1 No
Source (Author, Year, Publication):
Population in province, county, etc.:
Population in area of subsidence: __ per capita income (year) :
Assessed valuation of area (year):
A- 24
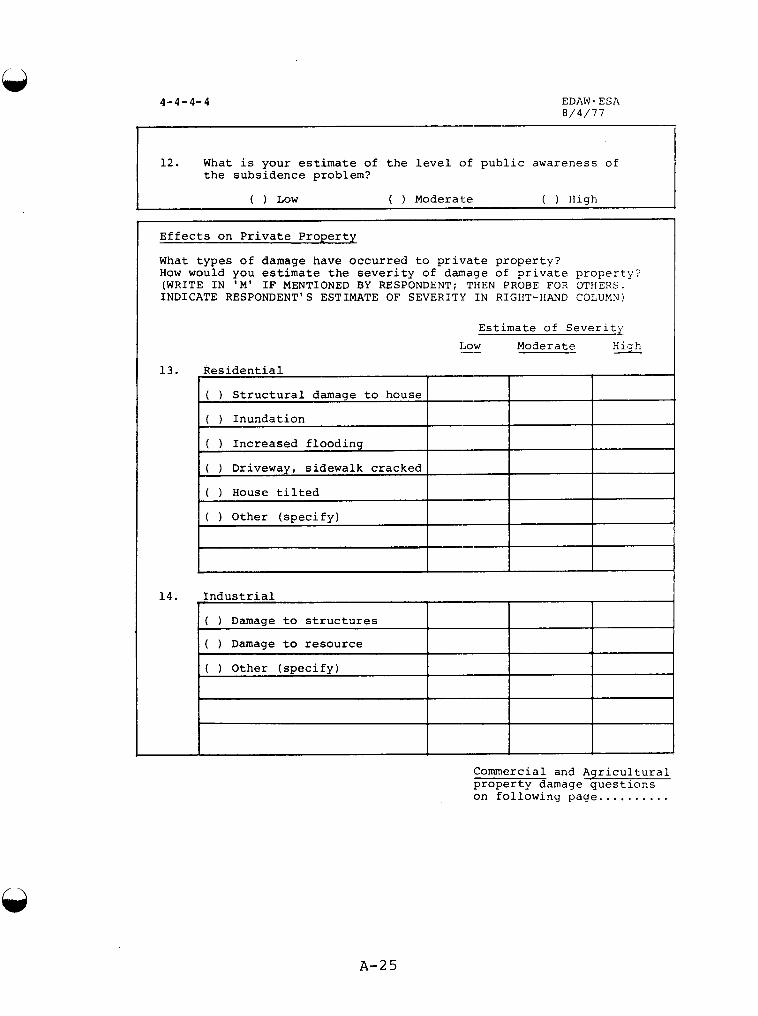
4-4-4-4
I 1 E f f e c t s on P r i v a t e P r o p e r t y
What t y p e s o f damage have o c c u r r e d t o p r i v a t e p r o p e r t y ? How would you estimate t h e s e v e r i t y of damage of p r i v a t e p r o p e r t y ? (WRITE I N ' M ' I F MENTIONED BY RESPONDENT: THEN PROBE FOR OTHERS. I N D I C A T E RESPONDENT'S ESTIMATE O F SEVERITY I N RIGHT-HAND COLUMN)
EDAW. ESA 8 / 4 / 7 7
1
12. What is your estimate of t h e l e v e l of p u b l i c awareness of t h e subs idence problem?
13.
1 4 .
Low .- Moderate H i J h
R e s i d e n t i a l
( ) S t r u c t u r a l damage t o house
( ) Inunda t ion
( 1 I n c r e a s e d f l o o d i n g
( ) Driveway, s idewa lk c racked
( ) House t i l t e d
( Other ( s p e c i f y )
I n d u s t r i a l
( ) Damage t o s t r u c t u r e s
( Damage t o r e s o u r c e
( 1 Other ( s p e c i f y )
f I I 1
1
Commercial and A g r i c u l t u r a l p r o p e r t y damage q u e s t i o n s on fo l lowing page ..........
A-25
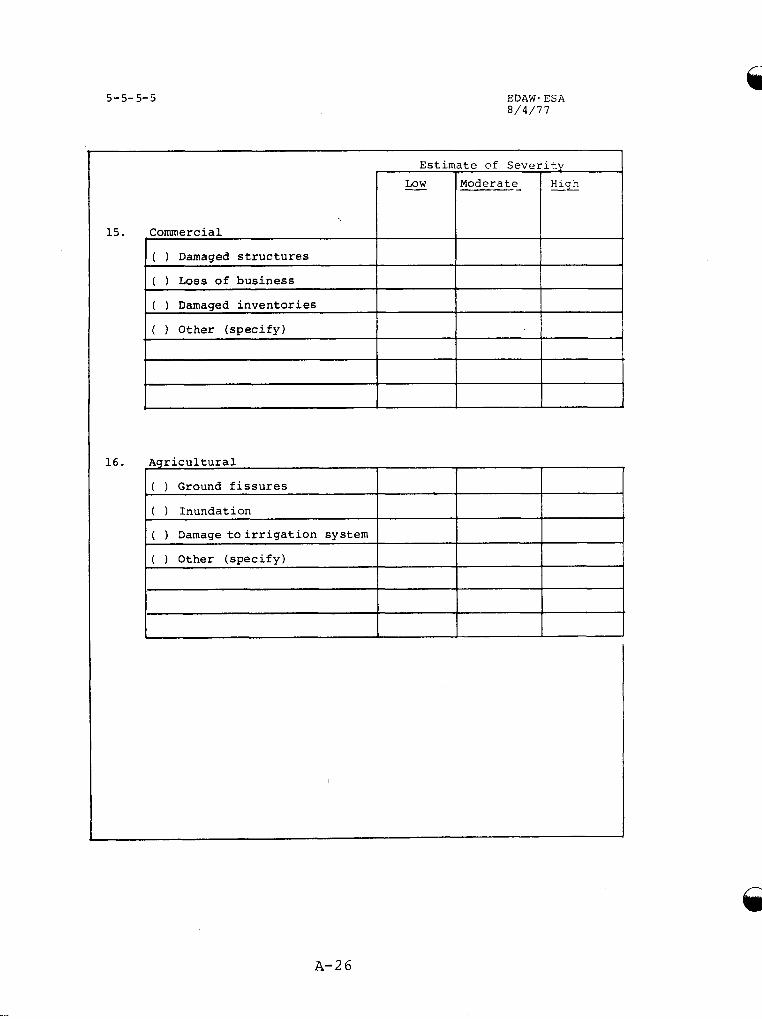
5-5-5-5
- Low
15. Commercial
( ) Damaged s t r u c t u r e s
( ) Loss o f b u s i n e s s
( ) Damaged i n v e n t o r i e s
( ) Other ( s p e c i f y )
EDAW- ESA 8 / 4 / 7 1
Moderate- Iiie
t I I I
1 6 . A g r i c u l t u r a l
( ) Ground f i s s u r e s
( 1 Inunda t ion
( ) Damage t o i r r i g a t i o n sys tem
( ) Other ( s p e c i f y )
A-26
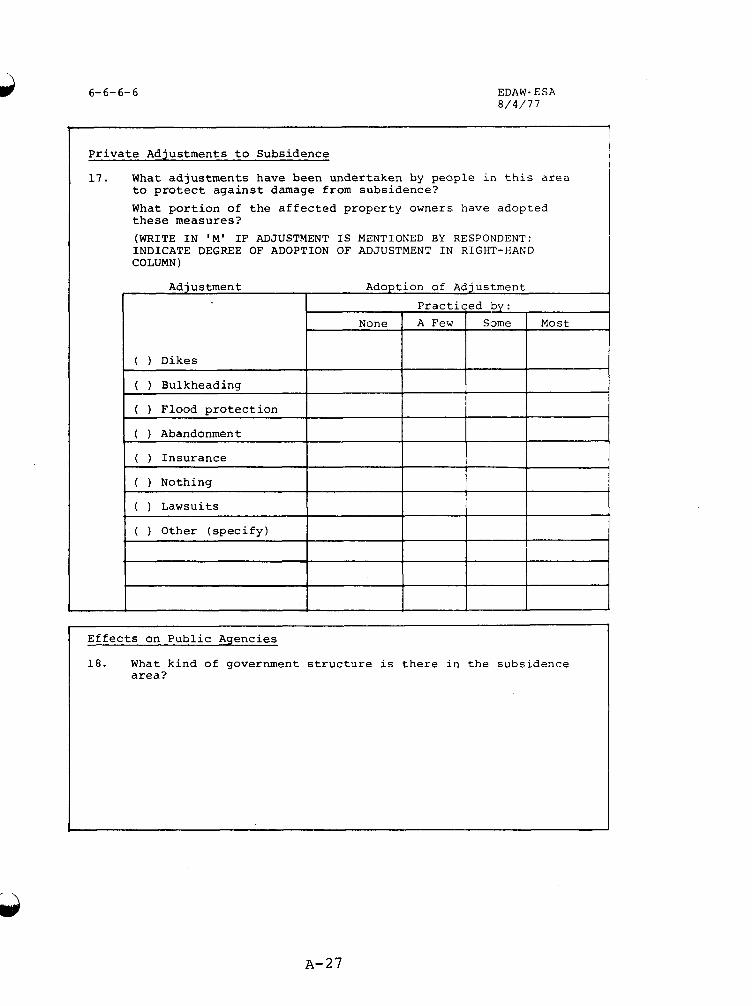
6-6 -6 -6 EDAW- ESA 8 /4 /77
Private Adjustments to Subsidence
17. What adjustments have been undertaken by people in this area to protect against damage from subsidence? What portion of the affected property owners have adopted these measures? (WRITE IN 'M' IF ADJUSTMENT IS MENTIONED BY RESPONDENT; INDICATE DEGREE OF ADOPTION OF ADJUSTMENT IN RIGHT-HAND COLUMN)
Effects on Public Agencies
18. What kind of government structure is there in the subsidence area?
A-27
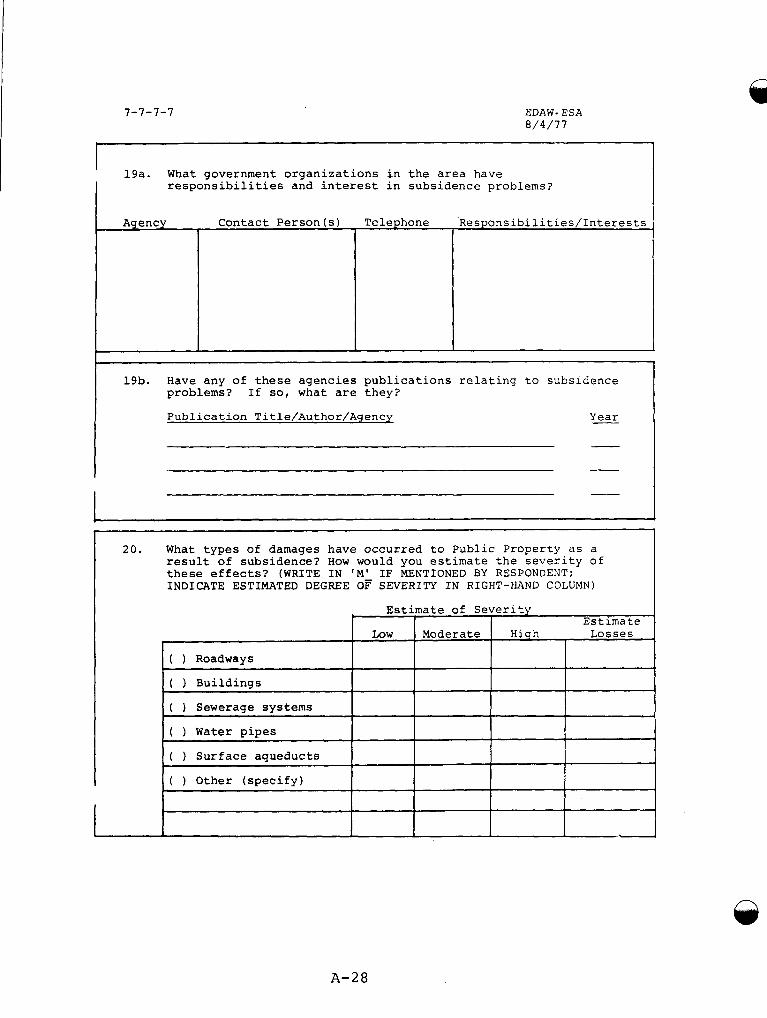
7-7-7-7 EDAW- ESA 8 /4 /17
19a. What government organizations in the area have responsibilities and interest in subsidence problems?
Agency Contact Person ( s ) Telephone Responsibilities/Interests
19b. Have any of these agencies publications relating to subsidence problems? If so, what are they?
Publication Title/Author/Agency Y e a r
20. What types of damages have occurred to Public Property as a result of subsidence? How would you estimate the severity of these effects? (WRITE IN ‘ M L IF MENTIONED BY RESPONDENT; INDICATE ESTIMATED DEGREE OF SEVERITY IN RIGHT-HAND COLUMN)
t I I 1 I
A-28
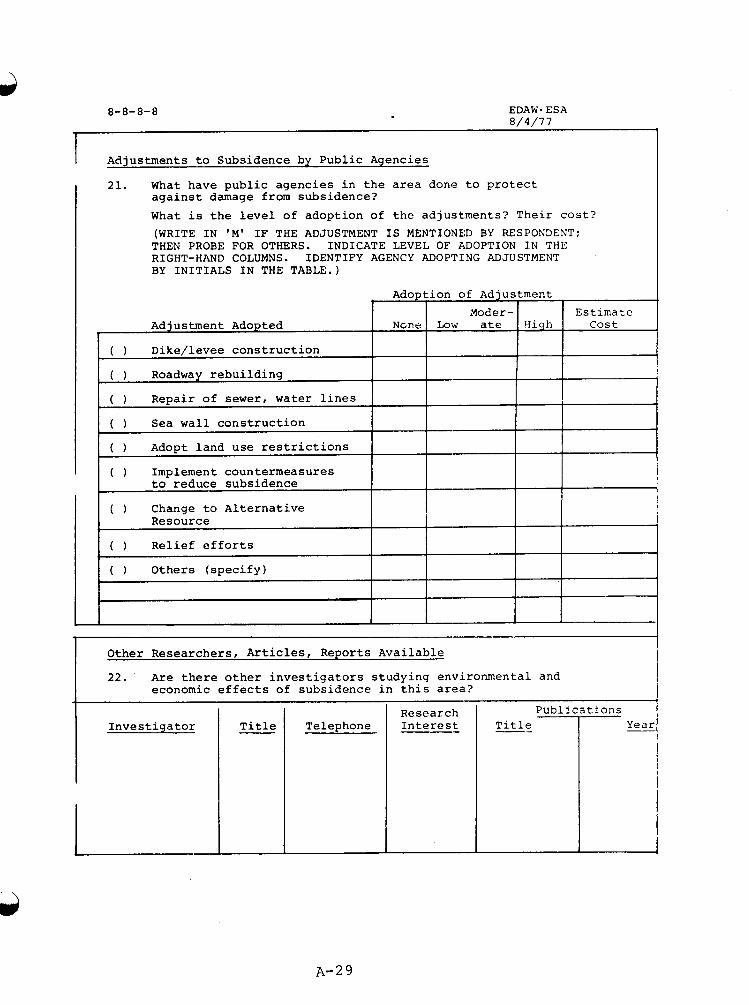
1 Adjustments to Subsidence by Public Agencies
21. What have public agencies in the area done to protect against damage from subsidence? What is the level of adoption of the adjustments? Their cost? (WRITE IN 'M' IF THE ADJUSTMENT IS MENTIONED BY RESPONDENT; THEN PROBE FOR OTHERS. INDICATE LEVEL OF ADOPTION IN THE RIGHT-HAND COLUMNS. IDENTIFY AGENCY ADOPTING ADJUSTMENT BY INITIALS IN THE TABLE.)
to reduce subsidence
( ) Change to Alternative Resource
( ) Relief efforts
( ) Others (specify)
Investigator Title Telephone Re search Publications
Title Year Interest -- -
A-29
, \
APPENDIX B
Subsidence Area Data Summaries
SUBSIDENCE AREA DATA SUMMARIES
In Task 1 of this project, some 52 areas listed on Table B-1 were reviewed in order to identify and select those with the greatest potential for yielding information on the environmental and economic effects of land subsidence due to fluid withdrawal. The information has been compiled as a data summary for each area. No data summaries were prepared for some geothermal areas where subsidence has not yet proven to be a problem. These areas are identified by an asterisk on Table B-1.
B-1
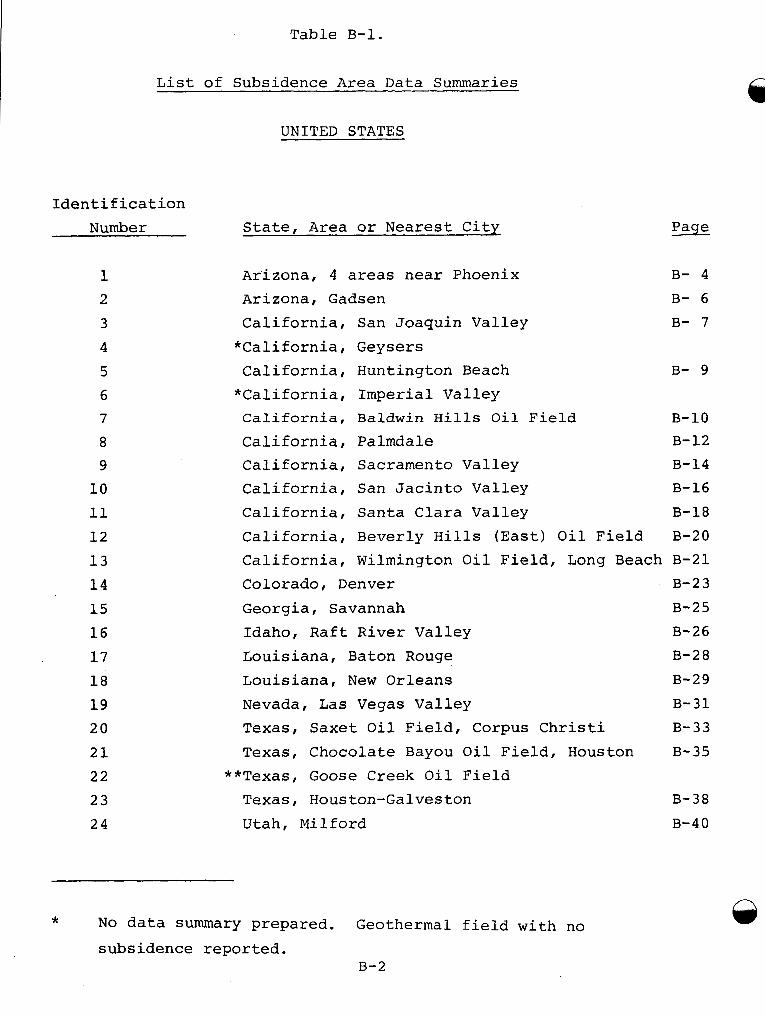
Table B-1.
List of Subsidence Area Data Summaries
UNITED STATES
Identification Number
1 2 3 4 5 6 7
8 9 10 11 12 13 14 15 16 17 18 19 20 21 22 23 24
State, Area or Nearest City Page
Arizona, 4 areas near Phoenix B- 4 Arizona, Gadsen B- 6 California, San Joaquin Valley B- 7
*California, Geysers California, Huntington Beach B- 9
*California, Imperial Valley California, Baldwin Hills Oil Field B-10
B-12 California, Sacramento Valley B-14 California, San Jacinto Valley B-16 California, Santa Clara Valley B-18
California, Palmdale
California, Beverly Hills (East) Oil Field B-20 California, Wilmington Oil Field, Long Beach B-21 Colorado, Denver B-23 Georgia, Savannah B-25 Idaho, Raft River Valley B-26 Louisiana, Baton Rouge B-28 Louisiana, New Orleans B-29 Nevada, Las Vegas Valley B-31 Texas, Saxet Oil Field, Corpus Christi B-33 Texas, Chocolate Bayou Oil Field, Houston B-35
**Texas, Goose Creek Oil Field Texas, Houston-Galveston B-38 Utah, Milford B-40
* No data summary prepared. Geothermal field with no
subsidence reported. B-2
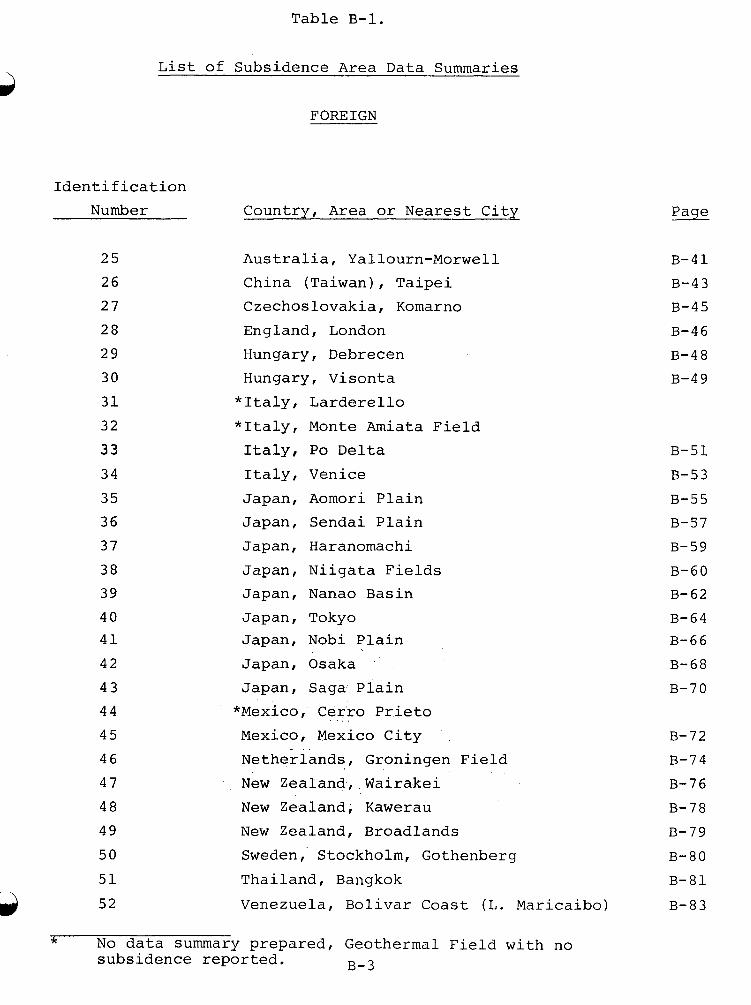
Table B-1.
List of Subsidence Area Data Summaries
FOREIGN
Identification Number
25 26 27 28 29 30 31 32 3 3 34 35 36 37 38 39 40 41 42 43 44 45 46 47 48 49 50 51
Countrv. Area or Nearest Citv
Australia, Yallourn-Morwell China (Taiwan), Taipei Czechoslovakia, Komarno England, London Hungary, Debrecen Hungary, Visonta *Italy, Larderello "Italy, Monte Amiata Field Italy, Po Delta Italy, Venice Japan, Aomori Plain Japan, Sendai Plain Japan, Haranomachi Japan, Niigata Fields Japan, Nanao Basin Japan, Tokyo Japan, Nobi Plain Japan, Osaka Japan, Saga Plain *Mexico, Cerro Prieto Mexico, Mexico City Netherlands, Groningen Field New Zealand, Wairakei New Zealand, Kawerau New Zealand, Broadlands Sweden, Stockholm, Gothenberg Thailand, Bangkok
52 Venezuela, Bolivar Coast (I,. Maricaibo)
B-57 B-59 B-60 B-62 B-64 B-66 B-68 B-70
B-72 B-74 B-76 B-78 B-79 B-80 B-81 B-83
* No data summary prepared, Geothermal Field with no B-3 subsidence reported.
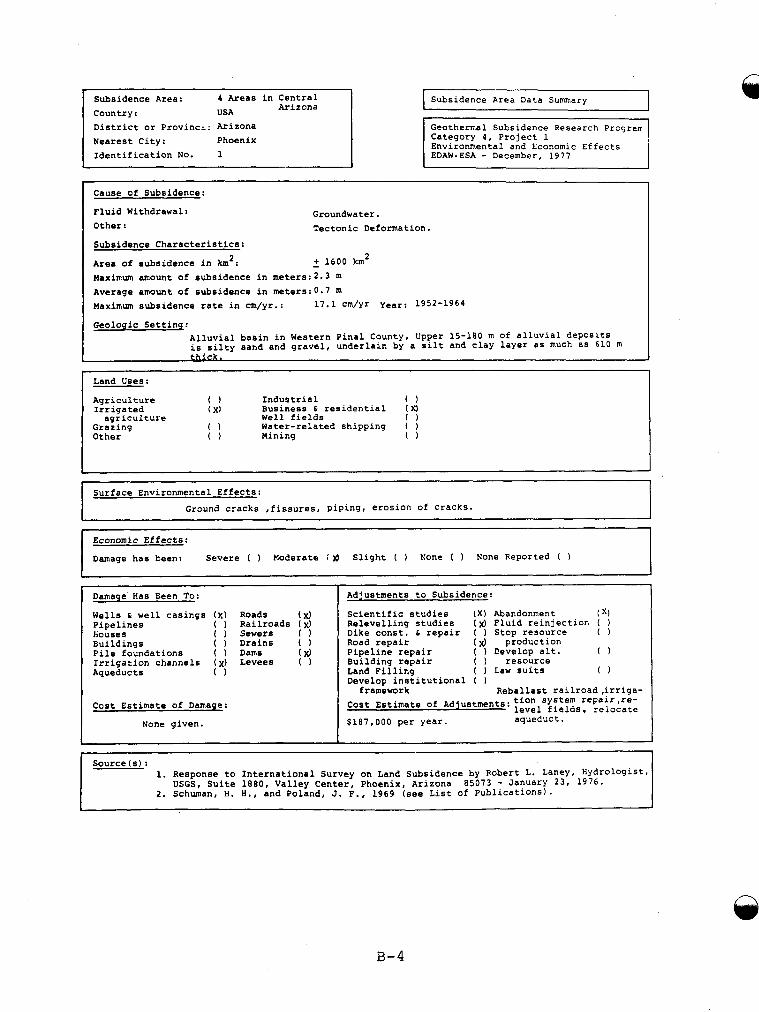
I Subsidence Area: 4 Areas in Central Arizona Country : U SA I
r Source (s) :
1. Response to International Survey on Land Subsidence by Robert L. Laney, Hydrologist USGS, Suite 1 8 8 0 , Valley Center, Phoenix, Arizona 85073 - January 23, 1976.
2. Schuman, H. H., and Poland, J. F., 1969 (see List of Publications). I
District or Provinct: Arizona Nearest City: Phoenix Identification NO. 1
I Subsidence Area Data Summary 1 Geothermal Subsidence Research Prograr Category 4, Project 1 Environmental and Economic Effects 1 EDAW-ESA - December, 1977
Cause of Subsidence:
Fluid Withdrawal: Other:
Groundwater. Tectonic Deformation.
Subsidence Characteristics:
Area of subsidence in km’: Maximum amount of subsidence in meters:2.3 m Average amount of subsidence in meters:0.7 m Maximum subsidence rate in cm/yr.: 17.1 cm/yr year: 1952-1964
- + 1600 km2
Geologic Settinq: Alluvial basin in Western Pinal County, Upper 15-180 m of alluvial deposits is silty sand and gravel, underlain by a silt and clay layer as much as 610 in
Land Uses:
Agriculture 0 Industrial 0
agriculture Well fields 0
Other 0 Mining 0
Irrigated ( x) Business 6 residential ( X I
Grazing 0 Water-related shipping ( )
I 1
Ground cracks ,fissures, piping, erosion of cracks.
Economic Effects:
Damage has been: Severe ( ) Moderate (~ Slight ( ) None ( ) None Reported ( )
~ -~
Damage Has Eeen To:
Wells 6 well casings ( X ) Roads (x) Pipelines ( ) Railroads (X, Iiouses ( ) Sewers ( 1 Buildings ( ) Drains ( ) Pile foundations ( Dams (x) Irrigation channels (x ) Levees ( ) Aqueducts 0
Cost Estimate of Damage:
None given.
Adjustments to Subsidence:
Relevelling studies (x) Fluid reinjection ( ) Dike const. 6 repair ( ) Stop resource ( 1 Road repair (X, production
Building repair ( resource
Develop institutional (
Cost Estimate of Adjustments: $187,000 per year. aqueduct.
Scientific studies ( X ) Abandonment ( X)
Pipeline repair ( ) Develop alt. 0
Land Filling ( ) Law suits 0
framework Reballast railroad,irriga- system repair1re-
level fields, relocate
B-4
Subsidence Area: 4 Areas in Central Country : United StatesArizona District or Province: Arizona Nearest City: Phoenix
Publications:
Bouwer, H., 1975, Subsidence of the Land Surface and Formation of Earth Cracks Due to Groundwater Withdrawal, Water Conservation Lab., Phoenix, Arizona, Geological Society of America/ New York 1975 Annual Meetings
Clyma, W.,Young, R. A., 1968, Environmental Effects of Irrigation in the Central Valley of Arizona. American Society of Civil Engineers, National Meeting on Environmental Engineer- ing, Chattanooga, Tennessee, May 13-17, Preprint. 28 p. SWRA W70-07053.
of Willcox Arizona. Unpublished report for Southwest Properties, Inc. 4219 Indian School Road,Phcenix, AZ, 85018, Earth Sciences Associates, 7 0 1 Welch Road, Palo Alto, CA 94304
Earth Sciences Associates, 1971, Investigation of Earth Fissure Phenomena in the Vicinity
Heindl, L. A.,and Feth, J. H., 1955, Pipinq and earth cracks-- a discussion: Am. Geophys. Union Trans., V. 36, NO. 2, p. 342-345
Review and Annotated Bibliography, Tucson, Arizona: University of Arizona,office of Arid Lands Studies.
Keith, Susan Jo, 1977,The Impact of Groundwater Development in Arid Lands: A Literature
Leonard, R . J., 1929, An earth fissure in southern Arizona: Jour. Geology v. 37, no. 8 p. 765-774.
McCauley, C. A., 1973, Management of Subsiding Lands: An Economic Evaluation. Arizona University, Tucson,Department of Hydrology and Water Resources, Available from the National Technica1,Information Service, Springfield, VA 22161 as PB-240 305, $4.75 in paper copy/$2.25 in microfiche. Phd.dissertation
Bulletin Vol 11, No. l., pp. 148-154
Tucson,Dept. of Hydrology and Water Resources, in: Hydrology and Water Resources in Arizona and the Southwest, Vol 2, Proceedings of the 1972 Meetings of the Arizona Section, American Water Resources Assn., and the Hydrology Section, Arizona Academy of Science May 5-6, 1972, Prescott, Arizona, p. 87-94
Arizona Geol. SOC. Digest, V. 4, p. 95-101.
McCauley c.~.andR. Gum, 1975, Land Subsidence: An Economic Analysis ,Water Resources
McCauley C.A.and Gum, R.L.,1972, Subsidence Damage in Southern Arizona, Arizona University,
Pashley, E. F., Jr., 1961, Subsidence cracks in alluvium near Casa Grande, Arizona:
Poland, J. F., 1973, Subsidence in United States due to ground-water overdraft--a review: Am. SOC. Civil Engineers, Proc. Irrigation and Drainage Div. Specialty Conf., Fort Collin! p. 11-38.
Poland, J. F., and Davis, G. H., 1969, Land Subsidence due to withdrawal of flulds, in Reviews in engineering geology, volume 2: Geol. SOC. America, p. 187-269.
Sauck, W. A., 1975, "Geophysical Studies near subsidence fissures in Ceqtral Arizona: American Geophysical Union,Transactions V. 56, no. 12, p. 984-985.
__. - - - -- Schumann, H. H., 1974, Land subsidence and earth fissures in alluvial deposits in the
Phoenix area, Arizona: U. S. Geol. Survey Misc. Inv. Ser. Map I-845-H. I sheet.
Schumann, H. H., and Poland, J. F., 1970, Land subsidence, earth fissures, and groundwater withdrawal in-soutfi-central Arizona, U. S. A. in Land Subsidence: Tokyo, Internat. ASSOC. Sci. Hydrology, Pub. 88, v. 1, p. 295-302.
Winikka, C. C. and P. D. Wold, 1977, "Land Subsidence in Central Arizona" in proceedings of Second Symposium on Land Subsidence December 10-17, 1976 Anaheim, CA. Association of Hydrological Sciences Publication no. 121. p. 95-103
International
B- 5
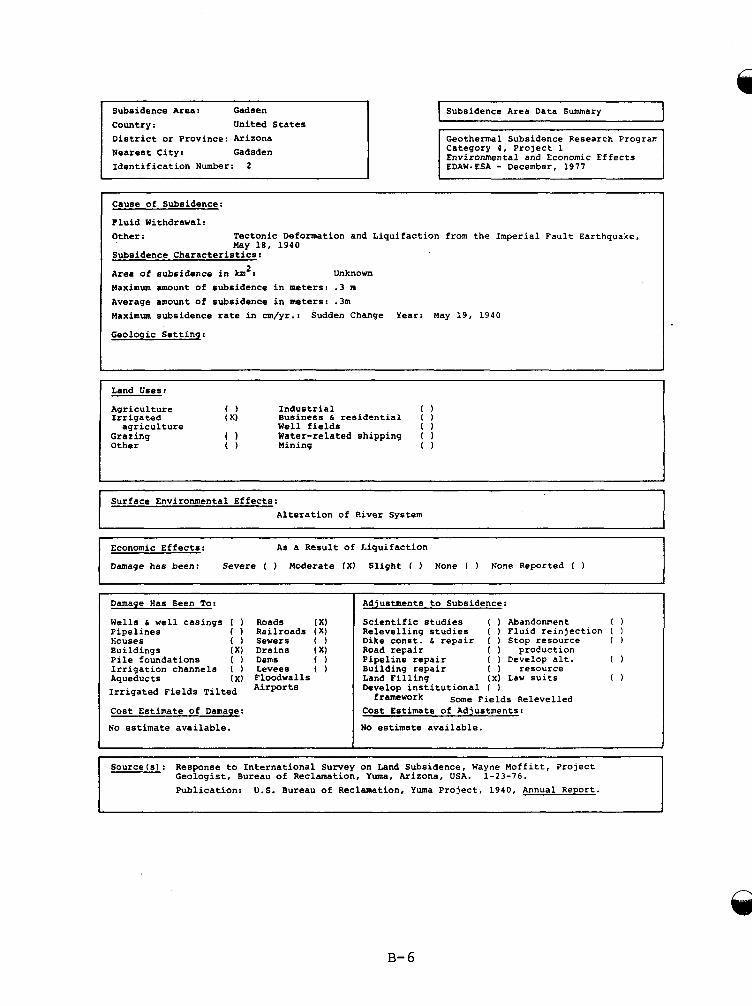
Subsidence Area: Gadsen Country: United States District or Province: Arizona Nearest City: Gadsden Identification Number: 2
I Subsidence Area Data Summary I Geothermal Subsidence Research Prograr Category 4, Project 1 Environmental and Economic Effects
Cause of Subsidence:
Fluid Withdrawal: Other: Tectonic Deformation and Liquifaction from the Imperial Fault Earthquake,
Subsidence Characteristics:
Area of subsidence in km2: Maximum amount of subsidence in meters: . 3 m Average amount of subsidence in meters: .3m Maximum subsidence rate in cm/yr.: Sudden Change Year: May 19, 1940
Geologic Settinq:
May 18, 1940
Unknown
_ _ _ ~ ~~
Land Uses:
Agriculture 0 Industrial 0 Irrigated ( X) Business b residential ( )
agriculture Well fields 0 Water-related shipping ( ) Mining 0
Grazing 0 Other 0
Surface Environmental Effects: Alteration of River System I
Economic Effects: As a Result of Liquifaction
Damage has been: Severe ( ) Moderate (X ) Slight ( ) None ( ) None Reported ( 1 I Damage Has Been To:
Wells 6 well casings [ 1 Pipelines 0 houses 0 Buildings ( X I Pile foundations ( ) Irrigation channels ( ) Aqueducts ( X I Irrigated Fields Tilted
Cost Estimate of Damage:
No estimate available.
Roads ( X I Railroads ( X ) Sewers ( Drains ( X I Dams 0 Levees ( Floodwalls Airports
Adjustments to Subsidence:
Scientific studies ( ) Abandonment 0 Relevelling studies ( ) Fluid reinjection ( Dike const. 6 repair ( ) Stop resource ( ) Road repair ( ) production
Building repair ( ) resource
Develop institutional ( )
Cost Estimate of Adjustments:
No estimate available.
Pipeline repair ( ) Oevelop alt. 0
Land Filling ( x ) Law suits 0
fr~rnevork Some Fields Relevelled
Source(s): Response to International Survey on Land Subsidence, Wayne Moffitt, Project Geologist, Bureau of Reclamation, Yuma, Arizona, USA. 1-23-76. Publication: U . S . Bureau of Reclamation, Yuma Project, 1940, Annual Report.
t
B- 6
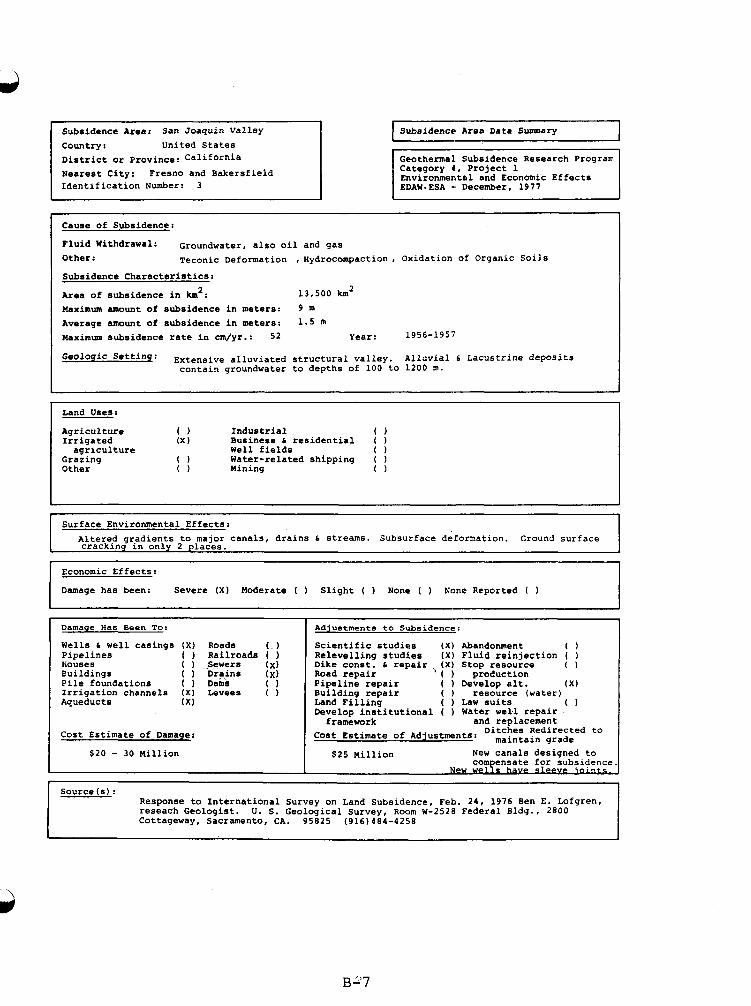
Subsidence Area: San Joaquin Valley Country : United States District or Province: California Nearest City: Fresno and Bakersfield Identification Number: 3
$ 2 0 - 30 Million
Subsidence Area Data Sununary 1
$ 2 5 Million New canals designed to nsate for subsidence
Geothermal Subsidence Research Prograr Category 4 , Project 1 Environmental and Economic Effects
Cause of Subsidence:
Fluid Withdrawal: Groundwater, also oil and gas Other: Teconic Deformation , Hydrocompaction, Oxidation of Organic Soils Subsidence Characteristics:
Area of subsidence in km2: Maximum amount of subsidence in meters: 9 m Average amount of subsidence in meters:
1 3 , 5 0 0 km2
1 . 5 m Maximum subsidence rate in cm/yr.: 5 2 year: 1956-1957
Setting: Extensive alluviated structural valley. Alluvial 6 Lacustrine deposits contain groundwater to depths of 100 to 1 2 0 0 m.
Land Uses:
Agriculture 0 Industrial 0 Irrigated (X 1 Business 6 residential (
agriculture Well fields 0 Grazing 0 Water-related shipping ( Other 0 Mining 0
Surface Environmental Effects:
cracking in only 2 places. Altered gradients to major canals, drains 6 streams. Subsurface deformation. Ground surface
Economic Effects:
Damage has been: Severe (XI Moderate ( 1 Slight ( ) None ( ) None Reported (
Damage H a s Been To: Adjustments to Subsidence:
Wells 6 well casings ( X ) Roads ( ) Pipelines f Railroads [ 1 tiouses ( Sewers (x) Buildings ( 1 Drains (x)
Irrigation channels ( X ) Levees ( ) Pile foundations ( ) Dahs 0 Aqueducts ( X I
Cost Estimate of DarnaE:
Scientific studies ( X ) Abandonment 0 Relevelling studies ( X I Fluid reinjection ( ) Dike const. 6 repair ( X I Stop resource ( Road repair ' ( production
Building repair ( resource (water)
Develop institutional ( Water wel.1 repair f ramevork and replacement
Cost Estimate of Adjustments: D i ~ ~ ~ , " : a ~ ~ d ~ ~ ~ ~ : e d to
Pipeline repair ( 1 Develop alt. ( X I
Land Filling ( ) Law suits 0
Source(s) : Response to International Survey on Land Subsidence, Feb. 2 4 , 1976 Ben E . LOfgren, reseach Geologist. U. S. Geological Survey, Room W-2528 Federal Bldg., 2 8 0 0 Cottageway, Sacramento, CA. 9 5 8 2 5 ( 9 1 6 ) 4 8 4 - 4 2 5 8
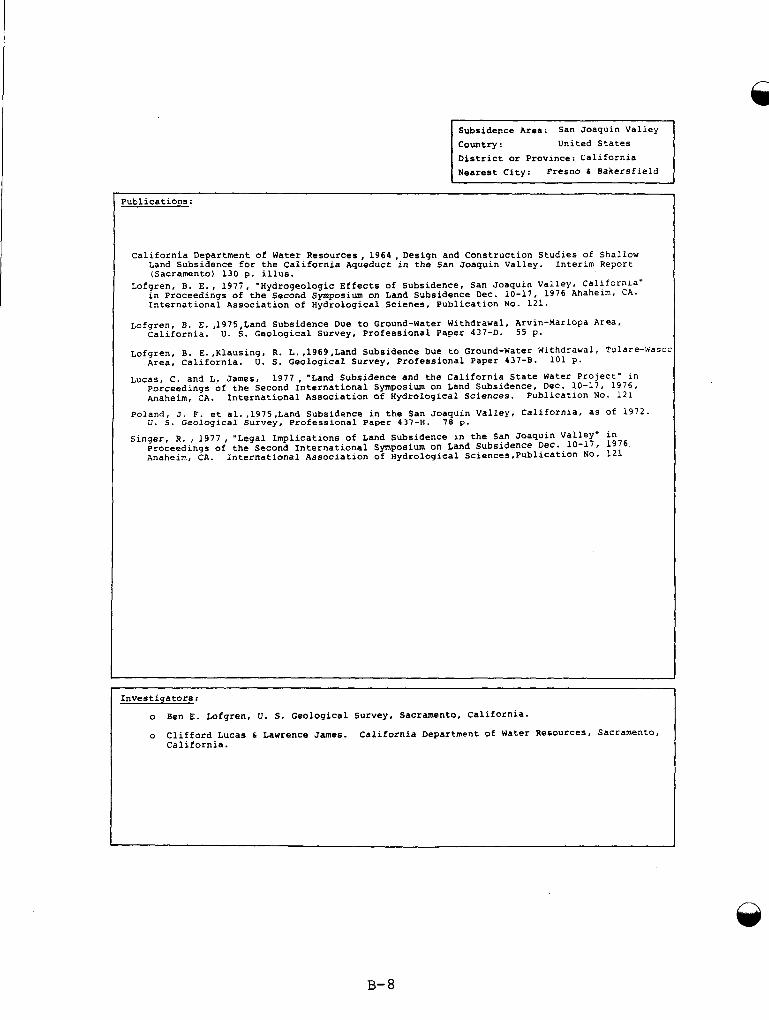
Subsidence Area: San Joaquin Valley
District or Province: California United States country:
Putlications:
California Department of Water Resources, 1964, Design and Construction Studies of Shallow
Lofgren, E. E., 1977, "Hydrogeologic Effects of Subsidence, San Joaquin Valley, California"
Land Subsidence for the California Aqueduct in the San Joaquin Valley. Interim Report (Sacramento) 130 p. illus.
in Proceedings of the Second Symposium on Land Subsidence Dec. 10-17, 1976 Ahahelm, CA. International Association of Hydrological Scienes, Publication NO. 121.
Lofgren, B. E. ,1975 Land Subsidence Due to Ground-Water Withdrawal, Arvin-Mariopa Area, California. W. 8 . Geological survey, Professional Paper 437-D. 5 5 p.
Lofgren, E. E.,Klausing, R. L..1969,Land Subsidence Due to Ground-Water Withdrawal, Tulare-Kascc Area, California. U. S. Geological Survey, Professional Paper 4 3 7 - 8 . 101 p.
Lucas, C. and L. James, 1977, "Land Subsidence and the California State Water Project" in Porceedings of the Second International Symposium on Land Subsidence, Dec. 10-17, 1976, Anaheim, CA. International Association of Hydrological Sciences. Publication No. 121
Poland. J. F. et al.,1975,Land Subsidence in the San Joaquin Valley, California, as of 1972. U. S. Geological Survey, Professional Paper 437-H. 7 8 p.
Singer, R. , 1977 ,"Legal Implications of Land Subsidence in the San Joaquin Valley" in Proceedings of the Second International Symposium on Land Subsidence Dec. 10-17, 1976 Anaheim, CA. International Association of Hydrological Sciences,Publication NO. 121
Investigators :
o
0 Clifford Lucas 6 Lawrence James. California Department of Water Resources, Sacramento,
Ben E. Lofgren, U. S. Geological survey, Sacramento, California.
California.
B- 8
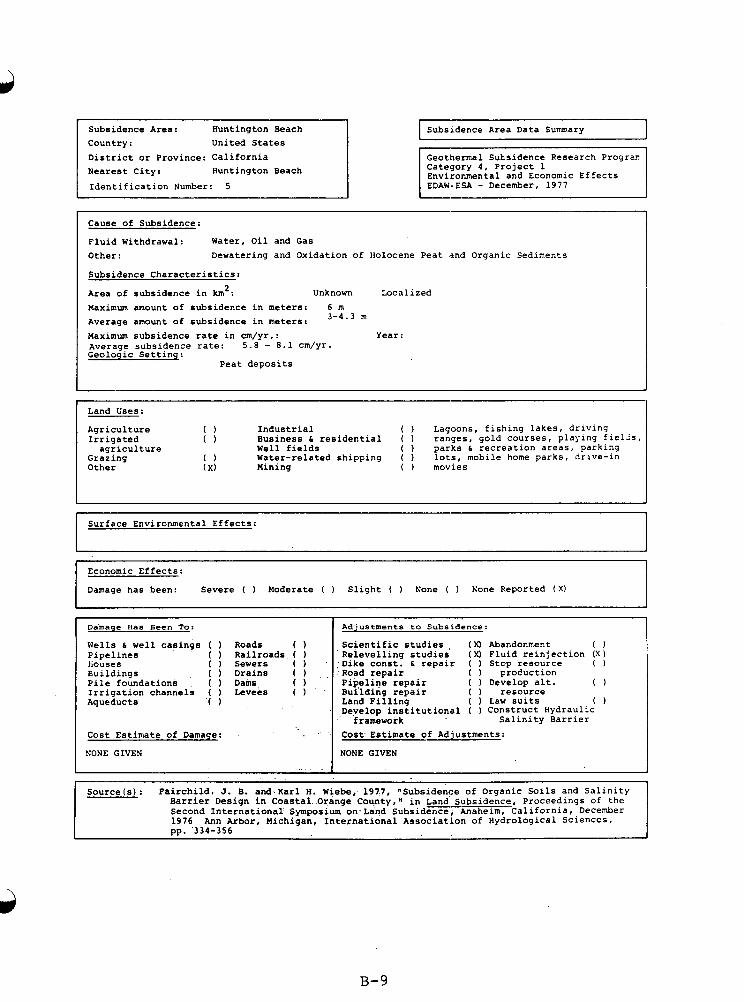
Country: United States District or Province: California Nearest City: Huntington Beach
Identification Number:
Damage Has Been To:
Subsidence Area Data Summary
Adjustments to Subsidence:
Category 4, Project 1 Environmental and Economic Effects EDAW-ESA - December, 1977
~~ ~ ~ ~~~~~~~~~~ ~ ~ ~~~~~ ~~ ~~~~ ~~~~~~ ~ ~
Cause of Subsidence:
Fluid Withdrawal: Water, Oil and Gas Other: Dewatering and Oxidation of Holocene Peat and Organic Sediments
Subsidence Characteristics:
Area of subsidence in km': Unknown Localized Maximum amount of subsidence in meters: 6 m Average amount of subsidence in meters: Maximum subsidence rate in cm/yr.: Year: Average subsidence rate: 5.8 - 8.1 cm/yr. Geologic Settine:
3 - 4 * 3
Peat deposits
Land Uses:
Irrigated 0 Business 6 residential ( ) ranges, gold courses, playing fielis, agriculture Well fields ( ) parks 6 recreation areas, parking
Grazing 0 Water-related shipping ( ) lots, mobile home parks, drive-in Other ( x) Mining ( 1 movies
Industrial ( ) Lagoons, fishing lakes, driving Agriculture 0
Surface Environmental Effects:
Wells 6 well casings ( ) Pipelines 0 Iiouses ( 1 Buildings 0 Pile foundations ( 1 Irrigation channels ( 1 Aqueducts 0
Cost Estimate of Damage:
Roads ( ) Railroads ( ) Sewers ( 1 Drains ( )
Levees ( ) Dams, 0
Scientific studies 'Relevelling studies Dike const. 6 repair Road repair Pipeline repair Bui'lding repair Land Filling Develop institutional
framework
( XI Abandonment 0 ( X I Fluid reinjection ( X ) ( 1 Stop resource ( ) ( production ( ) Develop alt. 0 ( 1 resource ( ) Law suits 0 ( ) Construct Hydraulic
Salinity Barrier Cost Estimate of Adjustments:
I I NONE GIVEN I NONE GIVEN Sourcecs): Fairchild. J. B. and Karl H. Wiebe, 1977, "Subsidence of Organic Soils and Salinity
Barrier Design in Coastal Orange County," in Land Subsidence, Proceedings of the Second International Symposium on Land Suhsidence, Anaheim, California, December 1976 Ann Arbor, Michigan, International Association of HydrologiCal Sciences. pp. 334-356
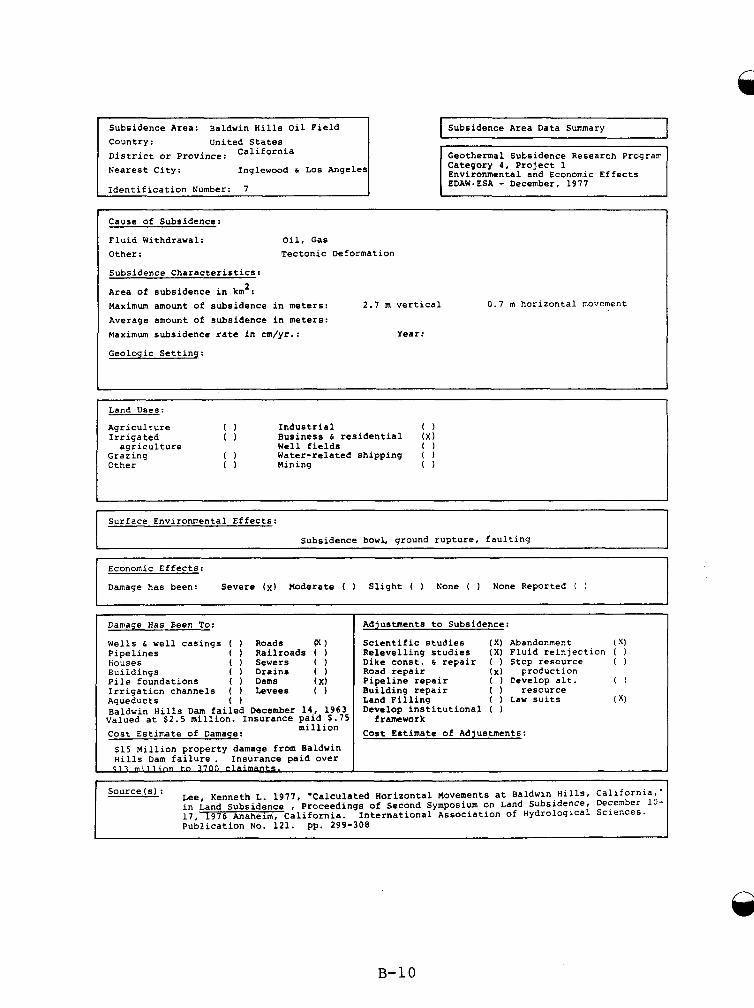
Subsidence Area Data Summary United States
District or Province: Nearest City: Inglewood 6 Los Angeles Category 4, Project 1
Environmental and Economic Effects EDAWeESA - December, 1977
Cause of Subsidence:
Fluid Withdrawal: Oil, Gas Other: Tectonic Deformation
Subsidence Characteristics:
Area of subsidence in kin :
Maximum amount of subsidence in meters: Average amount of subsidence in meters: Maximum subsidence rate in cm/yr.: Year:
Geologic Settinq:
2
2.7 m vertical 0.7 m horizontal movement
Land Uses: I Agriculture 0 Industrial 0
agriculture Well fields 0
Other 0 Mining 0
Irrigated 0 Business 6 residential ( X )
Grazing 0 Water-related shipping ( )
Surface Environmental Effects:
Subsidence bowl, ground rupture, faulting
Economic Effects:
Damage has been: Severe ( x ) Moderate ( ) Slight ( None ( None Reported ( )
Damage Has 6een To:
Pipelines ( Railroads ( ) tiouses ( ) Sewers ( ) Buildings ( 1 Drains ( 1 Pile foundations ( Dams ( X I Irrigation channels ( ) Levees ( ) Aqueducts 0 Baldwin Hills Dam failed December 14, 1963 valued at $2.5 million. Insurance paid 5.75 Cost Estimate of Damage:
Wells 6 well casings ( ) Roads p c )
mil 1 ion
$15 Million property damage from Baldwin Hills Dam failure. Insurance paid over 917 1 1 7 to 3700 claimants. . .
Adjustments to Subsidence:
Scientific studies Relevelling studies Dike const. 6 repair Road repair Pipeline repair Building repair Land Filling Develop institutional
framework
( X ) Abandonment ( )o ( X ) Fluid reinjection ( ) ( ) Stop resource ( 1 ( x ) production ( ) Develop alt. 0 ( ) resource ( ) Law suits ( X) 0
Cost Estimate of Adjustments:
Source (s) : Lee, Kenneth L. 1977, "Calculated Horizontal Movements at Baldwin Hills, California," in Land Subsidence , Proceedings of Second Symposium on Land Subsidence, December 10- 17, 1976 Anaheim, California. Publication No. 121. pp. 299-308
International AssOCiation of Hydrological Sciences.
A
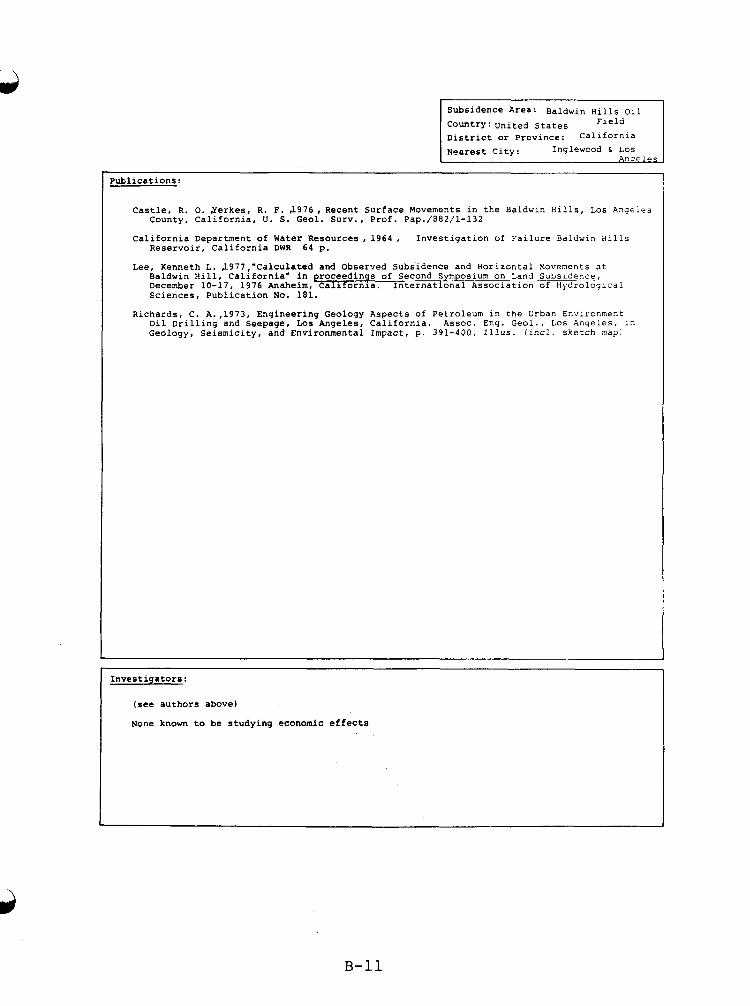
Contry: United States F1eld District or Province: California Nearest City: Inglewood 5 Los
Investigators:
(see authors above)
None known to be studying economic effects
I
Publications:
Castle, R . 0. ,Yerkes, R . F. J976, Recent Surface Movements in the Baldwin Hills, Los Angeles County, California, U. S. Geol. Surv., Prof. Pap./882/1-132
California Department of Water Resources, 1964 , Investigation of Failure Baldwin Hills Reservoir, California DWR 64 p.
Lee, Kenneth L. J977,”Calculated and Observed Subsidence and Horizontal Movements at Baldwin Hill, California” in roceedings of Second Symposium on Land Subsldence, December 10-17, 1976 Anaheim,‘California. Sciences, Publication No. 181.
International Association of Hydrological
Richards, C. A.,1973, Engineering Geology Aspects of Petroleum in the Urban Environment Oil Drilling and Seepage, L o s Angeles, California. Assoc. Eng. Geol., Los Angeles, 12 Geology, Seismicity, and Environmental Impact, p . 391-400, Illus. (incl. sketch mapi
B-11
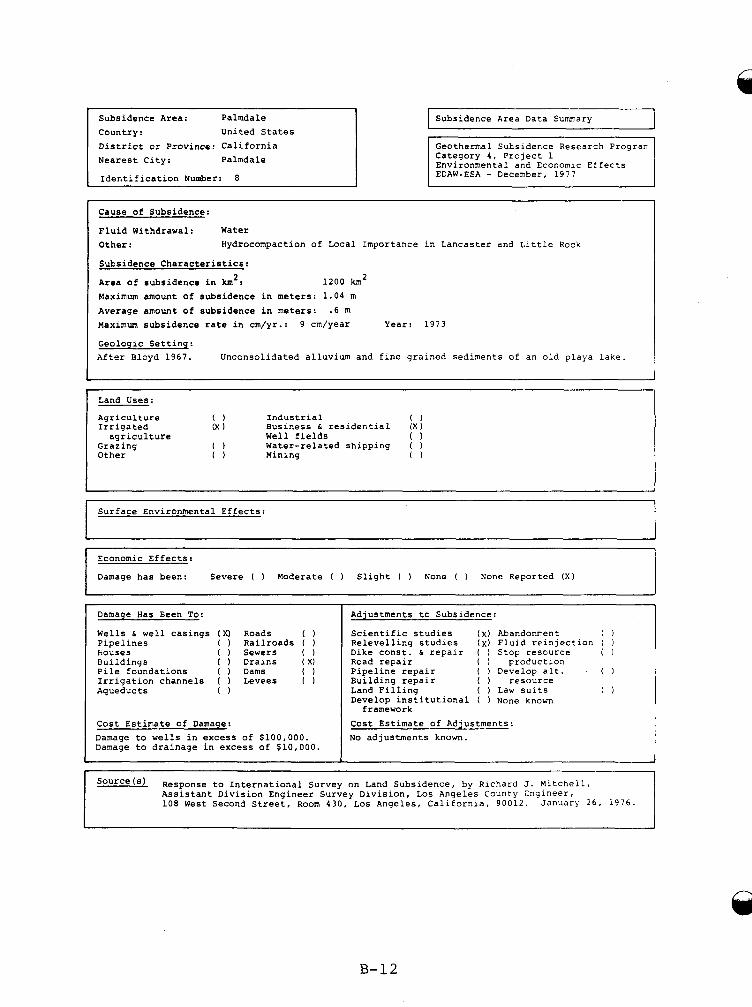
A
Subsidence Area: Palmdale Country : United States District or Province: California Nearest City: Palmdale
Identification Number:
I I Subsidence Area Data Summary Geothermal Subsidence Research Prograrr Category 4 , Project 1 Environmental and Economic Effects
Cause of Subsidence:
Fluid Withdrawal: Water Other: Hydrocompaction of Local Importance in Lancaster and Little Rock
Subsidence Characteristics:
Area of subsidence in km2: 1 2 0 0 km2
Maximum amount of subsidence in meters: 1.04 m Average amount of subsidence in meters: .6 m Maximum subsidence rate in cm/yr.: 9 cm/year Year: 1973
Geologic Settinq: After Bloyd 1967. Unconsolidated alluvium and fine grained sediments of an old playa lake.
Land Uses:
Agriculture 0 Industrial 0
agriculture Well fields ( 1
Other 0 Mining 0
Irrigated Ix) Business & residential ( X I
Grazing 0 Water-related shipping ( )
Surface Environmental Effects:
Economic Effects:
Damage has been: Severe ( 1 Moderate ( Slight ( ) None ( ) None Reported ( X )
Damage Has Been To:
Wells 6 well casings ( X ) Roads 0 Pipelines ( ) Railroads ( ) houses ( 1 Sewers ( 1 Buildings ( 1 Drains ( X I Pile foundations ( ) Dams 0 Irrigation channels ( 1 Levees ( 1 Aqueducts 0
Cost Estimate of Damage: Damage to wells in excess of $100,000. Damage to drainage in excess of $10,000.
Adjustments to Subsidence:
Scientific studies ( x ) Abandonment 0 Relevelling studies ( x ) Fluid reinjection ( ) Dike const. 6 repair ( 1 Stop resource ( ) Road repair
0 Pipeline repair Building repair ( 1 resource Land Filling ( ) Law suits 0 Develop institutional ( ) None known
Cost Estimate of Adjustments: No adjustments known.
( ) Froeuction ( ) Cevelop alt.
framework
Source(s1 Response to International Survey on Land Subsidence, by Richard J. Mitchell, Assistant Division Engineer Survey Division, Los Angeles County Engineer, 108 West Second Street, Room 4 3 0 , Los Angeles, California, 90012. January 2 6 . 1976.
B-12
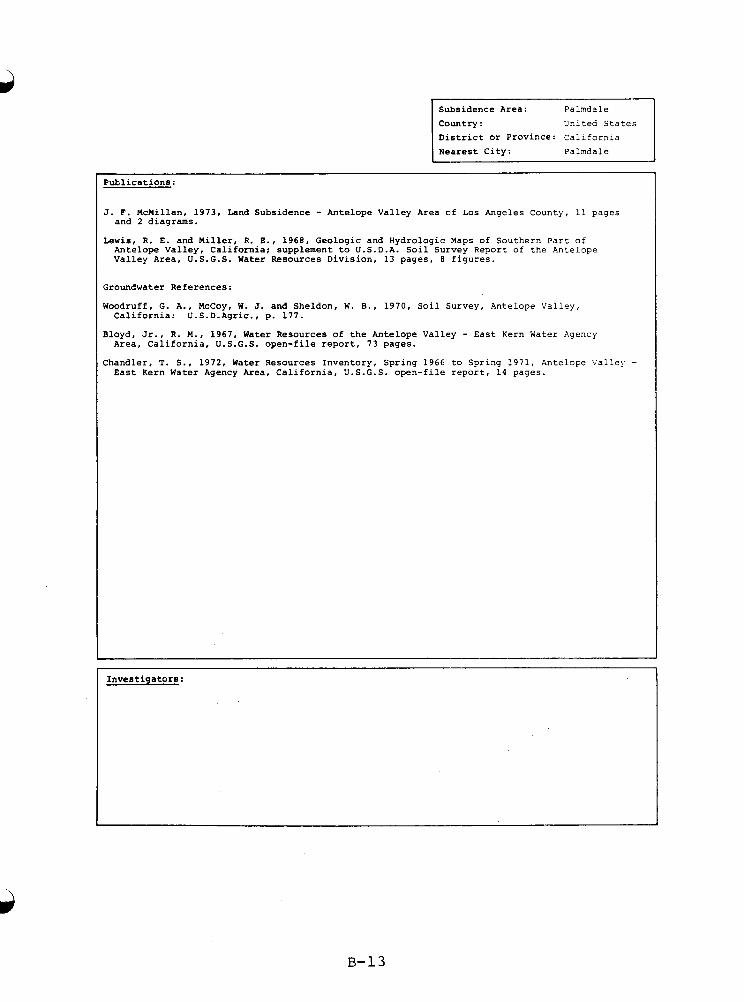
country: United States District or Province: California Nearest City: Palmdale
Publications:
J. F. McMillan, 1973, Land Subsidence - Antelope Valley Area of Los Angeles County, 11 pages and 2 diagrams.
Lewis, R . E. and Miller, R. E., 1968, Geologic and Hydrologic Maps of Southern Part of Antelope Valley, California; supplement to U.S.D.A. Soil Survey Report of the Antelope Valley Area, U.S.G.S. Water Resources Division, 13 pages, 8 figures.
Groundwater References:
Woodruff, G. A. , McCoy, W. J. and Sheldon, W. B., 1970, Soil Survey, Antelope Valley, California: U.S.D.Agric., p. 177.
Bloyd, Jr., R . M., 1967, Water Resources of the Antelope Valley - East Kern Water Agency
Chandler, T. S.. 1972, Water Resources Inventory, Spring 1966 to Spring 1971, Antelope Valley - Area, California, U.S.G.S. open-file report, 73 pages.
East Kern Water Agency Area, California, U.S.G.S. open-file report, 14 pages.
Investigators:
B-13
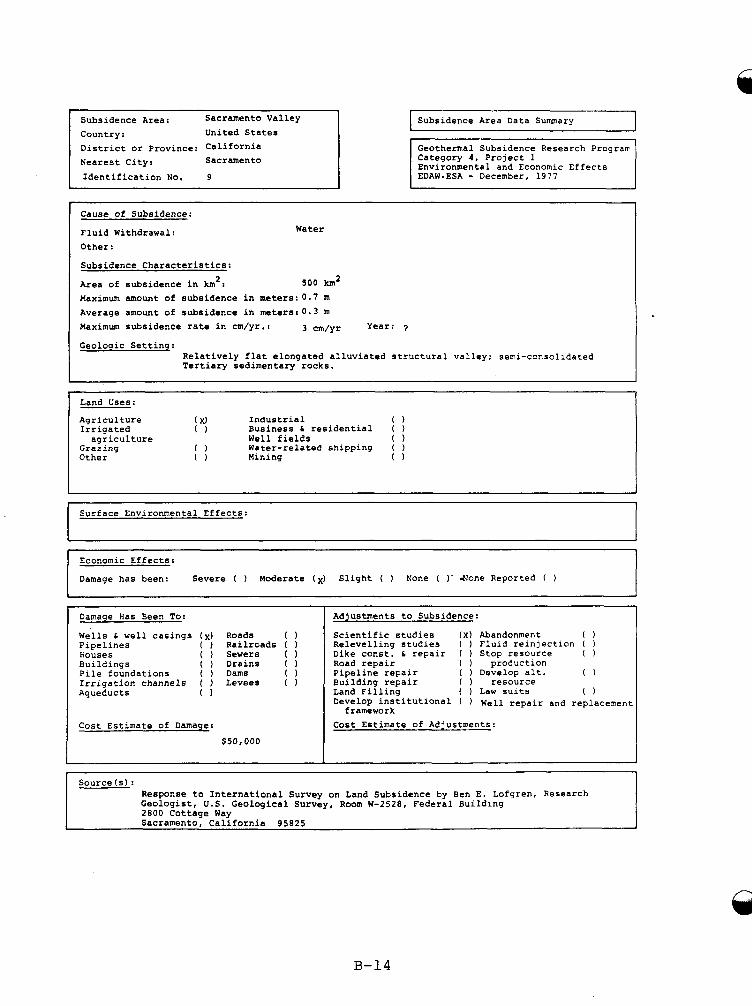
Country: United States District or Province: California Nearest City: Sacramento
Identification No.
I
Subsidence Area Data Summary I
I
Geothermal Subsidence Research Prograrr Category 4, Project 1 Environmental and Economic Effects EDAW-ESA - December, 1977
I
Economic Effects:
Damage has been: Severe ( ) Moderate (x) Slight ( ) None ( 1- d o n e Reported ( )
Cause of Subsidence:
Fluid Withdrawal: Other:
Subsidence Characteristics:
Water
Area of subsidence in km': 900 km2 Maximum amount of subsidence in meters: 0.7 m Average amount of subsidence in meters:0.3 m Maximum subsidence rate in cm/yr.: 3 cm/yr Year: ?
Geologic Setting: Relatively flat elongated alluviated structural valley: semi-consolidated Tertiary sedimentary rocks.
Land Uses:
Irrigated 0 Business h residential ( )
Grazing 0 Water-related shipping ( )
Agriculture ( X I Industrial 0
agriculture Well fields 0
Other 0 Mining 0
Surface Environmental Effects: I
Damage Has Geen To:
We'lls 6 well casings ( x ) Roads ( 1 Pipelines ( ) Railroads ( 1 Louses ( ) Sewers ( ) Buildings ( ) Drains ( ) Pile foundations ( ) Dams 0 Irrigation channels ( 1 Levees ( Aqueducts 0
Cost Estimate of Damage: $50,000
Adjustments to Subsidence:
Scientific studies ( X I Abandonment 0 Relevelling studies ( Fluid reinjection ( ) Dike const. 6 repair ( Stop resource ( ) Road repair ( ) production
Building repair ( resource
Develop institutional ( ) Well repair and replacement
Cost Estimate of Adjustments:
Pipeline repair ( ) Develop alt. 0
Land Filling ( ) Law suits 0
framework
Source ( 5 ) : Response to International Survey on Land Subsidence by Ben E. Lofgren, Research Geologist, U.S. Geological Survey, Room W-2528, Federal Building 2800 Cottage Way Sacramento, California 95825
B-14
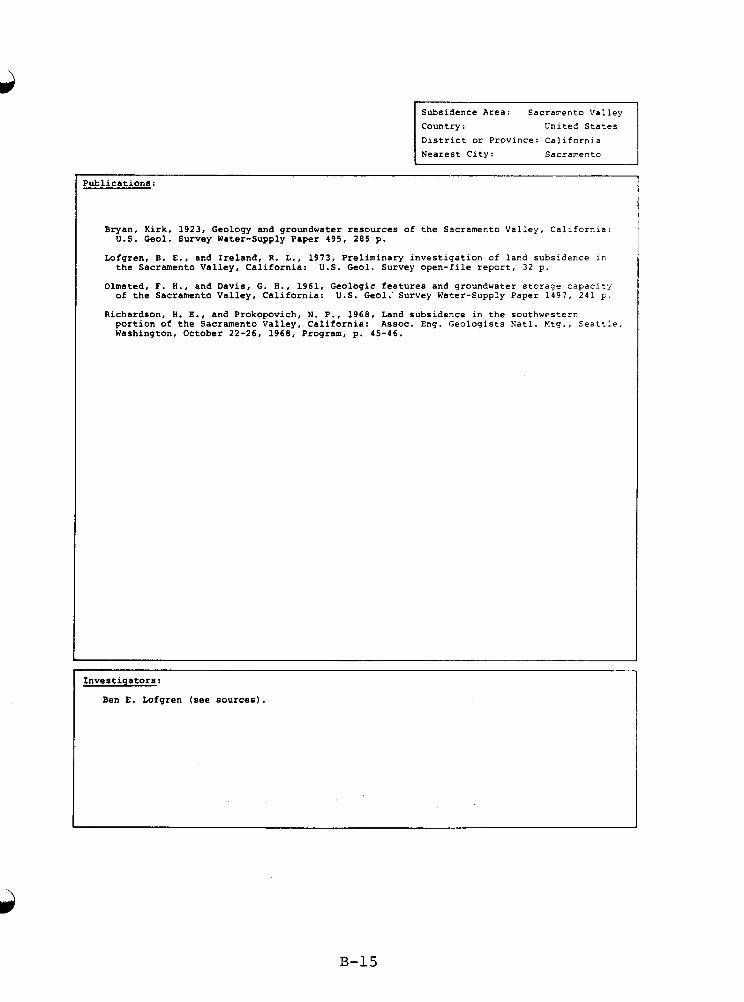
Country : United States District or Province: California Nearest City: Sacramento
Publications:
Bryan, Kirk, 1923, Geology and groundwater resources of the Sacramento Valley, California: U.S. Geol. Survey Water-Supply Paper 495, 285 p.
the Sacramento Valley, California: U.S. Geol. Survey open-file report, 32 p.
Olmsted, F. H., and Davis, G. H., 1961, Geologic features and groundwater storage capacity of the Sacramento Valley, California: U.S. Geol.'Survey Water-Supply Paper 1497, 241 p.
Lofgren, B. E., and Ireland, R. L., 1973, Preliminary investigation of land subsidence i n
Richardson, H. E., and Prokopovich, N. P., 1968, Land subsidence in the southwestern portion of the Sacramento Valley, California: ASSOC. Eng. Geologists Natl. Mtg., Seattle, Washington, October 22-26, 1968, Program, p. 45-46.
Investigators:
Ben E. Lofgren (see sources).
B-15
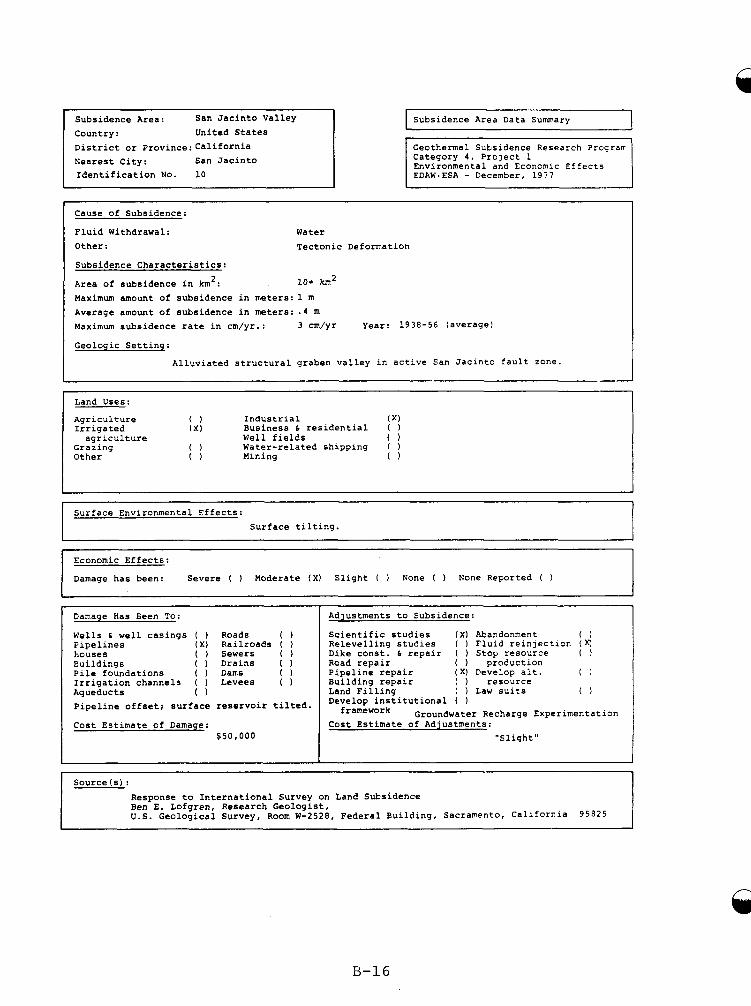
Subsidence Area: San Jacinto Valley Country: United States District or Province:California Nearest City: San Jacinto Identification No. 10
Subsidence Area Data Summary 1
Category 4, Project 1 Environmental and Economic Effects EDAWaESA - December, 1977
Cause of Subsidence:
Fluid Withdrawal: Water Other: Tectonic Deformation
Subsidence Characteristics:
Area of subsidence in km': 10+ km2
Maximum amount of subsidence in meters:l m Average amount of subsidence in meters: . 4 m Maximum subsidence rate in cm/yr.: 3 cm/yr Year: 1938-56 (average)
Geologic Setting:
Alluviated structural graben valley in active San Jacinto fault zone.
Land Uses:
Irrigated ( X ) Business 6 residential ( )
Grazing 0 Water-related shipping ( )
Agriculture 0 Industrial ( X )
agriculture Well fields 0
Other 0 Mining 0
I J
Surface Environmental Effects: I Surface tilting.
Economic Effects:
Damage has been: Severe ( Moderate ( X I Slight ( ) None ( ) Kone Reported ( )
I Damage Has Been TO: I Adjustments to Subsidence: I Wells 6 well casings ( ) Roads 0 Pipelines ( X ) Railroads ( ) liouses ( ) Sewers ( Euildings ( ) Drains ( ) Pile foundations ( ) Dams 0 Irrigation channels ( ) Levees ( ) Aqueducts 0 Pipeline offset: surface reservoir tilted.
Cost Estimate of Damage: $50,000
Scientific studies ( X I Abandonment 0 Relevelling studies ( Fluid reinjection ( x ) Dike const. 6 repair ( ) Stop resource ( ) Road repair ( production Pipeline repair ( X I Develop alt. 0 Building repair ( ) resource Land Filling ( ) Law suits 0 Develop institutional ( )
Cost Estimate of Adjustments: framework Groundwater Recharge Experimentation
" S 1 igh t "
Source (s) : Response to International Survey on Land Subsidence Ben E. Lofgren, Research Geologist, U . S . Geological Survey, Room W-2528, Federal Building, Sacramento, California 95825
B-16
Subsidence Area: San Jacinto Valley country: United States District or Province:California I Nearest City: San Jacinto
Put;lications:
Fett, J. D., Hamilton, D. H., and Fleming, F. A . , 1967, Continuing surface displacements along the Casa Loma and San Jacinto faults in San Jacinto Valley, Riverside County, California: Eng. Geol., V. 4, No. 1, p. 22-32.
Lofgren, 8. E., 1976, Land subsidence and aquifer-system compaction in the San Jacinto Valley, Riverside County, California -- A progress report: U.S. Geol. Survey Journal of Research, V. 4, No. 1, February 1976, p. 9-18.
Lofgren, 8. E., and Rubin, Meyer, 1975, Radiocarbon dates indicate rates of graben downfaultin?, San Jacinto Valley, California: U . S . Geol. Survey Journal of Research, V. 3, No. 1, p. 45-46.
aquecudt trench near San Jacinto, California: Geol. SOC. America Bull., V. 73, p. 1293-1296.
Proctor, R. J., 1974, New localities for fault creep in southern California -- Rayrond and Casa
Proctor, R. J., 1962, Geologic features of a section across the Casa Lona fault, exposed in an
Loma faults: Cordilleran Section, 70th Ann. Mtg., Geol. SOC. America, Las Vegas, Sevada, 1974, Abst. with Prog., p. 238.
Geol. SOC. America Bull., V. 78, No. 6, p. 705-730. Sharp, R. V., 1967, San Jacinto fault zone in the Peninsular Ranges of Southern California:
Sharp, R. V., 1972, Map showing recently active breaks along the San Jacinto fault zone between San Bernardino area and Borrego Valley, California: U . S . Geol. Survey Misc. Geologic Inv., Map 1-675, Sheet 2 of 3.
Waring, G. A . , 1919, Groundwater in the San Jacinto and Temecula basins, California: U . S . Geol. Survey Water Supply Paper 429, p. 113.
Woodford, A . O., Shelton, J. S., Doehring, D. O., and Morton, D. K., 1971, Pliocene-Pleistocece history of the Perris Block, Southern California: Geol. SOC. America Bull., V . 82, No. 12, p. 3421-3448.
Investigators :
Ben E. Lofgren (see sources).
B-17
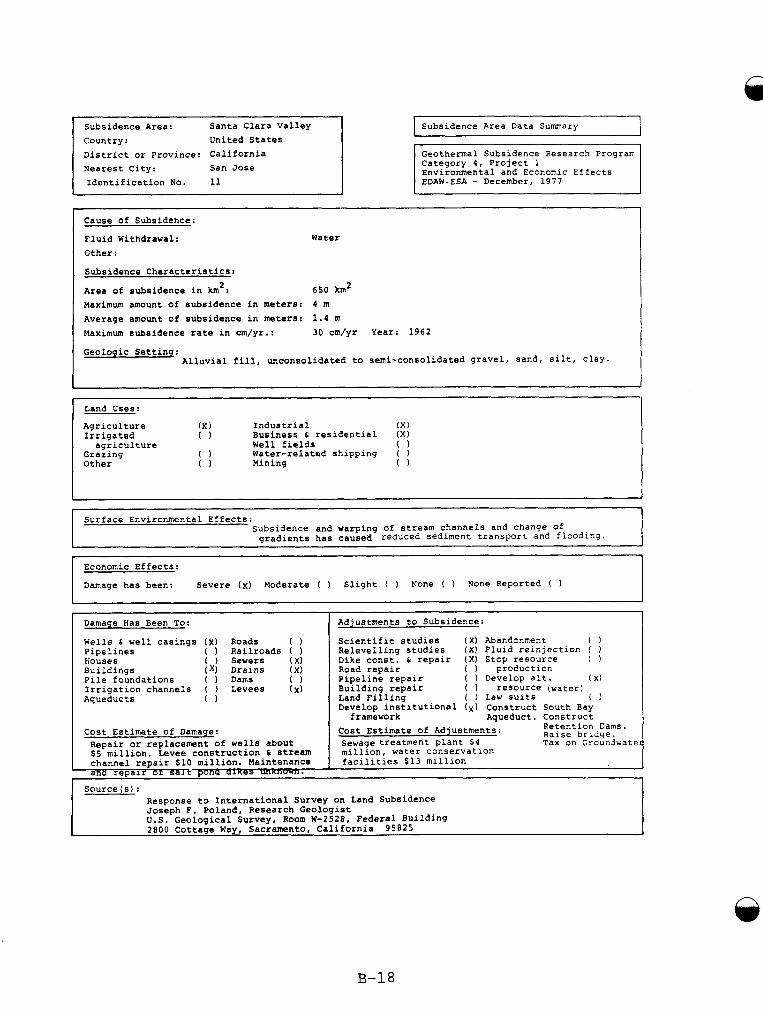
Country: United States District or Province: California Nearest City: Sen Jose Identification No.
r
Cause of Subsidence:
Fluid Withdrawal: Water Other:
Subsidence Characteristics:
Area of subsidence in km : Maximum amount of subsidence in meters: 4 m Average amount of subsidence in meters: 1.4 m Maximum subsidence rate in CIn/yr.: 30 cm/yr Year: 1962
650 kmZ 2
Subsidence Area Data Summary
Economic Effects:
Damage has been: Severe (x) Moderate ( ) Slight ( ) None ( ) None Reported ( 1
Damage Has Seen To: Adjustments to Subsidence:
Wells 6 well casings (x) Roads 0 Scientific studies ( X ) Abandonment 0 Pipelines ( Railroads ( ) Relevelling studies ( X ) Fluid rein~ection I ) houses ( 1 Sewers (XI Dike const. & repair ( X ) Stop resource ( 1 Buildings ( x ) Drains ( X ) Road repair ( ) production Pile foundations ( ) Dams 0 Pipeline repair ( ) Develop alt. ( x) Irrigation channels ( ) Levees (x) Building repair ( 1 resource (water) Aqueducts 0 Land Filling ( ) Law suits 0
Develop institutional ( x ) Construct South Bay framework Aqueduct. Construct
Retention Dams.
Tax on Groundwater Cost Estimate of Damage: Cost Estimate of Adjustments: Raise bridge. Repair or replacement of wells about $ 5 million. Levee construction 6 stream million, water conservation channel repair $10 million. Maintenance ana repair or salt pona O l r e - r m X m w n .
Sewage treatment plant $4
facilities f13 million
Source (s) : Response t3 International Survey on Land Subsidence Joseph F. Poland, Research Geologist U.S. Geological Survey, Room W-2528, Federal Building 2800 Cottage Way, Sacramento, California 95825
Geothermal Subsidence Research Prograrr Category 4, Project 1 Environmental and Economic Effects EDAW-ESA - December, 1977
Settin':Alluvial fill, unconsolidated to semi-consolidated gravel, sand, silt, clay. I I
I Land Uses:
Irrigated 0 Business & residential ( X )
Grazing 0 Water-related shipping ( )
Agriculture I X i Industrial ( X )
agriculture Well fields 0
Other 0 Mining 0
I
A
Surface Environmental Effects: Subsidence and warping of stream channels and change Of gradients has causea reduced sediment transport and flooding.
B-18
Subsidence Area: Santa Clara valley country : District OK Province: California Nearest City: San Jose
United States
Publications:
California State Water Resources Board, 1955, Santa Clara Valley Investigation: Bull. no.7,
California Department of Water Resources, 1967, Evaluation of ground-water resources, South
Hunt, G. W., 1940,Description and results of operation of the Santa Clara Valley Water
Poland, J. F., and Green, J. H., 1962, Subsidence in the Santa Clara Valley, California--
Poland, J. F., 1977 "Land Subsidence Stopped by Artesian-Head Recovery", Proceedings of
154 p.
Bay: Bull. No. 118-1, Appendix A, Geology, 153 p.
Conservation Districts project: Am. Geophys. Union Trans., pt. 1, p. 13-22.
A progress report: U. S. Geol. Survey Water-Supply Paper 1619-C, 16 p.
Second Symposium on Land Subsidence. December 10-17 , 1976 Anaheim, California International Association of Hydrological Sciences. Publication No. 121
A progress report: U. S. Geol. Survey Water-Supply Paper 1619-C, 16 p.
v. 59, no.1, p. 80-88.
Poland, J. F., and Green, J. H., 1962, Subsidence in the Santa Clara Valley, California--
Roll, J. R., 1967, Effect of subsidence on well fields: Am. Water Works ASSOC. Jour.,
Investigators:
Joseph F. Poland (See Sources)
Contacts
Santa Clara Valley Water District
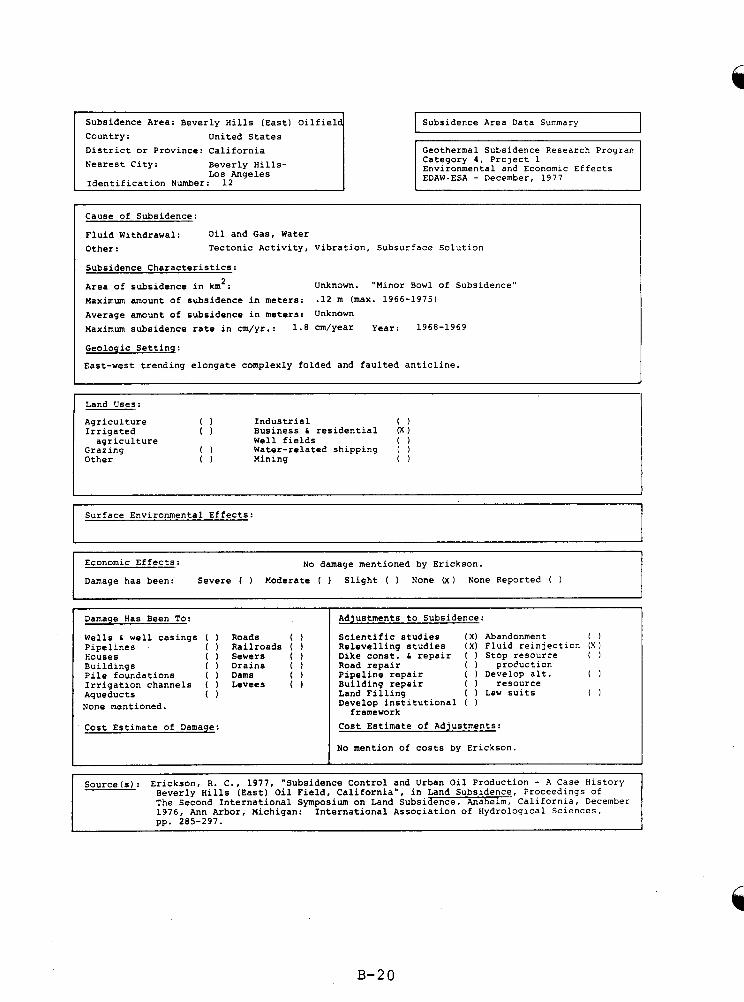
n
Country: United States District or Province: California Nearest City: Beverly Hills-
Identification Number: Los Angeles
Subsidence Area Data Summary
Geothermal subsidence Research Prograrr Category 4, Project 1 Environmental and Economic Effects EDAW-ESA - December, 1977
Cause of Subsidence:
Fluid Withdrawal: Oil and Gas, Water Other: Tectonic Activity, Vibration, Subsurface Solution
Subsidence Characteristics:
Area of subsidence in km2: Unknown. "Minor Bowl of Subsidence"
Maximum amount of subsidence in meters: .12 in (maX. 1966-1975) Average amount of subsidence in meters: Unknown Maximum subsidence rate in cm/yr.: 1 . 8 cm/Year Year: 1968-1969
Geologic Settinq:
East-west trending elongate complexly folded and faulted anticline.
I Land Uses:
Agriculture 0 Industrial 0
agriculture Well fields 0
Other 0 Mining 0
Irrigated 0 Business 6 residential ( X )
Grazing 0 Water-related shipping ( 1
I Surface Environmental Effects: I
Economic Effects:
Damage has been: Severe ( ) Moderate ( ) Slight ( ) None ( x ) None Reported (
No damage mentioned by Erickson.
Damage Has Been TO:
Wells 6 well casings ( ) Roads 0 Pipelines ( ) Railroads ( houses ( ) Sewers ( ) Buildings ( I Drains ( ) Pile foundations ( ) Dams 0 Irrigation channels ( ) Levees ( 1 Aqueducts 0 None mentioned.
Cost Estimate of Damage:
Adjustments to Subsidence:
Scientific studies ( X ) Abandonment 0 Relevelling studies ( X ) Fluid reinjection ( X ) Dike const. 6 repair ( ) Stop resource ( ) Road repair ( ) production
Building repair ( ) resource
Develop institutional ( )
Cost Estimate of Adjustments:
No mention of costs by Erickson.
Pipeline repair ( ) Develop alt. 0
Land Filling ( ) Law suits 0
framework
Source(s): Erickson, R. C., 1977, "Subsidence Control and Urban Oil Production - A Case History Beverly Hills (East) Oil Field, California", in Land Subsidence, Proceedings of The Second International Symposium on Land Subsidence, Anaheim, California, December 1976, Ann Arbor, Michigan: International Association of Hydrological Sciences, DD. 285-297.
B-20
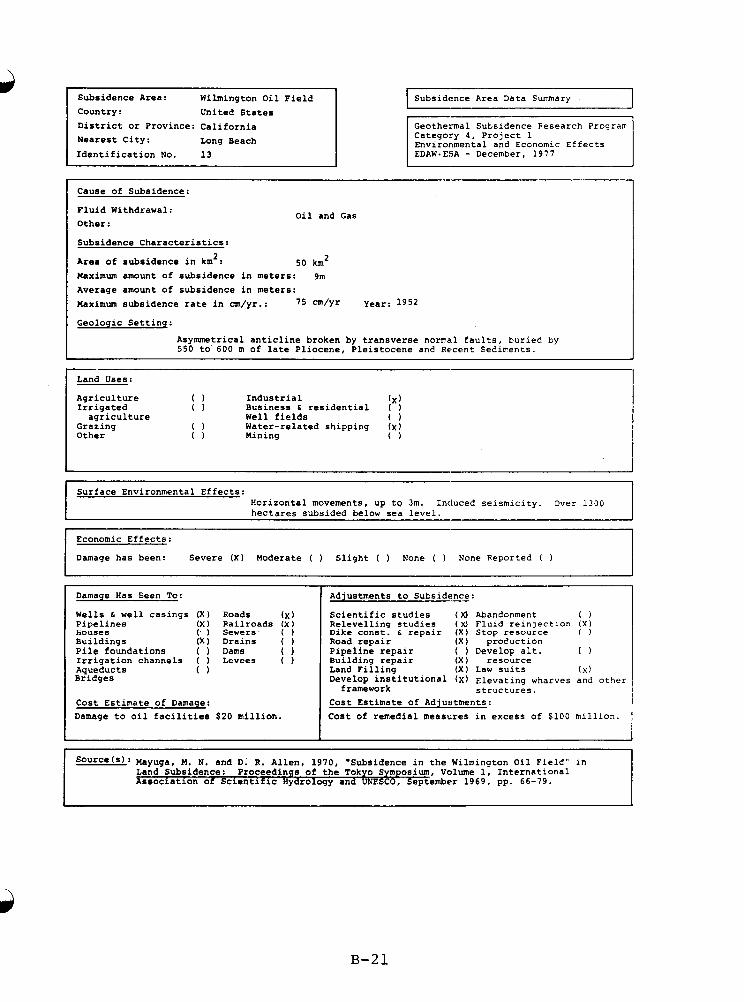
Subsidence Area: Wilmington Oil Field Country: United States District or Province: California Nearest City: Long Beach Identification No. 13
1 I Subsidence Area Data Summary Geothermal Subsidence Research Prograr Category 4, Project 1 Environmental and Economic Effects
Cause of Subsidence:
Fluid Withdrawal: Other:
Subsidence Characteristics:
Area of subsidence in km2: Maximum mount of subsidence in meters: 9m Average amount of subsidence in meters: Maximum subsidence rate in cm/yr.: '5 a / Y r Year: 1 9 5 2
Geologic Settinq:
Oil and Gas
50 km2
Asymmetrical anticline broken by transverse n o m a 1 faults, buried by 550 to'600 m of late Pliocene, Pleistocene and Recent Sediments.
Land Uses:
Agriculture ( 1 Industrial ( X )
agriculture Well fields 0
Other 0 Mining 0
Irrigated 0 Business 6 residential ( )
Grazing 0 Water-related shipping ( x )
Surface Environmental Effects: Horizontal movements, up to 3m. Induced seismicity. Over 1300 hectares subsided below sea level.
Economic Effects:
Damage has been: Severe ( X ) Moderate ( ) Slight ( ) None ( ) None Reported (
I I Damage Has Been To: I Adjustments to Subsidence: Wells 6 well casings ( X I Roads (XI Pipelines ( X I Railroads ( X ) houses ( ) Sewers- ( 1 Buildings ( X ) Drains ( )
Irrigation channels ( 1 Levees (
Bridges
Cost Estimate of Damage: Damage to oil facilities $20 million.
Pile foundations ( Dams 0
Aqueducts 0
Scientific studies ( X I Abandonment 0 Relevelling studies (XI Fluld rein]ectlon (X) Dike const. 6 repair (X ) Stop resource ( 1 Road repair ( X I proBuction
Building repair ( X ) resource
Develop institutlonal ( X ) Elevating wharves and other
Cost Estimate of Adjustments: Cost of remedial measures in excess of $100 million.
Pipeline repair ( ) Develop alt. 0
Land Filling ( X I Law suits (XI
f rarnework structures.
1 I I
Source(s): Mayuga, M. N. and D. R. Allen, 1970, 'Subsidence in the Wilmington Oil Field" in Land Subsidence: Proceedings of the Tokyo Symposium, Volume 1, International Association of Scientific Hydrology and UNESCO, September 1969, pp. 66-79.
B-21
United States Country : District or Province: California Nearest City: Long Peach
~ ~ ~~
Putlications:
Allen, D. R., Chilingar, G. C., Sawabini, C. T., Mayuga, M. N., 1971, Study and Prevention of Subsidence. (Translated by) Dept. of Oil Properties, Long Beach, Calif., 1971, 21 p . , Translated from Encyclopedia Della Scienza e Della Teonica Mondadcri, Annuario Della Est.
Allen, D. R., Mayuga, M. N., 1970, The Mechanics of Compaction and Rebound, in Procee6iacs of the Tokyo Symposium on Land Subsidence, Vol. 2, International Association of Scientific Hydrology and UNESCO, September 1969, Tokyo, p. 410-423.
Production and O i l Field Subsidence, in Proceedings of the Tokyo Symposium on Land Sutside?.ce, Vol. 1, International Association of Scientific Hydrology and UNESCO, September 1969, p. 162.
Wilmington and Long Beach Offshore O i l Fields, Los Angeles County, Calif., M.S. Thesis, Cr.1~. of Southern California, Los Angeles, Calif., 1971, 198 p.
Review, 49:354-367.
in Wilmington Oil Field, California.
Huey, W. F., 1964, Subsidence and Repressuring in Wilmington Oil Field, Summary of Operaticns 5 0 ( 2 ) , Calif., Div. of Oil and Gas, Sacramento, California, 1964, p. 5-25.
Mayuga, M. N., 1965, How Subsidence Affects the City of Long Beach in the State of Califcrnia, The Resources Agency, Landslides and Subsidence, Geologic Hazards Conference, Los Bnqeles, California, p. 122-129.
California, in Proceedings of the Tokyo Symposium on Land subsidence, Vol. 1, International Association of Scientific Hydrology and UNESCO, September 1969, pp. 66-79.
Casile, R. U., Yerkes, R. F., Riley, F. S., 1970, A Linear Relationship Between Liquid
Colazas, 2 . C., 1971, Subsidence, Compaction of Sediments and Effects of Water Injection,
Compton, R. L., 1962, The Right to the Subjacent Support of Oil and Gas, California Law
Gates, G. L., Caraway, W . H., Lechtenberg, H . J., 1977, Problems in Injection of tiaters
Mayuga, M. N., Allen, D.,R., 1970, Subsidence in the Wilmington Oil Field, Long Beach,
Pierce, R. L., 1970, Reducing Land Subsidence in the Wilmington Oil Field by Use of Saline Waters, Water Resources Res., V. 6 ( 5 ) , p. 1505-1514.
Investigators:
Allen, D. R., Subsidence Engineer, City of Long Beach, Deparment of Oil Properties.
A
B-22
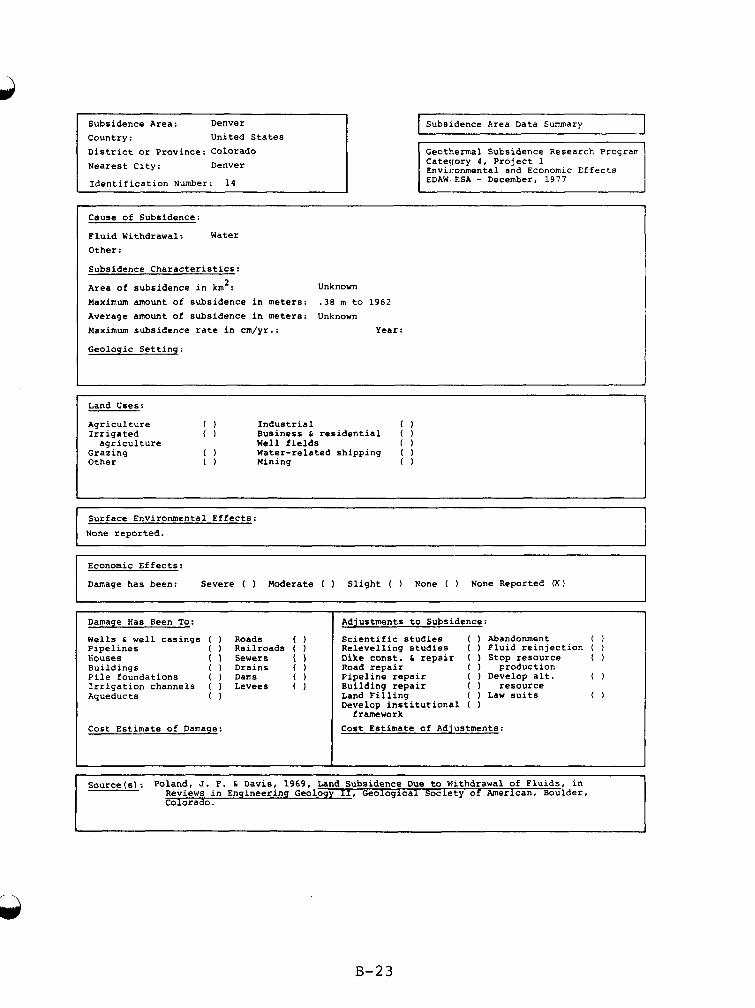
.
Subsidence Area: Denver Country : United States District or Province: Colorado Nearest City: Denver
Identification Number:
Subsndence Area Data Summary I Geothermal Subsidence Researct ProSrar Category 4, Prolect 1 Environmental and Economic Effects
Cause of Subsidence:
Fluid Withdrawal: Water Other:
Subsidence Characteristics:
Area of subsidence in km2: Maximum amount of subsidence in meters: .38 m to 1962 Average amount of subsidence in meters: Unknown Maximum subsidence rate in cm/yr.: Year:
Geologic Setting:
Unknown
Land Uses:
Agriculture 0 Industrial 0
agriculture Well fields 0
Other 0 Mining 0
Irrigated 0 Business 6 residential ( 1
Grazing 0 Water-related shipping (
Surface Environmental Effects: None reported.
Damage has been: Severe ( ) Moderate ( 1 Slight ( ) None ( ) None Reported 00
Economic Effects:
Damage Has Seen To:
Wells 6 well casings ( Roads 0 Pipelines ( 1 Railroads ( ) houses ( ) Sewers ( ) Buildings ( Drains ( ) Pile foundations ( ) Dams 0 Irrigation channels ( Levees ( Aqueducts 0
Cost Estimate of Damage:
Adjustments to Subsidence:
Scientific studies ( ) Abandonment 0 Relevelling studies ( ) Fluid reinjection ( ) Dike const. 6 repair ( ) Stop resource ( ) Road repair ( ) production Pipeline repair ( ) Develop alt. 0 Building repair ( 1 resource Land Filling ( Law suits 0 Develop institutional ( )
Cost Estimate of Adjustments: framework
Source(s): Poland, J. F. 6 Davis, 1969, Land Subsidence Due to Withdrawal of Fluids, in Reviews in Engineering Geology 11, Geological Society of American, Boulder, Colorado.
B-23
B-24
Subsidence Area: Denver country: United States District or Pr0vince:Colorado Nearest City: Denver
Publications:
Poland 6 Davis, 1969.
Miller, W. L., 1974, "Geothermal Energy and the Environment", in proceedings of A Slmposium on Geothermal Energy and Colorado, Denver, Colorado, United States, December 6 , 1973. Pearl, R. H. (ed.) Bureau of Mines, Washington, D. C.; Colorado Geological Survey, Denver 1 5 7 4 .
Investigators:
Hansen, W. R., U. S. Geological Survey, Denver, Colorado, "Denver Urban Corridor Studies". Period of performance: July 1974 to June 1975. Note: Project aims to derive maximum possible geotechnical information from existing available data.
A
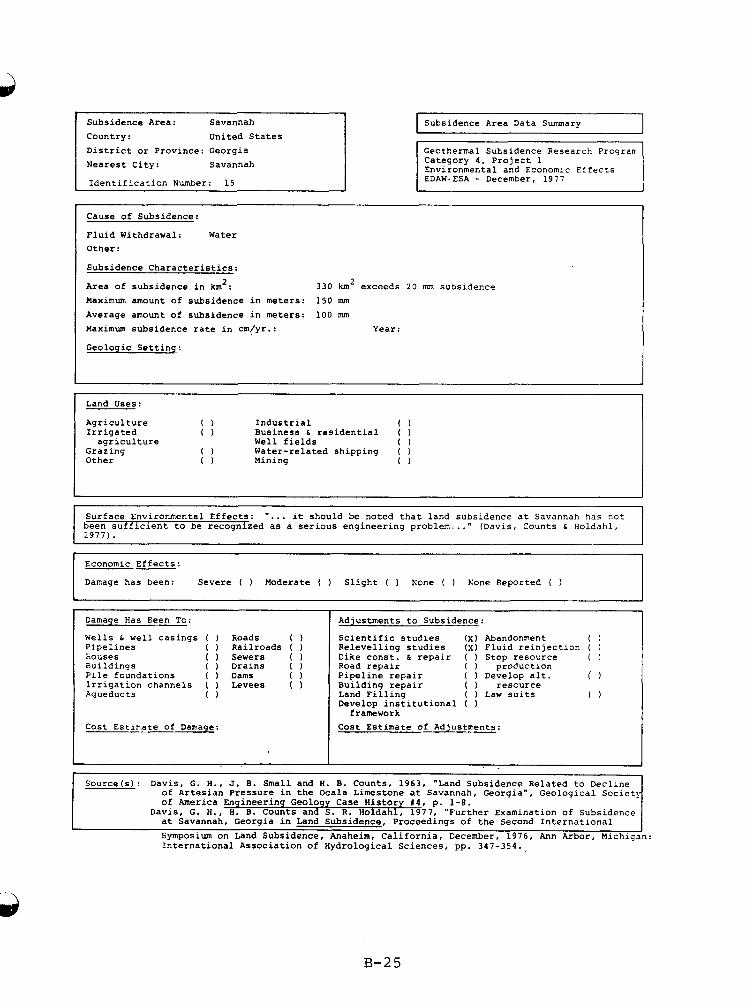
Country: United States District or Province: Georgia Nearest City: Savannah
Identification Number:
I Subsidence Area Data Summary I Geothermal Subsidence Research Prograrr Category 4, Project 1 Environmental and Economic Effects €DAW-ESA - December, 1977
Cause of Subsidence:
Fluid Withdrawal: Water Other:
Subsidence Characteristics:
Area of subsidence in km': Maximum amount of subsidence in meters: 150 mm Average amount of subsidence in meters: 100 nun Maximum subsidence rate in cm/yr.: Year:
Geologic Settinq:
330 km2 exceeds 2 0 mm subsidence
Land Uses:
Agriculture 0 Industrial 0 Irrigated 0 Business 6 residential ( )
agriculture Well fields 0 Grazing 0 Water-related shipping ( ) Other 0 Mining 0
Surface Environmental Effects: ' I . . . it should be noted that land been sufficient to be recognized as a serious engineering problem ..." (Davis, Counts 6 Holdahl, 1977).
Damage has been: Severe ( ) Moderate ( ) Slight ( ) Mone ( ) None Reported (
Economic Effects:
Damage Has Been To:
Wells 6 well casings ( ) Roads 0 Pipelines ( ) Railroads ( houses ( 1 Sewers ( ) Buildings ( ) Drains ( ) Pile foundations ( Dams 0 Irrigation channels ( ) Levees ( ) Aqueducts 0
Cost Estimate of Damage:
. .
Adjustments to Subsidence:
Scientific studies (x ) Abandonment 0 Relevelling studies ( x ) Fluid reinjection ( Dike const. 6 repair ( ) Stop resource ( 1 Road repair ( ) production Pipeline repair ( 1 Develop alt. 0 Building repair ) resource Land Filling ( ) Law suits 0 Develop institutional ( )
Cost Estimate of Adjustments: framework
Source(s): Davis, G. H., J. B. Small and H. 8. Counts, 1963, "Land Subsidence Related to Decline of Artesian Pressure in the Ocala Limestone at Savannah, Georgia", Geological Society of America Engineering Geology Case History X 4 , p . , , l - 8 .
at Savannah, Georgia in Land Subsidence, Proceedings of the Second International Symposium on Land Subsidence, Anaheim, California, December, 1976, Ann Arbor, Michigan: International Association of Hydrological Sciences, pp. 347-354.
Davis, G. H., H. 8. Counts and S. R. Holdahl, 1977, Further Examination of Subsidence
B-25
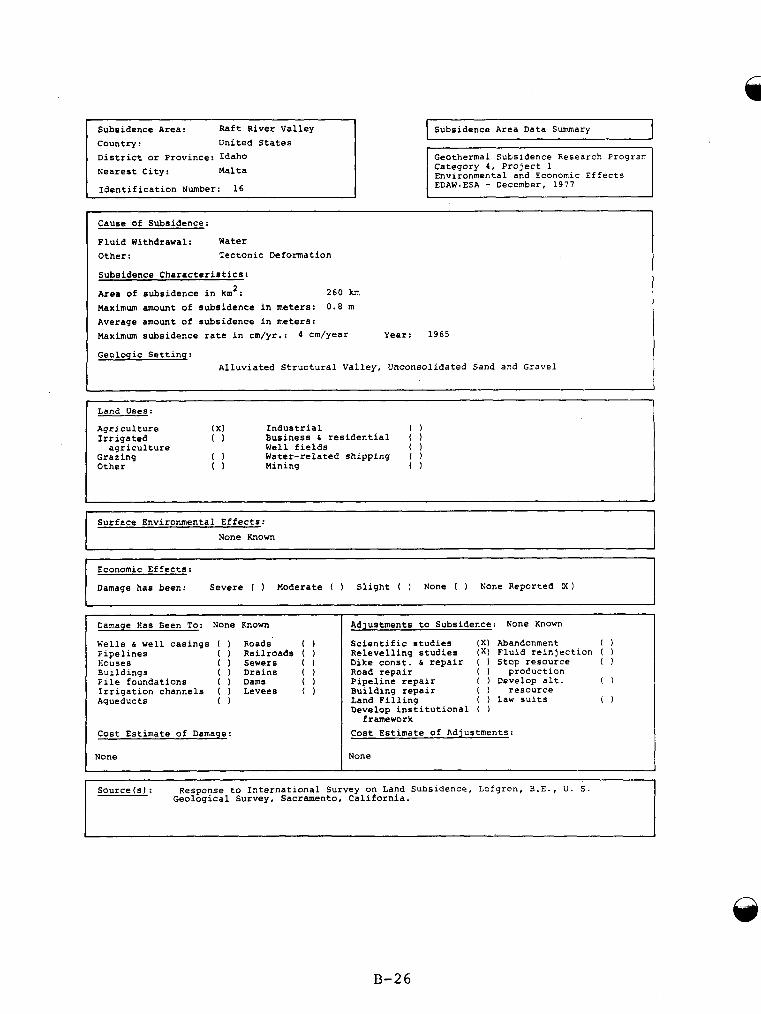
Subsidence Area: Raft River Valley Country: United States District or Province: Idaho Nearest City: Malta
Identification Number: 16
-~ ~ ~
Economic Effects:
Damage has been: Severe ( ) Moderate ( ) Slight ( ) None ( ) None Reported 00 I
I I Subsidence Area Data Summary Geothermal Subsidence Research Prograrr Category 4, Project 1 Environmental and Economic Effects
~
Cause of Subsidence:
Fluid Withdrawal: Water Other: Tectonic Deformation
Subsidence Characteristics:
Area of subsidence in km2: Maximum amount of subsidence in meters: 0.8 m Average amount of subsidence in meters: Maximum subsidence rate in cm/yr.: 4 cm/year Year: 1965
Geologic Setting:
260 km
Alluviated Structural Valley, Unconsolidated Sand and Gravel
Land Uses:
Irrigated 0 Business 6 residential ( 1
Grazing ( 1 Water-related shipping ( )
Agriculture (X) Industrial 0
agriculture Well fields 0
Other 0 Mining 0
Surface Environmental Effects: None Known
~~ ~
Damage Has Been To: None Known
Wells 6 well casings ( Roads ( ) Pipelines ( ) Railroads ( ) tiouses ( ) Sewers ( Buildings ( ) Drains ( ) Pile foundations ( Dams 0 Irrigation channels ( ) Levees ( ) Aqueducts 0
Cost Estimate of Damage:
None
Adjustments to Subsidence: None Known
Scientific studies (X) Abandonment 0 Relevelling studies (x) Fluid reinjection ( ) Dike const. 6 repair ( ) Stop resource ( 1 Road repair ( ) proCuction
Building repair ( resource
Develop institutional ( )
Cost Estimate of Adjustments:
None
Pipeline repair ( ) Develop alt. 0
Land Filling ( ) Law suits 0
framework
Source(s): Response to International Survey on Land Subsidence, L o f g r e n , B.E., U. S . Geological Survey, Sacramento, California.
B-26
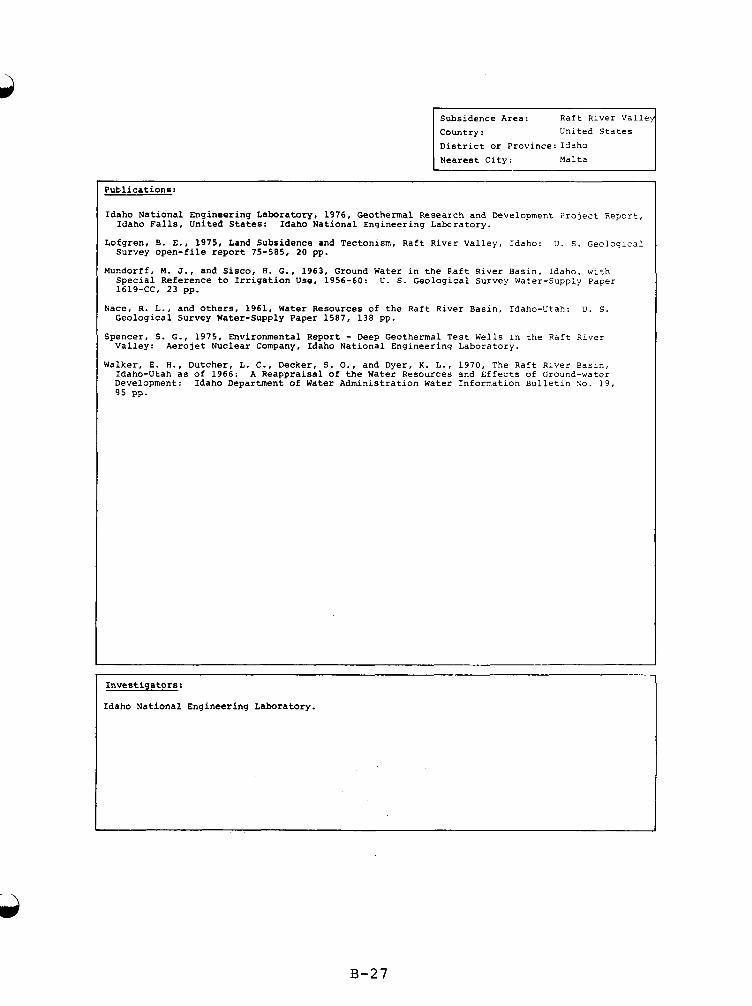
Subsidence Area: Country : United States District or Province: Idaho Nearest City: Malta
Publications:
Idaho National Engineering Laboratory, 1976, Geothermal Research and Development Project Report, Idaho Falls, United States: Idaho National Engineering Labcsratory.
Lofgren, B. E., 1975, Land Subsidence and Tectonism, Raft River Valley, Idaho: U. s. Geologlcsl Survey open-file report 75-585, 20 pp.
Mundorff, M. J., and Sisco, H. G., 1963, Ground Water in the Raft River Basin, Idaho, with Special Reference to Irrigation Use, 1956-60: U. S. Geological Survey Water-Supply PapeI 1619-CC, 23 pp.
Nace, R. L., and others, 1961, Water Resources of the Raft River Basin, Idaho-Utah: u . 5 . Geological Survey Water-Supply Paper 1587, 138 pp.
Valley: Aerojet Nuclear Company, Idaho National Engineering Laboratory.
Walker, E. H., Dutcher, L. C., Decker, S. O., and Dyer, K. L . , 1970, The Raft River Basin, Idaho-Utah as of 1966: A Reappraisal of the Water Resources and Effects of Ground-water Development: Idaho Department of Water Administration Water Information Bulletin S o . 19,
Spencer, S. G., 1975, Environmental Report - Deep Geothermal Test Wells in the Raft River
9 5 PP.
Investigators:
Idaho National Engineering Laboratory.
B-27
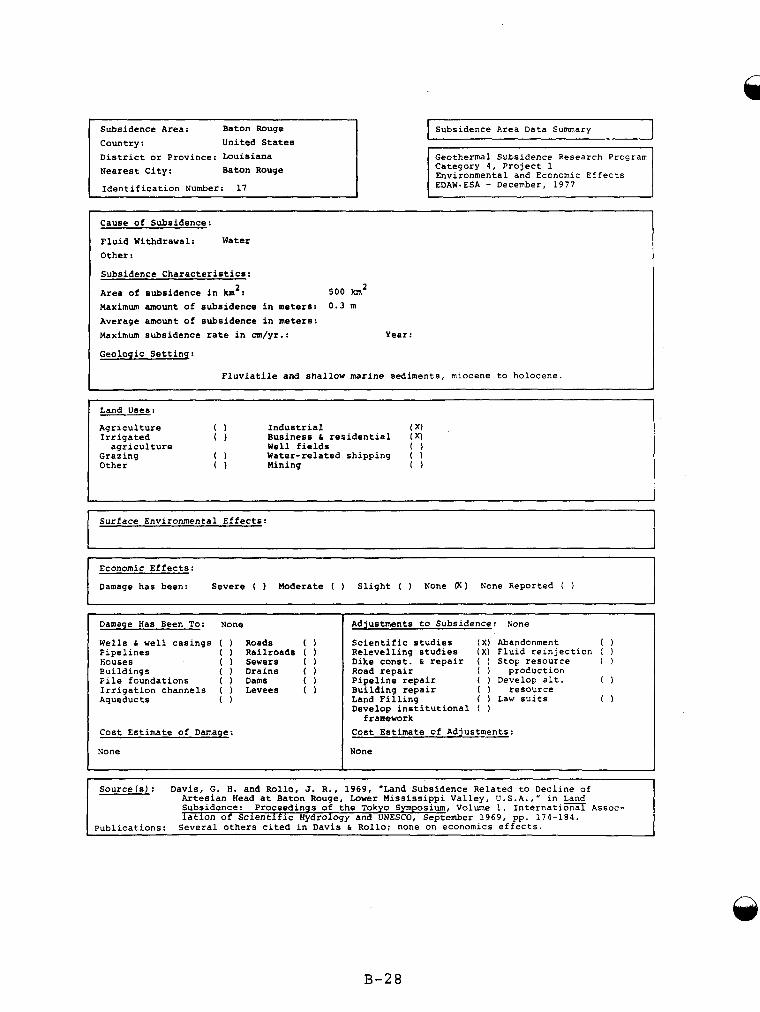
A
Subsidence Area: Baton Rouge Country: United States District or Province: Louisiana Nearest City: Baton Rouge
Identification Number: 17
Subsidence Area Data Summary I Geothermal Subsidence Research Prograr Category 4, Project 1 Environmental and Economic Effects EDAW-ESA - December, 1977
Cause of Subsidence:
Fluid Withdrawal: Water Other:
Subsidence Characteristics:
Area of subsidence in km': Maximum amount of subsidence in meters: 0.3 m Average amount of subsidence in meters: Maximum subsidence rate in cm/yr.: Year:
Geologic Setting:
500 km2
Fluviatile and shallow marine sediments, miocene to holocene.
Land Uses:
Irrigated 0 Business b residential (XI
Grazing 0 Water-related shipping ( )
Agriculture 0 Industrial ( X)
agriculture Well fields 0
Other 0 Mining 0
Surface Environmental Effects:
Economic Effects:
Damage has been: Severe ( ) Moderate ( ) Slight ( ) None Q ) tione Reported ( )
Damage Has Geen To: None Adjustments to Subsidence: None
Wells 6 well casings ( ) Roads ( ) Pipelines ( Railroads ( 1 houses ( ) Sewers ( ) Buildings ( I Drains ( I Pile foundations ( ) Dams 0 Irrigation channels ( ) Levees ( I Aqueducts 0
Cost Estimate of Damage:
I None
Scientific studies (X) Abandonment 0 Relevelling studies (X) Fluid reinjection ( Dike const. b repair ( 1 Stop resource ( )
( ) production Pipeline repair ( ) Develop alt. Building repair ( ) resource
Develop institutional (
Cost Estimate of Adjustments:
None
~ Road repair 0
Land Filling ( ) Law suits 0
framework
I I
Source(s): Davis, G. H. and Rollo, J. R., 1969, "Land Subsidence Related to Decline of Artesian Head at Baton Rouge, Lower Mississippi Valley, U.S.A.," in Land Subsidence: Proceedings of the Tokyo Symposium, Volume 1, International Assoc- iation of Scientific Hydrology and UNESCO, September 1969, pp. 174-184.
Publications: Several others cited in Davis b Rollo; none on economics effects.
B-28
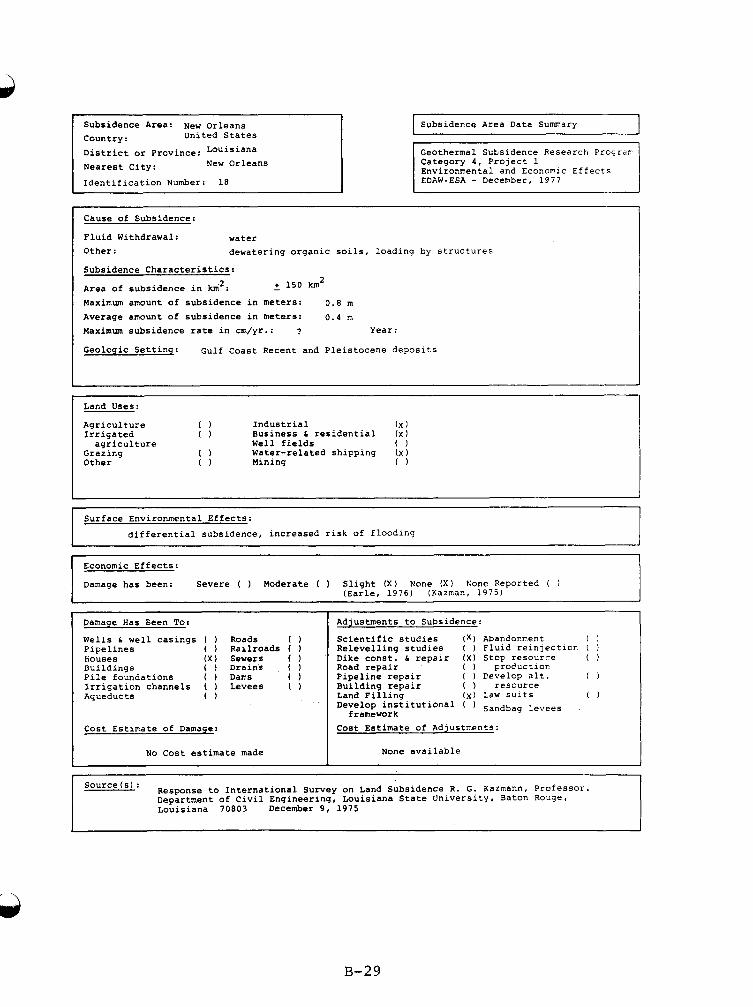
Subsidence Area: New Orleans United States Country:
District or Province: Louisiana Nearest City:
Identification Number: 18
New Orleans
Response to International Survey on Land Subsidence R. G. Kazmann, Professor. Department of Civil Engineering, Louisiana State University, Baton Rouge, Louisiana 70803 December 9, 1975
Source (s :
-
I I Subsidence Area Data Summary ~~ ~
Geothermal Subsidence Research Prograr Category 4, Project 1 Environmental and Economic Effects r EDAWsESA - December, 1977
~~~~ ~~
Cause of Subsidence:
Fluid Withdrawal: water Other: dewatering organic soils, loading by structures
Subsidence Characteristics:
Area of subsidence in km': Maximum amount of subsidence in meters: 0.8 m Average amount of subsidence in meters: 0 . 4 m Maximum subsidence rate in cm/yr.: ? Year:
Geologic Setting: Gulf Coast Recent and Pleistocene deposits
- + 150 km2
Land Uses:
Irrigated 0 Business h residential ( x ) agriculture Well fields 0
Grazing 0 Water-related shipping I x ) Other 0 Mining 0
Agriculture 0 Industrial (X
1
Surface Environmental Effects: r differential subsidence, increased risk of flooding
Economic Effects:
Damage has been: Severe ( ) Moderate ( ) Slight ( X ) None (X) Kone Reported ( ) (Earle, 1976) (Kazman, 1975)
Damage Has Eeen To:
Wells h well casings I Roads 0 Pipelines ( ) Railroads ( 1 tiouses ( X I Sewers ( Euildings ( Drains ( 1 Pile foundations ( ) Dams 0 Irrigation channels ( ) Levees I ) Aqueducts 0
Cost Estimate of Damage:
No Cost estimate made
Adjustments to Subsidence:
Relevelling studies ( ) Fluid reinjectlor ( ) Dike const. h repair (X) Stop resource ( ) Road repair ( ) FroCuction
Building repair I ) resource
Develop institutional
Cost Estimate of Adjustments:
Scientific studies (x) Abandonment 0
Pipeline repair ( 1 Cevelop alt. 0
Land Filling (x) Law suits 0 ( 1 Sandbag levees framework
None available
B-29
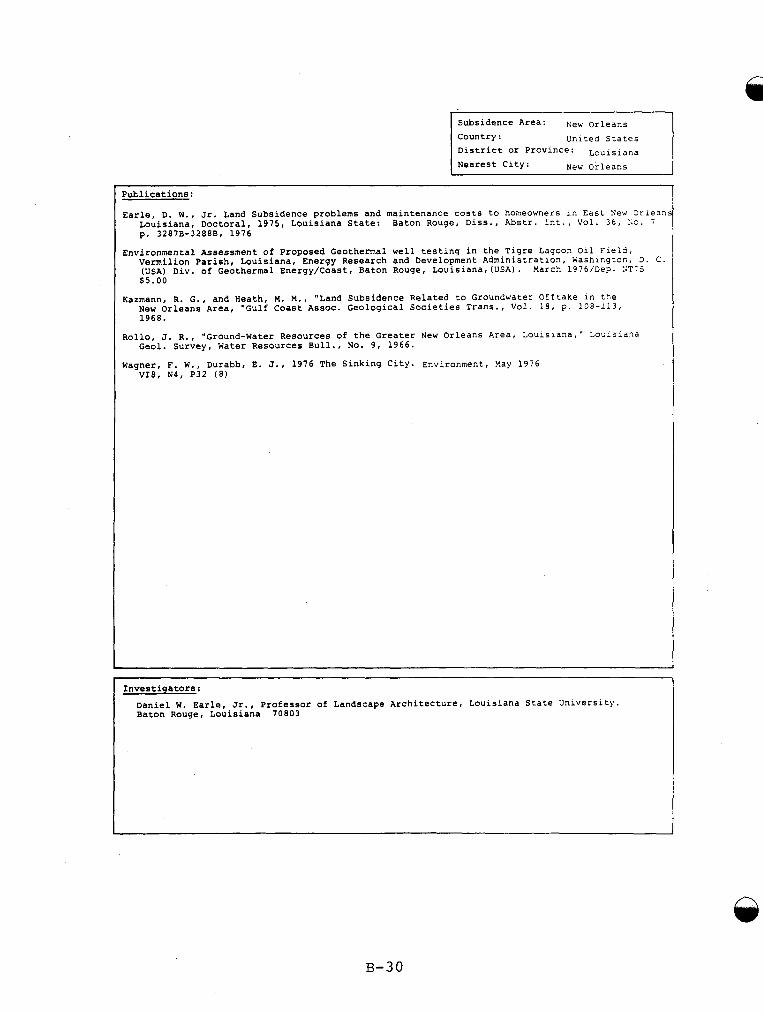
Subsidence Area: N~~ orleans
Country : United States District or Province: Louisiana
Nearest City: New Orleans
Puhlications:
Earle, D. W., Jr. Land Subsidence problems and maintenance costs to homeowners in East New Orlea?.: Louisiana, Doctoral, 1975, Louisiana State: Baton Rouge, Diss., Abstr. Int., Vol. 36, ! ;o. i p. 32878-32888, 1976
Environmental Assessment of Proposed Geothermal well testing in the Tigre Lagoon Oil Field, Vermilion Parish, Louisiana, Energy Research and Development Administration, Washington, 3. C. (USA) Div. of Geothermal Energy/Coast, Baton Rouge, Louisiana,(USA). March 1976/Dep. :;TIS $5.00
Kazmann, R. G., and Heath, M. M., "Land Subsidence Related to Groundwater Offtake in tbe New Orleans Area, "Gulf Coast ~ s s o c . Geological Societies Trans., Vol. 18, p. 108-113, 1968.
Rollo, J. R., "Ground-Water Resources of the Greater New Orleans Area, Loulslana," Loulslana
Wagner, F. W., Durabb, E. J., 1976 The Sinking City. Environment, Kay 1976
Geol. Survey, Water Resources Bull., No. 9, 1966.
VI8, N4, P32 ( 8 )
Investigators:
Daniel W. Earle, Jr., Professor of Landscape Architecture, Louisiana State Universlty. Baton Rouge, Louisiana 70803
n
B-30
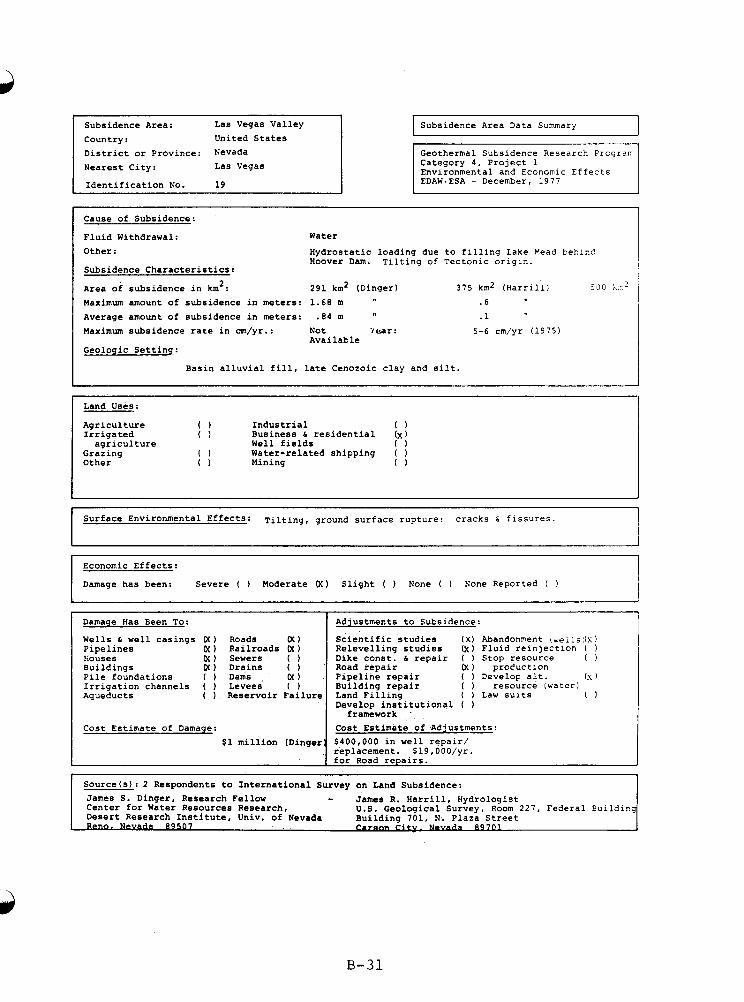
Subsidence Area: Las Vegas Valley Country: United States District or Province: Nevada Nearest City: Las Vegas
Identification No.
Cost Estimate of Damage: $1 million (Dinger'
I Subsidence Area Data Summary
Cost Estimate of Adjustments: $400,000 in well repair/ replacement. $19,00O/yr. for Road repairs.
Geothermal subsidence Research Proqrar Category 4, Project 1 Environmental and Economic Effects
Cause of Subsidence :
Fluid Withdrawal: Water
Other: Hydrostatic loading due to filling Lake Mead behinc'
Subsidence Characteristics: Hoover Dam. Tilting of Tectonic origin.
Area of subsidence in km2: 291 km2 (Dinger) 375 km2 (Harrill) 5 0 0 h?'
Maximum amount of subsidence in meters: 1.68 m " . 6
Average amount of subsidence in meters: .84 m Maximum subsidence rate in cm/yr.: Not Y e a r :
Geologic Settinq: Available
.1 5-6 cm/yr (1975)
Basin alluvial fill, late Cenozoic clay and silt.
Land Uses:
Agriculture 0 Industrial ( Irrigated 0 Business 6 residential (x
agriculture Well fields ( Grazing 0 Water-related shipping ( Other 0 Mining (
~ ~ ~ ~ ~ ~ _ _ _ _ _ _ _ ~ ~
Surface Environmental Effects: Tilting, ground surface rupture: cracks 6 fissures. r Economic Effects:
Damage has been: Severe ( ) Moderate 00 Slight ( ) None ( ) None Reported ( )
I Damage Has Geen To: I Adjustments to Subsidence: Wells C well casings 00 Roads 00 Pipelines ( x ) Railroads ( X I fiouses ( x ) Sewers ( ) Buildings C f ) Drains ( ) Pile foundations ( ) Dams C f ) Irrigation channels ( 1 Levees ( 1 Aqueducts ( Reservoir Failure
Scientific studies ( X ) Abandonment (weilsl(X) Relevelling studies ( x ) Fluid reinjection ( ) Dike const. 6 repair ( ) Stop resource ( ) Road repair o( proCuction
Building repair ( ) resource (water1
Develop institutional ( 1
Pipeline repair ( ) Develop alt. (A 1
Land Filling ( ) Law suits ( 1
framework .
Source(s): 2 Respondents to International Survey on Land Subsidence: James S. Dinger, Research Fellow - James R. Harrill, Hydrologist Center for Water Resources Research, U . S . Geological Survey, Room 2 2 7 . Federal Euilding Desert Research Institute, Univ. of Nevada Building.701, N. Plaza Street Reno. Nevada 89507 r-. N O V ~ 8 9 7 0 1
B-31
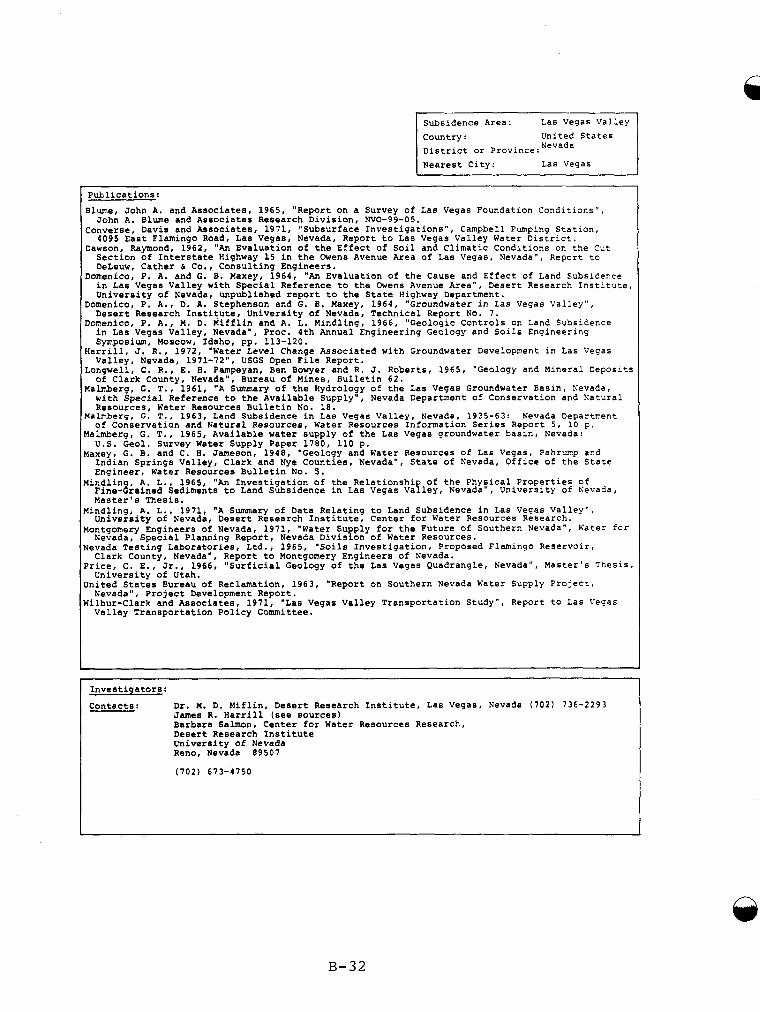
country : United States District or Province :Nevada Nearest City: Las Vegas
~ ~~~
Publications: Blume, John A. and Associates, 1965, "Report on a Survey of Las Vegas Foundation Conditions",
John A. Blume and Associates Research Division, NVO-99-05. Converse, Davis and Associates, 1971, "Subsurface Investigations", Campbell Pumping Station,
4095 East Flamingo Rord, LaS Vegas, Nevada, Report to Las Vegas Valley Water District. Dawson, Raymond, 1962, An Evaluation of the Effect of Soil and Climatic Conditions on the Cut
Section of Interstate Highway 15 in the Owens Avenue Area of Las Vegas, Nevada", Report to DeLeuw, Cather h Co., Consulting Engineers.
Domenico, P. A. and C. 8. Maxey, 1964, "An Evaluation of the Cause and Effect of Land Subsidence in La8 Vegas Valley with Special Reference to the Owens Avenue Area", Desert Research Institute, University of Nevada, unpublished report to the State Htghway Department.
Domenico, P. A., D. A. Stephenson and G. E. Maxey, 1964, Groundwater in Las Vegas Valley", Desert Research Institute, University of Nevada, Technical Report No. 7.
Domenico, P. A., M. D. Mifflin and A. L. Mindling, 1966, "Geologic Controls on Land Subsidence in Las Vegas Valley, Nevada", Proc. 4th Annual Engineering Geology and Soils Engineering Symposium, Moscow, Idaho, pp. 113-120.
Harrill, J. R., 1972, "Water Level Change Associated with Groundwater Development in Las Vegas Valley, Nevada, 1971-72", USGS Open File Report.
Longwell, C. R., E. R. Pampeyan, Ben Bowyer and R. J. Roberts, 1965, "Geology and Mineral Deposits of Clark County, Nevada", Bureau of Mines, Bulletin 62.
Malmberg, G. T., 1961, "A Summary of the Hydrology of the Las Vegas Groundwater Basin, Kevada, with Special Reference to the Available Supply", Nevada Department of Conservation and Katural Resources, Water Resources Bulletin No. 18.
Malmberg, G. T., 1963, Land Subsidence in Las Vegas Valley, Nevada, 1935-63: Nevada Departrent of Conservation and Natural Resources, Water Resources Information Series Report 5 , 10 p.
Yalmberg, G. T., 1965, Available water supply of the Las Vegas groundwater basin, Nevada: U.S. Geol. Survey Water Supply Paper 1780, 110 p.
aaxey! G. B. and C. 8. Jameson, 1948, "Geology and Water Resources of Las Vegas, Pahrump and Indian Springs Valley, Clark and Nye Counties, Nevada", State of Nevada, Office of the State Engineer, Water Resources Bulletin No. 5.
lindlin A. L., 1965, "An Investigation of the Relationshi of the PhyEical Properties of Fine-&ained Sediments to Land Subsidence in Lab Vegas Vafley, Nevada , University of Kevada, Master's Thesis.
lindling, A. L., 1971, "A Summary of Data Relating to Land Subsidence in Las Vegas Valley", University of Nevada, Desert Research Institute, Center for Water Resources Research.
lontgomery Engineers of Nevada, 1971, "Water Su ply for the Future of Southern Nevada", Kater f c r Nevada, Special Planning Report, Nevada Divisfon of Water Resources.
Uevada Testing Laborattries, Ltd., 1965, "Soils Investigation, Proposed Flamingo Reservoir, Clark County, Nevada , Report to Montgomery Engineers of Nevada.
?rice, C. E., Jr., 1966, "Surficial Geology of the Las Vegas Quadrangle, Nevada", Master's Thesis, University of Utah.
Jnited States Bureau of Reclamation, 1963, "Report on Southern Nevada Water Supply Project, Nevada", Project Development Report.
Yilbur-Clark and Associates, 1971, "Las Vegas Valley Transportation Study", Report to Las L'egas Valley Transportation Policy Committee.
Investigators:
Contacts : Dr. M. D. Miflin, Desert Research Institute, Las Vegas, Nevada (702) 736-2293 James R. Harrill (see sources) Barbara Salmon, Center for Water Resources Research, Desert Research Institute University of Nevada Reno, Nevada 89507
(702) 673-4750
B-32
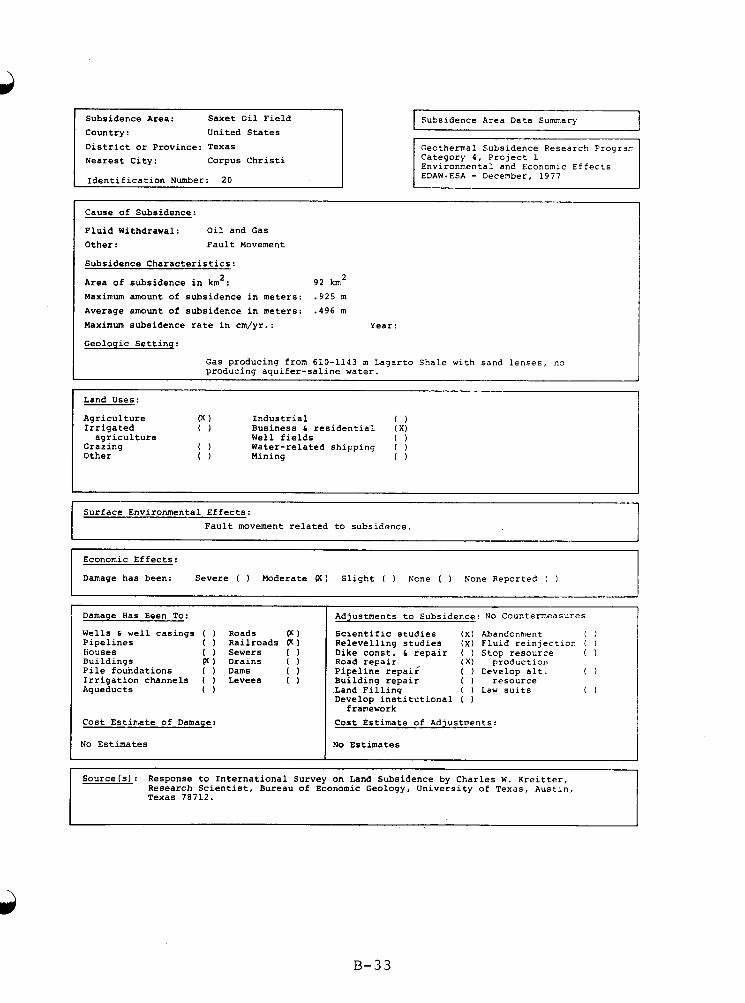
Subsidence Area: Saxet Oil Field Country : United States District or Province: Texas Nearest City: Corpus Christi i Identification Number:
Subsidence Area Data Summary 1 Geothermal Subsidence Research Progran Category 4 , Project 1 Environmental and Economic Effects 1 EDAW-ESA - December, 1977
Cause of Subsidence:
Fluid Withdrawal: Oil and Gas Other: Fault Movement
Subsidence Characteristics:
Area of subsidence in km2: 9 2 km2 Maximum amount of subsidence in meters: , 9 2 5 m Average amount of subsidence in meters: . 4 9 6 m Maximum subsidence rate in cm/yr.: Year:
Geologic Settinq:
Gas producing from 610-1143 m Lagarto Shale with sand lenses, no producing aquifer-saline water.
~ ~~ ~~~ ~~ ~ ~~~~
Land Uses:
Agriculture W ) Industrial 0
agriculture Well fields 0
Other 0 Mining 0
Irrigated 0 Business 6 residential ( X )
Grazing 0 Water-related shipping ( )
I 1 Surface Environmental Effects:
Fault movement related to subsidence. I Economic Effects:
Damage has been: Severe ( ) Moderate (7.) Slight ( ) None ( ) None Reported ( )
- Damage Has Been To:
Wells 6 well casings ( ) Roads P ) Pipelines ( ) Railroads P ) Iiouses ( Sewers ( ) Buildings P ) Drains ( 1 Pile foundations ( Dams 0 Irrigation channels ( ) Levees ( ) Aqueducts 0
Cost Estimate of Damage:
No Estimates
Adjustments to Subsidence: No Countermeasures
Scientific studies ( X I Abandonment 0 Relevelling studies (x) Fluid reinjection ( 1 Dike const. 6 repair ( Stop resource ( 1 Road repair (X) production Pipeline repaii ( ) Develop alt. 0 Building repair ( ) resource .Land Filling ( ) Law suits 0 Develop institutional ( )
Cost Estimate of Adjustments:
No Estimates
framework
Source(s): Response to International Survey on Land Subsidence by Charles W. Kreitter, Research Scientist, Bureau of Economic Geology, University of Texas, Austin, Texas 70712.
B - 3 3
Subsidence Area: SaXet Oil Field Country : United States District or Province:Texas Nearest City: Corpus Christi
Publications:
Kreitler, C. W. and Gustavson, T. C., "Geothermal Resources of the Texas Gulf Coast - Environ- mental Concerns Arising from the Production of Geothermal Waters", 2nd Geopressure, Geothemal Conference, February 23-24, 1976, CES, University of Texas at Austin, (in press)-
operations in the United States," Land Subsidence, Publication No. 88, AIHS-UNESCO (no date of issue) I, 55.
Yerkes, R. P. and Castle, R. O., "Surface Deformation Associated with Oil and Gas Field
Investigatorr:
B-34
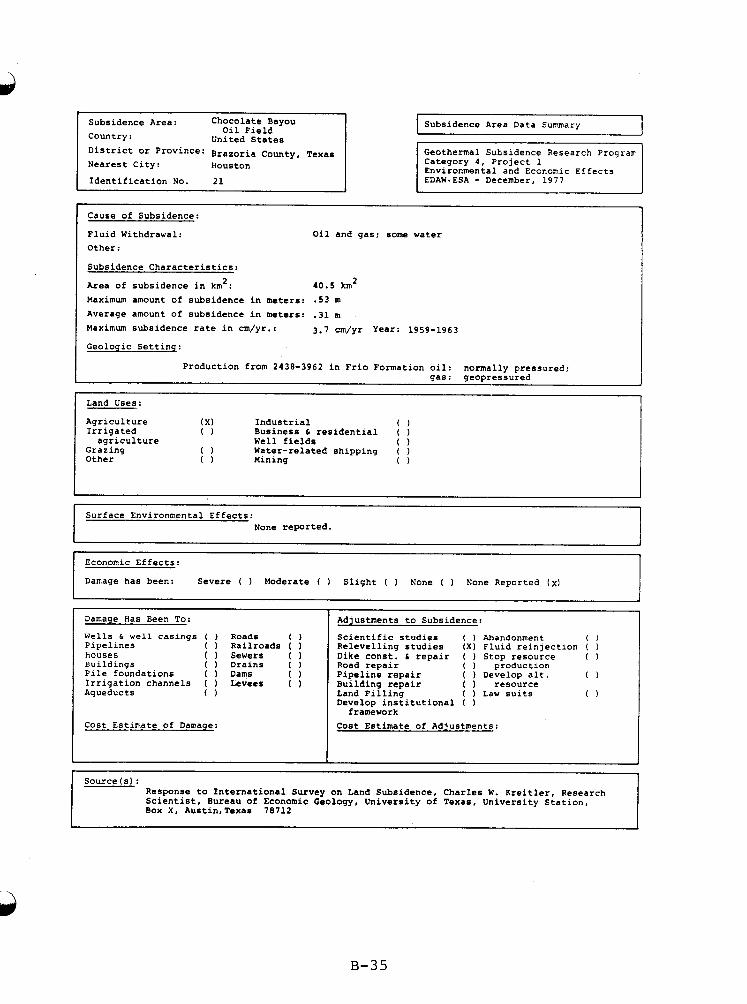
Subsidence Area: Chocolate Bayou Country: District or Province: ~~~~~~i~ County, T~~~~ Nearest City: Houston Identification No.
Oil Field United States
r Land Uses: 1 Agriculture ( X I Industrial 0
agriculture Well fields 0
Other 0 Mining 0
Irrigated 0 Business 6 residential ( )
Grazing 0 Water-related shipping ( )
I Surface Environmental Effects:
None reported.
Economic Effects:
Damage has been: Severe ( ) Moderate ( 1 Slight ( ) None ( None Reported ( x )
Subsidence Area Data Summary 1 Geothermal Subsidence Research Prograr Category 4, Project 1 Environmental and Economic Effects EDAW-ESA - December, 1977
Damage Has Been To:
Wells 6 well casings ( Pipelines ( Iiouses ( Buildings ( Pile foundations ( Irrigation channels ( Aqueducts (
Cost Estimate of Damage
Roads 0 Railroads ( 1 Sewers ( ) Drains ( ) Dams 0 Levees ( )
Adjustments to Subsidence:
Scientific studies ( Abandonment 0 Relevelling studies ( X I Fluid reinjection ( ) Dike const. 6 repair ( ) Stop resource ( ) Road repair ( production Pipeline repair ( ) Develop alt. 0 Building repair ( resource Land Filling ( ) Law suits 0 Develop institutional (
Cost Estimate of Adjustments: framework
Response to International Survey on Land Subsidence, Charles W. Xreitler, Research Scientist, Bureau of Economic Geology, University of Texas, University Station, Box X , Austin,Texas 78712
Source (s) :
B-35
A
Subsidence Area: Chocolate Qayou Cil Country :
Fielf United States
District or Province:Brazoria cocr.t;, Nearest City: Texas
Pouston
Publications:
Kreitler, C. W , , "Lineations and Faulting in Texas Coastal Zone", Report of Investigaticrs No. 85, Bureau of Economic Geology, University of Texas at Austin, (in press).
Coast -- Environmental Concerns Arising from the Production of Geothemal Waters", 2nd Geopressure, Geothermal Conference, February 23-24, 1976, CES, University of Texas at Austin (in press).
Xreitler, C. W . , and Gustavson, T. C., "Geothermal Resources of the Texas Gulf
- Investigators:
B-36
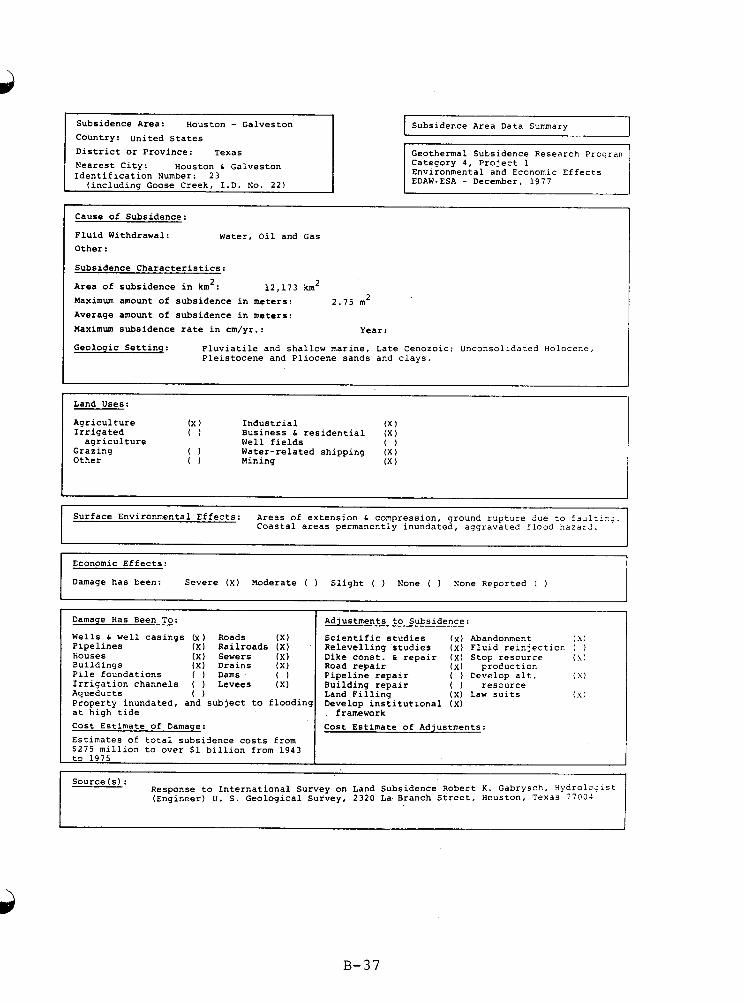
Subsidence Area: Houston - Galveston Country: United States District or Province: Texas Nearest City: Houston 6 Galveston Identification Number:
Damage Has Been To:
Subsidence Area Data Summary 1
Adjustments to Subsidence:
Geothermal subsidence Research Prograrr Category 4, Project 1 Environmental and Economic Effects EDAW-ESA - December, 1977
Cost Estimate of Damage: Estimates of total subsidence costs from $275 million to over $1 billion from 1943 to 1975
Cause of Subsidence:
Fluid Withdrawal: Water, Oil and Gas Other:
Subsidence Characteristics:
Area of subsidence in km2: Maximum amount of subsidence in meters: Average amount of subsidence in meters: Maximum subsidence rate in cm/yr.: Year:
Geologic Settinq: Fluviatile and shallow marine, Late Cenozoic; Unconsolidated Holocene,
12,173 km2 2.75 m2
Pleistocene and Pliocene sands and clays.
Land Uses: I Agriculture (X ) Industrial ( X )
agriculture Well fields 0
Other 0 Mining (X )
Irrigated 0 Business 6 residential ( X )
Grazing 0 Water-related shipping ( X )
Cost Estimate of Adjustments:
~ ~~
Surface Environmental Effects: Areas of extension 6 compression, ground rupture due to f a ~ l t ~ - ; . Coastal areas permanently inundated, aggravated flood hazar3.
I I
Economic Effects:
Damage has been: Severe ( x ) Moderate ( Slight ( ) Hone ( ) None Reported ( )
Wells 6 well casings (x) Roads ( X ) Pipelines ( X I Railroads ( X ) iiouses (x ) Sewers (x ) Bu i Id ing s ( X ) Drains ( X ) Pile foundations ( ) Dams 0 Irrigation channels ( Levees ( x ) Aqueducts 0 Property inundated, and subject to floodi at high tide
Scientific studies ( x ) Abandonment I S ) Relevelling studies ( x ) Fluid reinjection ( Dike const. 6 repair ( X I Stop resource (s! Road repair ( x ) proCuction Pipeline repair ( ) Cevelop .alt. ( S ) Building repair ( resource Land Filling ( x ) Law suits (s: Develop institutional ( x )
framework
Source ( s ) : Response to International Survey on Land Subsidence Robert K. Gabrysch, Hydrolcaist (Engineer) U. S . Geological survey, 2320 La Branch Street, ousto on, Texas 77004
B-37
Subsidence Area: Houston-Galveston Country : United States District or Province: Texas Nearest City: Houston-Galveston
Publications: Brown, L. F. Jr.et al. 1974. Natural Hazards of the Texas Coastal Zone, Texas Bureau of
Carothers, H. P., and Lockwood, M. G., 1964, Discussion of "Land Subsidence Problems", Journal
Economic Geology, University of Texas Austin
of the Surveying and Mapping Division, AXE, NO. su 1, pp. 75-78. Dawson, R . F., 1963. "Land Subsidence Problems", Journal of the Surveying and Mapping Division,
ASCE, NO. SU 2, pp. 1-12.
Gabrygch, R. K., 1969, Land-surface subsidence in the Houston-Galveston region, Texas: Interna-
Gabrysch, R. K., 1977 "Land-surface Subsidence in the Houston-Galveston Region, Texas" in
tional symposium on land subsidence, Tokyo, Japan, 1969, Proc., p. 43-54.
proceedings of the Second Symposium on Land Subsidence, December 10-17, 1976 Anaheim, CA International Association of Hydrological Sciences,publication No. 121.
Gabrysch, R. K., and Bonnet, C. W., 1974, Land-surface subsidence in the area of Burnett, S c o t t , and Crystal Bays near Baytown, Texas: U . S . Geol. Survey Water Resources Inv. 2 1 - 7 4 , 4 8 2 .
1974a, Land-surface subsidence in the Houston-Galveston region, Texas: Texas Water Development Board Report 188, 19 p.
1975b, Land-surface subsidence at Seabrook, Texas, U.S. Geol. Survey Water Resources Inv. 75-413
1975c, Land-surface subsidence in the area of Moses Lake near Texas City, Texas, U.S. Geol. Survey Water Resources Inv. 7 5 - 4 2 4 .
Gray, E. V., 1958. "The Geology, Ground Water, and Surface Subsidence of the Baytown-LaPorte Area, Harris County, Texas", unpublished thesis, Dept. of Geology, Texas A6M Univ., Bryan
Groat, Charles G., 1973, Holocene Faulting and Subsidence in the Texas Coastal Zone ABSTR., ieol SOC. Am., ABSTR., Vol. 5, No. 7, p. 6 4 5
Gustavson, T.C./Kreiiler, C. W., 1976, Geothermal Resources of the Texas Gulf Coast: Envlrsn- mental Concerns Arising from the production and disposal of Geothermal Waters, Geologlcal Circular 76-71, Texas univ., Autstin (u.s.A.), Bureau of Economic Geology, Univ. of Texas, Bureau of Economic Geology, Austin.
geopressured reservoirs with discussion, in proceedings: First Geopressured Geothermal Energy Conference, p. 311-320, University of Texas, at Austin, Austin,Texas, United States.
Herrin, E., Goforth. T., 1975, Environmental problems associated with power production from
Jones, Lonnie L., James Larson, 1975, Economic Effects of Land Subsidence due to Excessive Gro;?.. water Withdrawal in the Texas Gulf Coast Area, Texas Water ReSOUTCeS Institute, Texas A b M University Techinical Report 1167
Jones, L. L., Warfen, J. P., Land Subsidence Costs in the Houston-Baytown Area of Texas; (Tesas Agricultural and Mechanical University, College Station (USA). Dept. of Agriculturol EconOrnl2: J. AM. Water Works ASSOC., V . 6 8 (ll), p. 597-599 (1976)
'ones, Lonnie L. 1977 "Economic Effects of Land Subsidence Due to Excessive Groundwater Kith- drawal in the Texas Gulf Coast Area", in proceedings of Second Symposium on Land Subsidence December 10-17, 1976 Anaheim, CA. International Association of Hydrological Sciences. Publication No. 121.
:reitler, C. W., 1977 "Fault Control of Land Subsidence, Houston-Galveston, Texas" in proceedln{s of the Second Symposium on Land Subsidence. December 10-17, 1976 Anaheim, CA. Internatlonai Association of Hydrological Sciences. Publication No. 121.
,ockwood, Mason G., 1954. "Ground Subsides in Houston Area". Civil Engineering, VO1. 2 4 , pp.
IcClelland Engineers, 1962, Study of probable subsidence, Manned Spacecraft Center, Clear Lake, Texas, in a study of land-surface subsidence conditions at the National Administrative Space Association site in the vicinity of Houston, Texas: Layne Texas CO., Inc.
IcClelland Engineers, Inc., 1966, Land-surface subsidence and surface faulting, Appendix C In Comprehensive study of Houston's Municipal Water System, Phase 1, Basic Studies: Turner, Collie and Braden, Inc.
370-372.
B-38
Subsidence Area: Houston-Galveston country: United States District or Province: Texas
Yorse, Everett D., 1964, Discussion of "Land Subsidence Problems", Journal of the Surveying ar.2
Pratt, W. E., and Johnson, D. W., 1926, Local subsidence of the Goose Creek Oil Field: The
Mapping Division, ASCE, No. SU 1, pp. 73-75.
Journal of Geology, v. XXXIV, no. 7, pt. 1, p. 577-590.
Society of Economic Geology. Rose, N. A., 1949. "Subsidence in the Texas City Area:, text of oral presentation Annual ?leeti?.<,
Sheets, Martin M., and Weaver, Paul, 1962, "Faulting on Surface and Progressive Subsidence in :ne Texas Gulf Coast in Vicinity of Fluid Withdrawals through Wells", text of oral presentatlor., Annual Meeting of Geological Society of America and Associated Societies, Houston, Texas.
jpencer, Glenn W. "The Flight to keep Houston from Sinking", Civil Engineerinq ASCE Sept. 1977 pp. 69-71. Describes history of subsidence in Houston-Galveston area. Discusses conseq-ences including abandonment of subdivision land fill to keep back tides, flood risk, rebuilt 2ocX structures. Class action suit $25 million filed in 1973. Texas A6M Studies. (Uarren 6 Jones ; cites annual losses of $ 3 0 million/yr. ASCE chapter active in public information and lzyis- lature formed Harris Galveston Coastal; Subsidence District. New Surface Water Supplies available to industry.
jteelhammer, R. H., Garland, J. G., 1970 , Subsidence Resulting from the Removal of Groundxaters, South Texas Law Journal 12: 201-213 SWRA W71-07209
Barren, John P., L. L. Jones., W. L. Griffin, R. D. Lacewell, July 1974, Costs of Land Subsi2en;e due to Groundwater Withdrawal. Texas Water Resources Institute, Texas A6M University. Tecnni- cal Report X57.
Mapping Division, ASCE, No. SU 3, pp. 218-223.
in the Houston, Texas Area", Geology of the Gulf Coast and Central Texas, Houston Geolo,-ica: Society, pp. 254-265.
Weaver,Paul, 1963. Discussion of "Land Subsidence Problems", Journal of the Surveying and
Weaver, Paul, and Sheets, Martin M., 6962. "Active Faults, Subsidence and Foundation Proble?s
Winslow, A. G., and Doyel, W. W., 1954, Land-surface subsidence and its relation to the wi t52rax j . of ground water in the Houston-Galveston region, Texas: Econ. Geol. v. 49, no. 4 , p. 413-422
Winslow, A. G., and Wood, L. A., 1959, Relation of Land subsidence Eo ground-water xithdrawals in the upper Gulf Coast Region, Texas: Mining Engin., Oct., p.1030-1034; Am. Inst. Xlnln~, Metall., Petroleum Engin., Trans. V. 214.
wolfskill, L. A., 1960, The consolidation characteristics of undisturbed soil samples of "e? formations and their application to problems of regional subsidence: Master of S c i e n c e Tnesis Texas ASM University, college Station, 70 p.
Yerkes, R. F.: Castle, R. 0.' (Dec. 1976) Seismicity and Faulting attributable to fluld eXtr3i:lS:. (us ~eol. surv.Menlo Park, California), Eng. Geol. ,(Amsterdam); 10, no. 2 - 4 , 151-167
Publications:
Dr. Lonnie Jones, Department of Agricultural Economics, Texas A6M University College Station, Texas
Investigators:
B-39
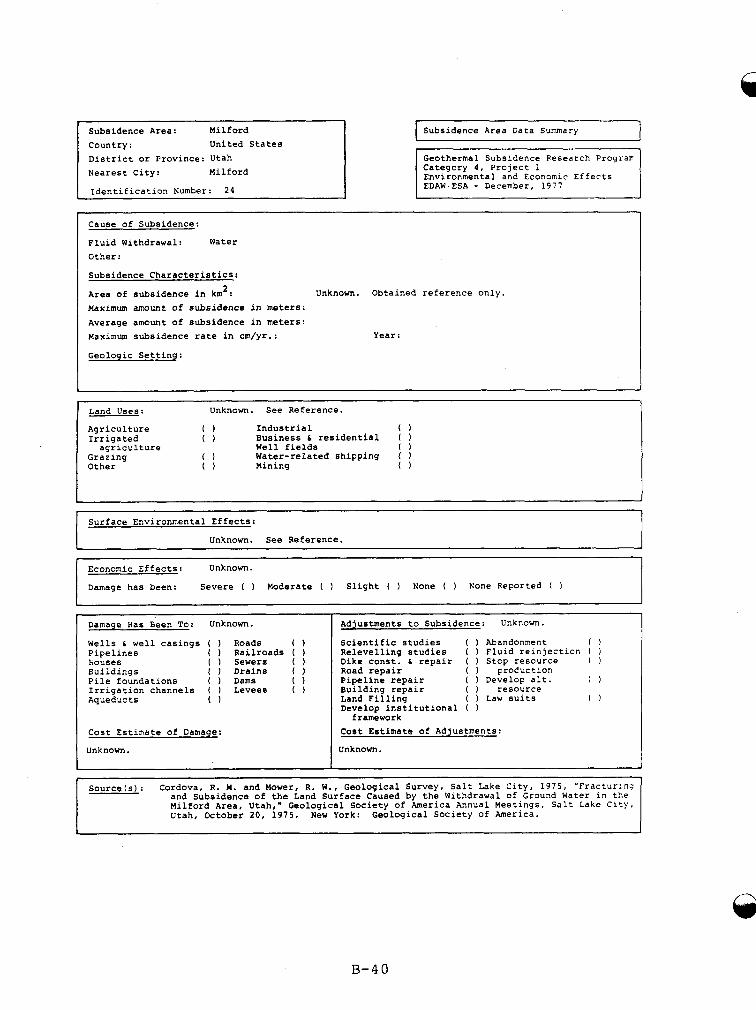
Subsidence Area: Milford Country: United States District or Province: Utah Nearest City: Milford
Identification Number: 24
' Land Uses:
Subsidence Area Data Summary 1 Category 4, Project 1 Environmental and Economic Effects EDAW.ESA - December, 1977
Cause of Subsidence:
Fluid Withdrawal: Water Other:
Subsidence Characteristics:
Area of subsidence in km : Maximum amount of subsidence in meters: Average amount of subsidence in meters: Maximum subsidence rate in an&.: Year:
Geologic Setting:
Unknown. Obtained reference only. 2
~~
Unknown. See Reference.
Agriculture 0 Industrial 0
agriculture Well fields 0
Other 0 Mining 0
Irrigated 0 Business & residential (
Grazing 0 Water-related shipping ( )
Surface Environmental Effects:
Unknown. See Reference.
Economic Effects: Unknown.
Damage has been: Severe ( ) Moderate ( 1 Slight ( None ( None Reported (
Damage Has Been To: Unknown.
Wells 6 well casings ( 1 Roads ( ) Pipelines ( 1 Railroads ( 1 Louses ( Sewers ( ) Buildings ( ) Drains ( ) Pile foundations ( 1 Dams 0 Irrigation channels ( Levees ( 1 Aqueducts 0
Cost Estimate of Damage:
Unknown.
Adjustments to Subsidence: Unknown.
Scientific studies ( 1 Abandonment ( 1 Relevelling studies ( ) Fluid reinjecticn ( 1 Dike const. 6 repair ( 1 Stop resource ( 1 Road repair
Building repair ( ) resource
Develop institutional (
Cost Estimate of Adjustments:
unknown.
( proCuction Pipeline repair ( ) Develop alt. 0
Land Filling ( Law suits 0
framework
Source(s): Cordova, R. M. and Mower, R. W . , Geological Survey, Salt Lake City, 1975, "Fracturing and Subsidence of t;e Land Surface Caused by the Withdrawal of Ground Water in the Milford Area, Utah, Geological Society of America Annual Meetings, Salt Lake Clty, Utah, October 20, 1975. New York: Geological Society of America.
B-40
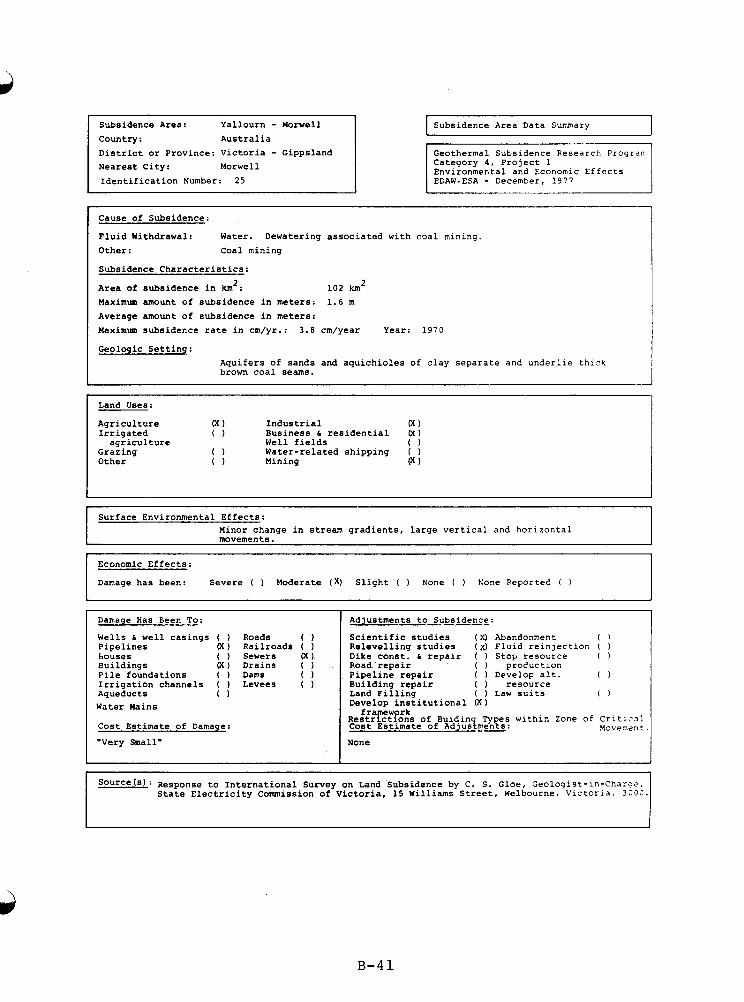
Subsidence Area: Yallourn - Morwell Country: Australia District or Province: Victoria - Gippsland Nearest City: Morwell Identification Number: 25
Damage Has Been To:
Subsidence Area Data Surrmary
Adjustments to Subsidence:
Geothermal Subsidence Research P r o g r a r ; Category 4, Project 1 Environmental and Economic Effects
Cause of Subsidence :
Fluid Withdrawal: Water. Dewatering associated with coal mining. Other: Coal mining
Subsidence Characteristics:
Area of subsidence in km': 102 km2 Maximum amount of subsidence in meters: 1.6 m Average amount of subsidence in meters: Maximm subsidence rate in cm/yr.: 3.0 cm/year Year: 1970
Geologic Settinq: Aquifers of sands and aquichioles of clay separate and underlie thick brown coal seams.
~~
Land Uses:
Agriculture (x) Industrial 00
agriculture Well fields 0
Other 0 Mining VI
Irrigated 0 Business 6 residential 60
Grazing 0 Water-related shipping (
1 J Surface Environmental Effects:
Minor change in stream gradients, large vertical and horizontal mavements.
Economic Effects:
Damage has been: Severe ( ) Moderate ( x ) Slight ( ) None ( ) h'one Reportec! ( )
Wells C well casings ( Roads ( ) Pipelines ( x ) Railroads ( ) Louses ( ) Sewers 00 Buildings P C ) Drains ( Pile foundations ( ) Dams 0 Irrigation channels ( ) Levees ( 1 Aqueducts 0 Water Mains
Cost Estimate of Damage:
"Very Small"
Scientific studies ( X I Abandonment 0 Relevelling studies (XI Fluid reinjection ( ) Dike const. 6 repair ( ) Stop resource ( Road. repair ( ) profuction
0 ( ) Develop alt. Building repair ( ) resource Land Filling ( ) Law suits ( 1 Develop institutional ( X I
Restrictions of Buidin Types within Zone of Criti?al Cost Estimate of Adjusqrnents: Xovenent, None
, Pipeline repair
f rapewprk
Source(s) : Response to International Survey on Land Subsidence by C. S. Gloe, Geologist-in-Char?e, State Electricity Commission of Victoria, 15 Williams Street, Welbourne, Victoria. 3550.
B-41
Subsidence Area: Yallourn - Norwell country: Australia District or Province: Victoria-
Gippsland Morwe 11 Nearest City: I I
~~
Publications:
Gloe, C. S., James, J. P. and McKenzie, R. J., 1973, “Earth Movements Resultlng from Brown Coal Open Cut Mining”, Latrobe Valley, Victoria Fourth Annual Symposium, Illavarra Branch, Australian Institute of Mining Met., 8 , pp. 1-9.
Gloe, C. S., 1977, “Land Subsidence Related to Brown Coal Open Cut Operations Latrobe Valley, Victoria, Australia, in Land Subsidence, Proceedlngs of the Second Symposi-3 on Land Subsidence, Anaheim, California, December 1976. Ann Arbor, Mlchlgan: International Association of Hydrological Sciences, pp. 399-407.
Investigators:
B-42
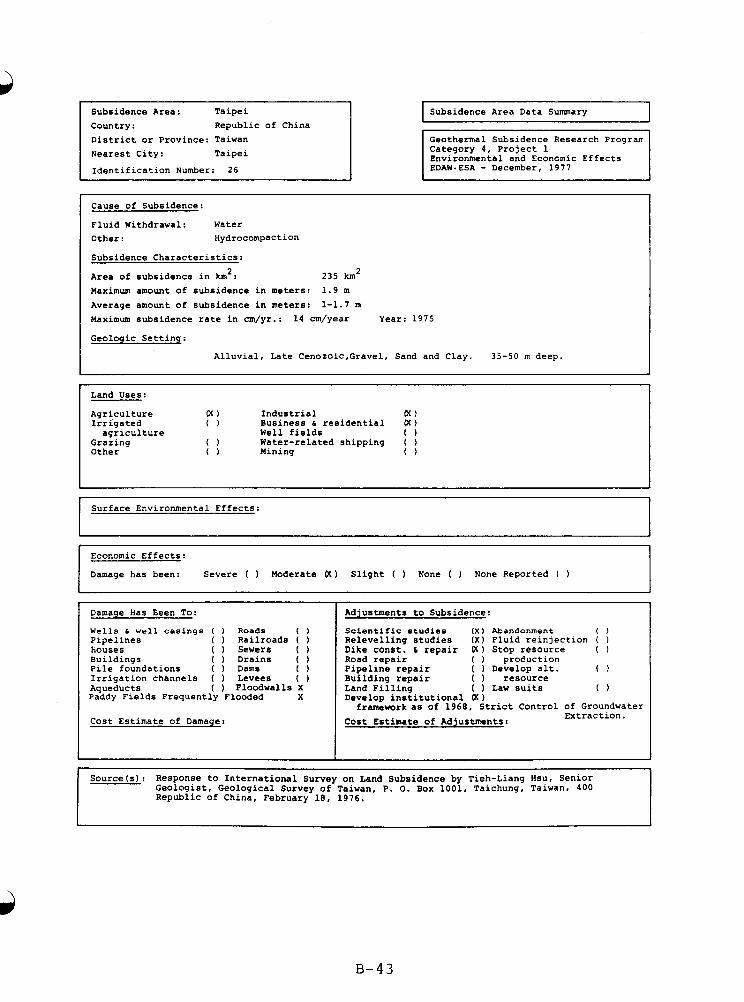
Country: Republic of China District or Province: Taiwan Nearest City: Taipei
Identification Number:
Subsidence Area Data Summary 1 Category 4, Project 1 Environmental and Economic Effects EDAW-ESA - December, 1977
Cause of Subsidence:
Fluid Withdrawal: water Other: Hydrocompaction
Subsidence Characteristics:
Area of subsidence in km2: Maximum amount of subsidence in meters: 1.9 m Average amount of subsidence in meters: 1-1.7 m Maximum subsidence rate in cm/yr.: 14 cm/year Year: 1975
Geologic Setting:
235 km2
Alluvial, Late Cenozoic,Gravel, Sand and Clay. 35-50 m deep.
Land Uses:
Agriculture 00 Industrial 00 Irrigated 0 Business h residential 00
agriculture Well fields 0 Grazing 0 Water-related shipping ( ) Other 0 Mining 0
Surface Environmental Effects:
Economic Effects:
Damage has been: Severe ( ) Moderate 00 Slight ( None ( None Reported ( 1
I 1 Damage Has Been To:
Wells 6 well casings ( ) Roads 0 Pipelines ( ) Railroads ( Iiouses ( ) Sewers ( ) Buildings ( ) Drains ( ) Pile foundations ( Dams 0 Irrigation channels ( ) Levees ( ) Aqueducts ( ) Floodwalls X Paddy Fields Frequently Flooded X
Cost Estimate of Damage:
Adjustments to Subsidence:
Scientific studies ( X ) Abandonment 0 Relevelling studies ( X ) Fluid reinjection ( 1 Dike const. 6 repair P C ) Stop resource ( 1 Road repair ( ) production
Building repair ( ) resource
Develop institutional 00
Cost Estimate of Adjustments:
Pipeline repair ( ) Develop alt. 0
Land Filling ( ) Law suits 0
framework as of 1968, Strict Control of Groundwater Extraction.
Source(s): Response to International Survey on Land Subsidence by Tieh-Liang Hsu, Senior Geologist, Geological Survey of Taiwan, P. 0. Box 1001, Taichung, Taiwan, 400 Republic of China, February 18, 1976.
B - 4 3
Subsidence Area: Taipei country : Republic of Chin District or Province:Taiwan
' Investigators:
Publications:
Hwang, Jui-Ming and Wu, Chiang-Min, 1969, "Land Subsidence Problems in Taipei Basin", in: Proceedings of the Tokyo Symposium on Land Subsidence, Vol, 1, International Association of Scientific Hydrology and UNESCO, September 1969 , Tokyo, pp. 21-34.
wu, Chian-Min, 1977, "Groundwater Depletion and Land Subsidence in Taipei Basin," in Land Subsidence, Proceedings of the Second Symposium on Land Subsidence, Anaheim, California, December 1976. Ann Arbor, Michigan: International Association of Hydrological Sciences, pp. 389-398.
B-44
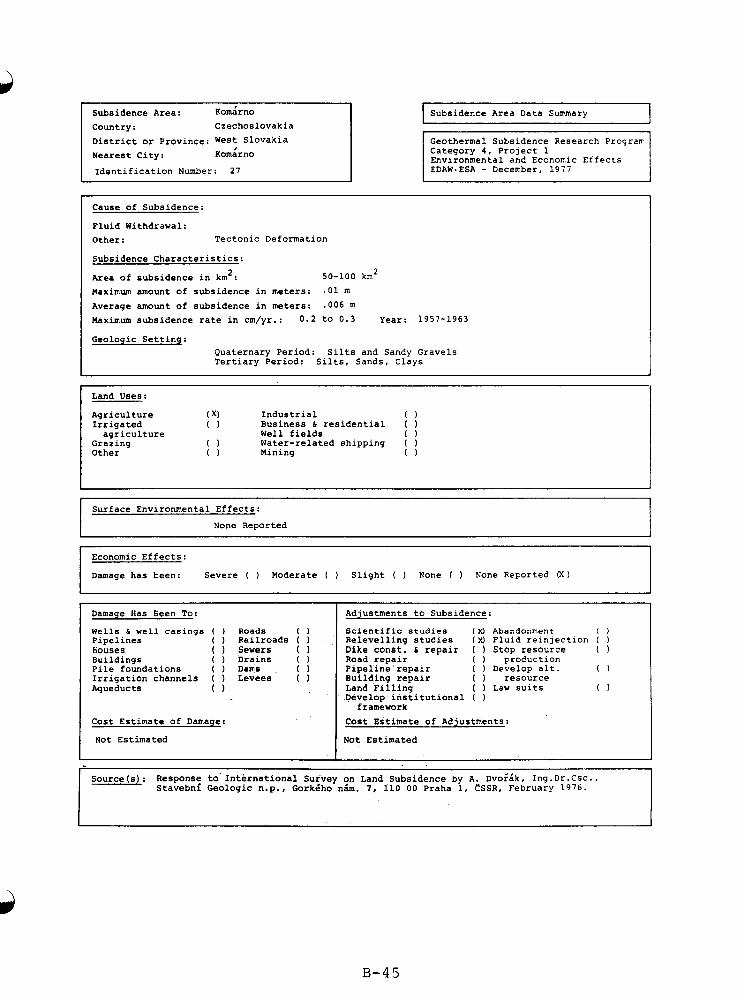
Subsidence Area: Kom6rno Country : Czechoslovakia District or Province: West Slovakia Nearest City:
Identification Number:
- Source (s) : Response to International Survey on Land Subsidence by A. Dvosik, 1ng.Dr.Csc. I
Stavebni Geologic n.p., Gorkdho n&. 7, 110 00 Praha 1, CSSR, February 1976.
I I Subsidence Area Data Summary Geothermal subsidence Research Prograr Category 4, Project 1 Environmental and Economic Effects EDAW.ESA - December, 1977
Cause of Subsidence:
Fluid Withdrawal: Other: Tectonic Deformation
Subsidence Characteristics:
Area of subsidence in km2: Maximum amount of subsidence in meters: .01 m Average amount of subsidence in meters: .006 m Haximum subsidence rate in cm/yr.: 0.2 to 0.3 Year: 1957-1963
Geologic Settinq:
50-100 km2
Quaternary Period: Silts and Sandy Gravels Tertiary Period: Silts, Sands, Clays
I Land Uses:
Agriculture ( X) Industrial 0
agriculture Well fields 0
Other 0 Mining 0
Irrigated 0 Business 6 residential (
Grazing 0 Water-related shipping ( )
Surface Environmental Effects:
None Reported
Economic Effects:
Damage has been: Severe ( ) Moderate ( ) Slight ( ) None ( ) h’one Reported 00
Damage Has Eeen To:
Wells L well casings ( ) Roads 0 Pipelines ( ) Railroads ( ) houses ( ) Sewers ( Buildings ( ) Drains ( Pile foundations ( ) Dams 0 Irrigation channels ( Levees ( 1 Aqueducts 0
Cost Estimate of Damage:
Not Estimated
Adjustments to Subsidence:
Scientific studies ( X I Abandonment 0 Relevelling studies ( X ) Fluid reinjection ( 1 Dike const. 6 repair ( ) Stop resource ( ) Road repair ( ) proc!uction
Building repair ( ) resource
Develop institutional ( )
Cost Estimate of Adjustments:
Not Estimated
Pipeline repair ( ) Develop alt. 0
Land Filling ( ) Law suits 0
frame work
B-45
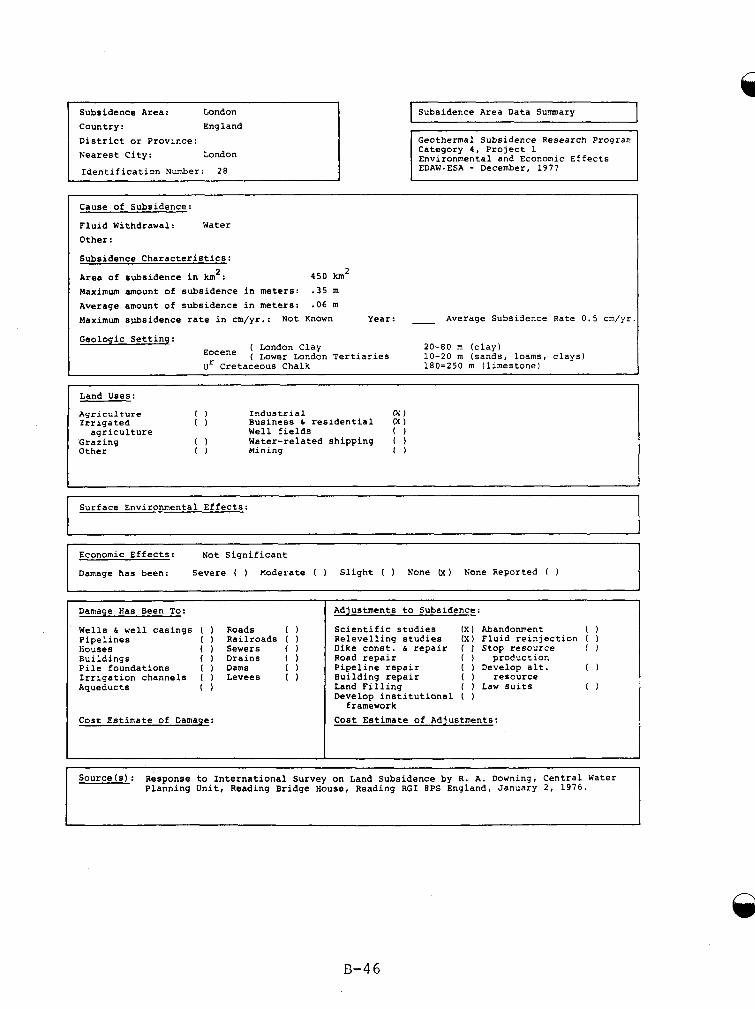
Country : England District or Province: Nearest City: London
Identification Number:
Subsidence Area Data Sumary
Category 4, Project 1 Environmental and Economic Effects EDAW-ESA - December, 1977
Cause of Subsidence:
Fluid Withdrawal: Water Other:
Subsidence Characteristics:
Area of subsidence in km’: Maximum amount of subsidence in meters: .35 m Average amount of subsidence in meters: .06 m Maximum s&sidence rate in cm/yr.: Not Known Year: - Average Subsidence Rate 0.5 cm/yr.
Geologic Setting:
4 5 0 km2
( London Clay 20-80 m (clay) ( Lower London Tertiaries 10-20 m (sands, loams, clays)
ur Cretaceous Chalk 180=250 m (limestone)
~~ ~
Land Uses:
Agriculture 0 Industrial (x ) Irrigated 0 Business 6 residential 00
agriculture Well fields 0 Grazing 0 Water-related shipping ( ) Other 0 Mining 0
Surface Environmental Effects:
Economic Effects: Not Significant
Damage has been: Severe ( ) Moderate ( ) Slight ( ) None (x ) None Reported ( )
Damage Has Been To: Adjustments to Subsidence:
Wells 6 well casings ( ) Roads 0 Pipelines ( ) Railroads ( 1 liouses ( ) Sewers ( ) Buildings ( ) Drains ( 1 Pile foundations ( ) Dams 0 Irrigation channels ( ) Levees ( ) Aqueducts 0
Cost Estimate of Damage:
Scientific studies (X) Abandonment 0 Relevelling studies (X) Fluid reinjection ( Dike const. 6 repair ( ) Stop resource ( ) Road repair ( ) production
Building repair ( ) resource
Develop institutional ( )
Cost Estimate of Adjustments:
Pipeline repair ( ) Develop alt. 0
Land Filling ( ) Law suits 0
framework
I I
SOurCe(s): Response to International Survey on Land Subsidence by R. A. Downing, Central Water Planning Unit, Reading Bridge House, Reading RGI 8PS England, January 2, 1976.
B-46
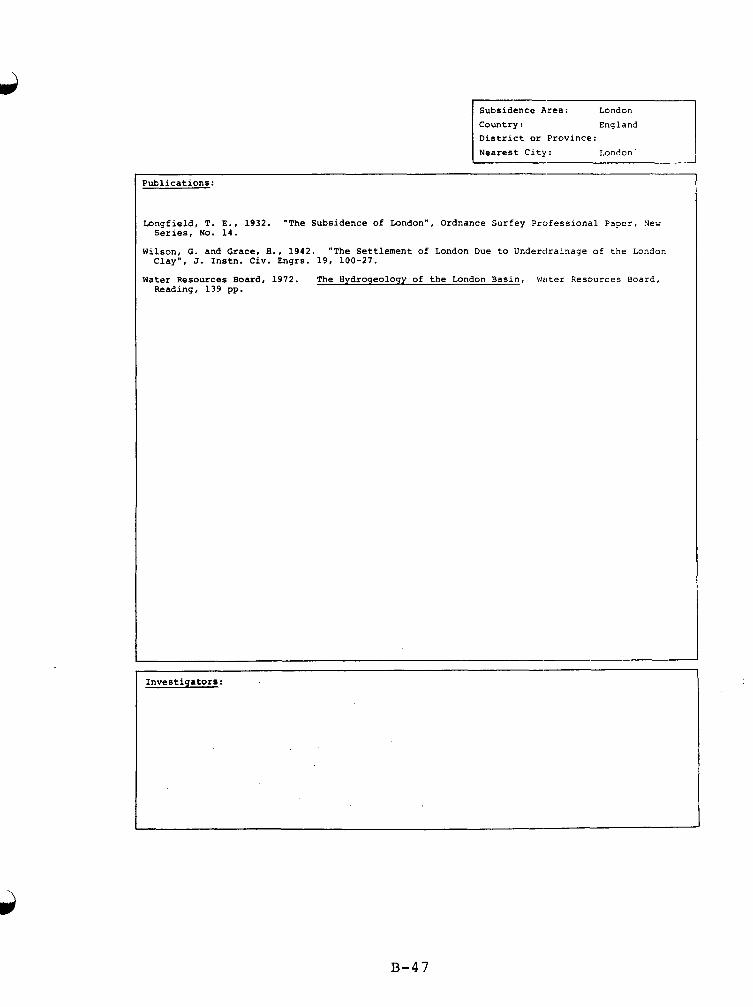
Subsidence Area:
District or Province: Nearest City:
Publications:
Longfield, T. E., 1932. "The Subsidence of London", Ordnance Surfey Professional Paper, New
Wilson; G. and Grace, E., 1942.
Series, No. 14.
"The Settlement of London Due to Underdrainage of the London Clay , J. Instn. Civ. Engrs. 19. 100-27.
Water Resources Board, 1972. Reading, 139 pp.
The Hydrogeology of the London Basin, Water Resources Board,
Investigators:
B-47
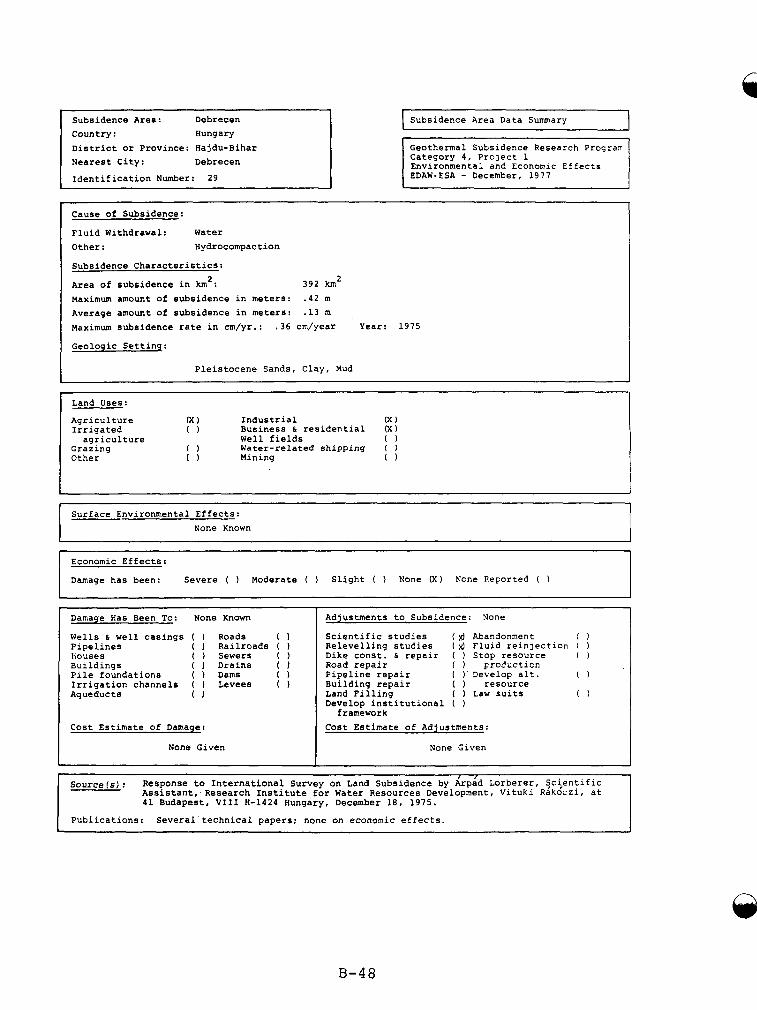
Subsidence Area: Debrecen Country: Hungary District or Province: Hajdu-Bihar Nearest City: Debrecen
Identification Number: 2 9
Source ( 8 ) : Response to International Survey on Land Subsidence by &p;d Lorberer, Scientific Assistant, Research Institute for Water Resources Development, Vituki Rikdczi, at 41 Budapest, VI11 H-1424 Hungary, December 18, 1 9 7 5 .
Publications: Several technical papers: none on economic effects. >
Subsidence Area Data Summary
Geothermal Subsidence Research Proqrar; Category 4, Project 1 Environmental and Economic Effects EDAWeESA - December, 1 9 7 7
Cause of Subsidence:
Fluid Withdrawal: Water Other: Hydrocompaction
Subsidence Characteristics:
Area of subsidence in km’: Maximum amount of subsidence in meters: .42 m Average amount of subsidence in meters: .13 m Maximum subsidence rate in cm/yr.: .36 cm/year Year: 1 9 7 5
Geologic Setting:
3 9 2 km2
Pleistocene Sands, clay, Mud
Land Uses:
Irrigated 0 Business 6 residential (X)
Grazing 0 Water-related shipping ( )
Agriculture (X 1 Industrial (X )
agriculture Well fields ( 1
Other ( 1 Mining 0
Surface Environmental Effects: None Known
Economic Effects:
Damage has been: Severe ( ) Moderate ( 1 Slight ( ) None ( X I None Reported ( )
Damage Has Geen To: None Known
Wells 6 well casings ( 1 Roads 0 Pipelines ( ) Railroads ( 1 iiouses ( Sewers ( ) Buildings ( ) Drains ( 1 Pile foundations ( ) Dams 0 Irrigation channels ( 1 Levees ( 1 Aqueducts 0
Cost Estimate of Damage:
None Given
Adjustments to Subsidence: None
Scientific studies ( d Abandonment 0 Relevelling studies ( d Fluid reinjection ( 1 Dike const. 6 repair ( Stop resource ( ) Road repair ( ) FroCuction Pipeline repair ( )~ Develop ale. 0 Building repair ( resource Land Filling ( 1 Law suits 0 Develop institutional ( 1
Cost Estimate of Adjustments:
None Given
framework
B-48
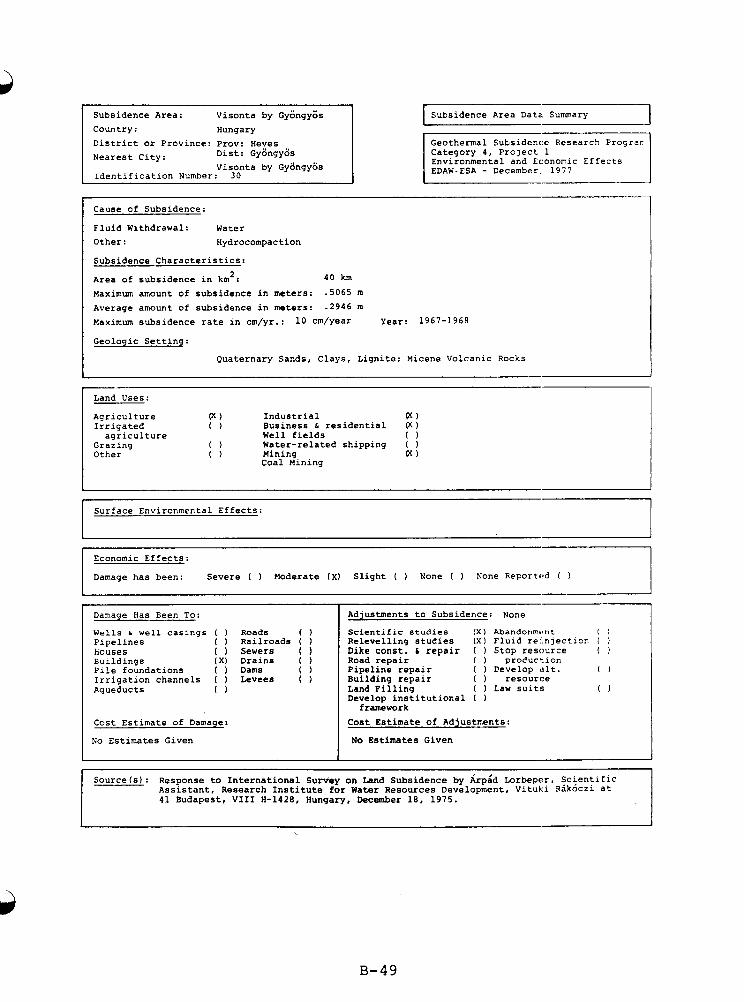
Subsidence Area: Visonta by Gyongyk Country: Hungary District or Province: Prov: Heves Nearest City:
Identification Number: 30
Dist: Gyijngyiis Visonta by Gyangyos
SOUrCe(S) : Response to International Survey on Land Subsidence by irpid Lorbeper, Scientific Assistant, Research Institute for Water Resources Development, Vituki R6k6czi at 41 Budapest, VI11 H-1428, Hungary, December 18, 1975.
I
Subsidence Area Data Summary I Geothermal Subsidence Research Prograr Category 4, Project 1 Environmental and Economic Effects EDAW.ESA - December, 1977
Cause of Subsidence:
Fluid Withdrawal: Water Other: Hydrocompaction
Subsidence Characteristics:
Area of subsidence in km2: Maximum amount of subsidence in meters: - 5 0 6 5 m Average amount of subsidence in meters: -2946 m Maximum subsidence rate in cm/yr.: 10 cm/year Year: 1967-1968
Geologic Settinq:
40 km
Quaternary Sands, Clays, Lignite: Micene Volcanic Rocks
~~~ ~
Land Uses:
Irrigated 0 Business 6 residential 6 )
Grazing 0 Water-related shipping ( )
Agriculture F ) Industrial 6 )
agriculture Well fields 0
Other 0 Mining 00 Coal Mining
1 I
Surface Environmental Effects: I Damage has been: Severe ( ) Moderate ( X ) Slight ( ) None ( 1 None Reportf?d (
Economic Effects: I Damage Has Been To:
Wells 6 well casings ) Roads 0 Pipelines ( ) Railroads ( ) houses ( ) Sewers ( 1 Buildings (X ) Drains ( 1 Pile foundations ( ) Dams 0 Irrigation channels ( ) Levees ( 1 Aqueducts 0
Cost Estimate of Damage:
NO Estimates Given
Adjustments to Subsidence: None
Scientific studies ( X ) Abandonmf?nt 0 Relevelling studies ( X I Fluid reinjection ( 1 Dike const. 6 repair ( Stop resource ( ) Road repair ( ) FroCuction
Building repair ( ) resource
Develop institutional ( )
Cost Estimate of Adjustments:
Pipeline repair ( ) Cevelop alt. 0
Land Filling ( 1 Law suits 0
framework
NO Estimates Given
B-49
Subsidence Area: vlsonta by Gyongyos country: Hungary District or Province: Prov: Heves
Dlst: Gyongyos
Publications:
Kesserii, Zsolt, 1970, "Land Subsidence Due to the Effects of Sinking the Groundwater Table, Conference of Mine- drainage Networks, Hungarian Academy of Sciences, Budapest, 1970, I.a/Vol. No. 3.
Kesserii, Zsolt, 1972, "Forecasting Potential Building Damages Due to the Effect of Sinking the Underground Water Table", 11. International Conference of Mining Geodesy, Budapest, Vol. V.
Investigators:
B-50
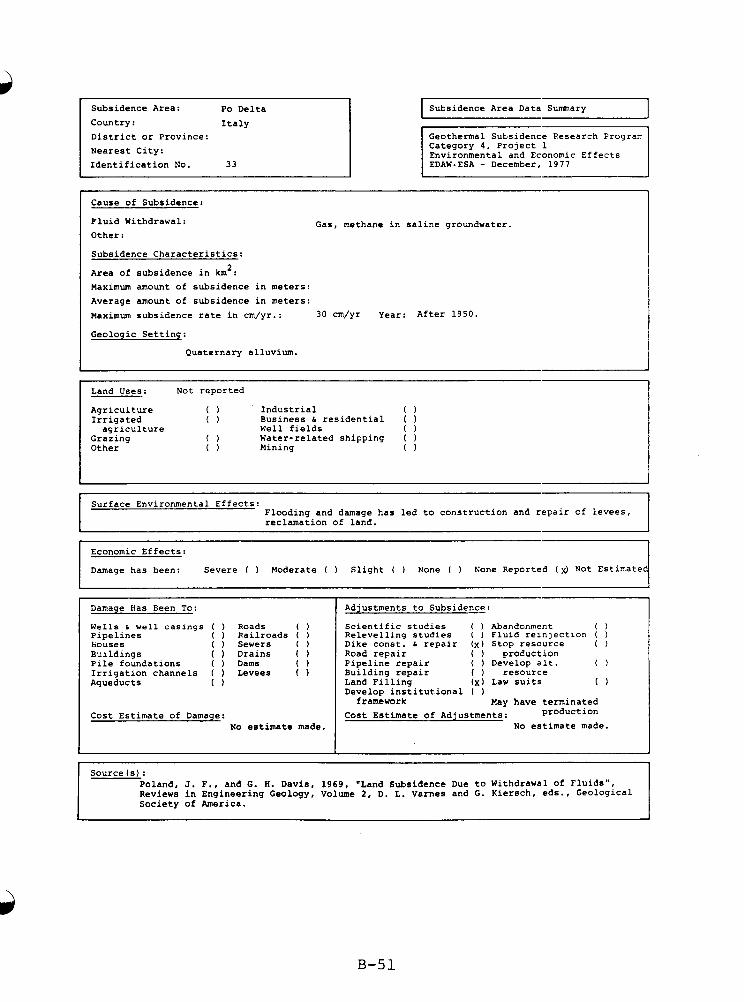
Subsidence Area: Po Delta Country: Italy District or Province: Nearest City: Identification No. 33
I I Subsidence Area Data Summary Geothermal Subsidence Research Prograrr Category 4, Project 1 Environmental and Economic Effects EDAW-ESA - December, 1977
Cause of Subsidence:
Fluid Withdrawal: Other:
Subsidence Characteristics:
Area of subsidence in km2: Maximum amount of subsidence in meters: Average amount of subsidence in meters: Maximum subsidence rate in cm/yr.: 30 cm/yr Year: After 1950.
Geologic Settinq:
Gas, methane in saline groundwater.
Quaternary alluvium.
I Land Uses: Not reported
Agriculture 0 Industrial 0
agriculture Well fields 0
Other 0 Mining 0
Irrigated 0 Business 6 residential ( )
Grazing 0 Water-related shipping ( )
Flooding and damage has led to construction and repair of levees, reclamation of land. I Surface Environmental Effects:
Damage has been: Severe ( 1 Moderate ( 1 Slight ( ) None ( None Reported CX, Not Estimate
Economic Effects:
Damage Has Been To:
Wells 6 well casings ( ) Roads 0 Pipelines ( Railroads ( ) houses ( ) Sewers ( ) Buildings ( ) Drains ( ) Pile foundations ( ) Dams 0 Irrigation channels ( Levees ( 1 Aqueducts 0
Cost Estimate of Damage: No estimate made.
Adjustments to Subsidence:
Scientific studies ( ) Abandonment 0 Relevelling studies ( ) Fluid reinjection ( ) Dike const. 6 repair (x ) Stop resource ( ) Road repair ( proeuction Pipeline repair ( ) Develop alt. 0 Building repair ( resource Land Filling ( x ) Law suits 0 Develop institutional ( )
Cost Estimate of Adjustments: framework May have terminated
production No estimate made.
Source ( s ) : Poland, J. F., and G. H. Davis, 1969, "Land Subsidence Due to Withdrawal of Fluids", Reviews in Engineering Geology, Volume 2, D. L. Varnes and G. Kiersch, eds., Geological Society of America.
B - 5 1
Subsidence Area: Po Delta
District or Province: country : Italy
Investigators:
Joseph F. Poland, U.S. GeologicAl Survey, Room W-2528, Federal Building, Professor Francisco Penta, University of Rome 2800 Cottage Way
Sacramento, California 95825
Contacts: A 1 Freeze, Univereity of British Columbia G. Gambolati
Publications:
Poland and Davis, 1969 (see sources).
Cormnents: Experience since the early 1960's is unknown at this time. In 1960, the Italians were contemplating terminating pumping for methane to halt subsidence, but they faced a trade-off between the cost of remedial measures and the value of gas produced.
B-52
.
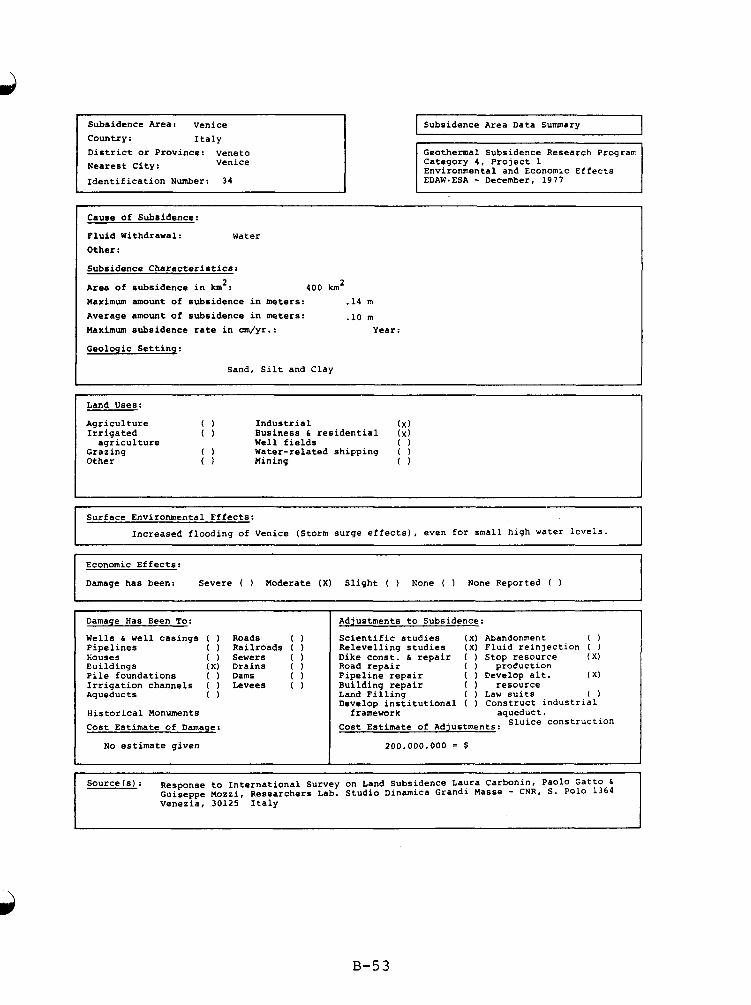
Subsidence Area: Venice Country : Italy District or Province: veneto
Venice Nearest City: Identification Number: 34
~
Subsidence Area Data Summary 1 Geothermal Subsidence Research Prograrr Category 4 . Project 1 Environmental and Economic Effects
Cause of Subsidence:
Fluid Withdrawal: water Other:
Subsidence Characteristics:
Area of subsidence in km': Maximum amount of subsidence in meters: .14 m
Average amount of subsidence in meters: .10 m Maximum subsidence rate in cm/yr.: Year:
Geologic Settinp:
400 km2
Sand, Silt and Clay
Land Uses:
Agriculture 0 Industrial (XI Irrigated 0 Business 6 residential ( x )
agriculture Well fields 0 Grazing 0 Water-related shipping ( 1 Other 0 Mining 0
Surface Environmental Effects:
Increased flooding of Venice (Storm surge effects), even for small high water levels.
Economic Effects:
Damage has been: Severe ( ) Moderate (X ) Slight ( ) None ( ) None Reported ( )
Damage Has Been To:
Wells 6 well casings ( 1 Roads 0 Pipelines ( ) Railroads ( ) Louses ( Sewers ( Euildings ( x ) Drains ( ) Pile foundations ( ) Dams 0 Irrigation channels ( ) Levees ( Aqueducts 0
Historical Monuments Cost Estimate of Damage:
NO estimate given
Adjustments to Subsidence:
Scientific studies ( x ) Abandonment 0 Relevelling studies ( x ) Fluid reinjection ( 1 Dike const. 6 repair ( Stop resource ( X ) Road repair ( ) production Pipeline repair ( ) Develop alt. ( X) Building repair ( ) resource Land Filling ( ) Law suits 0 Develop institutional ( ) Construct industrial
Cost Estimate of Adjustments: 'Iuice construction framework aqueduct.
200.000.000 = s
Source (s) : Response to International Survey on Land Subsidence Laura Carbonin, Paolo Gatto 6 Guiseppe Mozzi, Researchers Lab. Studio Dinamica Grandi Masse - CNR, S. Polo 1364 Venezia, 30125 Italy
B-53
Country : Italy District or Province: veneto
Nearest City: Venice
Publications:
Carbognin, L., P. Gatto, G. Mozzi, G. Gambolati, G. Ricceri, 1977. New Trend in the Subsidence of Venice, in Proceedings of Second Symposium on Land Subsidence December 10-1 1976 Anaheim, CA. International Association of Hydrological Sciences Publication No. 121
Carbognin L., Gatto P. and Mozzi G., 1972, Situatione Idro geologica ne1 Sottosuolo di Venezia - Ricostruzione degli acquiferi soggetti a struttamento sulla base dei dati relativi ai pozzi artesiani. Tech. Rep. 32, Cons. Naz. delle Rlc. Lab. per lo S. della D. della G. M., Venezia.
Theory: Water Resources Research, v. 9, n. 3, p. 721-733. Gambolati G. end Freeze R. A . , 1973, Mathematical Simulation of the Subsidence of Venice I.
Gambolati G., Gatto P. and Freeze R. A., 1974, Mathematical Simulation of the Subsidence of
Gambolati G., Gatto P. and Freeze R. A., 1974, Predictive Simulation of the Subsidence of
Venice 2. Results: Water Resources Research, V . 10, n. 3 p. 563-577.
Venice: Science, v. 183, p. 849-851.
I Investigators:
B-54
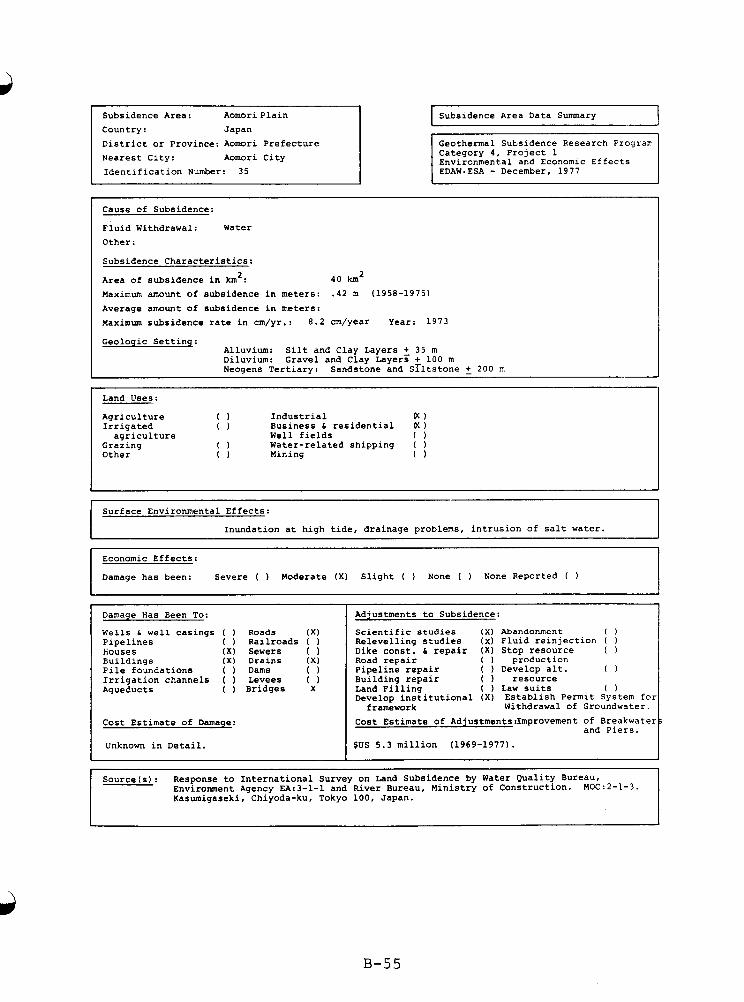
Subsidence Area: AomoriPlain Country: Japan District or Province: Aomori Prefecture Nearest City: Aomori City Identification Number: 35
Subsidence Area Data Summary J Geothermal Subsidence Research Prograr Category 4, Project 1 Environmental and Economic Effects
Cause of Subsidence:
Fluid Withdrawal: Water Other:
Subsidence Characteristics:
Area of subsidence in kmz: Maximum amount of subsidence in meters: .42 m (1958-1975) Average amount of subsidence in meters: Maximum subsidence rate in cm/yr.: 8.2 cm/year Year: 1973
40 km2
Geologic Settinq: Alluvium: Diluvium: Gravel and Clav Lavers + 100 m
Silt and Clay Layers 5 35 m
Neoqens Tertiary: Sandstbne ;nd Srltstone + 200 m
Agriculture 0 Industrial 00
agriculture Well fields 0
Other 0 Mining 0
Irrigated 0 Business 6 residential 00
Grazing 0 Water-related shipping ( 1
I I
Surface Environmental Effects:
Inundation at high tide, drainage problems, intrusion of salt water.
Economic Effects:
Damage has been: Severe ( ) Moderate ( X ) Slight ( ) h'one ( ) None Reported ( 1
Damage Has Been To:
Wells 6 well casings ( 1 Roads ( X ) Pipelines ( ) Railroads ( 1 liouses ( X I Sewers ( 1 Buildings ( X ) Drains ( X ) Pile foundations ( ) Dams 0 Irrigation channels ( ) Levees ( ) Aqueducts ( ) Bridges X
Cost Estimate of Damage:
Unknown in Detail.
Adjustments to Subsidence:
Scientific studies Relevelling studies Dike const. 6 repair Road repair Pipeline repair Building repair Land Filling Develop institutional
framework
( X I Abandonment 0 ( x ) Fluid reinjection ( ) ( X ) Stop resource ( ) ( ) production ( ) Develop alt. 0 ( ) resource ( ) Law suits 0 ( X ) Establish Permit System for
Withdrawal of Groundwater.
Cost Estimate of Adjustments:Improvement of Breakwater
$US 5.3 million (1969-1977). and Piers.
Source(s): Response to International Survey on Land Subsidence by Water Quality Bureau, Environment Agency EA:3-1-1 and River Bureau, Ministry of Construction. MOC:2-1-3. Kasumigaseki, Chiyoda-ku, Tokyo 100, Japan.
B-55
Subsidence Area: Aomori Plain Country : Japan District or Pr0VinCe:Aomori Prefecture Nearest City:
1 Investigators:
Publications:
Environment and Health Department, Aomori Prefectural Government, March 1973, Report on Analysis
Sendai Industry Office, 1973, Investigation Report on Proper Usage of Ground Water Around
of Water Balance in Aomori Region (in Japanese).
Aomori City (in Japanese).
B-56
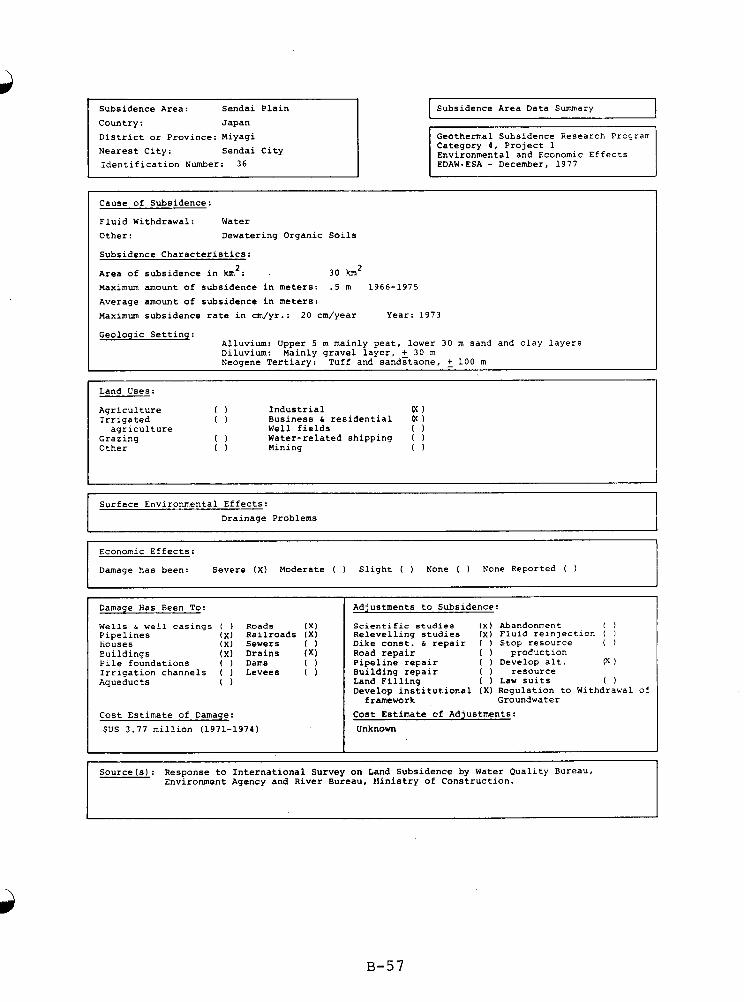
Country : Japan District or Province: Miyagi Nearest City: Sendai City Identification Number:
~~
Economic Effects:
Damage has been: Severe (X) Moderate ( ) Slight ( ) None ( ) None Reported ( 1
I Subsidence Area Data Summary I
I
Geothermal Subsidence Research Prograr; Category 4, Project 1 Environmental and Economic Effects
Cause of Subsidence:
Fluid Withdrawal: Water Other: Dewatering Organic Soils
Subsidence Characteristics:
Area of subsidence in km2: Maximum amount of subsidence in meters: . 5 m 1966-1975 Average amount of subsidence in meters: Maximum subsidence rate in cm/yr.: 2 0 cm/year Year: 1973
Geologic Setting:
30 km2
Alluvium: Upper 5 m mainly peat, lower 30 m sand and clay layers Diluvium: Mainly gravel layer, + 30 m Neogene Tertiary: Tuff and sandFtaone, 5 100 m
Land Uses: I Agriculture 0 Industrial 00 Irrigated 0 Business 6 residential 00 agriculture Well fields 0
Grazing 0 Water-related shipping ( ) Other 0 Mining 0
Surface Environmental Effects: Drainage Problems
Damage Has Been To:
Wells 6 well casings ( ) Roads (XI Pipelines (x) Railroads (XI tiouses ( X I Sewers ( ) Euildings ( x ) Drains ( x ) Pile foundations ( ) Dams 0 Irrigation channels ( ) Levees ( Aqueducts 0
Cost Estimate of Damage: $US 3.77 million (1971-1974)
Adjustments to Subsidence:
Scientific studies (x) Abandonment 0 Relevelling studies (x) Fluid reln~ectlon ( ) Dike const. 6 repair ( ) Stop resource ( ) Road repair ( pro6uct1on Pipeline repair ( ) Develop alt. @ )
Land Filling ( ) Law suits 0 Building repair ( ) resource
Develop institutional ( X ) Regulation to Withdrawal of
Cost Estimate of Adjustments: Groundwater framework
Unknown
Source(s): Response to International Survey on Land Subsidence by Water Quality Bureau. Environment Agency and River Bureau, Ninistry of Construction.
B-57
Subsidence Area: Sendai Plain Country: Japan District or Province:Miyagi
Sendai City
Publications:
Sendai Industry Office, 1975, Investigation Report on Proper Usage of Groundwater i n Sendai
Environment Countermeasure Council, Sendai City, October 1975, Report on Cause of Subsidence
and Natori (in Japanese).
and its Countermeasure in East Region of Nigatake, Sendai City (in Japanese).
Investigators :
B-58
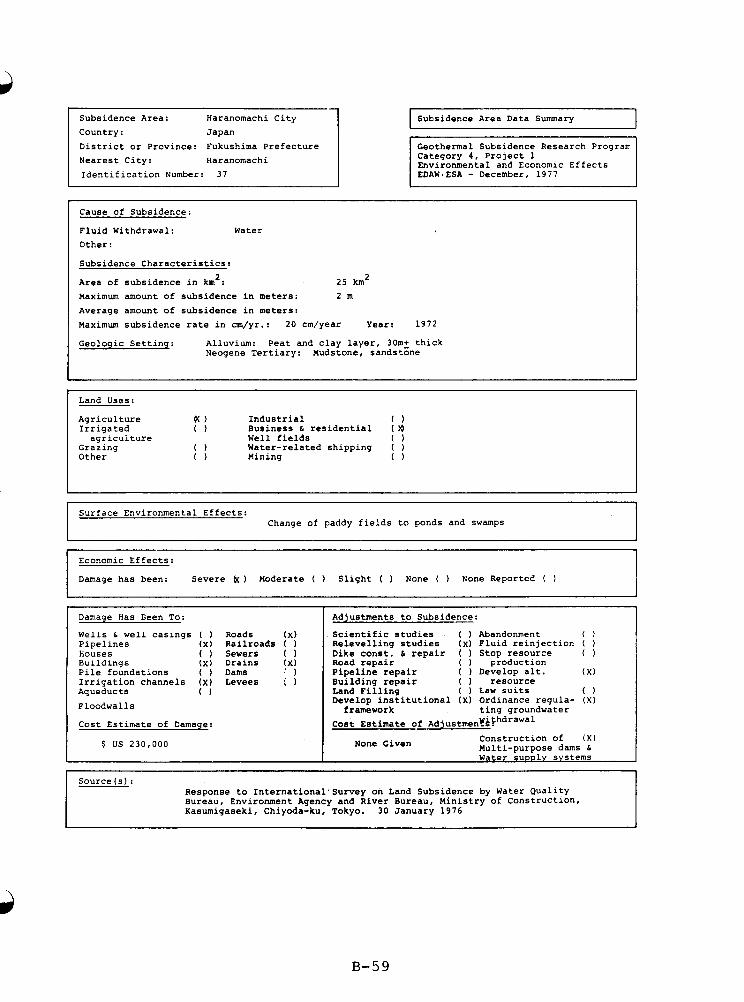
Subsidence Area: Haranomachi City Country: Japan District or Province: Fukushima Prefecture Nearest City: Haranomachi Identification Number: 3 7
Land Uses:
Agriculture 00 Industrial 0
agriculture Well fields 0
Other 0 Mining 0
Irrigated 0 Business 6 residential ( 1
Grazing 0 Water-related shipping ( 1
J
I I Subsidence Area Data Summary
1 Damage Has Been To:
Wells 6 well casings ( Roads ( X ) I Pipelines (x) Railroads ( )
houses ( Sewers ( 1 Buildings ( x ) Drains !x1 Pile foundations ( ) Dams ) Irrigation channels (x) Levees z ) Aqueducts 0 Floodwalls
Cost Estimate of Damage:
$ US 230,000
Geothermal Subsidence Research Progran Category 4, Project 1 Environmental and Economic Effects
Cause of Subsidence:
Fluid Withdrawal: Water Other:
Subsidence Characteristics:
Area of subsidence in km2: Maximum amount of subsidence in meters: 2 m Average amount of subsidence in meters: Maximum subsidence rate in cm/yr.: 20 cm/year Year: 1972
Geologic Setting: Alluvium: Peat and clay layer, 30m+ thick
25 km2
Neogene Tertiary: Mudstone, sandstone
Surface Environmental Effects: Change of paddy fields to ponds and swamps
Economic Effects:
Damage has been: Severe k ) Moderate ( Slight ( ) None ( ) None Reported ( 1
Adjustments t o Subsidence:
Scientific studies ( Abandonment 0 Relevelling studies ( x ) Fluid reinjection ( ) Dike const. b repair ( Stop resource ( ) Road repair ( ) production
Building repair ( ) resource
Develop institutional ( X ) Ordinance regula- ( X )
Cost Estimate of Adjustmenv&fhdrawal
Pipeline repair ( ) Develop alt. ( X I
Land Filling ( ) Law suits 0
framework ting groundwater
construction of ( X ) None Given Multi-purpose dams 6
Water suDulv systems
Source (s) : Response to International'Survey on Land Subsidence by Water Quality Bureau, Environment Agency and River Bureau, Ministry of Construction, Kasumigaseki, Chiyoda-ku, Tokyo. 30 January 1976
B-59
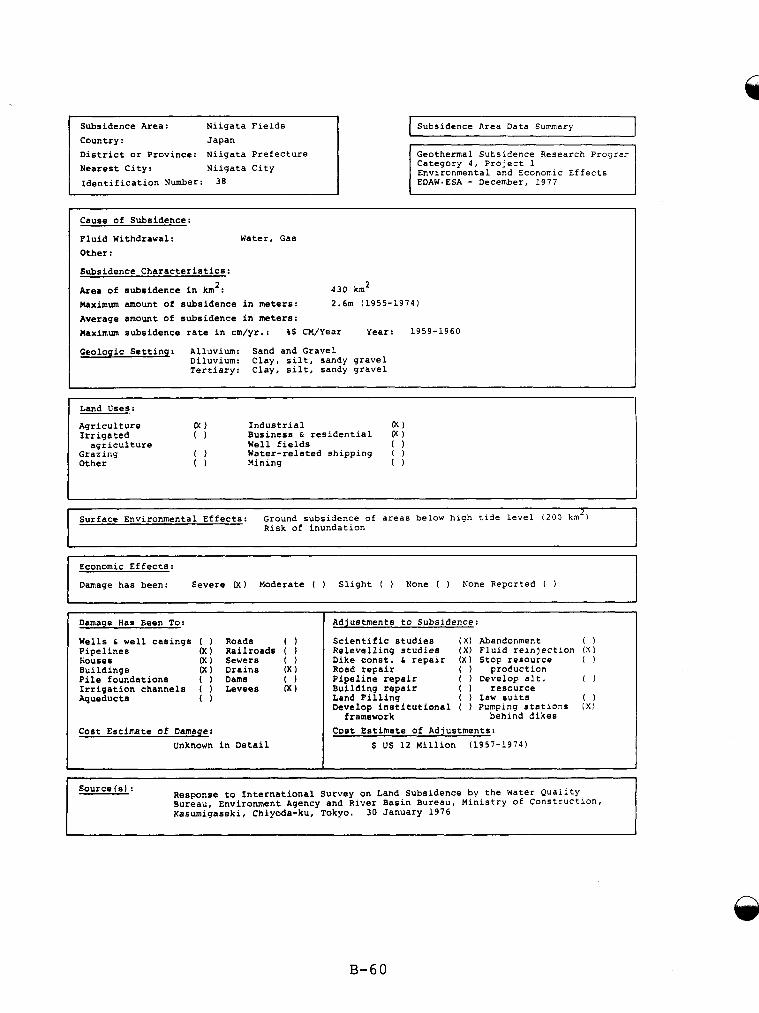
Subsidence Area: Niigata Fields Country : Japan District or Province: Niigata Prefecture Nearest City: Niigata City Identification Number: 38
Subsidence Area Data Sumnary J Geothermal Subsidence Research P r o g r a r Category 4, Project 1 Environmental and Economic Effects EDAWaESA - December, 1977
Cause of Subsidence:
Fluid Withdrawal: Water, Gas Other:
Subsidence Characteristics:
Area of subsidence in km2: Maximum amount of subsidence in meters: 2.6m (1955-1974) Average amount of subsidence in meters: Maximum subsidence rate in cm/yr.: $$ CM/Year Year: 1959
Geologic Setting: Alluvium: Sand and Gravel
430 km2
Diluvium: Clay, silt, sandy gravel Tertiary: Clay, silt, sandy gravel
,1960
Land Uses:
Irrigated 0 Business & residential 00
Grazing 0 Water-related shipping ( )
Agriculture & ) Industrial 00
agriculture Well fields 0
Other 0 Mining 0
I 1 Surface Environmental Effects: Ground subsidence of areas below high tide level (200 kn2)
Risk of inundation
Economic Effects:
Damage has been: Severe Ix) Moderate ( ) Slight ( ) None ( ) Xone Reported ( 1
Damage Has Been To:
Wells & well casings ( ) Roads ( ) Pipelines (XI Railroads ( ) liouses ( X I Sewers ( ) Buildings ( X I Drains ( X I Pile foundations ( Dams 0 Irrigation channels ( ) Levees 00 Aqueducts 0
Cost Estimate of Damage: Unknown in Detai
Adjustments to Subsidence:
Scientific studies ( X I Abandonment 0 Relevelling studies ( X ) Fluid reinjection ( S ) Dike const. & repair ( X I Stop resource ( 1 Road repair ( ) production
Building repair ( I resource
Develop institutional ( ) Pumping stations ( X )
Cost Estimate of Adjustments:
Pipeline repair ( ) @evelop alt. I )
Land Filling ( ) Law suits 0
framework behind dikes
S US 12 Million (1957-1974)
Response to International Survey on Land Subsidence by the Water Quality Bureau, Environment Agency and River Basin Bureau, Ministry of Construction, Kasumigaseki, Chiyoda-ku, Tokyo. 30 January 1976
Source ( 8 ) :
B-60
Putlications:
Subsidence Area: Niigata Fields Country : Japan District or Province: Niigata Prefec- Nearest City: ture
N ~ I O R ~ ~ r l t i .
Poland, J. F. and Davis, G. H., 1969, "Land Subsidence Due to Withdraval of Fluids," reviews in Engineering Geology, Volume 11, D . L. Varnes and G. Kiersch, eds., Geological Society of America, Boulder, Colorado.
in Niigata (in Japanese). Niigata Prefectural Government, 1961, Report on present status of subsidence
Investigation Committee of Subsidence in Niigata, 1958, 1962, 1963, Subsidence in Niigata No. 1, 2 , 3 (in Japanese).
Industry Promotion Section, Niigata Prefecture, 1965, Subsidence in and aroxi Niigata (in Japanese).
Shnano River Agricultural Water Usage Investigation Office, Hokuriku AgricultLral Water Usage Investigation Office, Hokuriku Agricultural Administration BZrea'J, Ministry of Agriculture, 1971, Subsidence in the Niigata Plain (in Japanese!.
Niigata Prefectural Government, 1971-1975, Subsidence in the Niigata Plain
Geographical Survey Institute, Ministry of Construction, 1959-1975, Report on surveying and investigation of ground level changes in Niigata No. 1-27 (in Japanese).
(in Japanese) .
Investigators:
B-61
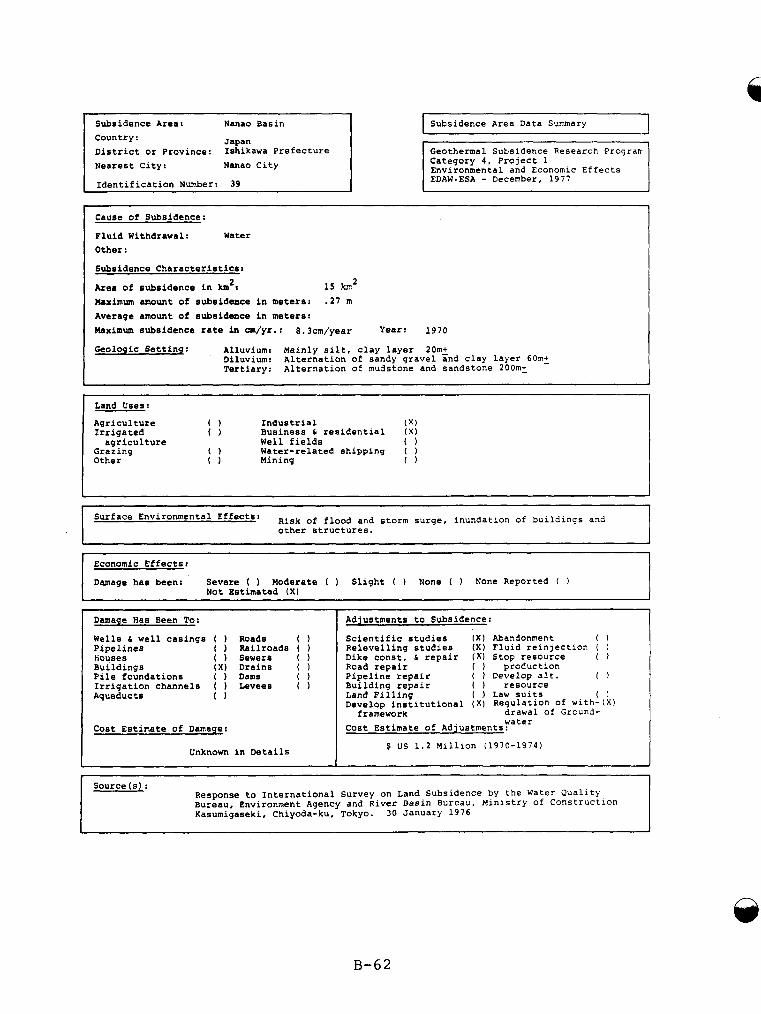
Subsidence Area: Nanao Basin
District or Province: Ishikawa Prefecture Nearest City: Nanao City
Identification Number:
Japan country: Subsidence Area Data Summary I Geothermal Subsidence Research Prograrr Category 4, Project 1 Environmental and Economic Effects EDAWaESA - December, 1977
Cause of Subsidence:
Fluid Withdrawal: Water Other:
Subsidence Characteristics:
Area of subsidence in km': Maximum amount of subaidence in meters: .27 m Average amount of subsidence in meters: Maximum subsidence rate in cm/yr.: 8.3cm/year Year: 1970
15 km2
Geologic Setting: Alluvium: Mainly silt, clay layer 201712 Diluvium: Alternation of sandy gravel and clay layer 60m+ Tertiary: Alternation of mudstone and sandstone 200m+
Land Uses:
Agriculture 0 Industrial ( X I Irrigated 0 Business 6 residential ( X ) agriculture Well fields 0
Grazing 0 Water-related shipping ( Other 0 Mining 0
I J ~
Surface Effects: Risk of flood and storm surge, inundation of buildings and other structures. r
Economic Effects:
Damage has been: Severe ( ) Moderate ( ) Slight ( ) None ( ) None Reported ( ) Not Estimated ( X I
Damage Has Been To:
Wells 6 well casings ( ) Roads ( Pipelines ( 1 Railroads ( ) houses ( ) Sewers ( ) Buildings ( X I Drains ( Pile foundations ( ) Dams 0 Irrigation channels ( ) Levees ( Aqueducts ( 1
Cost Estimate of Damage:
Unknown in Details
Adjustments to Subsidence:
Scientific studies ( X I Abandonment 0 Relevelling studies ( X ) Fluid reinjection ( ) Dike const. 6 repair ( X I Stop resource ( ) Road repair ( ) proCuction
Building repair ( resource
Develop institutional ( x ) Regulation of with-(XI
Cost Estimate of Adjustments.
Pipeline repair ( Develop alt. 0
Land Filling I ) Law suits 0
drawal of Ground- yater
framework
S US 1.2 Million (1970-19741
Source ( s ) : Response to International Survey on Land Subsidence by the Water Quality Bureau, Environment Agency and River Basin Bureau, Ministry of COnstrUCtlOn Kasumigaseki, Chiyoda-ku, Tokyo. 30 January 1976
n
B-62
Subsidence Area: Nanao Basin Country : Japan District or Province: Ishikawa Pre-
fecture Nanao City Nearest City:
Publications:
Committee on Countermeasures of Subsidence around the Nanao Port, Ishikawa Prefecture, 1971-1974, Investigation Report on Subsidence around the Nanao Port (in Japanese).
. . I
B-63
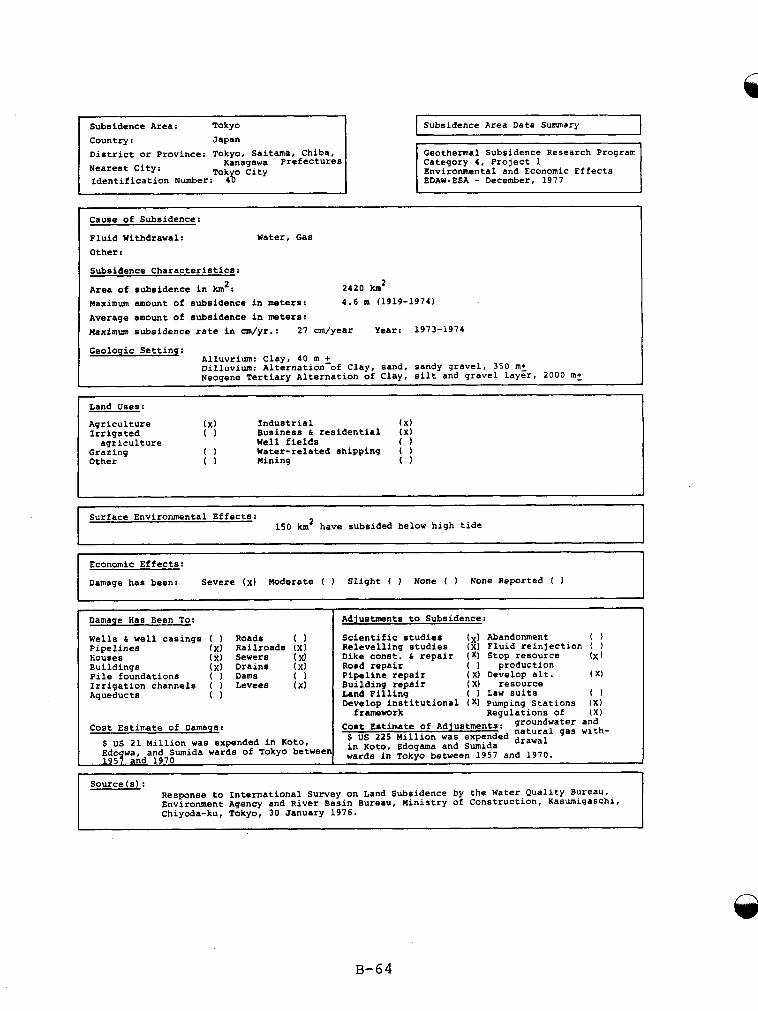
Subsidence Area: Tokyo I Country : Japan
Surface Environmental Effects: 150 km’ have subsided below high tide
District or Province: Tokyo, Saitama, Chiba,
Nearest City: Tok 0 City Identification Number: 4%
Kanagawa Prefectures
Subsidence Area Data Summary I Geothermal Subsidence Research Program Category 4, Project 1 Environmental and Economic Effects EDAW-ESA - December, 1977
Cause of Subsidence:
Fluid Withdrawal: Water, Gas Other:
subsidence Characteristics:
Area of subsidence in km2: Maximum amount of subsidence in meters: 4.6 m (1919-1974)
Average amount of subsidence i n meters: Maximum subsidence rate in cm/yr.: 27 cm/year Year: 1973-1974
2420 km2
Settins: Alluvrium: Clay, 40 m + Dilluvium: Alternation-of Clay, sand, sandy gravel, 350 m+ Neocfene Tertiary Alternation of Clay, silt and gravel layer, 2000 m+
~~~ ~~
Economic Effects:
Damage has been: Severe (x) Moderate ( ) Slight ( ) None ( ) None Reported (
~~
Damage Has Been To:
Wells 6 well casings ( ) Roads ( ) Pipelines (x) Railroads ( X ) houses (XI Sewers (XI Buildings (x ) Drains ( X I Pile foundations ( ) Dams 0 Irrigation channels ( ) Levees ( X I Aqueducts 0
Cost Estimate of Damage: $ US 21 Million was expended in Koto, Edo a, and Sumida wards of Tokyo betweer 195yand 1970
Adjustments to Subsidence:
Scientific studies Relevelling studies Dike const. b repair Road repair Pipeline repair Building repair Land Filling Develop institutional
framework
Abandonment 0 (x ) Fluid reinjection ( ) ( X ) Stop resource ( x ) ( ) production (X) Develop alt. ( X) ( X I resource ( ) Law suits 0 ( X I Pumping Stations ( X I
Reaulations of ( X ) Cost Estimate of Ad ustments: groundwater and
$ US 225 Million w:s expended in Koto, Edogama and Sumida drawal wards in Tokvo between 1957 and 1970.
gas with-
Source ( 8 ) : Response to International Survey on Land Subsidence by the Water Quality Bureau, Environment Agency and River Basin Bureau, Ministry of Construction, Kasumigaschi, Chiyoda-ku, Tokyo, 30 January 1976.
B-64
Country: Japan District or Province: Nearest City: Tokyo City
Publications:
Investigation Group of Subsidence in South Kanto, 1974, Bulletin on
civil Engineering Research Institute, Tokyo Metropolitan Government (TMG) ,
Environment Department and Environment Research Institute, Chiba
Subsidence in South Kanto R551 (in Japanese).
1950-1975, Bulletin on Subsidence (in Japanese).
Prefectural Government, 1964-1975, Subsidence in Chiba Prefecture (in Japanese).
Miyamoto Takashi, 1975, "Estimates of Economic Losses Caused by Environmental pollution," Annual Report of the Tokyo Metropolitan Research Institute for Environmental Protection, pp. 45-85 (in English).
Tokyo Metropolitan Government, 1977, Tokyo Fights Pollution. (in English)
B-65
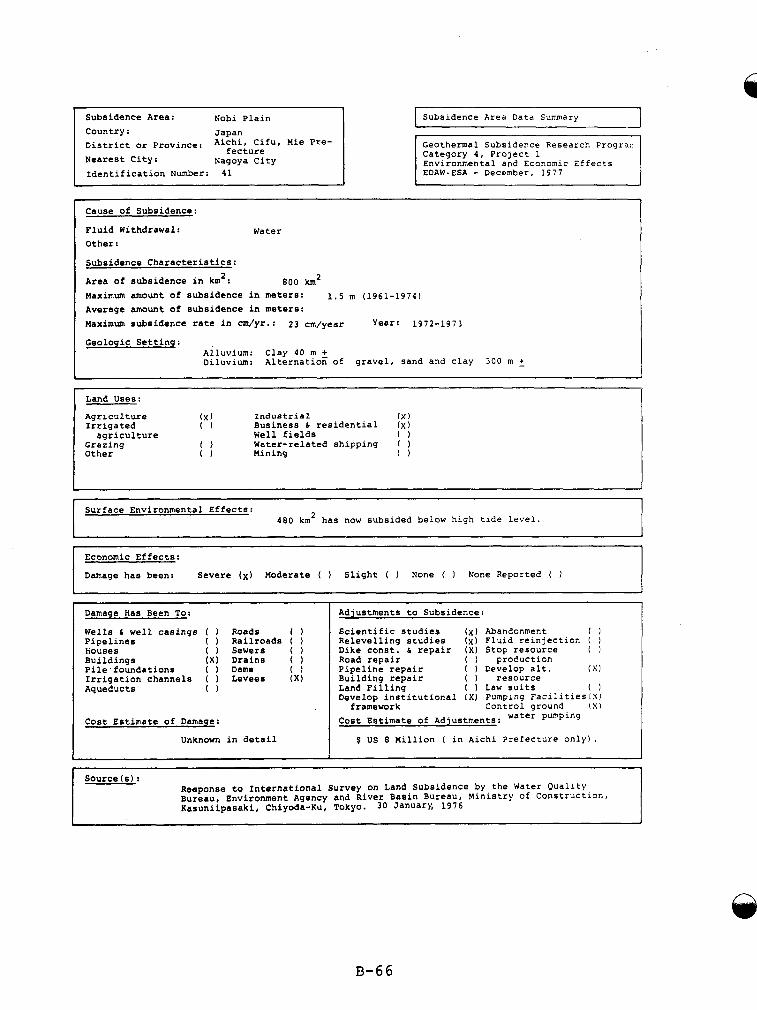
Subsidence Area: Nobi Plain Country : Japan District or province: Aichi, Cifu, Mie Pre-
Nearest City: Nagoya City Identification Number: 41
fecture
Subsidence Area Data Bumnary I Geothermal subsidence Research Progrzr Category 4, Project 1 Environmental and Economic Effects EDAW.ESA - December, I977
Cause of Subsidence:
Fluid Withdrawal: Other:
Water
Subsidence Characteristics:
Area of subsidence in km2: 800 km2 Maximum amount of subsidence in meters: 1.5 m (1961-1974) Average amount of subsidence in meters: Maximum subsidence rate in cm/yr.: 23 cm/year Year: 1972-1973
Geologic Settinq: Ailuvium: Clay 40 m 2 Diluvium: Alternation of gravel, sand and clay 300 m 5
I Land Uses:
Agriculture (X 1 Industrial lx) Irrigated ( 1 Business 6 residential (x)
agriculture Well fields 0 Grazing 0 Water-related shipping ( 1 Other 0 Mining 0
Surface Environmental Effects: 480 km2 has now subsided below high tide level. I
Economic Effects:
Damage has been: Severe ( x ) Moderate ( 1 Slight ( 1 None ( ) h'one Reported ( 1
Damage Has Geen TOI
Wells 6 well casings Pipelines Kouses Buildings Pile.foundations Irrigation channels Aqueducts
) Roads ( 1 1 Railroads ( 1 1 Sewers ( 1
X ) Drains ( 1 1 Dams 0 ) Levees ( X ) 1
Cost Estimate of Damage:
Unknown in detail
Adjustments to Subsidence:
Scientific studies (x) Abandonment 0 Relevelling studies ( x ) Fluid reinjection ( ) Dike const. 6 repair ( x ) Stop resource ( 1 Road repair ( ) production
Building repair ( ) resource
Develop institutional ( x ) Pumping FacilitleSlS) Control ground ( X I
Cost Estimate of Adjustments:
Pipeline repair ( ) Cevelop alt. ( S I
Land Filling ( 1 Law suits 0
framework water
$ US 8 Million ( in Aichi Prefecture only).
Source ( 8 ) : Reeponse to International Survey on Land Subsidence by the Water Quallty Bureau, Environment Agency and River Basin Bureau, Ministry of Construction, Kasuniipasaki, Chiyoda-Ku, Tokyo. 30 January, 1976
I 1
B-66
Subsidence Area: Nobi Plain country : Japan District or Province: Aichi, Cifu, Nearest City: 1 ' Mie 1
Nagoya City
Publications:
Environment Department and Research Group of Subsidence, Aichi Prefectural Government, 1975, Report on Research and Investigation on the Actual Condition of Subsidence and its Countermeasure, p354 (in Japanese).
Geographical Survey Institute and Chubu Regional Construction Bureau, Ministry of Construction, 1973-1975, Investigation on the Correlation between Subsidence and Regional Structure No. 1-3. (in Japanese).
Geographical Survey Institute, Ministry of Construction, 1959-1975, Report on surveying and investigation of ground level changes in Tokai-Regional No. 1-3 (in Japanese).
Investigators:
B-67
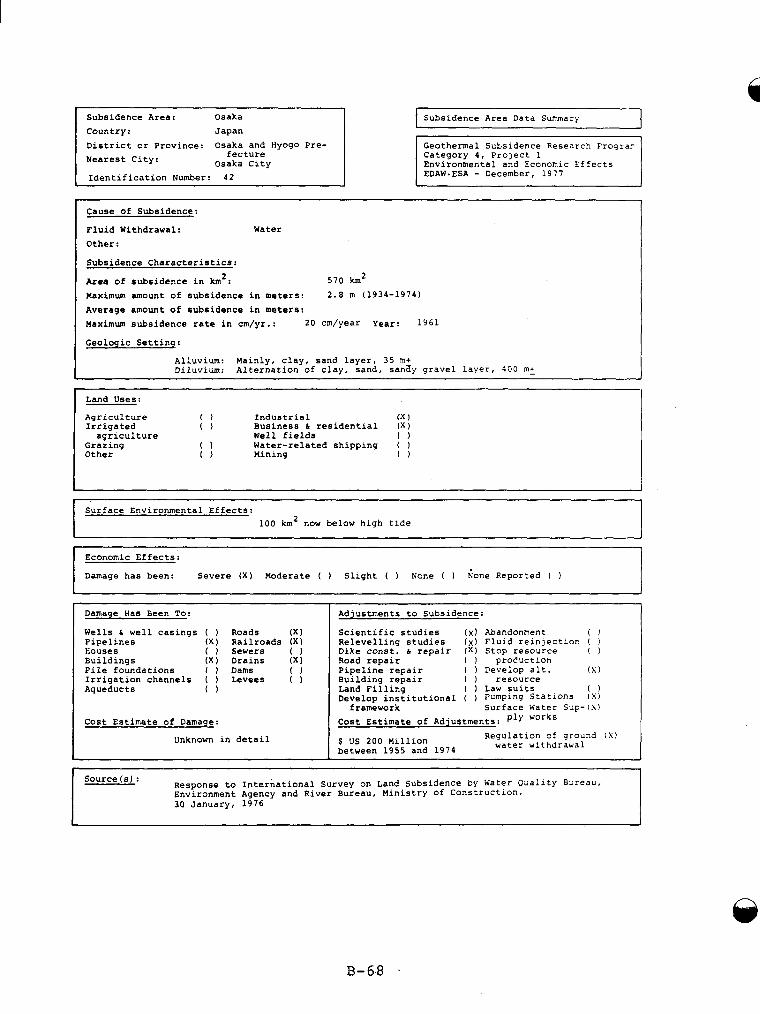
Subsidence Area: Osaka I Country 2 Japan
I
District or Province: Osaka and Hyogo Pre- Nearest City: fecture
Osaka City I
I
I Identification Number: 42 I
Subsidence Area Data Summary
Geothermal subsidence Research Prograr Category 4, Project 1 Environmental and Economic Effects EDAW.ESA - December, 1977
Cause of Subsidence:
Fluid Withdrawal: Water Other:
Subsidence Characteristics:
Area of subsidence in km2: Maximum amount of subsidence in meters: 2.8 m (1934-1974) Average amount of subsidence in meters: Maximum subsidence rate in cm/yr.: 20 cm/year Year: 1961
Geologic Setting:
570 km2
Alluvium: Mainly, clay, sand layer, 35 m+ Diluvium: Alternation of clay, sand, sandy gravel layer, 400 m+
Agriculture 0 Industrial (X I Irrigated 0 Business 6 residential ( X )
agriculture Well fields 0 Grazing 0 Water-related shipping ( 1 Other 1 ) Mining ( 1
Surface Environmental Effects: I 100 km2 now below high tide
Economic Effects:
Damage has been: Severe ( X ) Moderate ( ) Slight ( ) None ( Gone Reported ( 1 I Damage Has Been To:
Pipelines ( X I Railroads ( X ) Louses ( ) Sewers ( ) Buildings ( X ) Drains ( X ) Pile foundations ( ) Dams 0 Irrigation channels ( Levees ( ) Aqueducts 0
Wells 6 well casings ( ) Roads ( X )
Cost Estimate of Damage:
Unknown in detail
Adjustments to Subsidence:
Scientific studies ( x ) Abandonment 0 Relevelling studies ( x ) Fluid reinjection ( ) Dike const. d repair ( X I Stop resource ( ) Road repair ( FroCuction Pipeline repair ( ) Eevelop alt. (SI Building repair ( resource Land Filling ( ) Law suits ( 1 Develop institutional ( ) Pumping Stations 1x1
framework Surface Water Sup- i s ) Cost Estimate of Adjustments: works
Regulation of ground ( S ) water withdrawal $ US 200 Million
between 1955 and 1974
Response to International Survey on Land Subsidence by Water Quality Bureau, Environment Agency and River Bureau, Ministry Of COnstruCtlOn. 30 January, 1976
Source (SI :
1
B-68 1
Country: Japan District or Province: Nearest City: Osaka City
Osaka and Hyogo
Publications:
Committee of Comprephensive Countermeasure for Subsidence in Osaka, 1966-1974, Outline of subsidence in Osaka (in Japanese).
of the levelling (in Japanese). Environment and Health Bureau, Osaka City, 1968-1974, Bulletin on the results
Investigators:
B-69
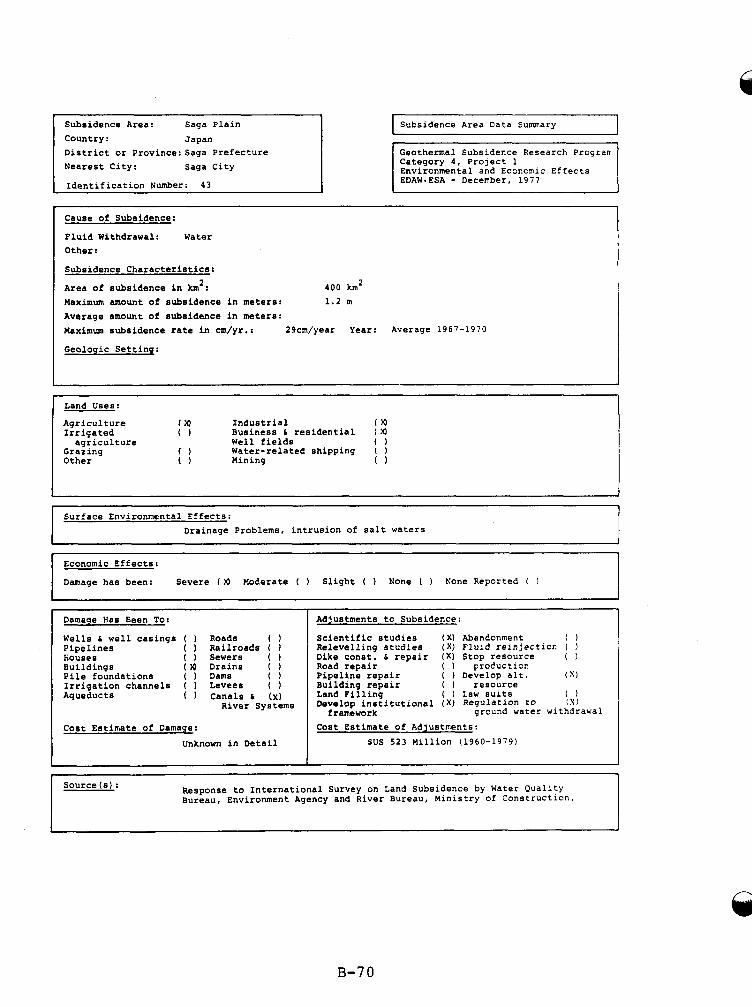
Subsidence Area: Saga Plain Country : Japan District or Province:Saga Prefecture Nearest City: Saga City
Identification Number: 4 3
1
Surface Environmental Effects: Drainage Problems, intrusion of salt waters
Subsidence Area Data Summary I Category 4, Project 1 Environmental and Economic Effects EDAWaESA - December, 1977
Cause of Subsidence:
Fluid Withdrawal: Water Other:
Subsidence Characteristics:
Area of subsidence in km2: Maximum amount of subsidence in meters: 1 . 2 m Average amount of subsidence in meters: Maximum subsidence rate in Cm/yr.: 29cm/year Year: Average 1967-1970
Geologic Settinq:
400 km2
Land Uses:
Irrigated 0 Business 6 residential ( 9
Grazing 0 Water-related shipping ( )
Agriculture ( x ) Industrial ( 9
agriculture Well fields 0
Other 0 Mining 0
Economic Effects:
Damage has been: Severe ( x ) Moderate ( 1 Slight ( ) None ( None Reported ( 1
Damage Has Been To:
Wells 6 well casings ( 1 Pipelines ( 1 tiouses 0 Buildings ( x ) Pile foundations ( 1 Irrigation channels ( 1 Aqueducts ( 1
Roads ( 1 Railroads ( 1 Sewers ( 1 Drains ( ) Dams 0 Levees ( 1 Canals 6 (x)
River Systems
Cost Estimate of Damage: Unknown in Detail
Adjustments to Subsidence:
Scientific studies ( X ) Abandonment 0 Relevelling studies ( X ) Fluid reinjection I ) Dike const. 6 repair ( X I Stop resource ( ) Road repair ( ) proeuction
Building repair ( ) resource
Develop institutional ( x ) Regulation to 1x1
Cost Estimate of Adjustments:
Pipeline repair ( Develop alt. (?o
Land Filling ( 1 Law suits 0
ground water withdrawal framework
$US 5 2 3 Million (1960-1979)
Response to International Survey on Land Subsidence by Water Quality Bureau, Environment Agency and River Bureau, Ministry of Construction.
Source ( 8 ) :
1 J
B-70
Publications:
Saga Plain Subsidence Area: country: Japan District or Province: saga prefecture
Nearest City: Saga City
Geology News, Sep. 1967, Geological condition in the Saga Plain and
Agriculture and Public Works Department, Saga Prefectural Government,
Subsidence in Saga City (in Japanese).
1966, Subsidence in the Shiraishi Plain (in Japanese).
Geographical Survey Institute, Ministry of Construction, 1974-1975. Report on surveying and investigation of ground level changes in Saga (in Japanese).
Investigators:
B-71
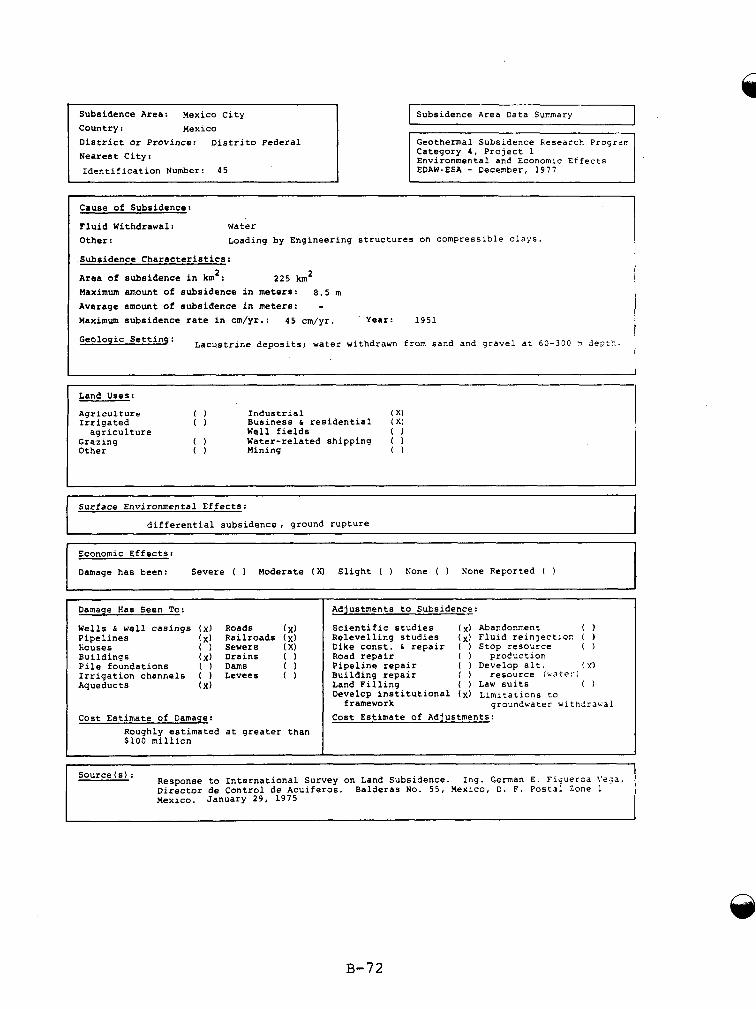
Country: Mexico District or Province: Distrito Federal Nearest City: Identification Number:
Response to International Survey on Land Subsidence. Ing. German E. Figueroa Veqa, Director de Control de Acuiferos. Balderas No. 55, Mexico, D. F. Postal Zone 1 Mexico. January 29, 1975
Source (s) :
-
Subsidence Area Data Summary
Geothermal Subsidence Research Procjrar Category 4, Project 1 Environmental and Economic Effects EDAWsESA - December, 1977
Cause of Subsidence:
Fluid Withdrawal: water Other:
Subsidence Characteristics:
Area of subsidence in km2: Maximum amount of subsidence in meters: 8.5 m Average amount of subsidence in meters: - Maximum subsidence rate in cm/yr.: 45 cm/yr. ' Year: 1951
Geologic Setting:
Loading by Engineering structures on compresslble clays.
2 2 5 km2
Lacustrine deposits; water withdrawn from sand and gravel at 60 ,300 a depth.
~~
Land Uses:
Agriculture 0 Irrigated 0
Grazing 0 Other 0
agriculture
Industrial ( X) Business 6 residential ( X I Well fields 0 Water-related shipping ( 1 Mining 0
Surface Environmental Effects:
differential subsidence, ground rupture
Economic Effects:
Damage has been: Severe ( ) Moderate ( X ) Slight ( ) Kone ( ) Lone Reported ( )
Damage Has Been To:
Wells 6 well casings (x ) Pipelines ( X ) liouses 0 Buildings ( X ) Pile foundations 0 Irrigation channels ( ) Aqueducts ( X )
Cost Estimate of Damage: Roughly estimate $100 million
Roads ( x ) Railroads ( x ) Sewers ( X ) Drains ( Dams 0 Levees ( I
at greater than
Adjustments to Subsidence:
Scientific studies ( x ) Relevelling studies (XI Dike const. 6 repair ( ) Road repair 0 Pipeline repair 0 Building repair 0 Land Filling 0 Develop institutional ( X I
framework
Abandonment 0 Fluid rein]ectio~ ( 1 Stop resource ( )
proCuction Develop alt. (xl
resource (ha:ezl Law suits 0 Limitations to
groundwater wlthdra*.31 Cost Estimate of Adjustments:
B-72
Subsidence Area: Mexico City country : Mexico District Or Pr0vince:Distrito Federal Nearest City:
Publications:
Chase, Arthur P., 1972, Precast Segmented Tunnel Lining for the Mexico City Subway, Geologic Conditions, Environmental Factors, Construction Methods in Two Tacubaya Tunnels. Nor th AM. Rapid Excavation Tunneling Conf., Proc., Vol. 1, p. 439-467. Illus. (Incl. Sketch Map),
Figueroa Vega, German E. 1977, "Subsidence of the City of Mexico: A Historical Review" in proceedings of Second Symposium on Land Subsidence December 10-17, 1976 Anaheim, California. International Association of Hydrological Sciences. Publication No. 121
Ortiz, T. S., 1967, Subsidence in Mexico City in Relation to Groundwater Overdraft. In Hydrology of Fractured Rocks, Proceedings of the Dubovnik Symposium, October 1965, Vol. 2. International Association of Scientific Hydrology, Publication 74:665-671
Powers, Patrick, 1972, Groundwater Control in Tunnel Construction Use of Predrainage In Free Air and Compressed Air Tunnels to Lower Construction Costs, Recent examples. North AM. Rapid Excavation Tunneling Conf., Pro., Vol. 1. p. 331-369. Illus..
Investigators:
Ing. German E. Figueroa Vega
B-73
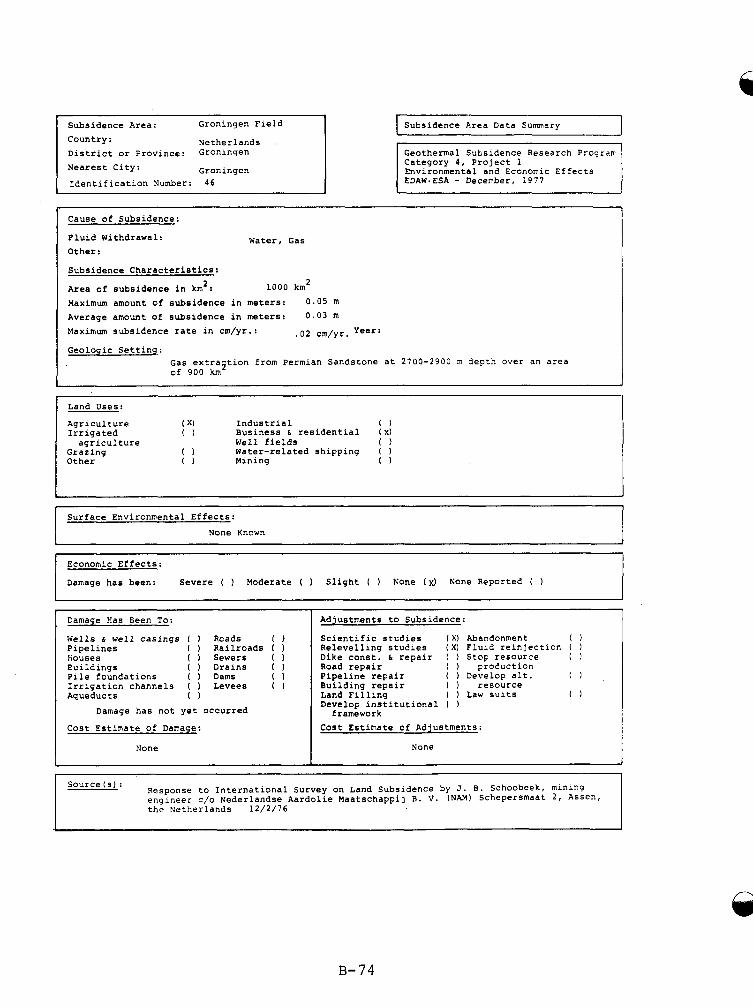
Country: Netherlands District or Province: Groningen
Nearest City: Groningen Identification Number:
1
Source (s) : Response to International Survey on Land Subsidence by J. 8. Schoobeek, mining engineer c/o Nederlandse Aardolie Maatschappi] B. V. the Netherlands 12/2/76
( N M ) Schepersmaat 2, Assen,
-
Subsidence Area Data Summary 1 Category 4, Project 1 Environmental and Economic Effects EDAWaESA - December, 1977
Cause of Subsidence:
Fluid Withdrawal: Other:
Water, Gas
Subsidence Characteristics:
Area of subsidence in km2: Maximum amount of subsidence in meters: 0 . 0 5 m Average amount of subsidence in meters: 0.03 m Maximum subsidence rate in cm/yr.:
Geologic Setting:
1000 km2
.02 cm/yr. Year:
Gas extrastion from Permian Sandstone at 2700-2900 m depth over an area of 900 km
Land Uses:
Agricult ure Irrigated
Grazina agriculture
Other
( X) Industrial ( 1 0 Business 6 residential (x)
Well fields 0 0 Water-related shipping ( ) 0 Mining 0
Surface Environmental Effects: None Known
Economic Effects:
Damage has been: Severe ( ) Moderate ( ) Slight ( ) KOne (x ) None Reported ( 1
~
Damage Has Geen To:
Wells 6 well casings ( ) Roads r ) Pipelines ( Railroads ( ) houses ( Sewers ( Euildings ( Drains ( Pile foundations ( ) Dams 0 Irrigation channels ( ) Levees ( ) Aqueducts 0
Damage has not yet occurred
Cost Estimate of Danage:
None
Adjustments to Subsidence:
Scientific studies (XI Abandonment ( 1 Relevelling studies ( X I Fluid reinjection ( ) Dike const. 5 repair ( ) Stop resource ( Road repair ( 1 profuction
Building repair ( resource
Develop institutional I )
Cost Estimate of Adjustments:
Pipeline repair ( ) bevelop alt. ( 1
Land Filling ( ) Law suits 0
framework
None
B-74
Publications:
Netherlands Country: District or Province: Groningen Nearest City: Groningen
Schoonbeek, J. B. 1976 "Land Subsidence as a result of natural gas extraction in the province of Groningen", preprint Spring Meeting SPE, Amsterdam (in preparation).
Kesteren, J. van, 1973, "The analysis of future surface subsidence resulting from gas production in the Groningen field". Verhandelingen Kon. Ned. Geol. Mi~nbouwk. Gen. volume 28, p. 11.
Investigators:
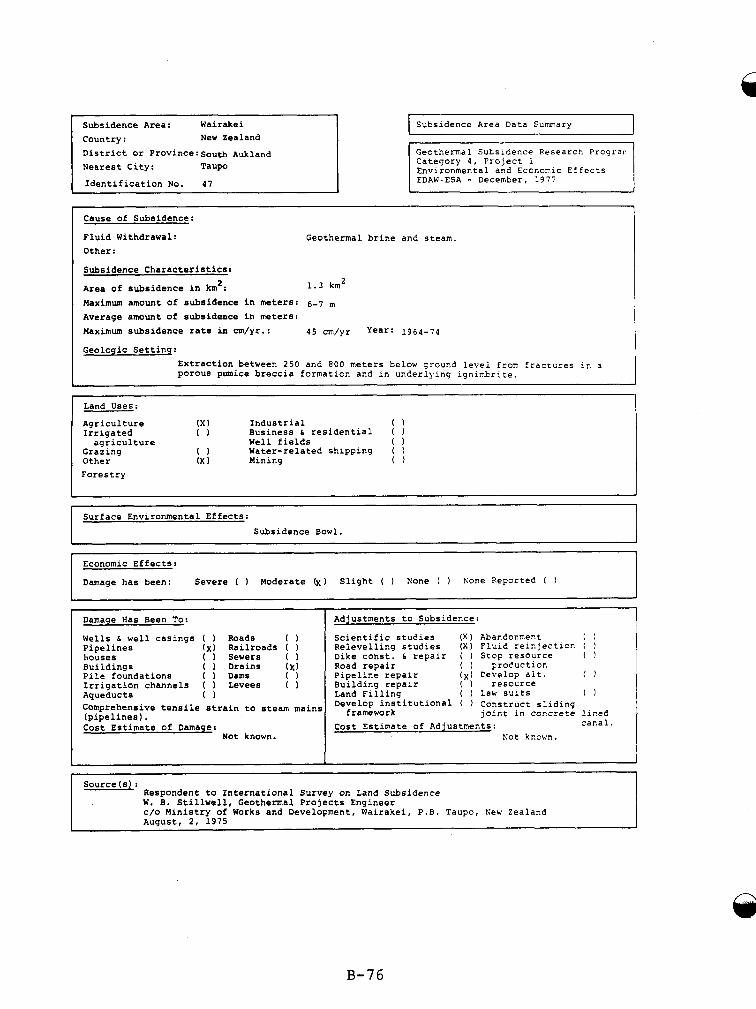
A
Economic Effects:
Damage has been: Severe ( Moderate Slight ( ) Kone ( Kone Reported ( )
Subsidence Area: Wairakei Country: New Zealand District or Province:south Aukland Nearest City:
Identification No.
I I Subsidence Area Data Sumnary Geothermal Subsidence Research Prograr Category 4, Project 1 Environmental and Economic Effects
Cause of Subsidence:
Fluid Withdrawal: Geothermal brine and steam. Other:
Subsidence Characteristics:
Area of subsidence in km2: 1.3 km2
Maximum amount of subsidence in meters: 6-7 Average amount of subsidence in meters: Maximum subsidence rate in cm/yr.: 45 cm/yr Year: 1964-74
Geologic Setting: Extraction between 250 and 800 meters below ground level fron fractures ~n a porous pumice breccia formation and in underlying ignirrbrlte.
Land Uses:
Agriculture ( X ) Industrial Irrigated 0 Business 6 residential
Grazing 0 Water-related shipping Other (X 1 Mining Forestry
agriculture Well fields
I I
Surface Environmental Effects: Subsidence Bowl.
Damage Has Been To:
Wells 6 well casings ( ) Roads ( ) Pipelines (XI Railroads ( ) Iiouses ( ) Sewers ( ) Buildings ( ) Drains ( x ) Pile foundations ( ) Dams 0 Irrigation channels ( ) Levees ( )
Comprehensive tensile strain to steam mains (pipelines). Cost Estimate of Damage:
Aqueducts 0
Not known.
Adjustments to Subsidence:
Scientific studies ( X ) Abandoni.ent Relevelling studies ( X ) Fluid reinjecticc I i Dike const. 6 repair ( ) Stop resource ( ) Road repair ( ) FroCuctior.
Building repair ( ) resource
Develop institutional ( ) Construct sliding
Cost Estimate of Adjustments:
Pipeline repair ( x ) Cevelop alt. 0
Land Filling ( ) Law suits 0
framework joint in concrete lined canal.
Kot known.
I Source ( 8 ) :
Respondent to International Survey on Land Subsidence W. 8. Stillwell, Geothennal Projects Engineer c/o Ministry of Works and Development, Wairakei, P.B. Taupo, New Zealand August, 2 , 1975
B-76
/ \
Wa irake i Subsidence Area: country: New Zealand District or Province: 5 . Aukland I Nearest City: Taupo
1 Putlications: Bowen, R. G., 1973, Environmental Impact of Geothermal Development. “Hot water fields by contrast could behave more like an unconsolidated petroleum reservoir and unless pressures are rnaintained by fluid return, there may be subsidence. Indeed this has occurred in Wairakei, New Zealand (Hatton, 19701, or where the water is not returned to the reservoir.
Production and Subsidence History of the Wairakei Field.
Works, Waikalei, New Zealand, Geothennics Special Issue.
Garg, S. K./Pritchett, J. W./Rice, L. F./ Brownell, D. H, Jr., 1976, Study of the Geothermal
Batton, J. W., 1970, Ground Subsidence of a Geothermal Field During Exploitation, Xinistry of
Hatton, J. W., 1970, Ground Subsidence of a Geothermal Field During Exploitation, in L‘nited h’aticr. Symposium on Utilization of Geothermal Resources, Pisa Italy, Elmsford, N.Y., Maxwell Scientific International, Inc.
Pritchett, J. W./Garg, S . K./Brownell, D. H., Jr./Levine, H. B., 1975, Geohydrological Enviromen- tal Effects of Geothermal Power Production: Phase I, Final Report, National Science Foundation, Washington, D.C.
Pritchett, J. W./Garg, S. K./Brownell, D. H., Jr./Rice, L. E./Rice, M. H./Riney, T. D./ Hendrickson, R. R., 1976, Geohydrological Environmental Effects of Geothermal Power Production: Phase IIA - Final Report, National Science Foundation, Washington, D.C.
Stilwell, W. B., et. al., 1975, Ground Movement in New Zealand Geothermal Field (Abstract) in Second U.N. Symposium on the Development and Use of Geothermal Resources, Abstracts, San Francisco, California, Lawrence Berkeley Laboratory, California, No. I V - 1 5 , May, 1975.
Garg, Sabood (Engineer, numerical analysis) Systems, Science and Softwave, Inc. La Jolla, California
.
8-77
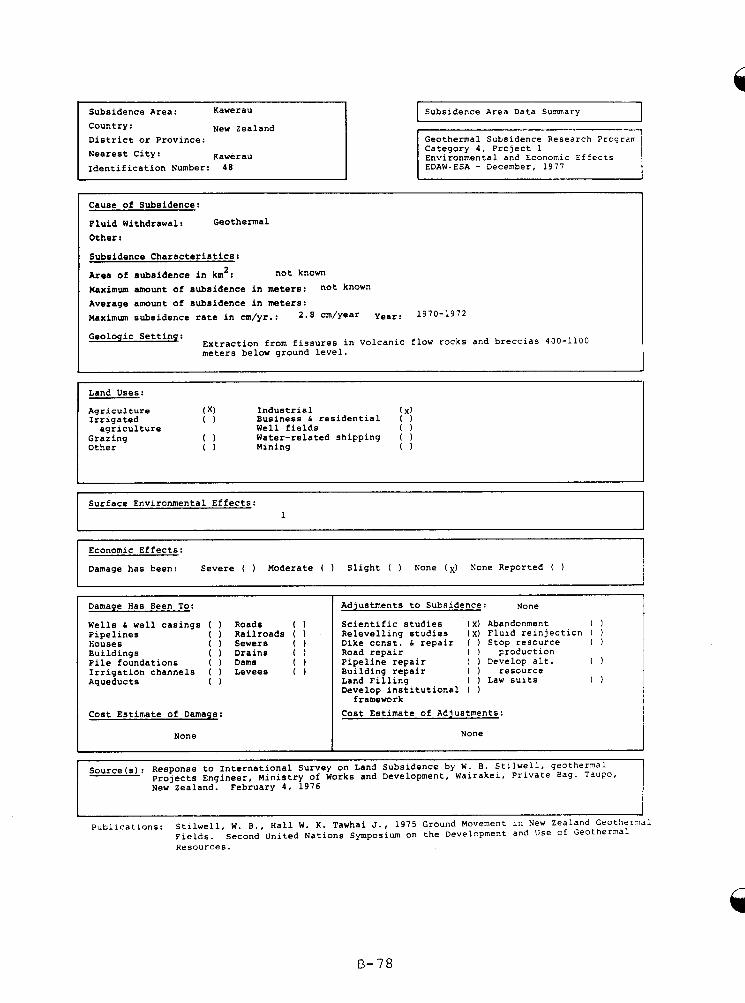
A.
Damage Has Been To:
Subsidence Area: Kawerau
Country : New Zealand District or Province:
Nearest City: Kawerau Identification Number: 48
Adjustments to Subsidence: None
I I Subsidence Area Data Summary
Cost Estimate of Damage:
None
Geothermal Subsidence Research Progran Category 4, Project 1 Environmental and Economic Effects
Cost Estimate of Adjustments:
None
Cause of Subsidence:
Fluid Withdrawal: Geothermal Other:
Subsidence Characteristics:
Area of subsidence in km 2 : Maximum amount of subsidence in meters: not known Average amount of subsidence in meters: Maximum subsidence rate in cm/yr.: 2 . 8 cm/Year Year: 1970-1972
Geologic Settinq:
not known
Extraction from fissures in Volcanic flow rocks and breccias 400-1100 meters below ground level.
Land Uses:
Agriculture (X) Industrial ( X) Irriga ted 0 Business 6 residential ( )
agriculture Well fields 0 Grazing 0 Water-related shipping ( ) Other 0 Mining 0
I
I J Surface Environmental Effects: I 1
Economic Effects:
Damage has been: Severe ( ) Moderate ( ) Slight ( ) Hone (x) None Reported ( )
Wells 6 well casings ( Roads Pipelines ( ) Railroads Louses ( ) Sewers Buildings ( ) Drains Pile foundations ( ) Dams Irrigation channels ( Levees Aqueducts 0
Scientific studies (x) Abandonment 0 Relevelling studies ( x ) Fluid reinjection ( ) Dike const. 6 repair ( Stop resource ( ) Road repair ( ) FroCuction
Building repair ( ) resource
Develop institutional ( 1
Pipeline repair ( ) Cevelop alt. 0
Land Filling ( ) Law suits 0
f ramework
A
8 - 7 8
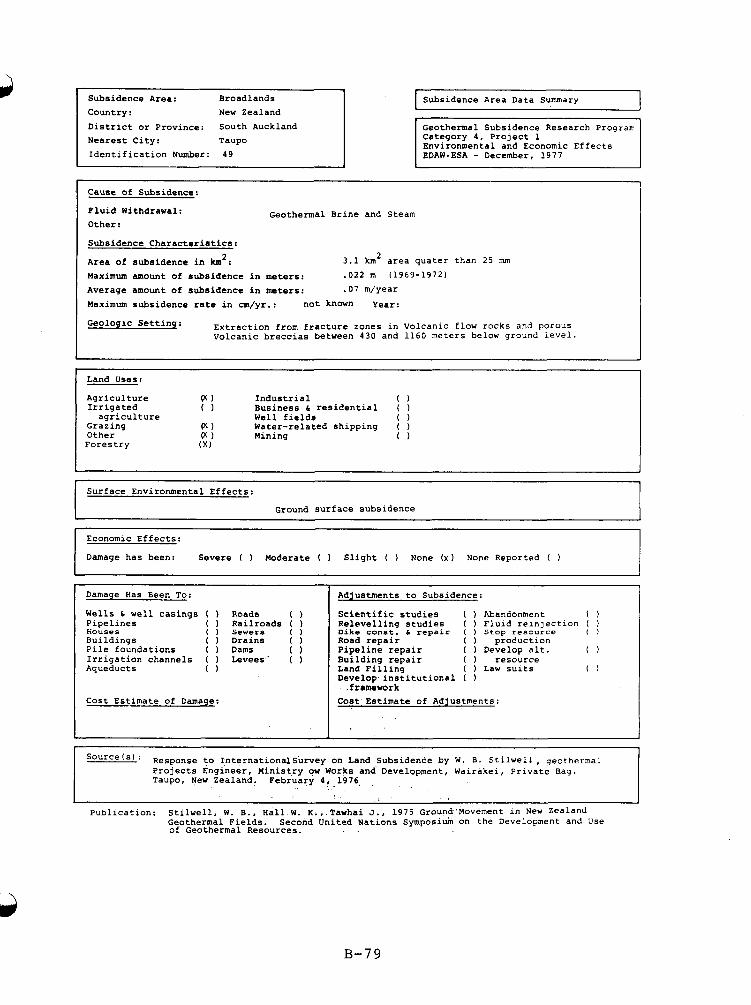
Subsidence Area: Broadlands Country : New Zealand District or Province: South Auckland Nearest City: Taupo Identification Number:
Surface Environmental Effects:
Ground surface subsidence 1
Subsidence Area Data Summary 1
~ ~ _ _ _ _ _ ~- ~ _ _ _ _ _ _ _ ~ ~ _ _ _ _ _
Economic Effects:
Damage has been: Severe ( ) Moderate ( Slight ( ) None (XI None Reported ( )
Geothermal Subsidence Research Prograrr Category 4, Project 1 Environmental and Economic Effects EDAW-ESA - December, 1977
Cause of Subsidence:
Fluid Withdrawal: Other:
Subsidence Characteristics:
Area of subsidence in km': Maximum amount of subsidence in meters: . 0 2 2 m (1969-1972) Average amount of subsidence in meters: .07 m/year Maximum subsidence rate in cm/yr.: not known Year:
Geologic Settinq:
Geothermal Brine and Steam
3.1 km2 area quater than 25 nun
Extraction from fracture zones in Volcanic flow rocks and porous Volcanic breccias between 430 and 1160 meters below ground level
Land Uses:
Agriculture 00 Industrial 0 Irrigated 0 Business h residential (
agriculture Well fields 0 Grazing 90 Water-related shipping ( ) Other pc ) Mining 0 Forestry ( X )
Damage Has Been To:
Wells h well casings ( 1 Roads ( ) Pipelines ( Railroads ( )
Buildings ( Drains ( ) Pile foundations ( ) Dams 0 Irrigation channels ( ) Levees' ( Aqueducts 0
Louses ( Sewers ( )
Cost Estimate of Damage:
Adjustments to Subsidence:
Scientific studies ( ) Abandonment 0 Relevelling studies ( ) Fluid reinjection ( ) Dike const. 6 repair ( ) Stop resource < ) Road repair ( 1 production Pipeline repair ( 1 Develop alt. 0 Building repair ( ) resource Land Filling ( 1 Law suits 0 Develop. institutional ( )
Cost Estimate of Adjustments: . f rarnework
Source(s) ' Response to InternationalSurvey on Land Subsidence by W. B. Stilwell , geothermal Prolects Engineer, Ministry ow Works and Development, Walrakei, Prlvate Bag. Taupo, New Zealand. February 4, 1976
1 Publication: Stilwell, W. B., Hall W. K., Tawhai J., 1975 Ground Movement in New Zealand
Geothermal Fields. Second United Nations Symposium on the Development and Use of Geothermal Resources.
B-79
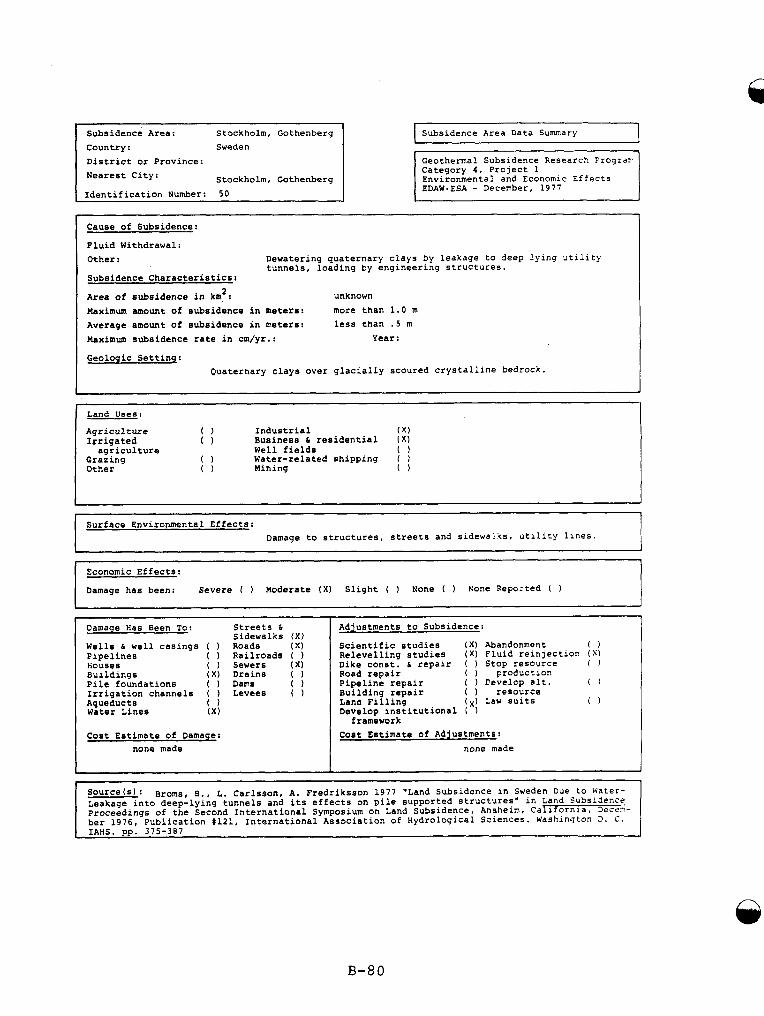
Subsidence Area: Stockholm, Gothenberg Country : Sweden District or Province: Nearest City:
Identification Number: 50 Stockholm, Gothenberg
r Source(s): BrOms, B., L. Carlsson, A. Fredriksson 1977 "Land Subsidence in Sweden Due to Water- Leakage into deep-lying tunnels and its effects on pile supported structures" in Land Subsidence Proceedings of the Second International Symposium on Land Subsidence, Anaheim, Carifornia, Desrm- ber 1976, Publication W l Z 1 , International Association of Hydrological Sciences. Washington D. 5 .
, IAHS. pp. 375-387
Subsidence Area Data Summary 1 Geothermal Subsidence Research Prograrr Category 4, Project 1 Environmental and Economic Effects EDAWeESA - December, 1977
Cause of Subsidence:
Fluid Withdrawal: Other: Dewatering quaternary clays by leakage to deep lylng utility
tunnels, loading by engineering structures. ' Subsidence Characteristics:
Area of subsidence in km : Maximum amount of subsidence in meters: more than 1.0 m Average amount of subsidence in meters: less than . 5 m Maximum subsidence rate in cm/yr.: Year:
Geologic Setting:
unknown 2
Quaternary clays over glacrally scoured crystalline bedrock.
Land Uses:
Irrigated 0 Business & residential ( X I
Grazing 0 Water-related shipping ( 1
Agriculture 0 Industrial ( X )
agriculture Well fields 0
Other 0 Mining 0
~
Surface Environmental Effects: Damage to structures, streets and sldewaiis, utlllty llnes.
Economic Effects:
Damage has been: Severe ( ) Moderate ( X ) Slight ( ) None ( ) None Reported ( )
Damage Has Been To: Streets b Sidewalks ( X )
Wells b well casings ( ) Roads ( X ) Pipelines ( ) Railroads ( ) houses ( ) Sewers ( X I Buildings ( X ) Drains ( Pile foundations ( Dams 0 Irrigation channels ( ) Levees ( 1 Aqueduct 8 0 Water Lines ( X )
Cost Estimate of Damage: none made
~~ ~~ ~~ ~
Adjustments to Subsidence:
Scientific studies ( X ) Abandonment 0 Relevelling studies ( X ) Fluid reinjection ( S ) Dike const. 6 repair ( ) Stop resource ( I Road repair ( ) production
Building repair ( ) resource
Develop institutional ( )
Cost Estimate of Adjustments:
Pipeline repair ( ) Pevelop alt. 0
Land Filling Law suits 0
framework
none made
B-80
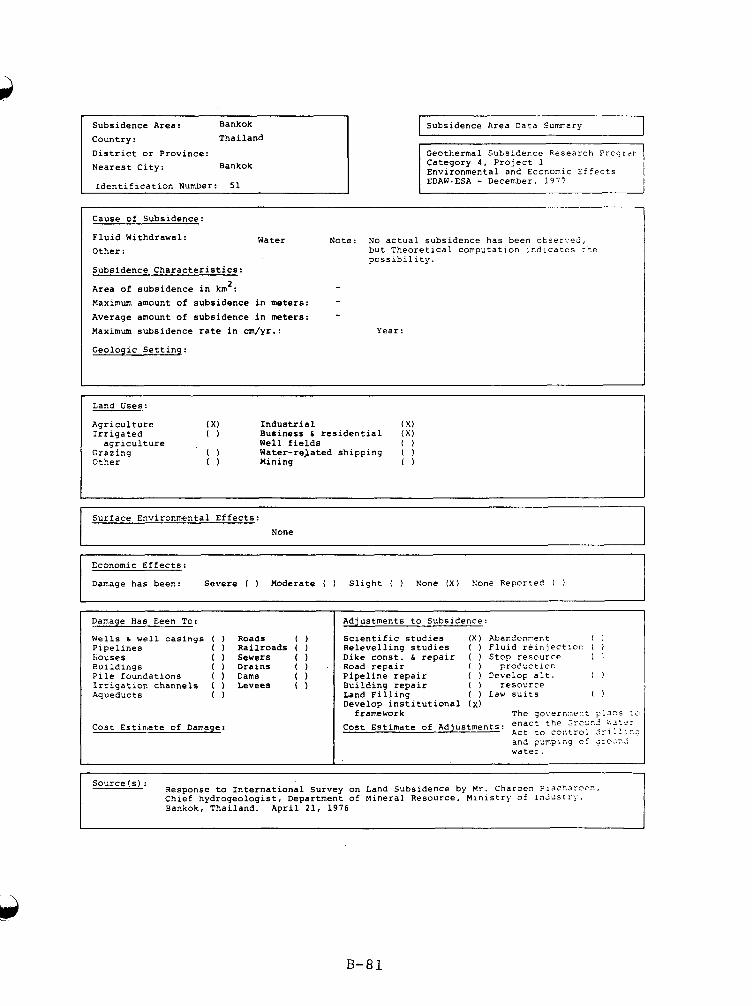
Subsidence Area: Bankok Country: Thailand District or Province: Nearest City: Bankok
Identification Number: 51
I Subsidence Area Data Currmary I Geothermal Subsidence Research Proqrrr Category 4 , Project 1 Environmental and Economic Effects EDAW.ESA - December, 1 9 i i
Cause of Subsidence:
Fluid Withdrawal: Water Note: No actual subsidence has been otser:.ei, Other: but Theoretical computation indicates :he
Subsidence Characteristics:
Area of subsidence in km2: Maximum amount of subsidence in meters: Average amount of subsidence in meters: - Maximum subsidence rate in cm/yr.: Year:
possibility.
- -
Land Uses:
Agriculture ( X I Industrial ( X ) Irrigated 0 Business 6 residential (X) agriculture Well fields 0
Grazing 0 Water-related shipping ( ) Other 0 Mining 0
Surface Environmental Effects: None
Economic Effects:
Damage has been: Severe ( ) Moderate ( ) Slight ( ) None ( X ) None Reported ( )
Damage Has Been To:
Wells 6 well casings ( ) Roads Pipelines ( ) Railroads houses ( ) Sewers Buildings ( Drains Pile foundations ( ) Dams Irrigation channels ( ) Levees Aqueducts 0
Cost Estimate of Damage:
Adjustments to Subsidence:
Scientific studies ( X ) Abandonrent 0 Relevelling studies ( ) fluid reiolect~cr 1 ) Dike const. 6 repair ( ) Stop resource ( ' Road repair ( ) Fro2uctior.
Building repair ( ) resource
Develop institutional ( x )
Pipeline repair ( ) Cevelop alt. 0
Land Filling ( ) Law suits 0
framework The governxe-t ~ 1 a - s t 3 enact the Zrsz-2 ir3:sr Act to control 3rl:::?..: and panping of 3ro-r.2 water.
Estimate of Ad.ustments:
Source(s) : Response to International Survey on Land Subsidence by Mr. Charoen Piasharocn. Chief hydrogeologist, Department of Mineral Resource, Ministry of InJilstrY, Bankok, Thailand. April 21, 1976
B - 8 1
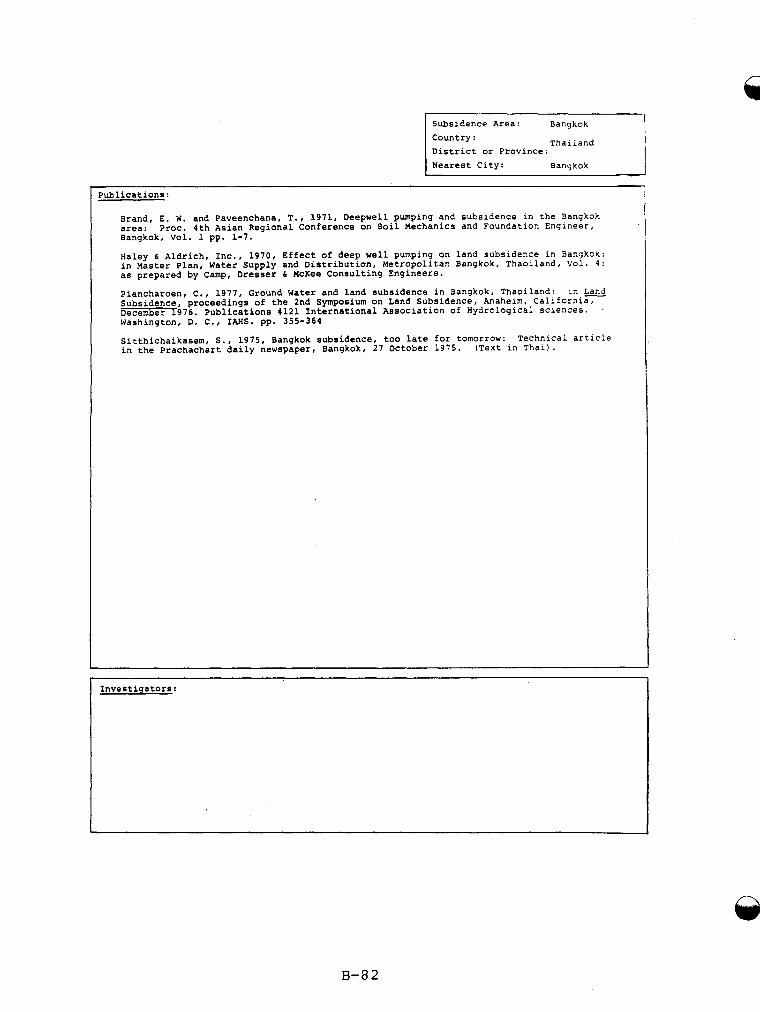
I Subsidence Area: Bangkok
Thai land Country: District or Province: I I Nearest City: Bangkok I
I Putlications: Brand, E. W. and Paveenchana, T., 1971, Deepwell pumping and subsidence in the Bangkok area: Bangkok, Vol. 1 pp. 1-7.
Haley 6 Aldrich, Inc., 1970, Effect of deep well pumping on land subsidence in Bangkok: in Master Plan, Water Supply and Distribution, Metropolitan Bangkok, Thaoiland, Vol. 4: as prepared by camp, Dresser 6 McKee Consulting Engineers.
Piancharoen, C., 1977, Ground Water and land subsidence in Bangkok, Thaoiland: in Land Subsidence, proceedings of the 2nd Symposium on Land Subsidence, Anaheim, California, December 1976. Publications #121 International Association of Hydrological sciences. Washington, D. C., IAHS. pp. 355-364
Sitthichaikasem, S., 1975, Bangkok subsidence, too late for tomorrow: Technical article in the Prachachart daily newspaper, Bangkok, 27 October 1975. (Text in Thai).
Proc. 4th Asian Regional Conference on Soil Mechanics and Foundation Engineer,
Investigators:
B-a2
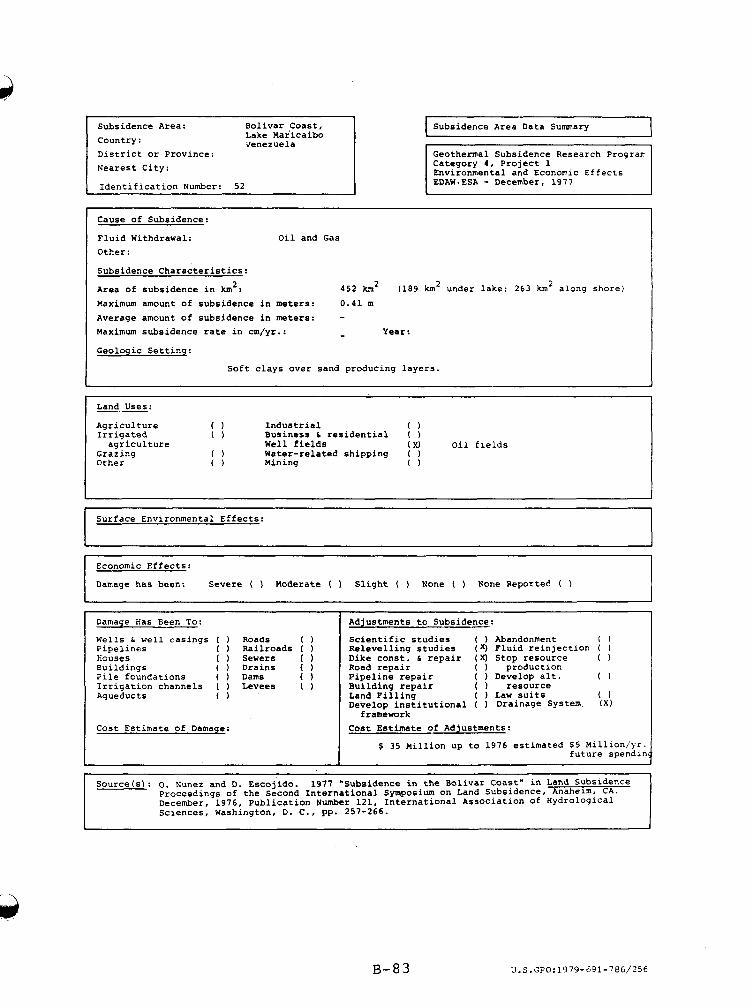
Subsidence Area: Bolivar Coast, Lake Maricaibo Venezuela Country:
District or Province:
Damage has been: Severe ( ) Moderate ( ) Slight ( ) None ( ) None Reported ( )
Economic Effects:
- i
Nearest City:
Identification Number: 52
I Subsidence Area Data Summary I ~
Geothermal Subsidence Research Progran Category 4, Project 1 Environmental and Economic Effects EDAW-ESA - December, 1977
I
Cause of Subsidence:
Fluid Withdrawal: Oil and Gas Other:
Subsidence Characteristics:
Area of subsidence in km2: Maximum amount of subsidence in meters: 0.41 m Average amount of subsidence in meters: - Maximum subsidence rate in cm/yr.: - Year:
Geologic Setting:
452 km2 (189 km2 under lake; 263 km2 along shore)
Soft clays over sand producing layers.
Land Uses: -- Agriculture 0 Industrial 0 Irrigated 0 Business 6 residential ( )
Grazing 0 Water-related shipping ( Other 0 Mining 0
agriculture Well fields (XI Oil fields
Surface Environmental Effects:
Damage Has Been To:
Wells 6 well casings ( Roads Pipelines ( ) Railroads tiouses ( ) Sewers Buildings ( ) Drains Pile foundations ( ) Dams Irrigation channels ( ) Levees Aqueducts 0
Cost Estimate of Damage:
Adjustments to Subsidence:
Scientific studies ( ) Abandonment 0 Relevelling studies (x ) Fluid reinjection ( ) Dike const. 6 repair (x) Stop resource ( ) Road repair ( production Pipeline repair ( 1 Develop alt. 0 Building repair ( resource Land Filling ( ) Law suits 0 Develop institutional ( Drainage System. ( X )
Cost Estimate of Adjustments: framework
$ 35 Mil lion UP to 1976 estimated $5 Mill future
.ion/yr. spendin
SOurce(s): 0. Nunez and D. Escojido. 1977 "Subsidence in the Bolivar Coast" in Land Subsidence Proceedings of the Second International Symposium on Land Subsidence, Anaheim, CA. December, 1976, Publication Number 121, International AssOCiatiOn of HydrOlOgiCal Sciences, Washington, D. C., pp. 257-266.
B - 8 3 U.S.GPO:1979-691-786/256
This report was done with support from the Department of Energy. Any conclusions or opinions expressed in this report represent solely those of the author(s) and not necessarily those of The Regents of the University of California, the Lawrence Berkeley Laboratory or the Department of Energy.
Reference to a company or product name does not imply approval or recommendation of the product by the University of California or the U.S. Department of Energy to the exclusion of others that may be suitable.