inv - escholarship@mcgill
TRANSCRIPT

The biological importance and mechanisms of long-chain
polyunsaturated fatty acids on bone growth in diet-induced obesity:
Investigation in children with obesity and rodents
Ivy L Mak
School of Human Nutrition,
McGill University, Montreal
Quebec, Canada
December 2019
A thesis submitted to McGill University in partial fulfillment of the requirements
of the degree of Doctor of Philosophy
© Ivy L Mak, 2019
All rights reserved

ii
Table of contents
Abstract ......................................................................................................................................... vii
Résumé ............................................................................................................................................ x
Statement of support .................................................................................................................... xiv
Preface and advancement of scholarly knowledge ....................................................................... xv
Contributions of authors .............................................................................................................. xix
Acknowledgments........................................................................................................................ xxi
List of tables ............................................................................................................................... xxiii
List of figures .............................................................................................................................. xxv
List of abbreviations ................................................................................................................. xxvii
CHAPTER 1: Introduction and Rationale ................................................................................. 1
1.1 Background ............................................................................................................................... 2
1.2 Thesis rationale ....................................................................................................................... 10
CHAPTER 2: Literature Review .............................................................................................. 12
2.1 Influence of obesity on bone health outcomes ........................................................................ 13
2.1.1 Epidemiological and clinical studies linking obesity to bone mass .............................. 13
2.1.1.1 Human studies .................................................................................................. 13
2.1.1.2 Animal studies .................................................................................................. 16
2.1.2 Potential mechanisms ................................................................................................... 19
2.1.2.1 Differentiation of mesenchymal stem cells into adipocytes or osteoblasts ...... 19
2.1.3 Adipokines .................................................................................................................... 22
2.1.3.1 Leptin ................................................................................................................ 22
Direct effects of leptin on bone cells ................................................................ 24
Leptin controls bone mass through a central hypothalamic relay ................... 25
2.1.3.2 Adiponectin ....................................................................................................... 27
2.2 Integrating relationships between childhood obesity, DHA status, and bone outcomes ........ 33
2.2.1 LCPUFA status in children with obesity ...................................................................... 33
2.2.2 Potential benefits of DHA supplementation to bone health in obesity ......................... 35
2.2.2.1 Omega-3 PUFA as potential modulators of adiposity ..................................... 35
2.2.2.2 Effects of DHA on obesity-mediated low-grade chronic inflammation ........... 36
2.2.2.3 Effects of DHA on leptin production ................................................................ 36
2.2.2.4 Effects of DHA on adiponectin production ...................................................... 37
2.2.3 Influences of obesity and fatty acid status on skeletal outcomes ................................. 38
2.3 Conclusion .............................................................................................................................. 41

iii
Bridge statement 1 ...................................................................................................................... 43
CHAPTER 3: Manuscript 1........................................................................................................ 45
3.1 Abstract ................................................................................................................................... 47
3.2 Introduction ............................................................................................................................. 48
3.3 Methods................................................................................................................................... 50
3.3.1 Study population ........................................................................................................... 50
3.3.2 Anthropometric and blood biochemistry ...................................................................... 50
3.3.3 Dietary assessment ....................................................................................................... 51
3.3.4 Fatty acid profiling ....................................................................................................... 52
3.3.5 Statistical analysis......................................................................................................... 53
3.3.6 Ethics approval ............................................................................................................. 54
3.4 Results ..................................................................................................................................... 54
3.4.1 Participant characteristics ............................................................................................. 54
3.4.2 Dietary intakes .............................................................................................................. 55
3.4.3 RBC fatty acid status and correlation with dietary fatty acids ..................................... 56
3.5 Discussion ............................................................................................................................... 62
3.6 Acknowledgments................................................................................................................... 67
Bridge statement 2 ...................................................................................................................... 72
CHAPTER 4: Manuscript 2........................................................................................................ 74
4.1 Abstract ................................................................................................................................... 76
4.2 Introduction ............................................................................................................................. 77
4.3 Materials and methods ............................................................................................................ 79
4.3.1 Study population and protocol ...................................................................................... 79
4.3.2 Body composition and bone assessment ...................................................................... 80
4.3.3 Dietary intake ............................................................................................................... 81
4.3.4 Fatty acid measurements .............................................................................................. 81
4.3.5 Blood biochemistry....................................................................................................... 82
4.3.6 Statistical analysis......................................................................................................... 83
4.3.7 Ethics approval ............................................................................................................. 84
4.4 Results ..................................................................................................................................... 84
4.4.1 Participant characteristics ............................................................................................. 84
4.4.2 Bone outcomes by AA tertiles ...................................................................................... 85
4.4.3 Serum biochemistry and RBC fatty acid status ............................................................ 86

iv
4.4.4 Dietary intake by AA tertiles ............................................................................................... 86
4.5 Discussion ............................................................................................................................... 95
4.6 Acknowledgments................................................................................................................... 99
Bridge statement 3 .................................................................................................................... 105
CHAPTER 5: Manuscript 3...................................................................................................... 107
5.1 Abstract ................................................................................................................................. 109
5.2 Introduction ........................................................................................................................... 110
5.3 Methods................................................................................................................................. 112
5.3.1 Animals and protocol.................................................................................................. 112
5.3.2 Diets ............................................................................................................................ 113
5.3.3 In vivo dual-energy X-ray absorptiometry .................................................................. 113
5.3.4 In vivo micro-computed tomography ......................................................................... 114
5.3.5 Ex vivo micro-computed tomography ......................................................................... 114
5.3.6 Bone strength testing .................................................................................................. 115
5.3.7 Biochemistry ............................................................................................................... 115
5.3.8 Fatty acid measurements in blood, tissue and 3T3-L1 adipocytes ............................. 116
5.3.9 Adipocyte differentiation and fatty acid treatment ..................................................... 117
5.3.10 Nile Red staining ...................................................................................................... 118
5.3.11 Total RNA isolation and quantitative RT-PCR measurements ................................ 119
5.3.12 Statistical analyses .................................................................................................... 120
5.3.13 Ethics approval ......................................................................................................... 120
5.4 Results ................................................................................................................................... 122
5.4.1 Body weight, body composition and food intake ....................................................... 122
5.4.2 Blood and tissue fatty acids ........................................................................................ 122
5.4.3 Blood biochemistry..................................................................................................... 123
5.4.4 DXA and in vivo μCT measurements of bone mass and density ............................... 124
5.4.5 Ex vivo bone microarchitecture .................................................................................. 124
5.4.6 Bone biomechanics ..................................................................................................... 125
5.4.7 Fatty acid treatment of 3T3-L1 adipocytes ................................................................. 125
5.5 Discussion ............................................................................................................................. 135
5.6 Conclusion ............................................................................................................................ 138
5.7 Acknowledgments................................................................................................................. 139

v
CHAPTER 6: General Discussion ........................................................................................... 146
6.1 Study 1 .................................................................................................................................. 147
6.1.1 Diet quality and food sources of n-3 LCPUFA .......................................................... 148
6.1.2 Lean body mass in children with obesity ................................................................... 149
6.2 Study 2 .................................................................................................................................. 152
6.2.1 Requirement of AA during growth ............................................................................. 152
6.2.2 Influence of AA on bone ............................................................................................ 153
6.2.3 AA and skeletal muscle growth .................................................................................. 154
6.2.4 Modulation of insulin resistance by AA and effect on bone metabolism .................. 155
6.2.5 Assessment of bone mass and body composition ....................................................... 156
6.3 Study 3 .................................................................................................................................. 158
6.3.1 Site-specificity of influence of HFD and AA on bone ............................................... 159
6.3.2 AA and glucose homeostasis in HFD-fed rats ............................................................ 160
6.3.3 Effects of LCPUFA on adipocyte metabolism in vitro .............................................. 161
6.4 Strengths and limitations....................................................................................................... 168
CHAPTER 7: Future Directions ............................................................................................. 171
7.1 Sex-specific response to LCPUFA ....................................................................................... 172
7.2 Pro-resolving lipid mediators ................................................................................................ 173
7.3 Adipo-myokines .................................................................................................................... 176
7.4 Interaction between genotype and LCPUFA intake ............................................................. 177
CHAPTER 8: Conclusion ........................................................................................................ 178
APPENDIX A ............................................................................................................................ 183
A.1 Abstract ................................................................................................................................ 185
A.2 Introduction .......................................................................................................................... 186
A.2.1 Overview of postnatal skeletal development ............................................................. 191
A.3 Epidemiological and clinical studies linking DHA to bone mass ........................................ 199
A.3.1 Human studies ........................................................................................................... 199
A.3.2 Animal studies ........................................................................................................... 200
A.4 Selected mechanisms of actions of DHA in growing bones ................................................ 216
A.4.1 DHA has anti-inflammatory properties ..................................................................... 216
A.4.2 DHA affects osteoblastogenesis and osteoclastogenesis ........................................... 220
A.4.3 DHA acts through PPARs to affect cell differentiation and gene expression ........... 222
A.4.4 Effects of DHA and prostaglandin metabolites on IGF-1 ......................................... 227

vi
A.5 Knowledge gaps and future directions ................................................................................. 230
A.5.1 Sexual dimorphism in metabolism of LCPUFA and skeletal growth ....................... 230
A.5.2 Dose and type of LCPUFA ........................................................................................ 232
A.5.3 The fat-1 transgenic model as potential model for studying DHA n-3 LCPUFA in
bone ..................................................................................................................................... 235
A.6 Conclusion ........................................................................................................................... 236
REFERENCES .......................................................................................................................... 238

vii
Abstract
Background: The majority of bone mass is acquired during childhood and adolescence.
Individuals with the highest bone mass are best protected against bone loss with aging. However,
excess adiposity could limit bone acquisition. Children with obesity are at greater risk of skeletal
fractures, due in part to the combination of poor dietary patterns, sedentary lifestyle, greater
propensity to fall, and force generated on impact through falls. In animal models of diet-induced
obesity, bone size is enlarged yet strength compromised due to thinner cortices and trabeculae.
Long-chain polyunsaturated fatty acids (LCPUFA) may benefit bone mass accrual and/or protect
against age-related bone loss; as well as modulate adipocyte metabolism, with opposing effects
of omega (n)-3 and n-6 LCPUFA on lipid accumulation, adipokine secretion and gene
expression. It is uncertain whether LCPUFA dually influence bone metabolism and adiposity
during growth. The global aim of the present thesis is to advance understanding of the role of
LCPUFA in vivo on bone mass and architecture in children with obesity through: (1) assessment
of dietary LCPUFA intake and testing the relationships with biological markers and adiposity;
(2) examining the relationship between LCPUFA status and bone health outcomes; and (3)
monitor longitudinal changes in bone mass accrual in an animal model of diet-induced obesity
supplemented with n-6 arachidonic acid (AA, C20:4 n-6).
Methods: (Aims 1 and 2) Baseline data were obtained from the McGill Youth Lifestyle
Intervention with Food and Exercise study. Healthy children (6-12 y) with obesity (n=108) were
classified as overweight or obese as per the World Health Organization cut-offs for body mass
index-for-age and -sex Z-scores. Whole body composition and bone mass was assessed with
dual-energy X-ray absorptiometry and complemented with non-dominant distal forearm
measurements with peripheral quantitative computed tomography for bone geometry and soft-

viii
tissue analyses. Red blood cell (RBC) fatty acid profile was quantified by gas chromatography.
Diet was assessed with 3-d food diaries. Children, after stratification by sex and Tanner stages
were divided into tertiles based on % body fat (Aim 1) or AA proportions in RBC (Aim 2) and
compared using a MIXED model ANOVA. (Aim 3): Male Sprague-Dawley rats (n=42, 4-week)
were randomized into groups fed a control diet (CTRL, AIN-93G), high-fat diet (HFD, 35% kcal
fat) or HFD+AA (1% w/w diet) for 6 weeks. Body composition, bone mineral density and
microarchitecture were measured using dual-energy X-ray absorptiometry and micro-computed
tomography. RBC fatty acid profile was measured with gas chromatography, and blood samples
collected to measure biomarkers of bone turnover and adipokines. Bone strength was assessed
with 3-point bending. 3T3-L1 adipocytes were treated with LCPUFA (10-100 μM) to assess lipid
accumulation and gene expression.
Results: (Aim 1): Children (n=63) were 9.0 ± 0.2 y of age with a BMI Z-score 3.1 ± 0.2. Dietary
fat intake averaged to 30.1 ± 0.6 % for all children; intakes of LCPUFA did not differ among
tertiles of % body fat. Moderate correlations were observed between RBC eicosapentaenoic acid
(EPA) and docosahexaenoic acid (DHA) proportions, dietary EPA and DHA (r=0.39, p<0.05) as
well as fish servings (r=0.33, p<0.05). RBC proportions of α-linolenic acid and EPA+DHA
adjusted for age, Tanner stages and race were 40% and 15% lower (p<0.05), respectively, in
children in the highest tertile of % body fat (tertile 3) compared to those in tertile 1. (Aim 2):
Ultra-distal, mid- and total- distal forearm bone mineral content, adjusted for sex, age, % body
fat, race and forearm length were 10 to 13% greater (p<0.05) in children in the first tertile of
RBC AA proportions relative to the third. Muscle cross-sectional area was 15% lower in the third
tertile compared to the first, along with higher fasting insulin concentrations (27%) and the
homeostatic model assessment of insulin resistance (31%). (Aim 3): Rats in the HFD+AA group

ix
had significantly greater body fat % (12%), body weight (6%) and serum leptin concentrations
(125%) than CTRL at end of study, whereas visceral fat (mass and %) was increased in both
HFD and HFD+AA groups. HFD+AA showed reduced whole body bone mineral content and
femur mid-diaphyseal cortical bone cross-sectional area than HFD and CTRL, without
impairment in bone strength. Contrarily, HFD+AA had greater femur metaphyseal trabecular
volumetric bone mineral density (29%) and bone volume fraction (20%) compared to CTRL. AA
treatment of 3T3-L1 adipocytes resulted in greater leptin secretion and mRNA levels relative to
controls, with the greatest effect observed at 25 μM. Nile red staining showed a greater
proportion of cells containing small, multiple lipid droplets in AA-treated cells compared to
single droplets in adipocytes with n-3 LCPUFA treatment.
Conclusion: This research enhanced the understanding of bone biology and mechanisms by
providing a link between the effects of obesity on LCPUFA and bone. Children with obesity do
not consume excess fat as a percentage of total energy. However, greater adiposity is associated
with lower n-3 LCPUFA status and is consistent with suboptimal dietary intakes of n-3 LCPUFA
and fish. Higher AA status in children aligned with deficits in forearm bone mass, geometry,
muscle mass, and early signs of insulin resistance. While AA exacerbated adiposity development
in the animal model, the impact on bone mass and bending strength was variable depending on
skeletal site, showing both beneficial and detrimental effects on the appendicular and axial
skeleton respectively. It remains to be determined if correction of low n-3 LCPUFA status in
children with obesity through encouraging fish/seafood intake will modulate the relationship
between AA and bone growth.

x
Résumé
Contexte: La majorité de la masse osseuse est acquise pendant l'enfance et l'adolescence. Les
personnes ayant une masse osseuse plus élevée sont mieux protégées contre la perte osseuse en
vieillissant. Cependant, un excès d'adiposité pourrait limiter l'acquisition d'os. Les enfants obèses
ont un risque plus élevés de fractures du squelette notamment à cause d’une mauvaise
alimentation, d’un style de vie sédentaire, d’une plus grande propension à chuter et de la force
générée par ces chutes. Selon certains modèles d’animaux d’obésité d’origine alimentaire, la
taille des os est agrandie, mais leur force est compromise à cause de la réduction de l’épaisseur
des corticales et trabécules osseuses. Les acides gras polyinsaturés à longue chaîne (AGPLC)
peuvent être bénéfiques pour la croissance de la masse osseuse et / ou protéger contre la perte
osseuse liée au vieillissement. Les AGPLC peuvent également moduler le métabolisme des
adipocytes, avec des effets opposés d’AGPLC oméga (n) -3 et n-6 sur l'accumulation de lipides,
la sécrétion d'adipokine et l'expression génique. Il est incertain que les AGPLC puissent à la fois
influencer le métabolisme osseux et l’adiposité pendant la croissance. L'objectif global de la
présente thèse est d’accroître la compréhension du rôle des AGPLC in vivo sur la masse et
l'architecture osseuses chez les enfants obèses en: (1) décrivant l'apport alimentaire en AGPLC et
sa relation avec certains marqueurs biologiques et l'adiposité, (2) examiner la relation entre le
statut d’AGPLC et les résultats de la santé des os, et (3) surveiller les modifications
longitudinales de l'accumulation de la masse osseuse dans un modèle animal d’obésité d’origine
alimentaire enrichi d'acide n-6 arachidonique (AA, C20: 4 n-6).
Méthodes: (Objectifs 1 et 2): Les données de base ont été obtenues par l’étude sur l’intervention
du mode de vie des jeunes avec alimentation et exercices de McGill. Les enfants en bonne santé
(6-12 ans) souffrant d'obésité (n = 108) ont été classés en surpoids ou obèses selon les seuils

xi
établis par Organisation Mondiale de la Santé pour les scores-Z d'indice de masse corporelle par
âge et de sexe. La composition corporelle et la masse osseuse ont été évaluées à l'aide
d'absorptiométrie à rayons X à double énergie (DXA), et complétée par des mesures de l’avant-
bras distal non-dominant avec un tomodensitomètre quantitatif, pour os périphériques pour la
géométrie de l’os et les analyses des tissus mous. Le profil en acides gras des globules rouges a
été quantifié par chromatographie en phase gazeuse. Le régime alimentaire a été évalué avec des
journaux quotidiens de 3 jours. Après stratification selon le sexe et les stades de Tanner, les
enfants ont été divisés en tertiles basés sur le pourcentage de graisse corporelle (objectif 1) ou en
AA dans les globules rouges (objectif 2) et comparés à une ANOVA modèle MIXTE. (Objectif
3): Des rats Sprague-Dawley mâles (n = 42, 4 semaines) ont été randomisés en groupes recevant
un régime témoin (CTRL, AIN-93G), un régime riche en gras (HFD, 35% de kcal) ou HFD + AA
(régime 1% p / p) pendant 6 semaines. La composition corporelle, la densité minérale osseuse et
la microarchitecture ont été mesurées par DXA et par micro-tomodensitométrie respectivement.
Le profil en acides gras des globules rouges a été mesuré par chromatographie en phase gazeuse
et des échantillons de sang ont été recueillis pour mesurer les biomarqueurs du remodelage
osseux et des adipokines. La force des os a été évaluée avec une flexion en 3 points. Les
adipocytes 3T3-L1 ont été traités avec AGPLC (10-100 µM) pour évaluer l'accumulation de
lipides et l'expression génique.
Résultats: (Objectif 1): Les enfants (n = 63) étaient âgés de 9,0 ± 0,2 ans avec un indice Z de
BMI de 3,1 ± 0,2. L'apport en graisses alimentaires a été en moyenne de 30,1 ± 0,6% pour tous
les enfants. Les AGPLC alimentaires ne différaient pas entre les tertiles. Des corrélations
modérées ont été observées entre les proportions d'acide eicosapentaénoïque (EPA) dans les
globules rouges et d'acide docosahexaénoïque (DHA), d'EPA et de DHA alimentaires (r = 0,39, p

xii
<0,05) ainsi que les de portions de poisson (r = 0,33, p <0,05). Les proportions d'acide alpha-
linolénique et d'EPA + DHA dans les globules rouges ajustées en fonction de l’âge, du stade de
Tanner et de la race étaient respectivement inférieures de 40% et 15% chez les enfants du tertile
le plus élevé du pourcentage de graisse corporelle (tertile 3) par rapport à ceux du tertile 1.
(Objectif 2): La teneur en minéraux de l'os de l'avant-bras ultra-distale, totale et distale, ajustée
en fonction du sexe, de l'âge, du pourcentage de graisse corporelle, de la race et de la longueur de
l'avant-bras était 10 à 13% supérieure chez les enfants du premier tertile des proportions d’AA
dans les glubules rouges par rapport à la troisième. La section transversale musculaire était
inférieure de 15% dans le troisième tertile par rapport au premier, ainsi qu’une concentration plus
élevée d'insuline à jeun (27%) et de l'évaluation du modèle homéostatique de résistance à
l'insuline (31%). (Objectif 3): À la fin de l'étude, les rats du groupe HFD + AA présentait des
taux de graisse corporelle (12%), de poids corporel (6%) et de la leptine sérique (125%)
significativement supérieurs à ceux du groupe CTRL. La graisse viscérale (masse et
pourcentage) a augmenté dans les groupes HFD et HFD + AA. Le groupe HFD + AA a montré
une réduction de la teneur en minéraux de l'os du corps entier et de la section transversale de l'os
cortical médian-diaphysaire du fémur par rapport aux HFD et CTRL sans affaiblissement de la
résistance des os. À l'inverse, HFD + AA présentait une densité minérale osseuse volumétrique
trabéculaire métaphysaire du fémur supérieure (29%) et une fraction de volume osseux (20%)
également supérieure à celle de la CTRL. Le traitement à l'AA des adipocytes 3T3-L1 a entraîné
une plus grande sécrétion de leptine et des niveaux de l’ARNm par rapport aux témoins, l'effet le
plus marqué étant observé à 25 μM. La coloration au rouge du Nil a démontré une plus grande
proportion de cellules contenant de petites gouttelettes lipidiques multiples dans les cellules
traitées à l'AA par rapport aux gouttelettes simples dans les adipocytes traités avec n-3 AGPLC.

xiii
Conclusion: Cette recherche a permis de mieux comprendre la biologie et les mécanismes
osseux en établissant un lien entre les effets de l'obésité sur les AGPLC et les os. Les enfants
obèses ne consomment pas un excès de graisse sous forme de pourcentage de l’énergie totale.
Cependant, une plus grande adiposité est associée à un statut inférieur en AGPLC n-3 et est
compatible avec des apports alimentaires sous-optimaux en AGPLC n-3 et du poisson. Un statut
AA plus élevé chez les enfants est aligné aux déficits de la masse osseuse de l'avant-bras, de la
géométrie, de la masse musculaire et des premiers signes de résistance à l'insuline. Alors que les
l’AA exacerbe le développement de l’adiposité dans le modèle animal, l'impact sur la masse
osseuse et la résistance à la flexion était variable selon le site du squelette, montrant des effets
bénéfiques et néfastes sur le squelette appendiculaire et axial respectivement. Il reste à
déterminer si l’amélioration du faible statut d’AGPLC n-3 chez les enfants obèses modulera la
relation entre AA et croissance osseuse en encourageant la consommation de poisson / fruits de
mer.

xiv
Statement of support
This work would not have been possible without the support from the following agencies:
The Natural Sciences and Engineering Research Council of Canada, the Dairy Research Cluster
Initiative: Dairy Farmers of Canada, Agriculture and Agri-Food Canada, and the Canadian Dairy
Commission (operational grant), and a Canadian Foundation for Innovation (infrastructure
grant).
The candidate was financially supported by the Alexander Graham Bell Canada Graduate
Scholarship (2013-18) from the Natural Sciences and Engineering Research Council of Canada,
the student scholarship from the Reseau du recherche en sante buccodentaire et osseuse (2014),
the Catherine Freeman Fellowship and Walter M Stewart Fellowship, both awarded by McGill
University (2014).

xv
Preface and advancement of scholarly knowledge
This thesis is based on (1) cross-sectional analyses of baseline data obtained from the
McGill Youth Lifestyle Intervention with Food and Exercise study; a study that enrolled healthy
children classified with overweight condition or obesity from Montreal, QC, Canada; and (2) an
animal model of diet-induced obesity designed based on the observations in human children. It
aims to fill current knowledge gaps in the understanding of biological responses of bone to long-
chain polyunsaturated fatty acids (LCPUFA) under the constraints of childhood obesity.
This thesis is presented in a manuscript-based format for submission to peer-reviewed
scientific journals. The health benefits associated with dietary LCPUFA across life stages extend
beyond the well-documented outcomes (e.g. brain and cognitive development, modulating
inflammatory and immune responses and cardiovascular diseases risks). Appendix A has been
published as a book chapter that aims to summarize the effects and selected mechanisms by
which docosahexaenoic acid supports optimal bone growth. The first manuscript aims to describe
the dietary intakes of children with obesity, with particular focus on omega-3 long-chain
polyunsaturated fatty acids (LCPUFA) and its relationship with a common biological marker.
The first study utilized comprehensive assessment methods including dietary recalls, gas
chromatography and absorptiometry-based (i.e. DXA) measures of adiposity. The data presented
in this manuscript are unique as they include assessment of body composition, representing a
more sensitive approach to estimate adiposity in children compared to body weight and/or the
body mass index. The inclusion of a biomarker of dietary intake was used to compensate for
errors related to recall bias associated with routine dietary assessment methods. The second
manuscript examined the relationship between LCPUFA status, particularly that of arachidonic
acid (AA) with bone health outcomes in children with obesity. To our knowledge, this is the first
xvi
study that reported on the association between AA status and bone in human children during
growth. The 3D imaging technique peripheral quantitative computed tomography complemented
DXA measurements and provided additional information on forearm bone geometry and local
tissue composition, which have important implications for bone strength. The third manuscript,
based on the animal model, investigated the effect of AA addition to high-fat diet in growing
male rodents. To date, a paucity of animal studies has examined the influence of omega-6
LCPUFA on growth in the post-natal period, and few are conducted in the context of diet-
induced obesity. Possible mechanisms and cellular mediators are identified but require
characterization of exact pathways involved are required. Together, these manuscripts will
contribute to the literature related to the biological roles of LCPUFA in the bone-fat relationship.
The recognition of the ability of LCPUFA to enhance intellectual and visual development
in young mammals has led to widespread supplementation that has extended beyond human
consumption to LCPUFA-enriched pet foods, due in part to the potent anti-oxidative and anti-
inflammatory properties of LCPUFA. For instance, feeding omega-3 LCPUFA have shown
efficacy in improving arthritic conditions in pet dogs affected by osteoarthritis. This work is not
intended for translation to set recommendations for human supplementation; the lack of intra-
cortical remodeling and a gallbladder in rats signifies the dissimilarity between humans and
rodents in terms of bone and fatty acid metabolism. This thus restricts the applicability of this
research’s outcome to humans unless further tests in larger animal models (e.g. sheep, pigs, non-
human primates) are performed. Nonetheless, this work remains highly applicable to
understanding mammalian bone biology; devising nutrition regimens in veterinary practices, as
well as the food industry in light of the prevailing fortification of omega fats either as a semi-
purified food ingredient or as fish oil to common foods.

xvii
Invited book chapter:
• Mak IL and Weiler HA. Docosahexaenoic acid (DHA) and properties, function and health
effects: DHA and growing bone. Docosahexaenoic acid (DHA): Properties, Function and
Health Effects. 2016. Nova Science Publishers, Incorporated (Appendix A)
Research articles currently submitted or under review in peer-reviewed journals:
• Mak IL, Cohen TR, Vanstone CA and Weiler HA. Increased adiposity in children with
obesity is associated with low red blood cell omega-3 fatty acid status and inadequate
LCPUFA dietary intake (Chapter 3: Under peer-review in Pediatric Obesity)
• Mak IL, Cohen TR, Vanstone CA and Weiler HA. Arachidonic acid status negatively
associates with forearm bone outcomes and glucose homeostasis in children with
overweight condition or obesity (Chapter 4: Published online in Applied Physiology,
Nutrition and Metabolism)
• Mak IL, Lavery P, Agellon S, Rauch F, Murshed M and Weiler HA. Arachidonic acid
exacerbates diet-induced obesity and reduces bone mineral content without impacting bone
strength in growing male rats (Chapter 5: Published online in The Journal of Nutritional
Biochemistry)
Abstracts at professional meetings:
• Mak IL, Cohen TR, Vanstone CA, Loiselle SE, Hazell TJ and Weiler HA. Arachidonic
acid status is associated with forearm bone outcomes and glucose homeostasis in
overweight and obese children. The American Society of Nutrition Annual Meeting,
2018. Boston, MA. USA
• Mak IL, Wang K, Lavery P, Agellon S and Weiler HA. Arachidonic acid reduces bone
mass without influencing visceral adiposity in growing obese rats. The Reseau de

xviii
Recherche en Sante Buccodentaire et Osseuse (RSBO) Scientific Day, 2016. Montreal,
QC, Canada
• Mak IL, Wang K, Lavery P, Agellon S and Weiler HA. Arachidonic acid reduces bone
mass without influencing visceral adiposity in growing obese rats. The American Society
for Bone Mineral Research Annual Meeting, 2015. Seattle, WA, USA
• Mak IL, Cohen TR, Loiselle SE, Vanstone CA, Hazell TJ and Weiler HA. Long-chain
polyunsaturated fatty acid status associated with bone mass in overweight and obese
children. Experimental Biology, 2015. Boston, MA, USA
• Mak IL, Wang K, Lavery P, Agellon S and Weiler HA. Elevated arachidonic acid intakes
reduce bone mineral content and trabecular volume in growing obese rats, 2015.
Experimental Biology, 2015. Boston, MA, USA
Oral conference presentations:
• Mak IL, Murshed MM and Weiler HA. Differential effects of long-chain polyunsaturated
fatty acids on lipid accumulation and adipokine secretion in mature 3T3-L1 adipocytes.
The International Society of the Study of Fatty Acids 2018. Las Vegas, NV, USA

xix
Contributions of authors
Manuscripts 1 and 2: The candidate was the primary author, responsible for posing the research
question, conducted all statistical analyses, wrote the first draft of the manuscript, and edited all
subsequent versions. Dr. T. Cohen and C. Vanstone aided with revisions to the manuscript. Dr. H.
Weiler made contributions to the manuscript, aided with data interpretation and statistical
analysis. All authors have read and approved the manuscript prior to submission for publication.
The McGill Youth Lifestyle Intervention with Food and Exercise (MYLIFE) study was funded
by the Dairy Research Cluster Initiative (Dairy Farmers of Canada, Agriculture and Agri-Food
Canada, and the Canadian Dairy Commission) (operating grant), and the Canadian Foundation
for Innovation (infrastructure funding).
Author study involvement for Manuscripts 1 and 2:
The candidate conducted all the gas chromatography analysis to assess fatty acid composition in
red blood cells, participated in the analysis and auditing of dietary data.
Dr. T. Cohen actively participated in participant recruitment and study visits, performed
anthropometric assessments, data entry and auditing.
C. Vanstone prepared the ethics submissions, actively participated in recruitment, collected blood
samples, and when necessary performed DXA assessments and anthropometry.
Dr. H. Weiler is the primary investigator of the MYLIFE study, was involved in the development
and grant proposal stages of the project and supervised all aspects of the study.
Manuscripts 3: The candidate was the primary author, responsible for posing the research
question, conducted all statistical analyses, wrote the first draft of the manuscript, and edited all
subsequent versions. P. Lavery, S. Agellon, Dr. F. Rauch and Dr. M. Murshed aided with
revisions to the manuscript. Dr. H. Weiler made contributions to the manuscript, aided with data

xx
interpretation and statistical analysis. All authors have read and approved the manuscript prior to
submission for publication. The study was funded by the Natural Resource and Engineering
Council of Canada and the Canadian Foundation for Innovation (infrastructure funding).
Author study involvement for Manuscript 3:
The candidate was responsible for developing the research project, helping with ethics approval,
welfare of animals, blood sample collection and processing, bone and body composition analysis
(DXA, in vivo and ex vivo µCT), bone strength testing, biochemistry, fatty acid analysis and cell
culture studies.
P. Lavery actively participated in sample collection during the animal study, involved in the
welfare of animals, and assisted with bone imaging and strength testing analysis.
S. Agellon was involved in blood sample processing, biochemistry and gas chromatography
analysis.
Dr. F. Rauch helped to guide the project and provided feedback on the manuscript and assisted in
the design of the in vitro experiments.
Dr. M. Murshed assisted in the conception of the in vitro work, supervised the experiments and
ensured proper techniques were used. All cell culture work was performed in his laboratory.
Dr. H. Weiler, the senior author, was involved in the development and grant proposal stages of
the project and supervised all aspects of the study.

xxi
Acknowledgments
This would not have been possible without the contribution of many individuals who have
played a role in many capacities in the completion of this thesis.
First and foremost, I would like to express my deepest gratitude to my supervisor, Dr Hope
Weiler, who has led me through this journey since I was the undergraduate intern. There may
have been few ups and downs throughout the years, but you have always trusted me and
respected my needs. Thank you for constantly challenging me and allowing the space for growth,
not only academically but also in character. I want to also acknowledge my co-supervisor Dr
Monzur Murshed, for your generous help with cell culture work, support and encouragement
over the years. I would like to thank my PhD committee member Dr Frank Rauch, for the
invaluable feedback with the study conceptions and manuscripts.
My sincere gratitude goes out to Sherry, Paula and Catherine. I would have been so lost
without you. Thank you for constantly being so patient, sympathetic, and willing to put up with
all the times when I cannot sort out my high-school Chemistry. You want me to succeed and
believed in what I am capable of; I am forever grateful for that.
Thank you, Dr Tamara Cohen, for sharing your work from the MYLIFE study and support
with the manuscripts. I am going to miss our chats on running and races.
I would like to acknowledge Dr Jingjing Li for your patience and invaluable assistance
with the cell culture experiments, the work could not have gone any smoother without your help.
Thank you to all the students at the Murshed lab for the willingness to help and share equipment,
and most importantly being so welcoming.
Dina Spigelski, Dr Linda Wykes, Dr Luis Agellon and Dr Stephanie Chevalier, I am
grateful for the trust and allowing me the opportunity to work alongside you as a teaching

xxii
assistant. It has enriched my graduate training and allowed me to discover areas that I otherwise
would not have been able to experience.
Dr Jason DeGuire and Dr Tom Hazell, thank you for making my very first research
experience a memorable one, and have inspired me to pursue it even further, mostly through
showing me what not to do.
I would like to express my gratitude to Lise Grant, for all the administrative support at the
beginning of the degree, and the continued encouragement and guidance in various capacities. It
is my deepest pleasure to be able to work with you.
Thank you to all the undergraduate students, Krystyna Wang, Julia Levy-Ndejuru, and
Kimberly O’Keefe for their assistance in the animal study and data collection. A special thanks to
Christine Ha who has assisted with the translation of the abstract of the present thesis.
To the friends I have met and worked with throughout the years, Yin, Baasir, Hailee, Sujin,
Claudia, Lucas, Shawna, Muriel, Laura, Michelle, Susan and Hinson, this journey would not
have been the same without all of you.
Finally, I am forever indebted to my parents, whom, to this date, probably still do not fully
comprehend what I have been doing this entire time, but supports me unconditionally
nonetheless. You have showed me through example what exceptional work ethics is like. I am
grateful for your faith in me, and knowing that I have your full support has given me the
confidence to be where I am today.

xxiii
List of tables
Table 2.1 Dietary intakes of EPA, DHA and fish/shellfish in Canadian children ....................... 40
Table 3.1 Characteristics of male and female children with obesity by tertiles of % body fat .... 57
Table 3.2 Proportion of children meeting the DRI recommendations defined by the Institute of
Medicine ....................................................................................................................................... 58
Table 3.3 Correlates of n-3 LCPUFA status with dietary LCPUFA, fish intake and demographic
characteristics in children with obesity ......................................................................................... 59
Supplementary Table S3.1 The Eating Well with Canada’s Food Guide (CFG) 2007 and US
Dietary Guidelines for Americans (DGA) 2015-2020 and MyPlate servings sizes according to
the CFG food groups ..................................................................................................................... 68
Supplementary Table S3.2 Dietary intakes and Canada’s Food Guide food groups by tertiles of
% body fat assessed by 3-d food diaries. ...................................................................................... 69
Supplementary Table S3.3 Red blood cell membrane fatty acid profile of children with obesity
by tertiles of % body fat ................................................................................................................ 70
Table 4.1 Anthropometry and demographics by tertiles of arachidonic acid in red blood cells .. 88
Table 4.2 Blood biochemistry by tertiles of arachidonic acid in red blood cells ......................... 90
Table 4.3 Dietary intake assessed by 3-day food diaries by tertiles of arachidonic acid in red
blood cells ..................................................................................................................................... 91
Supplementary Table S4.1 Red blood cells fatty acid proportions in children with obesity by
tertiles of arachidonic acid (AA, C20:4 n-6) % in red blood cells ............................................. 100
Supplementary Table S4.2 Anthropometry and DXA measurements of the forearm by tertiles
of α-linolenic acid (ALA, C18:3 n-3) % in red blood cells ........................................................ 101
Supplementary Table S4.3 Anthropometry and DXA measurements of the forearm by tertiles
of linoleic acid (LA, C18:2 n-6) % in red blood cells ................................................................ 102
Supplementary Table S4.4 Anthropometry and DXA measurements of the forearm by tertiles
of eicosapentaenoic acid (EPA, C20:5 n-3) % in red blood cells ............................................... 103
Supplementary Table S4.5 Anthropometry and DXA measurements of the forearm by tertiles
of docosahexaenoic acid (DHA, C22:6 n-3) % in red blood cells .............................................. 104
Table 5.1 Diet composition ........................................................................................................ 121

xxiv
Table 5.2 Assessment of bone biomarkers concentrations in rats fed a control, HFD, or
HFD+AA diet for 6 wk ............................................................................................................... 127
Table 5.3 Bone mass in whole body and lumbar vertebrae 2-5 assessed by in vivo μCT in rats fed
a control, HFD, or HFD+AA diet at baseline and wk 6 ............................................................. 128
Table 5.4 Ex vivo µCT measurements of bone mass and geometry of the femur mid-diaphysis
and bone biomechanics assessed by 3-point bending ................................................................. 129
Supplementary Table S5.1 Red blood cell fatty acid profile (expressed as % weight of total FA)
at wk 0, 3 and 6 in rats fed a control, HFD, or HFD+AA for 6 wk ............................................ 140
Supplementary Table S5.2 Fatty acid profile (expressed as % weight of total FA) in
subcutaneous and visceral adipose tissue, liver and quadriceps at end of study in rats fed a
control, HFD, or HFD+AA for 6 wk .......................................................................................... 142
Supplementary Table S5.3 Whole body, lumbar vertebrae 1-4, femur and tibia area, bone
mineral content (BMC) and areal bone mineral density assessed by DXA in rats fed a control,
HFD, or HFD+AA diet at baseline, wk 3 and wk 6 .................................................................... 143
Supplementary Table S5.4 Fatty acid profile (expressed as % weight of total FA) in 3T3-L1
adipocytes following 48 h fatty acid treatment ........................................................................... 144
Table A1 Summary of the recommended EPA + DHA intake from expert organizations ........ 197
Table A2 Selected animal studies on the effects of LCPUFA on bone growth ......................... 206

xxv
List of figures
Figure 1.1 The vicious cycle of childhood obesity, musculoskeletal discomfort and reduced
physical activity. ............................................................................................................................. 9
Figure 2.1 Factors involved in differentiation of mesenchymal stem cells osteoblastogenesis and
adipogenesis .................................................................................................................................. 30
Figure 2.2 Production of cytokines associated with obesity-mediated low-grade chronic
inflammation affects processes of osteoblastogenesis and osteoclastogenesis............................. 31
Figure 2.3 Leptin-dependent regulation of bone mass through its direct action on bone cells or
the central relay ............................................................................................................................. 32
Figure 3.1 Proportions of α-linolenic acid (C18:3 n-3), eicosapentaenoic acid (EPA, C20:5 n-3)
and EPA + docosahexaenoic acid (DHA, C22:6 n-3) in red blood cells membrane by tertiles of
% body fat ..................................................................................................................................... 60
Figure 3.2 Spearman correlation between total fish & seafood intake and eicosapentaenoic acid
(EPA)+ docosahexaenoic acid (DHA) proportions in red blood cells (RBC) .............................. 61
Supplementary Figure S3.1 Canada’s Food Guide food groups intakes by tertiles of % body fat
assessed by 3-d food diaries. ......................................................................................................... 71
Figure 4.1 Differences in DXA measurements of non-dominant forearm bone area, bone mineral
content (BMC) and areal bone mineral density (aBMD) among tertiles of arachidonic acid in red
blood cells ..................................................................................................................................... 92
Figure 4.2 pQCT measurements of total bone mass and geometry at the non-dominant 4% radius
(metaphysis) among tertiles of arachidonic acid in red blood cells .............................................. 93
Figure 4.3 pQCT measurements of total bone mass and geometry at the non-dominant 66%
radius (diaphysis) among tertiles of arachidonic acid in red blood cells ...................................... 94
Figure 5.1 Changes in (A) body weight (B) total body fat % (C) food intake / body weight
gained per wk (D) abdominal fat % and (E) abdominal visceral fat % in growing male rats fed
control, HFD or HFD+AA diet over course of study ................................................................. 130
Figure 5.2 Proportions of ALA, LA, AA, DPA and DHA in total lipids of (A) red blood cells
and (B) adipose tissue in growing male rats fed control, HFD and HFD+AA diet for 6 wk ..... 131
Figure 5.3 (A) Serum leptin and adiponectin concentrations in growing male rats fed control,
HFD, and HFD+AA diet for 6 wk; (B) 3T3-L1 adipocytes were treated with difference
concentrations of AA, EPA, DPA and DHA (10, 25, 50 or 100 μM) for 48 h. Leptin and
adiponectin concentrations were measured in culture media; and (C) mRNA levels of leptin,

xxvi
adiponectin and PPARγ were quantified with quantitative RT-PCR and presented as relative
expression compared to vehicle-treated cells ............................................................................. 132
Figure 5.4 Ex vivo μCT measurements of the trabecular micro-architectural properties at the (A)
distal femur metaphysis (B) representative 3D reconstruction of trabecular bone ..................... 133
Figure 5.5 (A) Representative images of Nile Red and DAPI-stained 3T3-L1 adipocytes (B)
Measurement of lipid droplet size in cells following 48h treatment of 25 and 100 μM of AA,
EPA, DPA and DHA (C) Adipocytes were categorized into containing uniloculus-like and
multiloculus-like lipid droplets ................................................................................................... 134
Supplementary Figure S5.1 Ex vivo μCT measurements of the trabecular micro-architectural
properties at the lumbar vertebrae 3............................................................................................ 145
Figure 6.1 Correlation between FMI and FFMI with BMI Z-score in (A) males and (B) females;
(C) absolute lean mass and fat mass by tertiles of % body fat measured by DXA .................... 151
Figure 6.2 Adipogenic gene regulation by LCPUFA ................................................................ 165
Figure 6.3 Context-dependent effects of PPARγ on bone resorption ........................................ 167
Figure 7.1 Biosynthetic cascades and actions of selected lipid mediators derived from AA, EPA
and DHA ..................................................................................................................................... 175
Figure A1 Metabolism of α-linolenic acid into longer chain omega-3 polyunsaturated fatty acids
in the endoplasmic reticulum and peroxisome via a desaturase/elongase enzyme system ......... 198
Figure A2 Effects of DHA on osteoblastogenesis and osteoclastogenesis via its anti-
inflammatory properties and the direct effects on bone cells ..................................................... 229

xxvii
List of abbreviations
25(OH)D 25-hydroxyvitamin D
α-MSH α-melanocyte stimulating hormone
µCT Micro-computed tomography
AA Arachidonic acid, C20:4 n-6
aBMD Areal bone mineral density
AI Adequate Intake
ALA α-linolenic acid, C18:3 n-3
ALP Alkaline phosphatase
AMDR Acceptable Macronutrient Distribution Range
AMPK AMP-activated protein kinase
ANOVA Analysis of variance
aP2 Fatty acid binding protein
ARASCO Arachidonic Acid-rich Single Cell Oil
BMC Bone mineral content
BMD Bone mineral density
BMI Body mass index
BS/TV Bone surface density
BSA Bovine serum albumin
BV/TV Bone volume fraction
cAMP Cyclic adenosine monophosphate
CART Cocaine- and amphetamine-regulated transcript
CCHS Canadian Community Health Survey
C/EBP CCAAT/enhancer-binding proteins
CE Cholesterol esters
CFG Canada’s Food Guide
CI Confidence interval
CNS Central nervous system
Conn.D Connectivity density
COX Cyclooxygenase
CSA Cross sectional area
Ct.Ar Cortical area
CT Computed tomography
CTRL Control
CTx Carboxy-terminal telopeptide of type I collagen
CV% Coefficient of variation
CVD Cardiovascular diseases
d Day (s)

xxviii
D6D Δ6 desaturase
DHA Docosahexaenoic acid, C22:6 n-3
DHGLA Dihomo-γ-linolenic acid, C20:3 n-6
DIO Diet-induced obesity
DMEM Dulbecco’s Modified Eagle’s medium
DPA Docosapentaenoic acid, C22:5 n-3
DRI Dietary Reference Intake
DXA Dual-energy X-ray absorptiometry
EAR Estimated Average Requirement
ELISA Enzyme-linked immunosorbent assay
EPA Eicosapentaenoic acid, C20:5 n-3
FAME Fatty acid methyl esters
FBS Fetal bovine serum
FFMI Fat-free mass index
FFQ Food frequency questionnaire
FiSK Fish, children, health and cognition
FMI Fat mass index
FOXO Forkhead box O
g Gram (s)
GC Gas chromatography
GLA γ-linolenic acid, C18:3 n-6
h Hour (s)
HFD High fat diet
HOMA-IR Homeostasis Model Assessment for Insulin Resistance
ICV Intracerebroventricular
IGF-1 Insulin-like growth factor-I
IL Interleukin
i.p. Intraperitoneal
IP-R Prostacyclin receptor
IQR Interquartile range
IR Insulin resistance
IU International units
kcal Kilocalorie
kg Kilogram (s)
LA Linoleic acid, C18:2 n-6
LCPUFA Long chain polyunsaturated fatty acids
LOX Lipoxygenase
LV Lumbar vertebrae
m Meter (s)

xxix
Ma.Ar Marrow area
MAPK Mitogen-activated protein kinase
M-CSF Macrophage colony stimulating factor
Meat & Alt Meat and Alternatives
Milk & Alt Milk and Alternatives
mo Month (s)
mRNA Messenger ribonucleic acid
MSC Mesenchymal stem cells
MUFA Monounsaturated fatty acids
MYLIFE McGill Youth Lifestyle Intervention with Food and Exercise
n-3 Omega-3
n-6 Omega-6
NEFA Non-esterified fatty acids
NHANES National Health and Nutrition Examination Survey
NIST National Institute of Standards and Technology
NPY Neuropeptide Y
O3I Omega-3 Index
OPG Osteoprotegerin
OR Odds ratio
Osx Osterix
PBMC Peripheral blood mononuclear cells
PBS Phosphate-buffered saline
PG Prostaglandin
PI3K Phosphoinositide 3-kinase
PKA Protein kinase A
PL Phospholipids
PLA2 Phospholipase A2
PPAR Peroxisome proliferator-activated receptor
PPRE Peroxisome proliferator-activated receptor response element
pQCT Peripheral quantitative computed tomography
RANK Receptor activator of nuclear factor-κB
RANKL Receptor activator of nuclear factor-κB ligand
RBC Red blood cells
RDA Recommended Dietary Allowance
ROI Region of interest
RT-QCR Reverse transcription polymerase chain reaction
Runx Runt-related transcription factor
SCD Stearoyl-CoA desaturase
SD Standard deviation

xxx
SEM Standard error of the mean
SFA Saturated fatty acids
SMI Structure model index
SNS Sympathetic nervous system
SREBP Sterol-response element binding protein
SSIp Strength-strain index (polar)
Tb.N Trabecular number
Tb.Sp Trabecular separation
Tb.Th Trabecular thickness
TNF Tumor necrosis factor
TRAF Tumor necrosis factor receptor associated factor
TRAP Tartrate-resistant acid phosphatase
Tt.Ar Total area
V&F Vegetables and Fruits
vBMD Volumetric bone mineral density
VMH Ventromedial nuclear of the hypothalamus
VOI Volume of interest
WHO World Heath Organization
wk Week (s)
WT Wild-type
y Year (s)

1
CHAPTER 1
Introduction and Rationale

2
1.1 Background
Childhood and adolescence represent the most critical stages for developing optimal bone
strength. Approximately 90% of bone mineral acquisition occurs between 12 and 18 y [1], where
genetic, hormonal and environmental influences interact to enhance skeletal mineralization,
expansion, and linear growth to the greatest extent. Peak bone mass is defined as the bone
mineral density (BMD) during the stable period following growth and accrual of bone mass [2].
In women, peak bone mass of the lumbar spine and proximal femur are attained in late
adolescence or early adulthood [3, 4], whereas total body bone mass continue to increase slightly
through the third decade of life [4]. Thereafter, bone mass declines at a rate of approximately
0.4-1.6% per year for both sexes before the age of 50 y [5-7], and could reach up to 10% per year
when levels of biologically-active sex steroids decline. The variance in bone mass among
individuals at completion of growth is an order of magnitude greater than the variance in rate of
bone loss during aging (1SD = 10% and 1% respectively) [8]. Hence one’s susceptibility to
fractures later in life is strongly dependent on whether peak bone mass is maximized during
growth. The full genetic potential for bone mineral accrual can be attained only if nutrition,
physical activity and other lifestyle factors are optimized. Therefore, any disorders or conditions
that alter bone formation and/or resorption during this maturation period may result in
suboptimal skeletal development, and eventually pose greater risks of osteoporotic fractures later
in life [9].
Excess adiposity due to compromised nutrition, activity and lifestyle has traditionally been
considered to positively influence BMD because of the anabolic osteogenic response from
additional mechanical loading. However, recent findings suggest that bone quality is
compromised. Furthermore, persistent weight-bearing associated with obesity during growth

3
may inhibit normal movement patterns, predisposing children with obesity to musculoskeletal
pain and injuries [10, 11]. Children and adolescents with obesity (n=227, 12.6 ± 2.7 y, BMI>95th
percentile) had significantly greater chances of skeletal fractures (OR: 4.54; 95% CI 1.6-13.2)
compared to their normal weight counterparts. They are also more likely to complain of
musculoskeletal pain (OR: 4.04; 95: CI 1.5-10.6) [12], and suffer from orthopedic complications
including lower-limb misalignment [12], Blount’s disease (adolescent bowing of the legs) [13]
and slipped capital femoral epiphyses [14].
About 40–50% of children sustain at least one fracture by the age of 18 y [15],
proportionately more compared to the fracture rates of 12-17% in elderly >50 y [16, 17]. The
incidence rate is most pronounced among boys [18, 19], and peaks during the pubertal growth
spurt [20]. Additionally, whereas fractures usually occur at the hip and spine of older adults, the
forearm is the most common site of fractures in children, showing nearly four times greater
incidence rates than the lower limbs [21]. Children (n=401, 3.5-17.3 y) with forearm fractures
are also more likely to be overweight or obese compared to those who suffered an upper arm or
hand fracture [22]. In addition, children with obesity mostly tend to fall from lower heights (as
they avoid rapid-movement activities and climbing activities), yet they still exhibit a greater risk
for fractures [23, 24]. It is possible that specific skeletal sites as well as skeletal compartments
are differentially affected by excess adiposity, underlying the deficits in bone strength observed
in children with obesity.
The impact of overweight and obesity on bone metabolism manifests as a result of direct
and indirect factors. In addition to the excess weight and adiposity associated with obesity and
disproportionate weight relative to bone strength, complications of childhood obesity include
acceleration of thelarche and menarche timing in girls [25], and pubertal advancement in boys

4
[26] that can result in adverse effects on maturing bones in both sexes [27]. Obesity also affects
pubertal timing through nutrition-related signals (e.g. insulin) on the reproductive axis [28].
Hormonal influences, such as increased conversion of androstenedione to estrogen, or secretion
of bio-active hormones including leptin and adiponectin from adipose tissue may play additional
roles. The regional distribution of fat may also alter bone mass independently of obesity,
contributing to a low-grade inflammation state that promotes bone resorption through increasing
production of pro-inflammatory cytokines expression.
Childhood obesity is a global epidemic. In Canada alone, the prevalence of youth that are
overweight or obese increased from 3% in 1978 to 31% in 2013 [29]. About 80% of adolescents
with obesity grow up to be adults with overweight condition or obesity [30]. If current trend
continues, up to 70% adults will be overweight or obese by 2040 [31]. With the rapid rise in
childhood obesity and concerns over associated musculoskeletal pain or disorders, the obesity
cycle may be perpetuated by reduced motivation to participate in physical activity in youths who
are overweight, thereby partially contributing to their lower activity and higher sedentary
behavior. It is therefore important to understand the effects of excess adiposity on bone health
outcomes, as well as factors contributing to bone mass deficits and increased fracture risks in
children with obesity to prevent progression of the cycle (Figure 1.1).
The role of specific nutrients, foods or food groups in the nutritional etiology of childhood
overweight and obesity remains controversial [32]. While certain dietary components (e.g.
excess caloric intake, fried foods and sugar-sweetened beverages) have been associated with
increased adiposity in children [33, 34]; others have reported no clear associations between
dietary patterns and measures of overweight and obesity in youths [35, 36]. The influence of diet
on adiposity and bone mass accrual in children has also only been scarcely investigated. Only

5
one study has reported high intakes of dark green and deep yellow vegetables to be related to low
fat mass and high bone mass in children (n=325, 3.8 – 7.8 y) [34]. Likewise, the importance of
high fat intake in childhood obesity has been challenged [37, 38]. There is a lack of evidence for
increased energy intake as fat, despite the striking increase in the prevalence of overweight and
obesity among youths over the last decades [39]. Long-term follow-up study of children (8-10 y)
of healthy weight counseled to lower total fat intake to <30% kcal, reported little or no
differences in BMI at 12 mo (-0.30 kg/m2, CI: -0.75 to 0.15, n=620) or at 5 years (0.0 kg/m2,
95% CI: -0.63 to 0.63, n=541) when compared to usual fat intake (31.4% kcal) [40]. This brings
into question the importance of the quality in the fatty acid composition of ingested fats.
Long chain polyunsaturated fatty acids (LCPUFA) have received substantial attention not
only due to a central role in brain and visual development early in life, but also the association
with chronic disease risks throughout life. The potential of LCPUFA in increasing bone mass and
protecting against bone loss with aging are more recently explored. Most [41-46] observational
studies suggest that diets high in fish and seafood are associated with benefits to bone health in
postmenopausal women. Recent studies have also indicated that various types of LCPUFA
intake, such as α-linolenic acid (ALA, C18:3 n-3) [44, 47] and arachidonic acid (AA, C20:4 n-6)
[48], were associated with reduced hip fracture rates. Accordingly, low LCPUFA intake,
particularly that of linoleic acid was considered as a risk factor of hip fractures in women
[45]. Recent systematic meta-analyses examining the relationship between dietary consumption
of fish (or their derivatives) reported that 11% of subjects (n=432,924) showed an increase in
BMD and decreased risk of fractures. The negative effects on bone linked to fish consumption
were almost null [49]. However, studies included in the analyses have been largely limited to
those in adults (84%). Human trials investigating the roles of LCPUFA in periods of bone

6
acquisition remain scarce.
Despite the reported benefits of high LCPUFA intake, data collected from the U.S.
National Health and Nutrition Examination Survey (NHANES) 2003-2008 showed more than
90% individuals (n=24,621) consumed less than 0.5 g/d of omega-3 (n-3) LCPUFA from food
sources. Median daily intake of n-3 LCPUFA in children aged 1-6 y (n=3354) and 7-12 y
(n=2846) was 0.06 and 0.09 g/d, respectively [50]. Among that, fish contributed to only 1% of
dietary sources of n-3 LCPUFA [50]. To date, no published data exist on dietary LCPUFA intake
specifically in children with obesity. Although children that are overweight or obese are more
likely to consume more calories than age-matched peers and consequently more
eicosapentaenoic acid (EPA, C20:5 n-3) and docosahexaenoic acid (DHA, C22:6 n-3), it is
unlikely for fish or shellfish intake to be to major contributor to the difference in energy intake. It
is therefore reasonable to expect LCPUFA intakes to be similar in children with obesity, if not
lower due to poorer diet quality.
LCPUFA and their derivatives play critical roles in modulating obesity-related metabolic
consequences including insulin resistance and inflammation [51]. Evidence from animal and
human studies supports the premise that increasing n-3 LCPUFA status decreases adipocyte
differentiation [52] and benefits body composition [53]. Possible mechanisms underlying its
effects include regulating mesenchymal stem cell lineage commitment, adipokine production,
and alleviating inflammatory responses in obesity [54]. It is known that cross talk exists between
adipocytes and osteoblasts in the bone milieu [55]. It can then be hypothesized that the
amelioration of obesity will benefit bone metabolism, yet to what extent does LCPUFA
participate in such relationship remains to be characterized.
Changes in LCPUFA profile are also influenced by the metabolic alterations due to obesity.

7
Such relationship has been scantily investigated in younger ages and results are nonetheless
controversial [56-58]. Youths that are overweight or obese exhibited lower n-3, but greater
omega-6 (n-6) LCPUFA proportions in plasma [59, 60]. Alternatively, an increase in plasma
levels of n-3 and n-6 LCPUFA, AA and DHA was reported in children with obesity following a
1-y nutritional-behavior intervention, along with 12% decrease in BMI Z-score [61]. The
differences observed in LCPUFA profile may be contributed by alterations in desaturase
activities. Since fatty acids from the n-3 and n-6 series are not equivalent in promoting
adipogenesis and adipose tissue development [62], varying the proportions of these essential
fatty acids would have important implications in changes in adiposity during growth.
Altogether, LCPUFA demonstrate great potential in modulating both adiposity and skeletal
metabolism and may represent a useful non-pharmacological mean of ameliorating the bone
mass deficits in obesity. Changes in the balance of essential LCPUFA could alter early stages of
adipocyte development, not only during fetal life and infancy which show the highest
adaptability and vulnerability to external factors, but also afterwards. Deviation from normal
bone mass trajectory in relation to excess adiposity may be confined to specific periods during
growth and development. In a study of healthy adults (n=509) between 20 and 97 y, the inverse
relationships between adiposity and vBMD was negated only in men >50 y after adjustments for
age, but not in younger men (20-50 y) or pre-menopausal women. This suggests that limiting fat
mass accumulation may be more important in early life to allow peak bone mass accrual [63].
Hence, timely interventions are necessary for minimizing the negative impacts of adiposity on
bone mass. The optimization of bone mass and body composition during growth can then reduce
comorbidities and/or burdens as a result of suboptimal bone-muscle-fat development later in life
(i.e. osteosarcopenia). The overarching goal of this thesis research is to determine the potential of

8
using LCPUFA to promote maximum accrual in bone mass and inhibit adiposity accumulation
during growth. To date, limited evidence exists for the influence of LCPUFA on peak bone mass
attainment in children with obesity. Hence, this project aims to fill this knowledge gap by
enhancing the understanding of the physiological importance and mechanisms by which
LCPUFA affects bone in children with obesity and a rodent model of diet-induced obesity during
growth.

9
Figure 1.1 The vicious cycle of childhood obesity, musculoskeletal discomfort and reduced
physical activity. Adapted from [64]

10
1.2 Thesis rationale
The beneficial role of LCPUFA on obesity-related metabolic consequences is recognized.
Many epidemiological and animal studies have also identified LCPUFA to be positively
associated with bone mass and/or protective against bone loss with aging. Despite so, limited
literature exists for the interaction among obesity, LCPUFA and bone metabolism, especially
during periods of growth. Given those with the highest peak bone mass are best protected against
age-related bone loss, this work aims to enhance understanding of the physiological importance
and mechanisms by which LCPUFA affects bone in children with obesity and in pre-clinical
studies using a rodent model of diet-induced obesity (DIO).
Study objectives and hypotheses
The global objective is to advance understanding of the role of LCPUFA in vivo on bone mass
and architecture in children with obesity, and to further characterize the important mediators in
this relationship using an appropriate animal model.
Aim 1: Dietary intakes (Manuscript 1)
To describe the diet of children with obesity and to determine if dietary intakes relate to body
composition outcomes.
Hypothesis: children with obesity will have suboptimal LCPUFA intake, and that omega-3
LCPUFA status measured in RBC membranes inversely relate to adiposity, due in part to lower
abundance in the diet.

11
Aim 2: Bone mass (Manuscript 2)
To examine the relationships between LCPUFA status, bone mass and geometry assessed using
dual-energy X-ray absorptiometry (DXA) and peripheral quantitative computed tomography
(pQCT) in children with overweight condition or obesity.
Hypothesis: based on previous studies that reported on altered fatty acid metabolism in
individuals with obesity, the higher omega-6 LCPUFA status in children with overweight
condition or obesity will negatively relate to bone health outcomes, particularly at sites where
fractures are common.
Aim 3: Microarchitecture and mechanisms (Manuscript 3)
To determine the effects of a moderately high-fat diet, with or without addition of arachidonic
acid on bone mass and LCPUFA status during growth in a growing rat model of diet-induced
obesity.
Hypothesis: the adverse effects of DIO on bone mass during growth are exacerbated by addition
of arachidonic acid, mediated in part through promoting adipogenesis and increasing omega-6
LCPUFA in circulation and tissue.

12
CHAPTER 2
Literature Review

13
There has been a significant rise in the worldwide prevalence of childhood obesity. The
concomitant rise in the incidence of childhood forearm fractures [65] has led to a focus on the
relationship between childhood obesity, bone mass and fracture incidence. Importantly, bone
mass acquired during childhood, as well as lifestyle habits such as dietary intake, physical
activity patterns, tracks into adulthood and may ultimately determine future osteoporotic risk. It
has been proposed that the greater risk of fracture in children in obesity is a result of a mismatch
between greater impact force generated during a fall, and suboptimal skeletal response to excess
adiposity [23]. The introduction of imaging modalities that generate information about bone
microarchitecture, soft tissue composition and indices of bone strength has pointed towards a
differential effect of excess fat mass and/or low lean mass on various skeletal sites, as well as
detailed alterations in the trabecular and cortical compartments observed in children with obesity.
2.1 Influence of obesity on bone health outcomes
2.1.1 Epidemiological and clinical studies linking obesity to bone mass
2.1.1.1 Human studies
The effects of obesity alleged to benefit bone, to date, are based mainly on the positive
relationship between body weight, or mechanical loading conferred by body weight and bone
mineral density (BMD) found in humans and animals. Bone is a mechanosensitive tissue that
continually adapts its mass, size and architecture in response to changes in mechanical stimuli
from muscle forces, as well as gravitational forces associated with body weight [66]. Growing
bones are more responsive to mechanical loading than mature bones [67]. Specifically, dynamic
loads induced by muscle contraction exert a greater anabolic effect on bone than do static loads
induced by excess adipose tissue [68]. Therefore, the impact of obesity on bone metabolism may
be more pronounced in childhood and adolescence than adulthood.

14
A considerable body of bone densitometry data in adults demonstrated protective effects of
body weight on BMD [69-71]; at least to a certain degree. Both body weight and body mass
index (BMI) explained up to 19.8% of total variance in areal BMD (aBMD) for weight-bearing
sites (proximal femur and spine) in elderly men and women (n=1132, mean age 76 y) from the
Framingham osteoporosis cohort [72]. In addition, postmenopausal women (n=417, 45-59 y) in
the lowest tertiles of % body fat and BMI had 12% lower hip and spine aBMD and more than 2-
fold greater bone loss after 2 y compared with those in the highest tertile [73]. In a meta-analysis
of the relationship between BMI and fracture risk, high BMI was in general related to reduced
fracture risk in men and women (n=59,644, mean age 63.2 y); yet the gradient of risk per unit
BMI increase was lower beyond a BMI of 30 kg/m2, suggesting that the protective effect might
be reduced at higher BMI [74].
In contrast to adults, the effects of obesity on bone mass accrual during growth are mixed.
Obesity (BMI ≥ 95th percentile) was positively associated with greater vertebral aBMD for
height, bone mineral content (BMC) for bone area, as well as bone mineral apparent density (r2 =
0.78 – 0.96) in children aged 4-20 y (n=103, mean age 9.8 ± 2.9 y) [75]. In the same study,
children with obesity also had 1.2-1.7 times greater whole body bone area and BMC for-age and
for-height compared to healthy weight counterparts after correction for sexual maturation and
lean mass. A strong positive relationship was reported between whole body fat mass and BMC
(r2 = 0.44-0.82) and area (r2= 0.46-0.87) after adjustment for height and/or lean mass in children
(n=3082, 9.9 y) that are overweight and obese. The adjustment for height had a minimal effect on
the relationship, suggesting that fat mass acts to increase bone size by stimulating appositional
rather than longitudinal bone growth, presumably by increasing the rate of periosteal apposition
[76]. The duration of obesity also contributes to the influence on BMD. Children (n=59, 11.8 ±
15
2.7 y) with a long (> 7 years) duration of obesity had approximately 15% and 35% greater
lumbar vertebrae (LV) 2-4 aBMD than those with an obesity duration of 4-7 y and those with a
recent onset (<4 y), respectively [77].
Contrarily, children (n=336, 3-19 y) who are overweight and obese (≥ BMI 85th percentile)
had lower total BMC and bone area (2.5-10.1%) for their body weight, despite their relatively
higher BMC and bone area (5-30%) for chronological age [78]. Children classified as obese
(BMI>99.6th percentile, 12.1 ± 2.9 y, n=52) who suffered prior fracture were also shown to have
0.8-3 SD reduction in whole-body LV 2-4 and aBMD of the distal radius [79]. In female
adolescents of healthy weight (n=60, 10-19 y), higher % body fat was negatively associated with
BMC despite wider bones [80]. Hence, the increase in growth velocity in children with obesity
may have occurred at the expense of optimal mineral accrual, resulting in bigger bones of lower
BMC, contributing to the reduced bone strength and/or higher fracture risks.
The conflicting relationships between adiposity and BMD reported above could in part be
related to limitations of dual-energy X-ray absorptiometry (DXA) assessments. The validity of
bone measuresments by DXA in individuals with obesity has been questioned due to the artifact
with larger tissue depth interfering with the X-ray attenuation and over-estimation of aBMD.
Magnification errors associated with fan-beam DXA also underestimates BMC, as the bone is
elevated at a greater distance off the scanning table, as occurs with obesity [81]. Three-
dimensional quantitative computed tomography (CT) techniques, on the other hand, allow for
assessment of volumetric BMD (vBMD) and bone geometry, along with delineation of the
trabecular and cortical bone compartments at appendicular sites. CT techniques therefore provide
a better estimate of bone strength as small changes in bone size or shape can lead to significant
changes in bone strength, independent of bone mass [82].

16
A cross-sectional study of pre-school children (n=329, 3-5 y) reported negative
relationships between % body fat and periosteal and endosteal circumference at the 20% distal
tibia [83]. Similarly, % body fat inversely related (r=-0.19 to -0.20) to bone size, BMC and the
strength-strain index at the distal radius (20% site) in late adolescent females (n=115, 18.2 ± 0.4
y). Such associations became stronger (r=-0.24 to -0.28) after correction for muscle cortical
surface area (CSA) and bone length [84]. Despite the greater cortical CSA in the distal radius of
children with overweight condition (n=93, 7-10 y), they had a smaller increase in bone strength
for a given estimated load (forearm length x body weight) [85]. Additionally, longitudinal
follow-up for 16 mo children who are overweight (n=143, 9-11y) showed that increases in bone
size and estimated strength at the tibial midshaft were related to increase in muscle mass only
and not fat mass. This mismatch in bone size and strength during development poses greater
challenge to bone stability in the event of a fall and can be expected to be more apparent in
children who are overweight compared to their normal-weight peers. Although children with
overweight condition appear to be at an advantage in terms of absolute bone strength, bone
strength is adapted to the greater muscle area instead of excess body fat [86]. Obesity due to
excess fat mass alone then is not predictive of greater bone acquisition in children, unless it is
coupled with physical activity that favors lean mass accrual and confers dynamic loads to
growing bone.
2.1.1.2 Animal studies
Studying the effect of obesity on bone health in humans is complicated by the multifaceted
factors contributing to excess adiposity; involving not only excessive fat intake, but possibly
disproportionate consumption of other nutrients (e.g. protein and minerals) known to influence
bone, as well as various lifestyle factors. The relationship between obesity and bone in humans

17
have therefore relied heavily on statistical correlation or modeling rather than controlled trials.
Employment of animal models of high-fat diet (HFD) induced obesity therefore allows for
singling out the effect of varying fat intake with other nutrients remaining the same when a diet
is formulated on an energy basis.
The higher body weight induced by high-fat feeding of rodents was found to be detrimental
to bone mineral accrual. Weaning mice (3 wk) fed a westernized diet of high sucrose, animal
protein, and saturated fatty acids (C16:0 and C18:0) showed a 20% reduction in whole-body,
femoral and vertebral aBMD at 30 wk of age [87]. Consistently, lower femoral BMC and aBMD
(43% and 15% respectively) were also observed in mice fed an atherogenic high-fat (15.8% w/w
fat and 1.25% cholesterol) diet for 4 mo [88]. From these studies, it appears that diet-induced
obesity (DIO) has a generalized or systemic effect on BMC and aBMD, i.e. not site specific.
However, the assessment of aBMD was based on DXA and thus bone geometry was not
examined.
Trabecular bone is a metabolically active bone compartment that has a turnover rate that is
5-10 times higher than cortical bone [89]. Any changes in bone turnover related to obesity are
therefore expected to first be observed in the trabecular-rich metaphyseal regions. Corn oil-fed
female mice (12 mo) for 6 mo had significantly lower metaphyseal aBMD at the distal femur as
well as proximal tibia [90]. Using high-resolution micro-computed tomography (μCT), growing
6-wk-old mice fed a HFD (45% kcal fat, from lard) for 14 wk had 20% lower trabecular bone
volume fraction (BV/TV), trabecular number (Tb.N), connectivity density (Conn.D), along with
15% greater trabecular separation (Tb.Sp) both at the distal femur and proximal tibia [91, 92], all
of which suggested decreased bone formation and/or increased resorption with obesity.
Assessment of micro-architectural properties of cortical bone showed reductions in tibia

18
mid-diaphyseal cortical porosity in rats (7 mo) fed high fat (44% kcal) /high sucrose diet for up
to 6 mo [93]. Contrarily, no effect on cortical porosity at the tibia mid-diaphysis or metatarsus
was reported in 8 wk-old female rats fed HFD (39.5% kcal) for 10 wk [94]. Cortical geometry
measurements (including total area, bone area, medullary area, bone perimeter, and cortical
thickness) at the femur or tibia mid-diaphysis were also not affected in mice fed a HFD
compared to controls [91, 92].
Bone strength is a function of both geometry and composition, thus changes in
microarchitectural or geometrical properties do not necessarily translate into alterations in bone
strength. Male rats (90 d) fed a high-energy diet composed of ‘junk food’ items including
marshmallows, potato chips, chocolate chip cookies, popcorn and 32% sucrose for 1 mo shown
significantly higher femoral maximum load, maximum deflection and failure energy; this is not
surprising given stronger bones are often required to support the greater body weight (19.1%) as
a result of DIO [95]. Female rats (8 wk) fed HFD (39.5% fat) for 10 wk had significantly lower
tensile stress and elastic modulus at the tibia and metatarsus after correction for bone size and
geometry, signifying the deterioration in material properties of cortical bone [94]. Likewise, bone
calcium content was reduced with increased dietary fat content (up to 9% w/w), and cannot be
restored by increasing dietary calcium in growing broiler chickens (day-old to 3 wk of age) [96].
Hence, the lower trabecular BMC could in part have contributed to the reductions in compressive
loads, failure energy, as well as stress and strain of trabecular-rich regions including femoral
condyles, tibial plateau and LV 6 of young rats (from 4 wk to 24 mo) and adult roosters (from 40
wk to 60 wk) fed a HFD [97, 98].

19
2.1.2 Potential mechanisms
2.1.2.1 Differentiation of mesenchymal stem cells into adipocytes or osteoblasts
Bone remodeling by resorption and formation add and reshape trabeculae and the cortex to
strengthen them. The rate of bone turnover is therefore reflected in the degree of mineralization,
bone collagen fiber orientation, trabecular preferential orientation (architectural anisotropy) and
trabecular connectivity [99].
Together, the bone-forming osteoblasts, bone-resorbing osteoclasts, and osteocytes form
the basic bone remodeling unit, and are found close to the stromal elements of the marrow.
Pluripotent mesenchymal stem cells (MSC) within the bone marrow have equal ability to
differentiate into osteoblasts, adipocytes and chondrocytes, among other cell types, depending on
the cell-derived transcription factors present within the bone milieu (Figure 2.1).
Given the plasticity of MSC in becoming either adipocytes or osteoblasts, there may be
decreased osteoblastogenesis with increased adipogenesis in obesity. However, increased
mechanical loading with excess body weight could stimulate bone formation by decreasing
apoptosis and promoting differentiation of osteoblasts and osteocytes [100]. Additionally,
osteoblastogenesis is favored through the down-regulation of peroxisome proliferator-activated
receptor-γ (PPARγ) [101]; or by stimulating a durable β-catenin signal that commits MSC to the
osteoblast lineage [102].
Consistently, human studies have reported decreased levels of circulating bone formation
markers in those with obesity compared to leaner populations. For example, serum osteocalcin
concentrations were 30% lower in postmenopausal women (n=258, 55-76 y) with obesity (BMI
≥ 30 kg/m2) than those who are of normal-weight [103]. Similarly, negative relationships
between BMI and osteocalcin (r=-0.17), and procollagen type I C-peptide (r=-0.30) was

20
observed in healthy postmenopausal women (n=130, 46-85 y) [104]. Only one study to date has
measured bone turnover markers in children with obesity (BMI Z-score 3.3 ± 0.6, 5-16 y, n=52),
where serum osteoprotegerin (OPG) levels were 10% lower in children classified as obese, in
addition to an inverse relationship with total body and truncal fat mass. The bone resorption
marker carboxy-terminal telopeptide of type I collagen (CTx), was also approximately 30%
higher in those with greater BMI [105].
Cultured bone marrow stromal/osteoblastic cells isolated from long bones of DIO (45%
kcal) C57BL/6 mice showed 50-75% greater alkaline phosphatase (ALP)-positive colony
forming units and calcium modules, indicative of increased bone formation presumably due to
greater mechanical loading. ALP and receptor activator of nuclear factor-κB ligand (RANKL)
mRNA levels were increased by 41% and 20% respectively, but not that for osteocalcin, OPG
and macrophage colony stimulating-factor (M-CSF) levels [91]. Together with higher serum
tartrate-resistant acid phosphatase (TRAP) and multinucleated TRAP-positive osteoclasts in bone
marrow in mice fed HFD, these results suggest that osteoclast activity and bone resorption
induced with high-fat feeding may blunt any positive effects of increased weight loading on bone
[92]. Alternatively, marrow stromal cells from C57BL/6 mice fed a high-fat, atherogenic diet
(15.8% w/w fat) for 4 mo failed to undergo osteoblastic differentiation in vitro [106] and led to
inhibition of osteocalcin expression [88]. Feeding of a 10% w/w corn oil diet in 12 mo female
C57BL/6J mice for 6 mo also significantly increased osteoclast number, superoxide production
in osteoclasts, as well as expression of Pparγ and ctsk, a cytokine protease instrumental in bone
matrix degradation necessary for bone resorption. This suggested high fat feeding favored
lineage selection of hematopoietic cells towards osteoclast, as well as adipocyte differentiation
from MSCs [90, 107]; fat infiltration of marrow space might also have replaced functional

21
hematopoietic and/or osteogenic cells in the cavity [108].
2.1.2.2 Low-grade inflammation and production of pro-inflammatory cytokines
Obesity is considered a state of low-grade chronic inflammation manifested with abnormal
cytokine production, increased acute-phase reactants, and activation of inflammatory signaling
pathways. Excess adipose tissue in obesity is infiltrated with an increased number of
macrophages, which act as a major source of pro-inflammatory cytokines. Individuals with
obesity have been reported to show higher circulating amounts of tumor necrosis factor-α (TNF-
α), interleukin-1 (IL-1), IL-6 and C-reactive protein [109-113].
These pro-inflammatory cytokines have been shown to mediate the process of osteoclast
differentiation and bone resorption through the regulation of RANKL/RANK/OPG pathway
[114, 115] (Figure 2.2). The expected bone loss associated with loss of active sex steroids in
ovariectomized mice was prevented with the abolition of IL-1 and TNF signaling pathways [116]
[117, 118]. IL-6-/- mice were protected against joint inflammation and bone loss, suggesting that
IL-6 is essential for bone formation only in conditions of high bone turnover, possibly via
enhancing osteoblast proliferation and differentiation as shown in murine embryonic fibroblasts
[119].
Few studies have investigated the direct relationship between obesity-induced
inflammation and its effect on bone metabolism. Adult female mice (12 mo) fed 10% corn oil
diet for 6 mo had increased visceral adiposity as well as bone marrow adipogenesis [90]. LPS-
stimulated IL-6 and TNF-α secretion by splenocytes and bone marrow cells was elevated [90],
accompanied by 0.2-0.3 fold greater IL-6, TNF-α and IL-1β mRNA levels at the femur [107].
Lower concentrations of the anti-inflammatory cytokine IL-10 [120-122] were secreted by bone
marrow-derived macrophages upon RANKL stimulation in young mice (9 wk) fed HFD (45%

22
energy) for 13 wk. Exogenous IL-10 administration inhibited osteoclast formation to a lesser
extent in obese relative to lean mice, suggesting that obesity led to reduced IL-10 inhibiting
recruitment of NF-κB onto the promoter of IL-10, and subsequently enhanced osteoclastogenesis
[123].
2.1.3 Adipokines
Adipose tissue is known to be an active endocrine organ, secreting hormones including
leptin and adiponectin that are shown increasingly to have both a direct and centrally mediated
influence on the bone-fat relationship.
2.1.3.1 Leptin
Leptin is a pleiotropic polypeptide hormone produced primarily by adipocytes [124-126].
Circulating leptin enters the central nervous system (CNS) in proportion to its plasma
concentration, and serves to communicate the state of body energy repletion. Through the
hypothalamic peptidergic network [127-129], leptin suppresses food intake and enhances energy
expenditure [130, 131]. Consequently, mouse models of leptin deficiency or modeling (ob/ob
and db/db mice) demonstrates increased food intake in combination with reduced energy
expenditure and a phenotype indicative of the neuroendocrine starvation response (including
hypothyroidism, decreased growth, infertility, and decreased immune function) in spite of
obesity [132-134].
Circulating concentrations of leptin in humans are in the range of 0.1-5 nM (1.6 – 80
ng/ml) [135] and is strongly correlated with body fat mass in both humans [136] and animals
[92, 137]. Children with obesity (n=18, 8.9 ± 1.8 y) have significantly higher serum leptin
concentrations (28.6 ± 17.4 vs 6.8 ± 7.1 ng/ml) than their healthy-weight age-matched
counterparts [138]. Circulating leptin levels have shown a negative relationship with markers of

23
bone resorption (urinary CTx and N-telopeptide of type I collagen) even after adjustment for fat
mass [139, 140]. Cross-sectional analyses in both healthy [141-143] and adults classified as
obese [144] have suggested an overall adverse effect of leptin on BMD, after adjustment for age,
body weight and fat mass. Leptin levels were also significantly lower in postmenopausal women
with vertebral fractures than those without fractures [145]. However, the independent
relationships between circulating leptin and BMD evaluated through cross-sectional studies are
confounded by the strong association between leptin and fat mass, given the almost exclusive
production of leptin by adipocytes [124].
Leptin-deficient rodents or models with impaired signaling (ob/ob or db/db mice, fa/fa rats)
have reduced femur length, cortical thickness, Tb.N, along with lower rates of osteoblast
differentiation and greater osteoclast number [146-148]. This resulted in substantial decreases in
biomechanical properties in appendicular bone of adolescent mice [149], suggesting the positive
effect of mechanical loading conferred by excess body weight on bone could not overcome the
detrimental effects of leptin deficiency. Accordingly, leptin administration (i.p.) in ob/ob mice (4
wk) increased femur length, BMC and BMD despite a 40% decrease in food intake and 14%
body weight loss [150]. This was mediated through promoting bone marrow adipocyte apoptosis,
and increasing osteoblast function evident by greater bone forming surfaces ob/ob mice [151].
To the author’s knowledge, the adverse effects of leptin deficiency on bone have scarcely
been reported at the lumbar vertebrae. No differences in LV 4 BMC, BMD nor maximum
compressive load was found between adolescent ob/ob mice (10 wk) and their wild-type (WT)
counterparts [149]. Adult ob/ob mice (6-10 mo) had significantly longer vertebrae and higher
trabecular BV/TV than WT mice [146, 152], in spite of the increase in osteoclast numbers and
resorption parameters [152]. This was explained in part by the increase in osteoblast bone

24
formation rate in ob/ob mice [152]. In addition, the potential positive effects of leptin signaling
on bone mass in long bones in ob/ob mice may be masked by the reduced muscle mass [146].
With regard to longitudinal growth, ob/ob mice (6 mo) have been observed to have shorter
femora yet longer vertebral length, and this led to the speculation that the increase in vertebral
body length is secondary to abnormal mechanical loading, since ob/ob mice begin to lose muscle
mass at 3 to 4 wk of age [146, 153]. The utility of the ob/ob mouse as a model of normal
childhood obesity is therefore questionable. Treatment of 25-day-old male ICR mice with leptin
injections (i.p.) increased tibial length in spite of lower body weight, suggesting the effect of
leptin on bone growth is independent of food intake [154].
The potential role of leptin in endochondral ossification has also been investigated.
Administration of exogenous leptin (43 ng/day) increased overall size and thickness of the tibial
epiphyseal growth plate by 11% and 4.2% respectively in young mice (37-40 d) over 4 wk [155],
through stimulating growth plate chondrocytes differentiation without affecting the overall
organization of the growth plate [154]. Histological analyses of the femoral growth plate of
ob/ob mice (4 wk) revealed failure of proliferative and hypertrophic chondrocytes to form the
normal columnar, and organized structure [153]. Administration of exogenous leptin at normal
physiological concentrations (1-10 ng/ml) restored all abnormal phenotypes, which is indicative
of the requirement of leptin in modulating events associated with terminal differentiation of
chondrocytes [153].
Direct effects of leptin on bone cells
Bone marrow stromal cells and other cells of the osteoblastic lineage [155-157] are targets
for leptin as they express both long and short forms of the leptin receptor [158]. Leptin is
therefore believed to have the ability to modulate the reciprocal differentiation of stromal cells

25
between osteoblastic and adipocytic cells.
Leptin treatment of human marrow stromal cells (hMS2-12) resulted in up to a 2.5 fold
increase in osteoblastic differentiation and mineralization of the extracellular matrix, along with
a 0.2-0.6 fold reduction in leptin expression, which is indicative of inhibited adipogenesis [157].
Similarly, increased osteoblast activity evident by higher number of mineralized modules after
leptin treatment has been observed in rat fetal osteoblasts [155] as well as in long-term human
osteoblast cultures [156].
Incubation of human peripheral blood mononuclear cells (PBMCs) and murine spleen cells
with leptin in the presence of M-CSF and soluble RANKL significantly inhibited osteoclast
generation [159]. Furthermore, leptin caused a 3-fold reduction in RANKL mRNA levels but
increased OPG mRNA and protein contents in PBMC and stromal cells [159, 160]. The effect of
leptin on osteoclastogenesis via alterations of the RANKL/RANK/OPG system could be exerted
through a dose-dependent effect. RANKL mRNA levels were initially increased when MC3T3-
E1 osteoblasts were exposed to 12 ng/mL leptin, yet higher concentrations of leptin (24 and 200
ng/ml, ten-fold greater than those optimal for OPG production) were associated with inhibition
of RANKL production by osteoblasts [161]. Subsequently, leptin administration prevented the
initial increase in bone resorption (through increase OPG mRNA expression) and decrease in
bone formation rate against disuse-induced bone loss in female rats [162]. This supported the
hypothesis that leptin promotes positive OPG/RANKL balance and therefore may directly
modulate bone remodeling.
Leptin controls bone mass through a central hypothalamic relay
Leptin controls energy homeostasis and appetite via the CNS, it is plausible that the same
hypothalamic relay is used for its action on the skeleton. Intracerebroventricular (ICV) infusion

26
of leptin in ob/ob mice that lack global leptin secretion hence allows for the determination of the
mode of action involves the central or peripheral pathways [163].
Leptin administration (I.C.V.) fully corrected the high bone mass phenotype at the lumbar
vertebrae of ob/ob female mice (4 mo), and other functions including body mass and food intake,
strongly arguing for the effect of leptin is mediated only via the central relay [152]. Consistently,
targeted leptin overexpression at the hypothalamus of ob/ob mice (8-10 wk) fully restored the
deficits in femoral length, total bone volume, and decreased trabecular bone volume at the distal
femur and LV 3 to WT levels [164].
The downstream pathway of the antiosteogenic effects of leptin were subsequently shown
to be mediated via the ventromedial hypothalamic nuclei of the hypothalamus, independent of
the anorexigenic networks (arcuate nuclei) of the CNS. The peripheral mediators also appeared
to be neuronal rather than through neuropeptides such as α-melanocyte stimulating hormone that
is responsible for the anorexigenic function [165]. Moreover, osteoblasts from db/db mice
showed no osteoblast defects compared to WT [152]. Transgenic mice with specific leptin
overexpression in osteoblasts did not display any skeletal abnormalities [165], supporting that
the effect of leptin on bone is exerted predominantly through the central relay, and specifically
through the sympathetic arm. Leptin infusion in mice deficient in dopamine β-hydroxylase did
not correct the high bone mass phenotype which mimics that of ob/ob mice [165]. Likewise, β2-
adrenergic receptor-deficient mice showed high bone mass [166, 167], along with reduced bone
resorption that cannot be restored to normal values with ICV leptin [168, 169].
The effects of leptin on bone metabolism likely involves multiple pathways that converge
to produce the ultimate phenotype. Depending on the bone tissue, administration route, or
signaling pathway, leptin may exert dual effects on the remodeling cycle. Observations in

27
humans showed stimulatory effects of leptin on bone size and longitudinal growth through its
angiogenic and chondrogenic activities early in life [170]. Later, it may decrease bone
remodeling during periods of accelerated bone loss in the mature skeleton. On the other hand,
leptin controls the central sympathetic tone to correct abnormal bone mass in states of leptin
deficiency by favoring bone resorption, and possibly increasing bone formation through the
neuropeptide Cocaine- and Amephetamine-Regulated Transcript via an, as of yet,
uncharacterized pathway [169] (Figure 2.3). What remains of question is whether these
observations made in in vitro and knockout mouse models hold true in humans with obesity,
especially in the face of leptin resistance where the elevated circulating leptin led to alterations in
the transport of leptin across the blood-brain barrier. This is supported by a recent study in
children with obesity (BMI Z-score 3.3 ± 0.6), where serum leptin levels (148 ng/mL) and free
leptin index (10.6) that is beyond normal physiological range was associated with decreased
OPG, resulting in up-regulation of osteoclastogenesis and failure to maximize bone mineral
acquisition in children [105].
2.1.3.2 Adiponectin
Adiponectin is a protein hormone produced almost exclusively by adipocytes. In contrast
to leptin, its circulating levels are reduced in obesity [171, 172]. An inverse relationship between
plasma adiponectin and increases in adiposity (r=-0.37) and BMI (r=-0.44) over 5 y were
reported in Pima Indian children (5-10 y) [173]. Consistently, plasma adiponectin decreased by
8.1% and 11.2% in boys and girls respectively for every unit increase in BMI Z-score in French
Canadian youths (n=1632, 9-16 y) [174]. Children with obesity also had about 10% lower free
adiponectin after correction for bone age and sex compared to their age-matched counterparts
[105].

28
Adiponectin receptors are expressed on osteoblasts [175] and on RANKL-induced
multinucleated osteoclast-like cells [176]. In vitro, adiponectin (0.01-1 μg/mL) stimulated the
proliferation, differentiation and mineralization of osteoblast-like MC3T3-E1 cells via the AMP-
activated protein kinase (AMPK) pathway [177], and is mitogenic to primary rat and human
osteoblasts in a dose-dependent manner [178]. Additionally, M-CSF- and RANKL-induced
osteoclast differentiation as well as bone resorption activity was reduced by adiponectin [179].
However, adiponectin also promoted RANKL expression while concomitantly reducing OPG
expression on osteoblasts through stimulating the p38 MAPK pathway, indirectly resulting in
increased osteoclast formation [180].
Observations from clinical and animal trials regarding the effects of adiponectin on bone to
date are inconclusive. Reduced adiponectin in children that are obese (n=103, 5-16 y) was
associated with higher Wnt-inhibitor Dickkopf-1, where it may favor adipogenesis over
osteoblastic differentiation [105]. Contrarily, a positive association (r2 = 0.79) between bone
marrow adipose tissue and adiponectin concentrations in early-pubertal girls (n=59, 4-10 y) has
been reported [181]. Mouse models of adiponectin deficiency had 15-56% greater trabecular and
cortical bone mass at both the axial and appendicular skeletons, that resulted in almost 2-fold
greater biomechanical strength [178, 182]. This was attributed to an increase in osteoblast
number, bone formation rate and circulating osteocalcin [178, 182].
The mechanisms of adiponectin on bone remains uncertain. It is possible adiponectin can
bind certain growth factors [183] that would oppose the direct anabolic effects on bone.
Adiponectin may also signal back to osteoblasts in response to increased osteocalcin to slow
osteoblast proliferation and favor apoptosis through decreasing Forkhead box O (FOXO)1
activity in a phosphoinositide 3-kinase (PI3K)-dependent pathway, altogether decreasing bone

29
mass and circulating osteocalcin. Overtime, however, these local effects could be masked as
adiponectin signals centrally to decrease sympathetic tone, partially opposing the influence of
leptin on the sympathetic nervous system, thereby increasing bone mass and decreasing energy
expenditure [182].

30
Figure 2.1 Factors involved in differentiation of mesenchymal stem cells osteoblastogenesis and
adipogenesis
Abbreviations: M-CSF, macrophage colony-stimulating factor; NF-κB, nuclear factor-κB; OPG,
osteoprotegerin; Osx, osterix; PPAR, peroxisome proliferator activated receptor; RANK,
receptor activator of nuclear factor-κB; RANKL, receptor activator of nuclear factor-κB ligand;
Runx, runt-related transcription factor; TRAF; tumor necrosis factor receptor associated factor

31
Figure 2.2 Production of cytokines associated with obesity-mediated low-grade chronic
inflammation affects processes of osteoblastogenesis and osteoclastogenesis
Abbreviations: IL, interleukin; M-CSF, macrophage colony-stimulating factor; NF-κB, nuclear
factor-κB; OPG, osteoprotegerin; Osx, osterix; PPAR, peroxisome proliferator activated
receptor; RANK, receptor activator of nuclear factor-κB; RANKL, receptor activator of nuclear
factor-κB ligand; Runx, runt-related transcription factor; TNF, tumor necrosis factor; TRAF;
tumor necrosis factor receptor associated factor

32
Figure 2.3 Leptin-dependent regulation of bone mass through its direct action on bone cells or
the central relay
Abbreviations: α-MSH, α-melanocyte stimulating hormone; CART, cocaine- and amphetamine-
regulated transcript; MSC, mesenchymal stem cell; NPY, neuropeptide Y; OPG, osteoprotegerin;
PBMC, peripheral bone mononuclear cells; RANKL, receptor activator of nuclear factor-κB
ligand; SNS, sympathetic nervous system; VMH, ventromedial nuclear of the hypothalamus

33
2.2 Integrating relationships between childhood obesity, DHA status, and bone outcomes
Omega-3 LCPUFA have been shown repeatedly in humans [184] and animal models fed
high-fat diets to protect against insulin resistance and limit adiposity accumulation [185]. The
independent beneficial effects of LCPUFA on bone alone are emerging. Despite so, studies that
explored the interaction among these factors are lacking.
2.2.1 LCPUFA status in children with obesity
Dietary intakes remains one of the most important determinant of LCPUFA status
(refernce), nonetheless the intakes of LCPUFA of children in Canada are variable (Table 2.1).
Adolescents classified with overweight condition (n=60, 12 y) had 4-9% higher saturated fatty
acids (SFA) in both phospholipid (PL) and cholesterol ester (CE) fractions, but 21% lower DHA
in PLs compared to their age-matched healthy weight peers [59]. Similarly, serum PL
concentrations of n-3 LCPUFA, including DHA were 33% lower in adolescents with obesity
(n=10, 10.4-16.4 y, BMI 26.8 – 40.4) than lean controls [186]. Phospholipid and sterol esters
AA, dihomo-γ-linolenic acid (DHGLA, C20:3 n-6) and linoleic acid (LA, C18:2 n-6)
concentrations were substantially higher in children with obesity (n=22, 13.7 ± 1.4 y, relative
body weight 170 ± 24%), despite no differences in levels of LA were observed [60]. In younger
children (6-12 y), however, concentrations of ALA, LA, DHA, total n-3 and n-6 LCPUFA in
plasma total lipids and triacylglycerols were greater in children in the highest quartile of BMI Z-
score, presumably due to the higher dietary intakes of n-3 LCPUFA [187].
Using the substrate:product ratio as a surrogate for fatty acid elongases and desaturases
activities, ratios of AA:LA and total n-6: n-3 LCPUFA were increased in children with obesity
[60, 186]. This pattern is consistent with the enhanced conversion of LA to other n-6 LCPUFA,
as concentrations of eicosadienoic acid (C20:2 n-6), a direct elongation product of LA, did not

34
differ between the obese and non-obese groups, indicating that desaturase activity, but not chain
elongation was enhanced in obesity. Only the γ-linolenic acid (GLA, C18:3 n-6) + DHGLA:LA
ratio but not that of AA:DHGLA was elevated in children who are obese, suggesting Δ6
desaturase (D6D) activity is predominantly affected by obesity [60]. Obese Zucker rats had
significantly lower hepatic PL AA than lean animals. It was however corrected by GLA feeding
which bypasses D6D to form AA, implying an abnormality in D6D activity in obesity [188].
In addition to LCPUFA, proportions of SFA (C16:0, C18:0) and palmitoleic acid (C16:1 n-
7) were up to 37% greater in children and adolescents with obesity [59, 186, 187, 189]. Unlike
oleic acid, C16:1 n-7 is uncommon in the human diet, and usually reflects endogenous
desaturation by the enzyme stearoyl-CoA desaturase (SCD) [190]. SCD activity (C16:1 n-
7/C16:0) was elevated (30%) in children with obesity (n=59, 11.8 ± 3.8 y) compared to age-
matched healthy controls. Likewise, waist-to-hip ratio and serum leptin concentrations were
positive determinants of SCD activity [189]. Obesity-prone C57BL/6J mice fed HFD (40% kcal)
for 8 wk showed 2-fold higher liver SCD mRNA levels versus controls [191]. Alternatively, mice
with targeted SCD1 disruption had decreased expression of lipogenesis genes such as fatty acid
synthase and increased expression of lipid oxidative genes including downstream targets of
PPARα [192]. Interestingly, a population-based cross-sectional study of 2021 elderly people
reported that plasma total, n-6, and n-3 LCPUFA were inversely associated with estimated SCD
indices as well as whole-body fat mass measured by DXA. This association with body fat was
markedly attenuated after adjustment for SCD indices, suggesting that high LCPUFA status may
decrease SCD activity in humans [193].

35
2.2.2 Potential benefits of DHA supplementation to bone health in obesity
2.2.2.1 Omega-3 PUFA as potential modulators of adiposity
Interventions with n-3 LCPUFA in children with obesity are scarce and results are
nonetheless inconclusive. Children with BMI classified as obese (≥ 95th percentile , n=201, 11.6
± 0.7 y, BMI) that received 1.8 g n-3 LCPUFA for 12 wk showed almost a two-fold greater
reduction in BMI than those treated with metformin (-0.55 vs -0.27 kg/m2 respectively) [194].
Alternatively, supplementation of 900 mg n-3 LCPUFA (360 mg DHA + 540 mg EPA) in
children with overweight condition (n=76, 9-18 y) for 1 mo reported mixed results in body
weight changes, but there were significant reductions (10-24%) in serum TNF-α and leptin, and
an 12% increase in adiponectin concentrations [195]. Both of these studies are promising, but of
too short a duration to examine influences on bone mass.
Adults rats of healthy weight fed fish oil for 6 mo had significantly lower total body and
intra-abdominal fat mass, than those that received an isocaloric diet containing lard, corn oil or
medium-chain triglycerides, despite no differences in body weight or energy expenditure were
observed [196]. A cross-over experiment in C57BL/6J mice showed that the hyperleptinemia and
excess adiposity induced by SFA-rich HFD (58% kcal) was completely reversed by a switch to
an n-3 LCPUFA diet of equal fat content, and significantly more effective than a low-fat diet
(10% kcal) [197], implicating an important role of n-3 LCPUFAs in reversing body weight and
fat mass gain induced by DIO [198]. Consistently, broiler chickens fed a high n-3 LCPUFA diet
for 5 wk had significant reductions in abdominal fat pad masses relative to those in a high SFA
diet, which was attributed to the greater portioning of energy into lean versus fat tissue in
LCPUFA group [199]. Taken together, these findings provide compelling evidence that n-3
LCPUFA reduce body mass, total body fat, and/or abdominal fat in animal models of DIO,

36
independent of changes in energy intake and/or expenditure.
2.2.2.2 Effects of DHA on obesity-mediated low-grade chronic inflammation
The anti-inflammatory properties of n-3 LCPUFA could play a role in restoring normal
adipocyte function in obesity. Feeding of db/db mice (7 wk) fed a moderately-HFD (30% kcal)
rich in n-3 LCPUFA for 6 wk reduced macrophage infiltration induced by HFD, the changes in
inflammatory gene expression, and reduced c-Jun N-terminal kinase (JNK) phosphorylation that
is critically involved in the deterioration of insulin sensitivity [200]. Similarly, the extent of
adipocyte hypertrophy and macrophage infiltration induced by high-fat feeding was almost
halved in C57BL/6 mice fed a corn oil-based HFD (35.2% w/w) substituted with 15% n-3
LCPUFA (46% DHA, 14% EPA) [201]. This suggested that n-3 LCPUFA can ameliorate
adipocyte stress, and normalize adipocyte metabolism; thereby hindering adipocyte expression of
pro-inflammatory cytokines, and preventing macrophage infiltration of adipose tissue [202].
2.2.2.3 Effects of DHA on leptin production
The effects of DHA on leptin production is scarcely reported and based largely on in vitro
models. Leptin mRNA levels in epididymal adipose tissue was almost two-fold lower in male
rats fed a n-3 LCPUFA-rich diet (6.5% w/w) for 3 wk compared to controls [156]. Treatment of
3T3-L1 adipocytes and human placental throphoblast (BeWo) cells with DHA showed 22% and
49% reduction in leptin mRNA levels respectively. Leptin promoter activity was decreased by
17-18% with DHA incubation in constructs containing the human leptin promoter. While the
proximal region of the promoter has the potential to bind sterol-response element binding
proteins (SREBP) [203], it has no sequence similarity to any known PPAR response elements
(PPRE) [204], indicating the leptin gene is not a direct target of the PPAR [156]. However, the
PPARγ agonist BRL 49653 reduced human leptin promoter activity by 35-53% in a dose- and

37
time-dependent manner in primary adipocytes, but not undifferentiated 3T3-L1 preadipocytes
lacking endogenous PPARγ. This suggests that PPARγ acts through an effector on the ob
promoter [205]. DHA treatment of BeWo cells reduced PPARγ and SREBP-1 mRNA levels by
31% and 27% respectively. The requirement of SREBP-1 in this process was evident when the
effect of DHA on leptin expression was negated when cells were starved of cholesterol [156].
Reductions in both leptin and leptin receptor mRNA levels in dorsal adipose tissue, but not
plasma leptin concentrations was observed in growing pigs fed an isocaloric diet containing fish
oil (5.73% w/w) compared to soybean oil for 21 days [206]. It was thus speculated that changes
in leptin output in response to nutritional stimuli might be mediated post-transcriptionally by
regulating both leptin secretion and synthesis. About 60% of the variation in circulating leptin
could be attributed to variations in leptin secretion rate, BMI, or fat cell volume but not that of
leptin mRNA levels in adipose tissue [207]. Likewise, the changes in circulating leptin did not
depend on the synthesis of new protein, this suggests that leptin was released from a preformed
pool within the cells where post-transcriptional regulation of leptin might occur [208].
2.2.2.4 Effects of DHA on adiponectin production
The modulating effects of DHA on adiponectin secretion have also been reported. The
inclusion of 40% of total fat as n-3 LCPUFA almost completely restored the reduction (35-40%)
in serum adiponectin concentrations in db/db mice, and could be regarded as a marker of
normalized adipocyte function [200]. Likewise, partial replacement (15%) of dietary lipids with
EPA/DHA in a composite HFD (35% w/w) upregulated adiponectin gene expression (Adipoq)
and adiponectin production in epididymal white adipose tissue as well as systemic levels [209].
Studies using 3T3-L1 adipocytes suggested the up-regulation of adiponectin expression by
n-3 LCPUFA could in part be mediated via PPARγ. A functional PPRE has been identified in the

38
human adiponectin promoter. The induction of adiponectin levels by the PPARγ agonist
thiazolidiedione was completely admonished by point mutation of the PPRE [210]. Both EPA
and DHA increased secreted adiponectin concentration by 44% and 102% respectively, but did
not alter cellular adiponectin protein content. Incubation with the PPARγ antagonist bisphenol-
A-diglycidyl ether inhibited adiponectin secretion in adipocytes induced by DHA. Furthermore,
DHA enhanced both adiponectin and PPARγ mRNA levels, emphasizing that DHA acts primarily
via transcriptional control that is mediated by PPARγ [211]. Contrary to observations in vitro
however, negligible changes in adiponectin mRNA levels were observed in humans treated with
pioglitazone despite a 2- to 3-fold increase in plasma adiponectin [212, 213], suggesting
regulation occurs through post-transcriptional mechanisms instead. The regulation of adiponectin
secretion by DHA varies among experimental models and animal species and remains to be
clarified.
2.2.3 Influences of obesity and fatty acid status on skeletal outcomes
Only one study to date has reported bone outcomes with DHA supplementation under the
constrains of childhood obesity. In adolescent boys with slight overweight conditions (n=78,
BMI 23.1-25.2, 13-15 y) randomly assigned to breads enriched with fish oil (1.1g) or control for
16 wk, fish oil intervention increased red blood cell (RBC) EPA and DHA levels, and reduced
LA and AA compared to controls. Despite so, examination of changes in bone mass by DXA
found no significant differences in any bone outcome, nor was DHA status correlated with
whole-body bone outcomes or markers of bone formation. The short duration of this study has
likely limited the ability for any skeletal changes to be captured; studies of longer duration and
more sensitive measures are required for determining the effects of DHA on bone mass and
adiposity [214].

39
Long-term DHA supplementation (0.13 mg DHA/g diet) in female C57BL/6J mice from 3
mo of age for 14 mo led to 8% and 25% higher body weight and fat mass % compared to
controls at the end of study. DHA significantly improved caudal vertebrae trabecular BV/TV,
Tb.N and trabecular thickness (Tb.Th) by 5-30% in early adulthood (8 mo), as well as cortical
bone volume (10%) of the tibia mid-diaphysis. This paralleled a continuous increase in leptin
concentrations that was not accompanied by body fat mass gain observed by 8 mo [215]. Finally,
in a rat model of DIO fed via total enteral nutrition varying amounts of fat (HFD, 45% kcal,
medium fat 25%, or control 14%) from 27 days of age for 4 wk (i.e. to early sexual maturity to
match body weight gain, those fed HFD had 3-fold lower tibia trabecular BMC and 2-fold
greater retroperitoneal and gonadal fat accumulation that was independent of body weight. The
expression of PPARγ and aP2 (fatty acid binding protein) in bone were significantly up-
regulated, whereas Runx2, osteocalcin and β-catenin were down-regulated in the femur of rats
fed HFD. Increases in serum non-esterified fatty acids (NEFA), particularly that of 16:0, 18:0,
18:1, LA and AA, possibly from dietary lipid and triglycerides hydrolysis were roughly 5-fold
greater in HFD animals. ALP activity and osteoblast differentiation of mesenchymal stromal ST2
cells were suppressed when incubated serum from HFD rats or NEFA mixture based on the
serum FA profile. In addition, both serum from HFD-fed rats and NEFA mixture increase PPARγ
promoter activity, accompanied by greater PPARγ protein abundance in obese animals and the
binding affinity of PPARγ to the aP2 enhancer. These results demonstrated that NEFA not only
increased PPARγ expression at the expense of β-catenin, but also in its transcriptional and
binding activity [216].

40
Table 2.1 Dietary intakes of EPA, DHA and fish/shellfish in Canadian children
Study Participants Assessment method Dietary intake (mg)
EPA DHA Fish/shellfish
(3 oz serving)
[217] Healthy children
2-3 y, n=20
Guelph, Ontario
Direct quantification
of food samples
collected over 3 days
9.6 ± 2.9 19.2 ± 6.8
[218] Healthy children
18-60 mo, n=84
Vancouver,
British
Columbia
FFQ
54 ± 6
88 ± 10
[219] Healthy children
4-8 y, n=41
Guelph, Ontario
Direct quantification
of food samples
collected over 3 days
38.4 ± 9.3 54.1 ± 11.4
[220] Healthy children
4-7 y, n=91
Edmonton,
Alberta
3-d food records and
FFQ
16.5 (0 - 350) * 0.03 ± 0.19
serving /mo
[221] Healthy children
2-8 y, n=49
Montreal,
Quebec
3-d food records and
FFQ
0.14 ± 0.14
serving/d
Mean ± SEM * median and interquartile range. EPA, eicosapentaenoic acid; DHA, docosahexaenoic acid;
FFQ, food frequency questionnaire

41
2.3 Conclusion
Childhood growth represents a critical period for the acquisition of bone mass. However,
excess adiposity at this stage may counteract the response of bone to mechanical force induced
by muscle, resulting in reduced skeletal mass relative to body size. As the incidence of obesity
has risen in children and adults, so has the number of studies examining the relationships
between fat and bone. The considerable body of densitometry-based evidence that exists to date
remains controversial as to whether fat has a detrimental effect on bone in the pediatric
population, and there is a paucity of prospective trials to monitor influences and explicate
mechanisms of excess adiposity on bone as children progress through adolescence into
adulthood. It is important to recognize that obesity-related changes in bone metabolism have no
single cause. Further complicating the bone-fat relationship in obesity is their interrelated roles in
regulating energy metabolism affected by emerging genetic, molecular and hormonal cues. What
remains to be determined is whether a compensatory mechanism between bone and adipose
tissue exists for adapting to the dysfunctional energy homeostasis as a result of DIO.
Omega-3 LCPUFA, especially DHA is one of the potential interventions given its
modulatory effects on bone acquisition as well as adiposity, although scarce reports are available
concerning skeletal outcomes with DHA supplementation in childhood obesity, and even less had
shed light on potential mechanisms. Inconsistencies in the sera composition used in vitro, fatty
acid profiles analysis, source of DHA and choice of control oils in feeding trials had made
comparison across studies difficult. Also, the applicability of supplementation either through
food sources or synthetic oils in the pediatric population has not been determined. More data is
therefore required before incorporating DHA into recommendations and guidelines for the
attainment and maintenance of bone mass in children, particularly in those that are with

42
overweight condition or obesity.
Bone mass acquired through childhood and adolescence tracks into adulthood and may
ultimately determine future osteoporotic risk. The possible detrimental effect of fat on bone mass
accrual in face of an increasing incidence of obesity has significant implications for future
skeletal health. Children with obesity may therefore require targeted interventions that considers
changes in body composition, lifestyle and diseases, to maximize bone mass accrual during
growth to achieve optimal peak bone mass and reduce the risk of osteoporosis later in life.

43
Bridge statement 1
The literature review has highlighted the potential roles of n-3 LCPUFA in dually
modulating the development of bone and adiposity during growth. The proportions of LCPUFA
in circulation, especially that of EPA and DHA are largely determined by their presence in the
diet. Several national and international organizations have provided guidance on desirable
dietary intakes of EPA and DHA. For adults, these recommendations range from approximately
250-500 mg/d and are based mainly on primary and secondary prevention of cardiovascular
diseases (CVD) [222]. For infants (0-2 y), the Food and Agriculture Organization /World Health
Organization recommended 20 mg DHA per kg (body weight)/d for optimal growth and
development [223]. There are, however, no agreed upon recommendations for dietary intake of
EPA and/or DHA for children between 2-12 y of age, due in part to the scarce information
available addressing dietary intake, measures of status, and health effects in this age group.
Using NHANES data from 2009 to 2012, 62% children aged 1-19 y (n=5656) reported
consuming seafood in the previous month, with only half consuming it at least three times each
month [224]. Unfortunately, no similar report at the national level is available for Canadian
children. The CHMS cycle 2.2 reported intakes of ALA and LA, but not that of EPA, DHA or of
fish intake. Of the few studies that have been conducted, a wide range of intakes was observed
but consistently low relative to recommendations (Table 2.1); daily intakes of DHA ranged from
16.5 to 88 mg/d for children residing in inland [217] and coastal communities [218] respectively.
While two of the present studies [217, 219] used direct quantification approach to assess EPA
and DHA intake, this method is tedious and limited by small sample sizes. Dietary assessments
methods including 24-h recalls and food frequency questionnaires (FFQ), although easily
administered, are known to be limited by memory-related reporting biases and imposes a large
44
respondent burden. Importantly, individuals may not be aware of the species of fish they ate,
particularly if consumed out of the home, and can result in substantial discrepancies in
estimation of n-3 LCPUFA intakes. Hence, the quantities of individual LCPUFA in the diet are
extremely difficult to estimate from reported dietary intakes; and may in part contribute to the
paucity of findings on the relationship between LCPUFA intake and CVD risk factors and
inflammatory markers in children [225].
The ability for dietary LCPUFA to be absorbed, incorporated into tissue and further
metabolized into longer-chain derivatives vary among individuals, and affected by factors
including excess adiposity. The aforementioned studies were all performed in children with
normal weight, and only one [218] has quantified fatty acid composition in RBC but found no
association with dietary n-3 LCPUFA intake. The following chapter describes a preliminary
analysis of dietary LCPUFA intake in children with obesity, using comprehensive assessment
methodologies including 3-d food records, gas chromatography quantification of fatty acid
proportions in RBC, and absorptiometry-based measures of body composition in addition to
anthropometry.

45
CHAPTER 3
Manuscript 1

46
Under peer review in Pediatric Obesity
Increased adiposity in children with obesity is associated with low red blood cell omega-3
fatty acid status and inadequate polyunsaturated fatty acid dietary intake
Ivy L Mak1, Tamara R Cohen2,3, Catherine A Vanstone1, Hope A Weiler1
1 School of Human Nutrition, McGill University, Ste-Anne-de-Bellevue, QC, Canada
2 PERFORM Centre, Concordia University, Montreal, QC, Canada
3 Faculty of Land and Food Systems, University of British Columbia, Vancouver, BC, Canada
47
3.1 Abstract
The association between total dietary fat intake and measures of body fatness in children with
obesity remains inconsistent. This study aimed to determine if dietary long-chain
polyunsaturated fatty acids (LCPUFA) and LCPUFA status relate to body composition in
children with obesity. Children (n=63, 9.0 ± 0.2 y, BMI Z-score 3.1 ± 0.2) were divided into
tertiles of % body fat assessed by dual-energy X-ray absorptiometry. Diet was assessed 3-d food
diaries. Fatty acid proportions in red blood cells (RBC) were measured by gas chromatography.
Data stratified by sex and Tanner stages were compared with a MIXED model ANOVA.
Associations between RBC fatty acid status and dietary intakes were examined with Spearman
correlation. Moderate correlations were observed between RBC eicosapentaenoic acid (EPA) and
docosahexaenoic acid (DHA) proportions, dietary EPA and DHA (r=0.39, p<0.05) as well as fish
servings (r=0.33, p<0.05). Dietary LCPUFA did not differ among tertiles. Children in tertile 3
had lower RBC α-linolenic acid (-40%) and EPA+DHA (-15%) proportions adjusted for age,
Tanner stages and race compared to tertile 1. The lower omega-3 LCPUFA status in children with
greater adiposity is consistent with suboptimal intakes of omega-3 LCPUFA and fish in the diet.

48
3.2 Introduction
Obesity is a key risk factor for chronic diseases. The prevalence of obesity among children
and youths in Canada has increased significantly over the last 4 decades. Results from the
Canadian Health Measures Survey (2014) classified approximately 23% of children between 12-
17 y to be overweight or obese, respectively, compared to 14% of children considered to be
overweight or obese in 1981 [226]. This is of concern as childhood obesity and its metabolic
complications are known to track into adulthood [227], hence timely interventions and
preventative measures are needed. While the etiology of childhood obesity is complex and
multifactorial [228], it is generally agreed that it can in part be attributed to energy intake that
exceeds energy expenditure. Diet quality and composition at this life stage may also have
important implications in addition to quantity of food intake alone.
The roles of specific nutrients (macro- and micro-nutrients), foods or food groups
contributing to energy dysregulation are unclear. Children with obesity are suggested to consume
snacks and foods with added sugar more frequently than normal-weight peers [229, 230]; while
others have found no association between dietary habits and the prevalence of childhood obesity
in Canada (n=5890, 11-16 y) [36]. Similarly, the importance of high fat diets in the increasing
rates of childhood obesity remains controversial, as obesity rates have increased even though
intakes of fat have not changed since the 1970s [231]. Recent studies suggest that dietary fatty
acid composition may be as important as the amount of fat consumed. For instance, long chain
polyunsaturated fatty acids (LCPUFA), particularly eicosapentaenoic acid (EPA) and
docosahexaenoic acid (DHA), are associated with improved cardiovascular health [232], and in
animal models prevent obesity and adipose-tissue specific inflammation [233, 234].
Despite the suggested benefits of LCPUFA, data collected from the 2003-2008 United
49
States National Health and Nutrition Examination Survey showed that median daily intake of
total omega-3 LCPUFA in children aged 1-6 y (n=3354) and 7-12 y (n=2846) was 0.06 and 0.09
g/d, respectively [50]. The Canadian Community Health Survey (CCHS 2.2) reported 81.1% of
Canadian children (4–8 y) met the Adequate Intake (AI) recommendation for α-linolenic acid
(ALA) [235], but no data for the intakes of EPA and DHA on the national level are available to
date. Of the few studies that have surveyed EPA and DHA intakes in Canadian children, a wide
range of intakes was observed but consistently low; daily intakes of EPA and DHA ranged from
29 to 142 mg/d for children residing in inland [217] and coastal communities [218] respectively.
The de novo synthesis rate of EPA and DHA from ALA is low [236], and unlikely to achieve
levels to produce beneficial effects on body weight regulation and disease prevention. Pre-
formed EPA and DHA are found almost exclusively in oily fish and shellfish, yet these foods do
not contribute substantially to the diets of children in North America [50].
Collection of LCPUFA intakes relies heavily on dietary assessment methods (e.g., 24-h
recalls, 3-d food diaries and food-frequency questionnaires), however, these methods are prone
to errors, and the extent of underreporting increases with body mass, especially in children [237,
238]. In addition, food items that are infrequently consumed as part of a regular diet are difficult
to capture in the recalls, leading to reporting bias. Biological samples provide an objective
measurement for determining omega-3 LCPUFA status. To date, no published data exist on
dietary LCPUFA and/or fish and seafood intake specifically in children with obesity, and if
LCPUFA in red blood cell membranes are associated with dietary LCPUFA intakes. This study
aims to describe the diet of children with obesity, and to determine if dietary intakes or LCPUFA
status relates to body composition outcomes. Fatty acid desaturation and elongation is adversely
impacted by excess adiposity in children [56], potentially resulting in lower endogenous
50
synthesis and availability of LCPUFA. Hence, we hypothesize that children with obesity will
have suboptimal LCPUFA intake, and that omega-3 LCPUFA status measured in red blood cell
(RBC) membranes inversely relate to adiposity, due in part to lower availability in the diet.
3.3 Methods
3.3.1 Study population
Data and biological samples for this study were obtained from the baseline visit of a trial,
as previously described [239]. Eligible participants were otherwise-healthy overweight or obese
children (6-13 y) living in or near Montreal, Quebec. Participants were recruited through public
and private elementary schools, primary healthcare organizations including physician referrals,
word of mouth and local advertisements (newspaper, internet, radio commercials and postal
mailings). The weight-for-height body mass index (BMI) cut-off for overweight or obese was
based on the World Health Organization criteria of BMI Z-score ≥ 1 or ≥ 2 respectively. Only
children in Tanner stages 1-3 were included in the study to minimize the confounding effects of
maturation on body composition and LCPUFA status. Assessments were performed at the McGill
University Mary Emily Clinical Nutrition Research Unit. In addition to parental consent,
participants provided written assent at the grade 1 reading level. Socio-demographic information
about parents and the child was collected from a parent-completed questionnaire developed
based on the CCHS, and data on parental education level, total household income and ethnicity
were collected.
3.3.2 Anthropometric and blood biochemistry
Anthropometry was measured using standard protocols. Height was measured to the
nearest 0.1 cm using a stadiometer (Seca 214, Hamburg, Germany), and weight was measured to
the nearest 0.2 kg using a balance-beam scale (Detecto, Missouri, USA). BMI Z-score was

51
derived using the World Health Organization’s ANTHRO software (version 3.2.2, Switzerland,
Europe). Waist circumference was measured to the nearest 0.1 cm. Maturation status was
assessed by parental survey of physical development using the Tanner criteria [240, 241]. Body
composition was obtained from a whole-body scan using dual-energy X-ray absorptiometry
(DXA, Hologic QDR-4500A Discovery Series, Bedford, MA). DXA provides useful information
on relative fat and lean masses in a single scan in an individual, and has been found to be more
accurate than density-based water displacement for estimating total body fat [242]. Gynoid and
android fat distribution was automatically-segmented by the analysis software (APEX version
13.3:3). Fat-mass index (FMI; kg/height2) and fat-free mass index (FFMI) that estimates fat mass
and fat-free mass relative to height respectively was calculated. Quality control was performed
using Hologic lumbar spine phantom (#14774). The coefficient of variation (CV%) for bone
mineral content measurements of the phantom was 0.5%.
3.3.3 Dietary assessment
Dietary intake was assessed using 3-d food diaries that reflected 2 weekdays and 1
weekend day that reflected the week after the baseline visit. Parents were instructed by a
registered dietitian to complete the food records, and once completed the records were mailed
back to the study unit. Food intakes were reported by a parent or caregiver. Recalls were
analyzed using Nutritionist Pro software (Axxya System, Stafford, TX) and the Canadian
Nutrient File 2010. Macronutrients (carbohydrates, protein and fat), as well as micronutrient
(vitamins and minerals) contents were averaged from the 3-d diaries. Individual food items were
categorized into one of four main food groups (i.e. Vegetables and Fruits (V&F), Grain Products,
Milk and Alternatives (Milk & Alt), and Meat and Alternatives (Meat & Alt)). Examples of
recommended serving sizes for common foods in each food group with reference to the Canada’s

52
Food Guide (CFG, 2007) and MyPlate servings is provided in Supp Table S3.1. Remaining food
items such as high-fat and/or high-sugar foods (e.g. candies, sugar-sweetened beverages,
cookies, syrups and sauces) were classified as “sometimes” foods.
3.3.4 Fatty acid profiling
Blood was drawn from the child in the 12-h fasted state. RBC were separated by
centrifugation from samples collected in EDTA-coated tubes with 1:1 saline, flushed with N2,
stored at -80ºC ≤ 2 y and were not thawed until analyses. Fatty acids were measured in RBC to
reflect habitual dietary consumption as the half-life of RBC measures approximately 120 days
[243], and the fatty acid profile resembles that of tissue cell membrane as RBC are composed
predominately of phospholipids [244]. RBC lipids were extracted using the modified Lepage-
Roy direct methylation method [245]. Fatty acid methyl esters (FAME) were separated using a
60-m CP Sil-88 capillary column (Varian-Chrompack CP 7489) installed in a gas chromatograph
(Varian CP-3800, Walnut Creek, CA) with a flame-ionization detector. An aliquot of a single
pooled blood sample was analyzed in triplicate during each extraction for quality control. Intra-
and inter-assay CV was <5%, the inter-run CV was <8%. Recovery was determined against
methylated C17:0 standard with known concentration and found to be > 90%. Chromatogram
peaks were identified against standard SuplecoTM 37 Component FAME mix (catalogue #47885-
U; Sigma-Aldrich Co, St Louis, MO). In total, 24 fatty acids from C:14 to C24:0 were identified
[246] and summed to calculate the total fatty acid content of the RBC membranes. Fatty acids
were expressed as the percentage of total as it offers the practical advantage of lower variability
and is distributed normally. The sum of RBC EPA and DHA as a proportion of total fatty acids
was calculated. While by definition the HS-Omega-3 Index® (O3I) is the proportion of total EPA
and DHA in RBC, we have refrained from using the term as integral to the definition of O3I was

53
a specific and standardized analytical procedure used only in laboratories that are also mandated
to conform to regular proficiency testing [247].
3.3.5 Statistical analysis
All data were tested for normality and homogeneity of variances with the Shapiro-Wilk test
and Levene’s test prior to analysis. Variables that were not normally distributed (i.e., dietary EPA
and DHA) were either log-transformed or a non-parametric test was performed. For nutrients
where the Dietary Reference Intake (DRI) values set by the Institute of Medicine are available,
dietary intakes were compared against the Estimated Average Requirement, Recommended
Dietary Allowance and AI. Spearman correlation coefficients were calculated to estimate the
association between RBC fatty acids and dietary fatty acid intakes from 3-d food diaries.
Multiple regression models were used to estimate the relationship between LCPUFA status and
dietary intake after adjusting for demographic factors (age, sex, Tanner stage, race and DXA-
measured body fat %). Participants were stratified by sex and Tanner stages, then divided into
tertiles according to body fat % measured by DXA, and subsequently pooled to obtain tertiles.
While increased abdominal or visceral adipose tissue during adulthood is known to be associated
with dyslipidemia and other symptoms of the metabolic syndrome [248], we have not divided
children by android fat %, as the skeletal landmarks (e.g. acromion, iliac crests, greater
trochanter) required for proper recognition of android fat are not fully developed in children.
This would lead to a misplacement of the region of interest of analysis, generating data of greater
variability that are less reproducible. The Chi-squared test was used to detect differences in
proportions among groups for categorical variables. Differences in anthropometry, biochemistry
and dietary intakes among groups were tested using a MIXED model ANOVA with post-hoc
Tukey’s HSD. Tertile classification and sex were included as fixed effects, while time (year and

54
month) of visit was included as a random variable. Covariates explored included age, race and
parental socio-demographic characteristics. Significant interactions across most outcomes were
observed hence results were presented stratified by sex. All tests were 2-sided with a p<0.05 used
to estimate the probability of differences. Analyses were performed with SAS 9.4 (Cary, NC).
3.3.6 Ethics approval
Ethics approval for the study was obtained from McGill University Faculty of Medicine
Institutional Review Board and English Montreal School Board.
3.4 Results
3.4.1 Participant characteristics
This analysis includes 63 children with parent-reported 3-d food diaries returned and who
provided adequate blood for the RBC LCPUFA analyses. Only children in Tanner stages 1-3
were included in the study to minimize the confounding effects of maturation on body
composition and LCPUFA status. Overall, 48% of the study group was female, the majority
(89%) were classified as obese (mean BMI Z-score: 3.3 ± 0.2), and 68% were classified as pre-
pubertal (Tanner stage 1), 8% and 24% were classified as stage 2 and 3, respectively.
Children were subdivided into tertile groups based on body fat % measured by DXA
(Table 3.1). The proportion of mothers classified as overweight or obese (BMI > 25 kg/m2) was
significantly greater in tertiles 2 and 3 compared to tertile 1. No differences in age, Tanner
stages, or height and its age- and sex- Z-score were observed among groups or between sexes.
Body weight and waist circumference were significantly different across tertiles and was 20%
and 10% greater in tertile 3 compared to tertile 1. An interaction between tertile and sex was
observed for BMI Z-score; an increase in BMI Z-score was observed across tertiles in boys, but
not in girls. DXA-measured gynoid fat% increased across groups in both sexes. Android fat%

55
was 8% greater in girls compared to boys, yet the increase across tertiles was apparent in boys
only (1st tertile: 34.2 ± 1.6% vs 3rd tertile: 46.5 ± 1.6%).
3.4.2 Dietary intakes
No differences were observed in average daily energy intake nor any nutrients in children
among tertiles of % body fat (Supp Table S3.2). The average distribution of macronutrients in
the diet were all within the acceptable macronutrient distribution range (AMDR). Intakes of total
sugars averaged 20.7 ± 5.5% of total energy, which is within the recommended Canadian limit of
25% of total energy. There were no differences in the proportion of children meeting the
recommendation for all nutrients among tertiles (Table 3.2). Differences in sex was observed for
the intakes of monounsaturated fatty acids and PUFA as a percentage of total energy, where boys
had 15% and 30% lower average intake compared to girls respectively. Intakes of LCPUFA were
low; overall the median intake of ALA was 0.79 g/d (IQR 0.54 – 1.16), with up to 63% children
not meeting the AI for ALA of 0.9 g/d. Expressed as a proportion of energy intake, 89% of
children had ALA intakes below the lower limit of the AMDR (i.e. 0.6% kcal). Similarly, 84% of
children did not meet the AI for LA. Consistently, despite the wide ranges observed for
combined EPA and DHA intakes, the median (32.3 mg/d; IQR 12.0 - 86.7) was below the
recommended 250-500 mg/d by various expert committees [249].
The number of food servings from the V&F group was lower in the third tertile compared
to the first (tertile 1: 6.4 ± 0.8 vs tertile 3: 5.0 ± 0.7 servings; p=0.02 (Supp Figure S3.1). The
difference was mainly attributed to the consumption of fewer fruits (tertile 1: 4.4 ± 0.7 vs tertile
3: 2.3 ± 0.5 servings; p=0.008). Boys consumed more Milk & Alt servings, especially as cow’s
milk (M: 1.2 ± 0.3 vs F: 0.8 ± 0.3; p=0.006) and yogurt (M: 0.5 ± 0.1 vs F: 0.3 ± 0.1; p=0.018)
compared to girls. Intakes of whole grain products averaged to 0.8 ± 0.3 servings in the tertile 3

56
and was lower compared to children in tertile 2 (1.8 ± 0.4 servings; p=0.004).
3.4.3 RBC fatty acid status and correlation with dietary fatty acids
The proportion of ALA in RBC membranes was greater in tertile 1 compared to tertiles 2
and 3 (tertile 1: 0.095 ± 0.01; 2: 0.067 ± 0.01; 3: 0.062 ± 0.01 %). Likewise, children in tertile 1
had higher proportions of EPA+DHA than tertile 3 (2.24 ± 0.86% vs 1.86 ± 0.35%) (Figure 3.1).
A sex difference was observed for EPA where boys had 14% greater proportions than girls.
Spearman correlation coefficients were calculated to compare dietary intakes of fatty acids with
their respective proportions in RBC membranes. Dietary intakes of EPA (r=0.33, p=0.008), DHA
(r=0.37, p=-.003) as well as combined EPA+DHA intakes (r=0.39, p=0.002) were significantly
correlated with their proportions in RBC membranes. No association between dietary total SFA,
LCPUFA, oleic acid, LA or ALA and RBC status was observed. The RBC EPA+DHA proportion
was positively related to total fish and seafood servings (average intake 0.2 ± 0.04 servings per
day) (Figure 3.2). The relationship was weaker but remained significant when the outlier (fish
intake > 2SD, 1.5 servings) was excluded from the analysis (r=0.29, p=0.02). In a multiple
regression model (Table 3.3) containing demographic factors (sex, age, Tanner stage and race),
body fat % and reported LCPUFA or fish consumption, only the latter was significantly
associated with their respective proportions in RBC. There was an estimated 0.5% and 1.8%
increase in RBC EPA+DHA proportions, respectively for each additional 1 g of dietary EPA
and/or DHA consumption; and a 1.1% increase for each additional fish serving. The relative
abundance of fatty acids in RBC membranes by % body fat tertiles are described in Supp Table
S3.3.

57
Table 3.1 Characteristics of male and female children with obesity by tertiles of % body fat
BMI, body mass index; DXA, dual-energy X-ray absorptiometry; FMI, fat mass index; FFMI, fat-free mass index. n=63. Within rows, different superscripts denote a probability of differences
among tertiles groups
Females Males Overall Main effect
1st tertile, n=10
(29.0-35.9%)
2nd tertile, n=10
(36.0-40.9%)
3rd tertile, n=10
(41.0-47.2%)
1st tertile, n=11
(25.7-32.2%)
2nd tertile, n=11
(32.3-38.7%)
3rd tertile, n=11
(38.8-48.7%)
1st tertile, n=21
(25.7 -37.1%)
2nd tertile, n=21
(32.9-40.8%)
3rd tertile, n=21
(35.0-48.7%) Ptertile Psex Ptertile*sex
Mean SEM Mean SEM Mean SEM Mean SEM Mean SEM Mean SEM Mean SEM Mean SEM Mean SEM
Age (y) 9.3 0.4 10.1 0.5 10.2 0.4 10.2 0.4 10.3 0.6 10.2 0.4 9.75 0.34 10.22 0.47 10.19 0.34 NS
Height (cm) 140.5 2.6 143.3 2.8 141.3 2.8 143.4 2.8 143.0 3.8 143.3 2.8 142.0 2.24 145.6 2.87 142.3 2.27 NS
Age-and-sex Z-score 1.17 0.38 1.38 0.42 0.58 0.58 0.60 0.41 0.89 0.56 0.65 0.41 0.89 0.32 1.14 0.43 0.62 0.32 NS
Weight (kg) 48.8 3.3 51.6 3.7 53.3 3.6 49.8 3.6 56.6 4.9 61.6 3.6 49.3 2.9 59.1 3.7 57.4 2.9 0.03 0.55 0.52
BMI (kg/m2) 24.0 1.2 27.5 1.3 26.2 1.2 23.8 1.2 27.3 1.7 30.2 1.2 23.9 1.0 27.4 1.3 28.2 1.0 0.005 0.17 0.10
Age-and-sex Z-score 2.32 a 0.36 2.56 a 0.41 2.78 a 0.39 2.48 a 0.39 3.25 ab 0.54 4.32 b 0.39 2.40 0.30 3.00 0.41 3.35 0.31 0.08 0.003 0.03
Waist circumference (cm) 82.4 2.8 93.4 3.1 86.4 3.1 83.1 3.0 91.4 4.1 95.8 3.1 82.8 2.4 92.4 3.1 91.1 2.4 0.01 0.20 0.11
DXA
Whole body fat (%) 34.3 1.0 38.3 1.2 42.6 1.1 32.0 1.1 35.9 1.6 41.3 1.1 33.1 0.9 37.1 1.2 42.0 0.9 <.0001 0.01 0.83
Whole body lean mass (%) 62.9 1.9 59.1 1.1 55.1 1.1 65.3 1.1 61.6 1.5 55.9 1.1 64.1 0.8 60.4 1.1 55.5 0.9 <.0001 0.01 0.64
Android fat (%) 40.5 a 1.5 44.8 ab 1.7 45.2 a 1.6 34.2 b 1.6 41.3 ab 2.2 46.5 a 1.6 37.3 1.3 43.0 1.7 45.8 1.3 <.0001 0.01 0.03
Gynoid fat (%) 39.3 1.0 42.0 1.1 46.7 1.1 35.9 1.1 39.6 1.5 43.4 1.1 37.6 0.9 40.8 1.1 45.0 09 <.0001 .0002 0.84
FMI (kg/m2) 8.2 0.7 10.6 0.7 11.2 0.7 7.7 0.7 9.9 1.0 12.7 0.7 8.0 0.6 10.2 0.7 12.0 0.6 <.0001 0.84 0.18
FFMI (kg/m2) 15.7 0.57 16.9 0.6 15.2 0.6 16.0 0.6 17.6 0.8 17.5 0.6 15.9 0.5 17.3 0.6 16.3 0.5 NS
n % n % n % n % n % n % n % n % n %
Tanner staging NS NS
Pre-pubertal / Stage 1 6 60 6 60 7 70 8 73 8 73 8 73 14 67 14 67 15 71
Stage 2 1 10 1 10 1 10 1 9 0 0 1 9 2 10 1 5 2 10
Stage 3 3 30 3 30 2 20 2 18 3 27 2 18 5 24 6 29 4 19
Race, white 6 60 10 100 9 90 9 82 7 64 8 73 15 71 17 81 17 81
Household income
(>$75,000 CAD/y) 3 30 9 90 5 50 9 82 8 73 6 55 12 57 17 81 11 52
Mother’s BMI category 0.01 NS
Normal (18-24.9 kg/m2) 5 56 1 11 2 25 7 64 3 27 0 0 12 60 4 20 2 12
Overweight (25-29.9 kg/m2) 2 22 1 11 4 50 2 18 6 55 4 44 4 20 7 35 8 47
Obese (> 30 kg/m2) 2 22 7 78 2 25 2 18 2 18 5 56 4 20 9 45 7 41
Father’s BMI category NS NS
Normal (18-24.9 kg/m2) 0 0 0 0 0 0 0 0 2 22 1 13 0 0 2 11 1 8
Overweight (25-29.9 kg/m2) 3 60 3 33 1 20 4 44 4 44 1 13 7 50 7 39 2 15
Obese (> 30 kg/m2) 2 40 6 67 4 80 5 56 3 33 6 75 7 50 9 50 10 77

58
Table 3.2 Proportion of children meeting the DRI recommendations defined by the Institute of Medicine
% children meeting recommendation DRI / CFG 2007 recommendation
Females Males Overall
1st tertile 2nd tertile 3rd tertile 1st tertile 2nd tertile 3rd tertile 1st tertile 2nd tertile 3rd tertile
Total sugar 70 90 70 73 45 82 71 86 76 < 25% kcal
Dietary fiber
AI 30 30 0 9 18 0 19 24 0 4-8 y: 25 g; 9-13 y: M: 31 g; F: 26 g
ALA
AI 40 40 40 18 18 36 29 29 38 4-8 y: 0.9 g; 9-13 y: M: 1.2 g; F: 1.0 g
AMDR 0 0 30 9 9 9 5 5 19 0.6 – 1.2%
LA
AI 40 20 30 9 0 18 24 10 24 4-8 y: 10 g; 9-13 y: M: 12 g; F: 10 g
AMDR 30 10 40 9 0 9 19 5 24 5 – 10 %
Calcium
EAR 70 20 40 73 73 82 72 48 62 4-8 y: 800 mg; 9-13 y: 1100 mg
RDA 40 10 0 55 27 64 48 19 33 4-8 y: 1000 mg; 9-13 y: 1300 mg
Vitamin D
EAR 0 10 0 0 9 9 0 10 5 400 IU
RDA 0 0 0 0 0 0 0 0 0 600 IU
Potassium
AI 50 60 40 36 45 45 43 52 43 4-8 y: 2300 mg; 9-13 y: M: 2500 mg; F: 2300 mg
Sodium
AI 90 100 100 100 100 100 95 100 100 4-8 y: 1000 mg; 9-13 y: 1200 mg
> limit 90 90 90 100 100 100 95 95 95 4-8 y: > 1200 mg; 9-13 y: >1800 mg
CFG food groups
V&F 70 60 50 55 55 36 62 57 43 4-8 y: 5 servings; 9-13 y: 6 servings
Grain Products 80 80 70 91 91 100 86 86 86 4-8y: 4 servings; 9-13 y: 6 servings
Meat & Alt 90 100 100 91 100 100 90 100 100 4-8 y: 1 serving; 9-13 y: 1-2 servings
Milk & Alt 60 30 30 64 64 82 62 48 57 4-8y: 2 servings; 9-13 y: 3-4 servings
n=63. AI, adequate intake; AMDR, acceptable macronutrient distribution range; CFG, Canada’s Food Guide; EAR, estimated average requirement; RDA, recommended dietary
allowance; V&F, Vegetables and Fruits

59
Table 3.3 Correlates of n-3 LCPUFA status with dietary LCPUFA, fish intake and demographic characteristics in children with obesity
Beta SE p Model p Model r2
RBC EPA (% total)
Intercept
Dietary EPA (g)
Sex, male
Age (y)
Body fat (%)
Race, white
Tanner stage
0.34
0.54
0.029
-0.0048
-0.0021
-0.053
0.0095
0.11
0.18
0.023
0.010
0.0023
0.028
0.021
0.0048
0.0037
0.21
0.64
0.39
0.06
0.65
0.016 0.25
RBC DHA (% total)
Intercept
Dietary DHA (g)
Sex, male
Age (y)
Body fat (%)
Race, white
Tanner stage
2.45
1.78
0.16
-0.031
-0.013
-0.32
0.096
0.84
0.58
0.17
0.075
0.017
0.20
0.15
0.005
0.0034
0.35
0.68
0.47
0.12
0.53
0.03 0.23
RBC EPA+DHA (% total)
Intercept
Dietary EPA+DHA (g)
Sex, male
Age (y)
Body fat (%)
Race, white
Tanner stage
2.76
1.44
0.19
-0.035
-0.014
-0.38
0.10
0.89
0.43
0.18
0.080
0.018
0.22
0.16
0.0032
0.0016
0.29
0.66
0.44
0.09
0.54
0.013 0.26
RBC EPA+DHA (% total)
Intercept
Fish (75 g serving/day)
Sex, male
Age (y)
Body fat (%)
Race, white
Tanner stage
2.88
1.06
0.12
-0.051
-0.012
-0.41
0.15
0.87
0.29
0.018
0.079
0.18
0.16
0.21
0.018
0.0005
0.50
0.52
0.49
0.36
0.06
0.0059 0.29
n=63. Values in this table are beta coefficients and are interpreted as the percentage point change in RBC fatty
acid for a one-unit change in the characteristic after adjusting for other characteristics. Characteristics were
entered based on previous report [250] in adults on factors hypothesized to affect RBC fatty acid status

60
Figure 3.1 Proportions of α-linolenic acid (C18:3 n-3), eicosapentaenoic acid (EPA, C20:5 n-3) and EPA + docosahexaenoic acid
(DHA, C22:6 n-3) in red blood cells membrane by tertiles of % body fat. Data are mean ± SEM. n=63. Different superscripts indicate
significant differences (p<0.05) among tertiles

61
Figure 3.2 Spearman correlation between total fish & seafood intake and eicosapentaenoic acid (EPA)+ docosahexaenoic acid (DHA)
proportions in red blood cells (RBC). n=63. Dietary intakes are presented as the daily average of 3-d food diaries

62
3.5 Discussion
This study presents results from a cross-sectional analysis of school age children with
obesity. Children in the highest tertile of % body fat had lower consumption of vegetables and
fruits compared to the first tertile. Both quantity and quality of fat intake did not differ among
tertiles. EPA and DHA status were associated with dietary EPA, DHA and fish intakes
irrespective of degree of adiposity. However, higher % body fat was related to lower ALA and
EPA+DHA status in RBC, possibly due in part to low n-3 LCPUFA from fish and/or seafood
intakes in the diet.
The role of excess dietary fat consumption in the cause of childhood obesity remains
questionable. This is supported by our results where only 11% children exceeded the AMDR for
fat of 35%. The fatty acid composition of ingested fat may have equal importance on the
increased obesity prevalence [186, 251]. In our study, median intakes of neither ALA or LA met
the recommended AI values. This is unexpected, and contrary to the CCHS (cycle 2.2) results
that showed a low prevalence of inadequate ALA intake in children 4-8 y (median intake 1.23
g/d) [235]. It is possible that there is a general avoidance of high-fat foods, irrespective of fat
quality, amongst children with obesity and/or their parents. We also cannot rule out the likelihood
of selective under-reporting of foods perceived as high in dietary fat in our participants, as ALA
is found predominantly in canola and soybean oil, as well as processed foods in Canada [252].
Added fats used in food preparation may also be missed in the reporting of dietary data.
No specific dietary recommendation to date exists for EPA and DHA, based on the
premise that they can be synthesized de novo from dietary ALA. However, the conversion rate is
limited, and influenced by factors including dietary (e.g. omega-6 fatty acids intake), hormonal
(sex steroids) and metabolic changes [253]. Excess body weight due to adiposity negatively

63
influences fatty acid desaturation [59, 60, 186] and RBC membrane fatty acid composition [187].
The lower ALA and EPA+DHA proportions in RBC was most apparent in children in the highest
tertile of % body fat in the present study. This is consistent with previous reports in children [56,
60] where inverse relationships between excess body weight or adiposity (estimated by skinfold
thickness) and LCPUFA, LA and DHA status was demonstrated. This is of concern as a recent
meta-analysis confirmed that a high (>8%) O3I, defined as the sum of RBC EPA+DHA
proportions, was related to a 35% risk reduction of cardiovascular death in adults [232]. Children
with obesity have a lower O3I than healthy weight children (4.4 ± 1.4 and 5.0 ± 1.4
respectively). A moderate inverse relationship was observed between O3I, fasting insulin levels
and Homeostatic Model Assessment for Insulin Resistance scores in children (5-12 y) [254].
These studies and ours have laid ground for future intervention trials investigating the benefits of
increasing EPA and DHA status on metabolic function or cardiovascular diseases risk, especially
in a population with low baseline EPA and DHA status where it is more likely to produce
measurable benefits.
Consumption of EPA and DHA directly from foods and/or dietary supplements is the most
practical way for humans to increase levels of these fatty acids in tissues. Consistent with reports
in adults [250, 255], we demonstrated that proportions of EPA+DHA in RBC is a useful
biomarker to reflect dietary EPA, DHA and fish servings in children with obesity. It is
noteworthy that due to possible differences in fatty acids extraction methods and analytic
procedures, the range of values in this study appeared to be lower than previously reported [256].
Hence the results presented herein can provide information on trends but cannot be directly
compared with other literature.
The moderate correlation between dietary LCPUFA and RBC proportions found in this

64
study contradicts previous research, which reported associations between dietary EPA and RBC
proportions (r=0.24, p<0.05) in children (n=93, 5-12 y) of healthy weight, and not those with
overweight status [257]. The discrepancy may be due to the overall low LCPUFA and fish intake
in our participants, where the increase in fish consumption would produce more apparent effect
compared to populations with higher baseline omega-3 LCPUFA status. Using multiple
regression analysis, we showed that for every additional serving of fish consumed, there was a
corresponding 1% increase in RBC EPA+DHA proportions. This is substantial considering the
mean EPA+DHA proportion is 2.2 ± 0.1%. Given the beneficial effects that omega-3 LCPUFA
has on obesity and its associated metabolic consequences, results from this study reinforces the
need to encourage fish consumption as an effective mean to raise blood omega-3 levels.
We acknowledge that the CFG has since been revised in early 2019. The most recent
version has eliminated the food groups and adapted an approach that focus on proportions.
Nonetheless, specific servings sizes are still of help to quantify dietary patterns and were
effective at the time of the data collection. The main criticism of the CFG 2007 was its focus on
meeting nutrient DRI requirements [258], yet deviations from the recommendations persisted for
many nutrients, including vitamin D, LA and fibre, even if the number of servings were met. In
the present study, children in the highest tertiles of % body fat had less V&F servings, and only
about 50% of all children met the CFG 2007 recommendation for V&F and Milk & Alt groups,
reflecting a generally poor diet quality in our participants. Specifically, on the occasions where
fish intake was reported, 20% was contributed by fried fish sticks/ fish burgers, which do not
align with recommendations for healthy choices, both in terms of fish species and cooking
methods. Children with obesity may also be more likely to exhibit fussy eating patterns and
unwilling to consume unfamiliar foods, as a result parents may offer foods based on children’s

65
tastes and preferences [259]. In addition, common barriers including cost of fish, accessibility,
the lack of inspiration or cooking skills, and differences in cultural background remain to be
important determinants of fish consumption [260]. Therefore, recommendations and education
strategies developed for parents and children with obesity may need to address the importance of
including a variety of food choices that are both healthy and enjoyable by children and parents
alike.
Despite similar ranges in % body fat between sexes, BMI Z-score increased across tertiles
in boys only but not in girls. The accuracy of BMI as a surrogate measure of adiposity among
children vary according to the degree of fatness [261-263]. Data from the Pediatric Rosetta
Project [261] showed a markedly nonlinear relation between BMI Z-score and FMI, where small
increases in BMI Z-score were associated with disproportionate increases in FMI. Sex
differences among older (>8 y) children were clear; at the same BMI Z-score, girls had a higher
FMI and a lower FFMI than boys [261]. In girls, increases in adiposity during puberty occurs
earlier and at a greater rate than lean mass accrual [264], and this change in body composition
may not be captured by BMI. Given the possible earlier maturation in children with obesity,
adiposity could be underestimated by examining BMI Z-score alone and represents an important
limitation. In addition, clear biological differences between sexes exist in the development of fat
patterning, association between adiposity and health risks, and in the effectiveness of
interventions [265]. The importance of the confounding effects of sex distribution and maturation
stage on body composition must be considered in accurate diagnosis of childhood obesity.
This study is not without limitations. Dietary intakes assessed using self-reported tools are
prone to respondent bias; the extent of under-reporting is also greater in children as relative
adiposity increases [266, 267]. While using proxy parental reports in part overcame this

66
limitation, the majority (90%) of the parents were overweight or obese and may underestimate
food intake of the child [268]. However, total energy intake exceeded estimated needs and thus
underreporting was not likely a major limitation. More importantly, 3-d food diaries have limited
usefulness in capturing the “true” average intake for nutrients (e.g. EPA and DHA) that are
provided in high amounts by a very small number of foods. The relatively small number of
dietary recalls collected may result in a temporal disconnect with the timeframe that the
biomarker reflects, contributing to the high variability in estimated intake values. This may in
part explain the lack of statistically significant differences in LCPUFA intake across tertiles
despite the lower status observed with greater adiposity. Inaccuracies and variations in fatty acid
composition database (e.g. farmed versus wild fish species, seafood variety, cooking method),
and exclusion of EPA+DHA from enriched foods further limits accuracy in estimating LCPUFA
intake. The assessment of Tanner stages was performed by parents and subject to bias. Early true
breast tissue is difficult to determine distinguish from fat tissue in overweight girls, similarly, the
assessment of maturity status in boys is based on testicular size rather than pubertal hair growth.
Measurements of sex steroids and gonadotropins would provide a more objective indication of
pubertal onset. High-income households were disproportionately higher in this study;
generalization of findings should therefore be cautioned, as prevalence of childhood obesity is
often associated with low socioeconomic status (employment, family income and education)
[269]. Finally, this study is cross-sectional and described the dietary patterns of the children at
one point in time, but still does not answer the question about the etiology of obesity.
Children with obesity in this study consumed typical healthy amounts of dietary fat as
part of the total diet but had suboptimal fish and EPA+DHA intakes relative to national
guidelines [270] and recommendations by regulatory committees including the Food and

67
Agricultural Organization of the United Nations [271] and the European Food Safety Authority
[272] of 200-250 mg/d. The proportions of EPA and DHA in RBC membranes reflected dietary
omega-3 LCPUFA and fish intake, and can serve as a useful proxy for dietary recall methods.
Excess adiposity along with poor dietary patterns in children with obesity, however, hinder the
potential for reaching optimal blood omega-3 LCPUFA levels that confer benefits to body weight
and metabolic regulation. This study provided unique information on fatty acid status based on
biological markers in children and its association with adiposity assessed with densitometry-
based methodology (DXA), representing a more sensitive measure of obesity compared to BMI.
The results provide further support for increasing habitual consumption of fish and omega-3
LCPUFA as part of targeted obesity prevention efforts in children.
3.6 Acknowledgments
The authors would like to thank Sarah-Eve Loiselle, MSc, RD, Popi Kavis, MSc, RD, and
Dr. Tom Hazell, PhD for their work in conducting the trial and data collection, as well as Sherry
Agellon, MSc for her technical assistance with fatty acids analyses

68
Supplementary Table S3.1 The Eating Well with Canada’s Food Guide (CFG) 2007 and US Dietary Guidelines for Americans (DGA) 2015-2020 and MyPlate
servings sizes according to the CFG food groups
Vegetables & Fruits CFG 2007 US DGA 2015 / MyPlate
Recommendation 4-8 y: 5 servings; 9-13 y: 6 servings Vegetables: 4-8 y: 1 ½ cup; 9-13 y: 2 – 2 ½ cups
Fruits: 4-8y: 1- ½ cups; 9-13 y: 1 ½ cups
Food item Equivalent Serving
Vegetables, fresh, frozen, canned 125 mL, ½ cup 1 cup
Vegetables, leafy, raw 250 mL, 1 cup 2 cups
Fruits, fresh, frozen, canned 1 fruit, ½ cup 1 cup
Juice, 100% fruit 125 mL, ½ cup 1 cup
Grain Products CFG 2007 US DGA 2015 / MyPlate
Recommendation 4-8 y: 4 servings; 9-13 y: 6 servings 4-8 y: 5 oz equivalent; 9-13 y: 5-6 oz equivalent
Food item Equivalent Serving
Bread, slice 35 g 1 slice
Bagel 45 g 1” mini bagel, ¼ large
Rice, quinoa, cooked 125 mL, ½ cup ½ cup
Cereal, cold, ready to eat 30 g 1 cup, flakes or rounds
Pasta, cooked 125 mL, ½ cup ½ cup
Milk & Alternatives CFG 2007 DGA 2015 / MyPlate
Recommendation 4-8 y: 2 servings; 9-13 y: 3-4 servings 4-8 y: 2 ½ cups; 9-13 y: 3 cups
Food item Equivalent Serving
Milk, skim, 1%, 2%, while 250 mL, 1 cup 1 cup
Cheese (e.g. Cheddar, Swiss) 50 g 1 ½ oz
Yogurt, plain and flavored 175 g, ¾ cup 8 fl. oz
Soy beverage, calcium-fortified 250 mL, 1cup 1 cup
Meat & Alternatives CFG 2007 DGA 2015 / MyPlate
Recommendation 4-8 y: 1 serving; 9-13 y: 1-2 servings 4-8 y: 4 oz equivalent; 9-13 y: 5 oz equivalent
Food item Equivalent Serving
Fish, shellfish, cooked 75 g, ½ cup 1 oz
Poultry, lean meat, cooked 75 g, ½ cup 1 oz
Legumes, cooked 175 mL, ¾ cup ¼ cup
Tofu 150 g, 175 mL, ¾ cup 2 oz, ¼ cup
Eggs 2 eggs 1 egg
Peanut, or other nut butter 30 mL, 2 tbsp 1 tbsp

69
Supplementary Table S3.2 Dietary intakes and Canada’s Food Guide food groups by tertiles of % body fat assessed by 3-d food diaries.
Data are presented as the average of 3-d food diaries. ALA, α-linolenic acid; DHA; docosahexaenoic acid; EPA, eicosapentaenoic acid; LA, linoleic acid; LM,
lean mass; V&F, Vegetables & Fruits. n=63. #Data presented as median, interquartile range
Females Males Overall
1st tertile, n=10
(29.0-35.9%)
2nd tertile, n=10
(36.0-40.9%)
3rd tertile, n=10
(41.0-47.2%)
1st tertile, n=11
(25.7-32.2%)
2nd tertile, n=11
(32.3-38.7%)
3rd tertile, n=11
(38.8-48.7%)
1st tertile, n=21
(25.7-37.1%)
2nd tertile, n=21
(32.9-40.8%)
3rd tertile, n=21
(35.0-48.7%)
Intake/d Mean SEM Mean SEM Mean SEM Mean SEM Mean SEM Mean SEM Mean SEM Mean SEM Mean SEM
Energy (kcal) 1943 193 1889 231 1683 218 1965 201 1954 247 2186 231 1954 165 1922 212 1935 194
(kcal/kg) 44.27 4.91 32.07 5.93 31.73 5.53 41.64 5.24 33.68 6.86 34.77 5.82 43.00 4.34 32.87 5.71 33.25 4.91
Carbohydrates (g) 264.99 25.75 271.62 28.55 234.77 27.19 271.31 26.55 294.63 33.23 297.47 27.19 268.15 20.76 283.12 26.59 266.12 21.49
% total kcal 53.9 1.8 55.7 2.0 54.7 2.0 54.1 1.9 58.8 2.4 53.6 1.9 54.0 1.5 57.3 1.9 54.1 1.5
Dietary fiber (g) 17.7 2.4 25.3 3.0 17.2 2.8 19.8 2.5 22.3 3.1 16.8 3.0 18.7 2.1 23.8 2.7 17.0 2.5
g/1000 kcal 9.3 1.2 13.7 1.3 10 1.3 10.0 1.2 10.8 1.5 7.8 1.3 9.6 1.0 12.2 1.2 9.0 1.0
Total sugars (% kcal) 21.0 2.4 20.3 3.3 22.2 2.9 19.6 2.6 26.1 3.4 20.9 3.3 20.3 2.3 23.2 3.1 21.6 2.8
Protein (g) 77.44 9.20 77.82 10.95 69.94 10.27 82.11 9.92 79.60 12.89 88.96 10.82 79.78 8.33 78.71 10.68 79.45 9.16
g/kg 1.71 0.21 1.35 0.25 1.34 0.23 1.71 0.22 1.48 0.29 1.44 0.24 1.71 0.19 1.41 0.24 1.39 0.21
% total kcal 16.2 1.2 17.3 1.3 17.0 1.2 17.7 1.2 17.1 1.5 17.4 1.2 16.9 0.9 17.2 1.2 17.1 1.0
Fat (g) 73.11 6.98 62.59 7.88 55.62 7.58 68.74 7.49 55.37 10.27 72.94 7.51 70.92 5.83 58.98 7.85 64.28 5.95
% total kcal 33.3 1.5 29.5 1.7 29.4 1.7 31.3 1.6 25.6 2.2 29.9 1.6 32.3 1.3 27.6 1.7 29.7 1.3
SFA (g) 21.42 2.62 20.09 3.17 17.98 2.97 22.40 2.74 19.18 3.36 25.04 3.18 21.91 2.24 19.63 2.90 21.51 2.66
% total kcal 9.94 0.81 989 0.90 9.44 0.86 10.09 0.84 8.98 1.05 10.43 0.86 10.02 0.66 9.43 0.84 9.94 0.68
MUFA (g) 19.72 2.77 19.03 3.36 16.83 3.16 17.88 2.89 14.73 3.55 21.39 3.37 18.80 2.37 16.88 3.07 19.11 2.82
% total kcal 9.10 0.66 9.27 0.73 9.05 0.69 8.23 0.68 6.72 0.85 8.52 0.69 8.67 0.53 8.00 0.68 8.78 0.55
PUFA (g) 12.80 1.58 11.50 1.79 10.00 1.73 10.59 1.72 9.47 2.40 7.80 1.72 11.69 1.34 10.49 1.81 8.90 1.36
% total kcal 5.71 0.49 4.59 0.55 6.24 0.52 4.79 0.51 3.56 0.64 3.77 0.52 5.25 0.40 4.07 0.51 5.01 0.41
LA (g) 9.74 1.30 7.59 1.48 8.93 1.42 8.39 1.40 5.83 1.94 7.77 1.39 9.06 1.08 6.71 1.48 8.35 1.10
% total kcal 4.38 0.42 3.46 0.47 4.89 0.45 3.79 0.44 2.62 0.55 3.10 0.45 4.08 0.34 3.04 0.44 4.00 0.35
ALA (g) 0.95 0.14 0.96 0.16 1.04 0.15 0.92 0.15 0.90 0.22 0.95 0.15 0.94 0.12 0.93 0.16 0.99 0.12
% total kcal 0.44 0.05 0.43 0.06 0.55 0.05 0.41 0.05 0.40 0.07 0.38 0.05 0.42 0.04 0.42 0.05 0.47 0.04
EPA + DHA (mg) (23.3, 6.3 – 43.0) (50.5, 34.3 -406.7) (29.3, 18.3 – 59.3) (32.3, 2.0 – 60.7) (54.0, 22.3 –
169.7)
(22.3, 4.7 – 214.0) (28.3, 6.3-55.7) (54.0, 24.0-169.7) (24.7, 15.3-59.3)
Vitamin D (IU) 159 51 138 57 124 56 181 53 195 63 245 58 170 46 167 55 184 51
Calcium (mg) 950 158 841 182 801 175 1044 164 1132 199 1275 183 997 138 986 171 1038 156
Sodium (mg) 2755 279 2820 316 2688 303 3094 300 2827 415 3386 299 2924 233 2824 316 3037 237
Potassium (mg) 2454 380 2819 471 2294 439 2462 397 2992 487 2674 476 2458 326 2906 427 2484 399

70
Supplementary Table S3.3 Red blood cell membrane fatty acid profile of children with obesity by tertiles of % body fat
Total n-6 = C18:2 n-6, C18:3 n-6, C20:4 n-6, C22:4 n-6, C22:5 n-6; Total n-3 = C18:3 n-3, C20:5 n-3, C22:5 n-3, C22:6 n-3; Total SFA = C16:0, C18:0, C20:0,
C22:0, C24:0; Total PUFA =Total n-6 + Total n-3. SFA, saturated fatty acids; PUFA, polyunsaturated fatty acids. n=63
Females Males Overall Main effect
1st tertile, n=10
(29.0-35.9%)
2nd tertile, n=10
(36.0-40.9%)
3rd tertile, n=10
(41.0-47.2%)
1st tertile, n=11
(25.7-32.2%)
2nd tertile, n=11
(32.3-38.7%)
3rd tertile, n=11
(38.8-48.7%)
1st tertile, n=21
(25.7-37.1%)
2nd tertile, n=21
(32.9-40.8%)
3rd tertile, n=21
(35.0-48.7%) Ptertile Psex Ptertile*sex
Mean SEM Mean SEM Mean SEM Mean SEM Mean SEM Mean SEM Mean SEM Mean SEM Mean SEM
C16:0 20.92 0.81 21.25 0.90 21.65 0.89 21.03 0.89 21.78 1.21 21.72 0.90 20.97 0.71 21.51 0.92 21.68 0.72 NS
C18:0 18.44 0.80 19.29 0.90 19.83 0.88 18.49 0.88 18.15 1.20 19.05 0.89 18.46 0.70 18.72 0.91 19.44 0.71 NS
C18:1 12.39 0.95 13.28 1.01 13.10 0.98 13.60 0.98 13.33 1.10 13.37 1.02 13.00 0.92 13.31 1.00 13.24 0.95 NS
C18:2 n-6 8.74 0.51 7.91 0.62 8.36 0.57 8.43 0.55 8.04 0.70 7.62 0.62 8.59 0.48 7.97 0.60 7.99 0.53 NS
C18:3 n-3 0.096 0.012 0.067 0.014 0.057 0.014 0.094 0.013 0.065 0.016 0.072 0.014 0.095a 0.011 0.063b 0.013 0.069b 0.012 0.03 0.87 0.82
C18:3 n-6 0.093 0.009 0.11 0.011 0.095 0.10 0.10 0.01 0.078 0.013 0.089 0.01 0.097 0.008 0.092 0.010 0.092 0.008 NS
C20:4 n-6 8.37 0.77 8.25 0.90 8.02 0.86 8.62 0.82 8.30 1.01 9.02 0.90 8.50 0.72 8.27 0.88 8.52 0.80 NS
C20:2 n-6 0.27 0.023 0.26 0.026 0.28 0.025 0.29 0.024 0.25 0.03 0.25 0.025 0.28 0.019 0.235 0.024 0.27 0.019 NS
C20:3 n-6 1.30 0.12 1.17 0.14 1.37 0.13 1.26 0.13 1.28 0.15 1.14 0.14 1.28 0.11 1.23 0.13 1.26 0.12 NS
C20:5 n-3 0.27 0.051 0.20 0.054 0.21 0.054 0.24 0.052 0.32 0.059 0.24 0.055 0.23 0.043 0.24 0.048 0.21 0.046 0.63 0.03 0.08
C22:4 n-6 1.81 0.13 1.89 0.15 1.69 0.14 1.91 0.14 1.77 0.19 1.92 0.15 1.86 0.11 1.83 0.15 1.81 0.11 NS
C22:5 n-6 0.28 0.064 0.32 0.075 0.27 0.079 0.35 0.07 0.34 0.096 0.31 0.091 0.32 0.059 0.33 0.077 0.29 0.075 NS
C22:5 n-3 1.30 0.15 1.28 0.17 1.48 0.16 1.27 0.15 1.53 0.19 1.77 0.16 1.28 0.12 1.40 0.15 1.63 0.12 NS
C22:6 n-3 1.80 0.32 1.76 0.37 1.68 0.35 2.24 0.44 1.98 0.34 1.63 0.37 1.89 0.30 2.00 0.37 1.66 0.32 NS
EPA + DHA 2.05 0.35 1.94 0.40 1.86 0.39 2.53 0.48 2.22 0.37 1.87 0.40 2.24a 0.33 2.14ab 0.40 1.86b 0.35 0.02 0.56 0.74
Total n-6 21.08 1.42 19.99 1.54 20.21 1.49 21.19 1.47 20.01 1.70 20.43 1.55 21.13 1.36 20.00 1.52 20.32 1.42 NS
Total n-3 3.44 0.45 3.17 0.49 3.40 0.49 3.58 0.46 4.17 0.54 3.55 0.50 3.31 0.26 3.63 0.34 3.46 0.27 NS
Total SFA 39.35 1.53 40.54 1.71 41.48 1.68 39.51 1.69 39.94 2.28 40.78 1.70 39.43 1.34 40.24 1.73 41.13 1.36 NS
Total PUFA 24.63 1.80 23.31 1.93 23.88 1.88 24.83 1.85 24.50 2.12 24.06 1.93 24.55 1.68 23.79 1.88 23.93 1.75 NS
D5D 6.46 0.53 7.01 0.58 6.09 0.56 6.82 0.54 6.85 0.68 7.43 0.56 6.64 0.43 6.93 0.54 6.76 0.44 NS
D6D 0.012 0.002 0.013 0.003 0.013 0.003 0.014 0.003 0.013 0.003 0.014 0.003 0.013 0.002 0.013 0.003 0.013 0.003 NS

71
Supplementary Figure S3.1 Canada’s Food Guide food groups intakes by tertiles of % body fat assessed by 3-d food diaries.
Data are mean ± SEM. n=63. The dotted lines represent recommended age-group specific serving sizes for each food group according
to The Canada’s Food Guide (2007). Different superscripts indicate significant differences (p<0.05) among tertiles
st1
nd
2 rd
3 st
1 nd
2 rd
3 st
1 nd
2 rd
3 st
1 nd
2 rd
3
0
5
10
15p (tertile) = 0.02
Tertile 1 vs Tertile 3
4-8 y
9-13 y
Females Males
Vegeta
ble
s &
Fru
its
(serv
ings)
st1
nd
2rd
3st1
nd
2rd
3st1
nd
2rd
3st
1nd
2rd
3
0
5
10
15
4-8 y
9-13 y
Males 4-8 y
Males 9-13 y
Females 4-8 y
Females 9-13 y
Females Males
Gra
in
Pro
du
cts
(serv
ings)
st1
nd
2 rd
3 st
1 nd
2 rd
3 st
1 nd
2 rd
3 st
1 nd
2 rd
3
0
1
2
3
4
5
4-8 y
9-13 y
p (sex) = 0.008
Females Males
Mil
k &
Alt
(se
rvin
gs)
st1 nd
2 rd
3st
1 nd
2 rd
3st1 nd
2 rd
3st1 nd
2 rd
3
0
1
2
3
4
5
4-8 y9-13 y
Females Males
Meat
& A
lt (
serv
ings)

72
Bridge statement 2
The results presented in manuscript 1 highlighted the pressing issue of low n-3 LCPUFA
status in children with increased adiposity, likely as a result of inadequate LCPUFA and/or fish
intake. A preliminary report from the FiSK (Fish, children, health and cognition) Junior Study
[260] has demonstrated that raising fish intake in children (n=199, 8-9 y) to at least 300 g per
day, resulted in an absolute increase of 2.5 ± 1.5% in RBC EPA and DHA proportions over 12
wk (baseline value: 4.9 ± 1.0%). It is however, important to note that fish were provided by the
researchers, hence common barriers to fish/seafood consumption including price and availability
[273] have been entirely eliminated. The observations from study 1 are consistent with the
literature [273-275], where tuna and processed fish (breaded or fried) are among the most
popular fish/seafood choices among children with obesity. As food habits established early in life
tracks into adulthood [276, 277], barriers including the lack of inspiration, cooking skills and the
liking of unfamiliar foods are important considerations for devising strategies to increase fish
intake in children.
As mentioned, the lack of consensus for specific dietary recommendations for n-3
LCPUFA are in part due to the scarcity of studies with functional outcomes with public health
importance (i.e. CVD, cognition, behavioral and immune modulatory functions) [225].
Importantly, the potential beneficial effects of EPA and DHA intakes in children on their future
risk of developing CVD have yet to been reported. A growing body of evidence are revealing a
link between the common occurrence of CVD and osteoporosis with aging [278] that cannot be
explained by shared common risk factors alone. It is clear that CVD starts in childhood and
progresses with advancing age. Likewise, alterations in body composition during childhood has
been shown to lead to a deviation from predicted bone mass tracking. An increase in % body fat

73
either limits the positive influence of lean mass, or results in a negative deviation from normal
bone mass tracking in both sexes [279, 280]. Hence, benefits derived from early interventions
that both optimize bone and cardiovascular health may extend into adulthood.
Traditional approaches (i.e. DXA) for skeletal assessments in growing children are fast,
readily available, and a wealth of reference data exists for comparison. However, densitometry-
based methods have neither the sensitivity nor specificity for optimal fracture risk assessment as
they are unable to assess aspects of bone’s complex design [281]. Evidence demonstrates that
modeling adaptations occur during growth lead to important structural changes independent of
bone mass that may not only determine peak bone strength (thus resistance to fracture), but also
track throughout life [282]. Thus, there has been a shift toward measuring biomechanically
relevant determinants (i.e. bone geometry) of bone strength in children.
The following chapter describes a cross-sectional analyses of fatty acid status in children
with obesity and bone health outcomes, using a combination of DXA with pQCT, which allows
for assessment of bone density and geometry in the cross-sectional plane, providing surrogate
measurements of bone strength.

74
CHAPTER 4
Manuscript 2

75
Published online: Applied Physiology, Nutrition and Metabolism
(https://doi.org/10.1139/apnm-2019-0046)
Arachidonic acid status negatively associates with forearm bone outcomes and glucose
homeostasis in children with overweight condition or obesity
Ivy L Mak1, Tamara R Cohen1,2, Catherine A Vanstone1, Hope A Weiler1
1 School of Human Nutrition, McGill University, Ste-Anne-de-Bellevue, QC, Canada
2 PERFORM Centre, Concordia University, Montreal, QC, Canada

76
4.1 Abstract
Long-chain polyunsaturated fatty acids are implicated in musculoskeletal health in adults. This
study examined whether fatty acid status relates to bone health outcomes in children with
overweigh condition or obesity (BMI Z-score 3.1 ± 0.1, 9.0 ± 0.2 y, n=108). Non-dominant
forearm bone density (distal 1/3rd), geometry (4% site) and soft tissue composition (66%) were
assessed using dual-energy X-ray absorptiometry and peripheral quantitative computed
tomography. Red blood cell (RBC) fatty acid profile and indices of glucose homeostasis were
measured. Differences in outcomes among RBC arachidonic acid (AA, C20:4 n-6) tertiles were
tested using mixed model ANOVA. Ultra-distal, mid- and total- distal forearm bone mineral
content, adjusted for sex, age percentage body fat, race and forearm length were 10 to 13%
greater in children in the first AA tertile relative to the third. Children in the second tertile had
the highest bone cross-sectional area and estimated strength at the 66% radius. Muscle cross-
sectional area was 15% lower in the third tertile compared to the first, along with higher fasting
insulin concentrations (27%) and HOMA-IR (31%). Higher RBC AA status aligns with deficits
in forearm bone mass, geometry, and muscle mass in children with excess adiposity and early
signs of insulin resistance.

77
4.2 Introduction
Childhood represents the most critical stage for developing optimal bone strength as
approximately 90% of bone mineral acquisition occurs before 18 y of age [2]. While excess body
weight and obesity are associated with elevated areal bone mineral density (aBMD), children
with obesity (3-19 y, BMI ≥ 95th percentile) are presented with lower whole body bone mineral
content (-9.1%, BMC) and bone area (-7.6%) relative to body weight [78], suggesting bone
quality may be compromised. However, measures using peripheral quantitative computed
tomography (pQCT) have shown that overweight children present with greater radial cortical
cross-sectional area, but have disproportionate bone strength for the estimated load from greater
body weight [85]. Hence, the increase in growth velocity in children with excess adiposity may
occur at the expense of optimal mineral deposition, compromising bone quality and elevate
fracture risk.
Dietary intake of long-chain polyunsaturated fatty acids (LCPUFA, ≥18C, ≥ 2 double
bonds) from fish or supplemental oils has been implicated in bone health in humans and animals
[283]. Data from the National Health and Nutrition Examination Survey (NHANES, 2005-2008)
showed significant positive associations between omega-3 (n-3) LCPUFA supplement use and
lumbar spine BMD in adults ≥ 60 y [284]. Conversely, serum linoleic acid (LA, C18:2 n-6), and
total n-6: n-3 ratio negatively associated with whole body and lumbar spine BMD in healthy
children (8.2 ± 0.3 y) [285]. Arachidonic acid (AA, C20:4 n-6), when consumed or present in
high or disproportionate amounts, can stimulate bone resorption as a result of elevated
metabolites such as prostaglandin E2 (PGE2) [286, 287]. These data suggest that dietary LCPUFA
of the n-3 or n-6 series can differentially influence bone health and that the n-6 series might be
implicated in adverse bone health outcomes.LCPUFA and their metabolites have shown

78
beneficial effects in the etiopathology of obesity in adults [184]. Obesity can be associated with
imbalances between n-6 and n-3 LCPUFA status [60, 186], therefore having a dual impact on
bone health of children. Youths who are overweight have lower docosahexaenoic acid (DHA,
C22:6 n-3) but increased n-6 LCPUFA status [59, 60]. Further, adipose tissue AA proportions
explained the variance in BMI (38.2%) more strongly than any other LCPUFA in pre-pubertal
children (n=88, 10-12 y), with higher AA proportions in children with greater adiposity [288].
The n-6 LCPUFA are also involved in regulating adipose tissue function and the
development of insulin resistance. Positive correlation between hyperinsulinemia and insulin-
resistance was found with adipose AA content in otherwise healthy children (n=83, 6.2 ± 3.6 y)
[289]. Obesity-related insulin resistance in children may contribute to the alterations in bone. In a
recent study, higher levels of insulin resistance negatively relate to spine BMC and total body
aBMD in adolescents (7-15 y) [290]. Negative associations between adiposity and trabecular
bone microarchitecture were attenuated after adjusting for insulin resistance, suggesting its
intermediary role between adiposity and bone [291]. Despite current knowledge of the linkages
between LCPUFA, obesity and related health outcomes, few studies have examined associations
between LCPUFA and the bone-fat relationship in childhood obesity. This study aimed to
examine the relationships between LCPUFA status, bone mass and geometry in children with
overweight condition or obesity. Based on previous reports on altered fatty acid metabolism in
individuals with obesity, we hypothesized that the higher omega-6 LCPUFA status in children
with overweight condition or obesity is negatively related to bone health outcomes, particularly
at sites where fractures are common.

79
4.3 Materials and methods
4.3.1 Study population and protocol
This is a cross-sectional study using baseline data from two randomized controlled trials
(Trial registration: ClinicalTrials.gov: NCT01290016). Details of the trial protocol have been
previously described [239]. Healthy children with obesity (n=138, 6-12 y) living in or near
Montreal, Quebec (Canada) were recruited through public and private elementary schools,
primary healthcare organizations including physician referrals, word of mouth and local
advertisements (newspaper, internet, radio commercials and postal mailings).
Assessments were performed at the McGill University Mary Emily Clinical Nutrition
Research Unit (Ste-Anne-de-Bellevue, QC, Canada). Participants provided written informed
assent by reading and signing an assent form written at the grade 1 level; parental consent was
also obtained. Height was measured to the nearest 0.1 cm using a stadiometer (Seca 214,
Hamburg, Germany), and weight was measured to the nearest 0.2 kg using a balance-beam scale
(Detecto, Missouri, USA) to calculate BMI. BMI Z-score was derived using the World Health
Organization’s ANTHRO software (version 3.2.2, Switzerland, Europe). The cut-off for
overweight or obese status was based on the WHO criteria of BMI for-age-and-sex Z-scores ≥ 1
or ≥ 2, respectively (World Health Organization, 2012). Demographics information and sun
exposure were collected through a questionnaire that contains questions adapted from the
Canadian Community Health Survey [292]. Physical activity data was collected using the
Physical Activity Questionnaire for Children [293] by parents/guardians. The questionnaire
reflected the child’s physical activity level the week prior to study visit and included questions
on total screen time (sedentary behavior) (time spent on television, video and computer games).

80
4.3.2 Body composition and bone assessment
Body composition and bone was examined using whole-body and non-dominant distal
1/3rd forearm (radius and ulna), and lumbar spine scans using DXA (Hologic QDR-4500A
Discovery Series, Bedford, MA) with APEX software (version 13.3:3), for whole body lean and
fat mass, as well as measurements of BMC, aBMD and bone area. The forearm was chosen as
the assessment site as it represents the most common site of fractures among children [21]. The
proximal femur / hip scan was not included given the skeletal landmarks for proper positioning
and ROI placement are not well-developed in children [294]. BMD Z-scores were calculated
using the Hologic age- and sex-specific database for children that are based on reference data
from NHANES III. Quality control was performed using Hologic lumbar spine phantom
(#14774) and yielded a coefficient of variation (CV%) for aBMD and BMC of <0.5%.
Peripheral quantitative computed tomography (pQCT, XCT-2000; Stratec, Pforzheim,
Germany) was used to assess volumetric BMD (vBMD) and cross-sectional area (CSA) of bone,
muscle and fat of the non-dominant radius. A single 2.5-mm thick slice with in-plane voxel size
of 0.5 mm3 was obtained at 4% and 66% proximal from the distal epiphysis of the radius. Total
BMC was calculated as the product of total CSA and total vBMD [295]. The strength-strain
index (SSI), a surrogate index for bone strength as a function of mass and geometry, as well as
estimated load were measured at the same sites. Age- and sex-specific Z-scores were calculated
for total BMC, vBMD, CSA and trabecular vBMD at the 4% distal radius, using reference data
(n=371, aged 6 to 20 years, 185 males, 186 females) as described [295]. Quality assurance scans
were performed prior to each visit using a hydroxyapatite cone phantom of known density and
mineral content supplied by the manufacturer, accuracy was >99%.

81
4.3.3 Dietary intake
Dietary intake was assessed using 3-d food diaries completed by caregivers, as instructed
by a registered dietitian. The diaries reflected 2 non-consecutive weekdays and 1 weekend day.
Dietary nutrient intake was analyzed using Nutritionist Pro software (Axxya System, Stafford,
TX) that uses the Canadian Nutrient File 2010b. Diets were assessed for total energy intakes
(kcal/d), macronutrients and micronutrients of interest (e.g., calcium), and presented as mean of
3 days. Children were sub-divided into two groups based on life stage (4-8 and 9-13 y), and
when appropriate, dietary intakes were compared with age- and sex-specific Dietary Reference
Intake recommendations [296].
4.3.4 Fatty acid measurements
Blood was sampled (12-h fasted state) by a registered nurse and separated into plasma and
red blood cells fractions, then stored immediately in 1:1 saline at -80ºC until analyses. Fatty
acids were measured in RBC membranes to reflect longer term dietary consumption, as well as,
tissue incorporation of fatty acids [297]. The methodology for lipid extraction, analysis and
reporting of data conformed to the recent guidelines recommended by the International Society
for the Study of Fatty Acids and Lipids [298]. In brief, RBC membrane fatty acids were extracted
using a modified direct methylation method [245]. RBC were combined with an internal standard
(heptadecanoic acid, C17:0) in toluene, fatty acid methyl esters (FAME) were prepared by
acidification by acetyl chloride and precipitated with K2CO3. FAME (C14:0 to C22:6 n-3) were
separated using a 60-m CP Sil-88 capillary column (Varian-Chrompack CP 7489) installed in a
GC (Varian CP-3800, Walnut Creek, CA, USA) with a flame-ionization detector. Hydrogen was
used as the carrier gas and nitrogen as the make-up gas. A single pooled blood sample was
analyzed in triplicate at each extraction for quality control. Intra-batch extraction CV were <5%,

82
the inter-run CV was <8%. Recovery was determined against C17:0 standard with known
concentration and found to be > 90%. Peaks were identified against standard SuplecoTM 37
Component FAME mix (catalogue #47885-U; Sigma-Aldrich Co, St Louis, MO). Fatty acids
were expressed as the weight percentage of total RBC fatty acids analyzed (C12:0 to C24:0).
Individual fatty acids were summed to calculate major lipids classes of SFA (C16:0, C18:0), total
n-3 (C18:3 n-3, C20:5 n-3, C22:5 n-3, C22:6 n-3), total n-6 (C18:2 n-6, C18:3 n-6, C20:3 n-6,
C20:4 n-6, C22:2 n-6, C22:4 n-6) and total LCPUFA.
4.3.5 Blood biochemistry
Fasting blood glucose, lipids (low-density lipoprotein, high-density lipoprotein, total
cholesterol and triacylglycerols) and sex hormones (luteinizing hormone and estradiol) were
measured in plasma, and fasting insulin in serum were measured using autoanalyzers (Beckman
Access and Meckman DxC600 CA, USA) at the Montreal Children’s Hospital (certified by the
provincial quality assurance program, the Laboratoire de santé publique du Québec). The
homeostasis model of assessment estimate of insulin resistance (HOMA-IR) was calculated as
fasting glucose (mg/dL) x fasting insulin (μU/mL)/405 [299]. Plasma 25-hydroxyvitamin D
(25(OH)D), parathyroid hormone, bone specific alkaline phosphatase, and osteocalcin
concentrations were examined using a chemiluminescence autoanalyzer (Liaison, DiaSorin,
Ontario, Canada). The laboratory participates in the Vitamin D External Quality Assessment
Scheme and follows the National Institute of Standards and Technology (NIST) guidelines. The
inter-assay CV% for 25(OH)D was 2%; and inter-kit CV% with NIST standards was 2.6% and
4.0% for high and low controls respectively. ELISA were used to measure levels of C-terminal
telopeptide of type 1 collagen (Immnunodiagnostic Systems Inc, MD, USA) and receptor
activator of NF-κB ligand (EMD Millipore, MA, USA). Adipokines (leptin and adiponectin) and

83
osteoprotegerin were measured in plasma using multiplex assays per the manufacturer’s
instructions (EMD Millipore, MA, USA). The inter-assay CV% for all assays were <10%.
Maturation status was assessed by parent’s identification of physical development as per
the Tanner criteria [240, 241]. Serum luteinizing hormone and estradiol concentrations were used
to confirm Tanner staging.
4.3.6 Statistical analysis
This study uses secondary data from a randomized controlled trial [239] where the primary
objective was to determine effectiveness of a 1-year family-centered lifestyle intervention on
changes in BMI for-age-and-sex Z-scores in children with obesity. This paper includes 108
children; thirty children were excluded due to inadequate blood sampling for RBC membrane
LCPUFA assessments. No differences in baseline characteristics were observed between children
included and excluded in the analyses. Based on previous work in healthy pre-pubertal children
[285], the sample size of n=108 has sufficient power to detect a correlation of at least r=0.27
between serum FA concentrations and whole body aBMD.
All data were tested for normality and homogeneity of variances with the Shapiro-Wilk test
and Levene’s test respectively, prior to analyses. Differences between sexes were assessed using
Student’s t tests for continuous variables; the Chi-squared test or Fisher’s exact test was used to
detect differences in proportions among groups for categorical variables. To determine whether
individual LCPUFA were related to bone outcomes, children were first stratified by Tanner
stages (stage 0-1, 2 and 3) and divided into tertiles based on RBC LCPUFA status to minimize
confounding effects of maturation on bone mass.
Differences in anthropometry, bone outcomes and blood biochemistry among tertiles of FA
were determined using a MIXED model ANOVA with post-hoc Tukey-Kramer comparison, to

84
ensure family-wide error rate of less than 5%. Tertile classification and Tanner stage were
included as fixed effects, and time of visit (year and month) as a random effect. Covariates
explored included sex, age, BMI, calcium and vitamin D intake, % body fat, race, and forearm
length. This paper reports on AA tertiles as significant differences were not observed among
other LCPUFA tertile categories. All tests were 2-sided with p<0.05. Analyses were performed
with SAS 9.4 (SAS Institute Inc., Cary, NC, USA).
4.3.7 Ethics approval
Ethics approval was obtained from the McGill University Faculty of Medicine Institutional
Review Board, the Lester B. Pearson School Board and the English Montreal School Boards.
McGill University Faculty of Medicine Institutional Review Board approval was granted for this
secondary use of samples and data.
4.4 Results
4.4.1 Participant characteristics
The majority (90.7%) of participants were classified as obese with BMI-for-age-and-sex Z-
scores of ≥2. When children were divided by RBC AA tertiles (Table 4.1), no differences in age,
anthropometric and body composition measurements by DXA, or demographics were observed.
Inherent to the study design, the proportion of children in each Tanner stage were balanced
across tertiles. There were no differences in luteinizing hormone and estradiol concentrations,
nor was the proportion of each sex different across tertile groups.
Average physical activity level estimated by the physical activity questionnaire did not
differ significantly among tertiles (1st: 80.4 ± 13.3; 2nd: 82.4 ± 11.8; 3rd: 78.9 ± 11.3 minutes /
day; p=0.34). Similarly, total screen time was not different among groups (1st: 6.5 ± 0.6; 2nd: 6.5
± 0.6; 3rd: 5.9 ± 0.7 hours/week; p=0.21).

85
4.4.2 Bone outcomes by AA tertiles
No differences were observed in whole body or lumbar spine (Table 4.1) bone area, BMC,
aBMD or aBMD Z-score among AA tertiles. After adjusting for forearm length, race, age and
sex, 1/3 ultra-distal forearm BMC and total area in children in the lowest (first) RBC AA tertile
had a 5% greater projected bone area compared to the highest (third) tertile (p=0.04) (Figure
4.1). Similarly, BMC in the ultra-distal, mid- and total forearm were also 10-13% greater in the
first tertile relative to the third. Total bone area was greatest in the second tertile (p=0.03).
However, aBMD did not differ among the groups. Observations from the radius and ulna
followed the same pattern hence these results are not reported in detail.
Based on pQCT assessments at the 4% radius (Figure 4.2), children in the first tertile had
significantly greater total BMC (7%, p=0.04) and bone CSA (6%, p=0.03) than the third tertile.
Total bone CSA was also lower in the third relative to the second tertile. Total BMC Z-score was
approximately 2-fold greater in tertile 1 (0.08 ± 0.10) compared to tertile 3 (-0.11 ± 0.12)
(p=0.01) but there were no differences in CSA Z-score. Total vBMD, trabecular vBMD or their
respective Z-scores did not differ among groups at this site. At the 66% radius (Figure 4.3),
children in the second tertile had approximately 30% greater total area (p=0.02) than those in the
third tertile. Cortical bone area and area ratio were not different among groups. SSIpolar, as well
as estimated fracture load, were significantly higher (p=0.03) in the second tertile relative to the
third.
Evaluation of muscle and fat at the 66% radius by pQCT showed lower forearm muscle
CSA in the third tertile compared to the first (Table 4.1). Fat CSA was also lower in the second
tertile compared to both other groups (p=0.02). There were no differences in muscle density, fat-
muscle density, bone-to-muscle and fat-to-muscle CSA, or forearm length among tertiles.

86
4.4.3 Serum biochemistry and RBC fatty acid status
Mean plasma 25(OH)D concentration of all children was 63.8 ± 1.8 nmol/L. No
differences in sun exposure (data not shown) or vitamin D status were observed among tertiles
(Table 4.2). Seventeen (14.3%) children had plasma 25(OH)D concentrations of ≤50 nmol/L,
which is below the Institute of Medicine cutoff for sufficient vitamin D status [300], whereas
n=47 (39.5%) children had 25(OH)D between 50 and 75 nmol/L. The proportion of children with
vitamin D status below the healthy threshold (25(OH)D ≤50 nmol/L) were not different among
AA tertiles. Fasting insulin concentrations and HOMA-IR index increased with AA tertiles,
although no differences in fasting glucose concentrations were observed. Bone alkaline
phosphatase concentration was approximately 15% lower in the third tertile compared to other
groups. There were no significant differences in concentrations of other biomarkers of bone
metabolism (bone alkaline phosphatase, receptor activator of NF-κB ligand, osteoprotegerin, C-
terminal telopeptide and osteocalcin).
Fatty acid status, when expressed as a proportion of total FA in RBC, also differed across
AA tertiles (Supp Table S4.1). Oleic acid (C18:1) was lowest in the third AA tertile, while the
AA:DHA ratio decreased with increasing AA status. Total LCPUFA, total n-6 and the AA:LA
ratio increased across AA tertiles. Proportions of LA, ALA and total n-3 were also greater in the
second and third AA tertiles relative to the first.
4.4.4 Dietary intake by AA tertiles
There were no significant differences in energy or nutrient intakes amongst RBC AA
tertiles based on the 3-d food diaries (n=63) (Table 4.3). The distribution of dietary
carbohydrates, protein and fat were all within the respective Acceptable Macronutrient
Distribution Ranges.

87
When examining the dietary data by age groups (4-8 y) and (9-13 y), the median intake of
ALA was 0.73 g/d (IQR 0.51 – 0.85) and 0.74 g/d (IQR 0.49 – 0.96) respectively, which
classified 78% children from both age-groups as not meeting the Adequate Intake (AI) 0.9 g/d of
ALA. Similarly, intakes of LA were low across AA tertiles, with 84% of all children not meeting
the AI of 10-12 g/d. Median combined intakes of EPA and DHA (25.667 mg/d, IQR 12.000 –
60.667) were also notably lower than the 250-500 mg EPA+DHA/d recommended by various
expert committees [249]. Mean dietary calcium intake (948 ± 132 mg/d) was close to the EAR of
800-1100 mg/d, where 34% and 64% of children between 4-8 y and 9-13 y respectively had
intakes below the EAR. Similarly, mean intakes of dietary vitamin D was low (155 ± 31 IU/d),
and none of the children met the EAR of 400 IU/d.

88
Table 4.1 Anthropometry and demographics by tertiles of arachidonic acid in red blood cells
Tertile 1 Tertile 2 Tertile 3
(4.67 - 7.72%, n=36) (7.73 - 9.26%, n=36) (9.27 - 14.06%, n=36)
N % N % N %
Demographics
Sex, male 16 44.4 15 41.7 19 52.8
Ethnicity, white † 30 83.3 29 80.6 25 69.4
Family income >$75,000 CAD/y 21 58.3 22 61.1 20 55.6
Parental self-repoted BMI
Mother, BMI >25 kg/m2 22 61.1 22 61.1 18 50
Father, BMI >25 kg/m2 17 47.2 63.9
Highest household education
Elementary school 0 0 0 0 0 0
Secondary school 1 2.8 2 5.6 1 2.8
Vocational eduation, apprentice 4 11.1 2 5.6 3 8.3
College 13 36.1 11 30.6 12 33.3
University 16 44.4 20 55.6 18 50.5
Mean SEM Mean SEM Mean SEM
Anthropometry
Age (y) 9.1 0.3 9.1 0.3 8.9 0.3
Height (cm) 143.3 1.7 144.0 1.7 139.9 1.8
Age-and-sex Z-score 0.9 0.1 1.1 0.1 0.9 0.1
Weight (kg) 56.2 2.2 55.4 2.2 53.5 2.4
Age-and-sex Z-score if < 10 y* 3.4 0.7 3.4 0.5 3.1 0.5
BMI (kg/m2) 27.0 0.80 26.2 0.80 26.3 0.9
Age-and-sex Z-score 3.1 0.2 2.8 0.2 3.2 0.3
Waist circumference (cm) 90.5 2.6 88.4 2.7 87.0 2.5
DXA whole-body
Percentage fat (%) 38.7 1.3 37.0 1.4 39.1 1.3
Fat mass (kg) 21.9 1.3 20.4 1.3 21.0 1.2
Percentage lean mass (%) 58.5 1.1 59.9 1.0 58.9 1.3
Lean mass (kg) 32.7 1.1 33.3 1.1 31.1 1.1

89
Bone area (cm2) 1430.51 40.59 1446.60 39.66 1356.70 42.41
BMC (kg) 1.31 0.64 1.34 0.63 1.24 0.67
aBMD (g/cm2) 0.904 0.028 0.910 0.027 0.919 0.029
Age-and-sex Z-score 1.8 0.3 2.0 0.3 1.8 0.3
DXA lumbar spine
Bone area (cm2) 42.98 0.90 42.42 0.90 41.44 0.97
BMC (g) 29.60 1.10 30.25 1.09 27.81 1.18
aBMD (g/cm2) 0.686 0.019 0.710 0.019 0.665 0.021
Age-and-sex Z-score 0.9 0.2 1.0 0.2 0.9 0.3
pQCT (66% radius)
Muscle density (mg/cm3) 68.88 5.28 67.24 5.53 66.40 5.91
Muscle CSA (mm2) 2070.20a 247.51 1991.70ab 261.19 1767.99b 281.30
Fat CSA (mm2) 2407.88a 232.94 1954.83b 249.40 2124.72ab 290.15
Fat-muscle density (mg/cm3) 34.2 3.98 36.48 4.30 34.33 4.43
Bone-muscle CSA (mm2) 5.31 1.69 3.82 1.83 4.78 2.03
Fat-to-muscle CSA ratio 102.99 15.35 90.51 16.62 95.75 18.46
Forearm length (cm) 22.64 0.75 22.65 0.74 22.35 0.77
aBMD, areal bone mineral density; BMI, body mass index; BMC, bone mineral content; DXA, dual-energy X-ray
absorptiometry; CSA, cross-sectional area; pQCT, peripheral quantitative computed tomography. Within row, mean
values with different superscripts indicate significant differences across AA tertiles (p<0.05). *weight Z-score are
calculated for children <10y only; n=24 for tertile 1, n=24 for tertile 2 and n=25 for tertile 3. †non-white races include
Black, African American, Hispanic, Latino, First Nations, Asian, Native Hawaiian / Pacific Islanders and others

90
Table 4.2 Blood biochemistry by tertiles of arachidonic acid in red blood cells
Tertile 1
(4.67 – 7.58%, n=36)
Tertile 2
(7.59 – 8.85%, n=36)
Tertile 3
(8.86 – 14.06%, n=36)
Mean SEM Mean SEM Mean SEM
Lipids
Total cholesterol (mmol/L) 4.17 0.28 4.07 0.25 4.41 0.26
High-density lipoprotein (mmol/L) 1.16 0.09 1.20 0.08 1.25 0.08
Low-density lipoprotein (mmol/L) 2.42 0.28 2.46 0.23 2.77 0.24
Triacylglycerols (mmol/L) 1.23 0.22 0.89 0.20 0.87 0.20
Glucose metabolism
Glucose (mmol/L) 4.9 0.1 5.0 0.1 4.9 0.1
Insulin (pmol/L) 7.7a 1.1 9.1ab 0.9 10.2b 1.0
HOMA-IR 1.0a 0.1 1.1b 0.1 1.4c 0.1
Adipokines
Leptin (μg/L) 20.1 2.9 16.1 2.5 17.3 2.7
Adiponectin (μg/L ) 10.6 4.0 9.3 4.1 14.8 4.7
Bone metabolism
25-hydroxy vitamin D (nmol/L) 64.1 5.7 58.3 5.7 56.8 5.4
Parathyoid hormone (pmol/L) 2.0 0.13 1.77 0.14 1.80 0.15
Bone alkaline phosphatase (μg/L) 93.6a 6.3 89.3a 6.6 76.6b 5.9
RANKL (pg/mL) 101.9 30.2 78.0 53.0 104.1 38.2
Osteoprotegerin (pg/mL) 234.8 25.6 214.1 45.8 200.3 33.09
CTx (ng/L) 1532.7 86.4 1781.1 108.5 1486.7 79.9
Osteocalcin (µg/L) 55.9 7.6 60.0 7.3 50.9 7.5
CTx, C-terminal telopeptide of type 1 collagen; HOMA-IR, Homeostatic Model Assessment for Insulin Resistance; RANKL,
receptor activator of NFκB ligand. Fasting glucose and CTx were measured in serum, while all other biomarkesr were measured
in plasma. Within row mean values with different superscripts indicate significant differences across AA tertiles (p<0.05)

91
Table 4.3 Dietary intake assessed by 3-day food diaries by tertiles of arachidonic acid in red blood cells
Tertile 1 Tertile 2 Tertile 3 DRI recommendation
(4.67 – 7.72%, n=23) (7.73-9.26%, n=20) (9.27 – 14.06%, n=20)
Mean SEM Mean SEM Mean SEM
Energy (kcal) 1559 139 1599 113 1590 150
Protein (g) 65.59 5.4 62.93 4.61 63.28 5.87 RDA: 19 g (4-8 y); 34 g (9-13 y)
g/kg 1.39 0.18 1.41 0.15 1.37 0.20
% total kcal 17.31 1.30 17.54 1.05 16.72 1.40 AMDR: 10-30%
Carbohydrate (g) 217.36 21.95 227.92 17.80 221.80 23.56 RDA: 130 g
% total kcal 55.74 2.22 53.56 1.85 54.45 2.35 AMDR: 45-65%
Total fiber (g) 13.0 1.7 16.4 1.4 18.1 1.9 AI: 25 g (4-8 y); 31 g (9-13y)
Fat (g) 49.68 6.64 60.74 5.52 55.89 7.19
% total kcal 28.33 2.28 32.01 1.94 31.84 2.55 AMDR: 25-35%
SFA (% kcal) 9.29 1.02 9.64 0.85 9.82 1.14
MUFA (% kcal) 8.50 0.85 8.76 0.70 8.99 0.92
LCPUFA (% kcal) 3.40 0.73 4.59 0.57 5.06 0.76
ALA (g) 0.752 0.117 0.816 0.092 0.914 0.129 AI: 0.9 g (4-8 y); 1.0 -1.2 g (9-13 y)
% total kcal 0.41 0.06 0.42 0.05 0.50 0.06 AMDR: 0.6 – 1.2%
LA (g) 6.363 1.407 6.887 1.171 6.818 1.563 AI: 10 g (4-8 y); 10-12 g (9-13 y)
% total kcal 3.06 0.59 3.61 0.50 3.93 0.65 AMDR: 5 – 10%
EPA + DHA (mg)# 18.3, 6.3 – 39.0 34.5, 13.3 – 103.3 25.2, 15.5 – 72.5
Calcium (mg) 948 132 897 104 803 138 EAR: 800 mg (4-8 y); 1100 mg (9-13y)
Vitamin D (IU) 155 31 147 25 120 33 EAR: 400 IU
AI, Adequate Intake; AMDR, Acceptable Macronutrient Distribution Range; DHA, docosahexaenoic acid; DRI, Dietary Reference Intakes; EPA,
eicosapentaenoic acid; LCPUFA, long-chain polyunsaturated fatty acids; MUFA, monounsaturated fatty acids; RDA, Recommended Dietary
Allowances; SFA, saturated fatty acids. # Data presented as mean, interquartile range

92
Figure 4.1 Differences in DXA measurements of non-dominant forearm bone area, bone mineral
content (BMC) and areal bone mineral density (aBMD) among tertiles of arachidonic acid in red
blood cells. Mean ± SEM. n=108. Different superscripts indicate significant differences (p<0.05)
among tertiles after adjustments for forearm length and race. UD, ultra-distal; Mid, mid-forearm;
1/3 Dist, distal 1/3rd epiphysis

93
Figure 4.2 pQCT measurements of total bone mass and geometry at the non-dominant 4% radius (metaphysis) among tertiles of
arachidonic acid in red blood cells. Mean ± SEM. n=108. Different superscripts indicate significant differences (p<0.05) among
tertiles after adjustments for sex, age, forearm length and race. BMC, bone mineral content; CSA, cross-sectional area; vBMD,
volumetric bone mineral density. Z-scores were calculated using reference data collected from a population of healthy Caucasian
children and adolescents

94
Figure 4.3 pQCT measurements of total bone mass and geometry at the non-dominant 66% radius (diaphysis) among tertiles of
arachidonic acid in red blood cells. Mean ± SEM. n=108. Different superscripts indicate significant differences (p<0.05) among
tertiles after adjustments for sex, age, forearm length and race. BMC, bone mineral content; CSA, cross-sectional area; SSIp: strength-
strain index (polar); vBMD, volumetric bone mineral density

95
4.5 Discussion
Obesity is now recognized to negatively impact LCPUFA status and the bone-fat
interaction [59, 186]. This study showed that children with the highest RBC AA status had
deficits in forearm bone mass, geometry and muscle mass, despite no difference in whole body
fat mass or aBMD among tertiles. In addition, AA status positively associated with biomarkers of
insulin resistance. The observed bone outcomes may be attributed to direct effects of LCPUFA
on bone growth, the etiopathology of obesity, and obesity-related metabolic consequences
including impaired glucose homeostasis.
Few studies have examined the relationships between LCPUFA intakes or status and bone
mass in children and the existing literature remain inconclusive. This study showed that while
moderate AA levels in RBC are related to greater bone mineral content and CSA, higher amounts
of AA may not confer additional benefits. In a cross-sectional study in children (8.2 ± 0.3 y) of
healthy weights, serum phospholipid AA proportion positively correlated with whole body BMC
(r=0.23), aBMD (r=0.33) and BMD Z-score (r=0.32) [285]. Positive associations between the
AA:LA ratio and whole body BMD Z-score (r=0.35), as well as the AA: dihomo-γ-linoleic acid
ratio with whole body BMC, aBMD, BMD Z-score and femur aBMD were also reported [285].
Although higher RBC AA did not associate with greater whole body assessments of bone health
in the present report, it did align with compromised outcomes at the forearm including SSIp. In
addition, while the magnitude of differences in forearm BMC observed in this study were modest
(10-13%), others have only observed a 4-6% deficit in ultra-distal radius aBMD in normal-
weight children who presented with forearm fractures compared to controls [279]. Retrospective
pQCT assessment of children (5-16 y) with recent (1 month) forearm fracture showed 3.4% and
0.9% lower vBMD at the 4% and 20% sites of the radius respectively [301]. Unlike adults, most

96
fractures in children are a result of traumatic force from falls rather than fragility fractures. The
upper limb is also the most common site of fracture in children compared to the hip or spine
often seen in older individuals [22]. While we did not prospectively assessed for fracture risk,
women with overweight body mass indices (n=469, 66-96 y, BMI 26.3 ± 4.2) in the second
tertile of plasma phospholipid n-6 LCPUFA and AA had the highest fracture risk (HR [95% CI]:
1.43 [1.10, 1.85] and 1.42 [1.09, 1.85], respectively) compared to the first and third tertiles [302].
Hence, even a slight deficit in bone mass at the distal forearm, along with poor balance, physical
inactivity and excess adiposity, may predispose children with obesity to significantly greater
fracture risks.
Consistent with observations in bone health outcomes, children with higher AA status
showed higher fasting insulin concentrations and HOMA-IR. Positive associations between
adipose tissue AA content and glycemia (r=0.37), hyperinsulinemia (r=0.47), and HOMA-IR
(r=0.47), after adjustments for age and weight have been reported in healthy weight children
(n=83, 6.2 ± 3.6 y, 90% male) [289]. Since ∆6 desaturase activity is stimulated by insulin [303],
the higher AA proportions in RBC could be a consequence of greater n-6 LCPUFA synthesis
from LA. However, our observations may not be related to increased ∆6 desaturase activity, as
RBC LA proportions also increased across AA tertiles despite similar ranges in dietary LA
intake. Nonetheless, the design of the current study precludes any conclusion to be drawn with
respect to causality or reverse causality between insulin concentrations and AA status.
Individuals with obesity have greater absolute muscle mass that could benefit bone
strength through regional muscle contractions [304]. Children in tertiles 2 and 3 of RBC AA had
significantly lower forearm muscle CSA, suggesting the deficits observed in cortical bone size
and BMC could be related to lack of mechanical stimulation at that site. Further, the relationship

97
between AA and bone outcomes were slightly weaker when muscle mass at the distal radius was
accounted for reflecting an association mediated, at least in part, through lean mass. Recent study
in children (9-13 y) reported positive relationships between whole body lean mass, insulin-like
growth factor-I and cortical bone outcomes, yet the beneficial effects were moderated depending
on HOMA-IR (β=0.20 vs β=0.41 for high and normal HOMA-IR respectively) [305]. Overall,
the positive influence of muscle on bone may be attenuated with increasing levels of insulin
resistance in children in tertile 3.
The ranges of RBC AA proportion across tertiles is unlikely to be explained by differences
in dietary AA intake. Although information on dietary AA intake was not available in our dietary
analysis software, the contribution of AA from diet is relatively minor in children, averaging
about 61.7 mg/d (0.04% energy intake) [219]. There are few foods in which AA constitutes more
than 2-6% of total FA by weight, and these foods, including egg yolk, beef liver, mackerel and
whale oils [306], do not contribute substantially to the diets of the average Canadian children.
Interactions between dietary EPA and DHA, sex, and AA status have been reported in older
adults; plasma AA positively associated with BMD in women with high EPA and DHA intakes,
while a negative association with BMD was seen men with the lowest intakes of EPA+DHA
[44]. However, no differences in dietary EPA+DHA or total n-3 LCPUFA were observed in the
present work; and while the proportions of other FA in RBC including LA and DHA (Supp
Table S4.1) differed across AA tertiles, similar results in forearm bone mass were not found
when participants were divided into groups by other FA tertiles (Supp Table S4.2-S4.5),
highlighting the role of AA in relation to our observations.
The inclusion of children with obesity represents one of the limitations of the present study,
as it precludes us from determining how much our study population deviates from children with

98
normal BMI. This was mitigated in part by use of Z-scores where possible as derived from
healthy populations. The relationships reported between LCPUFA and bone cannot be
extrapolated to normal weight children, given children with excess adiposity exhibit different
patterns in LCPUFA metabolism [56, 307]. In addition, the cross-sectional analyses cannot
capture the unique attributes of pubertal maturation over time. Children with obesity can enter
puberty earlier, and often presented with more advanced bone age compared to age-matched
normal weight peers [308]. Transient fluctuations in insulin sensitivity occurs during puberty and
does so irrespective of adiposity [309, 310]. However, the current analyses included only
children from Tanner stages 1-3 and, were performed stratified by maturation status; hence the
influence of puberty should be minimized. Utilization of pQCT to complement DXA lessened
the potential errors in quantifying bone size and mineral content in growing bones based on
projection images by DXA. It is possible that non-linear trends exist between fatty acid status
and obesity-related consequences [311]. However, the relatively small sample size available in
the current study limited the ability to generate a non-linear model. Furthermore, measurement of
PGE2 was not available in the current study. A biphasic response of bone to PGE2 have been
reported, showing an initial stimulatory effect at lower normal concentrations, but suppressed
bone formation at higher concentrations [312]. Our observations in forearm BMC support the
hypothesis that the negative relationship with AA involve PGE2-related mechanisms. Whether an
optimal level of n-6 LCPUFA or AA intake exist to support growth needs to be clarified. Finally,
physical activity levels of children in the current analysis were collected through a parent-
reported questionnaire and were most likely overestimated; 47% of children had physical activity
levels that met the Canadian Physical Activities Guidelines of 60 minutes per day. This is
substantially higher than the Canadian National Survey that suggested only 10% of children with
99
obesity met the recommendation [313]. Poor agreement was observed between a physical
activity questionnaire and accelerometers in children with severe obesity [314]. The
appropriateness of using questionnaires to estimate physical activity in children with obesity
needs to be further validated.
This study described the relationship between RBC AA status using a well-accepted
biomarker of LCPUFA status and forearm bone mass and geometry in children with excess
adiposity. Those with higher AA status presented with lower bone mass and size and accordingly
not vBMD. Additionally, fasting insulin concentrations and HOMA-IR were higher with
increasing AA status despite no differences in fat mass. Whether these observations are mediated
independently by AA through distinct pathways, or an interplay exists between LCPUFA
signaling, other aspects of body composition and glucose metabolism is not clear. Given the
prominent roles of LCPUFA in modulating both bone growth and obesity-related metabolic
consequences, further clarification of the implication in the bone-fat relationship is warranted.
4.6 Acknowledgments
The authors would like to thank Dr. Tom J Hazell, PhD, Sarah-Eve Loiselle, MSc, RD and
Popi Kasvis, MSc, RD for their work in conducting of the study and data collection, as well as
Sherry Agellon, MSc for her technical assistance with biochemical assays.

100
Supplementary Table S4.1 Red blood cells fatty acid proportions in children with obesity by tertiles of arachidonic acid (AA, C20:4 n-6) % in
red blood cells
Tertile 1 Tertile 2 Tertile 3 Ptertile
(4.67 – 7.51%, n=36) (7.52 – 8.42%, n=36) (8.44 – 14.06%, n=36)
Mean SEM Mean SEM Mean SEM
Palmitate acid (C16:0) 18.39 0.82 18.52 0.88 19.21 0.76 0.10
Stearic acid (C18:0) 17.33 0.45 16.59 0.46 16.30 0.48 0.85
Oleic acid (C18:1) 12.23a 0.37 11.57ab 0.36 10.79b 0.36 0.009
Linoleic acid (C18:2 n-6) 7.07a 0.20 7.85b 0.21 8.10b 0.22 0.007
α-linolenic acid (C18:3 n-3) 0.062a 0.009 0.078b 0.009 0.079b 0.009 0.01
γ-linolenic acid (C18:3 n-6) 0.16 0.12 0.12 0.11 0.08 0.12 0.92
Dihomo-γ-linolenic acid (C20:3 n-6) 1.10 0.11 1.23 0.11 1.25 0.12 0.50
Arachidonic acid (C20:4 n-6) 6.50a 0.17 8.29b 0.16 9.94c 0.17 <.0001
Eicosapentaenoic acid (C20:5 n-3) 0.20 0.03 0.22 0.03 0.25 0.03 0.17
Docosapentaenoic acid (C22:5 n-3) 0.98 0.15 1.14 0.14 1.22 0.15 0.85
Docosahexaenoic acid (C22:6 n-3) 1.39a 0.16 1.79ab 0.18 2.09b 0.19 0.003
Total saturated fatty acids 35.61 0.92 34.86 0.94 35.63 0.98 0.55
Total polyunsaturated fatty acids 19.09a 0.60 22.79b 0.65 25.31c 0.70 <.0001
Total omega-3 2.53a 0.26 3.21b 0.25 3.15b 0.28 0.29
Total omega-6 16.63a 0.60 19.65b 0.67 21.78c 0.73 <.0001
Total SFA = C16:0, C18:0, C20:0; Total PUFA = C18:2 n-6, C18:3 n-3, C18:3 n-6, C20:4 n-6, C20:3 n-6, C20:5 n-3, C22:2 n-
6, C22:4 n-6, C22:5 n-3, C22:6 n-3; Total omega-3 = C18:3 n-3, C20:5 n-3, C22:5 n-3, C22:6 n-3; Total omega-6 = C18:2 n-6,
C18:3 n-6, C20:3 n-6, C20:4 n-6, C22:2 n-6, C22:4 n-6. Within row, mean values with different superscripts were
significiantly difference across AA tertiles (p<0.05)

101
Supplementary Table S4.2 Anthropometry and DXA measurements of the forearm by tertiles of α-linolenic acid (ALA, C18:3 n-3) % in red
blood cells
Tertile 1
(0.029-0.061%, n=36)
Tertile 2
(0.061-0.084%, n=36)
Tertile 3
(0.085-0.188%, n=36)
Ptertile
Mean SEM Mean SEM Mean SEM
Age (y) 8.9 0.3 9.0 0.3 9.1 0.4 0.92
Weight (kg) 52.7 2.3 55.2 2.1 56.8 2.1 0.41
BMI (kg/m2) 26.0 0.8 26.2 0.8 27.2 0.8 0.52
Age-and-sex Z-score 3.0 0.3 3.0 0.2 3.1 0.2 0.94
DXA whole body
Body fat (%) 38.1 1.3 37.9 1.2 38.6 1.3 0.89
Lean mass (kg) 31.2 1.2 32.0 1.1 33.0 1.1 0.55
aBMD (g/cm2) 0.948 0.029 0.941 0.027 0.966 0.028 0.67
Age-and-sex Z-score 2.3 0.3 1.9 0.3 1.8 0.3 0.37
BMC (kg) 1.39 0.53 1.38 0.48 1.40 0.48 0.95
Area (cm2) 1456.37 36.93 1463.18 33.36 1488.03 33.48 0.79
DXA distal forearm
UD BMC (g) 1.30 0.08 1.35 0.07 1.27 0.08 0.72
MID BMC (g) 3.08 0.15 3.17 0.14 3.27 0.15 0.52
1/3 Dist BMC (g) 2.02 0.12 2.13 0.11 2.19 0.12 0.90
Total BMC (g) 6.50 0.28 6.68 0.26 6.80 0.30 0.65
Biochemistry
Glucose (mmol/L) 4.96 0.11 5.04 0.11 4.95 0.11 0.17
Insulin (pmol/L) 62.45 6.98 60.22 6.40 64.98 6.84 0.42
HOMA-IR 1.17 0.13 1.18 0.12 1.14 0.14 0.49
aBMD, areal bone mineral density; BMC, bone mineral content; BMI, body mass index; Dist, distal; DXA, dual energy X-ray
absorptiometry; HOMA-IR, Homeostatic Model Assessment of Insulin Resistance; UD, ultra-distal. Data were compared with
MIXED model ANOVA adjusted for age, sex, race, body fat % and time of baseline visit. DXA measurement of the forearm
were adjusted also for forearm length

102
Supplementary Table S4.3 Anthropometry and DXA measurements of the forearm by tertiles of linoleic acid (LA, C18:2 n-6) % in red blood
cells
Tertile 1
(4.37-7.25%, n=36)
Tertile 2
(7.26-8.13%, n=36)
Tertile 3
(8.15-10.46%, n=36)
Ptertile
Mean SEM Mean SEM Mean SEM
Age (y) 9.1 0.3 9.0 0.3 9.0 0.3 0.79
Weight (kg) 57.3 2.4 53.8 2.1 54.1 2.2 0.47
BMI (kg/m2) 27.5 0.8 26.2 0.8 25.8 0.8 0.29
Age-and-sex Z-score 3.1 0.3 3.1 0.2 2.8 0.2 0.53
DXA whole body
Body fat (%) 38.8 1.1 38.2 1.0 37.9 1.0 0.83
Lean mass (kg) 33.5 1.2 31.4 1.1 31.7 1.1 0.37
aBMD (g/cm2) 0.991 0.033 0.954 0.031 0.932 0.030 0.12
Age-and-sex Z-score 2.4 0.3 1.9 0.3 1.7 0.3 0.22
BMC (kg) 1.50 0.70 1.35 0.62 1.37 0.58 0.10
Area (cm2) 1506.93 38.49 1448.28 33.82 1449.39 34.16 0.43
DXA distal forearm
UD BMC (g) 1.38 0.08 1.35 0.07 1.25 0.07 0.42
MID BMC (g) 3.21 0.17 3.22 0.16 3.08 0.15 0.62
1/3 Dist BMC (g) 2.18 0.12 2.22 0.12 2.10 0.11 0.76
Total BMC (g) 6.85 0.31 6.73 0.30 6.43 0.27 0.35
Biochemistry
Glucose (mmol/L) 5.11 0.10 4.82 0.09 5.02 0.10 0.71
Insulin (pmol/L) 47.78a 6.59 49.56a 6.80 75.41b 6.10 0.02
HOMA-IR 1.01ab 0.12 0.96a 0.13 1.39b 0.12 0.05
aBMD, areal bone mineral density; BMC, bone mineral content; BMI, body mass index; Dist, distal; DXA, dual energy X-ray
absorptiometry; HOMA-IR, Homeostatic Model Assessment of Insulin Resistance; UD, ultra-distal. Data were compared with
MIXED model ANOVA adjusted for age, sex, race, body fat % and time of baseline visit. DXA measurement of the forearm
were adjusted also for forearm length. Within row mean values with different superscripts indicate significant differences across
tertiles (p<0.05)

103
Supplementary Table S4.4 Anthropometry and DXA measurements of the forearm by tertiles of eicosapentaenoic acid (EPA, C20:5 n-3) % in
red blood cells
Tertile 1
(0.097-0.18%, n=36)
Tertile 2
(0.18-0.23%, n=36)
Tertile 3
(0.23-0.46%, n=36)
Ptertile
Mean SEM Mean SEM Mean SEM
Age (y) 9.0 0.3 9.0 0.3 9.0 0.3 0.37
Weight (kg) 55.0 2.0 50.3 2.2 51.0 2.0 0.33
BMI (kg/m2) 26.9 0.8 27.1 0.8 25.5 0.8 0.30
Age-and-sex Z-score 3.1 0.2 3.2 0.3 2.8 0.2 0.37
DXA whole body
Body fat (%) 39.5 1.01 37.9 1.13 37.2 1.02 0.24
Lean mass (kg) 31.6 1.05 35.0 1.16 30.51 1.06 0.49
aBMD (g/cm2) 0.954 0.027 0.981 0.025 0.919 0.026 0.41
Age-and-sex Z-score 2.3 0.3 2.1 0.3 1.7 0.3 0.23
BMC (kg) 1.42 0.46 1.48 0.51 1.30 0.46 0.32
Area (cm2) 1474.09 31.75 1537.50 34.95 1411.48 31.84 0.18
DXA distal forearm
UD BMC (g) 1.33 0.08 1.38 0.08 1.26 0.07 0.45
MID BMC (g) 3.29 0.15 3.22 0.13 2.98 0.14 0.42
1/3 Dist BMC (g) 2.21 0.12 2.18 0.12 2.12 0.11 0.87
Total BMC (g) 6.88 0.29 6.79 0.26 6.33 0.26 0.13
Biochemistry
Glucose (mmol/L) 4.97 0.12 5.12 0.11 4.87 0.11 0.17
Insulin (pmol/L) 59.97 6.15 75.00 7.86 57.58 5.84 0.19
HOMA-IR 1.08 0.12 1.40 0.14 1.10 0.11 0.18
aBMD, areal bone mineral density; BMC, bone mineral content; BMI, body mass index; Dist, distal; DXA, dual energy X-ray
absorptiometry; HOMA-IR, Homeostatic Model Assessment of Insulin Resistance; UD, ultra-distal. Data were compared with
MIXED model ANOVA adjusted for age, sex, race, body fat % and time of baseline visit. DXA measurement of the forearm
were adjusted also for forearm length
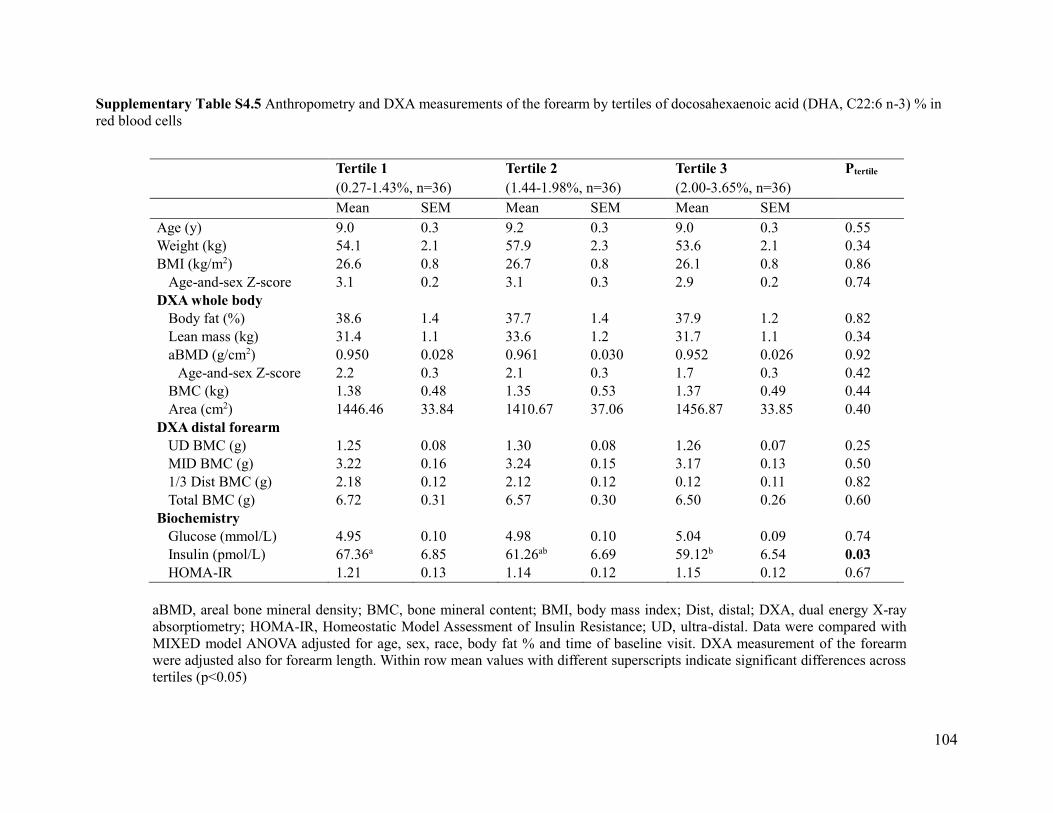
104
Supplementary Table S4.5 Anthropometry and DXA measurements of the forearm by tertiles of docosahexaenoic acid (DHA, C22:6 n-3) % in
red blood cells
Tertile 1
(0.27-1.43%, n=36)
Tertile 2
(1.44-1.98%, n=36)
Tertile 3
(2.00-3.65%, n=36)
Ptertile
Mean SEM Mean SEM Mean SEM
Age (y) 9.0 0.3 9.2 0.3 9.0 0.3 0.55
Weight (kg) 54.1 2.1 57.9 2.3 53.6 2.1 0.34
BMI (kg/m2) 26.6 0.8 26.7 0.8 26.1 0.8 0.86
Age-and-sex Z-score 3.1 0.2 3.1 0.3 2.9 0.2 0.74
DXA whole body
Body fat (%) 38.6 1.4 37.7 1.4 37.9 1.2 0.82
Lean mass (kg) 31.4 1.1 33.6 1.2 31.7 1.1 0.34
aBMD (g/cm2) 0.950 0.028 0.961 0.030 0.952 0.026 0.92
Age-and-sex Z-score 2.2 0.3 2.1 0.3 1.7 0.3 0.42
BMC (kg) 1.38 0.48 1.35 0.53 1.37 0.49 0.44
Area (cm2) 1446.46 33.84 1410.67 37.06 1456.87 33.85 0.40
DXA distal forearm
UD BMC (g) 1.25 0.08 1.30 0.08 1.26 0.07 0.25
MID BMC (g) 3.22 0.16 3.24 0.15 3.17 0.13 0.50
1/3 Dist BMC (g) 2.18 0.12 2.12 0.12 0.12 0.11 0.82
Total BMC (g) 6.72 0.31 6.57 0.30 6.50 0.26 0.60
Biochemistry
Glucose (mmol/L) 4.95 0.10 4.98 0.10 5.04 0.09 0.74
Insulin (pmol/L) 67.36a 6.85 61.26ab 6.69 59.12b 6.54 0.03
HOMA-IR 1.21 0.13 1.14 0.12 1.15 0.12 0.67
aBMD, areal bone mineral density; BMC, bone mineral content; BMI, body mass index; Dist, distal; DXA, dual energy X-ray
absorptiometry; HOMA-IR, Homeostatic Model Assessment of Insulin Resistance; UD, ultra-distal. Data were compared with
MIXED model ANOVA adjusted for age, sex, race, body fat % and time of baseline visit. DXA measurement of the forearm
were adjusted also for forearm length. Within row mean values with different superscripts indicate significant differences across
tertiles (p<0.05)

105
Bridge statement 3
The observations from manuscript 2 suggested a possible inverse relationship may exist
between the proportions of arachidonic acid (AA) in red blood cells (RBC) and forearm bone
health outcomes in children with obesity. Despite so, limited conclusion can be drawn regarding
the influence and mechanisms by which AA modifies bone metabolism as statistical modeling in
cross-sectional datasets only provide information on trend but does not imply causality. The
availability of RBC fatty acid measures at baseline only limits our ability to assess how
longitudinal changes in fatty acid proportions over time may affect bone outcomes. Dietary AA
information was not available in study 2, hence it is uncertain to what extent does AA intake
contribute to the variation in AA status in RBC, and whether AA in circulation resembles its
incorporation in biological tissues. In addition, AA is found in protein-rich animal food sources,
including eggs and meat. While no association was observed between intakes of Meat & Alt
servings and AA status was observed, the possible confounding effect of other nutrients and/or
bioactive compounds present in these foods cannot be entirely eliminiated. Finally, the etiology
of obesity in children are multi-factorial; socio-economic factors, physical inactivity, access to
healthy foods and family eating behaviors all contribute to the development of the habits of the
child, rendering it difficult to delineate specific nutritional factors contributing to childhood
obesity.
An important observation from the children recruited in the MYLIFE study is that the diets
of children are not excessively high in dietary fat content. This is in line with a recent Cochrane
review that reported no consistent effects between total fat intake and measures of body fatness
in generally healthy children [38]. Many animal models of diet-induced obesity have utilized
high-fat diets ranging from 45-70% of total energy as fat. While these diets are effective in

106
inducing obesity and related metabolic complications, they are not representative of the
children’s diet, and may only reflect the consequences seen in the most extreme cases of obesity
in humans. The development of excess adiposity in children occurs gradually; a reduction in the
energy gap of as little as 110-165 kcal/d, which is equivalent to one can of sugar-sweetened
beverage, was estimated to be sufficient to prevent excess weight gain in children 2-7 y [315].
Adipocytes exhibit a certain extent of metabolic flexibility and are able to buffer a certain range
of energy fluctuations for maintenance of whole-body energy homeostasis. It is however
uncertain how much of this buffering capacity is affected by the rate and magnitude of energy
surplus. The diet used in animal models of diet-induced obesity should therefore be carefully
chosen to reflect the rate of obesity development in children as much as possible, given the
response of adipocytes to excess energy availability may not be linear after all. Furthermore, as
rodents have relatively faster growth rate and reach sexual maturity earlier compared to that of
human children, it is uncertain if the initial bone adaptations such as increased bone mass and
strength to a rapid increase in adiposity observed in growing rodents can be sustained in
adulthood [95, 316].
The following chapter describes an animal-trial in male Sprague-Dawley rats using a
moderately high-fat diet (35% total energy) with the addition of 1% AA (w/w) to investigate the
effects on body composition, bone outcomes and LCPUFA status in a model of diet-induced
obesity during periods of rapid growth.

107
CHAPTER 5
Manuscript 3

108
Published online: Journal of Nutritional Biochemistry
(https://doi.org/10.1016/j.jnutbio.2019.108226)
Arachidonic acid exacerbates diet-induced obesity and reduces bone mineral content
without impacting bone strength in growing male rats
Ivy L Mak1, Paula Lavery1, Sherry Agellon1, Frank Rauch2, Monzur Mursed2,3, Hope A Weiler1
1 School of Human Nutrition, McGill University, Ste-Anne-de-Bellevue, QC, Canada
2 Shriner’s Hospital for Children, Montreal, QC, Canada
3 Faculty of Dentistry, Montreal, QC, Canada

109
5.1 Abstract
Long-chain polyunsaturated fatty acids modulate bone mass and adipocyte metabolism.
Arachidonic acid (AA, C20:4 n-6) is elevated in obesity and postulated to stimulate bone
resorption. This study aimed to determine the effect of AA on bone mass, quality, and adiposity
in diet-induced obesity during growth. Male Sprague-Dawley rats (n=42, 4-wk) were
randomized into groups fed a control diet (CTRL, AIN-93G), high-fat diet (HFD, 35% kcal fat)
or HFD+AA (1% w/w diet) for 6 wk. Body composition, bone mineral density and
microarchitecture were measured using dual-energy x-ray absorptiometry and micro-computed
tomography. Red blood cell fatty acid profile was measured with gas chromatography. Group
differences were evaluated using repeated measures two-way analysis of variance with Tukey-
Kramer post-hoc testing. Total energy intake did not differ among diet groups. At wk 6,
HFD+AA had significantly greater body fat % (12%), body weight (6%) and serum leptin
concentrations (125%) than CTRL, whereas visceral fat (mass and %, assessed with micro-
computed tomography) was increased in both HFD and HFD+AA groups. HFD+AA showed
reduced whole body bone mineral content and femur mid-diaphyseal cortical bone cross-
sectional area than HFD and CTRL, without impairment in bone strength. Contrarily, HFD+AA
had greater femur metaphyseal trabecular vBMD (29%) and bone volume fraction (20%)
compared to controls. Inclusion of AA elevated leptin concentrations in male rats. The early
manifestations of diet-induced obesity on bone mass were accelerated with AA. Studies of longer
duration are needed to clarify the effect of AA on peak bone mass following growth cessation.

110
5.2 Introduction
The influence of obesity on development, maturation and remodeling of the skeleton is not
well studied. Body weight can be a strong determinant of bone mineral density (BMD) [72].
Individuals with obesity have higher areal BMD as a result of greater mechanical loading.
However, epidemiological studies reported positive associations between obesity and risk of
fragility fractures [317, 318]. Inverse relationships were described between whole body fat mass
and areal BMD at multiple sites in children, despite the greater lean mass in those with obesity
[79], suggesting body composition is an important determinant of BMD. In addition to
suboptimal physical activity and/or diet quality in obesity, a combination of mechanisms has
been proposed to explain the effect of obesity on BMD and fracture risk. These include low-
grade chronic inflammatory responses that favor bone resorption [107], and imbalances in the
differentiation of mesenchymal stem cells to osteoblasts, chondrocytes or adipocytes [108].
These interrelated factors that contribute to increased fracture risk despite greater bone mass in
obese individuals are not well-explained and warrants further clarification.
Peroxisome proliferator activator receptors (PPAR), specifically PPARγ, have a central role
in mediating the balance between adipocytes and osteoblasts during stem cell differentiation
[319]. Long-chain polyunsaturated fatty acids (LCPUFA) are natural ligands for PPARs and can
influence gene expression of its downstream targets [320]. Increased intakes of the omega-3
LCPUFA eicosapentaenoic acid (EPA, C20:5 n-3) and docosahexaenoic acid (DHA, C22:6 n-3),
either as supplements or from fish intake are associated with higher BMD in adults [10, 321].
Conversely, studies that report on the influence of the omega-6 arachidonic acid (AA, C20:4 n-6)
on bone mass are scarce. Dietary supplementation of AA elevated whole body BMC in growing
piglets with healthy body composition [322]. Of relevance to growth, AA and its metabolite

111
prostaglandin E2 demonstrated a biphasic effect on bone, showing initial stimulatory effects but
suppressed bone formation at higher concentrations [287]. In vitro, AA (40 μM) significantly
inhibited human osteoblastic cell proliferation and the osteogenic markers expression to a greater
degree than EPA or DHA [323, 324]. This was accompanied by a 4 to 5-fold induction in PPARγ
mRNA levels [324], although PPARγ activation with thiazolidinedione in osteoblast lineage cells
resulted in terminally differentiated adipocytes [325, 326]. Hence the effects of fatty acids on
bone cells and adipocytes likely involve multiple mechanisms, producing both beneficial and
potentially deleterious effects on BMD depending on the extent of exposure.
The release of adipokines including leptin and adiponectin by adipose tissue is another link
between obesity, LCPUFA and regulation of bone turnover through central and peripheral
signaling [182]. The response of adipokine secretion to LCPUFA is varied. Studies in vitro show
mixed effects on triglyceride accumulation and adipokine expression in 3T3-L1 adipocytes
treated with LCPUFA alone or in combination. This can be attributed to different properties of
fatty acids of the n-6 or n-3 series, variation in treatment concentrations, and maturation stage of
the cells. [211, 327-329]. Additionally, adolescents who are obese (10.4-16.4 y, BMI 26.8 – 40.4)
have lower omega-3 LCPUFA and higher AA:DHA ratio in serum phospholipids compared to
lean controls [186]. Despite the potential links among LCPUFA, adiposity and bone health, the
interaction among these factors is not well characterized. This study therefore utilizes a growing
rat model of diet-induced obesity to determine the effects of a moderately high-fat diet, with or
without the addition of AA on bone mass and LCPUFA status during growth. We hypothesize the
adverse effects of diet-induced obesity on bone mass and strength during growth may be
exacerbated by the addition of AA. This effect is mediated in part through promoting
adipogenesis and decreasing levels of omega-3 fatty acids in circulation and tissue.
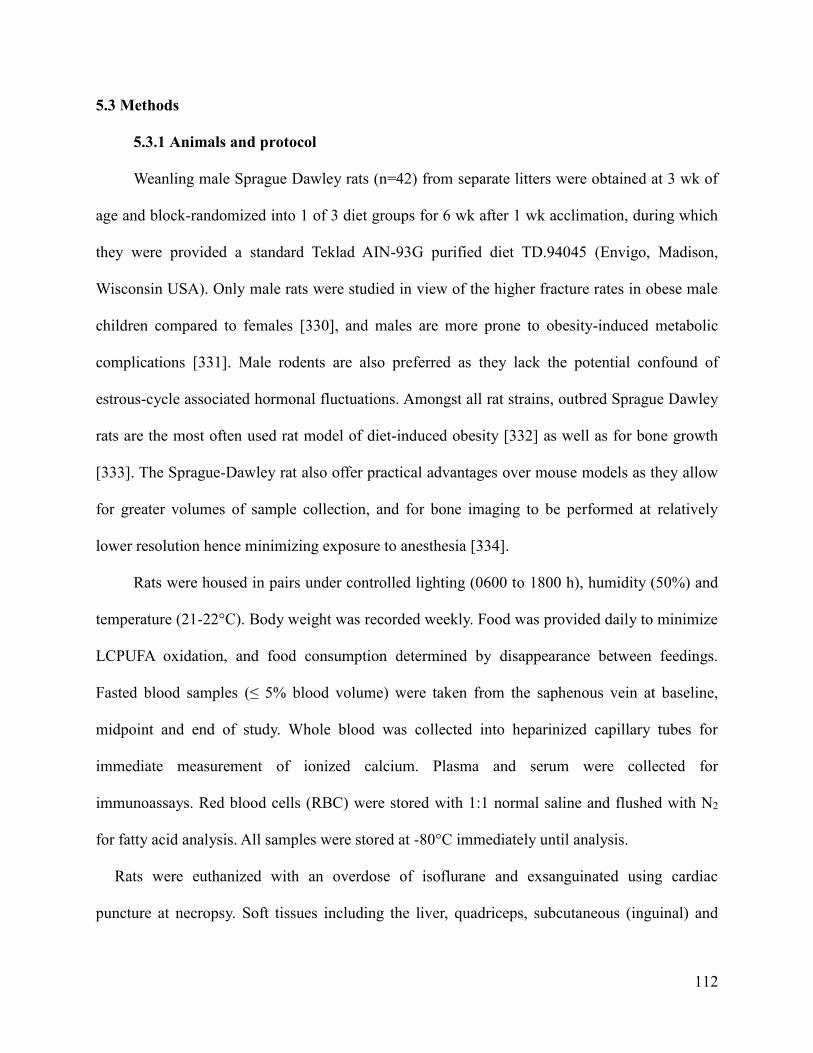
112
5.3 Methods
5.3.1 Animals and protocol
Weanling male Sprague Dawley rats (n=42) from separate litters were obtained at 3 wk of
age and block-randomized into 1 of 3 diet groups for 6 wk after 1 wk acclimation, during which
they were provided a standard Teklad AIN-93G purified diet TD.94045 (Envigo, Madison,
Wisconsin USA). Only male rats were studied in view of the higher fracture rates in obese male
children compared to females [330], and males are more prone to obesity-induced metabolic
complications [331]. Male rodents are also preferred as they lack the potential confound of
estrous-cycle associated hormonal fluctuations. Amongst all rat strains, outbred Sprague Dawley
rats are the most often used rat model of diet-induced obesity [332] as well as for bone growth
[333]. The Sprague-Dawley rat also offer practical advantages over mouse models as they allow
for greater volumes of sample collection, and for bone imaging to be performed at relatively
lower resolution hence minimizing exposure to anesthesia [334].
Rats were housed in pairs under controlled lighting (0600 to 1800 h), humidity (50%) and
temperature (21-22°C). Body weight was recorded weekly. Food was provided daily to minimize
LCPUFA oxidation, and food consumption determined by disappearance between feedings.
Fasted blood samples (≤ 5% blood volume) were taken from the saphenous vein at baseline,
midpoint and end of study. Whole blood was collected into heparinized capillary tubes for
immediate measurement of ionized calcium. Plasma and serum were collected for
immunoassays. Red blood cells (RBC) were stored with 1:1 normal saline and flushed with N2
for fatty acid analysis. All samples were stored at -80°C immediately until analysis.
Rats were euthanized with an overdose of isoflurane and exsanguinated using cardiac
puncture at necropsy. Soft tissues including the liver, quadriceps, subcutaneous (inguinal) and

113
visceral (epididymal) adipose tissue were weighed and flash-frozen in liquid N2 for fatty acid
extraction. The right femur was excised, carefully cleaned of soft tissue, and stored in saline-
moistened gauze at -20°C for micro-computed tomography (μCT) scanning and biomechanical
tests.
5.3.2 Diets
Rats were randomized into one of three diet groups: (1) standard AIN-93G growth purified
diet (CTRL, Harlan Teklad Global 19% Protein Rodent Diet, Harlan Laboratories Inc., Madison,
WI); (2) a moderately high-fat diet (HFD) with 35% energy from fat (lard was added as
additional source of saturated fat); and (3) the same HFD with 1% w/w AA (HFD+AA) in the
form of ARASCO (Martek Biosciences Corporation, MA, USA; Table 5.1). ARASCO contains
approximately 40% AA derived from the fermentation of Mortierella alpine, and may contain
trace amounts of C22:5 n-3 [335]. The amount of AA supplementation is based on a previous
study in 6 wk old rats to double tissue enrichment of AA without causing neurotoxicity over 90
days [336]. All diets met the calcium requirement (2.5 g/kg) necessary to support normal growth
in Sprague-Dawley rats [337]. The energy supplied by fat in the HFD (35%) mimics the average
% fat intake of North American children and adolescents [338]. It is also within the accepted
macronutrient distribution range defined in the 2015-2020 Dietary Guidelines for America
recommendations for children and adolescents [339].
5.3.3 In vivo dual-energy X-ray absorptiometry
Rats were scanned under anesthesia with a fan-beam QDR-4500A densitometer (Hologic
Inc., Bedford, MA) in a prone position with limbs extended at baseline, midpoint, and end of
study. Prior to scanning, nose-to-rump and nose-to-tail lengths were measured. Whole body and
regional (scans of the left and right femurs and tibias, and lumbar vertebrae (LV) 1 to 4) scans

114
were performed and analyzed using small animal software (QDR 4500A version 12.5). Quality
control was performed each day of scanning using a spine phantom provided by the
manufacturer and yielded a coefficient variation (CV%) of <0.5% for areal BMD (aBMD).
Triplicate scans of each region of interest were done prior to necropsy and CV% for whole body
and regional scans were below 5 and 7% respectively for all measurements in 10-wk-old rats.
5.3.4 In vivo micro-computed tomography
Whole body and regional bone and abdominal fat were assessed with a small laboratory
animal CT system (LaTheta LCT-200; Aloka, Tokyo, Japan). Scans were performed at baseline
and wk 6 only, to minimize X-ray exposure in growing rats. Whole-body and regional scans of
LV2-5 were performed as previously reported [340]. Thresholds for segmenting bone from soft
tissue and trabecular from cortical bone were set at 160 and 500 mg/cm3 respectively; the
datasets were automatically segmented by the LaTheta software (version 1.3). Similarly,
distinction between lean and fat body mass was based on differences in X-ray attenuation.
Visceral and subcutaneous abdominal fat depots were discriminated based on detection of the
abdominal muscle wall [341] and manually corrected slice-by-slice by a single operator (I.M.).
Quality control was performed each day of scanning using the manufacturer’s hydroxyapatite
phantom with known density. Triplicate scans of the LV2-5 were performed in 10-wk old rats
prior to necropsy, and CV% for all measurements were < 2%. In addition, a 1% variability was
noted between the in vivo and ex vivo (Skyscan, Belgium, Germany) μCT when cross-calibrated
with the 0.75 mg/cm3 phantom provided by the Skyscan manufacturer.
5.3.5 Ex vivo micro-computed tomography
Ex vivo microarchitecture of the right femur distal metaphysis, mid-diaphysis and LV3
were assessed using a Skyscan 1174 scanner (Skyscan, Belgium, Germany) as described [342].

115
An isotropic voxel size of 11.2 μm and 30.6 μm was used for trabecular and cortical regions
respectively. Images were reconstructed with the manufacturer’s software (NRecon v1.6.4.1;
Skyscan) and segmented into bone and marrow compartments based on adaptive thresholding for
trabecular bone, and fixed global threshold (120-255 gray level value) for cortical bone (CT
Analyzer v1.11.8.0; Skyscan). The threshold is optimized by visually comparing the binarized
images with original gray-scale images. All segmenting was performed by the same operator
(I.M.).
The trabecular region at the distal femur was selected by manually contouring the region
of interest (ROI) away from the endosteal surface on a slice-by-slice basis as recommended
[343]. The trabecular region of interest (ROI) at the distal femur was set at a longitudinal
distance of 0.8 mm proximal to the epiphysis, contained 90 slices with the same thickness (11.2
μm), reaching a total volume of interest (VOI) of approximately 1 mm3. Cortical bone at the
femur mid-diaphysis was analyzed on 100 slices (50 slices above and below the mid-point) and
included a total VOI of 3 mm3. A set of 2 hydroxyapatite phantoms (0.25 and 0.75 mg/cm3) was
used to calibrate and compute vBMD.
5.3.6 Bone strength testing
Ex vivo bone strength of the femur was assessed by three-point bending test with a
servohydraulic material testing system (Instron version 5544; Canton, MA) as described [342].
The femur was centered between the fulcrums with a constant span length of 17 mm. Load was
applied at the mid-diaphysis in the antero-posterior direction at a constant rate of 0.1 N/s until
failure (defined as 35% decrease in detected load and/or until bone fractured).
5.3.7 Biochemistry
Biomarkers were measured in fasted blood samples. Plasma 25-hydroxyvitamin D

116
(25(OH)D) was assessed using a chemiluminescence autoanalyzer (Liaison, DiaSorin, Stillwater,
MN). Ionized calcium was measured in heparinized capillary tubes (ABL800 FLEX analyzer,
Radiometer, Copenhagen, Denmark). Serum receptor activator of nuclear factor-κB ligand
(RANKL) and osteocalcin concentrations were measured using singleplex immunoassays
(Milliplex, Millipore, MA, USA). Leptin and OPG were quantified using multiplex magnetic rat
bone panel 1 (Milliplex, Millipore). Adiponectin (Milliplex, Millipore) insulin (Alpco, Salem,
NH), bone turnover markers C-telopeptide (CTx, IDS, Bolden, UK) and procollagen Type-I N-
terminal propeptide (P1NP, IDS, Bolden, UK) were measured in serum with standard ELISA
methods per kit manufacturer’s instructions. Adiponectin and leptin production in media by 3T3-
L1 adipocytes after 48 h fatty acids treatment were measured using mouse-specific singleplex
immunoassays (Milliplex, Millipore). Pooled rat serum (n=9) and culture media (n=4) were
analyzed in triplicate, the CV% for all parameters (inter- and intra-assay) was less than 10% for
all assays.
5.3.8 Fatty acid measurements in blood, tissue and 3T3-L1 adipocytes
RBC were used to measure fatty acid composition as they reflect fatty acid composition of
the habitual diet [243]. A modified Lepage-Roy RBC direct methylation method [245] was used
to prepare fatty acid methyl esters (FAME) for gas chromatography (GC) separation. RBC (100
μl) were combined with toluene containing 20 μg/ml C17:0 internal standard. The mixture was
methylated with acetyl chloride, followed by precipitation with 6% K2CO3 and extracted with
hexane for GC analysis. Fatty acids in soft tissues (subcutaneous and visceral adipose tissue,
liver, quadriceps) and rodent feed pellets were extracted using the O’Fallon method [344].
Samples were hydrolyzed in KOH in methanol containing C17:0, and free fatty acids were
methylated by concentrated sulfuric acid. The mixture was vortex-mixed with hexane and

117
collected for analyses.
Following 48 h of fatty acid treatment, 3T3-L1 adipocytes were trypsinized, washed twice
in cold phosphate-buffered saline (PBS), and frozen in saline until analysis. Adipocytes were
combined with freshly-prepared 1:10 acetyl-chloride:methanol with internal standards C19:1 (40
μg/ml) and C21:0 (20 μg/ml). The reaction was precipitated with NaCl, and then a second
extraction was performed with hexane, and the upper hexane layer was collected [345].
FAME were separated using a 60-m CP-Sil-88 capillary column (Varian-Chrompack,
CP7489), installed in a Varian CP-3800 Gas Chromatograph (Varian, Inc., Walnut Creek, CA)
with a flame-ionization detector. FAME peaks on the chromatogram were identified against
standard SupelcoTM 37 Component FAME mix (Sigma-Aldrich Co, St. Louis, MO), and
reference standards of known concentration were used to calculate recovery (>85%). Quality
control was performed using a single pooled sample analyzed in triplicate with each extraction.
The fatty acids were expressed as the weight percentage of the total fatty acids analyzed from
C10:0 to DHA, the sum of fatty acids reported herein represented (93 ± 3%) of total fatty acids.
Individual fatty acids were summed to calculate major lipid classes of total n-3 (C18:3 n-3,
C20:5 n-3, C22:5 n-3, C22:6 n-3) and total n-6 (C18:2 n-6, C18:3 n-6, C20:2 n-6, C20:3 n-6,
C20:4 n-6, C22:4 n-6, C22:5 n-6).
5.3.9 Adipocyte differentiation and fatty acid treatment
3T3-L1 pre-adipocytes were passaged every 2-3 days for approximately 7 days in
Dulbecco’s Modified Eagle’s medium (DMEM) with 10% fetal bovine serum (FBS) and 1%
penicillin-streptomycin (Sigma-Aldrich, MO, USA) in a 5% CO2 humidified environment at
37°C until about 80% confluent. Pre-adipocytes were seeded on 6-well plates with a seeding
density of 0.8 x 10⁵ cells/well and kept in the same growth medium until confluent. Two days

118
post-confluence, differentiation was induced (day 0) by DMEM/F12 supplemented with: 10%
FBS, 1 μM dexamethasone (Sigma), 1.5 μg/ml insulin (Sigma), 500 μM isobutylmethylxanthine
(Sigma), and 1 μM rosiglitazone (Sigma) for 3 days. After differentiation, medium was replaced
with DMEM/F12 with 10% FBS, antibiotics, and 1.5 µg/ml insulin and changed every 2 days.
Cells were maintained in this medium over an 8-d period, with day 8 representing mature
adipocytes with lipid droplet accumulation.
Stock solutions of AA, EPA, docosapentaenoic acid (DPA, C22:5 n-3) and DHA (Nu-Chek
Prep Inc., Elysian, MN) were dissolved in 100% ethanol to a final concentration of 0.1 M. Fatty
acids were complexed to 1% fatty-acid free bovine serum albumin (BSA) (Sigma) in serum-free
DMEM at 37°C, corresponding to a free fatty acid: BSA ratio of approximately 0.16-0.66:1.
Fatty acid treatment was preceded by overnight starvation in serum-free DMEM supplemented
with 1% BSA and antibiotics. Differentiated adipocytes (day 8) were then cultured for 48 h in the
presence of 10, 25, 50 or 100 μM of AA, EPA, DPA and DHA, while controls were treated with
BSA and 0.1% ethanol. The concentrations of fatty acids and BSA used were based on previous
studies [52, 211] in 3T3-L1 adipocytes to influence adipokine secretion without causing cell
toxicity. In addition, normal physiological ranges of plasma FFA levels have been reported to be
around 0.5 – 2.3 mmol/L in rats [346] and 0.25-0.73 mmol/L in humans [347]. The selected
concentration of fatty acids is therefore within the physiological range for free fatty acids for
rodents and humans.
5.3.10 Nile Red staining
Nile Red staining was used to confirm adipocyte differentiation and lipid accumulation in
3T3-L1 adipocytes. Adipocytes were washed with PBS and fixed with 4% paraformaldehyde.
Cells were subsequently washed twice in PBS and stained in Nile Red working solution (10

119
μg/mL) for 15 min, and then washed and stained again with DAPI for 5 min. Images of stained
cells were taken using the EVOS FL Cell Imaging System (Invitrogen) and processed with
ImageJ (NIH, Maryland, USA).
5.3.11 Total RNA isolation and quantitative RT-PCR measurements
Total RNA was isolated using TRIzol reagent (Invitrogen) according to the manufacturer’s
instructions. RNA integrity and concentration were quantified spectrophotometrically after
extraction. Total RNA was treated with DNase (New England BioLabs), cDNA was synthesized
from 1 μg of total RNA using MultiScribe reverse transcriptase with RNase inhibitor (Applied
Biosystems) and RT random primers. Relative gene expressions of leptin, adiponectin and
PPARγ were determined with quantitative RT-PCR using SYBR Advanced qPCR Master Mix
(Winsent Inc., St-Bruno, QC) with the 7500 RT-PCR System. (Applied Biosystems). HPRT was
amplified in parallel as the house keeping gene. The following primers as previously described
[329, 348] were used: 5’-GACCATTGTCACCAGGATCA-3’ (forward) and 5’-
TGAAGCCCAGGAATGAAGTC-3’ (reverse) for leptin, 5’-
GCACTGGCAAGTTCTACTGCAA-3’ (forward) and 5’-GTAGGTGAAGAGAACGGCCTTGT
-3’ (reverse) for adiponectin, 5’-CTCCTGTTGACCCAGAGCAT-3’ (forward) and 5’-
TCTTCCATCACGGAGAGGTC-3’ (reverse) for PPARγ, and 5’-
GTTGAGAGATCATCTCCACC-3’ (forward) and 5’-AGCGATGATGAACCAGGTTA-3’
(reverse) for HPRT. All primers were validated by PCR to ensure the absence of multiple
amplification products. Cycling conditions started with an initial denaturation step at 50°C for 2
min and 95°C for 3 min, amplification was performed for 40 cycles of 95°C for 10 s and 60°C
for 45 s. Relative expressions of target genes were calculated using 2-ΔΔCt method [349]. All cell
treatments and PCR reactions were performed in triplicate.

120
5.3.12 Statistical analyses
Based on a previous study in 12-wk old male rats [350], a sample size of n=9 per group
was estimated to detect a 10% difference for distal femur metaphysis vBMD in a two-sided t-test
with α=0.05 and power of 0.80. Using a total sample size of 42 (14 per group) provided coverage
in the event of loss of an animal or smaller effect size. One rat in the HFD+AA group died during
the 1-wk acclimation period, thus a total of 41 rats (control: n=14; HFD: n=14; HFD+AA: n=13)
were included in this analysis. Analysis with and without the single-housed rat led to same
interpretation of the results.
Data were analyzed using SAS statistical package (version 9.4, SAS Institute Inc., Cary,
NC). Summary statistics were computed for all baseline characteristics to ensure treatment
groups were comparable. Differences among diet groups were examined using repeated-
measures MIXED model ANOVA with diet and time as fixed effects, and study block as a
random effect nested within groups. Covariates explored included body weight, body
composition, food intake and bone length for bone measurements (ex vivo µCT femur scans,
biomechanics). A post-hoc Tukey-Kramer multiple comparison test was used to ensure family-
wide error rate of 5%. All data was tested for normality and homogeneity of variances prior to
analysis.
5.3.13 Ethics approval
All procedures were reviewed and approved by The Macdonald Campus Facility Animal
Care Committee, which follows the guidelines established by the Canadian Council on Animal
Care and the McGill University Animal Care Committee.

121
Table 5.1 Diet composition
CTRL
(AIN-93G) HFD HFD+AA
Energy (kcal/g) 3.9 4.3 4.3
Protein (% kcal) 18.7 18.7 18.7
Carbohydrate (% kcal) 65.1 46.1 46.1
Fat (% kcal) 16.4 35.5 35.3
Formula (g/kg)
Casein 200 225 225
L-Cystine 3 3.4 3.4
Corn Starch 397 277 277
Maltodextrin 132 132 132
Sucrose 100 100 100
Soybean oil 70 70 70
Lard 95 70
ARASCO1 25
Cellulose 50 50 50
Mineral Mix, AIN-93G-MX 35 35 35
Vitamin Mix, AIN-93G-VX 10 10 10
Choline Bitartrate 2.5 2.5 2.5
TBHQ (antioxidant)2 0.014 0.014 0.014
Fatty acid composition (% total FA by weight) 3
C12:0 0.019 ± 0.001 0.054 ± 0.002 0.041 ± 0.003
C14:0 0.12 ± 0.008 0.84 ± 0.014 0.66 ± 0.004
C16:0 11.26 ± 0.22 18.2 ± 0.14 16.37 ± 0.10
C16:1 --- 1.13 ± 0.007 0.85 ± 0.004
C18:0 4.18 ± 0.10 9.97 ± 0.07 9.02 ± 0.03
C18:1 20.80 ± 0.12 31.09 ± 0.087 28.80 ± 0.06
C18:2 n-6 54.99 ± 0.41 32.51 ± 0.055 31.15 ± 0.04
C18:3 n-3 7.32 ± 0.09 3.47 ± 0.012 3.38 ± 0.003
C18:3 n-6 --- --- ---
C20:0 --- --- 0.37 ± 0.004
C20:1 0.16 ± 0.01 0.45 ± 0.02 0.39 ± 0.007
C20:4 n-6 --- --- 6.56 ± 0.03
C22:0 --- --- 0.36 ± 0.0001
C22:5 n-3 --- --- 0.023 ± 0.0003
C24:0 --- --- 0.21 ± 0.007
Purified diets were provided in pellet form and made by Harlan (Indianapolis, IN, USA), ARASCO provided in-kind
by DSM (Columbia, MD, USA) 1 ARASCO contained about 40.6% AA 2 TBHQ = tert-Butylhydroquinone 3 Mean ± SD. Average of samples analyzed in triplicate by gas chromatography

122
5.4 Results
5.4.1 Body weight, body composition and food intake
There were no differences in body weight or body composition among diet groups at
baseline. Beginning at wk 4, HFD+AA showed greater rates of weight gain, resulting in a 6%
higher body weight compared to CTRL at wk 6 (Figure 5.1A). Body weight of rats fed the HFD
did not differ significantly from controls or HFD+AA. Similarly, HFD+AA had significantly
higher total body fat % (assessed by DXA) compared to controls and but not HFD (Figure
5.1B). Both HFD and HFD+AA had 15% greater abdominal fat mass compared to controls,
predominantly in the form of visceral adipose tissue (Figure 5.1C,D). Addition of AA did not
result in greater gains in abdominal fat mass than the HFD alone. Epididymal fat pads were 25%
and 16% greater in HFD and HFD+AA rats compared to controls respectively; whereas only
HFD+AA group showed greater (30%) inguinal fat pad weight compared to controls or the HFD
group. Body length (nose-to-rump and nose-to-tail) and total lean mass were similar among
groups throughout the study (data not shown).
Daily food intake was similar among the three dietary groups until wk 2 of study; the
control group consumed a greater absolute quantity (in grams) of food than the HFD groups from
wk 3 until end of study (data not shown). However, feed efficiency (food consumed / change in
body weight (Figure 5.1E), total energy intake, food intake (grams) adjusted for lean mass, total
protein intake (grams), and protein intake adjusted for body weight did not differ among groups
(data not shown).
5.4.2 Blood and tissue fatty acids
The proportion of RBC and soft tissue (visceral and subcutaneous adipose, liver,
quadriceps) AA was significantly elevated in the HFD+AA group at wk 6 compared to both

123
control and HFD (Figure 5.2, Supp Tables S5.1-2). This was accompanied by lower DHA
proportions in RBC membranes, liver and quadriceps in the HFD+AA compared to both control
and HFD, however both HFD and HFD+AA had lower DHA in adipose tissues. High-fat feeding
led to lower EPA in RBC membranes and liver, with greater reductions in RBC EPA when AA
was added to the diet; whereas EPA was not observed in detectable amounts in adipose or
quadriceps tissue. Detailed FA composition of tissues is provided in Supplementary Tables S5.1
and S5.2.
5.4.3 Blood biochemistry
Serum RANKL concentrations were lower in the HFD group beginning wk 3 of study
(Table 5.2), with no difference between control and HFD+AA groups. A significant time x diet
interaction was observed in the RANKL/OPG ratio, with an initial decrease in the ratio in the
HFD groups at wk 3, but the HFD+AA group showing the greatest reduction compared to
baseline at the end of study. A similar interaction was found for osteocalcin; the HFD group had
the highest concentrations at wk 3, yet the levels decreased significantly by the end of study, with
HFD+AA showing intermediate levels at wk 6. There were no differences in CTx or P1NP.
Serum leptin concentrations were significantly elevated in HFD+AA beginning at wk 3
(Figure 5.3A), leptin continued to increase where HFD+AA had 1 and 2.5-fold greater
concentrations than HFD and controls respectively at the end of study. There was an initial
increase in adiponectin concentrations in the control and HFD+AA groups only, followed by a
reduction in all groups with HFD having 15% lower values than controls at wk 6. No differences
in circulating 25(OH)D (range: 37.8 – 79.6 nmol/L) or ionized calcium (range: 1.18 – 1.41
mmol/L) were observed at wk 6.

124
5.4.4 DXA and in vivo μCT measurements of bone mass and density
Longitudinal assessment by in vivo μCT (Table 5.3) showed that the HFD+AA group had
significantly lower whole body BMC at wk 6. Total bone volume did not differ among groups,
yet vBMD was higher in both the HFD and HFD+AA groups compared to controls. This
difference in BMC and vBMD was contributed predominantly by the trabecular compartment,
where the HFD+AA group had the lowest trabecular bone volume and BMC. In LV2-5, total and
trabecular BMC as well as bone volume at wk 6 were reduced in the HFD+AA group but not in
the HFD group. There were no differences in cortical bone measurements in neither whole body
nor vertebrae scans among all groups.
Results from the DXA imaging (Supp Table S5.3) showed no differences in whole body or
LV1-4 aBMD, BMC or area among groups throughout the study. At wk 6, the HFD and
HFD+AA groups had smaller projected area in the left femur than the control groups. No
differences in femur BMC were observed, resulting in slightly greater aBMD in the HFD (10%)
and HFD+AA (5%) groups relative to the control group.
5.4.5 Ex vivo bone microarchitecture
Distal femur metaphysis vBMD was increased by 29% in the HFD and HFD+AA groups
relative to controls (Figure 5.4). The HFD+AA group also showed improved microarchitectural
properties (increased BV/TV, BS/TV, Tb.N, Conn.D and lower SMI) compared to controls.
However, no differences in trabecular vBMD were observed at LV3 (Supp Figure S5.1).
At the femur mid-diaphysis (Table 5.4), total cross-sectional and medullary area (area
enclosed by the periosteal and endosteal envelope, respectively) were lower in the HFD+AA
group. However, there were no differences in cortical bone area, resulting in a slightly (5%)
greater cortical area/ total area in the HFD+AA group. Mid-diaphyseal diameter measured at

125
anterior-posterior direction was also reduced in the HFD+AA group compared to controls. There
were no significant differences in cortical vBMD or intra-cortical porosity among groups.
5.4.6 Bone biomechanics
The HFD group had significantly lower energy absorbed at break at the femur mid-
diaphysis compared to controls (Table 5.4). No significant differences in other measurements of
bone strength or bone length (data not shown) were observed.
5.4.7 Fatty acid treatment of 3T3-L1 adipocytes
The effects of varying concentrations of LCPUFA on adipose development and adipokine
secretion were explored in vitro using 3T3-L1 pre-adipocytes. Analysis of lipid accumulation by
Nile Red staining showed multiple small lipid droplets in cells treated with 25 µM of all lipids,
comparable to that of vehicle-treated control culture (Figure 5.5A). Accumulation of lipid
droplets increased in a dose-dependent manner. The effect was most pronounced in DPA- and
DHA-treated cells, although there were no significant differences in average droplet size among
treatments at 100 µM (Figure 5.5B). The relative proportion of adipocytes with small/
multiloculus-like lipid droplets (<20 µm2) was greater in AA-treated cells; whereas for cells
treated with EPA, DPA and DHA, a higher proportion of cells that contained uniloculus-like lipid
droplets was observed (Figure 5.5C). Except for DHA, the enrichment of respective LCPUFA
(AA, EPA and DPA) was notable, showing linear increases from 10-55% of total fatty acids
weight as LCPUFA treatment concentration increased (Supp Table S5.4). The proportion of
DHA in adipocytes plateaued at 30-35% at treatment concentrations above 50 μM. EPA
treatment increased accumulation of its elongation product n-3 DPA and vice versa, suggesting
these fatty acids are interconvertible in 3T3-L1 cells. AA treatment also resulted in 1.2- to 1.5-
fold greater leptin secretion relative to controls at all concentrations (Figure 5.3B), with the

126
greatest effect observed at 25 μM. Contrarily, all n-3 LCPUFA decreased leptin production. All
LCPUFA treatments lowered adiponectin secretion. The effect of suppression was greatest with
DHA (20-35%) and least with AA (10-15%).
The effects on leptin, adiponectin and PPARγ mRNA levels were explored with AA and
DHA treatment at 25, 50 and 100 µM (Figure 5.3C), as these fatty acids produced the most
prominent effects on adipokine secretion. Changes in leptin mRNA levels closely resembled the
secretion pattern in media. AA at 25 μM significantly increased leptin mRNA compared to
vehicle-treated cells. Conversely, mRNA levels of leptin, adiponectin and PPARγ were lowered
by DHA treatment at 50 and 100 µM.

127
Table 5.2 Assessment of bone biomarkers concentrations in rats fed a control, HFD, or HFD+AA diet for 6 wk
Time
(wk) CTRL HFD HFD+AA Main effect
Pdiet Ptime Pdiet*time
RANKL (pg/mL) 0 63.37 ± 10.72 48.63 ± 8.61 55.07 ± 8.14 <.0001 <.0001 0.86
3 52.26 ± 14.47a 37.35 ± 12.55b 49.63 ± 12.92a
6 45.49 ± 16.02a 35.28 ± 9.65b 43.71 ± 18.54a
OPG (pg/mL) 0 874.79 ± 245.52 842.20 ± 187.22 882.03 ± 260.87 0.11 0.76 0.56
3 1057.74 ± 288.39 778.90 ± 281.74 1006.17 ± 360.50
6 925.85 ± 220.63 707.52 ± 200.26 1211.59 ± 161.41
RANKL/OPG 0 0.078 ± 0.02 0.060 ± 0.01 0.068 ± 0.02 0.23 0.002 0.038
3 0.057 ± 0.02a 0.052 ± 0.02b 0.058 ± 0.03b
6 0.055 ± 0.02ab 0.054 ± 0.02ab 0.046 ± 0.02a
Osteocalcin (mg/mL) 0 292.72 ± 112.10 300.33 ± 78.54 252.19 ± 104.31 0.15 <.0001 0.022
3 334.95 ± 65.03ab 358.95 ± 44.26a 315.48 ± 37.02ab
6 265.46 ± 47.50ab 235.18 ± 26.93b 245.74 ± 31.65b
CTx (pg/mL) 0 140.00 ± 10.24 134.29 ± 12.72 138.61 ± 11.66 0.72 <.0001 0.73
3 121.83 ± 16.52 120.41 ± 9.10 122.32 ± 11.53
6 110.71 ± 17.69 114.59 ± 11.46 115.38 ± 11.67
P1NP (ng/mL) 0 59.22 ± 0.94 59.27 ± 1.21 58.64 ± 1.60 0.64 <.0001 0.26
3 55.84 ± 1.19 56.12 ± 0.93 56.85 ± 1.44
6 50.87 ± 2.00 49.88 ± 2.44 50.71 ± 0.82
Insulin (ng/mL) 6 0.15 ± 0.08 0.14 ± 0.04 0.16 ± 0.08 0.68
Data are mean ± SD. Significant differences determined using MIXED model ANOVA with post-hoc Tukey comparisons. Different superscript
indicates significant differences among diet groups over time (p<0.05). CTRL, n=14, HFD, n=14, HFD+AA, n=13. CTx, C-terminal
polypeptide; OPG, osteoprotegerin; P1NP, procollagen type-I N-terminal propeptide; RANKL, receptor activator of nuclear factor-κB ligand

128
Table 5.3 Bone mass in whole body and lumbar vertebrae 2-5 assessed by in vivo μCT in rats fed a control, HFD, or HFD+AA diet at baseline and wk 6
Time
(wk) CTRL HFD HFD+AA
Main effect
Pdiet Ptime Pdiet*time
Whole body
Total Volume (cm3) 0 3.2 ± 0.3 3.2 ± 0.3 3.3 ± 0.3 0.57 <.0001 0.78
6 14.4 ± 0.7 14.0 ± 0.9 13.8 ± 1.3
BMC (g) 0 1009.5 ± 58.1 1004.3 ± 120.8 1009.5 ± 92.9 0.038 <.0001 0.65
6 6828.9 ± 387.6a 6819.4 ± 488.7a 6671.7 ± 492.2b
vBMD (g/cm3) 0 313.4 ± 7.3 314.1 ± 11.2 307.9 ± 8.8 0.042 <.0001 0.34
6 475.0 ± 15.8a 486.0 ± 12.9b 483.6 ± 19.3b
Trabecular Volume (cm3) 0 0.9 ± 0.1 0.9 ± 0.1 0.9 ± 0.01 0.036 <.0001 0.71
6 6.2 ± 0.4a 6.0 ± 0.5ab 5.9 ± 0.7b
BMC (g) 0 173.3 ± 15.2 171.9 ± 29.9 174.3 ± 18.2 0.033 <.0001 0.56
6 2151.8 ± 185.2ab 2201.2 ± 266.7a 2118.5 ± 205.5b
vBMD (g/cm3) 0 195.3 ± 5.0 197.0 ± 14.3 193.1 ± 5.8 0.041 <.0001 0.28
6 346.6 ± 15.9a 364.0 ± 22.2b 359.9 ± 20.7ab
Lumbar Vertebrae 2-5
Total Volume (cm3) 0 0.1 ± 0.01 0.1 ± 0.01 0.2 ± 0.00 0.039 <.0001 0.46
6 0.82 ± 0.05a 0.84 ± 0.02ab 0.80 ± 0.02b
BMC (g) 0 41.5 ± 2.7 40.5 ± 5.2 41.04 ± 3.9 0.027 <.0001 0.37
6 331.3 ± 24.3ab 330.0 ± 27.6a 309.7 ± 19.3b
vBMD (g/cm3) 0 294.7 ± 9.7 286.8 ± 11.3 281.8 ± 9.5 0.25 <.0001 0.92
6 405.2 ± 18.6 404.8 ± 16.1 406.3 ± 21.0
Trabecular Volume (cm3) 0 0.06 ± 0.001 0.06 ± 0.001 0.06 ± 0.002 0.034 <.0001 0.88
6 0.40 ± 0.01a 0.41 ± 0.01ab 0.35 ± 0.01b
BMC (g) 0 11.3 ± 1.4 11.3 ± 2.0 11.7 ± 1.5 0.028 <.0001 0.41
6 138.7 ± 13.9ab 138.9 ± 18.3a 126.2 ± 9.8b
vBMD (g/cm3) 0 201.5 ± 5.3 197.8 ± 11.2 195.7 ± 7.6 0.48 <.0001 0.59
6 333.5 ± 13.8 331.3 ± 20.5 341.0 ± 19.0
Data are mean ± SD. Significant differences determined using MIXED model ANOVA with post-hoc Tukey comparisons. Within rows,
different superscript indicates significant differences among diet groups (p<0.05). CTRL, n=14, HFD, n=14, HFD+AA, n=13. BMC,
bone mineral content; vBMD, volumetric bone mineral density

129
Table 5.4 Ex vivo µCT measurements of bone mass and geometry of the femur mid-diaphysis and bone biomechanics assessed by 3-point bending
CTRL HFD HFD+AA Pdiet
Micro-CT measurements
vBMD (g/cm3) 1.83 ± 0.04 1.83 ± 0.03 1.82 ± 0.04 0.76
Tt.Ar (mm2) 13.72 ± 1.04a 13.45 ± 1.11ab 12.87 ± 1.40b 0.038
Ct.Ar (mm2) 6.71 ± 0.46 6.78 ± 0.34 6.52 ± 0.52 0.53
Ma.Ar (mm2) 7.01 ± 0.85a 6.67 ± 0.56ab 6.38 ± 0.78b 0.034
Ct.Ar / Tt.Ar (%) 49.01 ± 3.29a 50.58 ± 2.90ab 51.17 ± 3.72b 0.041
Mid-diaphyseal diameter
(antero-posteral) (mm)
3.60 ± 0.14a 3.42 ±0.46ab 3.24 ± 0.57 b 0.028
Bone biomechanics
Maximum load (N) 105.05 ± 11.78 106.40 ± 13.76 108.51 ± 20.37 0.34
Maximum extension (mm) 1.04 ± 0.19 1.01 ± 0.18 0.94 ± 0.22 0.58
Energy at break (mJ) 94.51 ± 25.14a 78.55 ± 28.55b 90.70 ± 22.27ab 0.035
Stressmax (MPa) 72.87 ± 18.08 79.27 ± 30.71 67.06 ± 12.68 0.54
Strainmax (%) 7.56 ± 1.50 7.14 ± 1.26 6.63 ± 1.79 0.67
Extrinsic stiffness (N/mm) 3.07 ± 0.27 3.22 ± 0.46 3.28 ± 0.57 0.71
Young’s Modulus (MPa) 29.26 ± 5.99 33.77 ± 12.69 29.32 ± 7.23 0.92
Moment of inertia (x-axis) (mm4) 11.15 ± 2.34 10.94 ± 4.06 12.05 ± 2.97 0.66
Data are mean ± SD. Significant differences determined using MIXED model ANOVA with post-hoc
Tukey comparisons. Within rows, different superscript indicates significant differences among diet groups
(p<0.05). CTRL, n=14, HFD, n=14, HFD+AA, n=13. Ct.Ar, cortical area; Ma.Ar, marrow area; Tt.Ar,
total area; vBMD, volumetric bone mineral density
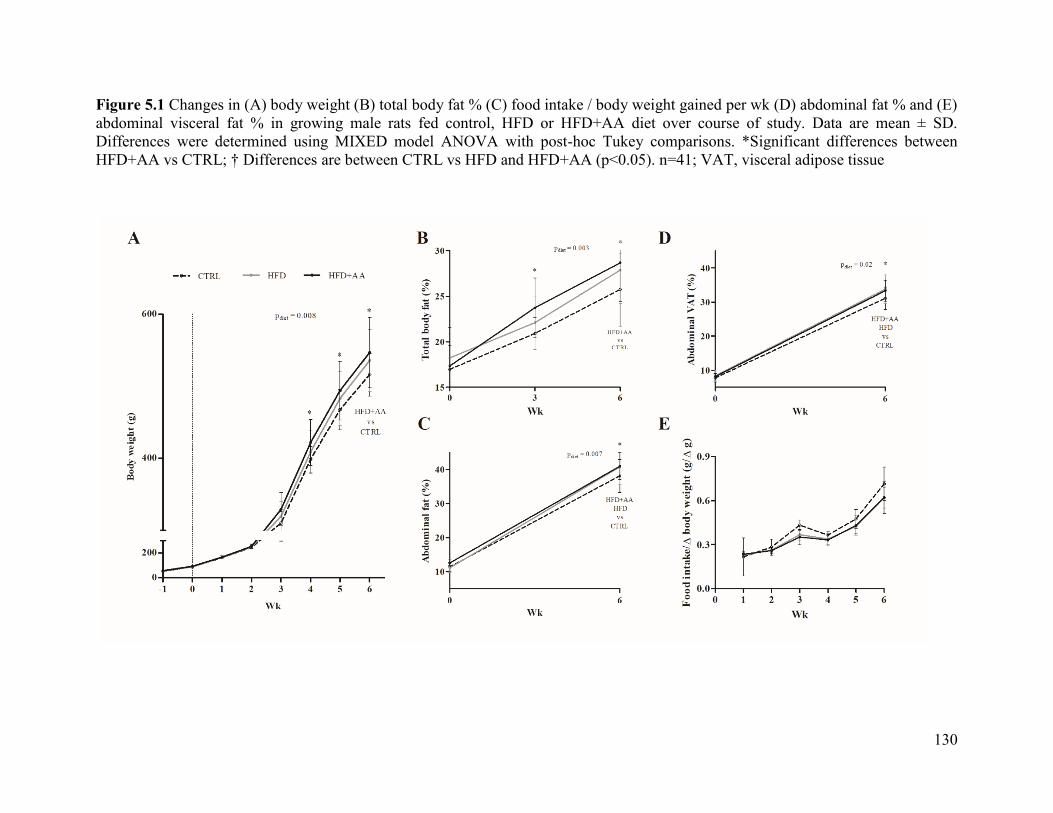
130
Figure 5.1 Changes in (A) body weight (B) total body fat % (C) food intake / body weight gained per wk (D) abdominal fat % and (E)
abdominal visceral fat % in growing male rats fed control, HFD or HFD+AA diet over course of study. Data are mean ± SD.
Differences were determined using MIXED model ANOVA with post-hoc Tukey comparisons. *Significant differences between
HFD+AA vs CTRL; † Differences are between CTRL vs HFD and HFD+AA (p<0.05). n=41; VAT, visceral adipose tissue

131
Figure 5.2 Proportions of ALA, LA, AA, DPA and DHA in total lipids of (A) red blood cells and (B) adipose tissue in growing male
rats fed control, HFD and HFD+AA diet for 6 wk. Data are mean ± SD. Differences were determined using MIXED model ANOVA
with post-hoc Tukey comparisons. Different superscript indicates significant differences among diets (p<0.05). n=41; RBC, red blood
cell; SAT, subcutaneous adipose tissue; VAT, visceral adipose tissue

132
Figure 5.3 (A) Serum leptin and adiponectin concentrations in growing male rats fed control,
HFD, and HFD+AA diet for 6 wk; (B) 3T3-L1 adipocytes were treated with difference
concentrations of AA, EPA, DPA and DHA (10, 25, 50 or 100 μM) for 48 h. Leptin and
adiponectin concentrations were measured in culture media; and (C) mRNA levels of leptin,
adiponectin and PPARγ were quantified with quantitative RT-PCR and presented as relative
expression compared to vehicle-treated cells. Data are mean ± SD. Differences were determined
using MIXED model ANOVA with post-hoc Tukey comparisons. Different superscripts indicate
significant differences among groups (p<0.05).; n=14 (leptin) and n=10 (adiponectin) per group /
time point; n=3 for 3T3-L1 adipocytes. * Differences are significant between treatment and
vehicle-treated cells

133
Figure 5.4 Ex vivo μCT measurements of the trabecular micro-architectural properties at the (A) distal femur metaphysis (B)
representative 3D reconstruction of trabecular bone. Data are mean ± SD. Differences were determined using MIXED model ANOVA
with post-hoc Tukey comparisons. Different superscripts indicate significant differences among groups. n=41. BV/TV, bone volume
fraction; BS/TV, bone surface density; Conn.D, connectivity density; SMI, structure model index; Tb.N, trabecular number; Tb.Th,
trabecular thickness; Tb.Sp, trabecular separation; vBMD, volumetric bone mineral density

134
Figure 5.5 (A) Representative images of Nile Red and DAPI-stained 3T3-L1 adipocytes (B) Measurement of lipid droplet size in cells
following 48h treatment of 25 and 100 μM of AA, EPA, DPA and DHA (C) Adipocytes were categorized into containing uniloculus-
like and multiloculus-like lipid droplets. Cellular distribution of each categorized cell type in adipocytes treated with 100 µM fatty
acids were measured with ImageJ, the scale bar represents 100 μm. n=3 per concentration / treatment

135
5.5 Discussion
This study examined the interaction between dietary AA with bone mass and adiposity in a
highly-controlled animal model of diet-induced obesity. The inclusion of AA in a HFD for 6 wk
increased body weight, adiposity, and serum leptin compared to the HFD alone, suggesting that
AA exacerbated diet-induced obesity. HFD+AA reduced whole body BMC and femur cortical
area at the mid-diaphysis, but not bone strength. Femur metaphyseal trabecular vBMD and
micro-architecture was improved in HFD+AA compared to controls. The inclusion of AA
promoted adipogenesis and augmented the early consequences of obesity on bone.
Along with the present results, a moderately HFD (30-35% energy) appears sufficient to
influence bone metabolism independent of weight gain, possibly through altering body
composition and adipokine metabolism. HFD (25-30% energy) increased femur mid-diaphyseal
cortical thickness [351] and decreased bone formation in tibia metaphysis [216]. Many studies of
diet induced obesity in animals used dietary fat content ranging from 45-70% of energy [91,
216], whereas the typical rodent diet contains approximately 14% of energy as fat. While these
HFD are effective in inducing weight gain and associated metabolic complications, this does not
mimic the human scenario, especially in light of the rising obesity prevalence in the absence of
increased dietary fat intake over the last decade [39]. It is therefore important to consider both
quantity and composition of fat in experimental diets that would reflect the timing and pattern of
obesity development in human as closely as possible.
It is increasingly clear that obesity is associated with lower bone vBMD or quality in both
children [352] and adults [353]. Using both in vivo and ex vivo μCT, we reported decreased
trabecular BMC as well as bone volume deficits in the whole body and LV2-5 in HFD+AA;
whereas at the distal femur metaphysis, high-fat feeding increased trabecular vBMD and

136
improved microarchitectural properties in HFD+AA. This contradicted our hypothesis where
both bone mass and quality are compromised in obesity. Previous studies have likewise reported
increases in trabecular vBMD and microarchitecture with diet-induced obesity in growing and
adult mice [316, 354]. These could be attributed to increased mechanical loading, circulating
levels of anabolic hormones including insulin and leptin, and the nutritive effects of excess
energy and/or fatty acid intake. The effects of obesity on bone may also manifest at non-weight
bearing sites (vertebrae) in rodents, hence the lower BMC with HFD was not observed in the
femur.
Leptin concentrations were notably elevated in HFD+AA. Murine models of leptin
deficiency or signaling (ob/ob, db/db mice and fa/fa rats) displayed reductions in trabecular
network and biomechanical properties of the femur [146, 148] but not in the lumbar vertebrae
[149]. These animal models suggest the static loads conferred by excess body weight do not
overcome the absence of leptin, or the potential benefits of leptin on bone may be masked by
reduced muscle load at the axial skeleton. The opposing effects of AA+HFD on trabecular bone
in femur and vertebrae observed in the current study are thus speculated to be mediated in part
through leptin action.
Obesity is associated with imbalances of essential LCPUFA status [60]. Phospholipid and
sterol esters AA, DHGLA and LA proportions were substantially higher in children who are
obese [60]. Similarly, AA proportions in subcutaneous adipose tissue positively associate with
the variance in BMI (38.2%), more so than any other LCPUFA in pre-pubertal children [288].
Here, HFD led to reductions in RBC and tissue proportions of n-3 ALA, EPA and DPA, while
addition of AA further diminished EPA and DHA. Although studies of dietary AA on bone
growth are inconsistent [322, 355, 356], the beneficial effects of EPA and DHA on bone mass

137
accrual are known in humans [357, 358] and animals [359]. The observed bone outcomes could
therefore be attributed to the lower n-3 LCPUFA status with AA feeding and consequential to
obesity.
The regulation of adipokine secretion by LCPUFA is likely nonlinear. Our elevated leptin
concentrations in HFD+AA cannot be explained by adiposity alone, hence the adipocyte
response to LCPUFA were tested in vitro. AA caused an initial increase in leptin production and
mRNA levels at 25 μM followed by a gradual decrease at higher doses. Similarly, AA at 200 μM
inhibited leptin expression in isolated rat adipocytes [360]. Here, we reported n-3 LCPUFA
decreased leptin and adiponectin secretion. While this contradicts earlier reports where EPA and
DHA (50-125 μM) upregulated leptin in differentiating and mature 3T3-L1 adipocytes [211, 327-
329], higher DHA (1 mM) reduced leptin mRNA by 22-40% [156]. Thus, the responses to
physiologically-relevant treatment dosages need to be characterized to guide further studies.
The involvement of PPARγ in regulating adipokine secretion is unclear. A PPAR response
element was identified in the promoter region of adiponectin gene [210] but not that of leptin
[204]. The changes in leptin and adiponectin mRNA levels after treatment with AA or DHA in
our study strongly resembled that of PPARγ, suggesting the expression of these adipokines may
relate directly to PPARγ expression and/or activity. The decreased PPARγ mRNA levels with
DHA treatment is contrary to previous studies [211, 327, 329, 361]. However, DHA dose-
dependently (25-200 μM) supressed lipid accumulation and droplet size in differentiating 3T3-
L1 cells [52]. The decreased expression of adipokines and PPAR could therefore be a
consequence of the anti-adipogenic effects of DHA. This may also explain the observation where
DHA-treated adipocytes contained uniloculus-like lipid droplets that were of similar size as cells
treated with AA. The potential role of LCPUFA in reducing both hyperplasic and hypertrophy of

138
growing adipocytes and remain to be clarified in vivo with longer intervention studies.
The inclusion of male rats only in this study limits the generalization of results given the
known effects of estrogen on raising LCPUFA status [362], and the sex dimorphism exhibited
during skeletal growth [363]. Our bone biomarker data were unable to show if the lower bone
mass in HFD+AA was due to increased bone absorption or decreased formation. The use of bone
biomarkers as indicators of skeletal health may be limited in our model, as the deviation from
normal (healthy) states may not be large enough to be detected [364]. Further studies should
include bone histomorphometry to quantify cellular activities in bone remodeling. The current
study examined the fatty acid profile in total lipids; the characterization of fatty acid proportions
in phospholipids or triglycerides, and/or coupled with use of fatty acid tracers would clarify the
metabolic fate of fatty acids after uptake into the cells, and determine if they are preferentially
stored, oxidized, or converted to other metabolites. Diet-induced obesity decreases bone mass in
rodents and contrasts observed increases in some human studies [75, 76]. This could in part be
related to different load-bearing patterns in rodents versus humans, and the complexities in the
etiology of obesity in humans. However, our study is relevant at least in the understanding of
consequences of diet-induced obesity on LCPUFA status and bone outcomes, providing insight
into the possible mechanisms of bone fragility observed in children with obesity.
5.6 Conclusion
The addition of AA to a moderately HFD promoted obesity development in growing male
rats, negatively impacting BMC and volume at the whole body and lumbar vertebra, without
impairing bone strength at the femur diaphysis. Improvements in femur metaphyseal
microarchitecture were also observed with AA. This study highlights the complexity of fat and
bone crosstalk and points to the interaction of multiple metabolic pathways which may explain

139
conflicting findings within existing literature. The longer-term effects of AA on BMD and
ultimately, fracture risks in children of overweight or obese weight status remains to be clarified.
5.7 Acknowledgments
The authors would like to thank Krystyna Wang, Julia Levy-Ndejuru and Kimberly
O’Keefe for their assistance with the animal study and laboratory analyses. We would also like to
thank Dr. Jingjing Li for her skillful technical assistance with cell culture experiments.
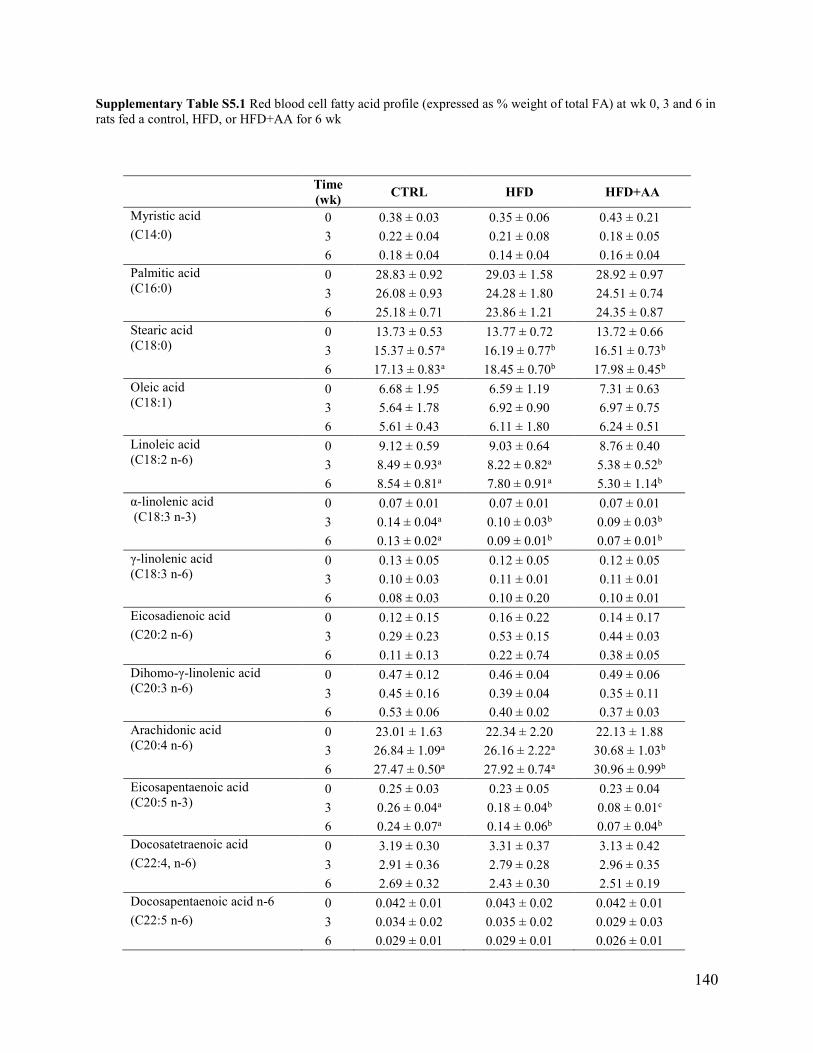
140
Supplementary Table S5.1 Red blood cell fatty acid profile (expressed as % weight of total FA) at wk 0, 3 and 6 in
rats fed a control, HFD, or HFD+AA for 6 wk
Time
(wk) CTRL HFD HFD+AA
Myristic acid 0 0.38 ± 0.03 0.35 ± 0.06 0.43 ± 0.21
(C14:0) 3 0.22 ± 0.04 0.21 ± 0.08 0.18 ± 0.05
6 0.18 ± 0.04 0.14 ± 0.04 0.16 ± 0.04
Palmitic acid
(C16:0) 0 28.83 ± 0.92 29.03 ± 1.58 28.92 ± 0.97
3 26.08 ± 0.93 24.28 ± 1.80 24.51 ± 0.74
6 25.18 ± 0.71 23.86 ± 1.21 24.35 ± 0.87
Stearic acid
(C18:0) 0 13.73 ± 0.53 13.77 ± 0.72 13.72 ± 0.66
3 15.37 ± 0.57a 16.19 ± 0.77b 16.51 ± 0.73b
6 17.13 ± 0.83a 18.45 ± 0.70b 17.98 ± 0.45b
Oleic acid
(C18:1) 0 6.68 ± 1.95 6.59 ± 1.19 7.31 ± 0.63
3 5.64 ± 1.78 6.92 ± 0.90 6.97 ± 0.75
6 5.61 ± 0.43 6.11 ± 1.80 6.24 ± 0.51
Linoleic acid
(C18:2 n-6) 0 9.12 ± 0.59 9.03 ± 0.64 8.76 ± 0.40
3 8.49 ± 0.93a 8.22 ± 0.82a 5.38 ± 0.52b
6 8.54 ± 0.81a 7.80 ± 0.91a 5.30 ± 1.14b
α-linolenic acid
(C18:3 n-3) 0 0.07 ± 0.01 0.07 ± 0.01 0.07 ± 0.01
3 0.14 ± 0.04a 0.10 ± 0.03b 0.09 ± 0.03b
6 0.13 ± 0.02a 0.09 ± 0.01b 0.07 ± 0.01b
γ-linolenic acid
(C18:3 n-6) 0 0.13 ± 0.05 0.12 ± 0.05 0.12 ± 0.05
3 0.10 ± 0.03 0.11 ± 0.01 0.11 ± 0.01
6 0.08 ± 0.03 0.10 ± 0.20 0.10 ± 0.01
Eicosadienoic acid 0 0.12 ± 0.15 0.16 ± 0.22 0.14 ± 0.17
(C20:2 n-6) 3 0.29 ± 0.23 0.53 ± 0.15 0.44 ± 0.03
6 0.11 ± 0.13 0.22 ± 0.74 0.38 ± 0.05
Dihomo-γ-linolenic acid
(C20:3 n-6) 0 0.47 ± 0.12 0.46 ± 0.04 0.49 ± 0.06
3 0.45 ± 0.16 0.39 ± 0.04 0.35 ± 0.11
6 0.53 ± 0.06 0.40 ± 0.02 0.37 ± 0.03
Arachidonic acid
(C20:4 n-6) 0 23.01 ± 1.63 22.34 ± 2.20 22.13 ± 1.88
3 26.84 ± 1.09a 26.16 ± 2.22a 30.68 ± 1.03b
6 27.47 ± 0.50a 27.92 ± 0.74a 30.96 ± 0.99b
Eicosapentaenoic acid
(C20:5 n-3) 0 0.25 ± 0.03 0.23 ± 0.05 0.23 ± 0.04
3 0.26 ± 0.04a 0.18 ± 0.04b 0.08 ± 0.01c
6 0.24 ± 0.07a 0.14 ± 0.06b 0.07 ± 0.04b
Docosatetraenoic acid 0 3.19 ± 0.30 3.31 ± 0.37 3.13 ± 0.42
(C22:4, n-6) 3 2.91 ± 0.36 2.79 ± 0.28 2.96 ± 0.35
6 2.69 ± 0.32 2.43 ± 0.30 2.51 ± 0.19
Docosapentaenoic acid n-6 0 0.042 ± 0.01 0.043 ± 0.02 0.042 ± 0.01
(C22:5 n-6) 3 0.034 ± 0.02 0.035 ± 0.02 0.029 ± 0.03
6 0.029 ± 0.01 0.029 ± 0.01 0.026 ± 0.01

141
Docosapentaenoic acid n-3
(C22:5 n-3) 0 1.90 ± 0.21 1.77 ± 0.31 1.84 ± 0.28
3 1.59 ± 0.16 1.42 ± 0.19 1.26 ± 0.07
6 0.86 ± 0.54 0.88 ± 0.55 1.02 ± 0.54
Docosahexaenoic acid
(C22:6 n-3) 0 3.69 ± 0.52 3.55 ± 0.69 3.55 ± 0.53
3 3.05 ± 1.21a 2.99± 0.68a 1.23 ± 0.41b
6 2.88± 0.58a 2.59 ± 0.66a 0.86 ± 0.21b
Total n-3 0 5.76 ± 0.78 5.61 ± 0.96 5.28 ± 1.70
3 5.03 ± 1.31a 4.68 ± 0.60a 2.47 ± 0.81b
6 4.09 ± 0.77a 3.70 ± 0.97b 1.88 ± 0.84b
Total n-6 0 36.05 ± 2.30 35.39 ± 0.96 32.26 ± 9.46
3 39.11 ± 1.21 38.22 ± 0.61 37.09 ± 10.76
6 39.45 ± 0.78 39.64 ± 1.11 36.79 ± 10.63sv
Data are mean ± SD. Significant differences determined using MIXED model ANOVA with post-hoc
Tukey comparisons. Within rows, different superscript indicates significant differences among diet groups
(p<0.05). CTRL, n=14, HFD, n=14, HFD+AA, n=13

142
Supplementary Table S5.2 Fatty acid profile (expressed as % weight of total FA) in subcutaneous and visceral adipose
tissue, liver and quadriceps at end of study in rats fed a control, HFD, or HFD+AA for 6 wk
Data are mean ± SD. Significant differences determined using MIXED model ANOVA with post-hoc Tukey comparisons.
Within rows, different superscript indicates significant differences among diet groups (p<0.05). CTRL, n=14, HFD, n=14,
HFD+AA, n=13. Levels of EPA were below the detection limit in subcutaneous and visceral adipose tissue and the
quadriceps
Subcutaneous adipose tissue Visceral adipose tissue
CTRL HFD HFD+AA CTRL HFD HFD+AA
C14:0 1.78 ± 0.14a 1.61 ± 0.11b 1.63 ± 0.08b 1.72 ± 0.12a 1.57 ± 0.18b 1.61 ± 0.14ab
C16:0 24.91± 1.57ab 22.46 ± 0.92b 22.37 ± 1.25b 26.51 ± 2.52a 23.46 ± 1.44b 23.07 ± 1.48b
C18:0 2.53 ± 0.30a 3.44 ± 0.40b 3.50 ± 0.40b 2.70 ± 0.53a 3.40 ± 0.29b 3.62 ± 0.33b
C18:1 26.72 ± 2.23a 34.24 ± 0.48b 31.51 ± 1.61c 26.57 ± 1.43a 34.05 ±0.70b 31.97 ± 0.88c
C18:2 n-6 31.19 ± 3.57a 29.18 ± 1.44b 28.49 ± 2.41b 30.19 ± 4.82a 29.04 ± 2.12ab 28.01 ± 2.20b
C18:3 n-3 3.39 ± 0.49a 2.44 ± 0.12b 2.63 ± 0.33b 3.35 ± 0.42a 2.47 ± 0.13b 2.57 ± 0.20b
C18:3 n-6 0.12 ±0.06a 0.12 ± 0.02a 0.26 ± 0.09b 0.10 ± 0.03a 0.09 ± 0.01a 0.20 ± 0.11b
C20:2 n-6 0.17 ± 0.05a 0.26 ± 0.02b 0.31 ± 0.05b 0.18 ± 0.02a 0.19 ± 0.05a 0.29 ± 0.03b
C20:3 n-6 0.13 ±0.10a 0.09 ± 0.29a 0.35 ± 0.08b 0.08 ± 0.04a 0.07 ± 0.04a 0.37 ± 0.05b
C20:4 n-6 0.77 ± 0.83a 0.48 ± 0.08a 3.01 ± 0.82b 0.43 ± 0.12a 0.41 ± 0.13a 2.71 ± 0.47b
C20:5 n-3 ND ND
C22:4 n-6 0.09 ± 0.19a 0.13 ± 0.03a 0.53 ± 0.16b 0.10 ± 0.04a 0.15 ± 0.05a 0.43 ± 0.18b
C22:5 n-3 0.11 ± 0.05ab 0.05 ± 0.05a 0.12 ± 0.03b 0.08 ± 0.06a 0.02 ± 0.04b 0.09 ± 0.06b
C22:6 n-3 0.16 ± 0.04a 0.10 ± 0.06b 0.11 ± 0.04b 0.14 ± 0.07a 0.07 ± 0.06b 0.07 ± 0.06b
Total n-6 30.23 ± 9.25 30.27 ± 1.39 32.91 ± 1.92 33.21 ± 4.69 29.59 ± 2.02 31.83 ± 1.97
Total n-3 3.40 ± 1.08a 2.59 ± 0.15b 2.86 ± 0.32ab 3.67 ± 0.39a 2.49 ± 0.17b 2.73 ± 0.17ab
Liver Quadriceps
CTRL HFD HFD+AA CTRL HFD HFD+AA
C14:0 0.86 ± 0.23a 0.63 ± 0.16b 0.60 ± 0.10b 1.04 ± 0.42 0.95 ± 0.33 0.97 ± 0.25
C16:0 29.71 ± 4.59a 26.46 ± 4.15b 22.42 ± 2.58c 23.69 ± 2.03a 22.53 ± 1.25ab 22.04 ± 1.62b
C18:0 10.12 ± 2.56a 9.91 ± 2.05ab 7.82 ± 1.65b 9.50 ± 2.98 10.02 ± 3.01 9.94 ± 2.72
C18:1 19.43 ± 5.20a 23.88 ± 4.08b 19.72 ± 2.87ab 16.36 ± 6.48 21.17 ± 8.21 20.11 ± 5.38
C18:2 n-6 15.31 ± 4.46a 18.44 ± 4.63ab 21.09 ± 3.57b 25.12 ± 2.17a 23.55 ± 2.33b 20.64 ± 3.05b
C18:3 n-3 0.67 ± 0.29a 0.69 ± 0.33a 1.12 ± 0.58b 1.48 ± 0.54 1.18 ± 0.52 1.30 ± 0.39
C18:3 n-6 0.21 ± 0.25 0.15 ± 0.10 0.28 ± 0.11 0.03 ± 0.04a 0.03 ± 0.05a 0.15 ± 0.07b
C20:2 n-6 0.31 ± 0.16ab 0.17 ± 0.12a 0.41 ± 0.15b 0.21 ± 0.05a 0.28 ± 0.03b 0.32 ± 0.03b
C20:3 n-6 0.53 ± 0.15a 0.41 ± 0.09b 0.57 ± 0.12a 0.33 ± 0.10a 0.30 ± 0.13a 0.44 ± 0.06b
C20:4 n-6 11.97 ± 3.71a 11.43 ± 2.66a 16.61 ± 2.73b 8.55 ± 3.64a 8.79 ± 4.77a 13.99 ± 4.62b
C20:5 n-3 0.23 ± ??a 0.09 ± ???b 0.11 ± 0.??b ND
C22:4 n-6 0.29 ± 0.09a 0.49 ± 0.22a 3.07 ± 0.88b 0.48 ± 0.15a 0.51 ± 0.18a 1.35 ± 0.31b
C22:5 n-3 0.44 ± 0.24ab 0.37 ± 0.15a 0.72 ± 0.14b 1.34 ± 0.54 1.09 ± 0.60 1.17 ± 0.50
C22:6 n-3 3.64 ± 1.24a 3.39 ± 0.83a 1.94 ± 0.52b 6.90 ± 3.33a 6.18 ± 3.71a 3.25 ± 1.48b
Total n-6 28.65 ± 8.11a 31.22 ± 6.71a 41.27 ± 4.88b 9.52 ± 3.80a 9.85 ± 4.97a 16.27 ± 4.88b
Total n-3 5.62 ± 1.46a 4.57 ± 1.12ab 3.80 ± 0.59b 9.72 ± 3.32a 8.46 ± 3.78a 5.71 ± 1.58b

143
Supplementary Table S5.3 Whole body, lumbar vertebrae 1-4, femur and tibia area, bone mineral content (BMC)
and areal bone mineral density assessed by DXA in rats fed a control, HFD, or HFD+AA diet at baseline, wk 3 and
wk 6
Time
(wk) CTRL HFD HFD+AA
Whole body
Area (cm2) 0 26.17 ± 2.09 27.03 ± 2.07 26.56 ± 3.17
3 61.42 ± 3.27 62.49 – 4.48 63.74 ± 4.02
6 86.01 ± 4.02 85.51 ± 4.37 87.27 ± 5.55
BMC (g) 0 2.32 ± 0.23 2.39 ± 0.21 2.34 ± 0.34
3 7.64 ± 0.46 7.82 ± 0.67 7.89 ± 0.69
6 13.05 ± 0.75 13.09 ± 0.84 13.08 ± 1.20
aBMD (g/cm2) 0 0.088 ± 0.002 0.088 ± 0.003 0.088 ± 0.003
3 0.124 ± 0.003 0.125 ± 0.004 0.123 ± 0.004
6 0.152 ± 0.005 0.153 ± 0.004 0.150 ± 0.005
Lumbar vertebrae 1-4
Area (cm2) 0 0.60 ± 0.03 0.62 ± 0.05 0.62 ± 0.06
3 1.20 ± 0.10 1.15 ± 0.10 1.18 ± 0.08
6 1.53 ± 0.08 1.49 ± 0.10 1.48 ± 0.12
BMC (g) 0 0.08 ± 0.01 0.08 ± 0.01 0.08 ± 0.01
3 0.23 ± 0.02 0.22 ± 0.02 0.23 ± 0.02
6 0.43 ± 0.02 0.42 ± 0.03 0.41 ± 0.04
aBMD (g/cm2) 0 0.141 ± 0.009 0.134 ± 0.011 0.133 ± 0.009
3 0.194 ± 0.017 0.195 ± 0.013 0.193 ± 0.011
6 0.278 ± 0.015 0.280 ± 0.017 0.275 ± 0.015
Left femur
Area (cm2) 0 0.53 ± 0.04 0.51 ± 0.03 0.52 ± 0.05
3 0.93 ± 0.04 0.88 ± 0.06 0.88 ± 0.08
6 1.08 ± 0.05a 1.00 ± 0.06b 1.02 ± 0.07b
BMC (g) 0 0.08 ± 0.01 0.08 ± 0.01 0.08 ± 0.01
3 0.26 ± 0.02 0.25 ± 0.03 0.25 ± 0.02
6 0.44 ± 0.03 0.44 ± 0.04 0.43 ± 0.02
aBMD (g/cm2) 0 0.148 ± 0.013 0.154 ± 0.017 0.151 ± 0.010
3 0.277 ± 0.019 0.285 ± 0.029 0.284 ± 0.031
6 0.404 ± 0.027a 0.439 ± 0.032b 0.421 ± 0.028b
Left tibia
Area (cm2) 0 0.62 ± 0.05 0.64 ± 0.07 0.66 ± 0.08
3 1.14 ± 0.09 1.14 ± 0.10 1.14 ± 0.09
6 1.45 ± 0.11 1.45 ± 0.09 1.44 ± 0.08
BMC (g) 0 0.07 ± 0.01 0.07 ± 0.01 0.07 ± 0.01
3 0.22 ± 0.02 0.21 ± 0.02 0.21 ± 0.02
6 0.36 ± 0.03 0.37 ± 0.04 0.35 ± 0.02
aBMD (g/cm2) 0 0.107 ± 0.010 0.111 ± 0.011 0.108 ± 0.011
3 0.189 ± 0.016 0.181 ± 0.018 0.183 ± 0.019
6 0.245 ± 0.015 0.252 ± 0.020 0.242 ± 0.011
Data are mean ± SD. Significant differences determined using MIXED model ANOVA with post-hoc Tukey
comparisons. Within rows, different superscript indicates significant differences among diet groups (p<0.05).
CTRL, n=14, HFD, n=14, HFD+AA, n=13. aBMD, areal bone mineral density; BMC, bone mineral content

144
Supplementary Table S5.4 Fatty acid profile (expressed as % weight of total FA) in 3T3-L1 adipocytes following
48 h fatty acid treatment
Conc
(μM) AA EPA DPA DHA
C16:0 10 31.41 ± 4.06a 34.50 ± 0.42a 32.86 ± 0.76a 32.51 ± 0.32a
25 28.11 ± 3.61a 27.81 ± 1.15b 27.25 ± 0.62b 27.08 ± 0.67b
50 24.57 ± 0.03ab 23.37 ± 1.08c 23.69 ± 0.29c 25.22 ± 0.11a
100 18.22 ± 0.16b 18.62 ± 0.21d 19.58 ± 0.61d 28.45 ± 0.87b
10 16.80 ± 2.37a 19.09 ± 0.46a 18.11 ± 0.37a 19.03 ± 0.25a
C16:1 25 14.45 ± 1.90ab 14.75 ± 0.71b 14.08 ± 0.62b 15.98 ± 0.59b
50 12.23 ± 0.15b 13.85 ± 0.60b 13.09 ± 0.45b 15.15 ± 0.22b
100 8.55 ± 0.25c 11.11 ± 0.14c 10.39 ± 1.29c 15.57 ± 0.62b
10 6.91 ± 0.59a 6.75 ± 0.06a 7.53 ± 0.59 6.67 ± 0.42a
C18:0 25 6.33 ± 0.60a 7.46 ± 0.89a 7.20 ± 1.01 5.72 ± 0.54ab
50 5.81 ± 0.31ab 5.71 ± 0.82a 5.27 ± 0.81 4.48 ± 0.22c
100 5.00 ± 0.48b 3.88 ± 0.32b 4.60 ± 2.23 5.97 ± 0.49bc
10 10.67 ± 1.49a 11.26 ± 0.27a 12.09 ± 0.32a 11.68 ± 0.14a
C18:1 25 9.08 ± 1.16a 9.86 ± 0.27b 10.00 ± 0.11b 9.67 ± 0.26b
50 8.26 ± 0.08ab 8.26 ± 0.10c 7.91 ± 0.09c 9.31 ± 0.08b
100 6.17 ± 0.10b 6.66 ± 0.09d 6.37 ± 0.54d 9.93 ± 0.23b
10 1.16 ± 0.22 1.41 ± 0.15 1.74 ± 0.55 1.45 ± 0.42
C18:2 n-6 25 1.59 ± 0.12 1.54 ± 0.62 1.56 ± 0.49 1.56 ± 0.68
50 1.21 ± 0.24 1.57 ± 0.73 1.28 ± 0.43 1.27 ± 0.42
100 1.15 ± 0.34 0.70 ± 0.31 1.66 ± 1.56 1.51 ± 0.37
10 0.51 ± 0.44 0.21± 0.01a 0.48 ± 0.18 0.19 ± 0.03
C18:3 n-6 25 0.16 ± 0.00 0.61 ± 0.19b 0.44 ± 0.16 0.17 ± 0.03
50 0.23 ± 0.00 0.36 ± 0.13ab 0.35 ± 0.02 0.15 ± 0.02
100 0.34 ± 0.04 0.27 ± 0.08a 0.56 ± 0.56 0.17 ± 0.03
C20:3 n-6
10 1.05 ± 0.08a 0.19 ± 0.01a 0.38 ± 0.26 0.20 ± 0.05
25 ND 0.63 ± 0.22b 0.18 ± 0.01 0.22 ± 0.05
50 0.24 ± 0.05ab 0.34 ± 0.11ab 0.28 ± 0.13 0.14 ± 0.07
100 0.34 ± 0.08b 0.25 ± 0.12a 0.55 ± 0.53 0.09 ± 0.01
C20:4 n-6
10 11.82 ± 1.56a 2.16 ± 0.21a 2.35 ± 0.06a 2.09 ± 0.14a
25 22.39 ± 2.65b 1.97 ± 0.20a 1.90 ± 0.07ab 1.62 ± 0.09a
50 37.99 ± 0.37c 1.44 ± 0.13ab 1.45 ± 0.12b 1.01 ± 0.03b
100 53.05 ± 0.70d 0.77 ± 0.51b 0.48 ± 0.37c 0.32 ± 0.33c
10 0.32 ± 0.04 11.91 ± 0.42a 4.34 ± 0.15a 0.63 ± 0.01a
C20:5 n-3 25 0.30 ± 0.04 24.55 ± 0.48b 6.86 ± 0.32bc 0.93 ± 0.09b
50 0.26 ± 0.01 35.15 ± 0.83c 7.71 ± 0.40c 0.72 ± 0.02a
100 0.29 ± 0.01 50.68 ± 0.09d 6.64 ± 0.46b 0.47 ± 0.01c
10 0.48 ± 0.07a 1.99 ± 0.08a 11.31 ± 0.27a 0.48 ± 0.01a
C22:5 n-3 25 0.46 ± 0.06a 2.85 ± 0.06b 22.14 ± 0.79b 0.67 ± 0.06b
50 0.37 ± 0.01ab 2.45 ± 0.25c 32.54 ± 1.23c 0.46 ± 0.01a
100 0.29 ± 0.06b 2.06 ± 0.02a 43.13 ± 3.51d 0.35 ± 0.02c
10 0.78 ± 0.12a 0.83 ± 0.03 0.91 ± 0.01 15.30 ± 0.26a
C22:6 n-3 25 0.68 ± 0.07ab 0.62 ± 0.37 0.72 ± 0.01 27.28 ± 1.08b
50 0.59 ± 0.00b 0.59 ± 0.06 0.50 ± 0.01 34.31 ± 1.18c
100 0.43 ± 0.01c 0.35 ± 0.01 13.26 ± 2.37 29.65 ± 0.42c
Data are mean ± SD. Differences were determined using one-way ANOVA with post-hoc Tukey comparisons.
Different superscript indicates significant differences among treatment concentration (p<0.05). All treatment was
performed in triplicates and repeated 3 times

145
Supplementary Figure S5.1 Ex vivo μCT measurements of the trabecular micro-architectural properties at the lumbar vertebrae 3.
Data are mean ± SD. Differences were determined using MIXED model ANOVA with post-hoc Tukey comparisons. Different
superscripts indicate significant differences among diet groups (p<0.05). CTRL, n=14, HFD, n=14, HFD+AA, n=13. BV/TV, bone
volume fraction; BS/TV, bone surface density; Conn.D, connectivity density; SMI, structure model index; Tb.N, trabecular number;
Tb.Th, trabecular thickness; Tb.Sp, trabecular separation; vBMD, volumetric bone mineral density

146
CHAPTER 6
General Discussion

147
The principle objective of this dissertation was to advance understanding of the role of
long-chain polyunsaturated fatty acids (LCPUFA) in vivo on bone mass and architecture in
children with obesity. The important mediators in this relationship were examined using an
animal model of diet-induced obesity. Studying obesity during childhood presents a unique
opportunity to examine the bone-fat relationship during a period of rapid growth and maturation,
where physiological changes and nutrient requirements are distinct from that in infancy or
adulthood. This chapter presents additional results and specific details pertaining to these
physiological needs and discusses additional considerations as they relate to the study findings.
Despite several limitations, this dissertation contributes to filling important knowledge gaps
particularly with respect to the health impact of omega-6 (n-6) LCPUFA in childhood and early
adolescence; and is positioned to extend recommendations for future related studies.
6.1 Study 1
Aim 1: The first study aimed to describe the diet of children with obesity, and to determine if
dietary intakes of LCUPFA status relate to body composition. The hypothesis stated that children
with obesity would have suboptimal LCPUFA intake, and that omega-3 (n-3) LCPUFA status
measured in red blood cell (RBC) membranes would inversely relate to adiposity, due in part to
lower availability in the diet. Median dietary intakes of n-3 LCPUFA eicosapentaenoic acid
(EPA) and docosahexaenoic acid (DHA) combined (32.3 mg/d; IQR 12.0 - 86.7) were
substantially below recommendation. Fish and seafood were not common constituents of the
diet. Adiposity was negatively related to α-linolenic acid (ALA), EPA and DHA proportions in
RBC. The results supported the hypothesis that children with high adiposity had low n-3
LCPUFA status ascribed, in part, to suboptimal dietary intakes.

148
6.1.1 Diet quality and food sources of n-3 LCPUFA
The increased prevalence of childhood overweight and obesity, coupled with knowledge
that childhood food intake patterns track through to adulthood [365], has led to an increased need
in characterizing the dietary intakes of children. The present study focused specifically on the
intakes of LCPUFA, but the inherent complexity of dietary intakes may be missed by analyzing
the effects of a single nutrient category. Therefore, the study also explored analysis of foods
and/or food groups from which the fatty acids were derived from, offering the benefits of
integrating nutrients and insight on the quality of the diet as a whole. Analyses of dietary
information collected from Canadian adults and children (n=611, 1.5-66 y) showed that dietary
EPA, DHA, and arachidonic acid (AA) were positively associated with protein, but not fat intake
as a percentage of energy, while only linoleic acid (LA) and ALA intakes were positively
associated with dietary fat intake (% kcal) [366]. Consistently, eggs and poultry meats
represented the most common sources for EPA and DHA of children in the present study, and
ALA was consumed in the form of margarine, salad dressings, and commercial baked products.
These findings, hence, raise the question if recommendations for dietary EPA and DHA should
be directed to the choice of foods that are rich in EPA and DHA (e.g., fatty fish), rather than
considering their intakes together with n-6 and n-3 fatty acids found primarily in vegetable oils.
The distinction of ALA or LA from their longer chain derivatives may be especially important as
children with obesity are often counseled to select lower fat alternatives [367-369], but the
decrease in overall fat intake might be attained at the expense of the physiologically active
LCPUFA.
An important drawback in the modelling of Canada’s Food Guide (CFG, 2007) was the use
of composite foods based on food choices of Canadians and food popularity (Provincial

149
Nutrition Surveys). The problem with such is that as Canadians’ eating habits deviate
significantly from a healthy diet, recommendations based on the then food choices are not
reflective of the appropriate choices for the role of diet in chronic disease prevention. The
revised version (2019) has acknowledged this limitation and provides visual representation, in
addition to specific statements that speak to high-quality food choices. As such, specific
recommendations to “consume foods with healthy fats” and “try different fishes such as trout,
salmon, herring, mackerel” are added to the update. While the dietary data in this thesis was not
classified into foods based on food quality, it can be predicted that a significant proportion of
foods consumed by children in the present study does not align with CFG 2019
recommendations; nor those set in 2007. Specifically, on the occasions where fish intake was
reported, about 20% was contributed by fried fish sticks/burgers. Despite the best efforts of
Health Canada to promote specific fishes, the public may still assume all fish provide heart-
healthy n-3 LCPUFA and do not distinguish among species [370]. For example, cod, tilapia and
shrimp remain good choices relative to most terrestrial meats when baked or broiled, but not
when breaded or fried. Children with obesity are also more likely to exhibit fussy eating patterns
and unwilling to consume unfamiliar foods, as a result parents may offer foods based on
children’s tastes and preferences [371]. In addition, common barriers including cost of fish,
accessibility, the lack of inspiration or cooking skills, and differences in cultural background
remain to be important determinants of fish consumption [260]. Hence, guidelines and education
strategies developed for families and children with obesity may need to be adapted depending on
the availability and acceptability of the healthier alternative.
6.1.2 Lean body mass in children with obesity
The cross-sectional design of the present study precluded the tracking of changes in body

150
composition with maturation status in children with obesity. We observed that only fat-mass
index (FMI), but not fat-free mass index (FFMI) was associated with body mass index (BMI) Z-
score. The relationship was sex-dependent and stronger in males, where the increase in FMI for
each unit of higher BMI Z-score was 1.75-fold greater than that in females (Figure 6.1). This
suggested that an increase in adiposity was not coupled with a proportionate lean mass accrual;
and in girls, lean mass is notably under-developed (i.e. reduced FFMI) compared to reference
data on normal weight age-matched peers. Children grow taller and heavier as they mature,
hence excess energy intake beyond daily activities is essential for growth. There is however, a
constraint on the size of lean body mass, as there is for stature. Therefore, the accelerated weight
gain in children with obesity mostly consists of body fat and not lean mass [372].
The sex dimorphism in the relation between adiposity and BMI Z-score may also be
explained by differences in physical activity level. Although there was no interaction between
sex and age in time spent (minutes /day) on physical activity in the present study, the limitations
in the data collected have been discussed in section 4.5 and must be interpreted with caution. A
longitudinal study in a representative sample of children found that while daily total energy
expenditure in males increased continuously between ages 5 and 10 y, that of females declined
from 1800 kcal at age 6 to 1600 kcal at 9 y. This reduction was explained by a 50% lower time
spent on physical activity between ages 6 and 9 y [373]. The benefits of encouraging physical
activity in children with obesity may extend beyond changes in energy expenditure by providing
additional stimuli for lean mass accrual and possibly benefit skeletal health.

151
Figure 6.1 Correlation between FMI and FFMI with BMI Z-score in (A) males and (B) females;
(C) absolute lean mass and fat mass by tertiles of % body fat measured by DXA
The top panel shows the simple correlation between BMI Z-score, Fat mass index (FMI) and Fat-
free mass index (FFMI) in (A) males and (B) females. BMI Z-score positively related with FMI
in both sexes (males: β= 1.36, r2 = 0.64, p<.0001; females: β= 2.38, r2 = 0.35, p=0.0009). There
were no significant association between BMI Z-score and FFMI. (C) The bottom panel shows
the differences in absolute lean mass and fat mass by tertiles of % body fat measured by DXA.
Groups were compared using a MIXED model ANOVA, data are shown as mean ± SEM, and
were adjusted for age, sex, Tanner stage and race (white vs non-white). Fat mass was
significantly higher in tertile 3 compared to tertile 1 (p=0.0002); there was no interaction with
sex. Lean mass did not differ across tertiles or between sexes. n=63
1st
2nd
3rd
1st
2nd
3rd
0
20
40
60
80Fat mass
Lean mass
Males Females
We
igh
t (k
g)
0 2 4 6 8 10
5
10
15
20 FMI
FFMI
BMI Z-score
FM
I o
r F
FM
I (k
g/m
2)
0 2 4 6 8 10
5
10
15
20 FMI
FFMI
BMI Z-score
FM
I o
r F
FM
I (k
g/m
2)
0 1 2 3 4 5
5
10
15
20FMI
FFMI
BMI Z-score
FM
I o
r F
FM
I (k
g/m
2)
0 1 2 3 4 5
5
10
15
20FMI
FFMI
BMI Z-score
FM
I o
r F
FM
I (k
g/m
2)
A B
C
aab
b
aab
b

152
6.2 Study 2
Aim 2: The second study aimed to examine the relationships between LCPUFA status, bone mass
and geometry in children with obesity. The hypothesis was that higher n-6 LCPUFA status in
children with obesity would be negatively related to bone health outcomes, particularly at sites
where fractures are common. Children with the highest RBC AA status (expressed as the
proportion of total fatty acids) had deficits in distal forearm bone mass, cortical bone geometry,
muscle mass and predicted strength. AA status was also positively associated with biomarkers of
insulin resistance (IR). The results supported the hypothesis that an inverse relationship exists
between AA and bone, and may have further influences on glucose homeostasis.
6.2.1 Requirement of AA during growth
The balance between these LCPUFA is important to the quality of growth. Much of the
research has evolved from studies in infancy. For example, preterm infants fed a marine oil-
supplemented formula containing 0.3% w/w EPA and 0.2% DHA had significantly lower Z-
scores for weight, length and head circumference [374]. The growth restriction observed was
related to the decline in AA status [375] and can be corrected when the n-3 and n-6 LCPUFA are
provided in balance. A recent study comparing infant formulas with 17 mg/100 kcal DHA and 25
mg or 34 mg/100 kcal AA (DHA:AA ratios of 1:2 or 1:1.5 respectively) in healthy term infants
showed no effects on growth nor DHA availability for central nervous system development
through 120 days of age [376]. Beneficial outcomes may even be observed; early life (4 to 12
wk) supplementation of AA (0.13 % w/w) and DHA (0.09 % w/w) in ApoE*3Leiden mice
limited high-fat diet (HFD)-induced body weight and fat mass gain later in life (12 to 20 wk).
The AA/DHA supplement was more efficient in reducing plasma lipids and adipose tissue
macrophage infiltration compared to the clinically applied n-3 LCPUFA mixture of EPA (0.3%

153
w/w) and DHA (0.25% w/w) (OMACOR®) [377].
Few explicit dietary recommendations for AA exist to date; possibly based on the
understanding that AA insufficiency is unlikely as it is plentiful in the diet, and it can be
synthesized endogenously from LA. The Early Nutrition Academy recommended 140 mg
AA/day during the first months of life [378]. Contrarily, the European Food Safety Authority has
stated that “there is no necessity to add AA to infant formula even in the presence of DHA”
[379]. This statement has been heavily challenged as endogenous synthesis of AA in early life is
low [380, 381], and the requirement for AA cannot be met by the low quantities found in
complementary foods alone [382]. A recent review of dietary LCPUFA (AA, EPA and DHA)
intakes in adults surveyed from 175 countries reported that AA intakes ranged from 101 to 351
mg/d and 44-331 mg/d in advanced and developing countries, respectively [383]. In contrast to
infancy, childhood and adolescence represent a life stage that is markedly under-represented in
the field of LCPUFA. It is uncertain if high n-6 LCPUFA intake and/or status during this period
will show similar associations as observed in adults, or if children have a greater requirement
and/or tolerance for high n-6 intake given the crucial role in growth. The following studies aimed
to fill this knowledge gap through investigating the relationship between n-6 fatty acids and
growth in children and adolescents.
6.2.2 Influence of AA on bone
While a wealth of evidence exists on the association between n-3 LCPUFA and bone
health, to our knowledge no reports to date have focused primarily on the role of AA in human
children. Previous studies that have focused on periods of growth were limited to those in animal
models. Maternal supplementation with dietary AA and DHA during lactation enhanced whole
body areal bone mineral density (aBMD) in rat pups with reduced birth weight [384]. Dietary

154
supplementation with AA (0.6-0.75% fat) and DHA (0.1% fat) elevated whole body bone mineral
content (BMC) in male piglets (5 d) compared to those supplemented with 0.3-0.45% AA [385].
In older adults recruited in the Framingham Osteoporosis Study, plasma AA status was protective
against hip fractures in women with high EPA+DHA intakes, but was detrimental in men with
the lowest intake of EPA+DHA [44]. These results suggest that the effects of AA may be
dependent on EPA+DHA intakes. Consistently, supplementation of 840 mg/d AA in healthy
Japanese adults (26-60 y) with high habitual EPA and DHA intakes had no effect on blood lipids
or platelet aggregation [386]. Earlier AA supplementation trials in populations with low fish
intake (USA and UK) reported increased synthesis of vasoactive eicosanoids [387] and modified
immune responses [388, 389], but there was no evidence for a directly promotive role of AA on
cardiovascular disease risk [390, 391]. Even though bone outcomes were not measured, results
from the trials largely suggested that the adverse effects associated with increased AA intake, at
least up to 1.5 g/d, are null [392]. Results from the present study are therefore useful for guiding
future interventions investigating influence of high dietary AA complemented with adequate EPA
and DHA while monitoring bone health outcomes during growth.
6.2.3 AA and skeletal muscle growth
AA makes up to 15-17% of total fatty acids in skeletal muscle in humans [393], in vitro
evidence has demonstrated a positive influence of AA on lean mass accrual [394]; therefore, an
increase in AA status can be speculated to affect skeletal muscle growth. Contrarily, we observed
approximately 15% deficit in forearm muscle area at the radial diaphysis, but not in the whole
body of children with higher AA status. There were no differences in muscle density observed
among groups, suggesting the lower muscle area is not related to intramuscular lipid
accumulation. The anabolic effect of AA (3-25 μM) is largely mediated through stimulating

155
prostaglandin E2 (PGE2) and PGF2α release via cyclooxygenase (COX)-2 activity, resulting in
cell hypertrophy (myotube size) and myonuclear accretion in C2C12 murine skeletal myocytes
[395]. Interestingly, the net effect of AA may depend on the relative quantities of individual
eicosanoid synthesized. Rates of protein synthesis and degradation in murine striated muscle
cells were increased by PGF2α and PGE2, respectively [396]. While we were unable to obtain
muscle biopsies from children for the assessment of tissue AA content and local PGE2
concentrations, circulating plasma AA are known to reflect levels of AA in skeletal muscle [397,
398]. The inverse relationship observed in the present study suggested the anabolic effect of
AA/PGE2 on lean mass accrual is blunted in obesity. In addition, the clinical relevance of this
difference in muscle area at the forearm needs to be further considered in relation to whole-body
lean mass and future risk of fracture at forearm sites. New studies will be able to build upon the
data brought forth in this thesis.
6.2.4 Modulation of insulin resistance by AA and effect on bone metabolism
The possible interaction observed between LCPUFA status, IR, and bone are intriguing; yet
the single measurement collected in the present study requires confirmation using more specific
clinical tests and does not offer inference on causality. Plasma and adipose tissue concentrations
of AA positively related to IR in both children [289] and adults that are healthy [399]. Exposure
of mature 3T3-L1 adipocytes to AA lowered GLUT4 mRNA and protein content; and AA
treatment diminished the response of GLUT4 transporters to insulin-mediated glucose uptake
[400], suggesting AA, at least in vitro, has a direct role in the development of IR.
Insulin-like growth factor-1 (IGF-1) may be an important mediator in the relationship
between IR and skeletal growth during the pre-pubertal years. The role of IGF-1 as a crucial
determinant in stimulating appositional bone growth is well-characterized [401]. Plasma AA

156
proportions positively related to IGF-1 levels in piglets [385]. Measurements of IGF-1 levels
were not available in the present study, but given insulin and IGF-1 share a common cellular
signaling cascade, it can be speculated that children with higher AA status and increased fasting
insulin would also have higher IGF-1 levels [402]. In support of this, children (n=315, 9-13 y)
with high Homeostasis Model Assessment for Insulin Resistance (HOMA-IR, ≥ 4.0) also had
greater circulating IGF-1, and IGF-1 levels positively predicted cortical bone size and bending
strength at the 66% radius. However, path analyses demonstrated that such relationships were
moderated by high HOMA-IR, implicating IR as a potential suppressor of IGF-1-dependent
cortical bone development [305]. HOMA-IR also negatively predicted dual-energy X-ray
absorptiometry (DXA)-measured total body bone area and mass (β=-0.10 and -0.08
respectively), as well as trabecular volumetric BMD (β=-0.21) and bone strength index (β=-0.18)
at the 4% tibia in girls (9-12 y) [403]. The negative relationship between fat mass and lumbar
spine BMC in children (n=240, 7-15 y) was thought to be mediated by HOMA-IR [290]. It is
noteworthy that although AA status positively related to HOMA-IR in the present study, all
observed values were relatively low and considered to be within the norm (range: 0.4 – 2.8). It
would be of interest to examine the longitudinal changes in fatty acid composition with HOMA-
IR during growth, and at what threshold, beyond the transient increase of IR during puberty, does
excess IR begin to impact bone metabolism.
6.2.5 Assessment of bone mass and body composition
DXA represents a safe, rapid, and clinically suitable reference method to analyze bone
mass/density, and body composition among children and adolescents [404]. However, the two-
dimensional assessment of DXA is prone to projection errors and can be confounded by
adiposity and bone size [405]. While scans of the lumbar spine and total body in general can

157
provide information about the status of trabecular and cortical bone, respectively [294],
assessment of bone mass at the spine or whole body do not adequately reveal risk of fracture in a
long bone. In addition, assessments of the spine will not be feasible in individuals with obesity
who may exceed the scanner’s weight limit (135 – 205 kg), which could be the case if the study
participants were to extend beyond the pre-teen years (upper range of body weight at baseline:
118 kg). The distal forearm offers a more practical and representative site for estimating fracture
risk, especially given that children with obesity have a disproportionate rate of forearm fractures
[22]. An additional advantage of the forearm scan is that it is conducted with the person sitting
on a chair and not on the bed; i.e. no concern for bed weight/size limits. In addition, DXA
measurements of the forearm are also useful for complementing the cross-sectional images and
strength indices obtained by peripheral quantitative computed tomography (pQCT).
The pQCT provides a non-invasive approach to understand changes in cortical and
trabecular geometry and strength during skeletal development. pQCT measurements are usually
confined to a particular slice of the radius and may not necessarily reflect changes at proximal
appendicular sites and central skeletal sites. Despite this potential limitation, emerging research
has used pQCT to quantify regional muscle density to gain insight on fat infiltration of skeletal
muscle which may have important implications on bone turnover. Reference data for regional
tissue distribution at the forearm in children and adolescents have recently become available
[406]; and allows for calculation of Z-scores to detect early changes in tissue composition. pQCT
also offers the potential for assessing bone marrow adiposity, a fat depot that is increasingly
recognized to be an important mediator of the bone-fat relationship. A recent study in healthy
children and adolescents [407] reported that whole body adiposity is positively associated with
bone marrow adipose tissue content measured by pQCT at the 65% radius. The influence of

158
marrow adipose tissue on bone during growth is conflicted, with some showing a negative [408,
409] or no effect [410, 411] on trabecular and/or cortical bone in animal studies. Both marrow fat
and osteoblast differentiation increase during puberty, suggesting that marrow fat may be
necessary for osteoblasts to produce bone [412]. Prospective trials utilizing three-dimensional
imaging modalities can evaluate if marrow adiposity is increased in children with obesity, and if
it is, what effects it has on bone.
6.3 Study 3
Aim 3: The third study aimed to determine the effects of a moderately high-fat diet, with or
without the addition of AA on bone mass and LCPUFA status during growth in an animal model
of diet-induced obesity. The hypothesis was that the adverse effects of diet-induced obesity on
bone mass and strength during growth may be exacerbated by AA. Addition of AA to a HFD
promoted increases in adiposity and leptin production than HFD alone. AA lowered whole body
bone mass, but improved vBMD and microarchitectural properties at the femur metaphysis
without impacting bone strength. The results supported the hypothesis that AA is pro-adipogenic
whereas the effect on bone is not uniform and may be skeletal-site specific.
The pathophysiology of obesity-related bone impairment is unclear and there are
conflicting results from clinical and basic research trying to explain this phenomenon.
Observations in children are complicated by: (1) the possible interaction among nutrients and
bioactive compounds in the diet; and (2) maturation timing leading to transient changes in body
composition and endocrine environment. As mentioned, the effects of AA may be due, in part, to
protein intake, as AA is found in protein-rich animal food sources, including eggs and meats.
Although no differences in protein intake were seen among participants, we cannot rule out
possible anabolic effects of high-quality animal proteins on skeletal growth. The employment of

159
a high-fat diet hence allows for singling out the effect of excess fat intake with other
macronnutrients remaining constant when the diet is formulated on an energy basis. Secondly, fat
mass rises during growth and puberty; the effect of the natural maturational increase in fat mass
on skeletal development and microarchitecture may be different compared to the presence of
excess fat mass from obesity. In lieu of a control group with children of normal weight, use of Z-
scores were applied in this thesis to describe deviation of our participants from the growth
trajectory of children with normal weight. The research in the final project, however, did include
a control group and offered more in-depth exploration of the early stages in the etiology of diet-
induced obesity using an animal model as well as in vitro studies of exposure to AA.
6.3.1 Site-specificity of influence of HFD and AA on bone
Animal models of diet-induced obesity offer the advantages of allowing the examination of
increased fat intake alone (with other nutrients remaining the same) on bone growth. A
differential effect on the central versus peripheral skeleton was observed at the end of 6 wk
feeding trial, where AA showed adverse effects on bone in the whole body and lumbar vertebrae,
but improved trabecular microarchitecture in long bones. In addition, the reduction in cortical
bone size, characterized by reduced total and medullary bone volume at the femur diaphysis
corresponded to our observations at the 66% radius in children. The skeletal site-specificity may
be attributed to differences in mechanical loading. Contrasting associations between adiposity
with bone microarchitecture and strength at non-weight bearing (radial) versus weight-bearing
(tibial) sites has been reported in children (8 – 15 y) [413]. The relationship between fat mass
and bone strength was essentially non-existent at the radius but fat mass positively related to
tibial bone strength. It is, however, necessary to highlight that differences exist in skeletal
loading patterns between humans (bipeds) and rodents (quadrupeds). The mechanical loads on

160
the horizontal spine in quadrupeds differ from mechanical loads in human, in which the spine
maintains an upright (vertical) position [414]; biomechanical data describing structural bone
changes as a result of loading requires careful scrutinization before extrapolation to humans.
A role for adipo- or myokines (discussed below in 7.3) in bone metabolism may also
contribute to the observations at distant skeletal sites that normally experience relatively low
bone strain. Total lean mass is a robust predictor of cortical bone size of long bones, including
that of the non-weight bearing radius [415]. This suggests that the correlation between cortical
bone size and lean mass at that site might be due to either auto and/or paracrine effects of
myokines on the radius, or to systemic endocrine effects of myokines on the whole skeleton.
Leptin, as described in section 2.1.3.1, may inhibit bone formation through the central nervous
system, or on the other hand, enhance bone formation and inhibit bone resorption peripherally,
the latter of which is possibly the dominant way leading to a stronger skeleton [416, 417]. In
humans, obesity is associated with central resistance to circulating leptin. Consistently, higher
leptin concentrations observed in the HFD+AA group did not result in reduced food intake in the
present study. It is possible for differential sensitivity to exist between the central (hypothalamus)
and peripheral effect of leptin on skeletal growth in obese animals.
6.3.2 AA and glucose homeostasis in HFD-fed rats
While in children a higher AA status is associated with increased HOMA-IR, there was no
evidence of impaired glucose homeostasis in HFD-fed rats, indicated by lack of differences in
fasting insulin concentrations. The increase in body weight and adiposity over 6 wk in HFD-fed
rats was modest. In addition, liver and quadriceps fat content (quantified by gas chromatography)
in high-fat fed rats were not different from controls, indicating the absence of lipid accumulation
in these tissues. Importantly, AA administration is able to prevent HFD induced IR by

161
maintaining membrane integrity and normal intracellular signalling [418]. Young rats may also
display greater metabolic flexibility than older animals and are able to adapt to the energy excess
with minimal impairment in glucose homeostasis. The relatively rapid development of obesity in
animals also does not necessarily reflect the physiological changes that occur over time in
humans. A delay (> 21 days) in the development of IR and impaired glucose transport in
response to rapid (2-3 days) increases in intramyocellular lipids was reported in HFD (60% kcal)
fed rats [419]. Finally, human studies frequently examine the relationship of fatty acids with an
already established metabolic dysfunction, whereas most animal studies are conducted in healthy
states at study inception; which aligns with investigation into the etiology of obesity rather than
its management. Hence, the time-frame and dosages required to both cause harm, as observed
with children in the present thesis, and to subsequently correct the defect in glucose homeostasis
is likely different in animal feeding trials. An oral glucose tolerance test was not performed,
given that the primary goal of the animal study was to test for bone health outcomes in the early
stages of diet-induced obesity, and in light of the normal ranges of HOMA-IR of children in
study 2. However, early consequences of adipocyte metabolism in response to exposure to
LCPUFA were tested in vitro.
6.3.3 Effects of LCPUFA on adipocyte metabolism in vitro
An in vitro model of 3T3-L1 adipocytes was used to derive possible mechanistic
explanation for the observations where AA stimulated leptin production despite no differences in
visceral adiposity in the HFD versus HFD+AA group. The employment of a model system
allows for the potential to identify cellular mediators to explain the influence of AA on adipocyte
metabolism. While differentiated 3T3-L1 adipocytes exhibit differences from in vivo adipocytes
such that they contain multilocular lipid droplets, compared to the single / unilocular droplets

162
seen in white adipocytes from humans, primary cells are physically and chemically fragile. 3T3-
L1 adipocytes offer the additional advantage as a “pure” fat cell model that is free from
contamination of stromal vascular cells (e.g. macrophages, T cells) found in adipose tissue.
Given the observations in this thesis, further studies are suggested regarding mechanisms.
The predominant adipogenic pathway of AA is suggested to be exerted through the production of
prostacyclins (Figure 6.2). Prostacyclin acts externally via the cell surface prostacyclin receptor
(IP-R), triggering cAMP production and activating the PKA pathway [62]. IP-R is transiently
expressed in preadipocytes and synthesis of prostacyclin ceases in mature adipocytes [420, 421].
The requirement of the IP-R system in mediating the adipogenic effect of n-6 LCPUFA was
confirmed in vivo using an IP-R knockout mouse model, where IP-R deletion prevented the
increase in body weight and fat mass induced by HFD enriched in corn oil (15% kcal) or both
corn and perilla oil (10 and 5% respectively) [422].
Other pathways that might also be further explored include AA and some of its metabolites
generated through COX and lipoxygenase (LOX) that are activators/ligands of the peroxisome
proliferator activated receptors (PPAR) [423]. Thus, AA can stimulate adipogenesis through both
cell surface IP-R and nuclear PPAR in early and late events of adipogenesis respectively. What
remains uncertain is to what extent does AA rely on each of these pathways to stimulate
adipogenesis. Tight regulation at the level of membrane esterification exists as unesterified AA is
cytotoxic [424]. AA reacylation is very efficient where a large portion of AA released by
phospholipase A2 (PLA2) is rapidly incorporated back into phospholipids [425]; only a minor
portion is released from cell membrane and converted into oxygenated metabolites [426].
Inhibition of calcium-independent PLA2 by small interfering RNA lowered AA availability and
impaired late events of adipogenesis in 3T3-L1 adipocytes [427]. Pancreatic PLA2-/- mice were

163
protected against HFD-induced obesity, in part due to decreased lipid absorption [428]. Future
studies utilizing stable-isotope labeled fatty acid tracers will provide insight into the uptake of
exogenous AA into the cell, incorporated and/or released from the membrane, and subsequently
transformed into metabolites that have potent adipogenic properties.
While the present study has focused on the isolated effects of LCPUFA on adipogenesis in
adipocytes, the influence of similar treatment on the differentiation of primary bone marrow stem
cells, or bone formation / resorption in osteoblastic cells lines should also be explored. PPARγ
acts as the master switch between the differentiation of mesenchymal stem cells (MSC) into
adipocytes or osteoblasts. It would therefore be expected that activation of PPARγ by excess
LCPUFA would lead to an unfavorable balance towards adipogenesis. In bone, PPARγ activation
with thiazolidinedione promoted bone resorption through combined effects on osteoblast
suppression and osteoclast activation [429]. PPARγ overexpression in MC3T3-E1 osteoblasts
reduced ALP activity [430], and osteoblastic cells treated with LCPUFA underwent trans-
differentiation into adipocytes [431]. Human MSC differentiated in the presence of AA, but not
EPA or DHA, showed reduction in osteoblasts formation and mineralization along with higher
PPARγ expression [323]. The activation of PPARγ by LCPUFA may be highly context-
dependent, where different tissues and cell types may display varying sensitivities to the
presence of LCPUFA. The action of LCPUFA on the bone-fat interaction via PPARγ activation
must also be considered beyond the cell-autonomous effects in isolated model systems such as
that employed in the present thesis, but also in concert with the systemic effects via other tissues
such as the brain, adipose tissue and the gut (Figure 6.3).
The beneficial effects of n-3 LCPUFA include modulation of both adipocyte hypertrophy
and hyperplasia in rodents [52] An increase in adipocyte number in inguinal fat depots and

164
decreased plasma leptin concentrations in rats (9 wk) was observed when menhaden oil (3.33 –
6.67%) was added to the diet for 22 wk [432]. Large lipid droplets function more for storage
[433], whereas smaller lipid droplets provide a larger surface-area-to-volume ratio, thus favoring
lipolysis [434]. Furthermore, hypertrophic adipocytes with large and uniloculuar lipid droplets
exhibited impaired insulin-dependent glucose uptake compared to cells with multiloculuar lipid
droplets [348]. Histology of adipocytes isolated from visceral fat depots would allow the
comparison of the effect of AA on adipocyte morphology in vivo relative to our observations in
vitro. In addition, analysis of gene expression markers specific to preadipocytes (Pref-1,
PPARβ/δ, C/EBPβ, and aP2) or mature adipocytes (PPARγ, C/EBPα, and M-CSF) would provide
further insight on whether the increase in adipose tissue mass is due to increased recruitment of
adipocyte precursor cells, or hypertrophy/hyperplasia of existing cells. Finally, assessment of
metabolic outcomes such as lipolysis, or insulin-stimulated glucose uptake will determine if
small, multilocular droplets formed following n-3 LCPUFA treatment are metabolically healthier.

165
Figure 6.2 Adipogenic gene regulation by LCPUFA
Adipocyte differentiation is regulated by two families of transcription factors, CCAAT/enhancer-
binding proteins (C/EBP) and peroxisome proliferator activated receptor (PPAR)γ. C/EBPβ and
C/EBPδ are involved in the early stages of adipogenesis. Once activated, C/EBPβ trans-activates
C/EBPα and PPARγ expression, which positively regulate each other and cooperate to promote
adipogenesis [435, 436]. Arachidonic acid (AA, C20:4 n-6) up-regulates the expression of
C/EBPβ and C/EBPδ via the prostacyclin/IP receptor system and the protein kinase A pathway.
AA may also act through prostacyclin as activator/ligand of PPARβ/δ which, in turn, up-
regulates the expression of PPARγ. Other LCPUFA also acts as activators / ligands of PPARβ/δ
or PPARγ [437, 438]. Activation of PPARγ promotes terminal differentiation through the
induction of a variety of differentiation-dependent target genes important for triglyceride update
and storage, including aP2, CD36, LPL, PEPCK, and others [55]. Upon terminal differentiation,
production of prostacyclins and other prostaglandin ceases and is accompanied by reduced
expression and loss of functional IP-R [439, 440]. The involvement of AA metabolites
synthesized through LOX as ligands of PPARγ are also implicated at a later step(s) of adipocyte
maturation [441]. It is noteworthy that LCPUFA activate all three members of the PPAR family
in the micromolar range [442], whereas fatty acid metabolites exhibit a more subtype-selective
pattern of activation in the nanomolar range [443]. The ERK/MAPK-pathway has been
suggested to be involved in FA signaling pathways. Inclusion of AA enhanced ERK1/2 activation
in 3T3-L1 adipocytes and prolonged the period during which ERK2 remains in the active state
[444]. Inhibition of MAPK-activation restored adipogenesis in the presence of AA and PGF2α,
thus MAPK activity is necessary for AA-mediated inhibition of adipocyte differentiation.
LCPUFA can also alter the expression of lipogenic genes by interfering with SREBP-1
expression. LCPUFA decreased SREBP-1c mRNA levels and inhibited the proteolytic
maturation that is necessary for SREBP to exert transcriptional activity. Forced expression of
SREBP-1c induced expression of adipocyte specific genes and increased differentiation of
fibroblast cell line NIH-3T3 [445]. SREBP-1c is also able to directly transactivate C/EBPα and
induce PPARγ expression

166
Abbreviations: AA, arachidonic acid; aP2, fatty acid binding protein; cAMP, cyclic adenosine
monophosphate; C/EBP, CCAAT/enhancer-binding proteins; ERK, extracellular signal-regulated
kinase; IP-R, prostacyclin receptor; MAPK, mitogen-activated protein kinase; PKA, protein
kinase A; PPAR, peroxisome proliferator activated receptor; RXR, retinoid X receptor; SREBP,
sterol response element binding protein 1-c

167
Figure 6.3 Context-dependent effects of PPARγ on bone resorption
The regulation of osteoclastogenesis by PPARγ depends not only on cell-autonomous effects but
also systemic effects via other tissues including the hypothalamic-pituitary-gonadal (HPG) axis,
fat and the gut. HPG axis: PPARγ activation in the hypothalamus and/or pituitary inhibits
luteinizing hormone secretion and gonadotropin-releasing hormone (GnRH) signaling and
subsequent increase in FSH levels; FSH may enhance ostoeclastogenesis independent of
estrogen action [446]. Estrogen decreases osteoclastic resorption put in bone by regulating
transcription factors (c-fos, c-jun). inflammatory cytokines (IL-1R) decrease osteoclastogenesis
[447]; and promote osteoclast apoptosis [448, 449]. PPAR-induced osteoclast activation and
bone loss may involve the suppression of estrogen function and/or production. Gut: gut-derived
serotonin and its transporter (5-HTT) promotes osteoclastogenesis by activating NF-κB.
Serotonin metabolites act as endogenous PPARγ agonists to regulate adipogenesis. Gut-derived
serotonin may inhibit bone formation and stimulate bone resorption, at least in part, via PPARγ
activation. Adipocytes: PPARγ and leptin have been suggested to be mutually inhibitory. PPARγ
activation represses leptin expression in adipocytes [205], and leptin downregulates PPARγ
mRNA levels in macrophages [450]. PPAR-/- mice exhibited higher serum leptin level that WT
littermates [451]. Ligand activation of PPARγ represses Adrb2 expression [452], suggesting that
also be contributed by suppressing leptin function and the sympathetic tone. PPARγ may also
promote osteoclastogenesis by inducing activating transcription factor 4 (ATF4) in osteoclasts,
where it is required for induction of RANK, NFATc1 and MAPK activation [453]. Together,
these suggest that PPARγ regulation of osteoclastogenesis may also cross-talk with the
leptin/CART/Adrb2/ATF4 pathway via a complex signaling network
Abbreviations: 5-HTT, serotonin transporter; Adrb2, β-2 adrenergic receptor; ATF4, activating
transcription factor 4; CART, cocaine amphetamine-regulated transcript; FSH, follicle-
stimulating hormone; GnRH, gonadotropin-releasing hormone; LH, luteinizing hormone; PPAR,
peroxisome proliferator activated receptor

168
6.4 Strengths and limitations
The research encompassed within this thesis has strengths and limitations, some as already
discussed. Significant advancements in the measuring and reporting of trials involving fatty acids
have been made. As new findings regarding the beneficial effects of LA, the primary dietary n-6
LCPUFA have been observed [392, 454, 455], as well as the emerging conceptual problems and
flawed assumption of the n-6: n-3 ratio are known, calls to abandon the use of this ratio have
become more frequent [456, 457]. The present study was concepted based on the knowledge that
fatty acids of the n-3 and n-6 families are not equipotent in various biological functions in the
body, and the absolute quantity consumed in the diet and/or in circulation may be a more
important determinant than the ratio alone. Relationships with bone health outcomes were
therefore assessed with individual fatty acids (or lipid classes), and in the experimental studies,
the use of an AA-only exposure instead of combined AA/DHA was a strength of this research.
Assessments of dietary fatty acids intake alone may be misleading due to physiological and
genetic variability in achieving a given blood level. The direct measure of fatty acids in RBC
thus provides a more accurate reflection of habitual fatty acids intake compared to that measured
in plasma or serum due to its longer half-life (120 days) [243]. The use of a biomarker thus
overcame the limitations of dietary recalls in capturing food sources of n-3 LCPUFA due to
infrequent intake, nor is it subjected to recall bias associated with dietary assessment methods.
Further, whole serum / plasma contains an undefined mixture of 4 lipid classes (phospholipids,
triglycerides, cholesteryl esters and free fatty acids), each with its own FA proportion unique to
that pool [244]. Except for the free fatty acids, these are all carried in unique proportions in 3
different lipoprotein particles (high-density lipoproteins, very-low density lipoproteins and low-
density lipoproteins) and will be influenced by dyslipidemia as well as feeding status (i.e. fasted

169
vs post-prandial states). RBC membranes, on the other hand, are composed predominantly of
phospholipids, hence offer the distinct advantage where they reflect the fatty acid profile in the
cell membranes of biological tissues [244]. The inclusion of a biomarker in addition to dietary
intake is a strength of the present studies. The analytical and reporting methods employed are
compliant to international guidelines [298], yet variation in methodologies and equipment may
contribute to the discrepancy in fatty acid profile compared to those previously reported [254].
Despite so, a recent report from Health Canada showed that average omega-3 index in a
representative sample of Canadian adults (n=1984, 20-79 y) averaged 4.5% [458], compared to
6.1% reported in US adults [232]. The deviations in EPA+DHA proportions in RBC of the results
presented herein therefore may not be as wide given the population mean is in general low.
Although the goal was to design an animal model of diet-induced obesity that mimics
obesity in human children, we acknowledge that the standard growth diet (AIN-93G) is
comprised of 14% energy as fat, hence on a relative scale the HFD utilized in the present study
does not translate to humans. Rats become sexually mature at around 6-8 wk of age, whereas
humans do not reach puberty until on average 11.5 y [459]. The exposure duration of animals to
the HFD is therefore expected to be longer than children in the MYLIFE study. In addition, the
quantity of AA provided in the rodent diet (1% w/w) averaged to 0.3 g/d, which exceeds the
average AA consumption of approximately 100 mg/d [378] in adults in both absolute quantity
and on a body weight basis. However, taking into account the short time frame (6 wk) of the
study and rapid growth pattern of rodents, the modest (6%) difference in body weight beginning
at 7 wk of age (peri-adolescent), in the absence of impaired glucose homeostasis is consistent
with patterns in children where obesity development is gradual. In addition, the expected effect
size of the differences in metaphyseal vBMD is approximately 20% with n=14 per group

170
(compared to the observed 25%). The magnitude of differences in bone mass is also comparable
to previous studies in growing rodents fed a HFD for longer duration (≥ 10 wk) [91, 92, 460].
Therefore, the intervention diet utilized demonstrated usefulness in inducing early manifestations
of HFD and AA on bone, even under the constrains of the short time frame without substantially
increasing body weight. The present study has also utilized standard commercial pellet control
diet (AIN-93G) that were otherwise identical from the HFD except for the fat content. This
allows for comparison with other animal trials employing the identical control diet and enhances
the ability for the current research to be replicated and/or validated.
The important role of AA in relation to the bone-fat relationship was highlighted, yet the
investigation of the associations with individual fatty acids is complex, as fatty acids are highly
correlated through common dietary sources and metabolic processes. Associations may be weak
when exposures to single fatty acids are considered in isolation, and effects may be obscured if
they are adjusted for correlated confounders (i.e. other fatty acids present in the sample). In
addition, fatty acid precursors and/or products are linked through well-defined metabolic
pathways; important synergistic effects may be missed by examining single fatty acids.
Employment of a pattern analysis approach should overcome this limitation by considering the
combined effects of multiple fatty acids acting simultaneously in the body [461]. The
associations between changes in anthropometry (weight or waist circumference) and n-3
LCPUFA content in adipose tissue in adults has been shown to vary depending on the rest of the
fatty acid pattern [462]. It is likely that the patterns of fatty acids are more representative of the
true endogenous exposure after digestion, metabolism, and storage in adipose tissue, as well as
providing new hypotheses regarding potential health effects of emerging fatty acids (e.g. very
long-chain PUFA e.g. C ≥28) [463].

171
CHAPTER 7
Future Directions

172
7.1 Sex-specific response to LCPUFA
Most studies on the health effects of LCPUFA to date have been conducted without
specific attention to differential response between sexes, but recent work indicated sex-specific
effects of n-3 LCPUFA on bone mass [464] and cardiometabolic risks in children [465, 466]
exist. While examination of sex differences was not one of the principle objectives of this
dissertation, it remains an important concept threading all studies. The sole use of male rats in
the present thesis represents one of the limitations, hence the results presented herein cannot be
extrapolated to females. The influence of sex steroids, particularly estrogen, on the up-regulation
of FADS1 and FADS2 expression are known [467]. Despite so, sex-specific outcomes in
response to n-3 LCPUFA supplementation exist early before adolescence [466], and it occurs
independent of the increase in sex steroid levels during puberty. A recent study in adult mice (14
wk) with existing HFD-induced obesity showed that even though long-term (15 wk) AA
treatment (1% w/w) aggravated existing obesity in both sexes, only male mice displayed the
adverse effects of AA on obesity-induced complications. AA-fed females had improved IR and
enhanced GLUT4 expression in adipose tissue; and this is possibly mediated via rescuing anti-
inflammatory gut microbiota [468]. Collectively, these results highlight the importance for future
clinical studies to address all LCPUFA-related outcomes separately for males and females or,
alternatively, noting that sex differences are absent.
In addition to the biological differences between sexes, there are gender-related social and
cultural influences on food choices, physical activity levels and body satisfaction. Studies
analyzing dietary pattern in adolescents and young adults (12-24 y) found that vegetable and fruit
intakes of girls were markedly higher in comparison to boys [469], presumably because girls
tend to pay attention to foods as a means to influence health and meet nutritional

173
recommendations [265]. Factors contributing to differences in food choices at younger ages,
such as culture-bound conventions, societal expectations and stereotypes of males and females
have not been identified. In addition, obesity clusters in families, and parental obesity remains
the most important risk factor for obesity in children [470]. It was noteworthy that, in study 1,
only the proportion of mothers and not fathers with BMI ≥ 25 kg/m2 is greater in children in the
highest tertile of % body fat. Parents, and particularly maternal behavior may play an important
role as children’s food environment is usually influenced more by mothers than fathers [471].
Hence, gender effects in children may be routed in gender-mediated parental behavior to the
child. Intervention strategies for childhood obesity may need to consider the relative parental
influence on dietary habits and physical activity of the child.
7.2 Pro-resolving lipid mediators
Despite the central role of AA in the initiation and progression of inflammation through
inducing PGE2 synthesis, it has recently become evident that the resolution phase of
inflammation is an active process, mediated by specialized lipid mediators involving lipoxins,
resolvins, protectins and maresins [472]. The recognition of the proactive nature of inflammation
resolution has revealed alternative therapeutic paradigms based on resolving, rather than
preventing the onset of acute inflammation [473]. Indeed, a number of endogenous lipid
mediators are capable of switching from the initial proinflammatory to anti-inflammatory actions
[474]. The biosynthetic and signaling pathways of these pro-resolving molecules, as well as their
relationships with selected pro-inflammatory mediators are outlined in Figure 7.1. Notably, AA
is prominently involved in the synthesis of the lipoxins LXA4 and LXB4 through the actions of
lipoxygenases [475, 476] and may downregulate inflammatory cytokine gene expression [474].
The prostaglandin-type pro-resolving lipid mediator 12d-PGJ2 has been shown to stimulate

174
collagen synthesis in human osteoblast cells [477, 478]. As aforementioned, an important
limitation is the lack of PGE2 measurement in all studies, yet the discovery of pro-resolving
mediators suggest that the overall effect of pro-inflammatory lipid mediators should be
considered in the context of the presence of pro-resolving mediators. Measurements of PGE2
alone may not provide sufficient information on inflammatory states in the bone milieu; targeting
the synthesis of pro-resolving mediators may represent a novel mean to stimulate return to
homeostasis, rather than the traditional approach of reducing synthesis of pro-inflammatory
mediators, for example, through decreasing n-6 LCPUFA.

175
Figure 7.1 Biosynthetic cascades and actions of selected lipid mediators derived from AA, EPA
and DHA
LCPUFA serve as substrates for the formation of specialized pro-resolving lipid mediators
involving lipoxygenases (human 5-LO, 12-LO and 15-LO) and cyclooxygenases (COX),
particularly the inflammation-induced isoform COX-2. EPA-derived mediators are known as E-
series Resolvins (RvE1-3) and DHA-derived lipid mediators are named D-series Resolvins
(RvD1-6), Protectins (PD1) and Maresins (MaR1-2). AA is involved in the initiation phase of
inflammation by forming pro-inflammatory leukotrienes (LTB4) and prostaglandins (PGE2 and
PGD2). The most prominent pro-resolving mediators formed from AA are the lipoxins (LXA4
and LXB4), which are formed via sequential actions 5-LO and 12-LO with LTA4, as an
intermediate or 15-LO-initiated interactions with 5-LO-bearing cells. The epimeric aspirin-
triggered lipoxins (AT-LXA4) [479, 480] have similar actions as the lipoxins but are formed
from COX-2 in the presence of aspirin or via the cytochrome 450 (CYTP450) pathway
Abbreviations: AT-LXA, aspirin-triggered lipoxins; COX, cyclooxygenase; LO, lipoxygenase;
HEPE, hydroxyeicosapentaenoic acid; HETE, hydroxyeicosatetraenoic acid; HPDHA,
hydroperoxydocosahexaenoic acid; HPETE, hydroxyperoxyeicosatetraenoic acid; LT,
leukotrienes; LX, lipoxins; MaR, maresins; PD, protectins; PG, prostaglandin; Rv, resolvins

176
7.3 Adipo-myokines
The influence of adipokines on bone metabolism was reviewed in section 2.1.3. Likewise,
secretory factors from skeletal muscles, known as myokines, are believed to mediate important
interactions between adipose tissue, skeletal muscle and bone. Considerable overlap between
adipokines and myokines (termed “adipo-myokine”) exists; among the best described members
of this family are IL-6 and TNF-α [481], where they induce bone resorption through enhancing
RANKL-dependent osteoclastogenesis [482, 483]. Irisin is an exercise-induced myokine derived
from the cleavage of fibronectin type III domain-containing 5 (FNDC5) protein, and functions to
induce switching of white adipocytes to brown fat-like cells [484]. Interestingly, adipose tissue
not only constitutes a target for irisin, it also expresses FNDC5 and secretes irisin [485, 486].
Leptin dually increased and decreased Fndc5/irisin expression in skeletal muscle and adipocyte
respectively, confirming the crosstalk between both tissues. Low-dose recombinant-irisin
improved cortical bone mass and geometry in vivo [487] through increasing osteoblast
differentiation and reducing osteoclast maturation [488]. Studies examining the association of
irisin concentrations with BMI and/or adiposity in children are emerging, but results are
inconsistent where both positive [489, 490] and negative [491] relationships have been found.
Interestingly, LA proportions in cholesteryl ester negatively associated with plasma irisin level
among children with obesity (6-9 y) [492]. The discovery of myokines and adipokines have
provided a new basis to understand the molecular mechanisms underlying the connection
between muscle, adipose and bone tissues. Future efforts are needed regarding the impact of
obesity on adipo-myokine secretion such as irisin, myostatin [493] and IGF-1 [494], and how
they relate to the muscle-adipose-bone axis.

177
7.4 Interaction between genotype and LCPUFA intake
The characterization of genetic variants that contribute to inter-individual differences in
nutrient metabolism is a topic of recently recognized importance in the design of clinical studies.
Studies have indicated that the effects of n-3 LCPUFA or oily fish intake is highly heterogenous,
and likely influenced by genetic variants which impact on LCPUFA metabolism and tissue
partitioning, transcription factor activity, or physiological end-point regulation [495].
Polymorphisms exist in genes coding for proteins involves in the metabolism and signaling of
LCPUFA including FADS, PPAR, COX and PPAR [496]. For example, genetic variation in the
FADS gene cluster (FADS1, FADS2, and FADS3) are important genetic determinants of LCPUFA
status [497, 498]. Genome-wide association studies identified significant association between
plasma AA levels and the SNP rs174537 near FADS1, where it accounted for 18.6% of the
addictive variance in AA [499]. A recent study in Chinese women showed that maternal genetic
variants in ELOVL2 and ELOVL5 interacts with DHA intake to affect LCPUFA levels in breast
milk [500]. Until now, most studies are performed in adults and little is known about the
variation across life stages. DNA methylation of the ELOVL2 promoter region showed a
progressive increase with age (r=0.92) and may be a promising marker of aging [501]. Hence,
the interaction among age and sex, among other factors may further contribute to the genetic
variation of LCPUFA metabolic pathways. The FiSK (Fish, children, health and cognition)
Junior study is a randomized controlled trial that examines the effect of consuming 300 g/wk of
oily fish versus poultry on cardiovascular risk markers, cognitive function, behavior and emotion
in Danish children (8-9 y); special attention is given to the sex- and genotype-specificity of
outcomes [502]. Results from this trial will advance the understanding on the importance of
dietary fish while considering the interaction of sex and genotype in childhood.

178
CHAPTER 8
Conclusion

179
Increasing intakes of fish and seafood is the most realistic and practical way to raise dietary
quantities of n-3 LCPUFA. Important questions then arise regarding the impact of aquaculture in
changing the consumption pattern of key fatty acids known to affect human health. The rising
demand and prices of fish oil are forcing the industry to reduce the reliance on fish oils and
increasing the use of vegetable oils in aquaculture feeds [503]. However, fatty acid profile of the
fish fillets reflected the fatty acid profile of the feed. Fish given feeds low in fish oil had a low
level of EPA and DHA in their fillets [504]. A study published in the Journal of the American
Dietetic Association suggested that certain farmed fish species, such as tilapia and catfish “have
low levels of n-3 fatty acids along with levels of AA so high they can be considered detrimental”
[505]; and argued that the inflammatory potential of an average serving of farmed tilapia (134
mg AA/100g) is greater than hamburger, pork bacon and donuts given their lower AA content (34
mg, 4 mg and 191 mg AA/100 g respectively). This opinion was met with considerable
resistance [506, 507] and supported by the lack of evidence to provide justification for vilifying
low n-3 fish (even if they might contain higher amounts of AA) as “pro-inflammatory” and “pro-
atherogenic” [507]. Nonetheless, this demonstrated that the belief that the presence of AA,
regardless of quantities, in food is considered harmful, is common, even among health
professionals.
The idea has developed that, since AA-derived mediators are involved in pathologies of
many diseases, AA itself and its eicosanoid derivatives must be harmful. This is compounded by
the observation that many health benefits of n-3 LCPUFA frequently involve an “antagonism” of
AA, where n-3 LCPUFA partly replace AA in cell membranes and inhibit AA metabolism to pro-
inflammatory eicosanoids. Despite so, studies in humans have yet to demonstrate definite
adverse health effects related to high AA intake. A study in healthy Japanese adults with

180
habitually high EPA+DHA intakes demonstrated that AA supplementation (840 mg/d) for 4 wk
had no effect on blood pressure, serum lipid and glucose concentrations, or markers of liver
function [386]. Consistently, an earlier cross-over study in US adults using 1.5 g AA/d showed
no effects on blood lipids [391]. Interestingly, bleeding time tended (p=0.06) to be longer, not
shorter, with higher AA intakes. There is also no evidence of an inverse relationship between AA
supplementation (ranging from 240 to 1500 mg/d) and plasma composition of EPA and DHA
[386, 389, 391, 508]. It appears appropriate then to conclude an increase in AA intake by healthy
adults, up to an intake of 1.5 g/d is unlikely to pose any adverse effects. Unfortunately, no similar
data on AA supplementation exists in children and adolescence, nor is there any information on
the impact of increased AA supply in individuals with pre-existing low-grade inflammation, such
as that in obesity. It is uncertain to what extent does exogenous AA beyond average intake (84 ±
0.3 mg/d) [509] exacerbates the inflammatory process.
Overall, in the human study, the negative relation in bone size and mass in the forearm, and
possibly IR is manifested in children with the highest AA status. However, no evidence of harm
was observed with AA at intermediate amounts based on the cross-sectional analyses. AA was
not associated with adiposity or BMI Z-score in children. Further, dietary n-3 LCPUFA intake
and consequently EPA and DHA status were low; and declined with increasing adiposity. It
remains uncertain if these outcomes would be modulated if intakes of EPA and DHA were to
increase in this population. In the animal study, AA accentuated the increases in body weight and
leptin production in early stages of diet-induced obesity. The influence of AA on bone is opposite
in the central versus appendicular skeleton, and further evidence was provided in vitro that AA
increased number of lipid droplets in adipocytes and leptin production, possibly involving
PPARγ. Given the scarcity of reports on the relationship between AA and bone health in children,

181
conclusions drawn regarding a strictly beneficial or adverse effects are premature. This thesis
adds to the existing literature by providing specific investigation on AA and pointed out
important outcomes and aspects related to study design to consider in future studies. Most
importantly, the biological importance of AA in childhood and adolescence remain largely
unknown, this work aimed to fill this knowledge gap by evaluating effects of AA in children with
obesity on well-defined and quantifiable outcomes of public health significance.
The emphasis of the health impacts of AA in adults appears to differ vastly from that in
children. High long-term intakes of n-6 fatty acids in adults, especially that of LA and AA have
been related to pro-inflammatory states, increased risks of cardiovascular diseases and type 2
diabetes [510]. The North American diet is heavily criticized for excessive total and relative n-6
fatty acid intakes compared to n-3s, hence fixing an upper limit to n-6 LCPUFA consumption has
been a recurrent issue in the international scientific agenda for dietary guidelines for fat.
Regrettably, the body of literature that showed either neutral or beneficial effects of dietary
intakes or blood levels of LA on chronic diseases risk [392, 454, 511-513] have received
relatively little attention compared to studies that reported adverse outcomes. In addition, at what
age and threshold of intake does excessive n-6 LCPUFA begin to cause harm is largely
undetermined. Until more systematic research is available to provide a sound scientific basis for
further encouraging the reduction of n-6 LCPUFA intakes, the priority may be to correct the low
n-3 LCPUFA intakes/status beginning in youths, as an effort to minimize future risks of diseases.
Measures of childhood obesity based on objective estimates of excess weight (i.e. BMI)
have remained stable over the last 10 y [29], suggesting the public effort to prevent and/or treat
childhood obesity may prove to be effective over time. However, it is frequently stated the use of
high BMI level to identify children who are obese results in high specificity but moderate (80-

182
85%) sensitivity [514]. It remains possible that a proportion of children who are obese (i.e.
excess adiposity) but not overweight due to low lean mass, are missed in the classification based
on the BMI Z-score cutoffs. Childhood trends including the under consumption of key nutrients
(calcium, vitamin D, fibre, etc.), lack of physical activity, increased screen time, and disordered
eating behaviors, are problems that affect children of all BMIs, and not just those above a certain
cutoff level. We must therefore readjust the focus to center on the promotion of optimal pediatric
health instead of concentrating on body size and shape.
The concept of achieving an ideal dietary n-6: n-3 ratio may have created unintended harm
by distracting attention away from increasing absolute intakes of n-3 LCPUFA. The idea that n-6
LCPUFA, at least in moderate amounts, has a critical and likely beneficial role in human health
and disease prevention is slowly gaining ground. Perhaps the issue is not the presence of the n-6
fatty acids, but the absence of the n-3s in the diet. Possible barriers to fish consumption,
including the conflicting messages conveyed through the media about benefits and risks
associated with eating fish needs to be clarified. Until further risks of increasing dietary intakes
of EPA and DHA or of fatty fish, related to methylmercury content or contamination with
environmental pollutants [224, 515] are identified, it remains safe to emphasize on raising the
consumption of n-3 without intentionally avoiding n-6 LCPUFA as part of targeted obesity
prevention effort for all children.

183
APPENDIX A

184
Published: Docosahexaenoic acid (DHA): properties, functions and health effects.
Nova Science Publisher’s, Inc.; 2016.
Docosahexaenoic acid (DHA) and Properties, Function and Health Effects:
DHA and Growing Bone
Ivy L Mak and Hope A Weiler

185
A.1 Abstract
Benefits of dietary long-chain polyunsaturated fatty acids (LCPUFA) on bone health across the
life stages (infancy, adulthood, aging and pregnancy) is apparent in a number of human and
animal investigations. Docosahexaenoic acid (DHA, 22:6 n-3), in particular, has been advocated
for ensuring optimal development of infant brain and visual systems, modulating inflammatory
and immune responses, reducing incidence of cardiovascular vascular diseases, and more
recently, in supporting optimal bone health. Childhood and adolescence represent the most
critical periods for developing optimal peak bone mass and bone strength. Almost half of adult
bone mass is acquired between 12 and 18 years of age, and those with the highest peak bone
mass are best protected against bone loss with aging. DHA supplementation in growing animals
is associated with increased bone formation and calcium retention, accompanied by reduced
resorption. Thereby resulting in improved micro-architectural properties and bone mass that
translated into greater bone strength. This chapter seeks to review the literature on the effects of
DHA in bone health with focus on the growth period. Herein, a summary of current knowledge
on DHA sources, intakes and current recommendations will be provided. This will lay a
foundation for examining the function of DHA in growing tissues with bone as an example,
including potential mechanisms involved, differences in the various sources of dietary DHA,
versus preformed DHA on bone; as well as possible sexual dimorphisms in DHA status and bone
growth. Lastly, this chapter will summarize basic and clinical findings on the consequences of
DHA supplementation on bone mass as an outcome. This seek to shed light on limitations of
existing studies and identify gaps in knowledge and needs for improved methodology and/or
technology to facilitate research on the effects of LCPUFA on bone mass during rapid periods of
growth.

186
A.2 Introduction
A vast body of evidence demonstrates multiple beneficial effects of dietary long-chain
polyunsaturated fatty acids (LCPUFA, ≥ 18C, ≥ 2 double bonds) on bone health. Data from both
cross-sectional and intervention studies indicate that LCPUFA can increase bone formation,
affect peak bone mass (PBM) in adolescents, and reduce age-related bone loss in older
populations. In addition to the established roles of LCPUFA in regulating membrane fluidity, cell
function and responses, LCPUFA appear to affect bone metabolism in multiple pathways. These
include modulation of fatty acid metabolites, direct regulatory effects on bone cells of the basic
multicellular unit (BMU), or via receptors or sensors that influence patterns of gene expression.
Docosahexaenoic acid (DHA, 22:6 n-3) is an essential fatty acid of the omega-3 (n-3) series
that has received substantial attention due to its pivotal roles in biological functions including
brain and visual development, cognition, inflammatory responses and with decreasing risk or
mortality with cardiovascular diseases [516]. In terms of the emerging role of DHA on bone
health, DHA supplementation in growing rodents has been shown to decrease bone resorption,
calcium excretion, and enhance PBM accrual in healthy as well as n-3 depleted states [517].
Moreover, DHA may mediate anti-inflammatory effects through its metabolites such as the
eicosanoids and resolvins. Overall, DHA demonstrates the ability to influence biological
processes by serving as signaling molecules, either indirectly as fatty acid derivatives, or directly
regulate gene transcription via binding to specific fatty acid receptors. Childhood and
adolescence represent the most critical periods for developing PBM and bone strength. Gains in
bone mass are most rapid during adolescence, with 25% of the PBM acquired during the two-
year period surrounding peak height velocity [518]. While the timing of PBM remains debatable
and varies by skeletal sites, it is generally recognized that about 90% of PBM is acquired by 18

187
years of age [519, 520]. The remaining 5-12% of gains in BMC are accounted for in the third
decade of life (i.e. 20 to 30 y) [3]. Variance in bone mass among individuals at completion of
growth is an order of magnitude greater than variance in rates of bone loss during aging (1 SD =
10% and 1% respectively) [8], thus the accrual of PBM during early adulthood is likely to be the
dominant determining factor for ones’ susceptibility to fracture later in life. This chapter thus
seeks to review the literature on the effects of DHA in bone health with a focus on the growth
stages of life.
PUFAs are divided into two classes according to their structure. Omega-3 (n-3) and omega-6
(n-6) represent fatty acids with the third and sixth carbon from the methyl end being unsaturated,
respectively. Mammals are incapable of synthesizing n-6 or n-3 fatty acids de novo, therefore the
availability of the 20- and 22-carbon LCPUFA is determined by the conversion of dietary n-6
fatty acid precursor linoleic acid (LA, 18:2 n-6) and n-3 fatty acid precursor α-linolenic acid
(ALA, 18:3 n-3) through a series of common and competitive microsomal desaturation-
elongation reactions within the peroxisomes (Figure A1).
Biosynthesis of LCPUFA requires the introduction of cis double bonds by the Δ5 desaturase
(D5D) and Δ6 desaturase (D6D) enzymes, that are encoded by the FADS1 and FADS2 genes,
respectively. Both D5D and D6D are membrane-bound proteins with amino-terminal cytochrome
b5 domains carrying heme-binding motifs, two membrane-spanning domains and three His-box
motifs [521]. In humans, D5D shares about 61% amino acid identities with D6D and has 75%
similarity to the human D6D [522]. These two enzymes are responsible for the two rate-limiting
steps in LCPUFA synthesis, being the desaturation of LA and ALA to 18:3 n-6 and 18:4 n-3,
respectively; and desaturation of 20:3 n-6 to arachidonic acid (AA, 20:4 n-6) and 20:4 n-3 to
eicosapentaenoic acid (EPA, 20:5 n-3). The expression along with catalytic activity of D5D and

188
D6D is highest in the liver, but it is also present to a smaller amount in the brain, heart, lungs,
adrenal glands, testes and subcutaneous adipose tissue of both rats and humans [521-523]. The
synthesis of DHA from its respective 22-carbon precursor docosapentaenoic acid (DPA, 22:5 n-
3) involves elongation, desaturation by D6D and peroxisomal β-oxidation that shortens the acyl
chain by 2 carbons, resulting in the addition of one double bond at the Δ4 position.
While DHA can be produced de novo via the conversion from dietary ALA by D5D and
D6D, the extent of conversion is insufficient to increase DHA concentration in tissues to a
physiologically significant concentration [524]. On average between 0.01% and 8% of ALA is
converted to EPA and less (<1%) to DHA [525, 526]. The rate of conversion also appears to be
different between sexes where in women of reproductive age, the fractional conversion rate of
ALA into EPA and DHA (n=6, 28 ± 4 y) was approximately 21% and 9.1% respectively [527], as
compared to men of 7.9% for EPA, and undetectable DHA production [528]. To date, no Dietary
Reference Intake (DRI) recommendations specifically for EPA and DHA have been established
by the Institute of Medicine (IOM) for the United States and Canada, owing, in part to a lack of
consensus for a clear functional endpoint, and uncertainty whether separate guidelines should be
set for EPA and DHA [529]. There is, however, an Adequate Intake (AI) for ALA with values for
children 1-3 y being set at 0.7 g/d and 0.9 g/d for children 4-8 y. For those over 13 y, AI values
are 1.2 g/d for boys and 1.0 g/d for girls. These AI values are based on the observed median
intake in the United States that supports normal growth and neural development and at which no
nutrient deficiency is present [296]. Up to 10% of the acceptable macronutrient distribution
range (AMDR) for ALA (0.6-1.2% of energy) can be consumed as EPA and/or DHA, which
approximately corresponds to the mean intake for EPA and DHA in the United States (~100
mg/day) [296].

189
Despite the absence of IOM-based DRI values for EPA and DHA, The Dietary Guidelines
for America, 2005 reported “there is evidence that suggests that consumption of approximately
two servings of fish per wk (approximately 8 oz (224 g) total) may reduce the risk of mortality
from coronary heart disease; and that consuming EPA and DHA may reduce the risk of mortality
from cardiovascular disease in people who have already experienced a cardiac event” [530]. The
Eating Well with Canada’s Food Guide also provides similar recommendations of consuming at
least two servings of fish per wk (75 g per serving) [531]. Given the potential health benefits
associated with EPA and DHA, many organizations and expert committees have recognized the
importance of n-3 LCPUFA, and thus have established recommendations for EPA and DHA.
Depending on the target population, suggested intake values can range from 250-4000 mg/d
(Table A1).
Oily fish such as salmon, herring and mackerel represents the richest sources of n-3
LCPUFA, providing approximately 3-3.5 g per 75g serving, with DHA comprising on average
65% of total n-3 LCPUFA. DHA content in fish typically corresponds with overall LCPUFA
content, with Atlantic salmon providing the greatest amounts of DHA at an estimated level of 1-
1.5 g per 75 g serving. Concentrations in other fish including cod and sole can vary between 100-
400 mg DHA per 75 g serving. Other non-fish marine sources including shrimps, mussels and
scallops also contain moderate amounts of approximately 250-600 mg DHA. Alternatively, given
the limited availability, high cost and low acceptance of fish to some consumers, meats, dairy
products and eggs can potentially contribute to n-3 LCPUFA intake, despite in relatively low
quantities. DHA is found predominantly as part of membrane phospholipids in land-based foods,
providing approximately <40 mg/100 g serving [532]. Enrichment of tissue DHA in such sources
appears to be dependent upon dietary DHA instead of de novo synthesis. For example, fish oil
190
[533], linseed oil and rapeseed oil [534] are commonly added to poultry feeds with an aim to
manipulate the LCPUFA composition of poultry. Inclusion of EPA and DHA in poultry diets
readily increases concentration of these fatty acids in edible tissue, but this is not achievable
through supplementation of the precursor ALA [535]. Furthermore, with the growing interest to
enrich or fortify foods that traditionally do not contain n-3 LCPUFA such as pasta, bread, milk,
dairy products, salad dressings and margarine; these foods have now become the second main
contributors to dietary LCPUFA sources in the North American diet following marine sources
[536]. While questions have been raised against an optimal ratio between n-6 and n-3 fatty acids
since LA and ALA competes for desaturation by D6D, a systematic review on the effect of
dietary LA on fatty acid metabolism reasoned that LA supplementation had little effect on DHA
concentrations, nor was LA associated with increased inflammatory markers that potentially
stimulate osteoclastogenesis [537].
Canadian adults are estimated to consume approximately 80 mg/day of EPA and DHA
combined based on the typical male 20-64y [538]. For inland communities (Ontario, Canada),
average intakes of 117 mg/d for pregnant women has been reported, although up to 20% of
residents in these communities may consume undetectable amounts of DHA [539]. This is in
contrast to much higher intakes of 238 mg/day for coastal communities (British Colombia,
Canada) with presumably greater accessibility to seafood and fish [540]. Similar observations
have also been reported in Australia [541] and Germany [542] where observed EPA and DHA
intakes are in general lower than expert committee recommendations, with the exception of
France where up to 400-497 mg/d combined EPA, DPA and DHA was consumed [543]. The
2009-2010 NHANES “What We Eat in America” report also placed average DHA intakes of
adult males and females at 80 mg/d and 60 mg/d respectively [544]. Hence, the recently

191
published Dietary Guidelines for Americas 2015-2020 recommend “incorporating seafood as the
protein food choice in meals twice per week in place of meat, poultry, or eggs” in light of low
average seafood intakes across all age-sex groups [339] .
Although it is generally recommended to employ a food-based approach for achieving
nutrient adequacy and preventing and treating diseases, recent data in 600 pregnant and lactating
women in the Alberta Pregnancy Outcome and Nutrition (APrON) cohort reported that only 27%
of women during pregnancy, and 25% at 3 months postpartum met the European Union
consensus recommendation of 200 mg DHA per day by diet alone; while those who took a
supplement containing DHA were 10.6 (95% CI: 6.80 – 18.14) and 11.1 (95% CI 6.95 – 16.07)
times more likely to meet the recommendation for pregnancy or postpartum respectively [545].
This suggests that supplementation may be beneficial for achieving recommended EPA and DHA
intakes in individuals who do not regularly consume fish as part of their diets. Similarly,
supplementation or consumption of DHA-enriched foods could ensure an adequate supply of n-3
LCPUFA in children with suboptimal ALA and LA intakes. This is especially relevant to children
in light of the established roles of essential fatty acids in growth and development in children,
combined with the limited conversion of LA and ALA into longer chains LCPUFA during the
first 2 years of life [546].
A.2.1 Overview of postnatal skeletal development
Despite the astounding range in the sizes and unique morphology of bone both within and
between individuals, all bones form through one of the two distinct processes: intramembranous
bone formation and endochondral bone formation [547].
Intramembranous bone formation is achieved by the transformation of mesenchymal stem
cells (MSC) into osteoblasts where soft connective tissue is replaced directly by bone tissue. This

192
process forms flat bones of the skull [548], and parts of the mandible and clavicle. Endochondral
bone formation, on the other hand, is the process where MSC differentiate into chondrocytes that
proliferate to form and enlarge the bone structure. It is responsible for the generation of most
bones. Critical events during postnatal bone formation includes the formation of secondary
ossification centers, longitudinal growth of long bones at the epiphyseal growth plate, the fusion
of secondary ossification centers, diametric bone growth, and vascularization of bone tissue
[549].
Ossification is the process in which either membranous fibrous tissue or cartilage is replaced
by bone tissue [550]. It begins in a focal area that expands progressively until all of the existing
tissue is replaced by bone tissue. While the primary ossification center is the initial site of
ossification and develops mostly during the embryonic and early fetal period, the secondary
ossification centers are generally formed postnatally, and develop in regions where primary
centers do not extend [550].
In long bones, the development of the growth plate results shortly after the appearance of the
secondary ossification center in the epiphyseal region. The growth plate is a thin disk of cartilage
that creates a barrier between the epiphysis and the diaphysis, and serves as a source of cartilage
for conversion to bone [551]. Bone is deposited in the transitional metaphyseal region located
directly below the growth plate as long bone lengthens. At the end of puberty where long bones
have reached adult length, the growth plate fuses with the diaphysis and longitudinal bone
growth ceases at this point [551].
As bone lengthens it also expands in diameter at the diaphysis to improve its ability to
support weight bearing loads. In long bones this is achieved by the excavation of a marrow
cavity and circumferential expansion of the cortical bone, also known as appositional growth.

193
The result is enhanced strength and resistance to bending [552]. In contrast to longitudinal bone
growth, periosteal apposition can occur at any time during development and is a form of
intramembranous bone formation [549].
Optimal vascular supply to the bone is essential for these processes to occur. This is
achieved through the hypertrophic chondrocytes in the central diaphysis, which stimulates the
invasion of blood vessels of the perichondrium surrounding the future diaphysis, and transforms
it into the periosteum [551]. Specific groups of arterial networks are responsible for supplying
blood and nutrients to the various portions of long bones to support its function for calcium
storage, vitality of bone cells as well as hematopoiesis [553, 554].
Bone is frequently categorized into two main and distinct types: cortical bone and trabecular
bone. Different regions of the skeleton contain variable amounts of cortical and trabecular bone.
Cortical bone is primarily formed at the diaphysis, complete perimeter of all long bones, as well
as the outer layer of nearly all short, flat and irregular bones. It comprises approximately 80% of
the skeleton and fulfills mechanical and protective functions. The trabecular compartment
accounts for the remaining 20% and has both mechanical and metabolic role, serving as a
reservoir for calcium and phosphorus [89]. Trabecular bone density in regions such as the lumbar
spine increases during puberty. In contrast, cortical bone density in the appendicular skeleton
remains relatively constant across age, gender and race, while cortical thickness increases
dramatically [555]. The relatively low turnover rate of 2-3% per year in cortical bone is adequate
to maintain biomechanical strength in adults. In contrast, the rate of trabecular bone turnover
may be 5-10 times higher, and is observed to be more than required for maintenance of
mechanical strength, indicating that trabecular bone turnover is more important for mineral
metabolism [556]. Rates of turnover in children are less whereas modeling is highly active and

194
necessary for bone growth. Most of the gains in bone mineral during growth are due to increases
in bone size, rather than density.
In addition to the chondrocytes of the growth plate, actively growing bone is composed of
intercellular calcified material called the bone matrix, and four major types of bone cells that
function throughout life: osteoblasts, osteoclasts, osteocytes and bone-lining cells; the collective
action of these cells is described as the “basic multicellular unit” (BMU). The BMU acts in a
highly coordinated manner to reconstruct bone in distinct locations on the three compartments
(trabecular, endocortical, and intracortical) of the endosteal envelope, and to a lesser extent the
periosteal envelope [557].
In an active remodeling sequence, osteoblasts that arise from osteoprogenitor cells would
quickly fill the remodeling space with a collagenous osteoid after osteoclasts resorbs bone.
Mature osteoblasts synthesize new collagenous organic matrix and regulate mineralization of
matrix by releasing small, membrane-bound matrix vesicles directed toward the bone formation
surface that concentrate calcium and phosphate, and enzymatically destroy mineralization
inhibitors such as pyrophosphate or proteoglycans [558]. At completion of bone formation,
approximately 50-70% of osteoblasts undergo apoptosis, with the remaining becoming
osteocytes within bone matrix that support bone structure, or protective lining cells that cover the
surface of quiescent bone.
During bone remodeling, resorption by osteoclasts precedes bone formation by osteoblasts.
The process of osteoclastogenesis is activated by the release of local factors by osteocytes [559].
While a range of stromal derived factors have been suggested to play a role in initiating
osteoclast formation, most converge to interaction between the surface receptor activator of
nuclear factor-κB (RANK), its ligand RANKL expressed on osteoblasts, and the decoy receptor

195
osteoprotegerin (OPG) that can prevent osteoclastogenesis by binding to RANK. Upon
activation, osteoclast precursor cells fuse into tartrate-resistant acid phosphatase (TRAP)- and
cathepsin K-positive multinucleated osteoclasts. At the resorption site, the osteoclasts form a
specialized cell membrane, the ruffled border, and release secretory vesicles containing
lyzosomal enzymes, hydrogen pumps and free radicals into a confined space that dissolve
minerals and degrade bone matrix [560].
Skeletal acquisition during growth is mediated by a myriad of endocrine factors. Of all,
growth hormone (GH) and its downstream effector insulin-like growth factor-1 (IGF-1) are
major determinants of bone mass accrual and longitudinal growth, as well as for maintaining
bone integrity. IGF-1 is mainly produced in the liver, but is also expressed locally in extrahepatic
tissue including skeletal muscle and bone, acting in a paracrine and/ or autocrine manner. IGF-1
synthesis in most extrahepatic tissue is not only under growth hormone control. It appears that
locally produced IGF-1 is more important for growth than hepatic derived IGF-1, as selective
hepatic deletion of IGF-1 did not result in significant growth impairment despite a 75% reduction
in circulating IGF-1 concentrations [561].
A multitude of in vivo and in vitro model systems have indicated that IGF-1 positively
regulates osteoblast and chondrocyte functions. The importance of IGF-1 in embryonic bone
development was apparent when chondrocyte-specific knockout of the IGF-1 receptor (IGF-1R)
in mice resulted in 10% reduced growth, reduced bone size and decreased skeletal mineralization
that was associated with reduced proliferation, delayed differentiation and hypertrophy, as well
as increased apoptosis of chondrocytes [562, 563]. Given the poor postnatal survival in models
of global IGF-1 deficiency, transgenic line expressing tamoxifen-dependent Cre recombinase
was developed to allow for conditional knockout during embryogenesis and postnatally [564].

196
Chondrocyte-specific deletion of the IGF-1 receptor (IGF-1R) in mice at 2 wk of age resulted in
significant growth restriction with a body weight about 70% of controls, and severely
disorganized growth plates [562], supporting a central role for locally produced IGF-1 in optimal
development of the epiphysis.
IGF-1 is the most abundant growth factor is that deposited in the bone matrix [565]. IGFs
are released during osteoclastic bone resorption, producing an osteogenic microenvironment to
stimulate new bone cell formation from MSC and matrix production, linking bone resorption
with formation [566]. Receptors for IGF-1 are expressed in osteogenic cells including
osteoblasts, osteoclasts and osteocytes, where IGF-1 signaling directly regulates bone cell
function. IGF-1 stimulates RANKL expression and osteoclastogenesis in bone MSCs [567, 568],
and deletion of IGF-1R from osteoclast precursors inhibits osteoclastogenesis [569]. Osteoblasts
from IGF-1 knockout mice have decreased RANKL expression and are poor stimulators of
osteoclastogenesis [569], suggesting that both osteoblasts and osteoclasts produce and are targets
of IGF-1, and exhibit anabolic as well as catabolic effects on bone. IGF-1 has also been
suggested to in part, mediate the anabolic effects of parathyroid hormone (PTH) on bone.
Osteoclast precursors lacking IGF-1R blocked the ability of PTH to stimulate the expression of
osteoblast differentiation markers including RANKL in coculture [569]. Mice lacking IGF-1R
from osteoprogenitor cells also showed blunted responses to PTH that was associated with
reduced osteoblast numbers, proliferation and differentiation resulting in decreased bone volume
fraction (BV/TV) in the proximal tibia [570]. Taken together, IGF-1 actions in bone tissue are
crucial for maintaining normal interaction between bone cells in some measure through
regulating RANK and RANKL expression [569].

197
Table A1 Summary of the recommended EPA + DHA intake from expert organizations.
Adapted from Flock et al. [249]
Source Recommended daily dose
of EPA + DHA (mg) Population
Academy of Nutrition and Dietetics
(United States)
≥ 500 General Population
International Society for the Study of Fatty
acids
≥ 500 General population
≥ 500 (≥ 200 DHA) Pregnant/lactating
women
British Nutrition Foundation Task Force 500-1000 People at risk of
cardiovascular diseases
U.K. Department of Agriculture ≥ 250 General population
American Heart Association Fatty fish ≥ 2 times/wk
(~500)
Adults without CVD
~ 1000 Adults with CVD
2000-4000 Adults with high
triglycerides
European Food Safety Agency ≥ 250 General population
≥ 250 (100-200 DHA) Pregnant/lactating
women
≥ 100 DHA Children 7-24 months
≥ 250 Children 2-18 years
World Health Organization 1-2 servings of fish/wk
(200-500 mg of EPA
+DHA / serving)
General population
Dietitians of Canada ≥ 500 n-3 LCPUFA General population
Ministry of Health, Labor and Welfare
(Japan)
> 1000 General population
1700 - 1900 total omega-3 Pregnant/lactating
women

198
Figure A1 Metabolism of α-linolenic acid into longer chain omega-3 polyunsaturated fatty acids
in the endoplasmic reticulum and peroxisome via a desaturase/elongase enzyme system

199
A.3 Epidemiological and clinical studies linking DHA to bone mass
A.3.1 Human studies
Studies in adults have repeatedly reported positive associations between n-3 LCPUFA
levels and bone mineral density (BMD) in adults, as well as its beneficial effects in preventing
age-related bone loss in aging populations. However, those that have investigated the possible
role of DHA in periods of bone acquisition in humans are sparse.
Some evidence for the benefits of LCPUFA in bone health of children comes from studies
designed to treat various clinical conditions. For example, in comparing the incidence of
fractures in neonates with congenital cholestasis receiving either a fish oil or soybean oil-based
intravenous emulsion, those maintained on the fish oil formula had a lower incidence of fractures
compared with soybean oil (5.3% and 12% respectively) [359]. Another study in girls aged 8.2-
16.5 y (n=190), dietary LCPUFA correlated positively (r=0.167) with gains in ultra-distal radius
areal BMD (aBMD) over a year [571]. In a 6-y follow-up study of a cohort of 78 healthy young
men between 16 and 22 y of age, concentrations of serum phospholipid n-3 fatty acids were also
associated with changes in whole body aBMD (r=0.27) and spine aBMD (r=0.25). This same
study also showed an independent positive relationship between DHA and aBMD (r=0.32 and
r=0.30 for whole body and spine respectively), thus favoring peak bone mass development in
adolescents [358]. Similar results have also been reported in 34 cystic fibrosis (CF) children
(male 13.2 ± 3.8 y, female 11.6 ± 3.4 y), where AA: DHA was negatively associated (r=-0.39)
with spine BMD z-score [572]. Moreover, endosteal circumference of the radius increased with
greater serum phospholipid DHA concentrations (r=0.79) in men with CF (n=14, 21.6 ± 2.2 y)
relative to healthy controls [573]. In younger children (8.2 ± 0.34 y), however, neither n-3 PUFA
nor DHA was related to whole body BMC or aBMD [285]. In slightly overweight adolescent

200
boys (n=78, BMI 23.1-25.2 kg/m2, 13-15 y) randomly assigned to breads enriched with fish oil
(1.1g of n-3 LCPUFA) or control for 16 wk, fish oil significantly increased red blood cell (RBC)
membrane EPA and DHA levels, and reduced n-6 PUFAs LA and AA. However, no significant
differences in bone mass measured by dual-energy X-ray absorptiometry (DXA) was found, nor
was DHA status correlated with whole-body aBMD, BMC and bone area. A weak (β=0.24), but
significant positive association between DHA status and IGF-1 concentrations was reported,
suggesting more sensitive measures for changes in bone mass, and studies over longer time spans
should be required for determining the potential bone-accumulating consequences exerted by
IGF-1 [214] Moreover, observations in healthy girls (n=351, 8-12 y) include inverse associations
between total dietary PUFA (β=-0.13) and trabecular BMC or predicted bone strength at distal
femur in pre-pubertal girls (≥1 y pre-menarche 9.8 ± 0.5 y). These observations were likely due
to high proportions of n-6 fatty acid intakes (89 % of total PUFA) in this population. In contrast,
in early pubertal girls (<1 y pre-menarche, 11.7 ± 0.5 y), dietary EPA intake was a positive
predictor (β=0.14) of proximal tibial trabecular BMC, femoral periosteal circumference and
cortical bone strength estimated by peripheral quantitative computed tomography (pQCT) [574].
These separate analyses suggest, that associations between dietary fatty acid intake and bone
health may vary by stages of maturation, and that trabecular and cortical bone may respond
differently to n-3 PUFA in the diet.
A.3.2 Animal studies
There is a wealth of animal feeding trials investigating the effects of LCPUFA using
different ratios of n-6: n-3 fatty acids, specific fatty acids, or combined with other dietary factors
such as boron and inulin to promote bone mass accrual during growth (Table A2). While purified
forms of n-3 fatty acids are the preferred source in these experiments, oils from vegetables or

201
marine origins are more often employed to provide polyunsaturated fats for practical reasons.
There are, however trade-offs in using purified fatty acids, as these are in the form of free fatty
acids or not necessarily positioned within the triglyceride as are dietary fatty acids [575] and
hence metabolism could vary.
Early studies in newborn rats reported pathological fractures induced by essential fatty acid
deficiency [576]. Maternal-fetal transfer represents one of the most important means for infants
to obtain sufficient amounts of LCPUFA. Maternal supplementation of high n-3 LCPUFA has the
potential of imposing imbalances in maternal-fetal transfer of n-6 LCPUFA in the fetus [577]. In
both rats and guinea pigs, when maternal diets during lactation were supplemented with 0.5% of
the fat as AA and 0.2% DHA, increased BMC of the lumbar spine and tibia were observed in the
pups [384]. Consistently, offspring born to rat dams fed a LCPUFA-deficient diet during late
gestation and lactation, and continued with diets equivalent to maternal intake had diminished
femur structural integrity. Administration of a LCPUFA-sufficient diet restored body weight and
accelerated increments in tibia length, mid-diaphyseal cross-sectional geometry and led to two-
fold greater gain in areal moment of inertia, which predicts the resistance of long bone to
bending around a given axis [578]. In a pregnancy model where female dams and their offspring
were fed menhaden oil (65g oil/kg diet) until 21 wk of age, maximum force and bending moment
of the femur was significantly improved, confirming that fish oil is beneficial to cortical bone
strength [579]. Supplementation of the maternal diet with fish oil also resulted in early changes
in longitudinal bone development. Offspring of Japanese quail hens fed 5 g/100g menhaden oil
had wider proliferative and hypertrophic zones in the tibial growth plates as early as 1 d old, and
consequently modified the conversion of cartilage to mineralized bone, resulting in a greater
cortical thickness by 3 wk of age [580].

202
Benefits of fish oil supplementation in young growing animals are also apparent. The
majority of studies performed in growing rodents reported positive effects feeding diets made
with fish oil on bone mass measured by DXA in the femur [581-583] as well as the vertebrae
[215, 581]. However, the limitations of DXA in accurately assessing bone mass, particularly in
growing bone is well-recognized [584]. The reliance on two-dimensional projection for
calculating BMD poses the difficulty to detect surface-specific changes in bone mass deposition
or resorption [585]. It is not uncommon for bone size and amount of bone mineral within it to
change independently and in opposite direction during growth. Areal BMD measurements only
reflect less bone mineral mass of a specific bone or region without distinguishing whether its due
to a smaller bone, less mineral in the bone, or both [405]. Using high-resolution micro-computed
tomography (μCT), a three-dimensional imaging technique that allows for characterization of
bone mass, geometry and micro-architectural properties, female mice fed DHA-supplemented
diet (2.1% kcal DHA) show greater BV/TV, trabecular number and connectivity, alongside
decreases in structure model index (SMI) values at the femur distal metaphysis [359]. This
suggests that DHA also exerts a positive influence on micro-architectural properties in addition
to bone mineral acquisition. Reports from studies where bone strength was assessed ex vivo
appeared to be in agreement with such observations. Japanese quails fed 50 g/kg diet of
menhaden oil for 7 mo from 4 wk of age had significantly improved shear force and stress in the
tibia [586]. Likewise, increased peak load, stiffness and the energy required to cause bone failure
have been reported in bending tests performed in long bones of rodents [215, 587, 588],
indicating that the benefits of DHA in bone mass acquisition and structural properties also
translate into building stronger bones that are more resistant to fractures.
In vivo observations suggest that DHA influences both bone formation and resorption.

203
Male piglets born small for gestational age (1-1.2 kg, 5 d) and fed a diet supplemented with AA:
DHA (6:1, 0.1-0.6g/100g DHA) for 15 d demonstrated significantly higher lumbar spine BMC,
and had lower rates of bone resorption with no changes in bone formation noted [589].
Alternatively, weaning rats (3 wk) fed greater proportions of DHA-rich menhaden oil (30:70
safflower: menhaden oil) had greater bone formation rates in the proximal tibia and alkaline
phosphatase (ALP) activity, a surrogate for osteoblast activity [287]. Furthermore, DHA
concentration in RBC membranes was positively associated with BMD, bone calcium content,
and calcium absorption in young rats (5 wk) consuming a diet with 5% tuna oil [581], possibly
due to increased cell membrane unsaturation, as well as intestinal calcium ATPase activity that
favors calcium transport [590].
Of greater interest is whether beneficial bone adaptations such as increased bone mass and
strength from PUFA will persist later in life and reduce risk of fracture. Long term DHA
supplementation (0.13 mg DHA/g diet) in mice beginning from 12 wk of age improved
trabecular bone volume in the caudal vertebrae by 17.2% at 8 mo of age but not thereafter [215],
consistent with observations in young men where DHA supports PBM acquisition during growth.
However, DHA did not prevent trabecular bone loss in the tibia beginning from 8 mo of age, and
that only EPA, but not DHA reduced age-related decline of osteocalcin, a marker of bone
formation [215]. It appears that n-3 LCPUFA influence bone growth and loss with aging
differentially depending on the bone compartment and skeletal site studied; and individual
actions of n-3 LCPUFA could change across the lifespan. All of these studies, however, used
difference sources of DHA, making firm conclusions difficult to draw and to cautiously ascribe
the benefits in bone specifically to DHA.
To compare effects of different n-3 PUFA sources on bone metabolism, growing female

204
rats (35 d) were assigned to a high-fat diet (HFD, 12% fat w/w, ~27% kcal) containing either
corn, flaxseed, krill, menhaden, salmon or tuna oil for 8 wk. Rats fed tuna oil with the highest
DHA content (2.9 g/kg diet) had higher tibia aBMD, BMC and longitudinal growth, whereas
those fed ALA-rich flaxseed or menhaden oil had improved bone microarchitecture at the distal
femur metaphysis associated with increased bone formation [582]. It is unlikely that the micro-
architectural change is mediated by conversion of ALA to EPA/DHA, given previous reports
where rats fed HFD rich in flaxseed oil had negligible amounts of EPA and DHA in the femur
marrow and epiphyses [587]. Additionally, tuna oil-fed rats also had 50% higher Ca retention
than those fed krill oil despite similar total n-3 LCPUFA concentrations in both oils. This could
in part be related to differences in EPA and DHA incorporation in various lipid fractions, where
they are preferentially esterified in forms of triglycerides and phospholipids in tuna and krill oil
respectively [582]. Therefore, while HFD comprised of n-3 LCPUFA rich oils has positive
effects on long bones, a combination of n-3 FA sources may be required for optimal bone
acquisition during rapid growth.
Excess LCPUFA can also lead to adverse effects on bone mass. High-dose supplementation
of either n-6 or n-3 LCPUFA results in impaired bone formation during growth. In weaning rats
(21 d) fed a fish oil diet (7% fat w/w, 60 g/kg menhaden + 10 g/kg soybean oil) for 5 wk,
significant reductions in length growth and a lower vertebral peak load were observed; these
were not explained by changes in urinary calcium excretion, circulating IGF-1 or estrogen.
However, this was confounded by the significantly lower food intakes relative to controls (12.2 ±
1.1 vs 13.5 ± 1.2 g/day), that resulted in approximately 10% lower cumulative calcium and
vitamin D intakes among females fed fish oil; and the fact that an interaction between sex and
diet was not considered by the authors [591]. Similarly, supplementation of fish oil (10 g/100 g

205
fish oil) in rabbits (28 d) for 40 days led to impaired longitudinal growth of the tibia, alterations
in tibial mid-diaphyseal morphology, and decreased structural strength properties but not that of
material property. Although rabbits on the fish oil diet had significantly less weight gain than
controls, energy-restriction alone did not explain these changes since they were not observed in
pair-fed rabbits [592]. It was speculated that this is due to an increase in the total amount of fat in
the diet, and resulted in altered production of tissue-specific cytokine and lipid peroxidation
products that caused damages to bone tissue. To date, many mechanisms of action of EPA and
DHA have been proposed, with inflammatory pathways among those most commonly studied.

206
Table A2 Selected animal studies on the effects of LCPUFA on bone growth
Gestation / Infancy
Ref. Diet Animals Biomechanics / Bone ash Bone Imaging Biochemistry
[578] (1) n-3 adequate
(2) n-3 deficient
(3) n-3 def-replete:
Flaxseed oil
(4.8g/kg/diet) +
DHASCO (3.0
g/kg/diet)
Long Evans pups born to
dams fed n-3 adq or n-3 def
diets through pregnancy
- maintained on diets
equivalent to maternal diets
(n=48) or switched from n-
3 def to n-3 adq (= n-3 def-
replete)
Duration: 8 wk (15 wk of
age)
3 point bending (tibia)
• ↑ loads at failure (~40%),
peak load (~20%) and
bending moment (~20%) in
n-3 adq vs n-3 def at wk 0
• ↑ ultimate stress (~35%) in
n-3 def-replete vs n-3 adq at
wk 8
• ↑ energy to peak load (45-
60%) in n-3 adq vs n-3 def-
replete and CTRL at wk 8
[593] Isocaloric diets of:
(1) n3: 70 g/kg
linseed oil,
n6:n3=0.4
(2) n6 + n3:
soybean oil;
n6:n3=9
(3) n6: sunflower
oil; n6:n3=216
Sprague Dawley dams (d 7
of gestation), fed diet
during late gestation +
through lactation
Female pups (n=30, 3 wk)
Duration: 27 wk (30 wk of
age)
Peripheral QCT (femur)
• ↑ cortical BMC (6.6-8.6%) + area
(6.6-9.2%) in n6+n3
• ↑ cortical thickness (4.0%) in n6+n3
vs n3
• ↓ periosteal (6.0%) and endosteal
circumference (8.7%), cortical cross-
sectional moment of inertia (22.9%),
cross-sectional moment of resistance
(16.1%) in n6 vs n6+n3
DXA (femur)
• ↑ BMC (8.4-15%) and area (9.7-
13.6%) in n6+n3
• No difference in aBMD
• ↓ serum IGF-1
(27.7 - 36.5%)
in n3
[579] 2 x 2 factorial:
(1) Boron-deprived
(0 mg/kg)
(2) boron-adequate
(3 mg/kg);
and
(1) SO: 75g
Sprague Dawley dams for
6 wk and male pups
(n=15@, 3 wk of age)
Duration: 19 wk (21 wk of
age)
3 point bending (femur)
• ↑ maximum force to break
(4.7-12.2%) and bending
moment (3.5 - 10.3%)
• ↓ femur length (0.7-3.0%) in
FO
Ex vivo μCT (LS4)
• ↓ connectivity density (26.1%) of
boron-deficient rats + FO vs boron-
sufficient + SO
• ↓ tibia PGE2
release (94.7 -
110.9%) in
FO

207
Safflower oil/kg or
(2) FO: 65g
Menhaden oil + 10
g LA/kg
Finite-element analysis by
μCT (LS4)
• ↑ compression force (4.3 –
48.8%) in FO
[594] (1) Control (6%
soybean oil w/w)
(2) AA+ DHA
(0.6% fat as AA +
0.2% fat as DHA)
(3) DHA (0.8% fat
as DHA)
AA and DHA in
form of single-cell
oil
Guinea pig sows (n=21) –
experimental diet during
pregnancy and lactation
Pups at d3 and d21 (n=15,
reared by natural mother, 2
pups @ sow)
DXA
Diet x sex interaction:
Males:
• whole body, tibia and LS BMC:
CTRL > DHA > AA+DHA
• ↓ whole body and femur aBMD (~4-
20%) in DHA
Females:
• ↑ WB and LS aBMD and BMC (~10-
30%) in DHA
• Tibia and LS BMC: DHA, AA+DHA
> CTRL
Ex vivo μCT (LS3, proximal tibia
metaphysis)
Males:
• ↑ tibia vBMD (~30%) in CTRL vs
DHA
Females:
• ↓ tibia vBMD (~10%) in CTRL vs
AA+DHA
• ↓ LS3 vBMD (~20%) in females fed
DHA female vs all others except
males AA+DHA
• ↑ plasma
deoxypyridin
oline (Dpd,
29.1 – 43.5%)
in DHA vs
control and
AA+DHA
[580] (1) 5 g/100 g
soybean oil (SBO)
(2) Hydrogenated
SBO (HSBO)
(3) Chicken fat
(CF) or
(4) Menhaden oil
(FO)
Japanese quail laying hens
fed one of four diets from 4
wk
Newly hatched quail fed
identical starter diet
Duration: 2 wk
Shear test (tibia)
• ↑ shear force (17.9%) and
stiffness (30.4%) in FO vs
CF at 2 wk
• ↑ Dpd (33.0 –
52.4%) and
total collagen
cross-links
(35.7-43.2%)
in FO vs CF or
SBO

208
Growing (non-rodents)
Ref Diet Animals Biomechanics / Bone ash Bone Imaging Biochemistry
[589] (1) CTRL
(2) AA:DHA as
0.6:0.1 g/100g
(3) AA:DHA as
1.2:0.2g/100g
Male Cotswold piglets
low-birth-weight (LBW,
1.1-1.2 kg) and very-low-
birth-weight (VLBW, =<1
kg) (n=30, 5 d)
Duration: 15 d (20 d of
age)
DXA (LS)
• ↑ BMC (23.2%) in LBW piglets with
0.6% AA + 0.1% DHA
↑BMC (35.5 – 42.9%) in VLBW
piglets in 1.2% AA + 0.2% DHA
• ↓ urinary n-
telopeptide:
creatinine
(65.3 – 71.7%)
in groups 2
and 3 vs
CTRL
• No difference
in OC, urinary
calcium, IGF-
1 or PGE2
release
[592] (1) CTRL
(2) FO (10 g
Menhaden oil /100g
diet, 31% energy as
fat)
(3) Pair-fed, 95%
energy intake of FO
to match body
weight of fish oil,
8% energy as fat
Male weaning New
Zealand White rabbits (~4
wk, n=50)
Duration: 40 d (~9 wk of
age)
3 point bending (tibia)
↓ load at proportional limit
(23%), maximal load (27%),
energy absorbed to
proportional limit (36%),
energy absorbed to maximum
(45%) in FO
Micro-radiography (tibia mid-
diaphysis)
• ↓ periosteal envelop area (15%),
intracortical porosities area (35%),
moments of inertia (30%), cortical
bone area (17%), and tibia length
(4%) in FO
[595] (1)70 g/kg diet
SBO
(2) Sesame oil (SO,
50g SO + 20g
SBO),
(3) Fish oil (FO,
50g FO + 20g
SBO),
(4) DHA (50g
DHASCO + 20g
SBO),
New Zealand white rabbits
(6 wk, n=45, 25 male)
Duration: 100 d (~20 wk of
age)
Bone ash
• ↑ Ca (13.6-50.4%), Mg
(15.9-54.5%), P (5.9-16.1%)
and Zn content (22.2-35.3%)
in the DHA/AA, DHA, and
FO
• No difference
in ex vivo
PGE2 levels

209
(5) DHA/AA (25g
DHASCO + 25g
ARASCO + 20g
SBO)
[586] (1) Control: 50g/kg
diet SBO,
(2) Hydrogenated
SBO (HSBO),
(3) Chicken fat
(CF)
(4) Menhaden oil
(FO)
Japanese quails (4 wk,
n=30@)
Duration: 7 mo (8 mo of
age)
Shear test (tibia)
• ↑ shear force and stress (24.7
– 29.9%) in FO
Bone ash
↑ % ash (12.7%), calcium
content (13.9-15.3%),
phosphorus content (9.8-
14.3%) and mineral content
(5.3-12.7%) in FO

210
Growing (rodents)
Ref Diet Animal Biomechanics / Bone ash Bone Imaging Biochemistry
[591] (1) Control: AIN-
93G (7% fat w/w),
70 g/kg SBO
(2) FO: 60 g/kg
Menhaden oil + 10
g/kg SBO
Sprague Dawley rats (3
wk, n=9-12 rats@
group/gender)
Duration: 5 wk (8 wk of
age)
Compression test (LS5)
• ↓ peak load (15.7%) among
females in FO vs CTRL
DXA (LS1-6, femur)
• No difference in length, bone area, BMC
and aBMD
• No difference
in serum IGF-
1, estradiol,
testosterone or
urinary
calcium in FO
vs CTRL
[588] 2 x 2 factorial:
(1) SO: modified
AIN-93G with 15%
w/w as SBO
(2) FO: 1:0.3 (w/w)
FO and SO mixture
(FSO)
With or without
10% inulin-type
fructans
Male Wistar rats (n=24, 6
wk)
Duration: 15 d (8 wk of
age)
3 point bending (tibia)
• ↑ peak load (20.9%), yield load
(15.0%) and absorbed energy
(28.3%) in FO vs SO
[287] Safflower:
Menhaden oil in
different proportions
(wt/wt):
(1) AIN-93G
(2) 90:10 (SMI)
(3) 80:20 (SMII)
(4) 50:50 (SMIII)
(5) 30:70 (SMIV)
Total fat: 70 g/kg
Male Sprague Dawley rats
(n=60, 3 wk)
Duration: 7 wk (10 wk of
age)
• ↓ PGE2 in liver
homogenates +
bone organ
culture (43-
55%) in SMIV
vs SMI
• ↑ alkaline
phosphatase
(ALP, 20.3 –
30.3%) in rats
fed higher n3
FA vs SMI
Total, intestinal,
liver and bone
ALP rose with

211
decline in
dietary n6/n3
ratio
[596] (1) AIN-93G, ad
libitum
(2) SBO
(3) Perilla oil (60%
ALA)
(4) DHA (49.5%
DHA, 9.8% EPA)
(5) EPA (28.1%
EPA, 14.1% DHA)
Groups 2-5: 50%
food restriction
Female Wistar rats (n=25,
7 wk)
Duration: 3 wk (10 wk of
age
• ↓ femur fracture force
(toughness, 21.3-41.5%) in
group 2
• No differences in BMD, density values
from bone X-ray images
• ↑ urinary Dpd
(7.3-20%) in
groups 2 and 3
• ↓ serum
estradiol
(~50%) in
groups 2-5 vs
group 1
• No difference
in serum PGE2
[597] 2 x 2 factorial:
(1) modified AIN-
93G with SBO at
70g/kg diet
(2) MSO (menhaden
+ safflower in
56:44)
With or without
10g/kg CLA
Male Sprague-Dawley rats
(n=40, 3wk)
Duration: 6 wk (10 wk)
Bone ash
• ↓ bone dry weight (11.1%), ash
weight (8.7%) and mineral
density (5.0%) in SBO vs
MSO
• ↑ ex vivo PGE2
(46.5 – 108%)
in bone organ
culture in SBO
vs MSO
• No difference
in serum IGF-1
↑ serum IGFBP-
3 (~45%) and
total IGFBP
levels in MSO
vs SBO
[581] AIN-93G diet
(1) CTRL: 5% corn
oil
(2) Evening
primrose oil (EPO)
(3) 4% fish oil + 1%
corn oil (FO)
(4) 4% tuna oil +
1% corn oil (TO)
Male Sprague-Dawley rats
(n=40, 6 wk)
Duration: 6 wk (12 wk of
age)
3 point bending (femur)
• No difference in bone strength
DXA
• ↑ right femur (8.3%) and lumbar spine
(3.7%) aBMD in TO vs CTRL

212
[598] AIN-93G based-
diet:
2 x 2 factorial:
(1) AIN-93G (SBO)
(2) Menhaden-
safflower oil (56:44
w/w, MSO) at
70g/kg diet
With or without
CLA (10 g/kg diet)
Male Wistar rats (n=40, 4
wk)
Duration: 8 wk (12 wk of
age)
Bone ash (femur)
↑ dry weight (2.4-4.0%,
p=0.075) and bone mineral mass
(2.2-5.4%, p=0.058) in MSO
• ↓ urinary
pyridinoline
and Dpd
(11.1-29.1%)
in MSO
• No difference
in serum
osteocalcin
and IGF-1
• ↓ ex vivo
PGE2
production
from tibia
(~50%) in
MSO
[359] (1) CTRL (AIN-
93M)
(2) Hydrogenated
coconut oil (HCO)
(3) Menhaden oil
(MO)
(4) 20:1 DHA: AA
(2.0% kcal DHA,
0.1% AA, 7.9%
HCO)
(5) DHA-rich (2.1%
kcal DHA, 7.9%
HCO)
Total fat kcal: 5%
Female mice (n=50, 21d)
Duration; 9 wk (13 wk of
age)
Ex vivo μCT
Femur distal metaphysis:
• ↑ trabecular bone volume fraction
(BV/TV, 55%), trabecular number (Tb N,
10%), trabecular thickness (Tb Th, 10%),
connectivity density (Conn D, 45%)
• ↓ trabecular separation (Tb Sp, 15%),
structure model index (SMI, 30%) in
DHA
Femur mid diaphysis:
• ↓ BV/TV (3.84%) in DHA,AA
• ↓ cortical thickness (7.81%) in MO and
DHA
↑cortical vBMD (1.2-1.4%) in DHA
[582] Modified AIN-93G
(12% w/w) with:
(1) Corn oil (CO)
(2) Flaxseed oil
(FO)
Female Sprague-Dawley
rats (n=60, 4 wk + 1 wk
acclimation)
Bone ash (tibia)
• ↑ dry weight (~3%) in SO and
TO
3 point bending (femur +
tibia)
DXA (tibia)
• ↑ bone area (16.4%), BMC (23.3%) and
aBMD (9.2%) in TO
• ↑ bone length (2.4-5.8%) in TO
• ↑ serum
osteocalcin
(18.6-41.8%)
in FO
• No difference

213
(3) Krill oil (KO,
10g/kg) + 2g/kg CO
(4) Menhaden oil
(MO,10g/kg) +
2g/kg CO
(5) Salmon oil (SO)
(6) Tuna oil (TO
Duration: 8 wk (13 wk of
age)
• No differences in bone strength Ex vivo μCT
• ↑ femur distal metaphysis BV/TV
(54.5%), Tb N (31.7%), Conn (55.6%)
and lower Tb Sp (32.9%) in MO
• ↑ tibia proximal metaphysis BV/TV
(56.0%), Tb N (46.2%) and Conn
(69.9%) in FO
No difference in tibia mid-diaphysis
cortical bone
in serum ALP
or pyridinoline
[583] (1) DR: Dam-reared
/ AIN-93G (10%
dietary fat)
(2) LA: n-3
deficient milk
(3) DPA: LA with
1% DPA n-6 of total
lipids (DPA)
(4) DHA: LA with
1% DHA
(5) DHA/DPA: LA
with 1% DHA-DPA
n-6 (2:1)
Male Long-Evans pups
(n=50)
Postnatal day 2: artificial
rearing system
Postnatal day 21: pelleted
diets of the same treatment
Duration: 12 wk (15 wk of
age)
DXA (femur, tibia, LS4)
• ↑ distal (15.7%) and proximal femur
(12.1-16.6%) BMC in DR and DHA/DPA
vs DPA
• No difference in tibia or LS4
[587] (1) Control (Prina
5L79) 5.2% fat
(w/w)
(2) SFA: 18%
coconut oil + 2%
SBO (w/w)
(3) n-3 PUFA: 20%
flaxseed oil
(4) n-6 PUFA: 20%
safflower oil
Male Sprague-Dawley rats
(n=31, 40 d)
Duration: 65d (15 wk of
age)
3 point bending (femur)
• ↑ bone width (2.6%, adjusted
for BW) in n-3 PUFA vs CTRL
• ↑ stiffness (31.3-34.4%) + peak
load (38.5-42.0%) adjusted for
BW) in n-3 PUFA and n-6
PUFA vs CTRL
DXA (femur)
No difference in aBMD, BMC or area
[215] (1) CTRL (55%
SFA, 40% MUFA,
10% PUFA)
Female C57BL/6 mice
(n=38, 12 wk)
3 point bending (femur and
tibia)
• ↑ ultimate force, ultimate stress
DXA (LS)
• ↑ decrease in aBMD in DHA (-15.3%)
between 8 and 17 mo of age vs CTRL (-
• ↑ serum
osteocalcin
(~40%) and

214
(2) DHA: 0.13 mg
DHA + 0.04 mg
EPA / g diet
(3) EPA: 0.14 mg
EPA + 0.02 mg
DHA / g diet
Duration: until 17 mo of
age
and plastic energy (12.3% -
29.9%) in EPA
• ↑ ultimate stress (27.3%) in
DHA
1.4%)
In vivo μCT
• ↑ increase in vertebral BV/TV and TbN
(~3-5%) between 3 and 8 mos of age with
EPA and DHA
• ↑tibia mid-diaphysis cortical BV (~7%)
and cortical thickness (~10%) in EPA
Ex vivo μCT (femur)
• ↑ cortical total volume (TV, 6.3%), BV
(8.1%) and thickness (4.4%) in EPA
Increase in cortical TV (6.3%) in DHA
tartrate-
resistant
alkaline
phosphatase
(~20%) at 17
mo in EPA
and DHA

215
Fat-1 mice
Ref. Diet Animals Biomechanics / Bone ash Bone Imaging Biochemistry
[670] AIN-93G with 10%
safflower oil
C57BL/6 x C3H fat-1 mice
(n=50, 3 wk)
Duration: 9 wk (12 wk of
age)
3 point bending (femur)
• No difference in bone strength
[349] Normal chow diet Fat-1 mice (2-, 5-, 12- and
24-wk)
Exposure to n-3 in
gestation and lactation:
Offspring (2 wk of age)
from fat-1 mother and WT
father (MF) vs fat-1 father
and WT other (MB)
3 point bending (tibia)
↑ area under curve, ultimate
load, failure load (wk 12 only),
slope and yield point (30-80%)
in fat-1 at 12 and 24 wk
Ex vivo μCT (tibia)
• ↑ metaphysis BV/TV (40-100%), Tb N
(85-90%) and lower Tb Sp (65-120%) in
fat-1 at 5 and 24 wk
• ↑ mid-diaphysis cortical thickness (15-
50%), cortical area (~20%), vBMD (~5-
10%) and smaller marrow area in fat-1 at
5 and 12 wk
MB vs MF:
• ↓ metaphysis BV/TV and Tb N (33-50%)
+ ↑ Tb Sp (~55%) in MF
• ↑ mid-diaphysis cortical thickness,
cortical area, vBMD (10-60%) + ↓ total
and marrow area (5-10%) in MF

216
A.4 Selected mechanisms of actions of DHA in growing bones
A.4.1 DHA has anti-inflammatory properties
Metabolites of the n-3 and n-6 PUFA, including the eicosanoids (prostaglandins and
leukotrienes), resolvins, protectins, and lipoxins are important mediators of inflammation. EPA
and DHA act as substrates for the 3-series prostaglandins that in general are viewed to have anti-
inflammatory properties. The 2- and 4- series of prostaglandins, thromboxanes and leukotrienes,
including prostaglandin E2 (PGE2) and leukotriene B4 (LTB4) are derived from the n-6 PUFA AA
by cyclooxygenase-2 (COX-2) and 5-lipoxygenase (5-LOX) respectively [599]. These substrates
are in direct competition for this key conversion enzyme and its isozymes, but COX exhibits the
greatest specificity for AA such that PGE2 is preferentially produced [600].
Prostaglandins act in an autocrine and/or paracrine manner through prostanoid receptors to
activate differential signaling cascades [601]. To date, at least four distinct G protein-coupled
receptors for PGE2 (EP) have been identified, designated as EP1, EP2, EP3 and EP4, affecting
various secondary messengers: EP1 is linked to inositol trisphosphate (IP3) signaling and
phospholipase C (PLC) through Gq/p activation, resulting in intracellular calcium mobilization
and exocytosis. EP2 and EP4 stimulates cyclic adenosine monophosphate (cAMP) production/
protein kinase A (PKA) signaling; and EP3 activated Gi to inhibit adenylyl cyclase, cAMP
production and opposed the effects of EP2 and/or EP4 [602, 603].
In growing animals fed moderate levels of n-6 PUFA, low levels of circulating PGE2
appeared to favor bone formation, yet excessive PGE2 production has been associated with
increased bone loss [604]. Inclusion of n-3 PUFA in diet significantly decreased ex vivo PGE2
production in rat femurs, while also reducing circulating pyridinoline levels, a marker of bone
resorption [605]. This suggests an effect of n-3 LCPUFA on lowering bone resorption by

217
modulating pro-inflammatory PGE2 synthesis. Exposure of MC3T3-E1 osteoblastic cells to AA
(20 μg/ml) stimulated PGE2 production [606], potentially due to auto-amplification by inducing
COX-2 mediated via the EP1 subtype of PGE receptors expressed in mouse osteoblasts.
PGE2 has also been shown in vitro to be a potent modulator of bone modeling and
remodeling, exhibiting biphasic properties in affecting both bone formation [607, 608] and
resorption [609]. PGE2 at low concentrations (0.01 – 1 nM) stimulated cell proliferation in
primary human bone cell cultures through enhancement of PLC, resulting in an increase in PKC
activity and intracellular calcium influx. Whereas at higher concentrations (0.1 μM), PGE2
stimulated cAMP production and inhibited human bone cell proliferation [610]. Similarly, time
course experiments in murine spleen cell cultures demonstrated that PGE2, in presence of
RANKL and macrophage colony-stimulating factor (M-CSF) showed initial inhibitory effects (5-
6 days of culture) and later a stimulatory effect (8 and 9 d) on osteoclastogenesis, accompanied
by increased osteoclast size and resorption pit formation and reduced osteoclast apoptosis [611].
Incubation with EP2 and EP3 agonists, but not that of EP1 or EP4 mimicked effects of PGE2 in
decreasing osteoclast number, indicating inhibitory effects possibly mediated by EP2 and EP3
receptors [611]. Conversely, selective EP4 deletion in fibroblasts abrogated expression of
RANKL that is normally induced after PGE2 signaling, inhibiting osteoclastoegensis [612]. Such
discrepancy can in part be due to the different expression patterns of prostaglandins receptors by
cell type, differentiation status, tissues, and species. MC3T3-E1 mouse osteoblastic cells were
reported to predominantly express EP1 and EP4 receptors [613], whilst human mesenchymal
stem cells express EP4 receptors [614].
Prostaglandin synthesis is also involved in osteoclastogenesis and bone resorption
mediated by pro-inflammatory cytokines including interleukin-1β (IL-1β), IL-6 and tumor

218
necrosis factor-α (TNF-α) [615, 616]. Addition of the COX-2 inhibitor celecoxib to co-cultures
of bone marrow cells markedly inhibited osteoclastogenesis induced by IL-1β, TNF-α,
lipopolysaccharides,1, 25-dihydroxyvitamin D3 (1,25(OH)2D3) and PTH. This effect was negated
when PGE2 is present in culture, suggesting that COX-2-dependent PG synthesis is essential for
osteoclast differentiation [615]. Offering further insight into the mechanism of PGE2 action on
the interaction among bone cells, disruption of COX-2 expression resulted in defective RANKL
secretion in osteoblasts and in turn impaired osteoclast formation in response to 1,25(OH)2D3
and PTH [617]. Consistently, COX-2 and PGE2 stimulated osteoclast formation through
inhibiting OPG secretion and enhancing RANKL production by osteoblasts, as well as
stimulating RANK expression in osteoclasts. While IL-6 alone had little direct effect on
osteoclast differentiation in monocultures of RAW264.7 macrophages, IL-6 significantly
enhanced expression of PGE2 receptors in both osteoblasts and osteoclasts, and demonstrated
reciprocal interaction with the COX-2/PGE2 system, inducing each other’s production [616].
On the other hand, the less inflammatory eicosanoids PGE3 and LTB5 that are derived from
EPA by the same COX-2 and 5-LOX enzymes [618] have functions in bone. Once synthesized,
PGE3 is equipotent to PGE2 in bone resorption [619]. However, conversion to PGs from n-3
PUFA is less effective than n-6 PUFAs, resulting in lower PGE3 levels [600]. Induction of COX-
2 and IL-6 expression in RAW 264.7 macrophages by PGE2 was significantly greater than that
by PGE3; and that LTB4 is more potent chemoattractant at promoting polymorphonuclear cell
adherence compared to LTB5 [620], thus the n-3 derived eicosanoids potentially benefit bone, as
the otherwise increased differentiation of cells in the granulocytic lineage has been associated
with enhanced bone resorption by osteoclasts [621]. Supplementation of n-3 PUFA significantly
reduced ex vivo PGE2 synthesis in rat femurs as well as serum pyridinoline [605]; whereas higher

219
DHA in the diet was associated with lower bone resorption based on urinary N-telopeptide [622],
another marker of bone resorption. Evidence from cell culture studies supports the underlying
mechanism that n-3 LCPUFAs reduce COX-2 protein levels and PGE2 production but increase
ALP activity in cultured osteoblast-like MC3T3-E1 cells [287]. Altogether these observations
provide support for a protective effect against bone resorption by reducing production of pro-
inflammatory prostaglandins [605].
The resolvins is a relatively new family of lipid mediators synthesized from EPA (E-series
resolvins) or DHA (D-series resolvins) through the COX and LOX pathways, and are identified
to be potent anti-inflammatory, proresolving molecules [623]. Resolvin E1 is generated in healthy
humans given EPA and aspirin, suggesting that in scenarios where COX-2 is induced during
inflammation, treatment with aspirin could initiate an active process involving production of
endogenous chemical modulators (i.e. resolvins) to resolve inflammation. In vitro, resolvin E1 is
associated with inhibiting dendritic cells migration and pro-inflammatory IL-12 production
possibly through terminating NF-κB activation [624]. In primary osteoclast cultures derived from
mouse bone marrow, treatment with resolvin E1 resulted in marked decreases in resorption pit
formation and the number of multinucleated osteoclasts, as well as the attenuation of RANKL-
induced nuclear translocation of the p50 subunit of NF-κB that forms part of the mature protein
for activating transcription [625]. Using a temporal metabololipidomics approach with self-
limited resolving exudates, resolvin D3 was reported to be uniquely associated within the
inflammation-resolution period. This study also demonstrated that resolvin D3 might have
specific roles in blocking neutrophil migration, modulating eicosanoid production, and
increasing anti-inflammatory IL-10 production [626]. In addition, resolvin D1 and the DHA
metabolite protectin D1 inhibited IL-1β and TNF-α production in human endothelial cells [627],

220
as well as osteoclastogenesis from mouse bone marrow macrophage culture [628]. The
mechanisms, as well as physiological effects of resolvins when applied in vivo remains to be
fully elucidated, however, it appears from available evidence that such fatty acid derivatives have
promising anti-inflammatory properties.
A.4.2 DHA affects osteoblastogenesis and osteoclastogenesis
Depending on the type of fatty acids present in the bone and marrow milieu, key mediators
of osteoblast- and osteoclastogenesis including RANKL, its receptor RANK, a decoy receptor
OPG, and PGE2 are modulated to various extents, possibly via peroxisome proliferator activated
receptor (PPAR) binding (Figure A2).
Increasing dietary intake of fish oil has been shown to prevent the ovariectomy-induced
increases in membrane bound RANKL expression in murine T cells [629]; and treatment with
DHA or EPA in vitro inhibited osteoclastogenesis evident by lowering TRAP activity and TRAP+
multinuclear cell formation [629]. In MC3T3-E1 osteoblast like cells, incubation with DHA (5
μg/ml) inhibited PGE2-induced RANKL expression [283]; whereas fish oil feeding in mice prone
to autoimmune diseases resulted in significantly reduced RANKL, but enhanced OPG mRNA
levels at the lymph node [630], implying that n-3 PUFA may exerts its influence on osteoclasts
through its action on osteoblasts by altering the RANKL/OPG ratio. More recently, DHA
strongly inhibited RANKL-induced osteoclastogenesis in bone marrow derived macrophages,
and was associated with a 40% reduction in dendritic cell-specific transmembrane protein (DC-
STAMP) mRNA levels [628], which could impair the normal cell-cell fusion during
osteoclastogenesis.
As mentioned previously, the n-3 PUFA may also act upon osteoclasts directly by
controlling their inflammatory responses. Osteoclasts are recruited and activated upon

221
stimulation from osteoclastogenic cytokines such as IL-6 and TNF-α, which leads to eventual
bone resorption. Exposure of the murine monocytic cell line RAW 264.7 to DHA reduced pro-
inflammatory responses induced by RANKL stimulation, via decreasing NF-κB and p38 MAPK
expression which eventually lowered TNF-α synthesis [631]. Aging C57BL/6 mice fed fish oil
for 6 months showed decreased IL-6 and TNF-α secretion in concanavalin-stimulated
splenocytes [632]; and as well in humans (73 ± 9 y) supplemented with 1.7 g DHA for 6 mo,
where IL-6 release is suppressed by about 40% in mononuclear leukocytes [633]. In vitro
evidence exists for an interaction between IL-6 and PGE2, where the PGE2-induced OPG
suppression in osteoblasts was dependent on IL-6 [616].
As aforementioned, osteoblastogenesis is influenced by the balance of chemical mediators
present in the marrow that determines lineage commitment into either adipocytes or osteoblasts.
Key transcription factors required for differentiation into osteoblasts are core binding factor α-1
(Cbfa-1), also known as Runx2, Wnt/LRP-5, and its downstream mediator β-catenin [634]. In
human hetapocellular carcinoma cells, Runx2 translocation into the nucleus was reported to be
stimulated by IGF-1 and PTH, but inhibited by TNF-α. Supplementation of DHA or n-3 PUFA in
dogs [635] and middle-aged rats [605] suppressed serum TNF-α and enhanced IGF-1, thus
allowing for DNA binding of Runx2 in the nucleus to promote osteoblast differentiation. The
anti-inflammatory effects of n-3 PUFAs may indirectly enhance osteogenic differentiation of
MSCs, as IκK-NF-κB activation by TNF-α and IL-17 promoted β-catenin ubiquitination and
degradation through induction of Smurf1 and Smurf 2 [636]. DHA treatment (5 – 60 μM)
resulted in a dose-dependent reduction in cell viability through simultaneous inhibition of COX-
2 and β-catenin [637], suggesting a possible explanation for the adverse effects of high n-3 PUFA
in early development, since loss of β-catenin produced severe osteopenia with substantial
222
increases in osteoclast activity [638].
Offering a novel molecular target of n-3 PUFAs on regulating bone mass, the free fatty
acid receptor 4 (FFA4; also known as GPR120), which is a newly deorphanized G-protein
coupled receptor (GPR) has been identified to be a receptor for n-3 PUFAs [639, 640].
Expression of FFA4 is greater in mature osteoblasts and osteoclasts relative to their precursors,
and DHA treatment (0.5 μM) of osteoclasts and MC3T3-E1 cells promoted internalization of
FFA4 into perinuclear space, confirming that DHA activates FFA4. Using a transgenic mouse
model that overexpresses n-3 fatty acids but lacking FFA4 by crossing fat-1 transgenic and FFA4
(Ffar4-/-) knockout mice, female fat-1 mice were protected against ovariectomy-induced bone
loss only when they had the Ffar4+/+ background but not the Ffar4-/- background. Similarly, male
fat-1 mice fed HFD displayed higher bone mass relative to their WT littermates, but this was
observed only in those with the Ffar4+/+ background. Higher bone mass in both models was
associated with increased osteoblastic bone formation, evident by greater osteocalcin and ALP
expression as well as β-catenin activity; alongside decreased osteoclastic resorption through
inhibition of NF-κB activity by FFA4 [641]. Given that receptors for PTH, calcitonin and
calcium also belong to the GPR superfamily, and the wide spectrum of cellular responses that
GPRs initiates, it is of particular interest to further characterize the role of FFA4 in bone
metabolism across various life stages and metabolic states.
A.4.3 DHA acts through PPARs to affect cell differentiation and gene expression
As discussed previously, another important family of transcription factor in directing the
fate of MSC into commitment of either lineage is the PPARs. The PPARs are ligand-activated
transcription factors of the superfamily of nuclear hormone receptors that contains a hydrophobic
ligand-binding site and a DNA binding domain [642]. To date, three subtypes of PPAR (α, β/δ,
223
and γ) have been identified. All PPARs share the same molecular mode of action via the
conformational change upon ligand binding, with subsequent formation of a heterodimer with
retinoid X receptor (RXR) and binding to peroxisome proliferator response elements (PPREs) in
the promoter region of the target genes. Expression of PPARα is found in many tissues but is
predominant in oxidative tissues such as brown adipose tissue, cardiac muscle, and liver.
PPARβ/δ is found ubiquitously, while expression of PPARγ is more restricted, with adipocytes
and macrophages expressing the highest level [643, 644]. Transcription activation by PPARs is
dependent on a series of steps including ligand binding to PPAR, binding of PPAR to the target
gene, removal of co-repressors and recruitment of co-activators, remodeling of chromatin
structure, and eventually facilitate gene transcription [643]. All 3 PPARs are able to bind fatty
acids with a general preference for LCPUFAs including DHA [320, 645, 646].
All PPAR subtypes are expressed in bone tissue. The function of PPARα and –γ are best
characterized to date. While PPARα appears to be important in channeling fatty acids towards β-
oxidation in the liver, PPARγ has a central role in mediating the balance between adipipogenesis
and osteoblastogenesis. in addition to direct effects on osteoclastogenesis [647]. PPARγ
expressed in adipose tissue regulates adipocyte differentiation and regulates the metabolic
responses of adipocytes, including insulin sensitivity [648]. In inflammatory cells, activation of
PPARγ favors an anti-inflammatory state by modulating inflammatory cytokines production
[649]. DHA has been found to be a dual ligand for PPAR α/γ [650-652], one can therefore reason
that DHA would exert its effect on bone at least directly via these surface or intracellular fatty
acid receptors.
The inhibitory role of PPARγ on maturation of various osteoblastic cell lines concomitant
with adipocyte differentiation had been well characterized in various in vitro models [431, 653].
224
Activation of PPARγ in cells of the osteoblast lineage resulted in conversion to terminally
differentiated adipocytes, and irreversibly suppressed osteoblast-specific signaling pathways
including the Wnt, TGF-β/bone morphogenic protein (BMP), IGF-1 and Runx2 [325, 326]. In
vivo, homozygous PPARγ-deficient embryonic stem cells fail to differentiate into adipocytes, but
spontaneously differentiate into osteoblasts; furthermore, PPARγ heterozygous mice display a
high bone mass due to increased osteoblast number and bone formation [451]. PPARγ agonists
such as pioglitazone lead to bone loss [654], suggesting that PPAR acts as a positive regulator of
adipogenesis, but not that of osteoblast differentiation. In a recent study using an osteoblast-
specific PPARγ knockout mouse model, suppression of PPARγ activity in osteoblasts
significantly increased osteoblast differentiation and distal femur metaphysis trabecular number
quantified by in vivo μCT [655]. Endogenous PPARγ in MSC and osteoblasts strongly inhibited
mTOR/p70S6k activity [655] that has been implicated to have essential roles in osteoblastic
differentiation [656, 657], suggesting that PPARγ may modulate bone formation both directly
and indirectly through regulation of mTOR pathway and diverting MSC differentiation into
adipocytes respectively.
In addition to the potent adipogenic function of PPARγ in bone marrow MSCs, more recent
studies suggest that it participates in regulating osteoclastogenic functions. Selective ablation of
the PPARγ gene in mouse osteoclasts resulted in osteopetrosis characterized by increased bone
mass and a reduced medullary cavity size that is indicative of impaired osteoclast differentiation.
Ligand activation of PPARγ by rosiglitazone further exacerbated osteoclast differentiation by
directly regulating c-fos protein content [647], a key determinant of osteoclast lineage
commitment and RANK development. Supporting evidence stems from a recent study, where
addition of rosiglitazone to murine bone marrow stem cells increased differentiation of

225
multinucleated osteoclasts by about 25%, and may be associated with TRAF6 and downstream
ERK signaling pathway indicated by 1.5-2 fold induction in protein and mRNA levels [658].
Taken together, PPARγ and its ligands appear to favor bone resorption through promoting
osteoclastogenesis and suppression of osteoblast differentiation.
Only a few studies have evaluated the direct effects of DHA on bone homeostasis via
PPARγ signaling. While a recent study in human MSC reported that DHA at a lower
concentration (20 μM) had no effect on differentiation into osteoblast/adipocytes [323];
treatment of human primary osteoblastic cells with DHA (30 μM), AA (30 μM) and 15d-PGJ2
(highly specific PPARγ activator) significantly inhibited cell proliferation and viability by 27-
51%, mediated through a 4-5 fold induction in PPARγ mRNA expression [324]. Of note is that
osteoblast cells express adipogenic transcription factors that are able to respond to adipogenic
agents including PUFA, demonstrating that a certain degree of plasticity exists between
osteoblasts and medullary adipocytes in cells cultured in an adipogenic medium [653]. In support
of this was the observation that DHA (50 μM) appeared to inhibit cell proliferation not by
inducing cell apoptosis, but by inhibiting the transition from G1 to the S phase in the cell cycle
of osteoblastic cells [659], this may represent the initiation of cell differentiation re-programming
and a potential switch into the adipocyte lineage. In bovine calcifying vascular cells incubated
with DHA (25 μM), ALP activity and mineralization of vascular cells were significantly down-
regulated, partially via the p38-MAPK pathway. Transient transfection of the PPAR response
element-luciferase construct in these cells revealed that DHA increased luciferase activity similar
to a known PPARγ ligand ciglitazone, indicating the inhibiting effects on mineralization of DHA
is mediated together by p38-MAPK and that of PPARγ [660]. Interestingly, EPA and DHA
stimulated osteoclastogenesis in bone marrow-derived monocytes (BMM) precursor cells,

226
evident by increased expression of PPARγ and osteoclast markers including c-fos, TRAP,
cathepsin K and nuclear factor of activated T cells, cytoplasmic, calcineurin-dependent-1
(NFATc1); addition of PPARγ antagonists inhibited stimulations of osteoclastogenesis and c-fos
expression. However, when EPA and DHA were incubated with bone marrow cells including
both BMMs and MSCs, osteoclastogenesis was inhibited through the suppression of expression
of RANKL and NF-κB-regulating genes, COX-2, TNF-α and IL-6 in culture. Similarly, the
PPARγ antagonists reversed inhibitions of NF-κB transcriptional activity and osteoclastogenesis
by EPA and DHA, confirming that effects of EPA and DHA on BMM and bone marrow cells are
PPARγ-dependent [661]. Treatment of primary BMM from mice with DHA in the presence of
RANKL and M-CSF inhibited osteoclastogenesis at the late stage (after 48h), gene expression
analyses with microarray shown that DHA significantly downregulated sets of genes related to
cell motility, cell adhesion, cell-cell signaling and morphogenesis, including DC-STAMP
following RANKL stimulation [662]. Given the wealth of evidence of a positive association
between n-3 PUFA and bone mass in animals and humans, and taking into account the dynamic
interaction of bone cells of the BMU, it is possible that n-3 PUFA suppresses osteoclastogenesis
by inhibiting NF-κB activation through PPARγ signaling in vivo.
It appears from in vitro evidence that PPARγ signaling adversely influences bone
homeostasis, which is contradictory to the observations in vivo where DHA is associated with
higher bone mass and stimulates osteoblastogenesis. Whether DHA acts directly on bone cells in
lieu of PPARγ signaling, along with its regulatory roles in inflammatory cytokines and PGE2
production to produce the final bone phenotype remains to be determined. To date no studies
have reported the effects of DHA on bone mass via PPARα signaling. PPARα agonists resulted in
elevated bone mass and OPG in vitro [654]. Likewise, both the PPARα/δ agonists LA and

227
bezafibrate up-regulate osteoblast differentiation in vivo, resulting in 7-11% and 15-221%
increases in trabecular and cortical periosteal bone formation respectively [663]. It is therefore
possible that DHA could benefit bone via this pathway. Recently it has also been suggested that
the regulation of skeletal homeostasis by PPARγ and its ligand rosiglitazone is age-dependent,
since in old mice, rosiglitazone increases bone resorption while sustaining bone formation. In
contrast, rosiglitazone decreases bone formation while sustaining bone resorption in young mice
[664]. This raises the importance of taking into consideration not only age, but also metabolic
state when one attempt to parallel in vitro results in in vivo models.
A.4.4 Effects of DHA and prostaglandin metabolites on IGF-1
Dietary PUFAs may influence levels of IGF-1 indirectly through PGE2 production.
Primary osteoblasts isolated from fetal rat bones exposed to PGE2 had up to 4.7 fold increase in
IGF-1 transcript and protein levels. This stimulatory effect of PGE2 was mediated through
induction of cAMP signaling, as its effect on IGF-1 production was mimicked by other agents
that increase cAMP levels [665]. Treatment of cells with COX-2 inhibitor indomethacin did not
alter PTH-stimulated IGF-1 levels, since PTH signaling also increases cAMP. This suggests that
PGE2 production contributes to bone modeling and remodeling processes by way of its ability to
increase cAMP and IGF-1 synthesis by osteoblasts [666]. The ability of PGF2α to stimulate
proliferation of osteoblastic MC3T3-E1 cells was completely abolished by the addition of a
neutralizing anti-IGF-1 antibody. While PGE2α decreased IGF-1 transcript levels and secretion
into the culture medium, the number of high affinity binding sites for IGF-1 were up-regulated in
a dose-dependent manner, suggesting the anabolic effects of prostaglandins may also occur
through increasing response of bone cells to IGF-1 [667].
The activity of IGF-1 is modulated by a family of IGF binding proteins (IGFBP). IGF-1

228
polypeptide degradation may depend on its association with a specific IGFBP, and changes in
IGFBP synthesis, degradation, and IGF-1 affinity could play a role in the stability of IGF-1.
Treatment of primary osteoblasts-enriched cultures from fetal rat bones with PGE2 elevated
transcript levels of IGFBP-3, -4 and -5 (~22-, ~2- and ~4 fold respectively) as well as the 30/32
kDa IGFBP complex that consists of IGFBP-2 and -5. It is thus possible that PGE2 modulates
activity of locally produced IGFs in skeletal tissue by altering association of complexes between
IGFs and certain IGFBP, storing IGFs for future utilization during bone formation [668].
Limited data exist to date for the direct effect of PUFA on IGF-1. Animal studies also
reported mixed data on the effect of LCPUFA on circulating IGF-1 concentrations. Female pups
(3 wk) born to dams fed a n-3 rich linseed oil- based diet through late gestation and lactation had
27.7-36.5% lower serum IGF-1 compared to those fed soybean or sunflower oil [593]. Whereas
growing male rats (3 wk) fed a fish-oil enriched diet for 7 wk had increased IGFBP-3 levels
[597], with more studies showing no effect of LCPUFA on IGF-1 concentrations [589, 591, 598].
In vitro, EPA and DHA inhibited Caco-2 cell proliferation compared to cells cultured with LA.
This was associated with reduction in IGF-2 and up to 3.5 fold increase in IGFBP-6 transcript
levels and secretion, resulting in less free IGF-2 thus contribute to the inhibition of Caco-2 cell
proliferation [669].

229
Figure A2 Effects of DHA on osteoblastogenesis and osteoclastogenesis via its anti-
inflammatory properties and the direct effects on bone cells

230
A.5 Knowledge gaps and future directions
A.5.1 Sexual dimorphism in metabolism of LCPUFA and skeletal growth
It is widely accepted that sex differences exist in bone development, and this becomes
apparent during puberty where boys and girls experience periods of rapid growth at different
ages with resultant differences in PBM. Bone strength and PBM are greater in adult men than
women. However, growth does not produce a denser skeleton in males, rather it is a result of
variation in structural properties formed during growth and sexual maturation.
The sex differences in bone strength are established during puberty and largely under the
influence of levels of circulating sex steroids. While the contribution of the height of the
vertebrae to sex dimorphism in height is modest, differences in appendicular growth are
apparent, and in part, is a result from the differences in timing of puberty. In humans, pubertal
growth in boys begin approximately 1 year later than girls, yet it lasts longer, and boys
experience greater growth velocity than girls [670, 671]. Males grow longer and wider bones that
are stronger than female bones. In females, earlier completion of longitudinal growth with
epiphyseal fusion, inhibition of periosteal apposition and reduced resorption at the endosteal
surface produces smaller bone and marrow cavity. While in males, continual lengthening of
bones and periosteal apposition increases cortical thickness, leading to a larger external bone size
in men than in women [405]. Pubertal growth in males is associated with adding bone mostly on
the periosteal surface, where the effect on bone strength is highest; whereas females deposit bone
on the endocortical surface, where bending stress is lowest, and the mechanical advantage of the
bone is least. Thus, for a given bone mass, males have stronger bones than females because of
placement of bone further from the neutral axis of the long bone. It has been suggested that the
purpose of this mechanically inefficient endocortical bone apposition during female puberty is to

231
create a reservoir of calcium that can be mobilized during reproduction without compromising
bone strength [304].
Sexual dimorphisms in circulating plasma concentrations of n-3 LCPUFA, especially DHA
has long been reported. While the majority of observational studies vary in their sample
population, age range, degree of dietary control exerted, and the range of blood lipids analyzed,
the prevailing view is that women have significantly higher circulating DHA concentrations
compared to men, and that it is independent of dietary intake [672, 673]. This has been
hypothesized to be an evolutionary adaptation to provide to the fetus DHA to support its major
roles in cognitive and visual development early in life, and could be mediated through estrogen
actions as shifts in fatty acid composition in plasma membrane during the menstrual cycle,
pregnancy, and menopause have been reported [674, 675]. The concentration of DHA in
maternal blood was also significantly elevated in the third trimester of pregnancy, when
circulating levels of estrogen are the highest [676, 677]. This increase in maternal DHA is
required, presumably, to support the fetal brain growth spurt in the third trimester, as the fetus’
capacity to produce DHA from ALA may be insufficient to meet the extreme demand [678].
Given the modulatory effects of sex steroids on bone development and LCPUFA status that
are amplified during puberty, one can anticipate a significant interaction among these three
aspects to impact patterns of bone growth. However, studies that evaluated the effect of LCPUFA
on bone growth in both genders remain scarce. A gender x genotype interaction was reported in
studies involved in fat-1 mice, males at 12 wk of age showed greater incorporation in DPA
(C22:5 n-3) and DHA in the femur, as well as approximately 20% greater femur width despite no
differences in bone strength [679]. In a study where diets of guinea pig sows were supplemented
with DHA alone or combined AA+DHA through pregnancy and lactation, contrasting

232
observations in bone outcomes measured in males versus female offspring at 3 wk of age was
reported. Male pups in both DHA and AA+DHA groups had lower values of whole body aBMD
as well as tibia metaphyseal trabecular volumetric BMD (vBMD) than controls; whereas in
female pups an opposite trend was observed, suggesting combined LPCUFA may have positive
effects in females. Despite so, no differences in circulating biomarkers for bone formation or
resorption, nor was LCPUFA status different in males and females [594]. This is in agreement
with previous reports in guinea pig pups where maternal LCPUFA supplementation during
lactation up to day 21 was beneficial for LS 1-4 aBMD in female but not male offspring [384].
Nonetheless, the relatively young age of offspring when measurements were obtained render it
difficult to draw a definitive conclusion on the influence of sex on LCPUFA and bone growth, as
it would be reasonable to expect the effect of sex steroids to be minimal during that period. It
remains to be determined if this difference in bone outcome observed early in life will persist
through puberty and relate with LCPUFA status.
A.5.2 Dose and type of LCPUFA
The majority of the studies performed in both humans and animals utilized fish oil as the
main source of DHA. While common fish oils and their supplements can provide up to 12-20%
DHA (or 200 mg DHA per capsule) [680], it could be potentially confounding as these fish oils
also contain high concentrations of EPA as well as other LCPUFA including ALA and DPA that
have been shown to affect bone [583, 681]. The fatty acid profile of fish oils can also vary
greatly depending on the species, location, as well as time of year of the catch [682]. DHA-rich
single-cell oi (DHASCO) has emerged as an alternative source of DHA to marine oils, yet
relatively few studies to date have utilized DHASCO as supplementation source or vehicle for
food fortification. As fish are incapable of synthesizing DHA, they rely on the microalgae at the

233
bottom end of the food chain that represent the primary source of DHA in the biosphere.
DHASCO is derived from the microalgal species Crythecodinium cohnii. It contains
approximately 40% DHA by weight, and no appreciable amount of any other LCPUFA [683]. It
has been designated by the FDA as Generally Recognized as Safe (GRAS), and is employed
commercially as the source of DHA in infant formulas and maternal supplements. Use of
DHASCO have been favored over marine oils, in part due to reports of reduced growth and
decline in measures of AA status in infants that consumed term and preterm infant formula
supplemented with fish oil [374]. The presence of n-3 LCPUFA, particularly that of EPA is
known to be an antagonist of AA metabolism by downregulating the chain elongation and
desaturation of LA to n-6 LCPUFA. This has also been demonstrated in vivo, where addition of
additional n-3 PUFA in diets of piglets with the sole source of n-6 LCPUFA being LA produced a
reduction in tissue AA [684]. Studies in human infants have also documented a reduction in
plasma and RBC AA status after administration of a formula supplemented with marine oil
[374]. This reduction in AA may result in decreased growth, since plasma AA levels are
positively correlated with the growth of premature infants [375]. It would therefore be reasonable
to speculate similar effects to be observed in bone given stimulatory effects of AA on bone
growth exerted indirectly through PGE2 synthesis.
It is recognized that the proportion of DHA in sn-2 position of triglycerides found in
DHASCO is different from human breast milk and potentially affect the extent to which they are
absorbed [685]. However, preclinical and clinical studies have indicated that DHASCO is
efficiently absorbed and capable of delivering target fatty acids to tissues to similar extents as
human milk, since the proportion of DHA at the sn-2 position is well within the range found in
human milk [575, 686, 687]. DHASCO thus represents a source of DHA which contains no other

234
significantly bioactive fatty acids. This oil offers the opportunity for researchers to distinguish
for the first time the clinical effects of DHA from those effects generally attributed to fish oil.
Future studies in older children are needed to confirm the metabolism of DHASCO and its
benefits to bone growth and PBM.
Another important consideration in feeding trials is the dietary consumption necessary to
achieve changes in DHA status associated with beneficial effects on bone. While ample data
exist on the physiological effects of DHA on bone, its effective dosage remains unknown. It is
well recognized that curvilinear relationship exists between dietary intakes of DHA and blood
levels of this nutrient [236]. Administration of DHA over daily dose range of 200 – 1000 mg
DHA in form of algal oil capsules or fortified foods in healthy adults (n=96, 18-70 y) showed
that plasma phospholipids levels of DHA increased at a rate of approximately 0.3 g per 100 g
fatty acids, and reached new equilibrium after 2 wk of supplementation, irrespective of dose. The
equilibration of RBC DHA levels in blood, on the other hand, occurred at a slower rate and
continued to rise throughout the 4 wk supplementation period, indicating that an equilibrium
status had not been reached [688]. Others have also reported slower equilibration of RBC DHA
levels in blood, which is not unexpected given their 120 d lifespan in the blood [689]. More
research should thus focus on dose response relationship both in dietary intakes of DHA,
responses in blood and tissue levels and influence on bone metabolism, taking into account the
variability in individual’s response to DHA supplementation given DHA accretion in plasma
have been shown to be highly inversely dependent on baseline DHA levels but is independent of
age, weight, gender, or race [688].

235
A.5.3 The fat-1 transgenic model as potential model for studying DHA n-3 LCPUFA
in bone
Offering an alternative approach to studying the influence of n-3 LCPUFA on metabolism
independent of dietary modulation, the fat-1 mouse is a transgenic model that carries a n-3 fatty
acid desaturase gene from C. elegans that enables endogenous conversion of n-6 to n-3 fatty
acids, circumventing practical difficulties with obtaining comparable n-3 LCPUFA sources from
the diet [690], and provides an unique tool to study how certain fatty acids influence bone
metabolism through different metabolic pathways the ingested fatty acids typically undergo.
While no studies to date had directly compared obtainable n-3 FAs levels in bone between fat-1
mice and mice supplemented with a n-3 FAs rich diet, it is commonly accepted that the fat-1
mice is an appropriate model for evaluating roles of n-3 FAs and n-6: n-3 ratios in certain chronic
diseases. Fat-1 mice consuming a 10% safflower oil diet showed comparable brain levels of
DHA as WT mice fed 2% fish oil + 8% safflower oil diet, and n-3 PUFA levels in brain of fat-1
mice were not augmented with fish oil feeding, suggesting that the fat-1 model can be an
alternative or complimentary approach to dietary modulation of brain n-3 PUFA levels [689].
Feeding fat-1 mice AIN-93G diet containing 10% safflower oil from weaning until 12 wk
of age resulted in a lower n-6: n-3 in the lumbar vertebrae of fat-1 mice, this was negatively
correlated with BMC and peak compression load upon biomechanical testing. On the other hand,
total n-3 PUFA, including ALA, EPA and DHA, were positively correlated with BMD and the
peak load in the vertebrae. Similar findings where reported for the femur, suggesting that n-3
PUFA have a favorable effect on mineral accumulation and functional measures of bone in
growing fat-1 mice [681, 691].

236
A.6 Conclusion
The LCPUFAs, especially the n-3 fatty acids including DHA have shown promising
benefits for bone metabolism and bone health. Studies in both humans and animals have
provided ample evidence that LCPUFAs can increase bone formation, affecting PBM in
adolescents [692]. Given the crucial role of DHA in brain and visual development early in life, it
would be of particular value to further characterize whether DHA plays an equally important role
in skeletal growth, and the relative amounts of DHA partitioned for utilization in bone especially
when dietary intake of DHA is suboptimal. It is also of interest to note that in most in vivo
studies, n-6 PUFA appeared to associate negatively with bone formation or BMD. However, it is
also apparent that certain amounts of n-6 PUFA are essential for optimal bone development. The
optimal dietary ranges of n-6 and n-3 LCPUFA through life stages and metabolic states thus
remains to be determined. Additionally, the role of EPA to support bone formation during growth
warrants clarification. Data from animal studies indicate that EPA is a potent n-3 PUFA that
moderate actions of AA and other fatty acid metabolites that enhance osteoclastic activity. Thus
DHA and EPA appear to both exert supporting roles in bone metabolism throughout the life
cycle, but through different mode of actions and mechanisms.
The cellular mechanisms of action of the LCPUFAs are complex and involve modulation
of fatty acid metabolites such as prostaglandins, resolvins and protectins, cytokines, growth
factors, and other molecular signaling pathways. Mechanisms by which DHA regulate bone
metabolism identified to date include modulating PGE2 production and subsequent RANKL
production. DHA and other n-3 LCPUFA may elevate or preserve bone mass through increasing
MSC number [693], and by enhancing expression of key transcription factors such as Runx2 and
osterix. Furthermore, n-3 may modulate the number of pro-inflammatory cytokines, increasing

237
production of IGF-1 and improving calcium accretion in bone [54, 692]. PPARγ has emerged to
be an important nuclear receptor central to effects of DHA on inflammatory response and MSC
lineage commitment into osteoblasts. Of equal significance is the dual roles of PPARγ in
regulating bone formation and resorption, and that antagonists of PPARγ hold potential for
simultaneous anabolic and anti-catabolic intervention of skeletal fragility.
Bone mass acquired through childhood and adolescence tracks into adulthood and may
ultimately determine future osteoporotic risk. However, inconsistencies in the sera composition
used in vitro, methods of analyzing fatty acid profiles, and source of DHA employed in feeding
trials have made comparison across studies difficult. Also, the applicability of supplementation
either through diet or capsule oils in the pediatric population has not been determined. More data
is therefore required before incorporating DHA into recommendations and guidelines for the
attainment and maintenance of bone mass in children.

238
REFERENCES
[1] Recker RR, Heaney RP. Peak bone mineral density in young women. JAMA 1993;
270(24):2926-7.
[2] Berger C, Goltzman D, Langsetmo L, Joseph L, Jackson S, Kreiger N et al. Peak bone mass
from longitudinal data: implications for the prevalence, pathophysiology, and diagnosis of
osteoporosis. J Bone Miner Res 2010; 25(9):1948-57.
[3] Recker RR, Davies KM, Hinders SM, Heaney RP, Stegman MR, Kimmel DB. Bone gain in
young adult women. JAMA 1992; 268(17):2403-8.
[4] Matkovic V, Jelic T, Wardlaw GM, Ilich JZ, Goel PK, Wright JK et al. Timing of peak bone
mass in Caucasian females and its implication for the prevention of osteoporosis. Inference
from a cross-sectional model. J Clin Invest 1994; 93(2):799-808.
[5] Ding M. Microarchitectural adaptations in aging and osteoarthrotic subchondral bone issues.
Acta Orthop Suppl 2010; 81(S340):1-53.
[6] Mosekilde L. Age-related changes in vertebral trabecular bone architecture—assessed by a
new method. Bone 1988; 9(4):247-50.
[7] Riggs BL, Melton LJ, Robb RA, Camp JJ, Atkinson EJ, McDaniel L et al. A population-
based assessment of rates of bone loss at multiple skeletal sites: evidence for substantial
trabecular bone loss in young adult women and men. J Bone Miner Res 2008; 23(2):205-14.
[8] Parfitt A. Skeletal heterogeneity and the purposes of bone remodelling; implications for the
understanding of osteoporosis. In: Fundamentals of osteoporosis. Academic Press, New
York, NY; 2009.
[9] Hui SL, Slemenda CW, Johnston Jr CC. Age and bone mass as predictors of fracture in a
prospective study. J Clin Invest 1988; 81(6):1804.
[10] Swallen KC, Reither EN, Haas SA, Meier AM. Overweight, obesity, and health-related
quality of life among adolescents: the National Longitudinal Study of Adolescent Health.
Pediatrics 2005; 115(2):340-7.
[11] Dowling AM, Steele JR, Baur LA. What are the effects of obesity in children on plantar
pressure distributions? Int J Obes Relat Metab Disord 2004; 28(11):1514-9.
[12] Taylor ED, Theim KR, Mirch MC, Ghorbani S, Tanofsky-Kraff M, Adler-Wailes DC et al.
Orthopedic complications of overweight in children and adolescents. Pediatrics 2006;
117(6):2167-74.
[13] Gordon JE, Hughes MS, Shepherd K, Szymanski DA, Schoenecker PL, Parker L et al.
Obstructive sleep apnoea syndrome in morbidly obese children with tibia vara. J Bone Joint
Surg Br 2006; 88(1):100-3.
[14] Murray AW, Wilson NI. Changing incidence of slipped capital femoral epiphysis: a
relationship with obesity? J Bone Joint Surg Br 2008; 90(1):92-4.
[15] Jones IE, Williams SM, Dow N, Goulding A. How many children remain fracture-free
during growth? A longitudinal study of children and adolescents participating in the Dunedin
Multidisciplinary Health and Development Study. Osteoporos Int 2002; 13(12):990-5.
[16] Melton LJ. Who has osteoporosis? A conflict between clinical and public health
perspectives. J Bone Miner Res 2000; 15(12):2309-14.
[17] Donaldson LJ, Reckless IP, Scholes S, Mindell JS, Shelton NJ. The epidemiology of
fractures in England. J Epidemiol Community Health 2008; 62(2):174-80.
[18] Khosla S, Melton III LJ, Dekutoski MB, Achenbach SJ, Oberg AL, Riggs BL. Incidence of
childhood distal forearm fractures over 30 years: a population-based study. JAMA 2003;

239
290(11):1479-85.
[19] Ryan LM, Teach SJ, Searcy K, Singer SA, Wood R, Wright JL et al. Epidemiology of
pediatric forearm fractures in Washington, DC. J Trauma 2010; 69(4):S200-S5.
[20] Brudvik C, Hove LM. Childhood fractures in Bergen, Norway: identifying high-risk groups
and activities. J Pediatr Orthop 2003; 23(5):629-34.
[21] Cooper C, Dennison EM, Leufkens HG, Bishop N, van Staa TP. Epidemiology of childhood
fractures in Britain: a study using the general practice research database. J Bone Miner Res
2004; 19(12):1976-81.
[22] Moon RJ, Lim A, Farmer M, Segaran A, Clarke NM, Dennison EM et al. Differences in
childhood adiposity influence upper limb fracture site. Bone 2015; 79:88-93.
[23] Davidson P, Goulding A, Chalmers D. Biomechanical analysis of arm fracture in obese
boys. J Paediatr Child Health 2003; 39(9):657-64.
[24] Ryan LM, Teach SJ, Searcy K, Singer SA, Wood R, Wright JL et al. The association
between weight status and pediatric forearm fractures resulting from ground-level falls.
Pediatr Emerg Care 2015; 31(12):835-8.
[25] Rosenfield RL, Lipton RB, Drum ML. Thelarche, pubarche, and menarche attainment in
children with normal and elevated body mass index. Pediatrics 2009; 123(1):84-8.
[26] Mamun AA, Hayatbakhsh MR, O'Callaghan M, Williams G, Najman J. Early overweight
and pubertal maturation—pathways of association with young adults’ overweight: a
longitudinal study. Int J Obes (Lond) 2009; 33(1):14-20.
[27] Denzer C, Weibel A, Muche R, Karges B, Sorgo W, Wabitsch M. Pubertal development in
obese children and adolescents. Int J Obes (Lond) 2007; 31(10):1509-19.
[28] DiVall SA, Radovick S. Endocrinology of female puberty. Curr Opin Endocrinol Diabetes
Obes 2009; 16(1):1-4.
[29] Rao DP, Kropac E, Do MT, Roberts KC, Jayaraman GC. Childhood overweight and obesity
trends in Canada. Health Promot Chronic Dis Prev Can 2016; 36(9):194-8.
[30] Daniels SR, Arnett DK, Eckel RH, Gidding SS, Hayman LL, Kumanyika S et al.
Overweight in children and adolescents pathophysiology, consequences, prevention, and
treatment. Circulation 2005; 111(15):1999-2012.
[31] Le Petit C, Berthelot J-M. Obesity, a Growing Issue. Statistics Canada; 2005.
[32] Nielsen SJ, Siega‐Riz AM, Popkin BM. Trends in energy intake in US between 1977 and
1996: similar shifts seen across age groups. Obes Res 2002; 10(5):370-8.
[33] Shin KO, Oh S-Y, Park HS. Empirically derived major dietary patterns and their
associations with overweight in Korean preschool children. Br J Nutr 2007; 98(2):416-21.
[34] Wosje KS, Khoury PR, Claytor RP, Copeland KA, Hornung RW, Daniels SR et al. Dietary
patterns associated with fat and bone mass in young children. Am J Clin Nutr 2010;
92(2):294-303.
[35] Reilly JJ, Armstrong J, Dorosty AR, Emmett PM, Ness A, Rogers I et al. Early life risk
factors for obesity in childhood: cohort study. BMJ 2005; 330(7504):1357.
[36] Janssen I, Katzmarzyk PT, Boyce WF, King MA, Pickett W. Overweight and obesity in
Canadian adolescents and their associations with dietary habits and physical activity
patterns. J Adolesc Health 2004; 35(5):360-7.
[37] Willett WC. Dietary fat and obesity: an unconvincing relation. Am J Clin Nutr 1998;
68(6):1149-50.
[38] Naude CE, Visser ME, Nguyen KA, Durao S, Schoonees A. Effects of total fat intake on
bodyweight in children. Cochrane Database Syst Rev 2018; (7):CD012960.

240
[39] Ailhaud G, Massiera F, Weill P, Legrand P, Alessandri J-M, Guesnet P. Temporal changes in
dietary fats: role of n− 6 polyunsaturated fatty acids in excessive adipose tissue development
and relationship to obesity. Prog Lipid Res 2006; 45(3):203-36.
[40] Obarzanek E, Kimm SY, Barton BA, Van Horn L, Kwiterovich PO, Simons-Morton DG et
al. Long-term safety and efficacy of a cholesterol-lowering diet in children with elevated
low-density lipoprotein cholesterol: seven-year results of the Dietary Intervention Study in
Children (DISC). Pediatrics 2001; 107(2):256-64.
[41] Feskanich D, Willett WC, Colditz GA. Calcium, vitamin D, milk consumption, and hip
fractures: a prospective study among postmenopausal women. Am J Clin Nutr 2003;
77(2):504-11.
[42] Zalloua PA, Hsu Y-H, Terwedow H, Zang T, Wu D, Tang G et al. Impact of seafood and
fruit consumption on bone mineral density. Maturitas 2007; 56(1):1-11.
[43] Chen Y, Ho S, Lam S. Higher sea fish intake is associated with greater bone mass and lower
osteoporosis risk in postmenopausal Chinese women. Osteoporos Int 2010; 21(6):939-46.
[44] Farina EK, Kiel DP, Roubenoff R, Schaefer EJ, Cupples LA, Tucker KL. Dietary intakes of
arachidonic acid and α-linolenic acid are associated with reduced risk of hip fracture in older
adults. J Nutr 2011; 141(6):1146-53.
[45] Virtanen JK, Mozaffarian D, Cauley JA, Mukamal KJ, Robbins J, Siscovick DS. Fish
consumption, bone mineral density, and risk of hip fracture among older adults: the
cardiovascular health study. J Bone Miner Res 2010; 25(9):1972-9.
[46] Calderon-Garcia JF, Moran JM, Roncero-Martin R, Rey-Sanchez P, Rodriguez-Velasco FJ,
Pedrera-Zamorano JD. Dietary habits, nutrients and bone mass in Spanish premenopausal
women: the contribution of fish to better bone health. Nutrients 2012; 5(1):10-22.
[47] Orchard TS, Ing SW, Lu B, Belury MA, Johnson K, Wactawski‐Wende J et al. The
association of red blood cell n‐3 and n‐6 fatty acids with bone mineral density and hip
fracture risk in the women's health initiative. J Bone Miner Res 2013; 28(3):505-15.
[48] Farina EK, Kiel DP, Roubenoff R, Schaefer EJ, Cupples LA, Tucker KL. Plasma
phosphatidylcholine concentrations of polyunsaturated fatty acids are differentially
associated with hip bone mineral density and hip fracture in older adults: the Framingham
Osteoporosis Study. J Bone Miner Res 2012; 27(5):1222-30.
[49] Perna S, Avanzato I, Nichetti M, D’Antona G, Negro M, Rondanelli M. Association
between dietary patterns of meat and fish consumption with bone mineral density or fracture
risk: A systematic literature. Nutrients 2017; 9(9):1029.
[50] Richter CK, Bowen KJ, Mozaffarian D, Kris-Etherton PM, Skulas-Ray AC. Total long-
chain n-3 fatty acid intake and food sources in the United States compared to recommended
intakes: NHANES 2003–2008. Lipids 2017; 52(11):917-27.
[51] Kuda O, Rossmeisl M, Kopecky J. Omega-3 fatty acids and adipose tissue biology. Mol
Aspects Med 2018; 64:147-60.
[52] Kim HK, Della-Fera M, Lin J, Baile CA. Docosahexaenoic acid inhibits adipocyte
differentiation and induces apoptosis in 3T3-L1 preadipocytes. J Nutr 2006; 136(12):2965-9.
[53] Flachs P, Horakova O, Brauner P, Rossmeisl M, Pecina P, Franssen-van Hal N et al.
Polyunsaturated fatty acids of marine origin upregulate mitochondrial biogenesis and induce
β-oxidation in white fat. Diabetologia 2005; 48(11):2365-75.
[54] Kruger MC, Coetzee M, Haag M, Weiler H. Long-chain polyunsaturated fatty acids:
selected mechanisms of action on bone. Prog Lipid Res 2010; 49(4):438-49.
[55] Rosen ED, MacDougald OA. Adipocyte differentiation from the inside out. Nat Rev Mol

241
Cell Biol 2006; 7(12):885.
[56] Scaglioni S, Verduci E, Salvioni M, Bruzzese MG, Radaelli G, Zetterström R et al. Plasma
long‐chain fatty acids and the degree of obesity in Italian children. Acta Paediatr 2006;
95(8):964-9.
[57] Decsi T, Molnár D, Koletzko B. The effect of under- and overnutrition on essential fatty
acid metabolism in childhood. Eur J Clin Nutr 1998; 52(8):541-8.
[58] Ailhaud G, Guesnet P. Fatty acid composition of fats is an early determinant of childhood
obesity: a short review and an opinion. Obes Rev 2004; 5(1):21-6.
[59] Klein-Platat C, Drai J, Oujaa M, Schlienger J-L, Simon C. Plasma fatty acid composition is
associated with the metabolic syndrome and low-grade inflammation in overweight
adolescents. Am J Clin Nutr 2005; 82(6):1178-84.
[60] Decsi T, Molnár D, Koletzko B. Long-chain polyunsaturated fatty acids in plasma lipids of
obese children. Lipids 1996; 31(3):305-11.
[61] Verduci E, Radaelli G, Salvioni M, Riva E, Giovannini M. Plasma long‐chain fatty acids
profile and metabolic outcomes in normolipidaemic obese children after one‐year nutritional
intervention. Acta Paediatr 2011; 100(4):585-9.
[62] Massiera F, Saint-Marc P, Seydoux J, Murata T, Kobayashi T, Narumiya S et al. Arachidonic
acid and prostacyclin signaling promote adipose tissue development a human health
concern? J Lipid Res 2003; 44(2):271-9.
[63] Ng AC, Melton LJ, Atkinson EJ, Achenbach SJ, Holets MF, Peterson JM et al. Relationship
of adiposity to bone volumetric density and microstructure in men and women across the
adult lifespan. Bone 2013; 55(1):119-25.
[64] Steinberg N, Nemet D, Pantanowitz M, Eliakim A. Gait pattern, impact to the skeleton and
postural balance in overweight and obese children: a review. Sports (Basel) 2018; 6(3):E75.
[65] Hedström EM, Svensson O, Bergström U, Michno P. Epidemiology of fractures in children
and adolescents: Increased incidence over the past decade: a population-based study from
northern Sweden. Acta orthopaedica 2010; 81(1):148-53.
[66] Turner C. Three rules for bone adaptation to mechanical stimuli. Bone 1998; 23(5):399-407.
[67] Daly R. The effect of exercise on bone mass and structural geometry during growth. Med
Sport Sci 2007; 51:33-49.
[68] Turner CH, Pavalko FM. Mechanotransduction and functional response of the skeleton to
physical stress: the mechanisms and mechanics of bone adaptation. J Orthop Sci 1998;
3(6):346-55.
[69] Bedogni G, Mussi C, Malavolti M, Borghi A, Poli M, Battistini N et al. Relationship
between body composition and bone mineral content in young and elderly women. Ann
Hum Biol 2002; 29(5):559-65.
[70] Kirchengast S, Peterson B, Hauser G, Knogler W. Body composition characteristics are
associated with the bone density of the proximal femur end in middle-and old-aged women
and men. Maturitas 2001; 39(2):133-45.
[71] MacInnis R, Cassar C, Nowson C, Paton L, Flicker L, Hopper J et al. Determinants of bone
density in 30‐to 65‐year‐old women: A co‐twin study. J Bone Miner Res 2003; 18(9):1650-6.
[72] Felson DT, Zhang Y, Hannan MT, Anderson JJ. Effects of weight and body mass index on
bone mineral density in men and women: the Framingham study. J Bone Miner Res 1993;
8(5):567-73.
[73] Ravn P, Cizza G, Bjarnason N, Thompson D, Daley M, Wasnich R et al. Low body mass
index is an important risk factor for low bone mass and increased bone loss in early

242
postmenopausal women. J Bone Miner Res 1999; 14(9):1622-7.
[74] De Laet C, Kanis JA, Odén A, Johanson H, Johnell O, Delmas P et al. Body mass index as a
predictor of fracture risk: a meta-analysis. Osteoporos Int 2005; 16(11):1330-8.
[75] Leonard MB, Shults J, Wilson BA, Tershakovec AM, Zemel BS. Obesity during childhood
and adolescence augments bone mass and bone dimensions. Am J Clin Nutr 2004;
80(2):514-23.
[76] Clark EM, Ness AR, Tobias JH. Adipose tissue stimulates bone growth in prepubertal
children. J Clin Endocrinol Metab 2006; 91(7):2534-41.
[77] Schepper J, Van den Broeck M, Jonckheer MH. Study of lumbar spine bone mineral density
in obese children. Acta Paediatr 1995; 84(3):313-5.
[78] Goulding A, Taylor RW, Jones IE, McAuley KA, Manning PJ, Williams SM. Overweight
and obese children have low bone mass and area for their weight. Int J Obes Relat Metab
Disord 2000; 24(5):627-32.
[79] Dimitri P, Wales JK, Bishop N. Fat and bone in children: differential effects of obesity on
bone size and mass according to fracture history. J Bone Miner Res 2010; 25(3):527-36.
[80] Weiler H, Janzen L, Green K, Grabowski J, Seshia M, Yuen K. Percent body fat and bone
mass in healthy Canadian females 10 to 19 years of age. Bone 2000; 27(2):203-7.
[81] Pocock NA, Noakes KA, Majerovic Y, Griffiths MR. Magnification error of femoral
geometry using fan beam densitometers. Calcif Tissue Int 1997; 60(1):8-10.
[82] Leonard MB, Feldman HI, Zemel BS, Berlin JA, Barden EM, Stallings VA. Evaluation of
low density spine software for the assessment of bone mineral density in children. J Bone
Miner Res 1998; 13(11):1687-90.
[83] Specker BL, Johannsen N, Binkley T, Finn K. Total body bone mineral content and tibial
cortical bone measures in preschool children. J Bone Miner Res 2001; 16(12):2298-305.
[84] Pollock NK, Laing EM, Baile CA, Hamrick MW, Hall DB, Lewis RD. Is adiposity
advantageous for bone strength? A peripheral quantitative computed tomography study in
late adolescent females. Am J Clin Nutr 2007; 86(5):1530-8.
[85] Ducher G, Bass SL, Naughton GA, Eser P, Telford RD, Daly RM. Overweight children have
a greater proportion of fat mass relative to muscle mass in the upper limbs than in the lower
limbs: implications for bone strength at the distal forearm. Am J Clin Nutr 2009; 90(4):1104-
11.
[86] Wetzsteon RJ, Petit MA, Macdonald HM, Hughes JM, Beck TJ, McKay HA. Bone structure
and volumetric BMD in overweight children: a longitudinal study. J Bone Miner Res 2008;
23(12):1946-53.
[87] Demigné C, Bloch-Faure M, Picard N, Sabboh H, Besson C, Rémésy C et al. Mice
chronically fed a westernized experimental diet as a model of obesity, metabolic syndrome
and osteoporosis. Eur J Nutr 2006; 45(5):298-306.
[88] Parhami F, Tintut Y, Beamer WG, Gharavi N, Goodman W, Demer LL. Atherogenic high‐fat
diet reduces bone mineralization in mice. J Bone Miner Res 2001; 16(1):182-8.
[89] Clarke B. Normal bone anatomy and physiology. Clin J Am Soc Nephrol 2008; 3(Suppl
3):S131-S9.
[90] Halade GV, Rahman MM, Williams PJ, Fernandes G. High fat diet-induced animal model of
age-associated obesity and osteoporosis. J Nutr Biochem 2010; 21(12):1162-9.
[91] Cao JJ, Gregoire BR, Gao H. High-fat diet decreases cancellous bone mass but has no effect
on cortical bone mass in the tibia in mice. Bone 2009; 44(6):1097-104.
[92] Cao JJ, Sun L, Gao H. Diet-induced obesity alters bone remodeling leading to decreased

243
femoral trabecular bone mass in mice. Ann N Y Acad Sci 2010; 1192:292-7.
[93] Gerbaix M, Metz L, Mac-Way F, Lavet C, Guillet C, Walrand S et al. Impact of an
obesogenic diet program on bone densitometry, micro architecture and metabolism in male
rat. Lipids Health Dis 2012; 11:91.
[94] Li KC, Zernicke RF, Barnard RJ, Li AF. Effects of a high fat-sucrose diet on cortical bone
morphology and biomechanics. Calcif Tissue Int 1990; 47(5):308-13.
[95] Brahmabhatt V, Rho J, Bernardis L, Gillespie R, Ziv I. The effects of dietary-induced
obesity on the biomechanical properties of femora in male rats. Int J Obes Relat Metab
Disord 1998; 22(8):813-8.
[96] Atteh JO, Leeson S, Julian RJ. Effects of dietary levels and types of fat on performance and
mineral metabolism of broiler chicks. Poult Sci 1983; 62(12):2403-11.
[97] Zernicke RF, Salem GJ, Barnard RJ, Schramm E. Long-term, high-fat-sucrose diet alters rat
femoral neck and vertebral morphology, bone mineral content, and mechanical properties.
Bone 1995; 16(1):25-31.
[98] Wohl GR, Loehrke L, Watkins BA, Zernicke RF. Effects of high-fat diet on mature bone
mineral content, structure, and mechanical properties. Calcif Tissue Int 1998; 63(1):74-9.
[99] Friedman AW. Important determinants of bone strength: beyond bone mineral density. J Clin
Rheumatol 2006; 12(2):70-7.
[100] Ehrlich P, Noble B, Jessop H, Stevens H, Mosley J, Lanyon L. The effect of in vivo
mechanical loading on estrogen receptor α expression in rat ulnar osteocytes. J Bone Miner
Res 2002; 17(9):1646-55.
[101] David V, Martin A, Lafage-Proust MH, Malaval L, Peyroche S, Jones DB et al. Mechanical
loading down-regulates peroxisome proliferator-activated receptor γ in bone marrow
stromal cells and favors osteoblastogenesis at the expense of adipogenesis. Endocrinology
2007; 148(5):2553-62.
[102] Sen B, Xie Z, Case N, Ma M, Rubin C, Rubin J. Mechanical strain inhibits adipogenesis in
mesenchymal stem cells by stimulating a durable β-catenin signal. Endocrinology 2008;
149(12):6065-75.
[103] Im JA, Yu BP, Jeon JY, Kim SH. Relationship between osteocalcin and glucose metabolism
in postmenopausal women. Clin Chim Acta 2008; 396(1):66-9.
[104] Papakitsou E, Margioris A, Dretakis K, Trovas G, Zoras U, Lyritis G et al. Body mass
index (BMI) and parameters of bone formation and resorption in postmenopausal women.
Maturitas 2004; 47(3):185-93.
[105] Dimitri P, Wales JK, Bishop N. Adipokines, bone-derived factors and bone turnover in
obese children; evidence for altered fat-bone signalling resulting in reduced bone mass.
Bone 2011; 48(2):189-96.
[106] Parhami F, Jackson SM, Tintut Y, Le V, Balucan JP, Territo M et al. Atherogenic diet and
minimally oxidized low density lipoprotein inhibit osteogenic and promote adipogenic
differentiation of marrow stromal cells. J Bone Miner Res 1999; 14(12):2067-78.
[107] Halade GV, El Jamali A, Williams PJ, Fajardo RJ, Fernandes G. Obesity-mediated
inflammatory microenvironment stimulates osteoclastogenesis and bone loss in mice. Exp
Gerontol 2011; 46(1):43-52.
[108] Naveiras O, Nardi V, Wenzel PL, Hauschka PV, Fahey F, Daley GQ. Bone-marrow
adipocytes as negative regulators of the haematopoietic microenvironment. Nature 2009;
460(7252):259-63.
[109] Xu H, Barnes GT, Yang Q, Tan G, Yang D, Chou CJ et al. Chronic inflammation in fat

244
plays a crucial role in the development of obesity-related insulin resistance. J Clin Invest
2003; 112(12):1821-30.
[110] Weisberg SP, McCann D, Desai M, Rosenbaum M, Leibel RL, Ferrante AW. Obesity is
associated with macrophage accumulation in adipose tissue. J Clin Invest 2003;
112(12):1796-808.
[111] Rasouli N, Kern PA. Adipocytokines and the metabolic complications of obesity. J Clin
Endocrinol Metab 2008; 93(11 Suppl 1):S64-73.
[112] Ford ES. Body mass index, diabetes, and C-reactive protein among U.S. adults. Diabetes
care 1999; 22(12):1971-7.
[113] Aeberli I, Molinari L, Spinas G, Lehmann R, l'Allemand D, Zimmermann MB. Dietary
intakes of fat and antioxidant vitamins are predictors of subclinical inflammation in
overweight Swiss children. Am J Clin Nutr 2006; 84(4):748-55.
[114] Pfeilschifter J, Köditz R, Pfohl M, Schatz H. Changes in proinflammatory cytokine activity
after menopause. Endocr Rev 2002; 23(1):90-119.
[115] Khosla S. Minireview: The opg/rankl/rank system. Endocrinology 2001; 142(12):5050-5.
[116] Vargas SJ, Naprta A, Glaccum M, Lee SK, Kalinowski J, Lorenzo JA. Interleukin‐6
expression and histomorphometry of bones from mice deficient in receptors for
interleukin‐1 or tumor necrosis factor. J Bone Miner Res 1996; 11(11):1736-44.
[117] Ammann P, Rizzoli R, Bonjour J-P, Bourrin S, Meyer J-M, Vassalli P et al. Transgenic
mice expressing soluble tumor necrosis factor-receptor are protected against bone loss
caused by estrogen deficiency. J Clin Invest 1997; 99(7):1699.
[118] Kimble RB, Matayoshi AB, Vannice JL, Kung VT, Williams C, Pacifici R. Simultaneous
block of interleukin-1 and tumor necrosis factor is required to completely prevent bone loss
in the early postovariectomy period. Endocrinology 1995; 136(7):3054-61.
[119] Taguchi Y, Yamamoto M, Yamate T, Lin SC, Mocharla H, DeTogni P et al. Interleukin-6-
type cytokines stimulate mesenchymal progenitor differentiation toward the osteoblastic
lineage. Proc Assoc Am Physicians 1997; 110(6):559-74.
[120] Xu LX, Kukita T, Kukita A, Otsuka T, Niho Y, Iijima T. Interleukin‐10 selectively inhibits
osteoclastogenesis by inhibiting differentiation of osteoclast progenitors into preosteoclast‐
like cells in rat bone marrow culture system. J Cell Physiol 1995; 165(3):624-9.
[121] Shin HH, Lee JE, Lee EA, Kwon BS, Choi HS. Enhanced osteoclastogenesis in 4‐1BB-
deficient mice caused by reduced interleukin‐10. J Bone Miner Res 2006; 21(12):1907-12.
[122] Sasaki H, Hou L, Belani A, Wang CY, Uchiyama T, Müller R et al. IL-10, but not IL-4,
suppresses infection-stimulated bone resorption in vivo. J Immunol 2000; 165(7):3626-30.
[123] Amar S, Zhou Q, Shaik-Dasthagirisaheb Y, Leeman S. Diet-induced obesity in mice causes
changes in immune responses and bone loss manifested by bacterial challenge. Proc Natl
Acad Sci U S A 2007; 104(51):20466-71.
[124] Klein S, Coppack SW, Mohamed-Ali V, Landt M. Adipose tissue leptin production and
plasma leptin kinetics in humans. Diabetes 1996; 45(7):984-7.
[125] Havel PJ. Role of adipose tissue in body-weight regulation: mechanisms regulating leptin
production and energy balance. In: Proc Nutr Soc. Cambridge Univ Press; 2000. pp. 359-
71.
[126] Barr VA, Malide D, Zarnowski MJ, Taylor SI, Cushman SW. Insulin stimulates both leptin
secretion and production by rat white adipose tissue. Endocrinology 1997; 138(10):4463-
72.
[127] Horvath TL, Diano S, Sotonyi P, Heiman M, Tschöp M. Minireview: ghrelin and the

245
regulation of energy balance-a hypothalamic perspective. Endocrinology 2001;
142(10):4163-9.
[128] Havel PJ. Control of energy homeostasis and insulin action by adipocyte hormones: leptin,
acylation stimulating protein, and adiponectin. Curr Opin Lipidol 2002; 13(1):51-9.
[129] Wang Q, Bing C, Al-Barazanji K, Mossakowaska DE, Wang XM, McBay DL et al.
Interactions between leptin and hypothalamic neuropeptide Y neurons in the control of
food intake and energy homeostasis in the rat. Diabetes 1997; 46(3):335-41.
[130] Bagnasco M, Dube MG, Katz A, Kalra PS, Kalra SP. Leptin expression in hypothalamic
PVN reverses dietary obesity and hyperinsulinemia but stimulates ghrelin. Obes Res 2003;
11(12):1463-70.
[131] Baldock PA, Allison SJ, Lundberg P, Lee NJ, Slack K, Lin E-JD et al. Novel role of Y1
receptors in the coordinated regulation of bone and energy homeostasis. J Biol Chem 2007;
282(26):19092-102.
[132] Clement K, Vaisse C, Lahlou N, Cabrol S, Pelloux V, Cassuto D et al. A mutation in the
human leptin receptor gene causes obesity and pituitary dysfunction. Nature 1998;
392(6674):398-401.
[133] Friedman JM, Halaas JL. Leptin and the regulation of body weight in mammals. Nature
1998; 395(6704):763-70.
[134] Elmquist JK, Maratos-Flier E, Saper CB, Flier JS. Unraveling the central nervous system
pathways underlying responses to leptin. Nat Neurosci 1998; 1(6):445-50.
[135] Considine RV, Sinha MK, Heiman ML, Kriauciunas A, Stephens TW, Nyce MR et al.
Serum immunoreactive-leptin concentrations in normal-weight and obese humans. N Engl
J Med 1996; 334(5):292-5.
[136] Zhong N, Wu XP, Xu ZR, Wang AH, Luo XH, Cao XZ et al. Relationship of serum leptin
with age, body weight, body mass index, and bone mineral density in healthy mainland
Chinese women. Clin Chim Acta 2005; 351(1–2):161-8.
[137] Ionova-Martin S, Do S, Barth H, Szadkowska M, Porter A, Ager J et al. Reduced size-
independent mechanical properties of cortical bone in high-fat diet-induced obesity. Bone
2010; 46(1):217-25.
[138] Klein KO, Larmore KA, de Lancey E, Brown JM, Considine RV, Hassink SG. Effect of
obesity on estradiol level, and its relationship to leptin, bone maturation, and bone mineral
density in children. J Clin Endocrinol Metab 1998; 83(10):3469-75.
[139] Roux C, Arabi A, Porcher R, Garnero P. Serum leptin as a determinant of bone resorption
in healthy postmenopausal women. Bone 2003; 33(5):847-52.
[140] Thomas T, Burguera B, Melton L, Atkinson E, O’Fallon W, Riggs B et al. Role of serum
leptin, insulin, and estrogen levels as potential mediators of the relationship between fat
mass and bone mineral density in men versus women. Bone 2001; 29(2):114-20.
[141] Blum M, Harris SS, Must A, Naumova EN, Phillips SM, Rand WM et al. Leptin, body
composition and bone Mineral density in premenopausal women. Calcif Tissue Int 2003;
73(1):27-32.
[142] Ruhl CE, Everhart JE. Relationship of serum leptin concentration with bone mineral
density in the United States population. J Bone Miner Res 2002; 17(10):1896-903.
[143] Di Monaco M, Vallero F, Di Monaco R, Mautino F, Cavanna A. Fat body mass, leptin and
femur bone mineral density in hip-fractured women. J Endocrinol Invest 2003;
26(12):1180-5.
[144] Morberg CM, Tetens I, Black E, Toubro S, Soerensen TI, Pedersen O et al. Leptin and

246
bone mineral density: a cross-sectional study in obese and nonobese men. J Clin
Endocrinol Metab 2003; 88(12):5795-800.
[145] Yamauchi M, Sugimoto T, Yamaguchi T, Nakaoka D, Kanzawa M, Yano S et al. Plasma
leptin concentrations are associated with bone mineral density and the presence of
vertebral fractures in postmenopausal women. Clin Endocrinol (Oxf) 2001; 55(3):341-7.
[146] Hamrick M, Pennington C, Newton D, Xie D, Isales C. Leptin deficiency produces
contrasting phenotypes in bones of the limb and spine. Bone 2004; 34(3):376-83.
[147] Lorentzon R, Alehagen U, Boquist L. Osteopenia in mice with genetic diabetes. Diabetes
Res Clin Pract 1986; 2(3):157-63.
[148] Foldes J, Shih MS, Levy J. Bone structure and calcium metabolism in obese Zucker rats.
Int J Obes Relat Metab Disord 1992; 16(2):95-102.
[149] Ealey KN, Fonseca D, Archer MC, Ward WE. Bone abnormalities in adolescent leptin-
deficient mice. Regul Pept 2006; 136(1):9-13.
[150] Steppan CM, Crawford DT, Chidsey-Frink KL, Ke H, Swick AG. Leptin is a potent
stimulator of bone growth in ob/ob mice. Regul Pept 2000; 92(1–3):73-8.
[151] Hamrick MW, Della‐Fera MA, Choi YH, Pennington C, Hartzell D, Baile CA. Leptin
treatment induces loss of bone marrow adipocytes and increases bone formation in leptin‐
deficient ob/ob mice. J Bone Miner Res 2005; 20(6):994-1001.
[152] Ducy P, Amling M, Takeda S, Priemel M, Schilling AF, Beil FT et al. Leptin inhibits bone
formation through a hypothalamic relay: a central control of bone mass. Cell 2000;
100(2):197-207.
[153] Kishida Y, Hirao M, Tamai N, Nampei A, Fujimoto T, Nakase T et al. Leptin regulates
chondrocyte differentiation and matrix maturation during endochondral ossification. Bone
2005; 37(5):607-21.
[154] Gat-Yablonski G, Ben-Ari T, Shtaif B, Potievsky O, Moran O, Eshet R et al. Leptin
reverses the inhibitory effect of caloric restriction on longitudinal growth. Endocrinology
2004; 145(1):343-50.
[155] Cornish J, Callon KE, Bava U, Lin C, Naot D, Hill BL et al. Leptin directly regulates bone
cell function in vitro and reduces bone fragility in vivo. J Endocrinol 2002; 175(2):405-16.
[156] Reseland JE, Syversen U, Bakke I, Qvigstad G, Eide LG, Hjertner Ø et al. Leptin is
expressed in and secreted from primary cultures of human osteoblasts and promotes bone
mineralization. J Bone Miner Res 2001; 16(8):1426-33.
[157] Thomas T, Gori F, Khosla S, Jensen MD, Burguera B, Riggs BL. Leptin acts on human
marrow stromal cells to enhance differentiation to osteoblasts and to inhibit differentiation
to adipocytes. Endocrinology 1999; 140(4):1630-8.
[158] Lee YJ, Park JH, Ju SK, You KH, Ko JS, Kim HM. Leptin receptor isoform expression in
rat osteoblasts and their functional analysis. FEBS Lett 2002; 528(1-3):43-7.
[159] Holloway WR, Collier FM, Aitken CJ, Myers DE, Hodge JM, Malakellis M et al. Leptin
inhibits osteoclast generation. J Bone Miner Res 2002; 17(2):200-9.
[160] Burguera B, Hofbauer LC, Thomas T, Gori F, Evans GL, Khosla S et al. Leptin reduces
ovariectomy-induced bone loss in rats. Endocrinology 2001; 142(8):3546-53.
[161] Lamghari M, Tavares L, Camboa N, Barbosa MA. Leptin effect on RANKL and OPG
expression in MC3T3-E1 osteoblasts. J Cell Biochem 2006; 98(5):1123-9.
[162] Martin A, de Vittoris R, David V, Moraes R, Bégeot M, Lafage-Proust M-H et al. Leptin
modulates both resorption and formation while preventing disuse-induced bone loss in tail-
suspended female rats. Endocrinology 2005; 146(8):3652-9.

247
[163] Ahima RS, Prabakaran D, Mantzoros C, Qu D, Lowell B, Maratos-Flier E et al. Role of
leptin in the neuroendocrine response to fasting. Nature 1996; 382(6588):250-2.
[164] Iwaniec UT, Boghossian S, Lapke PD, Turner RT, Kalra SP. Central leptin gene therapy
corrects skeletal abnormalities in leptin-deficient ob/ob mice. Peptides 2007; 28(5):1012-9.
[165] Takeda S, Elefteriou F, Levasseur R, Liu X, Zhao L, Parker KL et al. Leptin regulates bone
formation via the sympathetic nervous system. Cell 2002; 111(3):305-17.
[166] Togari A, Arai M, Mizutani S, Mizutani S, Koshihara Y, Nagatsu T. Expression of mRNAs
for neuropeptide receptors and β-adrenergic receptors in human osteoblasts and human
osteogenic sarcoma cells. Neurosci Lett 1997; 233(2):125-8.
[167] Moore RE, Smith II CK, Bailey CS, Voelkel EF, Tashjian Jr AH. Characterization of beta-
adrenergic receptors on rat and human osteoblast-like cells and demonstration that beta-
receptor agonists can stimulate bone resorption in organ culture. Bone Miner 1993;
23(3):301-15.
[168] Elefteriou F, Takeda S, Ebihara K, Magre J, Patano N, Kim CA et al. Serum leptin level is
a regulator of bone mass. Proc Natl Acad Sci U S A 2004; 101(9):3258-63.
[169] Elefteriou F, Ahn JD, Takeda S, Starbuck M, Yang X, Liu X et al. Leptin regulation of
bone resorption by the sympathetic nervous system and CART. Nature 2005;
434(7032):514-20.
[170] Sierra-Honigmann MRo, Nath AK, Murakami C, Garcı́a-Cardeña G, Papapetropoulos A,
Sessa WC et al. Biological action of leptin as an angiogenic factor. Science 1998;
281(5383):1683-6.
[171] Yang WS, Lee WJ, Funahashi T, Tanaka S, Matsuzawa Y, Chao CL et al. Weight reduction
increases plasma levels of an adipose-derived anti-inflammatory protein, adiponectin. J
Clin Endocrinol Metab 2001; 86(8):3815-9.
[172] Yamauchi T, Kamon J, Waki H, Terauchi Y, Kubota N, Hara K et al. The fat-derived
hormone adiponectin reverses insulin resistance associated with both lipoatrophy and
obesity. Nat Med 2001; 7(8):941-6.
[173] Stefan N, Bunt JC, Salbe AD, Funahashi T, Matsuzawa Y, Tataranni PA. Plasma
adiponectin concentrations in children: relationships with obesity and insulinemia. J Clin
Endocrinol Metab 2002; 87(10):4652-6.
[174] Punthakee Z, Delvin EE, O’Loughlin J, Paradis G, Levy E, Platt RW et al. Adiponectin,
adiposity, and insulin resistance in children and adolescents. J Clin Endocrinol Metab
2006; 91(6):2119-25.
[175] Berner HS, Lyngstadaas SP, Spahr A, Monjo M, Thommesen L, Drevon CA et al.
Adiponectin and its receptors are expressed in bone-forming cells. Bone 2004; 35(4):842-
9.
[176] Pacheco-Pantoja EL, Waring VJ, Wilson PJ, Fraser WD, Gallagher JA. Adiponectin
receptors are present in RANK-L-induced multinucleated osteoclast-like cells. J Recept
Signal Transduct Res 2013; 33(5):291-7.
[177] Kanazawa I, Yamaguchi T, Yano S, Yamauchi M, Yamamoto M, Sugimoto T. Adiponectin
and AMP kinase activator stimulate proliferation, differentiation, and mineralization of
osteoblastic MC3T3-E1 cells. BMC Cell Biol 2007; 8(1):51.
[178] Williams GA, Wang Y, Callon KE, Watson M, Lin JM, Lam JB et al. In vitro and in vivo
effects of adiponectin on bone. Endocrinology 2009; 150(8):3603-10.
[179] Oshima K, Nampei A, Matsuda M, Iwaki M, Fukuhara A, Hashimoto J et al. Adiponectin
increases bone mass by suppressing osteoclast and activating osteoblast. Biochem Biophys

248
Res Commun 2005; 331(2):520-6.
[180] Luo X-H, Guo LJ, Xie H, Yuan LQ, Wu XP, Zhou HD et al. Adiponectin stimulates
RANKL and inhibits OPG expression in human osteoblasts through the MAPK signaling
pathway. J Bone Miner Res 2006; 21(10):1648-56.
[181] Newton AL, Hanks LJ, Davis M, Casazza K. The relationships among total body fat, bone
mineral content and bone marrow adipose tissue in early-pubertal girls. Bonekey Rep
2013; 2(4).
[182] Kajimura D, Lee Ha W, Riley Kyle J, Arteaga-Solis E, Ferron M, Zhou B et al.
Adiponectin regulates bone mass via opposite central and peripheral mechanisms through
FoxO1. Cell Metab 2013; 17(6):901-15.
[183] Wang Y, Lam KS, Xu JY, Lu G, Xu LY, Cooper GJ et al. Adiponectin inhibits cell
proliferation by interacting with several growth factors in an oligomerization-dependent
manner. J Biol Chem 2005; 280(18):18341-7.
[184] Delarue J, LeFoll C, Corporeau C, Lucas D. N-3 long chain polyunsaturated fatty acids: a
nutritional tool to prevent insulin resistance associated to type 2 diabetes and obesity?
Reprod Nutr Dev 2004; 44(3):289-99.
[185] Ruzickova J, Rossmeisl M, Prazak T, Flachs P, Sponarova J, Vecka M et al. Omega-3
PUFA of marine origin limit diet-induced obesity in mice by reducing cellularity of adipose
tissue. Lipids 2004; 39(12):1177-85.
[186] Karlsson M, Mårild S, Brandberg J, Lönn L, Friberg P, Strandvik B. Serum phospholipid
fatty acids, adipose tissue, and metabolic markers in obese adolescents. Obesity 2006;
14(11):1931-9.
[187] Gil-Campos M, del Carmen Ramírez-Tortosa M, Larqué E, Linde J, Aguilera CM, Cañete
R et al. Metabolic syndrome affects fatty acid composition of plasma lipids in obese
prepubertal children. Lipids 2008; 43(8):723-32.
[188] Phinney SD, Tang AB, Thurmond DC, Nakamura MT, Stern JS. Abnormal polyunsaturated
lipid metabolism in the obese Zucker rat, with partial metabolic correction by γ-linolenic
acid administration. Metabolism 1993; 42(9):1127-40.
[189] Okada T, Furuhashi N, Kuromori Y, Miyashita M, Iwata F, Harada K. Plasma palmitoleic
acid content and obesity in children. Am J Clin Nutr 2005; 82(4):747-50.
[190] Phinney SD. Fatty acids, inflammation, and the metabolic syndrome. Am J Clin Nutr 2005;
82(6):1151-2.
[191] Hu CC, Qing K, Chen Y. Diet-induced changes in stearoyl-CoA desaturase 1 expression in
obesity-prone and -resistant mice. Obes Res 2004; 12(8):1264-70.
[192] Ntambi JM, Miyazaki M, Stoehr JP, Lan H, Kendziorski CM, Yandell BS et al. Loss of
stearoyl–CoA desaturase-1 function protects mice against adiposity. Proc Natl Acad Sci U
S A 2002; 99(17):11482-6.
[193] Vinknes KJ, Elshorbagy AK, Drevon CA, Nurk E, Tell GS, Nygård O et al. Associations
between plasma polyunsaturated fatty acids, plasma stearoyl-CoA desaturase indices and
body fat. Obesity 2013; 21(9):E512-E9.
[194] Juárez-López C, Klünder-Klünder M, Madrigal-Azcárate A, Flores-Huerta S. Omega-3
polyunsaturated fatty acids reduce insulin resistance and triglycerides in obese children and
adolescents. Pediatr Diabetes 2013; 14(5):377-83.
[195] López-Alarcón M, Martínez-Coronado A, Velarde-Castro O, Rendón-Macías E, Fernández
J. Supplementation of n3 long-chain polyunsaturated fatty acid synergistically decreases
insulin resistance with weight loss of obese prepubertal and pubertal children. Arch Med

249
Res 2011; 42(6):502-8.
[196] Hill JO, Peters JC, Lin D, Yakubu F, Greene H, Swift L. Lipid accumulation and body fat
distribution is influenced by type of dietary fat fed to rats. Int J Obes Relat Metab Disord
1993; 17(4):223-36.
[197] Wang H, Storlien LH, Huang XF. Effects of dietary fat types on body fatness, leptin, and
ARC leptin receptor, NPY, and AgRP mRNA expression. Am J Physiol Endocrinol Metab
2002; 282(6):E1352-E9.
[198] Huang XF, Xin X, McLennan P, Storlien L. Role of fat amount and type in ameliorating
diet-induced obesity: insights at the level of hypothalamic arcuate nucleus leptin receptor,
neuropeptide Y and pro-opiomelanocortin mRNA expression. Diabetes Obes Metab 2004;
6(1):35-44.
[199] Newman RE, Bryden WL, Fleck E, Ashes JR, Buttemer WA, Storlien LH et al. Dietary n-3
and n-6 fatty acids alter avian metabolism: metabolism and abdominal fat deposition. Br J
Nutr 2002; 88(01):11-8.
[200] Todoric J, Löffler M, Huber J, Bilban M, Reimers M, Kadl A et al. Adipose tissue
inflammation induced by high-fat diet in obese diabetic mice is prevented by n−3
polyunsaturated fatty acids. Diabetologia 2006; 49(9):2109-19.
[201] Kuda O, Jelenik T, Jilkova Z, Flachs P, Rossmeisl M, Hensler M et al. n-3 Fatty acids and
rosiglitazone improve insulin sensitivity through additive stimulatory effects on muscle
glycogen synthesis in mice fed a high-fat diet. Diabetologia 2009; 52(5):941-51.
[202] Wellen KE, Hotamisligil GS. Inflammation, stress, and diabetes. J Clin Invest 2005;
115(5):1111-9.
[203] He Y, Chen H, Quon MJ, Reitman M. The mouse obese gene. Genomic organization,
promoter activity, and activation by CCAAT/enhancer-binding protein alpha. J Biol Chem
1995; 270(48):28887-91.
[204] Hwang CS, Mandrup S, MacDougald OA, Geiman DE, Lane MD. Transcriptional
activation of the mouse obese (ob) gene by CCAAT/enhancer binding protein alpha. Proc
Natl Acad Sci U S A 1996; 93(2):873-7.
[205] De Vos P, Lefebvre A-M, Miller SG, Guerre-Millo M, Wong K, Saladin R et al.
Thiazolidinediones repress ob gene expression in rodents via activation of peroxisome
proliferator-activated receptor gamma. J Clin Invest 1996; 98(4):1004-9.
[206] Chen X, Li D, Yin J, Ding Y, Zhang H, Zhang H et al. Regulation of dietary energy level
and oil source on leptin and its long form receptor mRNA expression of the adipose tissues
in growing pigs. Domest Anim Endocrinol 2006; 31(3):269-83.
[207] Lönnqvist F, Nordfors L, Jansson M, Thörne A, Schalling M, Arner P. Leptin secretion
from adipose tissue in women. Relationship to plasma levels and gene expression. J Clin
Invest 1997; 99(10):2398.
[208] Russell CD, Petersen RN, Rao SP, Ricci MR, Prasad A, Zhang Y et al. Leptin expression in
adipose tissue from obese humans: depot-specific regulation by insulin and
dexamethasone. Am J Physiol 1998; 275(3):E507-E15.
[209] Flachs P, Mohamed-Ali V, Horakova O, Rossmeisl M, Hosseinzadeh-Attar MJ, Hensler M
et al. Polyunsaturated fatty acids of marine origin induce adiponectin in mice fed a high-fat
diet. Diabetologia 2006; 49(2):394-7.
[210] Iwaki M, Matsuda M, Maeda N, Funahashi T, Matsuzawa Y, Makishima M et al. Induction
of adiponectin, a fat-derived antidiabetic and antiatherogenic factor, by nuclear receptors.
Diabetes 2003; 52(7):1655-63.

250
[211] Oster RT, Tishinsky JM, Yuan Z, Robinson LE. Docosahexaenoic acid increases cellular
adiponectin mRNA and secreted adiponectin protein, as well as PPARγ mRNA, in 3T3-L1
adipocytes. Appl Physiol Nutr Metab 2010; 35(6):783-9.
[212] Rasouli N, Yao-Borengasser A, Miles LM, Elbein SC, Kern PA. Increased plasma
adiponectin in response to pioglitazone does not result from increased gene expression. Am
J Physiol Endocrinol Metab 2006; 290(1):E42-E6.
[213] Tiikkainen M, Häkkinen AM, Korsheninnikova E, Nyman T, Mäkimattila S, Yki-Järvinen
H. Effects of rosiglitazone and metformin on liver fat content, hepatic insulin resistance,
insulin clearance, and gene expression in adipose tissue in patients with type 2 diabetes.
Diabetes 2004; 53(8):2169-76.
[214] Damsgaard CT, Mølgaard C, Matthiessen J, Gyldenløve SN, Lauritzen L. The effects of n-
3 long-chain polyunsaturated fatty acids on bone formation and growth factors in
adolescent boys. Pediatr Res 2012; 71(6):713-9.
[215] Bonnet N, Ferrari SL. Effects of long-term supplementation with omega-3 fatty acids on
longitudinal changes in bone mass and microstructure in mice. J Nutr Biochem 2011;
22(7):665-72.
[216] Chen JR, Lazarenko OP, Wu X, Tong Y, Blackburn ML, Shankar K et al. Obesity reduces
bone density associated with activation of PPARgamma and suppression of Wnt/beta-
catenin in rapidly growing male rats. PloS One 2010; 5(10):e13704.
[217] Lacombe RS, Kratz RJ, Holub BJ. Directly quantified dietary n-3 fatty acid intakes of
Canadian toddlers are lower than current dietary recommendations. Nutr Res 2018; 53:85-
91.
[218] Innis SM, Vaghri Z, King DJ. n−6 docosapentaenoic acid is not a predictor of low
docosahexaenoic acid status in Canadian preschool children. Am J Clin Nutr 2004;
80(3):768-73.
[219] Madden SM, Garrioch CF, Holub BJ. Direct diet quantification indicates low intakes of (n-
3) fatty acids in children 4 to 8 years old. J Nutr 2009; 139(3):528-32.
[220] Lien VW, Clandinin MT. Dietary assessment of arachidonic acid and docosahexaenoic acid
intake in 4–7 year-old children. J Am Coll Nutr 2009; 28(1):7-15.
[221] Parks CA, Brett NR, Agellon S, Lavery P, Vanstone CA, Maguire JL et al. DHA and EPA
in red blood cell membranes are associated with dietary intakes of omega-3-rich fish in
healthy children. Prostaglandins Leukot Essent Fatty Acids 2017; 124:11-6.
[222] Abdelhamid AS, Brown TJ, Brainard JS, Biswas P, Thorpe GC, Moore HJ et al. Omega‐3
fatty acids for the primary and secondary prevention of cardiovascular disease. Cochrane
Database Syst Rev 2018; (11):CD003177.
[223] Food and Agricultural Organization & World Health Organization. Fats and Oils in Human
Nurtition. FAO Food and Nutrition Paper. Rome; 1994.
[224] Nielsen SJ, Aoki Y, Kit BK, Ogden CL. More than half of US youth consume seafood and
most have blood mercury concentrations below the EPA reference level, 2009-2012. J Nutr
2015; 145(2):322-7.
[225] Koletzko B, Uauy R, Palou A, Kok F, Hornstra G, Eilander A et al. Dietary intake of
eicosapentaenoic acid (EPA) and docosahexaenoic acid (DHA) in children–a workshop
report. Br J Nutr 2010; 103(6):923-8.
[226] Health Canada. Overweight and obese youth (self-repoted), 2014.
https://www150.statcan.gc/n1/pub/82-625-x/2015001/article/14185-eng.htm. Published
November 27 2015. Accessed May 25 2019.
251
[227] Singh AS, Mulder C, Twisk JW, Van Mechelen W, Chinapaw MJ. Tracking of childhood
overweight into adulthood: a systematic review of the literature. Obes Rev 2008; 9(5):474-
88.
[228] Maffeis C. Aetiology of overweight and obesity in children and adolescents. Eur J Pediatr
2000; 159(1):S35-S44.
[229] Gillis LJ, Bar-Or O. Food away from home, sugar-sweetened drink consumption and
juvenile obesity. J Am Coll Nutr 2003; 22(6):539-45.
[230] Collison KS, Zaidi MZ, Subhani SN, Al-Rubeaan K, Shoukri M, Al-Mohanna FA. Sugar-
sweetened carbonated beverage consumption correlates with BMI, waist circumference,
and poor dietary choices in school children. BMC Public Health 2010; 10(1):234.
[231] Troiano RP, Briefel RR, Carroll MD, Bialostosky K. Energy and fat intakes of children and
adolescents in the United States: data from the National Health and Nutrition Examination
Surveys. Am J Clin Nutr 2000; 72(5):1343s-53s.
[232] Harris WS, Del Gobbo L, Tintle NL. The Omega-3 Index and relative risk for coronary
heart disease mortality: Estimation from 10 cohort studies. Atherosclerosis 2017; 262:51-4.
[233] Okuno M, Kajiwara K, Imai S, Kobayashi T, Honma N, Maki T et al. Perilla oil prevents
the excessive growth of visceral adipose tissue in rats by down-regulating adipocyte
differentiation. J Nutr 1997; 127(9):1752-7.
[234] Parrish C, Pathy D, Angel A. Dietary fish oils limit adipose tissue hypertrophy in rats.
Metabolism 1990; 39(3):217-9.
[235] Health Canada. Canadian Community Health Survey Cycle 2.2, Nutrition - Nutrient
Intakes from Food - Provincial, Regional and National Summary Data Tables. Ottawa,
Ontario; 2004.
[236] Arterburn LM, Hall EB, Oken H. Distribution, interconversion, and dose response of n− 3
fatty acids in humans. Am J Clin Nutr 2006; 83(6):S1467-76S.
[237] Schoeller DA. Limitations in the assessment of dietary energy intake by self-report.
Metabolism 1995; 44:18-22.
[238] Bandini LG, Schoeller DA, Cyr HN, Dietz WH. Validity of reported energy intake in obese
and nonobese adolescents. Am J Clin Nutr 1990; 52(3):421-5.
[239] Cohen TR, Hazell TJ, Vanstone CA, Plourde H, Rodd CJ, Weiler HA. A family-centered
lifestyle intervention to improve body composition and bone mass in overweight and obese
children 6 through 8 years: a randomized controlled trial study protocol. BMC Public
Health 2013; 13(1):383.
[240] Marshall WA, Tanner JM. Variations in the pattern of pubertal changes in boys. Arch Dis
Child 1970; 45(239):13-23.
[241] Marshall WA, Tanner JM. Variations in pattern of pubertal changes in girls. Arch Dis Child
1969; 44(235):291-303.
[242] Prior BM, Cureton KJ, Modlesky CM, Evans EM, Sloniger MA, Saunders M et al. In vivo
validation of whole body composition estimates from dual-energy X-ray absorptiometry. J
Appl Physiol 1997; 83(2):623-30.
[243] Poppitt SD, Kilmartin P, Butler P, Keogh GF. Assessment of erythrocyte phospholipid fatty
acid composition as a biomarker for dietary MUFA, PUFA or saturated fatty acid intake in
a controlled cross-over intervention trial. Lipids Health Dis 2005; 4(1):1.
[244] Hodson L, Skeaff CM, Fielding BA. Fatty acid composition of adipose tissue and blood in
humans and its use as a biomarker of dietary intake. Prog Lipid Res 2008; 47(5):348-80.
[245] Clayton EH, Gulliver CE, Piltz JW, Taylor RD, Blake RJ, Meyer RG. Improved extraction

252
of saturated fatty acids but not omega-3 fatty acids from sheep red blood cells using a one-
step extraction procedure. Lipids 2012; 47(7):719-27.
[246] Harris W, Polreis J. Measurement of the omega-3 index in dried blood spots. Ann Clin Lab
Res 2016; 4(4).
[247] Harris W, von Schacky C, Park Y. Standardizing methods for assessing omega-3 fatty acid
biostatus. In: The omega-3 fatty acid deficiency syndrome: opportunities for disease
prevention. Nova Science Publishers, Inc.; 2013. pp. 385-98.
[248] Despres JP, Lemieux I, Bergeron J, Pibarot P, Mathieu P, Larose E et al. Abdominal obesity
and the metabolic syndrome: contribution to global cardiometabolic risk. Arterioscler
Thromb Vasc Biol 2008; 28(6):1039-49.
[249] Flock MR, Harris WS, Kris-Etherton PM. Long-chain omega-3 fatty acids: time to
establish a dietary reference intake. Nutr Rev 2013; 71(10):692-707.
[250] Jackson KH, Polreis JM, Tintle NL, Kris-Etherton PM, Harris WS. Association of reported
fish intake and supplementation status with the omega-3 index. Prostaglandins Leukot
Essent Fatty Acids 2019; 142:4-10.
[251] Micallef M, Munro I, Phang M, Garg M. Plasma n-3 polyunsaturated fatty acids are
negatively associated with obesity. Br J Nutr 2009; 102(9):1370-4.
[252] Gebauer SK, Psota TL, Harris WS, Kris-Etherton PM. n−3 Fatty acid dietary
recommendations and food sources to achieve essentiality and cardiovascular benefits. Am
J Clin Nutr 2006; 83(6):1526S-35S.
[253] Brenner RR. Nutritional and hormonal factors influencing desaturation of essential fatty
acids. Prog Lipid Res 1981; 20:41-7.
[254] Burrows T, Collins C, Garg M. Omega-3 index, obesity and insulin resistance in children.
Int J Pediatr Obes 2011; 6(2-2):e532-9.
[255] Block RC, Harris WS, Pottala JV. Determinants of blood cell omega-3 fatty acid content.
Open Biomark J 2008; 1:1.
[256] Clayton EH, Hanstock TL, Hirneth SJ, Kable CJ, Garg ML, Hazell PL. Long‐chain omega‐
3 polyunsaturated fatty acids in the blood of children and adolescents with juvenile bipolar
disorder. Lipids 2008; 43(11):1031-8.
[257] Burrows T, Berthon B, Garg M, Collins C. A comparative validation of a child food
frequency questionnaire using red blood cell membrane fatty acids. Eur J Clin Nutr 2012;
66(7):825-9.
[258] Jessri M, L’Abbe MR. The time for an updated Canadian Food Guide has arrived. Appl
Physiol Nutr Metab 2015; 40(8):854-7.
[259] Sandvik P, Ek A, Eli K, Somaraki M, Bottai M, Nowicka P. Picky eating in an obesity
intervention for preschool-aged children - what role does it play, and does the measurement
instrument matter? Int J Behav Nutr Phys Act 2019; 16(1):76.
[260] Vuholm S, Teisen MN, Buch NG, Stark KD, Jakobsen J, Mølgaard C et al. Is high oily fish
intake achievable and how does it affect nutrient status in 8–9-year-old children?: the FiSK
Junior trial. Eur J Nutr 2019:1-14.
[261] Freedman DS, Wang J, Maynard LM, Thornton JC, Mei Z, Pierson Jr RN et al. Relation of
BMI to fat and fat-free mass among children and adolescents. Int J Obes (Lond) 2005;
29(1):1-8.
[262] Bray GA, DeLany JP, Harsha DW, Volaufova J, Champagne CC. Evaluation of body fat in
fatter and leaner 10-y-old African American and white children: the Baton Rouge
Children's Study. Am J Clin Nutr 2001; 73(4):687-702.

253
[263] Schaefer F, Georgi M, Wühl E, Schärer K. Body mass index and percentage fat mass in
healthy German schoolchildren and adolescents. Int J Obes Relat Metab Disord 1998;
22(5):461-9.
[264] Brufani C, Tozzi A, Fintini D, Ciampalini P, Grossi A, Fiori R et al. Sexual dimorphism of
body composition and insulin sensitivity across pubertal development in obese Caucasian
subjects. Eur J Endocrinol 2009; 160(5):769-75.
[265] Sweeting HN. Gendered dimensions of obesity in childhood and adolescence. Nutr J 2008;
7(1):1.
[266] Champagne CM, Baker NB, DeLany JP, Harsha DW, Bray GA. Assessment of energy
intake underreporting by doubly labeled water and observations on reported nutrient
intakes in children. J Am Diet Assoc 1998; 98(4):426-33.
[267] Bratteby LE, Sandhagen B, Fan H, Enghardt H, Samuelson G. Total energy expenditure
and physical activity as assessed by the doubly labeled water method in Swedish
adolescents in whom energy intake was underestimated by 7-d diet records. Am J Clin Nutr
1998; 67(5):905-11.
[268] Lichtman SW, Pisarska K, Berman ER, Pestone M, Dowling H, Offenbacher E et al.
Discrepancy between self-reported and actual caloric intake and exercise in obese subjects.
N Engl J Med 1992; 327(27):1893-8.
[269] Oliver LN, Hayes MV. Neighbourhood socio-economic status and the prevalence of
overweight Canadian children and youth. Can J Public Health 2005; 96(6):415-20.
[270] Health Canada. Canada's Dietary Guidelines for health professionals and policy makers.
Ottawa. https://food-guide.canada.ca/static/assets/pdf/CDG-EN-2018.pdf. Published
January 2019. Accessed October 31 2019
[271] Food and Agricultural Organization of the United Nations. Fats and fatty acids in human
nutrition: Report of an expert consultation. Rome; 2010.
[272] EFSA Panel on Dietetic Products N, Allergies. Scientific Opinion on Dietary Reference
Values for fats, including saturated fatty acids, polyunsaturated fatty acids,
monounsaturated fatty acids, trans fatty acids, and cholesterol. EFSA Journal 2010;
8(3):1461.
[273] McManus A, Burns SK, Howat PA, Cooper L, Fielder L. Factors influencing the
consumption of seafood among young children in Perth: a qualitative study. BMC Public
Health 2007; 7(1):119.
[274] Kranz S, Huss LR, Dobbs-Oates J. Food sources of EPA and DHA in the diets of American
children: NHANES 2003–2010. BAOJ Nutrition 2015; 1(005).
[275] Kranz S, Jones N, Monsivais P. Intake levels of fish in the UK paediatric population.
Nutrients 2017; 9(4):392.
[276] Mikkilä V, Räsänen L, Raitakari O, Pietinen P, Viikari J. Consistent dietary patterns
identified from childhood to adulthood: the cardiovascular risk in Young Finns Study. Br J
Nutr 2005; 93(6):923-31.
[277] Northstone K, Emmett PM. Are dietary patterns stable throughout early and mid-
childhood? A birth cohort study. Br J Nutr 2008; 100(5):1069-76.
[278] Sprini D, Rini GB, Di Stefano L, Cianferotti L, Napoli N. Correlation between
osteoporosis and cardiovascular disease. Clin Cases Miner Bone Metab 2014; 11(2):117-9.
[279] Goulding A, Jones IE, Taylor RW, Williams SM, Manning PJ. Bone mineral density and
body composition in boys with distal forearm fractures: A dual-energy x-ray
absorptiometry study. J Pediatr 2001; 139(4):509-15.

254
[280] Goulding A, Cannan R, Williams SM, Gold EJ, Taylor RW, Lewis‐Barned NJ. Bone
mineral density in girls with forearm fractures. J Bone Miner Res 1998; 13(1):143-8.
[281] Chavassieux P, Seeman E, Delmas PD. Insights into material and structural basis of bone
fragility from diseases associated with fractures: how determinants of the biomechanical
properties of bone are compromised by disease. Endocr Rev 2006; 28(2):151-64.
[282] Wang Q, Cheng S, Alén M, Seeman E, Group FCS. Bone’s structural diversity in adult
females is established before puberty. J Clin Endocrinol Metab 2009; 94(5):1555-61.
[283] Poulsen RC, Wolber FM, Moughan PJ, Kruger MC. Long chain polyunsaturated fatty acids
alter membrane-bound RANK-L expression and osteoprotegerin secretion by MC3T3-E1
osteoblast-like cells. Prostaglandins Other Lipid Mediat 2008; 85(1-2):42-8.
[284] Mangano KM, Sahni S, Kerstetter JE, Kenny AM, Hannan MT. Polyunsaturated fatty acids
and their relation with bone and muscle health in adults. Curr Osteoporos Rep 2013;
11(3):203-12.
[285] Eriksson S, Mellstrom D, Strandvik B. Fatty acid pattern in serum is associated with bone
mineralisation in healthy 8-year-old children. Br J Nutr 2009; 102(3):407-12.
[286] Meghji S, Sandy JR, Scutt AM, Harvey W, Harris M. Stimulation of bone resorption by
lipoxygenase metabolites of arachidonic acid. Prostaglandins 1988; 36(2):139-49.
[287] Watkins BA, Li Y, Allen KG, Hoffmann WE, Seifert MF. Dietary ratio of (n-6)/(n-3)
polyunsaturated fatty acids alters the fatty acid composition of bone compartments and
biomarkers of bone formation in rats. J Nutr 2000; 130(9):2274-84.
[288] Savva SC, Chadjigeorgiou C, Hatzis C, Kyriakakis M, Tsimbinos G, Tornaritis M et al.
Association of adipose tissue arachidonic acid content with BMI and overweight status in
children from Cyprus and Crete. Br J Nutr 2004; 91(4):643-9.
[289] Aldámiz-Echevarría L, Prieto JA, Andrade F, Elorz J, Sanjurjo P, Soriano JR. Arachidonic
acid content in adipose tissue is associated with insulin resistance in healthy children. J
Pediatr Gastroenterol Nutr 2007; 44(1):77-83.
[290] Kindler JM, Lobene AJ, Vogel KA, Martin BR, McCabe LD, Peacock M et al. Adiposity,
insulin resistance, and bone mass in children and adolescents. J Clin Endocrinol Metab
2019; 104(3):892-99.
[291] Kindler JM, Pollock NK, Ross HL, Modlesky CM, Singh H, Laing EM et al. Obese Versus
normal-weight late-adolescent females have inferior trabecular bone microarchitecture: a
pilot case-control study. Calcif Tissue Int 2017; 101(5):479-88.
[292] Statistics Canada. Canadian Community Health Survey. Ottawa, Ontario, Canada:
Government of Canada; 2004.
[293] Crocker PR, Bailey DA, Faulkner RA, Kowalski KC, McGRATH R. Measuring general
levels of physical activity: preliminary evidence for the Physical Activity Questionnaire for
Older Children. Med Sci Sports Exerc 1997; 29(10):1344-9.
[294] Crabtree NJ, Arabi A, Bachrach LK, Fewtrell M, El-Hajj Fuleihan G, Kecskemethy HH et
al. Dual-energy X-ray absorptiometry interpretation and reporting in children and
adolescents: the revised 2013 ISCD Pediatric Official Positions. J Clin Densitom 2014;
17(2):225-42.
[295] Rauch F, Schonau E. Peripheral quantitative computed tomography of the distal radius in
young subjects-new reference data and interpretation of results. J Musculoskelet Neuronal
Interact 2005; 5(2):119.
[296] Institute of Medicine. Dietary reference intakes for energy, carbyhydrate, fiber, fat, fatty
acids, cholesterol, protein, and amino acids. Washington, D.C.: The National Academies

255
Press; 2005.
[297] Harris WS, Von Schacky C. The Omega-3 Index: a new risk factor for death from coronary
heart disease? Prev Med 2004; 39(1):212-20.
[298] Brenna JT, Plourde M, Stark KD, Jones PJ, Lin Y-H. Best practices for the design,
laboratory analysis, and reporting of trials involving fatty acids. Am J Clin Nutr 2018;
108(2):211-27.
[299] Matthews D, Hosker J, Rudenski A, Naylor B, Treacher D, Turner R. Homeostasis model
assessment: insulin resistance and β-cell function from fasting plasma glucose and insulin
concentrations in man. Diabetologia 1985; 28(7):412-9.
[300] Ross AC. The 2011 report on dietary reference intakes for calcium and vitamin D. Public
Health Nutr 2011; 14(5):938-9.
[301] Kalkwarf HJ, Laor T, Bean JA. Fracture risk in children with a forearm injury is associated
with volumetric bone density and cortical area (by peripheral QCT) and areal bone density
(by DXA). Osteoporos Int 2011; 22(2):607-16.
[302] Harris TB, Song X, Reinders I, Lang TF, Garcia ME, Siggeirsdottir K et al. Plasma
phospholipid fatty acids and fish-oil consumption in relation to osteoporotic fracture risk in
older adults: the Age, Gene/Environment Susceptibility Study. Am J CLin Nutr 2015;
101(5):947-55.
[303] Nakamura MT, Nara TY. Structure, function, and dietary regulation of Δ6, Δ5, and Δ9
desaturases. Annu Rev Nutr 2004; 24:345-76.
[304] Schoenau E, Neu C, Rauch F, Manz F. The development of bone strength at the proximal
radius during childhood and adolescence. J Clin Endocrinol Metab 2001; 86(2):613-8.
[305] Kindler JM, Pollock NK, Laing EM, Oshri A, Jenkins NT, Isales CM et al. Insulin
resistance and the IGF‐I‐cortical bone relationship in children ages 9‐13 years. J Bone
Miner Res 2017; 32(7):1537-45.
[306] Nordøy A, Dyerberg J. n‐3 fatty acids in health and disease. J Intern Med Suppl 1989;
225(S731):1-3.
[307] Fekete K, Györei E, Lohner S, Verduci E, Agostoni C, Decsi T. Long‐chain
polyunsaturated fatty acid status in obesity: a systematic review and meta‐analysis. Obes
Rev 2015; 16(6):488-97.
[308] Sopher AB, Jean AM, Zwany SK, Winston DM, Pomeranz CB, Bell JJ et al. Bone age
advancement in prepubertal children with obesity and premature adrenarche: possible
potentiating factors. Obesity 2011; 19(6):1259-64.
[309] Moran A, Jacobs DR, Steinberger J, Steffen LM, Pankow JS, Hong CP et al. Changes in
insulin resistance and cardiovascular risk during adolescence. Circulation 2008;
117(18):2361-8.
[310] Jeffery AN, Metcalf BS, Hosking J, Streeter AJ, Voss LD, Wilkin TJ. Age before stage:
insulin resistance rises before the onset of puberty: a 9-year longitudinal study (EarlyBird
26). Diabetes Care 2012; 35(3):536-41.
[311] Alsharari ZD, Riserus U, Leander K, Sjogren P, Carlsson AC, Vikstrom M et al. Serum
fatty acids, desaturase activities and abdominal obesity - A population-based study of 60-
year old men and women. PLoS One 2017; 12(1):e0170684.
[312] Watkins BA, Shen C-L, McMurtry JP, Xu H, Bain SD, Allen KG et al. Dietary lipids
modulate bone prostaglandin E2 production, insulin-like growth factor-I concentration and
formation rate in chicks. J Nutr 1997; 127(6):1084-91.
[313] Statistics Canada. Directly measured physical activity of chidlen and youth, 2012 and

256
2013. Ottawa, Ontario, Canada: Government of Canada; 2017.
[314] Lockwood J, Jeffery A, Schwartz A, Manlhiot C, Schneiderman JE, McCrindle BW et al.
Comparison of a physical activity recall questionnaire with accelerometry in children and
adolescents with obesity: a pilot study. Pediatr Obes 2017; 12(5):e41-e5.
[315] Wang YC, Gortmaker SL, Sobol AM, Kuntz KM. Estimating the energy gap among US
children: a counterfactual approach. Pediatrics 2006; 118(6):e1721-e33.
[316] Lecka-Czernik B, Stechschulte L, Czernik P, Dowling A. High bone mass in adult mice
with diet-induced obesity results from a combination of initial increase in bone mass
followed by attenuation in bone formation; implications for high bone mass and decreased
bone quality in obesity. Mol Cell Endocrinol 2015; 410:35-41.
[317] Zhao LJ, Liu YJ, Liu PY, Hamilton J, Recker RR, Deng HW. Relationship of obesity with
osteoporosis. J Clin Endocrinol Metab 2007; 92(5):1640-6.
[318] Gonnelli S, Caffarelli C, Nuti R. Obesity and fracture risk. Clin Cases Miner Bone Metab
2014; 11(1):9.
[319] Wan Y, Chong LW, Evans RM. PPAR-γ regulates osteoclastogenesis in mice. Nat Med
2007; 13(12):1496-503.
[320] Keller H, Dreyer C, Medin J, Mahfoudi A, Ozato K, Wahli W. Fatty acids and retinoids
control lipid metabolism through activation of peroxisome proliferator-activated receptor-
retinoid X receptor heterodimers. Proc Natl Acad Sci U S A 1993; 90(6):2160-4.
[321] Cui LH, Shin MH, Chung EK, Lee YH, Kweon SS, Park KS et al. Association between
bone mineral densities and serum lipid profiles of pre-and post-menopausal rural women in
South Korea. Osteoporos Int 2005; 16(12):1975-81.
[322] Weiler HA. Dietary supplementation of arachidonic acid is associated with higher whole
body weight and bone mineral density in growing pigs. Pediatr Res 2000; 47(5):692-7.
[323] Casado-Diaz A, Santiago-Mora R, Dorado G, Quesada-Gómez JM. The omega-6
arachidonic fatty acid, but not the omega-3 fatty acids, inhibits osteoblastogenesis and
induces adipogenesis of human mesenchymal stem cells: potential implication in
osteoporosis. Osteoporos Int 2013; 24(5):1647-61.
[324] Maurin AC, Chavassieux PM, Meunier PJ. Expression of PPARγ and β/δ in human
primary osteoblastic cells: influence of polyunsaturated fatty acids. Calcif Tissue Int 2005;
76(5):385-92.
[325] Lecka‐Czernik B, Gubrij I, Moerman EJ, Kajkenova O, Lipschitz DA, Manolagas SC et al.
Inhibition of Osf2/Cbfa1 expression and terminal osteoblast differentiation by PPARγ2. J
Cell Biochem 1999; 74(3):357-71.
[326] Muruganandan S, Roman AA, Sinal CJ. Adipocyte differentiation of bone marrow-derived
mesenchymal stem cells: cross talk with the osteoblastogenic program. Cell Mol Life Sci
2009; 66(2):236-53.
[327] Murali G, Desouza CV, Clevenger ME, Ramalingam R, Saraswathi V. Differential effects
of eicosapentaenoic acid and docosahexaenoic acid in promoting the differentiation of
3T3-L1 preadipocytes. Prostaglandins Leukot Essent Fatty Acids 2014; 90(1):13-21.
[328] Pinel A, Pitois E, Rigaudiere JP, Jouve C, De Saint-Vincent S, Laillet B et al. EPA prevents
fat mass expansion and metabolic disturbances in mice fed with a Western diet. J Lipid Res
2016; 57(8):1382-97.
[329] Prostek A, Gajewska M, Bałasińska B. The influence of eicosapentaenoic acid and
docosahexaenoic acid on expression of genes connected with metabolism and secretory
functions of ageing 3T3-L1 adipocytes. Prostaglandins Other Lipid Mediat 2016; 125:48-

257
56.
[330] von Heideken J, Svensson T, Iversen M, Ekbom A, Janarv PM. Femur shaft fracture at a
young age and the risk of subsequent severe injuries during childhood: a cohort study.
BMC Pediatr 2014; 14(1):62.
[331] Hwang LL, Wang CH, Li TL, Chang SD, Lin LC, Chen CP et al. Sex differences in high‐
fat diet‐induced obesity, metabolic alterations and learning, and synaptic plasticity deficits
in mice. Obesity 2010; 18(3):463-9.
[332] Bagnol D, Al‐Shamma HA, Behan D, Whelan K, Grottick AJ. Diet‐induced models of
obesity (DIO) in rodents. Curr Protoc Neurosci 2012; 59(1):9.38. 1-13.
[333] Iwaniec UT, Turner RT. Animal models for osteoporosis. In: Osteoporosis. Elsevier; 2013.
pp. 939-61.
[334] Hildebrandt IJ, Su H, Weber WA. Anesthesia and other considerations for in vivo imaging
of small animals. ILAR J 2008; 49(1):17-26.
[335] Food Standards Australia New Zealand. DHASCO and ARASCO oils as sources of long-
chain polyunsaturated fatty acids in infant formula : a safety assessment / Food Standards
Australia New Zealand. Canberra: Food Standards Australia New Zealand; 2003.
[336] Koskelo EK, Boswell K, Carl L, Lanoue S, Kelly C, Kyle D. High levels of dietary
arachidonic acid triglyceride exhibit no subchronic toxicity in rats. Lipids 1997; 32(4):397-
405.
[337] Hunt JR, Hunt CD, Zito CA, Idso JP, Johnson LK. Calcium requirements of growing rats
based on bone mass, structure, or biomechanical strength are similar. J Nutr 2008;
138(8):1462-8.
[338] Ervin RB, Ogden CL. Trends in intake of energy and macronutrients in children and
adolescents from 1999-2000 through 2009-2010. NCHS Data Brief 2013; (113):1-8.
[339] U.S. Department of Health and Human Services and U.S. Department of Agriculture.
2015-2020 Dietary Guidelines for Americans. 8th Edition. Published December 2015.
[340] Bianchini C, Lavery P, Agellon S, Weiler HA. The generation of C-3α epimer of 25-
hydroxyvitamin D and its biological effects on bone mineral density in adult rodents.
Calcif Tissue Int 2015; 96(5):453-64.
[341] Kobayashi J, Tadokoro N, Watanabe M, Shinomiya M. A novel method of measuring intra-
abdominal fat volume using helical computed tomography. Int J Obes Relat Metab Disord
2002; 26(3):398.
[342] DeGuire JR, Mak IL, Lavery P, Agellon S, Wykes LJ, Weiler HA. Orchidectomy-induced
alterations in volumetric bone density, cortical porosity and strength of femur are
attenuated by dietary conjugated linoleic acid in aged guinea pigs. Bone 2015; 73:42-50.
[343] Bouxsein ML, Boyd SK, Christiansen BA, Guldberg RE, Jepsen KJ, Müller R. Guidelines
for assessment of bone microstructure in rodents using micro–computed tomography. J
Bone Miner Res 2010; 25(7):1468-86.
[344] O’Fallon JV, Busboom JR, Nelson ML, Gaskins CT. A direct method for fatty acid methyl
ester synthesis: application to wet meat tissues, oils, and feedstuffs. J Anim Sci 2007;
85(6):1511-21.
[345] Bell JG, Mackinlay EE, Dick JR, Younger I, Lands B, Gilhooly T. Using a fingertip whole
blood sample for rapid fatty acid measurement: method validation and correlation with
erythrocyte polar lipid compositions in UK subjects. Br J Nutr 2011; 106(9):1408-15.
[346] Peyron-Caso E, Fluteau-Nadler S, Kabir M, Guerre-Millo M, Quignard-Boulange A,
Slama G et al. Regulation of glucose transport and transporter 4 (GLUT-4) in muscle and

258
adipocytes of sucrose-fed rats: effects of N-3 poly-and monounsaturated fatty acids. Horm
Metab Res 2002; 34(7):360-6.
[347] Mook S, Halkes Cj C, Bilecen S, Cabezas MC. In vivo regulation of plasma free fatty
acids in insulin resistance. Metabolism 2004; 53(9):1197-201.
[348] Kim JI, Huh JY, Sohn JH, Choe SS, Lee YS, Lim CY et al. Lipid-overloaded enlarged
adipocytes provoke insulin resistance independent of inflammation. Mol Cell Biochem
2015; 35(10):1686-99.
[349] Livak KJ, Schmittgen TD. Analysis of relative gene expression data using real-time
quantitative PCR and the 2− ΔΔCT method. Methods 2001; 25(4):402-8.
[350] Djekic-Ivankovic M, Lavery P, Agellon S, Weiler HA. The C-3α Epimer of 25-
Hydroxycholecalciferol from Endogenous and Exogenous Sources Supports Normal
Growth and Bone Mineral Density in Weanling Rats. J Nutr 2016; 147(2):141-51.
[351] Yarrow JF, Toklu HZ, Balaez A, Phillips EG, Otzel DM, Chen C et al. Fructose
consumption does not worsen bone deficits resulting from high-fat feeding in young male
rats. Bone 2016; 85:99-106.
[352] Cole Z, Harvey N, Kim M, Ntani G, Robinson S, Inskip H et al. Increased fat mass is
associated with increased bone size but reduced volumetric density in pre pubertal
children. Bone 2012; 50(2):562-7.
[353] Sornay‐Rendu E, Boutroy S, Vilayphiou N, Claustrat B, Chapurlat RD. In obese
postmenopausal women, bone microarchitecture and strength are not commensurate to
greater body weight: the Os des Femmes de Lyon (OFELY) study. J Bone Miner Res 2013;
28(7):1679-87.
[354] Malvi P, Piprode V, Chaube B, Pote ST, Mittal M, Chattopadhyay N et al. High fat diet
promotes achievement of peak bone mass in young rats. Biochem Biophys Res Commun
2014; 455(1-2):133-8.
[355] Boeyens JC, Deepak V, Chua WH, Kruger MC, Joubert AM, Coetzee M. Effects of ω3-and
ω6-polyunsaturated fatty acids on RANKL-induced osteoclast differentiation of RAW264.
7 cells: a comparative in vitro study. Nutrients 2014; 6(7):2584-601.
[356] Kasonga AE, Deepak V, Kruger MC, Coetzee M. Arachidonic acid and docosahexaenoic
acid suppress osteoclast formation and activity in human CD14+ monocytes, in vitro. PloS
One 2015; 10(4):e0125145.
[357] Koren N, Simsa-Maziel S, Shahar R, Schwartz B, Monsonego-Ornan E. Exposure to
omega-3 fatty acids at early age accelerate bone growth and improve bone quality. J Nutr
Biochem 2014; 25(6):623-33.
[358] Högström M, Nordström P, Nordström A. n− 3 Fatty acids are positively associated with
peak bone mineral density and bone accrual in healthy men: the NO2 Study. Am J Clin
Nutr 2007; 85(3):803-7.
[359] Fallon EM, Nazarian A, Nehra D, Pan AH, O’Loughlin AA, Nose V et al. The effect of
docosahexaenoic acid on bone microstructure in young mice and bone fracture in neonates.
J Surg Res 2014; 191(1):148-55.
[360] Perez-Matute P, Marti A, Martinez J, Moreno-Aliaga M. Effects of arachidonic acid on
leptin secretion and expression in primary cultured rat adipocytes. J Physiol Biochem
2003; 59(3):201-8.
[361] Vaidya H, Cheema SK. Arachidonic acid has a dominant effect to regulate lipogenic genes
in 3T3-L1 adipocytes compared to omega-3 fatty acids. Food Nutr Res 2015; 59(1):25866.
[362] Decsi T, Kennedy K. Sex-specific differences in essential fatty acid metabolism. Am J Clin

259
Nutr 2011; 94(6 Suppl):1914S-9S.
[363] Callewaert F, Sinnesael M, Gielen E, Boonen S, Vanderschueren D. Skeletal sexual
dimorphism: relative contribution of sex steroids, GH–IGF1, and mechanical loading. J
Endocrinol 2010; 207(2):127-34.
[364] Allen M. Biochemical markers of bone metabolism in animals: uses and limitations. Vet
Clin Pathol 2003; 32(3):101-13.
[365] Demory-Luce D, Morales M, Nicklas T, Baranowski T, Zakeri I, Berenson G. Changes in
food group consumption patterns from childhood to young adulthood: the Bogalusa Heart
Study. J Am Diet Assoc 2004; 104(11):1684-91.
[366] Novak EM, Innis SM. Dietary long chain n-3 fatty acids are more closely associated with
protein than energy intakes from fat. Prostaglandins Leukot Essent Fatty Acids 2012;
86(3):107-12.
[367] Epstein LH, Gordy CC, Raynor HA, Beddome M, Kilanowski CK, Paluch R. Increasing
fruit and vegetable intake and decreasing fat and sugar intake in families at risk for
childhood obesity. Obes Res 2001; 9(3):171-8.
[368] Talvia S, Lagström H, Räsänen M, Salminen M, Räsänen L, Salo P et al. A randomized
intervention since infancy to reduce intake of saturated fat: calorie (energy) and nutrient
intakes up to the age of 10 years in the Special Turku Coronary Risk Factor Intervention
Project. Arch Pediatr Adolesc Med 2004; 158(1):41-7.
[369] De Bourdeaudhuij I, Brug J, Vandelanotte C, Van Oost P. Differences in impact between a
family-versus an individual-based tailored intervention to reduce fat intake. Health Educ
Res 2002; 17(4):435-49.
[370] Jacobs S, Sioen I, Pieniak Z, De Henauw S, Maulvault AL, Reuver M et al. Consumers'
health risk-benefit perception of seafood and attitude toward the marine environment:
Insights from five European countries. Environ Res 2015; 143(Pt B):11-9.
[371] Campbell KJ, Crawford DA, Salmon J, Carver A, Garnett SP, Baur LA. Associations
between the home food environment and obesity‐promoting eating behaviors in
adolescence. Obesity 2007; 15(3):719-30.
[372] Forbes GB. Do obese individuals gain weight more easily than nonobese individuals? Am
J Clin Nutr 1990; 52(2):224-7.
[373] Goran MI, Gower BA, Nagy TR, Johnson RK. Developmental changes in energy
expenditure and physical activity in children: evidence for a decline in physical activity in
girls before puberty. Pediatrics 1998; 101(5):887-91.
[374] Carlson SE, Cooke RJ, Werkman SH, Tolley EA. First year growth of preterm infants fed
standard compared to marine oil n− 3 supplemented formula. Lipids 1992; 27(11):901-7.
[375] Carlson SE, Werkman SH, Peeples JM, Cooke RJ, Tolley EA. Arachidonic acid status
correlates with first year growth in preterm infants. Proc Natl Acad Sci U S A 1993;
90(3):1073-7.
[376] Hoffman DR, Harris CL, Wampler JL, Patterson AC, Berseth CL. Growth, tolerance, and
DHA and ARA status of healthy term infants receiving formula with two different ARA
concentrations: Double-blind, randomized, controlled trial. Prostaglandins Leukot Essent
Fatty Acids 2019; 146:19-27.
[377] Wielinga PY, Harthoorn LF, Verschuren L, Schoemaker MH, Jouni ZE, van Tol EA et al.
Arachidonic acid/docosahexaenoic acid‐supplemented diet in early life reduces body
weight gain, plasma lipids, and adiposity in later life in ApoE* 3Leiden mice. Mol Nutr
Food Res 2012; 56(7):1081-9.

260
[378] Koletzko B, Boey CC, Campoy C, Carlson SE, Chang N, Guillermo-Tuazon MA et al.
Current information and Asian perspectives on long-chain polyunsaturated fatty acids in
pregnancy, lactation, and infancy: systematic review and practice recommendations from
an early nutrition academy workshop. Ann Nutr Metab 2014; 65(1):49-80.
[379] EFSA Panel on Dietetic Products, Nutrition and Allergies. Scientific Opinion on the
essential composition of infant and follow‐on formulae. EFSA Journal 2014; 12(7):3760.
[380] Brenna JT. Arachidonic acid needed in infant formula when docosahexaenoic acid is
present. Nutr Rev 2016; 74(5):329-36.
[381] Crawford MA, Wang Y, Forsyth S, Brenna JT. The European Food Safety Authority
recommendation for polyunsaturated fatty acid composition of infant formula overrules
breast milk, puts infants at risk, and should be revised. Prostaglandins Leukot Essent Fatty
Acids 2015; 102:1-3.
[382] Michaelsen KF, Dewey KG, Perez‐Exposito AB, Nurhasan M, Lauritzen L, Roos N. Food
sources and intake of n‐6 and n‐3 fatty acids in low‐income countries with emphasis on
infants, young children (6–24 months), and pregnant and lactating women. Matern Child
Nutr 2011; 7:124-40.
[383] Kawashima H. Intake of arachidonic acid-containing lipids in adult humans: dietary
surveys and clinical trials. Lipids Health Dis 2019; 18(1):101.
[384] Weiler HA, Zhao J, Park L, Kohut JR, Burr LL, Fitzpatrick-Wong SC. Maternal
supplementation with dietary arachidonic and docosahexaenoic acids during lactation
elevates bone mass in weanling rat and guinea pig offspring even if born small sized.
Prostaglandins Leukot Essent Fatty Acids 2012; 86(1):61-70.
[385] Blanaru JL, Kohut JR, Fitzpatrick-Wong SC, Weiler HA. Dose response of bone mass to
dietary arachidonic acid in piglets fed cow milk-based formula. Am J Clin Nutr 2004;
79(1):139-47.
[386] Kusumoto A, Ishikura Y, Kawashima H, Kiso Y, Takai S, Miyazaki M. Effects of
arachidonate-enriched triacylglycerol supplementation on serum fatty acids and platelet
aggregation in healthy male subjects with a fish diet. Br J Nutr 2007; 98(3):626-35.
[387] Ferretti A, Nelson GJ, Schmidt PC, Kelley DS, Bartolini G, Flanagan VP. Increased dietary
arachidonic acid enhances the synthesis of vasoactive eicosanoids in humans. Lipids 1997;
32(4):435-9.
[388] Kelley DS, Taylor PC, Nelson GJ, Mackey BE. Arachidonic acid supplementation
enhances synthesis of eicosanoids without suppressing immune functions in young healthy
men. Lipids 1998; 33(2):125-30.
[389] Thies F, Nebe-von-Caron G, Powell JR, Yaqoob P, Newsholme EA, Calder PC. Dietary
supplementation with eicosapentaenoic acid, but not with other long-chain n-3 or n-6
polyunsaturated fatty acids, decreases natural killer cell activity in healthy subjects aged
>55 y. Am J Clin Nutr 2001; 73(3):539-48.
[390] Seyberth HW, Oelz O, Kennedy T, Sweetman BJ, Danon A, Frölich JC et al. Increased
arachidonate in lipids after administration to man: effects on prostaglandin biosynthesis.
Clin Pharmacol Ther 1975; 18(5 Pt 1):521-9.
[391] Nelson G, Schmidt P, Bartolini G, Kelley D, Phinney S, Kyle D et al. The effect of dietary
arachidonic acid on plasma lipoprotein distributions, apoproteins, blood lipid levels, and
tissue fatty acid composition in humans. Lipids 1997; 32(4):427-33.
[392] Harris WS, Mozaffarian D, Rimm E, Kris-Etherton P, Rudel LL, Appel LJ et al. Omega-6
fatty acids and risk for cardiovascular disease: a science advisory from the American Heart

261
Association Nutrition Subcommittee of the Council on Nutrition, Physical Activity, and
Metabolism; Council on Cardiovascular Nursing; and Council on Epidemiology and
Prevention. Circulation 2009; 119(6):902-7.
[393] Baur LA, O'Connor J, Pan DA, Kriketos AD, Storlien LH. The fatty acid composition of
skeletal muscle membrane phospholipid: its relationship with the type of feeding and
plasma glucose levels in young children. Metabolism 1998; 47(1):106-12.
[394] Briolay A, Jaafar R, Nemoz G, Bessueille L. Myogenic differentiation and lipid-raft
composition of L6 skeletal muscle cells are modulated by PUFAs. Biochim Biophys Acta
2013; 1828(2):602-13.
[395] Markworth JF, Cameron-Smith D. Arachidonic acid supplementation enhances in vitro
skeletal muscle cell growth via a COX-2-dependent pathway. Am J Physiol Cell Physiol
2013; 304(1):C56-C67.
[396] Rodemann HP, Waxman L, Goldberg AL. The stimulation of protein degradation in muscle
by Ca2+ is mediated by prostaglandin E2 and does not require the calcium-activated
protease. J Biol Chem 1982; 257(15):8716-23.
[397] Inoue T, Hashimoto M, Katakura M, Tanabe Y, Al Mamun A, Matsuzaki K et al. Effects of
chronic administration of arachidonic acid on lipid profiles and morphology in the skeletal
muscles of aged rats. Prostaglandins Leukot Essent Fatty Acids 2014; 91(4):119-27.
[398] Markworth JF, Mitchell CJ, D'Souza RF, Aasen KM, Durainayagam BR, Mitchell SM et
al. Arachidonic acid supplementation modulates blood and skeletal muscle lipid profile
with no effect on basal inflammation in resistance exercise trained men. Prostaglandins
Leukot Essent Fatty Acids 2018; 128:74-86.
[399] Galgani JE, Aguirre CA, Uauy RD, Díaz EO. Plasma arachidonic acid influences insulin-
stimulated glucose uptake in healthy adult women. Ann Nutr Metab 2007; 51(5):482-9.
[400] Tebbey PW, McGowan KM, Stephens JM, Buttke TM, Pekala PH. Arachidonic acid down-
regulates the insulin-dependent glucose transporter gene (GLUT4) in 3T3-L1 adipocytes
by inhibiting transcription and enhancing mRNA turnover. J Biol Chem 1994; 269(1):639-
44.
[401] Yakar S, Canalis E, Sun H, Mejia W, Kawashima Y, Nasser P et al. Serum IGF‐1
determines skeletal strength by regulating subperiosteal expansion and trait interactions. J
Bone Miner Res 2009; 24(8):1481-92.
[402] Boni-Schnetzler M, Schmid C, Meier P, Froesch E. Insulin regulates insulin-like growth
factor I mRNA in rat hepatocytes. Am J Physiol 1991; 260(6):E846-E51.
[403] Hetherington-Rauth M, Bea JW, Blew RM, Funk JL, Lee VR, Roe DJ et al. Relationship of
cardiometabolic risk biomarkers with DXA and pQCT bone health outcomes in young
girls. Bone 2019; 120:452-8.
[404] Sopher AB, Thornton JC, Wang J, Pierson Jr RN, Heymsfield SB, Horlick M.
Measurement of percentage of body fat in 411 children and adolescents: a comparison of
dual-energy X-ray absorptiometry with a four-compartment model. Pediatrics 2004;
113(5):1285.
[405] Seeman E. Sexual dimorphism in skeletal size, density, and strength. J Clin Endocrinol
Metab 2001; 86(10):4576-84.
[406] Jaworski M, Graff K. Peripheral quantitative computed tomography of the distal and
proximal forearm in children and adolescents: bone densities, cross-sectional sizes and soft
tissues reference data. J Musculoskelet Neuronal Interact 2018; 18(2):237-47.
[407] Esche J, Shi L, Hartmann MF, Schonau E, Wudy SA, Remer T. Glucocorticoids and body

262
fat inversely associate with bone marrow density of the distal radius in healthy youths. J
Clin Endocrinol Metab 2019; 104(6):2250-6.
[408] Tencerova M, Figeac F, Ditzel N, Taipaleenmäki H, Nielsen TK, Kassem M. High‐fat diet–
induced obesity promotes expansion of bone marrow adipose tissue and impairs skeletal
stem cell functions in mice. J Bone Miner Res 2018; 33(6):1154-65.
[409] Devlin MJ, Cloutier AM, Thomas NA, Panus DA, Lotinun S, Pinz I et al. Caloric
restriction leads to high marrow adiposity and low bone mass in growing mice. J Bone
Miner Res 2010; 25(9):2078-88.
[410] Bornstein S, Moschetta M, Kawano Y, Sacco A, Huynh D, Brooks D et al. Metformin
affects cortical bone mass and marrow adiposity in diet-induced obesity in male mice.
Endocrinology 2017; 158(10):3369-85.
[411] Doucette CR, Horowitz MC, Berry R, MacDougald OA, Anunciado‐Koza R, Koza RA et
al. A high fat diet increases bone marrow adipose tissue (MAT) but does not alter
trabecular or cortical bone mass in C57BL/6J mice. J Cell Physiol 2015; 230(9):2032-7.
[412] Paccou J, Penel G, Chauveau C, Cortet B, Hardouin P. Marrow adiposity and bone:
Review of clinical implications. Bone 2019; 118:8-15.
[413] Farr JN, Amin S, Melton III LJ, Kirmani S, McCready LK, Atkinson EJ et al. Bone
strength and structural deficits in children and adolescents with a distal forearm fracture
resulting from mild trauma. J Bone Miner Res 2014; 29(3):590-9.
[414] Jee WS, Yao W. Overview: animal models of osteopenia and osteoporosis. J Musculoskelet
Neuronal Interact 2001; 1(3):193-207.
[415] Lorentzon M, Landin K, Mellstrom D, Ohlsson C. Leptin is a negative independent
predictor of areal BMD and cortical bone size in young adult Swedish men. J Bone Miner
Res 2006; 21(12):1871-8.
[416] Kawai M, de Paula FJ, Rosen CJ. New insights into osteoporosis: the bone–fat connection.
J Intern Med 2012; 272(4):317-29.
[417] Reid IR. Fat and bone. Arch Biochem Biophys 2010; 503(1):20-7.
[418] Wu M, Wang X, Duan Q, Lu T. Arachidonic acid can significantly prevent early insulin
resistance induced by a high-fat diet. Ann Nutr Metab 2007; 51(3):270-6.
[419] Bonen A, Jain SS, Snook LA, Han XX, Yoshida Y, Buddo KH et al. Extremely rapid
increase in fatty acid transport and intramyocellular lipid accumulation but markedly
delayed insulin resistance after high fat feeding in rats. Diabetologia 2015; 58(10):2381-91.
[420] Gaillard D, Negrel R, Lagarde M, Ailhaud G. Requirement and role of arachidonic acid in
the differentiation of pre-adipose cells. Biochem J 1989; 257(2):389-97.
[421] Négrel R, Gaillard D, Ailhaud G. Prostacyclin as a potent effector of adipose-cell
differentiation. Biochem J 1989; 257(2):399-405.
[422] Massiera F, Barbry P, Guesnet P, Joly A, Luquet S, Moreilhon-Brest C et al. A Western-like
fat diet is sufficient to induce a gradual enhancement in fat mass over generations. J Lipid
Res 2010; 51(8):2352-61.
[423] Grimaldi PA, Knobel SM, Whitesell RR, Abumrad NA. Induction of aP2 gene expression
by nonmetabolized long-chain fatty acids. Proc Natl Acad Sci U S A 1992; 89(22):10930-4.
[424] Pompeia C, Lima T, Curi R. Arachidonic acid cytotoxicity: can arachidonic acid be a
physiological mediator of cell death? Cell Biochem Funct 2003; 21(2):97-104.
[425] Pérez R, Matabosch X, Llebaria A, Balboa MA, Balsinde J. Blockade of arachidonic acid
incorporation into phospholipids induces apoptosis in U937 promonocytic cells. J Lipid
Res 2006; 47(3):484-91.

263
[426] Korotkova M, Lundberg IE. The skeletal muscle arachidonic acid cascade in health and
inflammatory disease. Nat Rev Rheumatol 2014; 10(5):295.
[427] Su X, Mancuso DJ, Bickel PE, Jenkins CM, Gross RW. Small interfering RNA knockdown
of calcium-independent phospholipases A2 β or γ inhibits the hormone-induced
differentiation of 3T3-L1 preadipocytes. J Biol Chem 2004; 279(21):21740-8.
[428] Huggins KW, Boileau AC, Hui DY. Protection against diet-induced obesity and obesity-
related insulin resistance in Group 1B PLA2-deficient mice. Am J Physiol Endocrinol
Metab 2002; 283(5):E994-E1001.
[429] Wan Y. PPARγ in bone homeostasis. Trends Endocrinol Metab 2010; 21(12):722-8.
[430] Kim SW, Her SJ, Kim SY, Shin CS. Ectopic overexpression of adipogenic transcription
factors induces transdifferentiation of MC3T3-E1 osteoblasts. Biochem Biophys Res
Commun 2005; 327(3):811-9.
[431] Diascro DD, Jr., Vogel RL, Johnson TE, Witherup KM, Pitzenberger SM, Rutledge SJ et
al. High fatty acid content in rabbit serum is responsible for the differentiation of
osteoblasts into adipocyte-like cells. J Bone Miner Res 1998; 13(1):96-106.
[432] Tekeleselassie AW, Goh YM, Rajion MA, Motshakeri M, Ebrahimi M. A high-fat diet
enriched with low omega-6 to omega-3 fatty acid ratio reduced fat cellularity and plasma
leptin concentration in Sprague-Dawley rats. ScientificWorldJournal 2013; 2013:757593.
[433] Murphy DJ. The dynamic roles of intracellular lipid droplets: from archaea to mammals.
Protoplasma 2012; 249(3):541-85.
[434] Mak HY. Lipid droplets as fat storage organelles in Caenorhabditis elegans thematic
review series: lipid droplet synthesis and metabolism: from yeast to man. J Lipid Res 2012;
53(1):28-33.
[435] Rosen ED, Hsu CH, Wang X, Sakai S, Freeman MW, Gonzalez FJ et al. C/EBPalpha
induces adipogenesis through PPARγ: a unified pathway. Genes Dev 2002; 16(1):22-6.
[436] Tang QQ, Lane MD. Adipogenesis: from stem cell to adipocyte. Annu Rev Biochem 2012;
81:715-36.
[437] Amri EZ, Ailhaud G, Grimaldi PA. Fatty acids as signal transducing molecules:
involvement in the differentiation of preadipose to adipose cells. J Lipid Res 1994;
35(5):930-7.
[438] Hihi A, Michalik L, Wahli W. PPARs: transcriptional effectors of fatty acids and their
derivatives. Cell Mol Life Sci 2002; 59(5):790-8.
[439] Vassaux G, Gaillard D, Ailhaud G, Negrel R. Prostacyclin is a specific effector of adipose
cell differentiation. Its dual role as a cAMP- and Ca(2+)-elevating agent. J Biol Chem
1992; 267(16):11092-7.
[440] Vassaux G, Gaillard D, Darimont C, Ailhaud G, Negrel R. Differential response of
preadipocytes and adipocytes to prostacyclin and prostaglandin E2: physiological
implications. Endocrinology 1992; 131(5):2393-8.
[441] Madsen L, Petersen RK, Sørensen MB, Jørgensen C, Hallenborg P, Pridal L et al.
Adipocyte differentiation of 3T3-L1 preadipocytes is dependent on lipoxygenase activity
during the initial stages of the differentiation process. Biochem J 2003; 375(3):539-49.
[442] Xu HE, Lambert MH, Montana VG, Parks DJ, Blanchard SG, Brown PJ et al. Molecular
recognition of fatty acids by peroxisome proliferator–activated receptors. Mol Cell 1999;
3(3):397-403.
[443] Yu K, Bayona W, Kallen CB, Harding HP, Ravera CP, McMahon G et al. Differential
activation of peroxisome proliferator-activated receptors by eicosanoids. J Biol Chem

264
1995; 270(41):23975-83.
[444] Petersen RK, Jørgensen C, Rustan AC, Frøyland L, Muller-Decker K, Furstenberger G et
al. Arachidonic acid-dependent inhibition of adipocyte differentiation requires PKA
activity and is associated with sustained expression of cyclooxygenases. J Lipid Res 2003;
44(12):2320-30.
[445] Kim JB, Spiegelman BM. ADD1/SREBP1 promotes adipocyte differentiation and gene
expression linked to fatty acid metabolism. Genes Dev 1996; 10(9):1096-107.
[446] Sun L, Peng Y, Sharrow AC, Iqbal J, Zhang Z, Papachristou DJ et al. FSH directly
regulates bone mass. Cell 2006; 125(2):247-60.
[447] Krum SA. Direct transcriptional targets of sex steroid hormones in bone. J Cell Biochem
2011; 112(2):401-8.
[448] Krum SA, Miranda-Carboni GA, Hauschka PV, Carroll JS, Lane TF, Freedman LP et al.
Estrogen protects bone by inducing Fas ligand in osteoblasts to regulate osteoclast survival.
EMBO J 2008; 27(3):535-45.
[449] Nakamura T, Imai Y, Matsumoto T, Sato S, Takeuchi K, Igarashi K et al. Estrogen prevents
bone loss via estrogen receptor alpha and induction of Fas ligand in osteoclasts. Cell 2007;
130(5):811-23.
[450] Cabrero A, Cubero M, Llaverias G, Alegret M, Sanchez R, Laguna JC et al. Leptin down-
regulates peroxisome proliferator-activated receptorγ (PPARγ) mRNA levels in primary
human monocyte-derived macrophages. Mol Cell Biochem 2005; 275(1-2):173-9.
[451] Akune T, Ohba S, Kamekura S, Yamaguchi M, Chung U-i, Kubota N et al. PPARγ
insufficiency enhances osteogenesis through osteoblast formation from bone marrow
progenitors. J Clin Invest 2004; 113(6):846-55.
[452] Chang L, Villacorta L, Zhang J, Garcia-Barrio MT, Yang K, Hamblin M et al. Vascular
smooth muscle cell-selective peroxisome proliferator-activated receptor-gamma deletion
leads to hypotension. Circulation 2009; 119(16):2161-9.
[453] Cao H, Yu S, Yao Z, Galson DL, Jiang Y, Zhang X et al. Activating transcription factor 4
regulates osteoclast differentiation in mice. J Clin Invest 2010; 120(8):2755-66.
[454] Farvid MS, Ding M, Pan A, Sun Q, Chiuve SE, Steffen LM et al. Dietary linoleic acid and
risk of coronary heart disease: a systematic review and meta-analysis of prospective cohort
studies. Circulation 2014; 130(18):1568-78.
[455] Wu JHY, Marklund M, Imamura F, Tintle N, Ardisson Korat AV, de Goede J et al. Omega-
6 fatty acid biomarkers and incident type 2 diabetes: pooled analysis of individual-level
data for 39 740 adults from 20 prospective cohort studies. Lancet Diabetes Endocrinol
2017; 5(12):965-74.
[456] Stanley JC, Elsom RL, Calder PC, Griffin BA, Harris WS, Jebb SA et al. UK Food
Standards Agency Workshop Report: the effects of the dietary n-6:n-3 fatty acid ratio on
cardiovascular health. Br J Nutr 2007; 98(6):1305-10.
[457] Harris WS. The Omega-6:Omega-3 ratio: A critical appraisal and possible successor.
Prostaglandins Leukot Essent Fatty Acids 2018; 132:34-40.
[458] Langlois K, Ratnayake WM. Omega-3 index of Canadian adults. Health Rep 2015;
26(11):3-11.
[459] Sengupta P. The laboratory rat: relating its age with human's. Int J Prev Med 2013;
4(6):624-30.
[460] Bagi CM, Edwards K, Berryman E. Metabolic syndrome and bone: pharmacologically
induced diabetes has deleterious effect on bone in growing obese rats. Calcif Tissue Int

265
2018; 102(6):683-94.
[461] Hu FB. Dietary pattern analysis: a new direction in nutritional epidemiology. Curr Opin
Lipidol 2002; 13(1):3-9.
[462] Dahm CC, Gorst-Rasmussen A, Jakobsen MU, Schmidt EB, Tjønneland A, Sørensen TI et
al. Adipose tissue fatty acid patterns and changes in anthropometry: a cohort study. PLoS
One 2011; 6(7):e22587.
[463] Hopiavuori BR, Anderson RE, Agbaga MP. ELOVL4: Very long-chain fatty acids serve an
eclectic role in mammalian health and function. Prog Retin Eye Res 2018.
[464] Fong L, Muhlhausler BS, Gibson RA, Xian CJ. Perinatal maternal dietary supplementation
of omega3-fatty acids transiently affects bone marrow microenvironment, osteoblast and
osteoclast formation, and bone mass in male offspring. Endocrinology 2012; 153(5):2455-
65.
[465] Damsgaard CT, Eidner MB, Stark KD, Hjorth MF, Sjodin A, Andersen MR et al.
Eicosapentaenoic acid and docosahexaenoic acid in whole blood are differentially and sex-
specifically associated with cardiometabolic risk markers in 8-11-year-old danish children.
PLoS One 2014; 9(10):e109368.
[466] Damsgaard CT, Harslof LB, Andersen AD, Hellgren LI, Michaelsen KF, Lauritzen L. Fish
oil supplementation from 9 to 18 months of age affects the insulin-like growth factor axis
in a sex-specific manner in Danish infants. Br J Nutr 2016; 115(5):782-90.
[467] Childs CE, Romeu-Nadal M, Burdge GC, Calder PC. Gender differences in the n-3 fatty
acid content of tissues. Proc Nutr Soc 2008; 67(1):19-27.
[468] Zhuang P, Shou Q, Lu Y, Wang G, Qiu J, Wang J et al. Arachidonic acid sex-dependently
affects obesity through linking gut microbiota-driven inflammation to hypothalamus-
adipose-liver axis. Biochim Biophys Acta Mol Basis Dis 2017; 1863(11):2715-26.
[469] Nicklas T, Webber L, Thompson B, Berenson G. A multivariate model for assessing eating
patterns and their relationship to cardiovascular risk factors: the Bogalusa Heart Study. Am
J Clin Nutr 1989; 49(6):1320-7.
[470] Shalitin S, Kiess W. Putative effects of obesity on linear growth and puberty. Horm Res
Paediatr 2017; 88(1):101-10.
[471] Safer DL, Agras WS, Bryson S, Hammer LD. Early body mass index and other
anthropometric relationships between parents and children. Int J Obes Relat Metab Disord
2001; 25(10):1532-6.
[472] Serhan CN, Levy BD. Resolvins in inflammation: emergence of the pro-resolving
superfamily of mediators. J Clin Invest 2018; 128(7):2657-69.
[473] Serhan CN, Brain SD, Buckley CD, Gilroy DW, Haslett C, O'Neill LA et al. Resolution of
inflammation: state of the art, definitions and terms. FASEB J 2007; 21(2):325-32.
[474] Serhan CN, Petasis NA. Resolvins and protectins in inflammation resolution. Chem Rev
2011; 111(10):5922-43.
[475] Serhan CN. Lipoxins and aspirin-triggered 15-epi-lipoxins are the first lipid mediators of
endogenous anti-inflammation and resolution. Prostaglandins Leukot Essent Fatty Acids
2005; 73(3-4):141-62.
[476] Petasis NA, Akritopoulou-Zanze I, Fokin VV, Bernasconi G, Keledjian R, Yang R et al.
Design, synthesis and bioactions of novel stable mimetics of lipoxins and aspirin-triggered
lipoxins. Prostaglandins Leukot Essent Fatty Acids 2005; 73(3-4):301-21.
[477] Tasaki Y, Takamori R, Koshihara Y. Prostaglandin D2 metabolite stimulates collagen
synthesis by human osteoblasts during calcification. Prostaglandins 1991; 41(4):303-13.

266
[478] Koshihara Y, Takamori R, Nomura K, Sugiura S, Kurozumi S. Enhancement of in vitro
mineralization in human osteoblasts by a novel prostaglandin A1 derivative TEI-3313. J
Pharmacol Exp Ther 1991; 258(3):1120-6.
[479] Takano T, Fiore S, Maddox JF, Brady HR, Petasis NA, Serhan CN. Aspirin-triggered 15-
epi-lipoxin A4 (LXA4) and LXA4 stable analogues are potent inhibitors of acute
inflammation: evidence for anti-inflammatory receptors. J Exp Med 1997; 185(9):1693-
704.
[480] Hachicha M, Pouliot M, Petasis NA, Serhan CN. Lipoxin (LX)A4 and aspirin-triggered
15-epi-LXA4 inhibit tumor necrosis factor 1alpha-initiated neutrophil responses and
trafficking: regulators of a cytokine-chemokine axis. J Exp Med 1999; 189(12):1923-30.
[481] Raschke S, Eckel J. Adipo-myokines: two sides of the same coin--mediators of
inflammation and mediators of exercise. Mediators Inflamm 2013; 2013:320724.
[482] Jilka RL, Hangoc G, Girasole G, Passeri G, Williams DC, Abrams JS et al. Increased
osteoclast development after estrogen loss: mediation by interleukin-6. Science 1992;
257(5066):88-91.
[483] Le Goff B, Blanchard F, Berthelot JM, Heymann D, Maugars Y. Role for interleukin-6 in
structural joint damage and systemic bone loss in rheumatoid arthritis. Joint Bone Spine
2010; 77(3):201-5.
[484] Rodriguez A, Becerril S, Ezquerro S, Mendez-Gimenez L, Fruhbeck G. Crosstalk between
adipokines and myokines in fat browning. Acta Physiol (Oxf) 2017; 219(2):362-81.
[485] Moreno-Navarrete JM, Ortega F, Serrano M, Guerra E, Pardo G, Tinahones F et al. Irisin is
expressed and produced by human muscle and adipose tissue in association with obesity
and insulin resistance. J Clin Endocrinol Metab 2013; 98(4):E769-78.
[486] Roca-Rivada A, Castelao C, Senin LL, Landrove MO, Baltar J, Belen Crujeiras A et al.
FNDC5/irisin is not only a myokine but also an adipokine. PLoS One 2013; 8(4):e60563.
[487] Colaianni G, Cuscito C, Mongelli T, Pignataro P, Buccoliero C, Liu P et al. The myokine
irisin increases cortical bone mass. Proc Natl Acad Sci U S A 2015; 112(39):12157-62.
[488] Colaianni G, Cuscito C, Mongelli T, Oranger A, Mori G, Brunetti G et al. Irisin enhances
osteoblast differentiation in vitro. Int J Endocrinol 2014; 2014:902186.
[489] Nigro E, Scudiero O, Ludovica Monaco M, Polito R, Schettino P, Grandone A et al.
Adiponectin profile and Irisin expression in Italian obese children: Association with
insulin-resistance. Cytokine 2017; 94:8-13.
[490] Elizondo-Montemayor L, Silva-Platas C, Torres-Quintanilla A, Rodriguez-Lopez C, Ruiz-
Esparza GU, Reyes-Mendoza E et al. Association of irisin plasma levels with
anthropometric parameters in children with underweight, normal weight, overweight, and
obesity. Biomed Res Int 2017; 2017:2628968.
[491] Shim YS, Kang MJ, Yang S, Hwang IT. Irisin is a biomarker for metabolic syndrome in
prepubertal children. Endocr J 2018; 65(1):23-31.
[492] Viitasalo A, Agren J, Venalainen T, Pihlajamaki J, Jaaskelainen J, Korkmaz A et al.
Association of plasma fatty acid composition with plasma irisin levels in normal weight
and overweight/obese children. Pediatr Obes 2016; 11(4):299-305.
[493] Buehring B, Binkley N. Myostatin–the holy grail for muscle, bone, and fat? Curr
Osteoporos Rep 2013; 11(4):407-14.
[494] Perrini S, Laviola L, Carreira MC, Cignarelli A, Natalicchio A, Giorgino F. The GH/IGF1
axis and signaling pathways in the muscle and bone: mechanisms underlying age-related
skeletal muscle wasting and osteoporosis. J Endocrinol 2010; 205(3):201-10.
267
[495] Minihane AM. Impact of genotype on EPA and DHA status and responsiveness to
increased intakes. Nutrients 2016; 8(3):123.
[496] Vallée Marcotte B, Cormier H, Rudkowska I, Lemieux S, Couture P, Vohl M-C.
Polymorphisms in FFAR4 (GPR120) gene modulate insulin levels and sensitivity after fish
oil supplementation. J Pers Med 2017; 7(4):15.
[497] Glaser C, Heinrich J, Koletzko B. Role of FADS1 and FADS2 polymorphisms in
polyunsaturated fatty acid metabolism. Metabolism 2010; 59(7):993-9.
[498] Lattka E, Illig T, Heinrich J, Koletzko B. Do FADS genotypes enhance our knowledge
about fatty acid related phenotypes? Clin Nutr 2010; 29(3):277-87.
[499] Tanaka T, Shen J, Abecasis GR, Kisialiou A, Ordovas JM, Guralnik JM et al. Genome-
wide association study of plasma polyunsaturated fatty acids in the InCHIANTI Study.
PLoS Genet 2009; 5(1):e1000338.
[500] Wu Y, Wang Y, Tian H, Lu T, Yu M, Xu W et al. DHA intake interacts with ELOVL2 and
ELOVL5 genetic variants to influence polyunsaturated fatty acids in human milk. J Lipid
Res 2019; 60(5):1043-9.
[501] Garagnani P, Bacalini MG, Pirazzini C, Gori D, Giuliani C, Mari D et al. Methylation of
ELOVL 2 gene as a new epigenetic marker of age. Aging Cell 2012; 11(6):1132-4.
[502] Damsgaard CT, Lauritzen L, Hauger H, Vuholm S, Teisen MN, Ritz C et al. Effects of oily
fish intake on cardiovascular risk markers, cognitive function, and behavior in school-aged
children: study protocol for a randomized controlled trial. Trials 2016; 17(1):510.
[503] Wolmarans P. Background paper on global trends in food production, intake and
composition. Ann Nutr Metab 2009; 55(1-3):244-72.
[504] Alvheim AR, Torstensen BE, Lin YH, Lillefosse HH, Lock EJ, Madsen L et al. Dietary
linoleic acid elevates endogenous 2-arachidonoylglycerol and anandamide in Atlantic
salmon (Salmo salar L.) and mice, and induces weight gain and inflammation in mice. Br J
Nutr 2013; 109(8):1508-17.
[505] Weaver KL, Ivester P, Chilton JA, Wilson MD, Pandey P, Chilton FH. The content of
favorable and unfavorable polyunsaturated fatty acids found in commonly eaten fish. J Am
Diet Assoc 2008; 108(7):1178-85.
[506] Nettleton JA. Concerning PUFA in fish. J Am Diet Assoc 2008; 108(11):1830-1; author
reply 1-2.
[507] Harris WS. You are what you eat applies to fish, too. J Am Diet Assoc 2008; 108(7):1131-
3.
[508] Kakutani S, Ishikura Y, Tateishi N, Horikawa C, Tokuda H, Kontani M et al.
Supplementation of arachidonic acid-enriched oil increases arachidonic acid contents in
plasma phospholipids, but does not increase their metabolites and clinical parameters in
Japanese healthy elderly individuals: a randomized controlled study. Lipids Health Dis
2011; 10(1):241.
[509] Rizzo NS, Jaceldo-Siegl K, Sabate J, Fraser GE. Nutrient profiles of vegetarian and
nonvegetarian dietary patterns. J Acad Nutr Diet 2013; 113(12):1610-9.
[510] Dow C, Mangin M, Balkau B, Affret A, Boutron-Ruault MC, Clavel-Chapelon F et al.
Fatty acid consumption and incident type 2 diabetes: an 18-year follow-up in the female
E3N (Etude Epidemiologique aupres des femmes de la Mutuelle Generale de l'Education
Nationale) prospective cohort study. Br J Nutr 2016:1-9.
[511] Kröger J, Zietemann V, Enzenbach C, Weikert C, Jansen EH, Döring F et al. Erythrocyte
membrane phospholipid fatty acids, desaturase activity, and dietary fatty acids in relation

268
to risk of type 2 diabetes in the European Prospective Investigation into Cancer and
Nutrition–Potsdam Study. Am J Clin Nutr 2010; 93(1):127-42.
[512] Mozaffarian D, Ascherio A, Hu FB, Stampfer MJ, Willett WC, Siscovick DS et al.
Interplay between different polyunsaturated fatty acids and risk of coronary heart disease in
men. Circulation 2005; 111(2):157-64.
[513] Mahendran Y, Agren J, Uusitupa M, Cederberg H, Vangipurapu J, Stancakova A et al.
Association of erythrocyte membrane fatty acids with changes in glycemia and risk of type
2 diabetes. Am J Clin Nutr 2014; 99(1):79-85.
[514] Freedman DS, Ogden CL, Berenson GS, Horlick M. Body mass index and body fatness in
childhood. Curr Opin Clin Nutr Metab Care 2005; 8(6):618-23.
[515] Innis SM, Palaty J, Vaghri Z, Lockitch G. Increased levels of mercury associated with high
fish intakes among children from Vancouver, Canada. J Pediatr 2006; 148(6):759-63.
[516] Swanson D, Block R, Mousa SA. Omega-3 fatty acids EPA and DHA: health benefits
throughout life. Adv Nutr 2012; 3(1):1-7.
[517] Maggio M, Artoni A, Lauretani F, Borghi L, Nouvenne A, Valenti G et al. The impact of
omega-3 fatty acids on osteoporosis. Curr Pharm Des 2009; 15(36):4157-64.
[518] Bailey DA, Faulkner RA, McKay HA. Growth, physical activity, and bone mineral
acquisition. Exerc Sprot Sci Rev 1996; 24(1):233-66.
[519] Bailey DA, McKay HA, Mirwald RL, Crocker PR, Faulkner RA. A six‐year longitudinal
study of the relationship of physical activity to bone mineral accrual in growing children:
the University of Saskatchewan bone mineral accrual study. J Bone Miner Res 1999;
14(10):1672-9.
[520] Bonjour JP, Chevalley T. Pubertal timing, bone acquisition, and risk of fracture throughout
life. Endocr Rev 2014; 35(5):820-47.
[521] Cho HP, Nakamura M, Clarke SD. Cloning, expression, and fatty acid regulation of the
human Δ-5 desaturase. J Biol Chem 1999; 274(52):37335-9.
[522] Cho HP, Nakamura MT, Clarke SD. Cloning, expression, and nutritional regulation of the
mammalian Δ-6 desaturase. J Biol Chem 1999; 274(1):471-7.
[523] Sjögren P, Sierra-Johnson J, Gertow K, Rosell M, Vessby B, De Faire U et al. Fatty acid
desaturases in human adipose tissue: relationships between gene expression, desaturation
indexes and insulin resistance. Diabetologia 2008; 51(2):328-35.
[524] Burdge GC, Calder PC. Dietary a-linolenic acid and health-related outcomes: a metabolic
perspective. Nutr Res Rev 2006; 19(1):26-52.
[525] Brenna JT. Efficiency of conversion of [alpha]-linolenic acid to long chain n-3 fatty acids
in man. Curr Opin Clin Nutr Metab Care 2002; 5(2):127-32.
[526] Plourde M, Cunnane SC. Extremely limited synthesis of long chain polyunsaturates in
adults: implications for their dietary essentiality and use as supplements. Appl Physiol Nutr
Metab 2007; 32(4):619-34.
[527] Burdge GC, Nagura T. Conversion of -linolenic acid to eicosapentaenoic,
docosapentaenoic and docosahexaenoic acids in young women. Br J Nutr 2002; 88(4):411-
20.
[528] Burdge GC, Jones AE, Scholz-Ahrens KE. Eicosapentaenoic and docosapentaenoic acids
are the principal products of a-linolenic acid metabolism in young men? Br J Nutr 2002;
88(4):355-64.
[529] Kris-Etherton PM, Grieger JA, Etherton TD. Dietary reference intakes for DHA and EPA.
Prostaglandins Leukot Essent Fatty Acids 2009; 81(2–3):99-104.
269
[530] U.S. Department of Health and Human Services and U.S. Department of Agriculture.
Dietary Guidelines for Americans, 2005. 6th Edition. Washington, DC, U.S.: Government
Printing Office; January, 2005.
[531] Health Canada. Eating well with Canada's Food Guide. Ottawa: 2007.
[532] Taber L, Chiu CH, Whelan J. Assessment of the arachidonic acid content in foods
commonly consumed in the American diet. Lipids 1998; 33(12):1151-7.
[533] Leskanich CO, Matthews KR, Warkup CC, Noble RC, Hazzledine M. The effect of dietary
oil containing (n-3) fatty acids on the fatty acid, physicochemical, and organoleptic
characteristics of pig meat and fat. J Anim Sci 1997; 75(3):673-83.
[534] Lopez-Ferrer S, Baucells MD, Barroeta AC, Grashorn MA. n-3 enrichment of chicken
meat using fish oil: alternative substitution with rapeseed and linseed oils. Poult Sci 1999;
78(3):356-65.
[535] Rymer C, Givens DI. n-3 fatty acid enrichment of edible tissue of poultry: a review. Lipids
2005; 40(2):121-30.
[536] Abedi E, Sahari MA. Long‐chain polyunsaturated fatty acid sources and evaluation of their
nutritional and functional properties. Food Sci Nutr 2014; 2(5):443-63.
[537] Johnson GH, Fritsche K. Effect of dietary linoleic acid on markers of inflammation in
healthy persons: a systematic review of randomized controlled trials. J Acad Nutr Diet
2012; 112(7):1029-41, 41 e1-15.
[538] Patterson AC, Stark KD. Direct determinations of the fatty acid composition of daily
dietary intakes incorporating nutraceuticals and functional food strategies to increase n-3
highly unsaturated fatty acids. J Am Coll Nutr 2008; 27(5):538-46.
[539] Denomme J, Stark KD, Holub BJ. Directly quantitated dietary (n-3) fatty acid intakes of
pregnant Canadian women are lower than current dietary recommendations. J Nutr 2005;
135(2):206-11.
[540] Innis SM, Elias SL. Intakes of essential n−6 and n−3 polyunsaturated fatty acids among
pregnant Canadian women. Am J Clin Nutr 2003; 77(2):473-8.
[541] Howe P, Meyer B, Record S, Baghurst K. Dietary intake of long-chain ω-3 polyunsaturated
fatty acids: contribution of meat sources. Nutrition 2006; 22(1):47-53.
[542] Linseisen J, Schulze MB, Saadatian-Elahi M, Kroke A, Miller AB, Boeing H. Quantity and
quality of dietary fat, carbohydrate, and fiber intake in the German EPIC cohorts. Ann Nutr
Metab 2003; 47(1):37-46.
[543] Astorg P, Arnault N, Czernichow S, Noisette N, Galan P, Hercberg S. Dietary intakes and
food sources of n-6 and n-3 PUFA in French adult men and women. Lipids 2004;
39(6):527-35.
[544] U.S. Department of Agriculture, Agricultural Research Service. Nutrient Intakes from
Food: Mean Amounts Consumed per Individual, by Gender and Age, What We Eat in
America, NHANES 2009-2010. www.ars.usda.gov/ba/bhnrc/fsrg. Published 2012.
Accessed February 15 2019
[545] Jia X, Pakseresht M, Wattar N, Wildgrube J, Sontag S, Andrews M et al. Women who take
n-3 long-chain polyunsaturated fatty acid supplements during pregnancy and lactation meet
the recommended intake. Appl Physiol Nutr Metab 2015; 40(5):474-81.
[546] Gibson RA, Muhlhausler B, Makrides M. Conversion of linoleic acid and alpha-linolenic
acid to long-chain polyunsaturated fatty acids (LCPUFAs), with a focus on pregnancy,
lactation and the first 2 years of life. Matern Child Nutr 2011; 7:17-26.
[547] Provot S, Schipani E, Wu J, Kronenberg H. Development of the skeleton. Fundamentals of
270
Osteoporosis 2009:203.
[548] Provot S, Schipani E. Molecular mechanisms of endochondral bone development.
Biochem Biophys Res Commun 2005; 328(3):658-65.
[549] Zoetis T, Tassinari MS, Bagi C, Walthall K, Hurtt ME. Species comparison of postnatal
bone growth and development. Birth Defects Res B Dev Reprod Toxicol 2003; 68(2):86-
110.
[550] Cunningham C, Scheuer L, Black S. Developmental juvenile osteology. Academic Press;
2000.
[551] Kronenberg HM. Developmental regulation of the growth plate. Nature 2003;
423(6937):332-6.
[552] Ruff CB, Hayes WC. Sex differences in age‐related remodeling of the femur and tibia. J
Orthop Res 1988; 6(6):886-96.
[553] Scheuer L, Black S. Developmental juvenile osteology. Academic Press; 2000.
[554] Brookes M, Revell WJ. Nutrient vessels in long bones. In: Blood Supply of Bone.
Springer; 1998. pp. 7-22.
[555] Gilsanz V, Skaggs DL, Kovanlikaya A, Sayre J, Loro ML, Kaufman F et al. Differential
effect of race on the axial and appendicular skeletons of children. J Clin Endocrinol Metab
1998; 83(5):1420-7.
[556] Raisz LG. Physiology and pathophysiology of bone remodeling. Clin Chem 1999;
45(8):1353-8.
[557] Rubin CT, Lanyon LE. Osteoregulatory nature of mechanical stimuli: function as a
determinant for adaptive remodeling in bone. J Orthop Res 1987; 5(2):300-10.
[558] Anderson HC. Matrix vesicles and calcification. Curr Rheunatol Rep 2003; 5(3):222-6.
[559] Seeman E, Delmas PD. Bone quality—the material and structural basis of bone strength
and fragility. N Engl J Med 2006; 354(21):2250-61.
[560] Boyle WJ, Simonet WS, Lacey DL. Osteoclast differentiation and activation. Nature 2003;
423(6937):337-42.
[561] Liu JL, Yakar S, LeRoith D. Conditional knockout of mouse insulin‐like growth factor‐1
gene using the Cre/loxP system. Proc Soc Exp Biol Med 2000; 223(4):344-51.
[562] Wang Y, Cheng Z, Elalieh HZ, Nakamura E, Nguyen MT, Mackem S et al. IGF‐1R
signaling in chondrocytes modulates growth plate development by interacting with the
PTHrP/Ihh pathway. J Bone Miner Res 2011; 26(7):1437-46.
[563] Govoni KE, Wergedal JE, Florin L, Angel P, Baylink DJ, Mohan S. Conditional deletion of
insulin-like growth factor-I in collagen type 1α2-expressing cells results in postnatal
lethality and a dramatic reduction in bone accretion. Endocrinology 2007; 148(12):5706-
15.
[564] Nakamura E, Nguyen MT, Mackem S. Kinetics of tamoxifen‐regulated Cre activity in
mice using a cartilage‐specific CreER(T) to assay temporal activity windows along the
proximodistal limb skeleton. Dev Dyn 2006; 235(9):2603-12.
[565] Bautista CM, Mohan S, Baylink DJ. Insulin-like growth factors I and II are present in the
skeletal tissues of ten vertebrates. Metabolism 1990; 39(1):96-100.
[566] Xian L, Wu X, Pang L, Lou M, Rosen CJ, Qiu T et al. Matrix IGF-1 maintains bone mass
by activation of mTOR in mesenchymal stem cells. Nat Med 2012; 18(7):1095-101.
[567] Hill PA, Reynolds JJ, Meikle MC. Osteoblasts mediate insulin-like growth factor-I and-II
stimulation of osteoclast formation and function. Endocrinology 1995; 136(1):124-31.
[568] Rubin J, Ackert-Bicknell CL, Zhu L, Fan X, Murphy TC, Nanes MS et al. IGF-I regulates
271
osteoprotegerin (OPG) and receptor activator of nuclear factor-κB ligand in vitro and OPG
in vivo. J Clin Endocrinol Metab 2002; 87(9):4273-9.
[569] Wang Y, Nishida S, Elalieh HZ, Long RK, Halloran BP, Bikle DD. Role of IGF‐I signaling
in regulating osteoclastogenesis. J Bone Miner Res 2006; 21(9):1350-8.
[570] Wang Y, Nishida S, Boudignon BM, Burghardt A, Elalieh HZ, Hamilton MM et al. IGF‐I
receptor is required for the anabolic actions of parathyroid hormone on bone. J Bone Miner
Res 2007; 22(9):1329-37.
[571] Gunnes M, Lehmann EH. Physical activity and dietary constituents as predictors of
forearm cortical and trabecular bone gain in healthy children and adolescents: a
prospective study. Acta Paediatr 1996; 85(1):19-25.
[572] Gronowitz E, Mellstrom D, Strandvik B. Serum phospholipid fatty acid pattern is
associated with bone mineral density in children, but not adults, with cystic fibrosis. Br J
Nutr 2006; 95(6):1159-65.
[573] Gronowitz E, Lorentzon M, Ohlsson C, Mellstrom D, Strandvik B. Docosahexaenoic acid
is associated with endosteal circumference in long bones in young males with cystic
fibrosis. Br J Nutr 2008; 99(1):160.
[574] Laudermilk MJ. Influences of select dietary components on bone volumetric density, bone
geometry and indices of bone strength in young girls. The University of Arizona; 2011
[575] Myher J, Kuksis A, Geher K, Park P, Diersen-Schade D. Stereospecific analysis of
triacylglycerols rich in long-chain polyunsaturated fatty acids. Lipids 1996; 31(2):207-15.
[576] Stĕpánková R, Funda DP, Smetana K. Essential fatty acid deficiency and bone fragility in
rats. Folia Biol (Praha) 1996; 42(5):257.
[577] Dubnov-Raz G, Finkelstein Y, Koren G. Omega-3 fatty acid supplementation during
pregnancy : for mother, baby, or neither? Can Fam Physician 2007; 53(5):817-8.
[578] Reinwald S, Li Y, Moriguchi T, Salem N, Watkins BA. Repletion with (n-3) fatty acids
reverses bone structural deficits in (n-3)–deficient rats. J Nutr 2004; 134(2):388-94.
[579] Nielsen FH, Stoecker BJ. Boron and fish oil have different beneficial effects on strength
and trabecular microarchitecture of bone. J Trace Elem Med Biol 2009; 23(3):195-203.
[580] Liu D, Veit HP, Wilson JH, Denbow DM. Maternal dietary lipids alter bone chemical
composition, mechanical properties, and histological characteristics of progeny of Japanese
quail. Poult Sci 2003; 82(3):463-73.
[581] Kruger MC, Schollum LM. Is docosahexaenoic acid more effective than eicosapentaenoic
acid for increasing calcium bioavailability? Prostaglandins Leukot Essent Fatty Acids
2005; 73(5):327-34.
[582] Lukas R, Gigliotti JC, Smith BJ, Altman S, Tou JC. Consumption of different sources of
omega-3 polyunsaturated fatty acids by growing female rats affects long bone mass and
microarchitecture. Bone 2011; 49(3):455-62.
[583] Li Y, Seifert MF, Lim SY, Salem N, Watkins BA. Bone mineral content is positively
correlated to n-3 fatty acids in the femur of growing rats. Br J Nutr 2010; 104(05):674-85.
[584] Nelson D, Koo W. Interpretation of absorptiometric bone mass measurements in the
growing skeleton: issues and limitations. Calcif Tissue Int 1999; 65(1):1-3.
[585] Seeman E. Pathogenesis of bone fragility in women and men. Lancet 2002;
359(9320):1841-50.
[586] Liu D, Veit HP, Wilson JH, Denbow DM. Long-term supplementation of various dietary
lipids alters bone mineral content, mechanical properties and histological characteristics of
Japanese quail. Poult Sci 2003; 82(5):831-9.

272
[587] Lau BY, Fajardo VA, McMeekin L, Sacco SM, Ward WE, Roy BD et al. Influence of high-
fat diet from differential dietary sources on bone mineral density, bone strength, and bone
fatty acid composition in rats. Appl Physiol Nutr Metab 2010; 35(5):598-606.
[588] Lobo AR, Mancini Filho J, Alvares EP, Cocato ML, Colli C. Effects of dietary lipid
composition and inulin-type fructans on mineral bioavailability in growing rats. Nutrition
2009; 25(2):216-25.
[589] Kohut J, Watkins B, Weiler H. Enhanced lumbar spine bone mineral content in piglets fed
arachidonic acid and docosahexaenoic acid is modulated by severity of growth restriction.
Br J Nutr 2009; 102(08):1117-20.
[590] Haag M, Magada ON, Claassen N, Böhmer LH, Kruger MC. Omega-3 fatty acids
modulate ATPases involved in duodenal Ca absorption. Prostaglandins Leukot Essent Fatty
Acids 2003; 68(6):423-9.
[591] Sirois I, Cheung AM, Ward WE. Biomechanical bone strength and bone mass in young
male and female rats fed a fish oil diet. Prostaglandins Leukot Essent Fatty Acids 2003;
68(6):415-21.
[592] Judex S, Wohl GR, Wolff RB, Leng W, Gillis AM, Zernicke RF. Dietary fish oil
supplementation adversely affects cortical bone morphology and biomechanics in growing
rabbits. Calcif Tissue Int 2000; 66(6):443-8.
[593] Korotkova M, Ohlsson C, Hanson LA, Strandvik B. Dietary n-6:n-3 fatty acid ratio in the
perinatal period affects bone parameters in adult female rats. Br J Nutr 2004; 92(4):643-8.
[594] Yin Z, Agellon S, Lavery P, Weiler H. Dietary supplementation with long chain
polyunsaturated fatty acids in pregnant guinea pigs has sex-dependent effects on growth
and bone outcomes in offspring. Prostaglandins Leukot Essent Fatty Acids 2014; 91(1):31-
8.
[595] Al-Nouri DM, Al-Khalifa AS, Shahidi F. Long-term supplementation of dietary omega-
6/omega-3 ratios alters bone marrow fatty acid and biomarkers of bone metabolism in
growing rabbits. J Funct Foods 2012; 4(3):584-93.
[596] Sun L, Tamaki H, Ishimaru T, Teruya T, Ohta Y, Katsuyama N et al. Inhibition of
osteoporosis due to restricted food intake by the fish oils DHA and EPA and perilla oil in
the rat. Biosci Biotechnol Biochem 2004; 68(12):2613-5.
[597] Li Y, Seifert MF, Ney DM, Grahn M, Grant AL, Allen KG et al. Dietary conjugated
linoleic acids alter serum IGF-I and IGF binding protein concentrations and reduce bone
formation in rats fed (n-6) or (n-3) fatty acids. J Bone Miner Res 1999; 14(7):1153-62.
[598] Kelly O, Cusack S, Jewell C, Cashman KD. The effect of polyunsaturated fatty acids,
including conjugated linoleic acid, on calcium absorption and bone metabolism and
composition in young growing rats. Br J Nutr 2003; 90(4):743-50.
[599] Wymann MP, Schneiter R. Lipid signalling in disease. Nat Rev Mol Cell Biol 2008;
9(2):162-76.
[600] Laneuville O, Breuer DK, Xu N, Huang Z, Gage DA, Watson JT et al. Fatty acid substrate
specificities of human prostaglandin-endoperoxide H synthase-1 and -2. Formation of 12-
hydroxy-(9Z, 13E/Z, 15Z)- octadecatrienoic acids from alpha-linolenic acid. J Biol Chem
1995; 270(33):19330-6.
[601] Boie Y, Stocco R, Sawyer N, Slipetz DM, Ungrin MD, Neuschäfer-Rube F et al. Molecular
cloning and characterization of the four rat prostaglandin E2 prostanoid receptor subtypes.
Eur J Pharmacol 1997; 340(2-3):227-41.
[602] Hatae N, Sugimoto Y, Ichikawa A. Prostaglandin receptors: advances in the study of EP3

273
receptor signaling. J Biochem 2002; 131(6):781-4.
[603] Sugimoto Y, Narumiya S. Prostaglandin E receptors. J Biol Chem 2007; 282(16):11613-7.
[604] Corwin Rs. Effects of dietary fats on bone health in advanced age. Prostaglandins Leukot
Essent Fatty Acids 2003; 68(6):379-86.
[605] Shen C-L, Yeh JK, Rasty J, Li Y, Watkins BA. Protective effect of dietary long-chain n-3
polyunsaturated fatty acids on bone loss in gonad-intact middle-aged male rats. Br J Nutr
2006; 95(03):462-8.
[606] Coetzee M, Haag M, Kruger MC. Effects of arachidonic acid, docosahexaenoic acid,
prostaglandin E(2) and parathyroid hormone on osteoprotegerin and RANKL secretion by
MC3T3-E1 osteoblast-like cells. J Nutr Biochem 2007; 18(1):54-63.
[607] Jee W, Ma Y. The in vivo anabolic actions of prostaglandins in bone. Bone 1997;
21(4):297-304.
[608] Lomri A, Fromigue O, Hott M, Marie PJ. Genomic insertion of the SV-40 large T
oncogene in normal adult human trabecular osteoblastic cells induces cell growth without
loss of the differentiated phenotype. Calcif Tissue Int 1999; 64(5):394-401.
[609] Collins DA, Chambers TJ. Effect of prostaglandins E1, E2, and F2α on osteoclast
formation in mouse bone marrow cultures. J Bone Miner Res 1991; 6(2):157-64.
[610] Baylink TM, Mohan S, Fitzsimmons RJ, Baylink DJ. Evaluation of signal transduction
mechanisms for the mitogenic effects of prostaglandin E2 in normal human bone cells in
vitro. J Bone Miner Res 1996; 11(10):1413-8.
[611] Ono K, Kaneko H, Choudhary S, Pilbeam CC, Lorenzo JA, Akatsu T et al. Biphasic effect
of prostaglandin E2 on osteoclast formation in spleen cell cultures: role of the EP2
receptor. J Bone Miner Res 2005; 20(1):23-9.
[612] Tsutsumi R, Xie C, Wei X, Zhang M, Zhang X, Flick LM et al. PGE2 signaling through the
EP4 receptor on fibroblasts upregulates RANKL and stimulates osteolysis. J Bone Miner
Res 2009; 24(10):1753-62.
[613] Suda M, Tanaka K, Yasoda A, Natsui K, Sakuma Y, Tanaka I et al. Prostaglandin E2
(PGE2) autoamplifies its production through EP1 subtype of PGE receptor in mouse
osteoblastic MC3T3-E1 cells. Calcif Tissue Int 1998; 62(4):327-31.
[614] Duffy MM, Pindjakova J, Hanley SA, McCarthy C, Weidhofer GA, Sweeney EM et al.
Mesenchymal stem cell inhibition of T‐helper 17 cell‐differentiation is triggered by cell–
cell contact and mediated by prostaglandin E2 via the EP4 receptor. Eur J Immunol 2011;
41(10):2840-51.
[615] Igarashi K, Woo JT, Stern PH. Effects of a selective cyclooxygenase-2 inhibitor, celecoxib,
on bone resorption and osteoclastogenesis in vitro Biochem Pharmacol 2002; 63(3):523-
32.
[616] Liu X-H, Kirschenbaum A, Yao S, Levine AC. Cross-talk between the interleukin-6 and
prostaglandin E2 signaling systems results in enhancement of osteoclastogenesis through
effects on the osteoprotegerin/receptor activator of nuclear factor-κB (RANK)
ligand/RANK system. Endocrinology 2005; 146(4):1991-8.
[617] Okada Y, Lorenzo JA, Freeman AM, Tomita M, Morham SG, Raisz LG et al. Prostaglandin
G/H synthase-2 is required for maximal formation of osteoclast-like cells in culture. J Clin
Invest 2000; 105(6):823-32.
[618] Bachi AL, Kim FJ, Nonogaki S, Carneiro CR, Lopes JD, Jasiulionis MG et al. Leukotriene
B4 creates a favorable microenvironment for murine melanoma growth. Mol Cancer Res
2009; 7(9):1417-24.

274
[619] Raisz LG, Alander CB, Simmons HA. Effects of prostaglandin E3 and eicosapentaenoic
acid on rat bone in organ culture. Prostaglandins 1989; 37(5):615-25.
[620] Moreno JJ. Differential effects of arachidonic and eicosapentaenoic acid-derived
eicosanoids on polymorphonuclear transmigration across endothelial cell cultures. J
Pharmacol Exp Ther 2009; 331(3):1111-7.
[621] Takahashi T, Wada T, Mori M, Kokai Y, Ishii S. Overexpression of the granulocyte colony-
stimulating factor gene leads to osteoporosis in mice. Lab Invests 1996; 74(4):827-34.
[622] Lucia VD, Fitzpatrick-Wong SC, Weiler HA. Dietary arachidonic acid suppresses bone
turnover in contrast to low dosage exogenous prostaglandin E2 that elevates bone
formation in the piglet. Prostaglandins Leukot Essent Fatty Acids 2003; 68(6):407-13.
[623] Tjonahen E, Oh SF, Siegelman J, Elangovan S, Percarpio KB, Hong S et al. Resolvin E2:
identification and anti-inflammatory actions: pivotal role of human 5-lipoxygenase in
resolvin E series biosynthesis. Chem Biol 2006; 13(11):1193-202.
[624] Arita M, Bianchini F, Aliberti J, Sher A, Chiang N, Hong S et al. Stereochemical
assignment, antiinflammatory properties, and receptor for the omega-3 lipid mediator
resolvin E1. J Exp Med 2005; 201(5):713-22.
[625] Herrera BS, Ohira T, Gao L, Omori K, Yang R, Zhu M et al. An endogenous regulator of
inflammation, resolvin E1, modulates osteoclast differentiation and bone resorption. Br J
Pharmacol 2008; 155(8):1214-23.
[626] Dalli J, Winkler Jeremy W, Colas Romain A, Arnardottir H, Cheng CY, Chiang N et al.
Resolvin D3 and aspirin-triggered resolvin D3 are potent immunoresolvents. Chem Biol
2013; 20(2):188-201.
[627] Serhan CN, Clish CB, Brannon J, Colgan SP, Chiang N, Gronert K. Novel functional sets
of lipid-derived mediators with antiinflammatory actions generated from omega-3 fatty
acids via cyclooxygenase 2–nonsteroidal antiinflammatory drugs and transcellular
processing. J Exp Med 2000; 192(8):1197-204.
[628] Yuan J, Akiyama M, Nakahama K-i, Sato T, Uematsu H, Morita I. The effects of
polyunsaturated fatty acids and their metabolites on osteoclastogenesis in vitro.
Prostaglandins Other Lipid Mediat 2010; 92(1–4):85-90.
[629] Sun D, Krishnan A, Zaman K, Lawrence R, Bhattacharya A, Fernandes G. Dietary n-3
fatty acids decrease osteoclastogenesis and loss of bone mass in ovariectomized mice. J
Bone Miner Res 2003; 18(7):1206-16.
[630] Bhattacharya A, Rahman M, Banu J, Lawrence RA, McGuff HS, Garrett I et al. Inhibition
of osteoporosis in autoimmune disease prone MRL/Mpj-Fas(lpr) mice by N-3 fatty acids. J
Am Coll Nutr 2005; 24(3):200-9.
[631] Rahman MM, Bhattacharya A, Fernandes G. Docosahexaenoic acid is more potent
inhibitor of osteoclast differentiation in RAW 264.7 cells than eicosapentaenoic acid. J Cell
Physiol 2008; 214(1):201-9.
[632] Bhattacharya A, Rahman M, Sun D, Fernandes G. Effect of fish oil on bone mineral
density in aging C57BL/6 female mice. J Nutr Biochem 2007; 18(6):372-9.
[633] Vedin I, Cederholm T, Levi YF, Basun H, Garlind A, Irving GF et al. Effects of
docosahexaenoic acid–rich n− 3 fatty acid supplementation on cytokine release from blood
mononuclear leukocytes: the OmegAD study. Am J Clin Nutr 2008; 87(6):1616-22.
[634] Long F. Building strong bones: molecular regulation of the osteoblast lineage. Nat Rev
Mol Cell Biol 2011; 13(1):27-38.
[635] LeBlanc CJ, Horohov DW, Bauer JE, Hosgood G, Mauldin GE. Effects of dietary

275
supplementation with fish oil on in vivo production of inflammatory mediators in clinically
normal dogs. Am J Vet Res 2008; 69(4):486-93.
[636] Chang J, Liu F, Lee M, Wu B, Ting K, Zara JN et al. NF-κB inhibits osteogenic
differentiation of mesenchymal stem cells by promoting β-catenin degradation. Proc Natl
Acad Sci U S A 2013; 110(23):9469-74.
[637] Lim K, Han C, Dai Y, Shen M, Wu T. Omega-3 polyunsaturated fatty acids inhibit
hepatocellular carcinoma cell growth through blocking β-catenin and cyclooxygenase-2.
Mol Cancer Ther 2009; 8(11):3046-55.
[638] Holmen SL, Zylstra CR, Mukherjee A, Sigler RE, Faugere MC, Bouxsein ML et al.
Essential role of beta-catenin in postnatal bone acquisition. J Biol Chem 2005;
280(22):21162-8.
[639] Hirasawa A, Tsumaya K, Awaji T, Katsuma S, Adachi T, Yamada M et al. Free fatty acids
regulate gut incretin glucagon-like peptide-1 secretion through GPR120. Nat Med 2005;
11(1):90-4.
[640] Talukdar S, Bae EJ, Imamura T, Morinaga H, Fan W, Li P et al. GPR120 is an omega-3
fatty acid receptor mediating potent anti-inflammatory and insulin-sensitizing effects. Cell
2010; 142(5):687-98.
[641] Ahn SH, Park SY, Baek JE, Lee SY, Baek WY, Lee SY et al. Free fatty acid receptor 4
(GPR120) stimulates bone formation and suppresses bone resorption in the presence of
elevated n-3 fatty acid levels. Endocrinology 2016; 157(7):2621-35.
[642] Mangelsdorf DJ, Thummel C, Beato M, Herrlich P, Schütz G, Umesono K et al. The
nuclear receptor superfamily: the second decade. Cell 1995; 83(6):835-9.
[643] Bookout AL, Jeong Y, Downes M, Yu RT, Evans RM, Mangelsdorf DJ. Anatomical
profiling of nuclear receptor expression reveals a hierarchical transcriptional network. Cell
2006; 126(4):789-99.
[644] Escher P, Braissant O, Basu-Modak S, Michalik L, Wahli W, Desvergne B. Rat PPARs:
quantitative analysis in adult rat tissues and regulation in fasting and refeeding.
Endocrinology 2001; 142(10):4195-202.
[645] Göttlicher M, Widmark E, Li Q, Gustafsson JA. Fatty acids activate a chimera of the
clofibric acid-activated receptor and the glucocorticoid receptor. Proc Natl Acad Sci U S A
1992; 89(10):4653-7.
[646] Forman BM, Tontonoz P, Chen J, Brun RP, Spiegelman BM, Evans RM. 15-Deoxy-Δ12,14-
Prostaglandin J2 is a ligand for the adipocyte determination factor PPARγ. Cell 1995;
83(5):803-12.
[647] Wan Y, Chong LW, Evans RM. PPAR-γ regulates osteoclastogenesis in mice. Nat Med
2007; 13(12):1496-503.
[648] Spiegelman B. PPAR-γ: adipogenic regulator and thiazolidinedione receptor. Diabetes
1998; 47(4):507-14.
[649] Jiang C, Ting AT, Seed B. PPAR-γ agonists inhibit production of monocyte inflammatory
cytokines. Nature 1998; 391(6662):82-6.
[650] Zand H, Rahimipour A, Salimi S, Shafiee SM. Docosahexaenoic acid sensitizes Ramos
cells to Gamma-irradiation-induced apoptosis through involvement of PPAR-γ activation
and NF-κB suppression. Mol Cell Biochem 2008; 317(1-2):113-20.
[651] Sethi S, Ziouzenkova O, Ni H, Wagner DD, Plutzky J, Mayadas TN. Oxidized omega-3
fatty acids in fish oil inhibit leukocyte-endothelial interactions through activation of
PPARα. Blood 2002; 100(4):1340-6.

276
[652] Deckelbaum RJ, Worgall TS, Seo T. n− 3 fatty acids and gene expression. Am J Clin Nutr
2006; 83(6):S1520-5S.
[653] Nuttall ME, Patton AJ, Olivera DL, Nadeau DP, Gowen M. Human trabecular bone cells
are able to express both osteoblastic and adipocytic phenotype: implications for osteopenic
disorders. J Bone Miner Res 1998; 13(3):371-82.
[654] Syversen U, Stunes AK, Gustafsson BI, Obrant KJ, Nordsletten L, Berge R et al. Different
skeletal effects of the peroxisome proliferator activated receptor (PPAR) α agonist
fenofibrate and the PPARγ agonist pioglitazone. BMC Endocr Disord 2009; 9(1):10.
[655] Sun H, Kim JK, Mortensen R, Mutyaba LP, Hankenson KD, Krebsbach PH. Osteoblast-
Targeted suppression of PPARγ increases osteogenesis through activation of mTOR
signaling. Stem Cells 2013; 31(10):2183-92.
[656] Kim J, Jung Y, Sun H, Joseph J, Mishra A, Shiozawa Y et al. Erythropoietin mediated bone
formation is regulated by mTOR signaling. J Cell Biochem 2012; 113(1):220-8.
[657] Kim JK, Baker J, Nor JE, Hill EE. mTOR plays an important role in odontoblast
differentiation. J Endod 2011; 37(8):1081-5.
[658] Wu H, Li L, Ma Y, Chen Y, Zhao J, Lu Y et al. Regulation of selective PPARγ modulators
in the differentiation of osteoclasts. J Cell Biochem 2013; 114(9):1969-77.
[659] Maurin AC, Chavassieux PM, Vericel E, Meunier PJ. Role of polyunsaturated fatty acids in
the inhibitory effect of human adipocytes on osteoblastic proliferation. Bone 2002;
31(1):260-6.
[660] Abedin M, Lim J, Tang T, Park D, Demer LL, Tintut Y. N-3 fatty acids inhibit vascular
calcification via the p38-mitogen-activated protein kinase and peroxisome proliferator-
activated receptor-γ pathways. Circ Res 2006; 98(6):727-9.
[661] Nakanishi A, Tsukamoto I. n-3 polyunsaturated fatty acids stimulate osteoclastogenesis
through PPARγ-mediated enhancement of c-Fos expression, and suppress
osteoclastogenesis through PPARγ-dependent inhibition of NFkB activation. J Nutr
Biochem 2015; 26(11):1317-27.
[662] Akiyama M, Nakahama K, Morita I. Impact of docosahexaenoic acid on gene expression
during osteoclastogenesis in vitro-A comprehensive analysis. Nutrients 2013; 5(8):3151-
62.
[663] Still K, Grabowski P, Mackie I, Perry M, Bishop N. The peroxisome proliferator activator
receptor alpha/delta agonists linoleic acid and bezafibrate upregulate osteoblast
differentiation and induce periosteal bone formation in vivo. Calcif Tissue Int 2008;
83(4):285-92.
[664] Lazarenko OP, Rzonca SO, Hogue WR, Swain FL, Suva LJ, Lecka-Czernik B.
Rosiglitazone induces decreases in bone mass and strength that are reminiscent of aged
bone. Endocrinology 2007; 148(6):2669-80.
[665] McCarthy TL, Centrella M, Canalis E. Cyclic AMP induces insulin-like growth factor I
synthesis in osteoblast-enriched cultures. J Biol Chem 1990; 265(26):15353-6.
[666] McCarthy TL, Centrella M, Raisz LG, Canalis E. Prostaglandin E2 stimulates insulin-like
growth factor I synthesis in osteoblast-enriched cultures from fetal rat bone. Endocrinology
1991; 128(6):2895-900.
[667] Hakeda Y, Harada S, Matsumoto T, Tezuka K, Higashino K, Kodama H et al.
Prostaglandin F2 alpha stimulates proliferation of clonal osteoblastic MC3T3-E1 cells by
up-regulation of insulin-like growth factor I receptors. J Biol Chem 1991; 266(31):21044-
50.

277
[668] McCarthy TL, Casinghino S, Centrella M, Canalis E. Complex pattern of insulin-like
growth factor binding protein expression in primary rat osteoblast enriched cultures:
regulation by prostaglandin E2, growth hormone, and the insulin-like growth factors. J Cell
Physiol 1994; 160(1):163-75.
[669] Kim EJ, Kim WY, Kang YH, Ha YL, Bach LA, Park JH. Inhibition of Caco-2 cell
proliferation by (n-3) fatty acids: possible mediation by increased secretion of insulin-like
growth factor binding protein-6. Nutr Res 2000; 20(10):1409-21.
[670] Tanner JM, Whitehouse RH, Marubini E, Resele LF. The adolescent growth spurt of boys
and girls of the Harpenden growth study. Ann Hum Biol 1976; 3(2):109-26.
[671] Veldhuis JD, Roemmich JN, Richmond EJ, Rogol AD, Lovejoy JC, Sheffield-Moore M et
al. Endocrine control of body composition in infancy, childhood, and puberty. Endocr Rev
2005; 26(1):114-46.
[672] Bakewell L, Burdge GC, Calder PC. Polyunsaturated fatty acid concentrations in young
men and women consuming their habitual diets. Br J Nutr 2006; 96(01):93-9.
[673] Giltay EJ, Gooren LJ, Toorians AW, Katan MB, Zock PL. Docosahexaenoic acid
concentrations are higher in women than in men because of estrogenic effects. Am J Clin
Nutr 2004; 80(5):1167-74.
[674] Mattsson LÅ, Silfverstolpe G, Samsioe G. Fatty acid composition of serum lecithin and
cholesterol ester in the normal menstrual cycle. Horm Metab Res 1985; 17(8):414-7.
[675] Maynar M, Mahedero G, Maynar I, Maynar JI, Tuya I, Caballero MJ. Menopause-induced
changes in lipid fractions and total fatty acids in plasma. Endocr Res 2001; 27(3):357-65.
[676] Stark KD, Beblo S, Murthy M, Buda-Abela M, Janisse J, Rockett H et al. Comparison of
bloodstream fatty acid composition from African-American women at gestation, delivery,
and postpartum. J Lipid Res 2005; 46(3):516-25.
[677] Stewart F, Rodie VA, Ramsay JE, Greer IA, Freeman DJ, Meyer BJ. Longitudinal
assessment of erythrocyte fatty acid composition throughout pregnancy and post partum.
Lipids 2007; 42(4):335-44.
[678] Su HM, Huang MC, Saad NM, Nathanielsz PW, Brenna JT. Fetal baboons convert 18: 3n-3
to 22: 6n-3 in vivo: a stable isotope tracer study. J Lipid Res 2001; 42(4):581-6.
[679] Lau BY, Ward WE, Kang JX, Ma DW. Femur EPA and DHA are correlated with femur
biomechanical strength in young fat-1 mice. J Nutr Biochem 2009; 20(6):453-61.
[680] Bays HE, Tighe AP, Sadovsky R, Davidson MH. Prescription omega-3 fatty acids and their
lipid effects: physiologic mechanisms of action and clinical implications. Expert Rev
Cardiovasc Ther 2008; 6(3):391-409.
[681] Lau BY, Ward WE, Kang JX, Ma DW. Vertebrae of developing fat-1 mice have greater
strength and lower n-6/n-3 fatty acid ratio. Exp Biol Med (Maywood) 2009; 234(6):632-8.
[682] Gruger EH, Nelson R, Stansby ME. Fatty acid composition of oils from 21 species of
marine fish, freshwater fish and shellfish. J Am Oil Chem Soc 1964; 41(10):662-7.
[683] Ratledge C. Fatty acid biosynthesis in microorganisms being used for single cell oil
production. Biochimie 2004; 86(11):807-15.
[684] Huang MC, Craig-Schmidt MC. Arachidonate and docosahexaenoate added to infant
formula influence fatty acid composition and subsequent eicosanoid production in neonatal
pigs. J Nutr 1996; 126(9):2199.
[685] Lien EL. The role of fatty acid composition and positional distribution in fat absorption in
infants. J Pediatr 1994; 125(5):S62-S8.
[686] Innis SM. n− 3 Fatty acid requirements of the newborn. Lipids 1992; 27(11):879-85.

278
[687] Martin J-C, Bougnoux P, Antoine JM, Lanson M, Couet C. Triacylglycerol structure of
human colostrum and mature milk. Lipids 1993; 28(7):637-43.
[688] Arterburn LM, Oken HA, Hoffman JP, Bailey-Hall E, Chung G, Rom D et al.
Bioequivalence of docosahexaenoic acid from different algal oils in capsules and in a
DHA-fortified food. Lipids 2007; 42(11):1011-24.
[689] Orr SK, Tong JY, Kang JX, Ma DW, Bazinet RP. The fat-1 mouse has brain
docosahexaenoic acid levels achievable through fish oil feeding. Neurochem Res 2010;
35(5):811-9.
[690] Kang JX. Fat-1 transgenic mice: a new model for omega-3 research. Prostaglandins Leukot
Essent Fatty Acids 2007; 77(5):263-7.
[691] Lau BY, Ward WE, Kang JX, Ma DW. Fat-1 gene modulates the fatty acid composition of
femoral and vertebral phospholipids. Appl Physiol Nutr Metab 2010; 35(4):447-55.
[692] Griel AE, Kris-Etherton PM, Hilpert KF, Zhao G, West SG, Corwin RL. An increase in
dietary n-3 fatty acids decreases a marker of bone resorption in humans. Nutr J 2007;
6(1):2.
[693] Atkinson TG, Barker HJ, Meckling-Gill KA. Incorporation of long-chain n-3 fatty acids in
tissues and enhanced bone marrow cellularity with docosahexaenoic acid feeding in post-
weanling Fischer 344 rats. Lipids 1997; 32(3):293-302.