qt00m031m8_nosplash_4b1b60... - escholarship
TRANSCRIPT
UNIVERSITY OF CALIFORNIA SANTA CRUZ
COMPARATIVE BEHAVIOR, DIET, AND POST-BREEDING STRATEGIES
OF TWO SYMPATRIC NORTH PACIFIC ALBATROSS SPECIES
A dissertation submitted in partial satisfaction
of the requirements for the degree of
DOCTOR OF PHILOSOPHY
in
OCEAN SCIENCES
by
Melinda G. Conners
December 2015
The Dissertation of Melinda Grace Conners is approved:
______________________________ Dr. Scott A. Shaffer, Chair
______________________________ Professor Raphael Kudela
______________________________ Dr. Elliott L. Hazen
______________________________
Professor Daniel P. Costa
______________________________ Tyrus Miller Vice Provost and Dean of Graduate Studies

ii
Copyright © by
Melinda Grace Conners
2015
iii
Table of Contents
LIST OF TABLES ..................................................................................................... vi
LIST OF FIGURES .................................................................................................. viii
THESIS ABSTRACT ................................................................................................ xi
ACKNOWLEDGEMENTS ........................................................................................ xiii
DEDICATION ......................................................................................................... xvii
Introduction & Synthesis .................................................................................... 1
THESIS SUMMARY ................................................................................................................ 4
SYNTHESIS OF ECOLOGICAL IMPLICATIONS ........................................................................ 6
REFERENCES ........................................................................................................................ 8
CHAPTER ONE: Shadowed by scale: subtle behavioral niche partitioning in
two synpatric, tropical breeding albatross species ............................................ 11
ABSTRACT ....................................................................................................................... 12
1.1 BACKGROUND ......................................................................................................... 13
1.2 METHODS................................................................................................................... 17
1.2.1 Study species and study location ................................................................... 17
1.2.2 Tracking methods ............................................................................................. 18
1.2.3 Individual characteristics ................................................................................. 18
1.2.4 Track analysis ..................................................................................................... 20
1.2.5 Foraging behavior: ............................................................................................ 20
1.2.6 Environmental data: ......................................................................................... 23
1.2.7 Statistical analyses: ........................................................................................... 23
1.3 RESULTS .................................................................................................................... 26
1.3.1 Individual characteristics ................................................................................. 27
1.3.2 Species and diurnal differences in movement parameters ........................ 27
1.3.3 Species differences in general track characteristics .................................... 28
1.3.4 Behavioral states – diurnal and species differences .................................... 28
1.3.5 Relationship between lunar phase and behavioral state ........................... 29
1.3.6 Within species foraging patterns .................................................................... 29
iv
1.3.7 Foraging patterns of black-footed albatrosses ............................................. 29
1.3.8 Foraging patterns of Laysan albatrosses ....................................................... 31
1.3.9 Intrinsic factors and foraging patterns .......................................................... 31
1.3.10 Extrinsic factors (year, wind and lunar phase) and foraging patterns .... 32
1.4 DISCUSSION ............................................................................................................. 33
1.4.1 Beyond “Area-Restricted Search” foraging behavior .................................. 33
1.4.2 Nocturnal and diurnal niche partitioning ...................................................... 35
1.4.3 Within- and among- species niche partitioning ........................................... 37
1.5 CONCLUSION ........................................................................................................... 40
1.6 REFERENCES ........................................................................................................... 40
CHAPTER TWO: Identifying fisheries-associated diet in the stomach oil of
tube-nosed seabirds using quantitative lipid analysis ....................................... 64
ABSTRACT ....................................................................................................................... 65
2.1 INTRODUCTION ........................................................................................................ 66
2.2 METHODS .................................................................................................................. 71
2.2.1 Study Species ..................................................................................................... 71
2.2.2 Stomach Oil ........................................................................................................ 72
2.2.3 Lipid Library of Potential Albatross Prey ....................................................... 73
2.2.4 Lipid analysis ...................................................................................................... 74
2.2.5 Understanding prey-driven error in the QFASA model ............................... 77
2.2.6 Statistical analyses ............................................................................................ 78
2.3 RESULTS .................................................................................................................... 79
2.3.1 Qualitative assessment of prey similarity by lipid signatures .................... 79
2.3.2 Species and functional group error associated with QFASA modeling ..... 80
2.3.3 Albatross Diet .................................................................................................... 81
2.3.4 Effect of Species, Breeding Phase, Sex and Age on Diet Composition ...... 81
2.3.5 Fisheries-associated diet.................................................................................. 82
2.3.6 Dietary specialization in albatrosses .............................................................. 83
2.4 DISCUSSION ............................................................................................................. 84
2.4.1 Incidence of fisheries-associated resources in albatross diet .................... 84
2.4.2 Deep, mesopelagic layer feeds surface-scavenging albatross ................... 86
2.4.3 Greater behavioral and dietary flexibility in black-footed albatrosses ..... 87
2.4.4 Older albatrosses consume more squid than younger birds ..................... 89
2.4.5 Estimating diet with QFASA: the good, the bad, and the ugly ................... 89
v
2.5 REFERENCES ........................................................................................................... 91
CHAPTER THREE: Interactions of self-maintenance, sex, and age impact the post-breeding migrations of two long-lived seabird species ........................... 123
ABSTRACT ..................................................................................................................... 124
3.1 BACKGROUND ....................................................................................................... 125
3.2 METHODS ................................................................................................................ 130
3.2.1 Tracking methods ........................................................................................... 130
3.2.2 Breeding Sequences as a Proxy of Molt ...................................................... 131
3.2.3 Statistical analyses .......................................................................................... 132
3.2.4 Estimating locations from geolocation data ............................................... 133
3.2.5 General characterization of post-breeding migrations ............................. 134
3.2.6 Space Use ......................................................................................................... 134
3.2.7 The dynamics of space-use change relative to molt series ...................... 135
3.2.8 Habitat use as a function of species, sex, age, molt series ....................... 135
3.2.9 The dynamics of site fidelity across the migration .................................... 136
3.3 RESULTS .................................................................................................................. 137
3.3.1 Study Population Breeding Patterns ............................................................ 137
3.3.2 Predicting nest initiation using discriminant function analysis ................ 137
3.3.3 Effect of nest failure on migration chronology .......................................... 138
3.3.4 The influence of species, sex, and subsequent breeding ......................... 138
3.3.5 The impact of sex, age and molt extent on home range size ................... 139
3.3.6 Change of core area size in relation to molt extent .................................. 139
3.3.7 Variability in habitat use of post-breeding albatrosses ............................ 140
3.4 DISCUSSION ........................................................................................................... 142
3.4.1 Synchrony constrains trip lengths ................................................................ 144
3.4.2 Large-scale molt patterns impact activity levels. ....................................... 145
3.4.3 Albatrosses “fine-tune” their migrations over their lifespans ................. 147
3.4.4 Birds with large molt extents use a variety of habitats ............................. 148
3.4.5 Samalga Pass in the Aleutian Islands ........................................................... 148
3.4.6 Habitat partitioning between ages and sexes ............................................ 149
3.5 REFERENCES ......................................................................................................... 150
vi
List of Tables
Chapter 1
Table 1.1 Mass and morphometrics (means ± SD) of Laysan and black-footed albatross breeding on Tern Island .......................................................................................................... 48
Table 1.2 Track characteristics by species and the effects of species and sex on track characteristics. ........................................................................................................................ 48
Table 1.3 Movement parameters by species and astronomical state .................................... 49
Table 1.4 Results from linear mixed models testing the effects of species, diurnal states and their interactions on albatross movement parameters. ........................................................... 50
Table 1.5 Percentage of time in each behavioral state. ......................................................... 51
Table 1.6 Mean values of behavioral parameters and track characteristics for each black-footed albatross behavioral cluster. ........................................................................................ 52
Table 1.7 Mean values of behavioral parameters and track characteristics for each Laysan albatross behavioral cluster. ................................................................................................... 53
Chapter 2
Table 2.1 Sample sizes of albatross stomach oil by species breeding phase and year. ....... 98
Table 2.2 Species collected for the lipid prey library to be used in QFASA estimations of albatross diet. .......................................................................................................................... 99
Table 2.3 Percent frequency of occurrence (% FO) and percent of pooled diet (% pooled) of prey items identified to lowest taxon in breeding black-footed albatrosses from Tern Island, 2009-2012. ............................................................................................................................ 101
Table 2.4 Percent frequency of occurrence (% FO) and percent of pooled diet (% pooled) of prey items identified to lowest taxon in breeding Laysan albatrosses from Tern Island, 2009-2012. ..................................................................................................................................... 103
vii
Table 2.5 Results from SIMPER analyses indicating the top six functional groups that contributed the most to the dissimilarity between age classes in Laysan and black-footed albatrosses ............................................................................................................................ 105
Chapter 3
Table 3.1 Sample sizes of GLS deployments over eight years ............................................ 156
Table 3.2 Discriminant Function Analysis to Predict Subsequent Breeding ........................ 156
Table 3.3 Post-Breeding Migration Chronology of Laysan albatrosses ............................... 157
Table 3.4 Migration Chronology of Black-footed albatrosses ............................................... 157
Table 3.5 Differences in home range and core area sizes relative to molt extent, sex and age for each species .................................................................................................................... 158
Table 3.6 Results from per-MANOVA analyses testing habitat composition as a function of sex, age class, and molt extent ............................................................................................. 159
Table 3.7 Site Fidelity across the migration.......................................................................... 160
viii
List of Figures
Chapter 1
Figure 1.1 GPS locations of incubating and chick-brooding Laysan (n=114) and black-footed (n=118) albatross breeding at Tern Island. ............................................................................. 54
Figure 1.2 A bimodal distribution of speeds in both species, indicating a speed threshold of ~6 km/hr below which birds do not remain aloft ...................................................................... 55
Figure 1.3 Wind speed did not affect sinuosity of tracks in drifting birds, validating the use of drift sinuosity as a proxy for drift foraging activity. .................................................................. 55
Figure 1.4 Black-footed (black) and Laysan (white) albatross GPS tracks deployed at Tern Island (black star) in 2006, 2009, 2010 and 2012. .................................................................. 56
Figure 1.5 Behavioral state classification schematic showing forage and non-forage modes for two flight behaviors (Transit and ARS) and for drifting behavior. ...................................... 57
Figure 1.6 Scatterplot of bill morphometrics indicates clustering in morphological space. .... 58
Figure 1.7 A simper analysis indicates that nocturnal foraging is more prevalent at night in Laysan albatross than it is in black-footed, while the opposite is true for diurnal foraging. .... 59
Figure 1.8 Effects of lunar phase on each behavioral state in albatrosses. .......................... 60
Figure 1.9 ‘Pvclust’ clustering output with the corresponding population-level foraging patterns shows higher population variability for black-footed albatrosses than for Laysan albatrosses. ............................................................................................................................. 61
Figure 1.10 The effect of intrinsic and extrinsic factors on foraging patterns in black-footed and Laysan albatross. ............................................................................................................. 62
Figure 1.11 Female Laysan albatrosses reach more distant foraging grounds than males .. 63
ix
Chapter 2
Figure 2.1 Collection sites across the North Pacific for albatross prey specimens ............. 106
Figure 2.2 Lipid classes in albatross stomach oil ................................................................. 107
Figure 2.3 Plot of MDS 1 and MDS 2 scores derived from non-metric multi-dimensional scaling analysis of raw FAME and FAlc values from all species. ......................................... 108
Figure 2.4 A hierarchical clustering analysis on the FAME/FAlc values of prey species using Euclidean distance shows relationships among functional groups of prey based on lipid constituents. .......................................................................................................................... 109
Figure 2.5 Species-specific accuracy of QFASA estimates. ................................................ 110
Figure 2.6 Summarized species-specific error in QFASA diet estimations. ........................ 113
Figure 2.7 Summarized error in QFASA diet estimations by functional groups................... 114
Figure 2.8 Side-by-side barplots of raw diet estimations from QFASA modeling for black-footed albatross stomach oil samples from a) incubation and b) chick-brood. ..................... 115
Figure 2.9 Side-by-side barplots of raw diet estimations from QFASA modeling for Laysan albatross stomach oil samples from a) incubation and b) chick-brood. ................................ 116
Figure 2.10 Side-by-side barplots of QFASA diet estimations grouped by functional group for black-footed albatross stomach oil samples from a) incubation and b) chick-brood ............ 117
Figure 2.11 Side-by-side barplots of QFASA diet estimations grouped by functional group for Laysan albatross stomach oil samples from a) incubation and b) chick-brood. ................... 118
Figure 2.12 Diet Composition of a) black-footed and b) Laysan albatrosses across the incubation and chick-brood breeding phases. ...................................................................... 119
Figure 2.13 A canonical analysis of principal components shows which functional groups of prey drive the major differences in diet composition between species and breeding phase.120
Figure 2.14 Laysan and black-footed albatrosses use different strategies to exploit fisheries resources. ............................................................................................................................. 121
Figure 2.15 Amundson-Costello plots showing feeding strategies of a) black-footed and b) Laysan albatrosses. .............................................................................................................. 122
x
Chapter 3
Figure 3.1 Post-Breeding Migration Chronology Relative to Flight Feather Molting Chronology ............................................................................................................................ 161
Figure 3.2 Using sea-surface temperature (SST) time-series records to truncate post-breeding migrations ............................................................................................................... 162
Figure 3.3 Final Trip Estimations from geolocation data processed through ‘BAStag’ and ‘SGAT’ packages in R for a) black-footed albatrosses and b) Laysan albatrosses .............. 163
Figure 3.4 Longhurst’s Marine Provinces ............................................................................. 164
Figure 3.5 Home range size (km2) decreases with age in both a) black-footed albatrosses and b) Laysan albatrosses .................................................................................................... 165
Figure 3.6 The effect of molt extent on activity (core area size) across the post-breeding migration in albatross ............................................................................................................ 166
Figure 3.7 Habitat composition during molting months of post-breeding albatross migrations .............................................................................................................................................. 167
Figure 3.8 Results of four separate canonical analyses of principle components showing the effect of sex and age class on habitat composition in post-breeding migrations.................. 168
Figure 3.9 Effect of molt extent on habitat composition in post-breeding migrations of a) black-footed and b) Laysan albatrosses ............................................................................... 169
Figure 3.10 Tracks of two individuals with migrations tracked in two consecutive years indicate a high level of site fidelity in these species .............................................................. 170
Figure 3.11 Site fidelity across years in post-breeding migrations is greatest in molting months................................................................................................................................... 171
Figure 3.12 Laysan albatrosses with large extent molts appear to take advantage of a spring bloom of primary productivity in the Transition Zone Chlorophyll Front ............................... 172
Figure 3.13 Samalga Pass (indicated by red dashed line) as a point of habitat delineation between Laysan albatross (yellow circles) and black-footed albatross (cyan circles). ......... 173
xi
Thesis Abstract
Comparative behavior, diet, and post-breeding strategies of two sympatric North Pacific albatross species (Phoebastria sp.)
Melinda Conners
A fundamental condition of the struggle for existence is resource limitation. Optimal foraging
theory describes how individuals refine behavior to most efficiently exploit available
resources. For colonial breeding animals, such as seabirds, competition for limited resources
is amplified by a high density of competitors at feeding grounds near the colony, which can
lead to a diversification of foraging strategies that best exploit available resources. Laysan
and black-footed albatrosses (Phoebatria immutabilis and P. nigripes, respectively) breed
sympatrically and synchronously in dense colonies on small atolls throughout the
northwestern Hawaiian Islands. While the distributions and habitat preferences of these
congeners are well described, the variability in foraging strategies driven by niche partitioning
is not. In chapter 1, I used fine-scale behavioral data from GPS data-loggers to tease apart
subtle behavioral nice partitioning between and within Laysan and black-footed albatrosses
constrained to poor-nutrient tropical waters during the most energetically-demanding
reproductive stage in birds: the brood-guard. Albatrosses showed discrete behavioral
partitioning both between and within species, which was driven by differences in nocturnal
and diurnal foraging and by sex-specific strategies. Black-footed albatrosses exhibited
greater variability in foraging patterns suggesting they may experience strong intraspecific
competition at Tern Island. In chapter 2, I employed a novel adaptation of a biochemical diet
analysis, quantitative fatty acid analyses, to investigate dietary niche partitioning across the
breeding season. This analysis characterized diet of individual adult albatrosses across the
breeding season, from incubation to the chick-brood, for the first time in these species.
xii
Additionally, this research extended beyond diet characterization to quantify dietary
dependence on fisheries-associated resources for these two species. One of the primary
threats to albatross is the incidental mortality of birds from fisheries bycatch, therefore,
understanding the incidence of fisheries-associated food in the diet of a breeding colony of
albatrosses could have important conservation implications. While older birds tended to
consume more squid than younger birds, we did not identify an age bias in birds that
exploited fisheries resources. Parallel with results from the behavioral analysis in chapter 1, I
found that black-footed albatrosses had greater dietary flexibility than Laysan albatrosses at a
population level, and a greater degree of dietary specialization at the individual level. In the
final chapter, I looked at how the obligatory act of flight feather molt impacted activity levels
and space use across the post-breed migrations, when albatrosses are freed from central
place foraging constraints, but limited by demands of self-maintenance. I found that activity
levels, but not habitat use, were impacted by molt extent. Habitat use appeared to be
primarily driven by consistent individual preferences, with birds showing a high degree of site
fidelity to their post-breeding molting grounds. A clear decrease in home range size with age
indicated that birds spend less time searching for profitable feeding grounds when they are
older, likely a product of accumulated memory and experience in these long-lived species.
This research was approved by the animal care and use committee of the
University of California Santa Cruz (UCSC) and by permits from the
Papahānaumokuākea Marine National Monument (PMNM-2008-006, PMNM-
2009-004, PMNM-2011-015) and Special Use Permits (SUPs) from the US Fish &
Wildlife Service (USFWS).

xiii
Acknowledgements
Eight years ago, I found myself on a tiny plane navigating toward a tiny atoll in the middle of
the Pacific Ocean with a briefcase full of electronic tagging equipment wondering just how I
was going to pull that field season off. Scott Shaffer, thank you for taking a huge chance on a
shy and awkward field grunt and passing me the academic baton to see how far I’d run with
it. I will always treasure the incredible opportunity of living among albatross for seventeen
months on Tern Island. They are now in my heart and under my skin, and I am infinitely
grateful for that experience. Additionally, thank you for your guidance in the development of
this dissertation and for your unwavering support for your students.
I am very grateful for the support of my committee members: Elliott Hazen, Daniel
Costa and Raphael Kudela. Raphe, thank you for the time you have invested in this thesis
and for your feedback along the way. Elliott, a huge thanks for your extremely rapid and
immensely helpful responses to late night statistical questions tinged with panic. I remember
the day I surprise ambushed you in the hallway to ask if you would be on my committee and I
am so very glad you said yes. Thank you for your approachability and great advice given,
throughout your time on my committee. Dan, it has been such an enriching experience being
part of your Marine Vertebrate Physiological Ecology lab here at UCSC - thank you for
adopting yet another wayward seabird student. Your feedback always brings my minutia-
focused mind into the broader scheme of things, greatly improving my work as a scientist.
Thank you so much for so genuinely caring about your students. In addition I want to
sincerely thank my collaborators: Suzanne Budge, William Walker, Michael Sumner and
Yoko Mitano for invaluable guidance, support, and advice along the way.
The text of this dissertation includes material from the following previously published
material: Conners MG, Hazen EL, Costa DP, Shaffer SA. 2015. Shadowed by scale: subtle behavioral niche partitioning in two sympatric, tropical breeding albatross species. Mov. Ecol. 3:28.
xiv
Reproduction of this manuscript as Chapter 1 falls under BioMed Central’s that “Copyright on
any open access article in a journal published by BioMed Central is retained by the
author(s)”. This work was original research by Melinda G. Conners, with contributions from
co-authors as minor revisions of text or of statistical advice. Supplementary materials from
this published material from Conners et al. (2015) were integrated into Chapter 1.
I am grateful for financial support from the Tagging of Pacific Predators (TOPP)
program (funded by the National Ocean Partnership Program, the Office of Naval, the
Gordon and Betty Moore, David and Lucille Packard and Alfred P. Sloan Foundations) and
from the the Pacific Islands Climate Change Cooperative (PICCC), together which provided
most of the financial support for the field and lab components of this project. I am deeply
grateful to NOAA’s Dr. Nancy Foster scholarship program which supported my graduate
career through tuition and stipend from 2010-2014, allowing me to spend a large proportion
of my time years on Tern Island or in Canada at the marine lipids laboratory of Dr. Sue
Budge. I am also thankful to the Nancy Foster program for the network of truly incredible
people that make up their staff and scholars, and for the extremely valuable trainings and
opportunities provided to the scholars through the program. I am deeply thankful for
additional funding from the Friends of Long Marine Lab, Dr. Earl H. Meyers and Ethel M.
Meyers Oceanographic and Marine Biology Trust, the UCSC Women’s Club, the Marilyn C.
and Raymond E. Davis Memorial, and UCSC for a Regent’s Fellowship.
I want to thank the U.S. Fish and Wildlife Service and the Papahānaumokuākea
Marine Natinal Monument for financial and logistic support and for permission to conduct
research on Tern Island. I extend my sincerest thanks to all the USFWS volunteers on Tern
Island that spent countless hours assisting me in the field, and without which this research
would not have been possible: S. Youngren, R. Brown, D. Rapp, C. Kroeger, M. Gilmour, J. &
K. Macaulay, I. L. Jones, K. Burkinshaw, C. Suidzinski, S. Leucht, B. Erickson, S. Thomsen,
and B. Drummond. Thank you to USWFS support staff: D. Zabriskie, P. Leary, P. Hartzell, T.

xv
Benally and especially E. Flint and M. Naughton. A huge thanks to the notorious M/V Kahana
& crew for numerous journeys to and from the northwestern Hawaiian Islands. I particularly
want to extend my deepest gratitude to Sarah Youngren, Dan Rapp, Ruth Brown, Ian Jones
and Caitlin Kroeger for their support in the field on Tern Island. Sarah Youngren and Dan
Rapp, you are family now. Ruth, I will come find you on the Shire. Ian, thank you so much for
your mentorship (and pizza-making skillz). Caitlin, I am grateful for you showing me the
proper way to bleed a bird, although I’m still glad we didn’t decide on the jugular. An
additional thanks to Michelle K, Morgan G and Caitlin K for collecting data on Tern that I
incorporated into this thesis or other manuscripts.
Many thanks to the small army that is, and was, the Costa Lab throughout my tenure:
Michelle Kappes, Sara Maxwell, Melinda Fowler, Cory Champagne, Mike Tift, Yann
Tremblay, Sam Simmons, Patrick Robinson, GItte McDonald, Stella Villegas, Luis Huckstadt,
Greg Breed, Autumn-Lynn Harrison, Nikky Teutcshel, Rachael Orben, Chandra Goetsch,
Sarah Peterson, Jen Maresh, Lisa Schwarz, Kimberley Goetz, Justine Jackson-Ricketts,
Claudio Rojas, Caitie Kroeger, Morgan Gilmour, Caroline Casey, Elizabeth McHuron, Sarah
Kienle, and Rachel Holser. Thanks to all of you for your support and laughter over the years.
Rachel O., Chandra G., Kim G., Rachel H. and Liz M., in particular, provided support in
reviewing drafts of this thesis, as well as many poster and oral presentation drafts, and I am
so grateful for your help.
Michelle K., the social scene of Santa Cruz has never recovered since you left.
Thank you for providing such a warm and welcoming environment for the newbie student.
Fowler, my “Melinda-in-Crime”, you really made our house on Errett a home. Thank you for
your bottomless cake pan and warm nurturing soul. Rachael and Chandra, I’m so glad I was
on this journey with the both of you. Seems like a lifetime ago, we were all sitting down at La
Cabaña for the first time. Thank you for your support in all dimensions: both academic and
personal. Kimberley Goetz, we have so many inside jokes and I want to write them all down,
but will have to limit it to “WWAD??” You’ve become a very dear friend and thank you for your

xvi
constant presence in my life, even while halfway around the world. If it weren’t for our daily
work sessions and accountability threats, I think I’d still be on my first chapter … Luis H. and
Rachel H., I am taking you both with me. Thank you for being the kind of people that I can
always count on no matter what. I’m already planning our city excursions in Chicago. Sara
Maxwell and Nikky Teutchel, you are life support. Thank you for the endless love, laughter
and merping. Sara Maxwell, in particular, you have become such a mentor over the years. I
am endlessly grateful for your guidance, your wisdom and your ‘you-know-what’ attacks. A
special thanks to the Henry’s: Bill, Alli, Savannah, Esme and Maise-Dog for being more like
family than neighbors. I will miss the morning pitter patter more than you will ever know.
Thank you to the house on Western for your friendship and support. I am sincerely grateful to
Jamie Grover, Lillian Carswell, and Jen Maresh for their joyful canid affections.
I am grateful beyond words for my family, scattered throughout California and
beyond. I want to thank my brothers for making me scrappy and independent, and my
grandparents for being the world’s best role models and always reminding me of what’s
important. Thank you mom and dad for your bottomless support, love and encouragement,
without which I would not have completed this dissertation. Thank you to all my family for
being patient while I missed yet another holiday during graduate school. Hundreds of miles
apart, you all keep me anchored into the ground, so thank you.
To my partner Adam Fox, thank you for making a huge leap of faith and moving from
Hawaii to Santa Cruz to see about a girl. Your boundless love and acceptance has made this
journey warm and full of light. Thank you for your courage, patience, and commitment to
stand by my side through all of it. And, to our Tuk, thank you for keeping me wild and always
reminding me of all the fantastical creatures that live in mysterious places far away from my
computer. And for keeping our house full of joy, laughter, and the ever-present dogfart.
Finally, to the birds themselves, my biggest thanks. *

xvii
Dedication
To those who have yet to fledge their nests: Mason, Wyatt, Hudson, Ollie-bean and Emma,
may you grow up into a world where albatross still scour the seas and squid haunt the depths
* To my grandparents for weaving me into a fabric of joy, grace, and love
* To my one and only mom and dad for always encouraging me to explore
where the wild things are
You can know the name of a bird in all the languages of the world, but when you’re
finished, you’ll know absolutely nothing whatsoever about the bird ….
So let’s look at the bird and see what it’s doing — that’s what counts.
— Richard Feynman
Mad as the sea and wind, when both contend
Which is mightier…
— William Shakespeare, Hamlet, 1601
1
Introduction & Synthesis
Seabirds are, in a sense, amphibious. While they rely exclusively on the marine environment
for feeding, they nest and raise their young on land. This habitat duality imposes two
interacting challenges on breeding seabirds: 1) given limited suitable land for nesting sites,
seabirds often breed in dense colonies and therefore face intense competition for food in
waters near the breeding colony (Ashmole 1971, Birt et al. 1987); and 2) foraging ranges are
limited by the need to return to the nest to feed and guard chicks, amplifying competition over
limited resources (Orians and Pearson 1979, Costa 1991). Competition at breeding colonies
can further intensify if similar species also breed in the same place at the same time, which is
often the case, since land suitable for breeding is rare and/or remote, and because most
species, especially those breeding in temperate latitudes, sync their breeding cycles with
seasonal booms in ocean productivity (Ainley 1977, Schreiber and Burger 2001).
Populations respond to competition by adjusting where or when they forage, or what
they feed on, resulting in the development of distinct species-specific niches over time
(Gause 1934). Furthermore, when food becomes scarce due to high density of competitors
from the same species, the population will begin to exploit less preferred prey, broadening its
dietary niche; but while the population niche broadens, individuals begin to specialize on what
they feed on, narrowing their niche relative to that of the population (Roughgarden 1972,
Holbrook and Schmitt 1992, Tinker et al. 2008). Alternatively, rather than responding by
dietary niche, populations can respond behaviorally by foraging at different times of day or in
different areas or by ranging farther from the colony where preferred prey is more abundant
(Lewis et al. 2001). When different behaviors and strategies diversify within a population due
to competitive pressures, it can result in different consequences from these different
strategies, with some individuals foraging less efficiently than others or foraging in riskier
areas (e.g. greater overlap with human development). This can have serious conservation
2
implications, especially if risk (and thus mortality) varies for different subsets of the
population.
While research on interactions between competing species is very common in
ecology, interactions are much more difficult to study in elusive pelagic animals like seabirds.
Albatrosses are the largest and most pelagic of seabirds, commonly ranging across entire
ocean basins in a single foraging trip (Tickell 2000). Consequently, it is difficult to observe
their behavior at sea, particularly their interactions with other species. Furthermore,
estimating the diet of Procelleriform seabirds, such as albatross, has proven difficult, in part
due to their hyperacidic stomachs (Grémillet et al. 2012) that rapidly digest prey into energy-
rich stomach oil (Imber 1976, Warham 1977). The quick conversation of prey into oil is
thought to be an adaptation to “lighten the load” for these highly transitory pelagic birds.
Thus, how albatrosses partition their exploitation of marine resources is not well understood.
Black-footed (Phoebastra nigripes) and Laysan (P. immutabilis) albatrosses are two
of three Phoebastria species in the North Pacific. They predominately breed throughout the
tropical atolls of the northwestern Hawaiian Islands, while the third species, the short-tailed
albatross (P. albatrus) breeds on a few islands in higher latitudes. Despite a near extinction
from human exploitation in the early 1900s (Tickell 2000), both Laysan and black-footed
albatross populations have recovered, although they are both listed as Near Threatened on
the IUCN Red List (IUCN 2014). With growing populations and dense breeding colonies,
these two species are likely to compete with each other, especially during the chick-brood
season when foraging grounds overlap in subtropical waters (Hyrenbach et al. 2002, Kappes
et al. 2015). While morphologically and functionally very similar, these two species show
different patterns in their reproductive success, with Laysan albatross success fluctuating to a
much greater degree than that of black-footed albatrosses (Arata et al. 2009, Flint 2009).
Understanding how this community of albatross partitions resources through behavior and
diet will potentially provide insight into the differences in reproductive success between the
two species.
3
When seabirds complete their breeding season, they are released from the
constraints of competition and central place foraging imposed on them by the dynamics of
breeding in dense colonies. However, the post-breeding season (June - November in
Phoebastria albatross species) is a critical part of the annual cycle for seabirds, in which they
must replace flight feathers through molting activity, a process which is considerably
energetically demanding (Murphy 1996). The costly activity of molt and high concentrations of
birds in so-called ‘molting grounds’ likely imposes their own sets of constraints and limitations
onto post-breeding albatrosses. Distributions of birds during the molting months are much
more localized than one would expect after being freed from constraints of central place
foraging, likely as a consequence of reduced flight efficiency, causing birds to switch to more
sedentary foraging tactics. Additionally, the summer months of the North Pacific follow a
seasonal spring bloom of phytoplankton, so birds are likely tracking areas of concentrated
prey abundance that follows the spring bloom. Phoebastria albatrosses have a unique
strategy to negotiate the constraints of molt in the post-breed season; in any given year
individuals can initiate one of four molt patterns, providing them with flexibility in the extent of
their molt. Molt extent is likely to have a large impact on movement patterns and habitat use
in the post-breeding season, potentially rendering some birds more vulnerable than others.
Ultimately, this thesis aims to understand the causes and consequences of variability
in behavior, diet, and movement patterns across the breeding and post-breeding seasons for
two morphometrically and functionally similar species of albatross. While ship-based studies
are highly valuable in their ability to map species distributions (Shuntov 1974, Kuletz et al.
2014), only by using electronic data-logging technology, can we link individual characteristics,
such as breeding colony, breeding history and age, to behavior, movement patterns and
habitat use. This dissertation used a combination of miniaturized electronic data-loggers in
combination with a novel biochemical analysis to gather information on the movements and
diets of a community of albatrosses.
4
Thesis Summary
In CHAPTER ONE, I use fine-scale GPS data-loggers and a novel behavioral classification
analysis to tease apart subtle behavioral niche partitioning both between and within two
species of albatross during the breeding phase when the two species have the highest spatial
overlap. This research identifies behavioral differences previously unseen from tracking work
and also placed these differences in the context of environmental (moon and wind) and
intrinsic (sex and body size) factors. Both species were highly active, foraging across day and
night; however, Laysan albatrosses relied on foraging at night to a greater extent. For both
species, foraging along direct flight paths and foraging while drifting in a “sit-and-wait”
strategy were just as prevalent as foraging in a searching flight mode, indicating flexibility in
foraging strategies in Hawaiian albatross. Both species strongly increased drift forage on the
darkest nights, suggesting Hawaiian albatross feed on diel vertically-migrating prey to some
extent. Black-footed albatrosses showed a greater behavioral variability within the population
which suggests a higher level of intra-specific competition.
In CHAPTER TWO, I use an adaptation of quantitative fatty acid analysis (QFASA), where I
incorporate fatty acids and fatty alcohols from two separate lipid classes, to estimate the diet
of individual Laysan and black-footed albatrosses. My objectives are 1) to characterize and
compare the diet of two North Pacific albatrosses species across the incubation and chick-
brood phases of the breeding season when both species switch from foraging in high latitude
temperate waters to warmer subtropical waters, 2) to assess the relative importance of
fisheries-associated resources in Laysan and black-footed albatross diet and to test whether
year, breeding phase, species, sex or age influence fisheries-associations, and 3) to identify
feeding strategies of Laysan and black-footed albatrosses along the spectrum of dietary
5
generalism or specialism. I found that fisheries-associated diet did occur in both albatross
species across both the incubation and chick-brood stages but neither species relied on
fisheries food as the dominant food source. Some individuals, however, appeared to
specialize on fisheries food. Mesopelagic gelatinous squid was most dominate food source of
both species, and older birds showed heavier reliance on squid than younger birds. Overall,
black-footed albatrosses had a broader population niche width and greater dietary flexibility
than Laysan albatrosses, which is consistent with recent behavioral analyses.
In CHAPTER THREE, I investigate space use, measured by activity and habitat, of Laysan
and black-footed albatrosses from Tern Island across the post-breeding migration, when
activities related to self-maintenance are paramount and manifest in two discrete stages:
flight feather replacement through molt and the regaining of body condition to prepare for the
breeding season. Using a long-term tracking study (8 years of data), I investigate how
intrinsic characteristics (molt extent, sex and age) impact the activity and habitat use of
Laysan and black-footed albatrosses during the post-breeding season. Finally, I measure the
degree of site fidelity across the breeding season with a focus on the molting months. I found
that molt extent (as classified as ‘large’, ‘medium’, or ‘small’) did indeed impact activity level,
but not habitat, with birds with largest molt extents having the most significant reduction in
space use that began earlier in the post-breeding season than other birds. Molt extent did not
impact habitat use, likely because albatrosses showed a large degree of site fidelity to their
molting grounds between years. Age influenced home range size, with sizes decreasing with
age, most likely reflecting that birds accumulate memory and experience over time, thereby
reducing searching effort when pursuing suitable feeding grounds. While the productive
passes of the Aleutian Island archipelago and the California Current upwelling region were
important habitats for molting albatrosses, many albatrosses spent the molting months in
pelagic areas of the Transition Zone Chlorophyll Front, suggesting offshore oceanic zones
can also have productivity levels high enough to support birds that switch to a high residency
6
behavioral pattern due to flight feather molt. Sex had a strong influence on the timing of
departure and arrival times but only a minor influence on habitat. While environmental factors
certainly influence behavior of albatross at multiple scales, I showed that the intrinsic factors
of molt extent, sex and age play a large role in dictating the spatial patterns of post-breeding
albatross and are important factors to consider when examining this critical phase of the
annual cycle.
Synthesis of Ecological Implications
An overarching theme that emerged from this body of work is that the metrics calculated from
black-footed albatrosses repeatedly had greater variability during the chick-brood season
than those measured in Laysan albatrosses. Black-footed albatrosses had twice the number
of behavioral foraging patterns and a broader dietary niche in the chick-brood than Laysan
albatrosses. Although I only measured fine-scale behavior from the chick-brood season, an
analysis of landing rates from wet/dry archival tags across the entire breeding season
(Kappes et al. 2015) showed a notable increase in the variance of landing rates in black-
footed albatrosses, but not Laysan albatrosses, during the chick-brood. This, with our results
from the diet analysis, indicates that the collapse of range and high overlap of competing
birds during the chick-brood causes black-footed albatrosses to diversify their feeding
strategies, while Laysan albatrosses do not show as strong a response. Within Laysan
albatrosses, a subset of individuals during the chick-brood ranged significantly farther from
the colony than average, suggesting that this species responds to competition by increasing
range rather than by diversifying feeding strategy. Both diversification of strategies and range
expansion align with theoretical and experimental theory describing population responses to
intra-specific competition (Sokolowski et al. 1997, Svanbäck and Bolnick 2007, Araújo et al.
2008), however, our research cannot conclude that these responses are a direct response to
competition. Brooding albatrosses forage in much different oceanic habitats than incubating
7
or chick-rearing birds (Suryan et al. 2006, Kappes et al. 2015), and therefore, the behavioral
and dietary responses seen in the chick-brood, might be a simple reflection of a different
composition and availability of prey.
Less flexibility in behavior and diet within the Laysan albatross population agrees
with recent findings of Thorne et al. 2015 who linked a weaker response of Laysan
albatrosses to years of “poor” environmental conditions with reduced reproductive success,
highlighting potential demographic consequences of behavioral plasticity between the
species. The greater adaptability of black-footed albatrosses both across the breeding
season, and inter-annually, indicates this species may be more resilient to changing climate
than Laysan albatrosses, despite having much smaller population sizes (due to mortality from
longline bycatch (Cousins et al. 2000, Lewison and Crowder 2003, Véran et al. 2007)).
Despite greater flexibility in black-footed albatrosses, this thesis showed that both species
rely heavily on squid (~ 50-60 % of diet for each species across the breeding season) whose
distributions are predicted to shift north with the changing climate (Alabia et al. 2015). While
breeding albatrosses might be able to track these shifting distributions during the less
constrained incubation and chick-rear phases, the poleward shift of squid distributions could
have negative consequences on brooding albatrosses given their highly constrained foraging
ranges, ultimately impacting reproductive success. Reduced access to squid during the
chick-brood season might also force birds to supplement their diet with more unnatural
sources of food, such as fisheries-associated resources. So, while results from this thesis
found incidence, but not dominance, of fisheries-associated food in the diet of these two
species (~ 10 % of the diet of both species), we emphasize the importance of monitoring diet,
including fisheries reliance, over time, because as the climate continues to change, squid
distributions are predicted to shift, potentially having a large impact on optimal foraging
strategies of breeding North Pacific albatrosses.
Finally, this thesis highlights intrinsic factors, such as sex, age and molt extent, as
important factors driving measureable differences in albatross foraging and movement
8
patterns. Older birds of both species ate more squid than younger birds, potentially using
prior experience and memory of squid spawning cycles to better exploit this resource. Older
birds additionally had smaller home ranges than younger birds in the post-breeding season,
which suggests that they spent less time searching for profitable feeding grounds. Albatross,
as long-lived K-selected species, are likely to use experience and memory in the
development of optimal foraging strategies. That we found a high degree of site fidelity to
post-breeding molting grounds further supports memory and experience as important factors
shaping the behavior of Laysan and black-footed albatrosses. Finally, this work highlights the
post-breeding season as an energetically-demanding phase in the annual cycle, critical for
self-maintenance, where molt extent has strong impact on activity levels of birds.
References
Ainley, D. G. 1977. Feeding methods in seabirds: a comparison of polar and tropical nesting
communities in the eastern Pacific ocean. Pages 669–685 in G. Llano, editor.
Adaptations within Antarctic ecosystems. Proceedings of the Third SCAR Symposium
on Antarctic Biology. Smithsonian Institution, Washington, D.C., USA.
Alabia, I. D., S.-I. Saitoh, H. Igarashi, Y. Ishikawa, N. Usui, M. Kamachi, T. Awaji, and M.
Seito. 2015. Future projected impacts of ocean warming to potential squid habitat in
western and central North Pacific. ICES Journal of Marine Science.
Arata, J. A., P. R. Sievert, and M. B. Naughton. 2009. Status assessment of Laysan and
Blackfooted Albatrosses, North Pacific Ocean, 1923–2005.
Araújo, M. S., P. R. Guimarães, R. Svanbäck, A. Pinheiro, P. Guimarães, S. F. Dos Reis, and
D. I. Bolnick. 2008. Network analysis reveals contrasting effects of intraspecific
competition on individual vs. population diets. Ecology 89:1981–93.
Ashmole, N. P. 1971. Seabird ecology and the marine environment. Avian Biology 1:223–
286.
Birt, V. L., T. P. Birt, D. Goulet, and D. K. Cairns. 1987. Ashmole’s halo: direct evidence for
prey depletion by a seabird. Marine Ecology Progress Series.
Costa, D. P. 1991. Reproductive and foraging energetics of high latitude penguins,
albatrosses and pinnipeds: implications for life history patterns. Integrative and
comparative biology 31:111–130.
Cousins, K., P. Dalzell, and E. Gilman. 2000. Managing pelagic longline-albatross
interactions in the North Pacific Ocean. Marine Ornithology 28:158–174.
Flint, E. 2009. Hawaiian Islands National Wildlife Refuge and Midway Atoll National Wildlife
Refuge – annual nest counts through hatch year 2009. U.S. Fish and Wildlife Service,
unpublished report.
9
Gause, G. F. 1934. Experimental analysis of Vito Volterra’s mathematical theory of the
struggle for existence. Science 79:16–17.
Grémillet, D., A. Prudor, Y. le Maho, and H. Weimerskirch. 2012. Vultures of the seas:
hyperacidic stomachs in wandering albatrosses as an adaptation to dispersed food
resources, including fishery wastes. PloS one 7:e37834.
Holbrook, S. J., and R. J. Schmitt. 1992. Causes and consequences of dietary specialization
in surfperches: patch choice and intraspecific competition. Ecology:402–412.
Hyrenbach, K., P. Fernández, and D. Anderson. 2002. Oceanographic habitats of two
sympatric North Pacific albatrosses during the breeding season. Marine Ecology
Progress Series 233:283–301.
Imber, M. J. 1976. The origin of petrel stomach oils: a review. The Condor 78:366–369.
IUCN2014. 2014. IUCN 2014. The IUCN Red List of Threatened Species.
http://www.iucnredlist.org.
Kappes, M. A., S. A. Shaffer, Y. Tremblay, D. G. Foley, D. M. Palacios, S. J. Bograd, and D.
P. Costa. 2015. Reproductive constraints influence habitat accessibility, segregation,
and preference of sympatric albatross species. Movement Ecology 3:34.
Kuletz, K. J., M. Renner, E. a. Labunski, and G. L. Hunt. 2014. Changes in the distribution
and abundance of albatrosses in the eastern Bering Sea: 1975–2010. Deep Sea
Research Part II: Topical Studies in Oceanography 109:282–292.
Lewis, S., T. N. Sherratt, K. C. Hamer, and S. Wanless. 2001. Evidence of intra-specific
competition for food in a pelagic seabird. Nature 412:816–819.
Lewison, R. L., and L. B. Crowder. 2003. Estimating fishery bycatch and effects on a
vulnerable seabird population. Ecological applications : a publication of the Ecological
Society of America 13:743–753.
Murphy, M. E. 1996. Energetics and nutrition of molt. Pages 158–198 Avian energetics and
nutritional ecology. Springer.
Orians, G. H., and N. E. Pearson. 1979. On the theory of central place foraging. Analysis of
ecological systems. Ohio State University Press, Columbus:155–177.
Roughgarden, J. 1972. Evolution of niche width. American naturalist.
Schreiber, E. A., and J. Burger. 2001. Biology of marine birds. CRC Press.
Shuntov, V. P. 1974. Sea birds and the biological structure of the ocean.
Sokolowski, M. B., H. S. Pereira, and K. Hughes. 1997. Evolution of foraging behavior in
Drosophila by density-dependent selection. Proceedings of the National Academy of
Sciences of the United States of America 94:7373–7377.
Suryan, R. M., F. Sato, G. R. Balogh, K. Hyrenbach, P. R. Sievert, and K. Ozaki. 2006.
Foraging destinations and marine habitat use of short-tailed albatrosses: A multi-scale
approach using first-passage time analysis. Deep Sea Research Part II: Topical Studies
in Oceanography 53:370–386.
Svanbäck, R., and D. I. Bolnick. 2007. Intraspecific competition drives increased resource
use diversity within a natural population. Proceedings: Biological Sciences 274:839–
844.
Thorne, L. H., E. L. Hazen, S. J. Bograd, D. G. Foley, M. G. Conners, M. A. Kappes, H. M.
Kim, D. P. Costa, Y. Tremblay, and S. A. Shaffer. 2015. Foraging behavior links climate
variability and reproduction in North Pacific albatrosses. Movement Ecology 3:27.
10
Tickell, W. L. N. 2000. Albatrosses 117:433–451.
Tinker, M. T., G. Bentall, and J. A. Estes. 2008. Food limitation leads to behavioral
diversification and dietary specialization in sea otters. Proceedings of the National
Academy of Sciences 105:560–565.
Véran, S., O. Gimenez, E. Flint, W. L. Kendall, P. F. Doherty JR, and J.-D. Lebreton. 2007.
Quantifying the impact of longline fisheries on adult survival in the black-footed
albatross. Journal of Applied Ecology 44:942–952.
Warham, J. 1977. The incidence, functions and ecological significance of petrel stomach oils.
Proceedings of the New Zealand Ecological Society 24:84–93.
11
CHAPTER ONE
Shadowed by scale: subtle behavioral niche partitioning in two sympatric, tropical breeding albatross species
Melinda G. Conners, Elliott L. Hazen, Daniel P. Costa, Scott A. Shaffer
12
ABSTRACT
To meet the minimum energetic requirements needed to support parents and their
provisioned offspring, the timing of breeding in birds typically coincides with periods of high
food abundance. Seasonality and synchrony of the reproductive cycle is especially important
for marine species that breed in high latitudes with seasonal booms in ocean productivity.
Laysan and black-footed albatrosses breeding in the northwestern Hawaiian Islands have a
dual reliance on both seasonally productive waters of high latitudes and on nutrient-poor
waters of low latitudes, because their foraging ranges contract during the short but critical
brood-guard stage. Therefore, these species face an additional constraint of having to
negotiate nutrient-poor waters during the most energetically-demanding stage of the breeding
cycle. This constriction of foraging range likely results in a higher density of foraging
competitors. Thus, our aim was to understand how Hawaiian albatross partition resources
both between and within species in this highly constrained breeding stage while foraging in
less productive waters and simultaneously experiencing increased competition. High-
precision GPS dataloggers were deployed on black-footed (Phoebastria nigripes, n=20) and
Laysan (Phoebastria immutabilis, n=18) albatrosses during the brood-guard stage of the
breeding season in 2006 (n=8), 2009 (n=13), 2010 (n=16) and 2012 (n=1). We used GPS
data and movement analyses to identify six different behavioral states in foraging albatrosses
that we then used to characterize foraging trips across individuals and species. We examined
whether variations in behavior were correlated with both intrinsic factors (sex, body size, body
condition) and extrinsic factors (lunar phase, wind speed, year). Behavioral partitioning was
revealed both between and within species in Hawaiian albatrosses. Both species were highly
active during chick-brooding trips and foraged across day and night; however, Laysan
albatrosses relied on foraging at night to a greater extent than black-footed albatrosses and
exhibited different foraging patterns at night. For both species, foraging along direct flight
paths and foraging on the water in a “sit-and-wait” strategy were just as prevalent as foraging
13
in a searching flight mode, indicating flexibility in foraging strategies in Hawaiian albatross.
Both species strongly increased drift forage at night when the lunar phase was the darkest,
suggesting Hawaiian albatross feed on diel vertically-migrating prey to some extent. Black-
footed albatrosses showed a greater variation in foraging behavior between individuals which
suggests a higher level of intra-specific competition. This behavioral variability in black-footed
albatrosses was not correlated with sex or body size, but differences in body condition
suggested varying efficiencies among foraging patterns. Behavioral variability in Laysan
albatrosses was correlated with sex, such that females exhibited greater flight foraging than
drift foraging, had longer trip durations and flew farther distances from the breeding colony,
but with no difference in body condition. Fine-scale movement data and an analysis of
multiple behavioral states identified behavioral mechanisms that facilitate coexistence within
a community of albatross during a critical life-history period when energetic demands are
high, resources are limited, and competition for food is greatest.
1.1 BACKGROUND
Reproductive strategies in birds arise from a complex interaction among phylogenetic and
morphological constraints and environmental conditions (Lack 1968, Martin 1987, Stearns
1992, Owens and Bennett 1995). Seabirds compared to other taxa, have low annual
fecundity and older minimum breeding ages, accruing reproductive output over long lifespans
(Ricklefs 1990, Weimerskirch 2001). Moreover, seabirds foraging in pelagic waters rely on
efficient flight and tend to have the lowest fecundities and highest rates of adult survival
(Weimerskirch 2001). These species are more likely to defer breeding if the cost of
reproduction reduces adult survival beyond a critical threshold (Chastel et al. 1995, Crossin
et al. 2013). To meet the minimum energetic requirements to support both parents and their
offspring, breeding typically coincides with periods of high food abundance (Lack 1968,
Perrins 1970, Le Corre 2001). Seasonality and synchrony of the reproductive cycle is
14
especially important in seabirds that breed in temperate and polar regions where mesoscale
features enhance ocean productivity and are predictable but occur in narrow temporal
windows (e.g., seasonal coastal upwelling, ice-edge blooms) (Ashmole 1971, Ainley 1977,
Nelson 1983, Bertram et al. 2001). In contrast, seabirds breeding in tropical and subtropical
regions rely on less abundant, patchier resources (Ainley 1977, Seki and Polovina 2001), and
associate with sub-mesoscale features such as eddies and filaments (Haney 1986a, 1986b,
Tew Kai et al. 2009). Here, productivity peaks with less magnitude than in higher latitudes,
and is episodic rather than confined to a single defined season (Ashmole 1971).
Consequently, breeding of tropical seabirds, in general, shows weaker synchrony than their
temperate counterparts (Harris 1969, Harrison 1990), is often protracted, and can occur
throughout the year (Schreiber and Ashmole 1970).
Black-footed (Phoebastria nigripes) and Laysan (P. immutibilis) albatrosses that
breed sympatrically and synchronously in dense colonies distributed throughout the
northwestern Hawaiian islands are atypical for albatrosses in their reliance on tropical feeding
grounds (sea-surface temperatures ≥ 25º C, Ballance and Pitman 1999) during the brood-
guard reproductive stage (Hyrenbach et al. 2002, Kappes 2009), when chicks are too small to
self-thermoregulate and are continually attended by at least one parent. The majority of
albatross species breed in high latitudes in the southern hemisphere and match the brood-
guard stage with seasonal highs in primary production in temperate or sub-polar waters
(Tickell 2000). Hawaiian albatrosses exploit cooler and more productive waters associated
with high latitudes during the longer foraging trips of the incubation and post-guard
reproductive stages when they can range farther from the nest. However, they are limited to
warm, tropical waters near the breeding colony while caring for small vulnerable chicks that
require frequent feedings (Hyrenbach et al. 2002, Kappes 2009). The brood-guard is the
most energetically demanding breeding stage in birds (Drent and Daan 1980, Ricklefs 1983),
and it is common for adult albatrosses to lose body mass during this period (Weimerskirch
15
and Lys 2000, Kappes 2009). It is therefore notable that Hawaiian-breeding albatrosses can
rely on such suboptimal feeding grounds during this particularly constrained life history stage.
The limited spatial extent of foraging grounds during the brood-guard increases the potential
for competitive interactions within and among species (Ashmole 1963, Birt et al. 1987,
Schreiber and Burger 2001). For most of the year, black-footed and Laysan albatrosses
clearly segregate at sea with distinct habitat preferences (Fernández et al. 2001, Fischer et
al. 2009, Kappes et al. 2010, Gutowsky et al. 2014), but during the brood-guard stage this
spatial segregation breaks down and focal ranges (defined as the highest 50% utilization
distribution) of the two species overlap by 75.4% (Kappes 2009) (Figure 1.1 GPS locations of
incubating and chick-brooding Laysan (n=114) and black-footed (n=118) albatross breeding
at Tern Island.). The radiation of foraging strategies among sympatrically-breeding seabirds
to minimize competition and maximize resource allocation is well documented with species
delineating strategies by time (e.g., Zavalaga et al. 2011), space (e.g.,Ballance et al. 1997),
and morphology (e.g., González-Solís et al. 2000); however, how black-footed and Laysan
albatrosses partition resources during the short but critical brood-guard stage remains
unclear.
The original characterization of niche partitioning between these species — that
Laysan albatrosses are nocturnal foragers of vertically-migrating squid while black-footed
albatross are predominantly diurnal scavengers of fish roe and carcasses (Harrison et al.
1983) — was based on two lines of evidence: 1) Laysan albatrosses have relatively high
levels of rhodopsin, a light-sensitive pigment typically found in high levels among nocturnal
birds (unpublished data, Sillman 1981, Harrison et al. 1983), and 2) Laysan albatrosses have
a larger component of squid in their diet than black-footed albatrosses who have greater
proportions of fish eggs and carrion (Harrison et al. 1983). But more recent diet and tracking
studies do not support nocturnal foraging in Laysan albatrosses and conclude that both
species likely have daytime biased foraging (Fernández and Anderson 2000, Pitman et al.
2004, Walker et al. 2012). Additionally, activity budgets (based on data from wet-dry loggers)
16
between the two species were found to be the most similar during the brood-guard (Kappes
2009), further complicating our understanding of how these albatross species partition
resources in tropical waters. However, niche separation between species can be obvious, but
it can also be quite subtle, like McArthur’s classic observation of congeneric warblers that
forage simultaneously on insects in the same trees but at distinct heights and on different
diameter branches (MacArthur 1958). Such subtlety can limit our understanding of niche
partitioning among difficult to observe animals, such as wide-ranging pelagic marine species
like albatross.
Niche partitioning within a species may also be important for central place foragers
as it provides an additional mechanism for reducing competition (Araújo et al. 2007, Villegas-
Amtmann et al. 2008, Masello et al. 2010). Often, within species variability of foraging
strategies is linked to distinct intrinsic characteristics such as sex, body size, and age (Polis
1984, Shaffer et al. 2001, Jeglinski et al. 2013), but has even been correlated with personality
(Patrick and Weimerskirch 2014a); this variability is important to understand as it can affect
fitness (Watanuki 1992, Votier et al. 2004, Patrick and Weimerskirch 2014a, 2014b) and,
therefore, population demographics. Within species niche partitioning is frequently more
pronounced as the density of conspecifics increases, often as a result of short-term
behavioral plasticity in foraging strategies (Svanbäck and Bolnick 2007, Tinker et al. 2008).
Consequently, quantifying the level of individual variability both within populations and among
closely related species can illustrate the degree of competitive stressors (Araújo et al. 2011).
Here, we propose that, given the reduction of spatial extent during the brood-guard,
behavioral niche partitioning within and between species is likely occurring at finer scales
than would be observable from the resolution of geolocation or Argos data used in previous
studies. We used GPS data with greater precision in spatial (<10 m error in >95% locations)
and temporal (1 fix 10 s-1) scales to identify six different behavioral states along albatross
foraging trips to: (1) investigate behavioral partitioning between black-footed and Laysan
albatrosses during the brood-guard, particularly focusing on diurnal/nocturnal differences and
17
the influence of the lunar cycle; (2) assess and quantify the amount of within species
partitioning of foraging patterns; and (3) identify intrinsic drivers (body size, sex) and potential
consequences (measured by body condition) of those patterns. Our ultimate objective was to
understand the behavioral mechanisms facilitating coexistence within a community of
albatross during a critical life-history stage when energetic demands are high, resources are
limited, and competition for food is great.
1.2 METHODS
1.2.1 Study species and study location
Black-footed and Laysan albatrosses are highly migratory and pelagic surface feeders
thought to depend primarily upon visual and olfactory cues to find prey at the ocean surface
(Nevitt et al. 2008). They are the smaller-bodied of the three Phoebastria species breeding in
the North Pacific, a trait thought to be related to the relatively lighter winds encountered in the
lower latitudes of the central North Pacific during the breeding season (Suryan et al. 2008).
Their populations primarily breed in the low-lying atolls of the northwestern Hawaiian Islands
and, unlike albatrosses of the southern hemisphere, they time breeding with the winter
season. Males and females are slightly sexually dimorphic, with males being marginally
larger and heavier than females, but there is overlap in all of these morphometric
measurements (Tickell 2000, this study). Single egg clutches are laid in November and
December, chicks hatch in January and February, and chicks are guarded and fed frequently
by adults into March. The post-guard period, when adults extend the range and duration of
foraging trips and chicks are fed infrequent meals, extends into summer until chicks fledge
(July-August).
The study colony at Tern Island in the French Frigate Shoals (23.870°N, 166.284°W,
712 km northwest of Kauai) supports ~4000 breeding pairs of black-footed albatrosses and
~3000 of Laysan albatrosses and is the only colony in the northwestern Hawaiian islands
18
where the density of black-footed albatrosses is greater than that of Laysan albatrosses (Flint
2009). Although populations of both species have partially recovered since their decimation
from the feather and egg trade in the early 1900s (Tickell 2000), they are listed as near-
threatened species on the IUCN red list, and population stability for black-footed albatrosses
is vulnerable to adult mortality from fisheries bycatch (Lewison and Crowder 2003, Véran et
al. 2007, IUCN 2014).
1.2.2 Tracking methods
To collect fine-scale behavioral data on foraging albatrosses during the brood-guard season,
we deployed GPS dataloggers on 18 Laysan and 20 black-footed albatrosses in February
and March (2006: (n=8), 2009: (n=13), 2010: (n=16), 2012: (n=1)) at Tern Island. GPS
dataloggers weighed either 35 g (iGot-U GT- 120, Mobile Action Technology Inc.) or 30 g
(Technosmart GiPSY-2 logger). Tags recorded positions with a temporal resolution of 1 fix
every 10 s to provide fine-scale foraging behavioral data without behavioral “noise” of fine-
scale flight adjustments to the wind that are recorded with smaller sampling rates (Fritz et al.
2003). GPS dataloggers were housed in unlubricated condoms and polyethylene pouches
and attached to 3-5 dorsal contour feathers using TESA cloth tape. For a subset of birds of
each species, 3.6 g Lotek geolocators (LAT2500) were attached to the plastic auxiliary leg
band with cable ties and epoxy for concurrent research (these data were not used in this
study). Total tag weight represented 1.2-1.6% the weight of the bird, depending on species
and datalogger combination; this range of percentages is well below the suggested maximum
tag weight of 3% recommended for gliding seabirds such as petrels and albatrosses (Phillips
et al. 2003, Vandenabeele et al. 2011).
1.2.3 Individual characteristics
To assess intrinsic factors as potential drivers of different foraging strategies, we created a
body size index for each bird from morphometrics. Lengths of the culmen, tarsus, and
19
minimum and maximum bill height were measured to ± 0.5 mm using vernier calipers. Body
Size and Body Condition: For each species, we ran a principal components analysis (PCA)
on standardized lengths of bill measurements and extracted single factor scores to construct
a composite body-size index for each albatross (Shaffer et al. 2001). Tarsus was not included
in the body-size PCA because measurements from 2006 were consistently smaller than
those from other years, likely due to measurement bias of data recording personnel.
Consequently the body size index includes only bill size, but provides an accurate score of
size because bill size often correlates with body size. To increase the power of the PCA, we
ran the analysis on a larger sample size of birds, from both species, by including
morphometrics of birds from a concurrent study (Laysan, n = 163; black-footed, n = 167).
Body mass was measured to ± 50 g on tag deployment and recovery using a spring-loaded
Pesola scale. Subsequently, general body condition was calculated as an individual’s
residual distance from the regression of body mass at deployment against body size index
(Shaffer et al. 2001). Sex Determination: Sex was recorded from either 1) a visual
comparison when a pair was seen together attending the nest and size differences were
observable, 2) predicted from a discriminant function analysis on morphometrics or 3) from
DNA molecular identification (Shaffer et al. 2001). The sex of all birds from 2006 was
identified with molecular DNA, so we included tarsus lengths along with both bill
measurements when calculating the discriminant function. To increase prediction power, our
discriminant function was calculated from measurements of birds of known sex (either
molecular or visual confirmation) from this study as well as a concurrent study (black-footed,
n = 43, Laysan, n = 35). Maximum bill depth, and culmen and tarsus lengths correctly
assigned the sex of black-footed albatrosses 91% of the time using the following regression:
7.475 maximum bill depth + 1.197 tarsus + 0.832 culmen, and 94% of the time for Laysan
albatrosses using: 2.174 culmen + 5.362 maximum bill depth + 0.697 tarsus, giving us a
sample size of 12 male and 8 female black-footed and 12 male and 6 female Laysan
albatrosses for further analyses.
20
1.2.4 Track analysis
All track and behavioral analyses were conducted in Matlab (2013a, The MathWorks, Inc.)
with custom-built functions unless otherwise specified. High precision and accuracy (<10 m
spatial error in >95% locations) of GPS dataloggers necessitated only minimal pre-processing
of tracks. A simple speed filter removed locations from raw GPS data with speeds greater
than 100 km hr-1 (< 0.1 % data removed); additionally, locations less than five kilometers from
the breeding colony were excluded, and only a single foraging trip per bird chosen at random
was included in the analysis. For a basic description of foraging trips, we calculated percent
trip on water, maximum range (as defined as farthest distance (km) reached from colony), trip
duration (days) and total distance traveled (km). To characterize movement behavior along a
trip, we calculated the following parameters: flight speed (km/hr), turning angle (°), drift
sinuosity, and landing rate (landings/hr). Birds were considered “on water” when speeds of
three consecutive locations were below 6 km hr-1. The high sampling rate of our GPS
dataloggers allowed us to identify this cutoff speed, apparent in a bimodal distribution of
speeds (Figure 1.2).
1.2.5 Foraging behavior
Area-restricted search (ARS) is often used to identify foraging behavior from animal tracking
data, with the logic that foraging individuals are likely to spend more time and have more
sinuous paths in profitable and predictable areas (Kareiva and Odell 1987, Fauchald and
Tveraa 2003). However, albatrosses use a suite of foraging tactics, including area-restricted
search, foraging along a direct (transiting) flight path and foraging while drifting at the surface
of the water using a “sit-and-wait” strategy (Harper and PC 1987, Catry et al. 2004,
Weimerskirch et al. 2007). To identify multiple foraging behaviors, we first calculated three
behavioral metrics (residence time (ARS), landing density, and drift sinuosity) then
21
incorporated all three metrics into a custom behavioral state classification routine outlined
below.
1.2.5.1 Behavioral metrics
Residence time: To identify areas of high search intensity (ARS), we calculated residence
time values at every location along a track using the Pascal program (translated to Matlab)
provided in Barraquand and Benhamou 2008. Residence time is a scale-dependent metric
that imposes a virtual circle with a user-defined radius over each consecutive location and
sums the time spent along all track segments within the circle, both forward and backward
(Barraquand and Benhamou 2008). To avoid overinflating residence times in locations where
birds were drifting on the water, drift segments greater than two minutes were re-discretized
as if the birds were flying at a constant speed (50 km hr-1) (see Weimerskirch et al. 2007).
The selection of the radius of the virtual circle in residence time analysis defines the spatial
scale of identified ARS, and therefore the radius requires justification. We selected a 10 km
radius (20 km circle), because we were interested in small-scale flight searching behavior,
the scale in which albatrosses would be reacting to prey through vision or scent (Nevitt et al.
2008), rather than large-scale reactions of birds to environmental features, as behavior at that
scale has been identified previously in these species (Kappes et al. 2010). Trips were
temporally re-discretized with a constant interval of 10 sec. The number of steps allowed
outside the virtual circle was set at 720 steps (equivalent to two hours). Finally, a Hampel
filter detected and replaced local outliers along the residence time series with appropriate
local values (Pearson 2005).
Landing density: Within the virtual circles (r = 10 km) calculated at each consecutive location
for residence time, we additionally calculated the number of landings for all track segments
that fell within the circle, both forward and backward. This approach allowed us to calculate
22
foraging effort at the same spatial scale as flight search intensity, allowing us to decipher
active versus non-active flight modes.
Drift sinuosity: To identify active drifts, indicating “sit-and-wait” foraging, drifting bouts were
defined as locations where the bird was sitting on the water (speeds < 6 km hr-1) for a
minimum of ten minutes (see Weimerskirch et al. 2007). Drifts that were separated by less
than three consecutive fixes (i.e. 30 sec) were combined as a single drift to avoid the artificial
discretization of drifts due to short spikes of speeds above 6 km/hr. We then calculated the
track sinuosity of each drift as the ratio of the straight-line distance from the beginning to end
of the drift and the summed distance between all consecutive locations in the drift. Sinuosity
values ranged from zero, representing a completely tortuous path, to one, a perfect line. To
ensure that drift sinuosity reflected albatross behavior, we tested if sinuosity was simply a
reflection of wind-induced roughness of the sea-surface (wind chop), or of fine-scale looping
currents induced by near-inertial oscillations. A linear mixed model regression of wind speed
on drift sinuosity with species included as a fixed cofactor and individual bird as a random
effect indicated no relationship between wind and drift sinuosity for either species (Figure
1.3). Inertial currents are fine-scale looping surface currents with a strictly anti-cyclonic flow
(clockwise in northern hemisphere) (Bograd et al. 1997). However, the directions of arcs in
albatross drifts were both clockwise and counter-clockwise. Additionally, the loop radius of
inertial currents is on average much larger (>103 m, Chaigneau et al. 2008) than loops in
drifts of albatrosses (<101 m).
1.2.5.2 Behavioral state classification:
Each location along a trip was assigned one of six behavioral states using residence time,
landing density, and drift sinuosity (Figure 1.5). An individual was assigned to one of two
flight behaviors: ‘Transit’ or ‘ARS’, identified by either low or high residence times,
respectively. A high landing density at that location indicated that the individual was in a
23
foraging mode of that flight behavior (Figure 1.5, ‘Transit Forage’ or ‘ARS Forage’), since
albatross are required to land on the surface of the ocean to forage, and likely limit their
landings to foraging activity given the high energetic cost of take-offs and landings
(Weimerskirch et al. 2000). Thresholds classifying residence time and landing density values
as ‘High’ or ‘Low’ were unique to each individual, with ‘High’ defined as values greater than
the 60th percentile of an individual’s distribution of residence times and greater than the 60th
percentile of an individual’s distribution of landing densities. Percentile-based threshold
values were selected to reflect biological and behavioral relevance based on a visual
inspection of different threshold scenarios on a subset of tracks from both species. Drifts
were classified as either passive drifts (low sinuosity) where the bird was resting, or active
foraging drifts (high sinuosity), indicating “sit-and-wait” behavior (Figure 1.5, ‘Drift Forage’)
(see Weimerskirch et al. 2007; Zavalaga et al. 2011). The threshold value for drift sinuosity
was fixed at 0.65 for all individuals of both species, identified as the local minima of a bimodal
distribution of drift sinuosity values for both species.
1.2.6 Environmental data:
We classified locations as day, night, or nautical twilight using local sun zeniths extracted at
each position along a foraging trip in Matlab (‘sun_position.m’). Moonrise and moonset along
each trip were identified by extracting moon elevation above the horizon at each location
(‘LunarAzEI.m’). Moon phase was defined as the proportion of lunar disc illuminated obtained
from the U.S. Naval Observatory. Three day composites of ocean surface wind speeds
derived from the quikSCAT (2006, 2009 data) and ASCAT (2010, 2012 data) scatterometer
observations were extracted along tracks using the Thematic Real-time Environmental
Distributed Data Services within NOAA’s Environmental Research Division.
1.2.7 Statistical analyses:
24
Except where noted, all statistical analyses were run using the ‘nlme’ (Pinheiro et al. 2015),
‘mgcv’ (Wood 2011), ‘multcomp’ (Hothorn et al. 2008), and ’pvclust’ (Suzuki and Shimodaira
2006) packages in R 3.1.1 (R Core development Team, 2014). When necessary, variance
structures were included in regression models to account for heterogeneity in residuals using
the ‘varComb’ and ‘varIdent’ functions in the ‘nlme’ package. Significance was defined as P ≤
0.05 and marginal significance as P ≤ 0.10. Permutational MANOVA and simper analyses
(Clarke 1993) were run in PRIMER statistical software.
1.2.7.1 Movement parameters and general track characteristics
Linear mixed effect models tested differences in movement parameters (flight speeds and
turning angles, landing rates, drift durations, drift sinuosities and percent of trip in flight).
Species, astronomical state (day, night or twilight), and their interaction were fixed effects and
individual birds were used as random factors. The fixed effects of sex and year were found
insignificant and not included in final models. Landing rate and turn angle distributions were
log transformed and percent trip in flight was arcsin transformed to meet assumptions of
normality. Posthoc multiple comparisons using Tukey contrasts identified diurnal differences
both between and within species. General track characteristics (total trip distance, maximum
distance reached, mean daily distance traveled and trip duration) were compared using
general linear models with species, sex and year as fixed effects. Maximum distance was
square root transformed before analysis.
1.2.7.2 Behavioral state species comparison
Multiple permutational MANOVA analyses tested for differences in behavioral composition of
trip (% trip in each behavioral state) between species. Species differences were tested for
both overall trip behavioral composition as well as behavioral composition of day and of night
portions of trip. The resemblance matrix was calculated using Euclidean distance, an
unrestricted permutation method, and Type III (partial) sums of squares. Then, a similarity
25
percentage analysis (simper, Clarke 1993)) identified the relative contribution of behavioral
states to the dissimilarity between species.
1.2.7.3 Effect of lunar phase on behavioral state
To understand how albatross foraging behavior responded to lunar phase, we ran a series of
generalized additive mixed models. Each behavioral state was examined separately and
modeled as a binomial dependent variable. Lunar phase, as an explanatory variable, was
included in the model using a cyclical smoothing spline and nested under astronomical state
to isolate the smoother at night, when behavior would be potentially affected by the moon. To
account for the contribution of individual variability to the error term, individual bird was
included as a random effect. A first order autoregressive correlation structure was
incorporated to account for temporal autocorrelation.
1.2.7.4 Identifying and characterizing foraging patterns within species
Within each species, a hierarchical clustering analysis grouped individuals into discrete
foraging patterns based on the duration of the trip (%) in each of the six behavioral states
(‘pvclust’, following Louzao et al. 2014). This method identifies significant clusters by
calculating approximately unbiased (AU) p-values using multiscale bootstrap resampling. We
used Euclidean distance and the Ward agglomeration method to identify significant clusters
at the P ≥ 0.95 level, but then applied the 50% similarity level to define population-level
foraging patterns (see Louzao et al. 2014). Once birds were clustered into overall foraging
patterns, we further characterized strategies by comparing additional behavioral parameters
and track characteristics between clusters. Behavioral parameters included the proportions of
day and night the birds were in the foraging mode of each behavioral state (‘% Day in Transit
Forage’, ‘% Night in Transit Forage’, etc.) and day and night landing rates (landings hr-1),
while track characteristics included mean daily distance traveled (km day-1), total cumulative
distance traveled (km), maximum range (km), and total trip duration (days). Means of
26
behavioral parameters and track characteristics were compared between clusters using linear
models. Tukey contrasts identified significantly different clusters.
1.2.7.5 Foraging patterns compared with environmental conditions
To test whether foraging strategies reflected intrinsic behavioral differences, rather than
responses to extrinsic environmental conditions, we compared year, wind strength and lunar
phase among population-level clusters (for each species). Years were compared among
clusters using chi-squared tests. To compare average wind regimes experienced by birds
across clusters, winds were extracted at each location along a track (subsampled to 1 fix
every 5 min-1) and then a mean was calculated for each bird. Mean winds and mean lunar
phase experienced by birds were compared between clusters with ANOVAs and a post hoc
Tukey test if clusters were significantly different. Lunar phase was square-root transformed to
meet assumptions of normality.
1.2.7.6 Foraging patterns and intrinsic factors
To explore potential drivers of foraging strategies we examined sex, body size, and body
condition among birds of different clusters. A chi-squared test tested for sex differences while
generalized least squares models tested for differences among clusters in body size and
body condition indices.
1.3 RESULTS:
Black-footed and Laysan albatrosses predominantly foraged north and northeast of Tern
Island in pelagic waters, with a subset of birds from each species (n=6 (30%) black-footed;
n=5 (28%) Laysan) visiting the sharp bathymetric slope of the northwestern Hawaiian island
seamount chain (Figure 1.4). Additionally, individuals from both species (n=2 (10%) black-
footed, n=8 (44%) Laysan) visited deeper seamounts in pelagic waters along their trips both
north and south of the breeding colony. Laysan albatrosses ranged farther north than black-
27
footed albatrosses (Figure 1.4, Table 1.2) however this was predominately driven by a small
subset of individuals that ranged much farther than the mean population.
1.3.1 Individual characteristics:
As expected, black-footed albatrosses were slightly heavier in mass than Laysan albatrosses,
and within each species, females weighed less than males (Table 1.1). Despite their larger
mass and overall size, black-footed albatrosses had shorter culmen lengths but thicker bill
depth than Laysan albatrosses (Table 1.1). Culmen length versus bill depth showed a distinct
clustering between species and between sexes (Figure 1.6). Black-footed albatross had a
shorter range of body size indices, ranging from -2.57 to 1.68, compared to -1.87 to 3.61 for
Laysan albatrosses. Black-footed albatrosses had greater overlap in bill morphometrics
between the sexes than Laysan albatrosses (Figure 1.6). Body size accounted for 20% of the
variation in black-footed albatross adult body mass (F1,166 = 42.6, P < 0.001) and only 6.2% of
the variation in adult Laysan albatross body mass (F1,161 = 11.2, P < 0.001).
1.3.2 Species and diurnal differences in movement parameters:
Movement parameters did not differ between species until examined separately between day
and night, with the exception of drift duration and landing rates (Table 1.3, Table 1.4). Both
species spent a similar proportion of total trip in flight, but while time in flight was similar
across day and night for black-footed albatross, Laysan albatross spent less of the night in
flight. Mean drift duration was overall longer in black-footed albatross than Laysan, and while
both species had shorter drifts during the day, this diurnal/nocturnal discrepancy was more
pronounced in Laysan albatrosses. There was no difference in mean drift sinuosity between
species, and no diurnal differences of mean drift sinuosity within species. Mean landing rates
of overall trips were almost identical between the species, but Laysan albatrosses had
significantly higher landing rates at night than black-footed. There were no significant
28
differences in overall flight speeds or flight angles between the species and both species
decreased speeds and increased turn angles at night.
1.3.3 Species differences in general track characteristics:
All general track characteristics differed between the species (Table 1.2). Means of daily
distance traveled, maximum distance reached, trip duration, and total distance traveled were
all greater in Laysan albatrosses (Table 1.2). Additionally, compared to males, female Laysan
albatrosses reached significantly greater maximum distances (female = 767.1 ± 352.4 km,
male = 363.3 ± 281.2 km, Table 1.2) and had significantly longer trip durations (female = 2.4
± 0.2 days, male = 1.9 ± 0.6 days, Table 1.2). In contrast, there were no differences between
sexes in black-footed albatross (Table 1.2).
1.3.4 Behavioral states – diurnal and species differences
The overall behavioral state composition of trips (percent of trip in each behavioral state)
between species was not different (t = 0.19, P = 0.91) with both species spending the largest
proportion of trip duration in ‘Transit’, followed by ‘ARS’ and then ‘Drift’ (Table 1.5). However,
when separated into day and night, the behavioral composition of trips varied significantly
different between species (day: t = 3.47, P = 0.03 and night: t = 2.18, P = 0.07). Simper
analyses identified which behaviors contributed the most to species dissimilarity (Figure 1.7).
Percent of trip in ‘Transit Non-Forage’ behavior was the largest contributor to species
dissimilarity, contributing 35.6% in day segments and 32.4% in night, followed by ‘Drift
Forage’ (day: 18.3%, night: 25.7%), ‘Drift Non-Forage’ (day:10.4%, night: 21.9%) and ‘Transit
Forage’ (day: 20.5%, night: 4.3%). Both ‘ARS Forage’ and ‘ARS Non-Forage’ contributed
<10% to species dissimilarity, both day and night. All three foraging states (Transit Forage,
ARS Forage, and Drift Forage) were greater contributors to species dissimilarity at night in
Laysan albatrosses and in day in black-footed albatrosses (Figure 1.7). On average, both
species were in an active foraging mode for almost half their foraging trips (Table 1.5, 46.4 ±
29
11.2%, 44.6 ± 17.6% for black-footed and Laysan, respectively), however total foraging
activity was partitioned between day and night differently for each species (Table 1.5, 55.8 ±
21.6% of day and 36.6 ± 21.5% of night for black-footed albatrosses and 44.6.6 ± 17.6% of
day and 49.3 ± 19.6% of night for Laysan albatrosses.
1.3.5 Relationship between lunar phase and behavioral states of albatrosses
Behavioral states associated with drifting on the water had the greatest response to lunar
phase for both species. Black-footed and Laysan albatrosses both increased ‘Drift Forage’
behavior on the darkest nights (Figure 1.8, black-footed: F = 7.30, P < 0.001; Laysan: F =
7.48, P < 0.001). Both species also increased ‘Drift Non-Forage’ behavior on the darkest
nights. However, this was a weak response in Laysan albatrosses (Figure 1.8, F = 1.17, P =
0.06), and black-footed albatrosses also increased ‘Drift Non-Forage’ on the brightest nights
(Figure 1.8, F = 5.12, P < 0.001). ‘Transit Non-Forage’ behavior increased with the moon
phase for both black-footed and Laysan albatrosses (Figure 1.8, F = 2.99, P = 0.002 and F =
2.49, P = 0.007, respectively). None of the other flight modes were significantly affected by
moon phase, although black-footed albatrosses showed a weak increase in ‘ARS Non-
Forage’ during the full moon (Figure 1.8, F = 0.96, P = 0.07).
1.3.6 Within species foraging patterns
The ‘pvclust’ hierarchical clustering algorithm identified three times as many behavioral
clusters in black-footed (six clusters) than Laysan albatrosses (two clusters) at the P > 0.95
significance level (indicated by red vertical lines, Figure 1.9). Defining population-level
foraging patterns at the 50% similarity level resulted in three behavioral clusters in black-
footed and two in Laysan albatrosses (dark grey shaded boxes, Figure 1.9) which we used in
subsequent analyses.
1.3.7 Foraging patterns of black-footed albatrosses
30
Cluster 1 – BF1 (Figure 1.9, Table 1.6): Individuals from Cluster 1 (BF1) spent the majority of
their foraging trips in flight. Of all black-footed albatrosses, birds in BF1 allocated the most
foraging time to the ‘Transit Forage’ behavioral state, which predominantly occurred during
the day; although compared to birds from BF2 and BF3, they also spent the largest
proportion of the night in this foraging mode. Birds from BF1 also spent the largest proportion
of night in ‘Transit Non-Forage’. This cluster had the highest percent trip in both the ‘ARS
Non-Forage’ and ‘ARS Forage’ behavioral states. Most of ‘ARS Non-Forage’ behavior
occurred during the night while ‘ARS Forage’ was allocated equally between day and night.
Birds from BF1 spent very little of their foraging trips drifting on the surface of the water, and
both the ‘Drift Non-Forage’ and Drift Forage’ behavioral states occurred during the day more
than at night. Correspondingly, these birds had the lowest landing rates, both day and night,
and had the highest values for all trip distance and duration metrics. Overall, these birds
spent more time foraging during the day than at night, and in flight forage mode, rather than
drift.
Cluster 2 – BF2 (Figure 1.9, Table 1.6): Individuals from Cluster 2 (BF2) spent the majority of
their foraging trips in on the water. These birds had the lowest allocation of time to either
flight foraging mode, and predominantly foraged in the ‘Drift Forage’ state, mostly during the
night. BF2 birds had a very large percentage of trip in ‘Drift Non-Forage’, also mostly during
the night, but they also had the largest percentage of the day in ‘Drift Non-Forage’ behavior,
compared to the other clusters. All four flight behaviors (Transit Forage/ Non-Forage, ARS
Forage/ Non-Forage) occurred more during the day than at night. These individuals had the
highest landing rates at night and had the lowest values for all trip distance and duration
metrics.
Cluster 3 – BF3 (Figure 1.9, Table 1.6): Cluster 3 (BF3) birds relied on both flight and drift
behavior. While BF3 birds spent a significant amount of the trip in flight, they predominantly
foraged using the ‘Drift Forage’ behavioral state. Although overall time on water was lower
31
than for BF2 birds, they had a higher proportion of the trip in ‘Drift Forage’ mode, and while
‘Drift Forage’ occurred more frequently at night than day within BF3 birds, these birds spent a
larger proportion of the day in ‘Drift Forage’ when compared to birds from other clusters.
Overall, birds from BF3 allocated the most time to non-foraging flight behaviors compared to
the other clusters, and despite the prevalence of flight, they foraged predominantly while
drifting, both day and night.
1.3.8 Foraging patterns of Laysan albatrosses
Cluster 1 – LA1 and Cluster 2 – LA2 (Figure 1.9, Table 1.7): Both Laysan albatross clusters
spent, on average, about one third of their foraging trips in the ‘Transit Non-Forage’
behavioral state, but for LA2 birds, this predominantly occurred during the day, while LA1
birds spent equal amounts of day and night in ‘Transit Non-Forage’. Although both clusters
had similar overall behavioral composition of trips, LA1 birds spent comparatively more time
foraging in flight, while LA2 birds spent more time drift foraging than LA1 birds. ‘Transit
Forage’ at night was more important for LA1 birds, but ‘ARS Forage’ at night was similarly
important for both clusters. Overall, LA2 birds spent the majority of the day in ‘Transit Non-
Forage’ while spending the majority of the night in ‘Drift Non-Forage’ and especially ‘Drift
Forage’, while LA1 birds spent the majority of the day in ‘Transit Forage’ and ‘ARS Forage’
and the majority of the night in ‘Transit Non-Forage’ and ‘ARS Non- Forage’. LA1 and LA2
birds had similar landing rates during the day, but landing rates at night were higher in LA2
birds. Birds from LA1 had greater distance and duration metrics.
1.3.9 Intrinsic factors and foraging patterns
There were neither sex nor body size differences among clusters in black-footed albatrosses
(sex: χ2 = 3.40, P = 0.18; body size: F2,16 = 0.93, P = 0.42); however, a posthoc Tukey HSD
test revealed a trend towards higher body condition in birds of Cluster 2 (Figure 1.10a), but
this was not significant (t = 1.38, P = 0.19), probably because of the small number of
32
individuals in Cluster 2. Laysan albatrosses did trend towards sex and body size differences
between clusters, with the first cluster being composed of smaller birds (F1,14 = 2.22, P =
0.16) and more females than males (χ2 = 2.53, P = 0.11, Figure 1.10a). Body condition was
the same between the two clusters of Laysan albatross (F1,14 = 0.01, P = 0.92). To explore
the potential for competitive exclusion within each species, we used a linear regression to
test the effect of body size on maximum distance reached from the colony. There was a
significant relationship in Laysan albatrosses, with smaller (and female) individuals reaching
farther maximum distances (Fig. 8a, F1,14 = 6.73, P = 0.02) than larger (and male) individuals
(Figure 1.11). Regressions run separately for the sexes showed different slopes between the
sexes (Figure 1.11 Female Laysan albatrosses reach more distant foraging grounds than
malesa, -0.18 for male and 0.24 for females), but sample sizes of sexes nested within
species were small and sex-specific regressions did not show a significant relationship
between body size and maximum distance. There was no relationship with body size and
maximum distance reached for black-footed albatrosses (Figure 1.11b, F1,17 = 1.26, P = 0.28)
but sex-specific regressions also had different slopes (Figure 1.11b, 0.52 for male and 0.0001
for females). Year as a cofactor had no effect for either species and was removed in final
regression models.
1.3.10 Extrinsic factors (year, wind and lunar phase) and foraging patterns
There was no difference in distribution of years among clusters in both black-footed and
Laysan albatrosses (χ-squared = 6.12, P = 0.19 and χ -squared = 5.4, P = 0.15, respectively,
Figure 1.10b). Lunar phase was not significantly different between clusters in black-footed
albatrosses (F2,17 = 1.65, P = 0.22), but wind strength experienced by birds was marginally
different between two of the three clusters (F2,17 = 2.44, P = 0.12), with birds from Cluster 1
experiencing lower mean winds than Cluster 3 (Tukey’s HSD, P = 0.09). However, flight
behaviors were more important in Cluster 1 birds experiencing lower winds (mean wind
strength = 5.40 ± 0.25 m/s) than Cluster 3 birds (mean wind strength = 6.52 ± 1.66 m/s),
33
directly contradicting what one would expect if behavioral clusters were being driven by wind
speeds alone. Mean wind was not different between the two Laysan albatross clusters (F1,16 =
0.30, P = 0.59). Laysan albatrosses in Cluster 1 did experience a fuller lunar phase (52.0 ±
33.4 % disc illuminated) than did birds from Cluster 2 (22.0 ± 20.0 % disc illuminated) (F1,16 =
4.01, P = 0.06). However, Cluster 1 birds also flew more during the day than birds from
Cluster 2, suggesting the heavy reliance on flight in these birds was not just an artifact of
lunar conditions.
1.4 DISCUSSION
1.4.1 Beyond “Area-Restricted Search” foraging behavior
Many studies classify short duration landings as foraging activity, whereas long drifting bouts
that occur at night are interpreted as resting, non-foraging periods. However, drift sinuosity
and ingestion events captured by GPS and stomach-temperature data-loggers indicate that
these drifts are often associated with active “sit-and-wait” foraging (Jodice et al. 2003, Catry
et al. 2004, Weimerskirch et al. 2007, Zavalaga et al. 2011, Cruz et al. 2013). Although prey
consumed in this manner tend to have smaller mass (Catry et al. 2004, Weimerskirch et al.
2007), the energetic content of prey available at night (e.g., myctophids and pelagic
crustaceans) can be high (Roby et al. 1997, Paredes et al. 2014), and the “sit-and-wait”
strategy may, at times, be the most optimal strategy (i.e., most energy gained for energy
used) (Jodice et al. 2003, Louzao et al. 2014).
Foraging in direct flight and “sit-and-wait” foraging tactics were as frequently used as
area-restricted search flight for brood-guarding Hawaiian albatross, but the use of ARS as the
only proxy of foraging behavior is widely prevalent in seabird foraging studies. ARS is an
informative metric valuable in identifying areas of high-use and for understanding spatial
scales employed by foraging animals. However, ARS is often measured as a two dimensional
spatial metric (Fauchald and Tveraa 2003) and if the aim is to understand foraging behavior
34
and/or activity budgets, our results caution against only considering ARS behavior, at least
for albatrosses and other species that have flexible foraging tactics. Methods like first
passage time and residence time are useful in identifying where animals spend the most
time, but by themselves do not incorporate behavioral variability within those areas. Using
ARS metrics alone, it would be possible to delineate “sit-and-wait” foraging from foraging in
flight due to the large differences in spatial scales (102 m vs 104 m) these behaviors operate
on; however, it would not be possible to effectively delineate the difference between the two
flight-based foraging strategies that operate on similar spatial scales. For example, it is
possible to calculate the same value of residence time within a virtual circle for a bird flying in
a straight line (direct flight) and landing frequently as for a bird flying in a tortuous path but not
landing at all. Therefore, by incorporating a measure of both spatial-temporal use (residence
time) and activity (landings), we were able to identify behaviors that would likely be masked if
using ARS metrics alone.
Fractal landscape methods that quantify track convolution (i.e. searching intensity)
within ARS regions (Nams 1996, Tremblay et al. 2007) circumvent some limitations of ARS
methods that use time as their metric; however, at least for brood-guarding Hawaiian
albatrosses, it was quite common for birds to fly in tortuous paths but not land, especially for
black-footed albatrosses at night. If we were evaluating the movement of birds solely by
identifying path tortuosity without landing activity we could make the erroneous assumption
that these birds were actively foraging, e.g. both searching for food and landing to feed. In the
case of black-footed albatrosses, without considering landing densities within regions of high
residency times, we would calculate that they are in ARS flight ~29% of the night versus
~24% of the day and might conclude the importance of nocturnal foraging in this species.
However, when delineating ARS flight into ‘ARS Forage’ and ‘ARS Non-Forage’ by looking at
landing densities, we see that ~19% of the night is in ‘ARS Non-Forage’ while only 10% of
that is in ‘ARS Forage’, an important distinction that leads us to a different conclusion. Thus,
incorporating measurements of activity, such as stomach-temperature loggers (Weimerskirch
35
et al. 2007), accelerometers (Weimerskirch et al. 2006), altimeters (Weimerskirch et al.
2004), wet/dry data (Cairns et al. 1987), etc., within analyses of spatial use is critical for
understanding the sometimes nuanced behavior of animals.
1.4.2 Nocturnal and diurnal niche partitioning between Hawaiian albatross species
Overall foraging behavior was remarkably similar between black-footed and Laysan
albatrosses. However, clear species differences emerged when delineating behavior by day
and night. Our results support greater nocturnality in Laysan albatrosses at least during the
brood-guard. While both species appear to rely on daylight for foraging while in transit,
Laysan albatrosses spent more of the night foraging in area-restricted search flight and
foraging while drifting than black-footed albatrosses. Black-footed albatrosses appear to rely
on daylight for both flight foraging modes, and they also drift foraged in daylight as much as
they did at night (Table 1.5, Figure 1.7). Although Laysan albatross foraging behavior
suggests greater nocturnality of the two Hawaiian albatrosses, foraging occurred across day
and night, to varying degrees, in both species. Foraging trips of Hawaiian albatross were very
active (~ 50% trip in active forage mode) - likely a reflection of the high provisioning demands
on parents during the brood-guard.
Seabirds can adjust their dependency on nocturnal and diurnal foraging in different
marine habitats (Dias et al. 2012) or under conditions of increased competition (Zavalaga et
al. 2011); the occurrence of nocturnal foraging in Hawaiian albatross, therefore, may be a
behavioral response to foraging in a tropical environment during a period of high competition.
The oligotrophic waters around the Hawaiian islands are generally described as patchy and
nutrient-poor (Seki and Polovina 2001), but they do support a large biomass of micronekton
associated with steep gradients of the archipelago and nearby seamounts (Boehlert and
Genin 1987, Drazen et al. 2011). This micronekton is associated with the diel vertically
migrating prey community – the primary prey resource in oceanic waters (Drazen et al. 2011)
– that has a more pronounced migration in lower than higher latitudes (Ashmole 1971).
36
Indeed, a recent investigation of stomach contents of fishery by-caught Laysan albatrosses
found myctophids to occur more frequently in the stomachs of birds from the Hawaiian fishery
compared to the Alaskan fishery (Walker and Fitzgerald 2012). Given the greater abundance
of this prey field in surface waters at night in tropical, pelagic waters, nocturnal foraging would
provide enhanced feeding opportunities for Hawaiian albatrosses given the relatively long
nights (~10-11 hours) of the boreal spring. Brood-guarding birds that need to maximize
provisioning rates while minimizing trip duration (Shaffer et al. 2003) would have an energetic
advantage if able to exploit the abundant micronekton in surface waters at night (see (Louzao
et al. 2014)), especially considering half the duration of foraging trips occurs at night for
brood-guarding Hawaiian albatrosses (48.0 ± 11.7% and 50.5 ± 4.8%, for black-footed and
Laysan albatrosses, respectively).
How albatrosses search for and locate prey at night is poorly understood; however,
foraging by flight in seabirds requires visual cues. The eyes of Laysan albatrosses have high
concentrations of rhodopsin, a light sensing pigment (16.30 optical density units (D/g), as
compared to 3.90 D/g for black-footed albatrosses and 19.50 D/g for the barn owl,
unpublished data Sillman 1981), indicating a morphological adaptation for higher visual acuity
at night. Indeed, foraging in ARS flight remained important at night for Laysan albatrosses –
behavior that implies an ability to search and locate prey through visual cues at night.
Additionally, nocturnal foraging in flight for Laysan albatrosses was not limited to birds
foraging under bright moonlight conditions (cluster 1 birds). While cluster 1 birds did spend
more time in transit forage at night, cluster 2 birds, which foraged under darker nocturnal
conditions, spent a similar proportion of night actively foraging in area-restricted search
behavior as cluster 1 birds. Laysan albatrosses appear to rely less upon moonlight to forage
in flight than black-footed albatrosses; however, moonlight likely assists navigation and
orientation given the predominance of transit behavior on bright nights (cluster 1 birds, also
Figure 1.8).
37
In contrast, black-footed albatross behavior showed a significant reduction of
nighttime flight forage behaviors and relied predominately on the “sit-and-wait” strategy at
night to forage. Despite a reduction of foraging in flight under dark conditions, black-footed
albatrosses spent a large proportion of night on the wing, perhaps commuting to areas where
the “sit-and-wait” foraging strategy was profitable. Interestingly, BF1 (cluster 1) birds
experienced the brightest moon conditions (Figure 1.10b) and were the only cluster of birds
within black-footed albatrosses that spent a substantial proportion of the night in both flight
foraging strategies, further supporting our conclusion that black-footed albatrosses have a
greater reliance on moonlight compared to Laysan albatrosses for flight foraging. Both
species showed a strong reduction in drift forage behavior on full moon nights (Figure 1.8),
likely due to the reduced accessibility of diel-migrating prey on bright nights. Increased transit
but decreased foraging behavior suggests a reduced foraging efficiency on bright moonlit
nights as compared to darker nights as seen in other seabird species (Phalan et al. 2007,
Mackley et al. 2011, Dias et al. 2012, Cruz et al. 2013) but see (Regular et al. 2011).
1.4.3 Within- and among- species niche partitioning in a community of albatross
The mechanisms that facilitate coexistence within a community is a central question in
ecology (Amarasekare et al. 2004). Intraspecific competition may be more intense than
competition between species, because smaller morphological differences lead to fewer
opportunities for niche partitioning (Begon et al. 2006). Indeed, colonies of conspecific
seabirds that are in close proximity often have highly delineated foraging grounds reducing
intraspecific competitive interactions (Grémillet et al. 2004, Masello et al. 2010, Wakefield et
al. 2013). Within a colony, density-dependent competition can select for individuals with
“roving” strategies (Sokolowski et al. 1997, Lewis et al. 2001) – increased range, longer trips,
decreased time at resource patches – sometimes with reduced fitness (Lewis et al. 2001). In
Laysan albatrosses, birds from cluster 1 (LA1) traveled more, reached further maximum
distances, and spent less time on water (Table 1.7), consistent with such a “roving” strategy.
38
Birds from cluster 1 were smaller, and were mostly females, such that differences
could reflect sex-specific foraging strategies in brood-guarding Laysan albatrosses. Sex-
specific foraging occurs across seabird taxa in dimorphic (see review in Lewis et al. 2002),
reversed dimorphic (Weimerskirch et al. 2005), and, increasingly, in monomorphic species
(Lewis et al. 2002, Thaxter et al. 2009, Pinet et al. 2012, Hedd et al. 2014). Compared to
black-footed albatrosses, there was less overlap between the sexes in bill dimensions
suggesting a potential morphological mechanism of intraspecific niche separation. Thus
these differences in foraging behavior appear not to be the result of short-term behavioral
plasticity but rather fixed trait-mediated niche specialization between the sexes (Shaffer et al.
2001), although these morphological differences are very slight compared to other dimorphic
albatross species. The longer trip durations and further maximum ranges of female Laysan
albatrosses might reflect enhanced flight efficiency of the smaller sex, as is seen in other
Procelleriform species that use gliding flight (Shaffer et al. 2001, Phillips et al. 2004). But if it
is flight efficiency driving these behaviors, we would expect to additionally see a relationship
between body size and maximum range within each species, and that is not the case (Figure
1.11), although sample size are small. Competitive exclusion of smaller females by larger
males from foraging grounds near the colony also seems unlikely as there remains significant
spatial overlap in core foraging grounds between the sexes.
The prevalence of studies showing sex-specific foraging strategies in monomorphic
or slightly sexual dimorphic species suggests sex differences can be unrelated to body size
(Thaxter et al. 2009, Stauss et al. 2012, Pinet et al. 2012). An alternative explanation is that
the foraging differences between the sexes in Laysan albatrosses are not related to size but
to different parental roles influence foraging differences, with shorter trips of males reflecting
male-biased provisioning. During incubation, male Laysan albatrosses spend more time
incubating the egg than females who spend more time foraging at sea (Rice and Kenyon
1962), likely regaining body condition lost in egg production (Tickell 2000). It is possible that
male-biased nest attendance continues into the brood-guard stage as females continue to

39
allocate more energy to self-maintenance than males. Parental roles can switch across the
breeding season with one sex contributing more time and energy to the nest early in season,
and the other sex contributing more later in season (Thaxter et al. 2009, Pinet et al. 2012), so
it would be informative to conduct a study of fine-scale foraging behavior across the breeding
season to see if sex-specific differences persist into the post-guard stage.
The breeding population of black-footed albatrosses in the French Frigate Shoals
(Tern Island and surrounding atolls) is ~30% larger than that of Laysan albatrosses (Arata et
al. 2009). Despite larger numbers of breeding birds, black-footed albatrosses have shorter
maximum ranges and trip durations than Laysan albatrosses (Table 1.2). We can thus expect
higher densities of black-footed albatrosses at-sea that should result in greater intra-specific
competition in foraging grounds near Tern Island. Often, a high level of individual variability
unrelated to morphological traits is a flexible behavioral response to increased intraspecific
competition (Svanbäck and Bolnick 2007, Tinker et al. 2008, Villegas-Amtmann et al. 2011).
Therefore, it is not surprising we see greater levels of variability in foraging strategies in
black-footed albatrosses, independent of body size or sex. Conducting a similar study at a
different breeding colony, such as Midway Atoll, where densities of Laysan albatrosses are
greater than that of black-footed albatrosses would help to clarify whether intraspecific
variability in these species is a short-term behavioral response dictated by density of
conspecifics or is a fixed intrinsic characteristic of the species.
Greater population-level behavioral plasticity in black-footed albatrosses might serve
as a buffer against environmental variability on breeding decisions. Indeed, black-footed
albatrosses breeding at Tern Island show more behavioral flexibility to poor environmental
conditions than Laysan albatrosses and have higher reproductive success at Tern Island in
“poor” years (Thorne et al. 2015). Furthermore, different behavioral patterns within black-
footed albatrosses appear to have varying efficiencies, at least for cluster 2 birds (BF2),
although the higher mean body condition of these birds was not statistically significant (Figure
1.10a). However, it is interesting that the birds with higher mean body condition were the
40
birds that predominantly foraged while drifting and spent a much larger proportion of their
foraging trips on the water. Foraging on the water in “sit-and-wait” was found to be the most
energy efficient foraging strategy in a study of wandering albatrosses during the brood-guard
(Louzao et al. 2014). Variable efficiencies of foraging patterns are likely to have a more
measurable effect on individuals in the brood-guard when constraints are high (Walter et al.
2014) and when birds are foraging in challenging environmental conditions (Lescroël et al.
2010).
1.5 CONCLUSION
We quantified behavioral mechanisms that enable coexistence within an albatross community
constrained to poor-nutrient tropical waters during the most energetically-demanding
reproductive stage in birds: the brood-guard. Albatrosses showed discrete behavioral
partitioning both between and within species which was driven by differences in nocturnal
and diurnal foraging and by sex-specific strategies. Our results are the first to observe
nocturnally-biased foraging behavior in Laysan albatrosses, but we emphasize foraging
behavior occurred across day and night in both species. Black-footed albatrosses exhibited
greater variability in foraging patterns suggesting they may experience strong intraspecific
competition at Tern Island. While foraging patterns in Laysan albatrosses were less variable,
behavioral differences were primarily associated with gender. Examining variability in
foraging strategies across breeding phases, when birds experience large regime shifts in
oceanic habitat and levels of competition will provide further understanding of behavioral
plasticity and capacity for short-term adaptation in Hawaiian albatross.
1.6 REFERENCES
Ainley, D. G. 1977. Feeding methods in seabirds: a comparison of polar and tropical nesting
communities in the eastern Pacific ocean. Pages 669–685 in G. Llano, editor.
41
Adaptations within Antarctic ecosystems. Proceedings of the Third SCAR Symposium
on Antarctic Biology. Smithsonian Institution, Washington, D.C., USA.
Amarasekare, P., M. F. Hoopes, N. Mouquet, and M. Holyoak. 2004. Mechanisms of
Coexistence in Competitive Metacommunities 164.
Arata, J. A., P. R. Sievert, and M. B. Naughton. 2009. Status assessment of Laysan and
Blackfooted Albatrosses, North Pacific Ocean, 1923–2005.
Araújo, M. S., D. I. Bolnick, and C. A. Layman. 2011. The ecological causes of individual
specialisation. Ecology Letters 14:948–958.
Araújo, M. S., D. I. Bolnick, G. Machado, A. a Giaretta, and S. F. dos Reis. 2007. Using
delta13C stable isotopes to quantify individual-level diet variation. Oecologia 152:643–
54.
Ashmole, N. P. 1963. The regulation of numbers of tropical oceanic birds. Ibis 103b:458–473.
Ashmole, N. P. 1971. Seabird ecology and the marine environment. Avian Biology 1:223–
286.
Ballance, L. T., and R. L. Pitman. 1999. S34 . 4 : Foraging ecology of tropical seabirds.
Ballance, L. T., R. L. Pitman, and S. B. Reilly. 1997. Seabird community structure along a
productivity gradient: importance of competition and energetic constraint. Ecology
78:1502–1518.
Barraquand, F., and S. Benhamou. 2008. Animal movements in heterogeneous landscapes:
identifying profitable places and homogeneous movement bouts. Ecology 89:3336–
3348.
Begon, M., C. R. Townsend, and J. L. Harper. 2006. Ecology: from individuals to ecosystems.
Bertram, D. F., D. L. Mackas, and S. M. McKinnell. 2001. The seasonal cycle revisited:
interannual variation and ecosystem consequences. Progress in Oceanography
49:283–307.
Birt, V. L., T. P. Birt, D. Goulet, and D. K. Cairns. 1987. Ashmole’s halo: direct evidence for
prey depletion by a seabird. Marine Ecology Progress Series.
Boehlert, G., and A. Genin. 1987. A review of the effects of seamounts on biological
processes. Pages 319–344 in B. Keating, P. Fryer, R. Batiza, and G. W. Boehlert,
editors. Geophysical Monograph. American Geophysical Union.
Bograd, S. J., A. B. Rabinovich, P. H. LeBlond, and J. A. Shore. 1997. Observations of
seamount-attached eddies in the North Pacific. Journal of Geophysical Research
102:12441.
Cairns, D. K., K. A. Bredin, and W. A. Montevecchi. 1987. Activity budgets and foraging
ranges of breeding common murres. The Auk:218–224.
Catry, P., R. A. Phillips, B. Phalan, J. R. D. SILK, and J. P. Croxall. 2004. Foraging strategies
of grey-headed albatrosses Thalassarche chrysostoma: integration of movements,
activity and feeding events.
Chaigneau, A., O. Pizarro, and W. Rojas. 2008. Global climatology of near-inertial current
characteristics from Lagrangian observations. Geophysical Research Letters
35:L13603.
Chastel, O., H. Weimerskirch, and P. Jouventin. 1995. Influence of Body Condition on
Reproductive Decision and Reproductive Success in the Blue Petrel. The Auk 112:964–
972.
42
Clarke, K. R. 1993. Non‐ parametric multivariate analyses of changes in community
structure. Australian journal of ecology 18:117–143.
Le Corre, M. 2001. Breeding seasons of seabirds at Europa Island (southern Mozambique
Channel) in relation to seasonal changes in the marine environment. Journal of Zoology
254:239–249.
Crossin, G. T., R. A. Phillips, Wynne-Edwards Katherine E., and T. D. Williams. 2013.
Postmigratory Body Condition and Ovarian Steroid Production Predict Breeding
Decisions by Female Gray-Headed Albatrosses. Physiological and Biochemical Zoology
86:761–768.
Cruz, S. M., M. Hooten, K. P. Huyvaert, C. B. Proaño, D. J. Anderson, V. Afanasyev, and M.
Wikelski. 2013. At-sea behavior varies with lunar phase in a nocturnal pelagic seabird,
the swallow-tailed gull. PloS one 8:e56889.
Dias, M. P., J. Granadeiro, and P. Catry. 2012. Working the day or the night shift? Foraging
schedules of Cory’s shearwaters vary according to marine habitat. Marine Ecology
Progress Series 467:245–252.
Drazen, J. C., L. G. De Forest, and R. Domokos. 2011. Micronekton abundance and biomass
in Hawaiian waters as influenced by seamounts, eddies, and the moon. Deep Sea
Research Part I: Oceanographic Research Papers 58:557–566.
Drent, R. H., and S. Daan. 1980. The prudent parent: energetic adjustments in avian
breeding. Ardea 68:225–252.
Fauchald, P., and T. Tveraa. 2003. Using First-Passage Time in the Analysis of Area-
Restricted Search and Habitat Selection. Ecology 84:282–288.
Fernández, P., and D. J. Anderson. 2000. Nocturnal and diurnal foraging activity of Hawaiian
albatrosses detected with a new immersion monitor. The Condor 102:577–584.
Fernández, P., D. J. Anderson, P. R. Sievert, and K. P. HUYVAERT. 2001. Foraging
destinations of three low‐ latitude albatross (Phoebastria) species. Journal of Zoology
254:391–404.
Fischer, K. N., R. M. Suryan, D. D. Roby, and G. R. Balogh. 2009. Post-breeding season
distribution of black-footed and Laysan albatrosses satellite-tagged in Alaska: Inter-
specific differences in spatial overlap with North Pacific fisheries. Biological
Conservation 142:751–760.
Flint, E. 2009. Hawaiian Islands National Wildlife Refuge and Midway Atoll National Wildlife
Refuge – annual nest counts through hatch year 2009. U.S. Fish and Wildlife Service,
unpublished report.
Fritz, H., S. Said, and H. Weimerskirch. 2003. Scale-dependent hierarchical adjustments of
movement patterns in a long-range foraging seabird. Proceedings of the Royal Society
B: Biological Sciences 270:1143–1148.
González-Solís, J., J. P. Croxall, and A. G. Wood. 2000. Sexual dimorphism and sexual
segregation in foraging strategies of northern giant petrels, Macronectes halli, during
incubation. Oikos 90:390–398.
Grémillet, D., G. Dell’Omo, P. G. Ryan, G. Peters, Y. Ropert-Coudert, and S. J. Weeks. 2004.
Offshore diplomacy, or how seabirds mitigate intra-specific competition: a case study
based on GPS tracking of Cape gannets from neighbouring colonies. Marine Ecology-
Progress Series 268:265–279.
43
Gutowsky, S. E., L. Gutowsky, I. D. Jonsen, M. L. Leonard, M. B. Naughton, M. D. Romano,
and S. a Shaffer. 2014. Daily activity budgets reveal a quasi-flightless stage during non-
breeding in Hawaiian albatrosses. Movement Ecology 2:23.
Haney, J. 1986a. Seabird affinities for Gulf Stream frontal eddies: responses of mobile
marine consumers to episodic upwelling. Journal of Marine Research:361–384.
Haney, J. C. 1986b. Seabird Patchiness in Tropical Oceanic Waters: The Influence of
Sargassum “Reefs.” The Auk 103:141–151.
Harper, P. C., and H. PC. 1987. Feeding behavior and other notes on 20 species of
Procelleriformes at sea. Notornis 34:169–192.
Harris, M. P. 1969. Breeding seasons of sea-birds in the Galapagos Islands. Journal of
Zoology 159:145–165.
Harrison, C. S. 1990. Seabirds of Hawaii: natural history and conservation. Cornell University
Press.
Harrison, C. S., T. S. Hida, and M. P. Seki. 1983. Hawaiian Seabird Feeding Ecology. Wildlife
Monographs:71.
Hedd, A., W. a Montevecchi, R. a Phillips, and D. a Fifield. 2014. Seasonal sexual
segregation by monomorphic Sooty Shearwaters Puffinus griseus reflects different
reproductive roles during the pre-laying period. PloS one 9:e85572.
Hothorn, T., F. Bretz, and P. Westfall. 2008. Simultaneous inference in general parametric
models. Biometrical Journal 50:346–363.
Hyrenbach, K., P. Fernández, and D. Anderson. 2002. Oceanographic habitats of two
sympatric North Pacific albatrosses during the breeding season. Marine Ecology
Progress Series 233:283–301.
IUCN2014. 2014. IUCN 2014. The IUCN Red List of Threatened Species.
http://www.iucnredlist.org.
Jeglinski, J. W. E., K. T. Goetz, C. Werner, D. P. Costa, and F. Trillmich. 2013. Same size -
same niche? Foraging niche separation between sympatric juvenile Galapagos sea
lions and adult Galapagos fur seals. The Journal of animal ecology.
Jodice, P. G. R., D. D. Roby, R. M. Suryan, D. B. Irons, A. M. Kaufman, K. R. Turco, and G.
H. Visser. 2003. Variation in energy expenditure among black-legged kittiwakes: effects
of activity-specific metabolic rates and activity budgets. Physiological and biochemical
zoology : PBZ 76:375–88.
Kappes, M. A. 2009. Comparative Foraging Ecology and Energetics of Albatrosses.
Kappes, M. A., S. A. Shaffer, Y. Tremblay, D. G. Foley, D. M. Palacios, P. W. Robinson, S. J.
Bograd, and D. P. Costa. 2010. Hawaiian albatrosses track interannual variability of
marine habitats in the North Pacific. Progress In Oceanography 86:246–260.
Kareiva, P., and G. Odell. 1987. Swarms of Predators Exhibit “Preytaxis” if Individual
Predators Use Area-Restricted Search. The American Naturalist 130:233–270.
Lack, D. L. 1968. Ecological adaptations for breeding in birds.
Lescroël, A., G. Ballard, V. Toniolo, K. J. Barton, P. R. Wilson, P. O. Lyver, and D. G. Ainley.
2010. Working less to gain more: when breeding quality relates to foraging efficiency.
Ecology 91:2044–2055.
Lewis, S., S. Benvenuti, L. Dall–Antonia, R. Griffiths, L. Money, T. N. Sherratt, S. Wanless,
and K. C. Hamer. 2002. Sex-specific foraging behaviour in a monomorphic seabird.
44
Proceedings of the Royal Society of London B: Biological Sciences 269:1687–1693.
Lewis, S., T. N. Sherratt, K. C. Hamer, and S. Wanless. 2001. Evidence of intra-specific
competition for food in a pelagic seabird. Nature 412:816–819.
Lewison, R. L., and L. B. Crowder. 2003. Estimating fishery bycatch and effects on a
vulnerable seabird population. Ecological applications : a publication of the Ecological
Society of America 13:743–753.
Louzao, M., T. Wiegand, F. Bartumeus, and H. Weimerskirch. 2014. Coupling instantaneous
energy-budget models and behavioural mode analysis to estimate optimal foraging
strategy: an example with wandering albatrosses. Movement Ecology 2:8.
MacArthur, R. H. 1958. Population ecology of some warblers of northeastern coniferous
forests. Ecology 39:599–619.
Mackley, E., R. A. Phillips, J. D. Silk, E. Wakefield, V. Afanasyev, and R. Furness. 2011. At-
sea activity patterns of breeding and nonbreeding white-chinned petrels Procellaria
aequinoctialis from South Georgia. Marine Biology 158:429–438.
Martin, T. E. 1987. Food as a Limit on Breeding Birds: A Life-History Perspective. Annual
Review of Ecology and Systematics 18:453–487.
Masello, J. F., R. Mundry, M. Poisbleau, L. Demongin, C. C. Voigt, M. Wikelski, and P.
Quillfeldt. 2010. Diving seabirds share foraging space and time within and among
species. Ecosphere 1.
Nams, V. 1996. The VFractal: a new estimator for fractal dimension of animal movement
paths. Landscape Ecology 11:289–297.
Nelson, J. B. 1983. Contrasts in breeding strategies between some tropical and temperate
marine pelecaniformes. Studies in Avian Biology 8:114.
Nevitt, G. A., M. Losekoot, and H. Weimerskirch. 2008. Evidence for olfactory search in
wandering albatross, Diomedea exulans. Proceedings of the National Academy of
Sciences 105:4576–4581.
Owens, I. P. F., and P. M. Bennett. 1995. Ancient Ecological Diversification Explains Life-
History Variation among Living Birds. Proceedings of the Royal Society of London B:
Biological Sciences 261:227–232.
Paredes, R., R. A. Orben, R. M. Suryan, D. B. Irons, D. D. Roby, A. M. A. Harding, R. C.
Young, K. Benoit-Bird, C. Ladd, H. Renner, S. Heppell, R. A. Phillips, and A. Kitaysky.
2014. Foraging Responses of Black-Legged Kittiwakes to Prolonged Food-Shortages
around Colonies on the Bering Sea Shelf. PLoS ONE 9.
Patrick, S. C., and H. Weimerskirch. 2014a. Personality, foraging and fitness consequences
in a long lived seabird. PloS one 9:e87269.
Patrick, S. C., and H. Weimerskirch. 2014b. Consistency pays: sex differences and fitness
consequences of behavioural specialization in a wide-ranging seabird. Biology letters
10:20140630.
Pearson, R. K. 2005. Mining imperfect data: Dealing with contamination and incomplete
records. Siam.
Perrins, C. M. 1970. The timing of birds’ breeding seasons. Ibis 112:242–255.
Phalan, B., R. A. Phillips, J. R. D. SILK, V. Afanasyev, A. Fukuda, J. Fox, P. Catry, H.
Higuchi, and J. P. Croxall. 2007. Foraging behaviour of four albatross species by night
and day:1–16.
45
Phillips, R. A., J. R. D. Silk, B. Phalan, P. Catry, and J. P. Croxall. 2004. Seasonal sexual
segregation in two Thalassarche albatross species: competitive exclusion, reproductive
role specialization or foraging niche divergence? Proceedings. Biological sciences / The
Royal Society 271:1283–91.
Phillips, R. A., J. C. Xavier, J. P. Croxall, and A. E. Burger. 2003. Effects of satellite
transmitters on albatrosses and petrels. The Auk 120:1082–1090.
Pinet, P., S. Jaquemet, R. A. Phillips, and M. Le Corre. 2012. Sex-specific foraging strategies
throughout the breeding season in a tropical, sexually monomorphic small petrel.
Animal Behaviour 83:979–989.
Pinheiro, J., D. Bates, S. DebRoy, D. Sarkar, and R Core Team. 2015. nlme: Linear and
Nonlinear Mixed Effects Models.
Pitman, R. L., W. A. Walker, W. T. Everett, and J. P. Gallo-Reynoso. 2004. Population status,
foods and foraging of Laysan albatrosses Phoebastria immutabilis nesting on
Guadalupe Island, Mexico. Marine Ornithology 32.
Polis, G. A. 1984. Age Structure Component of Niche Width and Intraspecific Resource
Partitioning: Can Age Groups Function as Ecological Species? The American Naturalist
123:541.
Regular, P. M., A. Hedd, and W. A. Montevecchi. 2011. Fishing in the dark: a pursuit-diving
seabird modifies foraging behaviour in response to nocturnal light levels. PLoS One
6:e26763.
Rice, D. W., and K. W. Kenyon. 1962. Breeding cycles and behavior of Laysan and Black-
footed Albatrosses. The Auk 79:517–567.
Ricklefs, R. 1983. Comparative Avian Demography. Pages 1–32 in R. Johnston, editor.
Current Ornithology SE - 1. Springer US.
Ricklefs, R. E. 1990. Ecology. Freeman New York.
Roby, D. D., K. R. Turco, and J. A. Anthony. 1997. Diet Composition , Reproductive
Energetics , and Productivity of Seabirds Damaged by the Exxon Valdez Oil Spill.
Schreiber, E. A., and J. Burger. 2001. Biology of marine birds. CRC Press.
Schreiber, R. W., and N. P. Ashmole. 1970. Sea-bird breeding seasons on Christmas Island,
Pacific Ocean. Ibis 112:363–394.
Seki, M., and J. Polovina. 2001. Biological enhancement at cyclonic eddies tracked with
GOES thermal imagery in Hawaiian waters. Geophysical Research Letters 28:1583–
1586.
Shaffer, S. A., D. P. Costa, and H. Weimerskirch. 2003. Foraging effort in relation to the
constraints of reproduction in free‐ranging albatrosses. Functional Ecology 17:66–74.
Shaffer, S. A., H. Weimerskirch, and D. P. Costa. 2001. Functional significance of sexual
dimorphism in Wandering Albatrosses, Diomedea exulans. Functional Ecology 15:203–
210.
Sillman, A. J. (1981). Univ. California, Davis.
Sokolowski, M. B., H. S. Pereira, and K. Hughes. 1997. Evolution of foraging behavior in
Drosophila by density-dependent selection. Proceedings of the National Academy of
Sciences of the United States of America 94:7373–7377.
Stauss, C., S. Bearhop, T. W. Bodey, S. Garthe, C. Gunn, W. J. Grecian, R. Inger, M. E.
Knight, J. Newton, and S. C. Patrick. 2012. Sex-specific foraging behaviour in northern
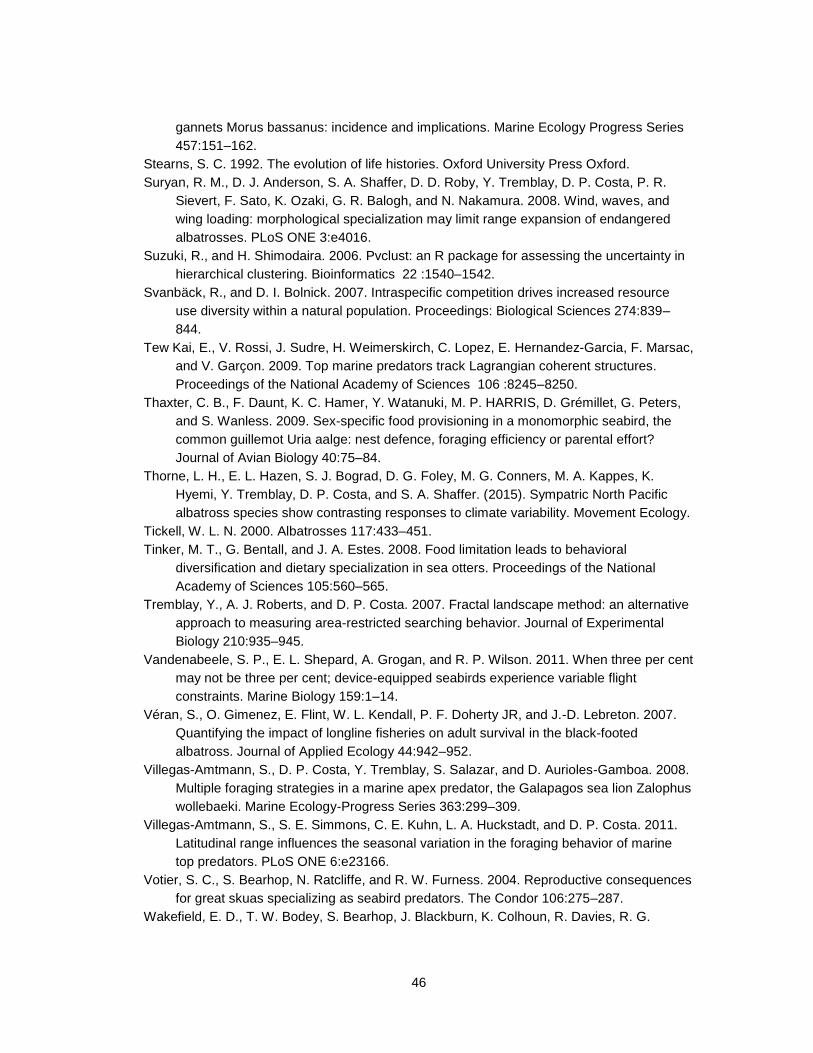
46
gannets Morus bassanus: incidence and implications. Marine Ecology Progress Series
457:151–162.
Stearns, S. C. 1992. The evolution of life histories. Oxford University Press Oxford.
Suryan, R. M., D. J. Anderson, S. A. Shaffer, D. D. Roby, Y. Tremblay, D. P. Costa, P. R.
Sievert, F. Sato, K. Ozaki, G. R. Balogh, and N. Nakamura. 2008. Wind, waves, and
wing loading: morphological specialization may limit range expansion of endangered
albatrosses. PLoS ONE 3:e4016.
Suzuki, R., and H. Shimodaira. 2006. Pvclust: an R package for assessing the uncertainty in
hierarchical clustering. Bioinformatics 22 :1540–1542.
Svanbäck, R., and D. I. Bolnick. 2007. Intraspecific competition drives increased resource
use diversity within a natural population. Proceedings: Biological Sciences 274:839–
844.
Tew Kai, E., V. Rossi, J. Sudre, H. Weimerskirch, C. Lopez, E. Hernandez-Garcia, F. Marsac,
and V. Garçon. 2009. Top marine predators track Lagrangian coherent structures.
Proceedings of the National Academy of Sciences 106 :8245–8250.
Thaxter, C. B., F. Daunt, K. C. Hamer, Y. Watanuki, M. P. HARRIS, D. Grémillet, G. Peters,
and S. Wanless. 2009. Sex-specific food provisioning in a monomorphic seabird, the
common guillemot Uria aalge: nest defence, foraging efficiency or parental effort?
Journal of Avian Biology 40:75–84.
Thorne, L. H., E. L. Hazen, S. J. Bograd, D. G. Foley, M. G. Conners, M. A. Kappes, K.
Hyemi, Y. Tremblay, D. P. Costa, and S. A. Shaffer. (2015). Sympatric North Pacific
albatross species show contrasting responses to climate variability. Movement Ecology.
Tickell, W. L. N. 2000. Albatrosses 117:433–451.
Tinker, M. T., G. Bentall, and J. A. Estes. 2008. Food limitation leads to behavioral
diversification and dietary specialization in sea otters. Proceedings of the National
Academy of Sciences 105:560–565.
Tremblay, Y., A. J. Roberts, and D. P. Costa. 2007. Fractal landscape method: an alternative
approach to measuring area-restricted searching behavior. Journal of Experimental
Biology 210:935–945.
Vandenabeele, S. P., E. L. Shepard, A. Grogan, and R. P. Wilson. 2011. When three per cent
may not be three per cent; device-equipped seabirds experience variable flight
constraints. Marine Biology 159:1–14.
Véran, S., O. Gimenez, E. Flint, W. L. Kendall, P. F. Doherty JR, and J.-D. Lebreton. 2007.
Quantifying the impact of longline fisheries on adult survival in the black-footed
albatross. Journal of Applied Ecology 44:942–952.
Villegas-Amtmann, S., D. P. Costa, Y. Tremblay, S. Salazar, and D. Aurioles-Gamboa. 2008.
Multiple foraging strategies in a marine apex predator, the Galapagos sea lion Zalophus
wollebaeki. Marine Ecology-Progress Series 363:299–309.
Villegas-Amtmann, S., S. E. Simmons, C. E. Kuhn, L. A. Huckstadt, and D. P. Costa. 2011.
Latitudinal range influences the seasonal variation in the foraging behavior of marine
top predators. PLoS ONE 6:e23166.
Votier, S. C., S. Bearhop, N. Ratcliffe, and R. W. Furness. 2004. Reproductive consequences
for great skuas specializing as seabird predators. The Condor 106:275–287.
Wakefield, E. D., T. W. Bodey, S. Bearhop, J. Blackburn, K. Colhoun, R. Davies, R. G.
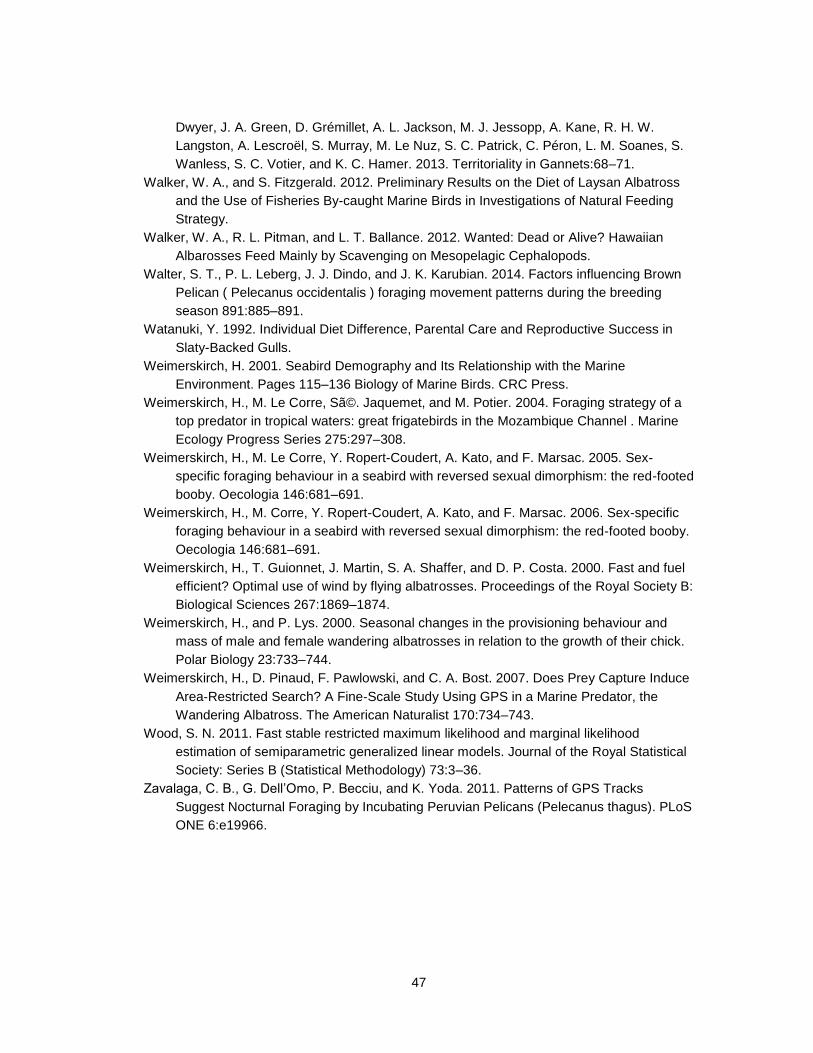
47
Dwyer, J. A. Green, D. Grémillet, A. L. Jackson, M. J. Jessopp, A. Kane, R. H. W.
Langston, A. Lescroël, S. Murray, M. Le Nuz, S. C. Patrick, C. Péron, L. M. Soanes, S.
Wanless, S. C. Votier, and K. C. Hamer. 2013. Territoriality in Gannets:68–71.
Walker, W. A., and S. Fitzgerald. 2012. Preliminary Results on the Diet of Laysan Albatross
and the Use of Fisheries By-caught Marine Birds in Investigations of Natural Feeding
Strategy.
Walker, W. A., R. L. Pitman, and L. T. Ballance. 2012. Wanted: Dead or Alive? Hawaiian
Albarosses Feed Mainly by Scavenging on Mesopelagic Cephalopods.
Walter, S. T., P. L. Leberg, J. J. Dindo, and J. K. Karubian. 2014. Factors influencing Brown
Pelican ( Pelecanus occidentalis ) foraging movement patterns during the breeding
season 891:885–891.
Watanuki, Y. 1992. Individual Diet Difference, Parental Care and Reproductive Success in
Slaty-Backed Gulls.
Weimerskirch, H. 2001. Seabird Demography and Its Relationship with the Marine
Environment. Pages 115–136 Biology of Marine Birds. CRC Press.
Weimerskirch, H., M. Le Corre, Sã©. Jaquemet, and M. Potier. 2004. Foraging strategy of a
top predator in tropical waters: great frigatebirds in the Mozambique Channel . Marine
Ecology Progress Series 275:297–308.
Weimerskirch, H., M. Le Corre, Y. Ropert-Coudert, A. Kato, and F. Marsac. 2005. Sex-
specific foraging behaviour in a seabird with reversed sexual dimorphism: the red-footed
booby. Oecologia 146:681–691.
Weimerskirch, H., M. Corre, Y. Ropert-Coudert, A. Kato, and F. Marsac. 2006. Sex-specific
foraging behaviour in a seabird with reversed sexual dimorphism: the red-footed booby.
Oecologia 146:681–691.
Weimerskirch, H., T. Guionnet, J. Martin, S. A. Shaffer, and D. P. Costa. 2000. Fast and fuel
efficient? Optimal use of wind by flying albatrosses. Proceedings of the Royal Society B:
Biological Sciences 267:1869–1874.
Weimerskirch, H., and P. Lys. 2000. Seasonal changes in the provisioning behaviour and
mass of male and female wandering albatrosses in relation to the growth of their chick.
Polar Biology 23:733–744.
Weimerskirch, H., D. Pinaud, F. Pawlowski, and C. A. Bost. 2007. Does Prey Capture Induce
Area‐Restricted Search? A Fine‐Scale Study Using GPS in a Marine Predator, the
Wandering Albatross. The American Naturalist 170:734–743.
Wood, S. N. 2011. Fast stable restricted maximum likelihood and marginal likelihood
estimation of semiparametric generalized linear models. Journal of the Royal Statistical
Society: Series B (Statistical Methodology) 73:3–36.
Zavalaga, C. B., G. Dell’Omo, P. Becciu, and K. Yoda. 2011. Patterns of GPS Tracks
Suggest Nocturnal Foraging by Incubating Peruvian Pelicans (Pelecanus thagus). PLoS
ONE 6:e19966.
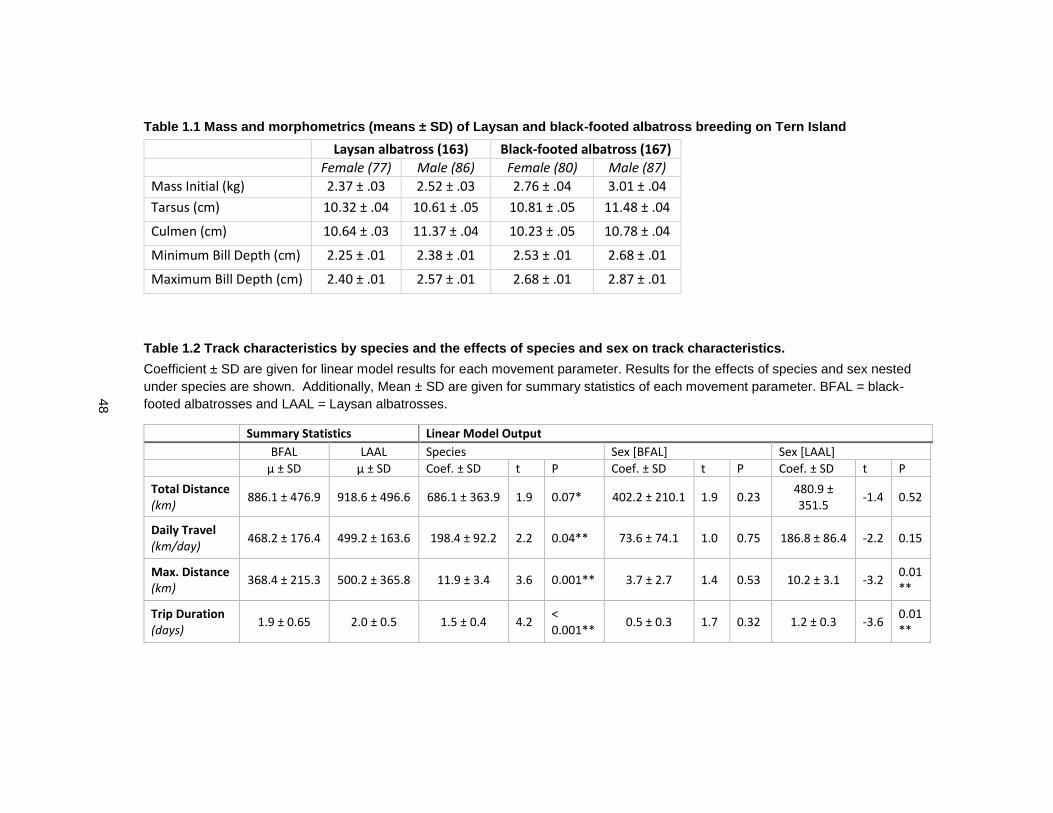
48
Table 1.1 Mass and morphometrics (means ± SD) of Laysan and black-footed albatross breeding on Tern Island
Laysan albatross (163) Black-footed albatross (167)
Female (77) Male (86) Female (80) Male (87)
Mass Initial (kg) 2.37 ± .03 2.52 ± .03 2.76 ± .04 3.01 ± .04
Tarsus (cm) 10.32 ± .04 10.61 ± .05 10.81 ± .05 11.48 ± .04
Culmen (cm) 10.64 ± .03 11.37 ± .04 10.23 ± .05 10.78 ± .04
Minimum Bill Depth (cm) 2.25 ± .01 2.38 ± .01 2.53 ± .01 2.68 ± .01
Maximum Bill Depth (cm) 2.40 ± .01 2.57 ± .01 2.68 ± .01 2.87 ± .01
Table 1.2 Track characteristics by species and the effects of species and sex on track characteristics.
Coefficient ± SD are given for linear model results for each movement parameter. Results for the effects of species and sex nested
under species are shown. Additionally, Mean ± SD are given for summary statistics of each movement parameter. BFAL = black-
footed albatrosses and LAAL = Laysan albatrosses.
Summary Statistics Linear Model Output
BFAL LAAL Species Sex [BFAL] Sex [LAAL]
µ ± SD µ ± SD Coef. ± SD t P Coef. ± SD t P Coef. ± SD t P
Total Distance (km)
886.1 ± 476.9 918.6 ± 496.6 686.1 ± 363.9 1.9 0.07* 402.2 ± 210.1 1.9 0.23 480.9 ± 351.5
-1.4 0.52
Daily Travel (km/day)
468.2 ± 176.4 499.2 ± 163.6 198.4 ± 92.2 2.2 0.04** 73.6 ± 74.1 1.0 0.75 186.8 ± 86.4 -2.2 0.15
Max. Distance (km)
368.4 ± 215.3 500.2 ± 365.8 11.9 ± 3.4 3.6 0.001** 3.7 ± 2.7 1.4 0.53 10.2 ± 3.1 -3.2 0.01**
Trip Duration (days)
1.9 ± 0.65 2.0 ± 0.5 1.5 ± 0.4 4.2 < 0.001**
0.5 ± 0.3 1.7 0.32 1.2 ± 0.3 -3.6 0.01**
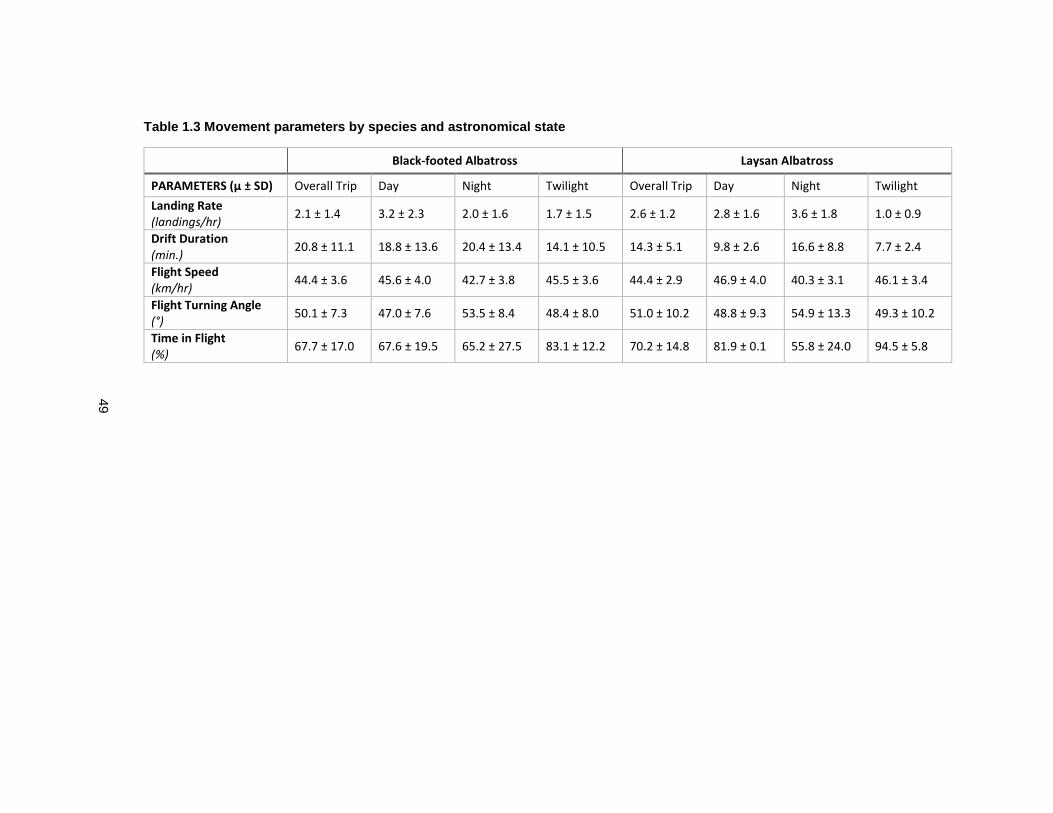
49
Table 1.3 Movement parameters by species and astronomical state
Black-footed Albatross Laysan Albatross
PARAMETERS (µ ± SD) Overall Trip Day Night Twilight Overall Trip Day Night Twilight
Landing Rate (landings/hr)
2.1 ± 1.4 3.2 ± 2.3 2.0 ± 1.6 1.7 ± 1.5 2.6 ± 1.2 2.8 ± 1.6 3.6 ± 1.8 1.0 ± 0.9
Drift Duration (min.)
20.8 ± 11.1 18.8 ± 13.6 20.4 ± 13.4 14.1 ± 10.5 14.3 ± 5.1 9.8 ± 2.6 16.6 ± 8.8 7.7 ± 2.4
Flight Speed (km/hr)
44.4 ± 3.6 45.6 ± 4.0 42.7 ± 3.8 45.5 ± 3.6 44.4 ± 2.9 46.9 ± 4.0 40.3 ± 3.1 46.1 ± 3.4
Flight Turning Angle (°)
50.1 ± 7.3 47.0 ± 7.6 53.5 ± 8.4 48.4 ± 8.0 51.0 ± 10.2 48.8 ± 9.3 54.9 ± 13.3 49.3 ± 10.2
Time in Flight (%)
67.7 ± 17.0 67.6 ± 19.5 65.2 ± 27.5 83.1 ± 12.2 70.2 ± 14.8 81.9 ± 0.1 55.8 ± 24.0 94.5 ± 5.8
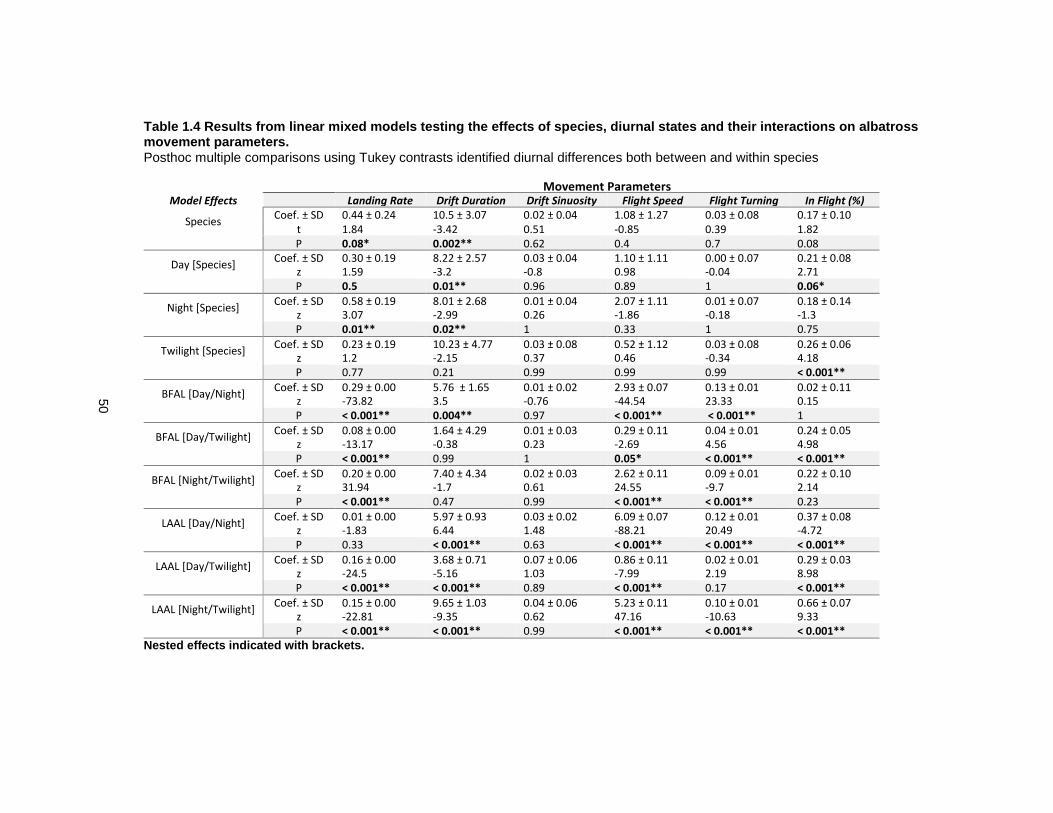
50
Table 1.4 Results from linear mixed models testing the effects of species, diurnal states and their interactions on albatross movement parameters.
Posthoc multiple comparisons using Tukey contrasts identified diurnal differences both between and within species
Movement Parameters Model Effects Landing Rate Drift Duration Drift Sinuosity Flight Speed Flight Turning
Angle In Flight (%)
Species Coef. ± SD 0.44 ± 0.24 10.5 ± 3.07 0.02 ± 0.04 1.08 ± 1.27 0.03 ± 0.08 0.17 ± 0.10
t 1.84 -3.42 0.51 -0.85 0.39 1.82 P 0.08* 0.002** 0.62 0.4 0.7 0.08
Day [Species] Coef. ± SD 0.30 ± 0.19 8.22 ± 2.57 0.03 ± 0.04 1.10 ± 1.11 0.00 ± 0.07 0.21 ± 0.08
z 1.59 -3.2 -0.8 0.98 -0.04 2.71 P 0.5 0.01** 0.96 0.89 1 0.06*
Night [Species] Coef. ± SD 0.58 ± 0.19 8.01 ± 2.68 0.01 ± 0.04 2.07 ± 1.11 0.01 ± 0.07 0.18 ± 0.14
z 3.07 -2.99 0.26 -1.86 -0.18 -1.3 P 0.01** 0.02** 1 0.33 1 0.75
Twilight [Species] Coef. ± SD 0.23 ± 0.19 10.23 ± 4.77 0.03 ± 0.08 0.52 ± 1.12 0.03 ± 0.08 0.26 ± 0.06
z 1.2 -2.15 0.37 0.46 -0.34 4.18 P 0.77 0.21 0.99 0.99 0.99 < 0.001**
BFAL [Day/Night] Coef. ± SD 0.29 ± 0.00 5.76 ± 1.65 0.01 ± 0.02 2.93 ± 0.07 0.13 ± 0.01 0.02 ± 0.11
z -73.82 3.5 -0.76 -44.54 23.33 0.15 P < 0.001** 0.004** 0.97 < 0.001** < 0.001** 1
BFAL [Day/Twilight] Coef. ± SD 0.08 ± 0.00 1.64 ± 4.29 0.01 ± 0.03 0.29 ± 0.11 0.04 ± 0.01 0.24 ± 0.05
z -13.17 -0.38 0.23 -2.69 4.56 4.98 P < 0.001** 0.99 1 0.05* < 0.001** < 0.001**
BFAL [Night/Twilight] Coef. ± SD 0.20 ± 0.00 7.40 ± 4.34 0.02 ± 0.03 2.62 ± 0.11 0.09 ± 0.01 0.22 ± 0.10
z 31.94 -1.7 0.61 24.55 -9.7 2.14 P < 0.001** 0.47 0.99 < 0.001** < 0.001** 0.23
LAAL [Day/Night] Coef. ± SD 0.01 ± 0.00 5.97 ± 0.93 0.03 ± 0.02 6.09 ± 0.07 0.12 ± 0.01 0.37 ± 0.08
z -1.83 6.44 1.48 -88.21 20.49 -4.72 P 0.33 < 0.001** 0.63 < 0.001** < 0.001** < 0.001**
LAAL [Day/Twilight] Coef. ± SD 0.16 ± 0.00 3.68 ± 0.71 0.07 ± 0.06 0.86 ± 0.11 0.02 ± 0.01 0.29 ± 0.03
z -24.5 -5.16 1.03 -7.99 2.19 8.98 P < 0.001** < 0.001** 0.89 < 0.001** 0.17 < 0.001**
LAAL [Night/Twilight] Coef. ± SD 0.15 ± 0.00 9.65 ± 1.03 0.04 ± 0.06 5.23 ± 0.11 0.10 ± 0.01 0.66 ± 0.07
z -22.81 -9.35 0.62 47.16 -10.63 9.33 P < 0.001** < 0.001** 0.99 < 0.001** < 0.001** < 0.001**
Nested effects indicated with brackets.
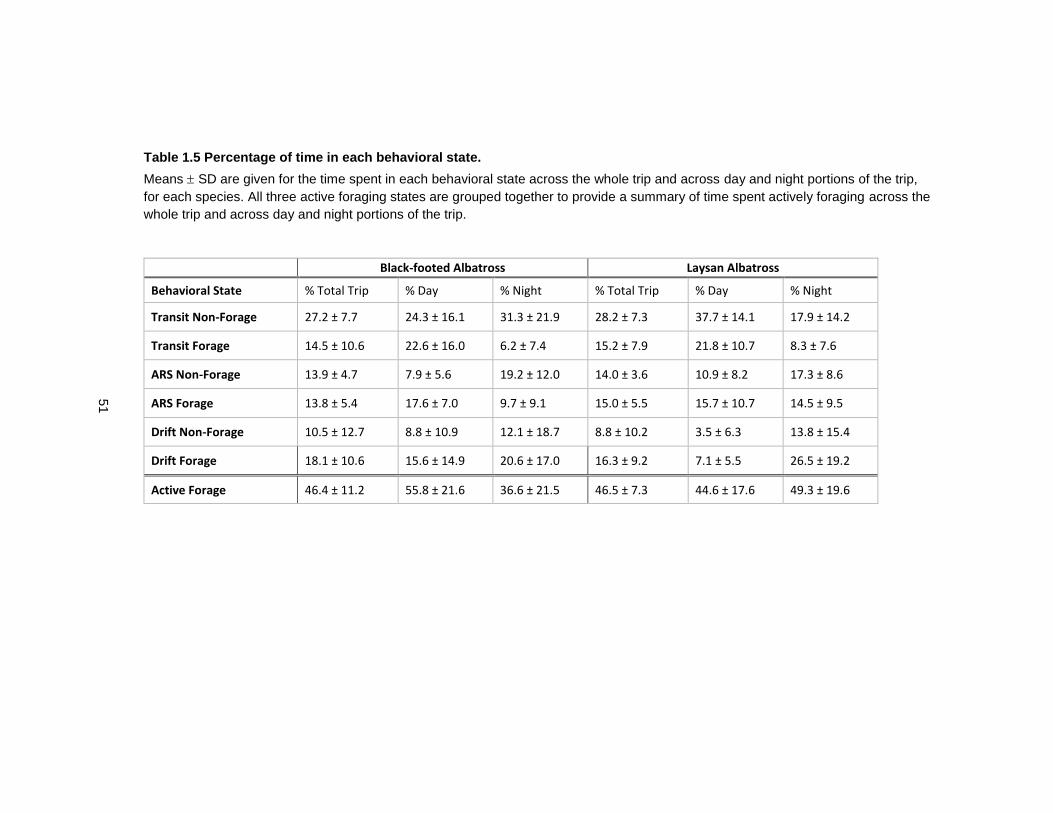
51
Table 1.5 Percentage of time in each behavioral state.
Means SD are given for the time spent in each behavioral state across the whole trip and across day and night portions of the trip,
for each species. All three active foraging states are grouped together to provide a summary of time spent actively foraging across the
whole trip and across day and night portions of the trip.
Black-footed Albatross Laysan Albatross
Behavioral State % Total Trip % Day % Night % Total Trip % Day % Night
Transit Non-Forage 27.2 ± 7.7 24.3 ± 16.1 31.3 ± 21.9 28.2 ± 7.3 37.7 ± 14.1 17.9 ± 14.2
Transit Forage 14.5 ± 10.6 22.6 ± 16.0 6.2 ± 7.4 15.2 ± 7.9 21.8 ± 10.7 8.3 ± 7.6
ARS Non-Forage 13.9 ± 4.7 7.9 ± 5.6 19.2 ± 12.0 14.0 ± 3.6 10.9 ± 8.2 17.3 ± 8.6
ARS Forage 13.8 ± 5.4 17.6 ± 7.0 9.7 ± 9.1 15.0 ± 5.5 15.7 ± 10.7 14.5 ± 9.5
Drift Non-Forage 10.5 ± 12.7 8.8 ± 10.9 12.1 ± 18.7 8.8 ± 10.2 3.5 ± 6.3 13.8 ± 15.4
Drift Forage 18.1 ± 10.6 15.6 ± 14.9 20.6 ± 17.0 16.3 ± 9.2 7.1 ± 5.5 26.5 ± 19.2
Active Forage 46.4 ± 11.2 55.8 ± 21.6 36.6 ± 21.5 46.5 ± 7.3 44.6 ± 17.6 49.3 ± 19.6
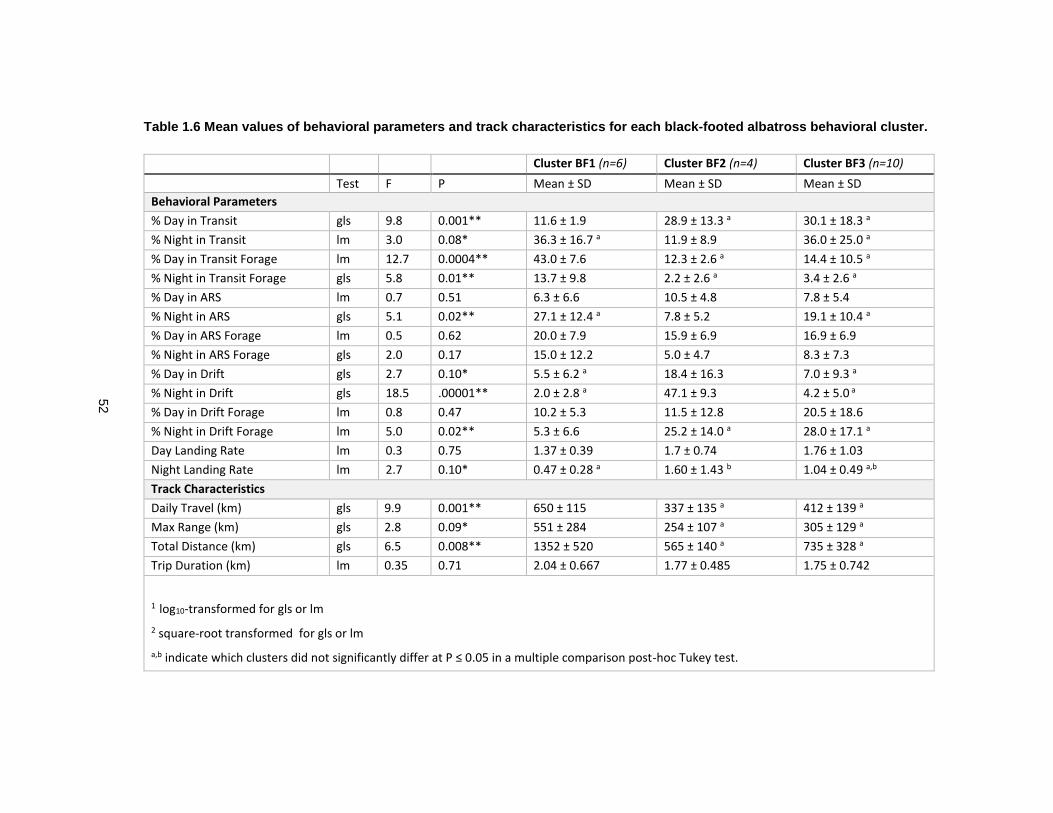
52
Table 1.6 Mean values of behavioral parameters and track characteristics for each black-footed albatross behavioral cluster.
Cluster BF1 (n=6) Cluster BF2 (n=4) Cluster BF3 (n=10)
Test F P Mean ± SD Mean ± SD Mean ± SD
Behavioral Parameters
% Day in Transit gls 9.8 0.001** 11.6 ± 1.9 28.9 ± 13.3 a 30.1 ± 18.3 a
% Night in Transit lm 3.0 0.08* 36.3 ± 16.7 a 11.9 ± 8.9 36.0 ± 25.0 a
% Day in Transit Forage lm 12.7 0.0004** 43.0 ± 7.6 12.3 ± 2.6 a 14.4 ± 10.5 a
% Night in Transit Forage gls 5.8 0.01** 13.7 ± 9.8 2.2 ± 2.6 a 3.4 ± 2.6 a
% Day in ARS lm 0.7 0.51 6.3 ± 6.6 10.5 ± 4.8 7.8 ± 5.4
% Night in ARS gls 5.1 0.02** 27.1 ± 12.4 a 7.8 ± 5.2 19.1 ± 10.4 a
% Day in ARS Forage lm 0.5 0.62 20.0 ± 7.9 15.9 ± 6.9 16.9 ± 6.9
% Night in ARS Forage gls 2.0 0.17 15.0 ± 12.2 5.0 ± 4.7 8.3 ± 7.3
% Day in Drift gls 2.7 0.10* 5.5 ± 6.2 a 18.4 ± 16.3 7.0 ± 9.3 a
% Night in Drift gls 18.5 .00001** 2.0 ± 2.8 a 47.1 ± 9.3 4.2 ± 5.0 a
% Day in Drift Forage lm 0.8 0.47 10.2 ± 5.3 11.5 ± 12.8 20.5 ± 18.6
% Night in Drift Forage lm 5.0 0.02** 5.3 ± 6.6 25.2 ± 14.0 a 28.0 ± 17.1 a
Day Landing Rate lm 0.3 0.75 1.37 ± 0.39 1.7 ± 0.74 1.76 ± 1.03
Night Landing Rate lm 2.7 0.10* 0.47 ± 0.28 a 1.60 ± 1.43 b 1.04 ± 0.49 a,b
Track Characteristics
Daily Travel (km) gls 9.9 0.001** 650 ± 115 337 ± 135 a 412 ± 139 a
Max Range (km) gls 2.8 0.09* 551 ± 284 254 ± 107 a 305 ± 129 a
Total Distance (km) gls 6.5 0.008** 1352 ± 520 565 ± 140 a 735 ± 328 a
Trip Duration (km) lm 0.35 0.71 2.04 ± 0.667 1.77 ± 0.485 1.75 ± 0.742
1 log10-transformed for gls or lm
2 square-root transformed for gls or lm
a,b indicate which clusters did not significantly differ at P ≤ 0.05 in a multiple comparison post-hoc Tukey test.
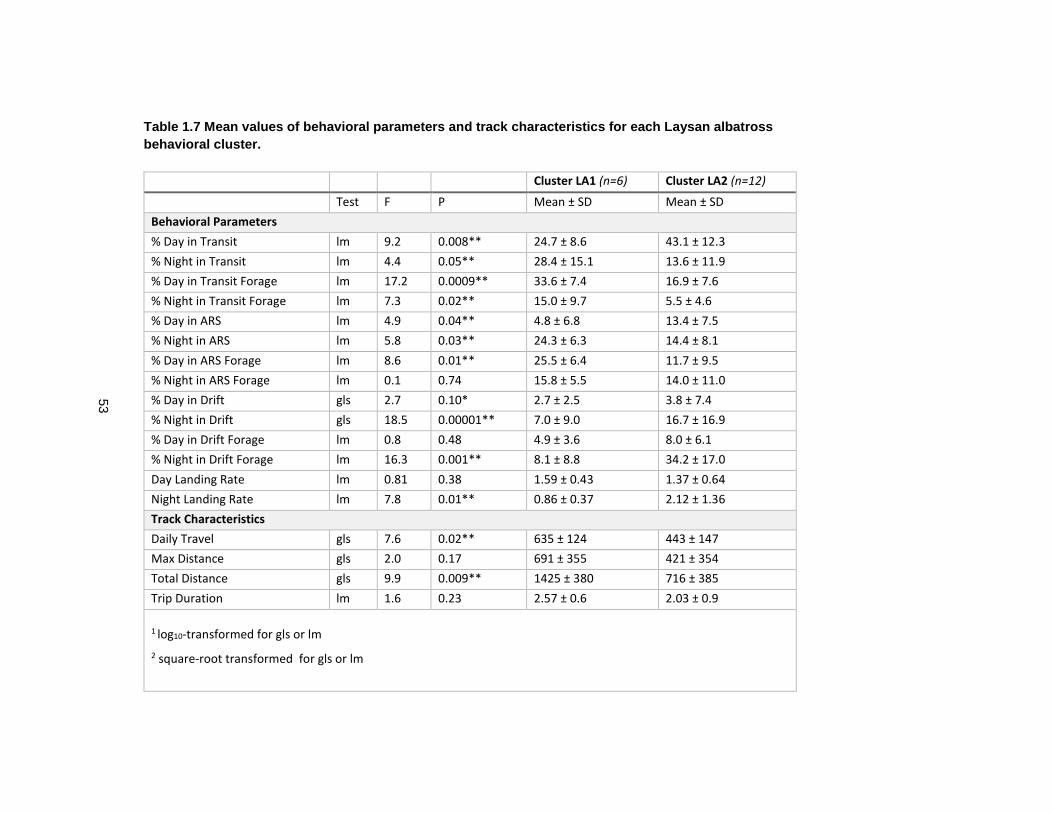
53
Table 1.7 Mean values of behavioral parameters and track characteristics for each Laysan albatross
behavioral cluster.
Cluster LA1 (n=6) Cluster LA2 (n=12)
Test F P Mean ± SD Mean ± SD
Behavioral Parameters
% Day in Transit lm 9.2 0.008** 24.7 ± 8.6 43.1 ± 12.3
% Night in Transit lm 4.4 0.05** 28.4 ± 15.1 13.6 ± 11.9
% Day in Transit Forage lm 17.2 0.0009** 33.6 ± 7.4 16.9 ± 7.6
% Night in Transit Forage lm 7.3 0.02** 15.0 ± 9.7 5.5 ± 4.6
% Day in ARS lm 4.9 0.04** 4.8 ± 6.8 13.4 ± 7.5
% Night in ARS lm 5.8 0.03** 24.3 ± 6.3 14.4 ± 8.1
% Day in ARS Forage lm 8.6 0.01** 25.5 ± 6.4 11.7 ± 9.5
% Night in ARS Forage lm 0.1 0.74 15.8 ± 5.5 14.0 ± 11.0
% Day in Drift gls 2.7 0.10* 2.7 ± 2.5 3.8 ± 7.4
% Night in Drift gls 18.5 0.00001** 7.0 ± 9.0 16.7 ± 16.9
% Day in Drift Forage lm 0.8 0.48 4.9 ± 3.6 8.0 ± 6.1
% Night in Drift Forage lm 16.3 0.001** 8.1 ± 8.8 34.2 ± 17.0
Day Landing Rate lm 0.81 0.38 1.59 ± 0.43 1.37 ± 0.64
Night Landing Rate lm 7.8 0.01** 0.86 ± 0.37 2.12 ± 1.36
Track Characteristics
Daily Travel gls 7.6 0.02** 635 ± 124 443 ± 147
Max Distance gls 2.0 0.17 691 ± 355 421 ± 354
Total Distance gls 9.9 0.009** 1425 ± 380 716 ± 385
Trip Duration lm 1.6 0.23 2.57 ± 0.6 2.03 ± 0.9
1 log10-transformed for gls or lm
2 square-root transformed for gls or lm
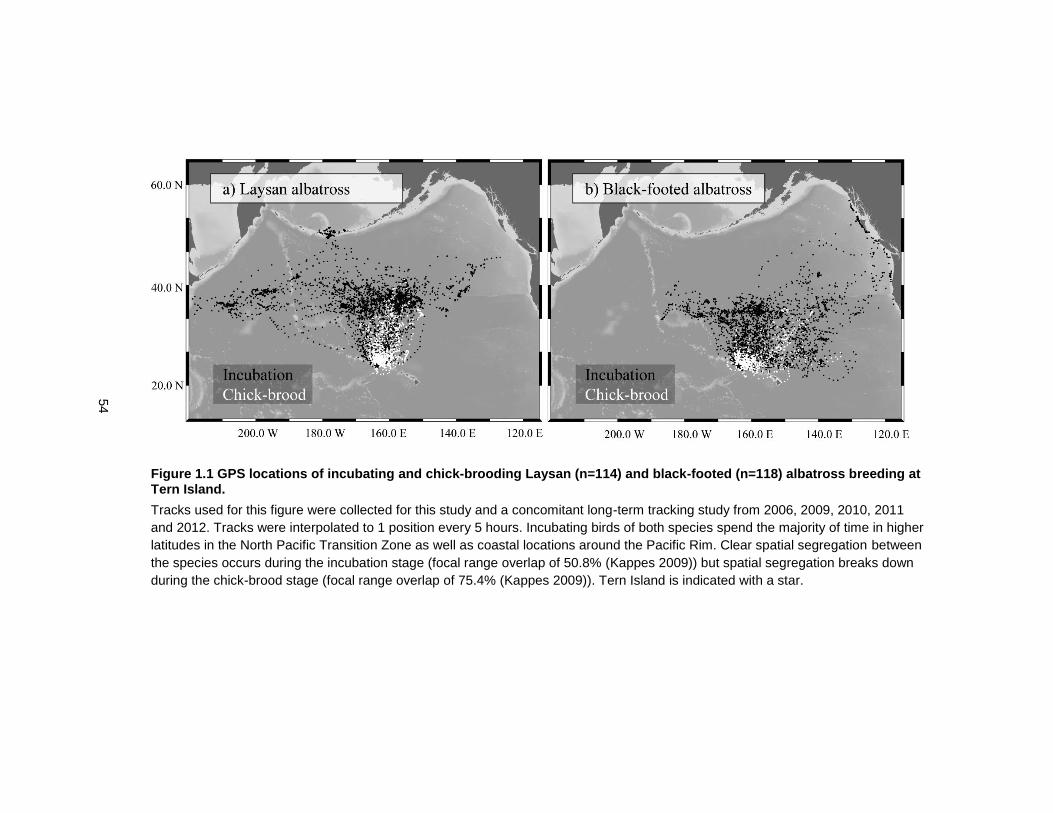
54
Figure 1.1 GPS locations of incubating and chick-brooding Laysan (n=114) and black-footed (n=118) albatross breeding at Tern Island.
Tracks used for this figure were collected for this study and a concomitant long-term tracking study from 2006, 2009, 2010, 2011
and 2012. Tracks were interpolated to 1 position every 5 hours. Incubating birds of both species spend the majority of time in higher
latitudes in the North Pacific Transition Zone as well as coastal locations around the Pacific Rim. Clear spatial segregation between
the species occurs during the incubation stage (focal range overlap of 50.8% (Kappes 2009)) but spatial segregation breaks down
during the chick-brood stage (focal range overlap of 75.4% (Kappes 2009)). Tern Island is indicated with a star.
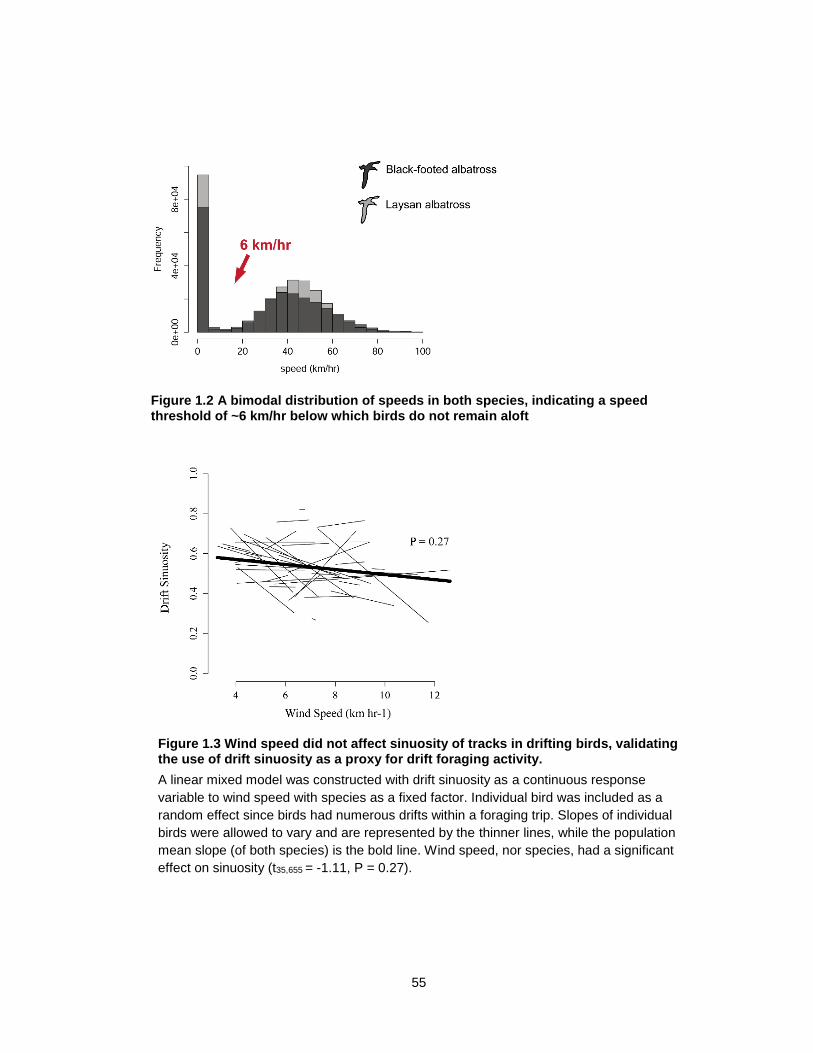
55
Figure 1.2 A bimodal distribution of speeds in both species, indicating a speed threshold of ~6 km/hr below which birds do not remain aloft
Figure 1.3 Wind speed did not affect sinuosity of tracks in drifting birds, validating the use of drift sinuosity as a proxy for drift foraging activity.
A linear mixed model was constructed with drift sinuosity as a continuous response
variable to wind speed with species as a fixed factor. Individual bird was included as a
random effect since birds had numerous drifts within a foraging trip. Slopes of individual
birds were allowed to vary and are represented by the thinner lines, while the population
mean slope (of both species) is the bold line. Wind speed, nor species, had a significant
effect on sinuosity (t35,655 = -1.11, P = 0.27).
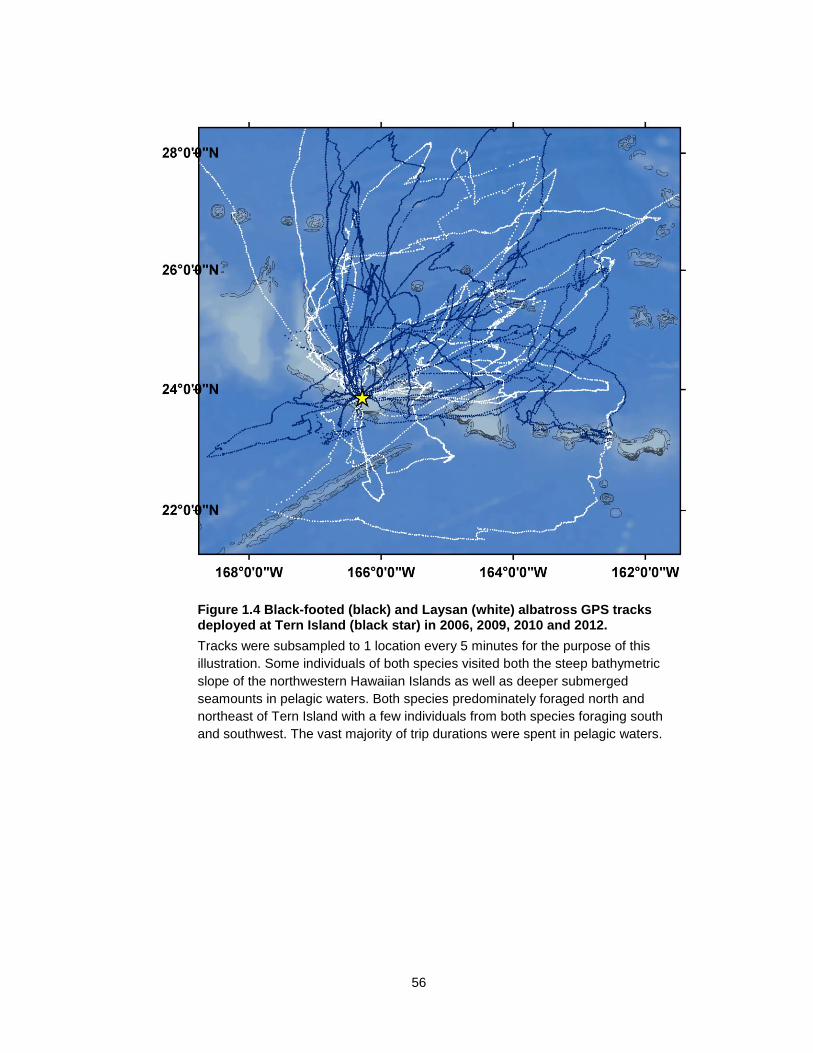
56
Figure 1.4 Black-footed (black) and Laysan (white) albatross GPS tracks deployed at Tern Island (black star) in 2006, 2009, 2010 and 2012.
Tracks were subsampled to 1 location every 5 minutes for the purpose of this
illustration. Some individuals of both species visited both the steep bathymetric
slope of the northwestern Hawaiian Islands as well as deeper submerged
seamounts in pelagic waters. Both species predominately foraged north and
northeast of Tern Island with a few individuals from both species foraging south
and southwest. The vast majority of trip durations were spent in pelagic waters.
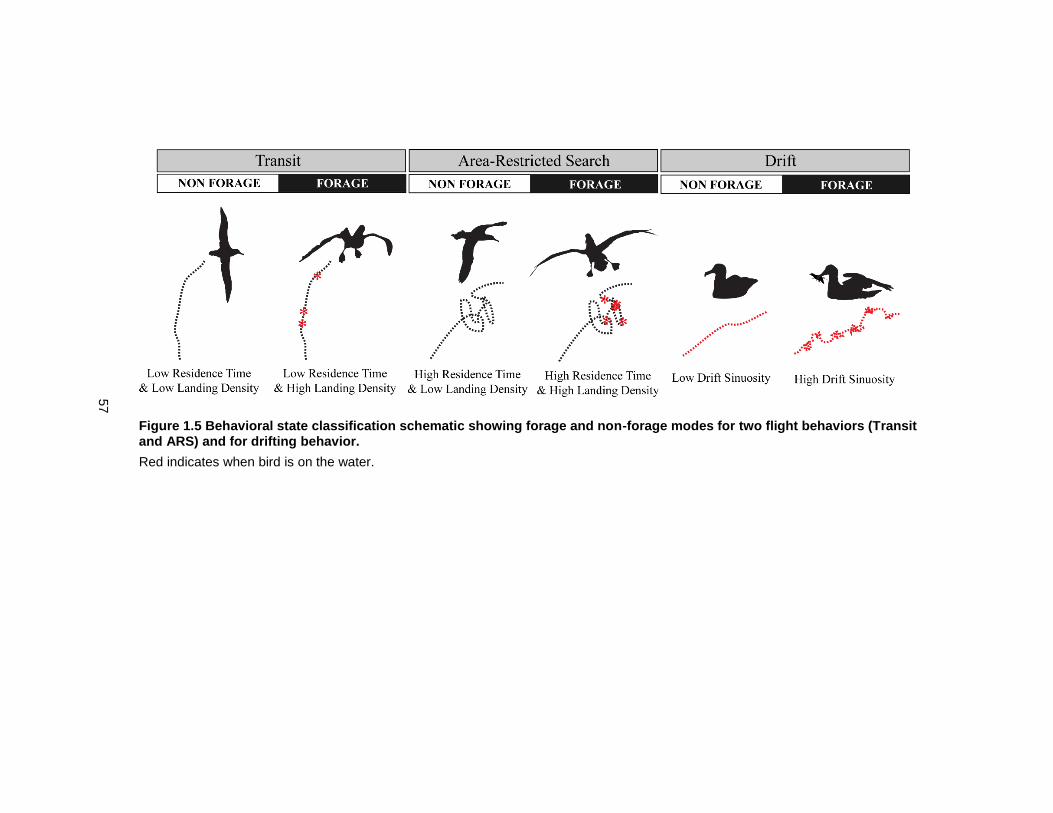
57
Figure 1.5 Behavioral state classification schematic showing forage and non-forage modes for two flight behaviors (Transit and ARS) and for drifting behavior.
Red indicates when bird is on the water.
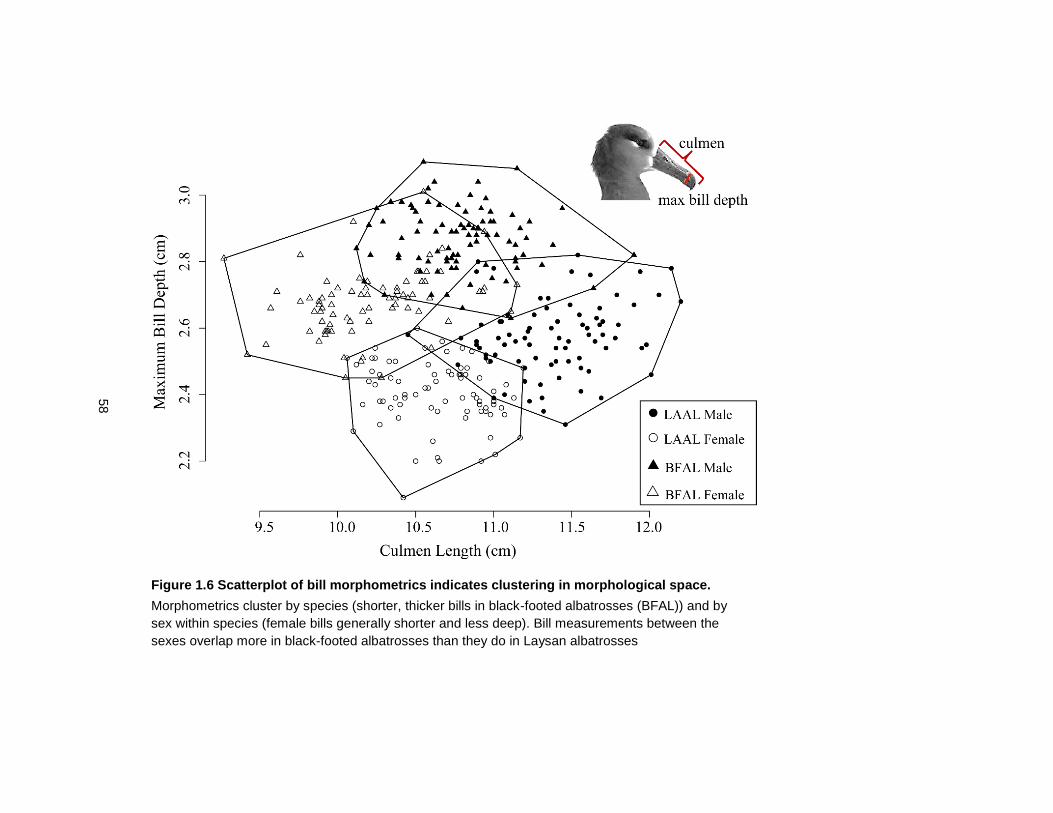
58
Figure 1.6 Scatterplot of bill morphometrics indicates clustering in morphological space.
Morphometrics cluster by species (shorter, thicker bills in black-footed albatrosses (BFAL)) and by
sex within species (female bills generally shorter and less deep). Bill measurements between the
sexes overlap more in black-footed albatrosses than they do in Laysan albatrosses
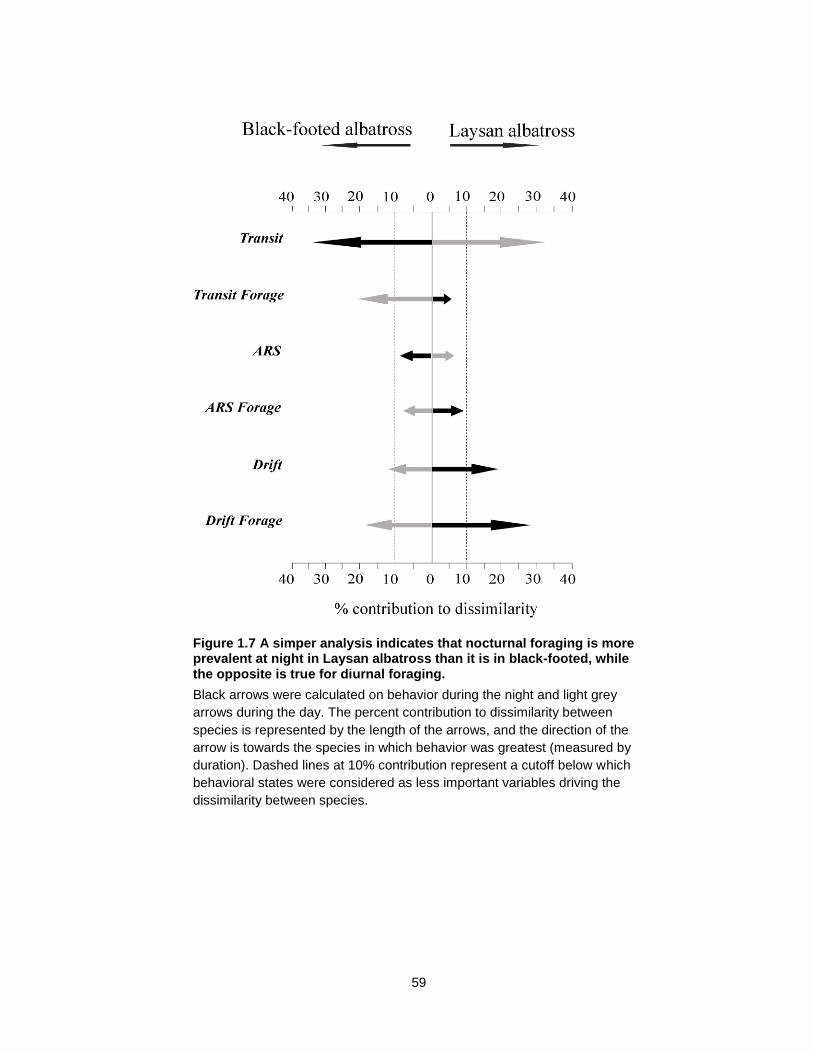
59
Figure 1.7 A simper analysis indicates that nocturnal foraging is more prevalent at night in Laysan albatross than it is in black-footed, while the opposite is true for diurnal foraging.
Black arrows were calculated on behavior during the night and light grey
arrows during the day. The percent contribution to dissimilarity between
species is represented by the length of the arrows, and the direction of the
arrow is towards the species in which behavior was greatest (measured by
duration). Dashed lines at 10% contribution represent a cutoff below which
behavioral states were considered as less important variables driving the
dissimilarity between species.
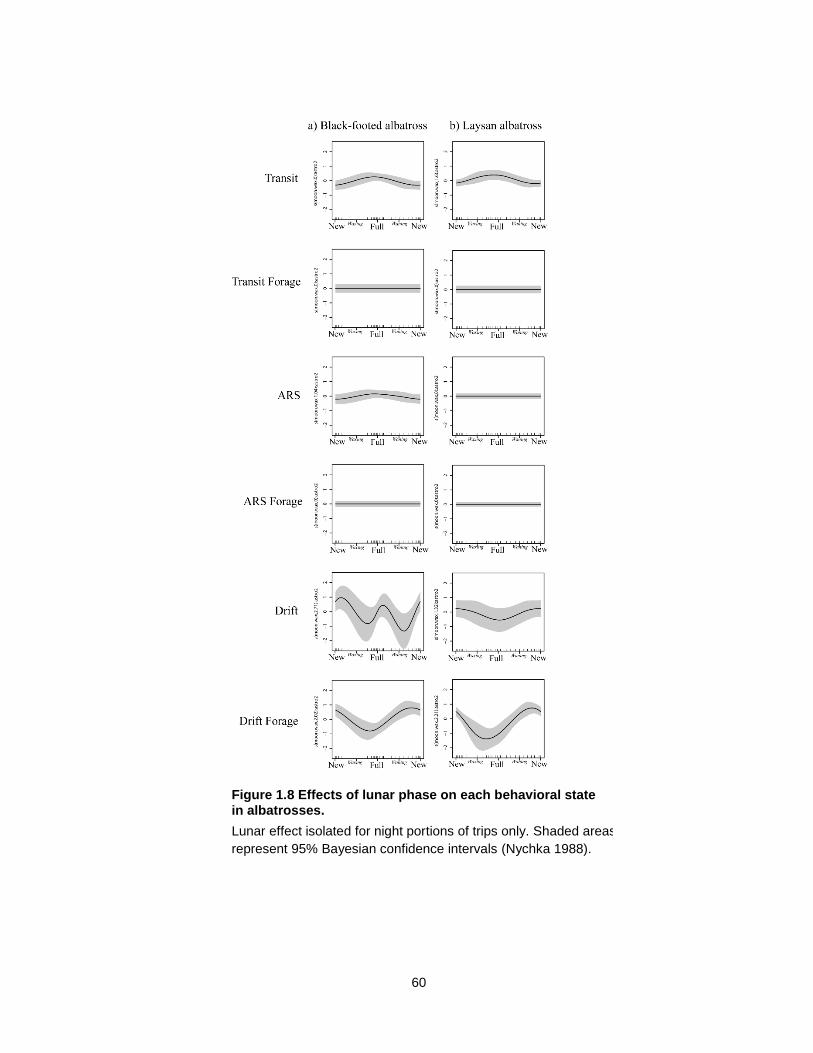
60
Figure 1.8 Effects of lunar phase on each behavioral state in albatrosses.
Lunar effect isolated for night portions of trips only. Shaded areas
represent 95% Bayesian confidence intervals (Nychka 1988).
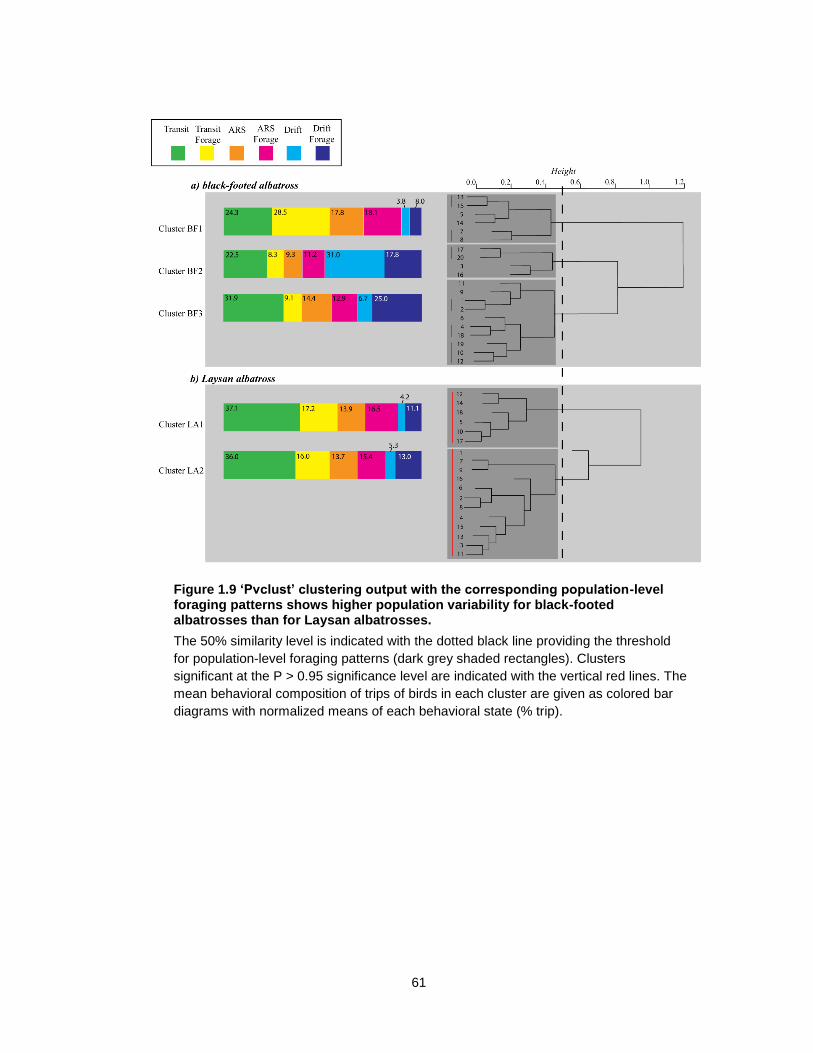
61
Figure 1.9 ‘Pvclust’ clustering output with the corresponding population-level foraging patterns shows higher population variability for black-footed albatrosses than for Laysan albatrosses.
The 50% similarity level is indicated with the dotted black line providing the threshold
for population-level foraging patterns (dark grey shaded rectangles). Clusters
significant at the P > 0.95 significance level are indicated with the vertical red lines. The
mean behavioral composition of trips of birds in each cluster are given as colored bar
diagrams with normalized means of each behavioral state (% trip).
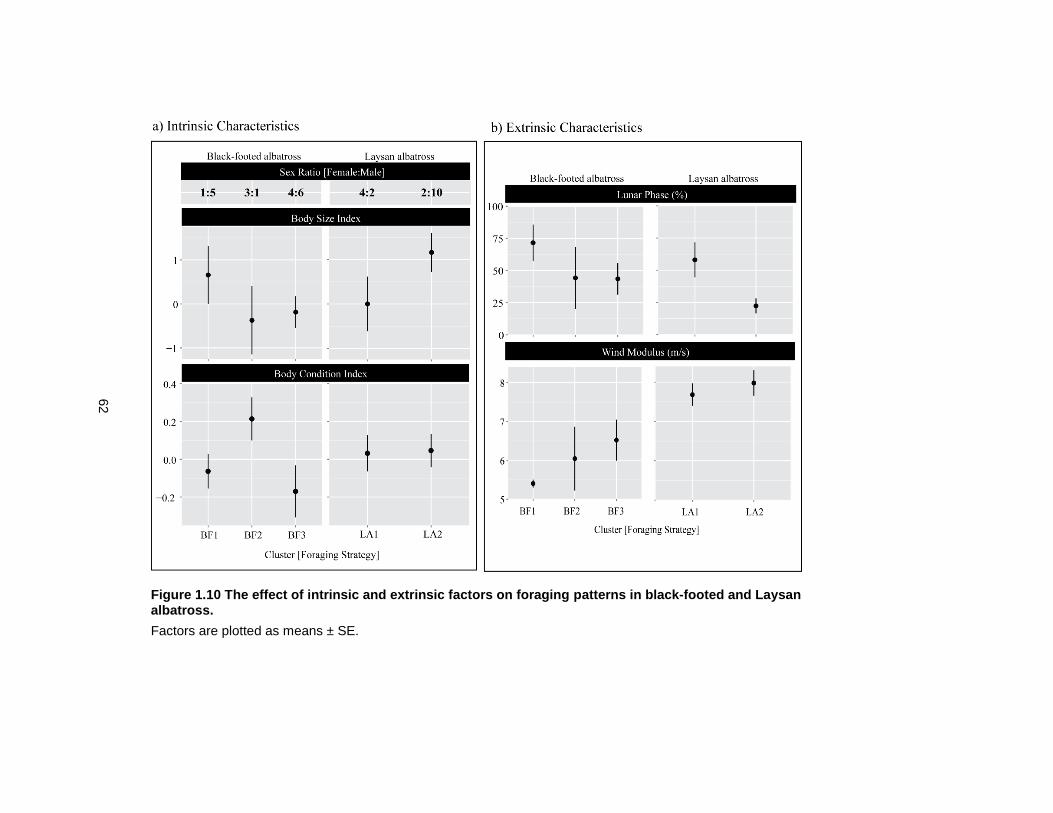
62
Figure 1.10 The effect of intrinsic and extrinsic factors on foraging patterns in black-footed and Laysan albatross.
Factors are plotted as means ± SE.
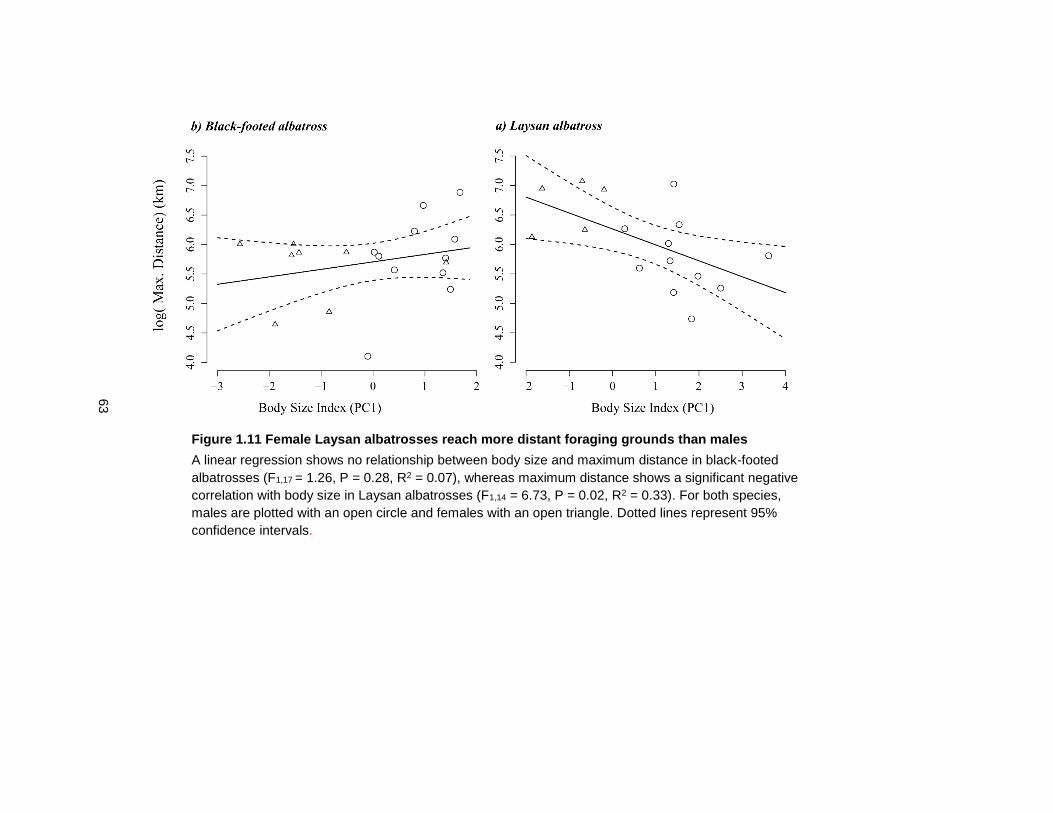
63
Figure 1.11 Female Laysan albatrosses reach more distant foraging grounds than males
A linear regression shows no relationship between body size and maximum distance in black-footed
albatrosses (F1,17 = 1.26, P = 0.28, R2 = 0.07), whereas maximum distance shows a significant negative
correlation with body size in Laysan albatrosses (F1,14 = 6.73, P = 0.02, R2 = 0.33). For both species,
males are plotted with an open circle and females with an open triangle. Dotted lines represent 95%
confidence intervals.
64
2 CHAPTER TWO
Identifying fisheries-associated diet in the stomach oil of tube-nosed seabirds using quantitative lipid analysis.
Melinda G. Conners, Chandra Goetch, Suzanne Budge, William Walker, Yoko Mitani, Daniel Costa, Scott A. Shaffer
65
ABSTRACT
Mortality from incidental bycatch in longline fishery operations is a global threat to seabird
populations, and especially so for the albatross family (Diomedeidae) in which seventeen out
of twenty-two species are threatened. Despite the risks, fisheries remain attractive to many
species of seabird by providing access to high-energy foods in the form of discarded fish and
offal, target fish, and baited hooks. Current policy regarding fisheries management is
increasingly aimed at discard reform, and the first discard ban recently passed in the
European Union Fisheries Common. While there is global agreement in the importance of
minimizing the waste inherent in bycatch and discards, there is also growing concern that
there is a lack of understanding the extent to which seabirds rely on fisheries-associated
resources, especially at the colony and individual levels. We used a novel adaptation of
quantitative fatty acid analysis (QFASA), to assess the fisheries-associated reliance of two
threatened North Pacific albatross species at the colony and individual levels. Albatross diet
was estimated with QFASA using multiple lipid classes from stomach oil collected from two
species of sympatrically-breeding adult albatrosses across multiple breeding seasons. Prey-
specific error was estimated by comparing QFASA estimated diets from known “simulated”
diet, which allowed us to interpret diet results on a prey-specific basis. Fisheries-associated
diet occurred in both albatross species across both the incubation and chick-brood stages
however neither species relied on fisheries food as the dominant food source (~ 10 % of the
diet for both species). Despite low overall population dependence, there were some
individuals whose diet consisted almost entirely of fisheries-associated food, indicating that
some individuals might specialize on this foraging tactic. Our analysis also showed significant
species differences in the type of fisheries resource consumed, with black-footed albatrosses
scavenging target fish species (swordfish) to a greater extent and Laysan albatrosses
predominately consuming fish species used to bait longline hooks, a behavior also observed
directly on vessels by fisheries observers. Overall diet characterization of the species

66
highlighted mesopelagic gelatinous squid to be the most dominate food source for both
Laysan and black-footed albatrosses, and the amount of squid in the diet increased with age.
Both species had similar diet composition during the incubation phase of the breeding cycle,
however during the chick-brood phase, black-footed albatrosses showed a significant dietary
shift towards flying fish eggs and crustaceans. Overall, black-footed albatrosses showed
greater dietary flexibility, which is consistent with recent behavioral analyses. Quantitative
fatty acid analysis proved a tractable method for estimating the importance of fisheries-
associated resources in the diet of albatrosses, which could be an important management
tool for future conservation efforts.
2.1 INTRODUCTION
Incidental mortality from fisheries bycatch is the principle threat to seabird biodiversity,
particularly so for albatrosses (Croxall and Gales 1998). Eighteen out of twenty-two
recognized species of albatrosses are currently threatened or endangered from extinction, of
which four are critically endangered (Gales 2008). Population declines of at least ten
albatross species are attributed at least in part to adult mortality from fisheries bycatch, and
specifically to demersal and pelagic longline operations (Weimerskirch et al. 1997, Gales and
Robertson 1998, Tuck et al. 2001, Lewison and Crowder 2003, Véran et al. 2007).
The widespread impact of fishery bycatch on seabird populations, along with a large
economic impact to the fishing industry due to bait loss from scavenging birds (Løkkeborg
2008, Gandini and Frere 2012), incited a global movement in the 1990s to understand
seabird-fishery interactions (Brothers 1991, Løkkeborg 2011, Melvin et al. 2014). Subsequent
research led to the development of vessel gear such as tori lines and weighted sinker hooks
and to operational changes such as night setting and underwater setting chutes (Brothers
1999). When implemented, these changes to fishing operations significantly reduce seabird
bycatch (summarized in Gilman et al. 2005), however, the global efficacy of these measures
67
is limited by a non-unanimous implementation among international longline fleets; and fishery
interactions, although reduced from historic levels, remain a significant threat to seabird
populations.
Despite the risk of injury or death, fisheries remain attractive to many albatross
species by providing lipid-rich meals in the form of target fish (Bisson 2008), baited hooks,
and discarded bait and offal (Furness 2003, Bicknell et al. 2013). Unwanted fish and offal
alone enter the oceans as fisheries waste at the rate of ~ 7.3 million tons a year (Kelleher
2005), and some longline fisheries lose up to 13-14 % of bait due to scavenging birds
(Gandini and Frere 2012). High energy content meals made accessible to seabirds through
fishery operations, along with fishery-induced collapse of higher trophic level fish stocks, has
led to a restructuring of marine communities since the advent of industrial fishing (Pauly et al.
1998, Dayton et al. 2002, Coll et al. 2008). Many seabird species now show behavioral (i.e.,
Torres et al. 2011, Collet et al. 2015), breeding (i.e., Furness and Tasker 2000, Frederiksen
et al. 2004), and dietary (i.e., Bearhop et al. 2001, Votier et al. 2008) responses to industrial
fishing efforts. Understanding the degree to which seabird populations rely on fisheries
subsidies remains an important, yet, in some cases, intractable problem. Particularly
challenging is identifying fisheries-associated food in diet analyses relying on stomach
contents. This is especially true for species in the Procelleriformes order, like albatrosses,
that rapidly digest prey into a homogenous stomach oil (Warham 1977, Tickell 2000), thereby
reducing, if not eliminating, the ability to visually identify fisheries-associated diet in stomach
contents.
In addition, while vessel-based studies have significantly advanced our
understanding of seabird-fishery interactions, much less is understood about the impact on
seabirds at the colony and individual levels (but see Bearhop et al. 2001, Votier et al. 2008,
2010, 2013, Navarro et al. 2009), especially for pelagic seabirds. Colony-specific studies are
important for predicting the response of seabird populations to changes in fishery
management, such as the recent discard ban of the EU Common Fisheries Policy.
68
Furthermore, measuring how dependency on fishery-associated resources changes across
an annual cycle increases understanding of when populations are most at-risk to both
changes in fishing practices (i.e. reduced discards) and to incidental mortality from bycatch.
Populations that rely on fishery-associated resources during critical phases of the breeding
cycle are vulnerable to changes in fishery policies if they lack flexibility in foraging strategies
or if natural resources are difficult to exploit (Oro et al. 1995).
Furthermore, understanding individual variability in response to fisheries is critical for
long term management of seabird populations. Generalist seabirds, especially those that
scavenge, such as albatross, tend to consume more fisheries discards than others (Bicknell
et al. 2013), and, generalist populations are often comprised of individual specialists (Bolnick
et al. 2003, Svanbäck and Bolnick 2007, Araújo et al. 2011). Given the skill required for
successful capture of bait from hooks during longline setting operations (Bisson 2008), it is
likely that some individuals within albatross populations are specializing in a fisheries-
dependent foraging pattern over their lifespans, as is seen in other seabird species (Patrick et
al. 2015). Additionally, there is growing evidence that individuals in many long-lived seabird
species are consistent in the foraging and/or spatial patterns they use (Woo et al. 2008,
Patrick et al. 2013, 2015, Patrick and Weimerskirch 2014b, Wakefield et al. 2015), potentially
throughout their lifespans. Therefore, when considering fisheries management with regards
to seabird populations, it is important to consider not just colony-specific dependence on
fishery subsidies, but also the level of consistency in foraging strategies.
Laysan (Phoebastria immutabilis) and black-footed (P. nigripes) albatrosses are
generalist scavengers of the North Pacific and their population trajectories are vulnerable to
incidental mortality from fisheries by-catch (Lewison and Crowder 2003, Naughton et al.
2007); particularly so for black-footed albatrosses (Lewison et al. 2004, Véran et al. 2007).
Although bycatch rates of albatrosses in U.S. pelagic longline operations dropped after the
implementation of mitigation gear on vessels (Anderson et al. 2011), there is little information
on birds taken in Japanese and Taiwanese fleets in the North Pacific. Furthermore, the
69
degree of dependence on fisheries subsidies among breeding colonies in the North Pacific is
unknown. Likewise, there is no information on the frequency of fisheries-associated individual
diet specialization in these albatross species.
An analysis of bulk stable isotopes in the tissues of Laysan albatrosses from a
recently established breeding colony on Guadalupe Island off Mexico revealed that birds
were more likely to be consuming fish than squid (Henry et al. 2007), however, it is not known
whether this reliance on fish was specific to naturally occurring prey in the California Current
or to fish exploited from pelagic longline fishery operations. The only comprehensive diet
study of both albatross species from breeding colonies in the northwestern Hawaiian Islands
was predominately based on accumulated squid beaks that represented feeding that
occurred during the late chick-rearing season, and as such does not represent diet across the
breeding season (Harrison et al. 1983, Pitman et al. 2004a). Considering the dramatic
change in feeding grounds from incubation to chick-guard and to chick-rear stages
(Hyrenbach et al. 2002, Kappes et al. 2015), there remains a critical need to understand how
diet, including the degree of fisheries exploitation, varies within a breeding season for North
Pacific albatrosses.
Traditional diet analyses have provided invaluable insight into Hawaiian albatross
feeding ecology (Gould et al. 1997, Pitman et al. 2004a, Walker et al. 2012), however, the
methods used in these analyses are limited by their omission of rapidly digested soft-bodied
prey (e.g. jellyfish, chunks of swordfish meat). This is especially true for scavenging birds
such as albatrosses, that have hyper-acidic stomachs with a pH that can dissolve bone over
short periods of time (Grémillet et al. 2012). The foraging trips of adult Laysan and black-
footed albatrosses can be very long (up to 30 days) and adults often return with stomachs full
of stomach oil and nothing else (personal obs.), especially during the incubation and early-
chick-guard phases; as a result, there is currently no information about diet of these two
species during these critical phases in the breeding cycle.
70
Biochemical dietary analyses, such as stable isotope, fatty acid, and DNA barcoding,
were developed to circumvent the biases of traditional dietary methods using stomach
contents and are becoming increasingly important in characterizing diet of free-ranging
animals that are difficult to observe and/or sample, such as albatross. Lipids, and specifically
fatty acids, have long been used in the forensic detailing of trophic webs both in terrestrial
and marine ecosystems (Ackman and Eaton 1966, Connan et al. 2005). Since fatty acids are
found in great diversity and, for many, can only be synthesized de novo in certain organisms,
they can serve as traceable biomarkers in food web studies (Budge et al. 2006).
Initial assessment of lipid composition of procellariform stomach oil indicated high
volumes of wax esters and triacylglycerides (Imber 1976) - lipid classes commonly found in
storage tissues of marine organisms. Quantitative fatty acid analysis (QFASA) employs a
robust statistical model to quantitatively estimate predator diet by identifying the combination
of prey lipid signatures most similar to that of the predator while accounting for predator
metabolism, and is a proven method that has been used to estimate diet of free-ranging
seals, sea lions, seabirds, porpoises and polar bears (Beck et al. 2007, Iverson et al. 2007,
Thiemann et al. 2008, Meynier et al. 2010, Bromaghin et al. 2013, Jansen 2013). A critical
requirement of QFASA is the collection of a comprehensive library of lipid signatures from
potential prey, which is exceedingly challenging for generalist pelagic predators, such as
albatross, which regularly forage across entire ocean basins and consume diverse prey.
Nevertheless, given access to a comprehensive prey library, procellariform stomach oil is
highly suitable for quantitative fatty acid analysis as it is dietary in origin (Place et al. 1989)
and thus requires no calibration for predator metabolism, eliminating a large source of error in
the model (Bromaghin et al. 2015). Additionally, stomach oil represents diet integrated from
days to weeks, and can be treated as longitudinal sampling of the same individual, opening
up the possibility of examining individual-based differences in foraging strategies and dietary
specialization.
71
Here, we employ a novel adaptation of QFASA using both fatty acids and fatty
alcohols from triacylglycerol and wax ester lipid classes to estimate the diet of individual
Laysan and black-footed albatrosses from stomach oil samples. Our objectives were 1) to
characterize and compare the diet of two North Pacific albatrosses species across the
incubation and chick-brood phases of the breeding season when both species switch from
foraging in high latitude temperate waters to warmer subtropical waters, 2) to assess the
relative importance of fisheries-associated resources in Laysan and black-footed albatross
diet and to test whether year, breeding phase, species, sex or age influence fisheries-
associations, and 3) to identify feeding strategies of Laysan and black-footed albatrosses
along the spectrum of dietary generalism or specialism.
2.2 METHODS
2.2.1 Study Species
Black-footed and Laysan albatrosses are highly migratory, pelagic surface feeders thought to
depend primarily upon visual and olfactory cues to find prey at the ocean surface (Nevitt et al.
2008). Black-footed albatrosses are slightly bigger than Laysan albatrosses by nearly all
morphometrics, except for bill length. Within both species, males and females are slightly
sexually dimorphic, with males being marginally larger and heavier than females, but there is
overlap in all of these morphometric measurements (Tickell 2000, Conners et al. 2015).
Single egg clutches are laid in November and December, chicks hatch in January and
February, and chicks are guarded and fed frequently by adults into March. The post-guard
period, when adults extend the range and duration of foraging trips and chicks are fed
infrequent meals, extends into summer until chicks fledge (July-August). The study colony at
Tern Island in the French Frigate Shoals (23.870°N, 166.284°W, 712 km northwest of Kauai)
supports ~4000 breeding pairs of black-footed albatrosses and ~3000 of Laysan albatrosses
72
and is the only colony in the northwestern Hawaiian islands where the density of black-footed
albatrosses is greater than that of Laysan albatrosses (Flint 2009).
2.2.2 Stomach Oil
Procellariform stomach oil is derived directly from prey (Place et al. 1989). The unique gastro-
intestinal anatomy of procellariforms results in the build up of neutral lipids inside the stomach
following slow gastric-emptying that is biased towards proteins, carbohydrates and aqueous
fluid, following mechanical rupture of ingested prey (Place et al. 1989). This unique
characteristic of procellariforms is thought to be advantageous for pelagic species relying
heavily upon gliding flight as a mechanism to increase transportability of calories (Warham
1977).
Sampling of Albatross Stomach Oil: We collected small aliquots of stomach oil (5-10 mL)
from 47 adult black-footed albatrosses and 48 adult Laysan albatrosses breeding at Tern
Island, French Frigate Shoals (23.870°N, 166.284°W) across the incubation and brood-guard
periods during 2010, 2011, and 2012 (Table 2.1). A small number of chicks were also
sampled during the late brood-guard (n = 6 black-footed, n = 5 Laysan, 2010 only). Sampled
adults were part of an ongoing tracking study of foraging behavior and each study bird was
equipped with either a GPS datalogger or satellite PTT that weighed well below three percent
of the birds’ body mass, the recommended maximum tag weight for albatrosses. When the
birds returned to the colony after a foraging trip, we removed the tracking device, collected
stomach oil samples and measured mass and morphometrics (bill length, bill depth, tarsus
length). Stomach oil was sampled through stomach intubation, using a sterile #5 Kendall
catheter tube attached to a 35 mL plastic monoject syringe. Stomach intubation is a quick
procedure (< 3 min.) that is less invasive than other methods of diet sampling, such as forced
regurgitations (Karnovsky et al. 2012). Lipid analysis only requires a small amount of oil (1-5
mL) from each bird, substantially less than the volume of diet held by the stomach.
Regardless, stomach oil has an extremely high caloric density and serves as an important
73
source of energy and hydration for birds on the nest, so we supplemented the diet of sampled
birds with a 35 mL blended mixture of market squid, Ensure® shake, and Pedialyte® solution
following the recommendation of a marine wildlife veterinarian. Oil samples were kept frozen
in 10 mL cryovials at 20 °C until analysis. Long-term USFWS banding records provided true
age and minimum ages for our study birds, and birds were classified into Young (5-11), Adult
(12-25), and Old (> 25) age classes. Sex was determined from either 1) a visual assignment
(recorded when possible when pairs were seen together) or 2) a discriminant function
analysis of morphometrics (see Conners et al. 2015).
2.2.3 Lipid Library of Potential Albatross Prey
Quantitative fatty acid analysis requires a comprehensive library of lipid signatures from all
prey species potentially consumed by the predator. North Pacific albatrosses are
opportunistic foragers and consume a wide variety of prey using flexible foraging tactics
(Conners et al. 2015), therefore collecting a library of all potential prey species for lipid
analysis would be both impractical and unfeasible. However, since the fatty acid composition
of an organism depends on its feeding ecology, collecting species from a comprehensive
array of functional groups regularly consumed by the predator should, in theory, be adequate
to represent the range in lipids consumed by the predator. We identified twelve important
functional groups of albatross prey, and collected species that would represent these groups
(Table 2.2).
Twenty-four species of fish, squid, and crustaceans were collected from the North
Pacific Transition Zone (NPTZ), a frontal zone heavily exploited by foraging albatross during
the breeding season (Fernández et al. 2001, Kappes et al. 2015, Thorne et al. 2015), using a
mid-water trawl, frame trawl, neuston tow, and an automated jigging machine on the M/V
Oshoromaru (University of Hokkaido, Japan) in the summer of 2011 (Figure 2.1,Table 2.2).
To represent prey from other regions that are important foraging grounds for albatrosses, five
additional fish and squid species were collected from a Cobb trawl conducted by National
74
Marine Fisheries Service in 2012 in waters off the main Hawaiian islands, while one
additional species of squid was collected from a demersal fishery off the Oregon-Washington
coast in 2014 (Figure 2.1, Table 2.2). Fisheries-associated bait and target fish is an important
source of food for albatross (Bisson 2008), so bait (Asian-sourced pacific saury and chub
mackerel) was collected from POP Bait supply (Honolulu, HI), the main supplier to the
Hawaiian longline fleet. Pacific sardines, sourced from the California Current, were
purchased at a market in California as they represent another common bait species used in
Hawaiian pelagic longline operations (Bisson 2008). As albatross are known to consume not
just bait from fishery operations, but also the catch (Bisson 2008), we additionally purchased
Pacific swordfish, sourced from the California Current. Flying fish eggs are a known important
source of food for black-footed albatrosses (Harrison et al. 1983) and were collected
opportunistically from the albatross breeding colony when found fresh. Albatrosses are
known scavengers of marine mammal carcasses, so we included elephant seal blubber lipid
data from a concurrent study (Goetsch et al., in preparation). Finally, a unique relationship
between North Pacific albatrosses and pacific sunfish was recently described by Takuzo Abe
et al. (2012) showing Laysan and black-footed albatrosses eating ecto-parasitic copepods (P.
pennella) off the skin of ocean sunfish; thus we opportunistically collected P.pennella from a
Pacific pomfret fished off the M/V Oshoromaru in the NPTZ. When possible, standard lengths
of fish, and dorsal mantle lengths of squid were measured to the nearest 0.1 cm; body mass
was measured to the nearest 0.1 g. Prey were identified to genus, or species when possible,
at the National Marine Mammal Laboratory in Seattle, Washington. In total, thirty-five prey
species, spanning all targeted functional groups, were collected for lipid analysis (Table 2.2).
All samples were kept frozen at -20 ˚C in plastic bags until analysis.
2.2.4 Lipid analysis
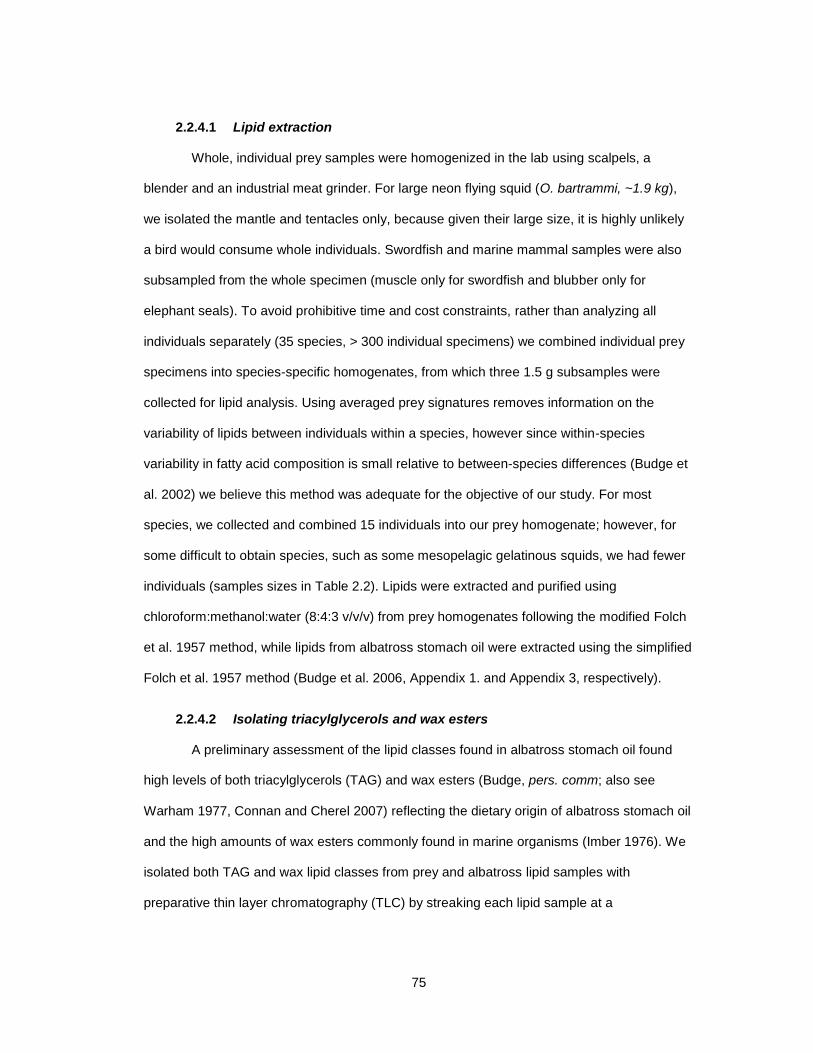
75
2.2.4.1 Lipid extraction
Whole, individual prey samples were homogenized in the lab using scalpels, a
blender and an industrial meat grinder. For large neon flying squid (O. bartrammi, ~1.9 kg),
we isolated the mantle and tentacles only, because given their large size, it is highly unlikely
a bird would consume whole individuals. Swordfish and marine mammal samples were also
subsampled from the whole specimen (muscle only for swordfish and blubber only for
elephant seals). To avoid prohibitive time and cost constraints, rather than analyzing all
individuals separately (35 species, > 300 individual specimens) we combined individual prey
specimens into species-specific homogenates, from which three 1.5 g subsamples were
collected for lipid analysis. Using averaged prey signatures removes information on the
variability of lipids between individuals within a species, however since within-species
variability in fatty acid composition is small relative to between-species differences (Budge et
al. 2002) we believe this method was adequate for the objective of our study. For most
species, we collected and combined 15 individuals into our prey homogenate; however, for
some difficult to obtain species, such as some mesopelagic gelatinous squids, we had fewer
individuals (samples sizes in Table 2.2). Lipids were extracted and purified using
chloroform:methanol:water (8:4:3 v/v/v) from prey homogenates following the modified Folch
et al. 1957 method, while lipids from albatross stomach oil were extracted using the simplified
Folch et al. 1957 method (Budge et al. 2006, Appendix 1. and Appendix 3, respectively).
2.2.4.2 Isolating triacylglycerols and wax esters
A preliminary assessment of the lipid classes found in albatross stomach oil found
high levels of both triacylglycerols (TAG) and wax esters (Budge, pers. comm; also see
Warham 1977, Connan and Cherel 2007) reflecting the dietary origin of albatross stomach oil
and the high amounts of wax esters commonly found in marine organisms (Imber 1976). We
isolated both TAG and wax lipid classes from prey and albatross lipid samples with
preparative thin layer chromatography (TLC) by streaking each lipid sample at a
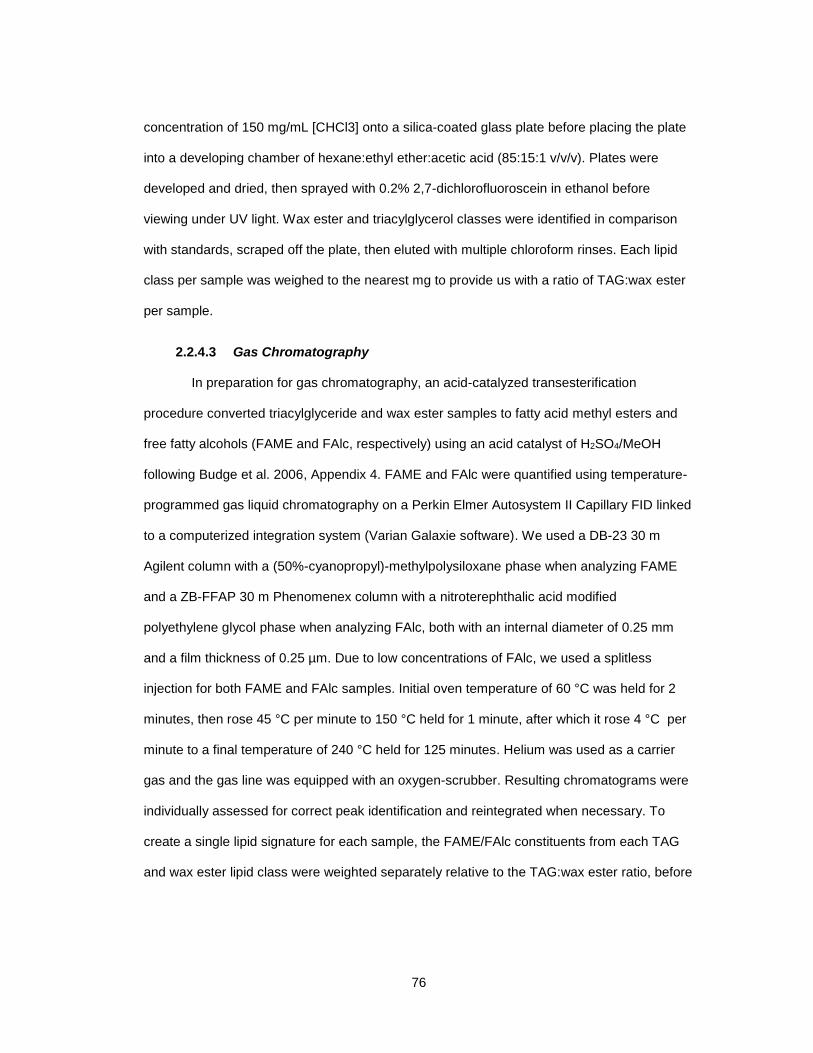
76
concentration of 150 mg/mL [CHCl3] onto a silica-coated glass plate before placing the plate
into a developing chamber of hexane:ethyl ether:acetic acid (85:15:1 v/v/v). Plates were
developed and dried, then sprayed with 0.2% 2,7-dichlorofluoroscein in ethanol before
viewing under UV light. Wax ester and triacylglycerol classes were identified in comparison
with standards, scraped off the plate, then eluted with multiple chloroform rinses. Each lipid
class per sample was weighed to the nearest mg to provide us with a ratio of TAG:wax ester
per sample.
2.2.4.3 Gas Chromatography
In preparation for gas chromatography, an acid-catalyzed transesterification
procedure converted triacylglyceride and wax ester samples to fatty acid methyl esters and
free fatty alcohols (FAME and FAlc, respectively) using an acid catalyst of H2SO4/MeOH
following Budge et al. 2006, Appendix 4. FAME and FAlc were quantified using temperature-
programmed gas liquid chromatography on a Perkin Elmer Autosystem II Capillary FID linked
to a computerized integration system (Varian Galaxie software). We used a DB-23 30 m
Agilent column with a (50%-cyanopropyl)-methylpolysiloxane phase when analyzing FAME
and a ZB-FFAP 30 m Phenomenex column with a nitroterephthalic acid modified
polyethylene glycol phase when analyzing FAlc, both with an internal diameter of 0.25 mm
and a film thickness of 0.25 µm. Due to low concentrations of FAlc, we used a splitless
injection for both FAME and FAlc samples. Initial oven temperature of 60 °C was held for 2
minutes, then rose 45 °C per minute to 150 °C held for 1 minute, after which it rose 4 °C per
minute to a final temperature of 240 °C held for 125 minutes. Helium was used as a carrier
gas and the gas line was equipped with an oxygen-scrubber. Resulting chromatograms were
individually assessed for correct peak identification and reintegrated when necessary. To
create a single lipid signature for each sample, the FAME/FAlc constituents from each TAG
and wax ester lipid class were weighted separately relative to the TAG:wax ester ratio, before
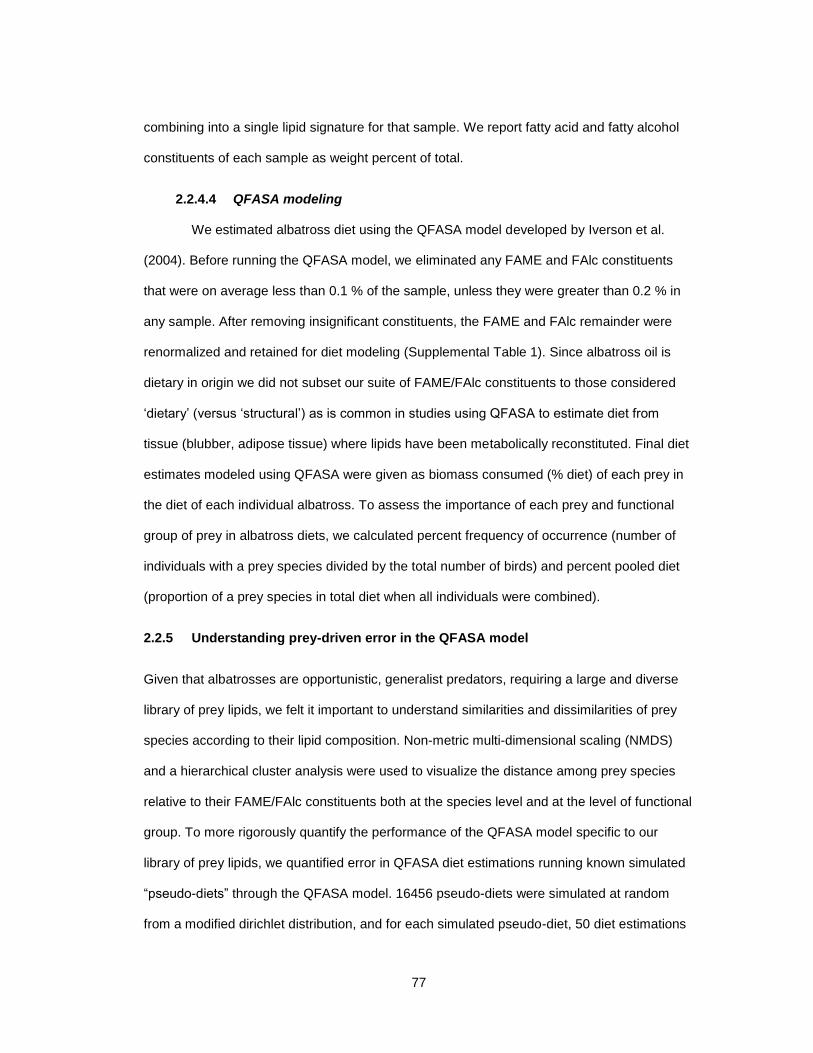
77
combining into a single lipid signature for that sample. We report fatty acid and fatty alcohol
constituents of each sample as weight percent of total.
2.2.4.4 QFASA modeling
We estimated albatross diet using the QFASA model developed by Iverson et al.
(2004). Before running the QFASA model, we eliminated any FAME and FAlc constituents
that were on average less than 0.1 % of the sample, unless they were greater than 0.2 % in
any sample. After removing insignificant constituents, the FAME and FAlc remainder were
renormalized and retained for diet modeling (Supplemental Table 1). Since albatross oil is
dietary in origin we did not subset our suite of FAME/FAlc constituents to those considered
‘dietary’ (versus ‘structural’) as is common in studies using QFASA to estimate diet from
tissue (blubber, adipose tissue) where lipids have been metabolically reconstituted. Final diet
estimates modeled using QFASA were given as biomass consumed (% diet) of each prey in
the diet of each individual albatross. To assess the importance of each prey and functional
group of prey in albatross diets, we calculated percent frequency of occurrence (number of
individuals with a prey species divided by the total number of birds) and percent pooled diet
(proportion of a prey species in total diet when all individuals were combined).
2.2.5 Understanding prey-driven error in the QFASA model
Given that albatrosses are opportunistic, generalist predators, requiring a large and diverse
library of prey lipids, we felt it important to understand similarities and dissimilarities of prey
species according to their lipid composition. Non-metric multi-dimensional scaling (NMDS)
and a hierarchical cluster analysis were used to visualize the distance among prey species
relative to their FAME/FAlc constituents both at the species level and at the level of functional
group. To more rigorously quantify the performance of the QFASA model specific to our
library of prey lipids, we quantified error in QFASA diet estimations running known simulated
“pseudo-diets” through the QFASA model. 16456 pseudo-diets were simulated at random
from a modified dirichlet distribution, and for each simulated pseudo-diet, 50 diet estimations
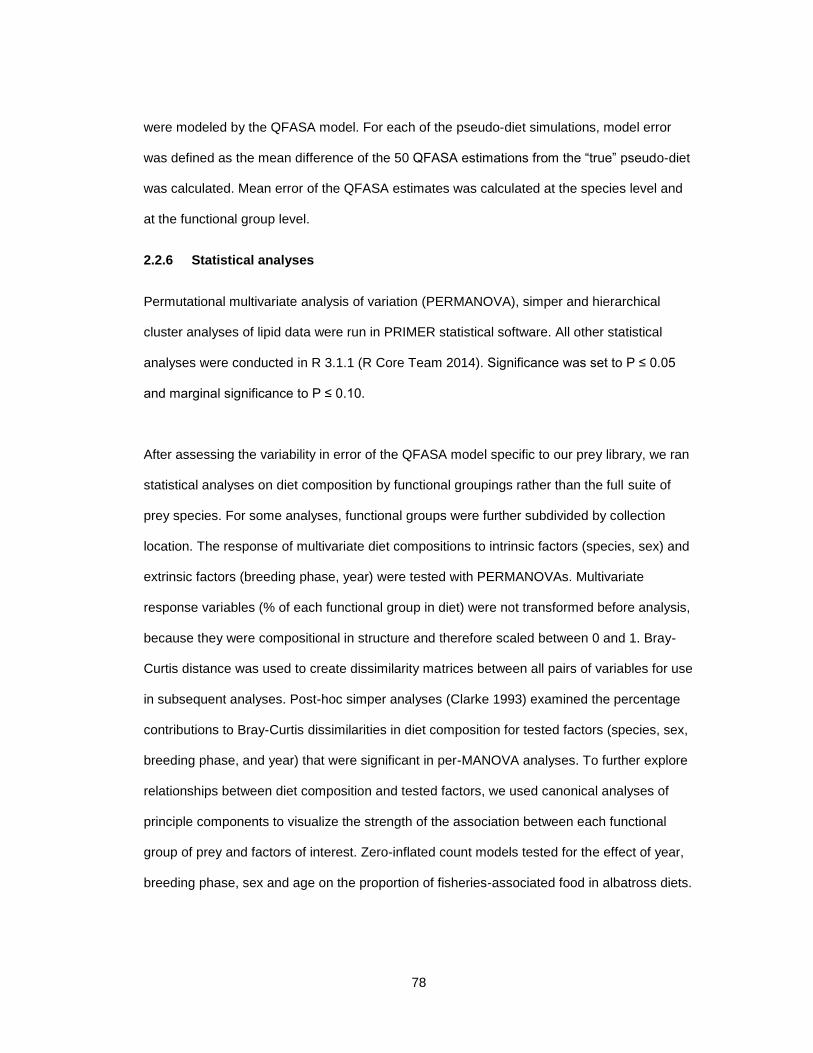
78
were modeled by the QFASA model. For each of the pseudo-diet simulations, model error
was defined as the mean difference of the 50 QFASA estimations from the “true” pseudo-diet
was calculated. Mean error of the QFASA estimates was calculated at the species level and
at the functional group level.
2.2.6 Statistical analyses
Permutational multivariate analysis of variation (PERMANOVA), simper and hierarchical
cluster analyses of lipid data were run in PRIMER statistical software. All other statistical
analyses were conducted in R 3.1.1 (R Core Team 2014). Significance was set to P ≤ 0.05
and marginal significance to P ≤ 0.10.
After assessing the variability in error of the QFASA model specific to our prey library, we ran
statistical analyses on diet composition by functional groupings rather than the full suite of
prey species. For some analyses, functional groups were further subdivided by collection
location. The response of multivariate diet compositions to intrinsic factors (species, sex) and
extrinsic factors (breeding phase, year) were tested with PERMANOVAs. Multivariate
response variables (% of each functional group in diet) were not transformed before analysis,
because they were compositional in structure and therefore scaled between 0 and 1. Bray-
Curtis distance was used to create dissimilarity matrices between all pairs of variables for use
in subsequent analyses. Post-hoc simper analyses (Clarke 1993) examined the percentage
contributions to Bray-Curtis dissimilarities in diet composition for tested factors (species, sex,
breeding phase, and year) that were significant in per-MANOVA analyses. To further explore
relationships between diet composition and tested factors, we used canonical analyses of
principle components to visualize the strength of the association between each functional
group of prey and factors of interest. Zero-inflated count models tested for the effect of year,
breeding phase, sex and age on the proportion of fisheries-associated food in albatross diets.
79
Feeding strategies of Laysan and black-footed albatrosses were visualized using
Amundson-Costello diagrams (Costello 1990). Prey-specific percentage abundances (i.e.
each prey’s percent contribution in only those stomachs that contained that particular prey)
were plotted against frequency of occurrence of each prey. Prey items that clustered together
with high prey-specific % abundance and high frequency of occurrence indicate specialism at
the population level, whereas high prey-specific % abundance but low frequency of
occurrence indicates specialism at the individual level. Generalist populations are
represented by prey types with high frequency of occurrence and low to moderate prey-
specific % abundances.
2.3 RESULTS
The overall lipid content and proportion of triacylglyceride and wax ester lipid classes from
each prey species (n=34) and of stomach oil samples from albatrosses (n=95) are presented
in Supplemental Table 1 along with their FA and FAlc compositions.
2.3.1 Qualitative assessment of prey similarity by lipid signatures
There was clear differentiation between some but not all functional groups using multi-
dimensional scaling (Figure 2.3). Species from crustacean and fish egg functional groups
clustered together and were relatively isolated, while species from the other functional
groups, mostly mesopelagic squid and fish, showed varying degrees of overlap, mostly driven
by dissimilarities between species classified under the same functional group (Figure 2.3).
Jellyfish were most closely associated with crustaceans, whereas northern elephant seal
blubber clustered with mesopelagic gelatinous squid collected from the North Pacific
Transition Zone. Species within the same functional group but collected in different regions
showed dissimilarities in lipid signatures as seen from the MDS plot. For example, squid
collected around local Hawaiian waters clustered away from squid collected in the North
Pacific Transition Zone. Large vertically-migrating muscular squid (i.e. G. borealis, O.
80
borealjaponicus) clustered close to small epipelagic (muscular) squid (i.e. A. felis, B.
anonychous) and myctophid fish, while they clustered away from mesopelagic gelatinous
squid (i.e. Taonius sp., Galiteuthis sp.). Asian-sourced Pacific saury (C. saira) clustered away
from both adult and juvenile Pacific saury sourced in the North Pacific Transition Zone.
Longline-associated prey as a functional group showed the greatest dissimilarity among
group members, likely because species were classified as longline-associated prey for
reasons unrelated to their own feeding ecology (Figure 2.3). The hierarchical cluster analysis
showed similar relationships between functional groups as inferred from the MDS plot Figure
2.4).
2.3.2 Species and functional group error associated with QFASA modeling
The amount of error in diet estimations from the QFASA simulations varied substantially
among functional groups of prey and also among species within the same functional group
(Figure 2.5 – Figure 2.7). Crustaceans, flying fish eggs and jellyfish were ranked the highest
in QFASA estimation accuracy (Figure 2.7). Mesopelagic gelatinous squid and small
epipelagic fish ranked the next highest followed by longline-associated bait and target fish,
and ectoparasitic copepods. Small, epipelagic squid were chronically overestimated while
vertically-migrating muscular squid were chronically underestimated (Figure 2.5 – Figure 2.7).
Most species of mesopelagic fish were only marginally overestimated and only when known
pseudo-diet proportions were low, with the exception of S. leucopsaurus which had the
largest species-specific error and was regularly underestimated, even at higher proportions in
pseudo-diets (Figure 2.6). Plotting QFASA estimations against known “pseudo-diets” for each
species showed that most prey species were spuriously overestimated when percentage
contribution to the “pseudo-diet” for that species was low (< 10 %) (Figure 2.5), but accuracy
in QFASA estimations for most, but not all, species increased with increasing percentage
contribution to the “pseudo-diet” of that species (Figure 2.5).
81
2.3.3 Albatross Diet:
Detailed diet estimations, including frequency of occurrence and percent of pooled diet for
black-footed and Laysan albatrosses are shown in Table 2.3 and Table 2.4. Breeding
albatrosses from Tern Island consumed a broad diversity of prey across all functional groups,
except ecto-parasitic copepods (both species) and small epipelagic fish (black-footed
albatrosses only). Mesopelagic gelatinous squid dominated the diet for both species
accounting for about approximately 30 % of the diet of each species across the breeding
season (Table 2.3 and Table 2.4, Figure 2.8 - Figure 2.12). The vertically-migrating muscular
squid functional group was the next largest component of diet for both species, however, the
importance of this functional group was more significant in the incubation phase of the
breeding cycle, especially for Laysan albatrosses. Flying fish eggs were a significantly large
component in the diet of black-footed albatrosses (22 %) but only during the chick-brooding
season. Consumption of flying fish eggs also occurred during incubation for black-footed
albatrosses but to a much smaller degree (5 %). Only a single Laysan albatross diet
estimation had flying fish eggs present, but they were the dominant prey item for this
particular individual (69 % of the diet), indicating a rare but potentially important food item for
this species. Mesopelagic fish (myctophids), fisheries-associated diet, crustaceans and small
epipelagic squid were common in diet of both species, but were less dominant functional
groups than mesopelagic gelatinous squid or vertically migrating muscular squid. Marine
mammal blubber, small epipelagic fish and jellyfish were present, but rare, in albatross diet.
2.3.4 Effect of Species, Breeding Phase, Sex and Age on Diet Composition:
Overall diet composition was significantly different between Laysan and black-footed
albatrosses for both phases of the breeding cycle (incubation: t1,61 = 1.75, P = 0.002; chick-
brood: t1,41 = 1.85, P = 0.005). Although diet composition changed significantly between
incubation and chick-brood breeding phases in black-footed albatrosses (t1,51 = 1.74, P =
0.01), it did not in Laysan albatrosses (t1,51 = 0.94, P = 0.53). Simper and CAP analyses
82
highlighted which prey species drove significant differences in diet composition (Figure 2.13).
Black-footed albatrosses had greater diet abundances of crustaceans, fish eggs, longline
target fish (swordfish) and mesopelagic gelatinous squid collected from the California Current
than Laysan albatrosses, which had higher abundances of all squid functional groups
collected from the North Pacific Transition Zone as well as mesopelagic fish and longline bait.
Chick-brooding black-footed albatrosses had higher abundances of crustaceans and fish
eggs than did incubating birds, which ate more squid and mesopelagic fish (Figure 2.10 &
Figure 2.12). Chick-brooding Laysan albatrosses had higher abundances of small epipelagic
squids and longline bait while incubating birds consumed more muscular and mesopelagic
gelatinous squid (Figure 2.11 & Figure 2.12).
Sex did not influence overall diet composition in either species (black-footed: t1,46 =
0.77, P = 0.76 and Laysan: t1,45 = 0.89, P = 0.60 , respectively). Age class did, however,
significantly effect diet composition but only for Laysan albatrosses, where young birds had
significantly different diet from both the adult and old age classes (t1,28 = 1.28, P = 0.09; t1,6 =
1.93, P = 0.03, respectively). Simper analyses indicated that older birds of both species had
higher abundances of muscular squid and mesopelagic gelatinous squid than younger birds,
while younger birds of both species had greater amounts of crustaceans, and mesopelagic
fish in their diets (Table 2.5).
2.3.5 Fisheries-associated diet
The proportion of fisheries-associated prey in diet estimations was not different between the
species (z = -0.85, P = 0.39), however, the two species differed significantly in their mode of
exploitation (Figure 2.14). Black-footed albatrosses had significantly more longline-associated
target fish (swordfish) in their diet than Laysan albatrosses (z = -2.79, P = 0.005), and Laysan
albatrosses had significantly more longline-associated bait fish in their diet (z = 2.26, P =
0.02). Year, breeding phase, sex, and age were all nonsignificant effects and so were
removed in final models.
83
2.3.6 Dietary specialization in albatrosses
Despite overall broad population-level diet, bar plots of raw diets (Figure 2.8 and Figure 2.9)
and of diets grouped by functional group (Figure 2.10 and Figure 2.11) revealed that both
species have some degree of individual dietary specialization with many individuals
consuming over 60 % of a single functional group of prey (with one black-footed albatross
consuming up to 93 % of mesopelagic gelatinous squid in a foraging trip during incubation).
Using the 60 % cut-off, black-footed albatrosses had more individuals that had specialized
diets than Laysan albatrosses, particularly so during the incubation, where many individuals
specialized on mesopelagic gelatinous squid or mesopelagic fish. During the chick-brood
phase, individual black-footed albatrosses specialized on a broader array of functional groups
than during the incubation phase, including squid and fish but also flying fish eggs and
longline-associated resources. Laysan albatrosses only showed a few individuals with
specialized diets during incubation, with those individuals specializing on mesopelagic
gelatinous and muscular squid. During chick-brood, Laysan albatrosses, like black-footed
albatrosses, showed specialization on a broader array of functional groups with some
individuals consuming over 60 % if squid, fish, longline-associated resources, flying fish eggs
and jellyfish.
Amundson-Costello plots further enhanced our understanding of the dietary niche
widths of the two species at an individual and population level (Figure 2.15). Not surprisingly,
the most dominant functional group of prey in the diet of both species was mesopelagic
gelatinous squid. Crustaceans and small epipelagic squid were as common in the diets of
both species as mesopelagic gelatinous squid, but individual albatrosses did not specialize
on these groups. Overall, the functional groups consumed by Laysan albatrosses clustered in
the ‘high occurrence / low abundance’ sector of the plot, suggesting overall generalization at
the population and individual levels. For black-footed albatrosses, however, many functional
84
groups clustered at the ‘low occurrence / high abundance’ sector of the plot, suggesting a
population with a greater degree of individual dietary specialization.
2.4 DISCUSSION
2.4.1 Incidence of fisheries-associated resources in albatross diet
Fisheries-associated prey occurred in the diets of Laysan and black-footed albatrosses
across both breeding stages, but neither species appeared to rely on fisheries-related food as
a dominant or primary food source. However, although the occurrence was low, it was not
insignificant (at ~ 10 % of population diet for both species). Furthermore, the diet of a few
individuals consisted almost entirely of fisheries-associated resources (i.e., 87 % of diet of
one Laysan albatross consisted of longline bait) indicating that some individuals might
specialize on fisheries resources. This result suggests that more long-term monitoring of diet
variability within individual albatrosses breeding in the northwestern Hawaiian Islands to
understand individual variability in fisheries reliance and whether specialization on fisheries
resources is a short or long term strategy within individuals. Given the skill required for
gleaning bait off longline hooks (Bisson 2008), it is reasonable to think that once an individual
develops this skill, it is maintained by continued exploitation of lipid-rich fish species used as
longline bait. Patrick and Weimerskirch 2014a described a relationship between personality
and foraging strategy in albatrosses, which suggests an underlying genetic structure to
different foraging strategies. If different foraging strategies impose different risks or lead to
birds with poorer body conditions (Votier et al. 2010), this could have important implications
for management strategies of populations.
The similarity in the importance of fisheries-associated prey in the diet of Laysan and
black-footed albatrosses was unexpected given disproportionally higher bycatch rates of
black-footed albatrosses documented by U.S. fisheries observer programs (Arata et al.
2009). These similar rates of fisheries exploitation might be specific to the colonies breeding
85
at Tern Island. Black-footed albatrosses breeding on Tern Island have smaller foraging
ranges than Laysan albatrosses, at least during the chick-brood season (Conners et al. 2015,
Kappes et al. 2015), and as a result might overlap less with fisheries than birds from other
colonies. Furthermore our diet sampling occurred across only a few breeding seasons and
fishery dependence is likely to fluctuate across years, as seen in inter-annual variability in
bycatch rates (Votier et al. 2008). Long-term monitoring of albatross diets from breeding
colonies in the northwestern Hawaiian Islands is critical to understand the dynamics of inter-
annual variability in fisheries dependence for Hawaiian-breeding albatrosses. Boluses,
regurgitated by fledgling albatrosses, are regularly collected from albatross colonies in the
northwestern Hawaiian Islands to monitor diet variation. Although useful for understanding
squid diversity in albatross diet, boluses do not retain any tracer of fishery resources or other
soft-bodied prey.
Distributions of squid, the dominant food of albatrosses, are strictly dictated by sea-
surfaces temperatures, and squid show species-specific temperature preferences for feeding
and spawning grounds (Ichii et al. 2009, 2011, Vijai et al. 2014). Given the anomalously warm
sea-surface temperatures in the central and eastern North Pacific over the last few years
(Bond et al. 2015), the distributions and ranges of squid occurrence are predicted to contract
and shift northward if temperature anomalies persist (Alabia et al. 2015). How albatrosses
respond to changing squid distributions is unknown. Foreseeably, they could shift foraging
ranges to track squid distributions during part of the year, however, during the chick-brood
phase of the breeding season, foraging ranges are highly constrained, leaving albatrosses
with limited options. Here, albatrosses might respond with an increased dependency on non-
cephalopod resources, such as fisheries-associated diet. Natural resource managers that
monitor Laysan and black-footed albatross populations should develop consistent and long-
term monitoring programs that track both natural (i.e. squid) and anthropogenic (i.e. fisheries-
associated resources) contributions to albatross diets.
86
Despite similar overall exploitation of fisheries-associated resources, diet differences
between Laysan and black-footed albatrosses indicate that the species use different feeding
strategies when they interact with fishing vessels. Fisheries-associated resources in black-
footed albatross diets were solely limited to swordfish meat, indicating this species
predominately scavenges target fish, while Laysan albatrosses more heavily exploited
baitfish. These results are congruent with direct observations of feeding behavior of the two
species at swordfish and tuna fishing vessels (Bisson 2008), validating the accuracy of
QFASA in estimating fisheries diet in albatross to some degree. Notably, behavioral
differences at fisheries vessels might have health consequences: black-footed albatrosses
have 400 % higher mercury body burdens than Laysan albatrosses (Finkelstein et al. 2006).
Although Finklestein and colleagues convincingly linked species differences in mercury loads
to habitat differences rather than diet, our results suggest that the greater consumption of
swordfish meat in black-footed albatrosses may also contribute to higher mercury loads,
given the remarkably high levels of mercury in swordfish meat compared to other fish species
(USFDA 2015).
2.4.2 Deep, mesopelagic layer feeds surface-scavenging albatross
Consistent with recent studies of squid beaks collected from Laysan and black-footed
albatross stomachs (Walker et al. 2012, Pitman 2004), our results also indicate that breeding
North Pacific albatrosses primarily scavenge dead mesopelagic gelatinous squid that float to
the ocean surface. Furthermore, relative abundances of squid species estimated from
QFASA are congruent with Walker et al. (2012), further validating QFASA as a viable method
to characterize the diets of North Pacific albatrosses. The present study and Walker et al.
(2012) both highlight Cranchiidae and Histioteuthidae to be the most important squid families
in North Pacific albatross diet. Our results also agree in the differences in squid composition
between the two species, where both studies found higher abundances of Gonatidae and
Cranchiidae, but lower abundances of Histioteuthidae, in Laysan albatross diet relative to that
87
of black-footed albatrosses. Between-species diet differences in squid composition is likely a
function of the distinct at-sea segregation between these two species, where Laysan
albatrosses forage in colder waters of higher latitudes than black-footed albatrosses during
the breeding season (Kappes et al. 2010, Kappes et al. 2015).
Diet estimations from QFASA corroborate previous studies describing the squid
component of North Pacific albatross diet, but additionally and importantly, broaden these
conclusions by highlighting other functional groups exploited by albatross, such as
mesopelagic fish, crustaceans, fish eggs and longline-associated resources. Mesopelagic
fish (myctophids) were relatively important in albatross diet (> 10 %), and particularly so for
incubating black-footed albatrosses in which a subset of individuals showed high dietary
specialization on this functional group (up to 77 % of the diet of one individual during
incubation). A previous study of the fine-scale behavior of Laysan and black-footed
albatrosses described how both species increase “sit-and-wait” foraging behavior on
moonless nights when the deep scattering layer is closer to the surface (Chapter 1, Conners
et al. 2015). Mesopelagic fish and red pelagic shrimp in the diet might be captured by this
“sit-and-wait” foraging strategy by birds at night, however, there are observations of black-
footed albatrosses eating red pelagic shrimp in daylight (Miller 1940), so interpretations about
nocturnal foraging from diet composition should be cautious. Deploying video-recording
cameras on free-ranging albatrosses to collect direct behavioral observations of foraging
albatross across day and night would be invaluable to clarify our understanding of albatross
foraging behavior and feeding ecology.
2.4.3 Greater behavioral and dietary flexibility in black-footed albatrosses
Diet composition changed significantly in black-footed albatrosses from the incubation to the
chick-brood breeding phase, however, the diet of Laysan albatrosses remained consistent
across the breeding season. The two species showed similar diet compositions during
incubation, feeding primarily on mesopelagic squid and fish. During the chick-brood,
88
however, black-footed albatrosses reduced their consumption of fish and squid while
increasing in the consumption of flying fish eggs and crustaceans. Flying fish eggs were
previously thought to be the dominant food of black-footed albatrosses during the breeding
season (Harrison et al. 1983, Tickell 2000), but our results suggest that while they are an
important component of chick-brood diet, mesopelagic gelatinous squid remains the most
important functional group. Although Laysan albatrosses consumed similar proportions of
prey across the breeding season, they fed on more vertically-migrating muscular squid
(Gonatid species, in particular) during the incubation. Feeding ranges of incubating Laysan
albatrosses extend into the cold waters of the North Pacific Transition Zone and subarctic
gyre, which overlaps with distributions of cold water Gonatid species (Watanabe et al. 2006).
Consistency in Laysan albatross diet across the breeding season is concomitant with
recent findings of Thorne et al. 2015 and Conners et al. 2015 (Chapter 1) that indicate
Laysan albatrosses have less flexibility in foraging behavior than black-footed albatrosses.
Thorne et al. 2015 further linked less flexibility in foraging behavior with reduced reproductive
success in years of “poor” environmental conditions, highlighting potential demographic
consequences of these behavioral differences. While Laysan albatrosses are generalist
foragers in the context of our twelve defined functional groups, more than 60 % of their diet is
composed of squid, classifying this species as a squid specialist. Thus, while black-footed
albatross populations are currently considered more vulnerable to fishery bycatch than
Laysan albatrosses (Lewison et al. 2004, Véran et al. 2007), their behavioral and dietary
flexibility might impart greater adaptable to warming ocean temperatures than Laysan
albatrosses if prey distributions shift with a changing climate (Hazen et al 2011, Alabia 2015).
When prioritizing conservation actions for these species, managers should consider a suite of
threats, including dependency on fisheries food subsidies, adult mortality from fisheries
bycatch, loss of breeding colonies from sea level rise, and changing prey distributions due to
climate change.
89
2.4.4 Older albatrosses consume more squid than younger birds
Dietary niche separation of age classes occurs in a number of seabird species, typically with
young or immature age classes foraging at lower trophic levels than adults (Forero et al.
2005, Votier et al. 2011) reflecting an ‘ontogenetic niche shift’ (Werner and Gilliam 1984),
although this is not always the case (Campioni et al. 2015). In our study, older birds
consumed more mesopelagic gelatinous squid and vertically-migrating muscular squid,
suggesting that learning and experience are important to find and exploit this prey type. Most
squid species consumed by North Pacific albatrosses are only available to scavenging birds
after the squids spawn and subsequently die (Pitman et al 2004, Walker et al 2012) since
they are either too large to capture alive (i.e. adult G. borealis) or are a species that do not
inhabit surface waters (i.e. Cranchiidae spp.). Thus, albatrosses are most likely consuming
these squid after spawning events when spent individuals die and subsequently float to the
surface. Using memory and experience to time their arrival in waters where squid spawning
events occur might provide older albatrosses a selective advantage to exploit these prey. Age
is known to influence the post-breeding distributions of North Pacific albatrosses with older
birds having smaller home ranges, indicating that older birds need to search less than
younger birds for prey (Chapter Three). Squid, however, are not the most lipid-rich functional
group of prey consumed by albatross (Supplementary Table 1), so it is surprising that lipid-
rich crustaceans and myctophids were more abundant in the diets of younger birds. Possibly,
given the large biomass of mesopelagic squid, spawning events provide dense aggregations
of moribund squid carcasses at the surface of the ocean, so if an individual knowns how to
find these patches, the low lipid contents of squid might pay off in large amounts consumed.
2.4.5 Estimating diet with QFASA: the good, the bad, and the ugly
By quantifying the species-specific error in QFASA and comparing our diet estimates with
direct observations of albatross diet from previous studies (Walker et al. 2012, Pitman et al.
2004, Bisson 2008, Henry 2011, Gould 1997, Harrison 1983), we show that QFASA, overall,

90
accurately estimated the diet of North Pacific albatrosses. The overall accuracy of our diet
estimations was likely a consequence of 1) modeling not just one, but two, lipid classes in
QFASA, 2) not requiring a calibration coefficient to account for predator metabolism because
albatross oil is dietary in origin, and most importantly, 3) collecting a large and
comprehensive prey library of lipids representing prey consumed by North Pacific albatrosses
across their range.
As seen in species-specific plots of ‘true’ pseudo-diet plotted against QFASA
estimated diet (Figure 2.5), the majority of error in QFASA estimations came from
underestimating species in mid ranges of % diet and overestimating species in low ranges of
% diet. Error biased towards some functional groups over others reflected the particular
trophic structure of our specific prey library, with most error occurring in species that co-occur
and feed on each other in the mesopelagic zone, and less error occurring in functional groups
unrelated (trophically) to each other (i.e. flying fish eggs). Some species were particularly
problematic. For examples, northern lanternfish, S. leucopsaurus, is a midwater myctophid
that dominates the biomass of midwater fishes in some regions of the Pacific and as such is
preyed on by a multitude of predators, from fish and cephalopod to marine mammal and
seabirds (Beamish et al. 1999). This species, however, was poorly estimated in our model,
being chronically under-estimated. This may be due to the likelihood that, given its
abundance, it is a common food of other species collected in our prey library and therefore its
lipid signature might be similar to many predators in our library. This species was never
estimated in any amount in the diet of either albatross species, but due to the chronic under-
estimation associated with this species, we do not know whether it truly was not in the diet of
albatross or if it was never estimated in diet due to modeling error. However, Walker et al
(2012) found only trace amounts of this myctophid in the stomach contents of by-caught
Laysan albatrosses and only in Alaskan-caught birds, with none in Hawaiian-caught birds –
an observation which provides us with some measure of confidence in our QFASA estimation
for this prey species despite the quantified error from simulations. This example highlights the
91
importance of interpreting results of QFASA in combination with other methods of diet
analysis such as stomach content analysis or DNA barcoding.
We stress the importance of estimating the performance of QFASA specific to each
implementation, because each predator is going to have a different suite of prey lipids which
will orchestrate their own unique set of error. Estimating error specific to each prey species in
a given prey library greatly facilitates interpretation of QFASA results – as seen in our study,
some species were estimated very well, while others very poorly; ultimately leading us to
group prey by functional group for statistical analyses. Overall, estimating albatross diets with
QFASA proved to be a highly effective method that provided diet estimations of these species
across multiple stages of the breeding season for the first time. Additionally, QFASA proved a
tractable method for estimating the importance of fisheries-associated resources in the diet of
albatrosses, which could be an important management tool for future conservation efforts.
2.5 References
Abe, T., K. Sekiguchi, H. Onishi, K. Muramatsu, and T. Kamito. 2012. Observations on a
school of ocean sunfish and evidence for a symbiotic cleaning association with
albatrosses. Marine Biology 159:1173–1176.
Ackman, R. G., and C. A. Eaton. 1966. Some Commercial Atlantic Herring Oils; Fatty Acid
Composition. Journal of the Fisheries Research Board of Canada 23:991–1006.
Alabia, I. D., S.-I. Saitoh, H. Igarashi, Y. Ishikawa, N. Usui, M. Kamachi, T. Awaji, and M.
Seito. 2015. Future projected impacts of ocean warming to potential squid habitat in
western and central North Pacific. ICES Journal of Marine Science.
Anderson, O., C. Small, J. Croxall, E. Dunn, B. Sullivan, O. Yates, and A. Black. 2011. Global
seabird bycatch in longline fisheries. Endangered Species Research 14:91–106.
Arata, J. A., P. R. Sievert, and M. B. Naughton. 2009. Status assessment of Laysan and
Blackfooted Albatrosses, North Pacific Ocean, 1923–2005.
Araújo, M. S., D. I. Bolnick, and C. A. Layman. 2011. The ecological causes of individual
specialisation. Ecology Letters 14:948–958.
Beamish, R. . J., K. . D. Leask, O. . A. Ivanov, A. . A. Balanov, A. . M. Orlov, and B. Sinclair.
1999. The ecology, distribution, and abundance of midwater fishes of the Subarctic
Pacific gyres. Progress in Oceanography 43:399–442.
Bearhop, S., D. R. Thompson, R. A. Phillips, S. Waldron, K. C. Hamer, C. M. Gray, S. C.
Votier, B. P. Ross, and R. W. Furness. 2001. Annual variation in great skua diets: the
importance of commercial fisheries and predation on seabirds revealed by combining
92
dietary analyses. The Condor 103:802–809.
Beck, C. A., S. J. Iverson, W. Bowen, and W. Blanchard. 2007. Sex differences in grey seal
diet reflect seasonal variation in foraging behaviour and reproductive expenditure:
evidence from quantitative fatty acid signature analysis. Journal of Animal Ecology
76:490–502.
Bicknell, A. W. J., D. Oro, K. C. J. Camphuysen, and S. C. Votier. 2013. Potential
consequences of discard reform for seabird communities. Journal of Applied Ecology
50:649–658.
Bisson, J. R. 2008. Diet dynamics and trophic relations of Laysan and Black-footed
albatrosses associated with pelagic longline fishing. University of Hawaii at Manoa.
Bolnick, D. I., R. Svanbäck, J. A. Fordyce, L. H. Yang, J. M. Davis, C. D. Hulsey, and M. L.
Forister. 2003. The Ecology of Individuals: Incidence and Implications of Individual
Specialization. The American Naturalist 161:1–28.
Bond, N. A., M. F. Cronin, H. Freeland, and N. Mantua. 2015. Causes and impacts of the
2014 warm anomaly in the NE Pacific. Geophysical Research Letters 42:3414–3420.
Bromaghin, J. F., S. M. Budge, G. W. Thiemann, and K. D. Rode. 2015. Assessing the
robustness of quantitative fatty acid signature analysis to assumption violations.
Methods in Ecology and Evolution.
Bromaghin, J. F., M. M. Lance, E. W. Elliott, S. J. Jeffries, A. Acevedo-Gutiérrez, and J. M.
Kennish. 2013. New insights into the diets of harbor seals (Phoca vitulina) in the Salish
Sea revealed by analysis of fatty acid signatures. Fishery Bulletin 111:13.
Brothers, N. 1991. Albatross mortality and associated bait loss in the Japanese longline
fishery in the Southern Ocean. Biological Conservation 55:255–268.
Budge, S. M., S. J. Iverson, W. D. Bowen, and R. G. Ackman. 2002. Among- and within-
species variability in fatty acid signatures of marine fish and invertebrates on the
Scotian Shelf, Georges Bank, and southern Gulf of St. Lawrence. Canadian Journal of
Fisheries and Aquatic Sciences 59:886–898.
Budge, S. M., S. J. Iverson, and H. N. Koopman. 2006. Studying trohic ecology in marine
ecosystems using fatty acids: a primer on analysis and interpretation. Marine Mammal
Science 22:759–801.
Campioni, L., J. P. Granadeiro, and P. Catry. 2015. Niche segregation between immature
and adult seabirds: does progressive maturation play a role? Behavioral Ecology .
Clarke, K. R. 1993. Non‐ parametric multivariate analyses of changes in community
structure. Australian journal of ecology 18:117–143.
Coll, M., S. Libralato, S. Tudela, I. Palomera, and F. Pranovi. 2008. Ecosystem Overfishing in
the Ocean. PLoS ONE 3:e3881.
Collet, J., S. Patrick, and H. Weimerskirch. 2015. Albatrosses redirect flight towards vessels
at the limit of their visual range. Marine Ecology Progress Series 526:199–205.
Connan, M., and Y. Cherel. 2007. Lipids from stomach oil of procellariiform seabirds
document the importance of myctophid fish in the Southern Ocean. Limnology ….
Connan, M., P. Mayzaud, M. Boutoute, H. Weimerskirch, and Y. Cherel. 2005. Lipid
composition of stomach oil in a procellariiform seabird Puffinus tenuirostris: implications
for food web studies - Google Scholar. Marine Ecology-Progress Series 290:277–290.
Conners, M. G., E. L. Hazen, D. P. Costa, and S. a. Shaffer. 2015. Shadowed by scale:
93
subtle behavioral niche partitioning in two sympatric, tropical breeding albatross
species. Movement Ecology 3:28.
Conroy, J. L., A. F. Collins, J. T. Overpeck, M. B. Bush, J. E. Cole, and D. J. Anderson. 2015.
A 400-year isotopic record of seabird response to eastern tropical Pacific productivity.
Geo: Geography and Environment:n/a–n/a.
Costello, M. J. 1990. Predator feeding strategy and prey importance: a new graphical
analysis. Journal of Fish Biology 36:261–263.
Croxall, J. P., S. H. M. Butchart, B. Lascelles, A. J. Stattersfield, B. Sullivan, A. Symes, and
P. Taylor. 2012. Seabird conservation status, threats and priority actions: a global
assessment. Bird Conservation International 22:1–34.
Croxall, J. P., and R. Gales. 1998. An assessment of the conservation status of albatrosses.
Pages 46–65 in G. Robertson and R. Gales, editors. Albatross Biology and
Conservation. NSW, Surrey Beatty.
Dayton, P. K., S. F. Thrush, and F. C. Coleman. 2002. Ecological effects of fishing in marine
ecosystems of the United States. Arlington, Virginia.
Einoder, L. D. 2009. A review of the use of seabirds as indicators in fisheries and ecosystem
management. Fisheries Research 95:6–13.
Fernández, P., D. J. Anderson, P. R. Sievert, and K. P. HUYVAERT. 2001. Foraging
destinations of three low‐ latitude albatross (Phoebastria) species. Journal of Zoology
254:391–404.
Finkelstein, M., B. S. Keitt, D. A. Croll, B. Tershy, W. M. Jarman, S. Rodriguez-Pastor, D. J.
Anderson, P. R. Sievert, and D. R. Smith. 2006. Albatross species demonstrate regional
differences in North Pacific marine contamination. Ecological applications : a publication
of the Ecological Society of America 16:678–686.
Flint, E. 2009. Hawaiian Islands National Wildlife Refuge and Midway Atoll National Wildlife
Refuge – annual nest counts through hatch year 2009. U.S. Fish and Wildlife Service,
unpublished report.
Folch, J., M. Lees, and G. H. Sloane-Stanley. 1957. A simple method for the isolation and
purification of total lipids from animal tissues. J Biol chem.
Forero, M. G., J. Gonzalez-Solis, K. A. Hobson, J. A. Donázar, M. Bertellotti, G. Blanco, and
G. R. Bortolotti. 2005. Stable isotopes reveal trophic segregation by sex and age in the
southern giant petrel in two different food webs. Marine Ecology-Progress Series
296:107–113.
Frederiksen, M., S. Wanless, M. P. Harris, P. Rothery, and L. J. Wilson. 2004. The role of
industrial fisheries and oceanographic change in the decline of North Sea black‐ legged
kittiwakes. Journal of Applied Ecology 41:1129–1139.
Furness, R. W. 2003. Impacts of fisheries on seabird communities. Scientia Marina 67:33–45.
Furness, R. W., and M. L. Tasker. 2000. Seabird-fishery interactions: quantifying the
sensitivity of seabirds to reductions in sandeel abundance, and identification of key
areas for sensitive seabirds in the North Sea. Marine Ecology-Progress Series
202:253–264.
Gales, R. 2008. Flagship species at half-mast. in T. DeRoy, M. Jones, and J. Fitter, editors.
Albatross: their world, their ways. Firefly Books, Buffalo.
Gales, R., and G. Robertson. 1998. Albatross biology and conservation. Surrey Beatty &
94
Sons.
Gandini, P., and E. Frere. 2012. The economic cost of seabird bycatch in Argentinean
longline fisheries. Bird Conservation International 22:59–65.
Gilman, E., N. Brothers, and D. R. Kobayashi. 2005. Principles and approaches to abate
seabird by-catch in longline fisheries. Fish and Fisheries 6:35–49.
Gould, P. J., P. Ostrom, and W. A. Walker. 1997. Trophic relationships of albatrosses
associated with squid and large-mesh drift-net fisheries in the North Pacific Ocean.
Canadian Journal of Zoology 75:549–562.
Grémillet, D., A. Prudor, Y. le Maho, and H. Weimerskirch. 2012. Vultures of the seas:
hyperacidic stomachs in wandering albatrosses as an adaptation to dispersed food
resources, including fishery wastes. PloS one 7:e37834.
Harrison, C. S., T. S. Hida, and M. P. Seki. 1983. Hawaiian Seabird Feeding Ecology. Wildlife
Monographs:71.
Hazen EL, Jorgensen S, Rykaczewski RR, Bograd SJ, Foley DG, Jonsen ID, Shaffer SA,
Dunne JP, Costa DP, Crowder LB, et al. 2013. Predicted habitat shifts of Pacific top
predators in a changing climate. Nat. Clim. Chang. 3:234–238.
Henry III, R. W., S. A. Shaffer, M. A. Kappes, and Y. Tremblay. 2011. COS 146-8: Movement
on the high seas: Consequences of range expansion for a pelagic top consumer, the
Laysan Albatross.
Hyrenbach, K., P. Fernández, and D. Anderson. 2002. Oceanographic habitats of two
sympatric North Pacific albatrosses during the breeding season. Marine Ecology
Progress Series 233:283–301.
Ichii, T., K. Mahapatra, M. Sakai, and Y. Okada. 2009. Life history of the neon flying squid:
effect of the oceanographic regime in the North Pacific Ocean. Marine Ecology
Progress Series 378:1–11.
Ichii, T., K. Mahapatra, M. Sakai, T. Wakabayashi, H. Okamura, H. Igarashi, D. Inagake, and
Y. Okada. 2011. Changes in abundance of the neon flying squid Ommastrephes
bartramii in relation to climate change in the central North Pacific Ocean. Marine
Ecology Progress Series 441:151–164.
Imber, M. J. 1976. The origin of petrel stomach oils: a review. The Condor 78:366–369.
Iverson, S. J., C. Field, W. Don Bowen, and W. Blanchard. 2004. Quantitative fatty acid
signature analysis: a new method of estimating predator diets. Ecological Monographs
74:211–235.
Iverson, S. J., A. M. Springer, and A. S. Kitaysky. 2007. Seabirds as indicators of food web
structure and ecosystem variability: qualitative and quantitative diet analyses using fatty
acids. MARINE ECOLOGY-PROGRESS … 352:235–244.
Jansen, O. E. 2013. Fishing for food: feeding ecology of harbour porpoises Phocoena
phocoena and white-beaked dolphins Lagenorhynchus albirostris in Dutch waters.
Wageningen University.
Kappes, M. A., S. A. Shaffer, Y. Tremblay, D. G. Foley, D. M. Palacios, S. J. Bograd, and D.
P. Costa. 2015. Reproductive constraints influence habitat accessibility, segregation,
and preference of sympatric albatross species. Movement Ecology 3:34.
Kappes, M. A., S. A. Shaffer, Y. Tremblay, D. G. Foley, D. M. Palacios, P. W. Robinson, S. J.
Bograd, and D. P. Costa. 2010. Hawaiian albatrosses track interannual variability of
95
marine habitats in the North Pacific. Progress In Oceanography 86:246–260.
Karnovsky, N. J., K. A. Hobson, and S. J. Iverson. 2012. From lavage to lipids: estimating
diets of seabirds. Marine Ecology-Progress Series 451:263–284.
Kelleher, K. 2005. Discards in the world’s marine fisheries: an update. Food and Agriculture
Organization of the United Nation.
Lewison, R. L., and L. B. Crowder. 2003. Estimating fishery bycatch and effects on a
vulnerable seabird population. Ecological applications : a publication of the Ecological
Society of America 13:743–753.
Lewison, R. L., S. A. Freeman, and L. B. Crowder. 2004. Quantifying the effects of fisheries
on threatened species: the impact of pelagic longlines on loggerhead and leatherback
sea turtles. Ecology Letters 7:221–231.
Løkkeborg, S. 2008. Review and assessment of mitigation measures to reduce incidental
catch of seabirdds in longline, trawl and gillnet fisheries.
Løkkeborg, S. 2011. Best practices to mitigate seabird bycatch in longline, trawl and gillnet
fisheries—efficiency and practical applicability. Marine Ecology Progress Series
435:285–303.
Melvin, E. F., T. J. Guy, and L. B. Read. 2014. Best practice seabird bycatch mitigation for
pelagic longline fisheries targeting tuna and related species. Fisheries Research 149:5–
18.
Meynier, L., P. C. H. Morel, B. L. Chilvers, D. D. S. Mackenzie, and P. J. Duignan. 2010.
Quantitative fatty acid signature analysis on New Zealand sea lions: model sensitivity
and diet estimates. Journal of Mammalogy 91:1484–1495.
Miller, L. 1940. Observations on the Black-footed Albatross. The Condor:229–238.
Monaghan, P. 1996. Relevance of the Behaviour of Seabirds to the Conservation of Marine
Environments. Oikos 77:227–237.
Montevecchi, W. A. 1993. Birds as indicators of change in marine prey stocks. Springer.
Naughton, M., M. D. Romano, and B. Zimmermann. 2007. A Conservation Action Plan for
Black-footed Albatross (Phoebastria nigripes) and Laysan Albatross (P. immutabilis).
Navarro, J., M. Louzao, J. M. Igual, D. Oro, A. Delgado, J. M. Arcos, M. Genovart, K. a.
Hobson, and M. G. Forero. 2009. Seasonal changes in the diet of a critically
endangered seabird and the importance of trawling discards. Marine Biology 156:2571–
2578.
Nevitt, G. A., M. Losekoot, and H. Weimerskirch. 2008. Evidence for olfactory search in
wandering albatross, Diomedea exulans. Proceedings of the National Academy of
Sciences 105:4576–4581.
Oro, D., M. Bosch, and X. Ruiz. 1995. Effects of a trawling moratorium on the breeding
success of the Yellow-legged Gull Larus cachinnans. Ibis 137:547–549.
Patrick, S. C., S. Bearhop, T. W. Bodey, W. J. Grecian, K. C. Hamer, J. Lee, and S. C. Votier.
2015. Individual seabirds show consistent foraging strategies in response to predictable
fisheries discards. Journal of Avian Biology 46:431–440.
Patrick, S. C., S. Bearhop, D. Grémillet, A. Lescroël, W. J. Grecian, T. W. Bodey, K. C.
Hamer, E. D. Wakefield, M. Le Nuz, and S. C. Votier. 2013. Individual differences in
searching behaviour and spatial foraging consistency in a central place marine predator.
Oikos 123:33–40.
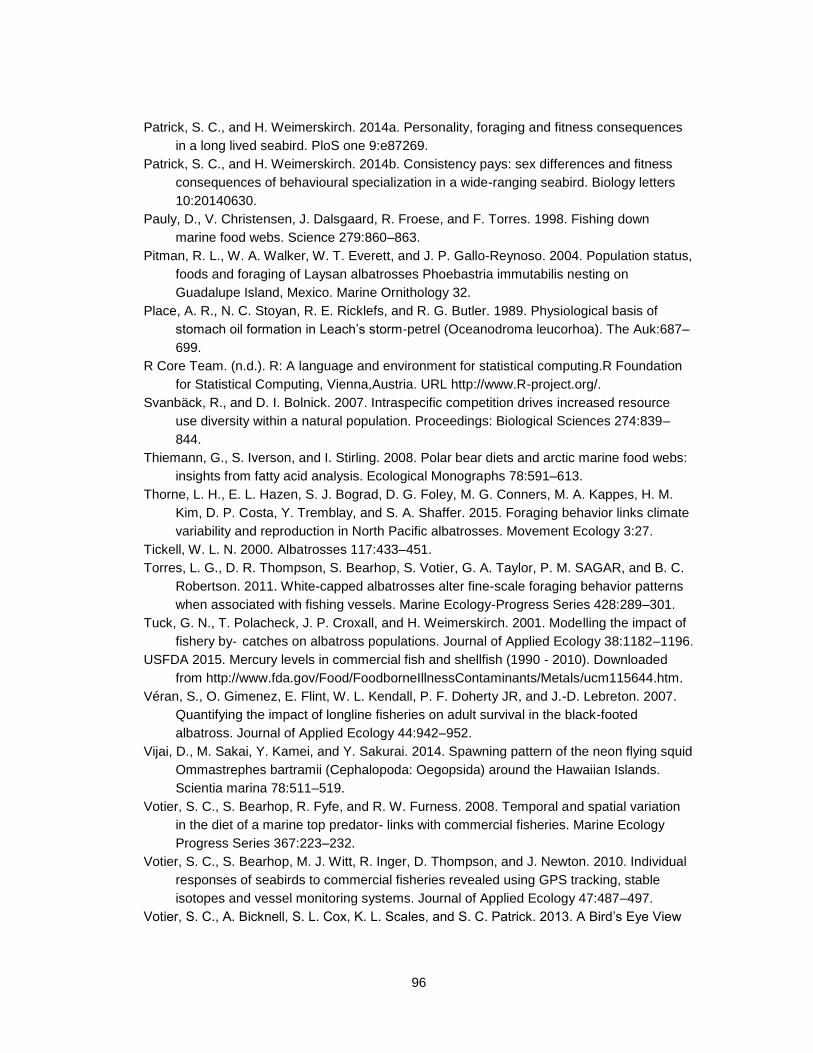
96
Patrick, S. C., and H. Weimerskirch. 2014a. Personality, foraging and fitness consequences
in a long lived seabird. PloS one 9:e87269.
Patrick, S. C., and H. Weimerskirch. 2014b. Consistency pays: sex differences and fitness
consequences of behavioural specialization in a wide-ranging seabird. Biology letters
10:20140630.
Pauly, D., V. Christensen, J. Dalsgaard, R. Froese, and F. Torres. 1998. Fishing down
marine food webs. Science 279:860–863.
Pitman, R. L., W. A. Walker, W. T. Everett, and J. P. Gallo-Reynoso. 2004. Population status,
foods and foraging of Laysan albatrosses Phoebastria immutabilis nesting on
Guadalupe Island, Mexico. Marine Ornithology 32.
Place, A. R., N. C. Stoyan, R. E. Ricklefs, and R. G. Butler. 1989. Physiological basis of
stomach oil formation in Leach’s storm-petrel (Oceanodroma leucorhoa). The Auk:687–
699.
R Core Team. (n.d.). R: A language and environment for statistical computing.R Foundation
for Statistical Computing, Vienna,Austria. URL http://www.R-project.org/.
Svanbäck, R., and D. I. Bolnick. 2007. Intraspecific competition drives increased resource
use diversity within a natural population. Proceedings: Biological Sciences 274:839–
844.
Thiemann, G., S. Iverson, and I. Stirling. 2008. Polar bear diets and arctic marine food webs:
insights from fatty acid analysis. Ecological Monographs 78:591–613.
Thorne, L. H., E. L. Hazen, S. J. Bograd, D. G. Foley, M. G. Conners, M. A. Kappes, H. M.
Kim, D. P. Costa, Y. Tremblay, and S. A. Shaffer. 2015. Foraging behavior links climate
variability and reproduction in North Pacific albatrosses. Movement Ecology 3:27.
Tickell, W. L. N. 2000. Albatrosses 117:433–451.
Torres, L. G., D. R. Thompson, S. Bearhop, S. Votier, G. A. Taylor, P. M. SAGAR, and B. C.
Robertson. 2011. White-capped albatrosses alter fine-scale foraging behavior patterns
when associated with fishing vessels. Marine Ecology-Progress Series 428:289–301.
Tuck, G. N., T. Polacheck, J. P. Croxall, and H. Weimerskirch. 2001. Modelling the impact of
fishery by‐ catches on albatross populations. Journal of Applied Ecology 38:1182–1196.
USFDA 2015. Mercury levels in commercial fish and shellfish (1990 - 2010). Downloaded
from http://www.fda.gov/Food/FoodborneIllnessContaminants/Metals/ucm115644.htm.
Véran, S., O. Gimenez, E. Flint, W. L. Kendall, P. F. Doherty JR, and J.-D. Lebreton. 2007.
Quantifying the impact of longline fisheries on adult survival in the black-footed
albatross. Journal of Applied Ecology 44:942–952.
Vijai, D., M. Sakai, Y. Kamei, and Y. Sakurai. 2014. Spawning pattern of the neon flying squid
Ommastrephes bartramii (Cephalopoda: Oegopsida) around the Hawaiian Islands.
Scientia marina 78:511–519.
Votier, S. C., S. Bearhop, R. Fyfe, and R. W. Furness. 2008. Temporal and spatial variation
in the diet of a marine top predator- links with commercial fisheries. Marine Ecology
Progress Series 367:223–232.
Votier, S. C., S. Bearhop, M. J. Witt, R. Inger, D. Thompson, and J. Newton. 2010. Individual
responses of seabirds to commercial fisheries revealed using GPS tracking, stable
isotopes and vessel monitoring systems. Journal of Applied Ecology 47:487–497.
Votier, S. C., A. Bicknell, S. L. Cox, K. L. Scales, and S. C. Patrick. 2013. A Bird’s Eye View
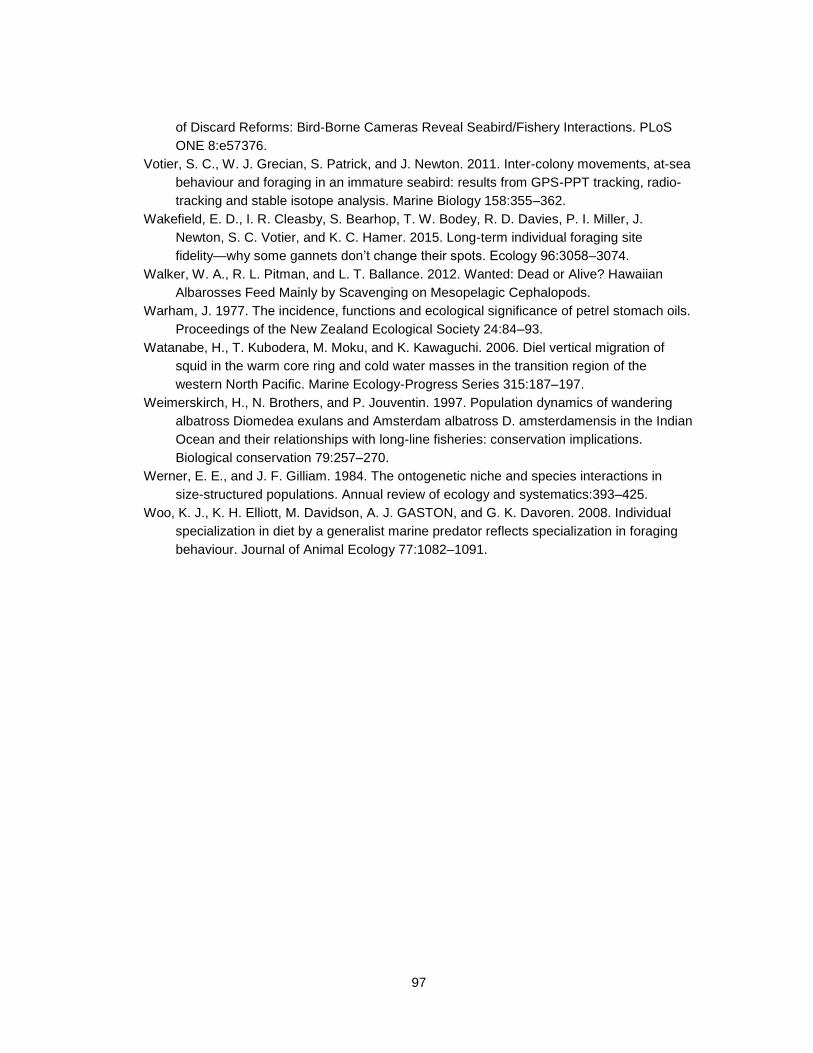
97
of Discard Reforms: Bird-Borne Cameras Reveal Seabird/Fishery Interactions. PLoS
ONE 8:e57376.
Votier, S. C., W. J. Grecian, S. Patrick, and J. Newton. 2011. Inter-colony movements, at-sea
behaviour and foraging in an immature seabird: results from GPS-PPT tracking, radio-
tracking and stable isotope analysis. Marine Biology 158:355–362.
Wakefield, E. D., I. R. Cleasby, S. Bearhop, T. W. Bodey, R. D. Davies, P. I. Miller, J.
Newton, S. C. Votier, and K. C. Hamer. 2015. Long-term individual foraging site
fidelity—why some gannets don’t change their spots. Ecology 96:3058–3074.
Walker, W. A., R. L. Pitman, and L. T. Ballance. 2012. Wanted: Dead or Alive? Hawaiian
Albarosses Feed Mainly by Scavenging on Mesopelagic Cephalopods.
Warham, J. 1977. The incidence, functions and ecological significance of petrel stomach oils.
Proceedings of the New Zealand Ecological Society 24:84–93.
Watanabe, H., T. Kubodera, M. Moku, and K. Kawaguchi. 2006. Diel vertical migration of
squid in the warm core ring and cold water masses in the transition region of the
western North Pacific. Marine Ecology-Progress Series 315:187–197.
Weimerskirch, H., N. Brothers, and P. Jouventin. 1997. Population dynamics of wandering
albatross Diomedea exulans and Amsterdam albatross D. amsterdamensis in the Indian
Ocean and their relationships with long-line fisheries: conservation implications.
Biological conservation 79:257–270.
Werner, E. E., and J. F. Gilliam. 1984. The ontogenetic niche and species interactions in
size-structured populations. Annual review of ecology and systematics:393–425.
Woo, K. J., K. H. Elliott, M. Davidson, A. J. GASTON, and G. K. Davoren. 2008. Individual
specialization in diet by a generalist marine predator reflects specialization in foraging
behaviour. Journal of Animal Ecology 77:1082–1091.
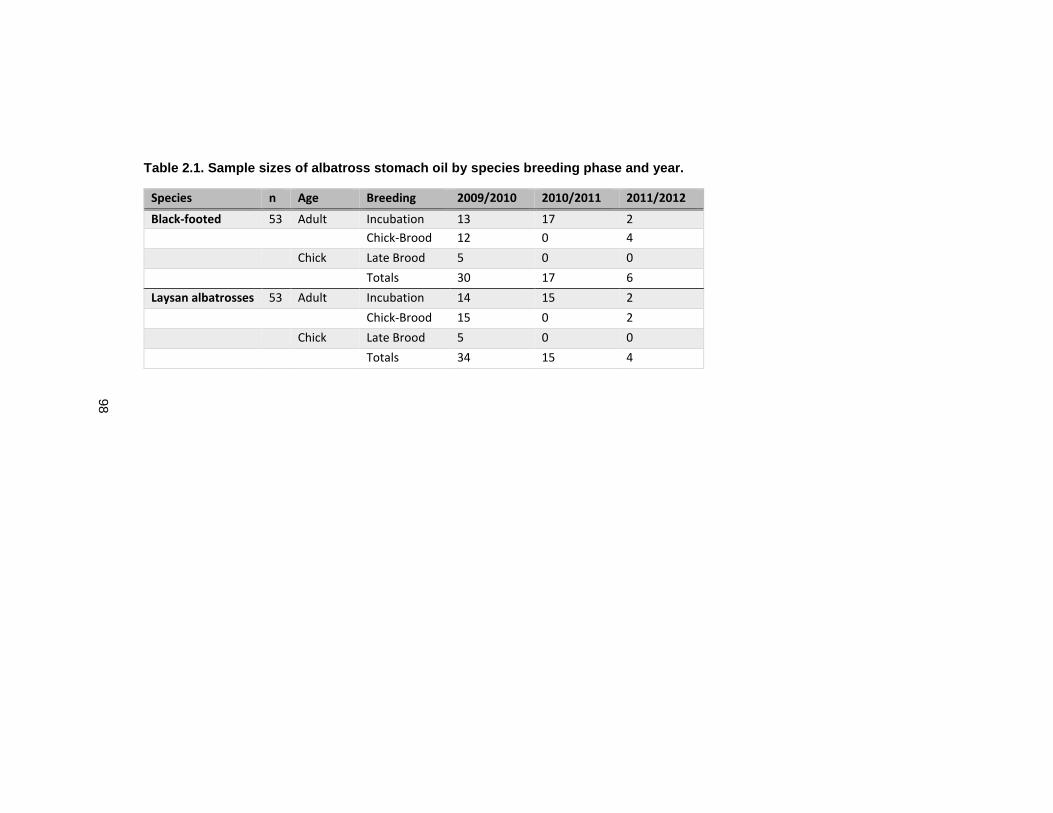
98
Table 2.1. Sample sizes of albatross stomach oil by species breeding phase and year.
Species n Age Breeding
Phase
2009/2010 2010/2011 2011/2012
Black-footed
albatrosses
53 Adult Incubation 13 17 2
Chick-Brood 12 0 4
Chick Late Brood 5 0 0
Totals 30 17 6
Laysan albatrosses 53 Adult Incubation 14 15 2
Chick-Brood 15 0 2
Chick Late Brood 5 0 0
Totals 34 15 4
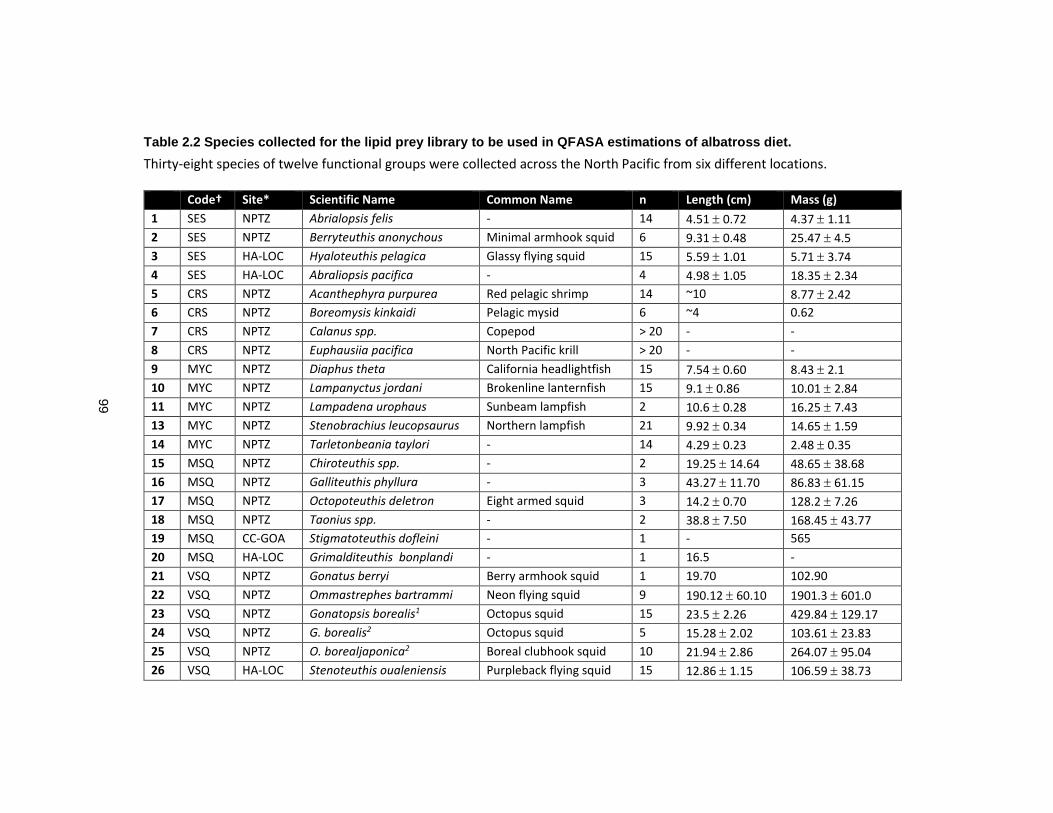
99
Table 2.2 Species collected for the lipid prey library to be used in QFASA estimations of albatross diet.
Thirty-eight species of twelve functional groups were collected across the North Pacific from six different locations.
Code† Site* Scientific Name Common Name n Length (cm) Mass (g)
1 SES NPTZ Abrialopsis felis - 14 4.51 0.72 4.37 1.11
2 SES NPTZ Berryteuthis anonychous Minimal armhook squid 6 9.31 0.48 25.47 4.5
3 SES HA-LOC Hyaloteuthis pelagica Glassy flying squid 15 5.59 1.01 5.71 3.74
4 SES HA-LOC Abraliopsis pacifica - 4 4.98 1.05 18.35 2.34
5 CRS NPTZ Acanthephyra purpurea Red pelagic shrimp 14 ~10 8.77 2.42
6 CRS NPTZ Boreomysis kinkaidi Pelagic mysid 6 ~4 0.62
7 CRS NPTZ Calanus spp. Copepod > 20 - -
8 CRS NPTZ Euphausiia pacifica North Pacific krill > 20 - -
9 MYC NPTZ Diaphus theta California headlightfish 15 7.54 0.60 8.43 2.1
10 MYC NPTZ Lampanyctus jordani Brokenline lanternfish 15 9.1 0.86 10.01 2.84
11 MYC NPTZ Lampadena urophaus Sunbeam lampfish 2 10.6 0.28 16.25 7.43
13 MYC NPTZ Stenobrachius leucopsaurus Northern lampfish 21 9.92 0.34 14.65 1.59
14 MYC NPTZ Tarletonbeania taylori - 14 4.29 0.23 2.48 0.35
15 MSQ NPTZ Chiroteuthis spp. - 2 19.25 14.64 48.65 38.68
16 MSQ NPTZ Galliteuthis phyllura - 3 43.27 11.70 86.83 61.15
17 MSQ NPTZ Octopoteuthis deletron Eight armed squid 3 14.2 0.70 128.2 7.26
18 MSQ NPTZ Taonius spp. - 2 38.8 7.50 168.45 43.77
19 MSQ CC-GOA Stigmatoteuthis dofleini - 1 - 565
20 MSQ HA-LOC Grimalditeuthis bonplandi - 1 16.5 -
21 VSQ NPTZ Gonatus berryi Berry armhook squid 1 19.70 102.90
22 VSQ NPTZ Ommastrephes bartrammi Neon flying squid 9 190.12 60.10 1901.3 601.0
23 VSQ NPTZ Gonatopsis borealis1 Octopus squid 15 23.5 2.26 429.84 129.17
24 VSQ NPTZ G. borealis2 Octopus squid 5 15.28 2.02 103.61 23.83
25 VSQ NPTZ O. borealjaponica2 Boreal clubhook squid 10 21.94 2.86 264.07 95.04
26 VSQ HA-LOC Stenoteuthis oualeniensis Purpleback flying squid 15 12.86 1.15 106.59 38.73
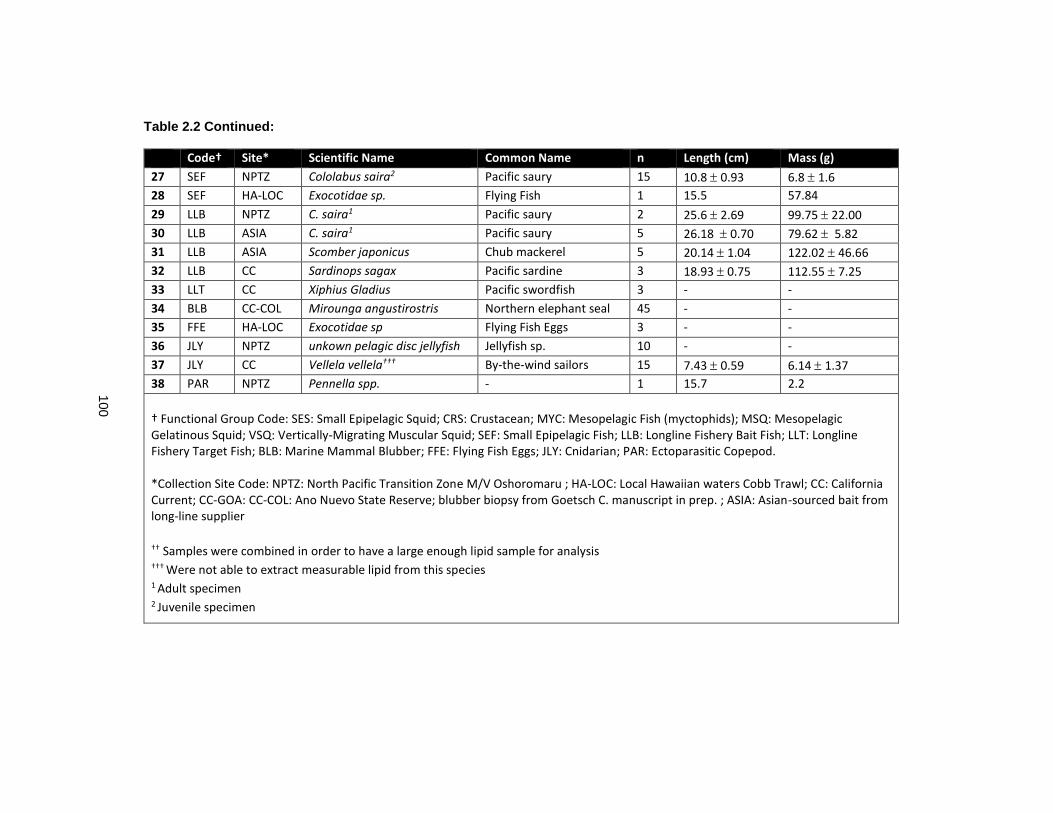
100
Table 2.2 Continued:
Code† Site* Scientific Name Common Name n Length (cm) Mass (g)
27 SEF NPTZ Cololabus saira2 Pacific saury 15 10.8 0.93 6.8 1.6
28 SEF HA-LOC Exocotidae sp. Flying Fish 1 15.5 57.84
29 LLB NPTZ C. saira1 Pacific saury 2 25.6 2.69 99.75 22.00
30 LLB ASIA C. saira1 Pacific saury 5 26.18 0.70 79.62 5.82
31 LLB ASIA Scomber japonicus Chub mackerel 5 20.14 1.04 122.02 46.66
32 LLB CC Sardinops sagax Pacific sardine 3 18.93 0.75 112.55 7.25
33 LLT CC Xiphius Gladius Pacific swordfish 3 - -
34 BLB CC-COL Mirounga angustirostris Northern elephant seal 45 - -
35 FFE HA-LOC Exocotidae sp Flying Fish Eggs 3 - -
36 JLY NPTZ unkown pelagic disc jellyfish Jellyfish sp. 10 - -
37 JLY CC Vellela vellela††† By-the-wind sailors 15 7.43 0.59 6.14 1.37
38 PAR NPTZ Pennella spp. - 1 15.7 2.2
† Functional Group Code: SES: Small Epipelagic Squid; CRS: Crustacean; MYC: Mesopelagic Fish (myctophids); MSQ: Mesopelagic Gelatinous Squid; VSQ: Vertically-Migrating Muscular Squid; SEF: Small Epipelagic Fish; LLB: Longline Fishery Bait Fish; LLT: Longline Fishery Target Fish; BLB: Marine Mammal Blubber; FFE: Flying Fish Eggs; JLY: Cnidarian; PAR: Ectoparasitic Copepod. *Collection Site Code: NPTZ: North Pacific Transition Zone M/V Oshoromaru ; HA-LOC: Local Hawaiian waters Cobb Trawl; CC: California Current; CC-GOA: CC-COL: Ano Nuevo State Reserve; blubber biopsy from Goetsch C. manuscript in prep. ; ASIA: Asian-sourced bait from long-line supplier †† Samples were combined in order to have a large enough lipid sample for analysis ††† Were not able to extract measurable lipid from this species 1 Adult specimen 2 Juvenile specimen
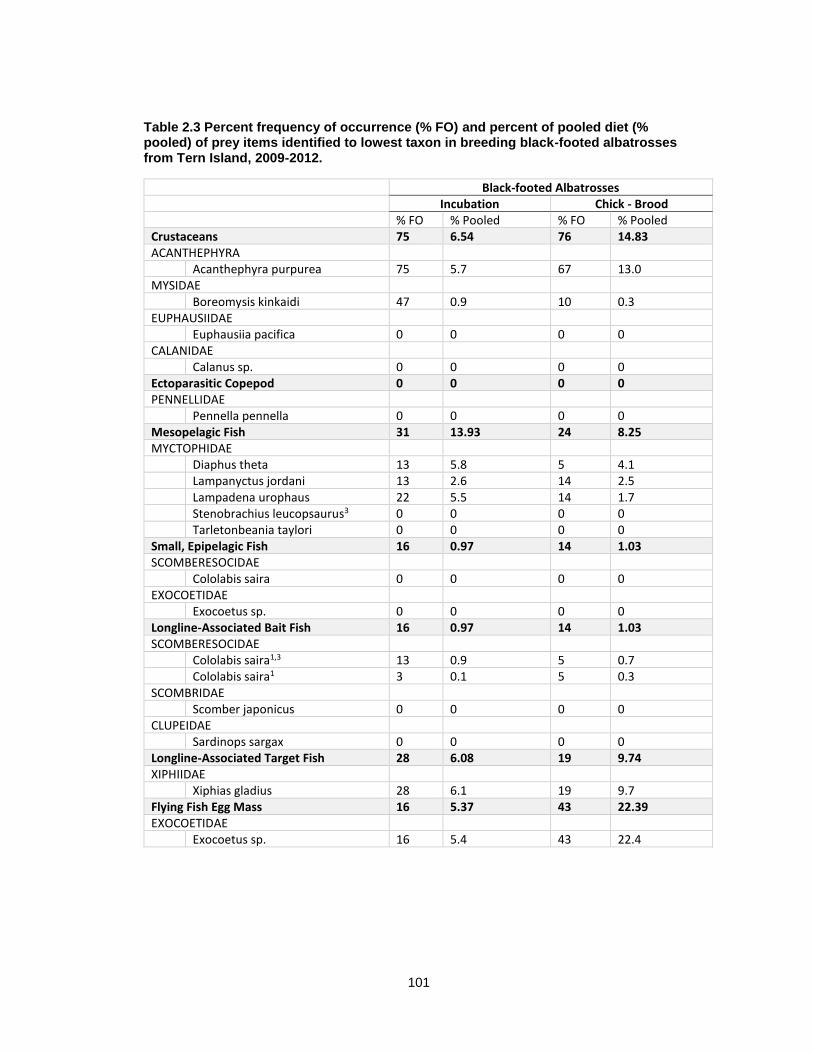
101
Table 2.3 Percent frequency of occurrence (% FO) and percent of pooled diet (% pooled) of prey items identified to lowest taxon in breeding black-footed albatrosses from Tern Island, 2009-2012.
Black-footed Albatrosses Incubation Chick - Brood % FO % Pooled % FO % Pooled Crustaceans 75 6.54 76 14.83 ACANTHEPHYRA
Acanthephyra purpurea 75 5.7 67 13.0 MYSIDAE
Boreomysis kinkaidi 47 0.9 10 0.3 EUPHAUSIIDAE
Euphausiidae
Euphausiia pacifica 0 0 0 0 CALANIDAE
Calanus sp. 0 0 0 0 Ectoparasitic Copepod 0 0 0 0 PENNELLIDAE
Pennella pennella 0 0 0 0 Mesopelagic Fish 31 13.93 24 8.25 MYCTOPHIDAE
Diaphus theta 13 5.8 5 4.1 Lampanyctus jordani 13 2.6 14 2.5 Lampadena urophaus 22 5.5 14 1.7 Stenobrachius leucopsaurus3 0 0 0 0 Tarletonbeania taylori 0 0 0 0 Small, Epipelagic Fish 16 0.97 14 1.03 SCOMBERESOCIDAE
Cololabis saira 0 0 0 0 EXOCOETIDAE
Exocoetus sp. 0 0 0 0 Longline-Associated Bait Fish 16 0.97 14 1.03 SCOMBERESOCIDAE
Cololabis saira1,3 13 0.9 5 0.7 Cololabis saira1 3 0.1 5 0.3 SCOMBRIDAE Scomber japonicus 0 0 0 0 CLUPEIDAE
Sardinops sargax 0 0 0 0 Longline-Associated Target Fish 28 6.08 19 9.74 XIPHIIDAE
Xiphias gladius 28 6.1 19 9.7 Flying Fish Egg Mass 16 5.37 43 22.39 EXOCOETIDAE
Exocoetus sp. 16 5.4 43 22.4
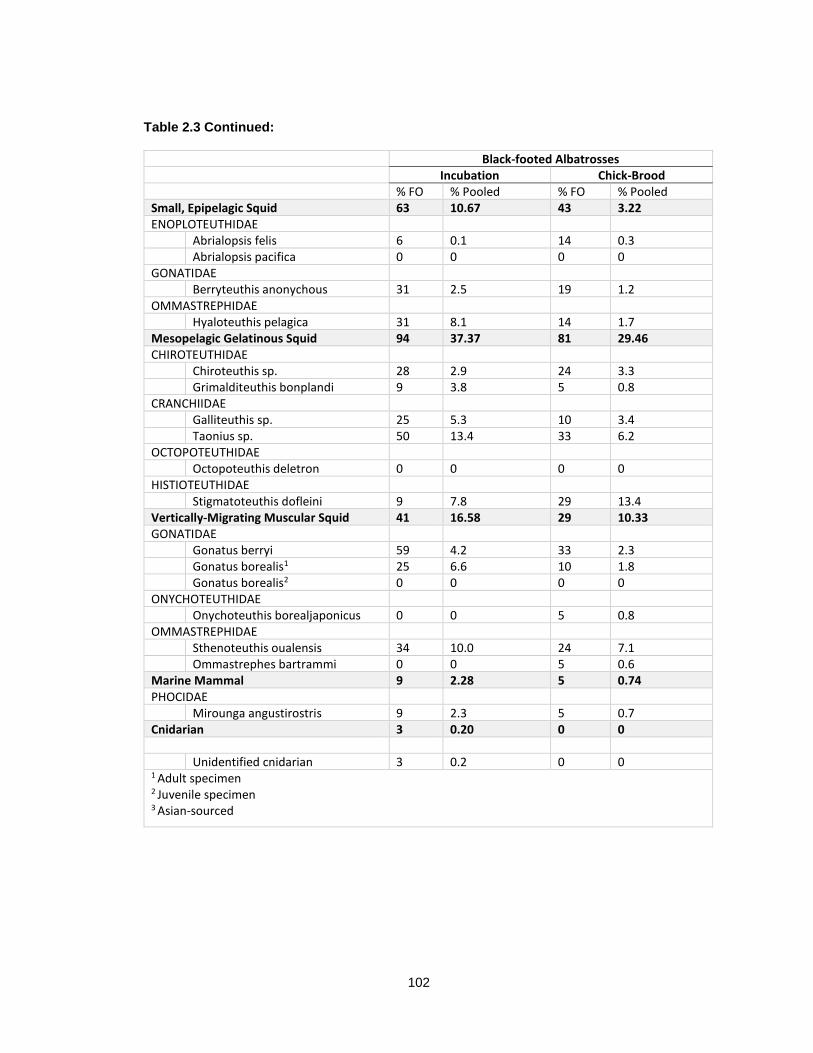
102
Table 2.3 Continued:
Black-footed Albatrosses Incubation Chick-Brood % FO % Pooled % FO % Pooled Small, Epipelagic Squid 63 10.67 43 3.22 ENOPLOTEUTHIDAE
Abrialopsis felis 6 0.1 14 0.3 Abrialopsis pacifica 0 0 0 0 GONATIDAE
Berryteuthis anonychous 31 2.5 19 1.2 OMMASTREPHIDAE
Hyaloteuthis pelagica 31 8.1 14 1.7 Mesopelagic Gelatinous Squid 94 37.37 81 29.46 CHIROTEUTHIDAE
Chiroteuthis sp. 28 2.9 24 3.3 Grimalditeuthis bonplandi 9 3.8 5 0.8 CRANCHIIDAE
Galliteuthis sp. 25 5.3 10 3.4 Taonius sp. 50 13.4 33 6.2 OCTOPOTEUTHIDAE
Octopoteuthis deletron 0 0 0 0 HISTIOTEUTHIDAE
Stigmatoteuthis dofleini 9 7.8 29 13.4 Vertically-Migrating Muscular Squid 41 16.58 29 10.33 GONATIDAE
Gonatus berryi 59 4.2 33 2.3 Gonatus borealis1 25 6.6 10 1.8 Gonatus borealis2 0 0 0 0 ONYCHOTEUTHIDAE
Onychoteuthis borealjaponicus 0 0 5 0.8 OMMASTREPHIDAE
Sthenoteuthis oualensis 34 10.0 24 7.1 Ommastrephes bartrammi 0 0 5 0.6 Marine Mammal 9 2.28 5 0.74 PHOCIDAE
Mirounga angustirostris 9 2.3 5 0.7 Cnidarian 3 0.20 0 0 Unidentified cnidarian 3 0.2 0 0 1 Adult specimen 2 Juvenile specimen 3 Asian-sourced
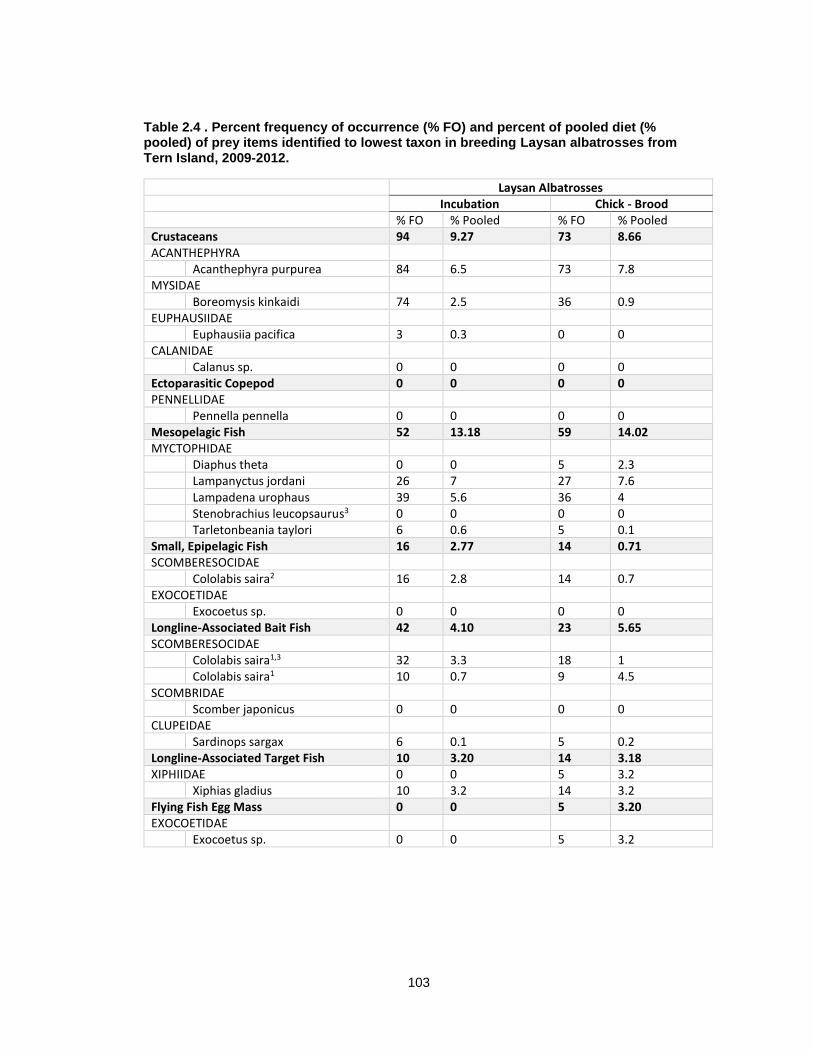
103
Table 2.4 . Percent frequency of occurrence (% FO) and percent of pooled diet (% pooled) of prey items identified to lowest taxon in breeding Laysan albatrosses from Tern Island, 2009-2012.
Laysan Albatrosses Incubation Chick - Brood % FO % Pooled % FO % Pooled Crustaceans 94 9.27 73 8.66 ACANTHEPHYRA
Acanthephyra purpurea 84 6.5 73 7.8 MYSIDAE
Boreomysis kinkaidi 74 2.5 36 0.9 EUPHAUSIIDAE
Euphausiidae
Euphausiia pacifica 3 0.3 0 0 CALANIDAE
Calanus sp. 0 0 0 0 Ectoparasitic Copepod 0 0 0 0 PENNELLIDAE
Pennella pennella 0 0 0 0 Mesopelagic Fish 52 13.18 59 14.02 MYCTOPHIDAE
Diaphus theta 0 0 5 2.3 Lampanyctus jordani 26 7 27 7.6 Lampadena urophaus 39 5.6 36 4 Stenobrachius leucopsaurus3 0 0 0 0 Tarletonbeania taylori 6 0.6 5 0.1 Small, Epipelagic Fish 16 2.77 14 0.71 SCOMBERESOCIDAE
Cololabis saira2 16 2.8 14 0.7 EXOCOETIDAE
Exocoetus sp. 0 0 0 0 Longline-Associated Bait Fish 42 4.10 23 5.65 SCOMBERESOCIDAE
Cololabis saira1,3 32 3.3 18 1 Cololabis saira1 10 0.7 9 4.5 SCOMBRIDAE Scomber japonicus 0 0 0 0 CLUPEIDAE
Sardinops sargax 6 0.1 5 0.2 Longline-Associated Target Fish 10 3.20 14 3.18 XIPHIIDAE
0 0 5 3.2 Xiphias gladius 10 3.2 14 3.2 Flying Fish Egg Mass 0 0 5 3.20 EXOCOETIDAE
Exocoetus sp. 0 0 5 3.2
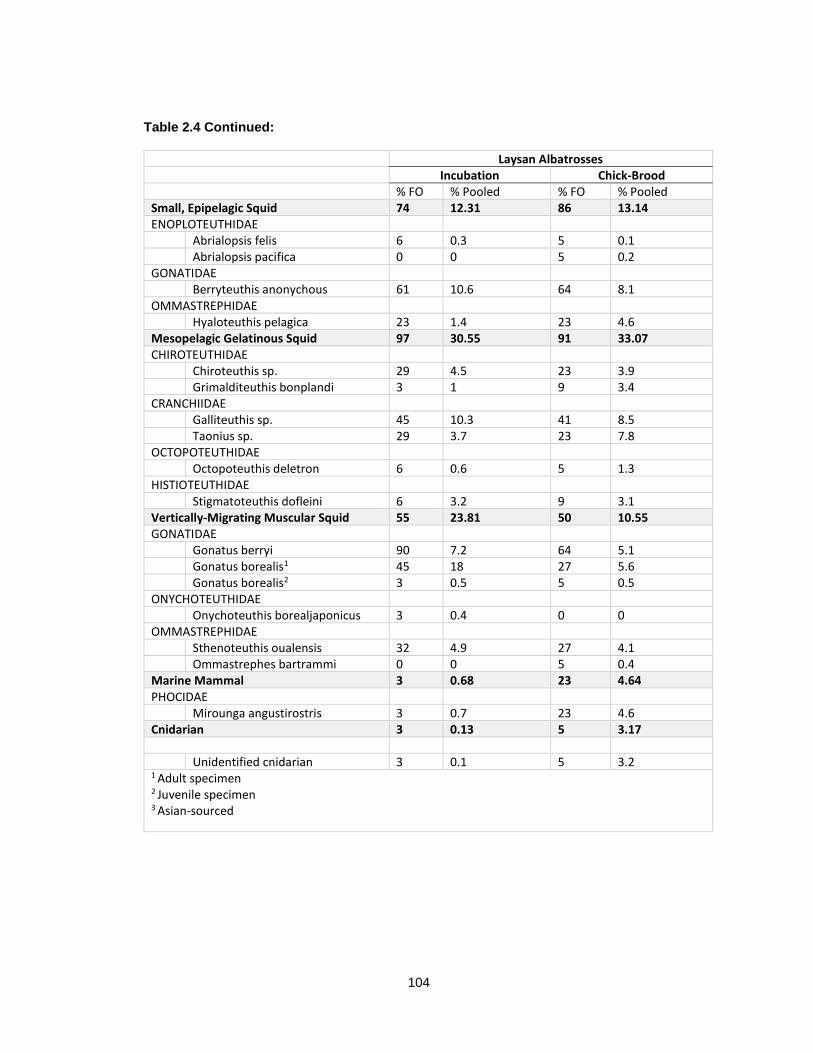
104
Table 2.4 Continued:
Laysan Albatrosses Incubation Chick-Brood % FO % Pooled % FO % Pooled Small, Epipelagic Squid 74 12.31 86 13.14 ENOPLOTEUTHIDAE
Abrialopsis felis 6 0.3 5 0.1 Abrialopsis pacifica 0 0 5 0.2 GONATIDAE
Berryteuthis anonychous 61 10.6 64 8.1 OMMASTREPHIDAE
Hyaloteuthis pelagica 23 1.4 23 4.6 Mesopelagic Gelatinous Squid 97 30.55 91 33.07 CHIROTEUTHIDAE
Chiroteuthis sp. 29 4.5 23 3.9 Grimalditeuthis bonplandi 3 1 9 3.4 CRANCHIIDAE
Galliteuthis sp. 45 10.3 41 8.5 Taonius sp. 29 3.7 23 7.8 OCTOPOTEUTHIDAE
Octopoteuthis deletron 6 0.6 5 1.3 HISTIOTEUTHIDAE
Stigmatoteuthis dofleini 6 3.2 9 3.1 Vertically-Migrating Muscular Squid 55 23.81 50 10.55 GONATIDAE
Gonatus berryi 90 7.2 64 5.1 Gonatus borealis1 45 18 27 5.6 Gonatus borealis2 3 0.5 5 0.5 ONYCHOTEUTHIDAE
Onychoteuthis borealjaponicus 3 0.4 0 0 OMMASTREPHIDAE
Sthenoteuthis oualensis 32 4.9 27 4.1 Ommastrephes bartrammi 0 0 5 0.4 Marine Mammal 3 0.68 23 4.64 PHOCIDAE
Mirounga angustirostris 3 0.7 23 4.6 Cnidarian 3 0.13 5 3.17 Unidentified cnidarian 3 0.1 5 3.2 1 Adult specimen 2 Juvenile specimen 3 Asian-sourced
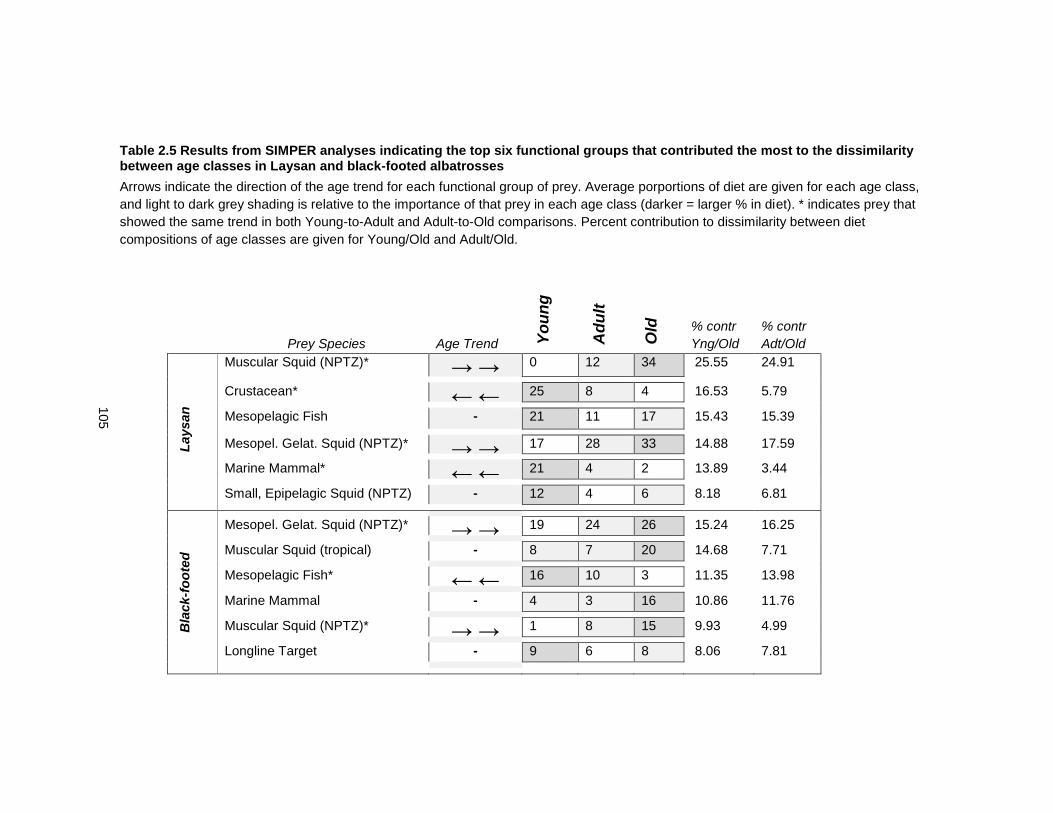
105
Table 2.5 Results from SIMPER analyses indicating the top six functional groups that contributed the most to the dissimilarity between age classes in Laysan and black-footed albatrosses
Arrows indicate the direction of the age trend for each functional group of prey. Average porportions of diet are given for each age class,
and light to dark grey shading is relative to the importance of that prey in each age class (darker = larger % in diet). * indicates prey that
showed the same trend in both Young-to-Adult and Adult-to-Old comparisons. Percent contribution to dissimilarity between diet
compositions of age classes are given for Young/Old and Adult/Old.
Prey Species Age Trend
Yo
un
g
A
du
lt
O
ld
% contr
Yng/Old
% contr
Adt/Old
Laysan
Muscular Squid (NPTZ)* → → 0 12 34 25.55 24.91
Crustacean* ← ← 25 8 4 16.53 5.79
Mesopelagic Fish - 21 11 17 15.43 15.39
Mesopel. Gelat. Squid (NPTZ)* → → 17 28 33 14.88 17.59
Marine Mammal* ← ← 21 4 2 13.89 3.44
Small, Epipelagic Squid (NPTZ) - 12 4 6 8.18 6.81
Bla
ck
-fo
ote
d
Mesopel. Gelat. Squid (NPTZ)* → → 19 24 26 15.24 16.25
Muscular Squid (tropical) - 8 7 20 14.68 7.71
Mesopelagic Fish* ← ← 16 10 3 11.35 13.98
Marine Mammal - 4 3 16 10.86 11.76
Muscular Squid (NPTZ)* → → 1 8 15 9.93 4.99
Longline Target - 9 6 8 8.06 7.81
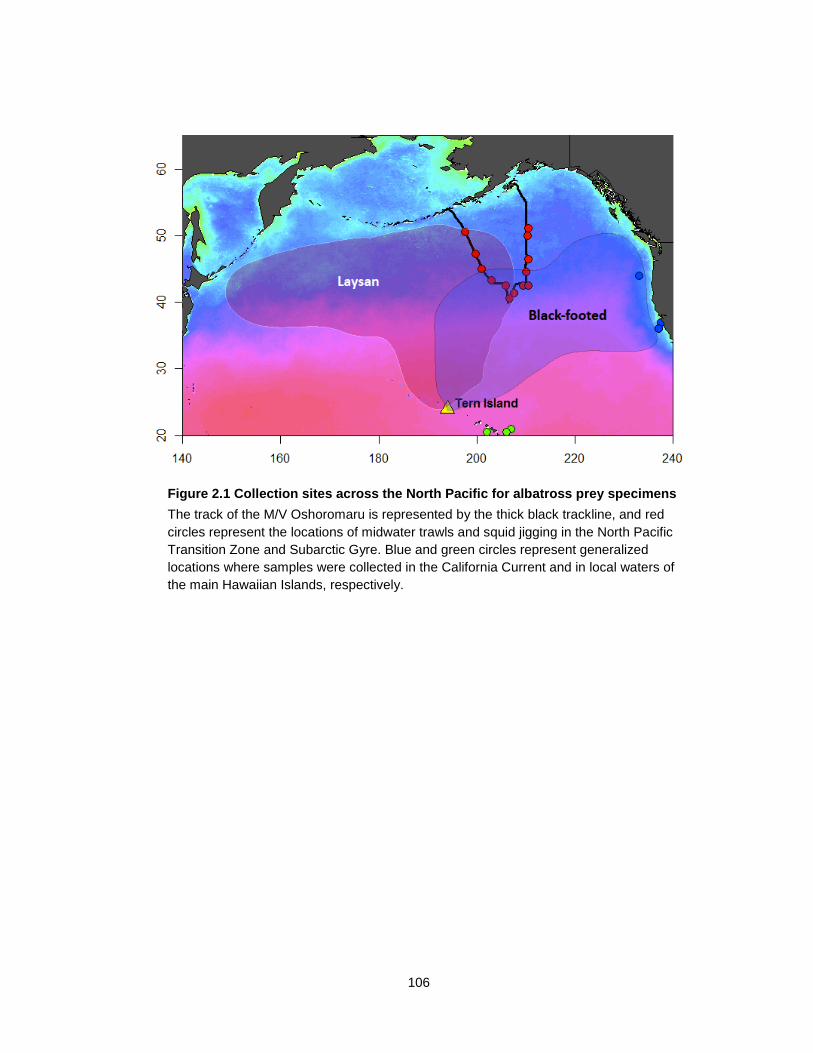
106
Figure 2.1 Collection sites across the North Pacific for albatross prey specimens
The track of the M/V Oshoromaru is represented by the thick black trackline, and red
circles represent the locations of midwater trawls and squid jigging in the North Pacific
Transition Zone and Subarctic Gyre. Blue and green circles represent generalized
locations where samples were collected in the California Current and in local waters of
the main Hawaiian Islands, respectively.
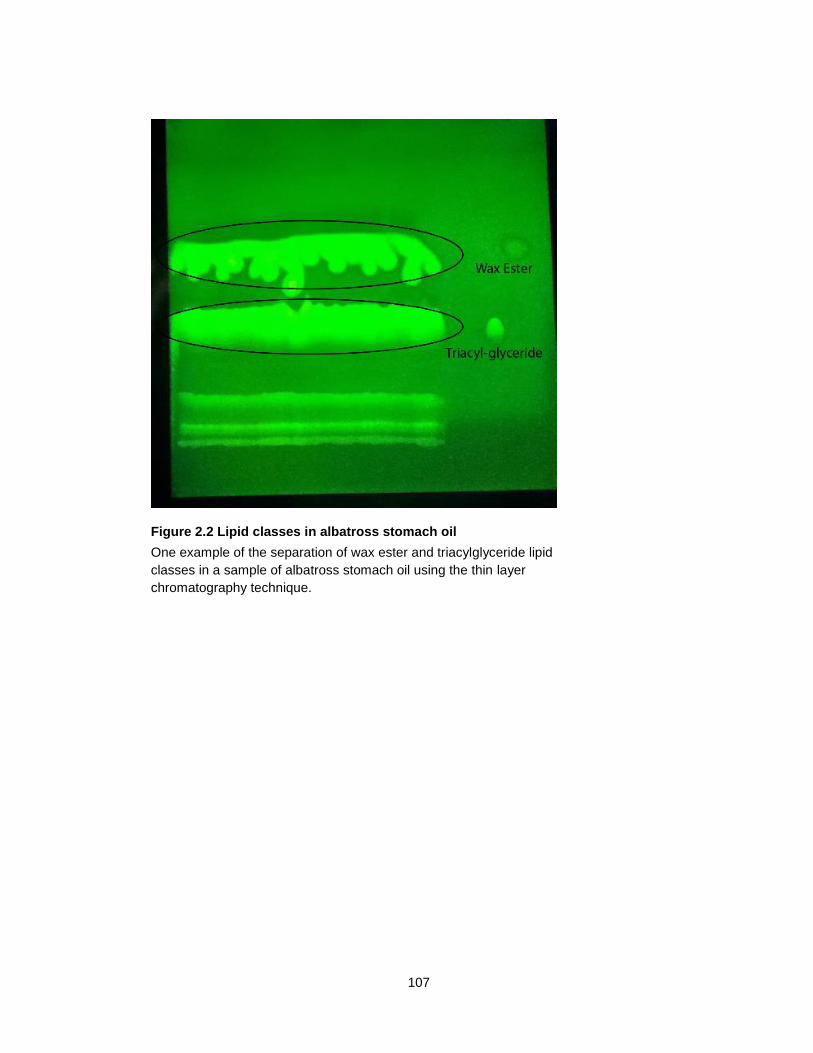
107
Figure 2.2 Lipid classes in albatross stomach oil
One example of the separation of wax ester and triacylglyceride lipid
classes in a sample of albatross stomach oil using the thin layer
chromatography technique.
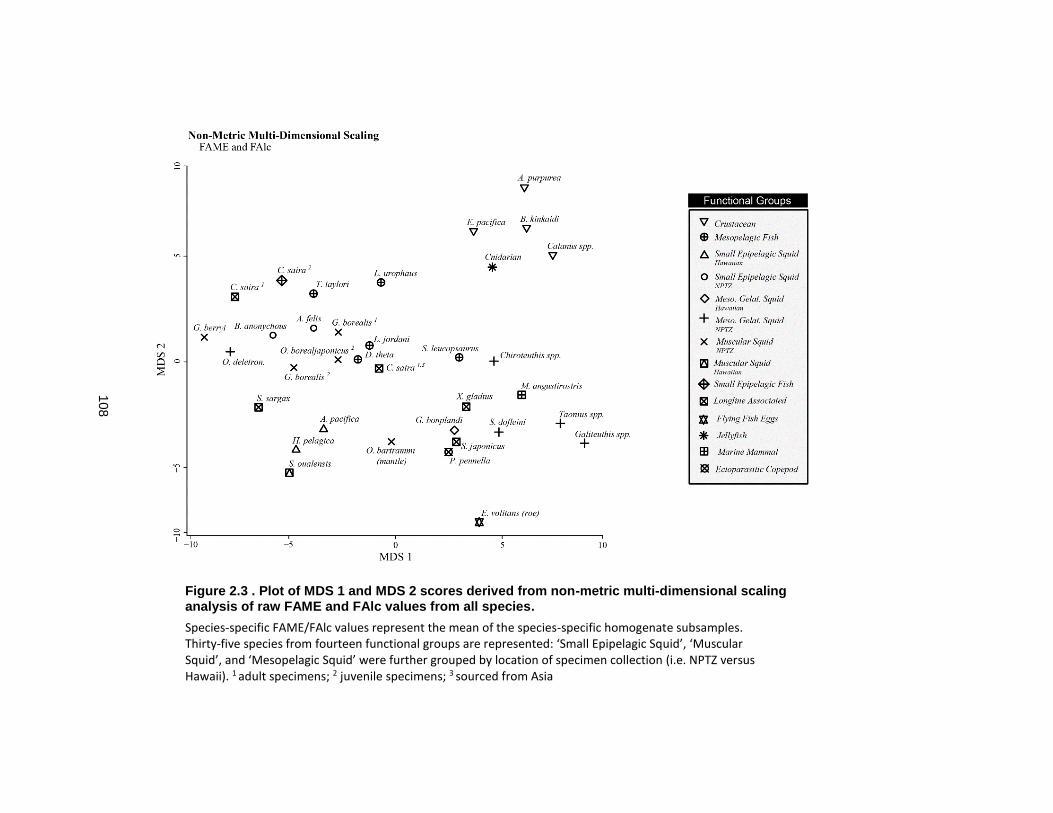
108
Figure 2.3 . Plot of MDS 1 and MDS 2 scores derived from non-metric multi-dimensional scaling analysis of raw FAME and FAlc values from all species.
Species-specific FAME/FAlc values represent the mean of the species-specific homogenate subsamples. Thirty-five species from fourteen functional groups are represented: ‘Small Epipelagic Squid’, ‘Muscular Squid’, and ‘Mesopelagic Squid’ were further grouped by location of specimen collection (i.e. NPTZ versus Hawaii). 1 adult specimens; 2 juvenile specimens; 3 sourced from Asia
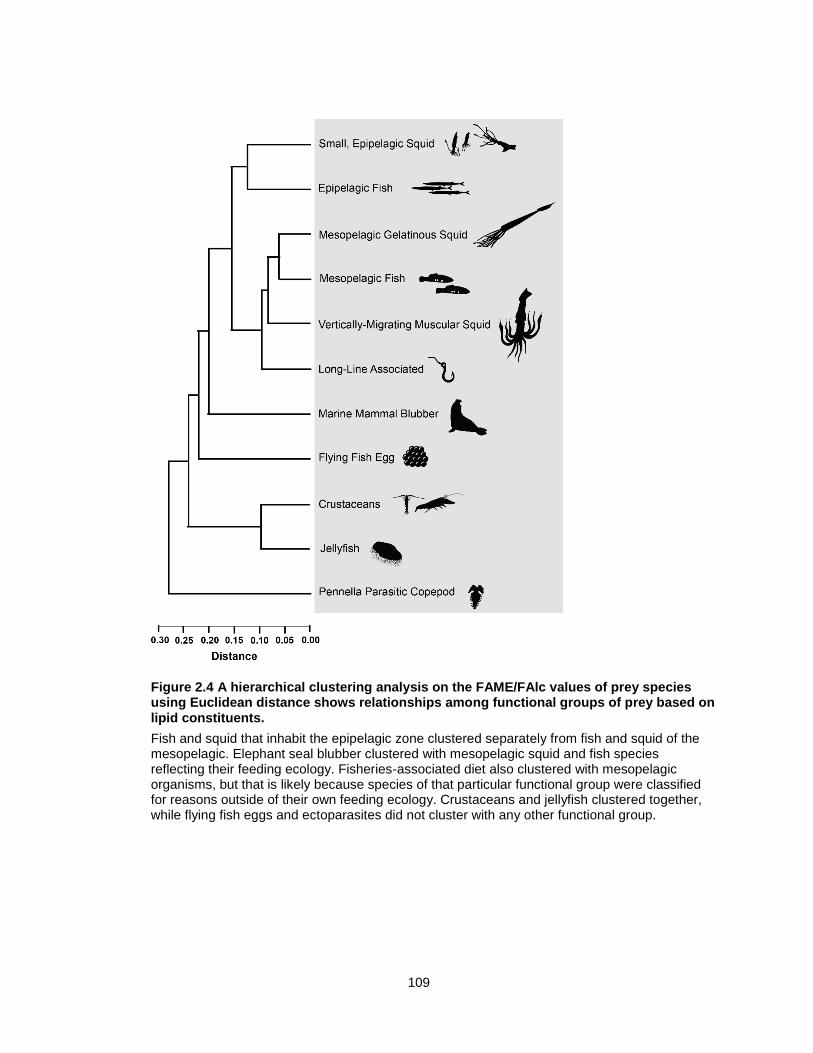
109
Figure 2.4 A hierarchical clustering analysis on the FAME/FAlc values of prey species using Euclidean distance shows relationships among functional groups of prey based on lipid constituents.
Fish and squid that inhabit the epipelagic zone clustered separately from fish and squid of the mesopelagic. Elephant seal blubber clustered with mesopelagic squid and fish species reflecting their feeding ecology. Fisheries-associated diet also clustered with mesopelagic organisms, but that is likely because species of that particular functional group were classified for reasons outside of their own feeding ecology. Crustaceans and jellyfish clustered together, while flying fish eggs and ectoparasites did not cluster with any other functional group.
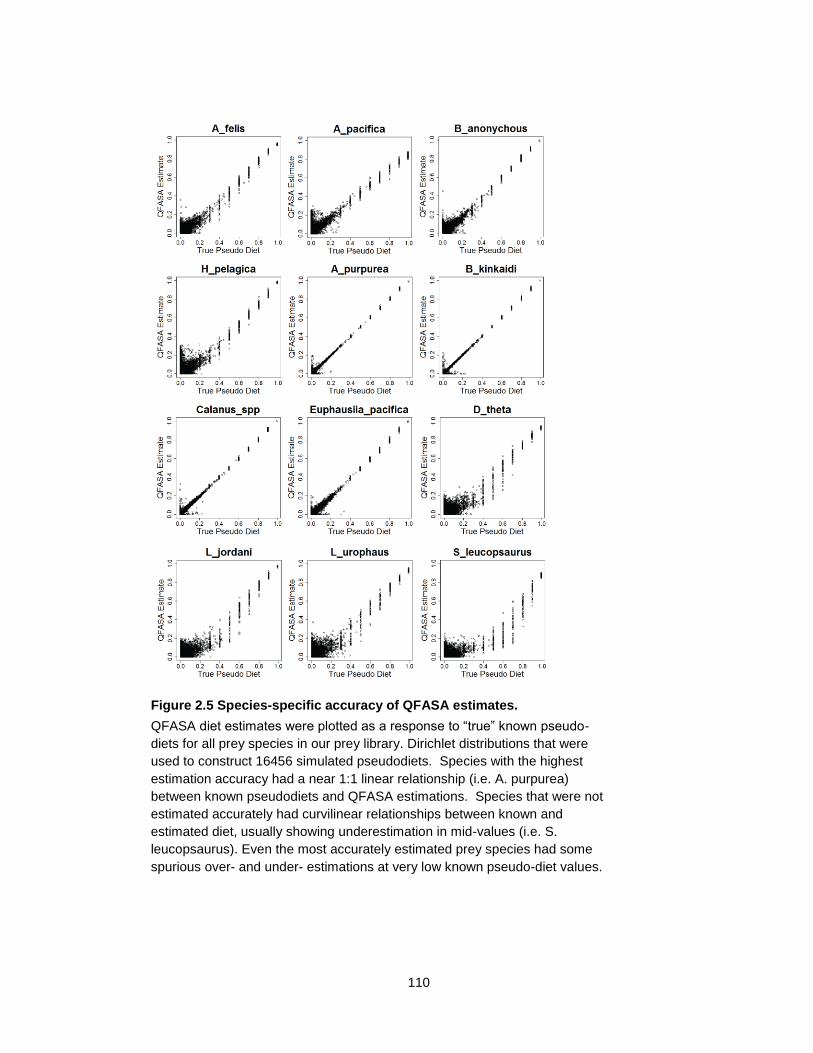
110
Figure 2.5 Species-specific accuracy of QFASA estimates.
QFASA diet estimates were plotted as a response to “true” known pseudo-
diets for all prey species in our prey library. Dirichlet distributions that were
used to construct 16456 simulated pseudodiets. Species with the highest
estimation accuracy had a near 1:1 linear relationship (i.e. A. purpurea)
between known pseudodiets and QFASA estimations. Species that were not
estimated accurately had curvilinear relationships between known and
estimated diet, usually showing underestimation in mid-values (i.e. S.
leucopsaurus). Even the most accurately estimated prey species had some
spurious over- and under- estimations at very low known pseudo-diet values.
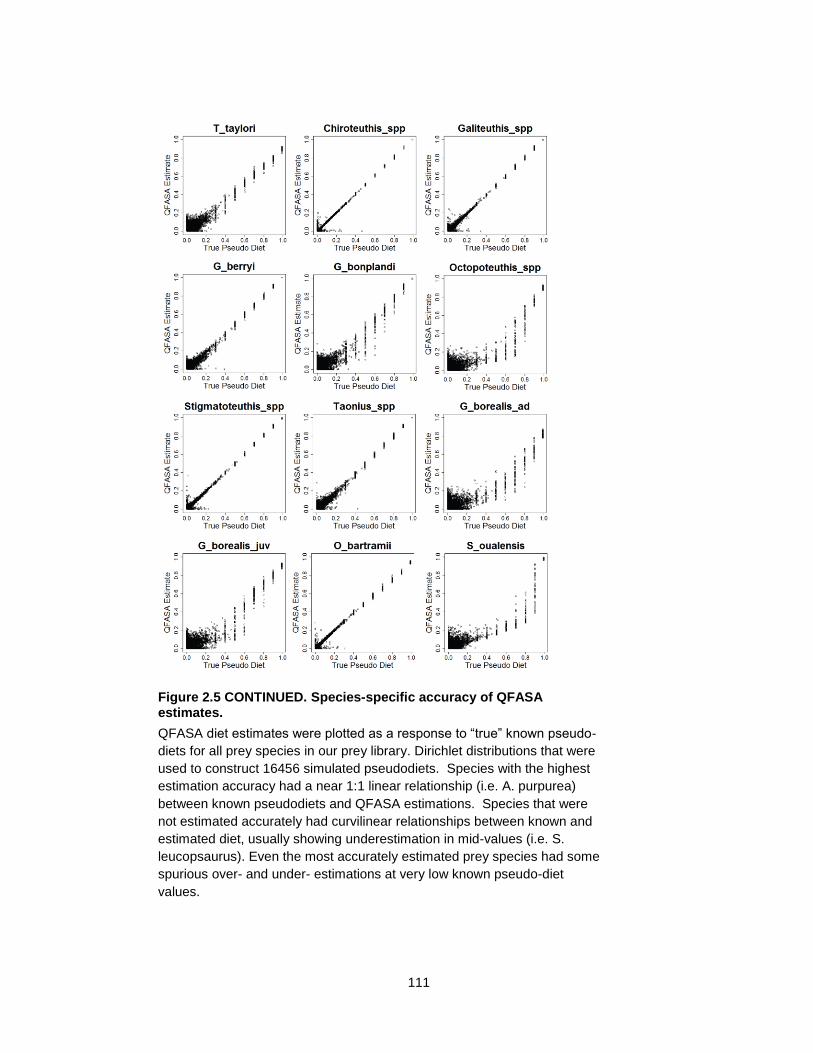
111
Figure 2.5 CONTINUED. Species-specific accuracy of QFASA estimates.
QFASA diet estimates were plotted as a response to “true” known pseudo-
diets for all prey species in our prey library. Dirichlet distributions that were
used to construct 16456 simulated pseudodiets. Species with the highest
estimation accuracy had a near 1:1 linear relationship (i.e. A. purpurea)
between known pseudodiets and QFASA estimations. Species that were
not estimated accurately had curvilinear relationships between known and
estimated diet, usually showing underestimation in mid-values (i.e. S.
leucopsaurus). Even the most accurately estimated prey species had some
spurious over- and under- estimations at very low known pseudo-diet
values.
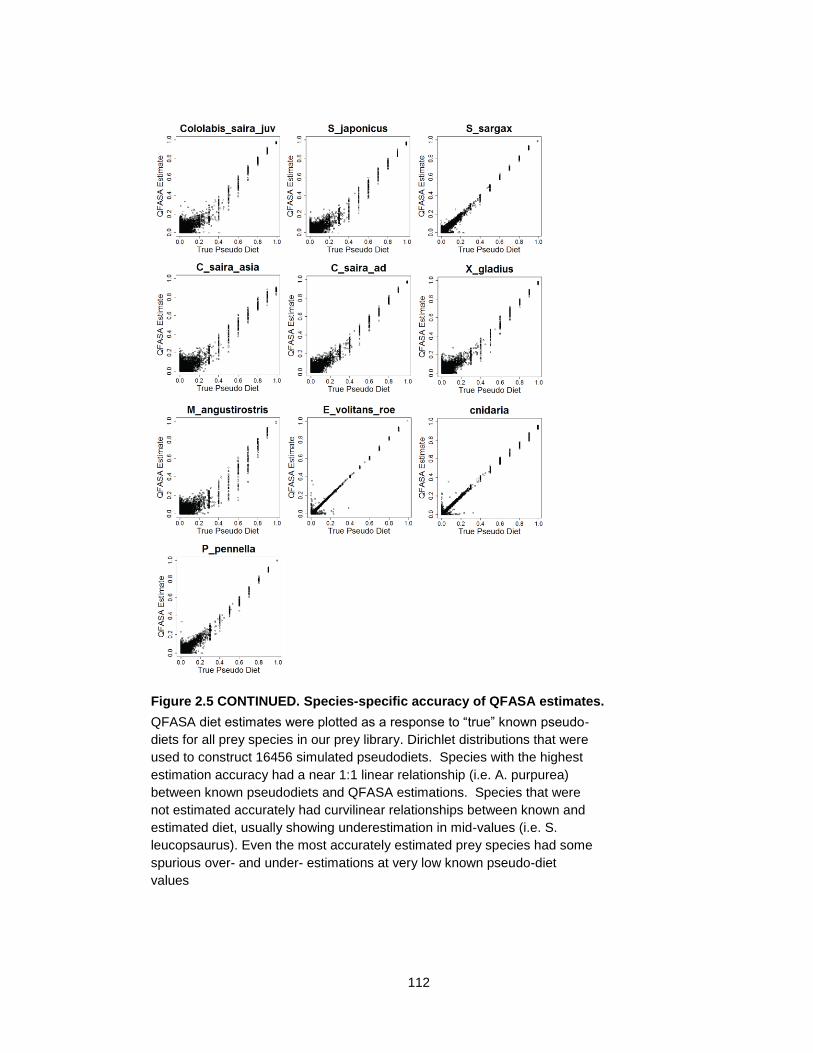
112
Figure 2.5 CONTINUED. Species-specific accuracy of QFASA estimates.
QFASA diet estimates were plotted as a response to “true” known pseudo-
diets for all prey species in our prey library. Dirichlet distributions that were
used to construct 16456 simulated pseudodiets. Species with the highest
estimation accuracy had a near 1:1 linear relationship (i.e. A. purpurea)
between known pseudodiets and QFASA estimations. Species that were
not estimated accurately had curvilinear relationships between known and
estimated diet, usually showing underestimation in mid-values (i.e. S.
leucopsaurus). Even the most accurately estimated prey species had some
spurious over- and under- estimations at very low known pseudo-diet
values
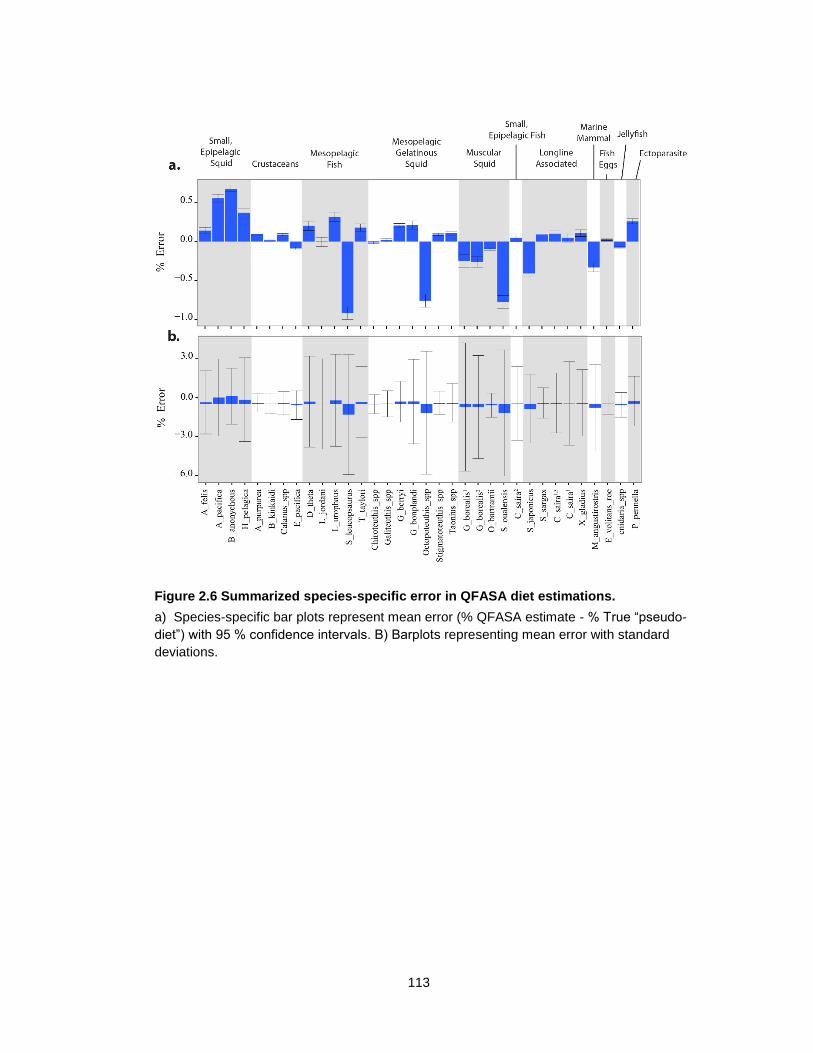
113
Figure 2.6 Summarized species-specific error in QFASA diet estimations.
a) Species-specific bar plots represent mean error (% QFASA estimate - % True “pseudo-
diet”) with 95 % confidence intervals. B) Barplots representing mean error with standard
deviations.
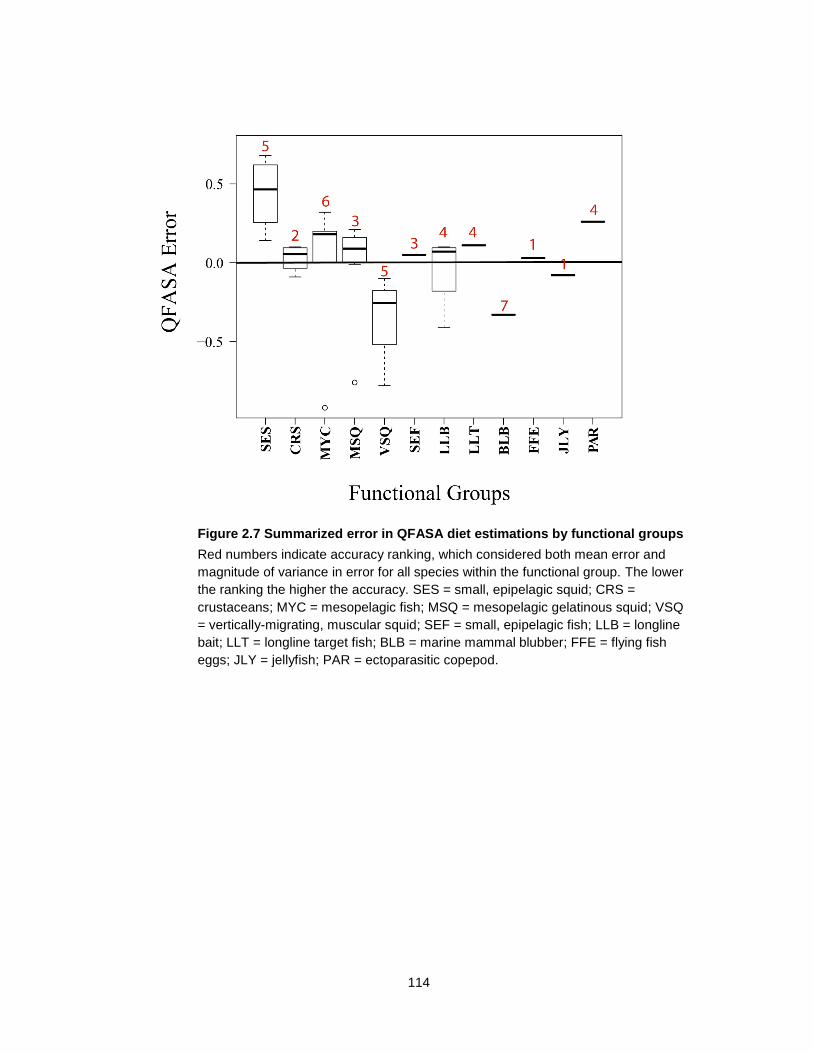
114
Figure 2.7 Summarized error in QFASA diet estimations by functional groups
Red numbers indicate accuracy ranking, which considered both mean error and
magnitude of variance in error for all species within the functional group. The lower
the ranking the higher the accuracy. SES = small, epipelagic squid; CRS =
crustaceans; MYC = mesopelagic fish; MSQ = mesopelagic gelatinous squid; VSQ
= vertically-migrating, muscular squid; SEF = small, epipelagic fish; LLB = longline
bait; LLT = longline target fish; BLB = marine mammal blubber; FFE = flying fish
eggs; JLY = jellyfish; PAR = ectoparasitic copepod.
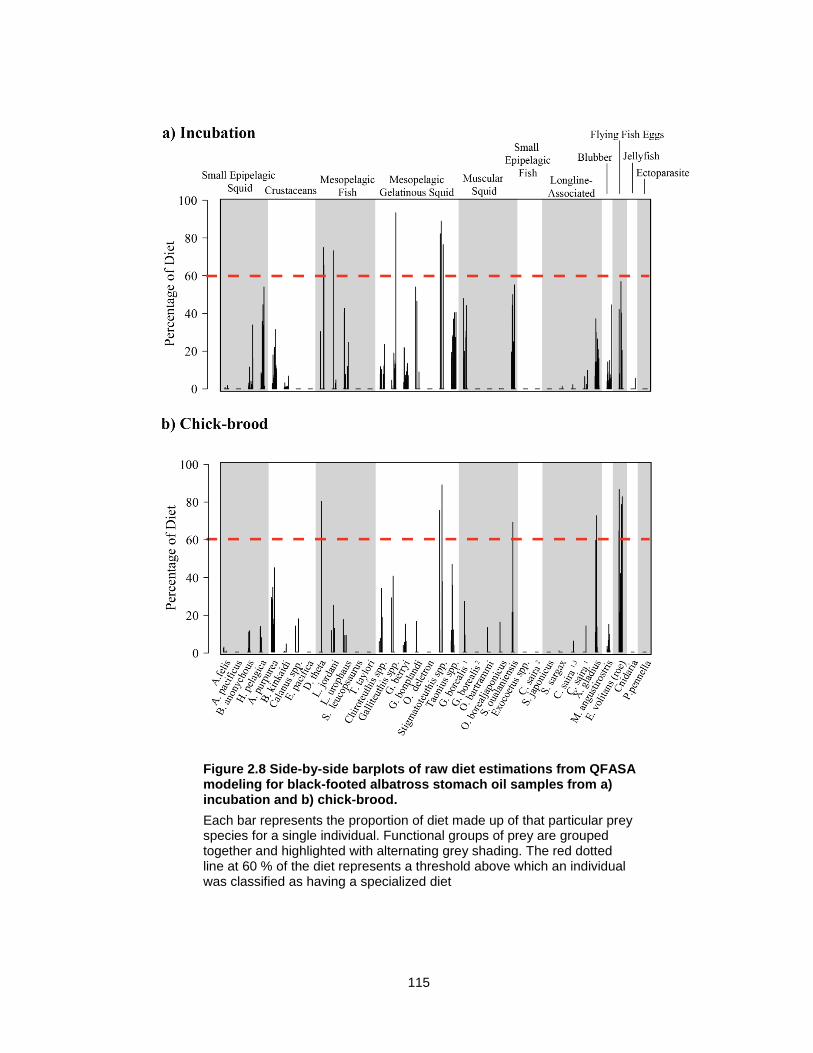
115
Figure 2.8 Side-by-side barplots of raw diet estimations from QFASA modeling for black-footed albatross stomach oil samples from a) incubation and b) chick-brood.
Each bar represents the proportion of diet made up of that particular prey species for a single individual. Functional groups of prey are grouped together and highlighted with alternating grey shading. The red dotted line at 60 % of the diet represents a threshold above which an individual was classified as having a specialized diet
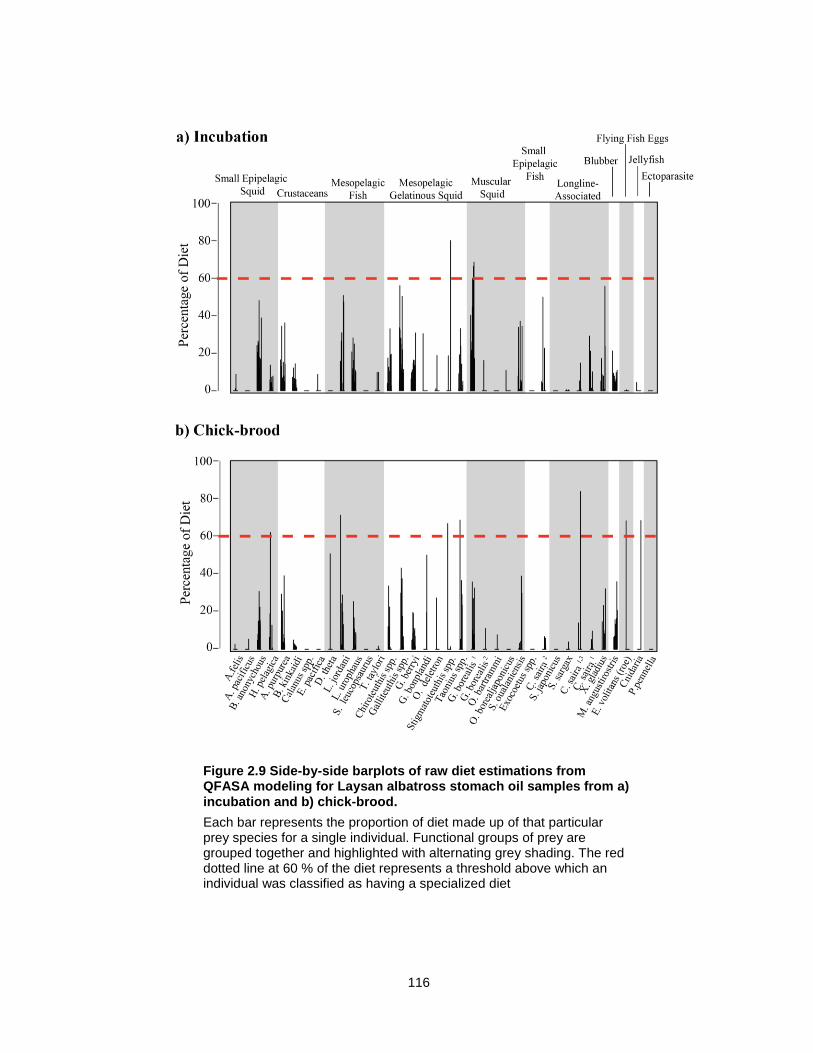
116
Figure 2.9 Side-by-side barplots of raw diet estimations from QFASA modeling for Laysan albatross stomach oil samples from a) incubation and b) chick-brood.
Each bar represents the proportion of diet made up of that particular prey species for a single individual. Functional groups of prey are grouped together and highlighted with alternating grey shading. The red dotted line at 60 % of the diet represents a threshold above which an individual was classified as having a specialized diet
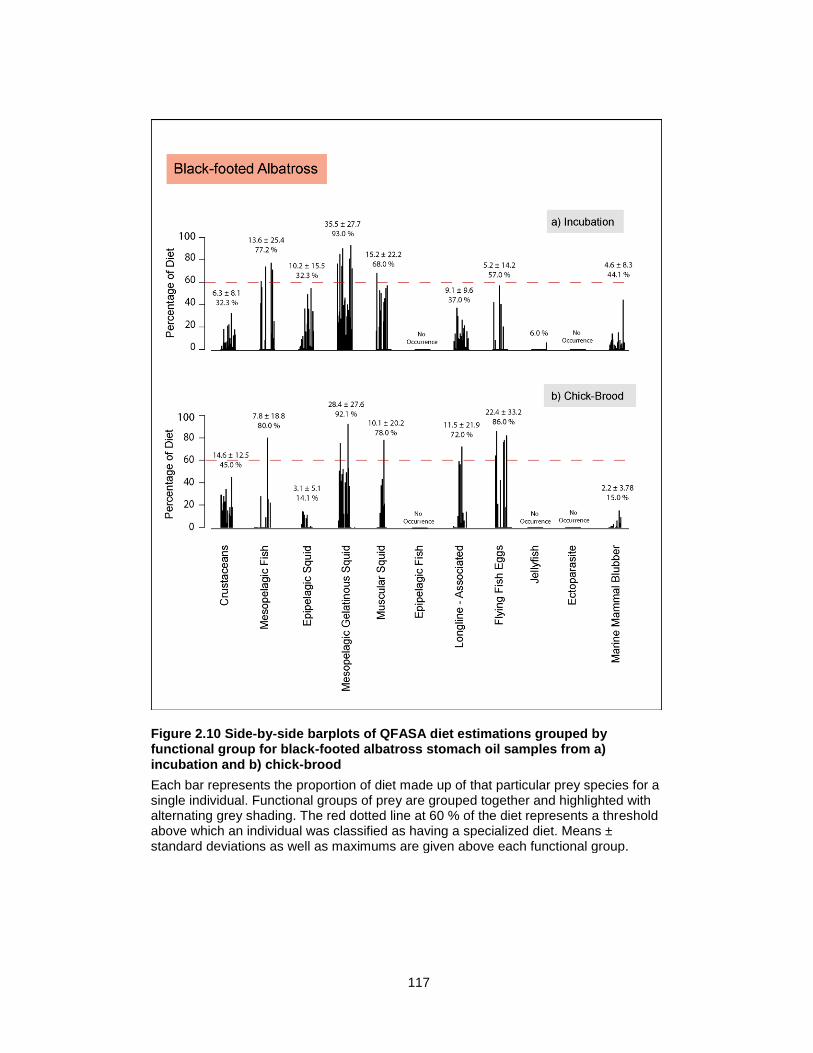
117
Figure 2.10 Side-by-side barplots of QFASA diet estimations grouped by functional group for black-footed albatross stomach oil samples from a) incubation and b) chick-brood
Each bar represents the proportion of diet made up of that particular prey species for a single individual. Functional groups of prey are grouped together and highlighted with alternating grey shading. The red dotted line at 60 % of the diet represents a threshold above which an individual was classified as having a specialized diet. Means ± standard deviations as well as maximums are given above each functional group.
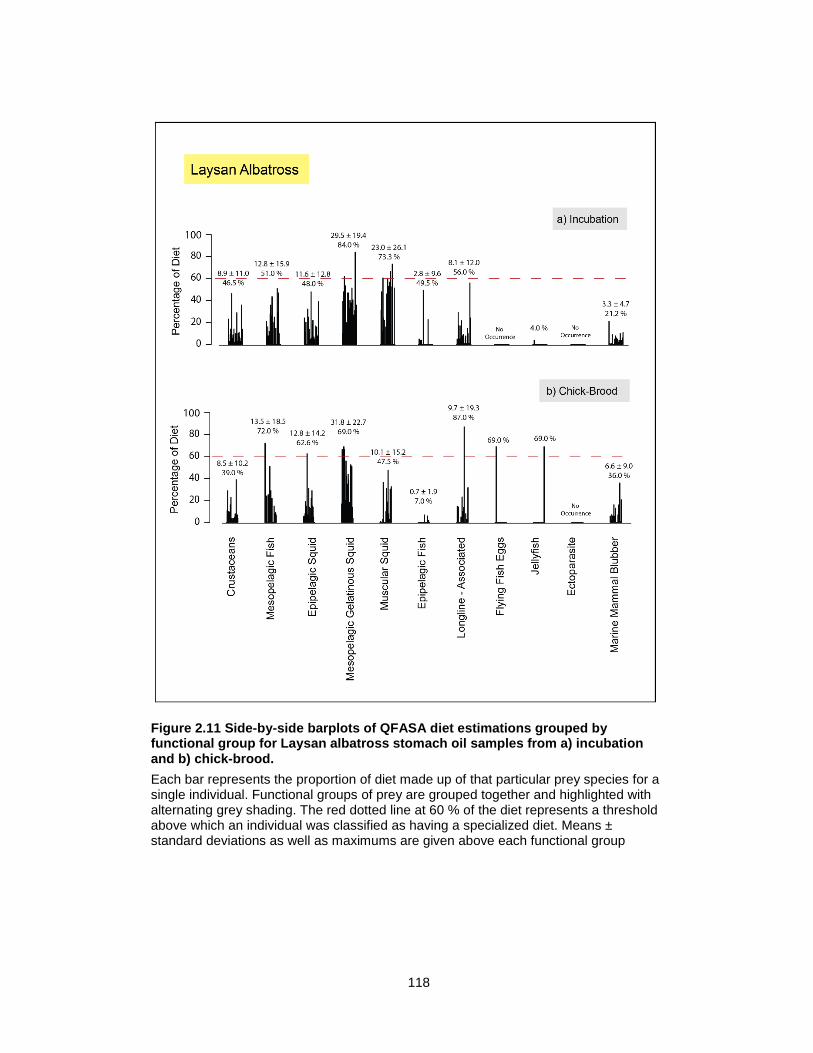
118
Figure 2.11 Side-by-side barplots of QFASA diet estimations grouped by functional group for Laysan albatross stomach oil samples from a) incubation and b) chick-brood.
Each bar represents the proportion of diet made up of that particular prey species for a single individual. Functional groups of prey are grouped together and highlighted with alternating grey shading. The red dotted line at 60 % of the diet represents a threshold above which an individual was classified as having a specialized diet. Means ± standard deviations as well as maximums are given above each functional group
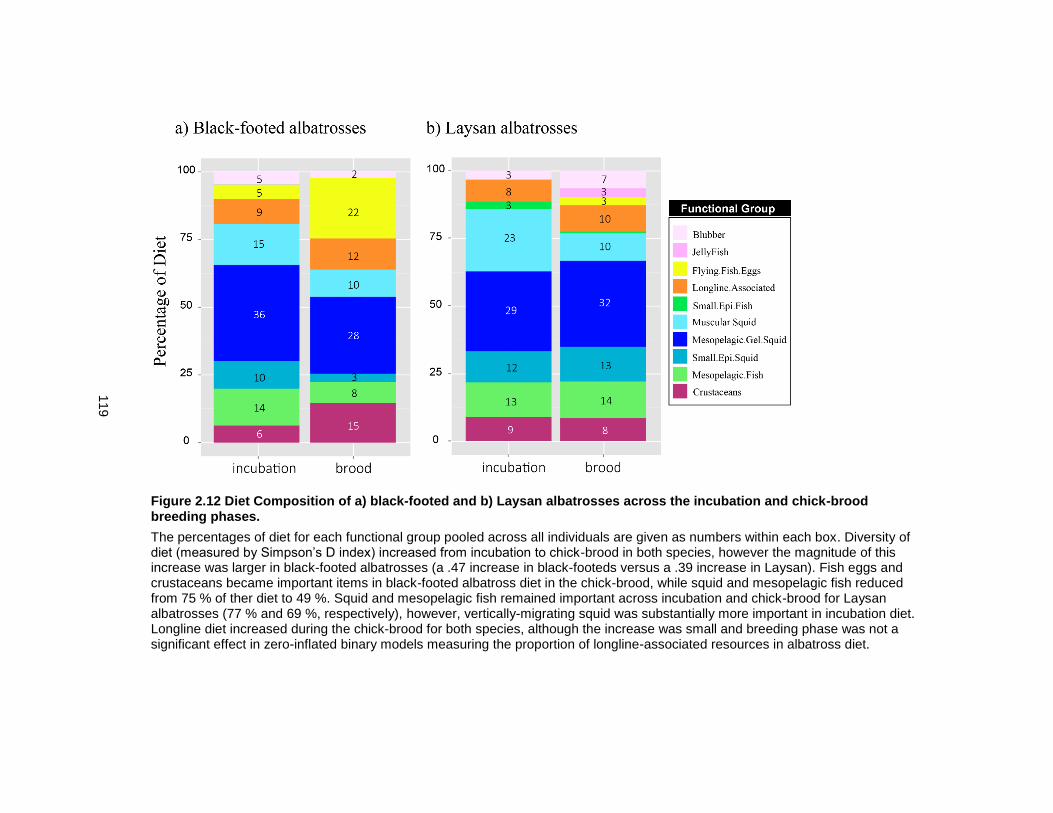
119
Figure 2.12 Diet Composition of a) black-footed and b) Laysan albatrosses across the incubation and chick-brood breeding phases.
The percentages of diet for each functional group pooled across all individuals are given as numbers within each box. Diversity of diet (measured by Simpson’s D index) increased from incubation to chick-brood in both species, however the magnitude of this increase was larger in black-footed albatrosses (a .47 increase in black-footeds versus a .39 increase in Laysan). Fish eggs and crustaceans became important items in black-footed albatross diet in the chick-brood, while squid and mesopelagic fish reduced from 75 % of ther diet to 49 %. Squid and mesopelagic fish remained important across incubation and chick-brood for Laysan albatrosses (77 % and 69 %, respectively), however, vertically-migrating squid was substantially more important in incubation diet. Longline diet increased during the chick-brood for both species, although the increase was small and breeding phase was not a significant effect in zero-inflated binary models measuring the proportion of longline-associated resources in albatross diet.
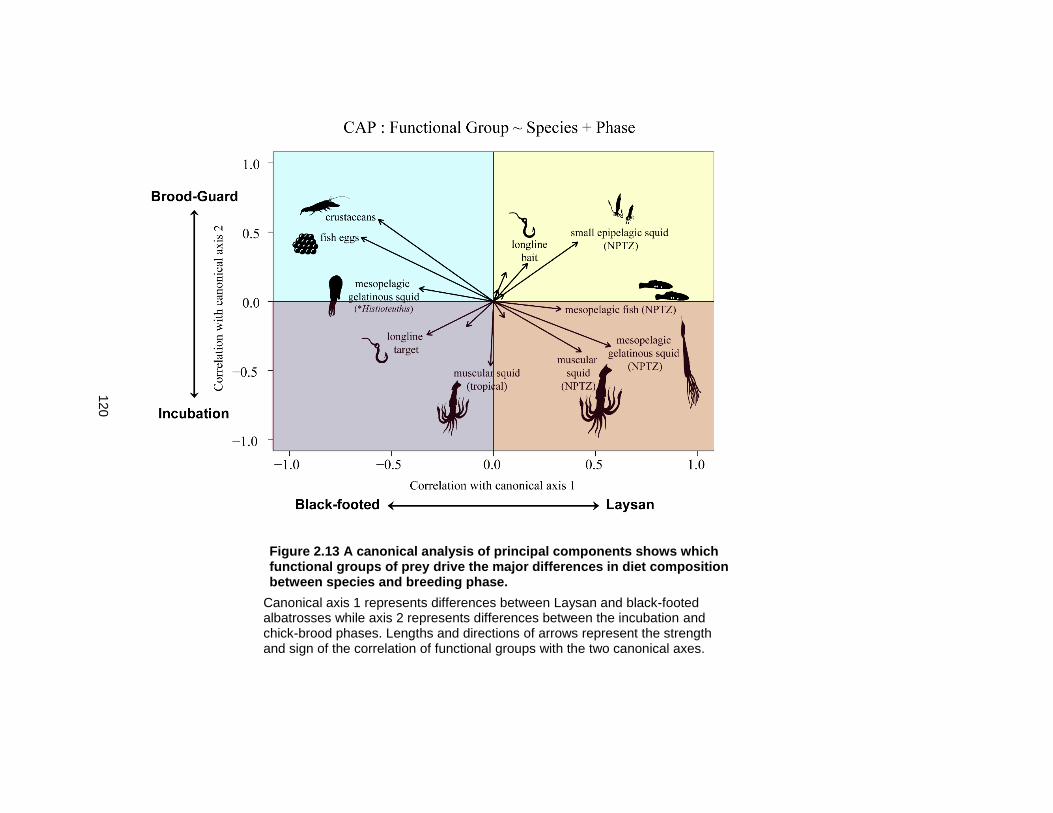
120
Figure 2.13 A canonical analysis of principal components shows which functional groups of prey drive the major differences in diet composition between species and breeding phase.
Canonical axis 1 represents differences between Laysan and black-footed albatrosses while axis 2 represents differences between the incubation and chick-brood phases. Lengths and directions of arrows represent the strength and sign of the correlation of functional groups with the two canonical axes.
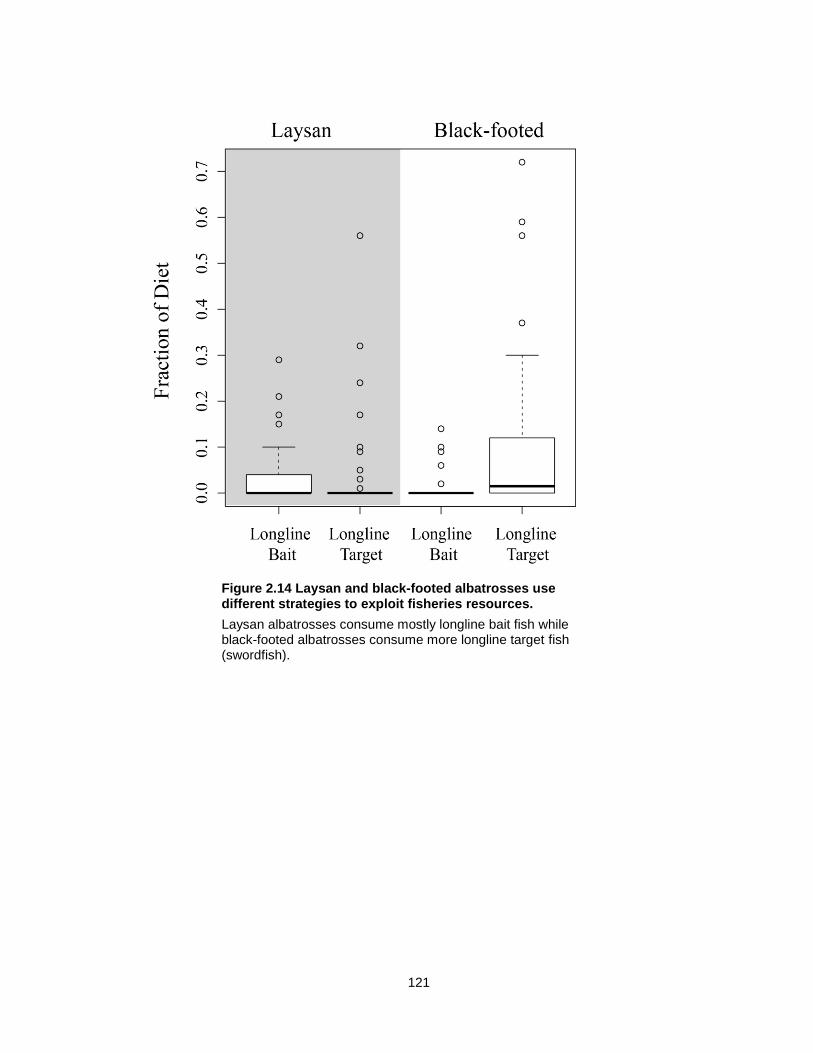
121
Figure 2.14 Laysan and black-footed albatrosses use different strategies to exploit fisheries resources.
Laysan albatrosses consume mostly longline bait fish while black-footed albatrosses consume more longline target fish (swordfish).
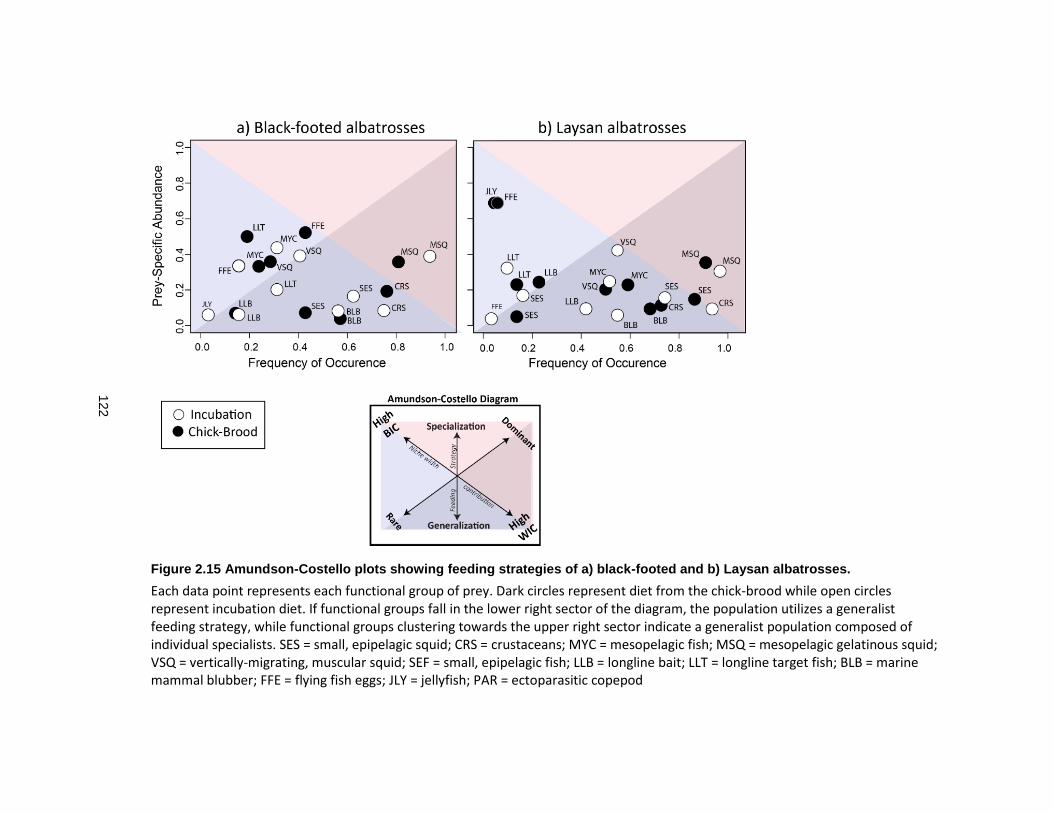
122
Figure 2.15 Amundson-Costello plots showing feeding strategies of a) black-footed and b) Laysan albatrosses.
Each data point represents each functional group of prey. Dark circles represent diet from the chick-brood while open circles represent incubation diet. If functional groups fall in the lower right sector of the diagram, the population utilizes a generalist feeding strategy, while functional groups clustering towards the upper right sector indicate a generalist population composed of individual specialists. SES = small, epipelagic squid; CRS = crustaceans; MYC = mesopelagic fish; MSQ = mesopelagic gelatinous squid; VSQ = vertically-migrating, muscular squid; SEF = small, epipelagic fish; LLB = longline bait; LLT = longline target fish; BLB = marine mammal blubber; FFE = flying fish eggs; JLY = jellyfish; PAR = ectoparasitic copepod
123
3 CHAPTER THREE
Flight feather molt, age and sex influence the post-breeding migrations of two long-lived seabird species.
Melinda Conners, Michael Sumner, Michelle Kappes, Daniel Costa, Scott Shaffer
124
ABSTRACT
Balancing the allocation of energy between reproduction and self-maintenance is a
fundamental trade-off in biology. To gain reproductive fitness organisms must successfully
bear viable offspring, but at what cost to one’s survival and future breeding efforts? Long
lived species act as “prudent parents” and only invest in reproduction if it comes at minimal
cost to their own survival probability. For birds, the replacement of flight feathers, critical for
survival, requires the largest investment of energy next to reproduction, and these activities
generally do not overlap in time. For large gliding oceanic birds, such as albatross, a
complete replacement of flight feathers and a successful breeding season sometimes do not
fit within the annual cycle. To negotiate the mutually exclusive time and energy constraints of
molt and breeding, Laysan and black-footed albatrosses have developed a unique molting
strategy in which birds can complete a full flight feather molt in discrete units across two post-
breeding seasons using a combination of different large-scale molt sequences. These
species are neither strictly annual nor strictly biennial breeders, and breeding frequency is
influenced heavily by large-scale molt patterns. Here, we used a long-term tracking study to
investigate how intrinsic characteristics of birds (molt extent, sex and age) impact the activity
and habitat use of Laysan and black-footed albatrosses during the post-breeding season. We
also measured the degree of site fidelity across the breeding season with a focus on the
molting months. We found that molt extent (as classified as ‘large’, ‘medium’, or ‘small’)
impacted activity level, but not habitat, with birds with largest molt extents having the most
significant reduction in space use that began earlier in the post-breeding season than other
birds. Molt extent did not impact habitat use, likely because albatrosses showed a large
degree of site fidelity to their molting grounds between years. Age influenced home range
size, with sizes decreasing with age, most likely reflecting that birds accumulate memory and
experience over time, thereby reducing searching effort when pursuing suitable feeding
grounds. While the productive passes of the Aleutian Island archipelago and the California
125
Current upwelling region were important habitats for molting albatrosses, many albatrosses
spent the molting months in pelagic areas of the Transition Zone Chlorophyll Front,
suggesting offshore oceanic zones can also have productivity levels high enough to support
birds that switch to a high residency behavioral pattern due to feather molt. Sex had a
stronger influence on post-breeding habitat of birds for both species, and these differences
were more apparent in the pre-breeding stages of the late post-breeding migrations. While
environmental factors certainly influence behavior of albatross spatial and activity levels at
multiple scales, we show that the intrinsic factors of molt extent, sex and age play a large role
in dictating the spatial patterns of post-breeding albatross and need to be considered in
studies of this critical phase of the annual cycle.
3.1 BACKGROUND
Balancing the allocation of energy between reproduction and self-maintenance is a
fundamental trade-off faced by all living organisms (Lack 1968, Stearns 1992). To gain
reproductive fitness organisms must successfully bear viable offspring, but at what cost to
one’s survival and future breeding efforts? Species-, population-, and sex- and age- specific
life history strategies negotiate this conflict, shaped by phylogenetic history, morphology and
physiology, as well as the availability and predictability of food at both regional and local
scales (Suryan et al. 2009, Froy et al. 2013, Schultner et al. 2013, Weimerskirch et al. 2015).
The broadest classification of reproductive life history strategies separates species or
populations into ‘fast-living’ and ‘slow-living’ – the so-called r/K gradient (Pianka 1970,
Gaillard et al. 1989) – where those species that are ‘fast-living’ (r-selected) sacrifice longevity
for early maturation and high annual fecundity, amassing large bursts of reproductive output
early in life before a quick senescence. ‘Slow-living’ species (K-selected), on the other hand,
invest heavily in self-maintenance, have low annual fecundity, and gradually accrue
reproductive investment over longer lifespans.
126
Seabirds that rely exclusively on the marine environment for food tend to be on the
slow end of the fast-slow life history gradient in birds (Weimerskirch 2002); a characteristic
tied to larger size and a reliance upon the marine environment, which, in general, has
patchier and less predictable resources than the terrestrial environment (Ashmole 1971,
Weimerskirch 2002). Within seabirds, the Diomedeidae family of albatrosses represents an
extreme case of the ‘slow-living’ demographic tactic: they have a delayed age at first
breeding (5-12 years old), low annual fecundity rates (< 1 offspring per nest), and high
survival paired with late breeding ages (Tickell 2000, Weimerskirch 2002). Low annual
reproductive rates are a consequence of single egg clutches and of notably slow growth rates
of chicks characteristic to all Diomedeidae (3.8 months in grey-headed albatrosses to 9.3
months in wandering albatrosses, Tickell 2000). Prolonged chick-rearing periods, resulting
from slow growth rates, partially contribute to the biennial breeding patterns of some
albatross species. Slow growth rates, in particular, are thought to be a consequence of
foraging in resource-limited pelagic environments with long transport times for parents to
return from foraging hotspots to nests (Ashmole 1971, Ainley 1977, Jouventin and Dobson
2002). To offset this challenge, many albatrosses species utilize efficient, low energy flight, to
seek productive regions far from their nest rather than relying on food conditions near the
colony (Ainley 1977, Weimerskirch et al. 1997)
Given the importance of efficient flight for survival and reproduction, it is not
surprising that albatrosses allocate a significant amount of energy to the annual maintenance
(through replacement) of flight feathers. Even a moderate amount of wear in flight feathers
can reduce flight efficiency (Hedenström and Sunada 1999) with measureable impacts on
current and future reproduction (Weimerskirch 1991, Langston and Rohwer 1996). However,
this obligatory act of self-maintenance requires a considerable investment of energy and time
(Murphy 1996), especially for albatrosses that, as a group, have the largest wingspans of all
seabirds. Considering the time and energy demands of both molting and breeding, these
activities generally do not overlap in time and are considered “incompatible” for most bird
127
species (Payne et al. 1972, Walsberg 1983, Edwards 2008, Alonso et al. 2009). As a
response to the temporal and energetic constraint of breeding, albatrosses have developed a
unique molting strategy in which birds can complete a full flight feather molt in discrete units
across two or more post-breeding seasons using a combination of different large-scale molt
sequences. Large-scale molt patterns vary among species, and are shaped by size, by
differences in the availability and abundance of resources in different habitats, and by the
duration of post-breeding intervals (Weimerskirch 1991, Edwards 2008, Alonso et al. 2009).
Many albatross species breed biennially, while others breed each consecutive year.
The smaller albatross species are typically annual breeders, with higher breeding frequencies
facilitated, in part, by shorter chick-rearing and molt durations (Weimerskirch 2002, but see
Weimerskirch et al. 2015). Laysan and black-footed albatrosses (Phoebastria immutabilis and
P. nigripes, respectively) that breed throughout the northwestern Hawaiian Islands and are on
the smaller end of the albatross size spectrum but fall somewhere between annual and
biennial breeders, with, on average, approximately 35% of the population skipping breeding
in any given year, although this varies among years and colonies (Arata et al. 2009).
Importantly, breeding frequency in both species is heavily influenced by flight feather molt
pattern (Viggiano 2001, Edwards 2008).
Laysan and black-footed albatrosses can complete a flight feather molt in two
consecutive post-breeding seasons using one of two different molt sequence patterns: 1) a
large molt series followed by a small molt series, or 2) two consecutive medium molts
(Edwards and Rohwer 2005) (see Figure 3.1a). Birds that complete a flight feather molt with
the medium-medium sequence can functionally breed annually, since the combined duration
of a medium molt and a full breeding cycle fit within a single annual cycle and do not overlap
(Edwards 2008). However, birds utilizing the large-small molt sequence are limited to biennial
breeding because the large molt is long in duration and overlaps in time with the chick-rearing
season (Edwards 2008). Having multiple molting pattern options allows North Pacific
128
albatrosses flexibility in molt-reproductive strategies, so that they can adjust their strategy if
they fail a breeding season and initiate a larger molt. However, the variability of breeding
frequency and molt patterns within an individual’s lifetime is not well known, and it is possible
some individuals consistently breed biennially with the large-small molt pattern, while others
are consistently annual breeders (see Weimerskirch et al. 2015).
While albatrosses do not undergo catastrophic molts that would render them
completely flightless, albatrosses actively replacing flight feathers do experience reduced
flight capabilities, evident in large mortality events of molting birds during storms (Kinsky
1968). Not surprisingly, Laysan and black-footed albatrosses show an overall population-level
reduction in flight activity for approximately 40 days during the post-breeding season when
birds are known to molt (Gutowsky et al. 2014). However, birds undergoing different molt
extents experience different physical and energetic constraints that must have variable
impacts on optimal foraging strategies – which would be seen in different activity levels and
habitat use among birds classified by molt extent. Individuals replacing the most flight
feathers would theoretically have the greatest wing loading, and might seek out areas with
stronger wind conditions and/or regions with predictable oceanographic features that
concentrate prey at the surface, enabling efficient use of the “sit-and-wait” drifting foraging
strategy (Weimerskirch et al. 2007, Louzao et al. 2014, Conners et al. 2015).
Across the breeding season, Laysan and black-footed albatrosses have large
foraging ranges and spend extensive time foraging in flight (Fernández and Anderson 2000,
Hyrenbach et al. 2002, Kappes et al. 2015), but the reduced flight efficiency during the flight
feather molt (post-breeding season) likely forces albatrosses to switch tactics to a less
mobile, higher residency strategy. Indeed, the idea of albatross “molting grounds” in the
productive passes of the Aleutian Island was first suggested by Suryan and Fischer (2010)
after encountering an unusually high occurrence of albatross with extremely worn feathers in
these passes. Here, they speculated that the Aleutian Island ecosystem, and specifically
certain passes that have extremely high levels of summertime productivity, were potentially of
129
critical importance for albatrosses undergoing the most extensive flight feather molts.
Vigorous tidal mixing in the archipelago combined with steep and variable bathymetry results
in seasonally enriched surface waters, as well as surface convergences that concentrate
food, consequently attracting a high biomass of seabirds and marine mammals (Hunt and
Stabeno 2005). Beyond a high abundance of predators in general, these passes might be
supporting a large proportion of albatrosses that have enhanced vulnerabilities to changing
wind conditions and local food availability due to an extensive molt of flight feathers.
Post-breeding distributions of North Pacific albatrosses have been thoroughly
mapped from ship-based observations and tracking studies (Shuntov 1974, Hyrenbach and
Dotson 2001, 2003, Hyrenbach et al. 2006, Fischer et al. 2009, Suryan and Fischer 2010,
Kuletz et al. 2014). However, colony-based tracking studies of these species are uncommon
and valuable in their potential to link post-breeding distributions with breeding colony and
individual characteristics such as breeding history and molt status, as well as sex and age.
The same ship-based tracking study that identified a high frequency of Laysan and black-
footed albatrosses undergoing extensive primary molts in the Aleutians also encountered a
male bias in birds captured off the ship (Fischer et al. 2009), although it was not possible in
that study to determine if the sex-bias was due to different distributions of the sexes or to a
male-bias in vessel attraction. At-sea segregation of males and females is not uncommon
among seabird species, even in sexually monomorphic species. If there are dense
aggregations of post-breeding albatrosses with restricted ranges during active flight feather
molt, intraspecific competitive forces might shape distributions based on sex or age structure.
For long-lived species such as albatrosses, age can influence both competitive ability and
space use. Older birds, with accumulated memories of foraging experience likely spend less
time searching for profitable areas. However, as individuals age, interactions between their
energy supplies and competitive ability might result in habitat segregation between older and
younger individuals, as seen in wandering albatrosses (Lecomte et al. 2010).
130
Here, we investigate space use, measured by activity and habitat, of Laysan and
black-footed albatrosses from Tern Island across the post-breeding migration, when activities
related to self-maintenance are paramount and manifest in two discrete stages: flight feather
replacement through molt and the regaining of body condition to prepare for the breeding
season. We hypothesize that: 1) birds will be least active during core molting months and
activity will be most reduced in birds undergoing the largest molt extent; 2) the habitat used
by post-breeding albatrosses will be least pelagic during molting months, and this will be
most notable for birds undergoing the largest molt extent; 3) the degree of site fidelity will be
greatest during the molting months; and 4) there will be sex and age effects in habitat-use of
post-breeding migrations due to niche partitioning.
3.2 METHODS
3.2.1 Tracking methods
To understand the post-breeding migration behavior of Laysan and black-footed albatrosses,
we deployed 166 geolocation data-loggers of three models (LTD2400, LAT2500 (Lotek
Wireless) & MK19 (British Antarctic Survey)) on individual albatrosses over eight seasons
(2004-2006, 2008- 2012) at Tern Island in the northwestern Hawaiian Islands (23.870°N,
166.284°W) (Table 1). Geo-locators were attached to plastic auxiliary leg bands with cable
ties and epoxy and weighed between 2.5 - 5 g – less than 1 % of the birds mass – well under
than the weight threshold recommended for gliding seabirds such as albatross (Phillips et al.
2003). Most individuals were followed for a single post-breeding trip, however, nine
individuals were tracked for two or more continuous years, capturing multiple post-breeding
trips.
Birds were weighed and measured at the time of tag deployment. Sexes were
identified through molecular DNA analysis, visual identification, or a discriminant function
131
analysis using morphometrics (see Shaffer et al. 2001, Conners et al. 2015). Ages of tracked
birds (known age and minimum age) were obtained from a long-term banding program
conducted by the U.S. Fish & Wildlife Service since the 1970s. For some statistical analyses
(Per-MANOVAs, canonical analyses of principal components) we grouped birds by age-class
(‘Younger’, ‘Older’). Given that black-footed albatrosses have younger mean ages at first
breeding than Laysan albatrosses (Fisher 1975, Viggiano 2001), we used a younger age-
class threshold for this species than for Laysan albatrosses: ‘Older’ black-footed albatrosses
were birds > 20 years of age, while ‘Older’ Laysan albatrosses were birds > 25 years of age.
We recovered 95% of deployed data-loggers but due to tag failure (1.8 % of
LTD2400 tags, 13.2 % of LAT2500 tags, and 9.3 % of MK19 tags), the final sample size of
post-breeding trips for analysis was 143 (86% of tags deployed). Tag recovery was high,
even among birds that skipped breeding efforts, because breeding-age albatrosses typically
visit their breeding colonies early in the nesting season whether they breed or not. Sample
sizes varied between tests depending on group size and are indicated by degrees of freedom
or in some cases are embedded in tables and figures.
3.2.2 Breeding Sequences as a Proxy of Molt
We recorded breeding parameters of birds both the year of deployment (‘egg laid’, ‘egg
hatched’, ‘chick fledged’) and the year of recovery (‘egg laid’). If a bird laid an egg, we
classified it as a bird that initiated a nest that season. Because each year we departed the
colony in early April prior to the fledging of chicks (June-July), we determined fledged vs.
failed nests by departure date estimated from sea-surface temperature (SST) time-series
(Figure 3.2). Because albatrosses breeding at Tern Island migrate to substantially colder
waters than those surrounding the breeding colony, arrival and departure dates were easily
identified in SST values recorded by tags. Birds that departed the colony earlier than May 15
were considered to have had failed nests.
132
We used the relationship between large-scale molt patterns and breeding described
in Edwards (2008, Figure 3.1b) to classify birds into different molt series (small, medium, or
large) based on their breeding histories before and after the migration: ‘Large’- Birds that
either failed or did not initiate nests the year of deployment were classified as those more
likely to initiate the large molt series, given their early departure dates (large molts initiate as
early as May 1, but not earlier); ‘Small’ - Birds that completed a breeding season on
deployment but did not initiate a nest the following year were classified as birds that were
more likely to initiate a small molt series; Finally, birds that completed a breeding season the
year of deployment and initiated a nest the following season were classified as birds that
were more likely to initiate a medium molt series.
Breeding information on either end of the migration was necessary to inform the
classification of molt extent for each bird, but for 16.0 % of trips we did not have information
on whether birds initiated a breeding effort the year following the migration. In order to include
these birds in analyses, we explored the viability of using a discriminant function analysis
(DFA) to predict whether a bird initiated a nest the following year as a function of migration
metrics (departure date, arrival date, trip duration, home range size, core area size).
Discriminant functions were created separately for each sex within each species and were
preceded with a stepwise forward variable selection using the ‘greedy.wilks’ function in R to
reduce model complexity. Predicted values from the DFA were only used in further analyses
if posterior probabilities for the predicted class were greater than or equal to 0.70.
3.2.3 Statistical analyses
Spatial analyses were conducted in R 3.1.1 (R Core development Team, 2014) using the
‘SGAT’, ‘BAStag’, ‘adehabitatHR’, ‘raster’, ‘sp’, ‘rgdal’, ‘maps’, ‘maptools’, ‘mapproj’, and
‘move’ packages. Statistical analyses were run in R 3.1.1 using the ‘nlme’, ’mgcv’, ’vegan’,
’pracma’, ’MASS’, ‘klaR’ and ’pscl’ packages. Significance was set to P ≤ 0.05 and marginal
133
significance to P ≤ 0.10. To avoid pseudo-replication, for birds with multiple trips, we
randomly selected a single trip for statistical analyses, except in mixed models where
individual bird was included as a random effect.
3.2.4 Estimating locations from geolocation data
We processed all geolocation data using light processing and trip estimation tools from the
‘SGAT’ and ‘BAStag’ R packages (Sumner et al. 2009). Locations were estimated twice daily
from either light profiles (MK19) or estimated times of sunrise and sunset (LTD2400 and
LAT2500) using a ‘threshold-sensitivity’ approach (Sumner et al. 2009). Equinox fix: During
the two annual equinox periods, day-lengths are nearly uniform across the globe,
consequently latitude cannot be accurately estimated from geolocation methods, and trip
portions during equinox are often discarded in studies. In order to keep our tracks continuous,
but correct for the equinox, we interpolated latitudes from the start and end of each equinox
period, then paired these corrected latitudes with their corresponding longitudes (that are
unaffected during the equinox). These preliminary geolocation coordinates (x0, y0) provided
the initial locations subsequently modeled in a Bayesian framework to give final location
estimations (x1, y1). A Bayesian method allowed us to incorporate geolocation estimation
uncertainty (Winship et al. 2012), behavioral constraints of albatrosses (travel speeds) and
geographical constraints (land mask, geographical range) to give realistic trip estimations
with increased accuracy. Since for each iteration, the model uses day-lengths along with
locations estimated from the previous iteration, there was a tendency for latitudes to stretch
artificially north during the equinox periods after each iteration in the model. To prevent this,
we constrained Bayesian estimated latitudes by including, as an additional prior, each
individual’s maximum latitude calculated from the initial equinox-corrected locations (x0, y0).
Once parameters were initialized, 1000 iterations of MCMC simulations were run and
updated three times using the metropolis algorithm to approximate the posterior probability.
134
The final trip path (i.e. the most likely path) was defined as the mean of the posterior
distribution (Figure 3.3).
3.2.5 General characterization of post-breeding migrations
Each full path estimation was then truncated from the day the bird left the colony for the last
time that breeding season (spring-summer) to when it first arrived the following breeding
season (fall-winter). A buffer of 500km around Tern Island removed portions of the track that
represented the immediate departure from and arrival to the breeding colony. We ran three
separate general linear models to assess the response of three different migration
chronology metrics – departure date, arrival date, and trip duration – to intrinsic (species,
age, sex, subsequent breeding status) and extrinsic factors (year).
3.2.6 Space Use
To measure the dynamics of space-use during post-breeding migrations, we assessed total
home range and core area use of all individual albatrosses across 1) the entire migration and
2) in monthly intervals to see how space-use changed over time. Individual home ranges
were identified using minimum convex polygons, which measure home range by wrapping a
minimum convex hull around all locations of a path. Core areas were delineated from total
area used by using a gridded utilization distribution technique (Maxwell et al. 2011) – this
technique measures the intensity of use within a home range by measuring the relative
frequency of occurrence of an individual in a cell of a defined spatial scale and reduces over
smoothing common in other utilization distribution techniques (Fieberg 2007). Given the
relatively coarse spatial and temporal resolution of geolocation estimations we used a spatial
grid of 100 km2 - large enough to absorb the spatial error inherent in GLS tags but small
enough to identify variability in space use of individuals. Core area was defined as the 50%
utilization area. We used general linear models to test the effects of species, sex, age class,
135
and molt series on home range size and on core area size. Home range (minimum convex
polygons) was log transformed to meet assumptions of normality.
3.2.7 The dynamics of space-use change relative to molt series
To identify how molting constraints affected space use during the post-breeding migration, we
examined the change of core area size across months spanning the post-breeding migration,
grouped by birds of different molt series. Since we were interested in how individuals
increased or decreased the size of their core area, rather than absolute size, monthly
calculations of core area size were mean-centered for each individual, so that our final metric
measured the relative magnitude of change in core area size per month for each individual.
We then used a generalized additive mixed model (GAMM) to identify the pattern of
space use change across the post-breed migration. Individual-centered space use change
was modeled as a Gaussian dependent response. Month was included as an explanatory
variable in the model using a cubic regression spline and nested under breeding status. Year,
species, sex and age were included as fixed factors, but were not significant and thus
removed in final models. We controlled for heterogeneity in residuals across months by
including a variance structure. Individual bird id was included as a random effect. Finally,
GAMM monthly smoothers were nested under molt classification (i.e. large, medium, and
small), so that we could discriminate differences in core use change relative to different molt
series scenarios.
3.2.8 Habitat use as a function of species, sex, age, molt series and migration stage
Longhurst’s biogeographical marine provinces divide the world’s oceans into 33 different
ecoregions defined by physical and chemical characteristics of the seas, such as wind and
current patterns and salinities, which ultimately drive distinct biota within each region
(Longhurst 2010) (Figure 3.4). These marine province boundaries are useful for identifying
136
macroscale differences in habitat use among populations or groups of animals. For each bird,
we calculated the percentage of its migration in each marine province for 1) the full migration,
2) for migration in molting months (May, June, July, August) and 3) for the migration in pre-
breeding months (September, October). To examine broad-scale differences in habitat
among groups, we modeled habitat composition (the percentage of trip spent in each
province) as a multivariate response to intrinsic (sex, age-class, molt extent) and extrinsic
(year) factors. Since data were compositional in structure (i.e. the sum of all the multivariate
response variables sum to one) we first transformed the response according to Aitchison
(1986). We then constructed a dissimilarity matrix on the multivariate response using Bray-
Curtis distance before running a permutational MANOVA to test habitat composition against
intrinsic and extrinsic factors. Per-MANOVAs were run separately for 1) the full trip, 2) the trip
during the core molting months, and 3) the trip during the pre-breeding months. Per-
MANOVAs were followed with post-hoc canonical analyses of principle components (CAP) to
identify which marine provinces had more influence on group differences.
3.2.9 The dynamics of site fidelity across the migration
To quantify the degree of site fidelity of individuals to their post-breeding migration grounds,
we calculated a fidelity index for birds that were tracked for two post-breeding migrations
(n=9). To see if and how site fidelity changed across the migration, fidelity indices were
calculated for the portions of trips of each repeat bird within each month of the post-breed
migration. Fidelity indices were calculated by first identifying cells of a given spatial scale that
were shared by locations from both trips. We then calculated the proportion of each trip that
fell inside shared cells. The final fidelity index per bird was the mean of those two proportions.
After multiple iterations fidelity analysis run at different spatial scales (grid sizes = 50, 100,
200, 300, 400, 500 km2), we identified the spatial scale where fidelity indices were asymptotic
– 300 km2 – which was then used as the grid size for final fidelity analyses of individuals with
137
paired trips. To see if birds showed greater site fidelity than expected by chance, we also
calculated fidelity indices for random pairs of birds (n = 38), from the same species and sex
and from two consecutive years. Using separate analyses for every month, we modeled
fidelity indices as a response to the categorical factor of whether or not pairs were random
birds or the same individual. Due to a large amount of zeros in the fidelity index response
variable, we used both Poisson and zero-inflated negative binomial regressions to model the
response, then used a Vuong test (Vuong 1989) to identify the model with the better fit.
3.3 RESULTS
3.3.1 Study Population Breeding Patterns
Within our study group, a larger percentage of Laysan albatrosses skipped breeding the
following year than black-footed albatrosses (25/60 (41.7 %) and 10/50 (20.0 %),
respectively. (2 = 4.21, P = 0.04). Subsequent non-breeders were as equally likely to be
male or female for both species (2 0, P = 1, for both species). Laysan albatrosses
experienced higher rates of nest failure than black-footed albatrosses (18/73 (24.7 %) and
3/61 (4.9 %) respectively, 2 = 8.67, p = 0.003).
3.3.2 Predicting nest initiation using discriminant function analysis
Predictive power of nest initiation the following season based on migration metrics varied
between species and sexes (Table 3.2). Overall, the DFA for black-footed albatross nest
initiation had higher predictive power than for Laysan albatrosses, and within each species,
prediction power was greater in females than males. The variables contributing most to
prediction power also varied between species and sex, with the main difference being that
Laysan albatross discriminant functions were less complex (i.e. were described by fewer
variables) than those for black-footed albatrosses, and that the date of the end of the
migration (‘End DOY’) was important in predicting nest initiation in males, but not for females.
138
We only used predicted values for subsequent breeding initiation if the posterior probabilities
of DFA predictions were greater than 0.70, which gave us an additional 4 out of 11 Laysan
and 9 out of 12 black-footed albatross trips.
3.3.3 Effect of nest failure on migration chronology
Birds with failed nests left, on average, in early March and arrived to the colony the following
year significantly earlier than birds that successfully fledged chicks the year of tag
deployment (Laysan: 4.1 days earlier (t = 2.18, P = 0.03); black-footed: 10.5 days earlier (t =
8.20, P < 0.001)). Despite earlier arrivals, migrations of birds with failed nests were
significantly longer than migrations of birds that finished a full breeding season (Laysan: 114
days longer (t = -16.15, P < 0.001); black-footed: 108 days longer (t = -50.18, P < 0.001)). All
birds that did not initiate a nest the year of deployment did so the following breeding season.
For birds that initiated but failed, 100 % of black-footed albatrosses and 83 % of Laysan
albatrosses returned the second year to initiate a nest.
3.3.4 The influence of species, sex, and breeding on migration chronology
Species, sex, age and subsequent breeding status, but not year, all impacted departure and
arrival dates and the duration of post-breed migration. Start of Migration: Species and
subsequent breeding status had significant effects on departure dates of albatrosses (Table
3.3 & Table 3.4, Figure 3.1a. Laysan albatrosses left the colony on average 15.8 ± 2.7 days
later than black-footed albatrosses (t5,103 = 5.86, P < 0.001), and within both species, birds
that did not initiate nests the following breeding season left later than those that did (t5,103 = -
2.61, P = 0.010). There were no significant sex differences in departure dates within each
species although males tended to leave earlier than females (t = -0.188, P = 4.71, Figure
3.1a). End of Migration: Overall, black-footed albatrosses arrived at the colony earlier than
Laysan albatrosses (t5,79 = -3.92, P < 0.001, Figure 3.1a, Table 3.3 & Table 3.4, Figure 3.1a).
There was a significant interaction of sex and subsequent breeding status where males of
139
both species arrived to the colony earlier if they initiated nests the subsequent breeding
season than males that subsequently did not initiate a nest (t5,79 = -2.14, P = 0.036, Table 3.3
& Table 3.4, Figure 3.1a).This was most pronounced within black-footed albatrosses, with
breeding males arriving 14.96 ± 4.95 days earlier than non-breeding males (t5,79 = -3.020, P =
0.004). There was no difference in arrival dates between females that subsequently bred or
skipped breeding. Duration: Species and subsequent breeding status had the biggest effects
on lengths of post-breeding migrations (Table 3.3 & Table 3.4, Figure 3.1a). Black-footed
albatross migrations lasted, on average, 8.2 ± 3.6 days longer than Laysan albatrosses (t5,79 =
-2.27, P = 0.026) and migrations of subsequent breeders lasted 12.3 ± 5.8 days longer than
migrations of subsequent non-breeders (t5,79 = 2.13, P = 0.037).
3.3.5 The impact of sex, age and molt extent on total home range and core area size
The effects of species, sex, age and molt extent better explained variance in overall home
range size (F4,73 = 9.35, R2adj = 0.30) than variance in core area size (F4,73 = 3.29, R2
adj =
0.11) of albatross post-breed migrations. Overall, Laysan albatrosses had smaller total home
range sizes than black-footed albatrosses (t4,73 = -2.47, P = 0.016, Table 3.5) but larger areas
of core use (t4,73 = 1.75, P = 0.084). Molt extent had significant effects on both overall home
range (t4,73 = -2.23 , P = 0.029) and core area sizes (t4,73 = -2.162 , P = 0.034), with sizes
increasing with molt extent. Age was marginally significant in explaining variance in total
home range size (t4,73 = -1.69, P = 0.095, Figure 3.5) with older birds having a reduced home
range size compared to younger birds, and although there was no significant effect of age on
core area size (t4,73 = -0.38, P = 0.711), there appeared to be a trend towards smaller core
area size in older birds for Laysan albatrosses, but only in birds that bred the year following
the migration (Figure 3.5).
3.3.6 Change of core area size across the migration in relation to molt extent
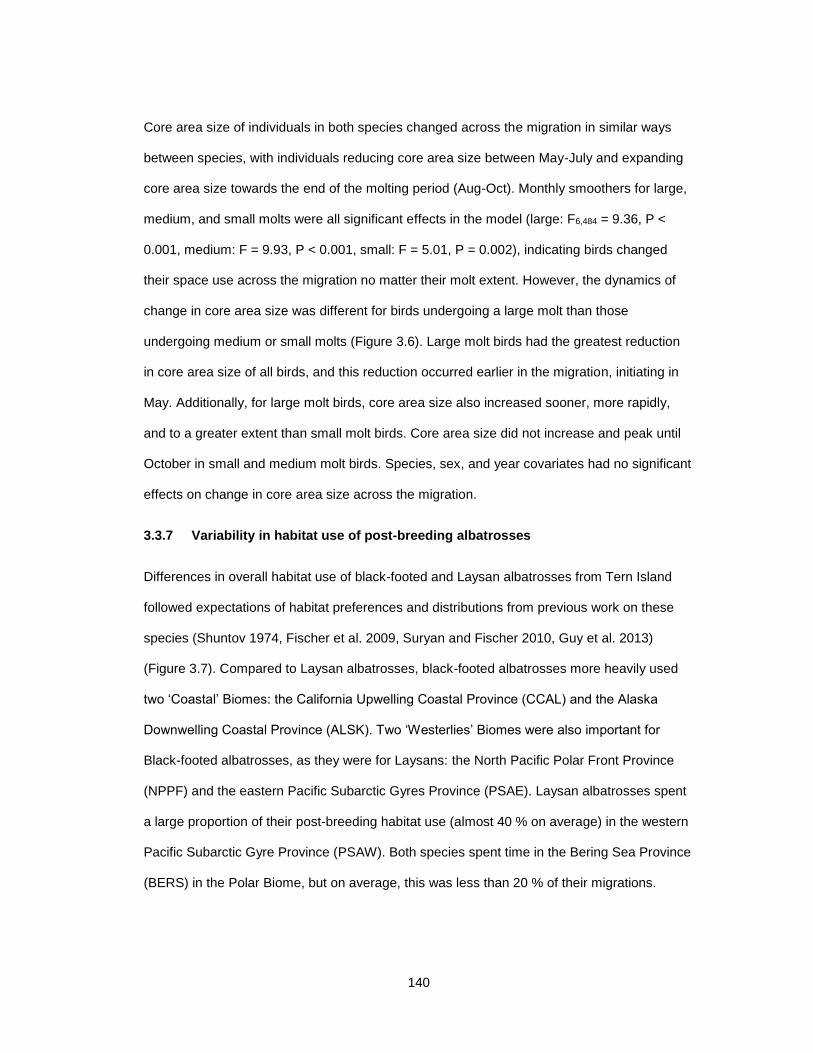
140
Core area size of individuals in both species changed across the migration in similar ways
between species, with individuals reducing core area size between May-July and expanding
core area size towards the end of the molting period (Aug-Oct). Monthly smoothers for large,
medium, and small molts were all significant effects in the model (large: F6,484 = 9.36, P <
0.001, medium: F = 9.93, P < 0.001, small: F = 5.01, P = 0.002), indicating birds changed
their space use across the migration no matter their molt extent. However, the dynamics of
change in core area size was different for birds undergoing a large molt than those
undergoing medium or small molts (Figure 3.6). Large molt birds had the greatest reduction
in core area size of all birds, and this reduction occurred earlier in the migration, initiating in
May. Additionally, for large molt birds, core area size also increased sooner, more rapidly,
and to a greater extent than small molt birds. Core area size did not increase and peak until
October in small and medium molt birds. Species, sex, and year covariates had no significant
effects on change in core area size across the migration.
3.3.7 Variability in habitat use of post-breeding albatrosses
Differences in overall habitat use of black-footed and Laysan albatrosses from Tern Island
followed expectations of habitat preferences and distributions from previous work on these
species (Shuntov 1974, Fischer et al. 2009, Suryan and Fischer 2010, Guy et al. 2013)
(Figure 3.7). Compared to Laysan albatrosses, black-footed albatrosses more heavily used
two ‘Coastal’ Biomes: the California Upwelling Coastal Province (CCAL) and the Alaska
Downwelling Coastal Province (ALSK). Two ‘Westerlies’ Biomes were also important for
Black-footed albatrosses, as they were for Laysans: the North Pacific Polar Front Province
(NPPF) and the eastern Pacific Subarctic Gyres Province (PSAE). Laysan albatrosses spent
a large proportion of their post-breeding habitat use (almost 40 % on average) in the western
Pacific Subarctic Gyre Province (PSAW). Both species spent time in the Bering Sea Province
(BERS) in the Polar Biome, but on average, this was less than 20 % of their migrations.
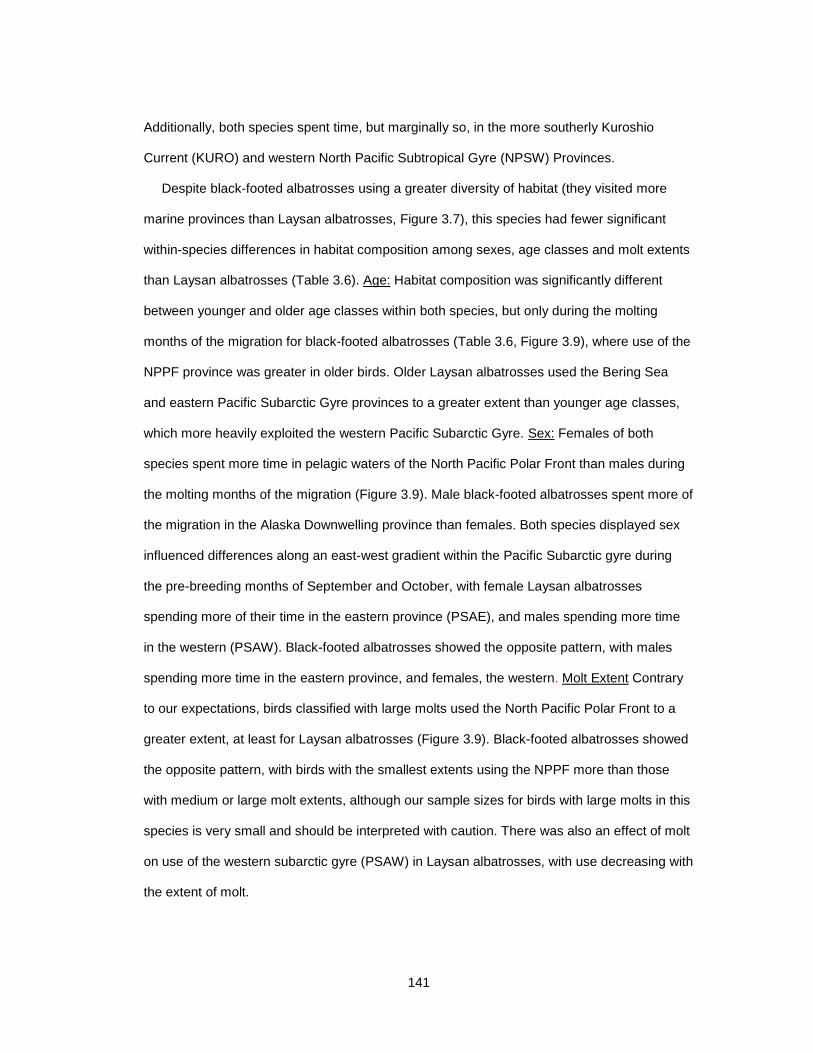
141
Additionally, both species spent time, but marginally so, in the more southerly Kuroshio
Current (KURO) and western North Pacific Subtropical Gyre (NPSW) Provinces.
Despite black-footed albatrosses using a greater diversity of habitat (they visited more
marine provinces than Laysan albatrosses, Figure 3.7), this species had fewer significant
within-species differences in habitat composition among sexes, age classes and molt extents
than Laysan albatrosses (Table 3.6). Age: Habitat composition was significantly different
between younger and older age classes within both species, but only during the molting
months of the migration for black-footed albatrosses (Table 3.6, Figure 3.9), where use of the
NPPF province was greater in older birds. Older Laysan albatrosses used the Bering Sea
and eastern Pacific Subarctic Gyre provinces to a greater extent than younger age classes,
which more heavily exploited the western Pacific Subarctic Gyre. Sex: Females of both
species spent more time in pelagic waters of the North Pacific Polar Front than males during
the molting months of the migration (Figure 3.9). Male black-footed albatrosses spent more of
the migration in the Alaska Downwelling province than females. Both species displayed sex
influenced differences along an east-west gradient within the Pacific Subarctic gyre during
the pre-breeding months of September and October, with female Laysan albatrosses
spending more of their time in the eastern province (PSAE), and males spending more time
in the western (PSAW). Black-footed albatrosses showed the opposite pattern, with males
spending more time in the eastern province, and females, the western. Molt Extent Contrary
to our expectations, birds classified with large molts used the North Pacific Polar Front to a
greater extent, at least for Laysan albatrosses (Figure 3.9). Black-footed albatrosses showed
the opposite pattern, with birds with the smallest extents using the NPPF more than those
with medium or large molt extents, although our sample sizes for birds with large molts in this
species is very small and should be interpreted with caution. There was also an effect of molt
on use of the western subarctic gyre (PSAW) in Laysan albatrosses, with use decreasing with
the extent of molt.
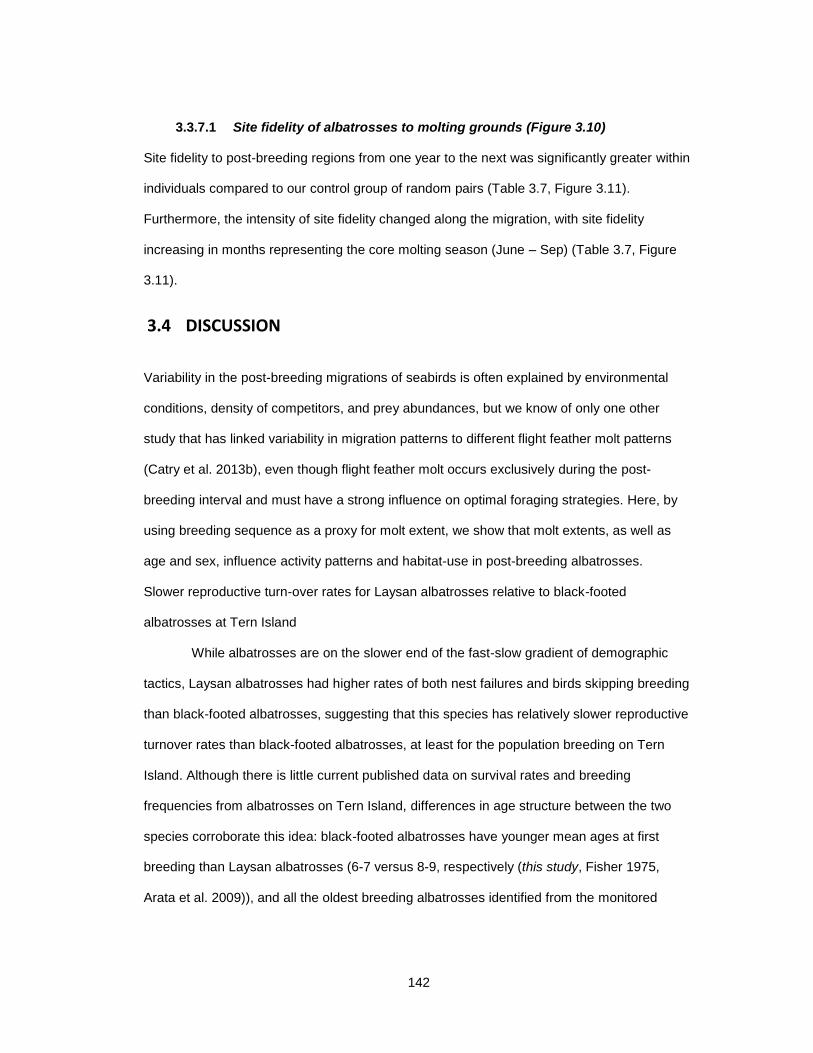
142
3.3.7.1 Site fidelity of albatrosses to molting grounds (Figure 3.10)
Site fidelity to post-breeding regions from one year to the next was significantly greater within
individuals compared to our control group of random pairs (Table 3.7, Figure 3.11).
Furthermore, the intensity of site fidelity changed along the migration, with site fidelity
increasing in months representing the core molting season (June – Sep) (Table 3.7, Figure
3.11).
3.4 DISCUSSION
Variability in the post-breeding migrations of seabirds is often explained by environmental
conditions, density of competitors, and prey abundances, but we know of only one other
study that has linked variability in migration patterns to different flight feather molt patterns
(Catry et al. 2013b), even though flight feather molt occurs exclusively during the post-
breeding interval and must have a strong influence on optimal foraging strategies. Here, by
using breeding sequence as a proxy for molt extent, we show that molt extents, as well as
age and sex, influence activity patterns and habitat-use in post-breeding albatrosses.
Slower reproductive turn-over rates for Laysan albatrosses relative to black-footed
albatrosses at Tern Island
While albatrosses are on the slower end of the fast-slow gradient of demographic
tactics, Laysan albatrosses had higher rates of both nest failures and birds skipping breeding
than black-footed albatrosses, suggesting that this species has relatively slower reproductive
turnover rates than black-footed albatrosses, at least for the population breeding on Tern
Island. Although there is little current published data on survival rates and breeding
frequencies from albatrosses on Tern Island, differences in age structure between the two
species corroborate this idea: black-footed albatrosses have younger mean ages at first
breeding than Laysan albatrosses (6-7 versus 8-9, respectively (this study, Fisher 1975,
Arata et al. 2009)), and all the oldest breeding albatrosses identified from the monitored
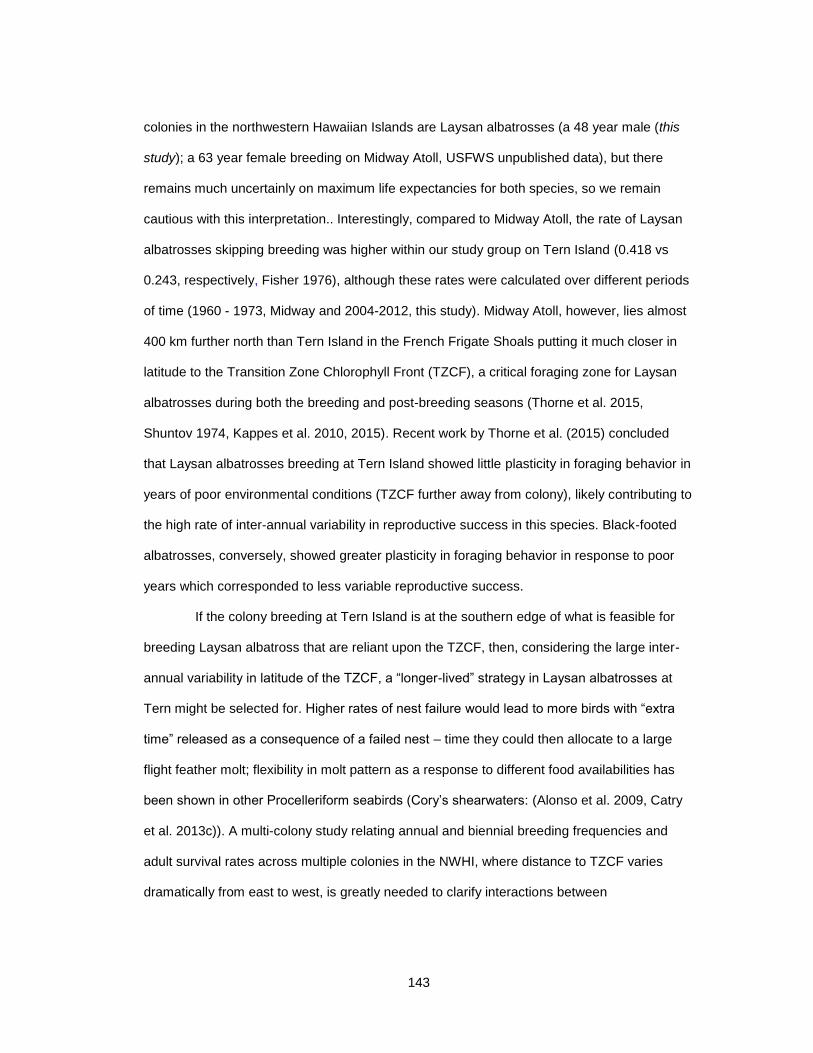
143
colonies in the northwestern Hawaiian Islands are Laysan albatrosses (a 48 year male (this
study); a 63 year female breeding on Midway Atoll, USFWS unpublished data), but there
remains much uncertainly on maximum life expectancies for both species, so we remain
cautious with this interpretation.. Interestingly, compared to Midway Atoll, the rate of Laysan
albatrosses skipping breeding was higher within our study group on Tern Island (0.418 vs
0.243, respectively, Fisher 1976), although these rates were calculated over different periods
of time (1960 - 1973, Midway and 2004-2012, this study). Midway Atoll, however, lies almost
400 km further north than Tern Island in the French Frigate Shoals putting it much closer in
latitude to the Transition Zone Chlorophyll Front (TZCF), a critical foraging zone for Laysan
albatrosses during both the breeding and post-breeding seasons (Thorne et al. 2015,
Shuntov 1974, Kappes et al. 2010, 2015). Recent work by Thorne et al. (2015) concluded
that Laysan albatrosses breeding at Tern Island showed little plasticity in foraging behavior in
years of poor environmental conditions (TZCF further away from colony), likely contributing to
the high rate of inter-annual variability in reproductive success in this species. Black-footed
albatrosses, conversely, showed greater plasticity in foraging behavior in response to poor
years which corresponded to less variable reproductive success.
If the colony breeding at Tern Island is at the southern edge of what is feasible for
breeding Laysan albatross that are reliant upon the TZCF, then, considering the large inter-
annual variability in latitude of the TZCF, a “longer-lived” strategy in Laysan albatrosses at
Tern might be selected for. Higher rates of nest failure would lead to more birds with “extra
time” released as a consequence of a failed nest – time they could then allocate to a large
flight feather molt; flexibility in molt pattern as a response to different food availabilities has
been shown in other Procelleriform seabirds (Cory’s shearwaters: (Alonso et al. 2009, Catry
et al. 2013c)). A multi-colony study relating annual and biennial breeding frequencies and
adult survival rates across multiple colonies in the NWHI, where distance to TZCF varies
dramatically from east to west, is greatly needed to clarify interactions between
144
environments, molt patterns, and reproductive life history strategies in Hawaiian-breeding
albatrosses.
3.4.1 Synchrony constrains trip lengths
With the exception of breeding male black-footed albatrosses, both males and females within
each species had highly synchronous arrivals (Figure 3.1), although females had a larger
range in arrival dates than males (Table 3.3 and Table 3.4).The significantly earlier arrival of
black-footed males to the breeding colony indicates that there might be stronger selective
pressure on early territory and nest establishment in this species than there are for male
Laysan albatrosses, possibly due to the higher density of black-footed albatross nests at this
particular colony (Flint 2009). Greater synchronicity in arrival dates than in departure dates in
both species suggests that variability in the duration of post-breed migration in albatrosses is
the consequence of when individuals decide to leave their chick for the last time the
preceding breeding season.
Unlike arrival dates, there is a large range in departure dates of birds from the colony,
but there is no current understanding of what triggers a bird’s decision to leave the colony
and begin the post-breed migration. In theory, this decision could be a cause or a
consequence of hormonally driven molt activation: birds may sense molt activation of flight
feathers thereby inducing their departure; however, it may be the departure of the bird from
the colony and arrival in higher latitudes with a substantially different photoperiod that triggers
molt activation. Given the strict temporal segregation of molting from breeding activities in
Hawaiian albatross and in many other bird species, especially those that breed far from
productive regions (Payne et al. 1972, Edwards 2008, Alonso et al. 2009 but see Catry et al.
2013b), it seems likely that molt activation plays a strong part in this decision.
Despite their smaller size, Laysan albatrosses have longer chick-rearing periods than
black-footed albatrosses -165 days versus 150 days, on average (Arata et al. 2009) - likely a
consequence of a heavier reliance on pelagic waters. Longer chick-rearing periods result in
145
delayed departure dates from the colony relative to black-footed albatrosses, and
correspondingly, later arrivals to the breeding colony the following season. Despite later
arrivals, the durations of Laysan albatross migrations were shorter than those of black-footed
albatrosses. Less time to molt and re-gain body mass during the post-breeding interval may
also contribute to the higher variability in reproductive success in Laysan albatrosses.
Migration duration appears to be a strong driver of overall home range sizes for post-
breeding albatrosses: black-footed albatrosses, with longer migration durations, have larger
home range sizes than Laysan albatrosses, and, within each species, birds with the larger
molt extents (which also have the longest migration durations, have the largest home ranges
(Table 3.5).
3.4.2 Large-scale molt patterns induce a larger, and earlier, reduction in activity
The larger home range sizes in birds with large molt extents was unexpected, given the
assumption of reduced flight efficiency; however, when the change in space-use was
examined across the migration, the effects of molt extent became apparent (Figure 3.6).
Birds that left early due to nest failure or because they did not initiate a nest that season (i.e.
large molt birds) were highly mobile for the first part of their migrations. But, this wide-ranging
behavior persisted only until May, when bird ranges rapidly reduced range and became much
more localized (Figure 3.6 and Figure 3.12). The timing of this reduction coincides
unmistakably with the finding of Edwards (2008) that flight feather molt in Laysan and black-
footed albatrosses never activated prior to May 1. Despite departures as early as February
and March in some non-initiating albatross, birds remained wide ranging until this sharp
reduction of core area use in May which persisted through July, supporting Edward’s
conclusions that the timing and extent of flight feather molt is controlled by both flexible (i.e.
breeding status) and inflexible factors (physiological limitations in molt activation chronology).
Despite having the largest (and earliest) reduction in space-use during molting
months, large molt birds successively increased their ranges sooner and to a greater extent
146
than birds undergoing smaller flight feather molts (Figure 3.6). By molting more flight
feathers, and molting them early, these birds might have an advantage of extra time and
enhanced flight capability in the pre-breeding season of September and October, where birds
build-up large reserves of body fat to sustain them throughout the majority of the breeding
season. Like in many animal species, in albatrosses, body condition influences both the
decision to breed as well as overall reproductive success in albatrosses (Weimerskirch 1992,
Chastel et al. 1995). That birds undergoing large molts have more time in the post-breeding
migration to build up fat reserves for the breeding season contributes directly to the trade-off
between self-maintenance and reproduction: birds that repeatedly use the large-small molt
pattern sequence breed less frequently but may ultimately have a higher rate of successfully
fledged chicks if they begin the breeding season in higher body condition. Additionally,
biennial breeders can have relatively extended chick-rearing periods since small molts are
the last molt pattern to activate (Figure 3.1b). Given more time available for self-conditioning
and chick-rearing, the lower nesting frequency in biennial breeders might be compensated for
by higher rates of successfully fledged, high quality chicks. A longitudinal study on the
relationship between molt patterns, adult survival, breeding frequency, and reproductive
success in these two species would improve our understanding of how variability in optimal
life-history strategies translates to the fitness of their young in these two sympatric
congeners. Individuals have flexibility in the molt patterns they activate; however, it is not
known if some individuals maintain a consistent biennial breeding frequency throughout their
lifetimes, while others consistently breed annually. Very recently, it was discovered that
wandering albatrosses breeding at Kerguelen Island, traditionally considered strictly biennial
breeders, actually have two reproductive strategies within the population: a small subset of
females consistently breed annually while all other individuals breed biennially (Weimerskirch
et al. 2015).
147
3.4.3 Hawaiian albatrosses “fine-tune” their post-breeding migrations over lifespans
Smaller home ranges in older birds suggest albatrosses use memory and experience to fine-
tune foraging ranges, requiring less searching behavior. Simulations of animal movements
incorporating the effects of memory have shown that memory leads to establishment of home
ranges and deterministic foraging behavior (Regular et al. 2013) which leads to increased
foraging efficiency ((Van Moorter et al. 2009, Nabe-Nielsen et al. 2013), especially in
landscapes with patchy resources (Merkle et al. 2014, Bracis et al. 2015). That Laysan and
black-footed albatrosses have high fidelity to molting grounds further highlights experience
and memory as important mechanisms shaping optimal foraging strategies in long-lived
seabirds (Hamer et al. 2001, Hedd et al. 2001, Patrick et al. 2014, Patrick and Weimerskirch
2014).
Banding records of wandering albatrosses suggest that juveniles likely establish
home ranges and repeatable foraging behavior, solidifying these patterns into consistent
individual strategies by the time they are breeding adults (Weimerskirch and Wilson 2000).
This is likely also true for Laysan and black-footed albatrosses, given their similar life
histories; indeed, one individual Laysan albatross visited the same coastal cove in central
California from December to March for 19 consecutive years. This bird’s remarkably
predictable behavior led to a local following that would await the arrival of “Mr. Al B. Tross”
every year for decades (Mendocino Coast Audubon Society).
Repeatable behavior and consistent molting grounds in albatrosses has obvious
conservation implications. For one, a strict adherence to an already established home range
during molting months combined with poorer flight efficiency reduces adaptability to changes
in local environmental conditions. An ongoing mass mortality event of common murres on the
coasts of the western U.S. and Canada is a current reminder of the amplified vulnerability of
molting birds to environmental variability. This mortality event of both adults and recently
fledged juveniles coincided with the molt season of common murres in a year of unusually
148
warm sea-surface temperatures. At the time of writing, the mortality event is still ongoing and
the causes are not yet fully understood, but a main hypothesis is that warm sea-surface
temperatures caused shifts in prey distributions, potentially both horizontally and vertically,
and molting murres, given their reduced mobility and foraging efficiency, were not able to
adapt to shifts in lower trophic levels.
3.4.4 Birds with large molt extents have molting grounds in a variety of habitats
We expected that birds classified with the largest molt extents would limit molting grounds to
the least pelagic, most predictably productive regions in the North Pacific, such as the
Aleutian Islands and the California Current since food availability is considered seasonally
more predictable in these areas (Longhurst 2010). Molting birds, however, used a variety of
ecoregions, including, for Laysan albatrosses, a heavy use of the North Pacific Polar Front –
an entirely pelagic habitat during the core months of molt (Figure 3.12b). Despite being
pelagic, the North Pacific Polar Front is a highly energetic frontal zone, where warm-core and
cold-core eddies born at the western confluence of the Kurishio and Oyashio currents
propagate eastward and concentrate flotsam, including food, at their outer boundaries (warm)
and cores (cold) (Longhurst 2010). Coherent structures formed by convergences and
divergences in areas of high eddy kinetic energy aggregate prey and appear to be areas of
predictable resources for marine predators such as seabirds (i.e., Burger 2003, Tew Kai et al.
2009, Tew Kai and Marsac 2010). A climatology of chlorophyll-a concentrations ([chl-a]) from
the years spanning this study show a consistent increase of [chl-a] during spring in the
western and eastern regions of the NPPF (Figure 3.12a) when it is consistently visiting by
large molt birds during the molting months (May-July) (Figure 3.12b).
3.4.5 Samalga Pass in the Aleutian Islands as a point of habitat delineation
In accordance with other studies (Shuntov 1974, Fischer et al. 2009, Suryan and Fischer
2010, Gutowsky et al. 2014), Laysan and black footed albatrosses maintained distinct habitat
149
segregation in the post-breeding seasons, with black-footed albatrosses more heavily
exploiting the coastal biomes of the Alaska Downwelling and California Upwelling provinces,
and with Laysan albatrosses predominantly using the more pelagic waters of the North
Pacific Polar Front and the western Pacific Subarctic Gyre (Figure 3.7). Both species showed
heavy use of the Aleutian Island archipelago (in the PSAW and PSAE provinces) but a clear
point of delineation between the two species distributions occurred in the vicinity of Samalga
Pass in the eastern Aleutians (170˚ W). Interestingly, the pass is a known point of transition
between two environmental and ecosystem regimes (Hunt and Stabeno 2005, Jahncke et al.
2005): east of the pass, waters are warmer and fresher and the ecosystem has a heavier
influence of the continental shelf, while west of the pass, waters are colder and more saline,
and the ecosystem is comprised of species associated with more oceanic waters.
Accordingly, the more oceanic and pelagic of the two species, Laysan albatrosses, occur
much more frequently west of Samalga Pass, while black-footed albatrosses, known to be
continental shelf specialists, increase in numbers east of the pass (Figure 3.13). Sea-surface
temperature has been identified as a good predictor of Laysan and black-footed albatross
distributions, with Laysan albatrosses occurring in waters a few degrees Celsius colder than
black-footed albatrosses (Kappes et al. 2010). Given the delineation of albatross distributions
at Samalga Pass, which separates a warmer water mass from a colder water mass, it
appears SST likely remains an important predictor of albatross distributions into the post-
breeding migrations as well.
3.4.6 Habitat partitioning between ages and sexes in post-breeding migrations
Much focus on understanding niche partitioning between and within seabird species takes
place during the breeding season when birds are constrained to their nests and are therefore
limited in range due to the constraints of central place foraging. Less attention is given to
understanding niche partitioning during the post-breeding season when individuals disperse
from the colony and are released from central place constraints and are therefore “free” to
150
forage where they please. However, accumulation of evidence showing clear habitat
segregation among breeding colonies within species (Wanless and Harris 1993, Grémillet et
al. 2004, Wakefield et al. 2011, 2013) suggests that this stage of the annual cycle is not
devoid of competition, especially given the localized behavioral patterns once albatrosses
migrate to their molting grounds. Post-breeding migrations are critical for self-maintenance in
the form of flight feather replacement and regaining lipid stores for subsequent breeding
efforts; and, thus the quality of an individual’s post-breeding season can have significant
carryover effects impacting the success of subsequent breeding efforts (Oppel and Powell
2009, Sorensen et al. 2009, Catry et al. 2013a, O’Connor et al. 2014). Dense aggregations of
birds in limited areas during molting months might impose a level of competition just as
strong, or stronger, than during the breeding season. The sex and age driven differences in
habitat use in Laysan and black-footed albatrosses that we identified in post-breeding
migrations could be explained as a response to intra-specific competition, although another
possibility is that habitat differences reflect group-specific requirements, such as differences
in nutrition or wind-regimes.
3.5 REFERENCES
Ainley, D. G. 1977. Feeding methods in seabirds: a comparison of polar and tropical nesting
communities in the eastern Pacific ocean. Pages 669–685 in G. Llano, editor.
Adaptations within Antarctic ecosystems. Proceedings of the Third SCAR Symposium
on Antarctic Biology. Smithsonian Institution, Washington, D.C., USA.
Aitchison, J. 1986. The statistical analysis of compositional data.
Alonso, H., R. Matias, J. P. Granadeiro, and P. Catry. 2009. Moult strategies of Cory’s
Shearwaters Calonectris diomedea borealis: The influence of colony location, sex and
individual breeding status. Journal of Ornithology 150:329–337.
Arata, J. A., P. R. Sievert, and M. B. Naughton. 2009. Status assessment of Laysan and
Blackfooted Albatrosses, North Pacific Ocean, 1923–2005.
Ashmole, N. P. 1971. Seabird ecology and the marine environment. Avian Biology 1:223–
286.
Bracis, C., E. Gurarie, B. Van Moorter, and R. A. Goodwin. 2015. Memory Effects on
Movement Behavior in Animal Foraging. PloS one 10:e0136057.
151
Burger, A. E. 2003. Effects of the Juan de Fuca Eddy and upwelling on densities and
distributions of seabirds off southwest Vancouver Island, British Columbia. Marine
Ornithology 122:113–122.
Catry, P., M. P. Dias, R. A. Phillips, and J. P. Granadeiro. 2013a. Carry-over effects from
breeding modulate the annual cycle of a long-distance migrant: an experimental
demonstration. Ecology 94:1230–1235.
Catry, P., R. T. Lemos, P. Brickle, R. A. Phillips, R. Matias, and J. P. Granadeiro. 2013b.
Predicting the distribution of a threatened albatross: The importance of competition,
fisheries and annual variability. Progress In Oceanography 110:1–10.
Catry, P., M. Poisbleau, M. Lecoq, and R. A. Phillips. 2013c. Differences in the timing and
extent of annual moult of black-browed albatrosses Thalassarche melanophris living in
contrasting environments. Polar biology 36:837–842.
Chastel, O., H. Weimerskirch, and P. Jouventin. 1995. Influence of Body Condition on
Reproductive Decision and Reproductive Success in the Blue Petrel. The Auk 112:964–
972.
Conners, M. G., E. L. Hazen, D. P. Costa, and S. A. Shaffer. 2015. Shadowed by scale:
subtle behavioral niche partitioning in two sympatric, tropical breeding albatross
species. Movement Ecology 3:28.
E Edwards, A. 2008. Large-scale variation in flight feather molt as a mechanism enabling
biennial breeding in albatrosses. Journal of Avian Biology 39:144–151.
Edwards, A. E. 2008. Large-scale variation in flight feather molt as a mechanism enabling
biennial breeding in albatrosses. Journal of Avian Biology 39:144–151.
Edwards, A. E., and S. Rohwer. 2005. Large-scale patterns of molt activation in the flight
feathers of two albatross species. The Condor 107:835–848.
Fernández, P., and D. J. Anderson. 2000. Nocturnal and diurnal foraging activity of Hawaiian
albatrosses detected with a new immersion monitor. The Condor 102:577–584.
Fieberg, J. 2007. Kernel density estimators of home range: smoothing and the
autocorrelation red herring. Ecology 88:1059–66.
Fischer, K. N., R. M. Suryan, D. D. Roby, and G. R. Balogh. 2009. Post-breeding season
distribution of black-footed and Laysan albatrosses satellite-tagged in Alaska: Inter-
specific differences in spatial overlap with North Pacific fisheries. Biological
Conservation 142:751–760.
Fisher, H. I. 1975. The relationship between deferred breeding and mortality in the Laysan
albatross. The Auk:433–441.
Fisher, H. I. 1976. Some dynamics of a breeding colony of Laysan albatrosses. The Wilson
Bulletin:121–142.
Flint, E. 2009. Hawaiian Islands National Wildlife Refuge and Midway Atoll National Wildlife
Refuge – annual nest counts through hatch year 2009. U.S. Fish and Wildlife Service,
unpublished report.
Froy, H., R. A. Phillips, A. G. Wood, D. H. Nussey, and S. Lewis. 2013. Age-related variation
in reproductive traits in the wandering albatross: evidence for terminal improvement
following senescence. Ecology Letters:n/a–n/a.
Gaillard, J.-M., D. Pontier, D. Allainé, J.-D. Lebreton, J. Trouvilliez, and J. Clobert. 1989. An
analysis of demographic tactics in birds and mammals. Oikos 56:59–76.
152
Grémillet, D., G. Dell’Omo, P. G. Ryan, G. Peters, Y. Ropert-Coudert, and S. J. Weeks. 2004.
Offshore diplomacy, or how seabirds mitigate intra-specific competition: a case study
based on GPS tracking of Cape gannets from neighbouring colonies. Marine Ecology-
Progress Series 268:265–279.
Gutowsky, S. E., L. Gutowsky, I. D. Jonsen, M. L. Leonard, M. B. Naughton, M. D. Romano,
and S. a Shaffer. 2014. Daily activity budgets reveal a quasi-flightless stage during non-
breeding in Hawaiian albatrosses. Movement Ecology 2:23.
Guy, T. J., S. L. Jennings, R. M. Suryan, E. F. Melvin, M. a. Bellman, L. T. Ballance, B. a.
Blackie, D. a. Croll, T. Deguchi, T. O. Geernaert, R. W. Henry, M. Hester, K. Hyrenbach,
J. Jahncke, M. a. Kappes, K. Ozaki, J. Roletto, F. Sato, W. J. Sydeman, and J. E.
Zamon. 2013. Overlap of north pacific albatrosses with the U.S. west coast groundfish
and shrimp fisheries. Fisheries Research 147:222–234.
Hamer, K. C., R. A. Phillips, J. K. Hill, S. Wanless, and A. G. Wood. 2001. Contrasting
foraging strategies of gannets Morus bassanus at two North Atlantic colonies: foraging
trip duration and foraging area fidelity. Marine ecology. Progress series 224:283–290.
Hedd, A., R. Gales, and N. Brothers. 2001. Foraging strategies of shy albatross Thalassarche
cauta breeding at Albatross Island, Tasmania, Australia. Marine Ecology-Progress
Series 224:267–282.
Hedenström, A., and S. Sunada. 1999. On the aerodynamics of moult gaps in birds. The
Journal of experimental biology 202:67–76.
Hunt, G. L., and P. J. STABENO. 2005. Oceanography and ecology of the Aleutian
Archipelago: spatial and temporal variation. Fisheries Oceanography 14:292–306.
Hyrenbach, K. D., and R. C. Dotson. 2001. Post-breeding movements of a male Black-footed
Albatross Phoebastria nigripes. Marine Ornithology 29:7–10.
Hyrenbach, K., and R. C. Dotson. 2003. Assessing the susceptibility of female black-footed
albatross (Phoebastria nigripes) to longline fisheries during their post-breeding
dispersal: an integrated approach. Biological Conservation 112:391–404.
Hyrenbach, K., P. Fernández, and D. Anderson. 2002. Oceanographic habitats of two
sympatric North Pacific albatrosses during the breeding season. Marine Ecology
Progress Series 233:283–301.
Hyrenbach, K., C. KEIPER, S. G. ALLEN, D. G. Ainley, and D. J. Anderson. 2006. Use of
marine sanctuaries by far-ranging predators: commuting flights to the California Current
System by breeding Hawaiian albatrosses. Fisheries Oceanography 15:95–103.
Jahncke, J., K. O. Coyle, and G. L. Hunt. 2005. Seabird distribution, abundance and diets in
the eastern and central Aleutian Islands. Fisheries Oceanography 14:160–177.
Jouventin, P., and F. S. Dobson. 2002. Why breed every other year? The case of
albatrosses. Proceedings. Biological sciences / The Royal Society 269:1955–1961.
Kappes, M. A., S. A. Shaffer, Y. Tremblay, D. G. Foley, D. M. Palacios, S. J. Bograd, and D.
P. Costa. 2015. Reproductive constraints influence habitat accessibility, segregation,
and preference of sympatric albatross species. Movement Ecology 3:34.
Kappes, M. A., S. A. Shaffer, Y. Tremblay, D. G. Foley, D. M. Palacios, P. W. Robinson, S. J.
Bograd, and D. P. Costa. 2010. Hawaiian albatrosses track interannual variability of
marine habitats in the North Pacific. Progress In Oceanography 86:246–260.
Kinsky, F. C. 1968. An unusual seabird mortality in the southern North Island (New Zealand).
153
April, 1968. Notornis 15.
Kuletz, K. J., M. Renner, E. a. Labunski, and G. L. Hunt. 2014. Changes in the distribution
and abundance of albatrosses in the eastern Bering Sea: 1975–2010. Deep Sea
Research Part II: Topical Studies in Oceanography 109:282–292.
Lack, D. L. 1968. Ecological adaptations for breeding in birds.
Langston, N. E., and S. Rohwer. 1996. Molt-Breeding Tradeoffs in Albatrosses: Life History
Implications for Big Birds. Oikos 76:498–510.
Lecomte, V. J., G. Sorci, S. Cornet, a. Jaeger, B. Faivre, E. Arnoux, M. Gaillard, C. Trouve,
D. Besson, O. Chastel, and H. Weimerskirch. 2010. Patterns of aging in the long-lived
wandering albatross. Proceedings of the National Academy of Sciences 107:6370–
6375.
Longhurst, A. R. 2010. Ecological geography of the sea.
Louzao, M., T. Wiegand, F. Bartumeus, and H. Weimerskirch. 2014. Coupling instantaneous
energy-budget models and behavioural mode analysis to estimate optimal foraging
strategy: an example with wandering albatrosses. Movement Ecology 2:8.
Maxwell, S. M., G. A. Breed, B. A. Nickel, J. Makanga-Bahouna, E. Pemo-Makaya, R. J.
Parnell, A. Formia, S. Ngouessono, B. J. Godley, D. P. Costa, M. J. Witt, and M. S.
Coyne. 2011. Using Satellite Tracking to Optimize Protection of Long-Lived Marine
Species: Olive Ridley Sea Turtle Conservation in Central Africa. PLoS ONE 6:e19905.
Mendocino Coast Audubon Society. (n.d.). .
http://www.mendocinocoastaudubon.org/mcas_al.html.
Merkle, J. A., D. Fortin, and J. M. Morales. 2014. A memory-based foraging tactic reveals an
adaptive mechanism for restricted space use. Ecology letters 17:924–931.
Van Moorter, B., D. Visscher, S. Benhamou, L. Börger, M. S. Boyce, and J.-M. Gaillard.
2009. Memory keeps you at home: a mechanistic model for home range emergence.
Oikos 118:641–652.
Murphy, M. E. 1996. Energetics and nutrition of molt. Pages 158–198 Avian energetics and
nutritional ecology. Springer.
Nabe-Nielsen, J., J. Tougaard, J. Teilmann, K. Lucke, and M. C. Forchhammer. 2013. How a
simple adaptive foraging strategy can lead to emergent home ranges and increased
food intake. Oikos 122:1307–1316.
O’Connor, C., D. R. Norris, G. T. Crossin, and S. J. Cooke. 2014. Biological carryover
effects : linking common concepts and mechanisms in ecology and evolution.
Ecosphere 5:1–11.
Oppel, S., and A. N. Powell. 2009. Does winter region affect spring arrival time and body
mass of king eiders in northern Alaska? Polar biology 32:1203–1209.
Patrick, S. C., S. Bearhop, D. Grémillet, A. Lescroël, W. J. Grecian, T. W. Bodey, K. C.
Hamer, E. D. Wakefield, M. Le Nuz, and S. C. Votier. 2014. Individual differences in
searching behaviour and spatial foraging consistency in a central place marine predator.
Oikos 123:33–40.
Patrick, S. C., and H. Weimerskirch. 2014. Consistency pays: sex differences and fitness
consequences of behavioural specialization in a wide-ranging seabird. Biology Letters
10.
Payne, R. B., D. S. Farner, and J. R. King. 1972. Mechanisms and control of molt. Avian
154
biology 2:103–155.
Phillips, R. A., J. C. Xavier, J. P. Croxall, and A. E. Burger. 2003. Effects of satellite
transmitters on albatrosses and petrels. The Auk 120:1082–1090.
Pianka, E. R. 1970. On r-and K-selection. American naturalist:592–597.
Regular, P. M., A. Hedd, and W. A. Montevecchi. 2013. Must marine predators always follow
scaling laws? Memory guides the foraging decisions of a pursuit-diving seabird. Animal
Behaviour 86:545–552.
Schultner, J., a S. Kitaysky, G. W. Gabrielsen, S. a Hatch, and C. Bech. 2013. Differential
reproductive responses to stress reveal the role of life-history strategies within a
species. Proceedings. Biological sciences / The Royal Society 280:1–10.
Shaffer, S. A., H. Weimerskirch, and D. P. Costa. 2001. Functional significance of sexual
dimorphism in Wandering Albatrosses, Diomedea exulans. Functional Ecology 15:203–
210.
Shuntov, V. P. 1974. Sea birds and the biological structure of the ocean.
Sorensen, M. C., J. M. Hipfner, T. K. Kyser, and D. R. Norris. 2009. Carry-over effects in a
Pacific seabird: stable isotope evidence that pre-breeding diet quality influences
reproductive success. Journal of Animal Ecology 78:460–467.
Stearns, S. C. 1992. The evolution of life histories. Oxford University Press Oxford.
Sumner, M. D., S. J. Wotherspoon, and M. A. Hindell. 2009. Bayesian Estimation of Animal
Movement from Archival and Satellite Tags. PLoS ONE 4:e7324.
Suryan, R. M., and K. N. Fischer. 2010. Stable isotope analysis and satellite tracking reveal
interspecific resource partitioning of nonbreeding albatrosses off Alaska. Canadian
Journal of Zoology 88:299–305.
Suryan, R. M., V. S. Saba, B. P. Wallace, S. A. Hatch, M. Frederiksen, and S. Wanless.
2009. Environmental forcing on life history strategies: Evidence for multi-trophic level
responses at ocean basin scales. Progress In Oceanography 81:214–222.
Tew Kai, E., and F. Marsac. 2010. Influence of mesoscale eddies on spatial structuring of top
predators’ communities in the Mozambique Channel. Progress in Oceanography
86:214–223.
Tew Kai, E., V. Rossi, J. Sudre, H. Weimerskirch, C. Lopez, E. Hernandez-Garcia, F. Marsac,
and V. Garçon. 2009. Top marine predators track Lagrangian coherent structures.
Proceedings of the National Academy of Sciences 106 :8245–8250.
Thorne, L. H., E. L. Hazen, S. J. Bograd, D. G. Foley, M. G. Conners, M. A. Kappes, K.
Hyemi, Y. Tremblay, D. P. Costa, and S. A. Shaffer. (n.d.). Sympatric North Pacific
albatross species show contrasting responses to climate variability. Movement Ecology.
Tickell, W. L. N. 2000. Albatrosses 117:433–451.
Viggiano, A. 2001. Investigating demographic and life history characteristics of black-footed
albatross: M.Sc. University of Washington. Seatlle, Washington.
Vuong, Q. H. 1989. Likelihood ratio tests for model selection and non-nested hypotheses.
Econometrica: Journal of the Econometric Society:307–333.
Wakefield, E. D., T. W. Bodey, S. Bearhop, J. Blackburn, K. Colhoun, R. Davies, R. G.
Dwyer, J. A. Green, D. Grémillet, A. L. Jackson, M. J. Jessopp, A. Kane, R. H. W.
Langston, A. Lescroël, S. Murray, M. Le Nuz, S. C. Patrick, C. Péron, L. M. Soanes, S.
Wanless, S. C. Votier, and K. C. Hamer. 2013. Space Partitioning Without Territoriality
155
in Gannets. Science 341 :68–70.
Wakefield, E. D., R. a. Phillips, P. N. Trathan, J. Arata, R. Gales, N. Huin, R. Graham, S. M.
Waugh, H. Weimerskirch, and J. Matthiopoulos. 2011. Habitat preference, accessibility,
and competition limit the global distribution of breeding Black-browed Albatrosses.
Ecological Monographs 81:141–167.
Walsberg, G. E. 1983. Avian ecological energetics. Avian biology 7:161–220.
Wanless, S., and M. P. Harris. 1993. Use of mutually exclusive foraging areas by adjacent
colonies of blue-eyed shags (Phalacrocorax atriceps) at South Georgia. Colonial
Waterbirds:176–182.
Weimerskirch, H. 1991. Sex-specific differences in molt strategy in relation to breeding in the
wandering albatross. Condor 93:731–737.
Weimerskirch, H. 1992. Reproductive effort in long-lived birds: age-specific patterns of
condition, reproduction and survival in the wandering albatross. Oikos:464–473.
Weimerskirch, H. 2002. Seabird demography and its relationship with the marine
environment. Pages 115–135 in E. A. Schreiber and J. Burger, editors. Biology of
Marine Birds. CRC Press.
Weimerskirch, H., Y. Cherel, F. Cuenot-chaillet, and V. Ridoux. 1997. Alternative foraging
strategies and resource allocation by male and female Wandering albatrosses. Ecology
78:2051–2063.
Weimerskirch, H., K. Delord, A. Guitteaud, R. A. Phillips, and P. Pinet. 2015a. Extreme
variation in migration strategies between and within wandering albatross populations
during their sabbatical year, and their fitness consequences. Scientific Reports 5:8853.
Weimerskirch, H., K. Delord, A. Guitteaud, R. A. Phillips, and P. Pinet. 2015b. Extreme
variation in migration strategies between and within wandering albatross populations
during their sabbatical year, and their fitness consequences. Scientific Reports 5:8853.
Weimerskirch, H., D. Pinaud, F. Pawlowski, and C.-A. Bost. 2007. Does prey capture induce
area-restricted search? A fine-scale study using GPS in a marine predator, the
wandering albatross. The American naturalist 170:734–43.
Weimerskirch, H., and R. P. Wilson. 2000. Oceanic respite for wandering albatrosses :
Abstract : Nature. Nature 406:955–956.
Winship, A. J., S. J. Jorgensen, S. a. Shaffer, I. D. Jonsen, P. W. Robinson, D. P. Costa, and
B. a. Block. 2012. State-space framework for estimating measurement error from
double-tagging telemetry experiments. Methods in Ecology and Evolution 3:291–302.
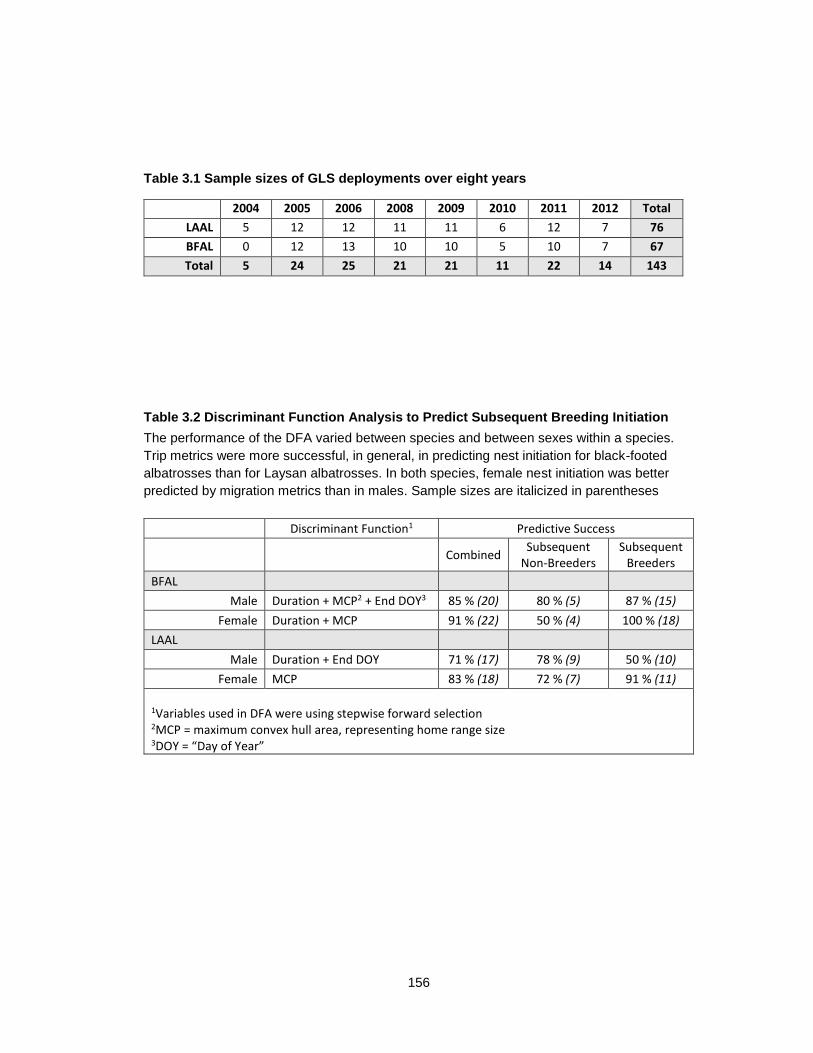
156
Table 3.1 Sample sizes of GLS deployments over eight years
2004 2005 2006 2008 2009 2010 2011 2012 Total
LAAL 5 12 12 11 11 6 12 7 76
BFAL 0 12 13 10 10 5 10 7 67
Total 5 24 25 21 21 11 22 14 143
Table 3.2 Discriminant Function Analysis to Predict Subsequent Breeding Initiation
The performance of the DFA varied between species and between sexes within a species.
Trip metrics were more successful, in general, in predicting nest initiation for black-footed
albatrosses than for Laysan albatrosses. In both species, female nest initiation was better
predicted by migration metrics than in males. Sample sizes are italicized in parentheses
Discriminant Function1 Predictive Success
Combined Subsequent
Non-Breeders Subsequent
Breeders
BFAL
Male Duration + MCP2 + End DOY3 85 % (20) 80 % (5) 87 % (15)
Female Duration + MCP 91 % (22) 50 % (4) 100 % (18)
LAAL
Male Duration + End DOY 71 % (17) 78 % (9) 50 % (10)
Female MCP 83 % (18) 72 % (7) 91 % (11)
1Variables used in DFA were using stepwise forward selection 2MCP = maximum convex hull area, representing home range size 3DOY = “Day of Year”
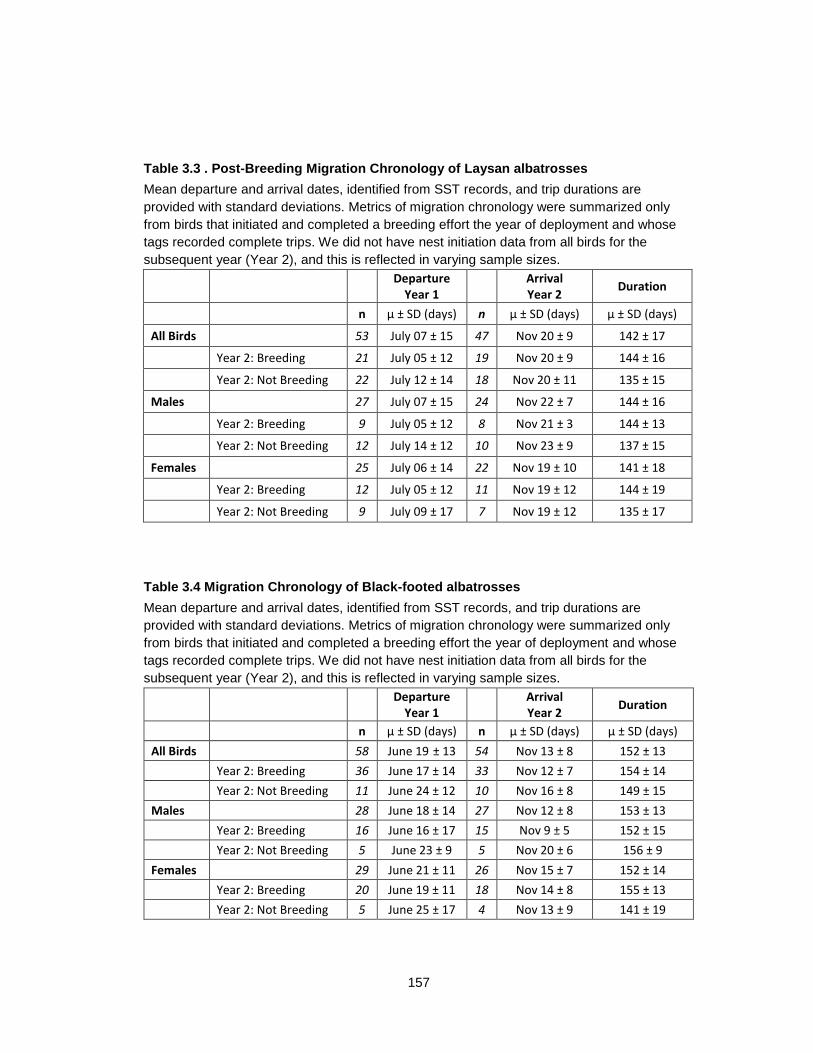
157
Table 3.3 . Post-Breeding Migration Chronology of Laysan albatrosses
Mean departure and arrival dates, identified from SST records, and trip durations are
provided with standard deviations. Metrics of migration chronology were summarized only
from birds that initiated and completed a breeding effort the year of deployment and whose
tags recorded complete trips. We did not have nest initiation data from all birds for the
subsequent year (Year 2), and this is reflected in varying sample sizes.
Departure
Year 1
Arrival Year 2
Duration
n µ ± SD (days) n µ ± SD (days) µ ± SD (days)
All Birds 53 July 07 ± 15 47 Nov 20 ± 9 142 ± 17
Year 2: Breeding 21 July 05 ± 12 19 Nov 20 ± 9 144 ± 16
Year 2: Not Breeding 22 July 12 ± 14 18 Nov 20 ± 11 135 ± 15
Males 27 July 07 ± 15 24 Nov 22 ± 7 144 ± 16
Year 2: Breeding 9 July 05 ± 12 8 Nov 21 ± 3 144 ± 13
Year 2: Not Breeding 12 July 14 ± 12 10 Nov 23 ± 9 137 ± 15
Females 25 July 06 ± 14 22 Nov 19 ± 10 141 ± 18
Year 2: Breeding 12 July 05 ± 12 11 Nov 19 ± 12 144 ± 19
Year 2: Not Breeding 9 July 09 ± 17 7 Nov 19 ± 12 135 ± 17
Table 3.4 Migration Chronology of Black-footed albatrosses
Mean departure and arrival dates, identified from SST records, and trip durations are
provided with standard deviations. Metrics of migration chronology were summarized only
from birds that initiated and completed a breeding effort the year of deployment and whose
tags recorded complete trips. We did not have nest initiation data from all birds for the
subsequent year (Year 2), and this is reflected in varying sample sizes.
Departure
Year 1
Arrival Year 2
Duration
n µ ± SD (days) n µ ± SD (days) µ ± SD (days)
All Birds 58 June 19 ± 13 54 Nov 13 ± 8 152 ± 13
Year 2: Breeding 36 June 17 ± 14 33 Nov 12 ± 7 154 ± 14
Year 2: Not Breeding 11 June 24 ± 12 10 Nov 16 ± 8 149 ± 15
Males 28 June 18 ± 14 27 Nov 12 ± 8 153 ± 13
Year 2: Breeding 16 June 16 ± 17 15 Nov 9 ± 5 152 ± 15
Year 2: Not Breeding 5 June 23 ± 9 5 Nov 20 ± 6 156 ± 9
Females 29 June 21 ± 11 26 Nov 15 ± 7 152 ± 14
Year 2: Breeding 20 June 19 ± 11 18 Nov 14 ± 8 155 ± 13
Year 2: Not Breeding 5 June 25 ± 17 4 Nov 13 ± 9 141 ± 19
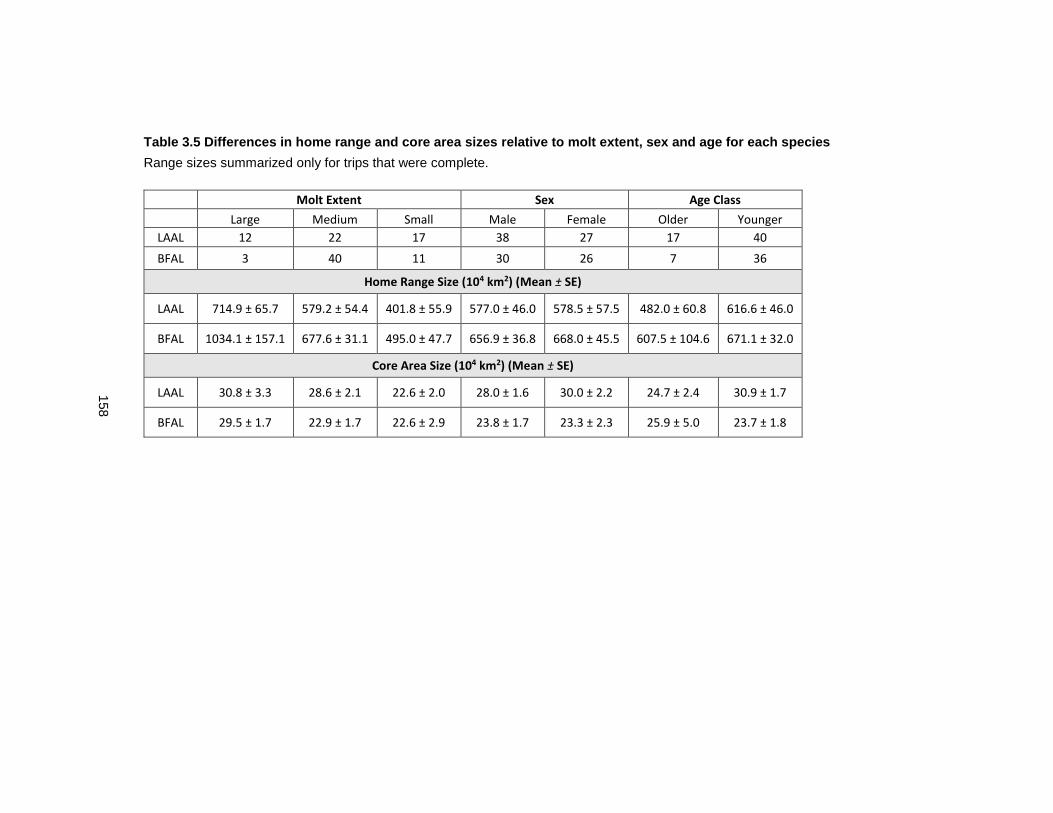
158
Table 3.5 Differences in home range and core area sizes relative to molt extent, sex and age for each species
Range sizes summarized only for trips that were complete.
Molt Extent Sex Age Class
Large Medium Small Male Female Older Younger
LAAL 12 22 17 38 27 17 40
BFAL 3 40 11 30 26 7 36
Home Range Size (104 km2) (Mean ± SE)
LAAL 714.9 ± 65.7 579.2 ± 54.4 401.8 ± 55.9 577.0 ± 46.0 578.5 ± 57.5 482.0 ± 60.8 616.6 ± 46.0
BFAL 1034.1 ± 157.1 677.6 ± 31.1 495.0 ± 47.7 656.9 ± 36.8 668.0 ± 45.5 607.5 ± 104.6 671.1 ± 32.0
Core Area Size (104 km2) (Mean ± SE)
LAAL 30.8 ± 3.3 28.6 ± 2.1 22.6 ± 2.0 28.0 ± 1.6 30.0 ± 2.2 24.7 ± 2.4 30.9 ± 1.7
BFAL 29.5 ± 1.7 22.9 ± 1.7 22.6 ± 2.9 23.8 ± 1.7 23.3 ± 2.3 25.9 ± 5.0 23.7 ± 1.8
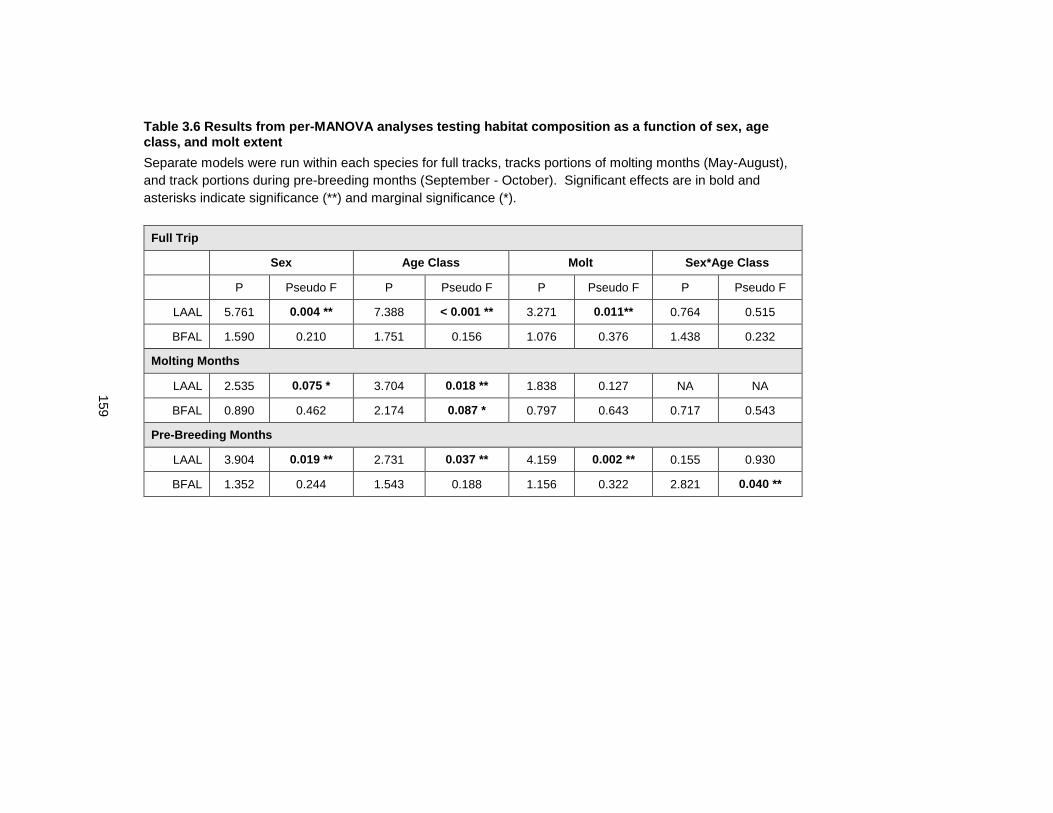
159
Table 3.6 Results from per-MANOVA analyses testing habitat composition as a function of sex, age class, and molt extent
Separate models were run within each species for full tracks, tracks portions of molting months (May-August),
and track portions during pre-breeding months (September - October). Significant effects are in bold and
asterisks indicate significance (**) and marginal significance (*).
Full Trip
Sex Age Class Molt Sex*Age Class
P Pseudo F P Pseudo F P Pseudo F P Pseudo F
LAAL 5.761 0.004 ** 7.388 < 0.001 ** 3.271 0.011** 0.764 0.515
BFAL 1.590 0.210 1.751 0.156 1.076 0.376 1.438 0.232
Molting Months
LAAL 2.535 0.075 * 3.704 0.018 ** 1.838 0.127 NA NA
BFAL 0.890 0.462 2.174 0.087 * 0.797 0.643 0.717 0.543
Pre-Breeding Months
LAAL 3.904 0.019 ** 2.731 0.037 ** 4.159 0.002 ** 0.155 0.930
BFAL 1.352 0.244 1.543 0.188 1.156 0.322 2.821 0.040 **
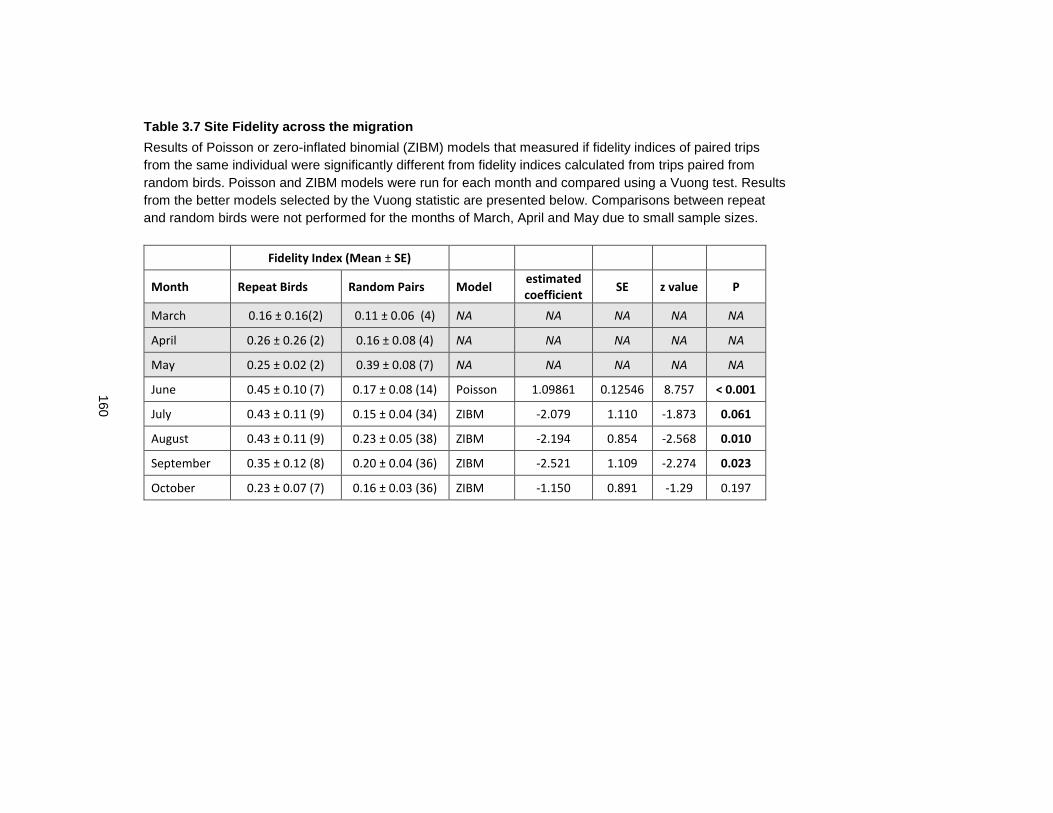
160
Table 3.7 Site Fidelity across the migration
Results of Poisson or zero-inflated binomial (ZIBM) models that measured if fidelity indices of paired trips
from the same individual were significantly different from fidelity indices calculated from trips paired from
random birds. Poisson and ZIBM models were run for each month and compared using a Vuong test. Results
from the better models selected by the Vuong statistic are presented below. Comparisons between repeat
and random birds were not performed for the months of March, April and May due to small sample sizes.
Fidelity Index (Mean ± SE)
Month Repeat Birds Random Pairs Model estimated coefficient
SE z value P
March 0.16 ± 0.16(2) 0.11 ± 0.06 (4) NA NA NA NA NA
April 0.26 ± 0.26 (2) 0.16 ± 0.08 (4) NA NA NA NA NA
May 0.25 ± 0.02 (2) 0.39 ± 0.08 (7) NA NA NA NA NA
June 0.45 ± 0.10 (7) 0.17 ± 0.08 (14) Poisson 1.09861 0.12546 8.757 < 0.001
July 0.43 ± 0.11 (9) 0.15 ± 0.04 (34) ZIBM -2.079 1.110 -1.873 0.061
August 0.43 ± 0.11 (9) 0.23 ± 0.05 (38) ZIBM -2.194 0.854 -2.568 0.010
September 0.35 ± 0.12 (8) 0.20 ± 0.04 (36) ZIBM -2.521 1.109 -2.274 0.023
October 0.23 ± 0.07 (7) 0.16 ± 0.03 (36) ZIBM -1.150 0.891 -1.29 0.197
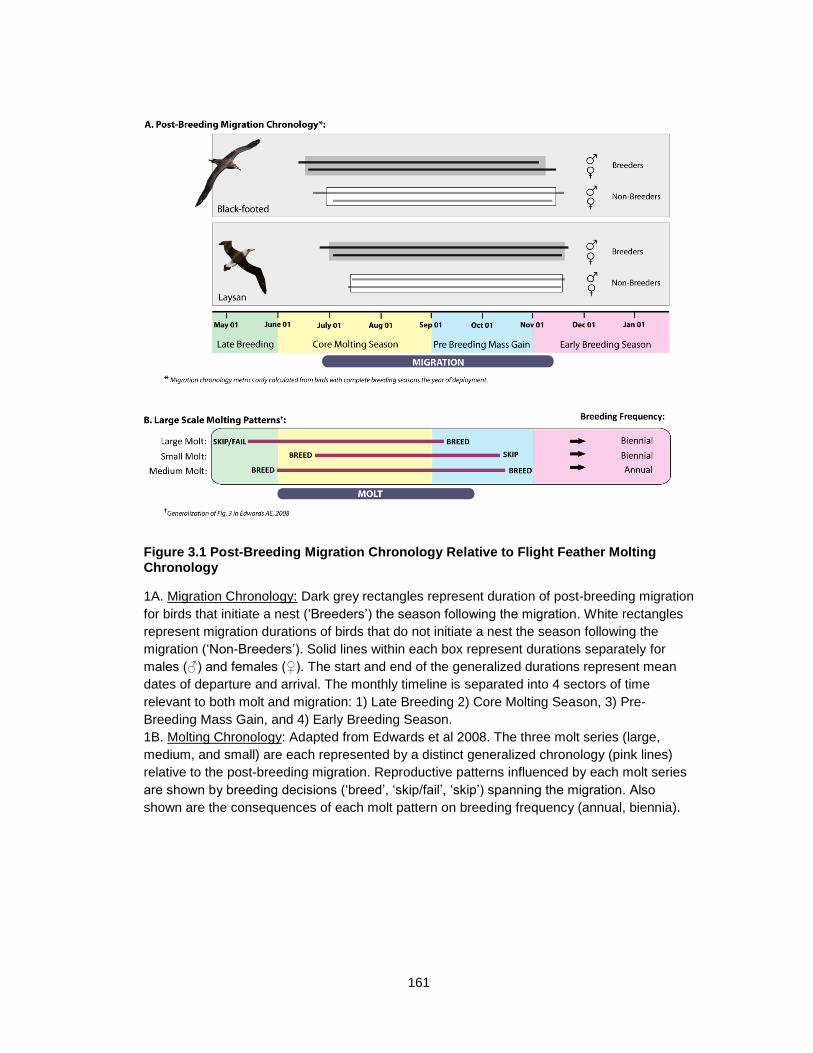
161
Figure 3.1 Post-Breeding Migration Chronology Relative to Flight Feather Molting Chronology
1A. Migration Chronology: Dark grey rectangles represent duration of post-breeding migration
for birds that initiate a nest (‘Breeders’) the season following the migration. White rectangles
represent migration durations of birds that do not initiate a nest the season following the
migration (‘Non-Breeders’). Solid lines within each box represent durations separately for
males (♂) and females (♀). The start and end of the generalized durations represent mean
dates of departure and arrival. The monthly timeline is separated into 4 sectors of time
relevant to both molt and migration: 1) Late Breeding 2) Core Molting Season, 3) Pre-
Breeding Mass Gain, and 4) Early Breeding Season.
1B. Molting Chronology: Adapted from Edwards et al 2008. The three molt series (large,
medium, and small) are each represented by a distinct generalized chronology (pink lines)
relative to the post-breeding migration. Reproductive patterns influenced by each molt series
are shown by breeding decisions (‘breed’, ‘skip/fail’, ‘skip’) spanning the migration. Also
shown are the consequences of each molt pattern on breeding frequency (annual, biennia).
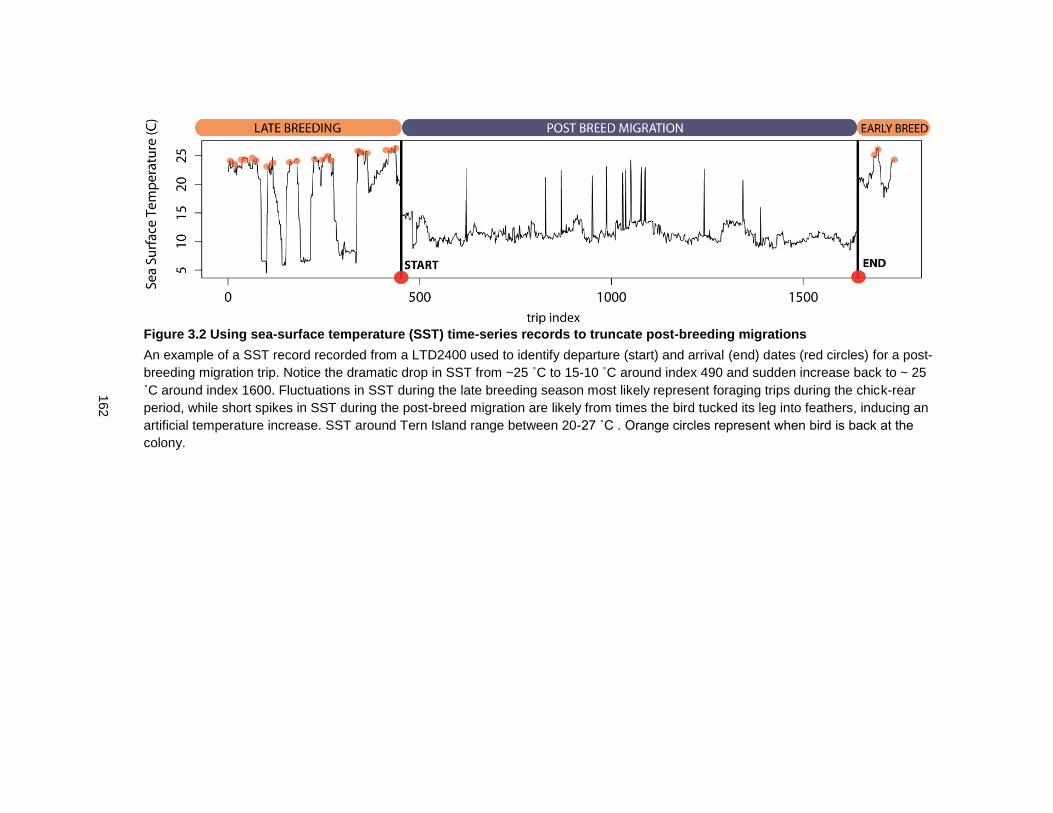
162
Figure 3.2 Using sea-surface temperature (SST) time-series records to truncate post-breeding migrations
An example of a SST record recorded from a LTD2400 used to identify departure (start) and arrival (end) dates (red circles) for a post-
breeding migration trip. Notice the dramatic drop in SST from ~25 ˚C to 15-10 ˚C around index 490 and sudden increase back to ~ 25
˚C around index 1600. Fluctuations in SST during the late breeding season most likely represent foraging trips during the chick-rear
period, while short spikes in SST during the post-breed migration are likely from times the bird tucked its leg into feathers, inducing an
artificial temperature increase. SST around Tern Island range between 20-27 ˚C . Orange circles represent when bird is back at the
colony.
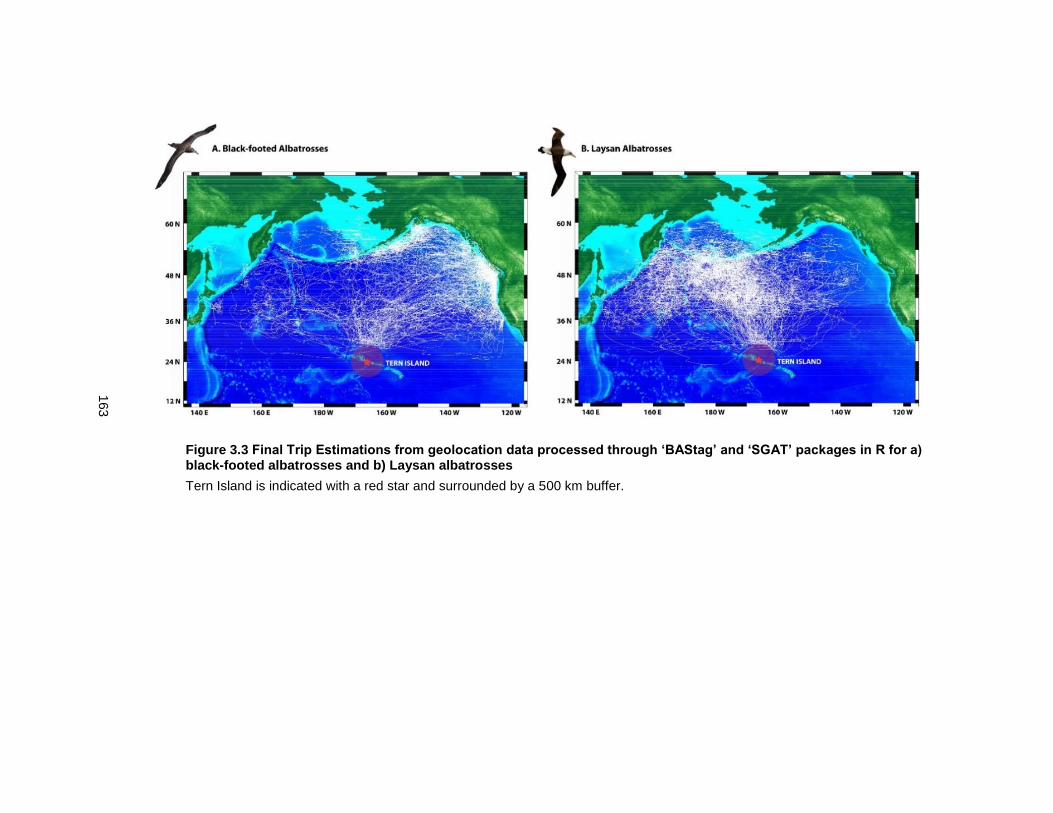
163
Figure 3.3 Final Trip Estimations from geolocation data processed through ‘BAStag’ and ‘SGAT’ packages in R for a) black-footed albatrosses and b) Laysan albatrosses
Tern Island is indicated with a red star and surrounded by a 500 km buffer.
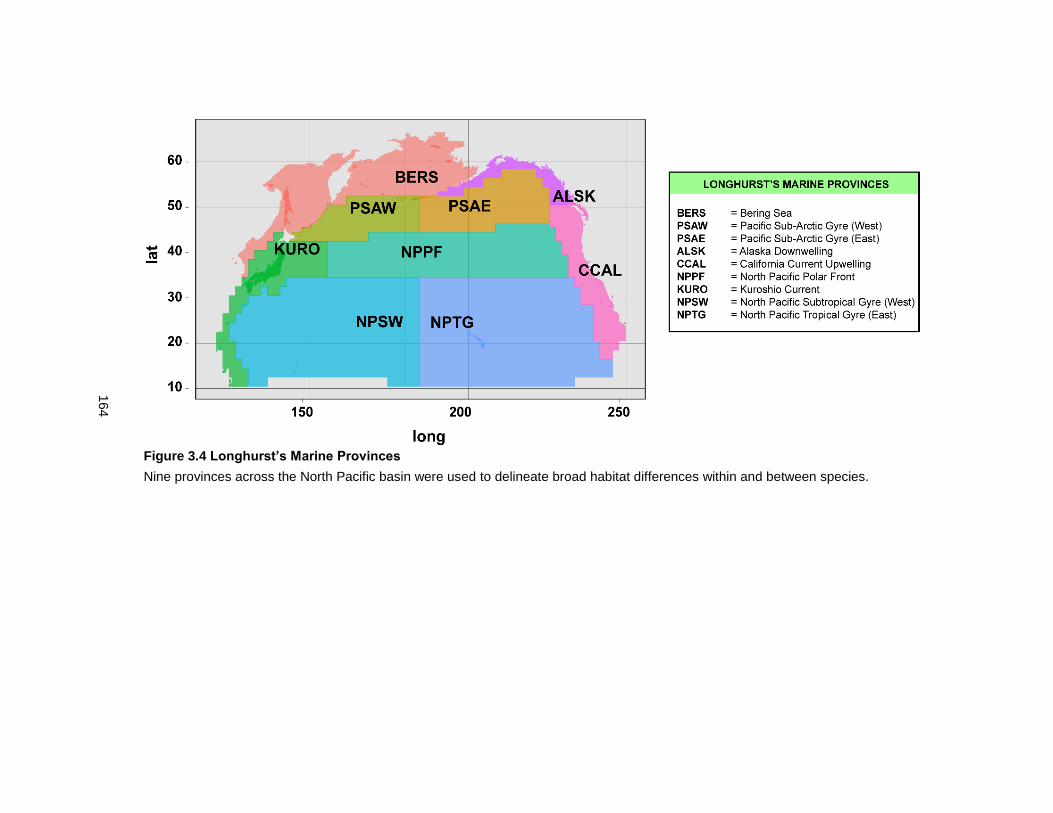
164
Figure 3.4 Longhurst’s Marine Provinces
Nine provinces across the North Pacific basin were used to delineate broad habitat differences within and between species.
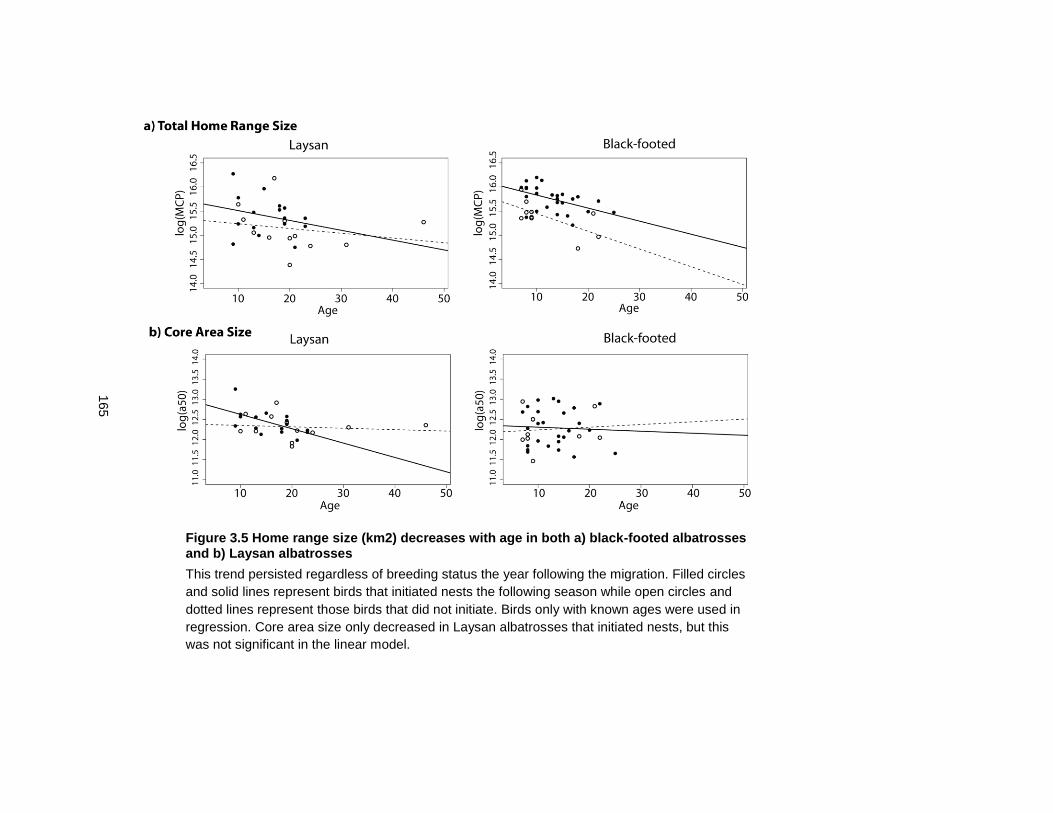
165
Figure 3.5 Home range size (km2) decreases with age in both a) black-footed albatrosses and b) Laysan albatrosses
This trend persisted regardless of breeding status the year following the migration. Filled circles
and solid lines represent birds that initiated nests the following season while open circles and
dotted lines represent those birds that did not initiate. Birds only with known ages were used in
regression. Core area size only decreased in Laysan albatrosses that initiated nests, but this
was not significant in the linear model.
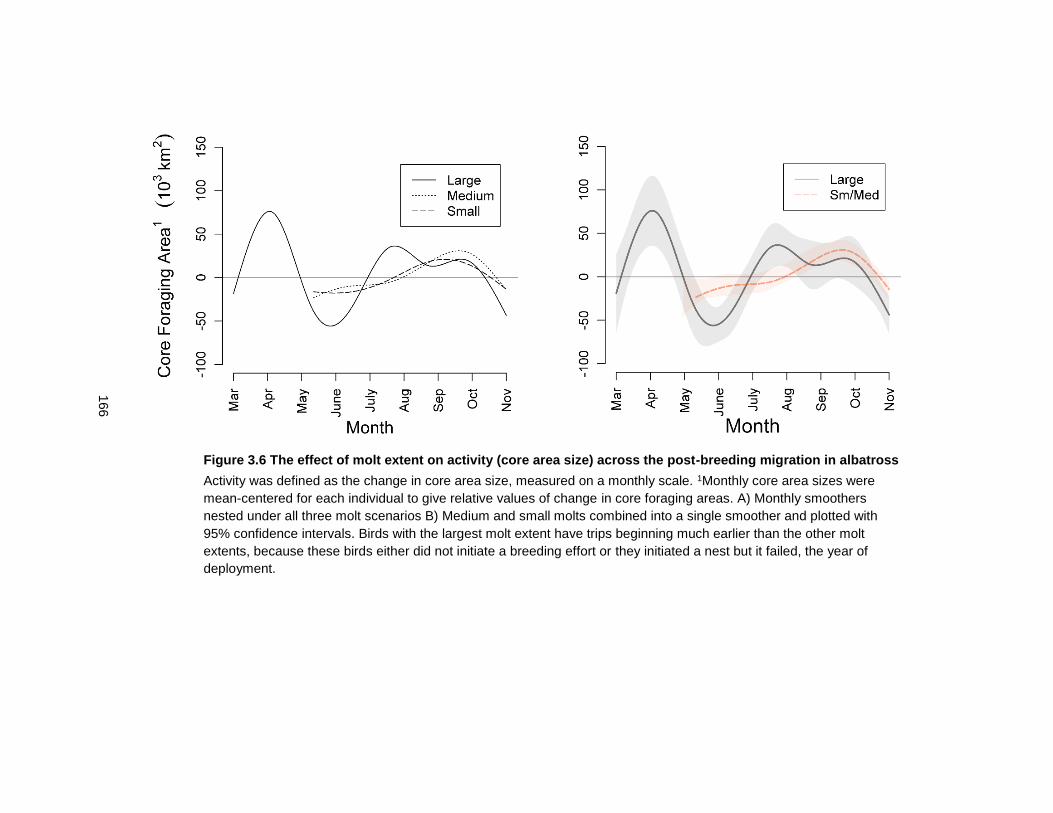
166
Figure 3.6 The effect of molt extent on activity (core area size) across the post-breeding migration in albatross
Activity was defined as the change in core area size, measured on a monthly scale. 1Monthly core area sizes were
mean-centered for each individual to give relative values of change in core foraging areas. A) Monthly smoothers
nested under all three molt scenarios B) Medium and small molts combined into a single smoother and plotted with
95% confidence intervals. Birds with the largest molt extent have trips beginning much earlier than the other molt
extents, because these birds either did not initiate a breeding effort or they initiated a nest but it failed, the year of
deployment.
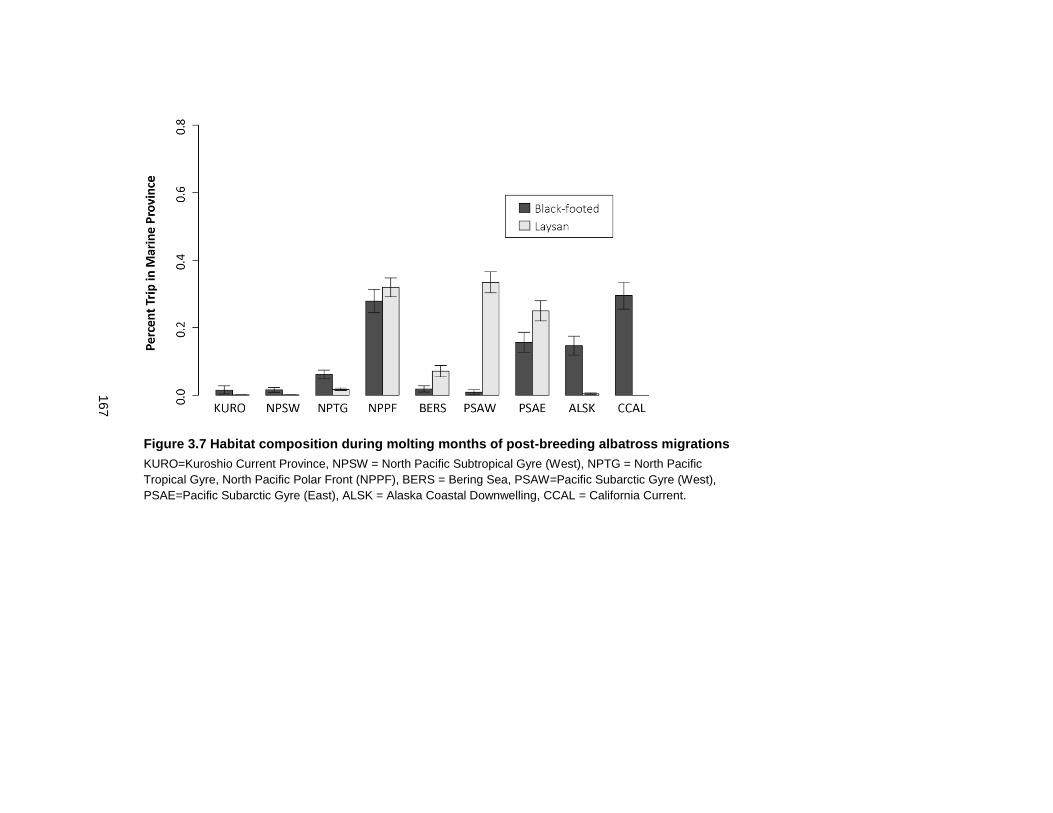
167
Figure 3.7 Habitat composition during molting months of post-breeding albatross migrations
KURO=Kuroshio Current Province, NPSW = North Pacific Subtropical Gyre (West), NPTG = North Pacific
Tropical Gyre, North Pacific Polar Front (NPPF), BERS = Bering Sea, PSAW=Pacific Subarctic Gyre (West),
PSAE=Pacific Subarctic Gyre (East), ALSK = Alaska Coastal Downwelling, CCAL = California Current.
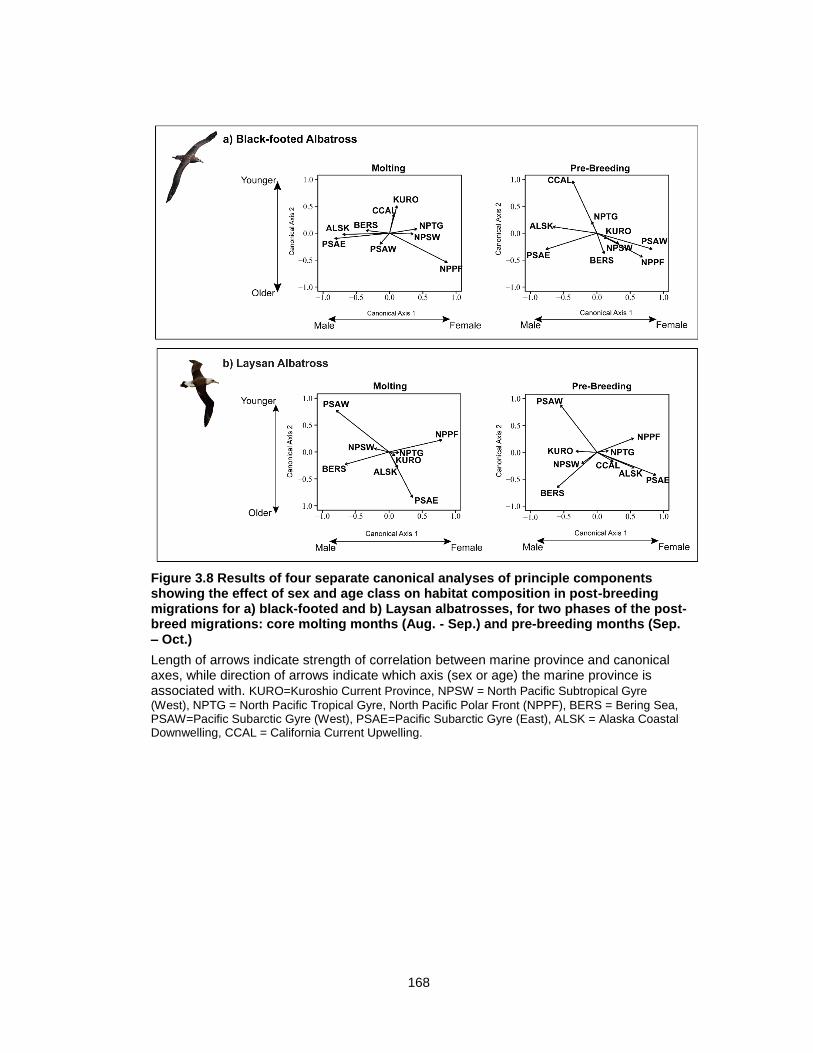
168
Figure 3.8 Results of four separate canonical analyses of principle components showing the effect of sex and age class on habitat composition in post-breeding migrations for a) black-footed and b) Laysan albatrosses, for two phases of the post-breed migrations: core molting months (Aug. - Sep.) and pre-breeding months (Sep. – Oct.)
Length of arrows indicate strength of correlation between marine province and canonical axes, while direction of arrows indicate which axis (sex or age) the marine province is associated with. KURO=Kuroshio Current Province, NPSW = North Pacific Subtropical Gyre
(West), NPTG = North Pacific Tropical Gyre, North Pacific Polar Front (NPPF), BERS = Bering Sea, PSAW=Pacific Subarctic Gyre (West), PSAE=Pacific Subarctic Gyre (East), ALSK = Alaska Coastal Downwelling, CCAL = California Current Upwelling.
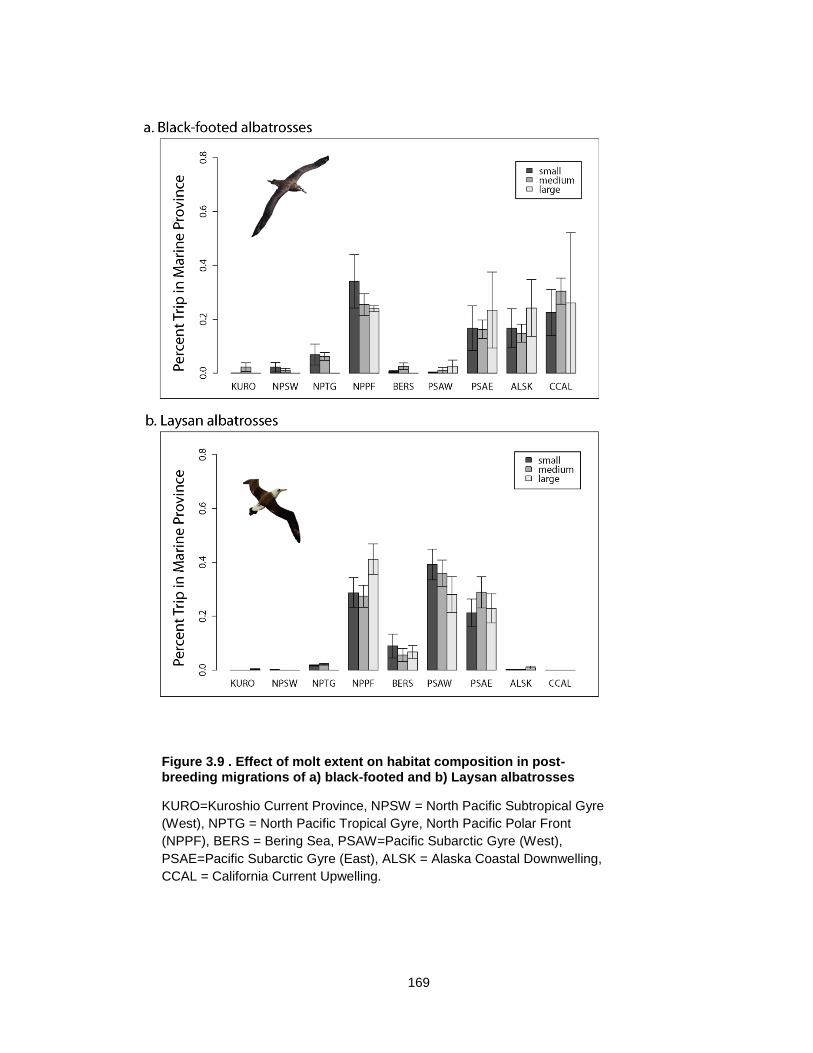
169
Figure 3.9 . Effect of molt extent on habitat composition in post-breeding migrations of a) black-footed and b) Laysan albatrosses
KURO=Kuroshio Current Province, NPSW = North Pacific Subtropical Gyre
(West), NPTG = North Pacific Tropical Gyre, North Pacific Polar Front
(NPPF), BERS = Bering Sea, PSAW=Pacific Subarctic Gyre (West),
PSAE=Pacific Subarctic Gyre (East), ALSK = Alaska Coastal Downwelling,
CCAL = California Current Upwelling.
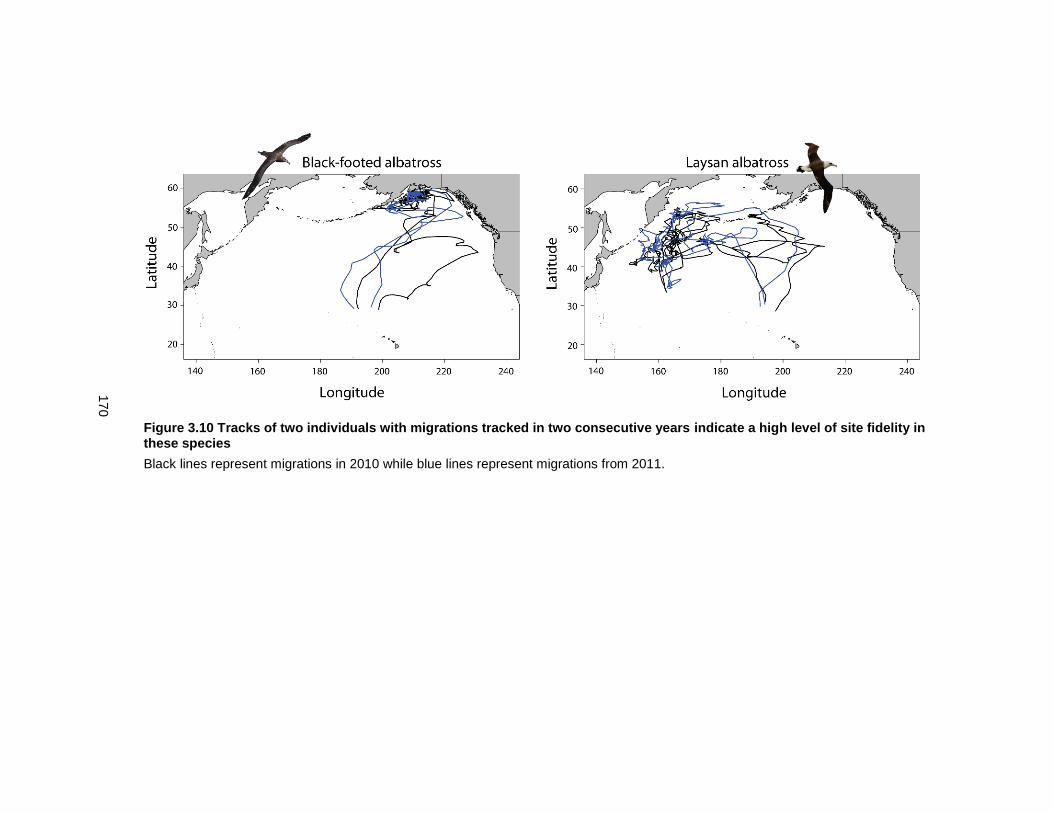
170
Figure 3.10 Tracks of two individuals with migrations tracked in two consecutive years indicate a high level of site fidelity in these species
Black lines represent migrations in 2010 while blue lines represent migrations from 2011.
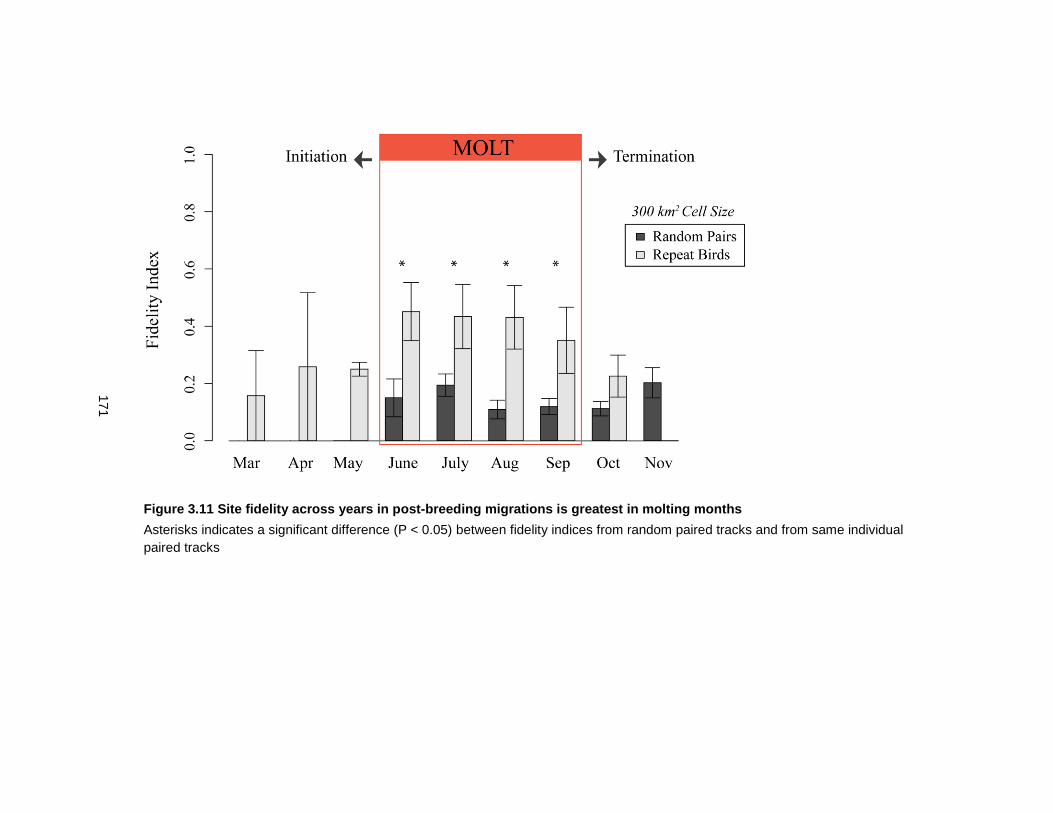
171
Figure 3.11 Site fidelity across years in post-breeding migrations is greatest in molting months
Asterisks indicates a significant difference (P < 0.05) between fidelity indices from random paired tracks and from same individual
paired tracks
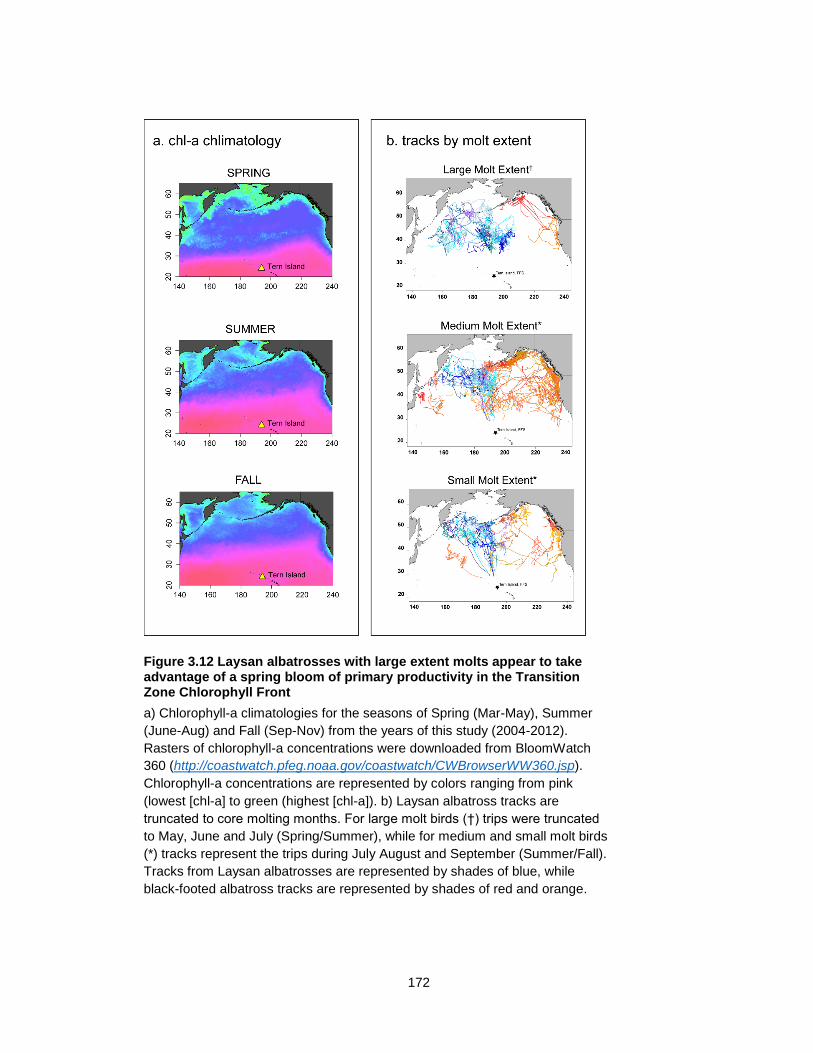
172
Figure 3.12 Laysan albatrosses with large extent molts appear to take advantage of a spring bloom of primary productivity in the Transition Zone Chlorophyll Front
a) Chlorophyll-a climatologies for the seasons of Spring (Mar-May), Summer
(June-Aug) and Fall (Sep-Nov) from the years of this study (2004-2012).
Rasters of chlorophyll-a concentrations were downloaded from BloomWatch
360 (http://coastwatch.pfeg.noaa.gov/coastwatch/CWBrowserWW360.jsp).
Chlorophyll-a concentrations are represented by colors ranging from pink
(lowest [chl-a] to green (highest [chl-a]). b) Laysan albatross tracks are
truncated to core molting months. For large molt birds (†) trips were truncated
to May, June and July (Spring/Summer), while for medium and small molt birds
(*) tracks represent the trips during July August and September (Summer/Fall).
Tracks from Laysan albatrosses are represented by shades of blue, while
black-footed albatross tracks are represented by shades of red and orange.
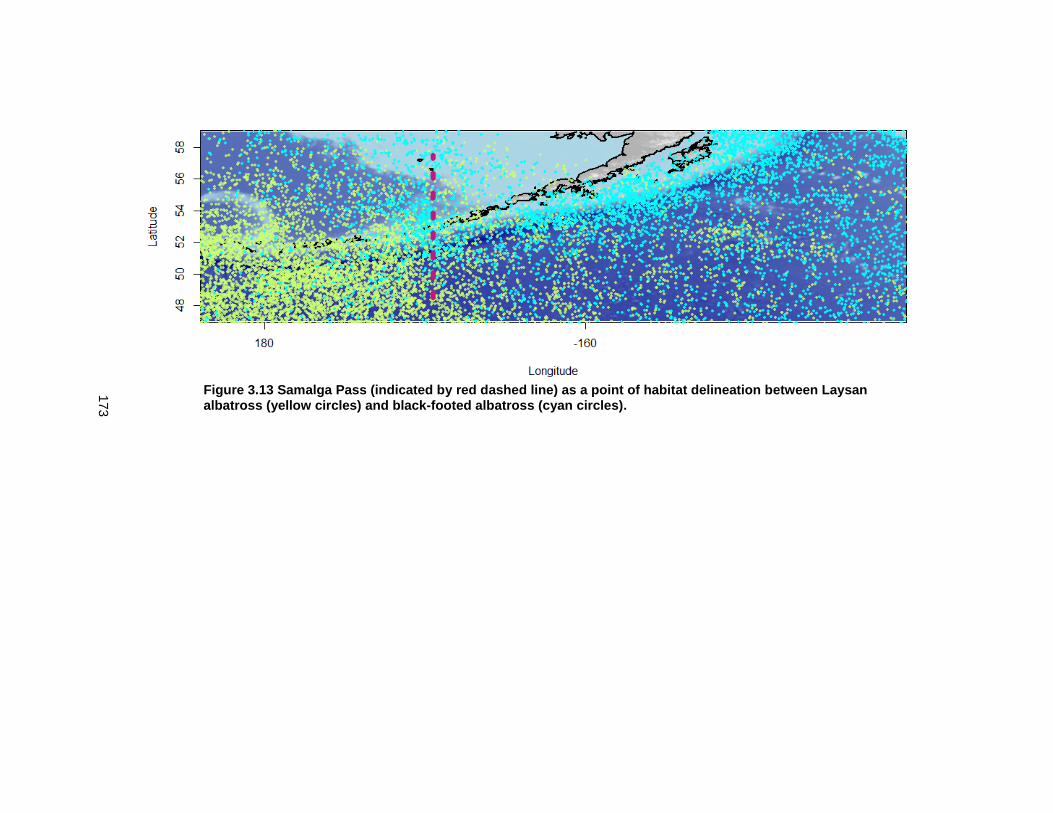
173
Figure 3.13 Samalga Pass (indicated by red dashed line) as a point of habitat delineation between Laysan albatross (yellow circles) and black-footed albatross (cyan circles).