qt9x36913k.pdf - escholarship
TRANSCRIPT
UC RiversideCliodynamics
TitleA Cultural Evolution Model for Trend Changes in the American Secular Cycle
Permalinkhttps://escholarship.org/uc/item/9x36913k
JournalCliodynamics, 10(1)
AuthorAlexander, Michael Allen
Publication Date2019
DOI10.21237/C7clio10141084
Supplemental Materialhttps://escholarship.org/uc/item/9x36913k#supplemental
Copyright InformationCopyright 2019 by the author(s).This work is made available under the terms of a Creative Commons Attribution License, available at https://creativecommons.org/licenses/by/4.0/ Peer reviewed
eScholarship.org Powered by the California Digital LibraryUniversity of California
Cliodynamics: The Journal of Quantitative History and Cultural Evolution
Corresponding author’s e-mail: [email protected]
Citation: Alexander, Michael Allen. 2019. A Cultural Evolution Model for Trend Changes in the American Secular Cycle. Cliodynamics 10: 1–30.
A Cultural Evolution Model for Trend Changes in the American Secular Cycle Michael Allen Alexander
Rising economic inequality in the United States has become a topic of political interest in recent years. Inequality appears to show cycles corresponding to secular cycles, suggesting the possibility of declining inequality in the future. The most recent episode of declining inequality in America is known as the Great Compression. It occurred in the middle of the twentieth century. This paper uses the guided variation cultural evolution model (Boyd and Richerson 1985: 95–97) to explain shifting trends in inequality in five nations. According to this analysis, the Great Compression was largely due to a shift in the business environment reflecting tax and other economic policy implemented over the 1914–45 era. The cultural evolutionary response to this environmental change was to replace “shareholder primacy” cultural variants with “stakeholder capitalism” variants, which resulted in lower inequality. Half a century later, new policy, implemented in response to the great inflation following the collapse of the Bretton Woods system, changed the business environment again in ways that favored shareholder primacy cultural variants and rising inequality. The extent to which this occurred depended on the degree to which stakeholder capitalism was integrated into institutions.
Introduction
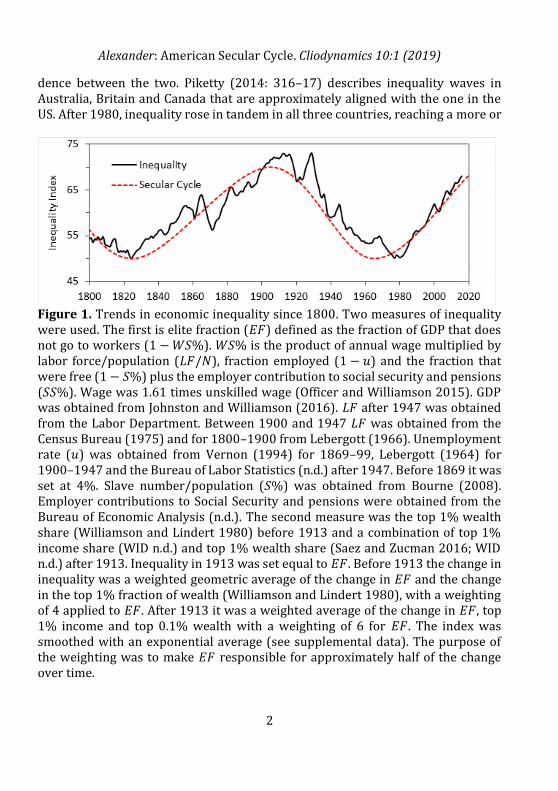
Rising economic inequality and political polarization in the United States has become a topic of political interest in recent years (Drutman 2017; Florida 2018; Teachout 2017). According to structural-demographic theory, rising economic inequality generates rising elite number, which is a major cause of political polarization and rising sociopolitical instability (Turchin 2013). These variables, and others, tend to rise and fall in concert, defining secular cycles (Turchin and Nefedov 2009: 5). Recently a comprehensive assessment of long-term trends in more than eight social variables was used to define a consensus American secular cycle (Turchin 2016: 247). Figure 1 presents this cycle and compares it to an empirical measure of economic inequality over time, showing a close correspond-
Alexander: American Secular Cycle. Cliodynamics 10:1 (2019)
2
dence between the two. Piketty (2014: 316–17) describes inequality waves in Australia, Britain and Canada that are approximately aligned with the one in the US. After 1980, inequality rose in tandem in all three countries, reaching a more or
Figure 1. Trends in economic inequality since 1800. Two measures of inequality were used. The first is elite fraction (𝐸𝐹) defined as the fraction of GDP that does not go to workers (1 − 𝑊𝑆%). 𝑊𝑆% is the product of annual wage multiplied by labor force/population (𝐿𝐹/𝑁), fraction employed (1 − 𝑢) and the fraction that were free (1 − 𝑆%) plus the employer contribution to social security and pensions (𝑆𝑆%). Wage was 1.61 times unskilled wage (Officer and Williamson 2015). GDP was obtained from Johnston and Williamson (2016). 𝐿𝐹 after 1947 was obtained from the Labor Department. Between 1900 and 1947 𝐿𝐹 was obtained from the Census Bureau (1975) and for 1800–1900 from Lebergott (1966). Unemployment rate (𝑢) was obtained from Vernon (1994) for 1869–99, Lebergott (1964) for 1900–1947 and the Bureau of Labor Statistics (n.d.) after 1947. Before 1869 it was set at 4%. Slave number/population (𝑆%) was obtained from Bourne (2008). Employer contributions to Social Security and pensions were obtained from the Bureau of Economic Analysis (n.d.). The second measure was the top 1% wealth share (Williamson and Lindert 1980) before 1913 and a combination of top 1% income share (WID n.d.) and top 1% wealth share (Saez and Zucman 2016; WID n.d.) after 1913. Inequality in 1913 was set equal to 𝐸𝐹. Before 1913 the change in inequality was a weighted geometric average of the change in 𝐸𝐹 and the change in the top 1% fraction of wealth (Williamson and Lindert 1980), with a weighting of 4 applied to 𝐸𝐹. After 1913 it was a weighted average of the change in 𝐸𝐹, top 1% income and top 0.1% wealth with a weighting of 6 for 𝐸𝐹. The index was smoothed with an exponential average (see supplemental data). The purpose of the weighting was to make 𝐸𝐹 responsible for approximately half of the change over time.
Alexander: American Secular Cycle. Cliodynamics 10:1 (2019)
3
less stable, higher value in the first decade of the twenty-first century. This rise was followed by a surge in sociopolitical instability in America (Turchin 2016) Britain and elsewhere in the world (Ortmans et al. 2017: 143, 147–48). Secular cycles have been most thoroughly characterized in preindustrial agrarian states and empires (Alexander 2016; Baker 2011; Korotayev et al 2006; Turchin and Nefedov 2009). Jack Goldstone (1991) developed demograph ic structural theory (DST) to explain the linkage between economic inequality and increased intra-elite competition, which led to conflict between elites, often result-ing in state breakdown in agrarian polities. Mathematical versions of DST that generate secular cycles in population, inequality, elite number and political instability have been developed (Turchin 2003, 2013; Turchin and Korotayev 2006). Turchin’s (2016) structural-demographic theory (SDT), used to model the American secular cycle, draws upon this preindustrial theory, as described below.
Overview of Secular Cycle Theory
The fundamental driver of the agrarian secular cycle is population growth relative to amount of arable land. As the land becomes fully occupied, agricultural employment reaches a maximum. Further population growth creates labor oversupply relative to a fixed demand for agricultural labor and real wages fall. Falling wages means a larger share of the economic pie goes to landowning elites, who flourish and see their numbers grow. With rising numbers, intra-elite competition rises, eventually leading to political instability. These instability-breeding social forces are tracked by PSI, the political stress indicator (Goldstone 1991: 141–45; Turchin 2013). High levels of PSI trigger a political crisis, often involving state breakdown, civil war or revolution, which may initiate a sustained decline in economic inequality, after which a new secular cycle begins. SDT holds that this basic demographic mechanism still applies to post-agrarian polities like the United States. The role of arable land in an agricultural economy is replaced with a labor demand function which is externally specified, either as a simple exponential function (Turchin 2016: 153) or as GDP divided by a measure of labor productivity (Turchin 2016: 212). If the labor force grows faster than demand for labor, then real wages fail to keep up with economic growth and inequality rises. According to this model, the inequality trend reversal in the early twentieth century reflected the reduction in immigration after 1924, which caused a reduction in labor supply, leading to faster wage growth and falling inequality. This idea is not compatible with standard economic theory, which holds that growth in GDP is largely determined by investment. Firms increase investment and hire workers when business is good (consumer demand is strong). Since workers are also consumers, demand (and consequently, investment) should grow with employment, provided rising GDP per worker translates into higher incomes for
Alexander: American Secular Cycle. Cliodynamics 10:1 (2019)
4
workers. That is, increased employment leads to increased aggregate demand, increased investment and further demand for labor, leading to more employment in a virtuous cycle. There should be no limitation on GDP expansion as long as the fruits of economic activity are shared between workers/consumers and own-ers/managers. Such sharing is necessarily the case when inequality is low. Thus rising inequality caused by the mechanism described by Turchin should not occur in an post-agrarian economy starting out from a condition of relative equality such as the 1970s (see Figure 1), yet it did. Alexander (2017) proposed a non-demographic mechanism for rising inequality based on Thomas Piketty’s (2014) hypothesis that the rate of wealth growth relative to economic growth drives inequality. Wealth was represented by an abstract portfolio consisting of stocks and bonds, which was divided by wage to provide an oscillator that reveals the relative success of the investor class versus the working class. In a capitalist society, the investing class can be considered as a proxy for elites. This oscillator showed that the cyclical trends in the relative financial well-being of elites served as a good proxy for inequality. Alexander proposed that a feedback effect of inequality on economic performance brought about a “capitalist crisis” denoted by a sharp decline in a proxy measure of “capital productivity” (GDP per unit capital), which led to the 1929 stock market crash and Great Depression. Application of a simplified version of Turchin’s PSI shows political stress peaking in 1929, after which policy was enacted that produced the inequality trend reversal. Turchin (2016: 34) identifies cultural factors such as social mood that may play an important role in inequality trend reversals in secular cycles. He describes how, along with immigration restriction, a coalition of elites “implemented a series of formal reforms, supplemented by a number of informal measures” that reversed the preexisting trends in inequality and well-being (Turchin 2016: 171). This article presents a cultural evolution model for how policies taken in response to the capitalist crisis produced falling inequality in the mid-twentieth century and how a later policy change reversed this trend in the 1970s (see Figure 1). The model is explicitly developed for the American experience, but it is then applied to a number of European countries to identify commonalities and differences between European and American inequality/secular cycles.
Theoretical Development
How income is divided between rich and poor in an industrial capitalist society is presumed to result from the collective beliefs and economic behavior of business executives, that is, business culture. In the simple analysis presented here, business culture is treated as a mixture of two cultural variants. The first variant, “shareholder primacy” (SP) was asserted by economic and legal scholar Adolf Berle
Alexander: American Secular Cycle. Cliodynamics 10:1 (2019)
5
in 1931: “all powers granted to a corporation or to the management of a corpora-tion … [are] at all times exercisable only for the ratable benefit of all the share-holders as their interest appears.” The second variant was asserted in response to Berle by Harvard law professor E. Merrick Dodd (1932), who noted that “there is in fact a growing feeling not only that business has responsibilities to the community but that our corporate managers who control business should voluntarily and without waiting for legal compulsion manage it in such a way as to fulfill those responsibilities.” He argued for “a view of the business corporation as an economic institution which has a social service as well as a profit-making function.” That is, a corporation has a responsibility to stakeholders other than shareholders, a view that may be called “stakeholder capitalism” (SC). This debate was an open issue at the end of the twenties boom. Two decades after his 1931 article, Berle acknowledged that it had been resolved in favor of stakeholder capitalism:
Twenty years ago, the writer had a controversy with the late Professor E. Merrick Dodd, of Harvard Law School, the writer holding that corporate powers were powers in trust for shareholders while Professor Dodd argued that these powers were held in trust for the entire community. The argument has been settled (at least for the time being) squarely in favor of Professor Dodd’s contention. (Berle 1954: 169)
SC was apparently still in force as late as 1981, as indicated by this statement from the Business Roundtable:
Corporations have a responsibility, first of all, to make available to the public quality goods and services at fair prices, thereby earning a profit that attracts investment to continue and enhance the enterprise, provide jobs, and build the economy. The long-term viability of the corporation depends upon its responsibility to the society of which it is a part. And the well-being of society depends upon profitable and responsible business enterprises. (quoted in Yang 2013)
Sixteen years later the Business Roundtable was asserting that the principal objective of a business enterprise is “to generate economic returns to its owners” (in Yang 2013). Business philosophy had come back full circle to Berle’s 1931 position. These changing views of the purpose of a corporation illustrate how business culture changed from primarily SP around 1930 to SC during the 1950s through the 1970s, and then back to SP after 1981. The timing of these cultural
Alexander: American Secular Cycle. Cliodynamics 10:1 (2019)
6
shifts corresponds to the timing of inequality trend reversals around 1930 and 1980 (see Figure 1), suggesting a relationship between the two. A primary role for executives is capital allocation, deciding how retained earnings should be deployed to produce the maximum return. The SC manager sees return as capital growth; earnings are invested to generate more capital in order to achieve a maximum rate of capital accumulation. This results in enterprise growth and job creation, which increases labor bargaining power and acts as a force for lower inequality. The SP manager sees return as financial (dollars per unit capital). If he can find a financial asset that delivers a higher financial return than business enterprise, he will purchase that asset instead. Doing this means less growth and less demand for workers, and acts as a force for rising inequality. Median real return on capital (ROC) in American corporations has run at about 5.5% over the long run (Jiang and Koller 2006). During long bull markets it is sometimes possible to capture gains higher than ROC, of which an SP manager might take advantage. Over 1980–2017, average real capital gains have been 5.5%, the same as ROC. They were higher (c. 9%) during the 1980–2000 bull market era. Since 1982, the US Securities and Exchange Commission (SEC) has permitted corporate stock buybacks, which in recent decades have been substantial, as reported by Lazonick (2014):
Consider the 449 companies in the S&P 500 index that were publicly listed from 2003 through 2012. During that period those companies used 54% of their earnings—a total of $2.4 trillion—to buy back their own stock, almost all through purchases on the open market. Dividends absorbed an additional 37% of their earnings. That left very little for investments in productive capabilities.
Clearly, most executive investment behavior today is consistent with SP culture. Prior to 1982 stock buybacks were not permitted, but even if they had been, they would not have made financial sense from an SP standpoint. From the 1942 stock market bottom to 1980, average real capital gains on the S&P 500 stock index averaged 2.7%, half the return on capital. Even during the 1950–70 bull market era, the price trend was less than 5.5% in real terms. The financial environment encouraged executives to invest as SC managers and focus on building great corporations rather than high stock prices. The two cultures also differ on how they view workers. SP business culture sees workers as costs to be managed in order to maximize shareholder value and achieve great wealth for the executives who run the corporations. An illustration of this share-value-centric view of workers as liabilities is the favorable short-term positive stock market response to announcements of layoffs due to corporate restructuring (Hahn and Reyes 2004). Restructuring implies that the laid-off
Alexander: American Secular Cycle. Cliodynamics 10:1 (2019)
7
workers were not necessary for achievement of bottom line results and so were financial liabilities. Their elimination should boost earnings and this perception drives share prices higher. In contrast, SC managers see workers as assets to be deployed in their quest to achieve business greatness. Through its investing behavior and stance towards employees, the evolution of business culture generates inequality trends as a side effect of the type of business management and state economic policy prescribed by the business culture. This article uses economic inequality as a proxy for business culture, in which the relative amount of SP to SC is assumed to be directly related to inequality: higher inequality means more SP; lower means more SC. Cultural change will be characterized with the guided variation model (Boyd and Richerson 1985: 95–98), which combines the effects of cultural transmission and individual learning. Cultural transmission is assumed to occur by businessmen copying those of their peers who are perceived as successful. Which peers to copy is indicated by symbolic markers. One of these is wealth, or as CNN founder Ted Turner is reported to have said, “life’s a game, money is how we keep score” (Brainyquote n.d.). Another is social prestige, which arises from the importance of the enterprise the executive runs as perceived by the larger society. The leader of a great corporation would serve as a prestige-based model, while an oil magnate or tech billionaire might serve as a wealth-based model. Achieving great wealth or prestige makes the achiever a model for emulation by other businessmen and results in the spread of the achiever’s culture. Which model is adaptive determines the direction of inequality trends. When executive compensation is strong there will be many very rich executives who can serve as cultural models. And when compensation tracks financial performance, SP managers focused on financial performance will tend to be richer than growth-centric SC managers and so comprise a disproportionate share of those possessing the wealth symbolic marker. Under conditions in which financial markets are strong, SP managers can exploit an acquisition strategy to build great companies and acquire the prestige marker, beating out SC managers employing a slower organic-growth strategy. Under conditions of strong executive compensation and strong stock market performance, SP culture-holders will produce more “cultural offspring,” SP prevalence will rise, and inequality with it. On the other hand, when executive compensation is weak there will be fewer very rich executives and fewer models identifiable by the wealth marker. Furthermore, if compensation does not follow financial performance, those following SP will get no richer than those who do not and so enjoy no cultural transmission advantage. Weak stock markets make it harder for SP managers to pursue an acquisition strategy to acquire the prestige symbolic marker. On the other hand, those following SC will be undeterred by lower profit margins and
Alexander: American Secular Cycle. Cliodynamics 10:1 (2019)
8
weak markets in their quest to build bigger business empires. They will achieve greater prestige via organic-growth strategies that have less appeal to their SP peers and so have correspondingly greater cultural reproductive success. In this case, SC is adaptive, its prevalence in the population would grow, and inequality fall. An illustration of which culture led to the greater prestige in the 1950s is provided by President Eisenhower. Eisenhower appointed General Motors CEO Charles Wilson as his Secretary of Defense. During his confirmation hearings, when asked if he could make a decision as Secretary that would be adverse to the interests of General Motors, Wilson answered affirmatively. But he then added that he could not conceive of such a situation “because for years I thought what was good for our country was good for General Motors, and vice versa” (quoted in Terrell 2016). Only a stakeholder capitalist manager, who sees himself as a steward for multiple stakeholders (i.e. society), would make a statement like this. An SP manager would accept as a matter of course that the shareholder interests he promotes are often at odds with the interests of the larger society. In contrast, this is what Eisenhower had to say about extremely rich oil magnates (and presumed SP cultural models) in a 1954 letter to his brother:
There is a tiny splinter group, of course, that believes you can do these things [abolish the New Deal]. Among them are H. L. Hunt (you possibly know his background), a few other Texas oil millionaires, and an occasional politician or business man from other areas. Their number is negligible and they are stupid.
Because the initial motivation for capitalist entrepreneurship is to achieve a financial return (i.e. get rich), financially orientated SP culture is the default during the early stages of capitalist development, when most firms are run by their founders or their heirs. The cause of a shift from SP to SC is a disruption in the normal functioning of capitalism that gives rise to a new business environment that makes financially based strategies less reproductively effective and organic-growth-based strategies more so. The Crash of 1929 and the subsequent Great Depression was such a disruption. It is likely not a coincidence that the journal articles defining the SP and SC cultural paradigms were published when they were. The business environment changed radically after 1929 in ways that made SC adaptive, as is described in the next section.
Which Environmental Changes Lead to Changing Business Culture?
Until about 1900 most large firms were run by their owners and so executive and shareholder interests were the same. In this situation SP is always favored. Business consolidation in the late nineteenth century and afterward resulted in the
Alexander: American Secular Cycle. Cliodynamics 10:1 (2019)
9
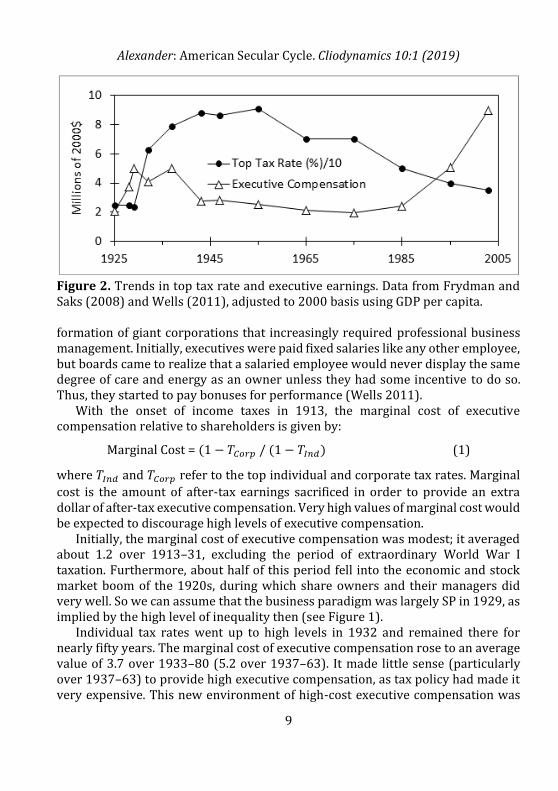
Figure 2. Trends in top tax rate and executive earnings. Data from Frydman and Saks (2008) and Wells (2011), adjusted to 2000 basis using GDP per capita. formation of giant corporations that increasingly required professional business management. Initially, executives were paid fixed salaries like any other employee, but boards came to realize that a salaried employee would never display the same degree of care and energy as an owner unless they had some incentive to do so. Thus, they started to pay bonuses for performance (Wells 2011). With the onset of income taxes in 1913, the marginal cost of executive compensation relative to shareholders is given by:
Marginal Cost = (1 − 𝑇𝐶𝑜𝑟𝑝 / (1 − 𝑇𝐼𝑛𝑑) (1)
where 𝑇𝐼𝑛𝑑 and 𝑇𝐶𝑜𝑟𝑝 refer to the top individual and corporate tax rates. Marginal
cost is the amount of after-tax earnings sacrificed in order to provide an extra dollar of after-tax executive compensation. Very high values of marginal cost would be expected to discourage high levels of executive compensation. Initially, the marginal cost of executive compensation was modest; it averaged about 1.2 over 1913–31, excluding the period of extraordinary World War I taxation. Furthermore, about half of this period fell into the economic and stock market boom of the 1920s, during which share owners and their managers did very well. So we can assume that the business paradigm was largely SP in 1929, as implied by the high level of inequality then (see Figure 1). Individual tax rates went up to high levels in 1932 and remained there for nearly fifty years. The marginal cost of executive compensation rose to an average value of 3.7 over 1933–80 (5.2 over 1937–63). It made little sense (particularly over 1937–63) to provide high executive compensation, as tax policy had made it very expensive. This new environment of high-cost executive compensation was
Alexander: American Secular Cycle. Cliodynamics 10:1 (2019)
10
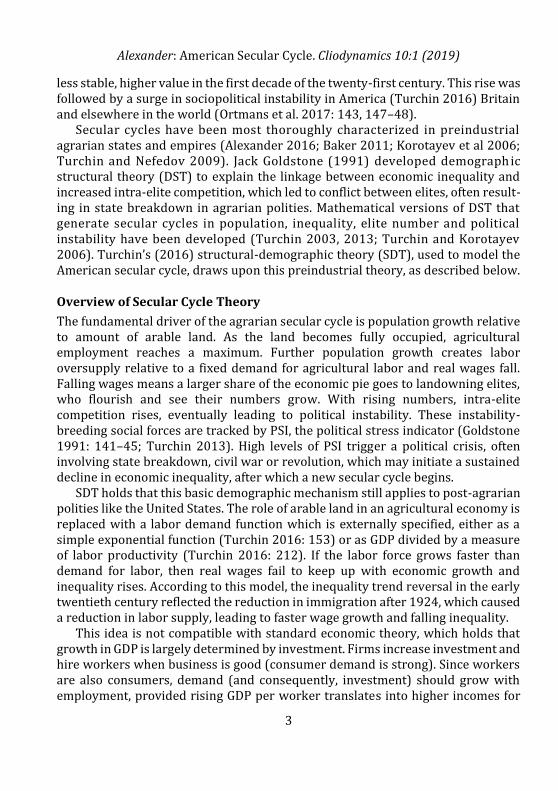
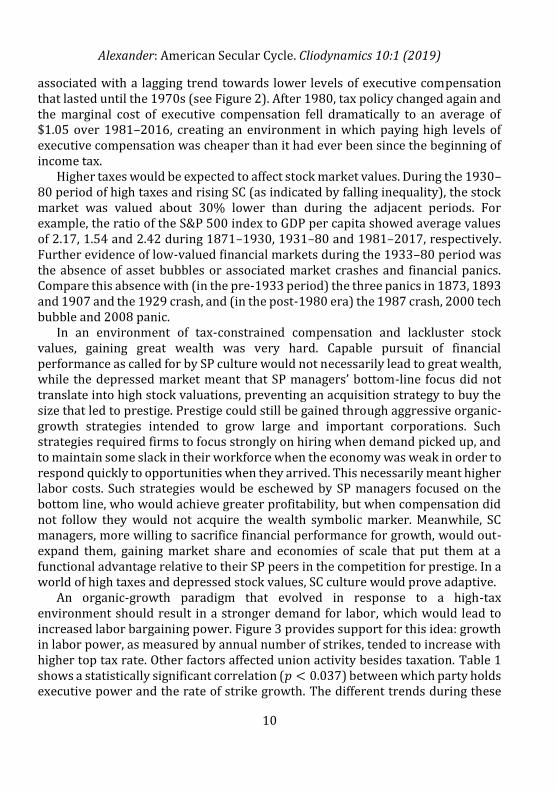
associated with a lagging trend towards lower levels of executive compensation that lasted until the 1970s (see Figure 2). After 1980, tax policy changed again and the marginal cost of executive compensation fell dramatically to an average of $1.05 over 1981–2016, creating an environment in which paying high levels of executive compensation was cheaper than it had ever been since the beginning of income tax. Higher taxes would be expected to affect stock market values. During the 1930–80 period of high taxes and rising SC (as indicated by falling inequality), the stock market was valued about 30% lower than during the adjacent periods. For example, the ratio of the S&P 500 index to GDP per capita showed average values of 2.17, 1.54 and 2.42 during 1871–1930, 1931–80 and 1981–2017, respectively. Further evidence of low-valued financial markets during the 1933–80 period was the absence of asset bubbles or associated market crashes and financial panics. Compare this absence with (in the pre-1933 period) the three panics in 1873, 1893 and 1907 and the 1929 crash, and (in the post-1980 era) the 1987 crash, 2000 tech bubble and 2008 panic. In an environment of tax-constrained compensation and lackluster stock values, gaining great wealth was very hard. Capable pursuit of financial performance as called for by SP culture would not necessarily lead to great wealth, while the depressed market meant that SP managers’ bottom-line focus did not translate into high stock valuations, preventing an acquisition strategy to buy the size that led to prestige. Prestige could still be gained through aggressive organic-growth strategies intended to grow large and important corporations. Such strategies required firms to focus strongly on hiring when demand picked up, and to maintain some slack in their workforce when the economy was weak in order to respond quickly to opportunities when they arrived. This necessarily meant higher labor costs. Such strategies would be eschewed by SP managers focused on the bottom line, who would achieve greater profitability, but when compensation did not follow they would not acquire the wealth symbolic marker. Meanwhile, SC managers, more willing to sacrifice financial performance for growth, would out-expand them, gaining market share and economies of scale that put them at a functional advantage relative to their SP peers in the competition for prestige. In a world of high taxes and depressed stock values, SC culture would prove adaptive. An organic-growth paradigm that evolved in response to a high-tax environment should result in a stronger demand for labor, which would lead to increased labor bargaining power. Figure 3 provides support for this idea: growth in labor power, as measured by annual number of strikes, tended to increase with higher top tax rate. Other factors affected union activity besides taxation. Table 1 shows a statistically significant correlation (𝑝 < 0.037) between which party holds executive power and the rate of strike growth. The different trends during these
Alexander: American Secular Cycle. Cliodynamics 10:1 (2019)
11
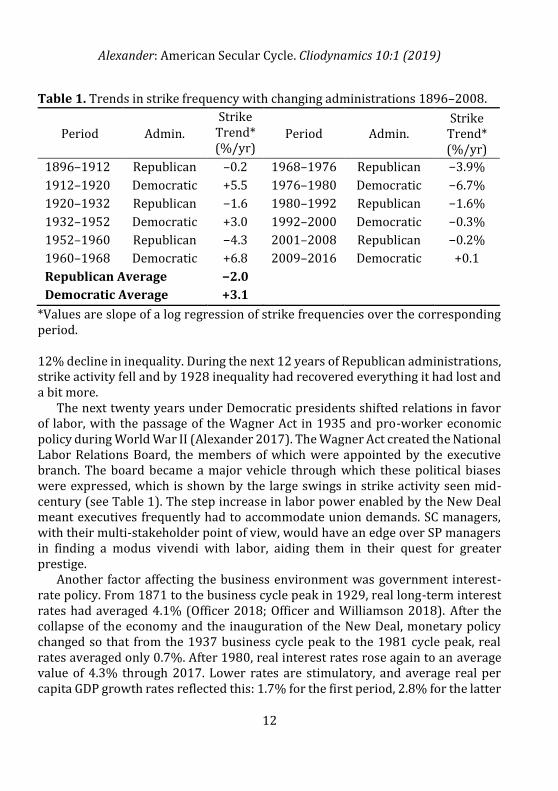
eras mostly reflected how the executive branch responded to labor-management conflicts, with Democratic administrations more sympathetic to the union side and Republican administrations more sympathetic towards management. For example, strike activity was largely flat during the 1896–1912 period of Republican rule. The inequality measure in Figure 1 rose 11% over this period. Strike activity rose strongly during the subsequent Democratic administration over 1912–20, with a
Figure 3. Higher tax rate promotes labor activity measured by strikes per year. Strike frequency is an exponential average (𝛼 = 0.05) of change in annual strike number. Strike data was obtained from the Bureau of Labor Statistics (n.d.) for the period after 1947 and from Mitchell (1998) for the period before.
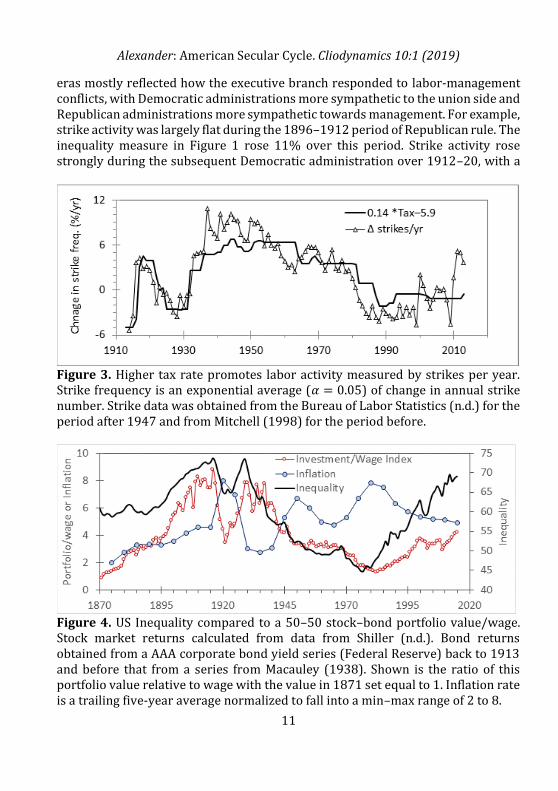
Figure 4. US Inequality compared to a 50–50 stock–bond portfolio value/wage. Stock market returns calculated from data from Shiller (n.d.). Bond returns obtained from a AAA corporate bond yield series (Federal Reserve) back to 1913 and before that from a series from Macauley (1938). Shown is the ratio of this portfolio value relative to wage with the value in 1871 set equal to 1. Inflation rate is a trailing five-year average normalized to fall into a min–max range of 2 to 8.
Alexander: American Secular Cycle. Cliodynamics 10:1 (2019)
12
Table 1. Trends in strike frequency with changing administrations 1896–2008.
Period Admin.
Strike Trend* (%/yr)
Period Admin. Strike
Trend* (%/yr)
1896–1912 Republican –0.2 1968–1976 Republican −3.9%
1912–1920 Democratic +5.5 1976–1980 Democratic −6.7%
1920–1932 Republican −1.6 1980–1992 Republican −1.6%
1932–1952 Democratic +3.0 1992–2000 Democratic −0.3%
1952–1960 Republican −4.3 2001–2008 Republican −0.2%
1960–1968 Democratic +6.8 2009–2016 Democratic +0.1
Republican Average −2.0
Democratic Average +3.1
*Values are slope of a log regression of strike frequencies over the corresponding period. 12% decline in inequality. During the next 12 years of Republican administrations, strike activity fell and by 1928 inequality had recovered everything it had lost and a bit more. The next twenty years under Democratic presidents shifted relations in favor of labor, with the passage of the Wagner Act in 1935 and pro-worker economic policy during World War II (Alexander 2017). The Wagner Act created the National Labor Relations Board, the members of which were appointed by the executive branch. The board became a major vehicle through which these political biases were expressed, which is shown by the large swings in strike activity seen mid-century (see Table 1). The step increase in labor power enabled by the New Deal meant executives frequently had to accommodate union demands. SC managers, with their multi-stakeholder point of view, would have an edge over SP managers in finding a modus vivendi with labor, aiding them in their quest for greater prestige. Another factor affecting the business environment was government interest-rate policy. From 1871 to the business cycle peak in 1929, real long-term interest rates had averaged 4.1% (Officer 2018; Officer and Williamson 2018). After the collapse of the economy and the inauguration of the New Deal, monetary policy changed so that from the 1937 business cycle peak to the 1981 cycle peak, real rates averaged only 0.7%. After 1980, real interest rates rose again to an average value of 4.3% through 2017. Lower rates are stimulatory, and average real per capita GDP growth rates reflected this: 1.7% for the first period, 2.8% for the latter
Alexander: American Secular Cycle. Cliodynamics 10:1 (2019)
13
and 1.8% for the third. This stronger growth potential also aided the organic-growth strategies called for by SC culture. Finally, inflation can affect inequality. Figure 4 shows a plot of the cumulative return on a hypothetical American investment portfolio relative to wage gains. This portfolio consists of 50% bonds and 50% stocks. Figure 4 shows how three periods of elevated inflation impacted financial returns in America. The impact of WWI inflation on portfolio value was very great. This experience was an important factor in generating political support for high taxes and price controls to deal with the inflation potential anticipated to come from WWII (Alexander 2017).
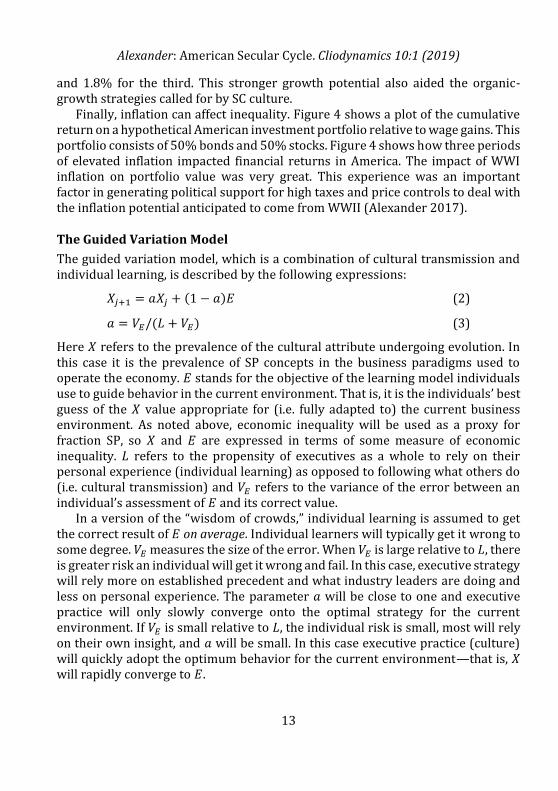
The Guided Variation Model
The guided variation model, which is a combination of cultural transmission and individual learning, is described by the following expressions:
𝑋𝑗+1 = 𝑎𝑋𝑗 + (1 − 𝑎)𝐸 (2)
𝑎 = 𝑉𝐸/(𝐿 + 𝑉𝐸) (3)
Here 𝑋 refers to the prevalence of the cultural attribute undergoing evolution. In this case it is the prevalence of SP concepts in the business paradigms used to operate the economy. 𝐸 stands for the objective of the learning model individuals use to guide behavior in the current environment. That is, it is the individuals’ best guess of the 𝑋 value appropriate for (i.e. fully adapted to) the current business environment. As noted above, economic inequality will be used as a proxy for fraction SP, so 𝑋 and 𝐸 are expressed in terms of some measure of economic inequality. 𝐿 refers to the propensity of executives as a whole to rely on their personal experience (individual learning) as opposed to following what others do (i.e. cultural transmission) and 𝑉𝐸 refers to the variance of the error between an individual’s assessment of 𝐸 and its correct value. In a version of the “wisdom of crowds,” individual learning is assumed to get the correct result of 𝐸 on average. Individual learners will typically get it wrong to some degree. 𝑉𝐸 measures the size of the error. When 𝑉𝐸 is large relative to 𝐿, there is greater risk an individual will get it wrong and fail. In this case, executive strategy will rely more on established precedent and what industry leaders are doing and less on personal experience. The parameter 𝑎 will be close to one and executive practice will only slowly converge onto the optimal strategy for the current environment. If 𝑉𝐸 is small relative to 𝐿, the individual risk is small, most will rely on their own insight, and 𝑎 will be small. In this case executive practice (culture) will quickly adopt the optimum behavior for the current environment—that is, 𝑋 will rapidly converge to 𝐸.
Alexander: American Secular Cycle. Cliodynamics 10:1 (2019)
14
The model is structured so that, every year, executives collectively take stock of their experiences in the current environment (individual learning) plus what they already know or have learned from observing what their peers do (cultural transmission) to adjust their practices and so transform their old practices/culture in year k (𝑋𝑘) into their new ones in the next year (𝑋𝑘+1).
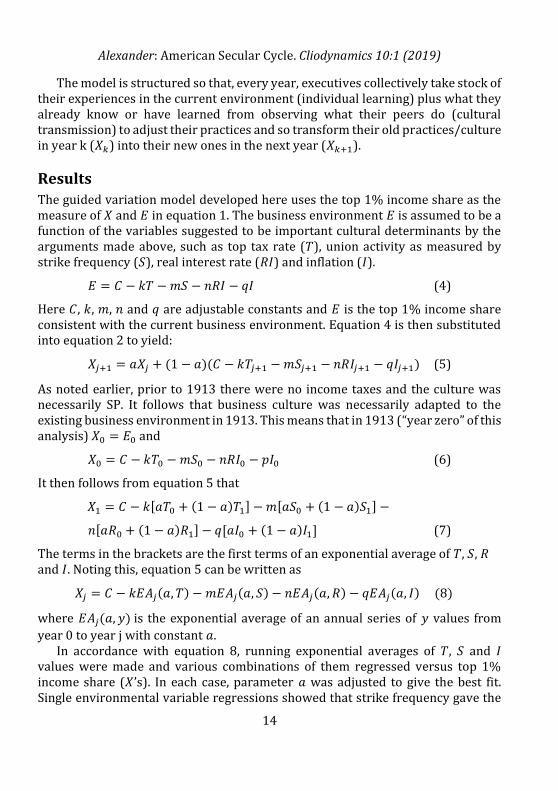
Results
The guided variation model developed here uses the top 1% income share as the measure of 𝑋 and 𝐸 in equation 1. The business environment 𝐸 is assumed to be a function of the variables suggested to be important cultural determinants by the arguments made above, such as top tax rate (𝑇), union activity as measured by strike frequency (𝑆), real interest rate (𝑅𝐼) and inflation (𝐼).
𝐸 = 𝐶 − 𝑘𝑇 − 𝑚𝑆 − 𝑛𝑅𝐼 − 𝑞𝐼 (4)
Here 𝐶, 𝑘, 𝑚, 𝑛 and 𝑞 are adjustable constants and 𝐸 is the top 1% income share consistent with the current business environment. Equation 4 is then substituted into equation 2 to yield:
𝑋𝑗+1 = 𝑎𝑋𝑗 + (1 − 𝑎)(𝐶 − 𝑘𝑇𝑗+1 − 𝑚𝑆𝑗+1 − 𝑛𝑅𝐼𝑗+1 − 𝑞𝐼𝑗+1) (5)
As noted earlier, prior to 1913 there were no income taxes and the culture was necessarily SP. It follows that business culture was necessarily adapted to the existing business environment in 1913. This means that in 1913 (“year zero” of this analysis) 𝑋0 = 𝐸0 and
𝑋0 = 𝐶 − 𝑘𝑇0 − 𝑚𝑆0 − 𝑛𝑅𝐼0 − 𝑝𝐼0 (6)
It then follows from equation 5 that
𝑋1 = 𝐶 − 𝑘[𝑎𝑇0 + (1 − 𝑎)𝑇1] − 𝑚[𝑎𝑆0 + (1 − 𝑎)𝑆1] −
𝑛[𝑎𝑅0 + (1 − 𝑎)𝑅1] − 𝑞[𝑎𝐼0 + (1 − 𝑎)𝐼1] (7)
The terms in the brackets are the first terms of an exponential average of 𝑇, 𝑆, 𝑅 and 𝐼. Noting this, equation 5 can be written as
𝑋𝑗 = 𝐶 − 𝑘𝐸𝐴𝑗(𝑎, 𝑇) − 𝑚𝐸𝐴𝑗(𝑎, 𝑆) − 𝑛𝐸𝐴𝑗(𝑎, 𝑅) − 𝑞𝐸𝐴𝑗(𝑎, 𝐼) (8)
where 𝐸𝐴𝑗(𝑎, 𝑦) is the exponential average of an annual series of 𝑦 values from
year 0 to year j with constant 𝑎. In accordance with equation 8, running exponential averages of 𝑇, 𝑆 and 𝐼 values were made and various combinations of them regressed versus top 1% income share (𝑋’s). In each case, parameter 𝑎 was adjusted to give the best fit. Single environmental variable regressions showed that strike frequency gave the
Alexander: American Secular Cycle. Cliodynamics 10:1 (2019)
15
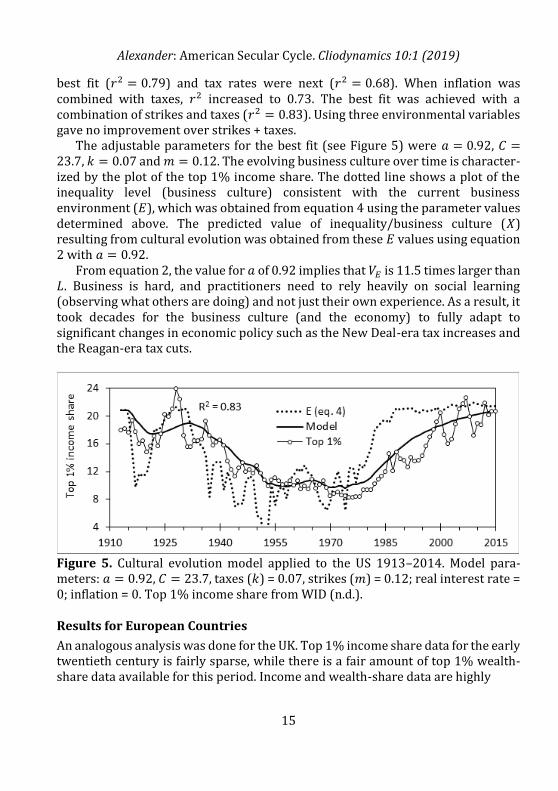
best fit (𝑟2 = 0.79) and tax rates were next (𝑟2 = 0.68). When inflation was combined with taxes, 𝑟2 increased to 0.73. The best fit was achieved with a combination of strikes and taxes (𝑟2 = 0.83). Using three environmental variables gave no improvement over strikes + taxes. The adjustable parameters for the best fit (see Figure 5) were 𝑎 = 0.92, 𝐶 =23.7, 𝑘 = 0.07 and 𝑚 = 0.12. The evolving business culture over time is character-ized by the plot of the top 1% income share. The dotted line shows a plot of the inequality level (business culture) consistent with the current business environment (𝐸), which was obtained from equation 4 using the parameter values determined above. The predicted value of inequality/business culture (𝑋) resulting from cultural evolution was obtained from these 𝐸 values using equation 2 with 𝑎 = 0.92. From equation 2, the value for 𝑎 of 0.92 implies that 𝑉𝐸 is 11.5 times larger than 𝐿. Business is hard, and practitioners need to rely heavily on social learning (observing what others are doing) and not just their own experience. As a result, it took decades for the business culture (and the economy) to fully adapt to significant changes in economic policy such as the New Deal-era tax increases and the Reagan-era tax cuts.
Figure 5. Cultural evolution model applied to the US 1913–2014. Model para-meters: 𝑎 = 0.92, 𝐶 = 23.7, taxes (𝑘) = 0.07, strikes (𝑚) = 0.12; real interest rate = 0; inflation = 0. Top 1% income share from WID (n.d.).
Results for European Countries
An analogous analysis was done for the UK. Top 1% income share data for the early twentieth century is fairly sparse, while there is a fair amount of top 1% wealth-share data available for this period. Income and wealth-share data are highly
Alexander: American Secular Cycle. Cliodynamics 10:1 (2019)
16
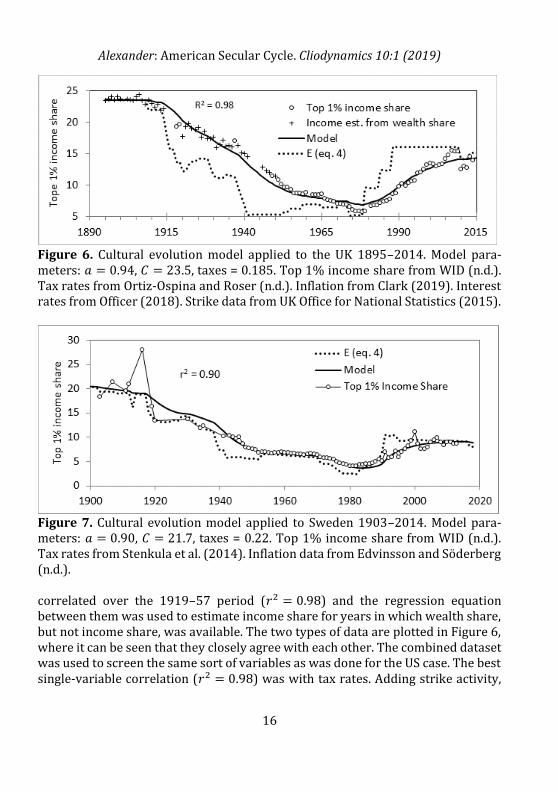
Figure 6. Cultural evolution model applied to the UK 1895–2014. Model para- meters: 𝑎 = 0.94, 𝐶 = 23.5, taxes = 0.185. Top 1% income share from WID (n.d.). Tax rates from Ortiz-Ospina and Roser (n.d.). Inflation from Clark (2019). Interest rates from Officer (2018). Strike data from UK Office for National Statistics (2015).
Figure 7. Cultural evolution model applied to Sweden 1903–2014. Model para- meters: 𝑎 = 0.90, 𝐶 = 21.7, taxes = 0.22. Top 1% income share from WID (n.d.). Tax rates from Stenkula et al. (2014). Inflation data from Edvinsson and Söderberg (n.d.). correlated over the 1919–57 period (𝑟2 = 0.98) and the regression equation between them was used to estimate income share for years in which wealth share, but not income share, was available. The two types of data are plotted in Figure 6, where it can be seen that they closely agree with each other. The combined dataset was used to screen the same sort of variables as was done for the US case. The best single-variable correlation (𝑟2 = 0.98) was with tax rates. Adding strike activity,
Alexander: American Secular Cycle. Cliodynamics 10:1 (2019)
17
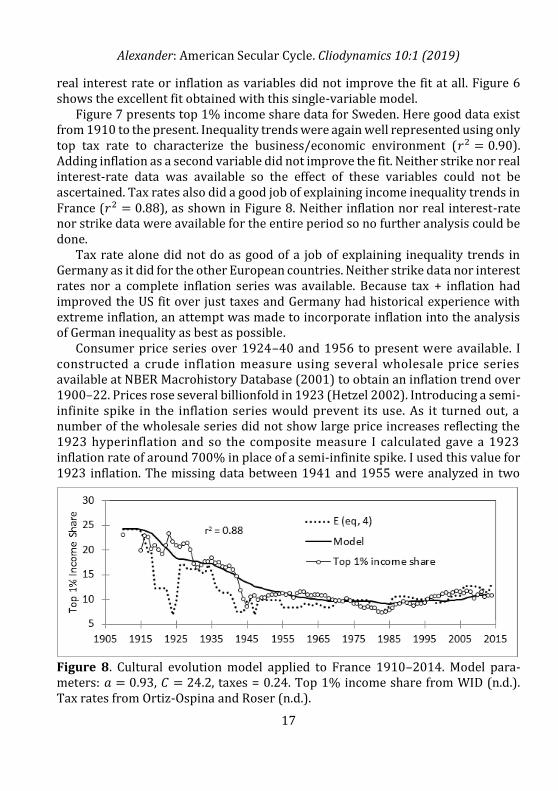
real interest rate or inflation as variables did not improve the fit at all. Figure 6 shows the excellent fit obtained with this single-variable model. Figure 7 presents top 1% income share data for Sweden. Here good data exist from 1910 to the present. Inequality trends were again well represented using only top tax rate to characterize the business/economic environment (𝑟2 = 0.90). Adding inflation as a second variable did not improve the fit. Neither strike nor real interest-rate data was available so the effect of these variables could not be ascertained. Tax rates also did a good job of explaining income inequality trends in France (𝑟2 = 0.88), as shown in Figure 8. Neither inflation nor real interest-rate nor strike data were available for the entire period so no further analysis could be done. Tax rate alone did not do as good of a job of explaining inequality trends in Germany as it did for the other European countries. Neither strike data nor interest rates nor a complete inflation series was available. Because tax + inflation had improved the US fit over just taxes and Germany had historical experience with extreme inflation, an attempt was made to incorporate inflation into the analysis of German inequality as best as possible. Consumer price series over 1924–40 and 1956 to present were available. I constructed a crude inflation measure using several wholesale price series available at NBER Macrohistory Database (2001) to obtain an inflation trend over 1900–22. Prices rose several billionfold in 1923 (Hetzel 2002). Introducing a semi-infinite spike in the inflation series would prevent its use. As it turned out, a number of the wholesale series did not show large price increases reflecting the 1923 hyperinflation and so the composite measure I calculated gave a 1923 inflation rate of around 700% in place of a semi-infinite spike. I used this value for 1923 inflation. The missing data between 1941 and 1955 were analyzed in two
Figure 8. Cultural evolution model applied to France 1910–2014. Model para- meters: 𝑎 = 0.93, 𝐶 = 24.2, taxes = 0.24. Top 1% income share from WID (n.d.). Tax rates from Ortiz-Ospina and Roser (n.d.).
Alexander: American Secular Cycle. Cliodynamics 10:1 (2019)
18
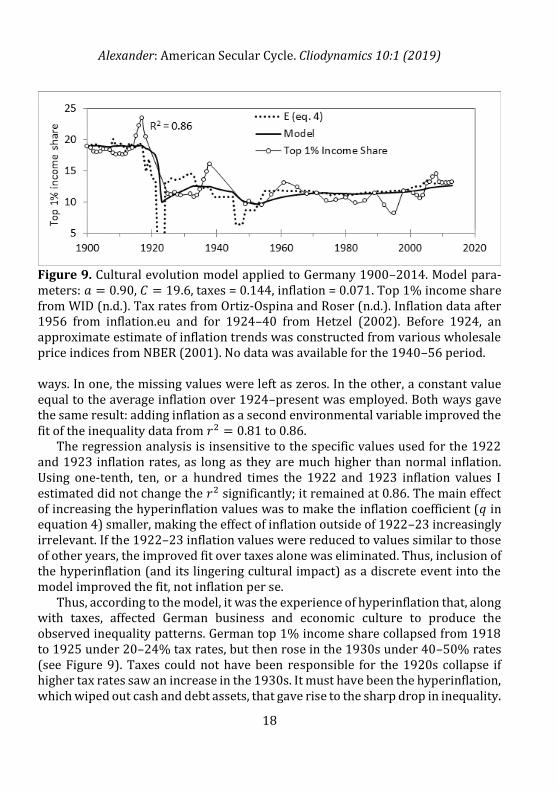
Figure 9. Cultural evolution model applied to Germany 1900–2014. Model para- meters: 𝑎 = 0.90, 𝐶 = 19.6, taxes = 0.144, inflation = 0.071. Top 1% income share from WID (n.d.). Tax rates from Ortiz-Ospina and Roser (n.d.). Inflation data after 1956 from inflation.eu and for 1924–40 from Hetzel (2002). Before 1924, an approximate estimate of inflation trends was constructed from various wholesale price indices from NBER (2001). No data was available for the 1940–56 period. ways. In one, the missing values were left as zeros. In the other, a constant value equal to the average inflation over 1924–present was employed. Both ways gave the same result: adding inflation as a second environmental variable improved the fit of the inequality data from 𝑟2 = 0.81 to 0.86. The regression analysis is insensitive to the specific values used for the 1922 and 1923 inflation rates, as long as they are much higher than normal inflation. Using one-tenth, ten, or a hundred times the 1922 and 1923 inflation values I estimated did not change the 𝑟2 significantly; it remained at 0.86. The main effect of increasing the hyperinflation values was to make the inflation coefficient (𝑞 in equation 4) smaller, making the effect of inflation outside of 1922–23 increasingly irrelevant. If the 1922–23 inflation values were reduced to values similar to those of other years, the improved fit over taxes alone was eliminated. Thus, inclusion of the hyperinflation (and its lingering cultural impact) as a discrete event into the model improved the fit, not inflation per se. Thus, according to the model, it was the experience of hyperinflation that, along with taxes, affected German business and economic culture to produce the observed inequality patterns. German top 1% income share collapsed from 1918 to 1925 under 20–24% tax rates, but then rose in the 1930s under 40–50% rates (see Figure 9). Taxes could not have been responsible for the 1920s collapse if higher tax rates saw an increase in the 1930s. It must have been the hyperinflation, which wiped out cash and debt assets, that gave rise to the sharp drop in inequality.

Alexander: American Secular Cycle. Cliodynamics 10:1 (2019)
19
According to the model, this brief period of hyperinflation left a cultural imprint (as modeled by the exponential average) that continued to exert effects after the inflation was over. Note the difference in the 1920s and 1930s between the environment (dotted line) and the predicted culture (solid line) in Figure 9. The environment implied rising inequality immediately after 1923, peaking in 1932, and then a sharp decline as tax rates rose. The data shows a large drop after WWI, stability through the mid-1930s, a brief rise, and then decline after 1938. The model shows a sharp drop due to the hyperinflation followed by a period of recovery, with the inequality decline beginning in the late 1930s, which is a closer approximation to reality than the environment model (dotted line). That is, the cultural model was still registering some residual effects of the hyperinflation after it had ended.
Discussion
Polynomial regressions were run on the inequality data for all five countries to compare the fit obtained with the cultural evolution model (CEM) to that from an arbitrary unstructured model with the same number of parameters. The 𝑟2 values of 0.98 for Britain and 0.86 for Germany obtained with CEM were dramatically better than the 0.69 𝑟2 seen with polynomials for both countries. For the US, the 𝑟2 of 0.83 with achieved with CEM was modestly better than the 0.76 𝑟2 obtained with the polynomial. The CEM 𝑟2 of 0.90 for Sweden was only marginally better than the polynomial 𝑟2 of 0.86, while the CEM fit for France was slightly worse (𝑟2 = 0.88 vs. 0.90). In 80% of the cases, CEM possessed one of the basic properties of a good explanatory model—it did a better job of representing the data than an arbitrary curve-fitting model. A key feature of CEM is the effect of the cultural learning variable a on the environmental variables of taxes, inflation and strike frequency. In the absence of the smoothing effect provided by the exponential average, the fits achieved with regression models using the environmental variables alone were worse than those obtained with a polynomial in 80% of the cases. This exponential average arises out of equation 2, which reflects the Bayesian-analog learning model employed in the derivation of the guided variation cultural evolution model (see Boyd and Richerson 1985: 95). The interaction between the environmental variables and inequality is mediated through culture, which was modeled with the exponential average. Culture was assumed as a mix of two hypothetical archetypes assumed to be correlated with inequality. These archetypes were not invented for use in this model. Rather, they reflect a preexisting concept of shareholder versus stakeholder capitalism and their relation to economic inequality (Ireland 2005).
Alexander: American Secular Cycle. Cliodynamics 10:1 (2019)
20
Piketty’s Explanation for Inequality
Piketty’s explanation for rising inequality is that return to wealth (𝑟) is greater than GDP growth (𝑔). This concept is developed further here into the Pikettian model. GDP growth can be divided into two components: growth per capita (𝑔𝑃𝐶) and population growth (𝑝):
𝑔 = 𝑔𝑃𝐶 + 𝑝 (9)
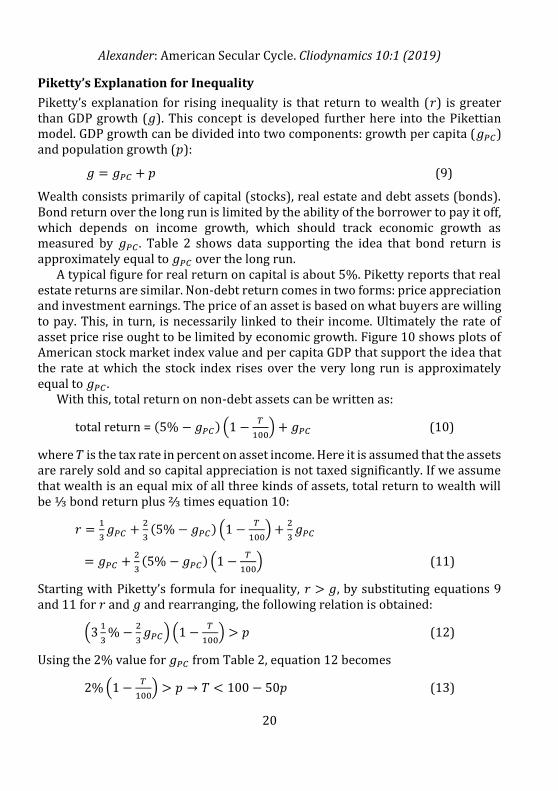
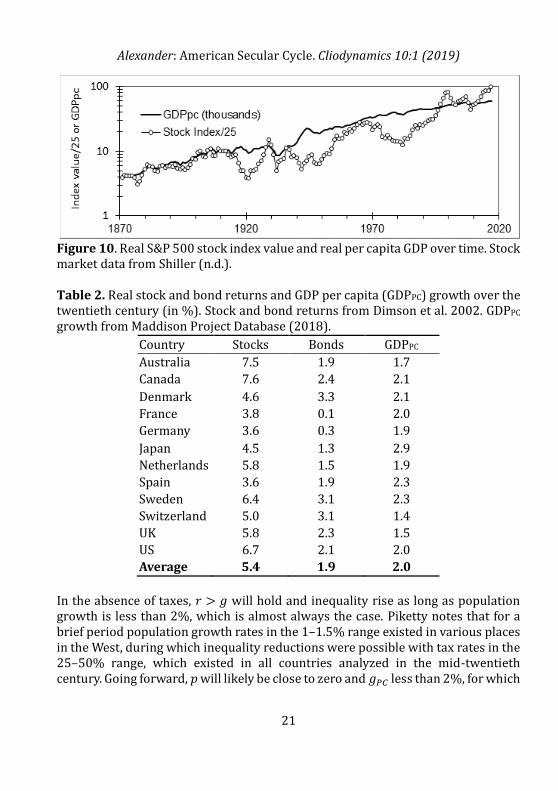
Wealth consists primarily of capital (stocks), real estate and debt assets (bonds). Bond return over the long run is limited by the ability of the borrower to pay it off, which depends on income growth, which should track economic growth as measured by 𝑔𝑃𝐶 . Table 2 shows data supporting the idea that bond return is approximately equal to 𝑔𝑃𝐶 over the long run. A typical figure for real return on capital is about 5%. Piketty reports that real estate returns are similar. Non-debt return comes in two forms: price appreciation and investment earnings. The price of an asset is based on what buyers are willing to pay. This, in turn, is necessarily linked to their income. Ultimately the rate of asset price rise ought to be limited by economic growth. Figure 10 shows plots of American stock market index value and per capita GDP that support the idea that the rate at which the stock index rises over the very long run is approximately equal to 𝑔𝑃𝐶 . With this, total return on non-debt assets can be written as:
total return = (5% − 𝑔𝑃𝐶) (1 −𝑇
100) + 𝑔𝑃𝐶 (10)
where 𝑇 is the tax rate in percent on asset income. Here it is assumed that the assets are rarely sold and so capital appreciation is not taxed significantly. If we assume that wealth is an equal mix of all three kinds of assets, total return to wealth will be ⅓ bond return plus ⅔ times equation 10:
𝑟 =1
3𝑔𝑃𝐶 +
2
3(5% − 𝑔𝑃𝐶) (1 −
𝑇
100) +
2
3𝑔𝑃𝐶
= 𝑔𝑃𝐶 +2
3(5% − 𝑔𝑃𝐶) (1 −
𝑇
100) (11)
Starting with Piketty’s formula for inequality, 𝑟 > 𝑔, by substituting equations 9 and 11 for 𝑟 and 𝑔 and rearranging, the following relation is obtained:
(31
3% −
2
3𝑔𝑃𝐶) (1 −
𝑇
100) > 𝑝 (12)
Using the 2% value for 𝑔𝑃𝐶 from Table 2, equation 12 becomes
2% (1 −𝑇
100) > 𝑝 → 𝑇 < 100 − 50𝑝 (13)
Alexander: American Secular Cycle. Cliodynamics 10:1 (2019)
21
Figure 10. Real S&P 500 stock index value and real per capita GDP over time. Stock market data from Shiller (n.d.). Table 2. Real stock and bond returns and GDP per capita (GDPPC) growth over the twentieth century (in %). Stock and bond returns from Dimson et al. 2002. GDPPC growth from Maddison Project Database (2018).
Country Stocks Bonds GDPPC
Australia 7.5 1.9 1.7
Canada 7.6 2.4 2.1
Denmark 4.6 3.3 2.1
France 3.8 0.1 2.0
Germany 3.6 0.3 1.9
Japan 4.5 1.3 2.9
Netherlands 5.8 1.5 1.9
Spain 3.6 1.9 2.3
Sweden 6.4 3.1 2.3
Switzerland 5.0 3.1 1.4
UK 5.8 2.3 1.5
US 6.7 2.1 2.0
Average 5.4 1.9 2.0
In the absence of taxes, 𝑟 > 𝑔 will hold and inequality rise as long as population growth is less than 2%, which is almost always the case. Piketty notes that for a brief period population growth rates in the 1–1.5% range existed in various places in the West, during which inequality reductions were possible with tax rates in the 25–50% range, which existed in all countries analyzed in the mid-twentieth century. Going forward, 𝑝 will likely be close to zero and 𝑔𝑃𝐶 less than 2%, for which
Alexander: American Secular Cycle. Cliodynamics 10:1 (2019)
22
even confiscatory income taxes will not be enough prevent rising inequality, hence his call for a wealth tax (which taxes wealth appreciation as well as its earnings).
Note that a negative effect of tax rate on inequality falls directly out of Piketty’s 𝑟 > 𝑔 concept. The finding that tax rate played the major role in explaining inequality trends in Europe is consistent with the Pikettian model.
The Pikettian Model Does Not Explain the US Experience
The Pikettian model effect of taxation does not involve culture. It is the same sort of effect of taxes shown by the portfolio analysis (red line) in Figure 4. That analysis can explain only some of the post-1980 rise in American inequality, however. As Piketty shows, perhaps half of the rise in inequality in the US since 1980 was due to rising labor compensation, not income from wealth. This is also illustrated by the trends in portfolio value and executive compensation shown in Figures 2 and 4. Since 1980, portfolio value relative to wage doubled (Figure 4) while executive income adjusted for economic growth quadrupled (Figure 2), indicating a larger impact of labor income on inequality. Although taxes directly affect wealth accumulation (historically most return comes from investment income, not price appreciation) they do not affect pre-tax labor compensation. Thus, the direct impact of taxation could not explain the entirety of the post-1980 American inequality rise. This is why a cultural approach was taken in this article. Because top 1% labor compensation did not rise in Europe to the extent it did in America, it is possible that cultural evolution was not a factor in Europe.
Cultural Evolution Is Likely Involved in European Inequality Trends Also
Just as rising inequality in labor compensation in the US requires an explanation, so does its absence in Europe. American executives were able to reap a larger com-pensation for doing the exact same job a previous generation of executives did for less. Presumably, European executives would like to have achieved such lofty com-pensation as well, particularly when their American peers were doing so. Yet they did not. Explanations for this failure often invoke structural or cultural differences be-tween Europe and the United States (Conyon and Murphy 2000; Derousseau 2014; Pollard 2012). Economic policy and business practice in Europe feature a stronger welfare state and a larger role for labor unions in economic and business management than in the US. Under German “Rhine capitalism,” labor unions participate in corporate governance (Kreijger 2017) while under the “Nordic model” in Sweden, unions run the unemployment insurance system (Mathews 2017). Unions in France bargain at the sector level in which wages and working conditions are negotiated for entire industries rather than individual companies as

Alexander: American Secular Cycle. Cliodynamics 10:1 (2019)
23
in America (Mathews 2017). French labor law is characterized by both social public order and employees’ protection (in order to restore “the balance of power”), whereas American labor law rests on the “balancing of power” by actors themselves. Even though working relationships are considered as contractual relations of private law in France, they are subjected to public-order rules intended to protect the weaker party of the contract (Chassagnon and Baudry 2016: 6). These descriptions seem similar in effect to what I presented as stakeholder capitalism culture in America. In fact, Piketty (2014: 145) refers to “Rhenish capitalism” as the stakeholder model. These observations suggest that pro-worker cultural elements, for example the welfare state, Rhine capitalism, and the Nordic model, played a role in falling inequality in Europe in addition to taxes. The incorporation of a workers’ perspective into economic/business institutions in Europe could have provided an inequality-reducing influence on European cultural evolution analogous to the effect of strike activity in America. Tax policy packed a bigger punch in Europe than America; the coefficient for tax rates in the European CEMs averaged 0.19, compared to 0.07 for America. This cannot be due to a Pikettian effect of taxes, which would be about the same for all. If tax rate is considered as a proxy for pro-worker government economic policy in parallel with the direct effect of taxes, the existence of pro-worker institutional structures in Europe could act as a “force multiplier” on the effect of tax rate in Europe. Without this force multiplier, the effect of taxes was too weak to achieve European-scale inequality reduction effects in America without sustained strike activity. Without pro-worker institutions, inequality reductions in America would dissipate were labor to become unable to strike effectively, as happened in the 1970s. Note how the dotted line in Figure 5 rose 60% over the four years before the first Reagan tax cut in 1981. With the incorporation of pro-labor elements directly into economic/business policy, the reduction in inequality achieved in Europe was harder to disrupt by political forces seeking higher inequality. As a result, the evolution of inequality followed a different trajectory in Europe than in America, as described below. Inequality profiles fall into two categories: the French, Swedish and German inequality profiles are L-shaped (see Figures 7–9), while the American and British are U-shaped (see Figures 5–6). Examination of the business environments (dotted lines) shows the difference between the two. The dotted line for America (see Figure 5) began a decade-long rise in the late 1970s, reflecting the 24% drop in labor power during the Carter administration, followed by tax cuts and a further 18% decline in labor power during the Reagan-Bush administrations. The dotted line for Britain showed a coincident rise (see Figure 6), reflecting the large tax cuts and privatization of nationalized industries implemented by the Thatcher
Alexander: American Secular Cycle. Cliodynamics 10:1 (2019)
24
administration and subsequent Tory administrations. Together these achieved a partial recovery of inequality to pre-WWI levels. Top rates fell more gradually and to a lesser degree in Sweden, France, and Germany, as shown by the smaller rise in the dotted lines in Figures 5, 7 and 9. A possibly relevant difference between the U-shaped and L-shaped countries was the degree to which stakeholder culture was integrated with institutions. In L-shaped countries, stakeholder capitalism had structural components that provided a cultural inertia, preventing conservatives from rapidly achieving large inequality gains. In contrast, stakeholder culture in America and Britain was imposed on a largely unchanged economic/business structure by high taxes and the pro-union bias of the Democratic and Labour parties. In these countries, stakeholder capitalism would decline if the political power of pro-union parties diminished. Inequality gains were largest in the US, where there never had been a labor party. Cooperation between Democrats and organized labor had always been an alliance of convenience, which ended in the post-civil rights era when a pro-union stance became less electorally advantageous. In Britain, where unions had their own party, the potential for a reinvigorated Labour party may have limited the extent of inequality gains achievable.
Inequality Trends among the Five Nations are Synchronous
All five nations begin a long-term decline in inequality, known as the Great Compression (Goldin and Margo 1991), at about the same time: Britain in 1914, Sweden in 1917, France and the US in 1930, and Germany between 1918 and 1925. Since tax policy was an important factor in the evolution of inequality in the five nations examined here, it is instructive to see when substantial taxes were first imposed in each nation. Top rates first reached 60% or higher in Britain, France and the US over 1917–23. These counties were all belligerents in WWII, and raised their taxes because of the war. As noted earlier, Germany’s Great Compression was probably initiated by the 1923 hyperinflation, which was also a product of the war. Interestingly, France and the US did not begin their Great Compressions because of WWI; rather, they came later, in 1930, with the start of the Great Depression. This is because both countries, after raising taxes to very high levels because of the war, cut them dramatically afterward, from 72% to 30% in France, and 77% to 24% in the US. This is shown by the upsurges in the dotted line during the 1920s in these countries and not the others. For four of the nations examined here, the Great Compression was approximately synchronous because of two events that affected all of them: WWI and the Great Depression. Given these external factors, the evolution of inequality in each country can be explained by national-level factors. Sweden’s Great Compression began during WWI, even though Sweden was not a belligerent and its tax rates did not reach 60% until two decades after the war.
Alexander: American Secular Cycle. Cliodynamics 10:1 (2019)
25
Swedish income taxes began in 1862, before any of the other countries, and showed a rising trend of about 40% per decade until 1978. Sweden’s Great Compression appears to have been the cumulative effect of a sustained program of rising taxes, which led to the lowest level of inequality of all five countries analyzed. Sweden appears to have developed an inequality-reducing, progressive national culture during the period of rising taxation independent of any external factors. Inequality began a rising trend in the 1970s and 1980s in all these countries except Germany. Synchronicity again reflected an external factor, the collapse of the Bretton Woods system. In 1944 the leading economies agreed to operate under a dollar standard to replace the gold standard, which had been suspended during the Depression and WWII. The US dollar was to be used for settling accounts between nations in the same way as gold had previously been used. The dollars could still be converted into gold by the US Treasury, which held large supplies of the metal at Fort Knox, Kentucky. Although the $35/oz exchange value adopted under Bretton Woods was quite appropriate in 1944, the “true value” of gold in dollars roughly doubled in the quarter century afterward. As the discrepancy between the official dollar price for gold and its true value in terms of goods became too extreme not to notice, increasing amounts of gold were exchanged for dollar reserves collected by foreign central banks. The ominous decline in US gold reserves eventually forced President Nixon to end gold–dollar interconvertibility in 1971. When this happened, gold began to trade freely. By 1973 gold prices had topped $100. This evidence that the dollar was truly worth a fraction of what the official $35 gold price had implied led to a bull market in commodities (Dennin 2016). In this environment the OPEC oil cartel massively increased oil prices, leading to the 1973 oil crisis and a decade of high inflation. The response to the 1970s inflationary crisis was aggressive action by central banks to contain inflation using high interest-rate policy. Such policy works by slowing consumer income growth, constraining consumers’ ability to pay higher prices. In the US, the Republican party had long supported higher taxes, when necessary, to prevent government deficits because they had believed deficits led to inflation. With the Federal Reserve providing inflation control, there was no longer any need for balanced budgets and Republicans were free to cut taxes and run deficits. The British response was similar to that of the US: the Bank of England took steps to bring inflation under control and the Tories cut taxes in response. Central banks in Europe played similar roles to the Federal Reserve to deal with the inflation problem, with the greatest success achieved by the German Bundesbank. Inflation rates were the lowest and subsequent tax cuts the smallest of the five countries examined here. As a result, Germany saw no significant rise in inequality from the end of postwar occupation to the 2008 financial crisis.

Alexander: American Secular Cycle. Cliodynamics 10:1 (2019)
26
Conclusions
The CEM provides a plausible explanation for observed trends in inequality in five countries over the past century. In most cases it gave a better fit of the data than a polynomial fit implying the CEM has a non-zero degree of explanatory power. CEM provides a way to combine verbal arguments invoking culture with data-driven assessments like that provided by Piketty (2014) to provide a more complete ac-count of inequality trends over the past century.
References
Alexander, Michael A. 2016. “Application of Mathematical Models to English Secular Cycles.” Cliodynamics 7 (1): 76–108. doi: 10.21237/C7clio7128325.
Alexander, Michael A. 2017. “Involvement of a Capitalist Crisis in the 1900–30 Inequality Trend Reversal.” Cliodynamics 8 (1): 18–47.
doi: 10.21237/C7clio8133347. Baker, David C. 2011. “The Roman Dominate from the Perspective of Demographic-
Structural Theory.” Cliodynamics 2 (2): 217–51. doi: 10.21237/C7clio22216. Berle, Adolf A. 1931. “Corporate Powers as Powers in Trust.” Harvard Law Review
44: 1049–74. Berle, Adolf A. 1954. The 20th Century Capitalist Revolution. New York: Harcourt,
Brace. Bourne, Jenny. 2008. “Slavery in the United States.” EH.Net Encyclopedia.
https://eh.net/encyclopedia/slavery-in-the-united-states. Boyd, Robert, and Peter J. Richerson. 1985. Culture and the Evolutionary Process.
Chicago: University of Chicago Press. Brainyquote. n.d. “Ted Turner Quotes.” https://www.brainyquote.com/quotes/ted_turner_378800. Bureau of the Census. 1975. “Labor Force Series D1–162.” In Historical Statistics
of the United States, Colonial Times to 1970. https://www2.census.gov/library/publications/1975/compendia/hist_stats_colonial-1970/hist_stats_colonial-1970p1-chD.pdf.
Bureau of Economic Analysis. n.d. National Income and Product Accounts. http://www.economagic.com/em-cgi/data.exe/nipa/A1010-W273RC.
Bureau of Labor Statistics. n.d. “Work Stoppages Involving 1,000 or More Workers, 1947–2017.” https://www.bls.gov/news.release/wkstp.t01.htm.
Chassagnon, Virgile, and Bernard Baudry. 2016. “American versus French Labor and Employment Law: A Critical Review of the Analysis of Employment Relationship in Contract Economic Theories.” Archive ouverte en Sciences de l'Homme et de la Société. No. 01371014.
https://halshs.archives-ouvertes.fr/halshs-01371014.
Alexander: American Secular Cycle. Cliodynamics 10:1 (2019)
27
Clark, Gregory. 2019. “What Were the British Earnings and Prices Then? (New Series)” MeasuringWorth. http://www.measuringworth.com/ukearncpi.
Conyon. Martin J., and Kevin J. Murphy. 2000. “The Prince and the Pauper? CEO Pay in the United States and United Kingdom.” The Economic Journal 110 (467): 640–71. doi: 10.1111/1468-0297.00577.
Dennin, Torsten. 2016. “Commodity Cycles 1970–2016: Characteristics of a Bull Market.” Seeking Alpha, May 19, 2016.
https://seekingalpha.com/article/3976344-commodity-cycles-1970minus-2016-characteristics-bull-market.
Derousseau, Ryan. 2014. “Why Do American CEOs Make Twice as Much as German CEOs?” Fortune, November 4, 2014. http://fortune.com/2014/11/04/why-do-american-ceos-make-twice-as-much-as-german-ceos.
Dimson, E., P. Marsh, and M. Staunton. 2002. Triumph of the Optimists: 101 Years of Global Investment Returns. Princeton, NJ: Princeton University Press.
Dodd, E. Merrick. 1932 “For Whom Are Corporate Managers Trustees?” Harvard Law Review 45: 1145–63. doi: 10.2307/1331697.
Drutman Lee. 2017. “We Need Political Parties. But Their Rabid Partisanship Could Destroy American Democracy.” Vox News, September 5, 2017.
https://www.vox.com/the-big-idea/2017/9/5/16227700/hyperpartisanship-identity-american-democracy-problems-solutions-doom-loop.
Edvinsson, Rodney, and Johan Söderberg. n.d. “The Evolution of Swedish Consumer Prices 1290–2008.” Historicalstatistics.org.
https://www.historicalstatistics.org. Datafile: http://www.historia.se/VolumeICh8ConsumerPriceIndex.xls. Eisenhower, Dwight D. 1954. Letter to Edgar Newton Eisenhower, November 8,
1954. http://teachingamericanhistory.org/library/document/letter-to-edgar-newton-eisenhower.
Florida, Richard. 2018. “America's Polarization Threatens to Undo Us.” Citylab, January 25, 2018.
https://www.citylab.com/equity/2018/01/americas-polarization-threatens-to-undo-us/551483.
Frydman, Carola, and Raven E. Saks. 2008. “Executive Compensation: A New View from a Long-Term Perspective, 1936–2005.” National Bureau of Economic Research Working Paper No. 14145. http://www.nber.org/papers/w14145.
Goldin, C., and Robert. A. Margo. 1991. “The Great Compression: The Wage Structure in the United States at Mid-Century.” National Bureau of Economic Research Working Paper No. 3817. www.nber.org/papers/w3817.
Goldstone, Jack A. 1991. Revolution and Rebellion in the Early Modern World. Berkeley: University of California Press.

Alexander: American Secular Cycle. Cliodynamics 10:1 (2019)
28
Hahn, TeWhan, and Mario G. Reyes. 2004. “On the Estimation of Stock-Market Reaction to Corporate Layoff Announcements.” Review of Financial Economics 13 (4): 357–70. doi: 10.1016/j.rfe.2003.12.004.
Hetzel, Robert. 2002. “German Monetary History in the First Half of the Twentieth Century.” Federal Reserve Bank of Richmond Economic Quarterly Volume 88 (1). https://www.richmondfed.org/publications/research/economic_quarterly/2002/winter/hetzel.
Ireland, Paddy. 2005. “Shareholder Primacy and the Distribution of Wealth.” The Modern Law Review 68 (1): 49–81. doi: 10.1111/j.1468-2230.2005.00528.x.
Jiang, Bin, and Timothy Koller. 2006. “A Long-Term Look at ROIC.” McKinsley Quarterly, February, 2006.
https://www.mckinsey.com/business-functions/strategy-and-corporate-finance/our-insights/a-long-term-look-at-roic.
Johnston, Louis, and Samuel H. Williamson. 2016. “What Was the U.S. GDP Then?” MeasuringWorth. https://www.measuringworth.com/usgdp.
Korotayev, Andrey, Artemy Malkov, and Daria Khaltourina. 2006. Introduction to Social Macrodynamics: Secular Cycles and Millennial Trends. Moscow: KomKniga.
Kreijger, Gilbert. 2017. “Why German Corporate Governance Is So Different.” Handelsblatt Global, February 28, 2017.
https://www.handelsblatt.com/today/companies/handelsblatt-explains-why-german-corporate-governance-is-so-different/23581290.html.
Lazonick, William. 2014. “Profits without Prosperity.” Harvard Business Review, September 2014. https://hbr.org/2014/09/profits-without-prosperity.
Lebergott, Stanley. 1964. Manpower in Economic Growth, the American Record Since 1800. New York: McGraw-Hill.
Lebergott, Stanley. 1966. “Labor Force and Employment, 1800−1960.” In Output, Employment, and Productivity in the United States after 1800, edited by Dorothy S. Brady, 117–204. New York: National Bureau of Economic Research.
Maddison Project Database, version 2018. Bolt, Jutta, Robert Inklaar, Herman de Jong and Jan Luiten van Zanden (2018), “Rebasing ‘Maddison’: New Income Comparisons and the Shape of Long-Run Economic Development.” Maddison Project Working Paper No. 10. https://www.rug.nl/ggdc/historicaldevelopment/maddison/releases/maddison-project-database-2018.
Mathews Dylan. 2017. “Europe Could Have the Secret to Saving America’s Unions.” Vox News, April 17, 2017.
https://www.vox.com/policy-and-politics/2017/4/17/15290674/union-labor-movement-europe-bargaining-fight-15-ghent.
Alexander: American Secular Cycle. Cliodynamics 10:1 (2019)
29
Macauley, F. R. 1938. Some Theoretical Problems Suggested by the Movements of Interest Rates, Bond Yields and Stock Prices in the United States Since 1856. New York: National Bureau of Economic Research, A142-A161.
Mitchell, Brian R. 1998. International Historical Statistics: The Americas 1750-1993. New York: Stockton Press.
NBER Macrohistory Database. 2001. Series from Germany. http://www.nber.org/databases/macrohistory/contents/de.html. Officer, Lawrence H., and S. H. Williamson 2015. “Annual Wages in the United
States, 1774–Present.” MeasuringWorth. www.measuringworth.com/USwages/. Officer, Lawrence H. 2018. “What Was the Interest Rate Then?” MeasuringWorth.
www.measuringworth.com/datasets/interestrates/result.php. Officer, Lawrence H., and S. H. Williamson. 2018. “The Annual Consumer Price
Index for the United States, 1774–Present.” MeasuringWorth. www.measuringworth.com/uscpi/. Ortiz-Ospina, Esteban, and Max Roser. n.d. “Taxation.” Our World in Data.
https://ourworldindata.org/taxation. Ortmans, Oscar, E. Mazzeo, K. Meshcherina, and A. Korotayev. 2017. “Modeling
Social Pressures toward Political Instability in the United Kingdom after 1960: A Demographic Structural Analysis.” Cliodynamics 8 (2): 113–58. doi: 10.21237/C7clio8237313.
Piketty, Thomas. 2014. Capital in the Twenty-First Century. Translated by Arthur Goldhammer. Cambridge, MA: The Belknap Press of Harvard University Press.
Pollard, Niklas. 2012. “Sweden, Where CEOs Come Cheap and Still Deliver.” Reuters Business News, June 14, 2012. https://www.reuters.com/article/us-sweden-executives-salaries/sweden-where-ceos-come-cheap-and-still-deliver-idUSBRE85D0R920120614.
Saez, Emmanuel, and Gabriel Zucman. 2016. “Wealth Inequality in the United States Since 1913: Evidence from Capitalized Income Tax Data.” Gabriel Zucman. http://gabriel-zucman.eu/uswealth/.
Shiller, Robert. n.d. “Online Data.” http://www.econ.yale.edu/~shiller/data.htm. Stenkula, Mikael, Dan Johansson, and Gunnar Du Rietz. 2014. “Marginal Taxation
on Labour Income in Sweden from 1862 to 2010.” Scandinavian Economic History Review 62 (2): 163–87. doi: 10.1080/03585522.2013.836985.
Teachout, Zephyr. 2017. “Goodbye to All That Democracy.” The American Prospect, Summer 2017. http://prospect.org/article/goodbye-all-democracy.
Terrell, Ellen. 2016. “When a Quote Is Not (Exactly) a Quote: General Motors.” Inside Adams: Science, Technology & Business (blog), April 22, 2016.
https://blogs.loc.gov/inside_adams/2016/04/when-a-quote-is-not-exactly-a-quote-general-motors.
Alexander: American Secular Cycle. Cliodynamics 10:1 (2019)
30
Turchin, Peter. 2003. Historical Dynamics: Why States Rise and Fall. Princeton, NJ: Princeton University Press.
Turchin, Peter, and Andrey V. Korotayev. 2006. “Population Dynamics and Internal Warfare: A Reconsideration.” Social Evolution and History 252: 112–47.
Turchin, Peter, and Sergey A. Nefedov. 2009. Secular Cycles. Princeton, NJ: Princeton University Press.
Turchin, Peter. 2013. “Modeling Social Pressures toward Political Instability.” Cliodynamics 4 (2): 241–80. doi: 10.21237/C7clio4221333.
Turchin, Peter. 2016. Ages of Discord. Chaplin, CT: Beresta Books. UK Office for National Statistics. 2015. Labour Disputes Annual Estimates; UK:
1891–2014. https://www.ons.gov.uk/employmentandlabourmarket/peopleinwork/employmentandemployeetypes/articles/thehistoryofstrikesintheuk/2015-09-21.
Vernon, J. R. 1994. “Unemployment Rates in Postbellum America: 1869–1899.” Journal of Macroeconomics 16 (4): 701–14.
doi: 10.1016/0164-0704(94)90008-6. Wells, Harwell. 2011. “U.S. Executive Compensation in Historical Perspective.” In
Research Handbook on Executive Compensation, edited by Jennifer Hill and Randall Thomas, Chap. 2. Cheltenham: Edward Elgar Publishing. Available online at https://ssrn.com/abstract=1775083.
WID. n.d. World Inequality Database. https://wid.world. Williamson, J. G., and P. H. Lindert. 1980. “Long-Term Trends in American Wealth
Inequality.” http://www.nber.org/chapters/c7443.pdf. Yang, Jia L. 2013. “Maximizing Shareholder Value: The Goal that Changed
Corporate America.” The Washington Post, August 26, 2013. www.washingtonpost.com/business/economy/maximizing-shareholder-
value-the-goal-that-changed-corporate-america/2013/08/26/26e9ca8e-ed74-11e2-9008-61e94a7ea20d_story.html?utm_term=.0fcf04b2c078.