groundwater resources of nanka sands
TRANSCRIPT

DOI : https://dx.doi.org/10.4314/gjpas.v23i1.10
GLOBAL JOURNAL OF PURE AND APPLIED SCIENCES VOL. 23, 2017: 87-105COPYRIGHT© BACHUDO SCIENCE CO. LTD PRINTED IN NIGERIA ISSN 1118-0579
www.globaljournalseries.com, Email: [email protected]
GROUNDWATER RESOURCES OF NANKA SANDS AQUIFERSAROUND NANKA-OKO AREA, SOUTHEASTERN NIGERIA
O. V. OMONONA, B. C. OZOBIALU AND C. O. OKOGBUE(Received 15 November 2016; Revision Accepted 2 February 2017)
ABSTRACT
Investigations were carried out for groundwater potentials and hydro-geochemical characteristics of the Nanka-Okoarea, southeastern, Nigeria. The area is underlain by the Nanka Sands Formation. Data from 14 vertical electricalsoundings (VES) were interpreted using IPI2win software. A total of 16 groundwater samples, were also analyzed fortheir physiochemical and biological properties with the aim of assessing their characteristics and quality for domesticand agricultural purposes. Based on the computed aquifer parameter (transmissivity), two groundwater potentials
zones (very high and high) were defined. Only2
4SO among the major ions shows a pronounced difference inconcentrations from the two aquifer horizon types. The geochemical data also reveal that the groundwater from thearea is not generally suitable for domestic but adequate for irrigation purposes.
KEYWORDS: Aquifer type; groundwater potentials; hydrochemical characteristics; Nanka Sands
INTRODUCTION
Demand for groundwater for domestic,agricultural and industrial uses has increased globallybecause of its attendant advantages over other sourcesof water. According to Vasanthavigar et al (2010)groundwater exists almost everywhere as subsurfaceresource not in a single widespread aquifer but inseveral thousand local aquifer systems andcompartments that have similar characters. In basementcomplex terrains, aquifers occur locally and indiscontinuous units while in most sedimentaryenvironments, they occur on regional scales and incontinuous units. The quantity and quality ofgroundwater of an aquifer depend on a number offactors which among others include lithology, geologicstructures, atmospheric precipitation, pattern and rate ofrecharge, inland surface water and subsurfacegeochemical processes. These factors indeed determinethe groundwater potentials of an area and to someextent the hydrochemical characteristics of the aquifers.Numerous studies have been done in Nigeria and otherparts of the world on the evaluation of groundwaterpotentials and hydrochemical characteristics of aquifers.Some of these studies in Nigeria include those ofAbiolaet al. (2009), Atakpo and Ayolabi (2009), Ehirimand Ofor (2011), Oyedeleet al. (2011), Okogbue et al.2012, Adenijiet al (2013), Okogbue and Omonona(2013), Okogbue and Ukpai (2013), Omonona et al(2013), Onwuka et al (2013). Those done outsideNigeria include Woodruff et al. (1972), Flores-Marqueset al. (2001), Braga et al. (2006), Mondalet al (2010). Ofall the studies done in Nigeria only few (Egboka andOkpoko, 1984, Uma et al., 1989, and Okoro et al, 2010)
are in the Nanka area of southeastern Nigeria wheregroundwater constitutes the dominant source of watersupply and is accessed via shallow hand dug wells aswell as deep boreholes.
These boreholes and hand dug wells often failor yield poorly especially during the dry season andsometimes permanently due to poor siting in terms ofproduction capacity of well location. Increasedurbanization of Nanka with a population growth rate of2.83 % (Census, 1991) and adjoining towns withattendant increase in demand for potable water fordomestic and agricultural purposes has increasedinterest in groundwater studies of the area. With thepresence of Federal Polytechnic at Oko, College ofPharmacy at Agulu, and a perennial expandingEkwuluobia Market for example, more groundwaterexploration has become necessary. The objectives ofthis study were to determine and characterize thegroundwater potentials of the area using the aquiferparameters as well as the hydrochemical characteristics.
DESCRIPTION OF THE STUDY AREAThe study area (Nanka-Oko area) lies between
latitudes 6000 and 6008’North, and longitude 7000’ and7008’ East with a total area of 12.67km2 (Figures 1). Theclimate of the area is tropical with an average yearlyrainfall of 1478mm, daily minimum and maximumtemperatures of 220 and 330 C, respectively. Relativehumidity ranges from 60% (at dry seasons) to 90 % (atrainy seasons) (Izuchukwu, 2010). Two seasons existnamely, wet season (March to October) and dry season(November to February). The dry season ischaracterized by dry air mass, causing high evapo-transpiration rate and lowering of water levels while the
87
O. V. Omonona, Department of Physic/Geology/Geophysics, Federal University, Ndufu Alike, Ikwo, Nigeria.B. C. Ozobialu, Department of Geology, University of Nigeria, Nsukka, Nigeria.C. O. Okogbue, Department of Geology, University of Nigeria, Nsukka, Nigeria.

rainy season is a period of heavy downpours, groundinfiltration and elevation of ground water table (Egbokaand Okpoko, 1984). Undulating landforms characterize
the topography of the area. The undulation is caused byserious gullying that is less intense towards thesoutheastern parts of the area (Izuchukwu, 2010).
Figure 1: Location map of the study area (Adapted from Okengwo et al, 2015).
GEOLOGY AND HYDROGEOLOGYThe study area is part of the Anambra River
Basin of southern Nigeria. The dominant geologicalFormation is the Eocene Nanka Sands (Figure 2) whichis a sequence of unconsolidated or poorly consolidatedsands, 305m thick, underlain by the Imo ShaleFormation of Paleocene age and overlain by the ligniteclay seams of the Oligocene Ogwashi Asaba Formation.
The Nanka Sands are predominantly sandy with thinclay stone and siltstone bands, lenses and laminations.The sand is poorly sorted, cross bedded and medium tocoarse grained. The deposits also exhibit well developedpatterns of alternating cross bedded sands and layers ofdark grey shales. The aquifer-aquitard units form amulti-aquifer system. The general stratigraphy ofAnambra Basin is presented in Table1.
88 O. V. OMONONA, B. C. OZOBIALU AND C. O. OKOGBUE

Figure 2: Geologic map of the study area (source: Okengwo et al., 2015)
Around Nanka, Idemili and Oko, the water tableis generally deep to very deep ranging from 30m to300m in depth (Offodile, 2002). Thus the aquifers inthese areas can be tapped only by deep boreholes.Shallower water tables are obtained in boreholes
located in lowland areas or valleys usually interspersingthe predominantly hilly areas.
Springs issue profusely at outcrop points, wherethe water table is intersected by deep erosional valleysforming scenic lakes at the foot of the hill.
Table 1: Stratigraphy of Anambra BasinAge Formation Lithology Thickness
(m)Oligocene Benin Sands, lenticular shale and clay >1000Miocene-Oligocene
Ogwashi-Asaba Unconsolidated sandstone with mudstone, ligniteseams
500
Eocene Ameki/Nanka Sands Sandstone and siltstone with clays as lenses. NankaSands consist of fine-coarse sandstone with lensesofcalcareous shale
130
Paleocene Imo Shale/EbenebeSandstone Member
Fine tectural dark grey shale with arenaceoussandstone
400/10-40
Masastrichtian-Paleocene
Nsukka Dark shale, sandy-shale, carbonaceous shale >300
Maastricchtian Ajali Sandstone Sandstone 300-1000Campanian Mamu Sandstone, shale mudstone, sandy-shale, coal
seams75-1000
Campanian Nkporo Dark grey shale, fissile shale 335.28
MATERIALS AND METHODS
Vertical electrical sounding (VES) was used todetermine the geo-electric layers of fourteen (14)locations spread across the study area and within thevicinity of existing borehole locations. The VES wascarried out using ABEM SAS 300 Terrameter withSchlumberger electrode array and a maximum currentelectrodes spacing of 316 m. The field results wereinterpreted using the IPI2Win software.
Although electrical sounding is the mostappropriate geophysical tool for groundwaterprospecting, it has limitations, the most of which is themasking of micro geologic features due to the distanceof electrode spread. This limitation was taken care of bycomparing the VES results with geologic log of drillcuttings from boreholes drilled by Anambra State WaterBoard which gives better results as it makes up for thedeficiencies of electrical sounding.
GROUNDWATER RESOURCES OF NANKA SANDS AQUIFERS AROUND NANKA-OKO AREA 89

Hydraulic conductivity values from the areawere estimated from grain size analysis results usingempirical relationship of Uma et al. (1989):
K= 6.0210d …………………..…………………… 1
(for poorly consolidated sand)
where
K = hydraulic conductivity (cm/s)210d = effective grain size cm (10% particles are finer,
90% coarser), andThe transmissivity values were determined from thecalculated hydraulic conductivity values using themathematical relation;
T = Kb ………………………………………………… 2
whereT is the transmissivity (cm2/s)b is the aquifer thickness (m).
A total of fourteen (14) groundwater samplesfrom boreholes were collected each with a 2-litre plasticcontainer. The water samples were first used to rinsethe containers before collection of the samples to beanalyzed in the laboratory. The water samples werecarefully labeled accordingly, stored in cool dry boxesand then transported to the laboratory to be tested within24 hours. The samples that could not be tested on theday of collection were stored in the refrigerator at aconstant temperature of 40C. However, measurementsof physical parameters, pH and temperature, werecarried out in the field using WTW LF 91 model meter.EC was measured using EC meter model 3084 at thepoints of sample collection. The determinations of theother physiochemical parameters (minor and majorelements) were conducted at the Enugu State WaterBoard Corporation, Enugu using standard procedures ofEPA (2005).
Total dissolved solids (TDS) was determined byevaporation method involving gravimetric analysis, andthis method has a detection limit of approximately10mg/l. Na and K were determined by the flamephotometric method, using Gallen Kamp Flame Analyzer(FGA 330c model). Ca 2 and Mg 2 were determinedby titrimetric method using EDTA complexometric
method. SO2
4 and NO3 were determined by
turbidometric titration using a spectrophotometer(Spronic 205 model). Cl was determined byelectrometric titration of the water using a chloridometer(model 4425000). HCO3
- concentration in water was bytitration of water with dilute (0.025M) H2SO4 acid having
a routine detection limit of 0.1meq/l. PO2
4 was analyzedusing HP liquid chromatography (Flexar SQ 300MS)method. Total Fe was determined by phenanthrolinmethod (Onwuka et al., 2013). Trace elements such aslead (Pb), chromium (Cr), cadmium (Cd), manganese(Mg) were determined with digital Bulk Scientific 205Atomic Absorption Spectrophotometer (AAS).
Irrigation water quality indices were determinedusing the following relationships with the anions andcations measured in meq/l in order to evaluate thesuitability of the groundwater of the area for irrigationpurposes (Brindha and Elango 2011; Ayuba et al, 2013).Sodium percentage (Na %):
Na% = 10022
KNaMgCa
KNa…………… 3
Sodium adsorption ratio (SAR):
SAR =
2
22
MgCa
Na………………………………. 4
Residual sodium carbonate (RSC):
RSC = )()( 223
23
MgCaHCOCO ………. 5
Permeability index (PI):
PI = 100(
)((22
3
NaMgCa
HCONa………………….. 6
Magnesium hazard (MH):
MH = 100)( 22
2
MgCa
Mg……………………… 7
Kelly ratio (KR):
KR =
22 MgCa
Na……………………………….. 8
RESULTS AND DISCUSSION
Geoelectrical characterizationThe geo-electric layers with their corresponding
thicknesses and resistivities are shown in Table 2. Thetable shows that the area is characterized by 4, 5 and 6subsurface geo-electric layers. Eight curve types weredefined based on the layers’ resistivity relationshipsnamely, QHAK (4), HAAK (2), AAKQ (1), HAK (2), KQQ(1), AKQ (1), AAK (2) and AK (1). The QHAK, HAAKand AAKQ denote a 6-subsurface geo-electric layerssection with various layers’ resistivity relationships whilethe HAK, KQQ, and AAK are characteristic of a 5-subsurface layers section with different layers’ resistivityrelationships. AK is a 4-subsurface layer section. Thefour curve types, H= > < , A= < < , K= < >and Q= > > of a 3-subsurface layer section formthe basis for the establishments of different curve typesfor a 4- or more- subsurface layers sections. In general,an n-layer section (where ≥3) is described by n-2 letters.The layers’ resistivity relationships for each of the curvetypes mentioned above are presented in (Table 3). Ugais characterized by 4, 5 and 6 subsurface geoelectriclayers which reveal variability in the subsurface geology,6 subsurface geoelectric layers was also observed atAkwaeze. The other locations show 5 geolectric
90 O. V. OMONONA, B. C. OZOBIALU AND C. O. OKOGBUE

Table 2: Summary of the results of resistivity and layer thicknesses from surveysLocation Ist
layer2nd
layer3rd
layer4th
layer5th
layer6thlayer Longitudinal
ConductanceCurvetype
Uga 2 4.422098.5
6.431299
14.4556
21.96058
78.13677
-6363
0.057811 QHAK
Uga 1 2.82184
8.546263
39.4325
-1489
0.13792 AK
Uga 3 1.723109.5
4.011573
18.14622
63.61483
-10804
0.049905 HAK
Mkpologwu 1.793166.5
8.374692
35.62420
92621
-1937
0.175412 KQQ
Ekwulobia 3.3469
9.452744
21.69287
1024263
-6374
0.036733 AKQ
Oko 1 1.92255
7.62753
21.15096
62.44559
-8689
0.02879 HAK
Oko 2 1.39256
13.65987
232219
75.7161
-8312
0.499811 AAK
AdaziNnukwu
0.81653
5.99184
28.32877
58.99303
-1750
0.252474 AAK
Akwaeze 1.332216
5.311586
10.34567
408551
49.17445
-12185
0.017476 HAAK
Neni 2 2.95370
4.291989
7.3610001
81.94446
-13925
0.021854 QHAK
Obeledu 1 1.62672
7.14246
14544
72.55179
-1852
0.069357 QHAK
Obeledu 2 14.541249
26.63705
51.111562
81.33157
-2875
0.048993 AAKQ
Agulu 2.43827
13.2171
19.81003
64.72886
-9474
0.122291 QHAK
Nanka 1.96143
8.97133
6.81268
68.71644
-649
0.148349 HAAK
*the upper values represent the layer thickness (m) and the lower values the resistivity Ωm
Table 3: Classification of curve typesCurve type Layer’s resistivity relationshipQHAK > > < < >HAAK > < < < >AAKQ < < < > >HAK > < < >KQQ < > > >AKQ < < > >AAK < < < >AK < < >
Note: : resistivity
layers. The VES curves are presented in figures 3a to 3l.In order to ascertain the correctness of the VES results,some of the geoelectric sections (Ekwulobia, Akwezeand Neni,) were correlated with lithologic logs obtainedfrom those localities, (Figure 4). From the figures, thegeoelectric sections from Ekwulobia, Akweze and Nenishowed similar number of layers with the lithologic logsfrom the same area.
Aquifers characteristics and parametersThe Nanka Sands generally dips southwest in
the Anambra Basin. The geology as revealed by thelogs is characterized with upper reddish to brownferruginised sands underlain by coarse to fine grained
sands alternating with lenses of siltstones, silty shaleand a predominant shale member interbedded withsands and sandstone horizons. Two aquifer horizons,upper and lower horizons were identified based on thelithologic logs, geoelectric sections and static waterlevels measured in the area. These aquifer horizons arewell seen in Figure 5 where for example, the Ekwulobia,Akweze, and Ugageolectric sections show lower (>50m) aquifer horizons whereas the Neni sections showupper (<50 m) aquifer horizons. The upper horizonaquifer was also observed at Oko, Agulu, Nanka andMkpologwu areas while the lower horizon aquifer wasalso observed at Obeledu. All the upper horizon aquifersare found within
GROUNDWATER RESOURCES OF NANKA SANDS AQUIFERS AROUND NANKA-OKO AREA 91

Figure 3a: Vertical electrical sounding (VES) curves for Uga 2
Figure 3b: Vertical electrical sounding (VES) curves for Awaramsiu
Figure 3c: Vertical electrical sounding (VES) curves for Umuchu
92 O. V. OMONONA, B. C. OZOBIALU AND C. O. OKOGBUE
Figure 3a: Vertical electrical sounding (VES) curves for Uga 2
Figure 3b: Vertical electrical sounding (VES) curves for Awaramsiu
Figure 3c: Vertical electrical sounding (VES) curves for Umuchu
92 O. V. OMONONA, B. C. OZOBIALU AND C. O. OKOGBUE
Figure 3a: Vertical electrical sounding (VES) curves for Uga 2
Figure 3b: Vertical electrical sounding (VES) curves for Awaramsiu
Figure 3c: Vertical electrical sounding (VES) curves for Umuchu
92 O. V. OMONONA, B. C. OZOBIALU AND C. O. OKOGBUE

Figure 3d: Vertical electrical sounding (VES) curves for Ekwulobia
Figure 3e: Vertical electrical sounding (VES) curves for Oko 2
Figure 3f: Vertical electrical sounding (VES) curves for Adazi
GROUNDWATER RESOURCES OF NANKA SANDS AQUIFERS AROUND NANKA-OKO AREA 93
Figure 3d: Vertical electrical sounding (VES) curves for Ekwulobia
Figure 3e: Vertical electrical sounding (VES) curves for Oko 2
Figure 3f: Vertical electrical sounding (VES) curves for Adazi
GROUNDWATER RESOURCES OF NANKA SANDS AQUIFERS AROUND NANKA-OKO AREA 93
Figure 3d: Vertical electrical sounding (VES) curves for Ekwulobia
Figure 3e: Vertical electrical sounding (VES) curves for Oko 2
Figure 3f: Vertical electrical sounding (VES) curves for Adazi
GROUNDWATER RESOURCES OF NANKA SANDS AQUIFERS AROUND NANKA-OKO AREA 93

Figure 3g: Vertical electrical sounding (VES) curves for Oko 1
Figure 3h: Vertical electrical sounding (VES) curves for Akwaeze
Figure 3i: Vertical electrical sounding (VES) curves for Ugah
94 O. V. OMONONA, B. C. OZOBIALU AND C. O. OKOGBUE
Figure 3g: Vertical electrical sounding (VES) curves for Oko 1
Figure 3h: Vertical electrical sounding (VES) curves for Akwaeze
Figure 3i: Vertical electrical sounding (VES) curves for Ugah
94 O. V. OMONONA, B. C. OZOBIALU AND C. O. OKOGBUE
Figure 3g: Vertical electrical sounding (VES) curves for Oko 1
Figure 3h: Vertical electrical sounding (VES) curves for Akwaeze
Figure 3i: Vertical electrical sounding (VES) curves for Ugah
94 O. V. OMONONA, B. C. OZOBIALU AND C. O. OKOGBUE

Figure 3j: Vertical electrical sounding (VES) curves for Neni
Figure 3k: Vertical electrical sounding (VES) curves for Obe-Edu
GROUNDWATER RESOURCES OF NANKA SANDS AQUIFERS AROUND NANKA-OKO AREA 95
Figure 3j: Vertical electrical sounding (VES) curves for Neni
Figure 3k: Vertical electrical sounding (VES) curves for Obe-Edu
GROUNDWATER RESOURCES OF NANKA SANDS AQUIFERS AROUND NANKA-OKO AREA 95
Figure 3j: Vertical electrical sounding (VES) curves for Neni
Figure 3k: Vertical electrical sounding (VES) curves for Obe-Edu
GROUNDWATER RESOURCES OF NANKA SANDS AQUIFERS AROUND NANKA-OKO AREA 95

Figure 4: Comparison of the VES inferred lithologies with the borehole lithologies..
Figure 4: contd.
96 O. V. OMONONA, B. C. OZOBIALU AND C. O. OKOGBUE

highland areas, for example, a borehole located atAlmasol quarter (Oko), with ground elevation of 339.6mabove mean sea levels (amsl) has static water level(swl) of 213.6 m while the lower horizons aquifers arelocated at the topographically low land areas. Forexample, a Federal Borehole located at Nanka area,about 2.5 km away from the Almasol Borehole, withground elevation of 162.9 m amsl has swl of 38.9 m.Further down the slope, 500 m distance from theFederal Borehole at Enugu-Nanka area, the aquifer is
exposed by erosion at its lowest point of 126 m amsl,where the water table is intersected, issuing as spring inthe location Figure 5. Figure 6 presents the spatialdistributions of the aquifer horizon types, with the upperhorizon aquifers confined to the northern section of thestudy area while the lower aquifer horizon is confined tothe central and southern sections. Both horizons areunconfined in view of the lithologies and the static waterlevels measured.
Figure 5: Sketch field diagram of the lower and upper horizon aquifers
The study area, Nanka-Oko area is a watershedridge in the Mamu sub-basin with River Otimi taking itsorigin from this ridge and then flows northwards to joinRiver Mamu and then with River Anambra in theextreme northern part of the Anambra basin.Groundwater recharge via precipitation constitutes thedominant or main contribution to groundwater in thearea. Because of the high porosity and permeability ofthe Nanka Sands sediments, recharge rate in the area is
high as there is absence of surface runoff in the area.The recharge pattern is direct and diffuse.
Groundwater potential of the area wasevaluated based on transmissivity values of the aquifers.The Krasny (1993) model was employed in classifyingthe area into groundwater potential zones. Aquiferparameters such as hydraulic conductivity, K andtransimissivity, T for some locations in the area arepresented in Table 4. From the
Figure 6: Spatial distribution map of the aquifer horizon types
GROUNDWATER RESOURCES OF NANKA SANDS AQUIFERS AROUND NANKA-OKO AREA 97highland areas, for example, a borehole located atAlmasol quarter (Oko), with ground elevation of 339.6mabove mean sea levels (amsl) has static water level(swl) of 213.6 m while the lower horizons aquifers arelocated at the topographically low land areas. Forexample, a Federal Borehole located at Nanka area,about 2.5 km away from the Almasol Borehole, withground elevation of 162.9 m amsl has swl of 38.9 m.Further down the slope, 500 m distance from theFederal Borehole at Enugu-Nanka area, the aquifer is
exposed by erosion at its lowest point of 126 m amsl,where the water table is intersected, issuing as spring inthe location Figure 5. Figure 6 presents the spatialdistributions of the aquifer horizon types, with the upperhorizon aquifers confined to the northern section of thestudy area while the lower aquifer horizon is confined tothe central and southern sections. Both horizons areunconfined in view of the lithologies and the static waterlevels measured.
Figure 5: Sketch field diagram of the lower and upper horizon aquifers
The study area, Nanka-Oko area is a watershedridge in the Mamu sub-basin with River Otimi taking itsorigin from this ridge and then flows northwards to joinRiver Mamu and then with River Anambra in theextreme northern part of the Anambra basin.Groundwater recharge via precipitation constitutes thedominant or main contribution to groundwater in thearea. Because of the high porosity and permeability ofthe Nanka Sands sediments, recharge rate in the area is
high as there is absence of surface runoff in the area.The recharge pattern is direct and diffuse.
Groundwater potential of the area wasevaluated based on transmissivity values of the aquifers.The Krasny (1993) model was employed in classifyingthe area into groundwater potential zones. Aquiferparameters such as hydraulic conductivity, K andtransimissivity, T for some locations in the area arepresented in Table 4. From the
Figure 6: Spatial distribution map of the aquifer horizon types
GROUNDWATER RESOURCES OF NANKA SANDS AQUIFERS AROUND NANKA-OKO AREA 97

table, the hydraulic conductivity value is highest atObedelu ( 2102.7 cm/s) and lowest at Uga( 2101.3 cm/s) while transmissivity varied from 33.48m2/hr at Uga to 77.76m2/hr at Obeledu. Table 4 also
shows a summary of the groundwater potentials of thearea in relation to the aquifer horizon (lower and upper)type.
Table 4: Borehole characteristics and Aquifer parameters of some boreholes drilled within the study area
Location Hydraulicconductivity(cm/s)* 10-2
Transmissivity(m2/day)
Groundwaterpotential rating
Aquifer horizon
Uga 3.1 803.52 High LowerEkwulobia 3.4 1468.8 Very high LowerOko 6.3 1360.8 Very high LowerAdaziNnukwu 5.2 1123.2 Very high Lower
Neni 6.8 1644.96 Very high UpperObeleedu 7.2 1866.24 Very high UpperNanka 4.8 1451.52 Very high LowerMkpologwu 3.8 820.8 High Lower
Groundwater chemistryThe results of the physiochemical and biologicalanalysis of groundwater from the study area arepresented in Table 5. From the table, pH ranges from5.9 to 7.0 with a mean of 6.43 and this shows that thegroundwater in the entire study area is slightly acidic toneutral. The order of magnitude of the ionic species is
Ca2+> Na+>3HCO >> Mg2+> Cl->
24SO >
3NO > Fe3+.
All the ionic species (3HCO ,
24SO , Cl-,
3NO , Fe2+/3+,
Na+, Mg2+ and Ca2+ ) and also SiO2 are thought to bereleased from weathering processes of ferromagnesian
minerals, clay minerals, calcite, dolomite, anorthite andplagioclase bearing rocks, as well as from dilution
processes except3NO which has an anthropogenic
source (domestic wastes and leachates from plantsnutrients and nitrate fertilizers) (Ayuba et al., 2017). Inaddition, ions in the groundwater may be affected byanthropogenic sources such as cation of nitrate fertilizer,anion of ammonium fertilizer, other soil amendmentsand domestic wastewater. The Box Plots of the majorions from the two
98 O. V. OMONONA, B. C. OZOBIALU AND C. O. OKOGBUE
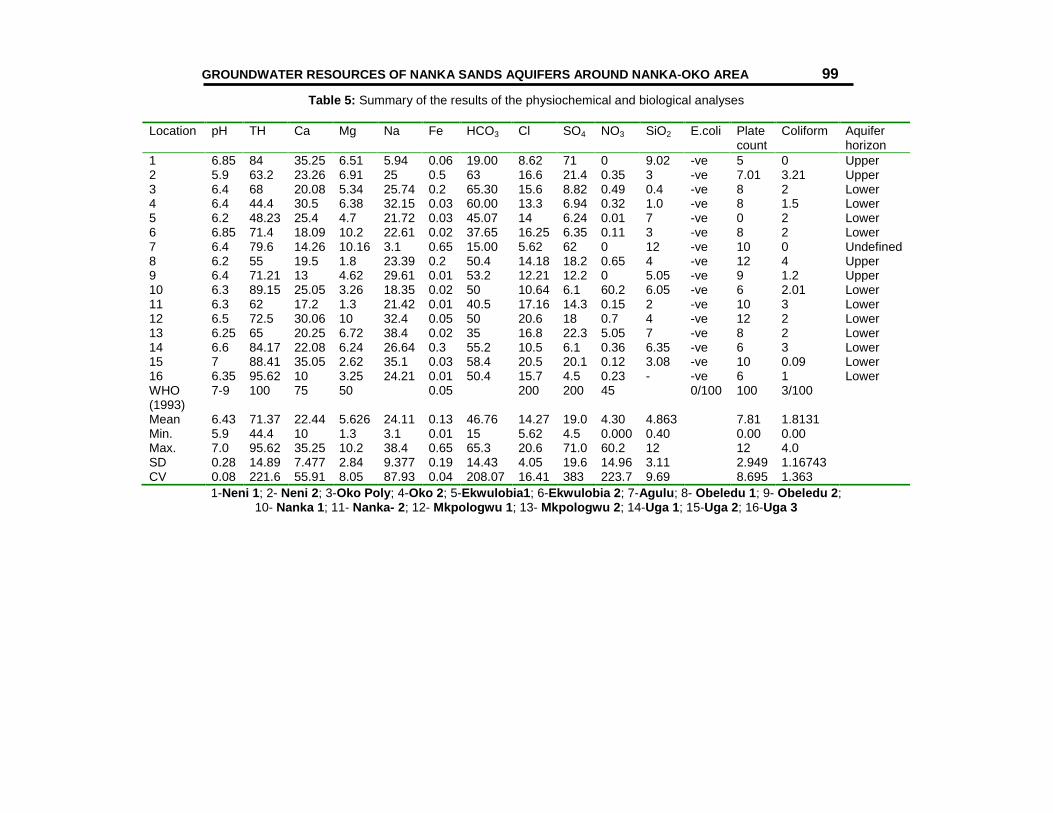
Table 5: Summary of the results of the physiochemical and biological analyses
Location pH TH Ca Mg Na Fe HCO3 Cl SO4 NO3 SiO2 E.coli Platecount
Coliform Aquiferhorizon
1 6.85 84 35.25 6.51 5.94 0.06 19.00 8.62 71 0 9.02 -ve 5 0 Upper2 5.9 63.2 23.26 6.91 25 0.5 63 16.6 21.4 0.35 3 -ve 7.01 3.21 Upper3 6.4 68 20.08 5.34 25.74 0.2 65.30 15.6 8.82 0.49 0.4 -ve 8 2 Lower4 6.4 44.4 30.5 6.38 32.15 0.03 60.00 13.3 6.94 0.32 1.0 -ve 8 1.5 Lower5 6.2 48.23 25.4 4.7 21.72 0.03 45.07 14 6.24 0.01 7 -ve 0 2 Lower6 6.85 71.4 18.09 10.2 22.61 0.02 37.65 16.25 6.35 0.11 3 -ve 8 2 Lower7 6.4 79.6 14.26 10.16 3.1 0.65 15.00 5.62 62 0 12 -ve 10 0 Undefined8 6.2 55 19.5 1.8 23.39 0.2 50.4 14.18 18.2 0.65 4 -ve 12 4 Upper9 6.4 71.21 13 4.62 29.61 0.01 53.2 12.21 12.2 0 5.05 -ve 9 1.2 Upper10 6.3 89.15 25.05 3.26 18.35 0.02 50 10.64 6.1 60.2 6.05 -ve 6 2.01 Lower11 6.3 62 17.2 1.3 21.42 0.01 40.5 17.16 14.3 0.15 2 -ve 10 3 Lower12 6.5 72.5 30.06 10 32.4 0.05 50 20.6 18 0.7 4 -ve 12 2 Lower13 6.25 65 20.25 6.72 38.4 0.02 35 16.8 22.3 5.05 7 -ve 8 2 Lower14 6.6 84.17 22.08 6.24 26.64 0.3 55.2 10.5 6.1 0.36 6.35 -ve 6 3 Lower15 7 88.41 35.05 2.62 35.1 0.03 58.4 20.5 20.1 0.12 3.08 -ve 10 0.09 Lower16 6.35 95.62 10 3.25 24.21 0.01 50.4 15.7 4.5 0.23 - -ve 6 1 LowerWHO(1993)
7-9 100 75 50 0.05 200 200 45 0/100 100 3/100
Mean 6.43 71.37 22.44 5.626 24.11 0.13 46.76 14.27 19.0 4.30 4.863 7.81 1.8131Min. 5.9 44.4 10 1.3 3.1 0.01 15 5.62 4.5 0.000 0.40 0.00 0.00Max. 7.0 95.62 35.25 10.2 38.4 0.65 65.3 20.6 71.0 60.2 12 12 4.0SD 0.28 14.89 7.477 2.84 9.377 0.19 14.43 4.05 19.6 14.96 3.11 2.949 1.16743CV 0.08 221.6 55.91 8.05 87.93 0.04 208.07 16.41 383 223.7 9.69 8.695 1.363
1-Neni 1; 2- Neni 2; 3-Oko Poly; 4-Oko 2; 5-Ekwulobia1; 6-Ekwulobia 2; 7-Agulu; 8- Obeledu 1; 9- Obeledu 2;10- Nanka 1; 11- Nanka- 2; 12- Mkpologwu 1; 13- Mkpologwu 2; 14-Uga 1; 15-Uga 2; 16-Uga 3
GROUNDWATER RESOURCES OF NANKA SANDS AQUIFERS AROUND NANKA-OKO AREA 99
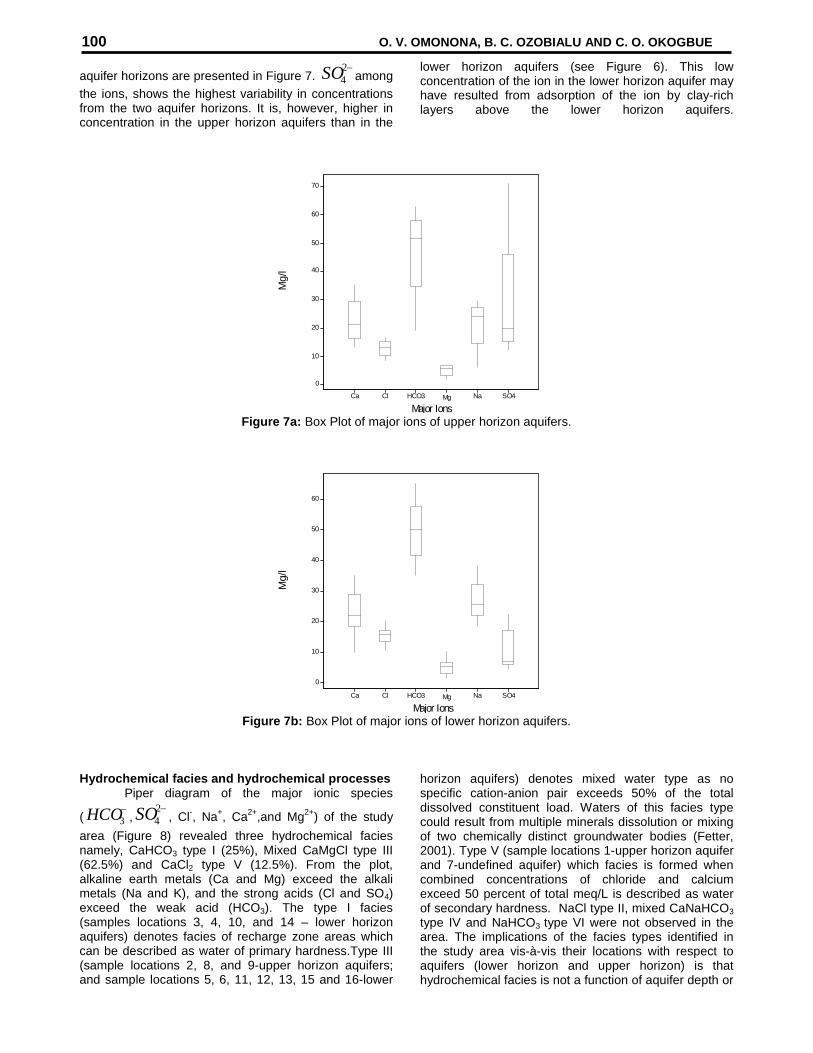
aquifer horizons are presented in Figure 7.2
4SO amongthe ions, shows the highest variability in concentrationsfrom the two aquifer horizons. It is, however, higher inconcentration in the upper horizon aquifers than in the
lower horizon aquifers (see Figure 6). This lowconcentration of the ion in the lower horizon aquifer mayhave resulted from adsorption of the ion by clay-richlayers above the lower horizon aquifers.
Figure 7a: Box Plot of major ions of upper horizon aquifers.
Figure 7b: Box Plot of major ions of lower horizon aquifers.
Hydrochemical facies and hydrochemical processesPiper diagram of the major ionic species
(3HCO ,
24SO , Cl-, Na+, Ca2+,and Mg2+) of the study
area (Figure 8) revealed three hydrochemical faciesnamely, CaHCO3 type I (25%), Mixed CaMgCl type III(62.5%) and CaCl2 type V (12.5%). From the plot,alkaline earth metals (Ca and Mg) exceed the alkalimetals (Na and K), and the strong acids (Cl and SO4)exceed the weak acid (HCO3). The type I facies(samples locations 3, 4, 10, and 14 – lower horizonaquifers) denotes facies of recharge zone areas whichcan be described as water of primary hardness.Type III(sample locations 2, 8, and 9-upper horizon aquifers;and sample locations 5, 6, 11, 12, 13, 15 and 16-lower
horizon aquifers) denotes mixed water type as nospecific cation-anion pair exceeds 50% of the totaldissolved constituent load. Waters of this facies typecould result from multiple minerals dissolution or mixingof two chemically distinct groundwater bodies (Fetter,2001). Type V (sample locations 1-upper horizon aquiferand 7-undefined aquifer) which facies is formed whencombined concentrations of chloride and calciumexceed 50 percent of total meq/L is described as waterof secondary hardness. NaCl type II, mixed CaNaHCO3type IV and NaHCO3 type VI were not observed in thearea. The implications of the facies types identified inthe study area vis-à-vis their locations with respect toaquifers (lower horizon and upper horizon) is thathydrochemical facies is not a function of aquifer depth or
0
70
50
30
10
SO4NaMg
60
HCO3
20
Cl
40
Ca
Major Ions
Mg/
l
50
30
10
SO4NaMg
60
HCO3
20
Cl
40
0
Ca
Major Ions
Mg/
l
100 O. V. OMONONA, B. C. OZOBIALU AND C. O. OKOGBUE

horizon type but a function of variations in lithologies,solution kinetics and flow pattern of the aquifers (Fetter(2001).
The distributions of the geochemical facies orwater type also tell of the geochemical flow path.
According to Poehls and Smith (2009), geochemical flowpaths begin at the calcium bicarbonate water type(CaHCO3, type I) through sodium bicarbonate mixedcalcium magnesium chloride water type (CaMgCl, typeIII),to calcium chloride water
Figure 8: Piper Diagram of the major ionic facies in the study area.
type (CaCl, type V). The geochemical flow path model(Figure 9a) revealed the flow paths of groundwater inthe area. The estimated hydraulic head data fromboreholes in the area was also used in constructing ahydraulic head model in order to decipher thegroundwater flow directions (Figure 9b). The hydraulichead model revealed a similar groundwater flow path asin the geochemical facies flow path model (see Figure9).
The predominant hydrochemical processescontrolling the hydrochemical characteristics ofgroundwater in the study area was deciphered using theDurov plot. The plot (Figure 10) shows that the mainhydrochemical process controlling the groundwaterchemistry is dilution and mixing. Dilution meansrendering of a concentrated chemical weaker by additionof water or another less concentrated liquid
GROUNDWATER RESOURCES OF NANKA SANDS AQUIFERS AROUND NANKA-OKO AREA 101
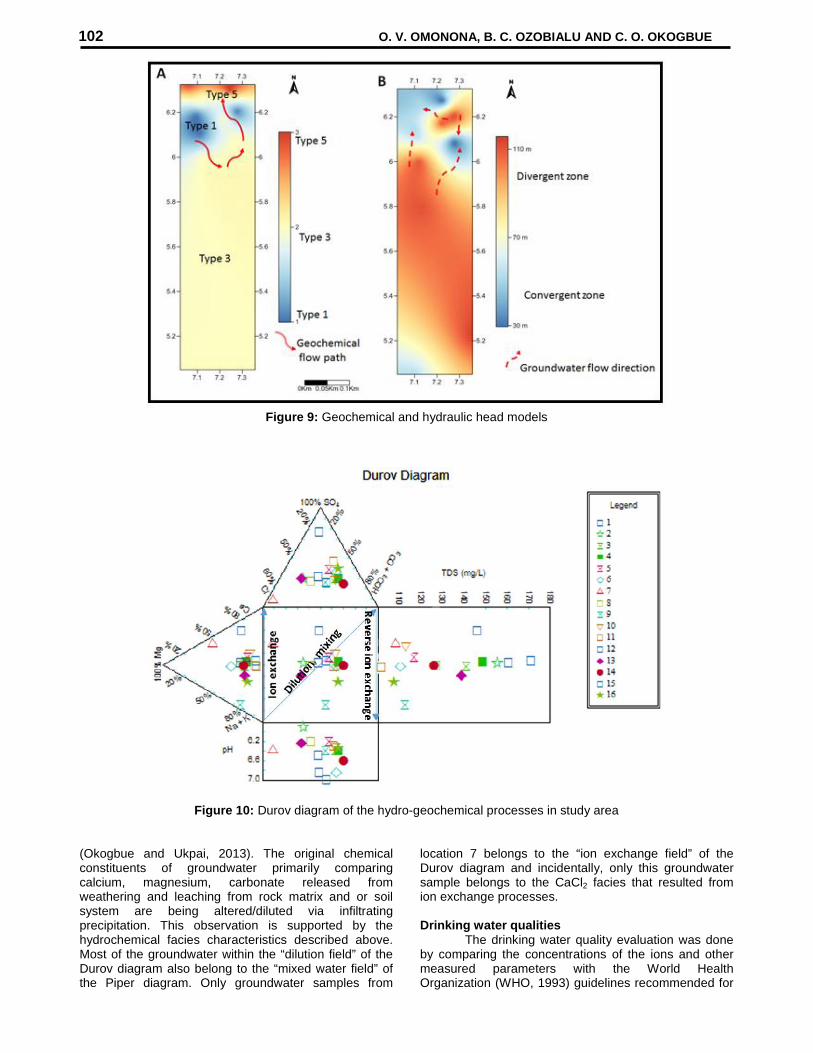
Figure 9: Geochemical and hydraulic head models
Figure 10: Durov diagram of the hydro-geochemical processes in study area
(Okogbue and Ukpai, 2013). The original chemicalconstituents of groundwater primarily comparingcalcium, magnesium, carbonate released fromweathering and leaching from rock matrix and or soilsystem are being altered/diluted via infiltratingprecipitation. This observation is supported by thehydrochemical facies characteristics described above.Most of the groundwater within the “dilution field” of theDurov diagram also belong to the “mixed water field” ofthe Piper diagram. Only groundwater samples from
location 7 belongs to the “ion exchange field” of theDurov diagram and incidentally, only this groundwatersample belongs to the CaCl2 facies that resulted fromion exchange processes.
Drinking water qualitiesThe drinking water quality evaluation was done
by comparing the concentrations of the ions and othermeasured parameters with the World HealthOrganization (WHO, 1993) guidelines recommended for
102 O. V. OMONONA, B. C. OZOBIALU AND C. O. OKOGBUE

drinking water. All physiochemical parameters
measured, except3NO were found to be below the
desirable limit guideline values at all the locations.3NO exceeded the limit at location 10 (Table 5). The
elevated concentration of3NO at this location is
assumed to come from domestic wastes. Groundwaterfrom this well (location 10) should be used only after ithas been treated by ion exchange processes, reverseosmosis, or distillation.
Groundwater classifications based on TDS(Davies and Dewiest, 1966 and Freeze and Cherry,1979) place the groundwater of the area at “waterdesirable for drinking” class and “freshwater type” classrespectively. Sawyer and McCarty (1967)’s classificationof groundwater based on total hardness shows that 37.5% groundwater samples (from locations 1, 7, 10, 14, 15and 16) falls in the “moderately hard” class (TH asCaCO375mg/l – 150mg/l) while 62.5% samples (fromlocations 2, 3, 4, 5, 6, 8, 9, 11, 12 and 13) falls in the“soft” class (TH as CaCO3 = 75 mg/L – 150 mg/L).Hardness in water causes scale in water heaters,boilers, pipes and turbines; it also consumes excessivequantities of soap during washing activities (Onwuka etal., 2013). Primary hardness in water, as observed inType I facies (groundwater samples from locations 3, 4,10 and 14 (Figure 7) can be removed by distillation(Freeze and Cherry, 1979) while secondary hardness,as observed in Type V facies (groundwater samplesfrom locations 1 and 7 (Figure 8) can be removed
through ion exchange processes and addition ofhydrated lime followed by sedimentation and thenfiltration.
Biological parameters of E.coli are below thestipulated standard of 0/100 ml per sample in all thegroundwater samples, just as Heterotrophic plate countmeasured in all the samples are below the stipulatedstandard of 100 counts. Total coliforms in samples 2, 8,11 and 14 are, however, above the guideline value of1/100 ml per sample (Table 5).
Irrigation water qualitiesThe mineral constituents of groundwater determine itssuitability for irrigation purposes. Dissolved salts ingroundwater used for irrigation affect both plant growthand soil structure; they also affect other properties suchas permeability, aeration and texture. High salt contentin irrigation water causes increased osmotic pressure insoil solution which in turn retards minerals and wateruptake by plants. Irrigation quality of the groundwater ofthe study area was evaluated based on the followingquality indices: electrical conductivity (EC), sodiumadsorption ratio (SAR), sodium percentage (Na %),residual sodium carbonate (RSC), magnesium hazard(MH), permeability index (PI) and Kelly ratio. Thesequality parameters are presented in Table 6 which whencompared with various specifications (salinity, sodiumpercentage, United States salinity classification ofgroundwater for irrigation (USSL), sodium residualcarbonate
Table 6: Irrigation water quality indicesEC(µS/cm)
SAR Na% RSC(meq/l)
MH PI(%)
Kellyratio
1 175 0.241246 10.12204 -1.98295 23.33474 31.98245 0.112622 125 1.169641 38.6124 -0.69638 32.86837 74.69164 0.6289943 40 1.319039 43.72348 -0.37089 30.47292 84.12178 0.776944 65 1.382498 40.59383 -1.06324 25.6367 69.37808 0.6833275 70 1.038958 36.3559 -0.91529 23.36946 69.42779 0.5712386 50 1.053994 36.09205 -1.12446 48.16705 64.91866 0.564757 100 0.153321 8.017325 -1.30128 54.00691 37.49639 0.0871618 30 1.358989 47.5774 -0.29503 13.20439 90.07711 0.9075749 65 1.796011 55.59822 -0.1567 36.93669 95.90504 1.25216210 95 0.9162 34.46088 -0.6986 17.66042 73.54276 0.52580611 40 1.341272 49.11907 -0.3014 11.07676 92.06859 0.96537312 45 1.30792 37.76736 -1.50289 35.41173 62.02546 0.60687413 40 1.889462 51.65875 -0.98948 35.35557 75.08198 1.06862714 60 1.289604 41.77792 -0.71024 31.7763 76.0691 0.71756115 70 1.540598 43.73282 -1.00729 10.96833 71.75533 0.77723516 65 1.701396 57.88317 0.059776 34.8802 107.8375 1.374347Max 175 1.889462 57.88317 0.059776 54.00691 107.8375 1.374347Min 30 0.153321 8.017325 -1.98295 10.96833 31.98245 0.087161Mean 70.94 1.19683 38.83295 -0.83219 29.4501 73.1222 0.726783
Min-minimum; Max-maximum;
(RSC), permeability index (PI)) shows that thegroundwater from the entire study area can be said to
range from “permissible” to “excellent”, with respect tosuitability for irrigation purposes.
GROUNDWATER RESOURCES OF NANKA SANDS AQUIFERS AROUND NANKA-OKO AREA 103
CONCLUSIONS
The groundwater potentials as well as thehydrochemical characteristics and quality of the aquifersof Nanka-Oko area and its environs have beenevaluated through an integrated technique embodyinggeological, geophysical and geochemical investigations.The electrical resistivity, mainly vertical electricalsounding (VES) conducted at different stations revealedthat the area is principally a five-geoelectric-subsurface-layer. The VES results in combination with availablelithologic logs from drilled boreholes showed that thearea is characterized by two aquifer depth horizon types(upper and lower horizons). Based on the estimatedhydraulic conductivity determined from Empirical formulaof grain size distribution, (Uma et al, 2001), twogroundwater potential zones (very high and high) wereobserved. The zones were found to be independent ofthe aquifer horizon type.
Piper diagram on the other hand defined threehydrochemical facies namely, CaHCO3, mixed CaMgCl,and CaCl2 water types. The principal hydrochemicalprocess shaping the groundwater chemistry is dilution.There was no observed marked difference in theconcentrations of the dissolved ions from the twoaquifers (lower horizon and upper horizon) except thatSO4 has a higher concentration in the upper horizonaquifers than in the lower horizon aquifers. The lowerconcentration of the ion in the lower horizon aquiferscould be explained in terms of adsorption of the ion bythe overlying layers which are absent in the upperhorizon aquifers. Groundwater of the area does notmeet the stipulated requirements for drinking purposes.However, the groundwater is suitable for irrigationpurposes.
REFERENCES
Abiola, O., Enikanselu, P. A and Oladapo, M. I., 2009.Groundwater potential and aquifer protectivecapacity of overburden units in Ado-Ekiti,Southwestern Nigeria. International Journal ofPhysical Sciences, 4: 120–132.
Adeniji, A. E., Obiora, D. N., Omonona, O. V and Ayuba,R., 2013. Geoelectric evaluation of groundwater
potentials of Bwari basement area, centralNigeria. International Journal of PhysicalSciences, 8: 1350–1361.
Atakpo, E. A and Ayolabi, E. A., 2009. Elevation ofaquifer vulnerability and protective capacity insome oil producing communities of westernNiger delta, Environmentalist. 29: 310–317.
Ayuba, R., Tijani, M. N and Omonona, O. V., 2017.Hydrochemical characteristics and qualityassessment of groundwater from shallow wellsin Gboloko area, central Nigeria. Global Journalof Geological Sciences, 15,(in press).
Ayuba, R., Omonona, O. V and Onwuka, O. S., 2013.Assessment of groundwater quality of LokojaBasement area. Journal of Geological Society ofIndia, 82:413-420.
Bhattacharya, P. K and Patra, H. P., 1968. Direct currentgeoelectric sounding principles andinterpretation. Elssterdam, Netherlands. 1:1-135.
Braga, A. O., Filho, W. M and Dourado, J. C., 2006.Resistivity (DC) method applied to aquiferprotection studies. Revista Brasileira Geofisica,Brazil. 24: 513–581.
Brindha, K and Elango, L., 2011. Hydrochemicalcharacteristics of groundwater for domestic andirrigation purposes in Madhuranthakan, TamilNadu. India Earth Sci. Res. 15(2): 101-108.
Chukwurah, S., 1992. Basic Technology of Borehole.Macmillan, Nigeria, 12p.
Davies, S. N and Dewiest, R. J. M., 1966.Hydrogeology. Wiley, New York, 463p
Dorbrin, M. B., 1976. Introduction to geophysicalprospecting. New York Hill Book Company,United Kingdom. 350p.
Egboka, B. C. E. and Okpoko, E. I. 1984. Gully erosionin the Agulu-Nanka Region of Anambra State,Nigeria: Challenges in African Hydrology andWater Resources (Proceedings of the HarareSymposium, July 1984). InternationalAssociation of Hydrogeologists SocietyPublication. No. 144.
Ehirim, C. N and Ofor, W., 2011. Assessing aquifervulnerability to contaminants near solid wastelandfill sites in a coastal environment, PortHarcourt Nigeria. Trends in Applied Sciencesresearch, 6 (2): 165–173.
EPA., 2005. Standard methods for the examination ofwater and wastewater 21st Edition EPA/600/R–94, 173p.
Fetter, C. W., 2001. Applied Hydrogeology. Prentice-Hall, New Jersey, 598p
Flores-Marquez E. L., 2001. Geophysicalcharacterization of the Etla Valley aquiferOaxaca, Mexico. Geofisica International. 40:245–262.
Freeze, R. A and Cherry, J. A., 1979. Groundwater.Prentice-Hall Inc., Eagle Wood Cliffs, NewJersey, 491p.
Izuchukwu, I. B., 2010. Statistical Year Book. EconomicPlanning and Budget, Awka, Anambra State, 65pp.
Jakosky, J. J.,1950. Exploration Geophysics SecondEdition. Trija Publications Company, LosAngeles United States America. 1-786.
Krasny, J. 1993. Classification of transmissivity
104 O. V. OMONONA, B. C. OZOBIALU AND C. O. OKOGBUE
magnitude and variation. Groundwater 31(2):230-236.
Murat, R. C., 1970. Stratigraphy and Palaeogeographyof the Cretaceous and Lower Tertiary inSouthern Nigeria. PhD Thesis University ofIbadan, Ibadan. 1- 268.
Nfor, B. N., Olobaniyi, S. B and Ogala, J. E., 2007.Extent and distribution of groundwaterresources in parts of Anambra State,southeastern, Nigeria. Journal of AppliedScience Management, 11, 215–221.
Offodile, M. E., 1975. A review of the Cretaceous of theBenue Valley. In Geology of Nigeria (C.AKogbeed.), Elizabethan Publishing CompanyLagos, Nigeria, 319-330.
Offodile, M. E., 2002. An Approach to GroundwaterStudy and Development in Nigeria 2nd Edition.Mecon Publishing, Jos, Nigeria. 240 pp.
Ofomah, J. C and Ezeigbo, H. I., 1997. Hydrogeologicalevaluation of the Anambra River Basin,Southeastern Nigeria. Water Resources, 8: 18–26.
Okagbue, C. O and Ezechi, J. I., 1988. Geotechnicalcharacteristics of soils susceptible to severegulling in eastern Nigeria. Bulletin ofInternational Association of EngineeringGeology, 38: 111–119.
Okengwo, O. N., Okeke, O. C., Okereke, C. N andPaschal, A. C., 2015. Geological and geotechnical
studies of gully erosion at Ekwulobia, Oko andNanka towns, Southeastern Nigeria, EJGE 20:113-122.
Okogbue, C. O., Omonona, O. V and Aghamelu, O. P.,2012. Qualitative assessment of groundwater from
Egbe-Mopa basement complex area,northcentral Nigeria. Environmental EarthSciences. 67:1069–1083.
Okogbue, C. O and Omonona, O. V., 2013.Groundwater potential of Egbe-Mopa basementarea, central Nigeria. Hydrological SciencesJournal 58: 1–15.
Okogbue, C. O and Ukpai, S. N., 2013. Geochemicalevaluation of groundwater quality in Abakalikiarea southeastern Nigeria. Jordan Journal ofEarth and Environmental Sciences. 5: 1-8.
Okoro, E. I., Egboka, B. C. E., Anike, O. L andEnekwechi, E. K., 2010. Evaluation of groundwater
potentials in parts of the escarpment areas ofsoutheastern, Nigeria. International Journal ofGeomatics and Geosciences, 1 (3): 544-551.
Omonona, O. V., Onwuka, O. S and Okogbue, C. O.,2013. Characterization of groundwater quality in three
settlement areas of Enugu metropolis,southeastern Nigeria, using multivariateanalysis. Environmental MonitoringAssessment. 186: 651–644.
Onwuka, O. S., Omonona, O. V and Anika, O. C., 2013.Hydrochemical characteristics and qualityassessment of regolith aquifers in Enugumetropolis, southeastern Nigeria. EnvironmentalEarth Sciences 70: 1135–1141.
Oyedele, K. F., Ogagarue, D. O. and Esse, O., 2011.Groundwater potential evaluation using surfacegeophysics at Oru-Imope, Southwestern NigeriaEuropean. Journal of Scientific Research, 63:515–522.
Poehls, D. J. and Smith, G. J. 2009. EncyclopedicDictionary of Hydrogeology, Academic Press,Amsterdam. 1-517.
Sawyer, C. N and McCarty, P. L., 1967. Chemistry forSanitary Engineers (2nd edition). McGraw—Hill,New York. 1-758p.
Uma, K. O., Egboka, B. C. E and Onuoha, K. M. 1989.New statistical grain-size method for evaluatingthe hydraulic conductivity of sandy aquifers.Journal of Hydrology, 108: 343–366.
Vasanthavigar, M., Srinivasamoorthy, K., Vijayaragavan,K., Rajiv-Ganthi, R., Chidambaram, S., Anandhan, P.,Manivannan, R. and Vasudevan, S. 2010. Application of
water quality index for groundwater qualityassessment: Thirumanimuttar sub-basin, TamilNadu, India. Environmental MonitoringAssessment. doi: 10.1007/s10661-009-1302-1
Zohdy, A. A. R., Eaton, G. P and Mabey, D. R., 1974.Application of Surface Geophysics toGroundwater Investigations: Techniques ofWater Resources Investigation of the UnitedGeophysical Survey Book. United StatesGovernment Printing Office, Washington D1:42–55.
GROUNDWATER RESOURCES OF NANKA SANDS AQUIFERS AROUND NANKA-OKO AREA 105
