petrophysical evaluation of shaly sands based on well
TRANSCRIPT
Petrophysical Evaluation of shaly sands based on well log and core data for Well
A, Field Y, North Eastern Niger Delta
Yannick Agbor Student of Khazar University
Supervisor: Associate Prof Ghasham Zeynalov

Agenda• Introduction• Objectives• Actuality• Methods • Results and Conclusion
Introduction• Field Y(Obagi) is an onshore field located within the Concession OML
Block 58 in the NE Niger delta.
• The Niger Delta is situated in the Gulf of Guinea, and was formed at the site of the rift triple junction related to the opening of the south Atlantic starting in the late Jurassic and Continuing into the Cretaceous[4].
• Accumulation of Sediments began from the Eocene to present.
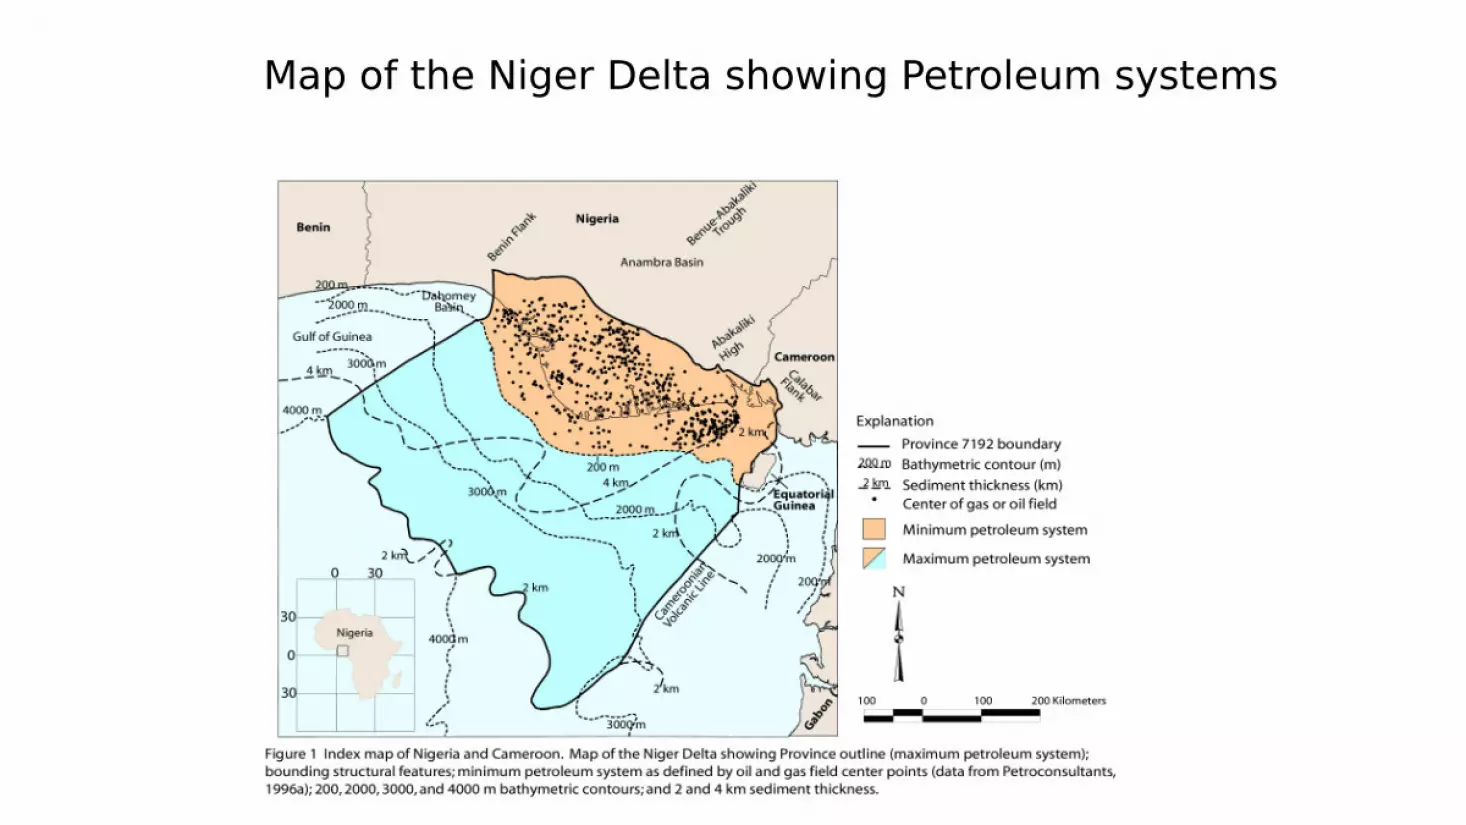
Map of the Niger Delta showing Petroleum systems

Map of the study area, Field Y (Obagi), OML Block 58

Objectives
• Study Porosity and Permeability variation in the shaly sands in two Horizons.
• Study what mainly controls the Permeability distribution.• Determine the Clay types and other elements which are related to
the rapid production decline from well A.• Determination of Equation relating movement of fines as a result of
production.• Recommendations
Actuality of Problem• Rapid Production decline of oil from Well A after a very short
production time.• Production decline from 25,667B/D to 25,000B/D in one year.• 15 wells shut including Well A for Geoscience studies and
investigation.• Previous researches suggested Clay swelling as the major cause of
production decline.

Methods and Discussions
• Wireline log and core data were used for this study. The wire line Logs include; Sonic, density, Resistivity, Neutron, Gamma, and SP logs.
• Cross plots of variable reservoir Parameters• Theoretical Formulation of fines movement towards well bore.
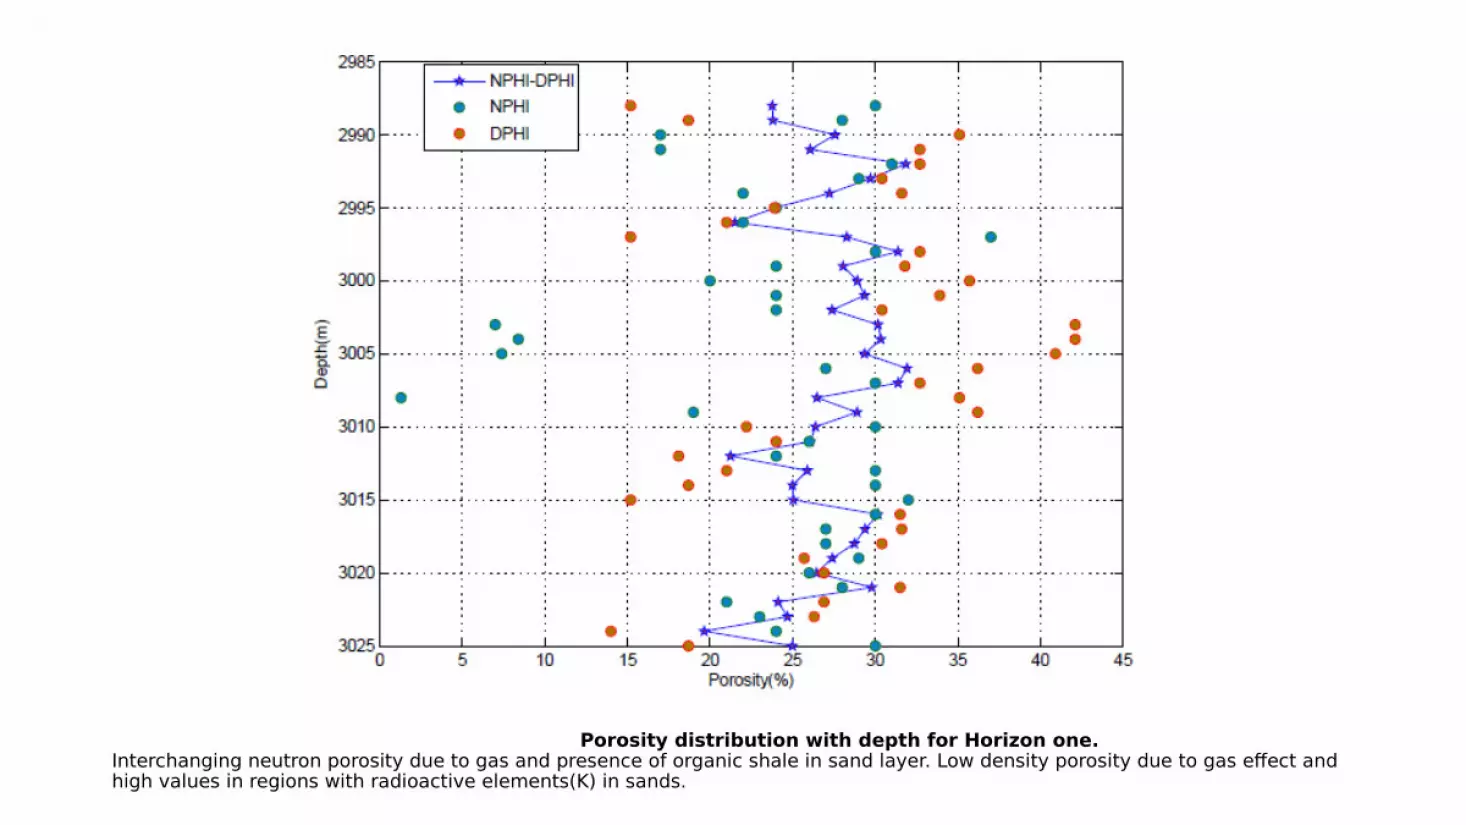
Porosity distribution with depth for Horizon one. Interchanging neutron porosity due to gas and presence of organic shale in sand layer. Low density porosity due to gas effect and high values in regions with radioactive elements(K) in sands.
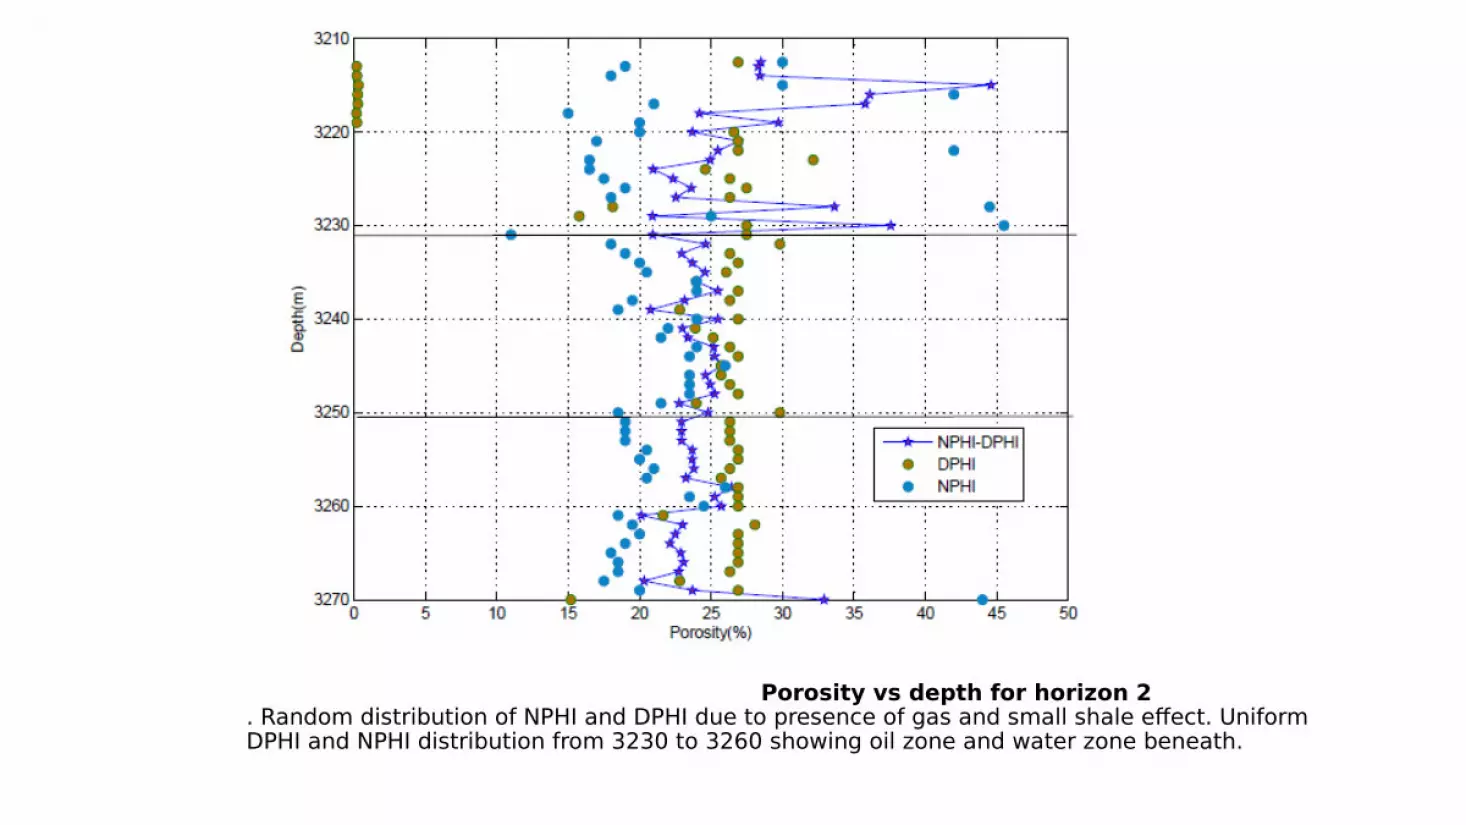
Porosity vs depth for horizon 2. Random distribution of NPHI and DPHI due to presence of gas and small shale effect. Uniform DPHI and NPHI distribution from 3230 to 3260 showing oil zone and water zone beneath.
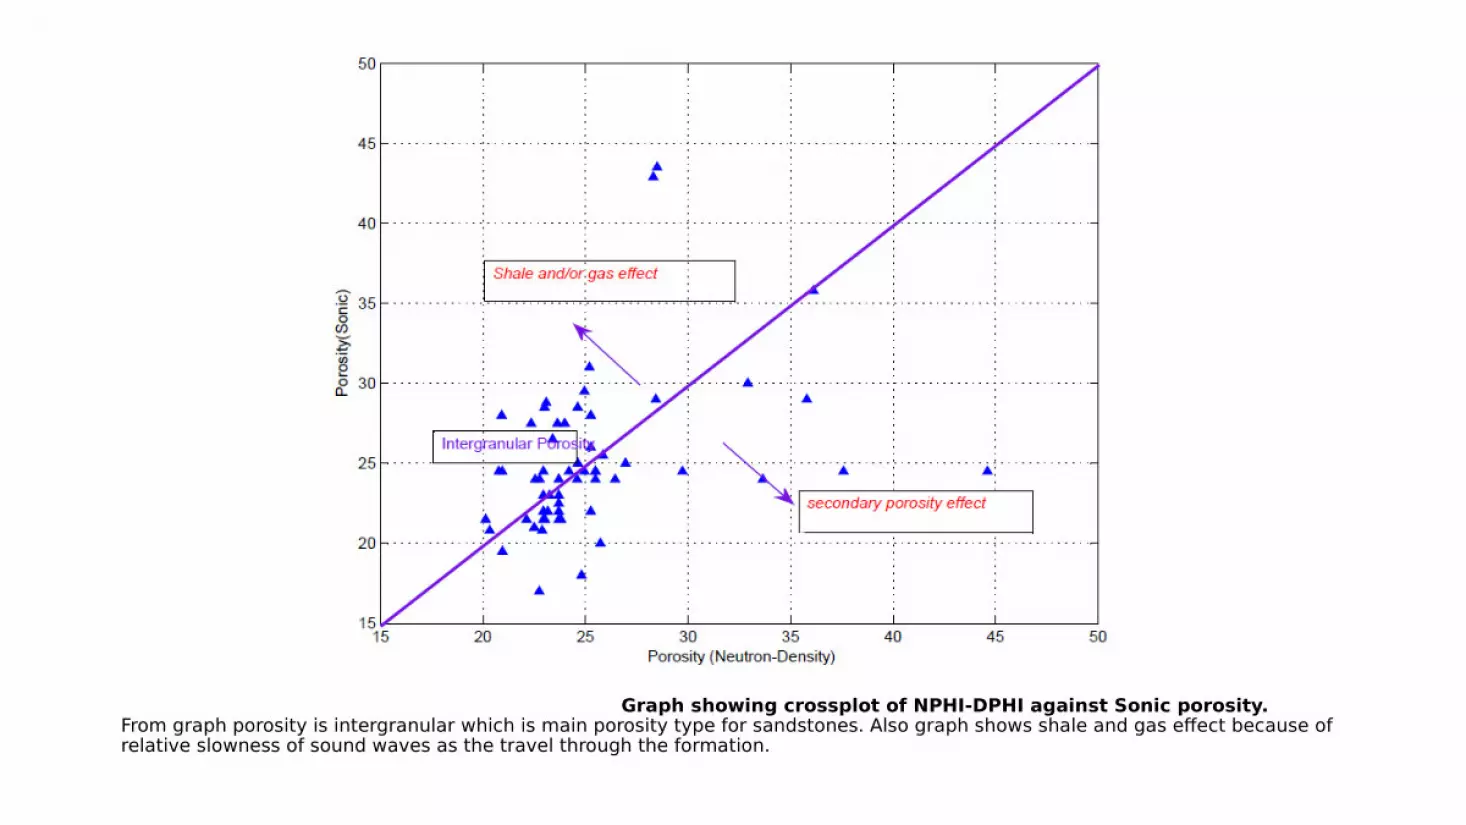
Graph showing crossplot of NPHI-DPHI against Sonic porosity.From graph porosity is intergranular which is main porosity type for sandstones. Also graph shows shale and gas effect because of relative slowness of sound waves as the travel through the formation.
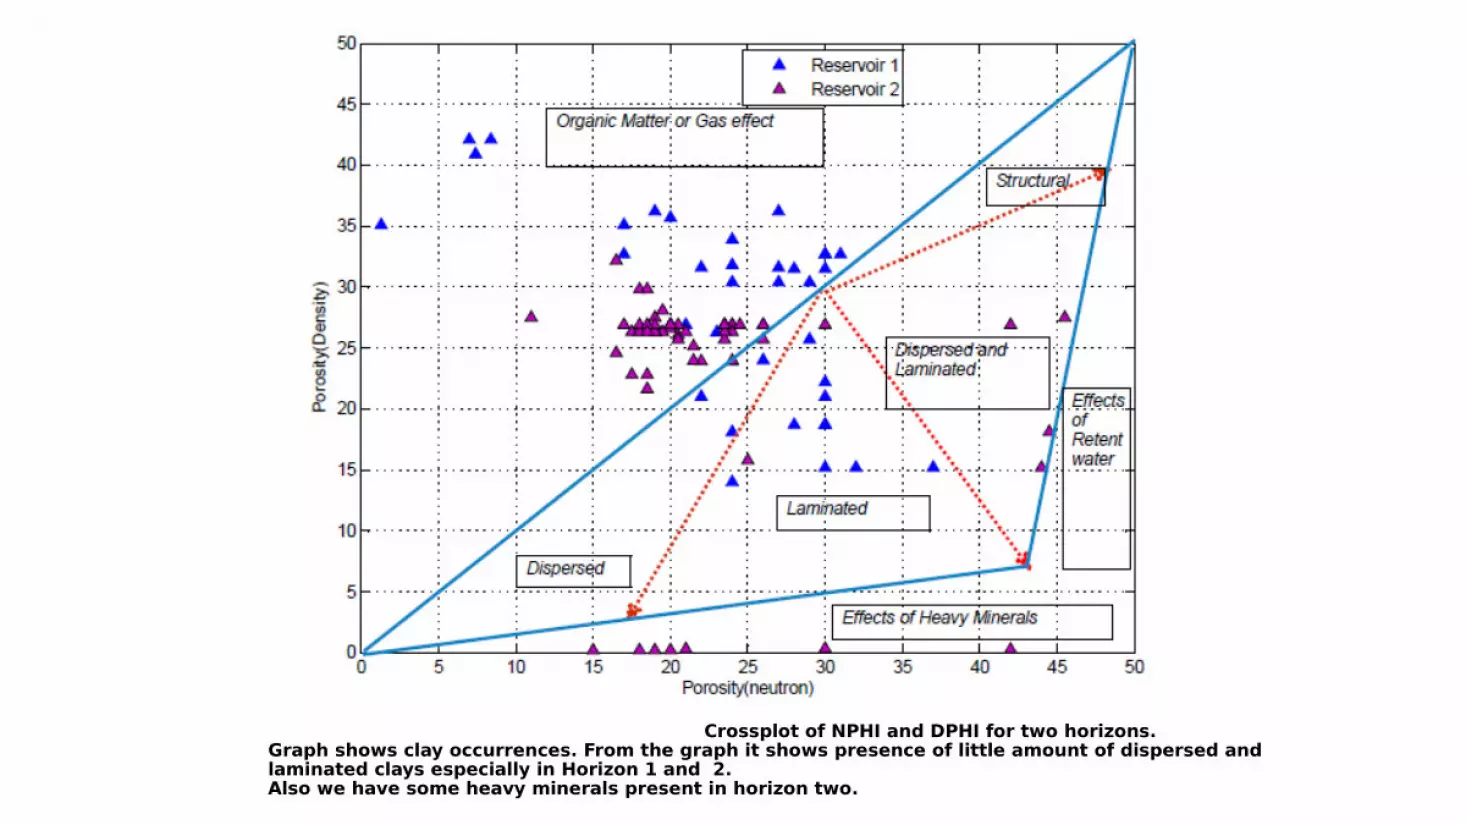
Crossplot of NPHI and DPHI for two horizons.Graph shows clay occurrences. From the graph it shows presence of little amount of dispersed and laminated clays especially in Horizon 1 and 2.Also we have some heavy minerals present in horizon two.

Crossplot of permeability against porosityPermeability is strongly controlled by porosity(Intergranular porosity).Permeability ranges from 647.3mD to about 72 235mD from wireline logs.

Core permeability vs log porosity.Average permeability from core 3408mD and 5358mD respectively for both horizons. This makes it a good reservoir.There are some differences between log permeability and core permeability because of reservoir heterogeneity.
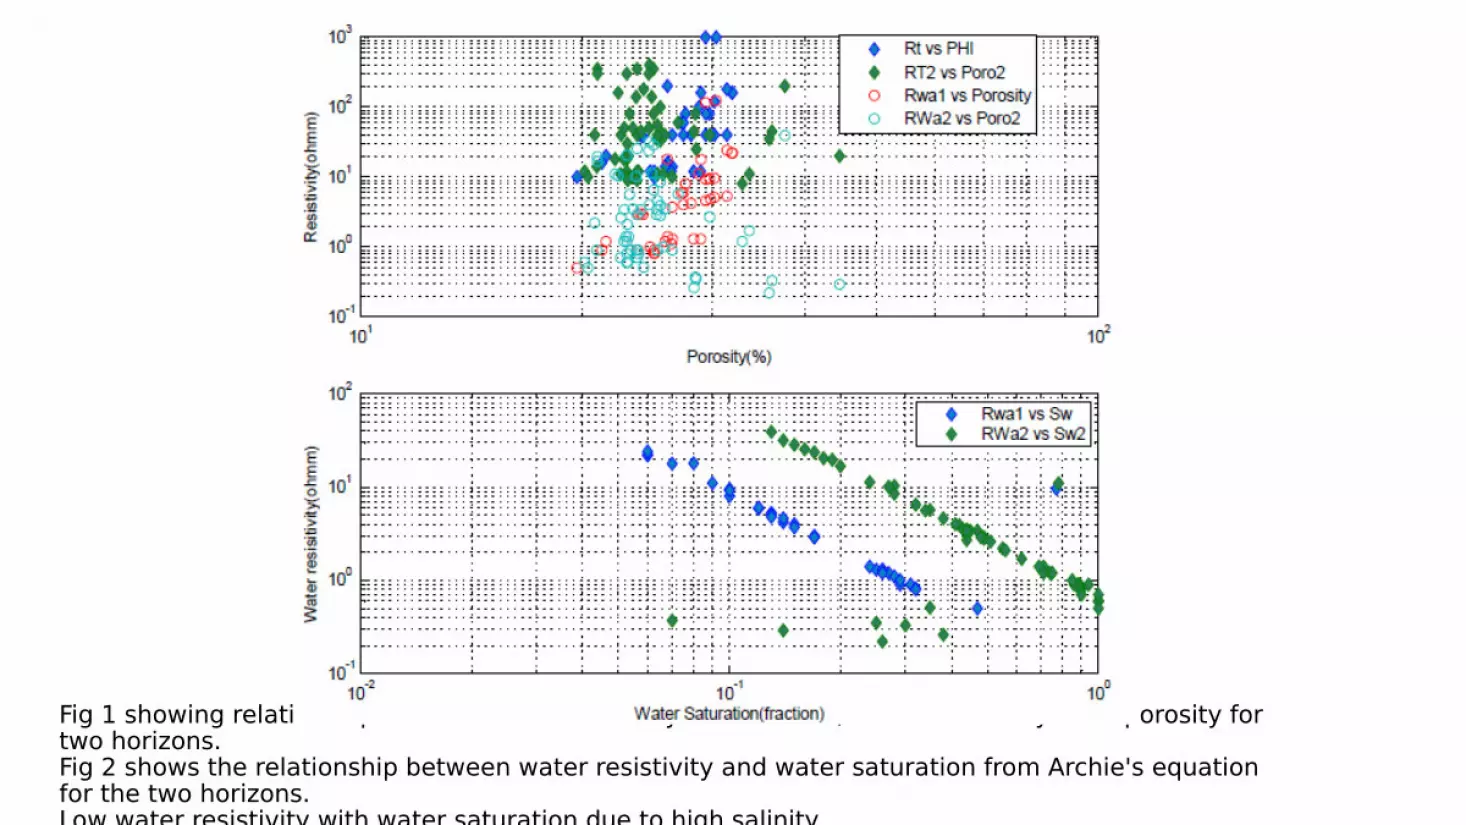
Fig 1 showing relationship between True Resistivity of formation, Water resistivity with porosity for two horizons.Fig 2 shows the relationship between water resistivity and water saturation from Archie's equation for the two horizons.Low water resistivity with water saturation due to high salinity

Formation factor against porositym of 1.5 and a of 0.8 for this reservoir is indicative of the good sorting in the sands despite some small clay occurances.
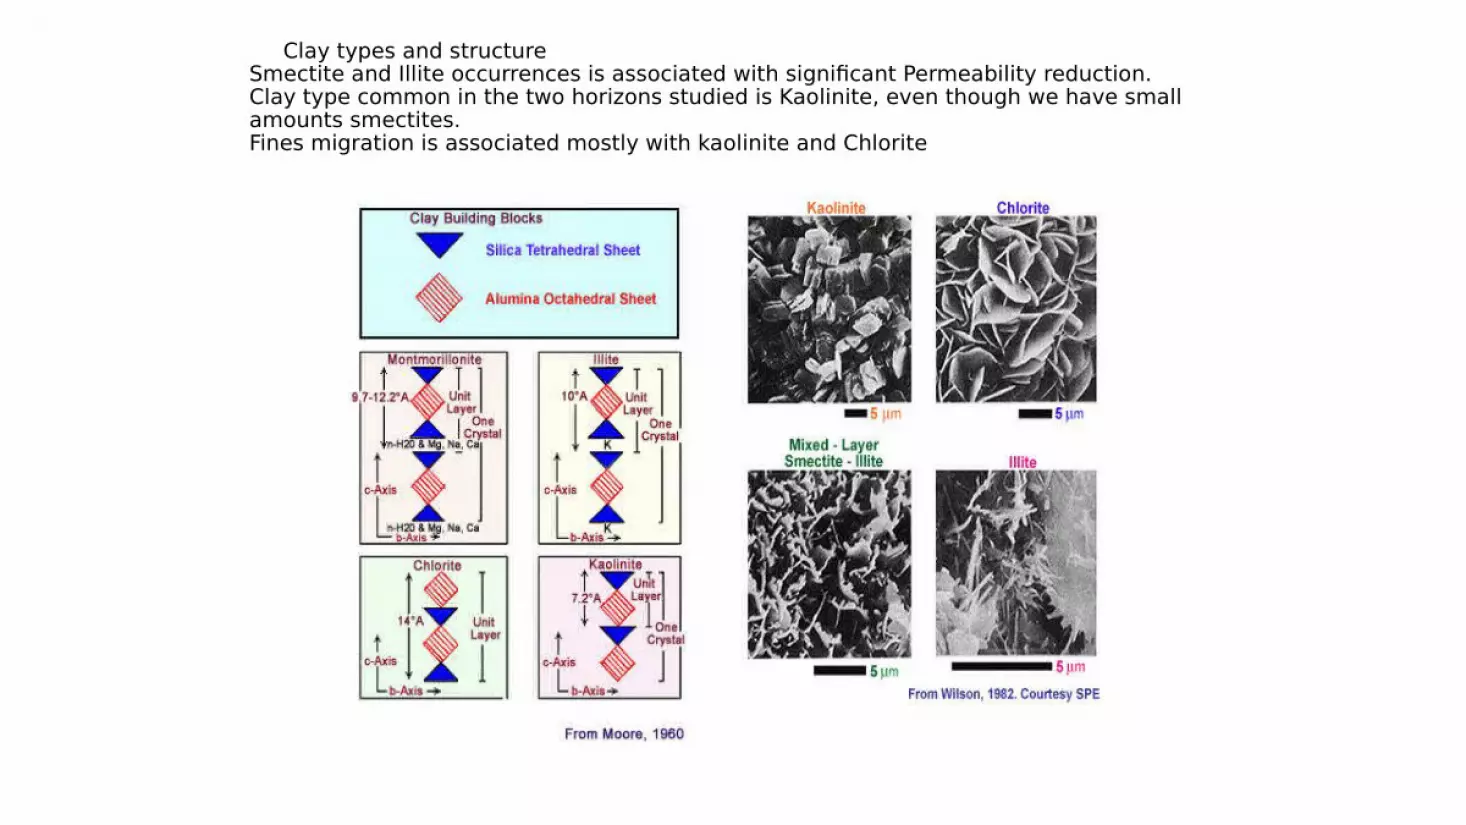
Clay types and structureSmectite and Illite occurrences is associated with significant Permeability reduction.Clay type common in the two horizons studied is Kaolinite, even though we have small amounts smectites.Fines migration is associated mostly with kaolinite and Chlorite
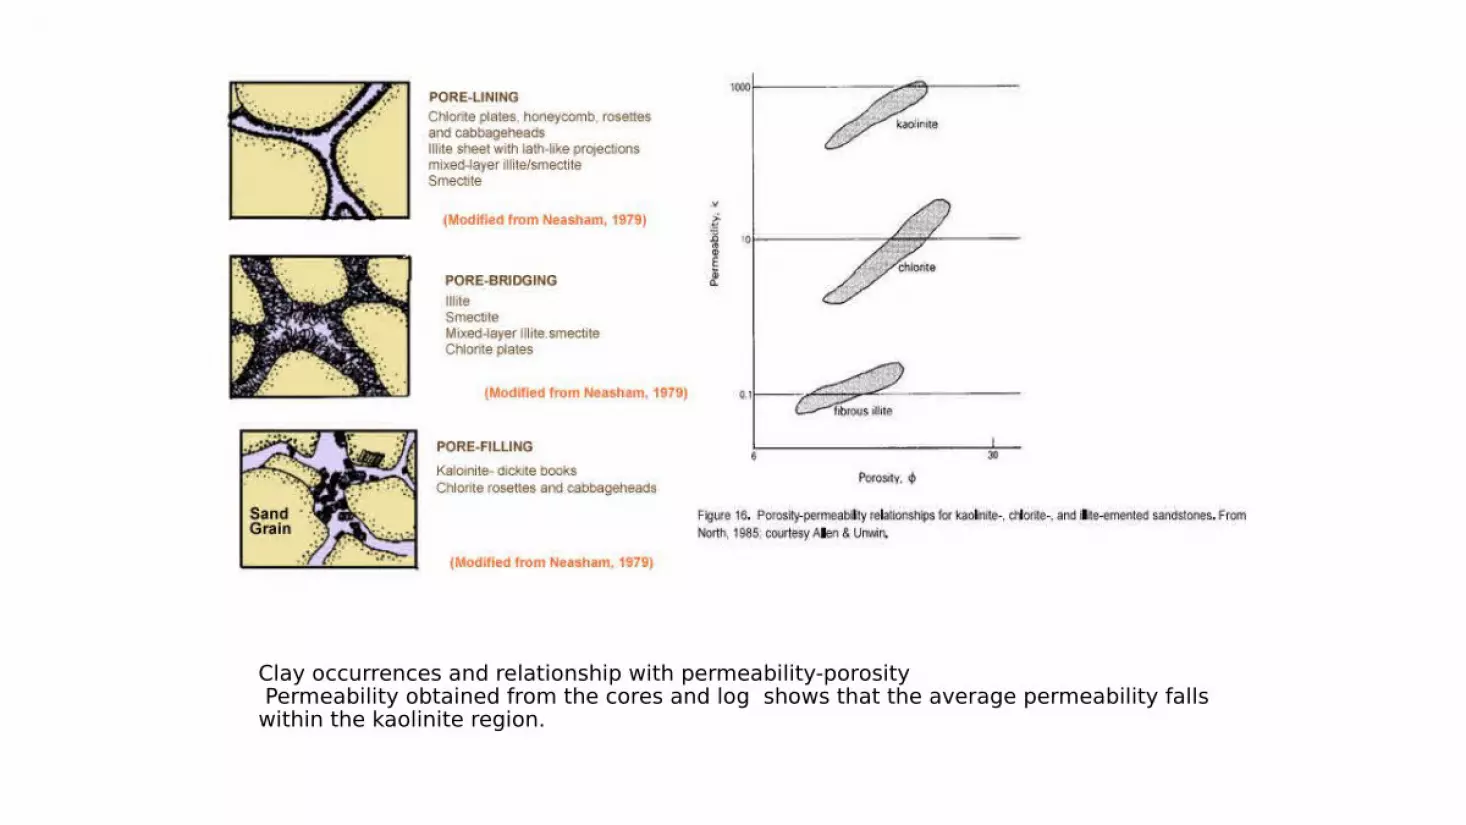
Clay occurrences and relationship with permeability-porosity Permeability obtained from the cores and log shows that the average permeability falls within the kaolinite region.
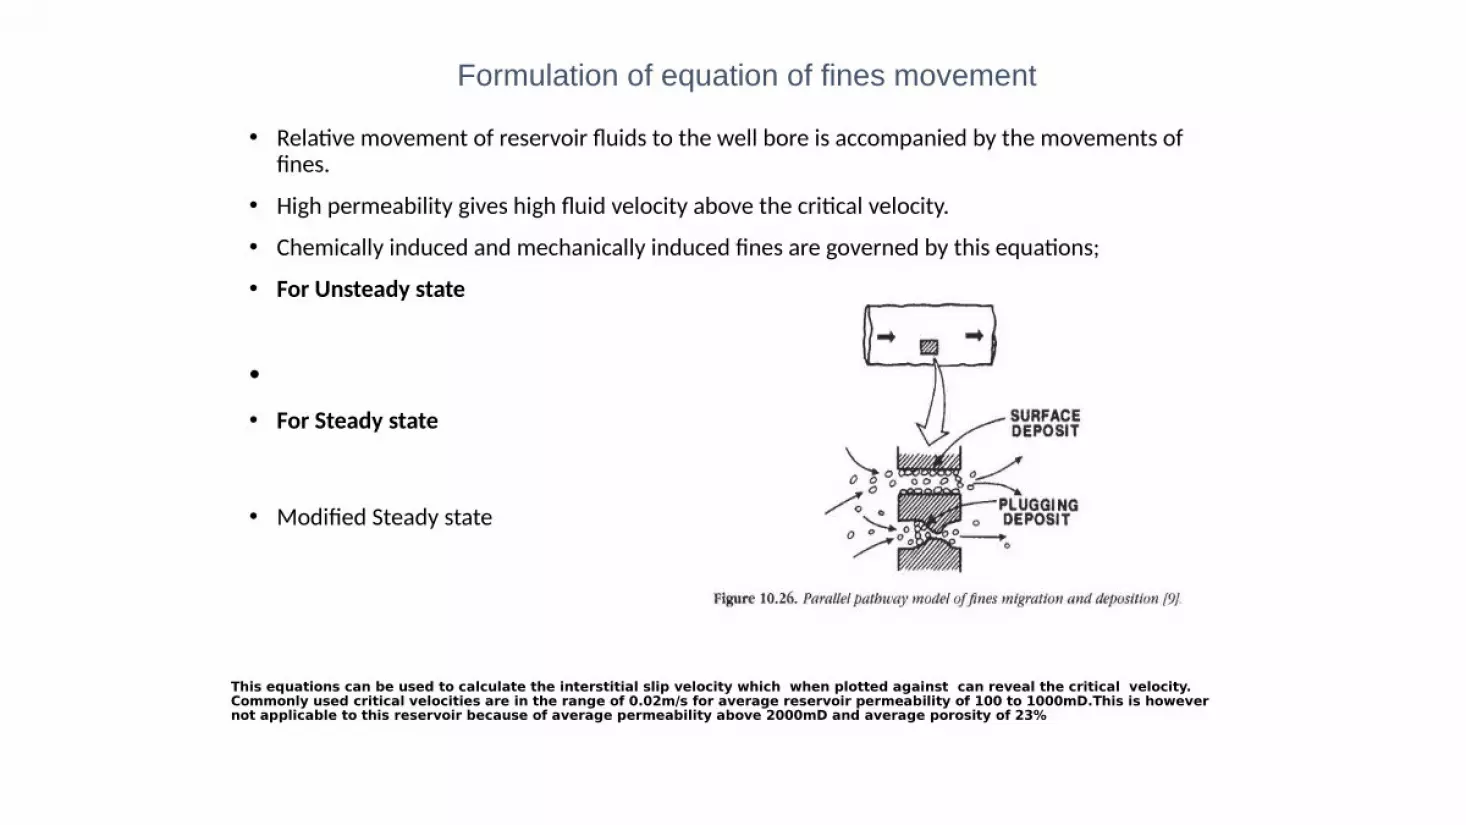
This equations can be used to calculate the interstitial slip velocity which when plotted against can reveal the critical velocity. Commonly used critical velocities are in the range of 0.02m/s for average reservoir permeability of 100 to 1000mD.This is however not applicable to this reservoir because of average permeability above 2000mD and average porosity of 23%
• Relative movement of reservoir fluids to the well bore is accompanied by the movements of fines.
• High permeability gives high fluid velocity above the critical velocity.
• Chemically induced and mechanically induced fines are governed by this equations;
• For Unsteady state
• • For Steady state
• Modified Steady state
Formulation of equation of fines movement

Conclusion
• Treatment of the well bore with acid mud to eliminate chemical and mechanical induced fines.
• Well should be operated at optimum production rate to create water influx front and reduction in flow velocities.

THANK YOU