distribution of oil sands formation water in bitumen froth
TRANSCRIPT

University of Alberta
Distribution of Oil Sands Formation Water in Bitumen Froth
by
Bei Jia
A thesis submitted to the Faculty of Graduate Studies and Research in partial fulfillment of the requirements for the degree of
Master of Science
Department of Chemical and Materials Engineering
©Bei Jia
Spring 2010 Edmonton, Alberta
Permission is hereby granted to the University of Alberta Libraries to reproduce single copies of this thesis and to
lend or sell such copies for private, scholarly or scientific research purposes only. Where the thesis is converted to,
or otherwise made available in digital form, the University of Alberta will advise potential users of the thesis of
these terms.
The author reserves all other publication and other rights in association with the copyright in the thesis and, except
as herein before provided, neither the thesis nor any substantial portion thereof may be printed or otherwise
reproduced in any material form whatsoever without the author's prior written permission.

Examining Committee Zhenghe Xu, Chemical and Materials Engineering Jacob Masliyah, Chemical and Materials Engineering Jozef Szymanski, Civil and Environmental Engineering Hongbo Zeng, Chemical and Materials Engineering

Abstract
Bitumen froth from oil sands extraction typically contains 60 wt.% bitumen, 30 wt.%
water, and 10 wt.% solids. To meet downstream process specifications, the water and
solids in bitumen froth have to be removed. The objective of this study is to identify
the source of the water reporting to the bitumen froth. The water comes from two
sources: formation water contained in mined oil sands ore, about 3-7 wt.%; and
processing water added during the extraction process to recover bitumen from oil
sands. Determining the distribution of the formation water will enable us to go one
step further to understand the effect of formation water on water removal from
bitumen froth.
After Denver Cell flotation process, the electrical conductivity of the emulsified water,
free water and tailings water was determined. The results showed that the
conductivity of emulsified water was higher than other water samples, indicating that
high salinity formation water preferentially reported to the bitumen froth.
To better differentiate distribution of formation water among various process streams,
oil sands extraction was carried out using heavy water instead of normal water as
processing water, the density of collected water samples was measured by high
precision density meter. However, no conclusive result could be obtained by this
method.
To obtain more accurate quantification of formation water distribution, cobalt as
chemical tracer was introduced in the processing water. Following the same procedure
of oil sands extraction and water samples collection as in conductivity measurement
and heavy water density measurement, the concentration of cobalt in various product
streams was determined accurately by Atomic-Absorption spectroscopy. The percent
of formation water in emulsified water was then calculated.
To understand formation water distribution in the context of oil sands ore
characteristics, different types of ores were tested. The results showed that the
characteristics of an oil sands ore were decisive factor determining formation water
distribution. It appeared that preferential distribution of formation water in the
bitumen froth was detrimental to froth treatment.

Acknowledgments
I would like to express my sincerest appreciation to:
My supervisors Dr. Jacob Masliyah and Dr. Zhenghe Xu for their excellent guidance
and immense encouragement throughout the course of this MSc research;
Mr. Jim Skwarok and Ms. Shiauyin Wu, for their generous help in the lab;
Dr. Hongying Zhao and Dr. Xianhua Feng, for their valuable discussions and
suggestions;
My wife Ms. Fang Li, for her whole-heartedly support;
All members in the Oil Sands Research Group at the University of Alberta, for their
kind assistance; and
The Financial support from the NSERC Industrial Research Chair in Oil Sands
Engineering.

Table of Contents
Chapter 1: Introduction ............................................................................................. 1
1.1 Oil sands overview ...................................................................................................... 1
1.2 Bitumen production process ...................................................................................... 2
1.3 Objective of thesis ....................................................................................................... 6
1.4 Organization of thesis ................................................................................................. 7
Chapter 2: Literature Review ................................................................................... 9
2.1 Oil sands compositions and characteristics ............................................................ 9
2.2 Microstructure of oil sands ...................................................................................... 11
2.3 Bitumen liberation ..................................................................................................... 14
2.4 Stability of water-in-oil (w/o) emulsions and mechanism of demulsification
....................................................................................................................................... 16
2.4.1 Emulsion stability ......................................................................................... 16
2.4.2 Mechanism of demulsification .................................................................. 18
2.5 Previous study on tracing water .............................................................................. 20
Chapter 3: Experimental Procedure ....................................................................... 21
3.1 Analysis of oil sands ores ......................................................................................... 21
3.1.1 Procedure for bitumen-water-solids analysis using Dean-Stark
apparatus ........................................................................................................ 21
3.1.2 Procedure for bitumen flotation tests ....................................................... 23
3.2 Heavy water experiments ......................................................................................... 25
3.2.1 Concept of experiments .............................................................................. 25

3.2.2 Materials ......................................................................................................... 26
3.2.3 Experimental procedure .............................................................................. 26
3.2.3.1 Density of formation water .............................................................. 26
3.2.3.2 Preparation of water samples .......................................................... 28
3.3 Electrical conductivity measurement ..................................................................... 30
3.4 Chemical tracer experiments ................................................................................... 31
3.4.1 Concept of experiments .............................................................................. 31
3.4.3 Chemical tracer feasibility experiments .................................................. 33
3.4.3.1 Bitumen recovery .............................................................................. 33
3.4.3.2 Loss of tracer in extraction of weathered oil sands ore ............. 34
3.4.4 Cobalt tracer experiments ........................................................................... 36
3.4.4.1 Bitumen froth settling ....................................................................... 36
3.4.4.2 Co-EDTA tracer experiments and mass balance calculations .. 37
Chapter 4: Results and Discussion .......................................................................... 45
4.1 Composition analysis of oil sands ores by Dean-Stark method ....................... 45
4.2 Bitumen recovery of oil sands ore samples .......................................................... 45
4.3 Results of heavy water tests ..................................................................................... 46
4.4 Results of electrical conductivity measurements ................................................ 48
4.5 Results of chemical tracer experiments ................................................................. 49
4.5.1 Cobalt concentration .................................................................................... 49
4.5.2 Water distribution calculations .................................................................. 51
4.5.3 Chemical tracer experiments for other ores ............................................ 54

4.5.3.1 Correlation between formation water selectivity index and
characteristics of oil sands ores ...................................................... 56
4.5.3.2 Correlation between selectivity index of formation water and
percent fines ........................................................................................ 58
4.5.3.3 Correlation between formation water selectivity index and
bitumen recovery ............................................................................... 61
4.5.3.4 Correlation between formation water selectivity index and
bitumen froth quality ......................................................................... 62
Chapter 5: Conclusions ............................................................................................ 68
Chapter 6: Recommendations for Future Study ................................................... 71
References ................................................................................................................... 72
Appendix ..................................................................................................................... 75

List of Tables
Table 2-1: Typical composition of Athabasca bitumen ......................................... 9
Table 2-2: Composition and ion concentration in formation water of a rich oil
sands ore and a poor oil sands ore (Zhao, et al., 2009) ...................... 10
Table 2-3: Mineral components of solids in a typical oil sands deposit (Helper and
Smith, 1994) ....................................................................................... 11
Table 3-1: Density of formation water measurement for TS ore ........................ 27
Table 3-2: EDTA complex stability constant ...................................................... 33
Table 3-3: Effect of weathering on ore composition (wt.%) ............................... 35
Table 3-4: Results of weathered ore extraction experiments .............................. 36
Table 3-5: Mass balance calculation of tailings water for TS ore ....................... 39
Table 3-6: Mass balance calculation of free water for TS ore............................. 40
Table 3-7: Results of bitumen froth drying experiment for TS ore (all in grams)
............................................................................................................ 41
Table 3-8: Mass balance calculation of water in the bitumen froth for TS ore ... 42
Table 3-9: Water mass balance calculation (all in grams) ................................... 43
Table 3-10: Cobalt mass balance calculation for a sample test............................. 43
Table 4-1: Descriptions and compositions of different ores ............................... 45
Table 4-2: Bitumen recovery and bitumen froth quality of five ores .................. 46
Table 4-3: Density of water samples ................................................................... 47
Table 4-4: Cobalt concentration in different water samples collected during
bitumen extraction using TS ores ....................................................... 50

Table 4-5: Percent of formation water and processing water in emulsified water
for TS ore ........................................................................................... 52
Table 4-6: Distribution of water (%) for TS ore .................................................. 53
Table 4-7: Percent formation water in emulsified water and selectivity index of
formation water .................................................................................. 56
Table 4-8: Percent fines in oil sands ores and corresponding diluted bitumen froth
(percent fines of total solids wt.%) .................................................... 59
Table 4-9: Froth composition of five oil sands ores ............................................ 62
Table 4-10: Percent water in diluted bitumen and emulsion stability ratio .......... 66

List of Figures
Figure 1-1: Generalized scheme for oil sands processing (Masliyah, 2004) ....... 5
Figure 2-1: Sketch of model structure of oil sands proposed by (a) J. H. Cottrell
(1963), and (b) G. D. Mossop (1980) .............................................. 12
Figure 2-2: The refined structure model of Athabasca oil sands proposed by
Takamura (1982). ............................................................................. 13
Figure 2-3: Correlation between water content and amount of fines in the solid
fraction for different grade oil sands (Cameron Engineers, 1978) .. 14
Figure 2-4: Schematic diagram showing the initiation of bitumen displacement
(Takamura and Chow 1983) ............................................................ 15
Figure 2-5: Polyhedral structure of concentrated water-in-oil emulsions (Socrates
Acevedo, 2001) ................................................................................ 18
Figure 3-1: Schematic diagram of a Dean-Stark apparatus ................................ 23
Figure 3-2: Schematic diagram of Denver Flotation Cell .................................. 24
Figure 3-3: Four layers structure of diluted bitumen froth from TS ore after
settling for 24 hours ......................................................................... 29
Figure 3-4: The diluted bitumen organic phase separated by high speed
centrifugation ................................................................................... 30
Figure 3-5: Bitumen recovery obtained from two procedures at the same
extraction condition ......................................................................... 34
Figure 3-6: Variation in the level of released free water with time .................... 37
Figure 3-7: Water distributions in oil sands extraction test ................................ 42

Figure 4-1: Density of water samples ................................................................. 47
Figure 4-2: Conductivity of water samples ........................................................ 48
Figure 4-3: (a) Total water distribution; (b) Processing water distribution; and (c)
Formation water distribution. .......................................................... 53
Figure 4-4: Correlation between percent formation water in emulsified water and
percent formation water in oil sands ore ......................................... 55
Figure 4-5: Correlation between percent bitumen in oil sands ore and formation
water selectivity index ..................................................................... 57
Figure 4-6: Correlation between percent formation water in oil sands ore and
formation water selectivity index .................................................... 57
Figure 4-7: Correlation between formation water selectivity index and percent
fines in oil sands ore ........................................................................ 60
Figure 4-8: Correlation between formation water selectivity index and percent
fines in diluted bitumen froth .......................................................... 60
Figure 4-9: Bitumen recovery as a function of formation water selectivity index
......................................................................................................... 61
Figure 4-10: Bitumen-to-water mass ratio in bitumen froth as a function of
formation water selectivity index .................................................... 63
Figure 4-11: Bitumen-to-solids mass ratio in bitumen froth as a function of
formation water selectivity index .................................................... 64
Figure 4-12: Stability ratio as a function of formation water selectivity index
......................................................................................................... 66

1
Chapter 1: Introduction
1.1 Oil sands overview
Oil sands, also known as tar sands, or extra heavy oil, are a type of bitumen deposit.
Alberta has huge deposits of oil sands containing an estimated 1.7 to 2.5 trillion
barrels of crude oil, making Canada the second largest oil reserves only after the
Saudi Arabia reserves (Oil and Gas Journal, 2005). These deposits covering 140,200
square kilometers (54,132 square miles) of the province are located in three main
regions: Peace River, Athabasca (Fort McMurray area) and Cold Lake (north of
Lloydminster). The Canadian oil sands were formed about 50-100 million years ago,
when crude oil was released from shale under the Rocky mountains and migrated
eastward and upward into sedimentary sand deposits in eastern Alberta. The crude oil
went through cold metamorphism, such as microbe biodegradation, volatilization of
light hydrocarbons, aqueous wash and oxidation, removing low-molecular weight
paraffin hydrocarbon components and enriching polar heteroatom complexes that
made up the dense and viscous bitumen.
Oil sands contain 7-13 wt.% bitumen, 3-7 wt.% water, and 80-85 wt.% mineral solids.
As a product of the oil sands, bitumen requires to be upgraded to synthetic crude oil
or diluted with lighter hydrocarbons to make it transportable by pipelines to refineries.
At room temperature, the viscosity of bitumen is usually much higher than 1.0×10⁴
mPa·s, the specific gravity is greater than 1.0, and it contains relatively high level of
heavy metals.

2
1.2 Bitumen production process
Since the first European saw the Athabasca oil sands, extensive efforts have been
made to achieve economic development for oil sands industry. G. Hoffman (1883)
working for the Geological Survey of Canada was one of the pioneers who attempted
to separate bitumen from oil sands by water. Sidney Ells (1913) employed by the
Federal Department of Mines advocated the hot water flotation method and conducted
a number of experiments to test this technique. He was the first to bring out samples
from the area for laboratory testing to pave 600 feet of road in Edmonton, Alberta,
which lasted for 50 years. Dr. Karl Clark, a scientist with the Alberta Research
Council in the 1920s, conducted experiments with a hot water flotation process which
involved mixing oil sand with hot water and aerating the resultant slurry. The hot
water flotation method is still the basis of the current commercial extraction processes
of mined oil sands industry. (Source: Syncrude Fact Book, 2009)
Commercial production of bitumen from mined oil sands began in 1967, when Great
Canadian Oil Sands Limited opened its first mine. Development was inhibited by
declining world oil prices. The second mine, operated by the Syncrude consortium,
did not begin its commercial production until 1978. Although the 1979 energy crisis
caused oil prices to peak again, introduction of the National Energy Program by Pierre
Trudeau discouraged foreign investment in the Canadian oil industry. During the
1980s, oil prices declined to very low levels, causing considerable retrenchment in the
oil industry. The third mine, operated by Shell Canada, did not begin until 2003. As a
result of oil price increases since 2003, the existing mines have been greatly expanded

3
and new ones are under planning. The global economic recession set back again the
entire oil sands industry because relative low oil prices since the end of 2008. The
newest oil sands producer, Canadian Natural Resources Limited started its operation
in spring 2009.
Oil sands mining: Oil sands ore is obtained by open pit mining for deposits buried less
than about 50 meters. Large scale shovels and trucks are used to remove overburden
and expose the oil sands ore. For in-situ production of bitumen from ore body below
100 meters, various techniques can be used. One technique is steam-assisted gravity
drainage (SAGD). In SAGD, steam is added to the oil sands formation using a
horizontal well to heat up the formation and hence reduce viscosity of bitumen. The
heated bitumen is pumped above ground using a second horizontal well located below
the steam injection well. SAGD operations can recover as much as 55% of the
bitumen in-place (Deutsch and McLennan, 2005). Another technique called the Vapor
Extraction Process (VAPEX) operates similarly to SAGD. But instead of steam,
ethane, butane or propane is injected into the reservoir to mobilize the hydrocarbons
toward the production well. This method requiring no steam in processing is 25%
lower in capital costs and 50% lower in operating costs than the SAGD process.
The basic bitumen extraction process from the mined oil sands consists of following
several steps.
Oil sands ore preparation: The mined ore lumps are crushed and mixed with hot water
to form slurry in mixing boxes, cyclo-feeders or rotary breakers. In order to liberate
bitumen from the sands grains, the slurry is then pumped through a hydrotransport

4
slurry pipeline. In some operations, air is injected into the slurry pipeline where
bitumen droplets are allowed to attach to air bubbles.
Bitumen extraction: The aerated slurry is pumped into a gravity separation vessel,
where the slurry is separated into primary bitumen froth, middlings and tailings. The
primary froth normally contains 60 wt.% bitumen, 30 wt.% water and 10 wt.% fine
solids by weight. The middle stream from the vessel called middlings containing
unrecovered small bitumen aggregates is re-aerated in flotation cells to allow more
bitumen to float to the surface of the pulp as secondary bitumen froth.
Froth treatment: The bitumen froth from gravity separation vessels or flotation cells is
generally de-aerated by steam. Diluents are then added to reduce the viscosity and
density of bitumen in the froth to further separate it from water and solids. The treated
bitumen after naphthenic froth treatment still contains 1.5-2.5 wt.% water (0-100 ppm
for paraffinic treatment) and 0.4-0.8 wt.% solids (500-800 ppm for paraffinic
treatment) (Canadian Heavy Oil Association, 2004).
Tailings management: Tailings from the separation vessels and flotation cells are
pumped into large tailings ponds. After formation of the mature fine tailings, coarse
solids from process tailings are mixed with MFT and gypsum to form non-segregating
consolidated tailings, thereby releasing water for recycle to the extraction process.
Bitumen upgrading: Upgrading involves thermal treatment and coke rejection while
adding hydrogen to make more valuable hydrocarbon products. This is done using
four main processes: thermal treatment breaks large bitumen molecules into smaller
fragments, distillation separates hydrocarbon molecules into their boiling point

5
components, catalytic conversion helps transform hydrocarbons into more valuable
products, and hydrotreating is used to remove sulfur and nitrogen and increase
hydrogen to carbon ratio in the product. The end product of upgrading is the synthetic
crude oil, SCO, which is shipped by underground pipelines to refineries across North
America, where it is refined further into jet fuels, gasoline and other petroleum
products.
A generic flow diagram of oil sands mining to bitumen upgrading is shown in Figure
1-1:
Figure 1-1: Generalized scheme for oil sands processing (Masliyah, 2004)

6
1.3 Objective of thesis
Stable water-in-oil emulsions are undesirable due to corrosions in upgrading and
refining of bitumen. The emulsions must be treated to remove the dispersed water
droplets and associated fine solids to meet the requirements for the downstream
upgrading processes, which is less than 0.5 vol.% of total water and solids.
The water in bitumen froth could come from two sources: formation water (connate
water) contained in oil sands ore, about 3-7 wt.%; and the added processing water in
the bitumen extraction process to recover bitumen from oil sands. The formation
water in the oil sands is of high salinity which can be at similar level as seawater. The
sodium and chloride ion concentrations can vary from 10-100 mg/kg of oil sands.
Calcium and magnesium ions can vary up to 40 mg/kg of oil sands (Masliyah, 2007).
Other inorganic ions (e.g. K+) are also present in the formation water. The process
water used in bitumen extraction processes contains dissolved ions from common
salts of sodium, magnesium, calcium, chloride and sulphate. Oil sands plants
presently operate with large scale treatment of recycle process water and have a zero
discharge policy due to the environment concerns. Consequently, the ionic content of
the process water has been continuously increasing.
In order to validate the necessity of water pretreatment, thereby reducing the difficulty
of dewatering from bitumen froth, it is important to determine the source and
distribution of water present in bitumen froth. This study was set up to determine
formation water distribution in the oil sands extraction process by using tracer
technique. To accomplish the objective, Denver flotation cell was used to extract

7
bitumen from oil sands ore. Poor, average and rich ores were tested. The composition
of the ores and corresponding bitumen froth was analyzed by Dean-Stark method.
More specific objectives of this study are:
To analyze the concentration of tracer in the water of various streams collected
during Denver Cell oil sands extraction process;
To analyze the composition of oil sands ores and bitumen froth for different types
of ores;
To analyze the percent of fines in the ore and bitumen froth of different types of
ores;
To analyze the bitumen recovery of different types of ores;
To analyze the percent of water at the specific level of diluted bitumen froth to
make sure water settling status in bitumen froth for different types of ores; and
To correlate the characteristics of ores, bitumen processability, bitumen froth
quality and bitumen froth treatment performance with formation water
distribution.
1.4 Organization of thesis
This thesis was organized as follows:
Chapter 1: History of oil sands industry and bitumen production methods were briefly
introduced, followed by the objective of this study and the overview of this thesis.
Chapter 2: Fundamental knowledge of oil sands and bitumen extraction, including the
composition and microstructure of the oil sands, was described. The mechanism of the
emulsions stability was reviewed, and previous work on the use of tracer to analyze

8
water distribution was briefly reviewed.
Chapter 3: Experimental equipment and procedures were described in detail.
Chapter 4: All the results and discussion were given.
Chapter 5: Conclusions were drawn based on previous analysis.
Chapter 6: Suggestions for future research in this field were provided.

9
Chapter 2: Literature Review
2.1 Oil sands compositions and characteristics
Oil sands primarily contain bitumen, water, sands and clays. The bitumen content in
oil sands deposits varies from 0-16 wt.% by weight. Oil sands are classified usually
by bitumen content: oil sands ores with bitumen content above 10 wt.% are
considered as high-grade (rich) ore, an ore of bitumen content between 8-10 wt.% is
considered as average-grade ore, and those with less than 8 wt.% are considered as
low-grade (poor) ore. Although oil sands ores contain different grade of bitumen, the
total content of bitumen and its formation water is fairly constant at around 16 wt.%.
The rest of 84 wt.% is the mineral solids. Bitumen contains mainly carbon, hydrogen,
sulphur, nitrogen, oxygen and metals present in organic structures. It is a mixture with
extremely complex molecular structure. It is almost impossible to describe exact
structures of all the components in bitumen. Some chemical elements of bitumen from
the Athabasca oil sands are listed in Table 2-1 (Nelson and Gray, 2004).
Table 2-1: Typical composition of Athabasca bitumen
Bitumen C H N O S Ni V
(wt.%) (ppm)
Syncrude 83.1 10.6 0.4 1.1 4.8 150 290
Suncor 83.9 10.5 0.4 1.0 4.2
Classified by alkane solvent solubility, bitumen contains mainly two groups of
organic components: asphaltenes and maltenes. Asphaltenes are the highest molecular

10
weight component which is soluble in benzene but not in alkane solvent such as
hexane. Athabasca bitumen contains 14-18 wt.% by weight of hexane-insoluble
asphaltenes. The maltene fraction (alkane solvent soluble) can be further separated
into following fractions: saturates, aromatics and resins.
The formation (connate) water content ranges from 0-9 wt.% by weight of oil sands
ore. Normally, it is high in a poor ore, and low in a rich ore. The formation water
contains different amount of inorganic and/or organic ions, such as Na+, K+, Mg2+,
Ca2+, Cl-, SO42+, HCO3
- and/or –COOH. Table 2-2 shows composition and ion
concentration in formation water of a rich oil sands ore and a poor oil sands ore from
Syncrude Canada Ltd.
Table 2-2: Composition and ion concentration in formation water of a rich oil sands
ore and a poor oil sands ore (Zhao, et al., 2009)
Rich Ore Poor Ore
Assays
(wt.%)
Bitumen 14.3 6.1
Water 3.4 7.0
Solids 82.3 86.9
Fines, <44 µm (of mineral solids) 12.8 43.0
Water Soluble Ions
in “Formation
Water”
(mg/kg of ore)
Na+ 62.4 18.1
K+ 5.2 19.8
Ca2+ 0.3 32.0
Mg2+ 0.1 18.4
Cl- 308.3 1.1
SO42+ 13.5 118.4
HCO3- 22.9 37.8
pH ~7.0 ~7.4

11
The mineral composition of the solids is over 90% quartz with minor amounts of
potash, feldspar, chert and muscovite (Carrigy and Kramers, 1973; Boon, 1978;
Masliyah 2004). Clay minerals, which are dominantly kaolinite, illite and a small
amount of montmorillonite, only appear in the fines fraction. “Fines” is referred to the
mineral solids that are smaller than 44 microns. A high-grade oil sands ore contains
less fines, and a low-grade oil sands ore contains a larger amount of fines. Total solids
analysis is given in Table 2-3.
Table 2-3: Mineral components of solids in a typical oil sands deposit (Helper and
Smith, 1994)
Mineral wt.% Mineral wt.%
Quartz 82 Kaolinite 4
K-feldspar 5 Illite 7
Calcite Trace Chlorite 1
Dolomite Nil Smectite Trace
Siderite Trace Mixed layer clays 1
Pyrite Nil Anhydrite Trace
2.2 Microstructure of oil sands
It is generally assumed that the hydrophilic nature of the sand grains is a key fact for
the hot water process to be feasible (Camp 1976; Ball 1935; Cottrell 1963). It is
hypothesized that a thin layer of water covers the entire surface of each sand grain.
The presence of this water layer is the single most important characteristic and

12
fortunate feature to make process of bitumen separation from oil sands easy and
economically feasible. However, the existence of such a water film has not directly
been verified experimentally.
In 1963, Cottrell was the first to propose a structural model for oil sands in terms of
the mutual arrangement of solids, water and bitumen.
Figure 2-1: Sketch of model structure of oil sands proposed by (a) J. H. Cottrell
(1963), and (b) G. D. Mossop (1980)
A schematic illusion of his model is shown in Figure 2-1(a). Cottrell assumed that the
sand grains were surrounded by a water film of uniform thickness, while clay
minerals were suspended in the water layer. This film of water was further encased by
the bitumen, which filled the voids between the individual sand grains. Mossop
updated the structure model in 1980. Figure 2-1(b) shows that the quartz grains were
all in direct contact with each other, and they constituted a stable framework that
remained virtually unchanged when the fluids were mobilized. The water film around
the grains, only a few micrometers thick, formed a physically continuous sheath that
prevented direct contact between bitumen and quartz. The bitumen phase was also

13
continuous, linked from one pore to the next through a three-dimensional network of
pore throats. Clay minerals were attached to the surface of sand grains, and it was
unlikely that they protruded through the water envelop (Mossop, 1980). However, the
above models have certain limitations: they assumed the thickness of the water film
was uniform, and the models were only applicable to high-grade oil sands.
Takamura reported a refined model in 1982 which is shown in Figure 2-2.
Figure 2-2: The refined structure model of Athabasca oil sands proposed by Takamura
(1982).
In this model, the water in the oil sands appears in three forms: as pendular rings at
grain-to-grain contact point; as a roughly 10 nm thick film which covers the sand
surface; and as water retained in fines clusters. In the case of high grade oil sands, the
pore space is filled with bitumen and water. The water occupies between 10-15% of
the pore volume and forms pendular rings at the contact points between the sand
grains. These pendular rings cover roughly 30% of the surface and the remaining 70%
of the surface is covered by a thin film of water which is stable because of the double
layer repulsive forces acting between the charged sands and the bitumen surfaces. In

14
lower grade oil sands, clusters of fine particles (<44 µm) exist within the framework
formed by coarse sand grains. These clusters of fine particles are saturated with water.
Thus it provides an explanation that the amount of formation water in oil sands
increases linearly with increasing fines content. The correlation between water content
and fines content is illustrated in Figure 2-3.
Figure 2-3: Correlation between water content and amount of fines in the solid
fraction for different grade oil sands (Cameron Engineers, 1978)
2.3 Bitumen liberation
Takamura and Chow (1983) proposed a theoretical model for initiation of bitumen
displacement from oil sands as shown in Figure 2-4. An oil sands aggregate is
represented by two sand grains covered by a bitumen layer. When this aggregate is
immersed in water, the bitumen migrates toward the grain-to-grain contact point and
develops a toroidal shape [Figure 2-4(b)]. The interfacial area between the bitumen

15
and water is smaller in this configuration, thus representing the thermodynamically
more stable state. Sometimes minute bitumen flecks may be trapped in cavities or at
sharp edges on the sand surface, thereby giving rise to the formation of small size
droplets. When the bitumen starts accumulating at the grain-to-grain contact point, it
also leads to the local thinning of the bitumen film, as schematically illustrated in
Figure 2-4(c). Here the formation water layer is also shown. Electrostatic repulsion
between the negatively charged bitumen-water and sand-water interfaces results in an
increased disjoining pressure between the bitumen and solid phases. This disjoining
pressure together with applied mechanical and thermal energy promotes the
separation of the bitumen from the sand. When the bitumen film ruptures, this
formation water is mixed with the aqueous phase into which the aggregate is
immersed [Figure 2-4(d)]. The stability of the formation water film will be modified
depending on the pH, and valence and concentration of electrolytes in the aqueous
phase.
Figure 2-4: Schematic diagram showing the initiation of bitumen displacement (Takamura and Chow 1983)

16
2.4 Stability of water-in-oil (w/o) emulsions and mechanism of demulsification
The bitumen froth from the hot water extraction process consists of oil, water, solids
and air. It has been found that a substantial amount of water in the bitumen froth is in
the form of a water-in-oil emulsion. This emulsified water is difficult to separate from
the bitumen froth.
2.4.1 Emulsion stability
According to Bancroft (1913), the stability of any emulsion is largely due to the
nature of the formed interfacial film. The stability of this film is dependent on a
number of factors, including the heavy organic components in the crude oil (e.g.
asphaltenes, resins, saturates, and aromatics), solids (e.g. clays, scales, and corrosion
product), temperature, droplet size and droplet-size distribution, pH, and composition
of oil and brine. Adsorption–desorption kinetics, solubility of emulsifiers and their
interfacial rheological properties are significant factors. Rheological properties are the
main characteristics of the dynamic properties of a film. There are two rheological
properties of interfacial films—interfacial shear and dilational viscoelasticity. It seems
that dilational viscoelastic parameters are usually much larger than the shear ones.
The difference can be of several magnitudes. Interfacial dilational viscoelasticity
seems to play a significant role in emulsion stabilization (Bonfillon and Langevin,
1993).
According to four traditional separation methods, bitumen has been divided into
asphaltenes, resins, aromatics and saturates, known as SARA. Among these,
asphaltenes and resins have higher polarity and surface activity so that they will be

17
adsorbed at an oil-water interface to form the interfacial film with considerable
strength and stabilize emulsions. Therefore, research on emulsion stability has been
mainly focused on asphaltenes. Many scholars believe that asphaltenes basically
comprise of densified aromatic cycloparaffin as core, around which there link some
cyclanes, aromatic hydrocarbon, and normal or isomeric alkane side chains with
different length in cyclanes (Waller, 1989). Asphaltene molecule contains heteroatoms
of S, N and O, and sometimes transition metals, such as Ni, V, Fe, etc. Resins and
asphaltenes contain compounds of carbonyl and aromatic unit, which play a critical
role in emulsion stabilization. Oxidation of interfacial materials has been found to
increase both carbonyl content and emulsion stability. Among the interfacial material,
the concentration of —C=O determines overall emulsion stability. However, the
concentration of —OH is also found to be important. Both —C=O and —OH together
promote asphaltenes molecule to form hydrogen bond, which surrounds droplets to
avoid coalescing. The research of Mohammed et al. (1994) indicated that interfacial
activity of asphaltenes is not very strong. Normally, oil-water interfacial tension in the
presence of asphaltene is around 25-35 mN/m, but its ability to stabilize emulsions is
strong. Natural surfactants, such as asphaltenes and naphthenic acids are found to
adsorb at the oil-water interface and form interfacial film with elasticity. And the
interfacial film formed from asphaltenes has sufficient strength to endure high
pressure. In general, the higher, the asphaltenes content, the stronger, the film strength,
and the more stable, the emulsions.

18
2.4.2 Mechanism of demulsification
Demulsification is to break an emulsion into oil and water phases. From a process
point of view, the oil producer is interested in two aspects of demulsification: a fast
rate at which this separation takes place and the low amount of water left in the crude
oil after separation. The stability of an emulsion can be quantified as the time elapsed
between its formation and its total collapse. Very concentrated emulsions (70% or
more of the dispersed phase) are often in the form of polyhedral droplets separated by
thin liquid films of the continuous phase (Figure 2-5).
Figure 2-5: Polyhedral structure of concentrated water-in-oil emulsions (Socrates
Acevedo, 2001)
Three adjacent liquid films meet at the Plateau border channels. The curvature at the
Plateau border walls generates a pressure difference between the thin liquid film and
the Plateau borders, causing liquid to flow out of the films into the Plateau border
channels. Thus, the liquid films become thinner with time, and eventually they might

19
collapse, promoting destabilization of emulsions. Therefore emulsion stability
depends on the stability of the thin liquid films. The stability of the thin liquid films
was first discussed in terms of a “disjoining pressure” by Derjaguin and Kussakov.
The disjoining pressure is the pressure in the interior of the films, operating at right
angles to the surface of the films, which opposes the approach and coalescence of two
droplets in an emulsion. In other words, it is the force per unit area that opposes film
drainage.
The purpose of demulsification is to destroy the interfacial film and make most water
droplets to coalesce. In recent decades, researchers mainly focus on the mechanism of
demulsification by following water droplet coalescence process and studying the
influence of demulsifier on the rheological properties of interfacial film. It has
become common sense that the demulsification includes three processes: droplet
contact, liquid film thinning and coalescence. Demulsifiers are surface-active
compounds. When added to an emulsion, they migrate to the oil-water interface.
Since demulsifiers are of stronger interfacial activity than natural surfactant in
bitumen, they will adsorb at the oil-water interface to partly displace natural
emulsifiers adsorbed at the interface, forming a compound film with lower film
strength. Eventually the rigid film will be broken to cause water droplets to coalesce,
forming bigger drops which settle at a much faster rate. The coalescence leads to
complete separation of oil and water phase, accomplishing demulsification. The
factors that enhance or speed up emulsion breaking include: increasing temperature,
solids removal, control of water chemistry and addition of chemical demulsifiers.

20
2.5 Previous study on tracing water
Sanford et al. (1992) carried out a series of experiments to study the formation of
water-in-oil emulsions in the hot water extraction process. The experiments were
conducted in a batch extraction unit (BEU) and a continuous pilot extraction test rig
with Athabasca oil sands. Heavy water was used as slurry water or flood water in the
BEU. The results showed that part of the slurry water was bound to the bitumen and
formed emulsified water droplets in the primary froth. Microscopy studies showed
that more droplets of smaller and more uniform sizes formed at high stirring speed.
The maximum diameters increased from 7 to 23 µm when the stirring speeds
decreased from 900 to 300 rpm. The maximum diameter of emulsified water droplets
in the froth from the pilot scale extraction tests was about 18 µm. The BEU aeration
procedure showed no effect on the emulsification process. The w/o emulsions in the
primary froth from the hot water process were mostly caused by the process units in
the slurrying step prior to the separation vessel. The w/o emulsions in bitumen froth
were found to be extremely stable. The study of Sanford et al. mainly focused on
when and which step the emulsified water formed, but it was not involved with
formation water distribution, which is the focus of this study.

21
Chapter 3: Experimental Procedure
3.1 Analysis of oil sands ores
Five oil sands ore samples were used in this study. The composition of the ore
samples was determined using standard Dean-Stark analysis procedures as described
below.
3.1.1 Procedure for bitumen-water-solids analysis using Dean-Stark apparatus
Dean-Stark apparatus was invented by Dean and Stark in 1920 for determination of
the water content in petroleum. It was used in this study to determine the composition
of oil sands ores and bitumen froth quantitatively. Figure 3-1 shows a schematic
diagram of a typical Dean-Stark apparatus.
A Dean-Stark apparatus consists of a burette-like vertical glass trap. The top of the
cylindrical trap is connected to the bottom of a vertical glass tube which is a reflux
condenser. The top of the trap has a side-arm sloping toward a reflux flask. A weighed
filtering container, called thimble in which the sample is placed, is hung on the joint
between the end of the side-arm and the reflux flask. About 200 ml toluene is placed
in the flask prior to analysis. The flask with toluene is then heated up to boiling at
200 oC. The vapors containing toluene and water rise out of the flask into the
condenser, and then into the distilling trap. Here, immiscible liquids are separated into
two phases with toluene on top of water. When the top toluene layer reaches the level
of the side-arm it flows back into the flask, while the bottom water phase is kept in the
trap. During the refluxing, bitumen in the oil sands or froth is dissolved in hot toluene,

22
which permeates the wall of thimble and drips in the flask. When the water level in
the trap reaches the level of the side-arm, the water will flow back into the flask as
well. It is important to drain the water from the trap as it accumulates. Reflux
continues until the toluene dripping from the thimble becomes colorless and the level
of the water in the trap is stable, usually lasting about 3 hours. At the end of refluxing,
the collected water is carefully drained and weighed. The thimble is transferred into a
glass jar and placed in the vacuum oven at 90 oC to dry over night. The dark organic
liquid (bitumen in toluene solution) in the refluxing flask is allowed to cool down at
room temperature and then transferred into a 250 ml flask. Additional toluene is added
to the flask to 250 ml mark. After thorough mixing, 5 ml organic liquid is taken by a
glass pipette and poured on a weighed filter paper evenly. After about 20 minutes in a
well-ventilated fume hood, the toluene is completely evaporated, while the bitumen
remains on the filter paper. The increase in the weight of the filter paper times by 50 is
the total mass of bitumen in the given oil sands or bitumen froth originally placed in
the thimble. The solid content is determined by the weight of dried thimble minus the
original weight of empty thimble. The water content is determined by weighing the
water collected. The bitumen-water-solids content is then obtained.

23
Figure 3-1: Schematic diagram of a Dean-Stark apparatus
3.1.2 Procedure for bitumen flotation tests
Bench-scale extraction unit, Denver Flotation Cell, was used to study ore
processability and water distribution. The bitumen froth and tailings from Denver
Flotation Cell tests were collected and analyzed using the above Dean-Stark method.
Figure 3-2 shows a sketch of a typical Denver flotation cell.

24
Figure 3-2: Schematic diagram of Denver flotation cell
The rotor in the center is fitted inside a solid stator composing a mixer. The bitumen is
liberated from the solids under the shear force caused by rotating rotor at certain
temperature. Air is introduced into the slurry through the central pipe along the stator,
and broken into small bubbles within the area between stator and rotor. The air
bubbles attach to bitumen droplets, decreasing the density of bitumen-air aggregates.
The aerated bitumen droplets are then floated under buoyancy force to the top of the
slurry in the flotation cell, forming bitumen froth.
The Denver cell flotation test was one of the most important steps of the study. A
water jacket 1-liter flotation cell was connected to a thermal water bath, setting the
temperature to 35 oC. After introducing 400 g of deionized water or processing water
at 35 oC into the flotation cell, 130 g of defrosted oil sands ore was placed into the cell.

25
The agitation was then started at 1500 rpm to form bitumen slurry without aeration for
5 minutes. This step was referred to as oil sands conditioning. After conditioning, air
flow at 150 ml/min was introduced into the flotation cell and aerated bitumen floated
to the top of slurry, forming bitumen froth. For oil sands recovery study, bitumen froth
was collected into four containers over desired time intervals of 3, 5, 10 and 15
minutes. For water distribution analysis of bitumen froth, the collected froth was
placed in a 250 ml separation funnel.
Denver Cell flotation operational conditions were as follows:
Medium: deionized water
Temperature: 35 oC
pH=8
Aeration rate: 150 ml/min
Stirring speed: 1500 rpm
Conditioning time: 5 min
Flotation time : 15 min
3.2 Heavy water experiments
3.2.1 Concept of experiments
Heavy water was first chosen as a tracer in this study. Normal water was replaced by
heavy water as processing medium in flotation. The samples of water in bitumen froth
and in tailings were collected. Since there was a density difference between the
formation water and process heavy water, determining the density of water in bitumen
froth and tailings would allow us to assess the source of water in bitumen froth and

26
hence formation water distribution.
The density of water determined at 25 oC by density meter was as follows:
ρ2H O =0.9973 g/cm3
ρ2D O =1.1045 g/cm3
leading to a density difference of Δρ =0.1072 g/cm3.
The density meter used in this study (DMA38, Anton Paar, Austria) could measure the
density of water with a precision of one-thousandth, which was well above the density
difference between the normal water and heavy water in the order of tens. It seemed
that the density method was capable of discriminating the source of water in bitumen
froth.
3.2.2 Materials
In this study, TS ore (bitumen 8.77 wt.%, water 9.37 wt.%, solid 81.86 wt.%) was first
attempted. The reason to choose TS ore as first sample was that it contained the
highest water content among the ores tested and was anticipated to provide the most
reliable results. Heavy water (deuterium oxide, D2O, 99%, density=1.1045 g/cm3) was
purchased from Cambridge Isotope Laboratories, Inc.
3.2.3 Experimental procedure
3.2.3.1 Density of formation water
Formation water contains high salinity, mainly Na+; K+; Ca2+; Mg2+ etc. The high
concentration of salt increases the density of formation water in comparison to pure
water. It was therefore important to determine the density of formation water. The
formation water was washed out from the oil sands ore by using heavy water. Since

27
the density of D2O had been already known, the density of formation water could be
obtained from the density of the water mixture.
An accurate amount of heavy water was blended with TS ore. The solid-liquid
mixture was shaken by a horizontal shaker (Reciprocal Shaker 6000, Ederbach, USA)
at low speed for 60 minutes. After centrifuging the mixture at 15,000 rpm for 30
minutes, a part of water including formation water and added heavy water was
separated from the solids. After collecting the released water, the density of water was
measured, which allowed calculation of density of formation water using:
2
2 2
22Added Water Added Water
Mixture Added Water
Formation H O Formation H O
Formation H OFormation H O
Formation H O
m mm mV m
ρ
ρ ρ
= =+
−
Results of three tests are summarized in Table 3-1.
Table 3-1: Density of formation water measurement for TS ore
1 2 3
Ore (g) 20.449 23.933 21.886
Added Heavy Water (g) 5.871 11.086 10.627
Formation Water (g)=ore×9.37 % 1.916 2.243 2.051
Measured Density of Mixture (g/cm3) 1.080 1.087 1.088
Calculated Density of Formation Water (g/cm3)
1.011 1.008 1.009
Average Density of Formation Water (g/cm3)
1.009±0.002

28
Average value ρ=1.009 g/cm3 was used as the density of formation water for future
calculations.
3.2.3.2 Preparation of water samples
In a 1000 ml beaker, 65 g TS ore and 200 g heavy water were loaded. The initial pH
of the mixture was measured to be 7.3 with no further chemical addition. To maintain
whole procedure at a constant temperature, 300 ml water was added into the 1-litre
Denver Flotation cell and the 1000 ml beaker was soaked in the water-containing
flotation cell. Denver Cell flotation was carried on at the same conditions as
mentioned in Section 3.1.2. The bitumen froth was completely skimmed off and
diluted by 4 g naphtha, leading to a solvent-to-bitumen mass ratio of 0.7:1. After
stirring, the diluted bitumen froth was loaded in a 250 ml separation funnel and
allowed to settle for 24 hours at room temperature. The mixture was separated into
four layers as shown in Figure 3-3.

29
Figure 3-3: Four layers structure of diluted bitumen froth from TS ore after settling for 24 hours
The top oil phase was diluted bitumen. This oil phase contained solvent, bitumen,
water and solids. Due to the addition of solvent, the average density of the
bitumen-solvent mixture was lower than water. Diluted bitumen was therefore
floating on the top. Beneath this top organic layer was an aqueous phase known as
free water, which was released from the bitumen froth. At the bottom there were two
layers of solids. In order to eliminate the error of collecting the free water and solids,
they were drained off from the bottom outlet of the separation funnel by controlling
the opening of the valve gently. The oil phase was collected and placed into a 30 ml
centrifuge tube. After centrifuging for 30 minutes at 15,000 rpm, part of trapped water
was separated out, as an aqueous layer as shown in Figure 3-4. The released water
Coarse Solids
Fine Solids
Free Water
Bitumen Froth: • Diluted bitumen • Water • Sands

30
after centrifugation was defined in this study as emulsified water.
Figure 3-4: The diluted bitumen organic phase separated by high speed centrifugation
The liquid from aqueous layer was carefully collected by 2 ml glass pipette to
minimize the trapping of oil droplet. The collected water was filtered using 25 mm
syringe filter (pore diameter 0.22 µm, Fisher Scientific) to remove the clays and oil
droplets. For density analysis, the tailings water and free water from the same set of
experiment were also filtered using the same method.
3.3 Electrical conductivity measurement
The electrical conductivity of water samples from oil sands extraction was measured.
Although it could not give a quantitative conclusion, a qualitative analysis could be
achieved. Electric conductivity is a measure of a material to conduct an electric
current. It is the inverse of electrical resistivity, and has the SI units of siemens per
Oil Phase
Released Water Solids

31
metre (S·m-1). The formation water is known to contain higher salinity which leads to
higher conductivity. The conductivity of water samples from Section 3.2.3.2,
including processing water, emulsified water, free water and tailings water, was
measured by Zeta Potential Analyzer (BrookHaven Instruments Corporation, USA).
3.4 Chemical tracer experiments
3.4.1 Concept of experiments
At the early stage of this study, heavy water experiments and conductivity
measurements were found to be not sufficiently sensitive to distinguish distribution of
formation water. An alternative chemical tracer method was developed. In this method,
a chemical element which was not present in the oil sands ore was added to the
deionized water that was used as the processing water for bitumen extraction. Once an
oil sands ore was extracted by such tracer-containing processing water, the
determination of tracer element concentration in various water samples would allow
the distribution of formation water in various water samples to be assessed. A lower
concentration of tracer element in a water sample would indicate a higher
concentration of formation water in that sample. Tracer analysis could provide a
material balance calculation and hence more quantitative conclusion. Identifying a
chemical tracer which did not interfere with extraction, did not adsorb on oil sands
components during extraction, and could be easily and accurately measured, was the
key for the entire project.
3.4.2 Chemical tracer selection and solution preparation
The criteria taken into consideration to select the tracer are as follows:

32
1. It should be completely soluble in water but highly insoluble in organic phase;
2. Accurate analysis is possible even at low concentrations;
3. It should not be present in the original oil sands ore;
4. Introduction of such tracer should not cause chemical reaction with the bitumen and
has no effect on bitumen extraction; and
5. It should not adsorb on oil sands components in oil sands extraction process.
Cobalt (Co) was selected as tracer in this study. The main reason of choosing cobalt as
tracer is that oil sands ore does not contain any detectable amount of Co. Secondary,
cobalt can be easily and accurately analyzed by Atomic-Absorption Spectroscopy
(AAS). Accurate measurements can be achieved to less than 1 ppm of metal ion
concentration. Other metals, such as Ca, Mg and Al can be precisely detected by AAS
analysis as well, but the presence of such metals at appreciable concentration in oil
sands ore disqualifies them as candidates.
To avoid adsorption of Co2+ on various components of oil sands, chelating of Co2+
with EDTA to form a high soluble, stable complex was applied. In preparation of 40
ppm Co tracer solution, a stoichiometric amount of Co (0.5 g CoCl2 dehydrated at
100 oC, blue powder) and EDTA (1.43 g EDTA disodium salt) was placed in a 500 ml
flask. Deionized water was added to the 500 ml mark. The 40 ppm pink Co in EDTA
complex solution was used after dilution by 10 times with water. The Co-EDTA is
highly soluble in water, and more stable than other metal-EDTA complexes as shown
by corresponding high complexation constant in Table 3-2.

33
Table 3-2: EDTA complex stability constant
Ions Co2+ Al3+ Fe2+ Ca2+ Mg2+ Na+ logK 16.31 16.11 14.32 10.69 8.70 1.66
In Table 3-2, K refers to EDTA complexation stability constant, given
by[ ]
2
2
( )Co EDTAK
Co EDTA
−
+
⎡ ⎤⎢ ⎥⎣ ⎦=⎡ ⎤⎢ ⎥⎣ ⎦
. With a value of Log K=16.31, it means that the concentration
of Co-EDTA is 1016 time higher than the product of concentration of Co ions and
EDTA molecules in solution. A high value of K means less dissociation of Co-EDTA
complex in water, namely the Co-EDTA complex is very stable in water.
3.4.3 Chemical tracer feasibility experiments
3.4.3.1 Bitumen recovery
As mentioned in the previous section, the introduction of a chemical tracer should not
affect bitumen extraction. Two sets of oil sands extraction experiments were carried
out at the same conditions in order to validate that the Co-EDTA addition did not
affect bitumen recovery. The only difference between these two tests was that the
processing water in one test contained 40 ppm Co in EDTA complex form, but not in
the other test.
The test was conducted using 200 g TS ore in 600 g processing water. The initial pH
value of the mixture for both tests was adjusted to be 8 by 0.1 mol/L NaOH solution.
The flotation tests were conducted in standard Denver Flotation Cell as described in
Section 3.1.2. During flotation, the bitumen froth was collected at exact time intervals
of 3, 5 and 10 minutes after air addition. The bitumen recovery results of the two tests

34
are shown in Figure 3-5.
0 2 4 6 8 1 0 1 20
2 0
4 0
6 0
8 0
D I W ater C o-E D T A Solu tion
Bitu
men
Rec
over
y(%
)
T im e (m inu tes)
Figure 3-5: Bitumen recovery obtained from two procedures at the same extraction condition
It is evident from Figure 3-5 that two bitumen recovery curves almost superimpose on
each other. This finding indicates that introducing cobalt-based chemical tracer in the
form of Co-EDTA complex does not alter bitumen recovery characteristics.
3.4.3.2 Loss of tracer in extraction of weathered oil sands ore
Whether a tracer is applicable or not is highly depended on whether it disappears or
not from processing water. Because of the complex nature of oil sands composition,
many situations may lead to loss of tracer from water by adsorption. Extracting
bitumen from a weathered ore which contains minute quantity of formation water
with tracer-contained water was carried out to test the loss of the tracer. Without the
effect of formation water, and comparing the concentration of cobalt in processing

35
water with that in the water after extraction test, whether the tracer disappears or not
can be determined. If the concentrations of cobalt are the same in the processing water
and tailings water after extraction, it indicates that the adsorption does not take place.
On the contrary, if the concentrations of cobalt are different, Co2+ can be possibly
trapped by solids because of cation exchange or Co-EDTA molecule may be adsorbed
on the surfaces.
In this test, 200 g TS ore was dried in vacuum oven at 80 oC for 48 hours. A small
amount (60 g) of this weathered ore was analyzed by Dean-Stark to determine water
content remained in the weathered ore. The results in Table 3-3 show that almost all
original formation water was removed during weathering. The remaining weathered
ore was then extracted with 38.6 ppm Co-EDTA solution at pH=8 by Denver Flotation
Cell.
Table 3-3: Effect of weathering on ore composition
Bitumen Water Solids
Original Ore (wt.%) 8.77 9.37 81.86
Weathered Ore (wt.%) 9.98 0.27 89.75
The water samples were collected using the same procedures as described in Section
3.2.3.2. The concentration of cobalt is given in Table 3-4.

36
Table 3-4: Results of weathered ore extraction experiments
Water Processing Emulsified Free Tailings
Co (ppm) 38.6 38.2 38.4 38.5
The experimental results using the weathered ore clearly show that, after the
extraction, the concentrations of cobalt in various water samples are comparable to
the concentration in the processing water, and distributed evenly in whole system.
This finding indicates that Co-EDTA is a good tracer for our targeting objective of
analyzing formation water distribution.
3.4.4 Cobalt tracer experiments
3.4.4.1 Bitumen froth settling
Water plays a critical role in oil sands extraction. Bitumen is liberated and floated in
water. In bitumen froth, water exists in two forms: stable emulsified water and free
water. The emulsified water is protected by a thin layer of strong surface activity
substance (such as asphaltenes) and fine solids, hence it is extremely difficult to be
removed from the bitumen froth. The free water, on the other hand, can be release
from the bitumen froth by a mild external force. By applying a sufficient external
force (such as centrifuge) or adding a demulsifier, the emulsified water can be
transformed into free water. In this study, emulsified water was given top
consideration. Existence of free water would cause large experimental errors.
Removal of this free water prior to water analysis would greatly improve the accuracy
of analysis.

37
The bitumen froth from TS ore extraction was diluted by naphtha to a naphtha to
bitumen mass ratio of 0.7. The diluted froth was loaded in a graduated cylinder, and
allowed to settle for 48 hours. During this period, the level of oil-water interface was
recorded at certain time intervals. The interface level as a function of settling time is
shown in Figure 3-6.
0 1 0 2 0 3 0 4 00
2 0
4 0
6 0
8 0
1 0 0
1 2 0
1 4 0
Leve
l of O
il-W
ater
Inte
rfac
e (m
l)
T im e (h o u rs )
Figure 3-6: Variation in the level of released free water with time
Figure 3-6 shows that the free water separated out continuously with time, leading to
an increase of the interface level. The quantity of released water shows minimal
changes after 24 hours, indicating completion of free water drainage. A 24-hour
settling to drain the free water was used in all further experiments.
3.4.4.2 Co-EDTA tracer experiments and mass balance calculations
In this study, several ores with different characteristics were tested to determine the
effect of ore characteristics on formation water distribution. In this section, TS ore is
used as an example to illustrate the experimental procedures and mass balance

38
calculations. Prior to extraction test, about 130 g TS ore and 400 g prepared Co-EDTA
processing water were weighed accurately and blended in a 1000 ml beaker. Since it
is necessary to collect all tailings at the end of the experiment, a 1000 ml beaker was
used instead of the Denver Flotation Cell. After adding 300 g water into Denver Cell
to keep the temperature at 35 oC by a constant heating system, the 1000 ml beaker was
fixed in the flotation cell, immersing in the water of constant temperature.
Denver Cell flotation was run with 5 minutes conditioning and 3 minutes aeration.
With continuing aeration, bitumen froth was collected for 15 minutes into a 250 ml
separation funnel. The bitumen froth was diluted with 6.5 g naphtha to obtain a
solvent to bitumen mass ratio of 0.7:1, which was based on the condition of the
industrial froth treatment operation. The mass of bitumen in froth is determined based
on mass of ore (130 g) times known bitumen content of ore (8.77 wt.%) times known
bitumen recovery (81%). The diluted froth was stirred gently by a glass rod to
homogenize the mixture.
In order to calculate the mass balance of cobalt, water mass balance should be
considered first. The strategy was to collect water in all the streams of an extraction
test. Since the collected water normally contained solids, the weight loss method after
completely evaporating the collected water, was used. In this case, the difference
between the weight of the total collected sample (container, solids and water) and the
dried sample (container plus solids) was the net weight of water.
In this test, the mass of tailings water, free water and emulsified water was calculated
respectively. For tailings water after the oil sands extraction by Denver Flotation Cell,

39
the tailings sample was allowed to settle for half hour. About 20 ml muddy tailings
was transferred into a 30 ml Teflon centrifuge tube, leaving the rest of tailings in the
beaker. At this stage, some water with sands was still adhering to the wall of rotator
and stator. The best way to collect it was to wrap the stator with paper of high water
absorption capacity and turn on the rotor. With the high speed rotation of rotor, water
and sands were thrown off and absorbed by the paper. All the paper used to wrap the
stator was put into the tailings-containing beaker. The beaker containing tailings and
wet paper was weighed and placed in a vacuum drying oven at 80 oC for 48 hours.
The other part of tailings in centrifuge tube was sent to centrifuge at 15,000 rpm.
Under high speed centrifugation, clear water was separated from solids. About 10 ml
“clean” water was collected and weighed. This water was analyzed by AAS. The rest
in the centrifuge tube was weighed and sent to vacuum drying oven as well. Table 3-5
summarizes the experimental data.
Table 3-5: Mass balance calculation of tailings water for TS ore
Beaker + Tailings Tailings Sample (g) Tube + Tailings
Wet (g) Dry (g) 10.17
Wet (g) Dry (g)
839.49 508.32 36.39 26.83
Difference (g)
331.17 10.17 9.56
Net Weight of Tailings Water (g)
350.90
To release the free water, diluted bitumen froth was allowed to settle for 24 hours.

40
This was based on the result from Section 3.4.4.1, which showed a complete release
of free water after 24 hours of settling. Free water was drained out and analyzed using
the same procedure as for tailings water. Table 3-6 shows the experimental data for TS
ore.
Table 3-6: Mass balance calculation of free water for TS ore
Beaker + Free water Free water Sample (g) Tube + Free water
Wet (g) Dry (g) 10.05
Wet (g) Dry (g)
70.38 46.36 28.31 23.43
Difference (g)
24.02 10.05 4.88
Net Weight of Free Water (g)
38.95
For the emulsified water in the diluted bitumen, since there were three phases (water,
oil, solids) in the bitumen froth, the situation was more complicated. It was possible
that the light component of bitumen might evaporate during drying. If this was true,
the mass loss of organics would be included in the water, leading to an inevitable
calculation error. To exclude this error, a froth drying experiment was conducted. The
bitumen froth was collected by Denver Cell flotation from TS ore. This bitumen froth
was settled for 24 hours without solvent addition and split into two parts. One part
was analyzed for composition by Dean-Stark; the other part was weighed and placed
in vacuum drying oven at 80 oC. The data obtained are given in Table 3-7.

41
Table 3-7: Results of bitumen froth drying experiment for TS ore (all in grams)
Bitumen Froth for Dean-Stark Analysis Bitumen Froth for Drying
70 70
Bitumen Water Solids Before Drying After Drying
27.2 26.2 16.6 474.95 448.9
Absolute Difference Difference
26.2 - 26.05 = 0.15 26.05
The data in Table 3-7 indicate that the difference between the mass of water by Dean
Stark analysis and drying experiment was 0.57%. This difference included loss of
organics by evaporation and experimental error. It was established that the loss of
organics was sufficiently small that it could be neglected for further calculations.
About 25 ml diluted bitumen obtained from the test described at the beginning of this
section for mass balance calculation was transferred into a 30 ml centrifuge tube.
After centrifuging at 15,000 rpm, the froth was separated into three layers as shown in
Figure 3-4. The clear water (5 ml) from the middle layer was taken, weighed and
analyzed by AAS. The remaining diluted bitumen was weighed and placed in vacuum
drying oven at 80 oC for 48 hours. Since the naphtha added as diluent would be
completely evaporated, the known mass of naphtha should be deducted from the total
mass loss. The data obtained are given in Table 3-8.

42
Table 3-8: Mass balance calculation of water in the bitumen froth for TS ore
Funnel + Froth Water Sample (g) Tube + Froth
Wet (g) Dry (g) 5.62
Wet (g) Dry (g)
78.56 63.81 40.07 34.50
Difference (g)
14.75 5.62 5.57
Naphtha (g) Net Weight of Emulsified Water (g)
6.50 19.44
At this point in the mass balance experiments, the mass of water in each stream of the
system was obtained, and the cobalt concentrations in various water samples were
determined. The total water balance in the system is shown in Figure 3-7.
Figure 3-7: Water distributions in oil sands extraction test
The data for water mass balance calculation are given in Table 3-9.

43
Table 3-9: Water mass balance calculation (all in grams)
Formation Water Processing Water Total Water
12.18 400.04 412.22
Emulsified Water Free Water Tailings Water Total Water
19.44 38.95 350.90 409.29
Absolute Error 2.93 Relative Error 0.71%
Based on water mass balance, mass balance of cobalt can be obtained as shown in
Table 3-10.
Table 3-10: Cobalt mass balance calculation for a sample test
Feed Formation Water Processing Water Total
Water 12.18 g 400.04 g 412.22 g
Co 0 ppm 36.6 ppm 14641.5×10-6 g
Product Emulsified Water Free Water Tailings Water Total
Water 19.44 g 38.95 g 350.90 g 409.29 g
Co 34.6 ppm 35.2 ppm 35.4 ppm 14465.5×10-6g
Absolute Error of Co 176×10-6 g Relative Error 1.2 %
The results of cobalt mass balance experiment show an overall 1.2 % cobalt loss
during the oil sands extraction test. The results here are consistent with those obtained
with laboratory weathered oil sands ore, described in Table 3-4 where Co-EDTA

44
complex balance was established. Considering the complex procedures of extraction,
sampling and analysis, this level of material balance was considered acceptable for
further chemical tracer experiments.

45
Chapter 4: Results and Discussion
4.1 Composition analysis of oil sands ores by Dean-Stark method
The Dean-Stark method described in Section 3.1.1 was applied to five oil sands ore
samples and the results are given in Table 4-1.
Table 4-1: Descriptions and compositions of different ores
Ore Type Source Description Bitumen Water Sands Fines
(wt.%)
POSYN Syncrude Poor Ore 5.91 7.43 86.66 43.0
TS Syncrude Transition Ore 8.77 9.37 81.86 33.0
SYN704 Syncrude Average Ore 9.39 5.38 85.23 25.5
Vince A2 Aurora Rich Ore 11.27 3.13 85.60 12.6
AL711 Shell Rich Ore 13.21 2.73 84.06 13.4
It is clear that the five oil sands ores used in this study cover a wide range of
characteristics in the content of bitumen, water and solids.
4.2 Bitumen recovery of oil sands ore samples
Bitumen recovery from five diverse grade ores (Denver-Cell test, deionized water as
processing water, 35 oC, pH=8, 15 minutes bitumen froth collection) is given in Table
4-2.

46
Table 4-2: Bitumen recovery and bitumen froth quality of five ores
Ore Type POSYN TS SYN704 Vince A2 AL711
Bitumen Recovery (%) 77 81 75 76 66
Bitumen/Solids (wt./wt.) 0.24 1.5 1.17 0.76 1.28
A wide range of processability in the context of bitumen recovery from 66% to 81% is
evident.
4.3 Results of heavy water tests
In this study, all the density data were measured by Anton Paar density meter
(DMA38). The density of the heavy water which functioned as processing water was
1.1045 g/cm3. Density of the formation water measured in Section 3.2.3.1, ρ=1.009
g/cm3 was used for calculation.
The materials used in heavy water test included TS ore (bitumen 8.77 wt.%, water
9.37 wt.%, solid 81.86 wt.%) and heavy water (deuterium oxide, D2O, 99%). The pH
values of processing medium (D2O) adjusted by NaOH D2O solution and density of
water samples collected using procedures described in Section 3.2.3.2 are given in
Table 4-3. The density of well-mixed water, i.e. the density of water calculated by
assuming a complete mixing of the processing medium with formation water is also
given in Table 4-3. The measured density of various water samples is compared with
the density of well-mixed water in Figure 4-1.
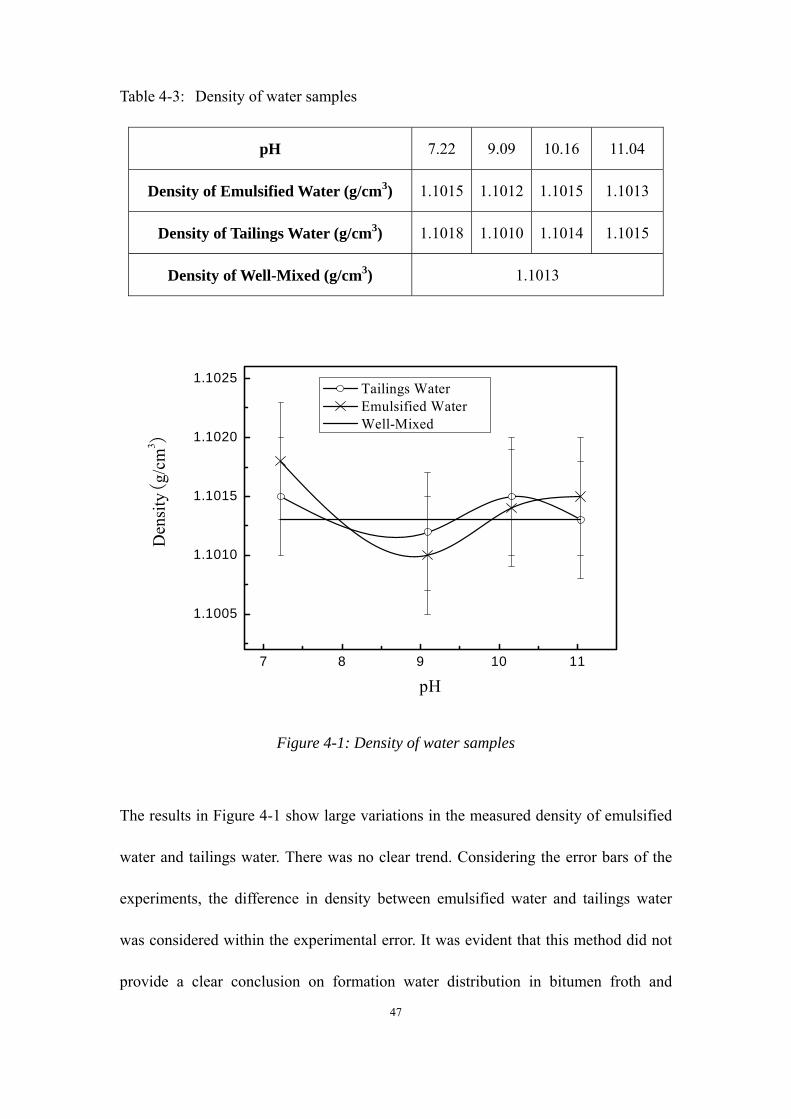
47
Table 4-3: Density of water samples
pH 7.22 9.09 10.16 11.04
Density of Emulsified Water (g/cm3) 1.1015 1.1012 1.1015 1.1013
Density of Tailings Water (g/cm3) 1.1018 1.1010 1.1014 1.1015
Density of Well-Mixed (g/cm3) 1.1013
7 8 9 10 11
1.1005
1.1010
1.1015
1.1020
1.1025
Den
sity(
g/cm
3 )
pH
Tailings Water Emulsified Water Well-Mixed
Figure 4-1: Density of water samples
The results in Figure 4-1 show large variations in the measured density of emulsified
water and tailings water. There was no clear trend. Considering the error bars of the
experiments, the difference in density between emulsified water and tailings water
was considered within the experimental error. It was evident that this method did not
provide a clear conclusion on formation water distribution in bitumen froth and

48
tailings.
4.4 Results of electrical conductivity measurements
TS ore was used in electrical conductivity experiments. The initial pH of the mixture
was measured to be 7.3 with no further chemical addition. The conductivity values of
various water streams obtained at 25 oC are shown in Figure 4-2.
0
200
400
600
800
1000
Elec
trica
l Con
duct
ivity(μS
.m-1)
Processing Water Emulsified Water Free Water Tailings Water
Figure 4-2: Conductivity of water samples
The conductivity of emulsified water was found to be 40% higher than that of free
water and tailings water. This finding suggested that the amount of salts in the
emulsified water was higher than that in the other water samples. It appeared that the
formation water of high salinity was more likely emulsified and stayed in the bitumen
froth. It is important to note that the conductivity of tailing water was much higher

49
than the processing water. Although the salts could come from two sources: one in the
original formation water; and the other released from solids during flotation, there is
no reason why more ions are distributed in the emulsified water. The results in Figure
4-2 suggested that the ions released from the solids were more likely evenly
distributed in free and tailings water. It could therefore be deducted that high salinity
formation water was preferentially partitioned in the bitumen froth, most likely in the
form of emulsified water. Due to the complication of ions released from solids, this
method could not provide a quantitative analysis on formation water distribution.
4.5 Results of chemical tracer experiments
The purpose of the chemical tracer experiment developed in this study was to
investigate the distribution of formation water in oil sands hot water extraction test.
Chemical tracer added in the processing water played a significant role in identifying
formation water distribution which was an important role in emulsion stabilization
encountered in froth treatment.
4.5.1 Cobalt concentration
In this section TS ore will be analyzed as an example, further analysis and comparison
of more ores will be discussed in the next section. The concentrations of cobalt in all
water samples derived from Section 3.4.4.2 were analyzed by AAS, as shown in Table
4-4 (numbers 1, 2, 3 indicate three sets of repeat experiments).

50
Table 4-4: Cobalt concentration in different water samples collected during bitumen extraction using TS ores
Co (ppm)
Test 1 Test 2 Test 3 Average Standard Deviation
Processing Water 36.6 38.1 37.5 37.4 0.8
Formation Water 0 0 0 0 0
Emulsified Water 34.6 35.5 34.7 34.9 0.5
Free Water 35.2 36.8 36.2 36.1 0.8
Tailings Water 35.4 37.0 36.3 36.2 0.8
Well-Mixed 35.5 37.0 36.4 36.3 0.8
The conditions of these experiments were 130 g of TS ore containing 12.18 g
formation water, 400 g of processing water.
In Table 4-4, the concentration in the well-mixed water is the cobalt concentration of
water when the processing water is assumed to be completely mixed with the
formation water, i.e. the amount of Co in the processing water divided by total water,
including formation water plus processing water. According to the data in Table 4-4,
the cobalt concentration in the emulsified water is lower than in the well-mixed water.
This finding indicates that formation water without cobalt accounts for larger
proportion in the emulsified water, as compared to the well-mixed situation. The ratio
of formation water and processing water in emulsified water, free water and tailings
water will be given in the next section.

51
4.5.2 Water distribution calculations
An assumption is made that the emulsified water comes from two sources: formation
water and processing water. The nomenclature for water distribution calculation is
given as follows:
mf : mass of water in emulsified water arising from formation water.
mp: mass of water in emulsified water arising from processing water.
Cf : concentration of cobalt in original formation water (0 ppm).
Cp: concentration of cobalt in the added processing water.
Ce : concentration of cobalt in the emulsified water.
Cw : concentration of cobalt in a well-mixed case.
Based on the principle of mass conservation applied to cobalt, the equation to
calculate the fraction of formation and processing water in the emulsified water of the
bitumen froth is
( )f f p p f p em C m C m m C⋅ + ⋅ = + ⋅
Since Cf = 0, above equation can be simplified to
p e
f p p
m Cm m C
=+ ; 1f e
f p p
m Cm m C
= −+
In above equations, f pm m+ represents the mass of emulsified water in the bitumen
froth. Thus the processing water fraction of emulsified water can be expressed as
/e pC C ; the formation water proportion of emulsified water can be expressed as
1 /e pC C− .
The calculated results of percent of formation water and processing water in the

52
emulsified water are shown in Table 4-5.
Table 4-5: Percent of formation water and processing water in emulsified water for TS ore
Co (ppm)
Test 1 Test 2 Test 3 Average
Processing Water ( pC ) 36.6 38.1 37.5 37.4
Formation Water ( fC ) 0 0 0 0
Emulsified Water ( eC ) 34.6 35.5 34.7 34.9
Well-Mixed ( wC ) 35.5 37.0 36.4 36.3
Percent Water in Emulsified Water (%)
Test 1 Test 2 Test 3 Average
Arising from Processing Water
( )/ 100%e pC C × 94.54 93.18 92.53 93.42
Arising from Formation Water
(1 ) 100%e
p
CC
− × 5.46 6.82 7.47 6.58
Well-Mixed (Processing Water)
( )/ 100%w pC C × 96.99 97.11 97.07 97.06
Well-Mixed (Formation Water)
(1 ) 100%w
p
CC
− × 3.01 2.89 2.93 2.94
The above calculations are not only suitable for emulsified water, but also applicable
for free water and tailings water. The calculated results of free water and tailings
water are listed in Table A-4 in Appendix. The mass of formation water and
processing water in every stream can be obtained based on the data in Table A-4. The

53
detailed results are listed in Table A-5.
The data in Table A-5 do not seem to have any trend. However, close analysis of the
data provides some insights on formation water distribution as shown by the results in
Table 4-6.
Table 4-6: Distribution of water (%) for TS ore
Emulsified Water Free Water Tailings
Water
Total Water Distribution 3.83 12.85 83.32
Formation Water Distribution 7.61 13.88 78.51
Processing Water Distribution 3.70 12.82 83.48
Figure 4-3: (a) Total water distribution; (b) Processing water distribution; and (c)
Formation water distribution.
The results in Figure 4-3 indicate that, distribution of processing water in free water
3.83%12.85%
83.32%
(a)
3.70%12.82%
83.48%
(b)
7.61%13.88%
78.51% Emulsified Water
Free Water
Tailings Water
(c)

54
and tailings water resembled distribution of total water due to its dominance in the
whole system when compared with the amount of formation water. For the formation
water, a part of it appeared to be isolated in oil phase from contacting processing
water during flotation and floated with bitumen to the top of slurry as bitumen froth,
leading to a higher distribution of formation water (lower cobalt concentration) as the
emulsified water than that of the processing water as the emulsified water in the
bitumen froth.
4.5.3 Chemical tracer experiments for other ores
In the above section, a single ore (TS) was analyzed as an example to find the source
of emulsified water. It is well known that the ores from different mining locations
have specific characteristics. Only after analyzing several ores, the correlation
between ore characteristics and formation water distribution can be found. Five
diverse grade ores were used in the tracer experiments. The compositions of these
ores determined by Dean-Stark analysis are given in Table 4-1 and bitumen recoveries
determined by Denver Cell Flotation are given in Table 4-2. The feed and water used
in oil sands extraction tests for five ores are given in Table A-1. The results of
chemical tracer experiments are given in Table A-2 to Table A-11 and presented in the
form of pie chart in Figure A-1 to Figure A-5 in appendix.
The correlation between percent formation water in emulsified water and percent
formation water in oil sands ore is shown in Figure 4-4.

55
0 1 2 3 4 5 6 7 8 9 100
1
2
3
4
5
6
7
8
For
mat
ion
Wat
er C
onte
nt
in E
mul
sifie
d W
ater
(wt.%
)
Formation Water Content in Oil Sands Ore (wt.%)
Figure 4-4: Correlation between percent formation water in emulsified water and
percent formation water in oil sands ore
The correlation in Figure 4-4 between formation water content in emulsified water
and that in oil sands ore is less evident. A maximum formation water content in
emulsified water is shown at 7.5% formation water of oil sands ore. Among these
tested oil sands ores, it is possible that a higher original percent formation water in an
ore leads to a higher percent formation water in emulsified water. Without a base line
for comparison, an ore with higher percent formation water in emulsified water can
not account for more preferential distribution of formation water in bitumen froth.
To better determine the preferential distribution of formation water in emulsified
water, the percentage of formation water in emulsified water was normalized by the
percentage of formation water in even distribution case. This ratio is referred to as the

56
selectivity index of formation water distribution. A larger selectivity index value
would indicate a more preferential distribution of formation water in emulsified water.
After linking the selectivity index of formation water with oil sands ore characteristics,
the factors which affect the formation water distribution in oil sands extraction
process can be found. The percent formation water in the emulsified water and
selectivity index for five tested ores are given in Table 4-7. It is interesting to note that
the formation water was preferentially distributed in the bitumen froth during
extraction for all five ores, as indicated by the selectivity index above 1.
Table 4-7: Percent formation water in emulsified water and selectivity index of formation water
Ore Type POSYN TS SYN704 Vince A2 AL 711
(A) Percent Formation Water in Emulsified
Water (measured) (%) 7.27 6.58 4.02 1.64 1.14
(B) Percent Formation Water in Emulsified
Water (well-mixed)(%) 2.36 2.96 1.70 1.01 0.88
Selectivity Index (A/B) 3.08 2.22 2.36 1.62 1.29
4.5.3.1 Correlation between formation water selectivity index and characteristics
of oil sands ores
In order to determine the factors that affected the formation water distribution in the
oil sands extraction process, the links between the characteristics of oil sands ores and
formation water selectivity index are investigated.
The percent bitumen and percent formation water in the five ores (Table 4-1)

57
determined by Dean-Stark method were correlated with the formation water
selectivity index in Figure 4-5 and 4-6.
4 5 6 7 8 9 10 11 12 13 14 150.0
0.5
1.0
1.5
2.0
2.5
3.0
Sele
ctiv
ity In
dex
Bitumen Content in Oil Sands Ore (wt.%)
Figure 4-5: Correlation between percent bitumen in oil sands ore and formation water selectivity index
0 1 2 3 4 5 6 7 8 9 100.0
0.5
1.0
1.5
2.0
2.5
3.0
Sele
ctiv
ity In
dex
Formation Water Content in Oil Sands Ore (wt.%)
Figure 4-6: Correlation between percent formation water in oil sands ore and
formation water selectivity index
Figure 4-5 shows that the selectivity index of formation water decreases with

58
increasing ore grade, suggesting that the formation water tends to distribute more
evenly for rich ores than poor ores. The correlation between selectivity index and
formation water content in the ore is less evident, showing a maximum in selectivity
index at 7.5% formation water. It appears that the original formation water content in
the ore plays a less critical role in determining formation water distribution in
emulsified water.
4.5.3.2 Correlation between selectivity index of formation water and percent
fines
The stability of any emulsion is largely due to the nature of the interfacial films. In
addition to temperature, droplet size and droplet-size distributions, the stability of this
film also depends on a number of factors, including the heavy organic components in
the crude oil (e.g. asphaltenes, resins, saturates, and aromatics), solid (e.g. clays,
fines), pH, and brine composition. Fines (less than 44 microns in size) are considered
as a factor that affects the formation water distribution.
In order to evaluate the effect of fines in the bitumen froth on formation water
distribution, the bitumen froth from all five ores were processed at the same
conditions as described below. The naphtha as diluent was added into the bitumen
froth obtained from Denver Cell flotation test, to 70% mass of bitumen. The diluted
bitumen froth was allowed to settle for 24 hours. After draining all free water, the
diluted bitumen froth was separated into solids, bitumen and water by Dean-Stark
method. The solids were placed in a vacuum drying oven at 80 oC overnight. The
percentage of fines was determined in this study by wet-sieving the dried solids.

59
Lumps of dried solids sample were first gently broken apart by mortar and weighed.
The solids were then placed in a 44 µm sieve for wet sieving in a water bath. The
surface of clays at this stage was found to be hydrophobic. Direct wet sieving was
difficult to perform in such case as all solids were floating on the surface of water.
Pre-wetting the solids by acetone helped to disperse the solids and hence facilitate
wet-sieving. The wet sieving continued till no more solids were washed into the water
bath. After wet sieving, all the solids retained on the sieve were larger than 44 µm in
size. The oversize fraction of solids was dried and weighed to calculate the percentage
of fines. Percent fines of solids in the original oil sands ores and corresponding
diluted bitumen froth are given in Table 4-8.
Table 4-8: Percent fines in oil sands ores and corresponding diluted bitumen froth
(percent fines of total solids wt.%)
Ore Type POSYN TS SYN704 Vince A2 AL 711
Percent Fines in Oil Sands Ore (%)
43 33 25 14 13
Percent Fines in Diluted Bitumen
Froth (%) 62 50 46 36 24
Difference (%) 31 34 45 61 46
The correlation between percent fines in oil sands ore and corresponding diluted
bitumen froth and formation water selectivity index is shown in Figure 4-7 and 4-8.

60
0 1 0 2 0 3 0 4 0 5 0 6 01 .0
1 .5
2 .0
2 .5
3 .0
3 .5
Sele
ctiv
ity In
dex
F in e s C o n te n t in O il S a n d s O re (w t. % )
Figure 4-7: Correlation between formation water selectivity index and percent fines in
oil sands ore
10 20 30 40 50 60 701.0
1 .5
2 .0
2 .5
3 .0
3 .5
Sel
ectiv
ity In
dex
Fines C ontent in D ilu ted B itum en Froth (w t.% )
Figure 4-8: Correlation between formation water selectivity index and percent fines in
diluted bitumen froth
It is evident from Figure 4-7 and 4-8 that formation water in emulsified water appears

61
to follow the percent fines, regardless in oil sands ore or diluted bitumen froth,
increasing selectivity index with increasing fines content either in the ore or in
bitumen froth.
4.5.3.3 Correlation between formation water selectivity index and bitumen
recovery
There are two important stages affecting bitumen recovery: liberation and aeration.
Aeration is affected by the surface characteristics of air, bitumen and sands, as well as
processing water chemistry, rather than the formation water itself. For liberation, it is
possible that processing water intermingles with the formation water at this step. How
intimately they contact each other is directly reflected in the distribution of formation
water, i.e. by selectivity index. The bitumen recovery of the five ores as a function of
formation water selectivity index is shown in Figure 4-9.
0.0 0.5 1.0 1.5 2.0 2.5 3.0 3.540
45
50
55
60
65
70
75
80
85
90
Bitu
men
Rec
over
y (%
)
Selectivity Index
Figure 4-9: Bitumen recovery as a function of formation water selectivity index
Although highly scattered, the results in Figure 4-9 show a positive correlation:

62
bitumen recovery increases with increasing formation water selectivity index. It
appears that more formation water encapsulated in bitumen without contacting
processing water leads to high bitumen recovery.
4.5.3.4 Correlation between formation water selectivity index and bitumen froth
quality
The bitumen froth was obtained from aforementioned five ores by Denver Flotation
Cell tests, and allowed to settle for 24 hours without naphtha addition. After the
removal of free water and associated solids, the bitumen froth was analyzed by
Dean-Stark method. The results are given in Table 4-9
Table 4-9: Froth composition of five oil sands ores
Ore Type Bitumen* Water Solids Bitumen/Water Bitumen/Solids
(wt.%) (wt./wt.)
POSYN 9 54 37 0.17 0.24
TS 36 40 24 0.90 1.50
SYN704 35 35 30 1.0 1.17
Vince A2 32 26 42 1.23 0.76
AL 711 45 20 35 2.25 1.28
* Feed bitumen content
The results in Table 4-9 show that the bitumen froth from rich ore contains less water
than that from poor ore. The selectivity index of formation water is compared with
bitumen-to-water mass ratio in bitumen froth in Figure 4-10.

63
0.0 0 .5 1 .0 1 .5 2.0 2.5 3 .0 3 .50 .0
0 .5
1 .0
1 .5
2 .0
2 .5
Bitu
men
/Wat
er in
Bitu
men
Fro
th (w
t/wt)
Selectivity Index
Figure 4-10: Bitumen-to-water mass ratio in bitumen froth as a function of formation
water selectivity index
The comparison in Figure 4-10 suggests that ores with large selectivity index of
formation water lead to a poor bitumen froth quality, i.e., low bitumen to water mass
ratio. It appears that preferential distribution of formation water in bitumen froth is
detrimental to the bitumen froth quality. Complete mixing of formation water with
processing water indicated by a selectivity index close to unity leads to the highest
bitumen froth quality.
The selectivity index of formation water is compared with bitumen-to-solids mass
ratio in bitumen froth in Figure 4-11.

64
0.0 0.5 1.0 1.5 2.0 2.5 3.0 3.5
0.2
0.4
0.6
0.8
1.0
1.2
1.4
1.6
Bitu
men
/Sol
ids i
n B
itum
en F
roth
(wt/w
t)
Selectivity Index
Figure 4-11: Bitumen-to-solids mass ratio in bitumen froth as a function of formation water selectivity index
The comparison in Figure 4-11 shows little correlation between formation water
selectivity index and bitumen-to-solids mass ratio in the bitumen froth. It appears that
the solids carry-over to bitumen froth does not depend on formation water
distribution.
4.5.3.3 Correlation between formation water selectivity index and froth
treatment
Percent water was measured at a specific level of diluted bitumen froth and compared
with selectivity index of formation water. Bitumen froth from all five ores in this
study was treated at the same conditions as description below. The bitumen froth
obtained from Denver Cell flotation test was allowed to settle for 24 hours. After
draining all the free water, naphtha was added as diluent to 70% mass of bitumen in

65
the froth. In order to ensure that the bitumen was sufficiently mixed with naphtha, the
diluted bitumen froth was shaken by a horizontal shaker at low speed for two hours.
The diluted bitumen froth was then transferred into a 100 ml graduated cylinder and
allowed to settle for one hour.
Coulometric Karl Fischer titration was used to measure water content in oil phase
sampled at a specific location in the oil phase. Cou-Lo Aquamax Karl Fisher moisture
meter (G.R. Scientific Ltd., UK) was used for this purpose. The instrument works on
coulometric principle: equal mole of water reacts with iodine. Therefore, 1 milligram
of water will generate 10.71 coulombs of electricity. The titrator determines the water
content of the sample by measuring the current of electrolysis necessary to produce
the required iodine. The measurement range of water content by this instrument is
1-10 µg, and the maximum sensitivity is 0.1 µg. A syringe was used to collect
0.01-0.05 g sample with the needle tip of syringe being placed at a specific level of
30% below the surface of total diluted bitumen height. The sample-containing syringe
was weighed accurately. After adding the sample into Karl Fisher moisture meter, the
empty syringe was weighed again to determine the exact mass of the sample added to
the titrator. At the end point of titration, the mass of water would be indicated on the
titrator screen. Water composition was presented as the mass of water divided by the
mass of sample.
To better illustrate the effect of the formation water distribution on the performance of
froth treatment, the percent water measured at this specific level is divided by the
original percent water in the diluted bitumen froth, which is referred to as emulsion

66
stability ratio in this study. A stability ratio of 1 represents a completely stable
emulsion. The percent water at specific level and emulsion stability ratio are given in
Table 4-10.
Table 4-10: Percent water in diluted bitumen and emulsion stability ratio
Ore Type POSYN TS SYN704 Vince A2 AL 711
Percent Water at Specific Level (wt.%)
41 18 22 11 8
Total Percent Water in Diluted Bitumen (wt.%)
51 32 28 21 15
Stability Ratio 0.80 0.56 0.79 0.52 0.53
In Table 4-10, a larger value of stability ratio indicates a stable emulsion. The stability
ratio for bitumen froth from the five ores as a function of formation water selectivity
index is shown in Figure 4-12.
0.0 0.5 1.0 1.5 2.0 2.5 3.0 3.50.4
0.5
0.6
0.7
0.8
0.9
Stab
ility
Rat
io
Selectivity Index
Figure 4-12: Stability ratio as a function of formation water selectivity index

67
Figure 4-12 shows that an ore with larger selectivity index value exhibits a higher
emulsion stability ratio. This finding suggests that for an oil sands ore featuring more
preferential distribution of the formation water in bitumen froth, the water in bitumen
froth tends to form more stable emulsified water in the froth. On the contrary, for the
ore with formation water being distributed evenly during oil sands extraction, the
emulsified water droplets in diluted bitumen froth are less stable. It appears that high
salt concentration in the formation water is detrimental to froth treatment. Careful
inspection of the results reveals that, although TS ore has a low stability ratio, its
formation water selectivity index is more than 2. The results in Table 4-9 show the
highest bitumen-to-solids mass ratio of bitumen froth from TS ore. The low solids
content in bitumen froth leads to low stability ratio of emulsions. This finding serves
as enlightenment that the content of solids, especially fines less than 44 µm by
diameter, is a more important factor affecting preferential distribution of oil sands
formation water in bitumen froth and hence stability of emulsified water.

68
Chapter 5: Conclusions
In this study, tracer technique as an analysis tool was introduced to determine the
formation water distribution during bitumen flotation and to study the effect of
formation water in bitumen froth on froth treatment. Two different procedures were
employed in the tracer experiments. In the heavy water experiment, heavy water was
used as processing water to conduct oil sands extraction tests. The density of
separated water samples from flotation extraction was determined by ultrasensitive
density meter. In the chemical tracer experiments, Co-EDTA complex was selected as
tracer and added to the processing water. The concentration of chemical tracer in
bitumen froth water was determined by AAS. From this study, the following
conclusions were drawn.
(1) The density technique was not sufficient to achieve definite conclusions. The
sensitivity of density instrument had some limitations. The variations of water
density during the flotation procedure did not go beyond the minimum error
range, making the differentiation of formation water extremely difficult and
prone to large errors.
(2) The results of electrical conductivity measurement qualitatively showed that
for some ores, the high salinity formation water was preferentially partitioned
in the bitumen froth. Due to unquantifiable release of ions during flotation,
this method could not provide quantitative analysis on formation water
distribution.

69
(3) Co-EDTA complex could be used as chemical tracer for tracking the
formation water distribution. First, cobalt could be detected with high
accuracy by Atomic Absorption Spectroscopy. Second, the complex of Co2+
and EDTA was absent in the ores and did not interfere with bitumen recovery.
In the complex form of Co2+ and EDTA, it did not react with oil sands
components during extraction as confirmed by mass balance tests.
(4) For both poor and rich ores, the formation water did not uniformly distribute
during oil sands extraction. Distribution of formation water as emulsified
water was higher than that of processing water as emulsified water in the
bitumen froth.
(5) The selectivity index of formation water, defined as the percent formation
water in emulsified water divided by the percent formation water in an even
distribution case, was a good measure of formation water distribution. It
correlated well with the grade of oil sands ores. The poor ore featuring low
bitumen content, high water content and high fines content exhibited a high
formation water selectivity index which indicates a more preferential
distribution of formation water in emulsified water of bitumen froth.
(6) Among other oil sands characteristics, the percent fines of an oil sands ore
was an important factor in determining formation water distribution. For high
fines ore, its percent formation water in emulsified water was high; for low
fines ore, its percent formation water in emulsified water was low, close to
even distribution or well mixed condition with processing water.

70
(7) The large formation water selectivity index appeared to be beneficial to the
bitumen recovery, but to lower froth quality, measured by low
bitumen-to-solids mass ratio and low bitumen-to-water mass ratio in bitumen
froth.
(8) An oil sands ore of higher formation water selectivity index featured more
stable emulsified water in diluted bitumen. The ore with formation water
being distributed evenly in all streams of oil sand extraction system, on the
other hand, exhibited less stable emulsified water in diluted bitumen froth. It
appeared that high salt concentration in the formation water was detrimental
to froth treatment.

71
Chapter 6: Recommendations for Future Study
(1) Heavy organic components (e.g. asphaltenes, resins, saturates, and aromatics)
in the bitumen are other important factors to make the emulsified water stable.
Heavy organic component content should be analyzed for different ores, and
the correlation with formation water distribution in bitumen froth and stability
of emulsified water should be established.
(2) In this study all the bitumen froth was not treated, except for addition of
naphtha as diluent. In industry, the froth is treated by going through several
dehydration methods such as inclined plate settling, centrifuge dewatering
and demulsifier addition. After froth treatment there is still about 2%
emulsified water remaining in bitumen product. Therefore in a future study,
the froth should be treated by following industry conditions, and the water
remained in the froth, which is the hardest to get rid of, should be separated
and analyzed.
(3) The oil sands flotation process should be conducted with different pH values
of processing water.
(4) Wettability of fines to be analyzed to understand the observed positive
correlation between percent fines and selectivity index of formation water in
bitumen froth and the mechanism of preferential distribution of formation
water in bitumen froth.

72
References
Acevedo, S., Gutierrez, X. and Rivas, H. “Bitumen-in-Water Emulsions Stabilized
with Natural Surfactants”, Journal of Colloid and Interface Science 242(1), 230–238
(2001).
Bancroft, W.D. “The Theory of Emulsification”, Journal of Physical
Chemistry, 17(6), 501-519 (1913).
Bonfillon, A. and Langevin, D. “Viscoelasticity of Monolayers at Oil-Water
Interfaces”, Langmuir 9, 2172-2177 (1993).
Cameron Engineers “Oil Sands”, Synthetic Fuels Data Handbook, 2nd Edition,
Cameron Engineers Inc., Colorado, U.S.A (1978).
Chung, K.H., Ng, S. and Sanford, E.C. “Formation of W/O Emulsions in the Hot
Water Extraction Process”, AOSTRA Journal of Research, 7(3), 183-93 (1991).
Clark, K.A. and Pasternack, D.S. “Hot-Water Separation of Bitumen from Alberta
Bitumen Sand”, Journal of Industrial and Engineering Chemistry, 24, 1410-1416
(1932).
Dai, Q. and Chung, K. “Bitumen-Sand Interaction in Oil Sand Processing”, Fuel,
74(12), 1858-1864 (1995).
Derjaguin, B.V. and Kussakov, M.M. “Acta Physicochimica”, URSS 10, 25-30 (1939).
Deutsch, C.V. and McLennan, J.A. “Guide to SAGD (Steam Assisted Gravity
Drainage) Reservoir Characterization Using Geostatistics”, Centre for Computational
Geostatistics Guidebook Series Vol. 3 (2005).

73
Eskjin, D., Leonenko, Y., Lezhnin, S. and Vinogradov, O. “A Model of Oil Sand
Lump Digestion”, Mineral Engineering, 15(6), 496-472 (2002).
Garrigy, M.A. and Kramers, J.W. “Guide to the Athabasca Oil Sands Area”, Alberta
Research Council (1974).
Gray, M., Xu, Z. and Masliyah, J. “Physics in the Oil Sands of Alberta”, Physics
Today, 62(3), 31-35 (2009).
Helper, L.G. and Smith, R.G. “The Alberta Oil Sands: Industrial Procedures for
Extraction and Some Recent Fundamental Research”, AOSTRA Technical Publication
Series 14 (1994).
Lee, S., Chung, S. and Park, S. “Chemical Tracer Method for Measurement of Flow
Rates in Closed Conduits”, Journal of Nuclear Science and Technology, 44(11),
1467–1473 (2007).
Li, P., Zheng, X. and Zhu, J. “Research Progress of the Stability and Demulsification
Mechanism of the Water in Crude Oil Emulsion”, Fine Chemicals, 18, 2 (2001).
Liu, J., Xu, Z. and Masliyah, J. “Role of Fine Clays in Bitumen Extraction from Oil
Sands”, AICHE Journal, 50(8), 1917-1927 (2004).
Long, Y., Dabros, T. and Hamza, H. “Stability and Settling Characteristics of
Solvent-Diluted Bitumen Emulsions”, Fuel, 81(15), 1945–1952 (2002).
Masliyah, J. “Fundamentals of Oil Sands Extraction”, University of Alberta (2007).
Mohammed, R.A., Bailey, A.I., Luckham, P.F. and Taylor, S.E. “The Effect of

74
Demulsifiers on the Interfacial Rheology and Emulsion Stability of Water-in-Oil
Emulsions”, Colloids and Surfaces, 91, 129-139 (1994).
Mossop, G. D. “Geology of the Athabasca Oil Sand”, Canadian Journal of Chemical
Enginnering, 60, 538-545 (1982).
Nelson, A. and Gray, M. “The Chemical Composition of Bitumen”, University of
Alberta (2004).
Takamura, K. “Microscopic Structure of Athabasca Oil Sand”, Canadian Journal of
Chemical Engineering, 60(4), 538-545 (1982).
Takamura, K. and Chow, R. “A Mechanism for Initiation of Bitumen Displacement
from Oil Sand”, Journal of Canadian Petroleum Technology, 22(6), 22-30 (1983).
Takamura, K. “Physico-Chemical Characterization of Athabasca Oil Sand and its
Significance to Bitumen Recovery”, AOSTRA Journal of Research, 2(1), 1-10 (1985).
Waller, P.R., William, A. and Bartle, K.D. “The Structure and Solubility of Residual
Fuel Oil Fractions”, Fuel, 68, 520-526 (1989).
Zhao, H., Dang-Vu, T., Long, J., Xu, Z. and Masliyah, J. “Role of Bicarbonate Ions in
Oil Sands Extraction Systems with a Poor Processing Ore”, Journal of Dispersion
Science and Technology, 30, 809-822 (2009).

75
Appendix
Table A-1: The feed and water used in oil sands extraction for five ores (all in g)
POSYN Test 1 Test 2 Test 3 Average
Processing Water 400.01 400.10 400.48 400.20
Ore 130.00 130.01 130.03 130.01
Formation Water 9.66 9.66 9.66 9.66
Total Water 409.67 409.76 410.14 409.86
TS
Processing Water 400.04 400.09 400.10 400.08
Ore 130.00 130.05 130.06 130.04
Formation Water 12.18 12.19 12.19 12.19
Total Water 412.22 412.28 412.29 412.26
SYN704
Processing Water 408.47 408.46 400.00 405.64
Ore 130.06 130.02 130.01 130.03
Formation Water 7.02 7.02 7.02 7.02
Total Water 415.49 415.48 407.02 412.66
Vince A2
Processing Water 400.01 400.08 400.03 400.04
Ore 130.00 130.01 130.03 130.01
Formation Water 4.07 4.07 4.07 4.07
Total Water 404.08 404.15 404.10 404.11
AL 711
Processing Water 400.02 400.08 400.03 400.04
Ore 130.11 130.02 130.01 130.05
Formation Water 3.55 3.55 3.55 3.55
Total Water 403.57 403.63 403.58 403.59

76
Table A-2: Water source of emulsified water, free water and tailings water for
POSYN ore
POSYN ore Co (ppm)
Test 1 Test 2 Test 3 Average
Processing Water 36.6 37.8 36.9 37.1
Formation Water 0.0 0.0 0.0 0.0
Emulsified Water 34.3 34.9 34.0 34.4
Free Water 35.8 37.1 35.9 36.3
Tailings Water 35.7 36.9 36.1 36.2
Well Mixed 35.7 36.9 36.0 37.1
Emulsified Water Percent of Water (%)
Test 1 Test 2 Test 3 Average
Arising from Formation Water 6.28 7.67 7.86 7.27
Arising from Processing Water 93.72 92.33 92.14 92.73
Free Water Percent of Water (%)
Test 1 Test 2 Test 3 Average
Arising from Formation Water 2.19 1.85 2.71 2.25
Arising from Processing Water 97.81 98.15 97.29 97.75
Tailings Water Percent of Water (%)
Test 1 Test 2 Test 3 Average
Arising from Formation Water 2.46 2.38 2.17 2.34
Arising from Processing Water 97.54 97.62 97.83 97.66
Well-Mixed Percent of Water (%)
Test 1 Test 2 Test 3 Average
Arising from Formation Water 2.36 2.36 2.36 2.36
Arising from Processing Water 97.64 97.64 97.64 97.64

77
Table A-3: Formation water and processing water distribution for POSYN ore
Total Water Emulsified Water Free Water Tailings Water Total Water
Mass(g) 27.33 71.31 307.26 405.9
Water
Distribution 6.73% 17.57% 75.70% 100%
Water Source for Different Water Streams
Emulsified Water Free Water Tailings Water
Percent of Formation
Water 7.27% 2.25% 2.34%
Percent of Processing
Water 92.73% 97.75% 97.66%
Mass of Water in Different Streams (g)
Emulsified Water Free Water Tailings Water
Arising from
Formation Water
1.99 1.60 7.18
Arising from
Processing Water
25.34 69.71 300.08
Water Distribution
Emulsified Water Free Water Tailings Water Total Water
Formation 18.46% 14.89% 66.65% 100%
Processing 6.41% 17.64% 75.95% 100%

78
Table A-4: Water source of emulsified water, free water and tailings water for TS ore
TS ore Co (ppm)
Test 1 Test 2 Test 3 Average
Processing Water 36.6 38.1 37.5 37.4
Formation Water 0.0 0.0 0.0 0.0
Emulsified Water 34.6 35.5 34.7 34.9
Free Water 35.2 36.8 36.2 36.1
Tailings Water 35.4 37.0 36.3 36.2
Well-Mixed 35.5 37.0 36.4 36.3
Emulsified Water Percent of Water (%)
Test 1 Test 2 Test 3 Average
Arising from Formation Water 5.46 6.82 7.47 6.59
Arising from Processing Water 94.54 93.18 92.53 93.41
Free Water Percent of Water (%)
Test 1 Test 2 Test 3 Average
Arising from Formation Water 3.83 3.41 3.47 3.57
Arising from Processing Water 96.17 96.59 96.53 96.43
Tailings Water Percent of Water (%)
Test 1 Test 2 Test 3 Average
Arising from Formation Water 3.28 2.89 3.20 3.12
Arising from Processing Water 96.72 97.11 96.80 96.88
Well-Mixed Percent of Water (%)
Test 1 Test 2 Test 3 Average
Arising from Formation Water 2.95 2.96 2.96 2.96
Arising from Processing Water 97.05 97.04 97.04 97.04

79
Table A-5: Formation water and processing water distribution for TS ore
Total Water Emulsified Water Free Water Tailings Water Total Water
Mass(g) 15.64 52.56 340.63 408.83
Water
Distribution 3.83% 12.85% 83.32% 100%
Water Source for Different Water Streams
Emulsified Water Free Water Tailings Water
Percent of Formation
Water 6.58% 3.57% 3.12%
Percent of Processing
Water 93.42% 96.43% 96.88%
Mass of Water in Different Streams (g)
Emulsified Water Free Water Tailings Water
Arising from
Formation Water
1.03 1.88 10.63
Arising from
Processing Water
14.61 50.68 330.00
Water Distribution
Emulsified Water Free Water Tailings Water Total Water
Formation 7.61% 13.88% 78.51% 100%
Processing 3.70% 12.82% 83.48% 100%

80
Table A-6: Water source of emulsified water, free water and tailings water for SYN
704 ore
SYN 704 ore Co (ppm)
Test 1 Test 2 Test 3 Average
Processing Water 40.7 41.3 42.4 41.5
Formation Water 0.0 0.0 0.0 0.0
Emulsified Water 39.1 39.7 40.6 39.8
Free Water 39.7 40.4 41.6 40.6
Tailings Water 40.1 40.6 41.8 40.8
Well-Mixed 40.0 40.6 41.7 41.5
Emulsified Water Percent of Water (%)
Test 1 Test 2 Test 3 Average
Arising from Formation Water 3.93 3.87 4.25 4.02
Arising from Processing Water 96.07 96.13 95.75 95.98
Free Water Percent of Water (%)
Test 1 Test 2 Test 3 Average
Arising from Formation Water 2.46 2.18 1.89 2.17
Arising from Processing Water 97.54 97.82 98.11 97.83
Tailings Water Percent of Water (%)
Test 1 Test 2 Test 3 Average
Arising from Formation Water 1.47 1.69 1.42 1.53
Arising from Processing Water 98.53 98.31 98.58 98.47
Well-Mixed Percent of Water (%)
Test 1 Test 2 Test 3 Average
Arising from Formation Water 1.69 1.69 1.72 1.70
Arising from Processing Water 98.31 98.31 98.28 98.30

81
Table A-7: Formation water and processing water distribution for SYN 704 ore
Total Water Emulsified Water Free Water Tailings Water Total Water
Mass(g) 17.23 56.61 335.64 409.48
Water
Distribution 4.21% 13.82% 81.97% 100%
Water Source for Different Water Streams
Emulsified Water Free Water Tailings Water
Percent of Formation
Water 4.02% 2.17% 1.53%
Percent of Processing
Water 95.98% 97.83% 98.47%
Mass of Water in Different Streams (g)
Emulsified Water Free Water Tailings Water
Arising from
Formation Water
0.69 1.23 5.13
Arising from
Processing Water
16.54 55.38 330.51
Water Distribution
Emulsified Water Free Water Tailings Water Total Water
Formation 9.81% 17.45% 72.74% 100%
Processing 4.11% 13.76% 82.13% 100%

82
Table A-8: Water source of emulsified water, free water and tailings water for Vince
A2 ore
Vince A2 ore Co (ppm)
Test 1 Test 2 Test 3 Average
Processing Water 37.2 38.3 40.5 38.7
Formation Water 0.0 0.0 0.0 0.0
Emulsified water 36.5 37.7 39.9 38.0
Free Water 36.6 37.7 40.1 38.1
Tailings Water 36.8 37.9 40 38.2
Well-Mixed 36.8 37.9 40.1 38.7
Emulsified Water Percent of Water (%)
Test 1 Test 2 Test 3 Average
Arising from Formation Water 1.88 1.57 1.48 1.64
Arising from Processing Water 98.12 98.43 98.52 98.36
Free Water Percent of Water (%)
Test 1 Test 2 Test 3 Average
Arising from Formation Water 1.61 1.57 0.99 1.39
Arising from Processing Water 98.39 98.43 99.01 98.61
Tailings Water Percent of Water (%)
Test 1 Test 2 Test 3 Average
Arising from Formation Water 1.08 1.04 1.23 1.12
Arising from Processing Water 98.92 98.96 98.77 98.88
Well-Mixed Percent of Water (%)
Test 1 Test 2 Test 3 Average
Arising from Formation Water 1.01 1.01 1.01 1.01
Arising from Processing Water 98.99 98.99 98.99 98.99

83
Table A-9: Formation water and processing water distribution for Vince A2 ore
Total Water Emulsified Water Free Water Tailings Water Total Water
Mass(g) 16.4 53.91 330.67 400.98
Water
Distribution 4.09% 13.44% 82.47% 100%
Water Source for Different Water Streams
Emulsified Water Free Water Tailings Water
Percent of Formation
Water 1.64% 1.39% 1.12%
Percent of Processing
Water 98.36% 98.61% 98.88%
Mass of Water in Different Streams (g)
Emulsified Water Free Water Tailings Water
Arising from
Formation Water
0.27 0.75 3.70
Arising from
Processing Water
16.13 53.16 326.97
Water Distribution
Emulsified Water Free Water Tailings Water Total Water
Formation 5.72% 15.88% 78.40% 100%
Processing 4.07% 13.42% 82.51% 100%

84
Table A-10: Water source of emulsified water, free water and tailings water for AL
711 ore
AL 711 ore Co (ppm)
Test 1 Test 2 Test 3 Average
Processing Water 42.3 39.4 41.5 41.1
Formation Water 0.0 0.0 0.0 0.0
Emulsified Water 41.9 39 40.9 40.6
Free Water 41.8 39 41.1 40.6
Tailings Water 41.9 39.1 41.1 40.7
Well-Mixed 41.9 39.1 41.1 41.1
Emulsified Water Percent of Water (%)
Test 1 Test 2 Test 3 Average
Arising from Formation Water 0.95 1.02 1.45 1.14
Arising from Processing Water 99.05 98.98 98.55 98.86
Free Water Percent of Water (%)
Test 1 Test 2 Test 3 Average
Arising from Formation Water 1.18 1.02 0.96 1.05
Arising from Processing Water 98.82 98.98 99.04 98.95
Tailings Water Percent of Water (%)
Test 1 Test 2 Test 3 Average
Arising from Formation Water 0.95 0.76 0.96 0.89
Arising from Processing Water 99.05 99.24 99.04 99.11
Well-Mixed Percent of Water (%)
Test 1 Test 2 Test 3 Average
Arising from Formation Water 0.88 0.88 0.88 0.88
Arising from Processing Water 99.12 99.12 99.12 99.12

85
Table A-11: Formation water and processing water distribution for AL 711 ore
Total Water Emulsified Water Free Water Tailings Water Total Water
Mass(g) 13.51 52.96 334.52 400.99
Water
Distribution 3.37% 13.21% 83.42% 100%
Water Source for Different Water Streams
Emulsified Water Free Water Tailings Water
Percent of Formation
Water 1.14% 1.05% 0.89%
Percent of Processing
Water 98.86% 98.95% 99.11%
Mass of Water in Different Streams (g)
Emulsified Water Free Water Tailings Water
Arising from
Formation Water
0.15 0.56 2.98
Arising from
Processing Water
13.36 52.40 331.54
Water Distribution
Emulsified Water Free Water Tailings Water Total Water
Formation 4.07% 15.18% 80.76% 100%
Processing 3.36% 13.19% 83.45% 100%

86
Figure A-1: (a) Total water distribution; (b) Processing water distribution;
(c) Formation water distribution. (POSYN ore)
6.73%17.57%
75.70%
(a)
6.41%17.64%
75.90%
(b)
18.45%
14.89%
66.65% Emulsified Water
Free Water
Tailings Water
(c)

87
Figure A-2: (a) Total water distribution; (b) Processing water distribution;
(c) Formation water distribution. (TS ore)
3.83%12.85%
83.32%
(a)
3.70%12.82%
83.48%
(b)
7.61%13.88%
78.51% Emulsified Water
Free Water
Tailings Water
(c)

88
Figure A-3: (a) Total water distribution; (b) Processing water distribution;
(c) Formation water distribution. (SYN 704 ore)
4.21%13.82%
81.97%
(a)
4.11%13.76%
82.13%
(b)
9.81%
17.45%
72.73% Emulsified Water
Free Water
Tailings Water
(c)

89
Figure A-4: (a) Total water distribution; (b) Processing water distribution;
(c) Formation water distribution. (Vince A2 ore)
4.09%13.44%
82.47%
(a)
4.07%13.42%
82.51%
(b)
5.72%15.88%
78.40% Emulsified Water
Free Water
Tailings Water
(c)

90
Figure A-5: (a) Total water distribution; (b) Processing water distribution;
(c) Formation water distribution. (AL 711 ore)
3.37%13.21%
83.42%
(a)
3.36%13.19%
83.45%
(b)
4.16%15.12%
80.72%Emulsified Water
Free Water
Tailings Water
(c)