vapor extraction of heavy oil and bitumen. - citeseerx
TRANSCRIPT

VAPOUR EXTRACTION OF HEAVY OIL AND BITUMEN
Swapan K. Das and Roger M. Butler Department of Chemical and Petroleum Engineering
The University of Calgary, Canada, T2N 1N4
Key Words : Heavy oil and Bilurnen, Vapour fitmetion, In Silu Vpgnuiing.
Introducfion The world's total estimated proved reserve of conventional oil is one trillion bbl and
the world average of the reserves-to-production ratio is only 46 years at 1990 production levelsl'l. This excludes the reserves of heavy oil, tar sands and bitumen that amounts to 6 trillion barrels of oil in place which are not economically recoverable with present technologies. If the proper technology is developed for extracting these resources it can supply the fuel demand for the next few centuries.
Heavy oil and bitumen have high viscosity and low API gravity. In some reservoirs, such as Athabasca, the oil viscosity is in millions of mPa.s at reservoir conditions making conventional recovery impossible. Flooding techniques cannot enhance recovery substantially, due to the adverse mobility ratio.
The viscosities of the heavy oil and bitumen decrease drastically with increase in temperature. Among the thermal recovery processes applied to produce these crudes, the Steam Assisted Gravity Drainage12] proved to be very successful. In this process steam is injected through a horizontal well and the hot oil being less viscous drains by gravity to the horizontal production well. Using long horizontal wells, very high production rates can be achieved in this process.
In steam processes the energy efficiency is poor due largely to heat losses to the underburden and overburden (specially in thin reservoirs). Enormous amount of effluent is to treated, a huge source for the supply of fresh water is required, clay swelling due to contact with fresh water from the condensed steam causes formation damage. However, instead of steam, if solvent is used to dilute bitumen some of these problems can be eliminated.
Butler and Mok~ys [~ ] studied the extraction of bitumen with toluene in a line source Hele-Shaw cell. On the basis of the magnitude of different physical properties affecting the production rates, it was concluded that the solvent leaching would be slower than the thermal processes. It was anticipated that vaporized solvent in combination with deasphalting may enhance the rate considerably.
Concept of the Vapex Pmcess In the Vapex (vapour extraction) process vaporized hydrocarbon solvents are injected
in the reservoir through a horizontal injection well. The solvent initially dissolves in bitumen around the injection well until diluted oil breaks through the horizontal production well placed vertically below the injection well. Solvent vapour rises slowly to form a vapour chamber in the extracted sand matrix above the injection well. Solvent vapour dissolves in bitumen at the solvent bitumen interface, diffuses through the bulk of bitumen and the diluted oil drains to the production well by gravity. The use of vaporized solvent produces higher driving force in gravity drainage and also reduces the residual amount of solvent in the extracted reservoir. The concept of the process is shown schematically in Figure 1. Several other configurations of injector and producer wells are also possible.
Selection of Solvent and Conditions In this process production rate is directly related to the amount of solvent dissolved
and diffused into bitumen. One important aspect of this process is deasphalting that yields in situ upgraded oil reducing many down stream problems. The extent of deasphalting also depends on the amount of solvent. The solubility of a vaporized solvent is maximum near its dew point pressure. Hence, the solvent pressure should be as close as possible to its vapoiir pressure at the reservoir temperature. If the dew point pressure of the solvent is lower than the reservoir pressure solvent liquefies and fill the extracted sand matrix with liquid solvent. Thus a barrel of oil is replaced by a barrel of liquid solvent which is not economic. Hence, to be suitable for the process, the solvent should have a dew point pressure slightly higher than the reservoir pressure so that it can be safely injected without liquefaction and the maximum solubility can be achieved at the same time. This criteria
962

combined with the abundant reservoir pressures and the cost and availability of the solvents limits the choice of solvent to ethane, propane and butane. In our experiments it was observed that performance of the process with ethane is inferior to that for propane and butane. Propane and butane yields comparable rates. However, propane upgrades the oil by dasphalting which is less prominent with butane. There are many heavy oil and bitumen reservoirs where the pressure is in the range of propane dew point pressure. In shallow reServoirs butane may be suitable. Theory
process using vaporized solvents predicts the production rates as The pseudo-steady state model developed by Butler and Mok~ys[~’ modified for the
where
and
q = 2 ~ a K
a = ,/-
H L q = production rate k = Permeability g 6 = porosity ASo p A p 0, c,, ci, c,,, = rn = cementation factor
= height of the reservoir = length of horizontal well
= acceleration due to gravity
= change in oil saturation = viscosity of mixture at solvent concentration, cs = density difference between solvent and bitumen = intrinsic diffusivity of propane in bitumen
mole fraction of solvent at different points in the boundary layer (Fig. 1)
Since the production rates are directly proportional to the vapex parameter, ‘a’, it can be used to evaluate the performance of the process at different conditions14]. Both the production rates and ‘a’ are proportional to the square root of permeability and this relation can .be used to scale up the production for different permeabilities.
Experiments in Hele-Shaw cell and Packed Visual Model Several experiments were carried out in Hele-Shaw cell by Das and Butler to assess
the impact of asphaltene deposition on the performance of the process. The experimental set up, procedures and the method of analysing data were described else whereI41. The photograph of the Hele-Shaw cell at the end of one interesting experiment carried out with Lloydminster heavy oil and propane is shown in Figure 2. The propane pressure in this experiment was varied by approximately 10 psi by varying the temperature of the propane supply cylinder between 19 and 22OC as shown in Figure 3. It was observed that at higher pressure, close to the dew point of the solvent, asphaltenes were deposited and at a lower pressure diluted oil drained without asphaltene precipitation. The alternate dark bands (deposited asphaltenes) and white bands (clean swept area) in Figure 2 clearly show the history of the pressure cycles. The corresponding vapex parameters, plotted in Figure 3, shows that the production rate is enhanced when asphaltene precipitation takes place. This due to the tremendous reduction of viscosity caused by deasphalting. Results of some experiments carried out in Hele-Shaw cell with different permeabilities are presented in Table 1. These show that under identical temperature of cell and propane, vapex parameters are proportional to the square roots of permeability,
Several experiments were carried out in visual packed cell using sands of different permeabilities and butane as a solvent. Experimental set up and procedure are described elsewherer5]. Cumulative productions from one of this experiment carried out with Peace River bitumen is shown in Figure 4, which is similar to the production profile in all of these packed cell experiments. As expected it is observed that the solvent vapour initially rises to form the solvent chamber, chamber grows to the top of the packed cell and then spreads sideways.
Comparison of Hele-Shaw and Packed Cell Res& /
963 i rU

Table 2 shows some results of the experiments in Hele-Shaw and Packed cell with Peace River bitumen. The production rates predicted for the packed cell on the basis of the results of the Hele-Shaw cell experiments and the experimental rates are presented in column 4 and 5 respectively. It shows that in the porous media the process goes approximately 10 times faster than expected.
Mechanism of the Vapex Process in Porous Media
1. 2. 3. 4. 5.
The basic mechanism of the process involves the following steps: Dissolution of solvent vapour at the solvent-bitumen interface Diffusion of the dissolved solvent into the bulk of bitumen Dissolved and diffused solvent dilutes the viscous oil and reduce the viscosity If the solvent concentration is high enough the oil is deasphalted in situ The diluted (and deasphalted) oil drains to the production well by gravity
Although the basic process mechanism is same in Hele-Shaw cell and in porous media in the later, the process takes place in a contact zone, instead of at a smooth interface as is the case in the former. This provides a ve high interfacial contact area that yields a high mass transfer rate of solvent into bitumenlq. The mass transfer is enhanced by capillary imbibition and the corresponding surface renewal. Although the diluted bitumen has a lower surface tension, due to its low viscosity it is quickly drawn away from the interface exposing a renewed interface of fresh bitumen to the solvent. If we consider diffusion of a solvent in a semi-infinite slab of bitumen, the transient concentration profiles and the corresponding mass flux at the solvent-bitumen interface with time are shown in Figure 5 and 6 respectively. It should be noted that as the concentration profile builds up, the mass transfer rate drops drastically. In the Butler Mokrys model it is assumed that a pseudo steady concentration profile is developed in the diffusion boundary layer and each point on the interface moves at a constant rate. This pseudo- steady profile represents a lower mass transfer rate which is probably true in case of Hele-Shaw cell. However, in porous media, with the periodic surface renewal, the early transient mass transfer is more prominent. Even with the periodic renewal, the interface will move at a constant rate resembling the pseudo- steady state. Hence the overall pseudo-steady state analysis will still be valid, although a very high diffusion coefficient is to be used to match the actual mass transfer rate.
Viabilify of the Process The production rate scaled up for a pair of loo0 m long horizontal injector and
producer in a 5-darcy Lloydminster reservoir (10 m thick) is 850 BOPD and Peace River bitumen reservoir (40 m thick) is 450 BOPD using propane as a solvent. These production rata Seem to be economic for field operation. For reservoirs of different thickness and permeability, the rate would vary in proportion to the square root of the vertical thickness and permeability. Although the solvent requirement is 0.5 glg of oil produced, most of this is recycled back and only a tenth of the solvent-Gapour is left behind to fill the reservoir. The energy requirement for this process is only - 3 % of that in the steam process. Hence, the process can be successfully implemented for field operations.
Conclusion 1. 2. 3.
References 1.
2.
The Vapex process can avoid many inherent problems of thermal processes. Better quality oil is produced due to in situ upgrading caused by deasphalting. Production rates could be economic.
Miremadi, A. and Ismail, I.A.H., "Middle EatDue Even Greater Role in Worldwide Oil Supply", Oil & Gas Journal, June 21, 1993, pp.61-71. Butler, R.M., McNab, G.S., Lo, H.Y., "Theoretical Studies on n2e Gravity Drainage of Heavy Oil During Sleam Heating", Canadian Journal of Chemical Engineering, Vol. 59, August 1981, pp.455-60. Butler, R.M. and Mokrys, I.J., "Solvent Analog Model of Steam Assisted Gravity Drainage", Aostra Journal of Research, Vol. 5, No. 1, 1989, pp. 17-32. Das, S.K. and Butler, R.M., "Effect ofAsphaltene Deposition on the Vapex Process: A preliminary Investigation Using a Hele-Shaw Cell", JCPT, Vol. 33, No. 6, 1994,
Das, S.K. and Butler, R.M., "Vapex Process in a Packed Cell Using Butane As a Solvent", paper No. HWC94-47, Canadian SPUCIMKANMET International Conference on Recent Advances in Horizontal Well Applications, Calgary, Alberta, Canada, March 20-24, 1994.
3.
4.
pp. 39-45. 5.
964

Vapour Extraction of Heavy oil and Bitumen
Figure 1 . Concept 01 the Vapex Process Figure 2. Pressure variation in HeleShaw cell (Lloydminster oil and propane).
I 25
10 L! s0 100 lk 2dO 250 300 358
lima (mi".)
Figure 3. Pressure cycles and corresponding \ ; Vapex parameters. /
300
200 s 7 0 m* wr. ""d R-YYI~ n Bul.W T.T. - 20d.C
100 C.u 1.v. - n.o'c
'0 20 40 60 80 100 0
Time (hr.)
Figure 4. Extraction of Peace River bitumen in 27d sand.
965
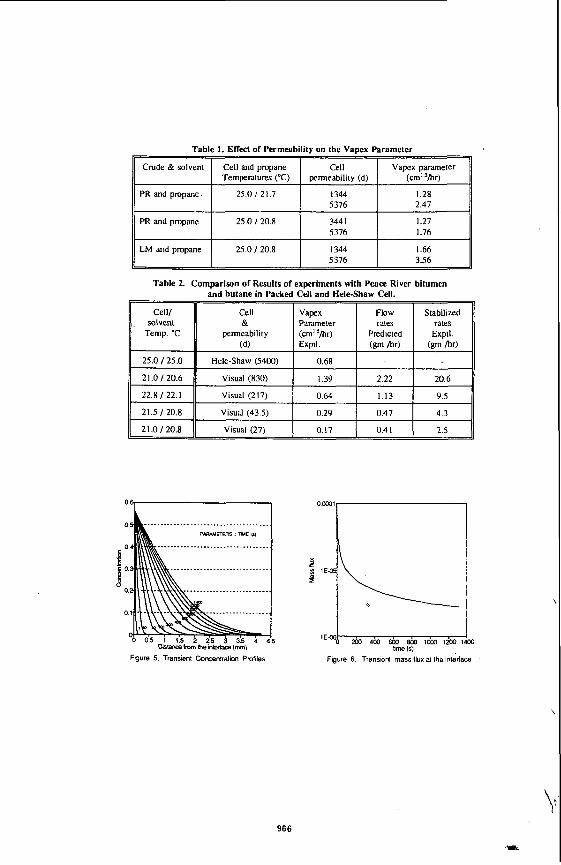
Table 1. Effect of Permeability on the Vapex parameter
Vapex parameter (cm' 'hr)
PR and propane 25.0 121.7 5376 2.47
PR and propane 25.0 120.8 5376 1.76
LM and propane 25.0 / 20.8 1344 1.66 5376 3.56
0 a: 0
I PIRulETERS : TIME (si
.........................
.......................
....
....
....
....
... 1
:I ._
4 5
Figure 5. Transient Concentration Profiles Figure 6. Transient mass flux at the interlacs
966

I
EFFECT OF POLYOLEFINS ON THERMAL CRACKING OF HEAVY RESIDUES
M. Stanciulescu, H. Seoud and J.F. Kelly CANMET, Energy Research Laboratories
Natural Resources Canada Ottawa, Ontario, Canada KIA OGI
Keywords: polyolefins, plastic wastes conversion, fuels, thermal cracking.
INTRODUCTION
Polyolefins, like polyethylene (PE), polypropylene (PP) and Polystyrene (ps) represent a major source of plastic waste. Annually in Canada, appdmately 50 Wlograms of organic wade per person Is post consumer plastic and over 40% of this plastic is PE. Less than 5% of the latter is recovered or recyded. However, the PE as well as the PP are the richest polyolefins in hydrogen content; they have the highest WC mU0, both In term of atomic (1.96) and weight ratio (0.17) of all polymers. This represents a tremendous waste of resoums. In an effort to use these resources many different pibsses are at various stages of development and new innovations continue to be introduced in plastic waste conversion (1-5). Most of them are pyrolytic processes which involve the conversion of polymeric wastes to monomers, chemicals, liquid and gaseous fuels and coke by heating the polymeric material to high temperature without oxygen or in a limited oxygen atmosphere. The decomposition temperatures for PE, PP and PS range from 400% to 45OOC (6). Thermal decomposition of PE and PP is a radical mechanlsm. Random rupture of G C bonds in the backbone of the chain yields free radicals (7). PS decomposes thermally by a mechanism which involves a hydrogen transfer at the site of scission. The bond scission is random and yields one saturated and one unsaturated molecule (8).
The objective of this present work was to determine the effect of these radicals produced from polyolefins on the aromatic radicals produced from the heavy residues (vacuum bottoms and bitumen) by analyzing the final effects on thermal cracking products. distillates and coke. A series of experiments has been undertaken using a tubing bomb reactor of 100 mL capadty. The experiments were conducted at 46OOC or 470'C for 10 min under an inert atmosphere (N2).
EXPERIMENTAL
Feedstocks Cold Lake vacuum bottoms (CLVB) and Athabasca bitumen were used as heavy
residues. The polyolefins used as additives were PE, PP and PS, pure resins. The elemental and proximate analyses are given in Table 1, Distillation of the heavy oils to determine pitch content (+52%) was canied out using an automated DY 160 unit.
Batch reactor unit The reaction vessel was a IOOrnL stainless steel tubing bomb reactor. The reactor
was charged with 20 g or 30 g of heavy residue mixed with polyolefins at various concentrations. The air from the reactor was purged using high pressure nitrogen. Subsequently, the reactor was depressurized to latm at room temperature and then the reactor was immersed in a fluldized sand bed preheated to 5OO0C. At 460°C or 470% the reaction was continued for 10 min. The reaction time was denned as the residence time at the desired temperature neglecting the preheating periods that increased with polyolefins concentrations from 6 to 10 min. During reaction, the system Is agitated by a pneumatic vibrator which assured good mixing. After 10 rnin the readion was stopped by rapidly cooling the reactor.by spraying with mid water mists. The gases were vented to a gas sampling bag. The remaining slurry was weighed and distilled or extracted with solvent, toluene or tetrahydrofuran (THF).
Product analysis Process gases were analyzed by gas chromatography (GC) for H2. H2S, CO, (x= 1 or
2) and hydrocarbons up to C,. The Slurry products were distilled using an ASTM D- 1160 apparatus to obtain the overall distillable and residue products at a cut point of 525% (9noF). The overall distillable has been fractioned to determine the amount of naphtha (lBP-185%), lighl'gas oil (LGO, 185-335%) and heavy gas oil (HGO: 335- 525%). The residue (+525'%) fraction from D-1 160 distillation was extracted by THF for d8terminatiOn of coke which is reported as tetrahydrofuran insolubles (THFI).
967

The liquid products were analyrad by GC using a capillary gas chromatograph (Perkin- Elmer, Sigma 2000), with a flame ionization detector (FID) and capillary column. Toluene solubles (TS), toluene insolubles (TI), tetrahydrofuran solubles (THFS) and tetrahydrofuran insolubles (THFI) were separated by soxhlet extraction.
RESULTS AND DISCUSSION The significant feature of this study is the conversion of waste Plastics (PE, p p and
Ps) into transportation fuels, Le.. gasoline or diesel fuel in the presence of heavy residues, through a thermal cracking route. The objectives were to Increase the distillate yield, to reduce the amount of residue and to reduce the formation of coke during the thermal cracking process at high temperatures and short residence times. The selected operating conditions must fevor the cracking of both feedstocks and additives (polyolefins). Without an external hydrogen source and any hydrogenation catalyst, coke fomatlon would be lnevltable at high temperature (460% or 470'C) even If the reaction tlme Is short (10 mln). Any increase In distillate yield or suppression of coke formation can be explained In terms of radical Interactions during thermal cracking. The Interactions of long aliphatic radicals with aromatic radicals from heavy oils compete with coke formation and other retrogressive reactions. The hydrogen donw ability of polyolefins wwkl convert heavy oil lo distillate. The qualilies of the distillates produced varied depending on the combination of polyolefinslheavy oils, but this aspect Is no1 addressed in this paper.
Heavy oil feedstocks and polyolefins Two different feedstocks were used for this study. One is CLVB, which contains a
high amount of pitch, 83.2%, high microcarbon residue and high content of sulphur. The WC atomic ratio is 1.42 and the metals content is low. The second one, Athabasca bitumen, has 52.4% pitch and a lower microcarbon residue. It's WC atomic ratio is 1.57. The polyolefins were pure, with no additives. The PE (HDPE) has a HIC atomic ratio of 1.96 that is very close to that of its monomer (2.00 for GH,). The PP has H/C ratio of 2.00 and PS a WC ratio of 1.01.
Effect of polyolefin concentration on product distribution Distribution of the products obtained by the thermal cracking of Athabasca bitumen
in the presence of different polyolefins (PE, PP and PS) at 460°C and 10 min residence time under nitrogen atmosphere is shown In Table 2. A comparison of polyolefins performance based on product yields was made by using polyolefins concentrations, from 0 to 20 wt I. The rint four lines of Table 2 show (he composition of the reactants In terms of bitumen and polyolefins concentrations. The distillate yields including losses show an inmase from 67.3 to 75.5 wl %. Losses are considered as ligM distillate. The non-distillable material decreased from 27.1 to 18.2 wt % for the run containing 13.5 wt X PE and 6.5 wl % PS. Asphaltenes t preasphaltenes (VIFS h m distillation residue) yields were almost constant for 20 wl % polyolefins additions. The mixture of PE and PP had a slightly lower effect on residue quality compared with 20% PE. Coke (lHFI) yield was constant for the three plyolefins concentrations and 32% lower than the run without polyolefins (Figure 1). The amount of gases increased in the presence of PE+PP and PE+PS compared to PE only. The distribution of products obtained from CLVB in the presence of PE is shown in Table 3. For these runs the distillates were not analyzed, the study concentrated on preasphaltenes (THFS) variation and coke (THFI) suppression (Figure 2). A significant effect on THFS was observed at 5% PE compared to 0% PE. The coke yield decreased with Increasing PE concentration. Yields of gases in the presence of PE were almost constant with one discrepancy at 15% PE.
The final pressure at reaction temperature decreased with Increasing polyolefins concentration. Table 4 shows final pressures for selected runs in the presence of PE. The gas composition indicates an increase in hydrogen consumption.
Effect of polyolefins concentration on distillates The composition of distillate products (IBP-525%) for selected runs are shown in
figure 3. The addifion Of PolYolefinS resulted In a slgniflcant Increase in the naphtha ffadion lnduding the loss. However, comparable HGO fractions were obtained for the five runs. Naphtha fraction was the highest (45.3% of the total distillate) in the Presence Of PS. Minimum Increase of 1.7% of dlstillates was estimatd for a 20% addition polyolefins (Table 2).
Effect of PolYOlefins concentration on coke suppression Figure 4 shows the effed Of Poblefins on coke suppression for selected runs using
Athabas- bitumen at em. The mixture of bitumen with PEtPP appean to be the
968

I'
1
best polyolefins combination for coke suppression with a maximum coke suppression measured at 20 wt I of polyolefins. Using CLVB and PE only the coke suppression effect was more pronounced (F~ure 5). At 20% PE the coke suppression was 44.7%. However, an increase of only 10°C In reaction temperature can offset the effect of Polyolefins on coke suppression (Figure 6).
hterpretatlon of effect of polyolefins on products At the reaction temperature (460%) the polyolefins are cracked to produce long
chain aliphatic radicals. These radicals can interact with aromatic radicals from heavy oils. The aliphatic radicals play the role of scavengers for aromatic fragments and prevent the recombination of large aromatic radicals to form coke, as follows:
-(-CH2-CH&H,-CH2-)- + -CH&H,O + 'CH2-CH,---
---CH,-CH,. + Ar. 3 -CH,-CH2- Ar
Fonnation of Ar-Ar (coke) was limited by the interaction of aliphatk radicals with AP to form -CH,-CH, - Ar.
Concluslons Addition of polyolefins in the thermal cracking of heavy oils increased the hydrogen
to carbon ratio of the feedstock and therefore improved the distillate yields. Competitive radical interactions reduced the retrogressive reactions and had a significant effect on coke suppression.
REFERENCES Sharp, L.L.. Ness R.O.. Randall, J.C. and Ellis, A.F., "Thermal Depolymerization of Plastics", presented at the 43rd Canadian Chemical Egineering Conference, Ottawa, Ontario, Oct. 3-6 (1993). Meszaros, M.W., "Emerging Technologies in Plastics Recycling", AMEC, 3195 (1993). Adam;, A.A:. Haritatos, N.J. and Robinson, R.C., "Recycling Waste Plastics by Coking", presented at the 43rd Canadian Chemical Engineering Conference, Ottawa, Ontario, Oct. 3-6 (1893). Redepenning, KH. and Wenzel, F., "Feasibility of Chemical Recycling", presented at the 43rd Canadian Chemical Engineering Conference. Ottawa. Ontario, Oct. 3-6 (1993). Siauw, H.N., Seoud, H., Stanclulescu, M. and Suglmoto, Y., "Conversion of Polyethylene to Transportation Fuels Through Pyrolysis and Catalytic cracking", to be published in Can.J.Chem.Eng. Madorsky, S.L. 'Thermal Degradation of Organic Polymers" John Wiley 8 Sons, Inc. (1965). Rice, O.F. and Rice, KK, "The Aliphatic Free Radicals", J. Hopkins Press, Baltimore, Md. (1936). Staudinger, H., Brunner, M.. Frey K, Garbsch. P.. Singer, R. and Wherli, S.. Ber., 62B:241 (1929) and Ann 4681 (1929).
Table 1 - C ~ w d f ~ &
CLVB A t h a b e PE PP PS Bltumen WPQ
01 180 DMOlsHon (nl%) 525@ 1e.8 47.8 625oc+ 83.2 52.4 Mlnaarbonraaidue(wl%) 17.1 14.3 R W e den% (erW 1 . a 1.013 0.W 0.89 1.00 Elemenld anal@ (Ma) P -w Carbon 78.8 €3.3 85.3 85.3 91.9 W m g W Nnmgen 0.6 0.6 - Sulphur 5.5 4.8 . WW 0.9 V. NI. Fe (Ppm) (- raco
VaMQUm 235 187.0
Iron 18 700.0
9.3 10.9 13.9 14.2 7.7
Nlckel 93 74.0
969

THFl 11.0 Resldue:THFS+THFI 27.1 18.8 20.3 182 18.9
avBvtx IMO ow 90.0 em 80.0 70.0 sa0 0.0
PEW% 0.0 5.0 10.0 15.0 M.0 30.0 50.0 lW.O
ywd.wlx
Ts 7~ 70.7 80.3 87.3 87.9 81.0 91.4 81.7
THFS 1.7 4.8 23 zi 0.6 1.4 a2 0.2
THFl 183 14.8 14.0 8.1 8.2 7.3 5.8 1.0
Gas.. 3.7 3.8 3.4 1.8 b3 1 4 2s 1.1
1 5.6 1 a8 7.3
Loss 3.0 10.4 a7 Total 97.0 83.7 63.8 81.3 m8
Table 4- Final pmaure id readon temperature d PE wim heavy o b ana hLdroeen mncentratlon In gases Initial pressure: 1 atm at room temperature (nltrogen)
PE. wt % 0.0 10.0 15.0 20.0 50.0 100.0
w(% 100.0 90.0 89.0 80.0 50.0 0.0 flnal Pressure
PSI 980.0 950.0 925.0 1080.0 900.0 620.0 Atm 66.8 64.8 63.1 73.6 61.3 42.3 HZwl %' 9.2 9.1 9.2 9.2 6.7 18.3 H2- mnsump. - 1.0 2 3 1.8 7.1 - FEEd: Bitumen, wt% 100.0 90.0 85.0 130.0 m.0 0.0
Final pressure
PSI 1468.0 1417.0 1100.0 W . 0 874.0 620.0 MPa 100.1 96.8 75.0 59.1 45.9 423 H2,wl%* 8.5 6.4 6.4 9.1 12.1 18.3 H2- mnsump. - 1.3 1.8 0 . 3 0.3 - I
~ t-iydrogen concamrailon In gases ** - Based on 1 w9( polyoleiins
970

5 25.0
8 15.0 n
10.0
5.0
0.0
Bltumen. wi %
10.0
5.0
0.0
Flgure 1. Effect of polyolefln on products formatlon from b p A n
PE concentration in feed, wi %
Flgure 2. Effect of PE concentration on products formatlon from CLVB
1m.o 90.0 80.0
8 70.0 5 60.0 f 50.0 1 40.0
a 30.0 20.0 10.0
0.0
POlYOlefIns. wt %
971

16.0
14.6
10 3b 40 50 60 70 80 90 100 0.0 T
Polyoleflns. wt %
I-=- a m e n + PE -I- Bmrmen+PE PP(1:l) -*c BItumn+PE PS(1:l) I
Figure 4 -Effect of polyoleflns concentratlon on coke formdon
10 ae
0 0 10 20 $0 40 50 60 70 80 90 100
PE concentration In feed, w i %
+ coke formation -e- coke suppresslon
Rgure 5 -Effect of PE concentration on suppression of coke from CLVB
2 o . o L
7 0.04 I , , , , , , I
0 10 20 30 40 50 60 70 80 90 ~~ ..
PE concentration in feed. wt %
I + THFI at 460% --e THFI at 4709: I FIgure 6 -Effect of temperature on
suppression of coke from CLVB
912

EXTRAHEAVY CRUDE OIL UPGRADING IN THE PRESENCE OF NATURAL GAS AS HYDROGEN SOURCE. CONTINUOUS FLOW EXPERIMENTS AND ECONOMIC EVALUATION Cesar Ovalles, Ely Saul Arias. Anronia Hamana, Carmcn B. BadclI and Gustavo Gonzalez, Department
of Pemleurn Chemistry, INTEVEP, S. A.. Apdo. 76343. Caracas 1070A. Venezuela
Key Words: Upgrading, Exwheavy audc Oil, Methane, Economic Evaluations
INTRODUCTION The presence of vast ~ S C N C S of natural gas available in di f€mt pans of the world has
motivated continuous research efforts in new routes for the utilization of this raw material [l- 81. Spcifically. the direct use of methane as a source of hydrogen for coal and crude oil upgrading has received the attention of several research p u p s during the last few ycars [5-8].
Sundaraa and coworkers [5] employed natural gas (methane) as hydrogen source for coal liquefaction and found a 73% conversion of a Illinois #6 coal at 425OC and 1000 psi using tewlin as a donor solvent. When employing nitrogen instcad of methane, lower conversion was found (67%) indicating that. most probably, methanc was involved ia h e IiqucfaCtiOa process
Egiebor and Gray reponed [q -70% conversion to liquid pmducts for the liquefaction of Highvale coal using methanc armDsphere in the presence or not of a d y s t eq with tewlia as a donor solvent at 4 W C and a pnssure of 27&350 psi. The chammimion of the hydmmbon products by IH-NMR showed similar spectra for the hydrogen and methane reactions. and by GC and GC-MS analysis of the donor solvent. methyl and dimthy1 substimted products were detected.
(Hamata. API 8.69 using mthanc as a source of hydrogen under thamal conditions. in the presence of water as additive. The reaction of Hamaca crude oil (warn content 4.4%) with mtham at 3 8 W and 1600 psi for4 h, led to a dcmasc in two orders of magnitude in the viscosity of the upgraded product (from 500.000 to 1990 CP at 3 m . a parentage of conversion of the WC+ M o n of 60% and 11.3% of HDS. with respcct to the original crude. compar#l to the Cl+mntaining expaimcnt. a naction carried out under nitrogen as an inat gas (conml expaiwnt) led to a product with higher viscosity (2600 cP), Iowa conversion of the heavy M o n (54%) and lower HDS (8.3%). Thee results indicated [7] that methane was involved in the upgrading reactions and, most probably. was behaving as a source of hydrogen for the thamal processes
According to the IH- and WNMR data [7] , the most probable pathway is a radical chain mec- which involves inanpmion of mthanc to the hydrocarbon molecUlcJ via the production of mahyl radicals. The pmposcd mchanism is as follows:
WCS and coworken studied [7-81 the Upgrading Of O d e B e l t urtraheavy crude oil
.- R-R' -+ R' + R*
R*+HzO 4 R H + O H $ (2)
R*+W -+ RH+CH3' (3) OH* + W -+ H2O + CH3' (4)
CH3' + R-R' -+ RCH3 (RCH3) + R'(R*) (5)
R' + CH3' + RCH3
CHf + a i 3 0 + CH3cH3 R' + R* -+ R - R
Where R and R am hydrocarbons. Rcacb'ons carried out using a dehydrated crude oil (less lhan 1% of H20) under mthane
and nimgcn ampsphau gave approximately similar mults (2400 cP. 45% of CQIVQsion and 8% of HDS), indicating that the prcscncc of warn is necessary in d e r to achieve methane incorporatioa into the upgraded produce. The beneficial effcca of water in the w+maiaing
4) with the concomitant production of methyl radicals to condnue tk chain proass [q.
(a)
0 (8)
upgrading rtactioas of binrmcns can be rationalized by the leaaioo of ow with mnhanc (eq.
973

this papa the upgrading of exnahcavy crude oil (Hamata. API 8.6'9 was demonstrated m a continuous flow system using natural gas as a source of hydrogen in the presence of water as additive. The &ects of the naaual gas pressure (1600,800 and 200 psi), residence timc (30 and 45 min) and percentage of water (10 and 20% w/w) were studied using a 0.11 barreWday hydrovisbreaking unit d e d to use nand gas. From now on, we refer to this profess as Methanetreatment for comparative reasons.
Due to the vast r e m e s of Orinoca Belt extraheavy crude oil and the diffculties in its uansportation we evaluate the feasibility of using Methanetreatment for this purpose due to availability of nafural gas and low cost energy in the vicinities of the production web. For these muons, a conceptual engincuing design and an economic evaluation were conducted for a 100 MBPD module. Fmally. comparisons with conventional technologies were c a n i d OUL
EXPERIMENTAL The urwbeavy crude oil employed in this work came 6um the Hamaca oil field in the
Orinoco Belt and its analysis can be found in Table 1. The percentages of volatile material were determined by the method reported by Ceballo and coworkers [9] using a Hewlet-Packard gas- chromatograph, model 5880. The pcmntage of conversion of the residue >5OOOC was defined as:
('KO of residue XWC+ in crude oil) - (46 of residue 5009c+ in upgraded product) x 100 __-______-_-----________________________---------------------------
('KO of residue XWC+ in crude oil)
The Viscosities of the crude oils wae measured in a Brookfield apparatus. model RVTDV- II. The water concenaations were determined by the Karl F h method according with the ASTM standard test D-1744-83. The composition of the natural gas can be found in Table 1. The Coluadson carbon contents werc measured by the ASTM standard test D-189.
The upgmding reactions were carried out in a 0.11 bamlslday hyhvisbrraldng unit modified to use natural gas. The plant consists of three d o n s : preheating. reaction and separation zone. In the preheating section. the hydrocarbons. water and nahlral gas were mixed and heated near the reaction tempemure ( 3 2 W at the d o n pressure (1600.800 or 200 psi). The d o n zone included a coil and a soaker reactors C O M C C ~ ~ in series with a volume of 0.285 and 4.7 litas. respectively. Both reactors were kept at the sa^ temperam (390 and 4 1 m duting each e-
'Ibe products of the upgrading reactions were Wed by separating the gases from the liquid using a m unit at 150T. The umacted natural gas wasrapmprcssed and -led with a ratio of= to 1 with respect to the purge gas. The 4uids were stripped with nitrogen at 1WC and top ploducts w a t condensed. From the last stream, wata and light hydrocarbons were separated d the Lam compounds were mixal with the bottoms of the stripped unit to obtain the rcconstitUted aude oil Mass balances were taken every 10-12 hours without formation of coke in the soaka reactor.
The conceplud engineering designs for Visbrealdng, Methaneacatmnt and H y h v i s b m b g processes as well as for mole conventional mnhods for h9 oil WnSpOrtation such as Heating and Dilution, were carried out. Technical bases for all altmacives were the same (Crude properties. flowme. pipelenghk etc.). Invesrment costs
datahe and rccent vendor quotations. Operating costs w a e eaimatd from INTEvEp's recent experiences in similarprojects and from fecdback from our Operating affiliates.
(orda ofmagninde, 25% contingency and grass mot) were e.5timataJ using m w s own
RESULTS AND DISCUSSION
"be reactiOa ofextraheavy Qude oil (MI = 8.69 with l600psiof natural gar at41OT with a concenwtioa of wata of 10% w/w and a residence tim of 30 ain (Table 2 exp. I), led to an haease h the API gtavity h 8.e to 12* in the upgraded product, a decnare in two ordcfsof~tudcintheviscosity(from500.ooOto 1700cPat?@C)andamvasioaof the e residue of358. with respect to the origihal crude. Duringa lodays run, mas balanc*, WQC taken may 12 hours without formation of coke in the soaker reactor after the experiment Similar d u e of viscoSity (1990 cP) was obtained [7] using a 300 ml-batch WIIX undcr
1600 @ of mcrbanc at 3 8 K for 4 h. Higher percentage of c011vcrsioa (60%) waq found for
974

the later rn lhaa that in continuous flow experiment and can be attributed to the longer residencetime.
An w i n the ~ n c c t i m e to 45 toin (Table 1. exp. 2) did not further elevate the API gravity of the upgraded nconstitucad crude oil . However. the viscosity of the pToduct decreased (1 100 cP) and the percentage of conversion of the residue i n d (49%) due to the longer residence time. On the other hand, the amount of Conradson carbon in the reconstituted crude oil increased from 16.5 to 18% as the residence tLm was raised fmm 30 to 45 min. These results indicate that coke was been produced during the crude oil upgrading and is Consistent with other thenually upgrading p e s s e s as for example ViSbrcaLing and Hydmvisbmking (14111.
An expaiment (Table 1, exp. 3) carried out with 20 % whv water concentration led to an upgraded product with slightly better properties (1590 cP,. 36% conversion of the nsidue and 16.2% of Conradson carbon) in comparison with those obtaimd with 10% wam content (exp. 1). The effect of water as additive for vkbmhng type of d o n is very well known in the literature [ 121. Its beneficial Proparies an amibuted to the reduction of coke formation and to its hydrogen donor capabilities p.121.
The effect of the pressure of n a n d gas on the viscosity of the upgraded reconstituted crude oilscan be seen in Fig. 1. The reactions w m carried out at 39oec with 30 tnin residence timc and the results are the average of 10 h mass balaac*r for up to 30 h. In general. it can be seen that theviscosilyof the upgraded product in the tempmtmrange 3Gm dccnasod as theoaturalgaspresSUrc i n d These R S u l t s i n d i c a t e t h c i n V ~ O f natural gas during the mdc oil upgrading reaction. Possible explanations can be atuibuwd to the need of high pressure in order to carry out the methane activation reactions as shown in cq. 3 and 4.
From these nsults, it can be concluded that the process of upgrading exuahcavy crude oil using natural gas as a source of hydmgen looks as a technically feasible option for the industriabation of these abundant raw materials.
In order to assess the Methanenearment process as an up-g technology to be used with wnsponaa ‘on purposes. an economic evaluation was conducted. Comparisons with similarprocesscs as VisbreaLing and HydrovisbnaLing were madc as well as with conventional technologies as Heating and Dilution. The basis for the ecowmic evaluations wae as follows:
100.ooO bamls pa day plant located at the orinof0 Oil Belt equipped with a 300 Km oil pipe line from the Orinoco reservoir to the Caribbean Sea
me opaation costs (for the k t uimester 1993 Veneplelan based) included: labor, main- in¶uana and utilities An evdpation puiod of 17 years and an intara rate of 10% wae considacd
In-ls and Opaating cost were estimated on 1993 tmsii A crrdit was added U) the technologies with crude oil upgrading (Viibreaking,
Methancaeatmnt and Hydrovisbreaking). Cash tlows for the evaluation period wcrc obtained considaing the invcsnncnts and
annual balanc*l bawcen operating costs and credits for crude oil upgrading when applicable. Net present value analysis was performed m arder to compare the diffnent altcnlatives.
The mults of the study arc shown in Table 3. It can be seen that the conventional aspon ethnologies (Heating and Dilution) present the lowest invcsmmts (145 and 143 MMUSS. Itspcctively) and opetation costs (1 1 and 10 MMUSf) that those dcdatcd for Visbrrakin& Methanemat and Hydmvisbmbg upgrading praxssrr lhereforr thc pnsmt net cost for the first two technologies (216 and 212 MMUSS) are Iowa than those f o u d for the lam three ( 2 4 25s and 330 MMUSS).
Oa the otha hand the VisbrraLing tcchnoiogy offcn the lowest hvcs?mcnI, opaation cost and p n m t net cost among the crude oil up@g processg However. the present net cost for the Methane-nt is relatively close (255 MMUSS) to that calculapd for the ViSbreaLing (246 MMUSO). due to the higher credits (hi- amvasias and lower viscositia of the products) of the forma in cornpariwn with the Later.
In conclusion, conventional wnsport technologies of Heating and Dilution have economical advantages over Visbrcalring, Methanemmmt and HydmisbrraLing upgrading processes used for wnsponation pupoxs. &twcen the l a m thne technologis visbtmking is d y slightly Wac economically amactive than the m*mproc*u
975

REFERENCES
1) Pitchai. R and mer. K. C a d Rev.-Sci. Eng., 2& 13 (1986) and refmnces thmh 2) Lee, J. S. and Oyama S. T. Catal. Rev.-Sci. Eng., 3Q., 249 (1988) and references thcrein.
Eng., 2 163 (1990) and references therein. 4) Preprints of the Symposium on M e w e and Alkane convasion Chemis@y, Division of Petroleum chemistry, 207th National Meeting. Amrican QKmical Sociery. San Diego. CA, March 13-18.1994. 5) a) Sundaram, M. U.S. Patent 4.687.570. (1987). b) Sundaram. M and Stcinberg, M ACS Fuel Chem Reprints, ZS. 77 (1986). 6) Egiebor, N. 0. a nd Gray, M. R Fuel, 6% 1276 (1990). 7) Ovalles C. Hamana. A.. Roja I. Bolivar, R. Proaxdm . gs of 1993 Eastern Oil Shale Symposium and submited to Fuel (1994). 8) Ovalles. C., Hamana, A.. Rajas, I, Bolivar. R., US F’atent 5269,909. (1993) 9) Ceballo, C D.. BeIler, A.. Arangunn. S. and Herrera. M. Rev. Tec. JNTEVEP, 2, 81 (1987). 1O)Del Biaaco, A, Panariti. Prandini. B., Beltramh P. L. Ciuniti. P.. Fuel, 22 81 (1993).
on Heavy Oil and Residue Upgrading and Utilization. Fushum. Lieanin& China, May 5-8. 1992. 12) Me, M G.. Ferguson. D. F. Oil Gas J., 1954. March 22nd. 166.
3) AmenOmi~a, Y.. Bins V., GolCdAIl~~ski M, Gal~szka. J. and Sang-, A. &tal. Rev.-Sci
11) Paies. J. P.. des Courieres. TIL. Espei i , M.. Roccdm . gs of Intanational symposium
976

Table 1. Analysis of theHamacaaude Oil andComposicm of the NanwlGas used for the upgrading Reactions
Asphaltenes (% wlw) 12.5
sulfur (%w/w) 3.71 Nitrogen (ppm) 7500
Nickel (ppm) 102 vanadium (ppm) 450 % of residue S O O W 57% Viscosity at u)pc (cP) 500,OOO
carboadioxide 11.2 Ethane 8.8 Ropane 3.65 Butanes 0.77 &ntancs+ 0.12 Nitrogen 0.02 Hydrogen 0.04
Table 2. Effects of the Residence Tune and the Percentage of Warn on the pr0pCnic.s of the Upgraded Reconstituted crude Oilsa
~ ~ ~~~
Enp. Residence %H20 O A P I ViscogitY %Conv. Comatison tim(min)b (w/w)c at3OT(cPP Rcsiduec carbon
(* 1%) (% WIW)
oude 8.6 m.Oo0 13.4 1 30 10 12.0 1700 35 16.5 2 45 10 12.0 1100 49 18.0 3 30 20 11.8 1590 36 16.2
m e reactions w m canid out in 0.1 1 bamVday conMwus flow plant at 41oOC. 1600 psi of aatural gas of final prrssrm. ll~e rcsultsan the average of 12 h mass balaoces for up to 36 h. b Residence time in minutes for the coil and soaker mctors. c Pacent of warn by weight in the
Pacentage of volatile mataid in the m d e oil 54% whv. feedstock. dvalues f 100 CP. ~Paceotage of aMvQsion m is defimd in the experimental Suxlon.
Table 3. Invesrmcnts and Net &sent Value (in million of US$) for the Technologies Used in the Transportatton of Extraheavy crude 0i.P
cam Visbreakingb Mcthanetreaunentb Hyd~~isbrraLin~ Healing Diluent Total ~n-sites 180 244 348 Total &-si- 127 172 247 oilpipcline 88 86 87 145 143 sy- Total Investment (In 3 YCaTs) 395 502 582 14F 143C Annualopaadon costs (21) (23) (40) (11) (10) -uP*g M O 46 64 97 NetRescntValue (246) (255) (330) (216) (212)
the bgsi of the study see text Calculus bascd on 1993 USS over a 17 yean life of ttw plant. bA topping step was added p i o u s to the upgrading KCXUX. 'Total Investment in a two yean paioa
977
R'

v i i i b
25 30 35 40 45 50 55 60 65
Temp. Crude Oil (‘c)
Ag. 1. Eff- of the Ressure of Natural Gas on the V i t y of the Upgraded Reconstituted Cmde Oils
978

t
I .
LIGHT OLEFlN PRODUCTION, SKELETAL OLEFlN lSOMERlZATlON AND ETHERlFlCATlON FOR OXYGENATED FUEL PRODUCTlON
Anne M. Gaffney ARCO Chemical Company 3801 West Chester Pike
Newtown Square, PA 19073 (215) 359-2271
Keywords: olefin production; olefin isomerization; SUPERFLEXsM; P, H-ZSM-5; catalytic cracking; MTBE
ARCOs newly developed SUP€RFLE#M process offers opportunities to product high yields of light olefins from a variety of readily available refinery and petrochemical feedstocks. The process is unique in that it employs a catalytic reactor system which is lower in capital and operating costs than conventional steam cracking reactors. The SUPERFLEX process is also more selective for production of propylene and butylenes (including isobutylene) than conventional steam cracking operations. The C4 product stream from the SUPERFLEXprocess contains about 20 to 30 percent isobutylene. The SUPERFLEX C4 product is, therefore, an excellent feedstock for producing MTBE via reaction of the contained isobutylene with methanol. After MTBE production, the isobutylene depleted C4 stream may be recycled to the SUPERFLEX process to produce additional isobutylene and propylene. This paper will focus on the chemistry and mechanism of catalytic cracking and skeletal olefin isomerization. In addition, there will be some discussion on catalyst activation, life and characterization.
Ught Oleffn Soumes There are several commercial routes to light olefins. Traditional routes are steam cracking( I), fluid catalytic cracking(Z), dehydrogenation(3) and metathesis(4). Recen I ARCO Chemical company has developed a new technology known as SUPERFLEAh which catalytically cracks higher paraffins and olefins in high selectivity to propylene and isobutylene(5). Unlike steam cracking, the propylene to ethylene ratio is high. In addition the butylenes and pentenes are isomerized to their thermodynamic distribution. This technology offers an alfernafe, low capital route to light olefins. It may be readily integrated into an olefins plant or refinery. Its scale-up is simplified by its analogy to the FCC process. Analogies in operating conditions are given in Table 1.
Super lkdM Tech o The SUPERFLE$ehnology has been demonstrated with olefin plant and refinery streams and with pure components such as isobutylene, butene-1, isopentane, n- pentane, cyclopentane and octane. An integrated pilot unit designed to simulate commercial operation has operated for two years. During this operation catalyst life was confirmed under simulated commercial operation, including recycle. In addition the catalyst was produced on commercial scale. Catalytic activity is sufficient to approach olefin equilibrium in 5 to 15 seconds. Selectivity to aromatics and paraffins is minimal. Catalyst attrition is low with less than 15 wt % loss on the 5 to 15 hour portion of the ASTM 0-32.02 TG 06 Jet Attrition Test. Catalyst hydrothermal stability is good with less than 7 % activity loss per day. The active catalyst component is a modified ZSM-A It is formulated into a fluidizable catalyst by combining it with a matrix of silica and kaolin and spray drying. The catalyst working environment is given in figure 1.
Catalyst Evaluation Numerous zeolites were synthesized, characterized and evaluated in catalytic cracking reactions to light olefins. H-ZSM-5 was found to be most active and selective. Others of noteworthy.activity are listed in Table I/. The WAl ratio of H-ZSM-5 was varied from 20 to 100. A ratio of approximately 40 was found to be optimal. An inexpensive, non- template H-ZSM-5 performed similar to that of a template one.
Catalyst evaluations were run with 60 to 100 mesh fixed beds consisting of active catalyst diluted in alpha alumina to adjust conversion to reasonable levels. The beds were held in quartz reactors of 6.5 mm bd. containing a 2 mm 0.d. thermowell. Bed lengths were typically 4 cm and bed volumes 1.4 ml. Results were obtained at 550 to 600 OC and 1 atm total pressure. The WHSVs are with respect to the active Component of the bed (not including diluent alumina).
979

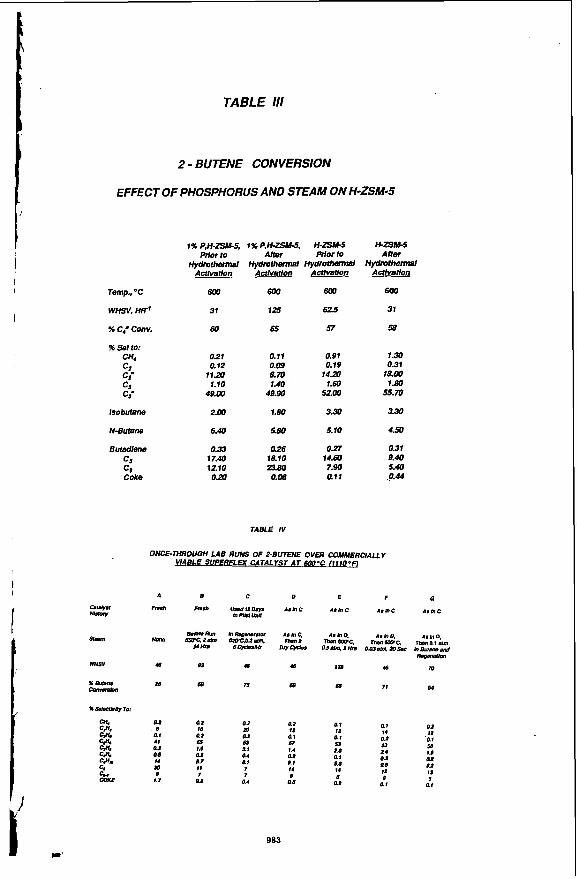
Hydmthennal. Stability Resistance to steam deactivation is important for catalyst performance and life since commercial catalyiic cracking units operate in the presence of steam and steam is generated in-situ during coke bum-off. Hydrothermal treatment of a catalyst containing H-ZSM-5 with no modifiers caused a two-fold decrease in catalyst activity. Numerous modifiers were evaluated of which phosphorous was most successfu!. Hydrothermal treatment of a catalyst containing P, H-ZSM-5 increased ,?-butene cracking activity fourfold. Deactivation was not evident with subsequent hydrothermal treatments and time on stream. In fact, to maintain high activity continuous or intermittent exposure to steam was necessary. Initial activation of fresh catalyst required more severe steaming at 1100 O F and 1 to 2 atm for 1 to 2 days. Steam pressures of 0.02 to 1 atm were adequate for activity maintenance. A weight loading study indicated the optimal phosphorous loading was close to 1 wt %. Phosphorous was most readi/y added to the H-ZSM-5 or matrix containing H-ZSM-5 by incipient wetness impregnation with phosphoric acid followed by drying at 120 @C and calcining at 600 OC for 2 hrs. The hydrothermal activation studies are given in Table 111 and the effect of steam in the feed is given in Table lV.
"A/ and"& MAS NMR of H-ZSM-5 indicated lhat silicon was in a highly silicious environment typical of H-ZSM-5 for both the fresh and steamed samples. Steaming resulted in fine structure fypical of dealumination(6). Aluminum was tetrahedrally coordinated within the zeolitic framework. With steaming, dealumination was evident. There was a decrease in signal intensity for zeolitic aluminum. Non-framework octahedral aluminum became evident(7).
"AI, 31P and "Si MAS NMR of P,H-ZSM-5 indicated phosphorous was bound to the framework and dealumination had occurred with phosphorous incorporation. With severe steaming phosphorous remained bound to the framework and further
am& tion of H-ZSM-5 and P,H-ZSM-5
dealurnination was evident. Silicon remained in a highly silicious environment typical of H-ZSM-5 with phosphorous addition and steaming. Once steamed and equilibrated no further dealumination was evident.
A mechanism for phosphorous bonding to the zeolite framework is given in Figure 2. Phosphorous converts strong Wronsted acid sites into weak ones. On doing so. the pore radius decreases and the geometry at the acid site is altered. Further reaction results in dealumination with AlP04 formation.
A constraint index experiment on P, H-ZSM-5 suggested phosphorous was blocking the channels and that catalysis was occurring at the pore mouth and external surface. Using literature procedures (8) the P,H-ZSM-5 gave a constraint index of c 1 whereas, the unmodified H-ZSM-5 gave a constraint index of 10.8. The low constraint index for the phosphorous modified H-ZSM-5 indicated the zeolite no longer discriminated between linear and branched hydrocarbon feed. This was largely attributed to the fact that nearly all reactivity occurred external to the channels. In a separate study a phosphorous modified H-ZSM-5 was analyzed by high resolution electron microscopy (9). In this study it was likewise concluded that phosphorous was blocking the zeolite channels.
Mechanistic Studies Compared to steam cracking and FCC technology, the SUPERFLE#M process is best conducted at higher space velocities and temperatures ranging from 550 to 625 8 C . West results are obtained under diffusional limiting conditions under which the majority of the chemistry occurs at the pore mouth where super acid sites are available. For butene conversion the reaction is bimolecular. Two molecules of butene react to give octene which subsequently disproportionates to efin alkanes and aromatics. See Figure 3. A second order rate constant of 1.1 X 10 cm /mole sec has been experimentally determined. Liftle or no diffusion into the ore occurs since the rate of diffusion is much slower, less than or equal-to 1 X
+Butene Skeletal Isomeri;rat&n A major objective was to 'integrate skeletal isomerization with SUPERFL€flM to make more isobutylene and isoamylene for MTWE and TAME production. By adjusting reaction condi I SUPERFLE isomerization over cracking. This is largely due to the fact that cracking is a bimolecular process requiring longer surface residence time. Whereas the skeletal isomerization is a
% ' 3 cg/sec. (10).
s skeletal isomerization could be conducted successfully over the catalyst. Higher temperatures, 625-650 8 C vs. 550-625 8 C, favored $7
980

I
uni-molecular process. By a similar argument, increased pressure favored cracking. Due to the fact that steam generates more Bronsted acid sites, under these conditions cracking was favored. Whereas, with no steam, Lewls acid sites predominated and skeletal isomerization was favored. /so-olefin selectivities increased with gas velocity due to increased mass transfer rates.
The SUPERFL€#M catalyst ran in a pilot fluid bed unit and gave 15% isobutylene yield under optimal isomerization conditions while meeting productivity, life, attrition and cost targets. Results from the lab and pilot unit are given in Table V. In addition, a catalyst Consisting of Mg-APSO-31 was found to b effective for skeletal isomerization (1 1). lt was more selective than the S U P € R F L d M catalyst due to lower acidity yet was lower in activity and more expensive. See Table V for results.
Etlmtitbbion A process scheme for converting the iso-olefins produced from an isomerization unit to ethers was proposed and patented (12). The process scheme could potentially utilize the approximately 350,000 BBUday of C5= olefins produced at U.S. refineries. The combined mole fraction of 2-methyl-2-butene and 2-methyl-1 -butene at equilibrium exceeds 0.80 at 300 OF. These olefins may be converted to TAA and/or TAME.
Conclusions A new technology for producing light olefins in high yields has been developed which uses a phosphorous modified H-ZSM-5. The catalyst has been extensively evaluated in a pilot unit and found to withstand hydrothermal and attrition testing. By modifying the reaction conditions skeletal olefin isomerization may be conducted with the same catalyst. Finally, an iso-olefin etherification step may be carried out for oxygenated fuel production.
Literatun, Cited (1)Hydrocarbon Processing, Special Report: 1987 Petrochemical Handbook, November
(2)Occelli. M.L., "Fluid Catalytic Cracking, " ACS Symposium Series 375, Division of
(3)De Witt 1990 Petrochem. Rev., "Catalytic Dehydrogenation Performance of the Catofin
(4)Bailey. G.C., Catalysis Reviews 9 (1). 37-60 (1969). (5)Leyshon, D. W., and Cozzone, G. E., U.S. Patent 5,043,522. (6)Fyfe, C.A., "Solid State NMR for Chemists,' pp. 337-361, C.EC. Press, P.O. Box 1720.
(7)Samoson, A. Lippmaa, E., Engelhardt, G., Lohse. U. Jerschkewitz. H.G., Chem. Phys.
(8)Frillette. V.J., Haag, W.O., and Lago, R.M., J. Catal. E 218 (1981). (9)Alfredsson, V., Terasaki, O., and Bovin, J.O.. "Zeolites for the Nineties,' Eth
(lO)Voogd, P.. and Van Bekkum, H., "Zeolites as Catalysts, Sorbents and Detergent
( 1 1)Gaffney. A.M.. and Jones, C.A.. U.S. Patent 5,107,050. (12)Gaffney. A.M., and Piel, W.J., U.S. Patent 5,136,108.
1987.
Petroleum Chemistry, New Orleans, LA., 1987.
Process,' Houston, TX, 1990.
Guelph, Ontario, Canada, N1H 629, 1983.
Lett. m, 589 (1987). .
lnternational Zeolite Conference, Amsterdam, p. 227, July 10-14, 1989.
Builders, " pp. 519-531, Elsevier Science Publishers 8. V., Amsterdam, The Netherlands, 1989.
981
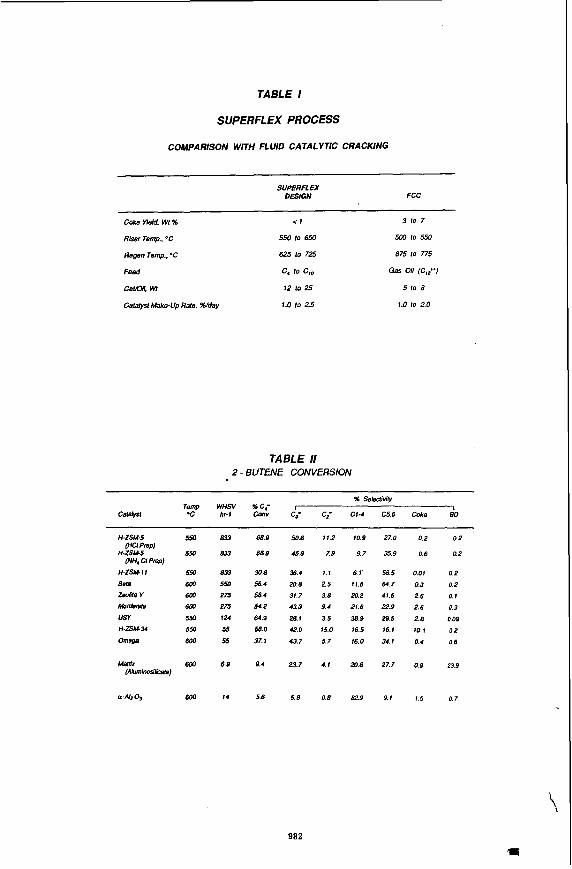
TABLE I
SUPERFLEX PROCESS
COMPARISON WITH FLUID CATALYTIC CRACKING
SUFERU EX DESIGN FCC
Coke yield. Wt % < 1
R h Temp., OC
Regen Temp., "C
550 IO 653
625 10 725
Feed c< to c14
CabtN, W 12 lo 25
Calalysl Make-up Rale. %/day 1.0 to 2.5
3 10 7
Mo to 550
675 lo 775
Gas Oil &++)
5 to 8
1.0 IO 2.0
TABLE II 2 - BUT€N€ CONV€RS/ON
% SeMinly Temp WHSV %C; I 1
Cararyrf 'C hr-1 CMV C; C; C I J C5.6 Coke 80
5 5 0 8 3 3
5 5 0 8 1 3
5 5 0 8 3 3 6 L m m 6Lm 275
bn, 275
55Ll 124
550 55
m a 5 5
6Lm 6.9
Mu) 14
68.9
bs. 9
308 56.4
58.4
542 643 58. 0
37.1
9.4
5.6
50.6
15.9
3s. 4
20.8
31.7
433 28.1
42 0
43 7
23.7
5. B
11.2
7.9
1.1
2.5
3.8
9.4
3.5
15.0
5.7
4.1
0.8
10.9
9.7
6. I'
11.8
20.2
21.6
38.9
16.5
16.0
20.6
82 9
27.0 0.2 0 2
359 0.6 0.2
56.5 0.01 02
64.7 0.3 0.2
41.6 2.6 0.1
229 2.6 0.3 295 2.8 0.09
16.1 10.1 0.2
34.1 0.4 0 6
27.7 0.9 23.9
9. I 1.5 0 7
982
I
f
TABLE Ill
2 - BUTENE CONVERSION
EFFECT OF PHOSPHORUS AND STEAM ON H-ZSM-5
Temp.. "C
WHSV, HR'
% C4- Conv.
% sei to: CH4 c2 c2- C¶ c¶=
lsobutane
N-Butane
Buradlena c5 c, Coke
0.21 0.11 0.91 1.30
11.20 8. m 14.Z 18.00 1.10 1.40 1.60 1.80
4800 49.90 5200 s . m 2.00 1.80 3.30 3.30
6.40 SBO 5.10 4.50
0.33 0.26 0.27 om 17.40 18.10 14.60 9.40 1210 ps(l 7.90 5.40 o a 0.06 air .O.M
0.12 0.09 0.19 0.31
TABLE IV
ONCE-THROUGH LAB RUNS OF 2-BUTENE OVER COMMERCLALLY
A
Fn.h
Nmr,
40
2a
01 d
Q1 41 OI QS I4 lo d
1.7
QI QI 0.2 18 m I t 12 I4 I t
Q1 02 'Ql 51 63 66 25 2 4 IS QI Qa QI 0.8 0.8 dP I4 I2 I t
0 5 QZ QI Q I
QI Q2 QZ
01 01 Q I m 01 57 1.0 ti 1.4 01 Q4 Q1
11 7 I 7 dl n. f
11 7
Q2 Ql QI 7 5 e
983

TABLE V
H YIELD % H SELECTlYrry% n-C,- CONVERSION %
TEMPERANRE, OC
WHSV, hr-'
LfFE
FLUIDITY
ATTRITION RESISTANCE
n-C,' SKELETAL ISOMERIZATION
SUPERFLEX Calafvsl Ma-APSO-31
LAB - LAB - PfLOT - 15 19 30 25 47 80 60 41 38
650 625 575
250 296 46
GOOD - TO BE DETERMINED
GOOD
57%
NGURE 1
CATALYST WORKING ENVIRONMENT
I: m r Reoenerator
Temp. 'C 550-650 550-650 550-650 Residenm Time 2 to 6 secs 4 m 5 min 4 to 6 min % steam Negl. 25 lo 50 5 to 20
ACTIVITY TOO LOW
PROBABLY GOOD
I
d l
984
.e

H I
FIGURE 2
Mechanism for Phosphorous Bonding to the Zeolite Framework
HO OH
/I\ /I\
I - 0 I
AI SI /I\ /I\
FIGURE 3
MECHANISM
3c4 + Q b I
AI, /I\
e,= '--c e,. a c,. + e,-
985
' SI /I\
SHAPE-SELECTIVE ISOPROPYLATION OF NAPHTHALENE OVER DEALUMINATED MORDENITES
M e w D. and Chunshan Song
Department of Materials Science and Engineering Fuel Science Program, 209 Academic Projects Building
Pennsylvania State University, University Park, PA 16802
Keywords: naphthalene, shape-selective alkylation, zeolite
INTRODUCTION In effort to enhance the economic feasibility of coal liquefaction we are continuing the
invdgation of non-fuel applications for coal-derived liquids (CDL). Conversion of a small fraction of the naphthalene can significantly increase value, while the majority of the CDL is used as transportation &el. This study is aimed at the regioselective alkylation of naphthalene. Of particular interest is 2,6-diisopropylnaphthalene (2,6-DIPN) that, when oxidized to the corresponding diacid, can be polymerized to produce high-value engineering plastics and liquid crystalline polymers. ' Mordenites having high selectiviy for 2,6-DIPN production have been reported in a patent by Fellmann et al. at Catalytica, Inc. However, iimdamentals of the alkylation process are poorly understood.
Our research is directed at optimizing .2,6-DIPN selectivity through control of reaction parameters. Eff's of temperature, identity of the alkylating agent, naphthalene to catalyst ratio, and addition of water are discussed. An understanding of catalyst physical and chemical properties is pertinent to the design of shape-selective catalysts. Beyond chemical analysis, X-ray powder diffraction has been used to measure crystallinity, cell constants, and crystallite size.
EXPERIMENTAL Materials. All chemicals were used as supplied. Naphthalene (99 %) and isopropyl alcohol
(99.5+ %) were obtained from Aldrich Chemical, Inc. 2.6-Diisopropylnaphthalene (GR) was obtained from TCI, Ltd. Propylene (99.5 % minimum,p.'pnerprify) was obtained from Matheson, Inc. and delivered to the reactor in vapor form.
Catalysts. Sodium and hydrogen mordenites were supplied as 9-10 pm average particle size powders (The PQ Corporation, Inc.). Properties of these materials are listed in Table 1. The H-form of NaM14 was obtained by sodium-exchange with 1 M NH,CI, followed by wash, dry and calcine procedures. Dealumination ofHM14 was accomplished by stirring in aqueous hydrochloric or nitric acid at reflux temperature. Time and acid concentration were varied to control the extent of aluminum removal as summarized in Table 2. Following the acid treatment, the catalysts were washed extensively with hot deionized water, dried, and calcined (5 .5 h at 465 "C unless otherwise specified). Samples were dissolved using lithium metaborate fkion and analyzed for silicon, aluminum and sodium by ICP-AES.
Catalyst Evaluation. A 30 cm3, stainless-steel tubing bomb, batch reactor was used for all experiments. The standard reactor charge was 0.10 g catalyst, 1.0 g (7.8 mmol) naphthalene, and 0.66 g (15.6 mmol) propylene. For runs with added deionized water, the catalyst amount was increased to 0.15 g. The reactor was mounted on a holder and immersed in a fluidized sand-bath heater. During the run, the reactor was agitated at 3.3 cps. Test conditions were typically a 2 h run at 200 "C. At the end ofthe test, the reaction was quenched in cold water. The reaction products were collected in acetone solution and analyzed by GC-MS and GC-FID for qualitative and quantitative analyses, respectively. The GC column was 30 m x 0.25 mm DB-17 (J&W Scientific).
RESULTS AND DISCUSSION Catalysis Test Results. Activity, selectivity and regioselectivity are compared in Table 3 for
all ofthe catalysts in 2 h mns at 200 "C. Hh41 IO and HM230 were tun both 2 and 4 h, at 200, 250 and 275 " C . The first five lines of Table 3 detail the results for dealumination of m 1 4 , while the other tests refer t o HM38, and HM54 and its dealumination. Isopropyl-substituted naphthalenes (IPN's) constituted 95-99+ % of the products. The major side products were alkyl-substituted naphthalenes @NAP'S) other than solely isopropyl-substituted naphthalenes. Disproportionation of IPN's and reaction between naphthalene and propylene dimer (or oligomer) are likely the main sources for RNAP's. Mass balances of less 100 % were primarily due to material loss as carbonaceous deposits on the catalysts, and to a lesser extent, uncharacterized minor products.
Comparing the 2 W200 "C data, naphthalene conversion increases slightly or remains unchanged with mild dealumination, but decreases markedly at higher levels of dealumination. HM230 shows higher activity than what is predicted by the trend observed for HM'IO-HMl IO, but this may be due to structural changes as discussed below. Similar volcano lots of activity vs. Si04AI,03 ratio have been reported for reactions of aromatics over mordenites.f4 One explanation for this behavior involves the number and nature of acid sites. Acid site density decreases, and acid
986
,1
strength increases, with aluminum removal leading to an increase in activity. Ultimately, activity is SUPPrWed by gross depletion ofacid sites at high levels of dealumination. Other justifications focus on factors that effect diffusion: changes in mesopore volume, changes in channel structure and dimensions (or channel collapse at high levels of dealumination), and differing rates of fouling. Regardless, the height and position ofthe activity maximum is dependent upon the reactant, reaction conditions and catalyst prepa~ation.~
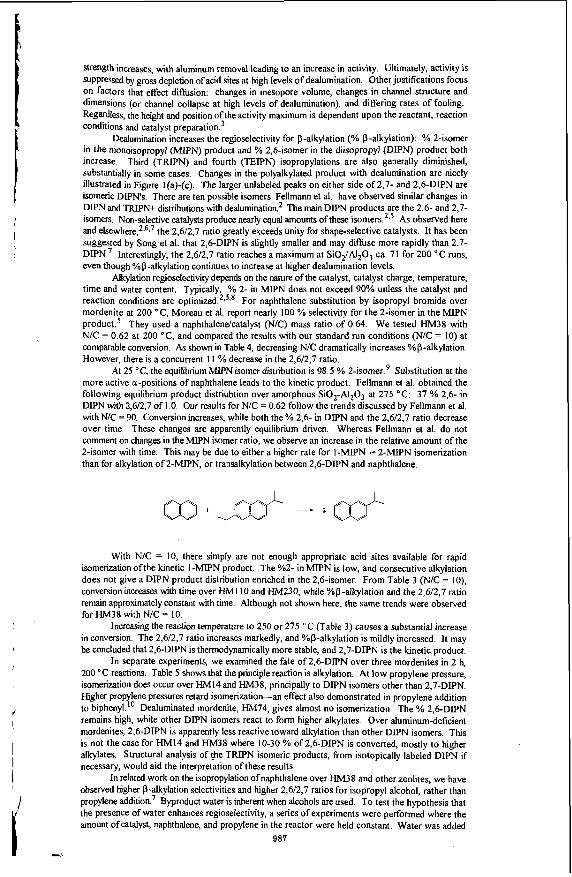
Dealumination increases the regioselectivity for P-alkylation (% P-alkylation): % 2-isomer in the monoisopropyl (MIPN) product and % 2,6-isomer in the diisopropyl @IPN) product both increase. Third (TRIPN) and fourth (TEIPN) isopropylations are also generally diminished, substantially in some cases. Changes in the polyalkylated product with dealumination are nicely illustrated in Figure ](a)-(c). The larger unlabeled peaks on either side of 2.7- and 2.6-DIPN are isomeric DIPN's. There are ten possible isomers. Fellmann et al. have observed similar changes in DIPN and TRIPN+ distributions with dealumination.2 The main DIPN products are the 2,6- and 2,7- isomers. Non-selective catalysts produce nearly equal amounts of these isomers.2v5 As observed here and el~ewhere,~.~,' the 2,6/2,7 ratio greatly exceeds unity for shape-selective catalysts. It has been suggested by Song et al. that 2,6-DIPN is slightly smaller and may diffuse more rapidly than 2,7- DIPN.' Interestingly, the 2,6/2,7 ratio reaches a maximum at SiO,/Al,O, ca. 71 for 200 " C runs, even though %P-alkylation continues to increase at higher dealumination levels.
Alkylation regioselectivity depends on the nature of the catalyst, catalyst charge, temperature, time and water content. Typically, % 2- in MIF'N does not exceed 90% unless the catalyst and reaction conditions are optimized.*"'* For naphthalene substitution by isopropyl bromide over mordenite at 200 "C, Moreau et al. report nearly 100 % selectivity for the 2-isomer in the MIF'N product.' They used a naphthalendcatalyst (N/C) mass ratio of 0.64. We tested HM38 with N/C = 0.62 at 200 "C, and compared the results with our standard run conditions (N/C = 10) at comparable conversion. As shown in Table 4, decreasing N/C dramatically increases %P-alkylation. However, there is a concurrent 11 % decrease in the 2,6/2,7 ratio.
At 25 "C, the equilibrium M P N isomer distribution is 98.5 % 2-isomer.' Substitution at the more active a-positions of naphthalene leads to the kinetic product. Fellmann et al. obtained the following equilibrium product distriubtion over amorphous SiO,-AI,O, at 275 "C: 37 % 2,6- in DIPN with 2,6/2,7 of 1 .O. Our results for N/C = 0.62 follow the trends discussed by Fellmann et al. with N/C = 90. Conversion increases, while both the % 2,6- in DIPN and the 2,6/2,7 ratio decrease over time. These changes are apparently equilibrium driven. Whereas Fellmann et al. do not comment on changes in the MIPN isomer ratio, we observe an increase in the relative amount of the 2-isomer with time. This may be due to either a higher rate for 1-MIPN - 2-MPN isomerization than for alkylation of 2-MIPN, or transalkylation between 2,6-DIPN and naphthalene.
With N/C = IO, there simply are not enough appropriate acid sites available for rapid isomerization ofthe kinetic 1-MIF'N product. The %2- in MIPN is low, and consecutive alkylation does not give a DIPN product distribution enriched in the 2,6-isomer. From Table 3 (N/C = IO), conversion increases with time over HMI 10 and HM230, while %P-alkylation and the 2,6/2,7 ratio remain approximately constant with time. Although not shown here, the same trends were observed for HM38 with N/C = 10.
Increasing the reaction temperature to 250 or 275 ' C (Table 3) causes a substantial increase in conversion. The 2,6/2,7 ratio increases markedly, and %P-alkylation is mildly increased. It may be concluded that 2,6-DIPN is thermodynamically more stable, and 2,7-DIPN is the kinetic product.
In separate experiments, we examined the fate of 2,6-DIPN over three mordenites in 2 h, 200 " C reactions. Table 5 shows that the principle reaction is alkylation. At low propylene pressure, isomerization does occur overHM14 and HM38, principally to DIPN isomers other than 2,7-DIPN. Higher propylene pressures retard isomerization-an effect also demonstrated in propylene addition
remains high, while other DIPN isomers react to form higher alkylates. Over aluminum-deficient mordenites, 2,6-DIPN is apparently less reactive toward alkylation than other DIPN isomers. This is not the case for HM14 and HM38 where 10-30 % of 2,6-DIPN is converted, mostly to higher alkylates. Structural analysis of $e TRIF'N isomeric products, from isotopically labeled DIPN if necessary, would aid the interpretation of these results.
In related work on the isopropylation of naphthalene over HM38 and other zeolites, we have obsewed higher 0-alkylation selectivities and higher 2,6/2,7 ratios for isopropyl alcohol, rather than propylene addition7 Byproduct water is inherent when alcohols are used. To test the hypothesis that the presence of water enhances regioselectivity, a series of experiments were performed where the amount ofcatalyst, naphthalene, and propylene in the reactor were held constant. Water was added
I
I
1,
f
I
to biphenyl." Dealuminated mordenite, HM74, gives almost no isomerization. The % 2.6-DIPN
I I 1
987 i c\

in various amounts. Catalyst mass in the reactor was increased to 0.15 g for these experiments to amplify the changes brought about by water addition. Changes in the polyalkylated product distribution with added water are illustrated in Figure I(d)-(9 and Table 6. A small amount of water poisons the catalyst, but larger amounts bolster activity up to an apparent saturation limit. The maximum in activity is approximately at 160 mg added water-very close to the mass of catalyst in the reactor. A possible explanation is that at low partial pressures, water adsorbs on catalytic acid- sites and impairs adsorption of reactants. Higher partial pressures of water lead to the genesis of new Bransted acid catalytic sites, leading to higher conversion. Ultimately, high moisture levels reduce conversion due to impeded reactant diffusion. This proposition may also explain the increase in p- alkylation selectivity and 2,6/2,7 ratio with added water. Adsorption of water impedes reaction on the non-selective external surface of the catalyst. A higher percentage of the naphthalene molecules react within the shape-selective confines of the mordenite channels. Adsorption of water within the mordenite channels impedes diffusion. More so in the case of the larger a-, u,P-, and a,a- substituted products. The result again is higher % p-alkylation. It is unclear why the 2,6/2,7 ratio drops sharply above 160 mg added water, even though % 0-alkylation does not. However, throughout this work there is a positive correlation between the 2,6/2,7 ratio and conversion. Our preliminary data show that the regioselectivity enhancement resulting from added water is even more pronounced for less shape-selective mordenites.
Catalyst Characterization by XRD. Four of the catalysts have been examined by XRD (Cu K, radiation): HM14, HM74, H M I IO and HM230. Overall, XRD shows that dealumination following calcination at 700 "C causes a patial structure collapse that is not observed for samples calcined at 465 "C. Estimates of mean crystallite dimension were made using the Scherrer equation, assuming Cauchy .profiles. Average results for measurements on the six strongest, well-resolved reflections are reported here. Natural sodalite was used as a standard for instrumental line broadening. Within error of measurement, HM14, HM74 and HMI 10 are of the same crystallite size, 230 f- 20 nm. However, HM230 crystallites are smaller, 140 f I O nm.
Comparison of the area sum for the six peaks allows an estimate of relative crystallinity. HM230 is approximately only two-thirds crystalline material; whereas, the other three samples are of the same relative crystallinity (assumed 100%).
Least-squares regression analyses were used to obtain precision measurements of the cell constants from the diffraction data. It is only possible to compare relative differences between the samples at this time (see Figure 2), since the data have not been zero- nor background-corrected. As summarized by Mishin et al., dealumination of mordenites results in a lattice contraction that is generally anisotropic.' Our data show that changes in the a-dimension are the largest. Decreases in band c are similar, but smaller than for a. HM230 showed the largest magnitude lattice contraction. HM74 and HMI I O show the same overall cell volume decrease. The contraction is isotropic for HM74; whereas, for HMI 10 and HM230, it is not.
CONCLUSIONS We have succeeded in identifying several important parameters that govern selectivity in the
addition of propylene to naphthalene. The naphthalendcatalyst ratio (N/C) has significant impact on the resulting p-alkylation selectivity. For a given N/C, the 2,6/2,7 ratio closely parallels naphthalene conversion. field of 2,6-DIPN was inherently higher for N/C = 0.62, but both % 2,6- in DIPN, and the 2,6/2,7 DIPN isomer ratio decrease over time. Increasing N/C to IO requires shape-selective dealuminated mordenites and reaction temperatures in excess of 200 " C to obtain good 2,6-DIPN yields. Longer reaction times increase conversion and DIPN yield, wihile MIPN and DIPN isomer distributions do not change. The 2,6/2,7 ratio increases with temperature, indicating that 2,6-DIPN is thermodynamically more stable. With N/C = IO, 2,6-DIPN is neither isomerized nor alkylated to any appreciable extent over high-silica mordenites. We have also found that addition of water to the reactor, in amounts up to approximately the mass of catalyst, results in substantial gains in regioselectivity.
ACKNOWLEDGEMENTS: We would like to thank Professor Harold Schobert at the Pennsylvania State University for
his encouragement and support. We would also like to thank the PQ Corporation, Inc. and Vicki Schillinger at PQ for providing the mordenite samples (NaM14 and HM38), and Lany Royer, also of PQ, for providing detailed analytical data for the samples we received.
REFERENCES 1. 2.
3 .
4. 5 .
Song, C.; Schobert, H.H. FuelProc. Tech. 1993, 34, 157. Fellmann, J.D.; Saxton, R.J.; Weatrock, P.R.; Derouane, E.G.; Massioni, P. U.S. Patent No. 5,026,942, June 25, 1991. Mishin, I. V.; Bremer, H.; Wendlandt, K.-P. in "Catalysis On Zeolites," (Kallo, D.; Minachev, Kh. M., Eds.); H. Stillman Publishers, Inc.: Boca Raton, FL, 1988, p 23 1. Seddon, Duncan Appl. Cafal. 1983, 7,327. Moreau, P.; Finiels, A,; Geneste, P. Solofo, J. J. Catal. 1992, 136, 487.
988

6.
7. 8. 9. 10.
Katayama, A,; Toba, M.; Takeuchi, G.; Mizukami, F.; Niwa, S.-i.; Mitamura, S. J. Chem. sot., Chem. Commun. 1991,39. Song, C.; Kirby, S. MicroporousMaterials, Elsevier, 1994, in press. Handrick, K.; Kolling, G.; Kiedel, P. U.S. Patent No. 4,440,957, April 3, 1984. Olah, G. A.; Olah, J . A. J. Am. Chem. Soc. 1976, 98, 1839, Tu, X.; Matsumoto, M.; Matsuzaki, T.; Hanaoka, T.; Kubota, Y.; Kim, J.-H.; Sugi, Y. Catd. Lett. 1993, 21, 71.
,
Table 1. Properties of the Mordenite Starting Materials'
catalyst molar wt % m2/g meso' micro3 NaM14 14.3 6.24 466 0.14 0.17 HM38 37.5 0.07 512 0.13 0.17
'Data as reported by the supplier. 'Meso refers to 20-600 A pores. 'Micro refers to < 20 A pores.
Si02/A120,, Na20, surface area, porosity, cm3/g
Table 2. Preparation and Composition ofMordenite Catalysts Used in This Work
catalyst treatment' Si0,/AIZ03, Na,O, molar wt %
HM14 exchange NaM14 with 1 M NH&I 13 0 19
HM54 stir NaM14 in 1 M HCI for 24 hat reflux 54 0 15
HM70 stir HM14 in 1 M HCI for 5 h at reflux 70 < 0 0 1
HM71 stir HM14 in 1 M HCI for I O h at reflux 71 < O O l
HM74 stir HM14 in 1 M HCI for 24 h at reflux 74 < O O l
HM90 stir HM14 in 3 M HCI for 24 h at reflux 90 <0.01
110 <0.01 HMI calcine HM54 at 465 "C, then stir product in 6 M HNO, for 24 hat reflux. Final calcination at 465 "C.
HM230 calcine HM54 at 700 "C, then stir product in 6 M HNO, for 24 hat reflux. Final calcination at 700 "C. 230 CO.01
'AI1 catalysts calcined 5.5 h at 465 C unless otherwise specified
Table 3. Results for Propylene Addition to Naphthalene' product distribution, molar basis
T, time,%NAP %yield % % % % 2- % 2,6- 2,6/2,7 catalyst "C h conv IPN's RNAP's MIF'N DIPN T m N + in MIPN in DIPN ratio HM14 200 2 76 67 0.9 64 33 3.6 60 33 1.76 HM70 200 2 83 69 1.4 53 41 5.7 59 44 2.17 HM71 200 2 74 65 1.2 61 37 2.3 64 51 2.29 HM74 200 2 47 41 0.5 76 23 0.6 71 55 2.24 HM90 200 2 36 32 0.3 80 19 0.9 70 53 2.21
HM38 200 2 73 61 1.0 61 34 4.5 58 39 1.99
HM54 200 2 43 41 0.6 76 23 1.2 68 50 2.11
HMllO 200 2 15 16 0.2 85 15 0.4 83 61 2.05 H M l l O 250 2 28 28 0.6 79 21 0.6 86 65 2.48 HMlIO 275 2 46 42 1.5 71 28 1.0 87 66 2.67
HMllO 200 4 19 19 0.3 83 17 0.4 83 61 2.09 HMllO 250 4 39 36 1.1 75 25 0.7 86 65 2.48 HMllO 275 4 58 51 2.3 66 33 1.3 87 65 2.64
HM230 200 2 41 40 0.8 74 25 1 . 1 74 58 2.32 HM230 250 2 63 58 1.2 59 39 2.3 78 62 2.57 HM230 275 2 76 61 1.6 49 47 4.0 79 62 2.58 HM230 200 4 49 46 0.9 70 29 1.2 73 59 2.37 HM230 250 4 75 68 1.7 50 46 4.3 75 60 2.51 HM230 275 4 84 74 1.9 41 54 4.4 78 62 2.54 'Catalyst charge 0.10 g.
989

Table 4. Comparison ofHM38 Using Different Naphthalene to Catalyst Ratios at 200 "C product distribution, molar basis
%NAP %yield % % % % 2- % 2,6- 2,6/2,7 conv IpNs RNAp's MIPN DIPN TRIPN+ in MIF'N in D P N ratio reactor charge
1.00 g naphthalene m d 0 , 1 0 g H M 3 8 9 0 75 1.1 46 46 7.2 53 38 2.06
88 67 2.5 51 46 3.4 90 52 1.85 0.62 g naphthalene and l.OOgHM38
Table 5. Reaction of 2,6-Diisopropylnaphthalene Over Mordenites in 2 h, 200 "C Runs' product distribution, molar basis
% % % %other % % % propylenel
2'6-DpN' MlPN 2,6-DPN 2,7-DIPN DIPN TRIPN TEJPN RNAP molar catalyst
- none start. mat'l. 3.48 95.46 0.39 0.31 0.17 0.00 0.19
HM14 4.0 0.00 69.58 0.09 0.26 26.06 3.67 0.33 HM14 1 .o 0.11 71.18 0.29 1.93 23.40 2.77 0.32 Hh414 0.5 0.43 72.61 1.06 4.57 19.09 1.93 0.31
HM3 8 4.0 0.19 71.59 0.11 0.29 24.92 2.73 0.17 HM3 8 1 .o 2.22 73.65 0.20 1.15 19.61 1.93 1.25 Hh438 0.5 0.12 83.54 0.21 1.25 13.44 1.18 0.25
HM74 4.0 0.00 94.72 0.07 0.09 4.42 0.46 0.24 HM74 1 .o 0.01 96.67 0.08 0.13 2.58 0.26 0.26 HM74 0.5 0.00 96.87 0.09 0.22 2.35 0.23 0.25
'Reactor charge: 1.00 g (4.71 mmol) 2,6-diisopropylnaphthalene, 0.10 g catalyst, and varied propylene pressure.
Table 6. Propylene Addition to Naphthalene Over HM74 in 2 h, 200 " C Runs with Various Amounts of Added Water'
product distribution (molar basis) added water, %NAP YO yield % % % % 2- % 2,6- 2,6/2,7
mg conv p~~ R N A ~ ' ~ MIPN DIPN TRIPN+ inMIF'N inDIPN ratio 0 56 51 1.2 69 29 1.7 67 53 2.24 10 40 38 0.7 77 23 0.7 75 59 2.22 40 33 32 0.6 79 21 0.6 80 64 2.37 50 29 28 0.6 77 23 0.8 80 63 2.38 100 45 42 0.9 75 25 0.5 84 68 2.61 1 20 54 52 1.2 73 27 0.5 84 69 2.62 120 55 51 1.2 72 28 0.5 84 69 2.65 160 59 54 1.4 72 28 0.4 84 68 2.56 300 22 22 0.3 88 12 0.1 86 66 2.15
'Catalyst charge 0.15 g.
990

Figure 1. Comparison of the polyalkylated naphthalene region of the gas chromatograms for 2 h catalytic runs at 200 "C, 1 g naphthalene, and propylendnaphthalene = 0.5. Parts (a) through (c) are neat runs with 0.10 g catalyst charge: (a) HM14, (b) HM71, and (c) HM230. Parts (d) through (0 compare 0.15 g HM74 charge with (d) no added water, (e) 40 mg added water, and (0 120 mg added water.
1.80
0.00
a
HM74 0 HMllO 0 HM230
0.75
0.42 05J
1.09 1.09 r l l ~ r 0 4 ' 036
1.81
b C cell volume
dimension
igure 2. Percentage decreases in cell constants and cell volumes as a result of dealumination. Calculations relative to the cell dimensions determined for HM74.
991

METHYL CHLORIDE VIA OXYHYDROCHLORINATION OF METHANE
B.M. N m z , J.S. Smith,A.I. Toupadakis, C.G. Knutson, R.F. Jarvis,and B.R.Crum Dow Corning Corporation U.S. Hwy 42 Carrollton, KY 41008
Keywords: oxyhydrochlorination, methyl chloride, selective chlorination
INTRODUCTION The historical aspects of oxyhydrochlorination of hydrocarbons began in the 1920's. Roka in 1923 first achieved the oxyhydrochlorination of methane with chlorine in the presence of oxygen. The bulk of the original work in oxyhydrochlorination was published in the 1940's and 1950's. A collection of papers and patents by Grin, Hirschkind, Randall, Fontana, Joseph, and F'ye are listed in references 1-9. An excellent review of oxyhydrochlorination catalysis through the end of the 1960's was written by Allen and Clark lo, An additional review by Kenney I' is helpful on the subject of catalytic melts.
There are several key technology challenges associated with the development of a CH, oxyhydrochlorination process. Among these are the chemistry problems associated with development of a selective CH,CI catalyst, and in addition, the chemical engineering challenges associated with the operation of a process containing HCI and CH,CI. This paper describes effort toward the goal of developing this technology by working on both the chemical and the engineering challenges in a parallel and linked effort.
RESULTS Figure 1 shows the process chemistry that is operative in the oxyhydrochlorination (OHC) of CH,. As is shown , this complex system is a mixture of chlorination and combustion reactions that are particularly challenging to control due to the consecutive nature of the reaction kinetics. The thermodynamics of these chemistries dictate the formation of the equilibrium favored CCI, as well as heavily oxidized byproducts. In addition, kinetic measurements, done both as part of our research and published previously,I2 show that the kinetics of chlorination also favor a fast succession of chlorination steps to the deeply chlorinated chloromethanes. Because of these facts, neither the kinetics or the thermodynamics of this chemical reaction system are driving this system to selective formation of CH,CI.
In addition to the kinetic and thermodynamic factors disfavoring monochlorination reactions, another thermodynamic problem exists. The measured apparent activation energies for combustion reactions of methane are significantly higher than those for the chlorination reactions. For reactant CH, the reaction to form CH,CI has an activation energy of 121 kJ/mol , this compares with 225 and 240 to form CO and CO, respectively. Clearly this dictates that the selectivity can be expected to be a function of temperature to a fairly significant extent, with higher temperatures favoring CO and CO, as a product. To compound this situation the heats of reaction for the combustion chemistries are significantly higher and as such any increase in temperature without an associated increase in heat transfer capability will likely add to the non-isothermal reactor profile that is common in laboratory experiments.
This rather straightforward analysis shows that the ideal condition for limiting the combustion side reaction will be one with adequate heat transfer capability to remove the heat of reaction. Thus, the ideal system will likely be an isothermal reactor. This key fact has been central in determining both our reactor design, and accordingly, our catalyst activity.
Figure 2 depicts the overall OHC process schematic for the oxyhydrochlorination of CH,. Without question the two most challenging unit operations are the reactor and the reactor effluent separation system. As such, it is these two unit operations that will be evaluated in the process development unit that is currently under construction.
Definition of the separation unit operation was a key technical challenge in this project effort. Many different methods of product scparation were evaluated. All indirect cooling methods looked both technically and economically non-feasible. The large amount of non- condensible gas simply made the separation impossible. Pressure Swing Adsorption was evaluated on paper as a possible alternative method for use in this application. While technically feasible, the economics of this method were unacceptable. It became clear that a
992

direct contact absorption followed by a steam stripping operation was the only acceptable route to recover the product CHJI. The potential of this approach was highly dependent on the identification of an appropriate process solvent.
The key requirements for the OHC process solvent are low volatility,strong absorption characteristics for C1 chlorocarbons, resistance to HCl(aq), insolubility with H,O, stability Over temperature range of -20 C to 180 C, and preferably a low viscosity.
The approach used to identify this solvent was fairly empirical, A great deal of information was gathered on potential process solvents. Once this database was put together a list of Potential solvents was identified and procured. A series of CH3CI single component saturation experiments was performed. Solvents that showed some promise were then evaluated for stability in acid. Finally, multicomponent absorption studies were performed on several potential candidates. An appropriate solvent has been identified.
The development of a highly selective OHC catalyst is a parallel objective to the process development described above. Several key catalysts have been described in the recent literature 13.14.15.16 regarding selective catalysis of the OHC reaction to CH3C1. The primary catalytic metals reported to be useful for the OHC reaction of CH, are Cu and Fe , with the PETC group also reporting the use of Co as a selectivity enhancing catalyst 16. Our work has primarily focused on the optimization of a Cu based catalyst.
! I
I i I-
Figure 3 shows a overview of the published results as well as previously unpublished Dow Coming results for Cu oxyhydrochlorination catalysts. This data represents a wide range of residence times, fluid velocities, stoichiometries and temperatures. The box with a lower left comer at 20% CH, conversion and 80% CH,CI selectivity represents the desired range of operation for this technology. As is shown, only the single point represented by the British Petroleum patent', is currently in this desired range. However, all three other groups have data that is very close to this range
Two key elements of catalyst development have been the focus of recent effort in this project. The first is to establish the deleterious impact of excess heat upon the product distribution. As shown earlier. the ability to control the combustion side reactions should be a key area in increasing the selectivity of the reaction. Figure 4 shows the internal bed temperature for two different Cu on silica catalysts. These data, taken under identical conditions by a thermocouple inserted directly into the catalyst bed, show quite clearly the extent of exotherm possible if a catalyst with too high of an activity is used without adequate heat transfer capability to remove the large heat of reaction. Note that Dow Coming catalyst #535 gives a nominally flat profile over 145 hours of reaction. By comparison, a PETC catalyst with very high Cu loading gives an exotherm of about 200 C over baseline conditions. A correlating degradation of selectivity was noted.
An additional verification of the impact of temperature upon selectivity is shown in Figure 5 . In this case a Cu on AI,03 catalyst was evaluated with a feed stoichiometry of 4.4W1.2 CH,/O,/HCI. The CH,CI and CH2CI, selectivities as well as the COX (oxygenated products) selectivity and CH, conversions are given by the Y axis. The X axis denotes reaction time. This reaction was conducted at a constant temperature of 340 C for 20 hours. At this point the temperature was lowered 5 C to 335 C. Note that the CH, conversion changed only very slightly, indicating that for this system a reactor temperature of 340 C was not necessary to obtain the target 20% conversion. The very interesting result however is that the COX products dropped from 18% to 8%. This was accompanied by a rise in the CH,CI selectivity from 68% to 78%. This is a fairly clear indication that the excess heat was serving only to further react product CHJI via combustion to CO and CO,.
The second key catalyst development issue is stability. A key reason for the use of very high metal loadings for some of the published catalysts is the fact that these catalysts deactivate, primarily via Cu loss. The technical approach followed in the current catalyst development was to establish the minimum amount of Cu necessary to maintain adequate activity and develop a mechanism to stabilize the catalyst. A series of experiments were performed to establish the impacts of several promoters that might be used to enhance the stability of these Cu catalysts. A simple Cu on SiO, catalyst that was not promoted in any way was first evaluated. The conditions used were a reaction temperature of 340 C, stoichiometry of CH,/OJHCI 4/1/1.3. The overall activity of this catalyst was very low with a CH, conversion of about 5%. Clearly this catalyst, with about 2% Cu loading , did not posses adequate activity to provide the targeted 20% CH, under these reaction conditions.
993

In a subsequent experiment, a promoter was added to the this Cu catalyst system. The activity increased to an initial value of about 20%, but declined over a period of 180 hours to less than half of the original activity. The reaction conditions were identical. The catalyst was the same with the promoter added by sequential impregnation. The Cu loading on the catalyst remained the same. This is a strong indication that large loadings of Cu are not necessary to yield an active OHC catalyst.
Figure 6 shows the impact of adding another promoter sequentially. In this case the activity again started at about 20% CH, conversion, but declined very slightly and was still about 17% after 180 hours of experimentation. This series of sequential impregnations shows the apparent strong impact that key promoters can have on the stability of Cu oxyhydrochlorination catalysts. The data indicates that a relatively low loading Cu OHC catalyst may be able to be modified by the appropriate promoters to have sufficient long term stability.
CONCLUSIONS Recent effort on the development of a commercially feasible oxyhydrochlorination route to CH,CI has dealt with a variety of technical challenges. Work has proceeded on the engineering development of a process demonstration unit to evaluate the process. Several technical development issues have been associated with this development. The results from our work on these issues over the past year have been two fold. First, a laboratory scale demonstration was initiated of a product recovery system that has the potential to solve the engineering challenge of removing the product CH,CI from the large amount of non- condensible gases that are in the reactor effluent. This is an unavoidable situation in this relatively low conversion process. This recovery process is the key economic driver in process capital expenditure. This system will be demonstrated at the process demonstration unit scale.
Second, a promoted Cu based catalyst system with sufficient metal loading to achieve the desired activity was demonstrated. The technical advance with this catalyst is that it is a low metal loading catalyst. This has the impact of restricting the catalyst activity to the desired amount is to limit the selectivity and deactivation problems associated with the large exotherms found while using high metal loading catalysts under the conditions necessary for realistic process operation. It is of clear benefit to use the lower metal loading as long as necessary activity can be demonstrated and sustained. Future work will focus on long term stability improvements for this new catalyst.
ACKNOWLEDGEMENTS The authors would like to acknowledge the following individuals for their valuable assistance in this work: Steve Freeburne, Bob Smith, Wayne Ellegood, and David Miller. In addition the a special thanks to Bruce Crum who performed a significant portion of the laboratory work cited in this paper.
This work was supported by the Pittsburgh Energy Technology Center under DOE contract #DE-AC22-91PC91030 and by the Gas Research Institute under contract #5091-222-2300.
The author's would like to also thank Texas Gas Transmission Company for their contributions supporting this effort.
REFERENCES I . E. Gorin et. al., Ind. Eng. Chem., U(II). (1948), 2128. 2. W. Hirschkind, Ind, Eng. Chem., 41(12), (1949), 2749. 3. C.M. Fontana, et. al. , Ind. Eng. Chem., 44(2), (1952), 395. 4. U.S. Patent 2,488,083 to E. Gorin, et& Socony Vacuum Oil,
Nov.15. 1949. 5. US. Patent 2,493.546 to E. Gorin, Socony Vacuum Oil,
Feb. 21, 1950. 6. U.S. Patent 2,547,139 to M. Randall, Apr. 3, 1951. 7. US. Patent 2,575,167 10 C.M. Fontana. et.al, Socony-Vacuum Oil,
Nov.13, 1951. 8. U.S. Patent 2,752,401. To W J.Joseph, Dow Chemical, June 26, 1956. 9. US. Patent 2,752,402 to D.J. Pye, Dow Chemical, June 26, 1956. IO. J.A. Allen and A.1. Clark, Rev. Pure and Appl. Chem., &(1971)145. 1 1 . C.N. Kenney, Catal-Rev. - Sci. Eng. U(2) . (1975) 197. 12. Y.A. Treger and V.N. Rozanov, Uspekhi Khimii, Vol. 58 ( I ) , (1989). pp. 138-164. 13. U.S. Patent 4,769,504. To R.D. Noceti,et.al., 06 Sept. 1988. 14. Int. Patent WO 841 03277. To J. Bromhead, Aug. 30, 1984. 15. V.N. Rozanov, Khim. Prom.-st., Z, (1989) ,495. 16. Taylor, C.E. and Noceti, R.P., Proc. In:. Cong. Cat., t 990, (1988).
994

'Figure 1 Major Reaction Pathways
Chlorination Reactions -CH4 + 1/202 + HCI --> CH3CI + H20 -CHIC1 + 1/202 + HCI ---> CH2C12 + H20 -CH2C12 + 11202 + HCI --> CHCB + H20
Combustion Reactions -CH4 + 3/202 --> CO + 2 H 2 0 -CH4 + 2 0 2 --> C02 + 2 H 2 0 -CH3CI + 0 2 --> CO + H20 + HCI -CHSCI + 31202 -> C02 + H20 + HCI
Deacon Chemistry - 2 HCI + 1/2 0 2 ---> C12 + H20
Figure 2 OHC PROCESS BLOCK FLOW DIAGRAM
I I 'I' cn'm--*
Figure 3 OHC Catalyst Evaluations
MeCl selectivity
I * + ++ +
+ I I
Investigator
+ Dow Coming
PETC
* Rozanov
"0 10 20 30 40 50 60 70
Conversion of methane Vanable -0 time. flutd Wlody, lurlchlOmW M d t ~ ~ ~ I ~
995

Corn parision Figure 4
of Internal Packed Bed Temperatures
Temperature (C)
5 25 45 65 85 105 125 145
Hours
Catalyst Comparison
Figure 5 Impact of Reaction Temperature upon Selectivity
80
1 10 15 20 25
Stoichiometry 4 4l1/1.2 CH4/02/HCI
- MeCl
CH2C12
* cox
'Conversion
Figure 6 Promoted OHC Catalyst with Increased Stabilitv
%MeCI
60
40 I +Methane Conversion
5 25 45 65 85 105 125 145 165
Time (hours)
Catalyst #5380, Teniperature 340 C Stoichiomelry CH410::XC! e : ! : : . : Experiment 11 046009
996

i -\
PRESSURE EFFECTS ON THE OXYHYDROCHLORINATION OF METHANE
Mark A. McDonald and Michael F. Zarochak Pittsburgh Energy Technology Center
U. S. Department of Energy, P. 0. Box 10940 Pittsburgh, PA 15236
and William J. Graham
Gilbert Commonwealth P. 0. Box 618
Library, PA 15129
KEYWORDS : Methane, Natural gas, liquid fuels, chlorination
INTRODUCTION A process, developed at PETC, uses a two-step approach for converting methane to liquid fuels’. In the first step, methane is oxyhydmhlohated to chloromethane:
CH, + HCI + ‘h O2 = CH,CI + H,O (1)
In the second step, the chloromethane is oligornerized on a zeolite catalyst such as ZSM-5, producing hydrocarbons and regenerating the HCI:
CH3CI = -CH2- + HCI (2)
The net result of these two process steps is similar to that of oxidative couplingloligomerization processes, the oxidation of methane to heavier hydrocarbons and watd.
Several publications have described work done at atmospheric pressure on the two steps in this process'^*. We report oxyhydrochlorination activity and selectivity data for the copper catalyst used in the previous work, but at higher pressures. These data provide a firmer basis for feasibility studies of various technologies for methane conversion2.
EXPERIMENTAL METHODS Flow rates of CH,, HCI, 0,, and N2 were controlled by means of Tylan mass flow controllers. Gases were mixed and passed over a bed of powdered catalyst in a tubular reactor. The method of catalyst preparation has been described in detail el~ewhere’.~. Analysis of this dried catalyst precursor yielded a composition that can be expressed as 41.7% CuCI, 11.5% KCI, 9.4% LaCI,, and 37.5% SO;. Pressure was regulated by means of a Badger research control valve downstream of the reactor. AU lines between the reactor entrance and the scrubber were. heat-traced. The system required special materials; the considerations required to construct and operate the reactor are discussed elsewhere’.
The primary method of product analysis was gas chromatography. The Hewlett-Packad 5730 gas chromatograph was equipped with dual packed columns and thermal conductivity detectors. Light gases (H2, O,, N,, CH,, and CO) were analyzed with a 3A molecular sieve column and an argon carrier gas. Chloromethanes and CO, were analyzed with a Chromosorb 102 column and a helium carrier gas. Water and HCI were analyzed with an Extrel C60 mass spectrometer fitted with a fused-silica inlet.
997

Fresh catalyst samples were pretreated for 0.5 h in 50 sccm of HCI at 573 K. A typical day’s operation gave results at three different experimental conditions, after which the catalyst was regenerated for use the following day in 100 sccm of flowing H, at 543 K for 0.5 h. Catalyst tests were typically carried out for a maximum of five days.
The N, BET surface area of a pretreated catalyst was determined with a Coulter Omnisorp 100 CX unit. Catalyst activity is reported as nominal site-time yield (STY), molecules of methane converted per catalyst surface atom per second, based on the total surface area determined from this BET area and assuming ll0” catalyst surface atoms per m2 BET area. Active catalyst surface atoms were not titrated, so the site-time yield values reported are likely to be lower Limits to the values based on measurement of a specific surface area.
RESULTS The BET surface area of the pretreated catalyst was 88 m’g-’, in contrast to the value of 325 mz g-’ for the pure Cab-0-Sil. Table 1 shows catalyst yield and selectivity data for relative compositions of 5:2:1 CH,:HCI:O,. The sevenfold increase in overall pressure increased the sitetime yield values by less than a factor of four. An Arrhenius plot of nominal site-time yield values is shown in Figure 1. The slopes for the data in Figure 1 yield apparent activation energies of 171 to 186 kl mol-’.
Figures 2 and 3 show selectivity to carbon-containing products as a function of temperature. At low pressure (Figure 2), selectivity to e n dioxide and to chloromethanes, defmed as the sum of selectivities to chloromethane, dichloromethane, and trichloromethane, was unaffected by temperature. (No tetrachloromethane was detected in any experiment.) However, the overall selectivity to chloromethane decreased with increasing temperature, as conversion to dichloromethane and trichloromethane increased. The intermediate pressure data in Figure 3 show more complex behavior; as temperature increased, conversion to carbon dioxide was constant within experimental error, overall conversion to chloromethanes decreased, and conversion to carbon monoxide jumped above 600 K. This drop in selectivity to chloromethane was apparently the result of the increase in conversions that accompanied the temperature increase; higher conversion clearly favors continued oxyhydrochlorination of chloromethane to dichloromethane and then to trichloromethane.
Although the tubular reactor was not appropriate for determination of detailed kinetic parameters, reaction orders were estimated at 510 kPa and 593 K. This was done by measuring site-time yield values for a given reaction composition at several different WHSV, plotting these values versus (WHSV).’, then taking the y-intercept of each of these plots as the initial rate. This process was repeated for several different compositions and a power-law fit was obtained. The reaction orders obtained for methane conversion are described by the following expression:
This approach does not account for dependence on product or other species.
DISCUSSION The yields reported here are consistent with previous work done at atmospheric pressure with this catalyst. Taylor er al.‘ reported CH, conversion at 604 K that converts to a STY value of 0.18. 10” s-I. Although this value is at least a factor of four lower than the values reported in Table 1, their results were obtained with a lower CH4 concentration in the feed (a stoichiometric 2 2 1 CH,:HCl:O, was used) and at generally higher CH, conversions. When
998

adjusted for the higher concentrations of CH, present in our work, the STY values differ by less than a factor of two.
The Selectivity trends do not agree nearly as well. Taylor et al. did find the Same trends in chloromethane yield, and CH, conversion to oxygen-containing products increased as temperature and conversion increased. However, the nature of these oxygen-containing products differed; Taylor et al. observed mainly HCOOH at intermediate conversion lt?VelS and mainly CO, at highest conversions and saw no CO. In contrast to their work and also to results of Conner et al.*, we saw no HCOOH in any experiment, even with the Same mass spectrometric analysis of reaction products.
This discrepancy may be. explained by noting the relative ease of HCOOH decomposition and the differences in the reaction systems involved. The HCOOH molecule is known to decompose on reduced nickel surfaces at ca. 400 K ', roughly the Same temperatures used in heat tracing the reactor exit lines and substantially below temperatures in the reactor. Very tittle exposed metal surface in the coated nickel alloy tubing and fittings in the reactor would be required to decompose formic acid produced by the catalyst. Although blank tests showed no significant activity for reactions of CH,, side reactions of any product HCOOH could have occurred. In contrast, Taylor et al. used a quartz reactor and PTFE tubing, which do not catalyze HCOOH decomposition.
CONCLUSION
The oxyhydrochlorination yield of a 5:2:1 ratio of CH,:HCl:O, increased over threefold as pressure increased from 130 to 930 kPa. This increase was accompanied by a decrease in selectivity to CH,C1, and an increase in dichloromethane and trichloromethane. Oxidation was not favored and never accounted for more than 20% of the methane converted. Carbon dioxide was the major oxidation product, accounting for 2-6% of methane converted. No product HCOOH was observed, likely due to HCOOH decomposition on the walls of the reactor upstream of the product analysis.
' REFERENCES 1. 2. 3. (1987). 4. D.M., Chang, C.D., Howe, R.F. & Yurchak, S.) 483 (Elsevier, Amsterdam, 1988). 5. 4,123,389, 1978. 6. 7. 8. (1984). 9.
Noceti, R.N. & Taylor, C.E., U. S. Patent 4,769,504, 1987. Fox, J.M., Chen, T.P., & Degen, B.D. C k m . Engr. Prog. 86, 42 (1990). Taylor, C.E. & Noceti, R.N. Preprinrs, Am. Chem SOC., W v . Fuel Chem. 32, 307
Taylor, C.E., Noceti, R.N. & Schehl, R.R. in Methane Conversion (eds. Bibby,
Pieters, W.J.M., Carlson, E.J., Gates, W.E. & Conner, W.C., Jr., U. S. Patent
Pieters, W. J.M., Conner, W.C., Jr. & Carlson, E.C. Appl. Card 11, 35 (1984). McDonald, M.A., Zarochak, M.F. & G~aham, W.J. Chem. Eng. Sci., in pq.aration. Conner, W.C., Jr., Pieters, W.J.M., Gates, W. & Wilkalis, J.E. Appl. Caral. 11, 49
Iglesia, E. & Boudart, M. J. Catal. 81, 224-238 (1983).
999

Table 1. Catalyst Activity and Selectivity
E l i= 6 0.5
0.3 C
0 .1 ' " " " " " ' I " " 1.60 1.62 1.64 1.66 1.68 1.70 1.72 1.74 1.76
In (IO4K' )
Figure 1. Arrhenius Plot
130 kPa
510 kPa
930 kPa
1000

100%
80%
60%
40%
20%
no/, " I "
573 594 61 5
Bl Chloromethane Dichloromethane Trichloromethane Carbon Dioxide 0 Carbon monoxide
~ ~~
Figure 2 Selectivities at 130 kPa
, 510 kPa, 930 kPa . 100%
80%
60%
40%
20%
no/n - ," 578 594 605 574
T (K)
Figure 3 Selectivities at 510 and 930 kPa
I
1001

BIOMIMETIC CATALYST DEVELOPMENT FOR NATURAL GAS CONVERSION
Margaret C. Showalter, John A. Shelnutt Fuel Science Department, Sandia National Laboratories
P.O. Box 5800 Albuquerque, NM 87185-0710
Craig J. Medfortb Department of Chemistry University of California
Davis, CA 95616
J. Martin E. Quirke Department of Chemistry
Florida International University Miami,FL 33199
Keywords alkane oxidation, metalloporphyrins, computer aided molecular design (CAMD)
INTRODUCTION Enzymes such as cytochrome P4s0 are known to catalyze difficult reactions
including the partial oxidation of unactivated alkanes to alcohols. We are using computer aided molecular design (CAMD) in conjunction with activity testing to develop biomimetic catalysts for the oxidation of light alkanes. Our stepwise approach to catalyst development involves fmt using CAMD to design and model potential metalloporphyrin catalysts, followed by synthesis and characterization of promising catalysts, and fmaIly utilizing our catalysts in bench scale oxidation reactions. The information gained in laboratory testing enables us to evaluate and refme our models, and thus continue to design catalysts which are incrementally better. We anticipate that this iterative approach will lead to the development of biomimetic catalysts which are active enough to use air for the conversion of natural gas to oxygentated products.
Metalloporphyrins have been shown to catalyze the oxidation of light alkanes with air or oxygen as the oxidant under mild conditions with no added co- reductant.’ Prior work has indicated three beneficial properties of the metalloporphyrin catalysts. These activity-enhancing features are.: (1) the presence of strongly electron- withdrawing substituent groups at the periphery of the porphyrin ring, (2) an axial ligand complex favoring the most negative Fe(UI)/Feol) redox potential, and (3) steric restraints on close bimolecular face-to-face approach of catalyst molecules.’.* We have designed and synthesized, and are currently testing a series of catalysts, the fluorinated iron dodecaphenylporphyb (FeF,DPP where x=0,20,28,36), with enhanced features (1) and (3). and with an additional feature -- a rigid cavity that promotes the binding of the substrate alkane molecule. Figure 1 shows the dodecaphenylporphyrin catalysts which are the subject of the current investigation.
EXPERIMENTAL Molecular mechanics calculations were carried out on Sicon Graphics
workstations using POLYGRAF software and a metalloporphyrin forcefield developed previously.’ The forcefield has been extensively validated for predicting metalloporphyrin structures and relative energie~.”~ Iron(II1) parameters were the same as those used previously4, and fluorine and oxygen parameters were taken from the DREIDING force field?
Catalysts were tested for activity in the oxidation of isopentane with both iodosylbenzene (PhIO) and oxygen as the oxidants. Catalyst concentration is 1- 100pM. In the PhlO reactions, substrate, catalyst, and oxidant are mixed in an organic solvent, usually benzene, at room temperature. In a typical experiment, substrate concentration is 2M and PhIO concentration is 50mM. For the oxygen reactions, a solution of substrate and catalyst in solvent is sealed into a bomb reactor in which all internal surfaces are coated in teflon. The bomb is then pressurized with oxygen and heated while stirring. In a typical experiment, substrate concentration is
1002

2M. oxygen pressure is 1M)-2oOpsi, and temperature is 100°C. Reaction products were analyzed by gas chromatography after 2-15 hours.
1
i
RESULTS AND DISCUSSION Catalyst Design. Electron withdrawing substituents at the periphery of an
iron porphyrin oxidation catalyst have at least two beneficial effects? First, such substituents may activate the high oxidation state metal-oxo intermediate thus increasing catalyst reactivity. Second, by removing electron density from the porphyrin ring, the substituents make the porphyrin macmycle less susceptible to self- destruction by electrophilic attack by the oxo intermediate of the catalyst. Iron dodecaphenylporphyrin can be systematically fluorinated to give the catalyst series shown in Figure 1. An interesting feature of this catalyst series is that it allows us to study the effect of electron withdrawing groups in the absence of significant structral changes of the macrocycle. Computer modelling aid spectroscopic characterization indicate that the series of FeF,DPP catalysts, where x=O,20,28,36, have essentially the same structure, thus any difference in activity should be due to electronic factors alone.
Molecular modeling studies show that the FeDPP catalysts have a rigid cavity formed by the porphyrin ring and the quasi-axial CHs and CFs of the phenyl substituents. The cavity is of the size and shape of small linear alkanes. Figure 2 shows the shape of FeF&PP. This rigid cavity is predicted to improve catalyst activity and selectivity by providing a "microreactof' environment for the oxidation reaction. In addition, these bulky catalysts should be more stable than typical planar porphyrin catalysts.
Energy minimization and molecular dynamics calculations show that methane will hind to the cavity and remain for signifcant times even in a vacuum at tempcratures up to and above room temperature. Substrate binding is partly a consequence of the rigidity of the binding cavity and the favorable electrostatic interaction between the light hydrocarbon and the fluorocarbon groups of the cavity. The presence of this light hydrocarbon binding cavity should enhance catalytic activity by increasing the residence time of the substrate at the active metal site. Radical trapping of the intermediates R. and *OH in the cavity may also promote recombination to form the alcohol product, thus enhancing selectivity. Finally, ejection of the product upon formation is expected as a result of the repulsion of the alcohol oxygen atom by the fluorine atoms lining the pocket. This repulsive interaction between the product and the substrate binding cavity serves two purposes. First, it clears the cavity after the reaction has occurred for the next alkane molecule to enter; and second, it prevents further oxidation of the alcohol molecule. The former effect is expected to improve catalytic rates; the later is expected to improve selectivity for alcohol versus other oxidation products (ketones, aldehydes).
Past work has shown that bulky substituents attached to the porphyrin which prevent close face-to-face approach of two porphyrin molecules increase the resistance of the porphyrin to bimolecular destruction? In our highly substituted FeDPP catalysts. there is considerable steric hinderance to the face-to-face approach of two porphyrin macrocycles. The steric constrants on face-to-face interactions of the porphyrin molecules may also play a beneficial rule in the reaction mechanism proposed by researchers at Sun Marketing and Refhg Company.' In the proposed mechanism, adventitious impurity or the alkane itself reduces Fe to start the catalytic cycle. A peroxo-bridged dimer is formed and splits to give the reactive Fe(IV)=O intermediate. This fenyl intermediate subsequently reacts with the alkane (RH) to form the alcohol (ROH). A competing reaction of the fenyl intermediate is the formation of p-oxo porphyrin dimer, Fe(IIr)-O-Fe(III), which is less reactive with the allcane. 'Ihus, steric hinderance of the formation of face-to-face p-oxo dimer is desirable, but formation of the peruxo dimer must still be favorable. Molecular modeling indicates that this is the case for the FeDPP catalysts as shown in Figure 3. The peroxo dimer, which should be able to form with the DPP catalysts, may however, be stmined which could aid in the formation of the active fenyl (OXO) intermediate thus further enhancing catalytic activity.
Initial experiments for testing our catalysts have been performed using either oxygen or iodosylbenzene (PhIO) as the oxidant and isopentane as the substrate. We have observed the predicted trend that as the number of fluorine substituents increases, so does the catalyst activity for the FeF.DPP series.
carulysr Testing.
1003
-\

Figure 4 shows the correlation between catalyst activity and overall electron depletion of the porphyrin measured by &s, the sum of the Hammett substituent constants. However, all of the designed catalysts were sigruficantly less active than the commercial planar catalyst FeFz0TPP (TPP = tetraphenylporphyrin), despite the built in cavity or "microreactor" of the FeDPP catalysts. We are trying to develop a better understanding of this apparent low activity on the part of our designed catalysts.
We have observed that the number of catalyst turnovers in our partial oxidation test reactions is dependent upon a number of experimental parameters, including initial catalyst concentration, solvent, and temperature. We are c m n t l y determining optimum experimental conditions so that more meaningful catalyst activity comparisons can be made. In a related experiment, solutions of substrate and solvent with no catalyst, FeFzoTPP, or FeF&PP, were prepared and allowed to stand in the laboratory with air in the headspace. After 4 months, GC analysis showed that essentially no reaction had occurred in the control and FeFzoTPP vials. However, the FeF2DPP had catalyzed the oxidation of isopentane to alcohols. This experiment indicates that under certain conditions, the FeFzODPP catalyst may be more reactive than its planar FeF20TF'P counterpart. Work is in progress to further our understanding of these results.
Because the ultimate goal of this research is to develop catalysts for natural gas conversion, we have begun testing our catalysts with gaseous substrates. We have attempted the oxidation of isobutane by both oxygen and PhIO using our catalysts. Results indicate the same trends observed with isopentane. That is, as the number of fluorines in the DPP series increases so does the catalytic activity. Again FeF2oTPP is more active than all of the FeDPP's toward the production of alcohols under the reaction conditions employed. However, unlike the isopentane experiments which were "clean" (the only signifcant products were alcohols), additional products were produced in the isobutane experiments. We are currently working to identify and quantitate these additional reaction products so that we can more accurately evaluate and compare our catalysts: We are also working on modi6ed reactor configurations and sample handling techniques so that we may also test our catalysts with the CI-C, hydrocarbons.
Future Work. In addition to continuing our catalyst testing to more adequately characterize and understand the current series of FeDPP catalysts, we are designing and synthesizing other highly substituted porphyrin catalysts. Synthesis of the fully fluorinated F e F d P P is in progress. This catalyst will complete the fluorinated DPP series and is expected to be more active than all those tested so far. In addition, we are developing other dodecaphenyl substituted porphryin catalysts in which groups such as C1 or NOz are substituted on the phenyl rings. We are also developing a new class of catalysts, the substituted octaphenylporphyrins (FeOPP). These catalysts will allow us to substitute electron withdrawing groups directly on the porphyrin macmycle at the meso positions. An example of this type of catalyst is iron octaphenyl meso-tetranitro porphyrin. However, while some of the substituted OPP catalysts are nonplanar, they do not have the deep, rigid binding cavity of the DPP catalysts.
CONCLUSIONS CAMD has been used to design a novel series of alkane oxidation catalysts, the
fluorinated iron dodecaphenylporphyh. Designed features in these catalysts include the systematic variation of the number of fluorine substituent across the series and a rigid binding cavity common to all catalysts in the series. Catalyst activity testing is underway for this series of catalysts. Results thus far indicate that catalytic activity does increase as the degree of fluorination increases. However, under the experimental conditions utilized, the overall activity of the catalysts is lower than expected. Further work is in progress to more adequately chmcterize the activity of this novel series of catalysts.
1004

LITERATURE C F E D 1. (a) Paulson, D.R.; Ulman, R.; Some, R.B.; Closs, G.L. J. Chem. SOC. Chem.
C o r n 1974, 186. (b) Ellis, Jr., P. E.; Lyons, J. E., Symp. Oxygen Activation in Catalysis, ACS, April 22-27, 1990. (c) Ellis, Jr., P. E.; Lyons, J. E. Coord. Chem. Rev. 1990,105,181-193.
2. Nappa, M. J.; Tolman, C. A. Inorg. Chem. 1985,24,4711-4719.
3. Shehutt, J.A.; Medfonh, C.J.; Berber, M.D.; Barkigia, K.M.; Smith, K.M J. Am. Chem. SOC. 1991,113,4077-4087.
4. sparks, L.D.; Medforth, C.J.; Park, M.S.; Chamberlain, J.R.; Ondrias, M.R.; Senge,M.O.; Smith, K.M.; Shelnutt, J.A. J. Am Chem SOC. 1993,115,581- 592.
5. Mayo, S.L.; Olafson, B.D.; Goddard, W.A., III J. Phys. Chem 1990, 94,8897- 8909.
Iron Dodecaphen ylporphyrin Iron F~~Dodecaphenylpnrphyrin (FeDPP) (FeSODPP)
ZO, = 0.72 ZoP = -0.12 Z&= 1.84 Zoo= 1.56
Iron Fdhdecaphenylporphyrin (F%DPP)
%== 2.16 1.72
Iron F&odecaphenylporphyrin (FeF=DPP)
Zom= 2.32 Zoo = 2.84
Figure 1. Structures of the catalysts in the fluorinated iron dodecaphenylporphyrin series. k is the sum of the Hammett substituent c0nstanr.s (shown for both meta and para), which is used as a measure of the overall electron depletion of the metal center.
1005

Figure 2. Energy minimized structure of FeF&PP showing the rigid binding cavity.
Figure 3. Calculated structures of the p-oxo (left) and peroxo- (right) dimers of a fluorinated dodecaphenylporphyrin. Calculated energies predict that the active peroxo-dimer is energetically favored, but the inactive p-oxo-dimer is unfavored by greater than SOkcaVmol.
...............
.............................. ............
M .............................................
0 6 08 1 11 1.4 1.6 1 6 I 11 1.4 smo H.mmr(tCaaBltr(md.)
Figure 4. Plot showing the correlation between catalyst activity and electron depletion of the metal center, measured by k, for the FeDPP catalyst series.
Supported by United Sates Depament of Energy Contract DE-ACO4-94AL85Mx).
1005A

GAS-TO-LIQUIDS RESEARCH PROGRAM OF THE U.S. DEPARTMENT OF ENERGY A PROGRAMMATIC OVERVIEW
Arun C. Bose and Gary J. Stiegel U.S. Department of Energy
Pittsburgh Energy Technology Center Pittsburgh, PA 15236
and
Rameshwar D. Srivastava Burns and Roe Services Corporation Pittsburgh Energy Technology Center
Pittsburgh, PA 15236
Keywords: Methane: Partial oxidation: Oxidative Coupling: Pyrolysis: Derivatization
ABSTRACT Commercially viable technology development for converting light hydrocarbon gases to value-added fuel forms and chemicals is of strategic and scientific importance for responding to the growing needs for energy security, environmentally superior liquid fuels, and economic stimulation from introducing new technologies in the market place. To assist the development of technologies, the United States Department of Energy (USDOE) established the Gas-to- Liquids Research Program. This paper describes the Gas-to-Liquids technology development projects sponsored by the Pittsburgh Energy Technology Center (PETC) of the USDOE.
INTRODUCTION Current proven world reserves of natural gas are estimated at around 4500 trillion cubic feet (TCF) , approximately half of which is in remote areas (1, 2). Additionally, 400 TCF are occluded as coal bed methane in the U . S . ( 3 ) . A potentially huge source of natural gas as gas hydrates has also been reported in the literature (4). Flaring of associated (oil field) gas in some regions of the world and venting of coal bed methane contribute to greenhouse effects. In energy equivalence terms, natural gas production has W e n predicted to grow faster than oil, but technology growth areas are not yet identified except for the electric utility sector (5). However, at identical capacity factors, it costs more to generate electricity by burning natural gas than coal. Monetization of natural gas by upgrading to value- added products, such as environmentally superior transportation fuels that will exceed requirements of the 1990 Clean Air Act Amendments (CAAA), is an attractive option. For effective utilization, natural gas reserves in remote areas will have to be converted to liquid hydrocarbon products on site and then transported to the marketplace. The increase in the Federal Energy Resources budget over the fiscal year 1994 appropriation shows government encouragement to develop natural gas utilization technologies.
In 1991, the Pittsburgh Energy Technology Center (PETC) of the United States Department of Energy (USDOE) issued a Program Research and Development Announcement (PRDA) inviting proposals for the development and demonstration of technologies for economical conversion of methane and other light hydrocarbon gases to transportation fuels and chemicals. The seven selected awards represented an optimal mix of projects believed to maximize the probability of achieving USDOE'S overall objectives.
Methane conversion technologies will allow efficient utilization of our Nation's abundant supply of natural gas to manufacture the cleanest burning fuels, and the new technologies can be easily integrated into the existing refinery and distribution system. USDOE supported gas-to-liquids program to conserve natural gas will help the agency deliver its role in implementing the Climate Change Action Plan aimed at reducing carbon dioxide emissions.
HISTORY Natural gas was first used as a fuel by the Chinese for lighting, circa 250 A.D., by piping it through bamboo tubes. In the United States, natural gas was first discovered in Fredonia, New York, in 1821 but was not considered a fuel source (4). After World War 11, natural gas was recognized as a fuel commodity.
1006

During the 1950s, natural gas dominated the market of fuel-gas industries. Gas pipelines were installed countrywide, reaching from gas fields to homes and factories. Natural gas not only became a predominating fuel gas, it also qualified as an important feedstock for synthesis of various liquid fuels, chemicals, and intermediates.
In the early 19509, a commercial natural gas-to-liquid fuels plant was built by the Carthage Hydrocol Company in Brownsville, Texas. However, due to the availability of cheap Middle Eastern petroleum, the operation was not economical, and thus the plant was shut down. A 14,500 barrel-per-day natural gas-to-gasoline plant started operating in New Zealand in 1985 and was on stream producing 87 octane unleaded gasoline until recently. In this process, natural gas was first converted to methanol via synthesis gas, followed by conversion of methanol to gasoline using a novel catalyst developed by Mobil in the 1970s. A portion of Mobills development efforts was funded by the Fossil Energy Program of the USDOE. In April 1993, Exxon announced its AGC-21 Advanced Gas Conversion Technology for converting natural gas to high quality refinery feedstock (6). Olefin-based transportation fuels from natural gas is produced in the Mossgas plant in South Africa (7). Recently, Shell Gas B.V. built a 12,000 barrels per day natural gas-to-middle distillate plant in Malaysia (8).
Coupling of two methane molecules to higher hydrocarbons is not thermodynamically feasible because the energy of formation is not favorable. However, in the presence of a co-reactant, such as oxygen, the reaction path can be altered, and methane conversion reactions can be successfully carried out. Natural gas (primarily methane) can be upgraded to higher hydrocarbons either by direct conversion routes (single-step or staged), or via synthesis gas (a mixture of carbon monoxide and hydrogen). In this paper, the synthesis gas based process is termed the indirect process. A discussion of terminology classifying methane conversion processes can be found in the literature (9). The important process considerations for commercially viable natural gas upgrading operations are methane conversion rate and selectivity to preferred products.
Based on chemistry, the processes for natural gas upgrading include 1) partial oxidation to oxygenates, such as methanol, 2) oxidative coupling to higher hydrocarbons, such as ethylene, 3) derivatization, such as oxyhydrochlorination to chlorinated hydrocarbons, which are subsequently converted to higher hydrocarbons, and 4) pyrolysis to aromatic and/or higher hydrocarbons.
In the indirect process, natural gas is first converted to synthesis gas, followed by catalytic hydrogenation of the carbon monoxide in a synthesis reactor to a variety of higher hydrocarbon fuels. Fischer-Tropsch (FT) synthesis and its variants are important synthesis reactions, involving low-pressure conversion of synthesis gas to gasoline, diesel fuel, wax, and oxygenates. The products of reaction depend on the temperature, pressure, and catalyst used in the synthesis reactor.
PETC'S GAS-TO-LIQUIDS PROGRAM The goals of PETC's Gas-to-Liquids program can be summarized as f OllOWS :
Discover new chemistry and catalysts for the conversion of methane and other light hydrocarbon gases to value-added, easily transportable fuels and chemicals.
Obtain necessary design and engineering information to develop prototype technologies for demonstration and commercial deployment.
Pursue crrst-shared, risk-shared, industry-driven R&D, demonstration, and technology transfer to ensure pay-off of Federal R&D investments.
Contribute to energy policy goals by selecting investments consistent with the four major policy thrusts:
GAS-TO-LIQUIDS CONVERSION TECHNOLOGIES
Energy security
1007

/
/
Economic growth Environmental quality improvement Enhancing scientific foundations.
PETC's program consists of R&D activities in several natural gas conversion chemistries. They will be discussed in the following
Partial Oxidation Oxidative Coupling Pyrolysis Der ivat izat ion
groups (io):
PARTIAL OXIDATION Partial oxidation of methane refers to the selective oxidation of methane to oxygenates, such as methanol, or to synthesis gas. In either technology, control of the extent of gas phase oxidation to prevent the formation of complete oxidation products is extremely important. For both technologies, oxygen must be separated from air, which is capital and energy intensive. PETC is managing three projects in this area of technology.
1) PETC is sponsoring a Cooperative Research and Development Agreement (CRADA) between Amoco Chemical Company and USDOE's Argonne National Laboratory (ANL). The research is focusing on the development of oxygen-specific, dense-phase ceramic membranes for the conversion of methane to synthesis gas or methanol. These oxygen specific membranes permit the transport of oxygen through the membrane while totally excluding nitrogen. Research and development efforts are focused on producing membranes that have sufficient strength and mechanical integrity to withstand the harsh reaction environment of a commercial reactor. Such membranes will permit the use of air instead of purified oxygen for the oxidation reactions, thereby substantially improving the economics of both exiting synthesis gas production technologies, as well as direct conversion technologies for methanol. Also, by using the ceramic membranes as a means of regulating the contact between oxygen and methane, and as a support for catalytic materials, achieving highly selective yields of tailored products may be possible. The project is examining the applicability of the membranes for partial oxidation of methane to both synthesis gas and methanol.
The Amoco/ANL team has developed novel, non-perovskite membrane materials for separation of oxygen from air, and conversion of methane into value-added, easily transportable liquid hydrocarbons. These proprietary membrane materials exhibited more than adequate oxygen separation capacity and thermal stability during a demonstration run. A pilot-scale demonstration is under active study, and the Amoco/ANL team has proposed several unique, conceptual process designs for the development of a commercial process.
2) Sandia National Laboratory (SNL) is developing catalysts for the low-temperature conversion of methane to methanol by simulating biological mechanisms using computer-aided molecular design techniques. SNL has tested several halogenated iron porphyrin catalysts for isopentane oxidation, and have gleaned mechanistic information for developing methane oxidation catalysts.
3) AHAX Research and Development has developed techniqms for the synthesis and activation of vanadium phosphate catalysts from precursors to form the required active phase for the conversion of methane to methanol. The Colorado School of Mines will continue this activity.
OXIDATIVE COUPLING Oxidative coupling refers to the chemistry of reacting methane with oxygen to form C,* hydrocarbons as intermediate reactive feedstocks for subsequent conversion to preferred products.
Worcester Polytechnic Institute (WPI) is investigating the use of high-temperature inorganic membranes that are specific for oxygen diffusion to achieve the oxidative coupling of methane. By incorporating a suitable oxidative coupling catalyst into the membrane system and controlling the flow of oxygen across the membrane, the coupling reaction may be favored over other methane
1008

oxidation reactions, thereby minimizing the production of carbon dioxide.
wPI is currently working to select suitable membrane material that will not undergo phase change at reaction conditions while providing optimal oxygen flux. Various perovskite type catalysts are being tested in suitable membrane reactors of various configurations.
PYROLYSIS Pyrolysis refers to thermal decomposition of methane in the absence of any oxidant. Theoretically methane can be pyrolyzed to higher hydrocarbons by successive dehydrogenation and radical recombination, and to aromatics by cyclization of radical fragments. However, the pyrolysis must be controlled at a certain time-temperature condition to maximize yields of low molecular weight products and prevent coke formation. SRI International and Altamira Instruments are the two participants in this category of research.
1) SRI International is attempting to develop a process for the direct conversion of methane to higher hydrocarbons under controlled thermal and catalytic conditions using Fullerene-based catalysts. SRI has prepared metallized Fullerene catalysts and these catalysts have been shown to be effective in stabilizing methyl radicals. Preliminary methane conversion tests using Fullerene containing soot in the presence of an inert diluent gave high selectivity to preferred higher hydrocarbons at lower activation temperature.
2) Altamira Instruments is investigating a catalytic and/or free radical-induced pyrolysis route for converting methane to higher unsaturated hydrocarbons or aromatics.
The thermal decomposition of methane shows potential as a process for the production of higher unsaturated and aromatic hydrocarbons when the extent of reaction is limited. Preliminary experiments have shown that cooling the products and reacting gases as the reaction proceeds can significantly reduce or eliminate the formation of solid carbon and C,,+ products. Optimizing the quenching process is one of the goals of the program. Another objective is to reduce the temperature of the pyrolysis reaction by using free-radical generators and catalysts.
Altamira has completed construction of a rapid-quench reactor to limit the extent of reaction and minimize coke formation. A thermodynamic simulation was used to determine yields of various pyrolysis products as a function of the time-temperature history in the reaction environment. Baseline runs in the absence of quench gave 31-48 mol% methane conversion, with the major detectable product being benzene. In the rapid-quenched mode operation, a conversion of 33 mol% was obtained with over 15 mol% selectivity to benzene, and at least a 20 mol% selectivity to C,' hydrocarbons. Product distribution shifted to lower hydrocarbon products as a result of quenching. Operating temperature was 900- 1100 OC at ambient pressures. A 1100 ' C quenched-mode run at a specific operating condition and methane feed rate gave 38 mol% methane conversion with 45 mol% selectivity to benzene.
The project was selected for economic and engineering analysis. The purpose of the analysis was to determine product and yield targcts for commercial viability of the process and to estimate capital requirements. It is believed that systematic feedback of information from engineering analysis to the researchers would result in a parallel evolution of both an engineering and a Scientific knowledge base for advancing the state-of-the-art needed for commercial demonstration.
DERIVATIZATION Derivatization, in this paper, refers to a two-step process where methane is first converted to a reactive, but stable, intermediate followed by subsequent conversion of the intermediate product to desired higher hydrocarbons or value-added chemicals. The participants in this category of research are Dow Corning Corporation, Massachusetts Institute of Technology (MIT), Institute of Gas Technology (IGT), and the USDOE'S Pittsburgh Energy Technology Center.
1009

I
1) A multi-step approach involving oxyhydrochlorination was developed by in-house researchers at PETC for converting methane to gasoline using several new and better catalyst formulations. Dow Corning Corporation, the largest manufacturer of silicone products in the United States, is attempting to improve the PETC process by developing a direct methane to methyl chloride conversion route. Because large quantities of methanol for methyl chloride production are imported, replacing it with domestic natural gas will ensure a stable source and price. The cost of a methyl group from methane is significantly lower than that of a methanol-derived methyl group at current pricing.
DOW Corning successfully developed a highly selective Cu-based catalyst and a separation unit to recover methyl chloride from unreacted non-condensible effluent streams. Construction of a bench-scale reactor for optimization of catalyst and process condition studies is nearing completion. This project is an example of government-industry collaboration on technology development. PETC will provide catalyst expertise, while Dow will provide engineering experience in commercialization of technology. Dow will have a cost-effective process for producing methyl chloride for its silicone business, and PETC will have an improved first step in its methane to gasoline process. Such industrial cost participation promotes technology or technical know-how transfer to target segments of industry and enhances U . S . competitiveness.
2) The objective of the MIT project is to develop a process for converting methane to solid metal carbides that can be easily stored, transported, and hydrolyzed to acetylene or methyl acetylene, which are reactive precursors to higher hydrocarbons. MIT researchers are investigating the use of a thermal plasma reactor to cause decomposition of methane into an ionized, electrically conducting plasma followed by energetic reaction with alkaline metal oxides, such as calcium or magnesium oxides, to form corresponding carbides. Stoichiometrically, these reactions are net hydrogen producers.
MIT performed a thermodynamic simulation study to determine equilibrium compositions for the Ca-C-H-0 and Mg-C-H-0 systems. It was observed that a significant driving force exists for converting methane to carbides at 2100 K. Although energy intensive, such a process will be useful for on-site upgrading of remote natural gas.
3) IGT is investigating the catalytic reaction of methane with hydrogen sulfide to carbon disulfide, followed by subsequent conversion of the carbon disulfide to gasoline range hydrocarbons. The second step is the MOBIL process. Reaction of methane with sulfur to make carbon disulfide is known. The novelty of this process, however, is the reaction with hydrogen sulfide (instead of sulfur), which results in the net production of hydrogen for use in the second step. In the second step, carbon disulfide is reacted with hydrogen, regenerating hydrogen sulfide for recycle to the first step.
IGT prepared several proprietary transition metal sulfide catalysts for the methane/hydrogen sulfide reaction. These catalysts have been used to investigate the decomposition of hydrogen sulfide. Hydrogen sulfide decomposition is one of the mechanisms postulated to occur in the first step of the proposed process. At 600-1100 'C, and ambient pressure, one catalyst gave hydrogen sulfide decomposition close to values predicted by equilibrium. However, the thermal background, if any, has not yet been determined for this reaction.
4) PETC in-house methane conversion research has evolved from chemical to photochemical reaction systems. Currently, the researchers are investigating the production of methanol from the photochemical reaction of methane and water. This project combines interesting chemistries from several different technology areas and could result in a commercially viable process.
CONCLUSION The USDOE Gas-to-Liquids R&D portfolio considers technical and policy objectives, and identifies key energy policy goals in the implementation of the program. The energy policy goals are based on balancing the economic, environmental, and energy security
1010

objectives. The major policy thrusts for evaluating investments in the natural gas conversion/upgrading technology projects are energy security, economic growth, environmental quality improvement, and fortifying scientific foundations. The criteria for evaluating investments are based on how potential R&D activities can assure a secure, fuel-diverse, and environmentally sensitive energy sector.
Technological advances are critical to achieving the Nation's energy, economic, and environmental objectives and maintaining U.S. competitiveness in a rapidly advancing global economy. Growth in economic productivity arises principally from the introduction of new technology into the market place. The PETC Gas-to-Liquids conversion R&D program is based upon these convictions.
1.
2.
3.
4.
5. 6.
7 .
8. 9.
10.
REFERENCES Energy Information Administration, U . S . Crude Oil, Natural Gas, and Natural Gas Liquid Reserves, p 25, 1991 Annual Report. Energy Statistics, vol 15, No. 3, p 25, Third Quarter 1992. A publication of the Institute of Gas Technology, Chicago, Illinois. Quarterly Review of Methane from Coal Seams Technology, vol 11, No. 1, p 2, August 1993. A publication of the Gas Research Institute. Speight, J. G., Fuel Science and Technology Handbook, Marcel Dekker, Inc., 1990. Oil & Gas Journal, NOV 29, 1993, p 80. Octane Week, vol IX, NO. 10, p 1, March 7, 1994. A Hart Publication. Also presented at the Alternate Energy '93, Council on Alternate Fuels, Colorado springs, Colorado, April 27-30, 1993. Eisenberg, B . , "Advanced Natural Gas Conversion Technology For Remote Natural Gas Utilization," preprint, International Symposium on Gas Conversion and Utilization, The Catalysis Society of Metropolitan New York, May 9-11, 1994. The Oil Daily, Wednesday, August 23, 1989, p 3. Anderson, J. R., Applied Catalysis, vol. 47, p 177-196, 1989. Elsevier Science Publishers B . V . , Amsterdam. Proceedings of Liquefaction and Gas Conversion Contractors' Review Conference, Eds. Rogers, S and P. Zhou. U.S. Department of Energy, Pittsburgh, Pennsylvania, September 27- 29, 1993.
1011

METHYLATION OF ETHYLENE OVER LEWIS-ACID CATALYSTS
M.V.C. Sekhar Energy Research Laboratories, CANMET, Natural Resources Canada, 555 Booth Street,
Ottawa, Canada, KIA OG1 [email protected]
Keywords: Alkylation, Lewis-acids, Methane conversion
INTRODUCTION
As a major constituent of natural gas, methane is abundant and is a relatively inexpensive feedstock for a variety of chemicals. The use of methane as a fuel is straightforward. Consequently, over the years, considerable research has been conducted to develop technologies for its efficient utiliition. Work' on adsorbents for storing natural gas on-board automotive vehicles promises to expand its use considerably. Conversely, the use of methane as a chemical feedstock requires either the energy- and capital-intensive production of intemediate synthesis gas or its thermal cracking to a range of hydrocarbons. In recent years there has been a great deal of interest in processes" that convert methane directly to olefins, methanol and other functionalized methane derivatives.
Among the various conversion processes currently under development, the Oxidative Coupling (OC) route is the most promising. With increased attention being given to OC process, engineers have also begun outlining the corresponding reaction engineering aspects. The OC of methane rich natural gas yields a dilute olefin stream. At 25% hydrocarbon conversion, the ethylene in the dry reactor effluent is about 596, with some propylene and other hydrocarbons. Because of the presence of large amounts of unconverted methane in the effluent, product separation is one of the main points of optimization in the existing oxidative coupling technology. Consequently, a processing scheme which does not require further separation of the product of the OC rector would be of considerable advantage. Reactions between methane and ethylene using a number of solid acids have also been reported by a number of a ~ t h o r s ~ - ~ in the past. However, some of these experiments were conducted at temperatures higher than ambient. In this paper we report some of the results obtained at ambient temperature as part of a screening program for developing catalyst systems for cureacting methane with ethylene to produce higher hydrocarbons.
PROCEDURES
Cadyst preparation. The catalyst that was most extensively tested was a mixture of NbF, and AIF,. The catalysts were prepared using anhydrous hydrogen fluoride as a solvent. The metal fluorides were first physically mixed and then dissolved in anhydrous hydrogen fluoride. The mixture was stirred for about an hour, then the excess HF was allowed to evaporate by heating the mixture to about 100°C for several hours.
Experimental conditions. All experiments were canid out in a continuous flow fixed bed micro-reactor with a catalyst volume of between 5 and 10 mL. Experiments were conducted at two pressures, ambient and 10 atm. On line chromatography was used for product analysis. Samples were also collected and analyzed by off-line GC-MS. Experiments were preformed with two different ratios of methane and ethylene. Nitrogen was used a tracer in several experiments in order to obtain a quantitative measure of the conversions. The catalysts were used in the form of fine powders and was diluted with dried sand or teflon chips.
RESULTS AND DISCUSSION
A number of reactions between methane and ethylene and other olefins are thermodynamically favoured even at ambient temperature, provided the products are alkanes, viz., (reactions 1 and 2)
CH, + GH, C&H, (1) AGO = -9.7 (kcaI/mol)
CH, + C&H, @ C4Hlo (2) AGO = -4.5 (kcallmol)
1012

CH, + C,H, P C,& + H, (3) AGO = +10.9 (kcaVmol)
2 CH, + C& P C,H, + 2H2 (4) AGO = +21.9 (kacVmo1)
The formation of unsaturates (reactions 3 and 4) are associated with positive free energy change at ambient temperature. Self-oligomerization of ethylene to alkenes, however, is thermodynamically feasible:
2 GH, P i-C,H, etc. (5) AGO = -18.7 (kcavmol)
Table 1 compares the ethylene conversions obtained for reaction between ethylene and methane for two different methandethylene feed ratios. The corresponding product dishibutions, excluding unreacted methane and ethylene are shown in Table 2. Using a 7:l molar ratio of methme to ethylene, almost complete conversion of ethylene is obtained, whereas at a higher ethylene content in the feed, conversions are reduced by half. The ethylene conversions continue to remain higher when the feedstream is richer with respect to methane. The presence of Cs hydrocarbons, n-pentane and 2-methyl butane, along with traces of propane suggests the participation of methane in the reaction sequence, since oligomerization of ethylene alone should yield even numbered unsaturated hydrocarbons. However, the methane conversions in these experiments were less than what would be expected based on the primary alkylation reaction (reaction l), suggesting a larger contribution from oligomerization. The absence of olefins in the product spectrum resulting from such oligomerization is probably due to secondary reactions.
When ethylene alone was used as a reactant, the conversions of ethylene are much lower than when methane was also present in the feed mixture (Table 3). The product spectrum in the case of ethylene only experiments, is qualitatively similar to the case where methane was also present, however, the product is relatively richer in heavier hydrocarbons (Table 4). Small amounts of methanewas also detected when ethylene alone was used as a feed, indicating that cracking of heavier hydrocarbons had occurred under these experimental conditions. The cracking also could explain the observation of negative methane conversions in some experiments. The absence of propane and butenes could be explained by the following reaction sequences. Propane which is formed by the primary alkylation reaction (reaction l), undergoes ethylation with ethylene to produce a C, W e (reaction 6).
+ C3Hg * CsHn (6)
Oligomerization of ethylene produces butenes (reaction 5) as intermediates, which are alkylated by methane, also producing Cs hydrocarbons (reaction 7). A similar reaction involving the alkylation of isobutane by ethylene was recently reported', producing mainly h e m e s in addition to a variety of other alkanes and alkenes formed by secondary reactions.
By far the most abundant C, hydrocarbon detected was isopentane and its formation can be explained by both of the above reactions. The formation of isobutane as the most abundant hydrocarbon product suggests extensive cracking of the C5 and C, species (reaction 8).
The CH, species could then be hydrogenated to methane by abstracting hydrogen from residual HF that was used in the preparation of the catalyst. Such cracking followed by hydrogenation could also explain the negative conversions of methane that was observed in a number of instances.
In order to discern the extent of the incorporation of methane in the reaction product, an experiment was performed using 13CH, and unlabelled ethylene. The products were collected and analyzed off-line using a Porapak Q column and a mass selective detector. The mass spectrum of isobutane form reactions using labelled and unlabelled methane were then compared.
1013

BY measuring the abundance of the parent ions it was possible to quantify the amount of hbelled isobutane present in the sample. From these data it was concluded that there was incorporation of at least one labelled carbon in the C, skeleton and it was ednated that 5 % Of the total isobutane formed contained the labelled I3C. By comparison, the methane ConVerSiOn for the same set of experiments was about 9%. This discrepancy can arise due to the fact that the formation of isobutane probably involves several alkylation and cracking steps. In such a scenario, the labelled carbon could be lost as either methane or some other hydrocarbon. The PreSenCe of labelled carbon in the other products such as 2,2dimethyl butane or 2,3dimethyl butane could not be established unambiguously due to the complex mass spectral fragmentation pattWn of these compounds. The GC-MS analysis also weald the formation of traces (about 50 ppm) of two fluorinated hydrocarbons, fluorwthane and 1,ldifluoroethane.
SUMMARY
The catalytic activity of metal fluoride based Lewis acid catalysts for the coreaction between methane and ethylene was studied. It was found that whereas substantial conversion of ethylene could be obtained even at ambient temperatures, methane conversions were much lower. Experiments using labelled methane confirmed the participation of the methane in the reaction sequences. The primary products were branched C, and C5 saturates, with smaller amounts of straight chain hydrocarbons. The activity of the catalyst was found to decrease sharply with time, with the product spectrum shifting towards C, and higher hydrocarbons.
ACKNOWLEDGEMENTS
This research was supported in part by the federal Panel on Energy Research and Development (PERD) and by the Consortium on Natural Gas Conversion, sponsored by Amoco Corporation, Canadian Occidental Petroleum Limited, Centre des technologies du gaz nature1 and Shell Canada Limited. I would like to express my thanks to N. Horvat for performing some of the preliminary experiments and M. Coffin for assistance with data analysis.
REFERENCES
1. R. Chahine and T.K. Bose, Twentieth Biennial Conference on Carbon, Santa Barbara, June 23-28, 1991.
2. Preprints Amer. Chem. Soc. Division of Petr. Chem., Symposium on Methane and A h e conversion, 39(2), 1994.
3. C. Mirodatos, J.M. Basset, G.A. Martin and J. Saint-Just, Eds., Catalytic Methane Conversion, Proceedings of the Third Fluropean Workshop on Catalytic Methane Conversion, Villeurbanne, France, May 27-29, 1991, Catalysis Today, 13(2-3), 1992.
4. PrepMts Amer. Chem. Soc. Division of Petr. Chem., Symposium on Natural gas Upgrading II, 37(1), 1992.
5. G.A. Olah, J.D. Felberg and K. Lammertsma, J. Am. Chem. Soc., m, 6529 (1983). 6. M.S. Scurrell, Appl. Catal., 34, 109 (1987). 7. F.T.T. Ng, C.R. Rourke and J. Lynn, F’mgress in Catalysis, K.J. Smith and E.C.
Sanford (Eds.,) Elsevier, 1992, p.31. 8. J-M. Goupil, J-L. Poirier and D. Comet, Ind. Eng. Chem. Res., a, 712 (1994).
Table 1. Comparison of Ethylene Conversions (mol%) for different feed compositions
Experimental conditions: Catalyst: lg; Tempemure: ambient; Pressure: 10 atm; Total flow: 40 Wmin.
I Time(min) 15 45
Methandethylene (7:l)
I 1014

Table 2. Product composition (mol%) excluding unconverted methane and ethylene.
Methandethylene (71)
Argon/ethylene (7:I)
Experimental conditions: same as in Table 1. Methand Ethylene Mol Ratio: 3: 1 (upright data); 7: 1 (italics data)
93.8 5.34 1.00 1.07 0.71
76.7 23.5 5.25 3.70 3.70 2.92 2.72
Component / Time(&) 14 Propane I 0.03 I
I isobutane 160.8
isobutane
n-butane
n-butane
isopentane
I isopentane 119.2
n-pentane
n-pentane
45 I 73 I 102
0.15 I I
3.6 14.06 16.5 ;;; I1.5 11.2
25.9 28.9 * 0.13
158 I 189 ' 1 217 * 65.3 63.8
8.12 18.81 13.49
Table 3. Ethylene conversions for ethylene oligomerization vs methandethylene coupling
Experimental conditions: Catalyst: Ig; Temperature: ambient; Pressure: 10 atm; Total flow: 120 mUmin.
i Time(&) I 5 I 33 I 62 1 90 I 119 I 219 I 251
\
i
1015

Table 4. Product composition (mol%) excluding unconverted methane and ethylene.
E l k
Propane
Experimental conditions: same as in Table 3. With ethylene alone as feed, argon was added to balance the total flow. Methand Ethylene Mol Ratio: 7: 1 (upright data); Ethylene alone (italics data)
3.25
0.02
n-butane
n-butane
10.02 I I I I I I
2.00 3.44 2.44 2.29 2.36
4.04 2.73 2.86 2.85 3.35 3.46
I isobutane 163.1 126.3 121.0 I 19.6 118.7 I I
isopemane
n-pentane
n-pentane
I isobutane 157.7 150.7 121.6 I 1 9 r I 1 5 . x
16.2 15.6 13.4 12.7 11.6 11.6
0.04 0.80 1.99 0.70 0.60
0.04 0.06
C,, hydrocarbons
C,, hydrocarboons
I isopentane 117.4 115.3 113.7 I 13.4 I 12.9 I I
17.4 54.2 60.9 64.0 65.4
18.8 31.2 62.9 65.5 69.2 69.6
1016

GASOLINE FROM NATURAL GAS BY SULFUR PROCESSING
Erek J. Erekson and Frank Q. Miao Institute of Gas Technology
Chicago, IL 60616
KEY WORDS:
ABSTRACT The conversion of natural gas to transportable liquids continues to be an area of research interest. New processes for the direct oxidation of methane either to ethylene or to methanol, are hampered by apparent yield barriers due to COX production. In addition new processes for fuel production fkom non-petroleum sources such coal, shale oil, tar sands are often hampered by the need for hydrogen. The subject process circumvents these difficulties in fuel production. The process consists of two steps that each utilize catalysts and sulfur containing intermediates:
Sulfur Catalysts, Methane conversion, CS,
1) to convert natural gas to CS,, and 2) to convert CS, to liquid hydrocarbons.
The general equations for the two steps are:
1) CH, + 2 H,S -+ CS, + 4H, 2) CS, + 3 HZ -+ [-CH,-] + 2 H,S
Total CH, + [-CH,-] + H,
H,S is recycled, and the overall process is a net hydrogen producer.
A catalyst is being developed for the first step. The second step has been studied by others'. Initial results are reported. Engineering aspects and economic implications of the overall process will be discussed.
INTRODUCTION Natural gas is an abundant resource in various parts of the world. The
major component of natural gas is methane, often comprising over 90% of the hydrocarbon fkaction of the gas. The expanded use of natural gas as fuel is often hampered because of difficulties in storage and handling a gaseous fuel. This is especially true for natural gas in remote areas such as the north slope of Alaska. It is desirable to convert natural gas to more valuable liquids. The successful implementation of this process would decrease dependence on imported oil for transportation fkels.
There are two commercialized methods for converting natural gas to gasoline range liquids:
1) Fischer-Tropsch synthesis 2) Mobil's MTG process.
Each has two basic steps: 1. Removal of sulfur compounds (H,S, COS and mercaptans with sulfur
adsorbing guard beds to prevent breakthrough of sulfur to the catalysts).
2. Steam reforming to make synthesis gas which requires 2 moles of superheated steam for every mole of methane.
In Fischer-Tropsch synthesis, the third step is the conversion of synthesis
1017
c

,
I
I
gas to hydrocarbons. A fourth step consisting of mild hydrocracking is necessary in high wax producing Fischer-Tropsch synthesis such as Shell’s Middle Distillate Synthesis Process. In Mobil’s MTG process, the third step is methanol synthesis, and the fourth step is methanol conversion to gasoline liquids is required. The commercial steps listed above; Le., steam reforming, methanol synthesis, or Fischer Tropsch synthesis, require the removal of sulfur compounds present in natural gas down to less than 0.1 ppm. This gas clean-up step adds cost, but it is necessary because the catalysts are quickly poisoned by sulfur compounds.
IGT has begun investigating a two-step process that uses H,S as a reactant to convert natural gas to gasoline-range liquids. Sulfur, which has been considered as a poison, is used as a reactant in the proposed process. This method of methane conversion utilizes H,S to catalytically convert methane to CS,. Then CS, plus hydrogen can be catalytically converted to gasoline range hydrocarbons. All of the H,S generated during the CS, to gasoline reaction is recycled. This process does not require steam reforming nor the manufacture of hydrogen.
There are two main steps involved in this process: 1) CH, + 2 H,S + CS, + 4 H, 2) CSZ + 3 Hz -+ [-CHz-] + 2 HZS
Total CH4 + [-CHZ-] + H,
H,S is recycled, and the overall process is a net hydrogen producer
Catalysts are being developed for the first step. The second step which has been demonstrated by researchers at Mobil’ will be studied later in this project to try to improve yields of gasoline range hydrocarbons. In this paper, we will discuss the ASPEN simulation as well as experimental results for step 1.
EXPERIMENTAL Figure 1. shows the schematic diagram of catalysis reactor system for
step 1. Feed gas flows of hydrogen sulfide, nitrogen and methane are controlled by mass flow controllers(Brooks Instruments 5850). Gas flow rates are calibrated by a dry test meter(SINGER, American Meter Company). The feed gas flows through the adapter into 42 inch long, 22 mm I.D. and 25 mm O.D. quartz reactor. The joint which connects with adapter and quartz reactor were sealed by TFE sleeve. There are three indents around quartz reactor at 26 inch from the top. The catalyst is held above the indents by a plug of quartz wool. The temperature of catalyst reactor were measured by a type R high temperature thermocouple which is protected by 1/4 inch O.D. ceramic thermowell. The heat was provided by a 2 inch I.D. 32 inch long split tube high temperature furnace with maximum temperature 1540°C. (Series 3420, APPLIED TEST SYSTEMS, Inc). There is a sample point just after the reactor. The product gas is sampled before it flows into condenser. The gases were analyzed by GC. The product gas fiom the catalyst reactor flows into a liquid condenser which is put into an ice bath. The sulfur was cooled and condensed in condenser. After the condenser product gases flow into a 30% Hydrogen peroxide and 6M Sodium hydroxide solution to scrub hydrogen sulfide. The composition of gas from the scrubber was also analyzed by GC. The gas flow rate was measured by a wet test meter(PRECISI0N WET TEST METER, Precision Scientific Co) before it is released into the vent system.
1018

Gas samples are analyzed by Gas Chromatograph (HP5890) with a thermal conductivity detector (TCD) and a flame photometric sulfur detector (FPD). A 1/8-inch diameter IO-f i long HayeSep C 80/100 column(SUF’ELC0 IC.) was used for gas separation. In order to measure hydrogen in the TCD detector, Argon was used as the carrier gas.
RESULTS AND DISCUSSION 1) Equilibrium calculations
Equilibrium calculations were performed with ASPEN PLUS process simulator. The Gibbs Energy Minimization method was used for the simulation of equilibrium conditions. Six independent reactions have been taken into account for the chemical equilibrium study:
CH4+2H,S = 4H,+CS, 2H,S = 2H,+S, 2CH, = H,+C,H, C,H, = H,+C,H, C,H, = C,H,+H,
2CH,+S, = 2CH,SH
Equilibrium for three feed gas compositions at 700 to 1200°C was calculated using the following feed gas compositions:
& H L - H,S/CH, Ratio
Case 1 3.33 % 6.67 % 90 % 2 Case 2 2.00 8.00 90 4 Case 3 1.11 8.89 90 8
Nitrogen was added as a diluent for all cases studied. Carbon graphite formation was not included in these calculations. At the temperatures of these equilibrium calculations, carbon graphite is so much more stable thermodynamically than methane or the other carbon compounds that including it would result in all the carbon going to graphite.
At equilibrium significant amounts of CS, and H, are predicted. In Figures 2, 3 and 4 equilibrium concentrations of CS, and CH, as well as experimental results are shown. The concentration of CS, at equilibrium increases with temperature. At 1100°C nearly all of CH, was converted in all three cases. There was very little of C,H,, C,H,, C,H, as well as CH,SH calculated in the products. The amount of C,H,, C,H,, C,H, as well as CH,SH was less than lo-,. In comparing the equilibrium calculations in Figures 2, 3 and 4 it appears that increasing the temperature as well as increasing H,S/CH, ratio will increase CS, concentration and decrease the CH, concentration at equilibrium.
2) Experimental Results Reactor tests of IGT-MS-105, a sulfide catalyst, were performed
using the same feed compositions as cases 1, 2 and 3 above. The experiments were performed at atmospheric pressure and in the range from 700 to 1200°C. The residence times were 1 to 5 seconds. 40 g. catalyst was put into the reactor. Only H,, CS, , S, as well as small amount of carbon soot were found in product steam. Figure 2, 3 and 4 show the concentration of the CS, in the product steams for these experiments as well as equilibrium concentrations calculated for cases 1 through 3. Hydrogen was
1019

I
formed, but is not shown in these figures. As indicated from Figure 2. at 7OOOC CS, concentration is low compared to the equilibrium line. Catalyst activity increases until at 1 I O O T , CS, concentration is approaches close to equilibrium. The yield of CS, from methane at 1 100°C for all three cases was above 90%. Methane concentration drops off as temperatures increases. In Figure 2. at llOO°C the concentration of methane for the 5 second residence time experiments falls below the equilibrium line. This may be attributed to the formation of some carbon solids in the reactor. As mentioned above carbon solids were not included in the equilibrium calculations. Carbon balances for these runs were in the range of 90 to 95%.
The results in this paper indicate that a catalyst for the first step, the conversion of CH, and H,S to CS, and hydrogen, has been found. We are continuing to develop catalysts from this beginning.
ACKNOWLEDGMENT
This work was supported by the U.S.Department of Energy, Pittsburgh Energy Technology Center, Pittsburgh, Pennsylvania under Contact No. DE- AC22-93PC92114.
REFERENCES 1. C.D.Chang, US patent #4,543,434, Sep.24, 1985
Pressure Gau@ 0 Thermocouple *' Mass Flow Contloll r Vent t
Wet test met J
Scrubber 1. Liquid
- Figure 1. Schematic diagram of flow reactor system
1020

C62 at 5 aec.
700 800 900 1000 1100 Temperature ( C )
Figure 2. CS2 production at H2S/CH4=2. for catalyst 1
CS2 at 5 aec.
Temperature (C)
Figure 3. CS2 production a1 H2S/CH4=4. for IGT-MS-105 catalyst,
cs2 t.t 5 (lee.
CS2 at 1 DOC.
CH4 at 5 aec,
700 800 900 1000 1100 Temperature IC)
Figure 4. CS2 production at H2S/CH4=8. for IGT-MS-105 catalyst
1021
I
I
I

CERAMIC MEMBRANES FOR GENERATION OF PARTIAL-OXIDATION PRODUCTS FROM METHANE
U. Balachandran, J. T. Dusek. S. M. Sweeney, R L. MievlIle. and P. S. Maiya
Argonne National Laboratory, Argonne, IL 60439
M. S. KleeRsch. S. Pei. and T. P. Kobylhski Amoco Research Center, Naperville. IL 60566
A C. Bose US. Department of Energy
Pittsburgh Energy Technology Center. Pittsburgh. PA 15236
Keywords: Dense membrane, mixed conductor. syngas
INTRODUCTION The most significant cost associated with partial oxidation of methane to syngas is that of the oxygen plant. In this paper, we offer a technology that is based on dense ceramic membranes and that uses air as the oxidant for methane-conversion reactions, and eliminating the need for an oxygen plant. Certain ceramic materials exhibit both electronic and ionic conductivities [of particular interest is oxygen-ion conductivity). These materials transport not only oxygen ions (functioning as selective oxygen separators), but also electrons. back from the reactor side to the oxygen/reduction interface. No external electrodes are required and if the driving potential of transport is sufficient, the partial oxidation reactions should be spontaneous. Such a system will operate without a n externally applied potential. Oxygen is transported across the ceramic material in the form of oxygen anions, not oxygen molecules.
Recent reports in the literature suggest that ceramic membranes made of these mixed conductors can successfully separate oxygen from air a t flw rates that could be considered commercially feasible, and thus can have potential applications for improving the economics for methane conversion processes [ 1-1 11.
EXPERIMENTAL Two ceramic powders of the La-Sr-Fe-Co-0 system with differing stoichiometries, designated SFC-1 and SFC-2. were made by solid-state reaction of the constituent cation salts. The stoichiometry of SFC-1 is the same as that of Lao.zSro.8Feo.6Coo.40~. which was used by Teraoka et al. I1.21. SFC-2 is an improved version of SFC-1. Appropriate amounts of La[N03)3. SrC03. Co(N03)2,6H20, and Fez03 were mixed and milled in isopropanol with ZrO2 media for =15 h. When dry, the mixtures were calcined in air at =850°C for -16 h. with intermittent grinding. After final calcination. with an agate mortar and pestle, we ground the powder to a n average particle size of =7 pm. The resulting powders were
1022

characterized by X-ray diffraction (W). scanning electron microscopy. and thermal analysis, and analyzed for particlesize distribution.
The powder was made into a slip containing a solvent, dispersant, binder. and plasticizer. Membrane tubes were fabricated by extrusion of the slip to an outside diameter of ~ 6 . 5 mm. lengths u p to =30 cm. and wall thicknesses of 0.25-1.20 mm. The tubes were sintered at -12OO0C for 5-10 h in stagnant air.
An Rh-based reforming catalyst was used inside the tubes. In addition to 80% methane, the feed gas contained 20% argon, which was used as a n internal calibration standard for gas analysis. Both the feed gas and the effluents were analyzed with a gas chromatograph. Outside the tube, air was the source of oxygen.
RESULTS AND DISCUSSION Tubes of SFC-1 lasted only a few minutes as a conversion reactor operating at 85OoC: they then broke into several pieces. XRD patterns of the original samples of SFC-1 were recorded a t 850°C in Ar-02 gas mixtures. The phase behavior of SFC-1 in 1 and 20% 0 2 is shown in Fig. 1. In an oxygen-rich (20% 0 2 ) atmosphere, the material was a cubic perovskite. However, once the oxygen partial pressure was lowered below 5Oh. the cubic phase transformed to a n oxygen-vacancy-ordered phase. New peaks appeared in the XRD pattern, as seen in Fig. 1 (1% 02). It is important to note that this material expanded substantially after the phase transition: this can be seen from the change in the position of the Bragg peak near 32". Evidently, this peak in the oxygen-vacancy- ordered phase (in 1% 0 2 ) was shifted to the low-angle (larger d-spacing) side of the corresponding peak in the cubic perovskite phase (in 20% 02).
Detailed thermogravimetric analysis (TGA) 1121 showed that the oxygen content x of the sample in 1% 0 2 was -0.1 lower than that in a sample in 20% 0 2 . Dependence of the unit cell volume on the oxygen content of the sample has been established by comparing lattice parameters. For example. the volume of the primitive perovskite cell Vp is 57.51 A3 for x = 2.67 and 59.70 A3 for x = 2.48. These results show that this material expands as oxygen is removed. Such behavior suggests that an electronic effect is predominant in influencing the specific volume: otherwise, a simple size effect would cause the lattice to shrink. By linear interpolation of the above results, we predict that a decrease in x of 0.1 will result in an increase in Vp by -2%.
Both XRD results and TGA data 1121 give a clear picture of the state of SCF-1 under reaction conditions. When the membrane tube is operating, high oxygen pressure 1s maintained outside the tube and low oxygen pressure is maintained inside the tube. Before the tube is brought up to high temperature, the distribution of oxygen is uniform. Upon heating, the tube begins to lose oxygen that was incorporated during the fabrica- tion process. Moreover, the material on the inner wall loses more oxygen
.'
1023

than that on the outer wall. As a result, a stable oxygen gradient is generated between the outer and inner walls. I t follows that the material, depending on its location in the tube, may contain different phase constituents. It is probable that the inner zone of lower oxygen content contains more ordered oxygen vacancies and hence less oxygen permeability.
The most remarkable factor, which can cause tube fracture, appears to be the lattice mismatch between the materials on the inner and outer walls of the tube. The difference in composition between the inner and outer zones leads to a n expansion of 2%. which is equivalent to thermal expansion caused by a 333°C temperature increase.
In comparison, SFC-2 exhibited a remarkable structural stability a t high temperature. as shown in Fig. 2. No phase transition was observed in this material as oxygen partial pressure was changed. Furthermore. the Bragg peaks stayed at the same position regardless of the oxygen partial pressure of the atmosphere. The mechanical properties of the SFC-2 were measured by conventional methods, Le.. bulk density was measured by the Archimedes' principle: flexural strength, in a four-point bending mode: fracture toughness, by a single-edge notch method 1131: and Young's modulus, shear modulus, and Poisson's ratio, by ultrasonic methods 1141. The thermal expansion coefficient was measured in a dilatometer. The results are shown in Table I.
Table I. Physical and mechanical properties of SFC-2
Property Value
Bulk density, g.cm-3
Coefficient of thermal expansion x 10-6/OC (200-8OO0C) Flexural strength, MPa Fracture toughness, M P a 6 Young's modulus, GPa 1 2 4 f 3 Shear modulus, GPa 4 8 f 2 Poisson's ratio 0.30 f 0.01
4.81 k 0.04
14.0
120.4 f 6.8 2.04 f 0.06
Percent of theoretical density 93
Figure 3 shows the probability of failure vs. flexural strength (Weibull statistics) for SFC-2 (151. The Weibull modulus was observed to be 15, indicating only moderate scatter in the strength data. Measured room- temperature properties were used to develop failure criteria for the membranes under actual reaction conditions in a plant where methane is expected to be at higher pressures. Figure 4 shows the computed allowable external pressure on SFC-2 as a function of tube wall thickness. These calculations were based on the assumptions that the tensile strength is =0.67 times the flexural stress and that the compressive strength of SFC-2 is greater than its tensile strength by a factor of 8.
1024

These results suggest an ability of this ceramic material to undergo rea- sonable stresses that might occur in a commercial reactor. Tubes made of this material, unlike those made of SFC-1. should not fracture under reactor conditions. Figure 5 shows the conversion data obtained with a membrane tube made of SFC-2 and operated a t 850°C for -70 h. As seen from Fig. 5, methane conversion efficiency is >98%. and CO selectivity is 90%. As expected. measured H2 yield is about N c e that of CO.
The role of the catalyst in the transport of oxygen across the membrane of a n SFC-2 tube was tested without the reforming catalyst. The results from a run of -350 h are shown in Fig. 6. The feed gases are the same as before. In the absence of a catalyst, the oxygen that was transported through the membrane reacted with methane and formed C02 and HzO. As seen in Fig. 6. methane conversion efficiency was ~ 3 5 % and CO2 selectivity was ~ 9 0 % . Under our operating conditions, the measured oxygen flux was ~ 0 . 3 std cm3/cm2/min. Figure 7 shows the result of a reactor run made under more severe conditions and in the presence of a catalyst for >500 h. Conversion and selectivities are similar to those of the 350-h run but the oxygen flux was one order of magnitude greater. Some small deactivation in oxygen permeation rate was observed.
CONCLUSIONS Long tubes of La-Sr-Fe-Co-0 (SFC) membrane have been fabricated by plastic extrusion. Thermodynamic stability of the tubes was studied as a function of oxygen partial pressure by high-temperature XRD. Mechanical properties were measured and found to be adequate for a reactor material. Performance of the membrane strongly depended on the stoichiometry of the material. Fracture of certain SFC tubes was the consequence of an oxygen gradient that introduced a volumetric lattice difference between the inner and outer walls. However, tubes made with a particular stoichiometry (SFC-2) provided methane conversion efficiencies of >99% in a reactor. Some of the reactor tubes have operated for up to =500 h.
ACKNOWLEDGMENTS Work at Argonne National Laboratory is supported by the US. Department of Energy. Pittsburgh Energy Technology Center, under Contract W-31- 109-Eng-38.
REFERENCES 1. Teraoka. Y., Zhang. H. M.. Furukawa. S.. and Yamozoe. N.. Chem.
Lett.. 1743, 1985. 2. Teraoka. Y.. Nobunaga. T., and Yamazoe. N., Chem. Lett., 503, 1988. 3. E. A. Hazbun. U S . Patent 4.791.079. Dec. 13, 1988. 4. Omata, K.. Hashimoto. S., Tominaga, H.. and Fujimoto. K., Appl.
Catal., L1. 52. 1989. 5. Balachandran. U.. Morissette. S. L.. Picciolo. J. J.. Dusek. J. T.,
Poeppel. R. B.. Pei, S.. Kleefisch. M. S.. Mieville. R. L.. Kobylinski, T. P.. and Udovich, C. A.. Proc. Int. Gas Research Conf.. ed. by H. A.
1025

6.
7.
8. 9. 10.
11.
12.
13.
14.
15.
Thompson (Government Institutes, Inc.. Rockville. MD 19921.
Mazanec. T. J.. Cable. T. L.. and Frye. Jr.. J. G., Solid State lonics.
Cur. T. M.. Belzner. A.. and Huggins. R. A.. J. Membrane Sci. 151. 75. 1992. Cable. T. L.. European Patent EP 0399 833 Al. Nov. 28. 1990. Cable. T. L.. European Patent EP 0438 902 A2. July 31. 1991. Bose. A. C.. Stigel. G. J.. and Srivastava. R. D., "Gas to Liquids Research Program of the U.S. Department of Energy: Programmatic Overview." paper to be presented at the Symposium on Alternative Routes for the Production of Fuels, American Chemical Society National Meeting, Washington. DC. August 2 1-26. 1994. Proceedings of Coal Liquefaction and Gas Conversion Contractors Review Conference, Eds. S. Rogers e t al.. US. Department of Energy. Pittsburgh Energy Technology Center, Pittsburgh. FA. September 27-29, 1993. Pel. S.. Zajak. G. W.. Faber, J.. Mieville. R. L.. Udovich. C. A.. and Kleefisch. M. S.. to be published. Brown, Jr.. W. F.. and Strawley. J. E., ASTM STP 410. Philadelphia. PA, 1967. Kradtkramer. J.. and Krautkramer. H.. Ultrasonic Testing of Materials, (Springer-Verlag. New York. 1983). Weibull, W.. J. Appl. Mech.. 293. 18. 1951.
PP. 565-573.
111. 53-56. 1992.
1026

1027

95 $ '
Hz selectivity II = - I' =R
200
195
185 E
175 2 170. I
180 $
8o0 L A : 10 20 30 40: 50 60 70
0 I ' I I ' ' I ' I I t I ' I t t L -
0 40 80 120 ,160 200' 240 280 320
0.50 % $
0.40 3 5
' C 0.20 g
t 0.10 g E
C
UJ 0.00 2
0
10 E 9 r
7 ;
U
C
8 g
5 2 €
4 :
601 3 5 7 9 11 13 15 17 19 21 3 0
0
6 5
0
1028

EFFECTS OF MASS TRANSFER AND HYDROGEN PRESSURE ON THE FIXED-BED PYROLYSIS OF SUNFLOWER BAGASSE
E. Putun (1). O.M. K o c h (I), F. Gercel ( I ) , E. Ekinci (*), J. Andresen (3) M.M. Maroto-Valer (3) and C.E. Snape (3)
(1)
(2)
(3)
Anadolu University, Dept. of Chemical Engineering, Faculty of Engineering & Architecture, 26470 Eskisehir, Turkey Istanbul Technical University, Dept. of Chemical Engineering, 80626 Istanbul, Turkey University of Strathclyde, Dept. of h e & Applied Chemistry, Glasgow G1 IXL, UK
Keywords: Sunflower bagasse, pyrolysis, hydropyrolysis.
INTRODUCTION There are a number of waste and biomass sources being considered as potential sources of fuels and chemical feedstocks (1). The ecomomics for biomass pyrolysis are generally considered to be most favourable for (i) plants which grow abundantly and require little cultivation in arid lands and (ii) wastes available in relatively large quantities from agricultural plants, for example, sunflower and hazel nuts. For the former, one such group of plants is Euphorbiaceae which are characterised by their ability to produce a milky latex, an emulsion of about 30% w/w terpenoids in water. One species in the family, Euphorbia Rigida from Southwestern Anatolia, Turkey is cultivated in close proximity to the sunflower growing regions and their oil extraction plants. The Turkish sunflower oil industry generates 800,000 tons of extraction residue (bagasse) per annum. Thus, both sunflower wastes and latex-producing plants are being considered as feedstocks for a future thermochemical demonstration unit in Turkey. It was demonstrated previously (2) that much higher oil yields can be obtained from Euphorbia Rigida by static retorting than by the traditional method of low temperature solvent extraction (18 cf. 10% daf basis). However, it is well known from studies on coals and oil shales (see, for example, references 3 and 4) that oil yields are severely limited under static retorting conditions and, as a consequence, flash pyrolysis processes, particularly fluidised-beds, have received considerable attention for converting biomass to liquid products (5,6). In contrast, pyrolysis at relatively high hydrogen pressures (hydropyrolysis) has not been widely investigated for biomass. A potential advantage of hydropyrolysis is the ability to upgrade tar vapours over hydroprocessing catalysts (7).
For Euphorbia Rigidu , it was reported previously that an oil yield of ca 40% caould be attained by hydropyrolysis at 150 bar pressure in a well-swept fixed- bed reactor (8). However, the main effect of raising the hydrogen pressure was to decrease the oxygen content of the resultant oil and, thus, on a carbon basis, increase the fraction converted to oil (9). This study extends the previous investigation on Euphorbia Rigidu to sunflower bagasse to ascertain the most appropriate pyrolysis regime for attaining oils in high yield with low oxygen contents,
Fixed-bed pyrolysis (atmospheric pressure) and hydropyrolysis experiments at temperatures in the range, 400-700.C have been conducted on sunflower bagasse to assess the effects of mass transfer and hydrogen pressure on oil yield and quality,. NMR characterisation of the liquid products and chars has been used to assess the extent of aromatisation of the cellulosic structure during pyrolysis.
EXPERIMENTAL Pyrolysis experiments have been carried out on sunflower bagasse samples obtained from both pressing and solvent extraction. For the pressed sample, a number of particle sizes and gas sweep velocities were used in a Heinze retort (40 g sample) with a heating rate of 7.C min-1. A faster heating rate of 300.C min-1
1029

was employed for atmospheric pressure pyrolysis experiments in a well-swept resistively-heated fixed-bed reactor (5 g sample) (10) which was also used for tests with hydrogen pressures of 50, 100 and 150 bar on all the samples investigated.
The product oils have been characterised by elemental and IH NMR analyses and column chromatographic separations, Solid state 13C NMR analysis was conducted on the bagasse samples and a selection of the chars. Cross- polarisation-magic-agIe spinning (CP-MAS) spectra were obtained using a Bruker MSLlOO spectrometer with a contact time of 1 ms.
% -
RESULTS AND DISCUSSION Pvrolvsis Figures 1 and 2 indicate that in the Heinze retort, overall conversions (100 - %char), oil and water yields are fairly independent of both particle size and the sweep gas flow rate for the pressed bagasse sample. As the flow rate is reduced from 600 to 100 cm3, the oil yield decreases by no more than 5% from the maximum value of close to 40% (daf basis). Similarly, the smallest (0.4 mm) and largest (>1.8 mm) particle sizes used give only ca 3% less oil than the intermediate sizes (Figure 2). Indeed, the overall conversions of nearly 80% achieved in the Heinze retort are the same as those in the resistively-heated fixed- bed reactor (Figure 3) where the gas velocity is an order of magnitude greater. The conversions are somewhat lower for the extracted bagasse than for the
42 - gO.4 mm - - -Q- -
* - 0.4-08mm * _._. a-.- o a 1 s m m
-.-.-._._._. - Q --w--------*--------
/-
35 I , 1
0 200 400 600
Nitrogen flow rate, cm3/min
FIGURE 1 EFFECT OF PARTICLE SIZE AND GAS FLOW RATE ON OIL YIELDS IN HEINZE RETORT
5 0 1
I FIGURE 2 EFFECT OF GAS FLOW RATE ON PRODUCT YIELDS IN HEINZE RETORT, 0.8-1.8 mm
1030 I

pressed sample which contains more residual oil. These results suggest that mass transfer restrictions to volatile evolution are much less marked for the sunflower bagasse compared to coals and oil shales where oil yields are generally reduced significantly by decreases in carrier gas flow rate (3.4), as well as increases in particle size. This major difference is probably attributable to the low bulk density of the bagasse. A rotary kiln would thus suffice to ensure that the maximum oil yields are obtained on a pilot plant scale.
H v d r o p ~ Figure 4 compares the oil yields from the extracted bagasse sample with those obtained from Euphorbia Rigida and pure cellulose. Compared to coals and oil shales, the effects of hydrogen pressure on oil yield are seemingly much less pronounced. For the cellulose and Euphorbia Rigida, hydrogen pressure hardly affects oil yield which attains a broad maximum between 30 and 40% as the hydrogen pressure is increased from 50 to 150 bar at 520.C (Figure 4). The variation is somewhat more pronounced for the sunflower bagasse sample where the oil yield reaches a maximum at cu 100 bar and then decreases due to water formation (Figure 4). However, in all cases, hydrocarbon gas yields increase monotomically and char yields decrease with temperature. For example. the methane yield increased from 1.2 to 4.8% (daf basis) at 150 bar pressure for the extracted bagasse.
50 -
(0 45 - 'I . a m 40-
e - m- 3.5 -
6 30-
h
a
- .- . h -
25
ul
1 a
I . , . *
"i . .
zn
Extracted Pressed
-1 I - I - , . I .
300 400 500 600 700
Temperature IC
FIGURE 3 EFFECT OF TEMPERATURE ON CONVERSIONS IN FIXED-BED REACTOR
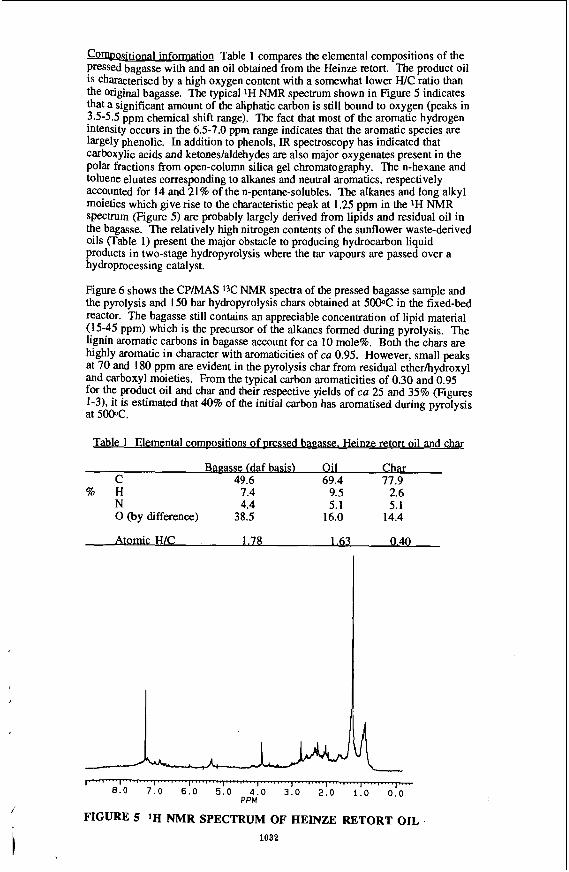
U D m Table 1 compares the elemental compositions of the pressed bagasse with and an oil obtained from the Heinze retort. The product oil 1s characterised by a high oxygen content with a somewhat lower WC ratio than the Original bagasse. The typical IH NMR spectrum shown in Figure 5 indicates that a significant amount of the aliphatic carbon is still bound to oxygen (peaks in 3.5-5.5 ppm chemical shift range). The fact that most of the aromatic hydrogen intensity occurs in the 6.5-7.0 ppm range indicates that the aromatic species are largely phenolic. In addition to phenols, IR spectroscopy has indicated that carboxylic acids and ketones/aldehydes are also major oxygenates present in the polar fractions from open-column silica gel chromatography. The n-hexane and toluene eluates corresponding to alkanes and neutral aromatics, respectively accounted for 14 and 21% of the n-pentane-solubles. The alkanes and long alkyl moieties which give rise to the characteristic peak at 1.25 ppm in the 'H NMR spectrum (Figure 5 ) are probably largely derived from lipids and residual oil in the bagasse. The relatively high nitrogen contents of the sunflower waste-derived oils (Table 1) present the major obstacle to producing hydrocarbon liquid products in two-stage hydropyrolysis where the tar vapours are passed over a hydroprocessing catalyst.
Figure 6 shows the CP/MAS 13C NMR spectra of the pressed bagasse sample and the pyrolysis and 150 bar hydropyrolysis chars obtained at 500.C in the fixed-bed reactor. The bagasse still contains an appreciable concentration of lipid material (15-45 ppm) which is the precursor of the alkanes formed during pyrolysis. The lignin aromatic carbons in bagasse account for ca 10 mole%. Both the chars are highly aromatic in character with aromaticities of ca 0.95. However, small peaks at 70 and 180 ppm are evident in the pyrolysis char from residual etherhydroxyl and carboxyl moieties. From the typical carbon aromaticities of 0.30 and 0.95 for the product oil and char and their respective yields of cu 25 and 35% (Figures 1-3), it is estimated that 40% of the initial carbon has aromatised during pyrolysis at 500.C.
Table 1 Elemental compositions of pressed bagasse. Heinze retort oil and char
- Bagasse (da f basis) Oil Char C 49.6 69.4 77.9
% H 7.4 9.5 2.6 N 4.4 5.1 5.1 0 (by difference) 38.5 16.0 14.4
Atomic WC 1.78 1.63 0.40
\ PPM
FIGURE 5 lH NMR SPECTRUM OF HEINZE RETORT OIL 1032

FIGURE 6 13C NMR SPECTRA OF PRESSED BAGASSE (top), A NITROGEN CHAR (middle) AND A HYDROPYROLYSIS CHAR (bottom)
CONCLUSIONS In contrast to coals and oil shales, oil yields from the sunflower bagasse were found to be largely independent of particle size (<2 mm) and sweep gas velocity with cu 40% w/w oil (dry basis) being obtained at 450-5oO.C in both the Heinze retort and fixed-bed reactor. The use of high hydrogen pressures (> 50 bar) increased the oil yields by up to ca 10% w/w but these increases are much greater when expressed on a carbon basis due to the reduced oxygen contents of the oils. Even at low pressure, it has been estimated that cu 40% of the initial carbon aromatised during pyrolysis.
ACKNOWLEDGEMENTS The authors thank the Science & Engineering Research Council and the Deaprtment of Trade & Industry for financial support (Grant no. GWJ108997). FG thanks British Gas for a University of Strathclyde Scholarship.
REFERENCES 1.
2.
3.
4..
5 .
6. 7. 8.
9.
10.
Sofer, S.S. and Zaborsky, O.R, Biomass enerw conversion processes for energv and fuels, Elsevier Applied Science, London (1981). E. Putun, S. Besler, A.E. Putun and E. Ekinci, Chimica Acta Turcica, 17, 307 (1 989). C. Bolton, C.E. Snape, R.J. O'Brien and R. Kandiyoti, m, 66, 1413 (1 987). E. Ekinci, A.E. Putun, M. Citiroglu, G.D. Love and C.J. Lafferty and C.E. Snape, m, 71,1192 (1992). N.Y. Chen, D.E. Walsh and L.R. Koenig, Ch24, p 279 in Pvrolvsis Oils from Biomass. Producing. Analvsing and Uper ading, ACS 376 (1988). D. Scott and J. Piskorz, Can. J. Chem. Em,, 60(5), 664 (1982). H.P. Stephens, C. Bolton and C. E. Snape, &J, 68, 161 (1989). E. Putun, C.J. Lafferty, F.J. Donald, C.E. Snape and E. Ekinci in Int. Conf. on Advances in Thermochemical Biomass Conversion, Ed. A.V. Brideewater (1993). F. Gircel, M.'Citiroglu, C.E. Snape, E. Putun and E. Ekinci, Fuel Process, Technol,, 36, 299 (1993). C.E. Snape, C.E. and C.J. Lafferty, Prepr. Am. Chem. SOC. Div. Fuel -,35, 1 (1991).
\
I 1033

BIOMASS TO HYDROGEN V I A PYROLYSIS A N D REFORMING
M . Mann, E. Chornet, S. Czernik and D. Wang National Renewable Energy Laboratory
1617 Cole Boulevard Golden, Colorado, 80401-3393
Keywords: Hydrogen, Biomass, Pyrolysis
ABSTRACT Pyrolysis o f lignocellulosic biomass and reforming o f the pyroligneous oils is being studied as a strategy for the production o f hydrogen. New technologies for the rapid pyrolysis o f biomass provide compact and efficient systems to transform biomass into vapors which are condensed to oils, with yields as high as 7540% by weight o f the anhydrous biomass. This "biocrude" is a mixture o f aldehydes, alcohols, acids, oligomers from the constitutive carbohydrates and lignin, and some water produced during the dehydration reactions. Hydrogen can be produced by reforming the biocrude with steam. A process o f this nature has the potential to be cost competitive with conventional means o f hydrogen production.
The concept o f hydrogen from biomass offers significant opportunities for novel research and development. The use o f a renewable resource feedstock is an alternative to conventional means o f hydrogen production from petroleum and natural gas. As a consequence, the environmental benefit o f zero net carbon dioxide emissions facilitates the approach to a pollution-free energy system.
Two scenarios for the production o f hydrogen from pyrolysis oi l can be envisioned. One would involve a regionalized system o f hydrogen production with small and medium-sized pyrolysis units ( 4 0 0 Mg/day) providing biocrude to a centralized reforming unit. The alternative is to pyrolyze biomass in a large unit and feed the uncondensed vapors directly to the reforming unit. The first case has the advantage o f the availability o f cheaper feedstocks, perhaps biomass waste. I n the integrated system, however, the costs of condensing the vapors to the oil and transporting them to the hydrogen facility are avoided. The reforming facility can be designed to handle alternate feedstocks, such as natural gas and naphtha, if necessary. Additionally, the biocrude can first be refined to yield valuable oxygenates so that only the residue is used for hydrogen production.
Thermodynamic modelling o f the major constituents of the biocrude has shown that reforming is possible within a wide range o f steam/compound ratios. Additionally, catalytic reforming o f model compounds to hydrogen using a Ni-based catalyst has begun Existing catalytic data on the reforming o f oxygenates has been studied to guide catalyst selection. An initial process diagram for the pyrolysis and reforming operations has been devised, and economic boundary estimates have been calculated.
FAST PYROLYSIS: BIOCRUDE YIELDS A N D COMPOSITION Gasification o f solid fuels to yield a mixture o f H, and CO, followed by shift conversion to produce H, and CO,, and steam reforming o f hydrocarbons are well established processes. Economics o f current processes favor the use o f hydrocarbons (natural gas, C,-C,, and naphtha) and inexpensive coal as feedstocks. However, biomass is a potentially cost-competitive feedstock for gasification. A n alternative approach to HI production begins with fast pyrolysis o f biomass.
Recent advances in the understanding of pyrolytic mechanisms and in the technology needed to achieve high heat transfer rates to particles, while controlling secondary cracking reactions responsible for gas and char production, have led to the development o f fast pyrolysis routes. These convert biomass materials in high yields (- 75% wt o f dry biomass) into a "pyrolytic oil," or "biocrude." Very little ash and char are present in the biocrude when appropriate filtration technology is used in the pyrolysis process. Results from fluid bed fast pyrolysis (Radlcin et al., 1991) have shown that a 76% wt yield of biocrude can be obtained from poplar (CHl,4,006,). The organic fraction o f the biocrude represents 85% wi and its elemental composition is CH,,,005,. Table 1 shows the expected yields o f hydrogen from two thermochemical routes (pyrolysis and gasification), compared to the theoretical yield o f the reaction between wood and Steam using externally supplied heat.
1034
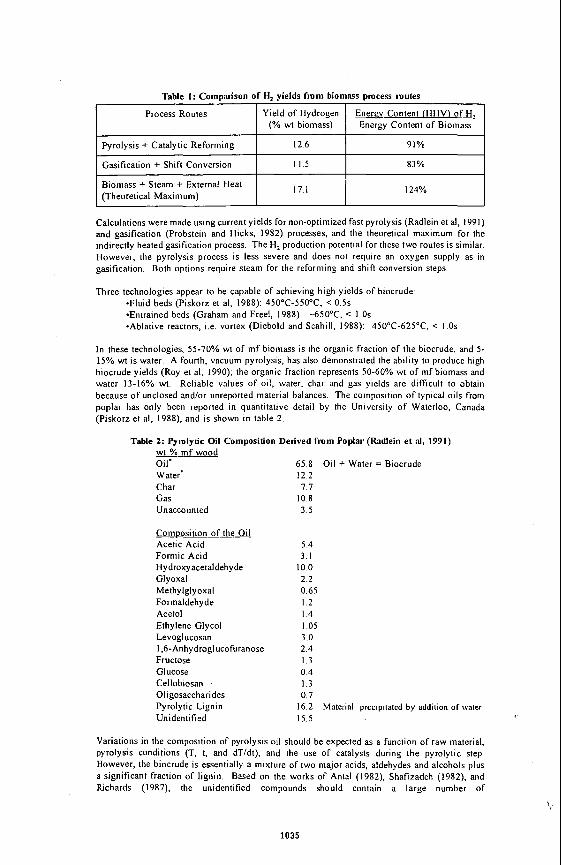
Process Routes Yield of Hydrogen (% wt biomass)
Enerav Content (HHV) o fA, Energy Content of Biomass
Pyrolysis + Catalytic Reforming
Gasification + Shift Conversion
Composition of the Oil Acetic Acid Formic Acid Hydroxyacetaldehyde Glyoxal Methylglyoxal Formaldehyde Acetol Ethylene Glycol Levoglucosan 1,6-Anhydroglucofuranose Fructose Glucose Cellobiosan Oligosaccharides Pyrolytic Lignin Unidentified
12 6 91%
11.5 83%
5.4 3. I
10.0 2.2 0.65 I .2 I .4 I .05 3.0 2.4 I .3 0.4 1.3 0.7
16.2 Material precipitated by addition of water 1 5 . 5
17.1 Biomass + Steam + External Heat (Theoretical Maximum)
Variations in the composition of pyrolysis oil should be expected as a function of raw material, pyrolysis conditions (T, t, and dT/dt), and the use of catalysts during the pyrolytic step. However, the biocrude is essentially a mixture of two major acids, aldehydes and alcohols plus a significant fraction of lignin. Based on the works of Anta1 (1982), Shafizadeh (l982), and Richards (1987), the unidentified compounds should contain a large number of
124%
1035

carbohydrate-derived components. Monomeric lignin-derived products having alcohol characteristics should also be present (Elliott, 1988).
THERMODYNAMICS Thermodynamic simulations o f the reforming reaction were performed in order to guide experimental design and determine equilibrium constraints. These simulations were performed on ASPEN Plus using a mixture o f compounds with the following composition, based on the results obtained by the University o f Waterloo and from the vortex reactor at NREL.
Table 3: Mixtuie Composition fo r Theirnodynamic Simulations Comnound Molar Pettent Weieht Peirent
acetic acid 27% 23%
guaiacol 3.7% 6.6%
formic acid 7.5% 4.8% coniferol 2.6% 6.6%
benzene 2.9% 3.3% toluene 2.5% 3.3% furfural 2.4% 3.3%
hydroxy acetaldehyde 38% 33% '
acetol 9.3% 9.8%
syringol 1.4% 3.3%
phenol 2.4% 3.3%
The plots of hydrogen production versus temperature and the molar ratio o f steam to carbon content (S/C,), were very similar for all compounds and the mixture. Because pyrolysis oil vapors are produced at approximately 450 - 600 "C, a practical temperature for the reforming reaction is 500 "C. Figure 1 shows the approach o f many o f the model compounds and the mixture o f compounds to maximum stoichiometric yields o f hydrogen as a function o f (SIC,). The necessary steam is dependent only on the carbon content o f the compound. Therefore, regardless o f the compounds in the oil, the appropriate amount o f steam for high hydrogen yields can be estimated solely from the empirical formula.
CATALYTIC REFORMING OF OXYGENATES Steam reforming o f hydrocarbons (C,-C,, naphtha and gas oils) is well understood and proceeds readily at steam to carbon ratios (SIC,) between 3.5 and 5.0, and temperatures up to 775°C. When the objective is to maximize the production o f H2, the stoichiometry describing the overall process is:
C, H, + 2n H,O = n CO, + (2n + m/2) HI ( 1 )
However, in a hydrocarbon reformer, the following reactions take place concurrently:
C, H, + n H,O = n CO + (n + m/2) HZ CH, + H,0 = CO + 3 HI CO + H,0 = CO, + H,
Reforming of higher hydrocarbons (Equation 2) is irreversible (Tottrup and Nielsen, 1982). whereas the methane reforming reaction (Equation 3) and the shift conversion reaction (Equation 4) approach equilibrium. A large molar ratio of steam to hydrocarbon wi l l ensure that the equilibrium for reactions (3) and (4) is shifted towards H, production.
The most commonly used catalyst is Ni on alumina. Ca, K and M g are often used with the alumina to enhance water adsorption. lower the acidity and favor mobility o f the OH species on the surface (Rostrup-Nielsen, 1984). Alternate Ni-based catalyst formulations with mixtures o f rare earth oxides and a refractory support, have been developed (Patil, 1987) to increase the resistance o f the catalyst to poisoning, particularly by sulfur.
Methanol i s readily steam reformed at low temperatures (< 300°C) Cu-based catalysts and recently developed Pd/ZnO preparations are extremely selective towards the formation o f CO, and H2 via the formate ester mechanism (Takahasi, 1982). Ethanol requires higher reforming temperatures than methanol. The mechanism proceeds through acetaldehyde and ethylacetate
1036

intermediates on the same Cu-based catalysts (Iwasa-Takezawa, 1991). The existing data on oxygenated aromatic compounds, Le. cresols, suggest that they can be steam reformed using Pd, Rh or Ni on alumina, silica or chromia-alumina. Litt le is known, however, about optimum experimental conditions that wi l l result in long-term catalyst activity The challenge lies in finding a catalyst that can reform both the complex fraction (pyrolytic lignin) as well as the carbohydrate-derived fractions (monomeric sugars, anhydrosugars, and oligomers) while l imiting undesirable side reactions which w i l l lower the yields o f H,.
I f the oxygen in the aldehydes, alcohols and acids could be removed as CO,, via ester intermediates as in methanol reforming, the production o f H, would be maximized. This could be done by separating a low molecdar weight fraction o f the biocrude from a high molecular weight fraction during the condensation o f the pyrolytic vapors. An alternate approach is to conduct the steam reforming o f the entire biocrude near equilibrium conditions. This may be possible by choosing a stable Ni-based catalyst operating in the 700"-800°C range. A favored formulation could be: N iO (20-30 wt%), MgO (10-15 wt%), Al2O3 (50-65 wt%), rare earth oxides (5-15 wt%), and a promoter l ike Cr,O,, V,O,, or WO, (5-10 wt%).
PROCESS DESIGN Unlike other reforming processes, steam reforming pyrolysis oi l to produce hydrogen involves very few unit operations, which should increase i t s economic feasibility. Because o f the low sulfur content o f biomass, a sulfur removal system is not likely to be required, while one is always used in petroleum and methane reforming. Also, according to current experimental results, only one medium temperature catalytic reformer is required; conventional methane reforming uses a furnace-like converter followed by a high temperature reformer and a low temperature reformer. Since the overall reaction o f pyrolysis oil to HI is endothermic, the char produced in the pyrolysis o f the biomass wi l l be burned to produce heat and steam. Preliminary energy balances indicate that a fraction of the oi l may also be used as a source o f heat, especially in the centralized reformer supplied by satellite pyrolysis units. I n the base-case design, a pressure swing adsorption unit wi l l be used to purify the H, produced.
ECONOMICS Preliminary calculations were performed in order to determine the boundaries o f economic feasibility o f the process. To examine these boundaries before plant costs can be figured, the ratio o f the current market selling price of H, to the pyrolysis oi l production cost was calculated. I f the ratio is greater than one, the process has the potential to be economically feasible. This method assumes that the process to produce H, is completely free o f capital and operating costs, and therefore sets the minimum limits on the recovery o f theoretical hydrogen and product selling price.
The maximum stoichiometric amount'of H, was calculated as that obtained by reforming all o f the carbon in the oil with steam plus the hydrogen in the oil; the oi l was defined to have the formula CH,,,O,,,, as described earlier. The current selling price o f H, in industry is between $5.OO/MM Btu and $15.00/MM Btu, depending on the size o f the production facility.
For these calculations, the feedstock was considered pyrolysis oi l rather than biomass, in order to take into account the cost o f the pyrolysis process. The cost of the oil is $0.141/kg, as calculated in an NREL report by C. Gregoire, on producing pyrolysis oi l from biomass for power generation. This study used a biomass cost o f $2.50/MMBtu, which is equivalent to $42/dry ton, I f 70% hydrogen recovery can be achieved, the selling price must be at least $7.50/MM Btu. I f the selling price is $8.80/MM Btu, 60% o f the H, that i s available from reforming pyrolysis oil must be recovered to reclaim the cost of the feedstock. Again, these results do not include capital and operating expenses.
Figure 2 shows the combinations of H, selling price and feedstock cost that w i l l result in a ratio greater than one. Hydrogen from pyrolysis o i l has the potential to be economically feasible if costs fall within the shaded region. This graph assumes that 70% o f the maximum stoichiometric H, wi l l be recovered. The pyrolysis oil cost w i l l depend heavily on the cost of the biomass; a regionalized system to produce oil for a central hydrogen facility could utilize waste biomass which would bring down the cost o f the oil considerably.
1037

Figure 1 : Approach to Maximum Stoichiometric Yield of Hydrogen at 500 O C
$ 0.25
- Acetol
----O--- Guaiacol
HAA
-0- Svringol
0.5 1.0 1.5 2 0 2.5 3.0 3.5 4.0 4.5 5.0 5.5 6.0 6.5 7.0 7.5 8.0 8.5 9.0 9.5 10.0
Molar ratio of steam to carbon ( C l )
Figure 2: Limit on Potential Economic Feasibility of Hydrogen from Pyrolysis Oil at 70%
Stoichiometric Maximum
Droduct $ I feedstock $ = 1
not economically feasible
~ ~ ~ % % o ~ - l l n t Y Y 9 ~ 9 9 m ? c 0 0 . - - c - . . . - - ’ - - “ - - N h
Hydrogen selling price (Slkg]
Sllkg = $7.42/MMEtu
1038

REFERENCES
Antal, M. J., in Advances in Solar Enerev, Boer, K. W. and Duffield, J. A,, eds., Solar Energy SOC., New York (1982) 61.
Diebold, J. and Scahill, J.. in Pvrolvsis Oils from Biomass: Producine. Analvzinc and Uperadin?. Soltes, E. J. and Milne, T. A,, eds., ACS Symposium Series 376, ACS, Washington, D.C. (1988) 31.
Elliott, D.C., in Pvrolvsis Oils from Biomass. Producinc. Analvzine and Upgrading, Soltes, E. J. and Milne, T. A,, eds., ACS Symposium Series 376, ACS. Washington, D.C. (1988) 55.
Graham, R. G.; Freel, B. A. and Bergougnou, M. A,, in Research in Thermochemical Biomass Conversion. Bridgwater. A. V. and Kuester, J. L., eds., Elsevier Applied Science, London (1988) 629.
lwasa, N. and Takezawa, N., Bull. Chem. SOC. Jpn. 64 (1991) 2619.
Patil, K. Z . , Chemical Ape of India 38, IO (1987) 519
Piskorz, J.; Scott, D. S. and Radlein, D., i n Pvrolvsis Oils from Biomass: Producinv Analyzing and Upcradinc Soltes, E. J. and Milne, T. A,, eds , ACS Symposium Series 376, ACS, Washington, D. C. (1988) 167.
Probstein, R. and Hicks, R., Svnthetic Fuels. Mc Graw Hill, New York (1982) 235
Radlein, D.; Piskorz, J. and Scott, D. S., J. Anal Appl Pyrolysis 19 (1991) 41
Richards, G. N., J. Anal. Appl. Pyrolysis IO (1987) 108
Roy, C.; de Caumia, B. and Plante, P., in EuroDean Conference on Biomass for Energy& Industry. Grassi, G.; Goose, G and dos Santos, G., eds., Elsevier Applied Science, London (1990) 2595.
Shafizadeh, F., J. Anal. Appl. Pyrolysis 3 (1982) 283
Takahashi, K.; Takezawa, N. and Kobayashi, H., Applied Catalysis 2 (1982) 363
Tottrup, P. 8 . and Nielsen, B.. Hydrocarbon Processing, March 1982. p 89.
1039

CONVERSION OF FATPY ACIDS AND ESTERS TO LOW-AROMATIC GASOLINE
Ramesh K. Sharma and Edwin S. Olson Energy & Environmental Research Center
University of North Dakota Grand Forks, ND 58202
Keywords: catalytic hydrocracking, reforming, fatty acids, rapeseed oil
ABSTRACT Agricultural oils and by-products have been used as fuels, but they can also serve 85 precursors for producing transportation fuels that require a highly isoparaffinic composition for high performance. Hydrocracking and reforming of biomass materials to the i s o p a r a i i c composition desired for gasoline are reported in this paper. Several catalysts, including natural and synthetic clays, have been effective for conversion of fatty acids and triglycerides to high-quality gasoline products. Reactions with nickel- substituted synthetic mica montmorillonite gave high yields of distillate in the gasoline range. A high percentage of the product waa isoparaffinic or branched alkanes (55%-61%) and a low percentage was aromatic. Rapeseed oil was converted to a highly isoparaffiinic product with minimal formation of benzene or toluene. These product compositions are appropriate for transportation fuels with low environmental risks.
INTRODUCTION Fuels derived from renewable resources currently comprise only a small proportion of the total fuel utilized in the US. Renewable biomass-derived fuels recycle carbon so that fuel combustion does not contribute to the accumulation of carbon dioxide in the atmosphere. Other advantages are the consistency of the energy supply in US. and even regional markets. Further development of liquid fuels for use in high-performance engines from renewable energy resources is needed. In order to be environmentally acceptable, the transportation fuels must contain very low amounts of benzene and other aromatic components. Catalytic methods are needed for converting crop oils to a low-aromatic fuel. The use of waste oils from vegetable oil processing or cooking and tall acids from paper pulping haa the potential for producing a low-cost fuel.
The conversion of tall and vegetable oils to alternative fuels with zeolite catalysts resulted in products containing very high concentrations of aromatic components (1-6). The objective of our investigations is to evaluate the catalytic conversion of oils and fatty acids to highly aliphatic gasoline-range products. Therefore, we have investigated catalysts and conditions that minimize the formation of aromatics and conserve the high hydrogen content of the fatty raw materials.
Synthetic clays, such as nickel-substituted synthetic mica montmorillonite (NiSMM), were effective for cleaving carbon-carbon bonds and isomerizing the alkyl chains to give branched alkanes, without extensive formation of aromatic hydrocarbons (7-9). Reactions of fatty acids and oils with NiSMM catalyst is reported in this paper.
EXPERIMENTAL
reported elsewhere (7-9). In a typical run, 0.5 g of the rapeseed oil or oleic acid and 0.25 g of the catalyst were placed in a 12-mL. microreactor. The microreactor was evacuated, pressurized with 1000 psi (6.9 MPa) of hydrogen (corresponding to 28 mmoles), and placed in a rocking autoclave heated to the desired temperature. The gas pressure increased from heating the gas (2400 psi at 400°C) and then increased further, owing to decarboxylation and other gas formation reactions. The heating was continued for 1-3 hours. At the end of the reaction period, the microreactor was cooled to room temperature, degassed, and opened. The desired amount of the internal standard was added to the product slurry, and the product slurry was transferred into a centrifugation tube by washing with methylene chloride and the solid catalyst removed by centrifugation.
Analvtical nrocedures: instrumentation. Identification of the product components in the gasoline range was by retention time measurement on a Petrocol 100-m capillary gas chromatograph (GC) column and by gas chromatographylmass spectrometry (GCNS) analysis wing a Finnigan 800 ITD ion trap detector with a HP 5890A gas chromatograph and a J&W 30-m x 0.32-mm (ID), 1.0-micron DB-5 film.
Quantitative GCFID analyses were performed with a Hewlett Packard 5880A gas chromatograph equipped with a Petrocol 100-m capillary column. Since it was not found in significant amounts in the reaction products, octadecane was added as the internal standard. Amounts of aromatic components were determined by multipoint calibration of the system with standard mixtures. Alkane components were determined from the area percent ratio with respect to octadecane, assuming the same response factor. To calculate the product molecular size distribution, the quantities of components in two size groups, C,-CB and C,,-C,, were added, and are reported as a percentage of the total volatile liquid
1040
Catalh ic Hvdrotxeat ine Reactions. Reparation and characterization of NiSMM was

product. Quantities of components in the compound type groups, such as n-alkanes, branched and cyclic alkanes, and aromatics, were also added and reported as percentages of the light volatile fraction that includes C,-C,, components.
GC analyses for higher molecular weight volatiles were obtained using a Quadrex 15-m by 0.25-mm diameter aluminumclad capillary column with a 0.10-pm methyl 5% silicone phase with 1 .0-dmin H, carrier measured at 400°C and on-column injection. Octadecane was added as the internal standard. Amounts of compounds in the range C,,-C,, were determined from the area percent with respect to octadecane and are reported as a percentage of the total volatile product. Total volatile yields were determined by adding the quantities in the three ranges or fractions described above. These are reported as weight percent yield of oleic acid starting material.
RESULTS Catalytic hydrocraeking/hydroimerization reactions were conducted with a crop oil and a by-product oil to evaluate the potential for synthetic clay catalyst upgrading to environmentally acceptable transportation fuels that contain large amounts of branched alkanes (iparaf€iis) and low amounts of aromatics. The R O ~ oil was inexpensive rapeseed oil, a triglyceride that contains large amounts of inedible erucic acid. The paper pulping by-product, tall oil, is composed of several fatty acids (mainly oleic and linoleic acids), resin acids, and sterols. Oleic (g-octadecenoic) acid was used as a model substrate in preliminary studies to determine appropriate conditions for the tests. Two synthetic clay catalysts were used in the reactions. In all the tests, the conversion of the oleic acid to liquid and gas products was loo%, and no coke or insoluble materials were detected on the recovered catalyst.
Noncatalvtic React ion. The noncatalytic reaction of oleic acid was performed to determine the nature of the products and yields for the thermal reactions of fatty materials a t 400°C under hydrogen atmosphere. Only a minor portion (26 wt%) of the products consisted of volatile liquids. Analyses showed the presence of large amounts of alkanes higher than C,, (63% of the volatile liquid material). Very small amounts of gasoline-range components (9% of volatile liquid) were produced. The high molecular weight compounds are dimers and other oligomers that are normally found in fatty acid pyrolysis products. Other alkane products resulted from secondary cracking reactions of the oligomeric materials, but very few branched alkanes were formed. The majority of product from the uncatalyzed reaction was nonvolatile polymeric material, since it did not appear in the GC analyses. Thus, the noncatalytic thermal hydropyrolysis of oleic acid a t moderate temperature does not effectively produce a usable fuel for a high-performance engine.
&actions with NiSMM Catalvst . The NiSMM-catalyzed hydrocracking reaction of oleic acid was carried out under several conditions to determine the effects of temperature, hydrogen pressure, and reaction time for production of low-aromaticity gasoline. The reaction products were a complex mixture of hundreds of components formed as a result of the extensive rearrangements or isomerizations of the primary cracked or oligomeric products. The major products from the synthetic-clay-catalyzed reactions were the desired isoparafFii: mono-, di- and trimethylalkanes.
The reaction of oleic acid with NiSMM at 400°C for 1 hour with 2400-psi-hydrogen pressure gave a high yield (80 wt%) of volatile liquid products. A large percentage of the product (6%) was in the gasoline range. High-resolution GC analysis indicated that the gasoline-range materials were composed mainly of branched alkanes and cycloalkanes (78%), with lower amounts (8%) of n-alkanes. Small amounts of aromatics were present, with only 8% BTEX in the liquid product.
The reaction period for oleic acid with NiSMM catalyst was extended to 3 hours to determine if the longer time would give higher yields of liquids in the gasoline range. The reaction for the %hour period also gave a high yield of liquid product (76%), but the distribution with respect to molecular size was similar to the reaction carried out for 1 hour (72% in the gasoline range). More importantly, the composition of the gasoline-range product was more aromatic than that from the 1-hour reaction, with 20% BTEX present. Thus, the longer reaction time period resulted in a less desirable product because of the higher aromatic content.
The reaction of oleic acid with the NiSMM catalyst a t a lower temperature might be expected to give a less aromatic product. At 350°C for 3 hours with 2200-psi-hydrogen pressure the reaction gave 76% conversion to volatile product. Low aromatic content was obtained (9% BTEX), but a lower percentage of the volatile liquid product (56%) was in the gasoline range. Despite the lower yields at this lower temperature, the NiSMM catalyst exhibits good selectivity for the hydrocracking and hydroisomerization reaction of the aliphatic chains.
\
1041

Raoeseedoil Reactim. Rapeseed oil was reacted with the NiSMM catalyst at 400°C for 1 hour with 2240-psi-hydrogen pressure. The conversion to volatile liquid was a little lower than that obtained with oleic acid (58%). High molecular weight ( > C,d material was absent, indicating that fewer dimerization or condensation reactions occurred with the t r i g b r i d e oil than with the free oleic acid. A higher yield of gas product was obtained with the rapeseed oil, compared to the oleic acid. A possible explanation for these yield results is that the catalyst remained more active in the rapeseed oil reaction.
The wmposition of the product h m rapeseed oil was much more isoparatTiiic than that obtained from the oleic acid. Only 4% n-alkanes were present, and branched alkanes comprised most of the product (90%). The aromatic content was very small, BTEX accounted for only 6% of the liquid product, and the benzene concentration was only 0.7%.
CONCLUSION Conversion of biomass fuels containing fatty acids to a highly calorific and environmentally acceptable fuel can be effected by catalytic processing. In the NiSMMcatalyzed reactions described in this paper, the aliphatic nature and inherent large hydrogen content of vegetable oils is mostly preserved, and the structures were mostly isomerized to isoparaffiiic molecules. Thus, not only was a high-performance fuel produced, but also one with low benzene content and consequently low toxicity. Previous investigations of vegetable oil conversions to fuels with shape-selective zeolite (HZSM-5) catalyst gave liquids that were highly aromatic (60%-70% aromatic content). Yields were similar to those reported here.
Coaddition of steam and tetralin could improve the conversion substantially at moderate temperatures (3-5). Steam addition also improved catalyst life and produced less coking.
REFERENCES 1. Bakhshi, N.N.; Furrer, R.M.; Sharma, R.K. "Catalytic Conversion of Tall Oil and
Plant Oils to Fuels and Chemicals," In Proc. 7th Canadian Bioenergy R t D Seminar; 1984, 687-691.
2. Basad, Y.S. e t al. "Effect of Steam Additon on Catalytic Upgrading of Canola Oil," Catalysis on the Energy Scene; Kaliaguine, S; Mahay, A. E&, Elsevier: Amsterdam, 1964, 85-92.
3. Sharma, R.K.; Bakhshi, N.N., "Catalytic Conversion of Tall Oil to Fuels and Chemicals over HZSM-5 Using Various Diluents," Energy from Biomass and Wastes XrV; Klass, D.L., Ed.; Inst. of Gas. Tech.: Chicago, 1991, 1033-1061.
4. Sharma, R.K.; Bakhshi, N.N. Fuel Proc. Tech 1991,27, 113-130. 5. Sharma, R.K.; Bakhshi, N.N. Applied CataL 1991, 76, 1-17. 6. Weisz, P.B.; Haag, W.0,; Rodewald, P.G. Science, 1979,206, 57-58. 7. Black, E.R.; Montagna, A.A.; Swift, H.E. US Patent 4,022,684, 1977. 8. Black, E.R.; Montagna, A.A.; Swift, H.E. US Patent 3,966,642, 1976. 9. Swift, H.E.; Black, E.R.; Ind. Eng. Chem. Prod. Res. Develop. 1974, 13, 106-110.
ACKNOWLEDGEMENTS The support of the U.S. Department of Energy is gratefully acknowledged.
1042

CATALYTIC UPGRADING OF BIOCRUDE OIL VAPORS TO PRODUCE EYDROCARBONS FOR OIL REFINERY APPLICATIONS
James Diebold, Steve Phillips, Dan Tyndall John Scahill, Calvin Feik, and Stefan Czernik
National Renewable Energy Laboratory, Golden, CO 80401
keywords: biomass pyrolysis to vapors; catalysis of biocrude vapors to hydrocarbons; zeolite catalysis.
BACKGROUND
Historically, liquid transportation fuels have been processed from petroleum crude oil through a series of chemical processes in a refinery. Initially, the refinery was little more than a distillation tower that made gasoline, kerosene, fuel oils, and asphalt. Over the last 90 years, this industry has become increasingly complex as the public demanded higher octane gasolines; removing tetraethyl I&, reducing aromatics and oleiins; reducing vapor pressure; adding ethers and alcohols to promote cleaner burning; and the in the future, completely reformulating gasoline to bum even cleaner. As a result of these changes, refiners have already begun to look at using commodity chemicals as a significant W o n ofthe gasoline pool, e.g., methanol, ethanol, methyl tertiary butyl ether (MTBE), and ethyl tertiary butyl ether (ETBE). This means that refiners are already incorporating non- traditional feedstocks into the gasoline pool.
Because methanol is made through a syngas route, any form of carbon can be used to produce the syngas and therefore the methanol. Although ethanol can be made from ethylene, it is now made commercially by fermentation. These alcohols are currently purchased from the chemical industry to produce MTBE or ETBE in many oil refineries. The interest in producing MTBE within the oil refinery goes back to the reduction of gasoline vapor pressure that resulted in a surplus of butanes at the refinery. These butanes can be converted to the isobutene needed to make MTBE within the refinery in a new process step that is now being widely practiced.
It has been widely predicted that the demand for MTBE or ETBE will exceed the availability of isobutene within the refinery. Ethers made from other feedstocks are now being investigated, e.g., diisopropyl ether PIPE) made from propene and water, as well as tertiary amyl methyl ether ( T M ) made from reactive isopentenes and methanol. However, there will be competition within the refinery for the propene and the isopentenes to react with isobutane to make the isoparafhic alkylates (Unzelman 1994). It appears that the time may be right for refiners to begin to consider alternative sources of olefins.
The threat of global warming, the current discussion about the capacity of the American fanning industry, and the increased dependence upon oil imported from politically unstable parts of the world all combine to create an interest in alternative fuel sources. An alternative fuel source that is commonly overlooked by the petroleum industry is renewable biomass. Currently research is underway to develop agricultural crops for their energy content. Although these crops are not yet widely available for industrial use, there is a large amount of municipal solid waste (MSW) that is generated on a daily basis that would be suitable for feedstocks.
The organic fraction of the MSW is called refuse derived fuel O F ) . After drying, RDF is composed primarily of paper derived from biomass, yard wastes, polyolefinic plastics, and miscellaneous plastics. Current projections are that the paper fraction will slowly decrease while the plastic fraction will increase with time. By the year 2000, it is projected that RDF will consist of 76 wt% lignocellulosic-derived material and 24% plastics. About two-thirds of these plastics are projected to be polyolefinic. (Franklin 1994) During thermal pyrolysis, these plastics tend to depolymerize to oligomers and monomers. With catalytic cracking, the yield of monomers can be increased, similar to cracking waxes. MSW is available now in commercial quantities and the olefin yields will be higher from RDF than from a typical biomass. Because of the increasing cost of landfilling, the projected costs of the RDF are very low.
As an example, the tipping fee paid by a city to the landfill may be $25 per ton, from which perhaps halfa ton ofRDF could be derived. If it were to cost $30 to recover and prepare this RDF for use as a feedstock, it would have a net cost of $5 for the half ton or $10 per ton. This RDF has a heating value ofabout 10,000 BTUAb that results in a cost of $0.55/GJ, $O.SO/MMBTU, or $2.90 per barrel of oil equivalent. This is clearly a bargain, even in today's depressed oil market. The problems with using RDF are many, but tend to be associated with the unknown minute-to-minute variability of its composition, including heavy metals, sulfur, and chlorine content.
\
1043

For a variety of reasons, many oil refineries are located near large metropolitan areas along the WW, East, and Gulf Coasts. Thus, these refineries are also located near potential sources of large mounts of RDF areas set aside for heavy industry, which should facilitate permitting an additional process. Also, the oil refineries typically already know how to deal with a variety of heavy metals, sulfur, and chlorine found in different crude oils. Using RDF as a feedstock in an oil refinety should Pose problems of a chemical nature that are similar to those dealt with now on a day-to-day basis. However, feeding biomass and/or RDF into a refinery involves a different set of problems, which we are now addressing in our DOE sponsored Biofuels Program.
INTRODUCTION
We have developed a thermal cracking or pyrolysis process in which the solid feed is metered into a Vortex reactor. An extremely rapid heat transfer to the solid particles through the reactor wall results primarily in the vaporization of the lignocellulosic and thermoplastic feedstock mixtures. Byproduct char is removed from the hot vapor stream. The vapors can then be condensed to form a biocrude oil or they can be passed immediately to a catalytic cracking and deoxygenation reactor. This pyrolysis technology has been demonstrated at the 20 kgh scale at NREL (Diebold and Scahill 1988) and is being scaled up to the 35 TPD scale by Interchem (Johnson, et al. 1993).
The biocrude oil made from lignocellulosic biomass is a fairly fluid, highly oxygenated, and polar liquid. More than 200 compounds have been identified in the biocrude, but typically at less than 5% each. However, the RDF-derived crude is a multiphase material because of the presence of polar liquids derived from the lignocellulosics and non-polar liquids and solid waxes that represent partially cracked plastics (Diebold, et al. 1989). If the pyrolysis step is integrated into an oil refinery, it is more efficient thermally to close-couple the pyrolysis step to a vapor-phase catalytic cracking step, than to condense the oil and then reheat it for further refining. Because of the highly oxygenated nature of the biocrude, it is a reactive material at elevated temperatures and does not distill well.
The challenge for the agricultural industry of the future will be to develop low cost biomass crops that have high hydrocarbon or lipid contents, which in turn would have high olefin yields in the process discussed here. In the mean time, a process that can convert RDF containing mixed plastics, paper, and yard wastes to an olefin rich stream has a niche market application that may have good economic potential. Initially using low cost RDF in this process will pave the way for the eventual use of more expensive, dedicated feedstocks produced by the agricultural industry.
This paper discusses the process of catalytically deoxygenating and cracking biocrude vapors to form hydrocarbons. The reaction of several oxygenated organic compounds over zeolite catalysts, especially ZSM-5, has been studied and reported in the literature, e.g., methanol, ethanol, acetic acid, acetone, methyl acetate, fatty acids, triglycerides, phenols, and carbohydrates. In general, the reactions that take place over ZSM-5 are those that result in forming hydrocarbons by the rejection of oxygen 60m the oxygenated feedstock as carbon oxides or as water. The oxygen-rejection mode is strongly dependent upon the feedstock. For example, water is rejected from methanol, carbon monoxide and water are rejected q d y from propionaldehyde on a molar basis, and carbon dioxide and water are e q d y rejected from acetic acid on a molar basis (Chang and Silvestri, 1977) (Chen, et al., 1989).
Using the ZSM-5 catalyst (donated by Mobil) to crack the pyrolysis vapors made from biomass (Evans and Milne 1988) and from RDF (Rejai, et al 1991) has been extensively studied at NREL, using a molecular beam mass spectrometer (MBMS). With this analytical technique, the vapor effluent 6om a reactor containing I gram of catalyst can be followed in real time, with several scans per second. This allows the study oftransient and steady-state products from the catalytic reactor over a range of molecular weights from near zero to several hundred.
1044

EXPERIMENTAX,
A larger reactor containing 100 g of Mobd's extruded ZSM-5 catalyst was used to study the conversion of a 1 to 3% slipstream of pyrolysis vapors made with the vortex reactor. This reactor was fitted with an axial thermocouple well and originally with a thermocouple that could be moved axially. This single thermocouple was replaced with a bundle of 12 miniature thermocouples with a 2.54 cm axial spacing. The reactions of the biomass vapors over the ZSM-5 were mildly exothermic with temperature rises of about 20°C commonly seen. These temperature rises correspond to about 75 J/g of biomass fed or the equivalent heat release of the combustion of 0.2 g of coke per 100 g of biomass fed. The gradual decline in the catalyst activity was monitored by the movement of the exothermic temperature profile down the bed, as it "band-aged.'' A series of experiments at different temperatures showed quite dramatically that when steam was used as the carrier gas, the rate ofband-aging was reduced at higher operating temperatures to become relatively low at 525°C. This rate of catalyst deactivation is relatively high for ked-bed operation, but is very low for riser cracker operation. The catalyst was repeatedly regenerated by controlled air oxidation. Gas analysis was by gas chromatography (GC). The mass balance of Run 119 for the slipstream reactor system is shown in Table 1.
The ked-bed reactor was them scaled up to be large enough to be fed the entire output of the vortex pyrolysis reactor. It has a diameter of 25 cm, a bed height 30 cm, and 7500 to 8500 g of ZSM-5 extrudate donated by Mobd. This reactor was originally fitted with an axial thermocouple well into which a bundle of 12 miniature thermocouples was placed, with an axial spacing of the thermocouples of 2.54 cm.
RDF was obtained from the MSW facility at Thief River Falls, MN, to be used as feed for the vortex pyrolysis reactor coupled to the large catalytic reactor. This RDF results after removing recyclables and non-organic materials. In Run 142, the oven dried, plastics-containing RDF was fed initially at a rate of 10 kg/h with a carrier-steam-to-RDF weight ratio of 2. The exothermic reactions appeared to take place near the entrance of the bed, with an exotherm of 15 to 20°C measured 2.5 cm into the bed. This exotherm corresponded to a heat of reaction of about 100 J/g of RDF. The feeding rate was then increased to 15 kg/h with a steam-to-RDF weight ratio of 1.3. Because of this decrease in the relative amount of steam present to absorb the heat of reaction, the temperature was seen to increase. an additional 15°C. The heat ofreaction was calculated to be a slightly higher value of 130 J/g of RDF for this higher feedig rate. However, the exotherm was still appearing in the first 2.5 cm of the 30 cm bed. The rest of the bed exhibited a slight cooling and then a slight exotherm near the outlet of the bed. We speculate that three sequential global reactions could be taking place that would have a net exothermic, endothermic, and finally exothermic effect. However, the temperature measuring arrangement was subject to apparent conductive errors that were progressively more severe in the last 7.5 cm of the reactor. These errors were because of a c o m b d o n of poor convective heat transfer from the axially flowing gases and heat conduction and radiation to the cooler exit flange of the reactor (which was massive and difficult to heat). Gas analysis was by GC. The yields from this run are shown in Table 1. We think that the plastics content of the RDF contributes to the relatively higher yields of olefins.
This reactor was later modified by adding 12 gas sampling tubes at 2.54 cm intervals along the reactor length. Each sampling tube penetrated two-thirds across the reactor diameter. Projecting a d i e t e r past the entrance of the sampling tube was a thermocouple to measure the local temperature, with the thermocouple serving to reduce the volume of the sampling port. The sample ports were angularly spaced in a helical fashion to minimize their interaction. With the thermocouples heated directly by crowflowing gases at 15 cm from the reactor wall, the conduction errors were greatly reduced. In addition, three thermowells were installed on diameters to allow the diametrical temperature gradient to be followed with a bundle of eight miniature thermocouples spaced 2.54 cm apart. With just carrier gas passing through this large fixed-bed reactor and with thermocouples from one manufacturefs lot, the helically spaced thermocouples showed that an isothermal bed could be maintained to within f 1°C. With this reactor, the progress of the conversion of the pyrolysis vapors as a function of the amount of catalyst encountered could be monitored by temperature measurements and gas samples. Thus, 12 different space velocities could be evaluated in a single experiment. Each sample port was fitted with an evacuated sample bottle so that the samples could be taken manually at essentially the same time in the run.
An example of using the modified large fixed-bed reactor was Run 144.. This run used oven-dried Southern Pine sawdust at a feeding rate of 15 kg/h. The steam-to-biomass weight ratio was 1.33. The weight hourly space velocity varied from 19 at the first sampling port to 1.6 at the twelfth sampling port. The initial bed temperature prior to the start of feeding the sawdust was 520°C. The temperature profile through the bed was different than had been measured for the smaller 100-g reactor using an axial thermowell. The temperature profile in this run with wood showed a steady
1045

I
!
I
increase in temperature over the length of the bed. This is indicative of exothermic reactions O C m h g throughout the bed. The initial temperature rise was 91'C and gradually decreased to 46°C after two hours of operation. These increases in temperature corresponded to exothermic reactions on the h s h catalyst of about 350 J/g of wood fed and on the partially deactivated catalyst ofabout 175 J/g after two hours on stream. It has been reported that with methanol as feed, ZSM-5 has an initially high rate of coke formation, followed by a long period of a lower rate of coke formation, while slowly losing activity (Bibby, et al. 1986). GC analysis of gas samples taken 43 minutes into the run showed that most of the methane, carbon monoxide, and carbon dioxide were formed in the first 3 cm of the 30 cm long bed. At 113 minutes into the run, the catalyst showed some deactivation and these permanent gases were produced in the first 10 cm of the bed. The olefin yields were shown to steadily increase throughout the bed, but the overall olefin yield appeared to decrease as the experiment progressed. The overall olefin yields were about 5 to 6 W% of the wood fed. We speculated that the initially observed high heat of reaction corresponds to an initially high rate of coke deposition on the catalyst, as well as to a lowered activity with time toward the more refractoly compounds in the vapor stream.
CON-
The limited operation ofthe 100 and the 8500 g fixed-bed reactors demonstrated general agreement with operating the 1 g reactor used in the MJ3MS experiments. Operating the larger reactors is not considered to have been sufficient to optimize the yields. However, we demonstrated that the overall reactions of the RDF and the wood vapors over ZSM-5 catalyst are slightly exothermic in nature, which was not observable with the 1 g reactor. The largest reactor appeared to be more adiabatic to result in higher temperatures from the reactions. The heat of reaction appears to be about 175 to 350 J/g ofwood and 100 to 135 J/g ofRDF. Much ofthe variation in the calculated heat of reaction is thought to be because of different products being made by the catalyst at different activity levels.
These heats of reaction are relatively small and correspond to the heat that would be released by the combustion of less than about 1 g of coke per 100 g of feed. However, the exothermic reactions have a very large impact on the design of a riser cracker. In the cracking of petroleum in an FCC refinery unit, the overall reactions are quite endothermic. This heat requirement is met by burning off some coke from the catalyst after each time the catalyst passes through the catalytic riser cracker in the FCC unit. This balance of heat around the FCC unit poses operational requirements, which dictates the rate of catalyst circulation and reduces the amount of heat that can be recovered from the catalyst regenerator. With an exothermic reaction taking place in the case of cracking pyrolysis vapors, the rate of catalyst circulation is dictated only by the chemistry involved, not a tradeoff of the chemistry against the energy balance.
With a fixed-bed reactor, there must be extra catalyst present to allow for some catalyst deactivation to occur prior to taking the bed out of service for regeneration. If the purpose ofthe reactor is to take the products toward thermodynamic equilibrium, there is no loss in the intended products by exposure to the added catalyst. However, at the high temperatures we must operate to minimize coke formation, any defins initially formed are being rapidly converted irreversibly to aromatics (Chen, et al. 1989). Thus, if the preferred products are olefins for manufacturing reformulated gasolines, rather than aromatics, it is desirable to have just enough catalyst present to prevent breakthrough of the unwanted py~olysis materials. In a riser cracker, this can be easily accomplished by simply adjusting the relative rate of catalyst circulated to the feeding rate. The non-steady state operation of a fixed-bed reactor undergoing rapid catalyst deactivation would tend to upset any downstream processing. For these and other reasons, the petroleum refining industry moved firom fixed-bed to fluidized-bed catalytic cracking (FCC) about 50 years ago, which in turn evolved into the riser cracker about 40 years ago. The results ofthe larger ked-bed reactors presented here were relatively preliminary, but they were used to confirm the conclusion that the preferred cracking reactor for pyrolysis vapors would be a more complex riser cracker.
We have constructed a catalytic riser cracker matched to the output of the vortex pyrolysis reactor. We currently are in the final stages of shakedown and expect to be generating experimental data very shortly. We will be evaluating the use of different feedstocks, e.g., wood, a uniform plastic- coated paper, real RDF, and a biomass naturally containing large amounts of oils or waxes for producing hydrocarbons of interest to petroleum refineries.
ACKNOWLEDGMENTS We gratefully acknowledge the financial support of the Biofuels Systems Division of the U.S.Department of Energy under the leadership ofMr. Gerson Santos-Leon, program manager.
1046

Iiauwms Bibby, D.M.; Milestone, N.B.; Patterson, J.E.; and Aldridge, L.P. (1986) I&&., 97, pp. 493-502.
Chang, C.D. and Silvestri, A.J. (1977) .!&at., 47, pp. 249-259.
Chen, N.Y.; Ganvood, W.E.; and Dwyer, F.G. (1 989) Aoohcatlons. Marcel Dekker, NY, pp. 117-140.
Diebold, J.P. and Scahill, J.W. (1988) eds., ACS Symposium Series 376, pp.31-40.
Diebold, J.P.; Evans, R.J.; and Scahill, J.W. (1989) IGT's Energy from Biomass and Waste XIII, New Orleans, LA.
Evans, R.J. and Milne, T.A. (1988) in eds., ACS Symposium Series 376, pp. 311-327.
Franklin and Assoc., Ltd., (1992) 3 1992, Prairie Village, KS, U S EPA Report 530-R-92-019.
Johnson, D.A.; Maclean, D.; Feller, J.; Diebold, J.P.; and Chum, H. (1993) ACS Spring Meeting, Symposium on Thermochemical Conversion: Fast Pyrolysis--Process, Technologies, and Products, March 28-April 2, Denver, CO. To appear in v. Rejai, B.; Evans, R.J.; Milne, T.A.; Diebold, J.P.; and Scahill, J.W. (1991) IGT's Energy from Biomass and Waste XV, Washington, D.C., March 25-29,
. . . .
' , E.J. Soltes and T.A. Milne, . .
' , E.J. S o h , and T.A. Milne,
. . . .
Unzelman, G.H. (1994) ' , March/April, pp. 69-73.
Table 1. Yields from Upgrading Pyrolysis vapors with Mobil's ZSM-5 catalyst
Run 119 Run 142
Feed So. Pine RDF
Catalyst bed size, g 100 7500
H2, wt % of dry feed co coz CH4 %-C4 C5+ gasoline Fuel Oil Pyrolysis Char Coke on catalyst HzO (by difference)
0.1 15.4 8.1 1.1
3.6* 8.8 13.2 15.1 9.4
25.2
100.0 _____
0.3 20.8 16.7 1.9
10.7' 4.9 4.3 19.8 6.8 13.8
100.0 ---_-
1047

CHARACTERIZATION AND CATALYTIC CONDmONlNG OF SYNTHESIS GAS PRODUCED BY BIOMASS GASIFICATION
Steven C. Gebhard, David A. Gratson, Richard J. French, Matthew A. Ratcliff and Joseph A. Patrick
Industrial Technologies Dvision National Renewable Energy LabOratory
Golden, Colorado 80401
Mark A. Paisley Banelle
Columbus, Ohio 43201
Xianghong Zhao and Scott W. Cowley Department of Chemistry and Geochemistry
Colorado School of Mines Golden, Colorado 80401
Keywords Biomass gasification; hot gas clean up; synthesis gas conditioning; steam refoming
1. INTRODUCTION Synthesis gas (syngas) is a mixture of carbon monoxide and hydrogen used as a feedstock for methanol, higher alcohols. and Fischer Tropsch hydrocarbon synthesis. SyngaS generated by thermal biomass gasification (referred to as biosyngas in this paper) represents a renewable feedstock because alcohol/hydrocarbn combustion returns the carbon and hydrogen to the atmosphere as CO, and H,O. These are converted back into plant material during photosynthesis when new biomass is culvated. Biomass gasification in this respect is a form of solar energy conversion.
Syngas from biomass gasification cannot be used directly for fuel synthesis because it contains particulate matter, methane, C, hydrocarbons, and tar.' These impurities cannot be tolerated by downstream catalytic fuel synthesis processes. Unprocessed biosyngas is also unacceptably rich in CO for most syngas chemistry; for example a I yCO ratio equal to 0.7 is typical in biosyngas but methanol synthesis stoichiometry requires that HJCO be equal to 2 (in industrial metharial synthesis some CO, is also added).
The most cost effective way to prepare biosyngas for luel synthesis is by syngas This is a direct on-stream process that destroys tars, reduces the level of methane and other low molecular weight hydrocarbons and simultaneously adjusts the HdCO ratio. Excess steam from gasiiication is used to catalytically reform tar and methane and simultaneously adjust the HdCO ratio in-situ.
A fluidized bed syngas condiiioning process using a proprietary catalyst, designated DN-34, is currently being developed in a joint effort between the National Renewable Energy Laboratory (NREL) and Battelle Columbus Laboratory (BCL).d.5 DN-34 is adve for tar destruction, exhibits waterqas shtt activity and contains no nidcel. DN-34 has also been tested for more than 50 hours on stream in a gasifier slipstream reactor at BCL without detectable deactiiatiions
The effectiveness of DN-34 in syngas condliining was recently confirmed using the NREL transportable molecular beam mass spectrometer (TMBMS). DN-34 was tested in a slipstream lluidized bed catalytic reactor attached to the BCL 9 tonne/day indirectly heated biomass gasifier. Real time mass spectra were obtained for unprocessed syngas and syngas processed over DN-34. In addition to methane and other permanent gases, the unprocessed syngas contained aromatic hydrocarbons including benzene, naphthalene, methylnaphthalenes, phenanthrenelanthracne and pyrene, as well as oxygenated aromatic compounds such as phenol and cresol. The oxygenated compounds were essentially eliminated by syngas condtioning. however, some benzene, naphthalene and smaller amounts of higher molecular weight aromatic hydrocarbons remained. This is qualitatively consistent wah the results from two separate 50-hour microscale lifetime tests w%h DN-34 and other. previous, microscale experiments4
This paper discusses the pertormance of DN-34 measured with the TMBMS and compares these resuns with the resuks of microscale tests pertormed in the laboratory.
2. EXPERIMENTAL METHODS 2.1 A transportable molecular beam mass spectrometer (TMBMS) has been designed by NREL thal can be moved by common carrier to a pilot plant or other engineering scale biomass conveffihn facility. The instrument weighs about 500 kg and there are about 200 kg of supporting electronics and ancillary instrumentation. The footprint of the TMBMS is approximately 1 m deep by 2 m wide by 1.5 m tall. The TMBMS uses a 1-750 Da quadrupole mass spectrometer with a differentially pumped molecular beam sampling interface and is computer controlled. The TMBMS is based on molecular beam mass spectrometry (MBMS) which uses extractive sampling and mass spectrometric analysis to identity chemical compounds in complex. highly reactive, high temperature process stream and systems6 In addition to reactive systems. partae laden streams can also be sampled.
Syngas Analysis by Mass Spectromety
I 1048

A sample transfer system was WnStNcted from stainless steel tubing and fittings to interlace the TMEMS to the BCL gasiiier. Fgure 1 shows the transfer line design concept. The combined,length of transfer line tubing was about 1 1 m (36 11) when installed on the gasifier. Separate laboratory experiments were performed prior to the BCL work to test for possible artifacts in sampling. Based on the results of that work both the raw and condiitioned syngas trom the BCL gasifier were diluted with nitrogen preheated to 300°C at a ratio of 51, and the residence time in the transfer line system was kept to less than one second.
2.2 Microscale DN-34 Lifetime Testing Microscale tests were performed with a model biosyngas and tar to examine DN-34 deactivation during syngas conditioning. The composition of the model biosyngas is shown in Table 1. For comparison, the table also shows a typical analysis of real biosyngas from the BCL gasifier. Two 50-hour lifetime tests with DN-34 were performed at the Colorado School of Mines (CSM) using a two stage upflow tubular reactor. The model syngas flow rate was controlled with a rotameter. Separate syringe pumps were used to meter water and model tar. The model tar was a solution of 10 wl % naphthalene dissolved in toluene. Both liquids were vaporized and mixed with the model syngas in a separate vaporker located just before the catalytic microreactor inlet. The catalytic microreactor was a 112 inch O.D. quam tube with a fritted quartz disk used to support a 2.0 gram DN-34 catalyst bed. The reactor exit lines were heated to approximately 300°C to prevent any condensatin. Two gas chromatographs were used: the first to analyze unreacted model tar and the second to determine the concentration of the permanent gases and water. The conditions for the lifetime catalvsts tests were: temoerature = 815%: steam in the feed = 40 vol %: and oas hourlv space veloci& (GHSV) = 2000 cm3,,, a, a15&m3~~, /hour .
3. RESULTS AND DISCUSSION 3.1 Figure 2 is a time trace for the benzene peak (dz78) for the second of two raw bosyngas samples taken in real time from the BCL gasifier using the TMBMS. The figure shows how the flow rate (as measured by this trace component) fluctuated over 25 minutes. These data were taken during a shakedown run of the BCL gasifier using hog fuel as the feedstock. Considerable difficulty was encountered in feeding the hog fuel to the gasifier because a continuous dlyer had not yet been installed. As a resuit. the wet hog fuel would bind and jam periodically in the screw feeding equipment, and we think that this is the origin of the large pulse-like fluctuations in Figure 2.
The two arrows in Figure 2 indicate the time interval used to obtain the averaged mass spectrum shown in Figure 3 (the d z 50-350 tar region for unprocessed bisyngas). The peak intensities are roughly propoltiinal to the relative concentratins of these compounds because they are chemically similar and because the instrument was tuned so that the mass spearal response was approximately constant as a function of dz: Therefore, Figure 3 indicates that benzene ( d z 78), toluene ( d z 92). phenol ( d z 94), styrene ( d z 104), cresol ( d z 108), indene ( d z 116), naphthalene ( d z 128) methylnaphthalene (dz 142 isomer unknown) and phenanthrenelanthracene (dz 178) are among the more abundant tar compounds. The tar in Figure 3 also appears to have a greater proportion of benzene and naphthalene, and somewhat lower amounts of aromatic hydrocarbons with 3 rings or greater, or oxygenates such as phenol and wesol. This is expected because the BCL gasifier is operated at approximately 800°C.5~8~g Oxygenates and unsaturated substituted aromatic hydrocarbons (e.g. styrene, d z 104) are more abundant under conditions of less severe thermal cracking of the pyrolysis vapors formed during the initial stages of biomass gasification.8”0 The exact composition of gasifier tar depends on both gasification temperature and residence time.’
3.2 DN-34 was tested in a slipstream fluidized bed reactor attached to the ECL gasifier during the hog fuel shakedown run. The total Slipstream flow was about 2.8 m3/h (100 SCFH) and the catalyst was operated at a GHSV of about 2000 cm3 a, m&m3m&our at a temperature of approximately 800°C. Details of the reactor configura?& are reported el~ewhere.~
Figure 4 shows the mass spectral peak intensities between nJI 50 and n%z 350 for the conditioned syngas stream exiting the fluidled bed slipstream reactor. Direct comparison of intensities between Figures 3 and 4 should not be made because the exact syngas flow rates in each case were Unknown. Comparison of relative peak intensities within each spectrum, however, indicates the compositiin of tar in that sample. Figure 4 shows that the peak intensities for the aromatic hydrocarbons were reduced, and the substituted aromatic and other hydrocarbon peaks were essentially eliminated, by catalytic conditioning with DN-34. This shows that DN-34 is adwe for destroying many of the compounds present in bomss gasifier tar, however, benzene, naphthalene and smaller amounts of higher molecular weight aromatic hydrocarbons were detected in the outlet gas. This is consistent with previous microscale activity teas using a synthetic syngas and tar dlerent than that listed in Table l! In that wofk. DN-34 exhibited high adivity for cresol, indene, 1-methylyhthalene and 2-methylnaphthalene destruction at 815’C, with 50 vol %Steam at a GHSV = 1500 h , but benzene and naphthalene destruction levels were typically 30 and 50 mole respedively4 We were not able to perform quantitative analysis of the BCL syngas with the TMEMS due to the limited time on-line so exact tar conversion levels are not reported. Future work will address quantitative analysis. Kinetic data are not yet available for DN-34, however lower space velocily operatiin may improve benzene and naphthalene destruction with DN-34. The small peaks at d z 55.73.91 and 109 in Figure 4 are from water clusters formed from the steam in the syngas sample. They form during adiabatic cooling of the sample gas in the first differentially pumped stage of the TMBMS inlet. Using hot N2 to dilute the sample gas minimized their formation.
Raw Syngas Analysis by TMBMS
Conditioned Syngas Analysis by TMBMS
1049

3.3 TWO 50 hour microscale tests of DN-34 were made using a model syngas and model tar (Table 1). The results from a duplicate lietime test were essentially identical to the first test. Toluene was not observed in these experiments but benzene (not originally in the feed) was. This is thought to be Steam dealkylation of toluene to form benzene and syngas as this reaction has been observed with different catalflic systems."
Gradual loss in benzene deStNctiOn activity was observed during the test. Benzene destNdiOn was initially 95 mle % and decreased to 75 mole % by the end of the 50 hours. Further data were not taken, thus, it could not be determined if catalyst selectivity would continue to change. Naphthalene deStNction was essentially complete during the entire 50 hours. The loss of benzene destruction activity in the microscale tests is in contrast with the lack of measurable deactivation seen in earlier slipstream gasifier tests5 The reason for the dinerence is not clear at this time. While quantitative comparisons are not possible at this time, the observation that DN-34 exhibits somewhat superior performance for destroying the hi her molecular weight aromatic hydrocarbons is consistent with the other microscale experiments and with the TMBMS work discussed here. This may simply reflect the ditfiilty in steam reforming more stable hydrocarbons using DN-34. Current eftorts in Catalyst development are aimed at determining the origin of activly in DN-34 and using this information to guide the formulation improved catalysts.
4. SUMWRY The NREL transportable molecular beam mass spectrometer (TMBMS) was successfully used to monitor unprocessed and catalytically conditioned biosyngas. Variations in the bosyngas flow rate were attributed to variations in the biomass feed rate. A large number of tar compounds were observed in the unprocessed syngas in addition to the known low molecular weight permanent gases (not shown) including, oxygenated and substituted aromatic hydrocarbons, and polynuclear aromatic hydrocarbons. Catalytic condtiining with DN-34 effectively destroyed the more reactive compounds. but Some benzene, naphthalene, phenanthrene/anthracene and pyrene remained.
The results from the gasifier slipstream experiment are qualitatively consistent with the resub of similar experiments performed at the microscale wRh DN-34. that is stable hydrocarbons (e.g. benzene) are less reactive than oxygenated or substituted aromatic hydrocarbons. The 50-hour lifetime tests indicated that the conversion 01 benzene gradually decreased during the test period.
REFERENCES 1. Philip, R.J.. Methanol Production from Biomass National Research Council of Canada (NRCC) Report No. 27743, NRCC, Ottawa. Ontario, Canada, 177 pp. (1986).
2. Amar, M.P.; Corella, J.; Deigado, J. and Lahoz, J. "Improved Steam Gasification of Lignocellulosic Residues in a Fluidized Bed with Commercial Steam Reforming Catalysts," Ind. Eng. Chem. Res. 32. 1- 10 (1993).
3. Baker. E.G.; Mudge, L.K. and Brown, M.D. "Steam Gasification 01 Biomass with Secondary Catalysts," lnd. Eng. Chem. Res. 26, 1335 - 1339 (1987).
4. Gebhard, S.C.; Wang. D.; Overend, R.P. and Paisley, M.A.. "Catalytic Conditioning of Synthesis Gas Produced by Biomass Gasification." Biomass and Bioenergy (1994), in press.
5. Paisley, M.A. and Lm, R.D.. "Hot-Gas Conditioning of Bornass Derived Synthesis Gas," Pmc. 7'' Biomass Conf. of the Americas, Budington, Vermont (1993), 1133.
6. Ratclii. M.A., M.S. Thesis (T-4606, Chemistry). Colorado School 01 Mines (1994).
7. Lias, S.G.; Ballmess. J.E.; Liebman, J.F.; Holmes, J.L.; Levin, R.D. and Mallard. G.W., "Gas- Phase Ion and Neutral Thermochemistry," J. Phys. Chem. Ref. Data 17 (1988) (supp. I), 424.
8. Evans, R.J. and Milne, T.A., "Molecular Characterization of the Pyrolysis of Biomass, 1 Fundamentals," Energy and Fuels 1 (1987), 123.
9. Evans, R.J. and Milne, T.A., "Molecular Characterization of the Pyrolysis of Biomass, 2 Applications." EnergyandFuels 1 (1987), 311.
10. Elliott, D.C., "Analysis and Comparison of Biomass PyrolysidGasification Condensates," Report NL-5943 (1986) Pacific Northwest Laboratory, Richland, WA.
11. Duprez, D.; Miloudi, A.; Delahay. G. and Maurel, R.; "Selective Steam Reforming of Aromatic Hydrocarbons," J. Catal. 90, 292 - 304 (1984).
DN-34 Lfetime Performance and Selectivity
a
I 1050

GaSifler Model
(mole Yo) (mole YO) Component Biosyngas Biosyngas
H2 15.8 15.3 co 23.0 22.6
9.2 8.8 9.1 8.8 0.4 0.3 3.0 2.9
C2He 0.3 0.3 TAR 0.2. 1 .o** H2O 39 40
co2 CH4 CZH, C2%
igure 1. Schematic of TMBMS interface to Battelle gasifier
0.0 5.0 10.0 15.0 20.0 25.0 Time (min)
gum 2. Benzene (mh 78) intensity vs. time for unprocessed biosyngas
I
1051

i
I
1
50 100 150 200 250 300 350 d E
lure 3. Mass spectrum for raw hog fuel gasifier tar
202 ;,71gi,Ll>l +'i" ~ , , , ,
109 lS2
50 100 150 200 250 300 350 d z
gum 4. Biosyngas conditioned with DN-34 catalyst
1052

THE APPLICATIOM 03 OABIBICATIOM TECSNOLOQY TO PRODUCE TRAU8PORTATIOIY BWLB
Richard 8. Dickiason, Vice President - Technology The genesis of the alternative fuels industry at the end of
the 1970's was based on the expectation of ever-increasing crude oil prices throughout the rest of the century. Fortunately, or unfortunately, depending on one's perspective, this has not come to pass. lows in recent months and the OPEC countries have not demonstrated the ability to cope with the challenges of controlling crude oil production to counter the increases of supply from geographically diverse regions of the world. Further shadowing the energy market is the potential for Iraq to reenter the world market with their crude production and the potential for the former states of the Soviet Union to upgrade and increase the export of crude oil into the world markets to raise much needed foreign currency.
These factors, combined with the significant reduction in federal support for the development of synthetic fuels in the early 1980's, have forced many companies to rethink their original strategy to enter the alternative energy business.
been largely focused on gasification technologies that would convert a carbon source like coal and organic waste streams to produce syngas, a combination of primarily carbon monoxide (CO) and hydrogen. These products can be converted to steam and electricity through combined cycle turbines, or converted to methanol or synthetic gasoline as a potential transportation fuel or feedstock for chemical manufacturing. In addition, the application of gasification technologies can be used to provide hydrogen that will be necessary for refiners to produce reformulated gasolines in the future.
technically successful, the economics of the energy market have forced a refocusing of the marketing strategy. of environmental requirements on stationary sources of air, pollution under the Clean Air Act Amendments of 1990, together with restrictions placed on waste disposal by the federal Resource Conservation and Recovery Act Amendments passed in 1984, has created new opportunities for gasification technology. This technology is ideally suited to produce energy from coal or waste materials that significantly reduce the environmental impacts of coal or waste combustion for power generation.
To quantify the environmental and economic benefits of gasification technology over alternatives, it is necessary to identify the environmental media that are of concern. Air
Texaco Inc.
Recent worldwide crude oil prices have dipped to record
At Texaco, the development of alternative energy sources has
While this technology has been repeatedly demonstrated to be
The proliferation
1053

pollution emissions of particulate matter, oxides of nitrogen (NOX), and sulfur dioxide (S02) are the principal air pollution concerns from coal combustion. Carbon dioxide (C02) emissions, a greenhouse gas, are not considered an air pollutant: however, they are a concern, given the current commitments by the federal government to reduce the U . S . C02 emissions over the next decade. Finally, the generation and disposal of solid waste materials including ash, scrubber sludge, petroleum coke, plastics, municipal wastewater sludge, and industrial waste is an important environmental concern throughout much of the industrialized world.
As will be presented in more detail later in this paper, gasification technologies can present a number of environmental advantages over other methods of coal combustion for power generation or the manufacture of synthetic fuels. Not only are the generation of solid wastes reduced using gasification technology, but the application of gasification technologies can also convert waste materials, including hazardous wastes, to syngas and other desirable forms of energy. Quantifying the value of these advantages is critical to determining the economic attractiveness of any particular gasification technology and its ability to compete.
In comparing a gasification technology with alternatives, it is necessary to establish a set of standard operating assumptions as a common basis. These assumptions are shown in Table 1. Note that these assumptions are based on the configuration of a 250 megawatt power plant and indicate the appropriate coal capacities for the three types of competing technologies -- Texaco advanced gasification with combined cycle electricity generation (TAGCC); pulverized coal with scrubbers (PCWS): and pressurized fluidized bed combustion (PFBC) .
Based on the above operating conditions, an estimate of the annual emissions of air pollutants and production of solid waste is shown in Table 2. The information provided is based on emission factors shown in parentheses on the table for each technology. The factors for the PCWS and PFBC technologies are derived from an Electric Power Research Institute Technical Assessment Guideline published in 1991. Emissions factors for the TAGCC technology are derived from work done by Texaco. Using TAGCC technology in lieu of the alternatives provides significant reductions in SOX, NOX, particulate matter, C02, and solid waste production.
The valuation of these emission reductions is a function of the environmental standards adopted for air pollution limits and waste disposal transportation costs and treatment requirements. These costs can be expected to vary significantly from one location to another.
1054

To provide further insight into this issue of valuation, an Externality Valuation comparison of TAGCC with PFBC and PCWS technologies is shown on Tables 3 and Table 4, respectively. The emissions reduced represent the total emissions stream differential over the twenty-year life of a project. The values per ton are based on an estimate from a study of externality costs conducted by Pace.University in 1992 that estimated the cost per ton of emissions reduced for various air pollutants, including C02. Solid waste disposal costs assume a twenty- dollar-per-ton transportation charge for disposal. In these tables, the cost numbers are unadjusted for inflation and calculated on a straight-line basis. reductions achieved from these technologies is substantial. As illustrated in the lower right-hand corner of Tables 3 and 4, the net reduction in cost for TAGCC technology over either of the competing technologies is also substantial. The ability of these savings to offset the additional capital cost requirement for building an AGCC facility is discussed in more detail below.
is approximately $1000 per kilowatt of electrical generating capacity. TAGCC technology has a capital cost of approximately $1200 to $1400 per kilowatt of capacity. This differential amounts to between 50 and 100 million dollars of increased capital cost for constructing a new facility with 250 megawatts of capacity.
To offset these capital cost differentials, it is critical that state and federal regulatory agencies recognize the value of the environmental benefits of gasification technologies over alternative combustion technologies. These costs include the responsibility from cradle to grave for the safe disposal of hazardous components in solid waste, the elimination of air pollution emissions of heavy metal compounds, and a reduction in emissions of oxides of nitrogen and particulate material. This recognition, when translated into government policies that provide incentives for utilities and others to recognize and reduce the real operating costs for waste disposal and air pollution emissions, will continue to make TAGCC technology even more competitive with conventional technologies.
The general public and government agencies will continue to demand actions by industry to produce a cleaner environment. A prudent operator should anticipate these requirements and select a technology that not only reduces the amount of waste generated, but can actually consume hazardous wastes as well.
If a power generating facility is located in an air pollution non-attainment area that requires emissions reductions, a market-based emissions trading system is one mechanism that will provide additional incentive to pursue TAGCC technology over other alternatives.
The emissions and waste
The capital cost of conventional PFBC and PCWS technologies
1055
Tables 5 and 6 compare the potential value of emissions reduction credits over the life of a project for an TAGCC facility versus PFBC and PCWS facilities, respectively. The current cost of solid waste disposal is relatively easy to quantify compared to air pollution emissions reductions credits. For the purpose of this illustration, it was assumed that the slag generated from gasification would incur no disposal cost since this material has value as a saleable commodity. cases no disposal costs were included for the PFBC and PCWS combustion technologies beyond a $20 per ton transportation charge. the recovery of saleable elemental sulfur.
The value of environmental credits, as developed by Pace University, represents reasonable approximations of per-ton control cost for the various pollutants in the United States. It should also be noted that while the United States Government has a stated policy of reducing greenhouse gas emissions, including Co2 to 1990 levels, the substantial reductions achieved by the TAGCC technology due to its higher overall efficiency were not credited in these cases.
Given the uncertainties in valuing emissions reduction credits, it is difficult to forecast the expected value of these credits at some future date. However, it is not hard to speculate that many regions of the United States will have difficulty demonstrating attainment of the ozone and particulate air quality standards, while continuing to pursue economic growth. These two competing concerns will increase the demand, and, therefore, the value of technologies that can produce emissions reduction credits in the future since the supply of potential credits is limited by the current sources in a region. The requirements for emissions offsets for new and rebuilt sources in most of the U.S. metropolitan areas will also stimulate demand for emissions reduction credits. The same case can be made for expected increases in waste disposal costs as landfill capacity declines over the next decade and increasingly stringent environmental regulations govern disposal of all types of wastes.
For these
In addition, no credit was given to TAGCC technology for
Tables 5 and 6 also show the value of this twenty-year stream of credits on a before-tax, discounted cash flov basis, assuming a 10% cost of capital and a 4% inflation rate. Using conservative estimates of emissions credit values, the net present value of these credits would range from 136.8 million dollars to 140.3 million dollars for TAGCC versus PFBC and PCWS technologies, respectively.
Recently, the EPA adopted regulations for reducing emissions of NOX. a component of ozone formation in the major urban areas, with estimated cost per ton of emissions reduced in excess of $7,000. These controls are for both motor vehicle emissions and reformulated gasolines that will be required by
I
I 1056

early in the next century. These cost-benefit ratios have been determined to be necessary by federal and state regulatory authorities in many regions of the United States. If the Value/Ton Environmental Credits column in Tables 5 and 6 is adjusted to use $7,000 for NOx reduction and the net present values are recalculated, then the advantage of Texaco's Advanced Gasification Technology increases substantially to range from 209 to 318 million dollars on a before-tax basis as is shown in Table 7.
Texaco's Advanced Gasification Combined Cycle technology can also be used by petroleum refiners in producing federally mandated reformulated gasolines. Because of the limits on gasoline, sulfur levels, and distillation ranges, production of these gasolines will require the expansion of hydrogen-consuming processes like catalytic hydrotreating and hydrocracking. Concurrently, limits on gasoline benzene content will move refiners towards lowering catalytic reformer severities, which will reduce hydrogen production. convert low-value petroleum coke, gaseous fuels, and refinery organic wastes to produce electricity, steam, and hydrogen for refinery utilization. This will reduce refiner utility costs, allow for optimization of coker operations through crude oil selection and coker liquids yield, and provide a means of cost effectively disposing of organic wastes produced at the refinery. These multiple benefits are expected to make TAGCC an important technology in the evolution of the refining industry over the next decade.
TAGCC technology can be used to
Coaclusiog:
Inherently low emissions technologies like Texaco's advanced gasification process that produce significantly lower levels of pollution will have an increasing competitive advantage in the future. ~n important factor in expanding the commercialization of innovative technologies like Texaco's AGCC is their ability to capture the true value of environmental credits. This ability is, in large part, dependent on the level of support given by state and federal regulatory agencies and policymakers in promoting markets for environmental credits. these are the same government agencies that are promoting alternative fuels as clean fuels for transportation purposes.
than current technologies used for electricity generation when environmental benefits are considered. The value of these credits should increase in the future as more areas struggle to balance the demands for environmental compliance with the need for economic growth. It is critical that the private sector work with state and federal regulators to recognize the value of environmental credits by establishing market-based mechanisms that will provide incentives for innovative technologies to emerge.
In many cases,
Texaco's AGCC has the potential to be more cost competitive
1051

1058

1
1059

1/


e !
.. c 0 0
0
a
Y
I i l

s i P I
J'i s I
t: SI..
8688
i
E l l f ? '
860

Coliquefaction of Waste Rubber Tires with Coal
Edward C. Orr, Wisanu Tuntawiroon, Larry L. Anderson, and Edward M. Eyring
Department of Chemistry and Department of Chemical and Fuels Engineering, University of Utah, Salt Lake City, UT 84 1 12
Keywords: EPMq coliquefaction of waste materials, coal, rubber tires
Introduction
There is an interest in the conversion of coal to liquid fuels because of the abundant supply of coal and the diminishing reserves of petroleum. Standard coal liquefaction techniques utilize Hz gas as a source of hydrogen to cap the radical species produced during liquefaction. Waste materials such as plastics, oils, and rubber tires with a high hydrogen content could be an alternative source of hydrogen that, in principle, could be transferred from the waste materials to the coal during liquefaction. An added benefit of such a program of waste material utilization would be a diminution in materials disposed of in landfills or incinerators.
Rubber tires are approximately one third by weight carbon black. Farcasiu and Smith have shown that carbon black increases yields in coal liquefaction.’ Since carbon black is one ofthe top fifty chemicals produced in America during 1993 (3.22 billion pounds)’the recovery and reuse of carbon black from tires could become economically attractive. Giavarini has shown in recent work that carbon black could be reclaimed and activated to produce quality carbon blacks after pyrolyzing waste rubber tires.’ Rubber tires also contain zinc oxide which is added as a filler and also aids in the Lulcanization of the rubber.4 The zinc oxide could play a role as a catalyst in liquefaction reactions. It could also decrease the amount of sulfur that ends up in the coal liquids.
Waste plastics contain many metals used for coloring, waste oils contain metals acquired while used as a lubricant, and waste rubber tires contab zinc. A past investigation suggested that coal undergoing liquefaction may act as a “scavenger” for heavy metal^.^ The ability of coal to trap metals will be discussed in the present paper.
Electron probe microanalysis (EPMA) is a technique which can map the dispersion of an element within a sample by the detection of characteristic X-rays. ‘,’ Using EPMq samples of the insoluble fraction produced by the coliquefaction experiments were analyzed to determine whether several heavy elements of interest were trapped in coal particles.
Exuerimental
Blind Canyon (Utah) coal (DECS-6, -60 mesh) was obtained from the Penn State Coal Sample Bank and ground under nitrogen to -1 00 mesh. Waste rubber tire samples were obtained (University of Utah waste material bank) that had been ground to -25 mesh. The catalyst, ammonium tetrathiomolybdate (Aldrich) was used to make an aqueous solution of molybdenum. The ground waste rubber tire and coal were mixed dry (40 % tire and 60 % coal, by weight) with different heavy metals (1 % by weight) (nickel acetylacetonate, vanadium oxide, manganese acetylacetonate, chromium acetylacetonate, and zinc oxide obtained from Strem and Aldrich) and then mixed with 1 % by weight molybdenum using the incipient wetness technique. The mixture was vacuum dried for 2 hours at 100” C. The dried mixture was placed in glass tubes and stoppered with glass wool. The glass tubes were placed in 35 cc tubing bombs, purged with nitrogen, and pressurized to 1000 psi& HZ (cold). Tubing bombs were placed in a fluidized sandbath held at 350” C. The tubing bombs were shaken at 160 rpm for one hour and removed. The tubing bombs were allowed to cool overnight while under pressure. Samples were removed and extracted
,
\
1065

with cyclohexane using a soxhlet extractor. Products soluble in cyclohexane were isolated using a rotary evaporator and then dried two hours under vacuum at 100" C. The insoluble sample (char/ash) was vacuum dried under similar conditions and then mixed with Petropoxy 154 (Pullman, Washington) and polished with a Syntron diamond paste polisher for eight hours. Micrographs were obtained using a CAMECA Model SX-50 electron microprobe (Courbevoie, France). Two different micrographs are presented: secondary electron images (SEM) and the characteristic X-ray micrograph for a specific element of interest (all micrographs shown are for a 50 p x 50 p field of View).
&&
Table 1 shows the percentage (by weight) of gas, cyclohexane solubles (oil), and char produced from coliquefaction of coal and tire samples. Percentages were calculated without including the weight of catalyst, weight of heavy metals added, and the ash weight of the coal (6.6 %). Also not included were the weight of carbon black, s u h r and zinc oxide in the tire sample that together constitute 35 % by weight of a rubber tire.
The oil yields indicate that the addition of zinc oxide and nickel acetylacetonate, in combination with the catalyst ammonium tetrathiomolybdate, have a positive effect on the oil yields. No effect is observed for samples doped with vanadium, manganese, and chromium.
Table 2 contains the elemental analysis of the Blind Canyon (DECS-6) Coal, and the trace analysis of heavy metals naturally found in the coal. EPMA is only sensitive to concentrations of approximately 200 ppm or greater. Therefore, metals in their natural abundance in the coal are undetectable by EPMA.
Table 3 shows an approximate percentage of the components of a tire. The zinc oxide is useful in the EPMA micrographs since it permits the operator to distinguish between tire particles and coal particles.
Figure 1 shows a variety of tire particles and coal particles from a sample that was doped with zinc oxide. The tire particles contain both sulfur and zinc which allows them to be easily distinguished by comparison of the sulfur and zinc micrographs. The particle in the upper right hand comer is a tire particle. Moving from the tire particle towards the lower left hand comer, a roughly circular coal particle can be observed in the s u h r micrograph. The coal particle contains less sulfur than the tire particles. In the zinc micrograph, the coal particle shows that some zinc is found in and around the edges of the coal particle. It appears as if the coal has scavenged some of the artificially added zinc during liquefaction.
Figure 2 shows a tire particle and a coal particle from a sample that has been doped with nickel acetylacetonate. The coal particle is distinguished in the left hand side of the s u l k micrograph and the tire particle in the right hand side of the sulfur micrograph. The nickel micrograph show an outline of nickel around the left hand side of the coal particle indicating the presence of nickel in the borders of the coal particle. Also interesting to note is the presence of zinc in the coal particle even though zinc was not added to this sample. The only source of zinc present is the tire. This further indicates that the coal could be acting as a scavenger for heavy metals.
Figure 3 shows a tire particle and a coal particle from a sample that has been doped with vanadium pentoxide. The coal particle makes up over half of the micrograph on the right hand side of the micrograph. The tire particle, observed in the left hand side of the micrograph, shows an increased sulfur density and is easily distinguished by the zinc abundance shown in the zinc micrograph. The vanadium micrograph shows that there is no evidence of vanadium in the coal particle.
Figure 4 shows a combination of tire particles and coal particles taken from a sample that was spiked with chromium acetylacetonate. The sulfur micrograph shows a coal particle at the center of the micrograph and three other coal particles surrounding the center particle at the 2, 3, and 6 o'clock positions. There are three tire particles. One tire
c
1066

particle is found in the upper right hand comer and the other two are found on the left hand side of the sulfur micrograph. The tire particles are easily distinguished from the coal particles by the presence of zinc obsewed in the zinc micrograph. The chromium micrograph shows an enhanced presence of chromium in all four coal particles.
Conclusion
Our experiments indicate that zinc oxide, nickel acetylacetonate, and chromium acetylacetonate are scavenged by coal particles during liquefaction. This scavenging effect could decrease the amount of heavy metals that end up in the derived liquids. Further work is needed to determine whether there is a decrease in the amount of zinc, nickel, and chromium found in the derived liquids.
The oil yields indicate an interesting effect arising from mixing zinc oxide or nickel acetylacetonate with the molybdenum catalyst. Further work is needed in order to determine the effect of these two metals on the type of liquids produced €iom liquefaction.
Acknowledgments
We would like to thank Ray Lambert for technical assistance with the EPMA, Professor Henk Meuzelaar for the ground rubber tire samples, Professor Henry White for the use of his computer to aid in printing micrographs and the U.S. Department of Energy (contract no. DE-FC22-93PC93053) through the CFFLS, University of Kentucky, for funding the research.
References
1 Farcasiu, M.; Smith, C. Prepr. Pap. Am Chem. SOC. Div. Fuel Chem. 1991,4, 1869.
2 C & E News,1994, April I I , p. 13
3 Giavarini, C. Fuel, 1985,64,1331.
4 Krejsa, M.; Koenig, J. Rubber Chemistry and Technology, 1993,66,377
5 Sommerfeld, D.; Tuntawiroon, W.; Anderson, L.; Eyring, E. Prepr. Pap. Am. Chem Soc. Div. Fuel Chem. 1993,38,211.
6 Newbury, D.; Fiori, C.; Marinenko, R.; Myklebust, R.; Swyt, C.; Bright, D. Anal. Chem., 1990,62,1 I 59A.
7 Newbury, D.; Fiori, C.; Marinenko, R.; Myklebust, R.; Swyt, C.; Bright, D. Anal Chem., 1990,62, 1245A.
8 Pennsylvania State University Coal Research Section.
9 Farcasiu, M. Chemtech, 1993, Jan., 23
1061

Product Distribution of Coliquefaction
Carbon 16.1
Table 1
Nickel 25
Blind Canyon Coal Analysis Table 2
r H E : 1 H; 1 1 Vanidium j I Man anese
0 en 9.43 Chromium
Rubber Tire Tread Composition Table 3
1 Zinc Oxide I 1 I
t
I 1068

Figure 1 EPMA Micrograph 40 % waste rubber tire mixed with 60 % Blind Canyon DECS-6 by weight Catalyst: 1 % ammonium tetrathiomolybdate Doped with: 1 % zinc oxide Hydrotreated for 1 hour at 350’ C under 1000 psig hydrogen (cold)
Secondary Electron Image Sulfur K,,
Zinc L,
1069
‘ I

Figure 2 EPMA Micrograph 40 %waste rubber tire mixed with 60 YO Blind Canyon DECS-6 by weight Catalyst: 1 % ammonium tetrathiomolybdate Doped with: 1 % nickel acetylacetonate Hydrotreated for I hour at 350" C under 1000 psig hydrogen (cold)
Secondary Electron Image Sulfur K,
Zinc L,
1070
Nickel K,

Figure 3 EPMA Micrograph 40 YO waste rubber tire mixed with 60 YO Blind Canyon DECS-6 by weight Catalyst: I % ammonium tetrathiomolybdate Doped with: I %vanadium pentoxide Hydrotreated for I hour at 350" C under 1000 psig hydrogen (cold)
Secondary Electron Image Sulfur K,
Zinc L, Vanadium K,
1071

Figure 4 EPMA Micrograph 40 % waste rubber tire mixed with 60 % Blind Canyon DECS-6 by weight Catalyst: 1 % ammonium tetrathiomolybdate Doped with: I % chromium acetylacetonate Hydrotreated for I hour at 350" C under 1000 psig hydrogen (cold)
Secondary Electron image Sulfur IC,
I Zinc L, Chromium K,
1072
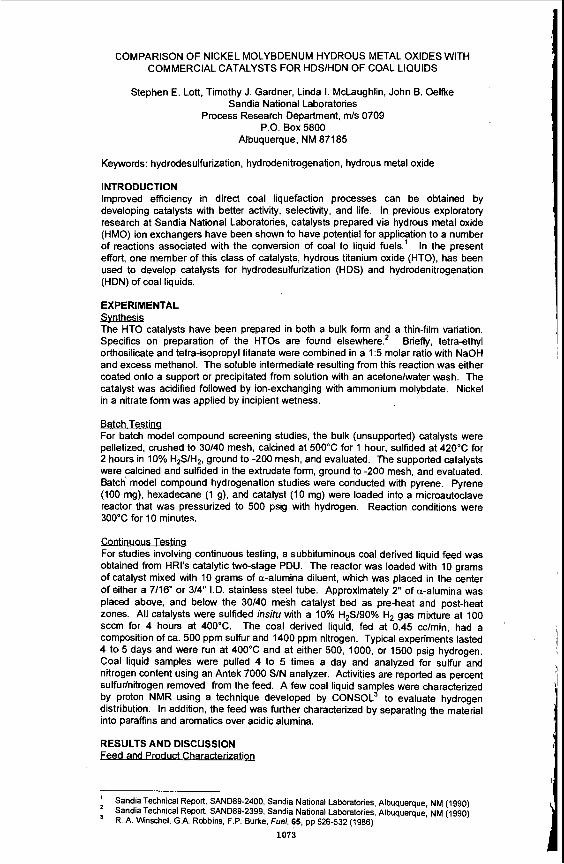
COMPARISON OF NICKEL MOLYBDENUM HYDROUS METAL OXIDES WITH COMMERCIAL CATALYSTS FOR HDSIHDN OF COAL LIQUIDS
Stephen E. Lott, Timothy J. Gardner, Linda I. McLaughlin, John B. Oeltlce Sandia National Laboratories
Process Research Department, m/s 0709 P.O. Box 5800
Albuquerque, NM 87185
Keywords: hydrodesulfurization. hydrodenitrogenation, hydrous metal oxide
INTRODUCTION Improved efficiency in direct coal liquefaction processes can be obtained by developing catalysts with better activity, selectivity, and life. In previous exploratory research at Sandia National Laboratories, catalysts prepared via hydrous metal oxide (HMO) ion exchangers have been shown to have potential for application to a number of reactions associated with the conversion of coal to liquid fuels.' In the present effort, one member of this class of catalysts, hydrous titanium oxide (HTO), has been used to develop catalysts for hydrodesulfurization (HDS) and hydrodenitrogenation (HDN) of coal liquids.
EXPERIMENTAL Svnthesls The HTO catalysts have been prepared in both a bulk form and a thin-film variation. Specifics on preparation of the HTOs are found elsewhere.' Briefly, tetraethyl orthosilicate and tetra-isopropyl titanate were combined in a 1.5 molar ratio with NaOH and excess methanol. The soluble intermediate resulting from this reaction was either coated onto a support or precipitated from solution with an acetone/water wash. The catalyst was acidified followed by ion-exchanging with ammonium molybdate. Nickel in a nitrate form was applied by incipient wetness.
Batch Testing For batch model compound screening studies, the bulk (unsupported) catalysts were pelletized, crushed to 30/40 mesh, calcined at 500°C for 1 hour, sulfided at 420°C for 2 hours in 10% H,S/H,, ground to -200 mesh, and evaluated. The supported catalysts were ,alcined and sulfided in the extrudate form, ground to -200 mesh, and evaluated. Batch model compound hydrogenation studies were conducted with pyrene. Pyrene (100 mg), hexadecane (1 g), and catalyst (10 mg) were loaded into a microautoclave reactor that was pressurized to 500 psig with hydrogen. Reaction conditions were 300°C for 10 minutes.
ous Testing For studies involving continuous testing, a subbituminous coal derived liquid feed was obtained from HRl's catalytic two-stage PDU. The reactor was loaded with 10 grams of catalyst mixed with 10 grams of a-alumina diluent, which was placed in the center of either a 7/16 or 314" I.D. stainless steel tube. Approximately 2 of a-alumina was placed above, and below the 30140 mesh catalyst bed as pre-heat and post-heat zones. All catalysts were sulfided insitu with a 10% H,SI90% H, gas mixture at 100 sccrn for 4 hours at 400°C. The coal derived liquid, fed at 0.45 cdrnin, had a composition of ca. 500 ppm sulfur and 1400 ppm nitrogen. Typical experiments lasted 4 to 5 days and were run at 400°C and at either 500, 1000, or 1500 psig hydrogen. Coal liquid samples were pulled 4 to 5 times a day and analyzed for sulfur and nitrogen content using an Antek 7000 SIN analyzer. Activities are reported as percent sulfur/nitrogen removed from the feed. A few coal liquid samples were characterized by proton NMR using a technique developed by CONSOL3 to evaluate hydrogen distribution. In addition, the feed was further characterized by separating the material into paraffins and aromatics over acidic alumina.
RESULTS AND DISCUSSION Feed and Pro
' Sandia Technical Report, SAND89-2400, Sandia National Laboratories, Albuquerque, NM (1990) Sandia Technical Report, SAND89-2399, Sandia National Laboratories, Albuquerque, NM (1990) R. A. Wnschel, G.A. Robbins. F.P. Burke, Fuel, 65, pp 526-532 (1986)
1073

Proton NMR spectra for the feed were compared to proton NMR spectra for product samples from two different catalyst runs: 500 psig and 1000 psig with nickel molybdenum hydrous metal oxide (NiMoHTO) on an Amocat 1C blank. These spectra indicated that little change in hydrogen character occurred at either condition. To further quantify the feed, the non-paraffinic portion of the feed was extracted over a column of acidic alumina. The effluent oil from the alumina column was compared to the feed oil by gas chromatography and results indicated that the feed was of a highly paraffinic nature. Due to the high paraffin content of the feed, it was reasonable that minimal boiling point upgrading occurred. These experiments indicated that the coal derived oil selected was an appropriate feed material, in that the HDSlHDN reactions would not be in competition for feed hydrogen with bond saturation reactions.
Batch Testina - HvdroaeWon (HYD! of P v r m The results for the pyrene HYD experiments are shown in Figure 1. The first order HYD activities are calculated on both a catalyst weight basis and on a weight of total active metals basis, Le. molybdenum and nickel. The activity of the bulk (unsupported) NiMoHTO (8.5%Mo/2.9%Ni) was higher than either Shell 324 (13%Mo/2,7%Ni) or Amocat (10.7%Mo/2.4%Ni) on either basis. When comparing the activities for the supported NiMoHTO catalysts with their commercial counterparts, the NiMoHTO catalysts had higher activities. For the NiMoHTO on the Shell support (8.8%Mo/2.9%Ni), the NiMoHTO was 12% more active on a catalyst weight basis and 81% more active on an active metals basis. The results for the NiMoHTO on the Amocat support (9.2%Mo/3.O%Ni) compared to the Amocat 1C catalyst were similar: 25% more active on a catalyst weight basis and 52% more active on a metals basis. The higher activities of the NiMoHTO catalysts as compared to the commercial catalysts, especially on an active metals basis, is due in part to the high dispersion of the MoS, on the HTO. TEM studies have indicated that the MoS, dispersion is higher on a NiMoHTO catalyst as compared to a commercial catalyst. A second explanation for the higher activity is the higher acidity of the NiMoHTO as compared to commercial catalysts supported on alumina. The catalyst acidity was measured by ammonia adsorption. In terms of moles of ammonia per gram of catalyst, the bulk NiMoHTO adsorbed 43% more ammonia than Shell 324. The higher acidity of the NiMoHTO may lead to a higher HYD activity for the HTO catalysts.
Flow Reactor Testina - HDS and HDN of Coal I tqu~!~ The HDSlHDN activity in terms of total removed sulfur and nitrogen was measured at 500, 1000, and 1500 psig for unsupported (bulk) NiMoHTO, Shell 324, Amocat lC, and NiMoHTO catalysts supported on Shell and Amocat blanks. The bulk and supported NiMoHTO catalysts had a lower total active metals concentration than either Shell 324 or Amocat 1C. The following results are presented as a percentage sulfur or nitrogen removed at a constant reactor space velocity (SV). The SV was based on total catalyst weight and not on active metals. If the results were based on total active metals, the activity of the NiMoHTO catalysts would be higher. In general, the estimated error in the HDS and HDN activities was estimated to be &1-2%. In the interest of publication space, only the HDS results are shown in Figures 2-7.
6) 500 o u The HDS activities of the evaluated catalysts are shown in Figures 2 and 3. At 500 psig, the bulk NiMoHTO activity (9.7%Mo/3.2%Ni) was higher than either Shell 324 or Amocat 1C. The bulk NiMoHTO catalyst had a higher activity than Amocat 1 C with a lower loading of active metals. Since the NiMoHTO catalysts have a higher dispersion of MoS, than standard commercial catalystsl. it is not unexpected that HDS activities can be maintained with a lower NiMo composition. At 500 psig. the bulk NiMoHTO was significantly more active for HDS than Shell 324 (Figure 3).
The trends for the HDN activities were similar to the HDS activities. After 80 hours on- line, the HDN activity for the bulk NiMoHTO was about 21%. This was significantly higher than the 80 hour HDN activities of Shell 324, Amocat lC, and NiMoHTO on an Amocat blank: 13%, 9%, and 15% respectively. In general at 500 psig, the bulk NiMoHTO outperformed, and the supported NiMoHTO catalysts achieved near equal performance to the commercial catalysts for HDS and HDN activities while containing less active metals.
1000 DSQ The HDS activities for the bulk NiMoHTO (9.6%Mo/3.2%Ni), Amocat supported NiMoHTO (8.1%Mo/2.7%Ni) and Amocat 1C catalysts are shown in Figure 4. Line-out HDS activities were between 86% and 90% for all three catalysts with the
I
. .
c L 1074

Amocat 1C activity being slightly higher than either of the NiMoHTO catalysts. Figure 5 shows the data for the bulk NiMoHTO, Shell 324, and Shell supported NiMoHTO (8.9%Mo/2.9%Ni) catalysts. The HDS activity of the Shell 324 was higher than either the Shell supported NiMoHTO or the bulk NiMoHTO catalysts by about 3%.
The 80 hour HDN performance for the five catalysts in Figures 4 and 5 were ranked as follows; Shell 324 (45%), bulk NiMoHTO (43%), Amocat 1C (42%), Amocat supported NiMoHTO (42%), and Shell supported NiMoHTO (39%). Given an estimated error of Q%, minimal differences were found in performance on a total catalyst weight basis, although the supported NiMoHTO catalysts contained 18% and 25% less active metals as compared to Amocat 1C and Shell 324 respectively.
m) 1500 ps ig The HDS activity for the bulk NiMoHTO (9.6%Mo/3.2%Ni), Amocat supported NiMoHTO (7.8%Mo/2.6%Ni) and Amocat 1C catalysts are shown in Figure 6. The bulk NiMoHTO and Amocat 1C catalysts performed slightly better than the Amocat supported NiMoHTO. The Shell 324, Shell supported NiMoHTO, and the bulk NiMoHTO performed similarly (Figure 7). The HDN activities for the Bulk NiMoHTO. Shell 324 and Shell supported NiMoHTO all performed similarly; about 64k2%. The results for the Amocat 1C and Amocat supported NiMoHTO were significantly less: about 55%.
CONCLUSIONS For HYD of pyrene, unsupported NiMoHTO catalysts performed better than commercial benchmark catalysts on either a catalyst weight or active metals basis. In a side-by-side comparison of supported NiMoHTO catalysts with commercial counterparts, the supported NiMoHTO catalysts outperformed the Shell 324 and Amocat 1C catalysts for HYD of pyrene. For HDSlHDN of coal liquids, the supported and bulk forms of the NiMoHTO catalysts equaled the performance of the commercial catalysts at 500, 1000, and 1500 psig while containing less active metals. Possible reasons for the high activity of the NiMoHTO catalysts are a high dispersion of the active MoS, phase and a high acidity of the bulk NiMoHTO.
This work performed at Sandia National Laboratories is supported by the U.S Department of Energy under contract DE-AC04-94AL85000.
0.25 V
t 5 0.20 - r g 0.15 9 5 0.10 z e 0
0.05 U % I
0.00
.............. ............I. ...................
- .... . . . . .
....
Shell HTO on Bulk Amocat HTO on 324 Shell HTO I C Amocat
(UCatalyst Wt. Basis .Active Metals Basis, x l01
Figure 1. HYD Pyrene Activity of Commercial and Hydrous Metal Oxide Catalysts
I'
1075
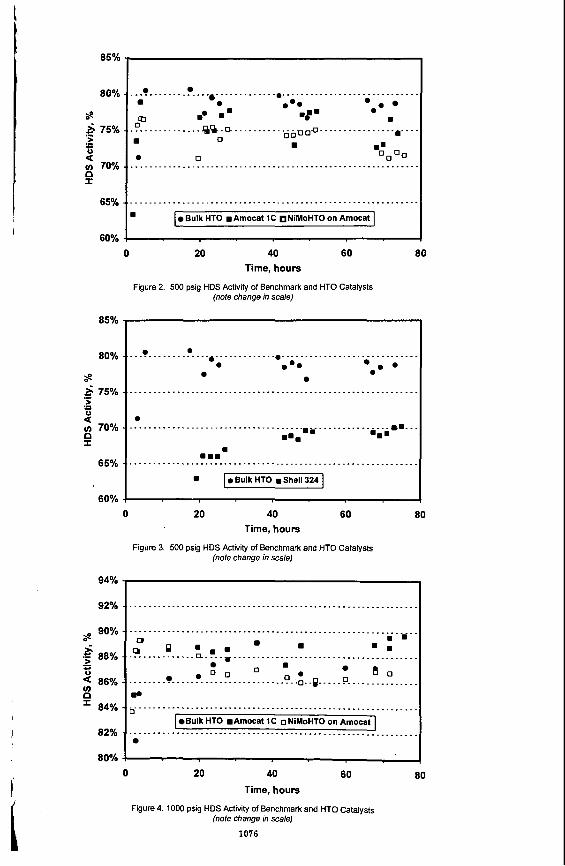
85%
80%
s .- & 75%
2 v) 70% 0 r
65%
60%
................. ... ...........
.0 . . . . . . . . . . . . .00. n. ............ o o n o ~ - -
I . 0
........... 0..
rtl .e m m =C.
0
... m
....... a"- ' W.
.............................................................
............................................................. Bulk HTO Amocat I C NiMoHTO on Amocat
.......
.......
0 20 40 60 80 Time, hours
Figure 2. 500 psig HDS Activity of Benchmark and HTO Catalysts (note change in scale)
.. .?.. .... ..?. ... .......... ............................ e . e.
*.--- 0..
s 3 75% 1". .................................. I.. ..................... .- > 'a
65% ............................................................. .Bulk HTO mShell324
i, a
I
60%
0 20 40 60 80 Time, hours
Figure 3. 500 psig HDS Activity of Benchmark and HTO Catalysts (note change in sca/e)
94%
92%
90% s $ 88%
86%
84%
82%
80%
.- *
0
...........................................................
............................................................ m m
9 . 0
0 9 . 9 ............ D.!.. 1; ...................................... 0 . 8 0 ................................ 0. .:. -0.. .. -0.. ............
m. 3 ...........................................................
Bulk HTO Amocat 1C o NiMoHTO on Amocat ...........................................................
0 20 40 60 ao Time, hours
Figure 4. 1000 psig HDS Activity of Benchmark and HTO Catalysts (note change in sca/e)
1076

94%
92%
90% s $ 88%
86%
I 84Oh
e 0
82%
80%
94%
92%
s .- d 90% > E 2 88Oh 0 I
86%
84%
d% ..........................................................
m m B m . 0 I
..................................................... .P.. 0. ..
. Ro. ... -?. .... .....................................
...................................... ........... a.0 ..... 0 0
0 0 0 0 0
0
............................................................. 10 Bulk HTO Shell 324 o NiMoHTO on Shell I
............................................................. 0
0 20 40 60 80
Time, hours
Figure 5. 1000 psig HDS Activity of Benchmark and HTO Catalysts (note change in sca/e)
................................................... .= 8 ' = - - - - - k om c & ............................ ? ..... ..... R ......e... .....
0 0 r o*. 0 0 0 0 0
....................................... ........... 0 U....... n o
............................................................ 3 Bulk HTO mAmocat I C o NiMoHTO on Amocat 0
0 20 40 60 80
Time, hours
Figure 6. 1500 psig HDS Activity of Benchmark and HTO Catalysts (note change in sca/e)
94%
92%
s .- 5 90%
8 5 *= v) 88% 0 I
86%
0 ............................................................ 0 0 0..
0 . 0 0 4 0 B
b' ........................ -9. ... .?. ... -8 ... .! .... x. ... .8-.
rn 0 0 0
0 . 0 0 0
..L ........................................................
............................................................ 0 Bulk HTO Shell 324 NiMoHTO on Shell
0
0 20 40 60 ao Time, hours
Figure 7. 1500 psig HDS Activity of Benchmark and HTO Catalysts (note change in scale)
1077

CHARACTERIZATION OF SILICA-DOPED HYDR6US TITANIUM OXIDE (HT0:Si)- SUPPORTED NICKEL MOLYBDENUM (NiMo) CATALYST COATINGS
Timothy J. Gardner, Linda I. McLaughlin, Stephen E. Lott, and John 8. Oelfke Sandia National Laboratories
Process Research Department, Mail Stop 0709 P.O. Box 5800
Albuquerque, NM 87185-0709
Keywords: hydrous titanium oxide, ion exchange, Mo
INTRODUCTION Hydrous Metal Oxides (HMOs) are chemically synthesized materials which contain a homogeneous distribution of ion exchangeable alkali cations that provide charge compensation to the metal-oxygen framework. Both the presence of these alkali cations and the resulting high cation exchange capacities (4-5 meqlg) clearly set these HMO materials apart from conventional precipitated hydrous oxides.1~2 For catalyst applications, the HMO material serves as an ion exchangeable support which facilitates the uniform incorporation of catalyst precursor species. Following catalyst precursor incorporation, an activation step is required to convert the catalyst precursor to the desired active phase.
Considerable process development activities at Sandia National Laboratories related to HMO materials have resulted in bulk silicadoped hydrous titanium oxide (HT0:Si)-supported NiMo catalysts that are more active in model reactions which simulate direct coal liquefaction (e.g., pyrene hydrogenation) than commercial NiMo catalysts. However, extension of this process to produce NiMolHT0:Si catalyst coatings on commercial supports is of interest for liquefaction applications since overall catalyst cost can be reduced and bulk HT0:Si mechanical limitations can be circumvented. This paper will describe how the bulk NiMolHT0:Si catalyst preparation process was extended to fabricate catalyst coatings on engineered supports. Initial efforts related to the catalyst coating procedures and the characterization of the Mo ion exchangeladsorption procedure will be discussed. The Mo ion exchangeladsorption process is complicated in the case of the catalyst coatings due to the presence of two potential Mo adsorption sites (Le., HT0:Si film vs. commercial support). These results will be correlated with pyrene hydrogenation reactivity and catalyst coating microstructure.
EXPERIMENTAL PROCEDURE HMO-supported catalyst preparation involves a multiple step chemical procedure which begins with the synthesis of a bulk HMO powder or HMO coating. This chemistry, which can be utilized to produce alkali titanates, alkali zirconates, alkali niobates. or alkali tantalates, has been described in detail elsewhere.3-5 Previous work has demonstrated that Si02 additions (Ti:Si molar ratio 51) to HMO materials act to stabilize HMO support surface area at high temperature (2 500°C) without significantly altering ion exchange proper tie^.^,^ A brief review of the synthesis of silica-doped sodium titanate (HT0:Si) with a maximum ion exchange capacity (Na:Ti mole ratio = 0.5) will be given here as an example. The first step of the reaction scheme involves the addition of a mixture of tetraethoxysilane and titanium isopropoxide to a dilute (-10 W.%) solution of sodium hydroxide in methanol, resulting in the production of a soluble intermediate species as follows:
Ti(OC3H7)4 + 0.2 Si(OC2H5)4 + 0.5 NaOH --------> Soluble Intermediate (1) CH30H
The exact chemistry involved in the formation and subsequent reaction of the soluble intermediate species is extremely complex. Possible competing reactions include exchange of methoxide groups for isopropoxide groups coordinated to Ti, precipitation and redissolution of titanium methoxide, partial hydrolysis or condensation of the various Si, Ti, or mixed alkoxide species, and sodium methoxide formation. Structural studies are in progress to better characterize the nature of the soluble intermediate species.
1078

To prepare bulk HT0:Si powders, the soluble intermediate is subsequently hydrolyzed in a mixed waterlacetone solution to produce the silica-doped sodium titanate as follows:
Soluble Intermediate Silica-Doped Sodium Titanate (2) H201C3H50H (NaTi2Si0.405.8H) or HT0:Si
The chemical formula in equation (2) assumes uniform incorporation of all reactants; this has been confirmed by various chemical analyses. The amorphous HT0:Si precipitate is filtered, washed, and vacuum dried at room temperature to produce the material for subsequent ion exchange (IE) processing.
As an alternative to bulk HT0:Si preparation, HT0:Si coatings can be prepared by exposing the soluble intermediate from equation (1) to other materials with a pre- engineered shape (e.g., monoliths, spheres, extrudates, etc.). Depending on the porosity and surface chemistry of the pre-engineered shape, dilution of the soluble intermediate, the coating technique and the drying conditions, thin or thick film HT0:Si coatings can be fabricated.4~5 This paper will focus on thick film catalyst coatings on y-Al203 extrudate (Amocat I C alumina blanks, 1/12 in. dia, 8879-85-C), and the resulting NiMo catalysts, although many other pre-engineered materials, shapes, and catalysts have been evaluated. These coatings were prepared by soaking the as-received y-Al2O3 extrudate in an undiluted soluble intermediate solution for 24 h, followed by vacuum filtration, and room temperature vacuum drying.
With the exception of the Amocat 1C catalyst , which was commercially prepared by an incipient wetness technique, similar Ni and Mo loading techniques were used for all other catalysts. Following the fabrication of the bulk HT0:Si powder or HT0:Si coated y-AlgOg extrudate. these materials were initially acidified with HCI to pH 2.5 or 4.0 (for coated vs. bulk catalysts, respectively) to remove Na, washed with deionized H20, and vacuum dried. Following this procedure, Mo anion exchange/adsorption was performed over a 30 rnin or 24 h period (for bulk vs. coated catalysts, respectively) in an aqueous solution (0.02-0.07 M) of ammonium heptamolybdate (AHM), (NH4)6Mo7024.4H20, at an initial pH of 3.5-3.9. Nominal targeted Mo loading for both the bulk HT0:Si powder and the HT0:Si coated y-AI2O3 catalysts was -10 wt.%. The Mo precursor loaded materials were vacuum filtered, rinsed with deionized H20 and acetone, and subsequently dried under vacuum at room temperature. Afler chemical analysis for Mo by atomic absorption spectrophotometry, Ni was added to the Mo precursor loaded materials via incipient wetness using Ni(N03)2,6H20, followed by overnight drying in ambient air at room temperature and oven drying in air at 100°C for 2 h. Regardless of the Mo loading level in the catalyst, a constant ratio of moles Ni/(moles Ni + moles Mo) = 0.35 was used to determine the Ni loading for each batch. The final catalyst precursor was activated by first calcining in air at 500°C for 1 h and then sulfiding in 10% H2S in H2 at 420°C for 2 h. Bulk catalysts were pelletized and granulated to -10/+20 mesh prior to activation, while coated catalysts were activated in extrudate form. Following activation, all catalysts were granulated to -200 mesh and evaluated for reactivity using pyrene hydrogenation as a model reaction. Pyrene (0.1 9). hexadecane (1 g), and catalyst (0.010 g) were loaded into a batch microautoclave reactor and tested at 300°C under 500 psig H2 for 10 min.
In addition to fabricating standard bulk NiMolHT0:Si catalysts, which contain nominally 8-10 wt.% Mo and 2.5-3.5 wt.% Ni, several other catalysts were made in an attempt to simulate the potential extremes involved in the Mo loading of NiMo/HTO:Si coated ?-AI203 extrudate. Because of the presence of at least two competing Mo anion adsorption sites, one for the HT0:Si film surface and one for the y-AI2O3 extrudate surface, it is important to determine the partitioning of Mo between these potential sites and the effect of this partitioning on catalyst reactivity, These two extremes were simulated by performing similar acidification and Mo exchange procedures on the y-AI2Og extrudate only and on bulk HT0:Si powder. The quantities of y-Al2O3 extrudate and bulk HT0:Si powder exposed to the AHM solution were determined by estimating the weight fractions of the HT0:Si coating and the y-Alp03 extrudate in the actual HT0:Si coated y-Al2O3 extrudate. These values, estimated from weight change measurements and separate chemical
1079

analyses, were 20 wt.% HT0:Si coating, and 80 wt.% y-AI2O3 extrudate. In both the case of the bulk HT0:Si powder and the y-Al2O3 extrudate, these IE conditions represented approximately a two fold excess of Mo relative to their respective individual Mo adsorption capacities.
RESULTS AND DISCUSSION The experimental conditions used to prepare these various sulfided NiMo catalysts resulted in a range of Ni and Mo loadings, which are summarized below in Table 1.
Table 1 Catalyst Compositions Resulting from Various Preparation Techniques
Catalyst weight loadings are expressed on a calcined basis.
For the bulk NiMolHT0:Si materials, high Mo loadings (7 20'wt.%) are possible due to the high affinity of acidified HT0:Si for anionic Mo species3 For our IE conditions, the predominant Mo species in solution should be either (M070230H)~~ or (Mo7024)4.6 Standard bulk NiMolHT0:Si batches, which contain 6-10 wt.% Mo incorporated via ion exchangeladsorption, are well within the Mo adsorption capacity for these materials. The high affinity of these HT0:Si materials for anionic Mo species is in contrast to oxide supports such as y-AI2O3 and TiO2, which have reported equilibrium Mo adsorption capacities of e 10 wt.%.7-9 Consistent with this literature, use of the same IE procedure with the y-AI203 extrudate only (referred to in Table 1 and Figure 1 as Blank IE) results in a lower Mo loading (< 5 wt.%) via ion exchangeladsorption. The fact that the Mo loading is significant, although smaller, on the y-AI203 extrudate, indicates that in the case of the NiMolHT0:Si coated y- Al2O3, a competition may exist between ion exchangeladsorption sites on the HT0:Si coating vs. the ?-AI203 extrudate surface.
The different Mo loading experiments also revealed potential problems with these I€ procedures. In the case of the extrudate samples, exposure to the Mo loading solution over a 24 h period resulted in a fine white precipitate which could clearly be differentiated from the y-AI203 extrudate. Several previous authors have reported similar results, with the precipitate being possibly attributed to a polymerized (NH&jMo8027,4H20 surface phase.7 Similar to aqueous Mo speciation, this precipitation is strongly influenced by the AHM concentration, solution chemistry and pH, and ageing.7.10 The significant difference in morphology between the extrudate and the precipitate allows easy visual identification of the precipitation problem; subsequent separation of the precipitate from the extrudate was achieved by repeated deionized H20 washing and filtering, and/or sieving. In agreement with previous work, blank IE treatments with y-AI203 extrudates using a lower concentration (0.007 M) AHM solution, resulted in similar Mo loadings with no obvious precipitation.7
Use of a bulk, granular powder (such as bulk HT0:Si or AI203 powder) precludes any visual identification of precipitation problem^.^ It is therefore possible that the high Mo adsorption capacity of the HT0:Si material might be at least partly attributed to surface precipitation. Further experiments will be performed in the future to confirm whether ion exchangeladsorption or precipitation of Ma species dominates in the case of the HT0:Si material.
Results of the pyrene hydrogenation experiments are shown in Figure 1. The first order hydrogenation activities are calculated on both a catalyst weight basis and on a weight of total active metals basis, Le. molybdenum and nickel. The activity of both the bulk NiMolHT0:Si and the Amocat 1C catalysts are based on large historical databases. As shown in a previous paper, the activity of the bulk NiMo/HTO:Si was
1080

higher than the Amocat 1C catalyst on either basis.11 A significant development effort resulted in the optimization of bulk NiMolHT0:Si catalyst activity; key steps in optimizing catalyst performance included the addition of silica to the HTO support, controlled drying procedures, optimizing acidification and Mo and Ni recursor loading conditions, and understanding the catalyst activation pr0cess.4~812 The combination of these improvements resulted in an increase in pyrene hydrogenation activity of 2-3X. Transmission electron microscopy (TEM) analysis of these catalysts showed that the NiMolHT0:Si catalyst possesses a higher dispersion of MoS2 than typical commercial catalysts. A second possible explanation for the higher activity is the higher acidity of the NiMo/HTO:Si as compared to commercial Arnocat 1C supported on alumina.11
0.30
a 0.25 .- E
m . - -
-
- &e&
0 Catalyst Weight Basis I E@@ Active Metals I
-cat 1c Bulk Blank IE High Mo NiMdhT0:Si
NiMoMT0:SI NiMolFAl,O, NiMdhTOSi Coated W20,
Catalyst Type
sis (xl0)
Figure 1. Pyrene Hydrogenation Activity of Commercial and Hydrous Metal Oxide Catalysts
For the other catalyst types, duplicate batches were prepared and tested to ensure representative data; with average values represented in Figure 1. Interesting results were observed for the two extreme cases which simulate NiMolHT0:Si coated y- AI203 IE conditions. For the NiMoly-Al2Og catalyst, a low pyrene hydrogenation activity was observed on a catalyst weight basis, but when normalized on a metals basis this proved to be a very active catalyst. This is consistent with the fact that higher MoS2 dispersions would be expected at lower weight loadings. The high Mo bulk (-15 wt.%) NiMolHT0:Si catalyst had a slightly lower pyrene hydrogenation activity on a catalyst weight basis than the standard bulk NiMolHT0:Si catalysts. This is in agreement with previous data suggesting that pyrene hydrogenation activity does not continue to improve with Mo loadings in excess of 10 wt.%.5 The significant decrease in catalyst activity of this catalyst on a metals basis probably indicates that the MoS2 dispersion is significantly lower for this sample relative to the standard (8- 10 wt.% Mo) bulk NiMolHT0:Si catalysts. Significant microstructural evaluation is necessary to confirm our speculation regarding changes in MoS2 dispersion for these samples.
The results for the NiMolHT0:Si coated y-Al2O-3 catalyst proved to be interesting with respect to the two extreme cases described above. Since a significant amount of Mo was used in the Mo IE procedure, it is plausible that both the HT0:Si coating and the
1081
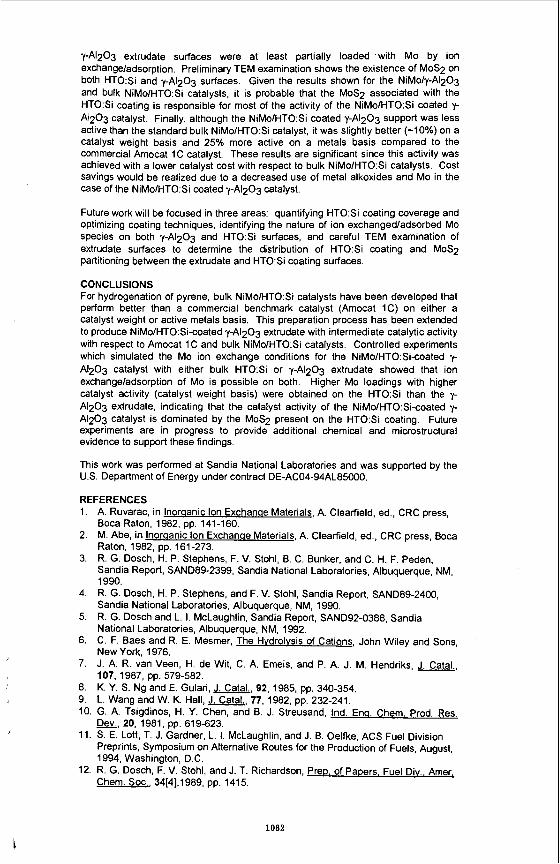
I
y-Alg03 extrudate surfaces were at least partially loaded .with MO by ion exchangeladsorption. Preliminary TEM examination shows the existence of MoS2 on both HT0:Si and y-AlpOg surfaces. Given the results shown for the NiMoly-AI203 and bulk NiMolHT0:Si catalysts, it is probable that the MoS2 associated with the HT0:Si coating is responsible for most of the activity of the NiMolHT0:Si coated y- A1203 catalyst. Finally, although the NiMolHT0:Si coated y-Al203 support was leSS active than the standard bulk NiMolHT0:Si catalyst, it was slightly better (40%) on a catalyst weight basis and 25% more active on a metals basis compared to the commercial Amocat 1C catalyst. These results are significant since this activity was achieved with a lower catalyst cost with respect to bulk NiMolHT0:Si catalysts. Cost savings would be realized due to a decreased use of metal alkoxides and Mo in the case of the NiMolHT0:Si coated y-Al2O3 catalyst.
Future work will be focused in three areas: quantifying HT0:Si coating coverage and optimizing coating techniques, identifying the nature of ion exchangedladsorbed MO species on both y-AI203 and HT0:Si surfaces, and careful TEM examination of extrudate surfaces to determine the distribution of HT0:Si coating and MoS2 partitioning between the extrudate and HT0:Si coating surfaces.
CONCLUSIONS For hydrogenation of pyrene, bulk NiMolHT0:Si catalysts have been developed that perform better than a commercial benchmark catalyst (Amocat IC) on either a catalyst weight or active metals basis. This preparation process has been extended to produce NiMolHT0:Sitoated y-AI203 extrudate with intermediate catalytic activity with respect to Amocat 1 C and bulk NiMolHT0:Si catalysts. Controlled experiments which simulated the Mo ion exchange conditions for the NiMolHT0:Si-coated y- AI203 catalyst with either bulk HT0:Si or ?-AI203 extrudate showed that ion exchangeladsorption of Mo is possible on both. Higher Mo loadings with higher catalyst activity (catalyst weight basis) were obtained on the HT0:Si than the y- AI203 extrudate, indicating that the catalyst activity of the NiMolHT0:Si-coated y- AI203 catalyst is dominated by the MoS2 present on the HT0:Si coating. Future experiments are in progress to provide additional chemical and microstructural evidence to support these findings.
This work was performed at Sandia National Laboratories and was supported by the U.S. Department of Energy under contract DE-AC04-94AL85000.
REFERENCES 1.
2.
3.
4.
5.
6.
7.
8. 9.
A. Ruvarac. in lnorqanic Ion Exchange Materials, A. Clearfield, ed., CRC press, Boca Raton, 1982, pp. 141-160. M. Abe, in lnoraanic Ion Exchanae Materials, A. Clearfield, ed., CRC press, Boca Raton, 1982, pp. 161-273. R. G. Dosch, H. P. Stephens, F. V. Stohl, 6. C. Bunker, and C. H. F. Peden, Sandia Report, SAND89-2399, Sandia National Laboratories, Albuquerque, NM, 1990. R. G. Dosch, H. P. Stephens, and F. V. Stohl, Sandia Report, SAND89-2400, Sandia National Laboratories, Albuquerque, NM, 1990. R. G. Dosch and L. I. McLaughlin, Sandia Report, SAND92-0388, Sandia National Laboratories, Albuquerque, NM, 1992. C. F. Baes and R. E. Mesmer, The Hvdrolvsis of Cations, John Wiley and Sons, New York. 1976. J. A. R. van Veen, H. de Wit, C. A. Emeis, and P. A. J. M. Hendriks, J. Catal., 107, 1987, pp. 579-582. K. Y. S. Ng and E. Gulari, J. Catal., 92, 1985, pp. 340-354. L. Wang and W. K. Hall, J. Catal., 77, 1982, pp. 232-241.
Dev., 20, 1981, pp. 619423.
Preprints, Symposium on Alternative Routes for the Production of Fuels, August, 1994, Washington. D.C.
10. G. A. Tsigdinos, H. Y. Chen, and B. J. Streusand, Ind. Enq. Chem. Prod. Res.
11. S. E. Lott, T. J. Gardner, L. I. McLaughlin, and J. 6. Oelfke, ACS Fuel Division
12. R. G.-Dosc~, f. V.'Stohl, and J. T. Richardson, Prep. of Papers. Fuel Div.. Amer. Chem. SOC., 34[4],1989, pp. 1415.
1082

The Effect of Promoter Metal Concentration on the Catalytic Activity of Sulfated Hematite for the Liquefaction of a
Subbituminous Coal
G. T. Hager, A. L. Compton, E. N. Givens, F. J. Derbyshk Center for Applied Energy Research
University of Kentucky 3572 Iron Works Pike
Lexington, KY 4051 1-8433
Abstract
The application of dispersed iron-based catalysts to the liquefaction of low rank coals has been well documented since the 1930's. More recent research has attempted to improve their activity, primarily by reduction in the particle size or by modification through the introduction of various promoters. The use of sulfated hematite has been shown to yield positive results for the liquefaction of a subbituminous coal. The addition of promoter metals such as molybdenum and tungsten were shown to effect further improvements in activity. This study has shown that the addition of promoters in combination, such as nickel with molybdenum, may significantly increase activity at low promoter concentrations and, potentially, low cost. The effects of the promoter metals nickel, cobalt, tungsten, and molybdenum, individually and in combination will be presented. Molybdenum showed the highest increase in activity for the single promoter metals examined. While the activity of tungsten and cobalt, when used in combination with molybdenum, appeared to be essentially additive, the combination of nickel and molybdenum exhibited a synergistic effect, resulting in high conversions at low promoter loading.
Introduction
Iron-based catalyst precursors have long been known to improve the conversion of low rank coals. Efforts to improve the activity of these catalyst has centered primarily on attaining very small particle size, improved dispersion, and chemical modification of the catalyst. The use of oil-soluble precursors, such as iron carbonyl, have demonstrated significant catalytic activity, presumably through their being efficiently dispersed in the coal-solvent slurry.. However, one study found that an oil-soluble precursor could lead to the formation of large crystallites more rapidly than a small particulate precursor.' The loss of dispersion is expected to be associated with a reduction in catalyst activity.
Small particle iron oxides have been shown to have moderate activity for coal liquefaction. The addition of sulfate groups to hematite (FQO,) has been shown to further improve the activity of these catalysts? ' Sulfated hematites have been produced by two methods. The first involves the addition of a source of sulfate ion to a previously formed goethite (FeOOH) particle by washing with sulfuric acid.' The second method involves the precipitation of goethite in the presence of a source of sulfate ions.' The particles may then be calcined to form F%OJSO,Z'. The nomenclature used does not denote a stoichiometric relationship between the iron and sulfate group but rather indicates SO, chemisorbed on the surface of the iron oxide. Both methods of preparation have been shown to yield improved activity for iron oxide catalyst precursors.
The high catalytic activity of molybdenum is well established. However, the use of a dispersed molybdenum catalyst in a coal dissolution process is cost prohibitive, except in very low concentrations, due to difficulties associated with catalyst recovery. Pradhan and coworkers found that the addition of up to 5 wt% molybdenum or tungsten based on iron as a promoter to sulfated hematite resulted in a significant increase in activity? As with most iron-based catalysts the addition of a source of sulfur is critical to achieving the maximum activity. The promoted sulfated hematites demonstrated significant activity at low catalyst loadings ( ~ 0 . 4 wt% iron on coal).
The purpose of the current study was to determine the effect of promoter metals on the
'
1083
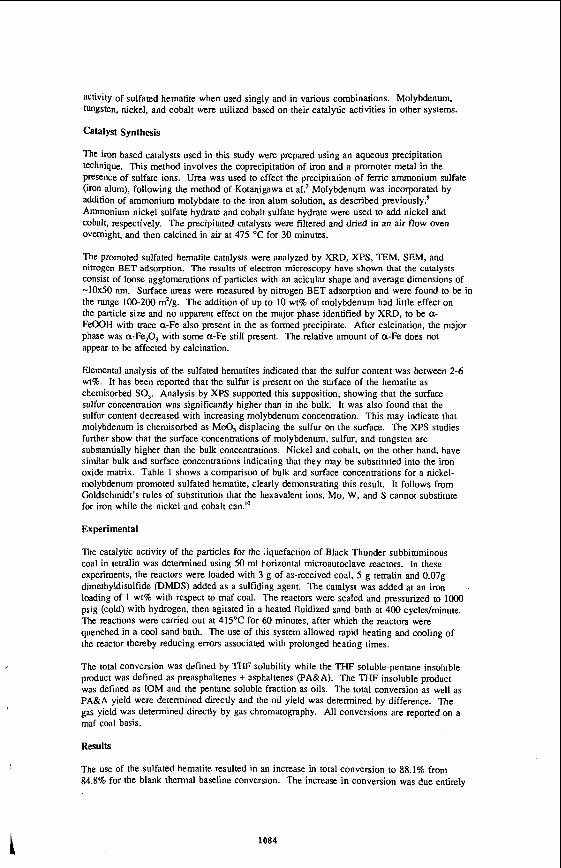
activity of sulfated hematite when used singly and in various combinations. Molybdenum, tungsten, nickel, and cobalt were utilized based on their catalytic activities in other systems.
Catalyst Synthesis
The iron based catalysts used in this study were prepared using an aqueous precipitation technique. This method involves the coprecipitation of iron and a promoter metal in the presence of sulfate ions. Urea was used to effect the precipitation of ferric ammonium sulfate (iron alum), following the method of Kotanigawa et al.' Molybdenum was incorporated by addition of ammonium molybdate to the iron alum solution, as described previously? Ammonium nickel sulfate. hydrate and cobalt sulfate hydrate were used to add nickel and cobalt, respectively. The precipitated catalysts were filtered and dried in an air flow oven overnight, and then calcined in air at 475 "C for 30 minutes.
The promoted sulfated hematite catalysts were analyzed by XRD, XPS, E M , SEM, and nitrogen BET adsorption. The results of electron microscopy have shown that the catalysts consist of loose agglomerations of particles with an acicular shape and average dimensions of -10x50 nm. Surface areas were measured by nitrogen BET adsorption and were found to be in the range 100-200 m2/g. The addition of up to IO wt% of molybdenum had little effect on the particle size and no apparent effect on the major phase identified by XRD, to be a- FeOOH with trace a-Fe also present in the as formed precipitate. After calcination, the major phase was a-Fe,O, with some a-Fe still present. The relative amount of a-Fe does not appear to be affected by calcination.
Elemental analysis of the sulfated hematites indicated that the sulfur content was between 2-6 wt%. It has been reported that the sulfur is present on the surface of the hematite as chemisorbed SO,. Analysis by XPS supported this supposition, showing that the surface sulfur concentration was significantly higher than in the bulk. It was also found that the sulfur content decreased with increasing molybdenum concentration. This may indicate that molybdenum is chemisorbed as MOO, displacing the sulfur on the surface. The XPS studies further show that the surface concentrations of molybdenum, sulfur, and tungsten are substantially higher than the bulk concentrations. Nickel and cobalt, on the other hand, have similar bulk and surface concentrations indicating that they may be substituted into the iron oxide matrix. Table 1 shows a comparison of bulk and surface concentrations for a nickel- molybdenum promoted sulfated hematite, clearly demonstrating this result. It follows from Goldschmidt's rules of substitution that the hexavalent ions, Mo, W, and S cannot substitute for iron while the nickel and cobalt can."
Experimental
The catalytic activity of the panicles for the liquefaction of Black Thunder subbituminous coal in tetralin was determined using 50 ml horizontal microautoclave reactors. In these experiments, the reactors were loaded with 3 g of as-received coal, 5 g tetralin and 0.07g djmethyldisulfide OMDS) added as a sulfiding agent. The catalyst was added at an iron loading of 1 wt% with respect to maf coal. The reactors were sealed and pressurized to loo0 psig (cold) with hydrogen, then agitated in a heated fluidized sand bath at 400 cycles/minute. The reactions were carried out at 415°C for 60 minutes, after which the reactors were quenched in a cool sand bath. The use of this system allowed rapid heating and cooling of the reactor thereby reducing errors associated with prolonged heating times.
The total conversion was defined by THF solubility while the THF soluble-pentane insoluble product was defined as preasphaltenes + asphaltenes (PA&A). The THF insoluble product was defined as IOM and the pentane soluble fraction as oils. The total conversion as well as PA&A yield were determined directly and the oil yield was determined by difference. The gas yield was determined directly by gas chromatography. AI1 conversions are reported on a maf coal basis.
Results
The use of the sulfated hematite resulted in an increase in total conversion to 88.1% from 84.8% for the blank thermal baseline conversion. The increase in conversion was due entirely
1084

to an increase in PA&A yield from 42.0% to 46.4% with no substantial change in oil or gas yield. Under the conditions used in this study. the gas yields were unaffected by any of the catalysts. These results were comparable to those obtained using a super fine iron oxide (SRO) catalyst at similar iron loadings. The SFIO catalyst is of smaller diameter (3 vs 19 nm) and has a higher surface area (190 vs 100 mz/g) than to the sulfated hematite.
Figure 1 shows the effect of molybdenum concenaation on the conversion of the Black Thunder coal in teaalin. The addition of 1 wt % molybdenum as a promoter metal to the sulfated hematite resulted in no significant increase in total conversion. However there was a slight increase in selectivity increasing the oil yield from 34.4% to 38.6%. The molybdenum concentration of 1 wt% with respect to iron corresponds to a loading of 100 ppm molybdenum on an maf coal basis. At this low loading the effect of molybdenum is very modest.
Increasing the promoter concentration to 5 wt% molybdenum on iron resulted in an increase in total conversion to 92% compared to 88% for the unpromoted sulfated hematite. Further, an increase in oil yield and a decrease in PA&A yield was also observed. This represents a significant improvement in the activity and selectivity of the sulfated hematite at a molybdenum loading of only 500 ppm on maf coal.
Increasing the promoter concentration to 10 wt% molybdenum on iron resulted in a further increase in both conversion and selectivity. The increase in total conversion arises from an additional increase in oil yield and a decrease in PA&A yield. The net effect of the addition of loo0 ppm molybdenum on maf coal loading is to increase total conversion by 6% and oil yield by 14% compared to the unpromoted sulfated hematite.
The addition of 1.4 wt % nickel resulted in a slight increase in total conversion over the unpromoted case, unlike the other singly promoted catalysts. This increase was due entirely to an increase in PA&A yield, as the oil yield remained unchanged ( within experimental error). In contrast, the other metals produced substantial increases in oil yield. The addition of 2.5 wt % cobalt caused a negligible increase in total conversion but a slight increase in oil yield. The effect of 4 wt % tungsten yielded the same results as the 2.5 wt % cobalt, within experimental error. Therefore, of these three metals, it is found that 500 ppm tungsten and 250 ppm cobalt (maf coal) have very similar catalytic activity for coal liquefaction, while 140 pprn nickel (maf coal) had slightly higher activity for total conversion but lower selectivity to oils.
Of the singly promoted hematites, molybdenum displays the highest activity for conversion and also the greatest selectivity to oils. Further, both the activity and selectivity of the catalyst increase with increasing molybdenum concentration. However, due to the significant cost associated with molybdenum, a loading of loo0 ppm on maf coal would be prohibitively expensive. Therefore the use of other promoters in combination with molybdenum was explored.
Cobalt /molybdenum doubly promoted sulfated hematite demonstrated considerable catalytic activity. As shown in Figure 2 the addition of 1 wt % molybdenum and 0.5 wt % cobalt (based on iron) to the sulfated hematite increased the total conversion to a level close to that obtained with 5 wt% molybdenum, and greater than that obtained with 2.5 wt % cobalt alone. This may indicate a possible synergistic effect between the molybdenum and the cobalt promoters. The oil yield was increased to 40 %, only slightly higher than the oil yield obtained with 1 wt % Mo. Thus, at a promoter concentration of 100 ppm molybdenum and 50 ppm cobalt (maf coal), the activity of the catalyst for total conversion approaches that of 500 ppm molybdenum, with slightly lower selectivity to oils.
Similar results were obtained for hematite doubly promoted by molybdenum and tungsten. The addition of 1 wt% molybdenum and 0.8 wt % tungsten gave a totd convzrsion of 92 % and an oil yield of 40%. In Figure 3, the molybdenum/tungsten promoted catalyst is compared to singly promoted molybdenum (5wt%) and tungsten (4wt%) catalyst. In combination with molybdenum, cobalt and tungsten appear to have similar effects.
A combination of nickel and molybdenum yielded somewhat better results. The use of 0.9 wt
'
1085

% molybdenum and 0.7 wt% nickel as promoters produced marginally higher total conversion than the cobalt/molybdenum and tungstedmolybdenum promoters. More importantly, however, is the fact that very high oil yields were obtained. As shown in Figure 4. the oil yield exceeds that obtained with 5 wt% molybdenum and strongly suggests a synergistic effect between the nickel and molybdenum. The combination of 90 ppm molybdenum, 70 ppm nickel, with 1 wt% iron on maf coal gave the highest selectivity to oils of the doubly promoted catalysts tested.
The promising results of these studies have prompted further interest in these catalysts. By varying the concentration of promoter metals it may be possible to obtain higher conversions or, mon probably, to increase the selectivity to oils. Studies are currently underway to Optimize the promoter metal concentrations to maximize catalytic activity and selectivity.
References
1. Djega-Mariadassou, G., er al. Fuel Processing Technology 12. 143-153 (1986). 2. Hattori, H., Yamaguchi, T. & Tanabe, K. Fuel Processing Technology 8, 117-122 (1984). 3. Tanabe, K., er al. Fuel Processing Technology 14, 247-260 (1986). 4. Yokoyama. S.. Yamamoto, M., Yoshida, R., Maekawa, Y. & Kotanigawa, T. Fuel 70, 163-168 (1991). 5. Radhan, V.R.. Tiemey, J.W., Wender, I. & Huffman, G.P. Energy & Fuels 5. 497-507 (1991). 6. Radhan. V.. Tiemey. J.W. & Wender, I. ACS Preprinr - Fuel 35. 793-800 (1990). 7. Kotanigawa, T., Yokoyama, S.. Yamamoto, M. & Maekawa, Y. Fuel 68, 618-621 (1989). 8. Radhan, V.R., Hu, J., Tiemey, J.W. & Wender, I. Energy & Fuels 7 , 446-454 (1993). 9. Hager, G.T., Givens, E.N. & Derbyshin, F.1. ACS-Division of Fuel Chemisrry Preprints 38,
10. Faurc, G. Principles and Applications of Inorganic Geochemisrry 1-626 (Macmillan Publishing Company. New York, 1991).
Table 1. Elemental Composition of Promoted Sulfated Hematite.
1087-1092 (1993).
Element Bulk wt % Surface wt 9%
Molybdenum
Nickel
Sulfur
No
4.0 7.5
2.3 2.5
2.7 4.7
Figure 1. Effect of Molybdenum Loading on Conversion
5wt%Mo l O w t % Mo % Oils
Conv.
1086

Figure 2. Effect of Molybdenum and Cobalt on the Activity of Sulfated Hematite
No 5wt%Mo ,
% Total Conv.
& A
2.5wt0/0 c0 \ % lwt% Mol 0.5 wt% CO Is
Figure 3. Effect of Molybdenum and Tungsten on the Activity of Sulfated Hematite
100 90 80 70 60 50 40 30
No Promoter
Figure 4. Effect of Molybdenum and Nickel on the Activity of Sulfated Hematite
40 30 t No Promoter
1.4wt% NI
0.9wt% MOl0.7wt% NI Oils
Conv.
Conv.
1087 c

TOWARDS IMPROVED IRON-BASED CATALYSTS FOR DIRECT COAL LIQUEFACTION
Dady B. Dadyburjor, Alfred H. Stiller, Charter D. Stinespring, John W. Zondlo, Jyi-Perng Wann, Ramesh K. Sharma, Dacheng Tian,
Sushant Agarwal and Ajay Chadha Department of Chemical Engineering
West Virginia University Department of Chemical Engineering, P.O. BOX 6102
Morgantown WV 26506-6102
Keywords: Direct coal liquefaction with iron-based catalyst, second metal, aerosol
INTRODUCTION
Iron-based catalysts for direct coal liquefaction (DCL) have several advantages: they are cheap and environmentally benign, and have a reasonable activity in the sulfide form. Work in this area has recently been collected and published [ll.
Work in our laboratory has focussed on catalysts made with ferric sulfide as a precursor. This material is unstable even at room temperature, and disproportionates to form pyrite (FeS,; PY), non-stoichiometric pyrrhotite (FeS,, x - 1; PH), and elemental S [21. The value of x and the relative amounts of PY and PH depend upon the time and temperature of disproportionation 13,41. Materials from hydrothermal disproportionation at 200°C for 1 h have roughly equal amounts of PH and PY (on an iron basis), and these materials appear to make the most active and selective catalysts for DCL [3,5]. These catalyst precursors and catalyst materials have been characterized by atomic adsorption spectroscopy (AA), Auger electron spectroscopy (AES) and x-ray diffraction (XRD) . The characterizations have been correlated to the reactions of Fe during disproportionation and to the performance of the catalysts 14,61.
Improvements in these catalysts can be made in two ways: by altering the active sites, and by decreasing the particle sizes. In the present work, we present examples of both types. The active sites are altered by using small amounts of a second metal. The particle sizes are reduced by using an aerosol technique for preparation.
AEROSOL-BASED PREPARATION OF IRON CATALYSTS
Advantages of the aerosol process have been described earlier [71. Besides generating particles of small size, the process is inherently scalable (so that large quantities of catalyst are possible). Further, the solvent need not be aqueous, and the potential exists for making materiqls not stable under other conditions.
A sketch of the apparatus is shown in Figure 1. A solution of a ferric salt, typically acetate, is pumped at high pressure thraugh a nozzle to a reactor. The micron-sized droplets react with H,S in the vapor phase (as 10% of an H,S/N, mixture) to form ferric sulfide at the interface. At the high temperatures involved, water evaporates from the liquid droplet. Hence the particle may be an annulus or a solid sphere. The ferric sulfide quickly reacts to PY, PH and elemental sulfur. The final size achieved depends upon the pump pressure, the diameter of the nozzle orifice, the viscosity and surface tension of the liquid, the concentration of reactants in liquid and vapor phases, and the effect of pH and anion basicity on the reaction rate. The particles stay in the reactor, where they are collected in tetralin; the vapor bubbles through an NaOH scrubber before being safely vented. The particles, collected after the process is complete, have been characterized and used for DCL.
XRD data, taken in the laboratory of Professor M.S. Seehra at West Virginia University, indicate interesting effects when conditions are changed. At low precursor conditions, 0.01M, when aerosol reactor conditions are maintained at 2OO0C and 200 psi, peaks are observed corresponding to FeS,, monoclinic pyrrhotite (Fe,S,, i.e., x = 1.143) and elemental S. This is consistent with XRD patterns obtained using earlier preparation techniques such as hydrothermal disproportionation 13.41. However, when the
1088
P

precursor concentration is higher, O.lM, and the temperature is 165"C, peaks observed include not only FeS, and S but now greigite (Fe,S,, x = 1.333). But greigite is stable typically only below lOOoC 181. Perhaps the thermodynamically unstable form is trapped in the particle due to the rapid quenching that takes place in the aerosol reactor. The role of the higher precursor concentration in facilitating the unstable form is not clear.
Other characterization data can be found in Table I. The samples are characterized in terms of the precursor concentration as well as the pressure and temperature in the reactor. Density was measured using He pycnometry. For sample 9, grinding the solid increased the density measurement by 0.1 g/cc, probably within the accuracy of the measurement. Hence the values measured are those of the density of the actual material, whether present as a solid or an annular shell, and not the bulk density of an annular shell. Accordingly, the changes in density between samples 8 and 9 and between samples 9 and 10 are related to the different solids produced under those two conditions, not changes in the inner and/or outer diameters of the particles. Note that increasing the temperature of the aerosol reactor causes less change than increasing the precursor concentration.
The mean diameter in Table I is measured using multiple-angle laser light scattering with photon correlation spectroscopy. For these measurements, the particles were suspended in tetralin, the same solvent used for the DCL experiments. In addition, a transmission electron microscope (TEM) in Professor G.P. Huffman's laboratory at the University of Kentucky was used. In the latter measurements, the particles were suspended in ethyl alcohol, which was then evaporated on the TEM slide. Sizes measured by TEM range from 3 - 580 nm, with a majority of particles in the lower portion of the range. The 1-2 orders of magnitude by which the two techniques differ is probably due to clumping of the particles in the tetralin. Since the physical situation with tetralin is closer to the conditions during liquefaction, the values in Table I are probably more realistic than TEM values. The larger particle size observed in sample 9 relative to sample 8 is probably due to the increased concentration of precursor used.
Bulk ratios of S to Fe and the corresponding surface ratios, obtained from energy-dispersive x-ray spectroscopy (EDX) and AES respectively, are also shown in Table I. Bulk ratios for samples 7 and 8 are similar, and greater than 1.5, the value expected for Fe,S,. A smaller value is obtained for sample 12, and the value decreases further for sample 9. The decreasing values may be due to loss of elemental S (found after disproportionation of the Fe,S,) in sample handling. Hence the decreasing values may indicate increasing amounts of elemental S formed, and increasing amounts of PH relative to PY.'The decreasing bulk values are consistent with decreasing surface S/Fe values as well. The ratios are higher on the surface than in the bulk, again consistent with the formation of elemental S and its migration to the surface. The AES peak shape corresponding to S is, in fact, characteristic of that ascribed to elemental sulfur.
The performance of these catalysts in DCL is shown in Table 11. The experiments were carried out at 35OoC and 1000 psi H, (cold) for 1 h using DECS-6 coal in tetralin with 0.1 ml CS, added. The catalyst loading was 5% and the reactor was agitated vertically at 500 rpm. Full experimental details have been provided earlier [ 3 , 4 1 . All catalyst samples used show noticeable improvements in conversion and asphaltene yield relative to the thermal runs, although oil yields are not improved. The improvement in conversion is most striking for catalysts prepared using the lower precursor concentration, and the oil yield is best for the catalyst prepared at the highest temperature.
MULTI-METAL IRON-BASED CATALYSTS
The Hume-Rothery rules (of thumb) govern which metals can be substituted into an existing lattice. The major requirement is that the substituent and the original metal should have ionic radii no more than 151 apart. For the Fe ion, this requirement provides a large number of potential substituents. For any of these to be useful, conversion and/or oil yield should increase at least marginally when the material is used as a DCL catalyst,
1089

I
and the material should be only marginally less attractive, economically and environmentally, than the iron-alone catalyst. Because of space constraints, we report here only on Fe-Ni-S catalysts. However, preliminary data have been gathered when other metals have been used, including Co, Mg, Mo and Cu.
Because of the long set-up times required for the aerosol reactor, the Fe-Ni-S catalysts were not prepared in this manner. Instead, variants of the old hydrothermal disproportionation technique [3,4] were used. When relatively low disproportionation temperatures, T,, were required, appropriate ratios of FeC1, and NiC1, solutions were combined with Na,S in a glass ampule in a cold room. This formed the precursors instantaneously as a gelatinous precipitate. For disproportionation of the ferric Sulfide, the ampule was then sealed and placed in an autoclave Containing water. The autoclave was maintained at T,, equal to 200°C or 250OC, for lh. The presence of high-temperature steam at equal pressure on both sides of the ampule prevented it from being destroyed. The ampule seal was broken and the material washed (to remove NaCl formed as a byproduct) and vacuum-dried. When a high-temperature disproportionation (HTD) was required, the precursors formed as above were washed and dried first, then heated (at 35OOC or 375OC) for 15 min. in 1500 psig H, (hot). In both cases, the material was formulated to have nickel fractions (Ni/{Ni + Fe)) of 0.0, 0.01, 0.1, 0.5, 0.9 and 1.0.
DCL results for a series of the Fe-Ni-S catalysts are shown in Figure 2 . Reaction conditions are the same as those in Table 11. Conversions using these catalysts go through a shallow maximum between nickel fractions of 0.1 and 0.5, regardless of the T, value. For T, = 200°C, the oil + gas yield passes through a minimum with increasing nickel fraction. Hence this is clearly not a viable catalyst, even though the corresponding catalyst in the absence of Ni was shown 13-51 to be the preferred catalyst. For T, = 3759C, the yield passes through a maximum corresponding to a nickel fraction of 0.5. Since the yield and the conversion of this HTD catalyst are superior to any other in Figure 2, this is the preferred catalyst in the Fe-Ni-S family.
Figure 3 represents XRD peaks for this HTD catalyst and for the two extreme values of the nickel fraction. The XRD pattern for the catalyst containing Fe alone shows stronger pyrrhotite peaks than those corresponding to the catalyst hydrothermally disproportionated at 2OO0C. This is consistent with the higher value of T, and the presence of H, during disproportionation. When Ni alone is present, the XRD peaks correspond to those of Ni,S,. However, when both Ni and Fe are present, a completely different pattern is seen. The major peaks correspond to those of (Fe,Ni),S,. Hence, XRD indicates that the present method of forming multi-metal catalysts results in alloy formation, not just a combination of two sulfides. The alloy appears to result in higher conversion and yield when used as a catalyst in DCL.
AES data for the HTD catalyst are shown in Figure 4 as a function of nickel fraction. The nickel fraction on the surface is never higher than the fraction in the bulk. This implies that, at all levels of nickel formulation, the nickel is preferentially found in the bulk, not the surface. S is enriched on the surface relative to the bulk, since almost all values can be seen to be greater than 1.5. However, comparing the values with that for zero nickel fraction indicates that there is less S on the surface when Ni is present than when it is absent. Further, comparing the latter value with those from Table I1 indicates that an aerosol catalyst typically contains more S on the surface than does the HTD catalyst. Finally, it is worth noting the complementary nature of the curves for S and for 0. If the S and 0 fractions are added, the numbers correspond to the surface S/Fe ratios for the aerosol catalyst. Since oxygen is not present in the formulation, oxidation must be occuring during handling. The role, if any, of the surface oxygen on the catalytic properties of the materials deserves further investigation.
SUMMARY ANJJ CONCLUSIONS
Iron-based sulfide catalysts can be modified to improve their performance in DCL. Preparation using an aerosol formulation results in small particle sizes and the possiblity of forming thermodynamically unstable structures. Preparation using Ni as a
1090

SAMPLE #
thermal
8
9 12
h h puure llne
Reactor
t i
CONVERSION ASPHALTENE OIL + GAS [ % I YIELD [ % I YIELD [ % ]
54.9 41.2 13.6
64.9 55.6 9.3
63.0 52.1 10.8
64.4 54.8 10.9
1091

FIGURE 2. DCL using Fe-Ni-S catalysts, as a function of Td, disproportionation temperature, and nickel fraction, Ni/ (Ni+Fe} .
-
-
60
o , A , Td=200"C. L,= 1 h
2-
a v
- $ 3
a ? a, 0
L '22
2 h
a, G, + z \
0 0
.- V
0- 00 0 5 1 0
N i / ( Fe + N i )
FIGURE 3. XRD for HTD catalyst with Ni/{Ni+Fe) = 0 (bottom), 0.5 (middle), and 1.0 (top).
10. 20. 30. 40. 50.
FIGURE 4. RES for HTD catalyst
0
60. 70. 80. 90. 100.
as a function of Ni fraction
2- 0 0 1 0 L; cco 0 5 1 0
Ni/(Ni+Fe) bulk value
1092
IMPREGNATION ALTERNATIVES FOR Fe-BASED COAL LIQUEFACTION CATALYSTS
, Barbara T. Armstrong, Edwin N. Givens, and Frank J. Derbyshire University of Kentucky Center for Applied Energy Research
3572 Iron Works Pike, Lexington, KY 40511-8433
Keywords: Coal liquefaction, iron catalyst, dispersion
Introduction Because of the cost effective and environmentally compatible nature of Fe, attention has been directed towards improving the utilization of this metal in direct coal liquefaction. Among the several factors thought to affect catalyst activity, much of this work has focused on dispersion. Weller and Pelipetzl reported the importance of catalyst dispersion. based on experiments with a wide variety of catalysts in solvent-free liquefaction studies. And in the presence of solvent, other studies have demonstrated the advantages of adding the precursor by impregnation over its addition in the form of particulates. In general, a high surface/volume ratio, along with intimate contact between the active catalyst and coal, are thought to be the controlling factors? Dispersion, as normally inferred from changes in catalyst activity, may be affected by the mode of addition, the presence of solvent, and the initial composition of the precursor (e.g., soluble organometallics); and for coal- impregnated catalyst precursors, the choice of impregnation solvent' and impregnation conditions.
A variety of innovative strategies have been developed to introduce catalyst precursors to the liquefaction reaction while seeking to maintain particle size and distribution. These have included the use of emulsions and addition of oil soluble organometallics and carbonyls,"~'*~." ion exchangeI4 and impregnating the c ~ a l . ' . ~ ~ . ' ~
One of the more effective ways of introducing an Fe catalyst precursor to the coal liquefaction process is to disperse the iron salt onto the coal surface using a liquid medium to impregnate the feedstock. In one technique, coal is impregnated with a metal salt solution up to the point where the unbound moisture begins to form drops." Additionally, the Fe salt may be precipitated with a base solution to fix the precursor onto the coal surface, called incipient wetness/ precipitation (IWP). Cugini and his co-worker~,~' using femc nitrate and ammonium hydroxide. recorded the benefits of this last method of preparation, which included high Fe dispersion levels and exploiting the sub- micron particle size of the FeOOH precursor, and follow-on active pyrrhotite phase. Andres, et al.,'a earlier verified that iron particles, in various forms as oxides and oxyhydroxides, retained their small size upon conversion to pyrrhotite under coal hydroliquefaction conditions.
The IWP preparation is a multistep process, consisting of coal preparation, metal impregnation, base precipitation, filtration, washing, and drying. The influence of these various steps on coal surface chemistry and liquefaction performance was reported previo~sly. '~ XPS studies showed the iron on IWP coals to be highly dispersed, more concentrated on the coal surface, and present as both FeOOH and Fe,O,.
Because of the cost of the several processing steps and related material handling requirements, the promise of IWP coal preparation may not be realized commercially without some simplification. In the case of Mo, studies have suggested that complete dispersion of the catalyst precursor at the outset of the reaction may not be essential for satisfactory results. Bockrath, et al.?' recognized that molybdenum sulfide concentrated in THF extracted liquefaction residues retained its catalytic activity when mixed with fresh coal slurry. In related work, molybdenum was impregnated onto coal which was then exposed to liquefaction conditions in a microautoclave. The products, which were subsequently mixed with 20 times as much fresh coal, were found to be active even in the initial stages of liquefaction.
The work presented here addresses impregnation alternatives which reduce the amount of prepared coal by loading the precursor Fe on only a fraction of thc feedsock. Concentrating the Fe on only a portion of the feed, referred to here as the "vector", would reduce the cost of handling the coal, which could be a significant factor in the overall economics of the project. Additionally, if the metal added in this way remains quite active, other more robust and/or active substrates might be considered as the catalyst carrier. Since it had been determined that ferrous sulfate is currently the lowest cost form of soluble iron commercially available (as copperas), work was performed
direct addition of ultra-fine particles to the
1093
exclusively with this salt.
Experimental w- Reagents were purchased as follows: Practical grade dimethyl disulfide (DMDS) from Fluka AG; 99% purity UV grade tetralin, high purity tetrahydrofuran (THF). and high purity pentane were Burdick & Jackson Brand from Baxter Sp; 98% purity FeSO,. 7H20 from Aldrich; and Concentrated ammonium hydroxide from Mallinkrodt. Ultra High Purity Grade hydrogen was Supplied by Air Products and Chemicals, Inc. Bum Away, petroleum coke was supplied by HRI, Inc. Coulometrics brand carbon black, commercially reduced in a 95% NJ 5% H, gas stream at 400°C, was purchased from UIC Inc. The coke and carbon black are described further in Table I, which shows they are predominantly fixed carbon. Wyodak subbituminous coal from the Black Thunder mine, supplied by CONSOL, Inc., was ground to -200 mesh, riffled and stored under nitrogen at 4°C. The analysis of the coal (dry basis) was: C- 72.2 %; H- 4.3%; N-1.2%, S- 0.5%; 0 (by difference)- 16.0%; ash- 5.8%. It had a moisture content of about 21 wt%.
b a r a t i o n of vectors- Four coal samples were impregnated with Fe using the IWP technique. The first (termed 100% IWp) had an Fe concentration of 0.8 wt% mf coal. The other three were impregnated with additional Fe sufficient to mix them with fresh coal in the proportions of 10:90, 5O:SO, and 90:10, to yield an overall Fe concentration the same as the 100% IWP sample. The coke and carbon black were also prepared using the same IWP technique as for the coal, at concentrations that would allow the Fe to be added on 10 wt% of the reactor feed. The 100% IWP sample and the mixed feed coals were then liquefied to compare product yields among the various ways Fe had been inuoduced to the reaction.
For each vector prepared, the FeSO,. 7H,O required was dissolved in 0.76 g H,O/g vector coal (dry basis). The solubility of ferrous sulfate presented no problems in the preparations. This solution was added dropwise while stining and then allowed to stand for % hour. A 3% ammonium hydroxide solution was added at a ratio of 138 mol NHJmol Fe and filtered. The filter cake was washed with 25 ml distilled water/g coal until the odor of ammonia was absent, and dried for 20 hours to about 20% water content with flowing N, at 25°C. Recovery of Fe on the samples was greater than 98%.
ke-s- Typical liquefaction experiments were carried out using a total of 3.0 g coal and 5.4 g tetralin in 50 ml microautoclaves. A blend of Fe-impregnated substrate and as- received coal comprised the reactor feed. When Fe was added to the reaction mixture, sulfur, as DMDS, was added at a minimum ratio of 1.5 mol .$/mol Fe, sufficient to produce pyrrhotite as the final form of the catalyst. The reactors were pressurized to 6.89 MPa with hydrogen and shaken at 400 cpm in an air-fluidized sand bath at 415°C for 30 minutes. Experiments were duplicated, at a minimum.
In the first step of product work-up, gases were collected and analyzed by gas chromatography. The other products were then scraped from the reactor with THF and extracted in a Soxhlet apparatus. The THF solubles were subsequently separated into pentane soluble (Oils) and pentane insoluble (PA+A) fractions. Total conversion was determined from the amount of THF insoluble material that remained. Added Fe was subtracted from this residue at the equivalent weight of pyrrhotite. Oils were calculated by difference, and as a result, water produced during liquefaction, as well as any experimental error, is included in that fraction. All product yields are stated on an maf coal basis.
In liquefaction experiments using the coke and carbon black substrates, the subsaates (and later, vector) weights were subtracted from the final THF insoluble residues at their mf starting weight, even though both substrates showed a slight propensity (-2-3 wt%) to adsorb THF during Soxhlet extraction. As before, liquefaction product yields were calculated on an maf coal basis.
Results and Discussion Limited Fe dimersion- To examine very limited dispersion of the starting Fe, the powdered FeSO,. 7H,O was added directly to the reactor without mixing with the coal feed. Additionally, to examine an alternate. simplified preparation similar to the IWP method, an aqueous solution of the same salt was added directly to the reactor using only 12% the solution weight needed to impregnate the coal by the I W P method, without base precipitation or drying. The results of these two experiments are shown in Table I1 in comparison with the thermal conversion of coal (uncatalyzed), and with liquefaction of the 100% IWP coal. Both the powdered and aqueous Fe additions showed only slight catalyst activity, with any added conversion reporting to the PA+A fraction. In contrast,
1094

impregnating the coal improved THF conversion by 8%. Again the increase in conversion reported primarily to the PA+A fraction; the slight increase in Oils yield is not significant.
with vector w- To investigate the effects of limited dispersion using IWP coals, liquefaction experiments were performed by impregnating Fe on the vector portion of the total feed coal. The greater the Fe concentration on the vector portion of the feed mixture, the less disperse Fe is at the outset of the liquefaction experiment. As the Fe and salt concentrations in the vector mixtures show in Table 111, the extreme case is the 10% vector, where the Fe concentration was nearly 8% mf coal, equal to 10 wt% salt (as FeOOH). At the start of liquefaction, the iron salt is highly concentrated on this portion of the feed coal, while the other 90% of the coal is relatively iron-free.
Liquefaction results using the vectors mixed with as-received coal are also shown in Table In. THF conversions of the mixed feed coals are all very similar, taken as a group, to the 100% IWP coal, and clearly higher than the uncatalyzed reaction. Oils yields also appear to be about the same, with a slight advantage for the 10% case, which canied a somewhat higher iron load. Overall, the results suggest that IW/P impregnation of the iron on a portion of the coal does not hinder its availability to participate in the liquefaction reaction in tetralin.
m e f a c t i o n with coke and carbon b lack s u b s t r w - Two stable, non-reactive substrates, coke and carbon black, were selected for comparison with coal, which rapidly dissolves during liquefaction. First, to determine a liquefaction yield background, experiments were performed using the coke and carbon black at 10 wt% of the reaction feed mix, without any added Fe. The coke alone improved coal conversion about 2%, but the carbon black did not affect conversion (see Table IV). As a commercial filtration aid, the coke may have improved Soxhlet extraction of the liquefaction products, or perhaps introduced a trace amount of catalyst material that will be revealed through ongoing analytical work.
After Fe impregnation of the two carbon substrates, SEM studies showed that the larger petroleum coke (see Table I) retained its size and structure after impregnation, but the nanometer-fine structure of the carbon black was lost and resulted in nominal 300 micron agglomerates. These larger agglomerates appeared to be completely coated with the Fe salt, an effect not visible on the coke.
Coal liquefaction experiments were performed as before, with the Fe-laden vectors at 10 wt% of the reactor feed. Iron added on the coke increased THF conversion about 4% compared with its background, as did Fe added to the carbon black. The increases in product yield were 3-4% less than with Fe dispersed on the 10% coal vector, but the yields evidence that Fe distributed on the two stable non-coal vectors participates in the liquefaction reaction.
Conclusions Very little activity was seen for ferrous sulfate added directly to the reactor either as a powder, or molecularly dispersed in an immiscible aqueous solution. High activity is observed when a coal vector is employed, and we can postulate the effect arises from dispersion throughout the reactor as the coal structure rapidly dissolves. Moreover, if catalyst dispersion may be inferred from its activity, then Fe added on a coal vector comprising only 10% of the feed coal is sufficiently dispersed through the course of a 30 minute reaction to give yields comparable to experiments where Fe is added to the entire feedstock. Some activity is observed when the Fe is dispersed on a carbon substrate that is stable under liquefaction conditions, but not as much as when dispersed on some fraction of the coal itself. However, this activity may be commensurate with the level of dispersion provided by the >lo0 pm coke and carbon black particles that were added to the reaction system.
Acknowledgement The authors gratefully acknowledge the support of the Commonwealth of Kentucky and the Department of Energy, under contract DE AC22-91PC91040. We also thank Roland0 Gonzalez for contributing the SEM studies, and 2. Feng for her TEM work.
References 1. 2.
Weller, S.; Pelipelz, M. G. Jndustrial and Engineering Chemistry 1951 43 (5). 1243-1246. Derbyshire, F. J. Catalysis in Coal Liquefaction, IEACR/OI, IEA Coal Research: London, UK, 1988,69 pp.
1095

3.
BET surface area, m*/g
4. 5.
< 1 (non-porous) 90
6 . 7.
8.
9.
10.
11.
12. 13.
14.
15.
16. 17.
18.
19.
20.
Bodily, D, M.; Wann, J.-P. Prepr. Pap: Am. Chem. SOC.. Div. Fuel Chem. 1986,31 (4), 119- 123. Moll, N. G.; Quarderer, G. J. Chemical Engineering Progress 1919, 75 ( I I ) , pp 46-50. Wilcoxon, J. P.; Sylwester, A,; Nigrey, P.; Martino, A,; Quintana, C.; Baughman, R. J. Proceedings Eighth Annual lnt. Pittsburgh Coal Conference 1991, pp 703-708. NaJcao, Y.; Yokoyama, S.; Maekawa, Y.; Kaeriyama, K. Fuel 1984.63.721. Anderson. R. K.; Givens, E. N.; Derbyshire, F. J. Prepr. Pap.-Am. Chem. Soc.. Div. Fuel Chem. 1993.38 (2), 495. Hager, G. T.; Bi, X-X.; Derbyshire, F. J.; Eklund. P. C.; Stencel, J. M. Prepr. Pap.- Am. Chem. SOC., Div. Fuel Chem. 1991. 36 (4 ) . 1900. Pradhan, V. R.; Tierney, J. W.; Wender. I.; Huffman, G. P. Energy and Fuels 1991. 5 (3), 497. Huffman, G. P.; Ganguly. B.; Taghiei, M.; Huggins, F. E.; Shah, N. Prepr. Pap.- Am. Chem. SOC., Div. Fuel Chem. 1991, 36 (2). 561. Hawk, C. 0.; Hiteshue, R. W. "Hydrogenation of Coal in the Batch Autoclave" Bulletin 6322 US Department of the Interior, Bureau of Mines: Washington, DC, USA, 1965, 42 pp. Watanabe, Y.; Yamada, 0.; Fujita, K.; Takegami, Y.; Suzuki T. Fuel 1984, 63, 752-755. Suzuki,T.; Yamada, 0.; Then, J. H.; Ando, T.; Watanabe, Y. Proceedings 1985 International Conference on Coal Science; Pergamon Press: New York, 1985, pp 205-8. Taghiei, M. M.; Huggins, F. E.; Ganguly, B; Huffman, G. P. Prepr. Pap.- Am. Chem. SOC., Div. Fuel Chem. 1993, 38 ( I ) , 149. Cugini, A. V.; Utz, B. R.; Krastman. D.; Hickey, R. F. Prepr. Pap.- Am. Chem. Soc., Div. Fuel Chem. 1991.36 ( I ) , 91. Utz, B. R.; Cugini, A. V. U. S. Patent S.096J70, March 17, 1992. Milburn, D. R.; Adkins, B. D.; Davis, B. H. Prepr. Pap.- Am. Chem. SOC., Div. Fuel Chem. 1989.34 (4). 1439. Andres, M.; Charcosset, H.; Chiche, P.; Davignon, L.; Djega-Mariadassou, G.; Joly, J-P.; ' Pregermain, S. Fuel 1983,62,69-72. Ni, H.; Anderson, R. K.; Givens, E. N.; Stencel, J. M. Prepr. Pap.- Am. Chem. SOC., Div. Fuel Chem. 1993,3813). 1107. Bockrath, B. C.; Illig, E. G.; Keller, M. J. Prepr. Pap. Am. Chem. Soc., Div. Fuel Chem. 1992,37 (l), 133.
Particle Size, pm (by TEM) THF insolubles, wt% mf
Volatile matter Fixed carbon
Total 100.0
u.u 3.3 2.8 93.1
100.0
I 1096

Additon Method Added Fe, wt% mf Coal
none Powdered Aqueous rWP 0 0.79 0.78 0.78
Impregnated CoaVtotal Coal, wt% Added Fe, wt% mf total Coal
a. Rc
10 50 90 100 0.81 0.78 0.78 0.78
Added Fe, wt% mf vector (salt- free basis) Added FeOOH. wt% wet vector mixtiire
7.59 1.55 0.87 0.78
10.3 2.0 1.1 0.8
a.
HC Gases 1 .o 1 .o 0.8 1.1 co+co, 1 4.8 4.9 4.1 5.7
Substrate
Vector /total mixture, wt%
Oils PA+A IOM
coke coke A carbon carbon A blank with Fe black black
blank with Fe 10 10 10 10
38.2 33.3 32.5 34.3 41.1 44.0 44.6 43.6 14.9 16.8 17.4 15.3
Added Fe, wt% mf Coal
THF Conversion I 85.1 83.2 82.6 84.7 ts of liquefaction studies at 415°C for 30 minutes, 2.3 tetra1in:coal ratio.
0.0 0.74 0.0 0.79
Added Fe, wt% mf vector (salt-free basis) Added FeOOH, wt% wet vector mixture
HC Gases
c o + c o , Oils PAiA IOM
1097
0.0 6.10 0.0 6.23
0.0 8.6 0.0 9.1
Products, wt% maf Coal' 0.7 0.5 -0.2 0.6 0.9 0.3 5.1 4.7 -0.4 5.1 4.7 -0.4
37.3 38.2 0.9 32.6 38.3 5.7 35.7 39.0 3.3 38.2 37.1 -1.1 21.2 17.6 -3.6 23.5 19.0 -4.5
THF Conversion 78.8 82.4 3.6 76.5 81.0 4.5

i
I
LIQUEFACTION OF COAL IMPREGNATED WITH CATALYST DURING PRESWELLING
Charles J. B r a w n and Christine W. Curtis Chemical Engineering Department
Auburn University, AL
Donald C. Cronauer Amoco Chemical Co.
Naperville, IL
ABSTRACT The effect of impregnating coal with slurry phase catalysts during solvent preswelling on coal conversion was investigated. Black Thunder subbituminous coal which was either untrqted or pretreated with aqueous SO, was used. The coal was placed into the swelling solvents, THF, methanol or isopropanol, for 96 hr prior to liquefaction. Slurry phase catalysts, Mo naphthenate, Molyvan L and Ni octoate, were introduced into the swelling solvents; catalyst uptake by coal was 90 to 95% of the catalyst introduced. Coal conversions of these impregnated coals were obtained at 410 "C in reaction solvents of 1-methylnaphthalene, coal-derived V1074, and dihydroanthracene, and were compared to those obtained with swelled and nonswelled coals. The swelling solvent and the SO, pretreatment affected the amount of coal conversion obtained. Coal conversions achieved with impregnated coals were somewhat less than those achieved when the catalyst was added directly to the reactor.
INTRODUCTION Increases in the liquefaction conversion and production of upgraded product from subbituminous coal are desirable to make the process a feasible option for production of transportation of fuels. To this end, a process was conceptualized and tested. The conceptual process involves several steps: (1) coal is pretreated with aqueous SO,; (2) the pretreated coal is then swelled in a hydrogen bonding solvent in which is placed a slurry phase catalyst; (3) during swelling the slurry phase catalyst is deposited within the pores of the coal; and (4) the impregnated coal is liquefied having the catalyst in intimate contact with the reacting coal molecules.
The research described herein tested the conceptual process using both untreated and SO, treated coal. The reason that a substantial number of experiments was performed with the untreated coal was that previous results' indicated that swelling coal prior to liquefaction was more beneficial to coal conversions of untreated coal than of SO, treated coal. Reactions were performed (1) without swelling prior to liquefaction; (2) with swelling prior to liquefaction with the catalyst being added directly to the reactor; and (3) with swelling prior to liquefaction with catalyst being added to the swelling solvent. Three different swelling solvents, tetrahydrofuran (THF), isopropanol, and methanol, were used'; three different catalysts, Mo naphthenate, Molyvan L and Ni octoate, were used; and three different reaction solvents, 1- methylnaphthalene, a relatively inert solvent; V1074, a coal-derived solvent and dihydroanthracene, a hydrogen donor solvent, were also used.
EXPERIMENTAL Materials. Liquefaction reactions were performed using untreated and aqueous SO, treated Black Thunder coals. The swelling solvents, THF, methanol, and isopropanol were obtained from Fisher and were used as received. The liquefaction reaction solvents used were 1- methylnaphthalene (1-MN) (98% purity) and 9,lO-dihydroanthracene (DHA), which were obtained from Aldrich, and V1074, a coal-derived solvent, supplied by Amoco. The catalysts used were Molyvan L from Vanderbilt Chemical and Mo naphthenate and Ni octoate from Shepherd Chemical Company; and Ni naphthenate from Strem Chemical Company.
Swelling and Reaction Procedures. Untreated and SO, treated Black Thunder coals were swelled by introducing 1.33 g maf coal to the swelling tube and then adding 7 ml of solvent. Molyvan L, Mo Mphthenate, and Ni octoate catalysts were charged to the swelling solvent at 1.05 times 600 to 800 ppm of active metal, the amount used when the catalyst was added directly to the liquefaction reactions. The coal was then allowed to sit unagitated in the swelling solvent for 96 hr. These experiments were designated with a "N" on the tables. Several experiments, designated with an "A" on the tables, were performed in which the coal and swelling solvent were agitated using an orbital shaken at 250 rpm during the 96 hr swelling period. Molyvan L was also added to the swelling solvent at twice the loading typically used, 1400 to 1600 ppm of active metal. These experiments in which the catalyst level was doubled are designated with a "D" on the tables.
1098

Liquefaction reactions using untreated Black Thunder coal in 1-MN were performed at 410°C for both 20 and 30 min in stainless steel tubular microreactors. The liquefaction reactions for SO, treated Black Thunder coal in 1-MN and for untreated Black Thunder coal in VI074 and DHA were conducted for 30 min. Each reaction contained - 1.33 g of maf coal, 2 g of solvent, 0.67 g of pyrene (PYR) and residual swelling solvent that remained in the swelled coal. The amount of solvent absorbed in the coal after swelling differed for each swelling solvent. ' The amount of solvent retained in the coal ranged from 0.6 to 1.0 times the coal mass. The amount of catalyst taken up by coal was obtained for selected reactions using x-ray fluorescence spectroscopy. Hydrogen gas was introduced at 1250 psig at ambient temperature. The reactor was well-agitated at 450 cpm.
Analysis. Products from the liquefaction reactions were removed from the reactor with THF. The conversion of the coal to THF solubles was determined. For the reactions where analysis of catalyst uptake was obtained, the values for the catalyst loading are given, otherwise, the presumed amount deposited ranged from 90 to 95% of the 600 to 800 ppm of active metal loaded on a per gram of coal basis. The amount of PYR hydrogenation to hydrogenated products was obtained by gas chromatographic analyses using a Varian Model 3400, a J&W DB- 5 fused silica capillary column and flame ionization detection. Pyrene hydrogenation is defied as the moles of hydrogen required to form the liquid hydrogenation products from PYR as a percentage of the moles of hydrogen required to form the most hydrogenated product, perhydropyrene. The hydrogenation products obtained from PYR were dihydropyrene (DHP) tetrahydropyrene (THF) and hexahydropyrene (HHP).
RESULTS AND DISCUSSION In the liquefaction reactions performed in this research, two primary parameters were measured to evaluate the efficacy of the catalyst impregnation step. The first parameter was the conversion of Black Thunder coal to THF soluble material. The second parameter measured was the hydrogenation reactivity of the added aromatic, PYR, in the system. By determining the conversion of PYR to hydrogenated species and the percent hydrogenation to partially saturated products, the intrinsic activity of the catalyst added to the reaction system in a particular manner could be obtained. The only products observed from PYR were DHP, THP, and HHP. Usually, higher conversions resulted in the production of all three products. However, DHP was the primary hydrogenation product produced in all reactions. Both THP and HHP, when formed, were always minor products.
Reactions in 1-Methylnaphthalene. Liquefaction reactions performed in the nondonor solvent 1-MN using untreated and SO, treated Black Thunder coal are presented in Tables 1 and 2, respectively. Evaluation of the coal conversions obtained with the untreated (Table 1) or SO, treated coal (Table 2) indicated that the presence of a Mo or Ni based catalyst regardless of method of introduction increased coal conversion. The Molyvan L catalyst was more active for both coal conversion and PYR hydrogenation than was either Ni octoate or Mo naphthenate reacted without sulfur. Longer reaction times of 30 min resulted in higher coal and PYR conversions than did shorter reaction times of 20 min. The type of swelling solvent used made a difference in coal conversion, depending on the solvent used. Methanol appeared to be the most effective swelling solvent for Molyvan L while isopropanol was most effective for Ni octoate. Agitation of the swelling solvent with coal and catalyst present did not increase coal conversion. Doubling the catalyst loading and the amount impregnated into the coal yielded only a slight improvement in coal conversion but a more substantial improvement in PYR conversion. When the coal conversion of coal impregnated with catalyst during the swelling process was compared to that achieved when the catalyst was added directly to the reactor, the Molyvan L systems with THF and isopropanol swelling solvents yielded less conversion with impregnated catalyst while the systems with methanol yielded more. For Ni octoate, all of the impregnated coals yielded less conversion than the coal reacted with the catalyst in the slurry phase. Pyrene conversions were also higher when the catalyst was added directly to the reactor.
Reactions with SO, treated coal showed that swelling of the pretreated coal had less effect than swelling the untreated coal. Impregnation of Molyvan L with any of the three swelling solvents resulted in approximately 5 % less coal conversion. Pyrene conversion remained high with Molyvan L; in some reactions adding the catalyst directly to the reactor yielded more activity while in other reactions the impregnated catalyst was more active. The type of swelling solvent had a stronger influence on coal conversion when Ni Octoate was used as a catalyst. Higher coal and PYR conversions were achieved with Ni Octoate when methanol was used as a swelling solvent than whcn either THF or isopropanol was used.
Reactions in V1074. A series of reactions was performed using THF as the swelling solvent and coal-derived V1074 as the reaction solvent (Table 3). Comparison of the reaction solvent V1074 to 1-MN for liquefaction of untreated Black Thunder coal showed a higher coal conversion with Molyvan L when no swelling prior to liquefaction was used. This advantage
1099

Of the Coal-derived solvent was maintained when the coal was swelled prior to reaction and reacted without catalyst. However, when coal was swelled prior to liquefaction and Molyvan L was added either directly to the reactor or to the swelling solvent, the reaction solvent 1-MN yielded slightly higher coal conversion and nearly equivalent pyrene conversions. The coal and pyrene conversions were quite similar with Ni octoate in the two reaction solvents. With V1074, the highest coal conversion achieved occurred without prior swelling, followed by swelling with THF and adding the catalyst to the reactor; the least coal conversion was achieved when either catalyst was added to the THF swelling solvent. Substantial variability in coal and pyrene conversion occurred when Molyvan L was introduced into the swelling solvent indicating nonuniform absorption of the catalyst by the coal.
Reactions in Dihydroanthracene.. Higher conversions of Black Thunder coal occurred in DHA when no catalyst was used. The hydrogen donor solvent promoted noncatalytic conversion of Black Thunder coal yielding 82.4% coal conversion after swelling in THF while 72.0% was achieved in VI074 and 59.7% in DHA. The highest coal conversion with Molyvan L in DHA was achieved without prior swelling, intermediate coal conversion occurred with swelling in THF and catalyst added directly to the reactor, while the lowest coal conversion occurred when the catalyst was added to the swelling solvent. The difference between the high and low values, though, was only 5 % .
SUMMARY The improvement in coal conversion expected by impregnating coal during the swelling process was not achieved. Swelling of untreated Black Thunder coal made the coal more accessible and more reactive under liquefaction conditions. However, absorbing the catalyst into coal, prior to liquefaction, thereby, making the catalyst more accessible to the dissolving coal molecule, did not achieve increased coal conversion at the liquefaction conditions used.
REFERENCES 1. Brannan, C.J., Curtis, C.W., Cronauer, D.C. ACS Fuel Chem. Div. PED. 38, 3, 1001,
1993.
Torres-Ordonez, R.J., Quinga, E.M., Cronauer, D.C. ACS Fuel Chem. Div. Preu. 38, 3, 1039, 1993.
Table 1. Coal and Pyrene Conversions for Untreated Black Thunder Coal
2.
MolyvanL
Reacted in 1-Methylnaphthalene
709f39 NA NA 82.4i3.0 30.0i5.4 11.2i2.4
Ni Octoate 604 i 6 NA NA 70.7i4.1 6 . 8 i 0 . 3 2.3kO.l
1100
None 0 I Nb I 34.2k7.0 I 59.7f8.9 I 0.0 0.0

Table 1 (Continued)
catalyst level doubled. bNA = not applicable. ‘NM = not measured; catalyst loading should be between 550 and 750 ppm,
Table 2. Coal and Pyrene Conversions for S0,Treated Black Thunder Coal Reacted in 1-Methylnaphthalene
1101

Table 2. (Continued)
Table 3. Coal and Pyrene Conversions for Untreated Black Thunder Coal Reacted in V1074
be between 500 and 700 ppm.
Table 4. Coal and Pyrene Conversions for Untreated Black Thunder / Coal Reacted in Dihydroanthracene
be between 500 and 700 pprn
1102

USING WATER AND DISPERSED MoS2 CATALYST
FOR COAL CONVERSION INTO FUELS AND CHEMICALS
(3unshan SONG* and Ajay K. S A M t
Fuel Science Program. Department of Materials Science and Engineering The Pennsylvania State University. University Park, PA 16802
Keywords: Water. Dispersed M o Catalyst. Coal Liquefaction
INTRODUCTION The historical development and advantages of dispened catalysts for direct Coal liquefaction have been reviewed by Weller [1982,1994], and by Derbyshire [1988.1990]. Due to their intimate contact with the surface of coal panicles, the use of dispersed U y s t s facilitates the activation and transfer of hydrogen to coalderived radicals or reactive fragments in the early stage of coal conversion into soluble products. Recently it has been recognized that coals are more reactive than had been thought previously, especially low-rank coals. Laboratory research has clearly demonstrated that dispersed catalysts can have significant impact on coal liquefaction. even with the solid coal without solvent at temperatures as low as 325-350°C. as reflected by the increase. in coal conversion [Bocloath et al.. 1986; Derbyshue et al., 1986a. 1986h Garcia and Schoben. 1989: Burgess and Schobert, 1991; Solomon et al.. 1991; Song et al.. 1986,1991,1993. 1994a; Hung et al.. 1992,19931. Spectroscopic characterization of residues from liquefaction of Blind Canyon bituminous coal (at 350 or 4 W 0 using dispersed Mo and Fe catalysts (muoduced onto coal by impregnation) has revealed that the metallic species have fully penetrated the coal particle [Anderson el al., 1993; Sommerfield et al., 1992, 19931. Recent pilot plant tests have also demonstrated that the use of dispersed calalyst can be superior to supported catalyst for primary liquefaction (dissolution) of coal, particularly subbituminous coals [Vimalchand et al., 1992: Lee el al., 1992; Swanson. 1992a. 1992b1. Coalderived liquids can be used as sources of aromatic chemicals and polymeric materials as well as transportation fuels [Song and Schobert. 1993; Derbyshire et al.. 19941.
This paper repons on an alternative process for convening coal to liquid fuels and useful chemicals through low- severity liquefaction using dispersed MoSz catalyst with added waler. It is well known that water or steam deactivate hydrotreating catalysts, such as Mo-based catalysts, under conventional process conditions. For coal liquefaction using dispersed catalysts, drying after impregnation of catalyst or precursor salt has been a standard procedure [Weller and Pelipetz, 1951; Derbyshk et al.. 1986a. 3986b Garcia and Schobert, 1989: Anok et al.. 1993; Weller, 19941. It was demonstrated that water removal and the drying conditions after impregnation of catalyst precursor were influential for liquefaction of subbituminous and bituminous coals at 400OC [Derbyshire et al., 1986bl. Several p u p s have reported on the negative impacts of water addition in Catalytic coal liquefaction [Bocknth et al., 1986, Ruether et al., 1987; Kamiya et al., 19881. In a preliminary work. however, we have observed the synergistic effect between water and dispersed molybdenum sulfide catalyst for promoting coal liquefaction at a temperature (350'C) lower than those used in the previous studies mentioned above [Song et al., 19931. The motivation of our study comes from several interesting findings in our recent work on the influence of drying (water removal) and oxidation of Wycdak subbituminous coal on its catalytic liquefaction at 3 5 0 T [Song et al.. 1994a1.
EXPERIMENTAL The coal used was a Wyodak subbituminous coal, which is one of the Department of Energy Coal Samples (DECS- 8) maintained in the DOEPenn State Sample Bank. Detailed propsties of the coal are described elsewhere [Song et al.. 1994a1. Ammonium twathiomolybdate (A"M) was dispersed as a catalyst precursor on to coal (1 wi% Moon dmmf basis) by incipient wetness impregnation from its aqueous solution. ATTM is expected to generate molybdenum sulfide panicles on coal surface upon thermal decomposition at 2 325 "C [Garcia and Schobert. 1989: A m k et al., 19931. The impregnated or the raw coal samples were dried in a vacuum oven at 100 "C for 2 h before use. For the experiments with added water, the weight ratio of water to dmmf coal was kept at 0.46.
The liquefztion was carried out in 25 mL tubing bomb reactors at a given t e m p e r a m (350,375.400,425°C) for 30 min (plus 3 min heat up) under an initial H2 pressure of 6.9 M h . For the experiments with added water, the weight ratio of added water to dmmf coal was kept constant (0.46) for both thermal and catalytic runs. All the liquefaction reactions described here were carried out in the absence of any organic solvents. The yields of gaseous products were determined in two different ways: by weight difference of microreactor (method I) and by GC analysis (method IO. More experimental details have been given elsewhere [Song et al.. 19931.
The oils were analyzed using a Waters high-performance (high-pressure) liquid chromatography (HFW) equipped with a photodiode array (PDA) detector and Millennium 2010 Chormatography-Manager software system, which allows continuous two-dimensional scanning analysis over W/VIS range. The molecular components in oils were identified using gas chromatography combined with mass spectrometry (GC-MS). More analytical details may be found elsewhere on the two-dimensional HF'LC [Saini and Song, 19941 and GC-MS [Song et al.. 1994b1.
RESULTS AND DISCUSSION Liquefaction a t 3 5 0 T Figure 1 shows the effect of water addition on the liquefaction of Wyodak subbituinous coal at 350'C for 30 min in the absence of a organic solvent. Relative to the non-catalytic run of vacuum-dried coal, the addition of water improved coal conversion from 14.5 to 22.5 wt% (dmmf). The use of AlTM increased the coal conversion from 14.5 to 29.8 ~ 1 % . On a percenlage basis, the use of ATTM and the addition of water improved coal conversion by 106% [(29.8-14.5)/14.5=1.061 and 55%. respectively. as compared to the noncatalytic run of the vacuum-driedcoal. Adding a small amount of water to the catalytic reactions at 350°C dramatically increased coal conversion, to 66.5 wt%. This represents a 123% increase from the catalytic run without water, and 359% increase from the noncatalytic run without water. We have confumed these trends by duplicate experiments. These interesting findings indicate that WrSed molybdenwn sulfide catalyst and added water can act in concert to promote coal liquefaction at relatively low Lemperalllre. 350°C.
* Corresponding author. Currently at CEIMIC Co.
1103

Figure 2 indicates hat the addition of water caused substantial increase in gas yields. This is manifested primarily by increased C@ yield CO yield decieased upon water addition. indicating the occurrence of water-gas-shift WGS)
reaction (eq. 1). According to he WGS reaction, the increased amount of C@ is 1.57 times the decreased amount Of co (MW ratio: 44/28 = 1.57). However. when water is added to the nonatalytic reaction of vacuwn-dried Coal, c o 2 yield increased from 4.5 8.3 wt% on a dmmf basis, whereas the CO yield decreased from 0.N to 0.12 wt% ( h m O . A similar trend was observed in catalytic runs at 3 5 0 T (Figure 2). Apparenlly. the enhanced c% fOrIIMtiOn is due primarily to the addition of water, but not the WGS reaction. hobably the majority Of increased c@ yield is due to chemical reactions between the water and he species in coal or coal products, such as the reaction between water and carbonyl gmups. as shown by eq. 2. This could partially rationalize the enhanced C@ formation together with increased coal conversion upon water addition.
C O + H 2 0 = C 0 2 + H2 1) RCOR' + H 2 0 = RH + C 0 2 + R'H 2)
Eflect of Reaction Temperature in the Range of 325-425OC Figure 3 shows the effect of water on the thermal and catalytic Liquefaction at 400°C for 30 min. Compared to the runs at 350°C. the positive effect of water addition to the non-catalytic becomes much less, but the positive impact of using ATTM becomes much more remarkable. The use of AlTM for reaction at 400°C for 30 min afforded a high coal conversion, 85.4 wt% (dmmf), and a high oil yield, 45.8 w t l . However, addition of water u) he Catalytic run decreased coal conversion (to 62.1 wt%) and oil yield (to 28.2 ~ 1 % ) . This is in distinct contrast lo the trends for corresponding runs at 350°C. We have performed several tests and have confirmed this trend. An important implication from Figure 3 is that the presence of water in the catalytic run at 400'C decreased the catalytic activity level that can be achieved in the absence of waw. In other words, water tends to passivate h e dispersed catalyst at higher reaction temperatures (400.30 min). It is clear from Figures 1 and 3 tha~ water can affect coal conversion in opposite directions at different temperatures. Therefore, we funher examined the effect of reaction temperature in the range of 325425'C at Z'C interval. Figure 4 shows the coal conversion as a function of reaction temperature for catalytic liquefaction using AlTM precursor with added water. It appears that coal conversion displays a volcano-shape change with increasing temperature from 325°C to 425 "C. Coal conversion increased with temperature up to 3 7 5 T and decreased with further increase in temperature up to 425°C. At 37S°C, maximum coal conversion, nearly 80 wt%, was achieved with added water in solvent-free catalytic runs. This suggests that retrogressive reactions in the coal-H20-cacalyst system become considerable at higher tempemam (400-425T).
HPLC and CC-MS Analysis of Oils We have reported on the characterization of oils using two-dimensional HPLC and GC-MS techniques in a companion paper [Saini and Song, 19941. In the present work we also applied these techniques. Figures 5 and 6 show the three-dimensional Hpu: chromatograms of oils from water-assisted liquefaction at 350°C with and without the catalyss respectively. In these 3-D chromatograms. peak intensity is plotted against W wavelength range (250- 400 nm) and retention time (0-120 min). The peaks between 2-30 min are due to I-, 2-, 3- and 4-Mg aromatics. and the two peaks between 50 and 60 min are due to phenolic compounds. Comparison of Figure 6 with Figure 5 indicates hat the oils from liquefaction with added water contain more phenolic compounds. We also confirmed this trend by GC-MS analysis. It should be noted that the phenolic compounds as well as alkylaromatics in the oils may be industrially useful chemical feedsurks [Song and SchoberL 19931.
Role of Water in Thermal and Catalytic Reactions ' Our results show &aC at constant water/coal mi0 (0.46, WI ratio). water can have either a strong promoting effect or
an inhibiting effect on coal conversion in catalytic liquefaction. depending on the reaction conditions. The most interesting finding from our work is the strong synergistic effects between water and dispersed molybdenum sulfide catalyst under certain conditions. This finding is important both from fundamental and practical viewpoints. Little has been reported in lhe literame on the positive effect of water addition on catalypic liquefaction under H2 pressure. The results of Bwlcrath et al. [I9861 showed that using water (waler/coal = 2, wt ratio) as solvent in the catalytic liquefaction of Illinois N0.6 coal at 350°C for 60 min gives much lower conversions than the runs using organic solvents. In an earlier work, Ruether et al. 119871 examined the effect of water addition in catalytic liquefaction of Illinois No.6 coal at 4 2 7 T for 1 h (water/coal= 0.33-1.5. wt ratio). They concluded that "at fixed total pressure. the most reactive environment contains no added water, so that H2 partial pressure is as high as possible". In the runs using 0.1% dispersed Mo catalyst at 427 "C for 60 min, highest coal conversions were obtained without added water. They reported hal "the absence of any positive effect of water in calalyzed reaction systems could be explained on the basis of a very strong catalytic effect of molybdenum in promoting hydrocracking and hydrogenation reactions." Kamiya el al. [19881 have observed that addition of water deactivates the imn catalyst for liquefaction of a bmwn coal at 4 0 0 T for 30 min and for upgrading of SRC from Wandoan coal (water/SRC = 0.1-0.2 wt ratio) at 4 5 0 T for 60 min. The negative influence of water was thought to arise from reoxidation of the active iron sulfide catalyst. Consequently, addition of sulfur can resist reoxidation of iron catalyst by water under coal liquefaction conditions [Kamiya et al.. 19881. Mikifa et al. (1988) reported on using water and non-donor vehicles for liquefaction of Illinois N0.6 coal at 385°C for 30 min. Their work was directed toward replacing or reducing the amount of organic recycle vehicle. They observed that coal conversion in water is greater than with dry hydrogenation under otherwise comaprable conditions. Conversion in a non-catalytic run with SRC II solvent and a small amount of water (water/coal=1.7 g14 9) was similar to a calalytic run with 0.1 wt% Mo and a larger amount of water (water/coal=3.4 g/4 g) (86-88 w t l vs 86-90 ~ 1 % ) . From these results they concluded that in the presence of Mo catalyst and water, it is not necessary to use hydrogen donor solvent. As discussed above, we have not found any published literature lhat repm on strong synergistic effect between water and dispersed catalyst for coal liquefaction.
The s m g promoling effect of water on catalytic liquefaction at 325-375°C observed in o w work may be paniaUy understood by the literature information from noncatalytic reactions. The orgin of the above-mentioned strong synergism, however. has not been clarified. For non-catalytic coal conversion such as pyrolysis, liquefaction and copess ing , hydrothermal pretreatments of coal has been reported to be beneficial in terms of increased conversion, or oil yield [Graff and Brandes, 1987; Bienkowski et al.. 1987; Ross and Huschon, 1990; Pollack et al., 1991; Sen0 et al., 1991, 1992% 1992k Tse et al.. 19911. Lewan [I9921 suggested that water could act as a source of hydrogen and oxygen in petroleum formation by hydrous pyrolysis. Siskin et al. [I9911 have suggested that the presence of water during coal pretreatment will facilifate depolymerization of the macromolecular structure to give an increased proportion of liquids by cleaving important thermally stable covalent cross-links in the coal s ~ ~ c t u r e . On the other
1104

hand, Tse et al. [1991] suggested that the prevcaunents of low mnk coals in the presence of water should minimize retrogressive reactions such as crosslink formation from phenolics and lead to higher conversion or a better quality producl.
SUMMARY We have found lhru there are strong synergistic effects between water and a dupersed molybdenum sulfide catalyst for promoting low-severity liquefaction of Wydak subbituminous coal. There is substantial improvement in Coal conversion upon addition of water to the reaction using dispersed Mo Catalyst at relatively low temperatures, 325- 375°C. Relative to the non-catalytic run of Ihe dried coal, the m u s e of the Catalyst and water (at walerldmmf coal = 0.46) can double the coal conversion at 350°C for 30 min, from 29-30 to 66-67 wt%. On the other hand. waler lends to passivate the dispersed Catalyst at higher reaction temperatures (400425°C. 30 min). HPLC and GC-MS of oils revealed that the oils from liquefaction with added water contain more phenolic compound?.. However, some fundamental questions concerning the role of water in catalytic liquefaction and catalytic reaction mechanisms involving water need to be answered by huther research.
ACKNOWLEDGMENTS We thank Prof. Harold Schobert for his encouragement and many helpful discussions. This work was supporled by !he US. Depanment of Energy. Pittsburgh Energy Technology Center, under contract No. DE-ACZZ-91PC91042.
REFERENCES Anderson. L.L.; Yuen. W.H.; Jaurapitpornsakul, J.: Sommerfeld. D.A.; Eyring. E.M. Am. Chem. Soc. Div. Fuel
Artok, L.; Davis, A.; Milchell, G.D.; Schobert. H.H. Energy & Fuels, 1993,7,67. Bienkowslti. P.R.; Narayan. R.; Greenkorn. R.A.; Chao. K.C. Ind. Eng. Chem. Res.. 1987.26.202. Bockmth. B.C.; Finseth. D.H.; Illig, E.G. Fuel Process. Technol., 1986. 12. 175. Derbyshire. FJ.; Davis, A,; Epstein, M.; Stanstemy, P.G. Fuel, 1986a, 65, 1233. Derbyshire, F.J.; Davis, A.; Lin, R.; Stansberry. P.G.; Terrer. M. Fuel Process. Technol.. 1986b, 12, 127. Derbyshire, F. Catalysis in Coal Liquefaction. IEACR48. IEA Coal Research, 1988. Derbyshire, F. Chemtech, 1990.20.439. Derbyshire, F.: Jagtoyen. M.: Fei. Y. Q.; Kimber. G. Am. Chem. Soc. Div. Fuel Chem. Prepr.. 1994, 39 (I). 113. Garcia. A.B.: Schoben, H.H. Fuel, 1989.68, 1613. Graff, R.A.: Brandes. S.D. Energy & Fuels, 1987. 1,W. Huang. L.; SongF.; Schobert, H.H. Am. Chem. Soc. Div. Fuel Chem. Prepr., 1992,37(1). 223. Huang, L.; S0ng.C.; Schobert, H.H. Am. Chem. Soc. Div. Fuel Chem. Prepr., 1993, 38(3), 1093. Kamiya. Y.; Nobusawa. T.; Futamum, S. FuelProcess. Technol., 1988, 18, 1. Lee, J.M.; Vimalchand, P.; Canuell, C.E.; Davies. O.L.
Lewan, M.D. Am. Chem. Soc. Div. Fuel Chem. Prepr., 1992.37 (4). 1643-1649. Milrila. M.A.; Bocloath, B.C.: Davis, H.M.; Friedman, S.; Illig, E.G. Energy & Fuels, 1988.2.534. Pollack, N.R.: Holder, G.D.: Warzinski. R.P. Ross. D.S.: Hirschon, A.S.; Tse. D.S.; Loo, B.H. Am. Chem. Soc. Div. Fuel Chem. Prepr., 1990,35 (Z), 352. Ross, D.S.; Lm. B.H.: Tse. D.S.; Hirschon. AS. Fuel. 1990, 70. 289. Ross, D. Am. Chem. Soc. Div. Fuel Chem. Prepr.. 1992,37 (l), 375. Ross, D. Am. Chem. Scc. Div. Fuel Chem. Prepr., 1992.37 (4). 1555. Ruether. J.A.; Mima, J.A.; Kornosky. R.M.; Ha, B.C. Energy &Fuels, 1987, 1. 198. Saini, A.K.; Song, C. Am. Chem. Soc. Div. Fuel Chem. Prepr.. 1994, 39 (3-9, in press. Serio, M.; Solomon, P.R.; Kroo. E.; Bassi1akis.R.; Malhotra. R.; McMillen. D.F. Am. Chem. Scc. Div. Fuel
Serio, M.; Solomon. P.R.; b o , E.; Charpenay. S. Am. Chem. Soc. Div. Fuel Chem. Prepr.. 1991. 36 (l), 7. Serio. M.; Kroo. E.; Solomon, P.R. Am. Chem. Soc. Div. Fuel Chem. Prepr.. 1992a, 37 (1). 432. Serio. M.; Kroo. E.: Charpenay, S.; Solomon, P.R. Am. Chem. Soc. Div. Fuel Chem. Prepr., 1992b. 37 (4). 1681. Siskin. M.; Kavitzky. A.R.; Balasubramanian. M. Energy & Fuels, 1991.5,770. Siskin, M.; Kauitzky, A.R. Solomon. PR.; Serio, M.; Deshpande, G.V.: K m . E.; Schobert. H.H.; Burgess, C. in Coal Science 11. SchoberL
Sommerfeld. D.A.; Tunlawiroon, W.; Anderson, L.L.; Eyring, E.M. Am. Chem. Soc..Div. Fuel Chem. Prepr.,
Sommerfeld, D.A.; Jaturapitpornsakul, J.; Anderson, L.L.; Eyring, E.M. Am. Chem. SOC. Div. Fuel Chem.
Song. C.; Nomum, M.; Miyake, M.; Fuel, 1986.65, 922. Song. C.; Hanaoka, K.; Nomum, M. Fuel, 1989,68,287. Song,C.; Nomwa. M.; Ono. T.. Repr. Pap.. Am. Chem. Soc. Div. Fuel Chem.. 1991, 36(2). 586. Song, C.: Saini. A.K.; Schoben, H. H. Am. Chem. Soc. Div. Fuel Chem. Prepr., 1993.38 (3). 1031. Song, C.; Schobea H. H. Fuel Processing Technol., 1993, 34 , 157. Song, C.; Saini. A.K.: Schobert H. H. Energy & Fuels. 1994a. 8.301.
Chem. Prepr., 1993. 38 (1). 142.
Proc. US DOE Liquefaction Contractors' Review Conference. S q t . 22-24. 1992. U.S. Department of Energy. Pittsburgh. pp. 35.
Am. Chem. Soc. Div. Fuel Chem. Prepr.. 1991.36 (1). 15.
Chem. Prepr.. 1990, 35 (I), 61.
Science, 1991.254.231.
H.H.; Bartle, K.D.; Lynch. L.J. Eds.. 1991. Chap. 15.
1993. 38 ( 1 ) . 211.
Prepr., 1992.37 (2). 749.
'
Song. C.; Lai. W.-C.; Schobert. H. H. Ind. I&. Chem.'Res.. 1994b. 33,534. SWanSOn. A. Roc. US DOE Liquefaction Conuactors' Review Conference, Sept. 22-24.1992a. U.S. Depamnent of
Swanson, A.; Prepr. Pap. - Am. Chem. Soc. Div. Fuel Chem., 1992b. 37(1). 149. Tse. D.S.; Hirschon. A.S.: Malhotra, R.; McMillen. D.F.; Ross, D.S.
Energy. Pittsburgh, pp.107.
1991.36 (1). 23. Am. Chem. Soc. Div. Fuel Chem. Prepr.,
Vimalchand, P.f Lee. J.M.: Davies. O.L.; Cantrell. C.E. Proc. US DOE Liquefaction Contractors' Roview
Weller, S.; Pelipetz, M.G. Ind. Eng. Chem. 1951.43. 1243. Weller. S.W. Coal Liquefaction with Molybdenum Catalysts. in H.F. Barry and P. C. H. (Eds.) "Chemisuy and
Weller. S. Energy & Fuels, 1994. 8.415.
Conference, Sepl. 22-24. 1992, U.S. Department of Energy, Pitaburgh. pp.175.
uses of MolyMenum". Climax Molybdenum Co., Ann Arbor. MI. 1982, pp.179.
1105

~~~~~~ ~
Runs a t 350°C without Organic Solvent
NonelNone NonelH2O ATTMlNone ATTMIH20 C a t a l y s t l H Z O
Figure 1. Effect of water on catalytic liquefaction of Wyodak coal at 350°C for 30 min.
,? R u n s a t 350°C without Organic So lvent
NonelNone NonelH20 ATTMlNone AmMIH2O C a t a l y s t / H 2 0
Figure 2. Effect of water on gas formation in catalytic liquefaction at 350°C for 30 min.
R u n s a t 400T without Organic Solvent
NoneINone NonelH2O ATTMINone ATTMIH20
C a t a l y s t / H Z O
Figure 3. Effect of water on catalytic liquefaction of Wyodak coal at 400°C for 30 min.
1106

- 1 325% 350'C 375% 400% 425%
Figure 4. Effect of temperature on conversion of Wycdak coal in the presence of H20 without any organic solvent
/' O.'O /I ,/
I/roo.oo 0.00 10.00 LO.00 60.00 80.00 100.00 110.00
*In"t.S
Figures 5. 3-D HPLC chromatogram of oils from non-catalytic liquefaction of Wyodak coal at 350°C for 30 min in the presence of water.
u 0.10
P58"o.
0.00 10.00 40.00 60.00 80.00 1oo.00 i1o.00 Unur..
Figures 6. 3-D HPLC chromatogram of oils from catalyllc Iiquefacnon of Wycdak coal at 350°C for 30 min with dispersed Mo catalyst ~n the presence of water
1107

CATALYST PERFORMANCE IN ASHY-RESID CONTAINING RECYCLE OZIS
Richard K. Anderson, Frank J. Derbyshire, Edwin N. Givens University of Kentucky Center for Applied Energy Research,
3572 Iron Works Pike, Lexington, KY 40511-8433
Keywords: Coal liquefaction, catalyst, iron, molybdenum
INTRODUCTION In recent years, the objective for coal liquefaction has switched from producing primarily a resid to making exclusively distillate product. In this revised configuration, improving conversion of the residual fraction becomes essential for developing a viable process.' Since resid conversion under typical process conditions does not proceed to any significant extent in the absence of a developing improved catalysts is a key element for improving the process. Although there is continuing interest in developing catalysts for coal liquefaction: much of this research effort has not been specifically directed toward conversion of coal in media incorporating coal-derived resid.5 The criteria for optimizing resid conversion is to maximize distillate yields at low hydrogen consumption levels while limiting gas make.6 Therefore, viable catalysts must be capable of meeting these criteria for resid conversion as well as attain maximum dissolution of the coal.
Both particulate and highly dispersed catalysts have been used for converting residual feeds to distillate products.' At the Advanced Coal Liquefaction Research and Development Facility at Wilsonville, Alabama, in thermallcatalytic or catalytic/thermal Runs 260, 262 and 263, an organically dispersed molybdenum catalyst (Molyvan L) plus iron oxide was used along with a particulate nickel-molydenum catalyst.* This system of dispersed iron and molydenum catalysts along with a supported particulate catalyst gave higher yields of C,' distillate than either system alone and among the highest ever observed. To realistically evaluate catalysts for processing resid containing feedstocks, it is necessary to measure their activity in feeds containing significant concentrations of residual material. This paper presents the results of a study in which catalyst candidates were evaluated in resid containing process solvents that were obtained from Wilsonville.
EXPERIMENTAL Wyodak coal obtained from the Black Thunder Mine in Wright, Wyoming, was ground to -200 mesh, riffled and stored under nitrogen at 4 'C. This material was supplied by CONSOL Inc. Proximate and ultimate analyses of the coal are presented in Table 1. A sample of V-131B recycle oil from Run 258 was obtained from Wilsonville. Samples of the individual components that were combined into the Run 262 recycle oil were obtained from CONSOL Inc. These included the V-1074 heavy distillate from the vacuum tower, the V-130 deashed resid product from the ROSE-SR dashing unit, and the V-1082 ashy resid feed to the dashing unit. All of these materials were produced at Wilsonville when the plant was operating in a closeaupled configuration and feeding Black Thunder coal. Analyses of these recycle oils given in Table 2 show that both contain sizable concentrations of iron resulting from addition of iron oxide to the feed slumes. Run 262 process oil also contains a sizable concentration of Mo since Molyvan L, an organic-based Mo containing material, was being added during this run. Based on previous Mossbauer studies on similar material, the iron is present in combination with sulfur as pyrrhotite. The molybdenum was presumed to be present as MoS,. Each of the recycle oils was characterized by separating into tetrahydrofuran (THF) insoluble, THF soluble-pentane insoluble, and pentane soluble fractions (see Table 2). A sample of THF insoluble material in the Run 262 V-1082 ashy resid was isolated by exhaustively extracting with THF for 2 days and drying overnight at 40 'C at 125 torr. A sample of the iron oxide catalyst (IO) that had been used at Wilsonville was supplied by CONSOL Inc. Molyvan L was supplied by R. I. Vanderbilt Co. A sample of superfine iron oxide (SFIO), which was described previously, was supplied b Mach 1 Company, King of Prussia, Pa.9 Impregnated coals were prepared as previously described."
Reactions were conducted in 50 cc microautoclaves pressurized to 1000 psig hydrogen at ambient temperature. In coal reaction experiments, 5.4 g of solvent, 3 g of coal, catalyst and dimethyl disulfide were added to the reactor. After pressurization, the reactor was placed in a fluidized sandbath set at the specified temperature and continuously agitated at a rate of 400 cycles per minute. At the end of the reaction period, the reactor was quenched to ambient temperature and the gaseous products collected and analyzed by gas chromatography. The solid and liquid products were scraped from the reactor using THF and the mixture was extrac'd in il Soxhlet 2pparaIus for 18 hours. The THF insoluble material, which included IOM and ash, was dried (80 'C at 125 torr) and weighed. The THF solubles Were concentrated by removing excess THF in a rotary evaporator and subjected to either a solvent separation scheme, which was described previously,' or vacuum distillation using a modified D-1160 procedure, which is described elsewhere.'' The methods for calculating material balances are
I 1108

included in the previous descriptions. In the following discussion, coal conversion equals 100 minus the yield of THF-insoluble organic material OOM).
Reactivity of Residual Feeds Samples of Wilsonville produced recycle oils or their individual components were used for evaluating catalysts. These oils contained slightly more than 40 wt% 1050 O F heavy distillate and 30-35 wt% resid, as shown in Table 2. The combined mineral matter and IOM made up the remaining 25-30 wt% of this material, nearly equivalent to the feed coal used at Wilsonville in these N n S . The higher oil and lower IOM concentrations in the Run 262 recycle oil, relative to the Run 258 recycle oil, indicates the higher level of conversion obtained in the presence of the added Mo catalyst. Each of the components in the Run 262 recycle oil were also subjected to solvent separation, the sum of which agreed with results from solvent separation of the combined Run 262 recycle oil. The Run 258 recycle oil was u& as received.
The composition of the Run 262 recycle oil changes quite significantly at temperatures above 300 O C .
As shown in Table 3, at 415 OC, the IOM in these recycle oils decreased from 14.0 wt% to 10.8 wt% after 30 min at 6.89MPa H, (cold). A net conversion of both PA+A and IOM to pentane soluble oils occurred, both of which had been observed previously.'2,2 Formation of hydrocarbon gases and CO+CO, was minimal. In a series of similar runs at 415 O C ranging from 3.8 min to 60 min, the THF- IOM concentration decreased rapidly from 14.0wt% in the starting material to approximately 10 to 11 wt%, even at the shortest time (Table 4). This same level of reactivity was observed at 300 'C, both in the presence and absence of hydrogen overpressure. The product from this latter run indicated a somewhat smaller shift to oil product. Similar reactivity was observed in the ashy resid fraction in the absence of any distillate solvent. The IOM decreased from an initial 26.8wt% in the starting ashyresid to 20.5 wt% after 15 min at 415 'C in 6.89 MPa H, (cold). This corresponded to 24 wt% conversion of the IOM. Therefore, most of the reaction is occurring in the residual fraction in the absence of donor solvent and independent of the presence of gaseous hydrogen, which appears to have a slightly positive effect. A sample of IOM that had been isolated from the ashy resid was subjected to reaction in tetralin at 415 'C for 15 min with 6.89 MPa H, (cold). Because only 5.2 wt% was solubilized, it appears this material does not respond to normal liquefaction conditions.
This change in ashy resid solubility in THF may be due to disassociation of the material making it more soluble in THF. Earlier results on vacuum tower bottoms and ROSE-SR ash concentrate showed that pyridine and mixed cresylic acids were significantly better solvents than THF.I3 However, a comparison of the insoluble organic matter in the Wilsonville filter feed stream determined with each of these solvents showed that pyridine, quinoline and mixed cresylic acids gave essentially the same res~1t.l~ In our laboratory, we determined the solubility of ashy resid in pyridine, THF and cresylic acids using a Soxhlet technique for pyridine and THF and the Wilsonville procedure for cresylic acid.15 The insolubles in THF, pyridine and cresylic acids were 26.8,23.1 and 24.0 wt%, respectively. In refluxing pyridine at 114 "C, as compared to the 84 O C temperature attained when using the Soxhlet, the insolubles decreased further to 21.4 wt%, which was very close to the 20.5 wt% THF IOM obtained after reacting the ashy resid at 415 'C for 15 min in 6.89 MPa H2 (cold).
The reactivity of the distillate fraction further complicated use of these materials in evaluating catalyst performance. The THF IOM fraction of this material was 3.1 wt% of which 1.8 wt% remained insoluble after heating at 300 'C in hydrogen for 15 minutes. This amount, though relatively small on a percentage basis, makes a larger impact on the amount of IOM in the sample that is converted and affects the overall conversion numbers.
Reactivity of Coal in Recycle Oil The conversion and product yields of Black Thunder Wyodak coal were determined using these Wilsonville derived recycle oils. Both oils contained sizable amounts of iron while the Run 262 oil also contained 163 ppmw molybdenum. For a 30 wt% coal concentration in the feed, this corresponds to a 300 ppmw Mo concentration on moisture and ash-free coal. Various iron and iron-molybdenum catalysts were added to these reaction systems; iron up to 1.0 wt% and Mo up to lo00 ppmw, based on maf coal, were added as shown in Table 5. Reactions were run at 440 'C for 22 min after which they were analyzed either by solvent separation or vacuum distillation. The amount of conversion was, of course, influenced by the IOM present in the starting recycle oil that became solubilized, which explains the > 100% values. Vacuum distillation was also used to measure the amount of conversion to distillable oils. A corresponding THF conversion value was also obtained using this techniqce sifice THF insolubles were removed prior to distillation.
Although there is considerable Scatter in the data, it is clear that as Mo concentration increases, reactivity improves. In Figure 1 THF conversion increases quite sharply from a low of 96 wt % in the
1109

absence of Mo. Similarly, C, solubles also increase as shown in Figure 2. This value increases from a low of 32 wt% in the absence of Mo up to 59 wt% upon addition of lo00 ppmw Mo. The corresponding 1050 O F value also varies similarly but with somewhat more scatter, as shown in Figure 3. These data indicate that distillate yield levels out at a Mo addition level of about 500 ppmw for the Run 258 recycle oil. All of the distillate yields taken in Run 262 recycle oil that already contained recycled Mo, were at a maximum, indicating that recycle oil performance had been optimized in Run 262.
The most striking example that fails to fall within this pattern is the reaction in the presence of SFIO to which no Mo had been added. Of the 2.9 wt% Fe present in the reaction feed, only 0.8 wt% was SFIO. Surprisingly, its THF conversion, C5 solubles and 1050 OF- distillate yield appears to be equivalent to addition of approximately 500 ppmw Mo in the Run 258 recycle oil. These data support a significant activity for this nanometer size material.
Conclusions The assessment of the activity of fresh catalysts for liquefaction of Wyodak coals in Wilsonville recycle oils is complicated by the presence of resid, unconverted coal, ash and dispersed catalyst. The presence of a THF-insoluble fraction that easily converts at temperatures above 300 OF in an inert atmosphere to a THF-soluble fraction results in apparent conversions of coal in excess of 100%, even under the mildest of conditions. Solubilization of this material was observed in refluxing pyridine at 114 'C, as well as this material is not susceptible to reaction in tetralin and hydrogen at reaction conditions to form a THF soluble material. Addition of Mo to Mo-free recycle oils resulted in increased THF- conversion, pentane solubles yield, and 1050 O F + conversion. Accumulated Mo catalyst in recycle oils, taken from runs at Wilsonville where dispersed Mo was being added, masks the effect of added fresh Fe or Mo catalysts. Catalyst testing in these systems requires careful control of the components in the residual fraction.
ACKNOWLEDGEMENT The authors gratefully acknowledge financial support provided by the Commonwealth of Kentucky and the U. S. Department of Energy under contract number DE-AC22-91PC91040.
REFERENCES 1. 2.
3. 4. 5.
6.
7.
8.
9.
10.
11.
12.
13.
14.
15.
- __ Lumpkin, R. E. Science 1988,239,873. Kang, D.; Givens, E. N. "Internal R&D Final Report: Effect of Asphaltene- and Preasphaltene-Rich Solvents upon Coal Liquefaction," DOE/OFU03054-64, Sept. 1983. Kang, D.; Givens, E. N. Chem Engr. Prog. 1984, 80 (I]), 38-41. Weller, S. W. Energy Fuels 1994, 8,415. Comolli, A. G.; Johanson, E. S.; Karolkiewicz, W. F.; Lee, L. K.; Stalzer, R. H.; Smith, T. 0. Topical Report; Catalytic Two-Stage Liquefaction (CSTL) Process Bench Studies with Bituminous Coal", DOE/PC/88818-T3, Mar. 1993. Quarterly Technical Progress Report for "Advanced Direct Liquefaction Concepts Program", DOE/PC/91040-29, Aug. 1993. Del Bianco, A,; Panariti, N.; Di Carlo, S.; Elmouchnino, J.; Fixari, B.; Le Perchec, P. Applied Catalysis A: General 1993, 94, 1. Technical Progress Report, Advanced Coal Liquefaction Research and Development Facility, Wilsonville, AL., DOE/PC/90033-23, Dec. 1992. Anderson, R. K.; Givens, E. N.; Derbyshire, F. K. Prep. Pap. -Am. Chem. Soc., Div. Fuel Chem. 1993,38 @), 495. Ni, H.; Anderson, R. K.; Givens, E. N.; Stencel, J. M. Prep. Pap.-Am. Chem. SOC., Div. Fuel Chem. 1994,39 (21, 537. Technical Progress Report, Advanced Coal Liquefaction Research and Development Facility, Wilsonville, AL., DOE/PC/90033-23, Dec. 1992, p. 1-1. Skinner, R. W.; Givens, E. N. Prep. Pap. - Am. Chem. SOC Div. Fuel Chem. 1982,
Schweighardt, F. K.; Kingsley, I. S.; Cooper, F. E.; Kamzelski, A. Z.; Pares, D. M. "Development of SRC-I Product Analysis", DOE/OR/03054-61, Sept. 1983, p. 234. Lewis, H. E. et al. "Solvent Refined Coal, SRC Process, Operation of the SRC Pilot Plant at Wilsonville, AL", Quarterly Teclinical Frog. Report No. FE-2270-3, Apr.-Jun. 1976, pp. 69, 84. See reference 12, p. 262.
27(3-4), 37.
1110

Tablc
Proximate Analvsis Ex% Moisture 21.2
Ash 5.15
Volatile Matter 34.4
Fixed Carbon 39.3
I . Black Thunder Coal Analy
Ultimate Analvsis wtx Carbon 68.68
Hydrogen 4.76
Nitrogen 1.21
Sulfur 0.56
Oxygen (diff) 18.25
Ash 6.54
Ash, SO,-free 5.42
-
Sulfur TVDQ !!.LE Total 0.39
Pyritic 0.07
Sulfate 0.09
Organic 0.23
I Table 2. Recvcle Oil Characterization. wt96 1 Run 262 V-131B' Run 258 V-131B
1050°F' Distillate 44.2 46.6
Ash 8.3 8.1
THF IOM 12.8 15.1
PA+A 18.6 22.1
Oils 60.3 54.7
Iron 1.7 1.2
Molybdenum, ppmw 163 3
a. Prepared by blending V-1074 heavy distillate, V-130 deashed resid
b. Not available and V-1082 ashy resid in ratio 42.7:6.6:50.7, respectively.
ecycle oil contains 1.8 wt% Fe on ash-free basis.
\
1111 i

I
8
9
10
262 Impregnated 0.8 FeIII 550b AM
262 Impregnated 0.8 FeIlI BOOb AM
258 Impregnated 0.8 FeIII lo00 AM
Figure 1. THF Conversion Figure 2. Pentane Soluble Oil
$106
=-lo4 2 0 .- > g 1 0 2 c100 0 0
I k 96
LL 98
108 I b -
C 5 06
'Y - 304
: C l
5 4
3 O 2
1
07
0 8
% I , , , , ,
0 9
010
94 ' 0 200 400
Mo Conc, 600 800 1,000 1 ppmw maf coal
,200
65 I
50
Q 45
3 40 B - 0 35
30
Figure 3. Distillate Oil Yield

A HIGH ACTIVITY ZEOLITE-SUPPORTED COBALT FISCHER- TROPSCH CATALYST
R.R.FRAME, S . A . B W L E Y , E.SCHUMACHER AND H.B.GALA UOP
50 EAST ALGONQUIN ROAD DES PLAINES, IL 6001 7-5016
KEYWORDS: Y ZEOLITE/COBALT FISCHER-TROPSCH CATALYST FIXED-BED TESTS SLURRY AUTOCLAVE TESTS
Cobalt-based Fischer-Tropsch (F-T) catalysts are currently in favor because they are useful for processing methane-derived synthesis gas. There is an excess of methane at remote sites that might be economically converted into liquid hydrocarbons by a processing scheme based on F-T. Shell is purported to use a cobalt-based catalyst a t their F-T plant in Sarawak. &on has worked extensively on supported cobalt F-T catalysts, particularly ones supported on titanium dioxide. Gulf-Cbe~ron'~'-'~' and Ewr~n'~~ have demonstrated that small amounts of ruthenium added to a supported cobalt F-T catalyst can cause catalyst activation.
Work done under a current DOE contract to UOP has resulted in a high activity, zeolite- supported, cobalt F-T catalyst (Contract No. DEACZZ89PC8969). This catalyst resulted from impregnation of cobalt onto a Y zeolitederived support. This support had been used in an earlier contract by workers from Union Carbide to prepare a less active cobalt F-T catalyst.
The support results from steaming and acid-washing Y zeolite. The purpose of the steaming is to create large amorphous pores in an otherwise crystalline matrix. The subsequent acid-washing removes alumina debris resulting from steaming thus clearing the remaining crystalline channels to facilitate diffusion of reactants and products to and from the catalyst active sites.
Compared to the catalyst developed during the previous Union Carbide contract, catalysts from the current work have hieher cobalt levels. Thus Figure 1 illustrates the actual metals loading in some of the current catalysts compared to a reference catalyst remaining from the earlier work
Catalysts prepared during this work were analyzed by scanning transmission electron microscopy (STEM). These analyses showed that at least some of the cobalt exists outside of the zeolite pores in crystallites attached to the external surface of the zeolite.
Short catalyst screening rum were performed in a fiied-bed pilot plant. In addition, one active catalyst was also evaluated in a longer run in a slurry autoclave pilot plant. Such a plant is useful for evaluating catalysts being developed for liquid phase F-T (LPFI') processing. The slurry autoclave run allowed determination of the catalyst deactivation rate and the change in selectivities as a function of time on stream.
When the fixed-bed reactor was used quartz sand was loaded with the catalyst to facilitate heat transfer since the F-T reactions are very exothermic. Prior to starting a run the metal oxide was reduced for two hours a t 350" C with flowing hydrogen. Following reduction the reactor temperature was reduced until the inlet temperature was 211" C; the feed was then introduced. The feed rate was 4.9 NL/hour.g of cobalt and the plant pressure was 287 psig. The feed was a pure blend of hydrogen, carbon monoxide and argon purchased from Scott Specialty Gas Co. The feed molar ratio of hydrogen to carbon monoxide was two which is the same as that of a methane derived synthesis gas. Argon was present as an internal standard for calculation of conversions and selectivities.
Figure 2 contains a tabular summary of Run 65 (reference catalyst from the previous contract) and Run 97 which used a catalyst containing about twice as much cobalt as the reference catalyst. The higher conversion during Run 97 was due, at least in part, to the d- higher operating temperature during this run (actual catalyst bed temperature profiles are in Figure 3). The high temperature resulted from the high density of active sites on the high cobalt catalyst which, in turn, caused extensive conversion near the inlet of the catalyst bed and, therefore, significant heat as well. Since cobalt-catalyzed F-T is very sensitive to temperature even a small difference between operating temperatures such as in Runs 65 and 97 can result in a significant conversion difference in
1113

\
I/
Conversion. Subsequent runs with even higher cobalt catalysts used less catalyst, however, due to Operational problems the amount used in these latter runs is as little as may be used.
A fresh sample of the catalyst used in Run 97 was bound with silica in preparation for use in the S h y autoclave pilot plant. For use in (LPFI') the powdery zeolite catalyst would have to be bound in order to form particulates large enough to have the required hydrodynamic properties. The bound catalyst was evaluated in the fixed bed reactor in Run 99. In this run, since the zmlitekobalt was diluted by the silica, eighteen rather than thirteen grams of catalyst were used. The amount of cobalt in the reactor in Runs 97 and 99 was thus the same. The bound catalyst was also evaluated in the slurry autoclave pilot plant in Run 61. Eighteen grams of catalyst were also used in this run, however, 290 grams of (C, oil) diluent were used. Since heat removal was expected to he much better in the slurry autoclave, the operating temperature was 221" C so that the performance data could be compared to that from Run 99 which operated at a de-facto temperature that was above the target inlet of 211" C. For Run 99 the catalyst was reduced at the normal temperature but gt&& to the reactor. It was carefully transferred to the reactor under an inert atmosphere. The feed rate and operating pressure during the slurry autoclave run were the same as during Runs 97 and 99 (4.9 NLlhr-g Co and 287 psig, respectively). Performance data from Runs 97, 99 and 61 are compared in Figure 4.
After binding the catalyst was less active, possibly because the binder covered some of the catalyst active sites. Although the slurry autoclave was operated at a slightly higher temperature than the catalyst maximum temperature in Run 99, the conversions were similar in both runs. The methane selectivity during Run 61, however, was slightly lower than during Run 99. Unlike the screening runs in the fixed-bed reactor which were of short duration, Run 61 was four hundred hours long. During this run the conversions and selectivities appeared to approach a line out, however, some condition changes were made during the run making it difficult to absolutely judge the rate of catalyst deactivation. Additional slurry autoclave runs with high cobalt, Y zeolite- supported catalysts are needed.
Catalysts wilh levels of cobalt even higher than the Run 97 catalyst have been evaluated in the fixed-bed pilot under conditions identical to Run 97 except a lower level of catalyst was used. The results of these runs are summarized in Figure 5.
The catalyst loading used in Runs 110 and 123 is as low as practical. Obviously excess heat removal was still a problem at this low level. This means that increasing the cobalt level from eighteen to twenty-eight weight percent did mnl t in the formation of quite a few additional active sites. The catalyst used in Run 110 contained ruthenium whereas the one used in Run 123 did not. Incorporation of small amounts of ruthenium into a cobalt catalyst composition should result in increased catalyst activity. This was not the case, however, the two very high cobalt catalysts above are merely first attempts. Perhaps the ruthenium is not yet well-dispersed into the cobalt. Modifications of the impregnationlactivation procedures should be explored to see if additional activity can result from addition of ruthenium to the Y zeolitesupported catalyst composition. The catalyst bed maximum temperature was very high in Run 123, however, in spite of this the methane selectivity was not excessively high.
Apparently new active sites are formed as the level of cobalt on steamed, acid-washed Y zeolite is increased from 8 to 28 w t l . This is a significant observation because in WIT processing the total volume of catalyst in the reactor will be critical. If a given volume of support can carry higher levels of catalytically active cobalt than previously thought possible, a superior LPIW catalyst will result. This is particularly true if these catalysts also retain the ability produce low levels of methane which, in fact, they do seem to do. Additional work with the very high cobalt-level catalysts is indicated. These should eventually be tested (after binding) in the slurry autoclave plant and compared to the catalyst evaluated in Run 61. However, before this additional compositions with small amounts of ruthenium should be prepared and screened in the fved-bed plant. For LPFI processing catalyst activity is critical because of the low volume of catalyst that can be eontained in an LPm reactor, it is very important to find out if small amounts of ruthenium c ~ n activate the catalyst.
REFERENCES
1. H. Beuther, T. Kobylinski, C. Kibby and R. Pannell, US. Patent 4,585,798, 1986. 2. H. Beuther, C. Kibby, T. Kobylinski and R. Pannell, U.S. Patent 4,413,064, 1983. 3. H. Beuther, C. Kibby, T. Kobylinski and R. Pannell, U.S. Patent 4,493,905, 1985. 4. T. Kobylinski, C. Kibby, R. Pannell and E. Eddy, U.S. Patent 4,605,676, 1986. 5. R. Fiato, European Patent Application Publication No. 0 414 555 Al, filing date 8/23/90.
I 1114

FIGURE 4
RUNNO.
EVALUATION OF BOUND HIGH COBALT CATALYST: FMED-BED AND SLURRY AUTOCLAVE TESTING
LOADING MAXT C O C O W SELEC, MOL%
110
1.23
I CATIQ:mTZ, I o c P I c, I c* I C,' II 6.51166.5 220 86 8.6 1.2 0
63166.5 230 90 10.5 1.5 0
11 97 I 131160 I 222 I 72 I 13 I 1.8 I 0.1 11
1115

6. E. Iglesia, S. Soled, R. Fiat0 and G. Via, J. Catal., 1993, 143, 345.
CAT NO/RUN NO
UNION CARBIDE165
6827-81197
6827-1601110
6827-1611123
FIGURE I
PROPERTIES: SUPPORTED OXIDES ON STEAMED Y ZEOLITE
SUPPORT METALS, WT%, AAS
Co Mn Zr Ru SAliPV
- 8.3 1.3 1.0 - 58210.56 17.6 2.0 1.6 1.0
56110.54 26.8 2.3 1.0 0.4
58810.55 28.7 , 1.8 1.1 -
RUNNO.
65
97
FIGURE 2
PERFORMANCE OF THE REFERENCE TO A HIGH COBALT CATALYST
LOADING MAXT CO COW, SELEC, MOL % CATIQUARTZ, "C I
g CI c, C,'
131160 213 40 7 0.6 0
131160 222 72 13 1.8 0.1
FIGURE 3
CATALYST BED TEMPERATURE PROFILES DURING RUN 97
2001 " " " " " " " " I - 4 - 3 - 2 - 1 0 1 2 3 4 5 8 7 8 B10111213
Inches
i
- 8Hrs f 48 Hrs * 84Hrs * 120Hrs
1116

EFFECTS OF SUPPORTS AND PROMOTERS ON
VS. SLURRY BUBBLE COLUMN REACTORS
R. Oukaci, J.G. Goodwin, Jr., G. Marcelin, and k Singleton' Chemical & Petroleum Engineering Department
University of Pittsburgh Pittsburgh, PA 15261
COBALT F-T CATALYST BEHAVIOR IN FIXED BED
Keywords: Fischer-Tropsch Synthesis, CO Hydrogenation, Cobalt Catalysts.
INTRODUCIlON One of the most promising ways for producing liquid hydrocarbons from coal is via coal gasification to synthesis gas, followed by Fischer-Tropsch (F-T) synthesis to convert the syngas to a mixed product consisting mainly of straight chain hydrocarbons. Traditionally, iron catalysts have been used for F-T synthesis when the syngas is coal-derived, because they have the ability to simultaneously cany out the water gas shift reaction.
Recently, there has been renewed interest in the use of Co as a commercial F-T catalyst. Co has a higher specific activity than Fe (1,Z); it produces primarily straight chain paraffim; and it has shown good lifetimes. The considerable commercial interest is evidenced by the large number of patents relating to Co catalysts and F-T processes which have been issued. These recently developed cobalt catalysts share some similarities in that they all consist of four major components: (a) the primary F-T metal, Co; (h) a second metal (Ru, Re, or other noble metal); (c) an oxide promoter (lanthana or zirconia, for example); and (d) a high surface area refractory oxide support (3).
Different types of reactor systems are proposed for commercial F-T synthesis. The slurry bubble column reactor has often been suggested as being one of the most appropriate for heat removal from the exothermic F-T synthesis reaction. However, most of the catalyst screening is carried out in fixed bed reactor systems, even for sluny bubble column reactor applications. In addition, there has been hardly any investigations of the effects of supports or promoters carried out in slurry bubble column reactor systems. Because of the different reaction conditions involved in these two systems, i.e., gas phase versus liquid phase, some of the effects observed in one system may not necessarily be found in the other.
A series of catalysts has been formulated in order to investigate the role of the supports and some promoters on affecting the F-T reaction both in a fixed-bed reactor as well as in a slurry bubble column reactor.
EXPERIMENTAL All catalysts compared in this study consisted of 12-20 wt% cobalt, a second metal promoter (Ru or Re), and/or an oxide promoter such as zirconia, the support being alumina (Vista B), silica (Davison 952), or titania (Degussa FT.5).
' Energy International Corporation, 135 William Pitt Way, Pittsburgh, PA 15238.
1117

These supports were chosen based on their low sulfur content and microspheroidal shape. The latter property is important when used in a slurry bubble column reactor as it prevents attrition.
All catalyst were prepared by impregnation of the supports with the appropriate solution of the nitrates of the various metals. After impregnation, the catalysts were dried at 120°C and calcined at temperatures no higher that 350°C. Prior to testing the catalysts were reduced in a flow of hydrogen. They have all been extensively characterized by different methods, including elemental analysis, BET physisorption, particle size distribution, X-ray diffraction, hydrogen chemisorption, temperature programmed reduction. Table 1 summarizes the relevant characterization data.
The catalysts were evaluated in te rm of their activity and selectivity both in a fixed bed reactor and in a slurry bubble column reactor. Typically, 0.1 to 0.3 g of prereduced catalyst were charged into the tubular fued-bed reactor and rereduced overnight at 300°C. The reaction was carried out at 220"C, 1 atm, H,/CO ratio of 2.0, and a total flow rate of 50 cm3/min. No inert diluent was used. Sample analyses were taken after approximately 2, 5, 9, and 24 hours on-stream. In some cases the temperature was varied between 210" and 240°C in order to calculate an Arrhenius activation energy. Product analysis for C,-C& hydrocarbons was performed by on-line gas chromatography. CO conversion rates were calculated based on the GC analysis of the products. Anderson-Schultz-Flory (A-S-F) distributions were plotted and the chain growth probability, (I, calculated using the C,-C, data.
For the slurry bubble column tests, the catalyst was first reduced ex-sifu in a fluidized bed assembly and then transferred into a glove box for weighing and subsequent transfer into the slurry bubble column reactor. Approximately 15 g of catalyst and 200 g of liquid medium were used in a run. Typically, the reaction was carried out at 240"C, a total pressure of 450 psi, H,/CO ratio of 2, and using 60% N, diluent. Analysis of the gas products, CO, COz, and C,-C,, was performed hourly. Liquid products were collected at the end of each 24 hour period, blended, and submitted for analysis. A-S-F plots of the liquid products were used to determine (I. After reaching steady-state under these conditions, temperature, pressure, and HJCO ratio were varied in turn to study the effect of process conditions. A typical complete run lasted about 10 days.
RESULTS AND DISCUSSION Table 2 shows selected data obtained from fued bed reaction which indicate the effects of noble metal and ZrO, promotion and of the support on F-T activity and selectivity. The alumina- and silica-supported Co catalysts were found to be more active, by about a factor of two, than their titania- supported analog.
The addition of ruthenium to the y-alumina supported cobalt catalyst increased its activity by a factor of ca. 6, while it had no effect on the silica-supported catalysts and only a slight enhancing effect on the activity of the Ti0,-supported catalyst. The effect on the Al,O,-supported catalyst may be explained by the fact that the presence of Ru increased the reducibility of the Co/Al,O, catalyst while
1118

it did not enhance the reducibility of the SiO, and the Ti0,-supported catalysts. In addition, hydrogen chemisorption measurements, shown in Table 1, show that the Ru promoter can increase the dispersion of the reduced Co/Al,O,. However, in the case of the SO,-supported catalyst, a factor of two in activity was gained by promotion with ZrO,, although the latter did not seem to affect the reducibility of the cobalt or its dispersion.
It should be noted that neither the support nor the promoters changed significantly the characteristics of the reaction products, i.e., no significant change was noted in (Y or CH, formation rate. This suggests that the F-T reaction is still being carried out on Co sites and not on new sites created by the promoter. Similar results were obtained when Re was used as a metal promoter in place of Ru. The results obtained for Ru and Re promotion are similar to those reported in the patent literature (4-7).
Table 3 shows selected data obtained at 240"C, 450 psi, and H,/CO ratio of 2, in the slurry bubble column reactor for Co/AI,O, and Co/Si02 catalysts. In this case, the support was found to strongly influence the overall hydrocarbon production rate with little effect on a, while the addition of a noble metal promoter seemed to have little effect on the catalytic properties of cobalt. On the other hand, as in the case of the fixed bed testing, the ZrO, promoter was found to influence the overall activity of the silica-supported catalyst.
Obviously, diffusion limitations and gas solubilities in the liquid medium in the slurry bubble column reactor may play a role in some of the differences in the results from the two reaction systems. It is also possible that certain promoters or supports may function best in a narrow range of conditions. Clearly, ZrO, was the most consistent activity promoter.
ACKNOWLEDGMENTS The authors gratefully acknowledge the funding of this project by DOE and the contribution of the following personnel involved in this study: S. Ali, L. Balawejder, P. Brim, B. Chen, W. Gall, G. Haddad, A. Kogelbauer, and S. Renaldi.
REFERENCES (1) M.A. Vannice, in Catalysis: Science and Technology, Vol. 3 (J.R. Anderson and M. Boudart, Ed.) Springer-Verlag, Berlin, 1982, pp. 139-198. (2) S.T. Sie, J. Eilers, and J.K. Minderhout, Proc. Int. Cong. Catal., Calgary, 743 (1988). (3) J.G. Goodwin, Jr., Preprints of Div. of Petr. Chemistry, ACS Nat. Meeting, Atlanta, April 14-19, 1991. Pp. 156-159. (4) T.P. Kobylinski, C.L. Kibby, R.B. Pannell, and E.L. Eddy, European Pt. Appl. 0 253 924 (1986). (5) S. Erie, J.G. Goodwin, Jr., G. Marcelin, and T. Riis, US. Patent 4,801,573 (1989). (6) KP. de Jong, J.H.E. Glazer, and M.F.M. Post, European Pat. Appl. 0 221598 (1986). (7) C.H. Mauldin, U.S. Pat. 4,568,663 (1986).
1119

N
F, 6 5 s
*
0 I-
1120

RATE SELECTIVITY CATALYST
(g CH,/g mol CO/mol CH, (Y
cat/hr) co/s x lo4 (wt%)
C 0 / ~ 2 O I 0.073 4.3 29.2 0.62 RuCo/Al,O, 0.470 28.0 29.0 0.60 Co/SiO, 0.083 4.8 28.9 0.65 RuCo/SiO, 0.085 4.9 18.9 0.73 ZrCo/Si02 0.160 9.4 23.5 0.63 RuZrCo/SiO, 0.136 8.0 0.69
ReCo/TiO, 0.052 5.1 45.0 0.49 RuCo/TiO, 0.034 3.3 27.7 0.69
Co/Ti02 0.021 2.0 0.64
Table 3. Slurry Bubble Column Reaction Data
P = 1 atm, T = 22L"C , H,/CO = 2, Conversion < 5%, Time-on-stream = c,
RATE CATALYST
SELECTIVITY
CO/~,OI RuCo/A1201 Co/SiO, RuCo/SiO, ZrCo/SiO, RuZrCo/SiOz Co/TiO, ReCo/TiO, RuCoITiO,
0.66 1.24 10.7 1.16 11.0 0.09 0.13 0.40 8.3 , - 1 I
atalyst weight: ca. 15g; T = 240°C ; P = 450 psi; HJCO ra
(Y
0.82 0.85 0.89 0.86 0.82 0.85
0.85 0.83
) = 2; totd 50 rate: k. 15 i./min, or 3 cm/sec linear velocity; diluent: ca. 60% NP
1121 '

A'ITRITION AND CARBON FORMATION ON IRON CATALYSTS
Steven D. Kohler, Mark S. Harrington, and Nancy B. Jackson Sandia National Laboratories P.O. Box 5800, MS 0790
Albuquerque, NM, 87185-0790
KEYWORDS: Attrition, carbon deposition, slurry bubble column
ABSTRACT A serious engineering problem that needs to be addressed in the scale-up of slurry-phase,
Fischer-Tropsch reactors is attrition of the precipitated iron catalyst. Attrition, which can break down the catalyst into particles too small to filter, results from both mechanical and chemical forces. This study examines the chemical causes of attrition in iron catalysts. A bench-scale, slurry-phase CSTR is used to simulate operating conditions that lead to attrition of the catalyst. The average particle size and size distribution of the catalyst samples are used to determine the effect of slurry temperature, reducing gas, gas flow rate and time upon attrition of the catalyst. Carbon deposition, a possible contributing factor to attrition, has been examined using gravimetric analysis and TEM. Conditions affecting the rate of carbon deposition have been compared to those leading to attrition of the precipitated iron catalyst.
INTRODUCTION In the investigation of the use of slurry-phase bubble columns for exothermic synthesis gas reactions, including Fischer-Tropsch synthesis and methanol synthesis, one of the biggest challenges presented by the process is development of the catalyst. In the typical Fischer- Tropsch use of the bubble column, the catalyst is suspended in a wax and synthesis gas is bubbled up through the column. Since the Fischer-Tropsch process produces wax, the wax must be continuously extracted from the column and the catalyst must be separated from the wax for sake of purity and to keep the catalyst concentration constant within the reactor. Therefore, the catalyst must be large enough to be filtered easily from the wax, but as small as feasibly possible to enhance activity. Catalyst attrition is a major problem at low Hz/CO ratios with carbon deposition proposed as the contributing factor to chemical attrition of the catalyst.
EXPERIMENTAL The catalyst used in this study was a precipitated and spray-dried, proprietary iron catalyst made by United Catalyst Inc. for the US . Department of Energy. The catalyst consisted of iron oxide and copper oxide in a ratio of about 9: I . Trace amounts of potassium oxide were also present. Transmission electron microscopy (TEM) and scanning electron microscopy (SEM) of the untreated catalyst particles showed that the samples were about 20-50 bm in diameter with a significant amount of micron and submicron fines. The larger particles were made up of angular, faceted, single-crystal grains (1-2 pm) with similar orientation that were agglomerated together. See Figure 1. The particle size of three similarly prepared Fischer-Tropsch catalysts were measured using a sedimentation-type particle size analyzer. Particle size analysis confirmed the existence of large amounts of micron and submicron fine particles. Particle size measurements are listed in Table 1.
The transmission electron microscopy was performed on a 200 kV JEOL JEM 2000FX microscope and the scanning electron microscopy utilized a Hitachi S800 microscope. Thermal gravimetric analysis (TGA) was performed using a Dupont 95 1 Thermalgravimetric Analyzer.
Carbon deposition was studied during pretreatment and during Fischer-Tropsch synthesis by TGA and TEM. The catalysts were pretreated in the TGA or in a microreactor for TEM work with Hz or CO at 270°C and then reacted in Hz/CO (0.7: I ) at 250"C, 275°C. and 300°C. The catalysts were pretreated for 10-14 hrs and reacted for 10-14 hrs in the TGA. In the microreactor for TEM studies, the catalysts were pretreated for 3 hrs and reacted for 3 hrs.
RESULTS Analysis in TEM showed that activation in carbon monoxide before reaction in synthesis gas deposited more carbon on the surface of the catalyst than activation in hydrogen before reaction. The deposited carbon was amorphous in structure. All catalysts, regardless of pretreatment, appeared to have both carbide and oxide phases present after reaction. As the temperature of the synthesis gas reaction is increased, the thickness of the carbon deposited on the iron oxide
i I
i 1122
catalyst also increased. Pretreatment in CO followed by synthesis gas at 300°C showed the thickest layer of amorphous carbon. The individual grains showed signs of separation; the agglomerate was breaking up. The diffraction pattern showed a greatly diminished oxide phase while the pattern of the carbide phase suggested randomly oriented grains with loss of orientation relative to the original crystal. This breakup was also seen in catalysts pretreated in hydrogen and followed by synthesis gas at 300°C. It also appears from TEM that there is a breakdown of the parent agglomerate template at synthesis temperature greater than 275°C which causes separation of the catalyst into individual crystallites (1-2 pm in size) which leads to attrition over time. At synthesis temperatures below 275OC, oxidation of the iron catalyst showcd a return of the original microstructure of the catalyst Oxidation immediately following pretreatment of the catalyst in either Hz or CO caused a retum to the original microstructure.
TGA results confirm the increase in the amount of amorphous carbon during pretreatment in carbon monoxide and at higher synthesis reaction temperatures. In addition, TGA results indicate that the breakdown of the catalyst due to carbon deposition can occur at temperatures lower than 275°C. but at reaction times longer than those analyzed using E M . TGA results show that regardless of the temperature of reaction or pretreatment gas, as the reaction in synthesis gas proceeds, the catalyst continues to gain weight at a rate proportional to the temperature. This continued weight gain implies continued carbon deposition leading to an eventual breakdown of the catalyst agglomerate into individual particles. The weight gain of the samples In the TGA due to synthesis reaction is shown in Table 2.
CONCLUSIONS 1. TEM analyses show that at reaction temperatures above 275°C there is significa:it carbon dcposition and a breakdown of the parent iron catalyst agglomerate which causes the particles to disintegrate into individual crystallites (1-2 pm in size), a phenomena which would lead to attrition.
2. amorphous carbon in TEM.
3. The amount of carbon deposited increased with increasing temperature. The deposition rate was proportional to temperature.
4. TGA results show that weight gain continues at reaction temperatures below 275OC. The continued weight gain implies continued carbon deposition which could lead to eventual breakdown of the agglomerate into individual crystallites.
5. The diffraction pattern of the catalyst after reaction showed both a carbide and oxide phase. The diffraction pattern did not depend upon the pretreatment gas used.
ACKNOWLEDGMENTS The authors would like to thank Dr. Abhaya Datye and his students, Dinesh Kalakkad and Mehul Shroff, of the University of New Mexico for the TEM and SEM work. This work performed at Sandia National Laboratories, which is, funded by the U.S. Department of Energy under contract
Pretreatment in CO followed by synthesis gas at 300°C showed the thickest layer of
DE-AC04-94AL85000.
1123

r'
SAMPLE NUMBER NUMBER MASS DISTRIBUTION DISTRIBUTION DISTRIBUTION
MEDIAN MODAL MEDIAN
CATALYST 0.37 pm 0.31 pn 7.91 pm DIAMETER DIAMETER DIAMETER
MASS DISTRIBUTION
MODAL DIAMETER
28.85 pm A
CATALYST B
CATALYST
Table 1 - Particle size analysis of iron oxide catalysts
0.32 pn 0.20 pm 22.22 pm 30.93 pn
NOT 1 0 . 0 ~ . 10.24 lull 21.94 pn
250T 275°C 300°C
MONOXIDE
Table 2 - Rate of catalyst weight gain during reaction in synthesis gas at 270°C. Weight gain was measured by thermal gravimetric analysis after pretreatment in either hydrogen or carbon monoxide at 250"C, 275"C, o r 300°C.
Figure 1 - SEM shows that the surface of the iron catalyst consists of agglomerated smaller, angular crystallites, which are particularly susceptible to attrition.
1124

6. E. Iglesia, S. Soled, R. Fiato and G: Via, L Catal., 1993, 143, 345.
CAT NO/RUN NO SUPPORT METALS, wT%, AAS Co Mn Zr Ru
SA1/PV' ----
1. mz/g 2. cdg
UNION CARBIDE165 - 8.3 1.3
6827-81/97 58210.56 17.6 2.0
6827-1601110 561/0.54 26.8 2.3
6827-1611123 58810.55 28.7 1.8
FIGURE 2
PERFORMANCE OF THE REFERENCE TO A HIGH COBALT CATALYST
1.0 - 1.6 1.0
1.0 0.4
1.1 -
RUNNO. LOADING MAXT CATIQUARTZ, 'C
65 131160 213
9.1 131160 222
g
FIGURE 3
CATALYm BED TEMPEIWTURE PROFILES DURING RUN 97
CO COW, SELEC, MOL % I
CI cz CZ'
40 7 0.6 0
72 13 1.8 0.1
2 a o " ' " " " " ' " " " - 4 4 - 2 - 1 0 1 2 9 4 6 6 I 8 D l 0 1 1 1 2 1 1
Inches - 6 t h + 48th * 84Hm IC 12OHm
1125

ULTRAFINE PARTICLES OF IRON IN FISCHER-TROPSCH SYNTHESIS
Devinder Mahajari and Kaumudi Pandya
Brookhaven National laboratory Upton, NY 11973-5000
Department of Applied Science, Building 815
Keywords: Fischer-Tropsch, Catalysis, Ultrafine Particles
INTRODUCTION Though direct combustion of natural gas is the most efficient use of this abundant, inexpensive, and cleaner fossil fuel, its potential to replace existing less efficient feedstocks f o r downstream processes is enormous. Direct conversion of methane to useful products under mild conditions is an ongoing area of research, and a few reported successes include higher hydrocarbons (Cz-C,) synthesis on Pt at 250'C,' Hg-catalyzed synthesis of methanol at 180'C,z and acetic acid synthesis catalyzed by aqueous RhCIJ at 100'C.3 Since these approaches are in early stages of development, improvements in other known routes are of interest. Fischer-Tropsch (F-T) synthesis is an indirect route to catalytic production of liquid fuels from synthesis gas derived from carbonaceous sources. The process is still uneconomical for widespread use due to low space-time-yield ( S T Y ) , low product selectivity, and catalyst intolerance to sulfur. To address these aspects, a few reports' describe the use of ultrafine particle (UFP) catalysts in slurry-phase F-T synthesis. We recently reported5 that a commercially available unsupported UFP Fez03 material (NANOCATN) (Mean particle diameter (MPD) - 3 nm; surface area (SA) .. 255 mz/g) slurried in a C30 hydrocarbon solvent, after reduction at 280°C under CO, catalyzed conversion of balanced synthesis gas (H,(CO - 2/1) at 2 220°C and 5 3 MPa. Described below are additional runs carried out to further scrutinize the Fe UFP system.
EXPERIMENTAL
All runs were carried out in a continuous gas flow unit customized to handle F-T synthesis. The core of the unit was'a 1L stirred reactor rated at 40 MPa at 343°C commercially available from Autoclave Engineers (AE). The unit was fitted with a mass flow meter to measure in-flow gas. Before entering the reactor, gas was purified by passing through Scott charcoal and molecular sieve filters. On the reactor head, several gas/liquid ports were provided to allow: 1) inlet gas through a dip tube, 2) catalyst sampling during a run, 3) liquid removal through a 0.5 p filter to avoid catalyst loss. Unreacted gas and volatile products exited the reactor and passed through a heated line to a 0.5 L hoke bomb, maintained at ambient temperature, where almost all of water and higher hydrocarbons condensed. The remaining gas passed through two 1L and 2L tanks maintained at 5°C and -45'C respectively. The dry gas was vented in a fume hood after passing through a dry test meter.
Analvsis Gases (Hz, CO, COz) were analyzed in the TCD mode under an argon flow on a Gow Mac 580 gas chromatograph fitted with a Poropak R column. Gaseous and liquid hydrocarbons were analyzed in the FID mode under a helium flow on a Perkin Elmer 8500 gas chromatograph fitted with an alumina column, whereas oxygenates in aqueous phase were analyzed in the TCD mode on a Poropak Q column.
UnitDescriDtion
1126

Materials Samples of NANOCAT' (a-Fe,O,; mean particle diameter (MPD) - 3 nm; surface area (SA) - 255 mZ/g; d (bulk) - 0 . 0 5 g/mL), from MACH-1, Inc., Ethylflopolyolefin-164 solvent, a dec-1-ene homopolymer (composition: 84.4% trimer, 14.5% tetramer; b.pt. - 518'C; d - 0.818 g/mL; mol. wt. - 437) from Ethyl Corporation, and UCI catalyst (Fe,O, - 69.6, KzO - 5.1, SiO, - 8.3, Cuo - 2.6, loss on ignition (LOI) - 14.8, all in wt%; MPD - 32.5 pm; SA - 232 m2/g from Air Products and Chemicals, Inc. were obtained. Gases were purchased from Scott Specialty Cases.
Catalvst Reduction A 4.6 wt% NANOCAT' in 330 g ethylflopolyolefin-164 solvent was loaded under argon into the 1L AE reactor. The vessel was flushed twice with 0 . 6 MPa CO before pressurizing to 1.43 MPa. The slurry temperature was slowly raised to 28O'C under a 0.2 L/min CO flow. The CO, concentration in the exit gas maximized to 4.3 vol% in 5 hours and then decreased to 0.3 vol% at 24 hours. At this time, the catalyst was assumed to be > 95% carbided. A similar CO, evolution profile was obtained with the UCI catalyst except that the CO, maximum was attained in about 2 hours. A freshly reduced catalyst was used in each run.
F-T Svnthesis After catalyst reduction, the temperature was lowered to a desired value, CO replaced with preblended syngas, and the reactor maintained at a set pressure. Typical reaction conditions were: P - 2.77 MPa; syngas: H,/CO - 65%/35%; gas hourly space velocity (GHSV) - 5.45-5.75 normal liters (NL).g Fe-'.h''; stirring speed - 250 rpm. RESULTS AND DISCUSSION NANOCATN, an unsupported Fe UFP catalyst with MPD of 3 nm, was of interest in this study. Though this was identified as a-FezO, by the manufacturer, a recent EXAFS/XANES study6 described this material to be iron oxyhydroxide (FeOOH.xHzO) with surface iron ions having tetrahedral symmetry and water molecules adsorbed on the surface. For data comparison, the UCI catalyst was selected. This supported material contained about 11,000 times larger particles (MPD - 32.5~ m) of a-Fe,O,. For the F-T reaction described here, a low (4.6 wt%) catalyst loading was selected to avoid mass transfer problems at low gas feed rates used. The precursor materials were initially reduced with CO at 280°C to generate the iron carbide phase.7 A time profile of COz in the exit gas indicated that reduction beyond 24 hours w a s unnecessary. Since nature of the pretreatment has a profound effect on catalyst performance,7 the same reduction procedure was used in all the runs.
Since the commercial F-T synthesis is carried out at T > 260'C,7 performance of the subject catalysts was initially evaluated at 260°C. After the F-T reaction was initiated, CO and H, conversions quickly maximized at 91 and 62% respectively. These values dropped to 61 and 52% at 50 hours and then slowly to 44 and 43% at 200 hours. Two subsequent runs at 240" and 220°C showed similar behavior. At 240'C, CO and H, conversions were 89, 35, 35% and 62, 38, 32% at 1, 50, 120 hours. At 22O'C, the values were 61, 37, 36% and 49, 27, 25% at 5, 50, 200 hours respectively. Since no non-volatile liquid was drained from the reactor during these runs, a decrease in conversion values observed during steady- state (50-200 h) can be attributed to a steady increase in the liquid volume though any contribution from catalyst deactivation cannot be ruled out. The corresponding H2/C0 consumption ratio increased for runs at 260'C
1127

(1.26 (1 h) to 1.81 (200 h)) and 240'C (1.40 (1 h) to 1.87 (120 h)) with time but decreased from 1.45 (5 h) to 1.22 (200 h) at 220'C.
In Table 1, volumetric yield of hydrocarbons produced and CO conversion values are compared as a function of temperature. Though CO conversion increased with Fe UFP with temperature (37.1 and 54.6% at 220 and 260'C respectively), this change was more dramatic with the UCI reference catalyst where the corresponding values changed from 7 to 68.8%. But as shown in Figure 1, any temperature-related increase in CO consumption translated into concomitant increase in hydrocarbons as well as COz concentrations. With Fe UFP, a 17.5% increase in CO consumption shifted the overall product selectivity by a 30.7 wt% decrease in hydrocarbons but a 30.8 wt% increase in C02 (Figure 1). With UCI, a 61.8% increase in CO consumption (Table 1) resulted in product selectivity of hydrocarbons and CO2 changing from 34.3 to 28.8 wt% and 20.3 to 46 wt% respectively. The volumetric yield values showed about 50% increase for Fe UFP but a factor of three for UCI both for C,-C, and C5+ products (Table 1).
The effect of temperature on hydrocarbon distribution resulting from Fe UFP catalyzed F-T reaction is shown in Table 2 . The C11+ fraction decreased with temperature whereas the C5-ClO and C2-C, fractions showed an increase. CH, increased from 10.5 to 17.3 w t % at 220 to 240'C but then decreased to 15.9 wt% at 260°C.
The hydrocarbon product distribution data were used to yield Schulz-Flory plots and u (probability of hydrocarbon chain growth) was calculated from the slope. The u values were 0.56, 0.57, 0.65 (Fe UFP) and 0.53, 0.58, 0.64 (UCI) at 220, 240, 260°C.
In Figure 1, as plotted, the aqueous phase values included oxygenates (5.7, 10.1, 6.0 wt% at 220, 240 260°C). Also, as already reported,5 the C02 data at 220'C are of interest. During this run, the total C02 generated decreased from a high of 23.9% (at 7 h) to 1.44% in 120 hours. Thereafter, no CO, was detected in the product stream suggesting no water- gas-shift (WGS) activity. Incidentally, WGS activity could be restored by raising the temperature. A recente technology review of slurry-phase F-T synthesis with CO-rich synthesis gas suggests the following equation to calculate temperature (T.K) dependence of the equilibrium constant (Keq) for the WGS reaction:
Keq - 0.0132 exp (4578/T) (1)
From the presented data of the Fe UFP and UCI systems, some preliminary conclusions are noteworthy. Since the unsupported UFP system permitted a higher iron loading, volumetric efficiency was higher with this system but showed a less dramatic decrease with decreasing temperature. The 220'c data of Fe UFP is of particular interest because the absence of WCS activity was demonstrated with balanced gas. Moreover, the Fe UFP system appeared more stable at 220'C since CO conversion declined less sharply (37 to 36%) compared to that at 260'C (61 to 44%) in 150 hours. Since particle aggregation is a function of temperature ,' this phenomenon may explain an overall better performance exhibited by Fe UFP at lower temperatures. FXAFS and Mossbauer data of the final Fe UFP catalyst from the 260'C run showed iron to be in the magnetite phase. Similar and other relevant studies are presently being carried out on these systems and will be the subject of a forthcoming publication.8
1128

ACKNOWLEDGEMENT The authors thank the US Department of Energy (under Contract No. DE-ACOS- 76CH00016) for financial support through the Pittsburgh Energy Technology Center (PETC).
REFERENCES 1. M. Belgued, P. Parja. A. Amariglio, and H. Amariglio. Nature 352 789-
2 . R. A. Periana, D. J. Taube, E. R. Evitt, D. G . Laffler, P. R. Wentrcek,
3. M. Lin and A. Sen. Nature 368 613-5 (1994). 4. E. Kikuchi and H. Itoh, in Methane Conversion, ed. D. M. Bibby. C. D.
Chang, R. F. Howe, and S . Yurchak. Elsevier Science Publishers B.V., Amsterdam, The Netherlands, 1988, 517; H. Itoh and E. Kikuchi. Appl. Catal. 67 1 (1990).
5. D. Mahajan, A. Kobayashi. and N. Gupta. J. Chem. SOC. Chem. Commun. 795-6 (1994).
6. J. Zhao, F. E. Huggins, 2 . Feng, F. Lu, N. Shah, and G . P. Huffman. J. Catal. 143 499-509 (1993).
7 M. E. Dry, in CATlLLYSIS - Science and Technology, ed. J. R. Anderson and M. Boudart, Springer-Verlag, Berlin, Heidelberg, 1981, vol. 1, chapter 4.
8. V. U. S . Rao, G . J. Stiegel. G . J. Cinquegrane, and R. D. Srivastava. Fuel Process. Tech. 30 83-107 (1992).
9. D. Mahajan, A. Kobayashi. and K. Pandya. Manuscript in preparation,
90 (1991).
G . Voss, and T. Masuda. Science 259 340-3 (1993).
Table 1. temperature during Fe UFP' and UCI' catalyzed F-T synthesis.b
Volumetric yields and CO conversion as a function of
T. 'C 220 24OC 260
m CO conversion, % 37.1 40.8 54.6
Volumetric yield, kg.Lcat-'.h-' C1-C4 0.008 0.009 0.012 c5i 0.004 0.005 0.006
VCI
CO conversion, % 7.0 27.0 68.8
Volumetric yield, kg. kat-'. h-' c1-c4 0.003 0,005 0,008 c5i 0.002 0.004 0.006
'Catalysts were prereduced under 1.43 MPa CO at 280°C for 24 h. bTypical F-T conditions were: 4.6 wt% catalyst slurried in 330 g ethylflopolyolefin-164; P - 2.77 MPa; syngas: 65% H2/35% CO; stirring speed - 250 rpm; space velocity - 5.45-5.75 NL.gFe.-' h-'. On-line time - 200 h. 'On-line time = 120 h.
1129
I
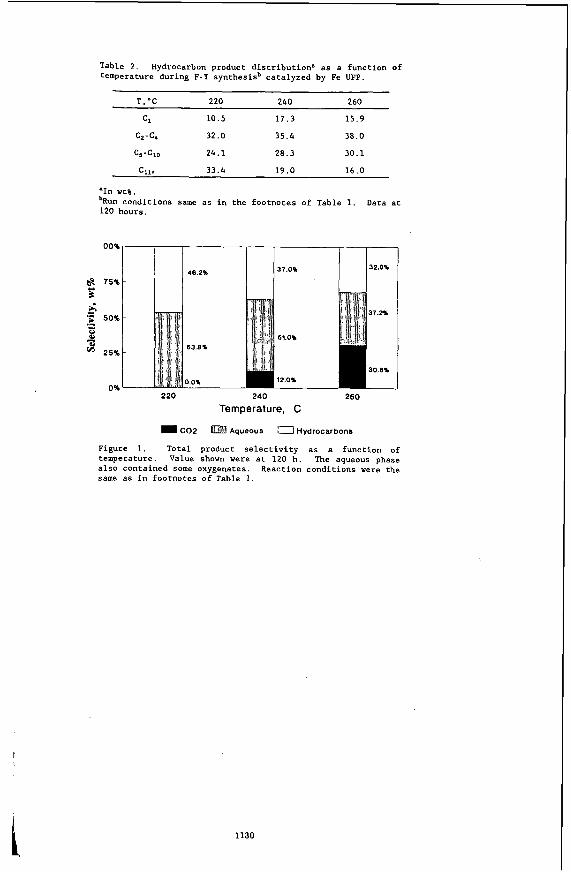
Table 2. Hydrocarbon product distribution' as a function of temperature during F-T synthesisb catalyzed by Fe UFP.
37.02 48.22
T.'C 220 240 260
Cl 10.5 17.3 15.9
c2-cb 32.0 35.4 38.0
c5-c10 24.1 28.3 30.1
32.02
Cll+ 33.4 19.0 16.0
'In wta. bRun conditions same as in the footnotes of Table 1. 120 hours.
Data at
220 240 260
Temperature, C
c02 Aqueous 0 Hydrocarbons
Figure 1. Total product selectivity as a function of temperature. Value shown were at 120 h. The aqueous phase also contained some oxygenates. Reaction conditions were the same as in footnotes of Table 1.
1130

ISOBUTYLENE SYNTHESIS FROM HYDROGEN LEAN SYNGAS IN SLURRY AND TRICKLE BED REACTORS
Can Erkey, Rayford G. Anthony and Aydin Akgerman Chemical Engineering Department
Texas A&M University College Station, TX 77843-3122
Keywords: Isobutylene, syngas, multiphase reactors
INTRODUCTION Due to environmental regulations, new gasoline fomulations will be introduced to the market in the coming decade to reduce automobile exhaust emissions of CO, nitrous oxides and photoreactive unburned hydrocarbons. Addition of oxygenates such as methyl tertiary butyl ether (MTBE) to new formulations is necessary to maintain an acceptable Octane number required for modem automobiles. The production of MTBE is currently limited by the supply of isobutylene. We and other groups have recently reported data on selective formation of isobutylene from hydrogen lean synthesis gas (isosynthesis) in fixed beds over catalysts based on zirconia in the temperature range 573-723 K and the pressure range 0.5 - 100 atm. All the studies in the literature on isosynthesis have been conducted in gas-solid fured bed reactors. Using a three phase gas-oil-catalyst slurry or trickle bed reactor for isosynthesis can have certain advantages. Continuous circulation of the oil phase may enable separation of light components from the heavy components (C5+ which are produced by the reaction) at the gas oil separator. The heavy components can be circulated back to the reactor dissolved in the oil and further converted into light hydrocarbons. The CO/H, ratio in the oil phase may also be quiet different than the COIH, ratio in the feed gas due to the differences in Henry’s Law Constants for hydrogen and carbon monoxide which may affect the product distribution. The reaction can be run in the absence of mass transfer limitations in a slurry reactor. There is evidence in the literature that isosynthesis reactions become controlled by external mass transfer at temperatures above 723 K. Other advantages for the slurry reactor include better temperature control and low capital costs. as opposed to fixed bed reactors. In this study, we report the results of experiments on isosynthesis conducted in a laboratory scale slurry reactor and a trickle bed reactor.
EXPERIMENTAL A schematic diagram of the trickle bed and slurry reactor system is shown in Figure 1. The feed gases are- purified by flow through a guard bed consisting of activated carbon and molecular sieves with particle size of 0.16 cm. Hydrogen and carbon monoxide flowrates are controlled with Brooks model 5850E mass flow meters which have flow ranges of 0-2 and 0-1.5 standard liters per hour, respectively. The flow meters were calibrated by checking the controller set point versus the volumetric flowrate determined by the bubble meter. The feed gas streams are combined at a predetermined COIH, ratio. To enhance mixing, the gases are passed through a bed of glass beads prior to the reactor. Decalin was fed to the unit using a Milton Roy pump. A relief valve, which is set at 106 atm, was placed before the reactor to prevent uncontrolled pressure rises in the system.
The trickle bed reactor is a 316 stainless steel tube, 25 cm long, 0.96 cm ID, and 1.2 cm OD. It was mounted vertically in a bed of aluminum pellets. The reactor is divided into three sections. Prior to and after the 7 cm catalyst bed are 6 and 12 cm supporting sections filled with 0.2 cm diameter glass beads. The reactor was heated by the heating block and controlled by a Omega model 6100 temperature controller. A thermocouple inserted through the middle of the catalyst bed was used to measure the temperature of the bed.
The slurry reactor was a stirred 100 cm3 Autoclave model EZ seal with six ports and one themowell. The feed was introduced to the bottom of the reactor through a dip tube. A 50 micron porous metal filter was connected to the effluent port to prevent the entrainment of mtalyst particles. A baffle bar and impeller were connected to the stainless steel reactor cover. The impeller was driven by a Magnadrive I1 stirrer. Cooling water was passed through the Magnadrive assembly to keep the temperature of the assembly in the permissible range. The reactor was heated using a furnace supplied by the manufacturer which was controlled by a Themolyne Furnatrol I furnace controller.
1131

1. carbon monoxide cylinder 5. mass tlav controller 2. hy4mgcn cylinder 6. mass tlw controller 9. heating elcmcnt 3. activated carbon trap 1. @as$ beads mixer 4. actinted carbon trao
8. trickle bed reactor
10. autoclave reactor 11. heating element 12. back pressure regulator 13. separator 14. oil circulation pump IS. soap bubble meter
11 r
sample ? The reactor pressure was maintained with a Grove model 91W back pressure regulator. The reactor effluent passed through the back pressure regulator where the pressure was reduced to atmospheric pressure prior to the gas oil separator. The decalin collected at the bottom of the separator was recycled to the reactor. After the gas oil separator a sampling port was used to take gas samples for analysis. The effluent gas was passed through a soap bubble meter to measure the volumetric flow rate before it was vented to a fume hood. The decalin used in this study was obtained from Sigma Chemical and exists as cis and rruns isomers of decahydronaphthalene with a minimum purity of 98 46 as determined by gas chromatography.
RESULTS AND DISCUSSION
Slurry reactor
Zirconia was synthesized in the laboratory by precipitation. It had a surface area of 92 dig. Figure 2 shows a comparison of the hydmarbon product distributions for the sluny and fixed bed reactors. The comparisons have been made at similar space velocities and similar conversions. Although the CO conversion is lower for the slurry reactor at a fixed space velocity, the selectivities to light hydrocarbon products are higher at equal conversions, and less C5+ products are produced. This is due the fact that some of the heavier C,+ products formed during the reaction are circulated back to the reactor in the oil and further crack to lighter hydrocarbons. The lower CO conversion for the slurry reactor at equal space velocity can be entirely accounted by lower performance of a CSTR as opposed to a PFR. As seen in Figure 3, changes were observed in the distribution of C, products. Figure 4 shows the comparison of product distribution for different CO/H, ratios.
The mass transfer resistances were calculated based on the data. Gas bubble to liquid mass transfer coefficients were calculated using the Calderbank and Moo-Young correlation and liquid to particle mass transfer coefficients were calculated using various correlations in the literature. These resistances were found to be negligible. The effectiveness factors were found to be very close to unity. Therefore, it is believed that the reactions were run in the kinetically controlled regime in the absence of any mass transfer limitations.
1132

slurry reactor, 60 atm, 1050hr 40 CO conversion=13.0%
2 0 fixed bed. 70 ntm. 24801hr CO conveainn=13.0%
OLi 'g 30 n L 20 3 e x 10
5
0
.e
0 c1 c 2 c 3 c 4 CS+
Flare 2. Hydrocarbon product distributions in fixed bed and slurry reactors at 400 "C.
fixed bed, 50 atm, 900hr CO aovenion=25.0%
isobutane n-butane I-butene isobutylene t-2-butene e-2-butene
Figure 3. C,+ product distributions in fixed bed and slurry reactors at 400 "C.
-" I
0 CO/H2=2.0
IN CO/H2-1.0
CO conversion-13.3%
CO conversion=13.0%
20
2 15 2 L g 10
5
0 c 1 c2 c 3 c 4 c 5 +
-re 4. Effect of CO/H, ratio on hydrocarbon product distribution at 400 "C.
1133

Trickle bed reactor:
Experiments using the trickle bed reactor were conducted with commercial zirconia with a surface area of 52 m2/g. A comparison of the performance of the catalyst when operating the reactor in the fixed and trickle bed modes at 669 K and 51 atm is shown in Figures 5 and 6. The selectivity for isobutylene and the C, components was higher when operating the reactor as a conventional gas phase. fixed bed reactor than when operating the reactor as a trickle bed. The CO conversion was approximately the same for both modes of operation. The product distribution obtained with the trickle bed contains more (2,’s , C4’s and methane and less C5+ than the product distribution obtained when operating in the gas phase fixed bed reactor mode. A greater amount of propylene is produced in the trickle bed than with the fixed bed gas phase reactor. As shown in Figure 7, oil flow rates were. shown to have minor effects on the product distribution. Figure 8 shows that as oil flow rate increases, a slight decrease in CO conversion is observed. This may be due to the decrease of the residence time of the gas through the reactor.
0 Rred bed, CO Conv.-IO.O%
trickle bed. 0.8 kplm2s.
1 2 3
4.9
4 5
Carbon Number
Figure 5. Comparison of hydrocarbon product distribution for fixed and trickle bed reactors at 669 K, 51 atm, 111 CO/H2 ratio and 89 seconds space time.
i-butane n-butane 1-butene i-butene t-2-butene c-2-butene
Figure 6. Comparison of C, distribution for fixed and trickle bed reactors at 669 K, 51 atm, 111 CO/H2 ratio and 89 seconds space time.
1134

35
30
25
20
2 15 s
v)
e .c:
; 10
5
0 c 1 c2 c 3 CJ c 5
Figure 7. Change in hydrocarbon distribution with oil flowrate at 669 K, 51 atm, 1/1 CO/H, ratio and 668 (Uhr) space velocity.
10 ,
0 0.5 1 1.5 2 2.5 3 Oil Flownte (kglrnts)
Figure 8. Variation of CO conversion with oil flow rate in the trickle bed reactor at 669 K, 51 atm, 1/1 COIH, ratio and 668 (Ilhr) space velocity.
1135

The Selective Pathway to Higher Oxygenates from CO, Hz, Olefins, and Chlorocarbons
Raja I(rishnamurthy, Steven S. C. Chuang', Mark A. Brundage and Michael W. Balakos Department of Chemical Engineering,
The University of h n , Akron, OH 44325-3906, U.S.A.
Keywords:
The synthesis of higher oxygenates from CO hydrogenation, ethylene addition and methylene chloride addition to syngas has been studied over RNSiO2 catalyst The insertion of linear CO into the adsorbed alkyl intermediates is the key step in the formation of higher oxygenates. Pulse transient technique incorporated with in situ infrared (IR) technique reveals that hydrogenation of acyl species is the rate limiting step for propionaldehyde formation. Increasing total pressure increases the residence time of alkyl intermediates for CO insertion.
CO insertion, Oxygenates, Reaction pathway, Transient kinetics.
INTRODUCTION
The synthesis of higher oxygenates from CO and related reactions involves a number of elementary steps: (i) the formation of alkyl intermediates, (i) the insertion of linear CO into the adsorbed alkyl intermediates to form acyl intermediates, and (iii) hydrogenation of the acyl intermediates (1-3). Figure 1 shows the possible reaction pathway for the formation of alkyl intermediates. Alkyl intermediates can be formed from (i) CO dissociation and hydrogenation in the CO and H2 reaction (4.5). (ii) partial hydrogenation of an olefin, such as ethylene, in the CO/H2/Olefur reaction (6). and (iu) dehalogenation of chloromethanes in the CO/H~CHxC~.x reaction (7).
The selectivity towards oxygenates depends on the ratio of hydrogenation rate to the CO insertion rate. Design of a selective catalyst for C2+ oxygenate synthesis requires an understanding of the reactivity of alkyl group towards hydrogenation and CO insertion reaction steps. This paper reports the use. of in situ IR and dynamic approach to study the nature of active sites and elementary steps involved in the higher oxygenate synthesis from CO/H2 and CO/H2/C2H4 reactions (8).
EXPERIMENTAL
st Preuaration and Characterization ?%% RhlSiO2 catalyst was prepared from RhC13.3H20 solution by incipient wetness impregnation method. After impregnation the catalyst was dried overnight in air at 300 K and then reduced in flowing hydrogen at 673 K for 16 hr. The exposed metal atoms was determined to be 244 pnoVg by H2 pulse. chemisorption at 303 K assuming an adsorption stoichiometry of Hads/Rh = 1.
Reaction Studies CO hydrogenation, ethylene addition, and methylene chloride addition were canied out in a differential reactor system. Space velocities of 11,ooO h * were used to keep the CO conversion below 5% in order to minimize heat and mass uansfer effects and secondary reactions. Methylene chloride was added to the reactant gas mixture by bubbling hydrogen through a saturator filled with cSrzC12 at 273 K. The product dismbution was determined using a HP-5890A gas chromatograph (GC) with a 6 f t Porapak PS column in series with a 6 f t Porapak QS column.
The prepared catalyst was pressed into a self-supporting disk and placed in an lR reactor cell capable of operating up to 723 K and 6.0 MPa. The catalyst was further reduced in situ at 673 K for 1 hr before each experiment. Steady-state flow of CO/H2 was admitted to the reactor. A 6-port GC
Author to whom correspondence should be addressed
1136
sampling valve was used to inject 10 c d of isotopic species into the steady-state CO flow which created a positive W O pulse and a negative 1wO pulse with symmetry as shown in Fig 2 (a). The symmemc response indicates that 12CO was replaced by 13CO at a 1 to 1 ratio and total C o (%O and 13CO) flow was maintained at steady-state. It should be noted that proper balancing of l3C0 pressure in the sampling loo and the 1zCO flow line is essential for maintaining steady-state flow conditions. The reactant &O gas contains 2% AI which is used to determine the effect of gas holdup in the reactor and the transportation lines on the transient response of gaseous products (Fig 2). Main components in the effluent of the IR cell were monitored by a mass spectrometer (MS). The change in the IR spectra of adsorbed species with time during the l3CO pulse was monitored by an FTIR spectrometer. The composition of the product gas was determined by the gas chromatograph.
RESULTS AND DISCUSSION
CO hydrogenation over RNSi02 produced methane as major product and C2-C5 hydrocarbons as minor products in the temperature range oP473 - 573 K and 0.1 MPa. No oxygenated product was produced at 0.1 MPa. Increasing reaction pressure to 0.4 MPa led to the formation of acetaldehyde. The higher oxygenate selectivity increases with reaction pressure (8). The effect of reaction pressure on oxygenate selectivity was studied by steady-state isotopic pulse transient. Residence time of reactants in the reactor cell for the 0.4 MPa runs was kept the same as for the0.l h4Pa runs by increasing the total flow rate from 60 cm3/min to 240 cm3/min.
The responses of 13CH4 and CH313CHO to 13CO pulse at 0.1 MPa and 0.4 MPa are shown in Figure 2 (a) and (b). The residence time, 2, of intermediate to products is determined by the following equation (9)
z for methane was determined to be 0.14 and 0.54 min for CO hydrogenation at 0.1 MPa and 0.4 MPa, respectively. Increasing reaction pressure increased the z for CH4 suggesting that CH, for hydrogenation stays on the surface longer at high pressure than at low pressure. z for CH-jCHO is smaller than that for CHq at 0.4 MPa. Formation of acetaldehyde at high reaction pressure can be explained by the increase in residence time of CHx intermediates at high CO/H2 pressure allowing CO insertion to occur.
An alternate approach to increase Cz oxygenate selectivity is to increase the surface concenuation of alkyl intermediates. Addition of CHzClz to Cob42 has been found to result in the formation of acetaldehyde on Rh/SioZ and Ni/SiOz at 0.1 MPa (10.11). Increasing methyl concentration accelerates the rate of CO insertion resulting in the formation of Cz oxygenates. Such a process even occurs on Ni/SiOz, which exhibits little CO insertion activity during CO hydrogenation. Increasing ethyl intermediate concentration by the addition of ethylene to CO/Hz over Ni/Si% can also lead to the formation of propionaldehyde, the product of CO insemon (12). The mechanism of the formation of propionaldehyde from CO/H2/C2H4 was further studied by isotopic pulse transient technique over WSiO2.
Figure 3 shows a response of a 10 cm3 pulse of 13C0 into 12CO/Ar flow at 0.1 MPa and 503 K durin the CO/H2/C2H4 reaction. The figure shows the transient response for Ar, 12W. W O , and CzH5hHO. The symmetrical nature of the 1zCO and W O response indicates that the species displaced each other and the total concentration of CO. isotopic and non-isotopic, remained the same during the pulse. Steady-state reaction conditions were maintained during the isotopic pulse transient study. The lag time between the argon and the CO response is due to the interaction of the as phase CO with the adsorbed CO. Le., adsorption and desorption effects. The time delay in the
!3C propionaldehyde response corresponds to the residence time of the 130 surface intermediates leading to the formation of propionaldehyde. Modeling results reveal that the hydrogenation of the acyl intermediate is the ratedetermining step for the formation of propionaldehyde (13).
1137

CONCLUSION
The higher oxygenate formation on Rh catalysts involve a key CO insertion step. The linearly adsorkd CO is inserted into the adsorbed hydrocarbon intermediate formed from reaction of chlonnated hydrocarbons and ethylene and CO hydrogenation. Hydrogenation of the acyl intermediate is the rate-determining step for the formation of propionaldehyde from COjHdCzH4. The higher oxygenates selectivity can be increased by increasing reaction pressure during CO hydrogenation, and addition of CHzClz and CzH4.
REFERENCES
1. 2. 3. 4. 5. 6. 7. 8. 9.
Chuang, S. C., Tian, Y. H., and Goodwin, J. G.. Jr., J. Catal., 96.449 (1985). Chuang, S. S. C., and Pien, S. I., J. Catal., 138,536 (1992). Chuang, S. S. C., Pien, S. I., and Narayanan, R., Appl. Cad., 57,241 (1990). Bell. A. T., Catal. Rev. Sci. Eng., 23,203 (1981). Biloen. P.. and Sachtler. W. M. H.. Adv. Catal.. 30.165 (1981). Chuang, S . S. C., and Pien. S. I., J.'Catal.. 135.618 (1992). van Bameveld, W. A. A,, Ph. D. Thesis, University of Leiden, Netherlands, 1985. Chuang, S. C., Goodwin. J. G.. Jr., and Wender. I., J. Catal., 95,435 (1985). Srinivas, G., Chuang, S. S. C., and Debnath, S., J. Catal., in press.
10. Srinivas, G.. M. S. Thesis, The University of Akron, Akron, 1991. 11. Balakos, M. W., Chuang, S. S. C.. Krishnamunhy, R., and Srinivas, G.. Proceedings of the
10th International Congress on Catalysis. Part B, (L. Guczi, F. Solymosi, and P. Tetenyi, Eds.), Elsevier Science Publishers, Amsterdam, p. 1467, 1993.
12. Chuang, S. S. C., and Pien, S. I., Catal. Lett., 6,389 (1990). 13. Balakos, M. W., and Chuang, S. S. C., J. Catal. (submitted).
'
I
1138

6
0
co - -c1 YCH4 *%8:3 'H *H + C H g H O 4 C$@H C H E l 2 L *CHx t
y * H . c H 4
co - c
Figure 1. Proposed reaction pathway for syngas related reactions.
I I 0 1 2 3 4
10
8
2 d e = 17 (I3CH ,)
0 1 2 3 4
Time (min) Time (min) Figure 2. MS response to 13C0 pulse in COIH2 on Rh(Cl)/Si@ at 543 K and (a) 0.1 MPa and
(b) 0.4 MPa
1139

1.5
1
0
-0.5 0
0.1 m a , 503 K f l
1 2 3 4 5 Time (mid
Figure 3. Transient response. of Ar, 13CO, and Cfi513CHO to a pulse of 1x0 in 12CO flow during ethylene hydroformylation on 4 wt% Rh/SiOz at 503 K and 0.1 MPa
1140

ISOBUTANOL COUPLING WITH -0L AND METHANOL TO ETHERS OVER SULFONATED RESIN CATALYSTS: ACTMTIES AND SELECI'MTES
Richard G. Herman, Kamil Klier, Owen C. Feeley, Marie A. Johansson, Qun Sun, and Luca Lietti
Zettlemoyer Center for Surface Studies and Department of Chemistry 7 h a Drive, LEHIGH UNIVERSITY, Bethlehem, PA 18015
Keywords: Alcohols, Ethers, Resin Catalysts
AWrRAcT
The synthesis of Cs-CB ethers from mixtures of C&, alcohols over strong acid Amberlyst resin catalysts has been initiated, and the overall activity pattern of the resins was found to be Amberlyst-35 > Amherlyst-36 > Amberlyst-15 > Amberlyst-1010, all of which were more active than Nafion-H. With methanol/isobutanol reactants, it was observed that increasing the reaction pressure strongly decreased the space time yield and selectivity of the butenes, principally isobutene, while tending to increase the space time yield of the ethers methylisobutylether (MIBE), methyl tertiarybutyl ether (MTBE), and dimethylether (DME). Other reactant mixtures utilized at high flow rates included ethanol/isobutanol, where EIBE and ETBE were products. Upon increasing the isobutanol/ethanol ratio above 1/1, it was shown that diethylether (DEE) formation decreased but the synthesis of tertiarybutyl isobutylether (TBIBE) increased. A reactant mixture of ethanol/isopropanol was also investigated, and dehydration of the isopropanol readily occurred to form propene and coupling gave diisoproplyether (DIPE) as the dominant product at 90°C.
INTRODUCTION
The objective of this research program is to explore new pathways for synthesizing high value oxygenates, e.g. fuel-grade ethers, from non-petroleum feedstocks. In particular, the development of catalysts and processes for converting alcohols produced from coal- or natural gas-derived Hz/CO/COZ synthesis gas is being pursued. Alkali-doped Cu/ZnO- based catalysts produce a mixture of alcohols from HJCO, and this mixture consists principally of methanol and isobutanol [l-61. The synthesis of ethers from these two alcohols has been shown to occur by the direct coupling of methanol and isobutanol over strong acid catalysts, and the observed dominant products were MIBE at moderate pressures anda mixture of methanol and isobutene at low pressures [7,8]. This research has now been extended to ethers containing the ethyl and isopropyl groups instead of the methyl moiety.
EXPERIMENTAL
The Amberlyst solid acid resin catalysts, designated as Amberlyst-15, -35, -36, and - 1010, were obtained from Rohm and Haas. These catalysts have similar polymeric structures, hut the Amherlyst-35 and -36 resins are more thermally stable (up to =14OoC) and have higher acidity (5.2 and 5.4 meq/g dry, respectively) than the commonly utilized Amberlyst-15 resin (4.7 meq/g dry), while the Amberlyst-1010 has a much higher surface area (e540 m2/g), smaller average pore size (5 nm rather than 20-30 nm), and lower concentration of acid sites (3.3 meq/g dry). Aqueous ion exchange titrations here with 0.5 NaOH confirmed the number of acid sites as stated by the manufacturer. The swelling properties of the dried (to 90°C) resins in water and in methanol were also determined, and it was observed that the Amberlyst-15, -35, and -36 resins swelled 42-58%, while the Amberlyst-1010 swelled 22-25% (the two liquids induced similar swelling behavior).
The catalysts were subjected to a standard test for ether synthesis in a downflow stainless steel bench-scale reactor system that is automated for continuous operation, as previously described [9,10]. The alcohols were injected at the top of the reactor in a preheated zone by means of a high pressure Gilson pump and an lSC0 piston pump provided by Air Products and Chemicals, Inc. The carrier gas consisted of He containing 18.5% of N,. The conversion and product composition were monitored by continual sampling of the exit stream by GC analysis using in-line, heated, automated Valco sampling values [lo]. The initial experimental conditions are as follows:
Catalyst weight 5.0 g dry resin Methanol feed 1.72 mol/kg cat/hr Temperature 90°C Isobutanol feed 1.72 mol/kg cat/hr Total pressure 1 atm (0.1 MPa) He/N, carrier 16 mol/kg cat/hr
1141

RESULTS
Activities and Selectivities of the Amber lvst Cata I-. Testing of the catalysts was carried out under steady state conditions at each temperature, and the data were tabulated as averages during 3-15 hr runs for each set of reaction parameters. Comparison of the conversions of the alcohols at 90°C is made in Table 1. Upon increasing the reaction temperature sequentially in 10°C increments to 130"C, the activity increased with each catalyst. Since the Amberlyst-35 resin was the most active catalyst, the stability of the catalyst was investigated. Table 2 shows that no deactivation was observed during this 50 hr test, and, therefore, testing at 130°C did not cause destruction nor fouling of the resin.
Selectivity data were compiled for all catalytic tests, but only those for the Amberlyst-35 catalyst will be presented here. Under the reaction conditions employed, the catalysts were generally rather non-selective, especially at the lower temperatures. The Amberlyst-1010 tended to exhibit higher selectivity toward DME than did the other Amberlyst resins. As shown in Figure 1, Amberlyst-35 mainly formed butenes at 9O-llO0C, but at 120°C and above DME was predominantly formed.
Pressure Deuendence Studv of Amberlvst-35. The reaction of methanol and isobutanol over a Nafion-H catalyst has previously been shown to be very sensitive to the total pressure [7,8]. To investigate the pressure dependence of the synthesis reaction over Amberlyst-type catalysts, the active Amberlyst-35 resin was chosen. The total reaction pressure was varying while maintaining a constant reactant flow rate. The experiment was carried out using the following conditions:
Catalyst weight 1.0 g dry catalyst Methanol feed 10.4 mol/kg cat/hr Temperature 90 and 117°C Isobutanol feed 5.2 mol/kg cat/hr Total pressure at He + N, 185 mol/kg cat/hr
90°C 0-79 psig (0.1-0.64 MPa) 117°C 0-180 psig (0.1-1.3 MPa)
Similar trends in selectivities were observed for the two reaction temperatures, and demonstrated that the formation of butenes (generally 4 5 % of the butenes consisted of isobutene) was very sensitive to the alcohol partial pressure, e.g. Figure 2. Thus, a small elevation of the alcohol pressure suppressed the formation of butenes rather drastically, while the synthesis rates of DME, MIBE, and MTBE ethers were affected much less significantly, although there was a trend to increase the space time yield of these ethers as the alcohol pressure was increased.
Coupliny Reactions of Ethanol with Isobutanol and IsoDroDanol. The coupling reactions of ethanol with isobutanol and isopropanol were investigated over the Amberlyst- 35 catalyst at 90°C and 1 MPa under a wide range of conditions; in particular the relatively low conversion levels were usually maintained so that the data could subsequently be incorporated into a kinetic and mechanistic model of ether synthesis over this catalyst. The lower conversion levels were achieved by utilizing high GHSV.
Table 3 shows the conversions and product selectivities from ethanol/isobutanol = 1/1 and 1/3 reactant mixtures at 110°C. The higher level of isobutanol tended to decrease the overall alcohol conversion and the selectivity toward DEE. However, it significantly increased the selectivity toward the formation of TBIBE. Decreasing the ethanol/isobutanol ratio to 1/5 and the temperature to 100°C decreased the reaction rates even more but increased the selectivity to TBIBE, as well as of the isobutene (Table 4). For comparison, the data obtained for the methanol/isobutanol reaction at 110°C are shown in Table 5. Similar selectivity trends are noted by comparing Tables 3 and 5.
Studies have also been carried out with ethanol/isopropanol reactant mixtures at high flow rates, and an example of the data is given in Table 6. It is evident that isopropanol is quite reactive, in particular with respect to dehydration to form propene and DIPE, which has a blending octane number of 105 [lo]. In addition, much more ethylisopropylether (EIPE) than DEE is formed. It is expected that high yields of these ethers could be formed by using much lower gas flow rates.
CONCLUSIONS
The strong acid Amberlyst resins are active for the synthesis of ethers and olefins from mixtures of alcohols. With the exception of Amberlyst-36, the activity of the macro-
1142

reticular Amberlyst catalysts at 90°C correlated with the content of the strong acid sites, with Amberlyst-35 being the most active, and differences in selectivity patterns were observed. With methanol, ether products consisted of DME, MIBE, MTBE, and isobutene.(with ethanol, analogous ethyl products were formed), and it was shown that increasing reaction pressure greatly decreased the selectivity toward isobutene. With ethanol/isobutanol reactants at 1 MPa over Amberlyst-35, tertiarybutylisobutylether (TBIBE) was a significant product, and this ether should have desirable fuel properties. In an experiment with ethanol/isopropanol = 1/1.6 reactants, it was shown that isopropanol was more reactive than ethanol and formed propene and DIPE, as well as EIPE.
ACKNOWLEDGEMENT
This research was partially supported by the U.S. Department of Energy (Pittsburgh Energy Technology Center), in part under Contract No. DE-AC22-90PC90044 and in part as a DOE Subcontract through Air Products and Chemicals, Inc.
R E F E E N C E S
1. Klier, K., Herman, R. G., and Young, C.-W., Preprints, Div. Fuel Chem., ACS, 29(5), 273 (1984).
2. Klier, K., Herman, R. G., Nunan, J. G., Smith, K. J., Bogdan, C. E., Young, C.-W., and Santiesteban, J. G., in “Methane Conversion,” ed. by D. M. Bibby, C. D. Chang, R. F. Howe, and S. Yurchak, Elsevier, Amsterdam, 109 (1988).
3. Nunan, J. G., Bogdan, C. E., Klier, K., Smith, K J., Young, C.-W., and Herman, R. G., J. CutuL, 116, 195 (1989).
4. Nunan, J. G., Herman, R. G., and Klier, IC, J. CatuL, 116,222 (1989). 5. Herman, R. G., in “New Tre& in CO Activufion,” ed. by L. Guczi, Elsevier,
Amsterdam, 265 (1991). 6. Herman, R. G., Klier, K., Young, C.-W., Nunan, J. G., Feeley, 0. C., and Johansson,
M. A., Proc. 9th Intern Pittsbuqh Coal Conference, 409 (1992). 7. Nunan, J., Klier, K, and Herman, R. G., J. Chem. Soc., Chem. Commun (1985) 676. 8. Nunan, J. G., Klier, K., and Herman, R. G., J. Cutul., 139 (1993) 406. 9. Klier, K., Herman, R. G., Johansson, M. A., and Feeley, 0. C., Preprints, Div. Fuel
Cliem., ACS, 37(1), 236 (1992). 10. Herman, R. G., Klier, K., Feeley, 0. C., and Johansson, M. A, Preprints, Div. Fuel
Chem., ACS, 39(2), 343 (1994).
Catalyst
Amberlyst-15
Amberlyst-35
Amberlyst-36
Amberlyst-1010
TABLE 1. Activity of the polymeric resin catalysts at 90°C
~ ~
% Methanol Conversion % Isobutanol Conversion
9.1 10.2
16.4 15.8
12.3 10.2
5.0 4.2
Temperature (“C)
90
100
110
120
130
90
% Methanol Conversion % Isobutanol Conversion
16.4 15.8
32.1 43.9
42.9 63.9
62.0 57.1
70.0 57.9
17.0 15.7
-
1143

TABLE 3. Activity and selectivity for the conversion of ethanol and isobutanol(103/10.4 and I0.3/31.2 mol/kg cat/hr) to products over the Amberlyst-35 catalyst (1 g) at 110°C and 1.1 MPa with total flow rate of 516 mol/kg cat/hr
-- Product Conversion Selectivity (%) Selectivity (%)
(mol%) Based on Ethanol Based on Isobutanol
Ethanol 1.7
EIBE
Isobutene
TBIBE
DIBE
11 Isobutanol I 1.8 I I
78.2 17.1
42.1
29.0
10.0
11 DEE I
Product
Methanol
Isobutanol
I 16.6 I
Conversion Selectivity (%) Selectivity (%) (mol%) Based on Methanol Based on Isobutanol
8.3, 9.8
43. 5.8
MTBE
MIBE
Isobutene
~
3.7, 8.1 63, 4.0
32.4, 53.9 55.7, 26.62
18.2 39.8
TAB= 5. Activity and selectivity for the conversion of methanol and isobutanol(22.8/26.0 and Z6/26.0 mol/kg cat/hr) to products over the Amberlyst-35 catalyst (1 g) at 110°C and 1.1 MPa with total flow rate of 524 mol/kg cat/hr
DIBE ____ ~~~
7.4, 8.6
DME I I 63.9. 38.0 I
TBIBE I I I 12.4. 21.0
1144

TABLE 6. Activity and selectivity for the conversion of ethanol and isopropanol (40/64 mol/kg cat/hr) to products over the Amberlyst-35 catalyst (0.5 g) at 90°C and 1.1 MPa with total flow rate of 596 mol/kg cat/hr
Product Conversion Selectivity (%) Selectivity (%) (mol%) Based on Methanol Based on Isobutanol
Ethanol 1.4
Isopropanol 4.0
DEE 14.4
EIPE 85.6 18.4
Propene 32.1
DIPE 49.5
60 B
504 I
90 100 110 120 130 90 Temperature (C)
40
30
20
10 n
90 100 110 120 130 90 Temperature (C)
FIGURE? 1. The selectivities of the products formed at different temperatures over the Amberlyst-35 resin at 0.1 MPa from a methanol/isobutanol = 1/1 reactant mixture.
DME A Butanes - MTBE IJ MlBE
0.50 l*oo* 0.004 m
h - M
0 10 20 30 40 50 60 70 80 90 100 110 Alcohol Partial Pressure (kPa)
FIGURE 2 Space time yields of the ethers and butenes (mainly isobutene, but also including trans-2-butene and ck-2-butene) formed over the Amberlyst-35 catalyst as a function of the alcohol partial pressure at 117°C (methanol/isobutanol = 2/1) .
1145

SHELL MIDDLE DISTILLATE SYNTHESIS: THE PROCESS, THE PLANT, THE PRODUCTS
I
I Peter J. A. Tijm Shell International Gas Ltd.
Shell Centre, Downstream Building London SEI 7NA. U.K.
Keywords: natural gas conversion. Shell Middle Distillate Synthesis, Fischer-Tropsch
i'
f
INTRODUCTION
The importance of natural gas as a source of energy has increased substantially in recent years and is expected to continue to increase. As a result of the frantic search for oil set off by the oil shocks of the early and late 1970s. many new gas fields were discovered around the world, leading to a dramatic increase in the proven world gas reserves. This growth in gas reserves is still continuing today and despite the low oil prices, the world proven gas reserves have been growing at a rate which is twice the current world natural gas consumption rate. Proven world gas reserves are now approaching those of oil and, on the basis of the current reserves situation and relative depletion rates, natural gas seems to be set to outlast oil.
Notwithstanding the growing importance of natural gas, its main drawback remains its low energy density, which makes its transportation to the point of use expensive and which, in the case of remote gas, may even prohibit its exploration and for development. Liquefaction is a way to overcome this problem and various liquefied natural gas (LNG) projects have already been realized around the world.
Recognizing the growing importance of natural gas, Shell has been looking at other ways of using natural gas profitably, particularly those reserves which are remote from the market. The key elemeht is in the transportation aspect and so cost improvements to conventional pipeline and LNG schemes are being studied However, where such schemes will continue to make an important contribution to the natural gas trade, their end products (natural gas) are by nature confined to markets for natural gas Shell has therefore also been looking at processes that chemically convert natural gas into liquid hydrocarbons. Using such processes not only reduces the transportation costs substantially, but also a much larger market becomes available, especially if these hydrocarbons are transport fuels. Moreover, apart from providing a means to commercialize remote gas reserves, this could also serve to reduce the reliance on oil or oil-product imports and perhaps as important, save on foreign exchange.
The foregoing underlines Shell's strategy in the natural gas business:
I. Bring gas to the market. 2. Bring value to the product.
It has been realized that there are many places in the world where gas is available, without a ready market and where, as a consequence, it would have a much lower intrinsic value compared with transportation fuels. It is this difference in value that would drive a synthetic fuel project and provide opportunities for both government and private enterprises.
The present scene in the field of oil and transportation fuels and the prospects for the near and medium term. however, call for a careful and selective approach to any synfuel development. At current oil prices almost no alternative energy technology can compete with existing refining. On the other hand, the crises of the early seventies and early eighties provided important lessons: emergencies come at relatively short notice, and, because of the lead times usually involved in technological development, in a crisis the answers to problems always come too late.
Next to the synthetic hydrocarbon transportation fuels, a similar role could be perceived for methanol. However, use of methanol as a transport fuel, either as M85 or neat methanol, has considerable drawbacks. These include the required modifications lo fuel distribution systems and lo cadengine fuel systems. Synthetic hydrocarbons, on the other hand, have the advantage that they can be readily incorporated into existing fuels which can be used in existing equipment. In addition, middle distillates manufactured from natural gas have very environmentally friendly properties, upon which we will elaborate in this paper, The cleanliness of natural gas is, as it were, transferred into its products. The middle distillates from SMDS will therefore be extremely well positioned in the market place.
THE PROCESS
The SMDS process consists of three stages:
1. Syngas manufacturing
1146

2. Heavy Paraftin Synthesis (HPS) 3. Heavy Paraffin Conversion (HPC)
The overall process starts with the conversion of natural gas into synthesis gas, for which there are several commercial processes available. For the production of predominantly saturated hydrocarbons, -(CH,)-, the syngas components H, and CO, are consumed in a molar ratio of about 2:1, so a production in about that ratio is desirable. This influences the choice of process, as will be explained below.
The next step of the process, the hydrocarbon synthesis, is, in fact, a modernized version of the classical Fischer-Tropsch (FT) process, with the emphasis on high yields of useful products. The Fischer-Tropsch process developed by Shell for SMDS favors the production of long chain waxy molecules which, as such, are unsuitable for transportation fuels. The hydrocarbon synthesis step is therefore followed by a combined hydro-isomerization and hydrocracking step to produce the desired, lighter products. By opting for the production of waxy molecules in the Fischer-Tropsch step, the amount of unwanted smaller hydrocarbons or gaseous products. produced as by-products, is substantially reduced. This means that the process, contrary to the old 1930s Fisher-Tropsch technology, can be fuel balanced and does not make "gas" out of gas. Combined with the high selectivity towards middle distillates in the hydrocracking step this leads to a very high overall yield of product in the desired range.
In the final stage of the process, the products, mainly kerosene, gas oil and some naphtha, are separated by distillation. By judicious selection of the severity of the hydrocracking reaction and the cut-points, the product slate can be biased towards kerosene or towards gas oil.
Synthesis Gas Manufacture
For the production of synthesis gas in principle two technologies are available, viz., steam reforming and partial oxidation.
Steam Reformins 6MR)
Starting from pure methane, SMR is the most commonly used conversion process, and could theoretically produce a synthesis gas with an HJCO ratio of about 3. However, as a result of the occurring CO - shift, more H, is produced and this ratio will be in the range of 5-7 rather than 3.
Because the H2/CO ratio in the synthesis gas is greater than 2, in the subsequent hydrocarbon synthesis step less hydrogen will be consumed than is produced in the syngas step. This means that steam reforming always results in the production of excess H,. An oflen practiced solution is to bum the surplus hydrogen in the reforming furnace. This means, however, that part of the synthesis gas is used as fuel. Another disadvantage is that the maximum SMR pressure is about 30 bar, while the Fischer-Tropsch reaction is preferably carried out at somewhat higher pressures.
Partial Oxidation
A synthesis gas suitable for the production of middle distillates, with a HJCO ratio of about 2, can be produced by partial oxidation:
2 CH, + 0, --> 2 CO + 4 H,
For partial oxidation with pure oxygen, an excellent eligible process is the Shell Gasification Process (SGP). The question, whether the costs involved with the production of a gas with the wrong H2/CO ratio, as in the case of steam reforming, are not substantially smaller than the cost required for the production of pure oxygen, has been answered in favor of the SGP process combined with modem oxygen technology.
For the Fischer-Tropsch type of catalysts, the synthesis gas must be completely free of sulphur. For this requirement, it has been found to be economical to remove all sulphur components upstream of the partial oxidation step for which, in principle, a number of well- known treating processes are available. In practice, zinc oxide beds are employed, to remove the last traces of sulphur and to act as an absolute safeguard.
The Hydrocarbon Synthesis Step
In the next step, the synthesis gas is converted into long chain, heavy paraffins, and this step is therefore called the Heavy Paraffin Synthesis (HPS) step, the heart of the SMDS process. In this step the reaction mechanism follows the well-known Schultz-Flory polymerization kinetics, which are characterized by the probability of chain growth (a) vs. chain termination (I-a). There is always a regular molecular mass distribution in the total product and a high
1147

alpha, corresponds with a high average molecular molecular mass of the paraffinic product. The Paraffinic hydrocarbons produced via the FT reaction are highly linear. This implies that the Synthesis reaction can be regarded as a stepwise addition of a C1 segment to the end of an existing chain. Since atoms of the alkyl chain remote from the end will hardly be capable of influencing this reaction, it is plausible that the relative probabilities of chain growth and chain termination will be independent of the length of the alkyl chain. The carbon number distribution of the FT product can therefore be described fairly accurately by a simple statistical model with as a single parameter (the Anderson Flory-Schultz [AFS] distribution, the value of being dependent upon the catalyst and reaction conditions. In a few hundred formulations under different operating conditions it was confirmed that the carbon number distributions were in close agreement with the AFS chain growth kinetics discussed above. with values varying between 0.70 and 0.95
The above feature implies, however, that the FT process will yield either large amounts of gaseous hydrocarbons such as methane, or products which have a very wide Carbon number distribution. Theoretically, only methane can be produced with 100% selectively. All other products including fractions boiling in specific ranges, such as gasoline, kerosene and gas oil, can be produced only with relatively low selectivities. The only product fraction, beside light gases, which can be produced with high selectivity is heavy paraffin wax. It is for this reason that the synthesis part of the SMDS process has been designed to produce a long-chain hydrocarbon wax.
During the reaction: 2 H, + CO ----> H,O + -(CH,)- an appreciable amount of heat is released. For the classical catalyst system, this requires a considerable control of the lemperature in view of the following constraints:
- - -
The temperature window of stable operation is rather small A high space-time yield demands a high temperature At only moderately higher temperature a side reaction leading to methane formation becomes more dominant, reducing selectivity and, eventually, stability.
Because of these shortcomings, Shell has developed a new and proprietary catalyst system, which establishes substantial improvements in all these areas. Its robustness allows the use of a fixed bed pipe reactor system at a temperature level where heat recovery, via production of steam, leads to an efficient energy recovery. The catalyst, which is regenerable (cycle > I year) has an expected useful life of well over five years.
Heavy Paraffin Conversion (HCP)
One of the prerequisites for attaining a high selectivity towards middle distillates is a sufficiently high average molecular weight of the raw product. This product, which is predominantly waxy but contains small amounts of olefins and oxygenates, has to be isomerized and cleaned up, white little hydrocracking should take place concurrently. A commercial Shell catalyst is used in a trickle-flow reactor as is employed in refinery hydrocracking operations, but under rather mild conditions of pressure and temperature.
An important observation in this respect is the carbon number distribution of the total product obtained afler hydro-cracking of a Fischer-Tropsch fraction containing normal paraffins. As an example the product distribution aHer cracking n-hexadecane shows that very little methane and ethane, if any at all, is formed. In addition, process conditions can be chosen such as to allow partial evaporation of the lighter hydrocarbons so that they escape easily from the reactor. Since the heavier paraffins may then preferentially condense or absorb on the catalyst surface, they will remain longer in the reactor and thus have a better chance to react. Initially, one might expect the curve to follow an approximately exponential increase with an increase in carbon number as the absorption coefficient is an exponential function of the heat of absorption, while this heat of absorption for normal paraffins is known to increase about linearly with increasing carbon number. The increment per carbon number amounts to some 10-15 kJImol. Above a certain chain length, however, one may expect the effect to level out as the degree of absorption approaches 100%. The result would be a chain-length-dependent reactivity, which shows a very steep increase in the lower carbon number range and an about linear increase in for the higher carbon numbers.
Taking this into account and assuming an equimolar production ratio for all cracked components except for those resulting from breakage of the first three bonds, one can calculate that a C-20 paraffin can be converted into some 80% wt of C-10 - C-20 material, while only some 20% wt ends up in the lighter fraction.
The principle of combining the length-independent chain growth process with a selective, chain-length dependent conversion process has been applied to selectively produce middle distillate paraffins from synthesis gas. To take full advantage of this concept, the Fischer- Tropsch catalyst and the operating conditions were chosen as to produce a heavy product with a high alpha-value, minimizing the formation of undesired light hydrocarbons. The
1148

effectiveness of the two stage approach also creates flexibility creating selective distributions of Fischer-Tmpsch liquid products after heavy paraffin conversion at different cracking severities.
The HPC product is subsequently fractionated in a conventional distillation section. The product fraction which is still boiling above the gas oil range is recycled to the HPC section. By varying the process severity or the conversion per pass one can influence the selectivity towards a preferred product. Hence one may opt for a kerosene mode of operation yielding some 50% kerosene on total liquid product or for a gas oil mode of operation producing some 60% gas oil. In practice the following variability has been proven:
- % w t Gas Oil mode Kerosene mode
Topslnaphtha Kerosene Gas Oil
15 25 60
25 50 25
Compared to syngas requirements of the total complex. the hydrogen demand for the HPC step is very modest. This hydrogen can be recovered from a slipstream of the syngas via any of several methods; one modem method makes use of membranes. Steam reforming of the synthesis purge gas andlor natural gas is also a possibility.
THE PLANT
Shell, together with its partners Petronas, Sarawak State Government and Mitsubishi Corporation, are the shareholders in the first commercial SMDS plant in Bintulu, Malaysia, adjacent to the Malaysia LNG plant. The plant will convert 100 million cubic Wday of natural gas from offshore fields into approximately 500,000 metric tonslyear of hydrocarbons. The Malaysian SMDS project, based on the conversion of natural gas to transportation fuels, like kerosene and gas oil, has through its development and in particularly the efforts spent at Shell's Research Laboratories, gained new grounds. For petrochemicals, the ability to produce naphtha as chemical feedstock is a further advantage. The topslnaphtha fraction is completely paraffinic and therefore makes an ideal cracker feedstock for ethylene manufacture. Obviously, taking into account the paraffinic nature of the hydrocarbons specific solvents provide another market opportunity for the SMDS products.
Further more the SMDS Bintulu project has taken advantage of producing high quality waxes by diverting part of the HPS product stream lo the Wax Production Unit. After a hydrogenation step the C17 minus fraction is distilled off in various distillation columns. Subsequently, the various wax qualities are produced by further distillation. The wax grades are either produced and transported as bulk liquids or as solids, in which case transportation will take place in containers, in the form of slabs or granulates.
Since November 1989 when the ground breaking ceremony took place, there has been a flurry of activities: detailed engineering, ordering of critical equipment, recruitment and training, formation of the start-up and operating crew, construction, commissioning and start-up. Construction was completed by end 1992. Commissioning of a complex plant, introducing new technology. is a time-consuming exercise. Starting with the pre-commissioning in De- cember 1992, it has been progressing in the first quarter of 1993. As a result, in the second quarter of 1993 the first middle distillates were produced.
THE PRODUCT
As can be expected from a Fischer-Tropsch process of this type, products manufactured by the SMDS process are completely paraffinic and free from nitrogen and sulphur. Both the kerosene and gas oil have excellent combustion properties, as the typical product data, given below, show. In this paper particular focus will be given lo the excellent properties of the SMDS gas oil and its potential in the market.
Cetane number Density (kglcum) Sulphur (ppm) Aromatics (% mlm) Cloud point (deg. C) CFPP (deg. C)
Distillation: 90% recovery (deg. C) 95% recovery (deg. C)
SMDS Gas Oil
76 780 zero zero
1 -2
340 350
CARB Specs.
40 min NIS 500
10 max -5
NIS
288-338
CEN Specs.
49 min 820-860
500 (1 996) NIS NIS
+5 to -20'
370 rnax
depending on climatic band chosen
1149

Because of these excellent properties, which are far in excess of the minimum specifications in terns of smoke point and cetane number, these products make excellent blending components for upgrading of lower-quality stock derived from catalytic and thermal cracking Operations; for example cycle oils. Alternatively the products could enter in a market where Premium specifications are valued to meet local requirements. Examples include the California diesel market, where the California Air Resources Board (CARB) has imposed a fuel Specification with low sulphur and aromatics and the Committee for European Norms (CEN) which has established a fairly high cetane number requirement.
OUTLOOK
As is well known, capital and operating costs for synfuel complexes are highly dependent on location and product slate produced. It has been found that the specific capital cost of a 10,000 bbVd plant built on a developed site in an industrialized country would be around US$ 30,000 per daily barrel, whereas for a similar plant in a remote and undeveloped location the Cost could be up to double that amount. The uniqueness of the SMDS products, though, in- cluding their added value, gives the SMDS process excellent opportunities to provide return on investment.
If feedstock is natural gas priced at US$ OS/MMBtu, the feedstock cost element in the product is about US$ 5/bbl. The total fixed and other variable operating costs are estimated at a further US$ 51bbl. The total required selling price for the product will depend on numerous factors, induding fiscal regimes, local incentives, debtlequity ratio, type of loans and corporate return requirements. The premium that may be realized for the high quality products is also a locally influenced and important aspect; it may be as high as 6-8 US$lbbl over and above the normal straight run middle distillate value.
Another important factor is whether the products are for inland use or for export. For countries with sufficient gas, but that need lo import oil or oil products to meet their local demand, SMDS products manufactured in that country should realize at least, import parity values. In some cases these may be far above the normal world spot market values. For such countries therefore, the national benefit of the SMDS process may be substantial.
In addition to these factors, the capacity of the plant is of great importance. Especially for remote locations, where self-sufficiency of the plant is essential, larger plants, in the 25,000 to 50,000 bblld range, have a much better economy of scale. Moreover, whilst the process is ready for commercialization, further developments are underway, directed at increasing the efficiency of the process even further and reducing the capital cost. An important area for these efforts is the synthesis gas manufacturing plant, which constitutes more than 50% of the total process capital cost. Other fields of interest include further catalyst improvement, the design of the synthesis reactors and general process integration within the project. It is expected that work in this area combined with further improvements for larger size plants, will bring the specific capital costs for remote areas to the range of US$25,000 to 30,00O/daily barrel.
SMDS technology has been developed to a stage where it can be considered as technically proven and, subject to local circumstances, commercially viable. Installation of SMDS plants
, can bring significant national benefits to countries with uncommitted gas reserves, either through export from the plant or inland use of the products, thereby reducing the need to import oil and oil products and saving on foreign exchange.
REFERENCES
Eilers, J., Posthuma, S.A, and Sie, S.T.. (1990). 'The Shell Middle Distillate Process (SMDS)', paper presented at the AlChE Spring National Meeting, Orlando, Florida, USA, March 18-20.
Oerlemans. T.W., Van Wechem, H.M.H., and Zuideveld, P.L., (1991). 'Conversion of Natural Gas to Middle Distillates via the SMDS Process', paper presented at the 18th World Gas Conference, Berlin, FRG, July 8-11,
Tijm, P.J.A., Van Wechem, H.M.H.. and Senden, M.M.G., (1993).'New Opportunities for Marketing Natural Gas: The Shell Middle Disillate Synthesis Process', paper presented at the GASTECH 93, 15th International LNG/LPG Conference 8 Exhibition, Pans, February 16-19.
1150

PRODUCT VALUATION OF
FISCHER-TROPSCH DERIVED FUELS
John J. Marano, Burns and Roe Services Corp. Shelby Rogers, U.S. Department of Energy
Pittsburgh Energy Technology Center Pittsburgh, PA 15236
Gerald N. Choi, Bechtel Corp. P.D. Box 193965, San Francisco, CA 94119
Sheldon J. Kramer, Amoco Oil Combany P.O. Box 3011, Naperville, IL 60566
Keywords: Fischer-Tropsch, Linear Programming, Clean Air Act
INTRODUCTION
The Clean Air Act Amendments (CAAA) of 1990 have placed stringent requirements on the quality of transportation fuels. Most petroleum refiners are scrambling to meet provisions of the Amendments to be implemented between 1995 and 2000. These requirements will also have significant imp1 ieations for the production of alternative fuels. These have been examined for Fischer-Tropsch (F-T) derived fuel s.
This analysis was conducted in conjunction with the U.S. Department o f Energy (DOE) sponsored project, Base1 ine Design/Economics for Advanced Fischer-Tropsch Technology, conducted by Bechtel and Amoco"'. The goal of this study was to develop a baseline design for indirect liquefaction of Illinois No. 6 coal using gasification, syngas conversion in slurry reactors with iron catalysts, and conventional refinery upgrading of the F-T derived hydrocarbon 1 iquids. One alternative case using ZSM-5 upgrading technology' was also considered. This study included complete capital and operating cost estimates for the processes.
To perform economic analyses for the different design cases, the products from the liquefaction plant had to be valued relative to conventional transportation fuels. This task was accomplished by developing a Linear Programming (LP) model for a typical midwest refinery, and then feeding the F-T liquids to the refinery. In this way, the breakeven value determined for these materials is indicative of the,price they could command if available in the marketplace.
Inputs to the LP model include: refinery size, configuration, feedstocks, products, specifications, prices, and operating and capital recovery costs. The model was set up to be representative of conditions anticipated for the turn of the century. This required inclusion of fuel specifications from the CAAA of 1990 which have or will come into force by the year 2000:
CAAA FUEL SPECIFICATIONS
Meeting the requirements of the 1990 CAAA have been the subject of negotiations between the government, the refining and transportation industries, and various environmental groups. At the time this study was conducted, agreement had only been reached in regards to fuel requirements up through 1995. Reduced summer gasoline volatility (RVP), a winter oxygenated gasoline program for CO non- attainment areas, and a low sulfur diesel program already have been implemented. A federal Phase I reformulation program is scheduled for implementation in 1995. It requires the production of reformulated gasoline for severe ozone non- attainment areas of the country.
The ultimate goal of the CAAA fuels program is the reduction of gasoline volatility, toxicity, and (more recently) NOx to below 1990 levels. These reduction goals are to be phased-in between 1995 and the year 2000 under the federal Phase I1 reformulation program. In December 1993, the U.S. Environmental Protection Agency published a first draft of the Complex Model which must be used by refiners before 2000 to establish reduction targets.
In addition to the federally mandated programs, California, through the California Air Resources Board (CARB), has promulgated its own Phase I and Phase I1 programs. In general, the requirements of the CARB programs are more strict than the federal programs. Fuels marketed in California will need to satisfy both the federal and CARB requirements. The CARB Phase I program coincides with the federal program, whereas the CARB Phase I1 program i s to be implemented in 1996. The significance of the California programs i s that the rest o f the nation has in the past followed California's lead in setting environmental policy. Thus, many of CARE'S more severe requirements could become effective nationwide sometime early in the next century.
1151

I
At the time this study was conducted, little was known regarding the federal Phase I1 program. Therefore, two different scenarios were modeled with the LP spanning a range of possibilities. The first scenario (Scenario I) assumes fuel specifications in accordance with the federal Phase I program, and the second scenario assumes specifications similar to the CARB Phase I 1 program. Table 1 lists key fuel specifications for gasoline and diesel fuel under the two scenarios.
LP MODELING
The crude capacity of the typical midwest refinery was set at 150,000 bbllday for this study. A composite crude with an API gravity of 32.9" and total sulfur content of 1.30 wt% was used as the basis for the comparisons with F-T liquids. These properties were projected by extrapolating historical crude quality trends. The crude oil was given a nominal price of $18 per bbl. Product values were based on current margins between crude and finished products and forecasts for incremental margins due to fuel reformulation. Product demands also were forecast for the year 2000. Table 2 lists the product rates used in the study.
Capital expansions will be required by U.S. refineries to make the fuels required by the CAAA. These were estimated in order to establish the base refinery configuration for the year 2000 and also to determine if any capital savings could be achieved from blending F-T derived fuels with their petroleum counterparts, Table 2 shows a comparison of the typical midwest refinery circa. 1990 and 2000.
Table 2 shows that major expansion of refinery hydrotreating capacity will be needed to meet both reduced gasoline and reduced diesel sulfur limits. Associated with the increase in hydrotreating are increases in hydrogen production and sulfur recovery. Producing oxygenated gasoline will require the addition of MTBE (methyl tert-butyl ether) and TAME (tert-amyl methyl ether) units. These ethers are produced from purchased methanol and isobutylene and isoamylene available within the refinery from the catalytic cracking and delayed coking operations. Supplemental n-butane will also be purchased and converted to isobutylene to supply additional MTBE. Benzene levels in gasoline will be controlled by dehexanizing the catalytic reformer feed to remove benzene and its precursors.
F-T PRODUCT DESCRIPTION
The indirect 1 iquefaction designs discussed above produce two distinct product slates. For the most part, these streams have been fully upgraded at the liquefaction plant and are suitable for blending to finished fuels. Important properties of these blending components are shown in Table 3. These properties were estimated based on available data from previous DOE-sponsored projects'.
In the baseline design, conventional upgrading of F-T liquids produces about one barrel o f gasoline for every barrel of diesel. The components o f the gasoline are alkylate, isomerate and reformate. These materials are essentially equivalent to their petroleum counterparts produced in a typical refinery. Alkylate, produced from reacting C3, C4, and C5 olefins with isobutane, is the highest octane component in the gasoline. Isomerate is produced from isomerizing normal pentane and hexane. It has a moderate octane rating but is relatively volatile. The reformate, on the other hand, has a high octane rating but contains undesirable aromatic components. The benzene content of the reformate is low due to the dehexanizing of the reformer feed. All of the gasoline blending components have zero sulfur and olefins, which is of considerable benefit when manufacturing CAAA mandated fuels.
Diesel produced from conventional upgrading of F-T products consists of hydrotreated straight-run distillate blended with distillate from wax hydrocracking. The F-T diesel has rather unique properties relative t o petroleum-derived diesels. It is sulfur free, almost completely paraffinic, and has an extremely high cetane rating.
The alternative upgrading case using ZSM-5 produces a gasol ine-to-diesel ratio of about 1.8, which is more typical of the U.S. transportation fuels market. The components of the gasoline are a1 kylate, ZSM-5 gasoline, and hydrocracker gasoline. The alkylate is of somewhat lower quality than alkylate produced from the conventional upgrading case due to dilution with C5 paraffins within the liquefaction plant. The ZSM-5 gasoline resembles cat cracker derived gasoline with a high octane rating, high olefins content, and moderate aromatics level. A lower yield loss is associated with the ZSM-5 upgrading compared to conventional catalytic reforming of the highly paraffinic F-T naphtha. The hydrocracker gasoline is of low quality and would be further upgraded in most petroleum refineries. It is the lowest octane material in either design case.
These are listed in the footnote beneath Table 3.
1152

The d iesel from the a l te rna t i ve upgrading case i s i d e n t i c a l t o the hydrocracked component f r o m the conventional case and has s im i la r superior proper t ies f o r d iesel blending.
F-T PRODUCT VALUATION
The F-T derived mater ia ls were added t o the blending pool o f the midwest r e f i n e r y model. A f te r the in t roduct ion of these new blending stocks, the re f i ne ry conf igurat ion was re-optimized. Inc lus ion o f these blending stocks resul ted i n reduced feedstock, operational, and c a p i t a l costs. Thus, the F-T derived mater ia l was found t o be more valuable than the r e f i n e r y gasol ine o r d iesel products. For example, the zero s u l f u r content o f the F-T derived mater ia ls enable the r e f i n e r y t o reduce petroleum hydrot reat ing requirements, r e s u l t i n g i n reduced cap i ta l and operating costs.
The resu l t s of the product va luat ion are shown i n Table 4 f o r both Scenario I and Scenario 11. This tab le shows t h a t the F-T derived gasol ines always command a premium over F-T derived diesel. Conventional wisdom has been t h a t F-T derived gasol ine i s o f low q u a l i t y and F-T d iesel production i s preferable t o gasol ine production. This study suggest t h a t t h i s conventional wisdom i s wrong f o r the U.S. fue ls market. There are two explanations f o r t h i s r e s u l t . F i r s t , the U.S. market i s skewed toward the production o f gasol ine which commands a higher p r i ce than d iesel . Second, a f t e r upgrading F-T gasol ine blending stocks are high q u a l i t y components for blending t o meet the CAAA gasol ine speci f icat ions.
The rami f icat ions o f the p r i c e d i f f e r e n t i a l between gasol ine and d iesel can be fu r the r i l l u s t r a t e d by comparing the a l te rna t i ve upgrading case t o the conventional case f o r Scenario I . While the F-T gasol ine from the a l te rna t i ve case i s o f lower value due t o i t s low octane ra t i ng , the composite values f o r the gasoline and diesel are much c loser due t o the higher gasol ine-to-diesel r a t i o f o r the a l te rna t i ve upgrading case. For Scenario 11, the composite value f o r the a l te rna t i ve upgrading case i s ac tua l l y higher. This i s a r e s u l t o f both the higher gasol ine-to-diesel r a t i o and the negative e f f e c t o f the high aromatics content o f the F-T gasol ine from the conventional upgrading case.
A lky la te and reformate are premium gasoline blending components and contr ibute s i g n i f i c a n t l y t o the F-T gasol ine value. Because o f aromatics r e s t r i c t i o n i n the CAAA, the reformate value, however, decreases i n Scenario 11. The ZSM-5 gasol ine also was found t o be a superior blending component. I n Scenario I , the low value o f the gasol ine from the a l te rna t i ve upgrading was p r imar i l y a r e s u l t of the low octane o f the hydrocracker gasol ine. However, i n Scenario I 1 t h i s gasol ine commands a substantial premium over the r e f i n e r y gasol ine product because o f i t s zero s u l f u r and low aromatics contents, which are more c r i t i c a l i n t h i s scenario.
The h igh cetane and zero s u l f u r content o f the F-T d iesel blending stock was not found t o have a s ign i f i can t e f f e c t on i t s value, which was only s l i g h t l y higher than the p r i ce used f o r low-sulfur, on-highway diesel. The CAAA force the re f i ne r t o invest heavi ly i n hydrot reat ing capacity both f o r gasol ine and d iesel su l fur reduction. Much o f the desu l fu r i za t i on derives from gas o i l (cat cracker feed) hydrotreating aimed p r imar i l y a t lowering the s u l f u r content o f the gasol ine and hydrocracking aimed a t increasing the gasol ine y i e l d . Any severe d i s t i l l a t e hydrot reat ing requi red has the added bene f i t o f improving the d i s t i l l a t e cetane index. For these reasons, the r e f i n e r y d i d no t receive much bene f i t from the superior F-T diesel propert ies.
The impl icat ions of the F-T product values given i n Table 4 on the economics o f i n d i r e c t 1 iquefact ion are reported elsewhere’.
CONCLUSIONS AND RECOMMENDATIONS
The resu l t s o f t h i s study ind icate tha t F-T derived mater ia ls look a t t r a c t i v e f o r blending w i t h conventional petroleum derived stocks t o produce CAAA mandated t ranspor tat ion fue ls . F-T derived gasol ine blending stocks bene f i t the re f i ne ry due t o t h e i r high octane, low su l fu r content, and low o l e f i n s content. The F-T d iesel , whi le superior t o i t s petroleum counterpart, does not show much bene f i t t o the t y p i c a l re f i ne ry . However, i t does command the same p r i c e as low s u l f u r d iesel fuel. Further work i s required t o quant i fy the value o f the high-cetane F-T d iesel . Refinery spec i f i c s i tuat ions might r e s u l t i n enhanced value f o r t h i s mater ia l . For Scenario I , the l i q u i d s from the conventional upgrading o f the F-T product were more valuable than those from the a l te rna t i ve upgrading. This was reversed i n Scenario 11. Optimization o f the F-T upgrading could improve the value o f t he gasol ine from the a l te rna t i ve upgrading case. Octane improvement could poss ib ly be achieved e i t h e r by more severe ZSM-5 operation o r by addi t ional upgrading o f the hydrocracker gasoline. Octane improvement f o r the conventional upgrading case i s l i m i t e d by the aromatics content o f the reformate stream.
1153

In addition, the alternative upgrading case results demonstrate the benefits of higher gasoline production from F-T upgrading. Other avenues for increasing the gasoline-to-diesel ratio from F-T upgrading include cat cracking F-T wax and low- wax F-T reactor operation. Both of these routes also could be used for the Production of ethers for gasoline blending. Isobutylene and isoamylene can be converted directly to MTBE and TAME, whereas normal olefins must be converted to their iso-counterparts first. Skeletal isomerization could prove attractive for Converting the large quantity of normal olefins obtained from iron-based F-T synthesis into etherification feedstocks.
Further work is necessary to optimize the production of transportation fuels from F-T synthesis. In addition to expanded LP studies including more upgrading options, experimental data are required to fill gaps in the existing LP data base and to confirm predictions from the LP model. Tests are necessary to establish the blending properties of the F-T derived materials. Additional testing of the ZSM-5 process for upgrading F-T liquids also should be performed.
The DOE-sponsored Refining and End Use Study of.Coa1 Liquids will attempt to address some of the issues outlined above. Participants in this recently initiated project include Bechtel, Southwest Research Institute, Amoco, and M.W. Kellogg. Results from the present study indicate that Fischer-Tropsch synthesis could be an important technology for satisfying our nation's transportation fuel needs in the next century. The potential benefits of F-T derived fuels for meeting the environmental requirements of the CAAA have been quantified. More new insights are anticipated from the End Use Study.
REFERENCES
1) Choi, G.N., S . S . Tam, J.M. Fox, S.J. Kramer, J.J. Marano, "Baseline Design/Economics for Advanced Fischer-Tropsch Technology, '' Proceedings o f The Coal Liquefaction and Gas Conversion Contractors Review Conference, September 27-29, 1993.
2) Choi, G.N., S.S. Tam, J.M. Fox, S.J. Kramer, J.J. Marano "Process Simulation for Indirect Coal Liquefaction Using Slurry Reactor Fischer- Tropsch Technology," Symposium on Alternative Routes for The Production of Fuels, ACS National Meeting, Washington, D.C., August 21-26, 1994
3) Kuo, J.C., et al. (Mobil), Two-Stage Process for Conversion of Synthesis Gas t o High Quality Transportation Fuels, Final Report, DOE Contract No. DE-AC22-83PC60019, October 1985.
Oxygen, Wt% 2.1 min 2.1 min Diesel Pool: 1- % Low Sulfur - 83 % 83 % 1
0.05 max Sulfur, Wt% 0.25 max 0.05 max Cetane Index 40 min 40 min 48 min
I
i 1154

TABLE 2: Typical Hidwest Refinery Capacity and Production (BPSD unless otherwise noted)
TABLE 3: F-T Derived Gasoline and Diesel Qual i ty
Gasoline Pool: 37X alkylate, m i e r a t e , UIX reformste; Diesel Pool: 67X hydmcrscbte, 33% distil late; besolineto-DieMl Ratio: 0.97.
"Gasoline Pool: 351 alkylate, 36% 291-5 -line, 29Z m r e c b t e : D i e s e l Pml: 1DOZ hydrocrechte; baooline-ta-DieMl Ratio: 1.8.
1155

Table 4: Fischer-Tropsch Product Values (dollars per barrel)
. Crude Oil B Refinery Products: Scenario I Scenario I1
Crude Oil 18.00 18.00 Composite Gasoline 26.00 26.70 Conventional Diesel Fuel 22.70 22.70 Low Sufur Diesel Fuel 24.80 24.80
F-T Conventional Upgrading:
F-T Gasoline Blendstocks 27.02 28.07 F-T Diesel Blendstock 24.90 25.19 Composite for Conv. Upgrading 25.95 26.61
F-T Alternative Upgrading:
F-T Gasoline Blendstocks 25.62 28.17 F-T Diesel Blendstock 24.91 25.19 Composite for Alt. Upgrading 25.36 27.10
i 1156

PROCESS SIMULATION MODEL FOR INDIRECT COAL LIQUEFACI'ION USING SLURRY REACTOR RSCHER-TROPSCH TECHNOLOGY
Gerald N. Choi and Samuel S. Tam (Bechtel Corporation, P.O. Box 193965, San Francisco, CA 941 19)
Joseph M. Fox (Consultant) Sheldon J. Kramer (Amoco Oil Company)
Shelby Rogers (DOE - Pittsburgh Energy Technology Center)
Key words: Indirect Coal Liquefaction Advanced Fischer-Tropsch Technology Process Simulation Model
INTRODUCTION
A detailed baseline design for indirect coal liquefaction using advanced Fischer-Tropsch (F-T) technology has been developed for Illinois No. 6 coal. This design forms the basis for an ASPEN process flowsheet simulation (PFS) model which can simulate the entire liquefaction plant and predict the effects of key process variables on the overall plant performance. A linear programming (LP) model based on a typical PADD I1 refinery was developed for product valuation and a discounted cash flow (DCF) spreadsheet model was developed for economic analysis. These closely coupled models constitute a research tool which the DOE can use to plan, guide and evaluate its ongoing and future research programs for the manufacture of synthetic liquid fuels by indirect coal liquefaction.
This paper covers the use of the ASPEN process simulation model and DCF spreadsheet model to look at the sensitivity of the economics to certain global process variables such as coal feed rate, synthesis gas conversion per pass and wax yield, together with certain specific reactor operating variables such as temperature, superficial velocity, slurry concentration, catalyst activity and catalyst life. Results are reported in terms of investment cost, yields and operating costs, which are then combined to determine a crude oil equivalent (COE) price. The COE is a hypothetical breakeven crude oil price at which a typical PADD ll refmery could buy either crude oil or the coal liquefaction products. It is a present day value and is defined assuming constant deltas between crude oil and its products (Le. constant refmery processing costs and margins).
OVERALL PLANT DESIGN
Block Flow Diagram
Figure 1 is a block flow diagram showing the overall process configuration. The facility is divided into three main sections:
1. oductioa Synthesis gas is generated in Shell gasifiers from ground, dried E e s s i n g of the raw synthesis gas from the gasifiers is conventional, with wet scrubbing followed by single stage COS/HCN Hydrolysis and Cooling, Acid Gas Removal by inhibited amine solution and Sulfur Polishing. Sour Water Smpping and Sulfur Recovery units are included in this section.
hesis low. The synthesis loop includes F-T Synthesis, C@ Removal, Recycle Gas Compression/Dehydration, Hydrocarbon Recovery by deep refrigeration, Hydrogen Recovery and Autothermal Reforming. The Hydrocarbon Recovery Unit also includes deethanization, depentenization, fractionation and an oxygenates wash column. At low HgCO ratios, COZ. is the primary byproduct of the F-T reaction so a large C02 removal unit is required. In the Autothermal Reformer, un- recovered light hydrocarbons in the recycle gas are converted to additional syngas which raises the HgCO ratio to the F-T reactors.
3. Product uuarad ine, The downstream upgrading units include Wax Hydrocracking, Distillate and Naphtha Hydrotreating for oxygenate removal and olefin saturation, Catalytic Naphtha Reforming, Isomerization, once-through C9C6 Isomerization, C3/Cq/Cg Alkylation and a Saturate Gas Plant. Liquid wax from the reactor, after catalyst recovery, is sent to the hydrocracker where high quality distillates are produced along with some naphtha and light ends. The naphtha, along with hydrotreated F-T naphtha, is catalytically reformed into aromatic gasoline blending components. Light hydrocarbons are isomerized and alkylated into quality gasoline blending stocks.
The F-T slurry reactor is essentially a bubble column reactor where the sluny phase is a mixture of molten wax and catalyst. The gas provides the agitation necessary for good mixing and mass
2.
1157

transfer of reactants to, and products from, the liquid phase. The slurry reactor was chosen over the fixed-bed reactor for the Fischer-Tropsch section based on an earlier Bechtel study1*2.
Further details concerning the design basis, process selection, cost estimating procedures and alternative cases studied are given in a paper presented at the 1993 DOEKoal Liquefaction and Gas Conversion Contractors Review Conference3.
Product and Byproduct Yields
The F-T liquefaction facility produces C3 LPG, an upgraded C5 - 350 OF naphtha and 350 OF - 850 "F combined light and heavy distillates. The primary byproduct is liquid sulfur. Yields and Product qualities, along with the baseline design F-T reactor operating conditions are given in Table 1. The hydrocarbon products have no measurable sulfur or niaogen contents because of the requirements and nature of the Fischer-Tropsch reaction. Oxygen is removed to less than 30 ppmv. There are virtually no aromatics in the distillate. Olefins are saturated to low levels of residual olefin concentration in both the naphtha and the distillate. The diesel fraction has a very high cetane number, on the order of 70, and the jet fuel fraction and heavy distillates have low smoke points.
The naphtha product is a mixture of C3/Cq/Cg alkylate, CS/G isomerate and catalytic reformate. It is basically a raw gasoline with a clear (R+M)/2 octane number of about 88. If insufficient butanes are available to alkylate all of the available C3/C4/C5 olefins, then n-butane is purchased and isomerized.
PROCESS SIMULATION MODEL
The process flowsheet simulation model predicts the effects of key process variables on the overall material and utility balances, operating requirements and capital costs. This model is implemented in the PC version of ASPEN/SP.
Development of the Model
Baseline design information was transmitted from Bechtel to Amoco for the development of the process flowsheet simulation computer model. Information transfer was expedited by Bechtel's development of a preliminary ASPEN/SP model for the design of the F-T synthesis loop. The computerized F-T slurry reactor yield correlations used for design purposes have been discussed previously4.
The computer model was developed as a planning/reseaxh guidance tool for the DOE and its subcontractors. The model is not designed to be a plant design and sizing program for every plant in the complex. The F-T synthesis loop design is handled in some detail and Bechtel's F-T reactor sizing and yield models are built into the design. For other plants, only overall yield, utility requirements and capital costs are estimated. Costs are prorated on capacity using cost- capacity exponents and information on the maximum and minimum capacity of single train
All ISBL plants in the three main processing sections discussed earlier are simulated; some by a combination of ASPEN/SP process simulation blocks and user Foman blocks and some by just user Fortran blocks. Material balances, as well as utility consumptions, operating personnel requirements and ISBL costs for each plant are produced. The OSBL, engineering and contingency costs are. estimated from the ISBL plant costs to generate the total installed cost of the facility.
This ASPEN model generates a file for direct nansfer of the significant model results to the DCF spreadsheet economics model. The spreadsheet model takes this input, and with a given set of financial assumptions calculates the cost of production and a crude oil equivalent price for a 15% return on investment.
F-T product values were. generated by a linear programming model of a typical PADD ll refinery at present day crude oil prices. These results are being reported separately at this meetings. In calculating the COE, several different assumptions can be used to relate feed and product values to crude oil price. The DCF spreadsheet allows for the use of a constant value, a constant ratio or a constant delta. Since what is desired is the equivalent refinery processing cost to produce the same product, this paper uses a constant delta to relate the hydrocarbon products and imported butane prices to the crude oil price. The effect of varying these deltas is shown.
Caution should be used in extrapolating COE to future pricing scenarios and drawing conclusions as to when coal liquids will become competitive with equivalent products from crude oil. The W E , as herein defined, is a conceptual tool allowing various yield configurations and coal processing scenarios to be compared as a single number on the basis of present day
plants.
1158

economics. When future. projections are made, it is necessary to consider inflation in construction costs as well as various price escalation scenarios for crude oil, coal and other energy sources. Such studies are beyond the scope of this paper.
PROCESS SENSITIVITY STUDIES
The PFS model is designed to handle the effects of the following process variables:
Priman, Variables Coal Feed Rate F-T Conversion per Pass F-T Wax Yield
RmX 4,500 to 45,000 mtpd 50 to 82% 10 to 75%
F-T Reactor Inlet Superficial Velocity F-T Reactor Catalyst Concentration
5 to 20 c d s 20 to 40%
Secondmy Variables HgCO Ratio Heat Transfer Flux
Flow Regime
0.36 to 0.7 68,000 KJhr-mZ - 114,000 KJ/hr-m2 (6,000 - 10,000 Btu/hr-ft2) Bubble to Chum Turbulent
Baseline design conditions are 18,400 mtpd coal feed rate, 82% conversion, 50% wax yield, 10 c d s superficial velocity and 22.5 wt% slurry.
This paper presents the results of parametric economic studies covering the primary variables cited above. A brief summary follows:
Effect of Desim Plant CaDacity - The effect of plant capacity on the overall F-T facility capital investment is exponential with an average cost-capacity exponent of 0.89..This large an exponent is not surprising since multiple process trains are involved. The effect on COE, over the entire range, is about $0.80/bbl.
Effect of Desien F-T Svncas Conversion Per Pass - As expected; high conversion per pass is economically favorable. Decreasing the syngas conversion from 82 to 68% at a constant 18,400 mtpd coal feed rate increases total plant investment by approximately 9%. with the main effect being on the F-T synthesis section loop due to increased recycle. The LJD of the F-T reactor becomes much smaller at low conversion and the designs become impractical unless other parameters, such as slurry concentration, are. relaxed as well.
Effect of Desien Wax Yield - The effect of design wax yield at the baseline capacity of 18,400 mtpd coal feed rate was studied over the range of 10 to 75 wt%, obtained by varying F-T reactor temperature from 271 to 242 "C. Increasing the wax yield from 10 to 75 wt% reduces the F-T naphtha to distillates production ratio from 2.38 to 0.62. An increase in light olefins production at 10 wt% wax yield requires the purchase of roughly 11,ooO bbVday of butane to make alkylate, whereas the 75 wt% wax yield case is in butane balance.
The F-T reactor size becomes larger at high wax yield and there is a minimum in plant investment cost at about 50 wt% wax yield. The variation in total plant cost, over the entire range of wax yields, is less than 3%. The optimum wax yield is highly dependent on the price of purchased butane, gasoline and diesel relative to crude oil. Present day price spreads for F-T gasoline and distillates relative to crude oil were determined as $9.00/bbl and $6.90/bbl, respectively, by linear programming studiess. The present price for butane is $3.50/bbl. less than crude oil. Using these deltas, the optimum wax yield appears to fall between 50 to 60 wt%.
Lowe+g the butanes price relative to crude oil drastically alters this trend, and when butanes are pnced at $20/bbl under the price of crude oil, the low wax yield case is preferred. The linear programming studies did not credit the exceptionally high cetane number of the F-T distillate product. Other sources indicate that a delta of $9.0/bbl instead of $6.90/bbl for the F-T distillates may be more realistic and this lowers the COE by $1.00 per barrel and makes the optimum wax yield slightly higher.
Effect of Slum F-T Reactor Desien Variables - The inlet superficial gas velocity was studied in conjunction with slurry concentration. The reason is that, if varied independently, as soon as these variable depart from the baseline design, the reactor L/D changes. Increasing superficial velety, at constant slurry concentration, leads to impractically high IJD ratios for which the costing algorithm is not equipped to handle accurately. This can be compensated for by inmasing slurry concentration. Figure 2 shows the combination of superficial velocity and slurry concentration necessary to maintain a constant L/D of 3.15 ( the baseline design reactor). The reactor inside diameter has been kept between 3.8 to 5.0 meters (12.5 to 16.5
1159

feet) by varying the number of reactors from 48 to 16. The baseline design, at lOcm/s superficial velocity and 22.5 wt% sluny concentration, has eight F-T synthesis trains with 3 reactors per uain, each reactor being 5 meters ID by 15.8 meters T-T.
Figure. 2 also shows the total cost of reactors as a function of the superficial velocity and slurry concentration while maintaining a constant reactor L/D of 3.15. The cost is inversely proportional to the inlet superficial gas velocity. The potential savings on increasing the superficial gas velocity from 5 to 20 c d s is on the order of $80 million, and this results in a reduction of the COE by about $0.80/bbl.
CONCLUSIONS AND RECOMMENDATIONS
These preliminary parametric sensitivity studies demonsaate the capability of the process flowsheet simulation model. When coupled to a discounted cash flow spreadsheet model, its effectiveness for examining the effects of various process variables on the F-T indirect coal liquefaction costs and economics has been demonsuated. The responsiveness of the model to a variety of F-T slurry reactor operating conditions has also been established.
REFERENCES
1) Fox, J.M.. "Slurry vs. Fixed-Bed Reactors for Fischer-Tropsch and Methanol", 1990 Topical Repon - DOE Contract No. DE-AC22-89PC89876.
2) Fox, J.M., "Fischer-Tropsch Reactor Selection", Catalysis Letters 7 (1990) 281-292
3) Choi, G.N., Tam, S.S.. Fox, J.M., Kramer, S.J. and Marano, J.J. "Baseline Desigdkonomics for Advanced Fischer-Tropsch Technology", DOEVProceedings of The Coal Liquefaction and Gas Conversion Contractors Review Conference, September 27-29.1993.
4) Fox, J.M. and Tam, S.S. "Correlation of Slurry Reactor Fischer-Tropsch Yield Data", Symposium on Fischer-Tropsch and Alcohol-Synthesis, ACS 1994 Spring Meeting, San Diego, California, March 14-18, 1994.
5 ) Marano, J.J., Rogers, S., Choi, G.N. and Kramer, S.J., "Product Valuation of Fischer- Tropsch Derived Fuels", Symposium on Alternative Routes for The Production of Fuels, ACS National Meeting, Washington, D.C., August 21-26, 1994.
Baseline Facility Design
Exit ROM as received coal 7.68~105 Kg/hr (18,420 mtpd) N-Butane 1.20~104 Kg/hr (3,120 BPSD) Electric power 50 MWh
C3 LPG 6.45~103 Kg/hr (1,920 BPSD) F-T gasoline blend 1.14~105 Kg/hr (23,900 BPSD) F-T diesel blend 1.26~105 Kg/hr (24,700 BPSD) Sulfy 2.12~104 Kg/hr
F-T h r a h ne Conditions: Temperamre/pressure 253 'Cn.17 MPa (50% wax) Syngas conversion 81.7 % Inlet superficial gas velocity 10.0 cm/sec Catalyst sluny concentration 22.5 wt% Catalyst make-up rate 0.5 % per day
mtpd [=] metric tons per stream day BPSD [=] Barrels per stream day
Ri-hoducts:
1160

EimLl INDIRECT COAL LIQUEFACTION BASELINE STUDY
OVERALL PROCESS CONFIGURATION
4 Sulfur SYNTHESIS GAS PREPARATION
Gasilication Grinding Handling
Autothermal Hydrogen Reformer Recovery
I
co2 fehydrat ion l I Removal Compression
I
WaxJAqueous OxvaenateslOther F-T Liquids
PRODUCT UPGRADING
Sat. Gas Plant Isomerization/
Figure 2 Total F-T Reactor Cost at Constant WD of 3.15
, 60 140 , A 2 4
24 dl 6 #of Reactors
/A 16 is Indicated
,:l O + . 'rl 80-
8 60- a I- d 40- m
ln
Q
- 2 20!
0 ) I I I
5 10 15 20 95 -- Inlet Superficial Gas Velocity - cm/sec
1161

COPRODUCTION OF HYDROGEN AND ELECTRICITY : CATALYTIC APPLICATIONS
G. Alex Mills Center for Catalytic Science and Technology
Department of Chemical Engineering, Newark, DE 19716
G. Alex Mills Center for Catalytic Science and Technology
Department of Chemical Engineering, Newark, DE 19716
Keywords: Hydrogen; Electricity; Catalysis.
There is a growing need for new technology for more economical manufacture of hydrogen and for generation of electricity, dictated by increasingly stringent ennronmental requirements.
Environmentally benign transportation fuels almost always re uire hydrogen for their manufacture. Hydrogen i s needed for production of Righ-performance oxygenate fuels - alcohols and ethers. Hydrogen is needed for hydrodesulfurization. Also, i t is expected that hydrogen will be needed for conversion of aromatics to naphthenes to meet environmental requirements. There is a growing recognition that there will be a significant future shortage of hydrogen supply.
The electric utility industry is most affected by the 1990 Clean Air Act Amendments requirements for the reduction of SO2 and NOx to meet acid rain provisions (Title IV) and by control of NOx in ozone nonattainment areas ( Title I ). The CAAA requires reduction of SO2 to half of 1980 levels.
These needs provide the motivation for the present paper which examines catalytic opportunities for advantageous co roduction of hydrogen and electricity from coal, peroleum coke andor biomass. TLe strategic concept involves modifications of the Integrated Gasification - Combined Cycle process. In IGCC, coal, petroleum coke or biomass is converted to synthesis gas, a mixture of H2, CO and C02. This syngas is used as fuel for generation of electricity in a combined turbine and steam cycle. The IGCC plant process steps of gasification, gas purification, and gas turbine and steam cycle for production of electricity are illustrated in Fig.1. Including the Cool Water plant in California, four IGCC coal-based demonstration plants have been built and operated world-wide. Eight additional plants are in various state of development under the DOE Clean Coal Program. A 305MWe plant is under construction in Spain. IGCC plants based on petroleum coke are in advanced planning and commitment stages.
I t has been proposed that the IGCC process be modified so that part of the synthesis gas is converted to chemicals and then the remainder of the syngas is used to generate electricity. Such a plant has been termed a powerplex. Technology for coproduction of electricity and methanol and dimethyl ether, (including once- through catalytic slurry-phase operation) have been proposed, and syngas conversion tested experimentally under appropriate conditions (1). The economics of oxygenates / electricity cogeneration evaluated and deemed to be favorable under certain conditions (2).
In this paper, various technologies for coproduction of hydrogen and electicity are proposed. Possible advantages are: pollution abatement; higher efiiciency; and improved economics; and use of national resources of coal, petroleum coke and biomass. Emphasis is given t o eight potential catalytic process applications, indicated in Fig. 1.
1 Catalytic Gasification. Gasification of solid fuels is carried out in the presence of steam by partial combustion at 900' - 1500' C. It has long been known that alkali hastens the critical slow reaction, C + H20 + CO + Ha. Extensive laboratory and pilot plant studies have established reaction mechanisms and practical process information (3). It was demonstrated that catalytic gasification of coal can be carried out a t industrial rates a t 600 - 700 "C. (3,4). 2 Integral Catalytic Gasification I Synthesis ICG/S is the concept of carrying out integral, that is simultaneous, gasification and synthesis of desired fuel hydrocarbons or oxygenates. Gasification and synthesis of methane was first proposed. Fairly high yields of CH4 becomes thermodynamically stable in the presence of steam and carbon a t 700°C and higher pressures, Fig. 2 (5). Indeed, potassium is also a catalyst for methane formation and high methane levels were found in extensive catalytic coal gasification pilot plant operations carried out a t Exxon with DOE support (3,4) This process has not been commercialized.
It is now suggested that a combination of gasification and oxygenate-synthesis catalysts be utilized to accomplish gasification and oxyenates synthesis. A problem is matching rates of gasification and thermodynamic contraints of oxgenate synthesis. a t a common temperature and pressure. Synthesis of methanol is carried out a t about 300' C. One option to increase synthesis conversion is to operate so as to produce methanol and dimethyl ether. Higher yields of MeOH and DME are thermodynamically possible a t a fixed temperture/pressure conditons than for
1162

methanol alone (6). Another option is gasification / production of mixed, higher alcohols. Higher alcohols, including isobutyl alcohol, were manufactured a t temperatures as high as 500 "C. Production of hydrogen from oxygenates is discussed later.
3 Catalytic Water Gas Shift The composition of synthesis gas is sensitive to gasification conditions, including the presence of larger amounts of steam, used in the Texaco process. Another application of catalysis is the adjustment of gas composition to that most suitable for further synthesis processing. The catalytic water gas shift processes high, 350" C, and low, 200" C, are well established industrially for hydrogen manufacture by the reaction, CO + H20 + C02 + Ha. Incorporation of the WGS reaction presents useful options in synthesis process technologies now discussed.
4. Catalytic Oxygenates Synthesis. Higher alcohols synthesis also offers opportunities for production of valuable coproducts, perhaps particularly isobutanol which has potential high value as an octane-enhancing gasoline additive, Several opportunities for improved higher alcohols synthtsis has recently been presented.7)
6 Catalytic Reforming of Oxygenates for Hydrogen Manufacture. A problem in coproduction of hydrogen and electricity is flucuating electricity demand which results in variable hydrogen generation rates. Gaseous hydrogen is not easily stored. If more easily-stored liquid methanol and dimethyl ether are produced, they can be utilized for production of hydrogen by catalytic decomposition or by catalytic steam reforming. Technology for reforming oxygenates for production of hydrogen is well established, has been used in certain instances, and may be a useful option com onent in an energyplex. Methanol decomposition is used for production of suppLmenta1 fuel gas in Berlin for peak demand conditions
The conversion of methanol (and DME ) to syngas is endothermic. The synthesis gas formed has higher heat of combustion than the methanol from which it is produced. It has been proposed that when waste heat is used to supply endothermic energy required for syngas formation, there would be an effective increase in heat value of the methanol, for automotive or electrical generation applications. Endothermic dissociation CHSOH(~). + 2H2 + CO, AH298~ = 21,664 cal/g-mole. Including the heating value increase in the methanol vaporization step, endothermic dissociation can increase the fuel heating value by over 20% over liquid methanol (8). If hydrogen is the sole desired fuel, methanol can be steam reformed. CH3OH(g) + H20 + 3H2 + C02 AH2g8~ = 11,826 cal/g-mole. Including the heating value g+ned from methanol vaiorization, the reformed methanol can have about 13% hlgher heating value than liquid methanol (8)
6 Electrocatalytic Hydrogen Separation. A new technique for hydrogen separation is an outgrowth of fuel cell technology. An electrochemical cell is used which has highly efficient catalytic electrodes. Impure hydrogen is consumed at the anode of the cell and purified hydrogen generated a t the cathode, Fig 3. By the application of a small potential across the electodes of this cell, i t is possible to ionize H2 a t the anode and simultaneously to produce an equivalent amo-t of high purity H2 at the cathode. The effect of gaseous feed rate over an anode on hydrogen removal efficiency is illustrated in Fig. 4 showing data from an early publications from the Houdry Laboratory (9, 10) .This concept has been much further developed with promising results. It has been shown that 80% of hydrogen recovery is feasible from very dilute Ha-containing streams, Fig 5 (11) It is a critical point that the catalytic electrodes are very efficient ( low overvoltage ). Therefo e, only a small amount of electricity is required, namely 2to 10 kw-hr per 1000 ft5 of hydrogen. In the present application hydrogen not separated is not wasted but is utilized as fuel in the combined cycle generation of electriciy.
7 Catalytic Fuel Cells. Fuel cells are catalytic devices. It should also be pointed out that a fuel cell could be used advantageously to supply the needed electricity for the electrocatalytic hydrogen separation, utilizing a small part of the hydrogen produced. Fuel cells are not discussed further here except to note that they could be used instead of or in combination with combined cycle for electicity generation
8 Membrane Separation, Separation/ Catalysis. Membranes offer special opportunities for separation of hydrogen from gaseous mixtures, based on diffusion, on sieving, or on permeation. The commercial Monsanto PRISM process utilizes hollow fiber membranes with an active siloxane layer. Active research is underway to develop membranes capable of separating gas mixtures based on molecular size, using molecular sieving mechanism. One direction is to begin with a mesoporous membrane ( > 50A) and to apply a layer of an inorganic oxides such as silica to produce a microporous structure.(l2). A gas separation membrane multi-layer structure has been described (13). Another approach is to utilize carbon molecular sieve and to reduce the pore size to 3 or 4 A, evaluated for separation of C02 and H2 (14)
.
1163

It is also possible to utilize a metal membrane. A special membrane is palladium which has almost infinite selectivity for passage of hydrogen. Here the mechanism 18 conversion to a hydride, migration of the hydride and reformation of molecdar hydrogen, Palladium membrane have been used commercially for hydrogen Purification. Pd alloyed with Ag or other metals has shown advantages (15). A metal-membrane-based process for production of hydrogen is based on a novel hydrogen-permeable composite membrane. Separation by permeation is also possible.
Combining separation and catalysis offers much potential. By removal of a reaction product for a thermodynamically limited reaction, the reaction can be driven further, as in the water gas reaction (16). Other reactions which could be combined are hydrodesulfurization or other hydrogenation reactions such as of aromatics to naphthenes.
Pressure Swing Adsorption Pressure Swing Adsorption, not a catalytic process, is used for separation in modern plants for manufacture of hydrogen.Microporous solids are used, in many ways structurally similar to catalysts. PSA offers a bench mark for comparison with alternative separation processes.
In summary, attention is drawn to a number of catalytic options which are deemed promising for needed new technology for production of hydrogen and electricity, technology which will be environmentally advantageous (16). Further, it is suggested that the electrical industry will be involved with catalytic chemistry and engineering.
References 1. Brown, D.M., Henderson, J.L., Hsiung, T.H., Studer, D.W. EPRI 15th Annual Conference on Fuel Science and Conversion, Palo Alto, CA June (1990). 2. Houston Light & Power Co. EPRI report TR-101789 Project 3226-04, (1992). 3. Penner, S., Wiesenhahn, D.F. Energy, Vol. 12, No. 819 pp 623-903, (1987). 4.Hirsch, R.L., Gallagher, J.E., Lesserd, R.R., WesselhoR, R.D. Science ~01.215, No.
5 . Haussinger, P., Lohmuller, R. Hydrogen. Ullman's Encyclopedia of Chemical Technology. VCH, (1989). 6. Hansen, J.B., Joensen, F. " High Conversion of Synthesis Gas to Oxygenates in Natural Gas Conversion." Natural Gas Conversion Symposium Proceedings. Eds A.Holman et al. Amsterdam. Elsevier, pp 457-467 (1991). 7. Summary of Higher Alcohols Synthesis Workshop. Ed, P. Zhou. DOE Contract DE-AC22-89PC88400 subtask 43.02 Feb. (1994) 8. Yoon, H., StoufTer, M.R., Dudt, P.J., Burke, F.P., Curran, G.P. Energy Progress 5:
9. McEvoy, J.E., Hess, R.A., Mills, G.A., Shalit, H. "Hydrogen Purification Using a Modified Fuel Cell Process". Ind. & Eng. Process Design and Development. Vol. 4,
10. McEvoy, J.E, "Electrolytic Method of Gas Separation", U.S.Patent 3,401,099.( 1968). 11. Farooque, M., Kush, A., Abens, S. Novel Electrochemical Hydrogen Separation Device Using Phosphoric Acid Membrane Cell. Separation Science and Technology.
12. Gavalas, G.R. "Hydrogen Separation by Ceramic Membranes"'in Proceedings of the Twelfth Annual Gasification and Gas Stream Cleanup Systems Contractors Meeting, Johnson and Jain, Eds. DOE Morgantown, W.VA. pp 338-345 Sept. (1992). 13. Goldsmith, R.L., Higgins, R.J., Bishop, B.A. 'Low Cost Ceramic Membranes and Supports for Gas Separations' see ref (12) p205-217.(1992). 14. Yates, S.F., Swamikannu, A.X. High Temperature Size Selective Membranes. Proceedings of the Coal-Fired Power Systems 93 Advances in IGCC and PFBC Review Meeting,.D.L.Bronk, Ed, U.S. DOE, Morgantown, W,VA. DE93000289 June (1993). 15. Armor, J.N. "Challenges in Membrane Catalysis". Chemtech. Sept. 557- 563.(1992) 16. Edlund, D.J. Catalytic Membranes Facilitating the Water Gas Shift Reaction see ref 14, pp 233-237 (1993) 17. Mills, G.A. Status and Future Opportunities for Conversion of Synthesis Gas to Liquid Energy Fuels D.0.E , NREYTP 421-5150, NTIS 93010025.(1993).
4529 pp 121-127.(1982).
~ ~ 7 8 - 8 3 , (1985).
ppl-3,.( 1965)
25 (13-15' ) pp 1361-1373 (1990).
1164

Petroleum Biomass
0 Catalytic Gasification 0 ICG/S
Oxygen
Purification
I 0 Water Gas Shift I
i
I
Oxygenates -9
1cI ii
pG-+zq-+D Electricity
Stack Gas
Fig. 1. Catalytic Modifications of IGCC for Production of Hydrogen and Electricity
Fig. 3. Schematic of an electocatalytic hydrogen separator (11). 1165
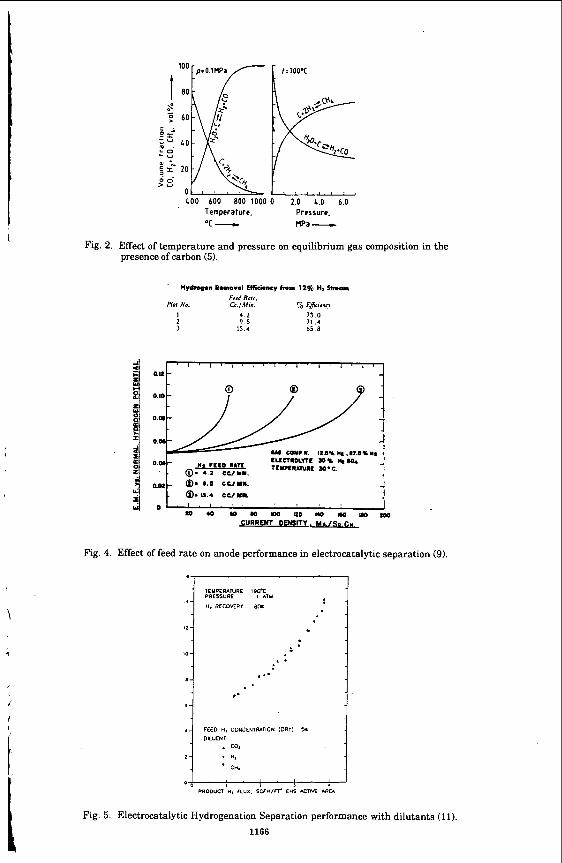
1
loo p;o.luPa
60
LO 2-
20
LOO 600 800 1000 Temperature, oc -
t.700.C
0 2.0 L.0 6.0 Pressure. MPa --c
Fig. 2. Effect of temperature and pressure on equilibrium gas composition in the presence of carbon (5).
' 8vdrop.n h m - r o l Efficiency ham 12% Hr Smom
F t d Rarr. Plot No. G./hfm. To Efiimcr
1 1 . 2 73 .0 2 9 5 71 , 4 3 15.4 65.8
Fig. 4. Effect of feed rate on anode performance in electrocatalytic separation (9).
I " " " " I lEYPER4UTURE 190.C PRESSURE 1 A lY
H, RECOVERY B D .
,-
Fig. 5. Electrocatalytic Hydrogenation Separation performance with dilutants (11).
1166

EQUILIBRIUM THERMODYNAMIC ANALYSIS OF LIQUID-PHASE ETHYL TERT- BUTYL ETHER (ETBE) SYNTHESIS
Kyle L. Jensen and Ravindra Datta* Department of Chemical and Biochemical Engneering
The University of Iowa Iowa City, Iowa 52242
Keywords: Reaction equilibrium, equilibrium constant, ethyl tert-butyl ether (ETBE)
INTRODUCTION There are two forces driving the increasing usage of oxygenates (alcohols and
ethers) in gasoline. First, lead compounds, long used for octane improvement in gasoline, have now been phased out by the EPA. The second reason is the Clean Air Act Amendments (CAAA) bill of 1990, which has two programs involving the use of oxygenates: 1) Oxygenated Gasoline Program that requires the use of gasoline containing a minimum of 2.7 wt. YO oxygen in 44 cities during the four winter months as a strategy to reduce CO emissions; and 2) Reformulated Gasoline Program for the nine worst ozone non-attainment areas, beginning Jan 1, 1995, that will require gasoline reformulation to lower toxic and ozone generating pollutants (VOC emissions), but containing atleast 2 wt. % oxygen.
The main competing oxygenates at present, are ethanol and methyl tertiary butyl ether (MTBE, or 2-methoxy 2-methyl propane). MTBE is now the second largest volume organic chemical, only behind ethylene, produced in the US. (Reisch, 1994). This is remarkable since its commercial production began barely two decades ago. Although MTBE is currently the industry standard, it has been proposed (Lucht, 1993) that ethanol and other renewable additives make up to 30% of the oxygenate market. This proposal is aimed primarily at reducing dependence on the finite fossil fuel resources. Furthermore, it would alleviate concerns about the buildup of carbon dioxide in the atmosphere, the major "greenhouse" gas. As a result, ethyl fertiary butyl ether (ETBE, or 2-ethyoxy 2-methyl propane), derived from renewable ethanol and isobutylene, has emerged as a promising new oxygenate . ETBE also has a somewhat lower blending Reid vapor pressure as well as a higher octane number than MTBE.
The commercial production of ETBE, by the equilibrium limited exothermic reaction of ethanol and isobutylene over an acid ion exchange catalyst, has recently begun (Oxy-Fuel News, 1992). In spite of its anticipated industrial importance, reliable information on the thermodynamics of the liquid-phase formation of ETBE is virtually non-existent in the open literature. Iborra et al. (1989) proposed an expression for the equilibrium constant for the ETBE reaction in the gas phase. However, since commercially the reaction occurs in the liquid phase, it is the thermodynamics of the liquid-phase reaction that is of the principal interest. Vila et al. (1993) have recently reported an expression for the liquid-phase ETBE equilibrium constant; however, the constants of integration in it were used as fitted parameters. Consequently, a careful thermodynamic analysis is warranted, and is provided here along with experimental data over a range of temperatures of practical interest. Alternate thermodynamic pathways are considered by Jensen and Datta (1994).
THERMODYNAMIC EQUILIBRIUM CONSTANT n
i=l The equilibrium constant for the non-ideal liquid-phase reaction, v,Aj = 0, among
the species Ai is
, .- , The second equality stems from the definition of activity, aj I xi. Upon relating the activity coefficients, y,, to the mole fraction, x i , through an appropriate relation, such as the UNIFAC correlation, the equilibrium composition may be determined for a given K(4) . The equilibrium constant, in turn, is- related to the thermodynamic properties of the mixture through
K(a) = exp -- 1 1167

for a reaction occurring in a phase a at the reaction temperature T . The standard Gibbs energy change for the reaction
where A c J a ) is the Gibbs energy of formation of species j in the phase a at the reaction temperature, T . Alternatively, the standard Gibbs energy change for the reaction may be computed from the standard enthalpy and entropy change for the reaction at the temperature T by
where the change in the standard enthalpy and entropy are determined by equations of the form of eq 3 for the reaction fin the a phase.
A G i ( a ) = A H i ( a ) - T A S i ( a ) (4)
Normally the reported data on Gibbs energy and enthalpy of formation are, however, available only at the standard state (ideal gas; Po= 1 bar; T o = 298.15 K), rather than at the reaction conditions of interest (e.g., condensed phase; P # Po,T # T o ) . While the effect of pressure is usually small, A G ; ( ~ ) for temperatures and phase other than the standard is obtained as follows. Using an integrated form of the v'ant Hoff equation the effect of temperature may be accounted for by
where the enthalpy of reaction as a-function of temperature may be obtained from the Kirchoff equation
T
T' AH:(a) = AH&a) + I A C i ( a ) d T (6)
where for the reaction
A C k ( a ) E 5 v , A C k j ( a ) (7)
C i j ( a ) = a j ( a ) + bj (a)T + c j ( a ) T 2 + d, (a)T3
j = 1 The molar heat capacities of species are generally expressed as a polynomial in
temperature of the form (Reid et al., 1987)
Upon using eqs 7 and 8 and carrying out the integration in eq 6, there results (8)
AH;(a) = I H ( a ) + Au(a)T + * T 2 (9) 2
+ a 7 . 3 + %T4 3 4
where IH(a) is the constant of integration obtainable from Eq 9 by using T =To and
The use of eq 9 in eq 5 results in
6 R 12R where I ~ ( c z ) is the constant of integration that can be obtained from Eq 9 by using T = T o . Finally, using eq 11 in eq 2 gives
6R 12R '
EXPERIMENTAL RESULTS AND DISCUSSION
Experimental results for the thermodynamic equilibrium constant were obtained from the disassociation of ETBE (obtained from Aldrich Chemical, 99% purity) with Amberlyst 15 ion exchange resin as a catalyst, in a 6 cm. stainless steel reactor tube (diameter 1/4"). The catalyst (obtained from Sigma Chemical Co.) was prepared by first washing the resin with distilled water, followed by 0.1 M nitric acid and dried overnight
1168

in a vacuum oven at 110 "C. After filling the stainless steel reactor tube with liquid ETBE, approximately 10 - 20 grains (particle size, 16 - 50 mesh) of Amberylst 15 were added and the tube was sealed and placed in a temperature controlled water bath. The experiments were performed over the range of temperatures, 20 - 60 "C. The reactor system was allowed to equilibrate for at least 24 hours before sampling, and for substantially longer periods for temperatures under 35" C. At least three liquid samples were taken by a syringe through a septum and analyzed by a Perkin Elmer Autosystem Gas Chromatograph with helium as the carrier gas (25 ml/min) using a PORAPAK R column (6x1/8") at an oven temperature of 170 "C. The GC was calibrated for ETBE over a wide range of compositions for accurate analysis, and, consequently, the maximum error in the measurement of its mole fraction was estimated to be k0.005. Activity coefficients were calculated making use of the UNIFAC method.
Thermochemical data given in Table 1 for the liquid-phase system was obtained from the TRC Thermodynamics Tables (1986). The coefficients for the third order polynomial in temperature, eq 8, were fitted to the experimental data for ethanol and isobutylene taken from Gallant (1968). However, the liquid-phase Gibbs energy of formation for isobutylene was not found in the literature and, therefore, was calculated making use of a form of the Clausius-Claperyon equation.
Table 1. Liquid Phase Thermochemical Data* and Liquid Phase Heat Capacity Equation Coefficients
Component Heat Capacity Coefficients of Equation 10 AGAP AH;,. I b j 4 dj kJ/mol kJ/mol
Isobutylene 35.44 0.802 -3.124E-3 5.045E-6 60.672a -37.7 Ethanol 29.01 0.2697 -5.658E-4 2.079E-6 -174.8b -277.51 ETBE 40.418 0.7532 -1.053E-3 1.8066E-6 -126.8 -357.5C
* TRC Thermodynamics Tables (1986) a not given in literature, calculated by Clausius-Claperyon equation b from CRC Handbook (1992) C adjusted value
Initially, the literature value of the standard liquid-phase enthalpy of formation of ETBE was taken from the TRC Thermodynamics Tables (1986) as -351.5 kJ/mol, but was subsequently adjusted to -357.5 kJ/moI, or by about 1.7%. Figure 1 shows the Iiquid- phase thermodynamic equilibrium constant as a function of temperature calculated using liquid-phase thermochemical data (Table l), with the adjusted and non-adjusted values for the standard enthalpy of formation of ETBE. The expression resulting from the adjusted value is
I n K ( 1 ) 4060.59
T (13) = 10.387 + - - 2.89055h T - 0.0191544 T
+ 5.28586x10"T2 - 5 . 3 2 9 7 7 ~ 1 0 ~ T3
As shown in Figure 2, eq 13 agrees quite well with experimental data from not only this work, but also those reported by Vila et al. (1993) and by Franqoisse and Thyrion (1991), and is, consequently, the recommended expression.
CONCLUSIONS
A thermodynamic analysis of the ETBE liquid-phase reaction is done to obtain an expression for the liquid-phase equilibrium constant (eq 13) that agrees well with experimental data. The analysis is based on the thermodynamic data reported in the literature, with the exception of ETBE, for which complete data are not yet available. Consequently, the standard enthalpy of formation of ETBE was adjusted to -357.5 kJ/mol, as compared with a reported value of -351.6 kJ/mol, in order to obtain better agreement with data over a range of temperatures. The liquid-phase equilibrium constant was also calculated using gas-phase thermochemical data, with good results as shown by Jensen and Datta (1994), further supporting the adjusted value for the standard enthalpy of formation of ETBE.
1169

Figure 1. Thermodynamic Equilibrium Constant with Adjusted and Nonadjusted Liquid-Phase
Enthalpy of Formation of ETBE
t
Nonadjusted ETBE Enthalpy
O.M)288 000304 0.0@32 0.00336 0.00352 I/Temperahue, 1 /K
Figure 2. Experimental and Literature Data Compared with the Predicted Liquid-Phase Equilibrium Constant
OM28 00029 0003 OW31 00032 OW33 00034 00035 l/Temperature, 1/K
ACKNOWLEDGMENT
The funding provided for this work by the Iowa Corn Promotion Board and the National Renewable Energy Laboratories is gratefully acknowledged.
NOMENCLATURE
uj,bj,cj,dj= coefficients of molar heat capacity expression, eq 10
ai = activity of species i, E Yjxj
OM28 00029 0003 OW31 00032 OW33 00034 00035 l/Temperature, 1/K
ACKNOWLEDGMENT
= molar heat capacity of species j in phase a, )/mol-K = ethyl tert-butyl ether = constant of integration in the Kirchoff equation, eq 11 = constant of integration in v'ant Hoff equation, eq 12 = liquid-phase thermodynamic equilibrium constant = thermodynamic equilibrium constant for phase a = equilibrium constant in terms of activities, eq 1 = equilibrium constant in terms of mole fractions, eq 1 = liquid phase = total number of species = pressure, bar = standard pressure, 1 bar
1170

R
SyT T = temperature, K T o
V j ( l ) VOC = volatile organic compound
x j
Greek letters
= gas constant, 8.3143 J/mol-K = standard entropy of species v at the temperature T, J/mol-K
= standard temperature, 298.15 K
= liquid molar volume of species j , mL/mol
= mole fraction of species i
I
a Yi A G O (a) = standard Gibbs energy of formation of species j in phase aa t temperature
fir T , kJ/mol
A G i ( a ) = standard Gibbs energy change for reaction in phase 01 at temperature T, eq 3, kJ/mol
A H f i , ( a ) = standard enthalpy of formation of species j i n phase a at temperature T, kJ/mol
AH”,a) = standard enthalpy change for reaction in phase a at temperature T, eq 5, kJ/mol
AS; vi
Subscripts
e = at equilibrium f = of formation i = ofspeciesj
T = at temperature T To = at standard temperature
Superscripts
= phase ( g or I ) = activity coefficient of species j
= standard entropy change for reaction at temperature T , J/mol-K = stoichiometric coefficient of species jin reaction
= at standard state (1 bar; also ideal gas for gas phase)
LITERATURE CITED
CRC Handbook of Chemistry and Physics, Lide, D. Ed., CRC: Boca Raton, 73rd Edition,
FranCoisse, 0.; Thyrion, F. C. Kinetics and Mechanism of Ethyl tert-Butyl Ether Liquid-
Gallant, R. Physical Properties of Hydrocarbons, Gulf Publishing: Houston, Volume 1,
Iborra, M.; Izquierdo, J.; Tejero, J. F.; Cunill F. Equilibrium Constant for Ethyl tert-
Jensen, K.; Datta, R. Equilibrium Thermodynamic Analysis of the Liquid-Phase Ethyl
Lucht, G. Ethanol Approval Creates Hugh Sighing Sound, rowa Farmer Today- Dec. 25,
Oxy-Fuel News. ARC0 Chemical, Coastal to Produce ETBE in Texas. Vol IV, No. 22,
Reid, R.; Prausnitz, J.; Poling, 8. The Properties of Gases b Liquids, McGraw-Hill:
Reisch, M. Top 50 Chemicals Production Rose Modestly Last Year, CbEN 1994, April 11,
TRC Thermodynamics Tables, Hydrocarbons and Nonhydrocarbons, Thermodynamics Research Center, Texas A&M University, 1986.
Vila, M.; Cunill, F.; Izquierdo, J. F.; Tejero, J.; Iborra, M. Equilibrium Constants For Ethyl tert-Butyl Ether Liquid-Phase Synthesis. Chem. Eng. Comm. 1993,124, 223- 232.
1992.
phase Synthesis. Chem. Eng. Process. 1991,30, 141-149.
1968.
Butyl Ether Vapor-Phase Synthesis. 1. C h . Eng. Data. 1989,34,1-5.
tert-Butyl Ether (ETBE) Reaction. rnd. Eng. Chem. Res. Submitted 1994.
1993, (lo), 1-2.
Sept. 7,1992,l.
New York, Fourth Edition, 1987.
12-15.
1171

I
METHANOL SYNTHESIS IN A TRICKLE BED REACTOR
by J i u a Wang, Sinoto Tjandra, Rayford G. Anthony, and Aydin Akgerman Department of Chemical Engineering
Texas A&M University College Station, TX 77843-3122
Keywords: Methanol synthesis, trickle bed reactors, syngas
INTRODUCTION The conversion of synthesis gas to methanol is practiced commercially in gas phase fixed bed reactors over a Cu/Zn/Al,O1 catalyst. However, because of the highly exothermic nature of the synthesis reactions, heat dissipation has been a bottleneck in the reactor design and process configuration. Moreover, coalderived synthesis gas, having a low H,/CO ratio, is not suitable for use in fixed bed reactors because of coke deposition. Trickle bed reactors combine advantages of both gas phase fixed bed and slurry reactors. With a liquid phase trickling over catalyst particles, the heat removal in trickle bed reactors is much more efficient compared to fixed bed reactors, which makes trickle bed reactors suitable for direct use of the coalderived synthesis gas. On the other hand, like fixed bed reactors, trickle bed reactor can operate at high gas space velocities and have high conversions per pass.
EXPERIMENTAL Figure 1 shows a schematic diagram of trickle bed reactor system. Feed gas to the reactor consists of pure Hz and a mixture of CO and C02 with a constant CO/COz ratio of 0.9 throughout the study. The feed gas streams flow through a guard bed p a d with activated carbon and molecular sieve having a particle size of 0.16 cm to remove any carbonyl that would poison the catalyst. Gas flow rates are controlled with Brooks model 5850E mass flow meters. To enhance mixing, the gas streams pass through a bed of glass beads prior to the reactor. A mineral oil consisting of saturated aliphatic and naphthenic hydrocarbons supplied by Witco Co. is introduced with a Milton Roy model DE-1-60P pump at the reactor inlet, along with the gas mixture. The oil flow rate is maintained at 2.5 kg/(m2 s) to ensure sufficient catalyst wetting.
The reactor is a 316 stainless steel tube with an ID of 0.96 cm, an OD of 1.20 cm, and length of 25 cm. It is mounted vertically in a bed of aluminum pellets. The reactor bed is divided into three sections. Prior to and after the 5.6 cm catalyst bed are 6.0 and 13.4 cm supporting sections filled with 0.2 cm diameter glass beads. The reactor is heated by a heating block and temperature in the reactor is controlled by Omega model 6100 temperature controller. Temperature in the catalyst bed is measured with a thermocouple inserted in the bed, while the pressure in the reactor is maintained at 5.2 MPa with a Grove model 91W back pressure regulator. A relief valve set to 10.6 MPa is placed before the reactor to prevent uncontrolled pressure rise in the system. The reactor is packed with 7 grams of crushed CuO/ZnO/AI,O, alcohol synthesis catalyst (United Catalyst L-951) having particle size of 500-600 pm. In situ reduction is carried out according to the procedure described by Sawant et al. (1987).
Reactor effluent passes through the back pressure regulator where the pressure is reduced to atmospheric pressure prior to the g a s 4 separator. The separator is heated to 100-110 "C with a heating tape, and the temperature is controlled with a Omega model 6100 temperature controller. The oil collected at the bottom of the separator is recycled back to the reactor. After the gas-oil separator, a Gow Mac 550 gas chromatograph equipped with a HP 3969 integrator is installed to check the steady state of the reaction. Methanol, water, and other products are separated from the unreacted gas by using a series of condensers immersed in a dry idacetone bath. The condensate. is analyzed off-line on the Gow Mac 550 gas chromatograph. The tail gas then passes through a soap bubble meter to record the volumetric flow rate before vented to the hood. A sample of the tail gas is taken at the sample port after the condensers and injected into a Carle gas chromatograph, equipped with a Varian 4290 integrator, to analyze its composition.
REACTOR MODELS To develop reactor models, the following assumptions have been made: (i) the gas phase is in plug flow and the liquid phase is in axially dispersed flow, (ii) the gas superficial velocity varies throughout the reactor, but the liquid superficial velocity is constant, (iii) catalyst particles have spherical geometry, (iv) the surface of each particle is partially wetted, but the pores inside the
1172

i Figure 1. Experimental apparatus.
particle are fully filled with the liquid, (v) at any point inside the reactor, temperatures in the gas, liquid, and solid phases are equal, (vi) methanol synthesis occurs only through the CO hydrogenation to methanol, and the water gas shift reaction is in dynamic equilibrium. With the above assumptions, a three phase reactor model was developed which incorporated plug flow, axial dispersion, mass transfer resistances between the gas and liquid phases, interparticle and intraparticle diffusion resistances, heat transfer, and pressure drop as well as two surface reactions. This reactor model equations with proper boundary conditions consist of a group of coupled, nonlinear partial differential and algebraic equations, and it is mathematically a two- point boundary-value problem.
Another two, simplified two-phase reactor models for trickle bed reactors are also developed for the purpose of comp&son. In the first two phase., simplified reactor model, the two-phase model I, the assumption of no interparticle and intraparticle diffusion resistances are added to the three phase reactor model. Mathematically, the reactor model consists of a group of coupled, nonlinear ordinary differential and algebraic equations, and it is also a two-point boundary-value problem. In the second two phase, simplified reactor model, the two-phase model 11, it is further assumed that: there is no mass transfer resistance between the gas phase and the liquid phase; both the gas and liquid phase are in plug flow; only the CO hydrogenation to methanol reaction occurs in the synthesis process; the reactor operates isothermally and there is no pressure drop. The model equation is mathematically a initial value problem.
For the system operated under typical commercial conditions, it was shown that assuming a perfect mixture gave better results than the Redlich-Kwong equation of state and similar results compared with the virial equation truncated after the second virial coefficient. In this study, the assumption of a perfect gas mixture is made. Parameters associated with model equations are mass and heat transfer coefficients, effective diffusion coefficient, Henry's constants, wetting coefficient, liquid axial dispersion coefficient and hold-up, as well as those parameters in kinetic rate expressions. An empirical kinetic rate expressions developed by AI-Adwani (1992) was used in the simulation. The expression was fitted from experimental data obtained in slurry reactors over a commercial CuO/ZnO/A1,0, catalyst. All other model parameters were estimated independently from either published correlations or literature data.
The model equations in two-point boundary-value problem were first rearranged into a dimensionless form, and transformed into linearized algebraic equations with combination of orthogonal collocation and quasi-linearization, and solved with an iteration scheme. In this study, 8 and 6 interior collocation nodes were used for longitudinal direction of the reactor and radial
1173

i
direction of catalyst particles, respectively. The initial value problem was solved with Gear's BDF method.
mUL"s AND DISCUSSION It was shown that the reactor operated in the trickle flow regime according to the published criterion for maintaining trickle flow regime. The time on stream study showed that catalyst activity decreased sharply during the first 150 hours, after which it had reached a steady state for 510 hours during a total 660 hours operation. Experiments were performed at three temperatures, 235,250, and 260 T; and a gas space velocity range of 5,200 to 35,000 h" at 250 T and 5,200 to 14,000 at 235 and 264 T. Gas space velocity is defined as volumetric flow rate divided by volume of catalyst calculated at the standard conditions through this study.
Figure 2 shows a comparison between predicted and experimental CH30H productivity under different gas space velocity. CH,OH productivity is defined as methanol production rate in moles per hour divided by total weight of catalyst loaded. In this plot, the reaction temperature, T,, is 250 T, and the hydrogen to carbon oxides ratio, H,/(O.9CO+O.lCOd, is 1. The solid circles represent experimental CH,OH productivity (Legend heading EXP). The short dash line denotes predicted CH,OH productivity from the two-phase model II (Legend heading MZPHS(II)), in which mass transfer resistance between the gas and liquid phases as well as interparticle and intraparticle diffusion resistances are neglected. The long dash line designates the prediction of CH,OH productivity from the two-phase model I (Legend heading MZPHSO), in which interparticle and intraparticle diffusion resistances are not accounted for. The solid line marks the predicted CH,OH productivity from the three-phase reactor model (Legend heading M3PHS), which considers both mass transfer resistance between the gas and the liquid phases and hterparticle and intraparticle diffusion resistances.
Figure 2 shows that the difference between the predicted CH,OH productivity from the three- phase reactor model and from the two-phase models is greater than the difference between the predicted results obtained from the two two-phase reactor models. As expected, the two-phase model II always gives the highest CH,OH productivity since this reactor model considers no mass transfer resistance among the gas, liquid, and solid phases, and, on the other hand, the three- phase reactor model predicts the lowest CH,OH productivity because this reactor model considers not only mass transfer resistance between the gas and liquid phases but also interparticle and intraparticle mass transfer resistances. Accordingly, the two-phase model I that accounts for only mass transfer resistance between the gas and liquid phases gives intermediate CH,OH productivity between the values obtained from the other two reactor models.
Figures 3 and 4 exhibit comparison between predicted and experimental CO and H, conversions under different gas space velocities at the same operating conditions as in Figure 2. Likewise, the highest predicted CO and H, conversions come from the two-phase reactor model II, and the lowest conversions from the three-phase reactor model. However, much lower values of H, conversion than the experimental values predicted from all three reactor models at gas space velocities greater than 20,000 h" result from uncertainty of the measurement of H, conversion. Figures 3 and 4 also show that there are obvious differences between predicted CO and H, conversions from the three-phase reactor model and ones from the two-phase reactor models. It should also be noted that in the simulation, all model parameters as well as the kinetic rate equations were estimated independently without using any experimental data obtained in the reactor studied, and that there was an average error of 11 96 associated with the evaluation of kinetic parameters for the kinetic rate expression. Moreover, with increasing catalyst sizes, especially when commercial size catalyst are packed, it is anticipated that both mass transfer resistance between the gas and liquid phases and interparticle and intraparticle diffusion resistanm plays an more important role. Hence, it is necessary to utilize the three-phase reactor model to predict the performance of trickle bed reactor packed with commercial size catalysts.
Figures 5 and 6 compare the predicted results from the three-phase reactor model with the experimental values at the same temperature of 250 "C but two different H2/(0.9C0+0. IC09 ratios of 0.5 and 2.0, respectively. In these figures, the scatter points marked by triangles and diamonds (Legend heading EXP) symbolize the experimental measurements. The line signifies the model predictions from the three-phase non-isothermal reactor model (Legend heading M3PHS). The ratios in the parenthesis following the legend headings of EXp and M3PHS designate H2/(o.9c0+0. IC09 ratios employed h the experiments and modeling. Figure 5 shows
.
1174

that the three-phase. reactor model under-predicts CH,OH productivity except at gas space velocities lower than 8,000 h-'. However, Figure 6 shows that the predicts CO conversion matches experimental values well at the H2/(0.9C0+0. I C 0 3 ratios of 0.5 and 2.0 under a broad range of gas space velocities. It should be noted that the stoichiometric ratio of H2 to CO in the CO hydrogenation reaction is 2.0. Hence, at the H2/(0.9CO+0.1CO~ ratio of 2.0 that is close to the stoichiometric ratio, CO conversion can go as high as 46% at low gas space velocities; then, the conversion declines quickly with increasing gas space velocities. On the other hand, at H2/(0.9C0+0. I C 0 3 ratios less than 2.0, H, is a limiting reactant and CO is in excess; therefore, CO conversion is substantially lower than one obtained at the H2/(0.9C0+0.1C03 ratio of 1 under low gas space velocities.
CONCLUSIONS Even though the two-phase reactor models are capable of predicting the expenmental results obtained in a laboratory trickle bed reactor, the three-phase reactor model is recommended for predicting the performance of trickle bed reactors packed with commercial size catalysts, with which severe diffusion effect could be conceived.
60 I 160
- 30
Figure 2
0 . I . I . , . , . I . I . I .
4000 Bo00 12000 16000 20000 24000 28000 32000 36000
SpoccVclocity. h-1
Comparison between predicted and experimental CH,OH productivity at Tw=250 "C and H2/(0.9C0+0. 1CO3=1.
40, (40
35 -
30 -
- 20
. * 10 -
4000 'Po 0 6000 12000 16000 20000 24000 28000 32000 36000
SpoceVelocity, h-1
Figure 3 Comparison between predicted and experimental CO conversion at Tw=250 "C and H2/(0.9CO+O.lC03= 1.
1175

2 20 -
10 - - 10
0 0 4000 8000 12000 16000 20000 24000 28000 32000 36000
SpoceVelocity. h-1
" " " " " " ' ~ ' ~
Figure 4 Comparison between predicted and experimental H2 conversion at TW=250 "C and H2/(0.9C0+0. lCO,)= 1.
Figure 5
0 " " " " " ' " ' " I 0 4000 8000 12000 16000 20000 24000 28OW 32000 36000
SpoceVelocity. h-1
Comparison between predicted and experimental CH,OH productivity at T,=250 "C and H2/(0.9CO+0.1C0,)=0.5 and 2.0, respectively.
f 60 60 I
0 0
0 ~ ~ " " " ' ~ ' . ' . ' . I 4000 8000 12000 16000 20000 24000 28000 32000 360000
SpoceVelocity. h-1
Figure 6 Comparison between predicted and experimental CO conversion at T,=250 "C and H2/(0.9C0+0.1C0~=0.5 and 2.0, respectively.
1176

A MODEL FOR LIQUID. PHASE METHANOL SYNTHESIS PROCESS IN A COCURRENT FLOW ENTRAINED REACTOR
P. Vijayaraghavan, Conrad I. Kulik*, and Sunggyu Lee+
Process Research Center Department of Chemical Engineering
The University of Akron Akron, OH 44325-3906
*Fuel Science Program Electric Power Research Institute
3412 Hillview Avenue Palo Alto, CA 94304
Experimental studies on the liquid phase synthesis of methanol were performed in an entrained reactor. In this three-phase process, syngas reacts in the presence of the catalyst-oil slurry, to form the product methanol. The effect of various operating conditions which included reactor temperature, pressure. flow rates of slurry and syngas, slurry holdup tank pressure, syngas composition and catalyst loadings, on the reactor productivity were studied. An overall experimental reaction rate model to predict the productivity of methanol using the operating conditions as the variables was developed, and the results were compared with the experimental data.
A computer model was also developed that predicts the reactivity of all species involved in the methanol synthesis process in an entrained reactor, from inlet conditions. This model incorporates the kinetic rate expression and the gas-liquid mass transfer correlation that was developed for the methanol synthesis process in a liquid entrained reactor. The rate of production of methanol predicted by this computer model agreed well with the experimental results. The overall experimental reaction rate model and the computer model assists in the development, scale-up and commercialization of the liquid phase methanol synthesis process in an entrained reactor. _ _ _ _ _ ~ ~
+To whom all correspondence should be directed
Keywords: Liquid phase methanol synthesis process, Entrained slurry reactor, Reactor modeling
S S METHANOL SYNTHESIS PROCESS
The liquid-phase methanol synthesis (LPMeOH) process that was developed by Chem Systems, Inc. in 1975 (Sherwin and Blum, 1979), was a three phase process that provided improved reactor stability and the compatibility of using a synthesis gas mixture with a higher CO content than Hz. However this process is not limited to CO-rich syngas only. The advantages of such a process in terms of reactant gas compositions include the use of coal derived feedstocks, and as a result, the process can be additionally significant in the production of clean liquid fuels (Lee, 1990).
The commercial reactor proposed for the LPMeOH process is an entrained reactor. In an entrained reactor, the catalyst particles in powder form are uniformly suspended in the liquid (oil) and this catalyst-oil slurry is continuously recirculated by a pump through a tubular reactor. Contact with the syngas is made by feeding the gas cocurrently with the upward flow of slurry (Vijayaraghavan and Lee, 1992). The inert liquid provides a much larger thermal mass than the vapor medium, thus facilitating the easier control of temperature by absorbing the exothermic heat generated during the methanol reaction.
The objective of this study is to develop an overall experimental reaction rate model to predict the production of methanol from operating conditions, and to develop a computer model to predict the reactivity of all species involved in the methanol synthesis process in a liquid entrained reactor, from inlet conditions. Such information is essential for the design, development and scale-up of the methanol synthesis process in a liquid entrained reactor.
A laboratory scale, continuous, mini-pilot plant was designed and built to carry out methanol synthesis research in a liquid entrained reactor (Vijayaraghavan, 1994). The details of the entrained reactor system and its peripherals is shown in Figure 1. The entrained reactor is a 76.2 cm. long stainless steel tube. Its outer diameter is I .3 I cm. The
1177

feed gas and the catalyst-oil slurry are introduced cocurrently from the bottom of the reactor. This provides effective dispersion of gas bubbles and along with the high flow rate of slurry, ensures a good suspension of solid particles in liquid. The reactor is equipped with an external heating device, capable of raising the temperature of the fluids in the reactor to the desired operating temperature.
Syngas is passed to the reactor at a desired flow rate by a mass flow controller. A pneumatically operated air-to-close back pressure control valve with positioner, connected to a pressure controller, maintains the entrained reactor at the desired pressure. The slurry is =circulated in the entrained reactor by a specially designed plunger type reciprocating slurry pump, which is capable of handling slurries containing as high as 40 wt.% of metallic catalyst solids. The entrained reactor system is provided with a slurry holdup vessel that is thoroughly agitated by a Magnedrive impeller, to prevent the catalyst settling and agglomeration. The unreacted gases and the product vapors from the slurry holdup vessel flow to the condenser. A sample bottle is installed at the exit of the condenser. The oil free gas flows to the lower chamber of a back pressure regulator, which maintains the slurry holdup tank pressure at a lower pressure than the entrained reactor, to facilitate product flashing and thereby separating the product vapors from the catalyst-slurry system. ' The flow rate of the vent gas is measured using a wet test meter. The on-line analyses of the feed and product gases and liquid product are carried out using a gas chromatograph coupled to an integrator.
g The syngas blending and compression procedure and the catalyst activation
procedure developed for low (< 25 wt. %) and high (> 25 wt. %) concentration of catalyst in slurry are published elsewhere (Sawant el al., 1987; Vijayaraghavan, 1994). A FORTRAN program that was developed to compute the material balance of experiments across the reactor system is given elsewhere (Lee, 1990 Parameswaran, 1987).
In order to develop an overall reaction rate model and a computer model to predict the reactivity of all species involved in the methanol synthesis process in a liquid entrained reactor, a statistical design of experiments was established and performed. From initial studies, it was found that the reactor temperature, pressure, syngas and slurry flow rates, and slurry hold-up tank pressure, are the important variables. A fractional factorial (25-2) design was used and is explained elsewhere (Vijayaraghavan, 1994). The high and low levels for each variable were chosen so that commercially interesting conditions would lie in the middle of the design. The levels of the variables are shown in Table I. These experiments were repeated for three different catalyst loadings by weight (10 %, 25 %, and 35 %) in sluny, to cover the kinetic and mass transfer controlling regimes.
ANALYSIS OF EXPERIMENTAL DATA
Experiments were performed according to the design mentioned earlier and the data obtained for IO%, 25% and 35% concentration by weight of catalyst in slurry were analyzed to develop an overall reaction rate expression model and a computer model that would predict the production of methanol in an entrained reactor, for any given operating condition. The data points cover 2 levels of reactor temperature, reactor pressure, syngas flow rate, slurry holdup tank pressure, slurry flow rate, syngas composition, and 3 levels of catalyst concentration by weight in slurry.
Overall Rate Exoression for LPMeOH Process in an Entrained Reactor
The development of an overall rate model is essential to predict the production of methanol in an entrained reactor, for any given operating condition. The 6 variables used for analyzing the data included reactor temperature, pressure, syngas flow rate, slurry holdup tank pressure, slurry flow rate, and catalyst concentration by weight in slurry. The overall rate expression for methanol productivity was developed using data described in detail elsewhere (Vijayaraghavan, 1994). The 6 variables were correlated using a SAS propam (PROC GLM) featuring a regression-correlation method that uses the principle of least squares to fit general linear models and generates the estimates of the unknowns.
The overall reaction rate expression for methanol productivity in an entrained reactor for the available data, can be best represented by the following statistical correlation model: RMeOH = 0.0027 x T - 0.039 x P - 24.75 x F, + 249.30 x C + 7.6 x x T x P + 0.044
. x T x Fg - 0.445 x T x C + 0.0026 x P x F, + 9.7 x x P x PH - 0.03 x P x C - 0.003 x Fg x PH + 0.025 x Fg x F, + 0.405 x Fg x C + 5.7 x 10⁻⁴ x PH x C
... (1) where R W ~ O H , T, P, Fg, PH. F,, and C represent the rate of methanol production (mol/kg.cat-h), reactor temperature (K), reactor pressure (psi), syngas flow rate (SLPM),
1178

slurry holdup tank pressure (psi), flow rate of slurry (MI), and catalyst concentration in slurry (weight fraction), respectively.
It is seen from Figure 2 that the rate of methanol production predicted by Equation ( I ) , match very well with the experimental rate data. It is observed that the average error between the experimental and the predicted rate values is 9.5%. Considering the range of practical experimental operating conditions and the inherent experimental error, the average deviation of the model seems quite good.
The overall rate expression shown in Equation ( I ) can help to predict the methanol production for any given operating condition, and would be extremely useful for process design, development and scale-up computations.
Cornouter Modeline of the Liauid Entrained Reactor
Modeling of the liquid entrained reactor was carried Out to predict the reactor productivity from inlet conditions. This computer program can accurately predict the multicomponent phase equilibria, ultimate chemical equilibria, and compositions of all reactant and product species exiting in the entrained reactor. Intrinsic reaction rate expressions and overall rate expressions based on the gas-liquid mass transfer correlation were developed earlier (Vijayaraghavan, 1994).
For CO-rich syngas, the intrinsic reaction rate expression is:
For H2-rich syngas, the intrinsic reaction rate expression is: R M ~ O H = 0.75 x 10'0Exp(-20500/RT) (CHZ - C:*)
R M ~ O H = 0.41 x 1Oi~E~p(-205O0/RT) (CHZ - C;pZ)
... (2)
... (3)
The overall reaction rate expression in terms of gas-liquid mass transfer coefficient
R M ~ H = (VoiIW (M-') (CHZ - C:z ) ... (4) M = (VoiiW ( I k ) + (IKLiaB) ... (5)
In Equations (2), (3). (4), and (3, R, Voii, W, KLiaB, k,, CHZ. and C;f, represent the universal gas constant (I-atm./mol-K), volume of oil at operating conditions (I), mass of catalyst in sluny (kg), overall gas-liquid mass transfer coefficient (Vh), intrinsic reaction rate constant represented by Equations (2) and (3). and the physical and chemical equilibrium concentrations of hydrogen in oil (moIA), respectively.
The overall gas-liquid mass transfer coefficient was best represented by the following correlation:
NSh = 1.07 x 10⁻⁹. N:: . Nif . Nki3 . N;: . ( U l / U , ) o . ~ . E:' ... (6) where Nsh, Nsc, Neo. N G ~ , and N F ~ represent the Sherwood Number (KLiaB d: / DHZ,~), Schmidt Number (pi/ (pi D~2.1)). Bond Number (d: PI g / IS), Galileo Number ( d l p: g / p:) and the Froude Number (U, / (g d,)O-5), respectively. The gas phase holdup is best represented by the following expression (Vijayaraghavan, 1994):
.._ (7). In Equations (6) and (7) &, D~2.1, pi, pg, pi, pg. IS, UI, U,, and g represent the column diameter, diffusivity of hydrogen in liquid, viscosity of slurry, viscosity of gas, density of slurry, density of gas, surface tension of oil, velocity of slurry, velocity of gas, gas holdup and gravitational acceleration, respectively.
The development of Equations (2) - (7) used in the computer modeling of the entrained reactor for the liquid phase methanol synthesis process, are described elsewhere (Vijayaraghavan, 1994). The length of the entrained reactor is divided into a number of segments and the concentration of each species in the liquid and vapor phase in each segment is calculated after the physical and chemical equilibrium criteria are met, using computer programs developed earlier (KO et al., 1987; Lee, 1990). Gas phase holdup, vapor phase compositions, pressure, temperature, volume of oil, and mass of catalyst in each segment of the reactor are required as input data for the next segment in this program. The ratios of reaction of hydrogen, carbon monoxide, carbon dioxide and water with respect to methanol were averaged for the entire data for facilitating modeling purposes. The number of moles of each species entering the (i+l)-th segment of the reactor, is the difference between the number of moles of that species entering the i-th segment and the number of moles of that species reacting in the i-th segment. Thus the number of moles of each reactant and product species entering and exiting each reactor segment is computed cumulatively, and hence the final exiting moles of each species in the reactor is determined.
is (Lee, 1990):
&g = 0.672 . (Ug.pl/0)o.~8 . (p: g/(pl 03)-0.13 . (pg /pi)0.06 . (pg /pi)O.l*
1179

i
The data used for the entrained reactor modeling purposes are described elsewhere (Vijayaraghavan, 1994). It is seen from Figure 3 that the experimental data and the modeling results agree well with each other, and the average error between the results is less than 14%. Since hydrogen is n o longer the limiting reactant for H2-rich syngas Operating condition, the concentration difference term (CHZ - C:*) plays an important role in the significant deviations observed in Figure 2 for certain experimental runs (5 , 11, 16). The average deviation of the computer model seems good considering the extensive thermodynamic Computations incorporated in the model, the experimental error, and the wide range of operating conditions employed.
This modeling of the entrained reactor can help to predict the production of methanol for any given inlet conditions and would be extremely useful for the optimization, improvement and scale-up of the methanol synthesis process in a liquid entrained reactor.
CONCLUSION
An overall reaction rate model that could predict the productivity of methanol for any given operating conditions, was successfully developed for the liquid phase methanol synthesis process in an entrained reactor. A computer model that would predict the reactivity of all chemical species involved in the methanol synthesis process in an entrained reactor, from inlet feed conditions was successfully developed. Data covering a wide range of operating conditions, including varying composition of syngas and catalyst loadings, has been used to develop the overall reaction rate model and the computer prediction model. The results obtained could be of great significance in the design, development, scale-up and commercialization of the methanol synthesis process in a liquid entrained reactor.
REFERENCES
KO, M. K., Lee, S . , and Kulik, C. J., 1987. "Multicomponent Physical Equilibrium of Liquid Phase Methanol Synthesis", -andFuels, 1(2), 21 1-216.
Lee, S., 1990. Methanol Synthesis Technology, CRC Press, Boca Raton, n. Parameswaran, V. R., 1987. "Roles of Carbon Dioxide and Water in the Liquid Phase Methanol Synthesis Process", Ph. D. Dissertation, The University of Akron.
Sawant, A. V., KO, M. K., Parameswaran, V. R., Lee, S., and Kulik, C. J., 1987. "In- Situ Reduction of a Methanol Synthesis Catalyst in a Three Phase Slurry Reactor", Euel Sci. &Tech. Int'l, 5(1), 77-88.
Sherwin, M. and Blum, D., 1979. "Liquid Phase Methanol", Final Report EPRI, AF-1292 (Project 317-2). Electric Power Research Institute, Palo Alto, CA.
Vijayaraghavan, P., and Lee, S., 1992. "Design and Operation of a Liquid Entrained Reactor Mini-Pilot Plant for Methanol Synthesis", FuelsSvmDosium, AIChE, New Orleans, LA.
Vijayaraghavan, P., and Lee, S., 1993. "Mini-Pilot Plant Design, and Operation of an Entrained Reactor for Liquid Phase Methanol Synthesis Process, "-,
Vijayaraghavan, P., 1994. "Entrained Reactor Studies on the Liquid Phase Methanol Synthesis Process", Ph.D. Dissertation, The University of Akron.
Table I
Levels of the Design Variables
I1(2), 243-268.
Number of the Design Variables (-) (+) Design Variable
1 Temperature (0 C) 235 250 2 Pressure (psi) 800 950 3 Syngas Flow Rate 1 .o 2.5
(SLPM)
4 Slurry Holdup Tank 300 500 Pressure (psi)
5 Slurry Flow Rate (Vh) 15 30
1180

FORWARD PRESSURE REGULATOR
i A 8 ,
L! m 7 1 z E 6 L
.E .- 5 a 2 4 : n
2.
e
v
m = 2 - 7i 3:
B 1 : 0
$ 0
SOLEWtD I I VALVE
Experimental Data 0 Modeling Results
0 0
0
0
0 8 0 : o o O o
0 0 0 0
0 8 8 0 ~ o o a o : g o o n
- ~ ~ " " " " " " ~ ~ " ' ~ ' " '
FEED G4S ANALYSIS
BACK PRESSURE
-> WS$ FLOW LYJNTROLLER
SLURRY PUMP
Figure I . Liquid Entrained Reactor System and its Peripherals
0 Experimental Rate 0 Predicted Rate (Equation 1)
5 0 0
E 2 0 0 0 5 10 15 20 25
Experimental Run Number
Figure 2. Comparison between Experimental Rate vs. Overall Reaction Rate Model Prediction (Equation 1)
I

EVALUATION OF LOW-TEMPERATURE METHANOL SYNTHESIS IN THE LIQUID PHASE
Sei-ichi Ohyama Atmospheric Science Department
Central Research Institute of Electric Power Indusrry 11-1 , Iwato-kitu 2 chome. Komae-shi, Tokyo 201, Japan
Keywords: Methanol synthesis, low temperature, space time yield
INTRODUCTION Methanol has recently attracted much public attention as one of the possible alternate fuels for oil. The electric power industry is considering the introduction of methanol as a fuel for gas turbines and fuel cells. Also, coproduction of methanol and electricity in an integrated gasification combined-cycle power plant (IGCC) has been proposed for operating IGCC at levels Corresponding to peak demand’. The electric power industry in Japan projects methanol power generation to be 1,000 MW in 2010. To employ methanol as a power plant fuel, a more efficient and more economical methanol production process, which can reduce methanol cost, is required.
Conventionally, .methanol is produced in the gas-solid phase process over copper-zinc-based oxide catalysts according to the following reaction, which is higyy exothermic:
This reaction is thermodynamically favorable at lower temperatures. Thus, if a catalyst that is highly active at low temperature is available and the reaction heat is removed efficiently, methanol production with high conversion per pass is achieved, which would result in a reduction of methanol cost.
Recently, low-temperature methanol synthesis in the liquid phase has been proposed and received considerable attention, since it has the potential to overcome problems in the conventional methanol processes. Two processes have been proposed: the Brookhaven National Laboratory (BNL) low- temperature methanol process2.3 and the process4-6 through methyl formate (MF) formation (hereafter referred to as “methanol synthesis via M F ) . Methanol synthesis via MF is supposed to proceed by the following two reactions occurring concurrently:
The BNL process employs a homogeneous Ni catalyst and alkoxide in an organic solvent, while methanol synthesis via MF employs a mixture of copper-based oxide and alkoxide as a catalyst. Both processes are operated at around 373 K, where high equilibrium conversion of carbon monoxide to methanol is expected. The processes have been reported to show excellent activity even at such low tcmperatures.
Believing that these low-temperature methanol processes show future promise, the author has examined their catalytic activities and their possibilities as industrial processes were estimated in terms of the space time yield (STY).
EXPERIMENTAL Experimental System All experiments were canied out in batch operation in a 465 cm3 stainless steel autoclave. A mixture of carbon monoxide and hydrogen with a stoichiometric ratio for methanol synthesis (H2/C0 = 2) was employed as feed gas. The feed gas was admitted to the reactor and pressurized to a certain pressure at ambient temperature. The reaction conditions were temperatures from ambient temperature to 433 K and initial pressures from 1.1 MPa to 5.0 MPa. The time courses of the pressure and the temperature were monitored during the run. After the run, the components of the gas phase and the liquid phase were withdrawn and analyzed by gas chromatography.
The carbon monoxide conversion and the selectivity to methanol were determined on the basis of the amount of carbon-containing products. The approximate STY was determined from the amount of methanol produced, the reaction time at which the catalyst showed a pressure decrease, and the total volume of the catalyst system. (In this paper, “catalyst system’’ indicates a mixture of the catalyst and the solvent.)
Catalyst Preparation The BNL Catulysts. The BNL low-temperature methanol synthesis catalysts were prepared according to their patent reports3. They were prepared from three compounds, ;.e., sodium hydride, alcohol and metal acetate. In this work, 60 mmol of sodium hydride, 52 mmol of tert- amyl alcohol as the alcohol component and 2.5-30 mmol of nickel acetate (typically I O mmol) that was fully dried and dehydrated, were employed as standard starting materials. The catalysts were suspended in a 50 or 100 cm3 solvent (triethylene glycol dimethyl ether, i.e., triglyme). A mixture of nickel acetate ( I 0 mmol) and sodium hydride (60 mmol) was also used as a catalyst to study the active species of the catalyst.
Cutulysts for Mefhunol Synthesis via MF. A mixture of oxide and alkoxide was employed as a catalyst for methanol synthesis via MF. The catalyst was suspended in triglyme (90 cm3). Oxides used in this study (normilly 4 g) were CuO (Wako Pure Chemical Industries), Cr103 (Wako Pure Chemical Industries), a mixture of CuO and Cr2O3 (CuO/Cr20 - 1 and 2, molar ratio), copper chromite (CuO/Cr203, Aldrich Chemical Company, Inc.) and Ba-promoted copper chromite (Cu0/Cr2O3/Ba0, Aldrich Chemical Company, Inc.). Copper-based oxide commercial catalysts,
CO + 2 H2 + CH30H (g) AHzg8 = -90.97 kJ/mol (1)
CH,OH+ CO --f HCOOCH, (2) HCOOCH, + 2H2 + 2 CH30H (3)
1182

N203SD (Nikki Chemical Co.), KMB (Toyo CCI Carp.), G66B and G89 (Nissan Girdler Catalyst Co.) were also employed. Potassium methoxide solution ( I O cm3, 30% in methanol solution) was employed as an alkoxide component.
RESULTS AND DISCUSSION The BNL Methanol Process The performance of the BNL Ni catalysts at 373 K and 433 K is summarized in Table I . Methanol was formed quite selectively over the BNL catalysts at 353-433 K and 1.1-5.0 MPa of initial pressure. (Experiments could not be carried out at temperatures above 433 K because the pressure started to decrease in the course of the heating process. Also, it is reported3 that the catalyst works only below 423 K.) The maximum STY was obtained at 433 K and at 5.0 MPa because higher temperatures and higher initial pressures tended to enhance methanol productivity under the studied conditions. The STY with the BNL catalysts also varied with Ni concentration in the catalyst system and reached 0.89 kg 1-1 h-1 at the optimum concentration. At 433 K, the BNL catalysts yielded almost 90% for C O conversion and over 99% for selectivity lo methanol. Ni is a well- known catalyst for methanation of carbon oxides and Fischer-Tropsch synthesis. However, to the author's knowledge, it has never been reported that a Ni-based compound catalyzes methanol synthesis from CO + H,. Thus, the BNL catalyst is quite novel at this point. Since the catalyst was highly active even at temperatures much lower than the operating temperature of the conventional methanol process (503-543 K), with this catalyst, it should be possible to eliminate recycling facilities for unconverted gas, which would reduce the production cost of methanol.
Small amounts of methyl formate and dimethyl ether were also produced. They were considered to be formed by the carbonylation of methanol (equation 2) and dehydration of methanol (equation 4), where produced methanol was a reactant:
(4) Sodium ten-amyl alkoxide that could possibly be formed and exist in the catalyst system, might be responsible for equation 2 since alkoxide is known to catalyze carbonylation of methanol7.
Figure 1 indicates the effect of methanol concentration in the catalyst system on the STY. In these experiments a certain amount (1-8 cm3) of methanol was initially added to the catalyst system and the reaction was carried out at 373 K and 5 MPa. As shown in Figure I , methanol addition did not affect catalytic activity significantly under the studied conditions although the STY showed a slight tendency to decrease with methanol concentration. A 99% selectivity to methanol was obtained, independent of methanol concentration. Therefore, constraints from chemical equilibrium or inhihition of the reaction by adding inethanol was not recognized. On the other hand, a large amount of methyl formate was formed in the experiments with methanol addition at ambient temperature. Carbonylation of methanol (equation 2) seemed to prevail at such low temperatures, where sodium alkoxide functioned as a catalyst. Figure 2 shows the time courses of the temperature and the pressure during the multiple-charging experiment. Even when the pressure decrease became small, thc pressure started to decrease again by recharging the feed gas, which suggested that the reaction continued to proceed. However, a marked pressure decrease was not observed after the second recharge of syngas (in the 3rd reaction). Methanol of 167 mmol was formed at the end of the entire reaction. Such an amount of methanol was not found to affect or inhibit the methanol productivity as shown in Figure 1. Therefore it was because of deactivation of the catalyst that only a slight pressure decrease was observed in the 3rd reaction.
To clarify the active species of the BNL catalyst, experiments with a mixture of sodium hydride and nickel acetate as a catalyst were carried out. Figure 3 shows the results. With sodium hydride and nickel acetate, methanol synthesis proceeded as well as with the BNL catalyst. The sodium hydride and nickel acetate catalyst exhibited a slightly lower STY than the BNL catalyst, but it showed almost the same value in CO conversion and selectivity as the BNL catalyst. On the other hand, in the experiments using a mixture of tert-amyl alcohol and sodium hydride as a catalyst (the nickel acetate component of the BNL catalyst was not employed), methanol synthesis did not occur at temperatures where the BNL catalyst works. Methyl formate and dimethyl ether were formed only when methanol was initially added into the catalyst system. Therefore, the nickel species that is activated or reduced by sodium hydride is responsible for methanol synthesis.
The BNL catalyst exhibited activity in several subsequent experiments, while a mixture of sodium hydride and nickel acetate that was employed in the previous experiment, did not show activity in the second experiment. Hence, tert-amyl alcohol, which is a component of the BNL catalyst and was not used in the experiments in Figure 3, may play a role in re-activating the nickel species and making the BNL catalyst function again in the subsequent reactions.
Methanol Synthesis via MF Methanol was formed rapidly at around 373 K using a mixture of copper-based oxide and alkoxide. Figure 4 shows the STY of methanol and methyl formate at 373 K and 5 MPa with various oxides and potassium methoxide as a catalyst. It should be noted that the catalyst system initially contains methanol (ca. 220 mmol) because potassium methoxide in methanol solution was employed as an alkoxide component. N203SD and G89, the copper-chromite-based catalysts, showed activity for methanol among the commercial catalysts. In particular, N203SD exhibited high STY. Copper chromite (unpromoted and Ba-promoted) also had the STY values comparable to N203SD. On the other hand, methanol was consumed and only methyl formate was formed over the CuOEnO-based catalysts (KMB and G66B), which are the conventional catalysts for methanol synthesis . Since all the oxides exhibiting high activity for methanol were copper-chromite-based compounds, it was considered that copper chromite is quite effective for methanol synthesis via MF. It is generally known that copper chromite promotes hydrogenation of carbonyl compounds. Thus, in this study,
1183
2 CH3OH -+ CH3OCH3 + H20

copper Chromite might catalyze hydrogenolysis of methyl formate that resulted from carbonylation of methanol.
When CuO or cr,O, was employed as an oxide component, only methyl formate was formed with consumption of methanol, which suggested the progress of carbonylation of methanol. However, amounts of methanol and methyl formate were produced using a mixture of both. Thus it is suggested that an active site for hydrogenolysis of methyl formate might be yielded by mixing of CuO and Cr203,
Figure 5 shows the dependence of the STY on temperature and initial pressure using N203SD and potassium methoxide. Methanol was formed rapidly and selectively over 353 K (CO conversion: 87-94%. selectivity to methanol: 87-98%). However, a significant amount of methyl formate was formed at ambient temperature, which indicated carbonylation of methanol proceeded rapidly at such low temperature. As seen in the figure, higher temperatures and higher initial pressures enhanced methanol productivity, while lower temperatures and higher pressures increased methyl formate formation.
The STY Evaluation of Low-Temperature Methanol Synthesis The STY of low-temperature methanol synthesis and that of the conventional methanol production process are compared in Figure 6. In the conventional process*, copper-zinc-based oxide catalysts (CuO/ZnO/AI20, or CuO/Zn0/Cr,03) are employed under the conditions of temperature of 503- 573 K, pressure of 5-20 MPa, and space velocity of 30,000-40,OOO h-I. In the IC1 process, a typical methanol process, the STY of 0.5-0.77 kg 1-1 h-1 (average 0.66 kg I - ’ h-1) is obtained under the conditions of 500-523 K and 5-10 MPa. The BNL process showed the STY of 0.89 kg I-I h 1 at the optimum Ni concentration (433 K, 5 MPa), which was almost the same value as that in the IC1 process Thus, the BNL process has the possibility of producing methanol more efficiently than the conventional process. On the other hand, methanol synthesis via MF showed the STY of 0.13 kg I-’ h-1 at 423 K and 5 MPa (feed: H,/CO = I ) , which is 1/5 of the STY in the IC1 process. However, the STY is expected to be improved by optimizing reaction conditions and catalyst concentration in the liquid phase, and by searching for an active catalyst system.
CONCLUSIONS Low-temperature methanol synthesis in the liquid phase has been studied and its possibility as an industrial process was evaluated in terms of the STY. Methanol productivity comparable to that of the conventional methanol process is anticipated under much milder conditions by using the BNL catalyst. It was suggested, however, that extension and stability of the catalyst life are the important subjects in the BNL process. Methanol synthesis via MF also showed activity for methanol at low temperatures but its productivity was still quite low. It is necessary to explore an active catalyst system and examine the catalytic behavior in more detail to improve the STY value.
REFERENCES ( I )
(2)
(3)
(4) ( 5 )
Deane, A. A,, Huber, D. A. and DeRosa, J., “Coproduction of Methanol and Electricity”; EPRl Report AP-3749 (1984). Mahajan, D. and Sapienza, R. S., “Proceedings: 15th Annual EPRl Contractors’ Conference on Fuel Science”; EPRI Report GS-7434 (1991). Sapienza, R. S., Slegeir, W. A,. OHare, T. E. and Mahajan, D., U.S. Patent 4,614,749, 4,619,946, 4,623,634 (1986). S0rum. P. A. and Onsager, 0. T., 8th Int. Congr. Catal., vol. 11,233 (1984). Gormley, R. J., Rao, V. U. S., Soong. Y. and Micheli, E., Appl. Catal. A: Genera/, 82, 81 119971
1
r’
\ . - - - I .
(6) Palekar, V. M., Tiemey, J. W. and Wender, I., Appl. Catal. A: General, 103, 105 (1993) (7) Gormley, R. J., Giusti, A. M., Rossini, S. and Rao, V. U. S., 9th Int. Congr. Catal. , vol.
11, 553 (1988). (8) Hetmann, R. G., Klier, K., Simmons, G. W., Finn, B. P., Bulko, J. B. and Kobylinski, T.
P., J . Caral., S, 407 (1979).
Table 1. CaIalytic activity f o r low-temperture methanol synthesis over BNL Ni catalysts.
(K) ( M a ) (h) (mol I-’) ($6) ($6) MeOH Me20 HCOOCH3 co2 CH4 H.C. (Lg-MeOHI-lh.’) 373 1 . 1 1 94.6 80 .O 93.4 54.4 0.001 0.662 0 ,059 uace --- 0.016 373 3.0 I 94.6 60.3 98.4 50.7 trace 0.403 --- 0.003 --- 0.024 373 5.0 I 94.6 87.8 99.5 140 0.010 0.353 0.017 --- --- 0.043 433 1.6 I 94.6 86.7 99.3 33.0 trace 0.049 --_ 0.005 ~ - - 0.025 433 3.0 I 94.6 95.5 99.8 98.8 0.013 0.046 --- 0.004 --- 0.12 433 5.0 I 94.6 90.7 99.8 203 0.017 0.237 --- 0.004 --- 0.25 433 5.0 1 23.7 98.9 99.7 213 0.196 0.031 --- 0.004 0.026 0.24 433 5.0 I 94.6 90.7 99.8 203 0.017 0.237 --- 0.004 0.001 0.25 433 5.0 1 94.6 93.0 99.9 237 0.044 0.025 --- 0.007 0.004 0.47 433 5.0 1 180 96.3 99.1 257 0.378 0.777 --- 0.005 0.005 0.89 433 5.0 I 284 88.6 99.0 136 trace 0.588 0.132 0.005 --- 0.41
CataIyst: NaHlren-amyl alcohoVNi(CH3C00)z Catalyst amount = 2.5-30 m o l as Ni(CHC00)z. volume of solvent = 50-100 cm3.
‘Initial pressure at ambient tempaature. %i concentation in the catalyst system. :Conversion of carbon monoxide. dSelectivity to MeOH.
Temp P a Time Ni conch Convc Select.d Productse (mmol) STY
___- . - - - -__-- -_- -_______________________~~~~~-- - - - - - - - - - - - - - - - - - -~~-- - . -~~~~~~-- - -~~~~~~~
___-.--_________________________________----------~--------------~--------------------.--
Products: Me20 = dimethyl ether; H.C. = hydrocarbons except CH4.
1184

0.0 0.2 0.4 0.6 0.8 1.0 1.2 1.4 1.6 1.8 2.0
Methanol concentranon (mol rl) Figure 1. Effect of methanol addition on space time yield nver BNL Ni catalysts Catalyst: NaHlren-amyl alcohoVNi(CHC00)z. Catalyst amounl: 10 mmol as Ni(CH3CW)z. Solvent: vigylme (100cm3). Reaction conditions: temperalure = 373 K. iniual ore.ssure = 5 MPa. H W O = 2.
.
600 I Y
500 cooling -1 - x 8 450 a e!
:y 6 -
k :; 3
2
I
250 I I I
0 I 0
50 100 I50 2w 250 300 Time (min)
Figure 2. Temperaturn and pressurn profiles using a BNL NI cnullysi (muluplechargmg expenmeni) Calalysi. NWVren-nm~l akohoVNI(CHT00)z Caralysl nmounl IO mmol as N I ( C H I C ~ ~ ) Z Sulvcni. melmc I IW cm'). Reaclain condmns. rnil1.4 ore(lure = 5 0 MP3. rcacuon hmDeralure = 373 K
4Z- BNL Ni catalyst Ni(CH,COO)z + NaH
.f 0.4
350 370 390 410 430 450
Temperature (K) Figure 3. Space time yield over BNL Ni catalysts and nickel acetate +sodium hydride catalysts. Catalystamounl: 10 mmol as Ni (CHK00)z. Solvent: viglyme (100cm3). Reaction conditions: initial pressure = 5 MPa. HzICO =2.
1185

0.14
I 0.12 - 0.10
5 z 0.08 t
.z 0.04
fi 0.02
P * ow
-* 0.06 P
(Y
-0.02
KMB
6668
GS9
NUMSD
Copper chromlte
Ba promoted copper chromlte
CUO
cr203 Cu01Cr20, (21)
cuo/cr ,03 ( I : I ~
-0.01 0 0.01 0.02 0.03 0.04 0.05 0.06
Space time yleld (kg-product 1.' h ' )
0.08
& Melhanol 4- Mclhyl lomate
I , N,
b) Effect of iniual pressure (at 373 K) Methanol
-Cy Mcthylfomarc
"."., 290 310 330 350 370 390 410 430 0 1 2 3 4 5 6 7
Temperature (K) Initial pressure (MPa)
Figure 5. Effect of reaction paramclers on space time yield for low-lemperdlure methanol synthesis vin methyl formate a) Effect of temperature (initial pressure: 5 MPa), b) Effect ol'initial pressure (reaction temperalure: 313 K). Catalyst: N203SD 4 e + CH3OK IO cm3 (30% in methanol solution). Solvent: uievlme (90 cm I). Feed ras: HzKO = 2.
Conventional methanol pmegs
(IC1 Process) sv = 1O.oOo~ 4o.m
NI(CH,COO)~ - NaH - an-amyl alcohol 433 K. 5 MPa Batch Reaction
BNL lowtemperature methanol process
Low4emperablre CuOICrZO1lMn0IBd0 + CH?OK methanol process YI(I 13 423 K, 5 MPd 1
methyl formate Batch Reaction
00 0 1 02 0 3 04 0 5 0 6 07 0 8 09 i n Space lime yield (kg-MeOH I-' h')
Figure 6. Space ume yield of vanous methanol synlhesis mhnologies
1186

THE DIRECT LIQUEFACTION PROOF OF CONCEPT PROGRAN
AG. Comolll - LK. (Theo) Lee - V.R. Pradhan - R.H Stalzer Hydrocarbon Research, Inc.
100 Overlook Center, Sulte 400 Prlnceton, NJ 08540
Keywords: Prwf-O1-Concept - llllnols 4% Coal - CTSl. Process
INTRODUCTIOM: - Demonstration Operations at the Dired Liquefaction Proof.Ol-Concept Facility at the HRI Research and Development Center in Lawremville. N.J. are funded by the U.S. Department of Energy. Hydrocarbon Research Inc. and the Ken-McGee Corporation. The facility is operated and managed by Hydrocarbon Research Inc.
The Proof of Concept Facility mnsists of several distinct process units, a Coal Handling System, a Slurry Preparation-Pumping-Preheating System. Two €bullated-Bed Reactors in Series, an On-Line Hydrotrealer, Separation and Pressure Let-Down System, Scrubbing and Oil-Water Separation. Flash Vessels and Atmospheric and Vawum Oistillation Equipment, a Rose-Sp and U.S. Filter Solid Lquid Separation Systems and Produd Storage. The POC Process Development Unl (PDU) processes about 3 tons a day of mal produang about 15 barrels per day of clean distillate liquid product and can operate wlh or without solids containing recyde soivent. The Rose-SR unit and On-Line Hydmtreater were added along wlh other improvements to the equipment and mntrol systems pmr to the CTSLTy Process Scale-up with Illinois 116 Bituminous Coal. F@um 1 shows a schematic of the process.
The CatalyticTwo Stage Lqueladion Process (CTSL) is an advanced direct coal liquefadion process that utiliies a low temperature first stage to foster hydrogenation in the presence of a nickel molybdenum ebullated bed cataiyst and a hgher temperature second stage to increase conversion and heteroatom removal. In POC Run 01, the main objective was to scaleup the CTSL Process wlh Illinois #6 mal in the extinction recycle mode to produce an all distillate slate of products.
The Prwf of Concept Program started in October 1992 wlh the first year devoted to a facility upgrade, folbwed by operations on POC Run 01 through Fetuuary 1994.
PROGRAN AND POCO1 OBJECllVES - The overall program objective is to develop direct mal liquefaction and assodated transitional techmbgies which are capable of produang premium liquid fuels, which are competitive with petroleum and which can be produced in an environmentally acceptable manner.
POC-1 objectives were to wnfirm equipment operability, to mlled data in the CTSL mode of operation while feeding Illinois #6 Crown II Mine mal, to mllect 2500 gallons of distillate for upgrading studies. to evaluate the FOSESRg" and US. Filter Systems. and to provide a comparison with the existing data base.
FACILITY UPGRADE - During the first year the POC facilty was modified to improve reliability and to povide the flexibility to operate in several alternate modes. Ken-McGee's Rose-SR"unit from Wilsonville. Alabama was redesigned and installed at HRI to allow a comparison with the U.S. Rtter solids separation system. Also induded was modifying a reactor from Wilsonville, enlarging the reactor structure, installing an on-line hydrotreater, providing interstage sampling. upgrading the mmputer mntml and data acquisition system, revising the preheaters and conneding to an alternate power supply grid.
OPERAllONS - Run POC-1 started on Odober 29. 1993 feeding Illinois #6 mal using 1116th inch NI-Mo on alumina catalyst in each of two ebullated readors and with hydrogenated Cat Cyde oil for start-up. The operating mndlions plan as shown in the foilowing Operating Summary consisted of five main conditions with some variations in mndflions 3 8 4. (See Table 1). As indicated the space vebciiy and reacton temperatures were increased and the solvenVcoal ratio was decreased as the run pcogressed. In addition
1187

/
I
the catalyst addZion rate was inaeased as planned and inadveltently decreased by maldperation of the catalyst addition system in periods 47-Y). Fifty-eight days on mal feed were completed mncluding in a planned shutdown in February 1994.
Illinois 116 mal with a Rose-SR solid separation una. In the first hK, operating conditions at moderate temperatures and at low space velocity (2 tonsldxy), hgh distillate yields and mnversion were observed; C4- 975Fyields of 73-82%01 W F m a l and 975R Conversions of 86.95%. These resub confined bench scale data and as seen in Table 2 were sustained in ensuing periods despite variations in Deasher performance as optimum operating mndiaions and procedures were baing developed. In the lmer stages of the operation, resid mnversion and distilhte yield decreased due to problems with the catalyst addition system and low reski recovery from the Rose-SR Deasher due to a 10% increas in asphailene yield. The downward trends of key performance indicators as the mn progressed are depided in Fgure 2.
Some of the mapr accomplishments of this initial run are:
'
RESULTS h ACCOMPUSHMENTS * This run WaS a SUCCeSSfUl scale-up Of the CTSL processing Of
Successfullyoperated a new3 towday two stage ebullated-bed reador system incorporating a Rose-SR sold separation unit.
Demonstrated distillate produdion at C4-975F levels of 70-75wt% MAF and coal conversions of 94.96% with Illinois 16 mal.
Achieved a Bottoms Energy Rejedion of 12% for a sustained p r o d of Rose-SR operalion. Retrograde reactions were not observed.
Achieved operation wfih a more concentrated feed slurry; mal conc8ntrations up to 53%.
Collected 3500 Gallons of 150-650F distillate ( 0.06% N, 0.03% S ) for upgrading and engine testing.
Evaluated various materials of construction in a hgh temperalure hydrogen environment.
'
'
Plana - Run POC-2 is starting in May of this year. It is scheduled to be a 40 day Wration on sub bituminous Black Thunder Mine Wyoming mal investigating scaleup of the CTSL Process with on-line hydrdreating, Rose-SRand Filtration Separation and most importantly whether or not sold deposition m r s in the prccess equipment and lines. POC-3 is scheduled for October 1994 and will study the cogmessing of subbhuminous mal and a hgh metals, CaMomia Petroleum Resid over a 40 day period. P W 4 is planned for early 1995 with the obpciive to study the scale-up Or the prooesjlrrg 01 sub-biitumiiiuus mal using dispersed and supported catdysfs.
The P m i o i Concspt Plogram is sponsored by the U.S. OOE at PETC, under mnlract DE-AC22- 92PC92148. Other sponsors incbde Hydmarbm Research, lm: and Ken-Mee Corporatkm.
1188

29 29
1.26 1.39
n 5 no 1.5 1 .S
815 810 3.0 3.0 I TpgLE 1
27
1.4
n 5 0
812 3.0 -
29
1 .o
775 0
820 0 -
28
1.1
7-15 0
824 0 -
1189
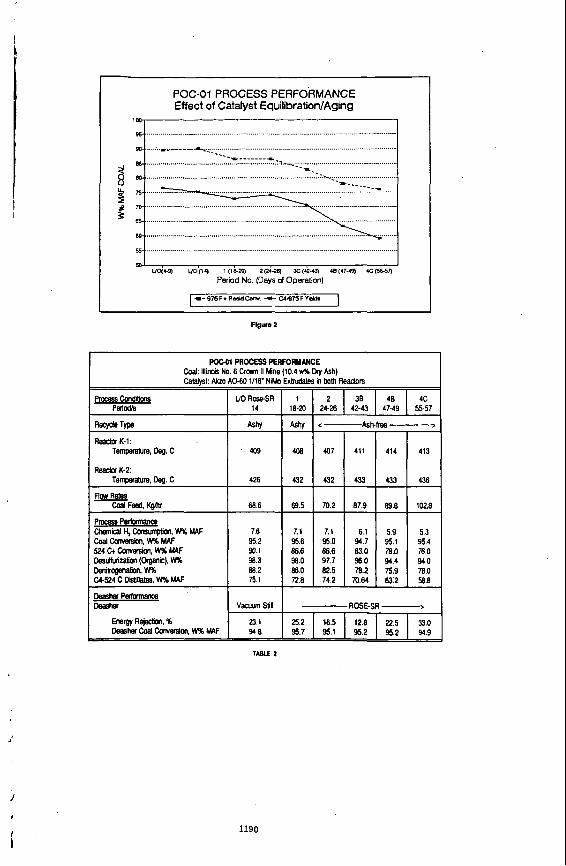
POGO1 PROCESS PERFORMANCE Effect of Catalyst EquiIibrationlAging
pmcess Condtions Periodh
..................................................................................... ................................ :.-L+ I
U O R w S R 1 2 38 48 C 14 18-20 24-26 42-43 47-49 55.57
16 ....................................................................................................................... ........................................................................................................................... -t Y ----------- I
R W e Type
R W K-1: Temperatvre, Oee. C
R W K-2: Tempecahne, Dee. C
Flw Rabr,
Pmcsslpertamanoe chemical yconsumpbml,w% M4F coal canversion, W% MAF 524 C+ Canveniar, W% klAF DesuMpizalim (&gallic), w% Denieogenalion. w% w524 c OMcalm. w% M4F
- coal Feed. KgRlr
............................................................................................................................
.......................................................................................................................... 1 \ I
Ashy Ashy c- Ash-frw ->
'409 408 407 411 414 413
426 432 432 433 433 436
68.6 69.5 70.2 87.9 89.0 102.8
7.6 7.1 7.1 6.1 5.9 5.3 95.2 95.6 95.0 94.7 95.1 95.4 90.1 86.6 86.6 83.0 78.0 76.0 98.3 98.0 97.7 96.0 94.4 94.0 88.2 86.0 82.5 78.2 75.9 78.0 75.1 72.8 74.2 m.w 63.2 58.8
1 4 ................................................................................................................................
Energy Rejecbon. % DeasherWconversim,w%M4F
Flgure 2
2 3 1 25.2 16.5 12.8 22.5 33.0 968 95.7 95.1 95.2 95.2 94.9
Poco1 PROCESS PERFORMANCE coal: Illirois No. 6 C r o m II Mine (10.4 w% By Ash) Catat@l: Akzo AOdO l/W NiMD Extndates in both Rexiom
I vacuumstin I - ROSE-SR ->
1190

LIQUEFACTION OF BLACK THUNDER COAL WITH COUNTERFLOW REACTOR TECHNOLOGY
R.J. Parker and P.L Slmpson Alberta Research Councll, W 011 Patch Drlve, Devon, Alberta, M C 1 EO
D.J. Beroer Canadlan Energy Developments Inc., W500 bop1 Trust Tower, Edmonton, Alberta,
T5J 2Z!
Keywords: Ilquefactlon, coUntelflOW reactor
INTRODUCllON There is currently a resurgence of interest in the use of carbon monoxide and water to promote the solubilization of low rank coals in liquefaction processeslJ. The mechanism for the water shift gas reaction (WGSR) is well documentd5 and proceeds via a formate ion intermediate at temperatures up to about 400°C. Coal solubilization is enhanced by CO/H,O and by the solvent effect of the supercritical water. The WGSR is catalyzed by bases (alkali metal cartmnates’, hydroxides, acetates7. aluminates’). Many inorganic salts which promote catalytic hydrogenation are rendered inactive in CO/H,O’B, although there is positive evidence for the benefit of using pyrite for both the WGSR and as a hydrogenation catalyst”.
The temperatures at which coal solubilization occurs are insufficient to promote extensive cracking or upgrading of the solubilized coal. Therefore, a two step process might achieve these two reactions sequentially. Alberta Research Council (ARC) has developed a two-stage process for the coprocessing of low rank coals and petroleum resids/bitumens”. This process was further advanced by utilizing the counterflow reactor (CFR) concept pioneered by Canadian Energy Developments (CED) and ARC. The technology is currently being applied to coal liquefaction. The two-stage process employs CO/H,O at relatively mild temperature and pressure to solubilize the coal. followed by a more severe hydrocracking step. The counterflow reactor offers several advantages over co-current operations including: separation of the gas and light oil components, thus permitted a reduction in size of the reactors; concentration of the heavier components in the liquid phase such that their time spent in the reactors exceeds the nominal residence time; concentration of the active catalyst in the liquid phase; removal of the light components in the gas phase, resulting in less secondary cracking to gas. This paper describes the results of an autoclave study conducted to s~~pporl a bench unit program on the direct liquefaction of coals.
EXP ERlM ENTAL The procedure for the operation of the stirred autoclave (1 litre) has been described elsewhere’. Briefly coal (8Og). solvent (12Og). catalyst and water were charged into the autoclave. Catbon monoxide (400-800 psi) or hydrogen (1000 psi) was introduced, resulting in a typical operating pressure of 2500 f 300 psi, depending on temperature and extent of the WGS reaction. The produced gas was discharged at -150% and collected. The autoclave flushed with a nitrogen purge (75L). Both gas samples were quantified by gas chromatography. Liquid products were transferred from the autoclave by addition of toluene at > 60°C (see later). Water, removed in the gas stream, was recovered by Dean-Stark extraction, at the same time toluene soluMe oils (including asphaltenes) were extracted. The solid residue was further extracted with tetrahydrofuran (THF). The insoluble organic matter was determined following a proximate analysis. Asphaltenes were measured on an aliquot of the toluene soluble oils following removal of the toluene by a rotary evaporator. Attempts were made to distill the soluble oils. This procedure (D1160) proved ineffective, largely because of the solvent cut off point (about 450°C) which resulted in a poor reproducibility since there was little product in the 450-525°C range.
The solvent was obtained from Wilsonville, run number 263. Five barrels of V-1074 oils were received. These oils were sufficiently different in properties that a blend was prepared containing 20% from each barrel. The oils were extremely waxy and did not flow until 55- 60°C. Black Thunder coal was provided by Thunder Basin Coal Company. It was partially dried prior to use to facilitate crushing and pulverization.
RESULTS and DISCUSSION Solvent Stablllty The solvent (V-1074 blend) had been produced from a hydrocracking process at Wilsonville and was partially hydrogenated (H/C mole ratio 1.16). Although listed as nominally toiling within the gas oil range. a crude simulated distillation found 14.2% of 525+ resid. A D1160 distillation of a similar material (Wilsonville Run 262) reported 95% of distillable by 501°C. Despite the apparent small amount of resid the V-1074 blend had 12.0% pentane insoluble asphaltenes.
’
1191

I
Under Standard 1st stage conditions (390°C/600 psi COB0 minutes), Run 49. the solvent distillation range was virtually unchanged and gas yield was barely detectable (Table 1). At the highest temperature tested for 1st stage operation 410"c, gas yield was still below 1% and light oil distribution was stable. It took operation at 2nd stage conditions before a substantial change in solvent properties occurred, then decomposition to lighter oils and gas was evident. Throughout the range of conditions the asphaltene content remained almost constant suggesting that regressive reactions were not likely to present a problem in bench unit operations. Introduction of coal however might alter this observation. When 5% coal was Introduced into the feed, asphaltenes increased from 12 to 19% under two-stage conditions.
stolchlometry of the WGSR The stoichiometry of the WGSR is complicated by the production CO and COz from the coal, the presence of the &C03 catalyst and the reaction of hydrogen with the coal/solvent. In tests with this catalyst, the COz produced exceeded the stoichiometric quantity from the CO consumption in the WGSR. Typically from 0.2-0.35 moles of excess COz was found with a variety of catalysts or in the absence of catalyst (Table 2), which eliminated &CO, as the source. The water recovered was also between 0.2 and 0.30 moles less than predicted by the WGSR. In the absence of catalyst (Run 55) CO was actually produced, therefore it appeared that missing water could have reacted with CO from the coal to give COz. If this explanation is valid, then hydrcgen consumption. defined as the difference between CO reacted and hydrogen produced, was greater than values previously reporteff. This would not add to the economics of the process since this addition of hydrogen was derived from the coal and water, not from introduced CO.
Catalyst Actlvlty Literature reports agree that potassium carbonate is amongst the most effective WGSR catalysts. This work confirmed that &CO, out performed the other tested catalysts in terms of CO conversion. however this did not correlate with coal conversion (Table 2). When using FeS, FezOs/CSz. KzCO, or NaAIO,. the coal conversions were all similar at 80-82% (repeat runs with K$O, gave a standard deviation of a%). yet the CO conversion ranged from 6-8O%. Surprisingly the only runs which gave poorer coal conversion. were those using the molybdenum salts, ammonium molybdate (AM) and ammonium tetrathiomolybdate (ATM) or no catalyst. Apart from potassium carbonate, only the aluminate gave substantial CO conversion.
Petrographic examination of the residues gave some insight into the liquefaction process. With &CO, the vitroplast was almost completely solubilized, and what was left (2.7%) appeared little changed from the original coal. At the other extreme, i.e. without catalyst. there was no vitroplast present. Here the majority of the coal fragments were rounded cenospheres and vacuoles (72%). as is often seen with coal pyrolysis residues. Iron sulphide catalyst duplicated the results seen without catalyst (i.e. 66% cenospheres and vacuoles). In both cases only 9% CO conversion was recorded. NaAIOz was intermediate between these extremes for both CO conversion and residue appearance. A small portion of the coal remained as vitroplast (5%) while some vacuoles were formed (4%). The devolatilization process could ultimately lead to the formation of char. The presence of CO, when it underwent the WGSR, appeared to suppress this pathway to char. A high concentration of CO was required since vacuoles were also observed with syngas or CO/nitrogen atmospheres.
Liquefaction product yields were measured as asphaltenes, preasphaltenes and hydrocarbon gases (Table 3). The remaining products, including pentane soluble oils, c a h n oxides and produced water, were grouped together as oils+, since their quantification was less reliable. Oils+ were, therefore, set numerically to the difference between the coal conversion and the sum of asphaltenes. preasphaltenes and hydrocarbon gases. This technique eliminated the need for corrections for mass balance, losses of light components during rotary evaporation of the toluene solubles, and changes in solvent composition during the run. Hydrocatbon gas yields at 390°C/30 minutes were consistent at 1.3-1.5g/lOOg MAF coal, irrespective of the catalyst employed. These values were independent of the coal conversion or the distribution of the distillable and nondistillable oils. Only a s.mall portion of this gas could be attributed to solvent decomposition. The remainder was from thermal decomposition of the coal.
With the benchmark catalyst (&C03) the majority of the products were asphaltenes and preasphaltenes. The remaining catalysts (ATM, Fe203, AM) performed less favourably, yielding less oils+ or less total product. ATM did show increased activity in terms of the improved ratios of asphaltenes: preasphaltenes and oils+: preasphaltenes. This activity was confirmed when &CO, and ATM were combined which resulted in much lighter product slate (increased oils+, reduced asphaltenes and preasphaltenes) at similar coal conversion. This was one combination which was subsequently selected for the bench unit program.
t 1192

Ptvcess Severity Earlier worl? had identified the minimum and preferred conditions for the solubilization of Black Thunder coal. but no work had been performed on the product yield distribution. Coal and CO conversion both increased with severity there was a noticeable progression from preasphaltenes --> asphaltenes --> oils+ with the &COS catalyst (Table 3, Figure 1). This contrasted with the aluminate catalyst (41OoC/30 min.)which had a sharp increase in asphaltenes (41 OoC/30 mins.) at the expense of oils+. Here solvent must have partiapated in regressive reactions to generate the additional asphaltenes. However the regressive reactions did not progress to preasphaltenes since little difference was seen between the &CO, and aluminate.
Simulated 2 stage tests were also performed. The test followed the standard procedure except that at the completion of the first stage the temperature was reduced to about 300°C. the CO gas was discharged and replaced with hydrogen. The temperature was raised to its new set ,
point and the procedure continued. As anticipated there was a dramatic increase in process performance. Coal conversion rose to 91-95%. Preasphaltenes dropped to below 5% with FeS catalyst and almost zero with the molybdenum catalyst. Much of the asphaltene was also converted to oils+, especially with molybdenum where only a quarter of the products remained as asphaltenes or preasphaltenes. Gas production in the second stage was nominally 10- 12g/lOOg coal, however much of this could be attributed to solvent breakdown.
Bench Unlt Program Much of the autoclave work was performed with potassium carbonate, as catalyst. Unfortunately this proved to be a poor practical choice because of the operational problems that arose due to its hydroscopic nature. In evitably the bench unit lines or valves plugged with solid potassium carbonate both when it was introduced as an aqueous solution or as a fine powder in the coaVsolvent slurry. Ultimately it was replaced by the sodium aluminate, which showed no tendencies to deposit or plug the narrower parts of the Bench Unit.
Coal solubilization and CO conversion in the bench unit were below the level achieved in the autoclave at nominally similar process severity for single stage operation (Figure 2). It was not possible to directly compare CO conversion in the 2 operations for a variety of reasons e.g. gas residence time, C0:coal ratio and CO/H,O mixing and contact were not the same. However, it can be seen that the trends observed in the autodave were paralleled by the bench unit. Coal conversion approached 80% in the best runs when the temperature was raised to 410°C. but was consistantly about 10% less than the corresponding autoclave runs. This did not have a negative impact on the overall performance in the 2 stage operation as long as a shift catalyst was present. In the absence of a shift catalyst overall coal conversion was only 73% (Figure 3) for a 2 stage bench unit test at 440°C. Most of the product was asphaltenes. with less than 10% oils. When sodium aluminate was present overall conversion reached the maximum for coal conversion 92-94%. Under these conditions the product was primarily pentane soluble oils, with molybdate as usual better than iron based catalyst. Oil yield exceeded that found in the autoclave, but this technique again illustrated the trends ie.. yield structure improved with process severity up to 440°C (2nd stage) and molybdate > iron catalysts. Therefore, the autocalve was a useful predictor of process performance.
The current bench unit is a once through operation. It is anticipated that further ocnversion of the asphaltenes to oils could be accomplished with recyde. Preliminary autoclave tesk have confirmed that the bottoms product from the counterflow reactor (including ash, catalyst and IOM) can be upgraded to lighter products.
CONCLUSIONS An effective shift catalyst is required to process Black Thunder coal. Once through countemow reactor processing can yield greater than 600A pentane soluble oils. Autoclave tests can predict processing trends in the bench unit counterflow reactor.
REFERENCES 1.
2.
3. 4.5. 6. 7. 8. 9. 10. 11.
Hinchon. AS.. Kim, S. and Wilson, RB., Proceedings Coal Liquefaction Contractor's Review Conference (CLCRC). 417-424. Pinsburgh. September 1993. Derbyshire. F.. Given, E.. Burke, F.. Winschel. R., Lancet. M.. Stephens, H.. Kottentette. R., and Peluso. M.. Proceedings CLCRC, 353-377. Pittsburgh, September 1993. Berger. O.J.. Simpson. P.L. and Parker, R.J.. Proceedings CLCRC. 397416, Pittsburgh. September 1993. Ross. D.S.. Green, T.K.. Mansani. R. and Hum. G.P.. Energy and Fuels. 1:287-291. 1987 and 1:292-294, 1987. Hodges, S. and Creasy. D.E.. Fuel. M: 12241234.1985. Cassidy. P.J.. Jackson, W.R.. Larkins, F. P. and Sukurovs, R.J.. Fuel, 65:1057-1061. 1986. Cassidy. P.J., Jackson. W.R.. Larkins. F. P. and Sulton. J. F.. Fuel. 65:374-379, 1986. Del Eianco, A. and Girardi. E., Fuel Processing Technology. 23:205-213, 1989. Sofiams, AX.. Butler, A.C. and Louwrens, H.E.. Fuel Processing Tech., 22175-188. 1989. Parker. RJ. and Eerger. DJ.. Ninth Pittsburg Coal Conference, 454464. October 1992.
1193
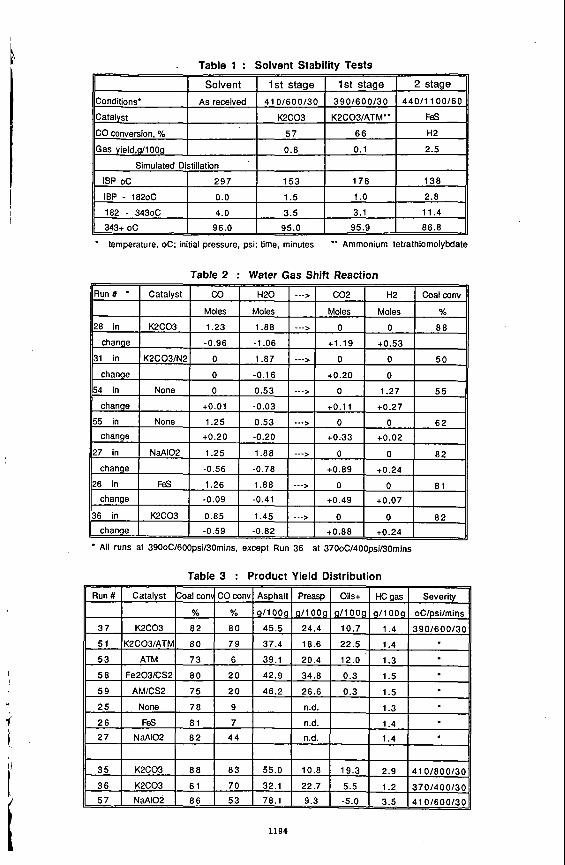
i
1, . Table 1 : Solvent Stability Tests
* temperature, oC; initial pressure, psi; time, minutes -* Ammonium tetrathiomolybdate
Table 2 : Water Gas Shift Reaction
* All runs at 390oC/600psi/30mins, except Run 36 at 370oC/400psi/30mins
Table 3 : Product Yield Distribution
1194
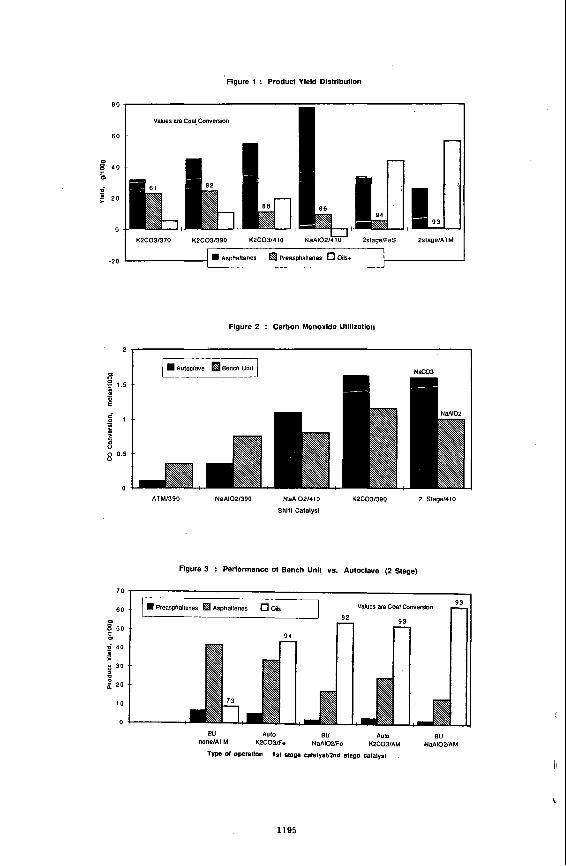
Figure 1 : Product Yield Distribution
80
60
0
- D
0
5 4 0
s ; 2 0
K2C031370 KZC03/390 K2C031410 N a A 1 0 2 1 ~ 26tage/FeS ZslageIATM
-20
Figure 2 : Carbon Monoxide Utilization
I 1 Autoclave Bench Unll1
ATM1390 NaA1021390 NaA1021410 K2C031390 2 Slagel410
Shlft Catalyst
Figure 3 : Performance 01 Bench Unit vs. Autoclave (2 Stage)
70
60
50
4 0
; 30
D
- 1
t 20
t o
0
Auto EU Auto BU BU nonelATM KZCO3lFe NaAlOlFe K2C03/AM NaA1021AM
1st stage catBlysUZnd stego catalyst Type of operation
1195

1 I i
WO-STAGE UPUEFACTION OF WYOMING S U E ~ M I N O U S COAL - EFFECT OF SYNGAS AS REDUCING GAS
LK. Lee, V. Pradhan, R.H. Staber and A.G Comolll Hydrocarbon Research, Inc.
100 Overlook Center, Sulte 4w1 Prlnmton, New Jersey 08512
Keywords: Llquefactlon, Sub-bltumlnwe mal, Water-gas ShlH Reactlon
lmowclloN
The produdion 01 hydrogen constitutes one of the major operating cmt components of a mal liqueladion process, Mernative sources of hydrogen such as synthesis gas, a mixture of W/t$ mming diredly lrom a gaslier or steam reformer with minimum processing, can potentially improve the economic 01 a liquefaction plant ALSO, il is known that in the presence of an alkali salt, COlyO is very effmive in solubilizing hgh oxygen mntaining bw rank coals at relativeiy mild severity mndiioffi‘J.
Non-ami promoters, like iron‘. mbaltlmolybdate”salts. were found to be adive in enhancing the produdion of hydrogen through the water-gas shill (WGS) readion. Wth the addLn of H$, the presence 01 promoters had only a minor effed on mal conversion? In a M-stage d i rm mufled operations. in which adivv of the semnd stage hydroprocessing catalyst can be severely reduced bj alkali salts, it is necessary to expbre non-alkali pmmoters lor the WGS reaction. This paper dwsses the work using a dbpersed and a wpporled nowalkali promoter to catalyze the mal solubilizing step using a mhture of syngas and water.
PROCESS AND BENCH UNIT DESCRIPTIONS Two-stage liquefaction tests were carried out in a bench scale mntinucus flow uniI of nominal capadty 01 1 Kgh 01 mal feed. Thb unit was conlgurated with M equal volume, fully baduniixed readors. Depending on the form of catalyst used, dispersed or sumrled. the first stage was operated either as a slurry reactor or an ebullated bed reactor: On the other hands, the semnd stage was utilued as an ebullated bed reactor. A simplified process flow diagram is shown in Figure 1. Coal dissohnion occurred in the first stage in the presence of y or COM, while the primary ligukjs were further upgraded in the m n d catalytic stage under typical hydraprocessing conditions.
An interstage separator was used to remove ex= syngaWater. hght distillates and gaseous pcoduds generated from the mal solubilizing stage. Produds from the second stage readw were recovered as Separator and Afmmpheric Still Overheads. Eonom materials from the Atmospheric Still, coffiisting 01 heavy distillates, umver led coal and ash, was subjeded to pressure filtration. The pressure liquid was recycled lor slunying the mal feed. Sullur additives can be injected to both stages.
CATALYST SCREENING
Several WGS pcomoters (scdiim carbonate. sodium aluminate. iron oxideslDMDS, ammonium heptmiybdate(AHM)1DMDS, Amocat tAIDMDS, Shell 3171DMDS) were evaluated using a 20 C.C. miaoautocalve at 399% and 5.5 MPa cold CO pressure with and without solvent. CO and HZ 0 was charged at a molar ratio 01 111. These catalysts were ranked according to the degree of the CO conversion. The rektive activv ranking is:
Armat 1 A, Shell 317 > AHM > I$CO>, NaAIO, >> FzOs
with or withan solvent, as illustrated in Fgufe 2. Higher conversions were observed for tests with no solvenr. it was probably due to beller interaction between the reactants and the catalyst
1196

BENCH SCALE TESTS
Two bench runs were conducted to compared the activii 01 AHM and Shell 31 7 NNO extrudate catalyst as promoter for the coal solubilizing stage. In CMSL-Q AHM was premked in the feed sluny at a mncentratbn equivalent to 1500 wppm of Moon a dry mal basis, while Shell 317 was loaded into the first reactor in CMSL-W. Due to the presence of the supported catalyst. the flui Mlume in the first stage was 25% smaller in CMSL-04. Therefore, for the same feed rate a higher spaw v e k c i through the first reactor was antidpated in CMSL-W. The tun condfins and pedormanw 01 these two tuns are compared in Table 1.
In the c~se of AHM, replacing y wilh COnyYO as reduang gas resuked in 2.53.0 W% higher mal conversion and a similar increase in distillate yield. Under similar operating c o n d l i i s , in the presem of Shell 31 7, the improvement in performance ty using syngas was less significant. less than 1 .O W%.
In comparing the performance of the first stage catalyst, AHM vs Shell 317, it is necessary to consider the different In flui mlume associated with each catalyst. The effedive flui volume was 25 %lower in the case of the suppotled catalyst As a result. at the same feed rate, both the wal conversion and distillate yield were lower when Shell 317 was used. Coal conversion reduced from 92.0 W% in CMSL-03 to 87.6 W% in CMSLOO, while the distillate yield declined from 64.6 to 58.5 W% under similar process cond l i n . However, as anticiied, Shell 317 was more effedive in removing heteroatoms. Nitrogen removal was 10 W% more effective with Shell 317 than when AHM was used.
FIRST STAGE PRODUCTS
The first stage reactor samples exhibited a similar trend as the two stage products in term of conversion and producl qualities. as shown in Table 2 The first stage wal conversion was higher in CMSL-03 than that of CMSLOO. Due to the hydrogenation tunaion of the supported catalyst, both the soli and liquid produds were richer in hydrogen and lower in heteroatoms.
Approximately, hall of the distillates were generated from the first stage. The first stage distillates were heavier and contained higher boiling materials when qngaslwater was used, as shown in Table 3. In CMSL- 03 the WC ratio declined from 1.65 and 1.59 when 4 was replaced by COnt, It seems that the removal of niirogen was more effective wilh CO/Y-AHM combinatbn. The nitrogen content of the first stage distillate, 0.057 W%, was 3.8 times lower than when was used. However, such improved pedormanca with COM, was not observed when supported catalyst was used as promoter.
ACKNOWLEDGEMENT
HRI wishes 10 acknowledge the financial supporl of the U.S. Department of Energy under the Centrad No. DE-AC22-WC92147. Ms. Sally Kornfeld and Dr. Edward Khmder pmvided helpful amments.
REFERENCES
1. C a w , PJ., &&on, W.R, Larkins, F.P.. buey, M.B. and Sakurovs, R.J.. Fuel Pmssing Tech.
Porter, C.R, Kmrdson, C.L. and Rindt. J.R., ACS Div. Fuel Chem. Prepint. 198631 (4), 7076.
1986, a 231-246.
2.
3. Lim. S.C.. Ralhbone, RF., (a, 618625.
Givens E.N. and Dewshire, FJ.. ACS Div. Fuel Chem. Preprim. 1993,3J
4. Ng, F.T.T. andTsakiri, S.K.. Fuel 1 9 9 3 , g 211-215. 5. Atnest& LA. and Won, E.E.. Fuel 1986, & 1226-1232. 6. NOWk. J. and Stenberg, V.I., ACS 1987,g (l)* 628-636.
\
1197

pmcess COndlHCns 1 2 1 2 1st slam:
w100 75/25 0/100 0/1W 3 8 8 3 8 8 3 8 8 427
m, Temperature. 'c Catalyst AHM AHM Shell317 Shell317
2nd slaw: C&H, 0/1W 0/1M 0/1W O/lW . Temperam, 'C 427 427 427 427 Gltalysl Shell 317 Shell 317 Shell 317 Shell 317
pmcess performance, w% mal coal Coal Conversion 89.5 92.0 86.8 87.6 514'C ConversMl 87.2 89.9 84.6 84.5 c1c3 6.50 6.56 6.30 7.65 C4524'C 61.6 64.6 57.6 50.5 H. Used 7.02 7.73 8.10 9.61
I H'DN I 75.9 I 84.8 I 96.9 95.1 I
Roeess Conditions
Coal Canversion, W% WC Ralio
Filter Liquid Filler Scl i
N in Filter Liquid
79.5 77.5
1.36 1.25 0.94 0.89 0.22 0.35
Recess c o n d m
VI GraVay BP, 'C %P, 'C
4sTy D88 Dlstllhtbn, w% IBP-177-c
260-343% 343.C
Carbon
i n - 2 w c
E l ~ A n a l y s $ , w %
L Y N i m n HIC Ratio
CmSL.03 1
26.9 85.0 414
14.1 10.3 51.6
85.56 11.74 0.079 0.22 1.65
CMSL.03 2
22.9 83.3 422
12.4 10.5 45.6
86.00 11 3 7 0.086 0.057 1.59
CMSL4.l 1
31.3 88.3 427
35.22 9.43 26.7
86.62 12.67 0.015 0.075 1.76
CHsL04 2
25.2 95.0 431
23.7 10.5 27.5
86.84 11.67 0.M 0.198 1.61
1198
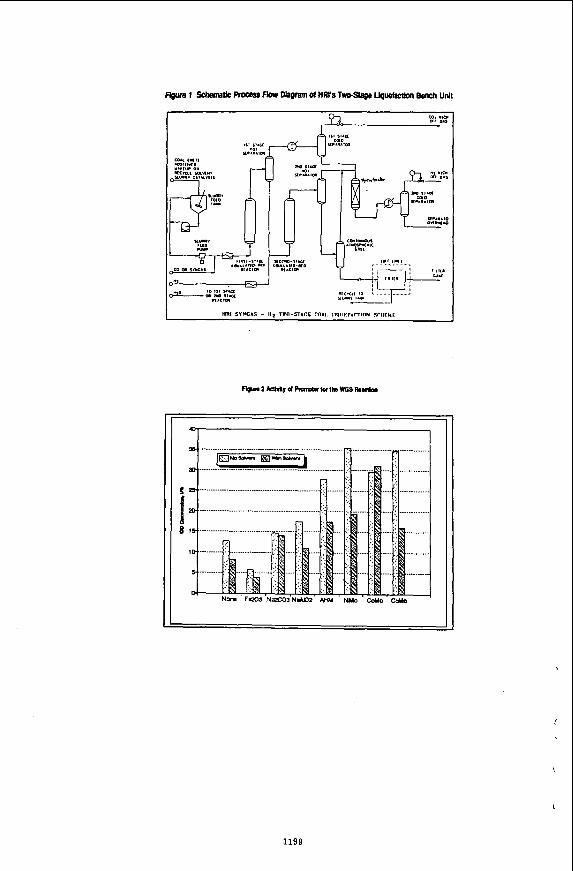
a m - mum%+,.-,
.......... ........___.___._._.
1199

PRMIW DISTILLATE PRODUCTS FRON DIRECT LIQUEFACTION OF COAL
P.-Z. Zhou, Burns and Roe Services Corp. (BRSC), Pit tsburgh, PA 15236; R. A. Winschel, CONSOL Inc., Library, PA 15129;
and E. B. Klunder, P i t tsburgh Energy Technology Center (PETC)/ 0. S. Dept. o f Energy (USDOE), Pittsburgh, PA 15236
Key words: Coal, Liquefaction, Product Qua l i t y , Refining
INTRODUCTIOM It has long been the prevalent impression t h a t coal-derived l i q u i d s are heavy, viscous, aromatic, hetero-compound-rich, and very d i f f i c u l t and expensive t o r e f i n e i n t o t ranspor tat ion fue l s . An extensive research and development program over the past two decades, sponsored by the U. S. OOE/PETC, has resul ted i n dramatic improvements i n coal l i que fac t i on product qua l i t y . High-qual i ty coal- derived d i s t i l l a t e s are now obtainable from modern c a t a l y t i c two-stage 1 iquefact ion (TSL) processes. Recently, the net products o f f ou r 1 iquefaction runs tha t represent va r ia t i ons o f s ta te-of - the-ar t technology were characterized i n de ta i l . The four samples were generated a t the Wi lsonv i l le 6 ton/day p i l o t p lan t (Runs 2596 and 2600) and the Hydrocarbon Research Inc. ( H R I ) 2 l b /h r bench u n i t (Runs CC-15 and CMSL-Z), as described i n Table 1. Complete background and character izat ion data o f t he samples appear i n the o r ig ina l repor ts o f t h i s work. 1-5
DISCUSSION The d i s t i l l a t i o n curves (Figure 1) o f the four coal l i q u i d s have s im i la r slopes over most o f the b o i l i n g range, r e f l e c t i n g the s im i la r f rac t i ona l composition o f the four l i qu ids , despi te the d i f f e r e n t feed coals and process condit ions. A l l four l i q u i d s are res id - f ree and have end points (ca. 370-420 'C) much lower than those o f ea r l y generation coal l i qu ids . The HRI products are somewhat lower b o i l i n g than the Wi l sonv i l l e products, p a r t l y as a r e s u l t o f d i f f e r e n t d i s t i l l a - t i o n operations. The s p e c i f i c g r a v i t i e s of these l i q u i d s range from 0.85 t o 0.91, and the d i f ferences are p r imar i l y re la ted t o b o i l i n g range dif ferences. These coal d i s t i l l a t e s possess excel lent low-temperature character is t ics : low v i scos i t i es (1.5-3.1 cSt @ 38 'C) and very low pour po ints (usually below
The fou r products are r e l a t i v e l y high i n hydrogen contents (11.2-12.7 w t %), and t h e i r H/C atomic r a t i o s (1.54-1.74) are comparable t o tha t o f petroleum, resu l t i ng i n f a i r l y h igh character izat ion factors (10.9-11.1). The coal l i q u i d s have low N (0.03-0.3 w t %) and S (0.02-0.05 w t %) contents and contain neg l i g ib le amounts o f metals. The mid-percent curves o f elements and hydrocarbon types i n these coal l i q u i d s are p l o t t e d i n Figures 2-8. For a l l four, the H content decreases gradually and the N content general ly increases w i t h increasing b o i l i n g point . The oxygen d i s t r i b u t i o n shows a maximum i n the 177-204 'C f r ac t i on , i n which the s ing le - r i ng phenols are concentrated. Sul fur content i s very low throughout most o f the b o i l i n g range. The N contents o f the subbituminous coal l i q u i d s (W260D and CC-15) are h igher than those o f the bituminous coal l i qu ids ; t h i s may r e f l e c t the use o f on ly a s ing le supported ca ta l ys t react ion stage i n the subbituminous coal runs.
The aromatics content increases r a p i d l y w i t h increasing b o i l i n g point , yet these modern coal l i q u i d s are much less aromatic than early-generation 1 iquefact ion products. Figure 6 shows tha t i t i s feas ib le t o produce from the coal l i q u i d s 30-40 LV% s t ra igh t - run gasol ine containing less than 22 LV% o f aromatics, the projected spec i f i ca t i on f o r the t u r n o f the century. These coal l i q u i d s contain approximately 60 LV% saturated hydrocarbons and the t177 'C naphthas contain as much as 91 LV% saturates. The pa ra f f i ns l eve l decreases subs tan t i a l l y wh i l e naphthenes content decreases s l i g h t l y w i th increasing b o i l i n g point . These l i qu ids contain only about 3-5 LV% o f o le f ins. Generally, the HRI l i q u i d s contain more H and less N, 0, S , and aromatics over t h e i r b o i l i n g range.
The po ten t i a l product y i e l d s t ructures o f the fou r coal l i q u i d s are shown i n Table 2. Clearly, only atmospheric d i s t i l l a t i o n i s required. The <177 'C naphtha y i e l d i s 24-28 LV%, w i th one exceptional ly h igh case (CC-15) o f 40 LV%. The y i e l d o f 204-288 'C l i g h t d i s t i l l a t e , normally a d iesel f ue l f rac t i on , i s 34- 36 LV%, except for W260D due t o i t s high end point . The 177-204 'C swing c u t (3.3-7.4 LVX) i s also su i tab le f o r the recovery o f s ing le - r i ng phenolics. The y i e l d of 288-343 'C heavy d i s t i l l a t e , which can be ref ined i n t o heavy d iesel fuels/fuel o i l s o r c a t a l y t i c a l l y cracked/hydrocracked f o r gasol ine and l i g h t diesel fue ls , ranges from 18 t o 26 LV%. The >343 'C atmospheric res id , which i s equivalent t o l i g h t vacuum gas o i l and can be a pa r t o f the cracking feedstock, i s less than 10 LV%, except f o r t he high end-point W2600. These pro ject ions requi re v e r i f i c a t i o n by f u r t h e r re f i n ing studies o f the coal l i q u i d s .
Major proper t ies o f the naphtha, l i g h t , and heavy d i s t i l l a t e s from these coal l i q u i d s are summarized i n Tables 3-5 and compared w i t h current ASTM and Federal
-50 *C).
1205

I
Phase I specifications and projected data for the year 2000. The aromatics and benzene contents of the naphthas are well below projected future specifications. This is a direct contradiction of the ,belief, no longer correct, that coal naphtha i s highly aromatic. The olefins content (3-5 LV%) of the coal-derived naphthas is also very low compared with that of the current gasoline pool (about 10 LV%), and could readily meet projected future requirements. The Octane numbers of the coal naphthas are within the range of straight-run naphthas from petroleum. The heteroatoms contents of the coal naphthas are low. They easily meet the current S specification and the HRI naphthas even meet the 1995 S requirement. The nitrogen levels are also low, particularly that of the CMSL-2 naphtha (0.01 wt %). Thus, the coal naphthas, after hydrofinishing, could be an excellent gasoline blending stock. Hydrotreating will simultaneously resolve the copper corrosion, oxidation stability, and existent gum deficiencies. The high- naphthene coal naphthas can also be good reformer feedstocks, if so required. In general, the coal naphthas exceed the 10% and 50% distillation-point maxima; however, this can always be adjusted through normal refinery blending operations.
The light distillates have excellent low-temperature properties (fr. pt. gener- ally (-50 'C) and very low S contents, two advantages for jet fuel production. The major deficiency is high aromaticity, which must be reduced by high-severity hydrotreatment. Compared to jet fuels, diesel fuel oils have much less stringent specifications and are thus easier to produce from coal distillates. In spite of the low cetane index, the very low S level makes the light distillates an attractive blending stock for the diesel pool. A moderate hydrotreatment may be needed to improve. their stability and to benefit the cetane index. The heavy distillates qualify as a No. 4 diesel/fuel oil, meeting the low S requirement. They may also be considered as a feedstock for catalytic cracking or hydro- cracking, and the ,343 'C fraction can be included for this purpose. However, hydrotreating may be necessary to boost the H content, for improved cracking behavior.
CONCLUSIONS The net liquid products from modern coal liquefaction processes are lower boiling and have much lower end points (mostly under 400 'C) than crude petroleum. Coal liquids have very low concentrations of heteroatoms, particularly S, and metals, and are free of resids and asphaltenes. High yields of low-S (0.01-0.03 wt %) naphtha, kerosene, and diesel fuel fractions can be obtained simply by atmospheric distillation, with a total yield o f light fuel fractions ranging from 68 to 82 LV% (W260D exclusive). The coal naphtha has a low aromatics content (5- 13 LV%), readily meeting projected year-2000 requirements. Its low Reid vapor pressure allows light components from other sources to be blended. The coal light distillate of an appropriate boiling range will be a good low-S blending stock for the light diesel fuel pool. The heavy distillate can be refined into a low-S No. 4 diesel fuel/fuel oil. This fraction, along with the >343 'C atmospheric bottoms, can be catalytically cracked or hydrocracked to make light liquid fuels. Thus, modern coal liquids should no longer be envisioned as thick liquids (or even solids) with high concentrations of aromatics and asphaltenes. Products obtained from advanced coal 1 iquefaction technologies are more like light naphthene-base petroleum, but with lower heteroatoms and metals contents, and they are free of resids. Coal liquids are likely to be co-refined in existing petroleum refineries; and hydroprocessing o f various severities would be needed for different fractions to produce quality blending stocks for refinery
CURRENT DEVELOPMENTS DOE continues to support work on improving and evaluating product quality. Additional detailed product inspections are planned. A newly initiated program will include actual refining and testing of the refined products. A recent development in coal liquefaction technology is to include in-line fixed-bed hydrotreating of the products. The resultant liquid products are expected to be o f even higher quality for conversion into transportation fuels.
\ fuel pools.
.
i
ACKNOWLEDGEMENT This work was supported by the U.S. Oept. of Energy under contracts DE-AC2Z- 89PC89883 and DE-AC22-89PC88400. Valuable suggestions from Drs. R. G. Lett, M. A. Nowak (DOE/PETC), and R . D. Srivastava (BRSC) are appreciated.
c
REFERENCES 1. Kramer, R. L. in Report DOE/PC89883-24, June 1991. 2. Kramer, R. L. in Report DOE/PC89883-34, Nov. 1991. 3. Sturm, Jr., G. P.; Kim, J.; and Shay, J. in Report DOE/PC89883-92, January
1994. 4.
5.
Robbins, G. A.; Brandes, S. D. ; Winschel, R. A . ; and Burke, F. P. Reports DOE/89PC89883-27, September 1991, -43, March 1992, and -86, March 1994. Zhou, P.-Z. "Assessment of Coal Liquids as Refinery Feedstocks," 1992, and "Characterization of Direct Liquefaction Distillate Products," 1994, BRSC Reports, DOE Contract No. DE-AC22-89PC88400.
1206

Plant/Run Feed Coal V i 1 sonvi 11 e 2596 Pi t t sburgh Seam
Vi 1 sonvi 11 e 260D Wyodak and Anderson
HRI CC-15 Wyodak and Anderson
HRI CMSL-2 I l l i n o i s No. 6
Table 2. Poten t ia l Product Yield S t ruc tu res
Process Description Ca ta ly t i c lCa ta ly t i c
Shel l 324 441/421 'C
Ca ta ly t i c/Thermal Shel l 324
421/412 'C Thermal/Catalyti c
Shel l 317 427/413 'C
Cata ly t i c /Ca ta ly t i c Shel l 317
400-414/424-433 'C
Table 3. Cha rac t e r i s t i c s o f Coal-Derived Naphtha Frac t ions
Currcntl Federal V259G yt600 CC-I5 OISL-2 Gasoline Phase I Projected
Properties I8P-193.C ~~
Specific brivity 0.7844 0.7758 0.7798 0.7171 P 15.6'C
I I I I I I
I 8 P - 1 9 3 ~ C 18P-193.C 18P-177°C specl f lca l lonr (1995) (2000)
:lane. Research
._ . 1.20 I I I mar I 0.w mal
_. 61.6 60 0, - I. I I
1207
Octane. by Gc 86.5 87 .1 74.8 75.2 _ _ _ _ ~ 3.1 2.54 2.74 9.0 m u 9 mi' _Reid vapor PT~IIWC. p" 2.8
copper corrorion I d l a 3b 3b I r n K 1 l i S t e n l Gum (lashed). 7 .6 40.2 11.2 1.0 5 Ea" al lm .I
086 Oirtillatlon. *C IO% SO% 90%
91 80 ea 96 70 mi 126 11s 123 I27 77-121 172 171 I69 166 190 ma" 119 max

Table 4. Characteristics o f Coal-Derived Light Distillates
- CI
I77-2M'C
0&92 - -
12.72 0.01 0.01 0.021 0.0019
7 . 5 61.3 28.4 2.8 0.48
-
- 4.m -
-72.8
15.6 - -
0.02
- 2 204-288'C
0.8890
12.27 0.01 0.01 0.029
- -
- 7.5 53.0 11.5 2.0 _ -
Jef A No. 2 Diesel
specs Fuel specs
0.775-0.840
2.50 1.9-4. I 8.0 .a1
-40 mi 25 .in'
42.8 rnl"
la 42.8
20.8
- - - 40
:Reduced lo 0.1 "1% i n Federal Phase I. y smtc point 70 rn (mnl and naphthalene 1 L V I (maxi. Reduced 10 0.05 "1% i n Federal Phase I.
Table 5. Characteristics of Coal-Derived Heavy Distillates
VZS9G 266' t i
0.9574
cnsL-2 288. C+
0.9262
110. 1-0 Diesel NO. I Fuel oil specs Fuel specs Properties
Specific Gravity P I5.6"C I 0.8762 min 1 Clementdl Analysis. "1%
10.5 0.04 0. I 0.091 __
- 8.91 -
11.8 0.01 0.06 0.01 -
2.00' I S 0.22
0.22 0.19 Basic N
varar1inr Naphthener LIOmalICI Olefins
IlydrOCarbon Group. LYI
V l s m i i l y . CSl P 18.C
Pour P t . . .C
copper tarroslon Flash Pl. . . C
Cetane Index 55 n i n I 55 nin
10 I 35.2 - 27.7 34.2
ILO* su l fur rpect f ia t ion 0.05 "1% 'at 4O.C
I
1208 c

%(M 'N33hX0
% P A ' S 3 N 3 H l W d V N
?JOA ' S N I J j V W d
o o o o ~
7elOA 'S311VWOMV
1209 i

I I
.f
Valuation of Coal Liquids as Refinery Feedstocks Using Linear Programming Tool (PIMS)
S. K. Poddar and E. S. Resurreccion Bechtel Corporation
3000 Post Oak Boulevard Houston, Texas 77056-6503
Keywords: Product Valuation, Coal Liquids, Linear Programming
'4BSTRACT
Product pricing follows the simple law of supply and demand, and therefore, it is extremely dependent on the market situation. As long as the identifiable market is established, product valuation should not be complicated. Because of the inherent characteristics of coal liquefaction products, however, direct marketing of coal liquid products to the end user may not be feasible. For coal liquid products, the market is primarily through the refinery. The purpose of this paper is to demonstrate the proper method of evaluating the economics of coal liquids as refinery feedstocks.
The approach of having a dedicated refinery to upgrade coal liquids to marketable products may not be a practical solution. When the products are brought into an existing refinery with a certain configuration already built in, the obvious question will then be how best the product can be routed to the various processing sections of the refinery to obtain the maximum margin for the various coal liquids. In addition, the coal liquid products are envisioned to be routed to more than one refinery in order to maximize product value. This complex scheme could be optimized by the application of linear programming (LP) method. However, because of the complexity of the situation, the success of the product pricing evaluation is very much dependent on the type of LP tool being used. In this paper, the LP tool utilized is Bechtel's proprietary linear programming tool, called Process Industry Modeling Systems (PIMS). The approach described in the paper utilizes PIMS in assigning value to various products obtained by direct liquefaction of coal.
INTRODUCTION
Depending on the complexity of the problem, there are three (3) possible ways of assessing product valuation and economic analysis in a refining environment. These three possible ways are: Back of the envelope calculations, application of Lotus (or similar) worksheets and utilization of LP-based optimization.
Back of the envelope type calculations could be sufficient for a topping refinery. Likewise, a Lotus worksheet tool may be suitable for a hydroskimming refinery. As combinations of crudes are processed in a refinery, and as the refinery configuration becomes more complex, it becomes difficult, if not impossible, to conduct a reasonably decent analysis by following either of the above mentioned two methods. In such situations, linear programming (LP) becomes, the only practical option of choice for such calculations.
The objective of this paper is to show how an LP system (PIMS) can be used effectively in determining the relative value of the coal liquids as they relate to a petroleum refinery as a feed stock. In a given refinery PIMS is able to assess the global effects of processing and/or blending the various coal liquids, either as a total mixture or as separate fractions.
PRODUCT VALUATION BY LINEAR PROGRAMMING (PIMS)
Typically the linear programming tool, PIMS, takes into account an array of data such as: product prices, crude oil price, utility costs, crude oil assays and characterization data (MI, sulfur, distillation, octane number, Cetane number, Bromine number, etc.).
When coal liquid is brought in as feed to a given refinery, PIMS allows the optimum disposition of the feed and assign the value of the coal liquid products with reference to the petroleum feed. The product valuation scheme is schematically shown in Figure 1.
Bases and Assumptions
Methodology - The evaluations have been conducted using Bechtel's proprietary LP system, PIMS (Process Industry Modeling Systems). The approach to the economic analysis is based on the break-even value concept, Le., that value of incremental volume of coal liquid that will result in no monetary loss (or gain) compared to the current, i.e., base case. The
1210

resulting product value is then expressed in t e r n of its syncrude premium ratio (SCP) relative to the price of PAD-I1 crude mix.
Refinery Configuration - The refinery LP model emulates a typical PAD-II district configuration (Refer to Fig. 2). Rated capacities of various process units are indicated in Table 1.
Prices/Volumes - The prices of feedstocks and finished products, including appropriate limits on supply and demand, were based on the recent DOE Study on direct liquefaction of coal (DOE Contract No. DEAC22 90PC89857) conducted by Bechtel.
Unit Capacities - The refinery is rated at 150 MBPD total crude charge (130 MBPD PAD- 11, 20 MBPD Alaskan North Slope).
Case Definitions
The volume of the coal liquid mixture is estimated to be 30,973 BPSD, and consists of the following:
m 0
MNC C5-35o"F Coal Naphtha 31.0 LDC 350450°F Coal Lt Distillate 12.6 HDC 450-650"F Coal Hv Distillate 34.9 LVC 650-850°F Coal Lt Vac Gas Oil 21.5
Coal Liquid Mix 100.0
The cases are separated into two broad categories. These two categories designated as A and B are defined below:
A B
Production is limited by market demand, and All products can be sold in the marketplace.
The individual cases are then further defined as follows:
Case 1 Case 2 Case 3 100% Coal Naphtha Case 4 Case 5 Case 6
Base Case, Zero Coal Liquids 100% Coal Liquid Mix
100% Coal Lt Distillate 100% Coal Hv Distillate 100% Coal Lt Vac Gas Oil
Processing Coal Liauids in a PAD-I1 Refinery
Coal naphtha (MNC) is fed to the Reformer and converted into high-octane reformate. Light distillate (LDC) is blended into finished diesel and finished fuel oil. Heavy distillate (HDC) is sent to the Cat Cracker as well as directly to diesel and fuel oil blending. Light vacuum gas oil (LVC) is used as a fuel oil blending component and as a Cat Cracker feedstock.
Results and Discussions
The product valuation for coal liquid was conducted utilizing the PIMS model described above. A typical PADD I1 refinery configuration and crude mix with a fixed price were used and assuming that the various fractions of coal liquid are available to the refinery. It was also assumed that the naphtha fraction of the coal liquid (C5-350°F) was sent to the reforming unit, the light distillate fraction (350450°F) was sent for blending (diesel and fuel oil), the heavy distillate fraction (450-650°F) was available for diesel and fuel oil blending and also used as FCCU feed, and the vacuum gas oil (65@850"F) was used as fuel oil blending stock and FCCU feed. The product valuation was theii calculated under two distinct scenarios. These two scenarios are: 1) force the refinery to make the same product slate that would make on its typical crude oil feed and 2) allow the product slate to float to maximize the profit. The product valuation.was expressed as the syncrude premium factor (SCP) which relates the coal liquefaction plant product values to a typical crude oil in PAD I1 refinery.
1211

A low SCP value of 1.07 was determined for scenario 1 and 1.27 for scenario 2 described above. In actual case SCP can range anywhere between these two limits.
The SCP is ultimately used to calculate the economics of coal liquefaction where the economics is expressed in terms of crude oil equivalent price. Figure 3 depicts a hterrelationshjp of various models developed in the previously referred DOE study on direct liquefaction of coal. The crude oil equivalent price is observed to be very sensitive to the value of SCP. When SCP was changed from 1.07 to 1.27 in the earlier referred DOE study on direct liquefaction of coal it was observed that the crude oil equivalent price reduced by $5.35. The result indicates that the accurate determination of SCP is important. The refinery model itself and the input data utilized in PIMS need to be carefdy examined to make a better assessment of SCP. Recently a refining end use study has been funded by DOE whereby Bechtel Corporation (contractor) in conjunction with a number of subcontractors has started updating the PIMS preliminary baseline model and the coal liquid products characterization data.
Table 1 Rated Capacities of Various Process Units
Refinery Unit
Crude Unit #I Crude Unit #2 Vacuum Unit #1 CS/CQ Isomerization Naph Hydrotreater Low-P Reformer Kern Hydrotrrater Dist Hydrotreater Catalytic Cracker Sulf Acid Alkylation Hydrocracking (Dist) H2 Plant MMSCFD Delayed Coker Sulfur Plant MLT/D
*All rated capacities unless listed, are in BPD
Figure 1 PIMS Product Valuation Scheme
I
J >
1 I
Conventional Refinery
Configuration
Data Needs
Characterization
in
Valuation
1212

Ngre 2 Coal Liquefaction Product Disposition
Scheme for a Given Refinery
Figure 3 Interrelationship of Various Models
Developed'in DOE Study on Direct Liquefaction of Coal
Simulatio
- Product Production Rates 0 E"try - Reference Crude Rice
Model
Flow Rates. Capital Cost
land Remlurns
1213

TECHNOECONOMIC ASSESSMENT OF DEWAXING & HYDROTREATING RECYCLE DISTILLATE SOLVENT
IN SUB-BITUHINOUS COAL LIQUEFACTION
Michael P e l u s o LDP A s s o c i a t e s 1581 Reed Rd.
Trenton , N. J . 08628
Keywords : Coal L i q u e f a c t i o n , S o l v e n t O u a l i t y , Economics
INTRODUCTION During W i l s o n v i l l e p i l o t p l a n t Runs #262 and #263 w i t h Black Thunder sub-bi tuminous c o a l , waxy d e p o s i t s were found i n t h e d i s t i l l a t e streams of t h e Two S t a g e L i q u e f a c t i o n p r o c e s s u n i t ( 1 ) . The q u a l i t y of t h e d i s t i l l a t e p o r t i o n of t h e r e c y c l e s o l v e n t s t r e a m from t h e s e two r u n s w a s p o o r ( 2 ) . T h i s r e s u l t i n d i c a t e d t h e p o t e n t i a l f o r improving o v e r a l l l i q u e f a c t i o n performance and economics by t r e a t i n g t h e waxy d i s t i l l a t e r e c y c l e s 'o lvent s t r e a m . T h i s i s one of t h e a r e a s o f l i q u e f a c t i o n b e i n g s t u d i e d under a DOE sponsored c o n t r a c t by a g r o u p headed by t h e C e n t e r f o r Applied Energy Research of t h e U n i v e r s i t y of Kentucky. CONSOL I n c . , S a n d i a N a t i o n a l L a b o r a t o r i e s and LDP A s s o c i a t e s a r e t h e o t h e r o r g a n i z a t i o n s p a r t i c i p a t i n g i n t h i s p r o j e c t . The t e c h n i c a l approach t a k e n t o improve t h e s o l v e n t q u a l i t y of t h i s d i s t i l l a t e is t o f i r s t , dewax i t u s i n g t h e commercially proven s o l v e n t dewaxing t e c h n i q u e , fo l lowed by c o n v e n t i o n a l h y d r o t r e a t m e n t t o improve t h e m a t e r i a l s donor c a p a b i l i t i e s .
DESCRIPTION OF SYSTEM A s i m p l i f i e d b lock f low diagram of t h e dewaxing and h y d r o t r e a t i n g p r o c e s s e s i s shown i n F i g u r e 1. Coal and a three-s t ream r e c y c l e p r o c e s s s o l v e n t are f e d t o t h e l i q u e f a c t i o n u n i t . The h e a v i e s t p roduct f rom t h e l i q u e f a c t i o n r e a c t i o n sys tem is f e d t o a vacuum tower which s e p a r a t e s a heavy d i s t i l l a t e f r a c t i o n from t h e ash- c o n t a i n i n g r e s i d u e f r a c t i o n . P a r t of t h e a s h y r e s i d u e is r e c y c l e d w h i l e a s m a l l e r p o r t i o n i s f e d t o a ROSE u n i t where t h e n e t a s h f e d t o t h e system is removed and a c l e a n r e s i d m a t e r i a l i s r e c o v e r e d and r e c y c l e d . The 6500F+ heavy d i s t i l l a t e s t r e a m from t h e vacuum tower i s a t l e a s t p a r t i a l l y dewaxed and h y d r o t r e a t e d b e f o r e b e i n g r e c y c l e d back t o t h e l i q u e f a c t i o n sys tem. I n W i l s o n v i l l e o p e r a t i o n t h e ana logous heavy d i s t i l l a t e s t r e a m was r e c y c l e d t o l i q u e f a c t i o n w i t h o u t e i t h e r dewaxing o r h y d r o t r e a t i n g .
DEWAXING T e s t i n g a t CONSOL i n d i c a t e d t h a t t h e s o l v e n t q u a l i t y of t h e heavy d i s t i l l a t e stream w a s s i g n i f i c a n t l y improved a f t e r s o l v e n t d e w a x i n g ( 2 ) . I n t h e dewaxing s t e p a s o l v e n t i s u s e d t o p r e c i p i t a t e and f i l t e r o u t t h e wax s p e c i e s a t below a tmospher ic t e m p e r a t u r e . S o l v e n t Dewaxing (SDW) i s a commonly a p p l i e d t e c h n i q u e i n t h e p e t r o l e u m r e f i n i n g i n d u s t r y t o remove p a r a f f i n i c hydrocarbons from l u b e o i l s t o c k s ( 3 ) . The waxy mater ia l o r s l a c k wax removed i n t h e Dewaxing u n i t i s h i g h l y p a r a f f i n i c ( F i g u r e 2 ) . When a d d i t i o n a l p r o c e s s i n g s t e p s ( d e o i l i n g 6 h y d r o t r e a t m e n t ) a re u s e d a h i g h v a l u e , f u l l y r e f i n e d p a r a f f i n wax c a n be produced from t h e s l a c k w a x ( 4 ) . A l t e r n a t i v e l y , t h e
1214
A'

h i g h l y p a r a f f i n i c s l a c k w a x s t r e a m c a n be s e n t t o a f l u i d c a t c r a c k i n g (FCC) u n i t where i t is r e a d i l y conver ted i n t o g a s o l i n e and o t h e r r e f i n e r y t y p e b y p r o d u c t s .
DEWAXED O I L HYDROTREATING Exper imenta l work done a t Sandia i n d i c a t e d t h a t f u r t h e r improvement i n s o l v e n t q u a l i t y c o u l d be o b t a i n e d by f i x e d bed h y d r o t r e a t i n g t h e dewaxed o i l s ( 5 ) . t h e h y d r o t r e a t m e n t i s t o add about 1% hydrogen t o t h e dewaxed d i s t i l l a t e s o l v e n t which w i l l s u b s e q u e n t l y be donated t o t h e c o a l i n t h e f i r s t s t a g e l i q u e f a c t i o n r e a c t o r , S i n c e hydrogenat ion of a r o m a t i c s o c c u r s r a p i d l y , mi ld o p e r a t i n g c o n d i t i o n s are a n t i c i p a t e d ( e . g . LHSV = 1, 1 , 8 0 0 p s i & 7500F max. ) .
Data from a p r o j e c t e d commercial s c a l e EDS s o l v e n t h y d r o t r e a t e r was u t i l i z e d t o e v a l u a t e t h e c o s t of dewaxed o i l h y d r o t r e a t i n g ( 6 ) . Es t imated a n n u a l i z e d h y d r o t r e a t i n g c o s t s ' a r e shown i n T a b l e 2 . A 50% i n c r e a s e i n s p a c e v e l o c i t y o n l y r e d u c e s l i q u e f a c t i o n u n i t g a s o l i n e product c o s t by a r e l a t i v e l y i n s i g n i f i c a n t 9CIBbl .
TECHNOECONOMIC ASSESSMENT A c o s t - b e n e f i t a n a l y s i s is be ing used t o d e t e r m i n e a n economical l e v e l of wax i n t h e d i s t i l l a t e r e c y c l e so lvent , f o r p r o j e c t e d commercial o p e r a t i o n . A good i n d i c a t o r of s o l v e n t q u a l i t y i s t h e c o n c e n t r a t i o n of a l k y l b e t a ( p a r a f f i n i c ) p r o t o n s (ABP) i n t h e s t r e a m . A s shown i n T a b l e 1, t h e r e c y c l e d i s t i l l a t e s o l v e n t s t r e a m ( V - 1 0 7 4 ) i n W i l s o n v i l l e Run #263J c o n t a i n e d 3 2 . 9 % A B P ' s . Using t h e CONSOL e x p e r i m e n t a l b a t c h SDW d a t a and commercial SDW i n f o r m a t i o n , e s t i m a t e d s t e a d y - s t a t e s i m u l a t i o n s of commercial SDW o p e r a t i o n s w e r e deve loped as a f u n c t i o n of t h e amount of t h e d i s t i l l a t e s o l v e n t f e d t o the dewaxer . As t h e p r o p o r t i o n of d i s t i l l a t e f e d t o t h e dewaxer i n c r e a s e s , t h e ABP c o n c e n t r a t i o n of t h e dewaxed o i l d e c r e a s e s ( F i g u r e 3 ) and i t s q u a l i t y as a s o l v e n t i n c r e a s e s , U n f o r t u n a t e l y , SDW c o s t s a l s o i n c r e a s e w i t h i n c r e a s i n g f e e d r a t e s . Because of t h e r a p i d d r o p i n ABP c o n c e n t r a t i o n v e r s u s SDWU f e e d r a t e , two SDWU f e e d r a t e c a s e s (25% & 100%) w e r e e v a l u a t e d .
Sunnnary data f o r t h e two S o l v e n t Dewaxing Uni t (SDWU) f e e d c a s e s i s shown i n T a b l e 3 . Two s l a c k wax byproduct d i s p o s i t i o n s c e n a r i o s were a l s o e v a l u a t e d a t each SDWU f e e d r a t e . The f i r s t s c e n a r i o assumes t h a t a l l of t h e s l a c k wax byproduct c a n b e s o l d as f u l l y r e f i n e d p a r a f f i n wax (FRPW) a f t e r t h e a p p r o p r i a t e p r o c e s s i n g s t e p s . I n t h e second s c e n a r i o i t i s assumed t h a t t h e sa le of FRPW i s l i m i t e d t o 1 0 % of t h e U . S . wax market demand. I n t h i s c a s e , some a s - i s s l a c k wax i s s o l d t o t h e c o n s t r u c t i o n i n d u s t r y ( 1 0 % of m a r k e t demand), w i t h most of t h e s l a c k wax s o l d as lower v a l u e FCC f e e d s t o c k . The v a l u e s of t h e FRPW, s l a c k wax f o r t h e c o n s t r u c t i o n i n d u s t r y and s l a c k wax as FCC f e e d s t o c k a r e a l l r e l a t e d t o c r u d e o i l p r i c e and a re shown i n Table 3 . FCC f e e d s t o c k p r i c e w a s de te rmined from t h e expec ted y i e l d s t r u c t u r e w i t h s l a c k wax f e e d (62 v o l . % g a s o l i n e ) , e s t i m a t e d product p r i c e s ( e . g . g a s o l i n e @ $ 4 0 / B b l ) l e s s e s t i m a t e d FCC p r o c e s s i n g c o s t s ( $ 2 / B b l ) . The a l m o s t t h r e e t imes h i g h e r v a l u e of t h e s p e c i a l t y FRPW v e r s u s t h e commodity t y p e FCC f e e d s t o c k v a l u e r e s u l t s i n huge d i f f e r e n c e s i n SDWU revenue between
The o b j e c t i v e of
1215

i
t h e All-Wax and 10% Wax c a s e s . When 100% of byproduct s a l e s a r e a s FRPW, t h e c o s t of SDW i s e x a c t l y o f f s e t by t h e va lue of t h e FRPW s a l e s f o r t h e 100% f e e d c a s e . An even more f a v o r a b l e r e s u l t o c c u r s f o r t h e 25% f e e d c a s e . FRPW s a l e s exceed SDW c o s t s t h e r e b y r e d u c i n g l i q u e f a c t i o n p l a n t g a s o l i n e product c o s t by 52C/Bbl. even b e f o r e t a k i n g i n t o account t h e b e n e f i t s of u s i n g t h e improved d i s t i l l a t e s o l v e n t i n l i q u e f a c t i o n . Thus i f t h e A l l - W a x byproduct d i s p o s i t i o n s c e n a r i o i s v a l i d , t h e u s e of a SDWU i s h i g h l y d e s i r a b l e ,
However, i n a f i v e sub-bi tuminous c o a l l i q u e f a c t i o n p l a n t s c e n a r i o , t h e amount of FRPW produced would be a s i g n i f i c a n t p o r t i o n of t h e t o t a l U . S . wax market demand. A t a low wax market p e n e t r a t i o n of l o % , SDWU c o s t s exceed byproduct revenues by $ l . l 6 / B b l of g a s o l i n e f o r t h e 25% f e e d c a s e and by $3.27!Bbl f o r t h e 100% f e e d c a s e .
The above r e s u l t s r a n g e from a d e c r e a s e i n l i q u e f a c t i o n p l a n t g a s o l i n e product c o s t of 52ClBbl f o r t h e 25% feed- 100% wax sales case t o a n i n c r e a s e of $ 3 . 2 7 / B b l f o r t h e 100% feed-10% wax market p e n e t r a t i o n c a s e . These r e s u l t s i n d i c a t e t h e ex t remely s i g n i f i c a n t e f f e c t byproduct d i s p o s i t i o n and SDWU f e e d r a t e have on SDW economics.
H y d r o t r e a t i n g t h e dewaxed o i l i s e s t i m a t e d t o i n c r e a s e o v e r a l l c o s t s by approximate ly $ 1 . 1 6 / B b l of l i q u e f a c t i o n p l a n t g a s o l i n e product i n a l l cases.
Therefore , t h e e s t i m a t e d t o t a l n e t c o s t f o r SDW and H y d r o t r e a t i n g t h e d i s t i l l a t e p o r t i o n of t h e r e c y c l e s o l v e n t r a n g e s from a low of 65C/Bbl f o r t h e All-Wax, 25% f e e d c a s e t o a h i g h of $ 4 . 4 2 / B b l f o r t h e 10% Wax, 100% f e e d c a s e .
FUTURE WORK The b e n e f i t t o t h e l i q u e f a c t i o n sys tem of u s i n g t h e b e t t e r dewaxed and h y d r o t r e a t e d d i s t i l l a t e s o l v e n t i s b e i n g e v a l u a t e d . It s e e m s l i k e l y t h a t t h e b e n e f i t of u s i n g dewaxing and h y d r o t r e a t i n g w i l l l i e i n between t h e r e s p e c t i v e c o s t s of t h e All-Wax and 10% Wax c a s e s a t each SDWU f e e d r a t e . I n a d d i t i o n , t h e use of C a t a l y t i c Dewaxing (CDW) i n s t e a d of SDW w i l l be e v a l u a t e d . I n CDW t h e waxy s u b s t a n c e s a re d i r e c t l y c r a c k e d t o l i g h t e r b o i l i n g r a n g e d i s t i l l a t e s and no waxy byproduct is produced .
REFERENCES 1 Southern Electric International, Inc.. ADVANCED COAL LIOUEFACTION RESEARCH AND DEVELOPNENT FACILITY, WILSONVILLE, ALABAMA, FINAL REPORT VOLUME I, DOEiPC1900331draft. January 1993, pp. 8-lh2. 2 Center f o r Applied Energy Research, ADVANCED COAL LIOUEFACTION CONCEPTS FOR THE PETC GENERIC UNITS, Ouarterly Progress Report f o r July-September 1992, DOE/PC/91040-17, Nov. 1992, pp 38-41. 3. Mcketta, J.J., ENCYCLOPEDIA OF CHEMICAL PROCESSING AND DESIGN, Dekker, New York, 1982, pp 353-370. 4 Texaco Development Carp., TEXACO DEWAXING-WAX FRACTIONATION PROCESS TECHNOLOGY- CURRENT STATUS S APPLICATIONS. Presented at the Texaco Teohnology Conference, Dubai,UAE, February 1992. 5 . Center f o r Applied Energy Research. ADVANCED COAL LIOUEFACTION CONCEPTS FOR THE PETC GENERIC UNITS, Ouarterly Progress Reporr for January-March 1993, DOEIPC191040-25. June 1993, pp.Seotion Two. 6. Exxon Research and Engineering Company. EDS COAL LIOUEFACTIDN PROCESS DEVELOPMENT, PHASE 5 . EDS WYONING COAL BOTTONS RECYCLE STUDY DESIGN ADDENDUn INTERIM REPORT. DE 84005843, D,eoember 1983.
1216

TABLE 1 DISTILLATE SOLVENT (V-1074) PROPERTIES
WILSONVILLE RUN # 2635 BLACK T H U P
WIGHT wno TO MF COAL : ESTIMATED SPECIFIC GRAVITY : ESTIMATED ELEMENTAL ANALYSIS, Wt%
0.858 1.04 (4.6API)
-Carbon 89.28
-Oryeen 0.76 -Nitrogen 0.44 -Sulfur 0.03
- Hydrogen 9.49
BOlLlNG RANGE, OF : ESTIMATED WATSON x" FACTOR : PROTW NMR DISTRIBN (CONSOL), Yo:
-Condensed Arornalk$ . Uncondensed Ammath - Cycllc Alpha -Alkyl Alpha - cyclic Beta . Alkyl Beta -Gamma
SOLVENT QUALW(CONS0L) : (1.Y1 SOLMNT-TO-COAllNOUNAVCOAL,~F.~MINUTES)
~ ~~
650 to 1,000 10.5
13.9 4.4
14.3 8.2
14.5 32.9 11.8 70.9
TABLE 2 ECONOMICS OF DEWAXED OIL HYDROTREATING
6)asIs; - 83,900 BPSD Feedrate * Wyoming Plant Location * Mid - '92 Dollas per Barrel of Gasoilne Product - 1% Estimating Allowance on Capital Costs - 0.15 Capital Charge Facmr - 320 Operating Days per Year
Two Year Catalyst Life Cosb of Makeup Hydrogen 8 Purge Hydrogen Excluded
LHSV L9 l.&
Catalyst Replacement @ $3M : 0.068 0.045
Fuel Gas @ $/MM& : 0.104 0.104 Operanng Labor : ma
Total = 1.154 1.062
Annuallzed Capital Cost : 0.874 0.805
Electrical Power @ 40/ kw-hr : 0.085 0.085
LHSV A = $0.092/Bbl
TABLE 3 BLACK THUNDER LIQUEFACTION STUDY
DEWAXING & HYDROTREATING THE DISTILLATE PORTION OF PROCESS SOLVENT
ECONOMIC EVAULATION OF NET COSTS * BASIS
- Lisueracaon : - Wax Ymld : - Wax Cracking Rate : - Crude oil P h e : - Gasonne Price : ~ Wax W e : - Slack Wax Value : . FCC Feed Value :
Five Plants @ 50,000 BPSD 01 Gasoline Each 4% of MAF Coal 22% of Wax Circulating $ 30/ FBI. $40 I &I. 34.3 0 I Ib. 18.8 o I ib. 11.5 o I Ib.
* TOTAL PRODUCTION DATA . Producl Dktrlbutlon All wax Wax = 1090 of Market
- Fully Refned Wax, TNr. 462,ooo 737.500 60,700 60.700 - Slack Wax, TNr. None None 67200 67200 - FCC Feed, TNr, None None 415.M)o 729,OOO - ECONOMIC DATA PER PLANT - ESfdDWuCapMlCosr$MM 236 463 180 41 0
-%Of Feed to DWU 25% 1m 25% 1 W O
- CapHal Savings in Upgrading 539 S A 4 . NdcaPiarCosr $!AM 150 346
32.5 46.9 - DWU Product Revenue. $ MMIYr. 63.4 1012 - Decreased GasolineRevenue a L3L6 3
33.8 83.6 4.7 3.1 - Increase In Revenue. $ MMNr.
LiIA - Net AnnuaI'd A In cap. C w u r n . Net Dewaxlng Cost $ MMNr. - 8.0 None
- NetDBwaxIngCostSIffl. ~ 0.52 None + 1.16 +327
+ 2.33 + 4.42 - NetAwGasolineCost$IBbl." +O.& +1.15
% +48.8
- Hydrotreater Cost $/Bbl. u u mtt15
* - MTINCLUDWQ BENEFW8 OF USlM THE iMPROMD SoLYeyr IN THE UQUEFACTION WIl ASWMMG 1W CAPITAL CHluaE FACTOR
1217

i
m f f i m LlDHTER MATERIAL 10 FURTHER PROCESSIN0 . NET PRODUCTS
t- I DEWAXW L H ~ R D T R E A ~ E D I--- I I DISTILLATE RECYCLE SOLVENT
ASHY RESID
SLACK WAX
10 FCC 01 WAX REFINING
AW CONCEMRATE
FIOURE 1 UUPLlFlED BLOCK FLOW DIAGRAM
DEWIXlNO L HYDROTREATING ol DISTILLATE RECYCLE SOLVENT
TEXACO DEVELOPMENT CORPORATION TWO STAGE SOLVENT DEWAXING UNIT
WITH INCREMENTAL DILUTION
DEWXED OIL TO RECOVERY SECTION
COOLERS CHILLERS PRIMARY REPULP FILTER FILTER
FEED
SLACK WAX A
I I I I I -
A - I
, MOIST WARM SOLVENT I - COLD FILTRATE AECYCLE
FIGURE 2
FIGURE 3 EFFECT OF DEWAXING UNIT BYPASS
34 1
32
30
%ALKYL 28
PROTONS 26 BETA
24
22
2 0 1 : : : : : : : : : I
0 10 2 0 30 40 50 60 70 80 90 100
% FED TO DEWAXING UNIT
i 1218

ALTERNATE ROUTES FOR THE PRODUCTION OF FUELS FROM COAL AND NATURAL GAS
David Gray, Glen Tomlinson, and Abdel ElSawy The MITRE Corporation
7525 Colshire Drive, McLean, Virginia 22102, U.S.A.
Keywords: Coal Liquefaction, Gasification, Fischer-Tropsch Synthesis
ABSTRACT Almost all transportation worldwide is powered by high energy density liquid hydrocarbon fuels produced from crude oil. Transportation fuels currently use over 50 percent of total world petroleum demand of 66 million barrels per day. Prior MlTRE studies indicate that crude oil supply will become severely limited after the year 2030 as increasing world energy demand, dnven by population growth and economic development, depletes oil resources. If conventional liquid hydrocarbon fuels that can use existing production and distribution infrastructures are still needed for transportation in the future, then alternate sources of these fuels will have to be utilized. Two such sources are natural gas and coal. Natural gas reserves worldwide are expected to last well into the 21st century, and coal resources are enormous. This paper examines the technologies for producing environmentally superior liquid transportation fuels from coal and natural gas using modern conversion technologies. Estimates of the costs of fuels from these sources are given, and the potential environmental impacts of these fuels are examined.
INTRODUCTION: High energy density liquid fuels are the predominant form of energy used for transportation worldwide. The existing infrastructure for production, refining, distribution, and use of liquid fuels represents an enormous investment worldwide, especially so for the Organization of Economic Cooperation and Development (OECD) countries that are transportation rich The pressures of potential resource limitations for petroleum and the drive toward a cleaner environment have aroused considerable interest in developing alternative fuels for transportation. These alternatives include non-liquid fuels like natural gas and, perhaps in the future, hydrogen. If it is considered to be economically and technically expedient to continue to use the existing liquid fuels infrastructure rather than to change to a gas-based system, liquid fuels could still be produced from non-petroleum sources. The most abundant fossil fuel source worldwide is coal and this can be used to produce high quality liquid fuels. Natural gas can also be used as a source of liquid transportation fuels. Previous studies at MITRE have examined potential world energy supply and demand scenarios till the year ZlOO(1). These hypothetical scenarios show that total world energy demand increases from the current annual use of 360 exajoules to about 1,100 exajoules by 2 100. This projection assumes that energy conversion and end-use efficiency increase such that after 33 years existing equipment is replaced by new equipment that saves 33 percent of the energy. This 33 cycle continues for another two cycles of continuing efficiency improvements saving an additional 16.6 and 8.3 percent respectively. Recoverable oil and gas resources are assumed to be 10,000 exajoules each(*). and they will be essentially depleted by 2100. The purpose of this look into the future is to demonstrate that after 2030 oil production will be in decline and an alternative to petroleum-based fuels will have to be found.
Coal as an alternative feedstock for transportation fuels: The key to converting solid coal to liquid fuel is hydrogen. Liquid fuels typically contain ahout 14 percent hydrogen whereas coal contains around 5 percent. This hydrogen deficit can be made up by forcing hydrogen into the coal under pressure (so-called direct liq~efaction(~)), or by gasifying the coal with oxygen and steam to a synthesis gas containing hydrogen and carbon monoxide that is then passed over catalysts to form hydrocarbons (so-called indirect liq~efaction(~)). For direct liquefaction, coal is slurried with a recycle oil and heated under a high pressure of hydrogen to produce a synthetic crude oil that can be upgraded into specification transport fuels by existing petroleum
1219
refinery processes. The hydrogen is produced by gasification of coal and residue or by natural gas Steam reforming. For indirect liquefaction, the synthesis gas produced is passed over Fischer-Tropsch (F-T) catalysts where a series of hydrocarbons ranging from c, to about C,,, are produced. These can also be refined to produce specification liquid fuels by using mild refinery operations.
Direct liquefaction, invented in the early 20th century by Bergius, was used extensively by the Germans in World War I1 to produce high octane aviation fuel, and since that time research and development have completely transformed the technology. Research Sponsored by the United States Department of Energy over the last fifteen years has led to the development of a catalytic two-stage liquefaction process(s) (CTSL) that uses two high pressure ebullating bed reactors in series to solubilize coal and upgrade it to a distillate raw product containing about 13 percent hydrogen at an overall thermal efficiency of about 66 percent. Liquid distillate yields of over 70 percent on a moisture ash-free (MAF) coal basis are regularly obtained with bituminous coals, and yields of 60 to 65 percent are usually obtained with low rank coals as feedstock. This translates into oil yields of over 3.5 barrels (557 litres) per tonne of MAF coal.
Indirect liquefaction technology is commercialized in South Africa and produces about a third of that country's gasoline and diesel fuel. The South African Synthetic Oil Company (SASOL)(6) plants produce together over 100,000 barrels per day of fuels. When SASOL made the decision to build these plants the only commercially available coal gasifier that met the requirement of processing high ash South African coals was the Lurgi dry-ash gasifier. Today, however, research and development in coal gasification has resulted in the commercialization of highly efficient entrained gasifiers such as Shell and Texaco. These systems that gasify coal at high temperatures and pressures can process all coals to produce a synthesis gas containing only carbon monoxide and hydrogen. These entrained gasifiers that have net efficiencies for synthesis gas production of about 80 percent greatly improve the overall efficiency, hence the economics, of indirect liquefaction. The other area that has led to significant improvements in the efficiency and economics of indirect liquefaction is the development of advanced F-T synthesis technology. Shell has developed advanced fixed-bed reactor technology for F-T synthesis and is currently operating a plant in Malaysia for the production of diesel fuel and waxes from off-shore natural gas. SASOL has developed an advanced Synthol reactor that uses a fixed fluid bed concept as opposed to the circulating fluid bed currently at use in the SASOL plants. SASOL has also developed a slurry F-T reactor that promises to be even more cost effective. The United States Department of Energy is also funding research aimed at developing both an advanced slurry F-T reactor system and an effective F-T catalyst to use in the advanced reactor. This system being studied both at the bench-scale and at the Alternate Fuels Development Unit at Laporte Texas will be compatible with the synthesis gas produced in the advanced entrained coal gasifiers mentioned above.
In a commercial indirect coal liquefaction facility, the synthesis gas produced in the coal gasifiers is purified and shifted then sent to the F-T reactors where a whole range of hydrocarbons are produced. The unconverted synthesis gas together with methane and ethane is sent to an autothermal reformer where the methane and ethane is converted to hydrogen and carbon monoxide. This is then recycled to the F-T reactors. The hydrocarbon products are separated and the gasoline and diesel boiling range fractions are sent to the downstream refinery to be upgraded to specification fuels. The heavy wax hydrocarbons are hydrocracked to additional gasoline and diesel and also sent to the
'refinery.
Natural gas as feedstock for production of liquid transportation fuels: As an alternative to using natural gas in its gaseous state as a transportation fuel, it can be converted to specification gasoline and diesel fuel so that the existing liquid fuels infrastructure can be utilized. This is commercialized in New Zealand where natural gas is converted into methanol and the methanol is converted into gasoline using the Mobil
1220

Methanol-to-Gasoline (MTG) technology(9). Shell is converting remote natural gas in Malaysia into liquids that can be transported by tanker to market.
For indirect liquefaction, natural gas can be steam reformed or partially oxidized to synthesis gas. This gas is then processed in the same manner as the coal-derived synthesis gas described above, Thus improvements in F-T technology are applicable to natural gas processing. In addition, there have been recent advances in catalytic partial oxidation that can produce lower hydrogen to carbon monoxide synthesis gas at lower cost. For direct liquefaction, natural gas can be used as the source of hydrogen instead of coal, so that coal is only sent to thc liquefaction reactors. This results in elimination of the coal gasification plant from the direct plant. In addition, the coal handling units can be reduced in size and the plant electric power required is reduced. Thus, using natural gas for this application lowers capital investment of the direct coal liquefaction plant and, depending on the cost of the natural gas, can result in a lower required selling price of the coal derived transportation fuels. A sensitivity analysis of the equivalent crude price versus natural gas price for this case, where gas is used to produce hydrogen in the direct coal liquefaction plant, shows that using natural gas can result in lower costs for coal liquids up to a natural gas price of about $4 per million Btu ($4.22 per Gigdoule). Using natural gas for hydrogen production also has a significant positive impact on the carbon dioxide produced per product barrel. This quantity can be reduced from about 0.42 tonnes per product barrel when coal is used for hydrogen to 0.21 tonnes in the natural gas case.
Economics of fuels production from coal and natural gas: At the MITRE Corporation, computerized simulation models of coal and natural gas based liquefaction technologies have been developed as part of our funding support from Sandia National Laboratories and the United States Department of Energy(7.S). In these models, test data from ongoing research and development is used to develop conceptual commercial plants for direct and indirect coal liquefaction, and natural gas based plants. Construction and capital costs of the plants are estimated together with operating costs. Using a constant set of economic parameters the required selling price of liquid fuels can be calculated. This price is then adjusted to an equivalent crude price.
Quality and environmental impact of coal-derived transportation fuels: Direct coal liquefaction produces an all distillate product that can be refined using conventional hydrotreating, hydrocracking, fluid catalytic cracking, and reforming to yield high octane gasoline, high density jet fuel and 45 cetane diesel. Indirect liquefaction produces a paraffinic gasoline whose octane can be adjusted by reforming or by adding octane enhancers like alcohols or ethers. The diesel fraction is excellent, has a cetane of over 70 and zero arcmatics and sulfur. These refined products can exceed current transportation fuel specifications and their use will have a positive effect on air quality. The paraffinic indirect naphtha can be blended with the aromatic direct naphtha to minimize the amount of refining required. Similarly, the aromatic diesel from direct liquefaction can be blended with the paraffinic diesel from indirect. Thus a hybrid plant concept where both direct and indirect technologies are sited at the same location may have considerable merit.
CONCLUSION Coal and natural gas can be used as resources to produce specification liquid transportation fuels that make use of the existing liquid fuels refining, distribution and end-use infrastructure. Although the costs of these fuels are higher than current crude prices, they can be competitive with crude oil at about $30 to $35 per barrel. The United States Energy Information Agency (EIA)(IO) has just published its latest World oil price (WOP) projections. In their reference scenario, the WOP is expected to reach $35 per barrel by the year 2015.
(This work performed at The MITRE Corporation was supported by Sandia National
’
Laboratories, which is funded by the USbepartment of Energy under contract DE-AC04-94AL85000,)
1221
4
REFERENCES: 1) Gouse, S . W., D. Gray, D. L. Morrison, and G. C. Tomlinson, Potential World Development through 2100: The Impact on Energy Demand, Resources and the Environment, Proceedings of the 15th Congress of the World Energy Council, Madrid, Spain, 20-25 September 1992, pp. 18-33, World Energy Council Journal, December 1992. 2) Masters, C. D., E. D. Altanasi, W. D. Dietzman, R. F. Meyer, R. W. Mitchell, and D. H. Root, World Resources of Crude Oil, Natural Gas, Natural Bitumen, and Shale Oil, Proceedings of the 12th World Petroleum Congress, Vol5, pp. 3-27, published by John Wiley. 3) Liquid Transportation Fuels from Coal Part I : Direct Liquefaction, PETC Review, Issue 3, pp.4-13, March 1991. 4) Stiegel, Gary J., Transportation Fuels from Coal Part 2: Indirect Liquefaction, PETC Review, Issue 4, pp. 14-23, Fall 199 1. 5 ) Advanced Coal Liquefaction Research and Development Facility, Wilsonville, Alabama, Technical Progress Report Run 258 Subbituminous Coal, DOE/PU50041-130, May 1991. 6) Dry. Mark, E., The Sasol Fischer-Tropsch Processes, Applied Industrial Catalysis Volume 2, Ed. Bruce Leach, Academic Press 1983. 7) Gray, David, Abdel EISawy, and Glen Todinson, Quantification of Progress in Indirect Coal Liquefaction, Proceedings of Liquefaction Contractors' Review Meeting, Pittsburgh, Pa. pp.344-356, September 1991. 8) Gray, David, and Glen Tomlinson, Assessing the Economic Impact of Two-Stage Liquefaction Process Improvements, Sandia Contractor Report SAND87-7 147, August 1988. 9) Haggin, Joseph, Methane-to-Gasoline Plant Adds to New Zealand Liquid Fuel Resources, Chemical and Engineering News, pp.22-25.22 June 1987. 10) Annual Energy Outlook 1993, published by Energy Information Administration, January 1993.
1222

DEASHING OF COAL LIQUIDS BY SONICALLY ASSISTED FILTRATION
Bogdan J. Slomka Fossil Energy Program
Ames Laboratory, Iowa State University Arnes, IA 50011
INTRODUCTION This project seeks to improve the effectiveness and reduce the cost of coal liquefaction by novel applications of sonic and ultrasonic energy. The specific purpose of this project is to develop and improve means for the economical removal of dispersed solid particles of ash, unreacted coal, and spent catalyst from direct and indirect coal liquefaction resids by using sonic or ultrasonic waves. Product streams containing solids are generated in both direct and indirect coal liquefaction processes. Direct coal liquefaction processes generate liquid products which contain solids including coal-originated mineral matter, unreacted coal, and spent dispersed catalyst. The removal of these solids from a product stream is one of the most difficult problems in direct coal liquefaction processes. In the existing direct liquefaction processes, the liquefaction reactor(s) effluent is distilled to recover valuable product fractions before the solids are separated from remaining liquids. In consequence, the solids are concentrated in the distillation bottom fractions which are difficult to filter due to their high viscosity. The problem is aggravated by the fact that the solids are predominantly present as micron-sized particles. Removal of solids from coal liquefaction products can be accomplished in scveral ways. Conventional filtration used in early liquefaction technologies was mechanically troublesome and proved inefficient for processes producing high concentrations of solids in coal liquefaction products of high viscosity, e.g., SRC-I. Efforts were made to improve sedimentation and filtration rates in the deashing of coal liquids through partial precipitation of asphaltenes’” and using electric fields3. However, no substantial process improvements resulted for the coal liquefaction technology at the time. During the seventies, two other operations for rejecting solids from coal liquefaction product streams were introduced, namely, anti- solvent deashini, implemented by Lummus in a two-stage liquefaction process, and Kerr- McGee’s critical solvent deashing’ which was employed at the Wilsonville coal liquefaction facility for solids rejection6. However, it was reported that up to 30% by weight of the feed could be lost in the rejected stream”’. At present, Hydrocarbon Research Inc. uses improved filtration of atmospheric distillation resids in a catalytic two- stage direct coal liquefaction process’. Other devel\opments9 indicate that advanced techniques of solidfliquid separation, e.g., crossflow filtration, could further improve the separation of solids from coal liquefaction products. It also has been suggested” that acoustic, electric, and magnetic fields can prevent filter clogging and membrane fouling during crossflow filtration of suspensions. Mechanisms at work include turbulence from cavitation, microstreaming effects and viscosity reduction due to localized heating. Increased filtrate fluxes result from insonation of filtration media during filtration. Crossflow filtration is suitable for continuous flow operation and, when coupled with a sonic or ultrasonic field, may constitute a solution to operational problems of solids separation in coal liquefaction. However, for the efficient and trouble-free operation of crossflow filters the problems arising from dealing with highly viscous coal liquefaction resids need to be avoided. Either crossflow filters suitable for work at elevated temperatures at reduced resid viscosity should be used or the coal liquefaction process network should be modified to allow for dilution of resids using a distillate fraction, e.g., naphtha, diesel oil, etc., to reduce the viscosity of resids. As perhaps even a more practical alternative. field-assisted crossflow filtration of the reactor’s effluent stream prior to the distillation step should be considered. Such an approach will circumvent the more difficult separation of fine and ultrafine solids from highly viscous coal liquefaction resids.
1223

t
EXPERIMENTAL Liquefaction Resid Characteristics. An atmospheric flashed bottoms stream from Wilsonville Run No. 260 was used in the deashing tests. The V-1067 resid sample @oiling above 850° F, specific gravity 1.24) represents the ashy second-stage product stream which was recycled after partial deashing in the Close-Coupled Integrated Two- Stage Liquefaction process. The resid typically contained 10.1% wt. ash, 30.1% tetrahydrofuran (THF)-insoluble solids, 2.0% THF-soluble and toluene-insoluble preasphaltenes, 21.1 % asphaltenes and 46.9% hexane-soluble oil component by weight. The THF-insoluble solids isolated from the resid were analyzed for particle size distribution by wet screening using THF-water mixtures as dispersing liquids. Analyses have shown that the largest particles are about 300 microns in diameter and that 59.5% by weight of the solids are smaller than 5 microns. Based on laser diffraction measurements, it was estimated that 42.9% by weight of the solids is smaller than 1.9 microns in diameter. Crossflow Filtration Apparatus. A state-of-the-art crossflow filter utilizing 2-micron porosity stainless steel tubes as the filtration medium was built and used in the deashing tests. The crossflow filter was coupled with a 650-watt computer-based variable- frequency sonic transducer to radiate sonic waves inside the crossflow filter directly exposing the filter elements to the sonic field. Figure 1 shows the configuration of the crossflow filter apparatus. Sonic waves were radiated parallel to the filtering surfaces of the crossflow filter. This feature was incorporated in the design of the crossflow filter after earlier, less successful, experiments in which in-situ sonic waves were radiated at a right angle to the filtering surface. In this way, the build-up of solids at the filter medium, often resulting in severe clogging, was eliminated possibly due to the sonically generated rapid movement of fluid parallel to the filtering surface. Detrimental fixing of solid particles in the pores of the filter medium due to the action of high-intensity sound was found to be minimal.
RESULTS AND DISCUSSION Crossflow Filtration. In this series of tests, the V-1067 resid, diluted with No. 2 fuel oil (1:3 by vol.), was used as the feed. A 5-m~ pulsed sound at 650 watts was used for the insonation according to a preprogrammed sequence of 5 pulses per second. Each pulse was 40cycles long, i.e., 8 milliseconds. Throughout the duration of filtration, samples of filtrate and of circulated slurry were collected for ash and solids content analyses. The filtrate flow rate was also measured as a function of filtration time. The reference test was performed in exactly the same manner except the sonic transducer was not energized. Table 1 and Figure 2 show the effect of 5-m~ sonic treatment on the filtrate flow rate and filtrate ash content as a function of filtration time. Solids-free and ashless filtrates were obtained in both cases, with and without the sonic energy present during filtration. A clear beneficial effect of sonic waves is evident from the comparison of the filtrate flow rates. In the presence of 5-kHz sonic waves applied in-situ, the filtrate flow rate was greater than that of the reference test by a factor of up to 2.74. Total filtrate volumes collected after 90-minute filtrations were 1.25 and 2.60 liters for the reference and the 5-kHz test, respectively. The increased filtration performance due to in-situ insonation of the crossflow filter is also confirmed by the increased solids and ash contents of the circulated slurry as shown in Table 2 and Figure 3. Based on these unoptimized bench-scale crossflow filtration tests, and assuming the cost of electricity at $O.O7/kwh, the operating cost of sonic treatment was calculated to be 1.70 $/bbl of filtrate. Batch Filtrations. Reference Tests. The remaining solids concentrates from continuous cross-flow filtration experiments still contain from 70 to 80% by weight of hexane-soluble oil components. To test further processing options for the solids concentrates, two samples of concentrate containing 77.6% of oil by weight were subjected to conventional batch filtration on Whatman No. 5 filter discs using vacuum at room temperature. Table 3 shows the results of solubility analyses by Soxhlet extraction using n-hexane, toluene, and
1224

THF, for cakes from two parallel batch filtrations, Cake I and Cake II. For comparison, solubility analyses of the as-received V-1067 resid and the solids concentrate are included. The oil and asphaltene contents of the filtration cakes are significantly reduced compared to oil and asphaltene contents of the V-1067 resid, while the percent of THF insolubles and percent preasphaltenes both have increased. Up to 88-hour long filtrations produced ashless filtrates and filtration cakes which appeared dry but still contained approximately 33% by weight of hexane-soluble oil. Sonically Assisted Batch Filtrations. Three batch filtrations of the solids concentrate were conducted at room temperature. Whatman No. 5 filter paper was used as the filter medium. A brief description of the test procedure is as follows. A well stirred sample of the solids concentrate was placed in a filtration funnel and the excess fuel oil was fdtered out by applying vacuum. As soon as air broke through the filter cake, a 20-kHz sonic probe was placed in contact with the cake and energized at 250 watts using a pulsed mode of operation at 80% duty cycle. Throughout the entire time of insonation, the probe was slightly pressed against the surface of the filter cake to ensure a good contact of probe with the surface of the cake. The cake rapidly liquified in the presence of sonic energy resulting in an additional amount of oil passing through the fdter and a dry and compact cake. The oil filtrate was found to contain no solids or ash. During the insonation, the filtration cakes released a significant amount of oil vapors and possibly products of a decomposition reaction. Cake temperatures as high as 170 OC were measured at the cake surface immediately after completion of insonations. It is worth noting that these high temperature increases of diluted V-1067 resid did not occur in earlier tests with liquid suspensions of V-1067 in No. 2 fuel oil, despite an intense acoustic cavitation taking place within the suspension. Possibly, the solids loading of the suspension must be above a certain threshold for efficient absorption of sonic energy. For a V-1067 resid and No. 2 fuel oil mixture, this solids loading threshold is at about 50% solids by weight. Table 3 shows the solubility analyses of filtration cakes; cake 3 through 5 were insonated for 5 , 10, and 20 minutes. As the insonation time increased the oil content of the filtration cake decreaed while the THF insolubles and preasphaltenes contents both increased. It is evident that more oil can be recovered from solids concentrates by using sonic energy. The effect of insonation on the rate of filtration is dramatic. The analysis of the filtration cake insonated for only 10 minutes showed an oil content of 24.3% while the 88-hour reference tests without insonation produced cakes containing 32.0 and 33.5% of oil by weight. This corresponds to an over 600-fold increase in the average filtration rate. Little further improvement in the quality of the filtered solids was achieved by prolonging the insonation to 20 minutes.
ACKNOWLEDGEMENTS This project has been funded by US. Department of Energy through Pittsburgh Energy Technology Center. Ames Laboratory is operated for the U.S. DOE by Iowa State University under Contract No. W-7405-ENG-82.
REFERENCES 1. Verhoff, F.H., Lui, S.S. and J.D. Henry, Jr.,Can. 1. Ch e m. En& . , 1978,%, 504. 2. Gorin, E., Kulik, C.J., and Lebowitz. H.E., bod. Enc. Ch em.. Proc. D es. Dev., 1977,16(1),
102- 107. 3. Lee, C.H., Gidaspow, D. and D. Wasan, 4. Peluso, M. and D.F. Ogren, m, Ene . Progc., 1979. 6,41. 5. Adam, R.M., Knebel, A.H. and D.E. Rhodes, Chem. Ene. Prw., 1979,6,44. 6. Gollakota, S.V., Davies, O.L., Vimalehand, P., Lee, J.M. and C.E. Cantrell,
Liauefaction Contractors ' Re v'e I w Co n ference , Sept. 24-26, 1990, Pittsburgh, PA. 7. Gorin, E., Kulik, C.J., and Lebowitz, H.E., Jnd. Ene. Chem.. Proc. Des. Dev. , 1977, &(I),
95-102. 8. Comolli. A.G.. DOE Liauefaction Contractors' Review m e r e n c e Pmeedina , Pittsburgh,
PA, September 22-24, 1992, pp. 97-105.
Ch em. Fundamentals., 1980,19(2), 166.
1225
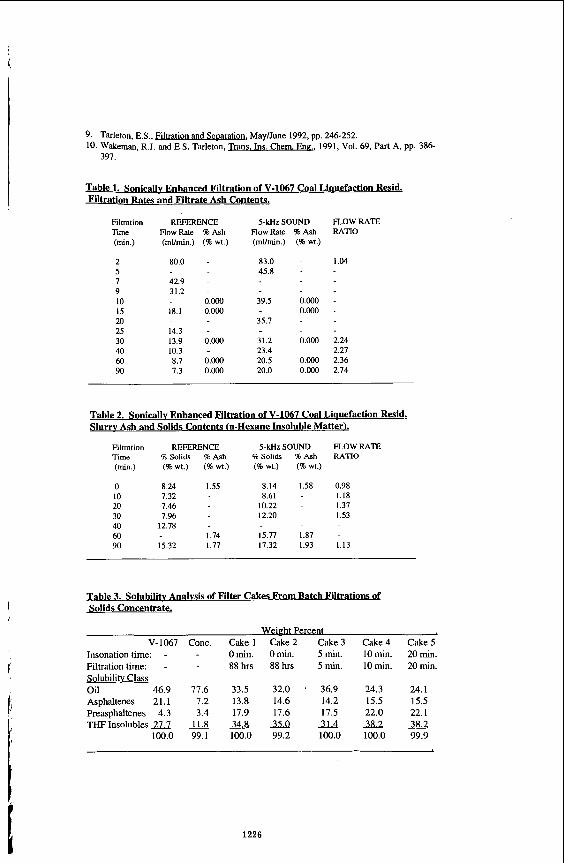
i
9. Tarleton, EX. Filtration and Seoarat ipn, MayIJune 1992, pp. 246-252. 10. Wakeman, R.J. and E.S. Tarleton,
397. Ins. Chem. E ne, 1991, Vol. 69, Part A, pp. 386-
Table 1. Sonicallv Enhanced Filtration of V-1067 Coal Liauefaction Resid. Filtration Rates and Filtrate Ash Contents.
Filtration REFERENCE 5-kH2 SOUND FLOW RATE Time FlowFate %Ash FlowRate %Ash RATIO (min.) (mumin.) (% wt.) (rnVmin.) (% wt.)
2 80.0 - 83.0 - I .04 5 45.8 - 7 42.9 - 9 31.2 - 10 0.0M) 39.5 0.000 - 15 18.1 0.000 0.000 - 20 35.7 - 25 14.3 - 30 13.9 O.Oo0 31.2 0.000 2.24 40 10.3 - 23.4 - 2.27 60 8.7 0.OOO 20.5 0.OOO 2.36 90 7.3 0.000 20.0 0.000 2.74
Table 2. Sonicallv Enhanced Filtration of V-1067 Coal Liauefaction Resid. Slurrv Ash and Solids Contents (n-Hexane Insoluble Matter).
Filtration REFERENCE 5-kHz SOUND FLOW RATE Time 5% Solids %Ash %Solids %Ash RATIO (min.) (% wt.) (% wt.) (% wt.) (% wt.)
0 8.24 1.55 8.14 1.58 0.98 10 7.32 8.61 - 1.18 20 7.46 10.22 - 1.37 30 7.96 12.20 - 1.53 40 12.78 60 1.74 15.77 1.87 - 90 15.32 1.77 17.32 1.93 1.13
Table 3. Solubilitv Analvsis of Filter Cakes From Batch Filtrations of Solids Concentrate.
V-1067 Conc. Insonation time: - Filtration time: - Solubilitv Class Oil 46.9 77.6 Asphaltenes 21.1 7.2 Preasphaltenes 4.3 3.4 THF Insolubles 27.7 11.8
100.0 99.1
Cake 1 0 min. 88 hrs
33.5 13.8 17.9
343 100.0
Weieht Percent Cake2 Cake3 Omin. 5 min. 88hrs 5min.
32.0 36.9 14.6 14.2 17.6 17.5 35.0- 31.4 99.2 100.0
Cake 4 10 min. 10 min.
24.3 15.5 22.0 38.2 100.0
Cake 5 20 min. 20 min.
24.1 15.5 22.1 38.2 99.9
1226
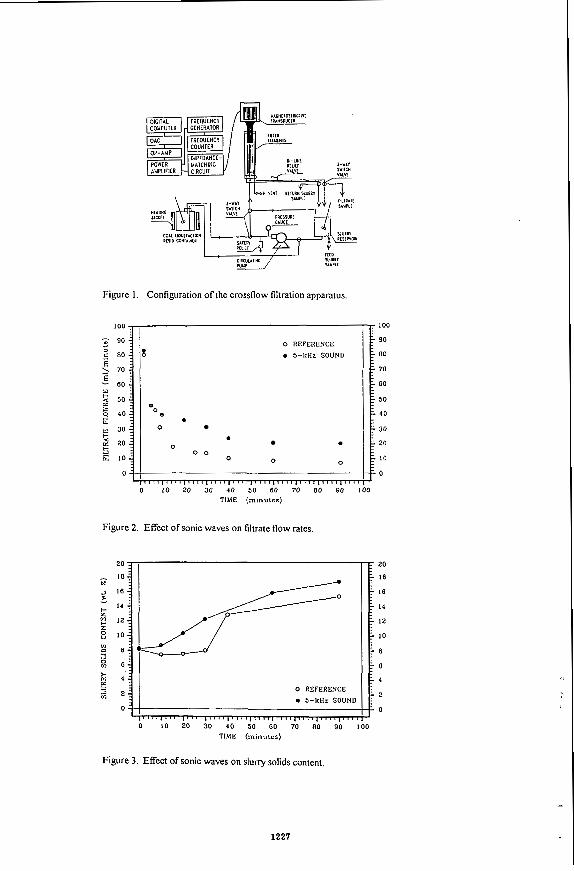
Figure 1. Configuration of the crossflow filtration apparatus.
0
e 0
0
0 *
O 0 0 0
0 REFERENCE 0 5-kHz S O U N D
0
0
1 , , , , " " , , , , , , , , , , 1 " ' , 1 ' , ' , 1 , , , , 1 ' , , , 1 , , , , 1 ' , , 10 20 30 4 0 50 60 70 E O 90
TIME ( m i n u t e s )
Figure 2. Effect of sonic waves on filtrate flow rates.
100
90
DO
70
GO
50
40
30
20
10
0
I
, t 20
0 REFERENCE 2; TIME ( m i n u t e s )
Figure 3. Effect of sonic waves on slurry solids content.
1227

t
PETC's ON-SITE NATURAL GAS CONVERSION EFFORTS
Charles E. Taylor U.S. Department of Energy
Pittsburgh Energy Technology center P.O. Box 10940
Pittsburgh, PA 15236-0940, USA
KEYWORDS Methane, Oxyhydrochlorination, Organometallic Reactions
ABSTRACT Investigation of the direct conversion of natural gas (i.e., methane) to transportation fuels has been an ongoing effort at PETC for over 10 years. TWO of our recent areas of interest have been the oxyhydrochlorination (OHC) of methane and the oxidation of methane by organometallics. The OHC reaction is a two-step process in which methane, hydrogen chloride, and oxygen are reacted to produce methyl chloride. The methyl chloride is then reacted over a zeolite to produce gasoline-range hydrocarbons. Another area of interest, the oxidation of methane with Organometallics, has produced interesting resulte. The reported reaction occurs between methane (at 800 psig, 5.52 MPa) and palladium(I1) acetate in trifluoroacetic acid at 80°C. The product, methyl trifluoroacetate, is readily hydrolyzed to produce methanol and trifluoroacetic acid.
INTRODUCTION A significant portion of proven global natural gas reserves are in remote areas of the world where transporting the gas to market is not economically feasible. The conversion of natural gas to liquid fuels would Permit facile storage, transportation, and distribution of a higher energy density fuel using established technologies and distribution networks. Key to a natural gas conversion process is the conversion of methane, the major component. The Pittsburgh Energy Technology Center (PETC) has been involved in this effort. Recent research has led to a two-step process for the conversion of methane to gasoline-range hydro~arbonsl-~. Methane, oxygen, and hydrogen chloride react over an oxyhydrochlorination (OHC) catalyst in the first step to produce predominantly chloromethane and water. In the second step, the chloromethane is catalytically converted to higher hydrocarbons, mainly in the gasoline (C4-Clo) boiling range, by a pentasil-type zeolite such as ZSM-5.
Reports have appeared in the literature describing the use of organometallic complexes to selectively oxidize ~nethane.~,~ Investigation of one of these reaction schemes in our laboratory has produced interesting results. Our research effort was an extension of work reported by Sen and coworker^.^-^ The reported reaction occurs between methane (at 800 psig 5.52 MPa) and palladium(I1) acetate in trifluoroacetic acid at 80°C (Equation 1). The product, methyl trifluoroacetate, is readily hydrolyzed to produce methanol and trifluoroacetic acid.
CH, + Pd(02CCH,) ~ cp3c00H* CF,CO,CH, + P d BO'C
OHC REACTIONS: EXPERIMENTAZ. The catalysts for the OHC reaction were prepared by sequential deposition of the appropriate metal chlorides, or their precursors, in non- aqueous solvents onto a fumed silica support. The catalysts were tested for OHC activity under a predetermined set of conditions and compared to the copperlpotassiumllanthanum chloride catalyst. All reactions were conducted i.1 a 0.5-in (1.27-cm) 0.d. x 7-in (17.8-cm) quartz A blank catalyst was prepared under identical conditions to those used for the metals but only containing potassium and lanthanum chlorides on the silica support. The catalysts were activated in a stream of hydrogen chloride at 300OC prior to testing. Composition of the catalysts, by weight, is given in Table I. An on-line mass spectrometer was used to determine conversions and product yield.
RESULTS AND DISCUSSION Table 11 lists reactant conversions under conditions utilized for the copperlpotassiumllanthanum chloride catalyst and Table I11 lists the normalized carbon product distribution. With the exception of the cobalt catalyst, all catalysts exhibited a lower conversion of methane and lower methyl chloride production than did the copper. Temperature profiles for all the catalysts were performed along with lifetime studies for the copper and cobalt catalysts. Reactant conversion and product distribution remained constant during the 400 hours on stream for both the copper and cobalt catalysts.
Differences in activity of the copper and cobalt OHC catalysts have been observed depending on the person in our laboratory who prepared them. The lower activity catalysts result in both lower conversions and poorer selectivity for chloromethane. In an effort to better understand these observations, the catalysts were analyzed for structural differences.
Preliminary scanning electron microscopic (SEN) examination of two supported copper OHC catalyst samples showed some differences in morphology and segregation of CU, C1, La, and K. The overall elemental compositions of the two samples were similar, as shown in the energy dispersive spectroscopy (Eos) spectra, however. the SEM micrographs displayed a difference in particle size. The more active catalyst exhibited a finer particle texture with fewer large copper-potassium chloride needles. Identical results were observed for two samples of the CO-OHC catalyst that exhibited different OHC activities.
X-ray diffraction (XRD) studies performed on the two Cu-OHC catalyst samples utilizing a Cu-K, radiation exhibited some differences. The most significant
up-flow reactor tube.
1228

was at 2e angles of 11.6 and 6.05 degrees. The more active catalyst exhibited intensities at these positions which were greater by a factor of 2 and 5 , respectively. Upon exposure of the catalyst sample to humid air the 20 peak at 6.05 degrees disappeared.
CBLOROuFmuLNE CONVERSION REACTIONS: EXPERIMENTAL All reactions were conducted in a 0.5-in (1.27-cm) 0.d. X 7-in (17.8-cm) quartz up-flow reactor tube. The ZSM-5 was obtained from Mobil Oil Corporation in the ammonium form with a silica-to-alumina ratio of 70:l. The ammonium form was converted to the acid form by calcining in air at 538OC for 16 hours. Typically, 1.0 g of ZSM-5 zeolite was supported on a deactivated quartz-wool plug, heated to 35OoC, and exposed to methyl chloride or mixtures of chloromethanes approximating the composition produced in the OHC reaction. Flows of reactants were selected to maintain a weight hourly space velocity (WHSV) of 1. An on-line mass spectrometer was used to determine conversion.
The liquid condensate was collected in an ice bath during the experiments and was analyzed by utilizing a 100 m X 0.25 mm i.d. fused silica column coated with a 0.5 pm film of 100% methylpolysiloxane (Petrocol DH) and a helium carrier gas having an average linear velocity of 31 cm per second at 3 O O C . The low boiling, low molecular weight products not condensed in the ice bath were determined by directly sampling the reactor effluent product vapor and analyzing it by gas chromatography using a 50 meter X 0.32 mm porous layer open tubular (PLOT) column containing A1203 /KC1l0. The identifications made in this manner were confirmed by combined GC-MS andfor GC-FTIR. GC-MS was performed using a Hewlett-Packard 59888 system equipped and operated with the same chromatographic column and conditions as above. Further confirmation of these identifications was obtained by combined GC-FTIR using a Digilab FTS 65 CCfC 32 system equipped with a Newlett-Packard 5880 GC and the same column mentioned above utilizing identical chromatographic conditions. The GC-FTIR experiments were performed at Digilab in Cambridge, Massachusetts.
RESULTS AND DISCUSSION In a typical experiment, chloromethane conversion varies from 98.56 to 1006. Over 240 compounds have been analytically separated in the reaction mixture and individual compounds constituting about 90 weight percent of the products have been identified. The liquid condensate did not contain significant amounts of the low boiling, low molecular weight products formed during the reaction. These compounds were determined in a separate experiment by sampling the reactor effluent immediately after exiting the reactor and analyzing them by using on-line gas chromatography employing an alumina PLOT column.
At 36OoC, 1,2,4-trimethylbenzene is a major organic product formed in the reaction and constitutes about 45 weight percent of the total liquid product. Tetra- and pentamethylbenzenes are also found in the product but in substantially lower amounts.
A few weight percent (-1%) of the products were identified to contain chlorine. A large portion of these are 2-chloroalkanes. These are postulated to be formed by Markovnikov addition of hydrogen chloride, an elimination product of chloromethane conversion, to terminal olefins. The addition may occur in the reactor or down stream of the reactor in a hot zone.
ORQANOMETWIC MeTHANB REACTIONS: EXPERIMENTF& All reactions were conducted in a sealed, 0.5-in (1.27-cm) 0.d. x 12-in (30.5-cm) silica-lined stainless-steel batch reactor. The reactor was lined by Restek, Inc. Total volume of the reactor system was 4 5 mL. In order to reproduce the literature results, experimental conditions were the same as those reported by Sen and coworkers.'
The reactor was rinsed with 5 . 0 g (3.3 mL) of dry trifluoroacetic acid, dried in a vacuum oven at llO°C, backfilled with dry nitrogen, and charged with reactants. Typically, the charge consisted of 0.15 g of palladium(I1) acetate dissolved in 5.00 g of trifluoroacetic acid. After being connected to the gas manifold, the reactor was purged several times with helium at 1000 psig (6.89 MPa), followed by several purges of methane with a final methane pressure of 800 psig (5.52 MPa), and isolated from the gas manifold.
When was used, the reactor was immersed in a liquid nitrogen bath after being purged with helium. When the temperature had reached -190OC. the reactor was connected to a mechanical vacuum pump and evacuated. The reactor wae then isolated from the vacuum pump and, while still immersed in liquid nitrogen, was connected to the cylinders of %H4 to allow transfer of the cylinders' contents to the reactor. After transfer of the cylinder's contents, the reactor was sealed and placed in a silicone oil bath. The 13CH4, specified by the supplier at 99+6 isotopic purity, was supplied in 1-L cylinders at 20 psig (0.14 MPa) pressure. The contents of two cylinders were required to obtain the necessary >EO0 psig (5.52 MPa) pressure for reaction.
When necessary, the gases were dried prior to entering the reactor by passing through an 8-ft (2.44-m) x 1f4-in (0.64-cm) coil of stainless-steel tubing immersed in an acetonefdry ice bath.
The reactor was heated in a bath of silicone oil at 80% for 5 days. The reactor pressure was monitored by a pressure transducer and recorded during the run. Blank runs followed the same procedure with the exception of helium replacing methane.
Upon completion of the run, the reactor was depressurized and the liquid was removed for analysis. After removal of the reactor's liquid contents, the reactor was filled with deionized water, capped, and placed in an 720-W ultrasonic cleaner for one hour. This procedure loosened the palladium metal
1229

which formed during the reaction. The solution was then passed through a preweighed 0.50-pm Teflon* filter and air dried. The residue on the filter was removed and identified by SEM and EDS. Gaseous components were analyzed on a Hewlett-Packard 5730 gas chromatograph. Liquid samples were analyzed on a Hewlett-Packard 5 9 8 8 ~ GC/MS system.
RESULTS AM) DISCUSSION The results reported by Sen and coworkers were reproduced (Run 241); production of methyl trifluoroacetate was observed and a fine metallic powder was recovered. SEM and EDS analysis of the powder confirmed it to be palladium metal with crystallites of the order of 1 p in size. Quantitative analysis of the palladium metal residue indicated 2806 of the palladium acetate was recovered as palladium metal. Methane conversion, calculated by the difference in pressure from the beginning to the end of the run, was -3 mol6 (Table IV). Analysis of the reaction mixture from Run 241 identified several other oxygenated compounds and water. To determine the source of these compounds, the palladium(I1) acetate dissolved in trifluoroacetic acid for Run 242 was analyzed prior to introduction of methane. This revealed the presence of methyl trifluoroacetate, the product of methane oxidation, prior to introduction of methane, and the same components identified before.
The trifluoroacetic acid was analyzed to determine if the methyl trifluoro- acetate and other compounds found in Runs 241 and 242 were present. All the unexpected compounds except methyl trifluoroacetate were detected, including a significant quantity of water. A blank run was conducted in which the methane was replaced with helium at 800 psig (5.52 Mpa). All reaction Conditions and operations were identical to previous runs. This experiment resulted in the production of methyl trifluoroacetate and a 68.306 recovery of palladium metal. The only logical origin of the methyl group of the ester is via decomposition of the acetate ligand of the starting material.
The gas in the reactor was sampled prior to venting and recovery of liquid products. Analysis of the gas samples by high-resolution gas chromatography, after completion of the experiments, showed only the components present in the feed gas.
For use in the remaining experiments, dry, high-purity trifluoroacetic acid was obtained in sealed ampules containing enough acid for a single use. Analysis of this trifluoroacetic acid revealed no detectable quantities of water or other impurities previously detected. The blank run was repeated. After 150 hours at 80°C and 800 psig (5.52 MPa) helium, the reactor was opened and the solution removed for analysis and comparison with the starting material. No dif erence in composition was detected between the two samples. Water (8 x
moles, a 10 fold excess) was then added to the mixture of Run 244, the reactor was charged with helium at 800 peig (5.52 MPa), and held at 80°C for 150 hours. Analysis of the products of reaction (Run 245) revealed the presence of methyl trifluoroacetate and methyl acetate. Since no methane was present in the system, the only source of the methyl group in the products is from the displaced acetate. This observation is inconsistent with that of sen9 in that he did not observe any deuterium incorporation into the methyl trifluoroacetate when Pd(02cCD~)z was used.
The first experiment (Run 246) to use both methane and the dry, high purity trifluoroacetic acid resulted in products similar to previous experiments with the exception that the amount of palladium metal recovered was only 39.20 mol%, a reduction of X 0 6 . We attribute this decrease to the absence of side reactions caused by the water in the trifluoroacetic acid.
To determine if any methane from the gas phase was involved in the reaction, an experiment (Run 248) was conducted using methane that was isotopically enriched in carbon-13. Oxidation products arising solely from the labelled methane, determined by GC-MS. would eliminate the possibility of products arising from the acetate ligand on the palladium(I1) acetate. The reactor was filled as described above. Operating under conditions similar to previous experiments resulted in similar methane conversions but a recovered palladium metal amount of only 7.88 111016. Analysis of the product mixture revealed both CF3C(O)O%H3 and CF~C(O)OCHJ. single Ion Monitori (SIM) analysis of the isotopic ratio of the labeled products gave a % / % 2 ratio of 4.98. The composition of the labeled methane was determined by mass spectroscopy to be 93.56 I3CH4 and 6.56 %H4, a ratio of 14.38. This means that -116 of the methyl carbon in the methyl trifluoroacetate comes from a source other than the labeled methane. This confirms our postulate that not all of the product arises from the methane introduced as a reactant.
To test the postulate that the presence of water in the reactor system was responsible for the observed decrease in palladium metal recovery, three experiments were conducted (Runs 250, 252, and 254) in which the gases were dried prior to entering the reactor as described above. The reactor was prepared as in the 13CH4 experiment. After warming to room temperature, 4.8 x 10⁻³ g (2.7 x 10⁻⁴ moles) of water was recovered from the drying trap. The result of these experiments is that the methane consumption and product distribution remained the same as previously observed, but recovery of palladium metal was only 4.21, 7.46, and 8.29 m016, respectively. This suggests that the presence of water in either the reactants or in the reactor system is responsible for the greater quantities of palladium metal reported in the literature. water was not detected in the product mixture by GC/MS for these experiments. Quantitation of reaction products for Run 254 revealed that 0.13 weight percent of the product is methyl trifluoroacetate. This corresponds to a conversion of reactants to the desired product of 0.86.
Sen and coworkers postulated that the mechanism of this reaction is electro- philic attack on the methane by Pd(I1)t followed by reductive elimination to give Pd metal and the alcohol derivative. This mechanism is supported only by
1230

the fact that palladium is a strong electrophile and a good two electron oxidant. Our observations do not support the original assumption that the reaction, as stated in Equation 1, is a 1:l stoichiometric reaction between methane and palladium(I1) trifluoroacetate. Table IV lists the molar balance for the experiments. The sixth column of the table shows the ratio of methane consumed to palladium metal recovered. The data from the early experiments, when water was present, show that the molar ratio of methane consumed to palladium metal recovered is of the order of 10. In later experiments, when water was removed from the reactants, this ratio is an order of magnitude larger.
These inconsistencies leave open the important questions about the reaction mechanism which is key to proper evaluation of this reaction as a method for direct oxidation of methane. If the methane is being consumed by some other reaction not involving palladium, is the palladium(0) being reoxidized to a palladium(I1) complex, or are other impurities present in the system7
CONaUSION This brief study may lead to the conclusion that ample opportunity exists to improve the OHC catalyst used in the first step of the PETC Methane-to-Higher Hydrocarbon Process and, accordingly, improve the entire process. Due to regulations limiting the aromatic and chlorine content of gasolines, the chloromethane conversion reaction will need to be fine tuned before commercial consideration. Chloromethane, a high-valued intermediate, may be the choice of product in this reaction scheme.
The study involving organometallics has shown that the reaction ex ressed in E ation 1 does occur, as confirmed by the production of CF3C02f3CH3 from &H4, but that this reaction is not responsible for all product methyl trifluoroacetate. When a blank experiment was performed using the highest purity starting materials and replacing methane with helium, methyl trifluoroacetate was detected in the product if water was not excluded from the system. The presence of water in the reaction mixture appears to cause the palladium acetate/trifluoroacetate complex to decompose and produce methyl trifluoroacetate and account for the high yields of palladium metal reported in the literature.
I would like to acknowledge the technical assistance of Richard R. Anderson, Joseph R . D'ESte, Louise J. Douglas, Elizabeth A. Frommell, Joseph P. Hackett, Donald V. Martello, Richard P. Noceti, Leonard J. Shaw, Thomas W. Snyder, Joseph P. Tamilia, and Curt M. White.
DISCL&IMER
Reference in this report to any specific commercial product, process, or service is to facilitate understanding and does not necessarily imply its endorsement or favoring by the United States Department of Energy.
REFERENCES 1. Noceti, R.P.; Taylor, C.E. U . S . Patent 4 769,504, September 6, 1988. 2.
3 . Taylor, C..; Noceti, R . P . U.S. Patent 5,019,652, May 28, 1991. 4. Taylor, C.E.; Noceti,R.P. U.S. Patent 5,139,991, August 18, 1992. 5. Crabtree, R.H. Chem. Rev. 1985, 8 5 , 245-269. 6. Schwartz, J. Acc. Chem. Res. 1985, 1 8 , 302-308. 7. Gretz, E.; Oliver, T.F.; Sen, A. J. Am. Chem. SOC. 1987, 109, 8109-8111. 8. Kao, L.-C.; Hutson, A.C.; Sen, A. J. Am. Chem. SOC. 1991, 113, 700-701. 9. Sen, A. Platinum Metals Review 1991, 3 , 126-132.
10. White, C.M.; Hackett. J.; Anderson, R.R.; Kail, S.; Spock. P.S. J. High
Taylor, C.E.; Noceti, R.P. Proceedings of ;he gth International Congress on Catalysis, vol.2, 990, 1988.
Res. Chrom. 1992, 15 . 105-20.
TABLE I CONSTITUENTS BY WEIGHT
1231

1
TABLE I1 REACTANT CONVERSION
FLOWS CHq = HC1 = 4.0 mL/MIN,.02 = N2 = 2.0 mL/MIN 3.0 GRAMS CATALYST, RESIDENCE TIME 8.3 SECONDS, TEMP. 34OOC.
=After 24 hours on stream bAfter 48 hours on stream
TABLE I11 NORHALIZED CARBON PRODUCT DISTRIBUTION
FLOWS CHq = HC1 = 4.0 mL/MIN, 3.0 GRAMS CATALYST, RESIDENCE TIME 8.3 SECONDS, TEMP. 340-12,
0 2 = N2 = 2.0 mL/MIN
aAfter 24 hours on stream bAfter 48 hours on stream
TABLE IV ORGANOMETALLIC METHANE OXIDATION RESULTS - RUN
- - 241
242
243
244
245
246
248
250
252
254
- - - - - - - - -
~ ~~
MOL % Pd MOL % METAL 1 CHq
CONSUMED
83.50
77.00
68.30
83.20
39.20
7.88 4.08
4.21 4.01
7.46 10.30
8.29 9.87
MOLES Pd METAL FORMED ( ~ 1 0 4 )
4.70
5.14
4.30
0.00
5.76
2.72
0.55
0.29
0.49
0.55
MOLES CH4 1 MOLES CH4 MOLES Pd CONVERTED CONSUMED ( ~ 1 0 3 ) CFjC(O)OCH3
1 l0CH4 1 1
1232

THE INVESTIGATION OF FULLERENE BASED CATALYSTS FOR METHANE ACTIVATION
H.-J . Wu, A. S. Hirschon, R. Malhotra, and R. B. Wilson
SRI International, Inorganic and Organic Chemistry Department and Department of Chemical Kinetics, Menlo Park, CA 94025
Keywords: Fullerene, Soot, Methane Activation
ABSTRACT
RDmpted by the interesting and unusual chemical activities exhibited by fullerenes. we began an investigation of fullerenes and fullerene soots for converting methane into higher hydrocarbons. We plan to ultimately study fullerene supported metal catalysts for this purpose. However, currently we are investigating the reactivity of various fullerene materials without metals for methane activation. These materials include a fullerene soot, a fullerene soot which has been extracted to remove the soluble fullerenes, like Qi) and C70. COZ-activated soot, as well as other carbons such as a Norit-A carbon. We found that fullerene soot activates the C-H bond of methane, allowing methane conversion at lower temperatures (lower by 25OOC) than found under purely thermal conditions. Furthermore, soot catalysis appears to produce a minimal amount of aromatic hydrocarbons. The extraction of w C 7 0 from the fullerene soot was found to reduce the selectivity for C2 hydrocarbons, while the CO2 activation of soot does not appear to alter the catalytic activity of the soot. The effect of reaction conditions such as temperature, residence time, added hydrogen and inert gas on the reactivity and selectivity of these materials are presently being studied.
INTRODUCTION
Methane is one of the most abundant sources of energy and is found naturally in underground reservoirs and as a by-product of indirect coal liquefaction and petroleum processes. However, methane has not been successfully utilized because of difficulties in storage and transportation. Conversion of methane into higher hydrocarbons would substantially increase its utilization, and intense efforts have been directed towards this goal. The main difficulty in converting methane is the production of undesirable side products. Oxidative methods easily convert methane to higher hydrocarbons, but over oxidation to C& makes it an uneconomical method. Alternatively, simple thermal decomposition of methane also makes higher hydrocarbons; however, the production of liquid fuels from methane by this method is not yet economically feasible because of the high C-H bond strength of methane compared with that of reaction products (ie. 98.2 kcaVmol for ethane). At the high temperatures required to activate methane, the Cz products formed will further decompose and produce still higher hydrocarbons. aromatics, and coke.
Direct coupling of methane can be achieved thermally without catalyst. The key to these pyrolysis reactions is to generate methyl radicals, which then polymerize. into higher hydrocarbons. However, current methods are thought to produce the radicals in the gas phase, which may lead to indiscriminate reactions and coke formation. In contrast, fullerenes, which have a great affinity for radicals, are expected to add methyl radicals and thereby provide for more selective reactions.’ Another attribute of these fullerenes is that they can easily incorporate metals either inside or outside the cage s t r u c t ~ r e . ~ ~ ~ Some of these metals may impart to the fullerenes properties that will aid in producing methyl radicals. A second reason why fullerenes may be effective catalysts for methane activation is their strong electrophilic character. Recent work shown by Sen et aL4 has shown that methane may be activated by electrophilic agents. and C70 fullerenes display remarkable electrophilic characteristics including direct amination with primary and secondary amines and a very low first reduction potential of -0.5 V (vs. NHE). WudlS has characterized fullerenes as. “electrophiles par excellence.’’ In the present study we are evaluating the feasibility of using fullerene based catalysts for methane activation. The full scope of the reactivity of these novel materials is not yet known. Because of the reasons cited above, we believe that catalysts based on & and other fullerenes will provide a facile pathway to convert methane into higher hydrocarbons.
In the arc process for preparing fullerenes, one obtains C a C70 and other extractable fullerenes along with a much larger amount of an insoluble soot. This soot most likely results from carbon clusters that did not close into fullerenes, but instead continued to grow into large particles. We therefore suspect that the soot SO generated also has a fullerene like structure and exhibits many of its properties. We report here the preliminary results on the methane activation catalyzed by this arc generated soot containing Qi) and C70 and compare the results with those obtained with activated carbon (Norit A). We also report on the effect of extracting the soot with toluene, or activating it by partial oxidation with C a .
1233

i
\
Batch hydrogen and methane activation experiments were conducted by charging a 5 mL tubular reactor with soot and 500 to loo0 psig of gaseous material for 2 hours. The methane activation experiments were conducted using flowing melhane at atmospheric pressures. The catalyst was supported on a fritted disk in a quartz reactor. The exit of the reactor was fitted with a quenching zone through which cooling gases could be inuoduced. The catalyst was heated using a dual furnace reactor system where the methane was fust heated in a preheating furnace (at 6oo°C) and then passed into a high temperature furnace with a short heating zone (4"). leading to the cool quenching zone to minimize any possible themal reactions after conversion. Soot (containing 12 96 W C 7 0 ) was obtained from Ulvick Indusmes. Inc. Toluene-Extracted soot was obtained from Materials & Electrochemical Research (MER) Corporation. Norit A activated carbon was obtained from Aldrich (750 m2/g). procedure described by Tsang et a16 by treating the fullerene soot or extracted soot with C@ (20mUmin) at 85OOC for five hours, Surface area of the materials were measured by BET method using N2. Surface area of the soot and extracted soot were determined to be 125 m2/g and 185 mZ/g, respectively. The surface areas of the C@-activated fullerene soot and extracted soot were found to approximately 600 m2/g for each material. The gaseous products were analyzed by a Carle CGC 500 gas chromatograph using a TCD detector. Argon was used in the methane gas stream as an internal standard. Fullerene soot, which was subjected to either methane or hydrogen, was analyzed using a surface analysis by SRI's surface analysis by laser ionization instrument (SALI).
Carbon dioxide activation was carried out using the
RESULTS AND DISCUSSION
The batch experiments were conducted in order to determine the reactivity of the fullerene soot to methane and hydrogen. Analysis by SALI showed that the hydrogen reacted with the Q contained in the soot to produce various hydrogenated Q species; however, no evidence was found for addition of methane to the C a under these conditions. However, since &was able to "activate" the 104-kcal/mol H-H bond, it seems reasonable that C&o, and other fullerenes, can also activate the 105-kcal/mol C-H bond in methane. One possible explanation for the lack of detection of methylated species is that any methane that does react with the fullerene in this batch system will be further decomposed to carbon and not be observed. Thus a continuous reactor system would be a better test of the reactivity of fullerenes for methane activation.
In order to test the effect of fullerenes, we used a high temperature flow through reactor with a minimal heating zone in order to prevent subsequent reactions of the reaction products. For these tests we used fullerene mot and, for comparison, an activated carbon (Norit A) under typical methane activation conditions (600OC to 1 l00"C). Carbons have been noted to have catalytic activity for methane activation and thus would provide a good comparison for the effect of fullerenes and fullerene During the thermal pyrolysis of methane without catalysis, the formation of tar in addition to coke and gaseous products was observed. However, in the case of fullerene soot or Norit catalyzed methane activation, no tar was observed. Figure 1 shows the extent of methane conversion for the soot, Norit A, and the thermal case (no catalyst) when subjected to flowing methane gas at 100 d m i n . As seen in this figure, whenjnduced by thermal pyrolysis without catalyst, the onset of the methane activation was 900 C, while the onset was observed to be approximately 800OC for the Norit-A and as low as 600°C for the fullerene soot. It is interesting to note that the fullerene soot with a substantially lower surface area (ca. 120 m2/g compared to 750 m2/g for Norit A carbon) lowered the onset temperature for methane conversion over that found for Norit A. Hence, the surface area of the carbon is not the discriminating factor. SALI analysis of the fullerene soot after exposure to methane under these reaction conditions, (Figure 2) shows evidence of methylated C a , further demonstrating the capability of w t to activate methane.
The selectivities of C2 hydrocarbon observed for methane activation at 95OOC under different reaction conditions are summarized in Table 1. In order to alter the selectivities we conducted the methane activation experiments in the presence of hydrogen, and for comparison, the presence of an inert gas, helium. The effect of hydro en dilution is generally recognized to increase the yield and selectivity of C2 hydrocarbons%10 These trends are consistent with the observation for the methane activation conducted without catalyst or with Norit carbon as catalyst. In contrast, with the fullerene soot, there appears to be only a minor effect with hydrogen, but a much more'pronounced and positive effect with helium. This effect may be key to determining the role that fullerene-soot plays in methane activation.
The comparison of methane conversions catalyzed by fullerene soot and extracted fullerene soot as well as these respective soots treated by C@ is shown in Figure 3. The extracted soot was prepared by room temperature toluene extraction of fullerene soot. This extraction process removes the soluble fullerenes like Cyl and C70. However, in the preparation of the mt by arc process, a large amount of large molecular weight fullerene like structures and incomplete fullerene structures are thought to be present. Most research has focused on the soluble pan of the soot and very little information of the insoluble mot is available. As seen in this figure both extracted soot and fullerene soot can activate methane at ca. 60OoC, with the extracted m t catalyzing more methane conversion than does the fullerene soot. However, as shown in Figure 4, the selectivity for C2 hydrocarbons is lower in the case of extracted soot than for the fullerene mot. which suggests more coke formation in the methane activation catalyzed bv extracted soot.
1234

The reason for this difference is not clear but it could be. attributed to the presence of W C 7 0 in fullerene soot. It might be argued that w C 7 0 will evaporate at the temperature that methane activation is carried out. But the possibility that Cm undergoes reactions with methane and becomes nonvolatile at this temperature can not be. excluded. Alternatively, the process of extraction may alter the'behavior of the fullerene soot by an as yet unknown manner. Contact with solvents does markedly increase the apparent density of the material. The reason for this anomaly is now under study.
Tsang et a16 recently reported that mating extracted soot at 8 5 0 T with COz leads to the formation of microporous carbon with high surface area. We therefore prepared the C@- activated fullerene soot and C%-activated extracted soot in the same manner. The weight loss during the C@-activation was 20.3 wt% for the fullerene soot and 19 wt% for the extracted soot. The C@-activation was found to increase the surface areas of the soots to over 600 rnz/g from 120 mZ/g for the fullerene soot and from 185 mz/g for the extracted soot. The methane activation study of these pretreated soots is shown in Figures 3 and 4. We found that although (2%- activation procedure increases the surface area of the soot dramatically, the methane activation catalyzed by (2%-activated soot does not show higher conversions under these conditions. On the other hand, the selectivity for Cz hydrocarbon is slightly improved. The C@-activated extracted m t does not show any difference from extracted soot in terms of methane conversion and Cz hydrocarbon selectivity. Comparing the effect of Co;? activation with extraction suggests that the difference of surface area is not as important as the nature of the catalyst in the catalytic activities and selectivies for methane activation.
CONCLUSIONS
These results obtained so far show that both activated carbon and fullerene soot appear activate the C-H bond of methane and conveTt ir into higher hydrocarbons, albeit to different extents. Both fullerene mt and extracted soot can lower the onset temperature for methane by ca. 250°C compared to the case without catalyst. This activity provides a good ground for the future work on the catalytic application of fullerene-based materials. We plan to explore these differences for both fullerene and metallized fullerenes in future work on the upgrading of natural gas and related work.
ACKNOWLEDGMENTS
We gratefully acknowledge the support of the Department of Energy under contract DE-AC22- 92pc92112.
REFERENCES
1.
2.
3.
4.
5.
6.
7.
8.
9.
IO.
P.J. Krusic, E. Wasserman, E.A. Parkinson, G. Malone, E.R. Holler, Jr., P.N. Keizer, J. R. Morton, and K.F. Preston J. Am. Chem. Soc. 113,6274 (1991).
Accounts of Chemical Research 25.97 (1992). entire issue devoted to fullerenes.
F. D. Weis. J. L. Elkind, S. C. OBrian, R. F. Aul, and R. E. Smalley. J. Am. Chem. Soc. 110.4464 (1988).
E. Gretz, T. Oliver, and A. Sen, J. Am. Chem. Soc., 109,8109 (1987).
F. Wudl, A. Hirsch, K.C. Khemani, and C. Suzuki in Fullerenes. edited by G.S. Hammond and V.J. Kuck (ACS Symposium Series, Washington, D.C., 1992). pp. 161.
S.C. Tsang, P.J.F. Hams, J.B. Clarigde, and M.L.H. Green J. Chern. SOC. Commun. 1519 (1993).
I. Mochida, Y. Aoyagi, S. Yatsunami, and H. Fujitsu J. Anal. Appl. Pyro., 21.95 (1992).
Broutin, P.; Busson. C.; Weill, J.; Billaud, F. "Thermal Coupling of Methane" in Novel Production Methods for Ethylene, Light Hydrocarbond, and Aromatics. Albright, L. F.; Crynes, B. L.; and Nowak, S. Us.; Marcel Dekker, New York, 1992; chapter 12, pp 239- 258.
Rokstad, 0. A,; Olsvik, 0.; Jenssen, B.; Holmen, A.; "Ethylene, Acetylene, and Benzene From Methane Pyrolysis" in Novel Production Methods for Ethylene, Light Hydrocarbond, and Aromatics. Albright, L. F.; Crynes, B. L.; and Nowak, S. as.; Marcel Dekker, New York. 1992; chapter 13, pp 259-272.
Billaud, F.; Baronnet, F. Ind. Eng. Chem. Res., 32, 1549-1554 (1993).
1235

Table 1 The Pyrolysis of Methane at 9500C and 100 W m i n
Catalyst Co-feed Gas C b Conversion Selectivity (%) Employed (VOI%) (%)
C z h c2H6 C2H2 Total
No Catalyst None No Catalyst H2(50%) No Catalyst He(50%)
Norit None Norit H2(50%) Norit He(50%)
Soot None soot H2(50%) Soot He(5OZ)
1.7 36 11 8 55 0.3 76 14 0 90 1 73 0 0 73
7.6 0.6 1.3
23 2 3 28 81 6 0 93 24 3 3 30
16.9 8 1 1 10 1.4 11 0 0 11 5 32 5 7 44
20
10
0 800 700 800 900 1000
Figure 1. Methane conversion as a function of catalyst. Methane flow rate 100 W m i n .
)ODD 7 M 7 M M I l O u p m
OYIl a
Figure 2. SAL1 spectrum of fullerene soot treated with methane at 900°C.
1236
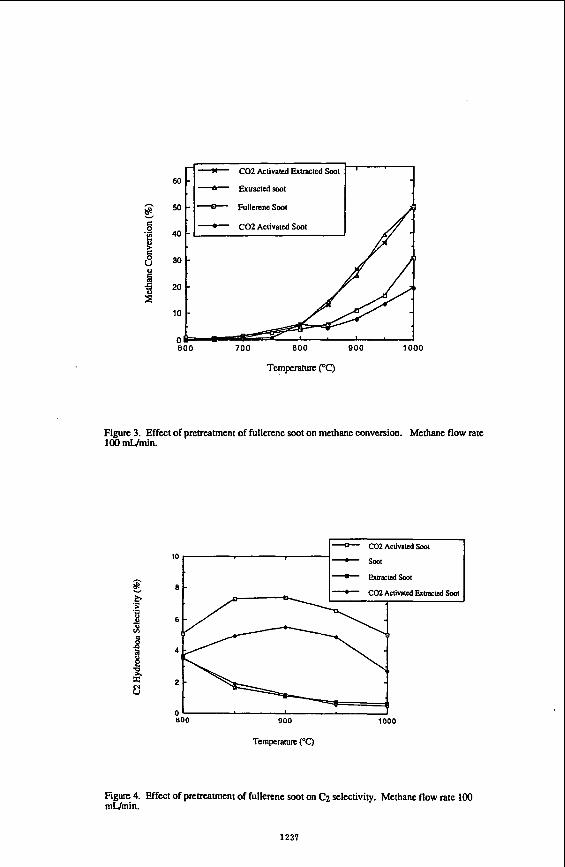
600 7 0 0 800 900 1000
Temperature (‘‘0
Figure 3. Effect of preaatment of fullerene soot on methane conversion. Methane flow rate 100 W m i n .
CO2 Aclivaud So01 - so01 10
no0 900
Temperahlre (“0
1000
Figure 4. Effect of pretreatment of fullerene soot on Cz selectivity. Methane flow rate 100 mUmin.
1237

Solid S u p e r a c i d Cata lys i s : n-Butane C o n v e r s i o n C a t a l y z e d b y Fe- and Mn-Promoted S u l f a t e d Z i r c o n i a
Julie L d h i , Tsz-Kewtg Cheung, and Bruce C. Gates Depanment of Chemical Engineering and Materials Science Universiry of California Davis. CA 95616
INTRODUCTION
Environmental concerns are leading to the replacement of aromatic hydrocarbons in gasoline by high-octane-number branched paraffins and oxygenated compounds such as methyl t-butyl ether. The ether is produced from methanol and isobutylene, and the latter can be formed from n -bu tane by isomerization followed by dehydrogenation. Paraffin isomerization reactions a re catalyzed by very strong acids such as aluminum chloride supported on alumina. The aluminum chloride-containing catalysts a re cor ros ive , a n d t h e i r d i sposa l i s expensive. A l t e r n a t i v e l y , hydroisomerization is catalyzed by zeolite-supported metals a t high temperatures, but high temperatures do .not favor branched products a t equilibrium. Thus there is a need for improved catalysts and processes for the isomerization, of n - b u t a n e and o ther s t ra ight -cha in paraff ins . Consequently, researchers have sought for solid acids that a re noncorrosive and act ive enough to catalyze isomerization of paraf f ins a t low temperatures. For example, sulfated zirconia catalyzes isomerization of n- butane a t temperatures as low a s 25OC (1). The addition of iron and manganese promoters has been reported to increase the activity of sulfated zirconia for n -bu tane isomerization by three orders of magnitude ( 2 ) . Although the high activity of this catalyst is now established (2, 3), the reaction ne twork is not known, and the mechanism h a s not been investigated.
The goal of the research was to investigate low-temperature reactions of n-butane catalyzed by iron- and manganese-promoted sulfated zirconia n-Butane was chosen as the reactant because it is a potentidy valuable source of i-butane.
EXPERIMENTAL
Iron- and manganese-promoted sulfated zirconia was prepared by incipient wetness impregnation from sulfated zirconium hydroxide (Magnesium Elektron, Inc.) that was impregnated with iron and with manganese nitrates. The weight percentages of iron, manganese. and sulfur in the catalyst were 1.0.0.5, and 1.8 %, respectively.
Before each catalytic reaction experiment, the catalyst in flowing N2 [30 mL(NTP)/min] was heated from 20 to 450°C at a rate of 7.1°Umin, and the temperature was then held at 450OC for 1.5 h. Reactions were canied out in a once-through plug-flow reactor at atmospheric pressure and temperatures in the range 40-225 OC.
1238

RESULTS
In the absence of a catalyst, no conversion of n-butane was observed. In the presence of the promoted sulfated zirconia catalyst, propane, i-butane, n-pentane, and i- pentane (with traces of methane, ethane, and hexanes) were observed as products. The selectivity for formation of i-butane from n-butane was greater than 85% for conversions less than 60%. At times on stream < 1 h, the carbon balance closed within -+lo%, and at longer times on stream this balance closed within f 5%.
The n-butane conversion as a function of time on stream is shown in Figure 1 for the temperature range 40 to 100OC. There are two distinct regimes, a break-in period followed by a deactivation period. At the lowest reaction temperature, the conversion of n- butane was still increasing even after 4 h on stream. In contrast, at 75'C and at 10OoC. the maximum conversion was observed after less than 1 h.
A linear correlation was observed between the maximum n-butane conversion observed in each experiment carried out at temperatures in the range 40-100 "C and the inverse space velocity. Thus the data demonstrate that these conversions are differential and determine reaction rates. However, catalyst deactivation was so fast at the higher temperatures that the maxima in conversion vs. inverse space velocity plots could not be discerned. Thus, the data at these higher temperatures do not determine the maximum conversions. Rates at these higher temperatures were calculated from conversions < 30% on the basisof the assumption that the conversions were still differential.
Rates of formation of the various products at l0OoC are summarized Figure 2. Maxima in the rates of formation of each of the following products were observed as a function of time on stream at temperatures < 150°C. provided that the partial pressure of n- butane in the feed was < 0.005 am: propane, i-butane. n-pentane, and i-pentane. Because of the break-in period, it was not possible to extrapolate these rates accurately to zero time on stream. Thus the values of the rates at the maxima are taken as the best available measures of the initial reaction rates (Le.. those characterizing the undeactivated catalyst).
The predominant product was i-butane, and thus it is concluded that the principal reaction was isomerization of n-butane. The observation of propane and pentanes suggests that disproportionation also occurred. The molar ratio of C3 to C5 approached a value of approximately 1.10 f0.05 at the lowest temperature investigated (40'C). after about 25 h onstream. Thus these data suggest that stoichiometric disproportionation and isomerization were virtually the only catalytic reactions taking place under these conditions. However, this simple result was not generally observed. Typically, the molar C3K5 ratio was greater than unity. For example, after 3 h on stream at temperatures of 75 to 150°C, the ratio was in the range of approximately 1.5-1.7.
selectivity for disproponionation relative to isomerization of n-butane. This ratio varied with reaction temperature and time on stream.
As the n-butane feed partial pressure increased, the rate. of reaction increased, indicating the positive order of the reaction. Catalyst deactivation was least at the lowest n- butane partial pressure.
The ratio of C3 to i-C4 in the product is taken as an approximate measure of the
1239

DISCUSSION
The data show that conversion of n-butane catalyzed by iron- and manganese- promoted sulfated zirconia at 40 OC gives propane, i-butane, and pentanes as the principal products, along with traces of methane, ethane, and hexanes. By far the predominant product was the isomerization product, i-butane. The same principal product has been observed for n-butane conversion catalyzed by unpromoted sulfated zirconia at 25°C; it was formed along with propane and traces of i-pentane (I). The activity of the promoted sulfated zirconia catalyst is higher than those of the other solid acid catalysts.
Hsu et nl. (2) reported the first characterization of the promoted sulfated zirconia cafalyst, investigating n-butane isomerization under approximately the same conditions as ours, but with a higher feed n-butane partial pressure (e.& 0.58 atm). These authors estimated rates of the isomerization reaction by extrapolating conversions to zero time on stream to approximate the performance of the fresh catalyst. Zarkalis (4 ) investigated a catalyst similar to that of Hsu et al. and estimated activities of the fresh catalyst from the maximum rates measured as a function of time on stream (as in this work). In the work of Hsu et al. and that of Zarkalis, liquid n-butane was used as a feed which was vaporized before introduction into the flow reactor. In the work reported here, the butane was fed as a gas, and the n-butane partial pressures were typically 1-2 orders of magnitude lower than those used by Hsu et nl. and Zarkalis. Thus, the rates reported by these workers are not directly comparable to the rates reported here. A rough comparison based on extrapolation of Zarkalis' data shows an order of magnitude agreement with our data.
The simplest product distribution observed in this work is consistent with a reaction network including only isomerization and stoichiometric disproportionation. At the lowest reaction temperature, 40T. the CgC5 molar ratio after the break-in period was nearly the stoichiometric ratio of unity for disproportionation, namely, 1.1, with an estimated experimental error of about f 5%. The only other demonstration of a nearly stoichiometric paraffin disproportionation reaction was reported for n-butane conversion catalyzed by aluminum chloride supported on sulfonic acid resin at 100°C; the principal reaction was isomerization, which was much faster than disproportionation (5).
The observation of disproportionation products (5) suggests that a Cg intermediate might have formed. This same suggestion was made by Bearez et al. (6, 7), who proposed a bimolecular pathway for i-butane conversions catalyzed by H-mordenite at about 350°C. According to their proposal. both the isomerization and disproportionation products could be formed from the Cg intermediate. Reactions involving Cg intermediates might be energetically favored over monomolecular isomerization because they would be expected to involve secondary and tertiary carbenium ions, whereas the monomolecular isomerization of n-butane requires the formation of a primary carbenium ion, which is highly unstable (8).
The product distributions at the higher temperatures show that the reaction network must in general be more complex than just isomerization and disproportionation. The observed CgCs molar ratios were always greater than 1, suggesting the further reaction of C5 products, which undergo cracking more readily than smaller paraffms (9). The results are not sufficient to demonstrate the stoichiometry of the cracking; they are consistent with the possible formation of Cg intermediates. Cracking of a Cg intermediate would give C3 and C6 products, among others, and trace amounts of C6 products were observed. A Cg intermediate would be formed only from secondary products of n-butane conversion, and therefore it is expected that the concentrations of these species were much lower than those of primary products.
i
t
I' 1240

The results suggest that the highly active solid superacid could be a practically useful catalyst for isomerization, which would be accompanied by disproportionation. It could be advantageous to operate at low temperatures to minimize the secondaly reactions and to favor the branched isomerization products.
C O N C L U S I O N S
1. Iron- and manganese-promoted sulfated zirconia is a superacid that catalyzes n- butane isomerization and disproportionation at temperatures in the range of 40°C to 225°C.
2. The predominant reaction was isomerization with the rate of isomerization being 4.2 x 10⁻⁸ mol/(, . g of catalyst) with a feed n-butane partial pressure of 0.0025 atm at 75oc.
3. Under the same conditions the rate of formation of propane was 1.2 x 1 0 9 mol& . g of catalyst).
4. As the temperature i n c r e d . the selectivity for isomerization decreased and that for disproportionation increased.
5. Following an initial break-in period of about an hour, the catalyst underwent rapid deactivation.
6. The C5 disproportionation products were partially converted to lower- molecular-weight products; the CgC5 ratio increased with increasing temperature.
7. The solid superacid catalyst is potentially valuable for practical low-temperature paraffm isomerization accompanied by disproportionation of n-butane.
ACKNOWLEDGMENTS
We thank David Clough of Magnesium Elektron, Inc.. for providing the sulfated zirconium hydroxide. The research was supported by the U.S. Department of Energy, Pittsburgh Energy Technology Center.
LITERATURE CITED
(1) Hino, M.. and Arata, K.. 1. Chem SOC. ,Chem Commun., 851 (1980).
(2) Hsu. C-Y., Heimbuch. C. R., Armes. C. T., and Gates, B. C., J. Chem SOC.. Chem Commun.. 1645 (1992).
(3) Jatia, A., Chang, C., MacLeod, J. D., Okubo, T., and Davis, M. E.. Caral. Len. 2, 21 (1994).
(4)
(5 )
(6)
Zarkalis, A., M.Ch.E. Thesis, University of Delaware. (1993).
Fuentes. G. A. and Guisnet, M.. 1. Card., 26,440 (1983).
Guisnet, M., Avendano, F..-B~.awz. C.. and Chevalier, F., J. Chem SOC., Chem
1241

~ommun., 336 (1985).
Bearez. C.. Avendano, F.. Chevalier, F., and Guisnet, F., Bull. SOC. Chim. Fr.. 346 (1985).
Brouwer, D. M., in "Chemistry and Chemical Engineering of Catalytic Processes" (R. F n s and G. C. A. Schuit Eds.), p. 137. Sijthoff and Nordhoff, Alphen an den Rqn, the Netherlands, 1980.
Pines, H.. "The Chemistry of Catalytic Hydrocarbon Conversions." p. 83. Academic Press, New York. 1981.
(7)
(8)
(9)
LIST OF FIGURES
Figure 1. Effect of reaction temperature on n-butane conversion catalyzed by Fe- and Mn- promoted sulfated zirconia Feed n-butane partial pressure = 0.0025 a m at 75T and IOOT and 0.005 a m at 40°C. Total feedflow rate = 80 mL(NTpYmin Catalyst mass = 1.5 g.
Figure 2. Rate ofproduct formationfram n-butane catalyzed by Fe- and Mn-promoted sulfated zirconia Feed n-butane partial pressure = 0.0025 a m Temperature = 100OC Total feedflow rate = 80 nu!hnin. Catalyst mass = 1.5 g.
1242

5 0
4 0
3 0
2 0
1 0
0 0
I I I
1 2 3 Time on Stream, h
4
Figure 1. Effect of reaction temperature on n-butane conversion catalyzed by Fe- and Mn- promoted sulfated zirconia. Feed n-butane partial pressure = 0.0025 arm at 75 T and I00T and 0.005 a m at 40T. Total feedfrow rate = 80 mUNTP)/min. Catalyst maw = 1.5 8.
1243

5
4
3
2
1
0
I I I
0 1 2 3 Time on Stream, h
Figure 2. Rate of product formarion from n-butane cotalyzed b.v Fe- and Mn-promored suyated zirconia Feed n-butane partial pressure = 0.0025 ahL Temperature = lOoT Total feedfIow rate = 80 mUmin. Catalyst nloss = 1.5 g.
4
I
I
1244

FEASIBILFY STUDY OF A NOVEL THERMAL PLASMA PROCESS FOR NATURAL GAS CONVERSION
B. A. Detering, P.C. Kong, and G. J. Maffia Idaho National Engineering LaboratoIy
M.S. 2210, P.O. Box 1625 Idaho Falls, Idaho 83415-2210
KEY WORDS: Thermal Plasma, Pyrolysis, Acetylene
OBJECTIVE The objective of this research was to conduct a feasibility study on a new process, called the plasma quench process, for the conversion of methane to acetylene. These efforts were focused on determining the economic viability of this process using bench scale experimental data previously generated.
INTRODUCTION During the last decade most major oil companies have conducted internal studies on "remote gas" in efforts to capitalize on the large quantities of natural gas known to exist in various parts of the world. Such studies have typically been directed toward gas resources which are located too far away from population centers and end-use markets for conventional use, and cannot be economically liquefied for liquid natural gas carriers.
The Huels Company1 in Germany has been using a plasma arc process to make light unsaturated hydrocarbons (acetylene and ethylene) from natural gas since the 1930s. These light hydrocarbons are subsequently converted to synthetic rubber and liquid hydrocarbons. The Huels process for arc plasma conversion of natural gas to acetylene requires quenching of the products by injection of cold liquefied hydrocarbons to prevent back reactions as the plasma is cooled. Quenching by this method is very energy intensive, inefficient, and the yield of the light olefin products is relatively low. The single pass yield of acetylene is less than 40% for the Huels process. Overall process yields are increased to 65% by recycling all of the hydrocarbons except acetylene and ethylene.
Patent protection for this novel process is being pursued by the inventors through the Idaho National Engineering Laboratory (INEL).2 Initial work on this process demonstrated yields of acetylene as high as 70%. Further experiments have resulted in yields greater than 85% acetylene. Application of catalysts downstream of the quench reactor gaseous prcducts can convert acetylene to higher molecular weight fractions such as liquid hydrocarbons.
The PFQR technology overcomes the limitations of other pyrolysis processes by adiabatic isentropic expansion of gases. Thermochemical modeling studies of the conversion of methane to acetylene were conducted to determine the equilibrium concentrations of acetylene and other reaction products between 500 to 3000 K. As expected, these studies determined that acetylene is a metastable compound that will decompose to carbon and other hydrocarbons if it is allowed to reach equilibrium at elevated temperatures (>go0 K). The basic concept of the PFQR is that it will maximize the acetylene yield by "freezing" the product out of the reaction zone with extremely rapid decrease in temperature and pressure.
Successful development of the plasma quench technology (i.e., favorable product conversion and energy efficiencies) will result in an economic process for conversion of natural gas to high value hydrocarbons. This technology provide a means for the petroleum industry to capitalize on the vast quantities of natural gas which are known to exist (Le., remote locations and shut-in gas wells) but are not in close proximity to population centers and thus end-use applications.
PROJECT DESCRIPTION Historically, methane in non-fuel applications has been limited to feed stock for methanol, ammonia or hydrogen. With the discovery of natural gas in remote locations, such as, the North Slope of Alaska, the need for technologies to convert gas to transpomble fuels has arisen. To this date, much of the research effort has been focused on the conversion of natura gas to methanol (Mobil case) or the oxidative coupling of methane (ARC0 Chemical, ACC, case). LNG is not a viable option in many cases because of the limitations on access to shipping lanes due to seasonally closed ports or other logistical considerations.
The key variable in the profitability of both the ACC and Mobil technologies is the cost of the natural gaq and the value of the gasoline produced. With the current cruddgasoline pricing, natural gas cost must be less than $1 per thousand standard cubic feet (MSCF) for an after tax return on investment (ATROI) of greater than 10%.
1245 \

i
I
RESULTS
TO GASOLINE ECONOMICS In this analysis, an alternate route using acetylene from methane pyrolysis is considered. It has been demonstrated that acetylene can be produced from methane in high yields by high temperature, short residence time pyrolysis. Free energy favors the formation of acetylene at high temperatures. Methane pyrolysis has been practiced in the past with varying degrees of success. The major drawback is the inability to raise the temperature of the feed natural gas very rapidly and to quench the products to a non-reacting mixture in less than half of the reaction time.
TO avoid the formation of non-selective byproducts via secondary reactions, the products must be quenched very rapidly. Historically, direct quench and direct reactive quench using LPG pyrolysis have been studied in this regard. Recently, the aerodynamic quench has been demonstrated by INEL to provide quenching in under two milliseconds. Acetylene yields have exceeded 90%.
Using this technology and "conventional" hydrogenation and oligomerization catalysts, an economic evaluation was performed. Given the current state of process development, the INEL technology is clearly the low raw material cost and the low cost capital option relative to ACC and Mobil. The estimated capital cost is about 80 % of the neamt competitor, ACC. The leveraging economic variable for the INEL reactor, however, is the amount of power consumed in the pyrolysis reactor and the cost of that power. In the INEL case, the power contribution to required netback can be 50%. easily the largest contributor and over twice the contribution of the cost of the natural gas feed.
The overall economics for the instantaneous constructionfoperation case indicate that the ACC Redox case is the most attractive for the conversion of natural gas to gasoline. Assuming a 4.5 $kWH power cost and a consumption of 3.6 k W b gasoline for the INEL case, the required netback is 30% greafer than the ACC Redox case. With lower cost power, less than 3 $/kWH, INEL technology becomes the most attractive of the conversion technologies.
However, the current and forecasted economic situation does not favor using natural gas conversion to make gasoline in any of the processes. Historical data indicate that the refinery gate price of gasoline reaches about $l/gal only when crude rises to $35/bbl. Currently, gasoline and crude oil are much lower, about 60% of these figures. As a target, natural gas would have to be free, when crude is $35/bbl in order for the ACC case at 12,500 barrels per standard day (BPSD) to approach a 12% ATROI. There are significant economies of scale that tend to improve the economics substantially, when dealing with large gas fields. The North Slope of Alaska, has a gas supply that would require. up to 20 plants of the size evaluated in this report. With these volumes, the ACC technology attains a 12% ATROI when the natural gas price is a maximum of $lNSCF at $35/bbl crude oil.
With $35/bbl crude and a 2 MMMSCFD field, the INEL technology shows break-even economics (12% ATROI, capital USGC basis) at a gas price of $ I N S C F , a power cost of 2.5 $kwh and a consumption of 2.5 k W b gasoline. If crude oil prices remain flat on average, as in the 1980s, then the target numbers get more severe.
ALTERNATIVE METHANE CONVERSION TECHNOLOGY Even given the gloomy economic picture for gas conversion technologies caused by the low crude oil cost, the INEL technology shows significant promise due to low capital cost and high yields. The key process questions that must be addressed are the scalability of the pyrolysis-quench, the reduction in the required power, and the reactor design for the acetylene hydrogenation to insure selective conversion to ethylene rather than ethane.
Developments in the cyclotrimerization of acetylene to benzene provide the possibility of additional improvement in the economics by reducing the capital and operating costs. The downside is the likely inability to use benzene directly as a motor fuel due to environmental and toxicity issues. Since benzene has a higher value than gasoline, the economics could be greatly improved if this market could be exploited. Technologies such as the direct coupled pyrolysis and oligomerization developed at NREL should be investigated. There may be operating conditions in the Plasma- Quench process where the NREL technology may be applicable.
Along the same lines as the benzene argument, the INEL technology may provide an attractive route to ethylene. Rough calculations indicate that the INEL technology is nearly competitive with EthanePropane steam pyrolysis. Although much of the US olefin capacity is already in place, there may be another, aggressive round of olefin plant construction in the next two decades, some of which will be based on non-conventional technology. This should be studied in further detail. In order to properly assess the INEL technology in an ethylene case, it is suggested that an entire petrochemical facility be considered based on
,
1246

natural gas. Products should include acetylene, ethylene, hydrogen, benzene, ethylbenzene and styrene. All of these products are. potentially recoverable in controllable, high yields and with high purity.
CONCLUSION The major conclusion of this analysis is that the INEL technology could be competitive with existing natural gas conversion technologies given the proper power consumption and pricing. However, none of the technologies will be economical if the predicted long term crude pricing is correct. The INEL technology does have the advantage of providing high yields of valuable chemicals (ethylene and acetylene) at low cost. Downgrading these to gasoline value, although taking advantage of the market demand, reduces the product value significantly and the margins are insufficient to carry the project.
REFERENCES
1. Gladish, H., "How Huels Makes Acetylene by DC Arc," Hydrocarbon Processing & Petroleum Refiner, Vol. 41, No. 6, pp. 159-64, June 1962.
B. A. Detering, P. C. Kong, and A. D. Donaldson, "Method to Convert Methane andor Natural Gas to Acetylene and Other Unsaturated Hydrocarbons in a Plasma Fast Quench Reactor," EGG-PI-655, March 3, 1993, Patent Pending.
2.
1247 \

A Hot-Recycled-Solid Oil Shale Retorting Process For The Production of Shale Oil and Specialty Chemicals
Robert J. Cena Lawrence Livermore National Laboratory 7000 East Avenue, Livermore CA. 94550
Keywords: Oil Shale, Solid Handling Pneumatic Transport, Specialty Chemical Production
ABSTRACT
At Lawrence Livermore National Laboratory, we are studying Hot-Recycled-Solid (HRS) oil shale retorting processes through a series of fundamental studies, operation of a 4 tonne-perday HRS pilot plant and development of an Oil Shale Rocess (OSP) mathematical model. Over the last two years, under an industrial CRADA with four major oil companies', we have completed a series of runs ( H l O - H27) using the pilot plant to demonstrate the technical feasibility of the technology, maintain and enhance the knowledge base gained over the past two decades through research and development and determine the follow on steps needed to advance the technology towards commercialization.
The pilot plant, which features no moving parts in critical areas, has been successfully operated for over 100 hours, demonstrating ease of conml and reliability of the process. Efficiency is obtained via high throughput, thorough c h n utilization, waste shale heat recovery, improved oil yield and one hundred percent utilization of mined material, including shale fines. We have demonstrated the ability to work with both lean and rich shales (22 - 38 gallons-per-ton). and environmentally the process has superior behavior producing non-hazardous waste shale, minimal sulfur emissions, lower NOx emissions and minimum C@ production.
Fundamental laboratory experiments support the pilot plant efforts with determination of kinetics for pyrolysis, combustion and carbonate decomposition for the process as well as determining specifications for produced raw shale oil. In addition, we have developed the Oil Shale Process (OSP) model to aid in critical thinking and scale up of the HRS process.
We have put forth a commercial plant concept which combines the production of refmed shale oil, meeting motor fuel specifications, with electric power and specialty chemical production. This plant concept would fully utilize available thermal energy, would solve the waste shale cooling problem and would produce a revenue stream through power and specialty chemical sales which would greatly offset plant operating costs. The net result would be a plant at modest scale (l0,OOO barrels per day) producing fifty percent specialty chemicals and fifty percent refined motor fuel product2. Under this scenario, the motor fuel price required to provide a fifteen percent rate of reutm on investment would be 71 cents per gallon, which equals the average wholesale price of motor fuel in 1993.
INTRODUCTION
The oil shale deposits in the Western US represent a massive liquid fuel resource, with over 600 billion barrels of recoverable deposits in the Piceance Basin alone. Our objective, together with our CRADA partners, is to demonstrate advanced technology that could lead to an economic and environmentally acceptable commercialization of oil shale.
We have investigated the technical and economic barriers facing the introduction of an oil shale industry and we have chosen Hot-Recycled-Solid (HRS) oil shale retomng as the primary advanced technology of interest. We are investigating this approach through fundamental research, operation of a 4 tonne-per-day HRS pilot plant and development of an Oil Shale Rocess (OSP) mathematical model.
Over the last three years, from June 1991 to June 1993, we completed a series of runs (H10 - H27) using the 4-TPD pilot plant to demonstrate the technical feasibility of the HRS process and answer key scale-up questions. With our CRADA partners, we seek to further develop the HRS technology, maintain and enhance the knowledge base gained over the past two decades through research and development by Government and industry and determine the follow on steps needed to advance the technology towards commercialization.
One of the crucial challenges in beginning a oil shale industry is how to overcome the high capital cost and long lead time needed to make process improvements which would enable shale oil to compete as a fuel feed stock. We have chosen to focus on an initial plant that converts a large
-
1 Cooperative Research and Development Agreement, established in February 1992 with Ammo, Chevron, Conoco and Unocal 2 A mixture of fuels, thirty percent each motor and aviation gasoline and forty permt diesel fuel.
1248
fraction of its production into high-valued specialty products to gain an initial market entry. We have determined the economics for a plant producing 10,ooO BbVday of oil from shale. The plant converts the raw shale oil into a slate of high valued products including specialty chemicals, a shale oil modified asphalt binder and bansportation fuels, while co-producing electric power. This small scale venture is shown to be competitive in today's market with a fifteen percent internal rate of return on a capital investment of $725 million dollars. Once in operation, expansion to 50,000 BbVday has the potential to become economic through economies-of-scale and cost reductions based on operating experience and plant innovation. This small beginning would provide. the operating experience prerequisite for a larger industry, if and when appropriate, that could supply a significant fraction of the US liquid transportation fuel needs.
PROJECT DESCRIPTION
The LLNL 4-tonne-perday pilot plant consists of a circulating loop and peripheral equipment for the production of oil from shale. Major units of the facility include a fluidized bed mixer, a moving packed bed pyrolyzer, a pneumatic lift pipe and a fluidized bed combustor. Solids are circulated around the loop at 10 kdmin. Fresh shale, crushed to a top size of 7mm, is mixed with hot circulating solids in the fluidized bed mixer. Rapid pyrolysis occurs in 2-3 minutes as the shale passes through the mixer and moving packed bed pyrolyzer. Produced oil vapor, containing water and dust pass through cyclones and filters prior to staged cooling for product recovery. Residual carbon on the spent shale, after pyrolysis, is combusted in the pneumatic lift pipe and fluidized bed combustor, providing the process heat, completing the circulation loop.
Solid flow and bed levels within the circulating loop are maintained using a pair of L-valves, one located below the pyrolyzer and one located below the fluidized bed combustor. Each valve is equipped with a horizontal skid separating inlet and exit by approximately 10 inches. Solids are mansported from inlet to exit using gas jets which are pulsed at a frequency of once every 1 to 2.5 seconds. Each pulse moves approximately 250 grams of material. By adjusting the pulse rate and local pressure in the vicinity of the L-valve we achieve a balanced loop at the designed circulation rate, processing 2.5 kdmin of raw shale.
Concurrent to our pilot plant studies is the development of a steady state OSP mathematical model. OSP models each of the major components of the process, allowing us to compute properties and phenomena not readily determined experimentally. The model serves as a critical judge of the experimens and an aid in process scale up. One of the major discrepancies early on between model and experiment was the degree of carbonate decomposition which occurred. To resolve this discrepancy, we have, in the laboratory, reexamined carbonate decomposition kinetics, focusing on the lower temperature ranges typical of our retorting conditions.
OIL SHALE PROCESS MODEL (OSP) RESULTS
We continue to develop our Oil Shale Process model (OSP) as a aid toward process scale up and critical thinking concerning our pilot plant resultsl. OSP is a steady state model, written in FORTRAN, which allows a variety of modules to be coupled together to simulate some overall process. The model consists of three interacting parts: a control portion which handles overall direction of computation and is responsible for coupling process units together through the use of stream variables; a service routine portion which allows common properties to be computed, and any number of modules which do the actual computations associated with a given unit operation. The model defines three types of sneams: solid, gas and liquid. All streams have associated with them values for composition, temperature and flow rate. Solid streams are treated as a homogeneous collection of a single specified particle size. Multiple particle sizes are handled by specifying multiple solid streams.
OSP currently contains 13 computational modules. These modules have been kept relatively simple but allow many of the important oil shale physical and chemical processes to be modeled. The modules rely on one of two simplifying assumptions, either one-dimensional co-current flow or complete mixing. The one-dimensional co-current flow construct allows particldgas systems to be modeled, such as a dense phase moving packed bed, or a dilute phase lift-pipe. The complete mixing construct has utility in modeling fluidized bed systems. Using some combination of these two module types, a variety of unit operations can be simulated.
The moving packed bed pyrolyzer provides a good example of how OSP operates. In this unit, the solids travel from top to bottom in plug flow, while a sweep gas and vapors produced in the bed travel radially from centerline to wall, where vapor removal ports are located. This non co-current gas solid contact is modeled within OSP as a series of well mixed modules coupled from top to bottom to simulate the solid motion.
Under most circumstances, pilot plant results are uses as a guide in verifying modeling assumptions. However, in one case, the discrepancy between model and pilot plant could not be rectified by altering model constructs. This was the case. for the measured amount of carbonate decomposition observed from the pilot plant.
.
1249
LABORATORY EXPERIMENTAL RESULTS
w e have recently published retorts of fundamental laboratory experiments in oil coking kinetics2, char combustion kinetics3 and flue gas NOx reduction with ammonia addition4. Our latest 1abOratoIy study focused on carbonate decomposition kinetics.
Decomposition kinetics were measured in the laboratory as an aid in resolving the discrepancy between model and experiment. In the experiments, raw shale was first prepared via slow combustion at low temperature (200 to 350 "C) to remove all of the kerogen while not affecting the initial mineral carbonate concentrations. The prepared sample was then dropped into a fluidized bed and the temperam was ramped from initially 500 'C to 850 'C at 5 deg/min. The evolved C02 was measured on a mass spectrometer as a determinate of the rate of carbonate decomposition. Analysis of the dropped sample showed 96% of the carbon to be inorganic. A first order kinetic expression was fit to the experimental data. The kinetics were faster, particularly at low temperatures, compared to previously reported results used in the OSP model. Incorporating these kinetics into OSP has eliminated the large discrepancy between model and experiment.
ECONOMICS AND COMMERCIALIZATION RESULTS
Our commercial concept for the HRS process combines reliability and efficiency with the production of high valued products and minimum environmental disruption. Economics for a 10,OOO BbVday plant producing a slate of high valued products and co-producing electric power is discussed below.
Development of an efficient, reliable retorting pmcess coupled with pioneering efforts by others in using shale oil as a chemical feed stock for the manufacture of high valued specialty chemicals and for use as an asphalt binder, using the Shale Oil Modified Asphalt (SOMAT)S process combine to make for a small scale venture potentially profitable in today's market.
The heart of the 10,OOO BbVday commercial HRS process is very similar to a combined cycle circulating bed boiler for power production. In this plant, raw shale would first be pyrolyzed to produce oil, followed by combustion of residual carbon to produce thermal energy to drive the process and electric power for on-site use and off-site sale. The power cycle provides a means for spent shale cooling and fuel gas utilization while providing enough revenue to offset the cost of mining the raw shale.
The produced shale oil is split into three fractions. Ten percent is converted into specialty chemicals, unique to shale oil, which could command a sale price of $100/Bbl. The heaviest forty percent is converted into an asphalt binder (SOMAT) for road paving, with a projected sale price of $100/Bbl. The lightest fifty percent is then hydrotreated/refined producing a slate of transportation fuel products ranging from diesel to aviation fuel. The wholesale market price for this transportation fuel mix, averaged in 1993, $.73/gallon or $31/Bbl.
The economics of this 10,OOO BbUday plant are shown in Table 1. Cost and revenue items are reported on per capacity basis, assuming a 330 day operating year. The capital cost on the $725 million dollar plant with a I5 percent internal rate of return (IRR) on investment equals a capital charge of $37/Bbl. Operating costs including mining, disposal, plant operations and maintenance are estimated by direct comparison with Unocal's operating experience at Parachute Creek. These costs are estimated at $23/Bbl. Hydrotreatinghefining costs of $10/Bbl are. also based on Unocal's experience, with fifty percent of the product needing hydrotreating in the current plant configuration, this equates to a $5/Bbl cost. The next two operating costs involve conversion of forty percent of the product into a shale oil modified asphalt binder SOMAT and ten percent into specialty chemicals.
Next in the table are the four products from the plant. The first is excess electrical production capacity obtained from the cooling the waste shale and on-site combusting of produced fuel gas. Off-site elecmcal sales amount to a $5/Bbl credit. The sale of SOMAT and specialty chemicals, each assumed to have a value of $100/Bbl bring in an additional $50/Bbl revenue, leaving a $15/Bbl gap between costs and revenues, with fifty percent of the product left. Here the table deviates from the heading by reporting the required price of the transportation fuel products needed to achieve the fifteen percent rate of return desired. As shown, the required price is about equal to the wholesale price of these fuels during 1993. Thus, the economics for a 10,ooO BbVday plant have been shown to provide a fifteen percent rate of retum on investment in today's market.
Table 2 shows the impact of scale up on economics. As more capacity is added, the capital and operating costs per barrel decline, while revenues from the production of high valued specialty products decline. The required motor fuel price increases to $39/Bbl or $.93/gallon to achieve the desired fifteen percent rate of return, which is a foreseeable rise in fuel price over the next 1-2 decades. In addition, process improvements and innovation based on experience will aid in lowering the overall cost projections for this plant
The New Paraho Corporation, Aurora, Colorado.
1250

CONCLUSIONS
Oil shale is one of the most promising alternatives to dwindling petroleum supplies in the US, with over 600 billion barrels of recoverable deposits in the Piceance Basin of Colorado alone. A commercial industry would provide domestic feed stock for specialty chemicals, asphalt binders for longer lasting roads, alternative mansportation fuel and electric power at a cost competitive in today's market. A demonsmated technology would provide domestic jobs, aid the US balance-of- payments and give a measure of energy security by serving to cap the price of imported oil and provide an option to partially replace foreign oil in an extended national emergency.
A small-scale indushy, today, exploiting high valued products would provide the framework for technological advancement to bringing down the cost for a potential large-scale fuels industry tomorrow. The Government owns most of the resource, and stands to benefit from a commercial oil shale industry through lease and tax revenues. Technical development, however, has been left to industry, with the cost of development proving to be too large for any single company to bear. A small investment by Government, now, could bring into being a small oil shale industry which would pave the way for further development, revenues and jobs in the future.
The LLNL Hot-Recycled-Solid process has the potential to improve existing oil shale technology. It processes oil shale in minutes instead of hours, reducing plant size. It processes all oil shale, including fines rejected by other processes. It provides controls to optimize product quality for different applications. It co-generates electricity to maximize useful energy output. And, it produces negligible SO2 and NOx emissions, a non-hazardous waste shale and uses minimal water.
REFERENCES
1. HRS Pilot Plant and Modeling Results, Cena, R. J. and Thorsness, C.B., 25th Annual Western Oil Shale Symposium, Golden, CO., April 21-22, 1992.
2. Coking and Cracking Reactions of Oil Vapor Over Hot Oxidized Oil Shale, Singleton, M.F. et.al., American Chemical Sociefy NationalMeeting, San Francisco, CA, April a5-10.1992.
3. Laboratory Measurement of Combustion Kinetics of Retorted Western Oil Shale, Watkins, B.E. et.al., 25th Annual Western Oil Shale Symposium, Golden, CO., April 21-22, 1992.
4. Catalytic Activity of Oxidized (Combusted) Oil Shale for Removal of Nitrogen Oxides with Ammonia as a Reductant in Combustion Gas Streams, Reynolds, J.G., Taylor, R.W., Moms, C.J., 204th ACS National Meeting, Division of Fuel Chemistry, Washington, D.C., August 23- 28, 1992.
1251

Table 1. Economics of a 10,000 Bbllday Plant
Cost & Description Revenue
$/Bbf
Capital cost @ 15% IRR - 725 Million
$37
Unocal's projected operating costs (full production excluding $23 hydrotreating) Hydrotreathefine 50% into $5 transportation fuel (cost $IO/Bbl) Convert 40% to SOMAT (seasonal $2 average - cost $5/Bbl)
Convert 10% to specialty $3 chemicals (cost $25/Bbl) Subtotal - Capital & $70 Operating Costs Off-site electxicity sales @ ($5) $.03/kWh SOMAT asphalt additive @ ($40) $IOO/Bbl Specialty chemicals @ $lOO/Bbl ($10)
Required transportation fuel $ 3 0 price for 15% rate of return
Table 2. Economics of a 50,OOo Bbllday Plant
cost &
§JB bl Description Revenue
Capital cost @ 15% IRR - 2,225 Million Operating costs including $25 hydrotreatinglrnfining
Subtotal - Capital & $48 Operating Costs
$23
Off-site electricity sales @ ($5) $.03kWh
SOMATasphalt additive 15% @ ($9) $tB/Bbl
Specialty chemicals 5% @ $60/BbI ($3)
Required transportation fuel $39 price for 15% rate of return
Transportation fuel $31 wholesale price in 1993
1252

EFFECTS OF SCALE-UP ON OIL AND GAS YIELDS IN A SOLID- RECYCLE FLUIDIZED BED OIL SHALE RETORTING PROCESS
S.D. Carter, D.N. Taulbee, A. Vego, and J.L. Stehn Center for Applied Energy Research
University of Kentucky 3572 Iron Works Pike Lexington, KY 405 11
Keywords: oil shale retorting;
BACKGROUND Fluidized bed Dvrolvsis of oil
fluidized bed; coking and cracking
ale in a non-hvdroaen atmomhere has been ! ~- l0wn to .- ~
significantly increase oil yield in laboratory-scale reactors compared to the Fischer assay by many workers.(1,2,3,4) The enhancement in oil yield by this relatively simple and efficient thermal technique has led to the development of several oil shale retorting processes based on fluidized bed and related technologies over the past fifteen years.(5,6,7,8) Since 1986, the Center for Applied Energy Research (CAER) has been developing one such process, KENTORT 11, which is mainly tailored for the Devonian oil shales that occur in the eastern U.S.(9) The process contains three main fluidized bed zones to pyrolyze, gasify, and combust the oil shale. A fourth fluidized bed mne serves to cool the spent shale prior to exiting the system. The autothermal process utilizes processed shale recirculation to transfer heat from the combustion to the gasification and pyrolysis zones. The CAER is currently testing the KENTORT 11 process in a 22.7-kglhr process-development unit (PDU).
INTRODUCTION Fluidized bed pyrolysis increases oil yield by reducing the extent of secondary coking and cracking reactions which result in carbonaceous deposition and gas production. The fluidizing gas dilutes the shale oil vapors and sweeps them quickly out of the bed of pyrolyzing shale to reduce both thermal cracking and solids-induced coking and cracking. Fluidized beds, in the case of oil shale retorting, offer an advantage over gas-swept fixed bed reactors because there is little gas/solid contact in the bubble phase of a fluidized bed. Assuming similar fluidization characteristics, the extent of secondary reaction (Le. oil loss) is affected by bed depth, solid type, and temperature as it is in any gaskolid reaction. For small fluidized beds the bed depth is shallow, so secondary reactions are minimal. Since it is unpractical to increase a fluidized bed to commercial scale by only increasing the cross-sectional area without also increasing the height, an unavoidable increase in secondary reactions will occur with scale up. T h e extent of this increase can only be reliably determined by experiment because of the difficulty in modeling fluidized bed contacting. Even at the laboratory scale, significant differences in oil yield have been observed as a result of retort size. Rubel and Carter (10) observed that oil yields from a 7.6-cm diameter fluidized bed pyrolyzer were approximately 13% less than the oil yields from an otherwise similar 3.8-cm diameter fluidized bed retort. Increased gas production in the larger retort confirmed that secondary reactions had increased in this study.
Another factor that contributes to high oil yield in small laboratory scale retorts is that the heat for pyrolysis is provided by preheated gas and/or through the walls by an external furnace. In these retorts the nascent shale oil vapors experience contact with
1253

an isothermal and homogenous mixture of pyrolyzing shale. Because processed shale is recycled in commercial-scale retorting schemes, however, the particles in the pyrolysis zone are not homogeneous and may potentially contribute to greater rates of secondary oil-loss reactions compared to pyrolyzed shale particles which have not been additionally processed. Rubel et al. (11) and Coburn and Morris (12) have found that carbon deposition from shale oil vapors is more rapid on combusted shale than pyrolyzed shale. While Udaja et al. (13) found combusted and pyrolyzed shales to have similar propensities for carbon deposition, they also noted that the pyrolyzed shale had a much higher surface area than the combusted oil shale. In general, it appears that oil shale which has had residual carbon burned off via combustion or gasification tends to have higher capacity for carbon deposition. This is consistent with the notion of the "coke clock", first identified by Voorhies (14) in the fluid catalytic cracking literature, where carbon deposits more slowly on cracking catalysts as time of exposure increases (i.e., at higher levels of carbon on the catalyst). Therefore, the oil yield potential of large-scale fluidized bed retorts is potentially affected not only by their size but also by the concentration and composition of recycled shale in the pyrolysis zone.
EXPERIMENTAL Aooaratus. A 7.6-cm diameter, 2.3-kg/hr fluidized bed reactor system has been used extensively at the CAER as a small prototype of the KENTORT I1 process (15.16) and as an apparatus to study the kinetics of coking and cracking of shale oil vapors over processed shales.(17,18) The prototype is enclosed in electric furnaces to preheat the system and to compensate for heat losses. The PDU (see Figure 1 for flow diagram), on the other hand, operates nearly autothermally and relies on a propane burner to preheat the air entering the combustor and an electric furnace to superheat the steam which fluidizes the cooling, gasification, and pyrolysis zones. In a commercial system the energy for preheating these streams would be recovered in part from cooling and condensing the hot gases and vapors exiting the system. Electric heat tapes surround the pyrolysis zone of the PDU, but provide little net heat to the system. In almost all respects the oil collection systems of the prototype and the PDU are similar, The temperature is reduced in stages which results in a crude fractionation of the oil product. The oil collected in the air-cooled heat exchanger and electrostatic precipitator (ESP) is heavy and viscous and is termed "heavy oil." The oil condensed downstream in the water-cooled condenser is low boiling and is termed "light oil."
There were two master samples of oil shale that were used in this work. Both are from the Cleveland Member of the Ohio Shale in northeastern Kentucky and are similar in nature except for kerogen content. The average shale analysis for the KENTORT I1 prototype was: 16.7% C, 2.0% H, 0.7% N, 1.7% S, and 74.5% ash, and the average analysis for the PDU was: 11.3% C, 1.1% H, 0.7% N, 1.8% S, and 82.5% ash. Each master sample was prepared to a size distribution of - 0.85mm +0.25mm.
Ooeratine Conditions. The prototype was run in three different modes of operation: 1) gas heating, 2) gadsolid heating w/o combustion, and 3) gadsolid heating w/combustion. Gas heating runs were performed to establish baseline oil yield data, and the unit was run with and without the combustor in the gaskolid-heating mode to observe the significance of combusted shale on product yields. Throughout the test series, the pyrolysis zone temperature was held at 530-540T because this temperature
1254

was found to maximize oil yield for this type of shale in a fluidized bed.(l9) The gasifier temperature ranged from 750 to 850°C and the combustor from 850 to 910°C. The shale recycle ratio between the gasifier and the pyrolyzer was varied from 1.3: l to 2.6: 1 (recycled shalexaw shale).
Due to its design, the PDU can only operate with all fhree zones functioning and with shale recycling to transfer heat to the pyrolysis zone. The temperature regimes achieved are similar to those in the prototype: pyrolysis 5O0-54O0C, gasification 700- 800°C, and combustion 750-900°C. Due to its larger size, the solid-recycle ratio between the gasifier and pyrolyzer is higher for the PDU and has been recorded in the range of 3.1 to 5 . 1 .
RESULTS AND DISCUSSION In the gas-heating mode of operation for the prototype, oil yields averaged 129% of the Fischer assay oil yield by weight. Under the most severe solid-recycle conditions (i.e. high recycle rate and temperature) in the second mode of operation, less than 15% oil loss was recorded. Under these conditions approximately 60% of the heat required for pyrolysis was supplied by recirculating shale from the gasification zone. The study was rather inconclusive in determining whether solid-recycle rate or temperature was the more influential parameter; however, it appeared that higher recycle-solid temperatures caused greater oil yield loss. The addition of the combustor to the operation of the prototype did not significantly affect the oil yield. The excess carbon in the shale following pyrolysis and gasification was not completely combusted because the combustion zone was purposefully starved of oxygen. The recycle loop between the combustor and gasifier was undersized, so the heat generated in the combustor with air as the oxidant could not be removed fast enough to maintain the combustor at a materials-safe temperature. Therefore, nitrogen was blended with air to fluidize the combustion zone resulting in partial combustion of the residual carbon. Since the burn out of carbon was not complete, the effect of combusted shale on oil yield in this case was probably masked.
The composite oil produced in the prototype is a heavy, viscous and aromatic material which is composed of 70% "heavy oil" as was described in the experimental section.(20) The character of the oil indicates that minimal secondary cracking and coking has occurred as compared to the oils produced from Fischer assay. There was evidence of increased secondary reactions by a somewhat improved oil quality for the oils produced in the solids-recycle modes of operation. These oils displayed higher WC ratios, lower viscosities. lower average molecular weights, and an improved boiling range distribution.
Unfortunately, at the time of this writing, complete analyses from the recently successful runs of the KENTORT I1 PDU are not available, and it is not possible to make quantitative oil yield comparisons to the prototype results. It is fairly certain, however, that the oil yields on a carbon conversion basis are lower than the prototype. A shift to a lighter composite oil is evident because approximately 60% of the total has been collected as "heavy oil." The loss of "heavy oil" is consistent with increased secondary oil-loss reactions because the heaviest and most aromatic fractions are most susceptible to carbon deposition and gas production.
1255

F m v R E WORK Most PDU runs that have been completed to date have been prematurely shortened because of various mechanical difficulties (ESP failure is most frequent). Therefore, more PDU runs are planned thar will attain the design steady-state operating period of ten hours. This amount of time is required so that the solids in the system will reach a steady state composition. Due to the nature of the start-up procedure, all zones of the reactor are composed of combusted shale when raw shale is first introduced. While we do not have a method of on-line oil yield measurement, it is likely that oil generation during this start-up period is very low.
ACKNOWLEDGMENT This work was supported in part by the Morgantown Energy Technology Center, USDOE, under Cooperative Agreement DE-FC21-90MC27286 (such support does not constitute an endorsement by the USDOE of the views expressed in this article).
REFERENCES 1.
2.
3.
4.
5.
6.
I.
8. 9.
I O .
1 1 .
12. 13. 14. 15. 16. 17. 18. 19. 20.
Rubel, A.M., Margolis, M.J., Haley, J.K., and Davis, B.H., 1983 Eastern Oil Shale Symposium Proceedings, 1983, IMMR83/089, University of Kentucky, Lexington, KY, Richardson, J.H., Huss, E.B., Ott, L.L., Clarkson, J.E., Bishop, M.O., Gregory, L.J., and Morris, C.J., Lawrence Livermore National Laboratory, 1982, UCID- 19548. Wallman, P.H., Tamm, P.W., and Spars, B.G., ACS Symp. Series 163, 1981, 93. Bissel, E.R., Bumham, A.K., and Braun, R.L., I and EC Proc. Des. Dev., 1985, 24, 381. Gwyn, J.E., Roberts, S.C., Hinds, Jr., G.P., Hardesty, D.E., and Johnson, G.L., Thirteenth Oil Shale Symposium Proceedings, 1980, Colorado School of Mines, Golden, CO. Tamm, P.W., Bertelsen, C.A., Handel, G.M., Spars, B.G., and Wallman, P.H., Energy Progress, 1982, 2 ( I ) , 37. Cena, R.J. and Thorsness, C.B., 25th Oil Shale Symposium Proceedings, 1992, Colorado School of Mines, Golden, CO. Dung, N.V. and Yip, V., Fuel, 1990, 69, 1129. Carter, S.D., 1987 Eastern Oil Shale Symposium Proceedings. 1987, University of Kentucky, Lexington, KY. Rubel, A.M. and Carter, S.D., American Chemical Society Preprints, 1984, Div. of Fuel Chemistry, Vol. 29, No. 3, pp. 202-208. Rubel, A.M., Rimmer, S.M., Keogh, R., Robl, T.L., Carter, S.D., and Derbyshire, F.J., Fuel, 1992, z1, 1427. Cobum, T.T. and Morris, C.J., Fuel, 1991, 70, 1362. Udaja, P., Duffy, G.J., and Chensee, M.D., Fuel, 1990, 69, 1150. Voorhies, Jr., A,, Ind. Eng. Chem., 1945, 37 (4), 3 18. Carter, S.D., Robl, T.L., Rubel, A.M., and Taulbee, D.N., Fuel, 1990, @, 1124. Carter, S.D., Robl, T.L., and Taulbee, DN., Fuel, 1991, 70, 1347. Carter, S.D. and Taulbee, D.N., Fuel, 1992, 21, 1421. Carter, S.D., Taulbee, D.N., and Robl, T.L., Fuel, 1993, 22, 851. Carter, S.D. and Taulbee, D.N., Fuel Processing Technology, 1985, 1, 251. Taulbee, D.N. and Carter, S.D., Fuel, 1991, 70, 1245.
0
1256

M-
m. ID-I1-W
Figure 1. Simplified flow diagram of the 22.7-kghr KENTORT I1 process- development unit (PDU) at the Center for Applied Energy Research
1257

/I
I
PROCESSlNGlECONOMlC STRATEGY FOR UPGRADING SHALE OIL
James W. Bunger, Christopher P. Russell, Prasad A. V. Devinenl Donald E. Cogswell and Jerry W. Wiser James W. Bunger and Associates, Inc.
P. 0. Box 500237 Salt Lake City, UT 841524037
Keywords: Shale Oil, Chemicals, Separations
NRODUCTION
Green River Shale Oil (Western U. S.) is comprised of polar compounds, principally nitrogen and oxygen types, and non-polar compounds, principally paraffins, olefins and aromatics. The former may be a valuable source of specialty and fine chemicals while the latter may be refined into fuels and other petroleum products. TO take full advantage of the values of the polar types, efficient processes for extraction, conversion and utilization of these types must be developed.
COMPOUND TYPES IN SHALE OIL
The compound types found in shale oil include homologs, analogs and benzologs of pyridines, pyrroles, phenols, amides, ketones, nitriles, carboxylic acids, thiophenes and aromatic hydrocarbons. Some of these types are of extremely high value in their pure form. JWBA estimates that up to 10% ofa shale oil barrel may be manufacturable into products of value greater than $1,00O/bbl.
ECONOMIC STRATEGY
Figure-1 shows the economic strategy for a value-enhancement venture from shale oil. Because recovery of shale oil has been a long-time historical focus, the technology and economics of retorting are fairly well understood (1). A guaranteed purchase of raw shale oil a t 53Ohbl (non-hytrotreated) is expected t o be sufficient to attract a qualified producer into production.
The intermediate stage of value-enhancement targets both broad-range concentrates and feedstocks for finishing by existing manufacturers of specialty and fine chemicals. In both cases, shale oil becomes a substitute source of feedstock. For broad-range concentrates, shale oil may substitute for coal tars; for specialty chemicals, shale oil intermediates may compete economically with synthetically produced intermediates.
PROCESS STRATEGY
Figure-2 shows a process strategy and a possibie suite of products obtainable &om shale oil. Shale oil is first separated by a thermodynamically logical sequence by molecular weight and polarity. The non-polar compounds are sent to a conventional petroleum refinery for manufacture of fuels, lube oils and waxes. Heavy ends may be used for asphalt or asphalt blending stock. The use of shale oil for specialty asphalt additives has been previously reported (2).
The polar fractions may be further separated to produce concentrates of specific types. Liquid-liquid extraction may employ acid, base, polar or polar-aromatics solvents, Also, liquid-solid adsorption may be used to isolate specific types.
For large molecules, some form of dealkylation is needed to reduce the molecules to their bare-ring or mildly-methylated form. Hydrodealkylation is one such process which has shown promise. The resulting products are finished into concentrates of specific types that are further processed for production of specialty and fine chemicals.
VENTURE STRATEGY
Before unconventional feedstocks can be incorporated into the marketplace as substi- tutes for conventional feedstocks or as a source of new products, technology must be developed to exploit potential values found in these materials. There has been relatively little attention paid to utilizing shale oil as a source of nitrogen and oxygen-based molecular types and the prospects for breakthrough discoveries is high.
1258

It is likely that unconventional resources such as shale oil, advanced process coal liquids, tar sand bitumen and biomass will become the source of products with new activities (biological, toxicological, etc.) and properties (materials, polymers, etc.).
Ultimately, an opportunity for profitable investment must be developed. This involves not only pricdcost relationships, but also market trends and acceptance of products. Current results show favorable pricdcost relationships and markets for potential shale oil products are growing (3, 4). The main task is to actually produce products for inspection and introduction to the buyer. Recent results aimed a t achieving these objectives will be reported.
REFERENCES
1. Refer to Proceedings of the Annual Oil Shale Symposia, Colorado School of Mines 1968-1993.
Lukens, L., et al., Proceedings 1993 Eastern Oil Shalemar Sand Symposium, University of Kentucky, Lexington, KY, Nov. 1993.
Bunger, J. W. and Devineni, P. A. V., "Technical Economic Framework for Market Enhancement of Shale Oil", Proceedings, 25th Annual Oil Shale Sym- posium, CSM, 1992a.
Bunger, J. W., et al., "Market Enhancement of Shale Oil by Selective Separa- tions", Preprints, Div. of Fuel Chem., 31(2), 581-9, 1992b.
2.
3.
4.
ACKNOWLEDGMENT
This work has been supported, in part, by the U. S. Department of Energy under Contract DE-AC21-93MC29240.
Illustration of Value - Enhancement Sequence Value. are In I PI b a m l V h l n / Mtsporpovnd Consumer
$2 $30 560 5300 [S.OI] [S.OSI IS. 171 [$.E61
- M U Contract Shale 011 CurrentINew
Value-Enhancement Industry
Figure 1
Process Strategy Shale Oil Value Enhanced Products
Solvents Waxes Lube Oils Aromatic Oils $ 5 0 - lOObbl
Feed Non-Polars Reflnery
$ l 8 . 2 5 b b l
~ a w + s e p a r ~ Shale Oil I $30 hbl
Speclalty &
Chemlcals $200 -<OW bbl
Crude Intermediates SSO-ZOObbl
Finishing Conversion
Figure 2.
1259

THE MEASUREMENT OF PHASE EQUILIBRIA FOR PROCESS STREAMS AT OPERATING TEMPERATURES AND THE IMPLICATIONS FOR THE CRE LIQUEFACTION PROJECT
A Waller, S T Walton CRE Point of Ayr Facility Ffynnongroew Clwyd UK CH8 9JJ
Keywords:
INTRODUCTION
CRE operates the Liquid Solvent Extraction process at its pilot plant in North Wales, UK. The process involves feeding pulverised coal, slurried with a solvent, to a digester in which much of the coal is dissolved. Filtration removes residual solids. The coal solution is fed to an ebulliating bed hydrocracker, together with hydrogen at 200 bar at 425°C. The catalytic reaction adds hydrogen to the coal solution which is distilled to recover solvent and yield a product.
The vessels and pipework are externally heated to ensure that liquids can be pumped but temperatures are not high enough to initiate regressive reactions with consequent formation of carbonaceous solids. However, coal derived liquids are complex mixtures of hydrocarbons which are not soluble in all proportions at all temperatures. Precipitation may occur, leading to blockages in process lines and equipment with subsequent interruption to plant operation. Coal liquids can be regarded simply as a three component system comprising pitch (material with a boiling point >45OoC), saturated hydrocarbon (saturates) having a boiling point ~450°C and distillate solvent, the remainder of the material boiling below 450°C.
Coal solution, of which LSE recycle solvent is a particular case, is a mixture of these three components. A study was undertaken to examine the quantity and nature of precipitates formed from coal solutions of various compositions, with a view to preventing plant shutdowns caused by blocked lines.
METHOD
Coal solutions and a coal derived wash oil were selected from appropriate process streams and analysed to determine their pitch and saturates content. The solutions were combined to prepare liquids of varying proportions of distillate solvent, pitch and saturates. The liquid was filtered on a laboratory scale filter rig. (Figure I ) to determine the quantity of precipitate formed.
Coal solution was added to the electrically heated reservoir and allowed to reach a temperature of 200°C. Wash oil was added slowly with stirring to ensure that the temperature of the liquid in the reservoir did not change. Any light material flashing ofT was collected in a cold trap and returned to the liquid, A 1 bar nitrogen over pressure was applied.
The electrically heated filter body was fitted with a glass fibre filter and allowed to reach 200°C.
On opening the valve the liquid was allowed to pass through the filter paper and the mass of filtrate collected per unit time was recorded. On completion the filter body was dismantled and the mass of precipitate recorded and expressed as a percentage of the total mass of liquid added to the reservoir.
RESULTS
The results were plotted on a triangular co-ordinate system to illustrate a family of curves. Each axis represents one of the three components of the system, distillate solvent, pitch and saturates. Each curve connects points of approximately equal amounts of precipitate (Table 1, Figure 2).
Phase Equilibria, Liquid Solvent Extraction Process, Coal Solution I
5
An important property of a hiangular diagram is the significance of a straight line joining an apex to a point on the opposite edge. Movement along this line represent a change in the composition of one component while the other two components remain in the same proportions. Therefore as one component is added to the system, the composition of the mixture will always lie at some point on the line.
Figure 3 shows such a system. Lines AA', BB' and Cc' drawn from the pitch apex to the opposite base line represents the case where pitch is added to an initial binary mix of distillate solvent and saturates with an initial composition of 80:20,90:10 and 95:s respectively. The lines show that as pitch levels increase the quantity of precipitate produced increases to a maximum at approximately 20% pitch and then decreases. The highest level of precipitated material occurs with the highest level of saturates in the mixture.
A typical coal solution will contain slightly more than 40% pitch and a typical LSE solvent some 30% pitch. Figure 3 illustrates the effect of increasing saturates in a typical coal solution (EE') and a solvent
1200 (DD).
I

Within the operating envelope of the plant then as the saturates levels increase the quantity of precipitate produced will continue to increase i.e. up to a saturates level of some 20%.
The name of the precipitate is reflected in the time that the mixture takes to pass through the precipitate layer on the filter paper. The time taken to filter nominally lOOg of the liquid varied and was not related to the quantity of precipitate produced. With the exception of Run 13 which appears to be a rogue result, there is a boundary below which filtration times are of the order of a few minutcs and above which filtration rates are much greater, Some precipitates, Runs 6, 8 and 17 blocked the flow completely leaving a quantity of d i l te red material in the filter body. Results for these m s are excluded. For a three component mixture and saturates levels between 2.5% and 20% then this boundary is defined as:-
% Pitch = 0.43 x % saturates + 19. - (')
If the pitch level in a mixture is less than the value calculated from its saturate content in equation (I), then the precipitate produced will offer only minimal resistance to flow. However, if the pitch level is greater than the calculated value, there will be increasing resistance to flow.
The boundary is shown in Figure 4. For a three component mixture with saturates levels below 2.5% there is minimal resistance to flow. The region within X, Y, Z is a hard brittle precipitate with high resistance to liquid flowing through it.
Mixtures of similar composition were filtered at 225"C, 250°C and 275'C. The results are shown in Table 2. The quantity of precipitate decreased with increasing temperature at a rate of approximately 1% absolute per 25°C rise above 200°C. It would be expected that if a triangular diagram similar to Figure 2, were to be drawn for the three component system at 275"C, there would be a greatly increased envelope in which precipitation would be insignificant and filtration times would also be reduced.
APPLICATION TO PROCESS CONDITIONS
Note: Triangular co-ordinates refer to (% Distillate Solvent, % Pitch, % Saturates).
Case 1 A typical LSE recycle solvent might contain 30% pitch and 10% saturates. If no saturates were present then the composition would be (70, 30, 0). As the saturates increase from 0 to IO%, the am,ount of precipitate produced rises to approximately 4% at 7% saturates (Le. 63, 30, 7) and only a further 1% at 15% saturates ( 5 5 , 30, 15). At this level resistance to flow could be experienced.
On occasions the solvent composition has reached (53, 40, 7) and blockages have occurred in the flow meter in the solvent feed line which is maintained at 150°C. As can be seen on Figure 4, this system would lie in the area where a hard, brittle and low permeability precipitate would form. Precipitation is eliminated at higher temperatures, however this would require replacement of trace heating and flow meters in the line and would increase the power consumption.
Case 2 Wash oil, which is comprised of distillate solvent and saturates only, is pumped along a line, approximately 20m long, to the base of the hydrocracker in order to continually flush the catalyst removal vessel. The line is narrow bore and the flow is 1 kghour at ambient temperature. If the flow in the line stops coal solution passes back down the line producing mixtures within a range of composition from wash oil (80, 0, 20) to coal solution (45,50, 5 ) causing a precipitate to form. The precipitate will be hard and brinle in nature, Figure.4. Because there is no flow in the line, its surface temperature will increase and the precipitate will form insoluble carbonaceous material and consequently block the line. It was proposed LSE recycle solvent be used as flush oil giving a possible range of compositions in the line from (64, 30, 6) to (45, 50, 5). This avoids the area in which hard precipitate kformed. Further, solvent contains hydrogen donors which help to prevent the regressive reactions which cause coke formation. Since the switch from wash oil to solvent no problems have been experienced in this line.
Case 3 The bearings in the hydrocracker ebullating pumps are flushed with wash oil to both cool the pump bearings and protect it from coal solution. The wash oil re-enten the process steam at 100°C &ugh an oil seal which has a 0.5 mm clearance. No solids can be tolerated in this oil as blockage of the oil seal would cause overheating and subsequent pump failure. Wash oil is chosen for this duty as the components are mutually soluble at these temperatures, no precipitate being prescnt.
CONCLUSION
The mutual solubility characteristics of coal derived liquids can be determined using simple laboratory equipment and may be represented in terms of a three component system. Investigation of such systems have yielded results which have been applied to modify process conditions in a successful attempt to reduce costly interruptions to pilot plant operation.
1201

i
% Distillate Solvent
60.1 60.8 65.0 57.6 55.0 50.4 60.3 68.5 71.0 73.0 78.3 82.7 86.4 59.4 58.2 59.4 70.7 82.1 92.5 89.9 70.4 78. I 81.0 79.6 58.0 61.9 69.2 59.3 53.9 50.1 65.5
ACKNOWLEDGEMENTS
The authors thank CRE for permission to publish this paper. The views expressed are those of the authors and not necessarily those of CRE. The work reported here was supported in part by the European Commission, the UK Department of Trade and Industry, Ruhrkohle Oel und Gas GmbH, Amoco and Exxon, who are Participants in the British Coal Liquefaction Project.
% Yo Saturates Precipitate
18.5 6.0 18.8 4.8 23.1 4.1 17.3 5.4 11.6 4.9 13.1 7.7 2.9 1.3 8.8 12.0' 6.2 5.6 3.8 3.3
12.5 3.8 8.6 3.9 4.5 2.2 3.9 1.4 5.0 3.1 3.9 I .6 6.3 11.6' 8.4 3.5 4.4 1.0 4.1 1.8
14.7 5.4 4.2 3.3
14.2 2.0 9.1 3.8 7.0 5.9
12.7 4.3 15.6 4.5 19.7 8.2 14.3 4.4 11.1 4.2 24.4 2.2
Table 1 - Quaotity of Precipitate Produced for 3 Compooeot Mixtures
Run Number
1 2 3 4 5 6 7 8 9 IO I I 12 13 14 15 16 17 18 19 20 21 22 23 24 25 26 27 28 29 30 31 32
% Pitch
21.4 20.4 11.9 25.1 33.4 36.4 36.8 22.7 22.9 23.2 9.2 8.7 9.2
36.7 36.7 36.7 23.0
9.4 3.1 6.0
14.9 17.7 4.7
11.3 35.0 25.4 15.3 20.9 31.8 38.8 10.1 16.7
62'o I 21'3 I 4.2
Table 2 - Effect of Temperature on the Quaotity of Precipitate Produced
3.0 11.4 2.1 20.5
275°C 27.2 68.1 8.7 1.2 46.6
i tates
1202

Figure 1 Laboratory Filter Rig
L
I Heating Jacket
Cold Trap 7
Reservoir
Heating Jacket
Balance
F4pre2
11*1
1203

IO LII 311 .IO JII
. .. .
J
1204