solvent extraction and extraction chromatography of
TRANSCRIPT
UNLV Theses, Dissertations, Professional Papers, and Capstones
May 2018
Solvent Extraction and ExtractionChromatography of Homologs andPseudohomologs of Rutherfordium Using TEHAand TEHPJeffrey [email protected]
Follow this and additional works at: https://digitalscholarship.unlv.edu/thesesdissertations
Part of the Chemistry Commons
This Dissertation is brought to you for free and open access by Digital Scholarship@UNLV. It has been accepted for inclusion in UNLV Theses,Dissertations, Professional Papers, and Capstones by an authorized administrator of Digital Scholarship@UNLV. For more information, please [email protected].
Repository CitationRolfes, Jeffrey, "Solvent Extraction and Extraction Chromatography of Homologs and Pseudohomologs of Rutherfordium UsingTEHA and TEHP" (2018). UNLV Theses, Dissertations, Professional Papers, and Capstones. 3322.https://digitalscholarship.unlv.edu/thesesdissertations/3322
SOLVENT EXTRACTION AND EXTRACTION CHROMATOGRAPHY OF HOMOLOGS
AND PSEUDOHOMOLOGS OF RUTHERFORDIUM USING TEHA AND TEHP
By
Jeffrey Neal Rolfes
Bachelor of Science in Chemistry
Newman University
2010
A dissertation submitted in partial
fulfillment of the requirements for the
Doctor of Philosophy – Radiochemistry
Department of Chemistry and Biochemistry
College of Sciences
The Graduate College
University of Nevada, Las Vegas
May 2018

Copyright by Jeffrey Neal Rolfes
All rights reserved
ii
Dissertation Approval
The Graduate College
The University of Nevada, Las Vegas
September 29, 2017
This dissertation prepared by
Jeffrey Neal Rolfes
entitled
Solvent Extraction and Extraction Chromatography of Homologs and Pseudohomologs of
Rutherfordium Using TEHA and TEHP
is approved in partial fulfillment of the requirements for the degree of
Doctor of Philosophy – Radiochemistry
Department of Chemistry and Biochemistry
Ralf Sudowe, Ph.D. Kathryn Hausbeck Korgan, Ph.D. Examination Committee Chair Graduate College Interim Dean
Ken Czerwinski, Ph.D. Examination Committee Member
Roger Henderson, Ph.D. Examination Committee Member
Steen Madsen. Ph.D. Graduate College Faculty Representative
iii
ABSTRACT
Studies of the chemical properties of the heaviest elements have always been difficult due to the
short half-lives and low cross sections involved. To solve this problem, atom-at-a-time methods
are necessary to determine the properties of these short-lived isotopes. Extremely fast kinetics for
the chemical reactions studied (on the same order as the nuclide’s half-life) are required, and the
system should have the potential for automation. Solvent extraction, with its selectivity and
quick kinetics, has historically been used for these investigations into characteristics of super
heavy elements. Another technique, extraction chromatography, offers potentially a way of
investigating rutherfordium’s properties, without the solvent waste generated in liquid-liquid
extractions. A rapid method involving the use of a ligand with high intragroup selectivity is
necessary to discover more about rutherfordium. Studies with the homologs of rutherfordium,
zirconium and hafnium, can be performed using liquid-liquid extractions as well as extraction
chromatography. These investigations can then be used as a basis for comparison with future
studies involving the transactinide element. Based on literature reviews, tertiary amines and
phosphates show promise in extracting group 4 elements. In particular, tris(2-ethylhexyl)amine
(TEHA) and tris(2-ethylhexyl)phosphate (TEHP) can be used to selectively extract zirconium,
hafnium, neptunium, and plutonium from a chloride matrix. The results of a detailed study
investigating the solvent extraction of Zr, Hf, and Pu from various mineral acids by these two
ligands will be presented together with the use of extraction chromatography to separate these
elements. The development of a suitable system for rutherfordium based on these extractants can
help to further elucidate its properties.

iv
ACKNOWLEDGEMENTS
This work was only possible with the encouragement and assistance of many people. First, I
would like Ralf Sudowe, my advisor, for his counsel and patience. Next, I would like to thank Roger
Henderson for being my lab mentor, LLNL supervisor, and for taking his time as a committee member.
Many thanks goes to Ken Czerwinski for his support as a professor and committee member and to Gary
Cerefice, who always had time for a long talk in the afternoon. I would like to thank the lab staff, Mary
Turner, Julie Bertoia, and Trevor Low at UNLV for day-to-day support, especially in my last days of
finishing my lab work in Las Vegas. Many thanks to John Despotupolus who helped me get started in my
extractions at UNLV and at LLNL. Also, I would like to thank all my fellow graduate students and office
mates, in particular: Derek McClain, Bill Kerlin, and Bradley Childs and the rest of the radiochemistry
program.
Lastly, and most importantly, I would like to commend and thank my wife Christine and
Ambrose for coming along with me on my journey through graduate school. I can’t possibly repay the
love and support you have given me in the past 6 years.
I would also like to thank the CAMS facility staff and Narek Gharibyan for preparing the
175Hf tracer over the course of this experiment.
Lastly, and most importantly, I would like to commend and thank my wife Christine and
Ambrose for coming along with me on my journey through graduate school. I can’t possibly
repay the love and support you have given me in the past 6 years.
Department of Homeland Security Disclaimer
This material is based upon work supported by the U.S. Department of Homeland
Security under Grand Award Number 2012-DN-130-NF0001. The views and conclusions
contained in this document are those of the author and should not be interpreted as representing
the official policies, either expressed or implied, of the U.S. Department of Homeland Security.
v
TABLE OF CONTENTS
ABSTRACT ................................................................................................................................... iii
ACKNOWLEDGEMENTS ........................................................................................................... iv
1. INTRODUCTION ................................................................................................................... 1
1.1 Project Goals .................................................................................................................... 1
1.2 Background ...................................................................................................................... 1
1.2.1 Historical Perspective ............................................................................................... 1
1.2.2 Transactinide Production .......................................................................................... 6
1.2.3 Solvent Extraction ................................................................................................... 12
1.2.4 Extraction Chromatography .................................................................................... 14
1.2.5 Atom-at-a-Time Chemistry ..................................................................................... 17
1.2.6 Zirconium and Hafnium Aqueous Chemistry ......................................................... 21
1.2.7 Group IV Liquid Phase Online Chemistry .............................................................. 23
2. MATERIALS AND INSTRUMENTatION .......................................................................... 26
2.1 Offline Studies ................................................................................................................ 26
2.1.1 Tris(2-ethylhexyl)amine and tris(2-ethylhexyl)phosphate ..................................... 26
2.1.2 Radionuclide tracers................................................................................................ 27
2.1.3 Other reagents used ................................................................................................. 30
2.2 Instrumentation............................................................................................................... 31
2.2.1 Sodium Iodide Detector .......................................................................................... 31
2.2.2 Germanium detectors .............................................................................................. 33
2.2.3 Liquid Scintillation Counting ................................................................................. 34
3 METHODS ............................................................................................................................ 37
3.1 Solvent Extraction .......................................................................................................... 37
3.2 Batch Studies .................................................................................................................. 38
3.2.1 Batch Study Corrections ......................................................................................... 38
3.3 Column Studies .............................................................................................................. 39
4 SOLVENT EXTRACTIONS ................................................................................................ 41
4.1 Exploratory Extractions .................................................................................................. 41
vi
4.2 Solvent Extraction from Hydrochloric Acid .................................................................. 41
4.2.1 Solvent Selection .................................................................................................... 41
4.2.2 Solvent Extractions with 89Zr, 175Hf, 239Pu ............................................................. 50
4.2.3 89Zr, 175Hf, 239Pu speciation .................................................................................... 54
4.2.4 Kinetics of 89Zr, 175Hf, and 239Pu Extraction ........................................................... 59
4.2.5 Discussion ............................................................................................................... 63
5 BATCH STUDIES ................................................................................................................ 66
5.1 Exploratory Batch Studies with Resin Backbones and Ligand Loading ....................... 66
5.1.1 TEHA ...................................................................................................................... 66
5.1.2 TEHP....................................................................................................................... 74
5.2 Kinetic Studies ............................................................................................................... 81
5.2.1 TEHA ...................................................................................................................... 81
5.2.2 TEHP....................................................................................................................... 83
5.2.3 Discussion ............................................................................................................... 86
6 COLUMN STUDIES ............................................................................................................ 87
6.1 Column Elution with 11 M HCl, 7 M HCl, and 6 M HCl .............................................. 87
6.2 Column Elution with 11M HCl and 6M HCl ................................................................. 90
6.3 Discussion ...................................................................................................................... 92
7 CONCLUSIONS ................................................................................................................... 94
7.1 Solvent Extraction .......................................................................................................... 94
7.2 Batch Studies and Column Studies ................................................................................ 95
7.3 Future Work ................................................................................................................... 96
REFERENCES ............................................................................................................................. 98
Curriculum vitae ............................................................................ Error! Bookmark not defined.
vii
LIST OF FIGURES
Figure 1.1: The current periodic table of the elements. 21 .............................................................. 5
Figure 1.2: A visual comparison of hot and cold fusion reactions.16 ............................................. 8
Figure 1.3 List of hot fusion reactions with a stable beam and a radionuclide beam (RNB) their
cross sections (σ) in picobarns and associated ion beam strength φ (ions/sec).39........................... 9
Figure 1.4: The relativistic (solid line) and non-relativistic (dashed lines) distribution of Db’s 7s
electrons.40 .................................................................................................................................... 11
Figure 1.5 Diagram of the components of an extraction chromatographic system.46 .................. 15
Figure 1.6 Schematic of the Dubna Gas-filled Recoil Separator (DGFRS).53 ............................. 20
Figure 2.1 Structure of Tris(2-ethylhexyl)amine ......................................................................... 26
Figure 2.2 and tris(2-ethylhexyl)phosphate ................................................................................. 27
Figure 2.3 Wizard 2480 automated gamma counter .................................................................... 33
Figure 4.1 Percent Extraction of 89Zr with 0.05 M TEHA in kerosene. ...................................... 43
Figure 4.2 Percent Extraction of 89Zr with 0.05 M TEHA in DCM ............................................ 44
Figure 4.3 Percent Extraction of 89Zr with 0.05 M TEHP in DCM. ............................................ 45
Figure 4.4 Percent Extraction of 89Zr with 0.05 M TEHA in hexanes. ....................................... 46
Figure 4.5 Percent Extraction of 89Zr with 0.05 M TEHP in hexanes. ........................................ 47
Figure 4.6 Percent Extraction of 89Zr with 0.05 M TEHA in toluene .......................................... 48
Figure 4.7 Percent Extraction of 89Zr with 0.05 M TEHP in toluene .......................................... 49
Figure 4.8 Percent Extraction of 89Zr, 175Hf, and 239Pu with 0.05 M TEHA ............................... 51
Figure 4.9 Separation factors of 89Zr, 175Hf, and 239Pu with 0.05 M TEHA ................................ 52
Figure 4.10 Percent Extraction of 89Zr, 175Hf, and 239Pu with 0.05 M TEHP .............................. 53
Figure 4.11 Separation factors of 89Zr, 175Hf, and 239Pu with 0.05M TEHP ................................ 54
viii
Figure 4.12 The natural log of the distribution ratios for 89Zr as a function of the natural log of
the concentration of TEHA in toluene at 8 M HCl. ...................................................................... 56
Figure 4.13 The natural log of the distribution ratios for 175Hf as a function of the natural log of
the concentration of TEHA in toluene at 8 M HCl. ...................................................................... 56
Figure 4.14 The natural log of the distribution ratios for 89Zr as a function of the natural log of
the concentration of TEHP in toluene at 8 M HCl........................................................................ 57
Figure 4.15 The natural log of the distribution ratios for 175Hf as a function of the natural log of
the concentration of TEHP in toluene at 8 M HCl........................................................................ 58
Figure 4.16 The natural log of the distribution ratios for 239Pu as a function of the natural log of
the concentration of TEHP in toluene at 8 M HCl........................................................................ 58
Figure 4.17 Kinetics of 89Zr in 0.05 M TEHA/12 M HCl ........................................................... 60
Figure 4.18 Kinetics of 175Hf in 0.05 M TEHA/12 M HCl .......................................................... 60
Figure 4.19 Kinetics of 239Pu in 0.05 M TEHA/12 M HCl .......................................................... 61
Figure 4.20 Kinetics of 89Zr in 0.05 M TEHP/12 M HCl ............................................................ 62
Figure 4.21 Kinetics of 175Hf in 0.05 M TEHP/12M HCl ........................................................... 62
Figure 4.22 Kinetics of 239Pu in 0.05 M TEHP/12M HCl ........................................................... 63
Figure 5.1 Batch study of 89Zr on different percent loadings TEHA loaded Amberchrome
backbone ....................................................................................................................................... 67
Figure 5.2 Batch study of 89Zr on different percent loadings TEHA loaded XAD7HP backbone
....................................................................................................................................................... 68
Figure 5.3 Batch study of 89Zr on different percent loadings TEHA loaded XAD4 backbone ... 68
Figure 5.4 Batch study of 175Hf on TEHA loaded Amberchrome, XAD7HP, and XAD4
backbone ....................................................................................................................................... 70
ix
Figure 5.5 Batch study of 239Pu on different percent loadings TEHA loaded Amberchrome
backbone ....................................................................................................................................... 71
Figure 5.6 Batch study of 239Pu on different percent loadings TEHA loaded XAD7HP backbone
....................................................................................................................................................... 72
Figure 5.7 Batch study of 239Pu on different percent loadings TEHA loaded XAD4 backbone . 72
Figure 5.8: Separation factors of 89Zr, 175Hf, and 239Pu on TEHA 40% Amberchrome resin ..... 74
Figure 5.9 Batch study of 89Zr on different percent loadings TEHP loaded Amberchrome
backbone ....................................................................................................................................... 75
Figure 5.10 Batch study of 89Zr on different percent loadings TEHP loaded XAD7HP backbone
....................................................................................................................................................... 76
Figure 5.11 Batch study of 89Zr on different percent loadings TEHP loaded XAD4 backbone .. 76
Figure 5.12 Batch study of 175Hf on a TEHP loaded Amberchrome, XAD7HP, and XAD4
backbone ....................................................................................................................................... 77
Figure 5.13 Batch study of 239Pu on different percent loadings TEHP loaded Amberchrome
backbone ....................................................................................................................................... 78
Figure 5.14 Batch study of 239Pu on different percent loadings TEHP loaded XAD7HP backbone
....................................................................................................................................................... 79
Figure 5.15 Batch study of 239Pu on different percent loadings TEHP loaded XAD4 backbone 79
Figure 5.16 Separation factors of 89Zr, 175Hf, and 239Pu on TEHP 40% Amberchrome resin ..... 81
Figure 5.17 Kinetics of 89Zr on TEHA Amberchrome in 12 M HCl ........................................... 82
Figure 5.18 Kinetics of 175Hf on TEHA Amberchrome in 12 M HCl ......................................... 83
Figure 5.19 Kinetics of 239Pu on TEHA Amberchrome in 12 M HCl ......................................... 83
Figure 5.20 Kinetics of 89Zr on TEHP Amberchrome in 12 M HCl ............................................ 84

x
Figure 5.21 Kinetics of 175Hf on TEHP Amberchrome in 12 M HCl .......................................... 85
Figure 5.22 Kinetics of 239Pu on TEHP Amberchrome in 12M HCl ........................................... 85
Figure 6.1 Column elution of 89Zr, 175Hf, and 239Pu on a 40% TEHA Amberchrome resin,
eluting by 2 mL of 11 M HCl, followed by 2 ml of 7 M HCl, and then by 2 mL of 6 M HCl. ... 89
Figure 6.2 Column elution of 89Zr, 175Hf, and 239Pu on a 40% TEHP Amberchrome resin, eluting
by 2 mL of 11 M HCl, followed by 2 ml of 7 M HCl, and then by 2 mL of 6 M HCl. ................ 89
Figure 6.3 Column elution of 89Zr, 175Hf, and 239Pu on a 40% TEHA Amberchrome resin,
eluting by 2 mL of 11 M HCl and then by 2 mL of 6 M HCl. ..................................................... 91
Figure 6.4 Column elution of and 239Pu on a 40% TEHP Amberchrome resin, eluting by 2 mL of
11 M HCl and then by 2 mL of 6 M HCl. ..................................................................................... 91
1
1. INTRODUCTION
1.1 Project Goals
The ultimate goal of this work is to find and investigate and find ligands suitable to explore the
chemistry of rutherfordium. Both solvent extraction and extraction chromatography can be used in
tandem with available automated chemistry setups that have been developed and utilized at accelerators.
By first using offline studies, the chemistry of the selected ligands can be fully understood to prepare the
experiments for online use with accelerator-produced homologs and rutherfordium. These offline
separations analyzing the kinetics, chemistry, and efficiency can determine whether a ligand can be used
in an actual online chemistry setup with rutherfordium.
A secondary goal can be the exploration and development of new extraction chromatographic
resins. Both ligands presented in this research have not been developed or characterized in the literature
as resins. New resins can possibly provide a unique separation method of different elements as each will
give different k’ values. Both TEHA and TEHP may offer another unique resin and lead to novel
separation method for radionuclides in fuel cycle and environmental procedures.
1.2 Background
1.2.1 Historical Perspective
The creation of transuranic elements began in the 1940s. Previously, only naturally
occurring elements up to uranium (Z=92) had been discovered. The first nuclear reaction that
had successfully achieved artificial transmutation was Rutherford’s reaction of alpha particles on
nitrogen, creating oxygen-17 in 1919.1 However, in the 1930s, developments in the
understanding of the structure of the nucleus provided the groundwork for techniques and
methods in artificial nuclide synthesis. In 1930, W. Bothe and H. Becker ran an experiment
where lithium, beryllium, and boron were bombarded by alpha particles.2 Their results found that
some of the radiation emitted was nonionizing, uncharged, and highly penetrating. Later, Irene
2
Curie and Frederic Joliot found that protons were produced when this radiation hit hydrogen
containing materials.3 Repeating the same experiments from Curie and Joliot, James Chadwick
interpreted the phenomena as caused by an undiscovered particle, the neutron, with the same
mass of a proton but uncharged.4
The first artificially created radioactive nuclide, 30P, was created by Curie and Joliot in
1932, using aluminum to absorb alpha particles and in the process being transmuted to
phosphorus with the emission of a neutron.5 This discovery, along with the development of
particle accelerators and cyclotrons and the discovery of β-decay, paved the way for using
nuclear reactions as a synthesis method for more new unstable elements. Later, in 1937, Carlo
Perrier, when visiting Lawrence Berkeley National Laboratory, asked Lawrence for some old
cyclotron parts, including a deflector molybdenum foil. Using this foil, Perrier was able
chemically isolate technetium, an element in the middle of the periodic table without any stable
isotopes.6
The transuranic element discoveries started shortly after the discovery of technetium with
a few false claims along the way. In 1934, Fermi claimed to have made a new element by
bombarding uranium with slow moving neutrons.7 However, in reality, he unwittingly had
discovered fission. Otto Hahn and Fritz Strassmann repeated the experiment and relayed the
results to Lise Meitner and her nephew, Otto Frisch.8 They then provided the theoretical
foundation for fission and concluded that the uranium nucleus was separating.9 Nonetheless,
Fermi is believed to have produced neptunium, though he did not provide the correct evidence
for its discovery. In 1940, Edwin McMillian and Philip H Abelson first discovered neptunium by
the following reaction:
𝑈 + 𝐻 → 𝑁𝑝238 + 2𝑛 → 𝑃𝑢238 + 𝛽− + �̅�2238
3
Glenn T. Seaborg and McMillian synthesized plutonium later that year by bombarding uranium
with deuterons using the 60 inch cyclotron.10 At a later time during the Manhattan Project, Glenn
Seaborg et. al. also discovered americium and curium.11 Seaborg then introduced the actinoid
concept, placing the elements from thorium to lawrencium (undiscovered at the time) underneath
the lanthanoid series. Although the chemistry of the early actinides somewhat mimicked the
transition metals, the later actinides (starting with curium) began to exhibit chemical properties
similar to the lanthanides. In 1949 and 1950, Berkelium and californium were later discovered
after deuteron bombardment of actinide targets.12-13 An analysis of the debris found in the
aftermath of the Ivy Mike test’s rubble led to the discovery of fermium and einsteinium in
1952.14 While using the method of successive neutron captures with β- decay allowed for to
successful discoveries of new elements leading up to Es, the elements beyond mendelevium
would have to be produced an atom-at-a-time. These heavier nuclides, starting with
mendelevium (Md), have low production rates, extremely short half-lives, and large probabilities
for spontaneous fission. Because of these factors, the production rates and half-lives of these
elements are too low to create quantities large enough for target preparation. Thus, the previously
described sequential neutron capture and β- decay process ceases to be a viable method of
element production.
The instability of the transfermium elements can be explained through the liquid drop and
nuclear shell model. A number of factors influence the stability of the nucleus, which include the
binding energy and size. By using the idea of a liquid drop, the liquid drop model states that the
binding energy is governed by the semi empirical mass formula15:
EB(MeV) = avA − asA2/3 − ac
Z(Z − 1)
A1/3− asym
(A − 2Z)2
A± δ(A, Z)
4
The avA term is defined as the volume term that accounts for the interaction of each nucleon in
relation to its nearest neighbor. The asA2/3 term is the surface term; for the nucleons on the edge
of the nucleus, they have fewer nucleons to interact with. The acZ(Z−1)
A1/3 term represents the
Coulomb repulsion between protons. The asym(A−2Z)2
A is the symmetry term; for low A nuclei,
stability is greater when N=Z. However, at higher A, more stable nuclei begin to favor more N
within the nucleus. This term accounts for this shift of conditions. Lastly, the pairing term
δ(A, Z) considers the effect of odd-even pairing of nucleons. For odd proton-odd neutron (odd-
odd) nuclei, the term is negative; for even proton-even neutron (even-even) nuclei, the term is
positive; and for odd A nuclei, the term is zero. The total value of the binding energy indicates
how much energy would be required to separate the nucleus into its basic components of protons
and neutrons. A higher binding energy signifies a higher nuclear stability. A general trend that
the semi empirical mass equation shows is that as Z increases, the symmetry term and
Coulombic term increase and thereby decreases the stability of the nucleus. This instability
increases the chance that the nucleus will spontaneously fission and decreases production rates
and half-lives of these higher Z elements. The liquid drop model predicts that elements beyond
Z=100 are too unstable to produce. However, since elements with a Z>100 have been produced,
the liquid drop is insufficient to explain all factors that increase nuclear stability affecting the
transfermium elements.
The nuclear shell model further expands on the stability of nuclei beyond fermium by
arranging protons and neutrons into separate shells, similar to electron orbitals. When a shell
becomes full with protons or neutrons, it gains a higher binding energy and greater stability. The
number of nucleons at which a shell becomes full is called a “magic number”; these occur at 2, 8,
20, 28, 50, and 82. When a nucleus has a closed shell of both protons and neutrons, it becomes

5
doubly magic and gains even more stability. At a higher A, the magic numbers for protons are
predicted to be 114, 164, and 182; for neutrons, they are 126, 184, and 196.16 According to
William Myers and Wladyslaw Swiatecki, an island of nuclear stability should occur at the
intersection of the proton number 114 and 184 due to the increase stability of a spherically
doubly magic nucleus. This island of nuclei would be separated from the known more stable
elements by a sea of instability.17 Initial calculations based on this island of stability predicted
half-lives up to a billion years for some nuclei. These predictions encouraged experimental
attempts to create and investigate the transactinides’ nuclear and chemical properties. Although
experiments have yet to explore the inland portion of island of stability, the believed shore of the
island has been reached. 18-20
The historical method of discovery heavy element based on the neutron capture and
successive β- decays becomes less reliable as Z increases. Figure 1.1 shows the current periodic
table.
1
Figure 1.1: The current periodic table of the elements. 21
6
Rutherfordium (Rf) starts the beginning of a new metal transition series, known as the
transactinides. In 1964, the Joint Institute for Nuclear Research (JINR) in Dubna claimed
discovery for this element with the following reaction: 22
2 242Pu + 22Ne → 260Rf +4n; (Dubna, G. N. Flerov et. al.)
In 1969, scientists at the Berkeley Heavy Ion Linear Collider (HILAC) in Berkeley, California
also claimed to have discovered the element as well:23
3 249Cf + 12C → 257Rf + 4n; (Berkeley, A. Ghiorso et. al.)
These same groups claimed discovery of element 105 with JINR in 1968 and HILAC in 1970:24-
25
4 243Am + 22Ne 260Db (261Db) +5n(4n); (Dubna, G. N. Flerov et. al.)
5 249Cf + 15N 260Db + 4n; (Berkeley, A. Ghiorso et. al.)
The International Union of Pure and Applied Chemistry (IUPAC) decided to award credit for
these elements to both of the teams. In the years that followed the beginning of the transactinide
discovery, the atom-at-a-time techniques were used to find elements all the way up to element
118. IUPAC has recognized discovery of elements 106-118 to JINR, HILAC, RIKEN and
Gesellschaft für Schwerionenforschung (GSI) and they have been designated as: seaborgium
(Sg), bohrium (Bh), hassium (Hs), meitnerium (Mt), darmstadtium (Ds), roentgenium (Rn),
copernicium (Cn), nihonium (Nh), flerovium (Fl), Moscovium (Mc), livermorium (Lv),
Tennessine (Ts), and Oganesson (Og).19, 26-34
1.2.2 Transactinide Production
Since transfermium elements have a high instability, they are all made artificially and are
not found in nature. Cyclotrons and accelerators are the only instruments that can create these
elements, using heavy ion nuclear reactions to achieve this goal.35 A target plated with up to
7
~0.8mg/cm2 of material is hit with beams containing approximately 3 x 10¹² ions per second and
then the reaction products recoil out of the foil and into a detection system. With this setup,
transactinide production rates can vary from a few atoms per minute for Rf and Db to as low as a
few atoms per year for the heavier super heavy elements.34, 36
Transactinides can be synthesized in two ways: through cold and hot fusion reactions. A
successful creation of a transactinide needs the projectile and target atom to fuse together and to
cook off neutrons to fully de-excite the compound nucleus that forms. The Coulomb barrier is an
obstacle that prevents effective fusion from occurring.34 Unstable compound nuclei, transfer
reactions (partial fusion) or no reaction at all are the results that occur if this barrier is not
overcome.
Cold fusion is a nuclear reaction that has an excitation energy of 10-15 MeV. These
reactions rely on spherical target nuclei and projectiles, such as 208Pb or 62,64Ni, to enhance the
stability of the reaction and to lower the chances of a spontaneous fission while fusing. They
typically evaporate 1-2 neutrons. GSI focused on using these reactions to discover elements 107-
112.37 However, cold fusion reactions have a serious drawback. Because these nuclides are more
neutron deficient, they have very short half-lives; since at a heavier A, they need more neutrons
to be stable. Chemical studies of these elements have not been performed because the short half-
lives do not provide the time, which is needed to perform automated experiments.16
Hot fusion is a nuclear reaction that has an excitation energy of 40-50 MeV. These
reactions rely on neutron rich actinide targets and a lighter projectile, such as 22Ne and 18O. Hot
fusions de-excite by evaporating 4 to 5 neutrons from the compound nucleus. While it is more
prone to spontaneous fission, the compound nuclei formed have much longer half-lives than
those formed through cold fusion. Their cross-sections are also typically higher than cold fusion
8
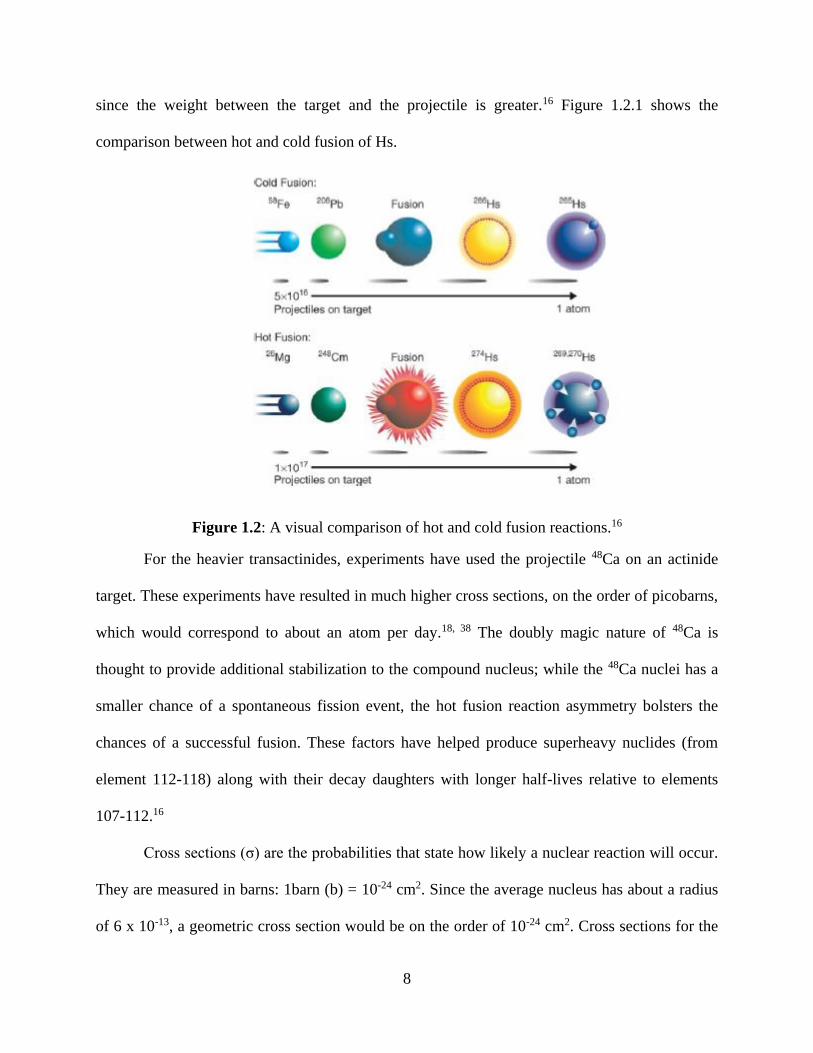
since the weight between the target and the projectile is greater.16 Figure 1.2.1 shows the
comparison between hot and cold fusion of Hs.
Figure 1.2: A visual comparison of hot and cold fusion reactions.16
For the heavier transactinides, experiments have used the projectile 48Ca on an actinide
target. These experiments have resulted in much higher cross sections, on the order of picobarns,
which would correspond to about an atom per day.18, 38 The doubly magic nature of 48Ca is
thought to provide additional stabilization to the compound nucleus; while the 48Ca nuclei has a
smaller chance of a spontaneous fission event, the hot fusion reaction asymmetry bolsters the
chances of a successful fusion. These factors have helped produce superheavy nuclides (from
element 112-118) along with their decay daughters with longer half-lives relative to elements
107-112.16
Cross sections (σ) are the probabilities that state how likely a nuclear reaction will occur.
They are measured in barns: 1barn (b) = 10-24 cm2. Since the average nucleus has about a radius
of 6 x 10-13, a geometric cross section would be on the order of 10-24 cm2. Cross sections for the
9
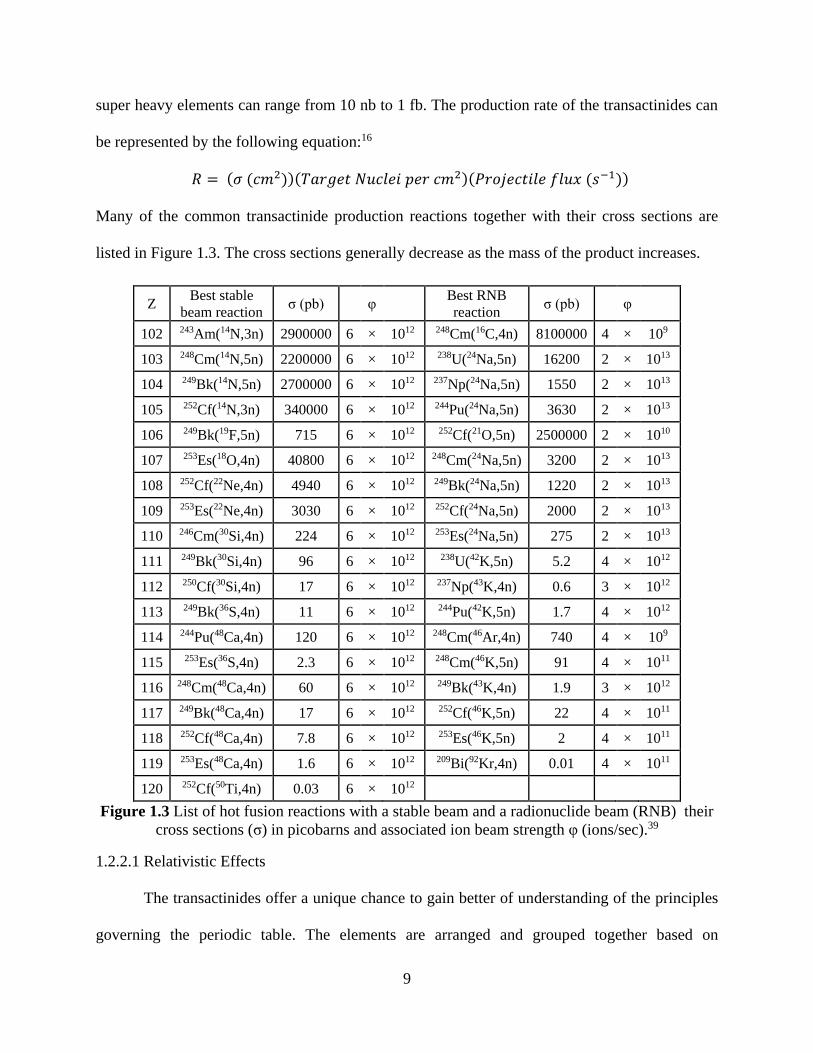
super heavy elements can range from 10 nb to 1 fb. The production rate of the transactinides can
be represented by the following equation:16
𝑅 = (𝜎 (𝑐𝑚2))(𝑇𝑎𝑟𝑔𝑒𝑡 𝑁𝑢𝑐𝑙𝑒𝑖 𝑝𝑒𝑟 𝑐𝑚2)(𝑃𝑟𝑜𝑗𝑒𝑐𝑡𝑖𝑙𝑒 𝑓𝑙𝑢𝑥 (𝑠−1))
Many of the common transactinide production reactions together with their cross sections are
listed in Figure 1.3. The cross sections generally decrease as the mass of the product increases.
Z Best stable
beam reaction σ (pb) φ
Best RNB
reaction σ (pb) φ
102 243Am(14N,3n) 2900000 6 × 10¹²I 248Cm(16C,4n) 8100000 4 × 10⁹I
103 248Cm(14N,5n) 2200000 6 × 10¹²I 238U(24Na,5n) 16200 2 × 10¹³I
104 249Bk(14N,5n) 2700000 6 × 10¹²I 237Np(24Na,5n) 1550 2 × 10¹³I
105 252Cf(14N,3n) 340000 6 × 10¹²I 244Pu(24Na,5n) 3630 2 × 10¹³I
106 249Bk(19F,5n) 715 6 × 10¹²I 252Cf(21O,5n) 2500000 2 × 10¹⁰I
107 253Es(18O,4n) 40800 6 × 10¹²I 248Cm(24Na,5n) 3200 2 × 10¹³I
108 252Cf(22Ne,4n) 4940 6 × 10¹²I 249Bk(24Na,5n) 1220 2 × 10¹³I
109 253Es(22Ne,4n) 3030 6 × 10¹²I 252Cf(24Na,5n) 2000 2 × 10¹³I
110 246Cm(30Si,4n) 224 6 × 10¹²I 253Es(24Na,5n) 275 2 × 10¹³I
111 249Bk(30Si,4n) 96 6 × 10¹²I 238U(42K,5n) 5.2 4 × 10¹²I
112 250Cf(30Si,4n) 17 6 × 10¹²I 237Np(43K,4n) 0.6 3 × 10¹²I
113 249Bk(36S,4n) 11 6 × 10¹²I 244Pu(42K,5n) 1.7 4 × 10¹²I
114 244Pu(48Ca,4n) 120 6 × 10¹²I 248Cm(46Ar,4n) 740 4 × 10⁹I
115 253Es(36S,4n) 2.3 6 × 10¹²I 248Cm(46K,5n) 91 4 × 10¹¹I
116 248Cm(48Ca,4n) 60 6 × 10¹²I 249Bk(43K,4n) 1.9 3 × 10¹²I
117 249Bk(48Ca,4n) 17 6 × 10¹²I 252Cf(46K,5n) 22 4 × 10¹¹I
118 252Cf(48Ca,4n) 7.8 6 × 10¹²I 253Es(46K,5n) 2 4 × 10¹¹I
119 253Es(48Ca,4n) 1.6 6 × 10¹²I 209Bi(92Kr,4n) 0.01 4 × 10¹¹I
120 252Cf(50Ti,4n) 0.03 6 × 10¹²I
Figure 1.3 List of hot fusion reactions with a stable beam and a radionuclide beam (RNB) their
cross sections (σ) in picobarns and associated ion beam strength φ (ions/sec).39
1.2.2.1 Relativistic Effects
The transactinides offer a unique chance to gain better of understanding of the principles
governing the periodic table. The elements are arranged and grouped together based on

10
similarities in chemical properties. These groupings allow for the extrapolation of chemical
behavior; therefore, the correct position of a transactinide can be determined by comparing its
chemical properties with its homologs and pseudo-homolog. A homolog of an element is located
in the same vertical group in the periodic table, whereas a pseudo-homolog is an element that
possesses the same oxidation state and similar ionic radii, but is not in the same group as the
transactinides. For example, rutherfordium’s homologs are zirconium and hafnium (Zr and Hf),
and its pseudo-homologs are thorium and plutonium (Th and Pu). One of the primary reasons to
investigate the chemical properties of the transactinide elements is due to relativistic effects that
may or may not change the chemical behavior of these elements in relation with its homologs
and/or pseudo-homologs.
Relativistic effects occur when the nucleus becomes populated with more protons. As
more protons are accumulated, the Coulombic attraction increases between the protons and
electrons. Specifically, the inner s and p orbital electrons’ velocities can come close to the speed
of light and these electrons’ radii begin to contract. This is shown by Einstein’s theory of
relativity; it reasons that as an object gains velocity near the speed of light, it increasingly gains
mass:
𝑚 = 𝑚𝑜
√(1 − (𝑣𝑐
))
If mo is the rest mass of an electron and v is the speed of an electron, the Bohr radius can be
calculated as:
𝑎𝑜 = (4𝜋𝜖𝑜)
(ћ2
𝑚𝑒2)
11
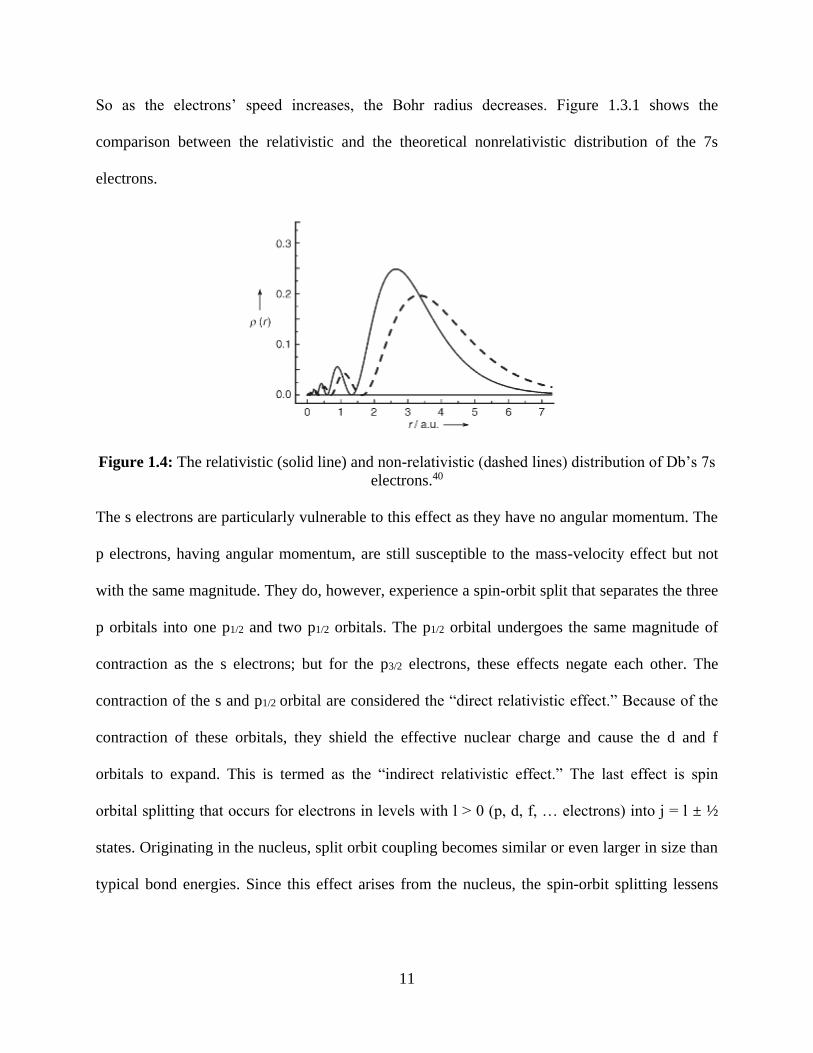
So as the electrons’ speed increases, the Bohr radius decreases. Figure 1.3.1 shows the
comparison between the relativistic and the theoretical nonrelativistic distribution of the 7s
electrons.
Figure 1.4: The relativistic (solid line) and non-relativistic (dashed lines) distribution of Db’s 7s
electrons.40
The s electrons are particularly vulnerable to this effect as they have no angular momentum. The
p electrons, having angular momentum, are still susceptible to the mass-velocity effect but not
with the same magnitude. They do, however, experience a spin-orbit split that separates the three
p orbitals into one p1/2 and two p1/2 orbitals. The p1/2 orbital undergoes the same magnitude of
contraction as the s electrons; but for the p3/2 electrons, these effects negate each other. The
contraction of the s and p1/2 orbital are considered the “direct relativistic effect.” Because of the
contraction of these orbitals, they shield the effective nuclear charge and cause the d and f
orbitals to expand. This is termed as the “indirect relativistic effect.” The last effect is spin
orbital splitting that occurs for electrons in levels with l > 0 (p, d, f, … electrons) into j = l ± ½
states. Originating in the nucleus, split orbit coupling becomes similar or even larger in size than
typical bond energies. Since this effect arises from the nucleus, the spin-orbit splitting lessens
12
with higher number of subshells. These effects has the same significance and increases
correspondingly to Z2.16
1.2.3 Solvent Extraction
Solvent extraction (SX) is a separation technique by which a compound can be
concentrated more readily between two immiscible liquid phases in based on its solubility
preference. While these phases can be any two liquids, the majority of solvent extractions are
aqueous and organic based. When the solubility of an analyte varies greatly between the two
phases, then this property can be exploited to selectively separately the solute from other
undesired impurities.41
To quantitatively measure the performance of a SX system, the distribution ratio, D, is
used. It compares the solubility of the solute in the organic phase with its solubility in the
aqueous phase at equilibrium. Mathematically, it can be represented by:
D =𝐴𝑜𝑟𝑔
𝐴𝑎𝑞
where [𝐴𝑜𝑟𝑔] described as the concentration of the solute in the organic phase, whereas [𝐴𝑎𝑞] is
the concentration of the solute in the aqueous phase.42 The D value is temperature dependent
since solubility and equilibrium rates are greatly affected by the heat present in the solution.
The phase boundary between the solvents is where the solute interacts and is transported
between the two solutions. If the phase boundary area is increased, the time necessary to reach
equilibrium will also be decreased. One of the simplest ways to achieve this is by robust mixing
of the solvents. To easily manipulate the extraction to possibly extract a variety of different
solute, the formation of the extracted complex can be controlled to selectively extract certain
solutes into the organic phase. The concentration of an acid in the aqueous phase can affect the
13
concentration of the complex. For systems with lower distribution ratios, the SX may have to be
performed multiple times to achieve satisfactory separation.43
Generally, higher distribution ratios are desired to achieve higher separation factors from
the undesired products. To accomplish this, an additional extractant may be added to the organic
to increase its performance. This solid or viscous extractant may require a solvent to be able to
operate as a functioning liquid phase. The appropriate solvent must be selected with respect to its
polar properties, as a solute may not dissolve in the right solvent or the solvent may not be
nonpolar enough to form an immiscible phase with the aqueous solution. Diluents should
generally exhibit the properties of having a low viscosity and a high surface tension to shorten
the length of time an emulsion occurs after mixing the two phases.
Because elements can have different solubilities in the two phases, a mixture of different
solutes can be separated by relying on their different distribution ratios in the phases. The desired
element can either be extracted in the organic phase leaving the impurities behind, or the
impurities can be extracted into the organic phase leaving the desire element behind. The
separation factor is the measure of the efficacy of this operation and can be expressed by the
following:
SF =𝐷𝐴
𝐷𝐵
where DA and DB are the distribution ratios of the particular solutes of interest.
Formation of a third phase is a problematic feature that can occur when a diluent and
extractant are contacted with the aqueous phase. The diluent with a small concentration of
extractant are contained in the lighter phase; the heavier third phase consists of a much higher
percentage of the extractant with little diluent. Generally, the third phase forms because of the
14
polar nature of the more polar metal-extractant molecules and the nonpolar diluent. Because
solvent extraction processes have strict flow and mixing requirements, the formation of a third
phase can form an additional obstacle to the separation. For example, in separations for the
nuclear fuel cycle, plutonium can become more concentrated in the third phase, which prompts
criticality concerns. The addition of a modifier chemical, such as an alcohol, can dissipate the
third phase by making the solute a slightly more polar environment for the metal extracted
complex to become dissolved.44 However, this should be avoided as modifiers generally decrease
the extraction capability.
1.2.4 Extraction Chromatography
Chromatography is a process where two substances can be separated, based on their
attraction for a solid or mobile phase. Extraction chromatography is a branch of this technique,
where a ligand bound to a solid support is considered the stationary phase and a liquid passes
along the solid as the mobile phase. This is analogous to the liquid-liquid extraction where the
organic phase would be placed onto resin bead and the aqueous phase would be the liquid
moving through the column. The organic extractant can be placed on the resin bead by dissolving
it in a volatile solvent (such as dichloromethane (DCM)) and allowing it to slowly evaporate
while in the presence of a support backbone. This method leads to a uniform and even coat of
extractant on the resin bead. After this method, the resin can be packed into a column and the
aqueous phase can be varied at various points in the extraction to manipulate the elution of
different substances. If the analyte of interest has a stronger affinity for the stationary phase, then
the elution time is longer for that substance, whereas other analytes with less attraction for the
resin will travel more quickly through the column. These components can then be separated by
collecting them in different fractions. Figure 1.51 shows the basic schematic of an extraction
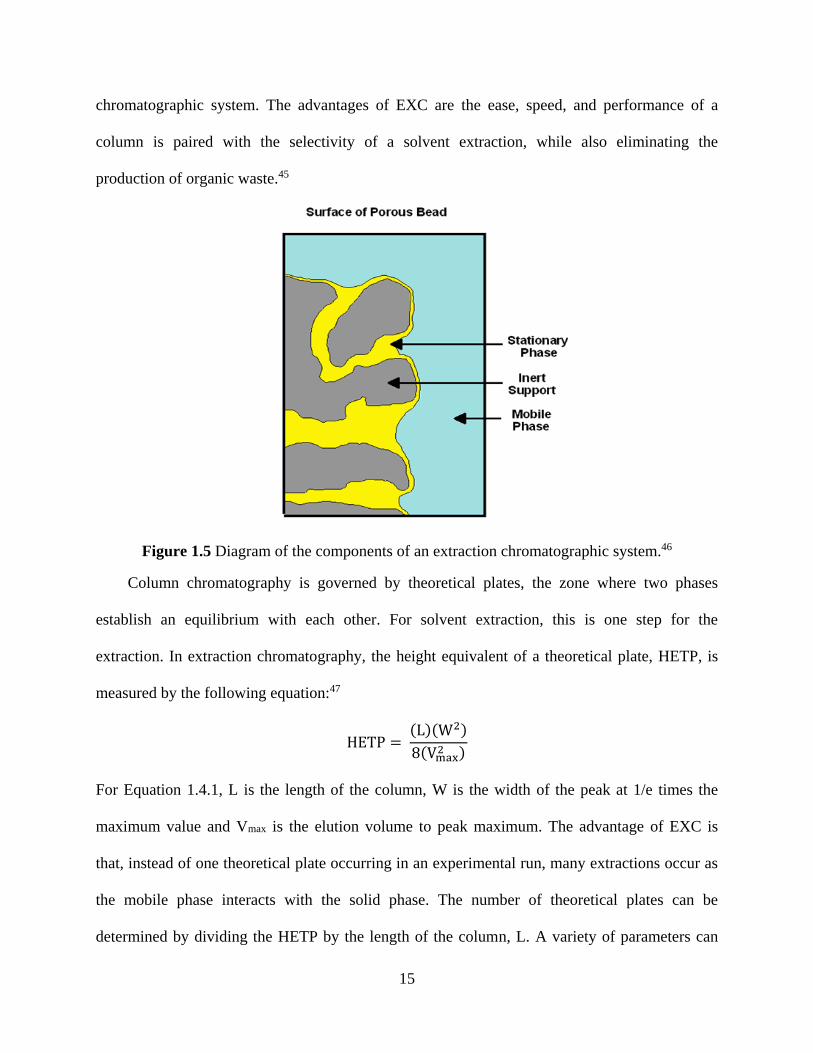
15
chromatographic system. The advantages of EXC are the ease, speed, and performance of a
column is paired with the selectivity of a solvent extraction, while also eliminating the
production of organic waste.45
Figure 1.5 Diagram of the components of an extraction chromatographic system.46
Column chromatography is governed by theoretical plates, the zone where two phases
establish an equilibrium with each other. For solvent extraction, this is one step for the
extraction. In extraction chromatography, the height equivalent of a theoretical plate, HETP, is
measured by the following equation:47
HETP = (L)(W2)
8(Vmax2 )
For Equation 1.4.1, L is the length of the column, W is the width of the peak at 1/e times the
maximum value and Vmax is the elution volume to peak maximum. The advantage of EXC is
that, instead of one theoretical plate occurring in an experimental run, many extractions occur as
the mobile phase interacts with the solid phase. The number of theoretical plates can be
determined by dividing the HETP by the length of the column, L. A variety of parameters can
16
influence the performance of an extraction chromatographic column’s elution profile. Horwitz
and Bloomquist considered many of these factors such as particle size of the inert support,
extractant weight loading, temperature, cross section of the column, elution rate, and the column
bed length and found that all can affect the HETP value. As such, lowering the HETP causes
higher retention times and larger elution volumes.
As stated previously with solvent extraction, Equation 1.5.2 defines the distribution ratio.
D =𝐴𝑜𝑟𝑔
𝐴𝑎𝑞
The difference between the distribution ratios of two analytes allows for the separation to
occur.47 In EXC, the number of free column volumes to peak maximum, k’, is used to describe
the attraction of the solutes to the stationary phase. The equation 1.5.3 shows have the k’ is
calculated:47
k′ =Vmax−vm
vm
Vmax is the elution volume to peak maximum and vm is the column void volume (or space within
the column not occupied by the stationary phase). The high the k’ for substance is, the more
affinity it shows for the stationary phase. Because k’ is dependent on volume and is a
dimensionless number, it is independent of the large variance of column parameters. With the k’
values, the separation factor between 2 analytes can be determined:
SF =𝑘′𝐴
𝑘′𝐵
The width of the elution band can be calculated by:48
SR =1
4(1 −
1
SF) (N1/2)
k′2
1 + k′2
17
Values such as k’ are also obtained in batch experiments where free resin is placed in an
aqueous solution instead of a column. Radiochemical tracers are often utilized in these studies
because they can be performed at high speed and are a simple setup. The weight distribution
ratio can be described by the following equation:
Dw = (Ao−As
As) (
mL
g)
Ao-As is the activity sorbed on a known weight of resin, g. As is the activity in a known volume
of solution, mL. The k’ value can be derived by converting from Dw to the volume distribution
ratio:
Dv = Dw ×dextr
wload
k′ = Dv ×vs
vm
The dextr is the density of the extractant, and wload is the extractant loading in grams of extractant
per gram of resin. The vs and vm values are the volumes of the stationary and mobile phases
respectively. The k’ value can also be calculated directly by multiplying the Dw by the resin
factor, Fc:
k′ = Dw × Fc
The Fc is a constant provided from the resin manufacturer that considers the various parameters
in the calculation of Dv.47-48
1.2.5 Atom-at-a-Time Chemistry
Experiments to study the chemistry of the transactinide elements are difficult due to the
atom-at-a-time production. For an effective trial, a highly sensitive detection system is necessary
to correctly identify the presence of a transactinide. The ideal method to confirm a positive
nucleus production is to measure the successive α-decays of the transactinide and its daughters
18
all the way to a nuclide with a known α-decay energy. However, due to the various decay
branches and nuclear instability, the transactinide or its daughter may also undergo spontaneous
fission. Although this outcome is not preferable, the α-decay energies of the previous nuclides
can be used for identification. Because of the low production rates and short half-lives, the
process of separation and identification must be rapid, selective and efficient. These chemical
studies can be carried out in two phases, either liquid or gas. Chemical studies for rutherfordium
through seaborgium (104-106) as well as hassium (108) have been carried out in both the gas and
as well as the liquid phases, whereas the chemistry of copernicium (112) and flerovium (114) has
only been studied in the gas phase. Gas phase studies are inherently more abundant due to a lack
of a solvent evaporation step. This gives a speed boost to the experiment because the solvent
does not need to be evaporated down before the detection of the transactinide.
Atom-at-a-time chemistry poses a challenge to chemical thermodynamics and kinetics.
Macroscopic chemistry is based on the assumption of many atoms undergoing a chemical
reaction or equilibrium, but transactinide studies do not have the luxury of having a large number
of atoms to perform reactions. Current macroscopic chemical equilibria is based on the law of
mass action:
K = 𝒂𝒄(𝑪)𝒂𝒅(𝑫)
𝒂𝒂(𝑨)𝒂𝒃(𝑩); For aA + bB ↔ cC + dD
K is defined as the equilibrium constant. If the metal ion is both a constituent of A and C, then at
the equilibrium point, the metal ions exchange at each site at a constant rate. However, if only
one atom of the metal ion exists, it cannot be present in A and C simultaneously. Therefore, an
equilibrium constant cannot be defined because the activity for A or C is zero. Guillaumont et.
al. have proposed a law of mass action for atom-at-a-time by substituting the concentration with

19
the probabilities of finding an atom in a given phase, deriving a formula for transactinide
studies.49-51
For the reaction,MA + B ↔ MB + A, the forward and reverse reaction rate is governed by
the height of the activation energy barrier. The higher the barrier the slower the reaction rate and
the slower the equilibrium will be established. This is because more energy is required to
overcome the resulting barrier. For transactinide chemical systems, the equilibrium must be
established on the order of seconds due to the short half-life of the transactinide of interest.
Activation energies less than 60 kJ provide enough time for the equilibrium to be reached
compared to the half-life of the transactinide element.51
Prior to performing an online transactinide chemistry experiment, the chemical system
must be tested with the homologs and pseudo-homologs of the transactinide element. Batch
studies are used to investigate the best parameters and performance of the resin with the
homologs for separation. Dynamic column studies are used to study the transport of the
radiochemical tracer or flow conditions of the resin. The kinetics of both these types of
experiments are also examined to ensure that the chemistry happens fast enough for the
transactinide chemical system. After the specifications are optimized, on-line studies at
accelerators are performed with the homologs and pseudo-homologs. Online experiments are
necessary because they provide invaluable data regarding the kinetics of the chemical system and
the species that form during the nuclear reaction and transport.
The chemical system must be very selective for the desired element. In the nuclear
reaction of the projectile and target foil, a large number and variety of transfer products are
created other than the transactinide of interest. These transfer reaction production rates are orders
of magnitude higher than the production of the transactinide and can interfere with the
20
identification of the transactinide element. Therefore, magnetic pre-separators, such as the
TransActinide Separator and Chemistry Apparatus (TASCA)) at Gesellschaft für
Schwerionenforschung (GSI), and the Berkeley Gas-filled Separator (BGS) at Lawrence
Berkeley National laboratory (LBNL) can be used as an effective instrument to separate out the
unwanted transfer products. They work by using the magnetic rigidities of the transfer
products:52
𝐵𝜌 =𝑚𝑣
𝑞
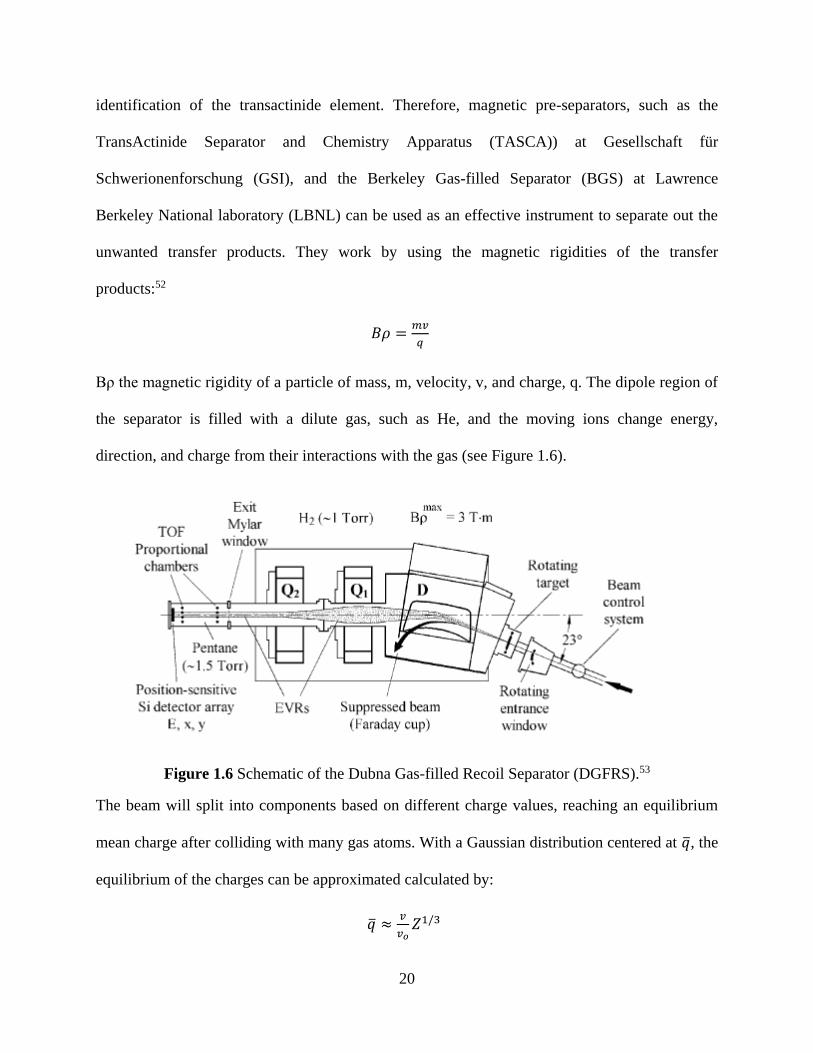
Bρ the magnetic rigidity of a particle of mass, m, velocity, v, and charge, q. The dipole region of
the separator is filled with a dilute gas, such as He, and the moving ions change energy,
direction, and charge from their interactions with the gas (see Figure 1.6).
Figure 1.6 Schematic of the Dubna Gas-filled Recoil Separator (DGFRS).53
The beam will split into components based on different charge values, reaching an equilibrium
mean charge after colliding with many gas atoms. With a Gaussian distribution centered at �̅�, the
equilibrium of the charges can be approximated calculated by:
�̅� ≈𝑣
𝑣𝑜𝑍1/3
21
Z is the ion atomic number and vo= 2.19 x 10⁶ m/s (Bohr velocity). Combining Equations 1.5.2
and 1.5.3 yields:
𝐵𝜌 = 0.02267𝐴
𝑍13
(𝑇𝑚)
For the online chemistry, the experiments can be operated in two different methods. A
static method measures the distribution coefficient of a single atom between two phases. This
experiment is performed repeatedly to get enough data to perform a statistical analysis. Some of
the earliest transactinide chemistry experiments were performed this way by using solvent
extractions and determining in which phase the superheavy element resided by alpha counting.
As an example, SISAK (Short-lived Isotopes Studied by the AKUFVE technique) has been used
as a continuous liquid-liquid extraction system.54 The other method is a dynamic study where
there are several successive static experiments performed. An example of this is a column
chromatography experiment where the atom undergoes hundreds of exchange steps between the
mobile and stationary phases. Both methods can be performed continuously or discontinuously.
ARCA (Automated Rapid Chemistry Apparatus), an extraction chromatography system, is a
dynamic system but it is also discontinuous because the system requires maintenance at regular
intervals.55-56
1.2.6 Zirconium and Hafnium Aqueous Chemistry
Zirconium and hafnium have such a similar chemical behavior that they are very difficult
to separate. Considering the electron configuration’s for both elements (Zr is [Kr]5s24d2 and Hf
is [Xe6s24f145d2]), both should have notably different chemical behaviors due to the addition of
the f shell for hafnium. However, the lanthanide contraction and relativistic effects shield the
nuclear charge for hafnium so that the atomic and ionic radius shrink to about the same size as
22
for zirconium. Having only the +IV oxidation state available, zirconium’s and hafnium’s
similarities in the structure of the electron orbitals prevents a great disparity in reaction rates and
complexation formation.
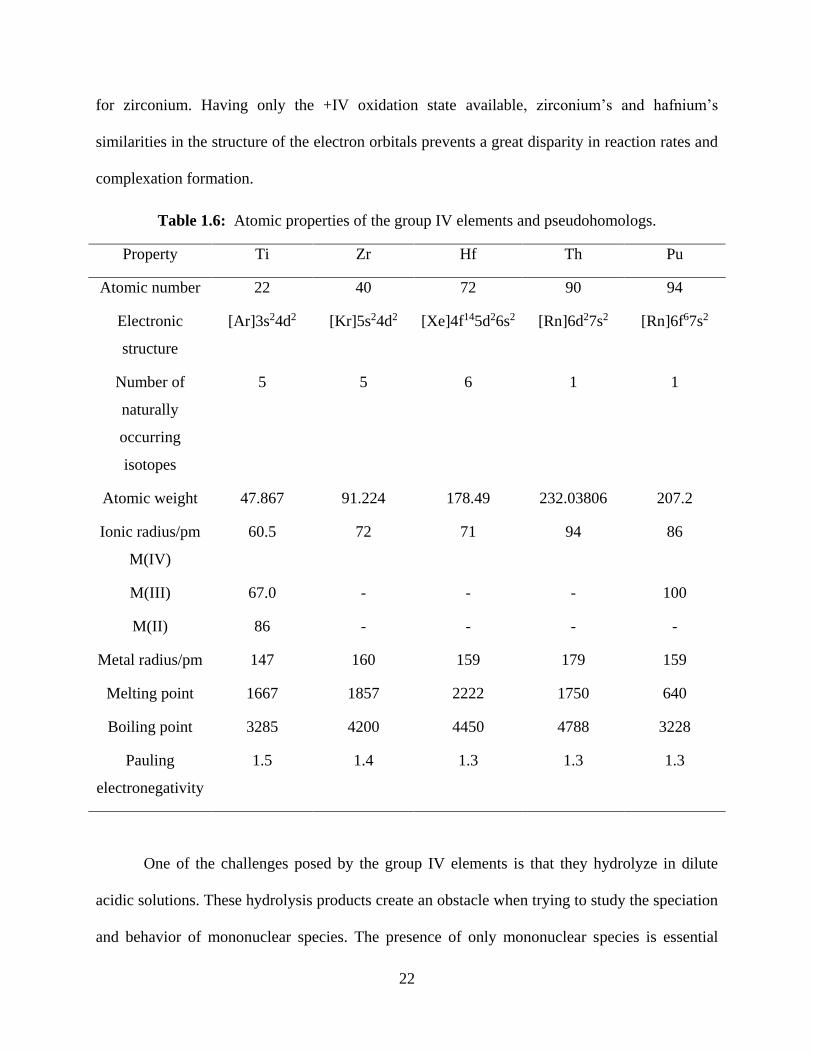
Table 1.6: Atomic properties of the group IV elements and pseudohomologs.
Property Ti Zr Hf Th Pu
Atomic number 22 40 72 90 94
Electronic
structure
[Ar]3s24d2 [Kr]5s24d2 [Xe]4f145d26s2 [Rn]6d27s2 [Rn]6f67s2
Number of
naturally
occurring
isotopes
5 5 6 1 1
Atomic weight 47.867 91.224 178.49 232.03806 207.2
Ionic radius/pm
M(IV)
60.5 72 71 94 86
M(III) 67.0 - - - 100
M(II) 86 - - - -
Metal radius/pm 147 160 159 179 159
Melting point 1667 1857 2222 1750 640
Boiling point 3285 4200 4450 4788 3228
Pauling
electronegativity
1.5 1.4 1.3 1.3 1.3
One of the challenges posed by the group IV elements is that they hydrolyze in dilute
acidic solutions. These hydrolysis products create an obstacle when trying to study the speciation
and behavior of mononuclear species. The presence of only mononuclear species is essential
23
since rutherfordium will only be created at an atom-at-a-time. Zr and Hf also form polynuclear
species in metal concentration of greater than 10-4 M and in less than 2 M acidic solutions.57
Therefore, even the addition trace amounts of Zr and Hf can greatly influence the chemical
speciation in solution. In column studies, these species cause the adsorption behavior to change
and may even block the active sites.
In chloric, nitric, hydrofluoric and perchloric acidic matrices (>>6 M acid), the hexa
complex predominates and is the main anionic species for extraction studies. However, at low
acid concentrations (<2 M), cationic species are formed. For HCl, neutral complexes are the
major species from 4-8 M HCl.58 Theory predicts that the complex formation strength between
the group IV elements follows this trend: Zr ≥ Hf > Rf.59
1.2.7 Group IV Liquid Phase Online Chemistry
Initial chemical studies of rutherfordium were carried out to determine its chemical
behavior and to confirm its placement on the periodic table. In 1970, R.J. Silva et. al. used cation
exchange chromatography and α-hydroxyisobutyric acid (α-HiB) for the first liquid phase chemistry
experiment.60 The isotope 261Rf was produced at the Berkeley Heavy Ion Linear Accelerator
(HILAC) by bombardment of a 248Cm target on a Be foil with a 92 MeV 18O beam. After being
transported from the target assembly in helium gas, the recoil products then were placed on a Pt
foil coated with ammonium chloride from the gas jet. This residue was washed with ~50
microliter of 0.1 M ammonium α-HiB and dropped into 2 mm x 2 cm long heated Dowex 50 x 12
cation resin. Three two drop fractions were then collected: the first fraction contained the free
column volume of liquid and had approximately no activity. The next two fractions were
collected onto platinum discs and measured on α-detectors. These two fractions possessed activity
attributed to 261Rf and chemically followed Zr and Hf behavior on the column resin, whereas the
24
lanthanides and trivalent actinides stuck strongly to the column. In 1980, E. K. Hulet et. al.
conducted a study with an extraction chromatographic resin using the ligand Aliquat 336
(trioctylmethyl ammonium chloride) because the extractant had faster thermodynamics. Due to the
anionic complex that forms and bonds with the resin, the recoil products were placed on the column
in 12 M HCl, and eluted off in 6 M HCl. They were then counted on α detectors. They found that Rf
showed the same behavior as Zr and Hf.61
Fluoride complexes have also been studied for rutherfordium and its homologs in a
variety of conditions. Rajan et. al. have used Amberlite IRA 400 and Dowex 2 to separate a
small amount of Hf from a large amount of Zr base on the hexafluoro complex.62 Using a
multicolumn system (an anion column between two cationic exchange columns), Pfrepper et. al.
successfully showed that Rf displayed similar behavior like Hf in an on-line experiment.63
Trubert et. al. used a Bio-Rad AG-MP1 resin to separate all the group IV elements at low
concentrations of HCl with 0.02 M HF.64 Since this separation was at low concentrations of acid,
the group IV element should be extracted as a neutral or cationic species. Employing a similar
experiment, Strub et. al. found with a Dowex 1x8 anion exchange column the group IV elements
can be loaded with a 0.1 M HNO3/0.1 M HF solution and eluted off with 5 M HNO3/0.001 M HF.65
Rutherfordium was eluted at an HF concentration an order of magnitude higher than Zr and Hf.
However, they also investigated the elution of Th and found that it took an even higher concentration
of HF to elute off than Rf. Toyoshima and Ishii discovered a similar behavior, but determined that
the formation of the fluoro complex of Rf is weaker than Zr and Hf.66-67 Kronenberg et. al. found that
for a mixed nitric and hydrofluoric system on an anion exchange column the Rf adsorption
diminishes due to the nitric acid.68 Rutherfordium then does not stick to the column and elutes
quickly. This contradicts the previous work of the other scientists. Initially, it is possible to
25
believe that with the presence of nitric acid that Rf does not form a hexafluoro complex, but the
authors cite that the nitric acid may be increasing competition for the exchange sites.
For pure and mixed chloride systems, Huffman, Street and Kraus et. al. have looked into
the chemical behavior for the group IV elements (excluding Rf). Huffman et. al. used an anion
exchange column and an Amberlite IRA 400 column.69 The group IV elements can be separated
in a mixture of hydrochloric and hydrofluoric acids. On the Dowex 2 column, this is due to the
formation of the hexachloro complex (only hydrochloric acid was used). For the Amberlite IRA
400, the separation was based on the fluoro-chloro complex.70 Hf and Zr can also be separated
using 6 M HCL to elute the elements off the 50 Dowex cation exchange column. With 1 M
HCl/0.5 M HF, Zr and Hf can be separated using a Dowex 1 column.
Group IV’s behavior can also be examined with sulfuric acid. Szeglowski et. al. and Li
et. performed experiment with H2SO4.71 Szeglowski used a multi-column system of (a Dowex
50WX8 column between two Dowex 1X8 exchange columns) and found that the system could
be used due to the metal cation formation in dilute sulfuric acid. In Li et. al.’s study, a mixed
sulfuric and nitric system was used to separate the group IV elements and thorium. They found
the resulting trend for the sulfate complex formation: Zr ≥ Hf > Rf>>Th.72
26
2. MATERIALS AND INSTRUMENTATION
2.1 Offline Studies
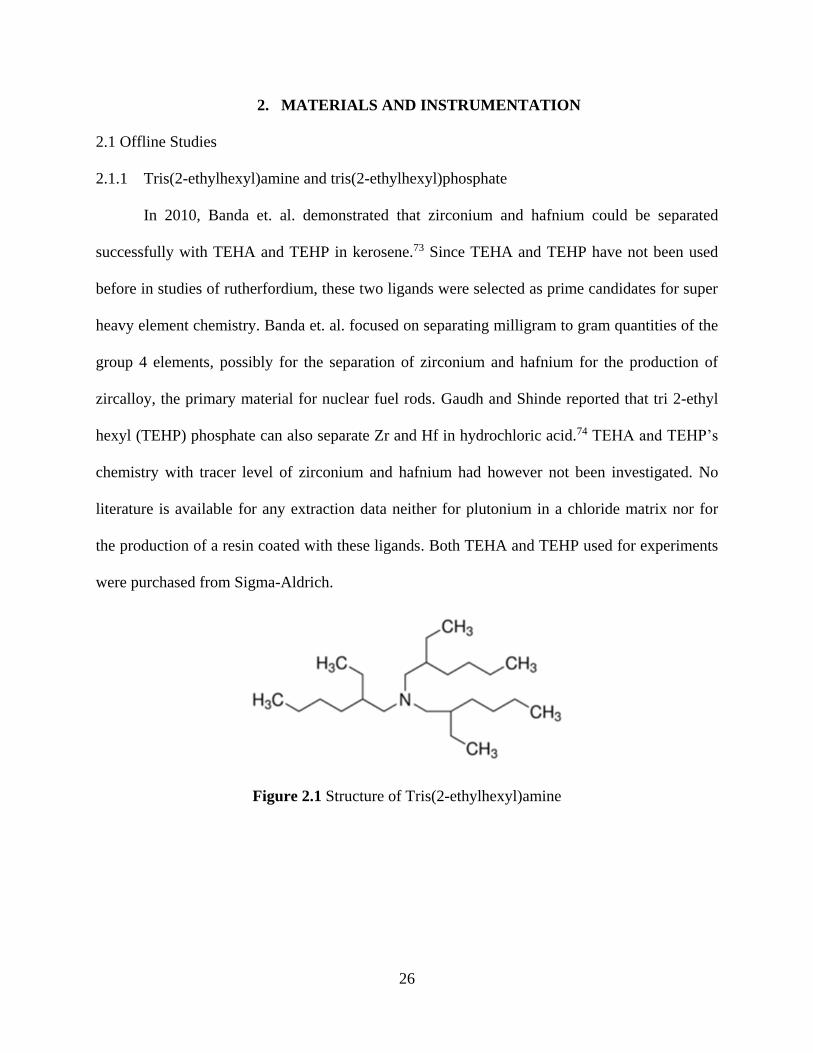
2.1.1 Tris(2-ethylhexyl)amine and tris(2-ethylhexyl)phosphate
In 2010, Banda et. al. demonstrated that zirconium and hafnium could be separated
successfully with TEHA and TEHP in kerosene.73 Since TEHA and TEHP have not been used
before in studies of rutherfordium, these two ligands were selected as prime candidates for super
heavy element chemistry. Banda et. al. focused on separating milligram to gram quantities of the
group 4 elements, possibly for the separation of zirconium and hafnium for the production of
zircalloy, the primary material for nuclear fuel rods. Gaudh and Shinde reported that tri 2-ethyl
hexyl (TEHP) phosphate can also separate Zr and Hf in hydrochloric acid.74 TEHA and TEHP’s
chemistry with tracer level of zirconium and hafnium had however not been investigated. No
literature is available for any extraction data neither for plutonium in a chloride matrix nor for
the production of a resin coated with these ligands. Both TEHA and TEHP used for experiments
were purchased from Sigma-Aldrich.
Figure 2.1 Structure of Tris(2-ethylhexyl)amine
27
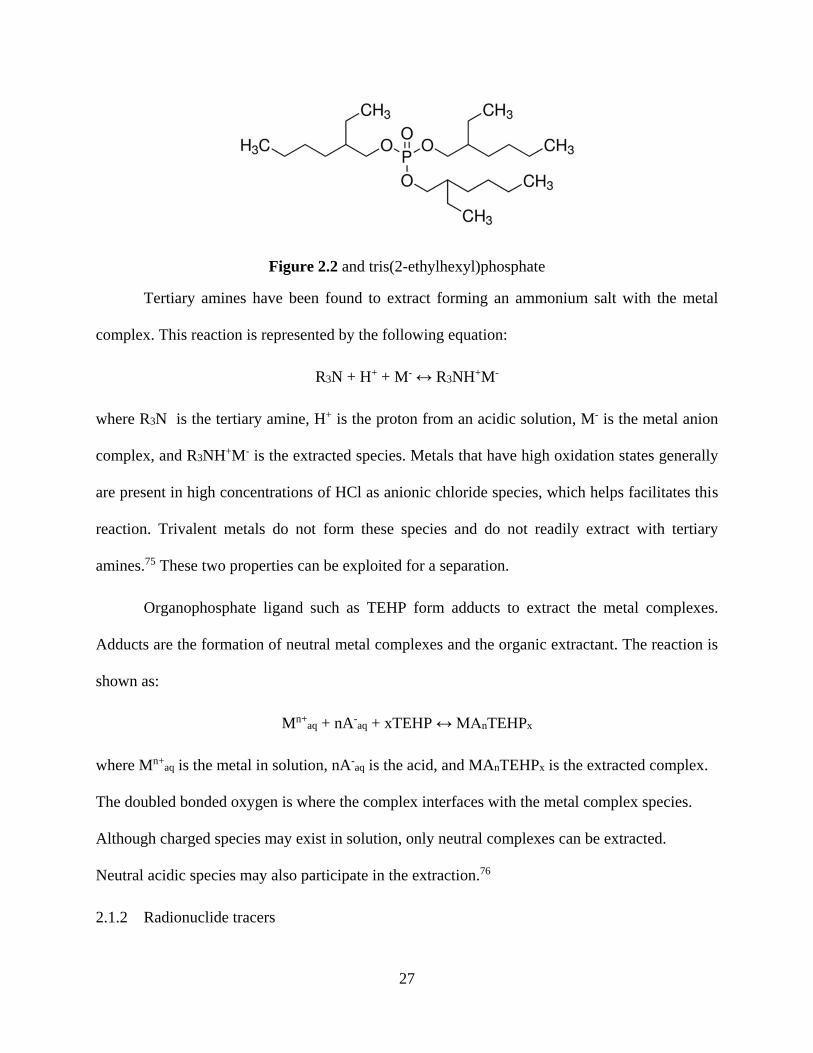
Figure 2.2 and tris(2-ethylhexyl)phosphate
Tertiary amines have been found to extract forming an ammonium salt with the metal
complex. This reaction is represented by the following equation:
R3N + H+ + M- ↔ R3NH+M-
where R3N is the tertiary amine, H+ is the proton from an acidic solution, M- is the metal anion
complex, and R3NH+M- is the extracted species. Metals that have high oxidation states generally
are present in high concentrations of HCl as anionic chloride species, which helps facilitates this
reaction. Trivalent metals do not form these species and do not readily extract with tertiary
amines.75 These two properties can be exploited for a separation.
Organophosphate ligand such as TEHP form adducts to extract the metal complexes.
Adducts are the formation of neutral metal complexes and the organic extractant. The reaction is
shown as:
Mn+aq + nA-
aq + xTEHP ↔ MAnTEHPx
where Mn+aq is the metal in solution, nA-
aq is the acid, and MAnTEHPx is the extracted complex.
The doubled bonded oxygen is where the complex interfaces with the metal complex species.
Although charged species may exist in solution, only neutral complexes can be extracted.
Neutral acidic species may also participate in the extraction.76
2.1.2 Radionuclide tracers
28
2.1.2.1 89Zr Solution
A solution of carrier-free 89Zr tracer was used in all experiments. It was obtained either
from Perkin-Elmer or from the cyclotron at the University of Wisconsin. All 89Zr was received as
a ~2 mCi solution in ~ 10 µL oxalic acid solution. To convert the oxalate to the chloride, a
conversion procedure was required.
First, the oxalic acid solution was mixed with 2 mL of a solution containing 10mg/mL
lanthanum nitrate. Next, about five drops of ammonium hydroxide were added to the solution to
turn the solution basic. This causes the precipitation of lanthanum hydroxide, which appears
white and grainy. After this step, the solution was centrifuged for 15 minutes to cause the 89Zr to
become trapped between the spaces of the precipitate, effectively separating out the 89Zr from the
oxalate. After the centrifugation, the solution was decanted from the precipitate and counted to
ensure that no activity was left with the oxalate. The precipitate was rinsed vigorously with 2 mL
of deionized water and centrifuged again for 10 minutes. Then, the supernatant solution was
counted again, and the precipitate was only lightly rinsed with deionized water. The deionized
water was removed and 3 mL of concentrated hydrochloric acid was added. Now exposed to
acidic conditions, the precipitate was dissolved and required further purification from the
lanthanum.
To achieve this, the solution was passed through an ion exchange column for separation.
A Dowex 1X8 column was prepared by first washing the column with 10 to 15 mL deionized
water. Next, the column was conditioned with 4 mL of 12 M hydrochloric acid, added in 1 mL
increments. The stock solution of 89Zr was then added to the column. A load fraction was
collected and counted. Next, the column was washed with 2 mL of 12M hydrochloric acid. This
wash fraction was also collected and counted to ensure no 89Zr was eluting. Finally, 6 mL of 2 M
29
hydrochloric acid was added to the column, with fractions being collected at 1 mL intervals. The
89Zr content in each fraction was counted, and the fractions were then dried down and combined
into one stock solution.
2.1.2.2 175Hf solution
The 175Hf used was produced at the Center for Accelerator Mass Spectrometry (CAMS)
at Lawrence Livermore National Laboratory (LLNL). The setup at the accelerator consisted of a
natural lutetium foil placed as a catcher foil in another experiment that was bombarded by
photons. With a proton beam energy of ~12 MeV the 175Lu(p,n)175Hf reaction was used to make
the no carrier added 175Hf. An approximate total activity of ~1000 cps was produced. The foil
was then partially dissolved in concentrated hydrochloric acid, leaving behind some black
residue. The solution was decanted and the residue was counted to ensure that none of the 175Hf
was remaining in the residue. This was followed by a purification step on a Dowex 1X8 column.
The same column procedure as described in section 2.1.2.1 was followed, with the exception of
the elution step (instead of eluting the 175Hf with 2 M hydrochloric acid, a solution of 7 M
hydrochloric acid was used).
2.1.2.3 239Pu solution
The 239Pu was purchased as a stock solution from Eckert-Zeigler Isotope Products in 4M
nitric acid. An amount containing approximately 15,000 cpm was obtained from the stock and
converted to hydrochloric acid through multiple evaporations of the solution, and reconstituting
the 239Pu in concentrated hydrochloric acid to drive off the NO3- present in the solution. The
oxidation state was controlled by adding a 1:10 HI/HCl solution to the plutonium and again
evaporating the solution drive off the HI remaining in solution.
30
Ultimately, 239Pu was chosen rather than Th as the homolog to study. While natural
thorium is abundant and cheap, carrier-free solutions are required for transactinide homolog
studies. The 232Th isotope has too long of half-life to be measured on a radiation detector and a
carrier-free 228Th isotope would require production at an accelerator. Therefore, 239Pu was
chosen as its accessibility was easier despite the more complex chemistry.
2.1.3 Other reagents used
Reagent grade acids and organic solvents were purchased from Sigma-Aldrich. Acid
solutions were prepared by diluting concentrated acids with deionized water from an 18MΩ cm
purification system, such as a Millipore or Milli Q, The Ultima Gold AB liquid scintillation
cocktail was obtained from Perkin Elmer. The different concentrations of acid and organic
solutions were prepared using volumetric pipettes and volumetric flasks.
The TEHA and TEHP resins utilized were created in-house using a rotovap procedure.
First, the resin backbones (Amberchrome CG71, XAD4, and XAD7HP) were washed with water
through a filtration setup to remove sodium chloride, sodium bicarbonate, or isopropyl alcohol
used to prevent bacterial formation in storage. The resin was dried in an oven for one week at
40ºC. Then, an amount of dry resin backbone was added to a round bottom flask along with the
appropriate amount of TEHA or TEHA to achieve the desired weight loading in a 25 mL to 100
mL of toluene or methanol slurry. The solution was allowed to mix on the rotovap for two hours
at ambient temperature and pressure so that the ligand was evenly coated on the resin particles.
Afterwards, the temperature of the water bath was increased to 30°C and the pressure was
lowered to ~45 torr. The solution was allowed to evaporate overnight. The remaining residue
was then placed in an oven at 40°C for 2 days to ensure complete evaporation of the solvent.
31
This dry weight was stored in plastic Nalgene container bottles at ambient temperature until use
in batch studies.
2.2 Instrumentation
2.2.1 Sodium Iodide Detector
Sodium iodide crystals doped with thallium (NaI(Tl)) detectors are useful gamma
detectors with excellent efficiencies and reasonable resolution of energy peaks. The NaI(Tl)
detector detects gamma rays through the interaction of the photon with the electrons of the
crystal. The incoming gamma photon causes the excitation and ionization of the electrons in the
K or L shells of the NaI(Tl) crystal (lasting around 0.2 μs), which give off a quantity of light
whose intensity is directly proportional to the energy of the initial gamma photon. The light can
be detected by a photomultiplier tube (PMT), which senses the flash of light photons and convert
it into an interpretable voltage pulse to be measured and analyzed by electronics.
Due to the three unique ways that a gamma photon can interact with matter, each type of
interaction must be understood in how the NaI(Tl) will provide output pulses from these
exchanges. With the photoelectric effect, the height of the pulse is directly proportional to the
original gamma ray energy. For this interaction, all of the energy of the incoming photon is
deposited within the detector. However, effects such as the actual amount of gamma ray energy
that is converted to light, the amount of light collected by the PMT, the efficiency of the PMT at
ejecting electrons, and the gain of the PMT can cause statistical fluctuations in the data and
affect the energy resolution. These variances do however not noticeably affect the net counts for
the total absorption peak. These counts are therefore used to calculate the absolute activity.
With Compton scattering, a gamma photon only gives up a portion of its energy to the
crystal. This fraction may vary from zero to the amount that can be transferred in a single
32
interaction. This is because the scattering angle determines how much of the energy from the
photon will be deposited. As a result, a Compton continuum (an area of elevated counts) is
created with an edge corresponding to the maximum kinetic energy of a Compton electron. A
single peak will not arise, but rather a broad spectrum due to the variance of the angle in each
Compton scattering (see Figure 2.1).
A gamma photon with an energy above 1.02 MeV can undergo pair production. This
interaction results in a photon creating an electron/positron pair. The positron will deposit its
kinetic energy within the crystal and then annihilate itself with an electron, giving rise to two
0.511 MeV photons. It is important to note because pair production with the materials
surrounding the detector can especially interfere with the analysis of spectrums, in particular
when expecting to have a gamma of ~0.511 MeV recorded. Also, the annihilation gammas (one
or both) may escape the detector giving rise to a voltage pulse of a single escape peak or double
escape peak.
Other characteristic peaks may also appear in the gamma spectrum that is produced. A
backscatter peak arises from the complete absorption of gammas scattered 180 degrees from the
shield. Other peaks can correspond to X-rays arising from the interactions of photons with the
shield surrounding the crystal. These interactions can be traced to the internal conversion in the
shield or surrounding materials.
One piece of the electronics that is used to evaluate these pulses’ energies and convert
them into a spectrum is a multichannel analyzer. It is different from the single channel analyzer
in that it can take the voltage pulse and transform it into a Gaussian shape. It then takes the shape
and begins placing the different pulse values into bins.
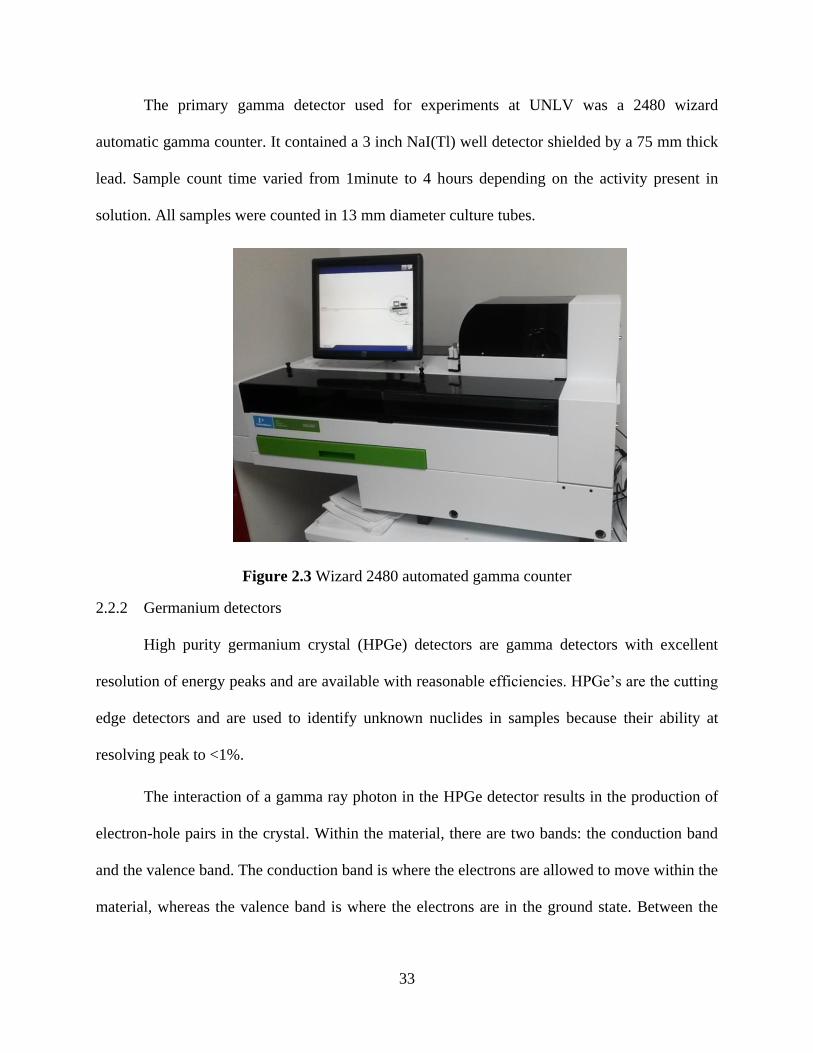
33
The primary gamma detector used for experiments at UNLV was a 2480 wizard
automatic gamma counter. It contained a 3 inch NaI(Tl) well detector shielded by a 75 mm thick
lead. Sample count time varied from 1minute to 4 hours depending on the activity present in
solution. All samples were counted in 13 mm diameter culture tubes.
Figure 2.3 Wizard 2480 automated gamma counter
2.2.2 Germanium detectors
High purity germanium crystal (HPGe) detectors are gamma detectors with excellent
resolution of energy peaks and are available with reasonable efficiencies. HPGe’s are the cutting
edge detectors and are used to identify unknown nuclides in samples because their ability at
resolving peak to <1%.
The interaction of a gamma ray photon in the HPGe detector results in the production of
electron-hole pairs in the crystal. Within the material, there are two bands: the conduction band
and the valence band. The conduction band is where the electrons are allowed to move within the
material, whereas the valence band is where the electrons are in the ground state. Between the
34
two states exists a region known as the band gap. No electrons are allowed to exist in this region
unless the material contains impurities that allow the electron to exist in the impurities’ energy
states. The band gap can be measured and is shown to be about 5 MeV for insulators and about 1
MeV for semiconductors. For metals, the band gap is either very small or nonexistent because
the bands can actually overlap. Because the band gap is close for semiconductors, it is necessary
to cool the detector (at least for germanium semiconductors) to avoid having electrons become
thermally excited and cross the band gap. A temperature of 77 K is used to stop the development
of a leakage current.
When radiation enters the germanium detector, it causes electron hole pairs to form in the
crystal matrix. Under the influence of an electric field, the electrons head to the anode and the
holes move towards the cathode. Due to the fast drift velocity and small size, these detectors are
among the fastest on the market. Its peak resolution is also very low because the large number of
information carriers decreases the statistical variation. As with the Na(Tl) detectors, they share
the same type of peak spectrum characteristics that are associated with the different interaction
mechanism gamma photons, albeit with better peak resolutions. For a review of how gamma
radiation interacts with matter, see the previous section.
2.2.3 Liquid Scintillation Counting
Liquid scintillation counting is an important technique used to examine the composition
of mono-radioisotope samples. It is especially useful for beta emitters such as 3H, 14C, 32P, and
35S in the medical industry and in life sciences.
A liquid scintillator relies on the fact that the organic molecules contained in the solution
emits light when it is excited by radiation. The mechanism that causes this process to happen can
be described as follows: when the beta or alpha emitter gives off radiation, the resulting energy
35
deposition lead to an excitation of the solvent. This excitation energy is then passed on to an
organic molecule, typically an aromatic compound such as toluene, which causes it to become
excited and emit a photon. Thus, the interaction travels from the ionizing radiation to the solvent
and then from the solvent to the scintillator. Then the solvent emits a photon and then the
wavelength shifter absorbs and reemits that photon to a different wavelength. However, for the
detector to see the fluorescence, a wavelength shifter is needed to better identify the light
emitted. Additionally, the cocktail contains surfactants to form a more homogenous mixture for a
variety of aqueous or chemically digested samples.
The primary advantage of liquid scintillation is the 100% efficiency of the instrument
since the “detector” completely surrounds the source of radiation, greatly aiding in achieving
superior counting statistics. Most LSC’s are also automated so that large numbers of samples can
be measured quickly. Since so many devices are used in the medical industry, LSCs also have
the advantage of being relatively inexpensive instruments compared to other detectors.
A drawback to a LSC is the extremely low resolution that it provides, making it a poor
instrument to use when measuring mixed isotope samples. Another large disadvantage is
associated with the disposal of LSC samples; the cocktail become mixed organic waste after use.
The high cost of this mixed waste may cause the consideration of another nondestructive sample
analysis.
LSC data may also be affected by the amount of quenches occurring in samples. A
quench is anything that reduces the number of photons that are being recorded by the
photomultiplier tube. Quenches are divided into two categories: chemical and color. A chemical
quench is one that interferes with the first steps of the scintillating process where another
chemical competes with the transfer of excitation energy. A common chemical quench is caused
36
by oxygen because it will absorb the excitation energy and then will release that energy through
vibration. Color quench occurs when the output of photons is absorbed by another interfering
agent. For example, if the solution is colored violet, blue, green, or can absorb ultra-violet, then
some of the photons will be absorbed by the solution and decrease the total amount of light
emitted from the sample.
However, it is possible to quantify the amount of quench in solution by spectral analysis. There
are several ways of doing this. Two of the more common ones are based on the Spectral Index of
the Sample (SIS) and the transformed Spectral Index of the External Standard (tSIE). The SIS
uses the sample isotope spectrum to monitor the quench. The tSIE uses the Compton spectrum
induced in cocktail by the external 133Ba source. The source is placed under the sample to induce
a Compton spectrum. The instrument makes a calculation on a scale of 0(most quenched) to
1,000 (unquenched).

37
3 METHODS
The performance of both TEHA and TEHP in extracting Zr, Hf, and Pu was measured in
solvent extraction, batch studies, and column studies. Experiments are typically first conducted
with solvent extractions, as the reaction responsible for the extraction is not limited by steric and
size interferences that might present themselves in batch studies and column studies. Batch
studies with free resin are then performed prior to the column studies as they allow the ability to
process a large number of samples under a variety of test conditions in a short amount of time.
Then the optimal conditions determined in the batch studies can be applied and tested in a
dynamic flow environment of the column.
3.1 Solvent Extraction
For the solvent extraction experiments involving Zr and Hf, the organic and aqueous
volumes used were 2 mL each in a 15 mL centrifuge tube. For studies involving the Pu, the
volumes were lowered to 0.7 mL to reduce the amount of LSC cocktail used and subsequent
waste generated. The solution with spiked was 50 µL of the individual radionuclide in either 8 M
or 12 M HCl and prior to its addition to the solution, the volume of acid in the vial was adjusted
to bring the total solution volume up to either 2mL or 0.7 mL (meaning the pre-spike volume
would be 1.95 mL or 0.65 mL, respectively). These volumes were mixed on a mixing table for
30 minutes at ~1200 rpm for the general solvent extraction and the speciation study. After
removal from the mixing table, an aliquot equaling half of the initial volume of each phase was
taken with a volumetric pipette. For the determination of Zr and Hf, these aliquots were then
placed in plastic 5 mL gamma counting tubes for analysis on an automated counter or a 2 mL
microcentrifuge for measurement on a HPGe detector. For Pu measurements, the aliquot was
38
placed into a 5 mL LSC vial and counted on a LSC instrument after ~5mL of LSC cocktail had
been added.
3.2 Batch Studies
For the batch studies conducted, ~50 µg of resin was weighed out into a 2 mL
microcentrifuge tube. Then, 1.45 mL of acid with a preselected concentration was added to the
vial to precondition the resin for extraction. The microcentrifuge tube was placed on tilt table and
the resin was allowed to mix with the acid for at least 30 minutes. After 30 minutes, 50 µL of the
radionuclide in 9 M hydrochloric acid was added to the solution. The vial was then mixed on a
vortex mixer for an additional 30 minutes at ~1200 rpm. The contents of the vial were then
transferred into a syringe and passed through a 0.45 µm PTFE syringe filter. A 1 mL aliquot of
this solution was then taken and added to either counting tubes or LSC vials filled with cocktail
for analysis.
3.2.1 Batch Study Corrections
When taking only an aliquot of the entire filtered solution, a verification is required to
determine whether the volume can be corrected back to the original volume after contact with the
resin. To conclude whether the matrix’s physical properties have changed, the density of the acid
before and after contact with the resin is measured to ensure no change has transpired. To do
this, a volumetric pipette was first calibrated by measuring the weight of 1 mL of water 10 times
on a scale. Using the known density of water at room temperature, the pipette’s delivery volume
was accurately determined. Then, knowing the pipette’s delivery volume, the weight of 1 mL of
acid was determined 10 times on the scale and recorded. After contacting the acid with the resin,
a 1 mL aliquot from those samples was then weighed and recorded. Since no density difference
39
was apparent between the before and after resin contact, no volume correction was required to be
made to the measurements.
Since the resin can also extract the acid, a correction may also be required to determine
the actual acid concentration after conditioning of the resin. A titration experiment was
performed to check the acid concentration before and after contact with the resin without any
radionuclides present in solution. To do this, trials with samples of acid were performed where
one group of samples was placed in contact with resin and another set with acid was not. The
samples were then diluted with deionized water and 1% phenolphthalein was added in
preparation for the titration. A 25 mL burette was filled with 1 N of sodium hydroxide, which
was then added dropwise to the samples until a pink color was observed in solution. Based on the
results of the titration, the concentration of acid did not change and therefore no correction was
necessary for all further calculations.
3.3 Column Studies
The first step was to prepare a 4 mm inner diameter Konte glass column for the studies.
The columns used had a 20 cm height and included a 15 mL reservoir on top of the column. Prior
to each use, the columns were washed with deionized water and dried. Glass wool was then
added to form a porous barrier, which provides a base for the resin to sit on but allows for the
solution to pass through. Resin was then measured directly into the column and weighed on a
scale. The column was filled with enough resin to achieve a bed height of 3 cm. Water was then
added, and acid washed sand was placed on the top of the resin to prevent the column bed from
being disturbed by future additions of solution. Air bubble formation was closely monitored, and
the column was resettled if any was observed. The free column volume (FCV) was subsequently
measured by adding 11 M hydrochloric acid to the column and monitoring the drops by placing
40
tiny strips of litmus paper near the exit of the column. The FVC was estimated to be ~ 150 µL
for a column with a 3 cm bed height. The columns were then conditioned with an additional 1
mL of 11 M hydrochloric acid. After the conditioning, a load solution of 50 µL of 11 M
hydrochloric acid containing a spike of the radionuclide of interest was added. A volume of
hydrochloric acid was then added to the column and fractions were collected until the volume of
acid reached the height of the resin bed. Fractions of 200 µL and 1 mL were taken and measured.
The volume used to collect was determined by preliminary column studies; the 200 µL fractions
were taken when elution of the radionuclide was expected to occur, and the 1 mL fractions were
collected when no elution was expected. These fractions were then prepared for counting.
41
4 SOLVENT EXTRACTIONS
4.1 Exploratory Extractions
Prior to the selection of tris(2-ethylhexyl)amine (TEHA) and tris(2-ethylhexyl)phosphate
(TEHP) as viable ligands, a variety of other substances were tested for extraction with zirconium.
It must be noted that only zirconium was used during these exploratory extractions. Previously,
dicyclo-18-crown-6 ether had shown extraction of zirconium and hafnium in hydrochloric acid,
so a solvent extraction using nitric and sulfuric acid was attempted with a spectrum of
concentration ranging from 0.1 M to concentrated acid. However, no extraction was observed
over the entire concentration range. Calixarenes, similar in structure and chemistry to the crown
ethers, were also investigated as a possible candidate for extraction. Over a range from 0.1 M to
concentrated, calix[4]arene showed no extraction behavior in hydrochloric, sulfuric, and nitric
acids. Likewise, thiacrown ethers were further considered as possible ligands; however, another
concurrent research project discovered that thiacrown ethers extract soft acids/bases (lead and
mercury). It was therefore extremely unlikely that an extraction would occur with hard acids
such as zirconium and hafnium. TEHA and TEHP were then tested for extraction from nitric and
sulfuric acid. Neither were found to have extracted zirconium and these acid systems were
therefore not pursued.
4.2 Solvent Extraction from Hydrochloric Acid
4.2.1 Solvent Selection
Before fully evaluating the extraction capabilities of TEHA and TEHP in more detailed
studies, a variety of solvents were examined to ensure the best conditions for the separation of
zirconium and hafnium. Solvent properties can affect the separation in different ways; its
viscosity, dipole moment, and measure of solubility in the polar phase are some examples how
42
the ligand can be inhibited or enhanced by the solvent in its extraction capability. Dichloro
methane (DCM), hexanes, diethyl ether (DEE), kerosene, and toluene were all chosen as
prospective solvents due to the high variability of their properties and commercial availability.
All of these solvents were tested over the range of 6 M to 12 M hydrochloric acid in 1 M or 0.5
M increments. Each data point was done in pentaplicate. The concentration for TEHA and TEHP
was at a 0.05 M concentration for all these experiments. Both the aqueous and organic phase
volumes were set at 2 mL in a 15 mL centrifuge tube and were mixed for 30 minutes on a timed
mixer. After the mixing, 1 mL of liquid was extracted from each phase and counted on an
automated gamma counter. With the DMC and DEE, a direct displacement pipette was used to
measure volumes for the organic phase.
4.2.1.1 Kerosene as a Solvent
Kerosene is a mixture of hydrocarbons chains ranging from 6 to 16 carbons per molecule
and is often used as solvent in industrial size separations due to the low cost and availability. It
also has the added benefit of not being as volatile at room temperature as other common solvents
used in solvent extraction. However, as noted from Banda et. al., a third phase forms between the
kerosene and aqueous phase. This third phase increased in volume as the acid concentration
increased. In preliminary experiments, it was noted that the zirconium increasingly extracted into
this third phase as the acid concentration rose. To avoid this third phase formation, dodecanol
was added to the kerosene stock solution at a concentration of 10% v/v.
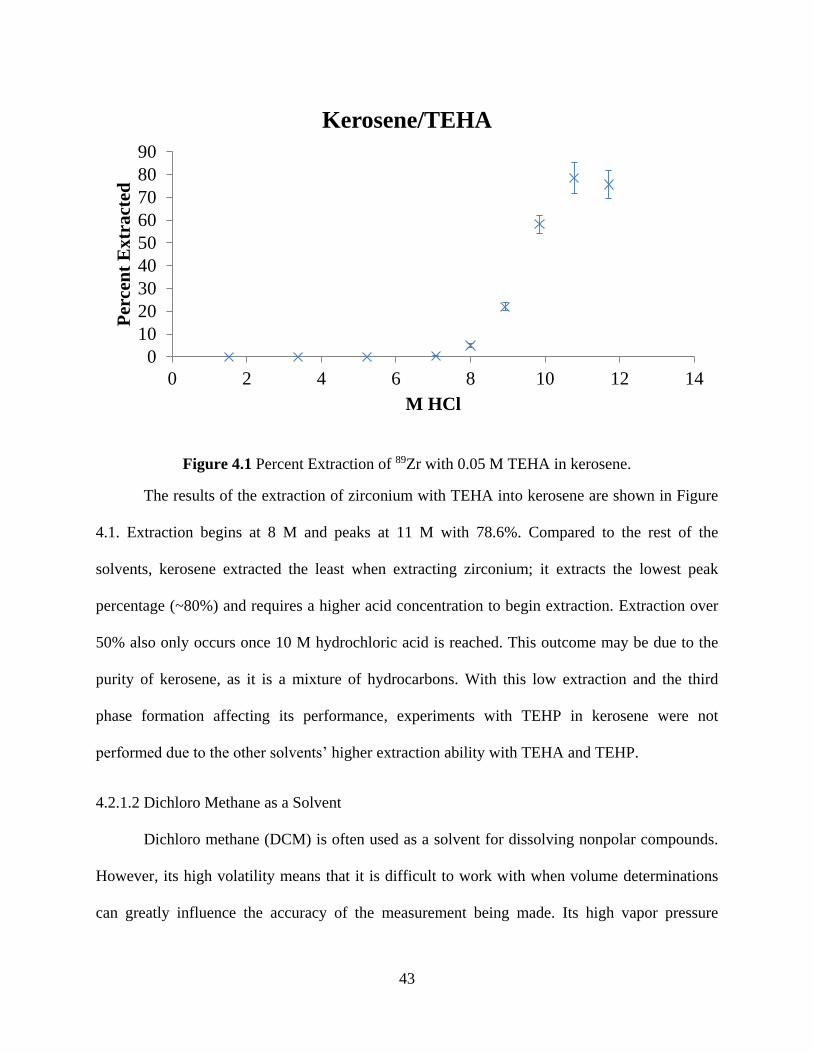
43
Figure 4.1 Percent Extraction of 89Zr with 0.05 M TEHA in kerosene.
The results of the extraction of zirconium with TEHA into kerosene are shown in Figure
4.1. Extraction begins at 8 M and peaks at 11 M with 78.6%. Compared to the rest of the
solvents, kerosene extracted the least when extracting zirconium; it extracts the lowest peak
percentage (~80%) and requires a higher acid concentration to begin extraction. Extraction over
50% also only occurs once 10 M hydrochloric acid is reached. This outcome may be due to the
purity of kerosene, as it is a mixture of hydrocarbons. With this low extraction and the third
phase formation affecting its performance, experiments with TEHP in kerosene were not
performed due to the other solvents’ higher extraction ability with TEHA and TEHP.
4.2.1.2 Dichloro Methane as a Solvent
Dichloro methane (DCM) is often used as a solvent for dissolving nonpolar compounds.
However, its high volatility means that it is difficult to work with when volume determinations
can greatly influence the accuracy of the measurement being made. Its high vapor pressure
0
10
20
30
40
50
60
70
80
90
0 2 4 6 8 10 12 14
Per
cen
t E
xtr
act
ed
M HCl
Kerosene/TEHA
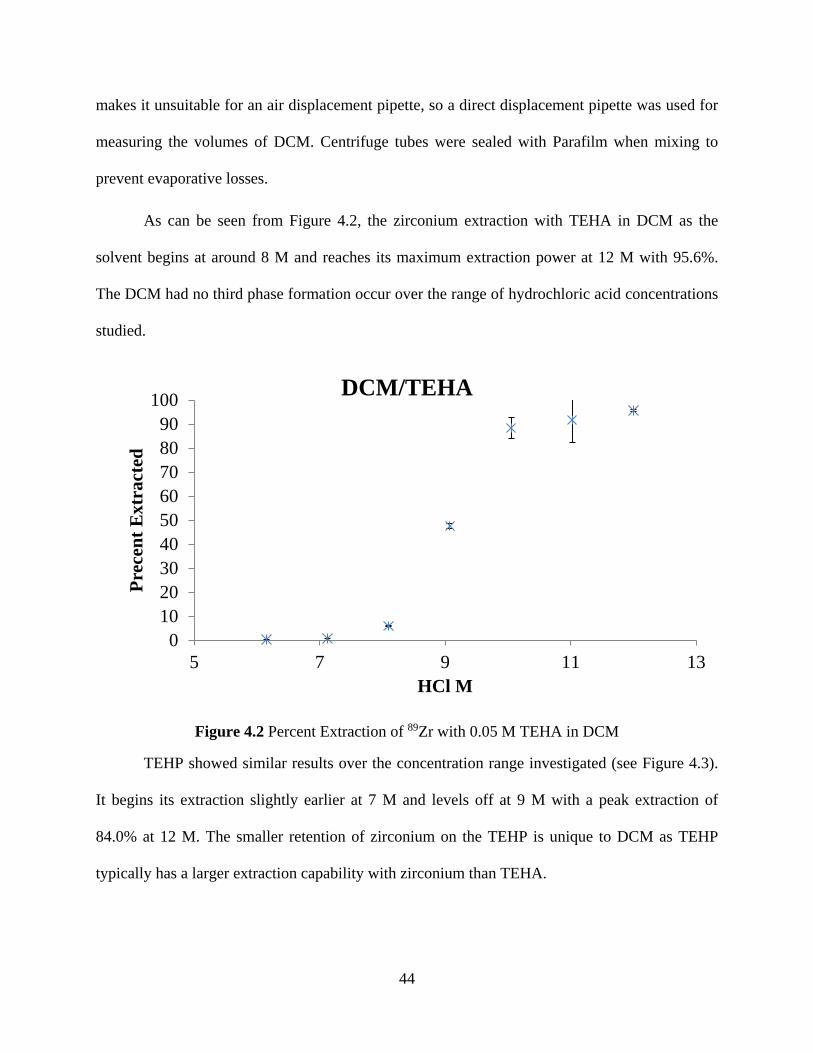
44
makes it unsuitable for an air displacement pipette, so a direct displacement pipette was used for
measuring the volumes of DCM. Centrifuge tubes were sealed with Parafilm when mixing to
prevent evaporative losses.
As can be seen from Figure 4.2, the zirconium extraction with TEHA in DCM as the
solvent begins at around 8 M and reaches its maximum extraction power at 12 M with 95.6%.
The DCM had no third phase formation occur over the range of hydrochloric acid concentrations
studied.
Figure 4.2 Percent Extraction of 89Zr with 0.05 M TEHA in DCM
TEHP showed similar results over the concentration range investigated (see Figure 4.3).
It begins its extraction slightly earlier at 7 M and levels off at 9 M with a peak extraction of
84.0% at 12 M. The smaller retention of zirconium on the TEHP is unique to DCM as TEHP
typically has a larger extraction capability with zirconium than TEHA.
0
10
20
30
40
50
60
70
80
90
100
5 7 9 11 13
Pre
cen
t E
xtr
act
ed
HCl M
DCM/TEHA
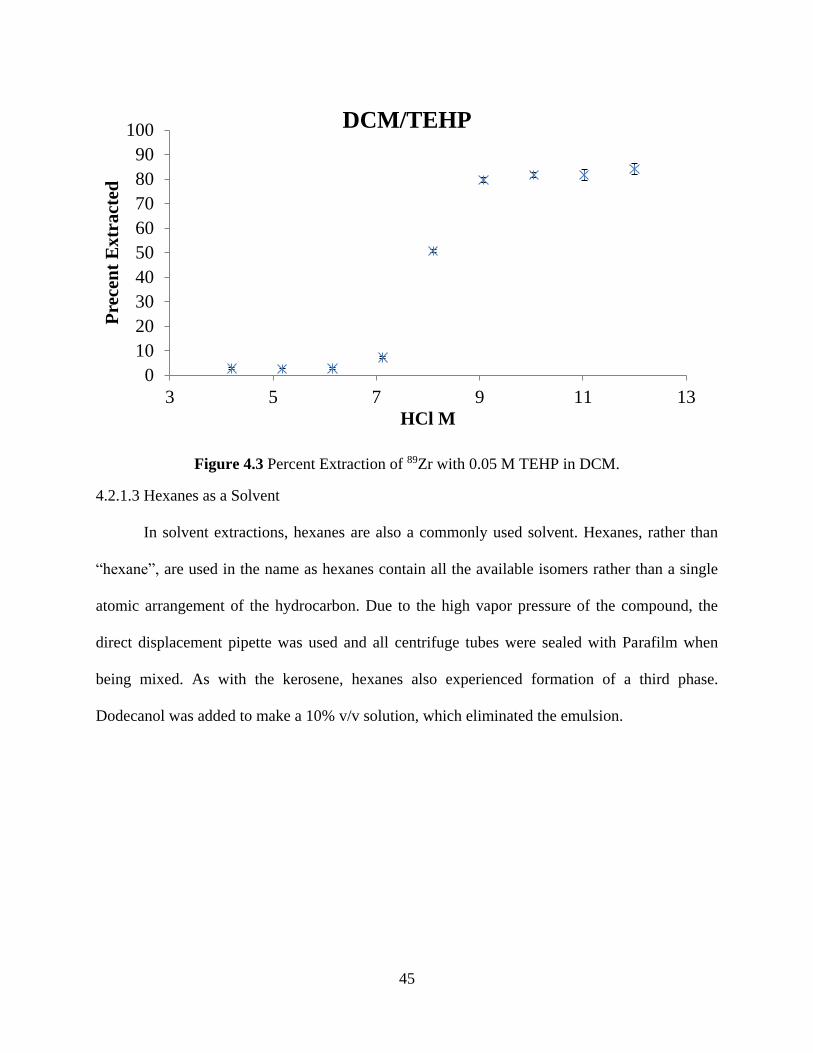
45
Figure 4.3 Percent Extraction of 89Zr with 0.05 M TEHP in DCM.
4.2.1.3 Hexanes as a Solvent
In solvent extractions, hexanes are also a commonly used solvent. Hexanes, rather than
“hexane”, are used in the name as hexanes contain all the available isomers rather than a single
atomic arrangement of the hydrocarbon. Due to the high vapor pressure of the compound, the
direct displacement pipette was used and all centrifuge tubes were sealed with Parafilm when
being mixed. As with the kerosene, hexanes also experienced formation of a third phase.
Dodecanol was added to make a 10% v/v solution, which eliminated the emulsion.
0
10
20
30
40
50
60
70
80
90
100
3 5 7 9 11 13
Pre
cen
t E
xtr
act
ed
HCl M
DCM/TEHP
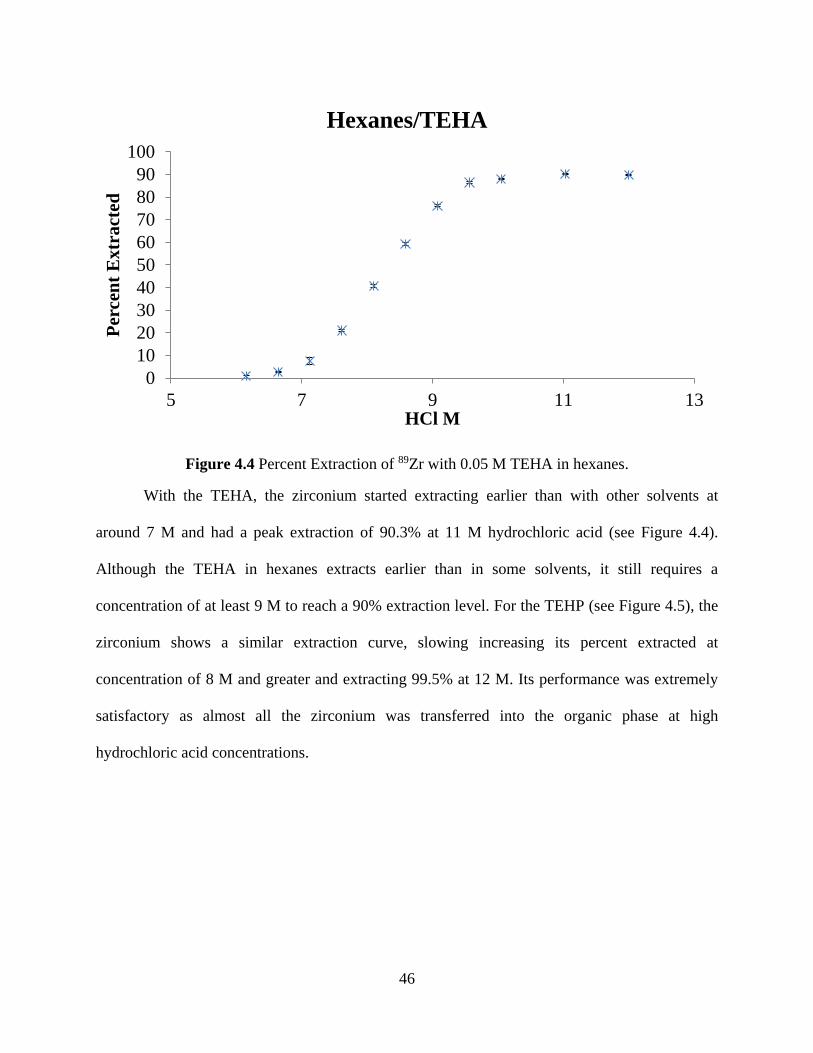
46
Figure 4.4 Percent Extraction of 89Zr with 0.05 M TEHA in hexanes.
With the TEHA, the zirconium started extracting earlier than with other solvents at
around 7 M and had a peak extraction of 90.3% at 11 M hydrochloric acid (see Figure 4.4).
Although the TEHA in hexanes extracts earlier than in some solvents, it still requires a
concentration of at least 9 M to reach a 90% extraction level. For the TEHP (see Figure 4.5), the
zirconium shows a similar extraction curve, slowing increasing its percent extracted at
concentration of 8 M and greater and extracting 99.5% at 12 M. Its performance was extremely
satisfactory as almost all the zirconium was transferred into the organic phase at high
hydrochloric acid concentrations.
0
10
20
30
40
50
60
70
80
90
100
5 7 9 11 13
Per
cen
t E
xtr
act
ed
HCl M
Hexanes/TEHA
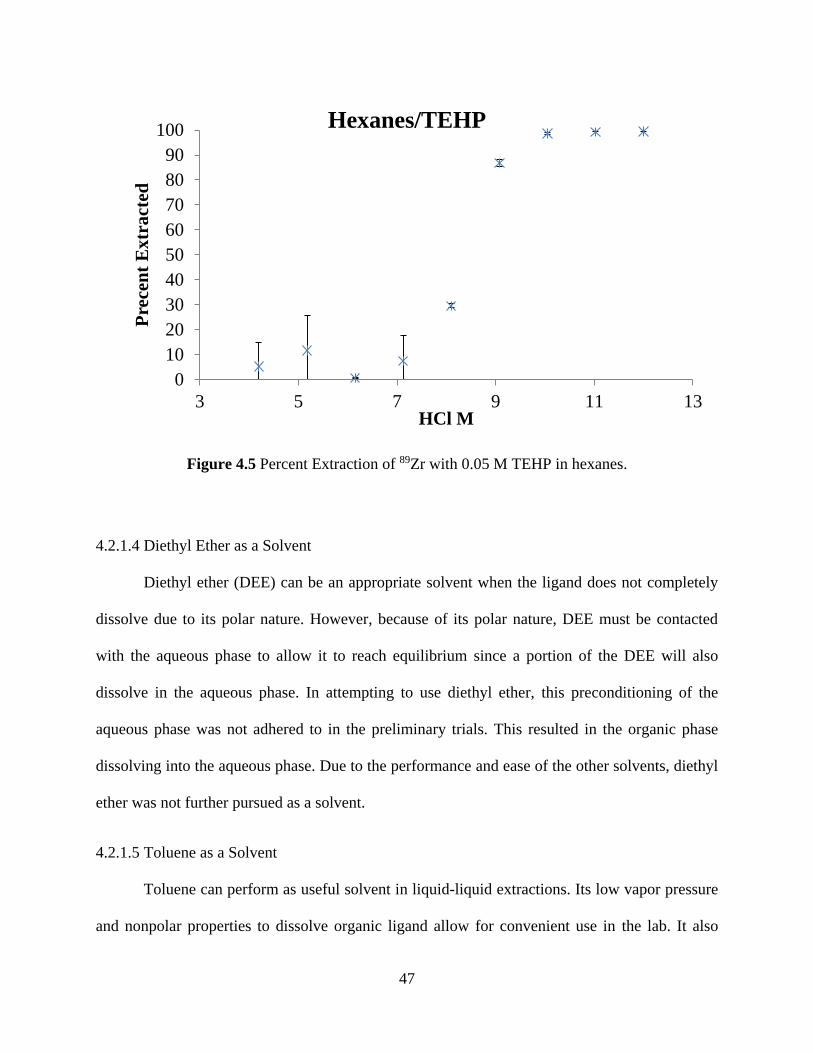
47
Figure 4.5 Percent Extraction of 89Zr with 0.05 M TEHP in hexanes.
4.2.1.4 Diethyl Ether as a Solvent
Diethyl ether (DEE) can be an appropriate solvent when the ligand does not completely
dissolve due to its polar nature. However, because of its polar nature, DEE must be contacted
with the aqueous phase to allow it to reach equilibrium since a portion of the DEE will also
dissolve in the aqueous phase. In attempting to use diethyl ether, this preconditioning of the
aqueous phase was not adhered to in the preliminary trials. This resulted in the organic phase
dissolving into the aqueous phase. Due to the performance and ease of the other solvents, diethyl
ether was not further pursued as a solvent.
4.2.1.5 Toluene as a Solvent
Toluene can perform as useful solvent in liquid-liquid extractions. Its low vapor pressure
and nonpolar properties to dissolve organic ligand allow for convenient use in the lab. It also
0
10
20
30
40
50
60
70
80
90
100
3 5 7 9 11 13
Pre
cen
t E
xtr
act
ed
HCl M
Hexanes/TEHP
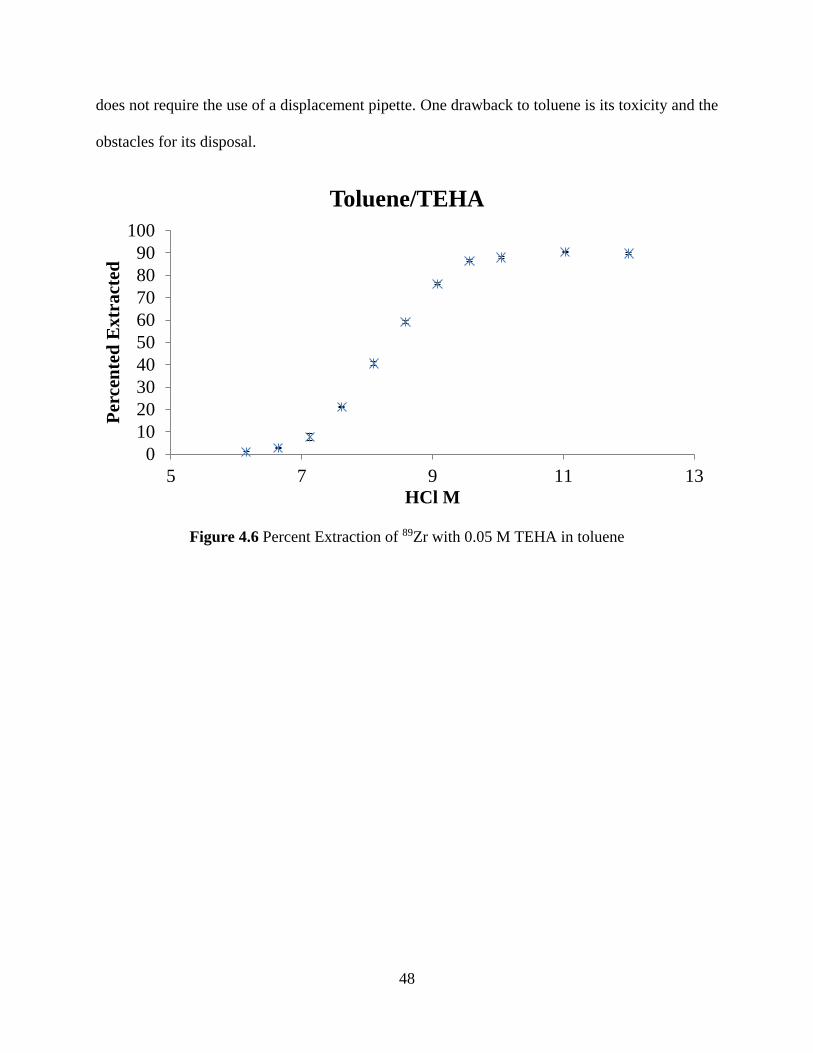
48
does not require the use of a displacement pipette. One drawback to toluene is its toxicity and the
obstacles for its disposal.
Figure 4.6 Percent Extraction of 89Zr with 0.05 M TEHA in toluene
0
10
20
30
40
50
60
70
80
90
100
5 7 9 11 13
Per
cen
ted
Extr
act
ed
HCl M
Toluene/TEHA

49
Figure 4.7 Percent Extraction of 89Zr with 0.05 M TEHP in toluene
As can be seen from Figure 4.6, with TEHA in toluene, the extraction begins at 7 M and reaches
a peak extraction of around 90% extraction at 9.5 M. TEHP begins its extraction at 6 M and
reaches a peak extraction of around 99% extraction at 9 M (see Figure 4.7). Since the extraction
with TEHP in toluene did not completely drop to 0% at 6 M hydrochloric acid, data points at 4
M and 5 M were added to show the complete curve of extraction.
4.2.1.6 Discussion
From all the solvents tested, ultimately toluene was chosen as the best for future solvent
extraction studies. Many of the solvents showed the same two problems: high vapor pressure and
third phase formation. For DMC, kerosene, and diethyl ether, their extraction performance was
more than 10% than that of hexanes and toluene and those three solvents were no longer
considered. While hexanes showed marginally better performance, the formation of a third phase
and the high vapor pressure made it unsuitable for these experiments with large numbers of
0
10
20
30
40
50
60
70
80
90
100
3 5 7 9 11 13
Pre
cen
t E
xtr
act
ed
HCl M
Toluene/TEHP
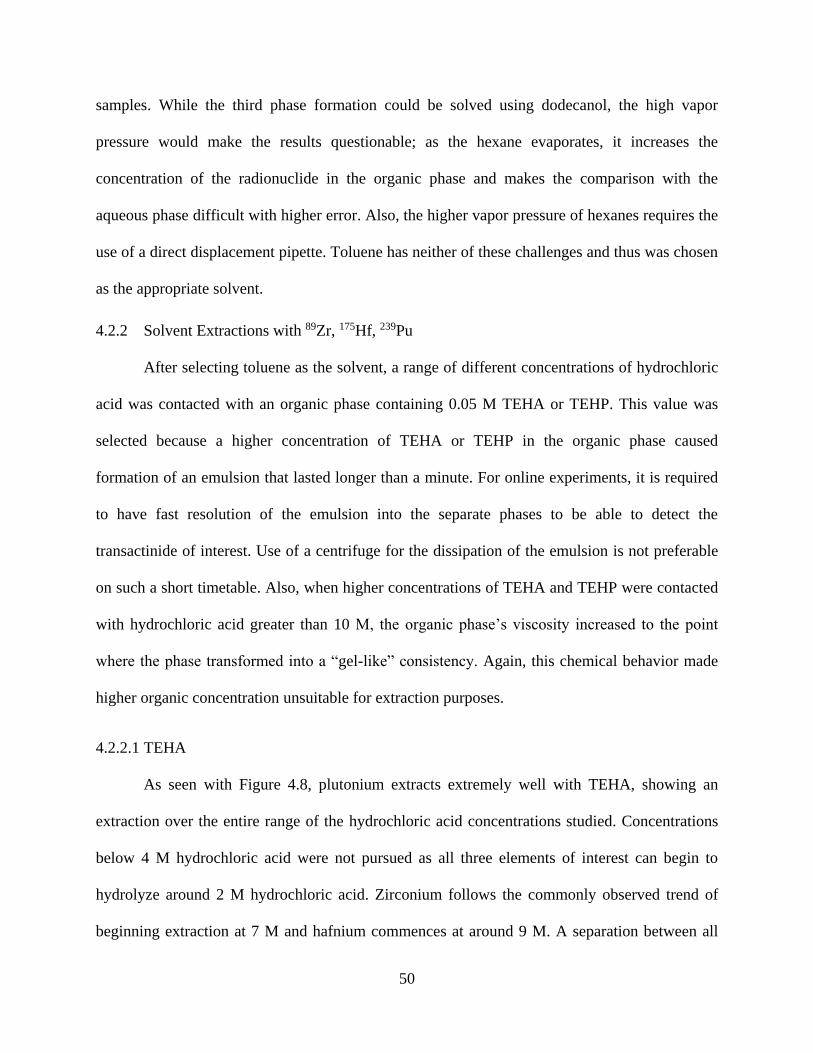
50
samples. While the third phase formation could be solved using dodecanol, the high vapor
pressure would make the results questionable; as the hexane evaporates, it increases the
concentration of the radionuclide in the organic phase and makes the comparison with the
aqueous phase difficult with higher error. Also, the higher vapor pressure of hexanes requires the
use of a direct displacement pipette. Toluene has neither of these challenges and thus was chosen
as the appropriate solvent.
4.2.2 Solvent Extractions with 89Zr, 175Hf, 239Pu
After selecting toluene as the solvent, a range of different concentrations of hydrochloric
acid was contacted with an organic phase containing 0.05 M TEHA or TEHP. This value was
selected because a higher concentration of TEHA or TEHP in the organic phase caused
formation of an emulsion that lasted longer than a minute. For online experiments, it is required
to have fast resolution of the emulsion into the separate phases to be able to detect the
transactinide of interest. Use of a centrifuge for the dissipation of the emulsion is not preferable
on such a short timetable. Also, when higher concentrations of TEHA and TEHP were contacted
with hydrochloric acid greater than 10 M, the organic phase’s viscosity increased to the point
where the phase transformed into a “gel-like” consistency. Again, this chemical behavior made
higher organic concentration unsuitable for extraction purposes.
4.2.2.1 TEHA
As seen with Figure 4.8, plutonium extracts extremely well with TEHA, showing an
extraction over the entire range of the hydrochloric acid concentrations studied. Concentrations
below 4 M hydrochloric acid were not pursued as all three elements of interest can begin to
hydrolyze around 2 M hydrochloric acid. Zirconium follows the commonly observed trend of
beginning extraction at 7 M and hafnium commences at around 9 M. A separation between all
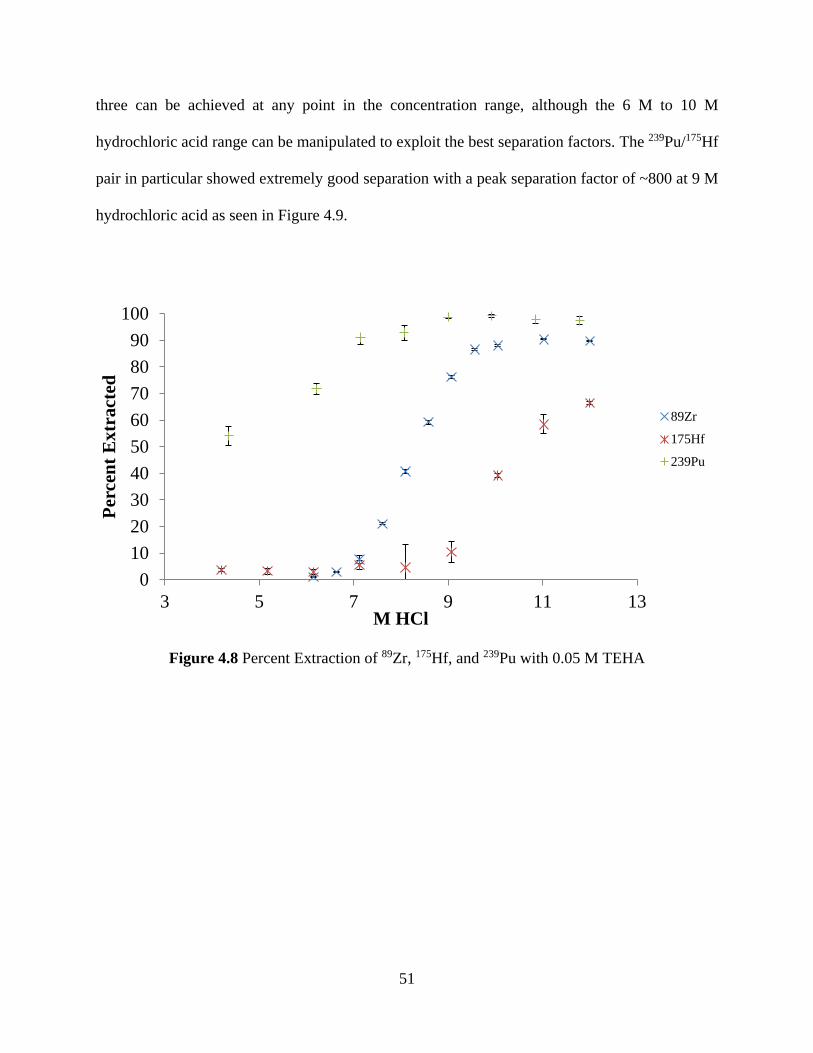
51
three can be achieved at any point in the concentration range, although the 6 M to 10 M
hydrochloric acid range can be manipulated to exploit the best separation factors. The 239Pu/175Hf
pair in particular showed extremely good separation with a peak separation factor of ~800 at 9 M
hydrochloric acid as seen in Figure 4.9.
Figure 4.8 Percent Extraction of 89Zr, 175Hf, and 239Pu with 0.05 M TEHA
0
10
20
30
40
50
60
70
80
90
100
3 5 7 9 11 13
Per
cen
t E
xtr
act
ed
M HCl
89Zr
175Hf
239Pu
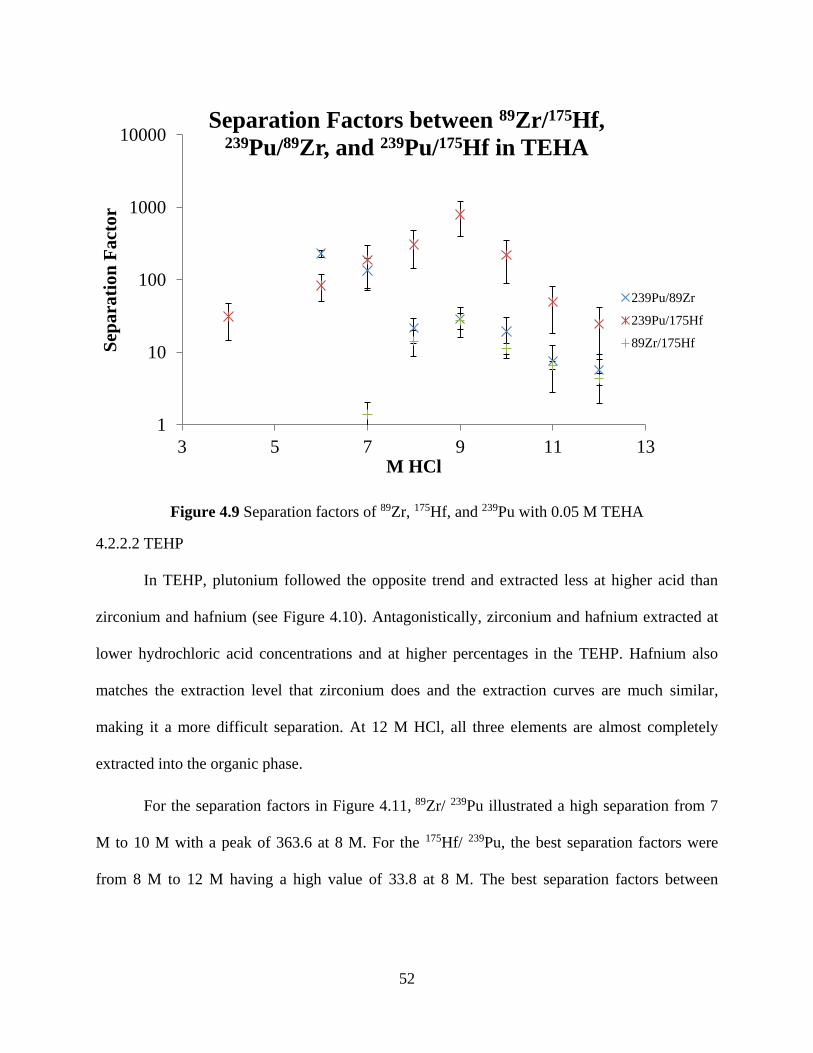
52
Figure 4.9 Separation factors of 89Zr, 175Hf, and 239Pu with 0.05 M TEHA
4.2.2.2 TEHP
In TEHP, plutonium followed the opposite trend and extracted less at higher acid than
zirconium and hafnium (see Figure 4.10). Antagonistically, zirconium and hafnium extracted at
lower hydrochloric acid concentrations and at higher percentages in the TEHP. Hafnium also
matches the extraction level that zirconium does and the extraction curves are much similar,
making it a more difficult separation. At 12 M HCl, all three elements are almost completely
extracted into the organic phase.
For the separation factors in Figure 4.11, 89Zr/ 239Pu illustrated a high separation from 7
M to 10 M with a peak of 363.6 at 8 M. For the 175Hf/ 239Pu, the best separation factors were
from 8 M to 12 M having a high value of 33.8 at 8 M. The best separation factors between
1
10
100
1000
10000
3 5 7 9 11 13
Sep
ara
tio
n F
act
or
M HCl
Separation Factors between 89Zr/175Hf, 239Pu/89Zr, and 239Pu/175Hf in TEHA
239Pu/89Zr
239Pu/175Hf
89Zr/175Hf
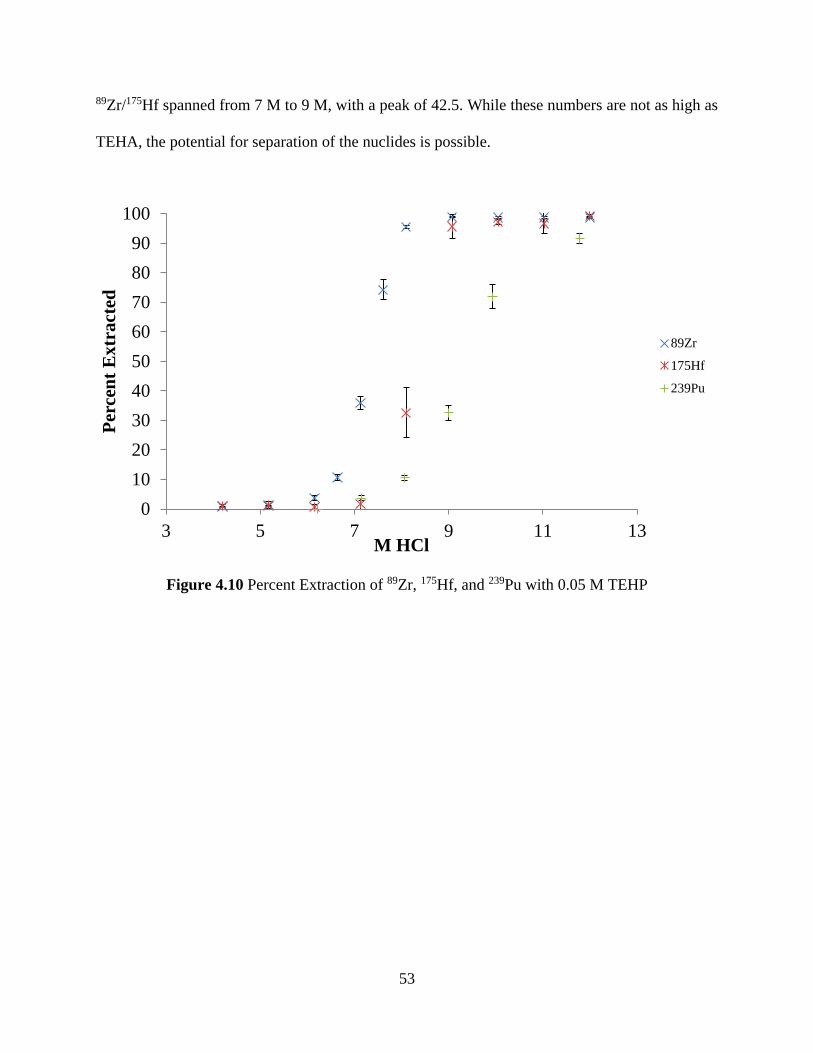
53
89Zr/175Hf spanned from 7 M to 9 M, with a peak of 42.5. While these numbers are not as high as
TEHA, the potential for separation of the nuclides is possible.
Figure 4.10 Percent Extraction of 89Zr, 175Hf, and 239Pu with 0.05 M TEHP
0
10
20
30
40
50
60
70
80
90
100
3 5 7 9 11 13
Per
cen
t E
xtr
act
ed
M HCl
89Zr
175Hf
239Pu
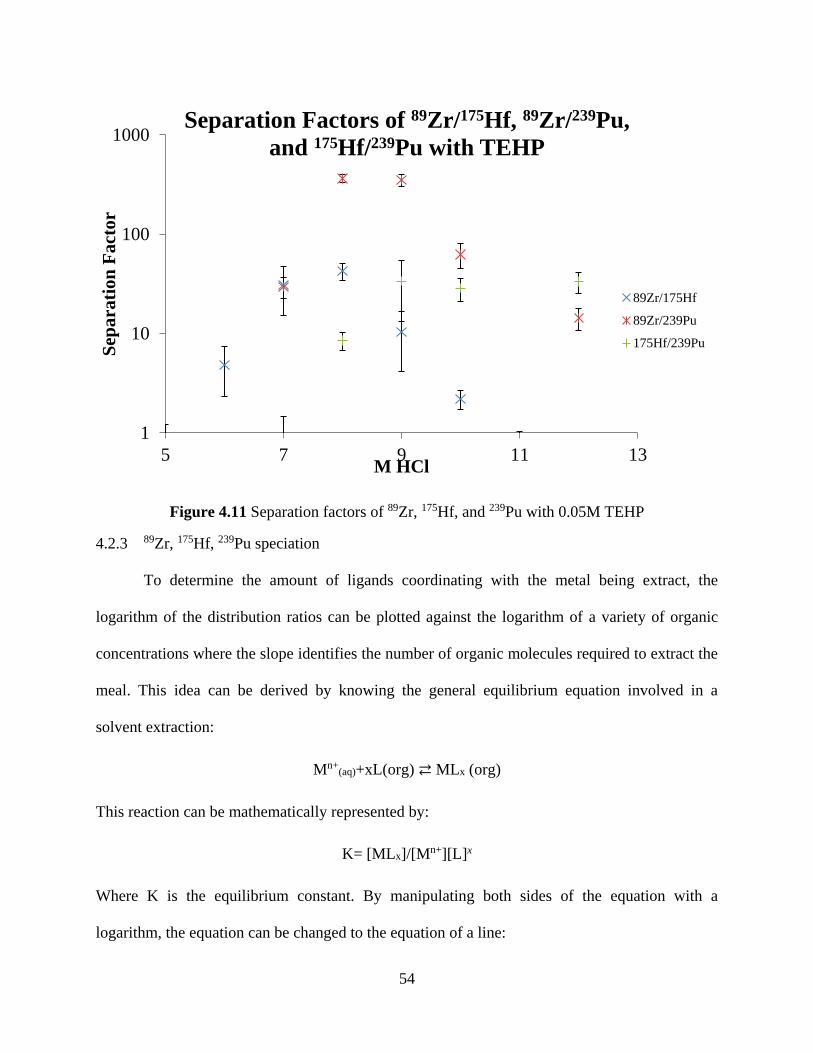
54
Figure 4.11 Separation factors of 89Zr, 175Hf, and 239Pu with 0.05M TEHP
4.2.3 89Zr, 175Hf, 239Pu speciation
To determine the amount of ligands coordinating with the metal being extract, the
logarithm of the distribution ratios can be plotted against the logarithm of a variety of organic
concentrations where the slope identifies the number of organic molecules required to extract the
meal. This idea can be derived by knowing the general equilibrium equation involved in a
solvent extraction:
Mn+(aq)+xL(org) ⇄ MLx (org)
This reaction can be mathematically represented by:
K= [MLx]/[Mn+][L]x
Where K is the equilibrium constant. By manipulating both sides of the equation with a
logarithm, the equation can be changed to the equation of a line:
1
10
100
1000
5 7 9 11 13
Sep
ara
tio
n F
act
or
M HCl
Separation Factors of 89Zr/175Hf, 89Zr/239Pu,
and 175Hf/239Pu with TEHP
89Zr/175Hf
89Zr/239Pu
175Hf/239Pu
55
logD=xlog[L]+logK
The acid concentration for these studies was kept constant at 8 M hydrochloric acid for
each experiment with the organic concentration varied from 0.001 M to 0.5 M for both TEHA
and TEHP. The rest of the procedure was carried out as outlined in the methods sections.
4.2.3.1 TEHA
For the TEHA, 89Zr and 175Hf showed very similar slope numbers at 1.81 with reasonable
R2 values. This seems to indicate that these two elements are extracted by 2 TEHA molecules as
seen in Figures 4.12 and 4.13. The 239Pu experiment was repeated three times at different
hydrochloric acid concentrations; however, a consistent slope was not achieved at any
conditions. Therefore, no information about the speciation of the 239Pu could be obtained.

56
Figure 4.12 The natural log of the distribution ratios for 89Zr as a function of the natural log of
the concentration of TEHA in toluene at 8 M HCl.
Figure 4.13 The natural log of the distribution ratios for 175Hf as a function of the natural log of
the concentration of TEHA in toluene at 8 M HCl.
y = 1.8106x + 3.7577
R² = 0.9732
-10
-8
-6
-4
-2
0
2
4
-6 -5 -4 -3 -2 -1 0
LN
[Kd
] T
EH
A
LN[TEHA]
89Zr
y = 1.8908x + 5.6725
R² = 0.9779
-8
-6
-4
-2
0
2
4
-6 -5 -4 -3 -2 -1 0
LN
[Kd
] T
EH
A
LN[TEHA]
175Hf
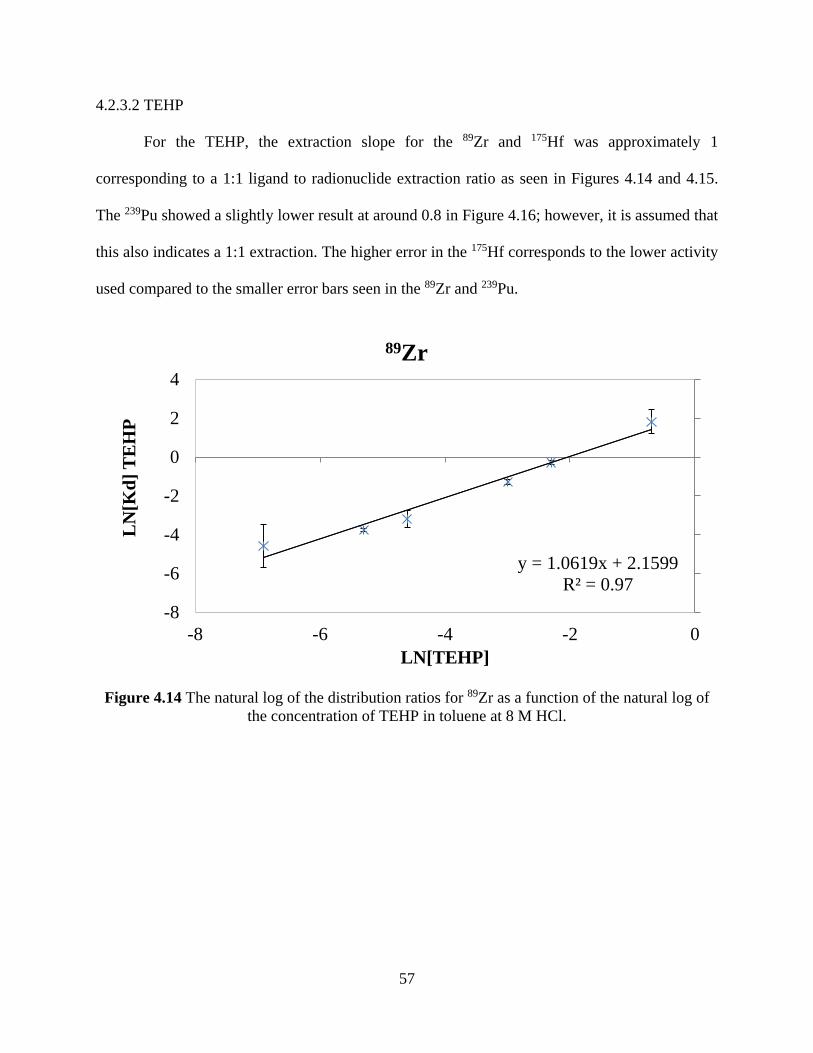
57
4.2.3.2 TEHP
For the TEHP, the extraction slope for the 89Zr and 175Hf was approximately 1
corresponding to a 1:1 ligand to radionuclide extraction ratio as seen in Figures 4.14 and 4.15.
The 239Pu showed a slightly lower result at around 0.8 in Figure 4.16; however, it is assumed that
this also indicates a 1:1 extraction. The higher error in the 175Hf corresponds to the lower activity
used compared to the smaller error bars seen in the 89Zr and 239Pu.
Figure 4.14 The natural log of the distribution ratios for 89Zr as a function of the natural log of
the concentration of TEHP in toluene at 8 M HCl.
y = 1.0619x + 2.1599
R² = 0.97
-8
-6
-4
-2
0
2
4
-8 -6 -4 -2 0
LN
[Kd
] T
EH
P
LN[TEHP]
89Zr
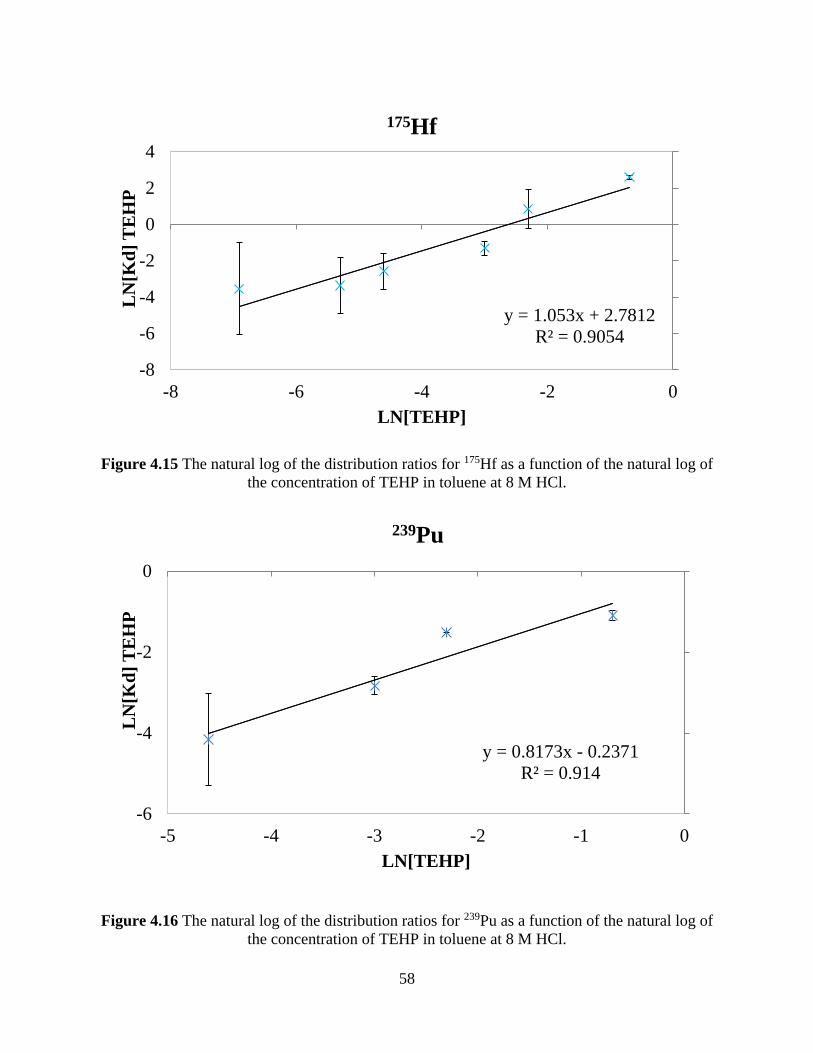
58
Figure 4.15 The natural log of the distribution ratios for 175Hf as a function of the natural log of
the concentration of TEHP in toluene at 8 M HCl.
Figure 4.16 The natural log of the distribution ratios for 239Pu as a function of the natural log of
the concentration of TEHP in toluene at 8 M HCl.
y = 1.053x + 2.7812
R² = 0.9054
-8
-6
-4
-2
0
2
4
-8 -6 -4 -2 0
LN
[Kd
] T
EH
P
LN[TEHP]
175Hf
y = 0.8173x - 0.2371
R² = 0.914
-6
-4
-2
0
-5 -4 -3 -2 -1 0
LN
[Kd
] T
EH
P
LN[TEHP]
239Pu
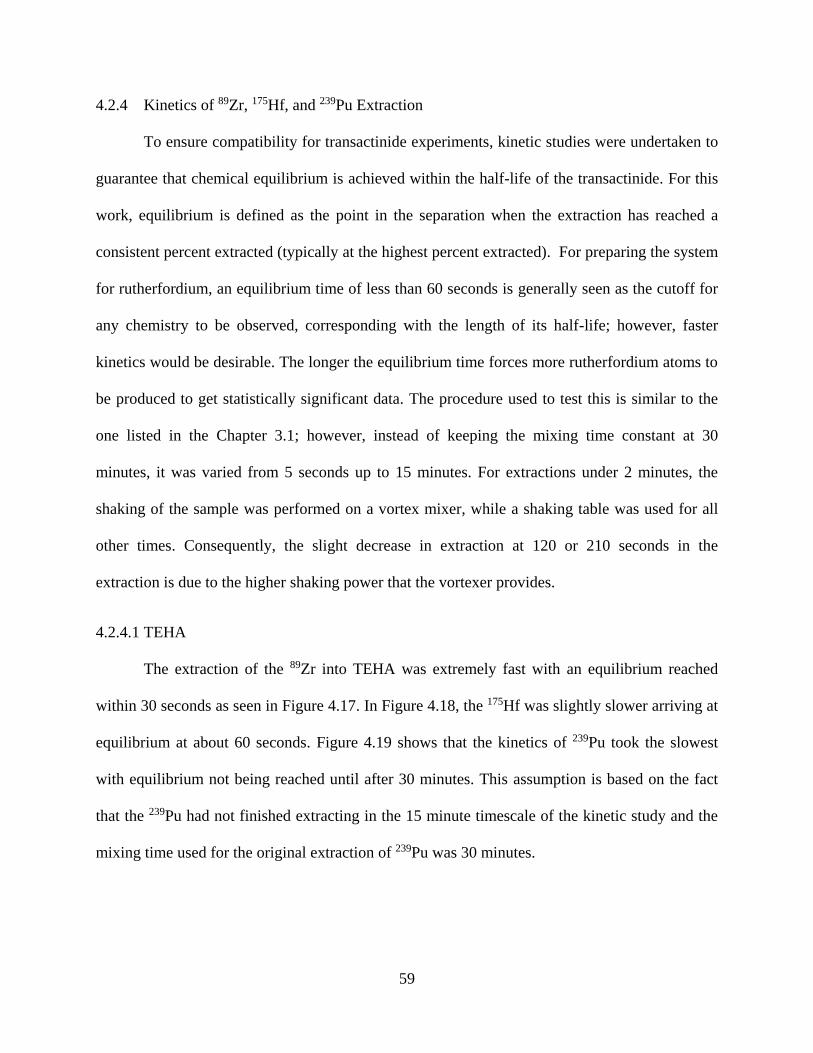
59
4.2.4 Kinetics of 89Zr, 175Hf, and 239Pu Extraction
To ensure compatibility for transactinide experiments, kinetic studies were undertaken to
guarantee that chemical equilibrium is achieved within the half-life of the transactinide. For this
work, equilibrium is defined as the point in the separation when the extraction has reached a
consistent percent extracted (typically at the highest percent extracted). For preparing the system
for rutherfordium, an equilibrium time of less than 60 seconds is generally seen as the cutoff for
any chemistry to be observed, corresponding with the length of its half-life; however, faster
kinetics would be desirable. The longer the equilibrium time forces more rutherfordium atoms to
be produced to get statistically significant data. The procedure used to test this is similar to the
one listed in the Chapter 3.1; however, instead of keeping the mixing time constant at 30
minutes, it was varied from 5 seconds up to 15 minutes. For extractions under 2 minutes, the
shaking of the sample was performed on a vortex mixer, while a shaking table was used for all
other times. Consequently, the slight decrease in extraction at 120 or 210 seconds in the
extraction is due to the higher shaking power that the vortexer provides.
4.2.4.1 TEHA
The extraction of the 89Zr into TEHA was extremely fast with an equilibrium reached
within 30 seconds as seen in Figure 4.17. In Figure 4.18, the 175Hf was slightly slower arriving at
equilibrium at about 60 seconds. Figure 4.19 shows that the kinetics of 239Pu took the slowest
with equilibrium not being reached until after 30 minutes. This assumption is based on the fact
that the 239Pu had not finished extracting in the 15 minute timescale of the kinetic study and the
mixing time used for the original extraction of 239Pu was 30 minutes.
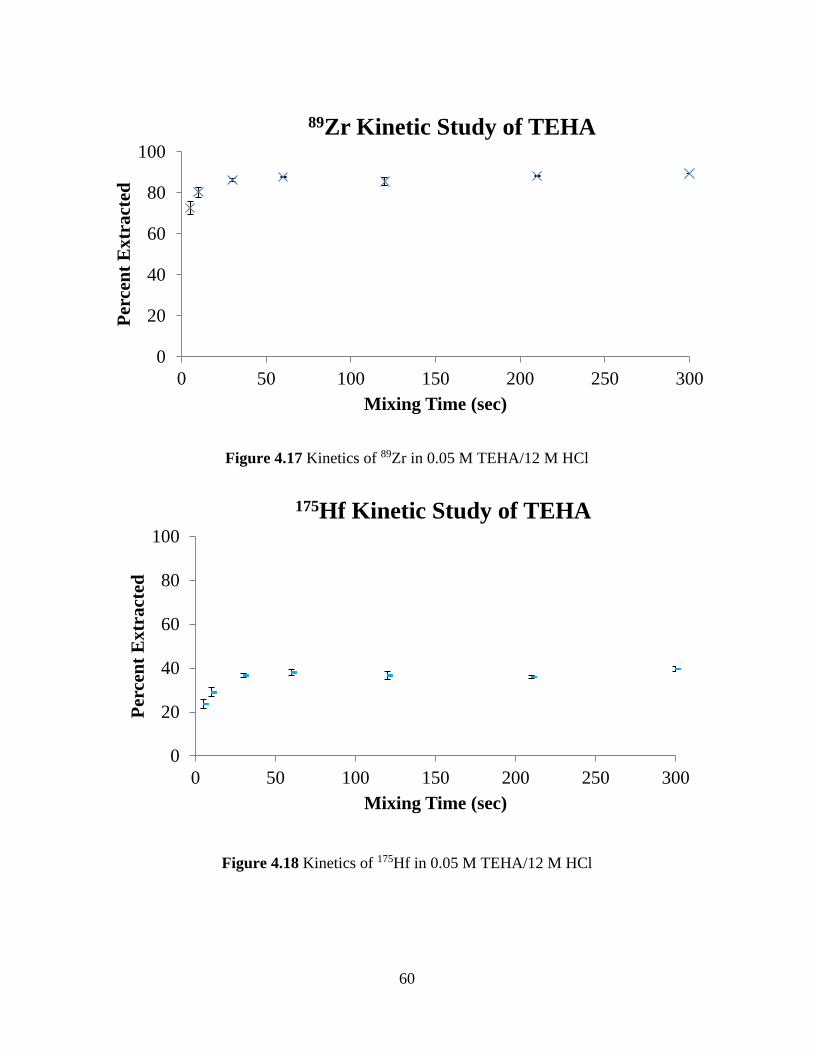
60
Figure 4.17 Kinetics of 89Zr in 0.05 M TEHA/12 M HCl
Figure 4.18 Kinetics of 175Hf in 0.05 M TEHA/12 M HCl
0
20
40
60
80
100
0 50 100 150 200 250 300
Per
cen
t E
xtr
act
ed
Mixing Time (sec)
89Zr Kinetic Study of TEHA
0
20
40
60
80
100
0 50 100 150 200 250 300
Per
cen
t E
xtr
act
ed
Mixing Time (sec)
175Hf Kinetic Study of TEHA
61
Figure 4.19 Kinetics of 239Pu in 0.05 M TEHA/12 M HCl
4.2.4.2 TEHP
The kinetics of extraction with TEHP proved to be similar kinetics with TEHA between
all three radionuclide with some slight differences. The 89Zr extraction into TEHP was the fastest
with its equilibrium reached in 10 seconds (see Figure 4.20). In Figure 4.21, the 175Hf was
slower, having to take 210 seconds to arrive at equilibrium (see Figure 4.21). Again, the kinetics
of 239Pu required the longest equilibrium time with 30 minutes (see Figure 4.22). This
assumption is based on the fact that the 239Pu had not finished extracting in the 15 minute
timescale of the kinetic study and the mixing time used for the original extraction of 239Pu was
30 minutes.
0
10
20
30
40
50
60
70
80
90
100
0 200 400 600 800 1000
Per
cen
t E
xtr
act
ed
Mixing Time
239Pu in TEHA Kinetic Study
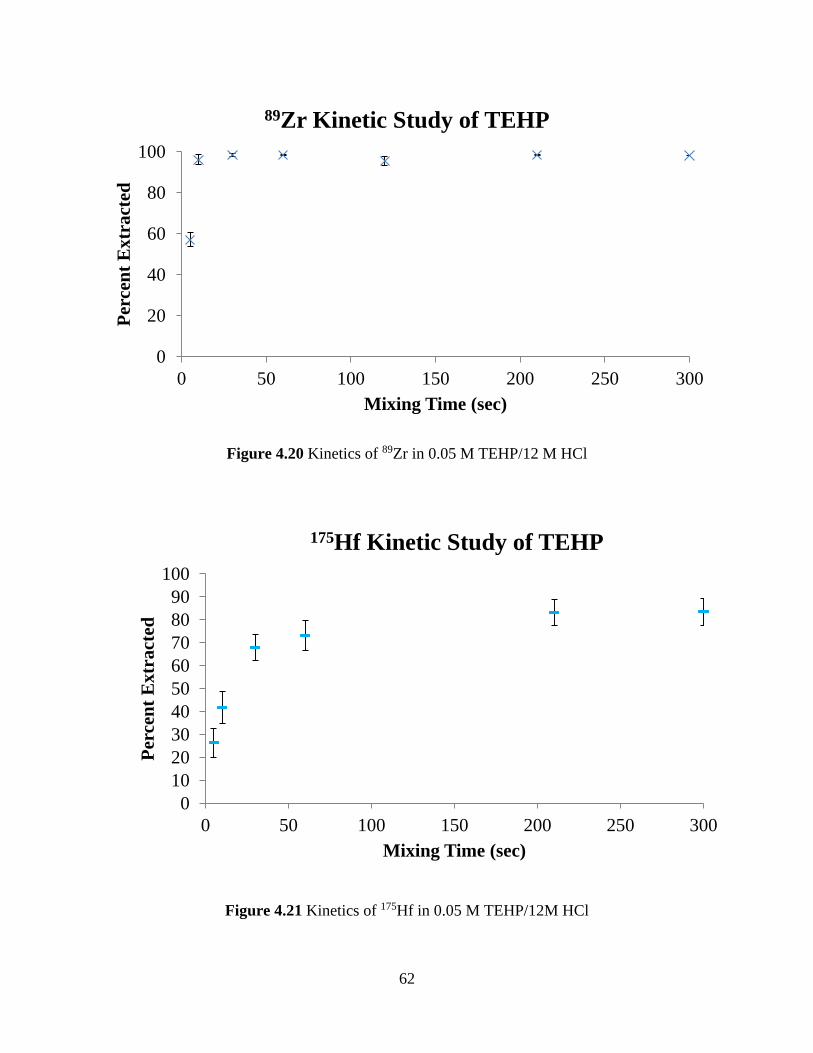
62
Figure 4.20 Kinetics of 89Zr in 0.05 M TEHP/12 M HCl
Figure 4.21 Kinetics of 175Hf in 0.05 M TEHP/12M HCl
0
20
40
60
80
100
0 50 100 150 200 250 300
Per
cen
t E
xtr
act
ed
Mixing Time (sec)
89Zr Kinetic Study of TEHP
0
10
20
30
40
50
60
70
80
90
100
0 50 100 150 200 250 300
Per
cen
t E
xtr
act
ed
Mixing Time (sec)
175Hf Kinetic Study of TEHP
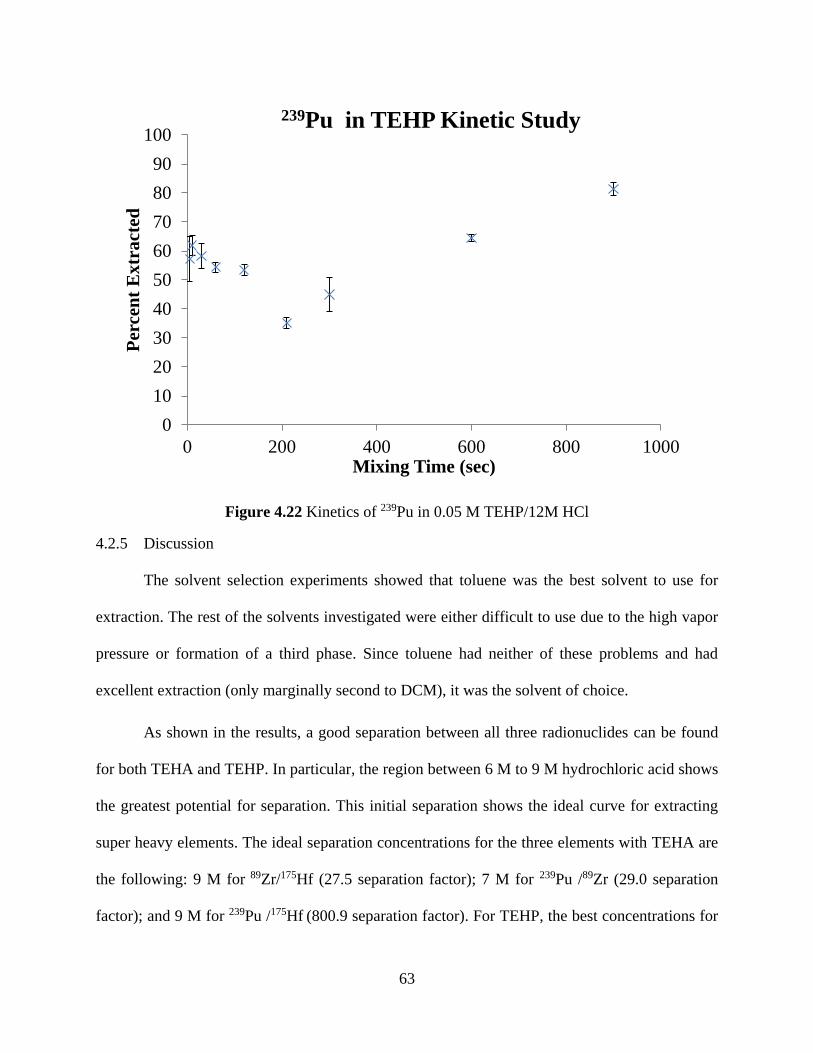
63
Figure 4.22 Kinetics of 239Pu in 0.05 M TEHP/12M HCl
4.2.5 Discussion
The solvent selection experiments showed that toluene was the best solvent to use for
extraction. The rest of the solvents investigated were either difficult to use due to the high vapor
pressure or formation of a third phase. Since toluene had neither of these problems and had
excellent extraction (only marginally second to DCM), it was the solvent of choice.
As shown in the results, a good separation between all three radionuclides can be found
for both TEHA and TEHP. In particular, the region between 6 M to 9 M hydrochloric acid shows
the greatest potential for separation. This initial separation shows the ideal curve for extracting
super heavy elements. The ideal separation concentrations for the three elements with TEHA are
the following: 9 M for 89Zr/175Hf (27.5 separation factor); 7 M for 239Pu /89Zr (29.0 separation
factor); and 9 M for 239Pu /175Hf (800.9 separation factor). For TEHP, the best concentrations for
0
10
20
30
40
50
60
70
80
90
100
0 200 400 600 800 1000
Per
cen
t E
xtr
act
ed
Mixing Time (sec)
239Pu in TEHP Kinetic Study
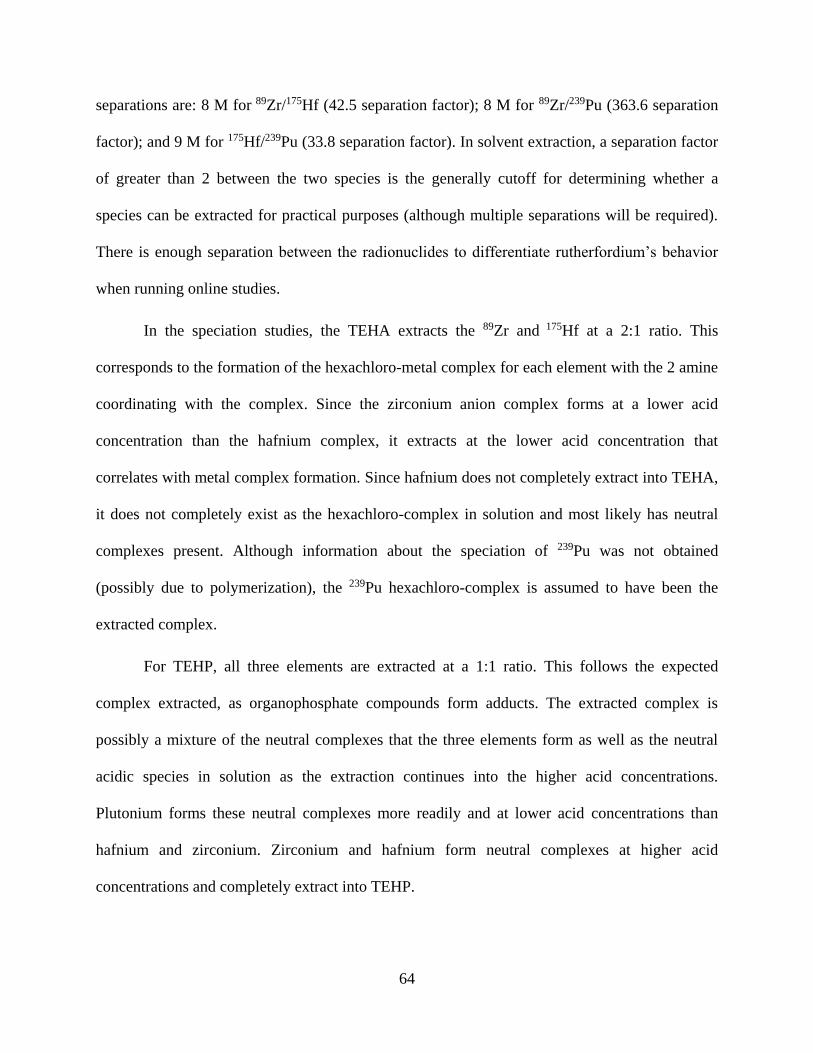
64
separations are: 8 M for 89Zr/175Hf (42.5 separation factor); 8 M for 89Zr/239Pu (363.6 separation
factor); and 9 M for 175Hf/239Pu (33.8 separation factor). In solvent extraction, a separation factor
of greater than 2 between the two species is the generally cutoff for determining whether a
species can be extracted for practical purposes (although multiple separations will be required).
There is enough separation between the radionuclides to differentiate rutherfordium’s behavior
when running online studies.
In the speciation studies, the TEHA extracts the 89Zr and 175Hf at a 2:1 ratio. This
corresponds to the formation of the hexachloro-metal complex for each element with the 2 amine
coordinating with the complex. Since the zirconium anion complex forms at a lower acid
concentration than the hafnium complex, it extracts at the lower acid concentration that
correlates with metal complex formation. Since hafnium does not completely extract into TEHA,
it does not completely exist as the hexachloro-complex in solution and most likely has neutral
complexes present. Although information about the speciation of 239Pu was not obtained
(possibly due to polymerization), the 239Pu hexachloro-complex is assumed to have been the
extracted complex.
For TEHP, all three elements are extracted at a 1:1 ratio. This follows the expected
complex extracted, as organophosphate compounds form adducts. The extracted complex is
possibly a mixture of the neutral complexes that the three elements form as well as the neutral
acidic species in solution as the extraction continues into the higher acid concentrations.
Plutonium forms these neutral complexes more readily and at lower acid concentrations than
hafnium and zirconium. Zirconium and hafnium form neutral complexes at higher acid
concentrations and completely extract into TEHP.
65
One concerning result when looking at the applicability of these ligand systems to
transactinide studies are the kinetic result for 175Hf and 239Pu. While the TEHA equilibrium for
175Hf is reached at just under a minute, the TEHP results for 175Hf and both the TEHA and TEHP
results for 239Pu are longer than a minute, even more so for the 239Pu. This delay could possibly
be due to the complex formation of the hexachloride complex in solution, which means that only
the 89Zr results of TEHA and TEHP and the 175Hf results of TEHP could be used in online
studies of rutherfordium to further elucidate its behavior.
Since 239Pu results could not be reproduced reliably, there are a number of possible
reasons that the chemistry could be more complicated. The 239Pu could extract differently than
the 89Zr and 175Hf, possibly as a different chemical species. This may be the reason why it begins
extracting at lower hydrochloric acid concentration than the 89Zr and 175Hf. In the TEHP
extractions, all three of 89Zr, 175Hf, and 239Pu show an approximate 1:1 ligand to element
extracted ratio. Another possibility may be due to the treatment of the 239Pu solution during the
solution preparation. While initially a tracer level solution, the 239Pu concentration in the solution
may have increased to the point that some of the 239Pu had undergone polymer formation. This
would explain some of the nonlinear trends seen in Figure 4.22.
Despite some incompatible results for online studies, a separation between 89Zr, 175Hf,
and 239Pu can be reliably achieved if the extraction required does not rely on fast kinetics. This
separation can be used for stable separation between zirconium and hafnium reliably.
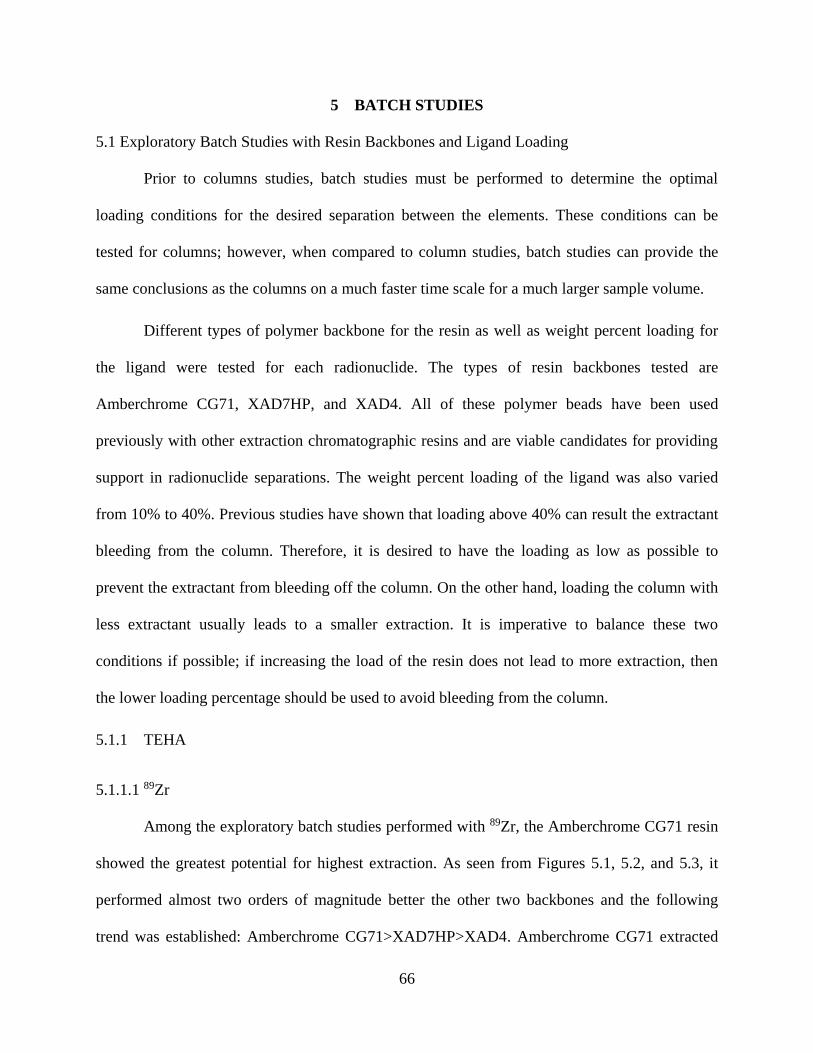
66
5 BATCH STUDIES
5.1 Exploratory Batch Studies with Resin Backbones and Ligand Loading
Prior to columns studies, batch studies must be performed to determine the optimal
loading conditions for the desired separation between the elements. These conditions can be
tested for columns; however, when compared to column studies, batch studies can provide the
same conclusions as the columns on a much faster time scale for a much larger sample volume.
Different types of polymer backbone for the resin as well as weight percent loading for
the ligand were tested for each radionuclide. The types of resin backbones tested are
Amberchrome CG71, XAD7HP, and XAD4. All of these polymer beads have been used
previously with other extraction chromatographic resins and are viable candidates for providing
support in radionuclide separations. The weight percent loading of the ligand was also varied
from 10% to 40%. Previous studies have shown that loading above 40% can result the extractant
bleeding from the column. Therefore, it is desired to have the loading as low as possible to
prevent the extractant from bleeding off the column. On the other hand, loading the column with
less extractant usually leads to a smaller extraction. It is imperative to balance these two
conditions if possible; if increasing the load of the resin does not lead to more extraction, then
the lower loading percentage should be used to avoid bleeding from the column.
5.1.1 TEHA
5.1.1.1 89Zr
Among the exploratory batch studies performed with 89Zr, the Amberchrome CG71 resin
showed the greatest potential for highest extraction. As seen from Figures 5.1, 5.2, and 5.3, it
performed almost two orders of magnitude better the other two backbones and the following
trend was established: Amberchrome CG71>XAD7HP>XAD4. Amberchrome CG71 extracted
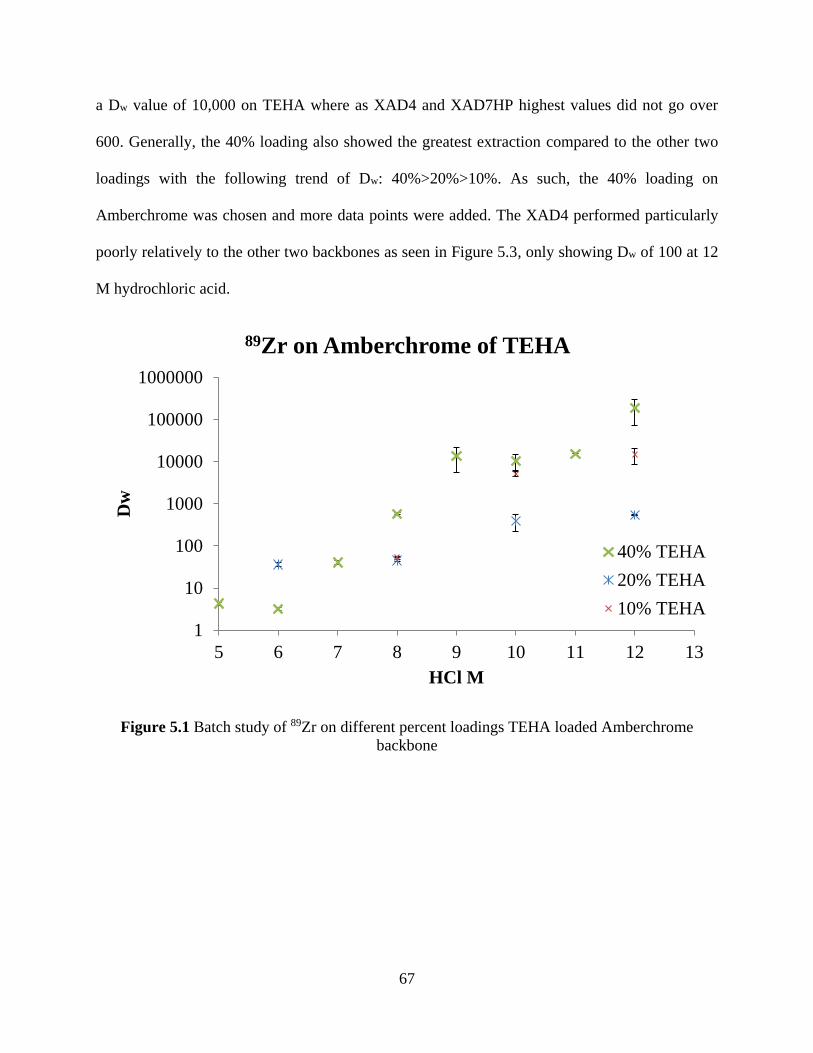
67
a Dw value of 10,000 on TEHA where as XAD4 and XAD7HP highest values did not go over
600. Generally, the 40% loading also showed the greatest extraction compared to the other two
loadings with the following trend of Dw: 40%>20%>10%. As such, the 40% loading on
Amberchrome was chosen and more data points were added. The XAD4 performed particularly
poorly relatively to the other two backbones as seen in Figure 5.3, only showing Dw of 100 at 12
M hydrochloric acid.
Figure 5.1 Batch study of 89Zr on different percent loadings TEHA loaded Amberchrome
backbone
1
10
100
1000
10000
100000
1000000
5 6 7 8 9 10 11 12 13
Dw
HCl M
89Zr on Amberchrome of TEHA
40% TEHA
20% TEHA
10% TEHA
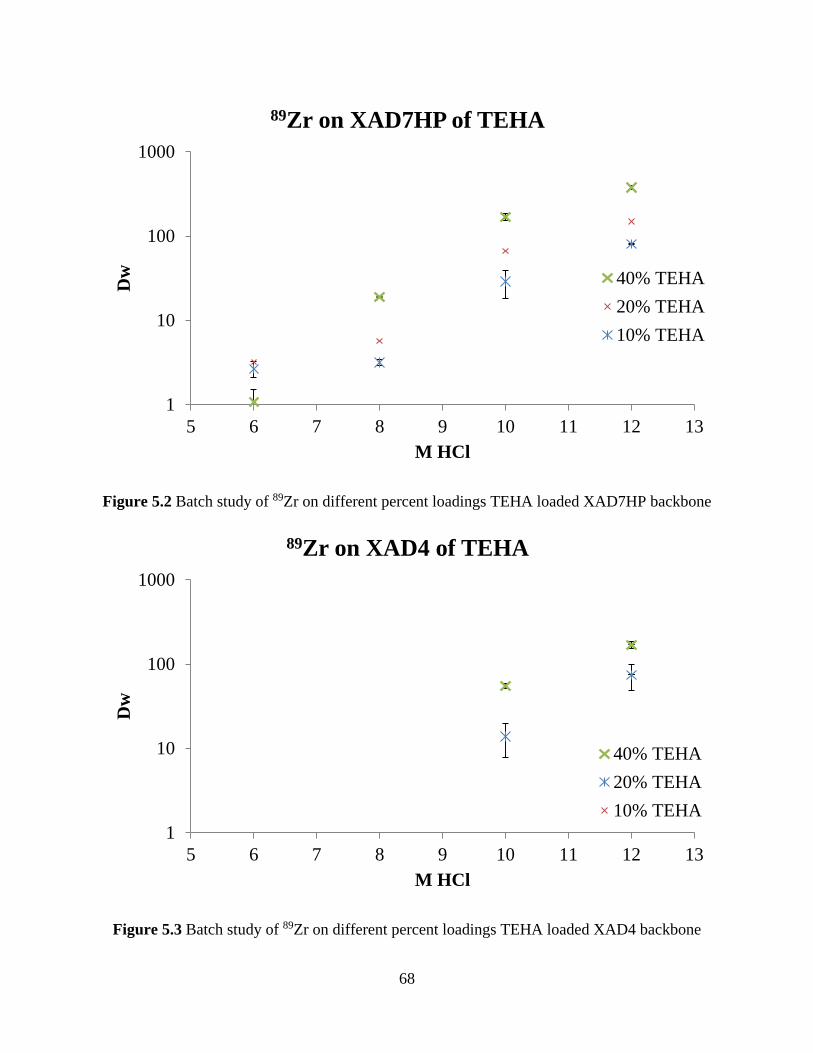
68
Figure 5.2 Batch study of 89Zr on different percent loadings TEHA loaded XAD7HP backbone
Figure 5.3 Batch study of 89Zr on different percent loadings TEHA loaded XAD4 backbone
1
10
100
1000
5 6 7 8 9 10 11 12 13
Dw
M HCl
89Zr on XAD7HP of TEHA
40% TEHA
20% TEHA
10% TEHA
1
10
100
1000
5 6 7 8 9 10 11 12 13
Dw
M HCl
89Zr on XAD4 of TEHA
40% TEHA
20% TEHA
10% TEHA
69
5.1.1.2 175Hf
Since the available 175Hf stock had such low activity (100 Bq), an extension study testing
each backbone and each loading as the ones performed for 89Zr and 239Pu was not feasible.
Instead, a scaled back version was carried out in which only the 40% loading of the three
backbones was tested. It was found that the Dw measured followed this trend: Amberchrome
CG71>XAD7HP>XAD4 (see Figure 5.4). For the XAD4, only the 12M hydrochloric acid data
point was done due to the poor performance of the resin on 89Zr. Since it extracted lower than
both the XAD7HP and Amberchrome CG71, no further trials were performed as the other two
backbones had greater extraction performance. Between the two other backbones, the
Amberchrome outperformed the XAD4HP by a small percentage. Consequently, Amberchrome
was chosen as the backbone and additional trials were added at the 7 M, 9 M, and 11 M
hydrochloric acid points along the extraction curve.
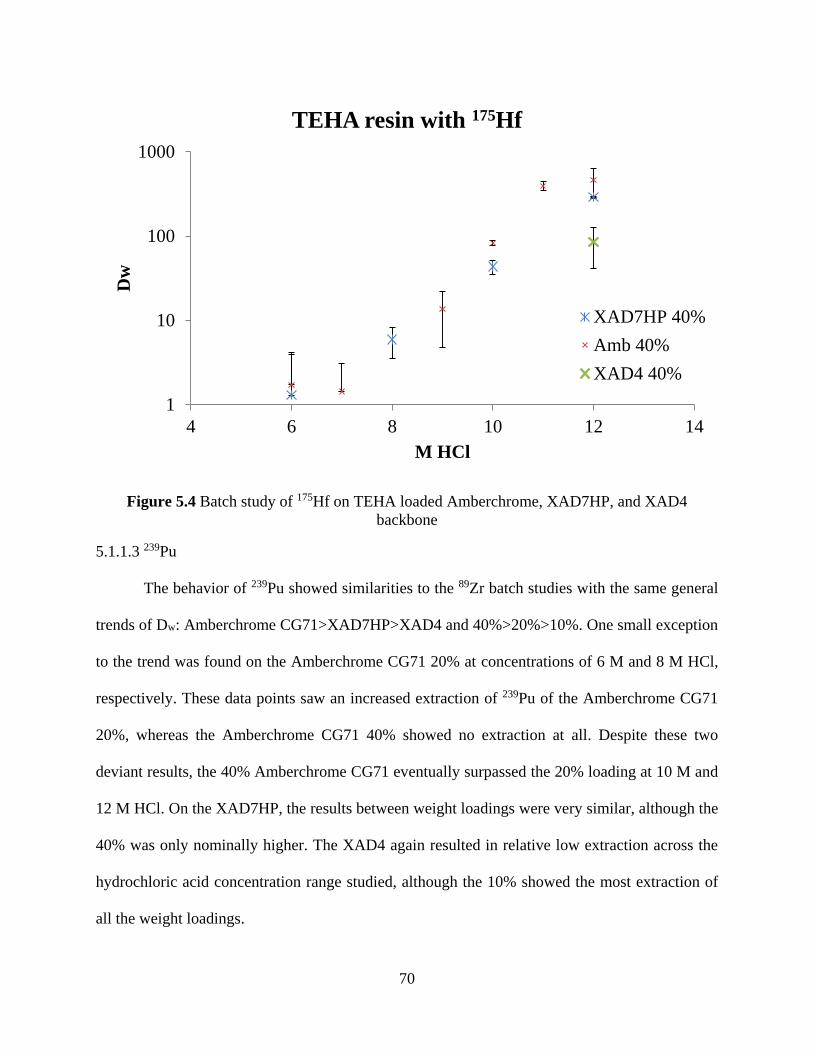
70
Figure 5.4 Batch study of 175Hf on TEHA loaded Amberchrome, XAD7HP, and XAD4
backbone
5.1.1.3 239Pu
The behavior of 239Pu showed similarities to the 89Zr batch studies with the same general
trends of Dw: Amberchrome CG71>XAD7HP>XAD4 and 40%>20%>10%. One small exception
to the trend was found on the Amberchrome CG71 20% at concentrations of 6 M and 8 M HCl,
respectively. These data points saw an increased extraction of 239Pu of the Amberchrome CG71
20%, whereas the Amberchrome CG71 40% showed no extraction at all. Despite these two
deviant results, the 40% Amberchrome CG71 eventually surpassed the 20% loading at 10 M and
12 M HCl. On the XAD7HP, the results between weight loadings were very similar, although the
40% was only nominally higher. The XAD4 again resulted in relative low extraction across the
hydrochloric acid concentration range studied, although the 10% showed the most extraction of
all the weight loadings.
1
10
100
1000
4 6 8 10 12 14
Dw
M HCl
TEHA resin with 175Hf
XAD7HP 40%
Amb 40%
XAD4 40%
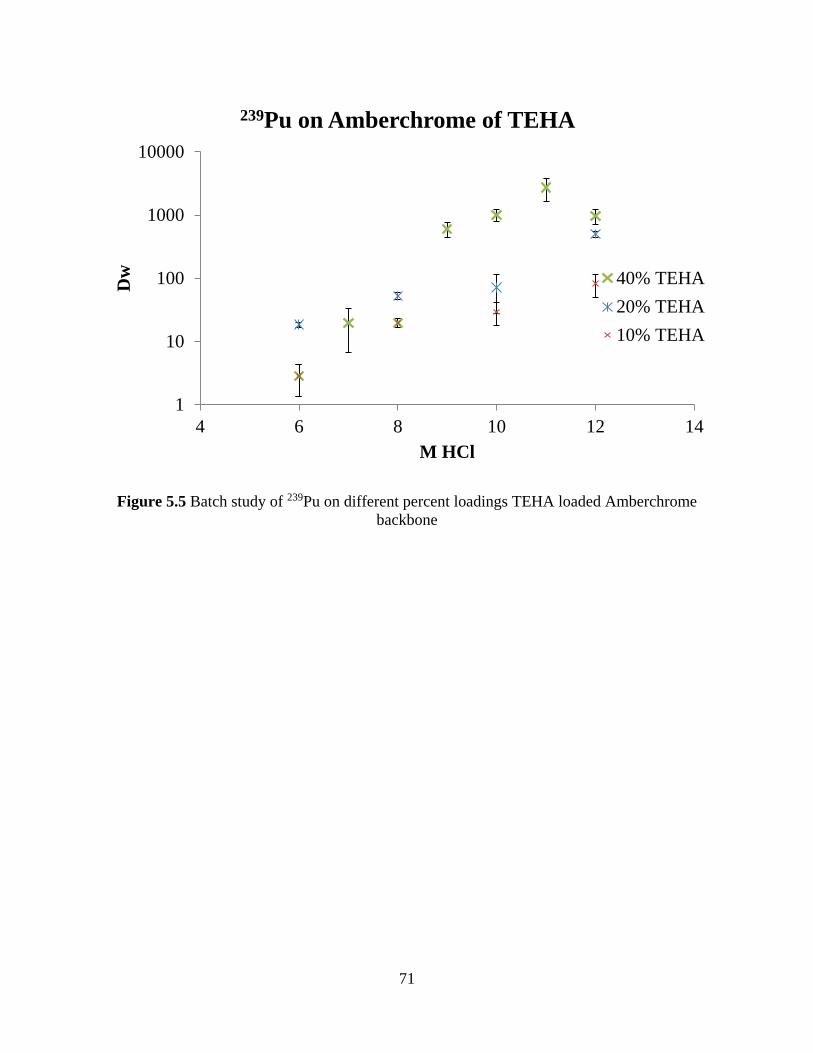
71
Figure 5.5 Batch study of 239Pu on different percent loadings TEHA loaded Amberchrome
backbone
1
10
100
1000
10000
4 6 8 10 12 14
Dw
M HCl
239Pu on Amberchrome of TEHA
40% TEHA
20% TEHA
10% TEHA
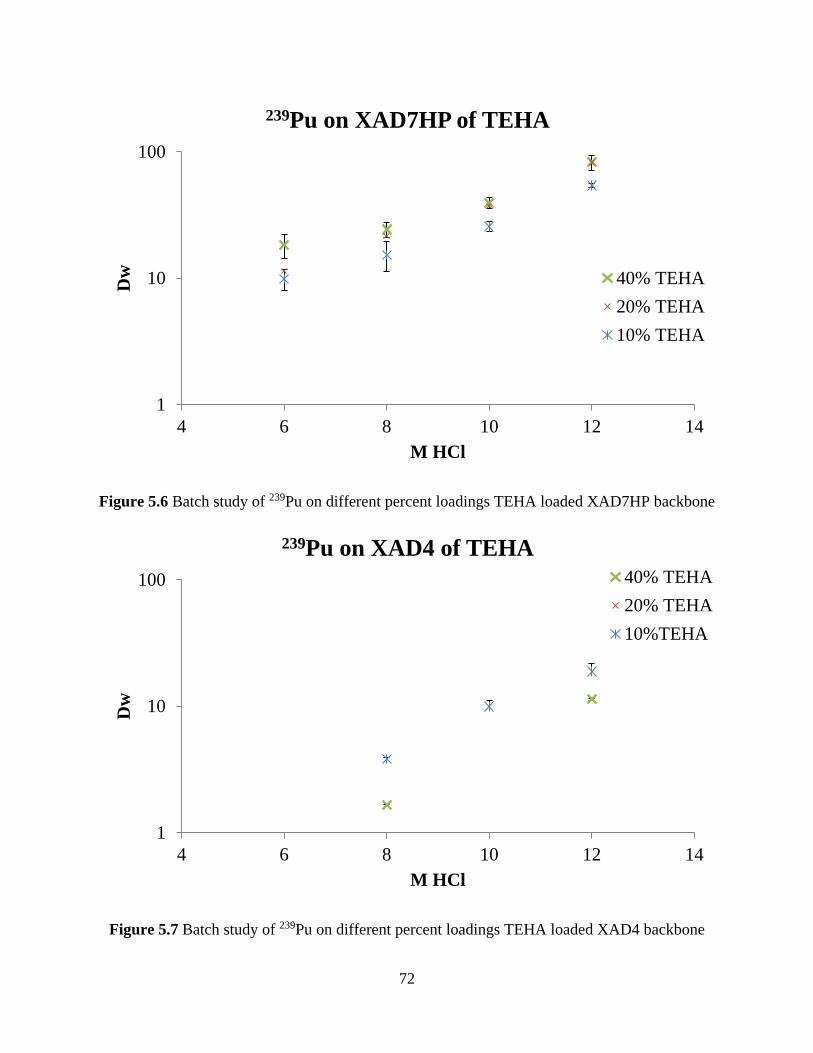
72
Figure 5.6 Batch study of 239Pu on different percent loadings TEHA loaded XAD7HP backbone
Figure 5.7 Batch study of 239Pu on different percent loadings TEHA loaded XAD4 backbone
1
10
100
4 6 8 10 12 14
Dw
M HCl
239Pu on XAD7HP of TEHA
40% TEHA
20% TEHA
10% TEHA
1
10
100
4 6 8 10 12 14
Dw
M HCl
239Pu on XAD4 of TEHA
40% TEHA
20% TEHA
10%TEHA
73
5.1.1.4 Discussion of 89Zr, 175Hf, and 239Pu Batch Studies with TEHA
From the previous results, the Amberchrome CG71 40% showed the greatest retention of
all the radionuclides to be separated and was chosen as the ideal candidate for column studies.
The behavior of 89Zr and 175Hf mirrors the solvent extraction results; however, the 239Pu batch
studies show a lower extraction potential than the 89Zr. In the solvent extraction, the 239Pu
extracted higher and at a lower hydrochloric acid concentrations than both the 89Zr and 175Hf.
The solvent extraction studies should typically predict a similar extraction behavior than is seen
in the resin batch studies. Since this is not the case, an interference, such as a steric hindrance or
plutonium polymer formation, may be inhibiting the extraction. Having two TEHA compounds
with a larger plutonium complex size may be preventing the plutonium extraction from showing
the same performance as the 89Zr and 175Hf.
Prior to the column studies, the separation factors between each radionuclide were also
determined and shown in Figure 5.8. These values help in judging how to construct the column
procedure by showing the greatest separation between the elements within the hydrochloric acid
concentration range. Also, 89Zr showed the highest retention at the lower acid concentrations and
best separation factor of 994.0 with 175Hf; this indicates that 89Zr should be eluted off last. The
239Pu also exhibited the second highest Dw and should be preferably eluted off next at a slightly
higher acid concentration. Therefore, 175Hf should be eluted first and at the highest concentration
possible without the 89Zr and239Pu bleeding through.
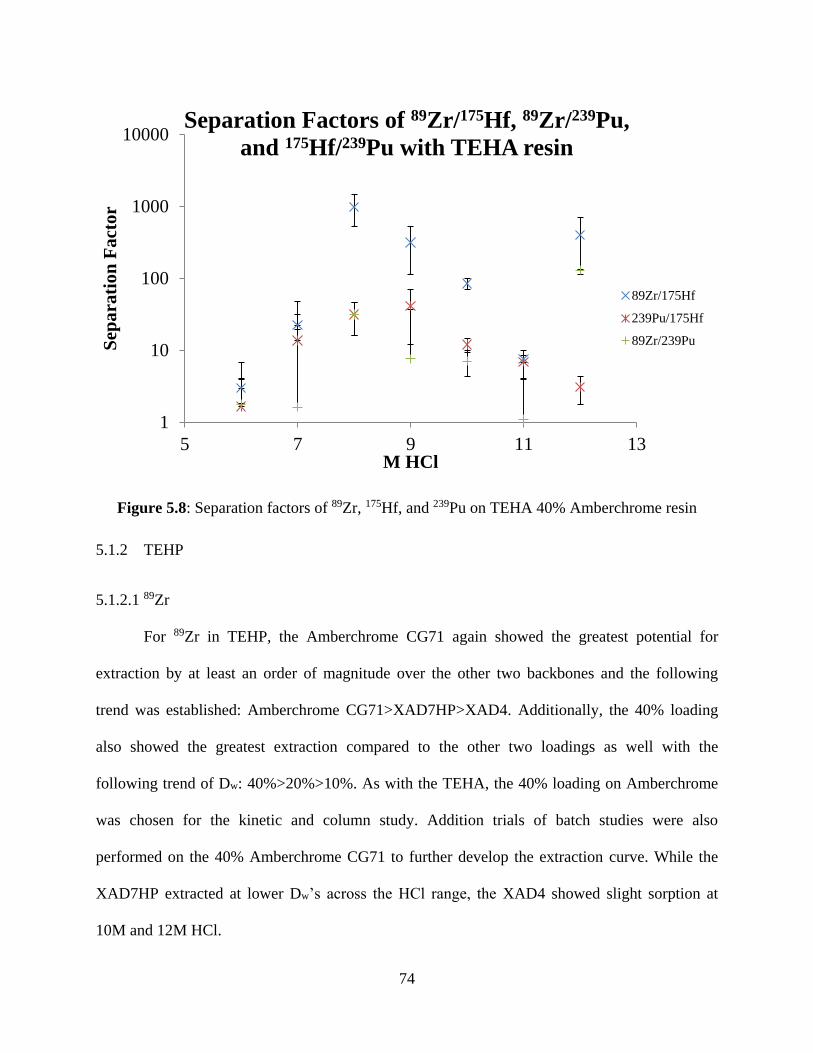
74
Figure 5.8: Separation factors of 89Zr, 175Hf, and 239Pu on TEHA 40% Amberchrome resin
5.1.2 TEHP
5.1.2.1 89Zr
For 89Zr in TEHP, the Amberchrome CG71 again showed the greatest potential for
extraction by at least an order of magnitude over the other two backbones and the following
trend was established: Amberchrome CG71>XAD7HP>XAD4. Additionally, the 40% loading
also showed the greatest extraction compared to the other two loadings as well with the
following trend of Dw: 40%>20%>10%. As with the TEHA, the 40% loading on Amberchrome
was chosen for the kinetic and column study. Addition trials of batch studies were also
performed on the 40% Amberchrome CG71 to further develop the extraction curve. While the
XAD7HP extracted at lower Dw’s across the HCl range, the XAD4 showed slight sorption at
10M and 12M HCl.
1
10
100
1000
10000
5 7 9 11 13
Sep
ara
tio
n F
act
or
M HCl
Separation Factors of 89Zr/175Hf, 89Zr/239Pu,
and 175Hf/239Pu with TEHA resin
89Zr/175Hf
239Pu/175Hf
89Zr/239Pu

75
Figure 5.9 Batch study of 89Zr on different percent loadings TEHP loaded Amberchrome
backbone
1
10
100
1000
10000
100000
1000000
4 6 8 10 12 14
Dw
M HCl
89Zr on Amberchrome of TEHP
40% TEHP
20% TEHP
10% TEHP
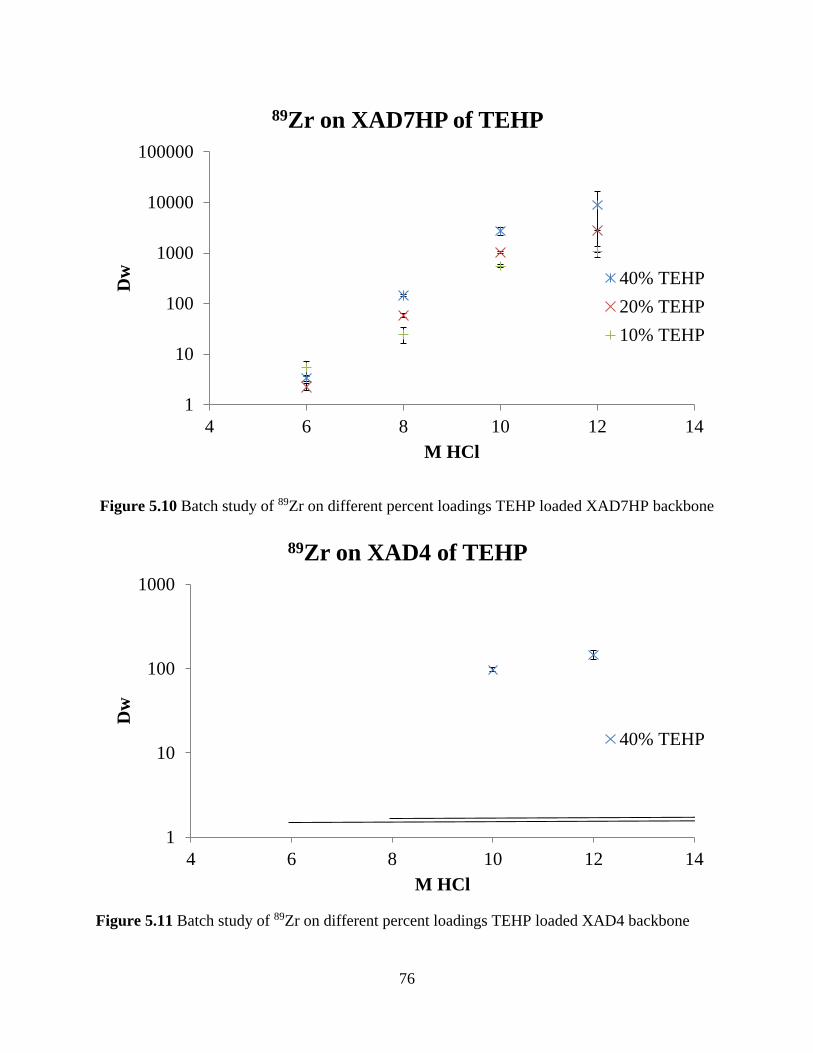
76
Figure 5.10 Batch study of 89Zr on different percent loadings TEHP loaded XAD7HP backbone
Figure 5.11 Batch study of 89Zr on different percent loadings TEHP loaded XAD4 backbone
1
10
100
1000
10000
100000
4 6 8 10 12 14
Dw
M HCl
89Zr on XAD7HP of TEHP
40% TEHP
20% TEHP
10% TEHP
1
10
100
1000
4 6 8 10 12 14
Dw
M HCl
89Zr on XAD4 of TEHP
40% TEHP
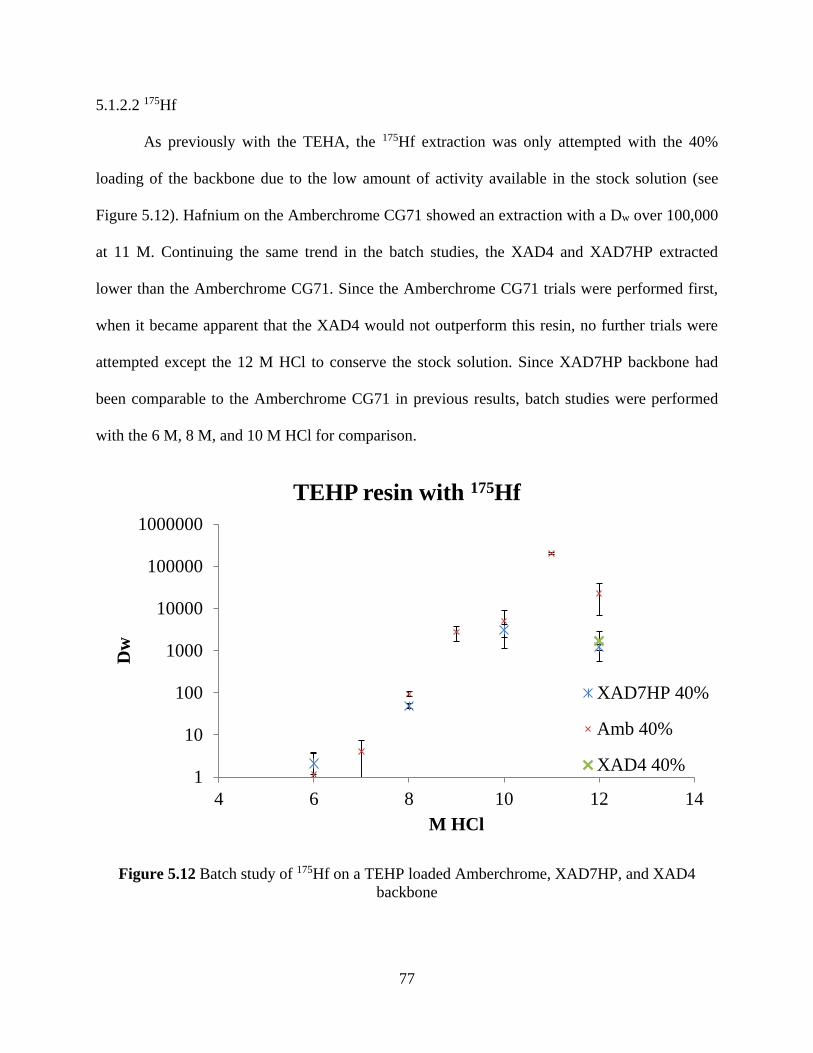
77
5.1.2.2 175Hf
As previously with the TEHA, the 175Hf extraction was only attempted with the 40%
loading of the backbone due to the low amount of activity available in the stock solution (see
Figure 5.12). Hafnium on the Amberchrome CG71 showed an extraction with a Dw over 100,000
at 11 M. Continuing the same trend in the batch studies, the XAD4 and XAD7HP extracted
lower than the Amberchrome CG71. Since the Amberchrome CG71 trials were performed first,
when it became apparent that the XAD4 would not outperform this resin, no further trials were
attempted except the 12 M HCl to conserve the stock solution. Since XAD7HP backbone had
been comparable to the Amberchrome CG71 in previous results, batch studies were performed
with the 6 M, 8 M, and 10 M HCl for comparison.
Figure 5.12 Batch study of 175Hf on a TEHP loaded Amberchrome, XAD7HP, and XAD4
backbone
1
10
100
1000
10000
100000
1000000
4 6 8 10 12 14
Dw
M HCl
TEHP resin with 175Hf
XAD7HP 40%
Amb 40%
XAD4 40%
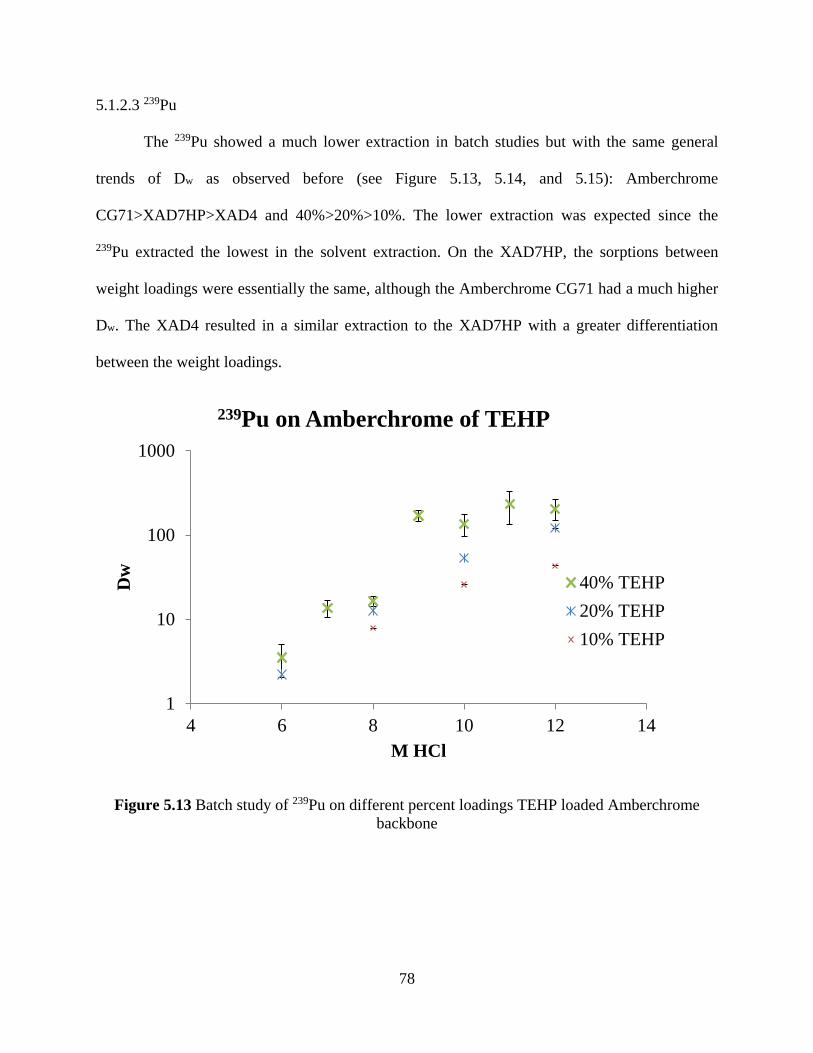
78
5.1.2.3 239Pu
The 239Pu showed a much lower extraction in batch studies but with the same general
trends of Dw as observed before (see Figure 5.13, 5.14, and 5.15): Amberchrome
CG71>XAD7HP>XAD4 and 40%>20%>10%. The lower extraction was expected since the
239Pu extracted the lowest in the solvent extraction. On the XAD7HP, the sorptions between
weight loadings were essentially the same, although the Amberchrome CG71 had a much higher
Dw. The XAD4 resulted in a similar extraction to the XAD7HP with a greater differentiation
between the weight loadings.
Figure 5.13 Batch study of 239Pu on different percent loadings TEHP loaded Amberchrome
backbone
1
10
100
1000
4 6 8 10 12 14
Dw
M HCl
239Pu on Amberchrome of TEHP
40% TEHP
20% TEHP
10% TEHP
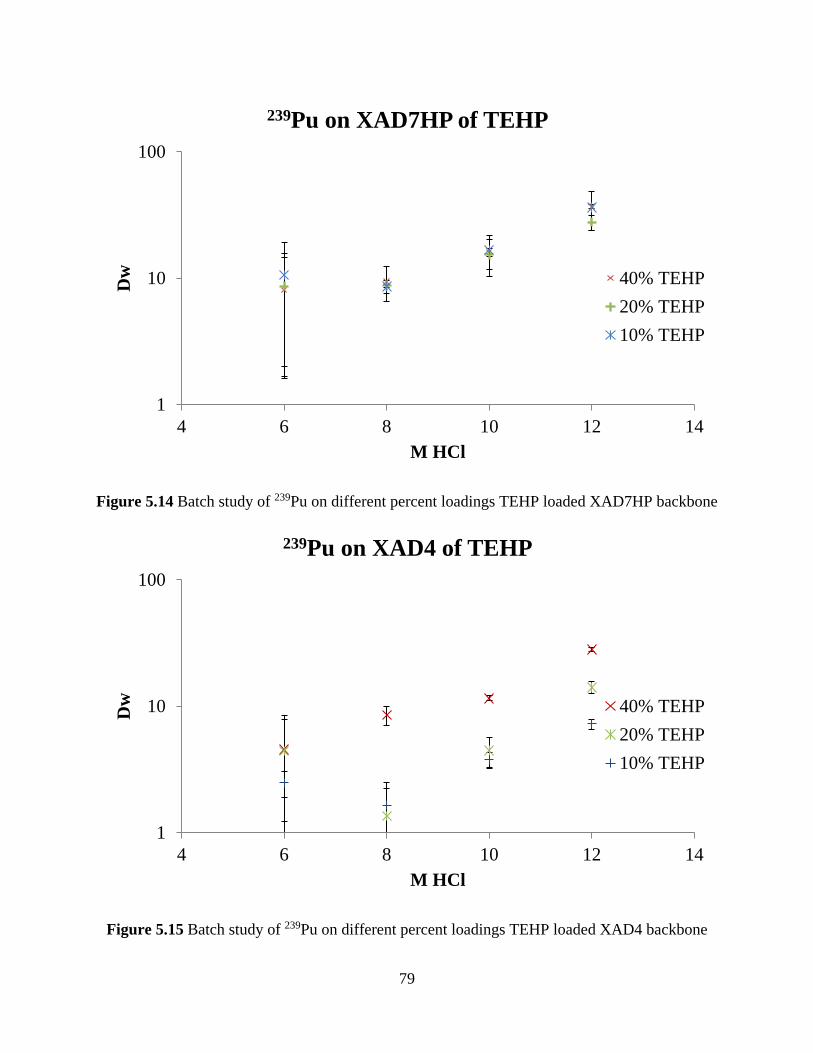
79
Figure 5.14 Batch study of 239Pu on different percent loadings TEHP loaded XAD7HP backbone
Figure 5.15 Batch study of 239Pu on different percent loadings TEHP loaded XAD4 backbone
1
10
100
4 6 8 10 12 14
Dw
M HCl
239Pu on XAD7HP of TEHP
40% TEHP
20% TEHP
10% TEHP
1
10
100
4 6 8 10 12 14
Dw
M HCl
239Pu on XAD4 of TEHP
40% TEHP
20% TEHP
10% TEHP
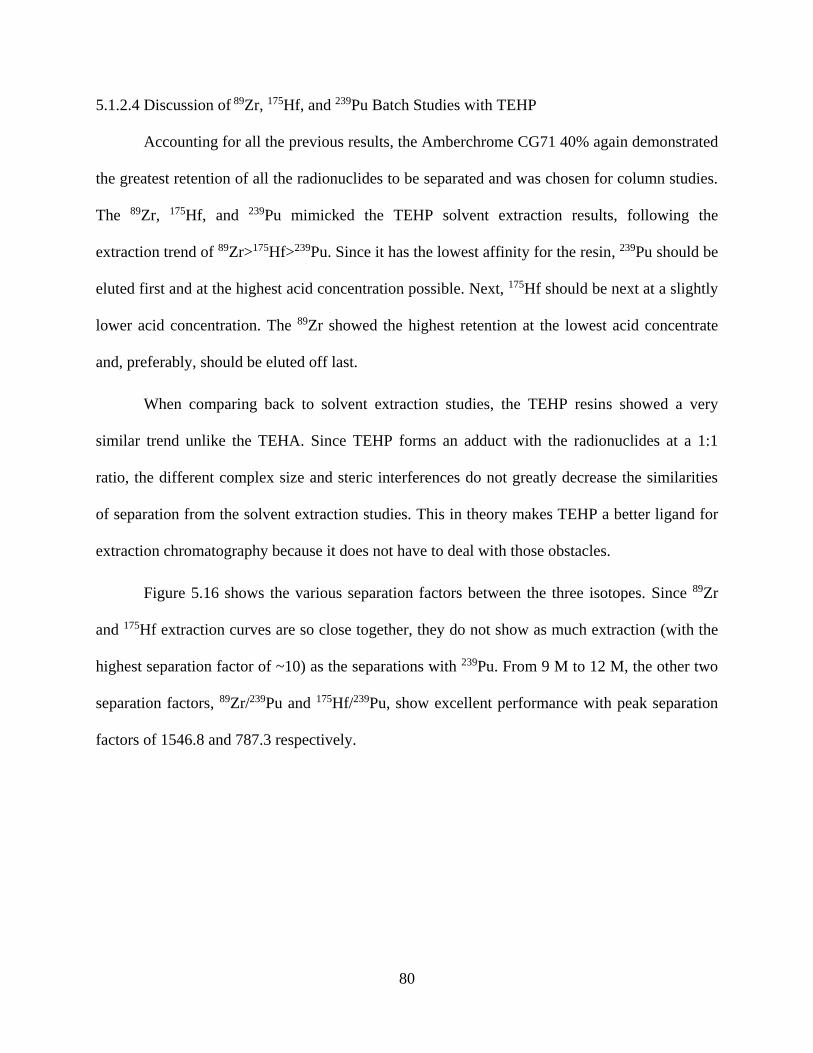
80
5.1.2.4 Discussion of 89Zr, 175Hf, and 239Pu Batch Studies with TEHP
Accounting for all the previous results, the Amberchrome CG71 40% again demonstrated
the greatest retention of all the radionuclides to be separated and was chosen for column studies.
The 89Zr, 175Hf, and 239Pu mimicked the TEHP solvent extraction results, following the
extraction trend of 89Zr>175Hf>239Pu. Since it has the lowest affinity for the resin, 239Pu should be
eluted first and at the highest acid concentration possible. Next, 175Hf should be next at a slightly
lower acid concentration. The 89Zr showed the highest retention at the lowest acid concentrate
and, preferably, should be eluted off last.
When comparing back to solvent extraction studies, the TEHP resins showed a very
similar trend unlike the TEHA. Since TEHP forms an adduct with the radionuclides at a 1:1
ratio, the different complex size and steric interferences do not greatly decrease the similarities
of separation from the solvent extraction studies. This in theory makes TEHP a better ligand for
extraction chromatography because it does not have to deal with those obstacles.
Figure 5.16 shows the various separation factors between the three isotopes. Since 89Zr
and 175Hf extraction curves are so close together, they do not show as much extraction (with the
highest separation factor of ~10) as the separations with 239Pu. From 9 M to 12 M, the other two
separation factors, 89Zr/239Pu and 175Hf/239Pu, show excellent performance with peak separation
factors of 1546.8 and 787.3 respectively.
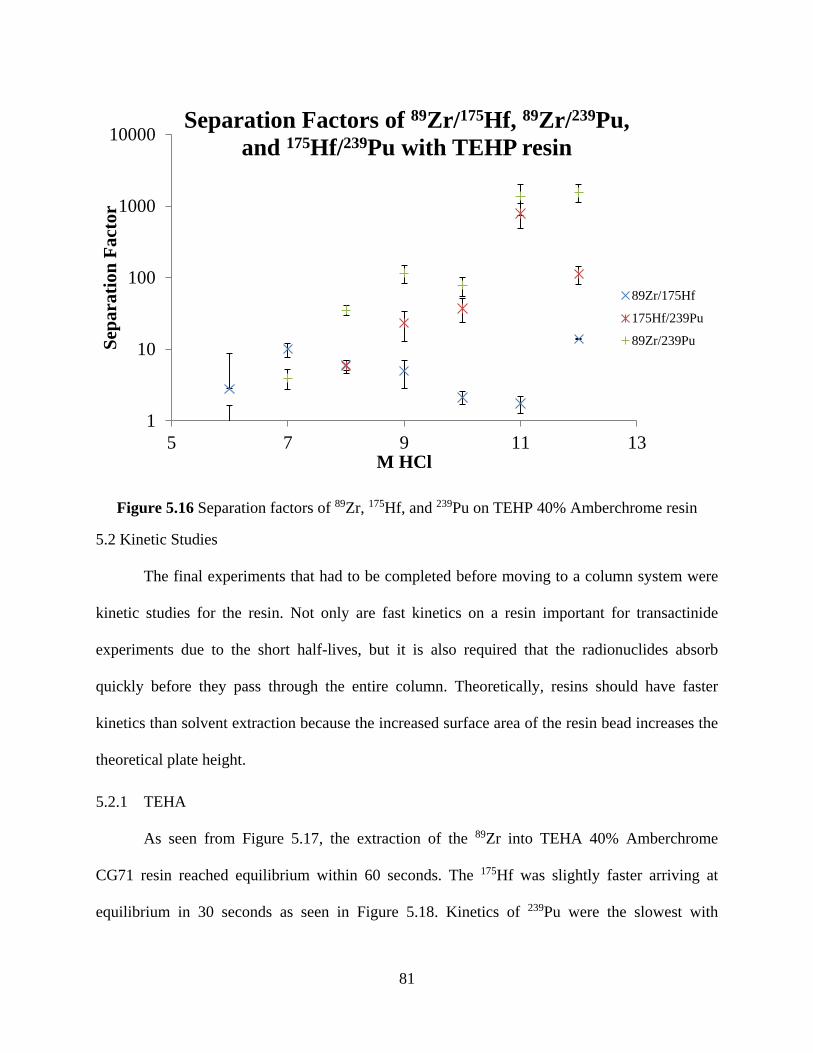
81
Figure 5.16 Separation factors of 89Zr, 175Hf, and 239Pu on TEHP 40% Amberchrome resin
5.2 Kinetic Studies
The final experiments that had to be completed before moving to a column system were
kinetic studies for the resin. Not only are fast kinetics on a resin important for transactinide
experiments due to the short half-lives, but it is also required that the radionuclides absorb
quickly before they pass through the entire column. Theoretically, resins should have faster
kinetics than solvent extraction because the increased surface area of the resin bead increases the
theoretical plate height.
5.2.1 TEHA
As seen from Figure 5.17, the extraction of the 89Zr into TEHA 40% Amberchrome
CG71 resin reached equilibrium within 60 seconds. The 175Hf was slightly faster arriving at
equilibrium in 30 seconds as seen in Figure 5.18. Kinetics of 239Pu were the slowest with
1
10
100
1000
10000
5 7 9 11 13
Sep
ara
tio
n F
act
or
M HCl
Separation Factors of 89Zr/175Hf, 89Zr/239Pu,
and 175Hf/239Pu with TEHP resin
89Zr/175Hf
175Hf/239Pu
89Zr/239Pu
82
equilibrium not being reached until 30 minutes (see Figure 5.19). This is assumed from the fact
that the 239Pu had not matched the extraction levels in the kinetics study that were reached in the
batch study with a mixing time of 30 minutes.
Figure 5.17 Kinetics of 89Zr on TEHA Amberchrome in 12 M HCl
1
10
100
1000
10000
100000
0 10 20 30 40 50 60 70
Dw
Mixing Time (sec)
Kinetics of 89Zr on TEHA Amberchrome in 12
M HCl
TEHA
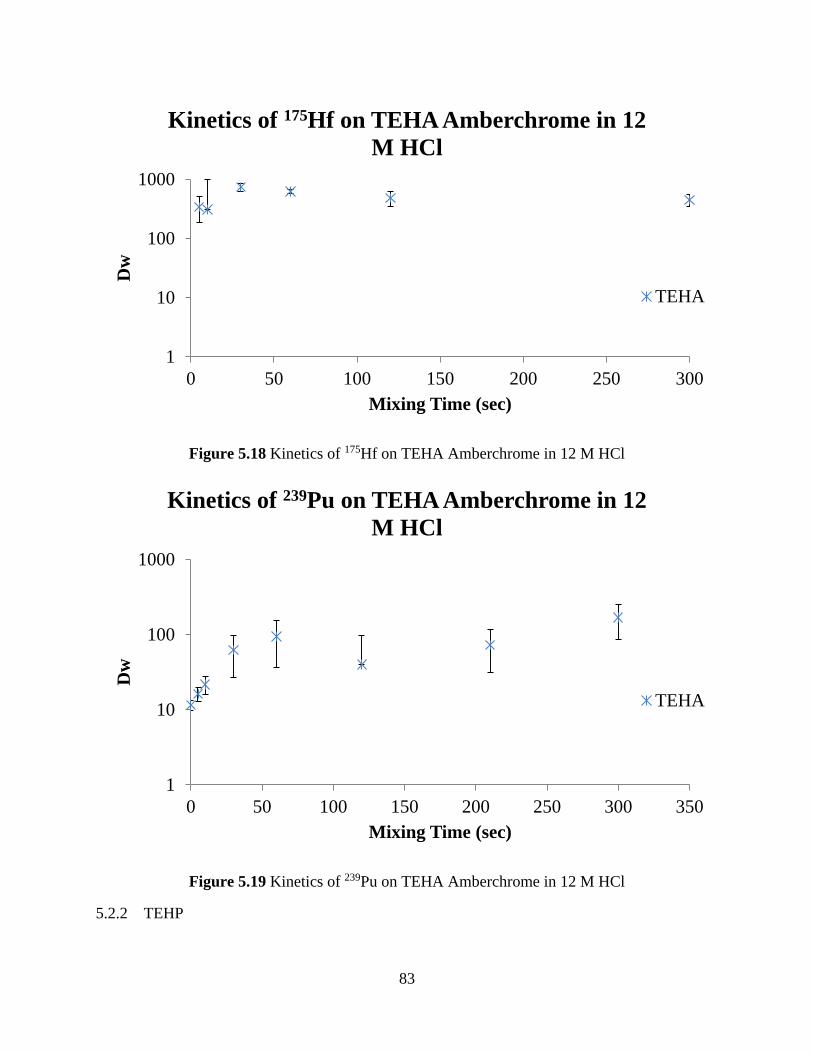
83
Figure 5.18 Kinetics of 175Hf on TEHA Amberchrome in 12 M HCl
Figure 5.19 Kinetics of 239Pu on TEHA Amberchrome in 12 M HCl
5.2.2 TEHP
1
10
100
1000
0 50 100 150 200 250 300
Dw
Mixing Time (sec)
Kinetics of 175Hf on TEHA Amberchrome in 12
M HCl
TEHA
1
10
100
1000
0 50 100 150 200 250 300 350
Dw
Mixing Time (sec)
Kinetics of 239Pu on TEHA Amberchrome in 12
M HCl
TEHA

84
TEHP showed faster kinetics compared to TEHA for all three radionuclides. The 89Zr
extracted into TEHP the fastest with its equilibrium reached within 5 seconds (see Figure 5.20); a
trial was completed with no mixing and this resulted in almost complete extraction as well. The
175Hf was slower as shown in Figure 5.21. It took about 120 seconds to arrive at equilibrium.
Again, the kinetics of 239Pu required the longest equilibrium time, taking up to 30 minutes as
seen in Figure 5.22. This is assumed based on the fact that the 239Pu had not finished extracting
in the 5 minute timeframe of the kinetic study and the original mixing time for extraction of
239Pu was 30 minutes.
Figure 5.20 Kinetics of 89Zr on TEHP Amberchrome in 12 M HCl
1
10
100
1000
10000
100000
0 10 20 30 40 50 60 70
Dw
Mixing Time (sec)
Kinetics of 89Zr on TEHP Amberchrome in 12
M HCl
TEHP
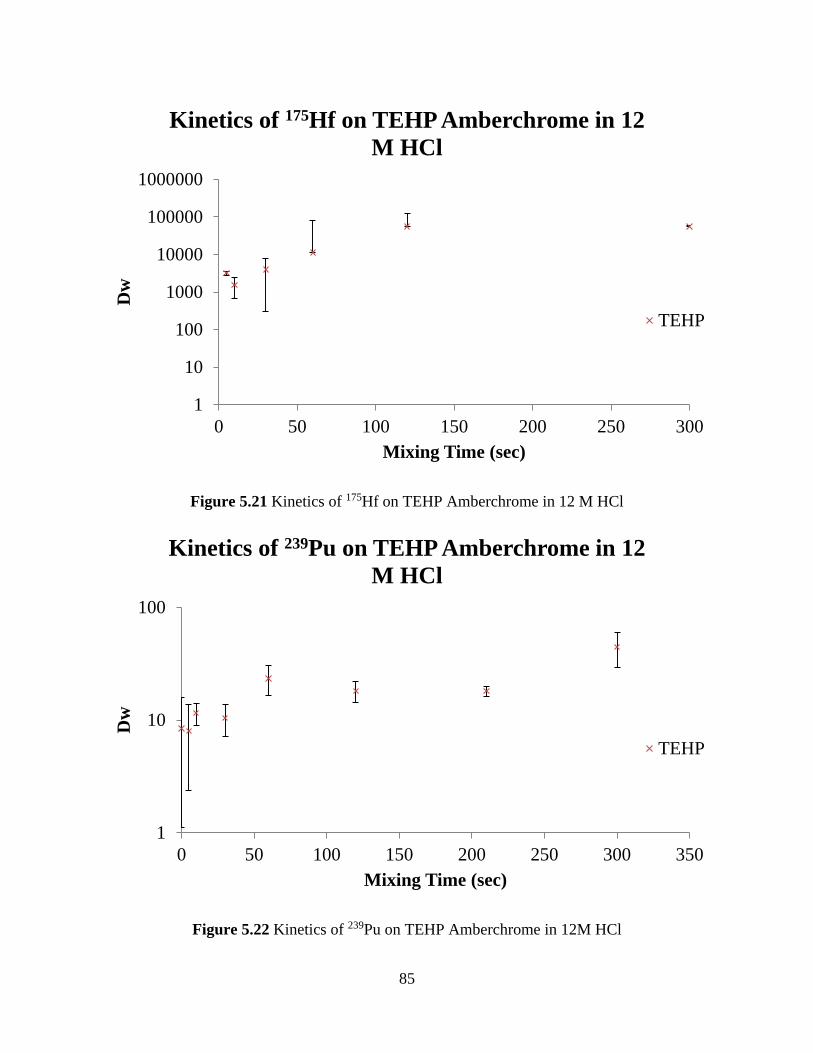
85
Figure 5.21 Kinetics of 175Hf on TEHP Amberchrome in 12 M HCl
Figure 5.22 Kinetics of 239Pu on TEHP Amberchrome in 12M HCl
1
10
100
1000
10000
100000
1000000
0 50 100 150 200 250 300
Dw
Mixing Time (sec)
Kinetics of 175Hf on TEHP Amberchrome in 12
M HCl
TEHP
1
10
100
0 50 100 150 200 250 300 350
Dw
Mixing Time (sec)
Kinetics of 239Pu on TEHP Amberchrome in 12
M HCl
TEHP
86
5.2.3 Discussion
The TEHA kinetics showed a reasonable result that would predict successful operation of
a column and potential for its use in a transactinide experiment with 89Zr and 175Hf, with a 60
second and 30 second equilibrium, respectively. However, the 239Pu kinetics do not lend itself to
the successful operation of a rapid column. Again, the possibility of 239Pu’s different chemistry
and steric interferences may be interfering with the relatively rapid uptake compared to 89Zr and
175Hf. The TEHP kinetics show a similar trend, with the 175Hf kinetics being slightly slower at
120 seconds and the 89Zr being much faster at 5 seconds. The same conclusion for 239Pu behavior
on TEHP can be reached; an interference is preventing the239Pu from sorbing to the resin
quickly.
The dissimilar kinetics of 89Zr and 175Hf on the two resins raises an interesting caveat
about the possible chemistries that are occuring. Intriguingly, 89Zr is slower than 175Hf on the
TEHA yet faster than 175Hf on the TEHP. With the 89Zr and 175Hf bearing almost identical
chemical behavior in solution, the variation in the kinetics would point to the slight anion
complex size difference that 89Zr and 175Hf form. The small divergence in the complex radius can
lead to large deviations in extraction behavior on resins due to the requirements of the ligand
coordination with the extracted species. This would explain the differences in the kinetics
behavior.
87
6 COLUMN STUDIES
Two preliminary studies were performed for TEHA and TEHP each to investigate the
column elution behavior of each of the radionuclides studied and to allow for comparison with
the batch studies. The columns were set up and prepared as described in the Methods chapter.
After the stock solution was added in 11 M HCl, more acid was passed through the column in 1
mL increments. The concentration of hydrochloric acid was decreased by 1 M for each
subsequent increment. This continued until the concentration reached 6 M. Looking at the
results, 239Pu had a large percentage (50%) bleed through almost immediately in the first fraction
and then the rest (50%) eluted off in the 6 M fraction for both ligands. For both TEHA and
TEHP, 175Hf had a small amount (~5%) of breakthrough in the load and wash fraction with most
of it (~80%) eluting off at 7 M hydrochloric acid and a small amount in the 6 M hydrochloric
acid. The 89Zr showed a somewhat similar result, with only a very small percent (1 to 2 %)
breaking through in the first fraction, a small amount (~10%) in the 7 M hydrochloric acid, and
the rest being eluted off with 6 M hydrochloric acid.
Therefore, two column separation strategies were designed based on these results. For the
first, it would be attempted to elute 239Pu in the first fraction of 2 mL of 11 M hydrochloric acid;
175Hf would come off the column in 2 mL of 7 M HCl; and 89Zr would be eluted off in the 6 M
HCl. In the second strategy, the 239Pu elution again would be attempted in the first fraction of 2
mL of 11 M hydrochloric acid; 175Hf would come off first in 2 mL of 6 M hydrochloric acid; and
89Zr would elute later in the subsequent fractions of 6 M hydrochloric acid.
6.1 Column Elution with 11 M HCl, 7 M HCl, and 6 M HCl
The column featuring the TEHA resin showed the expected elution behavior as seen in
Figure 6.1. A 40% of the 239Pu broke through the column and a small percentage throughout the
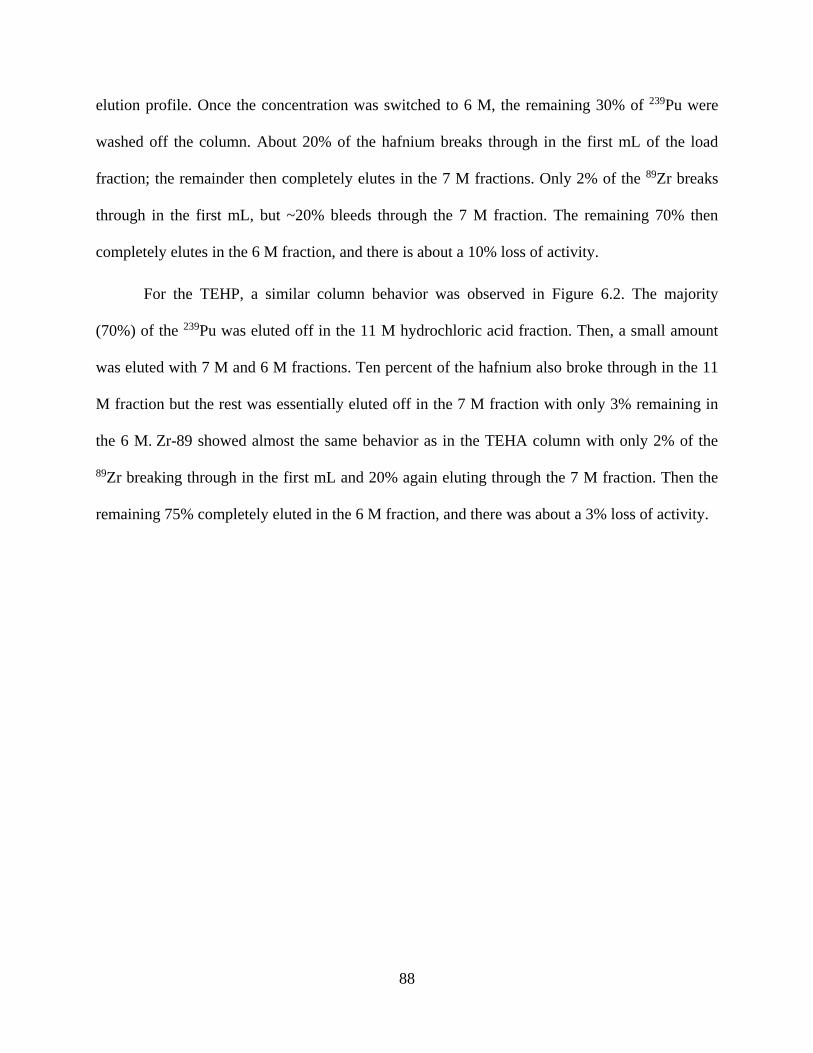
88
elution profile. Once the concentration was switched to 6 M, the remaining 30% of 239Pu were
washed off the column. About 20% of the hafnium breaks through in the first mL of the load
fraction; the remainder then completely elutes in the 7 M fractions. Only 2% of the 89Zr breaks
through in the first mL, but ~20% bleeds through the 7 M fraction. The remaining 70% then
completely elutes in the 6 M fraction, and there is about a 10% loss of activity.
For the TEHP, a similar column behavior was observed in Figure 6.2. The majority
(70%) of the 239Pu was eluted off in the 11 M hydrochloric acid fraction. Then, a small amount
was eluted with 7 M and 6 M fractions. Ten percent of the hafnium also broke through in the 11
M fraction but the rest was essentially eluted off in the 7 M fraction with only 3% remaining in
the 6 M. Zr-89 showed almost the same behavior as in the TEHA column with only 2% of the
89Zr breaking through in the first mL and 20% again eluting through the 7 M fraction. Then the
remaining 75% completely eluted in the 6 M fraction, and there was about a 3% loss of activity.
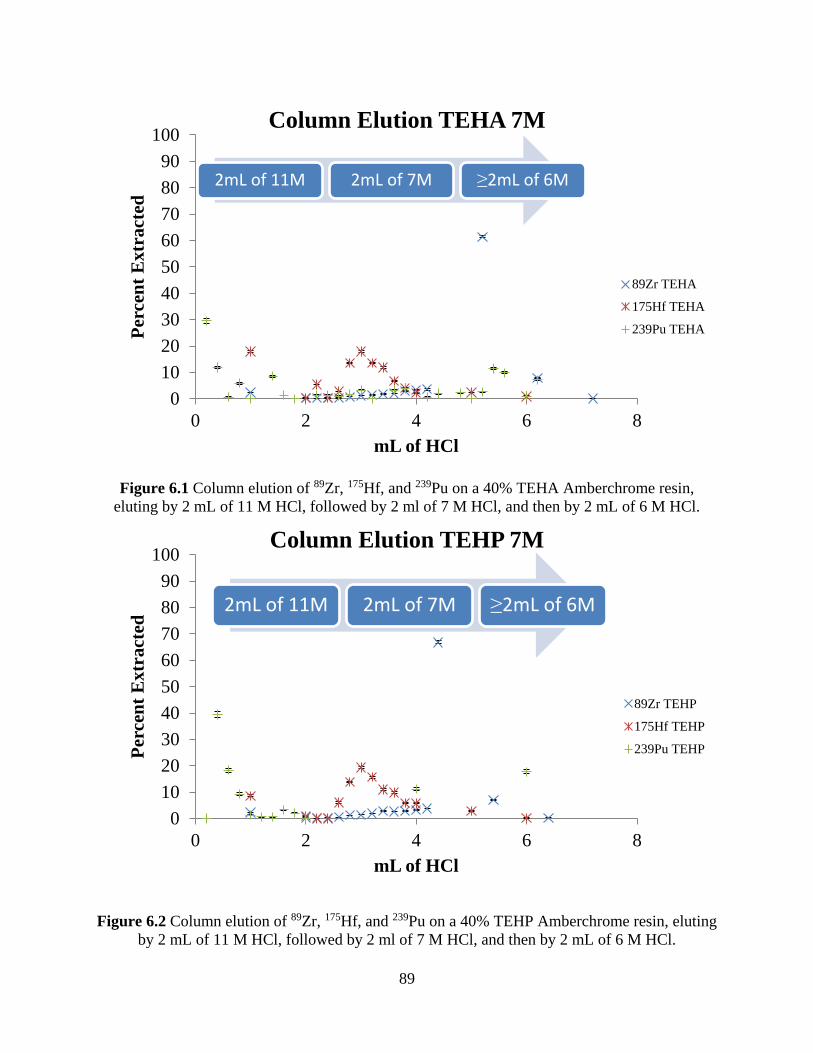
89
Figure 6.1 Column elution of 89Zr, 175Hf, and 239Pu on a 40% TEHA Amberchrome resin,
eluting by 2 mL of 11 M HCl, followed by 2 ml of 7 M HCl, and then by 2 mL of 6 M HCl.
Figure 6.2 Column elution of 89Zr, 175Hf, and 239Pu on a 40% TEHP Amberchrome resin, eluting
by 2 mL of 11 M HCl, followed by 2 ml of 7 M HCl, and then by 2 mL of 6 M HCl.
0
10
20
30
40
50
60
70
80
90
100
0 2 4 6 8
Per
cen
t E
xtr
act
ed
mL of HCl
Column Elution TEHA 7M
89Zr TEHA
175Hf TEHA
239Pu TEHA
0
10
20
30
40
50
60
70
80
90
100
0 2 4 6 8
Per
cen
t E
xtr
act
ed
mL of HCl
Column Elution TEHP 7M
89Zr TEHP
175Hf TEHP
239Pu TEHP
2mL of 11M 2mL of 7M ≥2mL of 6M
2mL of 11M 2mL of 7M ≥2mL of 6M

90
6.2 Column Elution with 11M HCl and 6M HCl
The results from the TEHA column elution with the 2mL of 11 M hydrochloric acid and
≥2 mL elution of 6 M is shown in Figure 6.3. Forty-one percent of the 239Pu eluted off in the first
2 mL of 11 M hydrochloric acid with a peak in the first 0.6 mL and then slowly off in the next 2
mL of 6 M hydrochloric acid. About 10% of the 175Hf came off in the initial 11 M of
hydrochloric acid with the rest coming off around the 2.6 mL elution. The 89Zr behaved
identically to the 175Hf and showed no separation between the two.
For the TEHP (Figure 6.4), 85% of the 239Pu eluted off in the first 2 mL of 11 M
hydrochloric acid with a peak in the first 0.6 mL and then the remainder was again slowly eluted
off in the next 2 mL of 6 M hydrochloric acid. Four percent of the 175Hf came off in the initial 11
M of hydrochloric acid with the rest coming off after approximately the 0.6 mL of 6 M of
hydrochloric acid had been passed through the column. The 89Zr behaved again identically to the
175Hf and almost no separation was achieved between the two elements.
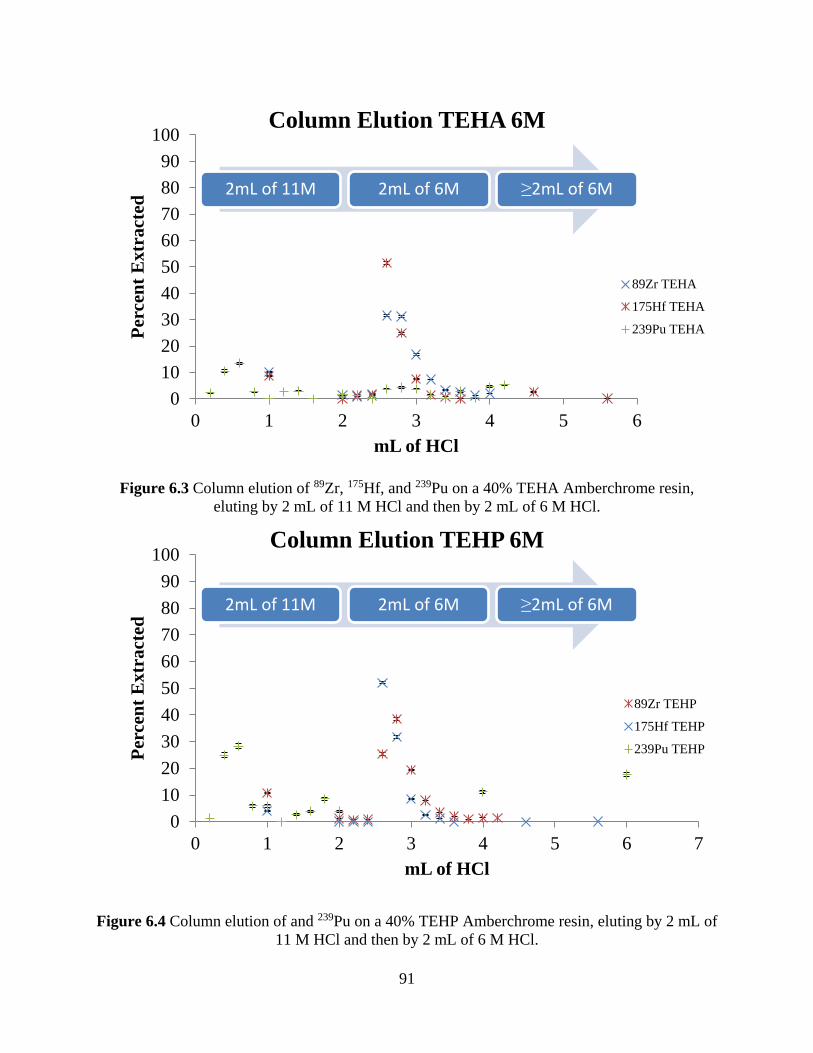
91
Figure 6.3 Column elution of 89Zr, 175Hf, and 239Pu on a 40% TEHA Amberchrome resin,
eluting by 2 mL of 11 M HCl and then by 2 mL of 6 M HCl.
Figure 6.4 Column elution of and 239Pu on a 40% TEHP Amberchrome resin, eluting by 2 mL of
11 M HCl and then by 2 mL of 6 M HCl.
0
10
20
30
40
50
60
70
80
90
100
0 1 2 3 4 5 6
Per
cen
t E
xtr
act
ed
mL of HCl
Column Elution TEHA 6M
89Zr TEHA
175Hf TEHA
239Pu TEHA
0
10
20
30
40
50
60
70
80
90
100
0 1 2 3 4 5 6 7
Per
cen
t E
xtr
act
ed
mL of HCl
Column Elution TEHP 6M
89Zr TEHP
175Hf TEHP
239Pu TEHP
2mL of 11M 2mL of 6M ≥2mL of 6M
2mL of 11M 2mL of 6M ≥2mL of 6M
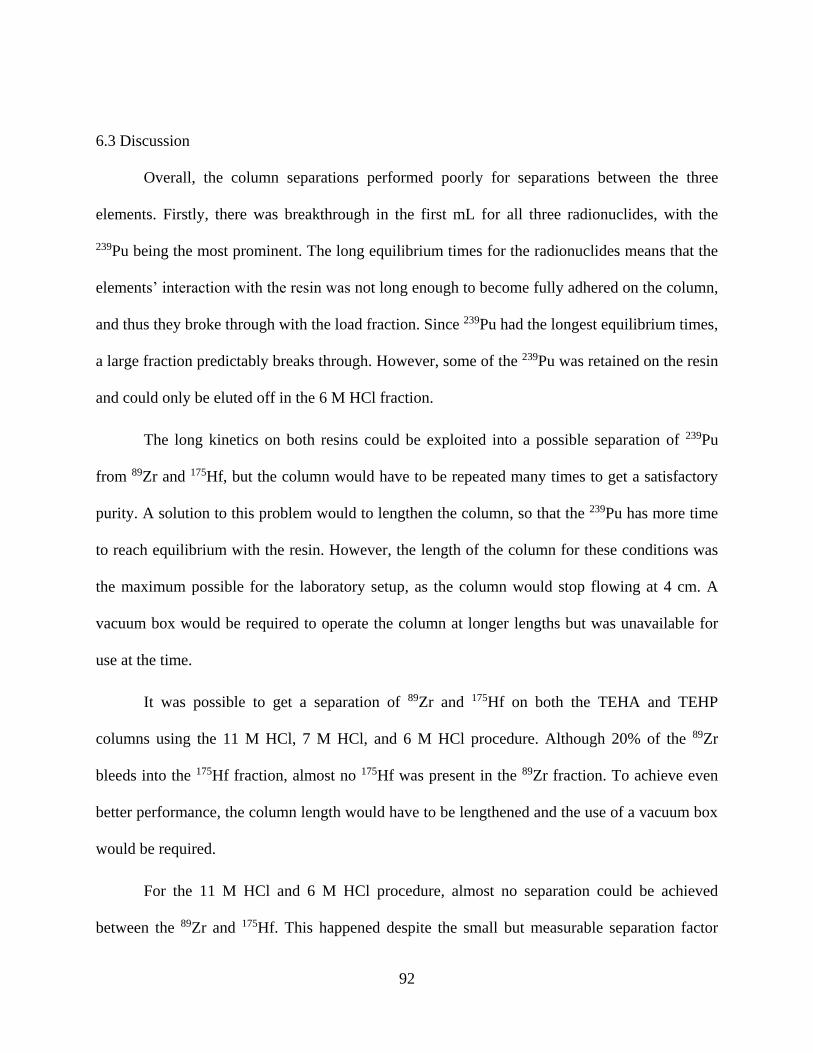
92
6.3 Discussion
Overall, the column separations performed poorly for separations between the three
elements. Firstly, there was breakthrough in the first mL for all three radionuclides, with the
239Pu being the most prominent. The long equilibrium times for the radionuclides means that the
elements’ interaction with the resin was not long enough to become fully adhered on the column,
and thus they broke through with the load fraction. Since 239Pu had the longest equilibrium times,
a large fraction predictably breaks through. However, some of the 239Pu was retained on the resin
and could only be eluted off in the 6 M HCl fraction.
The long kinetics on both resins could be exploited into a possible separation of 239Pu
from 89Zr and 175Hf, but the column would have to be repeated many times to get a satisfactory
purity. A solution to this problem would to lengthen the column, so that the 239Pu has more time
to reach equilibrium with the resin. However, the length of the column for these conditions was
the maximum possible for the laboratory setup, as the column would stop flowing at 4 cm. A
vacuum box would be required to operate the column at longer lengths but was unavailable for
use at the time.
It was possible to get a separation of 89Zr and 175Hf on both the TEHA and TEHP
columns using the 11 M HCl, 7 M HCl, and 6 M HCl procedure. Although 20% of the 89Zr
bleeds into the 175Hf fraction, almost no 175Hf was present in the 89Zr fraction. To achieve even
better performance, the column length would have to be lengthened and the use of a vacuum box
would be required.
For the 11 M HCl and 6 M HCl procedure, almost no separation could be achieved
between the 89Zr and 175Hf. This happened despite the small but measurable separation factor

93
between 89Zr and 175Hf that was determined in the batch studies. To exploit this small separation
factor, the column would have to be lengthened so that the elements would separate from each
other thoroughly. At the current column length this could not be achieved.
94
7 CONCLUSIONS
7.1 Solvent Extraction
The solvent extraction studies carried out to evaluate the potential of TEHA and TEHP to
be used in a rutherfordium experiment were semi-successful. It would however not be possible to
compare the behavior of rutherfordium with 239Pu due to its long kinetics with TEHA and TEHP.
However, with 89Zr and 175Hf, it is possible to compare the data to a rutherfordium experiment,
especially with the TEHA. A large separation factor between 89Zr and 175Hf with kinetics faster
than a minute allows for the
For the TEHP, 89Zr and 175Hf show a similar trend of extraction with smaller separation
factors between the two but a higher percent extracted into the organic phase when compared to
TEHA. The kinetics for 89Zr are much faster at five seconds but 175Hf takes up to two minutes to
reach equilibrium. The hafnium kinetics would require that more rutherfordium atoms be
collected for comparison of hafnium’s and rutherfordium’s chemistry.
If not comparing the data for an online rutherfordium experiment, it is possible to
separate all three elements in both TEHA and TEHP, given enough mixing time for the solvent
extraction. All elements have a >10 separation factor from each other at a certain hydrochloric
acid concentration, which is an excellent factor for solvent extractions. For a few data points, the
separation factor even exceeded values of 1000. Those values may allow for this separation to be
investigated further for use in industrial applications.
The speciation data gathered shows good agreement with what previously was reported in
the literature. From the experimental results, zirconium and hafnium both extract at a 2:1 ratio in
TEHA, which lends evidence that both form hexachloro complex anions as the extracted species
(MCl62-). For TEHP, the data shows that zirconium and hafnium both extract at a 1:1 ratio in

95
TEHP, with plutonium extracting at a 0.8:1. One reason that there may be a difference in this
ratio is because the plutonium species in HCl is PuO2Cl42-.
One potential drawback to using high concentrations of HCl in an online chemistry
system is the corrosion of the steel parts. Currently, the available liquid chemistry setups cannot
handle high concentration of HCl because of this limitation. To remedy this drawback, the use of
Teflon based materials would allow automated online use at an accelerator but the high cost of
those materials prevents the manufacture of such a system.
7.2 Batch Studies and Column Studies
Batch studies for TEHA and TEHP illustrate much of the same results found for the
solvent extractions but the possibility of steric hindrances interfering remains an issue with the
extraction of all three nuclides with the exception of 89Zr on TEHP. These steric interferences are
seen more greatly with TEHA than with TEHP due to TEHA requiring 2 ligands to extract each
nuclide of interest. These interferes continue to influence the performance of kinetics with the
exception of the 89Zr on TEHP. The size of the hexachloro complex for 89Zr on TEHP must be a
complimentary fit into the pore size.
Column studies have shown that for both TEHA and TEHP the use of a column for
separating these three elements is not feasible, much less even so when using a column for an
automated online study for transactinide chemistry. The kinetics of these elements are too slow
in interacting with the resin to be able to have a clear separation from each other. It may be
possible to separate these elements with a longer column, however, a vacuum box system will be
required to accomplish this process. The columns prepared may possibly be useful for the
separation of 89Zr from other elements as its breakthrough in the load fraction is very minimal.
96
However, these elements could not be 175Hf and 239Pu, as the 239Pu elutes in every fraction and
the 89Zr bleeds into the 175Hf fraction.
The poor performance of 239Pu on the resin could possibly indicate 239Pu forming the
polymer chain and interfering with the poor extraction and slow kinetics. However, since the
same stock was used for the all experiments, the 239Pu still eventually extracts almost completely
in the solvent extractions. If the 239Pu polymer is present, there should be no eventual extraction
as this polymer formation is irreversible. Therefore, the likelihood that 239Pu forming a polymer
to inhibit its extraction seems small. Rather, the larger 239Pu ion forming a larger anion complex
than the 89Zr and 175Hf complexes making it more difficult to fit into the pores of the resin and
coordinate with the TEHA and TEHP ligands seems a more likely conclusion.
7.3 Future Work
Some of the work that needs to be further elaborated on is an in depth study of the resin
characteristics and properties. If these are further investigated, then k’ values could be calculated
for the radionuclides on each of the resins. The use of k’ values is superior to the use of Dw
values as they provide a measure of column performance that is independent of the column
parameters. Another way to improve performance would to lengthen the column to separate the
peaks further from each other.
It is desirable to also study the 239Pu kinetics further. The longest mixing time used in this
work only went up to 30 minutes. It is possible that the 239Pu could extract even more, but this
was not attempted to because the purpose of these experiments is to test the suitability of the
solvent extraction and resin in a super heavy element study.
Only three elements in one acid matrix were evaluated for extraction in TEHA and
TEHP. While other preliminary studies failed to see extraction in nitric and sulfuric matrices

97
with zirconium, it is possible that plutonium may behave differently in those acids. It is also
possible that other elements may be able to be extracted by TEHA and TEHP as well. The first
preliminary solvent extraction study carried out for this research with TEHA used 95Zr as the
tracer, and 95Nb (a decay product of 95Zr) was observed being extracted in the organic phase
starting at 4-6 M HCl. Such studies may be beneficial for extractions with other elements.
98
REFERENCES
1. Rutherford, E., Atomic Projectiles and Their Collisions with Light Atoms. Science 1919,
50 (1299), 467-73.
2. Bothe, B. H. a. W., The γ-rays excited in boron and beryllium. 1932; Vol. 76.
3. Joliot, I. C. a. F., The Emission of High energy Photons from Hydrogenous Substances
Irradiated with Very Penetrating Alpha Rays. Cr Acad Sci Ii C 1932, 194 (273).
4. Chadwick, J., The existence of a neutron. P R Soc Lond a-Conta 1932, 136 (830), 692-
708.
5. Joliot, I. C. a. F., Effect of Absorption of Gamma Rays of Very High Frequency by
Projection of Light Nuclei. Comptes Rendus 1932, 194 (708).
6. Perrier, C.; Segre, E., Radioactive isotopes of element 43. Nature 1937, 140, 193-194.
7. Fermi, E.; Amaldi, E.; D'Agostino, O.; Rasetti, F.; Segre, E., Artificial radioactivity
produced by neutron bombardment. P R Soc Lond a-Conta 1934, 146 (A857), 0483-0500.
8. Hahn, O.; Strassmann, F., About the evidence and the behavior in uranium radiation
using neutron occuring earth alkaloid metals. Naturwissenschaften 1939, 27, 11-15.
9. Meitner, L.; Frisch, O. R., Products of the fission of the uranium nucleus. Nature 1939,
143, 471-472.
10. Seaborg, G. T.; Mcmillan, E. M.; Kennedy, J. W.; Wahl, A. C., Radioactive Element-94
from Deuterons on Uranium. Phys Rev 1946, 69 (7-8), 366-367.
11. Seaborg, G. T., The chemical and radioactive properties of the heavy elements. Chem.
Eng. News 1945, 23, 2190-3.
12. Thompson, S. G.; Ghiorso, A.; Seaborg, G. T., Element 97. Phys Rev 1950, 77 (6), 838-
839.
13. Thompson, S. G.; Street, K.; Ghiorso, A.; Seaborg, G. T., Element 98. Phys Rev 1950, 78
(3), 298-299.
14. Ghiorso, A.; Thompson, S. G.; Higgins, G. H.; Seaborg, G. T.; Studier, M. H.; Fields, P.
R.; Fried, S. M.; Diamond, H.; Mech, J. F.; Pyle, G. L.; Huizenga, J. R.; Hirsch, A.; Manning,
W. M.; Browne, C. I.; Smith, H. L.; Spence, R. W., New Elements Einsteinium and Fermium,
Atomic Numbers 99 and 100. Phys Rev 1955, 99 (3), 1048-1049.
15. Choppin, G. R., Liljenzin, J.O., Rydberg, J., Radiochemistry and Nuclear Chemistry.
Butterworth-Heinemann: Woburn, 2002.
16. Schadel, M., Chemistry of superheavy elements. Angew Chem Int Edit 2006, 45 (3), 368-
401.
17. Myers, W. D.; Swiateck.Wj, Nuclear Masses and Deformations. Nucl Phys 1966, 81 (1),
1-&.
18. Oganessian, Y. T.; Utyonkov, V. K.; Dmitriev, S. N.; Lobanov, Y. V.; Itkis, M. G.;
Polyakov, A. N.; Tsyganov, Y. S.; Mezentsev, A. N.; Yeremin, A. V.; Voinov, A. A.; Sokol, E.
A.; Gulbekian, G. G.; Bogomolov, S. L.; Iliev, S.; Subbotin, V. G.; Sukhov, A. M.; Buklanov, G.
V.; Shishkin, S. V.; Chepygin, V. I.; Vostokin, G. K.; Aksenov, N. V.; Hussonnois, M.; Subotic,
K.; Zagrebaev, V. I.; Moody, K. J.; Patin, J. B.; Wild, J. F.; Stoyer, M. A.; Stoyer, N. J.;
Shaughnessy, D. A.; Kenneally, J. M.; Wilk, P. A.; Lougheed, R. W.; Gaggeler, H. W.;
Schumann, D.; Bruchertseifer, H.; Eichler, R., Synthesis of elements 115 and 113 in the reaction
Am-243+Ca-48. Phys Rev C 2005, 72 (3).
19. Oganessian, Y. S.; Utyonkov, V. K.; Lobanov, Y. V.; Abdullin, F. S.; Polyakov, A. N.;
Shirokovsky, I. V.; Tsyganov, Y. S.; Gulbekian, G. G.; Bogomolov, S. L.; Gikal, B. N.;
99
Mezentsev, A. N.; Iliev, S.; Subbotin, V. G.; Sukhov, A. M.; Voinov, A. A.; Buklanov, G. V.;
Subotic, K.; Zagrebaev, V. I.; Itkis, M. G.; Patin, J. B.; Moody, K. J.; Wild, J. F.; Stoyer, M. A.;
Stoyer, N. J.; Shaughnessy, D. A.; Kenneally, J. M.; Lougheed, R. W., Measurements of cross
sections for the fusion-evaporation reactions Pu-244(Ca-48,xn)(292-x)114 and Cm-245(Ca-
48,xn)(293-x)116. Phys Rev C 2004, 69 (5).
20. Oganessian, Y. T.; Utyonkov, V. K.; Lobanov, Y. V.; Abdullin, F. S.; Polyakov, A. N.;
Sagaidak, R. N.; Shirokovsky, I. V.; Tsyganov, Y. S.; Voinov, A. A.; Gulbekian, G. G.;
Bogomolov, S. L.; Gikal, B. N.; Mezentsev, A. N.; Iliev, S.; Subbotin, V. G.; Sukhov, A. M.;
Subotic, K.; Zagrebaev, V. I.; Vostokin, G. K.; Itkis, M. G.; Moody, K. J.; Patin, J. B.;
Shaughnessy, D. A.; Stoyer, M. A.; Stoyer, N. J.; Wilk, P. A.; Kenneally, J. M.; Landrum, J. H.;
Wild, J. F.; Lougheed, R. W., Synthesis of the isotopes of elements 118 and 116 in the Cf-249
and Cm-245+Ca-48 fusion reactions. Phys Rev C 2006, 74 (4).
21. Dayah, M., Casagrande., Periodic Table of the Elements.
22. Flerov, G. N.; Oganesyan, Y. T.; Lobanov, Y. V.; Kuznetsov, V. I.; Druin, V. A.;
Perelygin, V. P.; Gavrilov, K. A.; Tretiakova, S. P.; Plotko, V. M., Synthesis and Physical
Identification of the Isotope of Element 104 with Mass Number 260. Phys Lett 1964, 13 (1), 73-
75.
23. Ghiorso, A.; Nurmia, M.; Harris, J.; Eskola, K.; Eskola, P., Positive Identification of 2
Alpha-Particle-Emitting Isotopes of Element 104. Phys Rev Lett 1969, 22 (24), 1317-&.
24. Flerov, G. N.; Oganesya.Yt; Lobanov, Y. V.; Lazarev, Y. A.; Tretyako.Sp; Kolesov, I.
V.; Plotko, V. M., Synthesis of Element 105. Sov at Energy-Ussr 1970, 29 (4), 967-&.
25. Ghiorso, A.; Nurmia, M.; Eskola, K.; Harris, J.; Eskola, P., New Element Hahnium,
Atomic Number 105. Phys Rev Lett 1970, 24 (26), 1498-&.
26. Ghiorso, A.; Nitschke, J. M.; Alonso, J. R.; Alonso, C. T.; Nurmia, M.; Seaborg, G. T.;
Hulet, E. K.; Lougheed, R. W., Element 106. Phys Rev Lett 1974, 33 (25), 1490-1493.
27. Munzenberg, G.; Hofmann, S.; Hessberger, F. P.; Reisdorf, W.; Schmidt, K. H.;
Schneider, J. H. R.; Armbruster, P.; Sahm, C. C.; Thuma, B., Identification of Element 107 by
Alpha-Correlation Chains. Z Phys a-Hadron Nucl 1981, 300 (1), 107-108.
28. Munzenberg, G.; Armbruster, P.; Folger, H.; Hessberger, F. P.; Hofmann, S.; Keller, J.;
Poppensieker, K.; Reisdorf, W.; Schmidt, K. H.; Schott, H. J.; Leino, M. E.; Hingmann, R., The
Identification of Element-108. Z Phys a-Hadron Nucl 1984, 317 (2), 235-236.
29. Munzenberg, G.; Armbruster, P.; Hessberger, F. P.; Hofmann, S.; Poppensieker, K.;
Reisdorf, W.; Schneider, J. H. R.; Schneider, W. F. W.; Schmidt, K. H.; Sahm, C. C.;
Vermeulen, D., Observation of One Correlated Alpha-Decay in the Reaction Fe-58 on Bi-209-
]267109. Z Phys a-Hadron Nucl 1982, 309 (1), 89-90.
30. Hofmann, S.; Ninov, V.; Hessberger, F. P.; Armbruster, P.; Folger, H.; Munzenberg, G.;
Schott, H. J.; Popeko, A. G.; Yeremin, A. V.; Andreyev, A. N.; Saro, S.; Janik, R.; Leino, M.,
Production and Decay of (269)110. Z Phys a-Hadron Nucl 1995, 350 (4), 277-280.
31. Hofmann, S.; Ninov, V.; Hessberger, F. P.; Armbruster, P.; Folger, H.; Munzenberg, G.;
Schott, H. J.; Popeko, A. G.; Yeremin, A. V.; Andreyev, A. N.; Saro, S.; Janik, R.; Leino, M.,
The New Element-111. Z Phys a-Hadron Nucl 1995, 350 (4), 281-282.
32. Oganessian, Y. T.; Utyonkov, V. K.; Lobanov, Y. V.; Abdullin, F. S.; Polyakov, A. N.;
Shirokovsky, I. V.; Tsyganov, Y. S.; Gulbekian, G. G.; Bogomolov, S. L.; Gikal, B. N.;
Mezentsev, A. N.; Iliev, S.; Subbotin, V. G.; Sukhov, A. M.; Buklanov, G. V.; Subotic, K.; Itkis,
M. G.; Moody, K. J.; Wild, J. F.; Stoyer, N. J.; Stoyer, M. A.; Lougheed, R. W., Synthesis of
superheavy nuclei in the Ca-48+Pu-244 reaction. Phys Rev Lett 1999, 83 (16), 3154-3157.
100
33. Morita, K.; Morimoto, K.; Kaji, D.; Akiyama, T.; Goto, S.; Haba, H.; Ideguchi, E.;
Kanungo, R.; Katori, K.; Koura, H.; Kudo, H.; Ohnishi, T.; Ozawa, A.; Suda, T.; Sueki, K.; Xu,
H. S.; Yamaguchi, T.; Yoneda, A.; Yoshida, A.; Zhao, Y. L., Experiment on the synthesis of
element 113 in the reaction Bi-209(Zn-70,n)(278)113. J Phys Soc Jpn 2004, 73 (10), 2593-2596.
34. Schadel, M., The chemistry of superheavy elements. Acta Phys Pol B 2003, 34 (3), 1701-
1728.
35. Hofmann, S., New elements - approaching Z=114. Rep Prog Phys 1998, 61 (6), 639-689.
36. Seaborg, G. T.; Loveland, W. D., The elements beyond uranium. Wiley: New York,
1990; p xiii, 359 p.
37. Pyykko, P., Relativistic Effects in Structural Chemistry. Chem Rev 1988, 88 (3), 563-594.
38. Oganessian, Y. T., Synthesis and properties of even-even nuclei with Z=114-116
produced in Ca-48 induced reactions. Acta Phys Hung Ns-H 2004, 19 (1-2), 39-52.
39. Loveland, W., Synthesis of transactinide nuclei using radioactive beams. Phys Rev C
2007, 76 (1).
40. Dvorak, J.; Bruchle, W.; Chelnokov, M.; Dressler, R.; Dullmann Ch, E.; Eberhardt, K.;
Gorshkov, V.; Jager, E.; Krucken, R.; Kuznetsov, A.; Nagame, Y.; Nebel, F.; Novackova, Z.;
Qin, Z.; Schadel, M.; Schausten, B.; Schimpf, E.; Semchenkov, A.; Thorle, P.; Turler, A.;
Wegrzecki, M.; Wierczinski, B.; Yakushev, A.; Yeremin, A., Doubly magic nucleus
(108)(270)Hs162. Phys Rev Lett 2006, 97 (24), 242501.
41. Rydberg, J., Solvent extraction principles and practice. 2nd ed.; M. Dekker: New York,
2004; p ix, 750 p.
42. Goto, T.; Smutz, M., Separation factors for solvent extraction processes: The system of 1
M di-(2-ethyl-hexyl) phosphoric acid (in amsco 125-82)-Pr-Nd salts as an example. Journal of
Inorganic and Nuclear Chemistry 1965, 27 (6), 1369-1379.
43. Countercurrent vs. Cross current Solvent Extraction. In Robatel Inc., Pittsfield MA.
44. Vasudeva, P., Third Phase formation in the extraction of thorium nitrate by trialkyl
phosphates. IOP Conference SeriesL Materials Science and engineering 2010, 9.
45. Horwitz, E. P.; McAlister, D. R.; Dietz, M. L., Extraction chromatography versus solvent
extraction: How similar are they? Separ Sci Technol 2006, 41 (10), 2163-2182.
46. Horwitz, E., Extraction Chromatography of actinides and Selected Fission Products:
Principles and Achievement of Selectivity.
47. Horwitz, E. P.; Bloomqui.Ca, Preparation, Performance and Factors Affecting Band
Spreading of High Efficiency Extraction Chromatographic Columns for Actinide Separations. J
Inorg Nucl Chem 1972, 34 (12), 3851-&.
48. Horwitz, E. P.; Bloomqui.Ca, High Speed High Efficiency Separation of Transplutonium
Elements by Extraction Chromatography. J Inorg Nucl Chem 1973, 35 (1), 271-284.
49. Guillaumont, R.; Adloff, J. P.; Peneloux, A., Kinetic and Thermodynamic Aspects of
Tracer-Scale and Single Atom Chemistry. Radiochim Acta 1989, 46 (4), 169-176.
50. Guillaumont, R.; Adloff, J. P.; Peneloux, A.; Delamoye, P., Sub-Tracer Scale Behavior of
Radionuclides - Application to Actinide Chemistry. Radiochim Acta 1991, 54 (1), 1-15.
51. Borg, R. J.; Dienes, G. J., On the Validity of Single Atom Chemistry. J Inorg Nucl Chem
1981, 43 (6), 1129-1133.
52. Ghiorso, A., Recoil Spectrometer for the Detection of Single Atoms. J Radioan Nucl Ch
Ar 1988, 124 (2), 407-413.
53. Subotic, K.; Oganessian, Y. T.; Utyonkov, V. K.; Lobanov, Y. V.; Abdullin, F. S.;
Polyakov, A. N.; Tsyganov, Y. S.; Ivanov, O. V., Evaporation residue collection efficiencies and
101
position spectra of the Dubna gas-filled recoil separator. Nucl Instrum Meth A 2002, 481 (1-3),
71-80.
54. Persson, H.; Skarnemark, G.; Skalberg, M.; Alstad, J.; Liljenzin, J. O.; Bauer, G.;
Haberberger, F.; Kaffrell, N.; Rogowski, J.; Trautmann, N., Sisak-3 - an Improved System for
Rapid Radiochemical Separations by Solvent-Extraction. Radiochim Acta 1989, 48 (3-4), 177-
180.
55. Schadel, M.; Bruchle, W.; Haefner, B., Fast Radiochemical Separations with an
Automated Rapid Chemistry Apparatus. Nucl Instrum Meth A 1988, 264 (2-3), 308-318.
56. Schadel, M.; Bruchle, W.; Jager, E.; Schimpf, E.; Kratz, J. V.; Scherer, U. W.;
Zimmermann, H. P., Arca-Ii - a New Apparatus for Fast, Repetitive Hplc Separations.
Radiochim Acta 1989, 48 (3-4), 171-176.
57. Noren, B., Hydrolysis of Zr-4+ and Hf-4+. Acta Chem Scand 1973, 27 (4), 1369-1384.
58. El-Ammouri, E. G. Hafnium solvent extraction from chloride solutions using
organophosphorus reagents (Cyanex 923, 925). Thesis (M Eng ), 1994.
59. Pershina, V.; Trubert, D.; Le Naour, C.; Kratz Jens, V., Theoretical predictions of
hydrolysis and complex formation of group-4 elements Zr, Hf and Rf in HF and HCl solutions.
In Radiochim Acta, 2002; Vol. 90, p 869.
60. Silva, R.; Harris, J.; Nurmia, M.; Eskola, K.; Ghiorso, A., Chemical Separation of
Rutherfordium. Inorg Nucl Chem Lett 1970, 6 (12), 871-&.
61. Hulet, E. K.; Lougheed, R. W.; Wild, J. F.; Landrum, J. H.; Nitschke, J. M.; Ghiorso, A.,
Chloride Complexation of Element-104. J Inorg Nucl Chem 1980, 42 (1), 79-82.
62. Rajan, K. S., Gupta, J., Separation of zirconium and hafnium by means of anion-
exchange resins. I. Qualitative studies. Journal of Scientific and Industrial Research 1955, 14B,
453-6.
63. Pfrepper, G.; Pfrepper, R.; Krauss, D.; Yakushev, A. B.; Timokhin, S. N.; Zvara, I., Ion
exchange equilibria and stoichiometry of complexes of element 104 and hafnium in hydrofluoric
acid solutions. Radiochim Acta 1998, 80 (1), 7-12.
64. Trubert, D.; Guzman, F. M.; Le Naour, C.; Brillard, L.; Hussonnois, M.; Constantinescu,
O., Behaviour of Zr, Hf, Nb, Ta and Pa on macroporous anion exchanger in chloride-fluoride
media. Anal Chim Acta 1998, 374 (2-3), 149-158.
65. Strub, E.; Kratz, J. V.; Kronenberg, A.; Nahler, A.; Thorle, P.; Zauner, S.; Bruchle, W.;
Jager, E.; Schadel, M.; Schausten, B.; Schimpf, E.; Li, Z. W.; Kirbach, U.; Schumann, D.; Jost,
D.; Turler, A.; Asai, M.; Nagame, Y.; Sakama, M.; Tsukada, K.; Gaggeler, H. W.; Glatz, J. P.,
Fluoride complexation of rutherfordium (Rf, element 104). Radiochim Acta 2000, 88 (5), 265-
271.
66. Ishii, Y.; Toyoshima, A.; Tsukada, K.; Asai, M.; Toume, H.; Nishinaka, I.; Nagame, Y.;
Miyashita, S.; Mori, T.; Suganuma, H.; Haba, H.; Sakamaki, M.; Goto, S.; Kudo, H.; Akiyama,
K.; Oura, Y.; Nakahara, H.; Tashiro, Y.; Shmohara, A.; Schadel, M.; Bruchle, W.; Pershina, V.;
Kratz, J. V., Fluoride complexation of element 104, rutherfordium (Rf), investigated by cation-
exchange chromatography. Chem Lett 2008, 37 (3), 288-289.
67. Toyoshima, A.; Haba, H.; Tsukada, K.; Asai, M.; Akiyama, K.; Goto, S.; Ishii, Y.;
Nishinaka, I.; Sato, T. K.; Nagame, Y.; Sato, W.; Tani, Y.; Hasegawa, H.; Matsuo, K.; Saika, D.;
Kitamoto, Y.; Shinohara, A.; Ito, M.; Saito, J.; Kudo, H.; Yokoyama, A.; Sakama, M.; Sueki, K.;
Oura, Y.; Nakahara, H.; Schadel, M.; Bruchle, W.; Kratz, J. V., Hexafluoro complex of
rutherfordium in mixed HF/HNO3 solutions. Radiochim Acta 2008, 96 (3), 125-134.
102
68. Kronenberg, A.; Eberhardt, K.; Kratz, J. V.; Mohapatra, P. K.; Nahler, A.; Thorle, P.;
Bruchle, W.; Schadel, M.; Turler, A., On-line anion exchange of rutherfordium in HF/HNO3 and
HF solutions. Radiochim Acta 2004, 92 (7), 379-386.
69. Huffman, E. H.; Iddings, G. M.; Lilly, R. C., Anion Exchange of Zirconium, Hafnium,
Niobium and Tantalum in Hydrochloric Acid Solutions. J Am Chem Soc 1951, 73 (9), 4474-
4475.
70. Huffman, E. H.; Lilly, R. C., Anion Exchange of Complex Ions of Hafnium and
Zirconium in Hcl-Hf Mixtures. J Am Chem Soc 1951, 73 (6), 2902-2905.
71. Szeglowski, Z.; Guseva, L. I.; Lien, D. T.; Domanov, V. P.; Kubica, B.; Tikhomirowa, G.
S.; Constantinescu, O.; Constantinescu, M.; Yakushev, A. B., Online ion exchange separation of
short-lived Zr, Hf, Mo, Ta and W isotopes as homologs of transactinide elements. J Radioanal
Nucl Ch 1998, 228 (1-2), 145-149.
72. Li, Z. J.; Toyoshima, A.; Asai, M.; Tsukada, K.; Sato, T. K.; Sato, N.; Kikuchi, T.;
Nagame, Y.; Schadel, M.; Pershina, V.; Liang, X. H.; Kasamatsu, Y.; Komori, Y.; Ooe, K.;
Shinohara, A.; Goto, S.; Murayama, H.; Murakami, M.; Kudo, H.; Haba, H.; Takeda, Y.;
Nishikawa, M.; Yokoyama, A.; Ikarashi, S.; Sueki, K.; Akiyama, K.; Kratz, J. V., Sulfate
complexation of element 104, Rf, in H2SO4/HNO3 mixed solution. Radiochim Acta 2012, 100
(3), 157-164.
73. Banda, R.; Lee, H. Y.; Lee, M. S., Separation of Zr and Hf from strong hydrochloric acid
solution by solvent extraction with TEHA. J Radioanal Nucl Ch 2013, 295 (2), 1537-1543.
74. Gaudh, J. S.; Shinde, V. M., Liquid-Liquid-Extraction of Vanadium(V) and Niobium(V)
with Tris(2-Ethylhexyl)Phosphate - Mutual Separation of Vanadium(V), Niobium(V), and
Tantalum(V), and Analysis of Steel Samples. Separ Sci Technol 1995, 30 (12), 2573-2584.
75. Marcus, Y.; Kertes, A. S., Ion exchange and solvent extraction of metal complexes.
Wiley-Interscience: London, New York etc., 1969; p ix, 1037 p.
76. Czerwinski, K. R. Studies of fundamental properties of rutherfordium (Element 104)
using organic complexing agents. ; Lawrence Berkeley National Lab. (LBNL), Berkeley, CA
(United States), 1992.

103
CURRICULUM VITAE
Jeff Rolfes Email:[email protected]
Education
Ph.D. University of Nevada Las Vegas Radiochemistry Spring 2018
Dissertation: Solvent Extraction and Extraction Chromatography of Homologs and Pseudohomologs
of Rutherfordium using TEHA and TEHP
Graduate Advisor: Dr. Ralf Sudowe
B.S. Newman University, Wichita, KS Chemistry May 2010
B.A. Newman University, Wichita, KS Biology & History May 2010
Work Experience
DTRA Postdoctoral Program Manager (Contractor through Penn State) Oct. 2017-present
Fort Belvoir, VA
Analyzed and identified DTRA technical needs in nuclear forensics
Assisted in planning, coordinating, integrating, implementing, and evaluating research and
development programs
Developed and presented information in a colloquium to support informed decision-making
ACS Nuclear Summer School Teaching Assistant 2010 Summer 2010
San Jose State University, San Jose, CA
Prepared and supervised 16 experiments in a nuclear chemistry lab
Assisted in lecturing and graded student lab assignments
Research Experience
Research Assistant Fall 2011-Sept. 2017
University of Nevada at Las Vegas, Las Vegas, NV
Tested solvent extractions using of novel ligands of zirconium, hafnium, thorium, neptunium, and
plutonium for homolog studies on rutherfordium
Developed new extraction chromatographic resin for the separation of zirconium, hafnium, thorium,
neptunium, plutonium, americium, and curium
Graduate Fellowship Practicum Summer 2013 & 2016
Lawrence Livermore National Laboratory, Livermore, CA
Continued thesis work in collaboration with Livermore scientists
Used isotopes produced at the Center for Accelerator Mass Spectrometry as tracers in separations
Graduate Intern in Environmental Sample Analysis IAEA Safeguards Summer 2012
Lawrence Livermore National Laboratory, Livermore, CA
Purified U and Pu from bulk environmental samples, and measured U and Pu isotope ratios by MC-
ICP-MS
Conducted research to analyze U collection efficiency on different swipes and other materials
Related Experience
104
ACS Nuclear Summer School Student 2009 Summer 2009
San Jose State University, San Jose, CA
Studied introductory nuclear chemistry and worked in a radiation laboratory
Attended the 2009 Actinides Conference in San Francisco, CA
Presentations
Oral Presentation: "Development of a Chemical System for Rutherfordium using TEHA and TEHP,"
Rolfes, Jeff; Despotopulos, John; Sudowe, Ralf. American Chemical Society Meeting;
Philadelphia, PA. August 22 2016
Oral Presentation: "Development of a Chemical System for Rutherfordium using TEHA and TEHP,"
Rolfes, Jeff; Despotopulos, John; Sudowe, Ralf. Academic Laboratory Collaboration Meeting,
SCUREF review meeting; Los Alamos, NM. August 5 2016
Oral Presentation: "Development of a Chemical System for Rutherfordium using TEHA and TEHP,"
Rolfes, Jeff; Despotopulos, John; Sudowe, Ralf. American Chemical Society Meeting; San
Diego, CA. March 17 2016.
Oral Presentation: "Development of a Chemical System for Rutherfordium," Rolfes, Jeff; Despotopulos,
John; Sudowe, Ralf. 5th International Conference on the Chemistry and Physics of the
Transactinide Elements, Urabandai, Japan. May 27 2015
Oral Presentation: "Development of a Chemical System for Rutherfordium," Rolfes, Jeff; Despotopulos,
John; Sudowe, Ralf. Methods and Application of Radiochemisty X, Kailua-Kona, HI. April 14
2015
Oral Presentation: "Development of a Chemical System for Rutherfordium," Rolfes, Jeff; Despotopulos,
John; Sudowe, Ralf. American Chemical Society Meeting, San Francisco CA, August 11 2014
Oral Presentation: "Development of a Chemical System for Rutherfordium," Rolfes, Jeff; Despotopulos,
John; Sudowe, Ralf. Academic Laboratory Collaboration Meeting, SCUREF review meeting;
Argonne National Lab, Lemont, IL August 5 2014
Poster Presentation: "Development of a Chemical System for Rutherfordium," Rolfes, Jeff;
Despotopulos, John; Sudowe, Ralf. LLNL Summer Student Symposium, Livermore, CA. August
8 2013
Skills
Radioanalytical chemistry & radiochemistry
Chemistry of the actinide and transactinide elements
Nuclear properties of the actinide and transactinide elements.
Handling of radioactive material
Alpha, beta and gamma Spectroscopy
Analytical chemistry (UV-Vis, FT-IR, MC-ICP-MS, GC-MS, ICP-AES, HPLC)
Manual and automated separation and chromatography techniques (liquid-liquid extraction, ion
exchange and extraction chromatography)
Nuclear forensics
Honors and Awards
Nuclear Forensics Graduate Fellow, Department of Homeland Security
Cardinal Newman Scholar, Newman University
Graduated summa cum laude, Newman University
Dean's list (10 semesters), Newman University
AP Scholar with Distinction
105
Eagle Scout
Two time Science Olympiad National Medalist in Tower Building
CITIZENSHIP: United States of America
CLEARANCE LEVEL: Interim Secret - DoD
References
Ralf Sudowe
Email: [email protected]
Gary Cerefice
Email: [email protected]
Roger Henderson
Email: [email protected]
Ken Czerwinski
Email: [email protected]