solvent extraction: classical and novel approaches this page intentionally left blank solvent...
TRANSCRIPT

Solvent Extraction: Classicaland Novel Approaches

This page intentionally left blank
Solvent Extraction:Classical and Novel
Approaches
Vladimir S. KislikCasali Institute of Applied ChemistryThe Hebrew University of Jerusalem
Campus Givat Ram, Jerusalem 91904, Israel
AMSTERDAM l BOSTON l HEIDELBERG l LONDON l NEW YORK l OXFORDPARIS l SAN DIEGO l SAN FRANCISCO l SINGAPORE l SYDNEY l TOKYO
ElsevierThe Boulevard, Langford Lane, Kidlington, Oxford OX5 1GB, UKRadarweg 29, PO Box 211, 1000 AE Amsterdam, The Netherlands
First edition 2012
Copyright � 2012 Elsevier B.V. All rights reserved.
No part of this publication may be reproduced, stored in a retrieval system or transmittedin any form or by any means electronic, mechanical, photocopying, recording orotherwise without the prior written permission of the publisher
Permissions may be sought directly from Elsevier’s Science & Technology RightsDepartment in Oxford, UK: phone (+44) (0) 1865 843830; fax (+44) (0) 1865 853333;email: [email protected]. Alternatively you can submit your request online byvisiting the Elsevier web site at http://elsevier.com/locate/permissions, and selectingObtaining permission to use Elsevier material
NoticeNo responsibility is assumed by the publisher for any injury and/or damage to persons orproperty as a matter of products liability, negligence or otherwise, or from any use oroperation of any methods, products, instructions or ideas contained in the materialherein.
British Library Cataloguing in Publication DataA catalogue record for this book is available from the British Library
Library of Congress Cataloging-in-Publication DataA catalog record for this book is available from the Library of Congress
ISBN: 978-0-444-53778-2
For information on all Elsevier publicationsvisit our web site at elsevierdirect.com
Printed and bound in Great Britain
12 13 14 10 9 8 7 6 5 4 3 2 1
Contents
Preface xiIntroduction xiii
Part IConventional (Classical) Principles and Practiceof Solvent Extraction
1. Modern (Classical) Fundamental Principlesof Solvent Extraction 3
1. Introduction 52. Solvent Extraction By Solvation 53. Solvent Extraction with Chemical Reactions
(By Complexation) 124. Driving Forces of Solvent Extraction 155. Influence of Kinetics Factors 176. Selectivity 347. Factors Affecting Extraction Process 368. Module Design Considerations 499. Experimental Determination of Distribution Ratios 55
10. Summarizing Remarks 58References 63
2. Principles of Solvent Extraction of Organicand Mineral Acids 69
1. Introduction 692. Extraction of Acids by Carbon-Bonded Oxygen-Donor
Extractants and Substituted Hydrocarbon Solvents 713. Phosphorus-Bonded Oxygen Donor Extractants 854. Aliphatic Amine Extractants 895. Extraction of Strong (Inorganic) Acids 986. Summarizing Remarks 102References 108
3. Chemistry of Metal Solvent Extraction 113
1. Introduction 1142. Metal Extraction by Cation Exchangers (Acidic Extractants) 1143. Metal Extraction by Anion Exchangers (Ion Pair Formation) 127
v
4. Extraction Through Formation of H-Bonding andSolvating Complexes 135
5. Extraction Through Mixed Complex Formation 1446. Extractable Complexation of Monovalent Metals 1507. Extraction with Aqueous Biphasic Systems 151References 153
4. Engineering Development of Solvent ExtractionProcesses 157
1. Introduction 1572. Extraction Stage 1593. Stripping Organic Solutions 1694. Extraction Efficiency 1705. Equipment Design for Continuous
Extraction-Stripping Processes 1736. Solvent Losses 1827. Economical Considerations 1838. Problems with Scale-Up to Industrial Systems 183References 184
5. Examples of Application of Solvent ExtractionTechniques in Chemical, Radiochemical, Biochemical,Pharmaceutical, Analytical Separations, andWastewater Treatment 185
1. Introduction 1882. Extraction in Hydrometallurgy (Metals Extraction) 1893. Solvent Extraction in Nuclear Chemistry and Technology 2184. Solvent Extraction in Analytical Chemistry 2395. Application of Solvent Extraction in Biochemical and
Pharmaceutical Separations 2736. Application of Solvent Extraction in Organic and Biofuels
Separation 2787. Solvent Extraction in Recovery of Waste and Wastewater
Treatment 284References 297
Part IINovel Competitive Complexation/Solvation Theory(CCST) of Solvent Extraction: Principles and Practice
6. Backgrounds of the Competitive Complexation/Solvation Theory of Solvent Extraction 317
1. Introduction 317
vi Contents
2. Complexation Through the H-Bonding andProton Transfer 317
3. Distribution Isotherm 3194. Modified Competitive Preferential Solvation Theory 3235. Electronic Acid–Base Theory and Amphoterity 3276. Aggregation 328References 329
7. Competitive Complexation/Solvation Theory ofSolvent Extraction: General Mechanismsand Kinetics 335
1. Basic Statements 3352. Extraction Systems with Low Solute Concentrations
in Organic Phase 3363. Systems with Medium Concentrations of the Solute 3454. Systems with High Solute Concentrations 3485. Comparison of Conventional and Presented Theories
Description 3506. Summarizing Remarks for the CCST 351References 352
8. CCST in Engineering Design, Procedures,and Calculations 355
1. Introduction 3552. Engineering Considerations in Experimental Investigation
of CCST 3563. Experimental Techniques for the Presented Theory 3584. Determination of Extraction Constant and its Comparison
with CCST Affinity Constant Ratios 3615. Analytical Methods Used for the CCST Verification 3636. Transferability of the Values of Affinity Constant Ratios 364References 364
9. The CCST in Solvent Extraction of Acidsby Amine-Based Extractants 367
1. Introduction 3672. Acid–Amine Systems in the CCST Interpretation 3723. The Systems with Active Solvent as an Additive 3814. Experimental Application of the CCST in Carboxylic
Acids Extraction 3845. Summarizing Remarks 395References 397
viiContents
10. Competitive Complexation/Solvation Theoryin Metal Solvent Extraction 399
1. Introduction 3992. CCST Basic Statements 4003. Mathematical Supplement for the CCST in Metal
Extraction 4154. Experimental Verification of the CCST Approach 4235. Summarizing Remarks 427References 428
11. Final Remarks on the Competitive Complexation/Solvation Theory of Solvent Extractionand its Application 433
Part IIIModern and Future Trends in Fundamentalsand Applications of Solvent Extraction
12. Modern and Future Trends in Fundamentalsof Solvent Extraction 439
1. Introduction 4392. Novel Molecular Models Theoretical Approach 4403. Low Energy Reactions Measurement 4424. Expected Advances in Kinetics Studies 4425. Supramolecular (SUPRAS) Theoretical Approach 443References 449
13. Advances in Development of Solventsfor Liquid–Liquid Extraction 451
1. Introduction 4522. Organic Solvents 4533. Water as a Solvent 4574. Renewable Water-Based Solvents 4585. Ionic Liquids as Solvents for Extraction 4656. Amphiphilic Compounds (Supramolecules) as Solvents
in Solvent Extraction 4677. Extraction by Microemulsion 4718. Recovery of Reagents 4749. Future Trends in the Development of New Solvents 475
10. Concluding Remarks 477References 478
viii Contents
14. Recent Advances in Solvent Extraction Processesand Techniques 483
1. Introduction 4842. Equipment Design and Scale-Up Considerations 4853. Supercritical Fluid Extraction 4864. Subcritical Water Extraction 4935. Aqueous Two-Phase Systems 4986. Extraction Processes with Ionic Liquids 4997. Liquid Membrane and Nondispersive, Membrane-Based
Solvent Extraction Techniques 5018. Supramolecular-Based Extraction Techniques 5049. Solid–Liquid Extraction Systems 511
10. Assisted Solvent Extraction 51311. Extraction of Gas in Analytical Applications 514References 515
Appendix 525Index 539
ixContents

This page intentionally left blank
Preface
Solvent extraction (SX) or liquid-liquid distribution1 techniques have a broadfield of applications in inorganic and organic chemistry and large-scale indus-trial separations, in analytical chemistry, in pharmaceutical and biochemicalindustries, and in waste treatment. In addition, SX is a good instrument forstudying fundamental understanding of equilibrium and kinetics of complexformation processes. Extraction methods have now become a routine procedurein separation technologies.
The literature volumes of publications on the subject, and the number ofnewly discovered extraction methods, increase every year. Many methods basedon chelate extraction have been considered as routine practice. The hithertounexplored potentialities are also very considerable. Extraction is a majortool in the study of the processes of complex formation and of the state ofcompounds in solution.
This monograph differs in scope and approach from the recent books byRydberg et al. and Ritcey (Rydberg J, CoxM,Musikas C, Choppin GR, editors.Solvent extraction: Principles and practice. New York: CRC; 2004 and RitceyGM. Solvent extraction principles and applications to process metallurgy.Elsevier; 2006, Amsterdam, The Netherlands) which give a detailed moderntreatment of the extraction processes and is therefore an excellent referenceworks.
The book consists of three parts. The first presents the fundamental2
principles of solvent extraction processes and practice during the last decade.In the second part novel principles of extraction processes interpretation arepresented. Examples of carboxylic acids and metals solvent extraction inter-preted using theses principles are presented and analyzed in comparison withconventional techniques. A more detailed treatment has been reserved for thesubjects that have been studied by the author and his colleagues over the lastdecade. Some unpublished data have also been included. Special stress hasbeen laid on the general theory of extraction, on extraction of coordination-unsaturated and charged complexes, and on the methods of determination ofthe composition of the extracted compounds. In studying the theoreticalaspects of extraction, the chemist often has to deal with a number of inter-connected problems. He has to consider the original form in which the species
1. IUPAC designation, but in this book the more commonly term “solvent extraction” is used.
2. In the book we use more often the nomination “classical” taking in mind modern fundamental
principles of extraction.
xi
exists in the aqueous solution, all the stages of the interaction with theextractants and the solvents, and the states of the extractant and the complexcompound in aqueous and organic phases.
The Competitive complexation/solvation theory is unified one, developedfor interpretation and quantification of interactions in solvent extractionsystems and may be used at R&D of many new separation systems in differentIndustries. The theory overcomes some limitations of the classic ion-exchangemodels, permits to make some standardization of parameters and requires lessexperimentation at R&D.
In the third part of the book the modern and future trends in SolventExtracion theoretical principles, new solvents and techniques development arediscussed. Topics concerned with extraction, calculation, and analytical tech-niques are mentioned only at the description of novel theory. Specific subjectstreated include the techniques of increasing the selectivity of the extraction,ways of effective combination of the extraction with subsequent determinationmethods, characteristic features of the extraction of this class of compounds,and radiochemical methods.
xii Preface
Introduction
The most common approach in explanation of extraction mechanisms is toperform equilibrium distribution studies, treated by Nernst’s distribution lawand supplemented by sets of mass action law equilibria.1–4 As a rule, threecategories of extraction are considered: non-specific solvation, specific solva-tion, and ionic interactions. The first two categories are based on the solutiontheories and on the strength of the solvation bonds. In many cases, the bonds aretoo weak for a specific number of solvating molecules per solute molecule to beidentified. The significantly more strong donor (or acceptor) properties renderthe specific solvation and the number of solvating molecules per solutemolecule may be experimentally determined. The third category of theextraction process is characterized by reversible ion-exchange reactions, byproton/electron transfer, or by ion pair structures formation. The readers canfind detailed description in Refs. 1–11.
The complicated behavior of extraction systems conflicts, in some cases,with the mass action law models. Because of quite complex associative inter-actions in extraction systems, the theories developed for processes taking placein dilute solutions can not be extended on systems of high solute concentra-tions. A generalization that can be drawn from these studies is that thestoichiometry (and maybe the nature) of the solute–extractant interactions arechanging with increasing solute concentration in organic phase. Most of theresearchers modeled the process as a simple cation- or anion-exchange reactionwith additional (over-stoichiometric) complexation at high solute concentra-tions. Some of the authors described over-stoichiometry through hydrogenbonding,2–5 aggregation,7,8,12 and even polymerization.13 The readers can findvarious aspects of the stoichiometric ion-exchange theories in Refs. 1–20.In this book these theories are called as conventional theories in common andare presented in Chapters 1–5 of Part I.
The difference in the extraction trends must be attributed to solvation(coordination) effects. In order to analyze solvation effects, identification and,most important, quantification of solute–solvent interactions must be accom-plished. Complexity of solvent structures makes this task extremely difficult.
The methodology of coordination chemistry in solution has been appliedextensively to the determination of the equilibrium constants for solventreplacement in the coordination spheres of ions. Coordination models often resultin good values for metal solvent extraction systems but within limited ranges ofconditions. They meet difficulties when modeling anion exchangers, acid solventextraction and, especially, at the attempts of quantification of the models.
xiii
The competitive complexation/solvation model, presented in Part II, isdeveloped as an attempt to quantify solvent extraction systems in a broad rangeof solute concentrations. The theory is based on the competitive preferentialsolvation (COPS) theory21 applicable also to the coordination models22 andmodified for extraction systems,23,24 the concepts of Lewis acid–base, ofhydrogen bonding and proton transfer,2 of chemical quantum mechanics,25–28
of amphoteric properties of solvents,23 and of different aggregation structuresformation at increasing solute concentrations in organic phase.24
In this book, the general statements of the competitive complexation/solvation theory, CCST, and the applications of the theory to solventextraction of acids by amines and amine-based mixed extractants, of metalions by acidic, basic, neutral, and mixed extractants are presented in Chapters6–11 of Part II. Influence of active solvents as synergistic agents and oftemperature is analyzed. Experimental arrangements for the novel techniquesare introduced. Suitable techniques for experimental verification of the modelare presented. The data available from the literature3,5,7,29 and our experi-ments30–34 are used for interpretation.
Modern developments (during the last two decades) in theoretical scienceand practice of solvent extraction–based techniques are presented in Chapters12–14 of Part III. Potential of these techniques and future trends of the directionin common are also suggested.
REFERENCES
1. Lo TC, Hanson C, Baird MHI, editors.Handbook of solvent extraction. NewYork: Wiley; 1983.
2. Szafran M. Recent aspects of the proton transfer reaction in H-bonded complexes. J Mol Struct
1996;381:39–64.
3. Tamada J, King C. Extraction of Carboxylic Acids by Amine Extractants. Ph.D. Thesis.
Lawrence Berkeley Laboratory, University of California, Applied Science Division; 1989.
4. Tamada J, Kertes A, King C. Extraction of carboxylic acids with amine extractant. 1. Equi-
libria and law of mass action modeling. Ind Eng Chem Res 1990;29:1319–26.
5. Eyal AM, Canari R. pH Dependence of carboxylic and mineral acid extraction by amine-based
extractants: effects of pKa, amine basicity, and diluent properties. Ind Eng Chem Res
1995;34(5):1789–98.
6. Rydberg J, Cox M, Musikas C, Choppin GR, editors. Solvent Extraction Principles and
Practice. 2nd ed. New York: CRC Press; 2004.
7. Neuman RD, Nai-Fu-Zhou, Wu J, Jons MA, Gaonkar AG. General model for aggregation of
metal-extractant complexes in acidic organophosphorus solvent extraction systems. Sep Sci
Technol 1990;25(13–5):1655–74.
8. Hogfeldt E, Fredlund F, Odberg L, Merenge G. Extraction of water, nitric and perchloric acids
by nitrobenzene. Acta Chem Scand 1973;18(5):1781–94.
9. Yang S, White S, Hsu S. Extraction of carboxylic acids with tertiary and quaternary amines:
effect of pH. Eng Chem Res 1991;30:1335–48.
10. Grinstead RR. Base strengths of amine in liquid-liquid extraction systems. Proceedings of
ISEC’67 1968;1:427–36.
xiv Introduction
11. Marcus Y, Kertes AS. Ion exchange and solvent extraction of metal complexes. London:
Wiley-Interscience; 1969.
12. Komasawa I, Otake T, Hattori I. The effects of diluent in the liquid-liquid extraction of copper and
nickel using 2-hydroxy-5-nonylbenzophenone oxime. J Chem Eng Japan 1983;16(5):377–88.
13. Kolarik Z, Grimm R. Acidic organophosphorus extractants. XXIII. Distribution of mono-
2-ethylhexyl phosphoric acid in two liquid phase systems. J Inorg Nucl Chem
1976;38(5):1761–3.
14. Sekine T, Hasegawa Y. Solvent extraction chemistry. New York: Marcel Dekker Inc; 1977.
15. Tamada J, Kertes A, King C. Extraction of carboxylic acids with amine extractant. 2.
Chemical interaction and interpretation of data. Ind Eng Chem Res 1990;29:1327–32.
16. Tamada J, Kertes A, King C. Extraction of carboxylic acids with amine extractant. 3. Effect
of temperature, water coextraction and process considerations. Ind Eng Chem Res
1990;29:1333–41.
17. Canari R, Hazan B, Eyal A. Carboxylic acids extraction by basic extractants: the effects of pH,
ion concentration and acid-base property of the extractant and extracted acid. Proceedings of
ASEC’96 1996;2:1517–22.
18. Vieux AS. Extraction of some dicarboxylic acids by tri-isooctylamine. Anal Chim Acta
1974;68:415–24.
19. Wardel JM, King CJ. Solvent equilibria for extraction of carboxylic acids from water. J Chem
Eng Data 1979;23(2):144–8.
20. Wen Mei, Yang Yiyan, Dai Youyuan. Studies on the mechanism of extraction of carboxylic
acids with tri-N-octylamine by chemical complexation. Proceedings ISEC’96 1996;1:
195–200.
21. Nagy OB, Muanda H, Nagy JB. Competitive preferential solvation theory of weak molecular
interactions. J Chem Soc Faraday Trans 1 1978;74:2210–29.
22. Szpakowska M, Nagy OB. Application of the preferential solvation theory to coordinative
solute-solvent interactions. J Chem Soc Faraday Trans 1 1989;85(9):2891–9.
23. Kislik V. Competitive complexation/solvation theory of solvent extraction. II. Solvent
extraction of metals by acidic extractants. Sep Sci Technol 2002;37(11):2623–57.
24. Kislik V. Application of preferential solvation concept for interpretation of the mechanisms of
acids solvent extraction by amines. Sep Sci Technol 2001;36(13):2899–926.
25. Pearson RG, Vogelsong DC. Developments in crystal field theory. J Am Chem Soc
1958;80:1038.
26. Pearson RG. Hard and soft acids and bases. J Am Chem Soc 1963;85:3533.
27. Luder WF, Zuffanti S. The electronic theory of acids and bases. New York: Wiley; 1946.
28. Douglas B, et al. Concepts and models of inorganic chemistry. 3rd ed. New York: John Wiley
& Sons; 1994. p. 309–49.
29. Neuman RD, Jons MA, Zhou NF. Photo-correlation spectroscopy applied to hydrometallur-
gical solvent-extraction systems. Colloids Surf 1990;46(1):45–61.
30. Kislik V, Eyal A. Acidity dependence of Ti(IV) extraction: a critical analysis. Solvent Extr Ion
Exch 1993;11(2):258.
31. Kislik V, Eyal A. Extraction of titanium(IV) by mixtures of mono- and d-(2-ethylhexyl)
phosphoric acids esters. Solvent Extr Ion Exch 1993;11(2):285–310.
32. Kislik V, Eyal A. Mechanisms of titanium (IV) and some other transition metals extraction by
organophosphorus acids. Proceedings of ISEC’93 1993;2:1353–60.
33. Kislik V, Eyal A. Hybrid liquid membrane (HLM) and supported liquid membrane (SLM)
based transport of titanium (IV). J Membr Sci 1996;111:273–81.
34. Kislik V, Eyal A. Unpublished experimental data; 1998.
xvIntroduction

This page intentionally left blank
Part I
Conventional (Classical)Principles and Practiceof Solvent Extraction

This page intentionally left blank
Chapter 1
Modern (Classical)Fundamental Principlesof Solvent Extraction
Chapter Outline
1. Introduction 5
2. Solvent Extraction By
Solvation
5
2.1. Solubility of Liquids 5
2.2. Mixtures of Solutions 6
2.2.1. Ideal Mixtures 8
2.2.2. Real Mixtures 8
2.3. SoluteeSolvent
Interactions
(Extractability)
8
2.3.1. The Solubility
Parameters
9
2.3.2. Thermodynamic
Relations
10
3. Solvent Extraction with
Chemical Reactions
(By Complexation)
12
3.1. Thermodynamics of
Extraction Systems
12
3.2. SoluteeSolvent
Interactions in Aqueous
Phase
13
3.2.1. Dissociation 13
3.3. SoluteeSolvent
Interactions in Organic
Phase
14
4. Driving Forces of Solvent
Extraction
15
5. Influence of Kinetics Factors 17
5.1. Diffusion Transport
Regime
17
5.1.1. Mathematical
description of
the diffusion
transport
19
5.1.2. Determination
of diffusion
coefficients
21
5.2. Chemical Reaction
Kinetics Regime
Transport
23
5.2.1. Complexatione
Decomplexation
23
5.2.2. LiquideLiquid
Interface
24
5.2.3. Mathematical
Description of
Kinetic Regime
25
5.2.4. Determination
of Kinetic
Parameters
27
Solvent Extraction. DOI: 10.1016/B978-0-4445-3778-2.10001-7
Copyright � 2012 Elsevier B.V. All rights reserved. 3
5.3. Mixed
DiffusionaleKinetic
Transport Regime
29
5.3.1. Identification of
the Rate-
Controlling
Transport
Regimes
29
5.3.2. Basic Parameters
of Transport
Regime
32
5.3.3. Determination
of Extraction
Kinetic
Parameters
32
6. Selectivity 34
7. Factors Affecting Extraction
Process
36
7.1. Extractant Properties 36
7.1.1. Mixtures of
Extractants (Ionic
Additives)
38
7.1.2. AcidityeBasicity
of the Extractant
Influencing
Extraction
39
7.1.3. Influence of
Dissociation
Constant and
Distribution
Coefficient of the
Extractant
40
7.2. Aggregate Formation 41
7.3. Solvent (Diluent)
Properties Influencing
Extraction
41
7.4. Coupling Ions: Anion
Type
44
7.5. Influence of
Temperature
45
7.6. Influence of Complex
Structure
45
7.6.1. Chelate Ring
Size
45
7.6.2. Steric Hindrance
Effect
47
7.6.3. Donor Ligand
Effects
47
7.6.4. Inner and Outer
Sphere
Coordination
Effect
48
7.7. Effects of the Aqueous
Medium
49
8. Module Design
Considerations
49
8.1. Calculation of
Equilibrium Constants
50
8.2. Identification of Species 50
8.2.1. Job’s Method 51
8.2.2. Ligand Number
Method
51
8.2.3. Graphic Slope
Analysis
52
8.2.4. Linear Plots 53
8.2.5. Nonlinear Plots 53
8.2.6. Numerical
Methods
54
9. Experimental Determination
of Distribution Ratios
55
9.1. Stirred Cell
Semicontinuous
Techniques
56
9.2. Centrifugal
ExtractioneSeparation
Systems
57
10. Summarizing Remarks 58
References 63
4 PART | I Conventional (Classical) Principles and Practice
1. INTRODUCTION
Solvent extraction (SX) is one of the favored separation techniques because ofits simplicity, speed, and wide scope. By utilizing relatively simple equipmentand requiring a few time to perform, extraction procedures offer much to thechemists and engineers. Frequently it appears to be the ideal method of sepa-rating trace constituents from large amounts of other substances.
Solution diffusion (with or without chemical reactions) is a commonlyaccepted mechanism for SX. The process is often very selective and theisolation of the solute of interest can usually be made as complete as desired byseveral repetitions of the extraction procedure.
Even at extraction without chemical reactions at partition of solute neutralmolecules between two immiscible phases, there is a chemical change of thesolute in its solvation environment. More drastic chemical changes of thesolute species take place with the presence of extractant, when differentchemical interactions (reversible or irreversible), formation of new coordi-nation compound, dissociation or association, and aggregation are possible.This is facilitated, enhanced SX.
Kinetics of the SX is a function of the rates of chemical changes that occur inthe system and the rates of diffusion of the various species that control thechemical reactions. At least one of the chemical or diffusion steps is slow enoughto control the overall rate of the process. So, analysis of mechanisms and kineticsof the chemical and diffusion steps of the overall process are needed.
In chemical technology, the SX plays an important role in the purification ofchemical reagents and semiconductor materials. This method is also widelyused in nuclear chemistry and technology for the separation of various radio-isotopes and for the reprocessing of nuclear fuels.
Using SX, important theoretical problems concerning the composition andstability of soluble as well as insoluble complexes can be solved. This quality isvery useful especially for the case when it is not possible to obtain reliableresults by other methods.
In this chapter, modern theoretical considerations in SX techniques arepresented and are reviewed with a classification and grouping. Better under-standing of the principles of SX allows the optimization of solute separationsby SX technique. Factors that influence the effectiveness and selectivity ofseparation are analyzed.
2. SOLVENT EXTRACTION BY SOLVATION
2.1. Solubility of Liquids
SX is the distribution of a solute or solutes between two immiscible liquids orphases. SX commonly takes place with aqueous and organic solutions. SX isgenerally carried out at ambient pressures and temperatures. Sometimes high
5Chapter | 1 Modern (Classical) Fundamental Principles of Solvent Extraction
pressures are used and liquid state can extend up to critical temperature.Organic phase usually consists of extractant dissolved in diluent. Normally, theorganic phase contains a diluent, an extractant, but in some cases, a modifier,and a synergistic agent. The modifier is added to improve the physical prop-erties of the system (e.g., to cause phase disengagement after mixing the twophases); synergistic agent is used for improvement and enhancement ofextractant. The aqueous phase, or feed phase, consists of solute or mixture ofsolutes, contamination compounds, and acids dissolved in water. As anexample, solubilities of water in some organic solvents and these solvents inwater are presented in Table 1.1.
Liquids have some properties that are important in SX techniques. These areviscosity, surface tension, vapor pressure, density, polarity (electronegativity,dipole moment), and polarization ability.
Many liquids used in SX are polar. Polarity is determined by electric dipolein molecule, since their atoms have different electronegativities. The value ofdifference is characterized by dipole moment, dd, e.g., dipole moment ofnitrobenzene, dd¼ 4.0 D (1 Debye unit¼ 3.34) 10�30 C)m) and water,dd¼ 1.83 D.
Liquid compounds that have not permanent dipole moment are callednonpolar. These are many of hydrocarbons. If this liquid is placed in electricfield, the electrons of atoms respond to the external field by atomic polarizationwhich is called relative permittivity and determined by dielectric constant, 3.The forces between charges, such as ions, of opposite signs are inverselyproportional to the relative permittivity of the liquid. So the dissociation ofmolecules into ions strongly depends on the relative permittivity of the solventused for electrolyte.
Forces that keep the molecules of liquids together and are responsible for theabove-mentioned properties are called as cohesive forces: dispersion (or London)forces, Van der Waals forces, dipole forces, and hydrogen bonding. Parameterthat is called square root of the cohesive energy density, d2, connects the molarheat of vaporization, DHV, with the liquid volume, V, and temperature, T:
d2 ¼ DHV � RT
V(1.1)
The d parameter is nominated as solubility parameter of the liquid.1
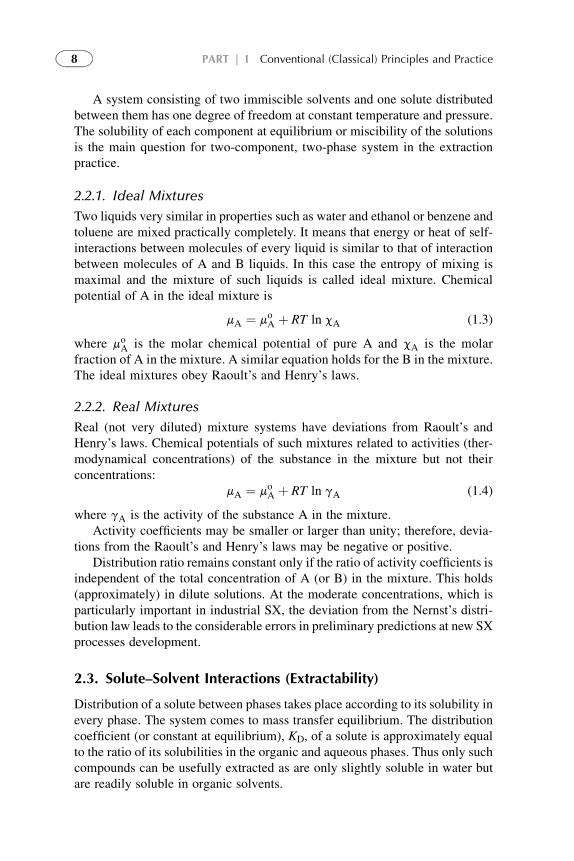
2.2. Mixtures of Solutions
The general behavior of the nature, the phase rule of Gibbs says:
pþ f ¼ nþ 2 (1.2)
where p is the number of phases, f is the number of degrees of freedom, andn is the number of components.
6 PART | I Conventional (Classical) Principles and Practice
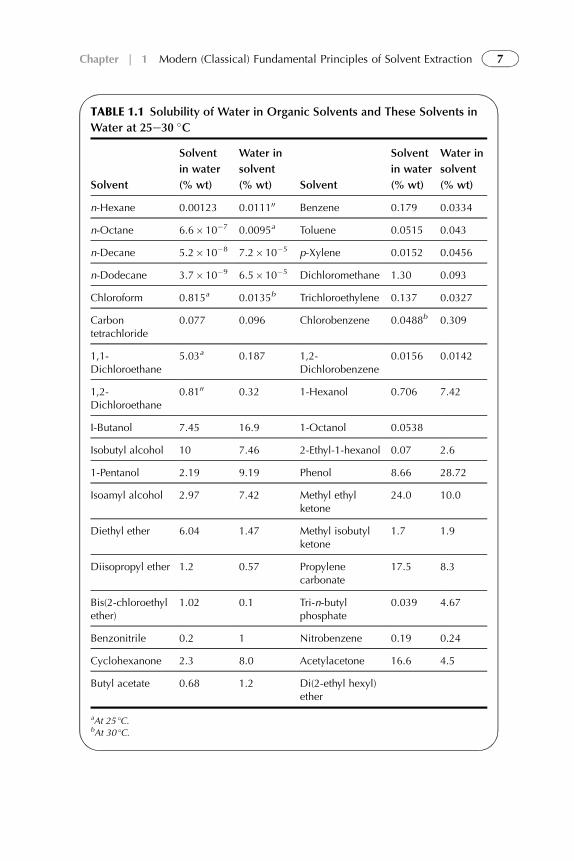
TABLE 1.1 Solubility of Water in Organic Solvents and These Solvents in
Water at 25e30 �C
Solvent
Solvent
in water
(% wt)
Water in
solvent
(% wt) Solvent
Solvent
in water
(% wt)
Water in
solvent
(% wt)
n-Hexane 0.00123 0.011100 Benzene 0.179 0.0334
n-Octane 6.6� 10�7 0.0095a Toluene 0.0515 0.043
n-Decane 5.2� 10�8 7.2�10�5 p-Xylene 0.0152 0.0456
n-Dodecane 3.7� 10�9 6.5�10�5 Dichloromethane 1.30 0.093
Chloroform 0.815a 0.0135b Trichloroethylene 0.137 0.0327
Carbontetrachloride
0.077 0.096 Chlorobenzene 0.0488b 0.309
1,1-Dichloroethane
5.03a 0.187 1,2-Dichlorobenzene
0.0156 0.0142
1,2-Dichloroethane
0.8100 0.32 1-Hexanol 0.706 7.42
I-Butanol 7.45 16.9 1-Octanol 0.0538
Isobutyl alcohol 10 7.46 2-Ethyl-1-hexanol 0.07 2.6
1-Pentanol 2.19 9.19 Phenol 8.66 28.72
Isoamyl alcohol 2.97 7.42 Methyl ethylketone
24.0 10.0
Diethyl ether 6.04 1.47 Methyl isobutylketone
1.7 1.9
Diisopropyl ether 1.2 0.57 Propylenecarbonate
17.5 8.3
Bis(2-chloroethylether)
1.02 0.1 Tri-n-butylphosphate
0.039 4.67
Benzonitrile 0.2 1 Nitrobenzene 0.19 0.24
Cyclohexanone 2.3 8.0 Acetylacetone 16.6 4.5
Butyl acetate 0.68 1.2 Di(2-ethyl hexyl)ether
aAt 25 �C.bAt 30 �C.
7Chapter | 1 Modern (Classical) Fundamental Principles of Solvent Extraction
A system consisting of two immiscible solvents and one solute distributedbetween them has one degree of freedom at constant temperature and pressure.The solubility of each component at equilibrium or miscibility of the solutionsis the main question for two-component, two-phase system in the extractionpractice.
2.2.1. Ideal Mixtures
Two liquids very similar in properties such as water and ethanol or benzene andtoluene are mixed practically completely. It means that energy or heat of self-interactions between molecules of every liquid is similar to that of interactionbetween molecules of A and B liquids. In this case the entropy of mixing ismaximal and the mixture of such liquids is called ideal mixture. Chemicalpotential of A in the ideal mixture is
mA ¼ moA þ RT ln cA (1.3)
where moA is the molar chemical potential of pure A and cA is the molarfraction of A in the mixture. A similar equation holds for the B in the mixture.The ideal mixtures obey Raoult’s and Henry’s laws.
2.2.2. Real Mixtures
Real (not very diluted) mixture systems have deviations from Raoult’s andHenry’s laws. Chemical potentials of such mixtures related to activities (ther-modynamical concentrations) of the substance in the mixture but not theirconcentrations:
mA ¼ moA þ RT ln gA (1.4)
where gA is the activity of the substance A in the mixture.Activity coefficients may be smaller or larger than unity; therefore, devia-
tions from the Raoult’s and Henry’s laws may be negative or positive.Distribution ratio remains constant only if the ratio of activity coefficients is
independent of the total concentration of A (or B) in the mixture. This holds(approximately) in dilute solutions. At the moderate concentrations, which isparticularly important in industrial SX, the deviation from the Nernst’s distri-bution law leads to the considerable errors in preliminary predictions at new SXprocesses development.
2.3. Solute–Solvent Interactions (Extractability)
Distribution of a solute between phases takes place according to its solubility inevery phase. The system comes to mass transfer equilibrium. The distributioncoefficient (or constant at equilibrium), KD, of a solute is approximately equalto the ratio of its solubilities in the organic and aqueous phases. Thus only suchcompounds can be usefully extracted as are only slightly soluble in water butare readily soluble in organic solvents.
8 PART | I Conventional (Classical) Principles and Practice
2.3.1. The Solubility Parameters
Solubility parameter of the liquid,1 d, connects cohesive forces with physico-chemical potentials DG; DH of the solutions (see Eqn (1.1)). This relationholds for ideal and regular solutions that show ideal entropy effects in mixingsolute and solvent, and no interactions occur besides the cohesive forcesbetween the solute and solvent molecules. Regular solutions exhibit heatchanges when mixed, while for ideal solutions, the heat of mixing is equal tozero. There is no change of state in association or in orientation.
The works correlating various types of cohesive forces with the Hansensolubility parameters2,3 are summarized by relation:
d2total ¼ d2dispersion þ d2polar þ d2hydrogen (1.5)
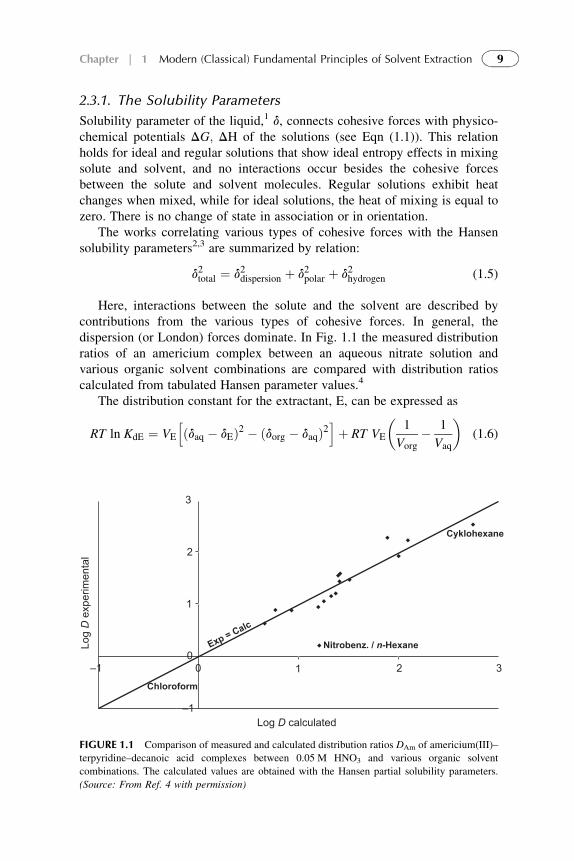
Here, interactions between the solute and the solvent are described bycontributions from the various types of cohesive forces. In general, thedispersion (or London) forces dominate. In Fig. 1.1 the measured distributionratios of an americium complex between an aqueous nitrate solution andvarious organic solvent combinations are compared with distribution ratioscalculated from tabulated Hansen parameter values.4
The distribution constant for the extractant, E, can be expressed as
RT ln KdE ¼ VE
hðdaq � dEÞ2 � ðdorg � daqÞ2
iþ RT VE
�1
Vorg� 1
Vaq
�(1.6)
3
2
1
00 1
–1
–1 2 3Chloroform
Exp
= C
alc
Nitrobenz. / n-Hexane
Cyklohexane
Log D
exp
erim
enta
l
Log D calculated
FIGURE 1.1 Comparison of measured and calculated distribution ratios DAm of americium(III)–
terpyridine–decanoic acid complexes between 0.05 M HNO3 and various organic solvent
combinations. The calculated values are obtained with the Hansen partial solubility parameters.
(Source: From Ref. 4 with permission)
9Chapter | 1 Modern (Classical) Fundamental Principles of Solvent Extraction
where KdE is distribution constant of extractant given in terms of mole frac-tions; molar volumes VE and solubility parameters have to be empiricallyestimated in each set of experiments, assuming constant values for the aqueoussystems in the two different two-phase systems.
The overall enthalpy and entropy changes for the distribution reaction (i.e.,transfer of the complex from the aqueous to the organic phase) can be obtainedfrom the temperature dependence of KdE according to
RT ln KdE ¼ �DH þ TDS (1.7)
From Eqn (1.6) an enthalpy and entropy formally can be obtained as
DH ¼ �VE
h�daq � dEÞ2 � ðdorg � daqÞ2
i(1.8)
and
DS ¼ RVE
�1
Vorg� 1
Vaq
�(1.9)
If the distribution constant for a standard system is used as a reference, changesin enthalpy and entropy relative to this standard system can be assessed byreplacing daq and Vaq with the corresponding data for the organic diluent in thereference system.
Rearrangement of Eqn (1.6) shows that logKDE/(daq� dorg) vs. dE, where
dE ¼ dorgRTðV�1
org � V�1aq Þ
ðdaq � dorgÞ (1.10)
should yield a straight line with slope VE/RT ln 10. This relation demon-strates a satisfactory correlation between distribution constants and solventparameters, indicating the usefulness of the solubility parameter concept.
2.3.2. Thermodynamic Relations
If concentration of the solute in one phase is constant, the concentration ofthe solute in the other phase is also fixed. The relationship betweenconcentration of solute in each of the phases led to Nernst’s formulation ofthe distribution law.5 Distribution constant, Kd (sometimes designated aspartition constant, P):
Kd ¼ Solute species : conc: org: phase
Solute species : conc: aq: phase(1.11)
Distribution constant has to be distinguished from the distribution ratio, D.When solute S is present in various differently complexed forms in the aqueousphase and in the organic phase, [S]tot refers to the sum of the concentrations of
10 PART | I Conventional (Classical) Principles and Practice
all S species in a given phase. It is important to distinguish between thedistribution constant, Kd, which is valid only for a single specified species, andthe distribution ratio, DS, which may involve sums of species and thus is notconstant:
DS ¼ Conc: of all species of S in org: phase
Conc: of all species of S in aq: phase¼ ½S�tot:org
½S�tot:aq(1.12)
Often in practice, a distribution ratio is less informative than one ofpercentage extraction S, %ES:
%ES ¼ 100DS
ð1þ DSÞ (1.13)
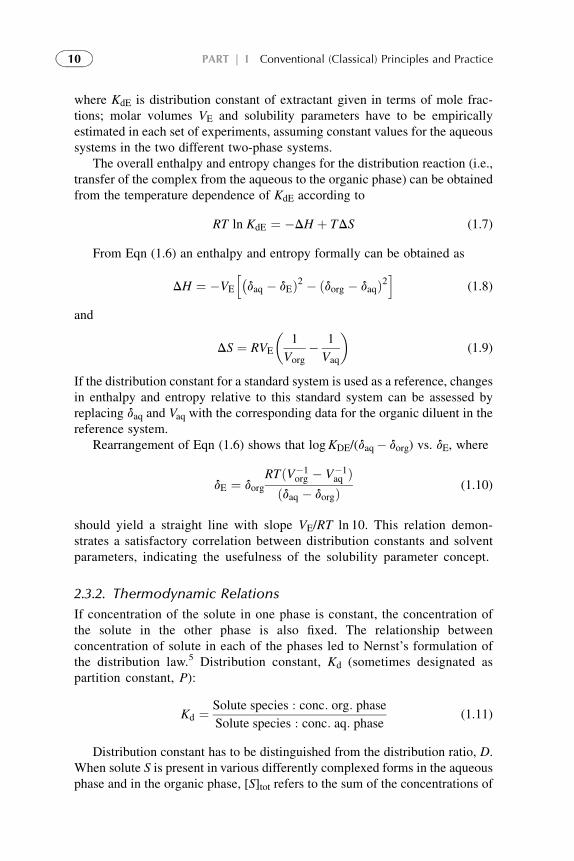
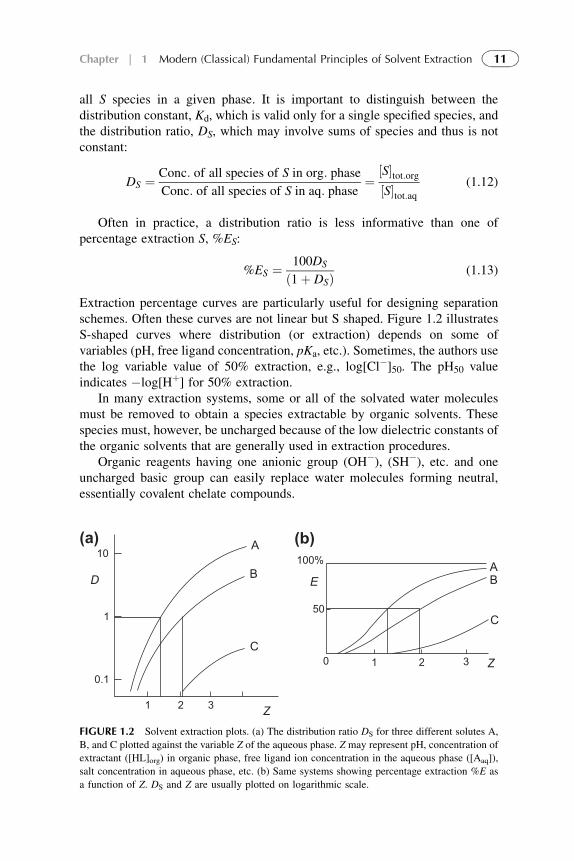
Extraction percentage curves are particularly useful for designing separationschemes. Often these curves are not linear but S shaped. Figure 1.2 illustratesS-shaped curves where distribution (or extraction) depends on some ofvariables (pH, free ligand concentration, pKa, etc.). Sometimes, the authors usethe log variable value of 50% extraction, e.g., log[Cl�]50. The pH50 valueindicates �log[Hþ] for 50% extraction.
In many extraction systems, some or all of the solvated water moleculesmust be removed to obtain a species extractable by organic solvents. Thesespecies must, however, be uncharged because of the low dielectric constants ofthe organic solvents that are generally used in extraction procedures.
Organic reagents having one anionic group (OH�), (SH�), etc. and oneuncharged basic group can easily replace water molecules forming neutral,essentially covalent chelate compounds.
10
1
0.1
D
A
B
C
1 2 3Z
0 1 2 3 Z
AB
C
100%
E
50
(a) (b)
FIGURE 1.2 Solvent extraction plots. (a) The distribution ratio DS for three different solutes A,
B, and C plotted against the variable Z of the aqueous phase. Z may represent pH, concentration of
extractant ([HL]org) in organic phase, free ligand ion concentration in the aqueous phase ([Aaq]),
salt concentration in aqueous phase, etc. (b) Same systems showing percentage extraction %E as
a function of Z. DS and Z are usually plotted on logarithmic scale.
11Chapter | 1 Modern (Classical) Fundamental Principles of Solvent Extraction
3. SOLVENT EXTRACTION WITH CHEMICAL REACTIONS(BY COMPLEXATION)
Species separated by SX may be organic as well as inorganic. Organiccompounds are usually easily dissolved in organic solvents (lipophilic andhydrophobic). Inorganic substances are opposite, particularly metal salts (lip-ophobic and hydrophilic). So, for extraction of inorganic substances, they mustbe changed to lipophilic by reaction with organic compound extractants (alsoextracting agents, reagents). This process is described as reactive extraction orextraction with complexation.
3.1. Thermodynamics of Extraction Systems
Extraction from aqueous into organic solutions can be achieved by solvationand through different chemical reactions. As a rule, they (chemical reactions)are very complicated and are usually presented through a number of simplifiedsteps. The subdivision of an extraction reaction into simple steps is useful forunderstanding the dependence of distribution ratio values on components of theextraction system variations. These models allow to determine some of ther-modynamic equilibrium constants.
Solutes may be both inorganic and organic nonelectrolytes and electrolytes(e.g., metal–organic complexes, metal ions soluble in organic solvents throughreactions with organic components). Reactions are considered in the aqueousphase, in the organic phase, or at the interface between the phases. The systemcomes to equilibrium state. Let us illustrate some subprocesses of the extractionprocess with an example of titanium(IV) extraction from the strong acidic(>7 mol/kg HCl) aqueous solution by di(2-ethylhexyl)phosphoric acid(DEHPA) in benzene.6 Overall extraction reaction is
½TiCl4�aq þ 4HOPOðORÞ2 org / TiO4½POðORÞ2�4 � 2HClorg þ 2HClaq
(1.14)
This extraction process may be described in four steps:First stepdcomplexation of titanium ion by HCl in aqueous phase
Ti4þ þ 6HCl 4 TiCl4 � 2HClþ 4Hþ (1.15)
It is known that titanium central atom may be surrounded by hydratedwatermolecules (orHCl), but they are usually omitted for simplification, althoughwater of hydration (or HCl of solvation) plays a significant role (see Part II).
Second stepdinteraction between titanium chloride complex and DEHPAon the phase interface with formation of Ti–DEHP organic complex
TiCl4 � 2HClaq þ 4HOPOðORÞ2 org 4 TiO4½POðORÞ2�4 � 2HClorg þ 4HClaq
(1.16)
12 PART | I Conventional (Classical) Principles and Practice
Third stepddistribution (mass transfer) from the interface of the organiccomplex to the bulk organic solution and hydrochloric acid to the bulk aqueoussolution
It is possible to make more intermediate step reactions, but this is of littlesignificance since the overall free energy change, DG0
ex, depends only on thestarting and final states of the system. If DG0
i of the steps are known, therelation between DG0
ex and Kex may be given as
DG0ex ¼
Xni¼1
DG0i ¼ �RT log Kex (1.17)
Kex may be determined experimentally and shows the efficiency of an extrac-tion process. It depends on the “internal chemical parameters” of the system,i.e., the chemical reactions and the concentration of reactants of both phases.The latter determine the numerical value of the distribution ratio of the solute.
3.2. Solute–Solvent Interactions in Aqueous Phase
3.2.1. Dissociation
Acids (or salts) dissociate in the aqueous phase with a dissociation constant Ka:
HL ¼ Hþ þ L� Ka ¼ ½Hþ�½L��½HL� (1.18)
The distribution ratio incorporates the Ka for extraction of acids, HL, as:
D ¼ ½HL�org½Hþ�½L�� ¼ KdHL
�1þ Ka
½Hþ��
(1.19)
Solubility in organic solvents is not a characteristic usually attributed to simplemetal salts. As can be expected from their highly ionic nature, most metal saltsare strong electrolytes: molecules dissociated to ions completely or partly. Theprinciple of electroneutrality stands for all solutions.X
a � zþ þX
b � z� ¼ 0 (1.20)
Ionic strength I is defined as summation over all ions present in the solution:
I ¼ 1
2
Xai � z2i (1.21)
The ions in the solution are likely to be solvated by the solvent or hydrated in theaqueous solutions. As a rule, electrolytes have large solubility in aqueous media.
Chemical potential may be formally considered as made by summation ofindividual ions.
mab ¼ mo� þ RT ln½S�� þ RT ln g� (1.22)
13Chapter | 1 Modern (Classical) Fundamental Principles of Solvent Extraction
Ionic activities and activity coefficients have a subscript � for ions withdifferent charges. The calculation of ionic activity coefficients of an electrolytein solution is required for the estimation of SX systems. The osmotic coefficientof water activity is also important, related to ability of solutions to dissolveelectrolytes and nonelectrolytes.
3.3. Solute–Solvent Interactions in Organic Phase
In organic solution, if its relative permittivity is 3> 40, electrolytes are more orless completely dissociate into ions. If 3< 10, dissociation is only slight orparticularly does not take place.
At the transfer of electrolyte ab from aqueous to organic solution, the Gibbsfree energy of transfer, DGabtr, may be determined:
DGoabtr ¼ moabðorganicÞ � moabðaqueousÞ (1.23)
Activity coefficient can be defined as
ln goabtr ¼DGo
abtr
RT(1.24)
These equations hold at the standard state of infinite dilution when onlysolute–solvent interactions take place. At visible concentrations of solute,ion–ion interactions take place and the above dependences need strongcorrections.
In weak polar or nonpolar organic solutions, at 3< 40, ion pairing with thesolute is observed. It close but should be distinguished from the ionic complexformation. Contrary to metal ion–anionic ligand complexes that have coordi-native bonds, the ion pair cannot be presented as geometrically orientedassociation, although it is presented as reaction with an equilibrium constantKass:
Kass ¼ ð1� aÞgn
Caba2g2�
(1.25)
where a is dissociated electrolyte fraction, (1 –a) is associated fraction, gn isactivity coefficient of the undissociated part, and g� is the ionic activitycoefficient of the dissociated part of electrolyte.
At relative permittivity of organic solvent less than 10, ionic dissociation canbecompletely neglected and solutes behave as if they are nonelectrolytes.As a rulethese solutions have negligible electrical conductivity. Interactions between soluteand solvent or solute–solute are taking place through solvation. These are donor–acceptor, hydrogen bond, dipole–dipole, and other cohesive forces interactions.
Dipole–dipole and hydrogen bond interactions can lead to solute aggrega-tion. Linear (head to head or head to tail), chainlike, or cyclic aggregates can beformed.
14 PART | I Conventional (Classical) Principles and Practice
One more phenomenon, formation of the second organic phase, oftenhappens in SX techniques. When organic solution comes to saturation bysolute, a new phase appears. It may be a liquid or a solid. One of the two organicphases is saturated by solute phase and the second is solvent-rich dilute solutionof the solute. According to phase rule, there are no degrees of freedom in thesecompositions.
4. DRIVING FORCES OF SOLVENT EXTRACTION
Solutes have different strength of interactions with different solvents ordifferent solubilities in different solvents. So, in the system of two immiscibleor partly miscible solvents, different solvents become differently distributedbetween these two phases. This is a base of solvent extraction technique.
At the simple solute distribution (without any chemical interactions), thetransport of the solute to and from the phase interface is proportional to thechemical potentials or to the concentration gradients of the solute in the phasesand to the partition coefficient KdSF: the constant giving the concentration ratioof the solute between both phases at equilibrium. It is called the (stoichio-metric) distribution coefficient (constant) and it can be expressed by thefollowing equation:
½CSF�aq 4k1
k�1
½CSE�org (1.26)
KdSF ¼ ½CSE�org½CSF�aq
(1.27)
Where [CSE]org and [CSF]aq denote the concentration of the distributedcompound in the organic and aqueous phases, respectively, at equilibrium.
It follows from Eqn (1.25) that the distribution coefficient KdSF does notdepend on the total solute concentration or on the actual phase volumes. Thedistribution law is only valid if the solute is in both phases in the identicalchemical form.
Equation (1.25) can also be derived thermodynamically from the equalityof the chemical potentials of the solute in organic and aqueous phases atequilibrium:
mSorg ¼ mSaq (1.28)
Substituting suitable expressions for mSorg and mSaq, the following relationcan be obtained:
m0Sorg þ RT ln Corg þ RT ln gorg ¼ m0aq þ RT ln Caq ln gaq (1.29)
where m0S org and m0S aq represent the standard chemical potentials of the solutein the organic and aqueous phases and gorg and gaq represent the activitycoefficients in the organic and aqueous phases respectively.
15Chapter | 1 Modern (Classical) Fundamental Principles of Solvent Extraction
From the above relation, we may obtain the expression for the distributioncoefficient at equilibrium:
KdSF ¼ Corg
Caq¼ gaq
gorgexp�� ½g0
org � g0aq�=RT
�(1.30)
When the solute concentration is low, the activity coefficients gorg and gaqapproach unity and the stoichiometric distribution coefficient KdSF becomesconstant because gorg
0 and gaq0 are also constant. Here, the extraction depends on
the partition (distribution) coefficient KdSF only.When the organic phase contains an extractant that is able to form
a complex with the solute:
Saq 4k1
Sorg þ E 4k2
SEorg 4k3 ðSEÞn (1.31)
Considering here only first two steps (chemical reaction of complexation):
KFE ¼ ½SSEE�½SSorg�½E� (1.32)
the forward extraction step becomes
KSFex ¼ KdSFKFE (1.33)
where driving factor of extractant at complex formation DSFex:
DSFex ¼ KSFex½E�0ð1þ KSFex½CSF�Þð1þ KSFex½CSE�Þ (1.34)
Now, let us consider the coupling effect, using the specific extractionreactions of metal ion, e.g., Cu2þ with acidic extractant HLorg:
Cu2þaq þ 2HLorg 4 CuL2org þ 2Hþ (1.35)
and total driving force of extraction process:
Ktot ¼½CuL2�org � ½H�2aq½Cu�aq � ½HL�2org
¼ KSFex �
½H�aq½HL�org
!2¼ KSFex
KScoup(1.36)
where KScoup is the coupling coefficient (metal ion–proton) at forwardextraction.
The process of solute extraction is driven by solute concentration gradient,partition (distribution) coefficient, and Donnan equilibrium coupling.
Driving force coefficients KSFex and Kbex may be determined by membrane-based extraction experiments.7
Basic features of extractant-mediated transport are as follows: (1) the effectof extraction is proportional to the extractant concentration and (2) the
16 PART | I Conventional (Classical) Principles and Practice
extraction shows typical saturation behavior at low solute concentrations, and isclose to be independent of [CS] at high solute concentrations. A very strongcomplexing extractant becomes fully loaded with solute even at low concen-trations. This leads to the conclusion that the best extractant is not necessarilythe strongest complexing one. Apart from this thermodynamic reason, theremay also be a kinetic reason: strong complexing agents frequently showa slow rate.
5. INFLUENCE OF KINETICS FACTORS
Extraction kinetics is a function of both the kinetics of the various chemicalreactions occurring in the system and the diffusion rate of the various speciesthat control the chemistry.
Products of any extraction process are usually in a chemical state differentfrom initial species. Even at simple partition of neutral molecules betweentwo immiscible phases, there is a chemical change in solvation environment.Using extractants that chemically react with the solute, drastic chemicalchanges take place. They can be described by subsequent partitioning, inter-action (complexation), and diffusion of the initial species from the bulk phaseto the reaction interface and product (solute–extractant complexes) from theinterface to the bulk phase. At first two processes, the solvated water moleculescan be removed from the solute ion; the carrier molecule can undergo an aciddissociation reaction; a new compound, soluble in the organic phase, may beformed with chelating group of the extractant; extractant–solute complex canundergo changes in aggregation; and so on. Usually these interactions are goingstepwise through several adducts, including dissociation, aggregation, etc.Every step has its own rate. At least one of the chemical steps of the overallreaction mechanisms or diffusion rate steps may be slow enough, and overalltransport kinetics would depend on this slow rate. So, we have to consider bothchemical kinetics and diffusion rate steps to determine rate-controlling step forthe overall process.
Very few tools have been developed up-to-date to investigate chemicalchanges occurring at liquid–liquid interfaces, and our knowledge is still limitedand is based on indirect experimental evidence and speculations.
5.1. Diffusion Transport Regime
Most extraction systems involve stirring of the phases to minimize the time fordiffusion of dissolved species toward and away from the interface. It followsthat transport of species from the bulk phase to a region very close to interfacecan be considered instantaneous and the diffusion in the bulk phase can beneglected. But even the most vigorously stirred systems possess two thin filmsat the aqueous–organic interface which are essentially stagnant. These films,often referred to as diffusion films, Nernst films, and diffusion layers, vary from
17Chapter | 1 Modern (Classical) Fundamental Principles of Solvent Extraction
50 to 500 mm thick8,9 and can be crossed only by diffusion processes. The two-film model is used here to describe the diffusional transport (see Fig. 1.3). Thethickness of the diffusion films never goes down to zero. The time required forthe diffusional crossing of the films by the solute may be longer or comparablewith the time required for chemical reactions. So diffusion across the boundarylayers may control the overall kinetics.
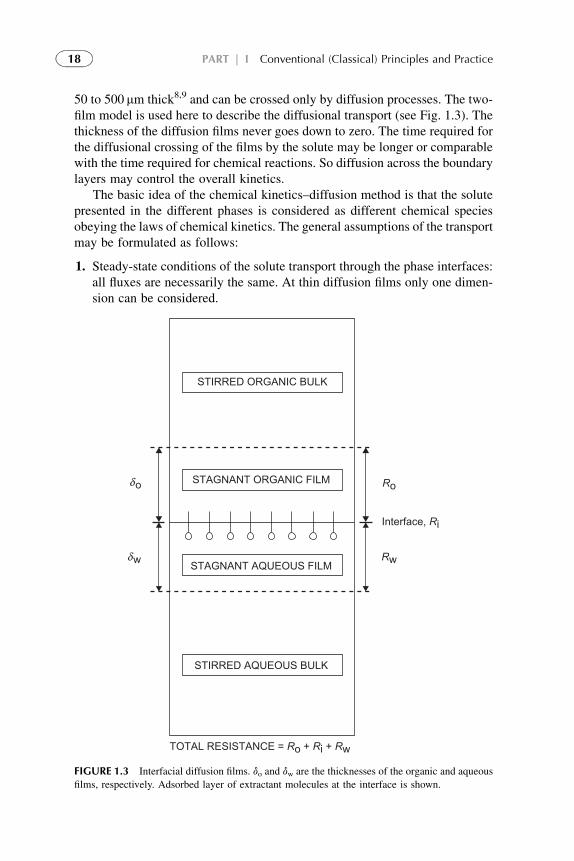
The basic idea of the chemical kinetics–diffusion method is that the solutepresented in the different phases is considered as different chemical speciesobeying the laws of chemical kinetics. The general assumptions of the transportmay be formulated as follows:
1. Steady-state conditions of the solute transport through the phase interfaces:all fluxes are necessarily the same. At thin diffusion films only one dimen-sion can be considered.
STAGNANT ORGANIC FILM
STAGNANT AQUEOUS FILM
STIRRED AQUEOUS BULK
STIRRED ORGANIC BULK
TOTAL RESISTANCE = Ro + Ri + Rw
o
w
Ro
Rw
Interface, Ri
FIGURE 1.3 Interfacial diffusion films. do and dw are the thicknesses of the organic and aqueous
films, respectively. Adsorbed layer of extractant molecules at the interface is shown.
18 PART | I Conventional (Classical) Principles and Practice
2. The overall mass transfer rate of species can be controlled by any of thechemical reaction–diffusion resistances.
3. The overall mass transfer resistance at steady state is the sum of individualmass transfer resistances at diffusional regime through the diffusion filmand chemical reaction resistances at the phase interface.
4. Thermodynamic local equilibrium at the interface.
Experience has shown that the film diffusion is very often predominating rate-controlling factor in the SX practice. The barriers to transport imposed by theneed for diffusion across diffusion layers can be minimized by decreasing filmthickness or by increasing the mobility of the diffusible species. The thicknessof the diffusional films depend on stirring rate of the phases and type of thestirrers used, on the geometry of the extraction equipment, and on theviscosity and density of both phases. The thickness, up to a certain limitingvalue, is inversely related to mechanical energy supplied (e.g., by stirring).10
Viscosity and density of the liquids used as well as equipment geometry alsoaffect film thickness but interfacial films apparently cannot be completelyeliminated.
5.1.1. Mathematical description of the diffusion transport
The diffusion flux JS (M, g/cm2/s) of the specie is defined as the amount ofmatter passing perpendicularly through the unit area during the unit time.Different solutes have different solubilities and diffusion coefficients, DS. Theflux of a species S through a film thickness, h, is related to the concentrationgradient through Fick’s first law:
JS ¼ �DSvCS
vh(1.37)
High fluxes can be obtained when a large chemical potential (concentrationgradient) is maintained over a thin film in which the diffusivity, DS, of thespecies is high (as a rule, 10�5–10�6 cm2/s). This diffusion is expressed byFick’s second law:
vC
vt¼ DS
v2C
vh2(1.38)
For steady-state diffusion occurring across thin films, only one dimensioncan be considered and solute flux, JS, can be presented as (see Fig. 1.3)
JS ¼ �kS
�½CS2� � ½CS1�Þ ¼ kSð½CS1� � ½CS2�
�(1.39)
where
kS ¼ DS
h(1.40)
19Chapter | 1 Modern (Classical) Fundamental Principles of Solvent Extraction
is individual mass transfer coefficient dependent on the thickness of thediffusion film, h, which is constant (as the diffusion coefficient) at the processparameters used.
At one-dimensional diffusion and assuming a linear solute (or extractant, orsolute–extractant complex) concentration profile, Ci� Cj within the filmthickness, h, the flux relation becomes
J ¼ �DJCi � Cj
h(1.41)
Following are descriptions of the diffusion steps of the system:
1. Diffusion of species through the aqueous-phase diffusion film:
Jf ¼ kfð½CSF� � ½CSf �Þ (1.42)
2. Diffusion of species through the organic-phase diffusion film:
JfO ¼ kfOð½CSO� � ½CSf �Þ (1.43)
Assuming the volumes of the organic and aqueous phases are equal,VF¼ VO¼V, the amount of diffusion matter inside the films is negligible to thatin the bulk phases; we obtain simple correlation between concentrations CSF
and CSO and time:
�dCSF
dt
VF
H¼ þdCSO
dt
VO
H¼ J (1.44)
where VF and VO are volumes of aqueous and organic phases, respectively, andH is the area of the interface.
At initial conditions: t¼ 0, C0 ¼ 0, and CF ¼ C0F, and integration we obtain
ln
�2CF � C0
F
C0F
�¼ �2HDS
Vht (1.45)
Some conclusions can be formulated from these considerations.
1. At equilibrium concentrations of the solute in organic and aqueous phasesare equal.
2. At approaching equilibrium the flux rate is proportional to the interface areaand diffusion coefficient and inverse to the phase volume and the thicknessof diffusion film.
3. Diffusion-controlled process can be experimentally identified by measuringkinetic parameters (forward and reverse rates) at film thicknesses hF and hOvariations.
This simple mathematical treatment with many assumptions helps betterunderstanding of the fundamental role of diffusion films in the rate-controlling
20 PART | I Conventional (Classical) Principles and Practice
SX. Of course, diffusion through two liquid films (organic and aqueous) on theopposite sides of the interface has to be considered.
Decreased film thicknesses are not the only way to increase diffusion rate.Structural features of phases can themselves alter diffusion. Thusmanipulation ofextractant structural features offers minimal benefit for increasing transport rates.
There is another, more general description for time dependency of the solutefluxes. Using postulates of nonequilibrium thermodynamics,11 the generalequation that relates the flux, JS, of the solute to its concentration C and itsderivative is
JS ¼ UC � DSdC
dh(1.46)
where U is the phase flow or stirring rate.Referring to equation continuity, as h approaches zero, the steady-state layers
are formed next to the phase interface and separation occurs by differentialdisplacement permeation. According Giddings’ analysis12 of such a system:
ln
26664�C � J0
U
��C0 � J0
U
�37775¼ U
h
D(1.47)
where C0 is initial solute concentration and J0 is initial flux.Using Eqn (1.45) we obtain individual mass transfer coefficient ki for every
layer at sampling time ti:
ki ¼ U
8>>><>>>:ln
��Ci � Jss
U
��h�
Ci�1 � JssU
�i9>>>=>>>;
�1
(1.48)
where Ci and Ci�1 are the concentrations of the solute in the bulk phase at timeti and time of previous sampling, ti�1, respectively, and Jss is the flux at steadystate.
5.1.2. Determination of diffusion coefficients
Different methods can be applied to determine diffusion coefficients inde-pendently from transport experiments, e.g., determination of the lag-time,13
pulsed-field gradient nuclear magnetic resonance (NMR),14 and permeabilitymeasurements.15
The bulk diffusion coefficient Db is derived by Stokes–Einstein relation-ship.16 Simplest relationship is
Db ¼ KT
6phr(1.49)
where k is the solute mass transfer coefficient based on concentration, T istemperature, h is the solvent viscosity, and r is the solute molecular radius.
21Chapter | 1 Modern (Classical) Fundamental Principles of Solvent Extraction
And the Wilke–Chung relation17 is
Db ¼ 7:4 � 10�8
½S�0:5ThV0:6
!(1.50)
This relationship is accurate for neutral molecules. For ionic species muchmore complex models are required, taking into account factors such as ioniccharge, ionic strength, and the presence of electric fields. In either case, therange of values for Db is quite narrow, usually 10�5–10�6 cm2/s.
Diffusion coefficientDb can be obtained from lag-time experiments.18 A lagtime is defined as the time required for the complex to diffuse through the filmsfrom the feed phase to the organic phase, assuming dilute conditions.
tlag ¼ h2S6Dlag
(1.51)
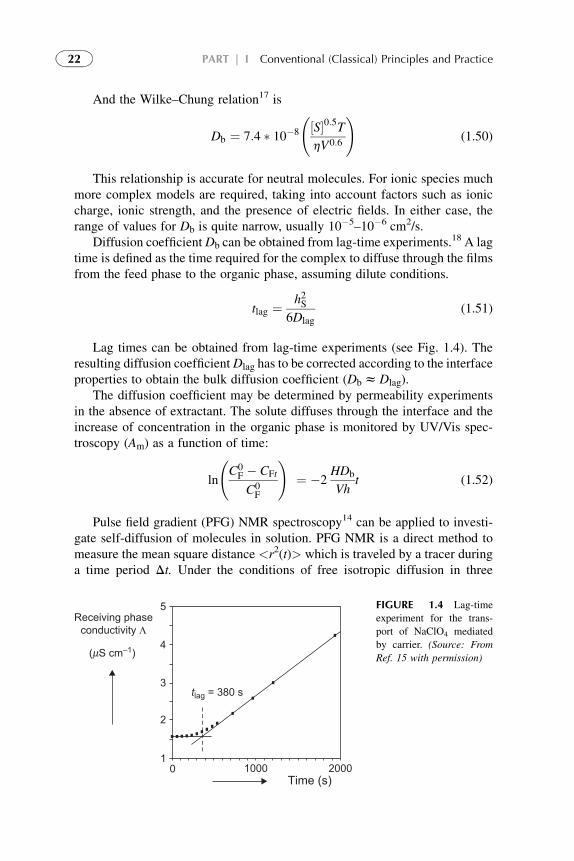
Lag times can be obtained from lag-time experiments (see Fig. 1.4). Theresulting diffusion coefficientDlag has to be corrected according to the interfaceproperties to obtain the bulk diffusion coefficient (DbzDlag).
The diffusion coefficient may be determined by permeability experimentsin the absence of extractant. The solute diffuses through the interface and theincrease of concentration in the organic phase is monitored by UV/Vis spec-troscopy (Am) as a function of time:
ln
C0F � CFt
C0F
!¼ �2
HDb
Vht (1.52)
Pulse field gradient (PFG) NMR spectroscopy14 can be applied to investi-gate self-diffusion of molecules in solution. PFG NMR is a direct method tomeasure the mean square distance <r2(t)> which is traveled by a tracer duringa time period Dt. Under the conditions of free isotropic diffusion in three
5
4
3
2
10 1000 2000
Time (s)
Receiving phaseconductivity Λ
( S cm–1)
tlag = 380 s
μ
FIGURE 1.4 Lag-time
experiment for the trans-
port of NaClO4 mediated
by carrier. (Source: From
Ref. 15 with permission)
22 PART | I Conventional (Classical) Principles and Practice
dimensions of dilute solutions), the replacement is related to the self-diffusioncoefficient Dsd by equation:
<r2ðtÞ> ¼ 6DsdDt (1.53)
With PFG NMR the molecular displacements by self-diffusion can bemeasured to give the microscopic diffusion coefficient Dsd in the range of10�6–10�14 m2/s with an optimum between 10�9 and 10�13 m2/s. The radialand axial diffusion coefficients were measured by changing the orientation ofthe magnetic field.
5.2. Chemical Reaction Kinetics Regime Transport
For the last time more and more investigations report that chemical reactionkinetics play sometimes critical role for overall extraction process kinetics.19
When one or more of the chemical reactions are sufficiently slow in comparisonwith the rate of diffusion to and away from the interfaces, diffusion can beconsidered “instantaneous,” and the solute transport kinetics occur in a kineticregime. Kinetic studies of chemical reactions between solute and reagent(extractant) seek to elucidate the mechanisms of such reactions. Information onthe mechanisms that control solvent exchange and complex formation isreported briefly below.
5.2.1. Complexation–Decomplexation
Two series of chemical reactions mechanisms and their kinetics have to beanalyzed:
1. Solute partition and chemical interactions with extractant (or solvents)and formation of solute–extractant complex (forward extraction orcomplexation).
2. Solute release from organic phase with chemical interactions and destruc-tion of the complex (decomplexation or back extraction) and partition ofthe solute between organic and aqueous strip phases.
In the solvent exchange, the composition of the coordination sphere oftenchanges, either because of the formation of complexes between the solutes anda complexing reagent, preferentially soluble in an organic phase, or because of thereplacement of a ligand in the aqueous phase solute complex with another morelipophilic one in the organic phase. Solvent exchange and complex formation arespecial cases of nucleophilic substitution reactions. The basic classification ofnucleophilic substitution is found on the consideration that when a new complexis formed through the breaking of a coordination bond with the first ligand (orwater) and the formation of a new coordination bond with the organic ligand, therupture and formation of the bonds can occur with different rates and through theformation of transition intermediates (adducts). The rate at which solvent
23Chapter | 1 Modern (Classical) Fundamental Principles of Solvent Extraction
molecules are exchanged between the primary solvation shell of an ion and thebulk solvent is of primary importance in the kinetics of complex formation fromions in aqueous solutions. In both water exchange and complex formation,a solvent molecule in the solvated ion is replaced with a new molecule (anotherwater molecule or a ligand). Therefore, strong correlations exist between thekinetics and themechanisms of the two types of reactions. Observations20 showedthat the rates and activation parameters for complex formation are similar to thosefor water exchange, with the complex formation rate constants usually abouta factor of 10 lower than those for water exchange with little dependence on theidentity of the ligand. This means that, at least as a first approximation, thecomplex formation mechanism can be described by the rapid equilibriumformation.
For ligand displacement reactions, very few generalizations can be made,since the reaction mechanisms tend to be specific to each chemical system.However, it has been experimentally observed, at least for aqueous-phase reac-tions, that the variation of the rates with the identity of the ligand correlateswell with the variation in the thermodynamic stability of the complex. Thermo-dynamically very stable complexes can be expected to react slowly with theextractant. For example, the rate of trivalent lanthanide or actinide cationextraction from aqueous solutionswithweakly complexing ligands (Cl� orNO�
3 )by DEHPA is very fast. On the other hand, in the presence of polyamino-carboxylic acids, such as Ethylene diamine tetraacetic acid (EDTA) (powerfulcomplexing agent), the extraction reaction proceeds only slowly.20 Ligandsubstitution reactions with planar tetracoordinated complexes are often slow incomparison with the rate of diffusion through the interfacial diffusional films.
5.2.2. Liquid–Liquid Interface
Contact, interaction, and transfer of chemical species on the liquid–liquidinterface of two immiscible phases have to be mentioned in the generalconsideration of chemical kinetics. Little direct information is available onphysicochemical properties (interfacial tension, dielectric constant, viscosity,density, charge distribution, etc.) of the interface. The physical depth of theinterfacial region can be estimated in the distance in which molecular and ionicforces have their influence. On the aqueous side (monolayers of charged or polargroups), this is several nanometers; on the organic side is the influence of Vander Waals forces. These interfacial zone interactions may slower exchange andcomplex formation reactions, but as a rule enough fast to be not rate controllingfor the most chemical interactions on the interface. The reader may obtain moredetailed information about interfacial phenomena in Refs. 21,22.
All considerations, presented for the kinetics of forward extraction reac-tions, may be applied in the reverse mode to the chemical interactions at stripinterface with the complex destruction (decomplexation or back extraction), thesolute release, and partition between organic and aqueous strip phases. It has to
24 PART | I Conventional (Classical) Principles and Practice
be taken into consideration two basic differences: quite different thermody-namic conditions on the organic–strip phase interface that may lead to differentinteraction mechanisms and kinetics and different, more slow kinetics ofcomplex destruction (comparing to the complexation), especially at destructionof aggregates or oligomers that can be formed in the organic phase at highinitial concentration of the solute23,24
Spectrometric NMR studies showed that the complexes can be kineticallystable25,26 and, as a consequence, decomplexation rates can be very slow.Recently, at cation interaction experiments with different calix crown etherderivatives,27 it was proven that the rate of decomplexation can be ratecontrolling in the extraction–back extraction techniques.
5.2.3. Mathematical Description of Kinetic Regime
The first goal of any kinetic study is to devise experiments that establish thealgebraic form of the rate law and to evaluate the rate constants. Rate laws canbe derived by measuring concentration variations as function of time or theinitial rates as function of the initial concentrations. Unfortunately, there is nogeneral method for finding the rate law and the reaction order. Usually, a trial-and-error procedure is used based upon intelligent guesses.
Experimental kinetic data derived by variables (concentration, temperature,nature of the solvent, presence of other solutes, structural variations of thereactants, etc.) refer to a reaction rate. Reaction mechanism is always onlyindirectly derived from primary data. Stoichiometry of the reaction, even whenthis is a simple one, cannot be directly related with its mechanism, and whenthe reaction occurs through a series of elementary steps, the possibility that theexperimental rate law may be interpreted in terms of alternative mechanismincreases. Therefore, to resolve ambiguities as much as possible, one must useall the physicochemical information available on the system. Particularly usefulhere is information on the structural relations between the reactants, theintermediate, and the reaction products.
Mathematical descriptions of simple rate laws used, as a rule, by investi-gators are presented below.
1. Irreversible first-order reactions depend only on concentration of a solute CS
because the rate of the reverse reaction is always close to or equal to zero.Reaction and rate expressions are
CS þ E /k
CSE (1.54)
�d½CS�dt
¼ k½CS� (1.55)
CS ¼ C0Se
�kt (1.56)
25Chapter | 1 Modern (Classical) Fundamental Principles of Solvent Extraction
where E is the extractant concentration, C0S is the solute initial concentration, k
is the reaction rate constant, and t is time.
2. Reversible first-order reactions are
CS þ E 4k1
k2CSE (1.57)
�d½CS�dt
¼ k1½CS� � k2½CSE� (1.58)
At t ¼ 0, ½CS� ¼ C0S , and [CSE] ¼ 0:
½CS� ¼ ½C0S�
k1 þ k2
�k2 þ k1e
�ðk1þk2Þt�
(1.59)
At t ¼N (at equilibrium, eq), k1[CS]eq¼ k2[CSE]eq and equilibriumconstant Keq is
Keq ¼ k1k2
¼ ½CSE�eq½CS�eq
(1.60)
and
ln
½CS� � ½CS�eq½C0
S� � ½CS�eq
!¼ �ðk1 þ k2Þt (1.61)
The individual rate constants of the reaction can be evaluated from the slopeof a plot, providing the equilibrium constant is available. Many distributionprocesses between immiscible liquid phases of noncharged species, as well asdistribution of solute ions (e.g., metal ions) performed at very low soluteconcentrations, can be treated as first-order reversible reactions when the valueof the equilibrium (partition) constant is not very high.
3. Series first-order reactions may be referred to the cases when the mecha-nism goes through an intermediate CSorg, e.g., at an interfacial adsorptionof the solute:
CSaq /k1
CSorg þ Eorg /k2
CSEorg (1.62)
d½CS�orgdt
¼ k1½C0S �e�k1t � k2½CS�org (1.63)
At steady-state approximation d[CS]org/dt ¼ 0
½CS�org ¼ ½C0S�k1k2
e�k1t (1.64)
26 PART | I Conventional (Classical) Principles and Practice
and
½CSE� ¼ ½C0S ��1�
�1þ k1
k2
�e�k1t
�(1.65)
k2>> k1 means that reactive intermediate (complex) is formed at low soluteconcentration which is then interacted with increasing concentration to formthe stable final complex aggregate (CSE)n:
28,29
CSaq /k1
CSorg þ E /k2
CSE /k3 ðCSEÞn (1.66)
5.2.4. Determination of Kinetic Parameters
Determination of a (Dimensionless Parameter Which RelatesDiffusion-Limited Species Transfer to Kinetically Limited)
In general for the layer:
a ¼ D
kh(1.67)
where h is layer (film) thickness and k is the rate of reaction.When the transport is purely limited by diffusion (a~ 0), parameters can be
obtained from measurements of the flux as a function of concentration. In prin-ciple, all parameters can be derived by measuring the flux with varying concen-trations and thickness of layers. In the case when the extractant at the feed phaseinterface is fully loaded by solute, the flux reaches its maximum value (JSmax):
9
JSmax ¼�DS
hSE0
��1
1þ a
�(1.68)
where E0 is activation energy of the chemical reaction.The first term in Eqn (1.68) describes the diffusion-limited flux, while the
second term l/(lþ a) is a correction factor for slow reaction kinetics. The valueof DS can be determined independently. Direct determination of k and DS fromflux measurements as a function of the layer thickness may be obtained byvarying the stirring rates. As a result a is also obtained. If a< 1, the transport ismainly limited by diffusion of the species, while the transport is primarilycontrolled by the reaction rate in the case that a > 1.
By combining Eqn (1.66) with relationship DS ¼ Dlag, obtained by lag-timeexperiments, a may be obtained from Dlag and JSmax:
a ¼ DlagE0
hSJSmax� 1 (1.69)
Separation of the diffusional and kinetic terms is achieved by expressing theflux as the ratio of driving force and flux:
E0
JSmax¼ hS
DSþ 1
kS(1.70)
27Chapter | 1 Modern (Classical) Fundamental Principles of Solvent Extraction
Consequently, a plot of E0 /JSmax vs. hS gives a straight line with a slope 1/DS
and an intercept of 1/k.The value of a can be determined directly by calculation:
a ¼ 1=k
hS=DS(1.71)
Determination of Activation Energy
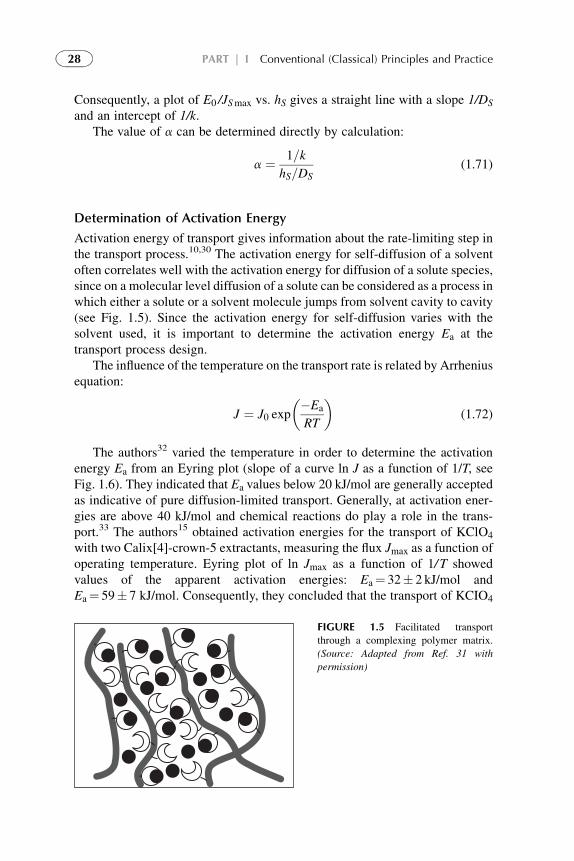
Activation energy of transport gives information about the rate-limiting step inthe transport process.10,30 The activation energy for self-diffusion of a solventoften correlates well with the activation energy for diffusion of a solute species,since on a molecular level diffusion of a solute can be considered as a process inwhich either a solute or a solvent molecule jumps from solvent cavity to cavity(see Fig. 1.5). Since the activation energy for self-diffusion varies with thesolvent used, it is important to determine the activation energy Ea at thetransport process design.
The influence of the temperature on the transport rate is related by Arrheniusequation:
J ¼ J0 exp
��Ea
RT
�(1.72)
The authors32 varied the temperature in order to determine the activationenergy Ea from an Eyring plot (slope of a curve ln J as a function of 1/T, seeFig. 1.6). They indicated that Ea values below 20 kJ/mol are generally acceptedas indicative of pure diffusion-limited transport. Generally, at activation ener-gies are above 40 kJ/mol and chemical reactions do play a role in the trans-port.33 The authors15 obtained activation energies for the transport of KClO4
with two Calix[4]-crown-5 extractants, measuring the flux Jmax as a function ofoperating temperature. Eyring plot of ln Jmax as a function of 1/ T showedvalues of the apparent activation energies: Ea¼ 32� 2 kJ/mol andEa¼ 59� 7 kJ/mol. Consequently, they concluded that the transport of KCIO4
FIGURE 1.5 Facilitated transport
through a complexing polymer matrix.
(Source: Adapted from Ref. 31 with
permission)
28 PART | I Conventional (Classical) Principles and Practice
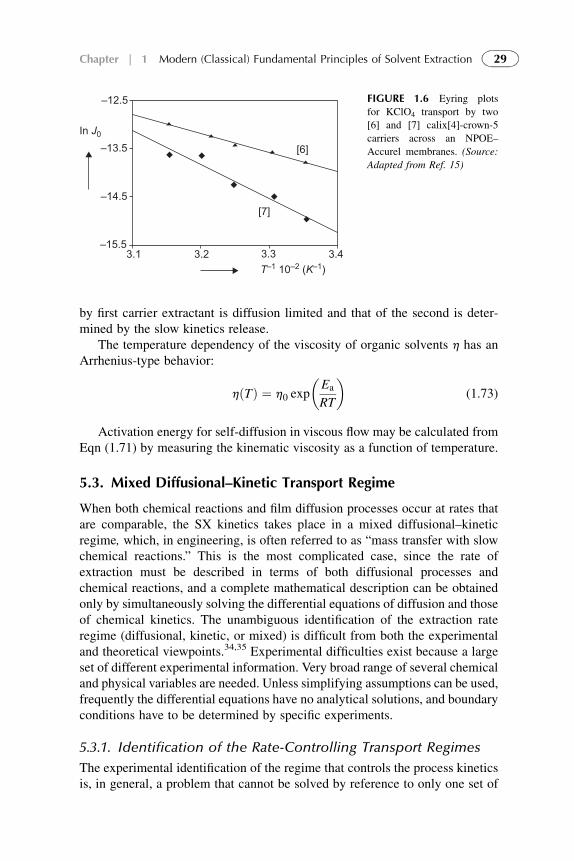
by first carrier extractant is diffusion limited and that of the second is deter-mined by the slow kinetics release.
The temperature dependency of the viscosity of organic solvents h has anArrhenius-type behavior:
hðTÞ ¼ h0 exp
�Ea
RT
�(1.73)
Activation energy for self-diffusion in viscous flow may be calculated fromEqn (1.71) by measuring the kinematic viscosity as a function of temperature.
5.3. Mixed Diffusional–Kinetic Transport Regime
When both chemical reactions and film diffusion processes occur at rates thatare comparable, the SX kinetics takes place in a mixed diffusional–kineticregime, which, in engineering, is often referred to as “mass transfer with slowchemical reactions.” This is the most complicated case, since the rate ofextraction must be described in terms of both diffusional processes andchemical reactions, and a complete mathematical description can be obtainedonly by simultaneously solving the differential equations of diffusion and thoseof chemical kinetics. The unambiguous identification of the extraction rateregime (diffusional, kinetic, or mixed) is difficult from both the experimentaland theoretical viewpoints.34,35 Experimental difficulties exist because a largeset of different experimental information. Very broad range of several chemicaland physical variables are needed. Unless simplifying assumptions can be used,frequently the differential equations have no analytical solutions, and boundaryconditions have to be determined by specific experiments.
5.3.1. Identification of the Rate-Controlling Transport Regimes
The experimental identification of the regime that controls the process kineticsis, in general, a problem that cannot be solved by reference to only one set of
–12.5
–13.5
–14.5
–15.53.1 3.2 3.3 3.4
In J0
[7]
[6]
T–1 10–2 (K–1)
FIGURE 1.6 Eyring plots
for KClO4 transport by two
[6] and [7] calix[4]-crown-5
carriers across an NPOE–
Accurel membranes. (Source:
Adapted from Ref. 15)
29Chapter | 1 Modern (Classical) Fundamental Principles of Solvent Extraction
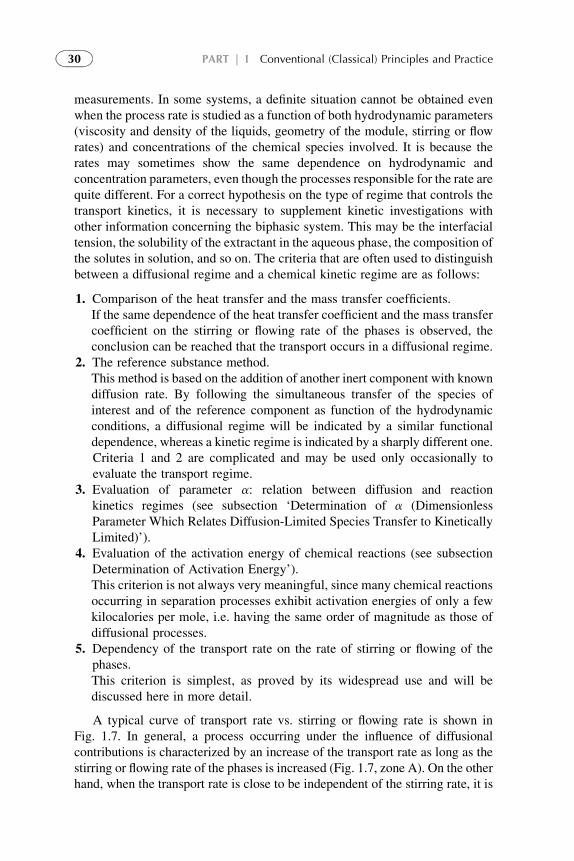
measurements. In some systems, a definite situation cannot be obtained evenwhen the process rate is studied as a function of both hydrodynamic parameters(viscosity and density of the liquids, geometry of the module, stirring or flowrates) and concentrations of the chemical species involved. It is because therates may sometimes show the same dependence on hydrodynamic andconcentration parameters, even though the processes responsible for the rate arequite different. For a correct hypothesis on the type of regime that controls thetransport kinetics, it is necessary to supplement kinetic investigations withother information concerning the biphasic system. This may be the interfacialtension, the solubility of the extractant in the aqueous phase, the composition ofthe solutes in solution, and so on. The criteria that are often used to distinguishbetween a diffusional regime and a chemical kinetic regime are as follows:
1. Comparison of the heat transfer and the mass transfer coefficients.If the same dependence of the heat transfer coefficient and the mass transfercoefficient on the stirring or flowing rate of the phases is observed, theconclusion can be reached that the transport occurs in a diffusional regime.
2. The reference substance method.This method is based on the addition of another inert component with knowndiffusion rate. By following the simultaneous transfer of the species ofinterest and of the reference component as function of the hydrodynamicconditions, a diffusional regime will be indicated by a similar functionaldependence, whereas a kinetic regime is indicated by a sharply different one.Criteria 1 and 2 are complicated and may be used only occasionally toevaluate the transport regime.
3. Evaluation of parameter a: relation between diffusion and reactionkinetics regimes (see subsection ‘Determination of a (DimensionlessParameter Which Relates Diffusion-Limited Species Transfer to KineticallyLimited)’).
4. Evaluation of the activation energy of chemical reactions (see subsectionDetermination of Activation Energy’).This criterion is not always very meaningful, since many chemical reactionsoccurring in separation processes exhibit activation energies of only a fewkilocalories per mole, i.e. having the same order of magnitude as those ofdiffusional processes.
5. Dependency of the transport rate on the rate of stirring or flowing of thephases.This criterion is simplest, as proved by its widespread use and will bediscussed here in more detail.
A typical curve of transport rate vs. stirring or flowing rate is shown inFig. 1.7. In general, a process occurring under the influence of diffusionalcontributions is characterized by an increase of the transport rate as long as thestirring or flowing rate of the phases is increased (Fig. 1.7, zone A). On the otherhand, when the transport rate is close to be independent of the stirring rate, it is
30 PART | I Conventional (Classical) Principles and Practice
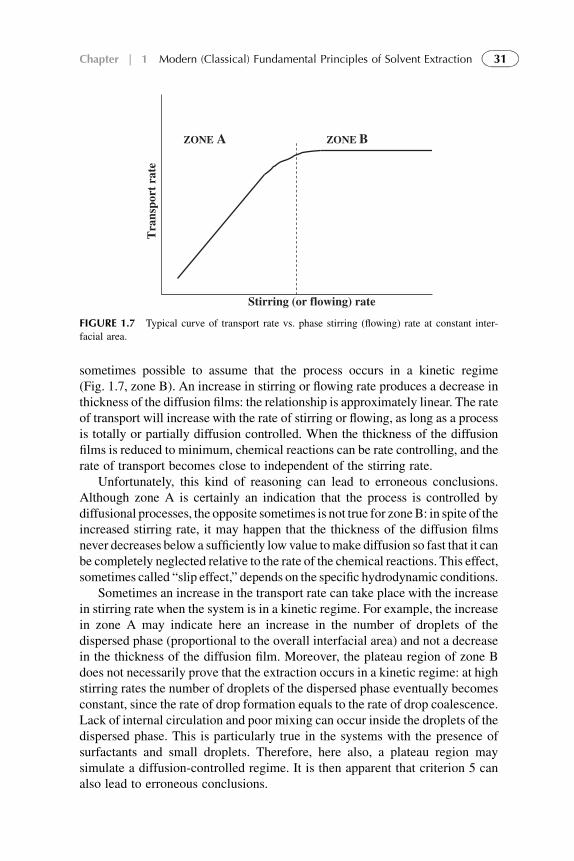
sometimes possible to assume that the process occurs in a kinetic regime(Fig. 1.7, zone B). An increase in stirring or flowing rate produces a decrease inthickness of the diffusion films: the relationship is approximately linear. The rateof transport will increase with the rate of stirring or flowing, as long as a processis totally or partially diffusion controlled. When the thickness of the diffusionfilms is reduced to minimum, chemical reactions can be rate controlling, and therate of transport becomes close to independent of the stirring rate.
Unfortunately, this kind of reasoning can lead to erroneous conclusions.Although zone A is certainly an indication that the process is controlled bydiffusional processes, the opposite sometimes is not true for zoneB: in spite of theincreased stirring rate, it may happen that the thickness of the diffusion filmsnever decreases below a sufficiently low value tomake diffusion so fast that it canbe completely neglected relative to the rate of the chemical reactions. This effect,sometimes called “slip effect,” depends on the specific hydrodynamic conditions.
Sometimes an increase in the transport rate can take place with the increasein stirring rate when the system is in a kinetic regime. For example, the increasein zone A may indicate here an increase in the number of droplets of thedispersed phase (proportional to the overall interfacial area) and not a decreasein the thickness of the diffusion film. Moreover, the plateau region of zone Bdoes not necessarily prove that the extraction occurs in a kinetic regime: at highstirring rates the number of droplets of the dispersed phase eventually becomesconstant, since the rate of drop formation equals to the rate of drop coalescence.Lack of internal circulation and poor mixing can occur inside the droplets of thedispersed phase. This is particularly true in the systems with the presence ofsurfactants and small droplets. Therefore, here also, a plateau region maysimulate a diffusion-controlled regime. It is then apparent that criterion 5 canalso lead to erroneous conclusions.
Tra
nspo
rt r
ate
ZONE A ZONE B
Stirring (or flowing) rate
FIGURE 1.7 Typical curve of transport rate vs. phase stirring (flowing) rate at constant inter-
facial area.
31Chapter | 1 Modern (Classical) Fundamental Principles of Solvent Extraction
Finally, it has to be emphasized that both the hydrodynamic parametersand the concentrations of the species involved simultaneously determinewhether the transport regime is of kinetic, diffusional, or mixed diffusional–kinetic type. Therefore, it is not surprising that different investigators, whostudied the same SX systems in different hydrodynamic and concentrationconditions, may have interpreted their results in terms of completely differentextraction regimes.
5.3.2. Basic Parameters of Transport Regime
The basic parameters of an extraction regime are related to the properties of thesolutes, extractants, solvents, and diluents. These are individual and overallmass transfer coefficients (in diffusional and chemical reactions kineticsregime), distribution constants, extraction and coupling coefficients of forwardextractiondKfd and Kfex, respectively, diffusion coefficients of complexes inall phases, and selectivity. Influence of these parameters on the solute transportin different configurations will be generally analyzed in the next sections andthe respective chapters in detail.
5.3.3. Determination of Extraction Kinetic Parameters
Let us consider an extraction process. Individual mass transfer coefficients ofsolute species in the aqueous feed and organic extractant solutions through theinterfacial stagnant layers are determined experimentally by feed and extractantphases with stirring or flow rate variations using Eqn (1.46).
For feed stagnant layer:
kðSFÞi ¼ UFj
8>>>><>>>>:
� ln
26664�½CSFi
� � JFSS
UFi
��h
CSFði�1Þ
i� JFSS
UFi
�37775
9>>>>=>>>>;
�1
(1.74)
kðSEÞi ¼ UEj
8>>>>><>>>>>:
� ln
2666664
½CSEi
� � JESS
UEj
! ½CSEi�1
� � JESS
UEj
!3777775
9>>>>>=>>>>>;
�1
(1.75)
where UFjand UEj
are j-flow velocities; JFSSand JESS
are fluxes at steady state;and ½CSFi
� and ½CSEi� are concentrations of solute species, sampled at time i, in
the feed and extractant solutions, respectively. In Eqn (1.75), “plus” (positive)is at increasing concentrations vs. time, and “minus” (negative) is at decreasingones.
32 PART | I Conventional (Classical) Principles and Practice
DS-“effective” diffusion coefficients of solute species in the feed andextractant solutions are evaluated by extrapolating the plots of ti ¼ f(U) atU/ 0. The magnitude of DS is far from the real diffusion coefficient of solutecomplexes in liquids, because of some assumptions mentioned above. Equation(1.23) at U/ 0 becomes undefined; however, for calculating mass-transfercoefficients of solutes at visible flow rates, this parameter (coefficient) is quiteapplicable.
Correlation factor between [CS]i and Jss/Ui in Eqns (1.74) and (1.75) hasbeen checked in experiments with several metal ions transport36–38 in the rangeof U¼ 0.1–1.5 cm3/s. Results showed that [CS]> Jss /U in 1.5–4.0 orders ofmagnitude. It means that the Jss/U ratio may be excluded from Eqns (1.74) and(1.75). Therefore, we obtain
kðSFÞi ¼ UFi
� ln
½CSFi�
½CSFi�1��1
(1.76)
or
kSFi¼ UFi
ln½CSFi�1
�½CSFi
��1
(1.77)
kSEi¼ UEj
(� ln
"½CSEi
�½CSEi�1
�
#)�1
(1.78)
Equations (1.74)–(1.76) are similar to those used by many researchers.18,19,25–28,32–35 Referenced authors obtained these equations by considering thebasic Stokes–Einstein equation. Here the same equations were obtained asparticular case from Eqn (1.47), based on kinetics of irreversible processes(nonequilibrium thermodynamics).
According to assumptions and linear concentration profiles, solute beingextracted can be described by the solute flux from the bulk feed aqueous phase tothe bulk organic phase in terms of individual mass transfer coefficients at steadystate and additivity of a one-dimensional series of diffusion resistances, Ri¼ 1/ki.Overall mass transfer coefficient, KF/E, is
1
KSF=E¼ 1
kSFþ 1
KFexkcomþ 1
KFexkSE(1.79)
where KSFex is solute distribution (extraction) coefficient; kSF and kSE are soluteindividual mass transfer coefficients in stagnant films; and kcom is individualcoefficient of chemical reaction (complexation) rate at the interface.
First and third components of the sum inEqn (1.79) present the diffusional stepresistances and second component is the chemical kinetics regime at forwardextraction. Analogical equation may be presented for back extraction technique.
If the system is polar organic–nonpolar organic, then the relation (1.79) foraqueous–organic systems are valid with the polar organic phase used instead ofthe aqueous phase.
33Chapter | 1 Modern (Classical) Fundamental Principles of Solvent Extraction
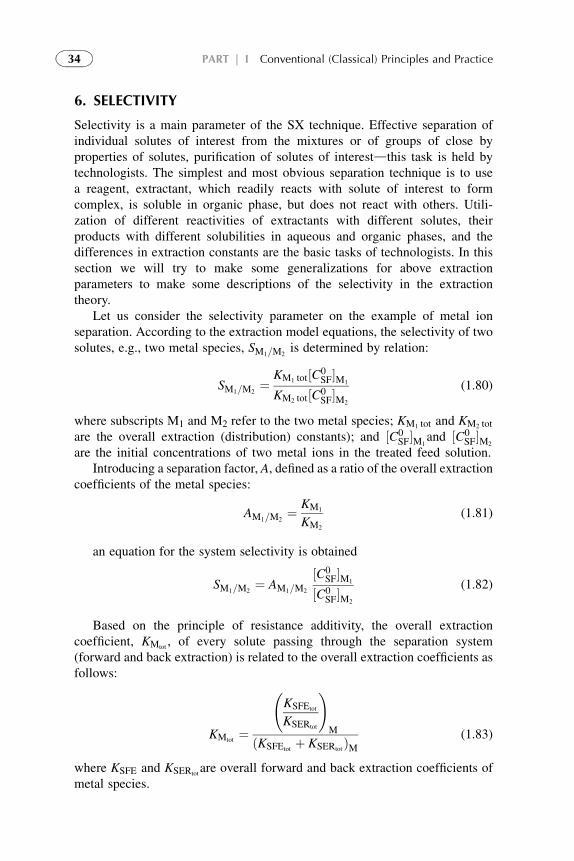
6. SELECTIVITY
Selectivity is a main parameter of the SX technique. Effective separation ofindividual solutes of interest from the mixtures or of groups of close byproperties of solutes, purification of solutes of interestdthis task is held bytechnologists. The simplest and most obvious separation technique is to usea reagent, extractant, which readily reacts with solute of interest to formcomplex, is soluble in organic phase, but does not react with others. Utili-zation of different reactivities of extractants with different solutes, theirproducts with different solubilities in aqueous and organic phases, and thedifferences in extraction constants are the basic tasks of technologists. In thissection we will try to make some generalizations for above extractionparameters to make some descriptions of the selectivity in the extractiontheory.
Let us consider the selectivity parameter on the example of metal ionseparation. According to the extraction model equations, the selectivity of twosolutes, e.g., two metal species, SM1=M2
is determined by relation:
SM1=M2¼ KM1 tot½C0
SF�M1
KM2 tot½C0SF�M2
(1.80)
where subscripts M1 and M2 refer to the two metal species; KM1 tot and KM2 tot
are the overall extraction (distribution) constants); and ½C0SF�M1
and ½C0SF�M2
are the initial concentrations of two metal ions in the treated feed solution.Introducing a separation factor, A, defined as a ratio of the overall extraction
coefficients of the metal species:
AM1=M2¼ KM1
KM2
(1.81)
an equation for the system selectivity is obtained
SM1=M2¼ AM1=M2
½C0SF�M1
½C0SF�M2
(1.82)
Based on the principle of resistance additivity, the overall extractioncoefficient, KMtot
, of every solute passing through the separation system(forward and back extraction) is related to the overall extraction coefficients asfollows:
KMtot¼
KSFEtot
KSERtot
!M
ðKSFEtotþ KSERtot
ÞM(1.83)
where KSFE and KSERtotare overall forward and back extraction coefficients of
metal species.
34 PART | I Conventional (Classical) Principles and Practice
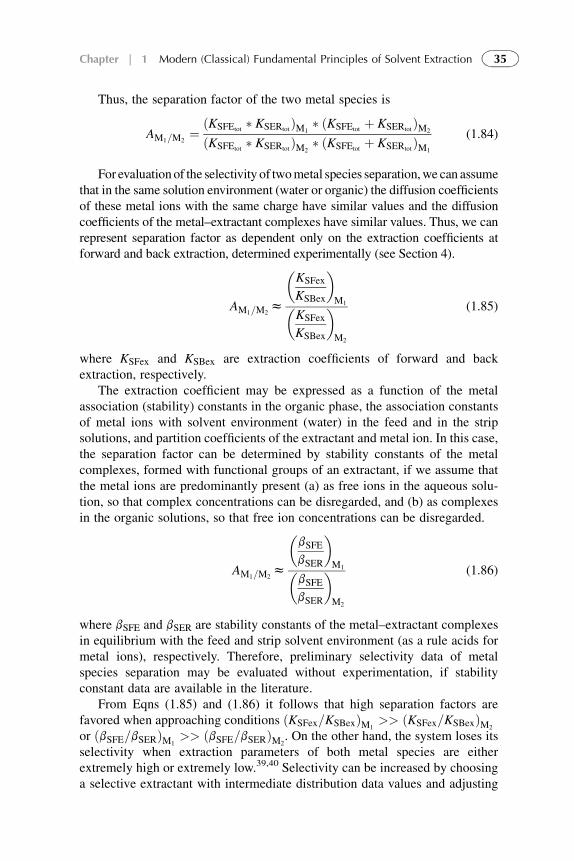
Thus, the separation factor of the two metal species is
AM1=M2¼ ðKSFEtot
� KSERtotÞM1
� ðKSFEtotþ KSERtot
ÞM2
ðKSFEtot� KSERtot
ÞM2� ðKSFEtot
þ KSERtotÞM1
(1.84)
For evaluationof the selectivity of twometal species separation,we can assumethat in the same solution environment (water or organic) the diffusion coefficientsof these metal ions with the same charge have similar values and the diffusioncoefficients of the metal–extractant complexes have similar values. Thus, we canrepresent separation factor as dependent only on the extraction coefficients atforward and back extraction, determined experimentally (see Section 4).
AM1=M2z
�KSFex
KSBex
�M1�
KSFex
KSBex
�M2
(1.85)
where KSFex and KSBex are extraction coefficients of forward and backextraction, respectively.
The extraction coefficient may be expressed as a function of the metalassociation (stability) constants in the organic phase, the association constantsof metal ions with solvent environment (water) in the feed and in the stripsolutions, and partition coefficients of the extractant and metal ion. In this case,the separation factor can be determined by stability constants of the metalcomplexes, formed with functional groups of an extractant, if we assume thatthe metal ions are predominantly present (a) as free ions in the aqueous solu-tion, so that complex concentrations can be disregarded, and (b) as complexesin the organic solutions, so that free ion concentrations can be disregarded.
AM1=M2z
�bSFE
bSER
�M1�
bSFE
bSER
�M2
(1.86)
where bSFE and bSER are stability constants of the metal–extractant complexesin equilibrium with the feed and strip solvent environment (as a rule acids formetal ions), respectively. Therefore, preliminary selectivity data of metalspecies separation may be evaluated without experimentation, if stabilityconstant data are available in the literature.
From Eqns (1.85) and (1.86) it follows that high separation factors arefavored when approaching conditions ðKSFex=KSBexÞM1
>> ðKSFex=KSBexÞM2
or ðbSFE=bSERÞM1>> ðbSFE=bSERÞM2
. On the other hand, the system loses itsselectivity when extraction parameters of both metal species are eitherextremely high or extremely low.39,40 Selectivity can be increased by choosinga selective extractant with intermediate distribution data values and adjusting
35Chapter | 1 Modern (Classical) Fundamental Principles of Solvent Extraction
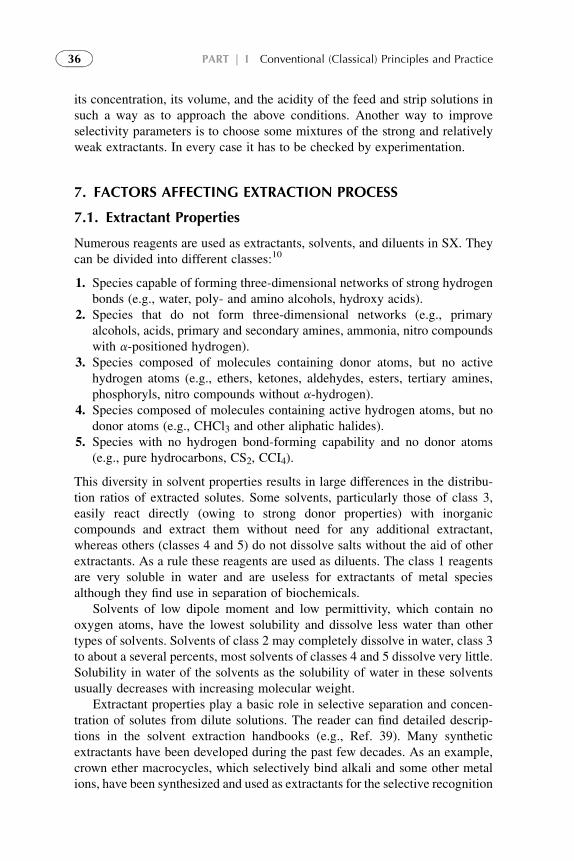
its concentration, its volume, and the acidity of the feed and strip solutions insuch a way as to approach the above conditions. Another way to improveselectivity parameters is to choose some mixtures of the strong and relativelyweak extractants. In every case it has to be checked by experimentation.
7. FACTORS AFFECTING EXTRACTION PROCESS
7.1. Extractant Properties
Numerous reagents are used as extractants, solvents, and diluents in SX. Theycan be divided into different classes:10
1. Species capable of forming three-dimensional networks of strong hydrogenbonds (e.g., water, poly- and amino alcohols, hydroxy acids).
2. Species that do not form three-dimensional networks (e.g., primaryalcohols, acids, primary and secondary amines, ammonia, nitro compoundswith a-positioned hydrogen).
3. Species composed of molecules containing donor atoms, but no activehydrogen atoms (e.g., ethers, ketones, aldehydes, esters, tertiary amines,phosphoryls, nitro compounds without a-hydrogen).
4. Species composed of molecules containing active hydrogen atoms, but nodonor atoms (e.g., CHCl3 and other aliphatic halides).
5. Species with no hydrogen bond-forming capability and no donor atoms(e.g., pure hydrocarbons, CS2, CCI4).
This diversity in solvent properties results in large differences in the distribu-tion ratios of extracted solutes. Some solvents, particularly those of class 3,easily react directly (owing to strong donor properties) with inorganiccompounds and extract them without need for any additional extractant,whereas others (classes 4 and 5) do not dissolve salts without the aid of otherextractants. As a rule these reagents are used as diluents. The class 1 reagentsare very soluble in water and are useless for extractants of metal speciesalthough they find use in separation of biochemicals.
Solvents of low dipole moment and low permittivity, which contain nooxygen atoms, have the lowest solubility and dissolve less water than othertypes of solvents. Solvents of class 2 may completely dissolve in water, class 3to about a several percents, most solvents of classes 4 and 5 dissolve very little.Solubility in water of the solvents as the solubility of water in these solventsusually decreases with increasing molecular weight.
Extractant properties play a basic role in selective separation and concen-tration of solutes from dilute solutions. The reader can find detailed descrip-tions in the solvent extraction handbooks (e.g., Ref. 39). Many syntheticextractants have been developed during the past few decades. As an example,crown ether macrocycles, which selectively bind alkali and some other metalions, have been synthesized and used as extractants for the selective recognition
36 PART | I Conventional (Classical) Principles and Practice
of neutral, charged, or zwitter-ionic species.41,42 The reader can finddescriptions of many extractants in the solvent extraction handbooks (e.g.,Ref. 43).
Extraction performance is strongly related to the characteristics of anextractant. The main parameters of extractant are as follows:
1. High selectivity to species has to be separated.2. High capacity of the species has to be extracted.3. High ability of an extractant to complexate a solute of interest from an
aqueous feed phase into organic phasedhigh extraction, or distribution,or partition constant, EF/E)
4. High ability of an extractant–solute complex to be decomplexed and strip-ped from loaded organic to an aqueous strip phasedhigh decomplexation,or stripping constant, EE/R).
5. Rapid kinetics of formation (complexation) and destruction (decomplexa-tion) of the complex.
6. Rapid kinetics of diffusion of the extractant–solute complex through theinterface organic layer (a high diffusion coefficient, DLM).
7. Stability of the extractant.8. No side reactions.9. No irreversible or degradation reactions.
10. Low solubility of the extractant in the aqueous phase.11. Low coextraction of water.12. Extractant should be easily regenerated.13. Extractant should have suitable physical properties, such as density,
viscosity, and surface tension.14. Low toxicity for biological systems and low corrosivity.15. Reasonable price at industrial applications.
A great variety of extractants may be divided to cation and anionexchangers and neutral ligands. First group are the big number of organicacids and their derivatives and related proton donors. For example, somecommercially available extractants: DEHPA, bis(2,2,4-trimethylpentyl)phosphinic acid (Cyanex 272), some hydroxyoximes (LIX or Acorgaseries), and oligoamide compounds containing 8-hydroxyquinolyl groups(Kelex or LIX-26 series).10,28–31,39,40,44,45 Crown ethers and relatedmacrocyclic multidentate ligands have a pronounced selectivity for cations(metal ions).10,41–43,46 Their ability to selectively and reversibly bind metalions may enable to perform difficult separations. Wide variety of macro-cyclic carriers exist and are developing in the past few years.40–43 Thecomplex stability, donor abilities of functional atoms (O, N, S, P, etc.), and/orgroups of macrocyclic carriers are intensively studied to develop some rulesfor predicting their properties.
Second group are water-immiscible primary, secondary, and tertiaryamines and their derivatives, quaternary amine salts, and other proton
37Chapter | 1 Modern (Classical) Fundamental Principles of Solvent Extraction
acceptors (see Chapters 2, 3, 5). Considerable effort has been devoted to thedevelopment of anion agents, playing an important role in the biological andbiochemical processes. Several amines, their derivatives, surfactants, lipo-philic metal complexes, and macrocycles with positively charged subunits areknown and developing as anion extractants.8–10,47–49
The third group are water-immiscible organic species with electron donoror acceptor properties or solvating extractants. They include carbon–oxygencompounds (amides, ethers, ketones); phosphorus–oxygen compounds (tri-n-butylphosphate (TBP), dibutyl-phosphate (DBP), or dibutyl-phosphonate(DBBP); phosphine oxides (tri-n-octylphosphine oxide (TOPO); phosphinesulfides (Cyanex 471); alkyl sulfides (dihexyl, diheptyl sulfides); nitrogen-containing compounds (CLX 50), etc.41–43,52,53 All of them are known asselective extractants.
7.1.1. Mixtures of Extractants (Ionic Additives)
Cotransport of oppositely charged ions is the most obvious way to maintainelectroneutrality. In recent years, many studies have been conducted to examinethe use of anionic additives for maintenance of electroneutrality at cationextraction.25,40,51–53 The anionic additives are typically lipophilic carboxylic,phosphoric, or sulfonic acids. Cation or neutral macrocyclic carriers coupledwith anionic additives result in a synergistic extraction of cations whichexceeds that accomplished by each component individually. Example of suchsynergism is demonstrated in Fig. 1.8. The authors of Ref. 54 observed a 10–100-fold enhancement of copper extraction while adding the anionic group tothe cation coordination macrocycle.
Parthasarathy and Buffle55 have systematically varied the chain length ofa series of lipophilic carboxylic acids with 1,10-didecyldiaza-18-crown-6 as anextractant. Chain lengths ranged from 10 to 18 carbons. Optimal Cu2þ separationwas achieved with additives from 12 to 14 carbons in length, and lauric acid(n¼ 12) yielded the best results due to its decreased tendency to formprecipitates.
As mentioned above, hydrogen ions can be solvated by strong donor mole-cules like TBP, sometimes leading to the extraction of a solvated hydrogen salt.For example, TBP extracts nitric acid, HNO3, in the form of the complex TBP–HNO3, which could be considered as the complexHðTBPþÞþNO�
3 ion pair. Theamines form stronger adducts with hydrogen ions; in fact, they are so strong thatthey remain protonated while exchanging the anion. A classical reaction is theformation of the ammonium ion NH4
þ when NH3 is dissolved in water.The organic amines have a nitrogen atom N attached to a large organic
molecule R usually containing aliphatic or aromatic carbon atoms. They arehighly soluble in organic solvents (diluents) and almost insoluble in water. Incontact with an aqueous phase containing acid HL, the amine base RN reactswith the acid HL to form (RNH)þþL�, but extracts with an excess amount ofacid HL (over the 1:1 HL/RN ratio) into the organic phase, and also with
38 PART | I Conventional (Classical) Principles and Practice
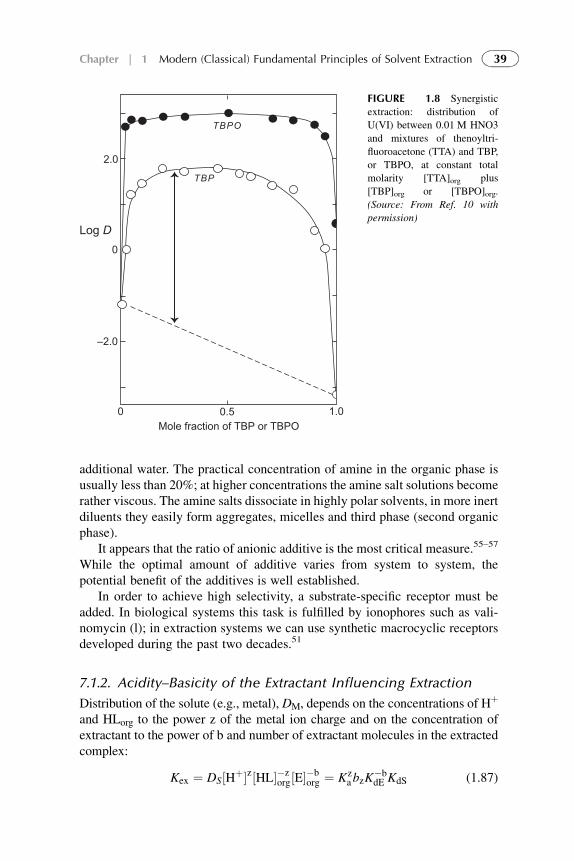
additional water. The practical concentration of amine in the organic phase isusually less than 20%; at higher concentrations the amine salt solutions becomerather viscous. The amine salts dissociate in highly polar solvents, in more inertdiluents they easily form aggregates, micelles and third phase (second organicphase).
It appears that the ratio of anionic additive is the most critical measure.55–57
While the optimal amount of additive varies from system to system, thepotential benefit of the additives is well established.
In order to achieve high selectivity, a substrate-specific receptor must beadded. In biological systems this task is fulfilled by ionophores such as vali-nomycin (l); in extraction systems we can use synthetic macrocyclic receptorsdeveloped during the past two decades.51
7.1.2. Acidity–Basicity of the Extractant Influencing Extraction
Distribution of the solute (e.g., metal), DM, depends on the concentrations of Hþ
and HLorg to the power z of the metal ion charge and on the concentration ofextractant to the power of b and number of extractant molecules in the extractedcomplex:
Kex ¼ DS½Hþ�z½HL��zorg½E��b
org ¼ KzabzK
�bdE KdS (1.87)
0 0.5 1.0Mole fraction of TBP or TBPO
2.0
0
–2.0
Log D
TBPO
TBP
FIGURE 1.8 Synergistic
extraction: distribution of
U(VI) between 0.01 M HNO3
and mixtures of thenoyltri-
fluoroacetone (TTA) and TBP,
or TBPO, at constant total
molarity [TTA]org plus
[TBP]org or [TBPO]org.
(Source: From Ref. 10 with
permission)
39Chapter | 1 Modern (Classical) Fundamental Principles of Solvent Extraction
According to Eqn (1.87), Kex increases to the z power of the dissociationconstant, Ka, for the extractant acid HL. Thus it appears desirable to use strongeracids as extractants, i.e., thosewith largeKa (or smallpKa). Thus factors that affectthe dissociation constant of an acid are of importance for extraction behavior. Theacidity of organic acids increases (i.e., pKa decreases) by electrophilic substitu-tion in the carbon chain. For example, replacing an H atom in the CH3 group ofacetic acid (pKa¼ 4.75) by I, Br, Cl, and F atoms yields monohalide acetic acidswith pKa of 3.0, 2.9, 2.8, and 2.7, respectively. The mono-, di-, and trichloroacticacids have pKa equal to 2.8, 1.48, and 1.1, respectively. Other electrophilic groupsthat can increase acidity are HO�, NC�, NO�
2 , etc.Conversely, nucleophilic substitution by aliphatic or aromatic groups
usually has little effect on the pKa, though it may affect the distribution constantKDR: e.g., the addition of a CH3� or C6H5– group in acetic acid changes thepKa to 4.9 (propionic acid) and 4.3 (phenyl acetic acid). The further substitutionis from the carboxylic group, the less the effect: e.g., while pKa for benzoic acidis 4.19, a Cl in orthoposition yields pKa of 2.92 and in paraposition, 3.98.
These general rules hold rather well for the acidic organic extractants andcan be used to extrapolate from related compounds to new ones as well as todevelop new extractants. The effect of various substituents on pKa is exten-sively discussed in textbooks on organic chemistry.58
7.1.3. Influence of Dissociation Constant and DistributionCoefficient of the Extractant
Kex also increases with increasing formation constant of the uncharged metalcomplex, bz. Thermodynamic factors and geometrical aspects that influence thesize of bz are discussed in Chapter 3.
To achieve the highest possible D value, the concentration of theextracted uncharged complex (MLz, MLzEb, or EbMLzþb) must be maxi-mized. A large value for the formation constant of the neutral complexfavors this goal. In Chapter 3, it is pointed out that for hard acids thecomplex formation constant increases with the charge density of the metalion, provided there is no steric hindrance. This is seen for the metal fluoridecomplexes with no steric hindrance. For the lanthanide acetylacetonates, theincrease in bz from
57La to 64Gd is due to a reduction in the ionic radius and,accordingly, to the increased charge density. It should be noted that thediminishing lanthanide size leads to a successive diminution of the coor-dination number (from 9 to 8 for H2O) for La/Gd. For Gd/Lu, thecoordination number is probably constant.59
Because the Hþþ ion acts as a hard metal ion, one should expect a closecorrelation between the formation constants for HL and MAz. Since Ka isdefined as the dissociation constant of HL, bz is the formation constant of MLz;therefore, a correlation is expected between pKa (�logKa) and log bz: largelog bz values are usually observed for organic acids with large log Ka. Since Kex
40 PART | I Conventional (Classical) Principles and Practice
is directly proportional to both bz and Kza (see Eqn (1.87)), a large bz value is
likely to be accompanied by a small Ka value (large pKa); in Eqn (87) the twoparameters counteract each other. Thus in order to obtain high free ligandconcentrations, which favors the formation of the MLz complex, [Hþþ] must below, i.e., pH must be high. However, at high pH the metal may be hydrolyzed. Acareful balance must be struck between bz, Ka, and pH to achieve an optimummaximum concentration of the uncharged complex.
7.2. Aggregate Formation
Some extractants tested meet serious problems: they show low rate ofdecomplexation which becomes a rate-limiting step of total extraction–backextraction process. In order to understand the phenomenon, mechanisms ofCu, Cd, and Zn extraction45 with DEHPA were investigated. Depending onmetal concentration in the organic phase, three different interaction stageswere suggested. At low Cu concentration in the organic phase, cationexchange extraction takes place with formation of tetrametric complexes asCuL2)2HL (stage I). With increasing Cu concentration, these nuclei grow insize by coordination bonding (extraction by solvation) with undissociatedcopper salt molecules, forming linear (or planar) aggregates (stage II). Uponreaching a critical size, a structural reorganization occurs: polyhedralaggregates, or “clusters”70,71 with polydentate, asymmetric bonds areforming (stage III). Some spectroscopic and chemical techniques showedresults, which indirectly confirmed mechanisms, taking place at stages II andIII. Kinetics of these aggregate decomposition and consequently backextraction of Cu to the strip phase is very slow. Of course, proposedaggregation mechanisms have to be proved, using direct techniques, e.g.,NMR, light scattering, zeta potential, etc. The knowledge of the extractionmechanisms is important for designing the extraction technology, processingfeed solutions with significant metal ions concentrations. The reader can findmore details in Part II.
7.3. Solvent (Diluent) Properties Influencing Extraction
Nearly every extraction system devised to date involves the solvation ofextraxtant in an organic solvent (diluent) through similar interactionsranging from that of cavity formation for very inert diluents like hexane andthrough dipole–dipole interactions, p-electron interaction, and hydrogenbonding for the more reactive solvents. The expected degree of interactioncan be judged from values of permittivity and solubility parameters. Soextraction rate and selectivity depend heavily upon the properties of thediluent–solvent. Authors of the review60 divided the free energy of extrac-tion process into four components in a thermodynamic cycle: free energy ofdesolvation of the cation, free energy of desolvation of the anionic ligand,
41Chapter | 1 Modern (Classical) Fundamental Principles of Solvent Extraction
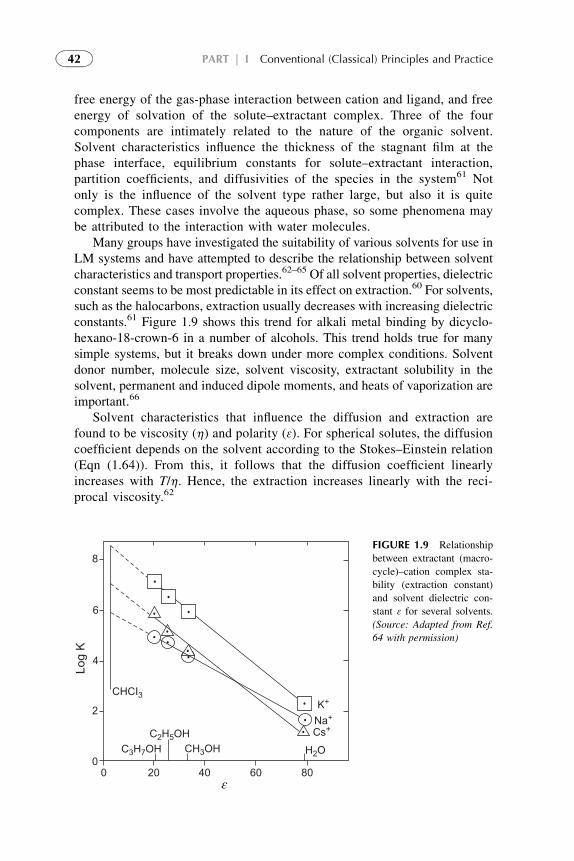
free energy of the gas-phase interaction between cation and ligand, and freeenergy of solvation of the solute–extractant complex. Three of the fourcomponents are intimately related to the nature of the organic solvent.Solvent characteristics influence the thickness of the stagnant film at thephase interface, equilibrium constants for solute–extractant interaction,partition coefficients, and diffusivities of the species in the system61 Notonly is the influence of the solvent type rather large, but also it is quitecomplex. These cases involve the aqueous phase, so some phenomena maybe attributed to the interaction with water molecules.
Many groups have investigated the suitability of various solvents for use inLM systems and have attempted to describe the relationship between solventcharacteristics and transport properties.62–65 Of all solvent properties, dielectricconstant seems to be most predictable in its effect on extraction.60 For solvents,such as the halocarbons, extraction usually decreases with increasing dielectricconstants.61 Figure 1.9 shows this trend for alkali metal binding by dicyclo-hexano-18-crown-6 in a number of alcohols. This trend holds true for manysimple systems, but it breaks down under more complex conditions. Solventdonor number, molecule size, solvent viscosity, extractant solubility in thesolvent, permanent and induced dipole moments, and heats of vaporization areimportant.66
Solvent characteristics that influence the diffusion and extraction arefound to be viscosity (h) and polarity (3). For spherical solutes, the diffusioncoefficient depends on the solvent according to the Stokes–Einstein relation(Eqn (1.64)). From this, it follows that the diffusion coefficient linearlyincreases with T/h. Hence, the extraction increases linearly with the reci-procal viscosity.62
8
6
4
2
00 20 40 60 80
ε
Log
K
CHCI3
C3H7OHC2H5OH
CH3OH H2O
K+
Na+
Cs+
FIGURE 1.9 Relationship
between extractant (macro-
cycle)–cation complex sta-
bility (extraction constant)
and solvent dielectric con-
stant 3 for several solvents.
(Source: Adapted from Ref.
64 with permission)
42 PART | I Conventional (Classical) Principles and Practice
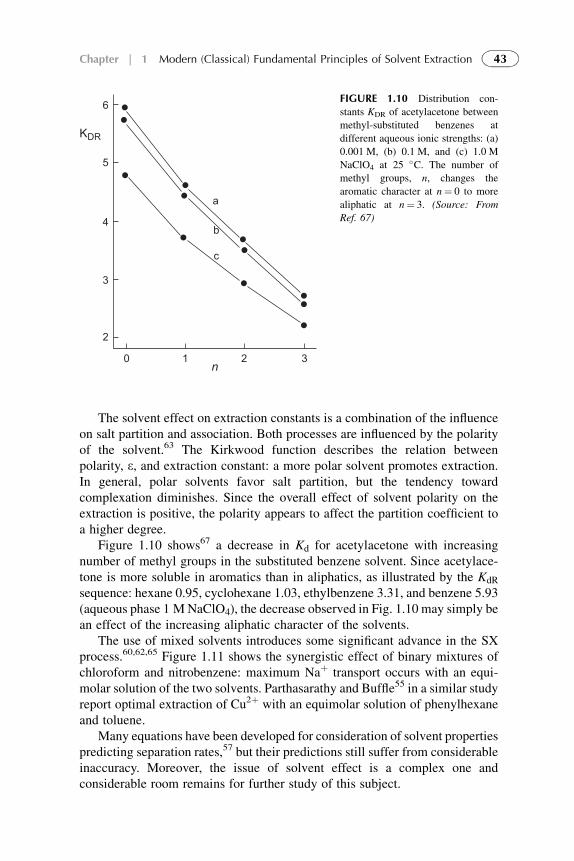
The solvent effect on extraction constants is a combination of the influenceon salt partition and association. Both processes are influenced by the polarityof the solvent.63 The Kirkwood function describes the relation betweenpolarity, 3, and extraction constant: a more polar solvent promotes extraction.In general, polar solvents favor salt partition, but the tendency towardcomplexation diminishes. Since the overall effect of solvent polarity on theextraction is positive, the polarity appears to affect the partition coefficient toa higher degree.
Figure 1.10 shows67 a decrease in Kd for acetylacetone with increasingnumber of methyl groups in the substituted benzene solvent. Since acetylace-tone is more soluble in aromatics than in aliphatics, as illustrated by the KdR
sequence: hexane 0.95, cyclohexane 1.03, ethylbenzene 3.31, and benzene 5.93(aqueous phase 1 MNaClO4), the decrease observed in Fig. 1.10 may simply bean effect of the increasing aliphatic character of the solvents.
The use of mixed solvents introduces some significant advance in the SXprocess.60,62,65 Figure 1.11 shows the synergistic effect of binary mixtures ofchloroform and nitrobenzene: maximum Naþ transport occurs with an equi-molar solution of the two solvents. Parthasarathy and Buffle55 in a similar studyreport optimal extraction of Cu2þ with an equimolar solution of phenylhexaneand toluene.
Many equations have been developed for consideration of solvent propertiespredicting separation rates,57 but their predictions still suffer from considerableinaccuracy. Moreover, the issue of solvent effect is a complex one andconsiderable room remains for further study of this subject.
6
5
4
3
2
0 1 2 3n
KDR
a
b
c
FIGURE 1.10 Distribution con-
stants KDR of acetylacetone between
methyl-substituted benzenes at
different aqueous ionic strengths: (a)
0.001 M, (b) 0.1 M, and (c) 1.0 M
NaClO4 at 25 �C. The number of
methyl groups, n, changes the
aromatic character at n¼ 0 to more
aliphatic at n¼ 3. (Source: From
Ref. 67)
43Chapter | 1 Modern (Classical) Fundamental Principles of Solvent Extraction
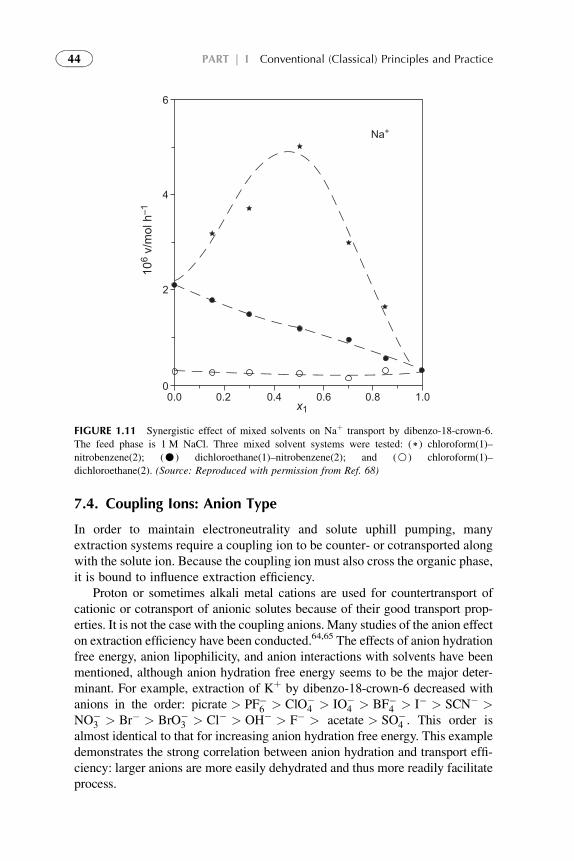
7.4. Coupling Ions: Anion Type
In order to maintain electroneutrality and solute uphill pumping, manyextraction systems require a coupling ion to be counter- or cotransported alongwith the solute ion. Because the coupling ion must also cross the organic phase,it is bound to influence extraction efficiency.
Proton or sometimes alkali metal cations are used for countertransport ofcationic or cotransport of anionic solutes because of their good transport prop-erties. It is not the case with the coupling anions. Many studies of the anion effecton extraction efficiency have been conducted.64,65 The effects of anion hydrationfree energy, anion lipophilicity, and anion interactions with solvents have beenmentioned, although anion hydration free energy seems to be the major deter-minant. For example, extraction of Kþ by dibenzo-18-crown-6 decreased withanions in the order: picrate > PF�6 > ClO�
4 > IO�4 > BF�4 > I� > SCN� >
NO�3 > Br� > BrO�
3 > Cl� > OH� > F� > acetate > SO�4 . This order is
almost identical to that for increasing anion hydration free energy. This exampledemonstrates the strong correlation between anion hydration and transport effi-ciency: larger anions are more easily dehydrated and thus more readily facilitateprocess.
6
4
2
00.0 0.2 0.4 0.6 0.8 1.0
x1
106
v/m
ol h
–1Na+
FIGURE 1.11 Synergistic effect of mixed solvents on Naþ transport by dibenzo-18-crown-6.
The feed phase is 1 M NaCl. Three mixed solvent systems were tested: ()) chloroform(1)–
nitrobenzene(2); (C) dichloroethane(1)–nitrobenzene(2); and (B) chloroform(1)–
dichloroethane(2). (Source: Reproduced with permission from Ref. 68)
44 PART | I Conventional (Classical) Principles and Practice
While nearly all investigations of anion effects have focused on kinetics, a fewrecent works suggest a correlation between anion type and selectivity. Atextraction of alkali metals into chloroform by dicyclohexano-18-crown-6,69
selectivity for Kþ over both Rbþ and Csþ decreases dramatically depending uponanion type in the order: NO�
3 > SCN > ClO�4 I� > Br�. Selectivity for Kþ/Csþ
decreases from 16.0 for nitrate to 3.5 for bromide. The authors were unable to tiethis trend to any particular parameter, though they discounted the possibility that itis correlated to anion radius, hydration enthalpy, or anion softness.
In research57 the authors demonstrated that anions are capable not only ofaltering selectivities but indeed of reversing them. Typically, 18-crown-6analogs show a strong preference for Hg2þ over Cd2þ. However, by usingSCN� as a counter-anion, completely reverse selectivity was obtained,resulting in highly selective extraction of Cd2þ over Hg2þ. This result is due tothe fact that the SCN ion forms coordination complexes with these cations,which lead to reverse selectivity. A similar result is present when Br� is used asan anion for altering selectivity between Cd2þ and Zn2þ. These results suggestthat careful consideration of coupling anion is crucial when designing anextraction system or when comparing results listed in the literature.
7.5. Influence of Temperature
In general, the distribution into organic phase of a metal complex increases withincreasing temperature for complexes with significant hydrophobic character.The introduction of a complex into organic phase involves a number of processesthat can be associated with large changes in enthalpy (solvation processes) andin entropy (solvent orientation and restructuring), leading to considerabletemperature effects. The metal acetylacetonate systems in Fig. 1.12 illustratethis effect. In these particular systems, the free energy of distribution betweenthe organic and aqueous phases is dominated by the enthalpy term.
The extraction coefficient Kex decreases with increasing temperature whilethe diffusion coefficient increases.
7.6. Influence of Complex Structure
The effect of various structures on the bond strengths in organic complexes hasbeen extensively treated in publications.71–75
7.6.1. Chelate Ring Size
Formation of metal–organic chelate complexes results in stronger complexation(i.e., larger bn values) compared to interaction with monodentate ligands. Thechemistry of these complexes has been discussed in the literature.72–75 Chapter 3presents the most important factors in the formation of such complexes: (1) thetype of binding atom; (2) the chelate ring size (or “bite”); and (3) the number ofchelate rings formed (mono- or polydentate).
45Chapter | 1 Modern (Classical) Fundamental Principles of Solvent Extraction
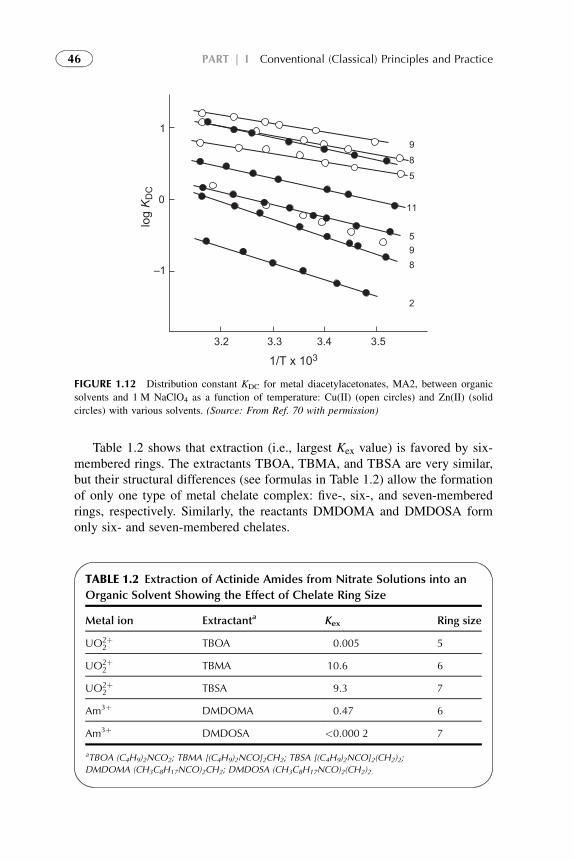
Table 1.2 shows that extraction (i.e., largest Kex value) is favored by six-membered rings. The extractants TBOA, TBMA, and TBSA are very similar,but their structural differences (see formulas in Table 1.2) allow the formationof only one type of metal chelate complex: five-, six-, and seven-memberedrings, respectively. Similarly, the reactants DMDOMA and DMDOSA formonly six- and seven-membered chelates.
1
0
–1
3.2 3.3 3.4 3.5
1/T x 103
log K
DC
985
11
598
2
FIGURE 1.12 Distribution constant KDC for metal diacetylacetonates, MA2, between organic
solvents and 1 M NaClO4 as a function of temperature: Cu(II) (open circles) and Zn(II) (solid
circles) with various solvents. (Source: From Ref. 70 with permission)
TABLE 1.2 Extraction of Actinide Amides from Nitrate Solutions into an
Organic Solvent Showing the Effect of Chelate Ring Size
Metal ion Extractanta Kex Ring size
UO2þ2 TBOA 0.005 5
UO2þ2 TBMA 10.6 6
UO2þ2 TBSA 9.3 7
Am3þ DMDOMA 0.47 6
Am3þ DMDOSA <0.000 2 7
aTBOA (C4H9)2NCO2; TBMA [(C4H9)2NCO]2CH2; TBSA [(C4H9)2NCO]2(CH2)2;
DMDOMA (CH3C8H17NCO)2CH2; DMDOSA (CH3C8H17NCO)2(CH2)2.
46 PART | I Conventional (Classical) Principles and Practice
The electron shells of the M3þþ elements with unfilled or partially filled 3d,4d, and 5f orbitals contract as these shells are being filled with electrons,increasing the charge density (z/r) of the cation. This leads to increased stabilityconstants for the ML3 complexes with increasing atomic number. For bidentateligands, the f-electron (lanthanide) ML3 complexes are coordinatively unsat-urated, i.e., only six of eight available coordination sites are filled. Therefore,the two remaining sites are occupied by H2O or HL or some other donormolecules E. The electronic structure of the central atom is also important forsynergism, as illustrated by the easy complex formation of metal ions withunfilled or partially filled d or f orbitals.
7.6.2. Steric Hindrance Effect
The closer the reactive ligand atoms get to the central metal ion, the stronger thebond, and, consequently, the greater the formation constant. This can be studiedby making substitutions in the organic ligand, which structurally interferes withthe formation of the complex. For example, Dyrssen76 substituted oxines(8-hydroxyquinolinols), in various positions, and measured their distributionconstants, Kd. Although the pKa and KdHL did not vary much with the substi-tution, the Kd for the ThL4 complex with unsubstituted oxine was 425, and forthe 5-methyl substituted complex around 1000, while the 2-methyl-substitutedcomplex was not extractable. This can be attributed to the 2-methyl groupblocking the complex formation.
Branching has complex effect on steric hindrance. Isoforms of TBP(TiBP) and DOBA (DOiBA) are more branched. But the branching has littleeffect on Kex when TBP is replaced by TiBP due to the free rotation of thesubstituents around the phosphorus atom. On the contrary, at using the lowergroup, the amide DOBA, and its branched isomer DOiBA, the branchedsubstituent strongly depresses the extraction constant and forms less stablecomplex due to the restricted rotation of substituents around the amidemoiety.
Steric hindrance can be predicted by modeling the molecular structures andchemical reactions. But advanced programs require mainframe computers.
7.6.3. Donor Ligand Effects
Table 1.3 shows extraction constants for some metal ions with three alkylphosphates substituted by 0, 1, and 2 sulfur atoms, but with almost identicalaliphatic branching. Previously (see Section 2.3) we discussed hard and softacids and bases (HSAB theory) due to the extraction processes. According tothis theory, hard acids form strong complexes with hard bases, while weak acidsform strong complexes with weak bases. In Table 1.3, the metals are ordered inincreasing hardness, the subgroup II.b being rather soft. Presumably, the Kex
values reflect this pattern, as they are proportional to Ka z and bz. In Table 1.3,the acidity of the acids increases (i.e., Ka increases) in order R–PSSH,
47Chapter | 1 Modern (Classical) Fundamental Principles of Solvent Extraction
R–POSH, and R–POOH, as sulfur is less basic than oxygen. In general, the Kex
increases for the dialkyl phosporic acid (hard donor ligand) with increasingmetal charge density within each group as is predicted in Chapter 3. For the softmetals, Kex also increases with increasing softness of the ligand, while theopposite effect is seen for the hard Ln–metal ions. The divalent subgroup II.bmetals prefer to bind to sulfur rather than to oxygen because they have a rathersoft acceptor character, while the hard metals III.b prefer to bind to the hard Oatom of the ligand.
7.6.4. Inner and Outer Sphere Coordination Effect
The extractabilities of metal–organic complexes depend on whether inner orouter sphere complexes are formed. Extraction of uranyl nitrate by TBP isa good example. The free uranyl ion is surrounded by water molecules formingUO2(H2O)6
2þ Thus, in solution (as well as in the solid salt), the uranyl ion issurrounded by six molecules of H2O in an inner coordination sphere. Withnitrate anions it forms [UO2(H2O)6]
2þ(NO3)22�, though it is commonly written
UO2(NO3)2(H2O)6. In the solid nitrate salt, the distance dU–O(nitrate) betweenthe closest oxygen atoms of the nitrate anions, (O)2NO, and the U–atom islonger than the corresponding distance, dU–O(water), to the water molecules.Thus the nitrate anions are in an outer coordination sphere.
When the extractant TBP is added, the OP(OC4H9)3 groups are closer to theU atoms than the OH2’s, dU–O(TBP)< dU–O(water). Two waters are expelled,although the OP bond only occupies one coordination site. The charge distri-bution around the UO2 group allows the nitrate group to enter the inner coor-dination sphere of the uranyl complex. Thus, the extraction reaction can morecorrectly be written:
UO2ðH2OÞ2þ6 þ 2NO�3 þ 2TBPðorgÞ 4 UO2TBP2ðNO3Þ2ðorgÞ þ 6H2OðaqÞ
(1.88)
TABLE 1.3 Comparison of the Extraction Constant Kex for the IIb-Subgroup
Divalent Ions, and IIIb Lanthanide Ions, with Oxygen (RePOOH) or Sulfur
(RePOSH, RePSSH) Dialkyl Phosphoric Acidsa
Metal ion Hg2þ Cd2þ Zn2þ 57La3þ
63Eu3þ
71Lu3þ
Charge density Z2/r 3.6 4.1 5.4 7.83 8.74 9.68
Log Kex for RePOOH �2.20 �1.80 �1.20 �2.52 �0.44 2.9
Log Kex for (C4H9O)2$POSH 5.40 3.70 0.70 �4.78 �4.23 0.34
Log Kex for (C4H9O)2$PSSH 4.40 3.49 2.40 �8.28
aR is (C4H9CH(C2H5)CH2O)2.
48 PART | I Conventional (Classical) Principles and Practice
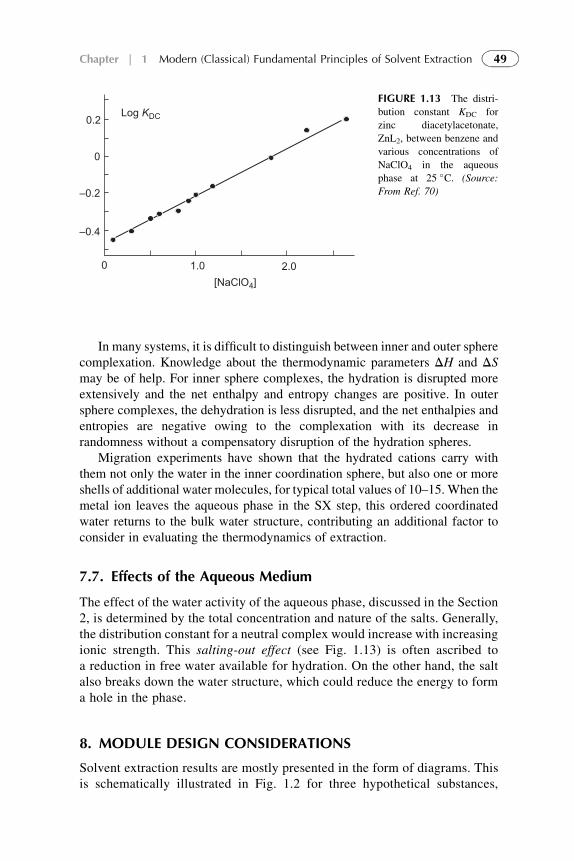
In many systems, it is difficult to distinguish between inner and outer spherecomplexation. Knowledge about the thermodynamic parameters DH and DSmay be of help. For inner sphere complexes, the hydration is disrupted moreextensively and the net enthalpy and entropy changes are positive. In outersphere complexes, the dehydration is less disrupted, and the net enthalpies andentropies are negative owing to the complexation with its decrease inrandomness without a compensatory disruption of the hydration spheres.
Migration experiments have shown that the hydrated cations carry withthem not only the water in the inner coordination sphere, but also one or moreshells of additional water molecules, for typical total values of 10–15. When themetal ion leaves the aqueous phase in the SX step, this ordered coordinatedwater returns to the bulk water structure, contributing an additional factor toconsider in evaluating the thermodynamics of extraction.
7.7. Effects of the Aqueous Medium
The effect of the water activity of the aqueous phase, discussed in the Section2, is determined by the total concentration and nature of the salts. Generally,the distribution constant for a neutral complex would increase with increasingionic strength. This salting-out effect (see Fig. 1.13) is often ascribed toa reduction in free water available for hydration. On the other hand, the saltalso breaks down the water structure, which could reduce the energy to forma hole in the phase.
8. MODULE DESIGN CONSIDERATIONS
Solvent extraction results are mostly presented in the form of diagrams. Thisis schematically illustrated in Fig. 1.2 for three hypothetical substances,
Log KDC0.2
0
–0.2
–0.4
0 1.0 2.0[NaClO4]
FIGURE 1.13 The distri-
bution constant KDC for
zinc diacetylacetonate,
ZnL2, between benzene and
various concentrations of
NaClO4 in the aqueous
phase at 25 �C. (Source:
From Ref. 70)
49Chapter | 1 Modern (Classical) Fundamental Principles of Solvent Extraction
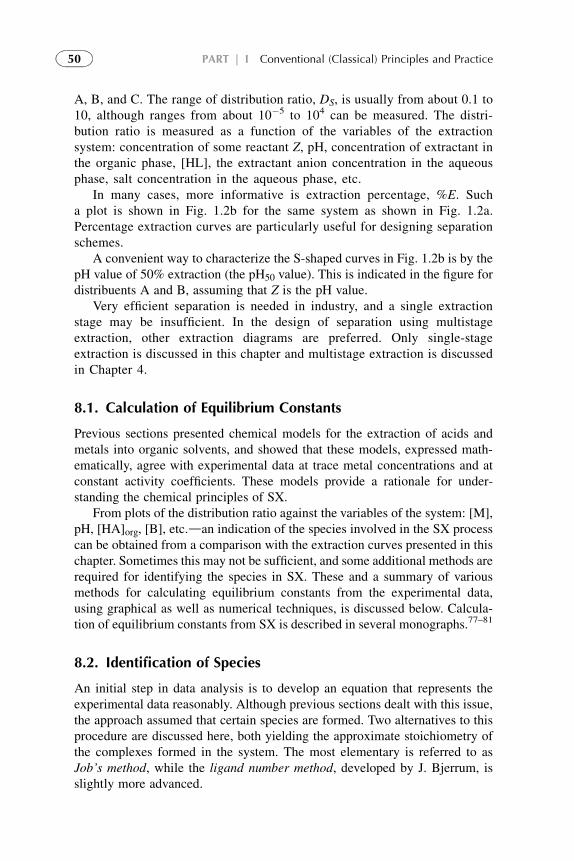
A, B, and C. The range of distribution ratio, DS, is usually from about 0.1 to10, although ranges from about 10�5 to 104 can be measured. The distri-bution ratio is measured as a function of the variables of the extractionsystem: concentration of some reactant Z, pH, concentration of extractant inthe organic phase, [HL], the extractant anion concentration in the aqueousphase, salt concentration in the aqueous phase, etc.
In many cases, more informative is extraction percentage, %E. Sucha plot is shown in Fig. 1.2b for the same system as shown in Fig. 1.2a.Percentage extraction curves are particularly useful for designing separationschemes.
A convenient way to characterize the S-shaped curves in Fig. 1.2b is by thepH value of 50% extraction (the pH50 value). This is indicated in the figure fordistribuents A and B, assuming that Z is the pH value.
Very efficient separation is needed in industry, and a single extractionstage may be insufficient. In the design of separation using multistageextraction, other extraction diagrams are preferred. Only single-stageextraction is discussed in this chapter and multistage extraction is discussedin Chapter 4.
8.1. Calculation of Equilibrium Constants
Previous sections presented chemical models for the extraction of acids andmetals into organic solvents, and showed that these models, expressed math-ematically, agree with experimental data at trace metal concentrations and atconstant activity coefficients. These models provide a rationale for under-standing the chemical principles of SX.
From plots of the distribution ratio against the variables of the system: [M],pH, [HA]org, [B], etc.dan indication of the species involved in the SX processcan be obtained from a comparison with the extraction curves presented in thischapter. Sometimes this may not be sufficient, and some additional methods arerequired for identifying the species in SX. These and a summary of variousmethods for calculating equilibrium constants from the experimental data,using graphical as well as numerical techniques, is discussed below. Calcula-tion of equilibrium constants from SX is described in several monographs.77–81
8.2. Identification of Species
An initial step in data analysis is to develop an equation that represents theexperimental data reasonably. Although previous sections dealt with this issue,the approach assumed that certain species are formed. Two alternatives to thisprocedure are discussed here, both yielding the approximate stoichiometry ofthe complexes formed in the system. The most elementary is referred to asJob’s method, while the ligand number method, developed by J. Bjerrum, isslightly more advanced.
50 PART | I Conventional (Classical) Principles and Practice
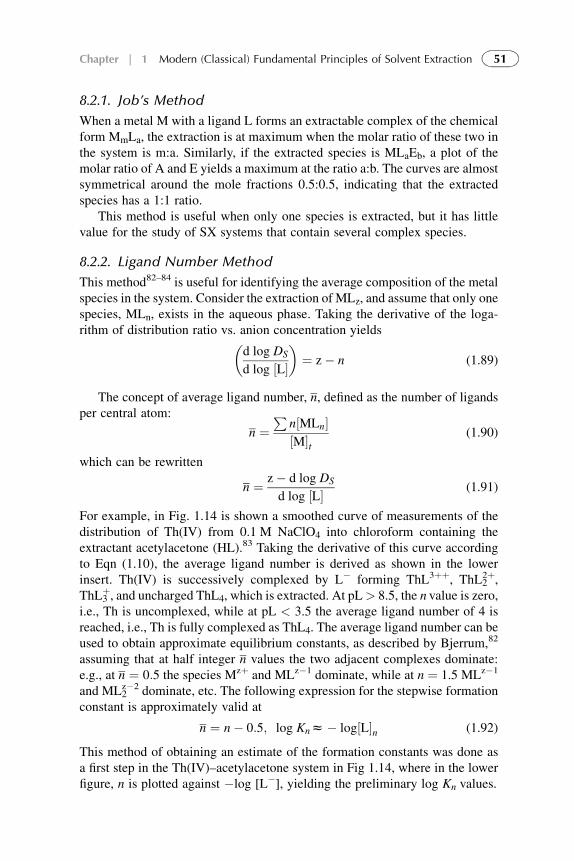
8.2.1. Job’s Method
When a metal M with a ligand L forms an extractable complex of the chemicalform MmLa, the extraction is at maximum when the molar ratio of these two inthe system is m:a. Similarly, if the extracted species is MLaEb, a plot of themolar ratio of A and E yields a maximum at the ratio a:b. The curves are almostsymmetrical around the mole fractions 0.5:0.5, indicating that the extractedspecies has a 1:1 ratio.
This method is useful when only one species is extracted, but it has littlevalue for the study of SX systems that contain several complex species.
8.2.2. Ligand Number Method
This method82–84 is useful for identifying the average composition of the metalspecies in the system. Consider the extraction of MLz, and assume that only onespecies, MLn, exists in the aqueous phase. Taking the derivative of the loga-rithm of distribution ratio vs. anion concentration yields�
d log DS
d log ½L��
¼ z� n (1.89)
The concept of average ligand number, n, defined as the number of ligandsper central atom:
n ¼P
n½MLn�½M�t
(1.90)
which can be rewritten
n ¼ z� d log DS
d log ½L� (1.91)
For example, in Fig. 1.14 is shown a smoothed curve of measurements of thedistribution of Th(IV) from 0.1 M NaClO4 into chloroform containing theextractant acetylacetone (HL).83 Taking the derivative of this curve accordingto Eqn (1.10), the average ligand number is derived as shown in the lowerinsert. Th(IV) is successively complexed by L� forming ThL3þþ, ThL2
2þ,ThL3
þ, and uncharged ThL4, which is extracted. At pL> 8.5, the n value is zero,i.e., Th is uncomplexed, while at pL < 3.5 the average ligand number of 4 isreached, i.e., Th is fully complexed as ThL4. The average ligand number can beused to obtain approximate equilibrium constants, as described by Bjerrum,82
assuming that at half integer n values the two adjacent complexes dominate:e.g., at n ¼ 0:5 the species Mzþ and MLz�1 dominate, while at n ¼ 1.5 MLz�1
and ML2z�2 dominate, etc. The following expression for the stepwise formation
constant is approximately valid at
n ¼ n� 0:5; log Knz� log½L�n (1.92)
This method of obtaining an estimate of the formation constants was done asa first step in the Th(IV)–acetylacetone system in Fig 1.14, where in the lowerfigure, n is plotted against �log [L�], yielding the preliminary log Kn values.
51Chapter | 1 Modern (Classical) Fundamental Principles of Solvent Extraction
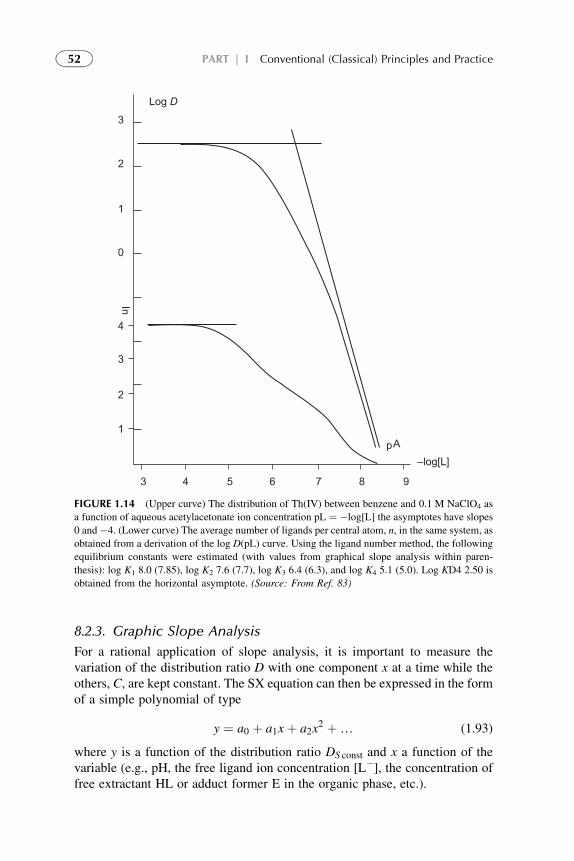
8.2.3. Graphic Slope Analysis
For a rational application of slope analysis, it is important to measure thevariation of the distribution ratio D with one component x at a time while theothers, C, are kept constant. The SX equation can then be expressed in the formof a simple polynomial of type
y ¼ a0 þ a1xþ a2x2 þ. (1.93)
where y is a function of the distribution ratio DS const and x a function of thevariable (e.g., pH, the free ligand ion concentration [L�], the concentration offree extractant HL or adduct former E in the organic phase, etc.).
A
9
p
876543
1
2
3
4
0
1
2
3
Log D
–log[L]In
FIGURE 1.14 (Upper curve) The distribution of Th(IV) between benzene and 0.1 M NaClO4 as
a function of aqueous acetylacetonate ion concentration pL ¼ �log[L] the asymptotes have slopes
0 and �4. (Lower curve) The average number of ligands per central atom, n, in the same system, as
obtained from a derivation of the log D(pL) curve. Using the ligand number method, the following
equilibrium constants were estimated (with values from graphical slope analysis within paren-
thesis): log K1 8.0 (7.85), log K2 7.6 (7.7), log K3 6.4 (6.3), and log K4 5.1 (5.0). Log KD4 2.50 is
obtained from the horizontal asymptote. (Source: From Ref. 83)
52 PART | I Conventional (Classical) Principles and Practice
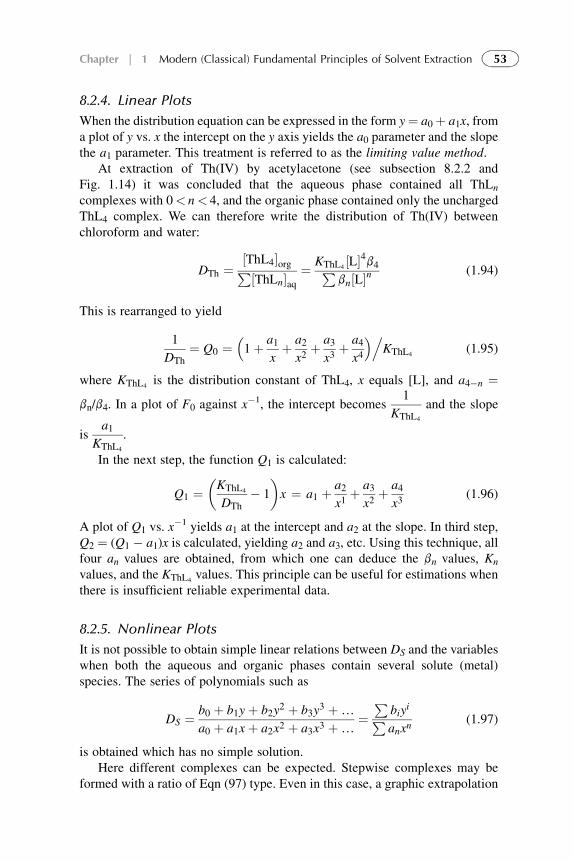
8.2.4. Linear Plots
When the distribution equation can be expressed in the form y¼ a0þ a1x, froma plot of y vs. x the intercept on the y axis yields the a0 parameter and the slopethe a1 parameter. This treatment is referred to as the limiting value method.
At extraction of Th(IV) by acetylacetone (see subsection 8.2.2 andFig. 1.14) it was concluded that the aqueous phase contained all ThLn
complexes with 0< n< 4, and the organic phase contained only the unchargedThL4 complex. We can therefore write the distribution of Th(IV) betweenchloroform and water:
DTh ¼½ThL4�orgP½ThLn�aq
¼ KThL4½L�4b4P
bn½L�n(1.94)
This is rearranged to yield
1
DTh¼ Q0 ¼
�1þ a1
xþ a2
x2þ a3
x3þ a4
x4
�.KThL4
(1.95)
where KThL4is the distribution constant of ThL4, x equals [L], and a4�n ¼
bn/b4. In a plot of F0 against x�1, the intercept becomes
1
KThL4
and the slope
isa1
KThL4
.
In the next step, the function Q1 is calculated:
Q1 ¼�KThL4
DTh� 1
�x ¼ a1 þ a2
x1þ a3
x2þ a4
x3(1.96)
A plot of Q1 vs. x�1 yields a1 at the intercept and a2 at the slope. In third step,
Q2 ¼ (Q1 � a1)x is calculated, yielding a2 and a3, etc. Using this technique, allfour an values are obtained, from which one can deduce the bn values, Kn
values, and the KThL4values. This principle can be useful for estimations when
there is insufficient reliable experimental data.
8.2.5. Nonlinear Plots
It is not possible to obtain simple linear relations between DS and the variableswhen both the aqueous and organic phases contain several solute (metal)species. The series of polynomials such as
DS ¼ b0 þ b1yþ b2y2 þ b3y
3 þ.
a0 þ a1xþ a2x2 þ a3x3 þ.¼P
biyiP
anxn(1.97)
is obtained which has no simple solution.Here different complexes can be expected. Stepwise complexes may be
formed with a ratio of Eqn (97) type. Even in this case, a graphic extrapolation
53Chapter | 1 Modern (Classical) Fundamental Principles of Solvent Extraction
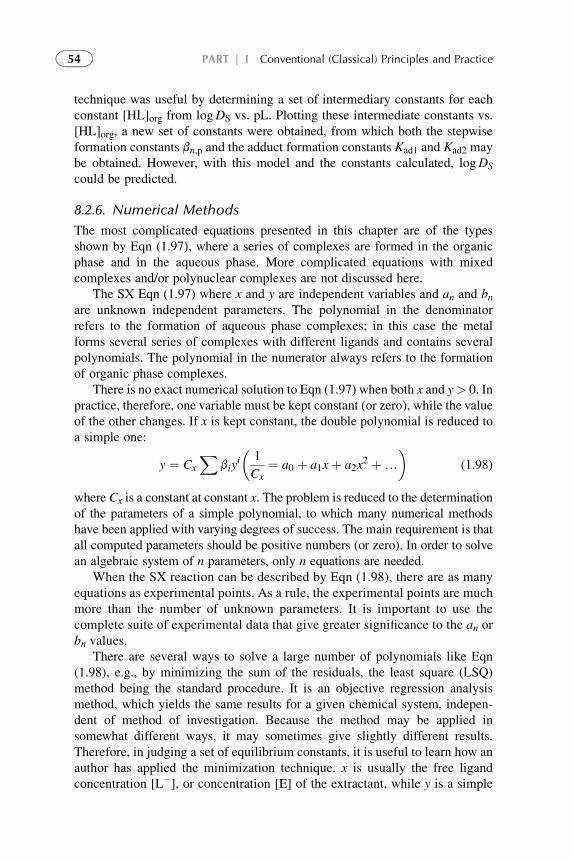
technique was useful by determining a set of intermediary constants for eachconstant [HL]org from logDS vs. pL. Plotting these intermediate constants vs.[HL]org, a new set of constants were obtained, from which both the stepwiseformation constants bn,p and the adduct formation constants Kad1 and Kad2 maybe obtained. However, with this model and the constants calculated, logDS
could be predicted.
8.2.6. Numerical Methods
The most complicated equations presented in this chapter are of the typesshown by Eqn (1.97), where a series of complexes are formed in the organicphase and in the aqueous phase. More complicated equations with mixedcomplexes and/or polynuclear complexes are not discussed here.
The SX Eqn (1.97) where x and y are independent variables and an and bnare unknown independent parameters. The polynomial in the denominatorrefers to the formation of aqueous phase complexes; in this case the metalforms several series of complexes with different ligands and contains severalpolynomials. The polynomial in the numerator always refers to the formationof organic phase complexes.
There is no exact numerical solution to Eqn (1.97) when both x and y> 0. Inpractice, therefore, one variable must be kept constant (or zero), while the valueof the other changes. If x is kept constant, the double polynomial is reduced toa simple one:
y ¼ Cx
Xbiy
i
�1
Cx¼ a0 þ a1xþ a2x
2 þ.
�(1.98)
where Cx is a constant at constant x. The problem is reduced to the determinationof the parameters of a simple polynomial, to which many numerical methodshave been applied with varying degrees of success. The main requirement is thatall computed parameters should be positive numbers (or zero). In order to solvean algebraic system of n parameters, only n equations are needed.
When the SX reaction can be described by Eqn (1.98), there are as manyequations as experimental points. As a rule, the experimental points are muchmore than the number of unknown parameters. It is important to use thecomplete suite of experimental data that give greater significance to the an orbn values.
There are several ways to solve a large number of polynomials like Eqn(1.98), e.g., by minimizing the sum of the residuals, the least square (LSQ)method being the standard procedure. It is an objective regression analysismethod, which yields the same results for a given chemical system, indepen-dent of method of investigation. Because the method may be applied insomewhat different ways, it may sometimes give slightly different results.Therefore, in judging a set of equilibrium constants, it is useful to learn how anauthor has applied the minimization technique. x is usually the free ligandconcentration [L�], or concentration [E] of the extractant, while y is a simple
54 PART | I Conventional (Classical) Principles and Practice
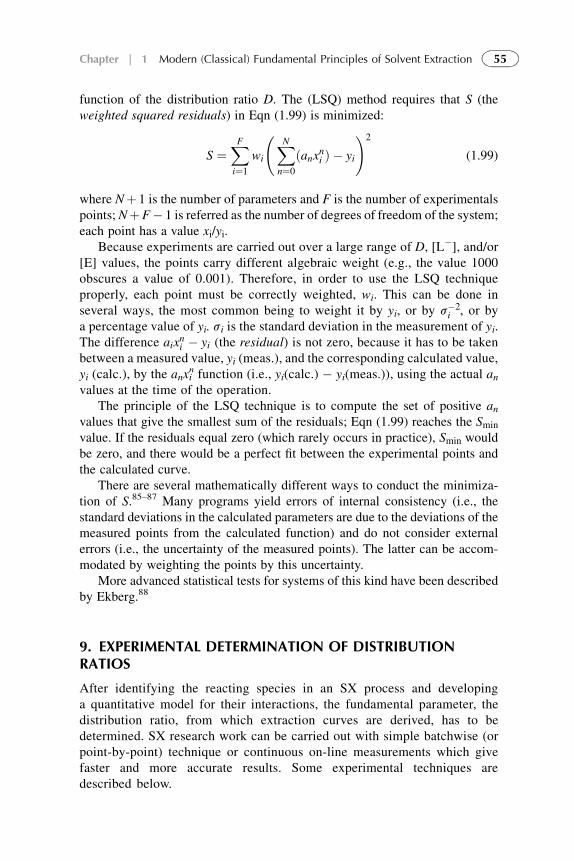
function of the distribution ratio D. The (LSQ) method requires that S (theweighted squared residuals) in Eqn (1.99) is minimized:
S ¼XFi¼1
wi
XNn¼0
ðanxni Þ � yi
!2
(1.99)
where Nþ 1 is the number of parameters and F is the number of experimentalspoints; NþF� 1 is referred as the number of degrees of freedom of the system;each point has a value xi/yi.
Because experiments are carried out over a large range of D, [L�], and/or[E] values, the points carry different algebraic weight (e.g., the value 1000obscures a value of 0.001). Therefore, in order to use the LSQ techniqueproperly, each point must be correctly weighted, wi. This can be done inseveral ways, the most common being to weight it by yi, or by s�2
i , or bya percentage value of yi. si is the standard deviation in the measurement of yi.The difference aix
ni � yi (the residual) is not zero, because it has to be taken
between a measured value, yi (meas.), and the corresponding calculated value,yi (calc.), by the anxi
n function (i.e., yi(calc.) � yi(meas.)), using the actual anvalues at the time of the operation.
The principle of the LSQ technique is to compute the set of positive anvalues that give the smallest sum of the residuals; Eqn (1.99) reaches the Smin
value. If the residuals equal zero (which rarely occurs in practice), Smin wouldbe zero, and there would be a perfect fit between the experimental points andthe calculated curve.
There are several mathematically different ways to conduct the minimiza-tion of S.85–87 Many programs yield errors of internal consistency (i.e., thestandard deviations in the calculated parameters are due to the deviations of themeasured points from the calculated function) and do not consider externalerrors (i.e., the uncertainty of the measured points). The latter can be accom-modated by weighting the points by this uncertainty.
More advanced statistical tests for systems of this kind have been describedby Ekberg.88
9. EXPERIMENTAL DETERMINATION OF DISTRIBUTIONRATIOS
After identifying the reacting species in an SX process and developinga quantitative model for their interactions, the fundamental parameter, thedistribution ratio, from which extraction curves are derived, has to bedetermined. SX research work can be carried out with simple batchwise (orpoint-by-point) technique or continuous on-line measurements which givefaster and more accurate results. Some experimental techniques aredescribed below.
55Chapter | 1 Modern (Classical) Fundamental Principles of Solvent Extraction
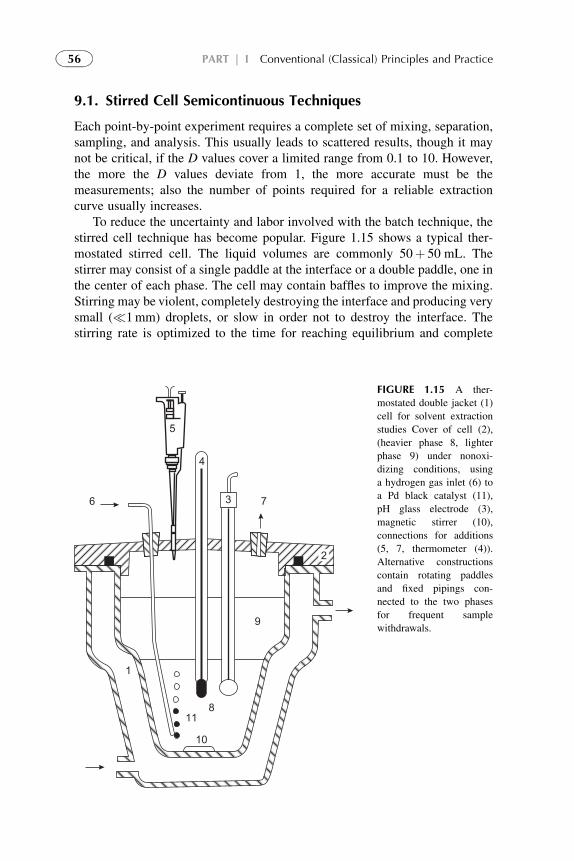
9.1. Stirred Cell Semicontinuous Techniques
Each point-by-point experiment requires a complete set of mixing, separation,sampling, and analysis. This usually leads to scattered results, though it maynot be critical, if the D values cover a limited range from 0.1 to 10. However,the more the D values deviate from 1, the more accurate must be themeasurements; also the number of points required for a reliable extractioncurve usually increases.
To reduce the uncertainty and labor involved with the batch technique, thestirred cell technique has become popular. Figure 1.15 shows a typical ther-mostated stirred cell. The liquid volumes are commonly 50þ 50 mL. Thestirrer may consist of a single paddle at the interface or a double paddle, one inthe center of each phase. The cell may contain baffles to improve the mixing.Stirring may be violent, completely destroying the interface and producing verysmall (�1mm) droplets, or slow in order not to destroy the interface. Thestirring rate is optimized to the time for reaching equilibrium and complete
6 7
9
8
1
11
10
5
4
3
2
FIGURE 1.15 A ther-
mostated double jacket (1)
cell for solvent extraction
studies Cover of cell (2),
(heavier phase 8, lighter
phase 9) under nonoxi-
dizing conditions, using
a hydrogen gas inlet (6) to
a Pd black catalyst (11),
pH glass electrode (3),
magnetic stirrer (10),
connections for additions
(5, 7, thermometer (4)).
Alternative constructions
contain rotating paddles
and fixed pipings con-
nected to the two phases
for frequent sample
withdrawals.
56 PART | I Conventional (Classical) Principles and Practice
phase separation. The experiments are carried out either with intermittentviolent stirring, in which case samples are withdrawn after each complete phaseseparation, or with mild stirring during which it is possible to continuouslywithraw samples. Equal volumes are sampled each time, commonly <1 mL.The simple stirred cell has been improved by introducing phase-discriminatingmembranes in the sampling outlet.89 This is particularly advantageous forkinetic experiments. The sampling of the stirred cell can be automated, so thatat regular intervals pH and temperature are recorded, and samples are with-drawn for automatic analysis of concentration of interesting species in a moreor less standard fashion. It is also possible to use ion-sensitive probes in one ofthe phases instead of sampling.
9.2. Centrifugal Extraction–Separation Systems
A different approach to SX experimentation is AKUFVE principle.90 TheAKUFVE is titanium made, or PEEK (polyether ether ketone) to allowmeasurements under very corrosive conditions. The separated phases passAMX gadgets for on-line detection (radiometric, spectrophotometric, etc.) orphase sampling for external measurements (atomic absorption, spectro-metric, etc.), depending on the system studied. The aqueous phase is alsoprovided with cells for pH measurement, redox control (e.g., by reductioncells using platinum black and hydrogen, metal ion determination, etc.), andtemperature control (thermocouples). The AKUFVE technique allowsa large number of points (50–100) to be determined in a one-day experimentover a D-range of better than 103–10�3, not counting time of preparation(Fig. 1.16).
The centrifugal separator of the AKUFVE system is also used for phaseseparation in the SISAK technique.91 SISAK is a multistage SX system that isused for studies of properties of short-lived radionuclides, e.g., the chemicalproperties of the heaviest elements, and SX behavior of compounds with exoticchemical states. In a typical SISAK experiment, radionuclides are continuouslytransported from a production site in an accelerator or a research reactor to theSISAK equipment via a gas jet transport system. The nuclides are dissolved inan aqueous phase that is fed into a centrifuge battery comprising 1–4 SX steps.The product solution leaving the last step is pumped, e.g., to a nuclear radiationdetection system. The transport time from the target site to the detection systemdepends on the centrifuge size, number of centrifuge steps, and flow rate. Fora one-step chemistry, i.e., dissolution step and a single centrifuge extraction,and maximum flow rates, the overall transport time is around 2.5 s. This fasttransport has allowed detailed g-spectroscopic studies of radionuclides withhalf-lives around 1 s. Recently, the SISAK equipment was successfully appliedto studies of the heaviest elements, and SX data were obtained for element104.92 Fast chemical separation systems have been developed for quite a largenumber of elements.93
57Chapter | 1 Modern (Classical) Fundamental Principles of Solvent Extraction
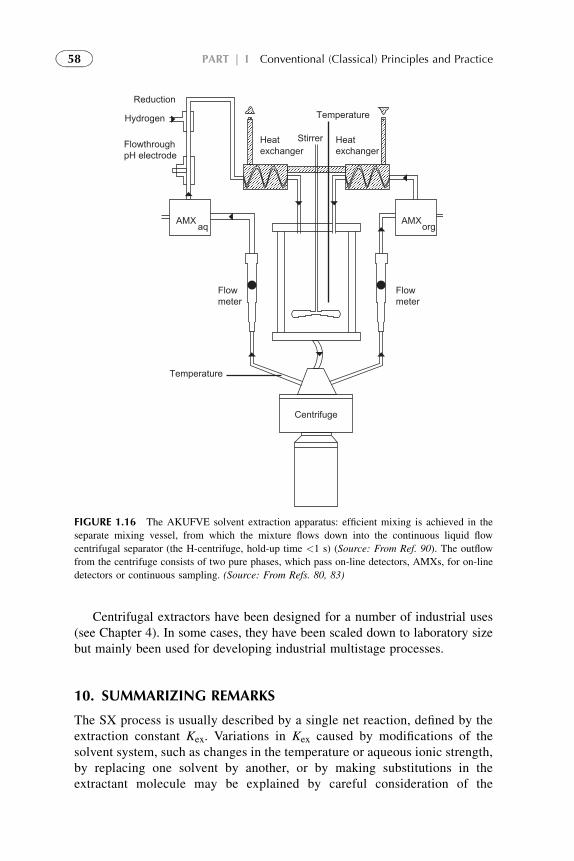
Centrifugal extractors have been designed for a number of industrial uses(see Chapter 4). In some cases, they have been scaled down to laboratory sizebut mainly been used for developing industrial multistage processes.
10. SUMMARIZING REMARKS
The SX process is usually described by a single net reaction, defined by theextraction constant Kex. Variations in Kex caused by modifications of thesolvent system, such as changes in the temperature or aqueous ionic strength,by replacing one solvent by another, or by making substitutions in theextractant molecule may be explained by careful consideration of the
Reduction
Heatexchanger
Heatexchanger
Stirrer
Hydrogen
FlowthroughpH electrode
AMX
Temperature
Centrifuge
Temperature
Flow meter
Flow meter
aq AMXorg
FIGURE 1.16 The AKUFVE solvent extraction apparatus: efficient mixing is achieved in the
separate mixing vessel, from which the mixture flows down into the continuous liquid flow
centrifugal separator (the H-centrifuge, hold-up time <1 s) (Source: From Ref. 90). The outflow
from the centrifuge consists of two pure phases, which pass on-line detectors, AMXs, for on-line
detectors or continuous sampling. (Source: From Refs. 80, 83)
58 PART | I Conventional (Classical) Principles and Practice
parameters of the system. However, such studies are difficult and not alwayssufficient for predicting new systems. A better foundation for understandingthe extraction process is to consider the steps in the process contributing to thenet extraction reaction, particularly when these steps are governed by regu-larities. Knowledge of these regularities helps in interpreting systems as wellas in predicting new ones. Extension of these distribution data to thermody-namic constants is likely to give benefits in increased chemical knowledge ofthe behavior of solutes in different solvent systems. Advanced quantumchemistry calculations and computer modeling of extraction processes canhelp us in designing new, selective SX systems, as well as in interpretingextraction phenomena.
Many organic substances as well as metal complexes are less extractedfrom aqueous solutions into organic solvents than expected from simpleconsiderations such as the amount of organic matter in the solute or theirsolubility in organic solvents. Such substances are hydrated. More basic donormolecules can replace such water, forming adducts. For the most commonoxygen-containing adduct molecules, the efficiency of the replacementdepends on the charge density, also referred as basicity, of the oxygen atoms.The basicity is presented in the form of donor number. The larger thedifference between the donor number of water and the adduct former, thelarger the adduct formation constant. Often the donor property has to be ratherstrong, which is the case for many phosphoryl compounds (such as TBP,tributylphosphineoxide (TBPO), and TOPO), because the concentration ofH2O in the aqueous phase is very large (often >50 M), even though H2O isonly a moderately strong donor.
Table 1.4 gives a survey of the most common extraction processes. Ingeneral, Type I extraction refers to the distribution of nonelectrolytes, without(A) or with adduct former (B). Type II refers to extraction of (mainly organic)acids, Type III to the extraction of metal complexes, and Type IV to the special(but common) use of SX for evaluation of formation constants for hydrophiliccomplexes. An arrow within parentheses suggests a reaction of secondaryimportance. Three examples are all of Type III-C, but also contain elements ofTypes I-A (the distribution of TBP) and II-A (the distribution of the weak acidThenoyltrifluoroacetic acid (HTTA)), though the presence of undissociatedacid (HTTA) or the acid adduct (TBP-HTTA) is not discussed. In the evaluationof experiments, all molecular species are present and all equilibria must betaken into account, as demonstrated subsequently for a number of cases.
Solutes containing metals can further be classified according to the type ofligand; N refers to the maximum coordination number of the metal relative tothe ligand:
Class A: Type MXN. (Note: It is generally assumed that the ligand ismonovalent.) A small number of almost purely covalent inorganic compoundsthat are extracted by nonsolvating organic solvents. These complexes arenonelectrolytes and almost as inert as the solutes of Type I-A.
59Chapter | 1 Modern (Classical) Fundamental Principles of Solvent Extraction
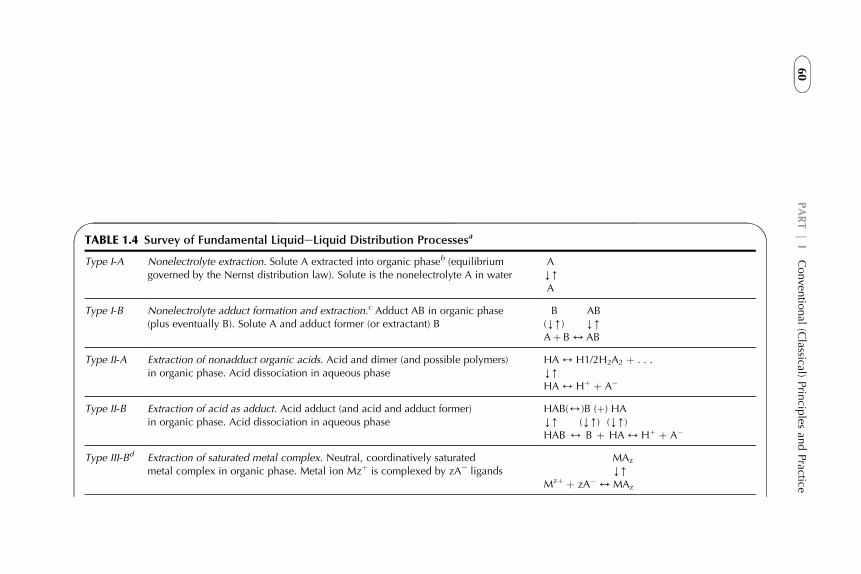
TABLE 1.4 Survey of Fundamental LiquideLiquid Distribution Processesa
Type I-A Nonelectrolyte extraction. Solute A extracted into organic phaseb (equilibriumgoverned by the Nernst distribution law). Solute is the nonelectrolyte A in water
AY[A
Type I-B Nonelectrolyte adduct formation and extraction.c Adduct AB in organic phase(plus eventually B). Solute A and adduct former (or extractant) B
B AB(Y[) Y[Aþ B4AB
Type II-A Extraction of nonadduct organic acids. Acid and dimer (and possible polymers)in organic phase. Acid dissociation in aqueous phase
HA4H1/2H2A2 þ . . .Y[HA4Hþ þ A�
Type II-B Extraction of acid as adduct. Acid adduct (and acid and adduct former)in organic phase. Acid dissociation in aqueous phase
HAB(4)B (þ) HAY[ (Y[) (Y[)HAB 4 B þ HA4Hþ þ A�
Type III-Bd Extraction of saturated metal complex. Neutral, coordinatively saturatedmetal complex in organic phase. Metal ion Mzþ is complexed by zAe ligands
MAz
Y[Mzþ þ zA�4MAz
60
PART|
IConven
tional
(Classical)
Prin
ciples
andPractice
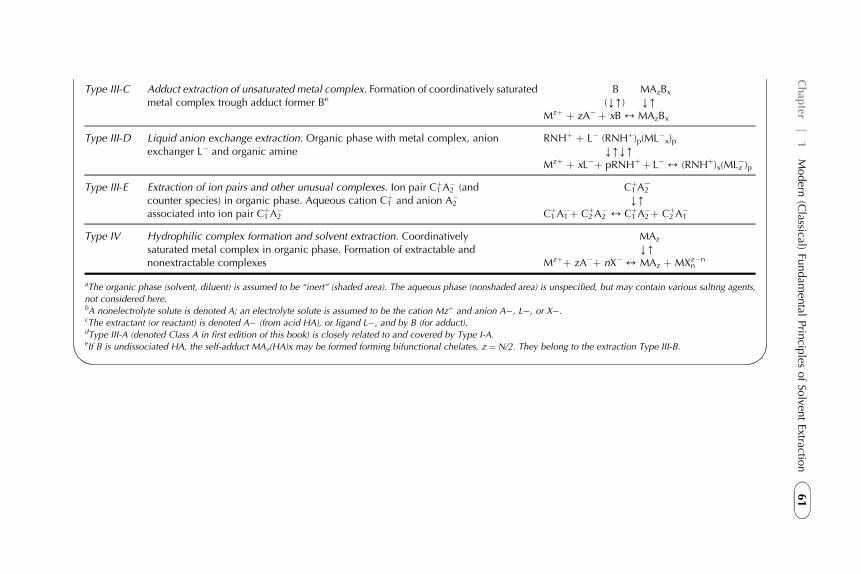
Type III-C Adduct extraction of unsaturated metal complex. Formation of coordinatively saturatedmetal complex trough adduct former Be
B MAzBx
(Y[) Y[Mzþ þ zA� þ xB4MAzBx
Type III-D Liquid anion exchange extraction. Organic phase with metal complex, anionexchanger L� and organic amine
RNHþ þ L� (RNHþ)p(ML�x)pY[Y[
Mzþ þ xL�þ pRNHþþ L�4 (RNHþ)x(MLz�)p
Type III-E Extraction of ion pairs and other unusual complexes. Ion pair C1þA2
� (andcounter species) in organic phase. Aqueous cation C1
þ and anion A2�
associated into ion pair C1þA2
�
C1þA2
e
Y[C1þA1
�þ C2þA2
�4C1þA2
�þ C2þA1
�
Type IV Hydrophilic complex formation and solvent extraction. Coordinativelysaturated metal complex in organic phase. Formation of extractable andnonextractable complexes
MAz
Y[Mzþþ zA�þ nX�4MAz þ MXn
z�n
aThe organic phase (solvent, diluent) is assumed to be “inert” (shaded area). The aqueous phase (nonshaded area) is unspecified, but may contain various salting agents,
not considered here.bA nonelectrolyte solute is denoted A; an electrolyte solute is assumed to be the cation Mzþ and anion A�, L�, or X�.cThe extractant (or reactant) is denoted A� (from acid HA), or ligand L�, and by B (for adduct).dType III-A (denoted Class A in first edition of this book) is closely related to and covered by Type I-A.eIf B is undissociated HA, the self-adduct MAz(HA)x may be formed forming bifunctional chelates, z ¼N/2. They belong to the extraction Type III-B.
61
Chap
ter|
1Modern
(Classical)
Fundam
ental
Prin
ciples
ofSo
lventExtractio
n
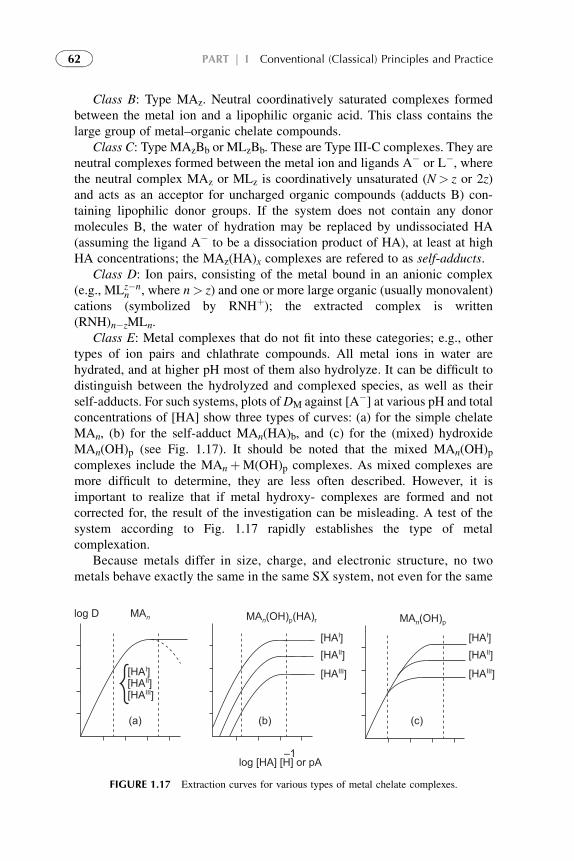
Class B: Type MAz. Neutral coordinatively saturated complexes formedbetween the metal ion and a lipophilic organic acid. This class contains thelarge group of metal–organic chelate compounds.
Class C: Type MAzBb or MLzBb. These are Type III-C complexes. They areneutral complexes formed between the metal ion and ligands A� or L�, wherethe neutral complex MAz or MLz is coordinatively unsaturated (N> z or 2z)and acts as an acceptor for uncharged organic compounds (adducts B) con-taining lipophilic donor groups. If the system does not contain any donormolecules B, the water of hydration may be replaced by undissociated HA(assuming the ligand A� to be a dissociation product of HA), at least at highHA concentrations; the MAz(HA)x complexes are refered to as self-adducts.
Class D: Ion pairs, consisting of the metal bound in an anionic complex(e.g., MLz�n
n , where n> z) and one or more large organic (usually monovalent)cations (symbolized by RNHþ); the extracted complex is written(RNH)n�zMLn.
Class E: Metal complexes that do not fit into these categories; e.g., othertypes of ion pairs and chlathrate compounds. All metal ions in water arehydrated, and at higher pH most of them also hydrolyze. It can be difficult todistinguish between the hydrolyzed and complexed species, as well as theirself-adducts. For such systems, plots ofDM against [A�] at various pH and totalconcentrations of [HA] show three types of curves: (a) for the simple chelateMAn, (b) for the self-adduct MAn(HA)b, and (c) for the (mixed) hydroxideMAn(OH)p (see Fig. 1.17). It should be noted that the mixed MAn(OH)pcomplexes include the MAnþM(OH)p complexes. As mixed complexes aremore difficult to determine, they are less often described. However, it isimportant to realize that if metal hydroxy- complexes are formed and notcorrected for, the result of the investigation can be misleading. A test of thesystem according to Fig. 1.17 rapidly establishes the type of metalcomplexation.
Because metals differ in size, charge, and electronic structure, no twometals behave exactly the same in the same SX system, not even for the same
log D
(a) (b)
–1
(c)
MAn
[HAI][HAII][HAIII]
[HAI][HAII]
[HAIII]
[HAI][HAII]
[HAIII]
MAn(OH)p(HA)r
log [HA] [H] or pA
MAn(OH)p
FIGURE 1.17 Extraction curves for various types of metal chelate complexes.
62 PART | I Conventional (Classical) Principles and Practice
class of solutes. Nevertheless, there are systematic trends in the formation andextraction of these complexes, as described in Chapter 3. Here, the emphasisis on models that give a quantitative description of the extraction within eachtype or class.
In the subsequent discussion, the following simplifications are made:
1. The systems behave “ideally,” i.e., the activity factors are assumed to beunity, unless specifically discussed.
2. The metal extracted is in trace concentration: [M]t_ [M]� [Extractant] andthis simplifies the equations.
3. The reactants are at very low concentrations in both phases.
These are great simplifications in comparison with the industrial SX systemsdescribed in later chapters. Nevertheless, the same basic reactions occur also inthe industrial systems, although activity factors must be introduced or otheradjustments are made to fit the data, and the calculation of free ligandconcentrations are more complex. Some of these simplifications are not used inlater chapters.
REFERENCES
1. Hildebrand JH, Scott RC. Solubilities of nonelectrolytes. New York, USA; London, UK:
Dover Publishers; 1964.
2. Barton AFM. CRC handbook of solubility parameters and other cohesion parameters. New
York, USA; London, UK: CRC Press; 1991.
3. Hansen C. Hansen solubility parameters: a users handbook. New York, USA; London, UK:
CRC Press; 2000.
4. Nilsson M. Influence of organic phase composition on the extraction of trivalent actinides.
Diploma work, Department of Nuclear Chemistry. Gothenburg: Chalmers University of
Technology; 2000.
5. Nernst WZ. Phys Chem 1891;8:110.
6. Kislik V, Eyal A. Mechanisms of titanium (IV) and some other transition metals extraction by
organophosphorus acids. Proceedings of ISEC’93, 1993;2:1353–60.
7. Kislik VS, editor. Liquid membranes. Principles and applications in chemical separations and
wastewater treatment. Elsevier; 2010.
8. Bird RB, Stewart WE, Lightfoot EN. Transport phenomena. New York: John Wiley &
Sons; 1960.
9. Cussler EL. Diffusion, mass transfer in fluid systems. Cambridge: Cambridge University Press;
1984.
10. Ridberg J, Cox M, Musikas C, Choppin GR, editors. Principles and practices of solvent
extraction. New York: CRC; 2004.
11. Giddings JC. Unified separation science. New York: John Wiley & Sons; 1991 17–48.
12. Giddings JC. Unified separation science. New York: John Wiley & Sons; 1991 112–4.
13. Bromberg L, Levin G, Kedem O. Transport of metals through gelled supported liquid
membranes containing carrier. J Membr Sci 1992;71:41.
14. Zhu XX, MacDonald PM. Pulsed-gradient spin-echo NMR measurements of the diffusion
coefficients of ketones in poly(methyl methacrylate). Macromolecules 1992;25:4345.
63Chapter | 1 Modern (Classical) Fundamental Principles of Solvent Extraction
15. Chrisstoffels LAJ, de Jong F, Reinhoudt DN. Mechanistic studies of carrier-mediated transport
through supported liquid membranes. In: Bartsch RA, Way JD, editors. Chemical separations
with liquid membranes. ACS Symposium Series 642. Washington, DC: American Chemical
Society; 1996 18–56. Ch 3.
16. Inoue Y. In: Araki T, Tsukube H, editors. Liquid membranes: chemical applications. Boca
Raton, FL: CRC Press; 1990. 77–102.
17. Noble RD, Koval CA, Pellegrino L. J Chem Eng Prog; 1989 March:58–70.
18. Kiani A, Bhave RR, Sirkar KK. Further studies on solvent extraction with immobilized
interfaces in a microporous hydrophobic membrane. J Membr Sci 1986;26:79.
19. LiY Gokel G. Hernandez 1, Echegoyen, L. Cation-exchange kinetics of sodium complexes
with amide- and ester-substituted crown ethers in homogeneous solution. J Am Chem Soc
1994;116:3087–96.
20. Eigen M, Wilkins RW. Mechanisms of inorganic reactions, Adv Chem Ser. Washington, D.C:
American Chemical Society; 1965: vol. 76, 49–68.
21. Adamson AW. Physical chemistry of surfaces. New York: John Wiley & Sons; 1982.
22. Davies T, Rideal EK. Interfacial phenomena. New York: Academic Press; 1961.
23. Neuman RD, Nai-Fu-Zhou, Wu J, Jons MA, Gaonkar AG. General model for aggregationof
metal-extractant complexes in acidic organophosphorus solvent extraction systems. Sep Sci
Technol 1990;25(13–15):1655–74.
24. Kislik V, Eyal A. Hybrid liquid membrane (HLM) and supported liquid membrane (SLM)
based transport of titanium(IV). J Mem Sci 1996;111:273–81.
25. Ghidini E, Ugozzoli F, Ungaro R, Harkema S, Abu EI-Fadl A, Reinhoudt DN. Complexation
of alkali metal cations by conformationally rigid, stereoisomeric calix[4]arene crown ethers:
a quantitative evaluation of preorganization. J Am Chem Soc 1990;112:6979.
26. Reinhoudt DN, Dijkstra PJ, in ’t Veld PJA, Bugge KE, Harkema S, Ungaro R, Ghidini E.
Kinetically stable complexes of alkali cations with rigidified calix[4]arenes. X-ray structure of
a calixspherand sodium picrate complex. J Am Chem Soc 1987;109:4761.
27. Casnati A, Pochini A, Ungaro R, Bocchi C, Ugozzoli F, Egberink RJM, Struijk W,
Lugtenberg RJM, de Jong F, Reinhoudt DN. 1,3-Alternate calix[4]arenecrown-5 conformers:
new synthetic ionophores with better Kþ/Naþ selectivity than valinomycin. Chem Eur J
1996;2(4):436–45.
28. Neuman RD, Nai-Fu-Zhou, Wu J, Jons MA, Gaonkar AG. General model for aggregationof
metal-extractant complexes in acidic organophosphorus solvent extraction systems. Sep Sci
Technol 1990;25(13–15):1655–74.
29 Eyal AM, Kislik VS. Hybrid liquid membrane (HLM) process for metal recovery. Avicenne
joint research project report: Membrane recovery of metal pollutants from waste waters of the
fertilizers industry (MERMEP), 1996, p. 25–9.
30. Danesi PR, Horwitz EP, Vandergrift GF, Chiarizia R. Mass transfer rate through liquid
membranes: interfacial chemical reactions and diffusion as simultaneous permeability
controlling factors. Sep Sci Technol 1981;16:201–10.
31. Michaels AS. Membranes, membrane processes, and their applications: needs, unsolved
problems, and challenges of the 1990’s. Desalination 1990;77:5–34.
32. Szpakowska M, Nagy OB. Chemical kinetic approach to the mechanism of coupled transport
of cu(ii) ions through bulk liquid membranes. J Phys Chem A 1999;103:1553–9.
33. O’Hara PA, Bohrer MP. Supported liquid membranes for copper transport. J Membr Sci
1989;44:273–81.
34. Schlosser S. Pertraction through liquid and polymeric membranes. In: Belafi-Bako K,
Gubicza L, Mulder M, editors. Integration of membrane processes into bioconversions.
64 PART | I Conventional (Classical) Principles and Practice
Proceedings of the16th European Membrane Society Annual Summer School. Veszprem,
Hungary, 2000. New York: Kluwer Academic/Plenum; August 1999. 73–100.
35. Wodzki R, Szczepanska G, Szczepanski P. Unsteady state pertraction and separation of cations
in a liquid membrane system: Simple network and numerical model of competitive M2þ /Hþ
counter-transport. Sep Pur Tech 2004;36(1):1–16.
36. Kislik V, Eyal A. Hybrid liquid membrane (HLM) system in separation technologies. J Mem
Sci 1996;111:259–72.
37. Kislik V, Eyal A. Hybrid liquid membrane (HLM) and supported liquid membrane (SLM)
based transport of titanium(IV). J Mem Sci 1996;111:273–81.
38. Eyal AM, Kislik VS. Hybrid liquid membrane (HLM) process for metal recovery. Avicenne
joint research project report: membrane recovery of metal pollutants from waste waters of the
fertilizers industry (MERMEP), 1996, p. 25–9.
39. Lo TH, Baird MHI, Hanson C, editors. Handbook of solvent extraction. John Wiley;
1983.
40. Ensor DD, McDonald GR, Pippin CG. Extraction of trivalent lanthanides by a mixture of
didodecylnaphthalenesulfonic acid and a crown ether. Anal Chem 1986;58:1814–6.
41. Nijenhuis WF, Buitnuis EG, et al. Calixcrowns as selective potassium cation carriers in
supported liquid membranes. J Am Chem Soc 1991;113:7963–8.
42. Cooper SR. Crown compounds, toward future applications. New York: VCH; 1992.
43. Lo TH, Baird MHI, Hanson C, editors. Handbook of solvent extraction. John Wiley;
1983.
44. Davies T, Rideal EK. Interfacial phenomena. New York: Academic Press; 1961.
45. Neuman RD, Nai-Fu-Zhou, Wu J, Jons MA, Gaonkar AG. General model for aggregationof
metal-extractant complexes in acidic organophosphorus solvent extraction systems. Sep Sci
Technol 1990;25(13–15):1655–74.
46. Ghidini E, Ugozzoli F, Ungaro R, Harkema S, Abu EI-Fadl A, Reinhoudt DN. Complexation
of alkali metal cations by conformationally rigid, stereoisomeric calix[4]arene crown ethers:
a quantitative evaluation of preorganization. J Am Chem Soc 1990;112:6979.
47. Marcus Y, Kertes S. Ion exchange and solvent extraction of metals. Chichester: Wiley-
Interscience; 1969.
48. Van Ooyen J, Dyrssen D, Liljenzin JO, Rydberg J, editors. Solvent extraction chemistry (ISEC
1966). Amsterdam: North-Holland; 1967.
49. Sekine T, Sakairi M. Bull Chem Soc Japan 1967;40:261.
50. Liljenzin JO, Vadasdi K, Rydberg J. Coordination chemistry in solution. Hogfeldt, E. Swedish
Nat Res Council; Trans Roy Inst Techn., 280, Stockholm, 1972.
51. Cooper SR. Crown compounds, toward future applications. New York: VCH; 1992.
52. Ansari SA, Mohapatra PK, Prabhu DR, Manchanda VK. Evaluation of N, N, N0, N0-tetraoctyl-3-oxapentane-diamide (TODGA) as a mobile carrier in remediation of nuclear waste using
supported liquid membrane. J Mem Sci 2007;298(1–2):169–74.
53. Shu-Lan Ma, Xiao-Zhu Wang, Cui-Hong Fan, Qian-Ling Guo, Wen-Xiang Zhu, Jing Zhang.
The syntheses of phenol-containing diazamacrocycles and liquid membrane transports of
alkali cations. J Mol Struct 2007;2:46–52.
54. Moyer BA, Case GN, Alexandratos SD, Kriger AA. Extraction of copper(II) from sulfuric
acid by macrocycle-synergized cation exchange: Comparing a novel impregnated resin with
its solvent-extraction analog. Anal Chem 1993;65:3389–95.
55. Parthasarathy N, Buffle J. Anal Chim Acta 1994;284:649–59.
56. Schaller U, Bakker E, Spichiger UE, Pretsch E. Ionic additives for ion-selective electrodes
based on electrically charged carriers. Anal Chem 1994;66:391–8.
65Chapter | 1 Modern (Classical) Fundamental Principles of Solvent Extraction
57. Bakker E, Malinowska E, Schiller RD, Meyerhoff ME. Anion-selective membrane electrodes
based on metalloporphyrins: the influence of lipophilic anionic and cationic sites on poten-
tiometric selectivity. Talanta 1994;41:881–90.
58. Carey FA, Sundberg RJ. Advanced organic chemistry. 3rd ed. New York: Plenum Press; 1990.
59. Fuks L, Majdan M. Min Pro Ext Met Rev 2000;21:25.
60. Lamb JD, Izatt RM, Christensen JJ. In: Izatt RM, Christensen JJ, editors. Progress in
macrocyclic chemistry, Vol. 2. New York: Wiley; 1981. 41–90.
61. Izatt RM, McBride DW, Brown PR, Lamb JD, Christensen JJ. The influence of halocarbon
solvent on macrocycle-mediated cation transport through liquid membranes. J Membr Sci
1986;28:69–76.
62. Dernini S, Paimas S, Poicara AM, Maronglu B. Extraction and transport of sodium ion
and potassium ion in a liquid membrane containing crown ethers: effect of the mixed
solvent. J Chem Eng Data 1992;37:281–4.
63. Christensen LL, Lamb LD, Izatt SR, Starr SE, Weed GC, Astin MS, Stitt BD, Izatt RM. Effect
of anion type on rate of facilitated transport of cations across liquid membranes via neutral
macrocyclic carriers. J Am Chem Soc 1978;100:3219–20.
64. Olsher U, Hankins MG, Kim YD, Bartsch RA. Anion effect on selectivity in crown ether
extraction of alkali metal cations. J Am Chem Soc 1993;115:3370–1.
65. Christensen JJ, Christensen SP, Biehl MP, Lowe SA, LambLD Izatt RM. Effect of receiving
phase anion on macrocycle-mediated cation transport rates and selectivities in water-toluene-
water emulsion membranes. Sep Sci Technol 1983;18:363–73.
66. Szpakowska M, Nagy OB. Application of the competitive preferential solvation theory to
facilitated ion transport through binary liquid membranes. J Phys Chem 1989;93:3851–4.
67. Johansson H, Rydberg J. Acta Chem Scand 1969;23:2797.
68. Izatt RM, Bruening RL, Bruening ML, Lamb JD. Macrocycle-mediated cation transport
through liquid membranes. Isr J Chem 1990;30:239–45.
69. Brown PR, Hallman JL, Whaley LW, Desai DH, Pugia MJ, Bartsch RA. Competitive, proton-
coupled, alkali metal cation transport across polymer-supported liquid membranes containing
sym-(decyl)-dibenzo-16-crown-5-oxyacetic acid: variation of the alkyl 2-nitrophenyl ether
membrane solvent. J Membr Sci 1991;56:195–206.
70. Allard B. The coordination of tetravalent actnide chelate complexes with b - diketones.
Gothenburg: Chalmers University of Technology; 1975. Dissertation.
71. Johnson BFG, Rodgers A. Polyhedral rearrangements and fragmentation reactions in cluster
complexes. In: Shriver DF, et al., editors. The chemistry of metal cluster complexes. VCH;
1990. 303.
72. Echt O. van der Waals clusters. In: Benedek et al., editors. Metastable decay, coulomb
explosion, and electron attachment, in elemental and molecular clusters. In: Proceedings of the
13th International School, Erice, Italy, July 1987, p. 263.
73. Hancock RD, Martell A. Chem Rev 1989;89:1875–913.
74. Hancock RD. Prog Inorg Chem 1989;36:187–290.
75. Martell AE, Calvin M. Chemistry of the metal chelate compounds. Englewood Cliffs:
Prentice-Hall; 1952.
76. Dyrssen D. Svensk Kem Tidskr 1956;68:212.
77. Rossotti FJC, Rossotti H. Determination of stability constants. New York: McGraw Hill;
1961.
78. Froneus S. Metal complexes in Aqueous Solution. In: Jonassen HB, Weissberger A, editors.
Technique of inorganic chemistry. Chichester: Wiley-Interscience; 1963.
79. Beck MT. Chemistry of complex equilibria. New York: Van Nostrand Reinhold; 1970.
66 PART | I Conventional (Classical) Principles and Practice
80. Hartley FR, Burgess C, Alcock R. Solution equilibria. New York: Ellis Hoorwood, John Wiley
& Sons; 1980.
81. Meloun M, Havel J, Hogfeldt E. Computation of solution equilibria. New York: John Wiley
Sons; 1988.
82. Bjerrum J. Metal ammine formation in aqueous solution: theory of the reversible step
reactions. Copenhagen, Denmark: P. Haase and Son; 1941. p. 296–325.
83. Rydberg J. Arkiv Kemi 1953;5:413.
84. Irving H, Williams RJP, Rossotti FJC. J Chem Soc 1955;1955:1906.
85. Fisher RA. Statistical methods for research workers. New York: Hafner Publishing; 1958.
86. Dixon LCW. Nonlinear optimization. London, UK: English University Press; 1972.
87. Albinsson Y, Mahmood A, Majdan M, Rydberg J. Radiochim Acta 1989;48:49.
88. Ekberg CH. Uncertainties in actinide solubility calculations illustrated using the Th� OH�PO4 System. Gothenburg: Chalmers University of Technology; 1999. Dissertation.
89. Watari H, Cunningham L, Freiser H. Anal Chem 1982;54:2390.
90. Reinhardt H, Rydberg. J Chem Ind 1970: 488.
91. Persson H, Skarnemark G, Skalberg M, Alstad J, Liljenzin JO, Bauer G, Heberberger F,
Kaffrell N, Rogowski J, Trautmann N. Radiochim Acta 1989;48:177.
92. Skarnemark G, et al. J Nucl Radiochem Sci 2002;3:1.
93. Skarnemark G. J Radioanal Nucl Chem 2000;243(1):219.
67Chapter | 1 Modern (Classical) Fundamental Principles of Solvent Extraction

This page intentionally left blank
Chapter 2
Principles of Solvent Extractionof Organic and Mineral Acids
Chapter Outline1. Introduction 69
2. Extraction of Acids by
Carbon-Bonded
Oxygen-Donor Extractants
and Substituted
Hydrocarbon Solvents
71
2.1. Thermodynamic (Mass
Action Law) Extraction
Equilibria
73
2.1.1. Dissociation of
the Acid
73
2.1.2. Protonation 74
2.1.3. Dimerization 74
2.2. Mutual Solubilities and
Phase Miscibilities
75
2.3. Parameters of Aqueous
Phase
80
2.4. Organic Phase
Parameters
81
2.5. Thermodynamic
Functions of Transfer
83
3. Phosphorus-bonded Oxygen
Donor Extractants
85
3.1. Mass Action Law
Equilibria
85
3.2. Extraction
Characteristics
86
4. Aliphatic Amine Extractants 89
4.1. Mass Action Law
Equilibria
90
4.2. Extraction
Characteristics
95
5. Extraction of Strong
(Inorganic) Acids
98
6. Summarizing Remarks 102
pH effect 103
Extractant basicity 103
Diluent effect 104
Selectivity 104
References 108
1. INTRODUCTION
Recovery and concentration of organic acids, as well as separation of acidmixtures, have attracted a great interest among researchers, especially inconnection with their recovery from fermentation broths, reaction mixtures,and waste solutions. Liquid extraction has been proposed as an alternative to
Solvent Extraction. DOI: 10.1016/B978-0-444-53778-2.10002-0
Copyright � 2012 Elsevier B.V. All rights reserved. 69
the classical precipitation process, and there have been several recent efforts todevelop process technologies based on extraction.1–8 The existing informationon liquid extraction recovery of the acids is still rather limited in scope.
Extraction of acetic, propanoic, lactic, tartaric, succinic, and citric acids hasreceived more attention because of industrial importance. Most of them arefreely soluble in water, some in alcohols, and some in polar solvents.
Extraction chemistry is concerned solely with the state of equilibrium inmulticomponent heterogeneous systems. Experience has shown that they arebest treated by Nernst’s distribution law supplemented by sets of mass actionlaw equilibria (for details see Chapter 1). The diversity of the extractionprocesses stems from the type of reaction governing the transfer.
The extraction of carboxylic acids may be presented according to threeextraction categories:
1. Extraction by solvation with carbon-bonded oxygen-bearing extractants.The partition of the acids between their aqueous solutions and inert aliphaticand aromatic hydrocarbons and some of their substituted homologs are alsoincluded here because of the similarity of the partition chemistry involved.
2. Acid extraction by solvation with phosphorus-bonded oxygen-bearingextractants.
3. Extraction by proton transfer or by ion-pair formation, with extractantsbeing high-molecular-weight aliphatic amines.
The first two categories involve the solvation of the acid by donor bonds ofsome kind which are to be distinguished from strong covalent bonds and fromionic interactions. The latter is the reaction involved in the third extractioncategory.
Conventional extraction systems using water-immiscible alcohols, ketones,or ethers are relatively inefficient for acid recovery from the dilute aqueous acidsolutions found in most fermentation streams. Organophosphorus oxygen-bearing extractants and aliphatic amines are opening new rooms for therecovery of organic acids from a wide variety of aqueous solutions, includingfermentation broths, waste waters, etc.
The fundamental chemistry involving all three categories of extractants isknown and defined. The basic mass action law presentations of the equilibriainvolved in the extraction process are given separately for the three categories.
The distinction between the first two categories is based on the strength ofthe solvation bonds and the specificity of solvation. Solvation with alcohols,ethers, and ketones, the typical carbon-bonded oxygen donor extractants, is notbeing specific. The coordinate bonds between the acid hydrogen and theoxygen donor are weak for a specific number of solvating molecules per acid tobe clearly identified.
On the other hand, the significantly more basic donor properties of thephosphorus-bonded oxygen move the solvation process to specific, and thenumber of solvating molecules per extracted acid is experimentally accessible.
70 PART | I Conventional (Classical) Principles and Practice
The specific behavior of the various classes of phosphorus and amine extrac-tants, their compatibility with common diluents, and the basic chemistryinvolved in the process of acid extraction are aspects that have been extensivelyinvestigated, reviewed, presented in the chemical literature,9–13 and discussedin this chapter.
2. EXTRACTION OF ACIDS BY CARBON-BONDEDOXYGEN-DONOR EXTRACTANTS AND SUBSTITUTEDHYDROCARBON SOLVENTS
Extraction of carboxylic acids into inert noninteracting hydrocarbons andsubstituted hydrocarbons is considered with oxygen-bearing organic solvents.In spite of the substantial difference in the extractive capacity between thesetwo types of solvents, the same mass action law description of the processapplies to both.
When acids do not react with other components and are not protonated,dissociated, polymerized, and hydrated, the distribution ratio of the acid DHL isconstant. The distribution constant KD,HL equals the measured distributionratio. When HL is used for the extraction of a metal, KD,HL is abbreviated KDE
as the distribution constant of extractant.Figure 2.1a shows the effect of aqueous salt concentrations on the DHL
value of acetylacetone at constant total HL concentration and pH. The salt hastwo effects: (a) it ties up H2O molecules in the aqueous phase (forminghydrated ions) so that less free water is available for solvation of HL; and (b)it breaks down the hydrogen bond structure of the water, making it easier forHL to dissolve in the aqueous phase. Figure 2.1 shows that the former effectdominates for NH4Cl, while for NaClO4 the latter dominates. Increase of thedistribution ratio with increasing aqueous salt concentration is described asa salting-out effect, and the reverse as a salting-in effect. Figure 2.1b showsDHL for the extraction of acetylacetone into CHCl3 and C6H6 for two constantaqueous NaClO4 concentrations at pH 3, but with varying concen-trations of HL. Acetylacetone is infinitely soluble in both CHCl3 and C6H6; at[HL]org¼ 9 M, about 90% of the organic phase is acetylacetone (Mw¼ 100),so the figure depicts a case for a changing organic phase. Polar CHCl3interacts with HL, making it more soluble in the organic phase; it is alsounderstandable why the distribution of HL decreases with decreasingconcentration (mole fraction) of CHCl3. C6H6 and aromatic solvents do notbehave as do most aliphatic solvents: in some cases the aromatics seem to beinert or even antagonistic to the extracted organic species, while in othercases their pi-electrons interact in a favorable way with the solute. For ace-tylacetone, the interaction seems to be very weak. The salting-in effect is seenin both Figs. 2.1a and 1b.
The distribution of an acid between water and a nonpolar hydrocarbon isnonreactive and can be regarded as physical distribution according to the
71Chapter | 2 Principles of Solvent Extraction of Organic and Mineral Acids
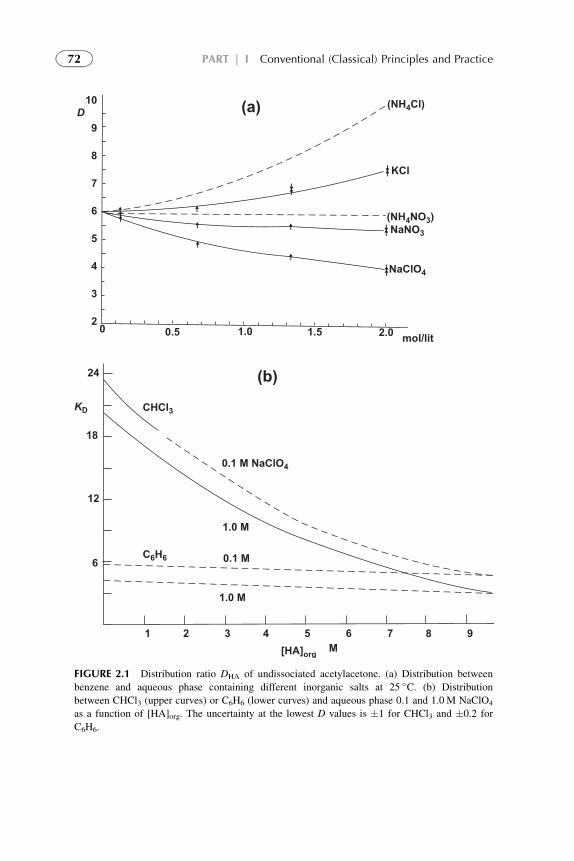
(a)D
(NH4Cl)
KCl
(NH4NO
3)
NaNO3
NaClO4
mol/lit
(b)
2.01.51.00.50
2
3
4
5
6
7
8
9
10
CHCl3
0.1 M NaClO4
1.0 M
0.1 MC
6H
6
KD
1.0 M
1 2 3 4 5 6 7 8 9
[HA]org
M
24
18
12
6
FIGURE 2.1 Distribution ratio DHA of undissociated acetylacetone. (a) Distribution between
benzene and aqueous phase containing different inorganic salts at 25 �C. (b) Distribution
between CHCl3 (upper curves) or C6H6 (lower curves) and aqueous phase 0.1 and 1.0 M NaClO4
as a function of [HA]org. The uncertainty at the lowest D values is �1 for CHCl3 and �0.2 for
C6H6.
72 PART | I Conventional (Classical) Principles and Practice
Nernst’s distribution law. But account has to be made for partial dissociation ofthe acid in the aqueous phase, its usual protonation, and its extensive dimer-ization (aggregation, polymerization) in the organic phase. On the other hand,acids extracted by carbon-bonded oxygen donor solvents are strongly hydratedby varying numbers of water molecules. The exact solvation number of the acidmolecules in the organic phase is usually undetermined, but it is known thata large number of solvent molecules are needed for an efficient competitionwith water molecules that hydrate the acid at the interface.
2.1. Thermodynamic (Mass Action Law) Extraction Equilibria
The set of mass action equations describing the transfer of a weak (monobasic)organic acid from water into an organic phase with which the acid does notinteract chemically must be taken into account.
2.1.1. Dissociation of the Acid
One of the properties have to be taken into account is the ionization (dissoci-ation) of the acid in the aqueous solution. When the acid dissociates in theaqueous phase, the distribution ratio becomes:
HL 4 Hþ þ L�; Ka ¼ ½Hþ�½L��½HL�AB�! (2.1)
DHL ¼ ½HL�o½HL�w½L��w
(2.2)
where the aqueous (w) and organic (o) phases in the denominator are concen-trations of all acids––as anions and as undissociated in the aqueous phase.
Equation (2.2) can be given as
DHL ¼ KD;HL
1þ Ka½Hþ�ðwÞ(2.3)
If acid is extracted as a solute in its undissociated form HL distributionconstant is KD,HL. If the acid is used as extractant KD,HL is identical to distri-bution constant of the extractant, KDE.
At low proton concentration (high pH), distribution ratio becomes inverselyproportional to proton concentration and dissociated form of acid increases.The concentration of the free anion, [L�], is an important parameter in theformation of complexes at extraction of metals by acidic extractants, referred toas the free ligand concentration and can be calculated by
log½L�� ¼ log Ka � log½Hþ� þ log C0HL � log
�KD;HL þ Vw
Vo
�1þ Ka
�Hþ���
(2.4)
73Chapter | 2 Principles of Solvent Extraction of Organic and Mineral Acids
where C0HL is the original concentration of HL in the organic phase at the
beginning of the experiment. At Vo¼ Vw and pH<< pKa, Eqn (2.4) will be
log½L�� ¼ log Ka � log½Hþ� þ log C0HL � logðKD;HL þ 1Þ (2.5)
From Eqns (2.4) and (2.5), it can be deduced that [L�] increases with increasingpH, but tends to become constant as the pH value approaches the pKa value. Asit was mentioned above at the extraction of metal complexes where HL isextractant, KD,HLh KDE.
2.1.2. Protonation
At low pH, some organic acids accept an extra proton to form theH2Lþ complex:
HLþ Hþ 4 H2Lþ KaH ¼ ½HL�½Hþ�
½H2Lþ� (2.6)
Because H2Lþ is ionic, it is not extracted into the organic phase, and thus
the distribution ratio becomes
Da ¼ ½HL�o½H2L
þ� þ ½HL� þ ½L�� ¼KD;HL�
Hþ�KaH
þ 1þ
Ka�Hþ�
(2.7)
2.1.3. Dimerization
The dimerization of the acid in the organic phase:
2HLðoÞ 4 ðHLÞ2ðoÞ; KD ¼½ðHLÞ2�ðoÞ½HL�2ðoÞ
(2.8)
The experimentally accessible distribution ratio DHL on the molarconcentration scale and expressed in terms of the total (analytical) concen-trations of the acid in all its possible forms in the aqueous phase, CHL(w), andthe organic phase, CHL(o), is formulated accordingly:
DHL ¼ CHLðoÞCHLðwÞ
¼½HL�ðoÞ þ 2½ðHLÞ2�ðoÞ½HL�ðwÞ þ ½L��ðwÞ
¼½HL�ðwÞPþ 2KD½HL�2ðoÞ
½HL�ðwÞ þ KHL½HL�ðwÞ½Hþ�ðwÞ
!
¼½HL�ðwÞPþ 2KDP
2½HL�2ðwÞ
½HL�ðwÞ 1þ
KHL
½Hþ�ðwÞ
!! ¼Pþ 2P2KD½HL�ðwÞ
1þ
KHL
½Hþ�ðwÞ
! (2.9)
The square brackets denote concentrations in moles per liter. If for dilutesolutions the term KHL/[H
þ](w) is negligibly small, Eqn (2.9) allows P andKD to
74 PART | I Conventional (Classical) Principles and Practice
be determined from a plot of DHL versus [HL](w) which in turn is obtained fromCHL,(w) via the known dissociation constant KHL. If there are sufficient datapoints at moderate enough CHL,(w) values (absolute concentrations depend onthe nature of both the acid and the solvent but are usually below 0.5 mol/L),any aberrant D value will become apparent, and the concentration beyondwhich the linear relationship called for by Eqn (2.9) no longer holds becomesobvious.
A strict thermodynamic expression of the partition process represented byEqn (2.9) requires quantities that measure the activity of the distributed: theactivity coefficient of the species in both phases and P on the mole fractionscale. The activity coefficients correct for the acid that might dimerize in theaqueous phase at higher concentrations and for the acid that might aggregatebeyond the dimer in the organic phase in the case of polybasic acids. Althoughnone of these reactions is likely to be significant, the activity coefficient maystill vary, mostly because the acid is hydrated in the organic phase to anunknown and varying degree depending on its concentration.
For similar reasons P and also KD, as derived via Eqn (2.9), may besomewhat misleading. Namely, the values so obtained refer to an equilibriumbetween two mutually saturated phases rather than to pure water and solvent.The values of P and KD, thus, need not be equal to those derived by other meansthat do not involve mutual saturation. For example, KD values are usuallylarger14 in anhydrous than in wet (water-saturated) solvents, probably becauseof the competing H-bonding between the water and the acid in the organicphase. However, if the acid concentration is kept low and there is low mutualsolubility of the phases, the P and KD values should not be much at variancefrom the values in pure media.
With equally good approximation, Eqn (2.9) can usually be applied toevaluate the P and KD functions of di- and tricarboxylic acids by neglecting theeffect of the second and third dissociation steps, which are usually smaller thanthe first by 2 or 3 orders of magnitude (see Table 2.1).
Most of the distribution data in the literature are either too fragmentary interms of the concentration range covered or too imprecise because of presen-tation in graphical form for the P and KD values to be derived via Eqn (2.9).15–22
Distribution data in the dilute concentration range obey Eqn (2.9) reasonablywell, yielding self-consistent and constant partition and dimerization constantsin a large variety of solvents. Presented in Table 2.2, information was criticallyevaluated for P and KD values.
2.2. Mutual Solubilities and Phase Miscibilities
Mutual solubility between an aqueous solution and a solvent at a fixedtemperature is affected by the nature of the acid distributed and its totalconcentration in the system. At extraction of weak organic acids mutualsolubilities cause dramatic volume changes. The trend is that the volume of
75Chapter | 2 Principles of Solvent Extraction of Organic and Mineral Acids
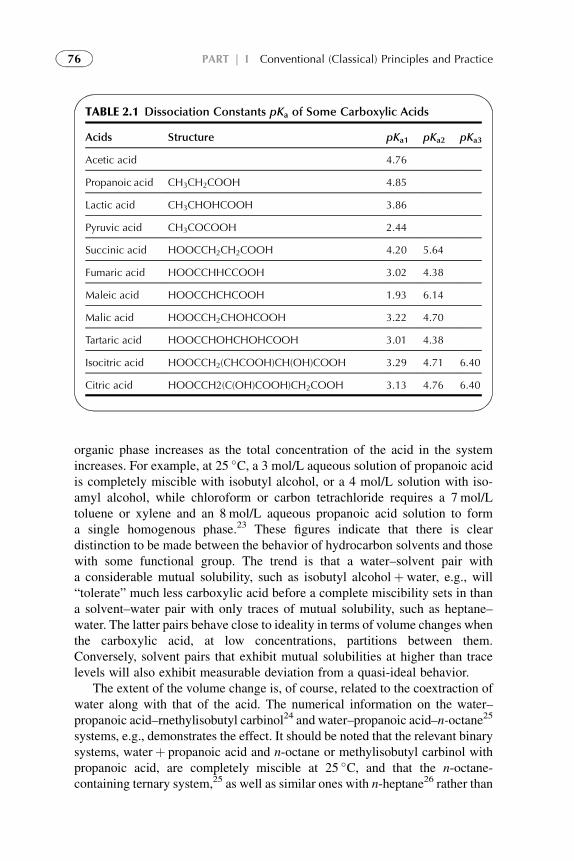
organic phase increases as the total concentration of the acid in the systemincreases. For example, at 25 �C, a 3 mol/L aqueous solution of propanoic acidis completely miscible with isobutyl alcohol, or a 4 mol/L solution with iso-amyl alcohol, while chloroform or carbon tetrachloride requires a 7 mol/Ltoluene or xylene and an 8 mol/L aqueous propanoic acid solution to forma single homogenous phase.23 These figures indicate that there is cleardistinction to be made between the behavior of hydrocarbon solvents and thosewith some functional group. The trend is that a water–solvent pair witha considerable mutual solubility, such as isobutyl alcoholþwater, e.g., will“tolerate” much less carboxylic acid before a complete miscibility sets in thana solvent–water pair with only traces of mutual solubility, such as heptane–water. The latter pairs behave close to ideality in terms of volume changes whenthe carboxylic acid, at low concentrations, partitions between them.Conversely, solvent pairs that exhibit mutual solubilities at higher than tracelevels will also exhibit measurable deviation from a quasi-ideal behavior.
The extent of the volume change is, of course, related to the coextraction ofwater along with that of the acid. The numerical information on the water–propanoic acid–rnethylisobutyl carbinol24 and water–propanoic acid–n-octane25
systems, e.g., demonstrates the effect. It should be noted that the relevant binarysystems, waterþ propanoic acid and n-octane or methylisobutyl carbinol withpropanoic acid, are completely miscible at 25 �C, and that the n-octane-containing ternary system,25 as well as similar ones with n-heptane26 rather than
TABLE 2.1 Dissociation Constants pKa of Some Carboxylic Acids
Acids Structure pKa1 pKa2 pKa3
Acetic acid 4.76
Propanoic acid CH3CH2COOH 4.85
Lactic acid CH3CHOHCOOH 3.86
Pyruvic acid CH3COCOOH 2.44
Succinic acid HOOCCH2CH2COOH 4.20 5.64
Fumaric acid HOOCCHHCCOOH 3.02 4.38
Maleic acid HOOCCHCHCOOH 1.93 6.14
Malic acid HOOCCH2CHOHCOOH 3.22 4.70
Tartaric acid HOOCCHOHCHOHCOOH 3.01 4.38
Isocitric acid HOOCCH2(CHCOOH)CH(OH)COOH 3.29 4.71 6.40
Citric acid HOOCCH2(C(OH)COOH)CH2COOH 3.13 4.76 6.40
76 PART | I Conventional (Classical) Principles and Practice
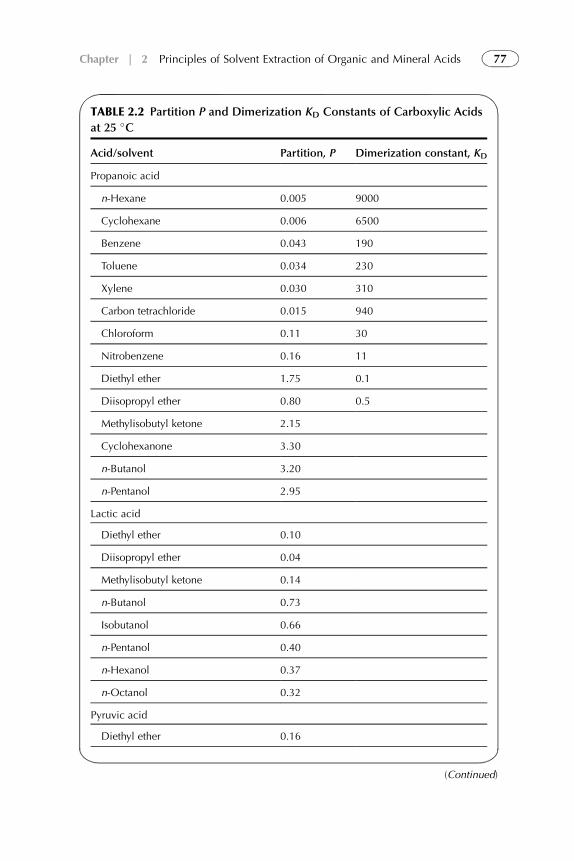
TABLE 2.2 Partition P and Dimerization KD Constants of Carboxylic Acids
at 25 �C
Acid/solvent Partition, P Dimerization constant, KD
Propanoic acid
n-Hexane 0.005 9000
Cyclohexane 0.006 6500
Benzene 0.043 190
Toluene 0.034 230
Xylene 0.030 310
Carbon tetrachloride 0.015 940
Chloroform 0.11 30
Nitrobenzene 0.16 11
Diethyl ether 1.75 0.1
Diisopropyl ether 0.80 0.5
Methylisobutyl ketone 2.15
Cyclohexanone 3.30
n-Butanol 3.20
n-Pentanol 2.95
Lactic acid
Diethyl ether 0.10
Diisopropyl ether 0.04
Methylisobutyl ketone 0.14
n-Butanol 0.73
Isobutanol 0.66
n-Pentanol 0.40
n-Hexanol 0.37
n-Octanol 0.32
Pyruvic acid
Diethyl ether 0.16
(Continued)
77Chapter | 2 Principles of Solvent Extraction of Organic and Mineral Acids
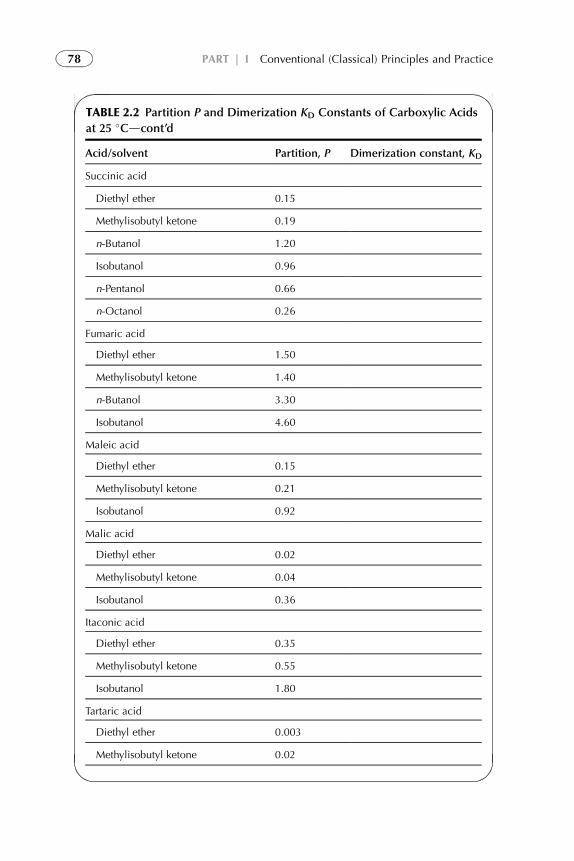
TABLE 2.2 Partition P and Dimerization KD Constants of Carboxylic Acids
at 25 �Cdcont’d
Acid/solvent Partition, P Dimerization constant, KD
Succinic acid
Diethyl ether 0.15
Methylisobutyl ketone 0.19
n-Butanol 1.20
Isobutanol 0.96
n-Pentanol 0.66
n-Octanol 0.26
Fumaric acid
Diethyl ether 1.50
Methylisobutyl ketone 1.40
n-Butanol 3.30
Isobutanol 4.60
Maleic acid
Diethyl ether 0.15
Methylisobutyl ketone 0.21
Isobutanol 0.92
Malic acid
Diethyl ether 0.02
Methylisobutyl ketone 0.04
Isobutanol 0.36
Itaconic acid
Diethyl ether 0.35
Methylisobutyl ketone 0.55
Isobutanol 1.80
Tartaric acid
Diethyl ether 0.003
Methylisobutyl ketone 0.02
78 PART | I Conventional (Classical) Principles and Practice
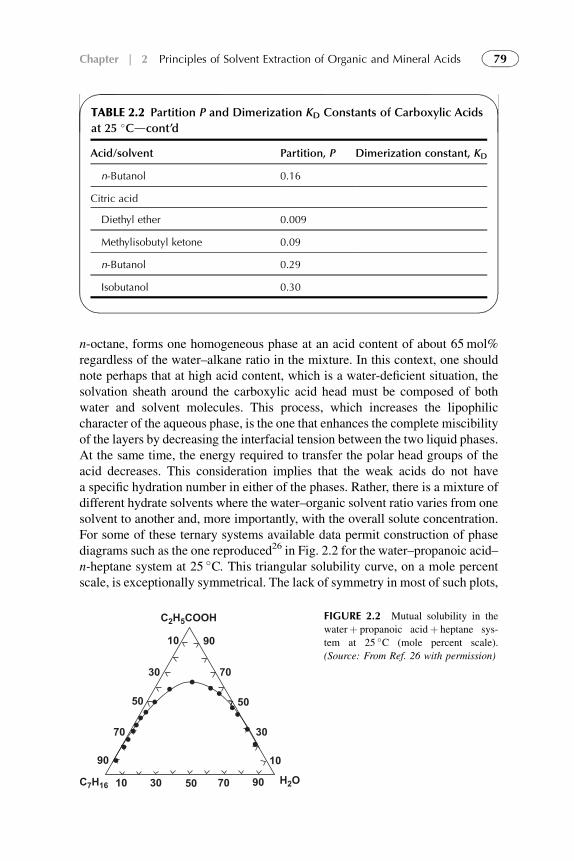
n-octane, forms one homogeneous phase at an acid content of about 65 mol%regardless of the water–alkane ratio in the mixture. In this context, one shouldnote perhaps that at high acid content, which is a water-deficient situation, thesolvation sheath around the carboxylic acid head must be composed of bothwater and solvent molecules. This process, which increases the lipophiliccharacter of the aqueous phase, is the one that enhances the complete miscibilityof the layers by decreasing the interfacial tension between the two liquid phases.At the same time, the energy required to transfer the polar head groups of theacid decreases. This consideration implies that the weak acids do not havea specific hydration number in either of the phases. Rather, there is a mixture ofdifferent hydrate solvents where the water–organic solvent ratio varies from onesolvent to another and, more importantly, with the overall solute concentration.For some of these ternary systems available data permit construction of phasediagrams such as the one reproduced26 in Fig. 2.2 for the water–propanoic acid–n-heptane system at 25 �C. This triangular solubility curve, on a mole percentscale, is exceptionally symmetrical. The lack of symmetry in most of such plots,
10
30
50
70
90
10 30 50 70 90
10
30
50
70
90
C2H
5COOH
H2OC
7H
16
FIGURE 2.2 Mutual solubility in the
waterþ propanoic acidþ heptane sys-
tem at 25 �C (mole percent scale).
(Source: From Ref. 26 with permission)
TABLE 2.2 Partition P and Dimerization KD Constants of Carboxylic Acids
at 25 �Cdcont’d
Acid/solvent Partition, P Dimerization constant, KD
n-Butanol 0.16
Citric acid
Diethyl ether 0.009
Methylisobutyl ketone 0.09
n-Butanol 0.29
Isobutanol 0.30
79Chapter | 2 Principles of Solvent Extraction of Organic and Mineral Acids
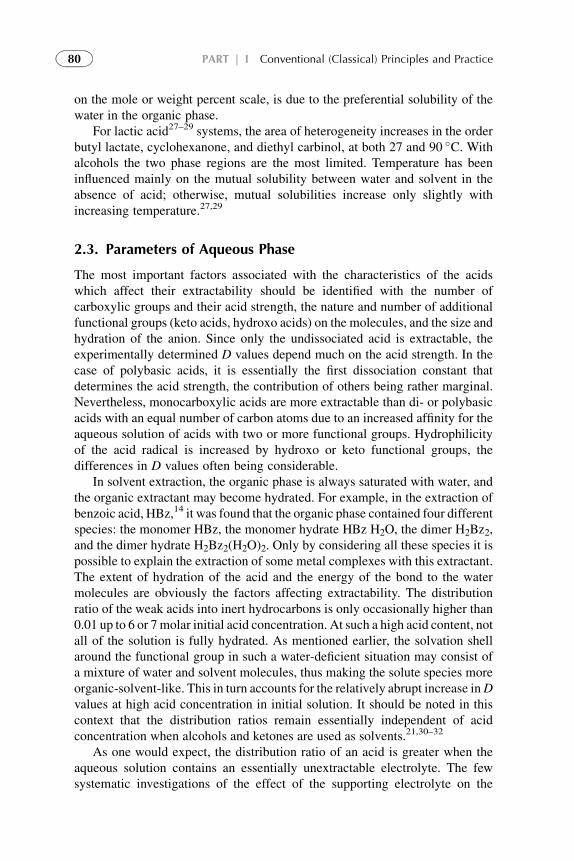
on the mole or weight percent scale, is due to the preferential solubility of thewater in the organic phase.
For lactic acid27–29 systems, the area of heterogeneity increases in the orderbutyl lactate, cyclohexanone, and diethyl carbinol, at both 27 and 90 �C. Withalcohols the two phase regions are the most limited. Temperature has beeninfluenced mainly on the mutual solubility between water and solvent in theabsence of acid; otherwise, mutual solubilities increase only slightly withincreasing temperature.27,29
2.3. Parameters of Aqueous Phase
The most important factors associated with the characteristics of the acidswhich affect their extractability should be identified with the number ofcarboxylic groups and their acid strength, the nature and number of additionalfunctional groups (keto acids, hydroxo acids) on the molecules, and the size andhydration of the anion. Since only the undissociated acid is extractable, theexperimentally determined D values depend much on the acid strength. In thecase of polybasic acids, it is essentially the first dissociation constant thatdetermines the acid strength, the contribution of others being rather marginal.Nevertheless, monocarboxylic acids are more extractable than di- or polybasicacids with an equal number of carbon atoms due to an increased affinity for theaqueous solution of acids with two or more functional groups. Hydrophilicityof the acid radical is increased by hydroxo or keto functional groups, thedifferences in D values often being considerable.
In solvent extraction, the organic phase is always saturated with water, andthe organic extractant may become hydrated. For example, in the extraction ofbenzoic acid, HBz,14 it was found that the organic phase contained four differentspecies: the monomer HBz, the monomer hydrate HBz H2O, the dimer H2Bz2,and the dimer hydrate H2Bz2(H2O)2. Only by considering all these species it ispossible to explain the extraction of some metal complexes with this extractant.The extent of hydration of the acid and the energy of the bond to the watermolecules are obviously the factors affecting extractability. The distributionratio of the weak acids into inert hydrocarbons is only occasionally higher than0.01 up to 6 or 7molar initial acid concentration. At such a high acid content, notall of the solution is fully hydrated. As mentioned earlier, the solvation shellaround the functional group in such a water-deficient situation may consist ofa mixture of water and solvent molecules, thus making the solute species moreorganic-solvent-like. This in turn accounts for the relatively abrupt increase inDvalues at high acid concentration in initial solution. It should be noted in thiscontext that the distribution ratios remain essentially independent of acidconcentration when alcohols and ketones are used as solvents.21,30–32
As one would expect, the distribution ratio of an acid is greater when theaqueous solution contains an essentially unextractable electrolyte. The fewsystematic investigations of the effect of the supporting electrolyte on the
80 PART | I Conventional (Classical) Principles and Practice
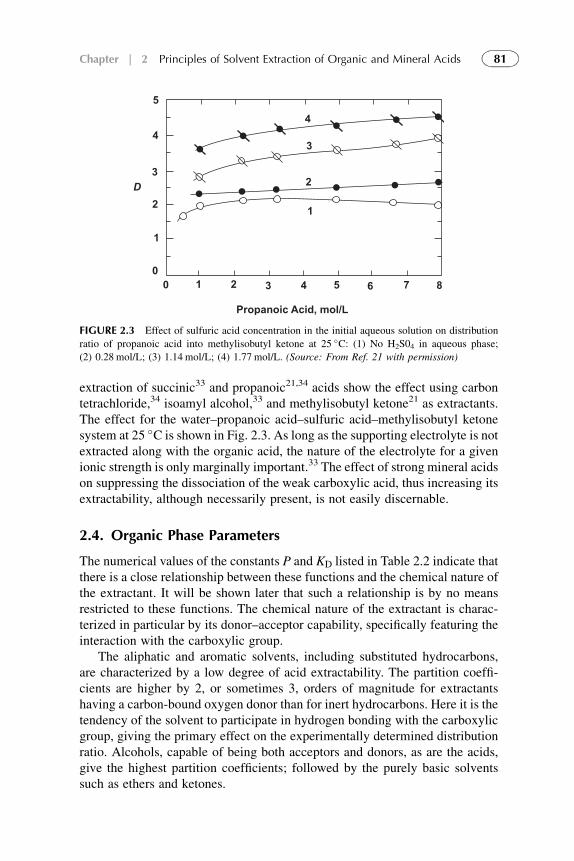
extraction of succinic33 and propanoic21,34 acids show the effect using carbontetrachloride,34 isoamyl alcohol,33 and methylisobutyl ketone21 as extractants.The effect for the water–propanoic acid–sulfuric acid–methylisobutyl ketonesystem at 25 �C is shown in Fig. 2.3. As long as the supporting electrolyte is notextracted along with the organic acid, the nature of the electrolyte for a givenionic strength is only marginally important.33 The effect of strong mineral acidson suppressing the dissociation of the weak carboxylic acid, thus increasing itsextractability, although necessarily present, is not easily discernable.
2.4. Organic Phase Parameters
The numerical values of the constants P and KD listed in Table 2.2 indicate thatthere is a close relationship between these functions and the chemical nature ofthe extractant. It will be shown later that such a relationship is by no meansrestricted to these functions. The chemical nature of the extractant is charac-terized in particular by its donor–acceptor capability, specifically featuring theinteraction with the carboxylic group.
The aliphatic and aromatic solvents, including substituted hydrocarbons,are characterized by a low degree of acid extractability. The partition coeffi-cients are higher by 2, or sometimes 3, orders of magnitude for extractantshaving a carbon-bound oxygen donor than for inert hydrocarbons. Here it is thetendency of the solvent to participate in hydrogen bonding with the carboxylicgroup, giving the primary effect on the experimentally determined distributionratio. Alcohols, capable of being both acceptors and donors, as are the acids,give the highest partition coefficients; followed by the purely basic solventssuch as ethers and ketones.
4
3
2
1
0 1 2 3 4 5 6 7 8
Propanoic Acid, mol/L
5
4
3
2
1
0
D
FIGURE 2.3 Effect of sulfuric acid concentration in the initial aqueous solution on distribution
ratio of propanoic acid into methylisobutyl ketone at 25 �C: (1) No H2S04 in aqueous phase;
(2) 0.28 mol/L; (3) 1.14 mol/L; (4) 1.77 mol/L. (Source: From Ref. 21 with permission)
81Chapter | 2 Principles of Solvent Extraction of Organic and Mineral Acids
As a consequence of the strong donor–acceptor interaction, the extractedacid molecules will dimerize to only a small extent, or not at all. As the solute–solvent hydrogen bond is apparently stronger than the solute–solute one thatleads to the formation of the dimer. Thus systems with low P values exhibithigh KD values and vice versa. For a given acid, a plot of log KD versus log Pyields a fairly good conforming straight line with a slope of �2, indicating thatP2KD is constant for different solvents. Furthermore, this implies that forsystems in which this relationship holds, the activity coefficient of the organicphase remains relatively constant.
Although attempts have been made to correlate the experimentally deter-mined P and KD values with the physical properties of the organic solvent, notmuch in the way of useful generalization has been made, except for the obviousqualitative observations that the dimerization constant decreases withincreasing dielectric constant and dipole moment of the solvent. The partitioncoefficient changes in the opposite direction, as does the mutual solubility ofsolvent–water pair. This in turn reduces the differences in dielectric constantand dipole moment between the two phases.
The attempt to correlate the partition coefficient of propanoic acid betweenwater and several organic solvents resulted in a seemingly self-consistent set ofsolubility parameters values. The conventional relationship between partitioncoefficient P* on a mole fraction scale and the solubility parameter of thecomponents, water (dw), solvent (do), and propanoic acid (dHL)
RT ln P*¼ vHL½ðdHL � dwÞ2 � ðdHL � doÞ2� (2.10)
where the vHL is the molar volume of the acid.This value for the solubility parameter of propanoic acid yields 16.3.
Because of the large number of adjustable parameters needed for the least-squares analysis of the experimental data, and because of the inadequacy of thetheory for polar liquids, the utility of correlation (10) is rather limited.
Finally, the interfacial tension of the solvent–water pair has been corre-lated with the partition coefficient and the distribution ratio of propanoic acid.Authors35 have found that logD of the acid in the heptane and dichloroethanesystems is linear function of the interfacial tension s at 20 �C which decreaseswith increasing total acid concentration. The difference between the inter-facial tension in the presence and in the absence of the acid is a function oflogD only and is independent of the solute concentration in the system.Furthermore, a plot of log P versus the interfacial tension s at 20 �C givesa straight line for solvents with s values higher than about 9 dynes/cm.36 Therelationship appears to be valid for n-heptane (s¼ 51), carbon tetrachloride(s¼ 45), benzene (s¼ 35), chloroform (s¼ 32), nitrobenzene (s¼ 26),isopropyl ether (s¼ 18.5), methylisobutyl ketone (s¼ 10.8), and methylcyclohexanone (s¼ 9.1). This order of decreasing interfacial tension of thesolvent–water pair parallels the increasing solubility of the solvent in waterfor which values are (mol/L): 0.0005, 0.005, 0.0073, 0.068, etc. The relation is
82 PART | I Conventional (Classical) Principles and Practice
not surprising in view of lipophilic–hydrophobic balance in the character ofpropanoic acid.
2.5. Thermodynamic Functions of Transfer
There is only a very slight effect, if any, of temperature in the 20–90 �C rangeon the distribution ratio of propanoic,19 lactic,27,37 and succinic20,38 acids intoalcohols, ketones, diethyl carbinol, and ethers. On the other hand, the partitioncoefficient of propanoic acid34,39 increases with increasing temperature atextraction into an aliphatic hydrocarbon benzene, chloroform, carbon tetra-chloride, or nitrobenzene, frequently by as much as a factor of 2 in the20–50 �C range.
The most detailed set of thermodynamic data on the extraction of propanoicacid has been reported in the Refs. 19,40. (see Table 2.3). The data have beenderived via the relationship DH0
P ¼ RT2ðd ln P=dTÞ (see Chapter 1) on theusual assumption that the standard molar enthalpy change is not temperaturedependent in the range studied. The probably low precision of the enthalpy andentropy values in Table 2.3, as well as the differences in the values repor-ted,19,36,39 is due, at least to some extent, to the subtle changes in the mutualsolubilities of the phases with temperature. These changes are not necessarilyreflected in the P values derived from the experiments.
In a similar way, the enthalpies and entropies of acid dimerization, as derivedvia the KD values determined at various temperatures, are compiled in Table 2.4.The negative sign of the functions reflects, of course, that KD decreases withincreasing temperature, indicating that the driving force of the dimerizationprocess is enthalpy governed. This is in contrast to the partition coefficientwhich increases with temperature, thus resulting in positive DH0
P values. Forthese solvents, partitioning must be an entropy-governed transfer process inwhich the main driving force for extraction is the dimerization of the acid. Itshould be remembered that there is practically no acid dimerization in solventswith an oxygen donor functional group (see Table 2.2) and that in these solventsP is only slightly affected by temperature. The acid solvates formed in theseextractants are of considerable stability, stable enough to prevent measurabledimerization of the acid.
Rationalizing the thermodynamic functions (X) of partition (P) of severalmembers of the homologous series of n-carboxylic acids into a variety ofaliphatic and aromatic solvents, ethers, and alcohols, the authors19,40 calculatedthat the transfer functions are additively composed of two separate terms––onecorresponding to the transfer of the carboxylic group (COOH) of the acid andthe other to its hydrocarbon tail (R) DX0
P ¼ DX0P;COOH þ DX0
P;R. The numericalvalues of the terms of COOH and R depend much on the nature of theextractant. In inert hydrocarbon solvents with no functional groups, the freeenergy change associated with the transfer of the methylene group is close to itsenthalpy of transfer, and practically independent of the acid–solvent pair, with
83Chapter | 2 Principles of Solvent Extraction of Organic and Mineral Acids
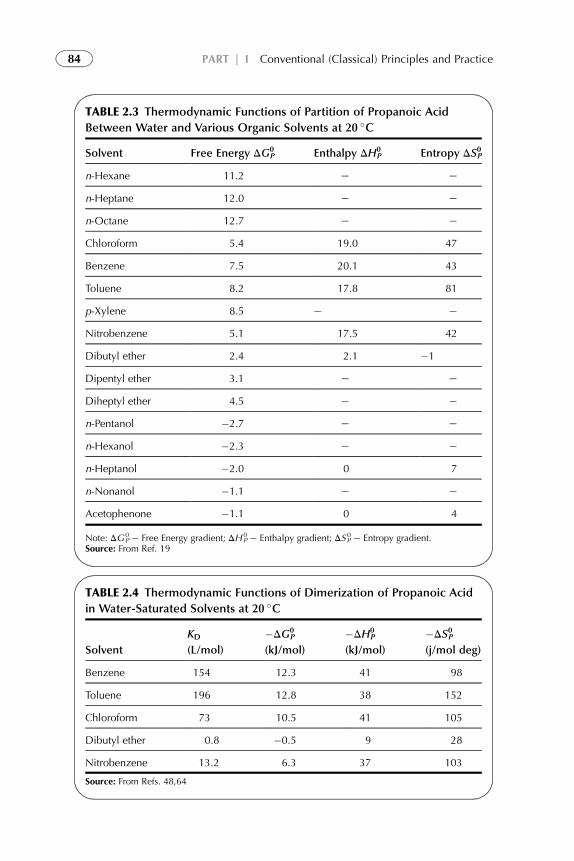
TABLE 2.3 Thermodynamic Functions of Partition of Propanoic Acid
Between Water and Various Organic Solvents at 20 �C
Solvent Free Energy DG0P Enthalpy DH0
P Entropy DS0P
n-Hexane 11.2 e e
n-Heptane 12.0 e e
n-Octane 12.7 e e
Chloroform 5.4 19.0 47
Benzene 7.5 20.1 43
Toluene 8.2 17.8 81
p-Xylene 8.5 e e
Nitrobenzene 5.1 17.5 42
Dibutyl ether 2.4 2.1 �1
Dipentyl ether 3.1 e e
Diheptyl ether 4.5 e e
n-Pentanol �2.7 e e
n-Hexanol �2.3 e e
n-Heptanol �2.0 0 7
n-Nonanol �1.1 e e
Acetophenone �1.1 0 4
Note: DG 0P e Free Energy gradient; DH 0
P e Enthalpy gradient; DS 0P e Entropy gradient.
Source: From Ref. 19
TABLE 2.4 Thermodynamic Functions of Dimerization of Propanoic Acid
in Water-Saturated Solvents at 20 �C
Solvent
KD
(L/mol)
�DG0P
(kJ/mol)
�DH0P
(kJ/mol)
�DS0P(j/mol deg)
Benzene 154 12.3 41 98
Toluene 196 12.8 38 152
Chloroform 73 10.5 41 105
Dibutyl ether 0.8 �0.5 9 28
Nitrobenzene 13.2 6.3 37 103
Source: From Refs. 48,64
84 PART | I Conventional (Classical) Principles and Practice
an average value of DH0P;CH2
¼�3:4 kJ=mol. The corresponding entropy term,DS0P;CH2
, is close to zero. On the other hand, both enthalpy and entropy oftransfer of the carboxylic group are positive.
For solvents with an oxygen-containing functional group,DS0P;CH2has a value
of about 10 J/mol deg. The DS0P;COOH term is negative, and its absolute valuedepends on the solvent. This implies that the difference in the extractive capacityof a solvent is governed essentially by the difference DS0P;R � DS0P;COOH, wherethe first term is positive and the second negative, with DH0
P z 0.
3. PHOSPHORUS-BONDED OXYGEN DONOR EXTRACTANTS
Generally speaking, weak organic acids are extracted by organophosphoruscompounds with a significantly higher distribution ratio than by carbon-bondedoxygen donor extractants under comparable experimental conditions.Furthermore, their extractability is higher than that of mineral acids.10 Distri-bution ratios for weak carboxylic acids extracted by undiluted tributyl phos-phate (TBP) are relatively high: malic (1.3), lactic (1.4), citric (2.0), maleic(3.6), succinic (5.7), and propanoic (8.4) at a 0.1 mol/L initial acid concen-tration at 25 �C, similar to that behavior in extraction systems of TBP withalcohols, ethers, and ketones. Monobasic acids are more extractable thandibasic; hydroxyl groups strongly depress extractability. So, this group ofextractants has strong extractive power. During the past few decades, severalseparation and recovery technologies for the organic acid recovery weredescribed1,41,42 and patented.6,43
3.1. Mass Action Law Equilibria
In describing the equilibria involved in the extraction of weak monocarboxylicacids by strong solvating extractants, E, such as the organophosphoruscompounds10 and sulfoxides,22 the pertinent steps of the heterogeneous processare the dissociation of the acid in the aqueous solution (see Eqn (2.1)) and theformation of the acid solvates in the organic phase:
HLðwÞ þ pEo 4 HL � EpðoÞ KDE ¼ ½HL � Ep�ðoÞ=½HL�ðwÞ½E�pðoÞ (2.11)
The experimentally accessible distribution ratioD on the molar concentrationscale and expressed in terms of the total concentration of the acid in all possibleforms in the aqueous, CHL(w), and the organic, CHL(o), phases is given by
D ¼ CHLðoÞCHLðwÞ
¼ ½HL � Ep�ðoÞ½HL�ðwÞ þ ½L��ðwÞ
¼KDE½HL�ðwÞ½E�pðoÞ
½HL�ðwÞ þKHL½HL�ðwÞ½Hþ�ðwÞ
¼KDE½E�pðoÞ1þ KHL
½Hþ�ðwÞ(2.12)
85Chapter | 2 Principles of Solvent Extraction of Organic and Mineral Acids
The concentration of free, unbound extractant at equilibrium is
½E�ðoÞ ¼ CEðoÞ � p½HL�ðoÞ (2.13)
If the ratio KHL/[Hþ](w) is constant or has a negligibly small value,
[Hþ]<< KHL, the solvation number p can be obtained by partial differenti-ation of D with respect to [E](o), a plot of
log D ¼ log KDE þ p log½E�ðoÞ (2.14)
yielding the slope p and the intercept KDE. Both of these quantities are known todepend on both the solute and extractant concentrations; however, they usuallyremain reasonably constant over some range. At high solute concentration, asan appreciable fraction of the extractant molecules becomes bound to the acid,lower values of p will predominate and the plot of Eqn (2.14) will deviate,sometimes significantly, from the straight-line requirement.
The two-equation set, Eqns (2.1) and (2.9), is a simplified, though realistic,version of a more general and thermodynamically strict one that includesactivity coefficient terms and/or allows for the simultaneous formation of two, orperhaps three, different solvates, depending on the organic phase loading. It isalso simplified by neglecting the partition equilibrium of the molecular acid,Eqn (2.3), and that of its dimerization in the organic phase, Eqn (2.4), on thegrounds that in the presence of strong solvating agents there are no unsolvatedacid species HL(o), and no acid dimers (HL)2(o), can be formed since theextracting agent E is a much stronger acceptor than the carboxyl oxygen of theacid’s carboxylic group. Under certain experimental conditions, however, thissimplification is unjustified. Thus, e.g., when there is a stoichiometric deficiencyof the solvating agent E in the system ([E](o) of Eqn (2.13) approaching zero),the distribution ratio (Eqn (2.12)) requires the addition of appropriate terms toaccount for the acid extraction by the diluent alone and its dimerization.
3.2. Extraction Characteristics
Few systems have been investigated extensively enough to permit the evalua-tion of the association equilibrium constant KDE using Eqn (2.9). For thosewhich were, the constants are shown in Table 2.5. The numerical data are in linewith what is known for the extractive capacity of various organophosphorusextractants;10 the extractive power increases markedly as the number of directC–P linkage increases. Thus, the acid adduct with trioctylphosphine oxide(TOPO) is 2 orders of magnitude more stable than that with TBP.
The solvation numbers of the acids in Table 2.5 appear to be the same as thenumber of COOH groups on the acid molecule. This indicates a stoichiometricassociation between individual phosphoryl group and individual carboxylicgroup and displays the strong effect of the extractant concentration on theexperimentally determined distribution ratios. Figure 2.4 shows the effect of
86 PART | I Conventional (Classical) Principles and Practice
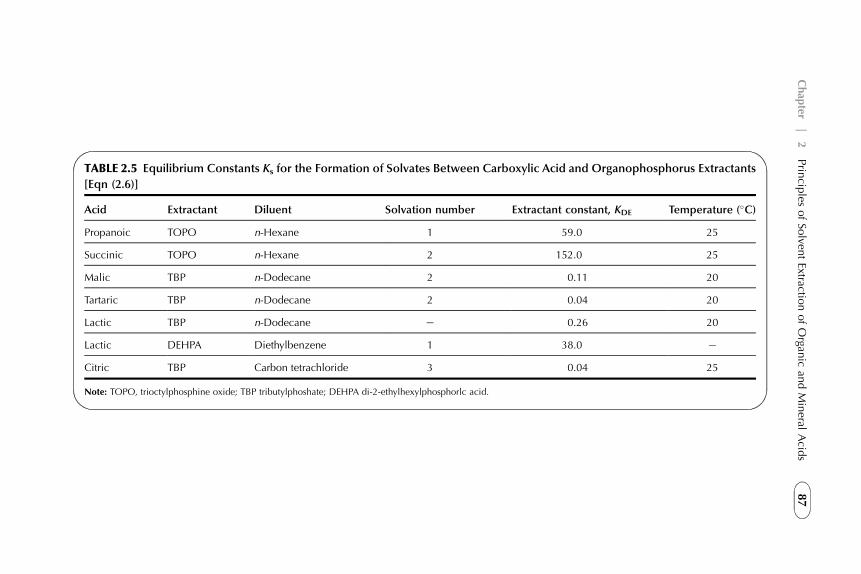
TABLE 2.5 Equilibrium Constants Ks for the Formation of Solvates Between Carboxylic Acid and Organophosphorus Extractants
[Eqn (2.6)]
Acid Extractant Diluent Solvation number Extractant constant, KDE Temperature (�C)
Propanoic TOPO n-Hexane 1 59.0 25
Succinic TOPO n-Hexane 2 152.0 25
Malic TBP n-Dodecane 2 0.11 20
Tartaric TBP n-Dodecane 2 0.04 20
Lactic TBP n-Dodecane e 0.26 20
Lactic DEHPA Diethylbenzene 1 38.0 e
Citric TBP Carbon tetrachloride 3 0.04 25
Note: TOPO, trioctylphosphine oxide; TBP tributylphoshate; DEHPA di-2-ethylhexylphosphorlc acid.
87
Chap
ter|
2Prin
ciples
ofSo
lventExtractio
nofOrgan
ican
dMineral
Acid
s
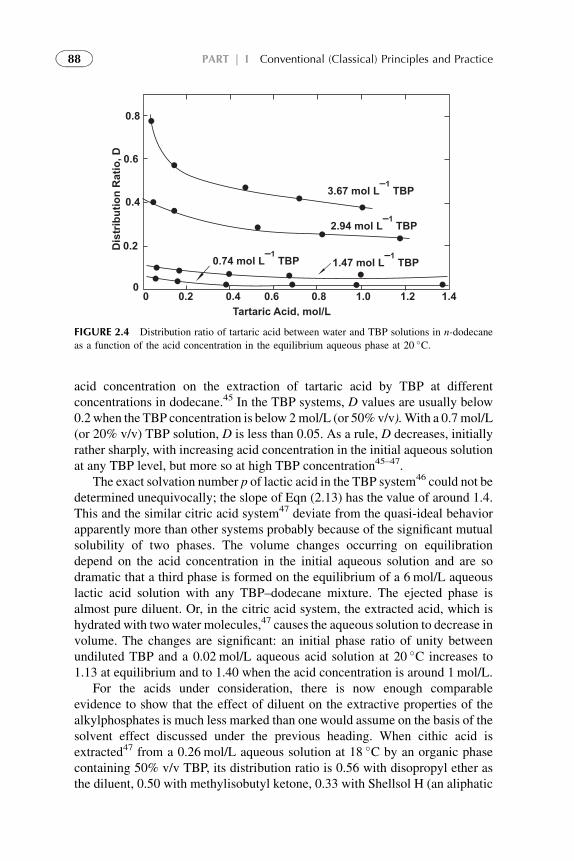
acid concentration on the extraction of tartaric acid by TBP at differentconcentrations in dodecane.45 In the TBP systems, D values are usually below0.2when the TBP concentration is below 2mol/L (or 50% v/v).With a 0.7 mol/L(or 20% v/v) TBP solution, D is less than 0.05. As a rule, D decreases, initiallyrather sharply, with increasing acid concentration in the initial aqueous solutionat any TBP level, but more so at high TBP concentration45–47.
The exact solvation number p of lactic acid in the TBP system46 could not bedetermined unequivocally; the slope of Eqn (2.13) has the value of around 1.4.This and the similar citric acid system47 deviate from the quasi-ideal behaviorapparently more than other systems probably because of the significant mutualsolubility of two phases. The volume changes occurring on equilibrationdepend on the acid concentration in the initial aqueous solution and are sodramatic that a third phase is formed on the equilibrium of a 6 mol/L aqueouslactic acid solution with any TBP–dodecane mixture. The ejected phase isalmost pure diluent. Or, in the citric acid system, the extracted acid, which ishydrated with twowater molecules,47 causes the aqueous solution to decrease involume. The changes are significant: an initial phase ratio of unity betweenundiluted TBP and a 0.02 mol/L aqueous acid solution at 20 �C increases to1.13 at equilibrium and to 1.40 when the acid concentration is around 1 mol/L.
For the acids under consideration, there is now enough comparableevidence to show that the effect of diluent on the extractive properties of thealkylphosphates is much less marked than one would assume on the basis of thesolvent effect discussed under the previous heading. When cithic acid isextracted47 from a 0.26 mol/L aqueous solution at 18 �C by an organic phasecontaining 50% v/v TBP, its distribution ratio is 0.56 with disopropyl ether asthe diluent, 0.50 with methylisobutyl ketone, 0.33 with Shellsol H (an aliphatic
3.67 mol L
–1
TBP
2.94 mol L
–1
TBP
1.47 mol L
–1
TBP0.74 mol L
–1
TBP
0 0.2 0.4 0.6 0.8 1.0 1.2 1.4
0
0.2
0.4
0.6
0.8
Tartaric Acid, mol/L
Distrib
utio
n R
atio
, D
FIGURE 2.4 Distribution ratio of tartaric acid between water and TBP solutions in n-dodecane
as a function of the acid concentration in the equilibrium aqueous phase at 20 �C.
88 PART | I Conventional (Classical) Principles and Practice
hydrocarbon mixture), and 0.31 with Shellsol A (an aromatic hydrocarbonmixture). The most extreme phenomenon, which is usually linked to the natureof the diluent, is the splitting of the organic phase to form a third phase,a second organic one, as described above for the lactic acid system. Thereappears to be a stronger diluent effect when TOPO is the extractant rather thanTBP, at least in the -extraction of acetic acid.48
Although the high distribution ratios of the acids are due to the successfulcompetition of the solvating phosphoryl group against water molecules at theinterface, the organic phase adducts with alkylphosphates are hydrated with oneor more water molecules.44,46 It is rather remarkable that the hydration numberappears to remain constant over wide concentration ranges of both the acid andthe extractant.
The very significant effect of temperature on the distribution ratio may belinked, at least in part,10 to a change in the hydration number of extractedspecies. In TBP systems, D for citric acid47,49 decreases by a factor of up to 4 inthe 0–80 �C range and that for tartaric acid49 by at least 2 in the 0–35 �C range.
Finally, mention should be made of alkylsulfoxides as extractants for theweak carboxylic acids under discussion.6,22,50 An unspecified mixture ofalkylsulfoxides of an average molecular weight of 270 has been shown toextract acids, among them propanoic, lactic, and pyruvic, with a distributionratio higher than that of TBP, under comparable experimental conditions.22 Theextracted species is a monosolvate of propanoic and pyruvic acids and a dis-olvate of lactic acid, as determined from plots of Eqn (2.13).
4. ALIPHATIC AMINE EXTRACTANTS
Extraction of proton-bearing organic and inorganic compounds from aqueousmedia by long-chain aliphatic amines dissolved in water-immiscible organicsolvents is one of the novel developments in separation technology.3,4,8,28,51–62
Amine-based extractants are highly favorable for carboxylic acid extraction(tridodecylamine is used in the citric acid process). In addition to high efficiencyand selectivity, they provide for product concentration through extraction atabout ambient temperature followed by back-extraction at an elevatedtemperature.5 Production of lactic acid (pKa of 3.86) fermented at a pH > 4.5.Lactic acid can be extracted by solvating extractants from the fermentationliquor into which a strong acid was added.4 Such processes are, however, lessattractive as they consume a base and an acid and form a salt as a byproduct.Alternatively, extraction from aqueous solutions of pH> pKa was proposed
56,57
Mineral and carboxylic acid distribution between aqueous solutions of relativelyhigh pH and amine-based extractants are of interest also in salt decomposi-tion.5,8 Effect of equilibrium pH on extraction of lactic, acetic, propionic, andbutyric acids by a tertiary amine (Alamine 336) and by a quaternary aminechloride (Aliquat 336) was studied.58 The amines were tested as singlecomponent extractants and in kerosene or in 2-octanol. A theory was developed.
89Chapter | 2 Principles of Solvent Extraction of Organic and Mineral Acids
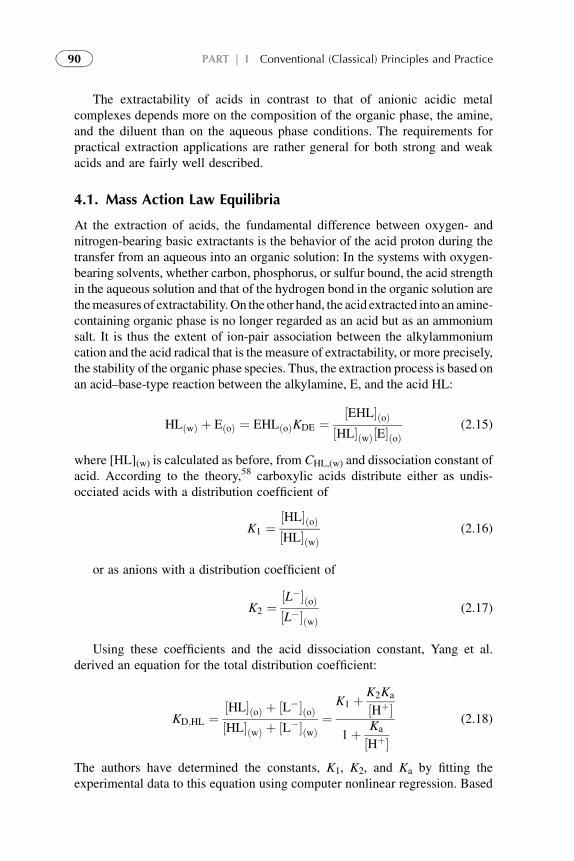
The extractability of acids in contrast to that of anionic acidic metalcomplexes depends more on the composition of the organic phase, the amine,and the diluent than on the aqueous phase conditions. The requirements forpractical extraction applications are rather general for both strong and weakacids and are fairly well described.
4.1. Mass Action Law Equilibria
At the extraction of acids, the fundamental difference between oxygen- andnitrogen-bearing basic extractants is the behavior of the acid proton during thetransfer from an aqueous into an organic solution: In the systems with oxygen-bearing solvents, whether carbon, phosphorus, or sulfur bound, the acid strengthin the aqueous solution and that of the hydrogen bond in the organic solution arethemeasures of extractability.On the other hand, the acid extracted into an amine-containing organic phase is no longer regarded as an acid but as an ammoniumsalt. It is thus the extent of ion-pair association between the alkylammoniumcation and the acid radical that is the measure of extractability, or more precisely,the stability of the organic phase species. Thus, the extraction process is based onan acid–base-type reaction between the alkylamine, E, and the acid HL:
HLðwÞ þ EðoÞ ¼ EHLðoÞKDE ¼½EHL�ðoÞ
½HL�ðwÞ½E�ðoÞ(2.15)
where [HL](w) is calculated as before, from CHL,(w) and dissociation constant ofacid. According to the theory,58 carboxylic acids distribute either as undis-occiated acids with a distribution coefficient of
K1 ¼½HL�ðoÞ½HL�ðwÞ
(2.16)
or as anions with a distribution coefficient of
K2 ¼½L��ðoÞ½L��ðwÞ
(2.17)
Using these coefficients and the acid dissociation constant, Yang et al.derived an equation for the total distribution coefficient:
KD;HL ¼½HL�ðoÞ þ ½L��ðoÞ½HL�ðwÞ þ ½L��ðwÞ
¼K1 þ K2Ka
½Hþ�1þ Ka
½Hþ�(2.18)
The authors have determined the constants, K1, K2, and Ka by fitting theexperimental data to this equation using computer nonlinear regression. Based
90 PART | I Conventional (Classical) Principles and Practice
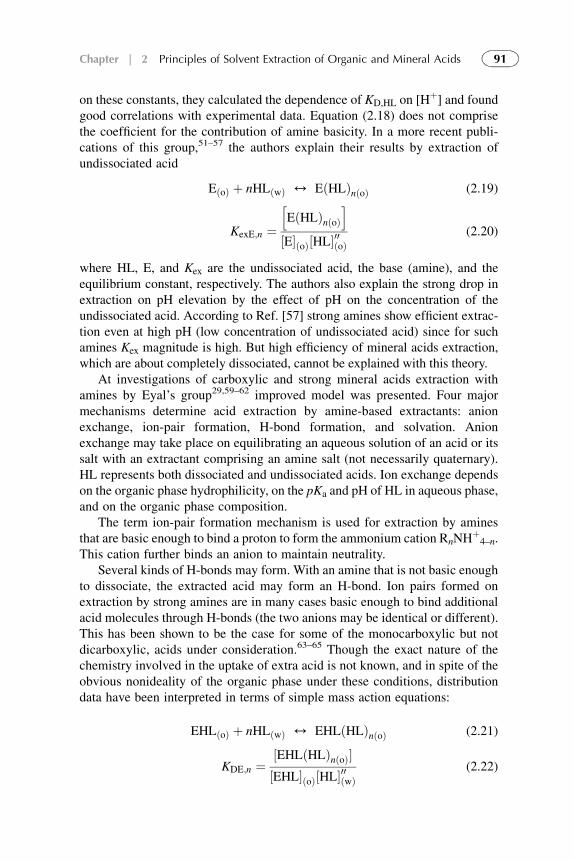
on these constants, they calculated the dependence of KD,HL on [Hþ] and found
good correlations with experimental data. Equation (2.18) does not comprisethe coefficient for the contribution of amine basicity. In a more recent publi-cations of this group,51–57 the authors explain their results by extraction ofundissociated acid
EðoÞ þ nHLðwÞ 4 EðHLÞnðoÞ (2.19)
KexE;n ¼hEðHLÞnðoÞ
i½E�ðoÞ½HL�00ðoÞ
(2.20)
where HL, E, and Kex are the undissociated acid, the base (amine), and theequilibrium constant, respectively. The authors also explain the strong drop inextraction on pH elevation by the effect of pH on the concentration of theundissociated acid. According to Ref. [57] strong amines show efficient extrac-tion even at high pH (low concentration of undissociated acid) since for suchamines Kex magnitude is high. But high efficiency of mineral acids extraction,which are about completely dissociated, cannot be explained with this theory.
At investigations of carboxylic and strong mineral acids extraction withamines by Eyal’s group29,59–62 improved model was presented. Four majormechanisms determine acid extraction by amine-based extractants: anionexchange, ion-pair formation, H-bond formation, and solvation. Anionexchange may take place on equilibrating an aqueous solution of an acid or itssalt with an extractant comprising an amine salt (not necessarily quaternary).HL represents both dissociated and undissociated acids. Ion exchange dependson the organic phase hydrophilicity, on the pKa and pH of HL in aqueous phase,and on the organic phase composition.
The term ion-pair formation mechanism is used for extraction by aminesthat are basic enough to bind a proton to form the ammonium cation RnNH
þ4–n.
This cation further binds an anion to maintain neutrality.Several kinds of H-bonds may form. With an amine that is not basic enough
to dissociate, the extracted acid may form an H-bond. Ion pairs formed onextraction by strong amines are in many cases basic enough to bind additionalacid molecules through H-bonds (the two anions may be identical or different).This has been shown to be the case for some of the monocarboxylic but notdicarboxylic, acids under consideration.63–65 Though the exact nature of thechemistry involved in the uptake of extra acid is not known, and in spite of theobvious nonideality of the organic phase under these conditions, distributiondata have been interpreted in terms of simple mass action equations:
EHLðoÞ þ nHLðwÞ 4 EHLðHLÞnðoÞ (2.21)
KDE;n ¼½EHLðHLÞnðoÞ�½EHL�ðoÞ½HL�00ðwÞ
(2.22)
91Chapter | 2 Principles of Solvent Extraction of Organic and Mineral Acids
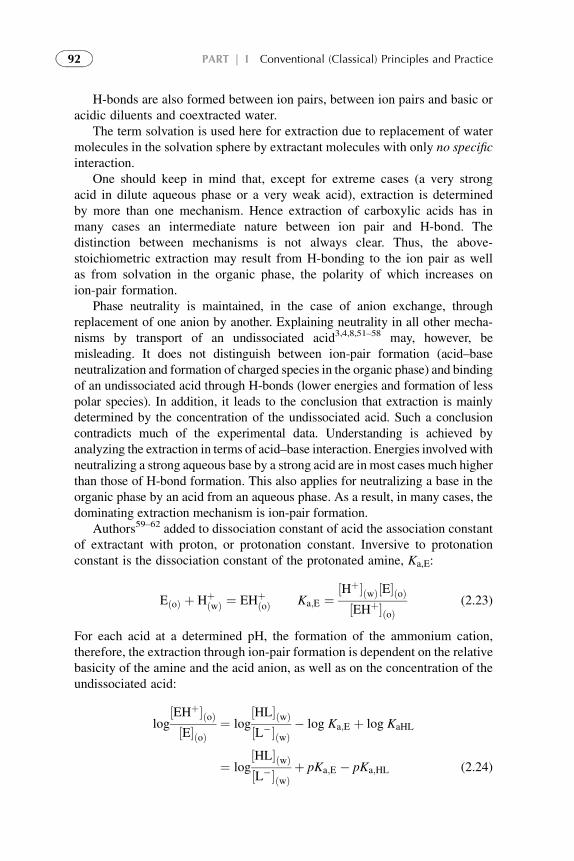
H-bonds are also formed between ion pairs, between ion pairs and basic oracidic diluents and coextracted water.
The term solvation is used here for extraction due to replacement of watermolecules in the solvation sphere by extractant molecules with only no specificinteraction.
One should keep in mind that, except for extreme cases (a very strongacid in dilute aqueous phase or a very weak acid), extraction is determinedby more than one mechanism. Hence extraction of carboxylic acids has inmany cases an intermediate nature between ion pair and H-bond. Thedistinction between mechanisms is not always clear. Thus, the above-stoichiometric extraction may result from H-bonding to the ion pair as wellas from solvation in the organic phase, the polarity of which increases onion-pair formation.
Phase neutrality is maintained, in the case of anion exchange, throughreplacement of one anion by another. Explaining neutrality in all other mecha-nisms by transport of an undissociated acid3,4,8,51–58 may, however, bemisleading. It does not distinguish between ion-pair formation (acid–baseneutralization and formation of charged species in the organic phase) and bindingof an undissociated acid through H-bonds (lower energies and formation of lesspolar species). In addition, it leads to the conclusion that extraction is mainlydetermined by the concentration of the undissociated acid. Such a conclusioncontradicts much of the experimental data. Understanding is achieved byanalyzing the extraction in terms of acid–base interaction. Energies involved withneutralizing a strong aqueous base by a strong acid are in most cases much higherthan those of H-bond formation. This also applies for neutralizing a base in theorganic phase by an acid from an aqueous phase. As a result, in many cases, thedominating extraction mechanism is ion-pair formation.
Authors59–62 added to dissociation constant of acid the association constantof extractant with proton, or protonation constant. Inversive to protonationconstant is the dissociation constant of the protonated amine, Ka,E:
EðoÞ þ HþðwÞ ¼ EHþ
ðoÞ Ka;E ¼½Hþ�ðwÞ½E�ðoÞ½EHþ�ðoÞ
(2.23)
For each acid at a determined pH, the formation of the ammonium cation,therefore, the extraction through ion-pair formation is dependent on the relativebasicity of the amine and the acid anion, as well as on the concentration of theundissociated acid:
log½EHþ�ðoÞ½E�ðoÞ
¼ log½HL�ðwÞ½L��ðwÞ
� log Ka;E þ log KaHL
¼ log½HL�ðwÞ½L��ðwÞ
þ pKa;E � pKa;HL (2.24)
92 PART | I Conventional (Classical) Principles and Practice
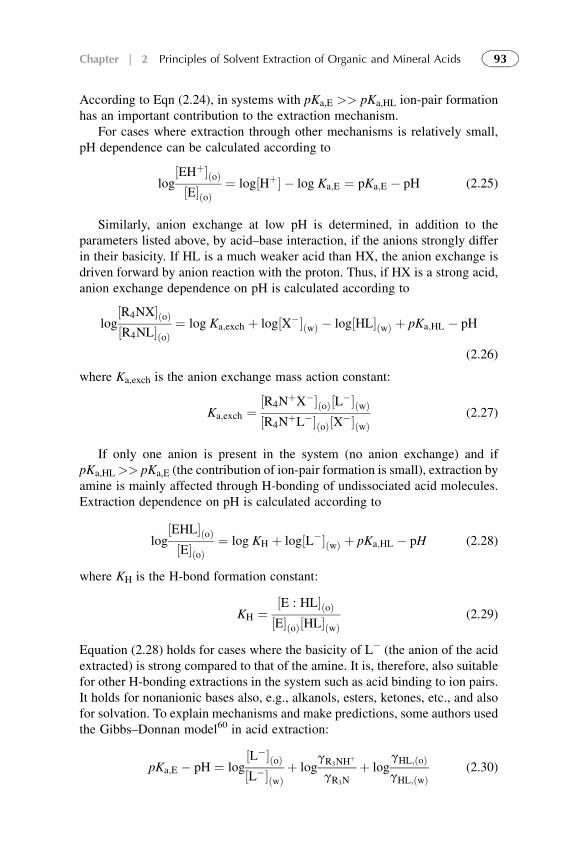
According to Eqn (2.24), in systems with pKa,E >> pKa,HL ion-pair formationhas an important contribution to the extraction mechanism.
For cases where extraction through other mechanisms is relatively small,pH dependence can be calculated according to
log½EHþ�ðoÞ½E�ðoÞ
¼ log½Hþ� � log Ka;E ¼ pKa;E � pH (2.25)
Similarly, anion exchange at low pH is determined, in addition to theparameters listed above, by acid–base interaction, if the anions strongly differin their basicity. If HL is a much weaker acid than HX, the anion exchange isdriven forward by anion reaction with the proton. Thus, if HX is a strong acid,anion exchange dependence on pH is calculated according to
log½R4NX�ðoÞ½R4NL�ðoÞ
¼ log Ka;exch þ log½X��ðwÞ � log½HL�ðwÞ þ pKa;HL � pH
(2.26)
where Ka,exch is the anion exchange mass action constant:
Ka;exch ¼½R4N
þX��ðoÞ½L��ðwÞ½R4N
þL��ðoÞ½X��ðwÞ(2.27)
If only one anion is present in the system (no anion exchange) and ifpKa,HL>> pKa,E (the contribution of ion-pair formation is small), extraction byamine is mainly affected through H-bonding of undissociated acid molecules.Extraction dependence on pH is calculated according to
log½EHL�ðoÞ½E�ðoÞ
¼ log KH þ log½L��ðwÞ þ pKa;HL � pH (2.28)
where KH is the H-bond formation constant:
KH ¼½E : HL�ðoÞ½E�ðoÞ½HL�ðwÞ
(2.29)
Equation (2.28) holds for cases where the basicity of L� (the anion of the acidextracted) is strong compared to that of the amine. It is, therefore, also suitablefor other H-bonding extractions in the system such as acid binding to ion pairs.It holds for nonanionic bases also, e.g., alkanols, esters, ketones, etc., and alsofor solvation. To explain mechanisms and make predictions, some authors usedthe Gibbs–Donnan model60 in acid extraction:
pKa;E � pH ¼ log½L��ðoÞ½L��ðwÞ
þ loggR3NH
þ
gR3Nþ log
gHL;ðoÞgHL;ðwÞ
(2.30)
93Chapter | 2 Principles of Solvent Extraction of Organic and Mineral Acids
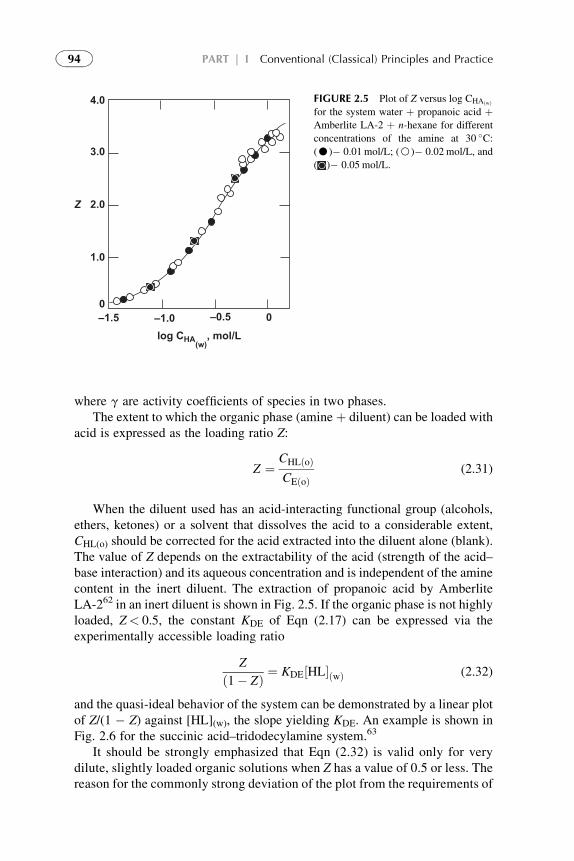
where g are activity coefficients of species in two phases.The extent to which the organic phase (amine þ diluent) can be loaded with
acid is expressed as the loading ratio Z:
Z ¼ CHLðoÞCEðoÞ
(2.31)
When the diluent used has an acid-interacting functional group (alcohols,ethers, ketones) or a solvent that dissolves the acid to a considerable extent,CHL(o) should be corrected for the acid extracted into the diluent alone (blank).The value of Z depends on the extractability of the acid (strength of the acid–base interaction) and its aqueous concentration and is independent of the aminecontent in the inert diluent. The extraction of propanoic acid by AmberliteLA-262 in an inert diluent is shown in Fig. 2.5. If the organic phase is not highlyloaded, Z< 0.5, the constant KDE of Eqn (2.17) can be expressed via theexperimentally accessible loading ratio
Z
ð1� ZÞ ¼ KDE½HL�ðwÞ (2.32)
and the quasi-ideal behavior of the system can be demonstrated by a linear plotof Z/(1 � Z) against [HL](w), the slope yielding KDE. An example is shown inFig. 2.6 for the succinic acid–tridodecylamine system.63
It should be strongly emphasized that Eqn (2.32) is valid only for verydilute, slightly loaded organic solutions when Z has a value of 0.5 or less. Thereason for the commonly strong deviation of the plot from the requirements of
4.0
3.0
2.0
1.0
0
–1.5 –1.0 –0.5 0
Z
log CHA
(w)
, mol/L
FIGURE 2.5 Plot of Z versus log CHAðwÞfor the system water þ propanoic acid þAmberlite LA-2 þ n-hexane for different
concentrations of the amine at 30 �C:(C)� 0.01 mol/L; (B)� 0.02 mol/L, and
( )� 0.05 mol/L.
94 PART | I Conventional (Classical) Principles and Practice
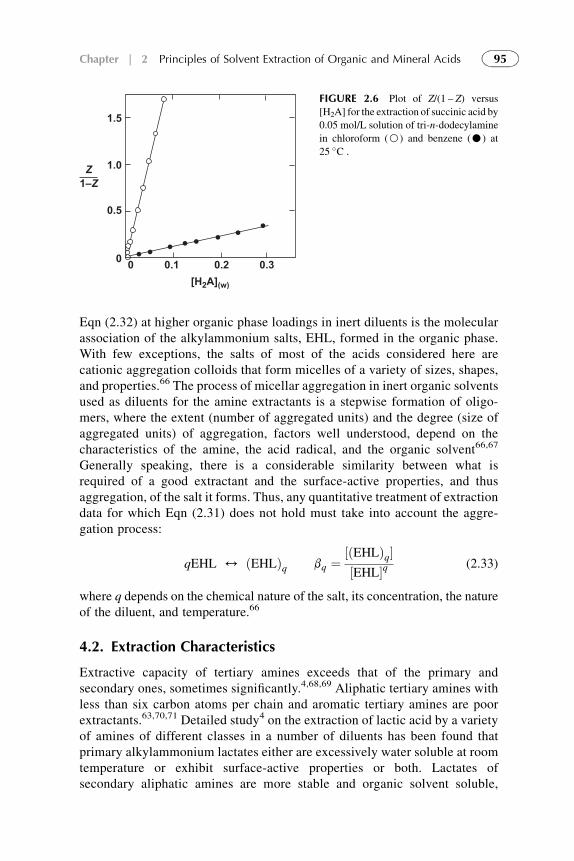
Eqn (2.32) at higher organic phase loadings in inert diluents is the molecularassociation of the alkylammonium salts, EHL, formed in the organic phase.With few exceptions, the salts of most of the acids considered here arecationic aggregation colloids that form micelles of a variety of sizes, shapes,and properties.66 The process of micellar aggregation in inert organic solventsused as diluents for the amine extractants is a stepwise formation of oligo-mers, where the extent (number of aggregated units) and the degree (size ofaggregated units) of aggregation, factors well understood, depend on thecharacteristics of the amine, the acid radical, and the organic solvent66,67
Generally speaking, there is a considerable similarity between what isrequired of a good extractant and the surface-active properties, and thusaggregation, of the salt it forms. Thus, any quantitative treatment of extractiondata for which Eqn (2.31) does not hold must take into account the aggre-gation process:
qEHL 4 ðEHLÞq bq ¼½ðEHLÞq�½EHL�q (2.33)
where q depends on the chemical nature of the salt, its concentration, the natureof the diluent, and temperature.66
4.2. Extraction Characteristics
Extractive capacity of tertiary amines exceeds that of the primary andsecondary ones, sometimes significantly.4,68,69 Aliphatic tertiary amines withless than six carbon atoms per chain and aromatic tertiary amines are poorextractants.63,70,71 Detailed study4 on the extraction of lactic acid by a varietyof amines of different classes in a number of diluents has been found thatprimary alkylammonium lactates either are excessively water soluble at roomtemperature or exhibit surface-active properties or both. Lactates ofsecondary aliphatic amines are more stable and organic solvent soluble,
0 0.1 0.2 0.3
[H2A]
(w)
1.5
1.0
0.5
0
Z
1–Z
FIGURE 2.6 Plot of Z/(1 – Z) versus
[H2A] for the extraction of succinic acid by
0.05 mol/L solution of tri-n-dodecylamine
in chloroform (B) and benzene (C) at
25 �C .
95Chapter | 2 Principles of Solvent Extraction of Organic and Mineral Acids
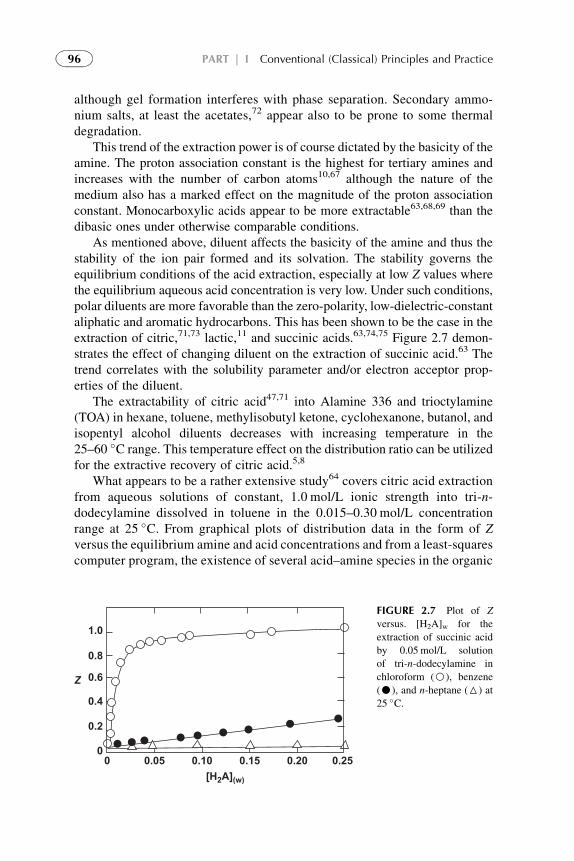
although gel formation interferes with phase separation. Secondary ammo-nium salts, at least the acetates,72 appear also to be prone to some thermaldegradation.
This trend of the extraction power is of course dictated by the basicity of theamine. The proton association constant is the highest for tertiary amines andincreases with the number of carbon atoms10,67 although the nature of themedium also has a marked effect on the magnitude of the proton associationconstant. Monocarboxylic acids appear to be more extractable63,68,69 than thedibasic ones under otherwise comparable conditions.
As mentioned above, diluent affects the basicity of the amine and thus thestability of the ion pair formed and its solvation. The stability governs theequilibrium conditions of the acid extraction, especially at low Z values wherethe equilibrium aqueous acid concentration is very low. Under such conditions,polar diluents are more favorable than the zero-polarity, low-dielectric-constantaliphatic and aromatic hydrocarbons. This has been shown to be the case in theextraction of citric,71,73 lactic,11 and succinic acids.63,74,75 Figure 2.7 demon-strates the effect of changing diluent on the extraction of succinic acid.63 Thetrend correlates with the solubility parameter and/or electron acceptor prop-erties of the diluent.
The extractability of citric acid47,71 into Alamine 336 and trioctylamine(TOA) in hexane, toluene, methylisobutyl ketone, cyclohexanone, butanol, andisopentyl alcohol diluents decreases with increasing temperature in the25–60 �C range. This temperature effect on the distribution ratio can be utilizedfor the extractive recovery of citric acid.5,8
What appears to be a rather extensive study64 covers citric acid extractionfrom aqueous solutions of constant, 1.0 mol/L ionic strength into tri-n-dodecylamine dissolved in toluene in the 0.015–0.30 mol/L concentrationrange at 25 �C. From graphical plots of distribution data in the form of Zversus the equilibrium amine and acid concentrations and from a least-squarescomputer program, the existence of several acid–amine species in the organic
1.0
0.8
0.6
0.4
0.2
0
0 0.05 0.10 0.15 0.20 0.25
[H2A]
(w)
Z
FIGURE 2.7 Plot of Z
versus. [H2A]w for the
extraction of succinic acid
by 0.05 mol/L solution
of tri-n-dodecylamine in
chloroform (B), benzene
(C), and n-heptane (6) at
25 �C.
96 PART | I Conventional (Classical) Principles and Practice
phase was inferred. There is no indication for the formation of species witha 1:1 composition. This is rather strange. The lowest species has a 1:2 ratioand an overall formation constant of 20.1 L2/mol2 followed by one with 2:3ratio and an overall formation constant of 1380 L4/mol4 and an aggregatedspecies of a 5:6 ratio with an overall stability constant of 5.9 * 108 L10/mol10.There is some indication for a micelle with aggregation number of 13. Allorganic phase species are hydrated, with one, two, or four water molecules,respectively.
In a recent series of papers, Kawano et al.76–78 have found that theextraction of propanoic acid from its aqueous solutions in the 0.05–2.50 mol/Lconcentration range by tri-n-octylamine in hexane and Amberlite LA-2 inhexane and benzene at 30 �C can be interpreted in terms of the consecutiveformation of four acid–amine species with stoichiometries of 1:1, 2:1, 3:1, and4:1. The reported stepwise formation constants, roughly in the 800–2000 L/molrange, derived via a curve-fitting least-squares computer program, suggest thatthe model chosen is probably unrealistic. Namely, the absolute values in anyone of the three sets of K11, K21, K31, and K41 constants are too similar(maximum difference is by a factor of 2) for a meaningful distinction betweenthe four species to be justified.
Most other reports are limited to the identification of the stoichiometry ofthe acid-amine species in the organic phase with no effort to derive stepwise oroverall formation constants. In the context of investigating the extraction ofvarious anionic metal complexes, Pyatnitskii et al.70,73,79–82 have studied theextraction of citric acid by dioctylamine, tributylamine, tripentylamine, andTOA in several diluents of varying polarity and dielectric constant. In mostamine–diluent systems, probably at room temperature the stoichiometry of theamine–acid species is 2:1, and only exceptionally a 1:1 ion pair was identifiedwhen a polar ketone or alcohol was used as the diluent. The same 2:1 amine–acid ratio of the extracted species predominates in the tartaric acid80,83 complexwhen extracted by tripentylamine or TOA in chloroform.
On the other hand, a 1:1 stoichiometry of the organic species is the pre-vailing one for malic,68 lactic,4,68and succinic74,75 acids when extracted bytripentylamine4,80 or TOA4,74,75 in chloroform and for succinic acid in severalother solvents. In the case of lactic acid extraction4 more than an equivalentamount of acid can pass into the organic phase.
Kawano et al.76–79 have recently determined the interfacial adsorptionequilibrium constants and the interfacial adsorption area in the process ofpropanoic acid transfer from an aqueous solution into hexane solutions ofTOA and Amberlite 336 at 30 �C. The effects, of both the acid and amineconcentrations, on the two adsorption functions have been related to the rateof the acid transfer. The rate-controlling steps are the adsorption of the aminebase at the interface, the reaction between the 1:1 ion pair formed and theextra acid molecules, and the desorption or diffusion of the acid-bearingspecies into the bulk organic phase. The desorption rate constants, which have
97Chapter | 2 Principles of Solvent Extraction of Organic and Mineral Acids
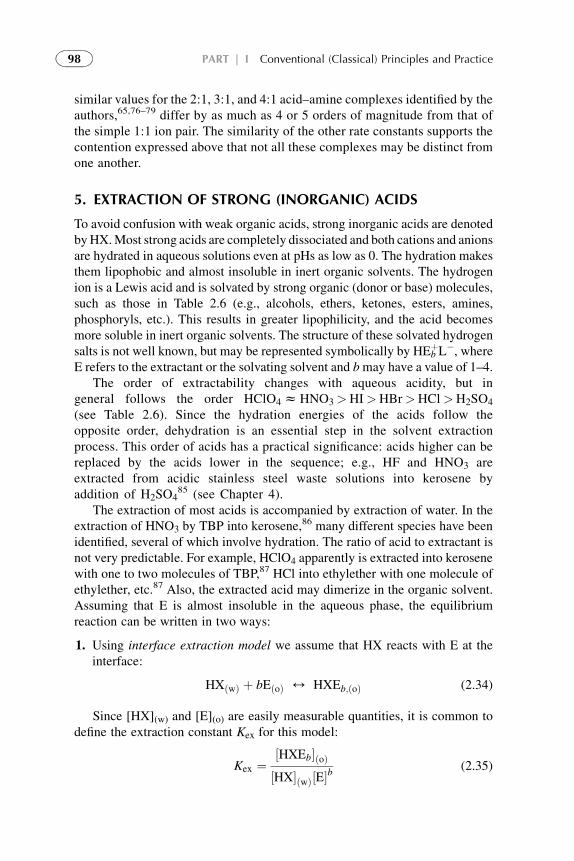
similar values for the 2:1, 3:1, and 4:1 acid–amine complexes identified by theauthors,65,76–79 differ by as much as 4 or 5 orders of magnitude from that ofthe simple 1:1 ion pair. The similarity of the other rate constants supports thecontention expressed above that not all these complexes may be distinct fromone another.
5. EXTRACTION OF STRONG (INORGANIC) ACIDS
To avoid confusion with weak organic acids, strong inorganic acids are denotedbyHX.Most strong acids are completely dissociated and both cations and anionsare hydrated in aqueous solutions even at pHs as low as 0. The hydration makesthem lipophobic and almost insoluble in inert organic solvents. The hydrogenion is a Lewis acid and is solvated by strong organic (donor or base) molecules,such as those in Table 2.6 (e.g., alcohols, ethers, ketones, esters, amines,phosphoryls, etc.). This results in greater lipophilicity, and the acid becomesmore soluble in inert organic solvents. The structure of these solvated hydrogensalts is not well known, but may be represented symbolically by HEb
þL�, whereE refers to the extractant or the solvating solvent and bmay have a value of 1–4.
The order of extractability changes with aqueous acidity, but ingeneral follows the order HClO4zHNO3>HI>HBr>HCl>H2SO4
(see Table 2.6). Since the hydration energies of the acids follow theopposite order, dehydration is an essential step in the solvent extractionprocess. This order of acids has a practical significance: acids higher can bereplaced by the acids lower in the sequence; e.g., HF and HNO3 areextracted from acidic stainless steel waste solutions into kerosene byaddition of H2SO4
85 (see Chapter 4).The extraction of most acids is accompanied by extraction of water. In the
extraction of HNO3 by TBP into kerosene,86 many different species have beenidentified, several of which involve hydration. The ratio of acid to extractant isnot very predictable. For example, HClO4 apparently is extracted into kerosenewith one to two molecules of TBP,87 HCl into ethylether with one molecule ofethylether, etc.87 Also, the extracted acid may dimerize in the organic solvent.Assuming that E is almost insoluble in the aqueous phase, the equilibriumreaction can be written in two ways:
1. Using interface extraction model we assume that HX reacts with E at theinterface:
HXðwÞ þ bEðoÞ 4 HXEb;ðoÞ (2.34)
Since [HX](w) and [E](o) are easily measurable quantities, it is common todefine the extraction constant Kex for this model:
Kex ¼½HXEb�ðoÞ½HX�ðwÞ½E�b
(2.35)
98 PART | I Conventional (Classical) Principles and Practice
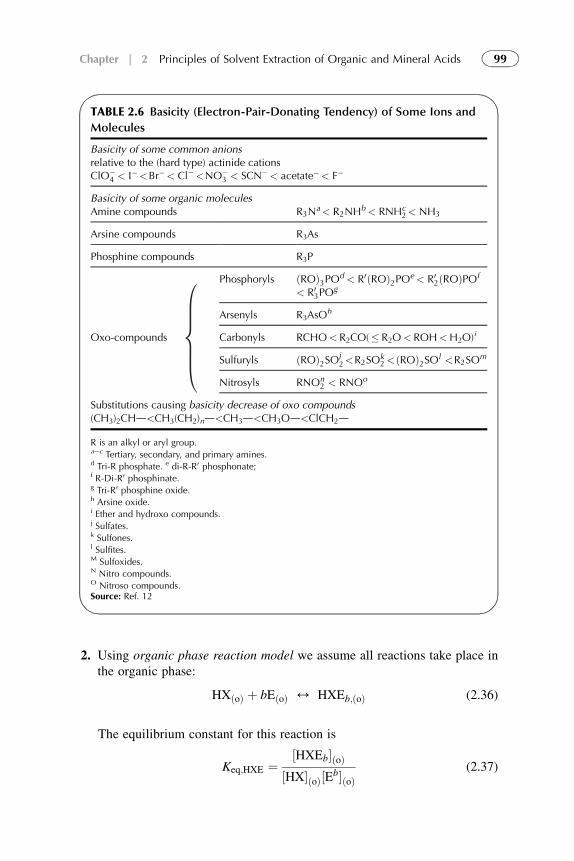
2. Using organic phase reaction model we assume all reactions take place inthe organic phase:
HXðoÞ þ bEðoÞ 4 HXEb;ðoÞ (2.36)
The equilibrium constant for this reaction is
Keq;HXE ¼½HXEb�ðoÞ
½HX�ðoÞ½Eb�ðoÞ(2.37)
TABLE 2.6 Basicity (Electron-Pair-Donating Tendency) of Some Ions and
Molecules
Basicity of some common anionsrelative to the (hard type) actinide cationsClO�
4 < I�<Br�< Cl�<NO�3 < SCN�< acetate�< F�
Basicity of some organic moleculesAmine compounds R3N
a< R2NHb< RNHc2< NH3
Arsine compounds R3As
Phosphine compounds R3P
Oxo-compounds
Phosphoryls ðROÞ3POd < R0ðROÞ2POe< R02ðROÞPOf
< R03PO
g
Arsenyls R3AsOh
Carbonyls RCHO< R2CO(� R2O< ROH<H2O)i
Sulfuryls ðROÞ2SOj2<R2SO
k2<ðROÞ2SOl <R2SO
m
Nitrosyls RNOn2 < RNOo
Substitutions causing basicity decrease of oxo compounds(CH3)2CHd<CH3(CH2)nd<CH3d<CH3Od<ClCH2d
R is an alkyl or aryl group.aec Tertiary, secondary, and primary amines.d Tri-R phosphate. e di-R-R0 phosphonate;f R-Di-R0 phosphinate.g Tri-R0 phosphine oxide.h Arsine oxide.i Ether and hydroxo compounds.j Sulfates.k Sulfones.l Sulfites.M Sulfoxides.N Nitro compounds.O Nitroso compounds.Source: Ref. 12
99Chapter | 2 Principles of Solvent Extraction of Organic and Mineral Acids
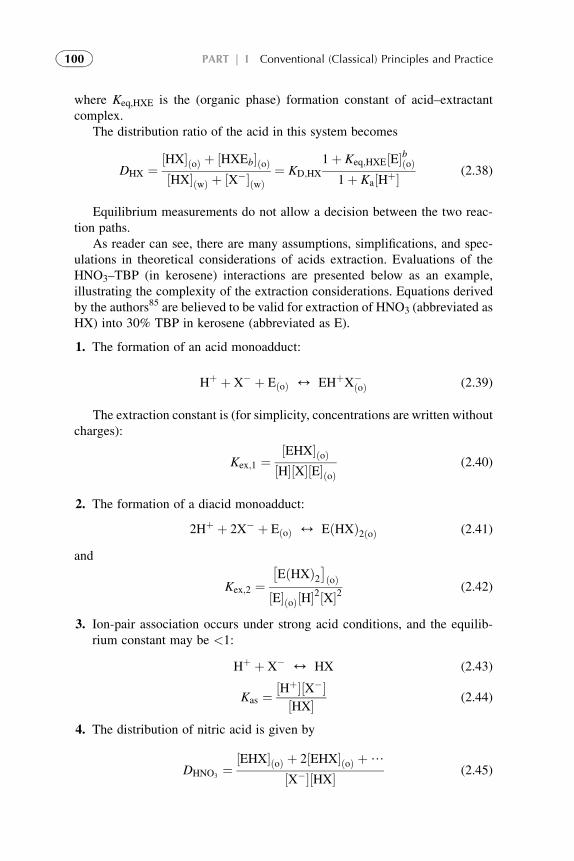
where Keq,HXE is the (organic phase) formation constant of acid–extractantcomplex.
The distribution ratio of the acid in this system becomes
DHX ¼½HX�ðoÞ þ ½HXEb�ðoÞ½HX�ðwÞ þ ½X��ðwÞ
¼ KD;HX
1þ Keq;HXE½E�bðoÞ1þ Ka½Hþ� (2.38)
Equilibrium measurements do not allow a decision between the two reac-tion paths.
As reader can see, there are many assumptions, simplifications, and spec-ulations in theoretical considerations of acids extraction. Evaluations of theHNO3–TBP (in kerosene) interactions are presented below as an example,illustrating the complexity of the extraction considerations. Equations derivedby the authors85 are believed to be valid for extraction of HNO3 (abbreviated asHX) into 30% TBP in kerosene (abbreviated as E).
1. The formation of an acid monoadduct:
Hþ þ X� þ EðoÞ 4 EHþX�ðoÞ (2.39)
The extraction constant is (for simplicity, concentrations are written withoutcharges):
Kex;1 ¼½EHX�ðoÞ
½H�½X�½E�ðoÞ(2.40)
2. The formation of a diacid monoadduct:
2Hþ þ 2X� þ EðoÞ 4 EðHXÞ2ðoÞ (2.41)
and
Kex;2 ¼�EðHXÞ2
�ðoÞ
½E�ðoÞ½H�2½X�2(2.42)
3. Ion-pair association occurs under strong acid conditions, and the equilib-rium constant may be <1:
Hþ þ X� 4 HX (2.43)
Kas ¼ ½Hþ�½X��½HX� (2.44)
4. The distribution of nitric acid is given by
DHNO3¼
½EHX�ðoÞ þ 2½EHX�ðoÞ þ/
½X��½HX� (2.45)
100 PART | I Conventional (Classical) Principles and Practice
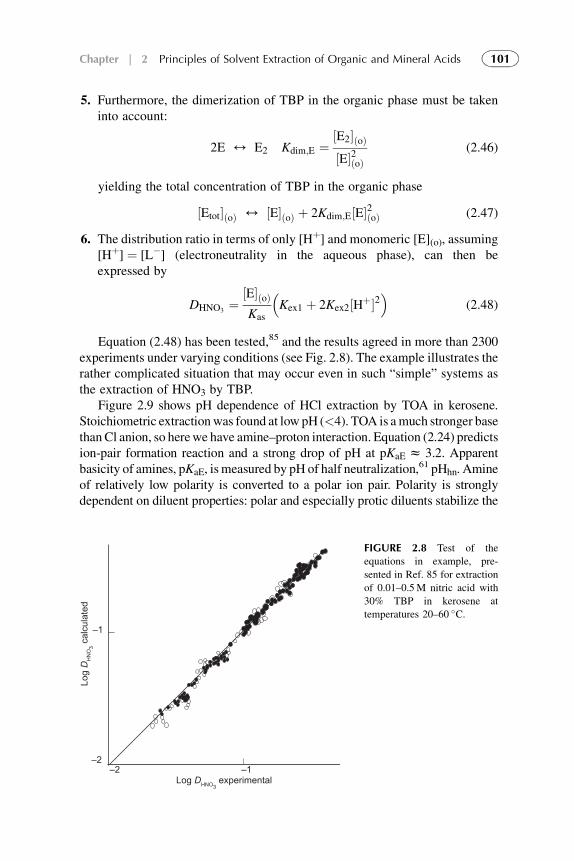
5. Furthermore, the dimerization of TBP in the organic phase must be takeninto account:
2E 4 E2 Kdim;E ¼½E2�ðoÞ½E�2ðoÞ
(2.46)
yielding the total concentration of TBP in the organic phase
½Etot�ðoÞ 4 ½E�ðoÞ þ 2Kdim;E½E�2ðoÞ (2.47)
6. The distribution ratio in terms of only [Hþ] and monomeric [E](o), assuming[Hþ] ¼ [L�] (electroneutrality in the aqueous phase), can then beexpressed by
DHNO3¼
½E�ðoÞKas
�Kex1 þ 2Kex2½Hþ�2
�(2.48)
Equation (2.48) has been tested,85 and the results agreed in more than 2300experiments under varying conditions (see Fig. 2.8). The example illustrates therather complicated situation that may occur even in such “simple” systems asthe extraction of HNO3 by TBP.
Figure 2.9 shows pH dependence of HCl extraction by TOA in kerosene.Stoichiometric extractionwas found at low pH (<4). TOA is amuch stronger basethanCl anion, so herewe have amine–proton interaction. Equation (2.24) predictsion-pair formation reaction and a strong drop of pH at pKaE z 3.2. Apparentbasicity of amines, pKaE, is measured by pH of half neutralization,61 pHhn. Amineof relatively low polarity is converted to a polar ion pair. Polarity is stronglydependent on diluent properties: polar and especially protic diluents stabilize the
–1
–1–2
–2Log DHNO3
experimental
Log D
HN
O3 c
alcu
late
d
FIGURE 2.8 Test of the
equations in example, pre-
sented in Ref. 85 for extraction
of 0.01–0.5M nitric acid with
30% TBP in kerosene at
temperatures 20–60 �C.
101Chapter | 2 Principles of Solvent Extraction of Organic and Mineral Acids
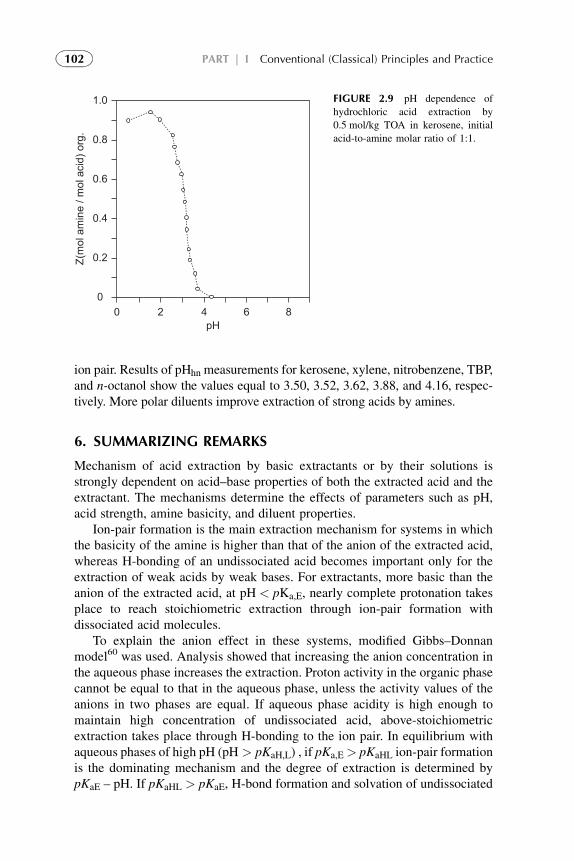
ion pair. Results of pHhn measurements for kerosene, xylene, nitrobenzene, TBP,and n-octanol show the values equal to 3.50, 3.52, 3.62, 3.88, and 4.16, respec-tively. More polar diluents improve extraction of strong acids by amines.
6. SUMMARIZING REMARKS
Mechanism of acid extraction by basic extractants or by their solutions isstrongly dependent on acid–base properties of both the extracted acid and theextractant. The mechanisms determine the effects of parameters such as pH,acid strength, amine basicity, and diluent properties.
Ion-pair formation is the main extraction mechanism for systems in whichthe basicity of the amine is higher than that of the anion of the extracted acid,whereas H-bonding of an undissociated acid becomes important only for theextraction of weak acids by weak bases. For extractants, more basic than theanion of the extracted acid, at pH < pKa,E, nearly complete protonation takesplace to reach stoichiometric extraction through ion-pair formation withdissociated acid molecules.
To explain the anion effect in these systems, modified Gibbs–Donnanmodel60 was used. Analysis showed that increasing the anion concentration inthe aqueous phase increases the extraction. Proton activity in the organic phasecannot be equal to that in the aqueous phase, unless the activity values of theanions in two phases are equal. If aqueous phase acidity is high enough tomaintain high concentration of undissociated acid, above-stoichiometricextraction takes place through H-bonding to the ion pair. In equilibrium withaqueous phases of high pH (pH > pKaH,L) , if pKa,E> pKaHL ion-pair formationis the dominating mechanism and the degree of extraction is determined bypKaE – pH. If pKaHL > pKaE, H-bond formation and solvation of undissociated
00
0.2
0.4
0.6
0.8
1.0
2 4 6 8
Z(m
ol a
min
e / m
ol a
cid)
org
.
pH
FIGURE 2.9 pH dependence of
hydrochloric acid extraction by
0.5 mol/kg TOA in kerosene, initial
acid-to-amine molar ratio of 1:1.
102 PART | I Conventional (Classical) Principles and Practice
molecules are the dominating mechanisms, and the degree of extraction isdetermined by pKaHL � pH.
Salts of water-immiscible amines (presented as quaternary amines R4NþL–)
extract acids of similar anion (HA) through H-bonding to the ion pairR4NL:HL. In equilibrium with other acids (HX), R4NX and R4NX:HL mayform. The degree of extraction through H-bonding is affected by the pHdetermining the concentration of the undissociated acid (RL or HX). pH mayalso affect the anion exchange. If, however, pKa,HL > pH > pKa,HX, proto-nation$of the acid anion becomes the determining factor, and [R4N
þX–] >>R4N
þL–].Extraction mechanism determines the effects of various parameters on
extraction efficiency and selectivity.
pH effect
Extraction controlled by H-bonding or solvation is mainly determined by theconcentration of the undissociated acid3,51–58 and strongly depends on pKa,HL –pH. However; when ion-pair formation is the dominating mechanism, extrac-tion is determined by extractant protonation at the given pH, or by pKa,E – pH).Therefore, strongly basic extractants (amines) are efficient in the extraction ofcarboxylic acids even at pH values much higher than pKa,HL.
Extractant basicity
For pKa,HL >> pKa,E the degree of extraction is determined by extractantefficiency for H-bonding and for solvation. Therefore, weak monocarboxylicacids such as propionic and butyric are highly extracted by polar and nonpolarsolvents and by amine salts. The contribution of free extractant, if present, issmall. However; extraction of strong mineral acids by any extractant orextraction of carboxylic acids by stronger amines with pKa,E > pKa,HL isdominated by the ion-pair-forming mechanism. As a result, it depends on thedegree of extractant protonation and thereby on the extractant basicity.
Acid form in the organic phase can be predicted by the difference betweenthe apparent basicity of the extractant determined at extraction of hydro-chloric acid, pHhn,HCl, (pH half neutralization for HCl) and the pKa of theextracted acid. As expected, the IR results showed that, in systems where thisdifference is close to zero, the dissociated acid and the undissociated acid areboth present in the organic phase. In systems where the difference is negative,the main acid form in the organic phase is the undissociated one, and wherethe difference is positive, the acid is mainly dissociated. The apparent basicityof extractants used for calculating the contribution of ion-pair formation isdetermined by the properties of the extractant, the diluent, and the anion of theextracted acid; pKa,E ¼ pKaE,3d3a where pKa,E’ is the specific basicity deter-mined by pHhn and 3d and 3a are coefficients for the efficiency of ion-pair
103Chapter | 2 Principles of Solvent Extraction of Organic and Mineral Acids
solvation by the diluent and for the anion compatibility with the medium,respectively.
The apparent basicity of the extractant, pHhn, was also determined whenhalf-loaded with various monocarboxylic acids instead of hydrochloric acid.Although the basicity sequences of the extractants are similar for the variousacids, the apparent basicity was found to be very sensitive to the properties ofthe anion. In most cases, the pHhn value decreases in the order extractant loadedwith trichloroacetic acid >> propionic acid > hydrochloric acid > aceticacid z lactic acid.
At extraction of trichloroacetic acid with aliphatic primary amine(Pimene JMT), the last has higher steric hindrance and lower polarity. Thishigh basicity is explained by the high acidity of trichloroacetic acid and byits low charge density, which reduces the energy lost when the ion leavesthe aqueous phase. On the other hand, the high pHhn values for the amineloaded with propionic acid are explained by the high hydrophobicity of thepropionate ion, i.e., by the low repulsion of the ion pairs from the organicphase.
Diluent effect
Extraction through ion-pair formation from aqueous solutions of relatively lowpH (pH < pKa,E) and extraction of acids by relatively strong amines(pKa,E > pKa,HL) are strongly dependent on solvation of the ion pair formed.Therefore, extraction is strongly enhanced by polar and particularly by proticdiluents. The effects of diluent on extraction through H-bonding (atpKa,HL << pKa,E) is governed by the diluent interaction with the undissociatedacid and with the free extractant.
Selectivity
The same considerations also provide for prediction of selectivity in theextraction of acids that differ mainly in their acidity.28,88 On the basis of thetheory analysis, the extraction systems can be divided into three classes interms of extraction selectivity and its dependence on pH:
1) Systems in which the two acids are extracted mainly by ion-pairinteractions. At relatively low pH (pH < pKa,E) and at higher pH forpKa,E > pKa,HL, the dominating mechanism is the ion-pair formation andstronger acids are extracted preferentially. In cases where both acids areextracted via ion-pair formation, the acidic species in the organic phasesare the conjugate acid of the protonated extractant (e.g., R3NH
þ) boundto the anions of the extracted acids. The acids compete for interactionswith the same amine. The extraction of one acid is decreased by the pres-ence of the other acid in the organic phase.
104 PART | I Conventional (Classical) Principles and Practice
Increasing the pH is equivalent to adding to the system a strong basethat neutralizes these acidic species. The selectivity, thus, depends on theacidity of the protonated extractant. This acidity was found to be verysensitive to the properties of the anion such as basicity, hydrophobicity,electron density, and ability to form H-bonds. Other important parametersare the extractant concentration and diluent properties. In many cases, thestronger acid forms a stronger interaction with the amine and is selec-tively extracted. In such cases, the protonated extractant bound to theanion of the stronger acid acts as a weaker acid than the protonated aminebound to the weaker acid. Thus, as the pH increases, the stronger acid inthe system is preferably neutralized, and the selectivity to it increases.Example is the extraction of dichloroacetic and trichloroacetic acidswith TOA at Z < 1. Extraction studies of some carboxylic acid mixturesby tri-n-octylamine in xylene or in 2-ethyl-hexanol89 or by tri-n-octyl-amine in methylisobutylketone, toluene, and chloroform90–92 showedthat the extractant is a stronger base than both anions of the acids andthat the selectivity was for the stronger acid and increased with pH.
However, the acidity of the extracted acid is not the only parameteraffecting the selectivity in this kind of interaction. The experiments withlactic and propionic acids and JMT as extractant28 demonstrate that thehydrophobicity of the anion is a very important parameter influencingthe selectivity: propionic acid was preferably extracted although it isthe weaker acid.
If total acid concentration in the aqueous phase is high enough tomaintain high activity of undissociated acid (or if a salt is present andaffects through salting out), the above-stoichiometric extraction takesplace. The mechanisms of the above-stoichiometric extraction,H-bonding to the ion pair (a relatively weak base), or solvation preferweaker acids. Thus, at extraction from dilute solutions, high selectivityis obtained for stronger acids, but this selectivity decreases in moreconcentrated solutions. At extracted acid to extractant molar ratiosconsiderably higher than 1, preference for the weak acid is observed.On back-extraction of the loaded extractant, however, the weaker acidis “washed out” first as H-bonding is a weaker bond than ion-pair forma-tion. The stronger acid remains in the extractant and can then be recov-ered in a pure form.
2) Systems in which both acids are extracted mainly by H-bonding or solva-tion interactions. In systems where the extraction is controlled mainly byH-bonding or by solvation, the aqueous solutions are of relatively highpH, where pKa,E is considerably smaller than the pKa,HL of the acids.The acids in these cases are present in the organic phase mainly in theirundissociated forms. In such cases, weaker and more hydrophobic acidsare preferably extracted. As pH increases (equivalent to the addition ofa strong mineral base), the stronger acid in the system is preferably
105Chapter | 2 Principles of Solvent Extraction of Organic and Mineral Acids
neutralized; thus, the selectivity to the weaker extracted acid increases.The strongest effect is observed around the pKa of the stronger acid.93–95
One more example of such interactions is extraction of propionic andlactic acids by tris-2-ethylhexyl amine (TEHA).28 The results show thatpropionic acid (the weaker acid) is preferably extracted in the lower pHrange, and the selectivity is increased at higher pH, particularly wherethe pH is higher than the pKa of lactic acid. Extraction of tartaric andmalic acids using a weak extractant TBP in dodecane96 showed that theweaker (malic) acid was selectively extracted and that the selectivityincreased with pH.
Extraction of one acid can be enhanced by the presence of anotheracid that increases the polarity and the protic properties of the organicphase. This synergistic effect can decrease as the pH is increased, becausethis extraction mechanism is dependent on the concentration of the undis-sociated acid.
H-bonding and/or solvation interactions are also the mechanisms forthe added acids in the above-stoichiometric range. In such cases, weakand hydrophobic acids are selectively extracted over stronger and lesshydrophobic ones. This selectivity can be seen in the experiment wheredichloroacetic and trichloroacetic acids are extracted by TOA,28,88 inwhich the main acid is dichloroacetic acid.
The values for the mass action constant of H-bond formation, KH,were calculated for cases in which the IR spectrum showed mainly undis-sociated acid in the organic phase.59 The weaker the acid and the higherthe hydrophobicity, the higher the KH. But KH values are low comparedwith the pKa of the acids. Thus, according to the theory, the pKa valueis the main factor that determines the sensitivity of the extraction to pH.
3) Systems in which one acid is extracted mainly through H-bonding orsolvation interactions, while the other is extracted through ion pairformation. Typically, such systems are formed when the extractant isa stronger base than the anion of one extracted acid (HX), but a weakerbase than the anion of the other acid (HL). At elevated pH, the strongestacid is preferably neutralized. This acid might be the undissociated oneor the protonated amine bound to the stronger acid. Therefore, the selec-tivity might reverse direction with increasing pH, as in the case of thehydrochloric and propionic acid extraction by TOA.28 In such cases,a synergistic extraction can be found. On one hand, the ion-pair interac-tion (e.g., R3NH
þX–) is enhanced by the presence of the undissociatedacid in the organic phase, HL, which acts as a polar diluent. On theother hand, the ion-pair species forms bonding sites for the undissoci-ated acid, HL. This was evident in the results of Kirsch90–92 whereacetic acid was extracted together with citric or oxalic acid by tri-n-octylamine. The distribution ratios of the acids were higher than thatpredicted from the single acid systems.
106 PART | I Conventional (Classical) Principles and Practice
Much more complicated are systems in which one of the extracted acids or bothare diprotic, and even more. The number of species that can potentially formand compete for the amine and protons (at elevated pH) increases significantly.A few publications are found in this field.90–92,96 Extractant here is too weak toionize the second (or more) acidic groups of the polyprotic extracted acid.Thus, the results in these systems are similar to those for monocarboxylic acids.The authors 28,88 studied the extraction selectivity and its dependence on pH insystems of binary mixtures containing at least one dicarboxylic acid. For thatpurpose, the extractant is chosen to be the strongest base in the examinedsystems. The authors suggest divalent ion-pair formation and their possiblereactions in the range below molar stoichiometry. At stoichiometry and higherconcentrations double salts of type R3NH
þL2–Naþ are formed throughneutralization which are converted to divalent ion pair R3NH
þL2–HNR3. So,extraction of this acid is visibly decreased. In the mixtures of monocarboxylicwith dicarboxylic acids of close pKa, the increased selectivity of mono-carboxylic acid may be expected.
At extraction of dicarboxylic acid mixtures if the extractant is a weakerbase than the anions, the dominant acid species in the organic phase is theundissociated acid, for all acid-to-amine molar ratios. These species areformed by H-bonding or by solvation interactions. If added, the mineral baseraises the pH, neutralizes the stronger acid, and forms the monovalent salt.This salt spontaneously leaves the organic phase, and, as a result, theextraction is reduced significantly at a pH close to the pKa1 of the acid down tozero loading.
If extractant is a stronger base than the first anion but a weaker base than thesecond anion, the dominant acid species in the organic phase is a function of pHand of the acid-to-amine molar ratio. At acid-to-amine molar ratios greater than1, the undissociated acid is above-stoichiometrically extracted acid in additionto the ion-paired extracted acid. At stoichiometric loading, the monovalention pair R3NH
þA� is the dominant species. The extraction curve shows aplateau.
If extractant is a stronger base than both anions the chemistry of the extractionis more complicated. The extraction curve has two drop-offs at acid-to-aminemolar ratios of 1 and 0.5. Extraction chemistry of systems in which the extractantis a stronger base than the two anions depends also on pH and acid–extractantmolar ratio: (a) At acid-to-amine molar ratios greater than 1, the neutralizedspecies are the first acidic group of the above-stoichiometrically extracted acid,and the extraction curve shows a drop-off close to pKa1, until stoichio-metric loading is reached; at pH < pKa1, the dominant species isR3NH
þ . LH– . HLH. (b) At stoichiometric loading, which is in the rangepKa2 > pH > pKa1, the monovalent ion pair (R3NH
þLH–) is the dominantspecies, and the curve shows a plateau. (c) The additional mineral base above thispoint neutralizes the stronger acid in the system, which is the second carboxylicacid, R3NH
þAH–, forming a kind of double salt R3NHþL2�Naþ. The extracted
107Chapter | 2 Principles of Solvent Extraction of Organic and Mineral Acids
carboxylic acid forms the divalent ion pair in the organic phase. As a result, theextraction curve shows a second drop-off at the pKa2 of the extracted acid, fol-lowed by a plateau at an acid-to-amine molar ratio of 0.5 and in the pH range ofpHhn > pH > pKa2, where the divalent ion pair R3NH
þL2� . þHNR3 is thedominant species. (d) The addition of mineral base above this point neutralizesthe next strongest acid in the system, which is the protonated amine R3NH
þ. Asa result, the free amine remains in the organic phase, and the acid, in its divalentmineral salt form, leaves into the aqueous phase. Thus, the extraction curve showsanother drop-off at the pHhn of the extractant.
In systems in which divalent ion pairs are formed, the value of the torsionpoint at 0.5 < Z < 1 is related to the pKa2 of the acid in the organic phase butnot equal. For example,28 at extraction of malic acid by JMT, the torsion pointis equal to 4, whereas pKa2 of malic acid is 5.1. For the extraction of glutaricacid, the pKa(o) is about 4.7, whereas pKa2 of glutaric acid is 5.4. The authorsexplained that this difference is a function of the difference in the protonactivities in the two phases.
In conclusion, the theory, presented in this chapter, is very complicated,speculative, and contradictive in the presentation of different authors.Knowing the pKa. of the acids in the system provides some preliminaryunderstanding for designing extractants. Extractant design should be basedon the pKa,E of the extractants, which, particularly in the case of ion-pairformation, is strongly dependent on the diluent and on the anion of theextracted acid. The use of these theories in the development of new processesrequires a big number of experimental data.
REFERENCES
1. Kaminski S, Kutermankiewicz M. Gaz: Cukrow 1979;87:107. Chern Ab 1979;91:173351.
2. Jiang Y, Lei Y, Dai G, Li D, Su Y. Hemaxue Shijie 1982;23(5):133. Chem Ab1983;100:
87647w.
3. Kertes AS, King CJ. Extraction chemistry of fermentation product carboxylic acid. Biotechnol.
Bioeng. 1986;28:269.
4. Thyrion FC. Solvent extraction of lactic acid and lactate from aqueous solutions. In:
Proceedings of International Solvent Extr. iConference (ISEC’88). 1988. vol. 3, p. 394.
5. Baniel AM. European patent No. EP 49429, 1982, Chem.
6. Grinstead RR. U.S. Patent No. 3,816,524, Chem Ab 1974;81:37253.
7. Colin P. French Patent No. 1,548.328 (1967), Chem Ab 1970;72: 2163r.
8. King CJ, Tung LA. Sorption of carboxylic acid from carboxylic salt solution at pHs close to or
above the pKa of the acid, with regeneration with an aqueous solution of ammonia or low-
molecular-weight alkylamine. U.S. Patent 5,132,456, 1992.
9. Leo A, Hansch C, Elkins D. Chem Rev 1971;71:525.
10. Marcus Y, Kertes AS. Ion exchange and solvent extraction of metal complexes. London:
Wiley-Interscience; 1969.
11. Sekine T, Hasegawa Y. Solvent extraction chemistry. New York: M. Dekker; 1977.
12. Hanson C, editor. Recent advances in liquid-liquid extraction. Oxford: Pergamon Press; 1971.
108 PART | I Conventional (Classical) Principles and Practice
13. Lo TC, Baird MHL, Hanson C, editors. Handbook of solvent extraction. New York: Wiley-
Interscience; 1982.
14. Ridberg J, Cox M, Musikas C, Choppin GR, editors. Principles and practices of solvent
extraction. New York: CRC; 2004.
15. Kovaleva AG. Ukr Khim Zhur 1973;39:561.
16. Sigematsu T, Tabushi M, Matsui M, Honiyo T. Bull Chem Soc Japan 1987;42:976 (1%9).
17. Paul RN. Brit Chem Eng Proc Technol 1972;17:800.
18. Sukhan VV, Pyatnitskii LV, Sakhno AG. J Anal Chem USSR 1973;28:476.
19. Charykov AK, Pavlovskaya EM. Russian J Physical Chem 1981;51:593.
20. Zaheeruddin M, Aslam H. Pak J Sci 1980;32:99.
21. Harris RD, Geankoplis CJ. J Chem Eng Data 1962;7:218.
22. Nikitin Yu E, Egutkin NL. Neftekhimiya 1974;14(5):780. Chern Ab 1975;82:139208k.
23. Kolossowsky N, Kulikow F, Bekturow A. Bull Soc Chem 1935;38:460
24. Rao MR, Ramamurty M, Rao CV. Chem Eng Sci 1958;8:265.
25. Johnson AI, Furter WF, Barry TW. Can J Technol 1954;32:179.
26. Kovaleva AG. Ukr Khim Zhur 1970;36:444.
27. Short JF, Eaglesfield P. Trans Inst Chem Eng 1952;30:109.
28. Canari R, Eyal A. Selectivity in monocarboxylic acid extraction from their mixture solutions
using an amine-based extractant: effect of pH. Ind Eng Chem Res 2003;42:1568.
29. Biancani M, De Filippo D. Gazz Chim ltal 1958;88:1202.
30. Kojima I, Yoshida M, Tanaka M. J Inorg Nucl Chem 1970;32:987.
31. Gordon KF. Ind Eng Chem 1953;45:1813.
32. Marvel CS, Richards JC. Anal Chem 1949;21:1480.
33. Zaheeruddin M, Khadim-Ul-Fagir. J Sci Technol (Peshawar, Pak) 1979;3:51.
34. Sekine T, Isayama M, Yamaguchi S, Moriya H. Bull Chem Soc Japan 1967;40:27.
35. Frumin GT, Ostrovskii MV, Abramzon AA. Russ J Appl Chem 1967;40:1275.
36. Vignes A. J Xhirn Phys 1960;57:966.
37. Sporidi G. German patent no. 1493196, 1964, Chern Ab 1970;72:100046z.
38. Forbes GS, Coolidge AS. J Am Chem Soc 1919;41:150.
39. Davis MM, Jones P, Patnaik D, Moelwyn-Hughes EA. J Am Chem Soc 1951:1249
40. Pavlovskaya EM, Charykov AK, Tikhornirov VL. Rus J Gen Chem 1975;46:2325.
41. Smith HA, Berman M. J Am Chem Soc 1937;59:2390.
42. Mottola HA, Freiser H. Talanta 1967;14:864.
43. Colin P, Moundlic J. French patent no. 1,494,958, 1967, Chem Ab 1968;69:43459.
44. Shevchenko VB, Renard EV. Russ J Inorg Chem 1963;8:268.
45. Pagel HA, McLafferty FW. Anal Chem 1948;20:272.
46. Tsvetkova ZN, Povitskii NS. Russ J Inorg Chem 1960;5:1364.
47. Wennersten R. In: Proceedings of the international solvent extraction conference, vol. 2, paper
80/63, University of Liege, Liege, Belgium: 1980.
48. Ricker NL, Michaels JN, King CJ. J Separ Proc Technol 1979;1:36.
49. Pagel HA, Schwab KD. Anal Chem 1950;22:1207.
50. Grinstead RR. U.S. Patents No. 3,980,701-4; Chem Ab 1976,85:159443–6.
51. Tamada JA. Extraction of carboxyilic acids by amine extractant. Ph.D. Thesis, Lawrence
Berkeley Laboratory, University of California; 1989.
52. Tamada JA, Kertes AS, King CJ. Extraction of carboxylic acids with amine extractant. 1.
Equilibria and law of mass action modeling. Ind Eng Chem Res 1990;29:1319.
53. Tamada J, King CJ. Extraction of carboxylic acids with amine extractants. 2. Chemical
interaction and interpretation of data. Ind Eng Chem Res 1990;29:1327.
109Chapter | 2 Principles of Solvent Extraction of Organic and Mineral Acids
54. Tamada JA, King CJ. Extraction of carboxylic acids with amine extractants. 3. Effect of
temperature, water coextraction, and process considerations. Ind Eng Chem Res 1990;29:1333.
55. Tamada JA, Kertes AS, King CJ. Extraction of carboxylic acid from aqueous solution by mean
of tertiary amine extractants: Equilibria and processing alternative. Proceedings of Interna-
tional Solvent Extraction Conference (ISEC’88) 1988;3:316.
56. Tung LA. Recovery of carboxylic acids at pH greater than pKa. Ph.D. Thesis, Lawrence
Berkeley Laboratory, University of California; 1993.
57. Tung UA, King CJ. Regenerable extraction and sorption of carboxylic acids from aqueous
solutions at pH > pKa. Proceedings of International Solvent Extraction Conference (ISEC)
1993;2:1010.
58. Yang ST, White SA, Hsu ST. Extraction of carboxylic acids with tertiary and quaternary
amines: effect of pH. Ind Eng Chem Res 1991;30:1335.
59. Canari R, Eyal AM. Extraction of carboxylic acids by amine-based extractants:
apparent extractant basicity according to the pH of half-neutralization. Ind Eng Chem
Res 2003;42:145–52.
60. Canari R, Eyal AM. Acids extraction by amine-based extractants: an analysis of the effect of
anion concentration in the aqueous phase using the Donnan model. Ind Eng Chem Res
2003;42:153–9.
61. Eyal AM, Canari R. pH Dependence of carboxylic and mineral acid extraction by amine-
based extractants: effect of pKa, amine basicity, and diluent properties. Ind Eng Chem Res
1995;34(4). 1789.
62. Poulad-Meyer, LA. Spectral study of the transfer of acidic or basic compounds from aqueous
phases into multicomponent organic extracting media. Ph.D. Thesis, Casali Institute of
Applied Chemistry, Jerusalem:The Hebrew University of Jerusalem; 2001.
63. Manenok GS, Korobanova VL, Yudina TN, Soldatov VS. Russ J Appl Chem 1979;52:156.
64. Vanura P, Kuca L. Collec Czech Chem Commun 1976;41:2857–77.
65. Kawano Y, Kusano K, Takahashi T, Kondo K, Nakashio F. Kagaku Kogaku Ronbunshu
1982;8:404.
66. Kertes AS, Gutmann H. In: Matijevic E, editor. Surf Colloid Sci 1975;8. Chapter 3.
67. Kertes AS. In: Hanson C, editor. Recent advances in liquid-liquid extraction. Oxford:
Pergamon Press; 1971. p. 15.
68. Moore FL. Anal Chem 1957; 29:1660. Report No. NAS$NS$31 0 1, Washington DC: National
Academy of Sciences; 1960.
69. Smith EL, Page JE. J Soc Chem Ind (London) 1948;67:48.
70. Pyatnitskii V, Tabenskaya TV. J Anal Chem USSR 1970;25:2060.
71. Wennersten R. J Chem Tech Biotechnol 1983;33B:85.
72. Ricker NL, Pittman EF, King CJ. J Separ Proc Technol 1980;1:23.
73. Pyatnitskii IV, Tabenskaya TV, Makarchuk TL. J Ana Chem USSR 1973;28:484.
74. Vieux AS, Rutagengwa N, Rulinda JB, Balikungeri A. Anal Chim Acta 1974;68:415.
75. Vieux AS, Rutagengwa N. Anal Chim Acta 1977;91:359.
76. Kawano Y, Kusano K, Inoue K, Nakashio F. Kagaku Kogaku Ronbunshu 1983;9:473. Chern
Ab 1983; 99:121728w.
77. Kawano Y, Kusano K, Takahashi T, Kondo K, Nakashio F. Extraction equilibria of lower
carboxylic acids with long-chain alkylamine. Soc Chem Eng Jpn 1982;8:404.
78. Kawano Y, Kusano K, Nakashio F. Kagaku Kogaku Ronbunshu 1983;9:21. Chern Ab 1983;
9:21–34.
79. Pyatnitskii IV, Harchenko RS. Ukr Khim Zhur 1964;30:635.
80. Pyatnitskii IV, Tabenskaya TV, Sukhan TA. J Anal Chem USSR 1971;26:2150.
110 PART | I Conventional (Classical) Principles and Practice
81. Pyatnitskii IV, Harchenko RS. Ukr Khim Zhur 1963;29:967.
82. Pyatnitskii IV, Tabenskaya TV. J Anal Chem USSR 1970;25:815.
83. Kaplunova AM, Eshova NI, Bolshova TA. J Anal Chem USSR 1977;33:1492.
84. Ahrland S, Liljenzin JO, Rydberg J. The chemistry of the actinides. In: Comprehensive
inorganic chemistry. London: Pergamon Press; 1973.
85. Jassim TM, Fridemo L, Liljenzin JO. Dissertation. In: Jassim TM, editor. Co-extraction of
pertechnetate with some metal nitrates in TBP-nitric acid systems. Gothenburg: Chalmers
Technical University; 1986.
86. Chiarizia R, Briand A. Third phase formation in the Extraction of Inorganic Acids by TBP in
n-Octane. Solv Extr Ion Exch 2007;25(3):351–71.
87. Eyal A, Hazan B, Bloch R. Recovery and concentration of strong mineral acids from dilute
solution through LLX, III. A “temperature swing based process”. Solvent Extr Ion Exch
1991;9(2):223.
88. Canari R, Eyal AM. Selectivity in extraction of lactic, malic, glutaric, and maleic acids from
their binary solutions using an amine-based extractant: effect of pH. Ind Eng Chem Res
2003;42:160–6.
89. Iagirdar GC, Sharma MM. Recovery and separation of mixtures of organic acids from dilute
aqueous solutions. J Sep Process Technol 1980;12:40.
90. Kirsch T, Maurer G. Distribution of binary mixtures of citric, acetic and oxalic acid between
water and organic solutions of Tri-n-octylamine. Part II: organic solvent methyl-
isobutylketone. Fluid Phase Equilib 1998;142:215.
91. Kirsch T, Maurer G. Distribution of binary mixtures of citric, acetic and oxalic acid between
water and organic solutions of Tri-n-octylamine. Part I: organic solvent toluene. Fluid Phase
Equilib 1991;131:213.
92. Kirsch T, Maurer G. Distribution of binary mixtures of citric, acetic and oxalic acid between
water and organic solutions of Tri-n-octylamine. Part III: organic solvent chloroform. Fluid
Phase Equilib 1998;146:297.
93. Anwar MM, Hanson C, Pratt MWT. Dissociation extraction. Part I: general theory. Trans Inst
Chem Eng 1971;49:95.
94. Anwar MM, Hanson C, Pratt MWT, Patel AN. Dissociation extraction. Part II: multi-stage
extraction. Trans Inst Chem Eng 1973;51:151.
95. Robinson RG, Cha DY. Controlled pH extraction in the separation of weak acids and bases.
Biotechnol Prog 1985;1(1):18.
96. Malmary G, Vezier A, Robert A, Mourgues J, Conte T, Molinier J. Recovery of tartaric and
malic acids from dilute aqueous effluents by solvent extraction. J Chem Technol Biotechnol
1994;60(67):647.
111Chapter | 2 Principles of Solvent Extraction of Organic and Mineral Acids

This page intentionally left blank
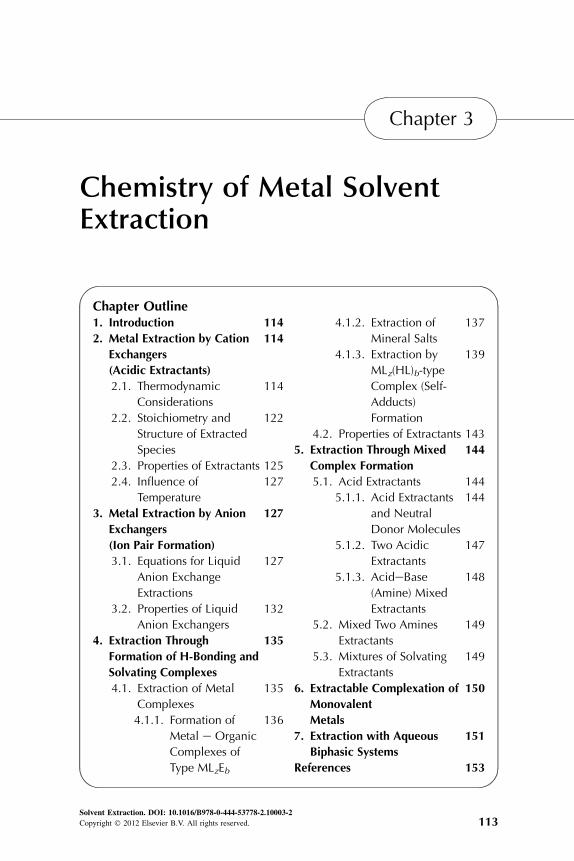
Chapter 3
Chemistry of Metal SolventExtraction
Chapter Outline1. Introduction 114
2. Metal Extraction by Cation
Exchangers
(Acidic Extractants)
114
2.1. Thermodynamic
Considerations
114
2.2. Stoichiometry and
Structure of Extracted
Species
122
2.3. Properties of Extractants 125
2.4. Influence of
Temperature
127
3. Metal Extraction by Anion
Exchangers
(Ion Pair Formation)
127
3.1. Equations for Liquid
Anion Exchange
Extractions
127
3.2. Properties of Liquid
Anion Exchangers
132
4. Extraction Through
Formation of H-Bonding and
Solvating Complexes
135
4.1. Extraction of Metal
Complexes
135
4.1.1. Formation of
Metal e Organic
Complexes of
Type MLzEb
136
4.1.2. Extraction of
Mineral Salts
137
4.1.3. Extraction by
MLz(HL)b-type
Complex (Self-
Adducts)
Formation
139
4.2. Properties of Extractants 143
5. Extraction Through Mixed
Complex Formation
144
5.1. Acid Extractants 144
5.1.1. Acid Extractants
and Neutral
Donor Molecules
144
5.1.2. Two Acidic
Extractants
147
5.1.3. AcideBase
(Amine) Mixed
Extractants
148
5.2. Mixed Two Amines
Extractants
149
5.3. Mixtures of Solvating
Extractants
149
6. Extractable Complexation of
Monovalent
Metals
150
7. Extraction with Aqueous
Biphasic Systems
151
References 153
Solvent Extraction. DOI: 10.1016/B978-0-444-53778-2.10003-2
Copyright � 2012 Elsevier B.V. All rights reserved. 113
1. INTRODUCTION
Solvent extraction of metals is an important technology in hydrometallurgicalindustry, analytical separations, and liquid waste treatment. Metal ions, cations,and anions are extracted from an aqueous phase into organic phase throughreversible chemical reactions, forming organic-soluble neutral complexes.Extractant has usually very low solubility in aqueous phase, but interactwithmetalions and obtain high solubility in organic phase complex. So, extraction isdescribed by a heterogeneous chemical reaction on either side of the aqueous–organic interface to the final equilibrium concentrations of the reaction products.
As it was described in previous chapters, chemical reaction may be consid-ered in (1) one of the phases accompanied by the mass transfer of reactants andproducts to or from another phase and (2) chemical interaction at the interface ofthe phases andmass transfer of the reactants and products to the bulk phases. Thesolubility principles and kinetics of the mass transfer were discussed in detail inChapter 1. Metal extraction is discussed in detail in the references;1–3 formationand extraction of metal chelates are presented in references.4,5
In this chapter, the factors underlying the strength of metal–extractantinteractions, their influence for different metals and extracting reagents, otherparameters of complexation are reviewed and discussed.
2. METAL EXTRACTION BY CATION EXCHANGERS(ACIDIC EXTRACTANTS)
The chemical reaction of solutes with organic compounds (termed as extrac-tants, or reagents), dissolved in the organic solvent (diluent), is accompanied bythe distribution of product complexes between two immiscible phases. Mostcommon classification of extractants of metals are presented in Table 3.1. Theextent of complexation for any solute–ligand system is defined by equilibriumconstant, which is termed stability or formation constant for metal–ligandinteraction.
2.1. Thermodynamic Considerations
Defining M as a metal cation and L as a ligand anion (charges are omitted forsimplicity), the complexation reaction steps may be presented as
Mþ L ¼ ML K1 ¼ ½ML�½M�½L� (3.1)
MLþ L ¼ ML2 K2 ¼ ½ML2�½ML�½L� (3.2)
MLn�1 þ L ¼ MLn Kn ¼ ½MLn�½MLn�1�½L� (3.3)
114 PART | I Conventional (Classical) Principles and Practice
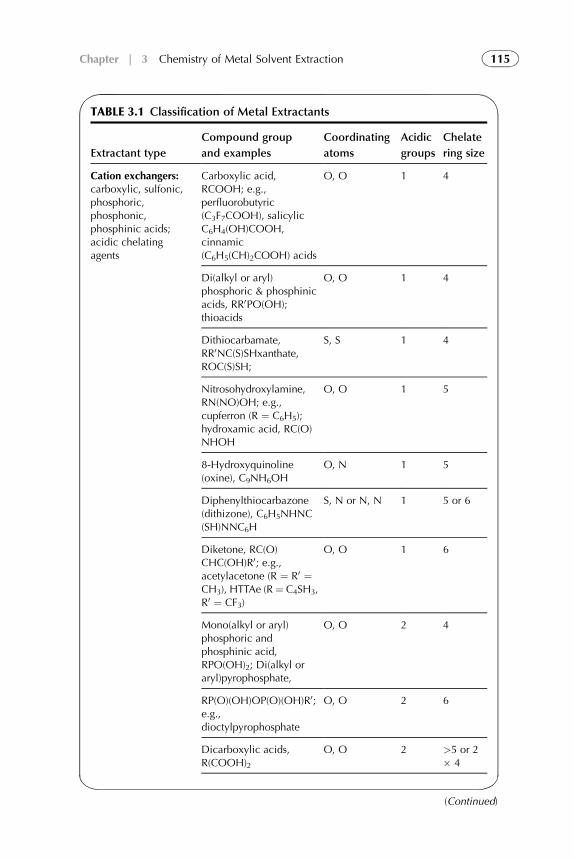
TABLE 3.1 Classification of Metal Extractants
Extractant type
Compound group
and examples
Coordinating
atoms
Acidic
groups
Chelate
ring size
Cation exchangers:carboxylic, sulfonic,phosphoric,phosphonic,phosphinic acids;acidic chelatingagents
Carboxylic acid,RCOOH; e.g.,perfluorobutyric(C3F7COOH), salicylicC6H4(OH)COOH,cinnamic(C6H5(CH)2COOH) acids
O, O 1 4
Di(alkyl or aryl)phosphoric & phosphinicacids, RR0PO(OH);thioacids
O, O 1 4
Dithiocarbamate,RR0NC(S)SHxanthate,ROC(S)SH;
S, S 1 4
Nitrosohydroxylamine,RN(NO)OH; e.g.,cupferron (R ¼ C6H5);hydroxamic acid, RC(O)NHOH
O, O 1 5
8-Hydroxyquinoline(oxine), C9NH6OH
O, N 1 5
Diphenylthiocarbazone(dithizone), C6H5NHNC(SH)NNC6H
S, N or N, N 1 5 or 6
Diketone, RC(O)CHC(OH)R0; e.g.,acetylacetone (R ¼ R0 ¼CH3), HTTAe (R¼ C4SH3,R0 ¼ CF3)
O, O 1 6
Mono(alkyl or aryl)phosphoric andphosphinic acid,RPO(OH)2; Di(alkyl oraryl)pyrophosphate,
O, O 2 4
RP(O)(OH)OP(O)(OH)R0;e.g.,dioctylpyrophosphate
O, O 2 6
Dicarboxylic acids,R(COOH)2
O, O 2 >5 or 2� 4
(Continued)
115Chapter | 3 Chemistry of Metal Solvent Extraction
where Kn is the stepwise formation or stability constant. Complex formationmay proceed up to coordination number (n) of the central metal atom.Complexes have to be saturated by negatively charged ligands, by neutral donormolecules (organic solvents, inorganic salts with donor properties or water).Overall stability (formation) constant bn:
bn ¼½MLn�½M�½L�n ¼ K1K2.Kn ¼
Yni¼1
Ki (3.4)
Of course this relation is valid for standard or ideal conditions, whenconcentrations are equal to their activities. For real conditions concentrationshave to be replaced by activities (see Chapters 1 and 2).
The degree of extraction of metal ions depends on the pH of the aqueousphase. The degree of extraction will also vary on the nature of the metal: in theabsence of steric effects, an increasing charge to radius ratio of the metal cationwill generally be followed by increased extraction. The rules of coordinationchemistry and ligand field theory are obeyed.
TABLE 3.1 Classification of Metal Extractantsdcont’d
Extractant type
Compound group
and examples
Coordinating
atoms
Acidic
groups
Chelate
ring size
Anion exchangers:Polyphenylmetalloidtype,polyalkylsulfoniumtype, polyalkyl-ammonium type, saltsof high molecularweight aliphaticamines
Solvating extractants:Carbon,sulfurephosphorus-bonded oxygen-bearing extractants,alkylsulfides, ketones,and others
Mixed extractants:Organic acids &neutral donorextractants, acid-aminemixtures, two acidicextractants, two neutraldonor extractants
116 PART | I Conventional (Classical) Principles and Practice
Metal extraction by acidic reagents is conventionally shown as a stepwiseprocess where the extractant partitions between the organic and aqueous pha-ses, going through the steps of ionization in the aqueous phase, reaction of themetal ion with acid anion until the neutral complex is formed, and then this finalcomplex partitions between two phases.
This description supposes extraction mechanism dependant on chemicalreactions in the aqueous phase, requiring a reasonable solubility of extractant inwater. If extractant is highly insoluble in water then the reactions are whollyinterfacial. In this case description should be replaced by adsorption isothermsrelating interfacial concentration of the extractant and metal complex to thebulk phase concentrations (details see Chapter 1). Depending on the acidity ofthe extractant and the pH range being considered, it may sometimes beappropriate to consider direct reaction between the molecular form of theextractant and the metal cation rather than the extractant anion. The schemepresented first, however, has considerable advantages in describing the chem-istry of metal extraction by acid reagents.
There are ligands that can bind to a metal ion in more than one site of basicatoms, such as O, N, S. They are called chelating agents and form metal chelatecomplexes. Chelates are commonly stronger than analogous nonchelatecomplexes. Chelation provides extra stability to the metal complex.
The metal ion distribution coefficient increases with increasing aqueoussolubility and increasing acidity of the reagent, increasing pH, and alsoincreasing reagent concentration. The value of the formation constant b clearlywill affect the value ofD, reflecting the specific interactions related to chelatingextractants and also other factors such as steric effects from extractantmolecular geometry.
Taking all metal species in the aqueous phase into account, the distributionof the metal can be written as
DME ¼½MLz�ðOÞP�MLz�n
n
� ¼ Knbn�L��zP
bn�L��z (3.5)
The distribution ratio depends only on the free ligand concentration, whichmay be calculated by Eqns (2.24–2.26 from Chapter 21). Most coordinativelysaturated neutral metal complexes behave just like stable organic solutes, becausetheir outer molecular structure are almost entirely of the hydrocarbon type, and
1. Eqns (2.24–2.26) from Chapter 2:
log
�EHþ�
ðOÞ½E�ðOÞ
¼ log�Hþ�� log Ka;E ¼ pKa;E � pH
log½R4NX�ðOÞ½R4NL�ðwÞ
¼ log Ka;exch þ log�X�1
�ðwÞ � log½HL�ðwÞpKa;HL � pH
117Chapter | 3 Chemistry of Metal Solvent Extraction
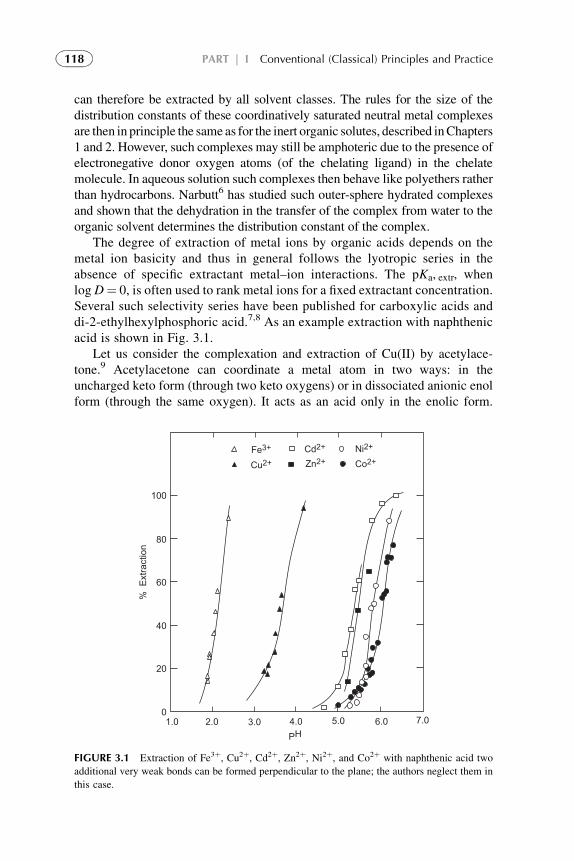
can therefore be extracted by all solvent classes. The rules for the size of thedistribution constants of these coordinatively saturated neutral metal complexesare then in principle the same as for the inert organic solutes, described inChapters1 and 2. However, such complexes may still be amphoteric due to the presence ofelectronegative donor oxygen atoms (of the chelating ligand) in the chelatemolecule. In aqueous solution such complexes then behave like polyethers ratherthan hydrocarbons. Narbutt6 has studied such outer-sphere hydrated complexesand shown that the dehydration in the transfer of the complex from water to theorganic solvent determines the distribution constant of the complex.
The degree of extraction of metal ions by organic acids depends on themetal ion basicity and thus in general follows the lyotropic series in theabsence of specific extractant metal–ion interactions. The pKa, extr, whenlogD¼ 0, is often used to rank metal ions for a fixed extractant concentration.Several such selectivity series have been published for carboxylic acids anddi-2-ethylhexylphosphoric acid.7,8 As an example extraction with naphthenicacid is shown in Fig. 3.1.
Let us consider the complexation and extraction of Cu(II) by acetylace-tone.9 Acetylacetone can coordinate a metal atom in two ways: in theuncharged keto form (through two keto oxygens) or in dissociated anionic enolform (through the same oxygen). It acts as an acid only in the enolic form.
100
80
60
40
20
1.0 2.0 3.0 4.0 5.0 6.0 7.0
PH
% E
xtra
ctio
n
0
Fe3+
Cu2+ Zn2+Cd2+ Ni2+
Co2+
FIGURE 3.1 Extraction of Fe3þ, Cu2þ, Cd2þ, Zn2þ, Ni2þ, and Co2þ with naphthenic acid two
additional very weak bonds can be formed perpendicular to the plane; the authors neglect them in
this case.
118 PART | I Conventional (Classical) Principles and Practice
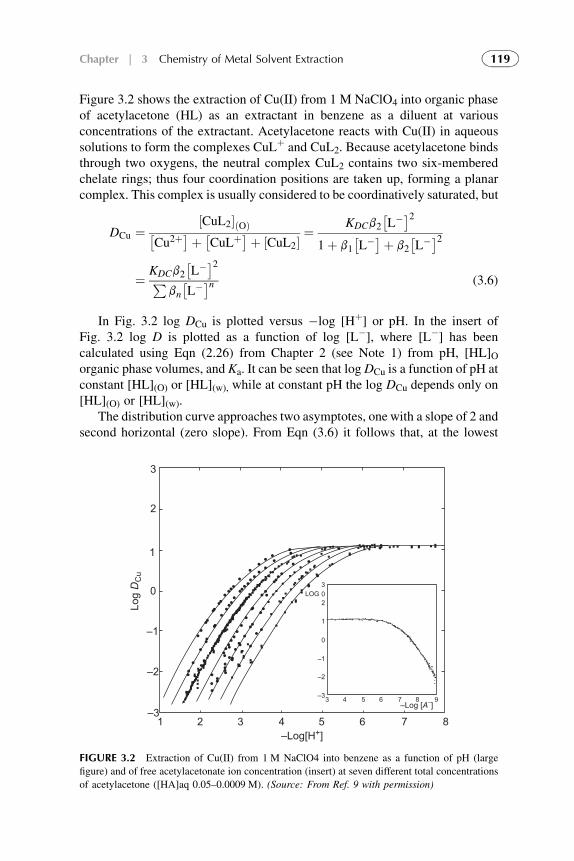
Figure 3.2 shows the extraction of Cu(II) from 1 M NaClO4 into organic phaseof acetylacetone (HL) as an extractant in benzene as a diluent at variousconcentrations of the extractant. Acetylacetone reacts with Cu(II) in aqueoussolutions to form the complexes CuLþ and CuL2. Because acetylacetone bindsthrough two oxygens, the neutral complex CuL2 contains two six-memberedchelate rings; thus four coordination positions are taken up, forming a planarcomplex. This complex is usually considered to be coordinatively saturated, but
DCu ¼½CuL2�ðOÞ�
Cu2þ�þ �
CuLþ�þ ½CuL2�¼ KDCb2
�L��2
1þ b1�L��þ b2
�L��2
¼ KDCb2�L��2P
bn�L��n (3.6)
In Fig. 3.2 log DCu is plotted versus �log [Hþ] or pH. In the insert ofFig. 3.2 log D is plotted as a function of log [L�], where [L�] has beencalculated using Eqn (2.26) from Chapter 2 (see Note 1) from pH, [HL]Oorganic phase volumes, and Ka. It can be seen that log DCu is a function of pH atconstant [HL](O) or [HL](w), while at constant pH the log DCu depends only on[HL](O) or [HL](w).
The distribution curve approaches two asymptotes, one with a slope of 2 andsecond horizontal (zero slope). From Eqn (3.6) it follows that, at the lowest
LOG302
1
0
–1
–2
–33 4 5 6 7 8 9–Log [A–]
3
2
1
0
–1
–2
–31 2 3 4 5 6 7 8
–Log[H+]
Log D
Cu
FIGURE 3.2 Extraction of Cu(II) from 1 M NaClO4 into benzene as a function of pH (large
figure) and of free acetylacetonate ion concentration (insert) at seven different total concentrations
of acetylacetone ([HA]aq 0.05–0.0009 M). (Source: From Ref. 9 with permission)
119Chapter | 3 Chemistry of Metal Solvent Extraction
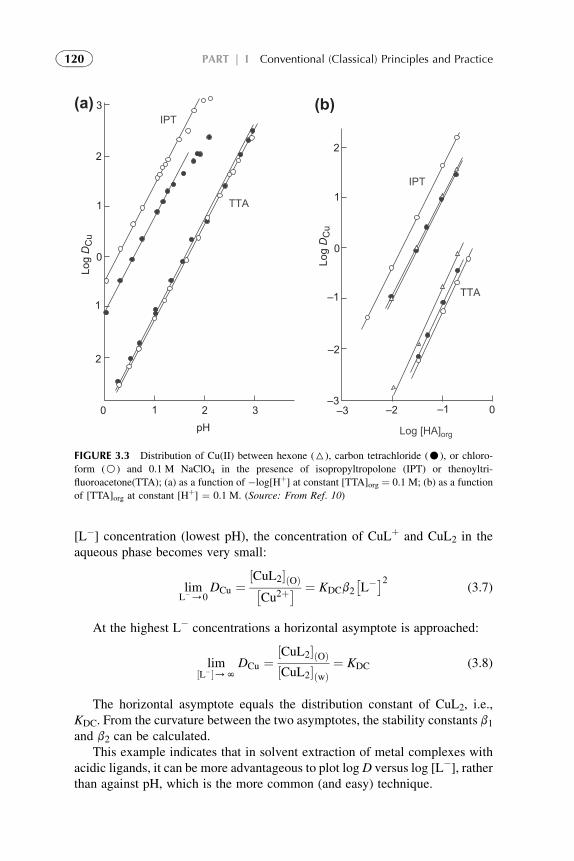
[L�] concentration (lowest pH), the concentration of CuLþ and CuL2 in theaqueous phase becomes very small:
limL�/0
DCu ¼½CuL2�ðOÞ�Cu2þ
� ¼ KDCb2�L��2 (3.7)
At the highest L� concentrations a horizontal asymptote is approached:
lim½L��/N
DCu ¼½CuL2�ðOÞ½CuL2�ðwÞ
¼ KDC (3.8)
The horizontal asymptote equals the distribution constant of CuL2, i.e.,KDC. From the curvature between the two asymptotes, the stability constants b1and b2 can be calculated.
This example indicates that in solvent extraction of metal complexes withacidic ligands, it can be more advantageous to plot log D versus log [L�], ratherthan against pH, which is the more common (and easy) technique.
3
3
2
1
0
0
1
1
2
2pH
Log D
Cu
–3–3
2
1
0
0–1
–1
–2
–2
Log D
Cu
TTA
TTA
IPT
IPT
Log [HA]org
(a) (b)
FIGURE 3.3 Distribution of Cu(II) between hexone (6), carbon tetrachloride (C), or chloro-
form (B) and 0.1 M NaClO4 in the presence of isopropyltropolone (IPT) or thenoyltri-
fluoroacetone(TTA); (a) as a function of �log[Hþ] at constant [TTA]org ¼ 0.1 M; (b) as a function
of [TTA]org at constant [Hþ] ¼ 0.1 M. (Source: From Ref. 10)
120 PART | I Conventional (Classical) Principles and Practice
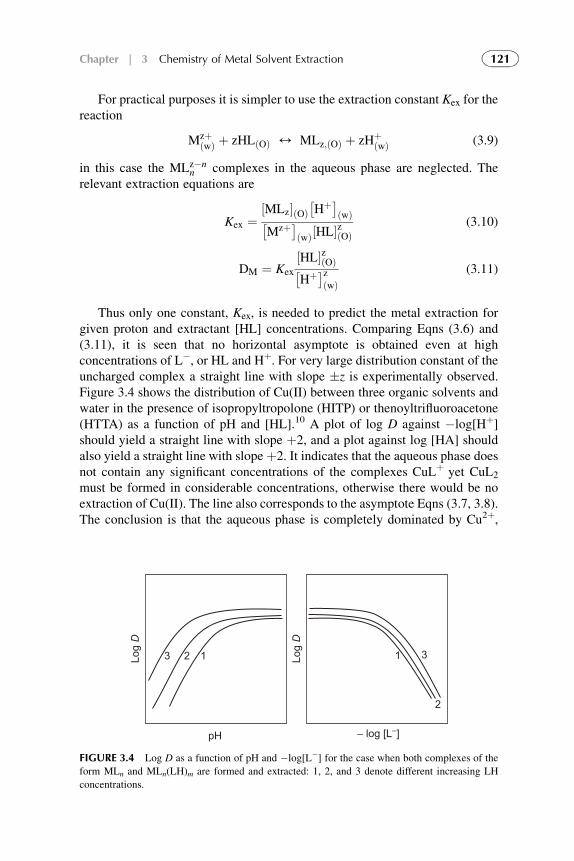
For practical purposes it is simpler to use the extraction constant Kex for thereaction
MzþðwÞ þ zHLðOÞ 4 MLz;ðOÞ þ zHþ
ðwÞ (3.9)
in this case the MLz�nn complexes in the aqueous phase are neglected. The
relevant extraction equations are
Kex ¼½MLz�ðOÞ
�Hþ�
ðwÞ�Mzþ�
ðwÞ½HL�zðOÞ(3.10)
DM ¼ Kex
½HL�zðOÞ�Hþ�z
ðwÞ(3.11)
Thus only one constant, Kex, is needed to predict the metal extraction forgiven proton and extractant [HL] concentrations. Comparing Eqns (3.6) and(3.11), it is seen that no horizontal asymptote is obtained even at highconcentrations of L�, or HL and Hþ. For very large distribution constant of theuncharged complex a straight line with slope �z is experimentally observed.Figure 3.4 shows the distribution of Cu(II) between three organic solvents andwater in the presence of isopropyltropolone (HITP) or thenoyltrifluoroacetone(HTTA) as a function of pH and [HL].10 A plot of log D against �log[Hþ]should yield a straight line with slope þ2, and a plot against log [HA] shouldalso yield a straight line with slope þ2. It indicates that the aqueous phase doesnot contain any significant concentrations of the complexes CuLþ yet CuL2
must be formed in considerable concentrations, otherwise there would be noextraction of Cu(II). The line also corresponds to the asymptote Eqns (3.7, 3.8).The conclusion is that the aqueous phase is completely dominated by Cu2þ,
Log D
Log D
– log [L–]
3 2 1 1
2
3
pH
FIGURE 3.4 Log D as a function of pH and �log[L�] for the case when both complexes of the
form MLn and MLn(LH)m are formed and extracted: 1, 2, and 3 denote different increasing LH
concentrations.
121Chapter | 3 Chemistry of Metal Solvent Extraction
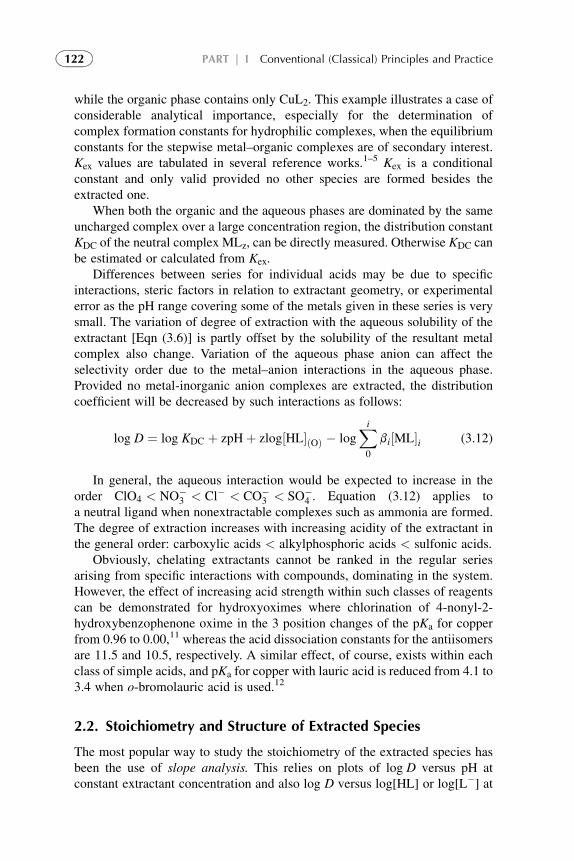
while the organic phase contains only CuL2. This example illustrates a case ofconsiderable analytical importance, especially for the determination ofcomplex formation constants for hydrophilic complexes, when the equilibriumconstants for the stepwise metal–organic complexes are of secondary interest.Kex values are tabulated in several reference works.1–5 Kex is a conditionalconstant and only valid provided no other species are formed besides theextracted one.
When both the organic and the aqueous phases are dominated by the sameuncharged complex over a large concentration region, the distribution constantKDC of the neutral complex MLz, can be directly measured. Otherwise KDC canbe estimated or calculated from Kex.
Differences between series for individual acids may be due to specificinteractions, steric factors in relation to extractant geometry, or experimentalerror as the pH range covering some of the metals given in these series is verysmall. The variation of degree of extraction with the aqueous solubility of theextractant [Eqn (3.6)] is partly offset by the solubility of the resultant metalcomplex also change. Variation of the aqueous phase anion can affect theselectivity order due to the metal–anion interactions in the aqueous phase.Provided no metal-inorganic anion complexes are extracted, the distributioncoefficient will be decreased by such interactions as follows:
log D ¼ log KDC þ zpHþ zlog½HL�ðOÞ � logXi
0
bi½ML�i (3.12)
In general, the aqueous interaction would be expected to increase in theorder ClO4 < NO�
3 < Cl� < CO�3 < SO�
4 . Equation (3.12) applies toa neutral ligand when nonextractable complexes such as ammonia are formed.The degree of extraction increases with increasing acidity of the extractant inthe general order: carboxylic acids < alkylphosphoric acids < sulfonic acids.
Obviously, chelating extractants cannot be ranked in the regular seriesarising from specific interactions with compounds, dominating in the system.However, the effect of increasing acid strength within such classes of reagentscan be demonstrated for hydroxyoximes where chlorination of 4-nonyl-2-hydroxybenzophenone oxime in the 3 position changes of the pKa for copperfrom 0.96 to 0.00,11 whereas the acid dissociation constants for the antiisomersare 11.5 and 10.5, respectively. A similar effect, of course, exists within eachclass of simple acids, and pKa for copper with lauric acid is reduced from 4.1 to3.4 when o-bromolauric acid is used.12
2.2. Stoichiometry and Structure of Extracted Species
The most popular way to study the stoichiometry of the extracted species hasbeen the use of slope analysis. This relies on plots of log D versus pH atconstant extractant concentration and also log D versus log[HL] or log[L�] at
122 PART | I Conventional (Classical) Principles and Practice
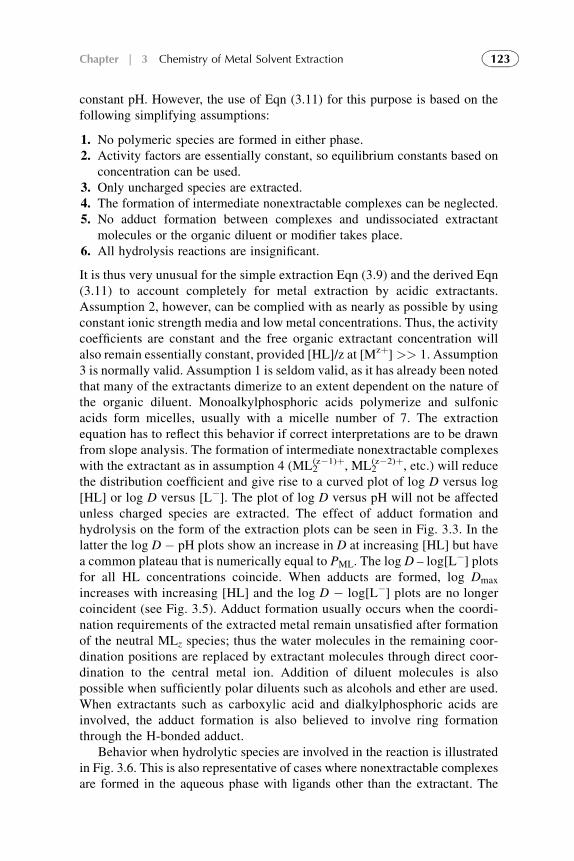
constant pH. However, the use of Eqn (3.11) for this purpose is based on thefollowing simplifying assumptions:
1. No polymeric species are formed in either phase.2. Activity factors are essentially constant, so equilibrium constants based on
concentration can be used.3. Only uncharged species are extracted.4. The formation of intermediate nonextractable complexes can be neglected.5. No adduct formation between complexes and undissociated extractant
molecules or the organic diluent or modifier takes place.6. All hydrolysis reactions are insignificant.
It is thus very unusual for the simple extraction Eqn (3.9) and the derived Eqn(3.11) to account completely for metal extraction by acidic extractants.Assumption 2, however, can be complied with as nearly as possible by usingconstant ionic strength media and low metal concentrations. Thus, the activitycoefficients are constant and the free organic extractant concentration willalso remain essentially constant, provided [HL]/z at [Mzþ] >> 1. Assumption3 is normally valid. Assumption 1 is seldom valid, as it has already been notedthat many of the extractants dimerize to an extent dependent on the nature ofthe organic diluent. Monoalkylphosphoric acids polymerize and sulfonicacids form micelles, usually with a micelle number of 7. The extractionequation has to reflect this behavior if correct interpretations are to be drawnfrom slope analysis. The formation of intermediate nonextractable complexeswith the extractant as in assumption 4 (ML2
(z�1)þ, ML2(z�2)þ, etc.) will reduce
the distribution coefficient and give rise to a curved plot of log D versus log[HL] or log D versus [L�]. The plot of log D versus pH will not be affectedunless charged species are extracted. The effect of adduct formation andhydrolysis on the form of the extraction plots can be seen in Fig. 3.3. In thelatter the log D � pH plots show an increase in D at increasing [HL] but havea common plateau that is numerically equal to PML. The log D – log[L�] plotsfor all HL concentrations coincide. When adducts are formed, log Dmax
increases with increasing [HL] and the log D � log[L�] plots are no longercoincident (see Fig. 3.5). Adduct formation usually occurs when the coordi-nation requirements of the extracted metal remain unsatisfied after formationof the neutral MLz species; thus the water molecules in the remaining coor-dination positions are replaced by extractant molecules through direct coor-dination to the central metal ion. Addition of diluent molecules is alsopossible when sufficiently polar diluents such as alcohols and ether are used.When extractants such as carboxylic acid and dialkylphosphoric acids areinvolved, the adduct formation is also believed to involve ring formationthrough the H-bonded adduct.
Behavior when hydrolytic species are involved in the reaction is illustratedin Fig. 3.6. This is also representative of cases where nonextractable complexesare formed in the aqueous phase with ligands other than the extractant. The
123Chapter | 3 Chemistry of Metal Solvent Extraction
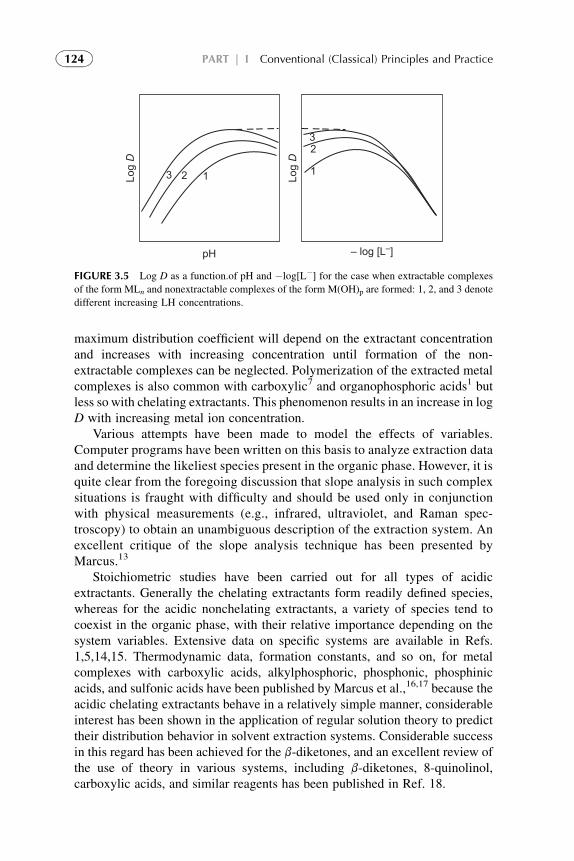
maximum distribution coefficient will depend on the extractant concentrationand increases with increasing concentration until formation of the non-extractable complexes can be neglected. Polymerization of the extracted metalcomplexes is also common with carboxylic7 and organophosphoric acids1 butless so with chelating extractants. This phenomenon results in an increase in logD with increasing metal ion concentration.
Various attempts have been made to model the effects of variables.Computer programs have been written on this basis to analyze extraction dataand determine the likeliest species present in the organic phase. However, it isquite clear from the foregoing discussion that slope analysis in such complexsituations is fraught with difficulty and should be used only in conjunctionwith physical measurements (e.g., infrared, ultraviolet, and Raman spec-troscopy) to obtain an unambiguous description of the extraction system. Anexcellent critique of the slope analysis technique has been presented byMarcus.13
Stoichiometric studies have been carried out for all types of acidicextractants. Generally the chelating extractants form readily defined species,whereas for the acidic nonchelating extractants, a variety of species tend tocoexist in the organic phase, with their relative importance depending on thesystem variables. Extensive data on specific systems are available in Refs.1,5,14,15. Thermodynamic data, formation constants, and so on, for metalcomplexes with carboxylic acids, alkylphosphoric, phosphonic, phosphinicacids, and sulfonic acids have been published by Marcus et al.,16,17 because theacidic chelating extractants behave in a relatively simple manner, considerableinterest has been shown in the application of regular solution theory to predicttheir distribution behavior in solvent extraction systems. Considerable successin this regard has been achieved for the b-diketones, and an excellent review ofthe use of theory in various systems, including b-diketones, 8-quinolinol,carboxylic acids, and similar reagents has been published in Ref. 18.
Log D
Log D
– log [L–]
3 2 1 1
23
pH
FIGURE 3.5 Log D as a function.of pH and �log[L�] for the case when extractable complexes
of the form MLn and nonextractable complexes of the form M(OH)p are formed: 1, 2, and 3 denote
different increasing LH concentrations.
124 PART | I Conventional (Classical) Principles and Practice
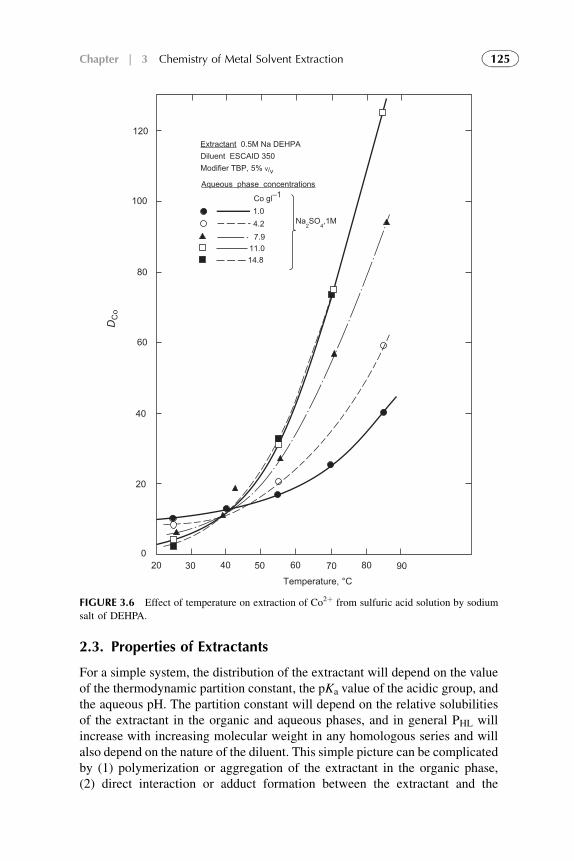
2.3. Properties of Extractants
For a simple system, the distribution of the extractant will depend on the valueof the thermodynamic partition constant, the pKa value of the acidic group, andthe aqueous pH. The partition constant will depend on the relative solubilitiesof the extractant in the organic and aqueous phases, and in general PHL willincrease with increasing molecular weight in any homologous series and willalso depend on the nature of the diluent. This simple picture can be complicatedby (1) polymerization or aggregation of the extractant in the organic phase,(2) direct interaction or adduct formation between the extractant and the
Extractant 0.5M Na DEHPADiluent ESCAID 350Modifier TBP, 5% v/v
Aqueous phase concentrations
120
100
80
60
40
20
070 80 90
Co gl–1
1.04.27.9
11.014.8
Na2SO
4,1M
DC
o
6050403020
Temperature, °C
FIGURE 3.6 Effect of temperature on extraction of Co2þ from sulfuric acid solution by sodium
salt of DEHPA.
125Chapter | 3 Chemistry of Metal Solvent Extraction
diluent, (3) formation of acid hydrates soluble in the aqueous phase, (4)amphoteric behavior of the extractant, mostly found for chelating extractantssuch as 8-quinolinol, and (5) polymerization or aggregation of the extractantand the ionized extractant anion in the aqueous phase.
For carboxylic acids, the major complications are dimerization of the acidsin the organic phase and the presence of singly charged anion molecule dimers,as well as doubly charged dimeric species in the aqueous phase. The mathe-matical treatment of such effects on the distribution of carboxylic acids hasbeen fully discussed in Ref. 7, as has the aqueous and organic phase chemistryof importance in solvent extraction systems. Quantitative information ondistribution and dimerization constants of carboxylic acids is given in Ref. 14.
The corresponding behavior of acidic organophosphorus compounds hasbeen reviewed in Ref. 1. A number of equilibria relating to polymerization,hydrate formation, and so on, have to be assumed in the distribution of theseacids between the organic and aqueous phases. The degree of polymerizationagain depends on the nature of the diluent, and it is found that the monoalkyldihydrogen phosphoric acids ROPO(OH)2 are more highly polymerized thanthe dialkyl monohydrogen phosphoric acids. The acids are also amphoteric,extracting mineral acids under certain conditions, and thus the equilibriaassociated with this behavior have to be included. H-bonded interactionsbetween the diluent and other donor compounds such as tri-n-butylphosphate(TBP) and alkylamines19 are also possible. H-bonding interactions are, in factimportant in all these systems and most of the interactions are likely to becompetitive. The combination of extractant with a neutral donor or anotherextractant can be of considerable significance in metal ion extraction and cangive rise to the phenomena of synergism and antagonism, which will be dis-cussed later. Data on distribution, dissociation, dimerization constants, andother parameters are available from the literature.1,14,16
Sulfonic acids are even more highly aggregated than alkylphosphoric acidsand tend to form micelles even at very low organic phase concentrations. Thepresence of micelles thus dominates the whole extraction chemistry of sulfonicacids. The solvent extraction behavior of these acids is reviewed in Refs.1,20,21. The physical chemistry of aggregation and micellization of carboxylic,sulfonic acids, and their salts in organic solvents has also reviewed.22 Greatcare must be taken when examining the literature for values of dimerizationconstants, critical micelle concentrations (CMC), and similar parameters.Anhydrous organic solution data must be treated cautiously, for it is certain thatin a solvent extraction situation the presence of water will produce hydratesand, through competitive H bonding with the extractants, materially affect thedegree of polymerization and observed CMC values.
The chelating extractants tend to behave in a more regular fashion than theorganic acids. Nevertheless, hydroxyoximes dimerize in the organic phase to anextent that depends not only on the aromaticity of the diluent, but also on thehydroxyoxime type. The presence of higher aggregates has recently been
126 PART | I Conventional (Classical) Principles and Practice
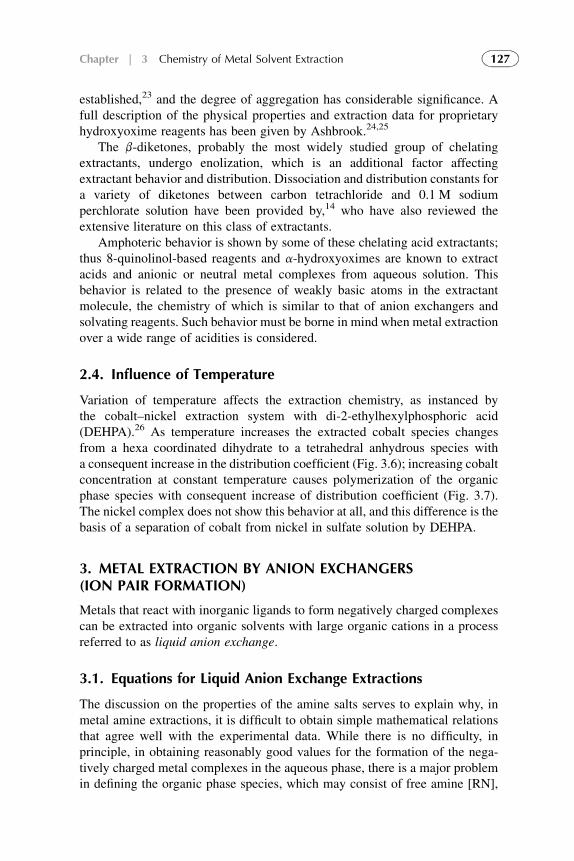
established,23 and the degree of aggregation has considerable significance. Afull description of the physical properties and extraction data for proprietaryhydroxyoxime reagents has been given by Ashbrook.24,25
The b-diketones, probably the most widely studied group of chelatingextractants, undergo enolization, which is an additional factor affectingextractant behavior and distribution. Dissociation and distribution constants fora variety of diketones between carbon tetrachloride and 0.1 M sodiumperchlorate solution have been provided by,14 who have also reviewed theextensive literature on this class of extractants.
Amphoteric behavior is shown by some of these chelating acid extractants;thus 8-quinolinol-based reagents and a-hydroxyoximes are known to extractacids and anionic or neutral metal complexes from aqueous solution. Thisbehavior is related to the presence of weakly basic atoms in the extractantmolecule, the chemistry of which is similar to that of anion exchangers andsolvating reagents. Such behavior must be borne in mind when metal extractionover a wide range of acidities is considered.
2.4. Influence of Temperature
Variation of temperature affects the extraction chemistry, as instanced bythe cobalt–nickel extraction system with di-2-ethylhexylphosphoric acid(DEHPA).26 As temperature increases the extracted cobalt species changesfrom a hexa coordinated dihydrate to a tetrahedral anhydrous species witha consequent increase in the distribution coefficient (Fig. 3.6); increasing cobaltconcentration at constant temperature causes polymerization of the organicphase species with consequent increase of distribution coefficient (Fig. 3.7).The nickel complex does not show this behavior at all, and this difference is thebasis of a separation of cobalt from nickel in sulfate solution by DEHPA.
3. METAL EXTRACTION BY ANION EXCHANGERS(ION PAIR FORMATION)
Metals that react with inorganic ligands to form negatively charged complexescan be extracted into organic solvents with large organic cations in a processreferred to as liquid anion exchange.
3.1. Equations for Liquid Anion Exchange Extractions
The discussion on the properties of the amine salts serves to explain why, inmetal amine extractions, it is difficult to obtain simple mathematical relationsthat agree well with the experimental data. While there is no difficulty, inprinciple, in obtaining reasonably good values for the formation of the nega-tively charged metal complexes in the aqueous phase, there is a major problemin defining the organic phase species, which may consist of free amine [RN],
127Chapter | 3 Chemistry of Metal Solvent Extraction
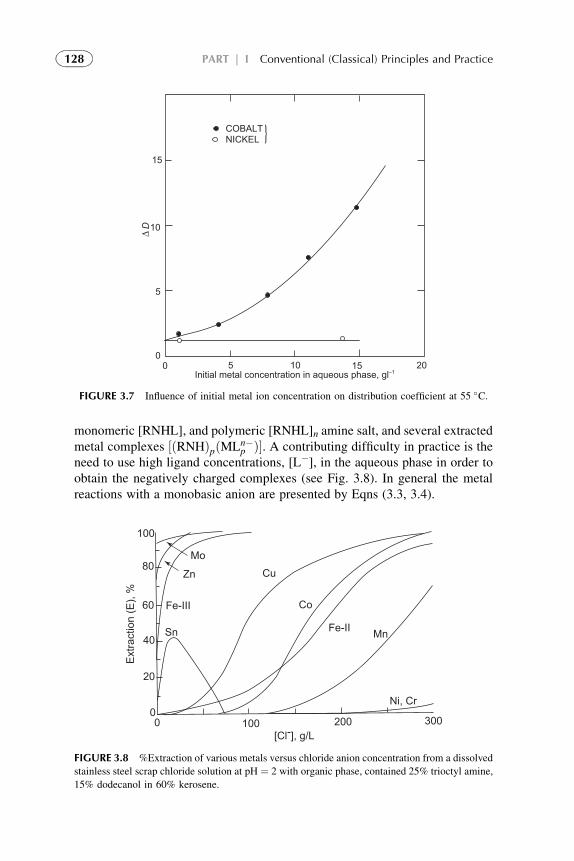
monomeric [RNHL], and polymeric [RNHL]n amine salt, and several extractedmetal complexes ½ðRNHÞpðMLn�
p Þ�. A contributing difficulty in practice is theneed to use high ligand concentrations, [L�], in the aqueous phase in order toobtain the negatively charged complexes (see Fig. 3.8). In general the metalreactions with a monobasic anion are presented by Eqns (3.3, 3.4).
15
10
5
00 5 10 15 20
Initial metal concentration in aqueous phase, gl–1
D
COBALTNICKEL
D}
FIGURE 3.7 Influence of initial metal ion concentration on distribution coefficient at 55 �C.
100
80
60
40
20
00 100 200 300
[Cl-], g/L
Ni, Cr
MnFe-II
Co
CuMo
Zn
Fe-III
Sn
Extra
ctio
n (E
), %
FIGURE 3.8 %Extraction of various metals versus chloride anion concentration from a dissolved
stainless steel scrap chloride solution at pH ¼ 2 with organic phase, contained 25% trioctyl amine,
15% dodecanol in 60% kerosene.
128 PART | I Conventional (Classical) Principles and Practice
When z – n ¼ q is negative, a negatively charged metal complex has beenformed, which can be extracted
ML�qn þ qRNHþL�
ðOÞ 4��
RNHþ�qq½ML��q
n
�ðOÞ
þ qL� (3.13)
And/or
MLn þ R4NL 4 RNþML� (3.14)
We define the extraction constant by
Kex ¼
h½RNH�þq
q
iðOÞ
�L�n
�qhML�q
n
i½RNHL�qðOÞ
(3.15)
It must be assumed that the aqueous phase contains all the stepwisecomplexes MLz�n
n . Thus, the distribution ratio is
DM ¼
hðRNHÞþq
q ML�qn
iðOÞP�
MLz�nn
� ¼ Kex
bq�L��q½RNHL�qðOÞ
1þPbq�L��q (3.16)
The distribution of M depends on both the free amine salt in the organicphase and the concentration of free ligand, L�, in the aqueous phase until allmetals in the aqueous phase are bound in the ML�q
n complex. At constant amineconcentration, Eqn (3.16) indicates that a plot of DM versus [L�] would havea linear slope q if the denominator of Eqn (3.16) is <<1; i.e., the metal speciesin the aqueous phase are dominated by the uncomplexed metal ion Mzþ. Athigher [L�] concentrations, where the ML�q
n complex begins to dominate in theaqueous phase, the DM value becomes equal to Kex[RNHL]q,org. Eqns (3.16)and (3.5) show that the S-shaped curves result for metals with large Kex values.In a plot of DM versus [RNHL]org a straight line of slope q is obtained only atconstant [L�]. From such measurements q, Kex, and bp can be evaluated.
The interaction of amine salts and quaternary ammonium ions with metalanionic complexes is mainly electrostatic; thus, as the degree of extraction isdue to the extent of ion pair formation, selectivity will depend on charge, ionsize, and extent of complex formation in the aqueous phase. Selectivity isgenerally achieved by varying the ligand concentration in the aqueous phase.
Stoichiometry for acidic extractants has traditionally been determined byslope analysis techniques, plotting the distribution coefficient of the metal ofinterest as a function of the aqueous concentration and extractant concentration.Interpretation of these results can be difficult because of hydrolytic polymer-ization of aqueous phase complexes when oxyanions are concerned and thedegree of aggregation of the amine salt and amine salt metal complex in theorganic phase. Extensive computer studies of distribution data have been
129Chapter | 3 Chemistry of Metal Solvent Extraction
carried out.27 Again, the use of slope analysis or numerical analysis alone forthe determination of stoichiometry must be done cautiously unless there areother appropriate physical chemical data.
Third-phase formation, that is, the splitting of the organic phase into two parts,is common in these systems and occurs through solubility problems relating toaggregation. This almost always results in a light organic phase rich in diluent andlean in amine and a dense organic phase rich in amine salt–metal complex. Third-phase formation is eliminated by addition of diluentmodifiers such as long-chainaliphatic alcohols that carry out specific solvation of the amine salts and metalcomplexes through either dipole–dipole interactions or H bonding.
Extractable anionic species are found with several different types of ligand.For example, some metals occur as oxyanions that are extractable by amines,such as ReO�
4 , TcO�4 , and MnO�
4 . The group VI metals chromium, molyb-denum, and tungsten also occur as oxyanions, but here the system is morecomplex in that aggregation and proton association with the anionic complexescan also occur. The anions derived from mineral acids are also known to formcomplexes with metals. The extent of complexation of metals by these anions,as before, is as follows:
ClO�4 < NO�
3 < Cl� < SO�4 ; thus the extraction of metals by quaternary
ammonium ions follows this ligand order.The nitrate ion tends to form only weak complexes with metal ions in
aqueous solution, but a few elements can be extracted in the form of nitratecomplexes with amine salts. These elements tend to be tetra- and hexavalentactinides and tervalent lanthanides, the heavier transition elements of GroupsIV and V, and some of the platinum elements.28,29
For example, at extraction of trivalent actinides by the tertiary amine salt,trilaurylmethylammonium nitrate, TLMA * HNO3, in o-xylene from 0.01 Mnitric acid solutions of various LiNO3 concentrations the authors
27 have foundthat the amine was monomeric only at very low concentrations (�0.1 M in theorganic phase) but at higher concentration formed both dimers and trimers.Using trace concentrations of Ce(III) and Am(III) a log–log plot of DM againstthe nitrate ion activity, mg� ¼ [LiNO3]
1/2, had a slope of approximately 3 (seeFig. 3.9b). From Eqn (3.15) this slope corresponds to the q-value of 3 when theaqueous phase is dominated by the free metal ion, which is not an unreasonableassumption at low nitrate concentrations.
In plots of log DAm against [TLMA * NO3]org at different nitrate concen-trations, the curves in Fig. 3.9a had straight slopes of 1.5–1.8 at low concen-trations of TLMA * NO3, but bending at higher concentrations, was explainedby the formation of polymeric amine species. If Eqn (3.15) is valid, theseslopes correspond to the number of TLMA * HNO3 groups attached to theextracted Am species. Thus, the authors27 described this complex as{(TLMA *NO3)n}2 * Am(NO3)3 for which n ¼ 1 only at the very low amineconcentrations. Thus, for n ¼ 1 the complex could be written as (TLMA)2Am(NO3)5. The Ce and other Am complexes would have similar configurations.
130 PART | I Conventional (Classical) Principles and Practice
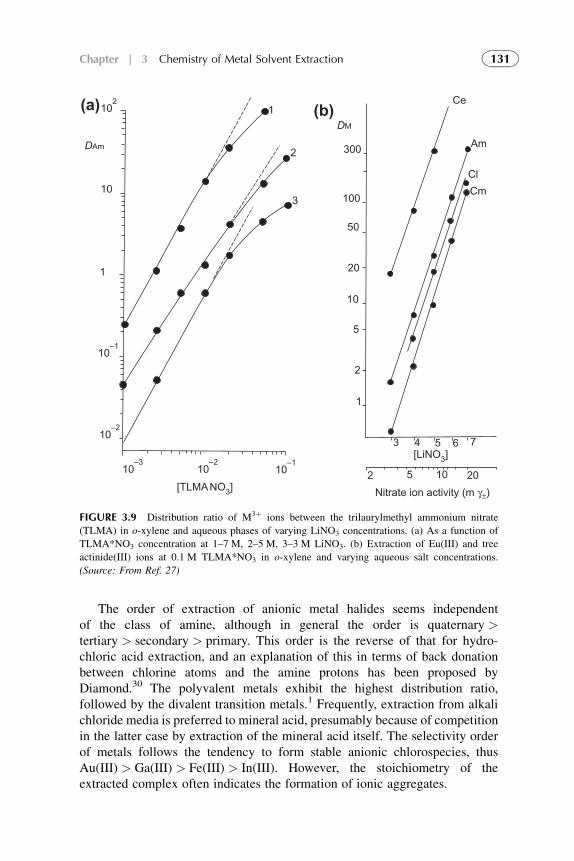
The order of extraction of anionic metal halides seems independentof the class of amine, although in general the order is quaternary >tertiary > secondary > primary. This order is the reverse of that for hydro-chloric acid extraction, and an explanation of this in terms of back donationbetween chlorine atoms and the amine protons has been proposed byDiamond.30 The polyvalent metals exhibit the highest distribution ratio,followed by the divalent transition metals.1 Frequently, extraction from alkalichloride media is preferred to mineral acid, presumably because of competitionin the latter case by extraction of the mineral acid itself. The selectivity orderof metals follows the tendency to form stable anionic chlorospecies, thusAu(III) > Ga(III) > Fe(III) > In(III). However, the stoichiometry of theextracted complex often indicates the formation of ionic aggregates.
102
DAm
10
1
10–1
10–2
10–3
10–2
10–1
[TLMA NO3]
(a)
1
2
5
10
20
50
100
300
DM
3 4 5 6 7[LiNO3]
2 5 10 20Nitrate ion activity (m γ±)
Ce
Am
ClCm
(b)1
2
3
FIGURE 3.9 Distribution ratio of M3þ ions between the trilaurylmethyl ammonium nitrate
(TLMA) in o-xylene and aqueous phases of varying LiNO3 concentrations. (a) As a function of
TLMA*NO3 concentration at 1–7 M, 2–5 M, 3–3 M LiNO3. (b) Extraction of Eu(III) and tree
actinide(III) ions at 0.1 M TLMA*NO3 in o-xylene and varying aqueous salt concentrations.
(Source: From Ref. 27)
131Chapter | 3 Chemistry of Metal Solvent Extraction
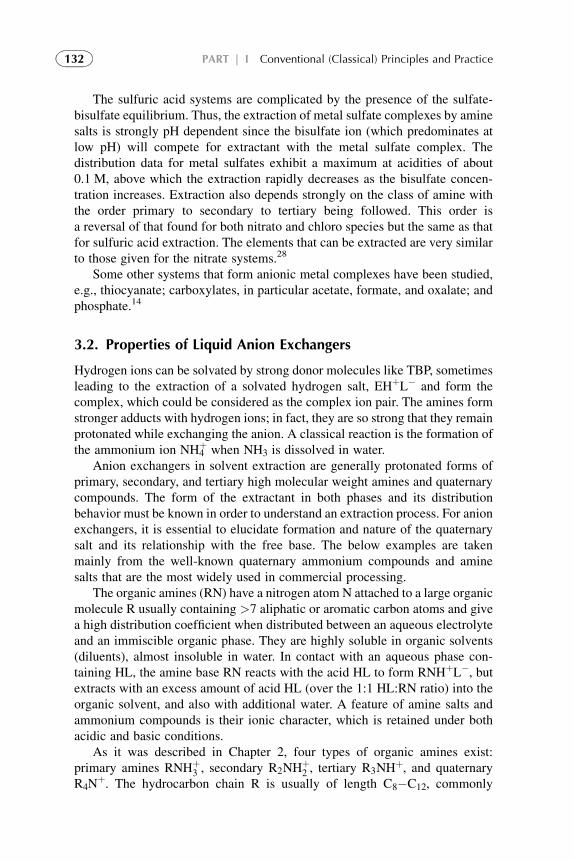
The sulfuric acid systems are complicated by the presence of the sulfate-bisulfate equilibrium. Thus, the extraction of metal sulfate complexes by aminesalts is strongly pH dependent since the bisulfate ion (which predominates atlow pH) will compete for extractant with the metal sulfate complex. Thedistribution data for metal sulfates exhibit a maximum at acidities of about0.1 M, above which the extraction rapidly decreases as the bisulfate concen-tration increases. Extraction also depends strongly on the class of amine withthe order primary to secondary to tertiary being followed. This order isa reversal of that found for both nitrato and chloro species but the same as thatfor sulfuric acid extraction. The elements that can be extracted are very similarto those given for the nitrate systems.28
Some other systems that form anionic metal complexes have been studied,e.g., thiocyanate; carboxylates, in particular acetate, formate, and oxalate; andphosphate.14
3.2. Properties of Liquid Anion Exchangers
Hydrogen ions can be solvated by strong donor molecules like TBP, sometimesleading to the extraction of a solvated hydrogen salt, EHþL� and form thecomplex, which could be considered as the complex ion pair. The amines formstronger adducts with hydrogen ions; in fact, they are so strong that they remainprotonated while exchanging the anion. A classical reaction is the formation ofthe ammonium ion NH4
þ when NH3 is dissolved in water.Anion exchangers in solvent extraction are generally protonated forms of
primary, secondary, and tertiary high molecular weight amines and quaternarycompounds. The form of the extractant in both phases and its distributionbehavior must be known in order to understand an extraction process. For anionexchangers, it is essential to elucidate formation and nature of the quaternarysalt and its relationship with the free base. The below examples are takenmainly from the well-known quaternary ammonium compounds and aminesalts that are the most widely used in commercial processing.
The organic amines (RN) have a nitrogen atom N attached to a large organicmolecule R usually containing >7 aliphatic or aromatic carbon atoms and givea high distribution coefficient when distributed between an aqueous electrolyteand an immiscible organic phase. They are highly soluble in organic solvents(diluents), almost insoluble in water. In contact with an aqueous phase con-taining HL, the amine base RN reacts with the acid HL to form RNHþL�, butextracts with an excess amount of acid HL (over the 1:1 HL:RN ratio) into theorganic solvent, and also with additional water. A feature of amine salts andammonium compounds is their ionic character, which is retained under bothacidic and basic conditions.
As it was described in Chapter 2, four types of organic amines exist:primary amines RNHþ
3 , secondary R2NHþ2 , tertiary R3NH
þ, and quaternaryR4N
þ. The hydrocarbon chain R is usually of length C8�C12, commonly
132 PART | I Conventional (Classical) Principles and Practice
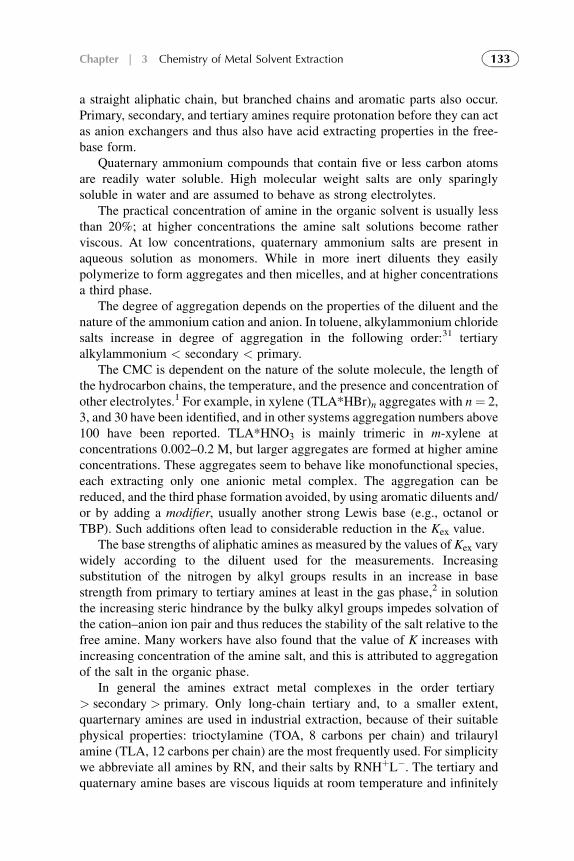
a straight aliphatic chain, but branched chains and aromatic parts also occur.Primary, secondary, and tertiary amines require protonation before they can actas anion exchangers and thus also have acid extracting properties in the free-base form.
Quaternary ammonium compounds that contain five or less carbon atomsare readily water soluble. High molecular weight salts are only sparinglysoluble in water and are assumed to behave as strong electrolytes.
The practical concentration of amine in the organic solvent is usually lessthan 20%; at higher concentrations the amine salt solutions become ratherviscous. At low concentrations, quaternary ammonium salts are present inaqueous solution as monomers. While in more inert diluents they easilypolymerize to form aggregates and then micelles, and at higher concentrationsa third phase.
The degree of aggregation depends on the properties of the diluent and thenature of the ammonium cation and anion. In toluene, alkylammonium chloridesalts increase in degree of aggregation in the following order:31 tertiaryalkylammonium < secondary < primary.
The CMC is dependent on the nature of the solute molecule, the length ofthe hydrocarbon chains, the temperature, and the presence and concentration ofother electrolytes.1 For example, in xylene (TLA*HBr)n aggregates with n¼ 2,3, and 30 have been identified, and in other systems aggregation numbers above100 have been reported. TLA*HNO3 is mainly trimeric in m-xylene atconcentrations 0.002–0.2 M, but larger aggregates are formed at higher amineconcentrations. These aggregates seem to behave like monofunctional species,each extracting only one anionic metal complex. The aggregation can bereduced, and the third phase formation avoided, by using aromatic diluents and/or by adding a modifier, usually another strong Lewis base (e.g., octanol orTBP). Such additions often lead to considerable reduction in the Kex value.
The base strengths of aliphatic amines as measured by the values of Kex varywidely according to the diluent used for the measurements. Increasingsubstitution of the nitrogen by alkyl groups results in an increase in basestrength from primary to tertiary amines at least in the gas phase,2 in solutionthe increasing steric hindrance by the bulky alkyl groups impedes solvation ofthe cation–anion ion pair and thus reduces the stability of the salt relative to thefree amine. Many workers have also found that the value of K increases withincreasing concentration of the amine salt, and this is attributed to aggregationof the salt in the organic phase.
In general the amines extract metal complexes in the order tertiary> secondary > primary. Only long-chain tertiary and, to a smaller extent,quarternary amines are used in industrial extraction, because of their suitablephysical properties: trioctylamine (TOA, 8 carbons per chain) and trilaurylamine (TLA, 12 carbons per chain) are the most frequently used. For simplicitywe abbreviate all amines by RN, and their salts by RNHþL�. The tertiary andquaternary amine bases are viscous liquids at room temperature and infinitely
133Chapter | 3 Chemistry of Metal Solvent Extraction
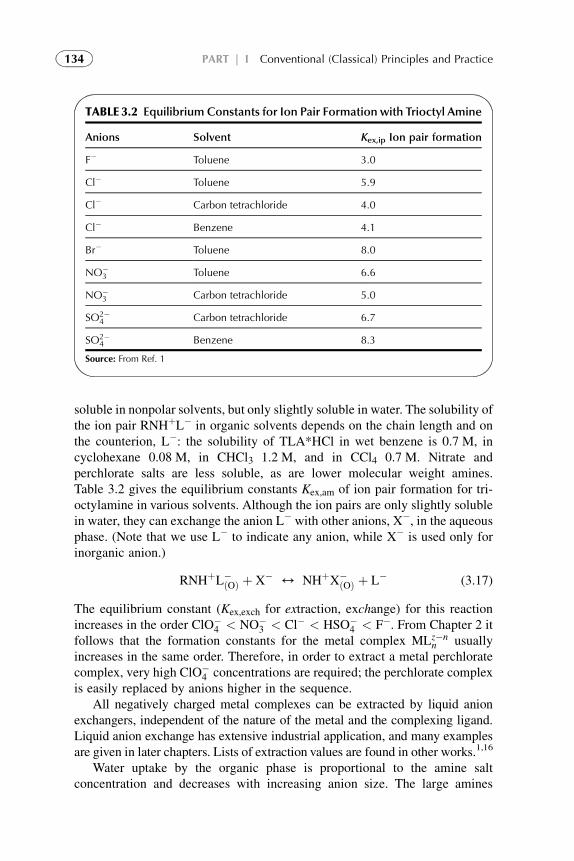
soluble in nonpolar solvents, but only slightly soluble in water. The solubility ofthe ion pair RNHþL� in organic solvents depends on the chain length and onthe counterion, L�: the solubility of TLA*HCl in wet benzene is 0.7 M, incyclohexane 0.08 M, in CHCl3 1.2 M, and in CCl4 0.7 M. Nitrate andperchlorate salts are less soluble, as are lower molecular weight amines.Table 3.2 gives the equilibrium constants Kex,am of ion pair formation for tri-octylamine in various solvents. Although the ion pairs are only slightly solublein water, they can exchange the anion L� with other anions, X�, in the aqueousphase. (Note that we use L� to indicate any anion, while X� is used only forinorganic anion.)
RNHþL�ðOÞ þ X� 4 NHþX�
ðOÞ þ L� (3.17)
The equilibrium constant (Kex,exch for extraction, exchange) for this reactionincreases in the order ClO�
4 < NO�3 < Cl� < HSO�
4 < F�. From Chapter 2 itfollows that the formation constants for the metal complex MLz�n
n usuallyincreases in the same order. Therefore, in order to extract a metal perchloratecomplex, very high ClO�
4 concentrations are required; the perchlorate complexis easily replaced by anions higher in the sequence.
All negatively charged metal complexes can be extracted by liquid anionexchangers, independent of the nature of the metal and the complexing ligand.Liquid anion exchange has extensive industrial application, and many examplesare given in later chapters. Lists of extraction values are found in other works.1,16
Water uptake by the organic phase is proportional to the amine saltconcentration and decreases with increasing anion size. The large amines
TABLE 3.2 Equilibrium Constants for Ion Pair Formation with Trioctyl Amine
Anions Solvent Kex,ip Ion pair formation
F� Toluene 3.0
Cl� Toluene 5.9
Cl� Carbon tetrachloride 4.0
Cl� Benzene 4.1
Br� Toluene 8.0
NO�3 Toluene 6.6
NO�3 Carbon tetrachloride 5.0
SO2�4 Carbon tetrachloride 6.7
SO2�4 Benzene 8.3
Source: From Ref. 1
134 PART | I Conventional (Classical) Principles and Practice
do not seem to be hydrated very much in common diluents. The degreeof hydration of the free base increases in the following order:tertiary < secondary < primary.2 It would appear that the amount of watercoextracted with the anion on amine salt formation is dependent on the ioniccharacter of the amine salt and on the nature of the diluent. Thus, the tertiaryamine hydrochlorides are monohydrates in benzene and toluene, but less wateris coextracted into chloroform or carbon tetrachloride, whereas cyclohexaneshows the greatest amount of coextracted water. This obviously relates to therelative ability of the diluent to solvate the amine salt ion pairs. The extractionof water by tri-n-octylamine and several of its salts in two diluents wasstudied.32 In benzene the amount of water extracted by the amine salt alwaysexceeded that extracted by the free base and increased in the following order:acetate < perchlorate < nitrate < chloride < bisulfate < sulfate.
The effect of coextracted water on the degree of extraction is not fullyclear. The authors1 conclude that water plays only a minor role, but others33
have shown that water can have a significant effect on the aggregation of freetri-n-octylamine in benzene. Although the degree of aggregation of tertiaryamine sulfates is considerably less than that of tertiary amine bisulfates, it isnot clear whether this is due to the greater amount of water associated with thesulfate form or the increased opportunities for H bonding with the bisulfatesystem. Certainly, the greater degree of aggregation found for secondaryamine sulfate salts compared with tertiary amine sulfate salts has beendirectly attributed to the opportunities for extensive H bonding in the former,which is not possible in the case of the latter.
These effects have been studied by use of a variety of techniques, such aslight scattering, vapor-phase osmometry, vapor-pressure lowering, cryoscopy,infrared spectroscopy, and the two-phase titration technique. Computer anal-ysis of the distribution data has also been widely used.
Organic-phase properties can change during the extraction process. Forexample, dielectric constant can change markedly with loading increase whenamine comprises a significant proportion of the organic phase.
In addition to alkylammonium compounds several other polyalkyl or poly-phenyl onium compounds such as quaternary arsenium and sulfonium salts, havebeen studied as anion exchangers. The properties of these reagents are very similarto those discussed above. More information may be found in Refs. 1–3,14.
4. EXTRACTION THROUGH FORMATION OF H-BONDINGAND SOLVATING COMPLEXES
4.1. Extraction of Metal Complexes
Extraction by solvation requires the transfer of a neutral species from theaqueous to the organic phase by solvation of the hydrogen ion of a complexmetal acid species (e.g., HFeCl4) or by solvation of the metal ion of a neutral
135Chapter | 3 Chemistry of Metal Solvent Extraction
salt species. If the neutral metal complex is coordinatively unsaturated, it formsMLz(H2O)x in the aqueous phase, where 2z � x (L being bidentate) equals themaximum coordination number. In the absence of solvating organic solvents,this complex has a very low distribution constant. Obviously, if water ofhydration can be replaced by organic molecules E, then the result is a morelipophilic adduct complex MLzEb.
Extraction by solvating extractants depends on the extent of complexformation in the aqueous phase, as in the case of the basic extractants.Depending on the ligand, several types of such adducts exist: (1) type MLzEb,where L and E are different organic structures; (2) type MXzEb, where MXz
is a neutral in organic compound (salt); and (3) type MLz(HL)b, where L andHL are the basic and neutral variant of the same molecule (so-calledself-adducts).
4.1.1. Formation of Metal – Organic Complexes of Type MLzEb
Extraction is by solvation of either the central metal atom of the complex or theproton in the case of formation of a complex acid species. The metal complexcan be written as
½MLz�ðOÞ þ bE 4 ½MLzEb�ðOÞ (3.18)
or
HMLzþ1 þ pEðOÞ 4hðHEbÞþðMLzþ1Þ�
iðOÞ
(3.19)
In the extraction of these metal complexes, as for acid extraction, thesolvating agent will replace primary and/or secondary waters of hydration, thusrendering the complex soluble in the organic phase. The degree of extraction ofa metal by a solvating extractant should depend on a number of factors,including the nature and concentration of the anionic coordinating ligand L,which, in turn, influences the type of metal complex formed; the degree ofhydration of these aqueous metal complexes; and the relative strength of thewater–metal and extractant–metal bonds, leading to a competition betweenwater and the extractant for the solvation sites. The authors1 have attempted torelate these factors to the electropositivity of the metal. The electrovalencyrequirements of strongly electropositive metals can be satisfied by the stronglypolar organophosphorus reagents and hence are readily extractable in anunhydrated form. A less strongly electropositive metal is usually extracted bythe same reagent in a partially hydrated form, a similar situation to theextraction of a strongly electropositive metal with the less polar carbon–oxygenextractants. This is explained by the persisting attraction of the metal for water.Similarly, it would be expected that mixed water–extractant complexes wouldbe formed by extraction of the less electropositive metals by carbon–oxygenextractants. Here it is postulated that the extractant cannot compete
136 PART | I Conventional (Classical) Principles and Practice
successfully with water for the primary coordination sites and that extractionoccurs by replacement of the secondary hydration sphere by extractant mole-cules H bonding to water in the primary sphere.
4.1.2. Extraction of Mineral Salts
The extraction of mineral salts is generally less complicated than the extractionof mineral acids. Metal salts with monodentate univalent anions like Cl�,ClO�
4 , SCN�, and NO�
3 are strongly hydrated in the aqueous phase and havequite small, if any, solubility in inert solvents. In order to extract these acids,they must either form an adduct with a strongly basic extractant like TBP orTOPO, or be in solvating solvents such as ethers, ketones, alcohols, or esters.Examples of extracted metal salt adducts are: Br3(EtO)b, PaCl3(MIBK),UO2(NO3)2(TBP)2, Co(ClO4)2(Octanol)b, etc. (b is uncertain). Tables of theextraction of a large number of metal salts by solvating solvents or commercialadduct formers dissolved in kerosene are given in Ref. 1.
It has been shown34 that monomeric metal hydroxides can be extracted bystrong donor molecules; e.g., Ln(OH)3(TOPO)b into CHCl3, where b is 2–3.Under favorable conditions, the DLn value may exceed 1, though the fraction ofhydroxide is quite low. When the solvent is a good solvater, the determinationof the solvation number b is difficult, unless the dependence of the extractantconcentration on the solvent can be obtained. Solvation numbers can beobtained in mixtures of a solvating extractant and an inert diluent like hexane.Further, in these systems the extraction of the metal commonly requires highconcentrations of salt or acid in the aqueous phase, so the activity coefficientsof the solutes must betaken into account.
Figure 3.10 shows the extraction of Zn(II) from aqueous thiocyanate (X�)solutions into 0.001 M TOPO (E) in hexane; the aqueous phase is 1.0 MNa(SCN)�, or Na(ClO4)
� at pH around 5.35 Zn(II) is known to form a numberof weak ZnðSCNÞz�2
z complexes in the aqueous phase. The uncharged one isassumed to accept TOPO to form the complex Zn(SCN)2(TOPO)b, whereb ¼ 1 or 2.
Assume that the reaction between the neutral complex and the solvatingmolecule takes place at the interface (to assume the reaction to take place in theorganic phase would be unrealistic, as the zinc thiocyanate is insoluble inhexane); thus the extraction reaction is
ZnX2 þ bEðOÞ 4 ZnX2Eb;ðOÞ (3.20)
for which we may define an equilibrium constant Kex,bE.Because more than one solvated species may be extracted, the distribution
ratio becomes
DZn ¼½ZnX2E�ðOÞ þ ½ZnX2E2�ðOÞþ/
½Zn� þ ½ZnX� þ ½ZnX2� þ/¼
b2½X2�P
Kex;bE½E�bðOÞ1þP
bn½X�n(3.21)
137Chapter | 3 Chemistry of Metal Solvent Extraction
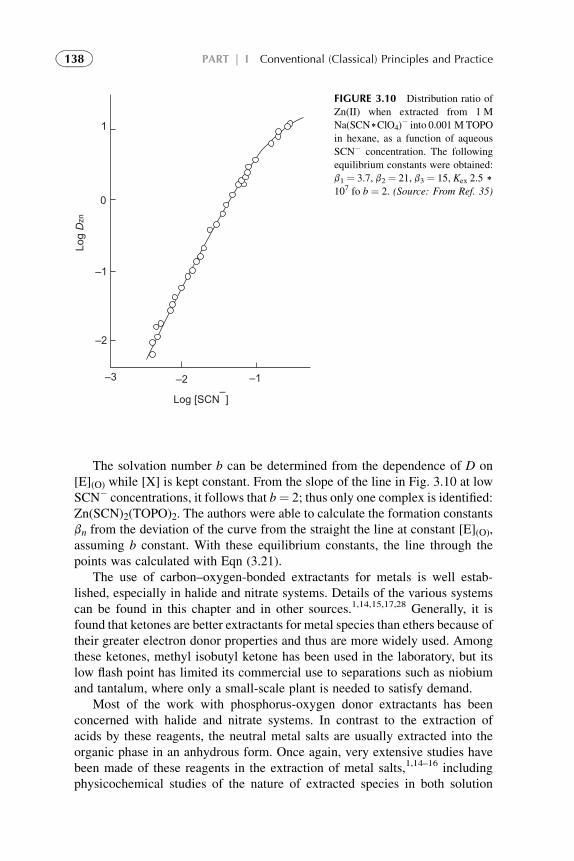
The solvation number b can be determined from the dependence of D on[E](O) while [X] is kept constant. From the slope of the line in Fig. 3.10 at lowSCN� concentrations, it follows that b¼ 2; thus only one complex is identified:Zn(SCN)2(TOPO)2. The authors were able to calculate the formation constantsbn from the deviation of the curve from the straight the line at constant [E](O),assuming b constant. With these equilibrium constants, the line through thepoints was calculated with Eqn (3.21).
The use of carbon–oxygen-bonded extractants for metals is well estab-lished, especially in halide and nitrate systems. Details of the various systemscan be found in this chapter and in other sources.1,14,15,17,28 Generally, it isfound that ketones are better extractants for metal species than ethers because oftheir greater electron donor properties and thus are more widely used. Amongthese ketones, methyl isobutyl ketone has been used in the laboratory, but itslow flash point has limited its commercial use to separations such as niobiumand tantalum, where only a small-scale plant is needed to satisfy demand.
Most of the work with phosphorus-oxygen donor extractants has beenconcerned with halide and nitrate systems. In contrast to the extraction ofacids by these reagents, the neutral metal salts are usually extracted into theorganic phase in an anhydrous form. Once again, very extensive studies havebeen made of these reagents in the extraction of metal salts,1,14–16 includingphysicochemical studies of the nature of extracted species in both solution
1
0
–1
–2
–3 –2 –1
Log [SCN–]
Log D
zn
FIGURE 3.10 Distribution ratio of
Zn(II) when extracted from 1 M
Na(SCN)ClO4)� into 0.001 MTOPO
in hexane, as a function of aqueous
SCN� concentration. The following
equilibrium constants were obtained:
b1 ¼ 3.7, b2 ¼ 21, b3 ¼ 15, Kex 2.5 )107 fo b ¼ 2. (Source: From Ref. 35)
138 PART | I Conventional (Classical) Principles and Practice
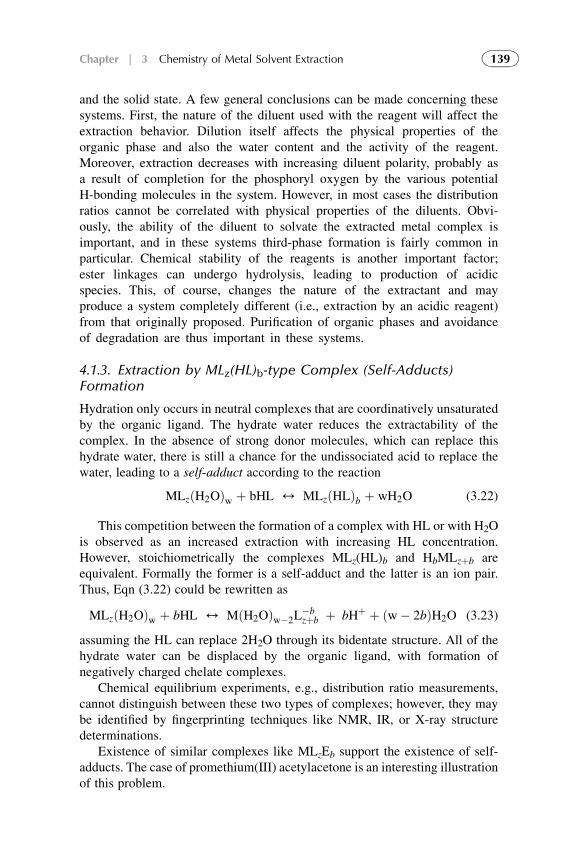
and the solid state. A few general conclusions can be made concerning thesesystems. First, the nature of the diluent used with the reagent will affect theextraction behavior. Dilution itself affects the physical properties of theorganic phase and also the water content and the activity of the reagent.Moreover, extraction decreases with increasing diluent polarity, probably asa result of completion for the phosphoryl oxygen by the various potentialH-bonding molecules in the system. However, in most cases the distributionratios cannot be correlated with physical properties of the diluents. Obvi-ously, the ability of the diluent to solvate the extracted metal complex isimportant, and in these systems third-phase formation is fairly common inparticular. Chemical stability of the reagents is another important factor;ester linkages can undergo hydrolysis, leading to production of acidicspecies. This, of course, changes the nature of the extractant and mayproduce a system completely different (i.e., extraction by an acidic reagent)from that originally proposed. Purification of organic phases and avoidanceof degradation are thus important in these systems.
4.1.3. Extraction by MLz(HL)b-type Complex (Self-Adducts)Formation
Hydration only occurs in neutral complexes that are coordinatively unsaturatedby the organic ligand. The hydrate water reduces the extractability of thecomplex. In the absence of strong donor molecules, which can replace thishydrate water, there is still a chance for the undissociated acid to replace thewater, leading to a self-adduct according to the reaction
MLzðH2OÞw þ bHL 4 MLzðHLÞb þ wH2O (3.22)
This competition between the formation of a complex with HL or with H2Ois observed as an increased extraction with increasing HL concentration.However, stoichiometrically the complexes MLz(HL)b and HbMLzþb areequivalent. Formally the former is a self-adduct and the latter is an ion pair.Thus, Eqn (3.22) could be rewritten as
MLzðH2OÞw þ bHL 4 MðH2OÞw�2L�bzþb þ bHþ þ ðw� 2bÞH2O (3.23)
assuming the HL can replace 2H2O through its bidentate structure. All of thehydrate water can be displaced by the organic ligand, with formation ofnegatively charged chelate complexes.
Chemical equilibrium experiments, e.g., distribution ratio measurements,cannot distinguish between these two types of complexes; however, they maybe identified by fingerprinting techniques like NMR, IR, or X-ray structuredeterminations.
Existence of similar complexes like MLzEb support the existence of self-adducts. The case of promethium(III) acetylacetone is an interesting illustrationof this problem.
139Chapter | 3 Chemistry of Metal Solvent Extraction
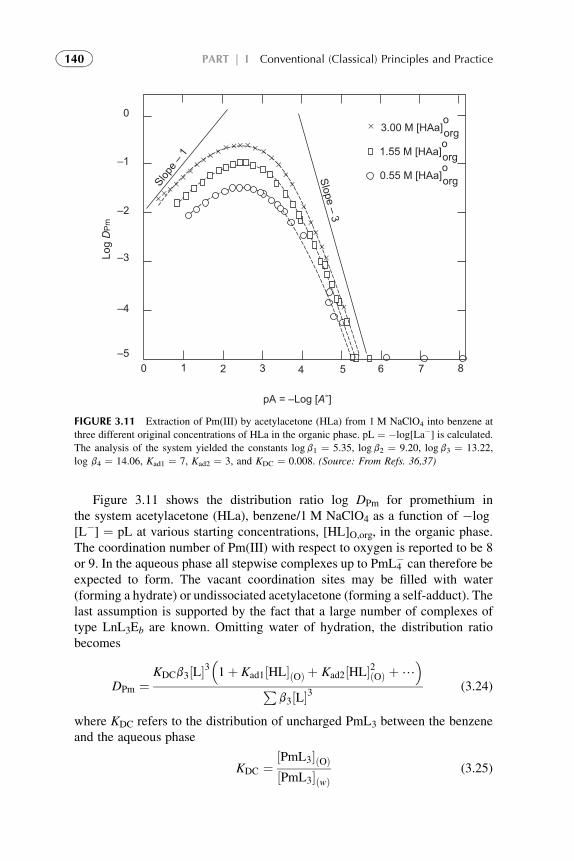
Figure 3.11 shows the distribution ratio log DPm for promethium inthe system acetylacetone (HLa), benzene/1 M NaClO4 as a function of �log[L�] ¼ pL at various starting concentrations, [HL]O,org, in the organic phase.The coordination number of Pm(III) with respect to oxygen is reported to be 8or 9. In the aqueous phase all stepwise complexes up to PmL4
� can therefore beexpected to form. The vacant coordination sites may be filled with water(forming a hydrate) or undissociated acetylacetone (forming a self-adduct). Thelast assumption is supported by the fact that a large number of complexes oftype LnL3Eb are known. Omitting water of hydration, the distribution ratiobecomes
DPm ¼KDCb3½L�3
�1þ Kad1½HL�ðOÞ þ Kad2½HL�2ðOÞ þ/
�P
b3½L�3(3.24)
where KDC refers to the distribution of uncharged PmL3 between the benzeneand the aqueous phase
KDC ¼½PmL3�ðOÞ½PmL3�ðwÞ
(3.25)
0
–1
–2
–3
–4
–50 1 2 3 4 5 6 7 8
pA = –Log [A-]
×
××× ××
×× × × × × × × × × ×
××
××
×
××
××
×
Slope – 3
Slope –
1
3.00 M [HAa]oorg
0.55 M [HAa]oorg
1.55 M [HAa]oorg
Log D
Pm
FIGURE 3.11 Extraction of Pm(III) by acetylacetone (HLa) from 1 M NaClO4 into benzene at
three different original concentrations of HLa in the organic phase. pL ¼ �log[La�] is calculated.The analysis of the system yielded the constants log b1 ¼ 5.35, log b2 ¼ 9.20, log b3 ¼ 13.22,
log b4 ¼ 14.06, Kad1 ¼ 7, Kad2 ¼ 3, and KDC ¼ 0.008. (Source: From Refs. 36,37)
140 PART | I Conventional (Classical) Principles and Practice
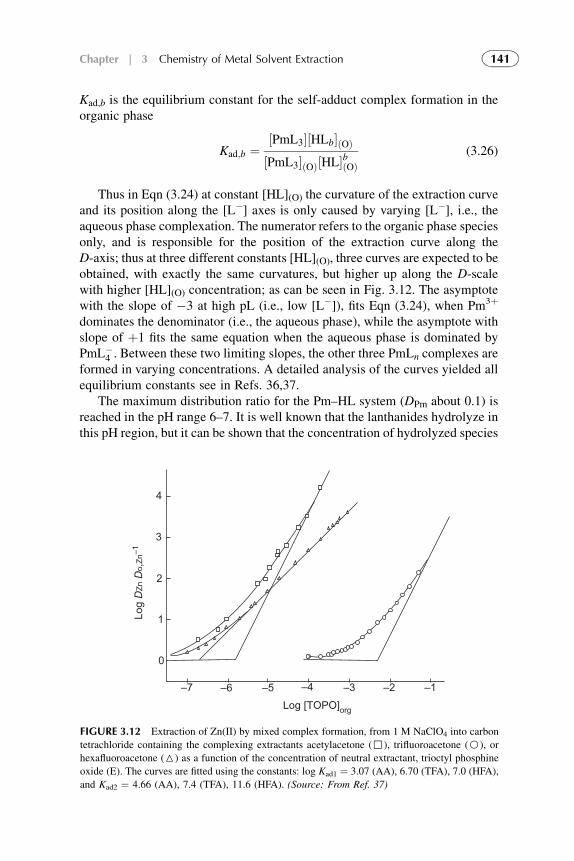
Kad,b is the equilibrium constant for the self-adduct complex formation in theorganic phase
Kad;b ¼½PmL3�½HLb�ðOÞ½PmL3�ðOÞ½HL�bðOÞ
(3.26)
Thus in Eqn (3.24) at constant [HL](O) the curvature of the extraction curveand its position along the [L�] axes is only caused by varying [L�], i.e., theaqueous phase complexation. The numerator refers to the organic phase speciesonly, and is responsible for the position of the extraction curve along theD-axis; thus at three different constants [HL](O), three curves are expected to beobtained, with exactly the same curvatures, but higher up along the D-scalewith higher [HL](O) concentration; as can be seen in Fig. 3.12. The asymptotewith the slope of �3 at high pL (i.e., low [L�]), fits Eqn (3.24), when Pm3þ
dominates the denominator (i.e., the aqueous phase), while the asymptote withslope of þ1 fits the same equation when the aqueous phase is dominated byPmL�
4 . Between these two limiting slopes, the other three PmLn complexes areformed in varying concentrations. A detailed analysis of the curves yielded allequilibrium constants see in Refs. 36,37.
The maximum distribution ratio for the Pm–HL system (DPm about 0.1) isreached in the pH range 6–7. It is well known that the lanthanides hydrolyze inthis pH region, but it can be shown that the concentration of hydrolyzed species
–7 –6 –5 –4 –3 –2 –1
4
3
2
1
0
Log [TOPO]org
Log D
Zn D
o,Zn
–1
FIGURE 3.12 Extraction of Zn(II) by mixed complex formation, from 1 M NaClO4 into carbon
tetrachloride containing the complexing extractants acetylacetone (,), trifluoroacetone (B), or
hexafluoroacetone (6) as a function of the concentration of neutral extractant, trioctyl phosphine
oxide (E). The curves are fitted using the constants: log Kad1 ¼ 3.07 (AA), 6.70 (TFA), 7.0 (HFA),
and Kad2 ¼ 4.66 (AA), 7.4 (TFA), 11.6 (HFA). (Source: From Ref. 37)
141Chapter | 3 Chemistry of Metal Solvent Extraction
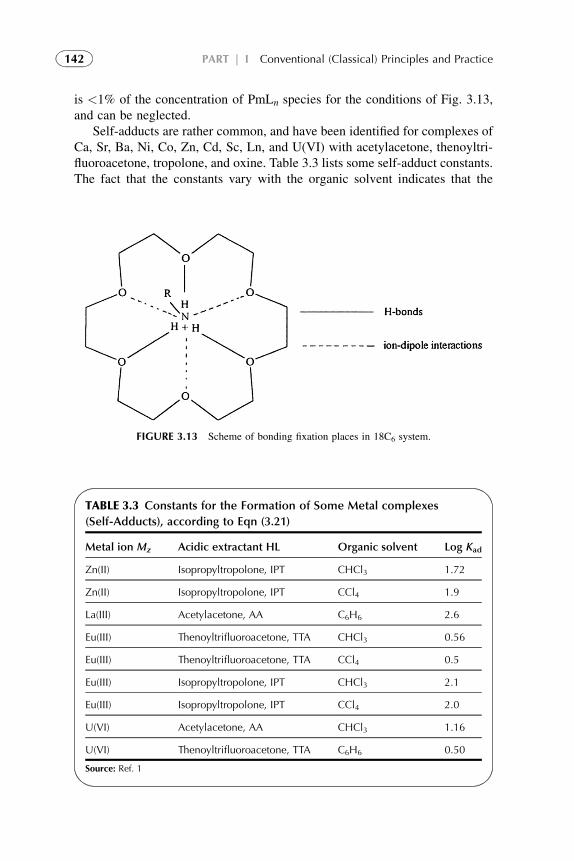
is <1% of the concentration of PmLn species for the conditions of Fig. 3.13,and can be neglected.
Self-adducts are rather common, and have been identified for complexes ofCa, Sr, Ba, Ni, Co, Zn, Cd, Sc, Ln, and U(VI) with acetylacetone, thenoyltri-fluoroacetone, tropolone, and oxine. Table 3.3 lists some self-adduct constants.The fact that the constants vary with the organic solvent indicates that the
FIGURE 3.13 Scheme of bonding fixation places in 18C6 system.
TABLE 3.3 Constants for the Formation of Some Metal complexes
(Self-Adducts), according to Eqn (3.21)
Metal ion Mz Acidic extractant HL Organic solvent Log Kad
Zn(II) Isopropyltropolone, IPT CHCl3 1.72
Zn(II) Isopropyltropolone, IPT CCl4 1.9
La(III) Acetylacetone, AA C6H6 2.6
Eu(III) Thenoyltrifluoroacetone, TTA CHCl3 0.56
Eu(III) Thenoyltrifluoroacetone, TTA CCl4 0.5
Eu(III) Isopropyltropolone, IPT CHCl3 2.1
Eu(III) Isopropyltropolone, IPT CCl4 2.0
U(VI) Acetylacetone, AA CHCl3 1.16
U(VI) Thenoyltrifluoroacetone, TTA C6H6 0.50
Source: Ref. 1
142 PART | I Conventional (Classical) Principles and Practice
self-adduct reaction probably occurs in the organic phase. Table 3.3 containsboth very inert (e.g., CCl4), polar (CHCl3), and p-bonding solvents (C6H6).
4.2. Properties of Extractants
From Table 3.1 it is seen that all oxygen-bearing organic solvents will act inthe way, as organophosphorus compounds such as the triesters of phos-phoric, phosphonic, and phosphinic acids; alkyl phosphites; amine oxides;organic sulfoxides; and organic sulfides. However, the solvating powerdepends strongly on the basicity of the reagent. In Ref. 1 the authors pointout, oxygen-containing solvents are very weakly basic and in general tendnot to form oxonium salts. In the carbon-bonded oxygen donor systems(e.g., ethers and ketones), water usually forms an essential part of thecomplex, forming a H-bonded bridge between the solvating agent and thesolute. However, in the organophosphorus systems, water is often eliminatedfrom the organic phase. Whereas, ethers, ketones, and so on are all electron-donating compounds, alcohols are amphoteric and exhibit both donor andacceptor properties. The relevant physical chemistry of carbon-bondedoxygen donors and the extraction of acids with these reagents have beenreviewed in Ref. 1.
A number of the extractants are appreciably miscible with water; henceternary phase diagrams are required to understand the extraction process. Asthe molecular weight of extractant increases, this solubility decreases.
Slope analysis for determination of the stoichiometry of extracted specieswas studied by Widmer.38 The author also shows how solvent extraction can beused to determine association numbers and association orders of the extractingspecies.
Extraction by phosphorus-bonded oxygen solvents has been extensivelystudied and is of particular interest in the atomic energy field. The most wellknown and most used organophosphorus ester is TBP. With regard to thephysical chemistry of this type of solvent in organic solution, nonideal behavioris the rule. Hydrogen bonding type and dipole–dipole interactions are common,and both self-association and extractant–diluent associations complexes arewell known for this class of extractant. Equilibrium data for such interactionshave been tabulated.16
Data on aqueous solubilities and hydrates of phosphorus-bonded oxygendonor solvents is abundant, particularly for TBP. Because of the increasingpolar nature of the phosphoryl group, the solubility of neutral organophos-phorus compounds in water decreases in the following order: phosphine oxi-des > phosphinates > phosphonates > phosphates. Solubility also decreaseswith increasing of alkyl chain length. Like the carbon oxygen donors, thesephosphorus oxygen compounds extract mineral acids from aqueous solutions.
In general, extraction power increases with increase in the number ofcarbon–phosphorus bonds. Excellent bibliographies are available,1,14,15 and
143Chapter | 3 Chemistry of Metal Solvent Extraction
equilibrium constant data are tabulated,16 including data on the extraction ofwater and the hydration of the extractants. Other oxygen-containing neutralextractants that have received some attention recently are amine oxides andsulfoxides; much of this work has been carried out and presented in Ref. 39.
5. EXTRACTION THROUGH MIXED COMPLEX FORMATION
Mixed complexes can often be formed in the solvent extraction of metal ions.This is the basis of synergism, wherein the degree of extraction of metal by themixed system exceeds the combined effects of the individual components, thatis, a stability constant effect associated with the mixed complex. It wasformerly thought that an opposite effect called antisynergism existed, but it isnow clear that the destruction of synergism is due merely to mass-action effectsor changes in physical properties of the organic phase, associated with thepredominance of one of the reactants in the organic phase. Thus, it is expectedthat mixed-complex systems will obey the same rules as single-extractantsystems. The compounds added to the organic phase to produce mixedcomplexes will also partition between both phases just like the primaryextractant and may also interact with all species present in both phases. Organicphase interactions between the two organic reactants are of extreme importanceas they will materially affect the metal extraction behavior of the system. Thethermodynamics of mixed-complex formation is of special interest, and mixed-complex phenomena are discussed in the following paragraphs.
5.1. Acid Extractants
Mixed-complex formation in acid extractant systems can occur in several ways.By far the most common is the addition to the systems of neutral donormolecules such as alcohols, organophosphorus compounds, nitrogen containligands such as amines, and acids where the compound remains undissociated.Mixed complexes are also formed between two acidic extractants with bothexchanging protons in the extraction reaction. Thus, a wide variety ofcomplexes and behavior arise, and it is common to find the same extractantacting as an acid toward one metal ion in a complex and as an unionized donormolecule toward another. The determination of formation constants anda general algebraic description of mixed-complex formation in acidic systemshas been discussed by Dyrssen.40
5.1.1. Acid Extractants and Neutral Donor Molecules
The formation of mixed complexes in these system can be described in twoways:
MzþðwÞ þ zHLðOÞ þ bEðOÞ 4 MLzEb;ðOÞ þ zHþ
ðwÞzb (3.27)
144 PART | I Conventional (Classical) Principles and Practice
Kex ¼½MLzEb�ðOÞ
�Hþ�z
ðwÞ�Mzþ�½HL�zðOÞ½E�bðOÞ ¼ DM
�Hþ�z
ðwÞ½HL�zðOÞ½E�bðOÞ
(3.28)
and
�MLzðHLÞb
�ðOÞ þ qE 4
hMLzðHLÞb�qEq
iðOÞ
þhðHLÞq
iðOÞ
(3.29)
Kex ¼
hMLzðHLÞb�qEq
iðOÞ
hðHLÞq
iðOÞ�
MLzðHLÞb�ðOÞ½E�
qðOÞ
(3.30)
Thus the distribution of the metal, DM, is shown to depend on theconcentrations of proton and HLorg to the power z of the charge of the metal ion,and on the concentration of E to the power of b (i.e., number of extractantmolecules in the extracted complex).
Equation (3.20) describes an addition mechanism, whereas Eqn (3.22)describes a substitution mechanism. Clearly, the addition mechanism willmostly occur when the central metal atom in the complex MLn is coordinatelyunsaturated. However, this is not always the case, and an increase in coordi-nation number of the central metal atom to accommodate the neutral ligand isalso found. It would seem, therefore, that in all cases neutral ligand bondsdirectly to the central atom. Kertes16 has listed some general rules for thestability of mixed complexes: (1) stability increases with increasing basestrength of the neutral ligand, in the absence of steric factors; (2) change of thediluent can materially affect complex stability, although not stoichiometry; and(3) the stronger the original complex, the less will be the tendency to forma mixed-complex species.
Without considering the independent parameters, it is often difficult tounderstand why Kex varies strongly, and it may be impossible to predictimprovements of the system. A good example is the extraction of Zn(II) byb-diketones and TOPO. Figure 3.12 illustrates the extraction of Zn(II) from1 M NaClO4 into carbon tetrachloride by b-diketones (HL) and TOPO as anadditional donor.41,42 At log DZn/D0,Zn plotted as a function of log [E](O)., thedistribution ratio proceeds from almost zero, when almost no adduct is formed,towards a limiting slope of 2, indicating that the extracted complex has addedtwo molecules of E to form ZnL2E2. From the curvature and slope the Kad,b
values were determined.Formation of solvated species in extraction systems can be considered as
a special case of mixed-complex formation, where the neutral donor moleculeis the undissociated acid. The formation of other mixed complexes from thesolvated species by substitution can be readily understood. Substitution is alsoobvious in the replacement of water in hydrated chelated molecules by neutraldonor compounds. It is less easy to understand the formation of species such as
145Chapter | 3 Chemistry of Metal Solvent Extraction
MLz(HL)b in the extraction of metals with dimeric extractants such ascarboxylic acids or dialkyl monohydrogen phosphoric acids. The acid dimermay interact in the organic phase with neutral ligand according to the equation
ðHLÞ2 þ 2E 4 2ðHL)EÞ (3.31)
But no proof exists that (HL*E) species actually take part in the extractionprocess. Indeed, this would be highly unlikely as the extraction reactionsgenerally take place at the interface, and for acidic systems, there is consid-erable evidence that the interfacial species are monomeric. It would thus beunlikely for the species LH*E to be present at the interface and thus be active inthe extraction reaction. Nevertheless, interaction between neutral ligands andthe extractant can have a profound effect on system behavior; e.g., as theconcentration of neutral ligand is increased, the associated mass-action effectscan very from synergistic to a considerable reduction in the degree of metal ionextraction. A corresponding effect on reaction kinetics will occur, as discussedlater.
In metal chelate extraction by far the most studied reagents are theb-diketones, which can form mixed complexes with a wide variety of neutralligands.
Of particular interest is the recent discovery that metal complexes ofalkylated 8-quinolinol and also hydroxyoximes can form adducts with neutraldonor molecules, for although this type of complex with 8-quinolinol isrecorded,43,44 little was known about the behavior of hydroxyoximes in thissituation. Addition of carboxylic and dialkylphosphoric acids to metal–hydroxyoxime systems produced mixed complexes and, for some metals,a considerable amount of synergism; thus synergistic extraction by mixturesof an aliphatic a-hydroxyoxime (LIX63, Henkel Corporation) and variouscarboxylic and phosphoric acids has been widely reported.12,45,46 Investiga-tions of nickel extraction showed that addition of the carboxylic acid to thefour-coordinate orange (LIX63)2Ni complex produced a green six-coordinatemixed complex.47 Spectral studies showed that the hydroxyoxime chelatestructure remained intact and the acids were acting as neutral donor molecules.It is also shown that no interaction between the two types of donor moleculeoccurred. An interesting feature of this mixed system was that the rate ofextraction of nickel was very slow.48 Other systems showing similar mixedcomplexes are aromatic b-hydroxyoximes and carboxylic49; dialkylphosphoricand aromatic sulfonic acids50 for copper, nickel, and cobalt; and alkylated8-quinolinol and carboxylic acids for nickel,49 cobalt,51 zinc, and cadmium.52
In this latter system, interaction between the carboxylic acid and the 8-qui-nolinol has been found53 that materially affects the interfacial properties of thesystem and thus permits the extraction of cobalt without simultaneous oxida-tion to cobalt(III). Although addition of nonyl phenol to hydroxyoxime systemsdoes not seem to cause mixed complex formation, the two reagents do interact
146 PART | I Conventional (Classical) Principles and Practice
to cause a decrease in copper extraction with increasing nonyl phenolconcentration and a decrease in the rate of extraction.54,55 There is someevidence for a similar effect with nonyl phenol and alkylated 8-quinolinolmixtures, but these reagents do show a small synergistic effect accompanyingmixed complex formation in the extraction of copper.56 Obviously, this is a casewhere the observed effect will depend critically on the relative amounts ofchelating agent and neutral ligand in the organic phase.
In the carboxylic acid extraction system, mixed complexes form on additionof TBP salicylic acid mixtures.7 Little synergism, however, is found with eithersystem. Synergism was found in the extraction of cesium with mixtures of4-phenylvaleric acid and 4-sec-butyl-2-(a-methylbenzyl) phenol:57 here thephenol behaves as a neutral solvating agent at pH values below 11. Some dataon mixed complex stability constants and adduct formation with neutral ligandshave been compiled.17
Mixed-complex formation and synergism in dialkylphosphoric acidsystems have been reported extensively, with particular interest in the additionof neutral organophosphorus compounds. Once again the stability of the mixedcomplex increases with increasing donor properties of the molecule; thus forneutral organophosphorus compounds the series, in order of effectiveness,is (RO)3PO < R(RO)2PO < R2(RO)PO < R3PO. Interaction between theextractant and the neutral ligand is again important in the determination of thechemistry of these systems. Mixed extractant systems containing alkylphos-phoric acid have also been studied with other neutral donors such as aliphaticand aromatic alcohols.
Mixed complexes in sulfonic acid, neutral ligand systems have beenreported58 for the extraction of zinc by dinonyl-naphthalene sulfonic acid(DNNSA) and its sodium salt with trioctylphosphine oxide (TOPO), TBP, or 2-ethylhexanol. No mixed complexes were formed with the systems containingthe free acid, and the observed decrease in zinc extraction on addition of theneutral ligands can be attributed to interaction between DNNSA and theligands. As expected, TOPO interacts more strongly with DNNSA than doesTBP. A mixed complex was formed between zinc, the sodium salt of DNNSA,and TOPO, and synergism occurred, but neither TBP or 2-ethylhexanol had anyeffect.
5.1.2. Two Acidic Extractants
In some mixed b-diketone systems both diketones combine in satisfying thecharge and coordination requirements of the central metal ion. This type ofmixed-complex formation does not necessarily lead to synergism. Differenti-ation must be made between systems wherein mixed-complex formation isproduced through adduct formation59 and by mixed-chelate formation. It hasbeen suggested60 that the stability of the mixed chelate species is achieved onlyby a combination of a weak and strong b-diketone. Similar phenomena foriridium and europium complexes with a b-diketone and b-isopropyltropolone
147Chapter | 3 Chemistry of Metal Solvent Extraction
have been reported.61 Recently, the formation of mixed complexes of lantha-nide and actinide cations with dinonylnaphthalene sulfonic acid (DNNSA) anddi-2-ethylhexylphosphoric acid (D2EHPA) has been reported.62 The degree ofcomplexation with D2EHPA and the dimensions of the complexed ion areshown to be the important factors for their inclusion in the DNNSA micelles.The core volume of the DNNSA micelles is about the size of the trivalent metalion D2EHPA complex, but inclusion of the neutral D2EHPA metal complexdoes not occur. Instead, only positively charged species are included in theDNNSA micelle, and the charge neutralization is achieved by loss of protons.Interfacial tension changes noted in these systems correlate bulk changes inmetal ion extraction behavior. Yet again, the importance of interfacialphenomena in solvent extraction systems is emphasized.
5.1.3. Acid–Base (Amine) Mixed Extractants
Mixed extractant systems containing acids with bases such as alkylamines havealso been studied. Various names were used for these extractants, includingamine salts, mixed extractants, mixed ionic solvents, binary extractants, acid–base-coupled (ABC) extractants. A full description of these systems may befound elsewhere,1,14,15,63–66 together with a useful compilation of stabilityconstant data.16 Several potential applications of acid-base mixed extractants insalt extraction were studied and were found to possess attractive properties. Theefficiency and selectivity of metal salt extraction by acid-base extractants andtheir dependence on extractant composition, aqueous phase composition, pH,and temperature have been reviewed and analyzed.67,68 Extraction is efficientand selective. Compared with liquid cation exchangers, acid-base extractantsare less sensitive to acidity in the aqueous phase and extract alkali and alkalineearth metals better. Both the cation and the anion are extracted; therefore, noacid or base addition is required for pH adjustment or for stripping. Extractionis reversible and provides for back-extraction of the extracted salt by water.
Dialkylphosphoric acid-alkylamine systems are unlikely to form mixedcomplexes as mixtures of these reagents evolve heat during the formation of theamine alkylphosphate salts. A large decrease in the extraction of metals can beexpected in such systems. However, if the pH of the aqueous phase is so highthat the amine is in the free-base form, adducts similar to those reported for thecarboxylic acids could be formed. Similarly, when the alkylphosphoric acid isin a salt form, e.g., the sodium salt, adduct formation with amines should bepossible.
The authors67 have shown that addition alkylphosphoric acids to tri-n-octylamine depressed the extraction of sulfuric acid through strong interactionbetween the organic acid and base. Their conclusion that extraction of inor-ganic species such as UO2SO4 and PtCl
2�6 by alkylamines should be depressed
by addition of alkylphosphoric acids was supported by a study of the extractionof PtCl2�6 with tri-isooctylamine in the presence of di-n-butylphosphoric acid.68
Similarly, at low sulfuric acid concentration the extraction of uranium from
148 PART | I Conventional (Classical) Principles and Practice
UO2SO4 by a mixture of tri-n-octylamine and di-2-ethylhexylphosphoric acidwas depressed by formation of the alkylphosphate amine salt. However, as thesulfuric acid concentration was increased synergistic extraction of uraniumwas found69–71 that was attributed to the formation of a mixed complex(R3NH)
þ(UO2SO4HR2)�. A similar behavior was discovered72 in the extrac-
tion of hafnium by 2-ethylhexylphosphoric acid and tri-x-octyl-amine. In thiscase the mixed complex had the structure (R3NH
þ)2[Hf(SO4)2R]2�. The
authors showed that similar mixed complexes were formed in the extraction ofuranyl sulfate by amine–monoalkylphosphoric acid mixtures. However, thedecrease in extraction found in earlier studies was absent in this system becauseof the weaker acid strength of the monoalkylphosphoric acids reducing theinteraction with the amine in the organic phase. It is clear, therefore, thatamines can act in mixed-complex systems both as adducts and extractantssimilar to the acid extractants such as carboxylic and alkylphosphoric acids.
The lower the stability of the metal diketones and the greater the basicity ofthe donor atom, the greater is the stability of the adduct formed. Largeexothermic enthalpy changes usually characterize these systems.42 Metal b-diketonates also form mixed complexes with alkylamines and alkylaminehydrochlorides. The inclusion of the amine hydrochloride in the complex isunusual; researchers73 have postulated the formation of AmT3R3NHCl,AMT3R3NHT, and AmT3NHClHT in the extraction of americium by a mixtureof tri-n-octylamine (R3N) and thenoyltrifluoroacetone (HT). Researchers74
have also found adduct formation with copper b-diketonates and alkylamineand alkylamine hydrochlorides. Visible and infrared spectra suggest that thealkylamines bond directly to the copper through the nitrogen atom while theamine hydrochloride binds directly through the chlorine atom. Full discussionsof these systems are available.1,14,15
5.2. Mixed Two Amines Extractants
Mixtures of two amines have been shown to produce mixed amine complexes inthe extraction of uranium from sulfuric acid,75 with a synergistic effect. Thisbehavior is analogous to the formation of mixed chelates with acidic extractants.
No information on mixed-complex formation of metals with amine salts andneutral donors is available.
5.3. Mixtures of Solvating Extractants
The role of solvating extractants and neutral ligands as donor compounds inacidic extraction systems has already been discussed. Systems with two neutralligands do exist, although not much information is available; Kertes15 hasgiven a short account. Clearly, H bonding is of prime importance as also isnonideality in these mixtures. Synergism seems to occur in these systems whenone of the extractants has a much higher dielectric constant than the other, or
149Chapter | 3 Chemistry of Metal Solvent Extraction
when one is a donor capable of H bonding and the other is an acceptormolecule. Diluent extraction interaction may also be important with organo-phosphorus reagents, and Nishimura et al.75 have shown that H bonding ofchloroform to TBP and tri-n-octylphosphine oxide appreciably depressed theextraction power of these extractants. The study showed a greater hydrogenacceptor strength for the phosphine oxide than the alkyl phosphate. A similareffect was found for alkylamines, but they were much poorer hydrogenacceptors in spite of their greater proton affinity.
6. EXTRACTABLE COMPLEXATION OF MONOVALENTMETALS
There are a few types of extractable metal complexes that do not fit well into theprevious classifications: monovalent metals that form extractable complexeswith large organic monobasic anions, and, conversely, monovalent inorganicanions that form extractable complexes with large organic cations. They aretreated as a separate homogenous class of extractants.2 The large monovalention pair, tetraphenylarsonium tetraphenylborate (Ph4As
þ Ph4E�), which has
been suggested as a reference in solvent extraction, also belongs to this class.Of some importance is the extraction of alkali ions by tetraphenylborate, bytetraphenylantimonium ions, and of perrhenate by tetraphenylarsonium ions.Because most of the volume of these complexes is taken up by organic groups,the complexes are highly lipophilic and, therefore, extractable into organicsolvents without additional solvation.
From these systems having limited applications, only the crown ethers offersome interesting extraction systems. The discovery of crown ethers76 gaveimpetus to the birth of host-guest complex chemistry. The ethers form cagecompounds (“clathrates”); i.e., the metal cation fits into a cage formed by thecrown structure. Because the cage can be designed to fit almost any ion ofa certain size, rather selective extractions are possible with these type ofextractants. The 18-crown-6 core is most perfectly suited for binding, alloxygen atoms in a crown-6 ring seemingly interact with the ammonium moiety.The thorough analysis of data on influence of the structural variations have ledto the following scheme of guest fixation by 18C6 systems (see Fig. 3.13).
This pattern, which emerge primarily from a purely chemical approach,was further proved by numerous X-ray crystal analyses77 and molecularmechanics–molecular dynamics calculations.78 In summary, 18C6 and itsanalogs bind protonated amines by three H bonds connecting alternate oxygenwith the three guest protons; the other three oxygen contributing to stabilizationof the complex through ion–dipole interactions O–Nþ. Various computationaltechniques suggest that the last term “weighs” two to three times less than Hbonds.
Very interesting is the selectivity of extraction toward different amines. Theassociation COnstants for primary amines slightly decrease or remain nearly
150 PART | I Conventional (Classical) Principles and Practice
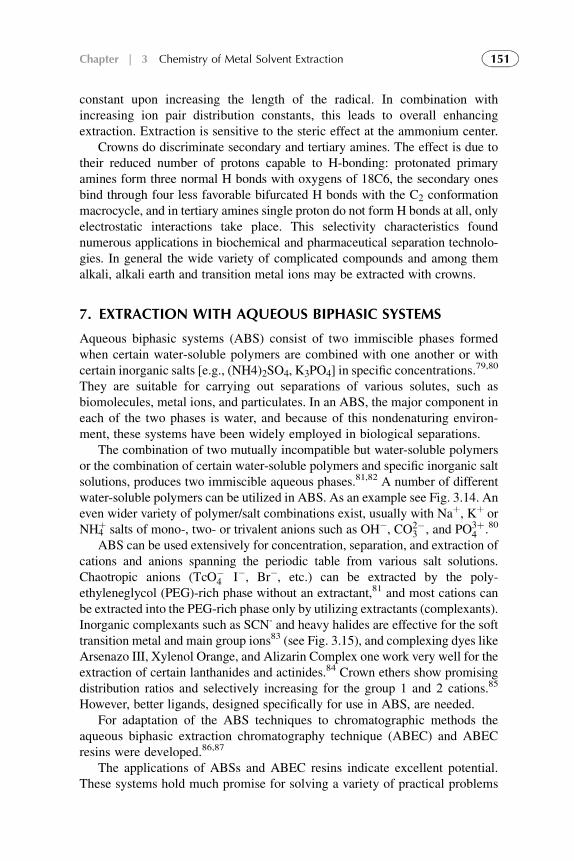
constant upon increasing the length of the radical. In combination withincreasing ion pair distribution constants, this leads to overall enhancingextraction. Extraction is sensitive to the steric effect at the ammonium center.
Crowns do discriminate secondary and tertiary amines. The effect is due totheir reduced number of protons capable to H-bonding: protonated primaryamines form three normal H bonds with oxygens of 18C6, the secondary onesbind through four less favorable bifurcated H bonds with the C2 conformationmacrocycle, and in tertiary amines single proton do not form H bonds at all, onlyelectrostatic interactions take place. This selectivity characteristics foundnumerous applications in biochemical and pharmaceutical separation technolo-gies. In general the wide variety of complicated compounds and among themalkali, alkali earth and transition metal ions may be extracted with crowns.
7. EXTRACTION WITH AQUEOUS BIPHASIC SYSTEMS
Aqueous biphasic systems (ABS) consist of two immiscible phases formedwhen certain water-soluble polymers are combined with one another or withcertain inorganic salts [e.g., (NH4)2SO4, K3PO4] in specific concentrations.
79,80
They are suitable for carrying out separations of various solutes, such asbiomolecules, metal ions, and particulates. In an ABS, the major component ineach of the two phases is water, and because of this nondenaturing environ-ment, these systems have been widely employed in biological separations.
The combination of two mutually incompatible but water-soluble polymersor the combination of certain water-soluble polymers and specific inorganic saltsolutions, produces two immiscible aqueous phases.81,82 A number of differentwater-soluble polymers can be utilized in ABS. As an example see Fig. 3.14. Aneven wider variety of polymer/salt combinations exist, usually with Naþ, Kþ orNH4
þ salts of mono-, two- or trivalent anions such as OH�, CO2�3 , and PO3þ
4 .80
ABS can be used extensively for concentration, separation, and extraction ofcations and anions spanning the periodic table from various salt solutions.Chaotropic anions (TcO�
4 I�, Br�, etc.) can be extracted by the poly-ethyleneglycol (PEG)-rich phase without an extractant,81 and most cations canbe extracted into the PEG-rich phase only by utilizing extractants (complexants).Inorganic complexants such as SCN- and heavy halides are effective for the softtransition metal and main group ions83 (see Fig. 3.15), and complexing dyes likeArsenazo III, Xylenol Orange, and Alizarin Complex one work very well for theextraction of certain lanthanides and actinides.84 Crown ethers show promisingdistribution ratios and selectively increasing for the group 1 and 2 cations.85
However, better ligands, designed specifically for use in ABS, are needed.For adaptation of the ABS techniques to chromatographic methods the
aqueous biphasic extraction chromatography technique (ABEC) and ABECresins were developed.86,87
The applications of ABSs and ABEC resins indicate excellent potential.These systems hold much promise for solving a variety of practical problems
151Chapter | 3 Chemistry of Metal Solvent Extraction
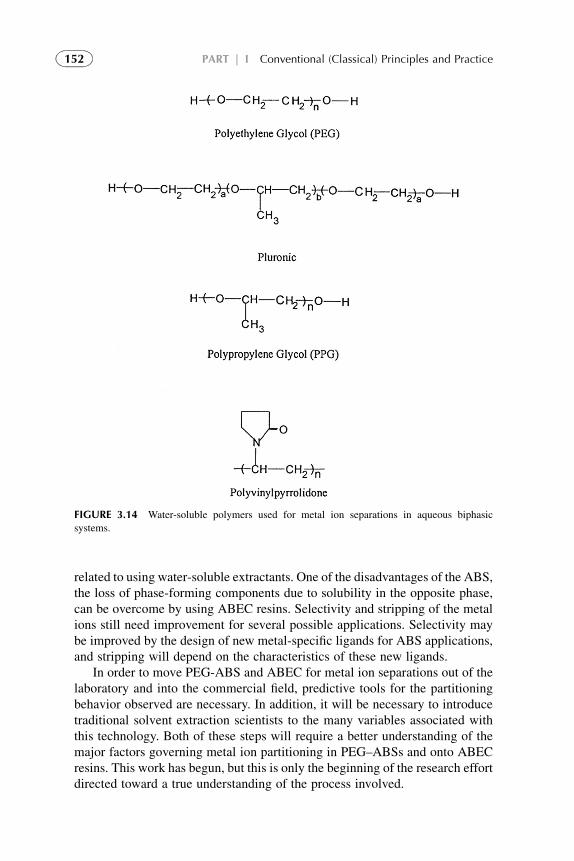
related to using water-soluble extractants. One of the disadvantages of the ABS,the loss of phase-forming components due to solubility in the opposite phase,can be overcome by using ABEC resins. Selectivity and stripping of the metalions still need improvement for several possible applications. Selectivity maybe improved by the design of new metal-specific ligands for ABS applications,and stripping will depend on the characteristics of these new ligands.
In order to move PEG-ABS and ABEC for metal ion separations out of thelaboratory and into the commercial field, predictive tools for the partitioningbehavior observed are necessary. In addition, it will be necessary to introducetraditional solvent extraction scientists to the many variables associated withthis technology. Both of these steps will require a better understanding of themajor factors governing metal ion partitioning in PEG–ABSs and onto ABECresins. This work has begun, but this is only the beginning of the research effortdirected toward a true understanding of the process involved.
FIGURE 3.14 Water-soluble polymers used for metal ion separations in aqueous biphasic
systems.
152 PART | I Conventional (Classical) Principles and Practice
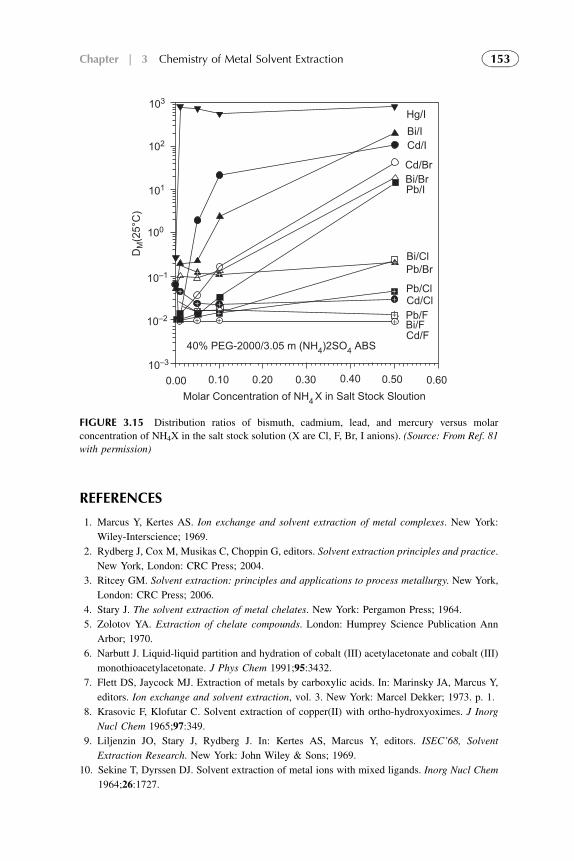
REFERENCES
1. Marcus Y, Kertes AS. Ion exchange and solvent extraction of metal complexes. New York:
Wiley-Interscience; 1969.
2. Rydberg J, Cox M, Musikas C, Choppin G, editors. Solvent extraction principles and practice.
New York, London: CRC Press; 2004.
3. Ritcey GM. Solvent extraction: principles and applications to process metallurgy. New York,
London: CRC Press; 2006.
4. Stary J. The solvent extraction of metal chelates. New York: Pergamon Press; 1964.
5. Zolotov YA. Extraction of chelate compounds. London: Humprey Science Publication Ann
Arbor; 1970.
6. Narbutt J. Liquid-liquid partition and hydration of cobalt (III) acetylacetonate and cobalt (III)
monothioacetylacetonate. J Phys Chem 1991;95:3432.
7. Flett DS, Jaycock MJ. Extraction of metals by carboxylic acids. In: Marinsky JA, Marcus Y,
editors. Ion exchange and solvent extraction, vol. 3. New York: Marcel Dekker; 1973. p. 1.
8. Krasovic F, Klofutar C. Solvent extraction of copper(II) with ortho-hydroxyoximes. J Inorg
Nucl Chem 1965;97:349.
9. Liljenzin JO, Stary J, Rydberg J. In: Kertes AS, Marcus Y, editors. ISEC’68, Solvent
Extraction Research. New York: John Wiley & Sons; 1969.
10. Sekine T, Dyrssen DJ. Solvent extraction of metal ions with mixed ligands. Inorg Nucl Chem
1964;26:1727.
DM
(25°
C)
Pb/IBi/BrCd/Br
Cd/IBi/IHg/I
Cd/FBi/FPb/FCd/ClPb/Cl
Pb/BrBi/Cl
40% PEG-2000/3.05 m (NH4)2SO4 ABS
X in Salt Stock SloutionMolar Concentration of NH4
0.600.500.400.300.200.100.00
101
102
10–3
10–2
10–1
100
103
+
++
++
+++
++
+
+++++
FIGURE 3.15 Distribution ratios of bismuth, cadmium, lead, and mercury versus molar
concentration of NH4X in the salt stock solution (X are Cl, F, Br, I anions). (Source: From Ref. 81
with permission)
153Chapter | 3 Chemistry of Metal Solvent Extraction
11. Carpenter JC, Christie PG, et al., editors. Extractive metallurgy of copper, vol. 2. New York:
AIME; 1976. p. 1025.
12. Cox M, Flett DS. Kinetics of nickel extraction by a-hydroxyoxime/carboxylic acid mictures.
In: Proceedings of the International Solvent Extraction Conference (ISEC’71), 1971, vol. 1,
p. 204 (Soc. Chem. Ind., London).
13. Marcus Y. Gibbs energies of transfer into aqueous alcohols. Pure Appl Chem 1969;20:85.
14. Sekine T, Hasegawa Y. Solvent extraction chemistry. New York: Marcel Dekker; 1977.
15. Kertes AS. Thermodynamics of solvent extraction processes: synergic adducts of copper and
zinc diketonates with bidentate nitrogen bases. In: Hanson C, editor. Recent advances in liquid
liquid extraction. London: Pergamon Press; 1971. p. 15.
16. Marcus Y, Kertes AS, Yanir E. Equilibrium constants of liquid-liquid distribution reactions, Part
1, Organophosphorus Extractants, IUPAC, Additional Publication. London: Butterworths; 1974.
17. Marcus Y, Kertes AS, Yanir E. Equilibrium constants of liquid-liquid distribution reactions,
Part III. Compound forming Extractants, Solvating Solvents and Inert Solvents. IUPAC.
London: Pergamon Press; 1977.
18. Irving HM. Ligand-exchange chromatography of racemates. In: Marinsky JA, Marcus Y,
editors. Ion exchange and solvent extraction, vol. 6. New York: Marcel Dekker; 1974. p. 139.
19. Liem DH. Acidic organophosphorus extractants. Acta Chem Scand 1972;26:191.
20. Markovits CY, Choppin GR. Solvent extraction of non-ferrous metals: a review. In:
Marinsky JA, Marcus Y, editors. Ion exchange and solvent extraction, vol. 3. New York:
Marcel Dekker; 1973. p. 1.
21. King Industries, Inc., Norwalk, Connecticut, SYNEX Liquid Ion Exchange Reagents, Product
Bulletin and Bibliography.
22. Kertes AS, Gutmann H. Decarboxylation of 6-nitrobenzisoxazole-3-carboxylate ion in
dichloromethane: the possible role of reverse micelles. In: Matijevic E, editor. Surface and
colloid science, vol. 8. New York: Wiley-Interscience; 1975. p. 193.
23. Hanson C, Hughes MA, Whewell RJ. The hydrophilic lipophilic balance of hydroxyoximes.
J Appl Chem Biotechnol 1978;28:426.
24. Ashbrook AW. Chelating reagents in solvent extraction processes: the present position. Coord
Chem Rev 1975;16:285.
25. Ashbrook AW. Commercial chelating solvent extraction reagents. III. Oximes: spectra,
structure and properties. Hydrometallurgy 1975;1:5.
26. Flett DS, West DW. Solvent extraction in hydrometallurgy: the role of organophosphorus
extractants Complex Metallurgy’78. London: IMM; 1978. p. 49.
27. Van Ooyen J, Dyrssen D, Liljenzin JO, Rydberg J, editors. Solvent extraction Chemistry (ISEC
1966). Amsterdam: North-Holland; 1967.
28. Ishimori T, Nakamura E. Japan atomic energy research institute, JAERI, 1047, 1963; JAERI
1062 (1964–1965).
29. Seeley FG, Grouse DJ. J Chem Eng Data 1971;16:393.
30. Diamond RM. In: Dyrssen D, Liljensin JO, Rydberg J, editors. Solvent extraction chemistry.
Amsterdam: North-Holland; 1967. p. 349.
31. Grinstead RR, Davis JC. Base strength of amine-amine. Hydrochloride. J Phys Chem
1968;72:1630.
32. Roddy JW, Coleman CF. The extraction of water by tri-n-octylamine. J Inorg Nucl Chem
1969;31:3599.
33. MuhammedM,SzabonJ,HogfeldtE.Extractionwith long-chain amines.ChemScripta1974;6:61.
34. Cecconie T, Freiser H. Liquid–liquid extraction and separation of lanthanum(III). Anal Chem
1990;62:622.
154 PART | I Conventional (Classical) Principles and Practice
35. Moryia H, Sekine T. Studies of the liquid-liquid partition systems. Bull Chem Soc Jap
1971;44:3347.
36. Rydberg J, Albinsson YJ. Configurational stability of 2-benzoylcyclohexanone. Solv Extr Ion
Exch 1989;7:577.
37. Albinsson Y, Rydberg J. Configurational stability of 2-benzoylcyclohexanone. Radiochim
Acta 1989;48:49.
38. Widmer HM. In: Proceedings of the International Solvent Extraction Conference (ISEC’73),
1973, Vol. 1, p. 37 (Soc. Chem. Ind., London).
39. Mikhailov VA. In: Proceedings of the International Solvent Extraction Conference (ISEC’77),
1979, vol. 1, p. 52 (Can. Inst. Min. Met., Montreal).
40. Dyrssen D. Proc Symp Coord Chem. p. 707. Tihany: Akademini Kiado; 1964. Budapest.
41. Ahrland S, Liljenzin JO, Rydberg J. The chemistry of the actinides. In: Comprehensive
inorganic chemistry. London: Pergamon Press; 1973.
42. Kassierer EF, Kertes AS. Synergic extraction of some lanthanides. J Inorg Nucl Chem
1972;34:3209.
43. Schweitzer GK, Neil RB, Clifford FR. Effects of the anion on the extraction of zinc with
8-hydroxyquinoline. Anal Chim Acta 1965;33:514.
44. Spigorelli JC, Meloan CF. Sep Sci Techn 1974;9:79.
45. Joe EG, Ritcey GM, Ashbrook AW. Polymer-supported phosphorus-containing ligands for
selective metal ion complexation. J Metals NY 1966;18:18.
46. Flett DS, West DW. In: Proceedings of the International Solvent Extraction Conference,
(ISEC’71), 1971, vol. 1, p. 214 (Soc. Chem. Ind., London).
47. Flett DS, Cox M, Heels JDG. In: Proceedings of the International Solvent Extraction
Conference (ISEC"73), 1974, vol. 3, p. 2559 (Soc. Chem. Ind., London).
48. Flett DS, Cox M, Heels JDG. J Inorg Nucl Chem 1975;37:2533.
49. Nyman BG, Hummelstedt L. In: Proceedings of the International Solvent Extraction
Conference (ISEC"73), vol. 1 1974, p. 669 (Soc. Chem. Ind., London).
50. Moore RH, Partridge JA. Battelle Pacific Northwest Laboratories Report No. BNWL*SA-
4476, 1972.
51. Lakshmanan VL, Lawson GJ. The behaviour of Lix, 63. J Inorg Nucl Chem 1973;35:4285.
52. Harrison G, Lakshmanan VL, Lawson GJ. Solvent extraction of zinc(II) and copper(II) with
mixtures of LIX. Hydrometallurgy 1976;1:339.
53. Flett DS, Cox M, Heels LDG. Solubilization versus microemulsification of extractant mole-
cules. J Inorg Nucl Chem 1975;37:2197.
54. Hanson C, Hughes MA, Preston JS, Whewell RJ. Purification and acid-base properties of
hydroxyoxime extractants. J Inorg Nucl Chem 1976;38:2306.
55. Dalton RF. In: Proceedings of the International Solvent Extraction Conference (ISEC"77),
1979, vol. 1, p. 40 (Can. Inst. Min. Met., Montreal).
56. Flett S, Spink DR. In: Proceedings of the International Solvent Extraction Conference
(ISEC"77), 1979, vol. 2, p. 496 (Can. Inst. Min. Met., Monttreal).
57. Zingaro RA, Coleman CF. J Inorg Nucl Chem 1967;29:1287.
58. Wang SM, Li NC. J Inorg Nucl Chem 1966;28:1091.
59. Woo C, Wagner WF, Sands DE. J Inorg Nucl Chem 1972;34:307.
60. Newman L, Klotz. Applications of mixed-ligand complexes in analytical. In: Dyrssen D,
Liljensin JO, Rydberg J, editors. Solvent extraction chemistry. Amsterdam: North-Holland;
1967. p. 128.
61. Sekine T, Dyrssen D. Solvent extraction of rare-earth metal ions with thenoyltrifluoroacetone.
J Inorg Nucl Chem 1967;29:1489.
155Chapter | 3 Chemistry of Metal Solvent Extraction
62. van Dalen A, Wijkstra J, Gerritsma KW. Liquid-liquid extraction of complexed metal ions by
inclusion in dinonyl naphthalene sulphonic acid micelles. J Inorg Nucl Chem 1978;40:875–81.
63. Eyal AM. Acid extraction by acid-base-coupled extractants. In: Marinsky JA, Marcus Y, editors.
Ion exchange and solvent extraction, vol. 13. New York: Marcel Dekker Inc; 1997. p. 31–93.
64. Schmuckler G, Harel G. Extraction of salts by mixed liquid ion exchangers. In: Marinsky JA,
Marcus Y, editors. Ion exchange and solvent extraction, vol. 13. New York: Marcel Dekker
Inc; 1997. p. 1–29.
65. Eyal AM, Bressler E, Bloch R, Hazan B. Extraction of ZnSO4 by acid base couple extractants.
Ind Eng Chem Res 1994;33:1067.
66. Eyal AM, Kogan L, Bressler E. Extraction of metal salts by mixtures of water-immiscible
amines and organic acids (acid-base couple extractants). 2. theoretical treatment and analysis.
Ind Eng Chem Res 1994;33:1076.
67. Neuman L, Klotz P. Synergistic effect of tri-n-octylamine on the solvent extraction of
cerium(III) by thenoyltrifluoroacetone. Inorg Chem 1972;11(9):2154–9.
68. Ke CH, Li NC. Synergic extraction of cobalt(II) by thenoyltrifluoroacetone. J Inorg Nucl
Chem 1969;31:1383.
69. Deptula C, Minc S. Nukleonika 1965;10:421.
70. Deptula C. J Inorg Nuc1 Chem 1967;29:1097.
71. Deptula C, Mine S. J Inorg Nuc1 Chem 1967;29:159.
72. Liem DH, Sinegribova OA. Acta Chem Scand 1971;25:301.
73. Deptula C. J Inorg Nucl Chem 1970;32:277.
74. Rinelli G, Abbruzzese C. In: Jones MJ, editor. Geology, mining and extractive processing of
uranium. London: IMM; 1977. p. 20.
75. Nishimura S, Ke CH, Li NC. Adducts of copper(II) b-diketone chelates with tertiary amines.
J Phys Chem 1968;72:1297.
76. Pedersen CJ. Brief overview on anion binding organic ligands. J Am Chem Soc 1967;89:7017.
77. Trueblood KN, Knobler CB, Lawrence DS, Stevens RV. Polysulfonylamines. J Am Chem Soc
1982;104:1355.
78. Gehin D, Kollman PA, Wipff G. Anchoring of ammonium cations to an 18-crown-6 binding
site: molecular mechanics and dynamics study. J Am Chem Soc 1989;111:3011.
79. Walter H, Brooks DE, Fisher D, editors. Partitioning in aqueous two-phase systems. Theory,
methods, uses, and applications to biotechnology. Orlando, FL: Academic Press; 1985.
80. Rogers RD, Fiteman MA, editors. Aqueous biphasic separations: biomolecules to metal ions.
New York: Plenum; 1995.
81. Albertsson PA. Partition of cell particles and macromolecules. 3rd ed. New York: John
Wiley & Sons; 1986.
82. RogersRD,Zhang J.Newtechnologies formetal ion separations. In:Marinsky JA,MarcusY, editors.
Ion exchange and solvent extraction, vol. 13. New York: Marcel Dekker Inc; 1997. p. 141–93.
83. Rogers RD, Bond AH, Bauer CB. In: Logsdeil DH, Slater MJ, editors. Proceedings of
ISEC’93, vol. 3. London: Elsevier; 1993. p. 1641.
84. Rogers RD, Bond AH, Bauer CB. Toward unusual aluminum-oxygen compounds. Sep Sci
Technol 1993;28:139.
85. Rogers RD, Bauer CB, Bond AH. Crown ethers as actinide extractants in acidic aqueous
biphasic systems: partitioning behavior in solution and crystallographic analyses of the solid
state. J Alloys Compd 1994;305:213–4.
86. Rogers RD, Bond AH, Griffin ST, Gorwitz EP. Extraction of strontium from acidic nitrate
media using a modified PUREX solvent. Solvent Extr Ion Exch 1996;14:919.
87. Rippel G, Alattiani E, Szepesy L. Effect of the characteristics of proteins in hydrophobic
interaction chromatography. J Chromatogr A 1994;668:301.
156 PART | I Conventional (Classical) Principles and Practice
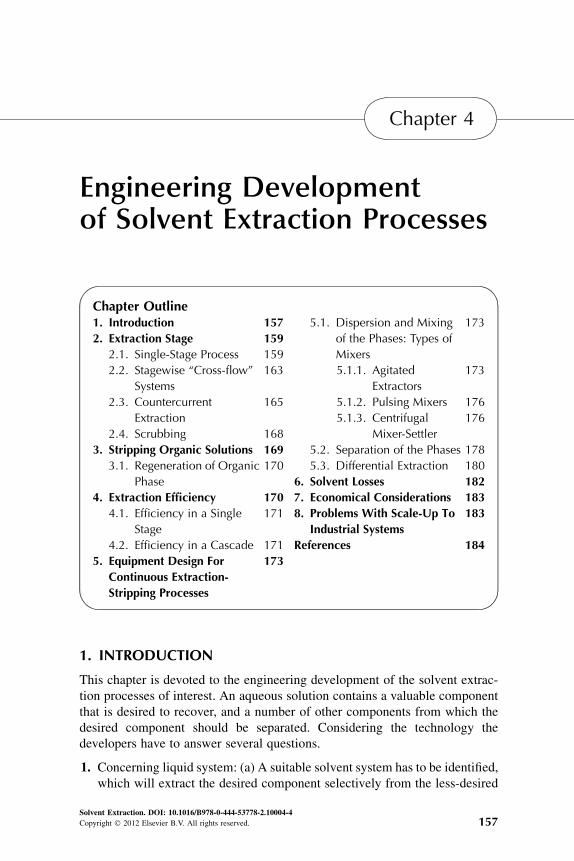
Chapter 4
Engineering Developmentof Solvent Extraction Processes
Chapter Outline1. Introduction 157
2. Extraction Stage 159
2.1. Single-Stage Process 159
2.2. Stagewise “Cross-flow”
Systems
163
2.3. Countercurrent
Extraction
165
2.4. Scrubbing 168
3. Stripping Organic Solutions 169
3.1. Regeneration of Organic
Phase
170
4. Extraction Efficiency 170
4.1. Efficiency in a Single
Stage
171
4.2. Efficiency in a Cascade 171
5. Equipment Design For
Continuous Extraction-
Stripping Processes
173
5.1. Dispersion and Mixing
of the Phases: Types of
Mixers
173
5.1.1. Agitated
Extractors
173
5.1.2. Pulsing Mixers 176
5.1.3. Centrifugal
Mixer-Settler
176
5.2. Separation of the Phases 178
5.3. Differential Extraction 180
6. Solvent Losses 182
7. Economical Considerations 183
8. Problems With Scale-Up To
Industrial Systems
183
References 184
1. INTRODUCTION
This chapter is devoted to the engineering development of the solvent extrac-tion processes of interest. An aqueous solution contains a valuable componentthat is desired to recover, and a number of other components from which thedesired component should be separated. Considering the technology thedevelopers have to answer several questions.
1. Concerning liquid system: (a) A suitable solvent system has to be identified,which will extract the desired component selectively from the less-desired
Solvent Extraction. DOI: 10.1016/B978-0-444-53778-2.10004-4
Copyright � 2012 Elsevier B.V. All rights reserved. 157
components. What fraction of the desired component can be recovered? (b)Suitable physical and chemical conditions for carrying out the extractionhave to be found. (c) Thermodynamic design of the extraction process;the rates of extraction of the desired, and possibly also some of the unde-sired, components have been determined. Optimal parameters for theextraction process are proposed.
These questions are considered as a result of literature search and laboratorystudies and answered mainly in the previous chapters.
2. Flow and mass transfer, thermodynamic design of the extractiondstrip-ping technological scheme: (a) Determination of the phase ratio and thenumber of separation stages necessary. How many of the undesiredcomponents are extracted with the desired component, and what canbe done to reduce their concentration? (b) Efficiency of the mass transferand solvent losses and its recovery. (c) Recovery of the desired compo-nent from the extract in a usable form: design of a strip flow and masstransfer conditions.
3. Design of the equipment for technology: Mainly extractor–stripper appa-ratus is discussed from chemical engineering point of view.
4. Energy-efficient, environmental and economic considerations have to beadded to these questions.
The initial bench-scale experimental work in solvent extraction processesfor answering some of these questions and determining main processparameters (the temperature, flow rate, acidity, and so forth) isconducted with small apparatus, such as separator funnels. Following thesuccessful completion of these tests, when the best reagent and otherconditions for the system have been established, small-scale continuousoperations are run, such as in a small mixer-settler unit. The data soobtained are used to determine scale-up factors for pilot plant or plantdesign and operation.
Pilot plant operations are considered from technological and economicpoint of view. If few (or no) modifications are required, considerablesavings can result on scale-up. On the other hand, problems encountered ina plant operation that has been designed without piloting the process couldresult in the loss of considerable time and expense. It should be pointed outthat the size of a pilot plant can vary from a few gallons per minute of totalthroughput to several hundred gallons per minute. Normally, one wouldexpect that the size of a pilot plant will be in direct proportion to the size ofthe final plant.
In this chapter, the engineering aspects of scale-up laboratory studies of anextraction process to industrial applications are presented in short. The choiceof material, stability, and other questions of mechanical engineering are notconsidered in this book.
158 PART | I Conventional (Classical) Principles and Practice
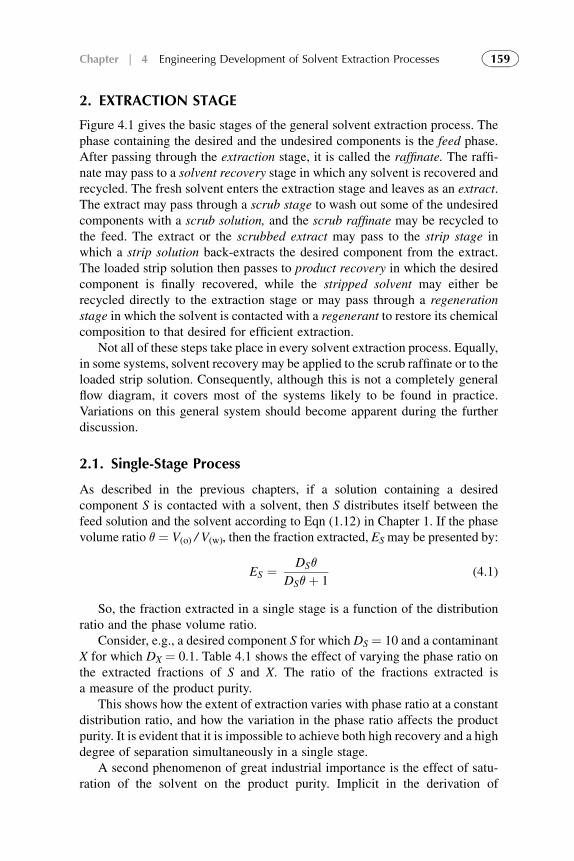
2. EXTRACTION STAGE
Figure 4.1 gives the basic stages of the general solvent extraction process. Thephase containing the desired and the undesired components is the feed phase.After passing through the extraction stage, it is called the raffinate. The raffi-nate may pass to a solvent recovery stage in which any solvent is recovered andrecycled. The fresh solvent enters the extraction stage and leaves as an extract.The extract may pass through a scrub stage to wash out some of the undesiredcomponents with a scrub solution, and the scrub raffinate may be recycled tothe feed. The extract or the scrubbed extract may pass to the strip stage inwhich a strip solution back-extracts the desired component from the extract.The loaded strip solution then passes to product recovery in which the desiredcomponent is finally recovered, while the stripped solvent may either berecycled directly to the extraction stage or may pass through a regenerationstage in which the solvent is contacted with a regenerant to restore its chemicalcomposition to that desired for efficient extraction.
Not all of these steps take place in every solvent extraction process. Equally,in some systems, solvent recovery may be applied to the scrub raffinate or to theloaded strip solution. Consequently, although this is not a completely generalflow diagram, it covers most of the systems likely to be found in practice.Variations on this general system should become apparent during the furtherdiscussion.
2.1. Single-Stage Process
As described in the previous chapters, if a solution containing a desiredcomponent S is contacted with a solvent, then S distributes itself between thefeed solution and the solvent according to Eqn (1.12) in Chapter 1. If the phasevolume ratio q ¼ V(o) / V(w), then the fraction extracted, ES may be presented by:
ES ¼ DSq
DSqþ 1(4.1)
So, the fraction extracted in a single stage is a function of the distributionratio and the phase volume ratio.
Consider, e.g., a desired component S for which DS ¼ 10 and a contaminantX for which DX ¼ 0.1. Table 4.1 shows the effect of varying the phase ratio onthe extracted fractions of S and X. The ratio of the fractions extracted isa measure of the product purity.
This shows how the extent of extraction varies with phase ratio at a constantdistribution ratio, and how the variation in the phase ratio affects the productpurity. It is evident that it is impossible to achieve both high recovery and a highdegree of separation simultaneously in a single stage.
A second phenomenon of great industrial importance is the effect of satu-ration of the solvent on the product purity. Implicit in the derivation of
159Chapter | 4 Engineering Development of Solvent Extraction Processes
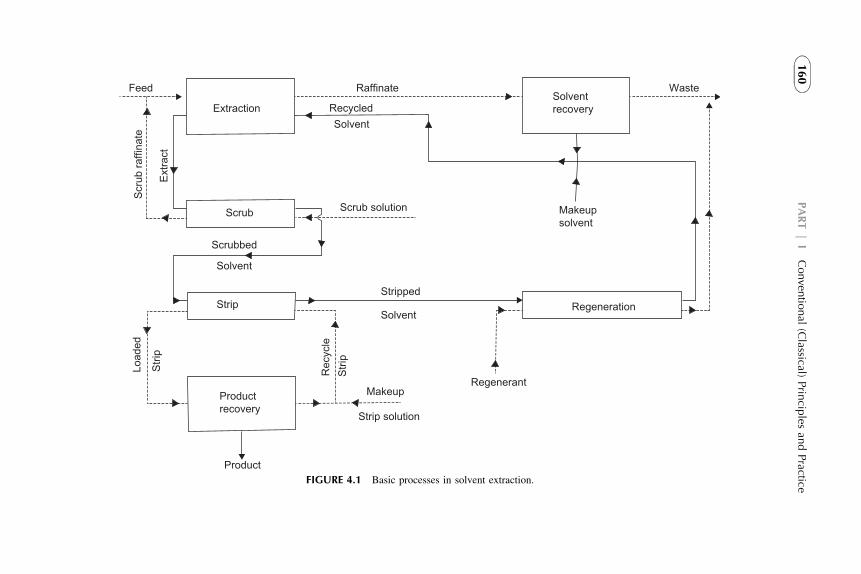
Feed
Extraction
Scru
b ra
ffina
te
Extra
ct
Scrub
Raffinate
RecycledSolvent
Solventrecovery
Waste
Scrub solution
Stripped
Solvent
Scrubbed
Solvent
Strip
Makeupsolvent
Regeneration
Load
ed
Strip
Productrecovery
Product
Rec
ycle
Strip
Makeup
Strip solution
Regenerant
FIGURE 4.1 Basic processes in solvent extraction.
160
PART|
IConven
tional
(Classical)
Prin
ciples
andPractice
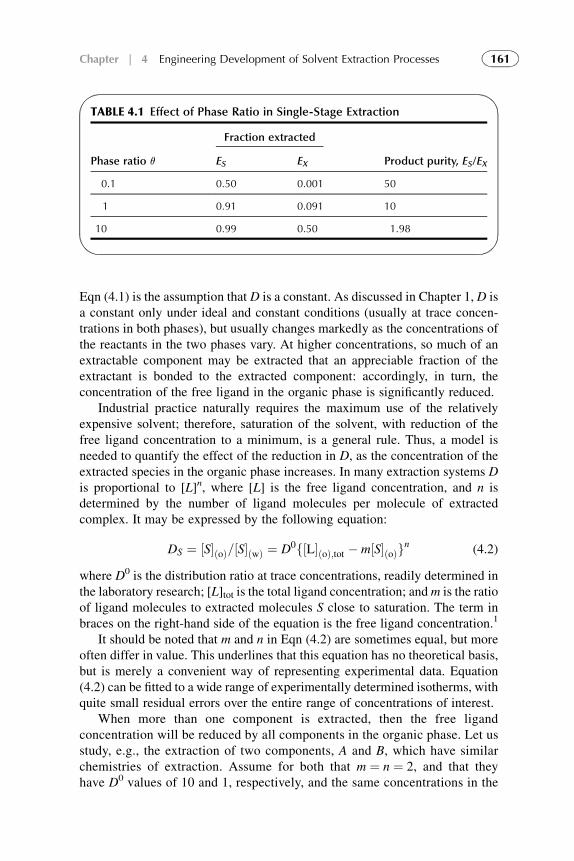
Eqn (4.1) is the assumption that D is a constant. As discussed in Chapter 1, D isa constant only under ideal and constant conditions (usually at trace concen-trations in both phases), but usually changes markedly as the concentrations ofthe reactants in the two phases vary. At higher concentrations, so much of anextractable component may be extracted that an appreciable fraction of theextractant is bonded to the extracted component: accordingly, in turn, theconcentration of the free ligand in the organic phase is significantly reduced.
Industrial practice naturally requires the maximum use of the relativelyexpensive solvent; therefore, saturation of the solvent, with reduction of thefree ligand concentration to a minimum, is a general rule. Thus, a model isneeded to quantify the effect of the reduction in D, as the concentration of theextracted species in the organic phase increases. In many extraction systems Dis proportional to [L]n, where [L] is the free ligand concentration, and n isdetermined by the number of ligand molecules per molecule of extractedcomplex. It may be expressed by the following equation:
DS ¼ ½S�ðoÞ=½S�ðwÞ ¼ D0f½L�ðoÞ;tot � m½S�ðoÞgn (4.2)
where D0 is the distribution ratio at trace concentrations, readily determined inthe laboratory research; [L]tot is the total ligand concentration; andm is the ratioof ligand molecules to extracted molecules S close to saturation. The term inbraces on the right-hand side of the equation is the free ligand concentration.1
It should be noted that m and n in Eqn (4.2) are sometimes equal, but moreoften differ in value. This underlines that this equation has no theoretical basis,but is merely a convenient way of representing experimental data. Equation(4.2) can be fitted to a wide range of experimentally determined isotherms, withquite small residual errors over the entire range of concentrations of interest.
When more than one component is extracted, then the free ligandconcentration will be reduced by all components in the organic phase. Let usstudy, e.g., the extraction of two components, A and B, which have similarchemistries of extraction. Assume for both that m ¼ n ¼ 2, and that theyhave D0 values of 10 and 1, respectively, and the same concentrations in the
TABLE 4.1 Effect of Phase Ratio in Single-Stage Extraction
Phase ratio q
Fraction extracted
Product purity, ES/EXES EX
0.1 0.50 0.001 50
1 0.91 0.091 10
10 0.99 0.50 1.98
161Chapter | 4 Engineering Development of Solvent Extraction Processes
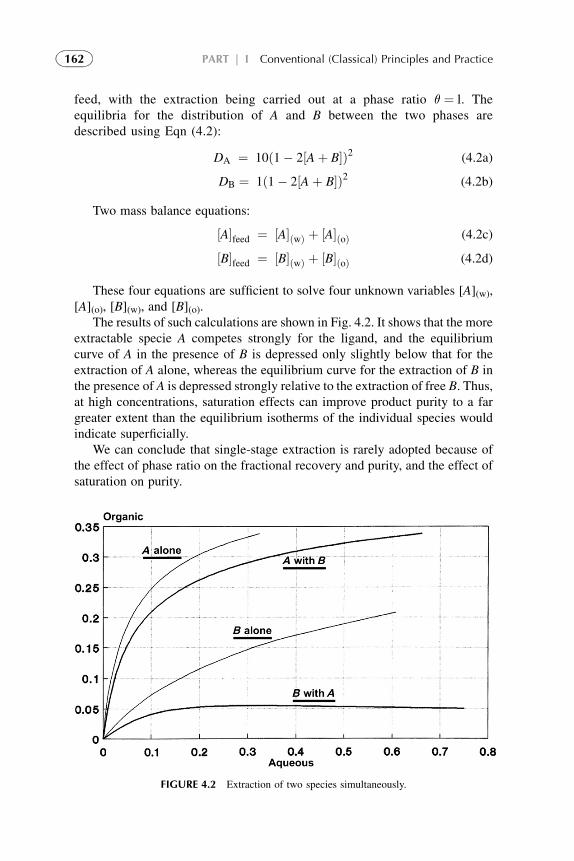
feed, with the extraction being carried out at a phase ratio q ¼ l. Theequilibria for the distribution of A and B between the two phases aredescribed using Eqn (4.2):
DA ¼ 10ð1� 2½Aþ B�Þ2 (4.2a)
DB ¼ 1ð1� 2½A þ B�Þ2 (4.2b)
Two mass balance equations:
½A�feed ¼ ½A�ðwÞ þ ½A�ðoÞ (4.2c)
½B�feed ¼ ½B�ðwÞ þ ½B�ðoÞ (4.2d)
These four equations are sufficient to solve four unknown variables [A](w),[A](o), [B](w), and [B](o).
The results of such calculations are shown in Fig. 4.2. It shows that the moreextractable specie A competes strongly for the ligand, and the equilibriumcurve of A in the presence of B is depressed only slightly below that for theextraction of A alone, whereas the equilibrium curve for the extraction of B inthe presence of A is depressed strongly relative to the extraction of free B. Thus,at high concentrations, saturation effects can improve product purity to a fargreater extent than the equilibrium isotherms of the individual species wouldindicate superficially.
We can conclude that single-stage extraction is rarely adopted because ofthe effect of phase ratio on the fractional recovery and purity, and the effect ofsaturation on purity.
FIGURE 4.2 Extraction of two species simultaneously.
162 PART | I Conventional (Classical) Principles and Practice
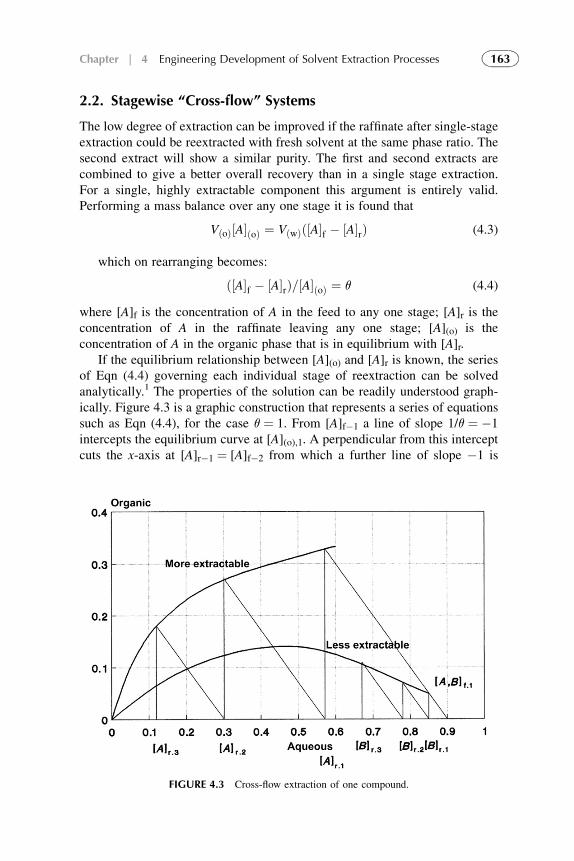
2.2. Stagewise “Cross-flow” Systems
The low degree of extraction can be improved if the raffinate after single-stageextraction could be reextracted with fresh solvent at the same phase ratio. Thesecond extract will show a similar purity. The first and second extracts arecombined to give a better overall recovery than in a single stage extraction.For a single, highly extractable component this argument is entirely valid.Performing a mass balance over any one stage it is found that
VðoÞ½A�ðoÞ ¼ VðwÞð½A�f � ½A�rÞ (4.3)
which on rearranging becomes:
ð½A�f � ½A�rÞ=½A�ðoÞ ¼ q (4.4)
where [A]f is the concentration of A in the feed to any one stage; [A]r is theconcentration of A in the raffinate leaving any one stage; [A](o) is theconcentration of A in the organic phase that is in equilibrium with [A]r.
If the equilibrium relationship between [A](o) and [A]r is known, the seriesof Eqn (4.4) governing each individual stage of reextraction can be solvedanalytically.1 The properties of the solution can be readily understood graph-ically. Figure 4.3 is a graphic construction that represents a series of equationssuch as Eqn (4.4), for the case q ¼ 1. From [A]f�1 a line of slope 1/q ¼ �1intercepts the equilibrium curve at [A](o),1. A perpendicular from this interceptcuts the x-axis at [A]r�1 ¼ [A]f�2 from which a further line of slope �1 is
FIGURE 4.3 Cross-flow extraction of one compound.
163Chapter | 4 Engineering Development of Solvent Extraction Processes
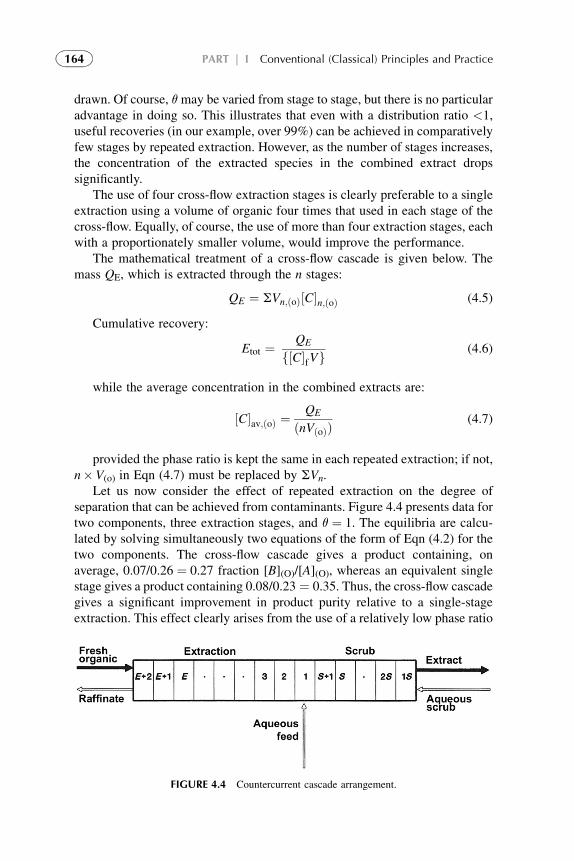
drawn. Of course, qmay be varied from stage to stage, but there is no particularadvantage in doing so. This illustrates that even with a distribution ratio <1,useful recoveries (in our example, over 99%) can be achieved in comparativelyfew stages by repeated extraction. However, as the number of stages increases,the concentration of the extracted species in the combined extract dropssignificantly.
The use of four cross-flow extraction stages is clearly preferable to a singleextraction using a volume of organic four times that used in each stage of thecross-flow. Equally, of course, the use of more than four extraction stages, eachwith a proportionately smaller volume, would improve the performance.
The mathematical treatment of a cross-flow cascade is given below. Themass QE, which is extracted through the n stages:
QE ¼ SVn;ðoÞ½C�n;ðoÞ (4.5)
Cumulative recovery:
Etot ¼ QE
f½C�fVg(4.6)
while the average concentration in the combined extracts are:
½C�av;ðoÞ ¼QE
ðnVðoÞÞ(4.7)
provided the phase ratio is kept the same in each repeated extraction; if not,n�V(o) in Eqn (4.7) must be replaced by SVn.
Let us now consider the effect of repeated extraction on the degree ofseparation that can be achieved from contaminants. Figure 4.4 presents data fortwo components, three extraction stages, and q ¼ 1. The equilibria are calcu-lated by solving simultaneously two equations of the form of Eqn (4.2) for thetwo components. The cross-flow cascade gives a product containing, onaverage, 0.07/0.26 ¼ 0.27 fraction [B](O)/[A](O), whereas an equivalent singlestage gives a product containing 0.08/0.23 ¼ 0.35. Thus, the cross-flow cascadegives a significant improvement in product purity relative to a single-stageextraction. This effect clearly arises from the use of a relatively low phase ratio
FIGURE 4.4 Countercurrent cascade arrangement.
164 PART | I Conventional (Classical) Principles and Practice
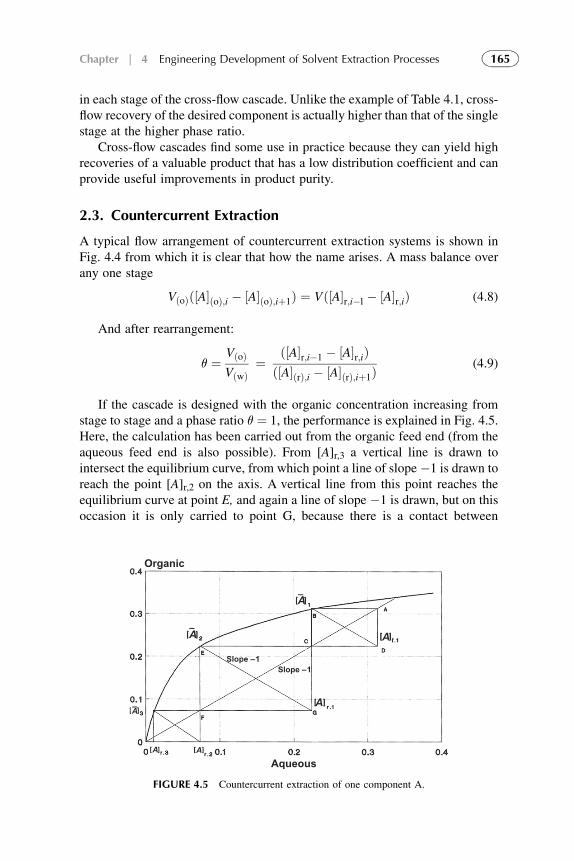
in each stage of the cross-flow cascade. Unlike the example of Table 4.1, cross-flow recovery of the desired component is actually higher than that of the singlestage at the higher phase ratio.
Cross-flow cascades find some use in practice because they can yield highrecoveries of a valuable product that has a low distribution coefficient and canprovide useful improvements in product purity.
2.3. Countercurrent Extraction
A typical flow arrangement of countercurrent extraction systems is shown inFig. 4.4 from which it is clear that how the name arises. A mass balance overany one stage
VðoÞð½A�ðoÞ;i � ½A�ðoÞ;iþ1Þ ¼ Vð½A�r;i�l � ½A�r;iÞ (4.8)
And after rearrangement:
q ¼ VðoÞVðwÞ
¼ ð½A�r;i�1 � ½A�r;iÞð½A�ðrÞ;i � ½A�ðrÞ;iþ1Þ
(4.9)
If the cascade is designed with the organic concentration increasing fromstage to stage and a phase ratio q ¼ 1, the performance is explained in Fig. 4.5.Here, the calculation has been carried out from the organic feed end (from theaqueous feed end is also possible). From [A]r,3 a vertical line is drawn tointersect the equilibrium curve, from which point a line of slope �1 is drawn toreach the point [A]r,2 on the axis. A vertical line from this point reaches theequilibrium curve at point E, and again a line of slope �1 is drawn, but on thisoccasion it is only carried to point G, because there is a contact between
Organic
Slope – 1
Slope – 1
Aqueous
A
A
A
A
AA
A
FIGURE 4.5 Countercurrent extraction of one component A.
165Chapter | 4 Engineering Development of Solvent Extraction Processes
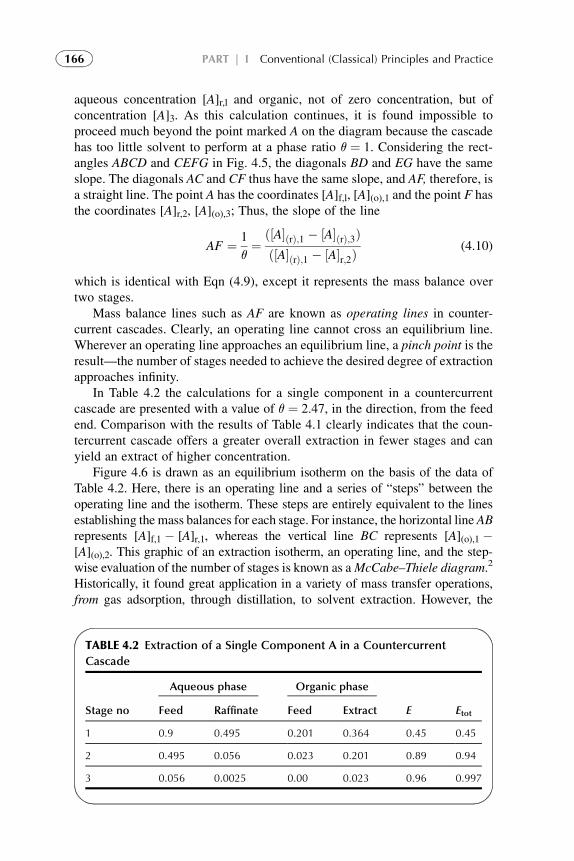
aqueous concentration [A]r,l and organic, not of zero concentration, but ofconcentration [A]3. As this calculation continues, it is found impossible toproceed much beyond the point marked A on the diagram because the cascadehas too little solvent to perform at a phase ratio q ¼ 1. Considering the rect-angles ABCD and CEFG in Fig. 4.5, the diagonals BD and EG have the sameslope. The diagonals AC and CF thus have the same slope, and AF, therefore, isa straight line. The point A has the coordinates [A]f,l, [A](o),1 and the point F hasthe coordinates [A]r,2, [A](o),3; Thus, the slope of the line
AF ¼ 1
q¼
ð½A�ðrÞ;1 � ½A�ðrÞ;3Þð½A�ðrÞ;1 � ½A�r;2Þ
(4.10)
which is identical with Eqn (4.9), except it represents the mass balance overtwo stages.
Mass balance lines such as AF are known as operating lines in counter-current cascades. Clearly, an operating line cannot cross an equilibrium line.Wherever an operating line approaches an equilibrium line, a pinch point is theresult––the number of stages needed to achieve the desired degree of extractionapproaches infinity.
In Table 4.2 the calculations for a single component in a countercurrentcascade are presented with a value of q ¼ 2.47, in the direction, from the feedend. Comparison with the results of Table 4.1 clearly indicates that the coun-tercurrent cascade offers a greater overall extraction in fewer stages and canyield an extract of higher concentration.
Figure 4.6 is drawn as an equilibrium isotherm on the basis of the data ofTable 4.2. Here, there is an operating line and a series of “steps” between theoperating line and the isotherm. These steps are entirely equivalent to the linesestablishing the mass balances for each stage. For instance, the horizontal line ABrepresents [A]f,1 � [A]r,1, whereas the vertical line BC represents [A](o),1 �[A](o),2. This graphic of an extraction isotherm, an operating line, and the step-wise evaluation of the number of stages is known as aMcCabe–Thiele diagram.2
Historically, it found great application in a variety of mass transfer operations,from gas adsorption, through distillation, to solvent extraction. However, the
TABLE 4.2 Extraction of a Single Component A in a Countercurrent
Cascade
Stage no
Aqueous phase Organic phase
E EtotFeed Raffinate Feed Extract
1 0.9 0.495 0.201 0.364 0.45 0.45
2 0.495 0.056 0.023 0.201 0.89 0.94
3 0.056 0.0025 0.00 0.023 0.96 0.997
166 PART | I Conventional (Classical) Principles and Practice
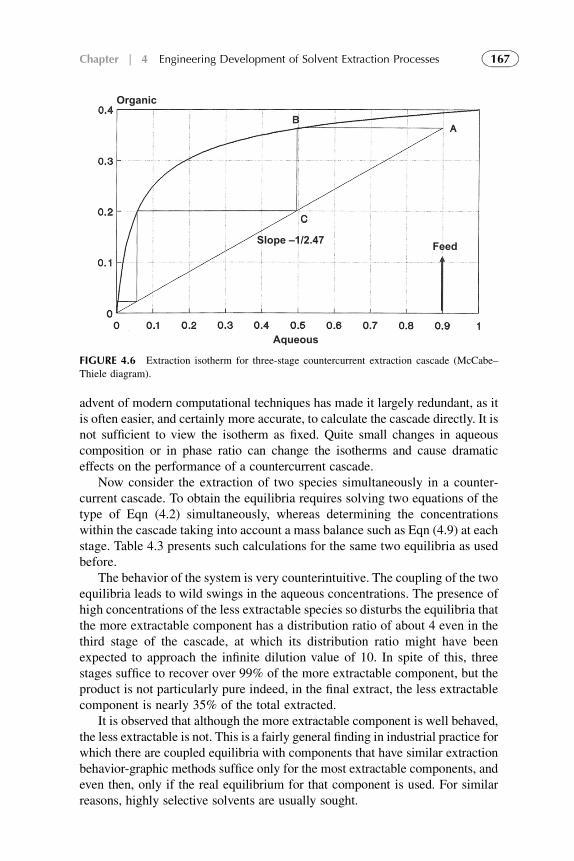
Slope –1/2.47
Organic
Feed
Aqueous
FIGURE 4.6 Extraction isotherm for three-stage countercurrent extraction cascade (McCabe–
Thiele diagram).
advent of modern computational techniques has made it largely redundant, as itis often easier, and certainly more accurate, to calculate the cascade directly. It isnot sufficient to view the isotherm as fixed. Quite small changes in aqueouscomposition or in phase ratio can change the isotherms and cause dramaticeffects on the performance of a countercurrent cascade.
Now consider the extraction of two species simultaneously in a counter-current cascade. To obtain the equilibria requires solving two equations of thetype of Eqn (4.2) simultaneously, whereas determining the concentrationswithin the cascade taking into account a mass balance such as Eqn (4.9) at eachstage. Table 4.3 presents such calculations for the same two equilibria as usedbefore.
The behavior of the system is very counterintuitive. The coupling of the twoequilibria leads to wild swings in the aqueous concentrations. The presence ofhigh concentrations of the less extractable species so disturbs the equilibria thatthe more extractable component has a distribution ratio of about 4 even in thethird stage of the cascade, at which its distribution ratio might have beenexpected to approach the infinite dilution value of 10. In spite of this, threestages suffice to recover over 99% of the more extractable component, but theproduct is not particularly pure indeed, in the final extract, the less extractablecomponent is nearly 35% of the total extracted.
It is observed that although the more extractable component is well behaved,the less extractable is not. This is a fairly general finding in industrial practice forwhich there are coupled equilibria with components that have similar extractionbehavior-graphic methods suffice only for the most extractable components, andeven then, only if the real equilibrium for that component is used. For similarreasons, highly selective solvents are usually sought.
167Chapter | 4 Engineering Development of Solvent Extraction Processes
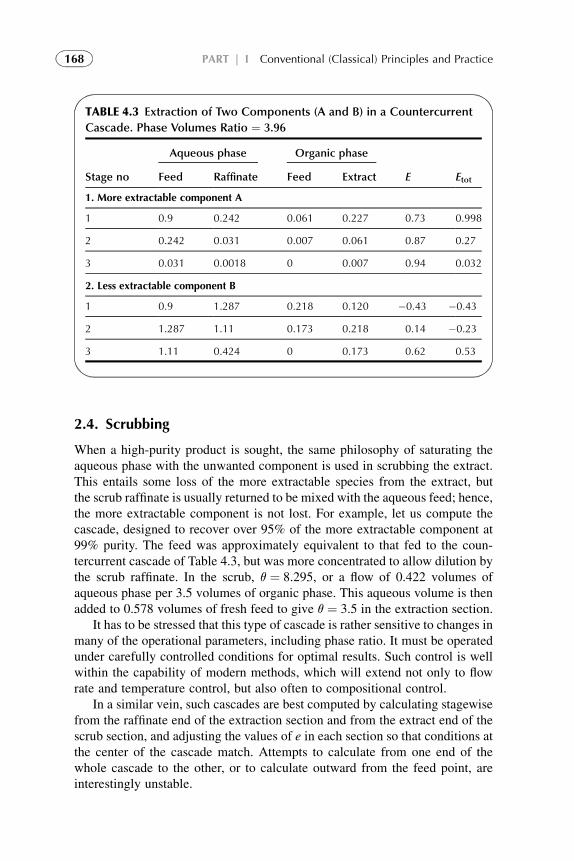
2.4. Scrubbing
When a high-purity product is sought, the same philosophy of saturating theaqueous phase with the unwanted component is used in scrubbing the extract.This entails some loss of the more extractable species from the extract, butthe scrub raffinate is usually returned to be mixed with the aqueous feed; hence,the more extractable component is not lost. For example, let us compute thecascade, designed to recover over 95% of the more extractable component at99% purity. The feed was approximately equivalent to that fed to the coun-tercurrent cascade of Table 4.3, but was more concentrated to allow dilution bythe scrub raffinate. In the scrub, q ¼ 8.295, or a flow of 0.422 volumes ofaqueous phase per 3.5 volumes of organic phase. This aqueous volume is thenadded to 0.578 volumes of fresh feed to give q ¼ 3.5 in the extraction section.
It has to be stressed that this type of cascade is rather sensitive to changes inmany of the operational parameters, including phase ratio. It must be operatedunder carefully controlled conditions for optimal results. Such control is wellwithin the capability of modern methods, which will extend not only to flowrate and temperature control, but also often to compositional control.
In a similar vein, such cascades are best computed by calculating stagewisefrom the raffinate end of the extraction section and from the extract end of thescrub section, and adjusting the values of e in each section so that conditions atthe center of the cascade match. Attempts to calculate from one end of thewhole cascade to the other, or to calculate outward from the feed point, areinterestingly unstable.
TABLE 4.3 Extraction of Two Components (A and B) in a Countercurrent
Cascade. Phase Volumes Ratio ¼ 3.96
Stage no
Aqueous phase Organic phase
E EtotFeed Raffinate Feed Extract
1. More extractable component A
1 0.9 0.242 0.061 0.227 0.73 0.998
2 0.242 0.031 0.007 0.061 0.87 0.27
3 0.031 0.0018 0 0.007 0.94 0.032
2. Less extractable component B
1 0.9 1.287 0.218 0.120 �0.43 �0.43
2 1.287 1.11 0.173 0.218 0.14 �0.23
3 1.11 0.424 0 0.173 0.62 0.53
168 PART | I Conventional (Classical) Principles and Practice
The scrubbing techniques were developed in the radiochemical industry,where total product impurities measured in parts per million (ppm) were firstrequired on a tonnage basis.
In conclusion of this section we have to stress the following:
1. The fraction of the desired component that can be recovered is determinednot only by its inherent extractability, but also by the phase ratio and thepresence of competing extractable components.
2. The volume of solvent needed for a particular duty depends on the systemadopted for the extraction; in general, a single-stage extraction requiresmore solvent than a cross-flow cascade, which in turn needs more thana countercurrent cascade.
3. The purity of the product is determined not only by the inherent selectivityof the solvent system for the component that is sought, but also on the phaseratio, the concentration of the contaminants, and the performance of anyscrubbing of the extract.
3. STRIPPING ORGANIC SOLUTIONS
The general principles established for extraction apply to stripping, although inorder to accomplish the strip as efficiently as possible, distribution ratios haveto be significantly less than unity. Stripping can equally be done in single stage,cross-flow, or countercurrent. As in extraction, the same mass balance limita-tions on phase ratio apply. Let us design a stripping countercurrent cascade withorganic feed concentration of 0.300, assuming >95% strip and a final aqueousphase of <2. The maximum phase ratio is qmax ¼ 2/(0.95 � 0.350) ¼ 7.02.(Maximum in this case because stripping is in the reverse direction to extrac-tion.) Results presented in Table 4.4 calculated for the phase ratio of 6.55. Fourstages are needed. The strip raffinate is nearly saturated and has a concentrationof 1.71. The stripped organic contains only 4% (0.012/0.30) of the componentA in the extract, so the stripping efficiency is 98%. The less extractable (morereadily stripped) component B was stripped in two stages to remove itcompletely from the organic.
Note that the stripped extract still contains traces of the desired component.This is a slight nuisance as the stripped extract will, in the normal course ofevents, be recycled to the extraction stages where it will reduce the extractionefficiency in the first stage. This practice is fairly common in industrial prac-tice, as it is more economic to lose a little of the desired component in theextraction stages than to have too dilute a strip raffinate by seeking a total strip.The purpose of seeking a concentrated strip solution is to reduce the energyrequired to recover the product from the strip solution. In the case of metal salts,precipitation, electrolysis, direct reduction, and a host of other techniques maybe used to generate the final product. In the case of the extraction of organiccompounds, distillation, crystallization, or similar separation methods are used.
169Chapter | 4 Engineering Development of Solvent Extraction Processes
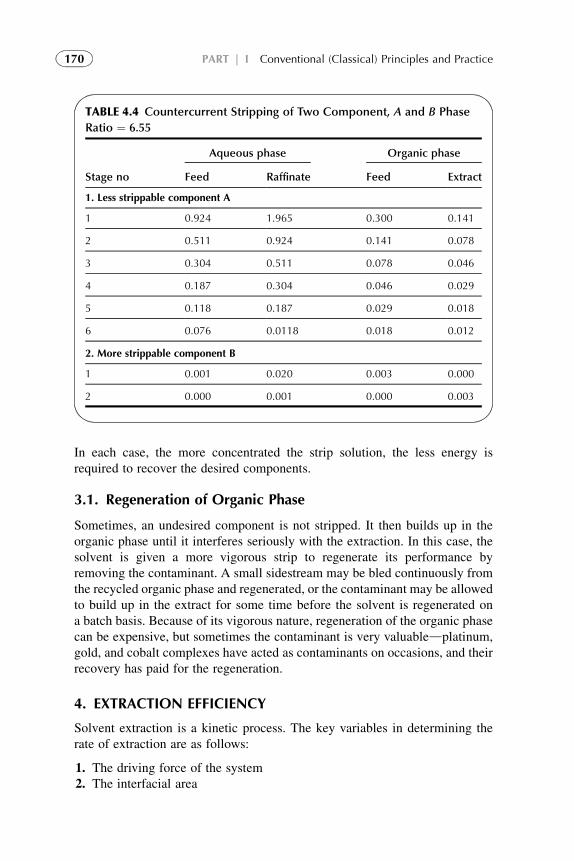
In each case, the more concentrated the strip solution, the less energy isrequired to recover the desired components.
3.1. Regeneration of Organic Phase
Sometimes, an undesired component is not stripped. It then builds up in theorganic phase until it interferes seriously with the extraction. In this case, thesolvent is given a more vigorous strip to regenerate its performance byremoving the contaminant. A small sidestream may be bled continuously fromthe recycled organic phase and regenerated, or the contaminant may be allowedto build up in the extract for some time before the solvent is regenerated ona batch basis. Because of its vigorous nature, regeneration of the organic phasecan be expensive, but sometimes the contaminant is very valuabledplatinum,gold, and cobalt complexes have acted as contaminants on occasions, and theirrecovery has paid for the regeneration.
4. EXTRACTION EFFICIENCY
Solvent extraction is a kinetic process. The key variables in determining therate of extraction are as follows:
1. The driving force of the system2. The interfacial area
TABLE 4.4 Countercurrent Stripping of Two Component, A and B Phase
Ratio ¼ 6.55
Stage no
Aqueous phase Organic phase
Feed Raffinate Feed Extract
1. Less strippable component A
1 0.924 1.965 0.300 0.141
2 0.511 0.924 0.141 0.078
3 0.304 0.511 0.078 0.046
4 0.187 0.304 0.046 0.029
5 0.118 0.187 0.029 0.018
6 0.076 0.0118 0.018 0.012
2. More strippable component B
1 0.001 0.020 0.003 0.000
2 0.000 0.001 0.000 0.003
170 PART | I Conventional (Classical) Principles and Practice
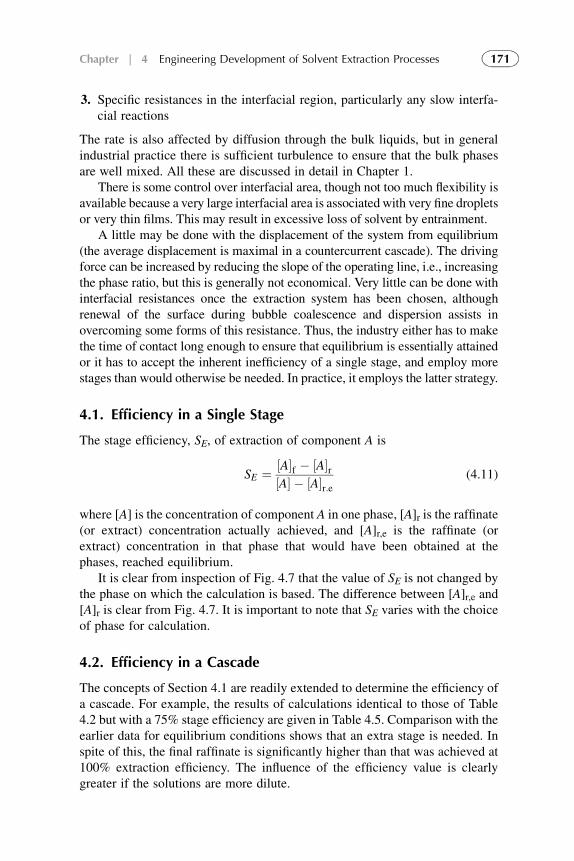
3. Specific resistances in the interfacial region, particularly any slow interfa-cial reactions
The rate is also affected by diffusion through the bulk liquids, but in generalindustrial practice there is sufficient turbulence to ensure that the bulk phasesare well mixed. All these are discussed in detail in Chapter 1.
There is some control over interfacial area, though not too much flexibility isavailable because a very large interfacial area is associated with very fine dropletsor very thin films. This may result in excessive loss of solvent by entrainment.
A little may be done with the displacement of the system from equilibrium(the average displacement is maximal in a countercurrent cascade). The drivingforce can be increased by reducing the slope of the operating line, i.e., increasingthe phase ratio, but this is generally not economical. Very little can be done withinterfacial resistances once the extraction system has been chosen, althoughrenewal of the surface during bubble coalescence and dispersion assists inovercoming some forms of this resistance. Thus, the industry either has to makethe time of contact long enough to ensure that equilibrium is essentially attainedor it has to accept the inherent inefficiency of a single stage, and employ morestages than would otherwise be needed. In practice, it employs the latter strategy.
4.1. Efficiency in a Single Stage
The stage efficiency, SE, of extraction of component A is
SE ¼ ½A�f � ½A�r½A� � ½A�r:e
(4.11)
where [A] is the concentration of component A in one phase, [A]r is the raffinate(or extract) concentration actually achieved, and [A]r,e is the raffinate (orextract) concentration in that phase that would have been obtained at thephases, reached equilibrium.
It is clear from inspection of Fig. 4.7 that the value of SE is not changed bythe phase on which the calculation is based. The difference between [A]r,e and[A]r is clear from Fig. 4.7. It is important to note that SE varies with the choiceof phase for calculation.
4.2. Efficiency in a Cascade
The concepts of Section 4.1 are readily extended to determine the efficiency ofa cascade. For example, the results of calculations identical to those of Table4.2 but with a 75% stage efficiency are given in Table 4.5. Comparison with theearlier data for equilibrium conditions shows that an extra stage is needed. Inspite of this, the final raffinate is significantly higher than that was achieved at100% extraction efficiency. The influence of the efficiency value is clearlygreater if the solutions are more dilute.
171Chapter | 4 Engineering Development of Solvent Extraction Processes
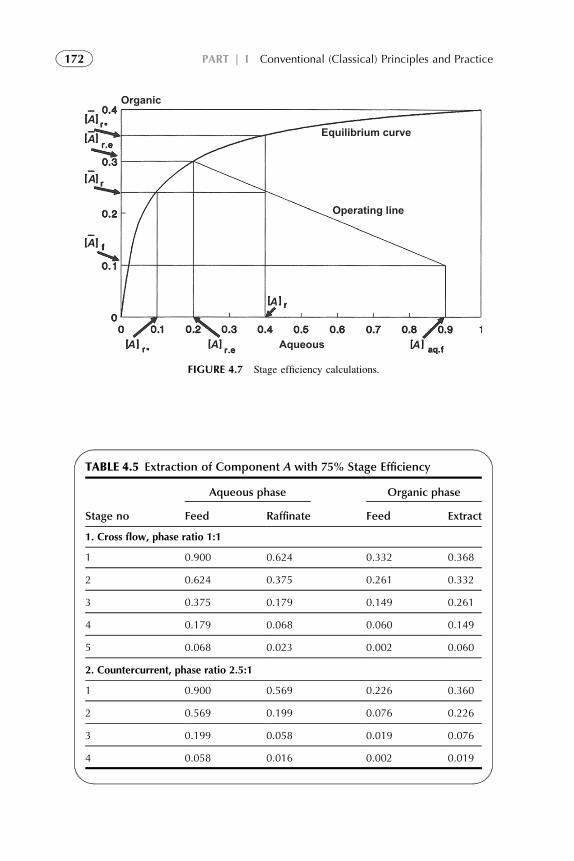
Aqueous
Organic
Equilibrium curve
Operating line
A
AA A
A
A
A
A
FIGURE 4.7 Stage efficiency calculations.
TABLE 4.5 Extraction of Component A with 75% Stage Efficiency
Stage no
Aqueous phase Organic phase
Feed Raffinate Feed Extract
1. Cross flow, phase ratio 1:1
1 0.900 0.624 0.332 0.368
2 0.624 0.375 0.261 0.332
3 0.375 0.179 0.149 0.261
4 0.179 0.068 0.060 0.149
5 0.068 0.023 0.002 0.060
2. Countercurrent, phase ratio 2.5:1
1 0.900 0.569 0.226 0.360
2 0.569 0.199 0.076 0.226
3 0.199 0.058 0.019 0.076
4 0.058 0.016 0.002 0.019
172 PART | I Conventional (Classical) Principles and Practice
In multicomponent systems where there is mutual interference in extractionby several components, the efficiency shrinkage comes on top of the otherreductions in the equilibrium curve, and for this reason there is stress in suchsystems on achieving high efficiency.
5. EQUIPMENT DESIGN FOR CONTINUOUSEXTRACTION-STRIPPING PROCESSES
The industry usually prefers continuous operations: it is generally simpler tocontrol automatically, and it makes better use of labor. To obtain a large transferarea between two phases dispersion of one of the phases into drops have to bemade during the mixing. It may be achieved in a construction of type ofa gravitational column or a mechanically mixing apparatus. As its namesuggests, the last comprises some means for mixing the two phases.
5.1. Dispersion and Mixing of the Phases: Types of Mixers
5.1.1. Agitated Extractors
In modern industry gravitational columns are practically not used becausethey are inefficient. Extraction techniques use mixing, stirred tanks, andsettlers together in so-called mixer-settlers. The mixer usually consists ofsome form of impeller or propeller in a tank that usually contains some thingsto prevent the mixed liquids from swirling and thus reducing the efficiencyof mixing. The simple stage can be calculated from the data, discussedabove. Several stages are connected in series to mixer-settler batteries.Figure 4.8 illustrates two stages of a mixer-settler cascade.3 The aqueous feedenters the first stage, where it is mixed with partially loaded extract from thesecond stage. The mixed phases pass to the settler, where they are separatedunder gravity. The fully loaded extract overflows an upper weir and passes toscrubbing and/or stripping. The first-stage raffinate overflows a lower weirand is pumped to the second stage, where it is mixed with the solvent feed.After settling again, the final raffinate passes to treatment before discharged aswaste.
There is physicochemical criterion that is important in industrial mixing,and that is ensuring the correct phase is dispersed in the other. Sometimes masstransfer is more rapid if one phase is the dispersed phase rather than the other.Alternatively, the dispersed phase is chosen because, by definition, it will notcontain droplets of the continuous phase. In this way the dispersed phase, aftersettling, will not entrain the continuous phase and entrainment losses from thesettler will be reduced. Whatever the reason for choosing the dispersed phase, itis important to ensure that the mixer will keep that phase dispersed duringoperation, as changes in the dispersed phase, i.e., phase inversion, can causeconsiderable operating problems.
173Chapter | 4 Engineering Development of Solvent Extraction Processes
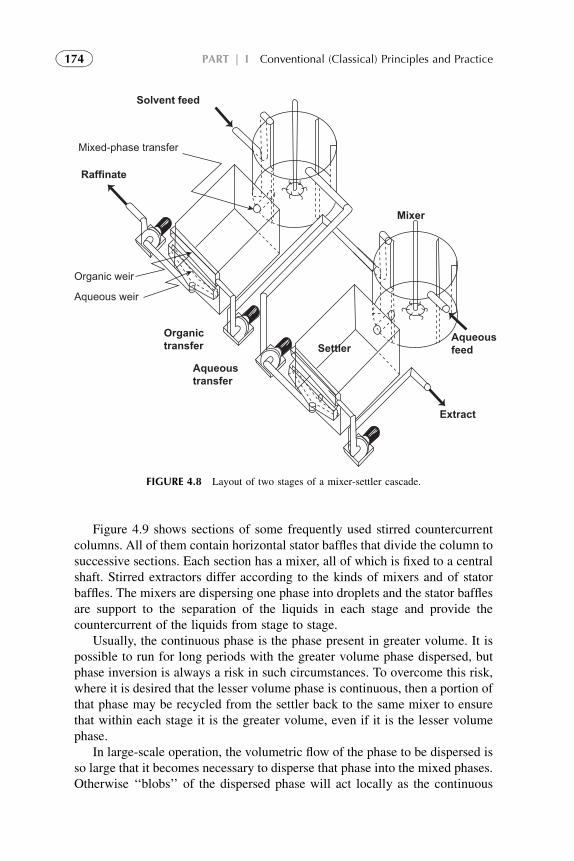
Figure 4.9 shows sections of some frequently used stirred countercurrentcolumns. All of them contain horizontal stator baffles that divide the column tosuccessive sections. Each section has a mixer, all of which is fixed to a centralshaft. Stirred extractors differ according to the kinds of mixers and of statorbaffles. The mixers are dispersing one phase into droplets and the stator bafflesare support to the separation of the liquids in each stage and provide thecountercurrent of the liquids from stage to stage.
Usually, the continuous phase is the phase present in greater volume. It ispossible to run for long periods with the greater volume phase dispersed, butphase inversion is always a risk in such circumstances. To overcome this risk,where it is desired that the lesser volume phase is continuous, then a portion ofthat phase may be recycled from the settler back to the same mixer to ensurethat within each stage it is the greater volume, even if it is the lesser volumephase.
In large-scale operation, the volumetric flow of the phase to be dispersed isso large that it becomes necessary to disperse that phase into the mixed phases.Otherwise ‘‘blobs’’ of the dispersed phase will act locally as the continuous
Solvent feed
Raffinate
Settler
Mixer
Organic
transfer
Aqueous
transfer
Aqueous
feed
Extract
Mixed-phase transfer
Aqueous weir
Organic weir
FIGURE 4.8 Layout of two stages of a mixer-settler cascade.
174 PART | I Conventional (Classical) Principles and Practice
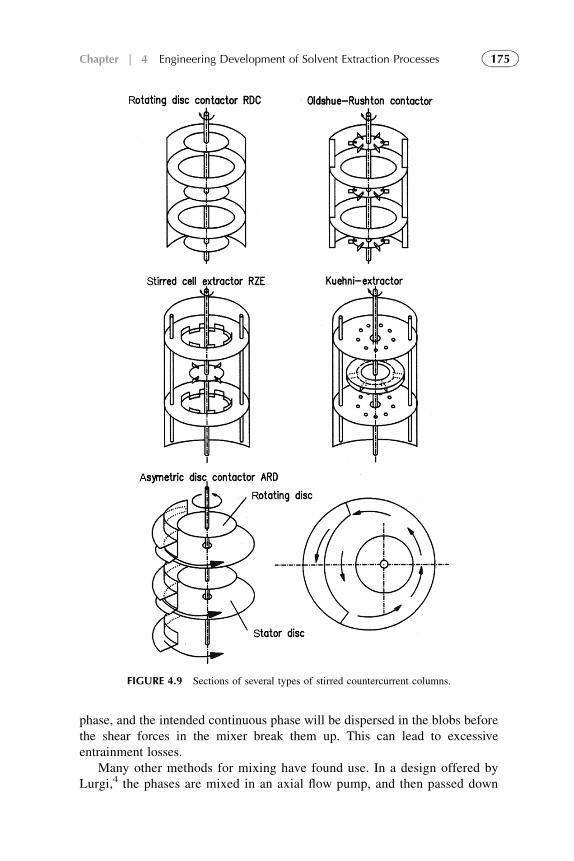
phase, and the intended continuous phase will be dispersed in the blobs beforethe shear forces in the mixer break them up. This can lead to excessiveentrainment losses.
Many other methods for mixing have found use. In a design offered byLurgi,4 the phases are mixed in an axial flow pump, and then passed down
FIGURE 4.9 Sections of several types of stirred countercurrent columns.
175Chapter | 4 Engineering Development of Solvent Extraction Processes
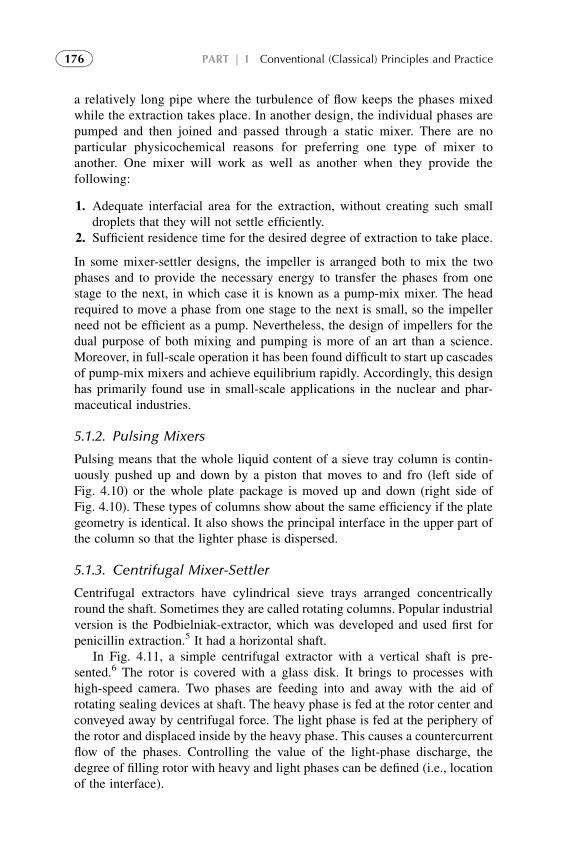
a relatively long pipe where the turbulence of flow keeps the phases mixedwhile the extraction takes place. In another design, the individual phases arepumped and then joined and passed through a static mixer. There are noparticular physicochemical reasons for preferring one type of mixer toanother. One mixer will work as well as another when they provide thefollowing:
1. Adequate interfacial area for the extraction, without creating such smalldroplets that they will not settle efficiently.
2. Sufficient residence time for the desired degree of extraction to take place.
In some mixer-settler designs, the impeller is arranged both to mix the twophases and to provide the necessary energy to transfer the phases from onestage to the next, in which case it is known as a pump-mix mixer. The headrequired to move a phase from one stage to the next is small, so the impellerneed not be efficient as a pump. Nevertheless, the design of impellers for thedual purpose of both mixing and pumping is more of an art than a science.Moreover, in full-scale operation it has been found difficult to start up cascadesof pump-mix mixers and achieve equilibrium rapidly. Accordingly, this designhas primarily found use in small-scale applications in the nuclear and phar-maceutical industries.
5.1.2. Pulsing Mixers
Pulsing means that the whole liquid content of a sieve tray column is contin-uously pushed up and down by a piston that moves to and fro (left side ofFig. 4.10) or the whole plate package is moved up and down (right side ofFig. 4.10). These types of columns show about the same efficiency if the plategeometry is identical. It also shows the principal interface in the upper part ofthe column so that the lighter phase is dispersed.
5.1.3. Centrifugal Mixer-Settler
Centrifugal extractors have cylindrical sieve trays arranged concentricallyround the shaft. Sometimes they are called rotating columns. Popular industrialversion is the Podbielniak-extractor, which was developed and used first forpenicillin extraction.5 It had a horizontal shaft.
In Fig. 4.11, a simple centrifugal extractor with a vertical shaft is pre-sented.6 The rotor is covered with a glass disk. It brings to processes withhigh-speed camera. Two phases are feeding into and away with the aid ofrotating sealing devices at shaft. The heavy phase is fed at the rotor center andconveyed away by centrifugal force. The light phase is fed at the periphery ofthe rotor and displaced inside by the heavy phase. This causes a countercurrentflow of the phases. Controlling the value of the light-phase discharge, thedegree of filling rotor with heavy and light phases can be defined (i.e., locationof the interface).
176 PART | I Conventional (Classical) Principles and Practice
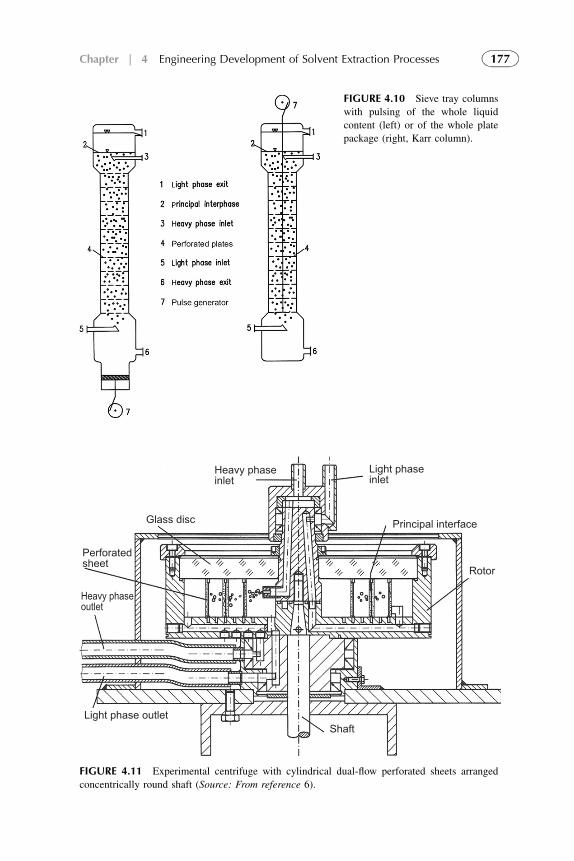
FIGURE 4.10 Sieve tray columns
with pulsing of the whole liquid
content (left) or of the whole plate
package (right, Karr column).
Perforatedsheet
Heavy phaseoutlet
Glass disc
Light phase outletShaft
Heavy phaseinlet
Principal interface
Light phaseinlet
Rotor
FIGURE 4.11 Experimental centrifuge with cylindrical dual-flow perforated sheets arranged
concentrically round shaft (Source: From reference 6).
177Chapter | 4 Engineering Development of Solvent Extraction Processes
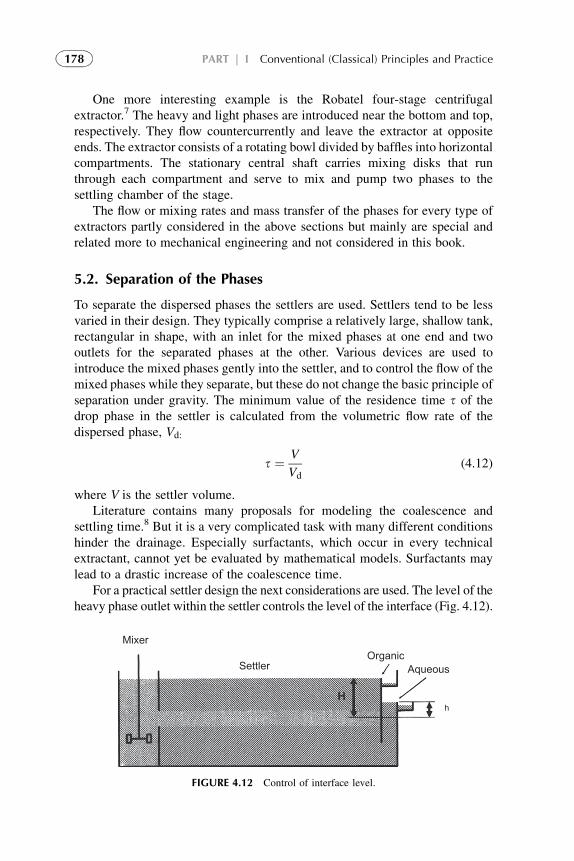
One more interesting example is the Robatel four-stage centrifugalextractor.7 The heavy and light phases are introduced near the bottom and top,respectively. They flow countercurrently and leave the extractor at oppositeends. The extractor consists of a rotating bowl divided by baffles into horizontalcompartments. The stationary central shaft carries mixing disks that runthrough each compartment and serve to mix and pump two phases to thesettling chamber of the stage.
The flow or mixing rates and mass transfer of the phases for every type ofextractors partly considered in the above sections but mainly are special andrelated more to mechanical engineering and not considered in this book.
5.2. Separation of the Phases
To separate the dispersed phases the settlers are used. Settlers tend to be lessvaried in their design. They typically comprise a relatively large, shallow tank,rectangular in shape, with an inlet for the mixed phases at one end and twooutlets for the separated phases at the other. Various devices are used tointroduce the mixed phases gently into the settler, and to control the flow of themixed phases while they separate, but these do not change the basic principle ofseparation under gravity. The minimum value of the residence time s of thedrop phase in the settler is calculated from the volumetric flow rate of thedispersed phase, Vd:
s ¼ V
Vd(4.12)
where V is the settler volume.Literature contains many proposals for modeling the coalescence and
settling time.8 But it is a very complicated task with many different conditionshinder the drainage. Especially surfactants, which occur in every technicalextractant, cannot yet be evaluated by mathematical models. Surfactants maylead to a drastic increase of the coalescence time.
For a practical settler design the next considerations are used. The level of theheavy phase outlet within the settler controls the level of the interface (Fig. 4.12).
Mixer
h
SettlerOrganic
Aqueous
FIGURE 4.12 Control of interface level.
178 PART | I Conventional (Classical) Principles and Practice
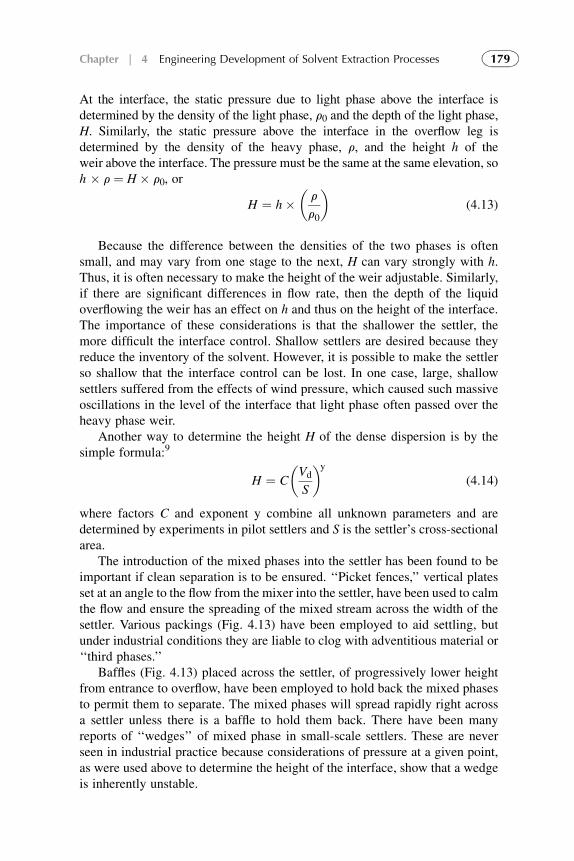
At the interface, the static pressure due to light phase above the interface isdetermined by the density of the light phase, r0 and the depth of the light phase,H. Similarly, the static pressure above the interface in the overflow leg isdetermined by the density of the heavy phase, r, and the height h of theweir above the interface. The pressure must be the same at the same elevation, soh � r ¼ H � r0, or
H ¼ h��r
r0
�(4.13)
Because the difference between the densities of the two phases is oftensmall, and may vary from one stage to the next, H can vary strongly with h.Thus, it is often necessary to make the height of the weir adjustable. Similarly,if there are significant differences in flow rate, then the depth of the liquidoverflowing the weir has an effect on h and thus on the height of the interface.The importance of these considerations is that the shallower the settler, themore difficult the interface control. Shallow settlers are desired because theyreduce the inventory of the solvent. However, it is possible to make the settlerso shallow that the interface control can be lost. In one case, large, shallowsettlers suffered from the effects of wind pressure, which caused such massiveoscillations in the level of the interface that light phase often passed over theheavy phase weir.
Another way to determine the height H of the dense dispersion is by thesimple formula:9
H ¼ C
�Vd
S
�y
(4.14)
where factors C and exponent y combine all unknown parameters and aredetermined by experiments in pilot settlers and S is the settler’s cross-sectionalarea.
The introduction of the mixed phases into the settler has been found to beimportant if clean separation is to be ensured. ‘‘Picket fences,’’ vertical platesset at an angle to the flow from the mixer into the settler, have been used to calmthe flow and ensure the spreading of the mixed stream across the width of thesettler. Various packings (Fig. 4.13) have been employed to aid settling, butunder industrial conditions they are liable to clog with adventitious material or‘‘third phases.’’
Baffles (Fig. 4.13) placed across the settler, of progressively lower heightfrom entrance to overflow, have been employed to hold back the mixed phasesto permit them to separate. The mixed phases will spread rapidly right acrossa settler unless there is a baffle to hold them back. There have been manyreports of ‘‘wedges’’ of mixed phase in small-scale settlers. These are neverseen in industrial practice because considerations of pressure at a given point,as were used above to determine the height of the interface, show that a wedgeis inherently unstable.
179Chapter | 4 Engineering Development of Solvent Extraction Processes
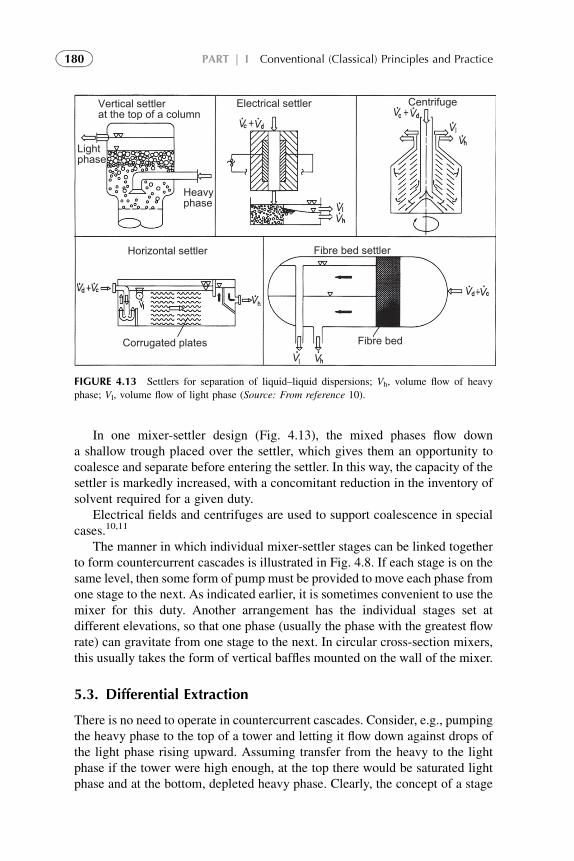
In one mixer-settler design (Fig. 4.13), the mixed phases flow downa shallow trough placed over the settler, which gives them an opportunity tocoalesce and separate before entering the settler. In this way, the capacity of thesettler is markedly increased, with a concomitant reduction in the inventory ofsolvent required for a given duty.
Electrical fields and centrifuges are used to support coalescence in specialcases.10,11
The manner in which individual mixer-settler stages can be linked togetherto form countercurrent cascades is illustrated in Fig. 4.8. If each stage is on thesame level, then some form of pump must be provided to move each phase fromone stage to the next. As indicated earlier, it is sometimes convenient to use themixer for this duty. Another arrangement has the individual stages set atdifferent elevations, so that one phase (usually the phase with the greatest flowrate) can gravitate from one stage to the next. In circular cross-section mixers,this usually takes the form of vertical baffles mounted on the wall of the mixer.
5.3. Differential Extraction
There is no need to operate in countercurrent cascades. Consider, e.g., pumpingthe heavy phase to the top of a tower and letting it flow down against drops ofthe light phase rising upward. Assuming transfer from the heavy to the lightphase if the tower were high enough, at the top there would be saturated lightphase and at the bottom, depleted heavy phase. Clearly, the concept of a stage
Vertical settlerat the top of a column
Lightphase
Heavyphase
Electrical settler Centrifuge
Horizontal settler Fibre bed settler
Fibre bedCorrugated plates
V V
V
V
V
V V
V
V
V V
V
V
V
V
FIGURE 4.13 Settlers for separation of liquid–liquid dispersions; Vh, volume flow of heavy
phase; Vl, volume flow of light phase (Source: From reference 10).
180 PART | I Conventional (Classical) Principles and Practice
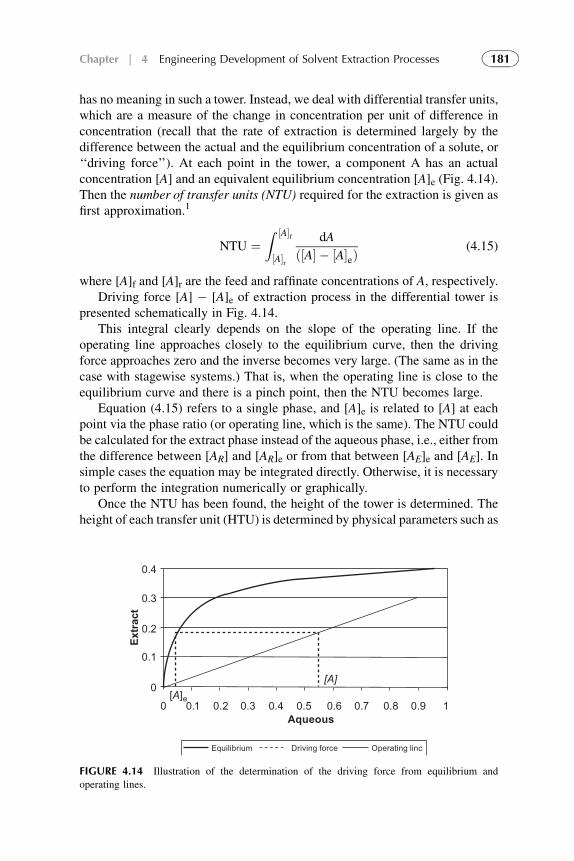
has no meaning in such a tower. Instead, we deal with differential transfer units,which are a measure of the change in concentration per unit of difference inconcentration (recall that the rate of extraction is determined largely by thedifference between the actual and the equilibrium concentration of a solute, or‘‘driving force’’). At each point in the tower, a component A has an actualconcentration [A] and an equivalent equilibrium concentration [A]e (Fig. 4.14).Then the number of transfer units (NTU) required for the extraction is given asfirst approximation.1
NTU ¼Z ½A�f
½A�r
dA
ð½A� � ½A�eÞ(4.15)
where [A]f and [A]r are the feed and raffinate concentrations of A, respectively.Driving force [A] � [A]e of extraction process in the differential tower is
presented schematically in Fig. 4.14.This integral clearly depends on the slope of the operating line. If the
operating line approaches closely to the equilibrium curve, then the drivingforce approaches zero and the inverse becomes very large. (The same as in thecase with stagewise systems.) That is, when the operating line is close to theequilibrium curve and there is a pinch point, then the NTU becomes large.
Equation (4.15) refers to a single phase, and [A]e is related to [A] at eachpoint via the phase ratio (or operating line, which is the same). The NTU couldbe calculated for the extract phase instead of the aqueous phase, i.e., either fromthe difference between [AR] and [AR]e or from that between [AE]e and [AE]. Insimple cases the equation may be integrated directly. Otherwise, it is necessaryto perform the integration numerically or graphically.
Once the NTU has been found, the height of the tower is determined. Theheight of each transfer unit (HTU) is determined by physical parameters such as
0.4
0.3
0.2
0.1
0
0[A]e
0.1 0.2 0.3 0.4 0.5 0.6 0.7 0.8 0.9
[A]
Aqueous
Equilibrium Driving force Operating linc
1
Extract
FIGURE 4.14 Illustration of the determination of the driving force from equilibrium and
operating lines.
181Chapter | 4 Engineering Development of Solvent Extraction Processes
the droplet size, the flow patterns in the tower, and the effect of any packing.These parameters affect the rate of mass transfer.
Very often the rate of mass transfer cannot be estimated from first princi-ples. In this case, it is necessary to estimate the height by determining the NTUachieved and then dividing the actual height of the column employed by theNTU, i.e.:
HTU ¼ H
NTU(4.16)
where H is the height of the column employed.HTU is subjected to the effects of both radial and axial mixing, and these are
not readily quantified, so scale-up of columns of this kind is often not based onfundamentals, but rather on correlations determined from detailed studies ofseveral systems in the particular design of the column chosen.
Physically, towers designed for countercurrent contact can be open, butmore usually contain some form of packing or plates. The material of thepacking is chosen so that one phase wets it preferentially, thus increasing thesurface area for mass transfer. Similarly, the plates are designed to break updroplets and increase the surface area. In addition, the contents of the towermay be agitated either by an internal agitator or by pulsing the fluids. Theenergy imparted by agitation or pulsation breaks up the droplets of thedispersed phase.
When the equilibrium curve is relatively linear, the driving force does notvary greatly down the length of the column, and the NTU approaches the numberof McCabe–Thiele theoretical stages. In this case, it is reasonable to speak of thenumber of stages in the column, and to calculate a height equivalent to a theo-retical stage (HETS). However, if the equilibrium curve and the operating lineare far from parallel, the number of theoretical stages becomes a poor measure ofthe column’s performance, and the NTU should be used.
6. SOLVENT LOSSES
All considerations through above theoretical chapters were based on assump-tion that the two phases, the aqueous and the organic, are totally immiscible.For many systems this is a reasonable approximation, but for some systemsmutual miscibility must be taken into account, particularly when the primarysolute is organic.
The basic principles remain unchanged: the primary difference is the choiceof a consistent basis for calculation, such as a solvent-free basis. Graphictechniques based on triangular coordinates provide approximate answers, butmodern computational techniques are preferred.
Some consideration should be given at this point to prevent loss of theorganic phase in the aqueous raffinate. This loss can arise by either solubility inthe aqueous phase or by entrainment of droplets not fully settled. The solvent
182 PART | I Conventional (Classical) Principles and Practice
lost in this way can offer a finite environmental hazard and be an economic coston the process.
Clearly, the primary duty is good engineering practice. Often, however,additional security is provided in the following forms:
1. Additional settler capacity for final raffinate.2. Extraction of residual organic phase using a third diluent, from which it is
later separated, typically by distillation.3. Coalescence on a solid wetted preferentially by the organic phase.4. Flotation with an air in the presence of surfactants.
7. ECONOMICAL CONSIDERATIONS
The need for pilot plant operations is considered by one school of thought to bean unnecessary expense in the development of a solvent process. The rationalehere is that money and time spent in piloting the process can be used to modifythe full-scale plant, if necessary. Thus, if few (or no) modifications are required,considerable savings can result. This approach is probably satisfactory if theprocess is very similar to an existing process and sufficient data are available onwhich to base the plant design and operation. The practical experience of theplant design engineers and operators is also of considerable importance in suchcases. On the other hand, problems encountered in a plant operation that hasbeen designed without piloting the process could result in the loss of consid-erable time and expense. Of course, almost any process or plant can be made towork, even though the basic data and design are poor. The costs, however, maybe astronomical. It should be pointed out, however, that the size of a pilot plantcan vary from a few gallons per minute of total throughput to several hundredgallons per minute. Normally, one would expect that the size of a pilot plantwill be in direct proportion to the size of the final plant.
8. PROBLEMS WITH SCALE-UP TO INDUSTRIAL SYSTEMS
From the previous sections it is evident that the experimental results have to beproven with pilot experiments. Pilot extractors are usually much smaller thanlarge-scale industrial equipment. For example, pulsed columns for pilotexperiments have diameter up to 30–250 mm, whereas industrial columns haveup to 2500–3000 mm and more.12 Can pilot data be used for the development ofindustrial apparatuses? This is the problem for engineers.
It depends much on the experience of the developer, its careful analysisobtained from laboratory and pilot experimental data. Nevertheless, somepreliminary calculations have to be supplemented by the large-scale experi-ments, including the following:
1. Determination of solubility in triangular diagram and their dependences onpH, temperature, and salt content of the raffinate.
183Chapter | 4 Engineering Development of Solvent Extraction Processes
2. Determination of the ratio of solvent to raffinate flow rate.3. Measuring the separation time to evaluate the coalescence behavior.
4. Measurement of the physical properties of the feed and product phases.
Obtained data have to be carefully analyzed comparing with pilot and labo-ratory experimental results.
In reference 13 original decision was proposed: a steady-state simulator forindustrial-scale processes. It performed well during process development,design, and optimization. The main problems were partial mass transfer(nonideal stages), backmixing caused by entrainment, and decrease in solventactivity due to contamination or change in the concentration of the activeingredients. The effect of the entrainment is introduced directly into themathematical model. The differences between the theoretical and real datawere taken into account when calculations and deviations were expressedthrough stage efficiency coefficient. Either the Murphree efficiency or the masstransfer factor (MTF) was used. The entrainment is measured directly in everystage. The stage efficiency coefficient is calculated periodically from plantdata. All the data are fed as input to the simulator. With the modifications, thesimulator was used successfully for the CaBr2 extraction from the sea waterbrine of the Dead Sea plants.
REFERENCES
1. Lloyd FJ. Principles of industrial solvent extraction. In: Rydberg J, Cox M, Musikas C,
Choppin GR, editors. Solvent extraction principles and practice. New York, Boca Raton:
Society of Chemical Industry; 2004.
2. Lo TC, Baird MHI, Hanson C, editors. Handbook of solvent extraction. New York: Wiley-
Interscience; 1983.
3. Warwick GCI, Scuffham JB. The Davy–McKee mixer–settler. In: Lo TC, Baird MHI, Hanson C,
editors. Handbook of solvent extraction. New York: Wiley-Interscience; 1983. p. 287–97.
4. Muller E, Stonner HM. In: Lo TC, Baird MHI, Hanson C, editors. Handbook of solvent
extraction. New York: Wiley-Interscience; 1983. p. 311–8.
5. Treybal RE. Liquid extraction. 2nd ed. New York: McGraw-Hill; 1963.
6. Otillinger F, Blass E. Chem Eng Technol. 1988;11:312.
7. Brunner KH, Hemfort H. Adv Biotechnol Processes 1988;8:1–50.
8. Hartland S, Jeelani SAK. Chem Eng Sci 1987;42:1927.
9. Ritcey GM. Solvent extraction: Principles and applications to process metallurgy.
Elsevier; 2006.
10. Blass E, Lobman A, Meon W, Rommel W. Chem Eng Technol 1989;61:597.
11. Rebelein F, Ein Beitrag zur Tropfenabscheidung aus Flussigkeiten mit Hilfe von Faserbetten.
Doctoral Thesis, TU Minchen, 1989.
12. Blass EF. Engineering design and calculation of extractors for liquid-liquid systems. In:
Rydberg J, Cox M, Musikas C, Choppin GR, editors. Solvent extraction principles and
practice. New York, Boca Raton: Society of Chemical Industry; 2004.
13. Grinbaum B, Angel SA. How to fit a simulator to a real liquid-liquid extraction plant. Process
Metallurgy 1992;7B:1235–40.
184 PART | I Conventional (Classical) Principles and Practice
Chapter 5
Examples of Application ofSolvent Extraction Techniquesin Chemical, Radiochemical,Biochemical, Pharmaceutical,Analytical Separations, andWastewater Treatment
Chapter Outline1. Introduction 188
2. Extraction in
Hydrometallurgy
(Metals Extraction)
189
2.1. Metal IoneExtractant
Complexes Formation
189
2.2. Types of Metal
Extractants
189
2.2.1. Chelation
Extractants
189
2.2.2. Organic Acid
Extractants
190
2.2.3. Ligand
Substitution
Extractants
190
2.2.4. Neutral or
Solvating
Extractants
190
2.2.5. Ion-Pair
Extractants
196
2.3. Modifiers 197
2.4. Synergistic Mixtures 197
2.5. Diluents 197
2.6. Copper Extraction 198
2.6.1. Laboratory Scale
Research
198
2.6.2. Industrial Scale
Copper
Extraction
199
2.7. CobalteNickel Solvent
Extraction
200
2.7.1. Laboratory Scale
CobalteNickel
Extraction
201
2.7.2. Industrial Scale
Solvent
Extraction of
CoeNi
203
2.8. Precious Group Metals
(PGM) Extraction
205
2.8.1. Extraction of
Gold
207
2.8.2. Extraction of
Silver
208
2.8.3. Extraction of
Palladium and
Platinum
208
Solvent Extraction. DOI: 10.1016/B978-0-444-53778-2.10005-6
Copyright � 2012 Elsevier B.V. All rights reserved. 185
2.8.4. Extraction of
Indium and
Rhodium
212
2.9. Lanthanide Extraction 213
2.9.1. Solvating
Extractants for
Lanthanides
215
2.9.2. Amine
Extractants
216
2.9.3. Acidic
Extractants
216
3. Solvent Extraction in Nuclear
Chemistry and Technology
218
3.1. Solvent Extraction in
Nuclear Fuel Processing
219
3.1.1. Uranium
Production
219
3.1.2. Thorium
Production from
its Ores
223
3.2. Spent Nuclear Fuel
Recycling
(Reprocessing)
223
3.2.1. Purex Process
Recycling
223
3.2.2. Other
Reprocessing
Flow Sheets
226
3.2.3. Reprocessing of
Irradiated
Thorium Fuels
227
3.3. Nuclear Waste
Management
228
3.3.1. TRUEX Process 229
3.3.2. SREX Process:
Extraction of 90Sr
and 134,135,137Cs
from Acidic
Wastes
230
3.3.3. Phosphine Oxide
Process
230
3.3.4. Cobalt
Dicarbollide
Processes
230
3.3.5. Universal Solvent
Extraction
Process
231
3.3.6. Bifunctional
Organo-
phosphorus
Compounds for
Waste Treatment
231
3.3.7. Monofunctional
Organo-
phosphorus
Reagents
for Waste
Treatment
232
3.4. Solvent Degradation
and Regeneration
232
3.5. New Developments 234
3.5.1. Partitioning of
Wastes
234
3.5.2. Trivalent
Actinidee
Lanthanide
Group
Separations
236
4. Solvent Extraction in
Analytical Chemistry
239
4.1. Solvent Extraction in
Samples Preparation and
Pretreatment Techniques
239
4.1.1. Solvent
Extraction for
Separation Steps
240
4.1.2. Preconcentration
for Trace Element
Determination
241
4.2. Extraction in Analytical
Determination
Techniques
244
4.2.1. Methods Based
on Spectro-
photometric
Detection
244
186 PART | I Conventional (Classical) Principles and Practice
4.2.2. Other Detection
Techniques
(Atomic
Absorption,
Flame Emission
Spectroscopy,
X-Ray
Fluorescence,
Luminescence,
etc.)
250
4.3. Basic Materials for
Solvent Extraction
techniques
251
4.3.1. Solvent-
Impregnated
Resins
251
4.3.2. Solid-Phase
Spectro-
photometry
Applications
252
4.3.3. Applications for
Fiber Optic
Chemical Sensors
252
4.4. Micelles in Analytical
Chemistry
253
4.5. Liquid Membranes in
Analytical Chemistry
258
4.5.1. Ion-Selective
Liquid
Membrane
Electrodes
258
4.6. Chromatography-Based
Analytical Techniques
261
4.6.1. LiquideLiquid
Partition
Chromatography
261
4.6.2. Supercritical
Fluid Extraction
263
4.7. Solvent Extraction in
Continuous Flow
Injection Analysis (FIA)
265
4.8. Solvent Extraction in
Nuclear Analytical
Applications
267
4.8.1. Spectroscopic
and Mass
Spectrometric
Detection
268
4.8.2. Radiometric
Detectors
269
4.8.3. Preparative
Techniques for
Radioactive
Elements
Analysis
271
4.8.4. Radiometric
Techniques
272
5. Application of Solvent
Extraction in
Biochemical and
Pharmaceutical Separations
273
5.1. Application of Solvent
Extraction in
Biotechnological
Separations
273
5.1.1. Carboxylic Acids
Separation
274
5.1.2. Amino Acids 275
5.2. Pharmaceutical
Separations
276
5.2.1. Production of
Penicillin
276
6. Application of Solvent
Extraction in Organic and
Biofuels Separation
278
6.1. Petroleum and
Petrochemical
Processing
278
6.1.1. The Union
Carbide Process
278
6.1.2. Re-refining
Process
280
6.2. Separation of Isomers 280
6.2.1. Separation of
m-Xylene from
o- and p-Xylene
281
187Chapter | 5 Examples of Application of Solvent Extraction Techniques
6.2.2. Separation of
Alkylnaphthalene
Isomers Using
Cyclodextrins
281
6.2.3. Separation of m-
and p-Cresol
Isomers
282
6.3. Biofuel Separations by
Solvent Extraction
282
6.3.1. Separation of
Ethanol
283
7. Solvent Extraction in
Recovery of Waste
and Wastewater Treatment
284
7.1. Solvent Extraction in
Metal Waste Treatment
285
7.1.1. Treatment of
Acidic Metal
Waste Solutions
285
7.1.2. Solvent
Extraction from
Ammoniacal
Feed Solutions
291
7.2. Recovery of Acids from
Waste by Solvent
Extraction
292
7.2.1. Recovery of
Hydrofluoric and
Nitric Acids from
Stainless Steel
Pickling Baths
292
7.2.2. Purification of
Green
Phosphoric Acid
(H3PO4) to Food
Grade Quality
294
7.2.3. Removal of
Arsenic Acid
(H3AsO4) from
Copper
Electrolytes
295
7.2.4. Cyanide
Recovery by
Solvent
Extraction
295
7.3. Separation of Organic
Pollutants by Solvent
Extraction
296
7.3.1. Phenosolvan
Process
297
References 297
1. INTRODUCTION
Solvent extraction theory and the engineering design aspects of solventextraction processes have been considered in the previous chapters. Thischapter was devoted to the examples of application of the process in laboratory,scaleup studies and commercial applications for specific separations indifferent fields of practice.
The initial bench-scale experimental work in solvent extraction processes isconducted for determination of main process parameters (the temperature, flowrate, acidity, etc.) using small apparatus such as separator funnels. Followingthe successful completion of these tests, when the best reagent and otherconditions for the system have been established, small-scale continuousoperations are run, such as in a small mixer-settler unit. The data so obtainedare used to determine scaleup factors for pilot plant or plant design andoperation.
188 PART | I Conventional (Classical) Principles and Practice
Pilot plant operations are considered from a technological and economicpoint of view. If few (or no) modifications are required, considerable savingscan result on scaleup. On the other hand, problems encountered in a plantoperation that has been designed without piloting the process could result inthe loss of considerable time and expense. It should be pointed out that thesize of a pilot plant can vary from a few gallons per minute of totalthroughput to several hundred gallons per minute. Normally, one wouldexpect that the size of a pilot plant will be directly proportional to the size ofthe final plant.
In this chapter examples, published during the last decade, since thepublication of the last books in the field1,2 of specific solvent extractionprocesses in the laboratory and/or scaleup practice are introduced.
2. EXTRACTION IN HYDROMETALLURGY(METALS EXTRACTION)
The use of solvent extraction in hydrometallurgy extends to a wide rangeof metals from different feeds including low-grade ore, scrap, waste leach-ates, and dilute aqueous solutions. The technology was used first inNuclear Technology (see Section 3). Then, some high-value metals (e.g.,precious group metals, PGM) solvent extraction technologies becamecommercially viable and were developed and used. After development ofselective chelating acidic reagents (extractants), the solvent extraction wasable to compete with classical separation–concentration operations inhydrometallurgy.
Liquid–liquid extraction of metals is widely used in analytical chemistry forpreparation and concentration of samples, which is discussed in Section 5. Thetheory of metal extraction was analyzed in detail in Chapter 3, and novel visionin Chapter 9. In this section, some recent publications in the field areconsidered.
2.1. Metal Ion–Extractant Complexes Formation
1. Metal cations: Cu2þ, Ni2þ, Co2þ, etc.2. Complex metal anions, e.g., [UO2(SO4)3]
4�, [Mo8O26]4� and others
3. Complex metal cations, e.g., [MoO2]2þ
4. Neutral metal species such as UO2(NO3)2
2.2. Types of Metal Extractants
2.2.1. Chelation Extractants
2RH þ [M2þ SO42�] ¼ R2M þ [2Hþ SO4
2�]
189Chapter | 5 Examples of Application of Solvent Extraction Techniques
Properties, advantages, and disadvantages are as follows:
1. They operate on a hydrogen ion cycle.2. Some operate well with both acid and ammonia leach solutions.3. They tend to be more selective than either ion-pair or organic acid
extractants.4. They tend to be kinetically slower than organic acid and ion-pair
extractants.5. They have good operating characteristics with respect to phase separation
(see Table 5.1).6. They are usually more difficult to produce.
Most common application is in the extraction of copper (over 3 million tonsannually), Ni, and Pd.
2.2.2. Organic Acid Extractants
4(RO)2 PO2 Horg þ Zn2D ¼ [(RO)2PO2]2 Zn[(RO)2PO2H]2org þ 2Hþ
Properties, advantages and disadvantages are as follows:
1. They show less selectivity than chelating extractants.2. They can promote stable emulsions with basic solutions.3. They operate on a hydrogen ion cycle.4. Their kinetics of extraction are usually quite rapid.5. Some of these reagents are easy to produce and some are difficult. Highly
variable selling prices depending on the reagent.
Most significant application is in the extraction of Zn and Co (see Table 5.2).
2.2.3. Ligand Substitution Extractants
[PdCl42�] þ 2R2Sorg ¼ [PdCl2(R2S)2]org þ 2Cl�
Properties, advantages, and disadvantages (see Table 5.3) are as follows:
1. Metal extraction is not normally sensitive to pH.2. At times remarkable selectivity can be achieved.3. Kinetics can be rapid or slow depending on the metal and the ligand.4. These reagents can be relatively inexpensive or very expensive depending
on the complexity.
2.2.4. Neutral or Solvating Extractants
[2(RO)3PO]org þ [UO2(NO3)2]aq ¼ [UO2(NO3)2 2(RO)3PO]org
Strength: R3PO > (RO)3PO > R2CO > ROH > R2O:Trialkylphosphine oxides > trialkylphosphates > ketones > alcohols>
ethers
190 PART | I Conventional (Classical) Principles and Practice
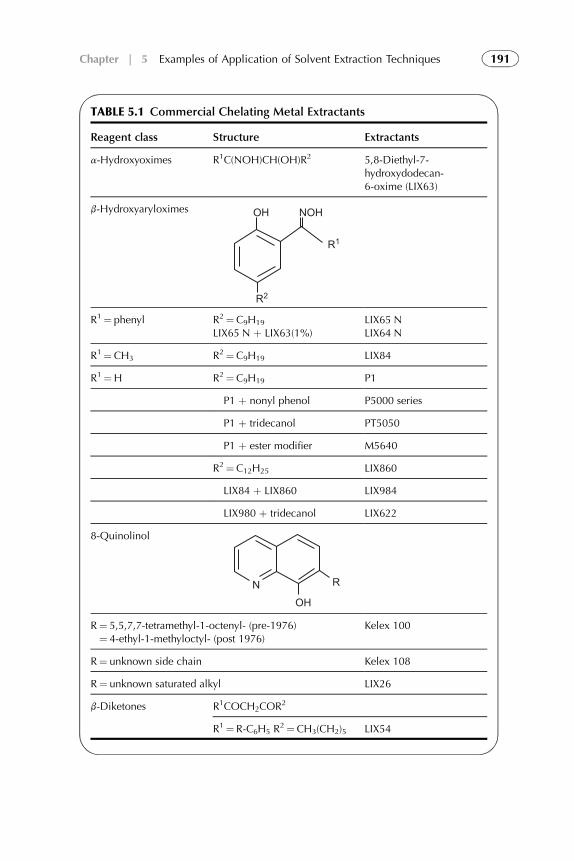
TABLE 5.1 Commercial Chelating Metal Extractants
Reagent class Structure Extractants
a-Hydroxyoximes R1C(NOH)CH(OH)R2 5,8-Diethyl-7-hydroxydodecan-6-oxime (LIX63)
b-Hydroxyaryloximes OH NOH
R2
R1
R1¼ phenyl R2¼C9H19
LIX65 N þ LIX63(1%)LIX65 NLIX64 N
R1¼ CH3 R2¼C9H19 LIX84
R1¼H R2¼C9H19 P1
P1 þ nonyl phenol P5000 series
P1 þ tridecanol PT5050
P1 þ ester modifier M5640
R2¼C12H25 LIX860
LIX84 þ LIX860 LIX984
LIX980 þ tridecanol LIX622
8-Quinolinol
OHN R
R¼ 5,5,7,7-tetramethyl-1-octenyl- (pre-1976)¼ 4-ethyl-1-methyloctyl- (post 1976)
Kelex 100
R¼ unknown side chain Kelex 108
R¼ unknown saturated alkyl LIX26
b-Diketones R1COCH2COR2
R1¼ R-C6H5 R2¼CH3(CH2)5 LIX54
191Chapter | 5 Examples of Application of Solvent Extraction Techniques
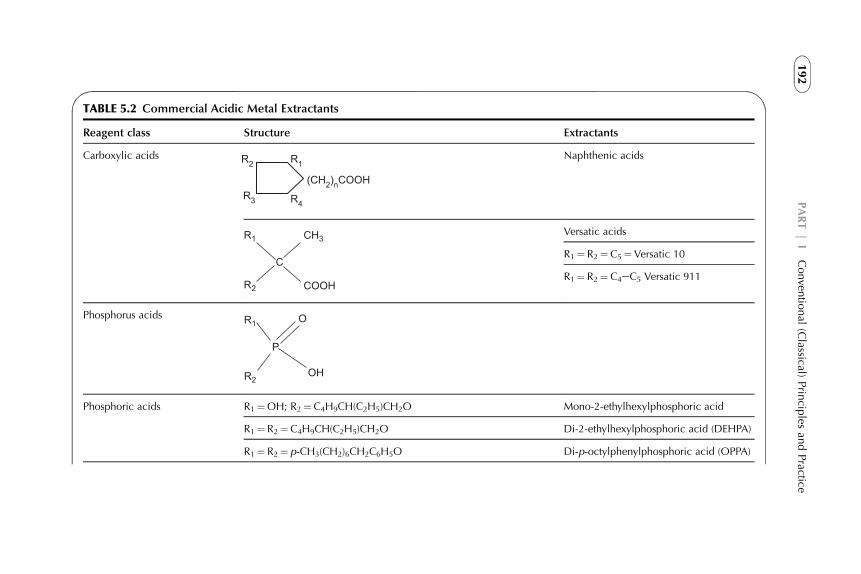
TABLE 5.2 Commercial Acidic Metal Extractants
Reagent class Structure Extractants
Carboxylic acids R2
R3
R1
(CH2)nCOOH
R4
Naphthenic acids
C
R1
R2
CH3
COOH
Versatic acids
R1¼ R2¼ C5¼Versatic 10
R1¼ R2¼ C4eC5 Versatic 911
Phosphorus acids R1
R2
O
P
OH
Phosphoric acids R1¼OH; R2¼C4H9CH(C2H5)CH2O Mono-2-ethylhexylphosphoric acid
R1¼ R2¼C4H9CH(C2H5)CH2O Di-2-ethylhexylphosphoric acid (DEHPA)
R1¼ R2¼ p-CH3(CH2)6CH2C6H5O Di-p-octylphenylphosphoric acid (OPPA)
192
PART|
IConven
tional
(Classical)
Prin
ciples
andPractice
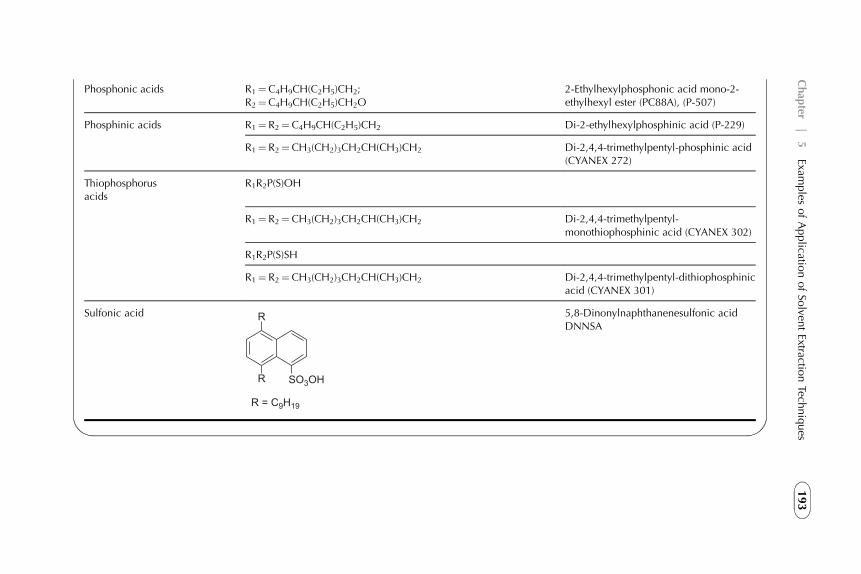
Phosphonic acids R1¼C4H9CH(C2H5)CH2;R2¼C4H9CH(C2H5)CH2O
2-Ethylhexylphosphonic acid mono-2-ethylhexyl ester (PC88A), (P-507)
Phosphinic acids R1¼ R2¼C4H9CH(C2H5)CH2 Di-2-ethylhexylphosphinic acid (P-229)
R1¼ R2¼CH3(CH2)3CH2CH(CH3)CH2 Di-2,4,4-trimethylpentyl-phosphinic acid(CYANEX 272)
Thiophosphorusacids
R1R2P(S)OH
R1¼ R2¼CH3(CH2)3CH2CH(CH3)CH2 Di-2,4,4-trimethylpentyl-monothiophosphinic acid (CYANEX 302)
R1R2P(S)SH
R1¼ R2¼CH3(CH2)3CH2CH(CH3)CH2 Di-2,4,4-trimethylpentyl-dithiophosphinicacid (CYANEX 301)
Sulfonic acid
R = C9H19
SO3OHR
R 5,8-Dinonylnaphthanenesulfonic acidDNNSA
193
Chap
ter|
5Exam
ples
ofApplicatio
nofSo
lventExtractio
nTech
niques
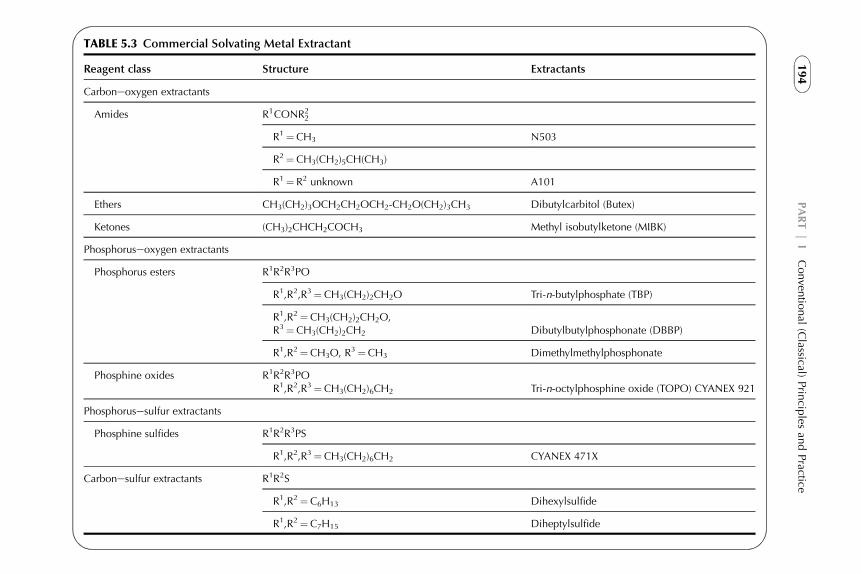
TABLE 5.3 Commercial Solvating Metal Extractant
Reagent class Structure Extractants
Carboneoxygen extractants
Amides R1CONR22
R1¼CH3 N503
R2¼CH3(CH2)5CH(CH3)
R1¼ R2 unknown A101
Ethers CH3(CH2)3OCH2CH2OCH2-CH2O(CH2)3CH3 Dibutylcarbitol (Butex)
Ketones (CH3)2CHCH2COCH3 Methyl isobutylketone (MIBK)
Phosphoruseoxygen extractants
Phosphorus esters R1R2R3PO
R1,R2,R3¼ CH3(CH2)2CH2O Tri-n-butylphosphate (TBP)
R1,R2¼CH3(CH2)2CH2O,R3¼CH3(CH2)2CH2 Dibutylbutylphosphonate (DBBP)
R1,R2¼CH3O, R3¼CH3 Dimethylmethylphosphonate
Phosphine oxides R1R2R3POR1,R2,R3¼ CH3(CH2)6CH2 Tri-n-octylphosphine oxide (TOPO) CYANEX 921
Phosphorusesulfur extractants
Phosphine sulfides R1R2R3PS
R1,R2,R3¼ CH3(CH2)6CH2 CYANEX 471X
Carbonesulfur extractants R1R2S
R1,R2¼C6H13 Dihexylsulfide
R1,R2¼C7H15 Diheptylsulfide
194
PART|
IConven
tional
(Classical)
Prin
ciples
andPractice
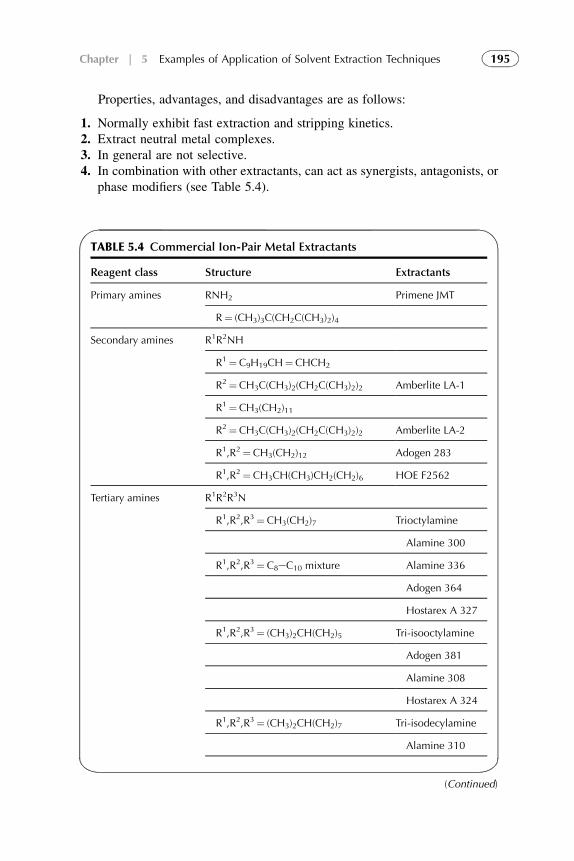
Properties, advantages, and disadvantages are as follows:
1. Normally exhibit fast extraction and stripping kinetics.2. Extract neutral metal complexes.3. In general are not selective.4. In combination with other extractants, can act as synergists, antagonists, or
phase modifiers (see Table 5.4).
TABLE 5.4 Commercial Ion-Pair Metal Extractants
Reagent class Structure Extractants
Primary amines RNH2 Primene JMT
R¼ (CH3)3C(CH2C(CH3)2)4
Secondary amines R1R2NH
R1¼C9H19CH¼CHCH2
R2¼CH3C(CH3)2(CH2C(CH3)2)2 Amberlite LA-1
R1¼CH3(CH2)11
R2¼CH3C(CH3)2(CH2C(CH3)2)2 Amberlite LA-2
R1,R2¼CH3(CH2)12 Adogen 283
R1,R2¼CH3CH(CH3)CH2(CH2)6 HOE F2562
Tertiary amines R1R2R3N
R1,R2,R3¼ CH3(CH2)7 Trioctylamine
Alamine 300
R1,R2,R3¼ C8eC10 mixture Alamine 336
Adogen 364
Hostarex A 327
R1,R2,R3¼ (CH3)2CH(CH2)5 Tri-isooctylamine
Adogen 381
Alamine 308
Hostarex A 324
R1,R2,R3¼ (CH3)2CH(CH2)7 Tri-isodecylamine
Alamine 310
(Continued)
195Chapter | 5 Examples of Application of Solvent Extraction Techniques
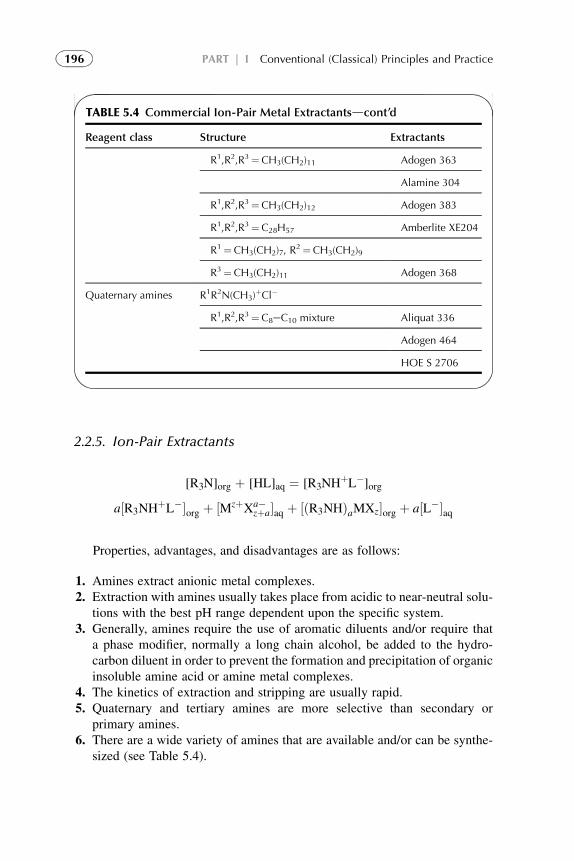
2.2.5. Ion-Pair Extractants
[R3N]org þ [HL]aq ¼ [R3NHþL�]org
a½R3NHþL��org þ ½MzþXa�
zþa�aq þ ½ðR3NHÞaMXz�org þ a½L��aq
Properties, advantages, and disadvantages are as follows:
1. Amines extract anionic metal complexes.2. Extraction with amines usually takes place from acidic to near-neutral solu-
tions with the best pH range dependent upon the specific system.3. Generally, amines require the use of aromatic diluents and/or require that
a phase modifier, normally a long chain alcohol, be added to the hydro-carbon diluent in order to prevent the formation and precipitation of organicinsoluble amine acid or amine metal complexes.
4. The kinetics of extraction and stripping are usually rapid.5. Quaternary and tertiary amines are more selective than secondary or
primary amines.6. There are a wide variety of amines that are available and/or can be synthe-
sized (see Table 5.4).
TABLE 5.4 Commercial Ion-Pair Metal Extractantsdcont’d
Reagent class Structure Extractants
R1,R2,R3¼CH3(CH2)11 Adogen 363
Alamine 304
R1,R2,R3¼CH3(CH2)12 Adogen 383
R1,R2,R3¼C28H57 Amberlite XE204
R1¼CH3(CH2)7, R2¼CH3(CH2)9
R3¼CH3(CH2)11 Adogen 368
Quaternary amines R1R2N(CH3)þCl�
R1,R2,R3¼C8eC10 mixture Aliquat 336
Adogen 464
HOE S 2706
196 PART | I Conventional (Classical) Principles and Practice
2.3. Modifiers
1. Organic compounds with the ability to donate and/or accept a hydrogenbond which are soluble in the diluent. Alcohols, esters, ketones, alkylphe-nols, phosphine oxides, phosphate esters, ethers, and nitriles.
2. When used with amines, modifiers help solubilize the amine acid and aminemetal ion pair complexes
3. When used with oximes for copper extraction, modifiers allow the oxime tobe stripped with less acid.
Modifiers that accept a hydrogen bond tend to increase stability of the oximeand also increase selectivity over iron. Modifiers that donate a hydrogen bondto an acceptor have the opposite effect.
2.4. Synergistic Mixtures
A mixture of D2EHPA with the oxime Reagent LIX 63 gives a blend thatextracts certain metals at lower pH than either extractant by itself. This is theonly example of many reagent combinations that show a synergistic behavior.For many other examples, see Preston (1983)6,7 The LIX 63/D2EHPAcombination was investigated as a Ni extractant but the poor stability of the LIX63 to hydrolysis made the combination too costly.
Kinetics can be accelerated by the addition of phase transfer catalysts, e.g.,protonated amines.
Synergistic mixtures are likely to be the future for “new reagents” instead ofactually developing expensive reagents that must then go through the regula-tory process. Synergism optimization is possibly difficult to control because ofthe differential losses, and the incentive will be to develop and optimize a mixfor a particular deposit.
2.5. Diluents
1. Solubilize the extractant and metal–extractant complex.2. Have a low viscosity and density in order to assist phase separation and
reduce entrainment.3. Should be free of objectionable components to minimize crud formation.4. Should be chemically stable to circuit conditions.5. Should have a flash point 25 �C or higher above the highest operating
temperature in the SX circuit.6. Should be insoluble in the aqueous phase.7. Must have low evaporation losses.8. Should not be detrimental to metal extraction/stripping chemistry.9. Should be readily available at a low cost
197Chapter | 5 Examples of Application of Solvent Extraction Techniques
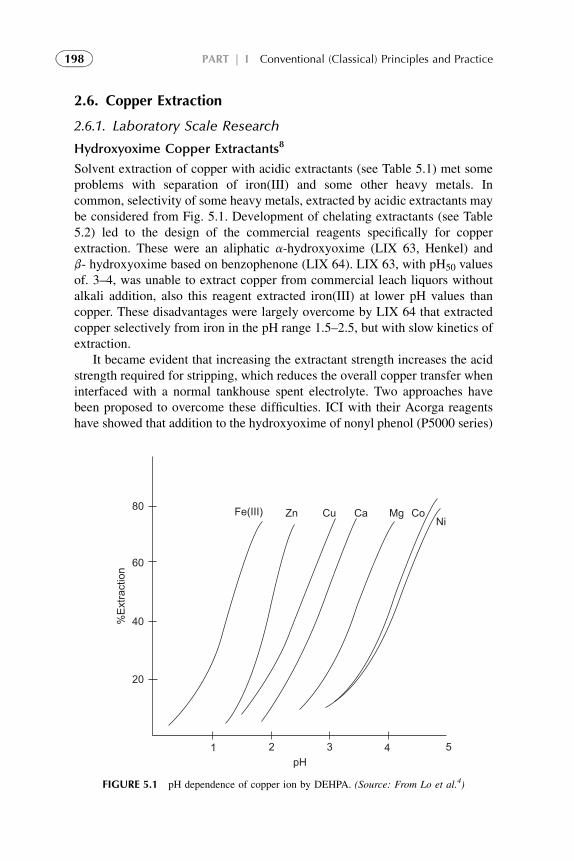
2.6. Copper Extraction
2.6.1. Laboratory Scale Research
Hydroxyoxime Copper Extractants8
Solvent extraction of copper with acidic extractants (see Table 5.1) met someproblems with separation of iron(III) and some other heavy metals. Incommon, selectivity of some heavy metals, extracted by acidic extractants maybe considered from Fig. 5.1. Development of chelating extractants (see Table5.2) led to the design of the commercial reagents specifically for copperextraction. These were an aliphatic a-hydroxyoxime (LIX 63, Henkel) andb- hydroxyoxime based on benzophenone (LIX 64). LIX 63, with pH50 valuesof. 3–4, was unable to extract copper from commercial leach liquors withoutalkali addition, also this reagent extracted iron(III) at lower pH values thancopper. These disadvantages were largely overcome by LIX 64 that extractedcopper selectively from iron in the pH range 1.5–2.5, but with slow kinetics ofextraction.
It became evident that increasing the extractant strength increases the acidstrength required for stripping, which reduces the overall copper transfer wheninterfaced with a normal tankhouse spent electrolyte. Two approaches havebeen proposed to overcome these difficulties. ICI with their Acorga reagentshave showed that addition to the hydroxyoxime of nonyl phenol (P5000 series)
%Ex
tract
ion
1 2 3 4 5
Fe(III) Zn Cu Ca Mg CoNi
80
60
40
20
pH
FIGURE 5.1 pH dependence of copper ion by DEHPA. (Source: From Lo et al.4)
198 PART | I Conventional (Classical) Principles and Practice
or tridecanol (PT5050) improves the stripping performance, with little effect onextraction.9,10 The M series of Acorga), produced by adding modifiers such aslong-chain alkyl esters, improved performance by reduction of entrainment andcrud formation. Second approach was developed by Henkel, which involvesa 1:1 mixture of an aldoxime and ketoxime, combining the extractive strength,selectivity, and fast kinetics of the akloxime with the proved hydrolytic stabilityand stripping performance of the ketoximes. These were second generation ofcommercial copper extractants.
Quinoline-Based Copper Extractants11
These are Kelex 100 (Sherex) and LIX 34 (Henkel), extractants derived of 8-quinolinol and 8-alkylarylsulfonamidoquinoline, respectively. They weredeveloped for selective separation of copper from iron(III). The separation wasbased on different extraction rate of copper and iron. Separation factor largerthan 1,000 were obtained. They have an advantage to extract copper from itshigh concentration and high acid concentration feeds in comparison withhydroxyoximes. Disadvantages of these extractants are easy protonation (takingacid at stripping) and high cost that are overweighed for commercial use.
b-Diketone Copper Extractants
These extractants, e.g., LIX 54, cannot compete with hydroxyoximes forextraction from acidic media but have some advantages at extraction fromammonia leach solutions (they do not transfer ammonia). The stripping ispossible with low acidity and high copper concentration solutions. Using LIX54 copper extraction from printed circuit board etch liquors was commercial-ized successfully.
Solvating, Nitrogen-Based Extractants
Chloride hydrometallurgy led to the interest in extractants, operating with highselectivity and a wide range of metals and metalloide but without pH control.An extractant, E, based on a pyridine-carboxylic ester derivative, readilyextract
CuCl2 þ 2Eorg þ CuCl2E2 org (5.1)
An example of this kind extractant is Acorga CLX 50. Unlike the amineextractants, this compound does not protonate easily and provides excellentselectivity for metals, existing as chloroanions in hydrochloric acid solutions.But extraction becomes significant at more than 8 M chloride concentration.12
2.6.2. Industrial Scale Copper Extraction
Addition of a small amount of LIX 63 to the LIX 64 solved the problems arisingwith the LIX 63. The mixture, LIX 64 N, for many years was the extractant of
199Chapter | 5 Examples of Application of Solvent Extraction Techniques
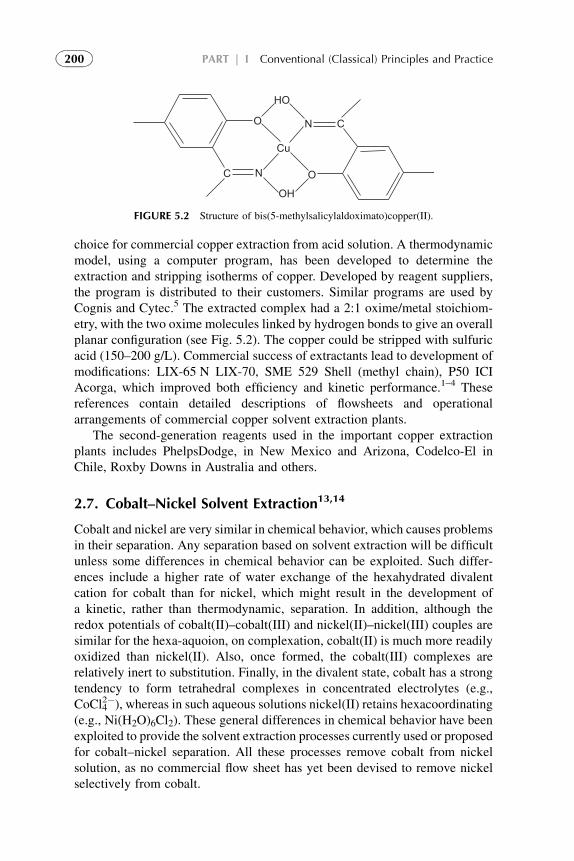
choice for commercial copper extraction from acid solution. A thermodynamicmodel, using a computer program, has been developed to determine theextraction and stripping isotherms of copper. Developed by reagent suppliers,the program is distributed to their customers. Similar programs are used byCognis and Cytec.5 The extracted complex had a 2:1 oxime/metal stoichiom-etry, with the two oxime molecules linked by hydrogen bonds to give an overallplanar configuration (see Fig. 5.2). The copper could be stripped with sulfuricacid (150–200 g/L). Commercial success of extractants lead to development ofmodifications: LIX-65 N LIX-70, SME 529 Shell (methyl chain), P50 ICIAcorga, which improved both efficiency and kinetic performance.1–4 Thesereferences contain detailed descriptions of flowsheets and operationalarrangements of commercial copper solvent extraction plants.
The second-generation reagents used in the important copper extractionplants includes PhelpsDodge, in New Mexico and Arizona, Codelco-El inChile, Roxby Downs in Australia and others.
2.7. Cobalt–Nickel Solvent Extraction13,14
Cobalt and nickel are very similar in chemical behavior, which causes problemsin their separation. Any separation based on solvent extraction will be difficultunless some differences in chemical behavior can be exploited. Such differ-ences include a higher rate of water exchange of the hexahydrated divalentcation for cobalt than for nickel, which might result in the development ofa kinetic, rather than thermodynamic, separation. In addition, although theredox potentials of cobalt(II)–cobalt(III) and nickel(II)–nickel(III) couples aresimilar for the hexa-aquoion, on complexation, cobalt(II) is much more readilyoxidized than nickel(II). Also, once formed, the cobalt(III) complexes arerelatively inert to substitution. Finally, in the divalent state, cobalt has a strongtendency to form tetrahedral complexes in concentrated electrolytes (e.g.,CoCl4
2�), whereas in such aqueous solutions nickel(II) retains hexacoordinating(e.g., Ni(H2O)6Cl2). These general differences in chemical behavior have beenexploited to provide the solvent extraction processes currently used or proposedfor cobalt–nickel separation. All these processes remove cobalt from nickelsolution, as no commercial flow sheet has yet been devised to remove nickelselectively from cobalt.
C
Cu
O
OH
N
N
HO
CO
FIGURE 5.2 Structure of bis(5-methylsalicylaldoximato)copper(II).
200 PART | I Conventional (Classical) Principles and Practice
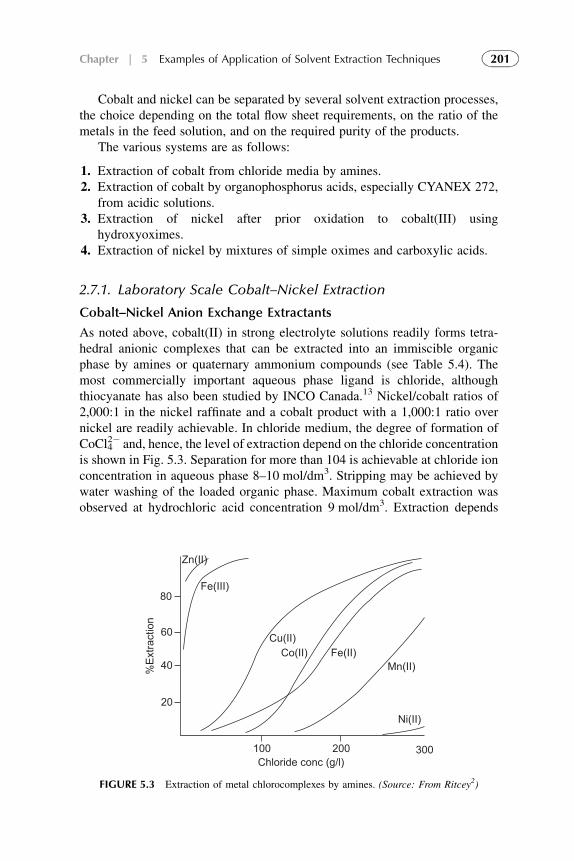
Cobalt and nickel can be separated by several solvent extraction processes,the choice depending on the total flow sheet requirements, on the ratio of themetals in the feed solution, and on the required purity of the products.
The various systems are as follows:
1. Extraction of cobalt from chloride media by amines.2. Extraction of cobalt by organophosphorus acids, especially CYANEX 272,
from acidic solutions.3. Extraction of nickel after prior oxidation to cobalt(III) using
hydroxyoximes.4. Extraction of nickel by mixtures of simple oximes and carboxylic acids.
2.7.1. Laboratory Scale Cobalt–Nickel Extraction
Cobalt–Nickel Anion Exchange Extractants
As noted above, cobalt(II) in strong electrolyte solutions readily forms tetra-hedral anionic complexes that can be extracted into an immiscible organicphase by amines or quaternary ammonium compounds (see Table 5.4). Themost commercially important aqueous phase ligand is chloride, althoughthiocyanate has also been studied by INCO Canada.13 Nickel/cobalt ratios of2,000:1 in the nickel raffinate and a cobalt product with a 1,000:1 ratio overnickel are readily achievable. In chloride medium, the degree of formation ofCoCl4
2� and, hence, the level of extraction depend on the chloride concentrationis shown in Fig. 5.3. Separation for more than 104 is achievable at chloride ionconcentration in aqueous phase 8–10 mol/dm3. Stripping may be achieved bywater washing of the loaded organic phase. Maximum cobalt extraction wasobserved at hydrochloric acid concentration 9 mol/dm3. Extraction depends
100 200 300Chloride conc (g/l)
Ni(II)
Mn(II)Fe(II)Co(II)
Cu(II)
Fe(III)
Zn(II)
80
60
40
20
%Ex
tract
ion
FIGURE 5.3 Extraction of metal chlorocomplexes by amines. (Source: From Ritcey2)
201Chapter | 5 Examples of Application of Solvent Extraction Techniques
also on the concentration and type of extractant in the following order:tertiary> secondary> primary amines.
Co–Ni Extraction by Acidic Extractants
Simple acidic extractants, such as carboxylic or sulfonic acids, have similarvalues of formation constants and are not used in cobalt–nickel separation.Also, the rate of nickel extraction is very slow compared with cobalt and, inaddition, atmospheric oxidation of cobalt(II) to three valent station is readilyoccurred, which prevents normal stripping processes.14 A similar oxidation ofthe loaded organic phase has been observed with substituted quinolines and b-diketones. The oxidation of cobalt(II) in the organic phase can be minimized bythe addition of donor molecules, such as the solvating extractants, such as tri-n-butylphosphate (TBP), tri-n-octylphosphine oxide (TOPO), and carboxylicacids. In addition to stabilizing cobalt(II), various degrees of synergism can beobtained, enhancing the separation of nickel from cobalt.
Although separation factors of up to 150 have been observed with thesystem LIX 63–carboxylic acid, but again, there are problems with the slowrate of nickel extraction. By using a nonchelating oxime instead of LIX 63,separation factors of about 200 have been obtained,8 without any reduction inthe rate of nickel extraction or oxidation of cobalt. The structure of theextracted complex for both metals is MR2(oxime)2.
6,7 The problem incontinuous operation with this system is that the acid strip solution tends tohydrolyze the oxime.
Earlier it was noted that nickel and cobalt could be extracted by carboxylicand sulfonic acids, with nickel being extracted at the lower pH. However, withalkylphosphorus acids, a selectivity reversal is observed, with cobalt beingfavored under acid conditions. The cobalt–nickel separation factor has beenshown to depend upon metal concentration, reagent structure, diluent,temperature, and the presence of a diluent modifier. Thus, with increasingcobalt concentration the color of the organic phase changes from pink to blue,indicating a change from octahedral coordinated species (e.g., [CoR2(HR)2]) toan unsolvated polymeric tetrahedral species [CoR2]n. In contrast, nickelremains octahedrally coordinated, with a structure [Ni(R2)HRx(H2O)4–x],maintaining a green color in the organic phase. This behavior was first noticedfor di-2-ethylhexylphosphoric acid (DEHPA).15 With phosphonic acid ester(PC88A, Daihachi) and a phosphinic acid (CYANEX) 272, Cytec), furtherstudies16 have shown a reagent dependence on the cobalt–nickel separationfactor, increasing from 14 (DEHPA) to 280 (PC88A) and 7,000 (CYANEX272), at pH 4 and 258 �C. Other factors that increased the separation includea change from aliphatic to aromatic diluents and an increase in temperature.Introduction of diluent modifiers, such as the solvating extractants TBP17 orisodecanol, reduces the separation factor by depolymerizing the system andpartially solvating the extracted complex to form octahedral species. A problemarises from oxidative degradation of the diluent by cobalt, which depends on
202 PART | I Conventional (Classical) Principles and Practice
the aromatic content of the diluent, on the temperature, and on cobalt loading.18
This degradation can be eliminated by an introduction of antioxidants suchas nonyl phenol. In addition to the diluents, oxidation of hydroxyoximes and8-quinolinols has also been reported.
Solvent extraction has become important at development of hydrometal-lurgical processes for producing high-purity nickel products from nickellateritic ores. The ammonia leach leaves the iron as an insoluble residue that isremoved by filtration. The filtrate is contacted with a ketoxime reagent (e.g.,LIX84I, Cognis) to extract the nickel:19
Ni(NH3)x2þ 2HRorg 4 NiR2 þ 2NH4
þ þ (x� 2)NH3 (5.2)
where R is oxime.However, this will also extract cobalt(II) under the same conditions, and
once extracted the cobalt is oxidized to cobalt(III) and cannot be stripped.Therefore to avoid this problem, the cobalt is oxidized prior to extraction. So,nickel can be selectively extracted from a feed solution (9 g/dm3 Ni and0.3 g/dm3 Co) leaving about 0.01 g/dm3 Ni in the raffinate. Nickel is subse-quently stripped from the loaded organic phase with strong ammonia.20
One of the main disadvantages of this flow sheet is that the cobalt(III)causes some oxidation of the reagent and a process of reoximation is required.20
Also, ammonia transfers to the organic phase, which again represents anoperating loss. However, the introduction of solvent extraction raises the nickelcontent of the products to >99.5% nickel as compared to 85–90% nickel withthe flow sheet that did not use solvent extraction.19
An alternative route to cobalt/nickel separation following ammonia leachingin the Caron process is to produce amixedCo/Ni carbonate product. This can thenbe dissolved in sulfate media and processed using one of the acidic extractants.18
2.7.2. Industrial Scale Solvent Extraction of Co–Ni
Some examples of industrial use of solvent extraction separations in thetreatment of Co–Ni hydrometallurgy are presented below.
Bulong Process
The Bulong operation is situated near Kalgoorlie in Western Australia. In 2000,the plant produced 9000 t/a nickel and 729 t/a cobalt. Following the pressureacid leach, the leachate is neutralized with lime to precipitate residual iron,chromium, and aluminum. The clarified filtrate is contacted with CYANEX272, containing TBP to inhibit third phase formation, at pH 5.5–6.0 and 508 �Cto extract the cobalt, zinc, and manganese and maximize the rejection of nickel.Then the nickel is extracted from the raffinate with a carboxylic acid (Versatic10) at pH 6.2–7.0.21 The coextracted calcium and magnesium are scrubbed.The nickel is finally stripped from the organic phase with recycled electrolytefrom the nickel electrowinning circuit. Coextracted impurities are removed
203Chapter | 5 Examples of Application of Solvent Extraction Techniques
initially from the cobalt circuit by sulfide precipitation of cobalt, copper, andzinc from the loaded strip liquor. The sulfide cake is then redissolved in acidand the zinc extracted with DEHPA, the copper removed by resin ion exchangeand the cobalt electrowon. DEHPA has been proposed commercially to sepa-rate cobalt–nickel with either column contractors or mixer-settlers,19 andPC88A has been incorporated into a flow sheet.20
Problems associated with this flow sheet include cross contamination of theorganic phases and aqueous solubility losses of the Versatic acid.21
Cawse Process8
The Cawse mine produced 8500 t/a nickel and 1900 t/a cobalt in 2000 at thelowest cost production in the world.
Purification of the pressure acid leachate from treatment of the Cawselimonitic ore involves the precipitation of cobalt and nickel hydroxides withmagnesium oxide following prior neutralization with limestone to remove ironand other impurities. The hydroxide cake is selectively leached with ammonia,rejecting any iron, manganese, or magnesium but redissolving any copper andzinc in the precipitate. The cobalt is then oxidized to cobalt(III) prior toextraction, to prevent coextraction with nickel with the hydroxyoxime LIX 84I(Cognis). The nickel is stripped with dilute sulfuric acid and electrowon.Copper and some cobalt build up in the organic phase and these levels arecontrolled by including a bleed stream, from which the copper is removed witha highly concentrated acid strip and cobalt by stripping in the presence ofa reducing agent. Another major problem is the oxidative degradation of theoxime extractant by the cobalt(III) requiring the addition of a reoximation stepto maintain extractant capacity. The cobalt in the raffinate is recovered bysulfide precipitation.
Murrin-Murrin Process
The Murrin-Murrin mine is also near Kalgoorlie in Western Australia. This isthe largest of the three projects, with a first-phase production of 45,000 t/a nickeland 3000 t/a cobalt with the expansion to 115,000 t /a nickel and 9000 t/acobalt.
The pressure acid leachate, following removal of the insoluble residue, istreated with hydrogen sulfide under pressure to precipitate nickel and cobaltand reject impurity elements. The sulfides are then dissolved in a pressureoxygen leach to produce a sulfate liquor that is treated with CYANEX 272.Initially, zinc is removed at low pH followed by a pH adjustment and cobaltextraction. Any coextracted nickel is scrubbed from the loaded organic phasewith a dilute cobalt sulfate solution and the cobalt stripped with dilute sulfuricacid. Both the cobalt and nickel are recovered from solution as powdersby hydrogen reduction that also produces ammonium sulfate as a by-product.The main problem in this flow sheet has been the crystallization of nickel
204 PART | I Conventional (Classical) Principles and Practice
ammonium sulfate because of the high nickel concentration (100 g/dm3) in thefeed to extraction. The problem was solved by preloading the extractant withnickel prior to extraction by contact with the nickel sulfate raffinate.
Several industrial scale flow sheets were developed recently. The anion-exchange process has been used commercially in Norway (FalconbridgeNikkelwerk) and Japan (Sumitomo) for cobalt–nickel separation.22 Extractionof metals from chloride solutions into kerosene containing trioctyl amine(TOA) has found application in the production of pure Co and Ni metals fromtheir ores. The aqueous phase contains the Co and Ni in addition to other metalsin chloride solution, where the chloride concentration goes to 300 g/L (i.e.,about 8.5 M). Negatively charged metal chloride complexes in the aqueousphase are formed at these concentrations are extracted by an amine like TOA,or by its amine salt, TOAHþCl�. Fe(III) forms much stronger complexes withCl� ions, so, it is much more easily extracted. The complex formation fromMzþ to MClz�n, where z� n��1, proceeds in the stepwise manner describedin Chapter 3. For example, Fe(III) forms the complex FeCl4
�, while cobaltforms CoCl4
2�.Bulk extraction followed by selective separation in smaller circuits will be
more popular. An example of bulk extraction is that of Goro,23 using Cyanex301 for Coþ Ni coextraction, followed by stripping with chloride and selectiveseparation of Co from Ni using an amine.
2.8. Precious Group Metals (PGM) Extraction
Chemical complexity of precious elements and the difference in the rawmaterial feed leads to the different flow sheets. The traditional route requiredmultiple precipitation and redissolution steps to provide the desired productpurity, which, with the consequent wash streams, involved increased recyclingand retreatment. This locks up considerable amounts of treated elements, whichplaces an economic constraint on the whole production. Sometimes the oper-ation may last a year between dissolving a sample of scrap at the start of theflow sheet and the emergence of the pure elements for marketing. During thistime, the value of the elements is locked up in the plant.
To understand these complexities of the production technologies, it isnecessary to outline some of the fundamental chemistry of the precious metals.These elements are noble metals and, as such, can be dissolved only with greatdifficulty. The usual leaching agent is hydrochloric acid, with the addition ofchlorine to increase the solution oxidation potential. This strong chloridemedium results in the almost exclusive formation of aqueous chloroanions,with, under certain circumstances, the presence of some neutral species. Veryseldom are cationic species formed in a chloride medium. However, theseelements do possess a range of easily accessible oxidation states and, with thepossibility of a number of different anionic complexes that are dependent onthe total chloride concentration; this provides a very complicated chemistry.
205Chapter | 5 Examples of Application of Solvent Extraction Techniques
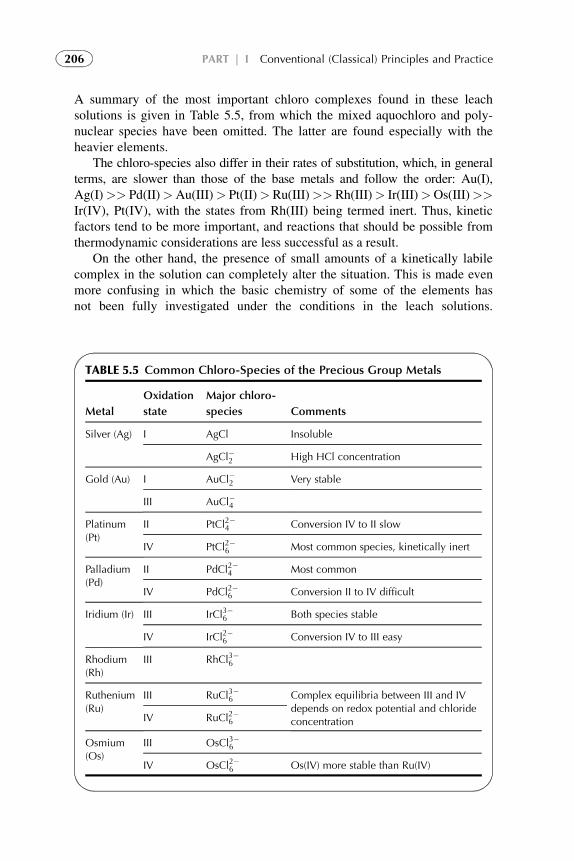
A summary of the most important chloro complexes found in these leachsolutions is given in Table 5.5, from which the mixed aquochloro and poly-nuclear species have been omitted. The latter are found especially with theheavier elements.
The chloro-species also differ in their rates of substitution, which, in generalterms, are slower than those of the base metals and follow the order: Au(I),Ag(I)>> Pd(II)>Au(III)> Pt(II)> Ru(III)>> Rh(III)> Ir(III)>Os(III)>>Ir(IV), Pt(IV), with the states from Rh(III) being termed inert. Thus, kineticfactors tend to be more important, and reactions that should be possible fromthermodynamic considerations are less successful as a result.
On the other hand, the presence of small amounts of a kinetically labilecomplex in the solution can completely alter the situation. This is made evenmore confusing in which the basic chemistry of some of the elements hasnot been fully investigated under the conditions in the leach solutions.
TABLE 5.5 Common Chloro-Species of the Precious Group Metals
Metal
Oxidation
state
Major chloro-
species Comments
Silver (Ag) I AgCl Insoluble
AgCl�2 High HCl concentration
Gold (Au) I AuCl�2 Very stable
III AuCl�4
Platinum(Pt)
II PtCl2�4 Conversion IV to II slow
IV PtCl2�6 Most common species, kinetically inert
Palladium(Pd)
II PdCl2�4 Most common
IV PdCl2�6 Conversion II to IV difficult
Iridium (Ir) III IrCl3�6 Both species stable
IV IrCl2�6 Conversion IV to III easy
Rhodium(Rh)
III RhCl3�6
Ruthenium(Ru)
III RuCl3�6 Complex equilibria between III and IVdepends on redox potential and chlorideconcentrationIV RuCl2�6
Osmium(Os)
III OsCl3�6
IV OsCl2�6 Os(IV) more stable than Ru(IV)
206 PART | I Conventional (Classical) Principles and Practice
Consequently, a solvent extraction process to separate the precious metals mustcope with a wide range of complexes in different oxidation states, which vary,often in a poorly known fashion, both in kinetic and thermodynamic stability.Therefore, different approaches have been tried and different flow sheets areproduced.
Because gold and silver can be easily separated from the remaining preciousmetals, they tend to be removed from the flow sheet at an early stage. Inaddition, significant quantities of gold and silver exist, in either primary ores orwaste materials that are not associated with the platinum group metals. Silveroften occurs as a residue from the chloride leaching operation and so isremoved first, followed by gold, which can be extracted as the tetra-chloroauric(III) acid, HAuCl4, by a solvating reagent.
Notice that none of the flow sheets uses solvent extraction exclusively.Because the aqueous chemistry of osmium and ruthenium is very complex,most operators remove these elements by distillation of the tetraoxides, MO4.Also, it has been advantageous to use ion exchange to separate and concentraterhodium. The various extraction routes for individual elements are discussed inthe following subsections.
Thermodynamic model has been developed24 for the precious metalcomplexes extracted from an ammonium copper thiosulfate solution.
2.8.1. Extraction of Gold
Leaching solution of gold is AuCl4�, and all the processes rely on the extraction
of this ion or the parent acid by ion-pair or solvating extractants, respectively.For example, dibutylcarbitol (diethyleneglycol dibutylether) by INCO,25
4-methyl-2-pentanone (methyl isobutylketone; MIBK),25 long-chain alcohols(the most effective: 2-ethylhexanol)26 Recovery of gold is best achieved bychemical reduction with, e.g., iron to give an impure product for subsequentrefining.
Gold, like silver, being classified as a soft acid, should prefer interactionwith soft donor atoms like sulfur. Therefore, it is no surprise to find thatextraction with the trialkylphosphine sulfide, CYANEX 471X, is very efficientand provides excellent separation from elements such as copper, lead, bismuth,and other metalloids found in anode slimes.26 Stripping can be achieved usingsodium thiosulfate that allows the separation of recovery and the reduction tothe metal.
Amine salts can also be used to extract anionic species, but, in general, theyare less selective for gold. However, trioctylamine (TOA) was used27 to extractgold from chloroanions such as copper, iron, tin, and zinc. The selectivity isattributed to the presence of TOA-HNO3 in the organic phase. Coextractedmetals are scrubbed with dilute nitric acid, and gold is recovered by a hydro-chloric acid–thiourea solution. The same authors also used N,N0-di-n-butyl-octanamide as a solvating extractant. The protonated forms of Kelex 100 and
207Chapter | 5 Examples of Application of Solvent Extraction Techniques
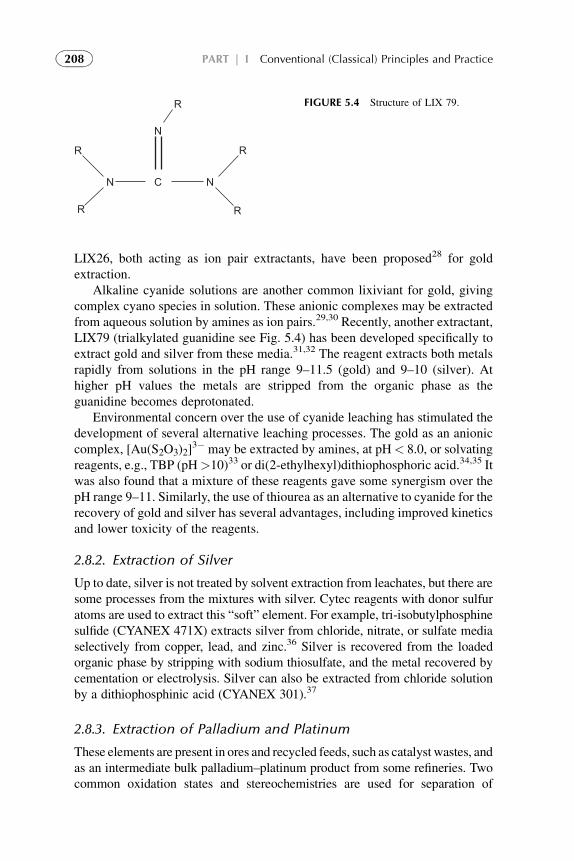
LIX26, both acting as ion pair extractants, have been proposed28 for goldextraction.
Alkaline cyanide solutions are another common lixiviant for gold, givingcomplex cyano species in solution. These anionic complexes may be extractedfrom aqueous solution by amines as ion pairs.29,30 Recently, another extractant,LIX79 (trialkylated guanidine see Fig. 5.4) has been developed specifically toextract gold and silver from these media.31,32 The reagent extracts both metalsrapidly from solutions in the pH range 9–11.5 (gold) and 9–10 (silver). Athigher pH values the metals are stripped from the organic phase as theguanidine becomes deprotonated.
Environmental concern over the use of cyanide leaching has stimulated thedevelopment of several alternative leaching processes. The gold as an anioniccomplex, [Au(S2O3)2]
3� may be extracted by amines, at pH< 8.0, or solvatingreagents, e.g., TBP (pH>10)33 or di(2-ethylhexyl)dithiophosphoric acid.34,35 Itwas also found that a mixture of these reagents gave some synergism over thepH range 9–11. Similarly, the use of thiourea as an alternative to cyanide for therecovery of gold and silver has several advantages, including improved kineticsand lower toxicity of the reagents.
2.8.2. Extraction of Silver
Up to date, silver is not treated by solvent extraction from leachates, but there aresome processes from the mixtures with silver. Cytec reagents with donor sulfuratoms are used to extract this “soft” element. For example, tri-isobutylphosphinesulfide (CYANEX 471X) extracts silver from chloride, nitrate, or sulfate mediaselectively from copper, lead, and zinc.36 Silver is recovered from the loadedorganic phase by stripping with sodium thiosulfate, and the metal recovered bycementation or electrolysis. Silver can also be extracted from chloride solutionby a dithiophosphinic acid (CYANEX 301).37
2.8.3. Extraction of Palladium and Platinum
These elements are present in ores and recycled feeds, such as catalyst wastes, andas an intermediate bulk palladium–platinum product from some refineries. Twocommon oxidation states and stereochemistries are used for separation of
R R
R
N
N NC
R R
FIGURE 5.4 Structure of LIX 79.
208 PART | I Conventional (Classical) Principles and Practice
elements: square planar palladium(II) and octahedral platinum(IV). Palladium(II)has the faster substitution kinetics.
Two general directions are considered: selective extraction of metals withdifferent reagents or coextraction of the elements followed by selective stripping.Flow sheets with di-n-octyl sulfide or a hydroxyoxime as selective extractants areused to remove the palladium, followed by tri-n-butylphosphate (TBP; INCO)and an amine (MRR) to recover platinum. The extraction of palladium by thesulfide38 is slowwith 2–3 h to achieve equilibrium. This inhibits commercial flowsheet design. Tertiary amines can act as a kinetic accelerator, reducing equilib-rium times to minutes, but no information has been published on the effect of theamines on selectivity of palladium–platinum separation. High loading of thesulfides is possible, and stripping is easy with aqueous ammonia. Neutralizationof the strip solution with hydrochloric acid gives Pd(NH3)2Cl2 as product.
The aqueous raffinate from extraction is acidified to 5–6 mol/dm3 withhydrochloric acid to optimize platinum extraction by the solvating extractantTBP. The coextraction of iridium is prevented by reduction with sulfur dioxide,which converts the iridium(IV) to the not extractable (III) species. The speciesH2PtCl6 are extracted by TBP and stripped by water.17 Metal is recovered byprecipitation with ammonia as (NH3)2PtCl2.
The second selective extractant (MRR) uses a hydroxyoxime to removepalladium.8 The actual compound used has not been specified, but publica-tions refer to both an aliphatic a-hydroxyoxime and an aromatic b-hydrox-yoxime. The a-hydroxyoxime LIX63 has the faster extraction kinetics, butsuffers from problems with stripping. For the b-hydroxyoxime, a kineticaccelerator in the form of an amine (Primene JMT) has been proposed. Theprecise mode of operation of this accelerator is unknown, but it may bea similar process to that proposed for the sulfide system (i.e., a form of proton-transfer catalysis where the protonated amine extracts PdCl4
2� which thenreacts with the hydroxyoxime in the organic phase). Good loading of palla-dium and palladium–platinum separation factors of 103–104 are found.Stripping of the palladium is easy with hydrochloric acid, and (NH3)2PdCl4 isobtained by precipitation. The raffinate from palladium extraction is treated toremove osmium and ruthenium. Stripping of the platinum is difficult becauseof the high-distribution coefficient, but techniques that have been successfulinclude the use of strong acids, such as nitric or perchloric, to break the ionpair, or alkali to deprotonate the amine salt.
Influence of residual gold on the solvent extraction-based recovery ofcyanide from more traditional industrial cyanidation liquors was presented inWoollam and Grant (2008)39 Some authors observed a significant increase inthe rate of acid catalyzed degradation of the hydroxyoxime LIX 84I in thepalladium solvent extraction circuit when the reagent concentration wasincreased. However, a reduction in strip acid concentration was found toalleviate this problem sufficiently, while leaving phase disengagement andoverall strip circuit efficiency at acceptable levels.
209Chapter | 5 Examples of Application of Solvent Extraction Techniques
The phosphine sulfide CYANEX 471X has been proposed as an alternativeto the foregoing reagents for palladium–platinum separation. Here, the fasterextraction of palladium affords separation factors of 10:1, with a 10-mincontact time. The chemistry of the process is similar to that of the alkyl sulfides.Various other separations have been published; e.g., TBP will extract plati-num(IV) chloroanions preferentially to palladium(II).
An alternative general process involves coextraction of palladium andplatinum, followed by selective stripping. A novel amino acid extractant, madeby the reaction between chloracetic acid and Amberlite) LA-2, a secondaryamine, is used to extract the two elements from the leach liquor. However, inthe given flow sheet, no selective stripping is employed, both elements beingstripped by hydrochloric acid. The resulting chloroanions are then separated byusing di-n-hexylsulfide to extract PdCl4
2�. Other coextraction-selective striproutes that have been proposed include the following:
1. Extraction with a secondary amine, followed by stripping of the palladiumby hydrazine, and bicarbonate to strip platinum by deprotonation of theamine ion pair.
2. Extraction with a tertiary amine, Alamine) 336, followed by palladiumstripping with thiourea and platinum with thiocyanate. Both of thesesystems suffer from problems with stripping and metal recovery fromthe strip solutions. Results of testing series of polyamines based on thetris(2-aminoethyl)amine (tren) platform as extractants of palladium(II),platinum(II), rhodium(III), and ruthenium(III)40 for the chloro complexesshow some hopes. This study helped to confirm the importance of water insome complex formation structures.New tripodal amido and urea group-basedanion-binding ligands as potential extractants for [PtCl6]
2– from acidic chlo-ride solutions are presented in Fig. 5.5.41 Much greater selectivity for thecomplex anion over chloride was reported compared to model reagents suchas trioctylamine. The efficient extraction of soft metal ions, including silver(I)and palladium(II), onto various copolymers of N-isopropylacrylamide andthioethers was reported.42 Some potential for enhanced selectivity mayencourage further development of these systems. On the base of secondaryamine,AmberliteLA-2 systema computer simulation of the solvent extractionof platinum froma chloridematrixwas developed43 and provedon several flowsheet options to be simulated. The results of the selected configuration werevalidated in a subsequent mini-pilot plant trial.
3. Extraction with 8-quinolinol derivatives, which can act as either a chelatingacid or, after protonation, as an anion extractant. It was observed44 thatpalladium extraction was favored at low acidity, but platinum was extractedbest at high acidity (see Fig. 5.6). Here, no chlorine atoms are retained in thecomplex, because a bidentate chelating ligand is used, and the system iseasy to strip. Fast kinetics are observed with a 3–5-min contact time to reachequilibrium at ambient temperature. The extraction conditions can be easily
210 PART | I Conventional (Classical) Principles and Practice
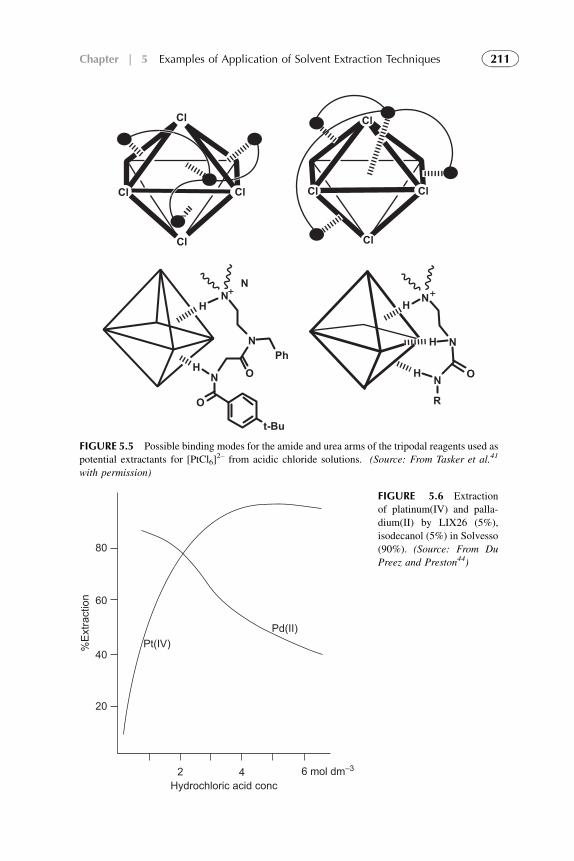
+ +
Cl
Cl
N
N
N N
N
N
H
H
H
R
N
HO O
O
t-Bu
H
Ph
Cl
Cl Cl
Cl
Cl
Cl
FIGURE 5.5 Possible binding modes for the amide and urea arms of the tripodal reagents used as
potential extractants for [PtCl6]2– from acidic chloride solutions. (Source: From Tasker et al.41
with permission)
80
60
40
20
%Ex
tract
ion
2 4 6 mol dm–3
Hydrochloric acid conc
Pd(II)Pt(IV)
FIGURE 5.6 Extraction
of platinum(IV) and palla-
dium(II) by LIX26 (5%),
isodecanol (5%) in Solvesso
(90%). (Source: From Du
Preez and Preston44)
211Chapter | 5 Examples of Application of Solvent Extraction Techniques
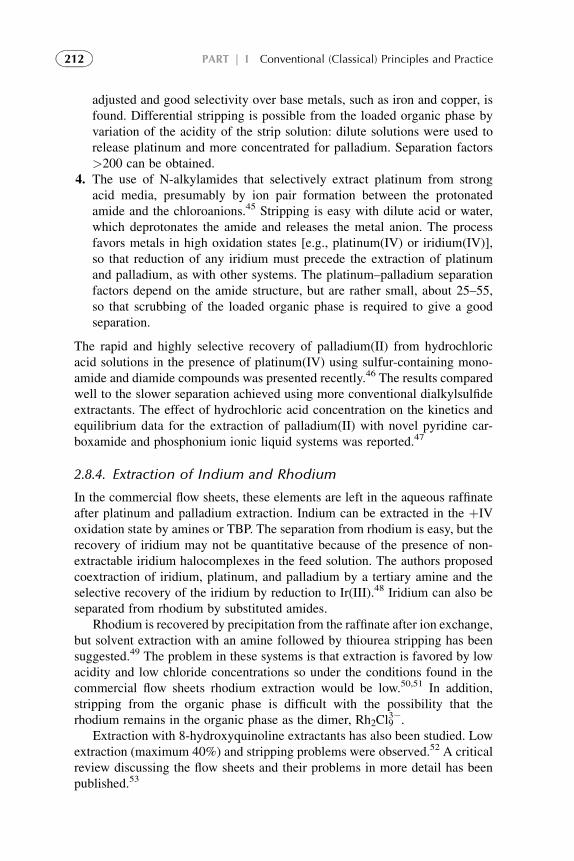
adjusted and good selectivity over base metals, such as iron and copper, isfound. Differential stripping is possible from the loaded organic phase byvariation of the acidity of the strip solution: dilute solutions were used torelease platinum and more concentrated for palladium. Separation factors>200 can be obtained.
4. The use of N-alkylamides that selectively extract platinum from strongacid media, presumably by ion pair formation between the protonatedamide and the chloroanions.45 Stripping is easy with dilute acid or water,which deprotonates the amide and releases the metal anion. The processfavors metals in high oxidation states [e.g., platinum(IV) or iridium(IV)],so that reduction of any iridium must precede the extraction of platinumand palladium, as with other systems. The platinum–palladium separationfactors depend on the amide structure, but are rather small, about 25–55,so that scrubbing of the loaded organic phase is required to give a goodseparation.
The rapid and highly selective recovery of palladium(II) from hydrochloricacid solutions in the presence of platinum(IV) using sulfur-containing mono-amide and diamide compounds was presented recently.46 The results comparedwell to the slower separation achieved using more conventional dialkylsulfideextractants. The effect of hydrochloric acid concentration on the kinetics andequilibrium data for the extraction of palladium(II) with novel pyridine car-boxamide and phosphonium ionic liquid systems was reported.47
2.8.4. Extraction of Indium and Rhodium
In the commercial flow sheets, these elements are left in the aqueous raffinateafter platinum and palladium extraction. Indium can be extracted in the þIVoxidation state by amines or TBP. The separation from rhodium is easy, but therecovery of iridium may not be quantitative because of the presence of non-extractable iridium halocomplexes in the feed solution. The authors proposedcoextraction of iridium, platinum, and palladium by a tertiary amine and theselective recovery of the iridium by reduction to Ir(III).48 Iridium can also beseparated from rhodium by substituted amides.
Rhodium is recovered by precipitation from the raffinate after ion exchange,but solvent extraction with an amine followed by thiourea stripping has beensuggested.49 The problem in these systems is that extraction is favored by lowacidity and low chloride concentrations so under the conditions found in thecommercial flow sheets rhodium extraction would be low.50,51 In addition,stripping from the organic phase is difficult with the possibility that therhodium remains in the organic phase as the dimer, Rh2Cl9
3�.Extraction with 8-hydroxyquinoline extractants has also been studied. Low
extraction (maximum 40%) and stripping problems were observed.52 A criticalreview discussing the flow sheets and their problems in more detail has beenpublished.53
212 PART | I Conventional (Classical) Principles and Practice
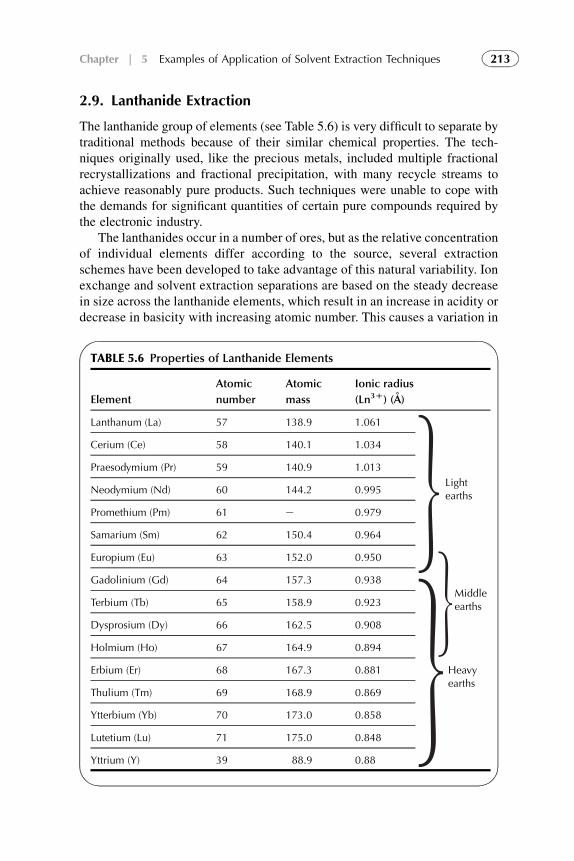
2.9. Lanthanide Extraction
The lanthanide group of elements (see Table 5.6) is very difficult to separate bytraditional methods because of their similar chemical properties. The tech-niques originally used, like the precious metals, included multiple fractionalrecrystallizations and fractional precipitation, with many recycle streams toachieve reasonably pure products. Such techniques were unable to cope withthe demands for significant quantities of certain pure compounds required bythe electronic industry.
The lanthanides occur in a number of ores, but as the relative concentrationof individual elements differ according to the source, several extractionschemes have been developed to take advantage of this natural variability. Ionexchange and solvent extraction separations are based on the steady decreasein size across the lanthanide elements, which result in an increase in acidity ordecrease in basicity with increasing atomic number. This causes a variation in
TABLE 5.6 Properties of Lanthanide Elements
Element
Atomic
number
Atomic
mass
Ionic radius
(Ln3D) (A)
Lanthanum (La) 57 138.9 1.061
Lightearths
Cerium (Ce) 58 140.1 1.034
Praesodymium (Pr) 59 140.9 1.013
Neodymium (Nd) 60 144.2 0.995
Promethium (Pm) 61 e 0.979
Samarium (Sm) 62 150.4 0.964
Europium (Eu) 63 152.0 0.950
Middleearths
Gadolinium (Gd) 64 157.3 0.938
Terbium (Tb) 65 158.9 0.923
Dysprosium (Dy) 66 162.5 0.908
Holmium (Ho) 67 164.9 0.894
Erbium (Er) 68 167.3 0.881 Heavyearths
Thulium (Tm) 69 168.9 0.869
Ytterbium (Yb) 70 173.0 0.858
Lutetium (Lu) 71 175.0 0.848
Yttrium (Y) 39 88.9 0.88
213Chapter | 5 Examples of Application of Solvent Extraction Techniques
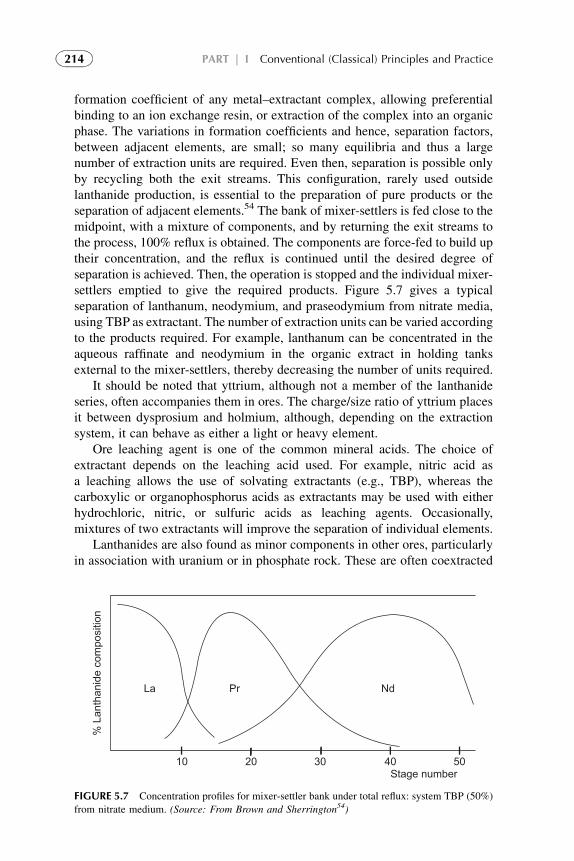
formation coefficient of any metal–extractant complex, allowing preferentialbinding to an ion exchange resin, or extraction of the complex into an organicphase. The variations in formation coefficients and hence, separation factors,between adjacent elements, are small; so many equilibria and thus a largenumber of extraction units are required. Even then, separation is possible onlyby recycling both the exit streams. This configuration, rarely used outsidelanthanide production, is essential to the preparation of pure products or theseparation of adjacent elements.54 The bank of mixer-settlers is fed close to themidpoint, with a mixture of components, and by returning the exit streams tothe process, 100% reflux is obtained. The components are force-fed to build uptheir concentration, and the reflux is continued until the desired degree ofseparation is achieved. Then, the operation is stopped and the individual mixer-settlers emptied to give the required products. Figure 5.7 gives a typicalseparation of lanthanum, neodymium, and praseodymium from nitrate media,using TBP as extractant. The number of extraction units can be varied accordingto the products required. For example, lanthanum can be concentrated in theaqueous raffinate and neodymium in the organic extract in holding tanksexternal to the mixer-settlers, thereby decreasing the number of units required.
It should be noted that yttrium, although not a member of the lanthanideseries, often accompanies them in ores. The charge/size ratio of yttrium placesit between dysprosium and holmium, although, depending on the extractionsystem, it can behave as either a light or heavy element.
Ore leaching agent is one of the common mineral acids. The choice ofextractant depends on the leaching acid used. For example, nitric acid asa leaching allows the use of solvating extractants (e.g., TBP), whereas thecarboxylic or organophosphorus acids as extractants may be used with eitherhydrochloric, nitric, or sulfuric acids as leaching agents. Occasionally,mixtures of two extractants will improve the separation of individual elements.
Lanthanides are also found as minor components in other ores, particularlyin association with uranium or in phosphate rock. These are often coextracted
La Pr Nd
10 20 30 40 50Stage number
% L
anth
anid
e co
mpo
sitio
n
FIGURE 5.7 Concentration profiles for mixer-settler bank under total reflux: system TBP (50%)
from nitrate medium. (Source: From Brown and Sherrington54)
214 PART | I Conventional (Classical) Principles and Practice
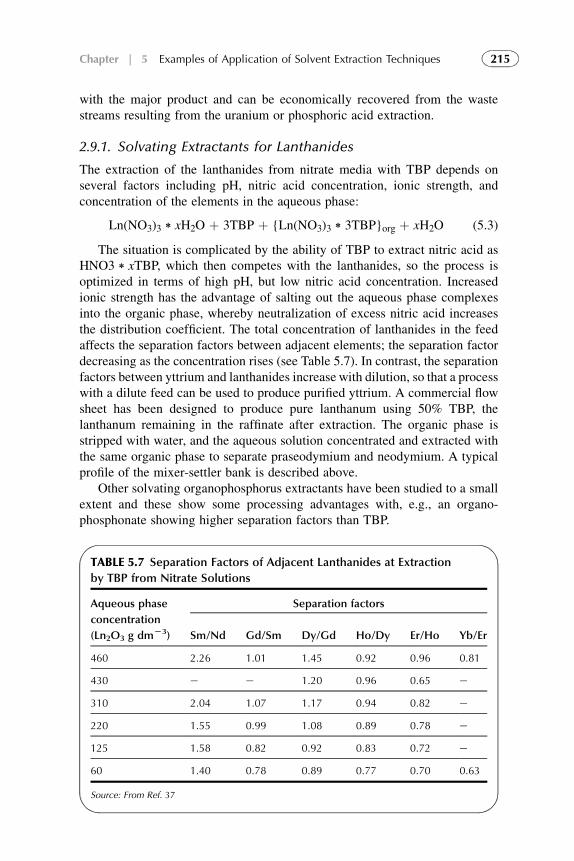
with the major product and can be economically recovered from the wastestreams resulting from the uranium or phosphoric acid extraction.
2.9.1. Solvating Extractants for Lanthanides
The extraction of the lanthanides from nitrate media with TBP depends onseveral factors including pH, nitric acid concentration, ionic strength, andconcentration of the elements in the aqueous phase:
Ln(NO3)3) xH2O þ 3TBP þ {Ln(NO3)3) 3TBP}org þ xH2O (5.3)
The situation is complicated by the ability of TBP to extract nitric acid asHNO3) xTBP, which then competes with the lanthanides, so the process isoptimized in terms of high pH, but low nitric acid concentration. Increasedionic strength has the advantage of salting out the aqueous phase complexesinto the organic phase, whereby neutralization of excess nitric acid increasesthe distribution coefficient. The total concentration of lanthanides in the feedaffects the separation factors between adjacent elements; the separation factordecreasing as the concentration rises (see Table 5.7). In contrast, the separationfactors between yttrium and lanthanides increase with dilution, so that a processwith a dilute feed can be used to produce purified yttrium. A commercial flowsheet has been designed to produce pure lanthanum using 50% TBP, thelanthanum remaining in the raffinate after extraction. The organic phase isstripped with water, and the aqueous solution concentrated and extracted withthe same organic phase to separate praseodymium and neodymium. A typicalprofile of the mixer-settler bank is described above.
Other solvating organophosphorus extractants have been studied to a smallextent and these show some processing advantages with, e.g., an organo-phosphonate showing higher separation factors than TBP.
TABLE 5.7 Separation Factors of Adjacent Lanthanides at Extraction
by TBP from Nitrate Solutions
Aqueous phase
concentration
(Ln2O3 g dmL3)
Separation factors
Sm/Nd Gd/Sm Dy/Gd Ho/Dy Er/Ho Yb/Er
460 2.26 1.01 1.45 0.92 0.96 0.81
430 e e 1.20 0.96 0.65 e
310 2.04 1.07 1.17 0.94 0.82 e
220 1.55 0.99 1.08 0.89 0.78 e
125 1.58 0.82 0.92 0.83 0.72 e
60 1.40 0.78 0.89 0.77 0.70 0.63
Source: From Ref. 37
215Chapter | 5 Examples of Application of Solvent Extraction Techniques
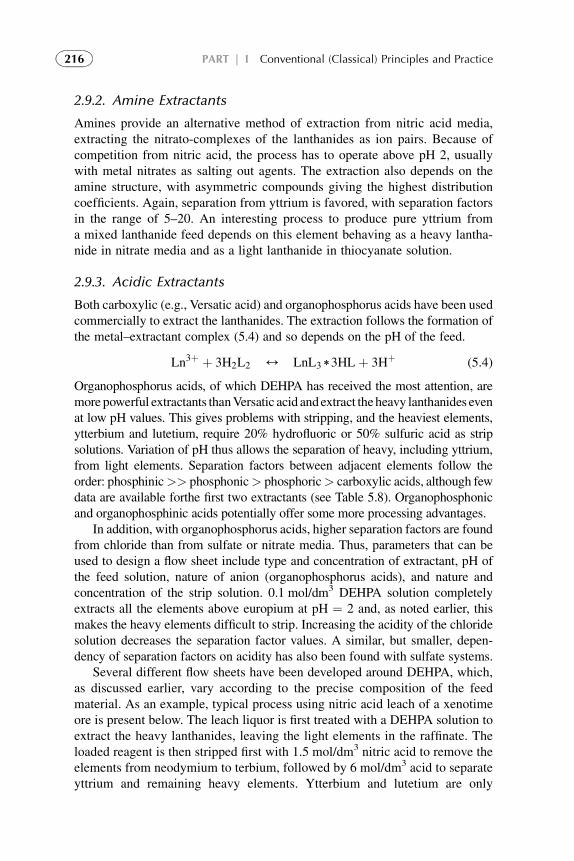
2.9.2. Amine Extractants
Amines provide an alternative method of extraction from nitric acid media,extracting the nitrato-complexes of the lanthanides as ion pairs. Because ofcompetition from nitric acid, the process has to operate above pH 2, usuallywith metal nitrates as salting out agents. The extraction also depends on theamine structure, with asymmetric compounds giving the highest distributioncoefficients. Again, separation from yttrium is favored, with separation factorsin the range of 5–20. An interesting process to produce pure yttrium froma mixed lanthanide feed depends on this element behaving as a heavy lantha-nide in nitrate media and as a light lanthanide in thiocyanate solution.
2.9.3. Acidic Extractants
Both carboxylic (e.g., Versatic acid) and organophosphorus acids have been usedcommercially to extract the lanthanides. The extraction follows the formation ofthe metal–extractant complex (5.4) and so depends on the pH of the feed.
Ln3þ þ 3H2L2 4 LnL3)3HLþ 3Hþ (5.4)
Organophosphorus acids, of which DEHPA has received the most attention, aremore powerful extractants thanVersatic acid andextract theheavy lanthanides evenat low pH values. This gives problems with stripping, and the heaviest elements,ytterbium and lutetium, require 20% hydrofluoric or 50% sulfuric acid as stripsolutions. Variation of pH thus allows the separation of heavy, including yttrium,from light elements. Separation factors between adjacent elements follow theorder: phosphinic>> phosphonic> phosphoric> carboxylic acids, although fewdata are available forthe first two extractants (see Table 5.8). Organophosphonicand organophosphinic acids potentially offer some more processing advantages.
In addition, with organophosphorus acids, higher separation factors are foundfrom chloride than from sulfate or nitrate media. Thus, parameters that can beused to design a flow sheet include type and concentration of extractant, pH ofthe feed solution, nature of anion (organophosphorus acids), and nature andconcentration of the strip solution. 0.1 mol/dm3 DEHPA solution completelyextracts all the elements above europium at pH ¼ 2 and, as noted earlier, thismakes the heavy elements difficult to strip. Increasing the acidity of the chloridesolution decreases the separation factor values. A similar, but smaller, depen-dency of separation factors on acidity has also been found with sulfate systems.
Several different flow sheets have been developed around DEHPA, which,as discussed earlier, vary according to the precise composition of the feedmaterial. As an example, typical process using nitric acid leach of a xenotimeore is present below. The leach liquor is first treated with a DEHPA solution toextract the heavy lanthanides, leaving the light elements in the raffinate. Theloaded reagent is then stripped first with 1.5 mol/dm3 nitric acid to remove theelements from neodymium to terbium, followed by 6 mol/dm3 acid to separateyttrium and remaining heavy elements. Ytterbium and lutetium are only
216 PART | I Conventional (Classical) Principles and Practice
TABLE 5.8 Separation Factors for Adjacent Lanthanides Using Acidic Extractants
Ce/La Pr/Ce Nd/Pr Sm/Nd Eu/Sm Gd/Eu Tb/Gd Dy/Tb Ho/Dy Er/Ho Tm/Er Yb/Tm Lu/Yb
Versatic 911a 3.00 1.60 1.32 2.20 e 1.96 e e 1.17 1.28 e e e
DEHPAa e e 1.40 4.00 2.30 1.50 5.70 2.00 1.80 2.40 3.40 e e
DEHPAb 5.24 1.86 1.32 9.77 2.14 1.99 e e e e e e e
Phosphonic acidb 13.8 3.47 1.51 13.80 2.45 1.86 6.92 3.23 2.17 2.82 2.63 3.71 1.74
Phosphinic acidb 16.98 1.86 1.32 13.80 2.14 1.32 6.02 2.82 1.74 2.63 3.47 2.63 1.51
aSource: Ref. 54bSource: Ref. 55 (All organophosphorus extractants used in this work had 2-ethylhexyl substituents)
217
Chap
ter|
5Exam
ples
ofApplicatio
nofSo
lventExtractio
nTech
niques
partially removed; hence, a final strip with stronger acid, as mentioned earlier,or with 10% alkali is required before organic phase recycle. The main productfrom this flow sheet was yttrium, and the yttrium nitrate product was furtherextracted with a quaternary amine to produce a 99.999% product.
The rate of extraction of the lanthanides by the 2-ethylhexyl ester of2-ethylhexylphosphonic acid (e.g., PC88A, P507) is slower than for DEHPAbut the higher distribution coefficients allow extraction from more dilutesolutions. Also, as acidic stripping is easier than with DEHPA, the reagent hasbeen used commercially to separate lutetium from terbium and ytterbium.56
Recently emphasis has shifted to the use of organophosphinic acids for theextraction of lanthanides57 with CYANEX 272, providing significant advan-tages over other organophosphorus acid extractants for the heavy lanthanideswith greater average separation factors and easier stripping. Furthermore, a 1:1mixture of CYANEX 272 and a carboxylic acid gives significant synergism forthe heavy lanthanides with higher loadings (0.2 mol/dm3) than either CYANEX272 (0.08 mol/dm3), DEHPA, or the phosphonic acid ester (P507) (0.17 mol/dm3).44 In addition, stripping from the synergistic mixture with either hydro-chloric or nitric acid is easy. The latter enables the production of high-purityproducts free from chloride ions.
Extraction with versatic acid takes place by a cation-exchange mechanismwith maximum extraction close to the pH of hydrolysis. No preference is shownfor a particular anion in the feed solution, and separation factors are lessdependent on the concentration of elements in the feed than with TBP. The highcerium–lanthanum separation factor indicates that versatic acid would bea better extractant than TBP to produce pure lanthanum. The small separationfactors still require both extractions to be performed under total reflux in a large(56-stage) mixer-settler train.
3. SOLVENT EXTRACTION IN NUCLEAR CHEMISTRYAND TECHNOLOGY
Nuclear chemistry and technology include the following:
1. Technology of production of fuel for nuclear reactors (U, Th).2. Reprocessing of the irradiated spent fuel for extraction of U, Np, Pu, trans-
plutonium elements.3. Treatment of the nuclear waste.
All technological flow sheets contain solvent extraction processes for separa-tion, concentration, purification of the radioactive elements as products and/orwastes.
There is a large bibliography of nuclear chemistry and technology. The readercan refer to some handbooks,58–61 encyclopedias,62,63 books,64–67 published after2000, and a huge number of articles, published in special journals such asNuclear Technology, Journal of Nuclear Materials, etc. The objective of this
218 PART | I Conventional (Classical) Principles and Practice
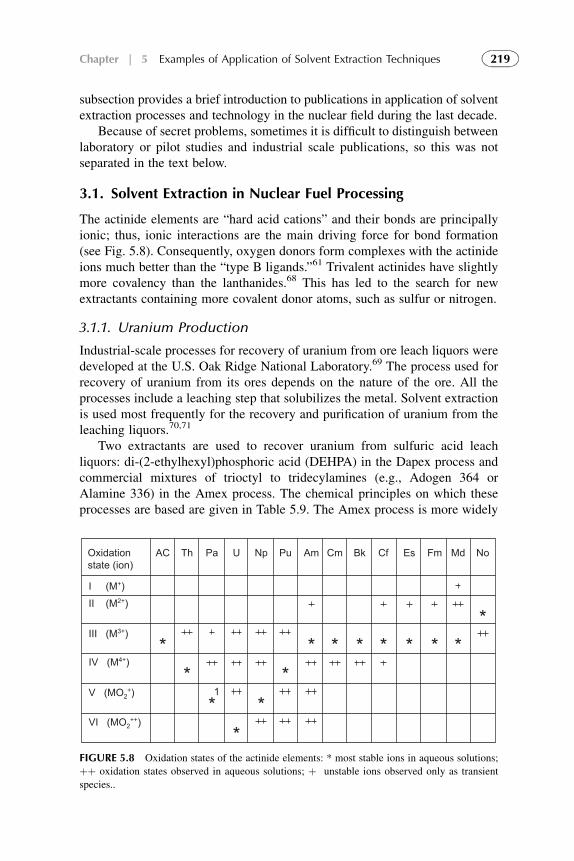
subsection provides a brief introduction to publications in application of solventextraction processes and technology in the nuclear field during the last decade.
Because of secret problems, sometimes it is difficult to distinguish betweenlaboratory or pilot studies and industrial scale publications, so this was notseparated in the text below.
3.1. Solvent Extraction in Nuclear Fuel Processing
The actinide elements are “hard acid cations” and their bonds are principallyionic; thus, ionic interactions are the main driving force for bond formation(see Fig. 5.8). Consequently, oxygen donors form complexes with the actinideions much better than the “type B ligands.”61 Trivalent actinides have slightlymore covalency than the lanthanides.68 This has led to the search for newextractants containing more covalent donor atoms, such as sulfur or nitrogen.
3.1.1. Uranium Production
Industrial-scale processes for recovery of uranium from ore leach liquors weredeveloped at the U.S. Oak Ridge National Laboratory.69 The process used forrecovery of uranium from its ores depends on the nature of the ore. All theprocesses include a leaching step that solubilizes the metal. Solvent extractionis used most frequently for the recovery and purification of uranium from theleaching liquors.70,71
Two extractants are used to recover uranium from sulfuric acid leachliquors: di-(2-ethylhexyl)phosphoric acid (DEHPA) in the Dapex process andcommercial mixtures of trioctyl to tridecylamines (e.g., Adogen 364 orAlamine 336) in the Amex process. The chemical principles on which theseprocesses are based are given in Table 5.9. The Amex process is more widely
Oxidationstate (ion)
AC
1
Th Pa U Np Pu Am Cm Bk Cf Es Fm Md No
I (M+)II (M2+)
III (M3+)
IV (M4+)
V (MO2+)
VI (MO2++)
FIGURE 5.8 Oxidation states of the actinide elements: * most stable ions in aqueous solutions;
þþ oxidation states observed in aqueous solutions; þ unstable ions observed only as transient
species..
219Chapter | 5 Examples of Application of Solvent Extraction Techniques
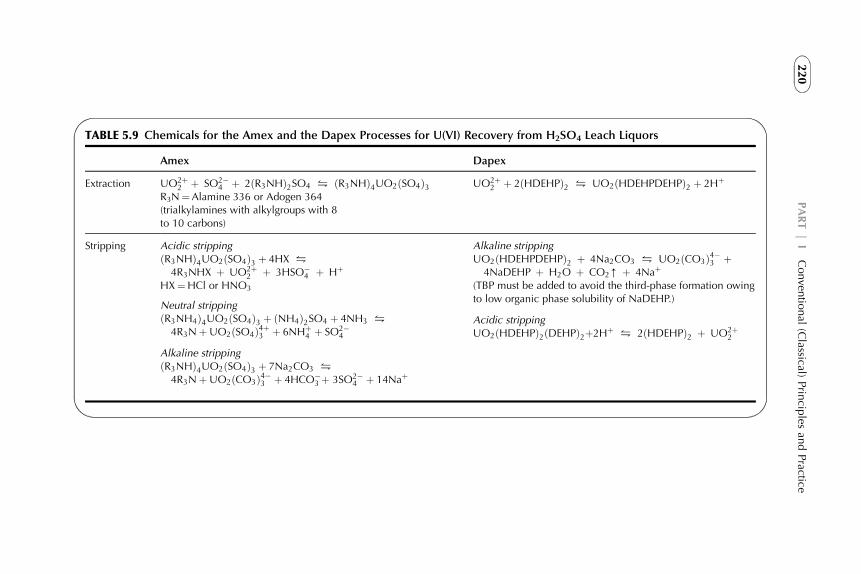
TABLE 5.9 Chemicals for the Amex and the Dapex Processes for U(VI) Recovery from H2SO4 Leach Liquors
Amex Dapex
Extraction UO2þ2 þ SO2�
4 þ 2ðR3NHÞ2SO4 ! ðR3NHÞ4UO2ðSO4Þ3R3N¼Alamine 336 or Adogen 364(trialkylamines with alkylgroups with 8to 10 carbons)
UO2þ2 þ 2ðHDEHPÞ2 ! UO2ðHDEHPDEHPÞ2 þ 2Hþ
Stripping Acidic strippingðR3NHÞ4UO2ðSO4Þ3 þ 4HX !4R3NHX þ UO2þ
2 þ 3HSO�4 þ Hþ
HX¼HCl or HNO3
Neutral strippingðR3NH4Þ4UO2ðSO4Þ3 þ ðNH4Þ2SO4 þ 4NH3 !4R3NþUO2ðSO4Þ4þ3 þ 6NHþ
4 þ SO2�4
Alkaline strippingðR3NHÞ4UO2ðSO4Þ3 þ 7Na2CO3 !4R3NþUO2ðCO3Þ4�3 þ 4HCO�
3 þ 3SO2�4 þ 14Naþ
Alkaline strippingUO2ðHDEHPDEHPÞ2 þ 4Na2CO3 ! UO2ðCO3Þ4�3 þ4NaDEHP þ H2O þ CO2[ þ 4Naþ
(TBP must be added to avoid the third-phase formation owingto low organic phase solubility of NaDEHP.)
Acidic strippingUO2ðHDEHPÞ2ðDEHPÞ2þ2Hþ ! 2ðHDEHPÞ2 þ UO2þ
2
220
PART|
IConven
tional
(Classical)
Prin
ciples
andPractice
used than the Dapex process because of the greater selectivity of trialkylaminesthan DEHPA for uranium in H2SO4 solution.
High-grade pitchblende ores are leached with nitric acid to recoveruranium. Extraction of uranium from nitrate solutions is usually performedwith TBP. TBP-based solvents are used in several areas of the nuclear industry,especially for reprocessing of spent nuclear fuels and for refining the uraniumproduct of the Amex and Dapex processes. Extraction of uranium by TBPsolvents is described in the next subsections.
The concentration of uranium contained in phosphate rocks (50–200 ppm)is higher than that in seawater (see below). Even though economic recovery ofuranium from phosphate rock is difficult, several phosphoric acid plants includeoperation of uranium recovery facilities. Various processes72,73 have been usedfor uranium extraction from phosphoric acid solution; their main features arelisted in Table 5.10. The DEHPA-TOPO process is increasingly preferred overothers because of the stability of the extractant and the well-understoodchemistry of the process. Today, phosphoric acid for use in the pharmaceuticalor food industry must be free from uranium and other harmful metals. Theprocessing of phosphate rock for production of fertilizers may be an importantsource of uranium because uranium removal may become compulsory to avoidits dissemination into the environment from the use of phosphate-basedfertilizers.
Hydrometallurgy of copper ores sometimes results in waste solutionscontaining appreciable amounts of uranium. The uranium bearing aqueousraffinate from copper extraction is usually a dilute sulfuric acid solution.Uranium can be recovered using the same technique as described above forsulfuric acid leach liquors. A typical example is uranium production at theOlympic Dam mine in Australia, where the copper ore bodies are estimated tocontain a total of over a million metric ton of uranium.
Estimates of the price of recovery uranium from seawater have shownthat the cost is several orders of magnitude higher than for recovering Ufrom high grade ores. High separation factors are needed for the recovery ofU as the seawater contains many other elements. However, recent researchon calixarenes74 has showed that this type of macrocycle can achieve veryhigh separation factors between U(VI) and other cations if the number offunctional groups on the calixarenes corresponds to the number of ligandsneeded to saturate the coordination sphere of the UO2
2þ ion in its equatorialplan. Figure 5.9 shows the structure of two lipophilic p-tert-butylcalixar-enes(6), bearing carboxylate or hydroxamate groups on the lower rim,which have been considered as extractants. The best functional group forthe calixarene(6) is the hydroxamic group, CONHOH, probably because, atthe pH of seawater, neutral U(VI) species are formed in the organic phase;with carboxylate groups the lower pKa of R–COOH favors anionic species.The influence of chlorides in the feed solutions is studied in Soldenhoffet al.75
221Chapter | 5 Examples of Application of Solvent Extraction Techniques
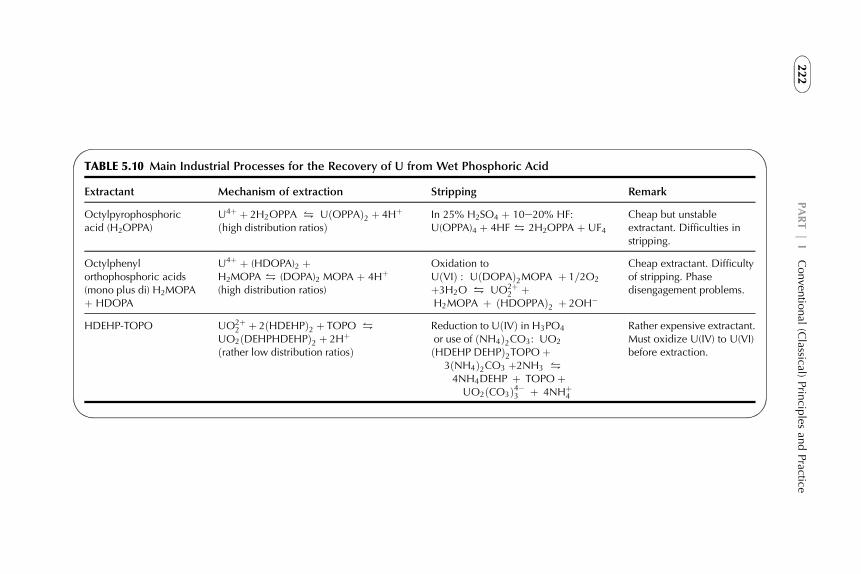
TABLE 5.10 Main Industrial Processes for the Recovery of U from Wet Phosphoric Acid
Extractant Mechanism of extraction Stripping Remark
Octylpyrophosphoricacid (H2OPPA)
U4þ þ 2H2OPPA ! UðOPPAÞ2 þ 4Hþ
ðhigh distribution ratiosÞIn 25% H2SO4 þ 10e20% HF:U(OPPA)4 þ 4HF ! 2H2OPPA þ UF4
Cheap but unstableextractant. Difficulties instripping.
Octylphenylorthophosphoric acids(mono plus di) H2MOPAþ HDOPA
U4þ þ (HDOPA)2 þH2MOPA ! (DOPA)2 MOPA þ 4Hþ
(high distribution ratios)
Oxidation toUðVIÞ : UðDOPAÞ2MOPA þ 1=2O2
þ3H2O ! UO2þ2 þ
H2MOPA þ ðHDOPPAÞ2 þ 2OH�
Cheap extractant. Difficultyof stripping. Phasedisengagement problems.
HDEHP-TOPO UO2þ2 þ 2ðHDEHPÞ2 þ TOPO !
UO2ðDEHPHDEHPÞ2 þ 2Hþ
ðrather low distribution ratiosÞ
Reduction to UðIVÞ in H3PO4
or use of ðNH4Þ2CO3: UO2
ðHDEHP DEHPÞ2TOPO þ3ðNH4Þ2CO3 þ2NH3 !4NH4DEHP þ TOPO þUO2ðCO3Þ4�3 þ 4NHþ
4
Rather expensive extractant.Must oxidize U(IV) to U(VI)before extraction.
222
PART|
IConven
tional
(Classical)
Prin
ciples
andPractice
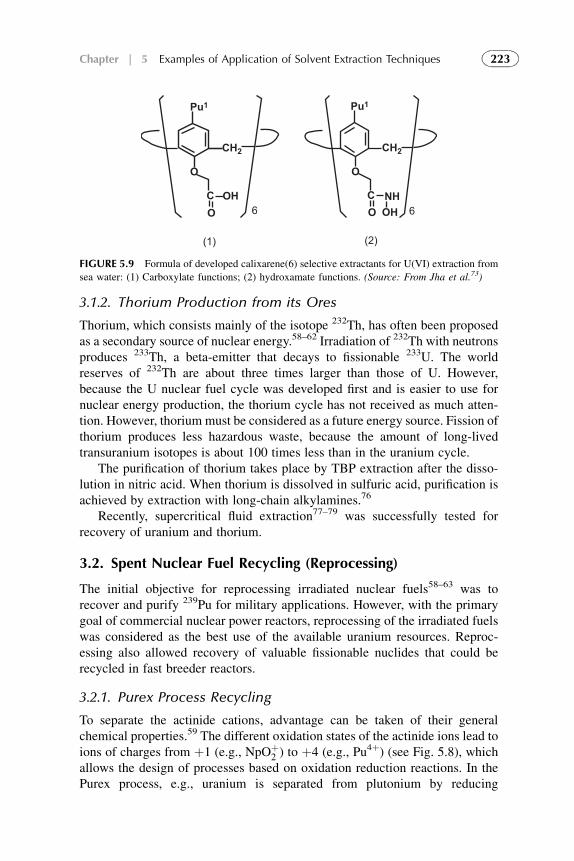
3.1.2. Thorium Production from its Ores
Thorium, which consists mainly of the isotope 232Th, has often been proposedas a secondary source of nuclear energy.58–62 Irradiation of 232Th with neutronsproduces 233Th, a beta-emitter that decays to fissionable 233U. The worldreserves of 232Th are about three times larger than those of U. However,because the U nuclear fuel cycle was developed first and is easier to use fornuclear energy production, the thorium cycle has not received as much atten-tion. However, thorium must be considered as a future energy source. Fission ofthorium produces less hazardous waste, because the amount of long-livedtransuranium isotopes is about 100 times less than in the uranium cycle.
The purification of thorium takes place by TBP extraction after the disso-lution in nitric acid. When thorium is dissolved in sulfuric acid, purification isachieved by extraction with long-chain alkylamines.76
Recently, supercritical fluid extraction77–79 was successfully tested forrecovery of uranium and thorium.
3.2. Spent Nuclear Fuel Recycling (Reprocessing)
The initial objective for reprocessing irradiated nuclear fuels58–63 was torecover and purify 239Pu for military applications. However, with the primarygoal of commercial nuclear power reactors, reprocessing of the irradiated fuelswas considered as the best use of the available uranium resources. Reproc-essing also allowed recovery of valuable fissionable nuclides that could berecycled in fast breeder reactors.
3.2.1. Purex Process Recycling
To separate the actinide cations, advantage can be taken of their generalchemical properties.59 The different oxidation states of the actinide ions lead toions of charges from þ1 (e.g., NpOþ
2 ) to þ4 (e.g., Pu4þ) (see Fig. 5.8), whichallows the design of processes based on oxidation reduction reactions. In thePurex process, e.g., uranium is separated from plutonium by reducing
CC
CH2
CH2
O
O
O
O
OH
OH
Pu1 Pu1
NH
6 6
(1) (2)
FIGURE 5.9 Formula of developed calixarene(6) selective extractants for U(VI) extraction from
sea water: (1) Carboxylate functions; (2) hydroxamate functions. (Source: From Jha et al.73)
223Chapter | 5 Examples of Application of Solvent Extraction Techniques
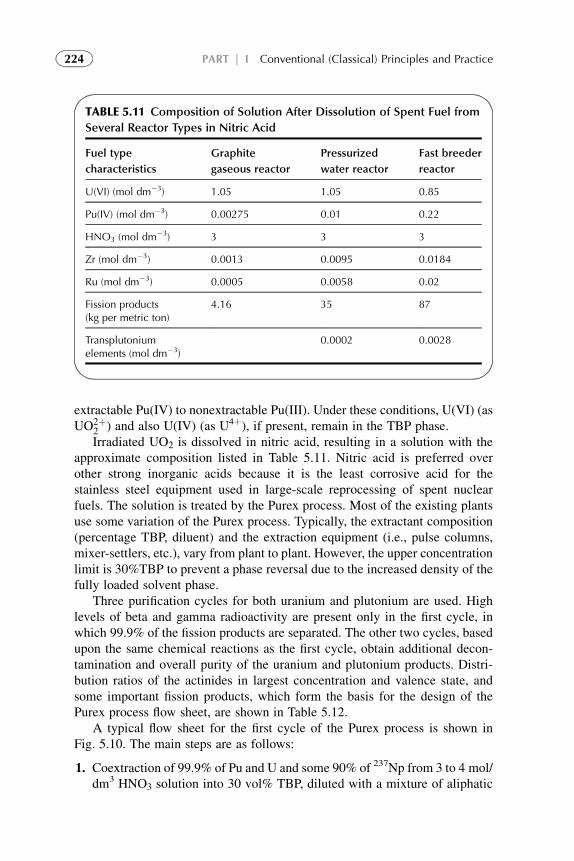
extractable Pu(IV) to nonextractable Pu(III). Under these conditions, U(VI) (asUO2þ
2 ) and also U(IV) (as U4þ), if present, remain in the TBP phase.Irradiated UO2 is dissolved in nitric acid, resulting in a solution with the
approximate composition listed in Table 5.11. Nitric acid is preferred overother strong inorganic acids because it is the least corrosive acid for thestainless steel equipment used in large-scale reprocessing of spent nuclearfuels. The solution is treated by the Purex process. Most of the existing plantsuse some variation of the Purex process. Typically, the extractant composition(percentage TBP, diluent) and the extraction equipment (i.e., pulse columns,mixer-settlers, etc.), vary from plant to plant. However, the upper concentrationlimit is 30%TBP to prevent a phase reversal due to the increased density of thefully loaded solvent phase.
Three purification cycles for both uranium and plutonium are used. Highlevels of beta and gamma radioactivity are present only in the first cycle, inwhich 99.9% of the fission products are separated. The other two cycles, basedupon the same chemical reactions as the first cycle, obtain additional decon-tamination and overall purity of the uranium and plutonium products. Distri-bution ratios of the actinides in largest concentration and valence state, andsome important fission products, which form the basis for the design of thePurex process flow sheet, are shown in Table 5.12.
A typical flow sheet for the first cycle of the Purex process is shown inFig. 5.10. The main steps are as follows:
1. Coextraction of 99.9% of Pu and U and some 90% of 237Np from 3 to 4 mol/dm3 HNO3 solution into 30 vol% TBP, diluted with a mixture of aliphatic
TABLE 5.11 Composition of Solution After Dissolution of Spent Fuel from
Several Reactor Types in Nitric Acid
Fuel type
characteristics
Graphite
gaseous reactor
Pressurized
water reactor
Fast breeder
reactor
U(VI) (mol dm�3) 1.05 1.05 0.85
Pu(IV) (mol dm�3) 0.00275 0.01 0.22
HNO3 (mol dm�3) 3 3 3
Zr (mol dm�3) 0.0013 0.0095 0.0184
Ru (mol dm�3) 0.0005 0.0058 0.02
Fission products(kg per metric ton)
4.16 35 87
Transplutoniumelements (mol dm�3)
0.0002 0.0028
224 PART | I Conventional (Classical) Principles and Practice
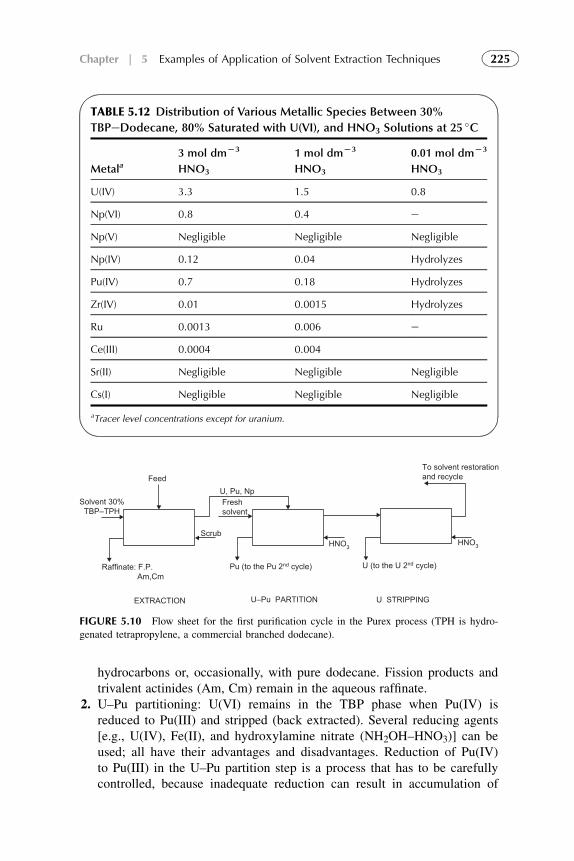
hydrocarbons or, occasionally, with pure dodecane. Fission products andtrivalent actinides (Am, Cm) remain in the aqueous raffinate.
2. U–Pu partitioning: U(VI) remains in the TBP phase when Pu(IV) isreduced to Pu(III) and stripped (back extracted). Several reducing agents[e.g., U(IV), Fe(II), and hydroxylamine nitrate (NH2OH–HNO3)] can beused; all have their advantages and disadvantages. Reduction of Pu(IV)to Pu(III) in the U–Pu partition step is a process that has to be carefullycontrolled, because inadequate reduction can result in accumulation of
TABLE 5.12 Distribution of Various Metallic Species Between 30%
TBPeDodecane, 80% Saturated with U(VI), and HNO3 Solutions at 25�C
Metala3 mol dmL3 1 mol dmL3 0.01 mol dmL3
HNO3 HNO3 HNO3
U(IV) 3.3 1.5 0.8
Np(VI) 0.8 0.4 e
Np(V) Negligible Negligible Negligible
Np(IV) 0.12 0.04 Hydrolyzes
Pu(IV) 0.7 0.18 Hydrolyzes
Zr(IV) 0.01 0.0015 Hydrolyzes
Ru 0.0013 0.006 e
Ce(III) 0.0004 0.004
Sr(II) Negligible Negligible Negligible
Cs(I) Negligible Negligible Negligible
aTracer level concentrations except for uranium.
Feed
Solvent 30%TBP–TPH
U, Pu, Np
Pu (to the Pu 2nd cycle) U (to the U 2nd cycle)
Freshsolvent
EXTRACTION
Raffinate: F.P. Am,Cm
U–Pu PARTITION U STRIPPING
Scrub
To solvent restorationand recycle
HNO3HNO3
FIGURE 5.10 Flow sheet for the first purification cycle in the Purex process (TPH is hydro-
genated tetrapropylene, a commercial branched dodecane).
225Chapter | 5 Examples of Application of Solvent Extraction Techniques
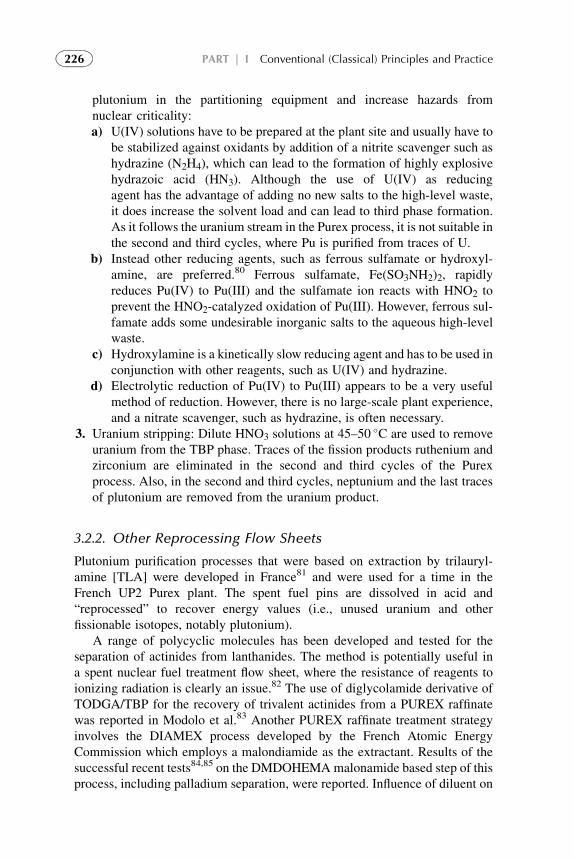
plutonium in the partitioning equipment and increase hazards fromnuclear criticality:a) U(IV) solutions have to be prepared at the plant site and usually have to
be stabilized against oxidants by addition of a nitrite scavenger such ashydrazine (N2H4), which can lead to the formation of highly explosivehydrazoic acid (HN3). Although the use of U(IV) as reducingagent has the advantage of adding no new salts to the high-level waste,it does increase the solvent load and can lead to third phase formation.As it follows the uranium stream in the Purex process, it is not suitable inthe second and third cycles, where Pu is purified from traces of U.
b) Instead other reducing agents, such as ferrous sulfamate or hydroxyl-amine, are preferred.80 Ferrous sulfamate, Fe(SO3NH2)2, rapidlyreduces Pu(IV) to Pu(III) and the sulfamate ion reacts with HNO2 toprevent the HNO2-catalyzed oxidation of Pu(III). However, ferrous sul-famate adds some undesirable inorganic salts to the aqueous high-levelwaste.
c) Hydroxylamine is a kinetically slow reducing agent and has to be used inconjunction with other reagents, such as U(IV) and hydrazine.
d) Electrolytic reduction of Pu(IV) to Pu(III) appears to be a very usefulmethod of reduction. However, there is no large-scale plant experience,and a nitrate scavenger, such as hydrazine, is often necessary.
3. Uranium stripping: Dilute HNO3 solutions at 45–50�C are used to remove
uranium from the TBP phase. Traces of the fission products ruthenium andzirconium are eliminated in the second and third cycles of the Purexprocess. Also, in the second and third cycles, neptunium and the last tracesof plutonium are removed from the uranium product.
3.2.2. Other Reprocessing Flow Sheets
Plutonium purification processes that were based on extraction by trilauryl-amine [TLA] were developed in France81 and were used for a time in theFrench UP2 Purex plant. The spent fuel pins are dissolved in acid and“reprocessed” to recover energy values (i.e., unused uranium and otherfissionable isotopes, notably plutonium).
A range of polycyclic molecules has been developed and tested for theseparation of actinides from lanthanides. The method is potentially useful ina spent nuclear fuel treatment flow sheet, where the resistance of reagents toionizing radiation is clearly an issue.82 The use of diglycolamide derivative ofTODGA/TBP for the recovery of trivalent actinides from a PUREX raffinatewas reported in Modolo et al.83 Another PUREX raffinate treatment strategyinvolves the DIAMEX process developed by the French Atomic EnergyCommission which employs a malondiamide as the extractant. Results of thesuccessful recent tests84,85 on the DMDOHEMAmalonamide based step of thisprocess, including palladium separation, were reported. Influence of diluent on
226 PART | I Conventional (Classical) Principles and Practice
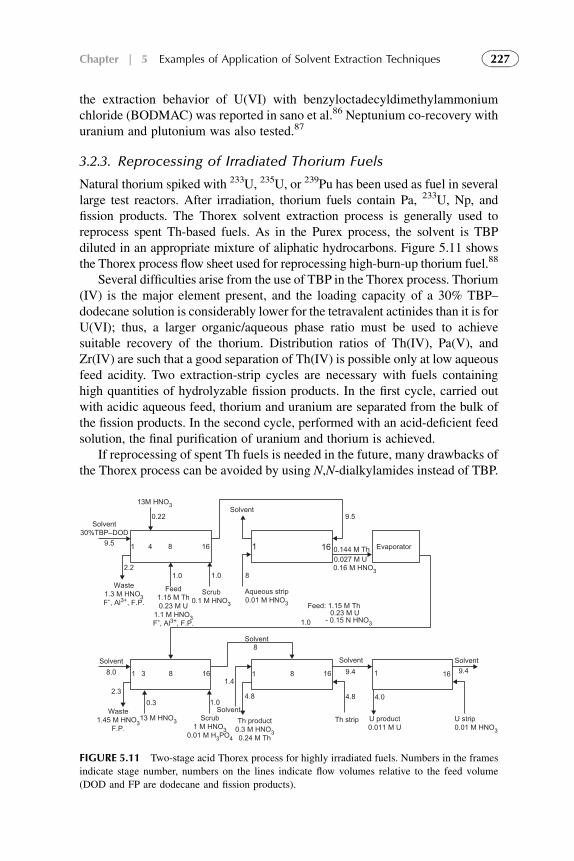
the extraction behavior of U(VI) with benzyloctadecyldimethylammoniumchloride (BODMAC) was reported in sano et al.86 Neptunium co-recovery withuranium and plutonium was also tested.87
3.2.3. Reprocessing of Irradiated Thorium Fuels
Natural thorium spiked with 233U, 235U, or 239Pu has been used as fuel in severallarge test reactors. After irradiation, thorium fuels contain Pa, 233U, Np, andfission products. The Thorex solvent extraction process is generally used toreprocess spent Th-based fuels. As in the Purex process, the solvent is TBPdiluted in an appropriate mixture of aliphatic hydrocarbons. Figure 5.11 showsthe Thorex process flow sheet used for reprocessing high-burn-up thorium fuel.88
Several difficulties arise from the use of TBP in the Thorex process. Thorium(IV) is the major element present, and the loading capacity of a 30% TBP–dodecane solution is considerably lower for the tetravalent actinides than it is forU(VI); thus, a larger organic/aqueous phase ratio must be used to achievesuitable recovery of the thorium. Distribution ratios of Th(IV), Pa(V), andZr(IV) are such that a good separation of Th(IV) is possible only at low aqueousfeed acidity. Two extraction-strip cycles are necessary with fuels containinghigh quantities of hydrolyzable fission products. In the first cycle, carried outwith acidic aqueous feed, thorium and uranium are separated from the bulk ofthe fission products. In the second cycle, performed with an acid-deficient feedsolution, the final purification of uranium and thorium is achieved.
If reprocessing of spent Th fuels is needed in the future, many drawbacks ofthe Thorex process can be avoided by using N,N-dialkylamides instead of TBP.
13M HNO3Solvent
9.5
161 Evaporator0.144 M Th0.027 M U0.16 M HNO3
13 M HNO3
0.22
9.5 1 4 8 16
Solvent30%TBP–DOD
2.21.0 1.0 8
Waste1.3 M HNO3F-, Al3+, F.P.
Waste1.45 M HNO3
F.P.
Feed1.15 M Th0.23 M U
1.1 M HNO3F-, Al3+, F.P.
Scrub0.1 M HNO3
Scrub1 M HNO3
0.01 M H3PO4
U strip0.01 M HNO3
Feed: 1.15 M Th
Th product0.3 M HNO30.24 M Th
Th strip U product0.011 M U
0.23 M U- 0.15 N HNO3
Aqueous strip0.01 M HNO3
1.0
9.4 9.4
4.8 4.0
1 16
Solvent
Solvent
Solvent SolventSolvent8.0
2.30.3
1 13 8 816 16
8
1.0
1.4
4.8
FIGURE 5.11 Two-stage acid Thorex process for highly irradiated fuels. Numbers in the frames
indicate stage number, numbers on the lines indicate flow volumes relative to the feed volume
(DOD and FP are dodecane and fission products).
227Chapter | 5 Examples of Application of Solvent Extraction Techniques
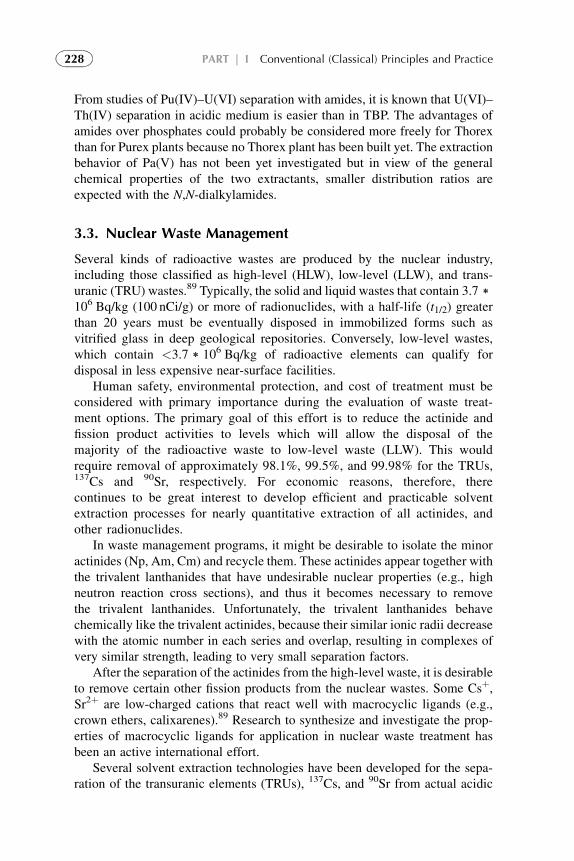
From studies of Pu(IV)–U(VI) separation with amides, it is known that U(VI)–Th(IV) separation in acidic medium is easier than in TBP. The advantages ofamides over phosphates could probably be considered more freely for Thorexthan for Purex plants because no Thorex plant has been built yet. The extractionbehavior of Pa(V) has not been yet investigated but in view of the generalchemical properties of the two extractants, smaller distribution ratios areexpected with the N,N-dialkylamides.
3.3. Nuclear Waste Management
Several kinds of radioactive wastes are produced by the nuclear industry,including those classified as high-level (HLW), low-level (LLW), and trans-uranic (TRU) wastes.89 Typically, the solid and liquid wastes that contain 3.7)106 Bq/kg (100 nCi/g) or more of radionuclides, with a half-life (t1/2) greaterthan 20 years must be eventually disposed in immobilized forms such asvitrified glass in deep geological repositories. Conversely, low-level wastes,which contain <3.7) 106 Bq/kg of radioactive elements can qualify fordisposal in less expensive near-surface facilities.
Human safety, environmental protection, and cost of treatment must beconsidered with primary importance during the evaluation of waste treat-ment options. The primary goal of this effort is to reduce the actinide andfission product activities to levels which will allow the disposal of themajority of the radioactive waste to low-level waste (LLW). This wouldrequire removal of approximately 98.1%, 99.5%, and 99.98% for the TRUs,137Cs and 90Sr, respectively. For economic reasons, therefore, therecontinues to be great interest to develop efficient and practicable solventextraction processes for nearly quantitative extraction of all actinides, andother radionuclides.
In waste management programs, it might be desirable to isolate the minoractinides (Np, Am, Cm) and recycle them. These actinides appear together withthe trivalent lanthanides that have undesirable nuclear properties (e.g., highneutron reaction cross sections), and thus it becomes necessary to removethe trivalent lanthanides. Unfortunately, the trivalent lanthanides behavechemically like the trivalent actinides, because their similar ionic radii decreasewith the atomic number in each series and overlap, resulting in complexes ofvery similar strength, leading to very small separation factors.
After the separation of the actinides from the high-level waste, it is desirableto remove certain other fission products from the nuclear wastes. Some Csþ,Sr2þ are low-charged cations that react well with macrocyclic ligands (e.g.,crown ethers, calixarenes).89 Research to synthesize and investigate the prop-erties of macrocyclic ligands for application in nuclear waste treatment hasbeen an active international effort.
Several solvent extraction technologies have been developed for the sepa-ration of the transuranic elements (TRUs), 137Cs, and 90Sr from actual acidic
228 PART | I Conventional (Classical) Principles and Practice
radioactive waste solution in a centrifugal contactor pilot plant. The solventextraction technologies include the Transuranic Extraction (TRUEX) process;the Strontium Extraction (SREX) process; a chlorinated cobalt dicarbollide(ChCoDiC) process; a chlorinated cobalt dicarbollide/polyethylene glycolprocess; a phosphine oxide (POR) process and a universal solvent extractionprocess. For each of these solvent extraction processes, considerable experi-mental development and flow sheet modeling were performed. Subsequentimmobilization processes for the high and low-level waste products from theseparations are also being developed, including trivalent americium andcurium, from all HNO3 waste solutions.
89,90
3.3.1. TRUEX Process
TRUEX process was developed for the removal of TRUs from acidic radio-active wastes. The process uses octyl(phenyl)-N,N-di-isobutyl carbamoylmethyl phosphine oxide (CMPO) as the active extractant, tributyl phosphate(TBP) as a phase modifier, and a hydrocarbon diluent. Trivalent lanthanidesfollow Am3þ and Cm3þ when the latter are stripped with dilute HNO3; Anion-exchange resin and solvent extraction procedures have been used for separatinguranium and technetium. The Truex process (see Fig. 5.12) has been
0.1 to 0.3 MCMPO
1.4 M TBP NPH
Feed Scrub
Scrub
Strip 1
Strip 1
Strip 2
Strip 2
HNO3 0.7–5 M
HNO3 0.7–5 M
H2C2O4 0–0.3 M
H2C2O4
0–0.3 M H2C2O4
0.04 M HNO3
0.05 M HNO3
0.25 M NO2CO3Solvent Wash
0.05 M HF
0.25–1.8 M HNO3
100% Actinides100% Lanthanides
Extraction
Aqueous Raffinate
~100%0–80%
F. PTc
100%
Am - Cm
100% Am1–2% Pu , Np
80–100% Lanthanides< 2% FP
10–100% TcNp- Pu product
98–99% Np,Pu
FIGURE 5.12 Truex process flow sheet for use with nitric acid wastes (NPH is a mixture of
aliphatic hydrocarbons).
229Chapter | 5 Examples of Application of Solvent Extraction Techniques
extensively and successfully tested.90 Laboratory batch tests with simulatedand actual waste solutions, as well as countercurrent pilot-scale flow sheet testswith simulated waste have been performed. The development of two TRUEXflow sheets has been demonstrated using actual tank waste in a centrifugalcontactor pilot plant.91
3.3.2. SREX Process: Extraction of 90Sr and 134,135,137Csfrom Acidic Wastes
To facilitate near-surface disposal of nuclear wastes, efficient removal of thet1/2� 30-year fission product 90Sr is needed. This has stimulated much researchin the area of solvent extraction. The remediation of radioactive wastes usuallyrequires the selective removal of Sr in the presence of numerous other ions. Thecomplexation of macrocyclic polyethers, also called crown ethers, for Sr inaqueous solutions has been studied extensively. The crown ether 4,4(5),di-(t-butyl cyclohexano)-18-crown-6 (DtBuCH18C6) was determined to bea highly selective and efficient extractant for Sr.92 TBP used as a phase modifierin a hydrocarbon diluent. The SREX process93 provides such removal fromhighly acidic solutions. Batch contacts with simulated waste solutions showthat the SREX process solvent is highly selective for strontium. From variouscontaminants, only barium and technetium coextract with strontium to anyextent. Irradiation tests confirm that the SREX process solvent is satisfactorilyresistant to radiolysis. Hydrolytic attack is also minimal. The SREX processhas been successfully tested in both batch contacts and continuous counter-current tests with simulated waste solutions. An overall 90Sr decontaminationfactor (SREX process feed to SREX process raffinate) of 4600 was achievedfrom Truex wastes. SREX flow sheet has been demonstrated using actual wastesolution in a centrifugal contactor pilot plant.93
3.3.3. Phosphine Oxide Process
Alkylated phosphine oxides are typically excellent extractants for TRUs in theþ3, þ4, or þ6 valence states from acidic waste solutions.94 Attachment ofdifferent alkyl or aryl substituents to the phosphonate group results in differentcompounds with variations in selectivity, extraction efficiency, solubility, andradiolytic and hydrolytic stability. A phosphine oxide solvent extractionprocess consists of an alkylated phosphine oxide in a hydrocarbon diluent.Laboratory batch contact, countercurrent pilot-scale testing with simulated andactual waste solutions has been performed. POR flow sheet has been demon-strated using actual waste solution in a centrifugal contactor pilot plant.89
3.3.4. Cobalt Dicarbollide Processes
Chlorinated cobalt dicarbollide (ChCoDiC) has been developed as an extractantfor Cs from acidic waste solutions. With the addition of polyethylene glycol
230 PART | I Conventional (Classical) Principles and Practice
(PEG) to the solvent, Sr can also be partitioned from acidic waste streams. Dueto the acid form of cobalt dicarbollide being completely dissociated in theorganic phase, a polar solvent such as nitrobenzene, has been used. TheChCoDiC process for the removal of 137Cs and 90Sr from acidic radioactivewaste was developed.95 Laboratory batch contact and countercurrent pilot-scaletesting with simulated and actual waste solutions has been performed. ChCo-DiC flow sheets (with and without PEG for the extraction of Sr) have beendemonstrated using actual waste solution in a centrifugal contactor pilotplant.96
3.3.5. Universal Solvent Extraction Process
A single solvent extraction process to remove all or most of radionuclides, wasdesired instead of combination of processes in separate unit operations. Thedevelopment of a universal solvent containing ChCoDiC with PEG to remove137Cs and 90Sr, and a carbamoylmethylphosphine oxide derivative (diphenylCMPO) to remove the TRUs, was initiated in 1996.89 Laboratory batch contactand countercurrent pilot-scale tests with simulated and actual waste solutionshave been performed. This testing has culminated in the development ofa universal solvent extraction flow sheet which has been demonstrated usingactual waste solution in a centrifugal contactor pilot plant.89
A review and comparison of the existing processes has been published.97–99
3.3.6. Bifunctional Organophosphorus Compounds for WasteTreatment
Strong efforts of researchers are devoted to development of novel universalextractants for the waste management. Several classes of reagents have been orare currently being investigated for their ability to extract actinides from bothHNO3 and HCl waste solutions. Bifunctional organophosphorus compoundsof the formula (R0Op)(ROm)PO–(CH2)n–PO(ROm)(R
0Op) are known to formcomplexes with metal ions.95 These compounds include diphosphonates (m¼ 1,p¼ 1), diphosphinates (mþ p¼ 1), or diphosphine oxides (m¼ p¼ 0). Higherdistribution ratios for þ3 actinides from strong HNO3 solutions are obtainedwhen n ¼ 1, which corresponds to the ideal size of a molecule for chelation ofmetal ions. Two carbamoyl-organophosphorus extractants have been intensivelytested for their usefulness in plant-scale removal of any and all actinides fromHNO3 waste solutions: dihexyl-N,N-diethylcarbamoylmethylphosphonate[(C6H13O)2POCH2CON(C2H5)2] and octyl(phenyl)-N,N-di-isobutyl-carba-moyl-methyl phosphine oxide [CMPO; C8H7(C6H5)POCH2CON(CH2–CH(CH3)2)2]. The latter extractant is used in the Truex process.
90,91 Of the manyradioactive and inert constituents in waste solutions, only 99Tc and lanthanidescoextract with actinides into the Truex process solvent.
The perceived advantages of bifunctional diamides as extractants for acti-nides in waste solutions include their ease of incinerability and the fact that
231Chapter | 5 Examples of Application of Solvent Extraction Techniques
radiolytic and hydrolytic degradation products are not deleterious to the process.These results were confirmed by extensive work in the last decade100,101 in anEU collaboration program to develop a process (DIAMEX) for the extraction ofactinides. Thirty new extractant molecules were synthesized and rated in orderof ability to extract trivalent actinides; with selectivities toward the fission andcorrosion products; third phase boundaries as a function of the aqueous nitricacid concentration; and the loading by lanthanides. Several tests using coun-tercurrent separation in mixer-settler or centrifugal extractors with simulatedand genuine high-level waste showed that the recovery of Am(III, IV, VI) isquantitative. The back extraction of Am(III) was complete.
These early flow sheets were not designed to strip U(VI) and Pu(IV). Thedistribution ratios of these ions at low acidities are lower than those measuredwith CMPO and one can guess that the stripping of Pu(IV) and U(VI) fromDiamex will not be a difficult task. In addition, the degradation products of thesolvent do not retain the actinides in the organic phase, as happens withthe organophosphorus extractants.
Inactive metals in the wastes, such as Fe(III), Mo(VI), and Zr(IV), areretained in the aqueous feed by addition of suitable quantities of oxalic acid Aswith CMPO, some Ru is extracted. Currently, the extraction of Pd, Tc, Np, andtheir poor stripping remain a problem for which process modifications arenecessary. The flow sheet in Fig. 5.13 has been tested in a battery of 16centrifugal extractors with a genuine raffinate from a small-scale Purex processat the European Institute for Transuranium Elements (ITU), Karlsruhe.
3.3.7. Monofunctional Organophosphorus Reagentsfor Waste Treatment
Various monofunctional organophosphorus reagents [e.g., TBP; DBBP (dibu-tylbutylphosphonate); DEHPA (di-(2-ethylhexyl)phosphoric acid)] wereconsidered for removal of alphaemitters from HNO3 waste solutions. Typicalflow sheets for the use of DEHPA, TBP and DBBP were tested. Many draw-backs were found:102–104 hydrolyzation of Zr(IV) and Pu(IV), difficulties instripping tetravalent and hexavalent actinides, etc.
3.4. Solvent Degradation and Regeneration
Routine regeneration of the TBP solvent is an important step in the Purexprocess. The TBP, as well as the diluents, are degraded by hydrolysis andradiolysis. Degradation of TBP results in products such as dibutylphosphoricacid (DBPA), monobutylphosphoric acid (H2MBP), and phosphoric acid.Depending upon the type of diluent, hydrolytic and radiolytic attack producesnitrato esters, nitro compounds, carboxylic acids, ketones, and others. Thedegradation products of TBP are stronger complexants for cations than TBPitself, and their complexes are not very soluble in the organic phase. Elimination
232 PART | I Conventional (Classical) Principles and Practice
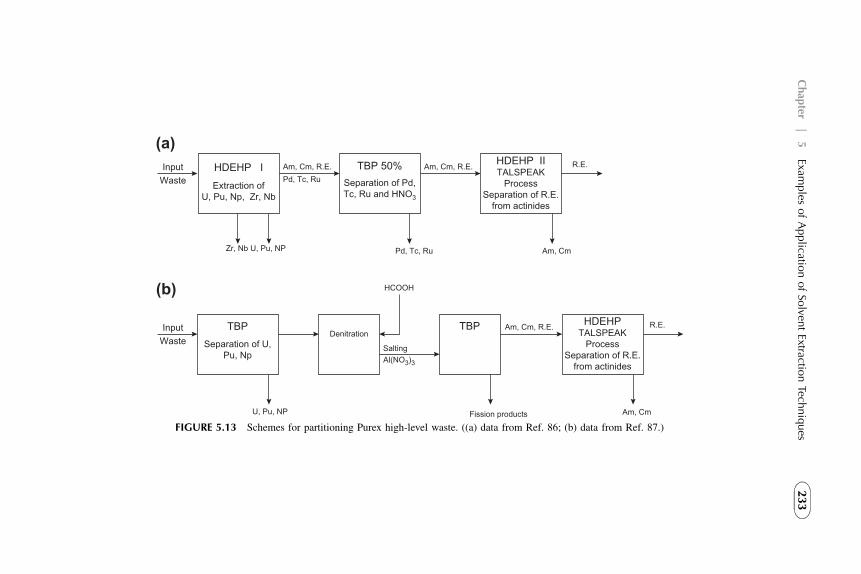
InputWaste
InputWaste
HDEHP I
TBP TBP
HDEHP IITALSPEAK
ProcessSeparation of R.E.
from actinides
TBP 50%
Extraction ofU, Pu, Np, Zr, Nb
Separation of U,Pu, Np
Denitration
Separation of Pd,Tc, Ru and HNO3
HDEHPTALSPEAK
ProcessSeparation of R.E.
from actinides
Am, Cm, R.E. Am, Cm, R.E.
Am, Cm, R.E.
Am, Cm
Am, Cm
Pd, Tc, Ru
HCOOH
Zr, Nb U, Pu, NP
U, Pu, NP Fission products
SaltingAl(NO3)3
R.E.
R.E.
Pd, Tc, Ru
(b)
(a)
FIGURE 5.13 Schemes for partitioning Purex high-level waste. ((a) data from Ref. 86; (b) data from Ref. 87.)
233
Chap
ter|
5Exam
ples
ofApplicatio
nofSo
lventExtractio
nTech
niques
of the degradation products, particularly the organophosphorus species, prior tosolvent reuse is an important factor in the success of the Purex separations.105
Degraded TBP solvent is typically cleaned by washing with sodiumcarbonate or sodium hydroxide solutions, or both. Such washes eliminateretained uranium and plutonium as well as HDBP and H2MBP. Part of the low-molecular-weight neutral molecules such as butanol and nitrobutane, entrainedin the aqueous phase, and 90–95% of the fission products ruthenium andzirconium are also removed by the alkaline washes.
Alkaline washing is not sufficient to completely restore the interfacialproperties of the TBP solvent, because some surfactants still remain in theorganic phase. Various additional (secondary solvent cleaning) procedures havebeen proposed, including vacuum distillation,106 treatment with macroreticularanion-exchange resins,107 and treatment with activated alumina.108 Thesesecondary cleanup operations increase solvent quality, and continue to bestudied to better evaluate their process and economic advantages. In the FrenchUP3 Purex plant, vacuum distillation is used to regulate TBP concentration andsolvent quality with beneficial effects. The latter include retention of metalsand use of less concentrated Na2CO3 in the solvent wash, which helps to limitthe amount of sodium salts that must be vitrified.
3.5. New Developments
3.5.1. Partitioning of Wastes
The fission products contain nearly 50 elements located in the middle part ofthe periodic system. Some of the fission products are produced in considerableamounts, though their radioactivity is rather low,109 and they were thereforethought to have a potential value on the mineral market. Some other fissionproducts were considered as suitable for radiation sources (heat sources,radiography, etc.). Thus, processes were designed to isolate these from the restof the fission products. Today, there is little interest in such applications, butthere is renewed interest in separating some key nuclides (e.g., 90Sr, 99Tc, 129I,134,135,137Cs), which have important medical applications. However, the primeinterest comes from the desire to generate wastes that could be more easily andsafely stored in deep geological repositories. In the most favorable situation,they could be safely stored in relatively inexpensive near-surface engineeredfacilities. The separation of the remaining actinides (traces of Pu, Np, Am, Cm,etc.) and of the most hazardous long-lived fission products is referred to aspartitioning. The partitioned radionuclides would either be transmuted (e.g.,actinides, 99Tc, 129I) in nuclear reactors or accelerators to form stable or short-lived nuclides, or stored (90Sr and 137Cs) in hardened engineered near-surfacefacilities for 300–500 years to allow them to decay to negligible levels.
Solvent extraction is thought to be a key technique for partitioning and suchpartitioning could improve the economics of final waste handling. The currentconventional approach (see Fig. 5.14a) to partition radionuclides from Purex
234 PART | I Conventional (Classical) Principles and Practice
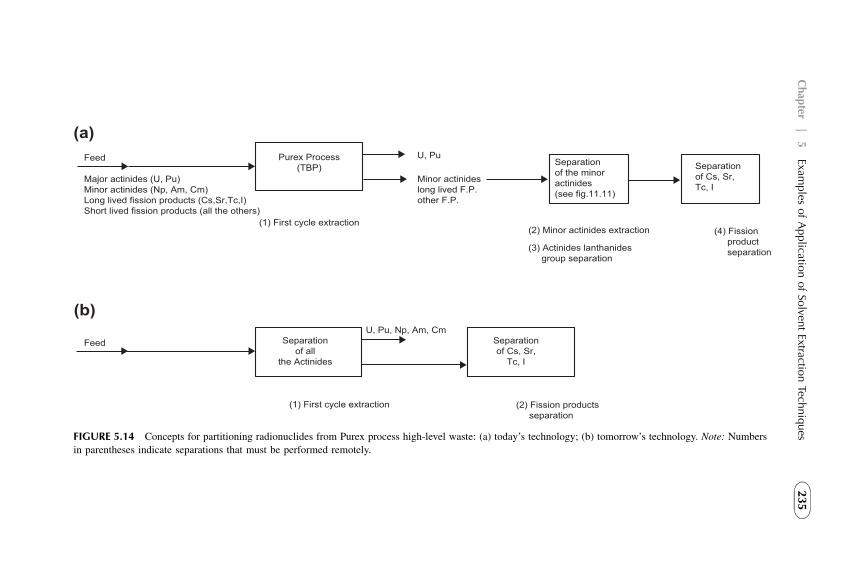
Feed
Feed
Purex Process(TBP)
U, Pu
U, Pu, Np, Am, Cm
Separationof the minoractinides(see fig.11.11)
Minor actinideslong lived F.P.other F.P.
Separationof Cs, Sr,Tc, I
Major actinides (U, Pu)Minor actinides (Np, Am, Cm)Long lived fission products (Cs,Sr,Tc,I)Short lived fission products (all the others)
(1) First cycle extraction
(1) First cycle extraction
(2) Minor actinides extraction
(3) Actinides lanthanides group separation
(4) Fission product separation
(2) Fission products separation
Separationof all
the Actinides
Separationof Cs, Sr,
Tc, I
(a)
(b)
FIGURE 5.14 Concepts for partitioning radionuclides from Purex process high-level waste: (a) today’s technology; (b) tomorrow’s technology. Note: Numbers
in parentheses indicate separations that must be performed remotely.
235
Chap
ter|
5Exam
ples
ofApplicatio
nofSo
lventExtractio
nTech
niques
process acidic high-level waste involves a sequential series of separationprocesses to remove selected nuclides or groups of radionuclides. An exampleof this approach is the United States “clean use of reactor energy” (CURE)concept110 that utilizes the Truex process to remove actinides, 99Tc, andlanthanides; the Srex process to remove 90Sr from the raffinate from the Truexprocess; and precipitation of cesium phosphotungstate from the Srex processraffinate by addition of phosphotungstic acid. Results of batch contacts to testthe Truex and Srex process portions of the Cure concept were discussedpreviously. The cesium phosphotungstate precipitation process has been usedextensively on a plant scale at the U.S. Hanford site.
The Cure concept and the Japanese OMEGA concept111 are quite similar,although they will likely employ different reagents. For example, for removalof actinides from Purex process high-level waste, Japanese scientists areinvestigating the properties of di-isodecylphosphoric acid. The JapaneseOmega concept also involves removal of valuable rhodium and palladium fromthe high-level waste.
The Cure and Omega concepts developed in the last decade but they havea number of potential disadvantages including the need to handle the highlyradioactive waste in three or more extraction cycles. Computer simulationsimprove the processes applications.112
Improved partitioning processes that will accomplish the separations infewer steps are highly desirable (as an example, see Fig. 5.14b). For example,a solvent extraction process that provides for quantitative recovery of both 90Srand 137Cs in a single extraction cycle is very much needed. In addition,a desirable goal is to find an extractant that will extract (III), (IV), and (VI)actinides, and reject the lanthanides to the aqueous raffinate. One such programis the SPIN (solvent partition–incineration) program113 for separation of thetrivalent actinides from the trivalent lanthanides. This separation is necessarybecause nuclear incineration of the actinides requires that the neutron-consuming lanthanides be removed.
Recent investigations114 indicate that certain soft donor ligands containingnitrogen and sulfur atoms extract trivalent actinides better than trivalentlanthanides from nitric acid solutions. However, the particular extractantsstudied then were not considered suitable for plant-scale use because of poorchemical stability. However, these results encourage further investigations ofsoft donor ligands for use in preferential extraction of (III) actinides, as well as(IV) and (VI) actinides, from HNO3 solutions. The search for good extractantsremains a challenge for the future.
3.5.2. Trivalent Actinide–Lanthanide Group Separations
Considerable interest of researchers has been attracted methods for theimprovement separation of the minor actinides and some of the fission productsfrom HLW. The goal was to optimize the formula of the soft donors (N and S)
236 PART | I Conventional (Classical) Principles and Practice
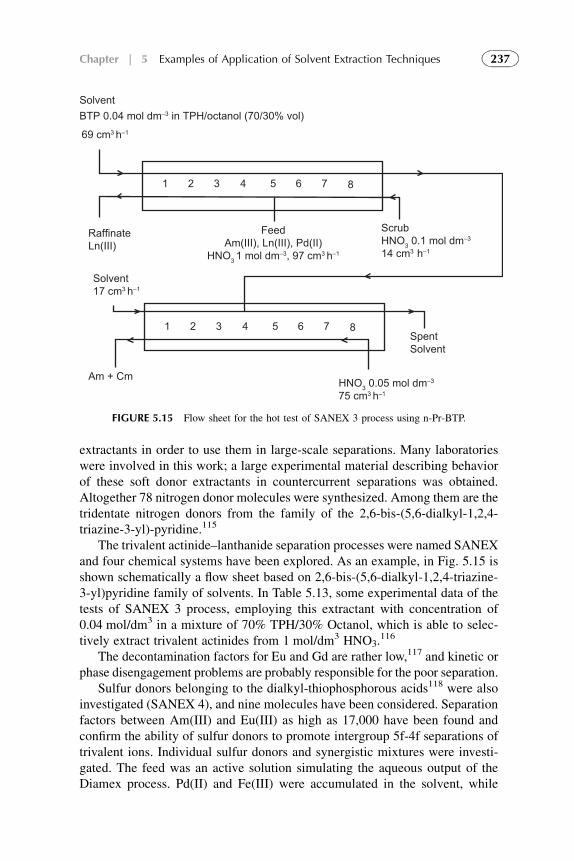
extractants in order to use them in large-scale separations. Many laboratorieswere involved in this work; a large experimental material describing behaviorof these soft donor extractants in countercurrent separations was obtained.Altogether 78 nitrogen donor molecules were synthesized. Among them are thetridentate nitrogen donors from the family of the 2,6-bis-(5,6-dialkyl-1,2,4-triazine-3-yl)-pyridine.115
The trivalent actinide–lanthanide separation processes were named SANEXand four chemical systems have been explored. As an example, in Fig. 5.15 isshown schematically a flow sheet based on 2,6-bis-(5,6-dialkyl-1,2,4-triazine-3-yl)pyridine family of solvents. In Table 5.13, some experimental data of thetests of SANEX 3 process, employing this extractant with concentration of0.04 mol/dm3 in a mixture of 70% TPH/30% Octanol, which is able to selec-tively extract trivalent actinides from 1 mol/dm3 HNO3.
116
The decontamination factors for Eu and Gd are rather low,117 and kinetic orphase disengagement problems are probably responsible for the poor separation.
Sulfur donors belonging to the dialkyl-thiophosphorous acids118 were alsoinvestigated (SANEX 4), and nine molecules have been considered. Separationfactors between Am(III) and Eu(III) as high as 17,000 have been found andconfirm the ability of sulfur donors to promote intergroup 5f-4f separations oftrivalent ions. Individual sulfur donors and synergistic mixtures were investi-gated. The feed was an active solution simulating the aqueous output of theDiamex process. Pd(II) and Fe(III) were accumulated in the solvent, while
SolventBTP 0.04 mol dm–3 in TPH/octanol (70/30% vol)
69 cm3 h–1
1 2 3 4 5 6 7 8
1 2 3 4 5 6 7 8
RaffinateLn(III)
Solvent17 cm3 h–1
SpentSolvent
ScrubHNO3 0.1 mol dm–3
14 cm3 h–1
HNO3 0.05 mol dm–3
75 cm3 h–1
Am + Cm
FeedAm(III), Ln(III), Pd(II)
HNO3 1 mol dm–3, 97 cm3 h–1
FIGURE 5.15 Flow sheet for the hot test of SANEX 3 process using n-Pr-BTP.
237Chapter | 5 Examples of Application of Solvent Extraction Techniques
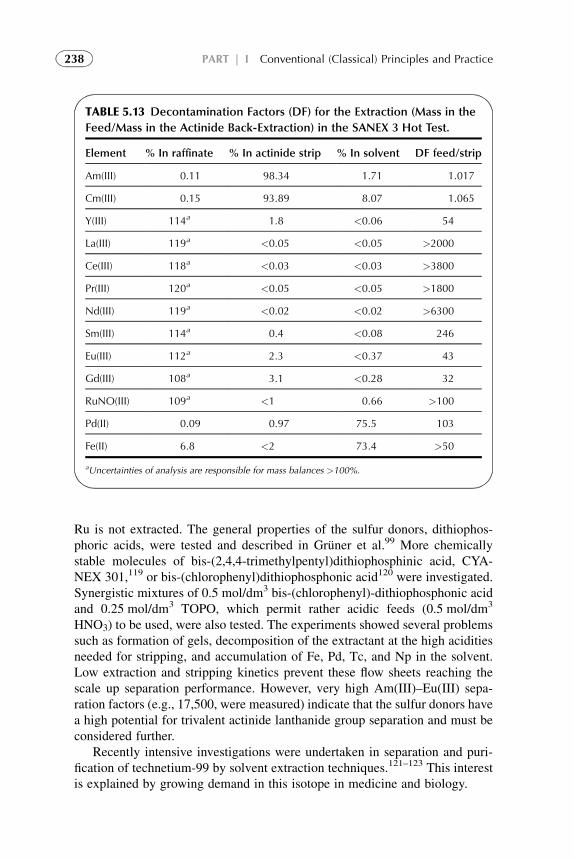
Ru is not extracted. The general properties of the sulfur donors, dithiophos-phoric acids, were tested and described in Gruner et al.99 More chemicallystable molecules of bis-(2,4,4-trimethylpentyl)dithiophosphinic acid, CYA-NEX 301,119 or bis-(chlorophenyl)dithiophosphonic acid120 were investigated.Synergistic mixtures of 0.5 mol/dm3 bis-(chlorophenyl)-dithiophosphonic acidand 0.25 mol/dm3 TOPO, which permit rather acidic feeds (0.5 mol/dm3
HNO3) to be used, were also tested. The experiments showed several problemssuch as formation of gels, decomposition of the extractant at the high aciditiesneeded for stripping, and accumulation of Fe, Pd, Tc, and Np in the solvent.Low extraction and stripping kinetics prevent these flow sheets reaching thescale up separation performance. However, very high Am(III)–Eu(III) sepa-ration factors (e.g., 17,500, were measured) indicate that the sulfur donors havea high potential for trivalent actinide lanthanide group separation and must beconsidered further.
Recently intensive investigations were undertaken in separation and puri-fication of technetium-99 by solvent extraction techniques.121–123 This interestis explained by growing demand in this isotope in medicine and biology.
TABLE 5.13 Decontamination Factors (DF) for the Extraction (Mass in the
Feed/Mass in the Actinide Back-Extraction) in the SANEX 3 Hot Test.
Element % In raffinate % In actinide strip % In solvent DF feed/strip
Am(III) 0.11 98.34 1.71 1.017
Cm(III) 0.15 93.89 8.07 1.065
Y(III) 114a 1.8 <0.06 54
La(III) 119a <0.05 <0.05 >2000
Ce(III) 118a <0.03 <0.03 >3800
Pr(III) 120a <0.05 <0.05 >1800
Nd(III) 119a <0.02 <0.02 >6300
Sm(III) 114a 0.4 <0.08 246
Eu(III) 112a 2.3 <0.37 43
Gd(III) 108a 3.1 <0.28 32
RuNO(III) 109a <1 0.66 >100
Pd(II) 0.09 0.97 75.5 103
Fe(II) 6.8 <2 73.4 >50
aUncertainties of analysis are responsible for mass balances >100%.
238 PART | I Conventional (Classical) Principles and Practice
4. SOLVENT EXTRACTION IN ANALYTICAL CHEMISTRY
In early analytical applications, optimal solvent extraction conditions wereobtained empirically. Then, general chemical and mathematical descriptions ofthe processes were developed by many researchers in many countries and havebeen reported in a large number of publications, among them several mono-graphs and reviews.124–129
Solvent extraction techniques are applicable in great range of concentrations(from weightless trace levels of radioisotopes to macro levels of metal ions) forwhich quantitative separations, therefore, is useful in analytical process that ismore concerned with measurements and preparative chemistry as a separation,concentration, and purification steps in many fields such as hydrometallurgy,radiochemistry, biochemistry, medicine, ecology, engineering, etc. Amongthese, automatic methods of analysis have gained a notable momentum and havemotivated the development of a large number of commercial instruments.
Solvent extraction has also played a major role in sample pre- or post-treatment to improve selectivity and sensitivity. Initially simple schemes ofliquid–liquid extraction were used as separation methods for the cleanup andpreconcentration of samples, mainly because of its simplicity, reproducibility,and versatility. Later, the distribution between two liquid phases was used as anefficient tool in chromatographic separation processes. More recently, the sameprinciples have been implemented using supercritical fluids in preconcentra-tion, cleanup, and column separation schemes. In the last decades, the princi-ples and the properties of solvent extraction reagents were used to developextraction chromatography techniques, to design different types of membraneelectrodes, and to prepare and develop impregnated materials, where theextractant is placed in a solid matrix.
In this subsection the application of solvent extraction techniques inanalytical chemistry is shortly presented. Analytical techniques in radio-chemistry are presented in Section 3.5. Liquid membrane and liquid membraneelectrode analytical techniques are excluded from this chapter because it ispresented in more detailed and organized order in Ref. 130.
4.1. Solvent Extraction in Samples Preparation andPretreatment Techniques
In sample preparation or sample pretreatment steps, there are a number ofimportant operations that may include dissolution of the sample, transformationof the elements into specific inorganic forms, conversion of the analytes intoalternative chemical species, separation of the analyte from other chemicalspecies present, and preconcentration. These first stages of the analytical processdecisively influence the precision, sensitivity, selectivity, rapidity, and cost.
Liquid–liquid extraction is by far the most popular separation method forthe cleanup and preconcentration of samples because it is simple, reproducible,
239Chapter | 5 Examples of Application of Solvent Extraction Techniques
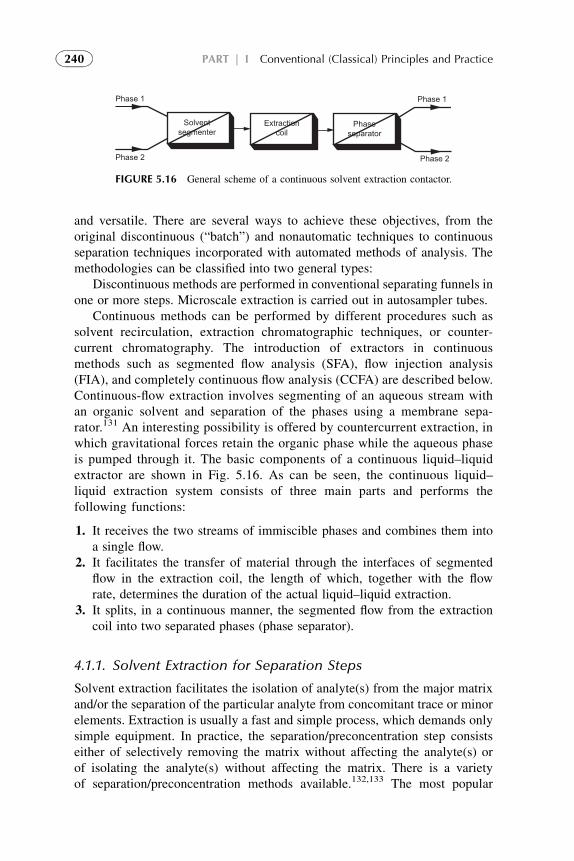
and versatile. There are several ways to achieve these objectives, from theoriginal discontinuous (“batch”) and nonautomatic techniques to continuousseparation techniques incorporated with automated methods of analysis. Themethodologies can be classified into two general types:
Discontinuous methods are performed in conventional separating funnels inone or more steps. Microscale extraction is carried out in autosampler tubes.
Continuous methods can be performed by different procedures such assolvent recirculation, extraction chromatographic techniques, or counter-current chromatography. The introduction of extractors in continuousmethods such as segmented flow analysis (SFA), flow injection analysis(FIA), and completely continuous flow analysis (CCFA) are described below.Continuous-flow extraction involves segmenting of an aqueous stream withan organic solvent and separation of the phases using a membrane sepa-rator.131 An interesting possibility is offered by countercurrent extraction, inwhich gravitational forces retain the organic phase while the aqueous phaseis pumped through it. The basic components of a continuous liquid–liquidextractor are shown in Fig. 5.16. As can be seen, the continuous liquid–liquid extraction system consists of three main parts and performs thefollowing functions:
1. It receives the two streams of immiscible phases and combines them intoa single flow.
2. It facilitates the transfer of material through the interfaces of segmentedflow in the extraction coil, the length of which, together with the flowrate, determines the duration of the actual liquid–liquid extraction.
3. It splits, in a continuous manner, the segmented flow from the extractioncoil into two separated phases (phase separator).
4.1.1. Solvent Extraction for Separation Steps
Solvent extraction facilitates the isolation of analyte(s) from the major matrixand/or the separation of the particular analyte from concomitant trace or minorelements. Extraction is usually a fast and simple process, which demands onlysimple equipment. In practice, the separation/preconcentration step consistseither of selectively removing the matrix without affecting the analyte(s) orof isolating the analyte(s) without affecting the matrix. There is a varietyof separation/preconcentration methods available.132,133 The most popular
Phase 1
Phase 2
Solventsegmenter
Phaseseparator
Phase 1
Phase 2
Extractioncoil
FIGURE 5.16 General scheme of a continuous solvent extraction contactor.
240 PART | I Conventional (Classical) Principles and Practice
method includes solvent extraction, precipitation, sorption and chromato-graphic techniques, volatilization, and electrodeposition. The choice is dictatedby the sample to be analyzed, the analytes, concentration levels to be deter-mined, and the characteristics of the determination technique. In any case, theincorporation of a separation/preconcentration step increases the analysis time,may result in losses of the analyte(s), and at the same time raises demands bothon the purity of reagents used and on the analytical expertize required.
The selectivity of the extraction is expressed by the separation factor S134
that is derived from the individual distribution coefficients (D1, D2) for twospecies (5.5, 5.6):
S1=2 ¼ D1
D2(5.5)
This coefficient gives quantitative information for the separation of bothspecies. Working with mixtures of extractants, additional experimental infor-mation is needed and the synergistic coefficient (SC) defined by Tagushi andGoto:135
SC ¼ log D1;2
D1 þ D2(5.6)
where D1,2 denotes the distribution coefficient of the species for the mixture ofextractants. In analytical chemistry, for an extraction system based on a pH-dependent extraction reaction, as in the case of acidic extractants, the value ofSC has been estimated by the following equation:
SC ¼ nDpH50 (5.7)
where n is the charge of the metal ion and DpH50 is the difference of pHcorresponding to 50% extraction when the total concentration of the extractionsystem is the same for the single system and for the mixtures.
4.1.2. Preconcentration for Trace Element Determination
Preconcentration is an operation in which the relative ratio of trace componentsvs. the macro component is increased; it is aimed, typically; for overcominglimited detection characteristics of the instrumental technique. The efficiencyof this operation, the preconcentration factor (PF), is defined in terms ofrecovery as:
PF ¼ ½CT�½C0
T�(5.8)
where [CT] and [CT0] are the concentrations of the microcomponent in the
concentrate and in the sample respectively. The need for preconcentration oftrace compounds results from the fact that instrumental analytical methodsoften do not have the required selectivity and/or sensitivity. Thus, the
241Chapter | 5 Examples of Application of Solvent Extraction Techniques
combination of instrumental techniques with concentration techniques signif-icantly extends the range of application of the instrument. The chemicaltechniques used in preconcentration can provide, in many cases, analyteisolation, as well as high enrichment factors. The concept of sample pre-concentration prior to determination could apply to many situations other thanjust concentration enrichment and minimization of matrix effects.
Selection of a preconcentration scheme based on any liquid–liquidextraction step will depend upon on the type of analyte and/or sample matrix.Concentration factors reasonably achieved by solvent extraction have practicallimits. However, considering a reasonable practical limit of extractinga 100 cm3 sample with 1–2 cm3 of organic phase, a concentration factor of100–50 can be achieved. One of the limitations of the preconcentration factor inbatch solvent extraction is the difficulty of obtaining good separation of thesmall volume of organic phase. Significant portions of the organic solvent mayadhere to the walls of the vessel, requiring repeated washings, which decreasesthe concentration factor. Thus, to conduct successful analyses for many organicand inorganic compounds at trace concentrations, it is necessary to extractthese compounds and use a concentration step prior to analysis. Many of thetechniques developed for preconcentration are described in specializedbooks.124–128 Proper choice of the extracting solvent can often be the criticalstep in the procedure.
Preconcentration of Inorganic Compounds
There has been a growing demand for highly sensitive analytical methods oftrace components in complicated matrices. Recent advances of new ligands,chelating reagents, and instrumentation have improved detection and speci-ficity. However, it is often necessary to concentrate the trace component withhigh selectivity. Chelating agents are typically widely used.
Considerable number of methods are not sufficiently specific and so priorseparation was required. For example, interference in atomic absorptiondeterminations is common, and so separations of interfering species arefrequently required.136 Group preconcentration of trace elements has theobjective of isolating the maximum number of elements in a single step usingthe minimum number of reagents, with the excess reagents being retained in theaqueous phase. Using appropriate masking agents, suitable choice of pH, thereagents may become highly selective and specific for a particular species. Insome cases, exchange techniques in which a less stable metal chelate is thesource of the chelating agent may be very useful. Extraction reagents availablefor this purpose fall into several basic categories: chelating, ion exchangers,solvating, etc. They are described in detail in the previous chapters.
A series of preconcentration techniques based on the use of a solid phasecarrying a liquid metal extractant has been developed.137–139 These solid phasessubstitute the solvent (liquid phase) carried of the liquid–liquid extractant witha solid phase. Such impregnated materials have been prepared using different
242 PART | I Conventional (Classical) Principles and Practice
types of solid supports: paper, resin beds, gels, polyurethane foams, flat andhollow fiber membranes, clays, silica, etc. The major advantage of most ofthese solid adsorbents is that the functional group is immobilized on a solidsubstrate, therefore providing the possibility of either batch extraction of theanalytes from solution or using the solid phase in a column.
Preconcentration and Separation of Organic Compounds
A scheme for analysis of organic compounds generally consists of sampling,extraction, prefractionation, and analysis, usually by gas chromatography (GC)or gas chromatography/mass chromatography (GC-MS). Determination oforganics at parts per trillion (ppt) levels can be performed by combiningsensitive and selective detection with sample preconcentration.140
Increasing the degree of preconcentration can make the limits of detectionextremely small. Many standard methods of analysis141–143 often includepreconcentration as an integral part of the sampling and extraction procedure. Itis especially important for environmental samples where many toxic andcarcinogenic compounds are distributed from a wide variety of sources.Because of their serious damaging effects at low levels, to assess their envi-ronmental impact it is necessary to achieve the greatest possible analyticalsensitivities. In some cases, detection limits as low as a few ppt are required. Inaddition to the polynuclear aromatic hydrocarbons (PAHs), much attention hasbeen focused on many halogenated pollutants such as pesticides, poly-chlorinated biphenyls (PCBs), trihalomethanes (THMs), polychlorinateddibenzofurans (PCDFs), and dibenzo-p-dioxines.144–149 Such substances canbe found in air, water, and solid and biological samples. Most preconcentrationtechniques fall into two classes: solvent extraction followed by solventreduction or sorbent trapping with subsequent solvent elution or thermaldesorption. There are many variations of these methods, and they are frequentlyused in combination.
Solvent extraction reduction is most frequently performed mainly inconnection with the extraction of solid and biological samples by liquidpartition. Extractions are typically accomplished using a Soxhlet apparatus150
that provides the benefits of multiple extractions. By repeated distillation andcondensation of the solvent, the apparatus allows multiple extractions using thesame (small) volume of solvent.
Preconcentration will only give precise results for quantitative work if theinitial extraction technique gives high, or at least known and reproducible,recoveries of the desired compounds from the initial sample. Typically,several cycles are needed, and the solvent containing the extractedcompounds must be concentrated to a small volume. This is normally carriedout by evaporation under reduced pressure. Volatile compounds may be lost inthis procedure. Even the very small volume losses on the glass walls of theflask or pipettes may result in significant and nonreproducible componentloss.
243Chapter | 5 Examples of Application of Solvent Extraction Techniques
Accelerated solvent extraction (ASE)151,152 is a relatively new extractiontechnique using equipment that holds the sample in a sealed high-pressureenvironment to allow conventional solvents to be used at higher temperatures.Using a higher temperature without boiling, ASE allows smaller volumes ofsolvent to be used in a single-stage extraction. Extraction kinetics are alsofaster, so the entire process is much faster than Soxhlet extraction. Afterheating, the cell is allowed to cool below the normal boiling point of the solventand pressure is applied to the cell to force the solvent and extracted materialsthrough a filter.
4.2. Extraction in Analytical Determination Techniques
Extraction may provide an appropriate measured signal for analysis. Examplesof this use of solvent extraction are found in spectroscopy, isotope dilutionradiometry, and ion-selective electrodes using liquid membranes. In the lattercase, electrochemical determinations are possible by controlling the localconcentration of specific ions in a solution by extraction.
4.2.1. Methods Based on Spectrophotometric Detection
Only a few element species (e.g., MnO42�, CrO4
2�) are capable of absorbing lightin the UV-VIS range. Usually, all spectrophotometric methods are based onreactions of analytes with color-forming reagents. The role of the most importantorganic reagents has been discussed in many publications.150,153,154 Thousandarticles have been published on analytical procedures for chemical elements inwhich solvent extraction is involved. The scope of this subsection limits us to fewexamples for each element which are presented in Table 5.14. Chelating reagentsare the most popular. Although most of these reactions were initially developedfor aqueous phase measurement, in many cases taking into account the lowaqueous solubility of the analyte-chromogenic reagents, extraction into an organicphase was used for direct spectroscopic measurements. Among the most impor-tant reagents used are the following:155 Dithizone (diphenylthiocarbazone) isa weak acid insoluble in water at pH< 7 but readily soluble in CCl4 and CHCl3. Itreacts with many metal ions to form chelates that can be extracted into the organicphase from which the excess of the green reagent156 is stripped with dilute NH3.The most stable dithizonates (Pt, Pd, Au, Ag, Hg, and Cu) are extracted fromstrongly acid solutions. Other metals (Bi, Ga, In, Zn) are extracted from weaklyacid media and some (Co, Ni, Pb, Tl, Cd) from neutral or alkaline media. Somecompounds are extracted rapidly (Ag, Hg, Pb, Cd) and others more slowly (Pd,Cu, Zn), while a few (Rh, Ir, and Ru) require prolonged heating to be formed.
Azo dyes contain an azo link between two aromatic rings possessing anorthohydroxy group. The most important reagents include PAN, PAR, andArsenazo III and generally they offer high sensitivity for the majority oftransition metals.
244 PART | I Conventional (Classical) Principles and Practice
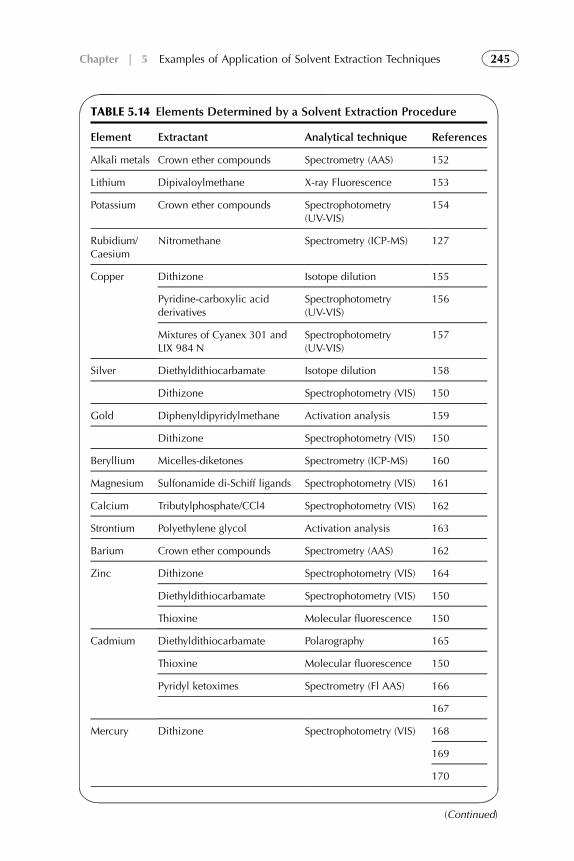
TABLE 5.14 Elements Determined by a Solvent Extraction Procedure
Element Extractant Analytical technique References
Alkali metals Crown ether compounds Spectrometry (AAS) 152
Lithium Dipivaloylmethane X-ray Fluorescence 153
Potassium Crown ether compounds Spectrophotometry(UV-VIS)
154
Rubidium/Caesium
Nitromethane Spectrometry (ICP-MS) 127
Copper Dithizone Isotope dilution 155
Pyridine-carboxylic acidderivatives
Spectrophotometry(UV-VIS)
156
Mixtures of Cyanex 301 andLIX 984 N
Spectrophotometry(UV-VIS)
157
Silver Diethyldithiocarbamate Isotope dilution 158
Dithizone Spectrophotometry (VIS) 150
Gold Diphenyldipyridylmethane Activation analysis 159
Dithizone Spectrophotometry (VIS) 150
Beryllium Micelles-diketones Spectrometry (ICP-MS) 160
Magnesium Sulfonamide di-Schiff ligands Spectrophotometry (VIS) 161
Calcium Tributylphosphate/CCl4 Spectrophotometry (VIS) 162
Strontium Polyethylene glycol Activation analysis 163
Barium Crown ether compounds Spectrometry (AAS) 162
Zinc Dithizone Spectrophotometry (VIS) 164
Diethyldithiocarbamate Spectrophotometry (VIS) 150
Thioxine Molecular fluorescence 150
Cadmium Diethyldithiocarbamate Polarography 165
Thioxine Molecular fluorescence 150
Pyridyl ketoximes Spectrometry (Fl AAS) 166
167
Mercury Dithizone Spectrophotometry (VIS) 168
169
170
(Continued)
245Chapter | 5 Examples of Application of Solvent Extraction Techniques
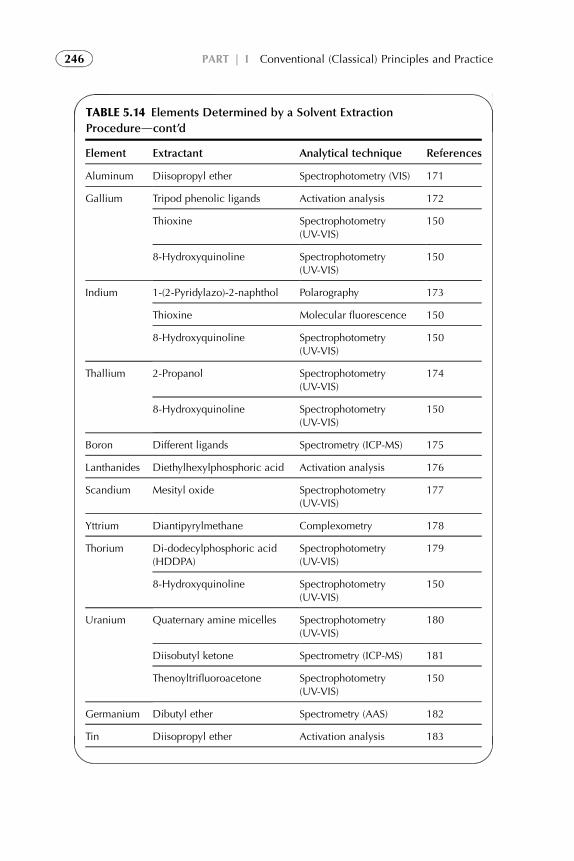
TABLE 5.14 Elements Determined by a Solvent Extraction
Proceduredcont’d
Element Extractant Analytical technique References
Aluminum Diisopropyl ether Spectrophotometry (VIS) 171
Gallium Tripod phenolic ligands Activation analysis 172
Thioxine Spectrophotometry(UV-VIS)
150
8-Hydroxyquinoline Spectrophotometry(UV-VIS)
150
Indium 1-(2-Pyridylazo)-2-naphthol Polarography 173
Thioxine Molecular fluorescence 150
8-Hydroxyquinoline Spectrophotometry(UV-VIS)
150
Thallium 2-Propanol Spectrophotometry(UV-VIS)
174
8-Hydroxyquinoline Spectrophotometry(UV-VIS)
150
Boron Different ligands Spectrometry (ICP-MS) 175
Lanthanides Diethylhexylphosphoric acid Activation analysis 176
Scandium Mesityl oxide Spectrophotometry(UV-VIS)
177
Yttrium Diantipyrylmethane Complexometry 178
Thorium Di-dodecylphosphoric acid(HDDPA)
Spectrophotometry(UV-VIS)
179
8-Hydroxyquinoline Spectrophotometry(UV-VIS)
150
Uranium Quaternary amine micelles Spectrophotometry(UV-VIS)
180
Diisobutyl ketone Spectrometry (ICP-MS) 181
Thenoyltrifluoroacetone Spectrophotometry(UV-VIS)
150
Germanium Dibutyl ether Spectrometry (AAS) 182
Tin Diisopropyl ether Activation analysis 183
246 PART | I Conventional (Classical) Principles and Practice
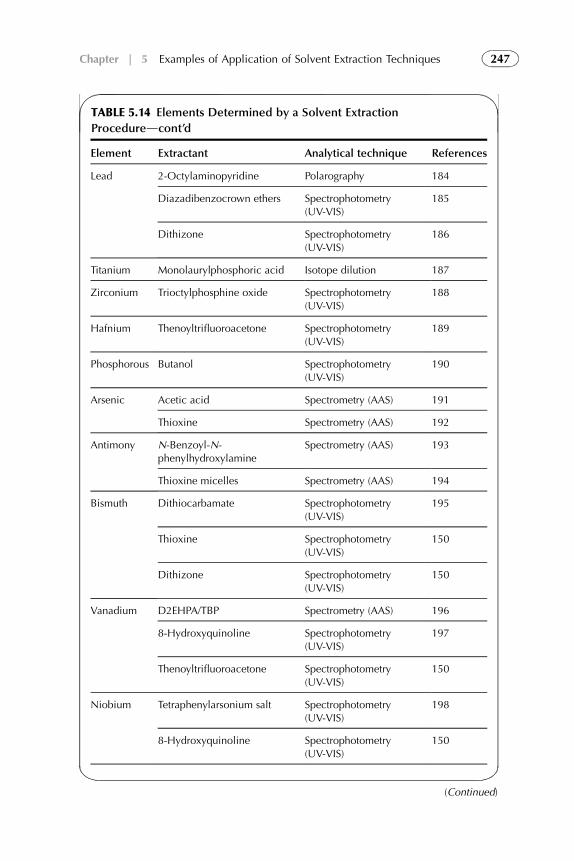
TABLE 5.14 Elements Determined by a Solvent Extraction
Proceduredcont’d
Element Extractant Analytical technique References
Lead 2-Octylaminopyridine Polarography 184
Diazadibenzocrown ethers Spectrophotometry(UV-VIS)
185
Dithizone Spectrophotometry(UV-VIS)
186
Titanium Monolaurylphosphoric acid Isotope dilution 187
Zirconium Trioctylphosphine oxide Spectrophotometry(UV-VIS)
188
Hafnium Thenoyltrifluoroacetone Spectrophotometry(UV-VIS)
189
Phosphorous Butanol Spectrophotometry(UV-VIS)
190
Arsenic Acetic acid Spectrometry (AAS) 191
Thioxine Spectrometry (AAS) 192
Antimony N-Benzoyl-N-phenylhydroxylamine
Spectrometry (AAS) 193
Thioxine micelles Spectrometry (AAS) 194
Bismuth Dithiocarbamate Spectrophotometry(UV-VIS)
195
Thioxine Spectrophotometry(UV-VIS)
150
Dithizone Spectrophotometry(UV-VIS)
150
Vanadium D2EHPA/TBP Spectrometry (AAS) 196
8-Hydroxyquinoline Spectrophotometry(UV-VIS)
197
Thenoyltrifluoroacetone Spectrophotometry(UV-VIS)
150
Niobium Tetraphenylarsonium salt Spectrophotometry(UV-VIS)
198
8-Hydroxyquinoline Spectrophotometry(UV-VIS)
150
(Continued)
247Chapter | 5 Examples of Application of Solvent Extraction Techniques
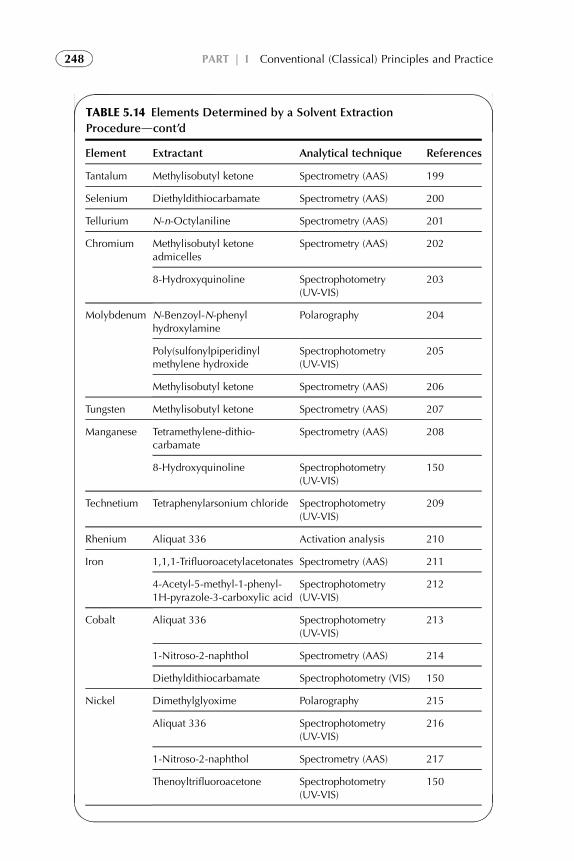
TABLE 5.14 Elements Determined by a Solvent Extraction
Proceduredcont’d
Element Extractant Analytical technique References
Tantalum Methylisobutyl ketone Spectrometry (AAS) 199
Selenium Diethyldithiocarbamate Spectrometry (AAS) 200
Tellurium N-n-Octylaniline Spectrometry (AAS) 201
Chromium Methylisobutyl ketoneadmicelles
Spectrometry (AAS) 202
8-Hydroxyquinoline Spectrophotometry(UV-VIS)
203
Molybdenum N-Benzoyl-N-phenylhydroxylamine
Polarography 204
Poly(sulfonylpiperidinylmethylene hydroxide
Spectrophotometry(UV-VIS)
205
Methylisobutyl ketone Spectrometry (AAS) 206
Tungsten Methylisobutyl ketone Spectrometry (AAS) 207
Manganese Tetramethylene-dithio-carbamate
Spectrometry (AAS) 208
8-Hydroxyquinoline Spectrophotometry(UV-VIS)
150
Technetium Tetraphenylarsonium chloride Spectrophotometry(UV-VIS)
209
Rhenium Aliquat 336 Activation analysis 210
Iron 1,1,1-Trifluoroacetylacetonates Spectrometry (AAS) 211
4-Acetyl-5-methyl-1-phenyl-1H-pyrazole-3-carboxylic acid
Spectrophotometry(UV-VIS)
212
Cobalt Aliquat 336 Spectrophotometry(UV-VIS)
213
1-Nitroso-2-naphthol Spectrometry (AAS) 214
Diethyldithiocarbamate Spectrophotometry (VIS) 150
Nickel Dimethylglyoxime Polarography 215
Aliquat 336 Spectrophotometry(UV-VIS)
216
1-Nitroso-2-naphthol Spectrometry (AAS) 217
Thenoyltrifluoroacetone Spectrophotometry(UV-VIS)
150
248 PART | I Conventional (Classical) Principles and Practice
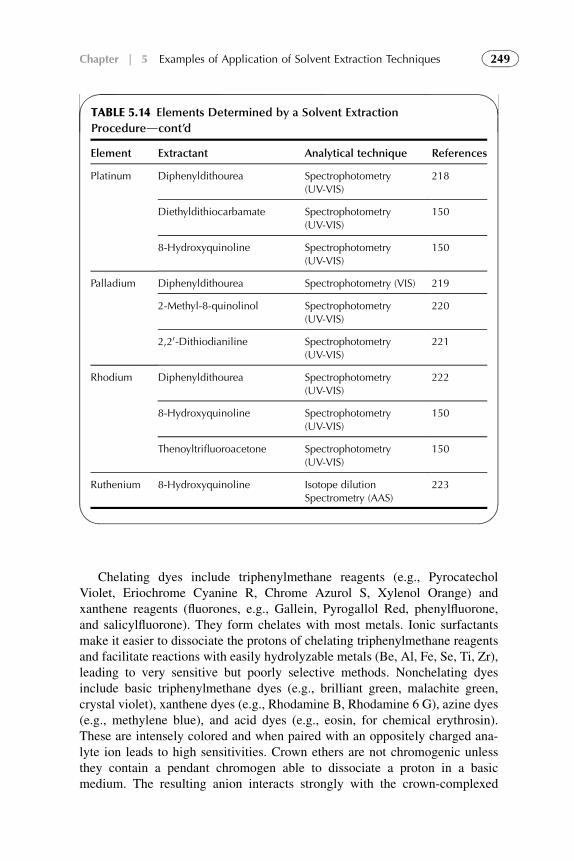
Chelating dyes include triphenylmethane reagents (e.g., PyrocatecholViolet, Eriochrome Cyanine R, Chrome Azurol S, Xylenol Orange) andxanthene reagents (fluorones, e.g., Gallein, Pyrogallol Red, phenylfluorone,and salicylfluorone). They form chelates with most metals. Ionic surfactantsmake it easier to dissociate the protons of chelating triphenylmethane reagentsand facilitate reactions with easily hydrolyzable metals (Be, Al, Fe, Se, Ti, Zr),leading to very sensitive but poorly selective methods. Nonchelating dyesinclude basic triphenylmethane dyes (e.g., brilliant green, malachite green,crystal violet), xanthene dyes (e.g., Rhodamine B, Rhodamine 6 G), azine dyes(e.g., methylene blue), and acid dyes (e.g., eosin, for chemical erythrosin).These are intensely colored and when paired with an oppositely charged ana-lyte ion leads to high sensitivities. Crown ethers are not chromogenic unlessthey contain a pendant chromogen able to dissociate a proton in a basicmedium. The resulting anion interacts strongly with the crown-complexed
TABLE 5.14 Elements Determined by a Solvent Extraction
Proceduredcont’d
Element Extractant Analytical technique References
Platinum Diphenyldithourea Spectrophotometry(UV-VIS)
218
Diethyldithiocarbamate Spectrophotometry(UV-VIS)
150
8-Hydroxyquinoline Spectrophotometry(UV-VIS)
150
Palladium Diphenyldithourea Spectrophotometry (VIS) 219
2-Methyl-8-quinolinol Spectrophotometry(UV-VIS)
220
2,20-Dithiodianiline Spectrophotometry(UV-VIS)
221
Rhodium Diphenyldithourea Spectrophotometry(UV-VIS)
222
8-Hydroxyquinoline Spectrophotometry(UV-VIS)
150
Thenoyltrifluoroacetone Spectrophotometry(UV-VIS)
150
Ruthenium 8-Hydroxyquinoline Isotope dilutionSpectrometry (AAS)
223
249Chapter | 5 Examples of Application of Solvent Extraction Techniques
cation compensating the electric charge. The formation of a zwitterion leads toa hydrophobic extractable species with a considerably shifted absorptionmaximum compared with the protonated species. This allows the same spec-trophotometric determination to be used for a large number of metal ions,provided the appropriate crown compound is used in each case. Anothermethod involves using specific macrocyclic reagents that incorporate a chro-mophoric group, even if the latter is not involved in the complexation of themetal ion.
4.2.2. Other Detection Techniques (Atomic Absorption, FlameEmission Spectroscopy, X-Ray Fluorescence, Luminescence, etc.)
High selectivity of Atomic Absorption and Flame Emission Spectroscopymakes a separation process superfluous. Preconcentration, especially theremoval of the solution medium, is often essential in atomic absorptiondeterminations. Extraction into an organic phase decreases the detection limitby increasing the rate of introduction of the solution into the flame, since mostorganic solvents have a lower viscosity and surface tension than aqueoussolutions. In addition, the sensitivity of the determination may be influencedfavorably by changes in flame temperature and composition.224 Using thecombination of solvent extraction-flame atomic absorption, attention must bepaid to the problems of vapor toxicity or noncombustibility of the extractantor its diluent. For example, benzene or chlorine containing solvents shouldalways be avoided. Favored extraction systems are solutions of a chelatingagent such as oxine (8-hydroxyquinoline), a ketone (methylisobutylketone),or butyl acetate.150
The advantages of solvent extraction in combination with atomic absorptionapply equally well for flame emission spectroscopy. In addition, the latteranalytical method often requires separation of the analyte from a large excessof other components. This may be achieved either by extracting the elements tobe determined or by carrying out the spectrometric analysis of an aqueoussolution from which the interfering components have been removed byextraction.225
Solvent extraction has also been used to enhance the selectivity of polar-ographic determinations. Such measurements are normally carried out inaqueous solutions, and extraction followed by back-extraction has been widelyused. However, it may be unnecessary to perform a back-extraction if theorganic extractant phase has a sufficiently high dielectric constant to dissolvesufficient background electrolyte for a voltammetric determination or if theorganic phase can be diluted with suitable polar solvents, such as methanol oracetonitrile.226
Although X-ray fluorescence is generally used on solid samples, it may bebeneficial in some cases to combine the procedure with solvent extraction. Inaddition to the usual advantages of separation and preconcentration (before the
250 PART | I Conventional (Classical) Principles and Practice
solid sample is prepared), it may be easier to prepare the required solid sample byevaporation or crystallization from an organic extract phase rather than from anaqueous solution.150 Of special interest is the technique that uses an extractionsystem that is solid at room temperature, but has a relatively low melting point.Liquid–liquid extraction is performed at a temperature above the melting pointand after separation of the phases, the organic melt is allowed to solidify to givea purified concentrate of the analyte.157
Solvent extraction is applied in several other analytical procedures. Forexample, (1) luminescence (fluorimetry), where detection limit of rhodaminecomplexes of gallium or indium can be increased by extraction;227 (2) electronspin resonance using a spin-labeled extractant;228 and (3) mass spectrometry,where an organic extract of the analyte is evaporated onto pure Al2O3 beforeanalysis.229
4.3. Basic Materials for Solvent Extraction techniques
4.3.1. Solvent-Impregnated Resins
In the last decade, the development of new impregnated materials withchelating and complexing properties has acquired great importance. Thesematerials are prepared principally by the simple immobilization of com-plexing organic reagents by adsorption onto conventional macroporouspolymeric supports (polar and nonpolar). They provide two importantadvantages over conventional ion exchange resins: the possibility of selectingthe functional group to be immobilized and the facility for continuous columnoperation. Such macromolecular resins containing an extractant within thelattice of the polymer were developed to bridge the gap between the twotechniques of solvent extraction and ion exchange and are roughly classifiedinto extractant-impregnated sorbents and Levextrel resins.135 The former areprepared by soaking a polymeric resin in a diluent containing the extractant,then evaporating the diluent (dry impregnation method) or retaining thediluent (wet method). Levextrel resins are prepared by adding an extractant tothe mixture of styrene monomers during bead polymerization with divinyl-benzene. This method has increased in importance mainly because of itsadaptability to preconcentration, separation, and/or determination of analytes.Additionally, they could be used in continuous-flow systems and in solidphase spectrophotometry by using chemical reactions that occur at interfaces(e.g., solid/liquid or gas/solid). Furthermore, most of the analytes could beanalyzed directly on the solid matrix using X-ray spectrometry, neutronactivation analysis, molecular absorption, fluorescence spectroscopy, orisotopic dilution methods. Alternatively, analytes may be eluted from thecolumn and the analysis completed on the solution. In this context, atomicabsorption (AAS) or inductively coupled plasma (ICP) spectroscopy aremainly used.
251Chapter | 5 Examples of Application of Solvent Extraction Techniques
The use of impregnated resins in the preconcentration and separation oftrace metal ions provides the following advantages:
1. The active part of the resin (complexing ligand) can be selected to becompatible with the nature of the metal ion and the matrix of the sample,and with the analytical procedure to be applied.
2. The impregnation procedures of the complexing molecules are simple.3. Their structure and composition could be compatible with integrated detec-
tion systems, when used in solid phase spectroscopic measurements.
4.3.2. Solid-Phase Spectrophotometry Applications
Solid-phase spectrophotometry (SPS) is a technique based on the preconcen-tration of the species of interest onto a solid, aided by complexants or otherreagents, and subsequent measurement of the spectrophotometric properties ofthe species in the solid phase.230 Depending on the spectrophotometricresponses of the analytes or analyte complexes, several procedures based onabsorbance and fluorescence measurements have been developed. In the firstcase, the absorbance of a resin containing the analyte fixed as a coloredchromogenic species is measured directly. In the second case, solid-phasefluorimetry (SPF), the diffuse reflected fluorescence, is measured. Mostprocedures using color or fluorescence measurement are based on the additionto the sample solution of a resin impregnated with a highly specific chromo-genic agent for the analyte.
Ion exchanger colorimetry has been used as a sensitive and rapid method forvanadium analysis by immobilization of 2[2-(3-5-dibromopyridyl) azo]-5-dimethylaminobenzoic acid onto an ion exchanger resin AG1X2.230
Solid phase fluorimetry can be useful for the analysis of very dilutesolutions in water analysis or trace metal determination; thus a chelating8-(benzene-sulfonamido)quinoline, immobilized on Amberlite XAD2 support,has been used for the spectrofluorimetric determination of Zn(II) andCd(II).231
4.3.3. Applications for Fiber Optic Chemical Sensors
The development of chemical sensors based on optical measurements hasgrown steadily in importance during the last decade. While a large variety ofdevices are possible, they share a common feature in multiple applications, i.e.,an immobilized reagent phase that changes its optical properties uponinteraction with an analyte on either a continuous or reusable basis. Systems inwhich chelating liquid extractants are immobilized onto solid polymericsupports have been used for chemical sensing. Particular attention has beengiven to fiber-optic devices for measuring and controlling metal ions andorganic compounds in aqueous media. The applications of such deviceshave covered areas such as environmental applications, industrial processcontrol, and biomedical and clinical applications. Small sensors based on
252 PART | I Conventional (Classical) Principles and Practice
immobilization of acid-base indicators such as bromothymol blue, bromo-phenol blue, bromocresol purple, phenolphthalein, phenol red, chlorophenolred alizarin, on nonionic macroporous supports, Amberlite XAD-2 andAmberlite XAD-4, have been developed and used for pHmeasurements.231
These fiber-optic probes provide advantages over conventional electrodes insafety, reliability, applicability, and cost. A sensor based on perylene dibutyrateadsorbed onto Amberlite XAD4 has been characterized in some depth.232 Fiberoptic sensors, particularly fluorescent sensors, have become the object ofconsiderable interest among researchers in recent years. Their performance isbased on the change in fluorescent properties of organic reagents immobilizedon a solid matrix upon contact with solutions of metals in a continuous system.
4.4. Micelles in Analytical Chemistry
Another of new techniques for extractive preconcentration, separation, and/orpurification of metal chelates, biomaterials, and organic compounds is based onthe use of surfactant micellar systems. Surface-active agents aggregate inaqueous solutions to form micelles if the concentration in aqueous solutionsexceeds the critical micelle concentration (CMC). Dilute aqueous solutions ofcertain surfactant micelles, when the conditions (i.e., temperature, pressure,and electrolyte concentration) of the solution are changed, have the ability toseparate into two isotropic liquid phases: a surfactant-rich phase with a smallamount of water (surfactant phase or coacervate phase) and a phase containingan almost micelle-free dilute aqueous solution. This separation is reversible sothat on changing the conditions, e.g., cooling, the two separated phases mergeto form a clear solution once again. This phenomenon can be exploited forseparation and concentration of solutes. If one solute has certain affinity for themicellar entity in solution then, by altering the conditions of the solution toensure separation of the micellar solution into two phases, it is possible toseparate and concentrate the solute in the surfactant-rich phase. This techniqueis known as cloud point extraction (CPE) or micelle-mediated extraction (ME).The ratio of the concentrations of the solute in the surfactant-rich phase to thatin the dilute phase can exceed 500 with phase volume ratios exceeding 20,which indicates the high efficiency of this technique. Moreover, the surfactant-rich phase is compatible with the micellar and aqueous-organic mobile phasesin liquid chromatography and thus facilitates the determination of chemicalspecies by different analytical methods.233 Typical preparation steps foranalytical determination are presented in Fig. 5.17.
The most common surfactants for analytical applications are nonionic(polyoxyethylene glycol monoethers, polyoxyethylene methyl-n-alkyl ethers,t-octylphenoxy polyoxyethylene ethers, and polyoxyethylene sorbitan esters offatty acids) that demonstrate cloud point behavior with increasing solutiontemperature, and zwitterionic surfactants (ammonioethyl sulfates, ammonio-propyl sulfates, ammoniopropane sulfonates, phosphobetaine, dimethylalkyl
253Chapter | 5 Examples of Application of Solvent Extraction Techniques
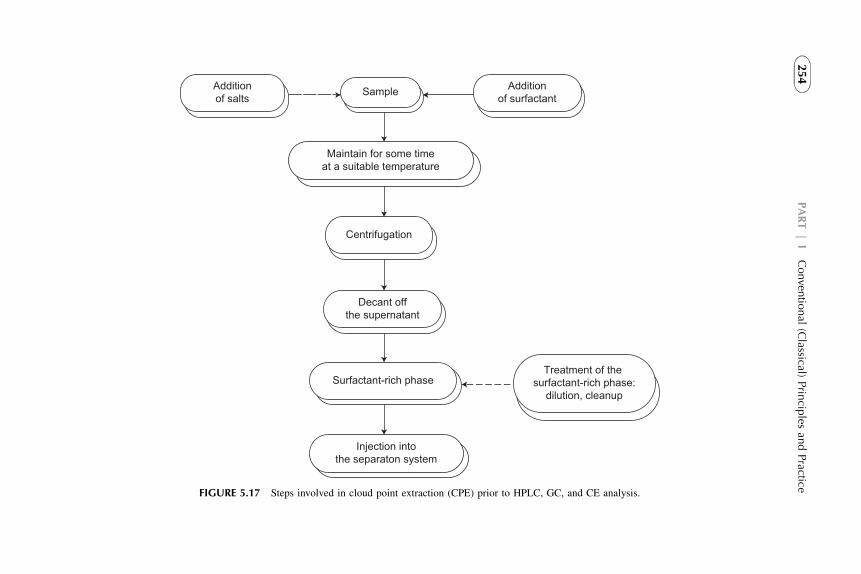
Additionof salts
Additionof surfactantSample
Surfactant-rich phase
Injection intothe separaton system
Treatment of the surfactant-rich phase:
dilution, cleanup
Decant offthe supernatant
Centrifugation
Maintain for some timeat a suitable temperature
FIGURE 5.17 Steps involved in cloud point extraction (CPE) prior to HPLC, GC, and CE analysis.
254
PART|
IConven
tional
(Classical)
Prin
ciples
andPractice
phosphine oxides) that show cloud point behavior on decreasing solutiontemperature. Thus, cloud point temperature depends on the structure of thesurfactant and its concentration and range from �0.5 �C to 120 �C.234,235 Ina homologous series of polyoxyethylated surfactants, the cloud point temper-ature increases with the hydrocarbon chain length and increasing length of theoxyethylene chain. At a constant oxyethylene content in the surfactant mole-cule, the cloud point temperature is lowered by decreasing the molecular massof the surfactant and by branching of the hydrophobic group.
The most important advantage of cloud point extraction is that only smallamounts of nonionic or zwitterionic surfactants are required and consequentlythe procedure is less costly and more environmentally benign than otherconventional extraction techniques such as liquid–liquid extraction and solid–liquid extraction.236,237 Moreover, CPE offers the possibility of combiningextraction and preconcentration in one step.
Cloud point extraction has been applied to the separation and preconcen-tration of analytes including metal ions, pesticides, fungicides, and proteinsfrom different matrices prior to the determination of the analyte by techniquessuch as atomic absorption, gas chromatography, high performance liquidchromatography, capillary zone electrophoresis, etc.
Cloud point extraction has been applied successfully to the extraction ofmetal chelates for spectrophotometric, atomic absorption, or flow injectionanalysis of trace metals in a variety of samples.236–238 Other metal complexessuch as AuCl4
� or thiocyanato-metal complexes can be extracted directly usingnonionic surfactants such as polyoxyethylene nonyl phenyl ether (PONPE) orTriton X prior to their determination by ICP or visible spectrometry.239–241 Themain advantages of cloud point extraction of metal ions include the simplicity ofthe extraction procedure and the possibility of obtaining high preconcentrationfactors ranging from 10 to 100 allowing the development of analytical methodsfor determining metal ions at very low concentrations. For example, Pd(II) canbe determined in a surfactant phase of Triton X-100 with coproporphyrin III asa complexing agent in a procedure based on phosphorescence at room temper-ature with detection limits of 20 nmol/dm3. Some parameters for the cloud pointextraction of metals with different surfactant micelles are given in Table 5.15.
The most frequent use of cloud point extraction is for the separation andpurification of biological analytes, principally proteins. In this way, the CPEhas been used as an effective tool to isolate and purify proteins when combinedwith chromatographic separations. Most of the applications deal with theseparation of hydrophobic from hydrophilic proteins, with the hydrophobicproteins having more affinity for the surfactant-rich phase, and the hydrophilicproteins remaining in the dilute aqueous phase. The separation of biomaterialsand clinical analytes by CPE has been described.234,235,240
Recently, CPE has been used for sample preparation and preconcentrationof organic analytes such as pesticides,242,243 herbicides, polycyclic aromatichydrocarbons (PAH),244 polychlorinated biphenyls (PCBs),245 and phenols246
255Chapter | 5 Examples of Application of Solvent Extraction Techniques
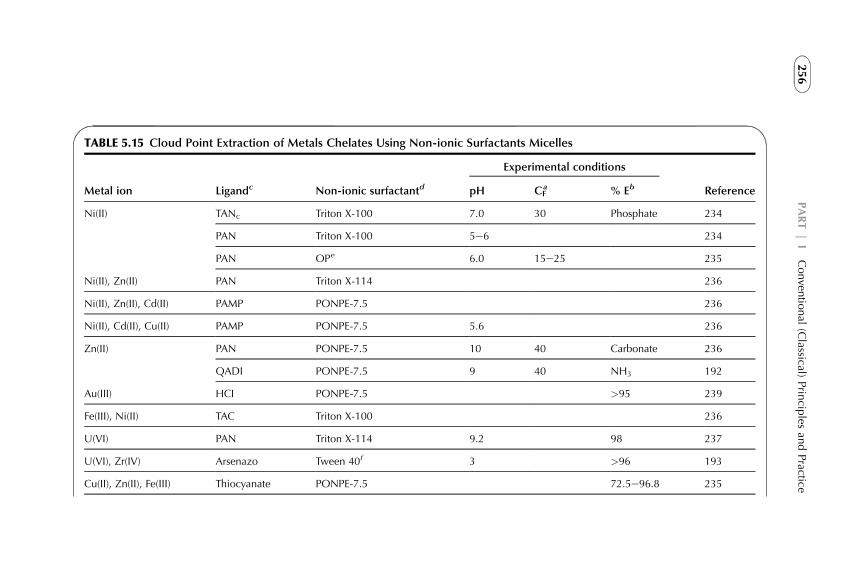
TABLE 5.15 Cloud Point Extraction of Metals Chelates Using Non-ionic Surfactants Micelles
Metal ion Ligandc Non-ionic surfactantd
Experimental conditions
ReferencepH CFa % Eb
Ni(II) TANc Triton X-100 7.0 30 Phosphate 234
PAN Triton X-100 5e6 234
PAN OPe 6.0 15e25 235
Ni(II), Zn(II) PAN Triton X-114 236
Ni(II), Zn(II), Cd(II) PAMP PONPE-7.5 236
Ni(II), Cd(II), Cu(II) PAMP PONPE-7.5 5.6 236
Zn(II) PAN PONPE-7.5 10 40 Carbonate 236
QADI PONPE-7.5 9 40 NH3 192
Au(III) HCI PONPE-7.5 >95 239
Fe(III), Ni(II) TAC Triton X-100 236
U(VI) PAN Triton X-114 9.2 98 237
U(VI), Zr(IV) Arsenazo Tween 40f 3 >96 193
Cu(II), Zn(II), Fe(III) Thiocyanate PONPE-7.5 72.5e96.8 235
256
PART|
IConven
tional
(Classical)
Prin
ciples
andPractice
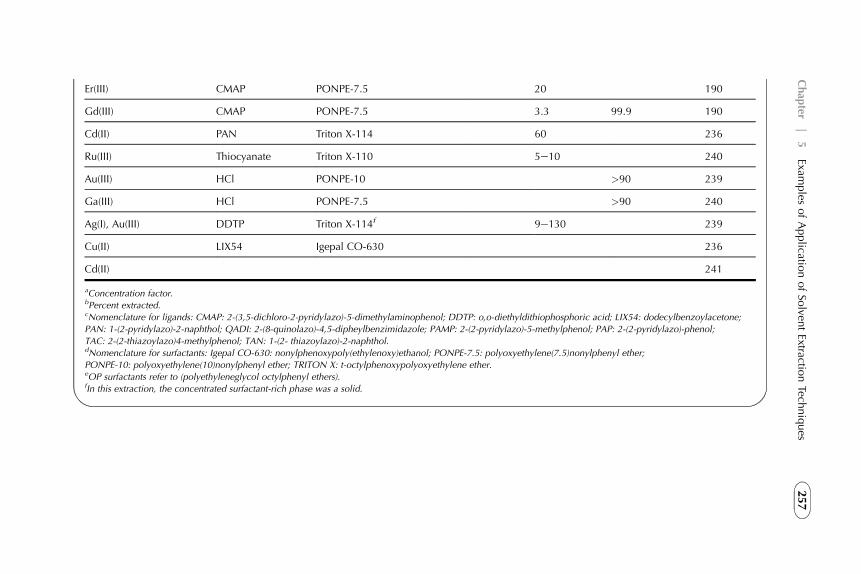
Er(III) CMAP PONPE-7.5 20 190
Gd(III) CMAP PONPE-7.5 3.3 99.9 190
Cd(II) PAN Triton X-114 60 236
Ru(III) Thiocyanate Triton X-110 5e10 240
Au(III) HCl PONPE-10 >90 239
Ga(III) HCl PONPE-7.5 >90 240
Ag(I), Au(III) DDTP Triton X-114f 9e130 239
Cu(II) LIX54 Igepal CO-630 236
Cd(II) 241
aConcentration factor.bPercent extracted.cNomenclature for ligands: CMAP: 2-(3,5-dichloro-2-pyridylazo)-5-dimethylaminophenol; DDTP: o,o-diethyldithiophosphoric acid; LIX54: dodecylbenzoylacetone;
PAN: 1-(2-pyridylazo)-2-naphthol; QADI: 2-(8-quinolazo)-4,5-dipheylbenzimidazole; PAMP: 2-(2-pyridylazo)-5-methylphenol; PAP: 2-(2-pyridylazo)-phenol;
TAC: 2-(2-thiazoylazo)4-methylphenol; TAN: 1-(2- thiazoylazo)-2-naphthol.dNomenclature for surfactants: Igepal CO-630: nonylphenoxypoly(ethylenoxy)ethanol; PONPE-7.5: polyoxyethylene(7.5)nonylphenyl ether;
PONPE-10: polyoxyethylene(10)nonylphenyl ether; TRITON X: t-octylphenoxypolyoxyethylene ether.eOP surfactants refer to (polyethyleneglycol octylphenyl ethers).fIn this extraction, the concentrated surfactant-rich phase was a solid.
257
Chap
ter|
5Exam
ples
ofApplicatio
nofSo
lventExtractio
nTech
niques
in environmental samples prior to their determination. The compatibility of thesurfactant-rich phase from CPE with micellar or conventional hydroorganicmobile phases allows subsequent determination of the analyte by thin layerchromatography, HPLC,247,248 micellar electrokinetic capillary chromatog-raphy, or CZE.249 Cloud point extraction is a rapid, simple, sensitive, andefficient sample pretreatment for trace environmental analysis and offers someadvantages over conventional liquid–liquid extraction technology in terms ofenhanced detection limits from the large preconcentration factors, eliminationof analyte losses during evaporation of solvents used in liquid–liquid extrac-tion, and elimination of toxic solvents.236
4.5. Liquid Membranes in Analytical Chemistry
The use of liquid membranes (LM) separation techniques in analytical appli-cations has greatly increased in the last 20 years. This field is not in the scope ofthis book and described in detail in Kislik (2010).130 Here we describe shortlybelow the application of LM techniques as ion-selective electrodes.
4.5.1. Ion-Selective Liquid Membrane Electrodes
Ion-selective electrodes (ISE) are described in the Liquid Membrane literatureas fixed active functional groups in pores of the membrane support, or Polymerinclusion membranes (PIM), or affinity permselective materials.130 The prin-ciple is incorporation of electron-rich complexing organic compounds as theionophore together with an appropriate plasticizer and additive into pores ofmembrane to provide the membrane with the properties of a liquid phase.Ionophores are lipophilic, capable of reversibly binding ions and transportingthem across membrane supports. The mode of action of these electrodes istherefore a reversible ion exchange process accompanied by diffusion andmigration effects.
Potentiometric sensors, such as ion-selective electrodes, ion-selectivemicroelectrodes, and ion-selective field effect transistors (ISFET) are used inanalytical systems. Moreover, the recently introduced ion-selective optodesbased on absorbance or fluorescence measurements provide additional sensorsfor a broad range of monitoring applications.250,251 In these systems, the activeconstituent of the liquid membrane is an ion-pairing or complexing agent that isselective for a limited number of specific ions. The reader can find details in ourbook on liquid membranes.130
Many different designs have been suggested to solve the problem ofinterposing the liquid membrane between the aqueous solutions. The supportprevents leakage of the organic solvent into the aqueous solution and at thesame time maintains efficient contact with the analyte solution. Schematicdesign of the electrode is illustrated in Fig. 5.18. The construction of a liquidmembrane electrode is rather similar to that of the glass electrode, in that itrequires an internal reference electrode. The ion selectivity of a membrane can
258 PART | I Conventional (Classical) Principles and Practice
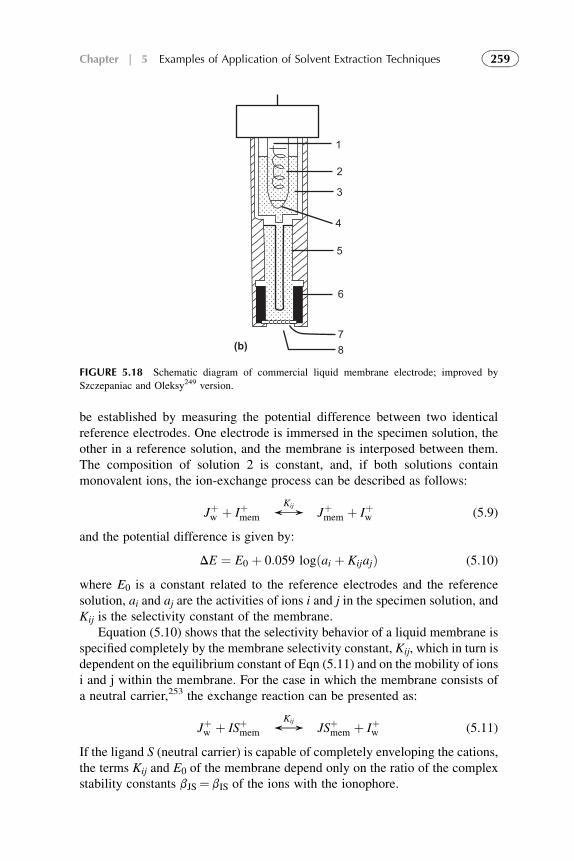
be established by measuring the potential difference between two identicalreference electrodes. One electrode is immersed in the specimen solution, theother in a reference solution, and the membrane is interposed between them.The composition of solution 2 is constant, and, if both solutions containmonovalent ions, the ion-exchange process can be described as follows:
Jþw þ Iþmem 4Kij
Jþmem þ Iþw (5.9)
and the potential difference is given by:
DE ¼ E0 þ 0:059 logðai þ KijajÞ (5.10)
where E0 is a constant related to the reference electrodes and the referencesolution, ai and aj are the activities of ions i and j in the specimen solution, andKij is the selectivity constant of the membrane.
Equation (5.10) shows that the selectivity behavior of a liquid membrane isspecified completely by the membrane selectivity constant, Kij, which in turn isdependent on the equilibrium constant of Eqn (5.11) and on the mobility of ionsi and j within the membrane. For the case in which the membrane consists ofa neutral carrier,253 the exchange reaction can be presented as:
Jþw þ ISþmem 4Kij
JSþmem þ Iþw (5.11)
If the ligand S (neutral carrier) is capable of completely enveloping the cations,the terms Kij and E0 of the membrane depend only on the ratio of the complexstability constants bJS¼ bIS of the ions with the ionophore.
1
2
3
4
5
6
78(b)
FIGURE 5.18 Schematic diagram of commercial liquid membrane electrode; improved by
Szczepaniac and Oleksy249 version.
259Chapter | 5 Examples of Application of Solvent Extraction Techniques
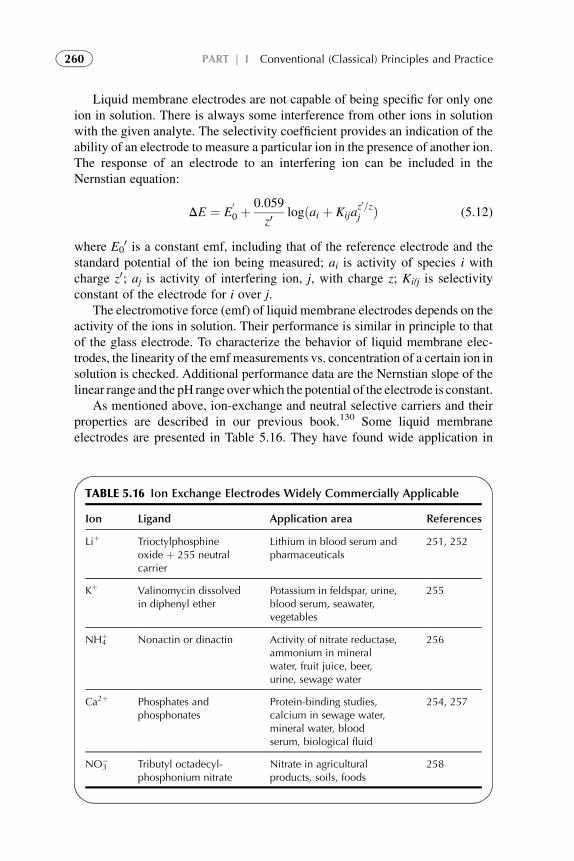
Liquid membrane electrodes are not capable of being specific for only oneion in solution. There is always some interference from other ions in solutionwith the given analyte. The selectivity coefficient provides an indication of theability of an electrode to measure a particular ion in the presence of another ion.The response of an electrode to an interfering ion can be included in theNernstian equation:
DE ¼ E00 þ
0:059
z0logðai þ Kija
z0=zj Þ (5.12)
where E00 is a constant emf, including that of the reference electrode and the
standard potential of the ion being measured; ai is activity of species i withcharge z0; aj is activity of interfering ion, j, with charge z; Ki/j is selectivityconstant of the electrode for i over j.
The electromotive force (emf) of liquid membrane electrodes depends on theactivity of the ions in solution. Their performance is similar in principle to thatof the glass electrode. To characterize the behavior of liquid membrane elec-trodes, the linearity of the emfmeasurements vs. concentration of a certain ion insolution is checked. Additional performance data are the Nernstian slope of thelinear range and the pH range overwhich the potential of the electrode is constant.
As mentioned above, ion-exchange and neutral selective carriers and theirproperties are described in our previous book.130 Some liquid membraneelectrodes are presented in Table 5.16. They have found wide application in
TABLE 5.16 Ion Exchange Electrodes Widely Commercially Applicable
Ion Ligand Application area References
Liþ Trioctylphosphineoxide þ 255 neutralcarrier
Lithium in blood serum andpharmaceuticals
251, 252
Kþ Valinomycin dissolvedin diphenyl ether
Potassium in feldspar, urine,blood serum, seawater,vegetables
255
NH4þ Nonactin or dinactin Activity of nitrate reductase,
ammonium in mineralwater, fruit juice, beer,urine, sewage water
256
Ca2þ Phosphates andphosphonates
Protein-binding studies,calcium in sewage water,mineral water, bloodserum, biological fluid
254, 257
NO3� Tributyl octadecyl-
phosphonium nitrateNitrate in agriculturalproducts, soils, foods
258
260 PART | I Conventional (Classical) Principles and Practice
biological and technological systems. All electrodes perform well in theconcentration range over which the Nernstian slope is maintained, i.e., from10�1 to 10�5 mol/dm3. These electrodes to a certain extent have replaced inboth chemical and clinical laboratories the more traditional instrumentalmethods of analysis, such as flame photometry and atomic absorption spec-trometry. There are, of course, many more liquid membrane electrodes, but theavailability of satisfactory solid electrodes has greatly restricted their devel-opment and practical application.
4.6. Chromatography-Based Analytical Techniques
The term “chromatography” now embraces a variety of processes that are basedon the differential distribution of the components in a chemical mixturebetween two phases. The chromatography is the technique with continuousequilibration between two phases: stationary and mobile. The same funda-mental laws of phase equilibrium apply to extraction and chromatography. Inprinciple, the latter is a multiple extraction process in which the mobile phasemoves continuously over the fixed phase in a chromatographic column.
4.6.1. Liquid–Liquid Partition Chromatography
The liquid–liquid partition chromatography (LLPC) method involvesa stationary liquid phase that is more or less immobilized on a solid support.The analyte is distributed between the two liquid phases. In conventional LLPCsystems, the stationary liquid phase is usually a polar solvent and the mobileliquid phase is an essentially water-immiscible organic solvent. On the otherhand, in reversed-phase chromatography (RPC), the stationary liquid is usuallya hydrophobic solvent, whereas the mobile liquid is the polar solvent, mostfrequently water or an aqueous mixture with polar organic solvents.259,260
In LLPC, solid support is used for the stationary liquid: silica gel, cellulosepowder, starch, alumina, silicic acid, etc. The practice of HPLC has greatlysimplified the technique in providing column stability for repeated use and fortreatment of large volumes.
Reversed-phase chromatography is the predominant technique in HPLC,and chemically bonded silica gel supports are made specifically for thenonpolar stationary phase. In the last decade, as many as 60% of the publishedLLPC techniques refer to RPC. The reasons for this involve the significantlylower cost of the mobile liquid phase and a favorable elution order that is easilypredictable based on the hydrophobicity of the eluate.
The selection of solvents for LLPC is similar to the selection of solvents inliquid–liquid extraction systems. The solid support has little effect upon theselection of the solvent pair, except for the obvious fact that a hydrophilicsupport for a polar stationary phase requires a hydrophobic mobile phase withthe opposite for a reversed-phase system. Both solvents should exhibit goodsolubility for the solute(s); otherwise the column loading capacity would be too
261Chapter | 5 Examples of Application of Solvent Extraction Techniques
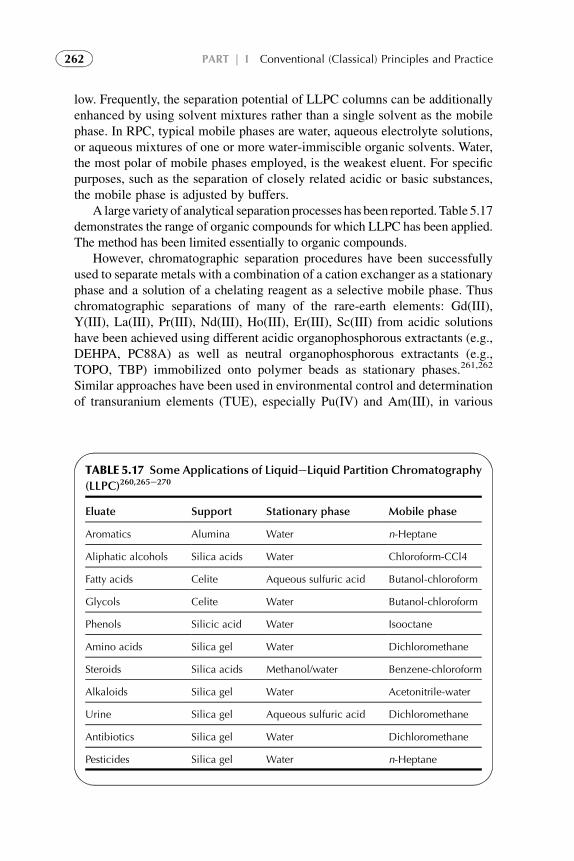
low. Frequently, the separation potential of LLPC columns can be additionallyenhanced by using solvent mixtures rather than a single solvent as the mobilephase. In RPC, typical mobile phases are water, aqueous electrolyte solutions,or aqueous mixtures of one or more water-immiscible organic solvents. Water,the most polar of mobile phases employed, is the weakest eluent. For specificpurposes, such as the separation of closely related acidic or basic substances,the mobile phase is adjusted by buffers.
A largevariety of analytical separation processes has been reported. Table 5.17demonstrates the range of organic compounds for which LLPC has been applied.The method has been limited essentially to organic compounds.
However, chromatographic separation procedures have been successfullyused to separate metals with a combination of a cation exchanger as a stationaryphase and a solution of a chelating reagent as a selective mobile phase. Thuschromatographic separations of many of the rare-earth elements: Gd(III),Y(III), La(III), Pr(III), Nd(III), Ho(III), Er(III), Sc(III) from acidic solutionshave been achieved using different acidic organophosphorous extractants (e.g.,DEHPA, PC88A) as well as neutral organophosphorous extractants (e.g.,TOPO, TBP) immobilized onto polymer beads as stationary phases.261,262
Similar approaches have been used in environmental control and determinationof transuranium elements (TUE), especially Pu(IV) and Am(III), in various
TABLE 5.17 Some Applications of LiquideLiquid Partition Chromatography
(LLPC)260,265e270
Eluate Support Stationary phase Mobile phase
Aromatics Alumina Water n-Heptane
Aliphatic alcohols Silica acids Water Chloroform-CCl4
Fatty acids Celite Aqueous sulfuric acid Butanol-chloroform
Glycols Celite Water Butanol-chloroform
Phenols Silicic acid Water Isooctane
Amino acids Silica gel Water Dichloromethane
Steroids Silica acids Methanol/water Benzene-chloroform
Alkaloids Silica gel Water Acetonitrile-water
Urine Silica gel Aqueous sulfuric acid Dichloromethane
Antibiotics Silica gel Water Dichloromethane
Pesticides Silica gel Water n-Heptane
262 PART | I Conventional (Classical) Principles and Practice
natural samples.263,264 Recently, new family of resins was developed andintensively studied. These resins are based on the impregnation of AmberliteXAD7 with highly specific reagents for actinide analysis in environmental andbiological samples.
4.6.2. Supercritical Fluid Extraction
Supercritical fluids were found to be highly efficient extraction media, chieflybecause of their high solvating power, their low viscosities (intermediatebetween a gas and a liquid), and their low surface tensions that enable theirpenetration deep into the extraction matrix. Supercritical fluid extraction (SFE)used in isolation is generally not selective enough to separate specific solutesfrom the matrix without further cleanup or resolution from coextracted speciesprior to qualitative and quantitative analysis. Consequently, for analyticalapplications, SFE is usually used in combination with chromatographic tech-niques to improve the overall selectivity in the isolation of specific solutes. Thecombined use of SFE with chromatographic techniques is quite recent. Theapplication of SFE for the preparation of samples in the analytical laboratoryhas received serious attention as a sample preparation step for extractinganalytes of interest from a bulk matrix prior to their determination by otheranalytical methods including chromatographic, spectrometric, radiochemical,and gravimetric techniques.
The need to replace conventional solvent extraction methods of samplepreparation with analytical-scale SFE systems comes because the latter arefaster, more efficient, have better potential for automation, and also reducethe need for large volumes of potentially hazardous liquid solvents. Thepotential for applying SFE to a wide variety of environmental and biologicalsamples for both qualitative and quantitative analyses is widely described inreviews.271–273
Analytical-scale SFE is most often applied to relatively small samples (e.g.,several grams or less). A good solvent for extraction should be selective so thatit dissolves the desired analytes to a greater degree than other constituents in thesample matrix. It should be unreactive and stable, preferably nontoxic,noncorrosive to equipment and inexpensive to buy. Many of these requirementsare met by supercritical fluids such as carbon dioxide.
Off-Line, On-Line SFE
Analytical-scale SFE can be divided into off-line and on-line techniques. Off-line SFE refers to any method where the analytes are extracted using SFE andcollected in a device independent of the chromatograph or other measurementinstrument. On-line SFE techniques use direct transfer of the extracted analytesto the analytical instrument, most frequently a chromatograph. While thedevelopment of such on-line SFE methods of analysis has great potential foreventual automation and for enhancing method sensitivities,271–273 the great
263Chapter | 5 Examples of Application of Solvent Extraction Techniques
majority of analytical SFE systems described use some form of off-line SFEfollowed by conventional chromatographic or spectroscopic analysis.
To perform off-line SFE, only the SFE step must be studied: the extract canbe analyzed at leisure by a variety of methods. The final product of an off-lineSFE experiment typically consists of the extract dissolved in a few milliliters ofliquid solvent, a form that is directly compatible with conventional chro-matographic injectors. In contrast, the successful performance of on-line SFErequires coupling step (i.e., the transfer and collection of extracted analytesfrom the SFE to the chromatographic system), and the final chromatographicconditions have to be controlled. With many on-line approaches the sampleextract is committed to a single analysis, and the extract is not available foranalysis by other methods. Off-line SFE has the advantages of simplicity andavailability of commercial instrumentation, provides extracts that can beanalyzed by several instrumental methods. On-line techniques have greaterpotential for enhanced sensitivity and automation.
The instrumental components necessary include a source of fluid, mostoften CO2 or CO2 with an organic modifier, a means of pressurizing the fluid,an extraction cell, a method of controlling the extraction cell temperature,a device to depressurize the supercritical fluid (flow restrictor), and a device forcollecting the extracted analytes.
On-Line Coupling SFE-GC, SFE-SFC
On-line supercritical fluid extraction/GC methods combine the ability ofliquid solvent extraction to extract efficiently a broad range of analytes withthe ability of gas-phase extraction methods to rapidly and efficiently transferthe extracted analytes to the gas chromatograph. The characteristics ofsupercritical fluids make them ideal for the development of on-line sampleextraction/gas chromatographic (SFE-GC) techniques. Since most super-critical fluids are converted to the gas phase upon depressurization toambient conditions, SFE has the potential to introduce extracted analytes tothe GC in the gas phase. Supercritical fluid chromatography (SFC), in whicha supercritical fluid is used as the mobile phase, was introduced.274,275 SFEdirectly coupled to SFC provides an extremely powerful analytical tool. Theefficient, fast, and selective extraction capabilities of supercritical fluidsallows quantitative extraction and direct transfer of the selected solutes ofinterest to be accomplished to the column, often without the need for furthersample treatment or cleanup. Extraction selectivity is usually achieved byadjusting the pressure of the supercritical fluid at constant temperature or,less often, by changing the temperature of the supercritical fluid at constantpressure. SFE coupled with packed column SFC has found many applica-tions in the last decade, particularly in connection with the determinationof food compounds, drug residues, herbicide and pesticide residues, andpolymer additives.
264 PART | I Conventional (Classical) Principles and Practice
4.7. Solvent Extraction in Continuous Flow InjectionAnalysis (FIA)
Flow injection analysis (FIA) is based on the injection of a liquid sample intoa continuously flowing liquid carrier stream, where it is usually made to react togive reaction products that may be detected. FIA offers the possibility in an on-line manifold of sample handling including separation, preconcentration,masking and color reaction, and even microwave dissolution, all of which canbe readily automated. The most common advantages of FIA include reducedmanpower cost of laboratory operations, increased sample throughput,improved precision of results, reduced sample volumes, and elimination ofmany interferences. Fully automated flow injection analyzers are based onspectrophotometric detection but are readily adapted as sample preparationunits for atomic spectrometric techniques. Some books276,277 and criticalreviews278,279 on FIA methods have been published.
A typical extraction manifold is shown in Fig. 5.19. The sample is intro-duced by aspiration or injection into an aqueous carrier that is segmented withan organic solvent and is then transported into a mixing coil where extractiontakes place. Phase separation occurs in a membrane phase separator wherethe organic phase permeates through the Teflon membrane. A portion of oneof the phases is led through a flow cell and an on-line detector is used to monitorthe analyte content. The back-extraction mode in which the analyte is returnedto a suitable aqueous phase is also sometimes used. The fundamentals ofliquid–liquid extraction for FIA280 and applications of the technique281 havebeen discussed. Preconcentration factors achieved in FIA (usually 2–5) areconsiderably smaller than in batch extraction, so FI extraction is used morecommonly for the removal of matrix interferences.
Chemical reactions between the analyte and a reagent or combination ofreagents can be implemented in continuous systems to obtain a reaction productthat is capable of facilitating mass transfer and/or continuous detection thatresults in increased sensitivity or selectivity. These reactions could take place indifferent locations of the schemes defined previously, e.g.:
1. In a coil after the sample is merged with a reagent stream.2. In the solvent segmenter (SS) when it is necessary to avoid precipitation of
the extractable compound in the aqueous phase before it reaches the contin-uous extractor.
3. In the extraction coil (EC), when the extraction reaction is based on theformation of metal chelates and the ligand is dissolved in the organic solvent.Here the reaction and the transfer of the chelate take place simultaneously.
4. In a coil located after the extractor using a reagent stream that is mergedprior to the detector with the phase containing the analyte.
The derivatizing reactions used in these systems are not substantially differentfrom those described in classical analytical determinations. The most common
265Chapter | 5 Examples of Application of Solvent Extraction Techniques
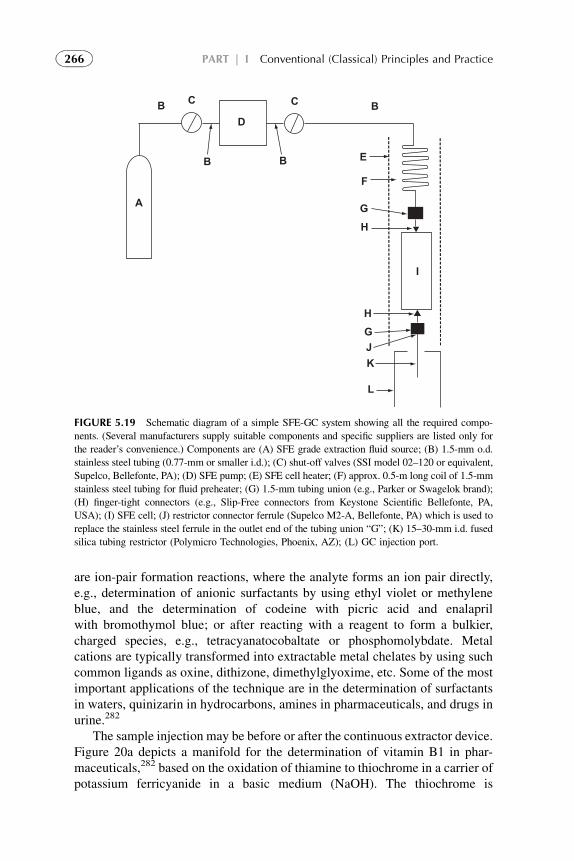
are ion-pair formation reactions, where the analyte forms an ion pair directly,e.g., determination of anionic surfactants by using ethyl violet or methyleneblue, and the determination of codeine with picric acid and enalaprilwith bromothymol blue; or after reacting with a reagent to form a bulkier,charged species, e.g., tetracyanatocobaltate or phosphomolybdate. Metalcations are typically transformed into extractable metal chelates by using suchcommon ligands as oxine, dithizone, dimethylglyoxime, etc. Some of the mostimportant applications of the technique are in the determination of surfactantsin waters, quinizarin in hydrocarbons, amines in pharmaceuticals, and drugs inurine.282
The sample injection may be before or after the continuous extractor device.Figure 20a depicts a manifold for the determination of vitamin B1 in phar-maceuticals,282 based on the oxidation of thiamine to thiochrome in a carrier ofpotassium ferricyanide in a basic medium (NaOH). The thiochrome is
B
D
C C
B
B
E
F
G
G
J
K
L
H
H
I
B
A
FIGURE 5.19 Schematic diagram of a simple SFE-GC system showing all the required compo-
nents. (Several manufacturers supply suitable components and specific suppliers are listed only for
the reader’s convenience.) Components are (A) SFE grade extraction fluid source; (B) 1.5-mm o.d.
stainless steel tubing (0.77-mm or smaller i.d.); (C) shut-off valves (SSI model 02–120 or equivalent,
Supelco, Bellefonte, PA); (D) SFE pump; (E) SFE cell heater; (F) approx. 0.5-m long coil of 1.5-mm
stainless steel tubing for fluid preheater; (G) 1.5-mm tubing union (e.g., Parker or Swagelok brand);
(H) finger-tight connectors (e.g., Slip-Free connectors from Keystone Scientific Bellefonte, PA,
USA); (I) SFE cell; (J) restrictor connector ferrule (Supelco M2-A, Bellefonte, PA) which is used to
replace the stainless steel ferrule in the outlet end of the tubing union “G”; (K) 15–30-mm i.d. fused
silica tubing restrictor (Polymicro Technologies, Phoenix, AZ); (L) GC injection port.
266 PART | I Conventional (Classical) Principles and Practice
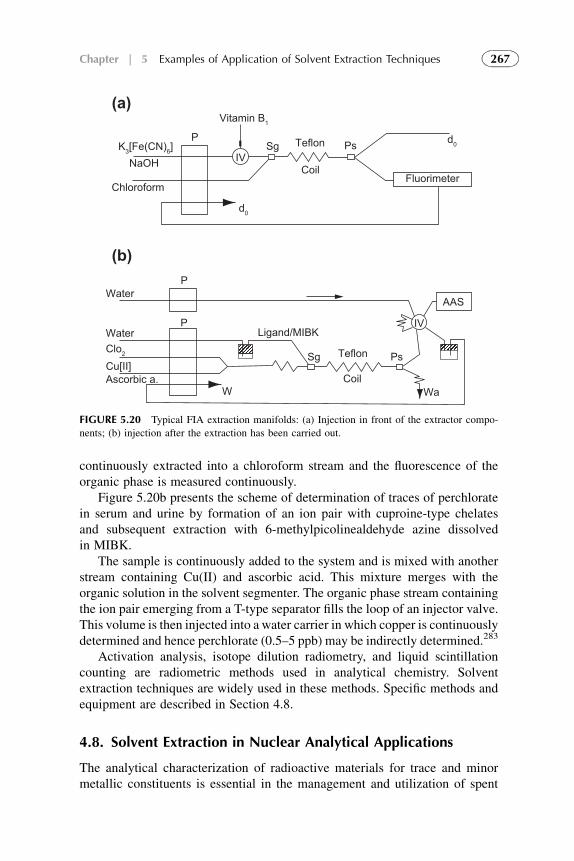
continuously extracted into a chloroform stream and the fluorescence of theorganic phase is measured continuously.
Figure 5.20b presents the scheme of determination of traces of perchloratein serum and urine by formation of an ion pair with cuproine-type chelatesand subsequent extraction with 6-methylpicolinealdehyde azine dissolvedin MIBK.
The sample is continuously added to the system and is mixed with anotherstream containing Cu(II) and ascorbic acid. This mixture merges with theorganic solution in the solvent segmenter. The organic phase stream containingthe ion pair emerging from a T-type separator fills the loop of an injector valve.This volume is then injected into a water carrier in which copper is continuouslydetermined and hence perchlorate (0.5–5 ppb) may be indirectly determined.283
Activation analysis, isotope dilution radiometry, and liquid scintillationcounting are radiometric methods used in analytical chemistry. Solventextraction techniques are widely used in these methods. Specific methods andequipment are described in Section 4.8.
4.8. Solvent Extraction in Nuclear Analytical Applications
The analytical characterization of radioactive materials for trace and minormetallic constituents is essential in the management and utilization of spent
(a)
(b)
Vitamin B1
IV
IV
Sg
Sg
P
P
P
W Wa
WaterClo2
Cu[II]Ascorbic a.
Water
K3[Fe(CN)6]NaOH
Chloroform
d0
d0Ps
Fluorimeter
Ps
AAS
Teflon
Coil
Coil
Teflon
Ligand/MIBK
FIGURE 5.20 Typical FIA extraction manifolds: (a) Injection in front of the extractor compo-
nents; (b) injection after the extraction has been carried out.
267Chapter | 5 Examples of Application of Solvent Extraction Techniques
nuclear fuels and associated radioactive waste treatment. These are verycomplex mixtures and are intensely radioactive. They must be analyzedremotely in a heavy shield box located in a controlled area, which further addsdifficulty to the analysis. On the other hand, it facilitates to develop highlysensitive analytical methods or analytical instruments that can accurately andquickly measure the trace amounts of metal elements.
There are two main directions in nuclear analytical chemistry: (1) massspectrometric analytical methods for samples of long-lived radioactive elements(LLR) such as uranium, thorium, plutonium, etc. at processing of nuclear fuelsand reprocessing of irradiated fuels, and (2) radiometric analytical techniques,used for short-lived radioactive (SLR) isotopes. The mass spectrometric detec-tion techniques become more and more popular method for the determination ofLLR. At present, inductively coupled plasma atomic emission spectrometry,ICP-AES, analysis is being used as a standard technique for the analysis ofuranium, thorium compounds in the fields of nuclear science and technology.
Sometimes, direct analysis of LLR bearing materials was not possible fortrace metal elements because of spectral interference and complex atomicemission spectra. Thus, an adequate pre-separation and concentration proce-dure has been required in advance of the analysis. Mainly conventional solventextraction methods of sample preparation and analysis are used. Many of theseconventional preparative techniques are described earlier.
There are many radionuclides naturally occurring in the environment,including decay products of the isotopes of uranium and thorium, those producedfrom the cosmic ray reactions, such as 3H, 7Be, 10Be, 14C, 26Al, and 129I. Theinterest in the determination of these radionuclides mainly comes from theapplication of them in geochronology and using them as environmental orpaleoclimate tracers. Determination of radionuclides, such as 222Rn, 226Ra in airand drinking water is important in the view of radiation protection. Radionu-clides applied in industry and hospital may also be released to environment andfor the radiation protection purpose, the level of these radionuclides in variousenvironmental and biological samples has to be determined. Radionuclidesreleased from the reprocessing plants can also be used as environmental tracerfor the investigation of transport of water mass (134,137Cs, 99Tc, 129I) andatmospheric circulation (129I). In decommissioning of nuclear facilities andrepository of nuclear waste, invitatory of radioactivity or concentration ofvarious radionuclides in the waste samples need to be determined.
4.8.1. Spectroscopic and Mass Spectrometric Detection
Spectroscopic and mass spectrometric techniques, including Capillary electro-phoresis–inductively coupled plasma mass spectrometry, CE-ICP-MS; Nuclearmagnetic resonance spectroscopy, NMR; Surface-enhanced Raman spectros-copy, SERS; Ultraviolet–visible spectroscopy, UV-Vis; Extended X-rayabsorption fine-structure spectroscopy, EXAFS; Time-resolved laser-induced
268 PART | I Conventional (Classical) Principles and Practice
fluorescence spectroscopy, TRLIF; electrospray ionization mass spectroscopy,ESI-MS all have been used for the quantitative determination of long-livedradionuclides. Sample preparation techniques and determination by spectro-scopic techniques, used for the nonradioactive materials are described earlier.
Mass spectrometry is extensively used for the determination of elementconcentrations in the trace and ultra-trace range by measuring the number ofatoms of isotopes of the element. It has also been used for the determination innonradioactive materials and radionuclides. Mass spectrometric detectiontechniques such as inductively coupled plasma atomic emission spectrometry(ICP-AES), or mass spectrometry (ICP-MS), accelerator mass spectrometry(AMS), thermal ionization mass spectrometry (TIMS), resonance ionizationmass spectrometry (RIMS), secondary ion mass spectrometry (SIMS), and glowdischarge mass spectrometry (GDMS) become more and more popular methodsfor the determination of LLR and allow direct determination of radionuclides insolid samples without any chemical preparation. The analysis is very simple andminimizes the risk from the contamination due to the limited sample handling.
Inductively coupled plasma atomic emission spectrometry (ICP-AES) hasbeen widely selected as the technique of choice to perform the analysis ofradioactive materials owing to its simultaneous measurement capability, wideanalytical dynamic range, high sensitivity, and relative freedom from matrixinterferences.284,285 At present, because of the high sensitivity, short analysistime and relatively easy operation ICP-AES analysis is being used as a standardtechnique for the analysis of uranium, thorium compounds in the fields ofnuclear science and technology.
Sometimes, direct analysis of LLR bearing materials was not possible fortrace metal detection. The limit for many radionuclides is not sufficient andchemical separation of the elements of interest from the matrix is the way forincreasing the signal strength and limiting interferences. Severe spectralinterference of other elements was found in the intensely complex atomicemission spectra of the actinide matrices. Thus, an adequate pre-separationprocedure has been required in advance of the mass spectrometric analysis.Several review articles have addressed the application of mass spectrometrictechniques for the determination of radionuclides.284–289 Many of these tech-niques are described earlier.
4.8.2. Radiometric Detectors
For great number of radionuclides with half-life of less than 10 years, theradiometric methods are exclusively used for their determination. In thesemethods, the decay rate (A, number of decays per unit of time) of the radio-nuclide of interest is measured, the atom number (N) of radionuclide of interestis calculated based on the statistical property of the decay of the radionuclideusing its half-life (T1/2):N¼A/g¼ A/(ln 2/T1/2). In these methods, the atomnumbers of the radionuclide of interest are directly measured.
269Chapter | 5 Examples of Application of Solvent Extraction Techniques
Different radiometric methods, such as gamma (g)-spectrometry, alpha (a)-spectrometry, and beta (b) counting are usually used. Three main radiometricdetecting methods are shortly presented below.
Alpha Spectrometry
There are several types of detector that can be used for the measurement ofalpha-emitting radionuclides; e.g., Frisch grid ionization chambers, propor-tional counters, plastic- and liquid scintillation detectors and semiconductordetectors. Frisch grid ionization chambers are used for total alpha activitymeasurements. Semiconductor detectors are normally used for the determina-tion of a-emitting radionuclides in the environmental and waste samples.
Although the resolution of semiconductors for a-spectrometry is good, therelatively small difference in alpha particle energy between some alpha emit-ters makes it difficult to spectrometrically separate the peaks. This is usually thecase with isotopes such as 241Am and 238Pu, 237Np, 233U, 234U, and 230Th. Inenvironmental samples, the concentration of radionuclides is normally verylow; it requires a long counting time. Therefore, a good chemical separation ofradionuclide of interest from the matrix is required.
The main disadvantage of a-spectrometry is the long analysis time, which isa result of the long chemical separation procedure for the complete separationof the target radionuclide(s) from the matrix as well as from interferingradionuclides, and the very long counting time (1–30 days). However, from theabove, it is obvious that normal separation procedures for a-spectrometry is notsuitable for fast analysis in emergency situations, which requires getting theanalytical results in a shorter time (less than 1 day). Several modified, rapidprocedures have therefore been worked out to handle such situations fordifferent radioisotopes in various matrixes.
Gamma Spectrometry
Many a- and b-decay radionuclides also emit g-rays; they can therefore bedetermined by g-spectrometry. A number of detectors can be used for themeasurement of g-rays, such as scintillation counter using NaI, CsF, and ZnS asscintillator, gas-filled counter, and semiconductor detectors based on lithium-doped Si or high purity Ge, CdTe, and GaAs. Mainly Si(Li) and Ge (lithiumdrift germanium Ge(Li)) semiconductor detectors are widely used for the g-spectrometry measurement of radionuclides in the biological, environmental,and nuclear waste samples, because of their high energy resolution. The recentdevelopment in the g-spectrometry is the introduction of large-volume Gecrystal that significantly increases the counting efficiency.
Due to the property of electromagnetic radiation, g-ray can penetrate a longdistance in the samples without significant absorption, especially high energyg-rays. Sample usually does not need any treatment before counting, whichmakes the analysis quick and easy, and minimizes the risk of contamination
270 PART | I Conventional (Classical) Principles and Practice
during sample preparation. It is therefore that the radionuclides with emissionof suitable energy g-rays are normally measured by g-spectrometry, such as60Co, 65Zn, 54Mn, 94Nb, 106Ru, 133Ba, 134Cs, 137Cs, 144Ce, 152Eu, 154Eu, and241Am. However, the counting efficiency of g-spectrometry is low (<10% forabsolute counting efficiency) and varies with the g-ray energy, distance ofsource to the detector and the size of the Ge or Si crystal. The detection limit ofg-spectrometry (>50 mBq) is typically a few orders of magnitude higher thanb-counting and a-spectrometry.
Beta Counting
Beta- or electron emitting radionuclides are normally measured by gas ioni-zation detector, such as ionization chamber, gas flow GM detector, or liquidscintillation counters (LSC). GM counter is normally used for radionuclidesemitting higher energy electrons due to the absorption of low energy electronsin the thin window separating the sample and gas volume. LSC has anadvantage in measuring low-energy electron emitters due to the absence ofattenuation when the sample is immersed within the scintillator. LSC can thusbe used for the measurement of both high and low energy b-emitters. Deter-mination of beta particle emitters therefore requires chemical separation of theradionuclide of interest from all other radionuclides before counting.
In order to minimize self-absorption in the sample and maintain a highcounting efficiency, samples for GM counting needs to be prepared as a thin solidsource which can be carried out by the same method as used for the a-spec-trometry. The counting efficiency of a GM counter varies from 10 to 70% withthe energy of the emitted electrons, thickness of the source, and counter prop-erties. GM counter cannot be used effectively for the determination of radio-nuclides emitting low energy electrons, such as 33H, 14CI, and 241Pu, because ofhigh absorption in the detector window. LSC has to be used in this case.
LSC has the advantage of none or minimal self-absorption, high countingefficiency, homogeneous distribution of the sample in the scintillation cocktail,relative simple sample preparation procedure and easy standardization usinginternal or external standard. The quench correction is a drawback of LSC.
4.8.3. Preparative Techniques for Radioactive Elements Analysis
Sometimes, direct analysis of plutonium, americium or uranium bearingmaterials was not possible for trace metal elements because a severe spectralinterference was found in the intensely complex atomic emission spectra of theactinide matrices. Thus, an adequate pre-separation procedure has beenrequired in advance of the ICP-AES analysis. Many separation methods, usingsolvent extraction and ion exchange chromatography,284–289 have beenproposed for the purification and recovery of actinides or fission products froma variety of radioactive materials in spent fuel reprocessing and associatedradioactive waste treatment processes. These techniques and processes were
271Chapter | 5 Examples of Application of Solvent Extraction Techniques
described previously as convenient preparation techniques. They are onlyrealized in hot chambers in radioactive security mode.
Among numerous techniques for radioanalytical purposes, a new family ofresins (TVEX) were developed and intensively studied. They are based onintroducing an extractant into the polymer matrix during synthesis264,265
similar to that of polymer inclusion membranes (PIM) in liquid membraneseparation technologies.130 The behavior of uranium, plutonium, and trans-plutonium elements (TPE) using TVEXs with TBP, TOPO, DEHPA, and TOA,etc. has been studied.
Another family of resins was developed279,280 by impregnation of Amber-lite XAD7 with highly specific reagents for actinide analysis in environmentaland biological samples.
4.8.4. Radiometric Techniques
Neutron Activation Analysis (NAA)
Neutron activation analysis is the main radiometric method used in analyticalchemistry. The sample is irradiated in a neutron flux, and the resulting specificradioactivity of the analyte determined. Although high-resolution gammaspectrometers would seem to eliminate the need for highly selective separationof individual gamma-emitting radioactive elements, group separation still maybe necessary.290 Various separation methods used in NAA such as distillation,precipitation and coprecipitation, electrochemical deposition. Solvent extrac-tion and ion exchange show several advantages. Solvent extraction can be usedin combination with activation analysis in two ways: either by separating theanalyte from interfering components and preconcentrating before irradiation,or by performing the neutron activation and separating the analyte before theradiometric determination. The latter method has the advantage of eliminatingthe need for a blank correction.
Good selectivity, quantitativeness, and simplicity of operation have made ion-exchange chromatography (IEC) the leading separation technique employed in theradiochemical version of NAA.Many of the extractants employed in this technique,such as tri-n-octylamine and di-(ethylhexyl) orthophosphoric acid, extract ions byanion-exchange mechanism. Chromatographic methods have been widely used inradiochemical NAA for the determination of trace elements in a variety of othermatrices such as semiconductor materials, high-purity metals and geologicalmaterials. In the analysis of geological materials, a strongly basic anion-exchangeresin in the chloride form or newly synthesized chelating resins were used.288,291
Sometimes, however, it may appear necessary to remove matrix elementsbefore irradiation. Certain types of samples activate too strongly to permit theirsafe handling without the use of hot chambers. When the interfering compo-nents become highly radioactive and the resulting radioisotopes are long-lived,it is preferable to remove them before irradiation. Another typical case is thedetermination of very low concentrations of elements in large volumes of
272 PART | I Conventional (Classical) Principles and Practice
solution (e.g., water, wastes), where it is necessary to perform preconcentrationand to bring the element(s) in question into the form compatible with therequirements set for irradiation in a nuclear reactor. These convenient pre-concentration techniques were described above.
Isotope Dilution Radiometry
In this type of radiometric analysis, a tracer quantity of a radioactive isotope isadded to the analyte, which is then partly extracted using a specific extractant.Since the extractant may be considered as reacting totally with the analyte, theratio of radioactivity in both phases provides the concentration of analyte in thesample.292
Liquid Scintillation Counting
Carbon-14 and tritium are radioisotopes with b-emissions of very low energythat are extremely difficult to detect with any form of window counter, due toself-absorption of the b-particles and absorption within the counter window. Toreduce the self-absorption losses, it is desirable to mix the active samplehomogeneously with the detecting material. This can be done by counting thesample in the gaseous phase. The gaseous activity can then be intimately mixedwith the filling gas of any type of gas ionization detector, thus minimizing theeffect of b-absorption and resulting in high counting efficiencies.
In this, the radioactive sample and a scintillator material are both dissolved ina suitable solvent, and the resulting scintillations are detected and counted.292,293
The method is called liquid scintillation counting. If a compound containing ana- or b-emitting isotope is dissolved in a solvent such as toluene, the radioactiveemissions result in the formation of electronically excited solvent molecules. Ifthe solution also contains a small amount of a suitable scintillator, the excitedsolvent molecules rapidly transfer their excitation energy to the scintillator,forming electronically excited scintillator molecules, which then relax by theemission of photons. All scintillator solutions contain: a solvent, a primarysolute, the scintillator material; and may contain a secondary solute. The func-tions of the solvent are to keep the scintillator or solute in solution, and to absorbthe decay energy of the radioisotope for subsequent transfer to the solute.Solvents may be effective, e.g., aromatic hydrocarbons such as toluene andxylene; moderate, e.g., many nonaromatic hydrocarbons and poor solvents.
5. APPLICATION OF SOLVENT EXTRACTION INBIOCHEMICAL AND PHARMACEUTICAL SEPARATIONS
5.1. Application of Solvent Extraction in BiotechnologicalSeparations
The recovery of products from biotechnological processes has traditionallybeen focused on separation approaches, such as electrophoresis or column
273Chapter | 5 Examples of Application of Solvent Extraction Techniques
liquid chromatography. These methods are difficult to scale up toproduction levels and often become expensive for medium and low-valueproducts.
Recently liquid extraction has been recognized as a potential method inthe primary recovery of fermentation cell culture products, such as carboxylicacids, proteins and amino acids. The separation problem, however, is difficultbecause the product mixtures are often complex, including cell debrisand enzymes. Proteins are not suitable for conventional solvent extractionbecause of incompatibility with organic solvents, but can be handled inaqueous two-phase systems or by extraction in reverse micellar systems (seebelow).
Although biotechnological processes often have been stated to be energyefficient in that the reaction temperature is low, it is important to realize that theproduct concentrations are low and that the product recovery step is often themost energy consuming.
5.1.1. Carboxylic Acids Separation
Citric Acid
Solvent extraction has been proposed as an alternative for the separation oforganic and amino acids from fermentation broth.294 Citric acid can beextracted by both high molecular weight amines and organophosphatesolvating reagents. Important criteria have been established for the pro-cessing of citric acid by solvent extraction: a distribution coefficient <10allows for easy stripping with water. Stripping with water is importantbecause, although the citric acid could be recovered with a base, theformation of a citrate salt would require further processing as in theconventional flow sheet, thus removing the advantages of solvent extraction.Extractant system with tri-n-butylphosphate (TBP) in Shellsol is shown inFig. 5.21. A diluent was temperature dependent with extraction decreasingwith increasing temperature. Therefore, extraction from the broth at roomtemperature and water stripping at higher temperature (60–70 �C) providedan efficient process (see Fig. 5.21). The extraction with long-chain amineswas hampered by the formation of emulsions and thus poor separation.Adding a modifier, such as octanol, stops emulsion formation. Alamine 336/Shellsol A/octanol gives the best separation.
Acetic Acid
Acetic acid is an important intermediate organic tonnage chemical that may beproduced by fermentation. Several technologies have been applied to thisseparation, including solvent extraction, azeotropic distillation, and extractivedistillation. A comparison of economics between azeotropic distillation andsolvent extraction combined with azeotropic distillation shows that the solvent
274 PART | I Conventional (Classical) Principles and Practice
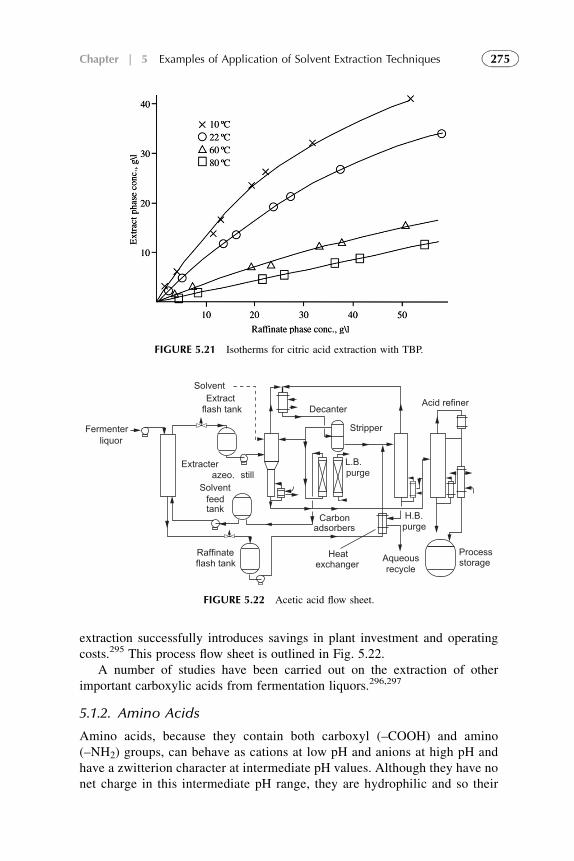
extraction successfully introduces savings in plant investment and operatingcosts.295 This process flow sheet is outlined in Fig. 5.22.
A number of studies have been carried out on the extraction of otherimportant carboxylic acids from fermentation liquors.296,297
5.1.2. Amino Acids
Amino acids, because they contain both carboxyl (–COOH) and amino(–NH2) groups, can behave as cations at low pH and anions at high pH andhave a zwitterion character at intermediate pH values. Although they have nonet charge in this intermediate pH range, they are hydrophilic and so their
FIGURE 5.21 Isotherms for citric acid extraction with TBP.
Fermenterliquor
Solvent
Solventazeo. still
Extract
Extracter
flash tank
flash tankRaffinate
feedtank
Decanter
L.B.purge
purgeCarbon
adsorbers
Heat Aqueousrecycleexchanger
H.B.
Processstorage
Acid refiner
Stripper
FIGURE 5.22 Acetic acid flow sheet.
275Chapter | 5 Examples of Application of Solvent Extraction Techniques
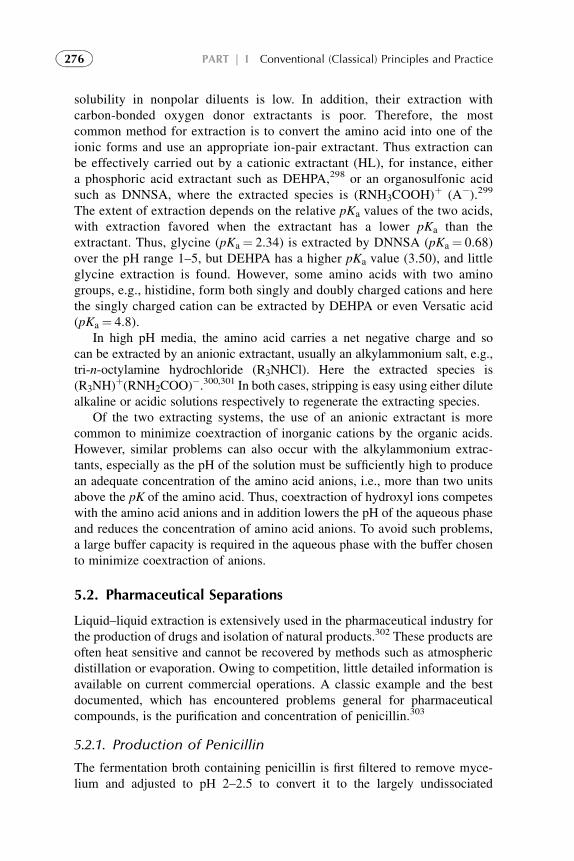
solubility in nonpolar diluents is low. In addition, their extraction withcarbon-bonded oxygen donor extractants is poor. Therefore, the mostcommon method for extraction is to convert the amino acid into one of theionic forms and use an appropriate ion-pair extractant. Thus extraction canbe effectively carried out by a cationic extractant (HL), for instance, eithera phosphoric acid extractant such as DEHPA,298 or an organosulfonic acidsuch as DNNSA, where the extracted species is (RNH3COOH)
þ (A�).299
The extent of extraction depends on the relative pKa values of the two acids,with extraction favored when the extractant has a lower pKa than theextractant. Thus, glycine (pKa¼ 2.34) is extracted by DNNSA (pKa¼ 0.68)over the pH range 1–5, but DEHPA has a higher pKa value (3.50), and littleglycine extraction is found. However, some amino acids with two aminogroups, e.g., histidine, form both singly and doubly charged cations and herethe singly charged cation can be extracted by DEHPA or even Versatic acid(pKa¼ 4.8).
In high pH media, the amino acid carries a net negative charge and socan be extracted by an anionic extractant, usually an alkylammonium salt, e.g.,tri-n-octylamine hydrochloride (R3NHCl). Here the extracted species is(R3NH)
þ(RNH2COO)�.300,301 In both cases, stripping is easy using either dilute
alkaline or acidic solutions respectively to regenerate the extracting species.Of the two extracting systems, the use of an anionic extractant is more
common to minimize coextraction of inorganic cations by the organic acids.However, similar problems can also occur with the alkylammonium extrac-tants, especially as the pH of the solution must be sufficiently high to producean adequate concentration of the amino acid anions, i.e., more than two unitsabove the pK of the amino acid. Thus, coextraction of hydroxyl ions competeswith the amino acid anions and in addition lowers the pH of the aqueous phaseand reduces the concentration of amino acid anions. To avoid such problems,a large buffer capacity is required in the aqueous phase with the buffer chosento minimize coextraction of anions.
5.2. Pharmaceutical Separations
Liquid–liquid extraction is extensively used in the pharmaceutical industry forthe production of drugs and isolation of natural products.302 These products areoften heat sensitive and cannot be recovered by methods such as atmosphericdistillation or evaporation. Owing to competition, little detailed information isavailable on current commercial operations. A classic example and the bestdocumented, which has encountered problems general for pharmaceuticalcompounds, is the purification and concentration of penicillin.303
5.2.1. Production of Penicillin
The fermentation broth containing penicillin is first filtered to remove myce-lium and adjusted to pH 2–2.5 to convert it to the largely undissociated
276 PART | I Conventional (Classical) Principles and Practice
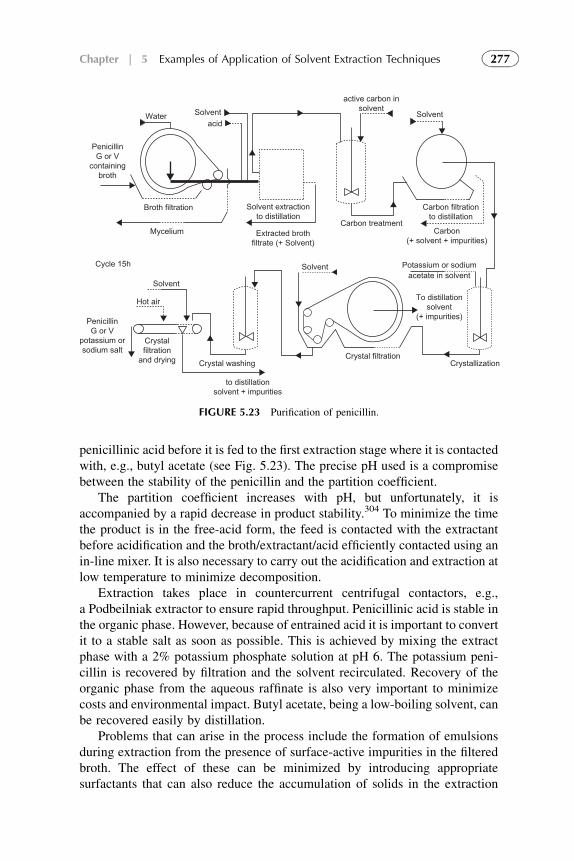
penicillinic acid before it is fed to the first extraction stage where it is contactedwith, e.g., butyl acetate (see Fig. 5.23). The precise pH used is a compromisebetween the stability of the penicillin and the partition coefficient.
The partition coefficient increases with pH, but unfortunately, it isaccompanied by a rapid decrease in product stability.304 To minimize the timethe product is in the free-acid form, the feed is contacted with the extractantbefore acidification and the broth/extractant/acid efficiently contacted using anin-line mixer. It is also necessary to carry out the acidification and extraction atlow temperature to minimize decomposition.
Extraction takes place in countercurrent centrifugal contactors, e.g.,a Podbeilniak extractor to ensure rapid throughput. Penicillinic acid is stable inthe organic phase. However, because of entrained acid it is important to convertit to a stable salt as soon as possible. This is achieved by mixing the extractphase with a 2% potassium phosphate solution at pH 6. The potassium peni-cillin is recovered by filtration and the solvent recirculated. Recovery of theorganic phase from the aqueous raffinate is also very important to minimizecosts and environmental impact. Butyl acetate, being a low-boiling solvent, canbe recovered easily by distillation.
Problems that can arise in the process include the formation of emulsionsduring extraction from the presence of surface-active impurities in the filteredbroth. The effect of these can be minimized by introducing appropriatesurfactants that can also reduce the accumulation of solids in the extraction
Water
PenicillinG or V
containingbroth
PenicillinG or V
potassium orsodium salt
Crystalfiltration
and drying Crystal filtrationCrystallizationCrystal washing
to distillationsolvent + impurities
Broth filtration
Mycelium
Cycle 15h
Solvent
Hot air
Solvent
Solvent extractionto distillation
Solvent
Solvent
acetate in solvent
To distillationsolvent
(+ impurities)
Potassium or sodium
active carbon insolvent
Extracted brothfiltrate (+ Solvent)
Carbon(+ solvent + impurities)
Carbon treatment
Carbon filtrationto distillation
acid
FIGURE 5.23 Purification of penicillin.
277Chapter | 5 Examples of Application of Solvent Extraction Techniques
equipment. In addition, other organic impurities are present that can be coex-tracted with the penicillin. It has been found that a number of these can beremoved by adsorption onto active carbon.
Most of the penicillin is used as intermediates in the production of, e.g.,cephalosporin, but if it is necessary to produce pure penicillin for pharma-ceutical use, it can be purified by reextraction at pH 2–2.5 and further strippingwith a phosphate solution at pH 6. This extraction of penicillin is an example ofthe direct use of a polar organic compound to partition a solute. An alternativeprocess that has been considered is to use organic reagents that form ion pairswith penicillin.305 Here the authors found that the penicillin anion could beextracted efficiently with a secondary amine (Amberlite LA-2) in the pH range5–7 where the product is most stable. This type of process is used extensively inhydrometallurgy and can be used to extract both anionic species using cationsas shown earlier, or cationic species using organic acid anions. In hydromet-allurgy, the system normally uses a hydrocarbon diluent, but for pharmaceuticalapplications more polar diluents are generally required.
Although the use of such chemically assisted extraction procedures isunlikely to displace the established extraction processes for commercialextraction of penicillin, there are a number of other systems in biotechnologywhere ion pair formation is used.
6. APPLICATION OF SOLVENT EXTRACTION IN ORGANICAND BIOFUELS SEPARATION
6.1. Petroleum and Petrochemical Processing
Oil refineries and the petrochemical industry constitute one of the largestapplication areas for liquid extraction. Other applications in this field are thetreatment of lubricating oils and the separation of aromatic and aliphatichydrocarbons. One more example is the production of high-purity fiber-gradecaprolactam. The success of solvent extraction in the petroleum and petro-chemical industry is due to careful process integration and also the develop-ment of large-scale column extractors.
The development of different processes and solvents for the separation ofaromatics from aliphatics has reached a rather stable state. A number ofdifferent processes, some of them with capacities of several hundred thousandtons of aromatics per year, are in operation. The more important ones are listedin Table 5.18.
6.1.1. The Union Carbide Process
The process equipment consists mainly of two extraction columns withpulsating trays and four distillation columns according to Fig. 5.24.306 Thefeed, with a high content of aromatics, is pumped to the middle of the firstextraction column where the aromatics are extracted with the solvent S1
278 PART | I Conventional (Classical) Principles and Practice
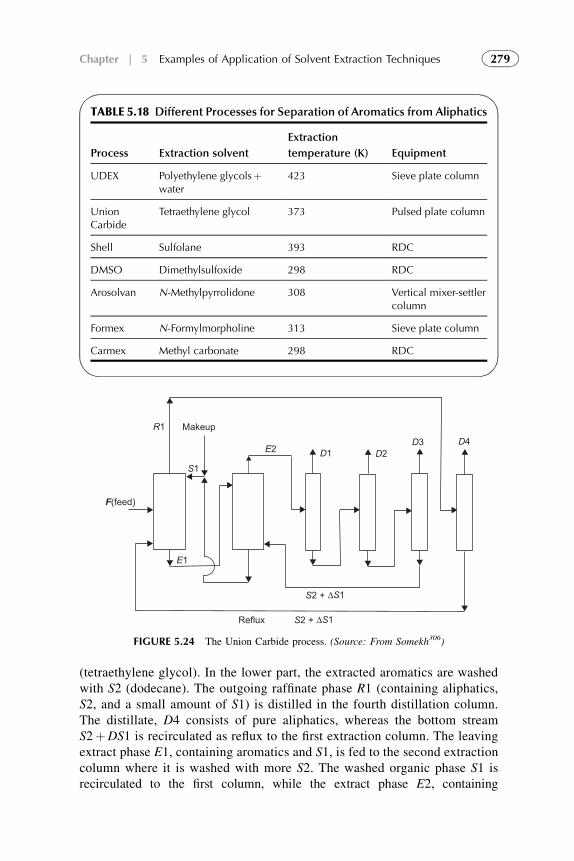
(tetraethylene glycol). In the lower part, the extracted aromatics are washedwith S2 (dodecane). The outgoing raffinate phase R1 (containing aliphatics,S2, and a small amount of S1) is distilled in the fourth distillation column.The distillate, D4 consists of pure aliphatics, whereas the bottom streamS2þDS1 is recirculated as reflux to the first extraction column. The leavingextract phase E1, containing aromatics and S1, is fed to the second extractioncolumn where it is washed with more S2. The washed organic phase S1 isrecirculated to the first column, while the extract phase E2, containing
TABLE 5.18 Different Processes for Separation of Aromatics from Aliphatics
Process Extraction solvent
Extraction
temperature (K) Equipment
UDEX Polyethylene glycolsþwater
423 Sieve plate column
UnionCarbide
Tetraethylene glycol 373 Pulsed plate column
Shell Sulfolane 393 RDC
DMSO Dimethylsulfoxide 298 RDC
Arosolvan N-Methylpyrrolidone 308 Vertical mixer-settlercolumn
Formex N-Formylmorpholine 313 Sieve plate column
Carmex Methyl carbonate 298 RDC
R1 Makeup
F(feed)
S1
S2
E2
E1
D1 D2D3 D4
Reflux + S1Δ
S2 + S1Δ
FIGURE 5.24 The Union Carbide process. (Source: From Somekh306)
279Chapter | 5 Examples of Application of Solvent Extraction Techniques
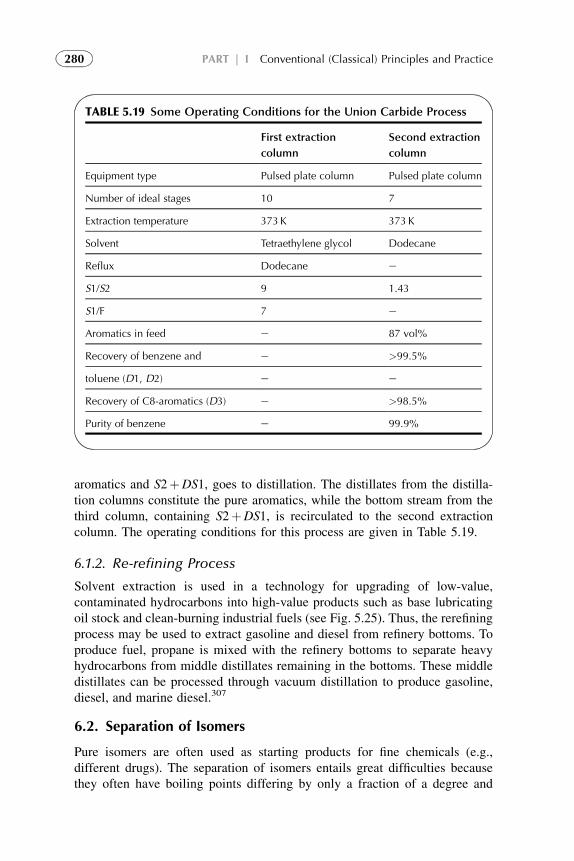
aromatics and S2þDS1, goes to distillation. The distillates from the distilla-tion columns constitute the pure aromatics, while the bottom stream from thethird column, containing S2þDS1, is recirculated to the second extractioncolumn. The operating conditions for this process are given in Table 5.19.
6.1.2. Re-refining Process
Solvent extraction is used in a technology for upgrading of low-value,contaminated hydrocarbons into high-value products such as base lubricatingoil stock and clean-burning industrial fuels (see Fig. 5.25). Thus, the rerefiningprocess may be used to extract gasoline and diesel from refinery bottoms. Toproduce fuel, propane is mixed with the refinery bottoms to separate heavyhydrocarbons from middle distillates remaining in the bottoms. These middledistillates can be processed through vacuum distillation to produce gasoline,diesel, and marine diesel.307
6.2. Separation of Isomers
Pure isomers are often used as starting products for fine chemicals (e.g.,different drugs). The separation of isomers entails great difficulties becausethey often have boiling points differing by only a fraction of a degree and
TABLE 5.19 Some Operating Conditions for the Union Carbide Process
First extraction
column
Second extraction
column
Equipment type Pulsed plate column Pulsed plate column
Number of ideal stages 10 7
Extraction temperature 373K 373K
Solvent Tetraethylene glycol Dodecane
Reflux Dodecane e
S1/S2 9 1.43
S1/F 7 e
Aromatics in feed e 87 vol%
Recovery of benzene and e >99.5%
toluene (D1, D2) e e
Recovery of C8-aromatics (D3) e >98.5%
Purity of benzene e 99.9%
280 PART | I Conventional (Classical) Principles and Practice
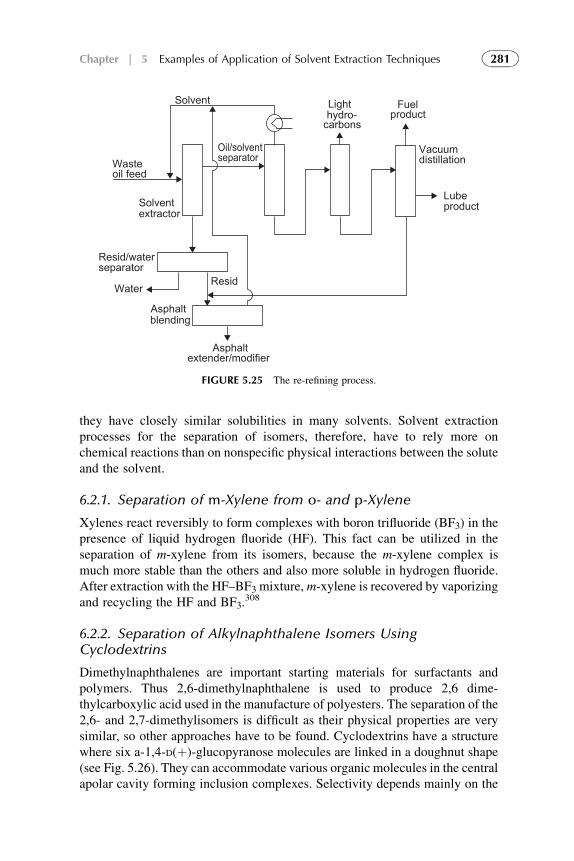
they have closely similar solubilities in many solvents. Solvent extractionprocesses for the separation of isomers, therefore, have to rely more onchemical reactions than on nonspecific physical interactions between the soluteand the solvent.
6.2.1. Separation of m-Xylene from o- and p-Xylene
Xylenes react reversibly to form complexes with boron trifluoride (BF3) in thepresence of liquid hydrogen fluoride (HF). This fact can be utilized in theseparation of m-xylene from its isomers, because the m-xylene complex ismuch more stable than the others and also more soluble in hydrogen fluoride.After extraction with the HF–BF3 mixture,m-xylene is recovered by vaporizingand recycling the HF and BF3.
308
6.2.2. Separation of Alkylnaphthalene Isomers UsingCyclodextrins
Dimethylnaphthalenes are important starting materials for surfactants andpolymers. Thus 2,6-dimethylnaphthalene is used to produce 2,6 dime-thylcarboxylic acid used in the manufacture of polyesters. The separation of the2,6- and 2,7-dimethylisomers is difficult as their physical properties are verysimilar, so other approaches have to be found. Cyclodextrins have a structurewhere six a-1,4-D(þ)-glucopyranose molecules are linked in a doughnut shape(see Fig. 5.26). They can accommodate various organic molecules in the centralapolar cavity forming inclusion complexes. Selectivity depends mainly on the
Solvent
Solventextractor
Oil/solventseparator
separator
Light Fuelproduct
product
Vacuumdistillation
Lube
hydro-carbons
Wasteoil feed
Resid/water
WaterResid
Asphalt
Asphalt
blending
extender/modifier
FIGURE 5.25 The re-refining process.
281Chapter | 5 Examples of Application of Solvent Extraction Techniques
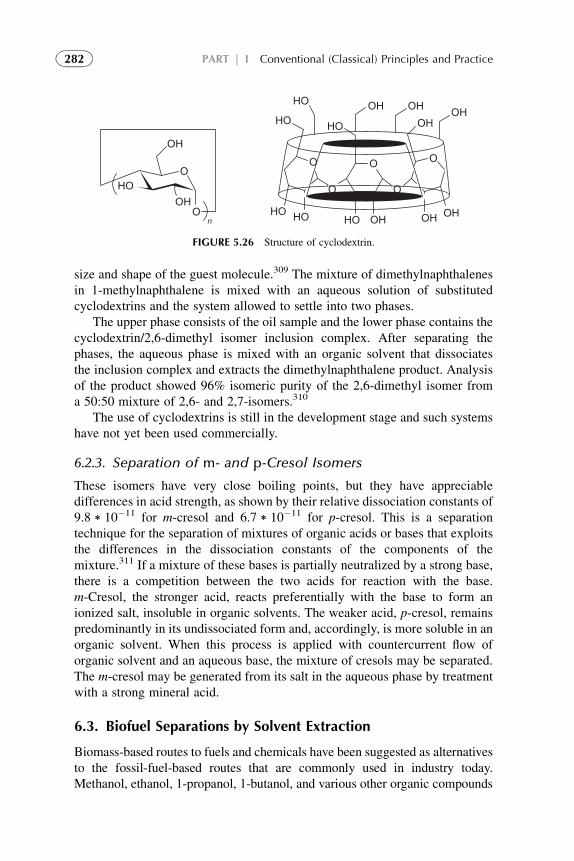
size and shape of the guest molecule.309 The mixture of dimethylnaphthalenesin 1-methylnaphthalene is mixed with an aqueous solution of substitutedcyclodextrins and the system allowed to settle into two phases.
The upper phase consists of the oil sample and the lower phase contains thecyclodextrin/2,6-dimethyl isomer inclusion complex. After separating thephases, the aqueous phase is mixed with an organic solvent that dissociatesthe inclusion complex and extracts the dimethylnaphthalene product. Analysisof the product showed 96% isomeric purity of the 2,6-dimethyl isomer froma 50:50 mixture of 2,6- and 2,7-isomers.310
The use of cyclodextrins is still in the development stage and such systemshave not yet been used commercially.
6.2.3. Separation of m- and p-Cresol Isomers
These isomers have very close boiling points, but they have appreciabledifferences in acid strength, as shown by their relative dissociation constants of9.8) 10�11 for m-cresol and 6.7) 10�11 for p-cresol. This is a separationtechnique for the separation of mixtures of organic acids or bases that exploitsthe differences in the dissociation constants of the components of themixture.311 If a mixture of these bases is partially neutralized by a strong base,there is a competition between the two acids for reaction with the base.m-Cresol, the stronger acid, reacts preferentially with the base to form anionized salt, insoluble in organic solvents. The weaker acid, p-cresol, remainspredominantly in its undissociated form and, accordingly, is more soluble in anorganic solvent. When this process is applied with countercurrent flow oforganic solvent and an aqueous base, the mixture of cresols may be separated.The m-cresol may be generated from its salt in the aqueous phase by treatmentwith a strong mineral acid.
6.3. Biofuel Separations by Solvent Extraction
Biomass-based routes to fuels and chemicals have been suggested as alternativesto the fossil-fuel-based routes that are commonly used in industry today.Methanol, ethanol, 1-propanol, 1-butanol, and various other organic compounds
OH
OH OHOH
OH
OHOHOHOH
HO
HOHOHO
HO
HO
HO
OO O O
OO
On
FIGURE 5.26 Structure of cyclodextrin.
282 PART | I Conventional (Classical) Principles and Practice
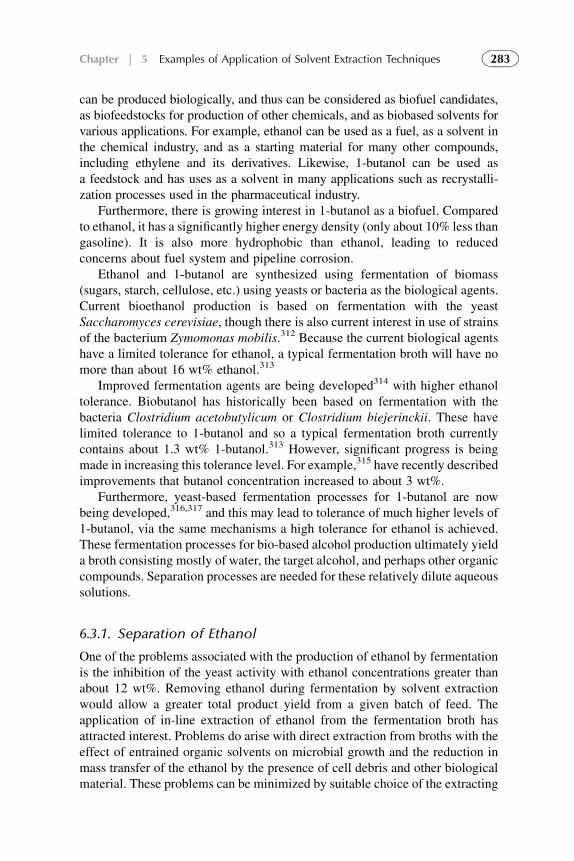
can be produced biologically, and thus can be considered as biofuel candidates,as biofeedstocks for production of other chemicals, and as biobased solvents forvarious applications. For example, ethanol can be used as a fuel, as a solvent inthe chemical industry, and as a starting material for many other compounds,including ethylene and its derivatives. Likewise, 1-butanol can be used asa feedstock and has uses as a solvent in many applications such as recrystalli-zation processes used in the pharmaceutical industry.
Furthermore, there is growing interest in 1-butanol as a biofuel. Comparedto ethanol, it has a significantly higher energy density (only about 10% less thangasoline). It is also more hydrophobic than ethanol, leading to reducedconcerns about fuel system and pipeline corrosion.
Ethanol and 1-butanol are synthesized using fermentation of biomass(sugars, starch, cellulose, etc.) using yeasts or bacteria as the biological agents.Current bioethanol production is based on fermentation with the yeastSaccharomyces cerevisiae, though there is also current interest in use of strainsof the bacterium Zymomonas mobilis.312 Because the current biological agentshave a limited tolerance for ethanol, a typical fermentation broth will have nomore than about 16 wt% ethanol.313
Improved fermentation agents are being developed314 with higher ethanoltolerance. Biobutanol has historically been based on fermentation with thebacteria Clostridium acetobutylicum or Clostridium biejerinckii. These havelimited tolerance to 1-butanol and so a typical fermentation broth currentlycontains about 1.3 wt% 1-butanol.313 However, significant progress is beingmade in increasing this tolerance level. For example,315 have recently describedimprovements that butanol concentration increased to about 3 wt%.
Furthermore, yeast-based fermentation processes for 1-butanol are nowbeing developed,316,317 and this may lead to tolerance of much higher levels of1-butanol, via the same mechanisms a high tolerance for ethanol is achieved.These fermentation processes for bio-based alcohol production ultimately yielda broth consisting mostly of water, the target alcohol, and perhaps other organiccompounds. Separation processes are needed for these relatively dilute aqueoussolutions.
6.3.1. Separation of Ethanol
One of the problems associated with the production of ethanol by fermentationis the inhibition of the yeast activity with ethanol concentrations greater thanabout 12 wt%. Removing ethanol during fermentation by solvent extractionwould allow a greater total product yield from a given batch of feed. Theapplication of in-line extraction of ethanol from the fermentation broth hasattracted interest. Problems do arise with direct extraction from broths with theeffect of entrained organic solvents on microbial growth and the reduction inmass transfer of the ethanol by the presence of cell debris and other biologicalmaterial. These problems can be minimized by suitable choice of the extracting
283Chapter | 5 Examples of Application of Solvent Extraction Techniques
solvent, e.g., long-chain aliphatic alcohols such as butanol, hexanol, etc., andremoval of cell debris by filtration.318 The process operates as a closed loopwith the filtered broth circulating through a suitable column extractor beforereturning to the fermenter via a carbon column to remove residual organicsolvent (see Fig. 5.27).
7. SOLVENT EXTRACTION IN RECOVERY OF WASTEAND WASTEWATER TREATMENT
Recently the protection of the environment has become increasingly importantfor industry with the requirement that the potential impact on the environmentis considered for all aspects of industrial processes. Such considerations aresupported by environmental legislation that controls all types of emissions aswell as the treatment of wastes. Limits for discharge into the aqueous envi-ronment have been established. The problems can be minimized by ensuringthat the treated solutions are recycled within the plant and that any solutionsdischarged into the environment are treated appropriately to remove entrainedorganic compounds and residual toxic metals.
Many technologies could be applied to treatment of these wastes: precipi-tation, adsorption, electrolysis, more recently developed ion exchange andmembrane processes. The flow sheet finally chosen will depend on a number offactors, including the precise composition of the waste, local expertize, disposaloptions, and of course the overall economics. As a rule, the flow sheet mayinvolve more than one technique. This chapter concentrates on the applicationsof solvent extraction which is the most appropriate technique for treatment ofliquid wastes. Usually, solvent extraction processes have low costs for chem-icals and energy. It seems to be good for application in the treatment of both,solid (with leaching) and liquid wastes.
Fermentor
Carboncolumn
columnExtraction
Ultrafilter
FIGURE 5.27 Extraction of alcohol.
284 PART | I Conventional (Classical) Principles and Practice
7.1. Solvent Extraction in Metal Waste Treatment
Metal pollution can arise from a number of different sources. The mostimportant metalliferous liquid effluents where solvent extraction could beapplied are from the various metal finishing operations: plating, pickling,etching, and the wash waters arising from the cleaning of work pieces. Somesources examples:
1. Mine waters, leachates from solid residues from the processing of primaryminerals such as flotation and leach residues, and from landfill;
2. Metal treatment processing including coating (zinc), plating (chromium,nickel, copper), neutralization sludge from the plating industries, pickling(hydrofluoric acid, iron), etching solutions, including rinse waters;
3. Chemical wastes from other industries: tanning (chromium), photographic(silver), electronic (copper, silver, gold, nickel, lead, cadmium)
4. There are more metal-containing solid wastes that may undergo leaching ifdisposed to land: spent catalysts (cobalt, nickel, vanadium); spent batteries(nickel, cadmium, lithium, lead); combustion ashes, flue dust from steel andbrass mills, ash and scrap from industrial production, etc.
In the treatment of waste, the objectives must be:
1. to remove the metals effectively so as to produce a liquid waste streamcapable of reuse or finally meeting environmental discharge limits
2. to recover the metals for recycling within the plant, or at appropriate purityfor sale
3. to separate other impurities in a form for resale as by-products or safe envi-ronmental discharge.
These principles are embodied in the concepts of zero discharge and sustain-able technology.
As metal containing wastes differ widely in nature and complexity, selectiveseparation techniques such as solvent extraction will be of increasing impor-tance. To use solvent extraction for metal separation, it is first necessary to havethe metals dissolved in an aqueous solution. Starting with a solid wastematerial, the initial treatment is therefore a leaching procedure to provide anaqueous solution from which the metals may be recovered.
7.1.1. Treatment of Acidic Metal Waste Solutions
It is clear from the previous chapters that extraction by acidic extractantsdecreases with decreasing pH. In addition, the extraction of each metal ion(Mzþ) liberates z hydrogen ions (Hþ), from the extractant. This means that thepH decreases with extraction, resulting in decreased transfer of metal to theorganic solvent. Thus, the more metal in solution and the higher acidity, the lessis extracted, no matter how many stages are used.
285Chapter | 5 Examples of Application of Solvent Extraction Techniques
For example, the extraction of nickel with di-(2-ethylhexyl)phosphoricacid (DEHPA) at a pH below 3 is <10%. If the extraction of nickel is carriedout between pH 3–4, the extraction of about 0.3 g/dm3 Ni2þ will decrease thepH to below 3 and the mass transfer of nickel will stop. For copper, theextraction is performed between pH 2–3 and thus, an amount of 3 g/dm3 Cu2þ
will decrease the pH from 3 to 2 and again extraction will stop.To allow a higher extraction capacity (net transfer) and avoid the influence
of liberated Hþ ions, simultaneous neutralization with NaOH directed into themixer is used. Such an example is described later, where nickel is extractedfrom a cadmium electrolyte. Other means of controlling the pH includes the useof acid extractants in either alkaline (NH4
þL) or neutral (NaþL) form.An increase of the net transfer of zinc was reported319 for the extraction
with DEHPA (50%) in kerosene of zinc from a feed solution containing 40 gdm_3 Zn, emanating from the leaching of steel furnace dust. The resultingraffinate, with a residual Zn concentration of 15–20 g/dm3, was recycled toleaching. Comparable net transfer conditions were obtained320 in the modifiedZincex process (MZP) for the processing of spent domestic batteries.
Similar high transfer of copper in a solvent extraction procedure has beenrecently reported.321 After pressure leaching to liberate copper (60 g/dm3)under conditions that minimize the free acid (pH¼ 1.4) and iron in solution,copper was extracted to 10 g/dm3 in three stages with loading in the organicphase of 12.5 g/dm3. The situation described is valid in sulfuric acid solutions,when no strong metal complexes are formed.
However with hydrochloric acid the formation of metal chloride complexesmakes the situation quite different. For example, the separation of zinc andiron(III) can be achieved at a low chloride concentration, and later the sepa-ration of cobalt and nickel is described. The disadvantage of using the chloridesystem is concerned with stripping. For example, when a zinc chloride complexZnCl4
2� is extracted with a tertiary amine, the stripped species corresponds toZnCl2, resulting in an increased chloride concentration and an interruption ofthe mass transfer. The consequence of this is that it is difficult to achieveconcentrated zinc chloride strip liquors.
Several specific examples of metal extraction from the acidic wastessolutions are presented below.
Extraction of Zinc from Weak Acid Effluents
This example describes the extraction of zinc from weak acid solutions. In themanufacture of rayon, rinse waters and other zinc-containing liquid effluentsare produced. The total liquid effluent in a rayon plant may amount to severalcubic meters per minute with a zinc concentration of 0.1–1 g/dm3 andpH¼ 1.5–2. In addition to zinc, the effluent contains surface-active agents anddirt (organic fibers and inorganic sulfide solids).
Solvent extraction has successfully been used to recycle the zinc back to theoperation (see Fig. 5.28). Zinc is extracted to greater than 95% (pH > 2) with
286 PART | I Conventional (Classical) Principles and Practice
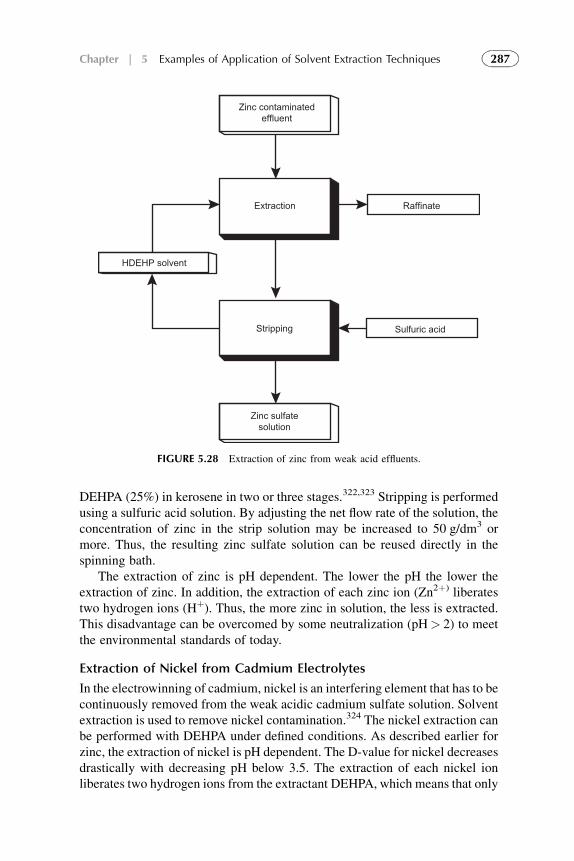
DEHPA (25%) in kerosene in two or three stages.322,323 Stripping is performedusing a sulfuric acid solution. By adjusting the net flow rate of the solution, theconcentration of zinc in the strip solution may be increased to 50 g/dm3 ormore. Thus, the resulting zinc sulfate solution can be reused directly in thespinning bath.
The extraction of zinc is pH dependent. The lower the pH the lower theextraction of zinc. In addition, the extraction of each zinc ion (Zn2þ) liberatestwo hydrogen ions (Hþ). Thus, the more zinc in solution, the less is extracted.This disadvantage can be overcomed by some neutralization (pH> 2) to meetthe environmental standards of today.
Extraction of Nickel from Cadmium Electrolytes
In the electrowinning of cadmium, nickel is an interfering element that has to becontinuously removed from the weak acidic cadmium sulfate solution. Solventextraction is used to remove nickel contamination.324 The nickel extraction canbe performed with DEHPA under defined conditions. As described earlier forzinc, the extraction of nickel is pH dependent. The D-value for nickel decreasesdrastically with decreasing pH below 3.5. The extraction of each nickel ionliberates two hydrogen ions from the extractant DEHPA, which means that only
Zinc contaminatedeffluent
RaffinateExtraction
Stripping
Zinc sulfatesolution
Sulfuric acid
HDEHP solvent
FIGURE 5.28 Extraction of zinc from weak acid effluents.
287Chapter | 5 Examples of Application of Solvent Extraction Techniques
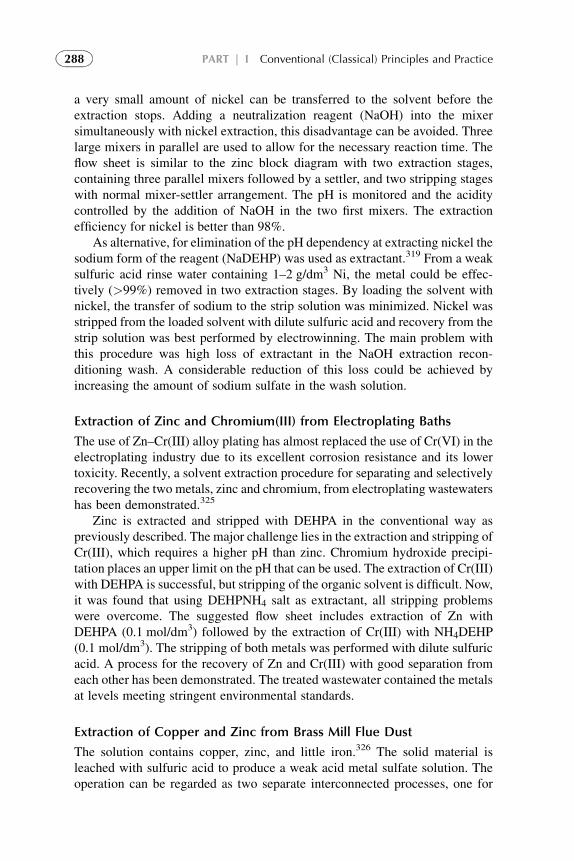
a very small amount of nickel can be transferred to the solvent before theextraction stops. Adding a neutralization reagent (NaOH) into the mixersimultaneously with nickel extraction, this disadvantage can be avoided. Threelarge mixers in parallel are used to allow for the necessary reaction time. Theflow sheet is similar to the zinc block diagram with two extraction stages,containing three parallel mixers followed by a settler, and two stripping stageswith normal mixer-settler arrangement. The pH is monitored and the aciditycontrolled by the addition of NaOH in the two first mixers. The extractionefficiency for nickel is better than 98%.
As alternative, for elimination of the pH dependency at extracting nickel thesodium form of the reagent (NaDEHP) was used as extractant.319 From a weaksulfuric acid rinse water containing 1–2 g/dm3 Ni, the metal could be effec-tively (>99%) removed in two extraction stages. By loading the solvent withnickel, the transfer of sodium to the strip solution was minimized. Nickel wasstripped from the loaded solvent with dilute sulfuric acid and recovery from thestrip solution was best performed by electrowinning. The main problem withthis procedure was high loss of extractant in the NaOH extraction recon-ditioning wash. A considerable reduction of this loss could be achieved byincreasing the amount of sodium sulfate in the wash solution.
Extraction of Zinc and Chromium(III) from Electroplating Baths
The use of Zn–Cr(III) alloy plating has almost replaced the use of Cr(VI) in theelectroplating industry due to its excellent corrosion resistance and its lowertoxicity. Recently, a solvent extraction procedure for separating and selectivelyrecovering the two metals, zinc and chromium, from electroplating wastewatershas been demonstrated.325
Zinc is extracted and stripped with DEHPA in the conventional way aspreviously described. The major challenge lies in the extraction and stripping ofCr(III), which requires a higher pH than zinc. Chromium hydroxide precipi-tation places an upper limit on the pH that can be used. The extraction of Cr(III)with DEHPA is successful, but stripping of the organic solvent is difficult. Now,it was found that using DEHPNH4 salt as extractant, all stripping problemswere overcome. The suggested flow sheet includes extraction of Zn withDEHPA (0.1 mol/dm3) followed by the extraction of Cr(III) with NH4DEHP(0.1 mol/dm3). The stripping of both metals was performed with dilute sulfuricacid. A process for the recovery of Zn and Cr(III) with good separation fromeach other has been demonstrated. The treated wastewater contained the metalsat levels meeting stringent environmental standards.
Extraction of Copper and Zinc from Brass Mill Flue Dust
The solution contains copper, zinc, and little iron.326 The solid material isleached with sulfuric acid to produce a weak acid metal sulfate solution. Theoperation can be regarded as two separate interconnected processes, one for
288 PART | I Conventional (Classical) Principles and Practice
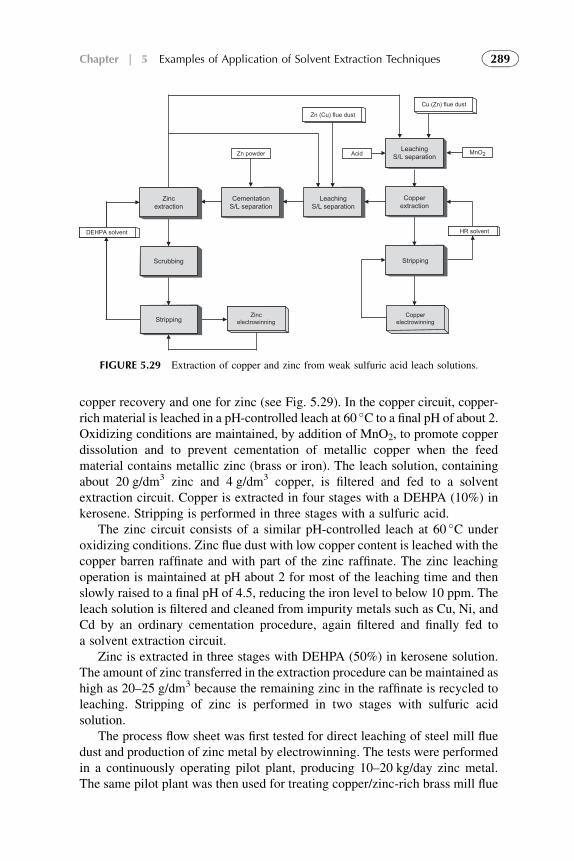
copper recovery and one for zinc (see Fig. 5.29). In the copper circuit, copper-rich material is leached in a pH-controlled leach at 60 �C to a final pH of about 2.Oxidizing conditions are maintained, by addition of MnO2, to promote copperdissolution and to prevent cementation of metallic copper when the feedmaterial contains metallic zinc (brass or iron). The leach solution, containingabout 20 g/dm3 zinc and 4 g/dm3 copper, is filtered and fed to a solventextraction circuit. Copper is extracted in four stages with a DEHPA (10%) inkerosene. Stripping is performed in three stages with a sulfuric acid.
The zinc circuit consists of a similar pH-controlled leach at 60 �C underoxidizing conditions. Zinc flue dust with low copper content is leached with thecopper barren raffinate and with part of the zinc raffinate. The zinc leachingoperation is maintained at pH about 2 for most of the leaching time and thenslowly raised to a final pH of 4.5, reducing the iron level to below 10 ppm. Theleach solution is filtered and cleaned from impurity metals such as Cu, Ni, andCd by an ordinary cementation procedure, again filtered and finally fed toa solvent extraction circuit.
Zinc is extracted in three stages with DEHPA (50%) in kerosene solution.The amount of zinc transferred in the extraction procedure can be maintained ashigh as 20–25 g/dm3 because the remaining zinc in the raffinate is recycled toleaching. Stripping of zinc is performed in two stages with sulfuric acidsolution.
The process flow sheet was first tested for direct leaching of steel mill fluedust and production of zinc metal by electrowinning. The tests were performedin a continuously operating pilot plant, producing 10–20 kg/day zinc metal.The same pilot plant was then used for treating copper/zinc-rich brass mill flue
DEHPA solvent
Zincextraction
CementationS/L separation
Scrubbing
StrippingZinc
electrowinning
LeachingS/L separation
Copperextraction
LeachingS/L separation
Stripping
Copperelectrowinning
Zn powder
Zn (Cu) flue dust
Acid
Cu (Zn) flue dust
MnO2
HR solvent
FIGURE 5.29 Extraction of copper and zinc from weak sulfuric acid leach solutions.
289Chapter | 5 Examples of Application of Solvent Extraction Techniques
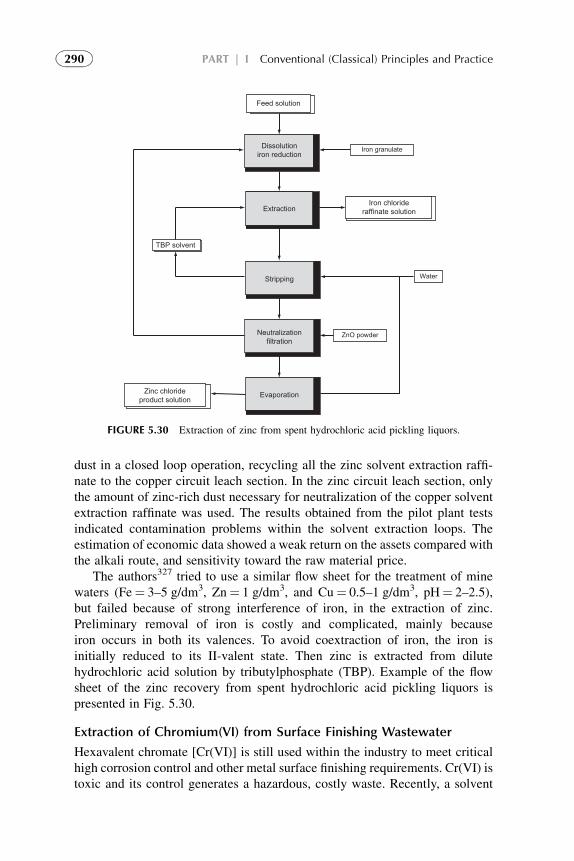
dust in a closed loop operation, recycling all the zinc solvent extraction raffi-nate to the copper circuit leach section. In the zinc circuit leach section, onlythe amount of zinc-rich dust necessary for neutralization of the copper solventextraction raffinate was used. The results obtained from the pilot plant testsindicated contamination problems within the solvent extraction loops. Theestimation of economic data showed a weak return on the assets compared withthe alkali route, and sensitivity toward the raw material price.
The authors327 tried to use a similar flow sheet for the treatment of minewaters (Fe¼ 3–5 g/dm3, Zn¼ 1 g/dm3, and Cu¼ 0.5–1 g/dm3, pH¼ 2–2.5),but failed because of strong interference of iron, in the extraction of zinc.Preliminary removal of iron is costly and complicated, mainly becauseiron occurs in both its valences. To avoid coextraction of iron, the iron isinitially reduced to its II-valent state. Then zinc is extracted from dilutehydrochloric acid solution by tributylphosphate (TBP). Example of the flowsheet of the zinc recovery from spent hydrochloric acid pickling liquors ispresented in Fig. 5.30.
Extraction of Chromium(VI) from Surface Finishing Wastewater
Hexavalent chromate [Cr(VI)] is still used within the industry to meet criticalhigh corrosion control and other metal surface finishing requirements. Cr(VI) istoxic and its control generates a hazardous, costly waste. Recently, a solvent
Feed solution
Dissolutioniron reduction
Extraction
Stripping
Neutralizationfiltration
EvaporationZinc chlorideproduct solution
ZnO powder
Water
TBP solvent
Iron chlorideraffinate solution
Iron granulate
FIGURE 5.30 Extraction of zinc from spent hydrochloric acid pickling liquors.
290 PART | I Conventional (Classical) Principles and Practice
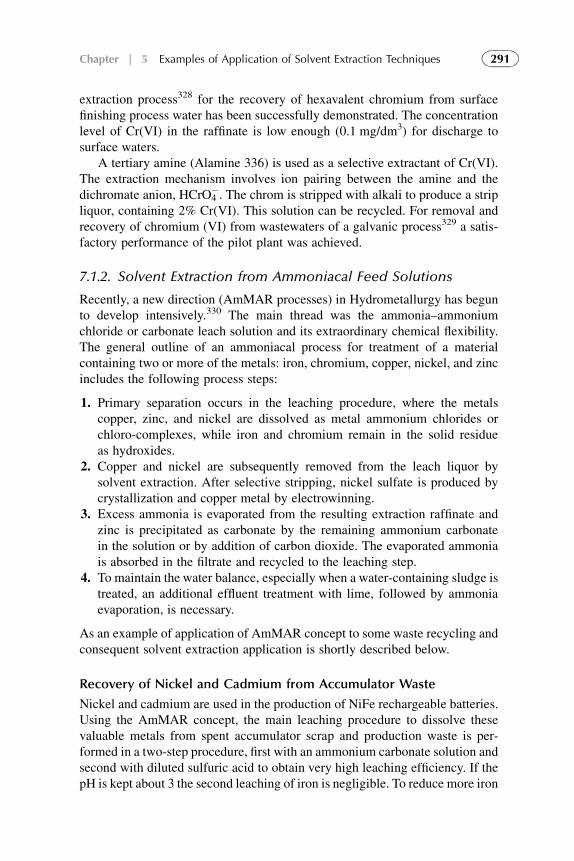
extraction process328 for the recovery of hexavalent chromium from surfacefinishing process water has been successfully demonstrated. The concentrationlevel of Cr(VI) in the raffinate is low enough (0.1 mg/dm3) for discharge tosurface waters.
A tertiary amine (Alamine 336) is used as a selective extractant of Cr(VI).The extraction mechanism involves ion pairing between the amine and thedichromate anion, HCrO4
�. The chrom is stripped with alkali to produce a stripliquor, containing 2% Cr(VI). This solution can be recycled. For removal andrecovery of chromium (VI) from wastewaters of a galvanic process329 a satis-factory performance of the pilot plant was achieved.
7.1.2. Solvent Extraction from Ammoniacal Feed Solutions
Recently, a new direction (AmMAR processes) in Hydrometallurgy has begunto develop intensively.330 The main thread was the ammonia–ammoniumchloride or carbonate leach solution and its extraordinary chemical flexibility.The general outline of an ammoniacal process for treatment of a materialcontaining two or more of the metals: iron, chromium, copper, nickel, and zincincludes the following process steps:
1. Primary separation occurs in the leaching procedure, where the metalscopper, zinc, and nickel are dissolved as metal ammonium chlorides orchloro-complexes, while iron and chromium remain in the solid residueas hydroxides.
2. Copper and nickel are subsequently removed from the leach liquor bysolvent extraction. After selective stripping, nickel sulfate is produced bycrystallization and copper metal by electrowinning.
3. Excess ammonia is evaporated from the resulting extraction raffinate andzinc is precipitated as carbonate by the remaining ammonium carbonatein the solution or by addition of carbon dioxide. The evaporated ammoniais absorbed in the filtrate and recycled to the leaching step.
4. To maintain the water balance, especially when a water-containing sludge istreated, an additional effluent treatment with lime, followed by ammoniaevaporation, is necessary.
As an example of application of AmMAR concept to some waste recycling andconsequent solvent extraction application is shortly described below.
Recovery of Nickel and Cadmium from Accumulator Waste
Nickel and cadmium are used in the production of NiFe rechargeable batteries.Using the AmMAR concept, the main leaching procedure to dissolve thesevaluable metals from spent accumulator scrap and production waste is per-formed in a two-step procedure, first with an ammonium carbonate solution andsecond with diluted sulfuric acid to obtain very high leaching efficiency. If thepH is kept about 3 the second leaching of iron is negligible. To reduce more iron
291Chapter | 5 Examples of Application of Solvent Extraction Techniques
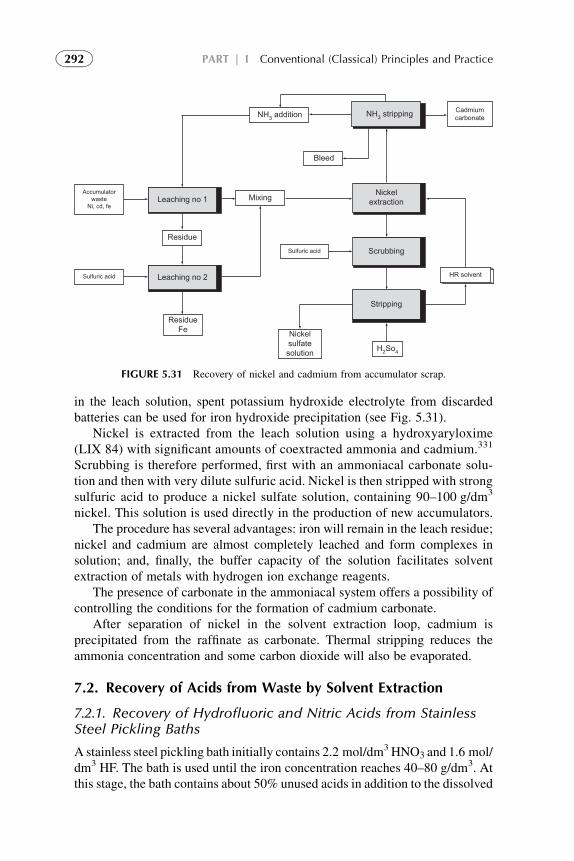
in the leach solution, spent potassium hydroxide electrolyte from discardedbatteries can be used for iron hydroxide precipitation (see Fig. 5.31).
Nickel is extracted from the leach solution using a hydroxyaryloxime(LIX 84) with significant amounts of coextracted ammonia and cadmium.331
Scrubbing is therefore performed, first with an ammoniacal carbonate solu-tion and then with very dilute sulfuric acid. Nickel is then stripped with strongsulfuric acid to produce a nickel sulfate solution, containing 90–100 g/dm3
nickel. This solution is used directly in the production of new accumulators.The procedure has several advantages: iron will remain in the leach residue;
nickel and cadmium are almost completely leached and form complexes insolution; and, finally, the buffer capacity of the solution facilitates solventextraction of metals with hydrogen ion exchange reagents.
The presence of carbonate in the ammoniacal system offers a possibility ofcontrolling the conditions for the formation of cadmium carbonate.
After separation of nickel in the solvent extraction loop, cadmium isprecipitated from the raffinate as carbonate. Thermal stripping reduces theammonia concentration and some carbon dioxide will also be evaporated.
7.2. Recovery of Acids from Waste by Solvent Extraction
7.2.1. Recovery of Hydrofluoric and Nitric Acids from StainlessSteel Pickling Baths
A stainless steel pickling bath initially contains 2.2 mol/dm3HNO3 and 1.6 mol/dm3 HF. The bath is used until the iron concentration reaches 40–80 g/dm3. Atthis stage, the bath contains about 50% unused acids in addition to the dissolved
Bleed
NH3 addition NH3 stripping Cadmiumcarbonate
Accumulatorwaste
Ni, cd, feLeaching no 1 Mixing Nickel
extraction
Residue
Sulfuric acid Leaching no 2
Sulfuric acid Scrubbing
ResidueFe Nickel
sulfatesolution
Stripping
HR solvent
H2So4
FIGURE 5.31 Recovery of nickel and cadmium from accumulator scrap.
292 PART | I Conventional (Classical) Principles and Practice
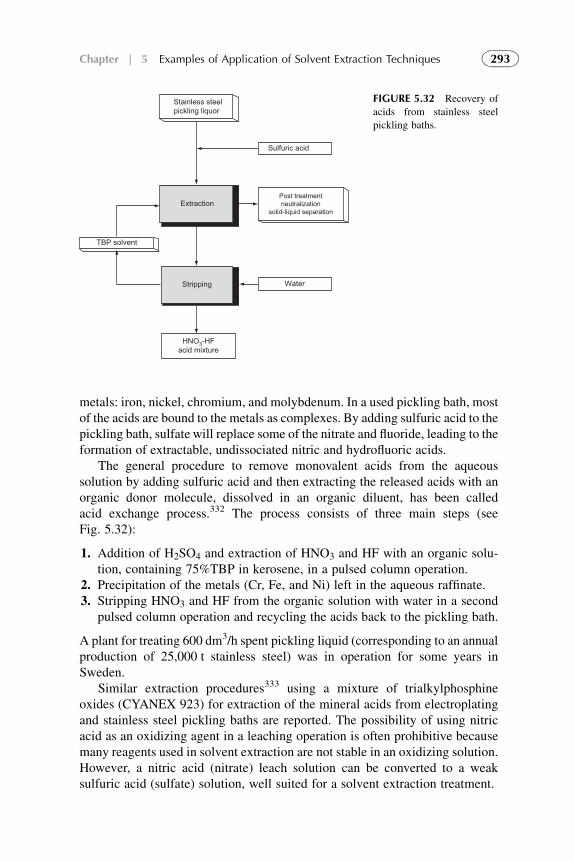
metals: iron, nickel, chromium, and molybdenum. In a used pickling bath, mostof the acids are bound to the metals as complexes. By adding sulfuric acid to thepickling bath, sulfate will replace some of the nitrate and fluoride, leading to theformation of extractable, undissociated nitric and hydrofluoric acids.
The general procedure to remove monovalent acids from the aqueoussolution by adding sulfuric acid and then extracting the released acids with anorganic donor molecule, dissolved in an organic diluent, has been calledacid exchange process.332 The process consists of three main steps (seeFig. 5.32):
1. Addition of H2SO4 and extraction of HNO3 and HF with an organic solu-tion, containing 75%TBP in kerosene, in a pulsed column operation.
2. Precipitation of the metals (Cr, Fe, and Ni) left in the aqueous raffinate.3. Stripping HNO3 and HF from the organic solution with water in a second
pulsed column operation and recycling the acids back to the pickling bath.
A plant for treating 600 dm3/h spent pickling liquid (corresponding to an annualproduction of 25,000 t stainless steel) was in operation for some years inSweden.
Similar extraction procedures333 using a mixture of trialkylphosphineoxides (CYANEX 923) for extraction of the mineral acids from electroplatingand stainless steel pickling baths are reported. The possibility of using nitricacid as an oxidizing agent in a leaching operation is often prohibitive becausemany reagents used in solvent extraction are not stable in an oxidizing solution.However, a nitric acid (nitrate) leach solution can be converted to a weaksulfuric acid (sulfate) solution, well suited for a solvent extraction treatment.
Stainless steelpickling liquor
Sulfuric acid
ExtractionPost treatmentneutralization
solid-liquid separation
Stripping Water
TBP solvent
HNO3-HFacid mixture
FIGURE 5.32 Recovery of
acids from stainless steel
pickling baths.
293Chapter | 5 Examples of Application of Solvent Extraction Techniques
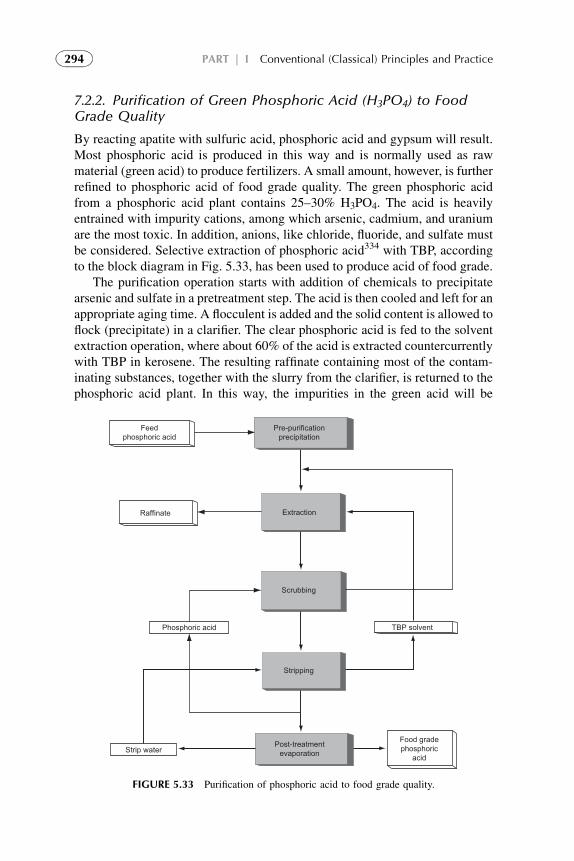
7.2.2. Purification of Green Phosphoric Acid (H3PO4) to FoodGrade Quality
By reacting apatite with sulfuric acid, phosphoric acid and gypsum will result.Most phosphoric acid is produced in this way and is normally used as rawmaterial (green acid) to produce fertilizers. A small amount, however, is furtherrefined to phosphoric acid of food grade quality. The green phosphoric acidfrom a phosphoric acid plant contains 25–30% H3PO4. The acid is heavilyentrained with impurity cations, among which arsenic, cadmium, and uraniumare the most toxic. In addition, anions, like chloride, fluoride, and sulfate mustbe considered. Selective extraction of phosphoric acid334 with TBP, accordingto the block diagram in Fig. 5.33, has been used to produce acid of food grade.
The purification operation starts with addition of chemicals to precipitatearsenic and sulfate in a pretreatment step. The acid is then cooled and left for anappropriate aging time. A flocculent is added and the solid content is allowed toflock (precipitate) in a clarifier. The clear phosphoric acid is fed to the solventextraction operation, where about 60% of the acid is extracted countercurrentlywith TBP in kerosene. The resulting raffinate containing most of the contam-inating substances, together with the slurry from the clarifier, is returned to thephosphoric acid plant. In this way, the impurities in the green acid will be
Feedphosphoric acid
Raffinate
Phosphoric acid
Strip waterPost-treatment
evaporation
Food gradephosphoric
acid
Stripping
Scrubbing
Extraction
Pre-purificationprecipitation
TBP solvent
FIGURE 5.33 Purification of phosphoric acid to food grade quality.
294 PART | I Conventional (Classical) Principles and Practice
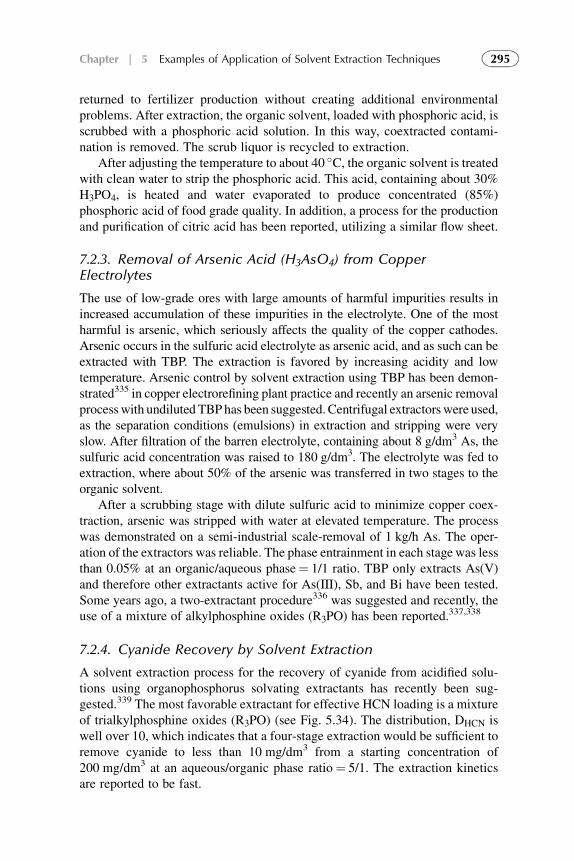
returned to fertilizer production without creating additional environmentalproblems. After extraction, the organic solvent, loaded with phosphoric acid, isscrubbed with a phosphoric acid solution. In this way, coextracted contami-nation is removed. The scrub liquor is recycled to extraction.
After adjusting the temperature to about 40 �C, the organic solvent is treatedwith clean water to strip the phosphoric acid. This acid, containing about 30%H3PO4, is heated and water evaporated to produce concentrated (85%)phosphoric acid of food grade quality. In addition, a process for the productionand purification of citric acid has been reported, utilizing a similar flow sheet.
7.2.3. Removal of Arsenic Acid (H3AsO4) from CopperElectrolytes
The use of low-grade ores with large amounts of harmful impurities results inincreased accumulation of these impurities in the electrolyte. One of the mostharmful is arsenic, which seriously affects the quality of the copper cathodes.Arsenic occurs in the sulfuric acid electrolyte as arsenic acid, and as such can beextracted with TBP. The extraction is favored by increasing acidity and lowtemperature. Arsenic control by solvent extraction using TBP has been demon-strated335 in copper electrorefining plant practice and recently an arsenic removalprocesswith undiluted TBPhas been suggested. Centrifugal extractors were used,as the separation conditions (emulsions) in extraction and stripping were veryslow. After filtration of the barren electrolyte, containing about 8 g/dm3 As, thesulfuric acid concentration was raised to 180 g/dm3. The electrolyte was fed toextraction, where about 50% of the arsenic was transferred in two stages to theorganic solvent.
After a scrubbing stage with dilute sulfuric acid to minimize copper coex-traction, arsenic was stripped with water at elevated temperature. The processwas demonstrated on a semi-industrial scale-removal of 1 kg/h As. The oper-ation of the extractors was reliable. The phase entrainment in each stage was lessthan 0.05% at an organic/aqueous phase¼ 1/1 ratio. TBP only extracts As(V)and therefore other extractants active for As(III), Sb, and Bi have been tested.Some years ago, a two-extractant procedure336 was suggested and recently, theuse of a mixture of alkylphosphine oxides (R3PO) has been reported.337,338
7.2.4. Cyanide Recovery by Solvent Extraction
A solvent extraction process for the recovery of cyanide from acidified solu-tions using organophosphorus solvating extractants has recently been sug-gested.339 The most favorable extractant for effective HCN loading is a mixtureof trialkylphosphine oxides (R3PO) (see Fig. 5.34). The distribution, DHCN iswell over 10, which indicates that a four-stage extraction would be sufficient toremove cyanide to less than 10 mg/dm3 from a starting concentration of200 mg/dm3 at an aqueous/organic phase ratio¼ 5/1. The extraction kineticsare reported to be fast.
295Chapter | 5 Examples of Application of Solvent Extraction Techniques
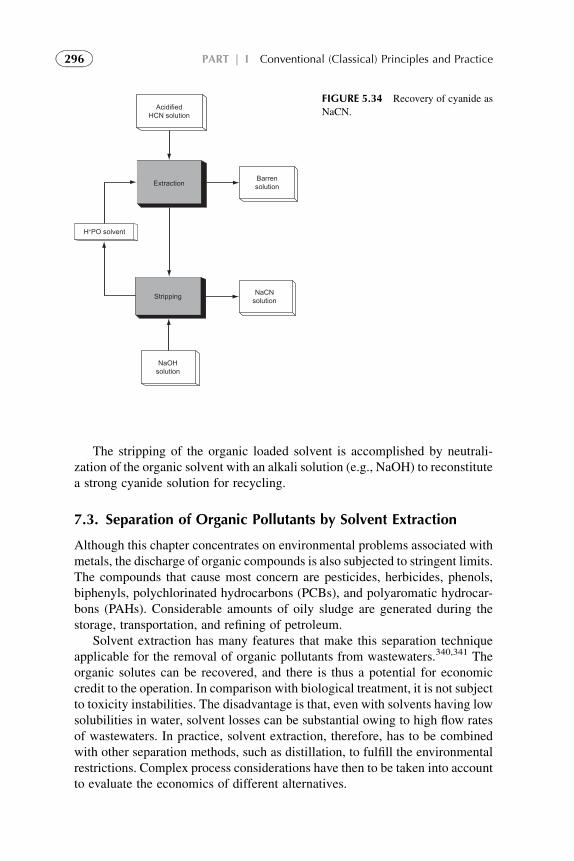
The stripping of the organic loaded solvent is accomplished by neutrali-zation of the organic solvent with an alkali solution (e.g., NaOH) to reconstitutea strong cyanide solution for recycling.
7.3. Separation of Organic Pollutants by Solvent Extraction
Although this chapter concentrates on environmental problems associated withmetals, the discharge of organic compounds is also subjected to stringent limits.The compounds that cause most concern are pesticides, herbicides, phenols,biphenyls, polychlorinated hydrocarbons (PCBs), and polyaromatic hydrocar-bons (PAHs). Considerable amounts of oily sludge are generated during thestorage, transportation, and refining of petroleum.
Solvent extraction has many features that make this separation techniqueapplicable for the removal of organic pollutants from wastewaters.340,341 Theorganic solutes can be recovered, and there is thus a potential for economiccredit to the operation. In comparison with biological treatment, it is not subjectto toxicity instabilities. The disadvantage is that, even with solvents having lowsolubilities in water, solvent losses can be substantial owing to high flow ratesof wastewaters. In practice, solvent extraction, therefore, has to be combinedwith other separation methods, such as distillation, to fulfill the environmentalrestrictions. Complex process considerations have then to be taken into accountto evaluate the economics of different alternatives.
AcidifiedHCN solution
H+PO solvent
Stripping
NaOHsolution
NaCNsolution
BarrensolutionExtraction
FIGURE 5.34 Recovery of cyanide as
NaCN.
296 PART | I Conventional (Classical) Principles and Practice
7.3.1. Phenosolvan Process
In this process,342 the phenolic effluent is contacted with the solvent ina multistage mixer-settler countercurrent extractor (see Fig. 5.35). The extract,containing phenol, is separated into phenol and solvent by distillation andsolvent is recycled to the extractor. The aqueous raffinate phase is stripped fromsolvent with gas, and the solvent is recovered from the stripping gas by washingwith crude phenol and passed to the extract distillation column. Initially theprocess utilized butyl acetate as a solvent, but more recently isopropyl ether hasbeen used, although the latter has a much lower partition coefficient for phenol.The reason for this choice of solvent is that the separation of solvent and phenolby distillation is easier and less costly. In addition, isopropyl ether is not subjectto hydrolysis, which can be a problem when using esters as solvents.
The Phenosolvan process is used in the treatment of wastewaters fromplants involving phenol synthesis, coke ovens, coal gasification, low pressurecarbonization, and plastic manufacturing. The residual phenol content afterdephenolization is usually in the range 5–20 mg/dm3 and plants treating 500 m3
water per day are in operation.
REFERENCES
1. Rydberg J, Cox M, Musikas C, Choppin GR, editors. Solvent extraction principles and
practice. New York, Boca Raton: Society of Chemical Industry; 2004.
2. Ritcey GM. Solvent extraction. Principles and applications to process metallurgy. Amsterdam:
Elsevier; 2006. book 1.
3. Ritcey GM. Solvent extraction. Principles and applications to process metallurgy.
Amsterdam: Elsevier; 2006. book 2.
ExtractionExtract
Cw
Dis
tilla
tion
CW Steam
Crude phenolDephenolizedeffluentGas condensate (feed)
A
CW
BC
D
GasGasblower
Solv
ent a
bsor
ber
Solv
ent s
tripp
er
Steam orhot water
FIGURE 5.35 The Phenosolvan process.
297Chapter | 5 Examples of Application of Solvent Extraction Techniques
4. Lo TC, Baird MHI, Hanson C. Handbook of solvent extraction. New York: Wiley-
Interscience; 1983.
5. Dudley KA, Moroney AS, Braaksma MO, Readett DJ. Copper solvent extraction oxime
selectivity: Operational experience at Girilambone Copper Company. In: Proceedings of the
4th COPPER 99-COBRE 99 international conference, Phoenix, 1999, vol. 4. p. 247–62.
6. Preston JS. Solvent extraction of base metals by mixtures of organophosphoric acids and non-
chelating oximes. Hydrometallurgy 1983;10:187.
7. Preston JS. Solvent extraction of nickel and cobalt by mixtures of carboxylic acids and non-
chelating oximes. Hydrometallurgy 1983;11:105.
8. Szymanowski J.Hydroximesandcopperhydrometallurgy. BocaRaton, Florida:CRCPress; 1993.
9. Dalton RF, Seward GW. Proceedings of reagents in the minerals industry. London: Institute
of Mining and Metallurgy; 1984. p. 106.
10. Dalton RF, Seward GW. The role of aryl aldoxime reagents in the technical advancement of
copper production by solvent extraction. In: Proceedings of ISEC’86, 1986, vol. 2. p. 11.
Frankfurt-am-Main: DECHEMA.
11. Murthy TKS, Koppiker KS, Gupta CK. Solvent extraction in extractive metallurgy. In:
Li NN, Navratil JD, editors. Recent developments in separation science, vol. 8. Boca Raton,
Florida: CRC Press; 1986. p. 1.
12. Dalton RF, Price R, Henmana E, Hoffmann B. Separation processes in hydrometallurgy.
Chichester: Ellis-Horwood; 1987. p. 466.
13. Burkin R, editor. Critical reviews in applied chemistry, Vol. 17; Extractive metallurgy of
nickel. Chichester: John Wiley & Sons; 1987.
14. Chapman TW. Extraction-metals processing. In: Rousseau RW, editor. Handbook of sepa-
ration process technology. New York: John Wiley & Sons; 1987. p. 467. Chap. 8.
15. Sadeghi R, Mohebbi A, Baniasadi M. CFD modeling of the launder of settler of an industrial
copper solvent extraction plant: A case study on Sarcheshmeh copper complex, Iran. Int J
Miner Process 2010;98:55–65.
16. Barnes JE, Stetchfield JH, Williams GOR. J. Solvent extraction of Fe(III) by di-(2-ethylhexyl)
phosphoric acid. Inorg Nucl Chem 1976;38:1065.
17. Schulz WW, Navratil JD, editors. Science and technology of tributyl phosphate, vols. 1 and 2.
Boca Raton, Florida: CRC Press; 1987.
18. NishimuraS.Extractionmetallurgy ’81. London: Institute ofMining andMetallurgy; 1981. p. 404.
19. Flett DS. New reagents or new ways with old reagents. J Chem Technol Biotechnol 1999;74:99.
20. Mackenzie JMW, Virnig MJ, Boley BD, Wolfe GA. ALTA 1998 nickel cobalt pressure
leaching and hydrometallurgy forum. Melbourne: ALTA Metallurgical Services; 1998.
21. Yamada H, Tanaka M. Solvent extraction of metal carboxylates. Adv Inorg Chem Radiochem
1985;29:143.
22. Osseo-Asare K, Miller JD, editors. Hydrometallurgy; research, development and plant
practice. New York: Metallurgical Society AIME; 1982.
23. Proceedings of extraction metallurgy conferences. London: Institution of Mining and
Metallurgy; 1989.
24. Lapidus GT, et al. Thermodynamic models for gold and silver extraction from copper-
ammonia-thiosulfate solutions. In: Moyer BA, editor. Proceedings of ISEC 2008 international
solvent extraction conference. Fundamentals to industrial Applications,Montreal,Canada:The
Canadian Institute of Mining, Metallurgy and Petroleum; 2008. Vols. 2. p. 299–304.
25. Sole KC, Cole PM. Purification of nickel by solvent extraction, in ion exchange. In:
Marcus Y, Sengupta AK, editors. Ion exchange and solvent extraction, vol. 15. New York:
Marcel Dekker; 2002. p. 143.
298 PART | I Conventional (Classical) Principles and Practice
26. Soldenhoff K, Wilkins D. Solvent extraction for the 21st century. In: Proceedings of ISEC’99,
vol. 1. London: Society of Chemical Industry; 2001. p. 777.
27. Grant RA, Drake VA. Proceedings of ISEC’2002, Cape Town, 2002, 940, vol. 1. p. 123.
28. Baroncelli F, Carlini D, Gasparini GM, Simonetti E. Proceedings ISEC ’88, vol. 4. Moscow:
Moscow; Vernadsky Inst.; Academy of Sciences USSR; 1988. p. 236.
29. Demopoulos GP, Pouskouleli G, Ritcey GM. Proceedings of ISEC ’86. Frankfurt-am-Main.
Munich: DECHEMA; 1986. vol. 2. p. 581.
30. Villaescusa I, Miralles N, de Pablo J, Salvado V, Sastre AM. Solv Extn Ion Exch 1993;11:613.
31. Argiropoulos G, Cattrall RW, Hamilton IC, Paimin R. Value adding through solvent
extraction. In: Proceedings of ISEC’96. University of Melbourne; 1996.
32. Kordosky GA, Sierokoski JM, Virnig MJ, Mattison PL. Gold solvent extraction from typical
cyanide leach solutions. Hydrometallurgy 1992;30:291.
33. Virnig MJ, Kordosky GA. Value adding through solvent extraction. In: Proceedings of
ISEC’96, vol. 1. University of Melbourne; 1996. p. 311.
34. Gamino-Arroyo Z, et al. Recovery of silver and gold from thiourea leaching Au-Ag ores
liquors by D2EHDTPA extraction. In: Moyer BA, editor. Proceedings of ISEC 2008 inter-
national solvent extraction conference. Montreal, Canada: The Canadian Institute of Mining,
Metallurgy and Petroleum; 2008. p. 293–8. in 2 vols.
35. Mansur MB, et al. Solvent extraction for metal and water recovery from industrial wastes and
effluent. In: Moyer BA, editor. Proceedings of ISEC 2008 international solvent extraction
conference. Montreal, Canada: The Canadian Institute of Mining, Metallurgy and Petroleum;
2008. p. 311–6. in 2 vols.
36. Zhao J, Wu Z, Chen J. Value adding through solvent extraction. In: Proceedings of ISEC’96,
vol. 1. University of Melbourne; 1996. p. 629.
37. Capela RS, Paiva AP. In: Proceedings of ISEC 2002. Cape Town: 2002. p. 335.
38. Facon S, Rodriguez MAvila, Cote G, Bauer D. Solvent extraction in the process industries.
In: Proceedings of ISEC93, vol. 1. Elsevier Applied Science; 1993. p. 557.
39. Woollam SF, Grant RA. In: Moyer BA, editor. Proceedings of ISEC 2008 international
solvent extraction conference. Montreal, Canada: The Canadian Institute of Mining,
Metallurgy and Petroleum; 2008. p. 281–6. in 2 vols.
40. Sbnchez-Loredo MG, et al. In: Moyer BA, editor. Proceedings of ISEC 2008 international
solvent extraction conference. Montreal, Canada: The Canadian Institute of Mining,
Metallurgy and Petroleum; 2008. p. 1049–55. in 2 vols.
41. Tasker PA, et al. Anion selectivity in zwitterionic amide-functionalised metal salt extractants.
In: Moyer BA, editor. Proceedings of ISEC 2008 international solvent extraction conference.
Montreal, Canada: The Canadian Institute of Mining, Metallurgy and Petroleum; 2008.
p. 1457–62. in 2 vols.
42. Chayama K, et al. In: Moyer BA, editor. Proceedings of ISEC 2008 international solvent
extraction conference. Montreal, Canada: The Canadian Institute of Mining, Metallurgy and
Petroleum; 2008. p. 1585–90. in 2 vols.
43. Grant RA, et al. In: Moyer BA, editor. Proceedings of ISEC 2008 international solvent
extraction conference. Montreal, Canada: The Canadian Institute of Mining, Metallurgy and
Petroleum; 2008. p. 415–20. in 2 vols.
44. Du Preez A, Preston JS. Proceedings of ISEC 2002. Cape Town: 2002. p. 896.
45. Pouskouleli G, Kelebek S, Demopoulos GP. In: Davies GA, editor. Separation processes in
hydrometallurgy. Chichester: Ellis-Horwood; 1987. p. 175.
46. Narita H, et al. Separation of palladium in hydrochloric acid solution with sulfide-containing
amide compound. In: Moyer BA, editor. Proceedings of ISEC 2008 International Solvent
299Chapter | 5 Examples of Application of Solvent Extraction Techniques
Extraction Conference. Montreal, Canada: The Canadian Institute of Mining, Metallurgy and
Petroleum; 2008. p. 1445–50. in 2 vols.
47. Wisniewski M, et al. Kinetics of zinc and iron ion extraction from acidic solutions with
phosphonium ionic liquid. In: Moyer BA, editor. Proceedings of ISEC 2008 International
Solvent Extraction Conference. Montreal, Canada: The Canadian Institute of Mining,
Metallurgy and Petroleum; 2008. p. 1295–300. in 2 vols.
48. Grant RA, Murrer BA. Extraction of platinum(IV) from hydrochloric acid solutions by amine
alamine 304 in xylene. Estimation of the interaction coefficient between PtCl62– and H+
European Patent No. 0210004, 1986.
49. Dhara SC. Solvent extraction with alkyl amines. In: Kudryk V, Corrigan DA, Laing WW,
editors. Proceedings of precious metals mining, extraction, and processing. Littleton,
Collorado: Metallurgical Society AIME; 1984. p. 199.
50. Dolgikh VI, Borikov PI, Borbat VF, Kouba EF, Gindin LM. Solvent extraction in hydro-
metallurgy. Tsvet Metal 1967;40:30.
51. Fedorenko NV, Ivanova TI. Solvent extraction of rhodium from chloride solutions. Russ. J
Inorg Chem 1965;10:387.
52. Benguerel E, Demopoulos GP, Cote G, Bauer D. Speciation and separation of rhodium (III)
from chloride solutions: a critical review. Solv Extn Ion Exch 1994;12:49.
53. Benguerel E, Demopoulos GP, Harris GB. Speciation and Separation of Rhodium (III) from
Chloride Solution: A Critical Review. Hydrometallurgy 1996;40:135.
54. Brown CG, Sherrington LG. Neutral organophosphorus extractants. J Chem Technol Bio-
technol 1979;29:193.
55. Preston JS, du Preez AC. Mintek Report M378. Randburg, South Africa: Council for Mineral
Technology; 1988.
56. Li D. Solvent extraction for the 21st century. Proceedings of ISEC’99, 2000; vol. 2. p. 108.
57. Yuan C, Ma H, Pan C, Rickelton WA. Value adding through solvent extraction. Proceedings
of ISEC’96, 1996; vol. 1. p. 733.
58. Vertis A, Nagy S, Klencsar Z. Handbook of nuclear chemistry. Amsterdam: Kluwer
Academic Publishers; 2003. in 3 vols.
59. Loveland WD, Morrissey DJ, Seaborg GT. Modern nuclear chemistry. New York: John
Wiley & Sons; 2006.
60. Choppin GR, Liljenzin J-O, Rydberg J. Radiochemistry and nuclear chemistry. 3rd ed.
Woburn, Massachusetts: Butterworth-Heinemann; 2002.
61. Musikas C, Schulz WW, Liljenzin J- O. Solvent extraction in nuclear science and technology.
In: Rydberg J, Cox M, Musikas C, Choppin GR, editors. Solvent extraction principles and
practice. New York: CRC Press; 2004.
62. Encyclopedia of materials: science and technology. 2008. Ganguly G. Nuclear reactor fuel
fabrication, p. 6324–39.
Rodrigues P. Nuclear fuel cycles, p. 6300–03.
Laidler JJ. Nuclear fuel reprocessing, p. 6303–09.
Ramanujan A. PUREX and THOREX processes, p. 7918–24.
63. Encyclopedia of physical science and technology; 2004.
Simnad MT. Nuclear reactor materials and fuels, p. 775–815.
Knief RA. Nuclear fuel cycles, p. 655–70.
Chenoweth WL, Pool TC. Uranium, p. 351–7.
Forsberg CW. Radioactive wastes, p. 643–9.
64. Friedlander G. Introduction to radiochemistry; 2007.
65. Bryan JC. Introduction to nuclear science; 2008.
300 PART | I Conventional (Classical) Principles and Practice
66. Neeb K- H. The radiochemistry of nuclear power plants with light water reactors. Europe:
Walter De Gruyter Inc; 1997.
67. Ehmann WD, Vance DE. Radiochemistry and nuclear methods of analysis. New York: John
Wiley & Sons; 1991.
68. Musikas C, Le Marois G, Fitoussi R, Cuillerdier C. Actinide separations. In: Navratil JD,
Schultz WW, editors. ACS symposium series 117. Washington, D.C.: American Chemical
Society; 1980. p. 131.
69. Coleman CF, Brown KB, Moore JG, Crouse D. J Ind Eng Chem 1958;50:1756.
70. Lloyd PJD. In: Lo TC, Baird MHI, Hanson C, editors. Handbook of solvent extraction.
New York: John Wiley & Sons; 1983. p. 763.
71. Ritcey GM. 2006. Solvent extraction, principles and applications to process metallurgy,
vol. 2. New York: Elsevier Scientific; 1979.
72. Singh H, Mishra SL, Vijayalakshmi R. Uranium recovery from phosphoric acid by solvent
extraction using a synergistic mixture of di-nonyl phenyl phosphoric acid and tri- n-butyl
phosphate. Hydrometallurgy 2004;73(1–2):63–70.
73. Jha RK, Gupta KK, Kulkarni PG, Gurba PB, Janardan P, Changarani RD, Dey PK,
Pathak PN, Manchanda VK. Third phase formation studies in the extraction of Th(IV) and
U(VI) by N, N-dialkyl aliphatic amides. Desalination 2008;232(1–3):225–33.
74. Nagasaki T, Shinkai S. The scavenging of uranyl from phosphate-containing media. J Chem
Soc Perkin Trans 1991;2:1063.
75. Soldenhoff K, Wilkins D, Shamieh M, Manis A. Mini-plant testing of uranium solvent
extraction process for acid leach liquors containing chloride. Proceedings of ISEC 2005; 2005.
76. Zuo Y, Chen J, Li D. Reversed micellar extraction and separation of thorium(IV) from
rare earth(III) by primary amine N1923 in ionic liquid. Sep Purif Technol 2008;63(3):
684–90.
77. Meguro Y, Iso S, Yoshida Z, Tomioka O, Enokida Y, Yamamoto I. Decontamination of
uranium oxides from solid wastes by supercritical CO2 fluid leaching method using
HNO3–TBP complex as a reactant. J Supercrit Fluids 2004;31(2):141–7.
78. Kumar P, Pal A, Saxena MK, Ramakumar KL. Supercritical fluid extraction of uranium and
thorium from solid matrices. Desalination 2008;232(1–3):71–9.
79. Trofimov TI, Samsonov MD, Kulyako YM, Myasoedov BF. Dissolution and extraction of
actinide oxides in supercritical carbon dioxide containing the complex of tri- n-butylphos-
phate with nitric acid. C R Chim 2004;7(12):1209–13.
80. Miles JH. In: Schulz WW, Burger LL, Navratil JD, editors. Science and technology of tributyl
phosphate, vol. 3. Boca Raton, Florida: CRC Press; 1990. Chap. 1, Part 2.
81. Sorel C, et al. In: Moyer BA, editor. Proceedings of ISEC 2008 international solvent
extraction conference. Montreal, Canada: The Canadian Institute of Mining, Metallurgy and
Petroleum; 2008. p. 715–20. in 2 vols.
82. Fermvik A, et al. Proceedings of ISEC 2008 international solvent extraction conference. In:
Moyer BA, editor. Montreal, Canada: The Canadian Institute of Mining, Metallurgy and
Petroleum; 2008. p. 551–6. in 2 vols.
83. Modolo G, et al. In: Moyer BA, editor. Proceedings of ISEC 2008 International Solvent
Extraction Conference. Montreal, Canada: The Canadian Institute of Mining, Metallurgy and
Petroleum; 2008. p. 521–6. in 2 vols.
84. Meyer M, Burgat R, Faure S, Batifol B, Hubinois J-C, Chollet H, Guilard R. Thermody-
namic studies of actinide complexes. 1. A reappraisal of the solution equilibria between
plutonium(IV) and ethylenediaminetetraacetic acid (EDTAH4) in nitric media. C R Chim
2007;10: 929–7.
301Chapter | 5 Examples of Application of Solvent Extraction Techniques
85. Guo JX, Sun SX, Li MX, Yin ZL, Pang H, Wang ZL, Meng ZL. The effects of diluent on the
extraction behavior of uranium (VI) with benzyloctadecyldimethyl ammonium chloride
(BODMAC) from chloride solution. Proceedings of ISEC 2005; 2005.
86. Sano Y, Kamiya M, Shibata A, Koizumi T, Koyama T. Neptunium co-recovery with uranium
and plutonium in next process. Proceedings of ISEC 2005; 2005.
87. Schulz WW, Navratil JD. In: Li NN, editor. Recent developments in separations science, vol.
7. Boca Raton, Florida: CRC Press; 1980. p. 31.
88. Ozawa M, Nemoto S, Toghashi A, Kawata T, Onishi A. Solv Extr Ion Exch 1992;10:829.
89. Law JD, Brewer KN, Herbst RS, Todd TA, Wood DJ. Development and demonstration of
solvent extraction processes for the separation of radionuclides from acidic radioactive waste.
Waste Manag 1999;19:27–37.
90. Herbst RS, Brewer KN, Law JD, Tranter TJ, Todd T. A separation of actinides and other
elements from simulated sodium-bearing waste using the TRUEX process. In: Proceedings
from SPECTRUM ’94. Atlanta, Georgia: 1994.
91. Law JD, Brewer KN, Todd TA. Actinide partitioning from actual Idaho chemical processing
plant acidic tank waste using centrifugal contactors. In: Proceedings from GLOBAL ’97,
Yokohama, Japan: 1997.
92. Horwitz EP, Dietz ML, Fisher DE. SREX: A new process for the extraction and recovery of
strontium from acidic nuclear waste streams. Solvent Extr Ion Exch 1991;9(1):1.
93. Wood DJ, Law JD. Evaluation of the SREX solvent extraction process for the removal of 90Sr
and hazardous metals from acidic nuclear waste solutions containing high concentrations of
interfering alkali metal ions. Sep Sci Technol 1997;32(1–4):241.
94. Myaesoedov BF, Chmutova MK, Smirnov IV, Shadrin AU. Global’93: Future nuclear
systems: Emerging fuels cycles and waste disposal options. La Grange Park, Illinois:
American Nuclear Society; 1993. p. 581.
95. Horwitz EP, Shulz WW. An improved extraction chromatographic resin for the separation of
uranium from acidic nitrate media. In: Bond AH, Dietz ML, Rogers RD, editors. Metal ion
separation and preconcentration progress and opportunities. Washington, D.C: American
Chemical Society; 1998.
96. Babain VA, Shadrin AY, Lazarev LN, Kiseleva RN. Extraction of cesium and strontium by
solutions of chlorinated cobalt dicarbollide in diethyleneglycol ditetrauoropropyl ether.
Radiokhimiya 1993;35:81.
97. Madic C, Hudson MJ. High level liquid waste partitioning by means of completely incin-
erable extractants. European Commission, Nuclear Science and Technology, EUR18038 EN;
1998. p. 208.
98. Madic C, Hudson MJ, Liljenzin JO, Glatz JP, Nannicini R, Facchini A, Kolarik Z, Odoj R.
New partitioning techniques for minor actinides. European Commission, Nuclear Science
and Technology, EUR19149 EN; 2000. p. 286.
99. Gruner B, Kvı�calova M, Selucky P, Lu�canıkova M. Anionic alkyl diglycoldiamides with
covalently bonded cobalt bis(dicarbollide)(1�) ions for lanthanide and actinide extractions.
J Organometallic Chem 2010;695(9):1261–4.
100. Liljenzin JO, Rydberg J, Skarnemark G. Synthetic development of c3-symmetric triphe-
noxymethane based reagents for the selective recognition and sequestration of lanthanides
and actinides. Sep Sci Technol 1980;15:799.
101. Cecille L, Dworschak H, Girardi E, Hunt BA, Mannone F, Mousty E. The TRUEX Process –
A Process for the Extraction of the Transuranic Elements from Nitric Acid. Waste utilizining
Modified PUREX Solvent Extraction. In: Navratil JD, Schulz WW, editors. Actinides
separations. Washington, D.C: American Chemical Society; 1980. p. 427.
302 PART | I Conventional (Classical) Principles and Practice
102. Liljenzin JO, Persson G, Svantesson I, Wingefors S. The CTH-process for HLLW treatment,
Part I – General description and process design. Radiochim Acta 1984;35:155.
103. Persson G, Wingefors S, Liljenzin JO, Svantesson I. The CTH-Process for HLLW treatment,
Part II – Hot test. Radiochim Acta 1984;35:163.
104. Persson G, Svantesson I, Wingefors S, Liljenzin JO. Hot test of a TALSPEAK procedure for
separation of actinides and lanthanides using recirculating DTPA-lactic acid solution. Solv
Extr Ion Exch 1984;2(1):89.
105. Dakshinamoorthy A, Dhami PS, Naik PW, Dudwadkar NL, Munshi SK, Dey PK, Venugopal V.
Separation of palladium from high level liquid waste of PUREX origin by solvent extraction
and precipitation methods using oximes. Desalination 2008;232(1–3):26–36.
106. Guillaume B, Germain M, Puyou M, Rouger H. Experimental study of CO2 Absorption in
a hollow fiber membrane contactor. Proceedings of international conference on nuclear fuel
reprocessing, RECORD 87, vol. 1. Paris: Soc. Francaise d’Energie Nucleaire; 1987. p. 433.
107. Schulz WW. Macroreticular Ion Exchange Resin Cleanup of Purex Process Solvent; U.S.
Atomic Energy Commission Report ARH-SA-58. Richland, Washington, D.C: Atlantic
Richfield Hanford Co.; 1970.
108. Mailen JC. Secondary Purex solvent cleanup: laboratory development. Nucl Technol
1998;83:182.
109. Choppin G, Liljenzin JO, Rydberg J. Radiochemistry and nuclear chemistry. 3rd ed. Oxford:
Butterworth-Heinemann; 2002. p. 593.
110. CURE. Clean Use of Reactor Energy, U.S. Department of Energy Report WHC-EP-0268.
Richland, Washington, D.C: Westinghouse Hanford Co.; 1990.
111. Mukaiyama T, Kubota M, Takizuka T, Ogawa T, Mizumoto M, Yoshida Y. Partitioning and
transmutation program OMEGA at JAERI. Proceedings of the GLOBAL’95 conference,
Versailles. France 1995; vol. 1. p. 110.
112. Yoshizuka K, Pietzsch HJ, Seifert S, Stephan H. Novel computational chemistry for
molecular design of radioactive metal complexes. In: Moyer BA, editor. Proceedings of ISEC
2005 international solvent extraction conference. Montreal, Canada: The Canadian Institute
of Mining, Metallurgy and Petroleum; 2005. in 2 vols, p. 952–60.
113. Barre JY, Bouchard J. French R&D strategy for the back-end of the fuel cycle. In:
Proceedings of the Global ’93, Seattle, Washington, D.C., September 1993, p. 12–7.
114. Musikas C, Vitart X, Pasquiou JY, Hoel P. Diamides as actinides extractants for various
wastes treatment. In: King CJ, Navratil JD, editors. Chemical separations, vol. 2. Denver:
Litarvan Literature; 1986. p. 359.
115. Kolarik Z, Mullich U, Gassner F. Extraction of Am(III) and Eu(III) nitrates by 2,6-
di(5,6-dipropyl-1,2,4-triazin-3-yl)pyridine. Solv Ext Ion Exch 1999;17(23):1155.
116. Modolo G, Odoj R. Influence of the purity and irradiation stability of Cyanex 301 on the
separation of trivalent actinides from lanthanides by solvent extraction. J. Radioanal Nucl
Chem 1998;228(1,2):83.
117. Charbonnel MC, Boubals N, Giroux S, Guillaumont D. Thermodynamic properties
accounting for differences in affinity and selectivity of BTPs toward Eu(III) and Am(III)
extraction. in 2 vols. In: Moyer BA, editor. Proceedings of ISEC 2005 International Solvent
Extraction Conference. Montreal, Canada: The Canadian Institute of Mining, Metallurgy and
Petroleum; 2005. p. 467–75.
118. Bosland L, Adnet JM, Berthon L, Pareau D, Stambouli M. Extraction kinetics of actinides
and lanthanides trivalent nitrates by DMDOHEMA molecule. In: Moyer BA, editor.
Proceedings of ISEC 2005 International Solvent Extraction Conference. Montreal, Canada:
The Canadian Institute of Mining, Metallurgy and Petroleum; 2005. in 2 vols, p. 1036–43.
303Chapter | 5 Examples of Application of Solvent Extraction Techniques
119. Weigl M, Geist A, Mullich U, Gompper K. Kinetics of americium extraction with
2,6-di(5,6-dipropyl-1,2,4-triazin-3-yl) pyridine. In: Moyer BA, editor. Proceedings of
ISEC 2005 international solvent extraction conference. Montreal, Canada: The
Canadian Institute of Mining, Metallurgy and Petroleum; 2005. in 2 vols, p. 671–9.
120. Hill MGB, Hudson C, Iveson MJ, Madic PB, Youngs C, Drew TGA. Solvent extraction and
lanthanide complexation studies with new terdentate ligands containing two 1,3,5-triazine
moieties. Dalton Trans 2004;2:244–51.
121. Maina TH, Chiotellis E. Synthesis, radiochemistry and biological evaluation of technetium-
99m complexes with 1,8-diamine-3,6-dithiaoctane (DDO) ligands. Int J Radiat Appl Instrum.
Part B. Nucl Med Biol May 1992;19(4):481–9.
122. Dileep CS, Jagasia P, Dhami PS, Achuthan PV, Dakshinamoorthy A, Tomar BS, Munshi SK,
Dey PK. Distribution of technetium in PUREX process streams. Desalination 30 November
2008;232(1–3):157–65.
123. Pillai MRA, Kothari K, Banerjee S, Samuel G, Suresh M, Sarma HD, Jurisson S. Radio-
chemical studies of 99mTc complexes of modified cysteine ligands and bifunctional chelating
agents. Nucl Med Biol July 1999;26(5):555–61.
124. Stary J. The solvent extraction of metal chelates. Oxford: Pergamon Press; 1964.
125. De AK, Khopkar SM, Chalmers RA. Solvent extraction of metals. London: Van Nostrand
Reinhold; 1970.
126. Alders L. Liquid–liquid extraction. New York: Amsterdam; Elsevier; 1995.
127. Zolotov YA, Bodnya VA, Zagruzina AN. Liquid-liquid extraction in inorganic analysis:
current status. CRC Crit Rev Anal Chem 1982;14:2.
128. Keller R, Mermet JM, Otto M, Widmer HM, editors. Analytical chemistry. Weinheim,
Germany: Wiley-VCH, Verlag GmbH; 1998. p. 25.
129. Rydberg J, Cox M, Musikas C, Choppin GR. Solvent extraction principles and practice.
2nd ed. New York: Marcel Dekker Publishers Inc.; 2004.
130. Kislik VS, editor. Liquid membrane. Principles and applications in chemical separations and
wastewater treatment. Amsterdam: Elsevier; 2010.
131. Valcarcel M. Liquid-liquid extraction in continuous flow analysis. In: Alegret S, editor.
Developments in solvent extraction. West Sussex, UK: Ellis Horwood Series in Analytical
Chemistry; 1988. p. 135.
132. Preconcentration of trace elements. In: Lobinsky L, editor. Comprehensive analytical
chemistry, vol. XXV. Amsterdam: Elsevier; 1992.
133. Tobiszewski M, Mechli�nska A, Zygmunt B, Namie�snik J. Green analytical chemistry in
sample preparation for determination of trace organic pollutants. TrAC Trends Anal Chem
2009;28(8):943–51.
134. Persson B-A, Vessman J. The use of selectivity in analytical chemistry – some consider-
ations. TrAC Trends Anal Chem 2001;20(10):526–32.
135. Tagushi S, Goto K. In: Alfassi ZB, Wai CM, editors. Pre-concentration techniques for trace
elements. Boca Raton, Florida: CRC Press; 1989. p. 31.
136. Kumar AR, Riyazuddin P. Chemical interferences in hydride-generation atomic spectrom-
etry. TrAC Trends Anal Chem 2010;29(2):166–76.
137. Luciano RM, Bedendo GC, Carletto JS, Carasek E. Isolation and preconcentration of Cd(II)
from environmental samples using polypropylene porous membrane in a hollow fiber
renewal liquid membrane extraction procedure and determination by FAAS. J Hazard Mater
2010;177(1–3):567–72.
138. Martinis EM, Berton P, Monasterio RP, Wuilloud RG. Emerging ionic liquid-based tech-
niques for total-metal and metal-speciation analysis. TrAC Trends Anal Chem. November
2010;29(10):1184–201.
304 PART | I Conventional (Classical) Principles and Practice
139. Cortina JL, Warshawsky A. Distribution studies of Zn(II), Cu(II) and Cd(II) with
levextrel resins containing di(2,4,4-trimethylpentyl)phosphonic acid. In: Marinsky JA,
Marcus Y, editors. Ion exchange and solvent extraction, vol. 13. New York: Marcel
Dekker; 1996. p. 195.
140. Herrera-Herrera AV, Asensio-Ramos M, Hernandez-Borges J, Rodrıguez-Delgado MA.
Dispersive liquid-liquid microextraction for determination of organic analytes. TrAC Trends
Anal Chem 2010;29(7):728–51.
141. Sarafraz-Yazdi A, Amiri A. Liquid-phase microextraction. TrAC Trends Anal Chem
2010;29(1):1–14.
142. Mester Z, Sturgeon R, Pawliszyn J. Solid phase microextraction as a tool for trace element
speciation. Spectrochim Acta Part B: Atomic Spectrosc 2001;56(3, 29):233–60.
143. Xiaoqi S, Yang J, Chen J, Jiutong MA. Solvent impregnated resin prepared using task-specific
ionic liquids for rare earth separation. J Rare Earths 2009;27(6):932–6.
144. Beyer A, Biziuk M. Applications of sample preparation techniques in the analysis of
pesticides and PCBs in food. Food Chem 2008;108(2):669–80.
145. Hu B, Song W, Xie L, Shao T. Determination of 33 pesticides in tea using accelerated solvent
extraction/gel permeation chromatography and solid phase extraction/gas chromatography-
mass spectrometry. Chinese J Chromatogr 2008;26(1):22–8.
146. Camel V. Microwave-assisted solvent extraction of environmental samples. TrAC Trends
Anal Chem 2000;19(4):229–48.
147. Abrha Y, Raghavan D. Polychlorinated biphenyl (PCB) recovery from spiked organic matrix
using accelerated solvent extraction (ASE) and Soxhlet extraction. J Hazard Mater
2000;80(1–3):147–57.
148. Dunford NT, Irmak S, Jonnala R. Pressurized solvent extraction of policosanol from wheat
straw, germ and bran. Food Chem 2010;119(3):1246–9.
149. Haskins SD, Kelly DG,Weir RD. Novel pressurized solvent extraction vessels for the analysis of
polychlorinated biphenyl congeners in avian whole blood. Anal Chim Acta 2010;677(1):19–23.
150. Cheng KL, Ueno K, Imamura T. Handbook of organic analytical reagents. Boca Raton,
Florida: CRC Press; 1982.
151. Townshend A, Burns DT, Guibault GG, Lobinski R, Marczenko Z, Newman EJ, Onishi H,
editors. Dictionary of organic analytical reagents. London: Chapman & Hall; 1993.
152. Kudo Y, Usami J, Katsuta S, Takeda Y. Solvent extraction of permanganates (Na, K) by 18-
crown-6 ether from water into 1,2-dichloroethane: Elucidation of an extraction equilibrium
based on component equilibria. Talanta 2003;59(6):1213–8.
153. Takeda Y, Yasui A, Morita M, Katsuta S. Extraction of sodium and potassium perchlorates
with benzo-18-crown-6 into various organic solvents. Quantitative elucidation of anion
effects on the extraction-ability and -selectivity for Naþ and Kþ. Talanta 2002;56(3):505–13.154. Misra NL, Dhara S, Ovari M, Zaray Gy, Aggarwal SK, Varga I. Determination of low atomic
number elements at trace levels in uranium matrix using vacuum chamber total reflection X-
ray fluorescence. Spectrochim Acta Part B: Atomic Spectrosc 2010;65(6):457–60.
155. Kagawa T, Ohno M, Seki T, Chikama K. Online determination of copper in aluminum alloy by
microchip solvent extraction using isotope dilution ICP-MSmethod.Talanta 2009;79(4):1001–5.
156. Shigematsu T, Kudo K. Substoichiometric determination of trace impurities in zinc selenide.
J Radioanal Chem 1978;45:373.
157. Tasaki T, Oshima T, Baba Y. Selective extraction and transport of copper(II) with new
alkylated pyridinecarboxylic acid derivatives. Talanta 2007;73(2):387–93.
158. Fouad EA. Separation of copper from aqueous sulfate solutions by mixtures of Cyanex 301
and LIX� 984N. J Hazard Mater 2009;166(2–3):720–7.
159. Hoentsch E, Flachowsky J. Nuclear and radiochemical analysis. Isotopenpraxis 1977;13:432.
305Chapter | 5 Examples of Application of Solvent Extraction Techniques
160. Iqbal M, Ejaz M, Chaudhri SA, Zamiruddin A. Extraction of arsenic(III) from chloride-
iodide solutions. J Radioanal Chem 1978;42:335.
161. Beiraghi A, Babaee S. Separation and preconcentration of ultra trace amounts of beryllium in
water samples using mixed micelle-mediated extraction and determination by inductively
coupled plasma-atomic emission spectrometry. Anal Chim Acta 2008;607(2):183–90.
162. Hirayama N, Taga J, Oshima S, Honjo T. Sulfonamide-type di-Schiff base ligands as chelate
extraction reagents for divalent metal cations. Anal Chim Acta 2002;466(2):295–301.
163. Oshima S, Hirayama N, Kubono K, Kokusen H, Honjo T. Ion-pair extraction behavior of
divalent transition metal cations as charged complexes with N, N0-bis(2-pyridylmethylidene)-
1,2-diiminoethane and its analogues. Anal Chim Acta 2001;441(1):157–64.
164. Shtefak M, Kirsh M, Rais I. Critical evaluation of stability constants for nucleotide
complexes with protons and metal ions. Zh Anal Khim 1976;32:1364.
165. Takeda Y, Suzuki S, Ohyagi Y. A Comparison of the trace analysis of heavy metal aerosols
with atomic absorption spectroscopy. Chem Lett 1978;12:1377.
166. Khajeh M. Optimization of microwave-assisted extraction procedure for zinc and copper
determination in food samples by Box-Behnken design. J Food Comp Anal 2009;22(4):343–6.
167. Maurı-Aucejo AR, Arnandis-Chover T, Marın-Saez R, Llobat-Estelles M. Application of
pressurized fluid extraction to determine cadmium and zinc in plants. Anal Chim Acta
2007;581(1):78–82.
168. Olszanowski A. Solvent extraction of cadmium(II) from chloride solutions by pyridyl
ketoximes. Hydrometallurgy 2011;105(3–4):284–9.
169. Anthemidis AN, Zachariadis GA, Farastelis CG, Stratis JA. On-line liquid–liquid extraction
system using a new phase separator for flame atomic absorption spectrometric determination
of ultra-trace cadmium in natural waters. Talanta 2004;62(3):437–43.
170. Leermakers M, Baeyens W, Quevauviller P, Horvat M. Mercury in environmental samples:
Speciation, artifacts and validation. TrAC Trends Anal Chem 2005;24(5):383–93.
171. Li Z, Wei Q, Yuan R, Zhou X, Liu H, Shan H, Song Q. A new room temperature ionic liquid
1-butyl-3-trimethylsilylimidazolium hexafluorophosphate as a solvent for extraction and
preconcentration of mercury with determination by cold vapor atomic absorption spec-
trometry. Talanta 2007;71(1):68–72.
172. Quevauviller P, Filippelli M, Horvat M. Method performance evaluation for methylmer-
cury determination in fish and sediment. TrAC Trends Anal Chem 2000;19(2–3):157–66.
173. Argollo RM, Schilling JG. Determination of germanium by atomic absorption spectrometry
following volatile hydride generation. Anal Chem Acta 1978;96:117.
174. Oshima S, Kubono K, Kokusen H, Honjo T. Selective extraction of gallium from aluminum
and indium using tripod phenolic ligands. Talanta 2001;53(4):857–62.
175. Taher MA. Differential pulse polarography determination of indium after column pre-
concentration with [1-(2-pyridylazo)-2-naphthol]-naphthalene adsorbent or its complex on
microcrystalline naphthalene. Talanta 2000;52(2):301–9.
176. Chung NH, Nishimoto J, Kato O, Tabata M. Selective extraction of thallium(III) in the
presence of gallium(III), indium(III), bismuth(III) and antimony(III) by salting-out of an
aqueous mixture of 2-propanol. Anal Chim Acta 2003;477(2):243–9.
177. Coedo AG, Dorado MT, Padilla I. Evaluation of different sample introduction approaches for
the determination of boron in unalloyed steels by inductively coupled plasma
mass spectrometry. Spectrochim Acta Part B: Atomic Spectrosc 10 January 2005;60(1):73–9.
178. Rao TP, Kala R. On-line and off-line preconcentration of trace and ultratrace amounts of
lanthanides. Talanta 2004;63(4):949–59.
179. Kaiyanarman S, Khopkar SM. Solvent extraction separation of hafnium with 4-methyl-3-
pentene-2. Anal Chem 1977;49:1192.
306 PART | I Conventional (Classical) Principles and Practice
180. Charib A, Morris DFC. Determination of rhenium at ultratrace levels by selective laser.
Talanta 1978;25:569.
181. Bayyari MA, Nazal MK, Khalili FI. The effect of ionic strength on the extraction of thor-
ium(IV) from perchlorate solution by didodecylphosphoric acid (HDDPA). Arab J Chem
2010;3(2):115–9.
182. Madrakian T, Afkhami A, Mousavi A. Spectrophotometric determination of trace amounts of
Uranium(VI) in water samples after mixed micelle-mediated extraction. Talanta
2007;71(2):610–14.
183. Fujino O, Umetani S, Ueno E, Shigeta K, Matsuda T. Determination of uranium and thorium
in apatite minerals by inductively coupled plasma atomic emission spectrometry with
solvent extraction separation into diisobutyl ketone. Anal Chim Acta 7 September
2000;420(1):65–71.
184. Shimomura S, Sakurai H, Morita I, Mino Y. Determination of germanium by atomic absorption
spectrometry following volatile hydride generation. Anal Chem Acta 1978;96:69.
185. Steinnes E. Analytical applications of solvent extraction. Radiochem Radioanal Lett
1978;33:205.
186. Mane CP, Anuse MA. Extraction behaviour of 2-octylaminopyridine towards lead(II) from
succinatemedia and its separation fromother toxicmetals. JHazardMater 2008;152(3):1146–54.
187. Aguilar JC, de San Miguel ER, de Gyves J, Bartsch RA, Kim M. Design, synthesis and
evaluation of diazadibenzocrown ethers as Pb2þ extractants and carriers in plasticized
cellulose triacetate membranes. Talanta 2001;54(6):1195–204.
188. Luconi MO, Olsina RA, Fernandez LP, Silva MF. Determination of lead in human saliva by
combined cloud point extraction–capillary zone electrophoresis with indirect UV detection.
J Hazard Mater 2006;128(2–3):240–6.
189. Zhu Z, Zhang W, Cheng CY. A literature review of titanium solvent extraction in chloride
media. Hydrometallurgy 2011;105(3–4):304–13.
190. Hasemann K, Bock R. Spectrochemical trace analysis for metals and metalloids. Z Anal
Chem 1985;274:185.
191. Huffman EH, Beaufait LJ. The fractional separation of zirconium and hafnium by extraction
with TTA. J Am Chem Soc 1949;71:3179.
192. Wadelin C, Mellon MG. Photometric determination of phosphate using metal oximates. Anal
Chem 1953;25:1668.
193. Moreda-Pineiro J, Alonso-Rodrıguez E, Lopez-Mahıa P, Muniategui-Lorenzo S, Prada-
Rodrıguez D, Moreda-Pineiro A, Bermejo-Barrera A, Bermejo-Barrera P. As, Cd, Cr, Ni and
Pb pressurized liquid extraction with acetic acid from marine sediment and soil samples.
Spectrochim Acta Part B: Atomic Spectrosc 2006;61(12):1304–9.
194. Shemirani F, Baghdadi M, Ramezani M. Preconcentration and determination of ultra trace
amounts of arsenic(III) and arsenic(V) in tap water and total arsenic in biological samples by
cloud point extraction and electrothermal atomic absorption spectrometry. Talanta 28
February 2005;65(4):882–7.
195. Garbo�s S, Bulska E, Hulanicki A, Fija1ek Z, So1tyk K. Determination of total antimony and
antimony(V) by inductively coupled plasma mass spectrometry after selective separation of
antimony(III) by solvent extraction with N-benzoyl- N-phenylhydroxylamine. Spectrochim
Acta Part B: Atomic Spectrosc 2000;55(7):795–802.
196. Madrakian T, Bozorgzadeh E. Spectrophotometric determination of Sb(III) and Sb(V) in
biological samples after micelle-mediated extraction. J Hazard Mater 2000;170(2–3):809–13.
197. Nakamura K, Ozawa T. Spectrophotometric determination of micro amounts of mercury,
cadmium, and zinc by stepwise extraction with tribenzylamine. Anal Chim Acta
1976;86:147.
307Chapter | 5 Examples of Application of Solvent Extraction Techniques
198. Li X, Wei C, Deng Z, Li M, Li C, Fan G. Selective solvent extraction of vanadium over iron
from a stone coal/black shale acid leach solution by D2EHPA/TBP. Hydrometallurgy
2011;105(3–4):359–63.
199. Poedniok J, Buhl F. Speciation of vanadium in soil. Talanta 2003;59(1):1–8.
200. Lapenko LA, Gibalo IM. Solvent Extraction of niobium, tantalum and some other elements
with tetraphenylarsonium chloride. Zh Anal Khim 1976;31:481.
201. Spivakov BY, Orlova YA, Malyutina TM, Kirilova TL. Extractant effect on the retention of
the stationary phase in a rotating coiled column. Zh Anal Khim 1979;34:161.
202. Kamada T, Shiroishi T, Yamamoto Y. Use of transition elements to enhance sensitivity for
selenium. Talanta 1978;25:15.
203. Sargar BM,AnuseMA. Liquid–liquid extraction study of Tellurium(IV) withN- n-octylaniline
in halide medium and its separation from real samples. Talanta 2001;55(3):469–78.
204. Nan J, Yan X- P. On-line dynamic two-dimensional admicelles solvent extraction coupled to
electrothermal atomic absorption spectrometry for determination of chromium(VI) in
drinking water. Anal Chim Acta 2005;536(1–2):207–12.
205. Abdollahi H. Simultaneous spectrophotometric determination of chromium(VI) and iron(III)
with chromogenic mixed reagents by H-point standard addition method and partial least
squares regression. Anal Chim Acta 2001;442(2):327–36.
206. Shrivas K, Agrawal K, Harmukh N. Trace level determination of molybdenum in environ-
mental and biological samples using surfactant-mediated liquid–liquid extraction. J Hazard
Mater 15 January 2009;161(1):325–9.
207. Alkan M, Kharun M, Chmilenko F. Spectrophotometric determination of molybdenum with
Alizarin Red S in the presence of poly(sulfonylpiperidinylmethylene hydroxide). Talanta
2003;59(3):605–11.
208. Filik H, Cengel T, Apak R. Selective cloud point extraction and graphite furnace atomic
absorption spectrometric determination of molybdenum (VI) ion in seawater samples.
J Hazard Mater 2009;169(1–3):766–71.
209. Musil J, Dolezal J. Preconcentration of trace amounts of tungsten on Amberlite XAD-7
for its spectrophotometric determination in hot spring water. Anal Chim Acta 1977;
92:301.
210. Roberts RF. Quantitative analysis of major, minor and trace elements in fluid. Anal Chem
1977;49:1861.
211. Tribalat S, Beydon J. Isoelement du technetium. Anal Chim Acta 1953;8:22.
212. Fujinaga T, Lee HL. Polarographic study of solutions of cadmium(l1) in acetylacetone.
Talanta 1977;24:395.
213. Bermejo-Barrera P, Moreda-Pineiro A, Gonzalez-Iglesias R, Bermejo-Barrera A. Multivar-
iate optimization of solvent extraction with 1,1,1-trifluoroacetylacetonates for the determi-
nation of total and labile Cu and Fe in river surface water by flame atomic absorption
spectrometry. Spectrochim Acta Part B: Atomic Spectrosc 2002;57(12):1951–66.
214. Sacmacı S, Kartal S. Selective extraction, separation and speciation of iron in different
samples using 4-acetyl-5-methyl-1-phenyl-1 H-pyrazole-3-carboxylic acid. Anal Chim Acta
2008;623(1):46–52.
215. Nayl AA. Extraction and separation of Co(II) and Ni(II) from acidic sulfate solutions using
Aliquat 336. J Hazard Mater 2010;173(1–3):223–30.
216. Bidabadi MS, Dadfarnia S, Haji Shabani AM. Solidified floating organic drop micro-
extraction (SFODME) for simultaneous separation/preconcentration and determination of
cobalt and nickel by graphite furnace atomic absorption spectrometry (GFAAS). J Hazard
Mater 2010;166(1):291–6.
308 PART | I Conventional (Classical) Principles and Practice
217. Zolotov YA, Petrukhin OM, Shevehenko UN, Dunina UY, Rukhadze EG. Extraction of
platinum metals from hydrochloric acid medium. Anal Chim Acta 1978;100:613.
218. Ougiyanagi J, Meguro Y, Yoshida Z, Imura H, Ohashi K. Solvent effect on distribution ratio
of Pd(II) in supercritical carbon dioxide extraction and solvent extraction using 2-methyl-8-
quinolinol. Talanta 2003;59(6):1189–98.
219. Bagher Gholivand M, Nozari N. Extraction and spectrophotometric determination of trace
amount of Pd(II) with 2,20-dithiodianiline. Talanta 2000;52(6):1055–60.
220. Shinotsuka K, Suzuki K. Simultaneous determination of platinum group elements and
rhenium in rock samples using isotope dilution inductively coupled plasma mass spec-
trometry after cation exchange separation followed by solvent extraction. Anal Chim Acta 12
November 2007;603(2):129–39.
221. Lobinski R, Marczenko Z. UV-VIS Spectroscopy and its Applications. CRC Crit Rev Anal
Chem 1992;23:55.
222. Armenta S, Garrigues S, de la Guardia M. Green analytical chemistry. TrAC Trends Anal
Chem 2008;27(6):497–511.
223. Zorov NB, Gocci TF, Winefordner JD. Comparison of figures of merit for fluorimetric
analysis of rhodamine complexes of gallium and indium by excitation with pulsed laser and
by xenon arc sources. Talanta 1976;23:455.
224. Zolotov YA, Petrukhin OM, Nagy VY, Volodarskii LB. Application of Stable Rradical-Con-
taining Complexing Reagents for the Esr Determination of Metals. Anal Chim Acta 1980;115:1.
225. Zolotov YA, Kuzmin NM, Petrukhin OM, Spivakov BY. Liquid-liquid extraction in inorganic
analysis: Current status and prospects. Anal Chim Acta 1986;180:137.
226. Matsuoka S, Yoshimura K, Waki H. Sorption-spectroscopic and test methods for the deter-
mination of metal ions on the solid-phase of ion-exchange materials. Mem Fac Sci Kyushu
Univ Ser C 1991;18:55–62.
227. Compano R, Ferrer R, Guiteras J, Prat MD. Spectrofluorimetric detection of trace elements
with 2,6-diacetylpyridine functionalized amberlite XAD-4 by flow injection and atomic
spectroscopy polymeric matrix. Analyst 1994;119:1225.
228. Kirkbright GF, Narayanaswamy R, Welti NA. Optical fibres in chemical sensing – a review.
Analyst 1984;109:15.
229. Narayanaswamy R, Sevilla F. Reversible sensor for High Alkalinity Measurement. Anal
Chim Acta 1986;189:365.
230. Scamerhorn JF, Harwell JH. Surfactant-based separations processes. New York: Marcel
Dekker; 1989. p. 139.
231. Hinze WL, Pramauro E. Use of surfactant – mediated phase separation (cloud point
extraction) with affinity ligands. Crit Rev Anal Chem 1993;24:133.
232. Carabias-Martınez R, Rodrıguez-Gonzalo E, Moreno-Cordero B, Pe�rrez-Pavoı n JL, Garcia-
Pinto C, Fernaı ndez Laespada E. Surfactant cloud point extraction and preconcentration of
organic compounds prior to chromatography and capillary electrophoresis. J Chromatogr A
2000;902:195.
233. Quina FH, Hinze WL. Surfactant-mediated cloud point extractions: an environmentally
benign alternative separation approach. Ind Eng Chem Res 1999;38:4150.
234. Huddleston JG, Willauer HD, Griffin ST, Rogers RDMetal Ion Separations in Aqueous
Biphasic Systems and Using Aqueous Biphasic Extraction Chromatography. Ind Eng Chem
Res 1999;38:2523.
235. Pinto G, Peırez Pavoın C, Moreno Cordero JL, Romero Beato B, Garcıa Saı nchez E,
Anal SJ. Micelle mediated extraction of metal ions from water samples. Atomic Spectrom
1996;11:37.
309Chapter | 5 Examples of Application of Solvent Extraction Techniques
236. Akita S, Rovira M, Sastre AM, Takeuchi H. Cloud-Point Extraction of Gold(III) with
Nonionic SurfactantdFundamental Studies and Application to Gold Recovery from Printed
Substrate. Sep Sci Technol 1998;33:2159.
237. Horvath WJ, Huie CW. Screening of urinary coproporphyrin using cloud point extraction and
chemiluminescence detection. Talanta 1993;9:1385.
238. Rezende HC, Nascentes CC, Coelho NMM. Cloud point extraction for determination of
cadmium in soft drinks by thermospray flame furnace atomic absorption spectrometry.
Microchem J 2011;97(2):118–21.
239. Garcıa Pinto C, Peırez Pavoın JL, Moreno Cordero B. Cloud point extraction coupled with
microwave or ultrasonic assisted back extraction as a preconcentration step prior to gas
chromatography. Anal Chem 1995;67:2606.
240. Stangl G, Niessner R. Cloud point extraction of napropamide and thiabendazole from water
and soil. Mikrochim Acta 1994;113:1.
241. Ferrer R, Beltran JL, Guiteras J. Use of cloud point extraction methodology for the deter-
mination of PAHs priority pollutants in water samples by high-performance liquid
chromatography with fluorescence detection and wavelength programming. Anal Chim Acta
1996;330:199.
242. Eiguren A, Sosa Z, Santana JJ. Application of cloud point methodology to the determination
of polychlorinated dibenzofurans in sea water by high performance liquid chromatography.
J Analyst 1999;124:487.
243. Calvo Seronero L, Fernandez Laespada ME, Peırez Pavoı n JL, Moreno Cordero B.
J Chromatogr A 2000;897:171.
244. Eiguren A, Sosa Z, Santana J. Application of cloud-point methodology to the determination
of polychlorinated dibenzofurans in sea water by high-performance liquid chromatography.
J Anal Chim Acta 1998;358:145.
245. Moreno B, Perez JL, Garcıa C, Fernandez ME. Cloud Point Methodology: A New Approach
for Preconcentration and Separation in Hydrody- namic Systems of Analysis. Talanta
1993;40:1703.
246. Carabias-Martınez R, Rodrıguez-Gonzalo E, Domınguez-Alvarez J, Hernaındez-Meındez.
Cloud point extraction as a preconcentration step prior to capillary electrophoresis. J Anal
Chem 1999;771:2468.
247. Janata J, Josowitz M, de Vaney DM. Chemical sensors. Anal Chem 1994;66:207R.
248. Camman K, Lemke U, Rohen A, Sander J, Wilken H, Winter B. Chemical sensors – from
molecules, complex mixtures to cells – supramolecular imprinting strategies. Angew Chem
1991;109:519.
249. Szczepaniac W, Oleksy J. Ion-selective electrodes in analytical chemistry. J Anal Chim Acta
1986;189:237.
250. Pretsch E, Buchi R, Amman D, Simon W. Essays on analytical chemistry. New York:
Pergamon Press; 1977. p. 321.
251. Xie RY, Christian GD. Flow injection study of lithium selectivity. Analyst 1987;112:61.
252. Pioda LAR, Stankova Y, Simon W. Ion selective polymeric membranes as chemically
selective coulometric electrodes. Anal Lett 1969;2:665.
253. Scholer RP, Simon W. The crystal and molecular structure of bis(cyclopentadienyl)
(-allyl)(carbon disulphide)niobium. Chimia 1970;24:372.
254. Hobby PC, Moody GJ, Thomas JDR. Studies of calcium ion-selective electrodes in the
presence of anionic surfactants. Analyst 1983;108:581.
255. Geissler M, Kunze R. Ion-selective electrodes based on the phosphonium salt. Anal Chim
Acta 1986;189:245.
310 PART | I Conventional (Classical) Principles and Practice
256. Peters DG, Hayes JM, Hieftje GM. Modern chemical analysis. Philadelphia: W.B.
Saunders; 1976.
257. Hamilton RJ, Sewei PA. Introduction to high performance liquid chromatography. London:
Chapman & Hall; 1977.
258. Wakui Y, Matsunaga H, Suzuki TM. Distribution of Rare Earth Elements between (2-
Ethylhexyl Hydrogen 2-Ethylhexylphosphonate)-Impregnated Resin and Acid Aqueous
Solution. Anal Sci 1988;4:325.
259. Muscatello AC, Yarbro SL, Marsh SF. In: Cecille L, Casarci M, Pietrelli L, editors. New
separation chemistry techniques for radioactive waste and other specific applications.
Amsterdam: Elsevier Science Publishing; 1991. p. 88.
260. Dietz ML, Horwitz EP, Nelson DM, Walgren M. Extraction Chromatography: Progress and
Opportunities. Health Phys 1991;61:871.
261. Horwitz EP, Dietz ML, Nelson DM, La Rosa JJ, Fairman W. Concentration and separation of
actinides from urine using a supported bifunctional organophosphorus extractant. Anal Chim
Acta 1990;238:263.
262. Snyder LR, Kirkland JJ. Modern liquid chromatography. New York: John Wiley &
Sons; 1974.
263. Parris NH. Instrumental liquid chromatography. Amsterdam: Elsevier; 1976.
264. Lawrence JF, Frei RW. Chemical derivitization in liquid chromatography. Amsterdam:
Elsevier; 1976.
265. Horvath C, editor. High-performance liquid chromatography, vols. 1–3. New York: Academic
Press; 1980–1983.
266. Mulier W. Precoating. Kontakte (Merck) 1986;3:3.
267. Braun R, Ghersini G. Extraction chromatography. Amsterdam: Elsevier; 1975.
268. Veuthy JL, Caude M, Rosset R. Metal speciation by supercritical fluid extraction with on-line
analysis. Analysis 1990;18:103.
269. Hawthorne SB. Analytical scale supercritical fluid extraction. Anal Chem 1990;62:633.
270. Vannoort RW, Chervet JP, Lingeman H, De Jong GJ, Brikman AUTh. Supercritical fluid
chromatography and extraction in surface coatings analysis d review of representative
applications. J Chromatogr 1990;505:45.
271. Sugiyama K, Saito M, Hondo T, Seda M. New double-stage analysis method. J Chromatogr
1985;332:107.
272. Anderson IGM. Supercritical fluid extraction coupled to packed column supercritical fluid
chromatography. In: Westwood SA, editor. Supercritical fluid extraction and its use in
chromatographic sample preparation. UK: Blackie Academic & Professional, Chapman &
Hall; 1993. p. 112.
273. Foreman JK, Sockweli PB. Topics in automatic chemical analysis, vol .1. Chichester, UK:
Ellis Horwood; 1979.
274. Valcarecel M, Luque de Castro MD. Flow-injection analysis. Chichester, UK: Ellis
Horwood; 1987.
275. Furman WB. Continuous flow analysis: Theory and practice. New York: Dekker; 1976.
276. Coakley WA. Handbook of automatic analysis. Continuous flow techniques; 1982. New York:
Dekker.
277. Ruzicka J, Hansen EH. Flow-injection analysis. New York: Wiley; 1981.
278. Valcarcel M, Gallego M. Separation techniques. In: Bruguera JL, editor. Flow injection
atomic spectroscopy. New York: Marcel Dekker; 1989.
279. Luque de Castro MD, Valcarcel M. Integration of separation and detection in continuous-
flow systems. Trends Anal Chem 1991;10:114.
311Chapter | 5 Examples of Application of Solvent Extraction Techniques
280. MacLaurin P, Andrew KN, Worsfold PJ. Flow injection analysis. In: McLennan F,
Kowalski BR, editors. Process analytical chemistry. Glasgow: Blackie Academic &
Professional; 1995. p. 159.
281. Valcarcel M, Luque de Castro M. Non chromatographic continuous separation techniques.
Cambridge, UK: Royal Society of Chemistry; 1990.
282. Shelly DC, Rossi TM, Warner IM. Multiple solvent extraction system with flow technology.
Anal Chem 1982;54:87.
283. Gallego M, Valcarcel M. Indirect continuous automatic determination of pharmaceuticals by
atomic absorption spectroscopy. Anal Chim Acta 1985;169:161.
284. Rao TP, Metilda P, Gladis JM. Preconcentration techniques for uranium(VI) and thorium(IV)
prior to analytical determinationdan overview. Talanta 2006;68(4):1047–64.
285. Gopalkrishnan M, Radhakrishnan K, Dhami PS, Kulkarni VT, Joshi MV, Patwardhan AB,
Ramanujam A, Mathur JN. Determination of trace impurities in uranium, thorium and
plutonium matrices by solvent extraction and inductively coupled plasma atomic emission
spectrometry. Talanta 1997;44(2):169–76.
286. May CC, Worsfold PJ, Keith-Roach MJ. Analytical techniques for speciation analysis of
aqueous long-lived radionuclides in environmental matrices. TrAC Trends Anal Chem
2008;27(2):160–8.
287. Desideri D, Feduzi L, Meli MA, Roselli C. Sequential determination of Am, Cm, Pu, Np and
U by extraction chromatography. Microchem J 2011;97(2):264–8.
288. Hou X, Roos P. Critical comparison of radiometric and mass spectrometric methods for the
determination of radionuclides in environmental, biological and nuclear waste samples. Anal
Chim Acta 2008;608(2):105–39.
289. Zamani A-A, Yaftian MR. Solvent extraction of thorium, lanthanum and europium ions by
bis(2-ethylhexyl)phosphoric acid using 2-nitrobenzo-18-crown-6 as ion size selective
masking agent. Sep Purif Tech 1 December 2004;40(2):115–21.
290. Dybczyriski R. Role of ion-exchange and extraction chromatography in neutron activation
analysis. J Chromatogr 1992;600:17–36.
291. Li Z, Conti PS. Radiopharmaceutical chemistry for positron emission tomography. Adv Drug
Deliv Rev 2010;62(11):1031–51.
292. Qiao J, Hou X, Miro M, Roos P. Determination of plutonium isotopes in waters and envi-
ronmental solids: a review. Anal Chim Acta 2009;652(1–2):66–84.
293. Keller C. Radiochemistry. English edition published by Ellis Horwood. Chichester, UK: Ellis
Horwood Series in Physical Chemistry; 1988.
294. Wennersten R. The extraction of malic acid from fermentation broth using a solution of
tertiary amine. J Chem Tech Biotechnol 1983;33:85.
295. Lloyd-Jones E. Recent advances in liquid-liquid extraction. Chem Ind 1967:1590.
296. Kertes AS, King C. Extraction chemistry of fermentation product carboxylic acids. J Bio-
technol Bioeng 1986;28:269–82.
297. Canari R, Hazan B, Bloch R, Eyal AM. Value adding through solvent extraction. In:
Shallcross DC, Paimin R, Prvcic LM, editors. Proceedings of ISEC’96, vol. 2. University of
Melbourne Press; 1996. p. 1517.
298. Yagodin GA, Yurtov E, Golubkov AS. Separation and concentration of amino acids using
liquid emulsion membranes. Proceedings of ISEC’86, vol. 3. Munich: DECHEMA; 1986.
p. 677.
299. Lukhezo M, Kelly NA, Reuben BG, Dunne LJ, Verrall MS. Value adding through solvent
extraction. In: Shallcross DC, Paimin R, Prvcic LM, editors. Proceedings of ISEC’96, vol. 1.
University of Melbourne Press; 1996. p. 87.
312 PART | I Conventional (Classical) Principles and Practice
300. Hano T, Matsumoto M, Ohtake T, Sasaki K, Hori F, Kawano Y. Separation of lactic acid from
aqueous solution. J. Chem Eng Jpn 1990;23(6):734.
301. Schugerl K. Solvent extraction in biotechnology. Berlin: Springer-Verlag; 1994. 113–25.
302. Verrall MS. In: Thornton JD, editor. Science and practice in solvent extraction. Oxford, vol.
2. Oxford Science Publications; 1992. Chap. 3.
303. Kirk-Othmer encyclopedia of chemical technology. 4th ed., vol. 10. New York: John Wiley &
Sons; 1993. p. 125.
304. Reuben BG, Sjoberg K. Chem technology 1981;11:315.
305. Reschke M, Schurgel K. Distribution equilibrium of penicillin G between water and organic
phase. Chem Eng J 1994;28:B1–29.
306. Somekh GS. Liquid-liquid extraction processes & process engineering. Proceedings of ISEC
71, vol. 1. London: Lyon: Society of Chemical Industry; 1971. p. 323.
307. Kane L, Romanow-Garcia S, Nakamura D. Hydrocarbon gas processing. Hydrocarb Process
1995;74:36.
308. Bailes PJ. Oxide solid solutions as catalysts. Chem Ind; 1977:69.
309. Bender ML, Komiyama M. Cyclodextrin chemistry. Berlin: Springer-Verlag; 1978.
310. Uemasu I. Value adding through solvent extraction. In: Shallcross DC, Paimin R, Prvcic LM,
editors. Proceedings of ISEC’96, vol. 2. University of Melbourne Press; 1966. p. 1635.
311. Pratt MWT. In: Lo TC, Baird MHI, Hanson C, editors. Handbook of solvent extraction. New
York: John Wiley & Sons; 1983. p. 605.
312. Rogers PL, Jeon J, Lee KJ, Lawford HG. Zymomonas mobilis forfuel ethanol and higher
value products. Adv Biochem Eng Biotechnol 2007;108:263–88.
313. Fischer CR, Klein-Marcuschamer D, Stephanopoulos G. Selection and optimization of
microbial hosts for biofuels production. Metab Eng 2008;10:295–304.
314. Alper H, Moxley J, Nevoigt E, Fink GR, Stephanopoulos G. Engineering yeast
transcription machinery for improved ethanol tolerance and production. Science
2006;314:1565–8.
315. Zhao J, Yang S-T, Jiang W, Yang S. Evolution of solvent-producing Clostridium beijerinckii
towards high butanol tolerance. Presented at 238th ACS national meeting, 2009.
316. Boles E. Genetic engineering of yeast strains for the production of bioalcohols from C6- and
C5-sugars. Presented at 27th International Specialized Symposium on Yeasts, 2009.
317. Steen EJ, Chan R, Prasad N, Myers S, Petzold CJ, Redding A, et al. Metabolic engi-
neering of Saccharomyces cerevisiae for the production of n-butanol. Microb Cell Fact
2008;7:36.
318. Simoni LD, Chapeaux A, Brennecke JF, Stadtherr MA. Extraction of biofuels and bio-
feedstocks from aqueous solutions using ionic liquids. Comp Chem Eng 2010;34:1406–12.
319. Flett DS, Pearson D. Recovery of the metal values from effluents. Chem Ind 1975:639.
320. Martin D, Diaz G, Garcia MA, Saınchez F. Solvent extraction in the primary and
secondary processing of zinc. In: Proceedings of ISEC 2002, Cape Town: South Africa;
2002, p. 1045.
321. Sole KC. Zinc solvent extraction in the process industries, Proceedings of ISEC 2002. South
Africa: Cape Town; 2002. p. 1033.
322. Reinhardt H. Zinc solvent extraction in the process industries. In: Proceedings of the
international waste treatment and utilization conference, Waterloo, Canada, 1978, p. 83.
323. Reinhardt H. Proceedings of Hydrometallurgy ’81. London: Society of Chemical Industry;
1981. Section F1.
324. MEAB Report. Extraction of nickel with simultaneous neutralization, 1989. www.meab-mx.se.
325. Sze YKP, Xue L. Sep Sci Technol 2003;38:405.
313Chapter | 5 Examples of Application of Solvent Extraction Techniques
326. Andersson SOS, Reinhardt H. Hydrometallurgical metals and acids recovery (MAR)
recovery process. Review. In: Proc. Int. Solvent Ext. Conf., ISEC 77, CIM, Special vol. 21,
The Canadian Institute of Mining and Metallurgy, 1979. p. 798–804.
327. Ottertun H, Strandell E. Extraction of vanadium from athabasca tar sands fly ash.
Proceedings of ISEC’77, vol. 1. Toronto: Canadian Institute of Mining, Metallurgy and
Petroleum; 1979. p. 501.
328. Monzyk B, Conkle HN, Rose JK, Chauhan SP. Solvent extraction in hydrometallurgy:
present and future. In: Proceedings of ISEC 2002, Cape Town: South Africa; 2002, p. 755.
329. Alonso AI, Galan B, Gonzalez M, Ortiz I. Experimental and theoretical analysis of
a nondispersive solvent extraction pilot plant for the removal of Cr(VI) from a galvanic
process wastewaters. Ind Eng Chem Res 1999;38(4):1666–75.
330. Reinhardt H. Proceedings of ISEC ’93, vol. 3. York, UK; London: Society of Chemical
Industry; 1993. p. 1625.
331. Ritcey GM. Proceedings of ISEC ’93, vol. 1. York, UK; London: Society of Chemical
Industry; 1993. p. 189.
332. Martin D, Garcia MA, Diaz G, Falgueras J. Neutralization sludge from the plating industries
flue dust from steel and brass mills. Proceedings of ISEC ’99, vol. 1. Barcelona, Spain;
London: Society of Chemical Industry; 2001. p. 201.
333. Demster JH, Bjoerklund P. Biological and toxicological effects of solvent extraction,
Proceedings of 4th annual meeting on hydrometallurgy section of the metallurgical society.
Toronto: CIM; 1994. p. 68.
334. Dias G, Martin D, Frias C, Peırez O. Emerging applications of ZINCEX and PLACID
technologies. Proceedings of ISEC ’99, vol. 2. Barcelona, Spain; London: Society of
Chemical Industry; 2001. p. 1449.
335. Kalujta VV, Kuznetsov GI, Kravchenko AN, Lanin VP, Miraevshy GP, Pushkov AA, Travkin
VF, Shklyar LI. In: Proceedings of ISEC ’88, Moscow, 1988, vol. 1, p. 252.
336. Dreisinger DB, Leong BJY, Balint BJ, Beyad MH. The solvent extraction of As, Sb and Bi
from copper refining electrolytes using organophosphorus reagents. Proceedings of ISEC
’93, vol. 3. York, UK, London: Society of Chemical Industry; 1993. p. 1271.
337. Wang C, Jiang K, Liu D, Wang H. NMR Spectroscopy in the liquid and gas phase. In:
Proceedings of ISEC 2002. Cape Town: South Africa; 2002, p. 1039.
338. Cox M, Flett DS, Velea T, Vasiliu C. The extraction of copper, zinc, cadmium and lead from
waste streams in the zinc-lead industry. In: Proceedings of ISEC 2002. Cape Town: South
Africa; 2002, p. 995.
339. Dreisinger D, Wassink B, Ship K, King J, Hames M, Hackl R. Cyanide recovery by solvent
extraction, Proceedings of ISEC 2002. South Africa: Cape Town; 2002. p. 798.
340. Hutchins D. (Nova Chemicals Ltd., Canada) Continuous solvent extraction process for
the separation of aromatic hydrocarbons from a mixed feed stock. Can Pat Appl CA
1997-2214305 (1999), p. 31.
341. Zubaidy EAH, Abouelnasr DM. Fuel recovery from waste oily sludge using solvent
extraction. Process Safety Environ Prot 2010;88(5):318–26.
342. Wohler E. Removal and recovery of phenol and ammonia from gas liquor. Frankfurt: Lurgi
Kohle und Mineraloltechnik GmbH; 1978.
314 PART | I Conventional (Classical) Principles and Practice
Part II
Novel CompetitiveComplexation/Solvation
Theory (CCST) of SolventExtraction: Principles and
Practice
1. INTRODUCTION
Complex chemistry, which occurs in extraction processes, is still not completelyunderstood. The complicated behavior of extraction systems conflicts, in somecases, with the classic stoichiometric ion-exchange models. Firstly, we have metwith difficulties explaining the phenomenon “Dual maximum behavior”observed at titanium(IV) and many other transition metals extraction: tworegions of effective extraction were observed, one at low acidity and the other athigh acidity of aqueous solutions (for details and citations see Chapter 3). Thisphenomenon was found for most families of extractants: acidic (organic acids),basic (amines or their mixtures), and neutral complexants. Ad hoc argumentsusing acid–base and coordination chemistry concepts were not so convincing.
The experimental data fitted to basic equations of the classic theories describewell the extraction by strong extractants, forming strong complexes but are far tobe satisfied for the extractants forming weak complexes with the solute. In allcases, these equations are reliable only for the separation factors in the certainlimits, namely 0.2� Z� 0.8. These conditions are rarely respected in practice. Inaddition, during studied extractive reactions the intermediates formed becomeextractants also, strongly complicate interaction chemistry, and cast doubt on thereliability of equilibrium (extraction) constants obtained by basic equations.
The difference in the extraction trends must be attributed also to solvation(coordination) effects. Solvents are known to have numerous different effects
on the reactivity: general effects stemming from polarity and polarizability andspecific effects originating from p- or n-donor ability, hydrogen-bond formingcapacity, etc. The solvents range from the very inert through non-polar butpolarizable to the polar, polarizable and hydrogen-bonding (as water). In orderto analyze solvation effects, identification and, most importantly, quantificationof solute–solvent interactions must be accomplished. Complexity of solventstructure makes this task extremely difficult.
Modeling extraction systems researchers use only basic equations of aninteraction reaction for a given solute ion and extractant. But a strong, some-times critical influence of solvation effects on the extraction efficiency is alsodiscussed in the same works. The polar, polarizable, hydrogen-bondingsolvents change the extraction order dramatically. Solvent effects on UV-VISabsorbancy or NMR chemical shifts leads to anomalous relationship betweenthese experimental data and extraction constants.
It is well known that the stoichiometry of the extracted species changes asloading increases. This phenomenon was described through aggregationmechanisms. Aggregation was observed at extraction of acids, metal ions, andsalts. The formation of linear, cyclic aggregates and reversed micelles wereproved using different experimental and analytical techniques. Classic modelsdo not handle this very important problem.
The methodology of coordination chemistry in solution has been appliedextensively to the determination of the equilibrium constants for solventreplacement in the coordination spheres of ions. Coordination models,explaining qualitatively some mechanisms of metal solvent extraction, meetdifficulties when modeling anion exchangers, acid solvent extraction, and,especially, at the attempts of quantification of the models.
The physicochemical modeling approach, preliminarily developed for theacid–amine extraction systems (see Chapters 7 and 9), was introduced toexplain the mechanisms of solvent extraction by different acidic, basic, ormixed extractants. This theory is based on the modified competitive preferentialsolvation (COPS) theory, the Lewis acid–base concept, the concept ofamphoteric properties of extractants, and the concept of different aggregationstructures formation at increasing extractant loading. Based on these well-known concepts a novel model for solvent extraction processes was developed.It interprets well both strong and weak ion–molecular interactions and itsequations describe the processes in all concentration range. This modelexplains some anomalies which required previously ad hoc arguments.
In the following chapters principles of the novel approach to solventextraction and its applications in acid and metal extraction are presented andinterpreted on the base of this model. The data available from the literatureand our experiments are used for interpretation. Mathematical description andsuitable experimental techniques for verification of the model are presented.
316 PART | II Novel Competitive Complexation/Solvation Theory
Chapter 6
Backgrounds of the CompetitiveComplexation/Solvation Theoryof Solvent Extraction
Chapter Outline1. Introduction 317
2. Complexation Through the
H-Bonding
and Proton Transfer
317
3. Distribution Isotherm 319
4. Modified Competitive
Preferential Solvation Theory
323
5. Electronic AcideBase Theory
and Amphoterity
327
6. Aggregation 328
References 329
1. INTRODUCTION
Novel competitive complexation/solvation theory (CCST) of solvent extrac-tion is based on the concepts well known in chemistry. These are H-bondingand proton transfer, competitive preferential solvation theory, electronicacid-base theory, and amphoterity and aggregation. These concepts presentedin short in this Chapter with the literature references for the purpose to makethe CCST material easier to understand.
2. COMPLEXATION THROUGH THE H-BONDINGAND PROTON TRANSFER
During the last decades the nature of H-bond, H-bonded complexes, and protontransfer have been intensively investigated by different methods.1–13 However,interpretation of the experimental data is very difficult. The simplest and mostclearly defined H-bonded species are carboxylic acid dimers. Strong evidencemay be mentioned for the presence of higher aggregates.6,7
Reactions can be divided into single, competing, and coupling. In a processdescribed by a single chemical equation, equilibrium constant are determined
Solvent Extraction. DOI: 10.1016/B978-0-444-53778-2.10006-8
Copyright � 2012 Elsevier B.V. All rights reserved. 317
by the initial concentrations of all reactants. This is what many experimentatorsdo in solvent extraction (SX) and what is far from real processes because theSX are not single reactions in most cases. Two or more reactions are competingif common solute reacts with different solvents (extractant, enhancer, diluent,etc.). Two reactions are coupled when a product of one reaction is a reactant forthe next. This reactant is usually nominated as an intermediate or adduct. Theequilibrium concentrations of the species participating in one reaction dependon the initial concentrations of all chemicals (including adducts) involved in allreactions. Competing and coupling play an important role in hydrogen bondand proton transfer reactions and SX processes.
Proton transfer in general and specifically in organic solvents has beeninvestigated using many techniques. The highly known organic compounds areproton acceptors and/or proton donors, and may be converted into highlyreactive intermediates by proton transfer:
SHþ E 4 SdH.E (6.1)
SHþ E 4 S�.HdEþ (6.2)
S�.HdE 4 EþdHþ S� (6.3)
SdHþ A 4 SdH.A (6.4)
SdH.A 4 S� þ HþA (6.5)
Where S, H, E, and A are solute, proton, extractant, and active solvent,respectively. As a rule reactions (6.4) and (6.5) in extraction experiments areomitted to simplify consideration.
These reactions are typical examples of competing and coupled reactions.In most cases, to explain experimental data of intermolecular proton transfer,three-step mechanism is applied:
Eþ SdH 4 E.SH 4 EþH.S� 4 EþHþ S� (6.6)
At excess of solute or extractant is added, and the following interactions arefound:
E.HdSþ SH 4 E.HdS.SH 4 EþdH.S�.SH 4 EþdH
þ ðSHSÞ�(6.7)
or
EþdH.Sþ E 4 ðEHEÞþS� 4 ðEHEÞþ þ S� (6.8)
In many cases, especially when aprotic solvents with low dielectric permit-tivity complexes are formed with dipole moment m � 5 D, these complexesinteract to form aggregates.2,5–7 Clusters of molecules are formed by H-bondingin solution and their structures vary strongly with solvent (its polarity, proton
318 PART | II Novel Competitive Complexation/Solvation Theory
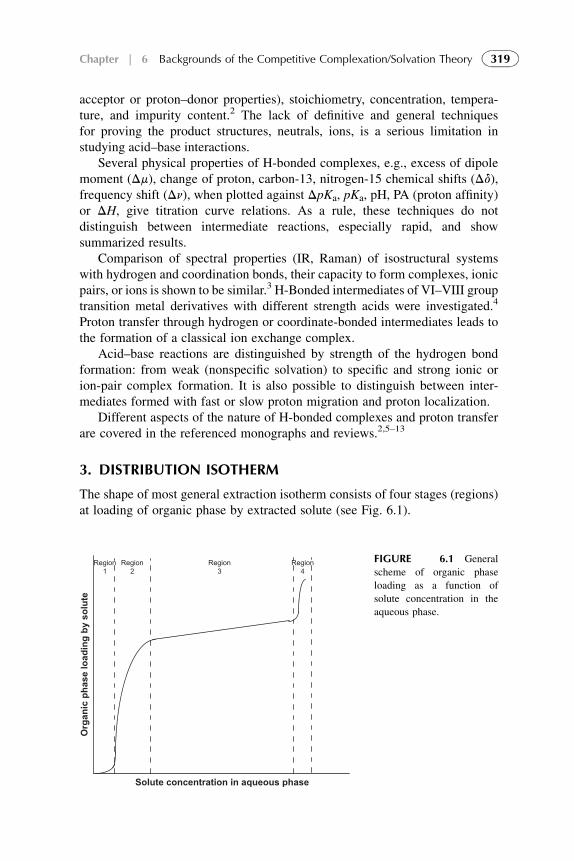
acceptor or proton–donor properties), stoichiometry, concentration, tempera-ture, and impurity content.2 The lack of definitive and general techniquesfor proving the product structures, neutrals, ions, is a serious limitation instudying acid–base interactions.
Several physical properties of H-bonded complexes, e.g., excess of dipolemoment (Dm), change of proton, carbon-13, nitrogen-15 chemical shifts (Dd),frequency shift (Dn), when plotted against DpKa, pKa, pH, PA (proton affinity)or DH, give titration curve relations. As a rule, these techniques do notdistinguish between intermediate reactions, especially rapid, and showsummarized results.
Comparison of spectral properties (IR, Raman) of isostructural systemswith hydrogen and coordination bonds, their capacity to form complexes, ionicpairs, or ions is shown to be similar.3 H-Bonded intermediates of VI–VIII grouptransition metal derivatives with different strength acids were investigated.4
Proton transfer through hydrogen or coordinate-bonded intermediates leads tothe formation of a classical ion exchange complex.
Acid–base reactions are distinguished by strength of the hydrogen bondformation: from weak (nonspecific solvation) to specific and strong ionic orion-pair complex formation. It is also possible to distinguish between inter-mediates formed with fast or slow proton migration and proton localization.
Different aspects of the nature of H-bonded complexes and proton transferare covered in the referenced monographs and reviews.2,5–13
3. DISTRIBUTION ISOTHERM
The shape of most general extraction isotherm consists of four stages (regions)at loading of organic phase by extracted solute (see Fig. 6.1).
Region4
Region3
Region2
Region1
Solute concentration in aqueous phase
Org
an
ic p
hase lo
ad
in
g b
y so
lu
te
FIGURE 6.1 General
scheme of organic phase
loading as a function of
solute concentration in the
aqueous phase.
319Chapter | 6 Backgrounds of the Competitive Complexation/Solvation Theory
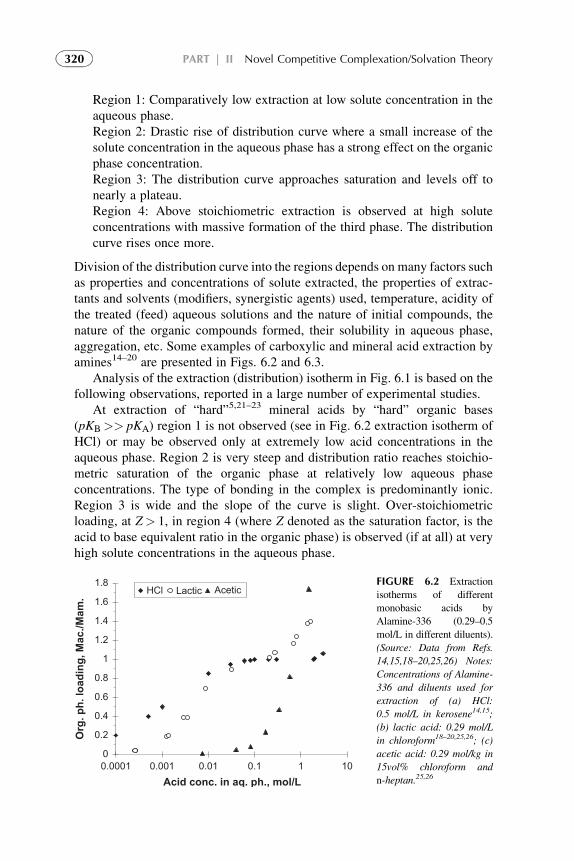
Region 1: Comparatively low extraction at low solute concentration in theaqueous phase.Region 2: Drastic rise of distribution curve where a small increase of thesolute concentration in the aqueous phase has a strong effect on the organicphase concentration.Region 3: The distribution curve approaches saturation and levels off tonearly a plateau.Region 4: Above stoichiometric extraction is observed at high soluteconcentrations with massive formation of the third phase. The distributioncurve rises once more.
Division of the distribution curve into the regions depends on many factors suchas properties and concentrations of solute extracted, the properties of extrac-tants and solvents (modifiers, synergistic agents) used, temperature, acidity ofthe treated (feed) aqueous solutions and the nature of initial compounds, thenature of the organic compounds formed, their solubility in aqueous phase,aggregation, etc. Some examples of carboxylic and mineral acid extraction byamines14–20 are presented in Figs. 6.2 and 6.3.
Analysis of the extraction (distribution) isotherm in Fig. 6.1 is based on thefollowing observations, reported in a large number of experimental studies.
At extraction of “hard”5,21–23 mineral acids by “hard” organic bases(pKB>> pKA) region 1 is not observed (see in Fig. 6.2 extraction isotherm ofHCl) or may be observed only at extremely low acid concentrations in theaqueous phase. Region 2 is very steep and distribution ratio reaches stoichio-metric saturation of the organic phase at relatively low aqueous phaseconcentrations. The type of bonding in the complex is predominantly ionic.Region 3 is wide and the slope of the curve is slight. Over-stoichiometricloading, at Z> 1, in region 4 (where Z denoted as the saturation factor, is theacid to base equivalent ratio in the organic phase) is observed (if at all) at veryhigh solute concentrations in the aqueous phase.
0
0.2
0.4
0.6
0.8
1
1.2
1.4
1.6
1.8
0.0001 0.001 0.01 0.1 1 10Acid conc. in aq. ph., mol/L
Org
. p
h. lo
ad
in
g, M
ac./M
am
.
HCl Lactic AceticFIGURE 6.2 Extraction
isotherms of different
monobasic acids by
Alamine-336 (0.29–0.5
mol/L in different diluents).
(Source: Data from Refs.
14,15,18–20,25,26) Notes:
Concentrations of Alamine-
336 and diluents used for
extraction of (a) HCl:
0.5 mol/L in kerosene14,15;
(b) lactic acid: 0.29 mol/L
in chloroform18–20,25,26; (c)
acetic acid: 0.29 mol/kg in
15vol% chloroform and
n-heptan.25,26
320 PART | II Novel Competitive Complexation/Solvation Theory
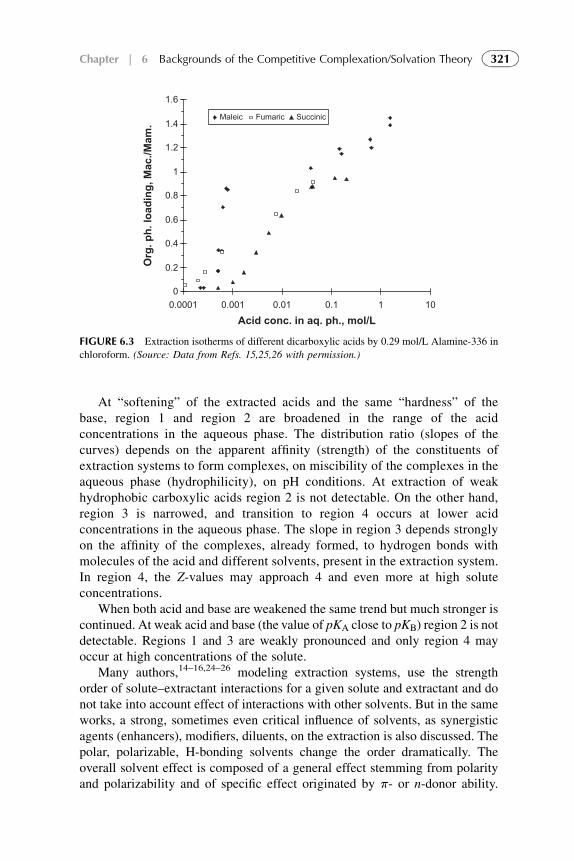
At “softening” of the extracted acids and the same “hardness” of thebase, region 1 and region 2 are broadened in the range of the acidconcentrations in the aqueous phase. The distribution ratio (slopes of thecurves) depends on the apparent affinity (strength) of the constituents ofextraction systems to form complexes, on miscibility of the complexes in theaqueous phase (hydrophilicity), on pH conditions. At extraction of weakhydrophobic carboxylic acids region 2 is not detectable. On the other hand,region 3 is narrowed, and transition to region 4 occurs at lower acidconcentrations in the aqueous phase. The slope in region 3 depends stronglyon the affinity of the complexes, already formed, to hydrogen bonds withmolecules of the acid and different solvents, present in the extraction system.In region 4, the Z-values may approach 4 and even more at high soluteconcentrations.
When both acid and base are weakened the same trend but much stronger iscontinued. At weak acid and base (the value of pKA close to pKB) region 2 is notdetectable. Regions 1 and 3 are weakly pronounced and only region 4 mayoccur at high concentrations of the solute.
Many authors,14–16,24–26 modeling extraction systems, use the strengthorder of solute–extractant interactions for a given solute and extractant and donot take into account effect of interactions with other solvents. But in the sameworks, a strong, sometimes even critical influence of solvents, as synergisticagents (enhancers), modifiers, diluents, on the extraction is also discussed. Thepolar, polarizable, H-bonding solvents change the order dramatically. Theoverall solvent effect is composed of a general effect stemming from polarityand polarizability and of specific effect originated by p- or n-donor ability.
0
0.2
0.4
0.6
0.8
1
1.2
1.4
1.6
0.0001 0.001 0.01 0.1 1 10
Acid conc. in aq. ph., mol/L
Maleic Fumaric Succinic
Org
. p
h. lo
ad
in
g, M
ac./M
am
.
FIGURE 6.3 Extraction isotherms of different dicarboxylic acids by 0.29 mol/L Alamine-336 in
chloroform. (Source: Data from Refs. 15,25,26 with permission.)
321Chapter | 6 Backgrounds of the Competitive Complexation/Solvation Theory
Appropriate way to represent these effects quantitatively is to use empirical orsemiempirical parameters. For example, donating specific effect may bedetermined by ionization potential (eV) of the donor molecule or by charge(proton) transfer energy of the complexes.
Various models and equations, using different parameters, have beendeveloped with the aim to describe and quantify solvation effects on thesolute–extractant interaction strength in organic compositions. Some authorsused the Hildebrand solubility parameter8,27–29 as a measure of solvation,some used linear free-energy relationships,30,31 and some combined “physicaland chemical modeling” calculating the activity coefficients for the reactantsand complexes.32,33 Headley with coworkers,34–36 studying solvation effectson the basicity of amines, introduced many parameters, such as hydrogen bonddonor and acceptor abilities, solvent’s dipolarity/polarizability, and dipolemoment. All models developed are very interesting from the scientific point ofview but they require a considerable number of adjustable parameters anddevelopment of calculation techniques to be useful for the technologicalpractice.
Stability constants can generally be estimated using classical theories forsolvates of definite geometry and solvation (coordination) number, n: theequilibrium constants for the replacement of some solvent (in our case, watermolecules, W) in the solvate S(W)Zþ by another solvent (extractant molecules,E) to form the solvated ion S(E)Zþ.8,27–29 This replacement reaction is gener-ally studied in mixed solvents, but the values may be extrapolated to apply tothe pure solvents. Marcus,27–29 Grunwald,37 Covington,38,39 and Cox40 derivedequations relating the equilibrium constants for solvent replacement to standardmolar Gibbs free energy of solute (S) transfer from a solvent (W) to its mixturewith another solvent (Wþ E).
According to Cox:
DGNt ðS;W/EÞ ¼ �n RT ln KSE (6.9)
where the KSE is the average equilibrium constant for W/E solventreplacement and n is the solvation (coordination) number.
According to Covington38 rather complicated relationship between chem-ical shift NMR (d) and solvent composition was proposed:
d� dSW
dSE � dSW¼ K1Y þ 2K1K2Y
2 þ 3K1K2K3Y3 þ 4K1K2K3K4Y
4
4ð1þ K1Y þ K1K2Y2 þ K1K2K3Y3 þ K1K2K3K4Y4Þ (6.10)
Where n ¼ 4 and Y¼aSE/aSW (ai – activity of solute species).At K ¼ ðK1K2K3K4Þ1=4 average constant Eqn (6.2) may be simplified and
presented in the linear form:
1
d� dSW¼ 1
dSE � dSW
�1þ 1
KY
�(6.11)
322 PART | II Novel Competitive Complexation/Solvation Theory
According to Scatchard–Deranleau equation41–43 measurements forUV-VIS (3) (if all solute species obey Beer’s law):
3SW � 3
CE¼ KSEð3SW � 3EÞ � KSEð3SW � 3Þ (6.12)
Z ¼ 3SW � 3
3SW � 3SE¼ CSE
C0S
¼ KSECE
1þ KSECEat 0 < Z < 1 (6.13)
It has been shown38–43 that data obtained by these equations are reliableonly between certain limits of saturation, Z, namely 0.15–0.2 < Z < 0.7–0.8 ornamely for the 1 and 2 regions of the general extraction isotherm (see Fig. 6.1).
This condition is rarely respected in practice. While for strong complexes itwould be easy to fulfill it, weak complexes require relatively high soluteconcentrations to reach, if ever, the appropriated degree of saturation. In thiscase the solute becomes one of the constituents of the reaction medium. Suchtransformation of complexing solute into complexing and solvating moleculescasts doubt on the reliability of equilibrium constants of weak complexes.According to the theory of charge transfer complexes, the absorption intensityshould increase with increasing components’ interaction. However, the oppo-site behavior is observed frequently with K ¼ 0 and 3 ¼N as a limiting case.This means that slope and intercept of above equations are both equal to 0 anddetermination of K and 3 impossible. In other cases negative intercepts andpositive slopes were found. This implies negative association constants and thatis thermodynamically unacceptable.
These phenomenological anomalies stimulated intensive research activity.Several ad hoc theories have been proposed.44–47 But all of them are reliableonly in specific cases. Competitive preferential solvation, COPS, theory ofweak molecular interactions, 48–51 modified for extraction systems, is verifiedand shows reliability in the whole concentration range. It can be applied to anykind of physico-chemical techniques (e.g., chemical kinetics, NMR, UV-V,fluorescence, relaxation time measurements). COPS theory modified forextraction systems52–54 is used in the presented work to describe and quantifycorrelations between complexation and solvation effects.
4. MODIFIED COMPETITIVE PREFERENTIAL SOLVATIONTHEORY
The following postulates (A–C) of the modified COPS theory are presented.
A. Solute in liquid phases is surrounded by a solvation shell. This means thata solute interacts with all the constituents of the environment, and therefore,“free” solute, free extractant, or free solute–extractant complex do not exist.The molecules in the solvation shell continuously and fastly relax betweencomplexing and solvating states. Therefore, coefficient, ki, represents thetotal, complexing, and solvating affinity constant.
323Chapter | 6 Backgrounds of the Competitive Complexation/Solvation Theory
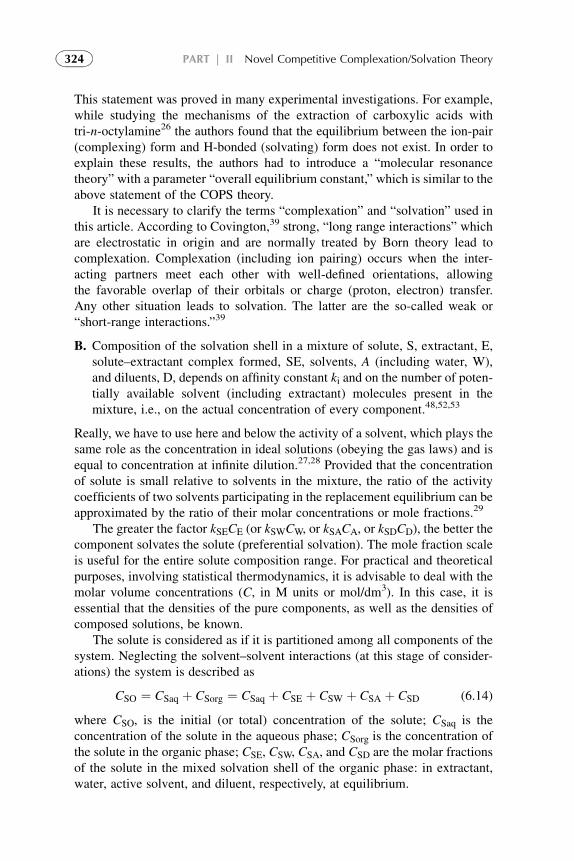
This statement was proved in many experimental investigations. For example,while studying the mechanisms of the extraction of carboxylic acids withtri-n-octylamine26 the authors found that the equilibrium between the ion-pair(complexing) form and H-bonded (solvating) form does not exist. In order toexplain these results, the authors had to introduce a “molecular resonancetheory” with a parameter “overall equilibrium constant,” which is similar to theabove statement of the COPS theory.
It is necessary to clarify the terms “complexation” and “solvation” used inthis article. According to Covington,39 strong, “long range interactions” whichare electrostatic in origin and are normally treated by Born theory lead tocomplexation. Complexation (including ion pairing) occurs when the inter-acting partners meet each other with well-defined orientations, allowingthe favorable overlap of their orbitals or charge (proton, electron) transfer.Any other situation leads to solvation. The latter are the so-called weak or“short-range interactions.”39
B. Composition of the solvation shell in a mixture of solute, S, extractant, E,solute–extractant complex formed, SE, solvents, A (including water, W),and diluents, D, depends on affinity constant ki and on the number of poten-tially available solvent (including extractant) molecules present in themixture, i.e., on the actual concentration of every component.48,52,53
Really, we have to use here and below the activity of a solvent, which plays thesame role as the concentration in ideal solutions (obeying the gas laws) and isequal to concentration at infinite dilution.27,28 Provided that the concentrationof solute is small relative to solvents in the mixture, the ratio of the activitycoefficients of two solvents participating in the replacement equilibrium can beapproximated by the ratio of their molar concentrations or mole fractions.29
The greater the factor kSECE (or kSWCW, or kSACA, or kSDCD), the better thecomponent solvates the solute (preferential solvation). The mole fraction scaleis useful for the entire solute composition range. For practical and theoreticalpurposes, involving statistical thermodynamics, it is advisable to deal with themolar volume concentrations (C, in M units or mol/dm3). In this case, it isessential that the densities of the pure components, as well as the densities ofcomposed solutions, be known.
The solute is considered as if it is partitioned among all components of thesystem. Neglecting the solvent–solvent interactions (at this stage of consider-ations) the system is described as
CSO ¼ CSaq þ CSorg ¼ CSaq þ CSE þ CSW þ CSA þ CSD (6.14)
where CSO, is the initial (or total) concentration of the solute; CSaq is theconcentration of the solute in the aqueous phase; CSorg is the concentration ofthe solute in the organic phase; CSE, CSW, CSA, and CSD are the molar fractionsof the solute in the mixed solvation shell of the organic phase: in extractant,water, active solvent, and diluent, respectively, at equilibrium.
324 PART | II Novel Competitive Complexation/Solvation Theory
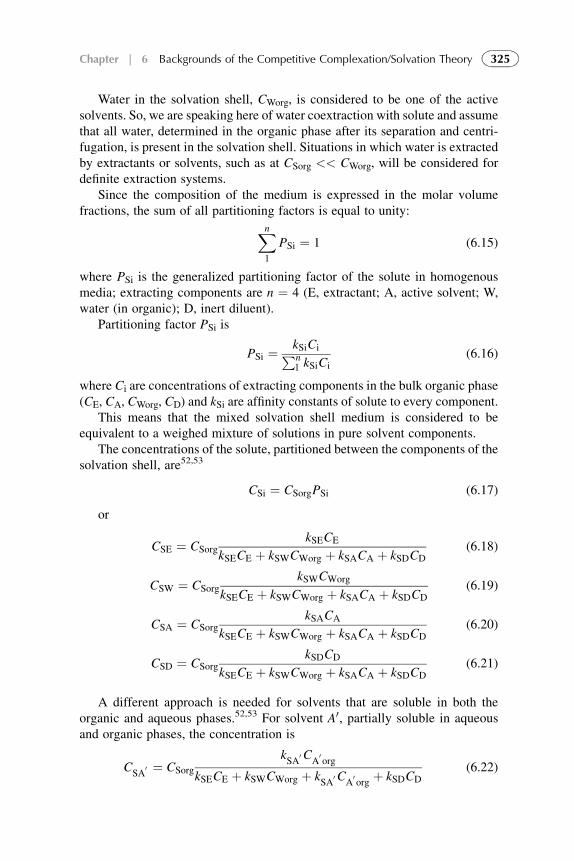
Water in the solvation shell, CWorg, is considered to be one of the activesolvents. So, we are speaking here of water coextraction with solute and assumethat all water, determined in the organic phase after its separation and centri-fugation, is present in the solvation shell. Situations in which water is extractedby extractants or solvents, such as at CSorg << CWorg, will be considered fordefinite extraction systems.
Since the composition of the medium is expressed in the molar volumefractions, the sum of all partitioning factors is equal to unity:Xn
1
PSi ¼ 1 (6.15)
where PSi is the generalized partitioning factor of the solute in homogenousmedia; extracting components are n ¼ 4 (E, extractant; A, active solvent; W,water (in organic); D, inert diluent).
Partitioning factor PSi is
PSi ¼ kSiCiPnl kSiCi
(6.16)
where Ci are concentrations of extracting components in the bulk organic phase(CE, CA, CWorg, CD) and kSi are affinity constants of solute to every component.
This means that the mixed solvation shell medium is considered to beequivalent to a weighed mixture of solutions in pure solvent components.
The concentrations of the solute, partitioned between the components of thesolvation shell, are52,53
CSi ¼ CSorgPSi (6.17)
or
CSE ¼ CSorgkSECE
kSECE þ kSWCWorg þ kSACA þ kSDCD(6.18)
CSW ¼ CSorgkSWCWorg
kSECE þ kSWCWorg þ kSACA þ kSDCD(6.19)
CSA ¼ CSorgkSACA
kSECE þ kSWCWorg þ kSACA þ kSDCD(6.20)
CSD ¼ CSorgkSDCD
kSECE þ kSWCWorg þ kSACA þ kSDCD(6.21)
A different approach is needed for solvents that are soluble in both theorganic and aqueous phases.52,53 For solvent A0, partially soluble in aqueousand organic phases, the concentration is
CSA
0 ¼ CSorg
kSA
0CA
0org
kSECE þ kSWCWorg þ kSA
0CA
0org
þ kSDCD(6.22)
325Chapter | 6 Backgrounds of the Competitive Complexation/Solvation Theory
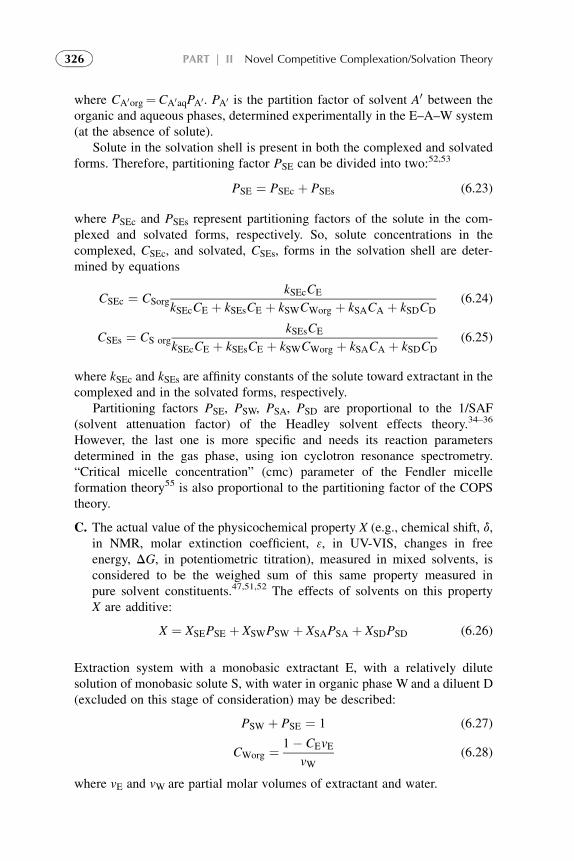
where CA0org¼ CA0aqPA0. PA0 is the partition factor of solvent A0 between theorganic and aqueous phases, determined experimentally in the E–A–W system(at the absence of solute).
Solute in the solvation shell is present in both the complexed and solvatedforms. Therefore, partitioning factor PSE can be divided into two:52,53
PSE ¼ PSEc þ PSEs (6.23)
where PSEc and PSEs represent partitioning factors of the solute in the com-plexed and solvated forms, respectively. So, solute concentrations in thecomplexed, CSEc, and solvated, CSEs, forms in the solvation shell are deter-mined by equations
CSEc ¼ CSorgkSEcCE
kSEcCE þ kSEsCE þ kSWCWorg þ kSACA þ kSDCD(6.24)
CSEs ¼ CS orgkSEsCE
kSEcCE þ kSEsCE þ kSWCWorg þ kSACA þ kSDCD(6.25)
where kSEc and kSEs are affinity constants of the solute toward extractant in thecomplexed and in the solvated forms, respectively.
Partitioning factors PSE, PSW, PSA, PSD are proportional to the 1/SAF(solvent attenuation factor) of the Headley solvent effects theory.34–36
However, the last one is more specific and needs its reaction parametersdetermined in the gas phase, using ion cyclotron resonance spectrometry.“Critical micelle concentration” (cmc) parameter of the Fendler micelleformation theory55 is also proportional to the partitioning factor of the COPStheory.
C. The actual value of the physicochemical property X (e.g., chemical shift, d,in NMR, molar extinction coefficient, 3, in UV-VIS, changes in freeenergy, DG, in potentiometric titration), measured in mixed solvents, isconsidered to be the weighed sum of this same property measured inpure solvent constituents.47,51,52 The effects of solvents on this propertyX are additive:
X ¼ XSEPSE þ XSWPSW þ XSAPSA þ XSDPSD (6.26)
Extraction system with a monobasic extractant E, with a relatively dilutesolution of monobasic solute S, with water in organic phase W and a diluent D(excluded on this stage of consideration) may be described:
PSW þ PSE ¼ 1 (6.27)
CWorg ¼ 1� CEvEvW
(6.28)
where vE and vW are partial molar volumes of extractant and water.
326 PART | II Novel Competitive Complexation/Solvation Theory
Using Eqn (6.25) we obtain the linear equation for the measured property X:
XSW � X
CE¼ kSE
kSWvWðXSW � XSEÞ �
�kSEkSW
vW � vE
�ðXSW � XÞ (6.29)
It can be seen that the treatment by COPS theory reached simple linearmathematical forms directly but classical treatment of Covington, Scatchard,Deranleau, etc., comes to the simple forms through many complicated steps andsimplifications. And COPS linear equations always has correct negative slopeeven in cases which show anomalies.
5. ELECTRONIC ACID–BASE THEORY AND AMPHOTERITY
The coordination process, interpreted as an acid–base reaction,5,8,22,23 distin-guishes between low electronegative but high polarizable (soft) bases and highelectronegative but low polarizable (hard) bases. As an extension of complexformation reactions the metal ions are classed in general as acids. Metal ionsthat form their most stable complexes with hard bases, containing as a rule,fluorine, oxygen, nitrogen, are described as hard acids, while those that formtheir most stable complexes with soft bases, containing the heavier elements ofthese groups, are soft acids. Hard bases prefer hard acids and soft bases prefersoft acids. The type of bonding between the acid and the base is of minorimportance: it is predominantly ionic in the case of hard acids, and predomi-nantly electron sharing in the case of soft acids. Some ligands, containing eithermonodentate and polydentate groups, form both kinds of bonds (with electrondonors of carboxyl-, phosphoryl-, sulfuryl-, amino-groups) with chelateformation.
There are solvents in which, though a slight self-ionization is observed, thiscannot longer serve as a foundation for the acid–base reactions.55,56 They aremainly organic solvents, particularly those containing nitrogen, phosphorus–oxygen, sulfur–oxygen functional groups. In these solvents the acid–base act isinitiated not by self-ionization but by solvation through H-bonding of thedissolved compounds. The comprehensive theory of Usanowitsch57 stated thatall coordinately unsaturated atomic groupings are acids and all coordinatelysaturated atomic groupings are bases.
The dual maximum behavior (two regions of effective metal extraction: oneat low acidity and the other at high acidity of the aqueous solutions) ofTi(IV)58,59 and many other transition metals60 was found for most families ofmetal extractants: acidic (organic acids), basic (amines or their mixtures), andneutral complexants. Examples with references,61–82 which show the univer-sality of the dual behavior at metals’ extraction, are presented in Table 6.1.
Pearson21,22 classifies many substances as both bases and acids: any speciewith pKa value higher than the given one may be conjugate base to it.According to the COPS theory44 ions (including metal ions) in solutions cannot
327Chapter | 6 Backgrounds of the Competitive Complexation/Solvation Theory
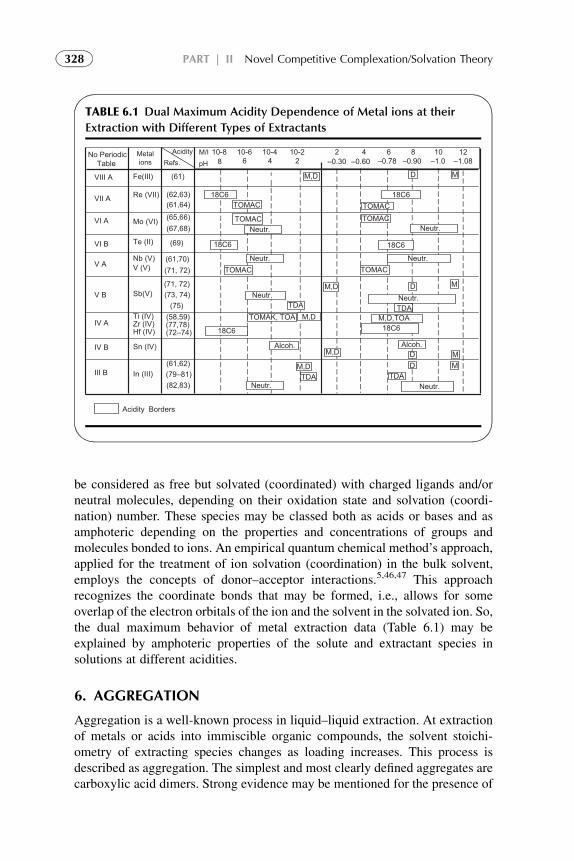
be considered as free but solvated (coordinated) with charged ligands and/orneutral molecules, depending on their oxidation state and solvation (coordi-nation) number. These species may be classed both as acids or bases and asamphoteric depending on the properties and concentrations of groups andmolecules bonded to ions. An empirical quantum chemical method’s approach,applied for the treatment of ion solvation (coordination) in the bulk solvent,employs the concepts of donor–acceptor interactions.5,46,47 This approachrecognizes the coordinate bonds that may be formed, i.e., allows for someoverlap of the electron orbitals of the ion and the solvent in the solvated ion. So,the dual maximum behavior of metal extraction data (Table 6.1) may beexplained by amphoteric properties of the solute and extractant species insolutions at different acidities.
6. AGGREGATION
Aggregation is a well-known process in liquid–liquid extraction. At extractionof metals or acids into immiscible organic compounds, the solvent stoichi-ometry of extracting species changes as loading increases. This process isdescribed as aggregation. The simplest and most clearly defined aggregates arecarboxylic acid dimers. Strong evidence may be mentioned for the presence of
TABLE 6.1 Dual Maximum Acidity Dependence of Metal ions at their
Extraction with Different Types of Extractants
VIII A
VII A
VI A
VI B
V A
V B
IV A
IV B
III B
Re (VII)
Mo (VI)
Nb (V) V (V)
Sb(V)
Zr (IV) Hf (IV)
Sn (IV)
In (III)
No PeriodicTable
Metalions Refs.
Acidity2468 –0.30 –0.60 –0.78 –0.90 –1.0 –1.08
18C6
M,D MD
18C6TOMAC TOMAC
TOMAC TOMAC
18C6 18C6
TOMAC TOMAC
M,D D M
TDA TDA
18C6 18C6
M,D D MM,D D M
TDA TDA
Acidity Borders
Ti (IV) (58,59)
pHM/I 10-8 10-6 10-4 10-2 2 4 6 8 10 12
Fe(III)
Te (II)
TOMAK, TOA M,D M,D,TOA
(61)
(62,63)(61,64)(65,66)(67,68)
(69)
(61,70)(71, 72)
(71, 72)
(75)
(77,78)(72–74)
(61,62) (79–81)(82,83)
(73, 74)
Neutr.
Neutr.
Neutr.
Neutr.Neutr.
Neutr.
Neutr.
Neutr.
Alcoh. Alcoh.
328 PART | II Novel Competitive Complexation/Solvation Theory
higher aggregates.6,7 Aggregation was observed at the extraction of metal ionsby acidic extractnts73,83–89 of metal ions and acids by basic and neutralextractans.14–16,18,19,27,90–93
Many investigators correspond the molecular aggregates to reversedmicellar structures.94–96 Some of them propose the formation of linearaggregates,84,89 which at a critical concentration of solute in organic phase isstructurally reorganized into reversed micelles84–87,94,95 or cluster-likeaggregates52–54 in nonpolar aprotic solvents. Three regimes of aggregationbehavior are considered as a function of metal ions M2þ concentration inorganic phase of acidic organophosphorus extractants:84–89 the tetrametricspecies of type ML2)2HL / linear aggregates / reversed micelles. Theauthors proved the formation of linear, cyclic aggregates and reversedmicelles using many different experimental and analytical techniques.Formation of three-dimensions cluster-like aggregates is expected also.52–54
The linear and subsequently three-dimensional aggregation was observedwith other organophosphorus extractants, namely, phosphonic and phosphinicacid esters.86
REFERENCES
1. Lo TC, Hanson C, Baird MHI, editors. Handbook of solvent extraction. New York: Wiley;
1983.
2. Szafran M. Recent aspects of the proton transfer reaction in H-bonded complexes. J Mol Struct
1996;381:39–64.
3. Epstein LM, Shubina ES, Kavtsov DN. Hydrogen and coordination bonds in isostrutural
systems. Are hydrogen bonds unique? J Mol Struct 1988;177:327–38.
4. Gutsul EI, Belkova NV, Epstein LM, Shubina ES, Peruzzini M, Bianchini C, Zanolini F,
Ledos AL, Maresca O. Hydrogen bonded intermediates and proton transfer to PP3MH. In:
Proceedings of XVth International Conference on Horizons in Hydrogen Bond Research.
Germany: Free University of Berlin; 2003. p. 3P06.
5. Huyskens PL, Luck WAP, Zeegers-Huyskens T, editors. Intermolecular forces. Berlin:
Springer-Verlag; 1991.
6. Douglas B, et al., editors. Concepts and models of inorganic chemistry. 3rd ed. JohnWiley &
Sons; 1994. p. 309–49.
7. Dotre JC, Teixeira J, editors. Hydrogen-bonded liquids. The Netherlands: Kluwer; 1991.
8. Marcus Y. Ion solvation. London: Wiley-Interscience; 1985.
9. Schuster P, Zundel G, Sandorfy C, editors. The hydrogen bond. Recent developments in theory
and experiments, vols. 1–3. Amsterdam: Holland; 1976.
10. Ratajczak H, Orville-Thomas WJ, editors. Molecular interactions, vols. 1–3. Chichester:
Willey; 1980. p. 1981–2.
11. Mayer JM, Rhile IJ. Thermodynamics and kinetics of proton-coupled electron transfer:
stepwise vs. concerted pathways. Biochim Biophys Acta Bioenerg 2004;1655:51–8.
12. Scheiner S. Relationship between strength of hydrogen bond and barrier to proton transfer.
J Mol Struct 1994;307:65–71.
13. Maechal Y. What mechanisms for transfers of protons through H-bonds? J Mol Liq
1991;48(2–4):233–51.
329Chapter | 6 Backgrounds of the Competitive Complexation/Solvation Theory
14. Tamada J, King C. Extraction of Carboxylic Acids by Amine Extractants. Ph.D. Thesis.
Lawrence Berkeley Laboratory, University of California, Applied Science Division; 1989.
15. Tamada J, Kertes A, King C. Extraction of carboxylic acids with amine extractant. 1. Equi-
libria and law of mass action modeling. Ind Eng Chem Res 1990;29:1319–26.
16. Eyal AM, Canari R. PH dependence of carboxylic and mineral acid extraction by amine-based
extractants: effects of pKa, amine basicity, and diluent properties. Ind Eng Chem Res
1995;34(5):1789–98.
17. Yang S, White S, Hsu S. Extraction of carboxylic acids with tertiary and quaternary amines:
effect of pH. Eng Chem Res 1991;30:1335–48.
18. Tamada J, Kertes A, King C. Extraction of carboxylic acids with Amine extractant. 2.
Chemical interaction and interpretation of data. Ind Eng Chem Res 1990;29:1327–32.
19. Tamada J, Kertes A, King C. Extraction of carboxylic acids with Amine extractant. 3. Effect
of temperature, Water coextraction and Process considerations. Ind Eng Chem Res
1990;29:1333–41.
20. Canari R, Hazan B, Eyal A. Carboxylic acids extraction by basic extractants: the effects of pH,
ion concentration and acid-base property of the extractant and extracted acid. Proceedings of
ASEC’96, vol. 2. 1996. p. 1517–22.
21. Pearson RG, Vogelsong DC. Developmentsin crystal field theory. J Amer Chem Soc
1958;80:1038.
22. Pearson RG. Hard and soft acids and bases. J Amer Chem Soc 1963;85:3533.
23. Luder WF, Zuffanti S. The electronic theory of acids and bases. New York: Wiley; 1946.
24. Vieux AS. Extraction of some dicarboxylic acids by tri-isooctylamine. Anal Chim Acta
1974;68:415–24.
25. Wardel JM, King CJ. Solvent equilibria for extraction of carboxylic acids from water. J Chem
Eng Data 1979;23(2):144–8.
26. Mei Wen, Yiyan Yang, Youyuan Dai. Studies on the mechanism of extraction of carboxylic
acids with tri-n-octylamine by chemical complexation. Proceedings ISEC’96, vol. 1. 1996.
p. 195–200.
27. Marcus Y. Preferential solvation of ions in mixed solvents. Rev Anal Chem 1980;53(5):127–35.
28. Marcus YA. quasi-lattice quasi-chemical theory of preferential solvation of ions in mixed
solvents. Austr J Chem 1983;36:1719–31.
29. Marcus Y. The properties of solvents. Wiley-Interscience; 1998.
30. Spala EE, Ricker NL. Thermodynamic model for solvating solutions with physical interac-
tions. Ind Eng Chem Process Des Dev 1982;21:409–15.
31. Taft RW, Abboud JLM, Kamlet MJ, Abraham MN. Linear solvation energy relations.
J Solution Chem 1985;14(3):153–86.
32. Shorter J. Correlation analysis in chemistry. Oxford: Clarendon Press; 1973.
33. Nagata I. Ternary liquid-liquid equilibria: the associated solution theory. Fluid Phase Equilib
1977/1978;1:267–75.
34. Headley AD. Solvent effects on the basicity of alkyl-substituted dimethylamines. J Org Chem
1988;53:312–4.
35. Headley AD, McMyrry ME, Starnes SD. Effects of substituents on the Acidity of Acetic acid.
J Org Chem 1994;59:1863–6.
36. Headley AD. Quantitative analysis of solvation effects and influence of alkyl substituents on
basicity of amines. J Org Chem 1991;56:3688–91.
37. Grunwald E, Baughman G, Kohnstam G. The solvation of electrolytes in dioxan-water
mixtures, as deduced from the effect of solvent change on the standard partial molar free
energy. J Am Chem Soc 1960;82:5801–11.
330 PART | II Novel Competitive Complexation/Solvation Theory
38. Covington AK, Newman KE, Lilley TN. J Chem Soc Faraday Trans 1 1973;69:963.
39. Covington AK, Newman KE. Thermodynamics of preferential solvation of electrolytes in
binary solvent mixtures. Adv Chem Ser 1976;155:153–96.
40. Cox BG, Parker AJ, Waghorne WE. Coordination and ionic solvation. J Phys Chem
1974;78:1731–40.
41. Scatchard G. The attraction of proteines for small molecules and ions. Ann NY Acad Sci
1949;51:660–7.
42. Deranleau DA. Theory of the measurement of weak molecular complexes. I. General
considerations. J Amer Chem Soc 1969;91:4044–9.
43. Deranleau DA. Theory of the measurement of weak molecular complexes. II. Consequence of
multiple equilibria. J Amer Chem Soc 1969;91:4050–62.
44. Orgel LE, Mulliken RS. Molecular Complexes and Their Spectra. Contact Charge-Transfer
Spectra. J Amer Chem Soc 1957;79:4839–43.
45. Carter S, Murrell JN, Rosch EJ. Donor-Acceptor properties. J Chem Soc 1965:2048–51.
46. Kuntz Jr ID, Gasparo FP, Johnston Jr MD, Taylor RP. Molecular Interactions and the
Benesi-Hildebrand Equation. J Amer Chem Soc 1968;90:4748–54.
47. Homer J, Everdell MH, Jackson CJ, Whitney PM. Molecular complexes. Part 7.dSome
comments on the processing of data obtained from nuclear magnetic resonance studies.
J Chem Soc Faraday II 1972;68:874–82.
48. Nagy OB, Muanda H, Nagy JB. Competitive preferential solvation theory of weak molecular
Interactions. J Chem Soc Faraday Trans I 1978;74:2210–29.
49. Parbhoo B, Nagy OB. Application of competitive preferential solvation theory to ion-
molecular interactions. J Chem Soc Faraday Trans I 1986;82:1789–93.
50. Szpakowska M, Nagy OB. Application of the preferential solvation theory to coordinative
solute-solvent interactions. J Chem Soc Faraday Trans I 1989;85(9):2891–9.
51. Nagy OB, Muanda M, Nagy JB. Quantititive evaluation of solute-solvent interactions.
Environmental effects on the n-butylaminolysis of tetrachloro-n-butylphtalamide. UJ Phys
Chem 1979;83:1961–79.
52. Kislik V. Competitive complexation/solvation theory of solvent extraction. II. Solvent
extraction of metals by acidic extractants. Sep Sci Technol 2002;37(11):2623–57.
53. Kislik V. Application of preferential solvation concept for Interpretation of the mechanisms of
acids solvent extraction by amines. Sep Sci Technol 2001;36(13):2899–926.
54. Kislik V. Application of preferential solvation model for interpretation of the mechanisms of
solvent extraction. Proceedings of the XVth International Symposium on Physico-Chemical
Methods of Mixtures Separation, “ARS SEPARATORIA 2000”, Poland, 2000, p. 34–40.
55. Fendler EJ. Proton magnetic resonance investigation of alkylammonium carboxylate micelles
in nonaqueous solvents. J Phys Chem 1973;77(11):1432–6.
56. Devis MM. Acid-base behavior in aprotic organic solvents. National Bureau of Standards.
Washington, D.C. Monograph 105; 1968.
57. Usanowitsch M. Theory of acids and bases. J Allg Chem (USSR) 1939;9:182–98.
58. Kislik V, Eyal A. Acidity dependence of Ti(IV) extraction: a critical analysis. Solvent Extr Ion
Exch 1993;11(2):258–66.
59. Kislik V, Eyal A. Extraction of titanium(IV) by mixtures of mono- and d-(2-ethylhexyl)
phosphoric acids esters. Solvent Extr Ion Exch 1993;11(2):285–10.
60. Tsuboi I, Kasai S, Yamamoto T, Komasawa I, Kunugita E. Recovery of rare metals from coal
fly ash. Part B. In: Proceedings of ISEC-90. Amsterdam: Elsevier; 1992. p. 1199–204.
61. Levin IS, Azarenko TG. Extraction of rare metals by alkylphosphorus acids. Zh Anal Khim
1968;23(7):1013–7.
331Chapter | 6 Backgrounds of the Competitive Complexation/Solvation Theory
62. Jewad SK, Al-Murab SR, Jalhoom MG. Studies on the extraction of perrhnate by use of crown
ethers. Part A. In: Proceedings of ISEC-90. Amsterdam: Elsevier; 1992. p. 907–11.
63. Zagorodnyaya AN, Ponomareva EI, Abisheva ZS, Tarasova EG. Rhenium extraction by
tri-n-octylamine hydrosulfate. Part A. In: Proceedings of ISEC-90. Amsterdam: Elsevier;
1992. p. 955–60.
64. Klimov IT. Extraction of Fe(III) with mixtures of cyclohexanone with isoamyl acetate, CHCl3,
CCl4 and bromobenzene. Gidrokhim Materialy 1964;37:114.
65. Hirai T, Komasawa I. Separation and purification of vanadium and molibdenium by solvent
extraction and subsequent reductive stripping. Proceedings of ISEC-90. Amsterdam: Elsevier;
1992. p. 1015–20.
66. Jalhoom MG. Extraction of pertechnetate ions by use of crown ethers from sulfuric acid
solutions. Radiochimica Acta 1986;39:195.
67. Jalhoom MG. Distribution of tetra-n-alkylammonium salts between water and organic
solvents. J Radioanal Nucl Chem Lett 1986;104:131.
68. Haesebroek G, Vliegen J, De Schepper A. Solvent extraction separation of niobium and
tantalum at MHO: potentialities of Cyanex 923 versus MIBK. Proceedings of ISEC-90.
Amsterdam: Elsevier; 1992. Part, B1115–20.
69. Levin IS. Concentration and separation of indium, gallium, thallium, antimony, and bismuth
by extraction with alkylphosphoric acids. Zh Prikl Khim 1962;35:2368–79.
70. Levin IS, Shatalova AA. Separation of Sb(III) by extraction with alkylphosphoric acids. USSR
Talanta 1967;14(7):801.
71. Dakar GM, Iofa BZ. Extraction of complex acids by O-containing solvents. V. Mechanism of
extraction of pentavalent Sb. Radiokhimia 1963;5(4):428–34.
72. Stronski I. Radiochemical studies on the extraction and stabilization of metal chelates and on
the separation of metal salts by extractive chromatography. Zh Physik Khim 1966;3:329–36.
73. Goto H, Kakita Y. Extraction of iodide complexes of Cu, Pb, Bi, Sb, Cd and Te with methyl
isobutyl ketone. Nippon Kagaku Zasshi 1966;87(9):962–71.
74. Lyle SJ, Shendrikar AD. Some aspects of N-benzoylphenylhydrxylamine and cupferron
reactions with tin, antimony and other selected elements. Anal Chim Acta 1966;36(3):286–97.
75. Iofa BZ, Mitrofanov KP. Investigation of the extraction mechanism of Sb from the HCl
solutions by dibutyl ether. Radiokhimia 1964;6:419–28.
76. Deorkar NV, Khopkar SM. Solvent extraction separation of thorium, uranium, zirconium and
hafnium with crown ethers. In: Proceedings of ISEC-90. Amsterdam: Elsevier; 1992. p. 467–
72. Part A.
77. Lomako VL, Starobinets GL. Effect of a solvent on the kinetics of draining extraction of zinc
thiocyonate complexes. Vesti Akad Nauk Belorus Ser Khim Nauk 1971;6:634–42.
78. Watanabe H, Akatsuka K. Solvent extraction of metal ions from sulfuric acid solutions with
a mixed extractant-long-chain primary amine and bis (2-ethylhexyl) phosphate. Nippon
Kagaku Zasshi 1968;89(3):280.
79. Good ML, Holland FF. Extraction of indium(III) and gallium(III) from aqueous chloride
media by long-chain alkyl amines and quaternary salts. J Inorg Nucl Chem 1961;26(2):321–7.
80. Kleiner KE, Markova LV. Extraction of indium(III) from water and sulfuric acid solutions by
MIBK. Zh Anal Khim 1969;8:279–84.
81. Hasegawa Yu. Behavior of indium(III) complexes in several liquid-liquid distribution systems.
Bull Chem Soc Japan 1970;43(9):2665–9.
82. Golinski M. Cerium removal from lanthanide nitrate solutions. Proceedings of ISEC-71.
Amsterdam: Elsevier; 1971. p. 603–10.
332 PART | II Novel Competitive Complexation/Solvation Theory
83. Neuman RD, Nai-Fu-Zhou, Wu J, Jons MA, Gaonkar AG. General model for aggregationof
metal-extractant complexes in acidic organophosphorus solvent extraction systems. Sep Sci
Technol 1990;25(13–15):1655–74.
84. Neuman RD, Jons MA, Zhou NF. Photo-correlation spectroscopy applied to hydrometallur-
gical solvent-extraction systems. Colloid Surf 1990;46(1):45–61.
85. Wilkinson G, Gillard RD, MaccLeverty JA, editors. Comprehensive coordination chemistry.
John Wiley & Sons; 1987. p. 2. pp. 43–76.
86. Gaonkar AG, Garver TM, Neuman RD. H-1-NMR spectroscopic investigation of reversed
micellization in metal organophosphorus surfactant system. Colloid Surf 1988;30(3–4):
265–73.
87. Yu ZJ, Ibrahim TH, Neuman RD. Aggregation behavior of cobalt(II), nickel(II) and copper(II)
bis(2-ethylhexyl) phosphate complexes in n-heptane. Solv Extr Ion Exch 1998;16(6):1437–63.
88. Neuman RD, Ibrahim TH. Novel structural model of reversed micelles: the open water-
channel model. Langmuir 1999;15:10–2.
89. Evers A, Hancock R. A study of aggregation in the organic phase of solvent extraction
systems and its influence on the extraction process. Report Natl Inst Metall Repub S Afr
1977;34:24–38.
90. Hogfeldt E, Fredlund F. On aggregation of the complex between nitric acid and trilaurylamine
dissolved in octan and m-xylene. Acta Chem Scandinavica 1964;18:543–7.
91. Hogfeldt E, Fredlund F, Odberg L, Merenge G. Extraction of water, nitric and perchloric acids
by nitrobenzene. Acta Chem Scandinavica 1973;18(5):1781–94.
92. Grinstead RR. Base strengths of amine in liquid-liquid extraction systems. Proceedings of
ASEC’67 1968:427–36.
93. Davis MM. Acid-Base Behavior in Aprotic Organic Solvents. In: Lagowski, editor. The
chemistry of nonaqueous solvents, vol. 3. New York: Academic Press; 1970. p. 1–32.
94. Dega-Szafran Z, Szafran M. Heterocycles 1994;37:627–34.
95. Tani Hirofumi, Kamidate Tamio, Watanabe Hiroto. Micelle-mediated extraction. J Chrom
1997;780(1–2):229–41.
96. Antico E, Masana A, Hidalgo M, Salvado V, Iglesias M, Valiente M. Solvent extraction of
yttrium from chloride media by di(2-ethylhexyl)phosphoric acid in kerosene. Speciation
studies and gel formation. Anal Chim Acta 1996;327(3):267–76.
333Chapter | 6 Backgrounds of the Competitive Complexation/Solvation Theory

This page intentionally left blank
Chapter 7
Competitive Complexation/Solvation Theory of SolventExtraction: General Mechanismsand Kinetics
Chapter Outline1. Basic Statements 335
2. Extraction Systems with Low
Solute Concentrations in
Organic Phase
336
3. Systems with Medium
Concentrations
of the Solute
345
4. Systems with High Solute
Concentrations
348
5. Comparison of Conventional
and Presented Theories
Description
350
6. Summarizing Remarks for
the CCST
351
References 352
1. BASIC STATEMENTS
Competitive complexation/solvation theory of solvent extraction is based onfour statements; each of them are very well-known facts in the chemistry that isdescribed in the previous chapter. The statements are as follows:
I. Extraction act is initiated by solvation of the solute compounds in organicsolvents with formation of hydrogen-(coordinate-)bonded intermediates(adducts). Kinetics of proton, electron transfer, and formation of finalcomplexes are stepwise and depends on kinetics of step reactions, compe-tition, coupling, strength of H-bonding and many other factors, asmentioned in Chapter 6. The kinetics of the step reactions may be fast,so, final products are formed during extraction process, or may be slow,so, extracted species are some of intermediates and the latter process canbe called as a pseudo-equilibrium extraction.
Solvent Extraction. DOI: 10.1016/B978-0-444-53778-2.10007-X
Copyright � 2012 Elsevier B.V. All rights reserved. 335
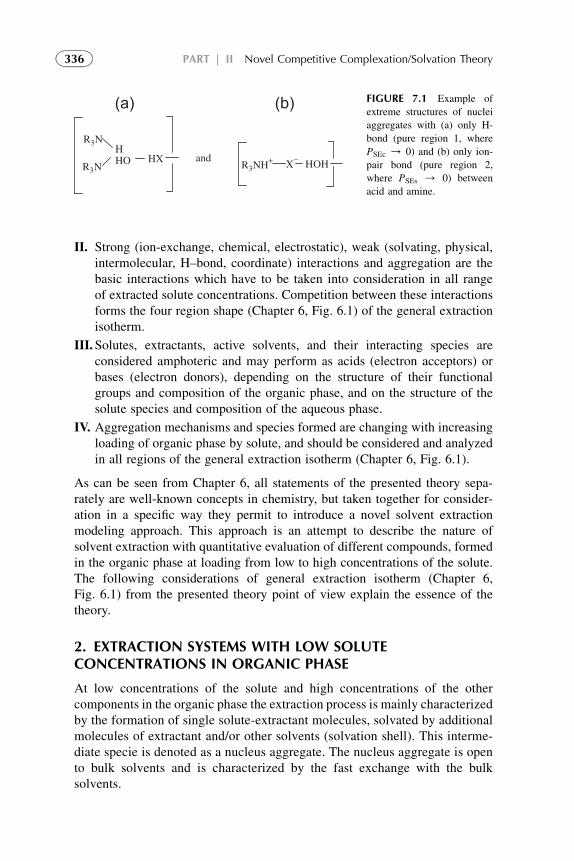
II. Strong (ion-exchange, chemical, electrostatic), weak (solvating, physical,intermolecular, H–bond, coordinate) interactions and aggregation are thebasic interactions which have to be taken into consideration in all rangeof extracted solute concentrations. Competition between these interactionsforms the four region shape (Chapter 6, Fig. 6.1) of the general extractionisotherm.
III.Solutes, extractants, active solvents, and their interacting species areconsidered amphoteric and may perform as acids (electron acceptors) orbases (electron donors), depending on the structure of their functionalgroups and composition of the organic phase, and on the structure of thesolute species and composition of the aqueous phase.
IV. Aggregation mechanisms and species formed are changing with increasingloading of organic phase by solute, and should be considered and analyzedin all regions of the general extraction isotherm (Chapter 6, Fig. 6.1).
As can be seen from Chapter 6, all statements of the presented theory sepa-rately are well-known concepts in chemistry, but taken together for consider-ation in a specific way they permit to introduce a novel solvent extractionmodeling approach. This approach is an attempt to describe the nature ofsolvent extraction with quantitative evaluation of different compounds, formedin the organic phase at loading from low to high concentrations of the solute.The following considerations of general extraction isotherm (Chapter 6,Fig. 6.1) from the presented theory point of view explain the essence of thetheory.
2. EXTRACTION SYSTEMS WITH LOW SOLUTECONCENTRATIONS IN ORGANIC PHASE
At low concentrations of the solute and high concentrations of the othercomponents in the organic phase the extraction process is mainly characterizedby the formation of single solute-extractant molecules, solvated by additionalmolecules of extractant and/or other solvents (solvation shell). This interme-diate specie is denoted as a nucleus aggregate. The nucleus aggregate is opento bulk solvents and is characterized by the fast exchange with the bulksolvents.
R3N
HOH X–
R3NH+HXR3N
H HO and
(a) (b) FIGURE 7.1 Example of
extreme structures of nuclei
aggregates with (a) only H-
bond (pure region 1, where
PSEc / 0) and (b) only ion-
pair bond (pure region 2,
where PSEs / 0) between
acid and amine.
336 PART | II Novel Competitive Complexation/Solvation Theory
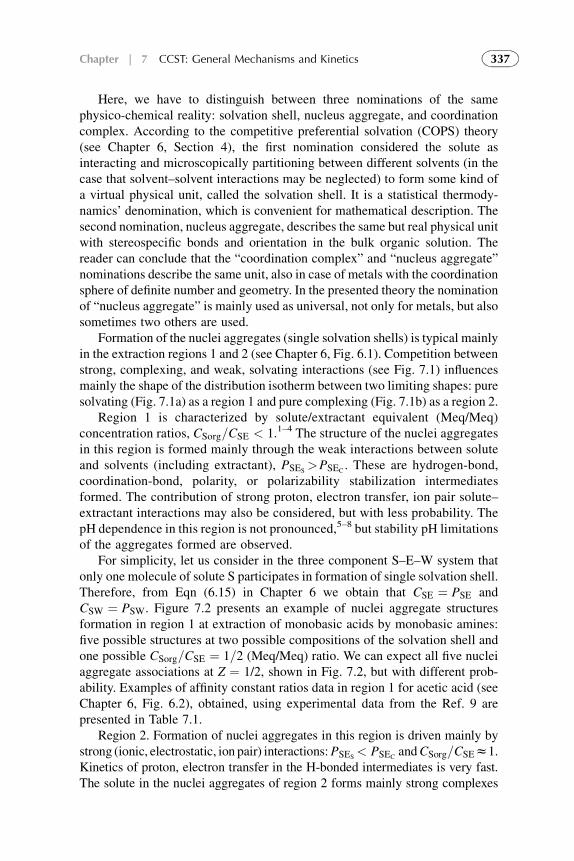
Here, we have to distinguish between three nominations of the samephysico-chemical reality: solvation shell, nucleus aggregate, and coordinationcomplex. According to the competitive preferential solvation (COPS) theory(see Chapter 6, Section 4), the first nomination considered the solute asinteracting and microscopically partitioning between different solvents (in thecase that solvent–solvent interactions may be neglected) to form some kind ofa virtual physical unit, called the solvation shell. It is a statistical thermody-namics’ denomination, which is convenient for mathematical description. Thesecond nomination, nucleus aggregate, describes the same but real physical unitwith stereospecific bonds and orientation in the bulk organic solution. Thereader can conclude that the “coordination complex” and “nucleus aggregate”nominations describe the same unit, also in case of metals with the coordinationsphere of definite number and geometry. In the presented theory the nominationof “nucleus aggregate” is mainly used as universal, not only for metals, but alsosometimes two others are used.
Formation of the nuclei aggregates (single solvation shells) is typical mainlyin the extraction regions 1 and 2 (see Chapter 6, Fig. 6.1). Competition betweenstrong, complexing, and weak, solvating interactions (see Fig. 7.1) influencesmainly the shape of the distribution isotherm between two limiting shapes: puresolvating (Fig. 7.1a) as a region 1 and pure complexing (Fig. 7.1b) as a region 2.
Region 1 is characterized by solute/extractant equivalent (Meq/Meq)concentration ratios, CSorg=CSE < 1.1–4 The structure of the nuclei aggregatesin this region is formed mainly through the weak interactions between soluteand solvents (including extractant), PSES
>PSEC. These are hydrogen-bond,
coordination-bond, polarity, or polarizability stabilization intermediatesformed. The contribution of strong proton, electron transfer, ion pair solute–extractant interactions may also be considered, but with less probability. ThepH dependence in this region is not pronounced,5–8 but stability pH limitationsof the aggregates formed are observed.
For simplicity, let us consider in the three component S–E–W system thatonly one molecule of solute S participates in formation of single solvation shell.Therefore, from Eqn (6.15) in Chapter 6 we obtain that CSE ¼ PSE andCSW ¼ PSW. Figure 7.2 presents an example of nuclei aggregate structuresformation in region 1 at extraction of monobasic acids by monobasic amines:five possible structures at two possible compositions of the solvation shell andone possible CSorg=CSE ¼ 1=2 (Meq/Meq) ratio. We can expect all five nucleiaggregate associations at Z ¼ 1/2, shown in Fig. 7.2, but with different prob-ability. Examples of affinity constant ratios data in region 1 for acetic acid (seeChapter 6, Fig. 6.2), obtained, using experimental data from the Ref. 9 arepresented in Table 7.1.
Region 2. Formation of nuclei aggregates in this region is driven mainly bystrong (ionic, electrostatic, ion pair) interactions:PSES
< PSECandCSorg=CSEz1.
Kinetics of proton, electron transfer in the H-bonded intermediates is very fast.The solute in the nuclei aggregates of region 2 forms mainly strong complexes
337Chapter | 7 CCST: General Mechanisms and Kinetics
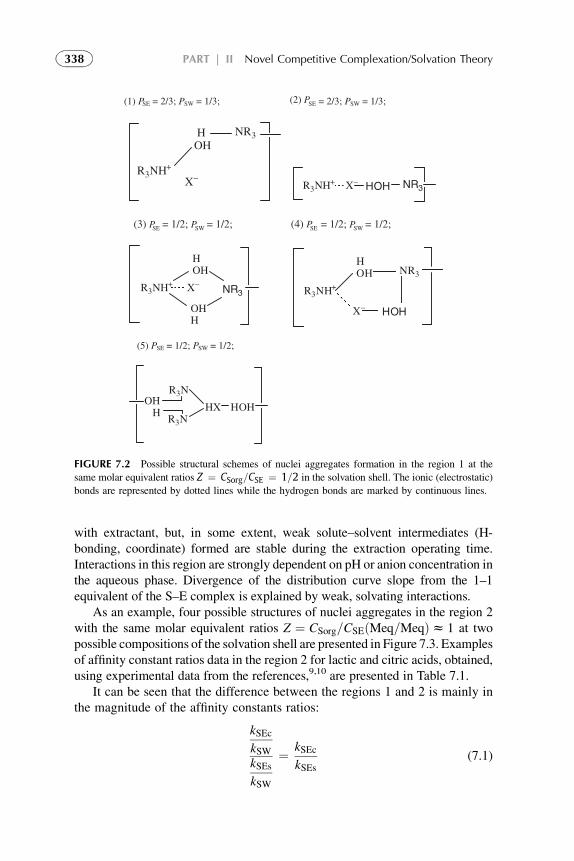
with extractant, but, in some extent, weak solute–solvent intermediates (H-bonding, coordinate) formed are stable during the extraction operating time.Interactions in this region are strongly dependent on pH or anion concentration inthe aqueous phase. Divergence of the distribution curve slope from the 1–1equivalent of the S–E complex is explained by weak, solvating interactions.
As an example, four possible structures of nuclei aggregates in the region 2with the same molar equivalent ratios Z ¼ CSorg=CSEðMeq=MeqÞz 1 at twopossible compositions of the solvation shell are presented in Figure 7.3. Examplesof affinity constant ratios data in the region 2 for lactic and citric acids, obtained,using experimental data from the references,9,10 are presented in Table 7.1.
It can be seen that the difference between the regions 1 and 2 is mainly inthe magnitude of the affinity constants ratios:
kSEckSWkSEskSW
¼ kSEckSEs
(7.1)
(1) PSE = 2/3; PSW = 1/3; SE = 2/3; PSW = 1/3;
R3NH+
H OH
X–
NR3
R3NH+ X– NR3HOH
(3) PSE = 1/2; PSW = 1/2; SE = 1/2; PSW = 1/2;
R3NH+
H OH
X–
OH H
NR3
(5) PSE = 1/2; PSW = 1/2;
OH H HX
R3NHOH
R3N
(4) P
(2) P
R3NH+
H OH
X–
NR3
HOH
FIGURE 7.2 Possible structural schemes of nuclei aggregates formation in the region 1 at the
same molar equivalent ratios Z ¼ CSorg=CSE ¼ 1=2 in the solvation shell. The ionic (electrostatic)
bonds are represented by dotted lines while the hydrogen bonds are marked by continuous lines.
338 PART | II Novel Competitive Complexation/Solvation Theory
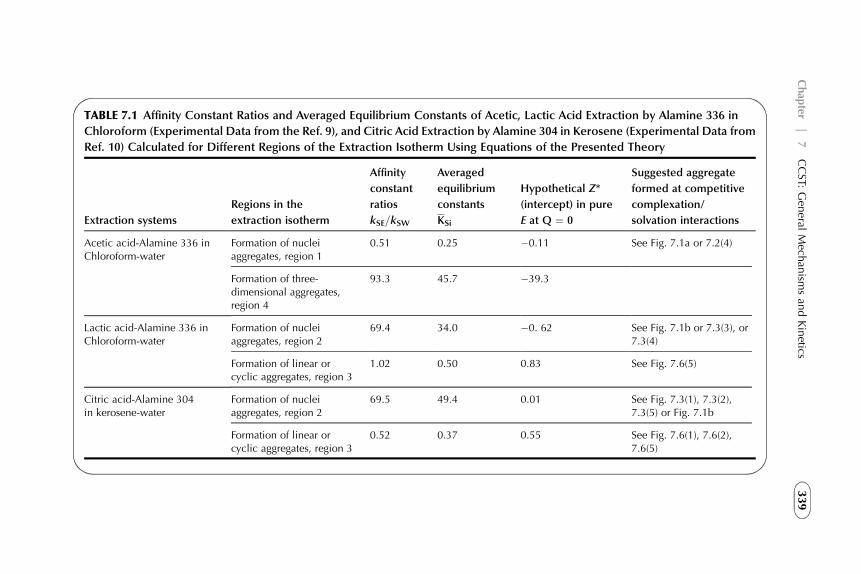
TABLE 7.1 Affinity Constant Ratios and Averaged Equilibrium Constants of Acetic, Lactic Acid Extraction by Alamine 336 in
Chloroform (Experimental Data from the Ref. 9), and Citric Acid Extraction by Alamine 304 in Kerosene (Experimental Data from
Ref. 10) Calculated for Different Regions of the Extraction Isotherm Using Equations of the Presented Theory
Extraction systems
Regions in the
extraction isotherm
Affinity
constant
ratios
Averaged
equilibrium
constants
Hypothetical Z*
(intercept) in pure
E at Q ¼ 0
Suggested aggregate
formed at competitive
complexation/
solvation interactionskSE=kSW KSi
Acetic acid-Alamine 336 inChloroform-water
Formation of nucleiaggregates, region 1
0.51 0.25 �0.11 See Fig. 7.1a or 7.2(4)
Formation of three-dimensional aggregates,region 4
93.3 45.7 �39.3
Lactic acid-Alamine 336 inChloroform-water
Formation of nucleiaggregates, region 2
69.4 34.0 �0. 62 See Fig. 7.1b or 7.3(3), or7.3(4)
Formation of linear orcyclic aggregates, region 3
1.02 0.50 0.83 See Fig. 7.6(5)
Citric acid-Alamine 304in kerosene-water
Formation of nucleiaggregates, region 2
69.5 49.4 0.01 See Fig. 7.3(1), 7.3(2),7.3(5) or Fig. 7.1b
Formation of linear orcyclic aggregates, region 3
0.52 0.37 0.55 See Fig. 7.6(1), 7.6(2),7.6(5)
339
Chap
ter|
7CCST:
Gen
eralMech
anism
san
dKinetics
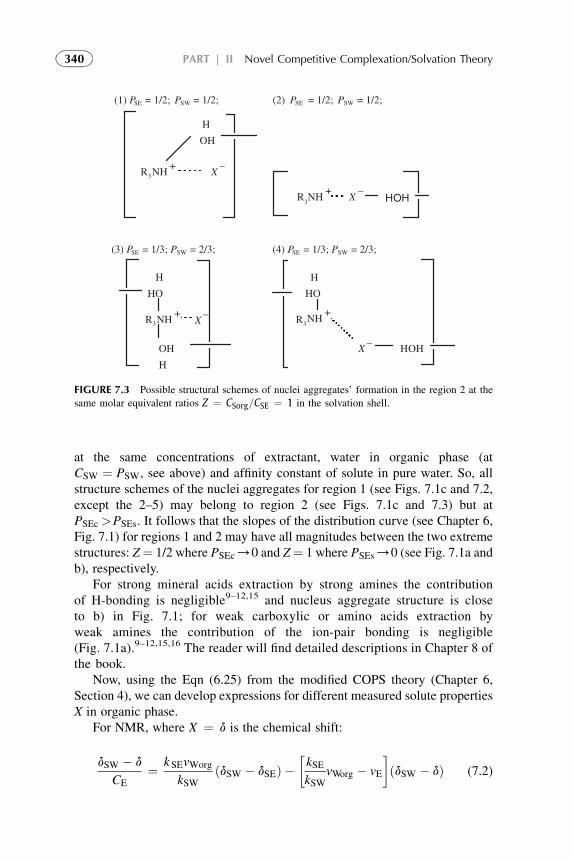
at the same concentrations of extractant, water in organic phase (atCSW ¼ PSW, see above) and affinity constant of solute in pure water. So, allstructure schemes of the nuclei aggregates for region 1 (see Figs. 7.1c and 7.2,except the 2–5) may belong to region 2 (see Figs. 7.1c and 7.3) but atPSEc>PSEs. It follows that the slopes of the distribution curve (see Chapter 6,Fig. 7.1) for regions 1 and 2 may have all magnitudes between the two extremestructures: Z¼ 1/2 where PSEc/0 and Z¼ 1 where PSEs/0 (see Fig. 7.1a andb), respectively.
For strong mineral acids extraction by strong amines the contributionof H-bonding is negligible9–12,15 and nucleus aggregate structure is closeto b) in Fig. 7.1; for weak carboxylic or amino acids extraction byweak amines the contribution of the ion-pair bonding is negligible(Fig. 7.1a).9–12,15,16 The reader will find detailed descriptions in Chapter 8 ofthe book.
Now, using the Eqn (6.25) from the modified COPS theory (Chapter 6,Section 4), we can develop expressions for different measured solute propertiesX in organic phase.
For NMR, where X ¼ d is the chemical shift:
dSW � d
CE¼ kSEvWorg
kSWðdSW � dSEÞ �
�kSEkSW
vWorg � vE
�ðdSW � dÞ (7.2)
(1) PSE = 1/2; P P PSW = 1/2; SE = 1/2; SW = 1/2;
R3NH+
R3 R3NH+ NH
+
H
OH
X–
X–
X–
X–
HOHR3NH
+
(3) PSE = 1/3; PSW = 2/3; (4) PSE = 1/3; PSW = 2/3;
H
HO
OH
H
HOH
H
HO
(2)
FIGURE 7.3 Possible structural schemes of nuclei aggregates’ formation in the region 2 at the
same molar equivalent ratios Z ¼ CSorg=CSE ¼ 1 in the solvation shell.
340 PART | II Novel Competitive Complexation/Solvation Theory
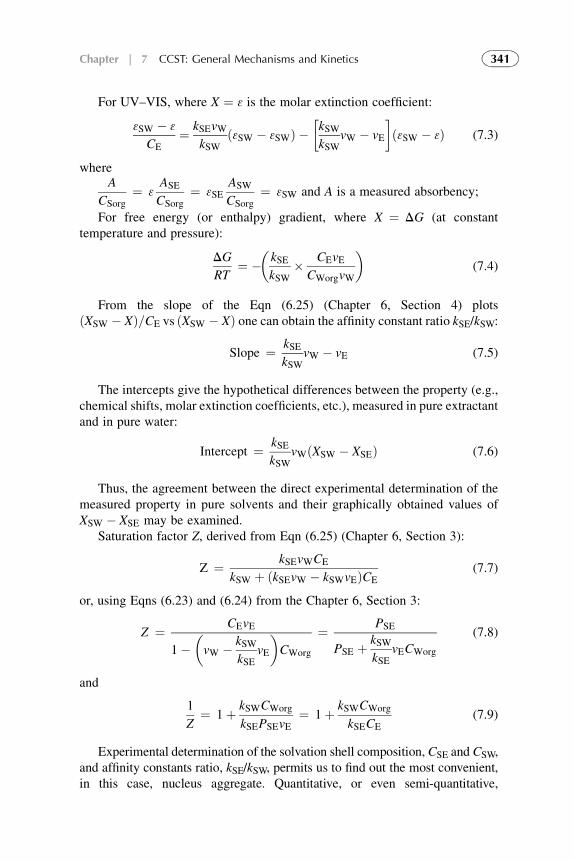
For UV–VIS, where X ¼ 3 is the molar extinction coefficient:
3SW � 3
CE¼ kSEvW
kSWð3SW � 3SWÞ �
�kSWkSW
vW � vE
�ð3SW � 3Þ (7.3)
whereA
CSorg¼ 3
ASE
CSorg¼ 3SE
ASW
CSorg¼ 3SW and A is a measured absorbency;
For free energy (or enthalpy) gradient, where X ¼ DG (at constanttemperature and pressure):
DG
RT¼ �
�kSEkSW
� CEvECWorgvW
�(7.4)
From the slope of the Eqn (6.25) (Chapter 6, Section 4) plotsðXSW � XÞ=CE vs ðXSW � XÞ one can obtain the affinity constant ratio kSE/kSW:
Slope ¼ kSEkSW
vW � vE (7.5)
The intercepts give the hypothetical differences between the property (e.g.,chemical shifts, molar extinction coefficients, etc.), measured in pure extractantand in pure water:
Intercept ¼ kSEkSW
vWðXSW � XSEÞ (7.6)
Thus, the agreement between the direct experimental determination of themeasured property in pure solvents and their graphically obtained values ofXSW � XSE may be examined.
Saturation factor Z, derived from Eqn (6.25) (Chapter 6, Section 3):
Z ¼ kSEvWCE
kSW þ ðkSEvW � kSWvEÞCE(7.7)
or, using Eqns (6.23) and (6.24) from the Chapter 6, Section 3:
Z ¼ CEvE
1��vW � kSW
kSEvE
�CWorg
¼ PSE
PSE þ kSWkSE
vECWorg
(7.8)
and
1
Z¼ 1þ kSWCWorg
kSEPSEvE¼ 1þ kSWCWorg
kSECE(7.9)
Experimental determination of the solvation shell composition, CSE and CSW,and affinity constants ratio, kSE/kSW, permits us to find out the most convenient,in this case, nucleus aggregate. Quantitative, or even semi-quantitative,
341Chapter | 7 CCST: General Mechanisms and Kinetics
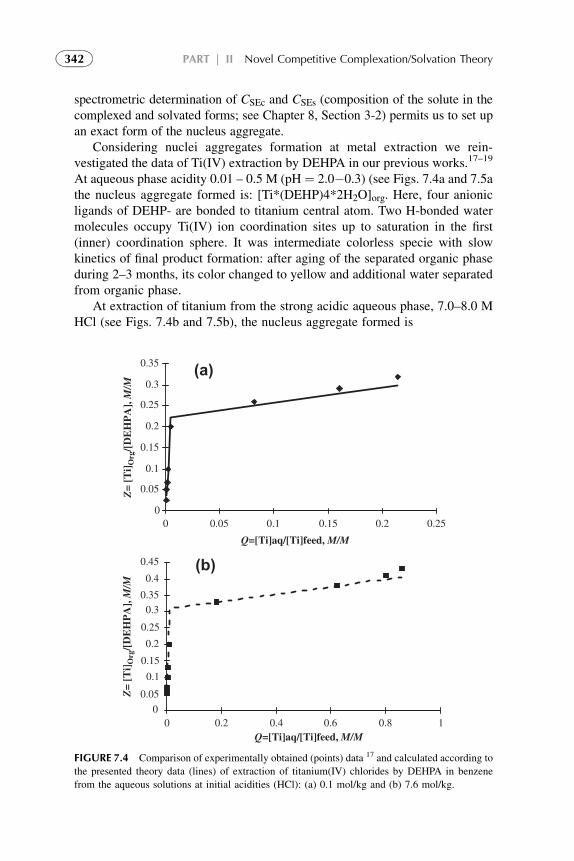
spectrometric determination of CSEc and CSEs (composition of the solute in thecomplexed and solvated forms; see Chapter 8, Section 3-2) permits us to set upan exact form of the nucleus aggregate.
Considering nuclei aggregates formation at metal extraction we rein-vestigated the data of Ti(IV) extraction by DEHPA in our previous works.17–19
At aqueous phase acidity 0.01 – 0.5 M (pH ¼ 2.0�0.3) (see Figs. 7.4a and 7.5athe nucleus aggregate formed is: [Ti*(DEHP)4*2H2O]org. Here, four anionicligands of DEHP- are bonded to titanium central atom. Two H-bonded watermolecules occupy Ti(IV) ion coordination sites up to saturation in the first(inner) coordination sphere. It was intermediate colorless specie with slowkinetics of final product formation: after aging of the separated organic phaseduring 2–3 months, its color changed to yellow and additional water separatedfrom organic phase.
At extraction of titanium from the strong acidic aqueous phase, 7.0–8.0 MHCl (see Figs. 7.4b and 7.5b), the nucleus aggregate formed is
0
0.05
0.1
0.15
0.2
0.25
0.3
0.35
0 0.05 0.1 0.15 0.2 0.25
Q=[Ti]aq/[Ti]feed, M/M
Z=
[Ti]
Org
/[D
EH
PA
], M
/MZ
= [T
i]O
rg/[
DE
HP
A],
M/M
Q=[Ti]aq/[Ti]feed, M/M
(a)
0.4
0.3
0.2
0.1
0.45
0.35
0.25
0.15
0.05
00 0.2 0.4 0.6 0.8 1
(b)
FIGURE 7.4 Comparison of experimentally obtained (points) data 17 and calculated according to
the presented theory data (lines) of extraction of titanium(IV) chlorides by DEHPA in benzene
from the aqueous solutions at initial acidities (HCl): (a) 0.1 mol/kg and (b) 7.6 mol/kg.
342 PART | II Novel Competitive Complexation/Solvation Theory
[TiCl(4�x)*(DEHP)x*(4�x)HCl*(4�x)DEHPA]org, where x, equal 2, is thenumber of DEHP-anion ligands, bonded to titanium central atom in the firstcoordination sphere. It was also an intermediate specie, but kinetics of finalproduct formation here is very fast: during equilibration, first 3–5 min theorganic phase was also colorless, but then, it yellowed and did not change afteraging. So, in comparison with dehydration, the rate of HCl separation andtransformation of monodentate complex to polydentate was very high andfinished during extraction process.17
More details of structure formation and transformation at extraction of sometransition metals (cobalt, nickel, copper, zinc, etc.)20 the reader will find inChapter 10 of the book.
FIGURE 7.5 Structural scheme examples of nuclei aggregates formation at equilibration of
titanuim chloride aqueous solutions with DEHPA in kerosene and transformation of structures
after aging of the separated organic phase: at (a) pH ¼ 1 and (b) 8 M HCl.
343Chapter | 7 CCST: General Mechanisms and Kinetics
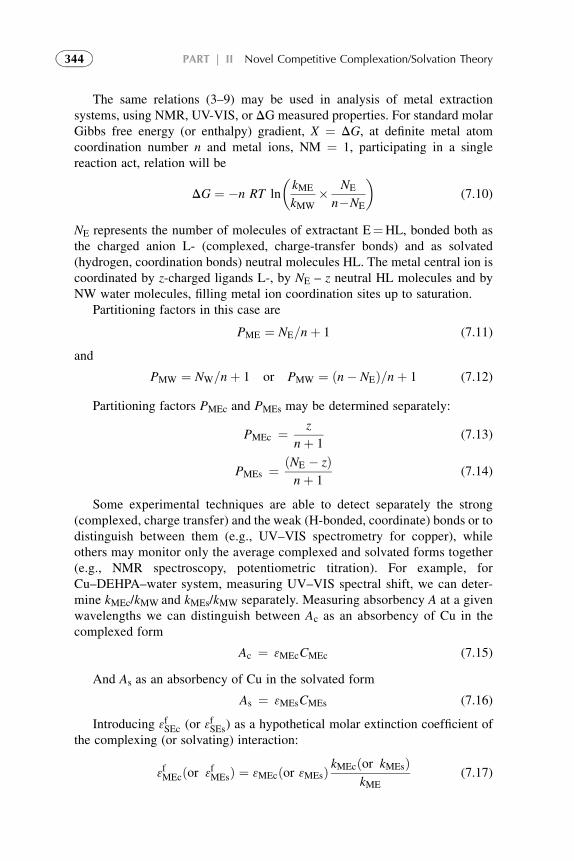
The same relations (3–9) may be used in analysis of metal extractionsystems, using NMR, UV-VIS, or DG measured properties. For standard molarGibbs free energy (or enthalpy) gradient, X ¼ DG, at definite metal atomcoordination number n and metal ions, NM ¼ 1, participating in a singlereaction act, relation will be
DG ¼ �n RT ln
�kME
kMW� NE
n�NE
�(7.10)
NE represents the number of molecules of extractant E¼HL, bonded both asthe charged anion L- (complexed, charge-transfer bonds) and as solvated(hydrogen, coordination bonds) neutral molecules HL. The metal central ion iscoordinated by z-charged ligands L-, by NE – z neutral HL molecules and byNW water molecules, filling metal ion coordination sites up to saturation.
Partitioning factors in this case are
PME ¼ NE=nþ 1 (7.11)
and
PMW ¼ NW=nþ 1 or PMW ¼ ðn� NEÞ=nþ 1 (7.12)
Partitioning factors PMEc and PMEs may be determined separately:
PMEc ¼ z
nþ 1(7.13)
PMEs ¼ ðNE � zÞnþ 1
(7.14)
Some experimental techniques are able to detect separately the strong(complexed, charge transfer) and the weak (H-bonded, coordinate) bonds or todistinguish between them (e.g., UV–VIS spectrometry for copper), whileothers may monitor only the average complexed and solvated forms together(e.g., NMR spectroscopy, potentiometric titration). For example, forCu–DEHPA–water system, measuring UV–VIS spectral shift, we can deter-mine kMEc/kMW and kMEs/kMW separately. Measuring absorbency A at a givenwavelengths we can distinguish between Ac as an absorbency of Cu in thecomplexed form
Ac ¼ 3MEcCMEc (7.15)
And As as an absorbency of Cu in the solvated form
As ¼ 3MEsCMEs (7.16)
Introducing 3fSEc (or 3fSEs) as a hypothetical molar extinction coefficient of
the complexing (or solvating) interaction:
3fMEcðor 3fMEsÞ ¼ 3MEcðor 3MEsÞ kMEcðor kMEsÞkME
(7.17)
344 PART | II Novel Competitive Complexation/Solvation Theory
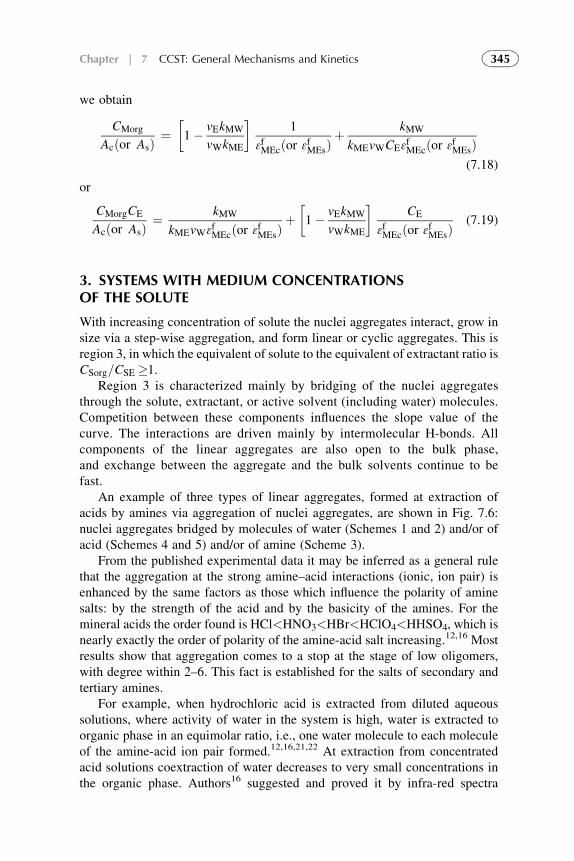
we obtain
CMorg
Acðor AsÞ ¼�1� vEkMW
vWkME
�1
3fMEcðor 3fMEsÞþ kMW
kMEvWCE3fMEcðor 3fMEsÞ
(7.18)
or
CMorgCE
Acðor AsÞ ¼ kMW
kMEvW3fMEcðor 3fMEsÞþ�1� vEkMW
vWkME
�CE
3fMEcðor 3fMEsÞ(7.19)
3. SYSTEMS WITH MEDIUM CONCENTRATIONSOF THE SOLUTE
With increasing concentration of solute the nuclei aggregates interact, grow insize via a step-wise aggregation, and form linear or cyclic aggregates. This isregion 3, in which the equivalent of solute to the equivalent of extractant ratio isCSorg=CSE �1.
Region 3 is characterized mainly by bridging of the nuclei aggregatesthrough the solute, extractant, or active solvent (including water) molecules.Competition between these components influences the slope value of thecurve. The interactions are driven mainly by intermolecular H-bonds. Allcomponents of the linear aggregates are also open to the bulk phase,and exchange between the aggregate and the bulk solvents continue to befast.
An example of three types of linear aggregates, formed at extraction ofacids by amines via aggregation of nuclei aggregates, are shown in Fig. 7.6:nuclei aggregates bridged by molecules of water (Schemes 1 and 2) and/or ofacid (Schemes 4 and 5) and/or of amine (Scheme 3).
From the published experimental data it may be inferred as a general rulethat the aggregation at the strong amine–acid interactions (ionic, ion pair) isenhanced by the same factors as those which influence the polarity of aminesalts: by the strength of the acid and by the basicity of the amines. For themineral acids the order found is HCl<HNO3<HBr<HClO4<HHSO4, which isnearly exactly the order of polarity of the amine-acid salt increasing.12,16 Mostresults show that aggregation comes to a stop at the stage of low oligomers,with degree within 2–6. This fact is established for the salts of secondary andtertiary amines.
For example, when hydrochloric acid is extracted from diluted aqueoussolutions, where activity of water in the system is high, water is extracted toorganic phase in an equimolar ratio, i.e., one water molecule to each moleculeof the amine-acid ion pair formed.12,16,21,22 At extraction from concentratedacid solutions coextraction of water decreases to very small concentrations inthe organic phase. Authors16 suggested and proved it by infra-red spectra
345Chapter | 7 CCST: General Mechanisms and Kinetics
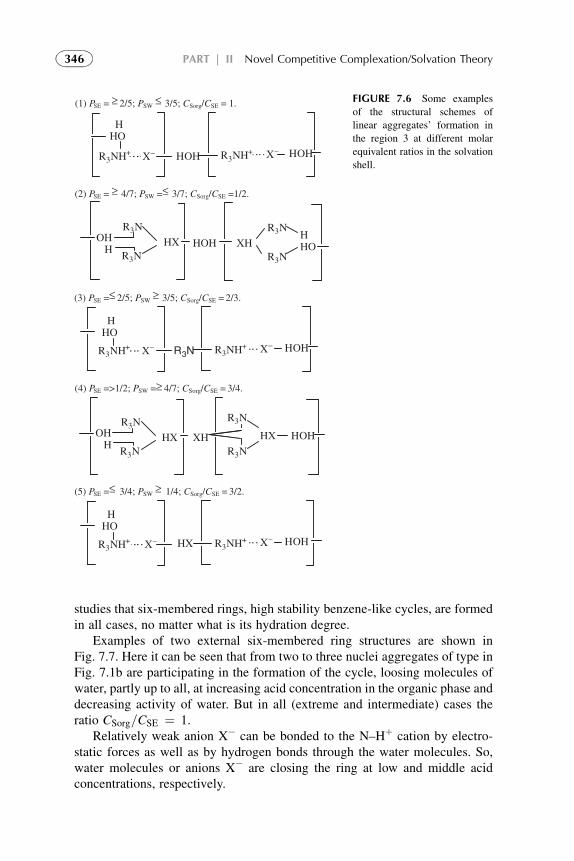
studies that six-membered rings, high stability benzene-like cycles, are formedin all cases, no matter what is its hydration degree.
Examples of two external six-membered ring structures are shown inFig. 7.7. Here it can be seen that from two to three nuclei aggregates of type inFig. 7.1b are participating in the formation of the cycle, loosing molecules ofwater, partly up to all, at increasing acid concentration in the organic phase anddecreasing activity of water. But in all (extreme and intermediate) cases theratio CSorg=CSE ¼ 1.
Relatively weak anion X� can be bonded to the N–Hþ cation by electro-static forces as well as by hydrogen bonds through the water molecules. So,water molecules or anions X� are closing the ring at low and middle acidconcentrations, respectively.
(1) PSE = ≥ 2/5; PSW≤ 3/5; CSorg/CSE = 1.
R3NH+ X– HOH
H HO
R3NH+ X– HOH
(2) PSE = ≥ 4/7; PSW =≤ 3/7; CSorg/CSE =1/2.
HXR3N
HOH OH H
HHO
R3N
XHR3N
R3N
(3) PSE =≤ 2/5; PSW≥ 3/5; CSorg/CSE = 2/3.
R3NH+ X–
H HO
R3NH+ X– HOHR3N
(4) PSE =>1/2; PSW =≥ 4/7; CSorg/CSE = 3/4.
HXR3N
OH H
R3NHX
R3N
R3N
XH HOH
(5) PSE =≤ 3/4; PSW≥ 1/4; CSorg/CSE = 3/2.
R3NH+ X–
H HO
R3NH+ X– HOHHX
FIGURE 7.6 Some examples
of the structural schemes of
linear aggregates’ formation in
the region 3 at different molar
equivalent ratios in the solvation
shell.
346 PART | II Novel Competitive Complexation/Solvation Theory
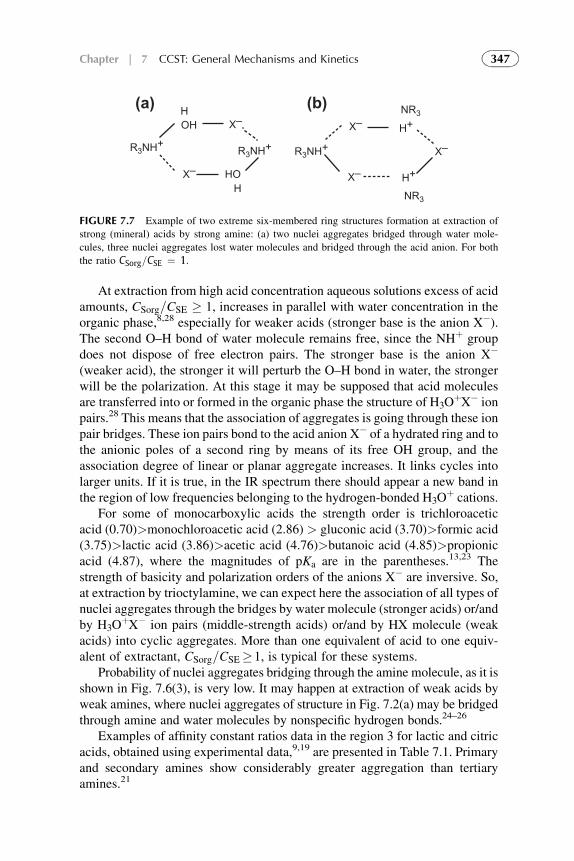
At extraction from high acid concentration aqueous solutions excess of acidamounts, CSorg=CSE � 1, increases in parallel with water concentration in theorganic phase,8,28 especially for weaker acids (stronger base is the anion X�).The second O–H bond of water molecule remains free, since the NHþ groupdoes not dispose of free electron pairs. The stronger base is the anion X�
(weaker acid), the stronger it will perturb the O–H bond in water, the strongerwill be the polarization. At this stage it may be supposed that acid moleculesare transferred into or formed in the organic phase the structure of H3O
þX� ionpairs.28 This means that the association of aggregates is going through these ionpair bridges. These ion pairs bond to the acid anion X� of a hydrated ring and tothe anionic poles of a second ring by means of its free OH group, and theassociation degree of linear or planar aggregate increases. It links cycles intolarger units. If it is true, in the IR spectrum there should appear a new band inthe region of low frequencies belonging to the hydrogen-bonded H3O
þ cations.For some of monocarboxylic acids the strength order is trichloroacetic
acid (0.70)>monochloroacetic acid (2.86) > gluconic acid (3.70)>formic acid(3.75)>lactic acid (3.86)>acetic acid (4.76)>butanoic acid (4.85)>propionicacid (4.87), where the magnitudes of pKa are in the parentheses.13,23 Thestrength of basicity and polarization orders of the anions X� are inversive. So,at extraction by trioctylamine, we can expect here the association of all types ofnuclei aggregates through the bridges by water molecule (stronger acids) or/andby H3O
þX� ion pairs (middle-strength acids) or/and by HX molecule (weakacids) into cyclic aggregates. More than one equivalent of acid to one equiv-alent of extractant, CSorg=CSE�1, is typical for these systems.
Probability of nuclei aggregates bridging through the amine molecule, as it isshown in Fig. 7.6(3), is very low. It may happen at extraction of weak acids byweak amines, where nuclei aggregates of structure in Fig. 7.2(a) may be bridgedthrough amine and water molecules by nonspecific hydrogen bonds.24–26
Examples of affinity constant ratios data in the region 3 for lactic and citricacids, obtained using experimental data,9,19 are presented in Table 7.1. Primaryand secondary amines show considerably greater aggregation than tertiaryamines.21
H
H
OH
HO
X– X–
X–
X–X–
R3NH+
NR3
NR3
H+
H+
R3NH+R3NH+
(a) (b)
FIGURE 7.7 Example of two extreme six-membered ring structures formation at extraction of
strong (mineral) acids by strong amine: (a) two nuclei aggregates bridged through water mole-
cules, three nuclei aggregates lost water molecules and bridged through the acid anion. For both
the ratio CSorg=CSE ¼ 1.
347Chapter | 7 CCST: General Mechanisms and Kinetics
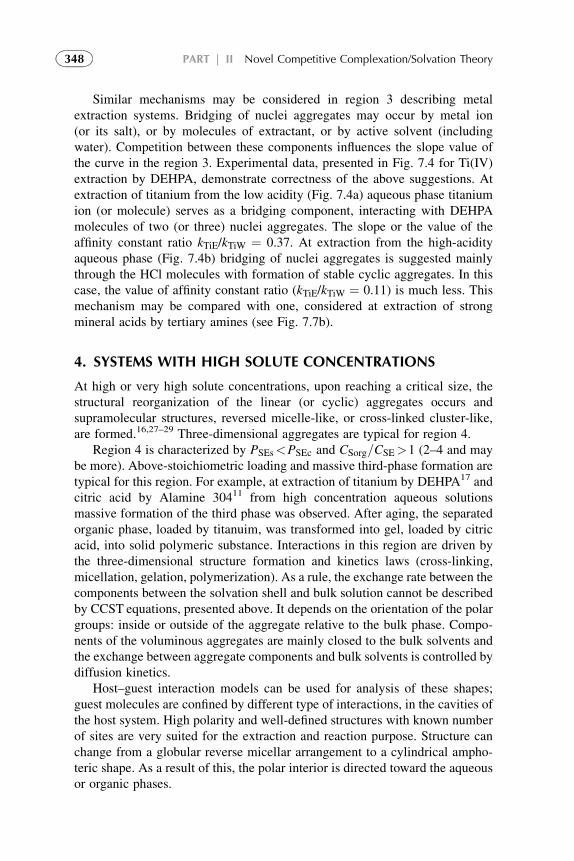
Similar mechanisms may be considered in region 3 describing metalextraction systems. Bridging of nuclei aggregates may occur by metal ion(or its salt), or by molecules of extractant, or by active solvent (includingwater). Competition between these components influences the slope value ofthe curve in the region 3. Experimental data, presented in Fig. 7.4 for Ti(IV)extraction by DEHPA, demonstrate correctness of the above suggestions. Atextraction of titanium from the low acidity (Fig. 7.4a) aqueous phase titaniumion (or molecule) serves as a bridging component, interacting with DEHPAmolecules of two (or three) nuclei aggregates. The slope or the value of theaffinity constant ratio kTiE/kTiW ¼ 0.37. At extraction from the high-acidityaqueous phase (Fig. 7.4b) bridging of nuclei aggregates is suggested mainlythrough the HCl molecules with formation of stable cyclic aggregates. In thiscase, the value of affinity constant ratio (kTiE/kTiW ¼ 0.11) is much less. Thismechanism may be compared with one, considered at extraction of strongmineral acids by tertiary amines (see Fig. 7.7b).
4. SYSTEMS WITH HIGH SOLUTE CONCENTRATIONS
At high or very high solute concentrations, upon reaching a critical size, thestructural reorganization of the linear (or cyclic) aggregates occurs andsupramolecular structures, reversed micelle-like, or cross-linked cluster-like,are formed.16,27–29 Three-dimensional aggregates are typical for region 4.
Region 4 is characterized by PSEs<PSEc and CSorg=CSE>1 (2–4 and maybe more). Above-stoichiometric loading and massive third-phase formation aretypical for this region. For example, at extraction of titanium by DEHPA17 andcitric acid by Alamine 30411 from high concentration aqueous solutionsmassive formation of the third phase was observed. After aging, the separatedorganic phase, loaded by titanuim, was transformed into gel, loaded by citricacid, into solid polymeric substance. Interactions in this region are driven bythe three-dimensional structure formation and kinetics laws (cross-linking,micellation, gelation, polymerization). As a rule, the exchange rate between thecomponents between the solvation shell and bulk solution cannot be describedby CCST equations, presented above. It depends on the orientation of the polargroups: inside or outside of the aggregate relative to the bulk phase. Compo-nents of the voluminous aggregates are mainly closed to the bulk solvents andthe exchange between aggregate components and bulk solvents is controlled bydiffusion kinetics.
Host–guest interaction models can be used for analysis of these shapes;guest molecules are confined by different type of interactions, in the cavities ofthe host system. High polarity and well-defined structures with known numberof sites are very suited for the extraction and reaction purpose. Structure canchange from a globular reverse micellar arrangement to a cylindrical ampho-teric shape. As a result of this, the polar interior is directed toward the aqueousor organic phases.
348 PART | II Novel Competitive Complexation/Solvation Theory
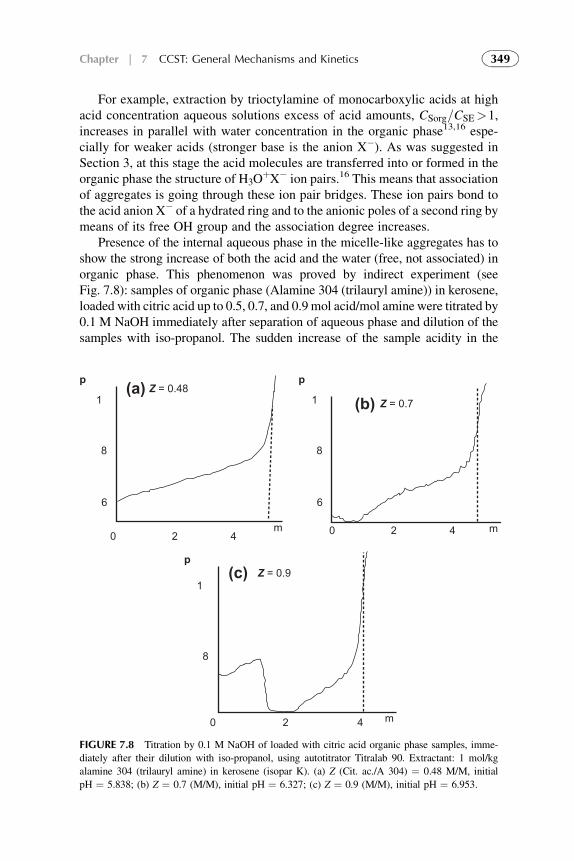
For example, extraction by trioctylamine of monocarboxylic acids at highacid concentration aqueous solutions excess of acid amounts, CSorg=CSE>1,increases in parallel with water concentration in the organic phase13,16 espe-cially for weaker acids (stronger base is the anion X�). As was suggested inSection 3, at this stage the acid molecules are transferred into or formed in theorganic phase the structure of H3O
þX� ion pairs.16 This means that associationof aggregates is going through these ion pair bridges. These ion pairs bond tothe acid anion X� of a hydrated ring and to the anionic poles of a second ring bymeans of its free OH group and the association degree increases.
Presence of the internal aqueous phase in the micelle-like aggregates has toshow the strong increase of both the acid and the water (free, not associated) inorganic phase. This phenomenon was proved by indirect experiment (seeFig. 7.8): samples of organic phase (Alamine 304 (trilauryl amine)) in kerosene,loaded with citric acid up to 0.5, 0.7, and 0.9 mol acid/mol amine were titrated by0.1 M NaOH immediately after separation of aqueous phase and dilution of thesamples with iso-propanol. The sudden increase of the sample acidity in the
p p
p
1
1
8
8
6
1
8
6
0
0
2
2
4
4
0 2 4 mm
m
Z = 0.48Z = 0.7
Z = 0.9
(a)
(b)
(c)
FIGURE 7.8 Titration by 0.1 M NaOH of loaded with citric acid organic phase samples, imme-
diately after their dilution with iso-propanol, using autotitrator Titralab 90. Extractant: 1 mol/kg
alamine 304 (trilauryl amine) in kerosene (isopar K). (a) Z (Cit. ac./A 304) ¼ 0.48 M/M, initial
pH ¼ 5.838; (b) Z ¼ 0.7 (M/M), initial pH ¼ 6.327; (c) Z ¼ 0.9 (M/M), initial pH ¼ 6.953.
349Chapter | 7 CCST: General Mechanisms and Kinetics
middle of titration of high loaded (0.9 M/M) samples witnesses destraction ofthe closed cavities (closed reversed micelles), filled with aqueous solution.
In the case of cluster-like aggregates formation, the concentration of waterconstituent in the solvation shells may increase, be the same or even decreasecompared with region 3.
The rates of the three-dimensional aggregates formation and destructionmay differ very much, especially in the case of closed micelle-like aggregatesformed. So, the researchers, which investigate the extraction systems by dilu-tion of very high loaded by solute organic phase,12 have to be sure that theycome to the equilibrium state.
5. COMPARISON OF CONVENTIONAL AND PRESENTEDTHEORIES DESCRIPTION
Comparing Eqn (7.10) of the CCSTwith Eqns (6.1)–(6.3) in Chapter 6 we obtain
KSE ¼ kSEkSW
� NE
n� NE(7.20)
where NE is a number of extractant molecules participating in a single reactionact.
Comparing Eqns (7.2) and (7.3) of the presented theory with Scatchard–Deranleau Eqns (7.11) and (7.12), presented in Chapter 6 we obtain
KSE ¼ kSEkSW
vW � vE (7.21)
As can be seen, the right parts of Eqns (7.5) and (7.21) are identical. So, theslope is identical to the average equilibrium constant of the classical theories.
One can see that the classical equilibrium constant parameter KSE repre-sents, in fact, an affinity constant ratio kSE/kSW when the active solvent (here,water in organic phase) is included in the thermodynamic treatment.
Using the classical theories, it is impossible to explain why equilibriumconstant Kex ¼ 0 or negative without employing some ad hoc arguments foreach individual case. The presented theory handles this problem in a straight-forward way. According to Eqns (7.5) and (7.21), the slope can be negative(normal case), positive, or equal zero depending on the relative magnitude of
componentskSikSj
vj and vi.
The presented theory explains the dual maximum behavior (see Chapter 6)using coordination model8,30 and the acid-base concept1,2 with amphotericproperties of solvents.
The presented theory considers metal ions in solutions as bonded withcharged ligands and neutral molecules in the solvation shells, depending ontheir oxidation state and solvation (coordination) number. These cationic,
350 PART | II Novel Competitive Complexation/Solvation Theory
neutral, or anionic species may be classed as both conjugate acids and bases,depending on properties and concentrations of ion groups and moleculesbonded.
Metal salts, dissolved in water, hydrolyzed, and coordinated by watermolecules (hydrated), or dissolved in strong acids, coordinated by acid mole-cules (solvated), can be conjugate base or acid, respectively, to the sameextractant.5,13,21,31 Example with Ti(IV) was presented above, in Section 3.
These considerations are valid for most of the metals and extractants(acidic, basic, neutral) presented in Table 6.1 of Chapter 6. They explain theuniversality of dual behavior of different extractants and prove their ampho-terity, depending on the composition of the solute in the aqueous phase and itsacidity.
6. SUMMARIZING REMARKS FOR THE CCST
In the chemical modeling approach,9,10,12–14,16,21,23,32,33 the authors considerthe system as a static, where one of the mechanisms (ion pair, anion exchange,H-bonding) is a dominating one and is not changed at changing concentrationsof solute. They have developed the mathematical models in which hypotheticalcomplexes of a specific stoichiometry are formed. This approach is the usefultool to describe the data quantitatively, if complexation is strong, as in theregion 2. The presented theory overcomes some limitations of chemicalmodeling approach. Here, different regions are analyzing separately andseparate mathematical descriptions are developed for different regions of theextraction system. It shows that the contradictions between King,13–15,34
Yang,32 and Eyal12,23 groups in the interpretation of experimental data are onlyseeming ones: really, they are analyzing different regions, in which the inter-action mechanisms are different.
The theory introduces an active solvent (including water) as a quantitativeparameter, which is participating and influencing the formation of differentcompositions of the aggregates (solvation shells) at changing of soluteconcentration in the organic phase.
Only relative values (affinity constant ratios) can be measured in solutionbecause of the ubiquitous nature of molecular interactions. Affinity constantratio’s value of unity suggests the same values of solvation effects of the solutewith extractant in the organic phase and with water in the aqueous phase;a large value of kSE/kSW means strong or very strong complexation effects withextractant. A positive sign of a slope means that the solvation of the reactantmolecules is stronger than the product molecules. The negative slope showsthat the solvation of product molecule is stronger than the reactant’s.
The linearity of the Eqn (6.19) plots (see Chapter 6) over the wholeconcentration range means that the same affinity constant ratio is valid at lowand high solute concentrations and does not depend on its concentration.Extraction of some carboxylic acids by alcohols may serve as examples of such
351Chapter | 7 CCST: General Mechanisms and Kinetics
systems (e.g., the reader is referred to Nagy,35–38 Laub,39 and Purnel.40 Inter-changes in the linearity of Eqn (6.19, Chapter 6), or the different slopes in theloading curve over the solute concentration range mean that the affinityconstant ratios and/or concentrations of the components in the solvation shellare different. It means, also, that the different charge-transfer complexationmechanisms, and consequently the different values of kSEc, or the differentsolvation mechanisms and consequently different values of kSEs, take place atdifferent solute concentration. So, we have to determine either kSEc/kSEs.
Regions 1–4 in the general distribution curve (Chapter 6, Fig. 6.1) withdifferent values of the slopes testify different compositions of the aggregatesformed and different influence of the constituents of extraction system on theinteraction mechanisms over the solute concentration range. It is evident that inthis case we will obtain different values of the hypothetical chemical shifts inpure solvents (water). This analysis is useful when studying polybasic solutesor extractants, and especially when studying mixtures of extractants, such asacid–amine or amine–amine mixtures.
REFERENCES
1. Kislik V. Competitive complexation/solvation theory of solvent extraction. II. Solvent
extraction of metals by acidic extractants. Sep Sci Technol 2002;37(11):2623–57.
2. Kislik V. Application of preferential solvation concept for interpretation of the mechanisms of
acids solvent extraction by amines. Sep Sci Technol 2001;36(13):2899–926.
3. Kislik V, Eyal A. Acidity dependence of Ti(IV) extraction: a critical analysis. Solvent Extr Ion
Exch 1993;11(2):258.
4. Kislik V. Application of Preferential solvation model for Interpretation of the Mecha-
nisms of Solvent Extraction. In: Proceedings of the XVth International Symposium on
Physico-chemical Methods of Mixtures Separation. Poland: ARS SEPARATORIA 2000;
2000. p. 34–40.
5. Marcus Y, Kertes AS. Ion exchange and solvent extration of metal complexes. London: Wiley-
Interscience; 1969.
6. Komasawa I, Otake T, Hattori I. The effects of diluent in the liquid-liquid extraction of
copper and nickel using 2-hydroxy-5-nonylbenzophenone oxime. J Chem Eng Japan 1983;
16(5):377–88.
7. Kolarik Z, Grimm R. Acidic organophosphorus extractants. XXIII. Distribution of mon-
o-2-ethylhexyl phosphoric acid in two liquid phase systems. J Inorg Nucl Chem 1976;
38(5):1761–3.
8. Sekine T, Hasegawa Y. Solvent extraction chemistry. New York: Marcel Dekker Inc; 1977.
9. Tamada J, King C. Extraction of Carboxylic Acids by Amine Extractants. Ph.D. Thesis.
Lawrence Berkeley Laboratory, University of California, Applied Science Division; 1989.
10. Vieux AS. Extraction of some dicarboxylic acids by tri-isooctylamine. Anal Chim Acta
1974;68:415–24.
11. Kislik V, Eyal A. unpublished experimental data, 1998.
12. Eyal AM, Canari R. pH dependence of carboxylic and mineral acid extraction by amine-based
extractants: effects of pKa, amine basicity, and diluent properties. Ind Eng Chem Res
1995;34(5):1789–98.
352 PART | II Novel Competitive Complexation/Solvation Theory
13. Tamada J, Kertes A, King C. Extraction of carboxylic acids with amine extractant. 3. Effect of
temperature, water coextraction and process considerations. Ind Eng Chem Res 1990;29:1333–41.
14. Tamada J, Kertes A, King C. Extraction of carboxylic acids with amine extractant. 1. Equi-
libria and law of mass action modeling. Ind Eng Chem Res 1990;29:1319–26.
15. Tamada J, Kertes A, King C. Extraction of carboxylic acids with amine extractant. 2.
Chemical interaction and interpretation of data. Ind Eng Chem Res 1990;29:1327–32.
16. Wardel JM, King CJ. Solvent equilibria for extraction of carboxylic acids from water. J Chem
Eng Data 1979;23(2):144–8.
17. Kislik V, Eyal A. Extraction of titanium(IV) by mixtures of mono- and d-(2-ethylhexyl)
phosphoric acids esters. Solvent Extr Ion Exch 1993;11(2):285–310.
18. Kislik V, Eyal A. Mechanisms of titanium (IV) and some other transition metals extraction by
organophosphorus acids. Proceedings of ISEC’93 1993;vol. 2:1353–60.
19. Kislik V, Eyal A. Hybrid liquid membrane (HLM) and supported liquid membrane (SLM)
based transport of titanium (IV). J Mem Sci 1996;111:273–81.
20. Neuman RD, Jons MA, Zhou NF. Photo-correlation spectroscopy applied to hydrometallur-
gical solvent-extraction systems. Colloids and Surfaces 1990;46(1):45–61.
21. Grinstead RR. Base strengths of amine in liquid-liquid extraction systems. Proceedings of
ASEC’67 1968;427–36.
22. Dotre JC, Teixeira J, editors. Hydrogen-bonded liquids. The Netherlands: Kluwer; 1991.
23. Canari R, Hazan B, Eyal A. Carboxylic acids extraction by basic extractants: the effects of pH,
ion concentration and acid-base property of the extractant and extracted acid. Proceedings of
ASEC’96 1996;2:1517–22.
24. Headley AD. Solvent effects on the basicity of alkyl-substituted dimethylamines. J Org Chem
1988;53:312–4.
25. Headley AD, McMyrry ME, Starnes SD. Effects of substituents on the acidity of acetic acid.
J Org Chem 1994;59:1863–6.
26. Headley AD. Quantitative analysis of solvation effects and influence of alkyl substituents on
basicity of amines. J Org Chem 1991;56:3688–91.
27. Spala EE, Ricker NL. Thermodynamic model for solvating solutions with physical interac-
tions. Ind Eng Chem Process Des Dev 1982;21:409–15.
28. Fendler EJ. Proton magnetic resonance investigation of alkylammonium carboxylate micelles
in nonaqueous solvents. J Phys Chem 1973;77(11):1432–6.
29. Toda F, Hyoda S, Okada K, Hirtsu R. Isolation of anhydrous hydrasine as stable inclusion
complexes with hydroquinone and p-methoxyphenol and their solide state reaction with esters
which gives pure hydrolyzides. J Chem Soc Chem Commun 1995;1531–2.
30. Kislik V, Eyal A. Heavy metals removal from wastewaters of phosphoric acid production:
a comparison of hybrid liquid membrane (HLM) and aqueous hybrid liquid membrane
(AHLM) technologies. In: Proceedings of the conference on membranes in drinking and
industrial, vol. 1. Paris, France: Water Production; 2000. p. 503–514.
31. Deranleau DA. Theory of the measurement of weak molecular complexes. I. General
considerations. J Amer Chem Soc 1969;91:4044–9.
32. Yang S, White S, Hsu S. Extraction of carboxylic acids with tertiary and quaternary amines:
Effect of pH. Eng Chem Res 1991;30:1335–48.
33. Mei Wen, Yiyan Yang, Youyuan Dai. Studies on the mechanism of extraction of carboxylic
acids with tri-N-octylamine by chemical complexation. Proceedings ISEC’96 1996;1:
195–200.
34. Hogfeldt E, Fredlund F, Odberg L, Merenge G. Extraction of water, nitric and perchloric acids
by nitrobenzene. Acta Chemica Scand 1973;18(5):1781–94.
353Chapter | 7 CCST: General Mechanisms and Kinetics
35. Nagy OB, Muanda H, Nagy JB. Competitive preferential solvation theory of weak molecular
interactions. J Chem Soc Faradey Trans1 1978;74:2210–29.
36. Szpakowska M, Nagy OB. Application of the preferential solvation theory to coordinative
solute-solvent interactions. J Chem Soc, Faradey Trans1 1989;85(9):2891–9.
37. Nagy OB, Muanda M, Nagy JB. Quantitative evaluation of solute-solvent interactions.
Environmental effects on the n-butylaminolysis of tetrachloro-n-n-butylphthalimide. J Phys
Chem 1979;83(15):1961–79.
38. Parbhoo B, Nagy O. Application of the competitive preferential solvation theory to ion-
molecule interactions. J Chem Soc Faradey Trans 1 1986;82:1789–93.
39. Laub RJ, Purnell JH. Solution and complexing Studies. III. Futher evidence for a microscopic
partitioning theory of solution. J Amer Chem Soc 1976;98(1):30–5.
40. Purnell JH, Vargas de Andrade. Solution and complexing studies. I.Gas-liquid chromatografic
investigation of supposed complexing systems. II. Comparison and correlation of nuclear
magnetic resonance and gas-liquid chromatografic data. J Amer Chem Soc 1975;97:3585–90.
354 PART | II Novel Competitive Complexation/Solvation Theory
Chapter 8
CCST in Engineering Design,Procedures, and Calculations
Chapter Outline1. Introduction 355
2. Engineering Considerations
in Experimental Investigation
of CCST
356
3. Experimental Techniques for
the Presented Theory
358
4. Determination of Extraction
Constant and its Comparison
with CCST Affinity Constant
Ratios
361
5. Analytical methods used for
the CCST verification
363
6. Transferability of the Values
of Affinity Constant Ratios
364
References 364
1. INTRODUCTION
When the classical theories are experimentally tested, water in the initialaqueous solution of solute-in-water, S, is replaced by extractant E, to arrive,finally, to the solution of solute-in-pure E. The corresponding variation of thephysicochemical property of S constitutes a substitution profile, the lineariza-tion of which makes it possible to determine the thermodynamic and spec-troscopic properties of S–E–W interactions and distributions. As a rule, thesetheories1–5 do not distinguish quantitatively between complexation andsolvation in the S–E–W interactions. Also, they do not predict quantitativelythe influence of different active solvents (enhancers, modifiers, synergisticagents, mixed extractants) and diluents.
The presented approach takes into account the influence of differentsolvents (including water extracted) and gives a key for quantitative anal-ysis and preliminary prediction of suitable extraction systems.
Solvent Extraction. DOI: 10.1016/B978-0-444-53778-2.10008-1
Copyright � 2012 Elsevier B.V. All rights reserved. 355
2. ENGINEERING CONSIDERATIONS IN EXPERIMENTALINVESTIGATION OF CCST
As mentioned in the previous chapters, a composition of the solvation shell ina mixture depends on affinity constant ki and on the number of potentiallyavailable solvent (extractant, active solvent, water) molecules present in themixture, i.e., on the actual concentration of every component. The greater thefactor kSECE (or kSWCW, or kSACA) the better the component solvates solute.Competition between extractant, active solvent, and water molecules tointeract with the solute molecules in the solvation shell determines thedistribution curve slope. According to the theory, the solute–solvent inter-actions are different for every solvent and result in different affinity constantratios kSE/kSW, kSE/kSA, kSA/kSW, kEA/kAW, and concentration ratios CSE/CSW,CSA/CSW, CSE/CSA, CEA/CAW, which have to be determined. Preliminary dataof the extraction compositions can be calculated using the results of threecomponent systems. Hence, the experimental studies simplify to the series ofmeasurements for the S–E–A, S–A–W, and E–A–W systems, analogically toS–E–W system (for details see Chapter 7).
Let us consider a S–E–W extraction system in which solute ion, S, NS-molecules–Extractant, E, NE-molecules–Water, W, NW-molecules participate ina single reaction act. Here, z is the oxidation state of solute ion.
We are repeating the basic equations of the CCST presented in the previouschapters:
XSW � X
CE¼ kSE
kSWvWðXSW � XSEÞ �
�kSEkSW
vW � vE
�ðXSW � XÞ (8.1)
where X is the value of the measured property.Saturation factor Z:
Z ¼ CEvE
1��vW � kSW
kSEvE
�CWorg
¼ PSE
PSE þ kSWkSE
vECWorg
(8.2)
and
1
Z¼ 1þ kSWCWorg
kSEPSEvE¼ 1þ kSWCWorg
kSECE(8.3)
Affinity constant ratio kSE/kSW is determined from the slope of Eqn (8.1)plots: (XSW � X)/CAorg versus (XSW – X). The intercept gives the hypotheticaldifference between the property, measured in pure extractant and in pure activesolvent. Determination of the affinity constant ratio kSE/kSW may be realized byconventional equilibrium extraction experiment series. Several physical prop-erties of complexes, e.g., excess of dipole moment (Dm) change of proton,carbon-13, nitrogen-15 chemical shifts (Dd), frequency shift (Dn), when plottedagainst DpKa, pKa, pH, PA (proton affinity), or DH, give titration curve
356 PART | II Novel Competitive Complexation/Solvation Theory
relations. As a rule, these techniques do not distinguish between intermediatereactions, especially rapid, and show summarized results.
For NMR, where X¼ d is the chemical shift:
dSW � d
CE¼ kSEvWorg
kSWðdSW � dSEÞ �
�kSEkSW
vWorg � vE
�ðdSW � dÞ (8.4)
For UV–VIS, where X¼ 3 is the molar extinction coefficient:
3SW � 3
CE¼ kSEvW
kSWð3SW � 3SEÞ �
�kSEkSW
vW � vE
�ð3SW � 3Þ (8.5)
where
A
CSorg¼ 3
ASE
CSorg¼ 3SE
ASW
CSorg¼ 3SW and A is a measured absorbency;
For free energy (or enthalpy) gradient, where X¼DG (at constanttemperature and pressure):
DG
RT¼ �ln
�kSEkSW
� CEvECWorgvW
�(8.6)
or for the metals:
DG ¼ �n RT ln
�kME
kMW� NE
n� NE
�(8.7)
where NE represents the number of molecules of extractant E¼HL, bondedboth as the charged anion L� (complexed, charge-transfer bonds) and as thesolvated (hydrogen, coordination bonds) neutral molecules HL. The metalcentral ion is coordinated by z-charged ligands L�, by NE� z neutral HLmolecules, and by NW water molecules, filling metal ion coordination sites upto saturation.
Partitioning factors in this case are
PME ¼ NE
nþ 1(8.8)
and
PMW ¼ NW
nþ 1or PMW ¼ ðn� NEÞ
nþ 1(8.9)
Partitioning factors PMEc and PMEs may be determined separately:
PMEc ¼ z
nþ 1(8.10)
PMEs ¼ NE � z
nþ 1(8.11)
357Chapter | 8 CCST in Engineering Design, Procedures, and Calculations
From the slope of the Eqn (8.1) (Chapter 6, Section 4) plots (XSW � X)/CE
versus (XSW � X) one can obtain the affinity constant ratio kSE/kSW:
Slope ¼ kSEkSW
vW � vE (8.12)
The intercepts give the hypothetical differences between the property(e.g., chemical shifts, molar extinction coefficients), measured in pure extrac-tant and in pure water:
Intercept ¼ kSEkSW
vWðXSW � XSEÞ (8.13)
Thus, the agreement between the direct experimental determination of themeasured property in pure solvents and their graphically obtained values ofXSW� XSE may be examined.
3. EXPERIMENTAL TECHNIQUES FOR THE PRESENTED THEORY
Experimental determination of the solvation shell composition, CSE and CSW,and affinity constants ratio, kSE/kSW, permit us to find out the most convenient,in this case, nucleus aggregate. Quantitative, or even semi-quantitative, spec-trometric determination of CSEc and CSEs (composition of the solute in thecomplexed and solvated forms (see Chapter 6, Section 4)) permits us to set upan exact form of the nucleus aggregate.
In many cases, studying interaction structures, chemical relaxation tech-niques,6 dynamic NMR spectroscopy, ultrasonic methods,7 IR, UV, dielectricmethods are useful. Mass spectroscopic methods permit precise determinationof proton affinities and equilibrium constants. As a rule, some techniquesmonitor only the average complexed and solvated forms together (e.g., NMRspectroscopy, potentiometric titration).
Some experimental techniques are able to detect separately the strong(complexed, charge transfer) and the weak (H-bonded, coordinate) bonds or todistinguish between them. For example, for Cu–DEHPA–water system,measuring UV-VIS spectral shift, we can determine kMEc/kMW and kMEs/kMW
by Eqn (8.3) (for details see Chapter 7). Measuring absorbency A at a givenwavelength we can distinguish between the complexed and the solvatedforms.
For the complexed form at the absorbencies Ac
Ac ¼ 3MEcCMEc (8.14)
For the solvated form at the absorbencies As
As ¼ 3MEsCMEs (8.15)
358 PART | II Novel Competitive Complexation/Solvation Theory
Introducing 3fSEc (or 3fSEs) as a hypothetical molar extinction coefficient of
the complexing (or solvating) interaction:
3fMEcðor 3fMEsÞ¼ 3MEcðor 3MEsÞkMEcðor kMEsÞkME
(8.16)
we obtain
CMorg
Acðor AsÞ ¼�1� vEkMW
vWkME
�1
3fMEcðor 3fMEsÞþ kMW
kMEvWCE3fMEcðor 3fMEsÞ
(8.17)
or
CMorgCE
Acðor AsÞ ¼kMW
kMEvW3fMEcðor 3fMEsÞþ�1� vEkMW
vWkME
�CE
3fMEcðor 3fMEsÞ(8.18)
The molar extinction coefficient (or chemical shift, or free energy change)of the solute in pure solvents (in this case water), 3SW, and the variation of theapparent molar extinction coefficient, 3, are measured as the water moleculesare stripped off stepwise from the solvation shell of the solute and replacedby molecules of the extractant E, throughout the whole concentration range,until reaching the corresponding value in pure extractant, 3SE. The affinityconstant ratios are determined by the slope of the plot (3SW � 3) versus(3SW � 3SE)/CE. The intercept of the plot gives the hypothetical molarextinction coefficient (or chemical shift in NMR measurements) of the solutein pure water or in pure extractant. Thus, the agreement between the directexperimental determination of the chemical shifts in pure solvents andtheir graphically obtained values at 3SW � 3 ¼ 0 or 3SE � 3 ¼ 0 can becompared.
The changes in the linearity of the plots (intersection points), or the differentslopes in the loading curve (Fig. 6.1 in Chapter 6) over the concentration range,mean that different complexation mechanisms, or different solvation mecha-nisms, take place at different solute concentrations. It is evident that in this casewe will obtain different values of the hypothetical chemical shifts in pure water.It means that we have different compositions of the solvation shell, dependingon solute concentration. In this case we have to use one more experimentallymeasured property, such as UV-VIS or quantitative IR measurements, todetermine either kSEc or kSEs, or both (see Chapter 9). This analysis is usefulwhen studying polyvalent metals or polybasic extractants, and especially whenstudying mixtures of extractants.
A serious limitation for studying acid–base interactions is a lack of defin-itive and general techniques for proving the structures of the product species.Very often the species are postulated in order to fit the experimental data witha given model. Most transition metals, post-transition and some main group
359Chapter | 8 CCST in Engineering Design, Procedures, and Calculations
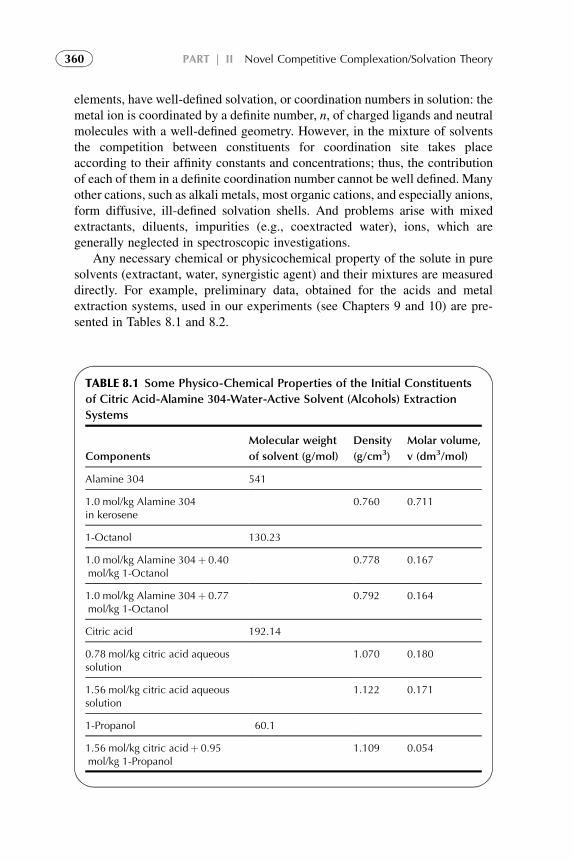
elements, have well-defined solvation, or coordination numbers in solution: themetal ion is coordinated by a definite number, n, of charged ligands and neutralmolecules with a well-defined geometry. However, in the mixture of solventsthe competition between constituents for coordination site takes placeaccording to their affinity constants and concentrations; thus, the contributionof each of them in a definite coordination number cannot be well defined. Manyother cations, such as alkali metals, most organic cations, and especially anions,form diffusive, ill-defined solvation shells. And problems arise with mixedextractants, diluents, impurities (e.g., coextracted water), ions, which aregenerally neglected in spectroscopic investigations.
Any necessary chemical or physicochemical property of the solute in puresolvents (extractant, water, synergistic agent) and their mixtures are measureddirectly. For example, preliminary data, obtained for the acids and metalextraction systems, used in our experiments (see Chapters 9 and 10) are pre-sented in Tables 8.1 and 8.2.
TABLE 8.1 Some Physico-Chemical Properties of the Initial Constituents
of Citric Acid-Alamine 304-Water-Active Solvent (Alcohols) Extraction
Systems
Components
Molecular weight
of solvent (g/mol)
Density
(g/cm3)
Molar volume,
v (dm3/mol)
Alamine 304 541
1.0 mol/kg Alamine 304in kerosene
0.760 0.711
1-Octanol 130.23
1.0 mol/kg Alamine 304þ 0.40mol/kg 1-Octanol
0.778 0.167
1.0 mol/kg Alamine 304þ 0.77mol/kg 1-Octanol
0.792 0.164
Citric acid 192.14
0.78 mol/kg citric acid aqueoussolution
1.070 0.180
1.56 mol/kg citric acid aqueoussolution
1.122 0.171
1-Propanol 60.1
1.56 mol/kg citric acidþ 0.95mol/kg 1-Propanol
1.109 0.054
360 PART | II Novel Competitive Complexation/Solvation Theory
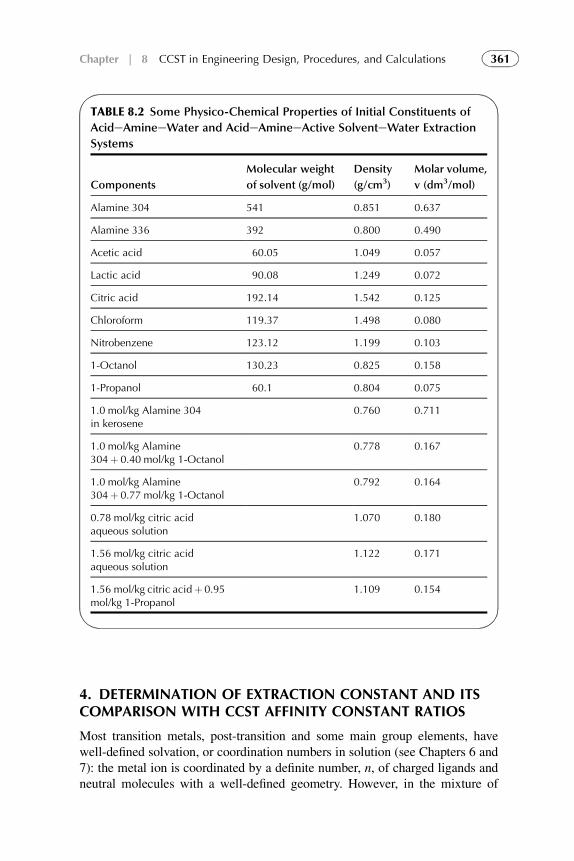
4. DETERMINATION OF EXTRACTION CONSTANT AND ITSCOMPARISON WITH CCST AFFINITY CONSTANT RATIOS
Most transition metals, post-transition and some main group elements, havewell-defined solvation, or coordination numbers in solution (see Chapters 6 and7): the metal ion is coordinated by a definite number, n, of charged ligands andneutral molecules with a well-defined geometry. However, in the mixture of
TABLE 8.2 Some Physico-Chemical Properties of Initial Constituents of
AcideAmineeWater and AcideAmineeActive SolventeWater Extraction
Systems
Components
Molecular weight
of solvent (g/mol)
Density
(g/cm3)
Molar volume,
v (dm3/mol)
Alamine 304 541 0.851 0.637
Alamine 336 392 0.800 0.490
Acetic acid 60.05 1.049 0.057
Lactic acid 90.08 1.249 0.072
Citric acid 192.14 1.542 0.125
Chloroform 119.37 1.498 0.080
Nitrobenzene 123.12 1.199 0.103
1-Octanol 130.23 0.825 0.158
1-Propanol 60.1 0.804 0.075
1.0 mol/kg Alamine 304in kerosene
0.760 0.711
1.0 mol/kg Alamine304þ 0.40 mol/kg 1-Octanol
0.778 0.167
1.0 mol/kg Alamine304þ 0.77 mol/kg 1-Octanol
0.792 0.164
0.78 mol/kg citric acidaqueous solution
1.070 0.180
1.56 mol/kg citric acidaqueous solution
1.122 0.171
1.56 mol/kg citric acidþ 0.95mol/kg 1-Propanol
1.109 0.154
361Chapter | 8 CCST in Engineering Design, Procedures, and Calculations
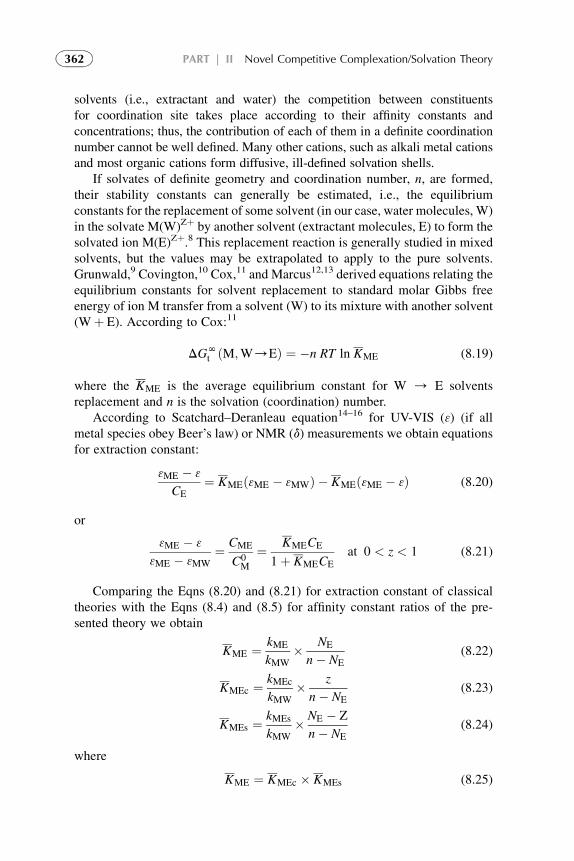
solvents (i.e., extractant and water) the competition between constituentsfor coordination site takes place according to their affinity constants andconcentrations; thus, the contribution of each of them in a definite coordinationnumber cannot be well defined. Many other cations, such as alkali metal cationsand most organic cations form diffusive, ill-defined solvation shells.
If solvates of definite geometry and coordination number, n, are formed,their stability constants can generally be estimated, i.e., the equilibriumconstants for the replacement of some solvent (in our case, water molecules, W)in the solvate M(W)Zþ by another solvent (extractant molecules, E) to form thesolvated ion M(E)Zþ.8 This replacement reaction is generally studied in mixedsolvents, but the values may be extrapolated to apply to the pure solvents.Grunwald,9 Covington,10 Cox,11 and Marcus12,13 derived equations relating theequilibrium constants for solvent replacement to standard molar Gibbs freeenergy of ion M transfer from a solvent (W) to its mixture with another solvent(Wþ E). According to Cox:11
DGNt ðM;W/EÞ ¼ �n RT ln KME (8.19)
where the KME is the average equilibrium constant for W / E solventsreplacement and n is the solvation (coordination) number.
According to Scatchard–Deranleau equation14–16 for UV-VIS (3) (if allmetal species obey Beer’s law) or NMR (d) measurements we obtain equationsfor extraction constant:
3ME � 3
CE¼ KMEð3ME � 3MWÞ � KMEð3ME � 3Þ (8.20)
or
3ME � 3
3ME � 3MW¼ CME
C0M
¼ KMECE
1þ KMECEat 0 < z < 1 (8.21)
Comparing the Eqns (8.20) and (8.21) for extraction constant of classicaltheories with the Eqns (8.4) and (8.5) for affinity constant ratios of the pre-sented theory we obtain
KME ¼ kME
kMW� NE
n� NE(8.22)
KMEc ¼ kMEc
kMW� z
n� NE(8.23)
KMEs ¼ kMEs
kMW� NE � Z
n� NE(8.24)
where
KME ¼ KMEc � KMEs (8.25)
362 PART | II Novel Competitive Complexation/Solvation Theory
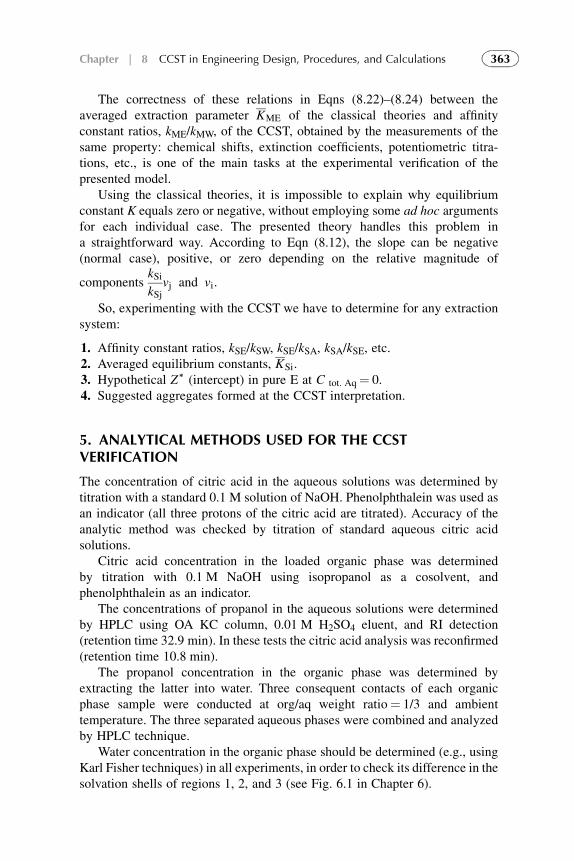
The correctness of these relations in Eqns (8.22)–(8.24) between theaveraged extraction parameter KME of the classical theories and affinityconstant ratios, kME/kMW, of the CCST, obtained by the measurements of thesame property: chemical shifts, extinction coefficients, potentiometric titra-tions, etc., is one of the main tasks at the experimental verification of thepresented model.
Using the classical theories, it is impossible to explain why equilibriumconstant K equals zero or negative, without employing some ad hoc argumentsfor each individual case. The presented theory handles this problem ina straightforward way. According to Eqn (8.12), the slope can be negative(normal case), positive, or zero depending on the relative magnitude of
componentskSikSj
vj and vi.
So, experimenting with the CCST we have to determine for any extractionsystem:
1. Affinity constant ratios, kSE/kSW, kSE/kSA, kSA/kSE, etc.2. Averaged equilibrium constants, KSi.3. Hypothetical Z) (intercept) in pure E at C tot. Aq¼ 0.4. Suggested aggregates formed at the CCST interpretation.
5. ANALYTICAL METHODS USED FOR THE CCSTVERIFICATION
The concentration of citric acid in the aqueous solutions was determined bytitration with a standard 0.1 M solution of NaOH. Phenolphthalein was used asan indicator (all three protons of the citric acid are titrated). Accuracy of theanalytic method was checked by titration of standard aqueous citric acidsolutions.
Citric acid concentration in the loaded organic phase was determinedby titration with 0.1 M NaOH using isopropanol as a cosolvent, andphenolphthalein as an indicator.
The concentrations of propanol in the aqueous solutions were determinedby HPLC using OA KC column, 0.01 M H2SO4 eluent, and RI detection(retention time 32.9 min). In these tests the citric acid analysis was reconfirmed(retention time 10.8 min).
The propanol concentration in the organic phase was determined byextracting the latter into water. Three consequent contacts of each organicphase sample were conducted at org/aq weight ratio¼ 1/3 and ambienttemperature. The three separated aqueous phases were combined and analyzedby HPLC technique.
Water concentration in the organic phase should be determined (e.g., usingKarl Fisher techniques) in all experiments, in order to check its difference in thesolvation shells of regions 1, 2, and 3 (see Fig. 6.1 in Chapter 6).
363Chapter | 8 CCST in Engineering Design, Procedures, and Calculations
6. TRANSFERABILITY OF THE VALUES OF AFFINITYCONSTANT RATIOS
One of the biggest advantages of the CCST is independence and transferabilityof the values of affinity constant ratios from one system to the other. The theoryof partitioning in the homogenous media implies that the components actindependently in their interaction with a given solute. In other words, thevalues of kSE are independent on the values of kSW or kSA and are transferablefrom one system to the other. As a result, predictions of the influence ofdifferent solvents on the effectiveness and selectivity of the extraction processare possible once some solvent parameters are ascertained. Transferability isattained by different independent experiments with three component systems,proving relations:
kS1E
kS2E¼ kðS1EÞ1
kðS1WÞ1� kðS2WÞ2
kðS2EÞ2¼ kðS1EÞ1
kðS1AÞ1� kðS2AÞ2
kðS2EÞ2(8.26)
kSE1
kSE2
¼ kðSE1Þ1kðSWÞ1
� kðSWÞ2kðSE2Þ2
¼ kðSE1Þ1kðSAÞ1
� kðSAÞ2kðSE2Þ2
(8.27)
kSA1
kSA2
¼ kðSA1Þ1kðSWÞ1
� kðSWÞ2kðSA2Þ2
¼ kðSA1Þ1kðSEÞ1
� kðSEÞ2kðSA2Þ2
(8.28)
where the systems (all in the same inert diluent) experimentally verified areS1–E–W, S1–E–A, and S2–E–W, S2–E–A, respectively, for Eqn (8.26); S–E1–W, S–E1–A, and S–E2–W, S–E2–A, respectively, for Eqn (8.27); S–A1–E, S–A1–W, and S–A2–E, S–A2–W, respectively, for Eqn (8.28).
The basic idea of the homogenous partitioning, independence, andtransferability of affinity constants was developed by Purnell withcoworkers.17,18 They have experimentally proved it for about 180 organicsystems, by chromatographic techniques. Nagy with coworkers19–22 devel-oped the mathematical analysis of homogenous partitioning and experimen-tally proved it, by NMR, UV-VIS, potentiometric titrations, and kineticmeasurement techniques.
Validity of the presented approach, verified experimentally, gives a key forquantitative analysis and preliminary prediction of suitable extraction systemsfor different metals’ separation.
REFERENCES
1. Lo TC, Hanson C, Baird MHI, editors. Handbook of solvent extraction. New York: Wiley; 1983.
2. Rydberg J, Cox M, Musikas C, Choppin GR, editors. Principles and practices of solvent
extraction. 2nd ed. New York: Marcel Dekker. Inc; 2004.
3. Ritcey GM. Solvent extraction. Principles and applications to process metallury. New York:
CRC; 2006.
364 PART | II Novel Competitive Complexation/Solvation Theory
4. Ionescu G, Hritcu D, Ionescu I. Theoretical and experimental aspects regarding the distri-
bution equilibrium in the aqueous phase-phenylacetic acid (AFA)dextraction solvent system.
Rev Roumaine Chim 1993;38(8):927–33.
5. Takeda Y, Takagi C. Solvent effects on extraction of sodium picrate with 15-crown-5. The
determination of ion-pair formation constant of crown ether-metal salt 1:1:1 complex in water.
Bull Chem Soc Japan 1994;67(1):56–60.
6. Strehlow H, Knohe W. Fundamental methods of chemical relaxation. Wenheim: Verlag
Chemie; 1977.
7. Limbach HH. Dynamic NMR Spectroscopy in the Presence of Kinetic Hydrogen/Deuterium
Isotope Effects. In: Huyskens PL, Luck WAP, Zeegers-Huyskens T, editors. Intermolecular
forces. Berlin: Springer-Verlag; 1991.
8. Marcus Y. Ion solvation. London: Wiley-Interscience; 1985. p. 194–216.
9. Grunwald E, Baughman G, Kohnstam G. The solvation of electrolytes in dioxan-water
mixtures, as deduced from the effectof solvent change on the standard partial molar free
energy. J Am Chem Soc 1960;82:5801–11.
10. Covington AK, Newman KE. Thermodynamics of preferential solvation of electrolytes in
binary solvent mixtures. Adv Chem Ser 1976;155:153–96.
11. Cox BG, Parker AJ, Waghorne WE. Coordination and ionic solvation. J Phys Chem
1974;78:1731–40.
12. Marcus Y. A quasi-lattice quasi-chemical theory of preferential solvation of ions in mixed
solvents. Austr J Chem 1983;36:1719–31.
13. Marcus Y. Preferential solvation of ions in mixed solvents. Rev Anal Chem 1980;5:267–82.
14. Scatchard G. The attraction of proteines for small molecules and ions. Ann NY Acad Sci
1949;51:660.
15. Deranleau DA. Theory of the measurement of weak molecular complexes. I. General
considerations. J Am Chem Soc 1969;91:4044–9.
16. Deranlea DA. Theory of the measurement of weak molecular complexes. II. Consequence of
multiple equilibria. J Am Chem Soc 1969;91:4050–62.
17. Laub RJ, Purnell JH. Solution and complexing Studies. III. Further evidence for a microscopic
partitioning theory of solution. J Am Chem Soc 1976;98(1):30–5.
18. Purnell JH, Vargas de Andrade. Solution and complexing studies. I.Gas-liquid chromatografic
investigation of supposed complexing systems. II. Comparison and correlation of nuclear
magnetic resonance and gas-liquid chromatografic data. J Am Chem Soc 1975;97:3585–90.
19. Nagy OB, Muanda H, Nagy JB. Competitive preferential solvation theory of weak molecular
interactions. J Chem Soc Faraday Trans 1 1978;74:2210–29.
20. Szpakowska M, Nagy OB. Application of the Preferential solvation theory to Coordinative
Solute-Solvent interactions. J Chem Soc Faraday Trans 1 1989;85(9):2891–9.
21. Nagy OB, Muanda M, Nagy JB. Quantitative evaluation of solute-solvent interactions.
Environmental effects on the n-butylaminolysis of tetrachloro- N-n-butylphthalimide. J Phys
Chem 1979;83(15):1961–79.
22. Parbhoo B, Nagy O. Application of the competitive preferential solvation theory to ion-
molecule interactions. J Chem Soc Faraday Trans 1 1986;82:1789–93.
365Chapter | 8 CCST in Engineering Design, Procedures, and Calculations

This page intentionally left blank
Chapter 9
The CCST in Solvent Extractionof Acids by Amine-BasedExtractants
Chapter Outline1. Introduction 367
1.1. Interaction Mechanisms 367
1.2. Acids’ Extraction
Modeling by CCST
368
1.3. Active Solvents 369
1.4. Influence of
Temperature
371
2. AcideAmine Systems in the
CCST Interpretation
372
2.1. The AcideAmine (in
Inert Diluent)eWater
(SeEeW) System
377
2.2. The System with Mixture
of Two Acids; Selectivity
378
2.3. The System with the
Mixture of Two Amines
380
3. The Systems with Active
Solvent as an Additive
381
3.3. High Acid
Concentrations
383
4. Experimental Application of
the CCST in Carboxylic Acids
Extraction
384
4.1. Acetic Acid Extraction 384
4.2. Lactic Acid Extraction 386
4.3. Citric Acid Extraction 388
4.4. Active Solvent-Swing
Regeneration
Technology
393
4.5. Modifying Effect of
Active Solvents
393
4.6. Temperature-Swing
Regeneration
394
5. Summarizing Remarks 395
References 397
1. INTRODUCTION
1.1. Interaction Mechanisms
The most common approach to investigate an acid extraction behavior is toperform equilibrium distribution studies and fit an extraction equation to thedata in order to determine species stoichiometry using Nernst’s distribution
Solvent Extraction. DOI: 10.1016/B978-0-444-53778-2.10009-3
Copyright � 2012 Elsevier B.V. All rights reserved. 367
law with sets of mass action law equilibria equations.1 According to the typeof distribution reactions, extractants for carboxylic acids were divided intothree main categories1,2: (1) carbon-bonded oxygen-donor extractants (inertaliphatic, aromatic, and substituted hydrocarbons are included in this type);(2) phosphorus-bonded oxygen-donor extractants, and (3) high-molecular-weight aliphatic amine extractants. The first two are classified as solvationextractants, based on the strength and specificity of the solvation bonds; thethird is based on charge transfer (ion-pair formation and/or proton transfer)reactions with amines. Amine-based extractants are used for considerationand analysis of new modeling approach, while the carbon- and phosphorus-bonded oxygen-donor extractants are considered here as active solventadditives.
Using the order of acid–base strength for a given acid and amine interac-tions the authors3–14 have developed models in which hypothetical acid–basecomplexes of a specific stoichiometry are formed. As a rule, they consider thesystem where one of the mechanisms is dominating and is not changed withchanging acid concentrations. In addition, over-stoichiometric complexation athigh acid loading is described through hydrogen bonding,7,11 aggregation5,13
and even polymerization.15 But generalization that can be drawn from thesestudies is that the stoichiometry (and maybe nature) of the solute–extractantcomplexes are changing with increasing acid concentrations.
1.2. Acids’ Extraction Modeling by CCST
Complicated behavior of extraction systems conflicts, in many cases, with thestoichiometric ion-exchange models. Coordination models, explaining somemechanisms of metal solvent extraction, meet difficulties when modeling acidextraction, and, especially, when quantification attempts are made.16 Thecompetitive complexation/solvation (CCS) theory strongly simplifies thistask.
CCS modeling approach is introduced here to explain the mechanisms ofsolvent extraction. For the following reading convenience the four basicstatements of the CCST approach are repeated here:
I. Extraction act is initiated by solvation of the solute compounds in organicsolvents with formation of hydrogen- (coordinate-) bonded intermediates(adducts). Kinetics of proton, electron transfer, and formation of finalcomplexes is stepwise and depends on kinetics of step reactions, competi-tion, coupling, strength of H-bonding, and many other factors. Interactingmechanisms and final compounds formed are changing with increasingextracted solute concentration in organic phase (see Chapter 6, Fig. 6.1).
II. Strong (ion-exchange, chemical, electrostatic) and weak (solvating, phys-ical, intermolecular, H-bond, coordinate) interactions and aggregationsare the basic interactions that have to be taken into consideration in all
368 PART | II Novel Competitive Complexation/Solvation Theory
ranges of extracted solute concentrations. Competition between these inter-actions forms the four region shape (Chapter 6, Fig. 6.1) of the generalextraction isotherm.
III.Solutes, extractants, active solvents, and their interacting species areconsidered amphoteric and may perform as acids (electron acceptors) orbases (electron donors), depending on the structure of their functionalgroups and composition of the organic phase, and on the structure of thesolute species and composition of the aqueous phase.
IV. Aggregation mechanisms and species formed are changing with increasingloading of organic phase by solute, and should be considered and analyzedin all regions of the general extraction isotherm (Chapter 6, Fig. 6.1).
CCS theory constitutes a general framework for interpretation of ion–molecularinteraction data in the solvent extraction systems. Mathematical description forthe process simulation presents the possibility of analysis of extraction systemsof interest and behavior predictions.
Some extraction systems, e.g., acid–amine–water, were analyzed in Chapter7. In this chapter the CCST approach is described using some morecomplicated acid–base systems. Influence of active solvents on the acidsolvent extraction by amine-based extractants is interpreted on the basis ofthe presented theory. Active solvent is introduced as an additional parameterto the quantitative consideration of the extraction systems. Data, availablefrom the literature1,6–14 and our experiments,17,18 are used for interpretation.
1.3. Active Solvents
The difference in the extraction trends must be attributed to solvation effects.Strong, sometimes even critical, influence of active solvents, used as synergistic(enhancing) agents, modifiers, and/or diluents, on the distribution of acids intoorganic phase is discussed in many research publications.2,6,9–11,13,15–21 Polar,polarizable, hydrogen-bonding solvents change the extraction order dramati-cally. In order to analyze solvation effects, identification, and most importantly,quantification of solute–solvent interactions must be accomplished.
Solvents can be classified into different ways.20 For our purpose, classifi-cation of solvents by their influence on the extraction systems’ effectiveness isuseful. Division into inert (nonpolar) and active (polar) solvents is made here.
Inert solvents. When used in extraction systems as diluents for amines,solvents such as alkanes, benzene, alkyl-substituted aromatics, and keroseneresult in relatively low distribution of acids into organic phase.6–9 Thesediluents do not affect extraction mechanisms and are added in order to improvephysical properties of the extraction system, e.g., reduction of viscosity andenhance separation of the phases. Alkanes, being nonpolar, provide very littlesolvation. Aromatic diluents provide slightly higher solvation values, whichhave been rationalized as solvation due to interaction of the aromatic
369Chapter | 9 The CCST in Solvent Extraction of Acids
p electrons with the complexes.2,16,20 All these diluents may serve as modifiers(if at all), stabilizing to varying degree by polarizability effect of the amine–acid complexes and their aggregates. The influence of the inert solvents on theextracting parameters of the system is not taken into account at this stage.
Active solvents (e.g., alcohols, esters, ethers, chlorinated hydrocarbons, etc.)have functional groups that enable much stronger interactions with thecomponents of the extraction system. For each solvent, the extent of thesesolute–solvent interactions is different. Identification and quantification ofsolute–solvent interactions are very difficult tasks due to the complexity ofsolvent structure.
Coextraction of water. There are many publications about coextraction ofwater and its influence on extraction process viability.2,4–13,17–23 Water mole-cule is self-complementary as regards optimal hydrogen bonding since itinvolves two donors (H atoms) and two acceptors (electron pairs) with tetra-hedral coordination.7,14 Despite the complete saturation of H-bonds valences,water is not fully satisfied, since the O(H)O hydrogen bonds cannot attainlengths short enough to prevent porous supertetrahedral structures. Hence,water participates in the solvation as one of the active solvents.
Alcohol solvents, added to amine–acid extraction systems, give unusuallyhigh formation constants, higher than would be expected from polarity argu-ments alone.24–27 Hydroxyl group can donate one H atom to a hydrogen bondand possesses two oxygen electron pairs as acceptors.28 Amino group involvestwo (primary), one (secondary), or no (tertiary) donor H atoms and oneacceptor electron pair. Therefore, alcohols and amines can form only onehydrogen bond per hydroxyl and amino groups, but have a potential to formadditional hydrogen bonds at specific compositions and conditions. So,hydroxyl groups in alcohols and amino groups in amines are complementary asregards hydrogen bond donors (HBDs) and acceptors both stoichiometricallyand geometrically. This is expected to lead to molecular recognition amongalcohols and amines toward formation of 1-1 alcohol–amine complexes, drivenby some increase of the number of hydrogen bonds as compared with theuncomplexed constituents. It is known28–30 that alcohol–amine complexesusually interact and form zigzag, helical, or cyclic geometrical patterns.Comparing hydrogen bonds of the type O(H)O, N(H)N, and N(H)O,authors28,29 come to conclusion of complete preference of N(H)O type. Thesizes and shapes of the residues R (amine) and R0 (alcohol) also may affect thespecific intermolecular interactions. Linear aliphatic side chains appear to fitwell into H-bond architecture.30 Three-dimensional assemblies adopt right- andleft-handed helical shapes. One NH2 group is bonded to three OH groups as twoacceptors and one donor, indicating that each hydrazine group is slightly fixedby six hydrogen bonds.30
Chlorinated aromatics promote about a fivefold greater equilibrium forma-tion constant than benzene.8 In case of ketone solvents formation constants are10-fold larger. Nitrobenzene and chlorinated hydrocarbons-containing amine
370 PART | II Novel Competitive Complexation/Solvation Theory
extractants have distribution ratios of 100-fold greater than benzene-containing ones.
For some solvents, e.g., phosphorus-bonded oxygen-donor solvents, equi-librium constants, higher than would be expected from polarity considerations,are explained by specific hydrogen bonding between proton of the solvent andacid–amine complex.8,19
Many models were developed to quantify the effect of solvents on the acid–amine complexation.3,5–7,9,11,15,16,18–21,23–26,30 Various parameters and equa-tions have been developed to describe solvation properties and their effects onthe acid–base strength of organic compositions. A simplified approach is toclassify solvents as protic or aprotic. Some authors used the Hildebrandsolubility parameter, d, as a measure of solvation,31 linear free-energy rela-tionships,24 and combined “physical and chemical modeling”, calculating theactivity coefficients for the reactants and complexes.32–34 Headley andcoworkers16,35,36 studied solvation effects of active solvents on the basicity ofamines, and introduced many parameters, such as hydrogen bond donor (HBD)and hydrogen bond acceptor (HBA) abilities, solvent’s dipolarity/polarzability,dipole moment, etc., in order to quantify the solvation effects. These models arequalitative, or successfully fit the data for some solvents but do not follow for theothers. All models, developed in this field, require a considerable number ofadjustable parameters and development of calculation techniques to be usefulfor the technological practice. The CCS theory strongly simplifies this task,establishes the correlation between complexation and solvation, and permits forpreliminary quantification of complex extraction systems.
1.4. Influence of Temperature
Effect of temperature on extraction of acids was studied experimen-tally.1,2,7,21,23,25 There is a slight effect, if any, of temperature in the range of20–90 �C on the distribution of propanoic, lactic, and succinic acids intoalcohols, ketones, diethyl carbinol, and ethers.1 Significant effect of tempera-ture on acid extraction was observed for alkylphosphates and amines asextractants.
As a rule, the distribution of the acid into the organic phase (a variety ofamines in a variety of diluents with modifiers) decreases with increasingtemperature. For some acids the concentrating effect in a product stream maybe achieved using temperature-swing process.36 Studying the effect oftemperature on extraction of citric acid by extractants, composed of tridecyl-amine with alcohol modifiers and xylene or nitrobenzene5–7,36 or by Alamine336,27 or by tributylphosphate21,26,27 in a variety of diluents the authors havefound a sharp decrease of the acid distribution into organic phase withincreasing temperature. At extraction of lactic, tartaric, succinic, and citricacids by trilaurylamine in xylene1,5–7 increasing temperature decreases thedistribution ratios by factors of 2–10, depending on acid and its concentration.
371Chapter | 9 The CCST in Solvent Extraction of Acids
The temperature-swing regeneration includes forward extraction at a lowtemperature, obtaining acid’s loaded organic phase and an aqueous raffinate,containing feed components that have to be separated, and back-extraction ata higher temperature, obtaining acid’s loaded aqueous product stream andregenerated organic phase. Back-extraction of some acids may be achievedwith fresh water without dilution of the acid.
2. ACID–AMINE SYSTEMS IN THE CCST INTERPRETATION
CCS theory constitutes a framework for interpretation of ion (or ion-pair)–molecular interaction data in the solvent extraction systems. Composition andbehavior predictions of an extraction system of interest can be analyzed. Fordetails of CCST, see Chapter 7.
Solute in the phases is surrounded by a solvation shell.17,18,37,38 This meansthat it interacts with all the constituents of the environment and, therefore, “free”solute, free extractant, or free solute–extractant complex do not exist. Compo-nents of the solvation shell compete to form a complex according to theirelectronic-geometric affinity ki (interaction strength), which is constant ata given temperature and pressure. Coefficient, ki, represents the total, com-plexing and solvating affinity constant. Competition between the constituents ofthe solvation shell takes place according to their affinity constants ki and thenumber of potentially available molecules of every component, i.e., its actualconcentration. A set of equations were developed for calculation of the gener-alized partitioning factors of the solute, PSi, and its concentrations, CSi, in thehomogenous media of the solvation shell at equilibrium (see Chapters 6 and 7).
Interaction mechanisms and species formed in the organic phase changewith increasing acid concentration (Statement I). The general extractionisotherm consists of four regions (Chapter 6, Fig. 6.1). The influencing effect ofsolvents may be different from one region to the other. Many authors,considering extraction systems of interest, do not distinguish between differentregions in which different interaction mechanisms dominate. Ignoring this factintroduces contradictions in the interpretations of the experimental data (fordetails see Chapter 6, 7).
Consider a system containing an acid, S, amine, E, water, W, active solvent,A, and inert solvent (diluent), D. Some preliminary assumptions are as follows:
1. All components of the system are monomers in a pure, initial state.2. The volume change on solvent mixing is neglected.3. The diluent D is inert enough and do not participate in solvation.4. Water in the organic phase after equilibration, separation, and centrifugation
is present as bonded only in the solvation shell, i.e., any solubility of waterin the bulk organic solvent mixture is excluded. Situations in which water isextracted by extractants or solvents, such as at CSorg<<CWorg, will beconsidered for definite extraction systems.
372 PART | II Novel Competitive Complexation/Solvation Theory
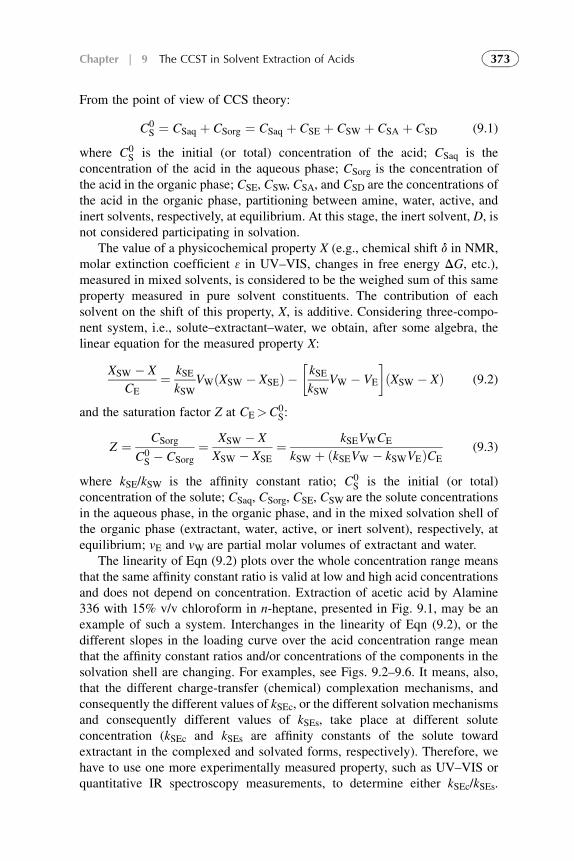
From the point of view of CCS theory:
C0S ¼ CSaq þ CSorg ¼ CSaq þ CSE þ CSW þ CSA þ CSD (9.1)
where C0S is the initial (or total) concentration of the acid; CSaq is the
concentration of the acid in the aqueous phase; CSorg is the concentration ofthe acid in the organic phase; CSE, CSW, CSA, and CSD are the concentrations ofthe acid in the organic phase, partitioning between amine, water, active, andinert solvents, respectively, at equilibrium. At this stage, the inert solvent, D, isnot considered participating in solvation.
The value of a physicochemical property X (e.g., chemical shift d in NMR,molar extinction coefficient 3 in UV–VIS, changes in free energy DG, etc.),measured in mixed solvents, is considered to be the weighed sum of this sameproperty measured in pure solvent constituents. The contribution of eachsolvent on the shift of this property, X, is additive. Considering three-compo-nent system, i.e., solute–extractant–water, we obtain, after some algebra, thelinear equation for the measured property X:
XSW � X
CE¼ kSE
kSWVWðXSW � XSEÞ �
�kSEkSW
VW � VE
�ðXSW � XÞ (9.2)
and the saturation factor Z at CE>C0S:
Z ¼ CSorg
C0S � CSorg
¼ XSW � X
XSW � XSE¼ kSEVWCE
kSW þ ðkSEVW � kSWVEÞCE(9.3)
where kSE/kSW is the affinity constant ratio; C0S is the initial (or total)
concentration of the solute; CSaq, CSorg, CSE, CSW are the solute concentrationsin the aqueous phase, in the organic phase, and in the mixed solvation shell ofthe organic phase (extractant, water, active, or inert solvent), respectively, atequilibrium; vE and vW are partial molar volumes of extractant and water.
The linearity of Eqn (9.2) plots over the whole concentration range meansthat the same affinity constant ratio is valid at low and high acid concentrationsand does not depend on concentration. Extraction of acetic acid by Alamine336 with 15% v/v chloroform in n-heptane, presented in Fig. 9.1, may be anexample of such a system. Interchanges in the linearity of Eqn (9.2), or thedifferent slopes in the loading curve over the acid concentration range meanthat the affinity constant ratios and/or concentrations of the components in thesolvation shell are changing. For examples, see Figs. 9.2–9.6. It means, also,that the different charge-transfer (chemical) complexation mechanisms, andconsequently the different values of kSEc, or the different solvation mechanismsand consequently different values of kSEs, take place at different soluteconcentration (kSEc and kSEs are affinity constants of the solute towardextractant in the complexed and solvated forms, respectively). Therefore, wehave to use one more experimentally measured property, such as UV–VIS orquantitative IR spectroscopy measurements, to determine either kSEc/kSEs.
373Chapter | 9 The CCST in Solvent Extraction of Acids
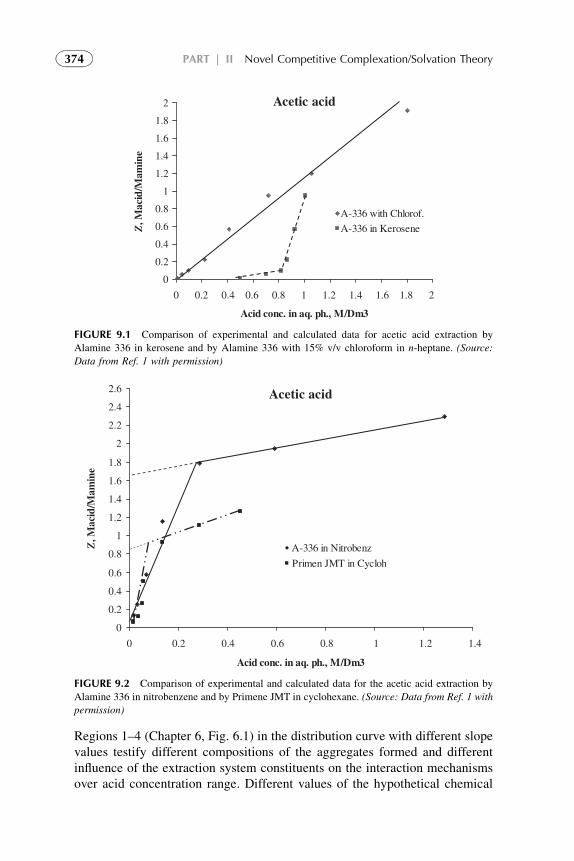
Regions 1–4 (Chapter 6, Fig. 6.1) in the distribution curve with different slopevalues testify different compositions of the aggregates formed and differentinfluence of the extraction system constituents on the interaction mechanismsover acid concentration range. Different values of the hypothetical chemical
Acetic acid
0
0.2
0.4
0.6
0.8
1
1.2
1.4
1.6
1.8
2
0 0.2 0.4 0.6 0.8 1 1.2 1.4 1.6 1.8 2
Acid conc. in aq. ph., M/Dm3
Z, M
acid
/Mam
ine
A-336 with Chlorof.
A-336 in Kerosene
FIGURE 9.1 Comparison of experimental and calculated data for acetic acid extraction by
Alamine 336 in kerosene and by Alamine 336 with 15% v/v chloroform in n-heptane. (Source:
Data from Ref. 1 with permission)
Acetic acid
0
0.2
0.4
0.6
0.8
1
1.2
1.4
1.6
1.8
2
2.2
2.4
2.6
0 0.2 0.4 0.6 0.8 1 1.2 1.4
Acid conc. in aq. ph., M/Dm3
Z, M
acid
/Mam
ine
A-336 in Nitrobenz
Primen JMT in Cycloh
FIGURE 9.2 Comparison of experimental and calculated data for the acetic acid extraction by
Alamine 336 in nitrobenzene and by Primene JMT in cyclohexane. (Source: Data from Ref. 1 with
permission)
374 PART | II Novel Competitive Complexation/Solvation Theory
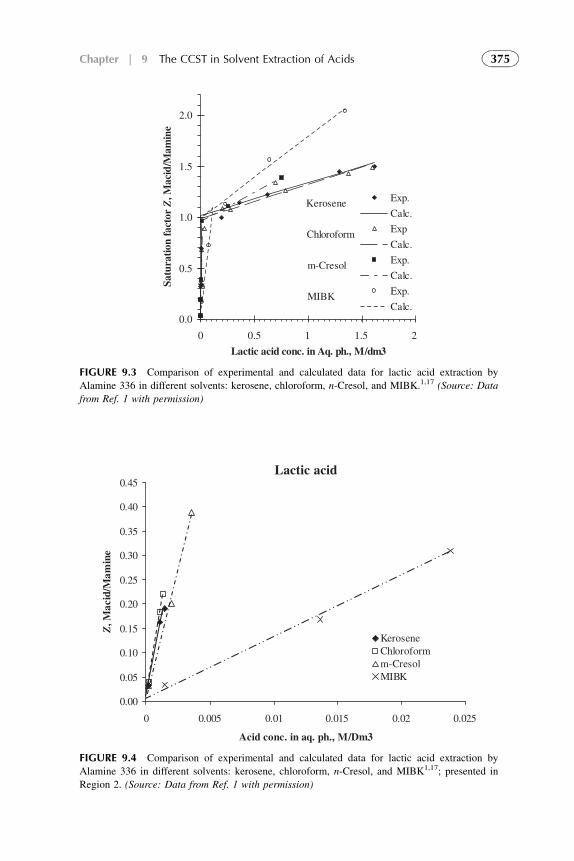
0.0
0.5
1.0
1.5
2.0
0 0.5 1 1.5 2
Lactic acid conc. in Aq. ph., M/dm3
Satu
ratio
n fa
ctor
Z, M
acid
/Mam
ine
Exp.
Calc.
Exp
Calc.
Exp.
Calc.
Exp.
Calc.MIBK
m-Cresol
Chloroform
Kerosene
FIGURE 9.3 Comparison of experimental and calculated data for lactic acid extraction by
Alamine 336 in different solvents: kerosene, chloroform, n-Cresol, and MIBK.1,17 (Source: Data
from Ref. 1 with permission)
Lactic acid
0.00
0.05
0.10
0.15
0.20
0.25
0.30
0.35
0.40
0.45
0 0.005 0.01 0.015 0.02 0.025
Acid conc. in aq. ph., M/Dm3
Z, M
acid
/Mam
ine
KeroseneChloroformm-CresolMIBK
FIGURE 9.4 Comparison of experimental and calculated data for lactic acid extraction by
Alamine 336 in different solvents: kerosene, chloroform, n-Cresol, and MIBK1,17; presented in
Region 2. (Source: Data from Ref. 1 with permission)
375Chapter | 9 The CCST in Solvent Extraction of Acids
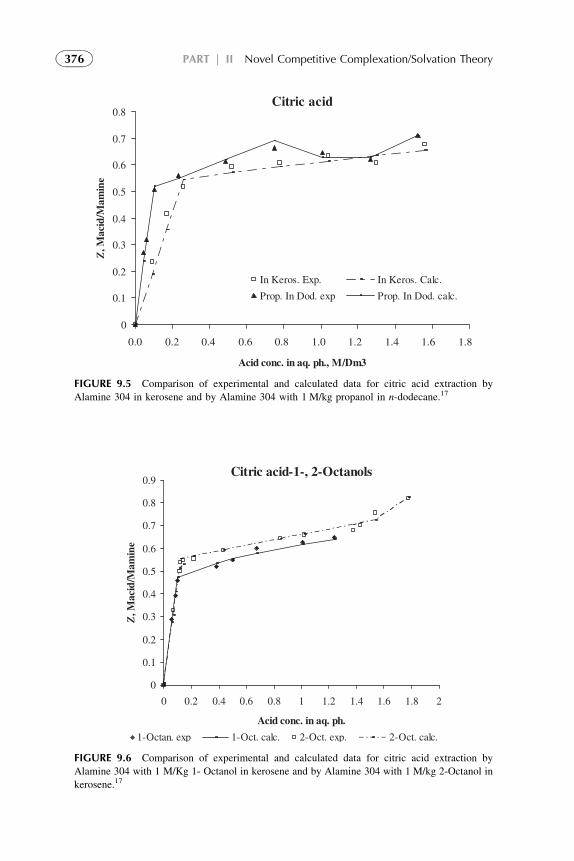
Citric acid
0
0.1
0.2
0.3
0.4
0.5
0.6
0.7
0.8
0.0 0.2 0.4 0.6 0.8 1.0 1.2 1.4 1.6 1.8
Acid conc. in aq. ph., M/Dm3
Z, M
acid
/Mam
ine
In Keros. Exp. In Keros. Calc.
Prop. In Dod. exp Prop. In Dod. calc.
FIGURE 9.5 Comparison of experimental and calculated data for citric acid extraction by
Alamine 304 in kerosene and by Alamine 304 with 1 M/kg propanol in n-dodecane.17
Citric acid-1-, 2-Octanols
0
0.1
0.2
0.3
0.4
0.5
0.6
0.7
0.8
0.9
0 0.2 0.4 0.6 0.8 1 1.2 1.4 1.6 1.8 2
Acid conc. in aq. ph.
Z, M
acid
/Mam
ine
1-Octan. exp 1-Oct. calc. 2-Oct. exp. 2-Oct. calc.
FIGURE 9.6 Comparison of experimental and calculated data for citric acid extraction by
Alamine 304 with 1 M/Kg 1- Octanol in kerosene and by Alamine 304 with 1 M/kg 2-Octanol in
kerosene.17
376 PART | II Novel Competitive Complexation/Solvation Theory
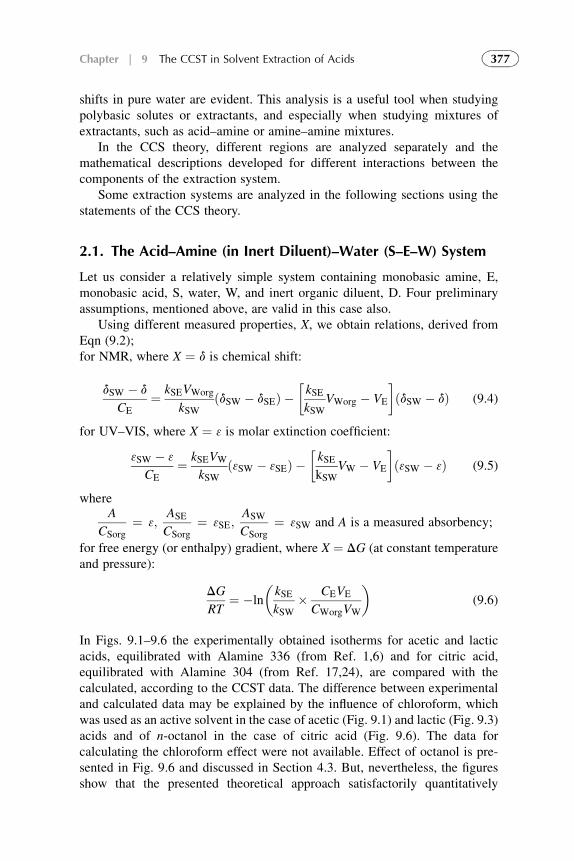
shifts in pure water are evident. This analysis is a useful tool when studyingpolybasic solutes or extractants, and especially when studying mixtures ofextractants, such as acid–amine or amine–amine mixtures.
In the CCS theory, different regions are analyzed separately and themathematical descriptions developed for different interactions between thecomponents of the extraction system.
Some extraction systems are analyzed in the following sections using thestatements of the CCS theory.
2.1. The Acid–Amine (in Inert Diluent)–Water (S–E–W) System
Let us consider a relatively simple system containing monobasic amine, E,monobasic acid, S, water, W, and inert organic diluent, D. Four preliminaryassumptions, mentioned above, are valid in this case also.
Using different measured properties, X, we obtain relations, derived fromEqn (9.2);for NMR, where X ¼ d is chemical shift:
dSW � d
CE¼ kSEVWorg
kSWðdSW � dSEÞ �
�kSEkSW
VWorg � VE
�ðdSW � dÞ (9.4)
for UV–VIS, where X ¼ 3 is molar extinction coefficient:
3SW � 3
CE¼ kSEVW
kSWð3SW � 3SEÞ �
�kSEkSW
VW � VE
�ð3SW � 3Þ (9.5)
whereA
CSorg¼ 3;
ASE
CSorg¼ 3SE;
ASW
CSorg¼ 3SW and A is a measured absorbency;
for free energy (or enthalpy) gradient, where X ¼ DG (at constant temperatureand pressure):
DG
RT¼ �ln
�kSEkSW
� CEVE
CWorgVW
�(9.6)
In Figs. 9.1–9.6 the experimentally obtained isotherms for acetic and lacticacids, equilibrated with Alamine 336 (from Ref. 1,6) and for citric acid,equilibrated with Alamine 304 (from Ref. 17,24), are compared with thecalculated, according to the CCST data. The difference between experimentaland calculated data may be explained by the influence of chloroform, whichwas used as an active solvent in the case of acetic (Fig. 9.1) and lactic (Fig. 9.3)acids and of n-octanol in the case of citric acid (Fig. 9.6). The data forcalculating the chloroform effect were not available. Effect of octanol is pre-sented in Fig. 9.6 and discussed in Section 4.3. But, nevertheless, the figuresshow that the presented theoretical approach satisfactorily quantitatively
377Chapter | 9 The CCST in Solvent Extraction of Acids
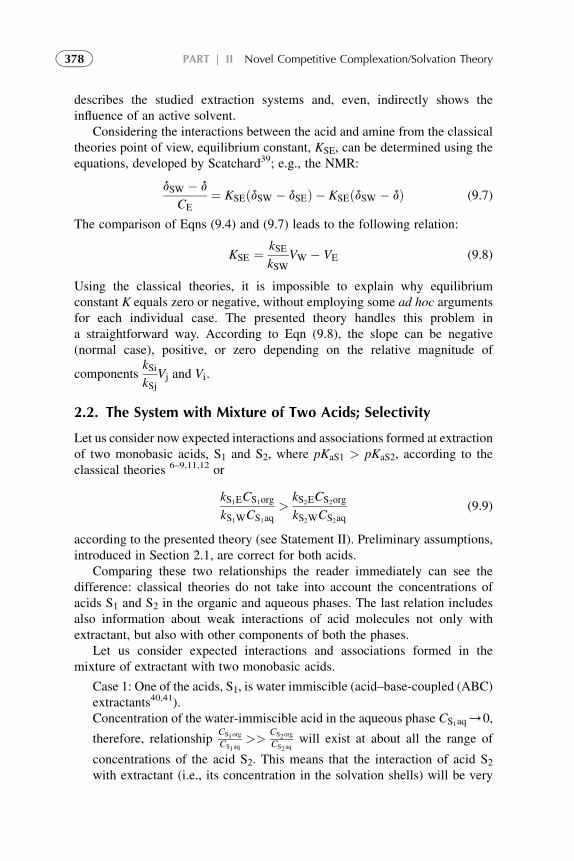
describes the studied extraction systems and, even, indirectly shows theinfluence of an active solvent.
Considering the interactions between the acid and amine from the classicaltheories point of view, equilibrium constant, KSE, can be determined using theequations, developed by Scatchard39; e.g., the NMR:
dSW � d
CE¼ KSEðdSW � dSEÞ � KSEðdSW � dÞ (9.7)
The comparison of Eqns (9.4) and (9.7) leads to the following relation:
KSE ¼ kSEkSW
VW � VE (9.8)
Using the classical theories, it is impossible to explain why equilibriumconstant K equals zero or negative, without employing some ad hoc argumentsfor each individual case. The presented theory handles this problem ina straightforward way. According to Eqn (9.8), the slope can be negative(normal case), positive, or zero depending on the relative magnitude of
componentskSikSj
Vj and Vi.
2.2. The System with Mixture of Two Acids; Selectivity
Let us consider now expected interactions and associations formed at extractionof two monobasic acids, S1 and S2, where pKaS1 > pKaS2, according to theclassical theories 6–9,11,12 or
kS1ECS1org
kS1WCS1aq>
kS2ECS2org
kS2WCS2aq(9.9)
according to the presented theory (see Statement II). Preliminary assumptions,introduced in Section 2.1, are correct for both acids.
Comparing these two relationships the reader immediately can see thedifference: classical theories do not take into account the concentrations ofacids S1 and S2 in the organic and aqueous phases. The last relation includesalso information about weak interactions of acid molecules not only withextractant, but also with other components of both the phases.
Let us consider expected interactions and associations formed in themixture of extractant with two monobasic acids.
Case 1: One of the acids, S1, is water immiscible (acid–base-coupled (ABC)extractants40,41).Concentration of the water-immiscible acid in the aqueous phase CS1aq/0,
therefore, relationshipCS1org
CS1aq>>
CS2org
CS2aqwill exist at about all the range of
concentrations of the acid S2. This means that the interaction of acid S2with extractant (i.e., its concentration in the solvation shells) will be very
378 PART | II Novel Competitive Complexation/Solvation Theory
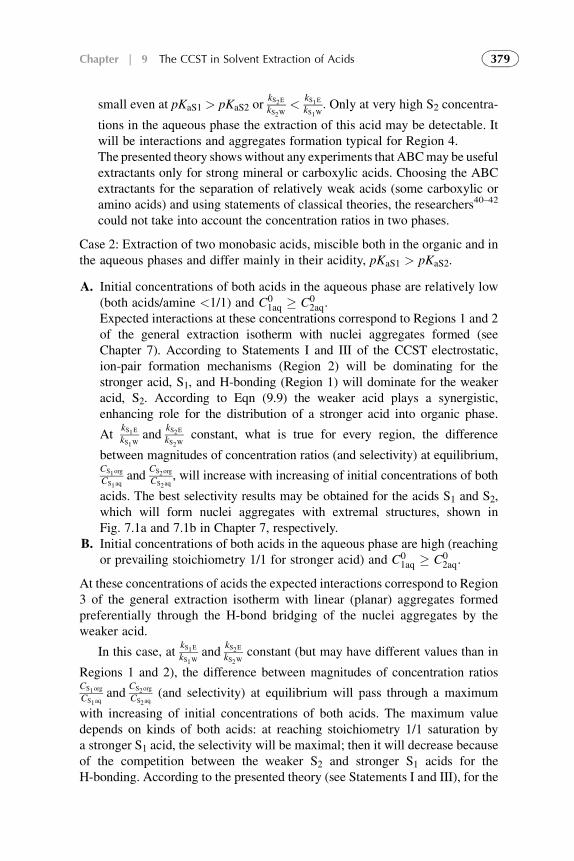
small even at pKaS1 > pKaS2 orkS2EkS2W
<kS1EkS1W
: Only at very high S2 concentra-
tions in the aqueous phase the extraction of this acid may be detectable. Itwill be interactions and aggregates formation typical for Region 4.The presented theory showswithout any experiments that ABCmay be usefulextractants only for strong mineral or carboxylic acids. Choosing the ABCextractants for the separation of relatively weak acids (some carboxylic oramino acids) and using statements of classical theories, the researchers40–42
could not take into account the concentration ratios in two phases.
Case 2: Extraction of two monobasic acids, miscible both in the organic and inthe aqueous phases and differ mainly in their acidity, pKaS1 > pKaS2.
A. Initial concentrations of both acids in the aqueous phase are relatively low(both acids/amine <1/1) and C0
1aq � C02aq.
Expected interactions at these concentrations correspond to Regions 1 and 2of the general extraction isotherm with nuclei aggregates formed (seeChapter 7). According to Statements I and III of the CCST electrostatic,ion-pair formation mechanisms (Region 2) will be dominating for thestronger acid, S1, and H-bonding (Region 1) will dominate for the weakeracid, S2. According to Eqn (9.9) the weaker acid plays a synergistic,enhancing role for the distribution of a stronger acid into organic phase.
AtkS1EkS1W
andkS2EkS2W
constant, what is true for every region, the difference
between magnitudes of concentration ratios (and selectivity) at equilibrium,CS1org
CS1aqand
CS2org
CS2aq, will increase with increasing of initial concentrations of both
acids. The best selectivity results may be obtained for the acids S1 and S2,which will form nuclei aggregates with extremal structures, shown inFig. 7.1a and 7.1b in Chapter 7, respectively.
B. Initial concentrations of both acids in the aqueous phase are high (reachingor prevailing stoichiometry 1/1 for stronger acid) and C0
1aq � C02aq.
At these concentrations of acids the expected interactions correspond to Region3 of the general extraction isotherm with linear (planar) aggregates formedpreferentially through the H-bond bridging of the nuclei aggregates by theweaker acid.
In this case, atkS1EkS1W
andkS2EkS2W
constant (but may have different values than in
Regions 1 and 2), the difference between magnitudes of concentration ratiosCS1org
CS1aqand
CS2org
CS2aq(and selectivity) at equilibrium will pass through a maximum
with increasing of initial concentrations of both acids. The maximum valuedepends on kinds of both acids: at reaching stoichiometry 1/1 saturation bya stronger S1 acid, the selectivity will be maximal; then it will decrease becauseof the competition between the weaker S2 and stronger S1 acids for theH-bonding. According to the presented theory (see Statements I and III), for the
379Chapter | 9 The CCST in Solvent Extraction of Acids
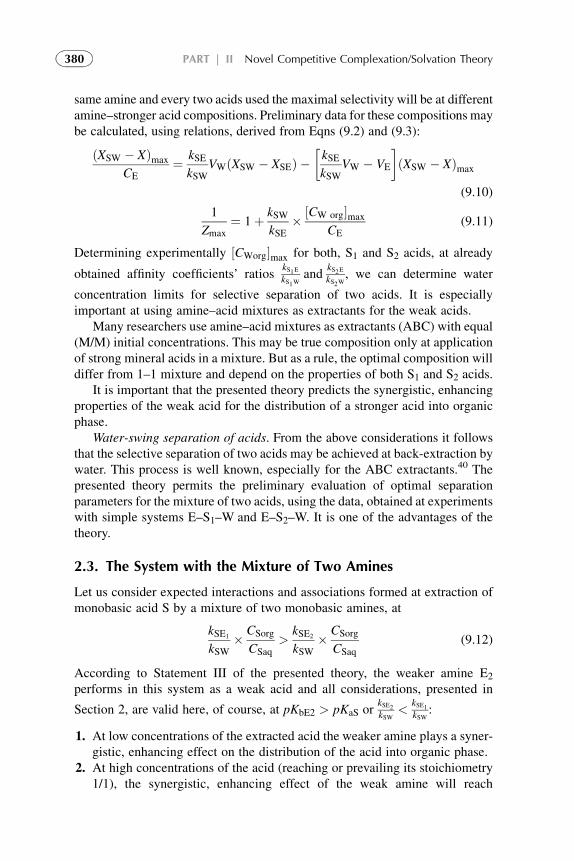
same amine and every two acids used the maximal selectivity will be at differentamine–stronger acid compositions. Preliminary data for these compositions maybe calculated, using relations, derived from Eqns (9.2) and (9.3):
ðXSW � XÞmax
CE¼ kSE
kSWVWðXSW � XSEÞ �
�kSEkSW
VW � VE
�ðXSW � XÞmax
(9.10)
1
Zmax¼ 1þ kSW
kSE� ½CW org�max
CE(9.11)
Determining experimentally ½CWorg�max for both, S1 and S2 acids, at already
obtained affinity coefficients’ ratioskS1EkS1W
andkS2EkS2W
, we can determine water
concentration limits for selective separation of two acids. It is especiallyimportant at using amine–acid mixtures as extractants for the weak acids.
Many researchers use amine–acid mixtures as extractants (ABC) with equal(M/M) initial concentrations. This may be true composition only at applicationof strong mineral acids in a mixture. But as a rule, the optimal composition willdiffer from 1–1 mixture and depend on the properties of both S1 and S2 acids.
It is important that the presented theory predicts the synergistic, enhancingproperties of the weak acid for the distribution of a stronger acid into organicphase.
Water-swing separation of acids. From the above considerations it followsthat the selective separation of two acids may be achieved at back-extraction bywater. This process is well known, especially for the ABC extractants.40 Thepresented theory permits the preliminary evaluation of optimal separationparameters for the mixture of two acids, using the data, obtained at experimentswith simple systems E–S1–W and E–S2–W. It is one of the advantages of thetheory.
2.3. The System with the Mixture of Two Amines
Let us consider expected interactions and associations formed at extraction ofmonobasic acid S by a mixture of two monobasic amines, at
kSE1
kSW� CSorg
CSaq>
kSE2
kSW� CSorg
CSaq(9.12)
According to Statement III of the presented theory, the weaker amine E2
performs in this system as a weak acid and all considerations, presented in
Section 2, are valid here, of course, at pKbE2 > pKaS orkSE2kSW
<kSE1kSW
:
1. At low concentrations of the extracted acid the weaker amine plays a syner-gistic, enhancing effect on the distribution of the acid into organic phase.
2. At high concentrations of the acid (reaching or prevailing its stoichiometry1/1), the synergistic, enhancing effect of the weak amine will reach
380 PART | II Novel Competitive Complexation/Solvation Theory
a maximum in the distribution of the acid into organic phase; then the distri-bution will decrease because of competition between the acid S and weakamine E2 for the H-bonding. For the every weak amine E2 and every acidextracted the maximal enhancing effect will be at different amine E2–acidcompositions.
It is evident from the theory that the initial concentration of the weak amine E2
has to be lower than amine E1 and acid S. If the amine E2 is immiscible in theaqueous phase, above considerations for two acids, where one is immiscible,are valid in this case also at CSE2aq/0 and
CE2org
CE2aq>>
CSorg
CSaq
Preliminary data for these compositions may be calculated using independentexperiments.
3. THE SYSTEMS WITH ACTIVE SOLVENT AS AN ADDITIVE
Many authors do not distinguish between different regions of the generalextraction isotherm in which different interaction mechanisms dominate. Theinfluencing effect of solvents may be different from one region to the other.Ignoring this fact introduces many contradictions in the interpretations of theexperimental data obtained.
Consider a system that contains a solute (acid) of interest, S, a water-immiscible amine, E, in an inert also water-immiscible diluent, D, and activesolvent, A, which may be water-immiscible, partly or completely soluble inboth organic and aqueous phases. Above assumptions are valid in this casealso.
As it was mentioned above, a composition of the solvation shell in a mixturedepends on affinity constant ki and on the number of potentially availablesolvent (amine, active solvent, and water) molecules present in the mixture, i.e.,on the actual concentration of every component. The greater the factor kSECE
(or kSWCW, or kSACA), the better the component solvates acid. Competitionbetween amine, active solvent, and water molecules to interact with the acidmolecules in the solvation shell determines the distribution curve slope.According to the theory, the solute–solvent interactions are different for everysolvent and result in different affinity constant ratios kSE/kSW, kSE/kSA, kSA/kSW,kEA/kAW and concentration ratios CSE/CSW, CSA/CSW, CSE/CSA, CEA/CAW,respectively, which have to be determined. Preliminary data of the extractioncompositions can be calculated using the results of three-component systems.Hence, the experimental studies simplify to the series of measurements for theS–E–A, S–A–W, and E–A–W systems, analogically to S–E–W system.17
Below, relations for the S–E–A system are presented:
PSE þ PSA ¼ 1 (9.13)
381Chapter | 9 The CCST in Solvent Extraction of Acids
CA ¼ 1� CEVE
VA(9.14)
XSA � X
CE¼ kSE
kSAVAðXSA � XSEÞ �
�kSEkSA
VA � VE
�ðXSA � XÞ (9.15)
Affinity constant ratio kSE/kSA is determined from the slope of Eqn (9.15) plots:(XSA�X)/CAorg versus (XSA�X). The intercept gives the hypothetical differ-ence between the properties, measured in pure extractant and pure activesolvent. Thus, the agreement between the direct experimental determination ofthe measured property in pure solvents and their graphically obtained values ofXSA � XSE may be examined.
Saturation factor Z:
Z ¼ kSEVACE
kSA þ ðkSEVA � kSAVEÞCE(9.16)
or
1
Z¼ 1þ kSA
kSE� CA
CE(9.17)
Using the Scatchard39 Eqn (9.7) for equilibrium constant KSE, developed fromthe classical theories point of view, and comparing it with the Eqn (9.5) of thepresented theory, we obtain relation:
KSE ¼ kSEkSA
VA � VE (9.18)
Affinity constant ratio, determined by free energy gradient measurements,X ¼ DG:
kSEkSA
¼ CAVA
CEVEexp
�DGSE
RT
�(9.19)
Analogical relations may be written for the S–A–W and E–A–W systems also.All needed parameters for the S–E–A–W system development and
predictions can be obtained by these measurements.In the case of water coextraction by free extractant, active or inert solvents,
and of active solvent, soluble in water, concentrations of CWorg, CAorg, and CAaq
in the bulk organic and aqueous phases have to be measured in the absence ofacid, S. Partitioning factor for the adduct A0, soluble in both phases is deter-mined according to Statement III of the theory at
kSECSorg
kSWCSaq>
kAECAorg
kAWCAaq(9.20)
An active solvent perform in this system as a weak acid and all considerations,presented above for the extraction system with two acids, are valid here. Thereader can see the difference between classical and presented theories: the
382 PART | II Novel Competitive Complexation/Solvation Theory
first do not take into account the concentration ratio of an active solvent inthe organic and aqueous phases.
Let us consider expected interactions and associations formed in a systemcontaining an amine, active solvent, and monobasic acid. Active solvent ismiscible in both organic and aqueous phases. Several important cases may beconsidered.
3.1. Case 1: kSEkSW
> kAEkAW
andCSorg
CSaq>CAorg
CAaq
At low acid concentration (lesser its stoichiometry 1/1 with the amine)expected interactions correspond to Regions 1 and/or 2 of the general extractionisotherm with nuclei aggregates formed. According to the statement ofamphoterity (Statement III), an active solvent performs as a weak acid. In thiscase, an active solvent, A, has a synergistic, enhancing effect on the distributionof the acid into the organic phase. This effect is explained by replacing one ofthe hydrogen-bonded molecules of the amine by a molecule of the activesolvent in the solvation shell, or nucleus aggregate. Therefore, apparentconcentration of amine increases for acid–amine interactions. Headley andcoworkers 16,35,36 denominate this phenomenon as a “relative increase of aminebasicity.”
The difference between magnitudes of concentration ratios,CSorg
CSaqand
CAorg
CAaq,
at equilibrium, increases with increasing acid and active solvent concentrations.
3.2. Case 2: kSEkSW
> kAEkAW
butCS org
CS aq<CAorg
CAaq
The synergistic effect of the active solvent decreases with increasing acid
concentration down to a minimum, whereCSorg
CSaq¼ CAorg
CAaq. Then, the system comes
to the first case. The extremal situation will be with the water-immiscible active
solvent, whenCSorg
CSaq<<
CAorg
CAaq: only at very high concentrations of acid the
synergistic effect of the active solvent can be detectable (if at all).
3.3. High Acid Concentrations
At concentrations of the acid, reaching or prevailing its stoichiometry with theamine, or at transition from Regions 1 and 2 to Regions 3 and 4 the syner-gistic, enhancing effect of the active solvent reaches a maximum withincreasing concentration, then stabilizes or decreases. This may be explainedby competition between acid and active solvent for nuclei aggregatesbridging. The maximum value may be evaluated, using relations, analogicalto Eqns (9.10 and 9.11):
ðXSA � XÞmax
CE¼ kSE
kSAVAðXSA � XSEÞ �
�kSEkSA
VA � VE
�ðXSA � XÞmax (9.21)
383Chapter | 9 The CCST in Solvent Extraction of Acids
1
Zmax¼ 1þ kSA
kSE� ½CA�max
CE(9.22)
For every solvent and every acid extracted the maximal enhancing effect will beat different solvent–acid compositions. But it is evident that the concentrationof the solvent in the organic phase, CAorg, has to be lower than amine CE andacid Csorg.
If the additive A is immiscible in the aqueous phase, above considerationsfor two acids, where weak one is immiscible, are valid in this case also.
3.4. Case 4: kSEkSW
< kAEkAW
andCS org
CS aq<CAorg
CAaq
The active solvent will play an antagonistic effect on the distribution of the acidinto organic phase.
Comparing values of the relations, kSEkSW
� CSorg
CSaq; kSEkSA
� CE
CAand kAE
kAW� CAorg
CAaq,
obtained at experiments with S–E–W, S–E–A and A–E–W systems, respec-tively, one can calculate [CAorg]max and [CAaq]
0 compositions for optimalextraction of the acid of interest at its different concentrations.
These are general considerations about enhancing effect of the activeadditives in the extraction system, arising from the presented theory.
It has to be stressed that the presented theory predicts the synergistic orantagonistic effect of neutral protic, polar/polarizable solvents when added tothe basic amine extractant on extraction of acids. Classical theories do notprovide direct knowledge about this effect.
4. EXPERIMENTAL APPLICATION OF THE CCSTIN CARBOXYLIC ACIDS EXTRACTION
Some experimental results of extraction are presented below with an aim toillustrate applicability of the CCST.
4.1. Acetic Acid Extraction
Original data for acetic acid extraction by Alamine 336 and Primene JMTwithdifferent solvents and diluents such as kerosene, nitrobenzene, chloroform, andcyclohexane were taken from Ref. 1,4–9 and rearranged according to theCCST. Results are presented in Table 9.1 and Figs. 9.1 and 9.2.
Distribution of acetic acid into organic phase of Alamine 336 in kerosene(see Fig. 9.1) did not detect up to 0.5 M/L concentration in the aqueous phase;then extraction begins but with very low effect as it is in Region 1. And only atacid concentration of >0.8 M/L in the aqueous phase visible extraction begins.High values of affinity constant ratios at high aqueous phase acid concentra-tions permit us to suppose that in this range of the extraction curve some three-dimensional cyclic- or cluster-like types of acid–amine aggregates are forming.
384 PART | II Novel Competitive Complexation/Solvation Theory
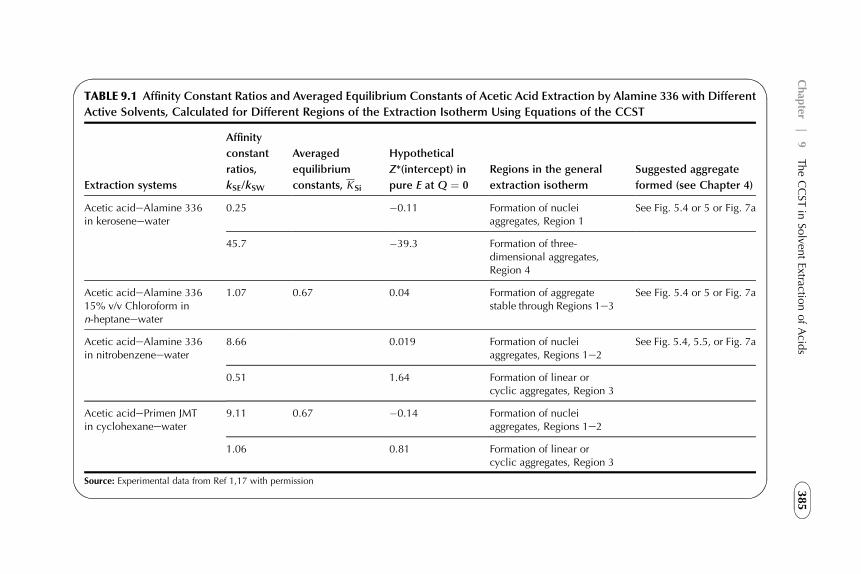
TABLE 9.1 Affinity Constant Ratios and Averaged Equilibrium Constants of Acetic Acid Extraction by Alamine 336 with Different
Active Solvents, Calculated for Different Regions of the Extraction Isotherm Using Equations of the CCST
Extraction systems
Affinity
constant
ratios,
kSE/kSW
Averaged
equilibrium
constants, KSi
Hypothetical
Z*(intercept) in
pure E at Q ¼ 0
Regions in the general
extraction isotherm
Suggested aggregate
formed (see Chapter 4)
Acetic acideAlamine 336in keroseneewater
0.25 �0.11 Formation of nucleiaggregates, Region 1
See Fig. 5.4 or 5 or Fig. 7a
45.7 �39.3 Formation of three-dimensional aggregates,Region 4
Acetic acideAlamine 33615% v/v Chloroform inn-heptaneewater
1.07 0.67 0.04 Formation of aggregatestable through Regions 1e3
See Fig. 5.4 or 5 or Fig. 7a
Acetic acideAlamine 336in nitrobenzeneewater
8.66 0.019 Formation of nucleiaggregates, Regions 1e2
See Fig. 5.4, 5.5, or Fig. 7a
0.51 1.64 Formation of linear orcyclic aggregates, Region 3
Acetic acidePrimen JMTin cyclohexaneewater
9.11 0.67 �0.14 Formation of nucleiaggregates, Regions 1e2
1.06 0.81 Formation of linear orcyclic aggregates, Region 3
Source: Experimental data from Ref 1,17 with permission
385
Chap
ter|
9TheCCST
inSo
lventExtractio
nofAcid
s
So, we can suggest transition of extraction curve from Region 1 directly toRegion 4: nucleus aggregates, forming in the beginning of the experiment serveas nucleation centers of formation of three-dimensional, voluminous aggre-gates or even as centers of polymerization.
We can see a quite different situation at extraction of acetic acid by Alamine336 with 15% v/v chloroform in n-heptane (see Fig. 9.1). Acid is distributed toorganic phase with formation of 1/1 Mac/Mam stable compound (nucleiaggregates) in the range from 0 to 2.0 M/L aqueous phase acid concentrations,or, in the range of 1–3 regions of the CCST. This is an example of the linearityof Eqn (9.2) plots (see Chapters 6 and 7) over the whole concentration rangewhen the same affinity constant ratio is valid at low and high solute concen-trations and does not depend on its concentration.
Organic solution of Alamine 336 in nitrobenzene shows new type ofextractant for acetic acid (see Table 9.1 and Fig. 9.2). The shape of the firstrange of the curve witnessed mainly strong interactions of Region 2. Twotypes of nucleus aggregates are mainly supposed to form: complexes withMac/Mam > 1/1, perhaps, with two molecules of acid to one molecule ofextractant, SHEHS ¼ 2/1 (see details in Chapter 6) and regular complexwith 1/1 Mac/Mam (EHS, see Chapter 6). Then, the shape is turning to theextraction mechanisms appropriate to Region 3. Linear (or cyclic)aggregates are formed with bridging partly through acid or solventmolecules.
Example with extraction of acetic acid by Primene JMT in cyclohexane(Table 9.1, Fig. 9.2) shows the same trend, but with different types ofcomplexes formed. Region 2 of nuclei aggregates consists mainly of 1/1Mac/Mam and 1/2 Mac/Mam (EHSE, see Chapter 6) complexes. Linear or cyclicaggregates, formed in Region 3, are bridged by acid molecules only.
More exact structures cannot be suggested because of lack of data required.The reader have to remember that these experimental data1,6 were obtainedwith classical approach.
4.2. Lactic Acid Extraction
Data for lactic acid extraction by Alamine 336 in kerosene, n-Cresol, MIBK,and with chloroform in n-heptane solvents and diluents were rearranged from1,6
and/or obtained in our laboratory.17,23 Results are presented in Table 9.2 andFigs. 9.3 and 9.4.
Shapes of the extraction curves show the same mechanism of the strongcomplexes formation, appropriate to Region 2; all of them with 1/1 Mac/Mam
ratio, but with different acid/amine affinity ratios: A-336 in m-Cresol>>A-336in kerosene > A-336 with chloroform in n-heptane >> A-336 in MIBK. Here,we can clearly see the influence of active solvents and/or diluents on extractioneffectiveness. Region 2 transfers to Region 3 with formation of linear (cyclic)aggregates with bridges bonded through competed acid and solvent (or water)
386 PART | II Novel Competitive Complexation/Solvation Theory
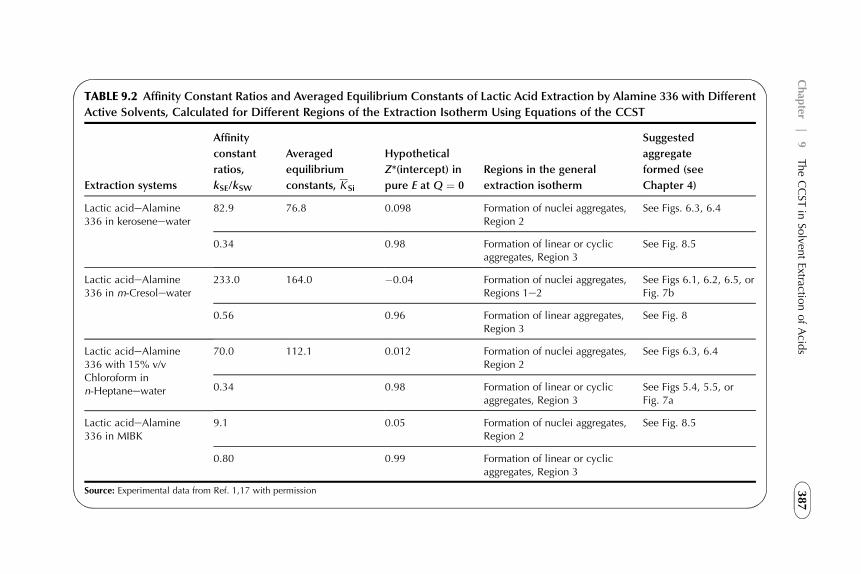
TABLE 9.2 Affinity Constant Ratios and Averaged Equilibrium Constants of Lactic Acid Extraction by Alamine 336 with Different
Active Solvents, Calculated for Different Regions of the Extraction Isotherm Using Equations of the CCST
Extraction systems
Affinity
constant
ratios,
kSE/kSW
Averaged
equilibrium
constants, KSi
Hypothetical
Z*(intercept) in
pure E at Q ¼ 0
Regions in the general
extraction isotherm
Suggested
aggregate
formed (see
Chapter 4)
Lactic acideAlamine336 in keroseneewater
82.9 76.8 0.098 Formation of nuclei aggregates,Region 2
See Figs. 6.3, 6.4
0.34 0.98 Formation of linear or cyclicaggregates, Region 3
See Fig. 8.5
Lactic acideAlamine336 in m-Cresolewater
233.0 164.0 �0.04 Formation of nuclei aggregates,Regions 1e2
See Figs 6.1, 6.2, 6.5, orFig. 7b
0.56 0.96 Formation of linear aggregates,Region 3
See Fig. 8
Lactic acideAlamine336 with 15% v/vChloroform inn-Heptaneewater
70.0 112.1 0.012 Formation of nuclei aggregates,Region 2
See Figs 6.3, 6.4
0.34 0.98 Formation of linear or cyclicaggregates, Region 3
See Figs 5.4, 5.5, orFig. 7a
Lactic acideAlamine336 in MIBK
9.1 0.05 Formation of nuclei aggregates,Region 2
See Fig. 8.5
0.80 0.99 Formation of linear or cyclicaggregates, Region 3
Source: Experimental data from Ref. 1,17 with permission 387
Chap
ter|
9TheCCST
inSo
lventExtractio
nofAcid
s
molecules at acid/solvent (or water) molecules ratio: A-336 in MIBK > A-336in m-Cresol > A-336 in kerosene ¼ A-336 with chloroform in n-heptane.
The same may be stated that more exact structures cannot be suggestedbecause of lack of data required.
4.3. Citric Acid Extraction
Some results, obtained for citric acid–Alamine 304 in kerosene–water (S–E–W)and citric acid–Alamine 304 in kerosene or dodecane as diluents-water-alcohol(1-(or 2-)octanol, 1-propanol) systems S–E–W–A, obtained in our labora-tory,17,23 are rearranged and presented in Table 9.3 and Figs 9.5 and 9.6 toillustrate the presented theory.
Shapes of the extraction curves show mechanism of the complexesformation, appropriate to Region 2. All of them are with 1/2 Mac/Mam ratio(type of ESHE, see Chapter 6). It is evident from the acid/amine affinityconstant ratios data, A-304 with 1-propanol, kSEA/kSAW ¼ 5.11 (S–E–W–Asystem) > A-304 with 1-octanol, kSEA/kSAW ¼ 4.57 > A-304 with 2-octanol,kSEA/kSAW ¼ 3.89 > A-304 in kerosene, kSE/kSW ¼ 2.1 (S–E–W system), thatalcohols show a small synergistic (enhancing) effect. Differences are not high,but alcohols play here a strong modification (stabilization) role, preventing thesystem from the formation of the third phase.
Analysis of water content in the organic phase of the S–E–W systemsamples shows two water molecules on every molecule of acid in Region 2(nuclei aggregates). Suggested structure examples of nuclei aggregates arepresented in Fig. 9.7a. Analysis of the water and 1-propanol in the organicphase of the S–E–W–PrOH system samples shows the same two water mole-cules and one 1-propanol molecule content on every molecule of acid in Region2. It seems that 1-propanol molecule is bound to the amine in the nucleusaggregate through the water molecule. Examples of suggested nuclei aggregatestructures are presented in Fig. 9.7b. In the systems with octanols the water inthe organic phase is not analyzed.
It should be noted, the absence of water in the organic phase after mixing ofAlamine 304 in kerosene (E–W system) and Alamine 304 with 1-propanol inkerosene (E–A–W system) with water and separation of the aqueous phase:content of water was on the detect level.
At transition of the extraction systems to Region 3 the alcohols influencedifferently. Considering the S–E–W system at formation of linear and/orcyclic aggregates in Region 3, each nucleus aggregate is loosing one of watermolecules on increasing aqueous phase acid concentration. Approaching toRegion 4, water content decreases to slightly more than one (z1.15) watermolecules to one acid molecule. The nuclei aggregates are bridging throughcompetition among second molecule of water, the neutral molecule of amine,or additional molecule of acid (see Fig. 9.8a). The linear aggregate is closed tothe cyclic form perhaps through the alcohol or acid molecule. According to
388 PART | II Novel Competitive Complexation/Solvation Theory
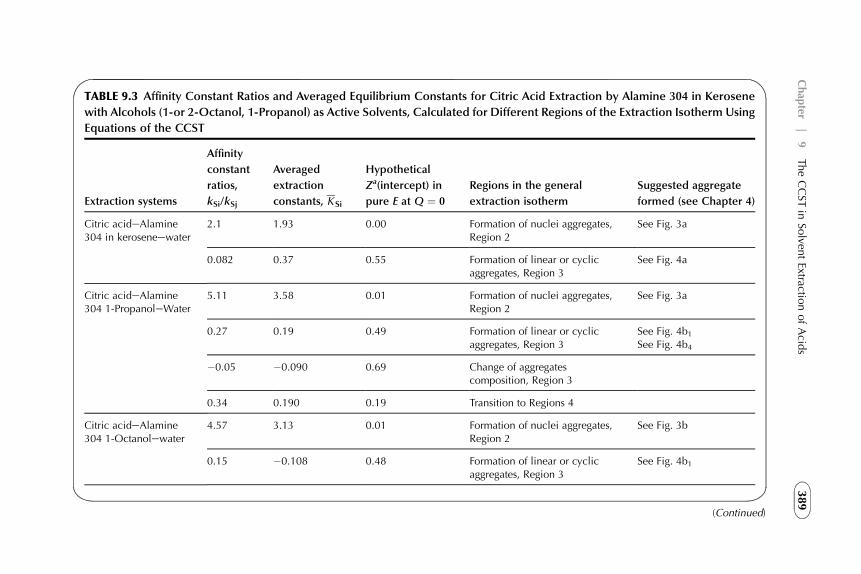
TABLE 9.3 Affinity Constant Ratios and Averaged Equilibrium Constants for Citric Acid Extraction by Alamine 304 in Kerosene
with Alcohols (1-or 2-Octanol, 1-Propanol) as Active Solvents, Calculated for Different Regions of the Extraction Isotherm Using
Equations of the CCST
Extraction systems
Affinity
constant
ratios,
kSi/kSj
Averaged
extraction
constants, KSi
Hypothetical
Za(intercept) in
pure E at Q ¼ 0
Regions in the general
extraction isotherm
Suggested aggregate
formed (see Chapter 4)
Citric acideAlamine304 in keroseneewater
2.1 1.93 0.00 Formation of nuclei aggregates,Region 2
See Fig. 3a
0.082 0.37 0.55 Formation of linear or cyclicaggregates, Region 3
See Fig. 4a
Citric acideAlamine304 1-PropanoleWater
5.11 3.58 0.01 Formation of nuclei aggregates,Region 2
See Fig. 3a
0.27 0.19 0.49 Formation of linear or cyclicaggregates, Region 3
See Fig. 4b1See Fig. 4b4
�0.05 �0.090 0.69 Change of aggregatescomposition, Region 3
0.34 0.190 0.19 Transition to Regions 4
Citric acideAlamine304 1-Octanolewater
4.57 3.13 0.01 Formation of nuclei aggregates,Region 2
See Fig. 3b
0.15 �0.108 0.48 Formation of linear or cyclicaggregates, Region 3
See Fig. 4b1
(Continued)
389
Chap
ter|
9TheCCST
inSo
lventExtractio
nofAcid
s
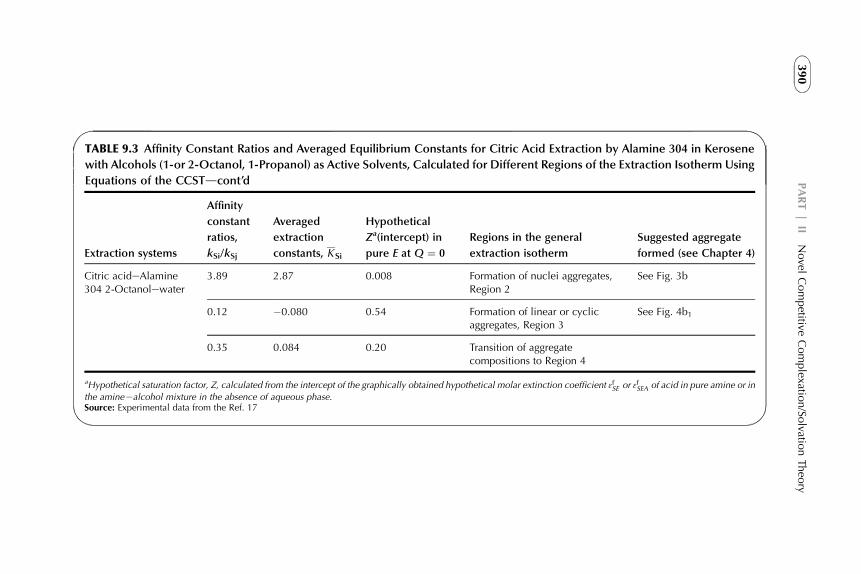
TABLE 9.3 Affinity Constant Ratios and Averaged Equilibrium Constants for Citric Acid Extraction by Alamine 304 in Kerosene
with Alcohols (1-or 2-Octanol, 1-Propanol) as Active Solvents, Calculated for Different Regions of the Extraction Isotherm Using
Equations of the CCSTdcont’d
Extraction systems
Affinity
constant
ratios,
kSi/kSj
Averaged
extraction
constants, KSi
Hypothetical
Za(intercept) in
pure E at Q ¼ 0
Regions in the general
extraction isotherm
Suggested aggregate
formed (see Chapter 4)
Citric acideAlamine304 2-Octanolewater
3.89 2.87 0.008 Formation of nuclei aggregates,Region 2
See Fig. 3b
0.12 �0.080 0.54 Formation of linear or cyclicaggregates, Region 3
See Fig. 4b1
0.35 0.084 0.20 Transition of aggregatecompositions to Region 4
aHypothetical saturation factor, Z, calculated from the intercept of the graphically obtained hypothetical molar extinction coefficient 3fSE or 3fSEA of acid in pure amine or in
the amineealcohol mixture in the absence of aqueous phase.Source: Experimental data from the Ref. 17
390
PART|
IINovel
Competitive
Complexatio
n/So
lvationTheo
ry
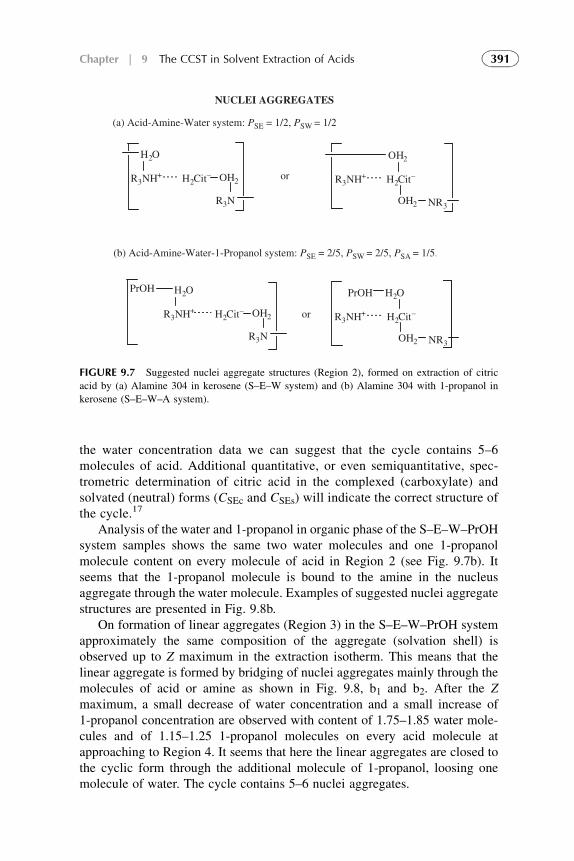
the water concentration data we can suggest that the cycle contains 5–6molecules of acid. Additional quantitative, or even semiquantitative, spec-trometric determination of citric acid in the complexed (carboxylate) andsolvated (neutral) forms (CSEc and CSEs) will indicate the correct structure ofthe cycle.17
Analysis of the water and 1-propanol in organic phase of the S–E–W–PrOHsystem samples shows the same two water molecules and one 1-propanolmolecule content on every molecule of acid in Region 2 (see Fig. 9.7b). Itseems that the 1-propanol molecule is bound to the amine in the nucleusaggregate through the water molecule. Examples of suggested nuclei aggregatestructures are presented in Fig. 9.8b.
On formation of linear aggregates (Region 3) in the S–E–W–PrOH systemapproximately the same composition of the aggregate (solvation shell) isobserved up to Z maximum in the extraction isotherm. This means that thelinear aggregate is formed by bridging of nuclei aggregates mainly through themolecules of acid or amine as shown in Fig. 9.8, b1 and b2. After the Zmaximum, a small decrease of water concentration and a small increase of1-propanol concentration are observed with content of 1.75–1.85 water mole-cules and of 1.15–1.25 1-propanol molecules on every acid molecule atapproaching to Region 4. It seems that here the linear aggregates are closed tothe cyclic form through the additional molecule of 1-propanol, loosing onemolecule of water. The cycle contains 5–6 nuclei aggregates.
H2O
H2Cit–
OH2H2O
R3N
or
NR3
H2Cit–
OH2
R3NH+OH2R3NH+
(a) Acid-Amine-Water system: PSE = 1/2, PSW = 1/2
NUCLEI AGGREGATES
(b) Acid-Amine-Water-1-Propanol system: PSE = 2/5, PSW = 2/5, PSA = 1/5.
H2Cit–
R3N
OH2R3NH+
PrOH H2O
NR3
H2Cit–
OH2
R3NH+or
PrOH
FIGURE 9.7 Suggested nuclei aggregate structures (Region 2), formed on extraction of citric
acid by (a) Alamine 304 in kerosene (S–E–W system) and (b) Alamine 304 with 1-propanol in
kerosene (S–E–W–A system).
391Chapter | 9 The CCST in Solvent Extraction of Acids
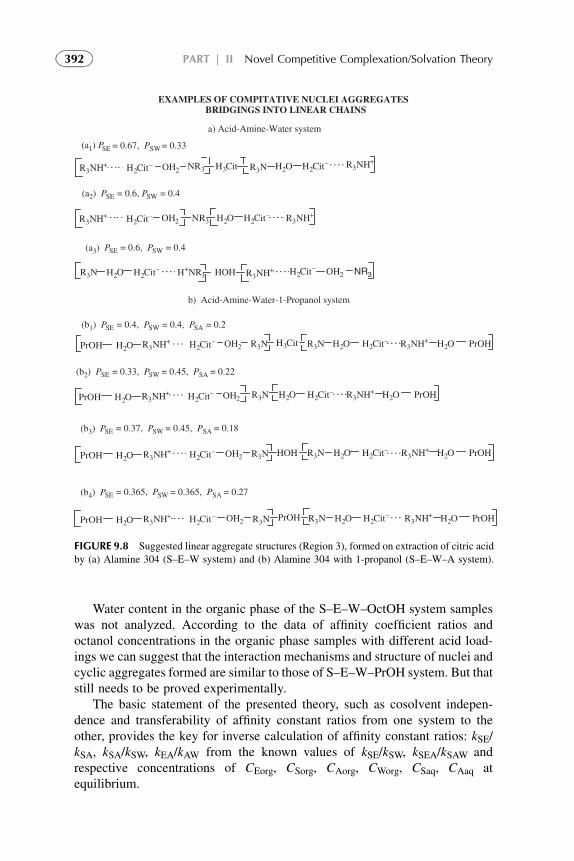
Water content in the organic phase of the S–E–W–OctOH system sampleswas not analyzed. According to the data of affinity coefficient ratios andoctanol concentrations in the organic phase samples with different acid load-ings we can suggest that the interaction mechanisms and structure of nuclei andcyclic aggregates formed are similar to those of S–E–W–PrOH system. But thatstill needs to be proved experimentally.
The basic statement of the presented theory, such as cosolvent indepen-dence and transferability of affinity constant ratios from one system to theother, provides the key for inverse calculation of affinity constant ratios: kSE/kSA, kSA/kSW, kEA/kAW from the known values of kSE/kSW, kSEA/kSAW andrespective concentrations of CEorg, CSorg, CAorg, CWorg, CSaq, CAaq atequilibrium.
H2Cit– OH2R3NH+ H2Cit– R3NH+NR3 H2O
H2Cit– OH2 NR3H2O H2Cit–R3N R3NH+H+NR3 HOH
(a2) PSE = 0.6, PSW = 0.4
R3NH+ H2Cit– OH2 NR3 H2Cit–H2O R3NH+R3NH3Cit
EXAMPLES OF COMPITATIVE NUCLEI AGGREGATES BRIDGINGS INTO LINEAR CHAINS
a) Acid-Amine-Water system
(a1) PSE = 0.67, PSW = 0.33
SE = 0.6, PSW = 0.4
b) Acid-Amine-Water-1-Propanol system
H2O H2Cit– R3NOH2R3NH+PrOH H2OH2Cit–H2O R3NH+ PrOH
SE = 0.33, PSW = 0.45, PSA = 0.22
H2O H2Cit– OH2R3NH+PrOH R3NR3N HHOH 2OH2Cit–H2O R3NH+ PrOH
(b1) PSE = 0.4, PSW = 0.4, PSA = 0.2
H2O H2Cit– OH2R3NH+PrOH R3NR3N H3Cit H2OH2Cit–H2O R3NH+ PrOH
SE = 0.37, PSW = 0.45, PSA = 0.18
H2O H2Cit– OH2R3NH+PrOH R3NR3N PrOH H2OH2Cit–H2O R3NH+ PrOH
SE = 0.365, PSW = 0.365, PSA = 0.27
(a3) P
(b2) P
(b3) P
(b4) P
FIGURE 9.8 Suggested linear aggregate structures (Region 3), formed on extraction of citric acid
by (a) Alamine 304 (S–E–W system) and (b) Alamine 304 with 1-propanol (S–E–W–A system).
392 PART | II Novel Competitive Complexation/Solvation Theory
Presence of the internal aqueous phase in the micelle-like aggregates(Region 4) is expected to show a strong increase of both acid and waterconcentrations in the organic phase. It was qualitatively observed on titration ofthe citric acid in the highly loaded (Z � 0.7) organic phase samples by NaOH(see Chapter 7, Fig. 7.8): the titration curves dramatically decreased and hadminima at destruction of the micelles.
It is well known that micelle destruction by dilution of the solutions issometimes a slow kinetic process. This means that kinetics of formation anddestruction of the micelle-like aggregates may differ very much. Someresearchers establish extraction experiments by equilibrating the highly loadedby acid organic samples with water or low acid concentration aqueous solu-tions4,9. Using this technique the equilibrium state has to be checked obligatorybecause of possible slow kinetics. In these experiments the equilibrium statehas to be controlled very strongly.
4.4. Active Solvent-Swing Regeneration Technology
The active solvent-swing regeneration technology was first described by Banielet al.42 The composition of the acid-loaded organic phase at equilibrium can bechanged by changing active solvent concentration. The forward extraction stepis conducted with extractant composition containing high proportions of activesolvent for efficient extraction. Prior to back-extraction, active solvent may beremoved from the extract or another solvent may be added for efficient acidback-extraction to the aqueous phase.
The presented theory predicts the solvent-swing regeneration and permitsits preliminary quantification. The values of [CWorg]max, [CAorg]max,½CAorg�max
CE;
½CAorg�max
CAaq, and [CAaq]
0 obtained by experiments with the three-
component systems provide for evaluating the limits for optimal swingregeneration in the S–E–A–W system of interest.
4.5. Modifying Effect of Active Solvents
Active solvent with (or without) synergistic or antagonistic effects may serve asa modifier in an extraction system, stabilizing polar species in the organic phaseby its dielectric properties. In general, the stabilizing effect is achieved byreplacing water molecules and even acid molecules in case of a weak acid, bymolecules of the active solvent in the solvation shell.
Below the reader can find some experimental results, obtained in ourlaboratory,23 on investigation of systems with four components: citric acid–Alamine 304–water–active solvents (S–E–W–A) using conventional extractionprocedures. The data were reinvestigated with an aim to explain and to provethe presented theory.
393Chapter | 9 The CCST in Solvent Extraction of Acids
At low acid concentrations, in Regions 1 and 2, the active solvent mole-cules, replacing water, form stable hydrophobic nuclei aggregates. This leads tobetter separation of the organic and aqueous phases.
On extraction from concentrated acid solutions, or on transition to Region 3,bridging of nuclei aggregates takes place through the H-bonded solvent mole-cules with preferential formation of the stable low membered ring structures(see Fig. 9.8a) where water molecules are replaced partly or even completely byactive solvent molecules. The coalescence of the cyclic aggregates into three-dimensional micelle-like or cluster-like aggregates (Region 4) and formation ofthe “third phase” takes place at much higher acid critical concentrations.Alcohols’ modifying effect on the extraction systems is a good example. Thetendency of alcohols to close aggregates into highly stable six-memberedbenzene-like cycles is a well-known fact.26–29 On extraction of naphthenic acidby amine, photo correlation spectroscopy (PCS) data43,44 showed that addition of2-octanol into diluent moves the formation of reversed micelles to a much higheracid concentrations in the aqueous phase. Analogical results were obtained in ourlaboratory23 on extraction of citric acid by trilauryl amine (A304) using 1-, or2-octanol, or 1-propanol as modifying (and enhancing) solvents.
4.6. Temperature-Swing Regeneration
The effect of temperature on extraction of carboxylic acids was studied bymany researchers.9,23,41,42 As a rule, the distribution of acid into the organicphase (a variety of tertiary amines in a variety of diluents with modifiers)decreases with increasing temperature, sufficiently to allow back-extraction ofsome acids (e.g., citric, succinic, and lactic) with a fresh aqueous phase withoutdilution of the acid. The distribution ratios’ decrease with temperature increasedepends upon the type and concentration of acid. The temperature-swingregeneration includes forward extraction at a low temperature, obtaining acid-loaded organic phase and an aqueous raffinate, containing feed componentsthat have to be separated, and back-extraction at a higher temperature,obtaining acid-loaded aqueous product stream and regenerated organic phase.For some acids, the acid concentrating effect in a product stream may beachieved using temperature-swing process.
The presented theory permits to achieve preliminary quantification of thetemperature effect for the temperature-swing regeneration for the S–E–A–Wextraction system using the data, obtained at experiments with the simple three-component S–E–W, S–A–W, S–E–A, and E–A–W systems.
From the Eqn (9.18) it follows:
ln
�kSEkSW
� CEVE
CWorgVW
�¼ �DHSEW
RTþ DSSEW
R(9.23)
ln
�kSEkSA
� CEVE
CAorgVA
�¼ �DHSEA
RTþ DSSEA
R(9.24)
394 PART | II Novel Competitive Complexation/Solvation Theory
ln
�kEAkAW
� CAorgVA
CWorgVW
�¼ �DHEAW
RTþ DSEAW
R(9.25)
ln
�kSAkSW
� CAorgVA
CWorgVW
�¼ �DHS AW
RTþ DSSAW
R(9.26)
If the enthalpy (�DH) and entropy (DS) of reaction are assumed to be constantover the temperature range, the Eqns (9.21–9.26) indicate that a plots of ln(.)versus 1/T give straight lines. The slopes are proportional to the enthalpy ofreactions and the intercepts are proportional to the entropy.
Formation of complexes and aggregates in the organic phase makes thesystem more ordered and thus decreases the entropy.
Affinity coefficients ratios, kSE/kSW, kSE/kSA, kSA/kSW, kEA/kAWand differentconcentration ratios, CSE/CSW, CSE/CSA, CEA/CAW, in the solvation shell, aremeasured, experimenting with simple systems at various temperatures.Temperature dependence of water coextraction by free extractant and active orinert solvents in the bulk organic and aqueous phases is measured in theabsence of acid. Temperature dependence of the solubility factors of activesolvent FA ¼ f(T) and water FW ¼ f(T), and concentrations of active solventCAorg ¼ f(T) and water CWorg ¼ f(T) in organic phase are obtained.
According to the theory, preliminary data for the temperature-swingregeneration of S–E–A–W system of interest may be calculated using the aboveindependent experiments’ data for the simple systems. So, the experimentalstudies simplify to the series of measurements for the three-component, S–E–W, S–A–W, S–E–A, and E–A–W, systems.
Validity of the presented approach was verified experimentally in ourlaboratory23 and has shown a good result between experimental and calculatedresults. This gives a key for quantitative prediction of suitable extractionsystems at different acids separation.
5. SUMMARIZING REMARKS
The presented CCS modeling approach constitutes a general framework forinterpretation of strong (ion exchange and electrostatic) and weak (H-bond,solvating, and coordinate) interactions data in the acid–solvent extractionsystems. It is an attempt to describe the mechanisms of solvent extraction withquantitative evaluation of different compounds, formed in the organic phase atdifferent concentrations of the acid and active solvent.
It is stressed once again that the presented theory predicts the synergistic,enhancing effect of weak amines, weak acids, or neutral protic, polar/polar-izable solvents as additives to the basic amine extractant on extraction of acids.Classical theories do not indicate the direct knowledge about this effect.
Two more parameters, water and active adduct concentrations in the organicphase, are introduced to the quantitative consideration of extraction system in
395Chapter | 9 The CCST in Solvent Extraction of Acids
every region of the general extraction systems’ isotherm. Mathematicaldescription for the process simulation is proposed.
Preliminary predictions may be made before experimentation; e.g., forstrong acid and amine Region 1 of the general extraction systems’ isothermmay be excluded. Region 3 is a plateau with small magnitude of the slope. Theslope depends on the influence of water and active solvent in the formation oflinear (planar) aggregates. Region 4 occurs (if at all) at the very highconcentrations of acid.
For weak acid and base Region 2 may be excluded and Region 1 is trans-ferred to Region 3 without visible shape changes on the distribution curve. Theslope of the curve shows strong dependency on the weak molecular interactionsof undissociated acid, water, and active diluent, competing at nuclei, then formslinear aggregates.
Experimental determination of the affinity constant ratios and solvationshell compositions, quantitative, or even semiquantitative, spectrometricdetermination of the acid in the complexed and solvated forms permits to set upexact form of the aggregates formed and predict the behavior of the extractionsystem of interest and influence of its different components.
The presented theory predicts the synergistic or antagonistic effect of activesolvents on distribution to organic phase in basic amine extractants. Classicaltheories do not indicate the direct knowledge about this effect.
Affinity constant ratios are easily acceptable through the independentmeasurements conducted with simple three-component systems. Experimentaldetermination of the affinity constant ratios and the aggregate structures formedpermits to analyze and predict the extraction system of interest. Relation (7)between equilibrium constant kSi of the classical theories and affinity constantratio, kSi/kSj, obtained by the measurements of the same property, permits the useof available equilibrium constant data for calculations in the presented theory.
Active solvent parameters as additional data are introduced into the quanti-tative consideration of extraction system in every region of the general extractionisotherm. Mathematical description for the process simulation is proposed.
The concept of partitioning in the homogenous media implies that theextraction system components act independently in their interaction witha given solute: the values of kSE/kSW and kSA/kSW are independent and trans-ferable from one system to the other. Cosolvent independence, establishedexperimentally, allows to compare directly the complexing-solvating power(competition order) of various extractants, solvents, and diluents. Once deter-mined and tabulated, the data can be used in any system, containing thesecomponents. Independence and transferability of affinity constants have beenproved for many organic systems. Nevertheless, it has to be proved for differentextraction systems of interest.
Although the theory has many simplifications and limitations, it is a startingpoint for the quantification of acid solvent extraction processes with an aim topredict suitable extraction systems for separation of different solutes.
396 PART | II Novel Competitive Complexation/Solvation Theory
REFERENCES
1. Tamada J, King C. Extraction of carboxylic acids by amine extractants. Ph.D. Thesis.
Lawrence Berkeley Laboratory, University of California, Applied Science Division;
1989.
2. Komasawa I, Otake T, Hattori I. The effects of diluent in the liquid-liquid extraction of
copper and nickel using 2-hydroxy-5-nonylbenzophenone oxime. J Chem Eng Japan 1983;
16(5):377–88.
3. Hogfeldt E, Fredlund F, Odberg L, Merenge G. Extraction of water, nitric and perchloric acids
by nitrobenzene. Acta Chem Scandinavica 1973;18(5):1781–94.
4. Eyal AM, Canari R. pH Dependence of carboxylic and mineral acid extraction by amine-based
extractants: effects of pKa, amine basicity, and diluent properties. Ind Eng Chem Res
1995;34(5):1789.
5. Tamada J, Kertes A, King C. Extraction of carboxylic acids with amine extractant. 1. Equi-
libria and law of mass action modeling. Ind Eng Chem Res 1990;29:1319–26.
6. Tamada J, Kertes A, King C. Extraction of carboxylic acids with amine extractant. 2. Chemical
interaction and interpretation of data. Ind Eng Chem Res 1990;29:1327–32.
7. Tamada J, Kertes A, King C. Extraction of carboxylic acids with amine extractant. 3. Effect of
temperature, water coextraction and process considerations. Ind Eng Chem Res
1990;29:1333–6.
8. Yang S, White S, Hsu S. Extraction of carboxylic acids with tertiary and quaternary amines:
effect of pH. Eng Chem Res 1991;30:1335.
9. Canari R, et al. Carboxylic acids extraction by basic extractants: the effects of pH, Ion
concentration and acid-base property of the extractant and extracted acid. In: In the
Proceedings of the ASEC’96, 1996, p. 1517–22.
10. Grinstead RR. Base strengths of amine in liquid-liquid extraction systems. In: In the
Proceedings of the ASEC’67, 1968, p. 427–36.
11. Grinstead R, Davis J. Base strength of amine-amine hydrochloride systems in toluene. J Phys
Chem 1968;72(5):1630.
12. Mrnka M, Kyrsova V, Celeda J. Mechanism of iron separation by extraction with tri-n-
octylamine from chloride solutions. Proceedings of ISEC’74 1975;1:49–62.
13. Vieux AS, et al. Extraction of some dicarboxylic acids by tri-isooctylamine. Anal Chim Acta
1974;68:415–24.
14. Wardel JM, King CJ. Solvent equilibria for extraction of carboxylic acids from water. J Chem
Eng Data 1979;23(2):144–8.
15. Kolarik Z, Grimm R. Acidic organophosphorus extractants. XXIII. Distribution of mono-2-
ethylhexyl phosphoric acid in two liquid phase systems. J Inorg Nucl Chem 1976;38(5):1761–3.
16. Headley AD. Quantitative analysis of solvation effects and influence of alkyl substituents on
basicity of amines. J Org Chem 1991;56:3688–91.
17. Kislik V, Eyal A, Hazan B. Competitive complexation/Solvation theory of solvent extraction.
III. Influence of active solvents on acid solvent extraction by amine based extractants. Sep Sci
Technol 2003;38(8):1681–704.
18. Kislik V. Application of preferential solvation concept for interpretation of the mechanisms of
acid solvent extraction by amines. Sep Sci Technol 2001;36(13):2899–926.
19. Lo TC, et al., editors. Handbook of solvent extraction. New York: Wiley; 1983.
20. Marcus Y. Ion solvation. London: Wiley-Interscience; 1985.
21. Kertes AS, King CJ. Extraction chemistry of fermentation product carboxylic acids. Biotech
Bioeng 1986;28:269–82.
397Chapter | 9 The CCST in Solvent Extraction of Acids
22. Kislik V, Eyal A. Extraction of titanium (IV) by mixtures of mono- and d-(2-ethylhexyl)
phosphoric acids esters. Solvent Extr Ion Exch 1993;11(2):285–310.
23. Eyal A, Kislik V, Hasan B. Experimental research project for private company, 1996–1998,
unpublished data.
24. Taft RW, Abboud JLM, Kamlet MJ, Abraham MN. Linear solvation energy relations. J
Solution Chem 1985;14(3):153–86.
25. Shorter J. Correlation analysis in chemistry. Oxford: Clarendon Press; 1973.
26. Fendler EJ, et al. Proton magnetic resonance investigation of alkylammonium carboxylate
micelles in nonaqueous solvents. J Phys Chem 1973;77(11):1432–6.
27. Mei Wen, Yiyan Yang, Youyuan Dai. Studies on the mechanism of extraction of carboxylic
acids with Tri-N-Octylamine by chemical complexation. In: In the Proceedings of the
ISEC’96, 1996. vol. 1, p. 195–200.
28. Ermer O, Eling A. Molecular recognition among alcohols and amines: Super-tetrahedral
crystal architectures of linear diphenol-diamine complexes and aminophenols. J Chem Soc
Perkin Trans 1994;2:925–44.
29. Loehlin JH, Etter MC, Gendreau C, Cervasio E. Hydrogen-bond patterns in several 2:1 amine-
phenol cocrystals. Chem Mater 1994;6:1218–21.
30. Fumio Toda, Hyoda S, Okada K, Hirtsu R. Isolation of anhydrous hydrasine as stable inclusion
complexes with hydroquinone and p-methoxyphenol and their solide state reaction with esters
which gives pure hydrolyzides. J Chem Soc Chem Commun 1995;1531–2.
31. Devis MM. Acid-base behavior in aprotic organic solvents. Washington, DC: National Bureau
of Standards, Monograph 105; 1968.
32. Anet FAL, Carter P, Wenstein S. Effects of steric compression on coupling constants. J Chem
Soc 1965;67:2048–57.
33. Spala EE, Ricker NL. Thermodynamic model for solvating solutions with physical interac-
tions. Ind Eng Chem Process Des Dev 1982;21:409–15.
34. Nagata I, et al. Ternary liquid-liquid equilibria: the associated solution theory. Fluid Phase
Equilib 1977/1978;1:267–75.
35. Headley AD. Solvent effects on the basicity of alkyl-substituted dimethylamines. J Org Chem
1988;53:312–4.
36. Headley AD, McMyrry ME, Starnes SD. Effects of substituents on the acidity of acetic acid.
J Org Chem 1994;59:1863–6.
37. Nagy OB, Muanda H, Nagy JB. Competitive preferential solvation theory of weak molecular
interactions. J Chem Soc Faraday Trans 1 1978;74:2210–29.
38. Nagy OB, et al. Quantitative evaluation of solute-solvent interactions. Environmental effects
on the n-butylaminolysis of tetrachloro-N-n-butylphthalimide. J Phys Chem 1979;83:15.
39. Scatchard G. The attraction of proteins for small molecules and ions. Ann NY Acad Sci
1949;51:660.
40. Eyal AM. Acid extraction by acid-base-coupled extractants. In: Marinsky JA, Marcus Y,
editors. Ion exchange and solvent extraction, vol. 13. New York: Marcel Dekker Inc.; 1997.
p. 31–93.
41. Cohn-Syzov N, Eyal AM. Extraction and interactions in two-phase, multi-acid, multi-base,
systems. In: In the Proceedings of the ISEC’99, 1999, p. 363.
42. Baniel AM, et al. Recovery of acids from aqueous solutions. U.S. Patent 4,275,234, 1981.
43. Parbhoo B, Nagy O. Application of the competitive preferential solvation theory to ion-
molecule interactions. J Chem Soc Faraday Trans 1 1986;82:1789–93.
44. Laub RJ, Purnell JH. Solution and complexing Studies. III. Further evidence for a microscopic
partitioning theory of solution. J Am Chem Soc 1976;98(1):30–5.
398 PART | II Novel Competitive Complexation/Solvation Theory
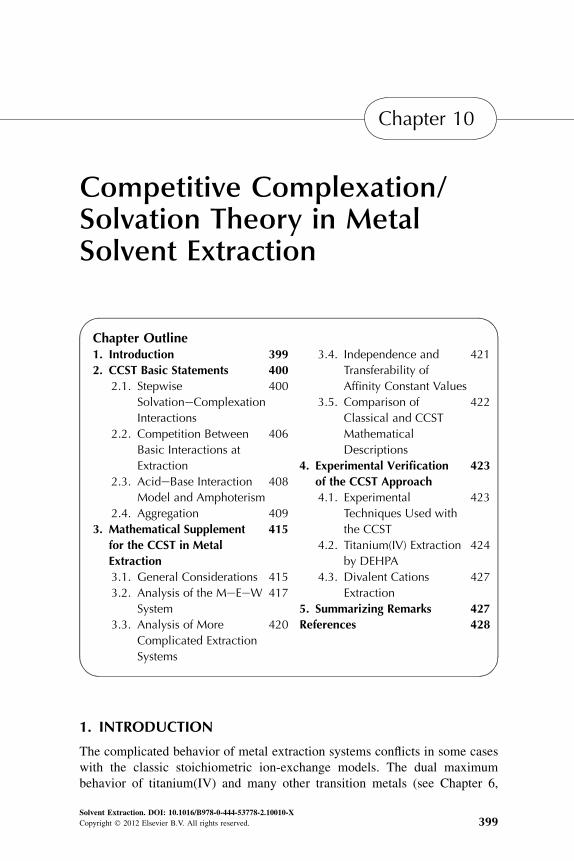
Chapter 10
Competitive Complexation/Solvation Theory in MetalSolvent Extraction
Chapter Outline1. Introduction 399
2. CCST Basic Statements 400
2.1. Stepwise
SolvationeComplexation
Interactions
400
2.2. Competition Between
Basic Interactions at
Extraction
406
2.3. AcideBase Interaction
Model and Amphoterism
408
2.4. Aggregation 409
3. Mathematical Supplement
for the CCST in Metal
Extraction
415
3.1. General Considerations 415
3.2. Analysis of the MeEeW
System
417
3.3. Analysis of More
Complicated Extraction
Systems
420
3.4. Independence and
Transferability of
Affinity Constant Values
421
3.5. Comparison of
Classical and CCST
Mathematical
Descriptions
422
4. Experimental Verification
of the CCST Approach
423
4.1. Experimental
Techniques Used with
the CCST
423
4.2. Titanium(IV) Extraction
by DEHPA
424
4.3. Divalent Cations
Extraction
427
5. Summarizing Remarks 427
References 428
1. INTRODUCTION
The complicated behavior of metal extraction systems conflicts in some caseswith the classic stoichiometric ion-exchange models. The dual maximumbehavior of titanium(IV) and many other transition metals (see Chapter 6,
Solvent Extraction. DOI: 10.1016/B978-0-444-53778-2.10010-X
Copyright � 2012 Elsevier B.V. All rights reserved. 399
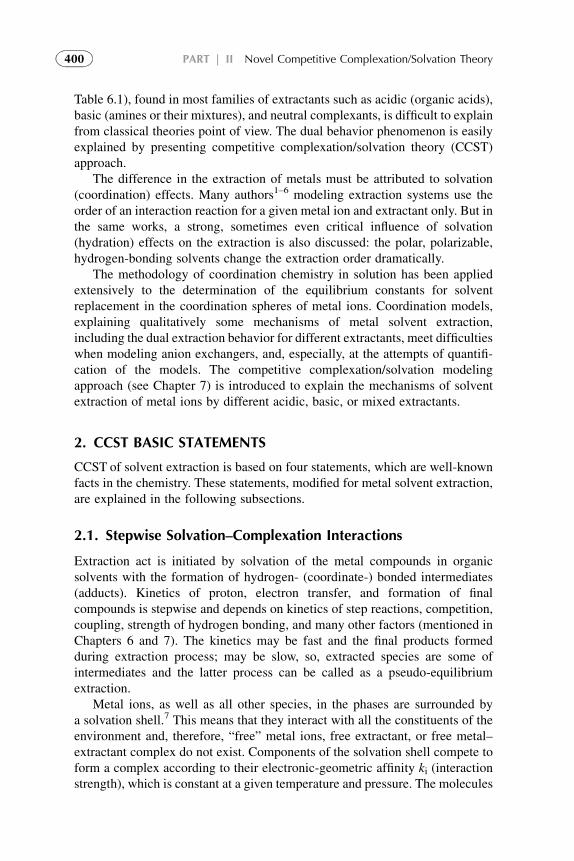
Table 6.1), found in most families of extractants such as acidic (organic acids),basic (amines or their mixtures), and neutral complexants, is difficult to explainfrom classical theories point of view. The dual behavior phenomenon is easilyexplained by presenting competitive complexation/solvation theory (CCST)approach.
The difference in the extraction of metals must be attributed to solvation(coordination) effects. Many authors1–6 modeling extraction systems use theorder of an interaction reaction for a given metal ion and extractant only. But inthe same works, a strong, sometimes even critical influence of solvation(hydration) effects on the extraction is also discussed: the polar, polarizable,hydrogen-bonding solvents change the extraction order dramatically.
The methodology of coordination chemistry in solution has been appliedextensively to the determination of the equilibrium constants for solventreplacement in the coordination spheres of metal ions. Coordination models,explaining qualitatively some mechanisms of metal solvent extraction,including the dual extraction behavior for different extractants, meet difficultieswhen modeling anion exchangers, and, especially, at the attempts of quantifi-cation of the models. The competitive complexation/solvation modelingapproach (see Chapter 7) is introduced to explain the mechanisms of solventextraction of metal ions by different acidic, basic, or mixed extractants.
2. CCST BASIC STATEMENTS
CCST of solvent extraction is based on four statements, which are well-knownfacts in the chemistry. These statements, modified for metal solvent extraction,are explained in the following subsections.
2.1. Stepwise Solvation–Complexation Interactions
Extraction act is initiated by solvation of the metal compounds in organicsolvents with the formation of hydrogen- (coordinate-) bonded intermediates(adducts). Kinetics of proton, electron transfer, and formation of finalcompounds is stepwise and depends on kinetics of step reactions, competition,coupling, strength of hydrogen bonding, and many other factors (mentioned inChapters 6 and 7). The kinetics may be fast and the final products formedduring extraction process; may be slow, so, extracted species are some ofintermediates and the latter process can be called as a pseudo-equilibriumextraction.
Metal ions, as well as all other species, in the phases are surrounded bya solvation shell.7 This means that they interact with all the constituents of theenvironment and, therefore, “free” metal ions, free extractant, or free metal–extractant complex do not exist. Components of the solvation shell compete toform a complex according to their electronic-geometric affinity ki (interactionstrength), which is constant at a given temperature and pressure. The molecules
400 PART | II Novel Competitive Complexation/Solvation Theory
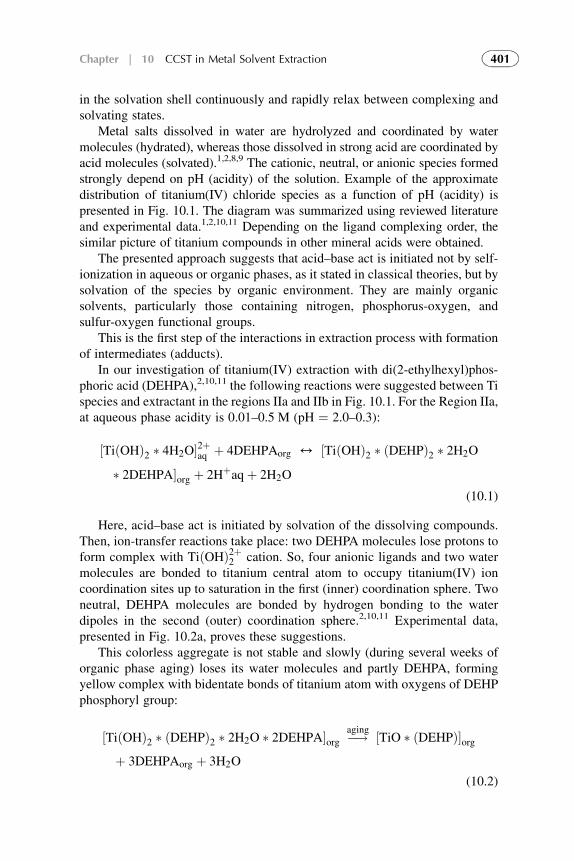
in the solvation shell continuously and rapidly relax between complexing andsolvating states.
Metal salts dissolved in water are hydrolyzed and coordinated by watermolecules (hydrated), whereas those dissolved in strong acid are coordinated byacid molecules (solvated).1,2,8,9 The cationic, neutral, or anionic species formedstrongly depend on pH (acidity) of the solution. Example of the approximatedistribution of titanium(IV) chloride species as a function of pH (acidity) ispresented in Fig. 10.1. The diagram was summarized using reviewed literatureand experimental data.1,2,10,11 Depending on the ligand complexing order, thesimilar picture of titanium compounds in other mineral acids were obtained.
The presented approach suggests that acid–base act is initiated not by self-ionization in aqueous or organic phases, as it stated in classical theories, but bysolvation of the species by organic environment. They are mainly organicsolvents, particularly those containing nitrogen, phosphorus-oxygen, andsulfur-oxygen functional groups.
This is the first step of the interactions in extraction process with formationof intermediates (adducts).
In our investigation of titanium(IV) extraction with di(2-ethylhexyl)phos-phoric acid (DEHPA),2,10,11 the following reactions were suggested between Tispecies and extractant in the regions IIa and IIb in Fig. 10.1. For the Region IIa,at aqueous phase acidity is 0.01–0.5 M (pH ¼ 2.0–0.3):
½TiðOHÞ2 � 4H2O�2þaq þ 4DEHPAorg 4 ½TiðOHÞ2 � ðDEHPÞ2 � 2H2O
� 2DEHPA�org þ 2Hþaqþ 2H2O
(10.1)
Here, acid–base act is initiated by solvation of the dissolving compounds.Then, ion-transfer reactions take place: two DEHPA molecules lose protons toform complex with TiðOHÞ2þ2 cation. So, four anionic ligands and two watermolecules are bonded to titanium central atom to occupy titanium(IV) ioncoordination sites up to saturation in the first (inner) coordination sphere. Twoneutral, DEHPA molecules are bonded by hydrogen bonding to the waterdipoles in the second (outer) coordination sphere.2,10,11 Experimental data,presented in Fig. 10.2a, proves these suggestions.
This colorless aggregate is not stable and slowly (during several weeks oforganic phase aging) loses its water molecules and partly DEHPA, formingyellow complex with bidentate bonds of titanium atom with oxygens of DEHPphosphoryl group:
½TiðOHÞ2 � ðDEHPÞ2 � 2H2O � 2DEHPA�org �!aging ½TiO � ðDEHPÞ�orgþ 3DEHPAorg þ 3H2O
(10.2)
401Chapter | 10 CCST in Metal Solvent Extraction
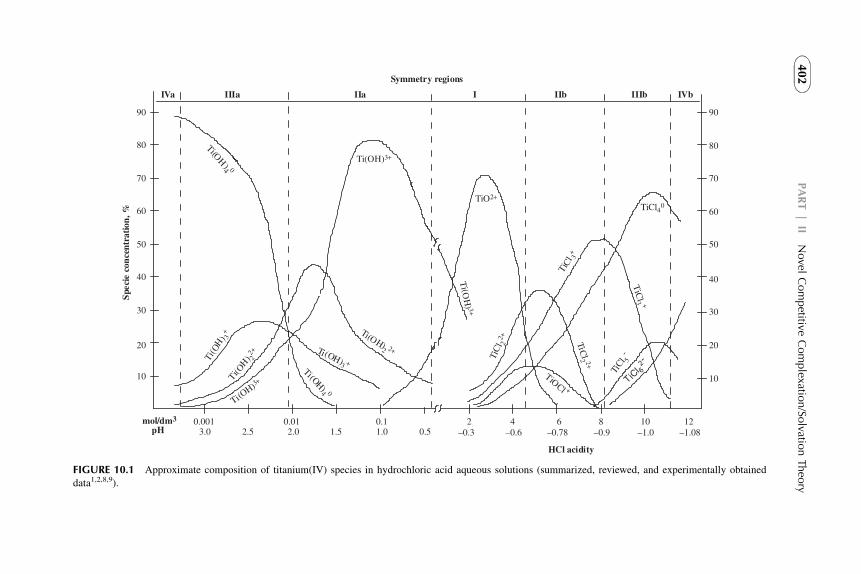
2 4 6 8 10 120.10.012.0 1.5 1.0 0.52.53.0
0.001
90
10
20
30
40
50
60
70
80
Spe
cie
con
cent
rati
on, %
mol/dm3
pH –0.3 –0.78 –0.9 –1.0 –1.08–0.6
20
10
30
40
50
60
70
80
90
bVIbIIIbIIIaIIaIIIaVI
HCl acidity
Symmetry regions
Ti(OH
)4 0
Ti(O
H) 3
+
Ti(OH)3+
Ti(OH
) 22+
Ti(OH)2 2+Ti(OH)3 +
Ti(OH)4 0
Ti(OH)3
+
Ti(O
H) 3+
TiO2+
TiC
l 22+ TiC
l2 2+
TiC
l 3+
TiC
l3 +
TiOCl +
TiCl40
TiCl 5
-
TiCl 62-
FIGURE 10.1 Approximate composition of titanium(IV) species in hydrochloric acid aqueous solutions (summarized, reviewed, and experimentally obtained
data1,2,8,9).
402
PART|
IINovel
Competitive
Complexatio
n/So
lvationTheo
ry
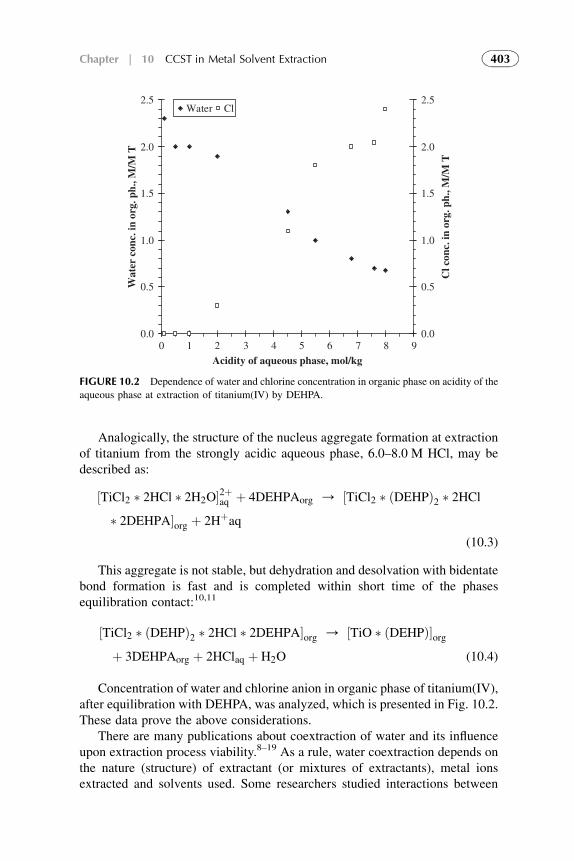
Analogically, the structure of the nucleus aggregate formation at extractionof titanium from the strongly acidic aqueous phase, 6.0–8.0 M HCl, may bedescribed as:
½TiCl2 � 2HCl � 2H2O�2þaq þ 4DEHPAorg / ½TiCl2 � ðDEHPÞ2 � 2HCl� 2DEHPA�org þ 2Hþaq
(10.3)
This aggregate is not stable, but dehydration and desolvation with bidentatebond formation is fast and is completed within short time of the phasesequilibration contact:10,11
½TiCl2 � ðDEHPÞ2 � 2HCl � 2DEHPA�org / ½TiO � ðDEHPÞ�orgþ 3DEHPAorg þ 2HClaq þ H2O (10.4)
Concentration of water and chlorine anion in organic phase of titanium(IV),after equilibration with DEHPA, was analyzed, which is presented in Fig. 10.2.These data prove the above considerations.
There are many publications about coextraction of water and its influenceupon extraction process viability.8–19 As a rule, water coextraction depends onthe nature (structure) of extractant (or mixtures of extractants), metal ionsextracted and solvents used. Some researchers studied interactions between
0.0
0.5
1.0
1.5
2.0
2.5
0 1 2 3 4 5 6 7 8 9
Acidity of aqueous phase, mol/kg
Wat
er c
onc.
in o
rg. p
h., M
/M T
0.0
0.5
1.0
1.5
2.0
2.5
Cl c
onc.
in o
rg. p
h., M
/M T
Water Cl
FIGURE 10.2 Dependence of water and chlorine concentration in organic phase on acidity of the
aqueous phase at extraction of titanium(IV) by DEHPA.
403Chapter | 10 CCST in Metal Solvent Extraction
metal cations and water molecules using different methods such as perturba-tion, molecular dynamic simulations, and quantum chemical calculations.18
Water molecules in the close vicinity of cations are strongly structured andpresent a constrained orientation toward the ion. Water molecules only are freeto rotate at cation–water oxygen distance of 2 A. At larger distances, the ion–water interactions are mainly electrostatic. Interaction energy vary from17 kcal/mol for Rb to 57 kcal/mol for Mg, and 98 kcal/mol for Be cations,interacting with a single water molecule of the first hydration shell. Polarizationeffects are arised from ion–water interactions.
Alcohols compete with water for coordination sites around cations.8c,20,21 Inthis approach, coextracted water plays a very active role forming H-bondedintermediates with extractant and other components of organic phase.
Low extraction of titanium by DEHPA from the aqueous phases withmedium acidities, z2 MHCl/kg (see Fig. 10.1, Region I) showed that interac-tion through solvation begins practically only at relatively high concentrationsof titanium (see Fig. 10.3) in the aqueous phase. Affinity constant ratiokTiDEHPA/kTiW ¼ 0.036 (see Table 10.1) is very small for detection of titaniumtransfer from the aqueous to organic phase at low concentrations.
Only at relatively high titanium concentrations in the aqueous phase itsvisual transfer into organic phase was observed. May be in this case, theinteractions with extractants begin through solvation with aggregation.Affinity ratio kTiDEHPA/kTiW ¼ 0.3 testifies the interaction mainly throughsolvation.
At extraction of divalent transition metals (i.e., cobalt, nickel, andcopper) with acidic organophosphorus extractants, e.g., DEHPA,22–25 nucleus
Ti extr. at acid. 2 M/kg
0
0.02
0.04
0.06
0.08
0.1
0.12
0.14
0.16
0 0.1 0.2 0.3 0.4 0.5 0.6 0.7
[Ti]aq/[Ti]total, M/M
[Ti]
org/
[DE
HP
A],
M/M
Exp Calc.
FIGURE 10.3 Comparison of experimentally obtained (points) and calculated (lines) data of
extraction of titanium(IV) chlorides by DEHPA in benzene from the aqueous solutions at initial
acidities (HCl): 2.0 mol/kg.
404 PART | II Novel Competitive Complexation/Solvation Theory
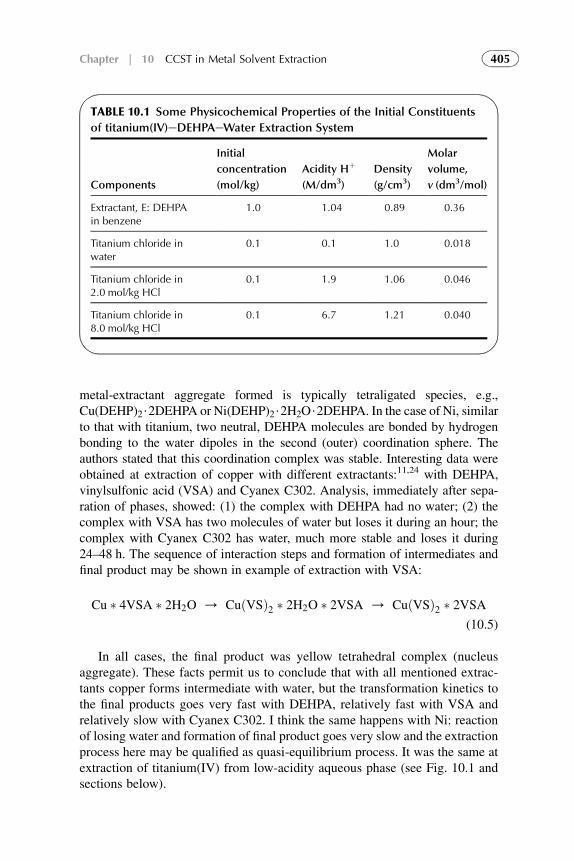
metal-extractant aggregate formed is typically tetraligated species, e.g.,Cu(DEHP)2$2DEHPA or Ni(DEHP)2$2H2O$2DEHPA. In the case of Ni, similarto that with titanium, two neutral, DEHPA molecules are bonded by hydrogenbonding to the water dipoles in the second (outer) coordination sphere. Theauthors stated that this coordination complex was stable. Interesting data wereobtained at extraction of copper with different extractants:11,24 with DEHPA,vinylsulfonic acid (VSA) and Cyanex C302. Analysis, immediately after sepa-ration of phases, showed: (1) the complex with DEHPA had no water; (2) thecomplex with VSA has two molecules of water but loses it during an hour; thecomplex with Cyanex C302 has water, much more stable and loses it during24–48 h. The sequence of interaction steps and formation of intermediates andfinal product may be shown in example of extraction with VSA:
Cu � 4VSA � 2H2O / CuðVSÞ2 � 2H2O � 2VSA / CuðVSÞ2 � 2VSA(10.5)
In all cases, the final product was yellow tetrahedral complex (nucleusaggregate). These facts permit us to conclude that with all mentioned extrac-tants copper forms intermediate with water, but the transformation kinetics tothe final products goes very fast with DEHPA, relatively fast with VSA andrelatively slow with Cyanex C302. I think the same happens with Ni: reactionof losing water and formation of final product goes very slow and the extractionprocess here may be qualified as quasi-equilibrium process. It was the same atextraction of titanium(IV) from low-acidity aqueous phase (see Fig. 10.1 andsections below).
TABLE 10.1 Some Physicochemical Properties of the Initial Constituents
of titanium(IV)eDEHPAeWater Extraction System
Components
Initial
concentration
(mol/kg)
Acidity Hþ
(M/dm3)
Density
(g/cm3)
Molar
volume,
v (dm3/mol)
Extractant, E: DEHPAin benzene
1.0 1.04 0.89 0.36
Titanium chloride inwater
0.1 0.1 1.0 0.018
Titanium chloride in2.0 mol/kg HCl
0.1 1.9 1.06 0.046
Titanium chloride in8.0 mol/kg HCl
0.1 6.7 1.21 0.040
405Chapter | 10 CCST in Metal Solvent Extraction
2.2. Competition Between Basic Interactions at Extraction
Strong (ion-exchange, chemical, electrostatic) and weak (solvating, physical,intermolecular, H-bond, and coordinate) interactions and aggregations are thebasic interactions that have to be taken into consideration in all range ofextracted metal concentrations. Competition between these interactionsforms the four region shapes (Chapter 6, Fig. 6.1) of the general extractionisotherm.
The division of the distribution curve between the regions depends on manyfactors, such as properties and concentrations of metal extracted, the propertiesof the extractants and solvents (modifiers, synergistic agents) used, tempera-ture, acidity of the treated (feed) aqueous solutions and the structure of initialcompounds, the structure of the organic compounds formed, and aggregation.
The field of extraction in literature is full of a strong, sometimes evencritical influence of solvation (hydration) effects on the extraction process. Thepolar, polarizable, hydrogen-bonding solvents change the extraction orderdramatically. Solvents are known to have numerous different effects on thereactivity.8 As a rule, two types of solvent effects are distinguished: generaleffects stemming from polarity and polarizability and specific effects origi-nating from p- or n-donor ability, hydrogen bond forming capacity, etc. Thesolvents range from the very inert through nonpolar but polarizable to the polar,polarizable and hydrogen-bonding (as water) solvents. The selectivity andposition of a given solvent is ion-specific and depends on its (solvent) basicity,but also on its bulk concentration, size of the ion, mono-poly-dentate nature,and other factors. In general, electron-withdrawing groups in the solventmolecules increase acidity and decrease basicity; electron-donating groups actin the opposite way. An increased extraction of metals may be achieved by theuse of oxygen-containing solvents, polar in nature, due to their ability toreplace water molecules. Such a cooperative effect is essentially a synergisticextraction. In order to analyze solvation effects, identification and, mostimportantly, quantification of solute–solvent interactions must be accom-plished. Complexity of solvent structure makes this task extremely difficult.
Coordination models, explaining qualitatively some mechanisms of metalsolvent extraction meets difficulties when modeling anion exchangers, acidsolvent extraction and, especially, at the attempts of quantification of themodels. The physicochemical modeling approach, competitive preferentialsolvation (COPS) approach, developed preliminary for the weak molecularinteractions26 and also applicable to strong–weak, ion–molecular interactions7
and acid–base systems5 was modified for metal extraction systems.9,10 Belowthe reader will find the mathematical description used for the CCST model inmetal extraction.
Metal ions, as well as all other species, in the phases are surrounded bya solvation shell.26 This means that they interact with all the constituents ofthe environment and, therefore, “free” metal ions, free extractant, or free
406 PART | II Novel Competitive Complexation/Solvation Theory
metal–extractant complex do not exist. Components of the solvation shellcompete to form a complex according to their electronic-geometric affinity ki(interaction strength), which is constant at a given temperature and pressure.The molecules in the solvation shell continuously and rapidly (10–11 s foralkali metal halides27) relax between complexing and solvating states. There-fore, coefficient, ki, represents the total, complexing and solvating affinityconstant.26 In all cases, the competition between the constituents of thesolvation shell for coordination sites takes place according to their affinityconstants and concentrations; thus, the contribution of each one of them ina definite coordination number cannot be well defined.
To proceed further, it is necessary to clarify the terms “complexation” and“solvation” used in this work. Strong, “long-range interactions,”27 which areelectrostatic in origin and are normally treated by Born theory, lead tocomplexation. Complexation (including ion-exchange) occurs when the inter-acting partners meet each other with well-defined orientations, allowing thefavorable overlap of their orbitals or charge (electron) transfer. Any otherinteractions lead to solvation. The last are so-called weak or “short-rangeinteractions”.27
Many transition, post-transition, and some main group elements have well-defined solvation shells, or coordination spheres in solution.4,5,7–9,26–29 This isnot the case, however, for many other cations, the solvation shells of which arediffuse and ill-defined.8a Any given arrangement, or architecture of the solva-tion shell persists for only a very short time. So, as a rule, measured property,e.g., NMR chemical shift, or UV spectral shift, can be formulated as theweighted average of the property, arising from all possible arrangements.
A composition of the solvation shell (or coordination complex) in a mixtureof metal, M, extractant, E, metal–extractant complex formed, ME, solvents, A(including water, W), and diluents, D, depends on affinity constant ki and on thenumber of potentially available molecules of every component, present in theorganic phase, i.e., on the actual concentration1 of every component.9,26
The metal ions are considered as if they are partitioned among all constituentsof the solvation shell medium and are equivalent to a weighed mixture2 ofsolutions in pure solvent components.30
As ions form definite solvates when placed in a pure solvent, they may beexpected also to form them in a mixture of solvents.8 The two solvents, A1 andA2, are considered as competing ligands. Here, the question of partitioning (and
1. Really we have to use here and below the activity of a solvent, which plays the same role as the
concentration in ideal solutions (obeying the gas laws) and is equal to concentration at infinite
dilution. Provided that the concentration of solute (acid) is small relative to solvents in the mixture,
the ratio of the activity coefficients of two solvents participating in the replacement equilibrium
can be approximated by the ratio of their molar concentrations or mole fractions. For simplicity of
the following considerations we apply a simplification where activity of every component of the
system is considered equal to its concentration.
2. For the present purpose the volume change on mixing of the solvents is neglected.8b
407Chapter | 10 CCST in Metal Solvent Extraction
selectivity) arises. Stepwise solvent replacement generally takes place as theconcentration of A2 in the bulk mixture increases, until the last A1 molecule isdisplaced (pure A2). The solvation numbers are not definite at the replacementreactions and depend on their bulk concentrations, mono-poly-dentate nature,sizes, etc.
2.3. Acid–Base Interaction Model and Amphoterism
Metal ions, extractants, active solvents, and their species formed are consideredamphoteric and may perform as acids (electron acceptors) or bases (electrondonors), depending on the structure of their functional groups and compositionof the organic phase, and on the structure of the metal species and compositionof the aqueous phase.
According to the Lewis4,5,31 and Pearson32,33 classification, manysubstances can be both bases and acids. These species have amphoteric prop-erties, depending on the ligand. Any specie with pKa value higher than the givenone may be conjugate base to it. Classification of metal ions as acids (seeSection 1) is not constant, but depends on its oxidation state and influenced bygroups and/or molecules bound to it.5,31,34
There are solvents in which a slight self-ionization is observed, and thiscannot serve as a foundation for the acid–base reactions. They are mainlyorganic solvents, particularly those containing nitrogen, phosphorus-oxygen,and sulfur-oxygen functional groups. In these solvents, the acid–base act isinitiated not by self-ionization, but by solvation of the dissolved compounds.An empirical quantum chemical methods’ approach is applied for the treatmentof metal ion solvation (coordination) in the bulk solvent, which employs theconcept of donor–acceptor interactions. The comprehensive theory of Usano-witsch35 stated that all coordinately unsaturated atomic groupings are acids andall coordinately saturated atomic groupings are bases. Coordination approachrecognizes the coordinate bond that may be formed, i.e., allows some overlap ofthe electron orbitals of the ion in the solvated ion.
As stated in Section 2.1 titanium(IV), e.g., forms very different species,depending on acidity of aqueous solution. This is evident from Fig. 10.1, whichpresents titanium(IV) chloride species as a function of pH (acidity). Thediagram shows the evident symmetry of complexing properties of titanium(IV)in acidic aqueous solutions. Region II can be divided into two symmetricalparts: IIa in the range of 0.5–0.01 MHCl (pHz 0.3–2.0) and IIb in the range of6.0–8.0 M HCl. The [TiO]2þ ion typical in Region I becomes unstable andchanges to [Ti(OH)2$4H2O]
2þ in the IIa and to [TiCl2$2HCl$2H2O]2þ in the
IIb, with coordination number of 6. The same, Regions III and IVare divided toIIIa (0.01–0.005 M HCl or pH ¼ 2.0–3.3), IVa (<0.0005 M HCl or pH > 3.3)and IIIb (8.0–11.0 M HCl), IVb (>11.0 M HCl). In the Region III, electrolyticactivity of titanium(IV) species decreases and a considerable part of them areelectroneutral: Ti(OH)4$2H2O in the IIIa and TiCl4$2HCl in the IIIb. In the
408 PART | II Novel Competitive Complexation/Solvation Theory
Region IV, the anionic complexes of titanium(IV), may be with coordinationnumber of 8 are supposed to exist in the aqueous solutions. Similar to picturesin Fig. 10.1 for titanium compounds with other mineral acids were obtainedanalyzing literature data.
Dealing with the above symmetry classification and the Statement 2 of themodel, extraction of titanium hydroxide ion, coordinated (hydrated) by watermolecules, with acidic organic extractants is considered as an acid–baseinteraction in which titanium(IV) complexed ion at pH � 2 of the aqueousphase behaves as a conjugate base (electron donor) to extractant. Extractant inan inert organic diluent (e.g., DEHPA in kerosene1,6) behaves in this case as anelectron acceptor (acid). The complexed titanium atom in organic phase iscoordinated via phosphoryl (sulfuryl, carboxyl) oxygen of organic acid andwater molecules. Suggested reaction at extraction of titanium(IV) at pH ¼ 1 inthe aqueous phase is presented in Eqn (10.1).
At pH � �0.9 (�8 mol/kg HCl) of the aqueous solutions, titanium ion,coordinated (solvated) by HCl molecules, behaves as a conjugate acid (electronacceptor) to the same acidic organic extractants. In this case, extractant behavesas an electron donor (base). The complexed titanium atom in organic phase iscoordinated via chlorine anions of HCl and phosphoryl (carbonyl) oxygenatoms of organic acid molecules (see Eqn (10.3)).
These considerations are valid for most metals and extractants: acidic,basic, and neutral, which are presented in Table 6.1 of Chapter 6. They explainthe universality of the dual behavior of different extractants and prove theiramphoterity, depending on the composition of the solute in the aqueous phaseand its acidity. The type of bonding here is predominantly ionic in the case ofhard acids and predominantly electron sharing in the case of soft acids. Someextractants, containing either monodentate and polydentate groups, form bothkinds of bonds (with electron donors of carboxyl-, phosphoryl-, sulfuryl-,amino-groups) with chelate formation. For the majority of chelating systems itseems to be a rule that whenever the coordination number of the metal equalsdouble its oxidation (or ionic charge) number, the chelate formed satisfies thecoordination requirements of the metal and the metal is readily extractable intoboth polar and nonpolar solvents.6,36 On the other hand, when a metal ion hasa coordination number higher than twice its ionic charge, the metal retains oneor more water (or acid) molecules in its first coordination sphere in order tosatisfy its coordination requirements.
2.4. Aggregation
Aggregation mechanisms and species formed are changing with increasingloading of organic phase by metal specie, and should be considered andanalyzed in all regions of the general extraction isotherm (Chapter 6, Fig. 6.1).
It is well known that the stoichiometry of the extracted species changes asloading increases. This phenomenon was described by some authors through
409Chapter | 10 CCST in Metal Solvent Extraction
aggregation mechanisms.2,9,10,22,23,26,37–41 Aggregation was observed atextraction of metal ions by acidic extractants,2,10,22,23,39–41 of metal ions andacids by basic and neutral extractans.9,15,26,37,38
According to CCST at low concentrations of the metal in the organic phase,metal–extractant complex, surrounded by its solvation shell (or coordinationsphere) forms a geometric structure, which is denoted as a nucleus aggregate.The solvation shell in the nucleus aggregate is open to bulk solvents and ischaracterized by the fast exchange with the bulk solvents. These are Regions1 and 2 on the shape of general extraction isotherm (Chapter 6, Fig. 6.1) inwhich the ratio CMorg/CME � 1.
Once again we have to repeat an important statement: What are thesolvation shell, the nucleus aggregate, and the coordination complex?These are three nominations of the same physicochemical reality. The firstnomination considers a metal ion as interacting and microscopically par-titioning between different solvents (in case that solvent–solvent interac-tions may be neglected) forming some kind of a virtual physical entity,called solvation shell. It is a statistical thermodynamics’ nomination, whichis convenient for mathematical description. The second description, nucleusaggregate, describes the same but real physical entity with stereo-specificbonds and orientation in the bulk organic solution. “Coordination complex”and “nucleus aggregate” nominations are equal for metals with the coor-dination sphere of definite number and geometry. In the presented theory,the nomination of “nucleus aggregate” is used as universal, not only formetals.
Region 1 (Chapter 6, Fig. 6.1) is characterized by metal–extractant equiv-alent concentration ratios, CMorg/CME < 1 (more than one equivalent ofextractant to one equivalent of metal) and PMEs � PMEc. The structures of thenuclei aggregates in this region are formed mainly through the weak interac-tions (hydrogen, coordination bonding), but, to some extent, through the strongelectrostatic, charge transfer interactions of metal ion with extractant. The pHdependence in this region is not pronounced,2,23,27,37,41 but stability pH limi-tations of the formed complexes are observed.
Formation of nuclei aggregates in Region 2 is driven mainly by strong(electrostatic, ion-exchange, ion-pair) interactions: PMEs < PMEc and CMorg/CME z 1. The structures of the nuclei aggregates in this region are formedmainly through the cation exchange of metal ions with proton of organic acid orwith another cation, but, to some extent, through the weak H-bond or coordi-nation interactions with molecule of extractant and/or other components.Divergence of the distribution curve slope from the 1/1 equivalents of the M–Ecomplex is explained by weak interactions. The interactions in this region arestrongly dependent on pH or anion concentration in the aqueous phase.
According to the presented theory (see Chapter 7), the difference betweenthe Regions 1 and 2 is mainly in the magnitude of the affinity constants ratioskMEc/kMes at the same concentrations of extractant, water in organic phase, and
410 PART | II Novel Competitive Complexation/Solvation Theory
affinity coefficient of metal ion in pure water. So, all coordination structureschemes of the nuclei aggregates in Region 1 may belong to Region 2, but atkMEc > kMEs. It follows that the slopes of the distribution curve in Chapter 6,Fig. 6.1 for Regions 1 and 2 may have all magnitudes between two extremalstructures: at kMEc / 0 and at kMEs / 0.
When metal concentration is increased the nuclei aggregates interact andform linear, or ringed (cyclic) aggregates.16,20–23,25,41 This is Region 3, inwhich the equivalent of metal to the equivalent of extractant ratio is: CMorg/CME > 1. The Region 3 is characterized by the bridging of nuclei aggregateswith metal ion (or its salt), molecules of extractant, or active adduct (includingwater). Competition between these components influences the slope value ofthe curve in the Region 3. All components of the linear (or cyclic) aggregatesare also open to the bulk solvents and exchange between the aggregatecomponents and the bulk solvents continue to be fast.
At high concentrations of metal ion, upon reaching a critical size, thestructural reorganization of the linear (or cyclic) aggregates occurs and three-dimensional supramolecular structures, reversed micelle-like, or cross-linkedcluster-like, are formed.20–23,25,41,42 This is Region IV. Above-stoichiometricloading and massive third-phase formation are typical for this region.
Region IV is characterized by PMEs < PMEc and CMorg/CME >> 1. Inter-actions in this region are driven by the three-dimensional structures formationlaws (cross-linking, micellation, gelation, and polymerization). Host–guestinteraction models can be used for analysis of these shapes; guest molecules areconfined by different types of interactions, in the cavities of the host system.High polarity and well-defined structures with known number of sites are verysuited for extraction and reaction purpose. Structure can change from a globularreverse micellar arrangement to a cylindrical amphoteric shape. As a result ofthis, the polar interior is directed toward the aqueous or organic phases. Fordetails, see supramolecular compounds formation and application in solventextraction, presented in the chapters of Part III.
The exchange rate (and therefore, preferential competition) between thecomponents in the solvation shell and the bulk phase depends on the orientationof the polar groups relative to the bulk phase, inside or outside the aggregatecavity. Components of the voluminous aggregates are mainly closed to the bulksolvents and the exchange between aggregate components and bulk solvents arecontrolled by diffusion kinetics.
The rates of three-dimensional aggregate formation and destruction maydiffer very strongly, especially in the case of micelle-like aggregates. So,equilibrium state has to be controlled, especially at stripping experiments.
At extraction of titanium from its high concentration aqueous solutions6
massive formation of the third phase was observed. After aging of the separatedorganic phase it was transformed into gel.
Spectrometric investigation of titanium(IV) loaded in DEHPA at contactwith aqueous phases of different acidities (ranged from 0.1 to 7.6 M/Kg)
411Chapter | 10 CCST in Metal Solvent Extraction
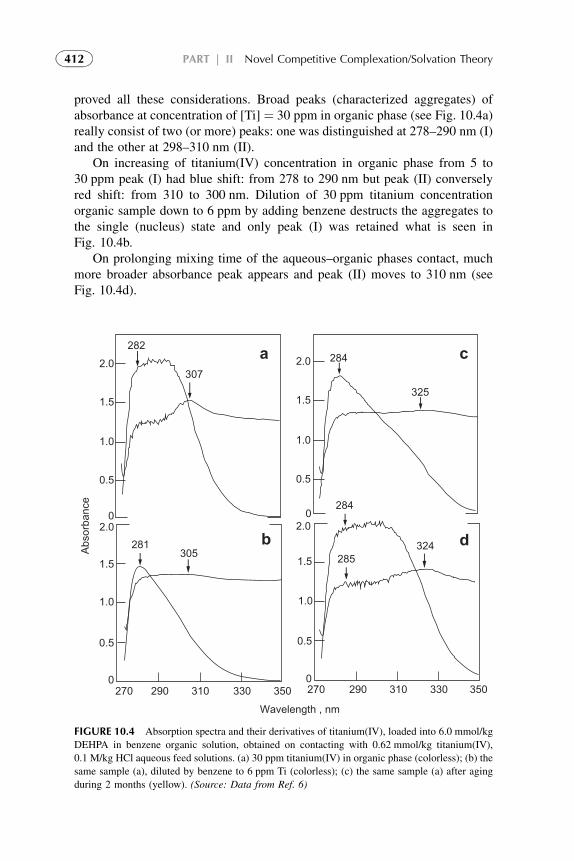
proved all these considerations. Broad peaks (characterized aggregates) ofabsorbance at concentration of [Ti] ¼ 30 ppm in organic phase (see Fig. 10.4a)really consist of two (or more) peaks: one was distinguished at 278–290 nm (I)and the other at 298–310 nm (II).
On increasing of titanium(IV) concentration in organic phase from 5 to30 ppm peak (I) had blue shift: from 278 to 290 nm but peak (II) converselyred shift: from 310 to 300 nm. Dilution of 30 ppm titanium concentrationorganic sample down to 6 ppm by adding benzene destructs the aggregates tothe single (nucleus) state and only peak (I) was retained what is seen inFig. 10.4b.
On prolonging mixing time of the aqueous–organic phases contact, muchmore broader absorbance peak appears and peak (II) moves to 310 nm (seeFig. 10.4d).
2.0
1.5
1.0
0.5
0
1.5
1.0
0.5
0270 290 310 330 350 270 290 310 330 350
1.5
2.0
1.0
0.5
0
1.5
1.0
0.5
0
2.02.0281
305b d
a c282
307284
325
Wavelength , nm
Abso
rban
ce
285324
284
FIGURE 10.4 Absorption spectra and their derivatives of titanium(IV), loaded into 6.0 mmol/kg
DEHPA in benzene organic solution, obtained on contacting with 0.62 mmol/kg titanium(IV),
0.1 M/kg HCl aqueous feed solutions. (a) 30 ppm titanium(IV) in organic phase (colorless); (b) the
same sample (a), diluted by benzene to 6 ppm Ti (colorless); (c) the same sample (a) after aging
during 2 months (yellow). (Source: Data from Ref. 6)
412 PART | II Novel Competitive Complexation/Solvation Theory
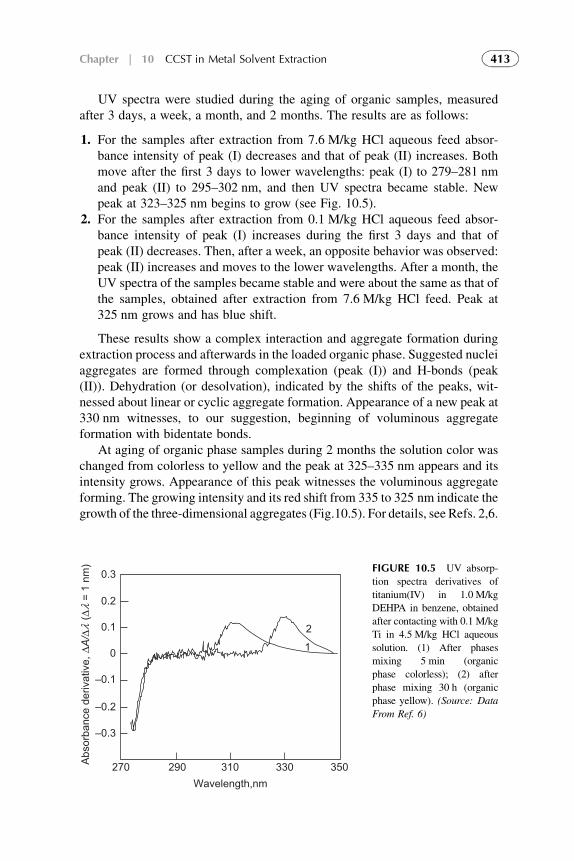
UV spectra were studied during the aging of organic samples, measuredafter 3 days, a week, a month, and 2 months. The results are as follows:
1. For the samples after extraction from 7.6 M/kg HCl aqueous feed absor-bance intensity of peak (I) decreases and that of peak (II) increases. Bothmove after the first 3 days to lower wavelengths: peak (I) to 279–281 nmand peak (II) to 295–302 nm, and then UV spectra became stable. Newpeak at 323–325 nm begins to grow (see Fig. 10.5).
2. For the samples after extraction from 0.1 M/kg HCl aqueous feed absor-bance intensity of peak (I) increases during the first 3 days and that ofpeak (II) decreases. Then, after a week, an opposite behavior was observed:peak (II) increases and moves to the lower wavelengths. After a month, theUV spectra of the samples became stable and were about the same as that ofthe samples, obtained after extraction from 7.6 M/kg HCl feed. Peak at325 nm grows and has blue shift.
These results show a complex interaction and aggregate formation duringextraction process and afterwards in the loaded organic phase. Suggested nucleiaggregates are formed through complexation (peak (I)) and H-bonds (peak(II)). Dehydration (or desolvation), indicated by the shifts of the peaks, wit-nessed about linear or cyclic aggregate formation. Appearance of a new peak at330 nm witnesses, to our suggestion, beginning of voluminous aggregateformation with bidentate bonds.
At aging of organic phase samples during 2 months the solution color waschanged from colorless to yellow and the peak at 325–335 nm appears and itsintensity grows. Appearance of this peak witnesses the voluminous aggregateforming. The growing intensity and its red shift from 335 to 325 nm indicate thegrowth of the three-dimensional aggregates (Fig.10.5). For details, see Refs. 2,6.
0.3
0.2
0.1
0
–0.1
–0.2
–0.3
270 290 310 330 350Wavelength,nm
Abso
rban
ce d
eriv
ativ
e,
= 1
nm)
1
2
ΔA/Δ
(Δ
FIGURE 10.5 UV absorp-
tion spectra derivatives of
titanium(IV) in 1.0 M/kg
DEHPA in benzene, obtained
after contacting with 0.1 M/kg
Ti in 4.5 M/kg HCl aqueous
solution. (1) After phases
mixing 5 min (organic
phase colorless); (2) after
phase mixing 30 h (organic
phase yellow). (Source: Data
From Ref. 6)
413Chapter | 10 CCST in Metal Solvent Extraction
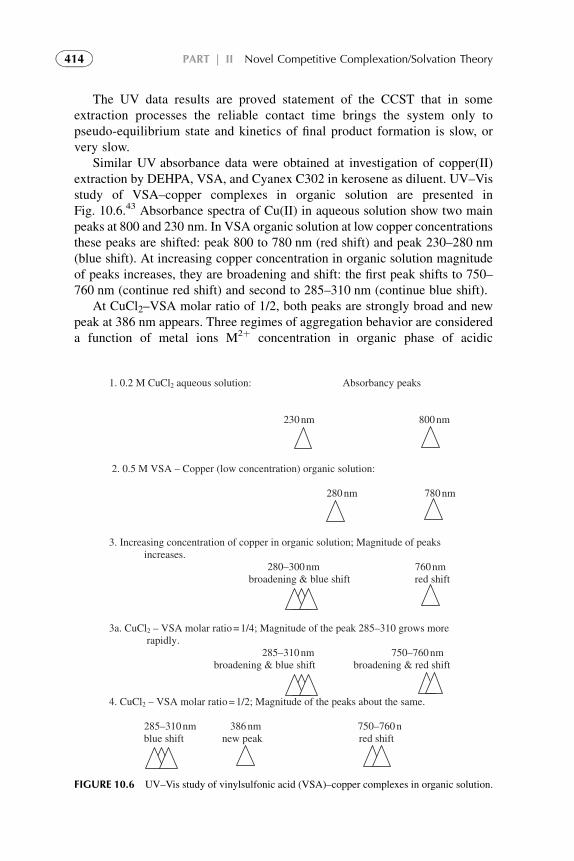
The UV data results are proved statement of the CCST that in someextraction processes the reliable contact time brings the system only topseudo-equilibrium state and kinetics of final product formation is slow, orvery slow.
Similar UV absorbance data were obtained at investigation of copper(II)extraction by DEHPA, VSA, and Cyanex C302 in kerosene as diluent. UV–Visstudy of VSA–copper complexes in organic solution are presented inFig. 10.6.43 Absorbance spectra of Cu(II) in aqueous solution show two mainpeaks at 800 and 230 nm. In VSA organic solution at low copper concentrationsthese peaks are shifted: peak 800 to 780 nm (red shift) and peak 230–280 nm(blue shift). At increasing copper concentration in organic solution magnitudeof peaks increases, they are broadening and shift: the first peak shifts to 750–760 nm (continue red shift) and second to 285–310 nm (continue blue shift).
At CuCl2–VSA molar ratio of 1/2, both peaks are strongly broad and newpeak at 386 nm appears. Three regimes of aggregation behavior are considereda function of metal ions M2þ concentration in organic phase of acidic
1. 0.2 M CuCl2 aqueous solution: Absorbancy peaks
230 nm 800 nm
2. 0.5 M VSA – Copper (low concentration) organic solution:
280 nm 780 nm
3. Increasing concentration of copper in organic solution; Magnitude of peaks increases.
280–300 nm 760 nm broadening & blue shift red shift
3a. CuCl2 – VSA molar ratio = 1/4; Magnitude of the peak 285–310 grows more rapidly.
285–310 nm 750–760 nm broadening & blue shift broadening & red shift
4. CuCl2 – VSA molar ratio = 1/2; Magnitude of the peaks about the same.
285–310 nm 386 nm 750–760 n blue shift new peak red shift
FIGURE 10.6 UV–Vis study of vinylsulfonic acid (VSA)–copper complexes in organic solution.
414 PART | II Novel Competitive Complexation/Solvation Theory
extractants:11,22,23 the tetrametric species of type ML2$2HL d> linearaggregates d> reversed micelles.
One more experimental proof of closed reversed micelles formation ispresented in Chapter 7, Fig. 7.8, where titration of the high-loaded (0.9 M/M)organic samples was followed by destruction of the closed reversed micelles,filled with aqueous solution, what was indicated by the sudden increase of thesample acidity in the middle of titration of samples.
3. MATHEMATICAL SUPPLEMENT FOR THE CCST IN METALEXTRACTION
3.1. General Considerations
Let us consider an extraction system in which E is a monobasic organic acid, Mis a monovalent metal ion, A is an active solvent, W is water (in organic), D isan inert diluent, Ci are concentrations of extracting components in the bulkorganic phase (CE, CA, CWorg, CD), and kMi are affinity constants of metal ion toevery component. A commonly used concentration scale is the mole fraction.32
Solvent–solvent interactions are neglected.A set of equations may be obtained for a relatively dilute solution of metal
at the equal volumes of the phases:
C0M ¼ CMaq þ CMorg ¼ CMaq þ CME þ CMW þ CMA þ CMD (10.6)
where C0M, is the initial (or total) concentration of the metal ion; CMaq is the
concentration of the metal in the aqueous phase; CMorg is the concentration ofthe metal in the organic phase; CME, CMW, CMA, and CMD are the concentra-tions of the metal in the mixed solvation shell of the organic phase: inextractant, water, active solvent, and diluent, respectively, at equilibrium.
Xn1
PMi ¼ 1 (10.7)
where PMi is the generalized partitioning factor of the metal ion in homogenousmedia.26 Partitioning factor PMi is
PMi ¼ kMiCiPn1kiCi
(10.8)
CMi ¼ CMorgPMi (10.9)
or for the system considered:
CME ¼ CMorgkMECE
kMECE þ kMWCWorg þ kMACA þ kMDCD(10.10)
415Chapter | 10 CCST in Metal Solvent Extraction
CMW ¼ CMorgkMWCWorg
kMECE þ kMWCWorg þ kMACA þ kMDCD(10.11)
CMA ¼ CMorgkMACA
kMECE þ kMWCWorg þ kMACA þ kMDCD(10.12)
CMD ¼ CMorgkMDCD
kMECE þ kMWCWorg þ kMACA þ kMDCD(10.13)
For solvent A0, partially soluble in both aqueous and organic phases, thepartitioning factor is
CMA0 ¼ CMorg
kMA0CA0org
kMECE þ kMWCWorg þ kMA0CA0org þ kMDCD(10.14)
where CA0 org ¼ C0A)FA0 ;C0
A is the total concentration of the solvent A0; F0A is
its partition factor between the organic and aqueous phases, determinedexperimentally at the absence of metal in the system.
Metal ions are present in both the complexed and the solvated forms withextractant in the solvation shell. Therefore, partitioning factor PME can bedivided into two:
PME ¼ PMEc þ PMEs (10.15)
where PMEc and PMEs represent partitioning factors of the metal ions in thecomplexed and solvated forms, respectively. So, metal ion concentrations in thecomplexed, CMEc, and solvated, CMEs, forms in the solvation shell are deter-mined by equations:
CMEc ¼ CMorgkMEcCE
kMEcCE þ kMEsCE þ kMWCWorg þ kMACA þ kMDCD
(10.16)
CMEs ¼ CMorgkMEsCE
kMEcCE þ kMEsCE þ kMWCWorg þ kMACA þ kMDCD
(10.17)
where kMEc and kMEs are affinity constants of the metal ion toward extractantin the complexed and solvating forms, respectively.
The actual value of the physicochemical property X (e.g., chemical shift, d,in NMR, spectral shift, n, or molar extinction coefficient, 3, in UV–Vis, changesin free energy, DG, etc.) measured in mixed solvents is considered to be theweighed sum of this same property measured in pure solvent constitu-ents.7,9,10,26–30 In a mixed system, the contribution of each solvent on the shiftof this property X is additive:
X ¼ PMEXME þ PMWXMW þ PMAXMA þ PMDXMD (10.18)
416 PART | II Novel Competitive Complexation/Solvation Theory
3.2. Analysis of the M–E–W System
When the classical theories are experimentally tested, water in the initial solutionof metal ion-in-water, M0
W, is replaced by extractant E, to arrive, finally, to thesolution of metal-in-pure E. The corresponding variation of the physicochemicalproperty ofM constitutes a substitution profile, the linearization ofwhichmakes itpossible to determine the thermodynamic and spectroscopic properties of M–E–W interactions and distributions. As a rule, these theories do not distinguishquantitatively between complexation and solvation in the M–E–W interactions.Also, they do not predict quantitatively the influence of different solvents andadducts (enhancers, modifiers, synergistic agents, and mixed extractants).
Validity of the presented approach, verified experimentally, gives a key forquantitative analysis and preliminary prediction of suitable extraction systemsfor different metals’ separation.
Let us consider an M–E–W extraction system in which metal ion, Mzþ,NM-molecules – extractant (E), NE-molecules – water (W), NW-moleculesparticipate in a single reaction act. Here, z is the oxidation state of metal ion.
For simplicity, let us introduce some preliminary assumptions:
1. One metal ion, Mzþ, participates in the formation of the single solvationshell, NM ¼ 1.
2. Acidic organic extractant is monobasic, E ¼ HL, where L is the dissociatedform (ligand) of the extractant molecule, and completely insoluble in theaqueous phase.
3. The diluent D is inert enough and does not participate in solvation.4. All components of the system are monomers in a pure, initial state.5. The volume change on mixing of the solvents is neglected.6. Water in the organic phase after equilibration, separation, and centrifugation
is present as bonded only in the solvation shell, i.e., any solubility of waterin the bulk organic solvents’ mixture is excluded.
Considering three-component M–E–W system:
PME þ PMW ¼ 1 (10.19)
CWorg ¼ 1� CEvEvW
(10.20)
where vE and vW are partial molar volumes (dm3/mol) of extractant andwater.
Using Eqn (10.18), we obtain, after some algebra, the linear equation for themeasured property X:
XMW � X
CE¼ kME
kMWvWðXMW � XMEÞ �
�kME
kMWvW � vE
�ðXMW � XÞ (10.21)
417Chapter | 10 CCST in Metal Solvent Extraction
and the saturation factor Z at CE > C0M:
Z ¼ CMorg
C0M � CMorg
¼ XMW � X
XMW � XME
¼ kMEvWCE
kMW þ ðkMEvW � kMWvEÞCE; 0 < Z < 1; 0
(10.22)
or, using Eqns (10.19) and (10.20):
Z ¼ CEvE
1��vW � kMW
kMEVE
�CWorg
¼ PME
PME þ kMW
kMEvECWorg
(10.23)
and
1
Z¼ 1þ kMWCWorg
kMEPMEvE¼ 1þ kMECWorg
kMWCE(10.24)
From the slope of Eqn (10.21) plots (XMW � X) versus (XMW � X)/CE onecan obtain the affinity constant ratio kME/kMW; the intercepts give the hypo-thetical differences between the property, measured in pure extractant and inpure water. Thus, the agreement between the direct experimental determinationof the measured property (e.g., molar extinction coefficients in UV–Vis) inpure solvents and their graphically obtained values of XMW � XME may beexamined.
It can be seen that only affinity constant ratios can be obtained but notindividual k’s. This is due to the fact that only relative values can bemeasured in solution because of the ubiquitous nature of molecularinteractions. Affinity constant ratio’s value of unity suggests the same valuesof solvation effects of the metal ion with extractant in the organic phase andwith water in the aqueous phase; a large value of kME/kMW means strong orvery strong solvation–complexation effects with extractant. A positive signof a slope means that the solvation of the reactant molecules is strongerthan the product molecules. The negative slope shows that the solvationof product molecules is stronger than the reactant molecules. The solvationof the proton can be neglected since its solvation is constant for solventsused.
Using different measured properties X, we obtain relations, derived fromEqn (10.21):
For NMR, where X ¼ d (ppm) is chemical shift:26
dMW � d
CE¼ kMEvWorg
kMWðdMW � dMEÞ �
�kME
kMWvWorg � vE
�ðdMW � dÞ (10.25)
418 PART | II Novel Competitive Complexation/Solvation Theory
For UV–Vis, where X ¼ n (nm) is spectral shift:27
vMW � v
CE¼ kMEvWorg
kMWðvMW � vMEÞ �
�kME
kMWvWorg � vE
�ðvMW � vÞ (10.26)
For UV–Vis, where X ¼ 3 is molar extinction coefficient:26
3MW � 3
CE¼ kMEvW
kMWð3MW � 3MEÞ �
�kME
kMWvW � vE
�ð3MW � 3Þ (10.27)
A
CMorg¼ 3;
AME
CMorg¼ 3ME;
AMW
CMorg¼ 3MW and A is measured absorbency.
For standard molar Gibbs free energy (or enthalpy) change,27–29 whereX ¼ 6G (at constant temperature and pressure):
DG ¼ �n RT ln
�kME
kMW� CMEvECWorgvW
�or DG ¼ �n RT ln
�kME
kMW� NE
NW
�(10.28)
At NM ¼ 1 and definite solvation (or coordination) number, n ¼ NE þ NW
for monodentate ligand/extractant:
DG ¼ �n RT ln
�kME
kMW� NE
n� NE
�(10.29)
According to the theory, partitioning factors in this case are
PME ¼ NE=nþ 1 (10.30)
and
P ¼ N=nþ 1 or PMW ¼ ðn� NEÞ=nþ 1 (10.31)
NE represents the number of molecules of extractant E ¼ HL, bonded both asthe charged anion L� (complexed bonds) and as solvated (solvation, or coor-dination bonds) neutral molecules HL. The metal central ion is coordinated byz charged ligands L�, by NE � z neutral HL molecules, and by NW watermolecules, filling metal ion coordination sites up to saturation.
According to Eqn (10.15) partitioning factors PMEc and PMEs may bedetermined separately:
PMEc ¼ z=nþ 1 (10.32)
PMEs ¼ ðNE � zÞ=nþ 1 (10.33)
Some experimental techniques are able to detect separately the complexed(charge transfer bonds) and the solvated (coordinate bonds) forms or todistinguish between them (e.g., UV–Vis spectrometry for copper), while others
419Chapter | 10 CCST in Metal Solvent Extraction
may monitor only the average complexed and solvated forms together(e.g., NMR spectroscopy, potentiometric titration). For example, for Cu–DEHPA–water system11,22–24,40,41,44 measuring UV–Vis spectral shift we candetermine kMEc/kMW and kMEs/kMW by Eqn (10.25).
Measuring absorbency A at a given wavelength we can distinguish betweenthe complexed and the solvated forms:
For the complexed form at the absorbencies, Ac
Ac ¼ 3MEcCMEc (10.34)
For the solvated form at the absorbencies, As
As ¼ 3MEsCMEs (10.35)
Introducing 3fMEc (or 3fMEs) as a hypothetical molar extinction coefficient of
the complexing (or solvating) interaction:
3fMEcðor 3fMEsÞ ¼ 3MEcðor 3MEsÞ kMEcðor kMEsÞkME
(10.36)
we obtain:
CMorg
Acðor AsÞ ¼�1� vEkMW
vWkME
�1
3fMEcðor 3fMEsÞþ kMW
kMEvWCE3fMEcðor 3fMEsÞ
(10.37)
or
CMorgCE
Acðor AsÞ¼kMW
kMEvW3fMEcðor 3fMEsÞþ�1� vEkMW
vWkME
�CE
3fMEcðor 3fMEsÞ(10.38)
3.3. Analysis of More Complicated Extraction Systems
The simplest M–E–W extraction system was analyzed above. The realextraction systems are much more complicated, in which two or more metalions (M1, M2, M3) have to be selectively separated, and/or mixture ofextractants (E1, E2) and/or different active solvents as adducts (A1, A2) areused, for synergistic effect, etc. In the following chapter these systems will beanalyzed in details with quantifying equations developed and predictionsmade on the basis of the presented theory. Here, it only has to be stressed thatanalysis is based on the experimentally determined affinity constant ratios andsolvation (coordination) numbers of the aggregates, formed at differentconcentrations of the solute (metals) and solvents (extractants, adducts, etc.).For example, the contribution of every component in the complicated M–E–A–W system, where A is any active Solvent or adduct, may be evaluated atthe determined affinity constant ratios kME/kMW, kME/kMA, kMA/kMW, and
420 PART | II Novel Competitive Complexation/Solvation Theory
kEA/kEW. These data may be realized by conventional equilibrium extractionexperiment series with the simple three-component systems M–E–W, M–E–A, M–A–W, and E–A–W. Equations similar to Eqns (10.28)–(10.41) of theM–E–W system can be developed.
3.4. Independence and Transferability of Affinity Constant Values
The reasonable question is arising: What is the advantage of the presentedtheory if so many experiments have to be done?
The basic idea of the competitive preferential solvation concept is theindependence and transferability of affinity constant values from one system tothe other.
The theory of partitioning in the homogenous media implies that thecomponents act independently in their interaction with a given solute (metal).In other words, the values of kME are independent on the values of kMW or kMA
and are transferable from one system to the other. Once determined andtabulated, the data may be used in any system, containing these components. Asa result, predictions of the influence of different solutes, extractants, adducts onthe effectiveness, and selectivity of the extraction process are possible oncesome of their parameters are ascertained.
Transferability can be proved by different independent experiments withthree-component systems, proving relations:
kM1E
kM2E¼ kðM1EÞ1
kðM1WÞ1� kðM2WÞ2
kðM2EÞ2¼ kðM1EÞ1
kðM1AÞ1� kðM2AÞ2
kðM2EÞ2(10.39)
kME1
kME2
¼ kðME1Þ1kðMWÞ1
� kðMWÞ2kðME2Þ2
¼ kðME1Þ1kðMAÞ1
� kðMAÞ2kðME2Þ2
(10.40)
kMA1
kMA2
¼ kðMA1Þ1kðMWÞ1
� kðMWÞ2kðMA2Þ2
¼ kðMA1Þ1kðMEÞ1
� kðMEÞ2kðMA2Þ2
(10.41)
where the systems (all in the same inert diluent) experimentally verifiedare: M1–E–W, M1–E–A, and M2–E–W, M2–E–A, respectively, for Eqn (10.39);M–E1–W, M–E1–A, and M–E2–W, M–E2–A, respectively, for Eqn (10.40);M–A1–E, M–A1–W, and M–A2–E, M–A2–W, respectively, for Eqn (10.41).
Concentrations of extraction components in the organic phase should beknown or determined in all experiments. Water concentration in the organicphase should be determined in order to check the differences of the waterconcentration in the solvation shell in Regions I–III (see Fig. 10.1).The sameshould be done for adduct A0 that is partially soluble in water. The solubility ofA0 in the organic phase is determined in the system E–A–W (in the absence ofmetal).
The independence and transferability of affinity constants was experimen-tally proved by Purnell with coworkers45,46 for about 180 organic systems,
421Chapter | 10 CCST in Metal Solvent Extraction
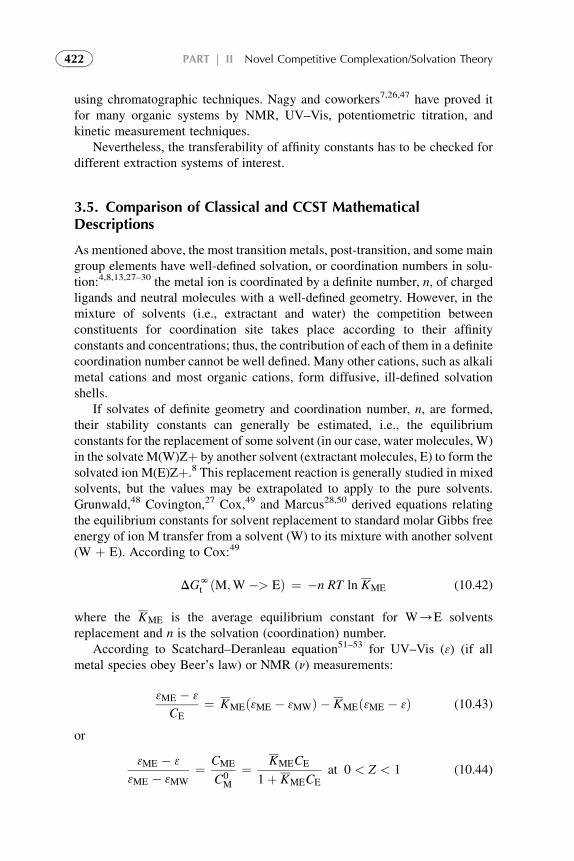
using chromatographic techniques. Nagy and coworkers7,26,47 have proved itfor many organic systems by NMR, UV–Vis, potentiometric titration, andkinetic measurement techniques.
Nevertheless, the transferability of affinity constants has to be checked fordifferent extraction systems of interest.
3.5. Comparison of Classical and CCST MathematicalDescriptions
As mentioned above, the most transition metals, post-transition, and some maingroup elements have well-defined solvation, or coordination numbers in solu-tion:4,8,13,27–30 the metal ion is coordinated by a definite number, n, of chargedligands and neutral molecules with a well-defined geometry. However, in themixture of solvents (i.e., extractant and water) the competition betweenconstituents for coordination site takes place according to their affinityconstants and concentrations; thus, the contribution of each of them in a definitecoordination number cannot be well defined. Many other cations, such as alkalimetal cations and most organic cations, form diffusive, ill-defined solvationshells.
If solvates of definite geometry and coordination number, n, are formed,their stability constants can generally be estimated, i.e., the equilibriumconstants for the replacement of some solvent (in our case, water molecules, W)in the solvate M(W)Zþ by another solvent (extractant molecules, E) to form thesolvated ion M(E)Zþ.8 This replacement reaction is generally studied in mixedsolvents, but the values may be extrapolated to apply to the pure solvents.Grunwald,48 Covington,27 Cox,49 and Marcus28,50 derived equations relatingthe equilibrium constants for solvent replacement to standard molar Gibbs freeenergy of ion M transfer from a solvent (W) to its mixture with another solvent(W þ E). According to Cox:49
DGNt ðM;W �> EÞ ¼ �n RT ln KME (10.42)
where the KME is the average equilibrium constant for W/E solventsreplacement and n is the solvation (coordination) number.
According to Scatchard–Deranleau equation51–53 for UV–Vis (3) (if allmetal species obey Beer’s law) or NMR (n) measurements:
3ME � 3
CE¼ KMEð3ME � 3MWÞ � KMEð3ME � 3Þ (10.43)
or
3ME � 3
3ME � 3MW¼ CME
C0M
¼ KMECE
1þ KMECEat 0 < Z < 1 (10.44)
422 PART | II Novel Competitive Complexation/Solvation Theory
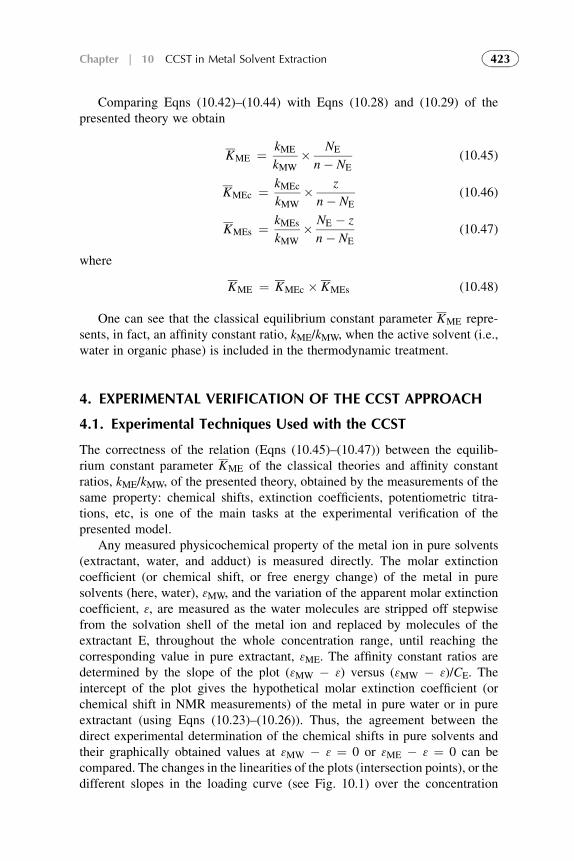
Comparing Eqns (10.42)–(10.44) with Eqns (10.28) and (10.29) of thepresented theory we obtain
KME ¼ kME
kMW� NE
n� NE(10.45)
KMEc ¼ kMEc
kMW� z
n� NE(10.46)
KMEs ¼ kMEs
kMW� NE � z
n� NE(10.47)
where
KME ¼ KMEc � KMEs (10.48)
One can see that the classical equilibrium constant parameter KME repre-sents, in fact, an affinity constant ratio, kME/kMW, when the active solvent (i.e.,water in organic phase) is included in the thermodynamic treatment.
4. EXPERIMENTAL VERIFICATION OF THE CCST APPROACH
4.1. Experimental Techniques Used with the CCST
The correctness of the relation (Eqns (10.45)–(10.47)) between the equilib-rium constant parameter KME of the classical theories and affinity constantratios, kME/kMW, of the presented theory, obtained by the measurements of thesame property: chemical shifts, extinction coefficients, potentiometric titra-tions, etc, is one of the main tasks at the experimental verification of thepresented model.
Any measured physicochemical property of the metal ion in pure solvents(extractant, water, and adduct) is measured directly. The molar extinctioncoefficient (or chemical shift, or free energy change) of the metal in puresolvents (here, water), 3MW, and the variation of the apparent molar extinctioncoefficient, 3, are measured as the water molecules are stripped off stepwisefrom the solvation shell of the metal ion and replaced by molecules of theextractant E, throughout the whole concentration range, until reaching thecorresponding value in pure extractant, 3ME. The affinity constant ratios aredetermined by the slope of the plot (3MW � 3) versus (3MW � 3)/CE. Theintercept of the plot gives the hypothetical molar extinction coefficient (orchemical shift in NMR measurements) of the metal in pure water or in pureextractant (using Eqns (10.23)–(10.26)). Thus, the agreement between thedirect experimental determination of the chemical shifts in pure solvents andtheir graphically obtained values at 3MW � 3 ¼ 0 or 3ME � 3 ¼ 0 can becompared. The changes in the linearities of the plots (intersection points), or thedifferent slopes in the loading curve (see Fig. 10.1) over the concentration
423Chapter | 10 CCST in Metal Solvent Extraction
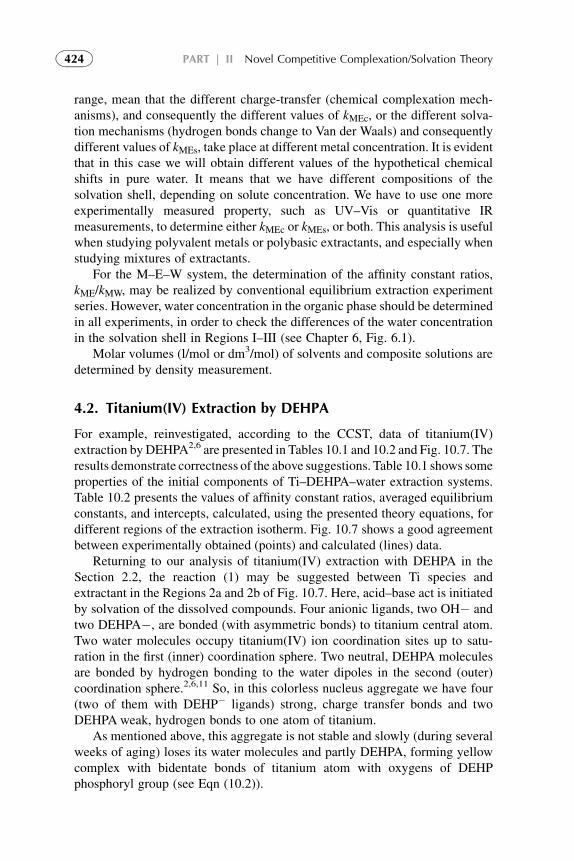
range, mean that the different charge-transfer (chemical complexation mech-anisms), and consequently the different values of kMEc, or the different solva-tion mechanisms (hydrogen bonds change to Van der Waals) and consequentlydifferent values of kMEs, take place at different metal concentration. It is evidentthat in this case we will obtain different values of the hypothetical chemicalshifts in pure water. It means that we have different compositions of thesolvation shell, depending on solute concentration. We have to use one moreexperimentally measured property, such as UV–Vis or quantitative IRmeasurements, to determine either kMEc or kMEs, or both. This analysis is usefulwhen studying polyvalent metals or polybasic extractants, and especially whenstudying mixtures of extractants.
For the M–E–W system, the determination of the affinity constant ratios,kME/kMW, may be realized by conventional equilibrium extraction experimentseries. However, water concentration in the organic phase should be determinedin all experiments, in order to check the differences of the water concentrationin the solvation shell in Regions I–III (see Chapter 6, Fig. 6.1).
Molar volumes (l/mol or dm3/mol) of solvents and composite solutions aredetermined by density measurement.
4.2. Titanium(IV) Extraction by DEHPA
For example, reinvestigated, according to the CCST, data of titanium(IV)extraction by DEHPA2,6 are presented in Tables 10.1 and 10.2 and Fig. 10.7. Theresults demonstrate correctness of the above suggestions. Table 10.1 shows someproperties of the initial components of Ti–DEHPA–water extraction systems.Table 10.2 presents the values of affinity constant ratios, averaged equilibriumconstants, and intercepts, calculated, using the presented theory equations, fordifferent regions of the extraction isotherm. Fig. 10.7 shows a good agreementbetween experimentally obtained (points) and calculated (lines) data.
Returning to our analysis of titanium(IV) extraction with DEHPA in theSection 2.2, the reaction (1) may be suggested between Ti species andextractant in the Regions 2a and 2b of Fig. 10.7. Here, acid–base act is initiatedby solvation of the dissolved compounds. Four anionic ligands, two OH� andtwo DEHPA�, are bonded (with asymmetric bonds) to titanium central atom.Two water molecules occupy titanium(IV) ion coordination sites up to satu-ration in the first (inner) coordination sphere. Two neutral, DEHPA moleculesare bonded by hydrogen bonding to the water dipoles in the second (outer)coordination sphere.2,6,11 So, in this colorless nucleus aggregate we have four(two of them with DEHP� ligands) strong, charge transfer bonds and twoDEHPA weak, hydrogen bonds to one atom of titanium.
As mentioned above, this aggregate is not stable and slowly (during severalweeks of aging) loses its water molecules and partly DEHPA, forming yellowcomplex with bidentate bonds of titanium atom with oxygens of DEHPphosphoryl group (see Eqn (10.2)).
424 PART | II Novel Competitive Complexation/Solvation Theory
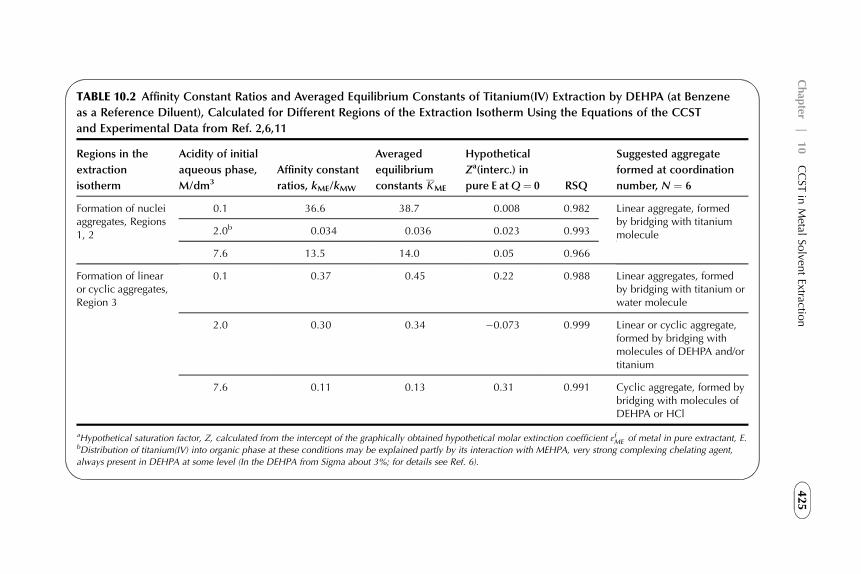
TABLE 10.2 Affinity Constant Ratios and Averaged Equilibrium Constants of Titanium(IV) Extraction by DEHPA (at Benzene
as a Reference Diluent), Calculated for Different Regions of the Extraction Isotherm Using the Equations of the CCST
and Experimental Data from Ref. 2,6,11
Regions in the
extraction
isotherm
Acidity of initial
aqueous phase,
M/dm3
Affinity constant
ratios, kME/kMW
Averaged
equilibrium
constants KME
Hypothetical
Za(interc.) in
pure E atQ¼ 0 RSQ
Suggested aggregate
formed at coordination
number, N ¼ 6
Formation of nucleiaggregates, Regions1, 2
0.1 36.6 38.7 0.008 0.982 Linear aggregate, formedby bridging with titaniummolecule2.0b 0.034 0.036 0.023 0.993
7.6 13.5 14.0 0.05 0.966
Formation of linearor cyclic aggregates,Region 3
0.1 0.37 0.45 0.22 0.988 Linear aggregates, formedby bridging with titanium orwater molecule
2.0 0.30 0.34 �0.073 0.999 Linear or cyclic aggregate,formed by bridging withmolecules of DEHPA and/ortitanium
7.6 0.11 0.13 0.31 0.991 Cyclic aggregate, formed bybridging with molecules ofDEHPA or HCl
aHypothetical saturation factor, Z, calculated from the intercept of the graphically obtained hypothetical molar extinction coefficient 3fME of metal in pure extractant, E.bDistribution of titanium(IV) into organic phase at these conditions may be explained partly by its interaction with MEHPA, very strong complexing chelating agent,
always present in DEHPA at some level (In the DEHPA from Sigma about 3%; for details see Ref. 6).
425
Chap
ter|
10
CCST
inMetal
Solven
tExtractio
n
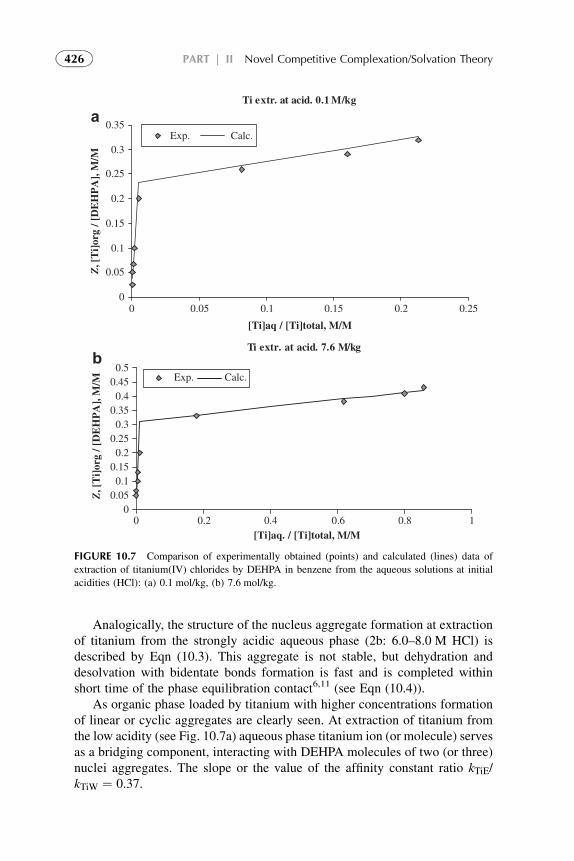
Analogically, the structure of the nucleus aggregate formation at extractionof titanium from the strongly acidic aqueous phase (2b: 6.0–8.0 M HCl) isdescribed by Eqn (10.3). This aggregate is not stable, but dehydration anddesolvation with bidentate bonds formation is fast and is completed withinshort time of the phase equilibration contact6,11 (see Eqn (10.4)).
As organic phase loaded by titanium with higher concentrations formationof linear or cyclic aggregates are clearly seen. At extraction of titanium fromthe low acidity (see Fig. 10.7a) aqueous phase titanium ion (or molecule) servesas a bridging component, interacting with DEHPA molecules of two (or three)nuclei aggregates. The slope or the value of the affinity constant ratio kTiE/kTiW ¼ 0.37.
Ti extr. at acid. 7.6 M/kg
00.050.1
0.150.2
0.250.3
0.350.4
0.450.5
0 0.2 0.4 0.6 0.8 1[Ti]aq. / [Ti]total, M/M
Z, [
Ti]
org
/ [D
EH
PA
], M
/M Exp. Calc.
Ti extr. at acid. 0.1 M/kg
0
0.05
0.1
0.15
0.2
0.25
0.3
0.35
0 0.05 0.1 0.15 0.2 0.25
[Ti]aq / [Ti]total, M/M
Z, [
Ti]
org
/ [D
EH
PA
], M
/M
Exp. Calc.
a
b
FIGURE 10.7 Comparison of experimentally obtained (points) and calculated (lines) data of
extraction of titanium(IV) chlorides by DEHPA in benzene from the aqueous solutions at initial
acidities (HCl): (a) 0.1 mol/kg, (b) 7.6 mol/kg.
426 PART | II Novel Competitive Complexation/Solvation Theory
At extraction from the high acidity aqueous phase (see Fig. 10.7b) the valueof affinity constant ratio (kTiE/kTiW¼ 0.11) is much less. In this case bridging ofnuclei aggregates is suggested mainly through the HCl molecules withformation of stable cyclic aggregates. This mechanism may be compared withone, considered at extraction of strong mineral acids by tertiary amines (fordetails see Chapter 9).
Visible extraction of titanium byDEHPA from the aqueous phases of mediumacidities begins only at relatively high titaniumconcentrations (see Fig. 10.3). Thesmall affinity constant ratio, kTiDEHPA/kTiW ¼ 0.3, permits to suggest thatextraction here is driven mainly through the solvation, typical for the Region 3.
4.3. Divalent Cations Extraction
At extraction of divalent transition metals (cobalt, nickel, and copper) withacidic organophosphorus extractants, e.g., DEHPA,7,22,23 nucleus metal-extractant aggregate is tetraligated intermediate species of type M(DEHP)2$2H2O$2DEHPAwith two H-bonded neutral DEHPA molecules, bonded to themetal central atom in the first coordination sphere, and two water molecules inthe second coordination sphere. Experiments showed that dehydration kineticswith copper was very fast and the authors determined Cu(DEHP)2$2DEHPAspecies after extraction experiment.7,22 For Ni dehydration kinetics is slow, sothe authors determined Ni(DEHP)2$2H2O$2DEHPA species. At extraction ofcopper with Cyanex C302 complexation mechanism and intermediate trans-formation kinetics was similar to nickel with DEHPA.24
The authors proved the formation of linear, cyclic aggregates and reversedmicelles using some different experimental and analytical techniques (seeabove). The linear and subsequently three-dimensional aggregation wasobserved with other organophosphorus extractants, namely, phosphonic andphosphinic acid esters.41
Cross-linking aggregation and cluster-like three-dimensional aggregateformation are also suggested.2
5. SUMMARIZING REMARKS
The readers can see that the presented model overcomes some limitations of“chemical modeling approach”,12–14 which is typical in the recent develop-ments of the classical theories of extraction. The authors consider the system asa static, where one of the mechanisms (ion exchange, coordination, or hydrogenbonding) is a dominating one, which is not changed at changing concentrationsof extracted solute. They have developed the mathematical models in whichhypothetical complexes of a specific stoichiometry or their mixtures areformed. This approach (chemical modeling) is a useful tool to describe the dataquantitatively, if complexation is strong (as in the Region 2 of generalextraction isotherm).
427Chapter | 10 CCST in Metal Solvent Extraction
In the presented theory, different regions are analyzed separately and themathematical descriptions are developed for different interactions between thecomponents of the extraction system. Interchanges in the linearity of Eqn(10.20), or the different slopes in the loading curve over the metal concentrationrange mean that the affinity constant ratios and/or concentrations of thecomponents in the aggregate (or coordination complex, or solvation shell) aredifferent. It means, also, that the different charge-transfer complexationmechanisms, and consequently the different values of kMEc, or the differentsolvation mechanisms and consequently different values of kMEs, take place atdifferent metal concentrations. So, we have to use one more experimentallymeasured property, such as UV–Vis or quantitative IR measurements, todetermine either kMEc or kMEs. Regions 1–4 in the distribution curve (seeChapter 6, Fig. 6.1) with different values of the slopes testify differentcompositions of the aggregates (solvation shells) formed and different influ-ences of the constituents of extraction system on the interaction mechanismsover the metal concentration range.
This theory introduces an active solvent (including water) as a quantitativeparameter, which is participating and influencing the formation of differentcompositions of the aggregates (solvation shells) at changing its concentrationin the organic phase.
The CCST approach is an attempt to describe the mechanisms of solventextraction with quantitative evaluation of different compounds, formed in theorganic phase at different concentrations of the solute in the aqueous phase.Of course, this theory has many simplifications and limitations (see above andthe following section). But we believe that it may be a starting point for thequantification of solvent extraction theories with an aim to predict suitableextraction systems for the separation of different metals.
REFERENCES
1. Kislik V, Eyal A. Acidity dependence of Ti(IV) extraction: a critical analysis. Solvent Extr Ion
Exch 1993;11(2):258–72.
2. Kislik V, Eyal A. Mechanisms of titanium(IV) and some other transition metals extraction by
organophosphorus acids. Proceedings of ISEC’93 1993;2:1353–60.
3. Tsuboi I, Kasai S, Yamamoto T, Komasawa I, Kunugita E. Recovery of rare metals from coal
fly ash. Proceedings of ISEC’90. Amsterdam: Elsevier; 1992. Part B, p. 1199–204.
4. Wilkinson G, Gillard RD, MaccLeverty JA, editors. Comprehensive coordination chemistry.
John Wiley & Sons, 1987, vol. 2, p. 3.
5. Douglas B, McDaniel D, Alexander J, editors. Concepts and models of inorganic chemistry.
3rd ed. New York: John Wiley & Sons; 1994. p. 309–49. 379–557.
6. Kislik V, Eyal A. Extraction of titanium(IV) by mixtures of mono- and d-(2-ethylhexyl)
phosphoric acids esters. Solvent Extr Ion Exch 1993;11(2):285–310.
7. Szpakowska M, Nagy OB. Application of the preferential solvation theory to coordinative
solute-solvent interactions. J Chem Soc Faraday Trans1 1989;85(9):2891–9.
428 PART | II Novel Competitive Complexation/Solvation Theory
8. Marcus Y. Ion solvation. London: Wiley-Interscience; 1985 (a) p. 44–6, (b) p. 184, (c) p.
194–216, (d) p. 218–234.
9. Kislik V. Application of preferential solvation model for interpretation of the mechanisms of
solvent extraction. In: Proceedings of the XVth international symposium on physico-chemical
methods of mixtures separation, “ARS SEPARATORIA 2000”, Poland, 2000, June 14–17,
p. 34–40.
10. Kislik V. Application of preferential solvation concept for interpretation of the mechanisms of
solvent extraction of acids by amines. Sep Sci Technol 2001;36(13):2899–926.
11. Kislik V, Eyal A. Unpublished experimental data, implemented for the private company,
1996–1999.
12. Eyal AM, Canari R. pH Dependence of carboxylic and mineral acid extraction by amine-
based extractants: effects of pKa, amine basicity, and diluent properties. Ind Eng Chem Res
1995;34(5):1789–98.
13. Tamada J, King C. Extraction of Carboxylic Acids by Amine Extractants. Ph.D. Thesis.
Lawrence Berkeley Laboratory, University of California, Applied Science Division; 1989.
14. Yang S, White S, Hsu S. Extraction of carboxylic acids with Tertiary and Quaternary amines:
effect of pH. Eng Chem Res 1991;30:1335.
15. Grinstead RR. Base strengths of amine in liquid-liquid extraction systems. Proceedings of
ISEC’66, Solvent Extraction Chemistry. Amsterdam: North-Holland; 1967. p. 426–32.
16. Mrnka M, Kyrsova V, Celeda J. Mechanism of iron separation by extraction with tri-n-
octylamine from chloride solutions. Proceedings of ISEC’74 1975;1:49–62.
17. Lo TC, Hanson C, Baird MHI, editors. Handbook of solvent extraction. New York: Wiley;
1983.
18. Periole X, Allouche D, Ramirez-Solis A, Ortega-Blake I, Daudey JP, Sanejound YH. New
effective potential extraction method for the interaction between cations and water. J Phys
Chem B 1998;102:8579–87.
19. Wardel JM, King CJ. Solvent equilibria for extraction of carboxylic acids from water. J Chem
Eng Data 1979;23(2):144–8.
20. Ermer O, Eling A. Molecular recognition among alcohols and amines: super-tetrahedral
crystal architectures of linear diphenol-diamine complexes and aminophenpls. J Chem Soc
Perkin Trans 2 1994;3:925–44.
21. Loehlin JH, Etter MC, Gendreau C, Cervasio E. Hydrogen-bond patterns in several 2:1 amine-
phenol cocrystals. Chem Mater 1994;6:1218–21.
22. Neuman RD, Nai-Fu-Zhou, Wu J, Jons MA, Gaonkar AG. General model for aggregation of
metal-extractant complexes in acidic organophosphorus solvent extraction systems. Sep Sci
Technol 1990;25(13–15):1655–74.
23. Neuman RD, Jons MA, Zhou NF. Photo-correlation spectroscopy applied to hydrometallur-
gical solvent-extraction systems. Colloid Surf 1990;46(1):45–61.
24. Kislik V, Eyal A. Heavy metals removal from wastewaters of phosphoric acid production:
a comparison of hybrid liquid membrane (HLM) and aqueous hybrid liquid membrane
(AHLM) technologies. Proceedings of the Conference on Membranes in Drinking and
Industrial Water Production, Paris, France, October 3–6, 2000, vol. 1, p. 503–14.
25. Yu ZJ, Ibrahim TH, Neuman RD. Aggregation behavior of cobalt(II), nickel(II), and cop-
per(II) bis(2-ethylhexyl) phosphate complexes in n-heptane. Solv Extr Ion Exch
1998;16(6):1437–63.
26. Nagy OB, Muanda H, Nagy JB. Competitive preferential solvation theory of weak molecular
interactions. J Chem Soc Faraday Trans 1978;1(74):2210–29.
429Chapter | 10 CCST in Metal Solvent Extraction
27. Covington AK, Newman KE. Thermodynamics of preferential solvation of electrolytes in
binary solvent mixtures. Adv Chem Ser 1976;155:153–96.
28. Marcus Y. Preferential solvation of ions in mixed solvents. Rev Anal Chem 1980;5:267–82.
29. Taft RW, Abboud JLM, Kamlet MJ, Abraham MN. Linear solvation energy relations. J Solut
Chem 1985;14(3):153–86.
30. Marcus Y. The properties of solvents. London: Wiley-Interscience; 1998.
31. Luder WF, Zuffanti S. The electronic theory of acids and bases. New York: Wiley; 1946.
32. Pearson RG, Vogelsong DC. Developments in crystal field theory. J Am Chem Soc
1958;80:1038.
33. Pearson RG. Hard and soft acids and bases. J Am Chem Soc 1963;85:3.
34. Devis MM. Acid-base behavior in aprotic organic solvents. Washington, D.C: National
Bureau of Standards, Monograph 105; 1968.
35. Usanowitsch M. Theory of acids and bases. J Allg Chem (USSR) 1939;9:182.
36. Dwyer A, Mellor D, editors. Chelating agents and metal chelates. Academic Press; 1964.
p. 10–93.
37. Komasawa I, Otake T, Hattori I. The effects of diluent in the liquid-liquid extraction of
copper and nickel using 2-hydroxy-5-nonylbenzophenone oxime. J Chem Eng Japan
1983;16(3):210–18.
38. Hogfeldt E, Fredlund F, Odberg L, Merenge G. On aggregation of the complex between
nitric acid and trilaurylamine dissolved in octane and m-xylene. Acta Chem Scand
1973;18(5):1781–94.
39. Marcus Y, Kertes AS. Ion exchange and solvent extraction of metal complexes. London:
Wiley-Interscience; 1969.
40. Evers A, Hancock R. A study of aggregation in the organic phase of solvent extraction systems
and its influence on the extraction process. Report Natl Inst Metall, Repub S Afr 1977;34.
41. Gaonkar AG, Garver TM, Neuman RD. H-1-NMR spectroscopic investigation of reversed
micellization in metal organophosphorus surfactant system. Colloid Surf 1988;
30(3–4):265–73.
42. Fumio Toda, Hyoda S, Okada K, Hirtsu R. Isolation of anhydrous hydrasine as stable inclusion
complexes with hydroquinone and p-methoxyphenol and their solide state reaction with esters
which gives pure hydrolyzides. J Chem Soc Chem Commun 1995;1531–2.
43. Kislik V. Reversible proton transfer and hydrogen-bond models in competitive complexation/
salvation theory of solvent extraction. In: Proceedings of International Conference: Hydrogen
bonding and Proton Transfer, Berlin, 2002, p. 324–27.
44. Kislik V, Eyal A. Hybrid liquid membrane (HLM) and supported liquid membrane (SLM)
based transport of titanium (IV). J Mem Sci 1996;111:273–81.
45. Purnell JH, Vargas de Andrade JM. Solution and complexing studies. I. Gas-liquid chro-
matographic investigation of supposed complexing systems. II. Comparison and correlation of
nuclear magnetic resonance and gas-liquid chromatografic data. J Am Chem Soc
1975;97:3585–90.
46. Laub RJ, Purnell JH. Solution and complexing Studies. III. Further evidence for a microscopic
partitioning theory of solution. J Am Chem Soc 1976;98(1):30–5.
47. Parbhoo B, Nagy O. Application of the competitive preferential solvation theory to ion-
molecule interactions. J Chem Soc Faraday Trans 1986;82(1):1789–93.
48. Grunwald E, Baughman G, Kohnstam G. The solvation of electrolytes in dioxan-water
mixtures, as deduced from the effect of solvent change on the standard partial molar free
energy. J Am Chem Soc 1960;82:5801–11.
430 PART | II Novel Competitive Complexation/Solvation Theory

49. Cox BG, Parker AJ, Waghorne WE. Coordination and ionic solvation. J Phys Chem
1974;78:1731–40.
50. Marcus Y. A quasi-lattice quasi-chemical theory of preferential solvation of ions in mixed
solvents. Austr J Chem 1983;36:1719–31.
51. Scatchard G. The attraction of proteins for small molecules and ions. Ann NY Acad Sci
1949;51:660.
52. Deranleau DA. Theory of the measurement of weak molecular complexes. I. General
considerations. J Am Chem Soc 1969;91:4044–9.
53. Deranleau DA. Theory of the measurement of weak molecular complexes. II. Consequence of
multiple equilibria. J Am Chem Soc 1969;91:4050–62.
431Chapter | 10 CCST in Metal Solvent Extraction

This page intentionally left blank
Chapter 11
Final Remarks on theCompetitive Complexation/Solvation Theory of SolventExtraction and its Application
The main objective of this book is to present a novel, competitive complexa-tion/solvation (CCS) theoretical approach to solvent extraction separationprocesses. This subject was described in Part II, Chapters 6–10, of this book. Inthis chapter some final remarks are presented in comparison with conventional(classical) principles approach.
CCS theory was developed for interpretation and quantification of inter-actions in solvent extraction systems. According to the theory the moleculesof an extracting mixture compete for solute (hydrated or solvated metal ions,acids, etc.) by the extent of their affinity to association and concentration.The solute is partitioned among the solvent components (i.e., extractant,synergistic agent, diluent, and water) forming, as a first step, H-bondedsolvation shells or reversible reactive intermediates (adducts). The followingstep is proton/electron transfer with ion-exchange or ion-pair structures’formation. As a consequence, a given measured property in mixed solventscan be calculated from values, measured in single solvent componentsystems. The theory establishes the correlation between complexation andsolvation. At low concentrations of the solute in the organic phase the solute–extractant complex with its solvation shell forms a geometric structure, whichis denoted as a single nucleus aggregate. Competition between strong(complexation) and weak (solvation) interactions causes the shape of thedistribution isotherm between two limiting shapes: pure complexation andpure solvation.
At increasing loading of organic phase different possible stages ofextraction behavior and interacting mechanisms are discussed. At higherconcentrations of the solute in the organic phase nuclei aggregates interact(“Self-assembly,” see supramolecular aggregates formation in Chapter 12) andform linear or cyclic aggregates. At high solute concentration the linear orcyclic aggregates eventually undergo a structural reorganization to form
Solvent Extraction. DOI: 10.1016/B978-0-444-53778-2.10011-1
Copyright � 2012 Elsevier B.V. All rights reserved. 433
micelle-like or cross-linking cluster-like three-dimensional association struc-tures (as a rule, forming a so-called third phase).
Active solvents (extractant, solute, synergistic agent, etc.) are consideredamphoteric and may behave as acids (electron acceptors) or bases (electrondonors), depending on the nature of their functional groups and composition ofthe organic phase and on the nature of solute species and composition of theaqueous phase. Acidic extractant interacts as a conjugate acid with hydratedsolute ions. The same acidic extractant behaves as a conjugate base to soluteions, solvated (coordinated) by strong acid molecules.
The main advantage of the presented approach lies in the mathematicaldescription that provides a key for quantitative analysis and preliminaryprediction of suitable extraction systems for different solutes separation. Moreparameters such as water and active solvent concentrations in the organic phaseare introduced to the quantitative consideration of the extraction systems inevery region of the general extraction isotherm.
The theory overcomes some limitations of the conventional stoichiometricion-exchange models. It presents the novel theoretical insights, and explainssome problems in a clear-cut manner, which required ad hoc arguments usingconventional theories.
The presented CCS modeling approach constitutes a general and usefulframework for interpretation of ion–molecular interaction data in the solventextraction systems.
Affinity constant ratios are easily acceptable through the independentmeasurements conducted with simple three-component systems. Only relativevalues of affinity constant ratios can be measured in solution because of theubiquitous nature of molecular interactions. Experimental determination of theaffinity constant ratios and solvation shell compositions, quantitative, or evensemiquantitative spectrometric determination of the solute in the complexedand solvated forms permits to set up exact form of the aggregates formed andpredicts the behavior of the extraction system of interest and influence of itsdifferent components. Affinity constant ratio’s value of unity suggests the samevalues of solvation effects of the solute with extractant in the organic phase andwith water in the aqueous phase; a large value of kSE/kSW means strongcomplexation–solvation effects with extractant. A positive sign of a slopemeans that solvation of the reactant molecules is stronger than that of theproduct molecules. A negative slope shows that solvation of the productmolecule is stronger than that of the reactant. Composition and behaviorpredictions of the extraction system of interest may be analyzed.
Interchanges in the linearity or the different slopes in the loading curveover the solute concentration range mean that the affinity constant ratiosand/or concentrations of the components in the aggregate are different. It alsomeans that the different charge-transfer complexation mechanisms, andconsequently the different values of kSEc, or the different solvation mecha-nisms, and consequently different values of kSEs, take place at different solute
434 PART | II Novel Competitive Complexation/Solvation Theory
concentrations. Therefore, we have to use an additional experimentallymeasured property, such as UV–VIS or quantitative IR measurements, todetermine kSEc/kSEs. Separate mathematical descriptions are developed fordifferent regions of the extraction isotherm.
The theory of partitioning in the homogenous media implies that thecomponents act independently in their interaction with a given solute. In otherwords, the values of kSE are independent of the values of kSW or kSA, and aretransferable from one system to the other. Influence of different solvent adductsto extractant on the effectiveness and selectivity of the extraction process ispredictable once some solvent parameters are ascertained.
The presented theory predicts the synergistic, enhancing effect of theweaker solute in the mixture of solutes on the distribution of the stronger soluteto the organic phase, or the weaker extractant in the mixture of extractants onthe distribution of the solute to the organic phase. Classical theories do notindicate the direct knowledge of this effect.
Relationship between equilibrium constant, KSi, of the conventional theoriesand affinity constant ratio, kSi/kSj, of the CCS theory, obtained by themeasurements of the same property, permits to use available equilibriumconstant data for calculations in the presented theory.
Cosolvent independence, established experimentally, allows to comparedirectly the solvating-complexing power (competition order) of variousextractants, synergistic agents, and diluents at a fixed other components of thesystem. Once determined and tabulated, the data may be used in any system,containing these components.
The readers can see now that the presented model overcomes some limi-tations of conventional “chemical modeling approach”, which is typical in therecent developments of the classical theories for extraction of metals. Theauthors consider the system as a static one, where one of the mechanisms (ionexchange, coordination, or H-bonding) is a dominating one, which is notchanged at changing concentrations of extracted solute. They have developedthe mathematical models in which hypothetical complexes of a specific stoi-chiometry or their mixtures are formed. This approach (chemical modeling) isa useful tool to describe the data quantitatively, if complexation is strong.
In the presented theory different regions are analyzed separately and themathematical descriptions are developed for different interactions between thecomponents of the extraction system. Interchanges in the linearity of equationor the different slopes in the loading curve over the metal concentration rangemean that the affinity constant ratios and/or concentrations of the componentsin the aggregate (or coordination complex or solvation shell) are different. Italso means that the different charge-transfer complexation mechanisms, andconsequently the different values of kMEc, or the different solvation mecha-nisms and consequently different values of kMEs, take place at different metalconcentrations. So, we have to use one more experimentally measured property,such as UV–VIS or quantitative IR measurements, to determine either kMEc or
435Chapter | 11 Final Remarks on the CCST of Solvent Extraction
kMEs. Regions 1–4 in the general distribution curve (see Fig. 6.1 in Chapter 6)with different values of the slopes testify different compositions of the aggre-gates (solvation shells) formed and different influences of the constituents ofextraction system on the interaction mechanisms over the metal concentrationrange. This approach is an attempt to describe the mechanisms of solventextraction with quantitative evaluation of different compounds, formed in theorganic phase at different concentrations of the solute in the aqueous phase.
Although conventional theories of solution (Chapter 1) and formation ofextractable complexes (Chapters 2 and 3) now are well advanced, predictions ofdistribution ratios are mainly done by comparison with known similar systems(Chapters 4 and 5). Solvatochromic parameters, solubility parameters, anddonor numbers, as discussed in the first part of this book, are so far mainlyempirical factors. Continuous efforts are made to predict such numbers. It islikely that with novel theory greater ranges of conditions for more systems willsuccessively encompass. Still much has to be done. In the future, the theorymay allow the assignment of exact numbers to the solvatochromic parameters,thus also permitting theoretical predictions of distribution constants for knownas well as for hypothetical (not yet synthesized) extractants.
Of course, this theory has many simplifications and limitations (see above).But I believe that it may be a starting point for the quantification of solventextraction theories with the aim to predict suitable extraction systems fordifferent Solutes’ separation.
436 PART | II Novel Competitive Complexation/Solvation Theory
Part III
Modern and Future Trendsin Fundamentals and
Applications of SolventExtraction
1. INTRODUCTION
Conventional solvent extraction, a technology for selective removal andrecovery of solutes employs an organic solvent and an aqueous solution as thetwo immiscible phases. The ability to utilize a number of different diluents,extractants, and aqueous phases makes solvent extraction a powerful separationmethod possessing a number of favorable characteristics. These include rapidextraction kinetics for many separations, the adaptability of the method toa wide number of solutes, the feasibility of back-extraction or stripping of thesolute, and the possibility of recycling the solvent and/or diluent. Furthermore,liquid–liquid extraction is capable of large volume throughput, is amenable tolarge-scale separations, and can be engineered for high selectivity and effi-ciency by the use of multistage contactors.
The suitability of using solvent extraction for a given separation is deter-mined by thermodynamic and kinetic considerations. The main thermodynamicparameter is the solute distribution ratio, DM, between the organic and theaqueous phase. The magnitude of DM and selectivity determines the feasibilityof the separation as an industrial process. Another consideration affecting thedesign of extraction processes is the extraction rate, kinetics of the process, as itdetermines the residence time of the phases in the contactor, and consequentlyits size.
In spite of the numerous advantages, there are several drawbacks to tradi-tional solvent extraction. Even with today’s environmental standards, a numberof extraction systems still utilize toxic and flammable organic diluents. When
the diluent is coupled with a highly selective extractant, the cost of the solventsystem can become very expensive. Partitioning of a polar or charged solutefrom an aqueous phase into an organic medium requires dehydration, the extentof which depends on the organic solvent. In some separation schemes this istrivial, whereas in others, particularly for the separation of metal ions, it can bevery complex.
The principle of solvent extraction - the distribution of chemical speciesbetween two immiscible liquid phases - has been applied to many areas ofchemistry. A typical one is liquid partition chromatography, where the principleof solvent extraction provides the most efficient separation process available toorganic chemistry today; its huge application has become a field (and anindustry!) of its own. The design of ion selective electrodes is another appli-cation of the solvent extraction principle; it has also become an independentfield. Both these applications are only briefly touched upon in this book onanalytical applications. Nevertheless, fundamental research on solventextraction will provide further important input into these two applications.
What are the future trends of solvent extraction?In the following chapters (12-14) I am trying to indicate some areas in this
field in which important advances in the future are expected. It may be dividedon three main subjects: 1) developments of the theory: chemistry, thermody-namics, kinetics; 2) development of materials: extractants, solvents, diluents;and 3) development of processes and techniques.
438 PART | III Modern and Future Trends in Fundamentals and Applications
Chapter 12
Modern and Future Trends inFundamentals of SolventExtraction
Chapter Outline1. Introduction 439
2. Novel Molecular Models
Theoretical Approach
440
3. Low Energy Reactions
Measurement
442
4. Expected Advances in
Kinetics Studies
442
5. Supramolecular (Supras)
Theoretical Approach
443
5.1. Supramolecular Solvent
Formation
444
5.1.1. Principles of Self-
assembly
444
5.1.2. The First Self-
assembly Process
(Self-assembly
of Amphiphilic
Molecules)
445
5.1.3. Second Self-
assemble: From
Nanometer-Sized
Amphiphilic
Aggregates to
Micrometer-
Sized Liquid
Phases
Separation
447
References 449
1. INTRODUCTION
Various instruments of theoretical chemistry have been widely used to describeseparate steps of solvent extraction. Because of the complexity of solventextraction systems, there is still no unified theory and no successful approachaimed at merging the extraction steps. The challenging problem for researchersdealing with solvent extraction, in particular with thermodynamic calculations,
Solvent Extraction. DOI: 10.1016/B978-0-444-53778-2.10012-3
Copyright � 2012 Elsevier B.V. All rights reserved. 439
is to evaluate correctly the solvent effects by the use of the most accurate explicitsolvation models and quantum mechanical (QM) calculations. However, suchcalculations on extremely large sets consisting of hundreds or even thousands ofmolecules––necessary to model all aspects of the extraction systems––are stillimpossible due to many limitations.
Chemical quantum mechanics are now promising to contribute to predictionof distribution ratios, particularly when used in interactive computer modelingof chemical structures and reactions. This will provide better understanding ofsolute–solvent interactions and the theory of solubility, which is the foundationfor prediction of distribution ratios. Progress is likely to speed up as efficientcomputing programs with large data bases become more easily available on themarket at more attainable prices. Such interactive computer research will beable to explain poor extractability due to steric hindrance, hydration, thesynergistic effect of specific additives, etc., and, as a consequence, give clues tobetter extraction reagents and conditions.
2. NOVEL MOLECULAR MODELS THEORETICAL APPROACH
The methods applied to the description of complex formation, hydration, andsolvation are characterized by different degrees of approximation made whensolving the equations. But even the introduction of quantum mechanics(QM), molecular mechanics (MM), and molecular Dynamics (MD) methodsdoes not allow one to make effective calculations. This is because it iscommon in this approach to neglect interactions for pairs of atoms separatedby distances greater than a selected cutoff value. The range of interactions inthe solution is thus limited by the size of the system studied. This arbitrarilyassumed division of the liquid phase into molecules that interact with oneanother and molecules that are neglected in the calculations and whosecontribution is estimated by corrections makes the calculations possible.Nevertheless, in spite of this simplification, such calculations are still verydifficult, time-consuming, and expensive; moreover, the results obtained areoften insufficiently accurate, inconsistent with the experiment, and thereforeinconclusive.
The development of other methods with less computing requirements andfree of such limitations seems to be necessary in order to better understand theprocesses that take place in the liquid phase, understand their molecularmechanism, predict the influence of various factors on their equilibria andkinetics, and evaluate correctly the thermodynamic functions for the wholeprocess and its particular steps.
The recent theoretical approach based on the information theory (IT) instudying aqueous solutions and hydration phenomena shows such a direction.IT is a part of the system based on a probabilistic way of thinking aboutcommunication.1 It consists of quantitative description of the information bydefining entropy as a function of probability.
440 PART | III Modern and Future Trends in Fundamentals and Applications
The probability of cavity formation in bulk water, able to accommodatea solute molecule by exclusion of a given number of solvent molecules,was inferred from easily available information about the solvent, such asthe density of bulk water and the oxygen–oxygen radial distributionfunction.2
MacKay’s textbook1 offers not only a comprehensive coverage of the IT, butalso probabilistic data modeling and the mathematical theory of neuralnetworks (NN). The wide range of applications of NN also comprises opti-mization issues. The information-theoretic capabilities of some NN algorithmsare examined and NN are motivated as statistical models.
The applications of NN to solvent extraction suffer from an essentiallimitation in that they do not apply to processes of quantum nature; therefore,they are not able to describe complexes in extraction systems on the micro-scopic level. In fact, the networks can describe only the pure state of simplestquantum systems, without superposition of states. NN that indirectly take intoaccount quantum effects have already been applied to chemical problems. Forexample, the combination of QM molecular electrostatic potential surfaceswith NN makes it possible to predict the bonding energy for bioactive mole-cules with enzyme targets. Computational NN were employed to identify theQM features of the inhibitory molecules that contribute to bonding. Thisapproach generates the relationships between the QM structure of the inhibitorymolecule and the strength of bonding.
Interactions on the microscopic level can be treated by a new kind ofNN––quantum neural networks (QNN).3 Early publications were concernedwith problems different from those discussed in this book. It may beexpected that the QNN approach will also be helpful in describing inter-molecular interactions accompanying the processes of extraction. Themethods developed from either NN or IT undoubtedly reduce the require-ments that must be applied.
Unfortunately, the application of these methods to the description ofprocesses that take place in solutions, such as solvation, still requires therejection of certain interactions between molecules that build the systems. Thisresults from the tremendous number of interactions of the order of 2 N, where Ndenotes the number of molecules in the system. Optimization of such largesystems consisting of mutually interacting elements requires special numericalprocedures. It seems that application of approximate algorithms bring us closerto the understanding of the processes that take place in solutions, in spite ofsome disadvantages.
As far as the author is aware, the competitive complexation/solvation theory(CCST)––described in Part II of this book––has been used in the novel QMapproach to the explicit solvation models, in particular to solvation of metalcomplexes. The author suggests that this direction is expected to be importantin the future developments of theoretical principles of solvent extractionprocesses.
441Chapter | 12 Future Trends in Fundamentals of Solvent Extraction
3. LOW ENERGY REACTIONS MEASUREMENT
Distribution ratio measurements offer a method to investigate low energyreactions in solutions, such as weak solute–solute and solute–solvent interac-tions, especially in the organic phase. A 10% change in the distribution ratio,which can be measured easily and accurately in the distribution range of 0.01–100 (most commonly used), corresponds to an energy change of only 0.2 kJ/mol. This technique has only been slightly exploited for this purpose. It isparticularly noteworthy to find how few thermodynamic studies have beenmade of the distribution or extraction constants, as enthalpy and entropy valuesgive a good indication of the driving force of the extraction and also mayindicate the structure of the molecular species in the organic solvent.
Separation of metals by solvent extraction is usually based on the variouscomplexing properties of the metals. Separation systems may be chosen on thebasis of complex formation constants obtained from the literature. However,the literature often shows different values for “same systems” causingconsiderable concern for process design chemists. There is an obvious need foran objective presentation of the uncertainty in the published equilibriumconstants––however conditional they may be.
The driving force of the transport of salts, proteins, etc., through the cellmembrane from the nucleus to the body fluids, and vice versa, is a complicatedbiochemical process. As far as is known, this field has not been explored bytraditional solution chemists, although a detailed analysis of these transferprocesses indicates many similarities with solvent extraction processes (equi-librium as well as kinetics). It is possible that studies of such simpler modelsystems could contribute to the understanding of the more complicatedbiochemical processes.
Fundamental solvent extraction research will continue to contribute to thedevelopment of further selective analytical techniques.
Solvent extraction deals with the transport of chemical substances from onephase into another, the chemical kinetics of this process, and the final equi-librium distribution of the substances between the two phases. Such transportand distribution processes are the motors that make life in biological systemspossible. Fundamental studies of such “solvent extraction” processes contributeto the better understanding of all processes in nature. Here, only the lack ofimagination stands in the way of important new scientific discoveries.
4. EXPECTED ADVANCES IN KINETICS STUDIES
All chemical reactions occur at a certain rate. For aqueous systems, in whichno redox reactions occur (e.g., simple complex formation), equilibrium isoften attained rapidly, which is also true for adduct reactions in the organicphase, all at normal temperatures. However, the transfer of a solute from anaqueous solution to an organic solvent occurs via a phase boundary; such
442 PART | III Modern and Future Trends in Fundamentals and Applications
reactions depend on several parameters and may be quite slow. Therefore,the kinetics of solvent extraction, which is of paramount importance to allindustrial applications, is largely determined by the interfacial chemistry. Tospeed up phase transfer, the engineer tries to maximize the interfacialsurface by, e.g., violent stirring, producing billions of small droplets.Although the theory is well advanced, the interface is very complicated andits properties are difficult to investigate, particularly at the molecular level.Few applicable techniques are available, and the results are often difficult tointerpret. The coalescence of the droplets (to produce two clean phases thatare easy to separate) presents another interfacial surface problem, and so-called phase reversals may further complicate the separation. This isparticularly important in the development of new types of contactor. Muchprogress is required here and as such presents a challenge to future scientistsand engineers.
The largest research effort in extraction kinetics is likely to be in thedevelopment of solvent extraction-related techniques, such as various versionsof liquid chromatography, liquid membranes, etc. These techniques requirea detailed knowledge of the kinetics of the system to predict the degree ofseparation. It is a practical fact that most industrial solvent extractions arecarried out under nonequilibrium conditions––however close the approach maybe; e.g., centrifugal contactor-separators rarely operate at distribution equi-librium. An interesting possibility is to expand this into extractions further fromequilibrium, if the kinetics of the desired and nondesired products is different.Such operations offer a real technological challenge.
5. SUPRAMOLECULAR (SUPRAS) THEORETICAL APPROACH
Supramolecular solvents (SUPRASs) is a recent term4 to refer to nano-structured liquids generated from amphiphiles through a sequential, self-assembly process occurring on two scales: molecular and nano. This processgives, at first, three-dimensional aggregates that coacervate, in a second stage,producing water-immiscible liquids made up of large supramolecular aggre-gates dispersed in a continuous phase, generally water. Supramolecularsolvents are well known to the analytical community and have been used forlong years in extraction processes under different names (e.g., cloud pointtechnique5–7 to refer to the temperature at which nonionic surfactants start toundergo phase separation in aqueous solutions, thus becoming clouding, orcoacervates8,9 to refer to the phenomenon through which liquid–liquid phaseseparation is produced, i.e., coacervation). The use of the term “supramolecularsolvents” is here encouraged to place greater emphasis on their solvent char-acter, to differentiate them from molecular and ionic solvents, to consider thenoncovalent interactions through which molecules are held together in thesolvent, and to take into account the self-assembly processes through whichthey are formed.
443Chapter | 12 Future Trends in Fundamentals of Solvent Extraction
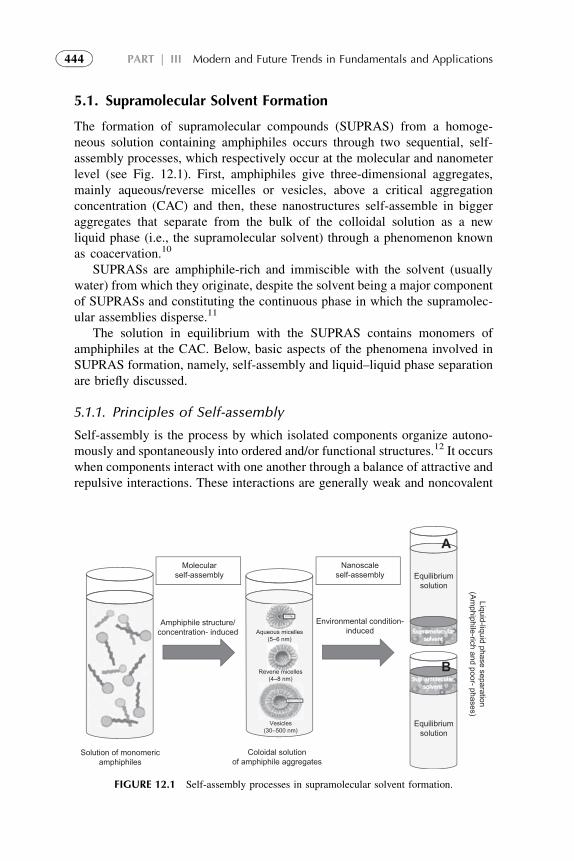
5.1. Supramolecular Solvent Formation
The formation of supramolecular compounds (SUPRAS) from a homoge-neous solution containing amphiphiles occurs through two sequential, self-assembly processes, which respectively occur at the molecular and nanometerlevel (see Fig. 12.1). First, amphiphiles give three-dimensional aggregates,mainly aqueous/reverse micelles or vesicles, above a critical aggregationconcentration (CAC) and then, these nanostructures self-assemble in biggeraggregates that separate from the bulk of the colloidal solution as a newliquid phase (i.e., the supramolecular solvent) through a phenomenon knownas coacervation.10
SUPRASs are amphiphile-rich and immiscible with the solvent (usuallywater) from which they originate, despite the solvent being a major componentof SUPRASs and constituting the continuous phase in which the supramolec-ular assemblies disperse.11
The solution in equilibrium with the SUPRAS contains monomers ofamphiphiles at the CAC. Below, basic aspects of the phenomena involved inSUPRAS formation, namely, self-assembly and liquid–liquid phase separationare briefly discussed.
5.1.1. Principles of Self-assembly
Self-assembly is the process by which isolated components organize autono-mously and spontaneously into ordered and/or functional structures.12 It occurswhen components interact with one another through a balance of attractive andrepulsive interactions. These interactions are generally weak and noncovalent
Supramolecularsolvent
Molecularself-assembly
Amphiphile structure/concentration- induced
Solution of monomericamphiphiles
Coloidal solutionof amphiphile aggregates
Nanoscaleself-assembly
Environmental condition-induced
Equilibriumsolution
Equilibriumsolution
Liquid-liquid phase separation(Am
phiphile-rich and poor- phases)
Aqueous micelles(5–6 nm)
Reverie micelles(4–8 nm)
Vesicles(30–500 nm)
A
B
Supramolecularsolvent
FIGURE 12.1 Self-assembly processes in supramolecular solvent formation.
444 PART | III Modern and Future Trends in Fundamentals and Applications
(Coulomb and hydrophobic interactions, and hydrogen bonds) but relativelyweak covalent bonds (coordination bonds) are increasingly recognizedappropriate for self-assembly.13
Components that assemble can have sizes from the molecular to the macro-scopic scales provided the appropriate conditions are met. Although much of thework in self-assembly has focused on molecular components, many of the mostinteresting applications of self-assembling processes can be found at larger sizes(nanometers tomicrometers). In fact, self-assembly is the preferredway for natureto build its animate creations onvarious length scales and is a ubiquitous process inchemistry and material science. Today, self-assembly has emerged as a discretefield of study and as a synthetic strategy.14,15
Directing self-assembling systems is possible by proper design of thecomponents, the environment, and the driving force.16 The inherent structure ofcomponents determines the complexity of the final self-assembled system, so,tailoring it provides the first means of controlling the process. Likewise, thecomponents have to be embedded in a proper environment (e.g., a solution) forthe binding force to act. Tailoring of the environment or dynamically changingit provides an important means of controlling the self-assembling system. Theenvironment can be manipulated to change the conformation of components orto alter binding forces in the system. If conditions are changed, aggregates willbe reformed and indistinguishable from the original, so they behave as adaptivematerial.17
On the other hand, components must be mobile for self-assembly to occur.In solution, thermal noise is the driving force for molecular self-assembly sinceit provides the major part of the motion required for bringing molecules intocontact. In nanoscale, mesoscopic, and macroscopic self-assembly systems,Brownian motion rapidly becomes irrelevant, and gravity and friction becomeimportant. The proper design of external agitation is fundamental to arrive ata high yield process.12
Reversibility or adjustability is a key factor for generating ordered struc-tures in self-assembly. Thus, the association of components either must bereversible or must allow them to adjust their positions within the aggregateonce it has formed. The strength of the bonds between the components,therefore, must be comparable to the forces tending to disrupt them.12
5.1.2. The First Self-assembly Process (Self-assemblyof Amphiphilic Molecules)
Aggregation of amphiphilic molecules in a variety of nanostructures is the firstself-assembly process in supramolecular solvent formation. Amphiphilesspontaneously associate, as a CAC is achieved, to minimize unfavorable sol-vophobic interactions. At CAC, it becomes energetically favorable for theamphiphiles to interact with one another. Thus, colloidal self-assembled struc-tures arise from a delicate interplay between solute–solvent and solute–soluteinteractions.18 The morphology of the aggregate depends on the relative size
445Chapter | 12 Future Trends in Fundamentals of Solvent Extraction
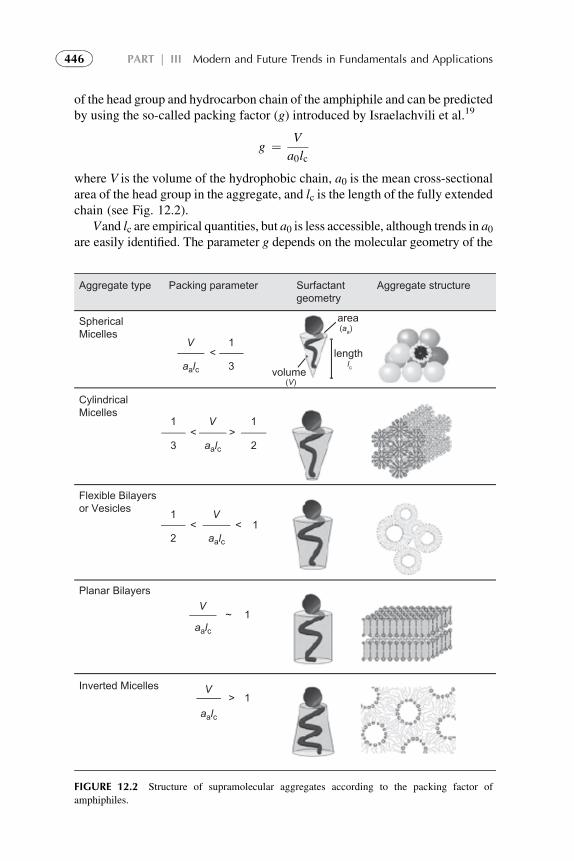
of the head group and hydrocarbon chain of the amphiphile and can be predictedby using the so-called packing factor (g) introduced by Israelachvili et al.19
g ¼ V
a0lc
where V is the volume of the hydrophobic chain, a0 is the mean cross-sectionalarea of the head group in the aggregate, and lc is the length of the fully extendedchain (see Fig. 12.2).
Vand lc are empirical quantities, but a0 is less accessible, although trends in a0are easily identified. The parameter g depends on the molecular geometry of the
SphericalMicelles
CylindricalMicelles
Flexible Bilayersor Vesicles
Planar Bilayers
Inverted Micelles
Aggregate type Packing parameter Surfactantgeometry
Aggregate structure
area(aa)
length
volume(V)
lc
1
1
1
1
1
1
1
V
V
V
V
V
3
3
<
<
< <
aalc
aalc
aalc
aalc
aalc
>2
2
~
>
FIGURE 12.2 Structure of supramolecular aggregates according to the packing factor of
amphiphiles.
446 PART | III Modern and Future Trends in Fundamentals and Applications
surfactant molecules, such as the number of hydrocarbon chains and carbonatoms, the degree of chain saturation, and the size and charge of the polar headgroup. In addition, the effects of solution conditions, including ionic strength, pH,surfactant concentration, and temperature, are included implicitly in V, a0, and lc.
Figure 12.2 depicts the structures formed by amphiphiles in a given solutionaccording to the g value. The size of an aggregate is affected by a number offactors, but can be considered in the abstract to depend primarily on thehydrocarbon chain length and the width of the head group in terms of inter-molecular forces. Small micelles composed of low numbers of amphiphiles willbe formed as the hydrocarbon chain is short and the head group is wide.
Aggregation of amphiphiles is a start–stop processdadding more surfactantresults in the formation of more aggregates of the same size. For most typicalsurfactants, the stop process emanates from head group–head group repulsion.20
5.1.3. Second Self-assemble: From Nanometer-SizedAmphiphilic Aggregates to Micrometer-Sized LiquidPhases Separation
Aggregate growth from the previously formed, nanometer-sized, amphiphilicaggregates is the second self-assembly process in supramolecular solventformation. This process cannot exist without the preceding one being in place.Aggregate growth in this step will proceed until a separate, amphiphilic-rich,liquid phase is produced. The phenomenon of liquid–liquid phase separation,typically occurring in colloidal solutions, is named coacervation.
Aggregate growth in this step involves reducing the head group–head grouprepulsions that stopped aggregation in the first self-assembly process. How toaccomplish this goal depends on the particular system. The free energy cost ofbringing the polar heads together is much smaller when the head group isuncharged than when it is charged.16
Aggregate growth in ionic systems can be promoted by adding a cosurfac-tant with a small head group––an electrolyte or an amphiphilic counterion––aswell as by a pH change. In nonionic systems, one very effective way to promoteaggregate growth is to lower the number of solvent molecules available forsolvation, which can be achieved by modifying the temperature or by addinga poor solvent for the aggregate to be coacervated.20
Adding a cosurfactant like a long-chain alcohol is a general strategy topromote growth of ionic aggregates, but this method is difficult to implementsince we can easily reduce the head group repulsion too much and causea transition to a lamellar phase. Effective screening of long-range electrostaticinteractions can also be achieved by adding high concentrations of electrolyte.In this case, the longer the apolar chain, the less salt is needed to induce growth.The larger the aggregate radius, the smaller is the change in curvature fora sphere-to-rod transition. For aqueous mixtures of oppositely chargedsurfactants, the growth of aggregates spontaneously occur when the attractionbetween the two types of amphiphiles is stronger than that required to form
447Chapter | 12 Future Trends in Fundamentals of Solvent Extraction
stable micelles in solution but weaker than that leading to precipitation. In orderto promote coagulation of micelles against precipitation, the addition of salt (toweaken the electrostatic attraction between the oppositely charged surfactantsdue to electrostatic screening) is a common strategy. With this aim, anappropriate amount of NaCl (>0.2 mol/kg) was added to the catanionic systemcomposed of a gemini cationic surfactant and sodium dodecyl sulfate in excessof the latter.21 The coacervates formed showed globular isotropic vesicularphases or mixed vesicular and lamellar microstructures.
A more specific way to reduce ionic head group repulsion is to add an amphi-philic counterion. Thus, sodium salicylate induces growth in micelles of hexadecyltetramethyl ammonium bromide. The aromatic ring of the salicylate enters themicelle and results in extensive aggregate growth even at low concentrations. Thesolution contains long thread-like aggregates that behave much like a polymer. Inthe growth process, adding a monomer simply adds to the length of a rod. On theother hand, the addition of tetrabutylammonium bromide to sodium dodecylsulfate causes the formation of clusters of small ellipsoidal micelles that resultfrom the interactions between the butyl chains belonging to different micelles.22
Fixing the pH of the solution below the pKa of the amphiphilic ionic grouphas been a successful strategy to coacervate alkylsulfates, sulfonates, andsulfoccinates, the major problem being the high hydrochloric acid required(2–3 M) to produce phase separation.8
For nonionic aggregates formed by surfactants of the CnEm type (m referringto the number of oxyethylene groups), an increase in temperature primarily leadsto the removal of some water from the palisade layer of ethylene oxide units andthis has two effects. First, the area per head group is reduced, which causesmicellar growth, and second, the head group regions of two micelles overlap,thus providing a mechanism for an attractive micelle–micelle interaction thatultimately triggers phase separation. Studies made through different techniqueshave revealed that micelles do grow in size as the cloud point is approached, butthe extent of the growth depends on the ratio of n to m.23 For surfactants witha moderate n to m ratio such as C12E5 the increase of the temperature inducesa spherical-to-rodlike micelle transition.24
In contrast, no sphere-to-rod transition has been observed for C12E8.25,26
Increasing the number of oxyethylene groups at a constant alkyl chain lengthdecreases the packing parameter and the spherical shape becomes thepreferred one.27 In these cases, micelle growth is not the inherent cause of theliquid–liquid phase separation.
Instead, it is the result of an attractive micelle–micelle interaction. Fornonionic micelles made up of zwitterionic head groups, a liquid–liquid phaseseparation can be observed as the temperature is lowered.Due to the stronglypolarcharacter of zwitterionic head groups, we should expect electrostatic interactionsto play amajor role for both intra- and inter-aggregate interactions.However, theseinteractions are of short range and their effects are qualitatively different fromthose of ionic surfactants. Spongemorphologies, i.e., a bicontinuous structurewithsurfactant bilayer films connected over macroscopic distances, have been
448 PART | III Modern and Future Trends in Fundamentals and Applications
observed for coacervates made up of zwitterionic gemini surfactants.28,29 Waterfills the pores of the continuous structure formed by the surfactant.
Partial removal of solvent molecules available for solvation of nonionicmicelles can also be achieved by adding a poor solvent for micelles that ismiscible with the solvation solvent. Competition for the solvation solvent willdesolvate surfactant polar groups, thus causing micellar growth and phaseseparation. An example is the phase separation of reverse micelles of alkyl-carboxylic acid in tetrahydrofuran (THF), promoted by the addition of water.30
As a general rule, the environmental conditions required for phase separationdepend on the hydrocarbon chain length of the amphiphile. Thus, for a homol-ogous series of polyoxyethylene nonionic surfactants, the temperature requiredfor phase separation increases as the number of carbon atoms in the hydrocarbonchain decreases.31 Different models for estimating the cloud point of nonionicsurfactants on the basis of their structures have been reported.32–34 In general,cloud points for aqueous mixtures of two nonionic surfactants are intermediatebetween those of the two, whereas cloud points for aqueous mixtures ofnonionic and ionic surfactants are higher than those of pure nonionic ones.
Likewise, the water content required for liquid phase separation of reversemicelles of alkyl carboxylic acids depends on the hydrocarbon chain length ofthe amphiphile. The shorter the apolar chain the larger is the water amount toinduce growth.30
Several novel separation techniques, based on the supramolecular solventsapplication will be presented in Chapter 14. Supramolecular chemistry ingeneral and different specific separation systems, thermodynamics, stability,and kinetics are expected to be perspective directions for future development.
REFERENCES
1. MacKay DJC. Information theory, inference and learning algorithms. Draft 3.1415, www.
inference.phy.cam.ac.uk/mackay/itprnn/book.html; January 2003.
2. Hummer G, Garde S, Garcia AE, Pratt LR. New perspectives on hydrophobic effects. Chem
Phys 2000;258(2–3):349–70.
3. Purushothaman G, Karayiannis NB. IEEE Trans Neural Networks 1997;8:679.
4. Ballesteros-Gumez A, Rubio S, Pkrez-Bendito DA. A potential of supramolecular solvents for
the extraction of contaminants in liquid foods. J Chromatogr 2009;1216:530–9.
5. Hinze WL. Cloud point extraction using NDTT reagent for preconcentration. Ann Chim
(Rome) 1987;77:167–208.
6. Pramauro E, Pelizzetti E. Surfactants in analytical chemistry. Applications of organized
amphiphilic media. New York: Elsevier; 1996.
7. Carabias R, Marthnez E, Rodrhguez-Gonzalo B, Moreno-Cordero JL, Pkrez- Pavyn C,
Garcha-Pinto E, Laespada EF. A. J Chromatogr 2000;902:251–65.
8. Casero I, Sicilia D, Rubio S, Pkrez-Bendito D. An acid-induced phase cloud point separation
approach using anionic surfactants for the extraction and preconcentration of organic
compounds. Anal Chem 1999;71:4519–26.
9. Cantero M, Rubio S, Pkrez-Bendito D. A. J Chromatogr 2004;1046:147–53.
10. Compendium of Chemical Terminology, IUPAC Recommendations, 2nd ed. compiled by
AD. McNaught and A. Wilkinson, Blackwell, 2004;31:613.
449Chapter | 12 Future Trends in Fundamentals of Solvent Extraction
11. Menger FM, Sykes BM. Anatomy of a coacervate. Langmuir 1998;14:4131–7.
12. Whitesides GM, Boncheva M. Supramolecular chemistry and self-assembly special feature:
beyond molecules: self-assembly of mesoscopic and macroscopic components. Proc Natl
Acad Sci USA 2002;99:4769–74.
13. Olenyuk B, Whiteford JA, Fenchtenkotter A, Stang PJ. Self-assembly of nanoscale cubocta-
hedra by coordination chemistry. Nature 1999;398:796–9.
14. Philip D, Stoddart JF. Self-assembly in natural and unnatural systems. Angew Chem Int Ed
Engl 1996;35:1155–96.
15. Lehn JM, Ball P. In: Hall N, editor. The new chemistry. Cambridge, UK: Cambridge University
Press; 2000. p. 300–51.
16. Pelesco JA. Self assembly. The Science of things that put themselves together. New York:
Chapman & Hall/CRC, Taylor & Francis Group; 2007. pp. 67–80, Chapter 4.
17. Lehn JM. Supramolecular chemistry: concepts and perspectives. Proc Natl Acad Sci USA
2002;99:4763–8.
18. Steed JW, Turner DR, Wallace KJ. Core concepts in supramolecular chemistry and nano-
chemistry. Chichester: John Wiley & Sons; 2007. p. 1–27, Chapter 1.
19. Israelachvili JN, Mitchell DJ, Ninham BW. Surfactant diffusion: new results and interpreta-
tions. J Chem Soc Faraday Trans 1976;72:1525–68.
20. Evans DF, Wennerstrxm H. The colloidal domain. Where physics, chemistry, biology, and
technology meet. New York: Wiley-VCH; 1999. p. 197–198.
21. Hao LS, Nan YQ. A. Colloids Surf 2008;325:186–93.
22. Zana R, Schmidt J, Talmon Y. Langmuir 2005;21:11628–36.
23. Glatter O, Fritz G, Lindner H, Brunner-Popela J, Mittelbach R, Strey R, Egelhaaf SU. Self-
assembly of medium-chain alkyl monoglucosides in ammonium sulfate solutions with
poly(ethylene glycol). Langmuir 2000;16:8692–701.
24. Bernheim-Groswasser A, Wachtel E, Talmon Y. Micellar growth, network formation, and crit-
icality in aqueous solutions of the nonionic surfactant C12E5. Langmuir 2000;16:4131–40.
25. Kato T, Anzai S, Seimiya T. Light scattering from semidilute solutions of nonionic surfactants
(C12E5 and C12E8) and the scaling law. J Phys Chem 1990;94:7255–9.
26. Danino D, Talmon Y, Zana R. Cryogenic temperature transmission electron microscopy in the
study of surfactant systems. J Colloid Interface Sci 1997;186:170–9.
27. Ezrahi S, Tuval E, Aserin A. Properties, main applications and perspectives of worm micelles.
Adv Colloid Interface Sci 2006;128–30, 77–102.
28. Menger FM, Peresypkin AV, Caran KL, Apkarian RP. A sponge morphology in an elementary
coacervate. Langmuir 2000;16:9113–6.
29. Menger FM, Peresypkin A. A Combinatorially-derived structural phase diagram for 42
zwitterionic geminis. J Am Chem Soc 2001;123:5614–5.
30. Ruiz FJ, Rubio S, Pkrez-Bendito D. Determination of bisphenols A and F and their diglycidyl
ethers in wastewater and river water by coacervative extraction and liquid chromatography-
fluorimetry. Anal Chem 2007;79:7473–84.
31. Taechangam P, Scamehorn JF, Osuwan S, Rirksomboon T. Colloids Surface Physicochem Eng
Aspects 2009;347:200–9.
32. Schott H. A linear relation between the cloud point and the number of oxyethylene units of
water-soluble nonionic surfactants valid for the entire range of ethoxylation. J Colloid
Interface Sci 2003;260:219–24.
33. Materna K, Szymanowski J. Separation of phenols from aqueous micellar solutions by cloud
point extraction. J Colloid Interface Sci 2002;255:195–201.
34. Ren Y, Liu H, Yao X, Liu M, Hu Z, Fan B. The accurate QSPR models for the prediction of
nonionic surfactant cloud point. J Colloid Interface Sci 2006;302:669–72.
450 PART | III Modern and Future Trends in Fundamentals and Applications
Chapter 13
Advances in Developmentof Solvents for Liquid–LiquidExtraction
Chapter Outline1. Introduction 452
1.1. Strategies for Solvent
Replacement
452
2. Organic Solvents 453
3. Water as a Solvent 457
3.1. Subcritical Hot Water
as a Solvent for
Extraction
457
4. Renewable Water-Based
Solvents
458
4.1. Aqueous Two-Phase
Systems as Extractants
459
4.2. Supercritical Fluid
Extractants
462
5. Ionic Liquids as Solvents for
Extraction
465
5.1. Properties of ILs 466
5.1.1. Toxicology
Considerations
467
6. Amphiphilic Compounds
(Supramolecules)
as Solvents in Solvent
Extraction
467
6.1. Surfactants 469
6.2. Toxicity of Surfactants 470
7. Extraction by
Microemulsion
471
7.1. Critical Micelle
Concentration
473
7.2. Water Solubilization
Capacity
473
7.3. Mechanisms of Solute
Extraction with
Microemulsions
473
8. Recovery of Reagents 474
8.1. Online
Decontamination of
Wastes
474
9. Future Trends in the
Development
of New Solvents
475
10. Concluding Remarks 477
References 478
Solvent Extraction. DOI: 10.1016/B978-0-444-53778-2.10013-5
Copyright � 2012 Elsevier B.V. All rights reserved. 451
1. INTRODUCTION
Chances of new extractant molecules being synthesized, developed, andcommercialized are not good due to the following:
1. Today’s commercially available extractants are good, and a better––lesscostly to use––molecule is not likely to conservative technologists.
2. The cost of developing and commercializing a new molecule is high fora variety of reasons, not the least of which is registration of any newmolecule and the accompanying toxicity testing.
3. There are not a lot of solutes that could be recovered in sufficient amounts tojustify the expense of a new molecule.
4. Over the years, many molecules have been made and investigated byreagent suppliers, but the results have not been made public. Thus, thereare fewer new molecules to investigate than the public realizes.
As a result, new reagents will likely come from combinations of existingreagents and new solvent extraction applications will come from fitting flowsheets to the properties of existing reagents.
Since the beginning of the green chemistry movement 15 years ago, thesearch for alternatives to classical procedures for solute extraction and sepa-ration has been one of the major challenges that scientists have faced. It has ledto substantial research effort worldwide within different emerging topicsincluding replacement of toxic reagents and/or organic solvents by innocuousones. The pollution prevention requires a new way to diminish the environ-mental side effects based on the reduction or elimination of wastes andpollutant chemicals at the source. It promotes changes in developmentprocesses and also in laboratory practices concerning chemicals and other rawmaterials. The pollution prevention initiative in solvent extraction results in themodification of techniques in order to reduce or avoid the use of toxic reagentsand products, and specially the solvents used for solutes of interest solution andextraction. This is the main trend in the improvement of existing solventextraction technologies and the development of new processes.
1.1. Strategies for Solvent Replacement
At the beginning of the “Green Era,” clean or environment-friendly methodswere adopted by removing contaminants from the waste streams, using filters,mineralization of organic compounds, and precipitation and passivation ofmetals. They were considered the most appropriate and easy-to-applyprocedures for “greening” leaching and extraction methods, and they areknown as end-of-the-pipe technologies. Later, the direction that the scientistswere following to adopt greener procedures changed completely. The “end-of-the-pipe” concept was gradually replaced by the “greening at the origin.” Asthe name indicates, it was based on the elimination of the contaminationsources. While applying this concept to extraction technologies, it is evident
452 PART | III Modern and Future Trends in Fundamentals and Applications
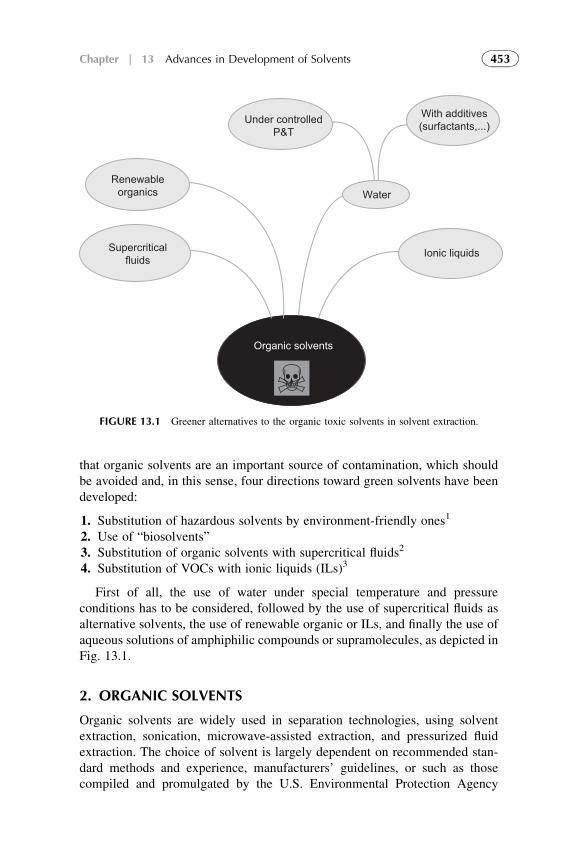
that organic solvents are an important source of contamination, which shouldbe avoided and, in this sense, four directions toward green solvents have beendeveloped:
1. Substitution of hazardous solvents by environment-friendly ones1
2. Use of “biosolvents”3. Substitution of organic solvents with supercritical fluids2
4. Substitution of VOCs with ionic liquids (ILs)3
First of all, the use of water under special temperature and pressureconditions has to be considered, followed by the use of supercritical fluids asalternative solvents, the use of renewable organic or ILs, and finally the use ofaqueous solutions of amphiphilic compounds or supramolecules, as depicted inFig. 13.1.
2. ORGANIC SOLVENTS
Organic solvents are widely used in separation technologies, using solventextraction, sonication, microwave-assisted extraction, and pressurized fluidextraction. The choice of solvent is largely dependent on recommended stan-dard methods and experience, manufacturers’ guidelines, or such as thosecompiled and promulgated by the U.S. Environmental Protection Agency
Under controlledP&T
With additives(surfactants,...)
Water
Ionic liquids
Organic solvents
Renewableorganics
Supercriticalfluids
FIGURE 13.1 Greener alternatives to the organic toxic solvents in solvent extraction.
453Chapter | 13 Advances in Development of Solvents
(US EPA) or the American Society for Testing and Materials (ASTM) andEuropean Committee for Standardization, Environmental Management.
From the Environmental, Health, and Safety (EHS)4 assessment resultsobtained for 26 commonly used pure organic solvents (see Fig. 13.2), overallhigh scores were obtained for formaldehyde, dioxane, formic acid, acetonitrile,and acetic acid. Formaldehyde had high scores for acute and chronic toxicity,irritation, and air hazard––dioxane had a high persistency, while both acetic andformic acids showed high scores for irritation. On the other hand, low overallscores were obtained for methyl acetate, ethanol, and methanol, whichparticularly pose low environmental hazards and relatively low health hazards.
The use of tetrahydrofuran, butylacetate, cyclohexanone, and 1-propanol isnot recommended from a life-cycle perspective because these solvents causehigh environmental impacts during petrochemical production. In addition,formic acid, ethyl acetate, acetonitrile, dioxane, 1-butanol, and dime-thylformamide are solvents of significantly high environmental impact. At theother end, hexane, heptane, and diethyl ether are environmentally favorablesolvents. With regard to the alkanes, these results are due to the energy recoveryby incineration in combination with relatively low environmental impacts oftheir production.
From Table 13.1 it can be seen that commonly used solvents in solventextraction have been included in the list of hazardous air pollutants published in2002 by the US EPA.5 Today, acetonitrile is by far the preferred organic solventused in liquid chromatography (LC) because of its physical properties. A recentdownturn in plastic production has resulted in severe shortages and escalatingcosts of acetonitrile, which is produced as a by-product of acrylonitrile.6 InJanuary 2009, the price of acetonitrile was recorded at US$ 100 per literwith disposal costs about double this price because of its toxic properties.Aqueous waste streams containing acetonitrile are typically disposed of aschemical waste.7 Moreover, acetonitrile is ranked by the EPA as a hazardoussolvent, and waste has to be incinerated, releasing NO2, partly responsible foracid rain. Taking into consideration all the problems related to acetonitrile, theLC community is considering greener replacements for acetonitrile.8 More-over, a common additive used in LC is trifluoroacetic acid (TFA), which iscytotoxic, corrosive, and persistent in the environment.
Carbon tetrachloride, chloroform, and dichloromethane were the solventsthat had been widely used in spectroscopy for their transparency in this spectralrange and for extraction, but they are not used now owing to their toxicity andcarcinogenic and ozone-depleting effects. Since then, considerable researcheffort is directed toward finding alternatives to chlorinated solvents.
The same problem is with volatile organic compounds (VOCs). Solventscommonly used in solvent extraction are often VOCs, and over the previousdecades, they were associated with a series of direct and indirect environmentaland health damages. Among the direct effects of VOCs, the following should benoted: their toxicity and carcinogenic effects, which depend on the nature of the
454 PART | III Modern and Future Trends in Fundamentals and Applications
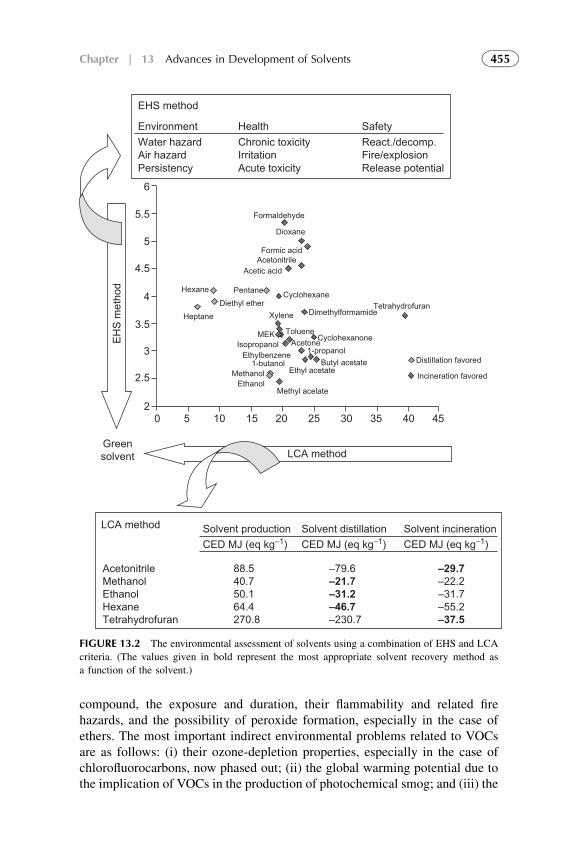
compound, the exposure and duration, their flammability and related firehazards, and the possibility of peroxide formation, especially in the case ofethers. The most important indirect environmental problems related to VOCsare as follows: (i) their ozone-depletion properties, especially in the case ofchlorofluorocarbons, now phased out; (ii) the global warming potential due tothe implication of VOCs in the production of photochemical smog; and (iii) the
EHS method
Environment Health SafetyWater hazardAir hazardPersistency
Chronic toxicityIrritationAcute toxicity
React./decomp.Fire/explosionRelease potential
0 5 10 15 20 25 30 35 40 45
6
5.5
5
4.5
4
3.5
3
2.5
2
Formaldehyde
Dioxane
Formic acidAcetonitrile
Acetic acid
Hexane Pentane CyclohexaneTetrahydrofuran
DimethylformamideDiethyl ether
Heptane Xylene
MEK TolueneCyclohexanone
Isopropanol Acetone1-propanol
Butyl acetateEthyl acetate
Ethylbenzene1-butanol
MethanolEthanol
Methyl acelate
Distillation favored
Incineration favored
LCA method
EHS
met
hod
Greensolvent
LCA method
AcetonitrileMethanolEthanolHexaneTetrahydrofuran
88.540.750.164.4270.8
–79.6–21.7
–31.2
–46.7
–230.7
–29.7
–22.2–31.7–55.2–37.5
Solvent production Solvent distillation Solvent incinerationCED MJ (eq kg–1) CED MJ (eq kg–1) CED MJ (eq kg–1)
FIGURE 13.2 The environmental assessment of solvents using a combination of EHS and LCA
criteria. (The values given in bold represent the most appropriate solvent recovery method as
a function of the solvent.)
455Chapter | 13 Advances in Development of Solvents
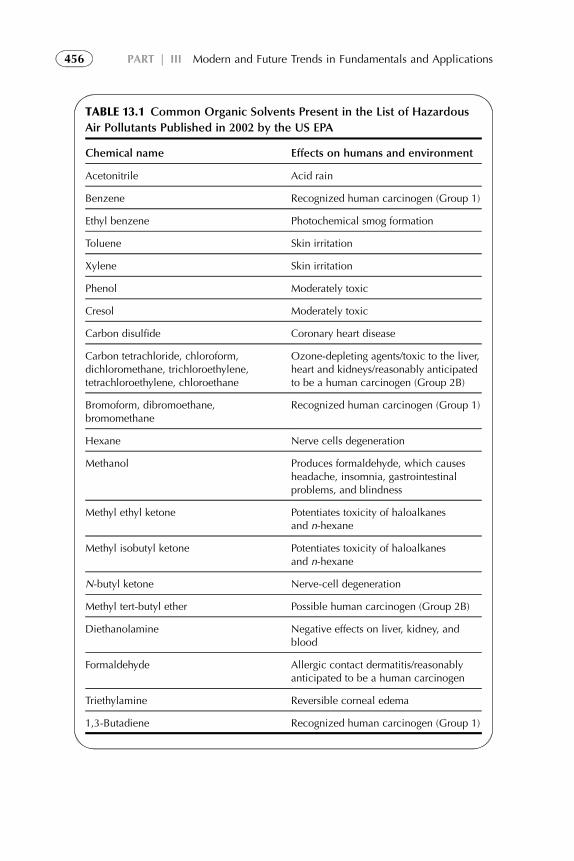
TABLE 13.1 Common Organic Solvents Present in the List of Hazardous
Air Pollutants Published in 2002 by the US EPA
Chemical name Effects on humans and environment
Acetonitrile Acid rain
Benzene Recognized human carcinogen (Group 1)
Ethyl benzene Photochemical smog formation
Toluene Skin irritation
Xylene Skin irritation
Phenol Moderately toxic
Cresol Moderately toxic
Carbon disulfide Coronary heart disease
Carbon tetrachloride, chloroform,dichloromethane, trichloroethylene,tetrachloroethylene, chloroethane
Ozone-depleting agents/toxic to the liver,heart and kidneys/reasonably anticipatedto be a human carcinogen (Group 2B)
Bromoform, dibromoethane,bromomethane
Recognized human carcinogen (Group 1)
Hexane Nerve cells degeneration
Methanol Produces formaldehyde, which causesheadache, insomnia, gastrointestinalproblems, and blindness
Methyl ethyl ketone Potentiates toxicity of haloalkanesand n-hexane
Methyl isobutyl ketone Potentiates toxicity of haloalkanesand n-hexane
N-butyl ketone Nerve-cell degeneration
Methyl tert-butyl ether Possible human carcinogen (Group 2B)
Diethanolamine Negative effects on liver, kidney, andblood
Formaldehyde Allergic contact dermatitis/reasonablyanticipated to be a human carcinogen
Triethylamine Reversible corneal edema
1,3-Butadiene Recognized human carcinogen (Group 1)
456 PART | III Modern and Future Trends in Fundamentals and Applications
environmental persistence. For the aforementioned reasons, the replacement ofcommonly used solvents by green ones is absolutely mandatory.
3. WATER AS A SOLVENT
It is clear that from an environmental point of view the best alternative fororganic solvents is water: it is cheap, safe, nontoxic, noninflammable, andrecyclable. The main problem with water as a solvent is that while it dissolvespolar compounds, most of the commonly analyzed organic compounds arehydrophobic with poor or extremely poor water solubility.
Subcritical water, or pressurized hot water, provides liquid water underpressure at temperatures between the usual boiling point (100 �C) and thecritical temperature (374 �C). The polarity of superheated water significantlydecreases on increasing temperature and pressure, and the properties ofsuperheated water seem to be those of an organic solvent, such as methanol orethanol. Over the superheated temperature range, the extensive hydrogen bondsbreak down, changing the properties more than usually expected by increasingtemperature alone. Solubility of organic solutes increases by several orders ofmagnitude and the water itself can act as a solvent, including extractions andseparations.
3.1. Subcritical Hot Water as a Solvent for Extraction
The polarity of water decreases markedly at temperatures between 80 �C and250 �C and high pressure, being able to replace organic modifiers andproviding environment-friendly green methods.9 The use of liquid water attemperatures above its boiling point in order to improve the solubility oforganic compounds is not a new topic. For many years, it has been used asa cleaning agent to enhance the extraction of oil shale,10 sulfur from orebodies,11 and as a vapor steam that is commonly used in hydrodistillation forthe isolation of essential oils from plant materials.12 The recent interest ofchemistry in superheated or subcritical water extraction (SWE), or pressurizedhot water extraction (PHWE) methods make it an interesting and environment-friendly alternative to organic solvents.
“Sub-critical water extraction (SWE)” is a commonly used term. The terms“pressurized hot water extraction (PHWE)”, “superheated water extraction(SWE)”, “extraction with water at elevated temperatures and pressures”, “high-temperature water extraction”, and “extraction using hot compressed water”have also been applied. To my opinion, one term has to be chosen and that isSWE. At high temperatures (above boiling point: 100–374 �C), steam needs tobe pressurized for efficient transfer through the sample.
The SWE is emerging as a powerful alternative for the extraction of solidsamples.13 It has been used to extract pollutants with a wide range of polaritiesfrom environmental samples14,15 and for the extraction of pesticides16 and
457Chapter | 13 Advances in Development of Solvents
polycyclic aromatic hydrocarbons17 from soils. The use of SWE as a verypromising alternative to conventional and supercritical CO2 extraction methodsfor isolation of essential oils was proposed by Basile et al.18 Since this date, thetechnique has shown its applicability in the field of essences19–22 as comparedwith conventional techniques like steam distillation23,24 and solvent extrac-tion,25 which have some well-known disadvantages, namely, low extractionefficiency, long extraction time, and large amounts of toxic solvent waste. Italso has the advantage of being selective.
The major advantage of SWE is that it considerably reduces the use oforganic solvents when compared to classical extraction methods, which causeconsiderable concern as the use of large amounts of volatile organic solventscauses severe environmental side effects (ozone hole and global warmingproblems).
However, the main drawbacks of SWE are that the extract is a diluteaqueous solution and possible problems of precipitation or readsorption into thematrix can occur on cooling water. These problems can be avoided usingdifferent approaches based on liquid–liquid extraction (LLE) or solid-phaseextraction (SPE). In LLE, the aqueous solution is collected and the solute isextracted in a small volume of organic solvent;26 in SPE,27 solid-phasemicroextraction (SPME),28 or stir bar extraction (SBE),29 the water solutionpasses through a filter retaining the solutes that are eluted with a small volumeof an organic solvent.
Water has been used in analytical techniques to extract solutes from solidmatrices in both static and dynamic modes. The main areas of application ofSWE are the analysis of environmental matrices, such as the extraction ofpolychlorinated biphenyls,30 polycyclic aromatic hydrocarbons,31 and pesti-cides32 from soils and plants, and volatile compounds from plant materials.18
Moreover, several strategies have been successfully developed to improveextraction efficiencies, such as pH control by the addition of a buffer,33 solvent-assisted SWE using water–ethanol mixtures,34 and SWE using micellar agentssuch as sodium dodecyl sulfate (SDS).35
4. RENEWABLE WATER-BASED SOLVENTS
There is a continuing demand for selective extractants that can be developed,e.g., by tailor-making organic molecules with preorganized metal-binding sites.The development of such extractants may be designed on computer-basedmodels. Environmental considerations require that the extractants and diluentsused are either nontoxic, nonvolatile and/or recovered within the process. Theincreasing combination of extraction and distillation, as used in biotechnology,places a whole host of new demands on the diluents employed. In the extractionof biologically active compounds, care must be taken to avoid the loss ofactivity that often occurs by contact with organic diluents. Thus, a series ofsystems have been developed specifically with these compounds in mind.
458 PART | III Modern and Future Trends in Fundamentals and Applications
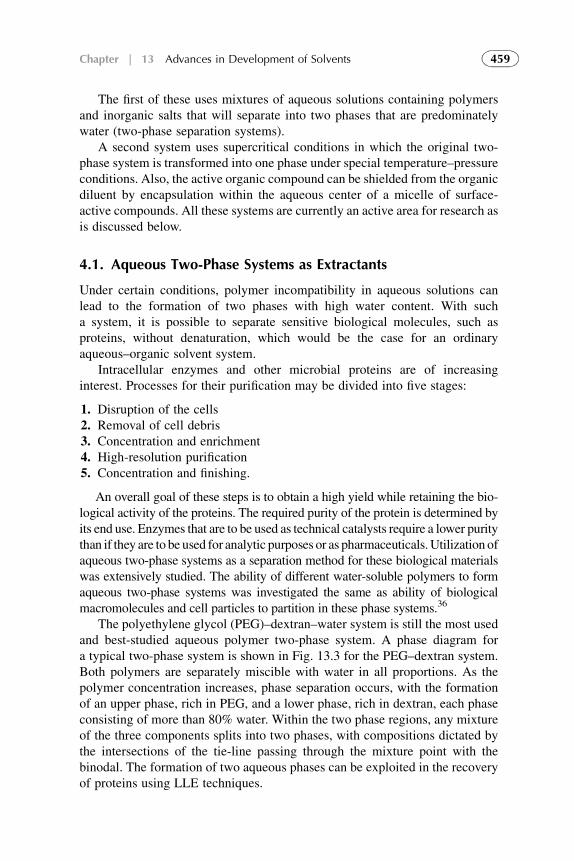
The first of these uses mixtures of aqueous solutions containing polymersand inorganic salts that will separate into two phases that are predominatelywater (two-phase separation systems).
A second system uses supercritical conditions in which the original two-phase system is transformed into one phase under special temperature–pressureconditions. Also, the active organic compound can be shielded from the organicdiluent by encapsulation within the aqueous center of a micelle of surface-active compounds. All these systems are currently an active area for research asis discussed below.
4.1. Aqueous Two-Phase Systems as Extractants
Under certain conditions, polymer incompatibility in aqueous solutions canlead to the formation of two phases with high water content. With sucha system, it is possible to separate sensitive biological molecules, such asproteins, without denaturation, which would be the case for an ordinaryaqueous–organic solvent system.
Intracellular enzymes and other microbial proteins are of increasinginterest. Processes for their purification may be divided into five stages:
1. Disruption of the cells2. Removal of cell debris3. Concentration and enrichment4. High-resolution purification5. Concentration and finishing.
An overall goal of these steps is to obtain a high yield while retaining the bio-logical activity of the proteins. The required purity of the protein is determined byits end use. Enzymes that are to be used as technical catalysts require a lower puritythan if they are to be used for analytic purposes or as pharmaceuticals.Utilization ofaqueous two-phase systems as a separation method for these biological materialswas extensively studied. The ability of different water-soluble polymers to formaqueous two-phase systems was investigated the same as ability of biologicalmacromolecules and cell particles to partition in these phase systems.36
The polyethylene glycol (PEG)–dextran–water system is still the most usedand best-studied aqueous polymer two-phase system. A phase diagram fora typical two-phase system is shown in Fig. 13.3 for the PEG–dextran system.Both polymers are separately miscible with water in all proportions. As thepolymer concentration increases, phase separation occurs, with the formationof an upper phase, rich in PEG, and a lower phase, rich in dextran, each phaseconsisting of more than 80% water. Within the two phase regions, any mixtureof the three components splits into two phases, with compositions dictated bythe intersections of the tie-line passing through the mixture point with thebinodal. The formation of two aqueous phases can be exploited in the recoveryof proteins using LLE techniques.
459Chapter | 13 Advances in Development of Solvents
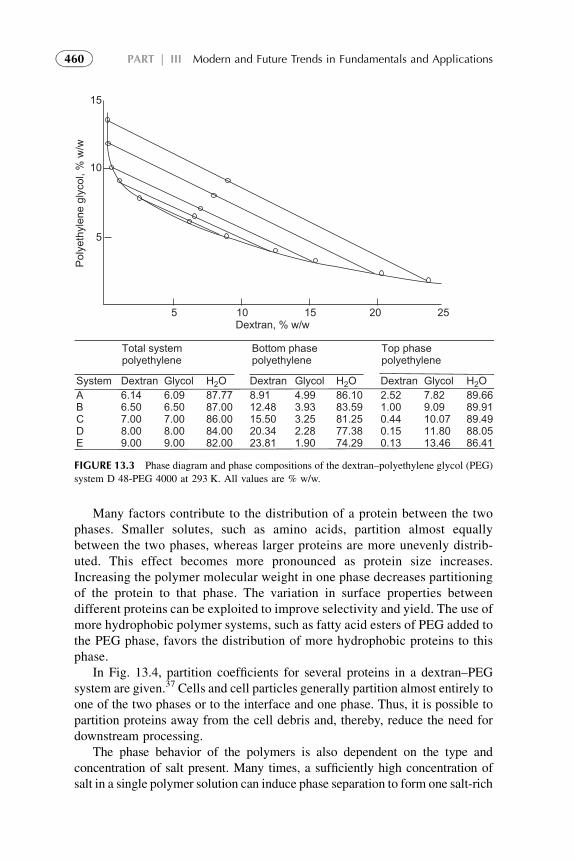
Many factors contribute to the distribution of a protein between the twophases. Smaller solutes, such as amino acids, partition almost equallybetween the two phases, whereas larger proteins are more unevenly distrib-uted. This effect becomes more pronounced as protein size increases.Increasing the polymer molecular weight in one phase decreases partitioningof the protein to that phase. The variation in surface properties betweendifferent proteins can be exploited to improve selectivity and yield. The use ofmore hydrophobic polymer systems, such as fatty acid esters of PEG added tothe PEG phase, favors the distribution of more hydrophobic proteins to thisphase.
In Fig. 13.4, partition coefficients for several proteins in a dextran–PEGsystem are given.37 Cells and cell particles generally partition almost entirely toone of the two phases or to the interface and one phase. Thus, it is possible topartition proteins away from the cell debris and, thereby, reduce the need fordownstream processing.
The phase behavior of the polymers is also dependent on the type andconcentration of salt present. Many times, a sufficiently high concentration ofsalt in a single polymer solution can induce phase separation to form one salt-rich
5 10 15 20 25Dextran, % w/w
15
10
5
Poly
ethy
lene
gly
col,
% w
/w
ABCDE
6.146.507.008.009.00
6.096.507.008.009.00
87.7787.0086.0084.0082.00
8.9112.4815.5020.3423.81
4.993.933.252.281.90
86.1083.5981.2577.3874.29
2.521.000.440.150.13
7.829.0910.0711.8013.46
89.6689.9189.4988.0586.41
System Dextran Glycol H2O H2O H2ODextran Glycol Dextran Glycol
Total systempolyethylene
Bottom phasepolyethylene
Top phasepolyethylene
FIGURE 13.3 Phase diagram and phase compositions of the dextran–polyethylene glycol (PEG)
system D 48-PEG 4000 at 293 K. All values are % w/w.
460 PART | III Modern and Future Trends in Fundamentals and Applications
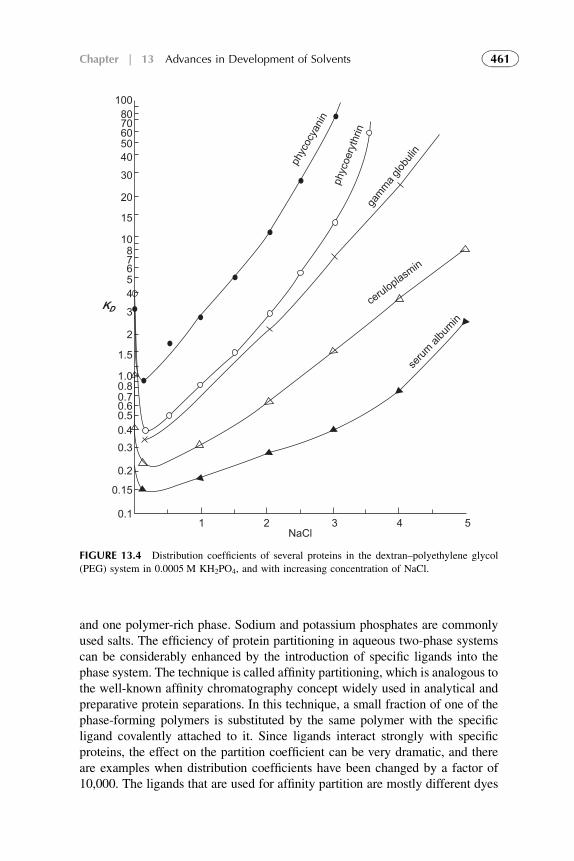
and one polymer-rich phase. Sodium and potassium phosphates are commonlyused salts. The efficiency of protein partitioning in aqueous two-phase systemscan be considerably enhanced by the introduction of specific ligands into thephase system. The technique is called affinity partitioning, which is analogous tothe well-known affinity chromatography concept widely used in analytical andpreparative protein separations. In this technique, a small fraction of one of thephase-forming polymers is substituted by the same polymer with the specificligand covalently attached to it. Since ligands interact strongly with specificproteins, the effect on the partition coefficient can be very dramatic, and thereare examples when distribution coefficients have been changed by a factor of10,000. The ligands that are used for affinity partition are mostly different dyes
1 2 3 4 5 NaCl
0.1
0.15
0.2
0.30.40.50.60.70.81.0
1.5
2
3
45678
10
15
20
304050607080
100
phyc
ocya
ninph
ycoe
ryth
ringa
mma glob
ulin
ceruloplasmin
serum
albu
min
KD
FIGURE 13.4 Distribution coefficients of several proteins in the dextran–polyethylene glycol
(PEG) system in 0.0005 M KH2PO4, and with increasing concentration of NaCl.
461Chapter | 13 Advances in Development of Solvents
linked to a PEG molecule. Recent developments in aqueous two-phase parti-tioning have been published.38
Biotechnological processes, in general, are run at low concentrations ofreactants and products. One reason for this is that most biocatalysts aresensitive to product inhibition. The reaction may stop when only a smallfraction of the substrate has been converted into product. In such cases, there isa strong need for continuous extractive procedures during which the productis continuously removed. The integration of bioconversion and extraction iscalled extractive bioconversion. The large differences in surface tension anddielectric constants between water and common organic solvents causeenzymes to unfold when they are exposed to the interface between the twosolvents. This problem can be overcome through extractive bioconversions inaqueous two-phase systems. A collection of cutting-edge methods intended toprovide practical guidelines for the area of separations in two-phase systemshas been reviewed.39
4.2. Supercritical Fluid Extractants
When a fluid is forced to a pressure and temperature above its critical point (seeFig. 13.5) it becomes a supercritical fluid. A supercritical fluid can be defined asa substance at a temperature and pressure above its critical point. Under theseconditions, various properties of the fluid are placed between those of a gas anda liquid. Although the density of a supercritical fluid is similar to a liquid and its
Liquid
Gas
Solid
Pres
sure
Temperature
Supercriticalfluid
Pc
Tc
FIGURE 13.5 Phase diagram for a pure compound.
462 PART | III Modern and Future Trends in Fundamentals and Applications
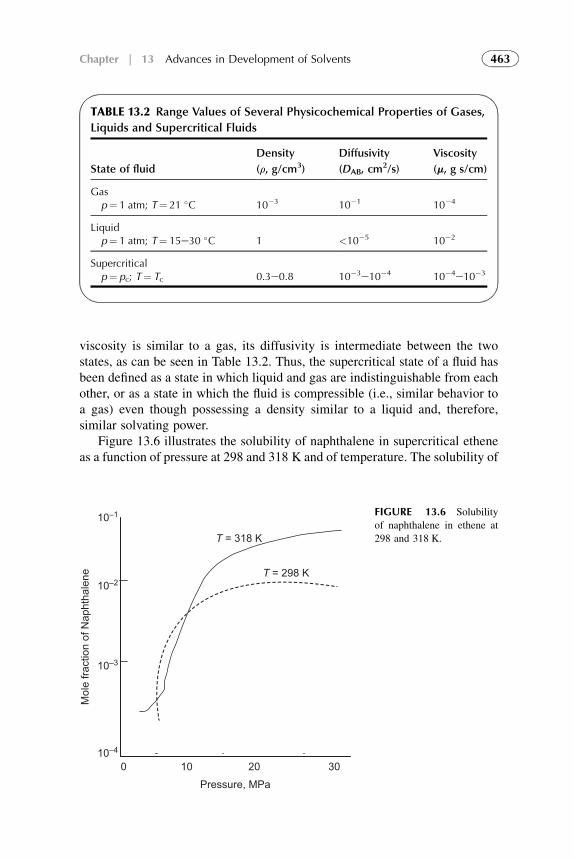
viscosity is similar to a gas, its diffusivity is intermediate between the twostates, as can be seen in Table 13.2. Thus, the supercritical state of a fluid hasbeen defined as a state in which liquid and gas are indistinguishable from eachother, or as a state in which the fluid is compressible (i.e., similar behavior toa gas) even though possessing a density similar to a liquid and, therefore,similar solvating power.
Figure 13.6 illustrates the solubility of naphthalene in supercritical etheneas a function of pressure at 298 and 318 K and of temperature. The solubility of
TABLE 13.2 Range Values of Several Physicochemical Properties of Gases,
Liquids and Supercritical Fluids
State of fluid
Density
(r, g/cm3)
Diffusivity
(DAB, cm2/s)
Viscosity
(m, g s/cm)
Gasp¼ 1 atm; T¼ 21 �C 10�3 10�1 10�4
Liquidp¼ 1 atm; T¼ 15e30 �C 1 <10�5 10�2
Supercriticalp¼ pc; T¼ Tc 0.3e0.8 10�3e10�4 10�4e10�3
10–1
10–2
10–3
10–4
0 10 20 30
T = 298 K
Mol
e fra
ctio
n of
Nap
htha
lene
Pressure, MPa
T = 318 K
FIGURE 13.6 Solubility
of naphthalene in ethene at
298 and 318 K.
463Chapter | 13 Advances in Development of Solvents
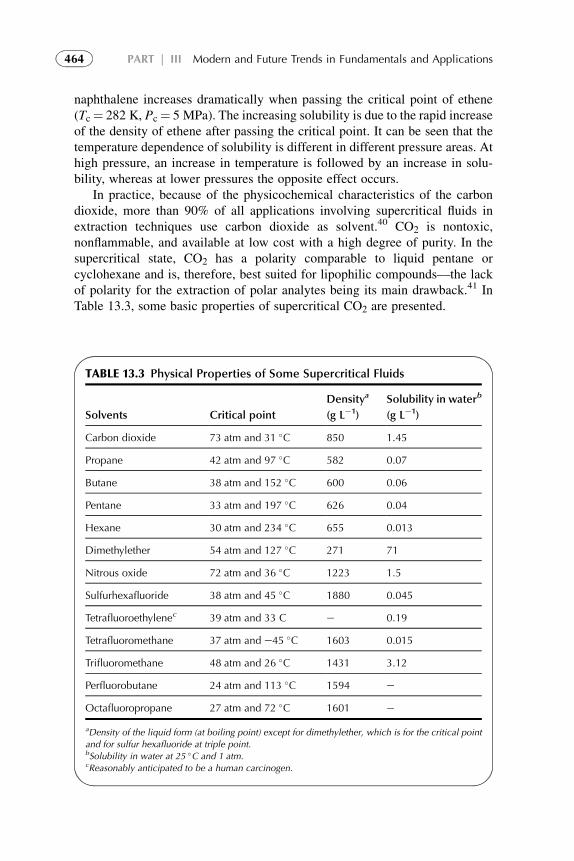
naphthalene increases dramatically when passing the critical point of ethene(Tc¼ 282 K, Pc¼ 5 MPa). The increasing solubility is due to the rapid increaseof the density of ethene after passing the critical point. It can be seen that thetemperature dependence of solubility is different in different pressure areas. Athigh pressure, an increase in temperature is followed by an increase in solu-bility, whereas at lower pressures the opposite effect occurs.
In practice, because of the physicochemical characteristics of the carbondioxide, more than 90% of all applications involving supercritical fluids inextraction techniques use carbon dioxide as solvent.40 CO2 is nontoxic,nonflammable, and available at low cost with a high degree of purity. In thesupercritical state, CO2 has a polarity comparable to liquid pentane orcyclohexane and is, therefore, best suited for lipophilic compounds––the lackof polarity for the extraction of polar analytes being its main drawback.41 InTable 13.3, some basic properties of supercritical CO2 are presented.
TABLE 13.3 Physical Properties of Some Supercritical Fluids
Solvents Critical point
Densitya
(g Le1)
Solubility in waterb
(g Le1)
Carbon dioxide 73 atm and 31 �C 850 1.45
Propane 42 atm and 97 �C 582 0.07
Butane 38 atm and 152 �C 600 0.06
Pentane 33 atm and 197 �C 626 0.04
Hexane 30 atm and 234 �C 655 0.013
Dimethylether 54 atm and 127 �C 271 71
Nitrous oxide 72 atm and 36 �C 1223 1.5
Sulfurhexafluoride 38 atm and 45 �C 1880 0.045
Tetrafluoroethylenec 39 atm and 33 C e 0.19
Tetrafluoromethane 37 atm and e45 �C 1603 0.015
Trifluoromethane 48 atm and 26 �C 1431 3.12
Perfluorobutane 24 atm and 113 �C 1594 e
Octafluoropropane 27 atm and 72 �C 1601 e
aDensity of the liquid form (at boiling point) except for dimethylether, which is for the critical point
and for sulfur hexafluoride at triple point.bSolubility in water at 25 �C and 1 atm.cReasonably anticipated to be a human carcinogen.
464 PART | III Modern and Future Trends in Fundamentals and Applications
As for the solvents, there is a wide range of compounds that can be used assupercritical fluids. Some examples of other compressed fluids can be seen inTable 13.3. These are propane, which has the potential to be a highly effectivesolvent for vegetable oil extraction,42 and dimethyl ether, which is an excellentsolvent for phospholipids43 (see Table 13.3). Other compounds examined assupercritical fluid extractants (SFE) solvents are as follows: (1) hydrocarbons,such as hexane, pentane, and butane;44 (2) nitrous oxide,45 which is consideredto be better suited for polar compounds because of its permanent dipolemoment––unfortunately, it can cause violent explosions in combination withsamples having high organic content; (3) sulfur hexafluoride, which isa nonpolar molecule that has been demonstrated to selectively extract aliphatichydrocarbons up to around C-24 from a mixture containing both aliphatic andaromatic hydrocarbons; and (4) fluorinated hydrocarbons,46 which have shownto increase the extraction efficiency compared to CO2. Table 13.3 lists thephysical properties of some supercritical fluids used in chemistry.
Due to their low viscosity and relatively high diffusivity, supercritical fluidshave better transport properties than liquids, can diffuse easily through solidmaterials, and can therefore give faster extraction yields. One of the maincharacteristics of a supercritical fluid is the possibility of modifying the densityof the fluid by changing its pressure and/or its temperature. Since density isdirectly related to solubility by altering the extraction pressure, the solventstrength of the fluid can be modified.
Supercritical CO2 is a good solvent for lipophilic compounds, and is lesseffective in the extraction of polar solutes. Therefore, for the isolation ofamphiphilic compounds, CO2 has to be combined with a polar cosolvent toconsiderably increase the solubility of those compounds in supercritical CO2.Ethanol and methanol are the most commonly used cosolvents.
Carbon dioxide is a gas at room temperature, so once the extraction iscompleted, and the system decompressed, a substantial elimination of CO2 isachieved without residues, yielding a solvent-free extract. On an industrialscale, when carbon dioxide consumption is high, the operation can becontrolled to recycle it. However, supercritical CO2, because of its low polarity,is less effective in extracting more polar compounds from natural matrices. Toovercome this problem, modifiers (cosolvents) are commonly used. Modifiersare highly polar compounds that, added in small amounts, can producesubstantial changes of the solvent properties of neat supercritical CO2. Anotherdrawback of SFE is the high investment costs as compared to traditionalatmospheric pressure extraction techniques.
5. IONIC LIQUIDS AS SOLVENTS FOR EXTRACTION
ILs are organic salts with melting point lower than 100 �C. They are calledroom-temperature ILs if the salt is liquid at room temperature. They are typi-cally composed of a poorly coordinating, bulky organic cation, and an organic
465Chapter | 13 Advances in Development of Solvents
or inorganic anion. ILs attract attention of the chemists at the synthesis of air-and water-stable ILs in the beginning of 1990s.47 ILs have numerous appli-cations in chemistry, where they have been termed as a “green alternative.” It iswell known that they have low vapor pressures and are rarely flammable orexplosive, which implies lower environmental effects than VOCs. ILs havenegligible vapor pressure as well as good solubility for inorganic and organiccompounds, thus being useful in LLE, liquid phase microextraction (LPME),and solid phase microextraction (SPME).48
5.1. Properties of ILs
ILs have many interesting and unique properties, among which is an exceed-ingly low vapor pressure. At normal process operating conditions, ILs essen-tially do not evaporate. Thus, there has been considerable interest in the use ofILs as industrial solvents to replace VOCs and thus eliminate a source of airpollution, as well as hazards due to inhalation and explosion.49–52 Also, ILs arestable as liquids over a very wide temperature range (e.g.,�70–400 �C).53 Bothof these properties (negligible vapor pressure and large liquidus range) willfacilitate the recovery and reuse of ILs in the context of LLE, and thus provideeconomic benefits (e.g., extremely low solvent loss and make-up requirement).
The hydrophobic character of some ILs allows them to extract hydrophobiccompounds. However, cationic compounds can be successfully extracted fromhydrophobic ILs using appropriate chelators or ligands that could formcomplexes to increase the hydrophobicity of the metal species.54 Parametersaffecting the extraction efficiency of metal ions are as follows:
1. The structure of the IL and side chain length, which change its hydropho-bicity and improve the partition coefficients55.
2. The ligand used should optimize selectivity.3. The pH of the system.56
By changing the anion, cation, and/or cation substituents, an essentiallyendless variety of ILs can be created. Thus, it may be possible to “design” or“tune” ILs that preferentially extract desired compounds from water. Theunique properties of ILs allow them to be conveniently adopted as extractionsolvents in analytical chemistry. Moreover, the nonvolatility of ILs makes thempotentially useful for long-time headspace LPME of volatile analytes forobtaining high enrichment factor. [C8MIM][PF6] was used for the LPME ofPAHs from water samples using the single-drop microextraction (SDME).57
Compared to 1-octanol, a larger drop volume of IL can be suspended duringlonger extraction times with high enrichment factors. Formaldehyde extractionfrom mushrooms by LPME using ILs has been successfully developed.58
SPME with a disposable IL has also been successfully developed.59 Themethod was applied to the extraction of benzene, toluene, ethylbenzene, andxylenes in paints. The SPME fiber was coated with IL before every extraction,
466 PART | III Modern and Future Trends in Fundamentals and Applications
the analytes were extracted and desorbed on the injection port of GC instru-ment, and the IL coating was washed with solvents.
5.1.1. Toxicology Considerations
The possibilities offered by ILs, with several million structures available by thecombination of different cations and anions, also represent an unusual problemrelated to the definition or identification of the toxicity and environmental sideeffects of those compounds. ILs are new molecules still not fully accepted inthe wider community: it is difficult for conservative scientists to throw awayconcepts grown from the fertile ground of molecular solvents over thousands ofyears. However, there are now many laboratories worldwide (and the growth inChina is spectacular) that work with ILs. Of course, deep and thoroughunderstanding of potential health hazards and environmental impact of ILs isessential.
Unfortunately, it has been demonstrated that the first generation of ILs,based on imidazolium or pyridinium cations, turned out to be as toxic asconventional solvents, and sometimes even worse.60 Development of simpletoxicity tests to enable rapid and inexpensive identification of the best ILstructures is the task for elimination of the most toxic ones. The remainingcandidate structures can be investigated using either minimum inhibitoryconcentrations (MICs) and minimum biocidal concentrations (MBCs) tests orgrowth rate measurements and EC50 (medium effective concentration)calculations, selecting only the most appropriate candidates for application.
Some researchers61 found that imidazolium, pyridinium, phosphonium, andammonium cations could not be described as having low freshwater toxicitywith EC50 values below 100 mg/L. The substituted alkyl chain length on thecation played a significant role by influencing the toxicity, i.e., ILs with eightatoms of carbon C8 were found to be more toxic than those with six and four,regardless of the type of cation.
The future of ILs seems really bright in separation techniques due to theirlarge structural diversity.62 Because some ILs are toxic, they cannot beconsidered as general green alternative solvents while some are benign andtechnologists need detailed investigations to accelerate the introduction of newnontoxic ILs in the developed new separation techniques.
6. AMPHIPHILIC COMPOUNDS (SUPRAMOLECULES)AS SOLVENTS IN SOLVENT EXTRACTION
Supramolecular solvents have a unique array of physicochemical propertiesthat render them very attractive to replace organic solvents in solventextraction. Main intrinsic properties of these solvents include: use of self-assembly-based synthetic procedures that are within everyone’s reach; ubiquityof amphiphiles in nature and synthetic chemistry, which makes them easilyaccessible; tunability of solvent properties by varying the hydrophobic or polar
467Chapter | 13 Advances in Development of Solvents
group of the amphiphile; presence of different polarity regions in the supra-molecular aggregates that provide excellent solvation properties for a variety oforganic and inorganic compounds; multiligand ability through the multiplepolar groups present in a supramolecular aggregate, which is an ideal platformfor amplification of solute binding; and nonvolatility and nonflammabilityof supramolecular aggregates, which permit the implementation of saferprocesses.
The use of amphiphilic compounds, such as surfactants, cyclodextrins, orcrown ethers, in aqueous solutions provides the so-called organized media,creating special characteristic points in the aqueous solution with differentdielectric properties and with increased solvent characteristics. Surfactants arethe less expensive and the most versatile amphiphilic compounds.
SinceWatanabe et al.63 firstly reported the cloud point technique, SUPRASsmade up of nonionic surfactant-based micellar aggregates have been exten-sively applied to the extraction of hydrophobic organic compounds and metals,mainly from environmental and biological liquids. Excellent published reviewscompile the phase-separation behavior of nonionic surfactants as a functionof the temperature, the type of applications developed, and the advantages/limitations of separations based on the cloud point phenomenon.64,65 Asa result, parameters affecting extraction efficiencies and pre-concentrationfactors achieved by this technique are well known, and that facilitates itsimplementation in new processes. In the last decade, progress in this area hasfocused on the development of SUPRASs based on ionic surfactants, otheraggregates than aqueous micelles (namely, reversed micelles and vesicles), andother stimuli than temperature (e.g., pH, electrolytes, or solvents) as the drivingforce phase separation. As a result, the scope of SUPRASs in solvent extrac-tions has been greatly extended.
This review mainly covers progress related to SUPRAS-based extractionreported over the last decade. Advances in SUPRAS formation, mainly derivedfrom recent developments in supramolecular chemistry, are outlined with theaim of better understanding the mechanisms of solvent production and arepresented in the previous chapter. This knowledge is of primary importance forthe synthesis of new solvents. The scarce studies reported so far on the structureof SUPRASs are presented and their physicochemical properties, mechanismsof interaction with solutes, extraction formats, compatibility with separationand detection techniques, and capability for the extraction of organiccontaminants from a variety of matrices are critically discussed. A great deal ofresearch is currently being conducted related to the extraction of metals bySUPRASs.66
It is clearly established nowadays that supramolecular solvents constitutea promising and powerful alternative to organic solvents in solvent extraction.The major asset of SUPRASs is their high capability of solubilization fora variety of solutes, which renders them ideal for multiresidue analysis in theenvironmental and agrifood fields––an outstanding feature hardly explored so
468 PART | III Modern and Future Trends in Fundamentals and Applications
far. Besides, they are ideally suited for developing generic sample treatmentsadaptable to the extraction of one or various solutes in very different types ofsamples with minor modifications.
Significant developments concerning both theoretical and practical aspectsrelated to SUPRASs have been reported over the last decade. Self-assembly istoday a discrete field of study and it seems to offer one of the most generalstrategies now available for generating nanostructures of interest in materialsscience, condensed matter science, and engineering. The wide expertise gainedin self-assembly-based synthetic processes is a promising basis to developsupramolecular solvents with targeted properties that provide selectiveextraction in specific applications.
As pointed above, great effort has been made in recent years by researchersfor targeting the extraction of polar solutes with the synthesis of new SUPRASsthat provide a variety of interactions (ionic, cation, and hydrogen bonding). Inthis way, the scope of the SUPRASs has been greatly expanded. Extraction ofcontaminants from solids such as food, soil, sludge, sediment, etc. has receivedspecial attention in the last decade. The results obtained in this sense prove thatSUPRASs offer advantages in terms of extraction efficiency and rapidity andare ideally suited for miniaturization of the extraction process.
SUPRASs have been successfully applied to the extraction of organiccompounds, including PAHs, pesticides, surfactants, bioactive compounds,dyes, endocrine disruptors, etc. High concentration of amphiphiles has beenfound for SUPRASs made up of carboxylic acids, thus permitting to get thehighest concentration factors reported so far (e.g., 769 in67,68).
There are still important efforts to be made in order to consolidate the use ofSUPRAS. Some of the topics that deserve attention are the design and synthesisof supramolecular solvents with specific functions and tasks that extend theirscope in extraction, the validation of methods including supramolecular-basedextractions, and the development of new strategies for automation andcompatibility with separation and detection techniques in analytical chemistry.The application of SUPRASs to the extraction of solutes from solid samples isanother item hardly explored and research in this area is worthy of furtherattention.
6.1. Surfactants
Surfactants are the less expensive and the most versatile amphiphiliccompounds.69 As indicated in Fig. 13.7, a surfactant molecule can be describedas a polar head with an unpolar tail, and different media can be prepared usingdifferent concentrations of surfactant molecules. Surfactant monomers canassociate forming dimers or trimers, in general, called premicellar aggregatesbecause the natural tendency of surfactants in aqueous solutions is to form aninterphase between air and water or between the recipient walls and water to actas a surface-active linker, which can reduce the surface tension of the bulk phase.
469Chapter | 13 Advances in Development of Solvents
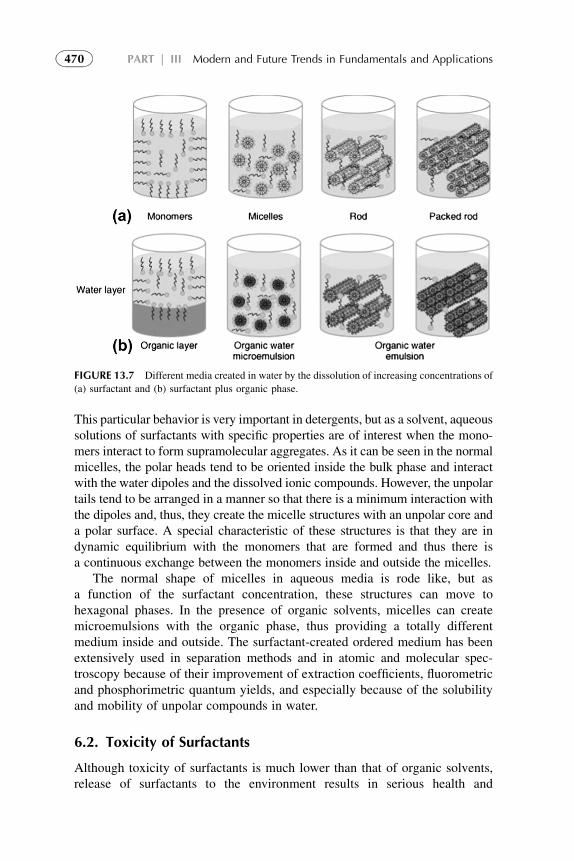
This particular behavior is very important in detergents, but as a solvent, aqueoussolutions of surfactants with specific properties are of interest when the mono-mers interact to form supramolecular aggregates. As it can be seen in the normalmicelles, the polar heads tend to be oriented inside the bulk phase and interactwith the water dipoles and the dissolved ionic compounds. However, the unpolartails tend to be arranged in a manner so that there is a minimum interaction withthe dipoles and, thus, they create the micelle structures with an unpolar core anda polar surface. A special characteristic of these structures is that they are indynamic equilibrium with the monomers that are formed and thus there isa continuous exchange between the monomers inside and outside the micelles.
The normal shape of micelles in aqueous media is rode like, but asa function of the surfactant concentration, these structures can move tohexagonal phases. In the presence of organic solvents, micelles can createmicroemulsions with the organic phase, thus providing a totally differentmedium inside and outside. The surfactant-created ordered medium has beenextensively used in separation methods and in atomic and molecular spec-troscopy because of their improvement of extraction coefficients, fluorometricand phosphorimetric quantum yields, and especially because of the solubilityand mobility of unpolar compounds in water.
6.2. Toxicity of Surfactants
Although toxicity of surfactants is much lower than that of organic solvents,release of surfactants to the environment results in serious health and
FIGURE 13.7 Different media created in water by the dissolution of increasing concentrations of
(a) surfactant and (b) surfactant plus organic phase.
470 PART | III Modern and Future Trends in Fundamentals and Applications
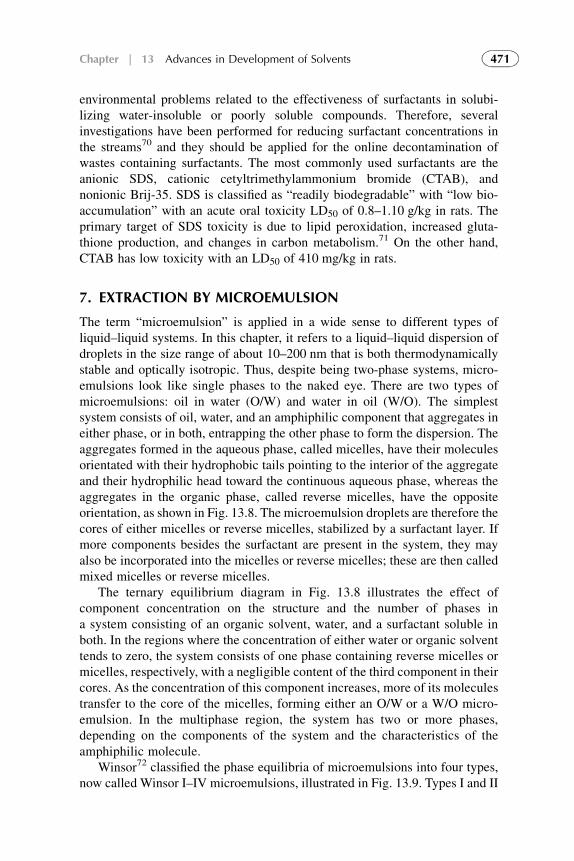
environmental problems related to the effectiveness of surfactants in solubi-lizing water-insoluble or poorly soluble compounds. Therefore, severalinvestigations have been performed for reducing surfactant concentrations inthe streams70 and they should be applied for the online decontamination ofwastes containing surfactants. The most commonly used surfactants are theanionic SDS, cationic cetyltrimethylammonium bromide (CTAB), andnonionic Brij-35. SDS is classified as “readily biodegradable” with “low bio-accumulation” with an acute oral toxicity LD50 of 0.8–1.10 g/kg in rats. Theprimary target of SDS toxicity is due to lipid peroxidation, increased gluta-thione production, and changes in carbon metabolism.71 On the other hand,CTAB has low toxicity with an LD50 of 410 mg/kg in rats.
7. EXTRACTION BY MICROEMULSION
The term “microemulsion” is applied in a wide sense to different types ofliquid–liquid systems. In this chapter, it refers to a liquid–liquid dispersion ofdroplets in the size range of about 10–200 nm that is both thermodynamicallystable and optically isotropic. Thus, despite being two-phase systems, micro-emulsions look like single phases to the naked eye. There are two types ofmicroemulsions: oil in water (O/W) and water in oil (W/O). The simplestsystem consists of oil, water, and an amphiphilic component that aggregates ineither phase, or in both, entrapping the other phase to form the dispersion. Theaggregates formed in the aqueous phase, called micelles, have their moleculesorientated with their hydrophobic tails pointing to the interior of the aggregateand their hydrophilic head toward the continuous aqueous phase, whereas theaggregates in the organic phase, called reverse micelles, have the oppositeorientation, as shown in Fig. 13.8. The microemulsion droplets are therefore thecores of either micelles or reverse micelles, stabilized by a surfactant layer. Ifmore components besides the surfactant are present in the system, they mayalso be incorporated into the micelles or reverse micelles; these are then calledmixed micelles or reverse micelles.
The ternary equilibrium diagram in Fig. 13.8 illustrates the effect ofcomponent concentration on the structure and the number of phases ina system consisting of an organic solvent, water, and a surfactant soluble inboth. In the regions where the concentration of either water or organic solventtends to zero, the system consists of one phase containing reverse micelles ormicelles, respectively, with a negligible content of the third component in theircores. As the concentration of this component increases, more of its moleculestransfer to the core of the micelles, forming either an O/W or a W/O micro-emulsion. In the multiphase region, the system has two or more phases,depending on the components of the system and the characteristics of theamphiphilic molecule.
Winsor72 classified the phase equilibria of microemulsions into four types,now called Winsor I–IV microemulsions, illustrated in Fig. 13.9. Types I and II
471Chapter | 13 Advances in Development of Solvents
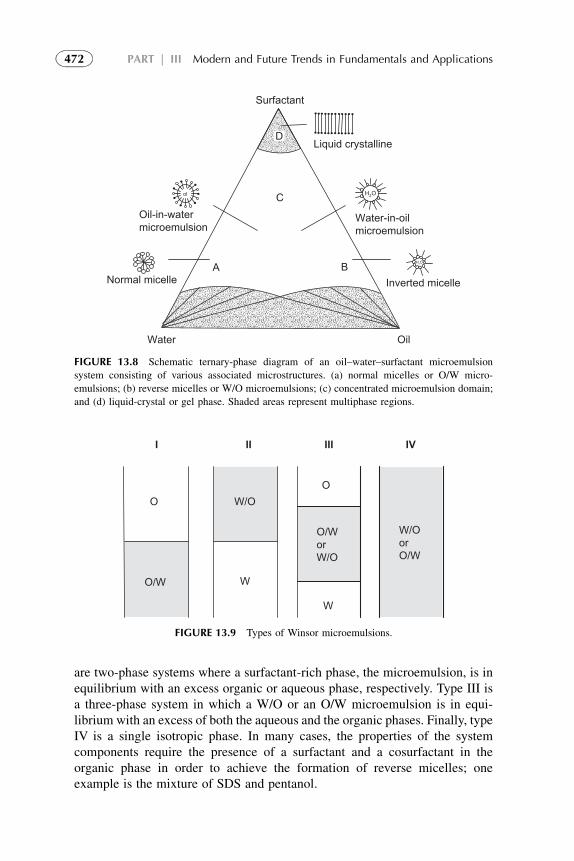
are two-phase systems where a surfactant-rich phase, the microemulsion, is inequilibrium with an excess organic or aqueous phase, respectively. Type III isa three-phase system in which a W/O or an O/W microemulsion is in equi-librium with an excess of both the aqueous and the organic phases. Finally, typeIV is a single isotropic phase. In many cases, the properties of the systemcomponents require the presence of a surfactant and a cosurfactant in theorganic phase in order to achieve the formation of reverse micelles; oneexample is the mixture of SDS and pentanol.
I II III IV
O
O
W
W
O/W
O/W
or
W/O
W/O
or
O/W
W/O
FIGURE 13.9 Types of Winsor microemulsions.
BA
C
Surfactant
Oil-in-watermicroemulsion
Water-in-oilmicroemulsion
Normal micelle
Water Oil
Inverted micelle
Liquid crystallineD
FIGURE 13.8 Schematic ternary-phase diagram of an oil–water–surfactant microemulsion
system consisting of various associated microstructures. (a) normal micelles or O/W micro-
emulsions; (b) reverse micelles or W/O microemulsions; (c) concentrated microemulsion domain;
and (d) liquid-crystal or gel phase. Shaded areas represent multiphase regions.
472 PART | III Modern and Future Trends in Fundamentals and Applications
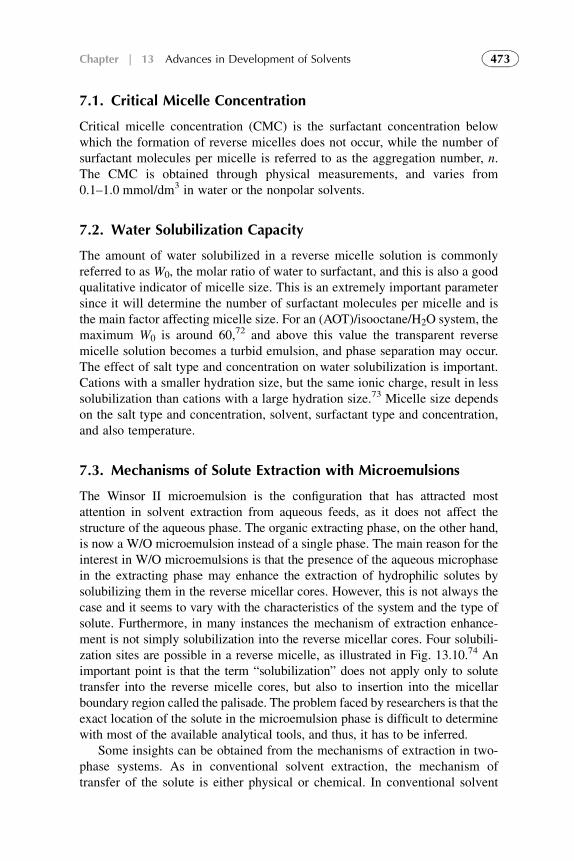
7.1. Critical Micelle Concentration
Critical micelle concentration (CMC) is the surfactant concentration belowwhich the formation of reverse micelles does not occur, while the number ofsurfactant molecules per micelle is referred to as the aggregation number, n.The CMC is obtained through physical measurements, and varies from0.1–1.0 mmol/dm3 in water or the nonpolar solvents.
7.2. Water Solubilization Capacity
The amount of water solubilized in a reverse micelle solution is commonlyreferred to as W0, the molar ratio of water to surfactant, and this is also a goodqualitative indicator of micelle size. This is an extremely important parametersince it will determine the number of surfactant molecules per micelle and isthe main factor affecting micelle size. For an (AOT)/isooctane/H2O system, themaximum W0 is around 60,72 and above this value the transparent reversemicelle solution becomes a turbid emulsion, and phase separation may occur.The effect of salt type and concentration on water solubilization is important.Cations with a smaller hydration size, but the same ionic charge, result in lesssolubilization than cations with a large hydration size.73 Micelle size dependson the salt type and concentration, solvent, surfactant type and concentration,and also temperature.
7.3. Mechanisms of Solute Extraction with Microemulsions
The Winsor II microemulsion is the configuration that has attracted mostattention in solvent extraction from aqueous feeds, as it does not affect thestructure of the aqueous phase. The organic extracting phase, on the other hand,is now a W/O microemulsion instead of a single phase. The main reason for theinterest in W/O microemulsions is that the presence of the aqueous microphasein the extracting phase may enhance the extraction of hydrophilic solutes bysolubilizing them in the reverse micellar cores. However, this is not always thecase and it seems to vary with the characteristics of the system and the type ofsolute. Furthermore, in many instances the mechanism of extraction enhance-ment is not simply solubilization into the reverse micellar cores. Four solubili-zation sites are possible in a reverse micelle, as illustrated in Fig. 13.10.74 Animportant point is that the term “solubilization” does not apply only to solutetransfer into the reverse micelle cores, but also to insertion into the micellarboundary region called the palisade. The problem faced by researchers is that theexact location of the solute in the microemulsion phase is difficult to determinewith most of the available analytical tools, and thus, it has to be inferred.
Some insights can be obtained from the mechanisms of extraction in two-phase systems. As in conventional solvent extraction, the mechanism oftransfer of the solute is either physical or chemical. In conventional solvent
473Chapter | 13 Advances in Development of Solvents
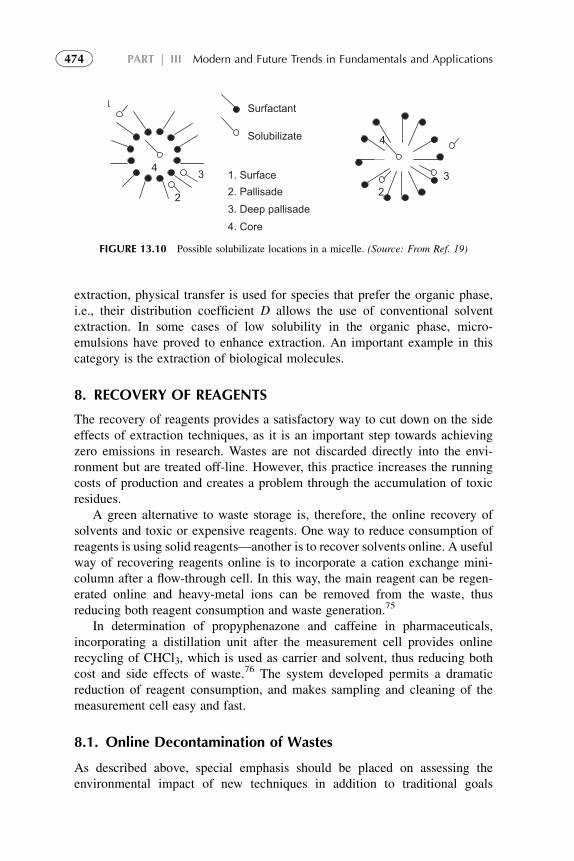
extraction, physical transfer is used for species that prefer the organic phase,i.e., their distribution coefficient D allows the use of conventional solventextraction. In some cases of low solubility in the organic phase, micro-emulsions have proved to enhance extraction. An important example in thiscategory is the extraction of biological molecules.
8. RECOVERY OF REAGENTS
The recovery of reagents provides a satisfactory way to cut down on the sideeffects of extraction techniques, as it is an important step towards achievingzero emissions in research. Wastes are not discarded directly into the envi-ronment but are treated off-line. However, this practice increases the runningcosts of production and creates a problem through the accumulation of toxicresidues.
A green alternative to waste storage is, therefore, the online recovery ofsolvents and toxic or expensive reagents. One way to reduce consumption ofreagents is using solid reagents––another is to recover solvents online. A usefulway of recovering reagents online is to incorporate a cation exchange mini-column after a flow-through cell. In this way, the main reagent can be regen-erated online and heavy-metal ions can be removed from the waste, thusreducing both reagent consumption and waste generation.75
In determination of propyphenazone and caffeine in pharmaceuticals,incorporating a distillation unit after the measurement cell provides onlinerecycling of CHCl3, which is used as carrier and solvent, thus reducing bothcost and side effects of waste.76 The system developed permits a dramaticreduction of reagent consumption, and makes sampling and cleaning of themeasurement cell easy and fast.
8.1. Online Decontamination of Wastes
As described above, special emphasis should be placed on assessing theenvironmental impact of new techniques in addition to traditional goals
3
2
4
Surfactant
Solubilizate
1. Surface
2. Pallisade
3. Deep pallisade
4. Core
43
2
FIGURE 13.10 Possible solubilizate locations in a micelle. (Source: From Ref. 19)
474 PART | III Modern and Future Trends in Fundamentals and Applications
(e.g., accuracy, precision, and sensitivity). Basically, online treatment of wasteinvolves adding a decontamination step after basic flowsheet to obtain cleanwaste.
To detoxify wastes online, the following processes are suggested:
1. Thermal degradation2. Oxidative detoxification3. Photodegradation4. Biodegradation77
Some of these strategies have yet to be applied to specific methods.A detoxification step based on in-line TiO2-catalyzed photodegradation
reduces the toxicity of wastes. It has been applied for the determination offormetanate in waters78 using their reaction with p-aminophenol (PAP).After the measurement step, the analytical waste was merged with a TiO2
(anatase)-catalyst slurry and then detoxified by online UV irradiation. Afterthat, the catalyst can be recovered through flocculation and reused.
Metal ions are nondegradable pollutants, so it is impossible to decon-taminate metal wastes. However, it is possible to passivate wastes containingheavy metals and to reduce greatly the volume of waste (e.g., in the deter-mination of Hg in milk by AFS).79 The analytical waste was merged withNaOH and that solution was mixed with a solution of Fe(III), which precip-itates Fe(OH)3 and co-precipitates Hg, thus contributing to deactivation oftraces of Hg and other heavy metals present in samples and standards,reducing the toxic wastes from several liters to less than 1 g of an hydroxidemixture with a high content of Fe.
9. FUTURE TRENDS IN THE DEVELOPMENTOF NEW SOLVENTS
The future will bring further increase in concern over the environmentalimpact of chemical operations. The liquid effluents must be rendered harmlessto the environment. The main efforts correspond to the improvement ofsolvent characteristics of water under appropriate temperature and pressureconditions or the use of water-miscible cosolvents or additives, such assurfactants. However, other alternatives such as development of new solventswith better separation properties, replacement of petrol-derived organicsolvents by renewable ones such as alcohols, or the use of supercritical fluidsand ILs can offer cheaper, highly innovative, and unexplored environment-friendly options.
To evaluate the different green alternatives to the commonly employedorganic solvents, the strengths, weaknesses, opportunities, and threats(SWOT) analysis80 may be applied. Figure 13.11 presents the SWOT analysisof current strengths and weaknesses of superheated water, renewableorganics, supercritical fluids, ILs, and surfactant solutions together with the
475Chapter | 13 Advances in Development of Solvents
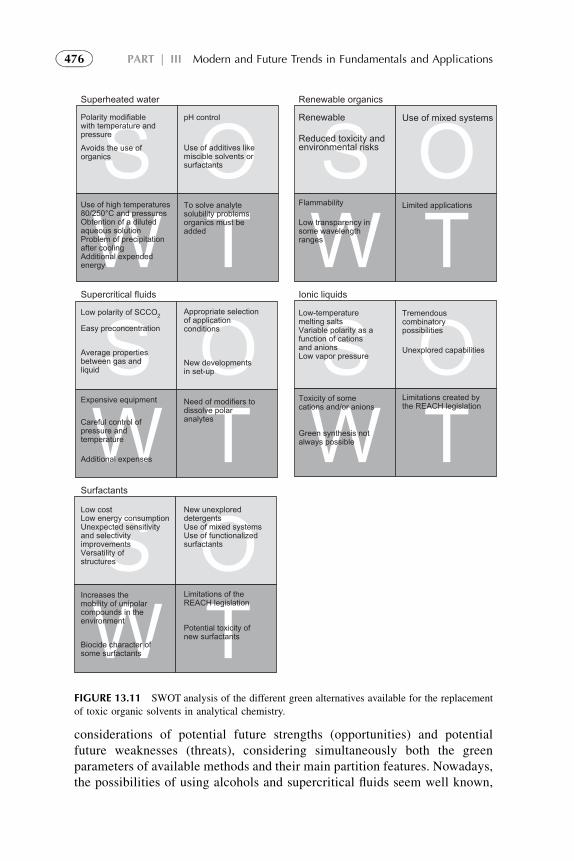
considerations of potential future strengths (opportunities) and potentialfuture weaknesses (threats), considering simultaneously both the greenparameters of available methods and their main partition features. Nowadays,the possibilities of using alcohols and supercritical fluids seem well known,
S O S OW T W TS O S OW T W TS OW T
Superheated water
Polarity modifiablewith temperature andpressureAvoids the use oforganics
pH control
Use of additives likemiscible solvents or surfactants
Renewable
Reduced toxicity and environmental risks
Use of mixed systems
Use of high temperatures80/250°C and pressuresObtention of a dilutedaqueous solutionProblem of precipitationafter cooling Additional expendedenergy
To solve analytesolubility problemsorganics must beadded
Flammability
Low transparency insome wavelengthranges
Limited applications
Supercritical fluids Ionic liquids
Low polarity of SCCO2
Easy preconcentration
Average propertiesbetween gas and liquid
Appropriate selectionof applicationconditions
New developmentsin set-up
Low-temperaturemelting saltsVariable polarity as afunction of cationsand anions Low vapor pressure
Tremendouscombinatorypossibilities
Unexplored capabilities
Expensive equipment
Careful control ofpressure andtemperature
Additional expenses
Need of modifiers to dissolve polaranalytes
Toxicity of somecations and/or anions
Green synthesis notalways possible
Limitations created bythe REACH legislation
Low costLow energy consumptionUnexpected sensitivityand selectivityimprovementsVersatility of structures
New unexploreddetergentsUse of mixed systemsUse of functionalizedsurfactants
Increases the mobility of unipolarcompounds in the environment
Biocide character ofsome surfactants
Limitations of the REACH legislation
Potential toxicity ofnew surfactants
Surfactants
Renewable organics
FIGURE 13.11 SWOT analysis of the different green alternatives available for the replacement
of toxic organic solvents in analytical chemistry.
476 PART | III Modern and Future Trends in Fundamentals and Applications
but there are tremendous unexplored possibilities involving the use of ILs andsurfactant solutions.
10. CONCLUDING REMARKS
The future will bring further increase in concern over the environmental impactof chemical operations. This requires removal of the hazardous substances. Formany of the dilute waste solutions, solvent extraction has proved to be aneffective process. This is even more truer for recycling of mixed metals fromvarious industries. Nevertheless, the increasing amounts of wastes from humanactivities require much more to be done in this field.
In principle, solvent extraction is an environment-friendly process with noair or water pollution, provided the plant flows are properly designed. It could,therefore, replace many of the present polluting processes. A particularproblem, however, is the solvent extraction effluents, which may containbiochemically active substances posing “new” hazards to the environment.These can be handled by various solid sorbents, which can then be inciner-ated, but the advantage of the solvent extraction process may be lost. There is,therefore, a demand for biodegradable and environmentally benign solventphases. In the future, additional attention is required to this field.
The principle of solvent extractiondthe distribution of chemical speciesbetween two immiscible liquid phasesdhas been applied to many areas ofchemistry. A typical one is liquid partition chromatography, where the principleof solvent extraction provides the most efficient separation process available toorganic chemistry today––its huge application has become a field (and anindustry!) of its own. The design of ion-selective electrodes is another appli-cation of the solvent extraction principle––it also has become an independentfield. Both these applications are only briefly touched upon in Chapter 5 onanalytical applications. Nevertheless, fundamental research on solventextraction will provide further important inputs into these two applications. It islikely that fundamental solvent extraction research will continue to contributeto the development of further selective analytical techniques.
The driving force of the transport of salts, proteins, etc., through the cellmembrane from the nucleus to the body fluids, and vice versa, is a complicatedbiochemical process81. As far as is known, this field has not been explored bytraditional solution chemists, although a detailed analysis of these transferprocesses indicates many similarities with solvent extraction processes (equi-librium as well as kinetics). It is possible that studies of such simpler modelsystems could contribute to the understanding of the more complicatedbiochemical processes.
Solvent extraction deals with the transport of chemical substances fromone phase into another, the chemical kinetics of this process, and the finalequilibrium distribution of the substances between the two phases. Suchtransport and distribution processes are the motors that make life in biological
477Chapter | 13 Advances in Development of Solvents
systems possible. Fundamental studies of such “solvent extraction” processescontribute to the better understanding of all processes in nature. Here, onlythe lack of imagination stands in the way of important new scientificdiscoveries.
REFERENCES
1. Gani R, Jimenez-Gonzalez C, Kate A, Crafts PA, Jones M, Powell L, Atherton JH,
Cordiner JL. A modern approach to solvent selection. Chem Eng 2006;1:30–41.
2. Henry MC, Yonker CR. Supercritical fluid chromatography, pressurized liquid extraction, and
supercritical fluid extraction. Anal Chem 2006;78:3909.
3. Zhao H, Xia S, Ma P. Use of ionic liquids as “green” solvents for extractions. J Chem Technol
Biotechnol 2005;80:1089–96.
4. http://www.epa.gov/ttn/atw/188polls.html (2010).
5. European Committee for Standardisation. Environmental Management d Life Cycle
Assessment d Principles and Framework. EN ISO 14040. Brussels, Belgium: European
Committee for Standardisation; 1997.
6. Tullo A. A solvent dries up. Chem Eng News 2008;86:27.
7. Agilent Technologies. Technical Note, Reducing HPLC Solvent Consumption. Publication
Number 5990-3472EN, http://www.chem.agilent.com/Library/technicaloverviews/Public/
5990-3472EN.pdf; 2009.
8. Welch CJ, Brkovic T, Schafer W, Gong X. Performance to burn? Re-evaluating the
choice of acetonitrile as the platform solvent for analytical HPLC. Green Chem
2009;11:1232–8.
9. Smith RM. Extractions with superheated water. J Chromatogr A 2002;975:31–46.
10. Ogunsola OM, Berkowitz N. Extraction of oil shales with sub-critical and near-critical water.
Fuel Proc Technol 1995;45:95–107.
11. Williams DD, Lee MK, Crawford JE, Tyree PO. Analysis of convective heat transfer in
deformed and stratified aquifers associated with frasch thermal mining. Ground Water
1999;37:517–22.
12. Cassel E, Vargas RMF, Martinez N, Lorenzo D, Dellacassa E. Steam distillation modeling for
essential oil extraction process. E Ind Crop Prod 2009;29:171–6.
13. Luque de Castro MD, Jimenez CMM. Potential of water for continuous automated sample-
leaching. Trends Anal Chem 1998;17:441–7.
14. Hawthorne SB, Yang Y, Miller DJ. Extraction of organic pollutants from environmental solids
with sub- and supercritical water. Anal Chem 1994;66:2912–20.
15. Yang Y, Bowadt S, Hawthorne SB, Miller DJ. Subcritical water extraction of polychlorinated
biphenyls from soil and sediment. Anal Chem 1995;67:4571–6.
16. Jimenez CMM, Manclus JJ, Montoya A, Luque de Castro MD. Sub- and supercritical-fluid
extraction of trichloropyridinol from soil prior to immunoassay. J Chromatogr 1997;785:329–36.
17. Kipp S, Peyrer H, Kleiboehmer W. Coupling superheated water extraction with enzyme
immunoassay for an efficient and fast PAH Screening in soil. Talanta 1998;46:385–93.
18. Basile A, Jimenez CMM, Clifford AA. Extraction of rosemary by superheated water. J Agri
Food Chem 1998;46:5205–9.
19. Fernandez PV, Jimenez CMM, Luque de Castro MD. An approach to the static-dynamic
subcritical water extraction of laurel essential oil: comparison with conventional techniques.
Analyst 2000;125:481–5.
478 PART | III Modern and Future Trends in Fundamentals and Applications
20. Gamiz-Gracia L, Luque de Castro MD. Continuous subcritical water extraction of medicinal
plant essential oil: comparison with conventional techniques. Talanta 2000;51:1179–85.
21. Jimenez CMM, Ubera JL, Luque de Castro MD. Comparison of continuous sub-critical
water extraction and hydrodistillation of marjoram essential oil. J Chromatogr A
1999;855:625–32.
22. Jimenez CMM, Luque de Castro MD. Isolation of eucalyptus essential oil for GC-MS analysis
by extraction with subcritical water. Chromatographia 1999;50:578–82.
23. Chalchat JC, Garry RP, Michet A. Chemical composition of essential oil of Calendula
officinalis L. (pot marigold). Flavour Fragr J 1991;6:189–92.
24. De-Pooter HL, Aboutabl EA, El-Shabrawy AO. Chemical composition and antimicrobial
activity of essential oil of lead, stem and rhizome of Alpinia speciosa (J.C. Wendl.) K. Schum.
grown in Egypt. Flavour Fragr J 1995;10:63–7.
25. Verma RK, Uniyal GC, Gupta MM. High-performance liquid chromatography of poppy straw.
Indian J Pharmaceut Sci 1990;52:276–8.
26. Ayala RS, Luque de Castro MD. Continuous subcritical water extraction as a useful tool for
isolation of edible essential oils. Food Chem 2001;75:109–13.
27. Di Corcia A, Caracciolo AB, Crescenzi C, Guiliano G, Murtas S, Samperi R. Subcritical water
extraction followed by liquid chromatography mass spectrometry for determining terbuthylazine
and its metabolites in aged and incubated soils. Environ Sci Technol 1999;33:3271–7.
28. Daimon H, Pawliszyn J. High temperature water extraction combined with solid phase
microextraction. Anal Commun 1996;33:421–4.
29. Wennrich L, Popp P, Breuste J. Determination of organochlorine pesticides and chloroben-
zenes in fruit and vegetables using subcritical water extraction combined with sorptive
enrichment and CGC-MS. Chromatographia 2001;53:S380–6.
30. Hawthorne SB, Grabanski CB, Hageman KJ, Miller DJ. Simple method for estimating
polychlorinated biphenyl concentrations on soils and sediments using subcritical water
extraction coupled with solid-phase microextraction. J Chromatogr A 1998;814:151–60.
31. Hyotylainen T, Andersson T, Hartonen K, Kuosmanen K, Riekkola ML. Pressurized hot water
extraction coupled on line with LC-GC: determination of polyaromatic hydrocarbons in
sediment. Anal Chem 2000;72:3070–6.
32. Crescenzi C, D’Ascenzo G, Di Corcia A, Nazzari M, Marchese S, Samperi R. Multiresidue
herbicide analysis in soil: subcritical water extraction with an on-line sorbent trap. Anal Chem
1999;71:2157–63.
33. Crescenzi C, Di Corcia A, Nazzari M, Samperi R. Hot phosphate-buffered water extraction
coupled on line with liquid chromatography/mass spectrometry for analyzing contaminants in
soil. Anal Chem 2000;72:3050–5.
34. Curren MSS, King JW. Ethanol-modified subcritical water extraction combined with solid-
phase microextraction for determining atrazine in beef kidney. J Agric Food Chem
2001;49:2175–80.
35. Fernandez-Perez V, Luque de Castro MD. Micelle formation for improvement of
continuous subcritical water extraction of polycyclic aromatic hydrocarbons in soil prior to high-
performance liquid chromatography-fluorescence detection. J Chromatogr A 2000;902:357–67.
36. Albertsson PA. Partition of cell particles and macromolecules. 2nd ed. New York: John Wiley
& Sons; 1971.
37. Raghavarao KSMS, Guinn MR, Todd P. Recent developments in aqueous two phase extraction
in bioprocessing. Sep Purif Methods 1988;27(1):1.
38. Hatti-Kaul R. Aqueous two-phase systems: methods and protocols. Totowa, New Jersey:
Humana Press; 2000.
479Chapter | 13 Advances in Development of Solvents
39. Hustedt H, Kroner KH, Kula MR. Extractive enzyme recovery. Proceedings of European
Congress on Biotechnology 1984;1:597.
40. Pourmortazavi SM, Hajimirsadeghi SS. Supercritical fluid extraction in plant essential and
volatile oil analysis. J Chromatogr A 2007;1163:2–24.
41. Wang SM, Ling YC, Giang YS. Forensic applications of supercritical fluid extraction and
chromatography. Forensic Sci J 2003;2:5–18.
42. Acosta GM, Smith Jr RL, Walsh JE, Boni KA. Beef shank fat solubility in supercritical carbon
dioxide-propane mixtures and in liquid propane. J Food Sci 1995;60:983–7.
43. Tallon S, Catchpole OJ, Grey JB, Fenton K, Fletcher K, Fletcher AJ. Extraction of lipids
from aqueous protein-rich streams using near-critical dimethylether. Chem Eng Technol
2007;30:501–10.
44. Favati F, King JW, Mazzanti M. Supercritical carbon dioxide extraction of evening primrose
oil. J Am Oil Chem Soc 1991;68:422–7.
45. Alexandrou N, Lawrence MJ, Pawliszyn J. Cleanup of complex organic mixtures using
supercritical fluids and selective adsorbents. Anal Chem 1992;64:301–11.
46. Levy JM, Storozynsky E, Ravey RM. The use of alternative fluids in online supercritical fluid
extraction-capillary gas-chromatography. J High Resolut Chromatogr 1991;14:661–6.
47. Wilkes JS, Zaworotko MJ. Air and water stable 1-ethyl-3-methylimidazolium based ionic
liquids. J Chem Soc Chem Commun 1992;13:965–7.
48. Chapeaux A, Simoni LD, Ronan T, Stadtherr MA, Brennecke JF. Extraction of alcohols from
water with 1-hexyl-3-methylimidazolium bis(trifluoromethyl sulfonyl)imide. Green Chem
2008;10:1301–6.
49. Fadeev AG, Meagher MM. Opportunities for ionic liquids in recovery of biofuels. Chem
Commun 2001;3:295–6.
50. Brennecke JF, Maginn EJ. Ionic liquids: innovative fluids for chemical processing. AIChE J
2001;47:2384–9.
51. Wasserscheid P, Keim W. Ionic liquidsdnew solutions for transition metal catalysis. Angew
Chem Int Ed 2000;39:3773–89.
52. Welton T. Room-temperature ionic liquids. Solvents for synthesis and catalysis. Chem Rev
1999;99:2071–83.
53. Fredlake CP, Crosthwaite JM, Hert DG, Aki SNVK, Brennecke JF. Thermophysical properties
of imidazolium-based ionic liquids. J Chem Eng Data 2004;49:954.
54. Visser AE, Swatloski RP, Griffin ST, Hartman DH, Rogers RD. Liquid/liquid Extraction of
metal ions in room temperature ionic liquids. Sep Sci Technol 2001;36:785–804.
55. Chun S, Dzyuba SV, Bartsch RA. Influence of structural variation in room-temperature ionic
liquids on the selectivity and efficiency of competitive alkali metal salt extraction by a crown
ether. Anal Chem 2001;73:3737–41.
56. Wei GT, Yang Z, Chen CJ. Room temperature ionic liquid as a novel medium for liquid/liquid
extraction of metal ions. Anal Chim Acta 2003;488:183–92.
57. Liu JF, Jiang GB, Chi YG, Cai YQ, Hu JT, Zhou QX. Use of ionic liquids for liquid-phase
microextraction of polycyclic aromatic hydrocarbons. Anal Chem 2003;75:5870–6.
58. Liu JF, Peng JF, Chi YG, Jiang GB. Determination of formaldehyde in shiitake mushroom by
ionic liquid-based liquid-phase microextraction coupled with liquid chromatography. Talanta
2005;65:705–9.
59. Liu JF, Li N, Jiang GB, Liu JM, Jonsson JA, Wen MJ. Disposable ionic liquid coating for
headspace solid-phase microextraction of benzene, toluene, ethylbenzene and xylenes in
paints followed by gas chromatography-flame ionization detection. J Chromatogr A
2005;1066:27–32.
480 PART | III Modern and Future Trends in Fundamentals and Applications
60. Kulacki KJ, Lamberti GA. Toxicity of imidazolium ionic liquids to freshwater algae. Green
Chem 2008;10:104–10.
61. Zhao D, Liao Y, Zhang Z. Toxicity of ionic liquids. Clean 2007;35:42–8.
62. http://www.rsc.org/Publishing/ChemScience/Volume/2010/04/searching_for_greener.asp
accessed year: 2010.
63. Watanabe H, Tanaka H. A nonionic surfactant as a new solvent. Talanta 1978;25:585–9.
64. Scamehorn JF, Harwell JH, editors. Surfactant-based separation processes. New York: Marcel
Dekker; 1989. p. 139–54.
65. HinzeWL, Pramauro E. Solubilization in micellar systems.Crit Rev Anal Chem 1993;24:133–77.
66. Butler OT, Cook JM, Davidson CM, Harrington CF, Miles DL. Atomic spectrometry update.
Environmental analysis. J Anal At Spectrom 2009;24:131–77.
67. Ballesteros-Gumez A, Ruiz FJ, Rubio S, Pkrez-Bendito D. Determination of bisphenols A and
F and their diglycidyl ethers in wastewater and river water by coacervative extraction and
liquid chromatography-fluorimetry. Anal Chim Acta 2007;603:51–9.
68. Ruiz FJ, Rubio S, Pkrez-Bendito D. Study of the influence of water matrix components on
admicellar sorbents. J Chromatogr A 2007;1163:269–76.
69. de la Guardia M. Espectrometria molecular de medios micelares. Molecular spectrometry of
micellar media. In: Valiente M, Hoffmann H, Rodenas E, editors. Propiedades, Caracter-
izacion y Aplicaciones de los Sistemas Coloidales. Properties, Characterization and Appli-
cations of the Colloidal Systems. Madrid, Spain: University of Alcala, Universidad de Alcala;
1994.
70. Gupta S, Pal A, Ghosh PK, Bandyopadhyay M. Performance of waste activated carbon as a
low-cost adsorbent for the removal of anionic surfactant from aquatic environment. J Environ
Sci Health A 2003;38:381–97.
71. Nickerson KW, Aspedon A. Detergent-shock response in bacteria.MolMicrobiol 1992;6:957–61.
72. Winsor PA. Solvent properties of amphiphilic compounds. London: Butterworth Scientific;
1954.
73. Zulauf M, Eicke HF. Inverted micelles and microemulsions in correlation spectroscopy. J Phys
Chem 1979;83(4):480.
74. Leodidis EB, Hatton TA. Specific ion effects in electrical double-layers – Selective solubi-
lization of cations in aerosol-OT reversed micelles. In: Pileni MP, editor. The structure and
reactivity in reversed micelles. Amsterdam: Elsevier; 1989. p. 270.
75. Zenki M, Minamisawa K, Yokoyama T. Clean analytical methodology for the determination
of lead with Arsenazo III by cyclic flow-injection analysis. Talanta 2005;68:281.
76. Bouhsain Z, Garrigues S, de la Guardia M. Clean method for the simultaneous determination
of propyphenazone and caffeine in pharmaceuticals by flow injection fourier transform
infrared spectrometry. Analyst 1997;122:441.
77. de la Guardia M. An integrated approach of analytical chemistry. J Braz Chem Soc
1999;10:429.
78. Escuriola MJ, Morales-Rubio A, de la Guardia M. A clean analytical method for the
spectrophotometric determination of formetanate. Anal Chim Acta 1999;390:147.
79. Cava-Montesinos P, Rodenas-Torralba E, Morales-Rubio A, Cervera ML, de la Guardia M.
Cold vapour atomic fluorescence determination of mercury in . sampling using multi-
commutation. Anal Chim Acta 2004;506:145.
80. Deetlefs M, Seddon KR. Assessing the greenness of some typical laboratory ionic liquid
preparations. Green Chem 2010;12:17–30.
81. Osseo-Asare K, Kenney ME. Aggregation, reversed micelles, and microemulsions in liquid-
liquid extraction. Proceedings of ISEC’80, Liege, 1980, vol. 1, paper no. 80, p. 121.
481Chapter | 13 Advances in Development of Solvents

This page intentionally left blank
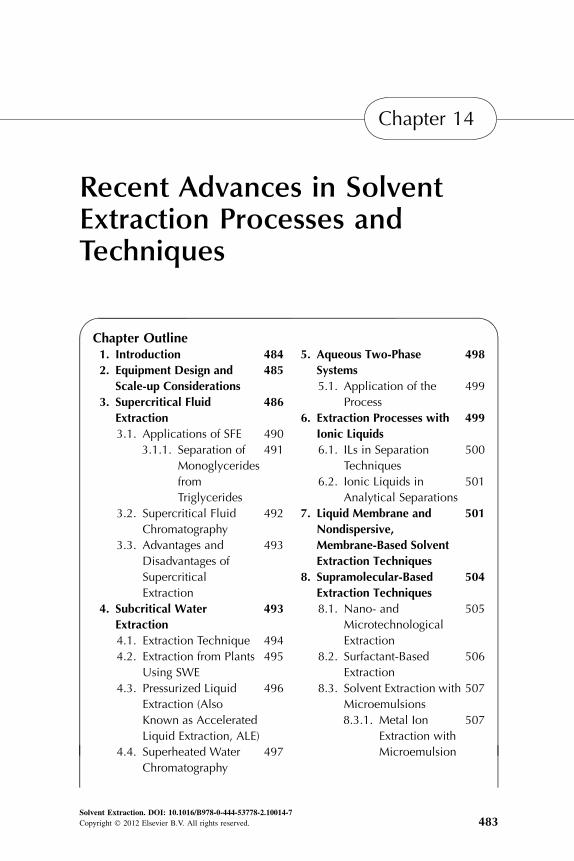
Chapter 14
Recent Advances in SolventExtraction Processes andTechniques
Chapter Outline1. Introduction 484
2. Equipment Design and
Scale-up Considerations
485
3. Supercritical Fluid
Extraction
486
3.1. Applications of SFE 490
3.1.1. Separation of
Monoglycerides
from
Triglycerides
491
3.2. Supercritical Fluid
Chromatography
492
3.3. Advantages and
Disadvantages of
Supercritical
Extraction
493
4. Subcritical Water
Extraction
493
4.1. Extraction Technique 494
4.2. Extraction from Plants
Using SWE
495
4.3. Pressurized Liquid
Extraction (Also
Known as Accelerated
Liquid Extraction, ALE)
496
4.4. Superheated Water
Chromatography
497
5. Aqueous Two-Phase
Systems
498
5.1. Application of the
Process
499
6. Extraction Processes with
Ionic Liquids
499
6.1. ILs in Separation
Techniques
500
6.2. Ionic Liquids in
Analytical Separations
501
7. Liquid Membrane and
Nondispersive,
Membrane-Based Solvent
Extraction Techniques
501
8. Supramolecular-Based
Extraction Techniques
504
8.1. Nano- and
Microtechnological
Extraction
505
8.2. Surfactant-Based
Extraction
506
8.3. Solvent Extraction with
Microemulsions
507
8.3.1. Metal Ion
Extraction with
Microemulsion
507
Solvent Extraction. DOI: 10.1016/B978-0-444-53778-2.10014-7
Copyright � 2012 Elsevier B.V. All rights reserved. 483
8.3.2. Extraction of
Biological
Molecules
508
8.3.3. Potential
Applications of
Micellar
Extraction
509
8.3.4. Scale-up
Considerations
510
8.4. Micellar Liquid
Chromatography
510
9. SolideLiquid Extraction
Systems
511
9.1. Solid-Phase Extraction 511
9.2. Solvent-Impregnated
Resins
511
9.3. Solid-Phase
Microextraction
513
10. Assisted Solvent Extracion 513
10.1. Microwave-Assisted
Extraction
513
10.2. Ultrasound-Assisted
Extraction
514
11. Extraction of Gas in
Analytical Applications
514
References 515
1. INTRODUCTION
Conventional solvent extraction is a well-established technology for theseparation of solutes from relatively concentrated feeds such as those found inthe industrial production of chemicals and of metals by hydrometallurgy. Dilutestreams, on the other hand, pose a challenge. Treatment of these streams usingconventional liquid–liquid extraction requires a very large value of distributionratio, otherwise the organic phase volume would become unacceptably highfrom environmental and safety considerations.
The novel solvent extraction technologies developed in the last decades tryto address these limitations. Their potential to improve the performance ofconventional solvent extraction is analyzed in this chapter according to moderntrends in the principles and in solvent development.
Preparation of treated solutions continues to play a basic role and a lotof effort has been devoted to the development of faster, safer, and moreenvironment-friendly techniques for leaching, extraction, and extract cleanup inthe last two decades. Reduction of organic solvent consumption has been theprimary driving force in the development of these techniques. Some strategiesincluding adsorption of solutes on solids (e.g., solid-phase extraction, SPE,1
matrix solid-phase dispersion, MSPD2), miniaturization (e.g., headspace solid-phase microextraction, HS-SPME,3 stir bar sorptive extraction, SBSE4), andenhanced solvent-extraction (e.g., pressurized liquid extraction, PLE,5
microwave-assisted extraction, MAE,6 etc.) currently play an important role insample handling in analytical labs. Attention has also been paid to the use ofalternative solvents, mainly supercritical fluids,7 and more recently ionic liquids(ILs).8 Many of these novel techniques are developed firstly by analyticalchemists for preparation of samples and determination needs, but modern andfuture trends in extraction-based technologies use and develop them.
484 PART | III Modern and Future Trends in Fundamentals and Applications
Some novel technologies that have been developed in the last decades willbe discussed in the following sections.
2. EQUIPMENT DESIGN AND SCALE-UP CONSIDERATIONS
Laboratory solvent extraction studies are often carried out with test tubes,a process that is cheaper but more laborious, time-consuming, and usuallyyields more scattered data than using semicontinuously stirred baffled beakersor Lewis-type cells. Highly precise distribution data can be obtained efficientlyeither “mechanically” by continuous flow centrifugal separators or “physi-cally” by using special phase separating filter devices––some of these methodsare described. Although these techniques are going to be improved, new, moreadvanced methods are likely to appear in the near future.
Specific reagents with exotic structures are costly to produce, whichrequires the experimentalist to use as small amounts as possible of the reagents.This leads to a desire to shift from “milli-experiments” (e.g., mixing 10 mL ofeach phase) to micro experiments (mixing 50 mL of each phase), which is nowtaking place, to even smaller sizes (volumes and amounts)dthe nano experi-ments. Progress in this field requires a high degree of ingenuity.
Although single-stage laboratory techniques provide the first step towardmultistage industrial processes, such process development usually requiressmall-scale multistage and pilot-plant scale equipment. A large number ofexcellent designs are available, and we consider further fundamentalimprovements.
The industrial application of solvent extraction is a mature technique, and itis now possible to move from laboratory experiments on a new extractionsystem to full industrial practice with little technological risk. There isa sufficient variety of large-scale equipments available to cope with mostproblems encountered in this application, although much of the equipmentremains rather massive. Attempts to miniaturize, for instance, by usingcentrifugal forces to mix and separate phases, still have to be developed further.
Many industrial processes begin with a leaching step, yielding a slurry thatmust be clarified before solvent extraction. The solid–liquid separation isa costly step. The solvent extraction of unclarified liquids (solvent-in-pulp) hasbeen proposed to eliminate solid–liquid separation. The increased revenue andreduced energy cost make this an attractive process, but many problems remainunsolved: loss of solutes and extractants to the solid phase, optimization ofequipment design, effluent disposal, etc.
An essential step in industrial solvent extraction is the regeneration of theextractant. This can be done in many ways, e.g., by distillation, evaporation, orstripping (back-extraction). While distillation and evaporation do notdiscriminate between solutes (the diluent is simply removed by heating),stripping, by careful choice of strip solution and conditions, can be made highlyselective. Alternatively, all the solutes can be stripped and then subjected to
485Chapter | 14 Recent Advances in Solvent Extraction Processes
a selective extraction by changing the extractant. The possibilities are many,and it may be worthwhile to explore new paths.
Membrane extraction is a relatively new technique for solvent extraction, inwhich a solute is transferred from one aqueous phase to another througha membrane holding an extractant dissolved in a diluent. This ingeniousscheme has only been slightly explored, though it offers great potential for thefuture, e.g., for wastewater cleaning.
The step from laboratory experiments via pilot plants to industrial scalerequires serious consideration of all the points here; practical experience isinvaluable in order to avoid mistakes and excess costs.
3. SUPERCRITICAL FLUID EXTRACTION
Solvent extraction processes usually run at ambient pressures and tempera-tures. If higher pressures are applied, it is mostly because a higher extractiontemperature is required when equilibrium or mass transfer conditions aremore favorable at an elevated temperature. Distillation is based on thedifferences in vapor pressures of the components to be separated, whereassolvent extraction utilizes the differences in intermolecular interactions in theliquid phase. Supercritical fluid extraction (SFE) is a separation techniquethat, to a certain extent, unites the principles of distillation and solventextraction.
Because of its different physicochemical properties, SFE provides severaloperational advantages over traditional extraction methods.9 Due to their lowviscosity and relatively high diffusivity, supercritical fluids have better trans-port properties than liquids, can diffuse easily through solid materials, and cantherefore give faster extraction yields. One of the main characteristics ofa supercritical fluid is the possibility of modifying the density of the fluid bychanging its pressure and/or its temperature. Since density is directly related tosolubility,10 by altering the extraction pressure, the solvent strength of thefluid can be modified. Other advantages––compared to other extractiontechniques––are the use of solvents generally recognized as safe, the higherefficiency of the extraction process (in terms of increasing yields and lowerextraction times), and the possibility of direct coupling with analytical chro-matographic techniques such as gas chromatography (GC) or supercritical fluidchromatography (SFC).
An increase in temperature at constant pressure, on one hand, leads toa decrease in solvent density, which would lower the solubility. On the otherhand, an increase in temperature results in an increase in vapor pressure. Athigh pressures, the density dependence on temperature is small compared withthe effect of vapor pressure, which results in an increased solubility. At lowerpressures, the density effect dominates when increasing the temperatures,resulting in a decrease in solubility. Figure 14.1 is characteristic for mostmixtures in which the mutual solubility of the components is limited. From
486 PART | III Modern and Future Trends in Fundamentals and Applications
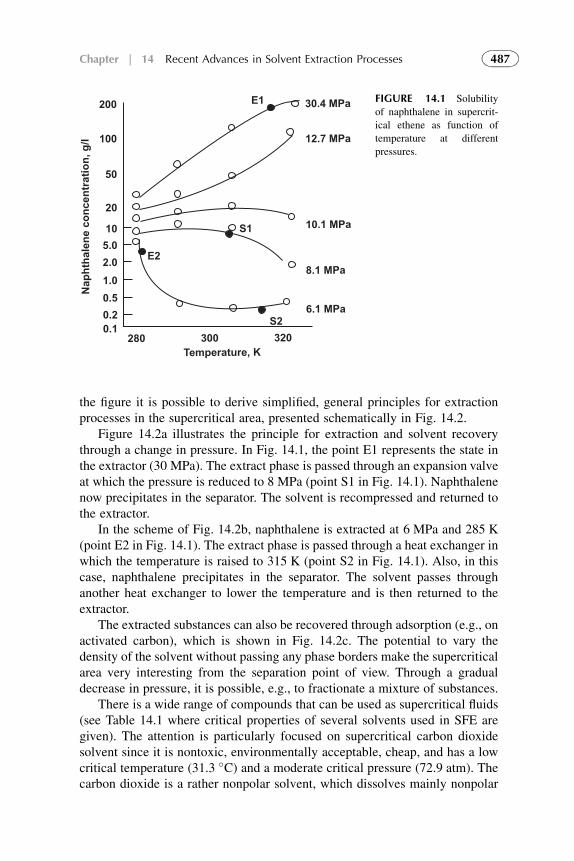
the figure it is possible to derive simplified, general principles for extractionprocesses in the supercritical area, presented schematically in Fig. 14.2.
Figure 14.2a illustrates the principle for extraction and solvent recoverythrough a change in pressure. In Fig. 14.1, the point E1 represents the state inthe extractor (30 MPa). The extract phase is passed through an expansion valveat which the pressure is reduced to 8 MPa (point S1 in Fig. 14.1). Naphthalenenow precipitates in the separator. The solvent is recompressed and returned tothe extractor.
In the scheme of Fig. 14.2b, naphthalene is extracted at 6 MPa and 285 K(point E2 in Fig. 14.1). The extract phase is passed through a heat exchanger inwhich the temperature is raised to 315 K (point S2 in Fig. 14.1). Also, in thiscase, naphthalene precipitates in the separator. The solvent passes throughanother heat exchanger to lower the temperature and is then returned to theextractor.
The extracted substances can also be recovered through adsorption (e.g., onactivated carbon), which is shown in Fig. 14.2c. The potential to vary thedensity of the solvent without passing any phase borders make the supercriticalarea very interesting from the separation point of view. Through a gradualdecrease in pressure, it is possible, e.g., to fractionate a mixture of substances.
There is a wide range of compounds that can be used as supercritical fluids(see Table 14.1 where critical properties of several solvents used in SFE aregiven). The attention is particularly focused on supercritical carbon dioxidesolvent since it is nontoxic, environmentally acceptable, cheap, and has a lowcritical temperature (31.3 �C) and a moderate critical pressure (72.9 atm). Thecarbon dioxide is a rather nonpolar solvent, which dissolves mainly nonpolar
200
100
50
20
10
5.0
2.0
1.0
0.5
0.2
0.1
Nap
hth
alen
e co
ncen
tratio
n, g
/l
280 300 320
E1
E2
S1
S2
30.4 MPa
12.7 MPa
10.1 MPa
8.1 MPa
6.1 MPa
Temperature, K
FIGURE 14.1 Solubility
of naphthalene in supercrit-
ical ethene as function of
temperature at different
pressures.
487Chapter | 14 Recent Advances in Solvent Extraction Processes
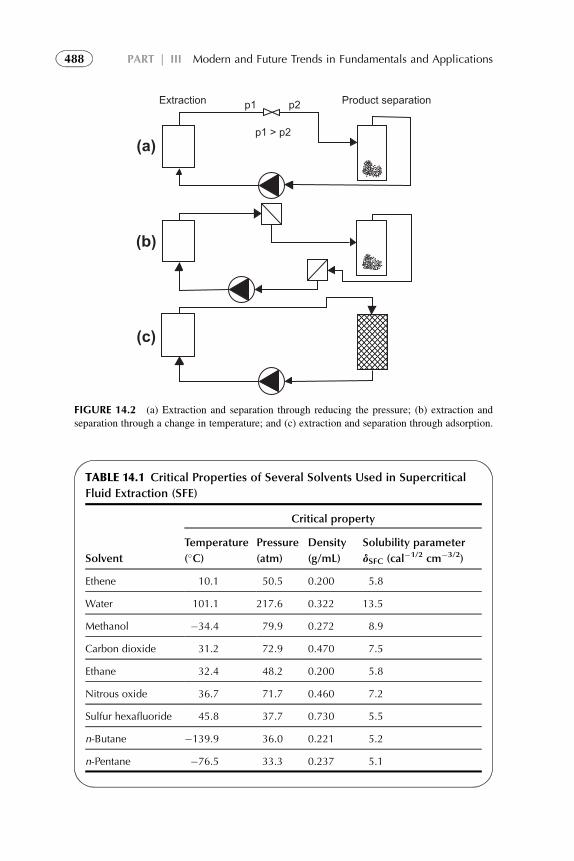
TABLE 14.1 Critical Properties of Several Solvents Used in Supercritical
Fluid Extraction (SFE)
Solvent
Critical property
Temperature
(�C)Pressure
(atm)
Density
(g/mL)
Solubility parameter
dSFC (cal�1/2 cm�3/2)
Ethene 10.1 50.5 0.200 5.8
Water 101.1 217.6 0.322 13.5
Methanol �34.4 79.9 0.272 8.9
Carbon dioxide 31.2 72.9 0.470 7.5
Ethane 32.4 48.2 0.200 5.8
Nitrous oxide 36.7 71.7 0.460 7.2
Sulfur hexafluoride 45.8 37.7 0.730 5.5
n-Butane �139.9 36.0 0.221 5.2
n-Pentane �76.5 33.3 0.237 5.1
Extraction Product separation
(a)
(b)
(c)
p1 p2
p1 > p2
FIGURE 14.2 (a) Extraction and separation through reducing the pressure; (b) extraction and
separation through a change in temperature; and (c) extraction and separation through adsorption.
488 PART | III Modern and Future Trends in Fundamentals and Applications
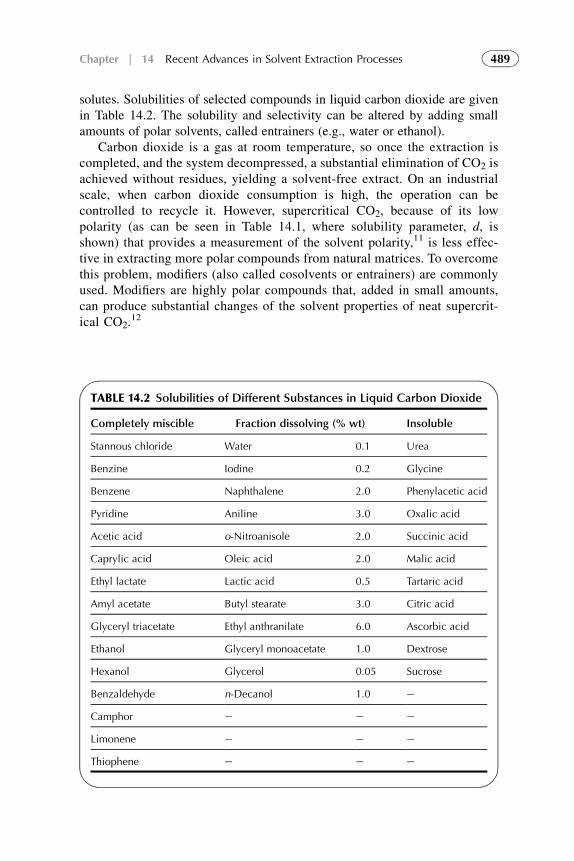
solutes. Solubilities of selected compounds in liquid carbon dioxide are givenin Table 14.2. The solubility and selectivity can be altered by adding smallamounts of polar solvents, called entrainers (e.g., water or ethanol).
Carbon dioxide is a gas at room temperature, so once the extraction iscompleted, and the system decompressed, a substantial elimination of CO2 isachieved without residues, yielding a solvent-free extract. On an industrialscale, when carbon dioxide consumption is high, the operation can becontrolled to recycle it. However, supercritical CO2, because of its lowpolarity (as can be seen in Table 14.1, where solubility parameter, d, isshown) that provides a measurement of the solvent polarity,11 is less effec-tive in extracting more polar compounds from natural matrices. To overcomethis problem, modifiers (also called cosolvents or entrainers) are commonlyused. Modifiers are highly polar compounds that, added in small amounts,can produce substantial changes of the solvent properties of neat supercrit-ical CO2.
12
TABLE 14.2 Solubilities of Different Substances in Liquid Carbon Dioxide
Completely miscible Fraction dissolving (% wt) Insoluble
Stannous chloride Water 0.1 Urea
Benzine Iodine 0.2 Glycine
Benzene Naphthalene 2.0 Phenylacetic acid
Pyridine Aniline 3.0 Oxalic acid
Acetic acid o-Nitroanisole 2.0 Succinic acid
Caprylic acid Oleic acid 2.0 Malic acid
Ethyl lactate Lactic acid 0.5 Tartaric acid
Amyl acetate Butyl stearate 3.0 Citric acid
Glyceryl triacetate Ethyl anthranilate 6.0 Ascorbic acid
Ethanol Glyceryl monoacetate 1.0 Dextrose
Hexanol Glycerol 0.05 Sucrose
Benzaldehyde n-Decanol 1.0 e
Camphor e e e
Limonene e e e
Thiophene e e e
489Chapter | 14 Recent Advances in Solvent Extraction Processes
3.1. Applications of SFE
Numerous vegetable matrices have been used as natural sources for compressedfluid extraction. Legumes, spices, aromatic plants, and even fruit beverages,such as natural orange juice have been processed to obtain natural antioxidantcompounds. Today, there are more than 60 SFE extraction plants operatingaround the world. Much of the interest in SFE has been focused on using carbondioxide to extract different natural products from solid and liquid materials.Examples of large application are processes in food, cosmetics, pharmaceuticalindustry, decaffeinating coffee beans, and oil and hop extraction. In the area ofextracting solutes from aqueous solutions, many systems have been screened infeasibility tests that have used carbon dioxide as a solvent. SFE carbon dioxideextraction of metal ions from aqueous solutions is intensively studied.13
A partial list of the solutes includes ethanol, acetic acid, dioxane, acetone, andethylene glycol. The reason for these efforts has been potential low energy costscompared with distillation and the environmental advantages of using carbondioxide.
According to the specific requirements, the design of a SFE system can berelatively simple or highly complex. It is possible to differentiate betweenanalytical instruments and pilot- or industrial-scale systems. The analyticalsystems are utilized in sample preparation prior to, e.g., a chromatographicanalysis. There are several configurations, depending on their degree ofautomation.
The pilot systems are used to extract grams of compounds when working ona pilot scale or kilograms on an industrial scale. Basically, this system ona pilot-scale plant consists (see Fig. 14.3) of a solvent pump, that delivers thefluid throughout the system, a modifier pump if necessary, an extraction cell orextraction column, according to the system configuration (i.e., for solids orliquids, respectively), and one or more separators (also called fractionationcells) in which the extract is collected and the solvent depressurized. Likewise,the extraction cell or column and the separators are commonly equipped withindependent control of temperature and pressure, in such a way that fraction-ation of the extracted compounds can be carried out by a stepwise depressur-ization. Therefore, different compounds can be obtained within each separator,depending on their differential solubility in the supercritical fluid. In addition,it is possible to install a refrigerated system, especially designed to trap themost volatile compounds, as well as a recycling system to recycle the fluidemployed.
As has been mentioned, the most important difference between pilot plantsto process solid or a liquid sample is in the use of an extraction cell or anextraction column. Solid processing is always done in batch in a discontinuousor semicontinuous process, while liquid processing is usually carried out undercountercurrent conditions in a continuous mode. In liquid-sample extractions,the supercritical fluid (usually CO2) is moving upwards while the sample feed,
490 PART | III Modern and Future Trends in Fundamentals and Applications
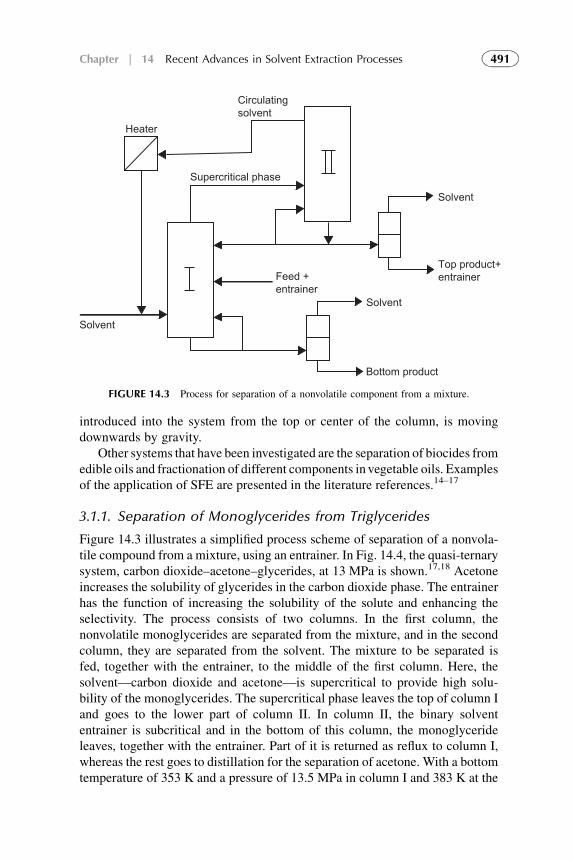
introduced into the system from the top or center of the column, is movingdownwards by gravity.
Other systems that have been investigated are the separation of biocides fromedible oils and fractionation of different components in vegetable oils. Examplesof the application of SFE are presented in the literature references.14–17
3.1.1. Separation of Monoglycerides from Triglycerides
Figure 14.3 illustrates a simplified process scheme of separation of a nonvola-tile compound from a mixture, using an entrainer. In Fig. 14.4, the quasi-ternarysystem, carbon dioxide–acetone–glycerides, at 13 MPa is shown.17,18 Acetoneincreases the solubility of glycerides in the carbon dioxide phase. The entrainerhas the function of increasing the solubility of the solute and enhancing theselectivity. The process consists of two columns. In the first column, thenonvolatile monoglycerides are separated from the mixture, and in the secondcolumn, they are separated from the solvent. The mixture to be separated isfed, together with the entrainer, to the middle of the first column. Here, thesolvent––carbon dioxide and acetone––is supercritical to provide high solu-bility of the monoglycerides. The supercritical phase leaves the top of column Iand goes to the lower part of column II. In column II, the binary solvententrainer is subcritical and in the bottom of this column, the monoglycerideleaves, together with the entrainer. Part of it is returned as reflux to column I,whereas the rest goes to distillation for the separation of acetone. With a bottomtemperature of 353 K and a pressure of 13.5 MPa in column I and 383 K at the
Heater
Supercritical phase
Solvent
Solvent
Solvent
Bottom product
Top product+entrainerFeed +
entrainer
Circulatingsolvent
FIGURE 14.3 Process for separation of a nonvolatile component from a mixture.
491Chapter | 14 Recent Advances in Solvent Extraction Processes
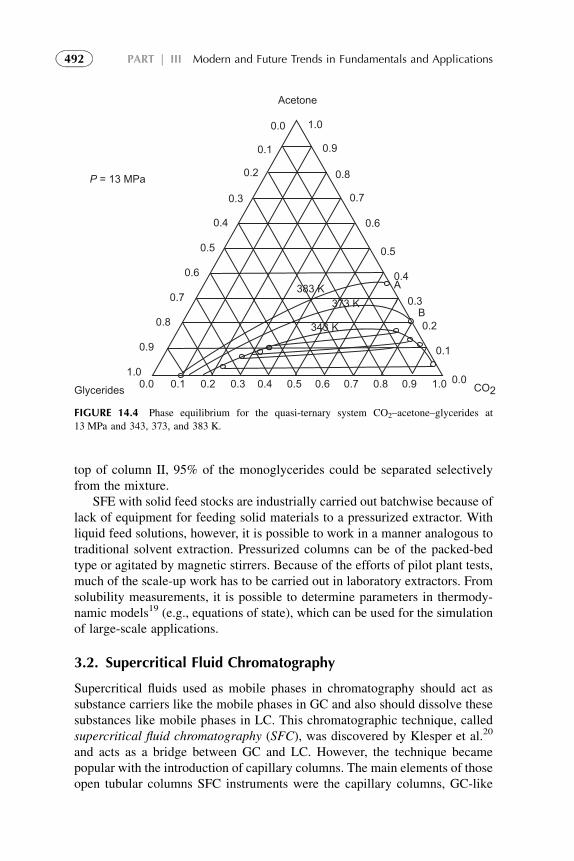
top of column II, 95% of the monoglycerides could be separated selectivelyfrom the mixture.
SFE with solid feed stocks are industrially carried out batchwise because oflack of equipment for feeding solid materials to a pressurized extractor. Withliquid feed solutions, however, it is possible to work in a manner analogous totraditional solvent extraction. Pressurized columns can be of the packed-bedtype or agitated by magnetic stirrers. Because of the efforts of pilot plant tests,much of the scale-up work has to be carried out in laboratory extractors. Fromsolubility measurements, it is possible to determine parameters in thermody-namic models19 (e.g., equations of state), which can be used for the simulationof large-scale applications.
3.2. Supercritical Fluid Chromatography
Supercritical fluids used as mobile phases in chromatography should act assubstance carriers like the mobile phases in GC and also should dissolve thesesubstances like mobile phases in LC. This chromatographic technique, calledsupercritical fluid chromatography (SFC), was discovered by Klesper et al.20
and acts as a bridge between GC and LC. However, the technique becamepopular with the introduction of capillary columns. The main elements of thoseopen tubular columns SFC instruments were the capillary columns, GC-like
383 K
P = 13 MPa
Acetone
Glycerides CO2
373 K
343 K
0.0
0.0
0.1
0.1
0.2
0.2
0.3
0.3
0.4
0.4
0.5 0.5
0.6
0.6
0.7
0.7
0.8
0.8
0.9
0.9
1.0
1.0
0.0 0.1 0.2 0.3 0.4 0.5 0.6 0.7 0.8 0.9 1.0
A
B
FIGURE 14.4 Phase equilibrium for the quasi-ternary system CO2–acetone–glycerides at
13 MPa and 343, 373, and 383 K.
492 PART | III Modern and Future Trends in Fundamentals and Applications
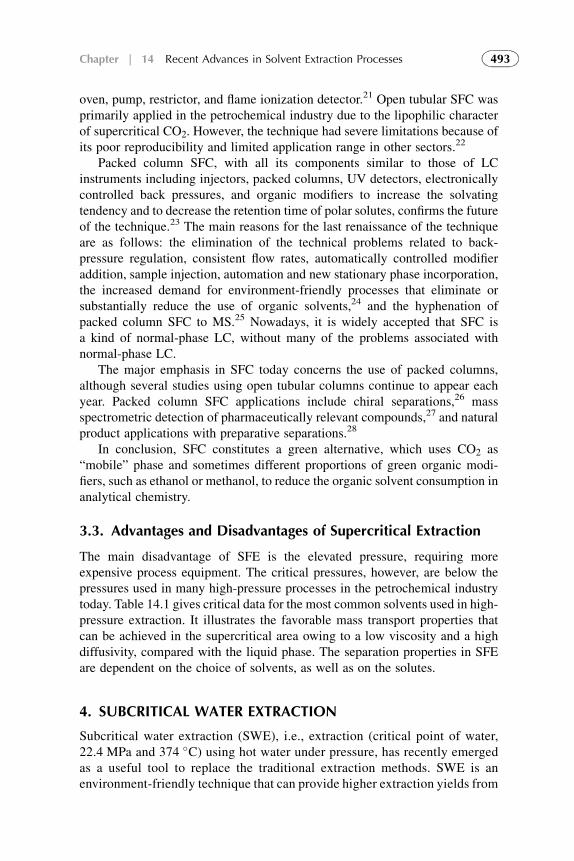
oven, pump, restrictor, and flame ionization detector.21 Open tubular SFC wasprimarily applied in the petrochemical industry due to the lipophilic characterof supercritical CO2. However, the technique had severe limitations because ofits poor reproducibility and limited application range in other sectors.22
Packed column SFC, with all its components similar to those of LCinstruments including injectors, packed columns, UV detectors, electronicallycontrolled back pressures, and organic modifiers to increase the solvatingtendency and to decrease the retention time of polar solutes, confirms the futureof the technique.23 The main reasons for the last renaissance of the techniqueare as follows: the elimination of the technical problems related to back-pressure regulation, consistent flow rates, automatically controlled modifieraddition, sample injection, automation and new stationary phase incorporation,the increased demand for environment-friendly processes that eliminate orsubstantially reduce the use of organic solvents,24 and the hyphenation ofpacked column SFC to MS.25 Nowadays, it is widely accepted that SFC isa kind of normal-phase LC, without many of the problems associated withnormal-phase LC.
The major emphasis in SFC today concerns the use of packed columns,although several studies using open tubular columns continue to appear eachyear. Packed column SFC applications include chiral separations,26 massspectrometric detection of pharmaceutically relevant compounds,27 and naturalproduct applications with preparative separations.28
In conclusion, SFC constitutes a green alternative, which uses CO2 as“mobile” phase and sometimes different proportions of green organic modi-fiers, such as ethanol or methanol, to reduce the organic solvent consumption inanalytical chemistry.
3.3. Advantages and Disadvantages of Supercritical Extraction
The main disadvantage of SFE is the elevated pressure, requiring moreexpensive process equipment. The critical pressures, however, are below thepressures used in many high-pressure processes in the petrochemical industrytoday. Table 14.1 gives critical data for the most common solvents used in high-pressure extraction. It illustrates the favorable mass transport properties thatcan be achieved in the supercritical area owing to a low viscosity and a highdiffusivity, compared with the liquid phase. The separation properties in SFEare dependent on the choice of solvents, as well as on the solutes.
4. SUBCRITICAL WATER EXTRACTION
Subcritical water extraction (SWE), i.e., extraction (critical point of water,22.4 MPa and 374 �C) using hot water under pressure, has recently emergedas a useful tool to replace the traditional extraction methods. SWE is anenvironment-friendly technique that can provide higher extraction yields from
493Chapter | 14 Recent Advances in Solvent Extraction Processes
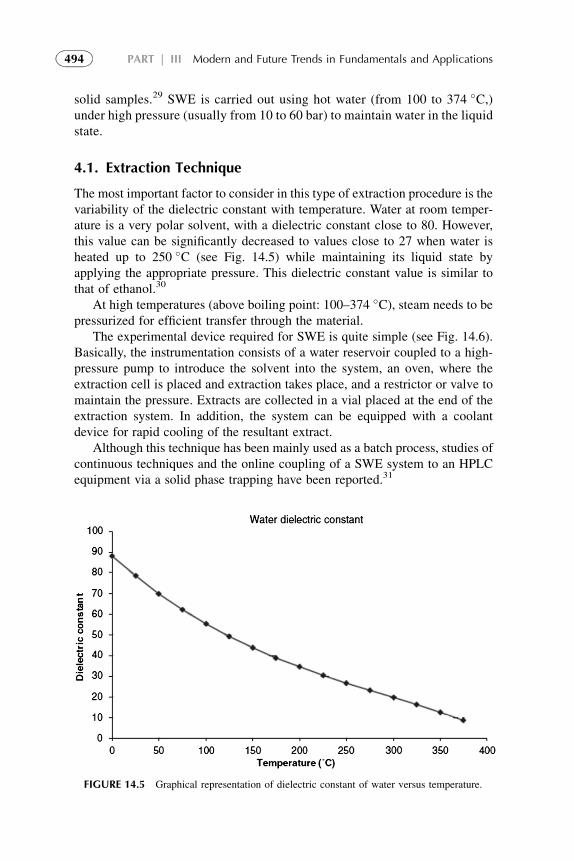
solid samples.29 SWE is carried out using hot water (from 100 to 374 �C,)under high pressure (usually from 10 to 60 bar) to maintain water in the liquidstate.
4.1. Extraction Technique
The most important factor to consider in this type of extraction procedure is thevariability of the dielectric constant with temperature. Water at room temper-ature is a very polar solvent, with a dielectric constant close to 80. However,this value can be significantly decreased to values close to 27 when water isheated up to 250 �C (see Fig. 14.5) while maintaining its liquid state byapplying the appropriate pressure. This dielectric constant value is similar tothat of ethanol.30
At high temperatures (above boiling point: 100–374 �C), steam needs to bepressurized for efficient transfer through the material.
The experimental device required for SWE is quite simple (see Fig. 14.6).Basically, the instrumentation consists of a water reservoir coupled to a high-pressure pump to introduce the solvent into the system, an oven, where theextraction cell is placed and extraction takes place, and a restrictor or valve tomaintain the pressure. Extracts are collected in a vial placed at the end of theextraction system. In addition, the system can be equipped with a coolantdevice for rapid cooling of the resultant extract.
Although this technique has been mainly used as a batch process, studies ofcontinuous techniques and the online coupling of a SWE system to an HPLCequipment via a solid phase trapping have been reported.31
FIGURE 14.5 Graphical representation of dielectric constant of water versus temperature.
494 PART | III Modern and Future Trends in Fundamentals and Applications
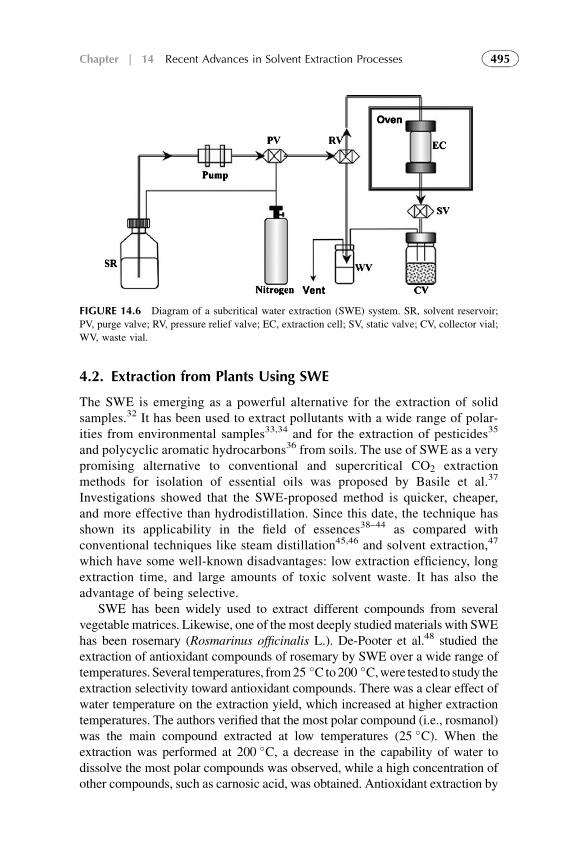
4.2. Extraction from Plants Using SWE
The SWE is emerging as a powerful alternative for the extraction of solidsamples.32 It has been used to extract pollutants with a wide range of polar-ities from environmental samples33,34 and for the extraction of pesticides35
and polycyclic aromatic hydrocarbons36 from soils. The use of SWE as a verypromising alternative to conventional and supercritical CO2 extractionmethods for isolation of essential oils was proposed by Basile et al.37
Investigations showed that the SWE-proposed method is quicker, cheaper,and more effective than hydrodistillation. Since this date, the technique hasshown its applicability in the field of essences38–44 as compared withconventional techniques like steam distillation45,46 and solvent extraction,47
which have some well-known disadvantages: low extraction efficiency, longextraction time, and large amounts of toxic solvent waste. It has also theadvantage of being selective.
SWE has been widely used to extract different compounds from severalvegetable matrices. Likewise, one of the most deeply studied materials with SWEhas been rosemary (Rosmarinus officinalis L.). De-Pooter et al.48 studied theextraction of antioxidant compounds of rosemary by SWE over a wide range oftemperatures. Several temperatures, from25 �C to200 �C,were tested to study theextraction selectivity toward antioxidant compounds. There was a clear effect ofwater temperature on the extraction yield, which increased at higher extractiontemperatures. The authors verified that the most polar compound (i.e., rosmanol)was the main compound extracted at low temperatures (25 �C). When theextraction was performed at 200 �C, a decrease in the capability of water todissolve the most polar compounds was observed, while a high concentration ofother compounds, such as carnosic acid, was obtained. Antioxidant extraction by
FIGURE 14.6 Diagram of a subcritical water extraction (SWE) system. SR, solvent reservoir;
PV, purge valve; RV, pressure relief valve; EC, extraction cell; SV, static valve; CV, collector vial;
WV, waste vial.
495Chapter | 14 Recent Advances in Solvent Extraction Processes
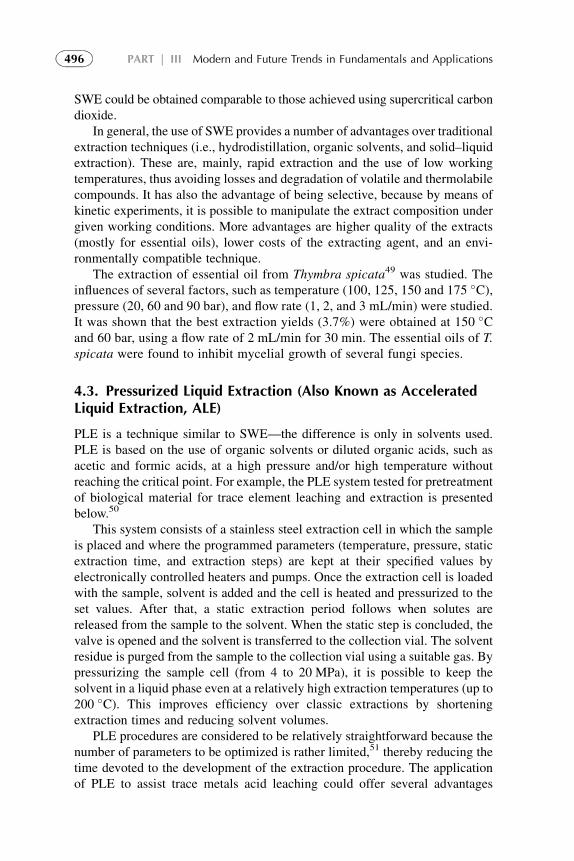
SWE could be obtained comparable to those achieved using supercritical carbondioxide.
In general, the use of SWE provides a number of advantages over traditionalextraction techniques (i.e., hydrodistillation, organic solvents, and solid–liquidextraction). These are, mainly, rapid extraction and the use of low workingtemperatures, thus avoiding losses and degradation of volatile and thermolabilecompounds. It has also the advantage of being selective, because by means ofkinetic experiments, it is possible to manipulate the extract composition undergiven working conditions. More advantages are higher quality of the extracts(mostly for essential oils), lower costs of the extracting agent, and an envi-ronmentally compatible technique.
The extraction of essential oil from Thymbra spicata49 was studied. Theinfluences of several factors, such as temperature (100, 125, 150 and 175 �C),pressure (20, 60 and 90 bar), and flow rate (1, 2, and 3 mL/min) were studied.It was shown that the best extraction yields (3.7%) were obtained at 150 �Cand 60 bar, using a flow rate of 2 mL/min for 30 min. The essential oils of T.spicata were found to inhibit mycelial growth of several fungi species.
4.3. Pressurized Liquid Extraction (Also Known as AcceleratedLiquid Extraction, ALE)
PLE is a technique similar to SWE––the difference is only in solvents used.PLE is based on the use of organic solvents or diluted organic acids, such asacetic and formic acids, at a high pressure and/or high temperature withoutreaching the critical point. For example, the PLE system tested for pretreatmentof biological material for trace element leaching and extraction is presentedbelow.50
This system consists of a stainless steel extraction cell in which the sampleis placed and where the programmed parameters (temperature, pressure, staticextraction time, and extraction steps) are kept at their specified values byelectronically controlled heaters and pumps. Once the extraction cell is loadedwith the sample, solvent is added and the cell is heated and pressurized to theset values. After that, a static extraction period follows when solutes arereleased from the sample to the solvent. When the static step is concluded, thevalve is opened and the solvent is transferred to the collection vial. The solventresidue is purged from the sample to the collection vial using a suitable gas. Bypressurizing the sample cell (from 4 to 20 MPa), it is possible to keep thesolvent in a liquid phase even at a relatively high extraction temperatures (up to200 �C). This improves efficiency over classic extractions by shorteningextraction times and reducing solvent volumes.
PLE procedures are considered to be relatively straightforward because thenumber of parameters to be optimized is rather limited,51 thereby reducing thetime devoted to the development of the extraction procedure. The applicationof PLE to assist trace metals acid leaching could offer several advantages
496 PART | III Modern and Future Trends in Fundamentals and Applications
when compared to mechanical shaking, ultrasound (water bath or probe), ormicrowave-assisted acid leaching methods.
The following are the advantages of the technique:
1. Less corrosive acids, such as weak organic acids, can be used instead ofstrong concentrated mineral acids, commonly needed for leaching. In addi-tion, low volumes of such acids are required, which implies low toxicwastes.
2. Short leaching or extraction times are enough to complete the extraction.This last fact increases the sample throughput.
3. High degree of automation is offered by PLE and no additional filtrationstep is required after acid leaching assisted PLE.
4. Since diluted organic acids can be used to leach metals, chemical speciesintegrity is guaranteed and PLE can be used for organometallic speciationstudies.52
The feasibility of PLE to extract or leach total elements may be fullyexploited in ores leaching and extraction avoiding concentrated mineral acidsapplication.
Under PLE conditions, diluted weak carboxylic acids can attack thematrix, and major and trace elements can be efficiently leached. Variablesaffecting the carboxylic acid, PLE process may be tested using multivariateapproaches in order to find out compromise acid leaching and extractionconditions.
4.4. Superheated Water Chromatography
In reversed-phase liquid chromatography (RPLC), water is used to reduce theelution strength of the organic modifiers, such as methanol, acetonitrile, andtetrahydrofuran. However, the same enhanced solvation strength described inthe previous section also enables superheated water to be used as a mobilephase in LC. This mode of separation has been named superheated waterchromatography (SHWC), pressurized water chromatography, or subcriticalwater chromatography.
The description of separation using hot water as the mobile phase53–56
provides an introduction to the technique, and indicates the enormous potentialof the method for greening analytical chemistry. The instrumentation requiredis essentially the same as that used for conventional LC, with the inclusion ofa high-temperature oven and a method of controlling the column back pressure(see Fig. 14.7). Another advantage of SHWC is that water can be used witha wide range of detectors. It is compatible with UVand fluorescence, refractiveindex, electrochemical, evaporative light scattering, and mass spectroscopy(MS) detection.57 Moreover, it is also compatible with flame ionizationdetection,58 being useful for the detection of analytes lacking chromophores,such as aliphatic alcohols, amino acids, and carbohydrates.
497Chapter | 14 Recent Advances in Solvent Extraction Processes
However, the limited availability of commercial systems seems to be themain reason for lack of widespread adoption of the method.
The selectivity changes on heating water are not equivalent to the effect ofadding an organic modifier, such as methanol, acetonitrile, or propan-2-ol.59
However, high-temperature water could provide a complementary selectivityand was most suited for polar analytes. A 3.5 �C rise in water temperaturecorresponds to a 1% increase in methanol and a 5–8 �C rise corresponded toa 1% increase in acetonitrile,60 using a series of aromatic analytes.
SHWC has been successfully applied in the pharmaceutical sector where thepolarity of analytes is often compatible with an aqueous eluent. For instance,anticancer drugs have been separated on a polystyrene–divinylbenzene columnwith buffered superheated water as the mobile phase. The temperature rangestudied was from ambient temperature up to 160 �C, and the pH of the waterwas adjusted to 11.5 and 3.5 with phosphate buffer. Total elution time wasless than 13 min.61 The separation of alkyl aryl ketones and barbiturates usingwater rich and superheated water at high temperature (100–200 �C) as theeluent has been successfully performed.62
SHWC may be investigated in the environmental and food industries tooffer some advantages.
5. AQUEOUS TWO-PHASE SYSTEMS
Under certain conditions, polymer incompatibility in aqueous solutions canlead to the formation of two phases with high water content. With sucha system, it is possible to separate sensitive biological molecules, such asproteins, without denaturation, which would be the case for an ordinaryaqueous–organic solvent system. Principles and properties of the system weredescribed in Chapter 13.
Cooling coilInjector
Deionizedwater
Pump anddegasser
OvenDetectorBack-pressureregulator
Column
Preheatingcoil
FIGURE 14.7 Schematic setup of superheated water chromatography.
498 PART | III Modern and Future Trends in Fundamentals and Applications
Biotechnological processes, in general, are run at low concentrations ofreactants and products. One reason for this is that most biocatalysts aresensitive to product inhibition. The reaction may stop when only a smallfraction of the substrate has been converted into product. In such cases, there isa strong need for continuous extractive procedures during which the productis continuously removed. The integration of bioconversion and extraction iscalled extractive bioconversion. The large differences in surface tension anddielectric constants between water and common organic solvents causeenzymes to unfold when they are exposed to the interface between the twosolvents. This problem can be overcomed through extractive bioconversions inaqueous two-phase systems. A collection of cutting-edge methods intended toprovide practical guidelines for the area of separations in two-phase systemshas been reviewed.63
5.1. Application of the Process
An important issue to be addressed in industrial applications of two-phasepolymer systems for enzyme recovery is the economic or product qualityrequirement that the phase-forming polymers and salts be recycled. In somerare cases, the polymer is accepted in the product (e.g., in a process for puri-fication of enzymes for detergent purposes). This process utilizes the systemPEG–Na2SO4–water, and more than 95% of the enzyme is extracted in a two-stage countercurrent process. No recycling of PEG is necessary, since thepolymer is a part of the product.
Usually, recycling of phase constituents is necessary, and several methodscan be applied. Enzymes can be recovered from salt solutions by ultrafiltration,which can also be used to separate PEG from lower-molecular-weight products.If the product is charged, an ion exchange chromatographic step could besufficient for isolation. Several methods to precipitate the polymer are alsoavailable.
Because of the small density difference between the two aqueous phases,the phase separation properties of the system are poor. Solid-free systems canbe separated in a few hours or overnight in simple cylindrical vessels.Centrifugal separators are usually necessary for phase separation when celldebris is present because of the relatively high viscosity of the bottom phase.The performance of centrifugal separators is greatly reduced by a high solidconcentration in the top phase. Thus, when extracting proteins from dis-integrated cells, conditions should be such that the protein is partitioned to thetop phase and the cell material to the bottom phase.
6. EXTRACTION PROCESSES WITH IONIC LIQUIDS
ILs are a new group of extractants of great interest studied as potential “greensolvents.”64–68 Practically, zero vapor pressure of IL and temperature stability
499Chapter | 14 Recent Advances in Solvent Extraction Processes
make them attractive solvents in many applications. ILs are gaining widerecognition as novel solvents in chemistry, although they are not new, e.g.,[EtNH3]
þ NO3�, was discovered in 1914.65 They are also known as room-
temperature (RT) ILs (not all ILs are RTILs), nonaqueous ILs, molten salts,liquid organic salts, or fused salts. The first example of a new IL, which iscurrently receiving much attention as a novel medium for homogeneouscatalysis, is ethyl methylimidazolium tetrafluoroborate (reported in 1992).66
The application of ILs in analytical chemistry, especially to separate analytes,is worthwhile because these solvents have some unique properties (e.g.,negligible vapor pressure, good thermal stability, tunable viscosity, andmiscibility with water and organic solvents, as well as good extractability forvarious organic compounds and metal ions64). Because they are nonvolatileand nonflammable, they have been proposed as environment-friendlysolvents for “clean processes” and “green chemistry,”67,68 and they are goodsubstitutes for traditional organic solvents that are volatile and flammable.69
A higher viscosity at room temperature could be their less favorableproperty.67
6.1. ILs in Separation Techniques
Extraction with ILs as extractants of metal ions, such as lanthanides,70
radioactive metals, such as actinides,71 are of particular industrialinterest. Moreover, the extraction of Naþ, Csþ, and Sr2þ;72 Cd2þ, Co2þ,Ni2þ, and Fe3þ;73 and Hg2þ and Cd2þ from wastewater using task-specific ILs74 has been successfully performed. ILs were also applied toextract various organic compounds including substituted benzene deriva-tives,75,76 carbohydrates,77 biofuels,78 and erythromycin A79 from aqueoussolutions.
Experiments with solvent extraction of organic acids by ILs showedpromising results80–83 in extraction of organic acids, especially of lactic acid.80
In extraction of butyric acid, lactic acid, and phenol, fairly higher distributioncoefficients were found for solvents with tested developmental ionic liquidIL-A compared to the solvents containing tertiary amines. The value of thedistribution coefficient of lactic acid is up to 30 at lower acid concentrations,which is promising. IL-A acts as an extractant forming undissociated lacticacid/IL-A complexes having ratios of 1:1 and 2:1 (lactate anions are notextracted).83
In the pertraction of LA through Supported liquid membrane, SLM, thevalue of the overall mass-transfer coefficient increases with decreasingconcentration of lactic acid in the aqueous phase what correlates withincreasing value of its distribution coefficient.81 Increased concentration of thecarrier IL-A did not change the value of the mass-transfer coefficient in per-traction of lactic acid contrary to the increased value of the distributioncoefficient. This may indicate that the slower kinetics of the interfacial reaction
500 PART | III Modern and Future Trends in Fundamentals and Applications
in decomposition of the complex plays a role or higher viscosity of membraneis responsible for this.
Separation of taurine (2-aminoethanesulfonic acid) and sodium sulfateby leaching a solid mixture by ILs is another example of its application.84
Dialkylimidazolium chloride IL as leaching agent and organic solvent asprecipitating agent (lower alcohols, like ethanol, are effective) were developed.Selective separation of taurine from a solid mixture containing a large amountof sodium sulfate could be realized with 67–98.5% yield in a single separationstep.
Transport of amines and neutral organic substances through liquidmembranes with IL was described in references.85,86 Pertraction of organicacids through liquid membranes facilitated by enzymatic reactions on L–Linterfaces using ILs as a liquid membrane was also studied.87,88 Tailoring of ILsto achieve good partitioning of target solutes and acceptable viscosity of ILmay lead to interesting results.
Formaldehyde extraction from mushrooms by LPME using ILs has beensuccessfully developed.89 Moreover, the methodology has been applied to thescreening of chlorinated anilines,90 dichlorodiphenyltrichloroethane and itsmetabolites,91 chlorobenzenes,92 phenols,93 and chlorophenols94 in watersamples. However, this SDME procedure is incompatible with GC due to thenonvolatility of the IL.
6.2. Ionic Liquids in Analytical Separations
Currently, scientists are interested in the applications of ILs in separation andanalysis.95 Reports on ILs used as running electrolytes in capillary electro-phoresis (CE)96 appeared frequently. Moreover, ILs possess many favorableproperties, such as nonvolatility, nonflammability, good solubility of manycompounds, high viscosity, and polarity, which make them unique stationaryphases in GC;97 however, both the topics are out of the scope of this chapter andare not discussed in detail. On the other hand, ILs cannot be used themselves asmobile phase due to their high viscosity being only useful as additives inmobile phases.98 For detailed information on the use of ILs in LC, readers canrefer to the work of Marsza and Kaliszan.99
7. LIQUID MEMBRANE AND NONDISPERSIVE,MEMBRANE-BASED SOLVENT EXTRACTION TECHNIQUES
Membrane separation is a relatively new and fast-growing field of supramo-lecular chemistry. Liquid membrane process is a three-phase system consistingof two phases of a similar nature but different compositions (aqueous–aqueous,organic–organic, gas–gas) separated by a third phase of a different nature andas insoluble as possible into the other two. The middle phase is nominated asliquid membrane.
501Chapter | 14 Recent Advances in Solvent Extraction Processes
There are three main configurations in liquid membrane separation tech-niques that have been more widely investigated due to their potential industrialapplication:
1. Supported liquid membrane (SLM)2. Emulsion liquid membrane (ELM), also called the surfactant liquid
membrane3. Bulk liquid membrane (BLM)
In the ELM configuration, the liquid membrane is formed by dispersing intothe feed an emulsion of the stripping phase in an organic phase containing anemulsifying agent.
In the SLM process, the liquid membrane phase impregnates into micro-porous solid support placed between the two bulk phases. The liquidmembrane is stabilized by capillary forces or through some kind of bonding.Two types of support configurations are used: hollow fiber or flat sheetmembrane modules.
BLM consist of three bulk phases––two phases of a similar nature butdifferent composition and between them a third, immiscible, phase. The phasesmay be separated by hollow fiber or flat sheet membrane supports, or may bewithout support. Many different BLM techniques are published lately, but all ofthem are based on membrane-based nondispersive selective solvent extractioncoupled to permselective diffusion of solute–extractant complexes and selec-tive stripping of the solute in one continuous dynamic process.
Nondispersive solvent extraction is one of the configurations of the BLM.The term “nondispersive solvent extraction” arises from the fact that instead
of producing a drop dispersion of one phase in the other, the phases are con-tacted through porous membrane.
There are two different arrangements for this process.100 One uses twomodules––one for extraction and the other for stripping––making it formallycloser to conventional solvent extraction (see Fig. 14.8). The other configura-tion uses one three-liquid phase module in which all the three phases flowthrough. In the hollow fiber module, the liquid membrane phase is in the shell,and the feed and the stripping phase passes through the lumen of different fibersin the module. The solution to be extracted is fed to the lumen side ofa microporous hollow fiber membrane module, with extracting organic solventbeing fed to the shell side. The membrane is selected to be preferentially wettedby one of the phases (usually the organic phase), and the pressure adjusted toprevent capillary penetration of the aqueous phase into the membrane. In thismanner, the solvent–water interface is stabilized at the membrane–aqueoussolution boundary, and extraction of the desired component into the organicphase takes place by transmembrane diffusion and convection. The solute-enriched organic phase is then delivered to a second membrane unit wheresolute is transferred into an aqueous solution in which it has elevated solu-bility––the solute-depleted organic is then recycled to the first unit.
502 PART | III Modern and Future Trends in Fundamentals and Applications
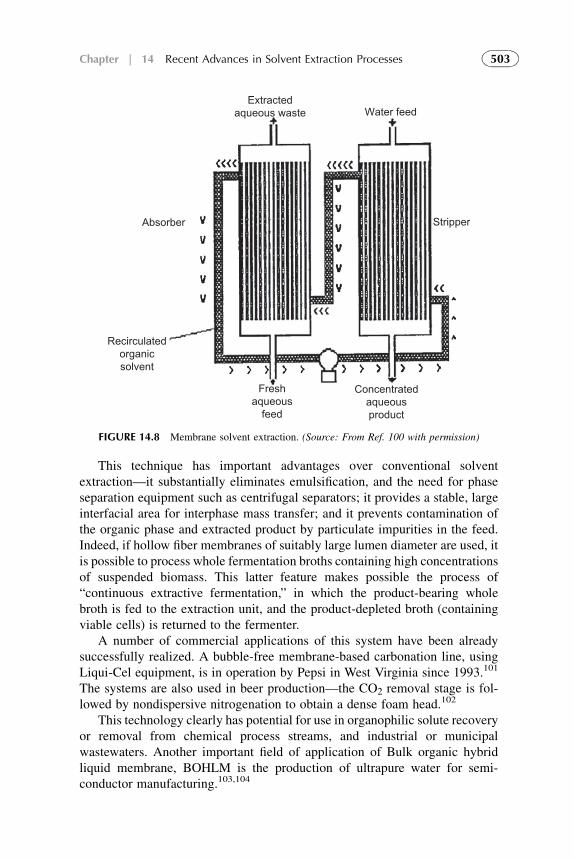
This technique has important advantages over conventional solventextraction––it substantially eliminates emulsification, and the need for phaseseparation equipment such as centrifugal separators; it provides a stable, largeinterfacial area for interphase mass transfer; and it prevents contamination ofthe organic phase and extracted product by particulate impurities in the feed.Indeed, if hollow fiber membranes of suitably large lumen diameter are used, itis possible to process whole fermentation broths containing high concentrationsof suspended biomass. This latter feature makes possible the process of“continuous extractive fermentation,” in which the product-bearing wholebroth is fed to the extraction unit, and the product-depleted broth (containingviable cells) is returned to the fermenter.
A number of commercial applications of this system have been alreadysuccessfully realized. A bubble-free membrane-based carbonation line, usingLiqui-Cel equipment, is in operation by Pepsi in West Virginia since 1993.101
The systems are also used in beer production––the CO2 removal stage is fol-lowed by nondispersive nitrogenation to obtain a dense foam head.102
This technology clearly has potential for use in organophilic solute recoveryor removal from chemical process streams, and industrial or municipalwastewaters. Another important field of application of Bulk organic hybridliquid membrane, BOHLM is the production of ultrapure water for semi-conductor manufacturing.103,104
Extractedaqueous waste Water feed
Absorber
Recirculatedorganicsolvent
Freshaqueous
feed
Concentratedaqueousproduct
Stripper
FIGURE 14.8 Membrane solvent extraction. (Source: From Ref. 100 with permission)
503Chapter | 14 Recent Advances in Solvent Extraction Processes
To my opinion, inclusion of this process to the solvent extraction techniquesis questionable, but more and more publications in the periodic and reports onthe ISEC are included this process to solvent extraction. The last is an equi-librium-based separation process. So, the membrane-based or nondispersivesolvent extraction process has to be equilibrium based also. “Liquid membraneseparation is a rate process and the separation occurs due to a chemicalpotential gradient, not by equilibrium between phases.”105 According to thesedefinitions, many authors who refer to their works as membrane-based ornondispersive solvent extraction processes are not correct. The theory ofmembrane-based solvent extraction suggests106 that overall mass transfer oftreated solute consists of several steps: diffusion of the solute through theaqueous layer from the bulk source aqueous solution to the phases’ interface(nonequilibrium process), interaction of the solute with extractant and forma-tion of the solute–extractant complex (as a rule, the process is rapid and reachesequilibrium), diffusion of the solute–extractant complex through the membranesupport itself (nonequilibrium process), and diffusion of the solute–extractantcomplex through the organic layer to the bulk organic solution (nonequilibriumprocess). Here, we can see that only one of the components may be equilibriumbased. So, we can conclude that all systems may be equilibrium based in twocases: (1) if the kinetics of solute–extractant interaction is a rate-controllingprocess, which is not true in the majority of separations published in theliterature, or (2) if the overall mass transfer of the solute from the bulk sourcesolution to the bulk membrane solution comes to equilibrium.
The authors of very many works on so-called membrane-based ornondispersive solvent extraction could not prove that the process reachesequilibrium. Therefore, we cannot confirm the processes, published in theseworks, as membrane-based solvent extraction, but can confirm them asliquid membrane processes. Liquid membrane separations are dynamicnonequilibrium processes, in which only local equilibrium at immisciblephases’ interface may be suggested. The works, in which the equilibriumstate is not proved, or cannot be reached (e.g., the process where thefeeddmembranedstrip flows are arranged in one continuously operatingmodule) are referenced as hybrid liquid membrane or hollow fiber liquidmembrane processes.
The reader interested in details of the liquid membrane separation principlesand applications is referred to the book published last year.106
8. SUPRAMOLECULAR-BASED EXTRACTION TECHNIQUES
In the last decades, several novel separation techniques were developed on thebasis of supramolecular extractants. Below the reader will find some examplesof these techniques, which have many perspectives in the future trends ofseparation technologies.
504 PART | III Modern and Future Trends in Fundamentals and Applications
8.1. Nano- and Microtechnological Extraction
As it was described in the previous chapter, nanometer-sized amphiphilicaggregates, formed by self-assembly process, continue to grow by addingsurfactant, and this is the second self-assembly process in supramolecularsolvent formation. This process cannot exist without the preceding one being inplace. Aggregate growth in this step will proceed until a separate, amphiphilic-rich, liquid phase is produced. The phenomenon of liquid–liquid phase sepa-ration, typically occurring in colloidal solutions, is named coacervation. Theseare micrometer-sized aggregates or reversed micelles.
Molecules making up the ordered structures in supramolecular solventscontain a hydrophilic and a hydrophobic part. As a result, these structures haveregions of different polarity that provide a variety of interactions for solutes.The type of interaction may be tuned varying the hydrophobic part or the polargroup of the amphiphile and, in theory, one may design the most appropriateaggregate for a specific application because amphiphiles are ubiquitous innature and synthetic chemistry.
The nature of polar groups in the ordered structures determines the type ofpolar compounds that can be extracted by supramolecular extractants. So far,the more frequent polar groups used in analytical applications include poly-ethylene oxides, carboxylic acids, sulfates, sulfonates, carboxylates, andammonium and pyridinium ions. Binding interactions involved duringextraction of polar compounds primarily include ionic, hydrogen bonding, p-cation, and p–p. Hydrogen bonding is an extremely effective retentionmechanism for polar compounds. On the other hand, when the surfactantcontains a benzene ring, electrophilic interactions are provided through delo-calized electrons in p-orbitals. These delocalized electrons interact withconjugated groups such as aromatic rings or double/triple bonds. A majorproperty of supramolecular compounds is their capability to extract amphi-philic compounds (e.g., surfactants, drugs, pesticides, etc.) through theformation of mixed aggregates with the amphiphiles making up the orderedaggregates. Both hydrophobic and polar interactions govern the formation ofmixed aggregates. These nanometer- and micrometer-sized aggregates ormicelles are novel extractants for many separation techniques.
For example, experimental setup of microextraction technique in analyticalchemistry is shown in Fig. 14.9. In liquid phase microextraction (LPME), thesolvent is placed in a hollow fiber.107 Analytes are transferred from the donorphase (usually aqueous) to a receptor phase through an organic phase immo-bilized in pores of the hollow fiber. In two-phase mode, the solvent in the poresof the fiber is the same as that present in the fiber. In three-phase mode, thesolvent placed in the pores of fiber differs from that inside the fiber. The three-phase mode is applied for extracting polar analytes, whereas the two-phasemode is applied for extracting nonpolar and semi-polar analytes. The amount ofsolvent in the fiber is about 10–25 L.108 The advantage of LPME over SDME is
505Chapter | 14 Recent Advances in Solvent Extraction Processes
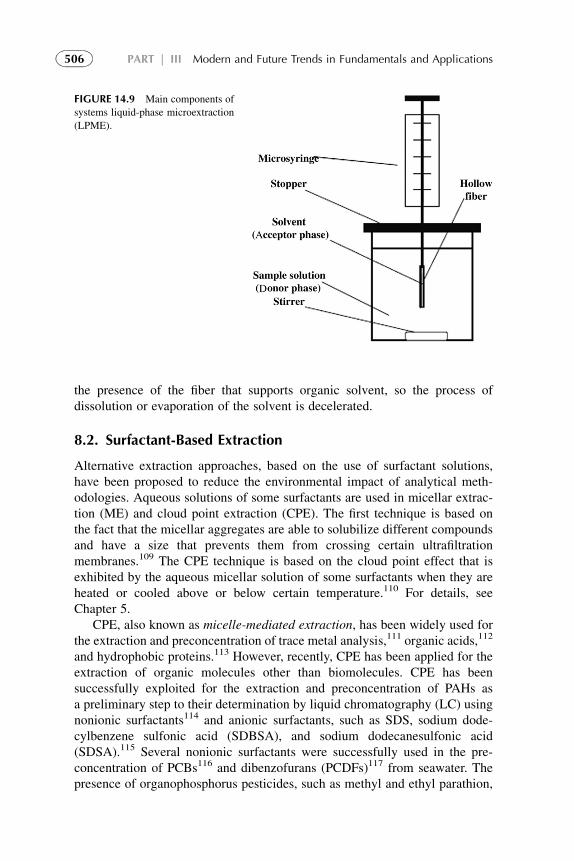
the presence of the fiber that supports organic solvent, so the process ofdissolution or evaporation of the solvent is decelerated.
8.2. Surfactant-Based Extraction
Alternative extraction approaches, based on the use of surfactant solutions,have been proposed to reduce the environmental impact of analytical meth-odologies. Aqueous solutions of some surfactants are used in micellar extrac-tion (ME) and cloud point extraction (CPE). The first technique is based onthe fact that the micellar aggregates are able to solubilize different compoundsand have a size that prevents them from crossing certain ultrafiltrationmembranes.109 The CPE technique is based on the cloud point effect that isexhibited by the aqueous micellar solution of some surfactants when they areheated or cooled above or below certain temperature.110 For details, seeChapter 5.
CPE, also known as micelle-mediated extraction, has been widely used forthe extraction and preconcentration of trace metal analysis,111 organic acids,112
and hydrophobic proteins.113 However, recently, CPE has been applied for theextraction of organic molecules other than biomolecules. CPE has beensuccessfully exploited for the extraction and preconcentration of PAHs asa preliminary step to their determination by liquid chromatography (LC) usingnonionic surfactants114 and anionic surfactants, such as SDS, sodium dode-cylbenzene sulfonic acid (SDBSA), and sodium dodecanesulfonic acid(SDSA).115 Several nonionic surfactants were successfully used in the pre-concentration of PCBs116 and dibenzofurans (PCDFs)117 from seawater. Thepresence of organophosphorus pesticides, such as methyl and ethyl parathion,
FIGURE 14.9 Main components of
systems liquid-phase microextraction
(LPME).
506 PART | III Modern and Future Trends in Fundamentals and Applications
paraoxon, and fenitrothion, has been determined in river water samples byusing CPE with the nonionic surfactant Triton X-114 prior to their separationby LC.118 The use of the nonionic surfactant poly(oxyethylene glycol) mon-ooctyl ether led to good extraction efficiency even for polar species, such aschlorinated phenols and anilines, with recoveries of 88–99%.119
8.3. Solvent Extraction with Microemulsions
Principles of microemulsion formation and solute extraction were presented inChapter 13. Below, the reader will find some examples of microemulsionapplication in solvent extraction of metal ions and biological compounds. Theinfluence of extraction parameters are discussed shortly.
8.3.1. Metal Ion Extraction with Microemulsion
Comparative to conventional extraction, in this case, the organic phase isreplaced by a W/O microemulsion containing the reactant. There are twopossible ways of forming a W/O microemulsion in the solvent phase:
1. The extractant forms reverse micelles in the organic phase leading to theformation of a microemulsion when this phase is contacted with the aqueousone (in which case, although perhaps unknown, the organic phase cannot beanything but a microemulsion).
2. The extractant does not form reverse micelles under the conditions of theprocess, in which case a surfactant, and sometimes also a cosurfactant,must be added to the organic phase in order to produce a reverse micellarphase. In this case, the reverse micelles are usually mixed, i.e., they includein the micellar shell the reactant and the additives.
Only case (2) can provide a comparison between conventional and micellarextraction. The few comparisons reported in the literature on the metalextraction performance of microemulsions containing an extractant with thatof the extractant on its own are, at first sight, contradictory. In some cases,microemulsions produce both synergism and extraction rate enhancement withrespect to the single surfactant, whereas in others they substantially reduce themetal distribution coefficient and the extraction rate, or leave them unchanged.An interesting example is found in the extraction with di(2-ethylhexyl)phos-phoric acid (DEHPA). DEHPA does not form microemulsions in aliphaticsolvents at pH 4 or below; however, it forms microemulsions on addition ofa surfactant and a cosurfactant, e.g., sodium dodecylbenzene sulfonate andn-butanol. Improvements in the extraction of trivalent and tetravalent metalswith respect to the conventional system with a DEHPA microemulsion werereported.120 At extraction of Al(III) using the same microemulsion enhance-ments were also obtained121 but not at the extraction of Zn(II), which wassignificantly reduced with respect to the conventional DEHPA system. Theauthors121 attempted to explain this phenomenon of the microemulsion by the
507Chapter | 14 Recent Advances in Solvent Extraction Processes
different interfacial behavior of their complexes––the aluminum complex asmore hydrophilic have a greater desorption energy than the zinc complex,making the interface its preferred location, whereas the zinc complex is moresoluble in the organic phase. This suggestion remains to be confirmed. Asimilar behavior of microemulsion in the extraction of Bi(III) and Zn(II) wasobserved122––an increase in the extraction of Bi(III), but not of zinc.
Microemulsion extraction is a complex process with three phases: twointerfaces and a usually unknown phase morphology. The prediction of itsperformance is quite difficult, particularly when dealing with solutes of diverseproperties. The literature indicates that it does not always improve metalextraction, and in some cases, it may even hinder it due to the effect of theemulsifying additives. The author does not see much perspective in the futuredevelopment in this direction.
8.3.2. Extraction of Biological Molecules
Separation mechanism and parameters that affect the distribution coefficientand kinetics of biological molecules such as proteins and amino acids extrac-tion by microemulsion have been studied more extensively than the extractionof inorganic solutes. This is mainly due to the variety of size and structure ofthese molecules and, furthermore, to the fact that their characteristics may beadversely affected by contact with solvents and surfactants.
The distribution of biomolecules between the aqueous and the reversemicelle phases depends on system parameters such as pH, ionic strength, salttype, solvent structure and type, temperature, surfactant and cosurfactantconcentration, and some others. Furthermore, protein size and hydrophobicityare also important in determining its partitioning behavior in the reversemicelle phase.
The pH of a solution affects the solubilization characteristics of a protein bymodifying the charge distribution over the protein surface. At pH values belowits isoelectric point (pI), or point of zero net charge, a protein acquires a netpositive charge, while above its pI the protein will be negatively charged. Thus,if electrostatic interactions are the dominant factor, solubilization should bepossible only with anionic surfactants at pH values less than the pI of theprotein. The opposite effect would be anticipated in the case of cationicsurfactants.
The ionic strength of the aqueous solution in contact with a reversemicelle phase affects protein partitioning in a number of ways.123,124 Thefirst is through modification of electrostatic interactions between the proteinsurface and the surfactant head groups by modification of the electricaldouble layers adjacent to both the charged inner micelle wall and the proteinsurface. The second effect is to “salt out” the protein from the micelle phasebecause of the increased propensity of the ionic species to migrate to themicelle water pool, reduce the size of the reverse micelles, and thus displacethe protein.
508 PART | III Modern and Future Trends in Fundamentals and Applications
An increase in surfactant concentration results in an increase in the numberof micelles rather than any substantial change in size, and this enhances thecapacity of the reverse micelle phase to solubilize proteins. Increasingthe surfactant concentration leads to the increasing of protein solubilization inthe reverse micelle phase.125 At low “minimal” concentrations (6–20 mmol/dm3 AOT), reverse micelles could be highly selective in separating very similarproteins from fermentation broths.126 Recovery in activity of up to 95% couldbe achieved.
The temperature markedly affected the transfer of a-chymotrypsin in achloroform–trioctylmethylammonium chloride (TOMAC) system.127 Byincreasing the temperature from 25 to 40 �C, about 50% higher transfer yieldwas realized. No appreciable transfer of glucagon took place at roomtemperature, whereas at 37 �C transfer was possible.
Back-extraction of proteins encapsulated in AOT reverse micelles wasevaluated by adding a counterionic surfactant, either TOMAC or DTAB, to thereverse micelles.128 This novel backward transfer method gave higherbackward extraction yields compared to the conventional method. The back-extraction process with TOMAC was found to be 100 times faster than back-extraction with the conventional method, and as much as three times faster thanforward extraction. The 1:1 complexes of AOT and TOMAC in the solventphase could be efficiently removed using adsorption onto montmorillonite sothat the organic solvent could be reused.
8.3.3. Potential Applications of Micellar Extraction
The series of binary and ternary protein mixtures were studied using reversemicelle extraction.126,129 Cytochrome c and lysozyme were quantitativelyseparated from a ternary mixture of these proteins with ribonuclease A.Separation of a mixture of ribonuclease A and concanavalin A showed nointeraction between the proteins.
Recovery of an extracellular alkaline protease from a whole fermentationbroth using microemulsion extraction was demonstrated.130 Purification factorsas high as 6 and yields of 56% were achieved in a three-stage cascade. Thecombination of a cascade with a higher aqueous/organic ratio, and the use oftrue cross-flow designs, shows promise for purification without dilution.
Application of the reverse micelle technique by extracting an a-amylasebroth of Bacillus licheniformis using a CTAB/isooctane/5% octanol reversemicelle system showed that in a two-step extraction the protein concentrationwas reduced by a factor of 10 with a purification factor of 8.9, and a maximumyield of 89% a-amylase activity.131
Extraction as high as 98% of lysozyme from egg white was achieved132 anda variety of demulsifiers, added to the mixture, enhanced yields substantially.
Several investigations of extraction of intracellular enzymes with reversemicelles were published recently.133–135 CTAB in octane with hexanol ascosurfactant liberated enzyme rapidly into the water from whole cells reported
509Chapter | 14 Recent Advances in Solvent Extraction Processes
to be able to lyse quickly and accommodate the pool of surfactant aggre-gates.133,134 In another case, a periplasmic enzyme, cytochrome c553, wasextracted from the periplasmic fraction using reverse micelles.135 The purityachieved in one separation step was very close to that achieved with extensivecolumn chromatography. These results show that reverse micelles can be usedfor the extraction of intracellular proteins.
8.3.4. Scale-up Considerations
Extractors developed for conventional liquid–liquid extraction are, in principle,also suitable for this application. Spray columns,136 Graesser contactor (rainingbucket),137,138 were successfully tested and integrated system of separation andback-extraction was developed.139 To scale up the process of biomolecularcompounds extraction using reverse micelles to an industrial-sized unit, stillmuch has to be done.
8.4. Micellar Liquid Chromatography
Micellar liquid chromatography (MLC) is an RPLC, in which the mobile phaseconsists of an aqueous solution of surfactant above its critical micellarconcentration (CMC).140 From a green analytical chemistry point of view, theidea of replacing organic solvents by surfactants as mobile phases in LC ishighly appreciated. MLC is based on the solubility changes provided by thevariation of the surfactant concentration above the CMC, which impliesthe increase of the concentration of amphiphilic aggregates or micelles in thesolution, remaining constant the number of monomers of surfactant in themobile phase. A detailed description of the retention mechanisms in MLC canbe found in the work.141 The advantages of MLC are the elimination of organicsolvents and the fast way offered to perform gradient elutions with a convenientphase equilibrium.
Since its introduction, because of two main problems, MLC was less usedwhen compared to conventional RPLC. The first is the excessive retentionobserved for hydrophobic compounds due to the weak eluting power ofmicellar mobile phases142 and the second is the reduced efficiency due to theresistance to analyte mass transfer and/or increased flow anisotropy.143 In MLCroutine applications, the addition of a small amount of an organic solvent to themicellar solution is needed to achieve retention in practical time windows andto improve peak efficiency and resolution.144 In 1983, the addition of a short-chain alcohol, 1-propanol or butanol, to the micellar eluent was proposed toenhance the efficiency of the separations. Propanol is the most commonly usedalcohol additive, followed by pentanol, butanol, and acetonitrile.145 From anenvironmental point of view, it is clear that a high percentage of organic solventis not desirable. Moreover, using a high percentage of organic modifier woulddiminish or annul the role of the micelle and the surfactant molecules adsorbedin the stationary phase can be completely removed. The concentration of
510 PART | III Modern and Future Trends in Fundamentals and Applications
organic solvent that preserves the integrity of micelles is approximately 15%for propanol and acetonitrile, 10% for butanol, and 6% for pentanol.146
MLC has proved to be a useful technique in the control of diverse groupsof drugs in pharmaceutical preparations, such as antihistamines and phene-thylamines,147 diuretics,148 and benzodiazepines149 using mobile phases thatcontain SDS and an alcohol, such as propanol, butanol, or pentanol. Moreover,SDS and an organic modifier have been used as mobile phases to determineantioxidants in foods, such as for the quantification of phenolic antioxidants inoils,150 synthetic antioxidants in meat,151 sulfonamides in milk,152 and aminesin wine.153
9. SOLID–LIQUID EXTRACTION SYSTEMS
Most techniques described in this and next sections of this chapter are devel-oped and used in analytical applications, but the author considers that they arevery perspective for development of commercial technologies in pharmaceu-tical, food, and environmental industries.
9.1. Solid-Phase Extraction
SPE is currently the most frequently employed technique for isolating orenriching solutes from water solutions. The isolation process comprisespartition of organic compounds dissolved in water between a solid sorbentand an aqueous phase, due to which solutes are selectively trapped on thissorbent.154 The trapping process is governed by the following mechanisms:
1. Adsorption of the solutes dissolved in water, on the surface of the sorbent(solid phase), mainly due to Van der Waals forces, hydrogen bonds, hydro-phobic effects, p–electron interactions, and cation- and anion-exchangeprocesses
2. Possible dissolution of a solute in some organic solid sorbents3. Partition of solutes between sample and liquid sorbent (liquid stationary
phase), in the form of thin film, coated on or chemically bonded to a solidsupport. SPE techniques can be applied in several modes, which are pre-sented in Table 14.3.155
9.2. Solvent-Impregnated Resins
SPE columns are one of the most commonly applied methods of cleanup.Various column packings are now commercially available and include silica,charcoal, Florisil, C8, C18 reversed phase, and aluminum oxide.156,157 Thesesurfaces are chemically modified to allow the adsorption of the solute ofinterest or the impurities. In summary, the feed solution is applied to a pre-conditioned SPE column, the solute is retained on the column, which is washedto remove impurities, then eluted by means of a solvent wash. In the majority of
511Chapter | 14 Recent Advances in Solvent Extraction Processes
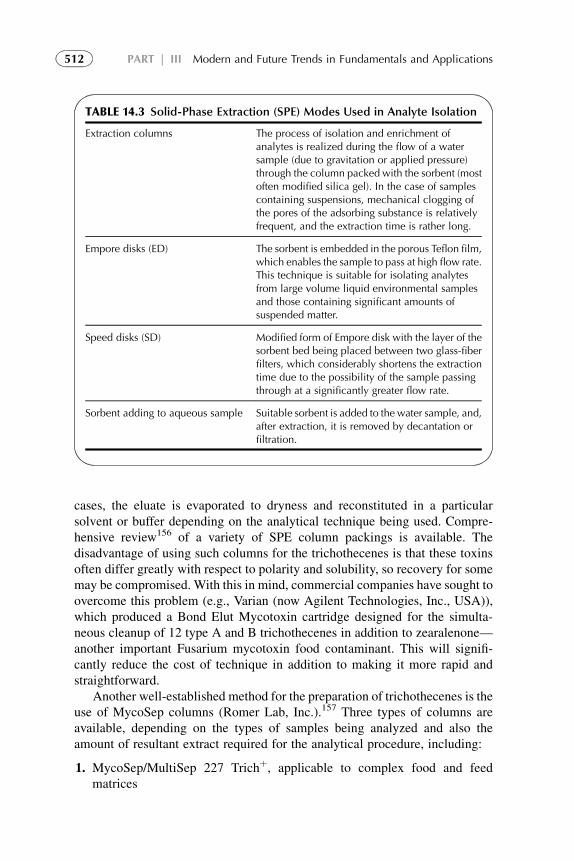
cases, the eluate is evaporated to dryness and reconstituted in a particularsolvent or buffer depending on the analytical technique being used. Compre-hensive review156 of a variety of SPE column packings is available. Thedisadvantage of using such columns for the trichothecenes is that these toxinsoften differ greatly with respect to polarity and solubility, so recovery for somemay be compromised. With this in mind, commercial companies have sought toovercome this problem (e.g., Varian (now Agilent Technologies, Inc., USA)),which produced a Bond Elut Mycotoxin cartridge designed for the simulta-neous cleanup of 12 type A and B trichothecenes in addition to zearalenone––another important Fusarium mycotoxin food contaminant. This will signifi-cantly reduce the cost of technique in addition to making it more rapid andstraightforward.
Another well-established method for the preparation of trichothecenes is theuse of MycoSep columns (Romer Lab, Inc.).157 Three types of columns areavailable, depending on the types of samples being analyzed and also theamount of resultant extract required for the analytical procedure, including:
1. MycoSep/MultiSep 227 Trichþ, applicable to complex food and feedmatrices
TABLE 14.3 Solid-Phase Extraction (SPE) Modes Used in Analyte Isolation
Extraction columns The process of isolation and enrichment ofanalytes is realized during the flow of a watersample (due to gravitation or applied pressure)through the column packed with the sorbent (mostoften modified silica gel). In the case of samplescontaining suspensions, mechanical clogging ofthe pores of the adsorbing substance is relativelyfrequent, and the extraction time is rather long.
Empore disks (ED) The sorbent is embedded in the porous Teflon film,which enables the sample to pass at high flow rate.This technique is suitable for isolating analytesfrom large volume liquid environmental samplesand those containing significant amounts ofsuspended matter.
Speed disks (SD) Modified form of Empore disk with the layer of thesorbent bed being placed between two glass-fiberfilters, which considerably shortens the extractiontime due to the possibility of the sample passingthrough at a significantly greater flow rate.
Sorbent adding to aqueous sample Suitable sorbent is added to the water sample, and,after extraction, it is removed by decantation orfiltration.
512 PART | III Modern and Future Trends in Fundamentals and Applications
2. MycoSep/MultiSep 225 Trich, for grain and simple sample matrices3. MycoSep 113 Trich, employed for analytical procedures requiring small
amounts of extracts
These columns comprise different adsorbents (e.g., charcoal and ion-exchange resins). A plastic tube is packed with the desired adsorbent betweenfilter discs and contains a rubber flange at the lower end of the tube, whichcontains a porous frit and a one-way valve. Immunoaffinity columns (IACs),ion-exchange columns, and the more traditional liquid–liquid partitioning.158
Antibodies are attached to an inert support and will specifically bind the soluteof interest while allowing interfering components to pass through the column.As with other SPE formats, preconditioning, rinsing, and elution of the toxinare required and, in this instance, the extract must be an aqueous solutioncontaining little or no organic solvent that will have a detrimental effect on theantibody and subsequently the antibody–antigen binding event. A majoradvantage of this approach is the specific interaction between the antibody andthe analyte in question, but, as with all antibody-based methods, nonspecificinteractions, due to cross-reactivities with other trichothecenes, may impair theresults achieved.
9.3. Solid-Phase Microextraction
Solid-phase microextraction (SPME) is a relatively new technique, introducedin the early 1990s by Pawliszyn and Lord.159 It can be easily automated160 andhas been increasingly used in sample preparation for chromatographicanalysis, with a rapid increase in applications since the first fibers becamecommercially available in 1993.161 The most common applications, limitedby the properties of commercially available fibers, are in the field of organiccompound determination (i.e., volatile organic compounds, alkylbenzenes,polycyclic aromatic hydrocarbons, and pesticides as target analytes).The technique is based on partitioning of an analyte between a sample anda fused-silica fiber coated with stationary phase, which can be a liquidpolymer or a solid polymer dispersed in the liquid polymer. The analyte isthen desorbed from the fiber directly into a suitable separation and detectionsystem.162
10. ASSISTED SOLVENT EXTRACION
10.1. Microwave-Assisted Extraction
Microwave-assisted extraction (MAE) is one of the milestones in the devel-opment of sample-preparation strategies.163 Microwaves, initially used in thefood and agricultural industries for conditioning food products, have begun tobe used for sample digestion.164 They are used in the solvent extraction oforganic analytes from solid samples. Enhancement of extraction is based on
513Chapter | 14 Recent Advances in Solvent Extraction Processes
absorption of microwave energy by molecules of chemical compounds. MAEcan be performed in two ways:
1. Pressurized MAE, which employs a microwave transparent, closed extrac-tion vessel, and a solvent of high dielectric constant. Such solvents absorbmicrowave radiation, and thus are heated to a temperature exceeding thesolvent boiling points under standard pressure conditions. However, boilingdoes not occur because the vessel is pressurized.
2. Atmospheric MAE system in open vessels––also called focused micro-waves (FMW). This technique employs solvents with low dielectricconstants. Such solvents are essentially microwave-transparent, so theyabsorb very little energy, and extraction can, therefore, be performed inopen vessels. The temperature of the sample increases during extraction,because it usually contains water and other components with high dielectricconstants. Because extraction conditions are milder, this mode of operationcan be used to extract thermolabile analytes (e.g., polycyclic aromatichydrocarbons, polychlorinated biphenyls, organochlorine pesticides, andalkanes).
The main advantages of MAE from the point of view of green chemistryare significant reduction in the amount of solvent used (25–50 mL), whichreduces waste generation, shortens extraction time (from 1 h to 3 min), andreduces the amount of the sample required and correspondingly reducesenergy input and cost.
10.2. Ultrasound-Assisted Extraction
Ultrasound-assisted extraction (UAE) is one of the techniques promising tospeed up and to simplify sample treatment.165 Ultrasonic energy, whenimparted to solutions, causes acoustic cavitation (i.e., bubble formation andsubsequent implosion).166 The collapse of bubbles created by the sonication ofsolutions generates extremely high local temperature and pressure gradients,which may be regarded as localized “hot spots” that can be employed forextracting analytes from solid matrices, so that species may then be measuredby instrumental techniques (e.g., atomic spectrometry). This technique isregarded as environment friendly because not only is the amount of solventrequired decreased (100–300 mL) and the extraction time (3 min–1 h) short-ened, but also ultrasound research is finding new applications in environmentalremediation.
11. EXTRACTION OF GAS IN ANALYTICAL APPLICATIONS
Gas extraction is used in static or dynamic headspace modes. The staticheadspace (gas-phase extraction) technique includes transfer of the partheadspace or gas phase above the sample in a condensed phase, by means of
514 PART | III Modern and Future Trends in Fundamentals and Applications
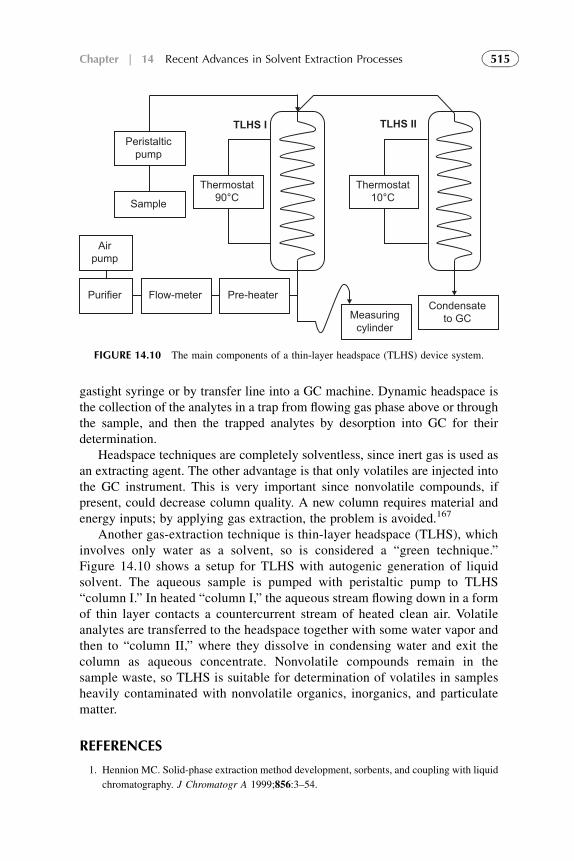
gastight syringe or by transfer line into a GC machine. Dynamic headspace isthe collection of the analytes in a trap from flowing gas phase above or throughthe sample, and then the trapped analytes by desorption into GC for theirdetermination.
Headspace techniques are completely solventless, since inert gas is used asan extracting agent. The other advantage is that only volatiles are injected intothe GC instrument. This is very important since nonvolatile compounds, ifpresent, could decrease column quality. A new column requires material andenergy inputs; by applying gas extraction, the problem is avoided.167
Another gas-extraction technique is thin-layer headspace (TLHS), whichinvolves only water as a solvent, so is considered a “green technique.”Figure 14.10 shows a setup for TLHS with autogenic generation of liquidsolvent. The aqueous sample is pumped with peristaltic pump to TLHS“column I.” In heated “column I,” the aqueous stream flowing down in a formof thin layer contacts a countercurrent stream of heated clean air. Volatileanalytes are transferred to the headspace together with some water vapor andthen to “column II,” where they dissolve in condensing water and exit thecolumn as aqueous concentrate. Nonvolatile compounds remain in thesample waste, so TLHS is suitable for determination of volatiles in samplesheavily contaminated with nonvolatile organics, inorganics, and particulatematter.
REFERENCES
1. Hennion MC. Solid-phase extraction method development, sorbents, and coupling with liquid
chromatography. J Chromatogr A 1999;856:3–54.
Peristalticpump
Sample
Airpump
Purifier Flow-meter
Thermostat90°C
Thermostat10°C
Pre-heater
Measuringcylinder
Condensateto GC
TLHS I TLHS II
FIGURE 14.10 The main components of a thin-layer headspace (TLHS) device system.
515Chapter | 14 Recent Advances in Solvent Extraction Processes
2. Gilbert-Lupez B, Garcıa-Reyes JF, Molina-Dıaz A. Sample treatment and determination of
pesticide residues in fatty vegetable matrices: A review. Talanta 2009;79:109–28.
3. Aulakh JS, Malik AK, Kaur V, Schmitt-Kopplin P. A review on solid phase microextration-
high performance liquid chromatography (SPME–HPLC) analysis of pesticides. Crit Rev
Anal Chem 2005;35:71–85.
4. Sbnchez-Rojas F, Bosch-Ojeda C, Cano-Pavun JM. 40 years of chromatographia: reviews of
current techniques and developments. Chromatographia 2009;69:S79–94.
5. Rodriguez E, Navarro F, Moreno-Bondi MC, Marazuela MD. Multiresidue determination of
fluoroquinolone antimicrobials in baby foods by liquid chromatography. J Chromatogr A
2010;1217:605–13.
6. Du G, Zhao HY, Zhang QW, Li GH, Yang FQ, Wang Y, Li YC, Wang YT. A rapid method for
simultaneous determination of 14 phenolic compounds in Radix Puerariae using microwave-
assisted extraction and ultra high performance liquid chromatography coupled with diode
array detection and time-of-flight mass spectrometry. J Chromatogr A 2010;1217:705–14.
7. Hauthal WH. Chemical synthesis using supercritical fluids. Chemosphere 2001;43:123–35.
8. Buszewski B, Studzinska S. A review of ionic liquids in chromatographic and electro-
migration techniques. Chromatographia 2008;68:1–10.
9. Anklam E, Berg H, Mathiasson L, Sharman M, Ulberth F. Supercritical fluid extraction (SFE)
in food analysis: a review. Food Additiv Contamin 1998;15:729–50.
10. Del Valle JM, Aguilera JM. Review: high pressure CO2 extraction. Fundamentals and
applications in the food industry. Food Sci Technol Int 1999;5:1–24.
11. Ravento M, Duarte S, Alarco R. Application and possibilities of supercritical CO2 extraction
in food processing industry: an overview. Food Sci Technol Int 2002;8:269–84.
12. Hildebrand JH, Scott RL. The solubility of nonelectrolytes. New York: Reinhold; 1958.
13. Valcarcel M, Tena MT. Applications of supercritical fluid extraction in food analysis.
Fresenius J Anal Chem 1997;358:561–73.
14. Erkey C. Supercritical carbon dioxide extraction of metals from aqueous solutions: a review.
J Supercrit Fluids 2000;17:259–87.
15. Bungert B, Sadowski G, Arlt W. Separations and material processing in solutions with dense
gases. Ind Eng Chem Res 1998;37(8):3208.
16. Teja AS, Eckert CA. Commentary on supercritical fluids: research and applications. Ind Eng
Chem Res 2000;39(12):4442.
17. Tonthubthimthong P, Douglas Peter L, Douglas S, Luewisutthichat W, Teppaitoon W,
Pengsopa L. Extraction of nimbin from neem seeds using supercritical CO2 and a super-
critical CO2-methanol mixture. J Supercrit Fluids 2004;30(3):287–301.
18. Fernandez-Ronco MP, Cismondi M, Gracia I, De Lucas A, Rodrıguez JF. High-pressure
phase equilibria of binary and ternary mixtures of carbon dioxide, triglycerides and free
fatty acids: measurement and modeling with the GC-EOS. Fluid Phase Equilibr
2010;295(1):1–8.
19. Perakis C, Loulis V, Voutsas E, Magoulas K. Supercritical CO2 extraction of dittany oil:
experiments and modelling. J Supercrit Fluids 2010;55:573–8.
20. Klesper E, Corwin AH, Turner DA. High pressure gas chromatrography above critical
temperatures. J Org Chem 1962;27:700–1.
21. Griffiths PR. Contemporary SFC d accomplishments and limitations. Anal Chem
1988;60:593A–7A.
22. Harris CM. The SFC comeback d Pharmaceuticals give supercritical fluid chromatography
a fighting chance. Anal Chem 2002;74:87A–91A.
516 PART | III Modern and Future Trends in Fundamentals and Applications
23. Taylor LT. Supercritical fluid chromatography for the 21st century. J Supercrit Fluids
2009;47:566–73.
24. Welch CW, Leonard WR, DaSilva JO, Baba M, Albaneze-Walker J, Henderson DW, Laing B,
Mathre DJ. Preparative chiral SFC as a green technology for rapid access to enantiopurity in
pharmaceutical process research. LC–GC 2005;23:16–29.
25. Bolanos B, Greig M, Ventura M, Farrell W, Aurigemma CM, Li H, Quenzer TL, Tivel K,
Bylund JMR, Tran P, Pham C, Phillipson D. SFC/MS in drug discovery at Pfizer, La Jolla. Int
J Mass Spectrom 2004;238:85–97.
26. Toribio L, del Nozal MJ, Bernal JL, Alonso C, Jimenez JJ. Enantiomeric resolution of
bifonazole by supercritical fluid chromatography. J Sep Sci 2006;29:1373–8.
27. Pinkston JD, Wen D, Morand KL, Tirey DA, Stanton DT. Comparison of LC/MS and SFC/
MS for screening of a large and diverse library of pharmaceutically relevant compounds.
Anal Chem 2006;78:7467–72.
28. Ramirez P, Santoyo S, Garcia-Risco MR, Senorans FJ, Ibanez E, Reglero G. Use of specially
designed columns for antioxidants and antimicrobials enrichment by preparative supercritical
fluid chromatography. J Chromatogr A 2007;1143:234–42.
29. Luque de Castro MD, Jimenez-Carmona MM, Fernandez-Perez V. Towards more rational
techniques for the isolation of valuable essential oils from plants. Trends Anal Chem
1999;19:708–16.
30. Miller DJ, Hawthorne SB. Solubility of liquid organic flavor and fragrance compounds in
subcritical (hot/liquid) water from 298 to 473 K. J Chem Eng Data 2000;45:315–8.
31. Li B, Yang Y, Gan Y, Eaton CD, He P, Jones AD. On-line coupling of subcritical water
extraction with high-performance liquid chromatography via solid-phase trapping.
J Chromatogr A 2000;873:175–84.
32. Luque de Castro MD, Jimenez CMM. Potential of water for continuous automated sample-
leaching. Trends Anal Chem 1998;17:441–7.
33. Hawthorne SB, Yang Y, Miller DJ. Extraction of organic pollutants from environmental
solids with sub- and supercritical water. Anal Chem 1994;66:2912–20.
34. Yang Y, Bowadt S, Hawthorne SB, Miller DJ. Subcritical water extraction of polychlorinated
biphenyls from soil and sediment. Anal Chem 1995;67:4571–6.
35. Jimenez CMM, Manclus JJ, Montoya A, Luque de Castro MD. Sub- and supercritical-fluid
extraction of trichloropyridinol from soil prior to immunoassay. J Chromatogr 1997;785:
329–36.
36. Kipp S, Peyrer H, Kleiboehmer W. Coupling superheated water extraction with
enzyme immunoassay for an efficient and fast PAH Screening in soil. Talanta
1998;46:385–93.
37. Basile A, Jimenez CMM, Clifford AA. Extraction of rosemary by superheated water. J Agric
Food Chem 1998;46:5205–9.
38. Fernandez PV, Jimenez CMM, Luque de Castro MD. An approach to the static-dynamic
subcritical water extraction of laurel essential oil: comparison with conventional techniques.
Analyst 2000;125:481–5.
39. Gamiz-Gracia L, Luque de Castro MD. Continuous subcritical water extraction of medicinal
plant essential oil: comparison with conventional techniques. Talanta 2000;51:1179–85.
40. Jimenez CMM, Ubera JL, Luque de Castro MD. Comparison of continuous sub-critical water
extraction and hydrodistillation of marjoram essential oil. J Chromatogr A 1999;855:625–32.
41. Jimenez CMM, Luque de Castro MD. Isolation of eucalyptus essential oil for GC-MS
analysis by extraction with subcritical water. Chromatographia 1999;50:578–82.
517Chapter | 14 Recent Advances in Solvent Extraction Processes
42. Chalchat JC, Garry RP, Michet A. Chemical composition of essential oil of Calendula
officinalis L. (pot marigold). Flavour Frag J 1991;6:189–92.
43. De-Pooter HL, Aboutabl EA, El-Shabrawy AO. Chemical composition and antimicrobial
activity of essential oil of lead, stem and rhizome of Alpinia speciosa (J.C. Wendl.) K.
Schum. grown in Egypt. Flavour Frag J 1995;10:63–7.
44. Soto Ayala R, Luque de Castro MD. Continuous subcritical water extraction as a useful tool
for isolation of edible essential oils. Food Chem 2001;75:109–13.
45. Verma RK, Uniyal GC, Gupta MM. High-performance liquid chromatography of poppy
straw. Indian J Pharm Sci 1990;52:276–8.
46. Ibanez E, Kubatova A, Senorans FJ, Cavero S, Reglero G, Hawthorne SB. Subcritical
water extraction of antioxidant compounds from rosemary plants. J Agric Food Chem
2003;51:375–82.
47. Kubatova A, Miller DJ, Hawthorne SB. Comparison of subcritical water and organic solvents
for extracting kava lactones from kava root. J Chromatogr A 2001;923:187–94.
48. De-Pooter HL, Aboutabl EA, El-Shabrawy AO. Chemical composition and antimicro-
bial activity of essential oil of lead, stem and rhizome of Alpinia speciosa (J.C. Wendl.)
K. Schum. grown in Egypt. Flavour Frag J 1995;10:63–7.
49. Ozel MZ, Gogus F, Lewis AC. Subcritical water extraction of essential oil from. Thymbra
spicata. Food Chem 2003;82:381–6.
50. Moreda-Pineiro J, Alonso-Rodrıguez E, Lopez-Mahıa P, Muniategui-Lorenzo S,
Fernandez-Fernandez E, Prada-Rodrıguez D, Moreda-Pineiro A, Bermejo-Barrera A,
Bermejo-Barrera P. Pressurized liquid extraction as a novel sample pre-treatment for
trace element leaching from biological material. Anal Chim Acta 2006;572:172–9.
51. Lou X, Janssen HG, Cramers CA. Parameters affecting the accelerated solvent extraction of
polymeric samples. Anal Chem 1997;69:1598.
52. Alonso-Rodrıguez E, Moreda- Pineiro J, Moreda- Pineiro A, Lopez-Mahıa P, Muniategui-
Lorenzo S, Fernandez-Fernandez E, Bermejo-Barrera P, Prada-Rodrıguez D. Trends Anal
Chem 2006;25:511.
53. Guillemin CL, Millet JL, Dubois J. Thermal aqueous liquid chromatography d the TALC
technique. J High Resolut Chromatogr 1981;4:280–6.
54. Smith RM, Burgess RJ, Chienthavorn O, Stuttard JR. Superheated water: a new look at
chromatographic eluents for reversed-phase HPLC. LC–GC N Am 1999;17:938.
55. Coym JW, Dorsey JG. Superheated water chromatography: a brief review of an emerging
technique. Anal Lett 2004;37:13–23.
56. Su Y, Jen JF, Zhang W. The Method development of subcritical water chromatography.
J Chin Chromatogr 2005;23:238–42.
57. Smith RM. Superheated water: the ultimate green solvent for separation science. Anal
Bioanal Chem 2006;385:419–21.
58. Ingelse BA, Janssen HG, Cramers CA. HPLC-FID with superheated water
as the fluent: improved methods and instrumentation. J High Resol Chromatogr 1998;21:
613–6.
59. Pawlowski TM, Poole CF. Solvation characteristics of pressurized hot water and its use in
chromatography. Anal Commun 1999;26:71–5.
60. Kondo T, Yang Y. Comparison of elution strength, column efficiency, and peak symmetry in
subcritical water chromatography and traditional reversed-phase liquid chromatography.
Anal Chim Acta 2003;494:157–66.
61. Teutenberg T, Lerch O, Gotze H-J, Zinn P. Separation of selected anticancer drugs using
superheated water as the mobile phase. Anal Chem 2001;73:3896–9.
518 PART | III Modern and Future Trends in Fundamentals and Applications
62. Sanagi MM, See HH. High temperature liquid chromatography on a poly(styrene-
divinylbenzene) stationary phase. J Liq Chromatogr 2005;28:3065–76.
63. Hatti-Kaul R. Aqueous two-phase systems: methods and protocols. Totowa, NJ: Humana
Press; 2000.
64. Wilkes JS, Zaworotko MJ. Air and water stable 1-ethyl-3-methylimidazolium based ionic
liquids. J Chem Soc Chem Commun 1992;13:965–7.
65. Rogers RD, Seddon KR. Ionic liquids in industrial applications to green chemistry.
Washington DC: ACS; 2002. p. 474.
66. Rogers RD, Seddon KR. Ionic liquids as green solvents. Progress and prospects. ACS
Symposium Series. Washington DC: American Chemical Society; 2003. p. 599.
67. Rogers RD, Swatloski RP, Visser AE. Liquid–liquid extraction of organics in room-
temperature ionic liquids: cationic effects. Abstr Papers Am Chem Soc 1999;218:22.
68. Rogers RD, Visser AE, Swatloski RP, Hartman DH. Room temperature ionic liquids as
alternatives to volatile organic solvents in liquid/liquid extraction. Abstr Papers Am Chem
Soc 2000;219:3.
69. Cornmell RJ, Winder CL, Tiddy GJT, Goodacre R, Stephens G. Accumulation of ionic
liquids in escherichia coli cells. Green Chem 2008;10:836–41.
70. Nakashima K, Kubota F, Maruyama T, Goto M. Ionic liquids as a novel solvent for
lanthanide extraction. Anal Sci 2003;19:1097–8.
71. Visser AE, Swatloski RP, Reichert WM, Mayton R, Sheff S, Wierzbicki A, Davis Jr JH,
Rogers RD. Task-specific ionic liquids for the extraction of metal ions from aqueous solu-
tions. Chem Commun 2001;1:135–6.
72. Visser AE, Swatloski RP, Reichert WM, Griffin ST, Rogers RD. Traditional extractants in
nontraditional solvents: groups 1 and 2 extraction by crown ethers in room-temperature ionic
liquids. Ind Eng Chem Res 2001;39:4596–604.
73. Visser AE, Swatloski RP, Griffin ST, Hartman DH, Rogers RD. Liquid/liquid extraction of
metal ions in room temperature ionic liquids. Sep Sci Technol 2001;36:785–804.
74. Visser AE, Swatloski RP, Reichert WM, Mayton R, Sheff S, Wierzbicki A, Davies JH,
Rogers RD. Task-specific ionic liquids incorporating novel cations for the coordination and
extraction of Hg2þ and Cd2þ: synthesis, characterization, and extraction studies. Environ Sci
Technol 2002;36:2523–9.
75. Liu Q, Janssen MHA, van Rantwijk F, Sheldon RA. Room-temperature ionic liquids that
dissolve carbohydrates in high concentrations. Green Chem 2005;7:39–42.
76. Vidal L, Psillakis E, Domini CE, Grane N, Marken F, Canals A. An ionic liquid as a solvent
for headspace single drop microextraction of chlorobenzenes from water samples. Anal Chim
Acta 2007;584:189–95.
77. Fadeev AG, Meagher MM. Opportunities for ionic liquids in recovery of biofuels. Chem
Commun 2001;1:295–6.
78. Cull SG, Holbery JD, Vargas-Mora V, Seddon KR, Lye GJ. Room-temperature ionic liquids
as replacements for organic solvents in multiphase bioprocess operations. Biotechnol Bioeng
2000;69:227–33.
79. Banerjee T, Verma KK, Khanna A. Liquid–liquid equilibrium for ionic liquid systems using
COSMO-RS: effect of cation and anion dissociation. AIChE J 2008;54:1874–85.
80. Huddleston JG, Willauer HD, Swatloski RP, Visser AE, Rogers RD. Room temperature ionic
liquids as novel media for ‘clean’ liquid-liquid extraction. Chem Commun 1998;1:1765–6.
81. Martak J, Schlosser �S. New formulations of liquid membranes and solvents based on ionic
liquids. In: Proceedings of conference PERMEA 2003, 2003, p. 1. Full text on CD ROM,
Tatranske Matliare (SK), September 7–11.
519Chapter | 14 Recent Advances in Solvent Extraction Processes
82. Martak J, Schlosser �S. Screening of ionic liquids for application in solvent extraction and
pertraction. In: Proceedings of 31st conference of SSCHI, 2004, p. 12. CD ROM with full
papers, Tatranske Matliare (SK), May 25–28.
83. Martak J, Schlosser �S. Ionic liquids in pertraction and extraction of organic acids.
In: Proceedings of 19th Symposium Ars Separatoria, Zloty Potok (PL), 2004, p. 106 (http://
www.ars separatoria.chem.uni.torun.pl/MATERIALY4.htm).
84. Gu Y, Shi F, Yang H, Deng Y. Leaching separation of taurine and sodium sulfate solid
mixture using ionic liquids. Separat Purif Technol 2004;35:153–9.
85. Fortunato R, Branco L, Afonso CAM, Reis MA, Crespo JG. Supported liquid membranes
using ionic liquids: study of transport mechanism and stability. Membr News (EMS)
2002;5:35–8.
86. Branco LC, Crespo JG, Afonso CAM. Highly selective transport of organic compounds
by using supported liquid membranes based on ionic liquids. Angew Chem Int
2002;41:2771.
87. Miyako E, Maruyama T, Kamiya N, Goto M. Enzyme-facilitated enantioselective transport
of (S)-ibuprofen through a supported liquid membrane based on ionic liquids. Chem Commun
2003:2926–7.
88. Miyako E, Maruyama T, Kamiya N, Goto M. Use of ionic liquids in a lipase-facilitated
supported liquid membrane. Biotechnol Lett 2003;25:805.
89. Wood N, Stephens G. Accelerating the discovery of biocompatible ionic liquids. Phys Chem
Chem Phys 2010;12:1670–4.
90. Bekou E, Dionysiou D, Qian R-Y, Botsaris GD. Extraction of chlorophenols from water
using room temperature ionic liquids. In: Rogers RD, Seddon KR, editors. Ionic liquids as
green solvents. Progress and prospects. Washington DC: ACS; 2003. p. 544.
91. Liu JF, Jonsson JA, Jiang G. Application of ionic liquids in analytical chemistry. Trends Anal
Chem 2005;24:20–7.
92. Liu JF, Peng JF, Chi YG, Jiang GB. Determination of formaldehyde in shiitake mushroom by
ionic liquid-based liquid-phase microextraction coupled with liquid chromatography. Talanta
2005;65:705–9.
93. Peng JF, Liu JF, Jiang GB, Tai C, Huang MJ. Ionic liquid for high temperature headspace
liquid-phase microextraction of chlorinated anilines in environmental water samples.
J Chromatogr A 2005;1072:3–6.
94. Ye CL, Zhou QX, Wang XM. Headspace liquid-phase microextraction using ionic liquid as
extractant for the preconcentration of dichlorodiphenyltrichloroethane and its metabolites at
trace levels in water samples. Anal Chim Acta 2006;572:165–71.
95. Liu JF, Jonsson JA, Jiang GB. Application of ionic liquids in analytical chemistry. Trend Anal
Chem 2005;24:20–7.
96. Ye CL, Zhou OX, Wang XM. Determination of phenols in environmental water samples by
ionic liquid-based headspace liquid-phase microextraction coupled with high-performance
liquid chromatography. J Sep Sci 2007;30:42–7.
97. Jiang TF, Gu YL, Liang B, Li JB, Shi YP, Ou QY. Dynamically coating the capillary with
1-alkyl-3-methylimidazolium-based ionic liquids for separation of basic proteins by capillary
electrophoresis. Anal Chim Acta 2003;479:249–54.
98. Breitbach ZS, Armstrong DW. Characterization of phosphonium ionic liquids through
a linear solvation energy relationship and their use as GLC stationary. Anal Bioanal Chem
2008;390:1605–17.
99. Marsza11 MP, Kaliszan R. Application of ionic liquids in liquid chromatography. Crit Rev
Anal Chem 2007;37:127–40.
520 PART | III Modern and Future Trends in Fundamentals and Applications
100. Michaels AS. Membranes, membrane processes, and their applications: needs, unsolved
problems, and challenges of the 1990’s. Desalination 1990;77:5–34.
101. Chou KH, Bell LN. Caffeine content of prepackaged national-brand and private-label
carbonated beverages. J Food Sci 2007;72(6):C337–42.
102. Seike S, Oishi K. Method of removing carbon dioxide using polymer electrolyte membrane,
and apparatus and system therefore. Japan Patent JP 2003306788 A, 2003, 10/31.
103. Li Guan-Shan. Method for recycling wastewater from paper industry. Faming Zhuanli
Shenqing Gongkai Shuomingshu, 2008, p. 9.
104. Drioli E, Criscuoli A, Curcio E. Integrated membrane operations for seawater desalination.
Desalination 2002;147:77.
105. Bartsch RA, Way JD, editors. Chemical separations with liquid membranes. Washington DC:
American Chemical Society; 1996. ACS Symposium Series 642.
106. Kislik VS, editor. Liquid membranes. Principles and applications in chemical separations
and wastewater treatment. Amsterdam: Elsevier; 2010.
107. Lambropoulou DA, Albanis TA. J Biochem Biophys Methods 2007;70:195.
108. Rasmussen KE, Pedersen-Bjergaard S. Trends Anal Chem 2004;23:1.
109. Tani H, Kamidate T, Watanabe H. Micelle-mediated extraction. J Chromatogr A
1997;780:229–41.
110. Carabias-Martınez R, Rodrıguez-Gonzalo E, Moreno-Cordero B, Perez-Pavon JL, Garcıa-
Pinto C, Fernandez Laespada E. Surfactant cloud point extraction and preconcentration of
organic compounds prior to chromatography and capillary electrophoresis. J Chromatogr A
2000;902:251–65.
111. Watanabe H, Tanaka H. Nonionic surfactant as a new solvent for liquid-liquid extraction of
zinc(II) with 1-(2-pyridylazo)-2-naphtol. Talanta 1978;25:585–9.
112. Ballesteros-Gumez A, Ruiz FJ, Rubio S, Perez-Bendito D. Anal Chim Acta 2007;603:51–9.
113. Bordier C. Phase-separation of integral membrane-proteins in triton X-114 solution. J Biol
Chem 1981;256:1604–7.
114. Boeckelen A, Niessner R. Combination of micellar extraction of polycyclic aromatic
hydrocarbons from aqueous media with detection by synchronous fluorescence. Fresenius
J Anal Chem 1993;346:435–40.
115. Casero I, Sicilia D, Rubio S, Perez-Bendito D. An acid-induced phase cloud point separation
approach using anionic surfactants for the extraction and preconcentration of organic
compounds. Anal Chem 1999;71:4519–26.
116. Eiguren-Fernandez A, Sosa-Ferrera Z, Santana-Rodriguez JJ. Cloudpoint extraction and
preconcentration of polychlorinated biphenyls and their determination using high perfor-
mance liquid chromatography. Quim Anal 1997;16:283–9.
117. Eiguren-Fernandez A, Sosa-Ferrera Z, Santana-Rodriguez JJ. Application of cloud-point
methodology to the determination of polychlorinated dibenzofurans in sea water by high-
performance liquid chromatography. Analyst 1999;124:487–91.
118. Garcia-Pinto C, Perez-Pavon JL, Moreno-Cordero B. Cloud point preconcentration and high
performance liquid-chromtaographic determination of organophosphorous pesticides with
dual electrochemical detection. Anal Chem 1995;67:2606–12.
119. Frankewich RP, Hinze WL. Evaluation and optimization of the factors affecting nonionic
surfactant-mediated phase separations. Anal Chem 1994;66:944–54.
120. Bauer D, Cote G, Komornicki J, Mallet-Faux S. Can Soc Chem Eng 1989;2:425.
121. Brejza EV, Perez de Ortiz ES. Phenomena Affecting the Equilibrium of Al(III)
and Zn(II) Extraction with Winsor II Microemulsions. J Colloid Interface Sci
2000;227:244–6.
521Chapter | 14 Recent Advances in Solvent Extraction Processes
122. Pepe EM, Otu EO. The synergistic Extraction of thorium(IV) and uranium(VI) by
2-ethylhexyl phenyl phosphonic acid and Micells of Dinonyl naphthalene sulphonic acid.
Solv Extr Ion Exch 1996;14(2):247.
123. Leodidis EB, Hatton TA. Specific ion effects in electrical double-layers – Selective solubi-
lization of cations in aerosol-OT reversed micelles. In: Pileni MP, editor. The structure and
reactivity in reversed micelles. Amsterdam: Elsevier; 1989. p. 270.
124. Marcozzi G, Correa N, Luisi PL, Caselli M. Protein extraction by reverse micelles: a study of
the factors affecting the forward and backward transfer of a-chymotrypsin and its activity.
Biotechnol Bioeng 1991;38:1239.
125. Woll JM, Hatton TA. A simple phenomenological thermodynamic model for protein parti-
tioning in reversed micellar systems. Bioprocess Eng 1989;4:193.
126. Jarudilokkul S, Poppenborg LH, Stuckey DC. Selective reverse micellar extraction of three
proteins from filtered fermentation broth using response surface methodology separation
science and technology. Sep Sci Tech 2000;35:503–17.
127. Luisi PL, Bonner FJ, Pellergrini A, Wiget P, Wolf R. Micellar solubilization of proteins in
aprotic solvents and their spectroscopic characterization. Helv Chim Acta 1979;62:740.
128. Jarudilokkul S, Poppenborg LH, Stuckey DC. Backward extraction of reverse micellar
encapsulated proteins using a counterionic surfactant. Biotech Bioeng 1999;62(5):593–601.
129. Goklen KE, Hatton TA. Liquid-liquid extraction of low molecular weight. In: Proceedings of
ISEC ’86, Munchen, 1986;3:587.
130. Rahaman RS, Lee JY, Cabral JMS, Hatton TA. Recovery of an extracellular alkaline protease
from whole fermentation broth using reversed micelles. Biotechnol Prog 1988;4(4):218.
131. Krei GA, Hustedt H. Extraction of enzymes by reversed micelles. Chem Eng Sci
1992;47(1):99.
132. Jarudilokkul S, Paulsen E, Stuckey DC. The effect of demulsifiers on lysozyme extraction
from hen egg white using reverse micelles. Biosep 2000;9:81–91.
133. Laane C, Dekker M. The effect of demulsifiers on lysozyme extraction from hen egg white
using reverse micelles. In: Proceedings of 6th International Symposium on Surfactants in
Solution. Mittal EL, editor. vol. 9, New York: Plenum Press; 1989, p. 9.
134. Giovenco S, Verheggen F, Laane C. Purification of intracellular enzymes from whole
bacterial cells using reversed micelles. Enzyme Microb Technol 1987;9:470.
135. Jarudilokkul S, Poppenborg LH, Valetti F, Gilardi G, Stuckey DC. Separation and purifi-
cation of periplasmic cytochrome c553 using reversed micelles. Biotech Techniques
1999;13:159–63.
136. Lye GY. Ph D Thesis, Reverse micellar mass-transfer processes: spray column extraction of
lysozyme. University of Reading, 1993.
137. Jarudilokkul S, Paulsen E, Stuckey DC. Lysozyme extraction from egg white using reverse
micelles in a graesser contactor: mass transfer characterization. Biotech Bioeng
2000;69:618–26.
138. Jarudilokkul S, Paulsen E, Stuckey DC. Extraction of monoclonal antibodies (IgG1) using
anionic and anionic/nonionic reverse micelles. Biotech Progress 2000;16:1071–8.
139. Jarudilokkul S, Stuckey DC. Protein extraction from fermentation broths using reverse
micelles: selectivity, activity recovery and contactor design. Sep Sci Technol 2001;36:
657–70.
140. Berthod A, Garcıa-Alvarez-Coque MC. Micellar liquid chromatography. In: Cazes J, editor.
Chromatographic science series, vol. 83. New York: Marcel Dekker; 2000, pp. 276–83.
141. Ruiz-Angel MJ, Carda-Broch S, Torres-Lapasio JR, Garcıa-Alvarez-Coque MC. Retention
mechanisms in micellar liquid chromatography. J Chromatogr A 2009;1216:1798–814.
522 PART | III Modern and Future Trends in Fundamentals and Applications
142. Khaledi MG. Micelles as separation media in high-performance liquid chromatography and
high-performance capillary electrophoresis: overview and perspective. J Chromatogr A
1997;780:3–40.
143. Berthod A. Causes and remediation of reduced efficiency in micellar liquid chromatography.
J Chromatogr A 1997;780:191–206.
144. Dorsey JG, DeEchegaray MT, Landy JS. Efficiency enhancement in micellar liquid chro-
matography. Anal Chem 1983;55:924–8.
145. Ruiz-Angel MJ, Garcıa-Alvarez-Coque MC, Berthod A. New insights and recent develop-
ments in micellar liquid chromatography. Sep Purif Rev 2009;38:45–96.
146. Ruiz-Angel MJ, Caballero RD, Simo-Alfonso EF, Garcıa-Alvarez-Coque MC. Micellar
liquid chromatography: suitable technique for screening analysis. J Chromatogr A
2002;947:31–45.
147. Gil-Agusti M, Capella-Peiro ME, Monferrer-Pons LL, Garcıa-Alvarez-Coque MC, Esteve-
Romero J. Chromatographic analysis of phenethylamine-antihistamine combinations using
C-8, C-18 or cyano columns and micellar sodium dodecyl sulfate-pentanol mixtures. Analyst
2001;126:457–64.
148. Carda Broch S, Esteve Romero JS, Garcıa-Alvarez-Coque MC. Chromatographic determi-
nation of diuretics in urine samples using hybrid micellar mobile phases with fluorimetric
detection. Anal Chim Acta 1998;375:143–54.
149. Gil-Agusti M, Carda-Broch SC, Garcıa-Alvarez-Coque M, Esteve Romero J. Use of micellar
mobile phases for the chromatographic determination of clorazepate, diazepam, and diltia-
zem in pharmaceuticals. J Chromatogr Sci 2000;38:521–7.
150. Noguera-Orti JF, Villanueva-Camanas RM, Ramis-Ramos G. Determination of phenolic
antioxidants in vegetal and animal fats without previous extraction by dilution with
n-propanol and micellar liquid chromatography. Anal Chim Acta 1999;402:81–6.
151. Gil-Agusti M, Esteve-Romero J, Carda-Broch S. Anserine and carnosine determination in
meat samples by pure micellar liquid chromatography. J Chromatogr A 2008;1189:444–50.
152. Raviolo MA, Rambla-Alegre M, Clausell-Tormos J, Capella-Peiro ME, Carda-Broch S,
Esteve-Romero J. Determination of sulfonamides in milk after precolumn derivatisation by
micellar liquid chromatography. Anal Chim Acta 2007;593:152–6.
153. Gil-Agustı M, Carda-Broch S, Monferrer-Pons L, Esteve-Romero J. Simultaneous determi-
nation of tyramine and tryptamine and their precursor amino acids by micellar liquid
chromatography and pulsed amperometric detection in wines. J Chromatogr A
2007;1156:288–95.
154. Marczak M, Wolska L, Chrzanowski W, Namie�snik J. Microanalysis of volatile organic
compounds (VOCs) in water samples – methods and instruments. Microchim Acta
2006;155:331.
155. Escher BI, Quayle P, Muller R, Schreiber U, Mueller JF. Passive sampling of herbicides
combined with effect analysis in algae using a novel high-throughput phytotoxicity assay
(Maxi-Imaging-PAM). J Environ Monit 2006;8:456.
156. Pavon JLP, Martın SH, Pinto CG, Cordero BM. Determining the Henry’s Law constants of
THMs in seawater by means of purge-and-trap gas chromatography (PT-GC): the influence
of seawater as sample matrix. Anal Chim Acta 2008;629:6.
157. De Almeida Bezerra M, Arruda MAZ, Ferreira SLC. Cloud point extraction as a procedure
of separation and pre-concentration for metal determination using spectro analytical tech-
niques: a review. Appl Spectrosc Rev 2005;40:269.
158. Yoshimura K, Waki H, Ohashi S. Enhancement of sensitivity of ion-exchanger absorpti-
ometry by using a thick ion-exchanger layer. Talanta 1986;23:449.
523Chapter | 14 Recent Advances in Solvent Extraction Processes
159. Lord H, Pawliszyn J. Evolution of solid-phase microextraction technology. J Chromatogr A
2000;885:153.
160. Blasco C, Fernandez M, Pico Y, Font G. Solid-phase microextraction-liquid chromatography-
mass spectrometry applied to the analysis of insecticides in honey. J Chromatogr A
2004;1030:77.
161. Zygmunt B, Jastrzebska A, Namie�snik J. Solid-phase microextraction a convenient tool for
the determination of organic pollutants in environmental matrices. Crit Rev Anal Chem
2001;31:1.
162. Poppa P, Bauer C, Wennrich L. Determination of human serum albumin by chem-
iluminescence immunoassay with luminol using a platinum-immobilized flow-cell. Anal
Chim Acta 2001;436:1.
163. Hayes BL. Recent advances in microwave-assisted synthesis. Aldrichim Acta 2004;37:66.
164. Gallagher PA, Schegel CA, Parks A, Gamble BM, Wymer L, Creed JT. Preservation of
As(III) and As(V) in drinking water supply samples from across the United States using
EDTA and acetic acid as a means of minimizing iron-arsenic coprecipitation. Environ Sci
Technol 2004;38:2919.
165. Ashley K, Andrews RN, Cavazos L, Demange M. Ultrasonic extraction as a sample prep-
aration technique for elemental analysis by atomic spectrometry. J Anal At Spectrom
2001;16:1147.
166. Cintas P, Luche JL. Green chemistry: the sonochemical approach. Green Chem 1999;4:115.
167. Piunno PAE, Krull UJ. Trends in the development of nucleic acid biosensors for medical
diagnostics. Trends Anal Chem 2009;28:946.
524 PART | III Modern and Future Trends in Fundamentals and Applications
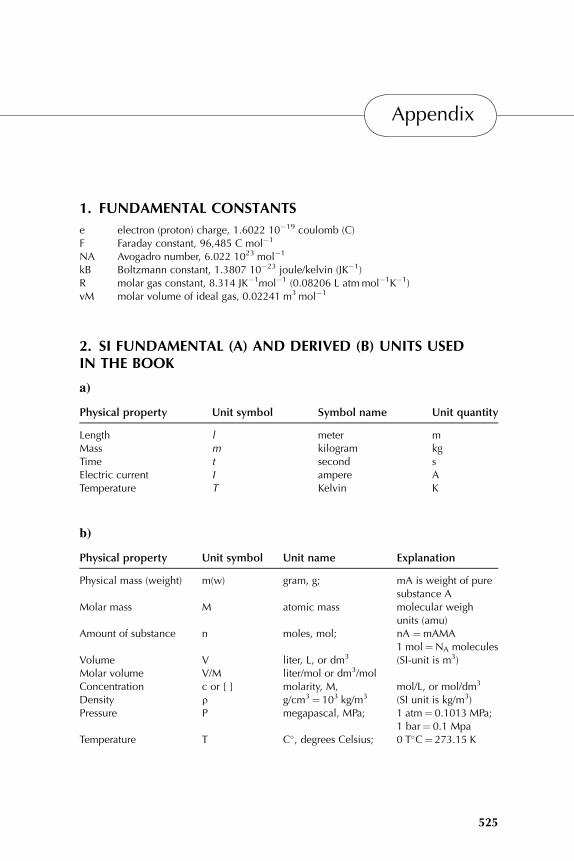
Appendix
1. FUNDAMENTAL CONSTANTS
e electron (proton) charge, 1.6022 10�19 coulomb (C)F Faraday constant, 96,485 C mol�1
NA Avogadro number, 6.022 1023 mol�1
kB Boltzmann constant, 1.3807 10�23 joule/kelvin (JK�1)R molar gas constant, 8.314 JK�1mol�1 (0.08206 L atmmol�1K�1)vM molar volume of ideal gas, 0.02241 m3mol�1
2. SI FUNDAMENTAL (A) AND DERIVED (B) UNITS USEDIN THE BOOK
a)
Physical property Unit symbol Symbol name Unit quantity
Length l meter mMass m kilogram kgTime t second sElectric current I ampere ATemperature T Kelvin K
b)
Physical property Unit symbol Unit name Explanation
Physical mass (weight) m(w) gram, g; mA is weight of puresubstance A
Molar mass M atomic mass molecular weighunits (amu)
Amount of substance n moles, mol; nA ¼mAMA1 mol¼NA molecules
Volume V liter, L, or dm3 (SI-unit is m3)Molar volume V/M liter/mol or dm3/molConcentration c or [ ] molarity, M, mol/L, or mol/dm3
Density r g/cm3¼ 103 kg/m3 (SI unit is kg/m3)Pressure P megapascal, MPa; 1 atm¼ 0.1013 MPa;
1 bar¼ 0.1 MpaTemperature T C�, degrees Celsius; 0 T�C¼ 273.15 K
525
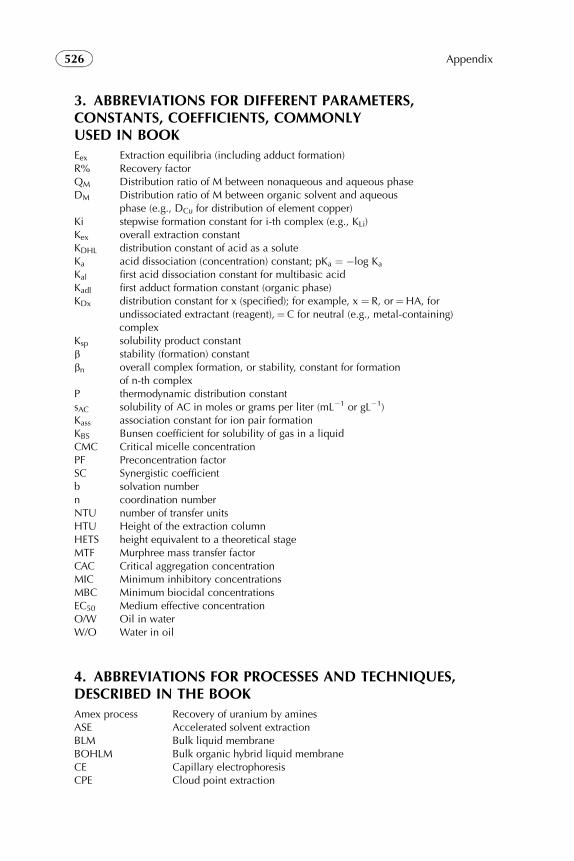
3. ABBREVIATIONS FOR DIFFERENT PARAMETERS,CONSTANTS, COEFFICIENTS, COMMONLYUSED IN BOOK
Eex Extraction equilibria (including adduct formation)R% Recovery factorQM Distribution ratio of M between nonaqueous and aqueous phaseDM Distribution ratio of M between organic solvent and aqueous
phase (e.g., DCu for distribution of element copper)Ki stepwise formation constant for i-th complex (e.g., KLi)Kex overall extraction constantKDHL distribution constant of acid as a soluteKa acid dissociation (concentration) constant; pKa ¼ �log Ka
Kal first acid dissociation constant for multibasic acidKadl first adduct formation constant (organic phase)KDx distribution constant for x (specified); for example, x ¼ R, or¼HA, for
undissociated extractant (reagent),¼C for neutral (e.g., metal-containing)complex
Ksp solubility product constantb stability (formation) constantbn overall complex formation, or stability, constant for formation
of n-th complexP thermodynamic distribution constantsAC solubility of AC in moles or grams per liter (mL�1 or gL�1)Kass association constant for ion pair formationKBS Bunsen coefficient for solubility of gas in a liquidCMC Critical micelle concentrationPF Preconcentration factorSC Synergistic coefficientb solvation numbern coordination numberNTU number of transfer unitsHTU Height of the extraction columnHETS height equivalent to a theoretical stageMTF Murphree mass transfer factorCAC Critical aggregation concentrationMIC Minimum inhibitory concentrationsMBC Minimum biocidal concentrationsEC50 Medium effective concentrationO/W Oil in waterW/O Water in oil
4. ABBREVIATIONS FOR PROCESSES AND TECHNIQUES,DESCRIBED IN THE BOOK
Amex process Recovery of uranium by aminesASE Accelerated solvent extractionBLM Bulk liquid membraneBOHLM Bulk organic hybrid liquid membraneCE Capillary electrophoresisCPE Cloud point extraction
526 Appendix
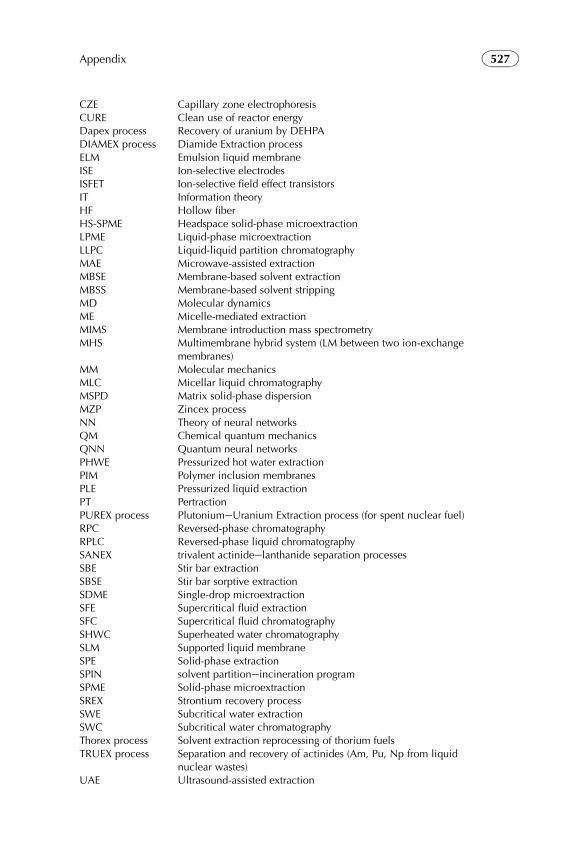
CZE Capillary zone electrophoresisCURE Clean use of reactor energyDapex process Recovery of uranium by DEHPADIAMEX process Diamide Extraction processELM Emulsion liquid membraneISE Ion-selective electrodesISFET Ion-selective field effect transistorsIT Information theoryHF Hollow fiberHS-SPME Headspace solid-phase microextractionLPME Liquid-phase microextractionLLPC Liquid-liquid partition chromatographyMAE Microwave-assisted extractionMBSE Membrane-based solvent extractionMBSS Membrane-based solvent strippingMD Molecular dynamicsME Micelle-mediated extractionMIMS Membrane introduction mass spectrometryMHS Multimembrane hybrid system (LM between two ion-exchange
membranes)MM Molecular mechanicsMLC Micellar liquid chromatographyMSPD Matrix solid-phase dispersionMZP Zincex processNN Theory of neural networksQM Chemical quantum mechanicsQNN Quantum neural networksPHWE Pressurized hot water extractionPIM Polymer inclusion membranesPLE Pressurized liquid extractionPT PertractionPUREX process PlutoniumeUranium Extraction process (for spent nuclear fuel)RPC Reversed-phase chromatographyRPLC Reversed-phase liquid chromatographySANEX trivalent actinideelanthanide separation processesSBE Stir bar extractionSBSE Stir bar sorptive extractionSDME Single-drop microextractionSFE Supercritical fluid extractionSFC Supercritical fluid chromatographySHWC Superheated water chromatographySLM Supported liquid membraneSPE Solid-phase extractionSPIN solvent partitioneincineration programSPME Solid-phase microextractionSREX Strontium recovery processSWE Subcritical water extractionSWC Subcritical water chromatographyThorex process Solvent extraction reprocessing of thorium fuelsTRUEX process Separation and recovery of actinides (Am, Pu, Np from liquid
nuclear wastes)UAE Ultrasound-assisted extraction
527Appendix
5. ABBREVIATIONS FOR SOLVENT EXTRACTIONEQUIPMENT
CF HF Cross-flow hollow fiber contactorEC Equilibrium cell for contacting two liquidsFSC Flat sheet contactorHF Hollow fiberIAC Immunoaffinity columnsPF HF Parallel flow hollow fiber contactorRDC ExtractorRFC Rotating film contactor with BLMTLHS thin-layer headspace
6. DETECTION TECHNIQUES IN ANALYTICAL CHEMISTRY,CONNECTED WITH SOLVENT EXTRACTION PRETREATMENT
AAS Atomic absorption spectrophotometryAMS accelerator mass spectrometryCCFA Completely continuous flow analysisCPE Cloud point extractionCZE Capillary zone electrophoresisESI-MS electrospray ionization mass spectroscopyEXAFS Extended X-ray absorption fine-structure spectroscopyFAAS Furnace atomic absorption spectrophotometryFIA Flow injection analysisGC Gas chromatographyGC-MS Gas chromatography - mass spectrometryGDMS Glow discharge mass spectrometryGF-AAS Graphite furnace atomic absorption spectrophotometryHPLC High-performance liquid chromatographyICP Inductively coupled plasma spectrophotometryICP-AES Inductively coupled plasma with atomic emission spectrophotometryICP-MS Inductively coupled plasma mass spectrometryISE Ion-selective electrodeISFET Ion-selective field effect transistorsLLPC Liquideliquid partition chromatographyLS Light-scatteringLSC Liquid scintillation countersMIMS Membrane introduction mass spectrometryNAA Neutron Activation AnalysisNMR Neutron magnetic resonanceRIMS resonance ionization mass spectrometrySFA Segmented flow analysisSERS Surface-enhanced Raman spectroscopySIMS secondary ion mass spectrometrySPF solid-phase fluorimetrySPS Solid-phase spectroscopyTIMS Thermal ionization mass spectrometryTRLIF Time-resolved laser-induced fluorescence spectroscopyUFA Unsegmented flow analysisZP Zeta-potential
528 Appendix
7. ABBREVIATIONS FOR INORGANIC COMPOUNDS
HLW high-level radioactive wastesLLW low level radioactive wastesLLR long-lived radioactive elementsREE Rare earth elementsSLR Short-lived radioactive isotopesTRU transuranic wastesTPE Transplutonium elements
8. ABBREVIATIONS FOR ORGANIC COMPOUNDS
AA acetylacetone; 2,4-pentanedioneABC acidebase-coupled extractantsABS Aqueous biphasic systemsABEC aqueous biphasic extraction chromatographyAdogen 364 mixtures from trioctyl to tridecylaminesAG1X2 2[2-(3-5-dibromopyridyl) azo]-5-dimethylaminobenzoic acid in
ion exchange resinALAMINE 336 Mixture of trioctyl- and tridecylamineALIQUAT 336 Methylated (quaternized) amine 336AOT Sodium di(2-ethylhexyl)sulfosuccinate (anionic surfactant)6-APA 6-Aminopenicillanic acidBA benzoylacetoneBDPDA Bis(2,20-dipyridyl-6-yl)diazeneBODMAC benzyl octadecyldimethyl ammonium chlorideBPHA N-benzoyl phenyl hydroxylamineCHN cyclohexanoneChCoDiC Chlorinated cobalt dicarbollideCLX 50 AcorgaCMPO octyl(phenyl)-N,N-di-isobutyl carbamoyl methyl
phosphine oxideC5-BTBP 6,60-Bis-(5,6-dipentyl-[1,2,4]triazin-3-yl)-[2,20]bipyridinylCTAB Cationic cetyltrimethylammonium bromideCYANEX 272 Organophosphinic acidCYANEX 301 bis-(2,4,4-trimethylpentyl)dithiophosphinic acidCyanex 302 monothiophosphinic acidCyanex 471 phosphine sulfidesCYANEX 471X trialkylphosphine sulfideCyanex 923 mixture of four types of trioctyl phosphine oxides (TOPO)DBP dibutyl phosphateDBBP dibutyl phosphonateDBPA dibutylphosphoric acidDCTA 1,2-diaminocyclohexane tetraacetic acidDEHPA Di(2-ethylhexyl)phosphoric acidDMDOMA Dimethyl dioctyl methylphosphinic acidDMDOHEMA N,N 0-dimethyl-N,N 0-dioctylhexylethoxymalonamideDMDOSA Dimethyl dioctyl sulfonic acidDMSO DimethylsulfoxideDNNSA Dinonylnaphtalenesulfonic acidDOBA N,N’ dialkylamidesDOiBA iso form of DOBA
529Appendix
DOTPA di-o-tolyl phosphoric acidDTPA diethylenetriamine pentaacetic acidEDTA ethylene diaminetetraacetic acidFAA hexafluoroacetylacetoneH2MBP monobutylphosphoric acidHenkel 1:1 mixture of an aldoxime and ketoximeHIBA a-hydroxyisobutyric acidHITP isopropyltropoloneHTTA thenoyltrifluoroacetoneIL Ionic liquidsIPT IsopropyltropoloneKelex 100 (Sherex) 8-quinolinolLa 2 AmberliteLIX 34 (Henkel) 8-alkylarylsulfonamidoquinolineLIX 54 b-DiketoneLIX63 mixture of aliphatic a-hydroxyoximesLIX64 o-hydroxybenzophenone oximeLIX 84I 20-Hydroxy-50-nonylacetophenone oxime (Ketoxime)MBP butyl phosphateMEHPA 2-ethylhexyl phosphateMIBK methyl-isobutyl ketoneMIPK methyl-isopropyl ketoneMPCA 5-Methyl-2-pyrazinecarboxylic acidNeutr. MIBK, MIPK, CHN, TTAc, MBP, TBP, TOPO,
Cyanex 923, etc.NTA nitrilotriaminoacetic acidOxine 8-hydroxyquinolinePAA Phenylacetic acidPAH Polynuclear aromatic hydrocarbonPAN 1-(2-pyridylazo)-2-naphtholPAR 4-(2-pyridylazo)resorcinolPC88A 2-ethylhexylphosphonic acid 2-ethylhexyl esterPCB Polychlorinated biphenylPCDF Polychlorinated dibenzofuranPEHPA pyroethylhexyl phosphatePEG Poyethylene glycoleP50 ICI AcorgaPPG Polypropylene glycolePVP Polyvinyl pyrrolidonePONPE Polyoxyethylene nonyl phenyl etherPTFE PolytetrafluoroethenePVC Porous polyvinyl chloridePT5050 tridecanolR organic radical in generalRNH+3 organic primary ammonium ionR2NH+2 organic secondary ammonium ionR3NH+ organic tertiary ammonium ionR3NHCl tri-n-octylamine hydrochloride
530 Appendix
R4N+ organic quaternary ammonium ionSDVB Styrene divinylbenzeneSDS sodium dodecyl sulfateSDBSA Sodium dodecylbenzene sulfonic acidSDSA Sodium dodecanesulfonic acidSHA salicyl hydroxamic acidShellsol H Aliphatic hydrocarbon mixtureShellsol A Aromatic hydrocarbon mixtureSME 529 Shell (methyl chain)SUPRAS Supramolecular solventsTAA triamyl amineTAMA trialkyl methyl amineTBA tributyl amineTBeA tribenzyl amineTBOA Tributyl oksalic acidTBMA Tributyl maleic acidTBSA Tributyl sulfonic acidTBP TributylphosphateTiBP iso form of TBPTBPO tributyl phosphine oxideTDA tridodecyl amineTEA triethyl amineTEDAHP triethyl-diamide heptyl 18C6, DC18C6, DB18C6-crown
ethersTrEDAHP tetraethyl-diamideheptylThioxine 8-quinolinethiolTHF TetrahydrofuranTHM TrihalomethaneTHPO trihexyl phosphine oxideTFA Trifluoroacetic acidTLA trilaurylamine; C12TLMA ) HNO3 trilaurylmethylammonium nitrateTOA Trioctyl amineTODGA N,N,N 0,N 0-tetraoctyldiglycolamideTOMAC Trioctylmethylammonium chlorideTOPO Trioctyl phosphine oxideTriton X-100 surfactant with coproporphyrin IIITTA thenoyltrifluoroacetoneTVEX New family of resinsVersatic 10 Versatic acidVOC Volatile organic compoundsXAD2 8-(benzene-sulfonamido)quinoline in AmberliteXAD4 perylene dibutyrate in Amberlite18C6, DC18C6,DB18C6
crown ethers
DtBuCH18C6 4,4(5),di-(t-butyl cyclohexano)-18-crown-6PCDF Polychlorinated dibenzofuransTriton X-114 Poly(oxyethylene glycol) monooctyl ether
531Appendix
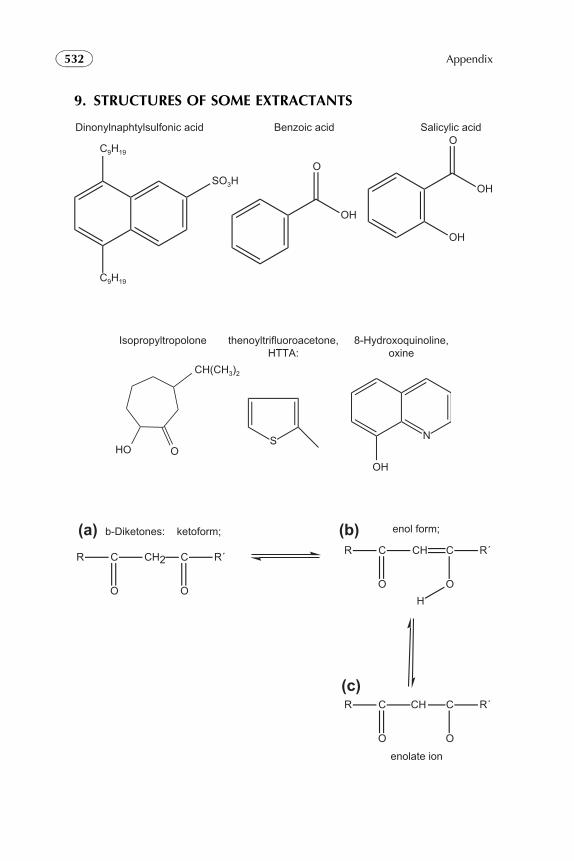
9. STRUCTURES OF SOME EXTRACTANTS
C9H19
SO3H
C9H19
OH
O
OH
OH
ODinonylnaphtylsulfonic acid Salicylic acidBenzoic acid
Isopropyltropolone thenoyltrifluoroacetone,HTTA:
8-Hydroxoquinoline,oxine
HO O
CH(CH3)2
N
OH
S
b-Diketones: ketoform;
enolate ion
enol form;
R C CH2 C R´
O O
R C CH R´
O
C
OH
R C CH C R´
O O
(c)
(a) (b)
532 Appendix
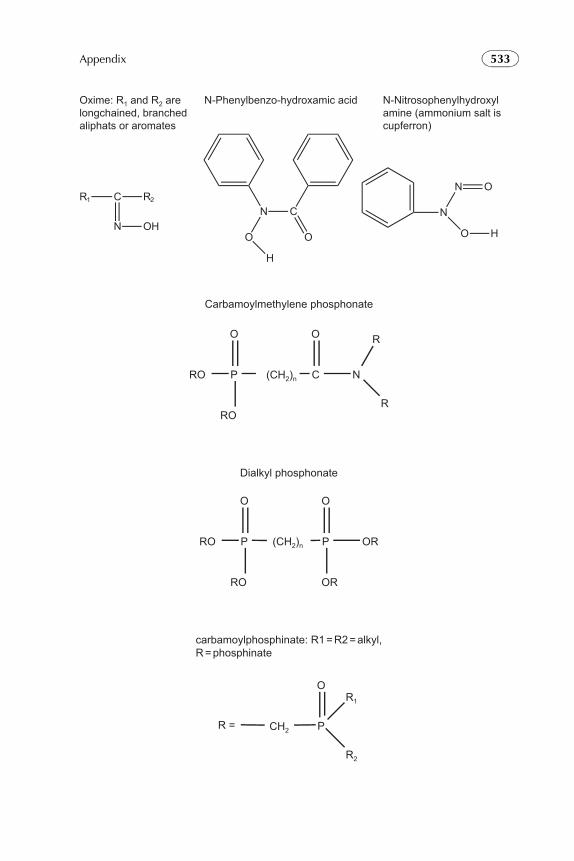
R1 C R2
N OHN C
O O
H
N
O
N
H
O
Oxime: R1 and R2 are longchained, branched aliphats or aromates
N-Phenylbenzo-hydroxamic acid N-Nitrosophenylhydroxylamine (ammonium salt iscupferron)
Carbamoylmethylene phosphonate
RO P (CH2)n C N
O
RO
O R
R
Dialkyl phosphonate
RO P P OR
O O
RO OR
(CH2)n
carbamoylphosphinate: R1 = R2 = alkyl,R = phosphinate
CH2 P
O
R2
R1
R =
533Appendix
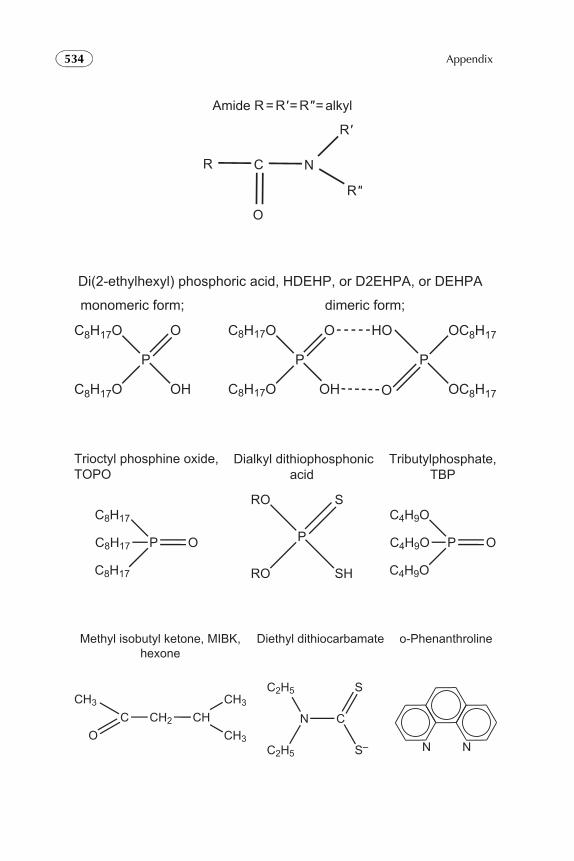
Amide R = R' = R" = alkyl
R C N
R'
R"
O
Di(2-ethylhexyl) phosphoric acid, HDEHP, or D2EHPA, or DEHPA
dimeric form;
C8H17O
P
OHC8H17O
O C8H17O
P
OHC8H17O
O HO
O
P
OC8H17
OC8H17
monomeric form;
Trioctyl phosphine oxide,TOPO
C8H17
P
C8H17
C8H17 O
RO
P
SHRO
SC4H9O
P
C4H9O
C4H9O O
Dialkyl dithiophosphonicacid
Tributylphosphate,TBP
Methyl isobutyl ketone, MIBK,hexone
o-PhenanthrolineDiethyl dithiocarbamate
OC
CH3
CH2 CHCH3
CH3
N
C2H5
C2H5
C
S
S– N N
534 Appendix
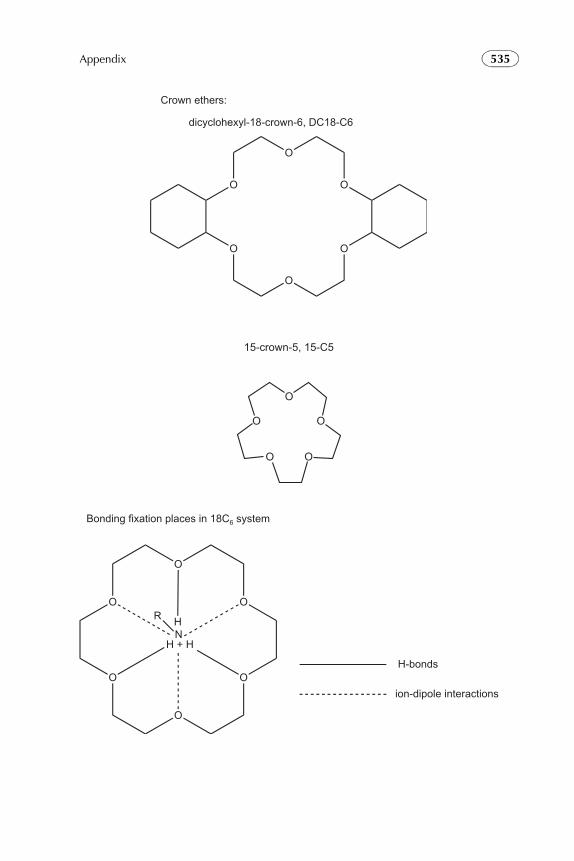
Crown ethers:
dicyclohexyl-18-crown-6, DC18-C6
O
O
O
O
O
O
15-crown-5, 15-C5
O
O
O
O
O
Bonding fixation places in 18C6 system
H-bonds
ion-dipole interactions
O
H
O
O
O
O
H + H
O
R
N
535Appendix
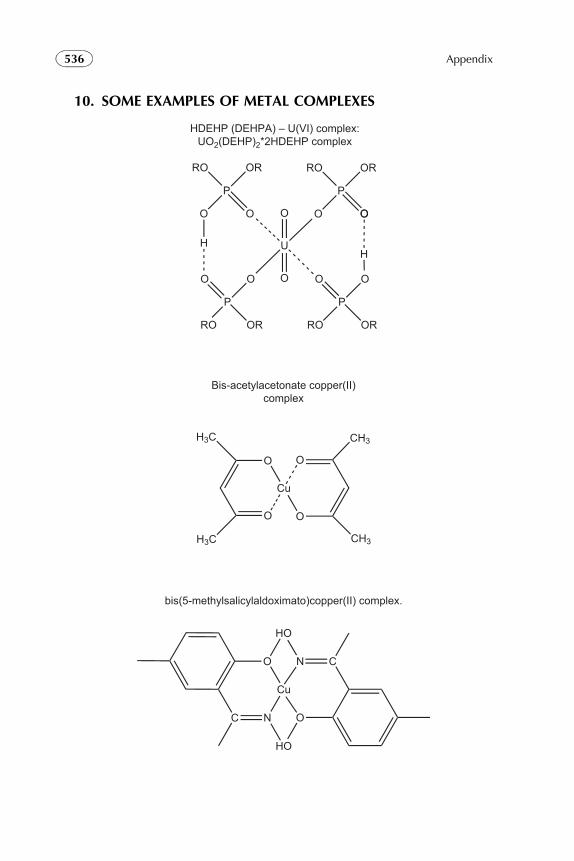
10. SOME EXAMPLES OF METAL COMPLEXES
RO
P
OO
OR
H
O
P
ORRO
O
O
H
O
RO
P
OO
OR
O
P
ORRO
U
O
O
HDEHP (DEHPA) – U(VI) complex:UO2(DEHP)2*2HDEHP complex
O
O
Cu
O
O
H3C
H3C
CH3
CH3
Bis-acetylacetonate copper(II)complex
bis(5-methylsalicylaldoximato)copper(II) complex.
C N
Cu
O
HO
HO
O
CN
536 Appendix
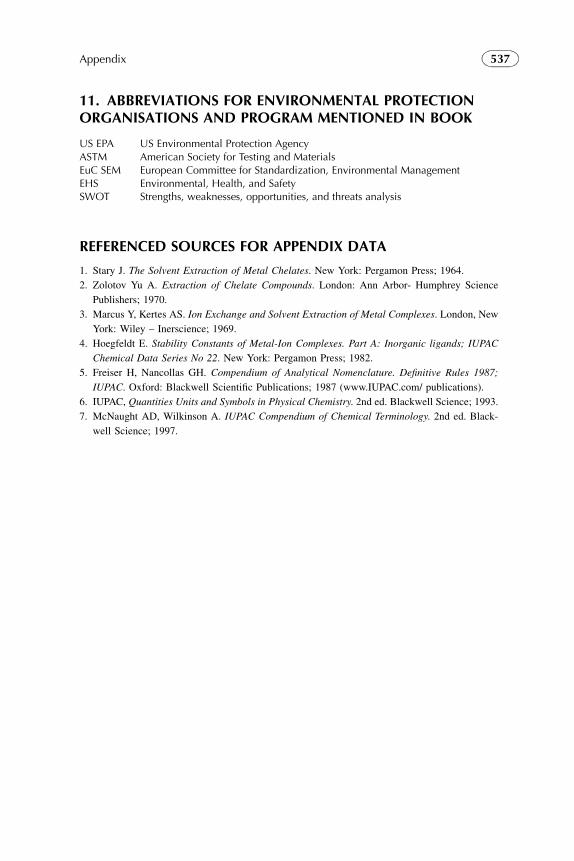
11. ABBREVIATIONS FOR ENVIRONMENTAL PROTECTIONORGANISATIONS AND PROGRAM MENTIONED IN BOOK
US EPA US Environmental Protection AgencyASTM American Society for Testing and MaterialsEuC SEM European Committee for Standardization, Environmental ManagementEHS Environmental, Health, and SafetySWOT Strengths, weaknesses, opportunities, and threats analysis
REFERENCED SOURCES FOR APPENDIX DATA
1. Stary J. The Solvent Extraction of Metal Chelates. New York: Pergamon Press; 1964.
2. Zolotov Yu A. Extraction of Chelate Compounds. London: Ann Arbor- Humphrey Science
Publishers; 1970.
3. Marcus Y, Kertes AS. Ion Exchange and Solvent Extraction of Metal Complexes. London, New
York: Wiley – Inerscience; 1969.
4. Hoegfeldt E. Stability Constants of Metal-Ion Complexes. Part A: Inorganic ligands; IUPAC
Chemical Data Series No 22. New York: Pergamon Press; 1982.
5. Freiser H, Nancollas GH. Compendium of Analytical Nomenclature. Definitive Rules 1987;
IUPAC. Oxford: Blackwell Scientific Publications; 1987 (www.IUPAC.com/ publications).
6. IUPAC, Quantities Units and Symbols in Physical Chemistry. 2nd ed. Blackwell Science; 1993.
7. McNaught AD, Wilkinson A. IUPAC Compendium of Chemical Terminology. 2nd ed. Black-
well Science; 1997.
537Appendix

This page intentionally left blank
Index
AABC extractants, 380
Above-stoichiometric loading, 411
Accelerated solvent extraction (ASE), 244
Accumulator waste treatment, 291–292
Acetic acid, 76, 88–89
affinity constant ratios, 385
averaged equilibrium constants of, 385
extraction of, 384–386
separation of, 274–275Acetylacetone, 71
in dissociated anionic enol form, 118
in uncharged keto form, 118–119Acid–amine systems, in CCST interpretation,
372–381
acid–amine–water system, 377–378
with mixture of two acids, 378–380
with mixture of two amines, 380–381Acid–amine–water and acid–amine–active
solvent–water extraction systems
physico-chemical properties of, 361Acid–base interaction model and
amphoterism, 408–409
Acid dyes, 249
Acid extractants, 114–127, 144–149
acid–base (amine) mixed extractants,
148–149
and neutral donor molecules, 144–147
two acidic extractants, 147–148Acidic metal extractants, commercial,
192–193
Acidic metal waste separations, 285–286
Acidic metal waste solutions, treatment of,
285–291
Acid monoadduct, formation of, 100
Acids extraction, effect of temperature on,
371–372
Acids recovery from waste, 292–296
arsenic acid removal from copper
electrolytes, 295
cyanide recovery by solvent extraction,
295–296
green phosphoric acid purification to food
grade quality, 294–295
hydrofluoric and nitric acids recovery,
from stainless steel pickling baths,
292–293Acids’ extraction modeling, by CCST,
368–369
Acorga CLX 50, 199
Acorga reagents, 198–199
Actinide elements, oxidation states of, 219
Activation energy, 28–29
Active solvents, 369–371, 381–384, 393,
396
modifying effect of, 393–394Active solvent-swing regeneration
technology, 393
Activity coefficient, 8, 14
Adduct formation, 123, 147
Affinity constant, 323, 325, 326, 418,
421–422
Affinity constant ratio, 351, 356, 359,
364, 404, 418, 420, 423–425,
434, 435
of acetic, lactic acid extraction, 339
transferability of values of, 364Affinity partitioning, 460–461
Aggregates, 41, 328–329
cluster-like aggregates, 329
linear, 329Aggregation, 125–130, 133, 328–329,
409–415
Agitated extractors, 173–176
AKUFVE principle, 57
Alamine 304 in kerosene, 388
Alamine 336, 96, 120, 386
acetic acid extraction by, 386
lactic acid extraction by, 386Alcohol solvents, 370
Aliphatic amines extractants, 89–98
extraction characteristics, 95–98
mass action law equilibria, 90–95Aliphatic solvents, 71
Alkyl naphthalene isomers separation, using
cyclodextrins, 281–282
Alkylsulfoxides, 89
a-hydroxyoxime, 191, 198, 209
539
Alpha spectrometry, 270
Amberlite* LA-2 system, 210
Amberlite 336, 97–98
Amex process, 219
Amine-based extractants
for solvent extraction of acids, 367
acids’ extraction modeling, 368–369
active solvents, 369–371
carboxylic acids extraction, experimental
application of CCST in, 384–386
interaction mechanisms, 367–368
systems with active solvent as additive,
381–384
temperature, influence of, 371–372Amino acids, 275–276
AmMAR processes, 291
Ammoniacal feed solutions, solvent
extraction from, 291
Amphiphiles, 443–447
aggregation of, 445Amphiphilic compounds, 467–471
surfactants, 469–470
toxicity of surfactants, 470–471Amphiphilic molecules, self-assembly of,
445–447
Amphoteric properties of solvents, 350
Amphoterism, 125–126, 127, 327–328,
408–409
Analytical chemistry, solvent extraction in,
239
analytical determination techniques,
extraction in, 244–251
basic materials for, 251–253
chromatography-based analytical
techniques, 261–264
flow injection analysis (FIA), 265–267
liquid membranes (LM) separation
techniques, 258–261
micelles in, 253–258
nuclear analytical applications,
267–273
samples preparation and pretreatment
techniques, 239–244Anion exchangers, metal solvent extraction
by, 127–135
liquid anion exchange extractions, equations
for, 127–132
liquid anion exchangers, properties of,
132–135Antagonistic effect, 384, 393, 396
Antisynergism. See antagonistic effect, 126,
144, 147, 149–150
Aqueous biphasic extraction chromatography
technique (ABEC), 152
Aqueous biphasic systems (ABS), 151–153
Aqueous phase, parameters of, 80–81
Aqueous two-phase systems, 498–499
application of, 499
as extractants, 459–462Aromatic diluents, 369
Aromatic solvents, 71, 81
Aromatics separation from aliphatics, 279
Arsenic acid removal from copper
electrolytes, 295
Assisted solvent extraction, 513–514
microwave-assisted extraction (MAE),
513–514
ultrasound-assisted extraction (UAE),
514Atmospheric microwave-assisted extraction
(MAE) system, 514
Atomic absorption, 250
Axial flow pump, 175–176
BBacillus licheniformis, 509
Basic interactions at extraction, 406–408
aggregation, 406
electrostatic bonding, 406
H-bonding, 406Basic triphenylmethane dyes, 249
Bench-scale experimental work, 158
Benzene, 97
8-(Benzene-sulfonamido) quinoline, 252
Benzoic acid, 80
Beta counting, 271
b-diketone copper extractants, 199
b-diketones, 127
b-hydroxyoxime (LIX 64), 198
Bifunctional organophosphorus compounds,
231–232
Biofuel separations, 282–284
ethanol separation, 283–284Biological molecules, extraction of, 508–509
Biosolvents, 453
Biotechnological separations, solvent
extraction in, 273–276
amino acids, 275–276
carboxylic acids separation, 274–275BOHLM, 503–504
Boron trifluoride (BF3), 281
Brass mill flue dust treatment, 288–290
Bulk liquid membrane (BLM), 502
540 Index
Bulong process, 203–204
Butanol, 96
Butyric acid, 89
CCage compounds (“clathrates”), 150
Calixarenes, 221, 223
Carbon-bonded oxygen-donor, 71–85, 368
Carbon dioxide (CO2), 464, 489Carboxylic acids, 202, 216
extractants for, 368Carboxylic acids extraction
by amines, 320, 321
CCST application in, 384–395
acetic acid extraction, 384–386
active solvents, modifying effect of,
393–394
active solvent-swing regeneration
technology, 393
citric acid extraction, 388–393
lactic acid extraction, 386–388
temperature-swing regeneration,
394–395Carboxylic acids separation, 274–275
acetic acid, 274–275
citric acid, 274Carcinogenic compounds, 243
Cation exchangers, metal solvent extraction
by, 114–127
influence of temperature, 127
properties of extractants, 125–127
stoichiometry and structure of extracted
species, 122–125
thermodynamic considerations, 114–122Cawse process, 204
Centrifugal contactor-separators, 443
Centrifugal extraction–separation systems,
57–58
Centrifugal mixer-settler, 176–178
Change of proton, 319
carbon-13, 319
nitrogen-15 chemical shifts (Dd), 319Charge transfer energy, 322
Chelate ring size, 45–47
Chelating agents (extractants), 117, 189–190,
191
“Chemical modeling approach,” 435
Chemical potential, 8, 13–14
Chemical quantum mechanics, 440
Chemical reaction kinetics, 23–29
complexation–decomplexation, 23–24
determination of kinetic parameters, 27–28
liquid–liquid interface, 24–25
mathematical description of kinetic regime,
25–27Chemical reactions, solvent extraction with,
12–15
solute–solvent interactions
in aqueous phase, 13–14
in organic phase, 14–15
thermodynamics of extraction systems,
12–13Chemical shift, d, 357–359
Chlorinated aromatics, 370–371
Chlorinated cobalt dicarbollide (ChCoDiC),
230–231
Chloroform, 75–77, 82–84, 95–97
Chloroform–trioctylmethylammonium
chloride (TOMAC) system, 509
Chromatographic separation processes, 239,
255, 262
Chromatography-based analytical
techniques, 261–264
liquid–liquid partition chromatography
(LLPC), 261–263
supercritical fluid extraction (SFE), 263Chromium(VI) extraction, from surface
finishing wastewater, 290–291
Citric acid, 70, 76, 77, 88, 89, 96
separation of, 274Citric acid extraction by Alamine 304,
388–393
affinity constant ratios and averaged
equilibrium constants of, 389Classical theories, 355, 363
Classification of metal extractants, 115
Cloud point extraction (CPE), 253–257, 506
“Clean use of reactor energy” (CURE), 236
Cloud point phenomenon, 468
Cluster-like three-dimensions aggregates,
329
Clusters, 318–319
Coacervation, 443–444, 447, 505
Coalescence, 171, 178, 183, 442–443
Cobalt dicarbollide processes, 230–231
Cobalt–nickel solvent extraction, 200–205
industrial scale extraction, 203–205
Bulong process, 203–204
Cawse process, 204
Murrin-Murrin process, 204–205
laboratory scale extraction, 201–203
by acidic extractants, 202–203
anion exchange extractants, 201–202
541Index
Codelco-El, 200
Coextraction of water, 370
Cognis, 199–200
Cohesive forces
dipole forces, 6
dispersion (London), 6
hydrogen bonding, 6
Van der Waals forces, 6Column separation, 239
Commercial ion-pair metal extractants,
195–196
Competition of reactions, 317–318
Competitive complexation/salvation theory
(CCST), 317–329, 335–352,
355–364, 399–428, 433–436, 441
acid–base interaction model and
amphoterism, 408–409
affinity constant ratios, 361–363
transferability of values of, 364
aggregation, 328–329, 409–415
basic statements, 335–336
competition between basic interactions at
extraction, 406–408
complexation through H-bonding and
proton transfer, 317–319
conventional and presented theories
description, comparison of,
350–351
distribution isotherm, 319–323
electronic acid–base theory and
amphoterity, 327–328
engineering considerations in experimental
investigation of, 356
experimental verification of, 423–427
divalent cations extraction, 427
experimental techniques, 423–424
titanium(IV) extraction by DEHPA,
424–427
extraction systems with low solute
concentrations, in organic phase,
336–345
mathematical supplement for, in metal
extraction, 415–423
affinity constant values, 421–422
analysis of more complicated extraction
systems, 420–421
classical and CCST mathematical
descriptions, 422–423
M–E–W system, analysis of,
417–420
modified competitive preferential solvation
theory, 323–327
presented theory, experimental techniques
for, 358–361
in solvent extraction of acids by amine-
based extractants, 367–396
acid–amine systems in CCST
interpretation, 372–381
acids’ extraction modeling, 368–369
active solvents, 369–371
carboxylic acids extraction, experimental
application of CCST in, 384–395
influence of temperature, 371–372
interaction mechanisms, 367–368
systems with active solvent as an
additive, 381–384
stepwise interactions, 400–405
systems with high solute concentrations,
348–350
systems with medium concentrations of
solute, 345–348
verification, analytical methods for, 363Competitive preferential solvation (COPS)
theory, 323–327, 406, 421
modified COPS theory, 323–327Completely continuous flow analysis
(CCFA), 240
Complexation through H-bonding,
317–319
Complex metal anions, 189
Complex metal cations, 189
Compounds
lipophilic and hydrophobic, 12
lipophobic and hydrophilic, 12Concentration gradient, 15, 16, 19
Concentration ratios, 356
Conjugate acid, 434
Conjugate base, 434
Contamination compounds, 5–6
Continuous extraction-stripping processes,
171–173
differential extraction, 180–182
dispersion and mixing of the phases,
173–178
separation of the phases, 178–180Continuous extractive fermentation/
separation, 503
Continuous-flow extraction, 240
Continuous methods, 240
Conventional and presented theories
description, comparison of,
350–351
Conventional solvent extraction, 484
Coordination complex, 337
542 Index
Coordination models, 406
Copper and zinc extraction, from brass mill
flue dust, 288–290
Copper extraction, 198–200
industrial scale extraction, 199–200
laboratory scale extraction,
198–199Correlation factor, 33
Countercurrent extraction, 165–168
Coupling coefficient, 16
Coupling reactions, 317–318
Covalent donor atoms (S, N), 219
Critical aggregation concentration (CAC),
444, 445
Critical micelle concentration (CMC),
473
Cross-flow cascade, 164–165
Cross-linked cluster-like structures, 411
Cross-section mixers, 180
Crown-6 ring, 150
Crown ethers, 230, 249
Crud, 197, 198134,135,137Cs extraction, from acidic wastes,
230Cu–DEHPA–water system, 358
CYANEX 272, 201–204
CYANEX 471X, 208, 210
CYANEX 923, 293
Cyanide recovery, by solvent extraction,
295–296
Cyclic aggregates, 433–434
Cyclodextrins, 281–282
Cyclohexanone, 77, 80, 82–83, 96
Cylindrical amphoteric reverse micelle,
348
Cytec, 200, 208
DDapex process, 219, 220
Decomplexation, 23–24
Decontamination factors (DF), for extraction,
238
Definite geometry of the complex, 362
Definite solvation (coordination) number,
359–360, 362
Degree of extraction, 116, 118
DEHPA-TOPOmixture in extraction process,
221
Dehydration, 117–118
Detoxification wastes online, 475
biodegradation, 475
oxidative detoxification, 475
photodegradation, 475
thermal degradation, 475Di-(2-ethylhexyl)phosphoric acid (DEHPA),
127, 147–148, 202, 203, 216–218,
232, 275, 286–289, 401, 507
Diacid monoadduct, formation of, 100
Dialkylphosphoric acid-alkylamine systems,
150–151
DIAMEX process, 226, 237
Dielectric constant, V, 6, 42
Differential extraction, 180–182
Diffusion coefficients, 19, 21
Diffusion flux, 19
Diffusion resistance, 19, 33
Diffusion transport regime, 17–23
determination of diffusion coefficients,
21–23
mathematical description of, 19–21Diluent effect, 104
Diluents, 41–44, 197
Dimerization
aggregation, 73
polymerization, 732,6- and 2,7-Dimethylisomers, separation of,
281
2,6-Dimethylnaphthalene, 281
N,N 0-Di-n-butyl-octanamide, 207–208
Dinonyl-naphthalene sulfonic acid
(DNNSA), 147–148
Dipole moment, 82, 322
Discontinuous methods, 240
Dispersion and mixing of the phases,
173–178
Dissociation, 13–14
Distribution coefficient, 15, 90
Distribution constant, Kd, 9–10Distribution isotherm, 319–323
Distribution ratio, 8–11, 49–50
experimental determination of,
55–58
centrifugal extraction–separation
systems, 57–58
stirred cell semicontinuous techniques,
56–57
measurements of, 442Divalent cations extraction, 427
DNNSA, 276
Donnan equilibrium coupling, 16
n-Donor ability, 321
Donor–acceptor hydrogen bonds, 14
Donor ligand effects, 47–48
543Index
Driving forces, 15–17
Dual maximum behavior at metal extraction,
327–328
E“Effective” diffusion coefficient, 33
Electrodeposition, 240–241
Electromagnetic radiation, 270–271
Electronic acid–base theory and amphoterity,
327–328
Electronic-geometric affinity ki (interaction
strength), 401, 407
Electroplating baths treatment, 288
Emulsion liquid membrane (ELM), 502
End-of-the-pipe technologies, 452
Engineering development of solvent
extraction processes, 157
continuous extraction-stripping processes,
171–173
differential extraction, 180–182
dispersion and mixing of the phases,
173–178
separation of the phases,
178–180
economical considerations, 183
extraction efficiency, 170–173
efficiency in a cascade, 171–173
efficiency in a single stage, 171
extraction stage, 159–169
countercurrent extraction,
165–167
scrubbing, 168–169
single-stage process, 159–162
stagewise “cross-flow” systems,
163–165
problems with scale-up to industrial
systems, 183–184
solvent losses, 182–183
stripping organic solutions, 169–170Enrichment factor, 241–242
Enthalpy gradient, DH, 10, 357
Entrainment, 197, 199
Entropy gradient, DS, 10
Environmental protection, 228
Environment-friendly methods, 452
Enzyme recovery with aqueous two-phase
systems, 499
Equilibrium constant, 133–134, 137
Equilibrium isotherm, 162, 166
Equipment design and scale-up
considerations, 485–486
Ethanol separation, 283–284
Ethylene diamine tetraacetic acid (EDTA), 24
2-Ethyl-hexanol, 104–105
Excess of dipole moment (Dm), 319
Experimental techniques, for presented
theory (CCST), 358–361
Extract, 159
Extractability, 8–11
Extractant basicity, 103–104
Extractant distribution constant, 9
Extractant-impregnated sorbents, 251
Extractants, properties of, 36–41, 125–127,
143–144
Extracted species, stoichiometry and
structure of, 122–124
Extraction efficiency, 170–173
Extraction kinetic parameters, determination
of, 32–33
Extraction
of copper, 288–290
of cobalt-nickel, 203–205
of gold, 207–208
of indium and rhodium, 212
of lanthanide group elements, 213–218
of palladium and platinum, 208–212
of silver, 208
of unclarified liquids, 485Extraction percentage, %E, 11, 50
Extraction process, 36–49
aggregate formation, 41
aqueous medium, effects of, 49
complex structure, influence of, 45–49
chelate ring size, 45–47
donor ligand effects, 47–48
inner and outer sphere coordination
effect, 48–49
steric hindrance effect, 47
coupling ions, 44
extractant properties, 36–41, 125–127,
143–144
acidity–basicity, 39–40
dissociation constant and distribution
coefficient, 40–41
mixtures of extractants, 38–39
solvent (diluent) properties influencing
extraction, 41–43
temperature, influence of, 45Extraction stage, 159–169
countercurrent extraction, 165–167
scrubbing, 168–169
single-stage process, 159–162
stagewise “cross-flow” systems, 163–165
544 Index
Extraction systems with low solute
concentrations, in organic phase,
336–345
Extractive bioconversion, 462
in aqueous two-phase systems, 499Extractor–stripper apparatus, 158
Eyring plots, 28
FFermentation agents, 283
Fermentation and separation of biofuels, 283
Fiber optic chemical sensors, 252–253
Fick’s first law, 19
Fick’s second law, 19
Fission product activities, 228
Flame emission spectroscopy, 250
Flammability, 455
Flash point, 197
Flotation, 183
Flow, 158
Flow injection analysis (FIA), 240,
265–267
solvent extraction in, 265–267Flux, 20, 21
Focused microwaves (FMW), 514
Formation constants, 40, 51
Formation
of intermediates (adducts), 23
of self-adducts, 139–143Fractional precipitation, 213
Fractional recovery, 162
Fractional recrystallization, 213
Free energy gradient, 357–358
Free ligand concentration, 73–74
Frequency shift (Dn), 319
Fumaric acid, 76, 77–79
GGamma spectrometry, 270–271
Gas chromatography (GC), 243
Gas chromatography/mass spectrometry
(GC-MS), 243
Gas extraction, 514
in analytical applications, 514–515General extraction (distribution) isotherm,
319–323
Gibbs-Donnan model, 93, 102
Gibbs free energy gradient, DE, 14
Gibbs’ phase rule, 6
Globular reverse micelle, 348
GM counting, 271
Gold, extraction of, 207–208
Graesser contactor, 510
Graphic Slope analysis, 52
Green chemistry, 452
Greening at the origin technologies, 452
Green phosphoric acid purification to food
grade quality, 294–295
Group preconcentration, 242
HHansen solubility parameters, 9
H-bond formation, 91
H-bonding, 105–106
and proton transfer, 317–319H-bonding and solvating complexes,
135–144
extractants, properties of, 143–144
extraction of metal complexes, 135–143
extraction by MLz(HL)b-type complex
formation, 139–143
metal–organic complexes, formation of,
136–137
mineral salts, extraction of, 137–139HCl, extraction isotherm of, 320
Height equivalent to a theoretical stage
(HETS), 182
Height of each transfer unit (HTU), 181–182
Henkel, 199
n-Hexane, 77, 84, 87
High-molecular weight aliphatic amine
extractants, 368, 369
Hildebrand solubility parameter, 371
Homogenous partitioning, 364
Host–guest interaction models, 348, 411
Human safety, 228
Hydration free energy, 44
Hydrofluoric and nitric acids recovery, from
stainless steel pickling baths,
292–293
Hydrogen- (coordinate-) bonded
intermediates (adducts), 400
Hydrogen bond acceptor ability, 322
Solvent’s dipolarity/polarizability, 322Hydrogen bond donor ability, 322
Hydrogen fluoride (HF), 281
Hydrometallurgy, extraction in, 189–218
cobalt–nickel solvent extraction,
200–205
industrial scale extraction, 203–205
laboratory scale extraction, 201–203
copper extraction, 198–200
545Index
Hydrometallurgy, extraction in (Continued )
industrial scale extraction, 199–200
laboratory scale extraction, 198–199
diluents, 197
lanthanide extraction, 213–218
acidic extractants, 216–218
amine extractants, 216–218
solvating extractants for, 215
metal extractants, types of, 189–196
chelation extractants, 189–190, 191
ion-pair extractants, 196
ligand substitution extractants, 190, 194
neutral/solvating extractants, 190, 195
organic acid extractants, 190, 192–193
metal ion–extractant complexes formation,
189
modifiers, 197
precious group metals (PGM) extraction,
205–212
gold, 207–208
indium and rhodium, 212
palladium and platinum, 208–212
silver, 208
synergistic mixtures, 197Hydroxylamine, 226
Hydroxyoxime copper extractants, 198–199
IIdeal mixtures, 8
Ill-defined solvation shells/coordination
spheres, 359, 361–362, 422
Immunoaffinity columns (IACs), 513
Indium, extraction of, 212
Individual
general mass transfer coefficients, 19Inductively coupled plasma atomic emission
spectrometry (ICP-AES), 269
Industrial scale copper extraction, 199–200
Inert solvents, 369
Information theory (IT), 440
Inner and outer sphere coordination effect,
48–49
Inner coordination sphere, 48
Inorganic compounds, preconcentration of,
242–243
Interface extraction model, 98
Interface level, control of, 178–179
Interfacial chemistry, 443
Interfacial concentration, 117
Interfacial tension, 30
Intermediate (adduct), 318
Ion exchange colorimetry, 252
Ionic liquids, 458–467, 499–501
in analytical separations, 501
properties of, 466–467
toxicology considerations, 467
in separation techniques, 500–501Ionic strength, 13
Ionic surfactants, 249–250
Ionic systems, aggregate growth in, 447
Ionization (dissociation), 73
Ionization potential (eV), 322
Ion pair bridges, 349
Ion-pair extractants, 196
commercial, 195–196Ion pair formation, 127–135
Ion-selective electrodes (ISE), 258–261
Irradiated thorium fuels, reprocessing of,
226–227
Irreversible first-order reactions, 25–26
Isocitric acid, 76, 77–79
Isomers, separation of, 280–282
alkyl naphthalene isomers separation, using
cyclodextrins, 281–282
m- and p-cresol isomers, separation
of, 282
m-xylene from o- and p-xylene, separation
of, 281Isopentyl alcohol, 96
Isotope dilution radiometry, 273
JJob’s method, 50, 51
KKelex 100 (Sherex), 199, 207
Kinetics factors, 17–33
chemical reaction kinetics regime transport,
23–29
complexation–decomplexation,
23–24
determination of kinetic parameters,
27–29
liquid–liquid interface, 24–25
mathematical description of kinetic
regime, 25–27
diffusion transport regime, 17–23
determination of diffusion coefficients,
21–23
mathematical description of, 19–21
mixed diffusional–kinetic transport regime,
29–33
extraction kinetic parameters,
determination of, 32–33
546 Index
rate-controlling transport regimes,
identification of, 29–32
transport regime, basic parameters of, 32Kinetics studies, expected advances in,
442–443
Kirkwood function, 43
LLactic acid, 76, 77–79, 88, 89
Lactic acid extraction, 386–388
affinity constant ratios and averaged
equilibrium constants of, 387
by Alamine 336, 375Lag-times, 21, 22
Lanthanide elements, properties of, 213
Lanthanide extraction, 213–218
acidic extractants, 216–218
amine extractants, 216
solvating extractants, 215Large-scale operation, 174–175
Levextrel resins, 251
Ligand complexing order, 401
Ligand field theory, 116
Ligand number method, 50, 51
Ligand substitution extractants, 190, 194
Linear aggregates, 329, 345, 346, 433
Linear aliphatic chains, 370
Linear plots analysis, 53
Liqui-Cel equipment, 503
Liquid anion exchange, 127
properties of, 132–135Liquid anion exchange extractions equations
for, 127–132
Liquid–liquid extraction (LLE), 239, 276,
451, 458. See also Solvent
extraction
Liquid–liquid partition chromatography
(LLPC), 261–263
Liquid membrane electrode, ion-selective,
258–261
Liquid membrane process, 501, 504
Liquid membranes, in analytical chemistry,
258–261
Liquid phase microextraction (LPME), 466,
505
Liquids cintillation counters (LSC), 271
Liquid scintillation counting, 273
Liquids solubility, 5–6
LIX 26, 208
LIX 34 (Henkel), 199
LIX 54, 199
LIX 63, 198, 209
LIX 63/D2EHPA combination, 197
LIX 64, 198
LIX-65 N LIX-70, 200
LIX 79, 208
LIX 84, 292
LIX 84I, 209
Long-lived radioactive elements (LLR), 268
Long-range interactions, 324, 407
Low energy reactions measurement, 442
Luminescence, 251
Lyotropic series, 118
MMacKay’s textbook, 441
Macrocyclic polyethers, 230
Malic acid, 76, 78, 106, 108
m- and p-cresol isomers, separation of, 282
Masking agents, 242
Mass action law equilibria, 85–86, 90–95
Mass action law equilibria equations, 368
Mass balance, 162, 165, 166
Mass spectrometric detection techniques, 269
Mass transfer, 158
Mass transfer factor (MTF), 184
Mathematical theory of neural networks
(NN), 441
McCabe–Thiele diagram, 166, 167
Medium effective concentration, 467
Membrane-based nondispersive selective
solvent extraction, 502
Membrane extraction, 486
Membrane solvent extraction, 503
Metal anion exchangers, 122
Metal cations, 189, 265–266
Co2+, 189
Cu2+, 189
Ni2+, 189Metal chelate complexes (Chelates), 117
Metal complexes, extraction of, 135–143
extraction by MLz(HL)b-type complex
formation, 139–143
metal–organic complexes, formation of,
136–137
mineral salts, extraction of, 137–139Metal electropositivity, 136
Metal extractants, 189–196
chelation extractants, 189–190, 191
classification of, 115–116
ion-pair extractants, 196
ligand substitution extractants, 190, 194
neutral/solvating extractants, 190, 195
organic acid extractants, 190, 192–193
547Index
Metal extraction, mathematical supplement
for CCST in, 415–423
affinity constant values, 421–422
analysis of more complicated extraction
systems, 420–421
classical and CCST mathematical
descriptions, 422–423
M–E–W system, analysis of,
417–420Metal extraction through H-bonding,
135–144
Metal ion–extractant complexes formation,
189
Metal ion extraction, 507
Metal ions, dual maximum acidity
dependence of, 328
Metal–organic complexes, formation of,
136–137
Metals, separation of, 442
Metals extraction, 189–218
Metal solvent extraction, 113
by anion exchangers, 127–135
liquid anion exchange extractions
equations for, 127–132
liquid anion exchangers, properties of,
132–135
aqueous biphasic systems, extraction with,
151
by cation exchangers, 114–127
influence of temperature, 127
properties of extractants, 125–127
stoichiometry and structure of extracted
species, 122–124
thermodynamic considerations,
114–122
H-bonding and solvating complexes,
135–144
extractants, properties of, 143–144
extraction of metal complexes,
135–143
mixed complex formation, extraction
through, 144–150
acid extractants, 144–149
mixed two amines extractants, 149
solvating extractants, mixtures of,
149–150
monovalent metals, extractable
complexation of, 150–151Metal waste treatment, solvent extraction in,
285–292
acidic metal waste solutions, treatment of,
285–291
ammoniacal feed solutions, solvent
extraction from, 291–292Methylisobutyl ketone, 77–79, 80–81, 82,
88, 96
M–E–W system, analysis of, 417–420
Micellar extraction (ME), 506
potential applications of, 509–510Micellar liquid chromatography (MLC),
510–511
Micelle-mediated extraction. See Cloud point
extraction (CPE)
Micelles, 470, 471
in analytical chemistry,
253–258Microemulsion extraction, 471–474,
508
of biological compounds, 508Micro experiments, 45
Micrometer-sized aggregates or reversed
micelles, 505
Microscale extraction, 240
Microwave-assisted extraction (MAE), 484,
513–514
Milli-experiments, 485
Mineral acid extraction, by amines,
320
Mineral salts, extraction of, 137–139
Minimum biocidal concentrations (MBCs),
467
Minimum inhibitory concentrations (MICs),
467
Miscibility, 8
Mixed complex formation, extraction
through, 144–150
acid extractants, 144–149
acid–base (amine) mixed extractants,
148–149
and neutral donor molecules,
144–147
two acidic extractants, 147–148
mixed two amines extractants, 149
solvating extractants, mixtures of,
149–150Mixed diffusional–kinetic transport regime,
29–33
extraction kinetic parameters, determination
of, 32–33
rate-controlling transport regimes,
identification of, 29–32
transport regime, basic parameters of,
32Mixer-settler cascade, 173, 174
548 Index
Mixer-settler unit, 158
Mixtures of solutions, 6–8
ideal mixtures, 8
real mixtures, 8Mixtures of solvating extractants,
149–150
MLz(HL)b-type complex formation,
extraction by, 139–143
[Mo8O26]4, 189
Mobile phase, 493, 495, 497, 498, 510
Modern and future trends in fundamentals,
439
kinetics studies, expected advances in,
442–443
low energy reactions measurement,
442
novel molecular models theoretical
approach, 440–441
supramolecular (SUPRAS) theoretical
approach, 443–449Modifiers, 197
Modifying effect of active solvents,
393–394
Module design, 49–55
equilibrium constants, calculation of, 50
species, identification of, 50–55
graphic slope analysis, 52
Job’s method, 51
ligand number method, 51
linear plots, 53
nonlinear plots, 53–54
numerical methods, 54–55Molar extinction coefficient, 3, 359, 418, 419,
423
Molecular dynamics (MD), 440
Molecular mechanics (MM), 440
Molecular recognition, 370
Molecular resonance theory, 324
Monofunctional organophosphorus
compounds, 232
Monoglycerides, separation of
from triglycerides, 491–492Monovalent metals, extractable complexation
of, 150–151
[MoO2]2+, 189
Multistage industrial processes, 485
Murphree mass transfer factor, 184
Murrin-Murrin process, 204–205
Mutual solubilities, 75–80
m-xylene from o- and p-xylene, separation
of, 281
MycoSep 113 Trich, 513
MycoSep/MultiSep 225 Trich, 513
MycoSep/MultiSep 227 Trich+, 512
NN-alkylamides, 212
Nano- and microtechnological extraction,
505–506
Nano-experiments, 485
Nernst films
diffusion layers, 17Nernst’s distribution law, 8, 70, 71–72,
367–368
Neutral metal species, 189
Neutral/solvating extractants, 190–196
Neutron activation analysis (NAA),
272–273
Nickel, extraction of, 286
Nickel and cadmium recovery, from
accumulator waste, 291–292
Nitric acid, distribution of, 100
Nitrogen-based extractants, 199
Nonequilibrium thermodynamics, 21
Nonionic surfactant-based micellar
aggregates, 468
Nonionic surfactants, 253–255
Nonlinear plots analysis, 53–54
Novel molecular models theoretical
approach, 440–441
Nuclear analytical applications, solvent
extraction in, 267–273
radioactive elements analysis, preparative
techniques for, 271–272
radiometric detectors, 269–270
radiometric techniques, 272–273
spectroscopic and mass spectrometric
detection, 268–269Nuclear chemistry and technology, solvent
extraction in, 218–238
new developments, 234–238
partitioning of wastes, 234–236
trivalent actinide–lanthanide group
separations, 236–238
nuclear fuel processing, 219–223
thorium production, 223
uranium production, 219–223
nuclear waste management,
228–232
bifunctional organophosphorus
compounds for, 231–233
cobalt dicarbollide processes,
230–231
549Index
Nuclear chemistry and technology, solvent
extraction in (Continued )
monofunctional organophosphorus
reagents for, 232
phosphine oxide process, 230
SREX process, 230
TRUEX process, 229–230
universal solvent extraction process, 231
solvent degradation and regeneration,
232–234
spent nuclear fuel recycling, 223–228
irradiated thorium fuels, reprocessing of,
227–228
Purex process recycling, 223–226
reprocessing flow sheets, 226–227Nuclear fuel processing, 218–223
thorium production, 223
uranium production, 219–223Nuclear waste management, 228–232
bifunctional organophosphorus compounds
for, 231–233
cobalt dicarbollide processes, 230–231
monofunctional organophosphorus reagents
for, 232
phosphine oxide process, 230
SREX process, 230
TRUEX process, 229–230
universal solvent extraction process, 231Nuclei aggregates, 337–338, 340, 342, 391,
433
bridging of, 348Number of transfer units (NTU), 180–181
Numerical analysis, 54–55
O2-Octanol, 394
n-Octanol, 377
Octyl(phenyl)- N,N-di-isobutyl
carbamoylmethyl phosphine oxide
(CMPO), 229–230
Off-line SFE techniques, 263–264
OMEGA concept, 236
On-line supercritical fluid extraction/GC
methods, 264
Operating characteristics, 190
Operating lines, 166
Organic acid extractants, 190, 192
Organic and biofuels separation, solvent
extraction in, 278–284
biofuel separations by solvent extraction,
282–284
isomers, separation of, 280–282
petroleum and petrochemical processing,
278–280Organic phase parameters, 81–83
Organic phase reaction model, 99–100
Organic pollutants separation, by solvent
extraction, 296–297
Phenosolvan process, 297Organic solvents, 453–457
Organophosphorus acids, 216
Outer coordination sphere, 48–49
Overall equilibrium constant, 324
Oxidation state, 350–351
PP50 ICI Acorga, 199–200
Packed columns, 493
Palladium and platinum, extraction of,
208–212
Partition coefficient, 15
Partition constant, 125–126
Partitioning factor, 325–326, 357, 415–416,
419
Partitioning in the homogenous media, 435
Partitioning of wastes, 234–236
P-donor ability, 318
Penicillin, production of, 276–278
Permanent dipole moment (Debye unit), 6
Permittivity of organic solvent, 14
Petroleum and petrochemical processing,
278–280
re-refining process, 280, 281
Union Carbide process, 278–280Pharmaceutical separations, 276–278
production of penicillin, 276–278Phase miscibilities, 75–80
Phase ratio, 158, 161
Phase separator, 240
pH effect, 103
PhelpsDodge, 200
Phenosolvan process, 297
Phosphine oxide process, 230
Phosphinic acid, 217
Phosphorus-bonded oxygen donor, 85–86,
367–368
extraction characteristics, 86–89
mass action law equilibria, 85–86Photochemical smog, 454–455
Pi-electrons, 71
Pilot plant, 158, 183
Pinch point, 166
550 Index
Plutonium purification processes, 226
Polarity and polarizability, 321–322
Polarity determination of, 6
Pollution prevention initiative, 452
Polyethylene glycol (PEG)–dextran–water
system, 459
Polymerization, 123–127
Polynuclear aromatic hydrocarbons (PAH),
243
Polyoxyethylene nonyl phenyl ether
(PONPE), 255
POR process, 228–229
Potentiometric sensors, 258
Precious group metals (PGM) extraction,
205–212
common chloro-species of, 206
gold, 207–208
indium and rhodium, 212
palladium and platinum, 208–212
silver, 208Preconcentration factor (PF), 241–242
Preconcentration of samples, 239–240
Preferential solubility, 76–80
Premicellar aggregates, 469–470
Presented theory (CCST), experimental
techniques for, 358–361
Pressurized hot water extraction (PHWE),
457
Pressurized microwave-assisted extraction
(MAE), 514
Pressurized water chromatography, 497
Primene JMT, 209
Principle of resistance additivity, 34
Probabilistic data modeling, 441
Problems with scale-up to industrial systems,
183–184
Processes in solvent extraction, 160
Production of penicillin, 276–278
Product recovery, 159
Propanoic acid, 76, 77, 82
1-Propanol, 394
Properties of cation exchangers, 125–127
Properties of liquids
anion exchangers, 132–135
density, 6
polarity (electronegativity, dipole
moment), 6
polarization ability, 6
surface tension, 6
vapor pressure, 6
viscosity, 6Propionic acid, 104–105
Proton affinity, 319
Protonated amines, 197
Protonation, 74
Proton transfer, 317–319
Pseudo-equilibrium extraction, 335
Pulse field gradient (PFG) NMR, 22
Pulsing mixers, 176
Purex process, 223–226
Pyruvic acid, 76, 77, 89
QQuantum chemistry, 58
Quantum mechanics (QM), 440–441
Quantum neural networks (QNN), 441
Quasi-ideal behavior, 75–76, 88
Quinoline-based copper extractants, 199
RRadioactive elements analysis, preparative
techniques for, 271–272
Radiometric detectors, 269–271
alpha spectrometry, 270
beta counting, 271
gamma spectrometry, 270–271Radiometric techniques, 272–273
isotope dilution radiometry, 273
liquid scintillation counting, 273
neutron activation analysis (NAA), 272–273Radionuclides, 228, 234–235, 268–271
Raffinate, 159
Rate-controlling transport regimes,
identification of, 29–32
Reagents, recovery of, 474–475
online decontamination of wastes, 474–475Real mixtures, 8
Regeneration stage, 159
Relative increase of amine basicity, 383
Renewable water-based solvents, 458–465
aqueous two-phase systems as extractants,
459–462
supercritical fluid extractants, 462–465Reprocessing flow sheets, 226–227
Re-refining process, 280
Reversed micelle-like structures, 329, 411,
434
Reversed-phase chromatography (RPC),
261–262
Reversed-phase liquid chromatography
(RPLC), 497
Reversible first-order reactions, 26
Reversible micelles, 434
551Index
Reversible reactive intermediates (adducts),
433
Rhodium, extraction of, 212
Room-temperature ILs, 465–466
RoxbyDowns, 200
SSalting-in effect, 71
Salting-out effect, 49, 71
Samples preparation and pretreatment
techniques, solvent extraction in,
239–244
separation steps, 240–241
trace element determination,
preconcentration for, 241–244Saturation of the solvent, 159–160
Scatchard–Deranleau equation, 362
Scrubbed extract, 159
Scrubbed raffinate, 159, 171
Scrubbing, 168–169
Scrub solution, 171
Segmented flow analysis (SFA), 240
Selectivity, 34–36, 104–108
Self-adducts, 136
formation of, 139–143Self-assembly, principles of, 444–445
Self-assembly process, 444–449
Semiconductor detectors, 270
Separation factors, 34, 35, 215–216, 218, 241
of adjacent lanthanides at extraction by TBP
from nitrate solutions, 215
for adjacent lanthanides using acidic
extractants, 217Separation
of aromatic and aliphatic hydrocarbons, 278
of ethanol, 283–284
of isomers, 280–282
of organic pollutants, 296–297
of the phases, 178–180
stages, 159Separator funnels, 158
Short-lived radioactive (SLR) isotopes, 268
Short-range interactions, 324, 407
Silver, extraction of, 208
Single-drop microextraction (SDME), 466
Single-stage process, 159–162
Slope analysis, 122–124, 143
SME 529 Shell (methylchain), 199–200
Sodium dodecyl sulfate (SDS), 448, 458
Sodium salicylate, 448
Solid adsorbents, 242–243
Solid–liquid extraction systems, 511–513
solvent-impregnated resins, 511–513Solid-phase extraction (SPE), 458, 511, 512
empore disks (ED), 512
extraction columns, 512
sorbent adding to aqueous sample, 512
speed disks (SD), 512Solid phase fluorimetry, 252
Solid-phase microextraction (SPME), 458,
465–466, 511, 512, 513
Solid-phase spectrophotometry (SPS), 252
Solute–extractant interactions strength,
321–322
Solute–solvent interactions, 8–11
in aqueous phase, 13–14
in organic phase, 14–15
solubility parameter, 9–10
thermodynamic relations, 10–11Solubility, 9
of liquids, 5–6
mixtures of solutions, 6–8
ideal mixtures, 8
real mixtures, 8Solvating, nitrogen-based extractants, 199
Solvating complexes, 135–144
Solvating extractants, mixtures of,
149–150
Solvating metal extractants, commercial,
194
Solvation (coordination) number, 322,
327–328, 350–351
Solvation, 12, 14, 17, 41–42, 45
Solvation effects, 406, 418
Solvation extractants, 367–368
Solvation shell, 337, 351–352
Solvatochromic parameters, 436
Solvent degradation, 232–234
and regeneration, in nuclear technology,
232–234Solvent extraction (SX), 318
of acids from waste (nitric, phosphoric,
arsenic acids), 292–296
from ammoniacal solutions,
291–292
for recovery of cyanide, 295–296
in sample pretreatment or post treatment,
239–244Solvent extraction with microemulsions,
507–510
biological molecules, extraction of,
508–509
metal ion extraction, 507–508
552 Index
micellar extraction, potential applications
of, 509–510
scale-up considerations, 510Solvent-impregnated resins, 251–252,
511–513
Solvent losses, 158, 182–183
Solvent recirculation, 240
Solvent recovery stage, 159
Solvent regeneration, 232–234
Solvent replacement, strategies for, 452–453
Soxhlet apparatus, 243
Spectral shift, 419
Spectrophotometric detection, methods based
on, 244–250
Spectroscopic and mass spectrometric
detection, 268–269
Spent nuclear fuel recycling, 223–228
irradiated thorium fuels, reprocessing of,
227–228
Purex process recycling, 223–226
reprocessing flow sheets, 226–227SPIN (solvent partition–incineration)
program, 236
Sponge morphologies, 448
Spray columns, 51090Sr extraction, from acidic wastes, 230SREX process, 230, 234–235
Stability constants, 322
Stability or formation constant, 114–116
Stage efficiency, 171
Stagewise “cross-flow” systems, 163–165
Steady-state, 18
Stepwise extraction process, 117
Steric effects, 116, 117
Steric hindrance effect, 47
Stir bar extraction (SBE), 458
Stirred cell semicontinuous techniques,
56–57
Stirred countercurrent columns, 174, 175
Stoichiometry, 122–123
Stokes–Einstein relation, 21, 42
Strengths, weaknesses, opportunities, and
threats analysis (SWOT),
475–476
Stripped solvent, 159
Stripping organic solutions, 169–170
Strip solution, 159
Strip stage, 159
Strong (electrostatic, ion-exchange, ion-pair)
interactions, 410
Strong (inorganic) acids, extraction of,
98–102
Strontium Extraction process. See SREX
process
Structure of extracted species, 122–125
Structures of the product species,
359–360
Subcritical water chromatography, 497
Subcritical water extraction (SWE),
457–458, 493–498
extraction from plants using, 495–496
extraction technique, 494–495
pressurized liquid extraction,
496–497Substituted hydrocarbons, 71–85
Succinic acid, 76, 77, 94, 96, 97
Sulfonic acids, 126
Sulfuric acid systems, 132
Supercritical fluid chromatography (SFC),
492–493
Supercritical fluid extractants,
462–465
Supercritical fluid extraction (SFE),
263–264, 486–493
advantages and disadvantages of, 493
applications of, 490–492
separation of monoglycerides from
triglycerides, 491–492Superheated water chromatography
(SHWC), 497–498
Supported liquid membrane (SLM), 502
Supramolecular (SUPRAS), 443–449,
468–469
supramolecular solvent formation,
444–449
amphiphilic molecules, self-assembly of,
445–447
nanometer-sized amphiphilic aggregates
to micrometer-sized liquid phases
separation,
447–449
self-assembly, principles of,
444–445Supramolecular-based extraction techniques,
469, 504–511
micellar liquid chromatography (MLC),
510–511
nano- and microtechnological extraction,
505–506
solvent extraction with microemulsions,
507–510
biological molecules, extraction of,
508–509
metal ion extraction, 507–508
553Index
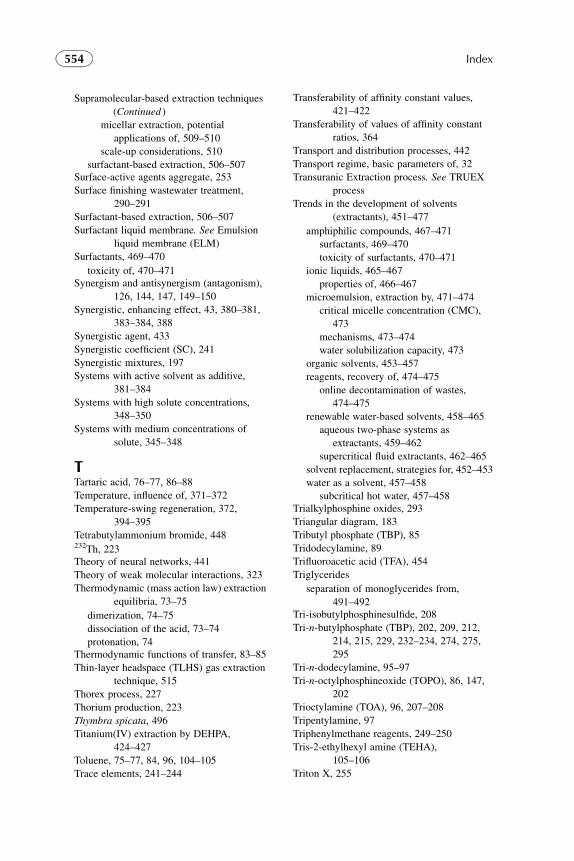
Supramolecular-based extraction techniques
(Continued )
micellar extraction, potential
applications of, 509–510
scale-up considerations, 510
surfactant-based extraction, 506–507Surface-active agents aggregate, 253
Surface finishing wastewater treatment,
290–291
Surfactant-based extraction, 506–507
Surfactant liquid membrane. See Emulsion
liquid membrane (ELM)
Surfactants, 469–470
toxicity of, 470–471Synergism and antisynergism (antagonism),
126, 144, 147, 149–150
Synergistic, enhancing effect, 43, 380–381,
383–384, 388
Synergistic agent, 433
Synergistic coefficient (SC), 241
Synergistic mixtures, 197
Systems with active solvent as additive,
381–384
Systems with high solute concentrations,
348–350
Systems with medium concentrations of
solute, 345–348
TTartaric acid, 76–77, 86–88
Temperature, influence of, 371–372
Temperature-swing regeneration, 372,
394–395
Tetrabutylammonium bromide, 448232Th, 223Theory of neural networks, 441
Theory of weak molecular interactions, 323
Thermodynamic (mass action law) extraction
equilibria, 73–75
dimerization, 74–75
dissociation of the acid, 73–74
protonation, 74Thermodynamic functions of transfer, 83–85
Thin-layer headspace (TLHS) gas extraction
technique, 515
Thorex process, 227
Thorium production, 223
Thymbra spicata, 496
Titanium(IV) extraction by DEHPA,
424–427
Toluene, 75–77, 84, 96, 104–105
Trace elements, 241–244
Transferability of affinity constant values,
421–422
Transferability of values of affinity constant
ratios, 364
Transport and distribution processes, 442
Transport regime, basic parameters of, 32
Transuranic Extraction process. See TRUEX
process
Trends in the development of solvents
(extractants), 451–477
amphiphilic compounds, 467–471
surfactants, 469–470
toxicity of surfactants, 470–471
ionic liquids, 465–467
properties of, 466–467
microemulsion, extraction by, 471–474
critical micelle concentration (CMC),
473
mechanisms, 473–474
water solubilization capacity, 473
organic solvents, 453–457
reagents, recovery of, 474–475
online decontamination of wastes,
474–475
renewable water-based solvents, 458–465
aqueous two-phase systems as
extractants, 459–462
supercritical fluid extractants, 462–465
solvent replacement, strategies for, 452–453
water as a solvent, 457–458
subcritical hot water, 457–458Trialkylphosphine oxides, 293
Triangular diagram, 183
Tributyl phosphate (TBP), 85
Tridodecylamine, 89
Trifluoroacetic acid (TFA), 454
Triglycerides
separation of monoglycerides from,
491–492Tri-isobutylphosphinesulfide, 208
Tri-n-butylphosphate (TBP), 202, 209, 212,
214, 215, 229, 232–234, 274, 275,
295
Tri-n-dodecylamine, 95–97
Tri-n-octylphosphineoxide (TOPO), 86, 147,
202
Trioctylamine (TOA), 96, 207–208
Tripentylamine, 97
Triphenylmethane reagents, 249–250
Tris-2-ethylhexyl amine (TEHA),
105–106
Triton X, 255
554 Index
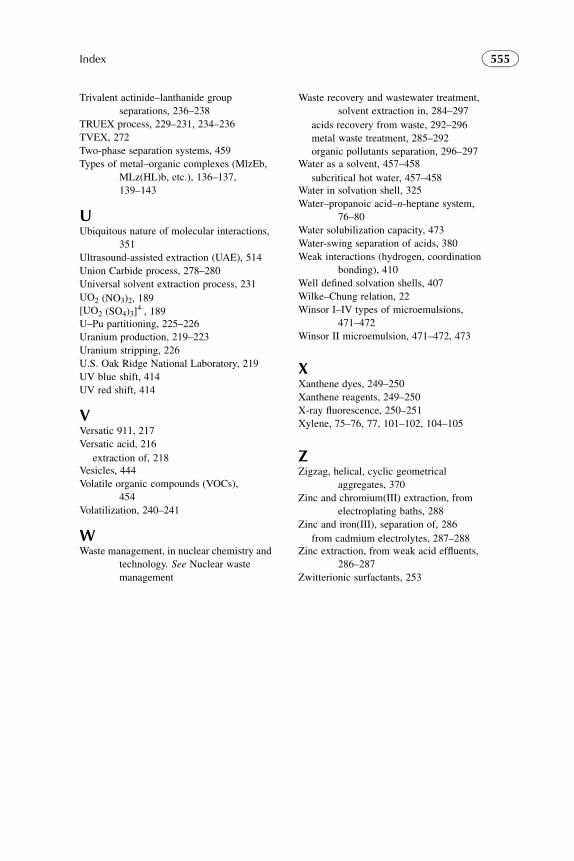
Trivalent actinide–lanthanide group
separations, 236–238
TRUEX process, 229–231, 234–236
TVEX, 272
Two-phase separation systems, 459
Types of metal–organic complexes (MlzEb,
MLz(HL)b, etc.), 136–137,
139–143
UUbiquitous nature of molecular interactions,
351
Ultrasound-assisted extraction (UAE), 514
Union Carbide process, 278–280
Universal solvent extraction process, 231
UO2 (NO3)2, 189[UO2 (SO4)3]
4-, 189U–Pu partitioning, 225–226
Uranium production, 219–223
Uranium stripping, 226
U.S. Oak Ridge National Laboratory, 219
UV blue shift, 414
UV red shift, 414
VVersatic 911, 217
Versatic acid, 216
extraction of, 218Vesicles, 444
Volatile organic compounds (VOCs),
454
Volatilization, 240–241
WWaste management, in nuclear chemistry and
technology. See Nuclear waste
management
Waste recovery and wastewater treatment,
solvent extraction in, 284–297
acids recovery from waste, 292–296
metal waste treatment, 285–292
organic pollutants separation, 296–297Water as a solvent, 457–458
subcritical hot water, 457–458Water in solvation shell, 325
Water–propanoic acid–n-heptane system,
76–80
Water solubilization capacity, 473
Water-swing separation of acids, 380
Weak interactions (hydrogen, coordination
bonding), 410
Well defined solvation shells, 407
Wilke–Chung relation, 22
Winsor I–IV types of microemulsions,
471–472
Winsor II microemulsion, 471–472, 473
XXanthene dyes, 249–250
Xanthene reagents, 249–250
X-ray fluorescence, 250–251
Xylene, 75–76, 77, 101–102, 104–105
ZZigzag, helical, cyclic geometrical
aggregates, 370
Zinc and chromium(III) extraction, from
electroplating baths, 288
Zinc and iron(III), separation of, 286
from cadmium electrolytes, 287–288Zinc extraction, from weak acid effluents,
286–287
Zwitterionic surfactants, 253
555Index

This page intentionally left blank