solvent extraction modeling of vegetable oil and its minor compounds
TRANSCRIPT
Journal of Food Engineering 107 (2011) 186–194
Contents lists available at ScienceDirect
Journal of Food Engineering
journal homepage: www.elsevier .com/locate / j foodeng
Solvent extraction modeling of vegetable oil and its minor compounds
Erica R. Baümler, Amalia A. Carelli, Guillermo H. Crapiste, María E. Carrín ⇑Planta Piloto de Ingeniería Química (PLAPIQUI), Universidad Nacional del Sur – Consejo Nacional de Investigaciones Científicas y Técnicas, 8000 Bahía Blanca, Argentina
a r t i c l e i n f o a b s t r a c t
Article history:Received 13 July 2010Received in revised form 22 May 2011Accepted 22 June 2011Available online 2 July 2011
Keywords:Mathematical modelOilseedsSolvent extractionMinor compounds
0260-8774/$ - see front matter � 2011 Elsevier Ltd. Adoi:10.1016/j.jfoodeng.2011.06.025
⇑ Corresponding author. Address: Planta Piloto de InUniversidad Nacional del Sur-Consejo Nacional deTécnicas, Camino La Carrindanga km. 7, CC 717, 80Tel.: +54 291 4861700; fax: +54 291 4861600.
E-mail address: [email protected] (M.E. Car
A two-dimensional transitory mathematical model developed in a previous paper is expanded andapplied to represent the extraction process of oil and its minor compounds (phospholipids, tocopherolsand waxes) in a De Smet industrial extractor. Diffusivities and equilibrium parameters are obtained fromexperimental batch extractions. The mathematical model is solved numerically to predict the concentra-tion of oil and minor compounds in miscella and collets in the different sections of the extractor. The con-centration of phospholipids and crystallized waxes in the solid decreases slowly, being sharper at the endof the process. Tocopherols and triacylglycerols are extracted more quickly at 60 �C. Numerical simula-tions of the extraction process reveal that it would be possible to obtain oil with smaller concentrationsof phospholipids and waxes, working at 60 �C and using fewer stages. Since the last stages do not producea significant increment of the oil yield at 60 �C, the model results show that the extractor is overdimensioned.
� 2011 Elsevier Ltd. All rights reserved.
1. Introduction
Most industrial extractors available for the solvent extraction ofvegetable oil have countercurrent, multistage designs. The basicprinciple of operation is similar in all the cases. In general, theyoperate based on the principle of countercurrent cross flows ofthe raw material (a solid porous medium that contains the sub-stance to be extracted) and the miscella, which is a liquid that ex-tracts the oil in contact with the porous solid. Inside the extractor,the miscella flows, interacting at the same time with the raw mate-rial, so that the solid has a low oil content at the outlet, whereasthe miscella at the exit of the extractor has a high oil concentration.In particular, in the De Smet type extractor the solid particles areplaced on a perforated base forming a bed that moves horizontallyalong the unit, while the miscella flows through the bed (Kemper,1997).
Several authors have presented mathematical models with sim-plified equations to represent the solvent extraction process.Veloso et al. (2005) developed a model which incorporates the fol-lowing features: countercurrent cross flow of the porous mediumand the miscella, mass transfer between the expanded flakes andthe miscella, diffusion in the entire extraction field, miscella trans-port between the percolation sections, influence of loading anddrainage zones, and transient operating regimes of the extractor.Their model considers neither the changes in oil flux resistances
ll rights reserved.
geniería Química (PLAPIQUI),Investigaciones Científicas y00 Bahía Blanca, Argentina.
rín).
along the extraction process, nor the mass transfer resistance inthe solid matrix. Moreover, it assumes an equilibrium state be-tween pore and solid phases at any point of the field, includingthe loading zone. Thomas et al. (2005) developed a model for soy-bean oil solvent extraction in a ‘‘Rotocell’’ extractor. The modelconsiders a two-dimensional approach to countercurrent crossflows with oil diffusion for miscella, the effect of the existing pro-cesses at the drainage and loading sections, oil losses, and the var-iation in miscella viscosity and density. The authors treated thesystem as a porous medium with two porosity types (bulk andpore), and they introduced the equilibrium concept between thesolid and pore phases. To describe the oil transfer between phasesthey considered the diffusion in the fluid phase.
Carrín and Crapiste (2008) developed a mathematical model torepresent the extraction process in two dimensions and transitorystate; they introduced the concept of different oil categories interms of extraction kinetics and availability. This mathematicalmodel was solved numerically to predict the oil concentration inmiscella and collets along the percolation sections and at the out-lets. The authors also compared the model predictions with indus-trial data for sunflower oil extraction with hexane, finding thatthose predictions closely represented the complex phenomena thattake place during the extraction process.
During the extraction studies, vegetable oils were considered asa single component, since all the triglycerides (main oil compo-nents) are strongly soluble in hexane. Nevertheless, other compo-nents are extracted together with the triglycerides. Some of thoseminor compounds have pro- or antioxidant properties (e.g. toc-opherols, metals and free fatty acids), while others have to beremoved in the refining process (e.g. free fatty acids, phospholipids
Nomenclature
ap collet surface area per volume unit (m�1)C concentration in bulk phase (component kg/miscella kg)Cs concentration in solid-occluded miscella phase
(component kg/inert solid kg)d diameter (m)D1 washing stage diffusivity (m2/s)D2 diffusion stage diffusivity (m2/s)Dz dispersion coefficient (m2/s)dp equivalent diameter of collet (m)K equilibrium constant (C/Cs)Kx mass transfer coefficient from the solid (m/s)kL convective mass transfer coefficient (m/s)L bed height (m)M molecular weightMt/Minf ratio between mass extracted at time t and at infinite
timems solid mass flow rate (kg/s)n diffusion flux of oil from collet to bulk phase (kg/s m2)Pe Peclet number (vmdp/Dz)PN pump number or number of trays in the extractort⁄ dimensionless time (vmt/L)t�r dimensionless residence time to each section of the bedV molar volume (m3/mol)vm vertical bulk phase velocity in the bed (m/s)Vt tray volume (m3)v�y dimensionless horizontal bulk phase velocity (vy/vm)v�z dimensionless vertical bulk phase velocity (vz/vm)W bed length (m)w oil volumetric fraction in miscellaWd drainage length (m)We stage length (m)X bed width (m)x oil molar fraction in miscella
y⁄ dimensionless horizontal coordinate (y/W)z⁄ dimensionless vertical coordinate (z/L)
Greek letters� porosityq bulk phase density (kg/m3)qs solid density (kg/m3)l bulk-phase viscosity (Pa s)
Subscripts0 initial state1 first stageb bedc componentcr critical componentd drainage stagefd first drainage point of the stageh hexanei component categoryip internal particleL bottom bedld last drainage point of the stagem miscella in trayso oilp colletPN pump number or number of trays in the extractorpo collet pores stageinf infinite time
Superscriptsa average at a fixed horizontal position of the bed0 initial state
E.R. Baümler et al. / Journal of Food Engineering 107 (2011) 186–194 187
and waxes). Baümler et al. (2010) performed kinetic assays in abatch reactor using collets and hexane as solvent. They presentedextractability data and effective liquid–solid diffusion coefficientsfor oil, tocopherols and phospholipids at different temperatures.These experimental data are necessary to model solvent extractionwhen considering an industrial extractor. At the moment, a contin-uous extraction model that takes into account minor compoundsextractability is not available in the literature. This knowledgecould contribute to the effective design of oil solvent extractionprocesses.
The main objective of this research work is to introduce modi-fications to the model developed by Carrín and Crapiste (2008),which considered the main oil component (triacylglycerols) as asingle component. In the present work, minor components are alsoconsidered and added to the solvent extraction modeling. Thus, thestudy and model equations are expanded to the differential extrac-tion of some minor oil components of industrial interest, such aswaxes, phospholipids and tocopherols, by using the informationabout their extraction kinetics.
In addition, as only phospholipid and tocopherol extractabilitydata are available in the literature (Baümler et al., 2010), kineticstudies have also been performed from original data of waxes ex-tracted from sunflower collets in a batch reactor using n-hexaneas solvent.
2. Extraction model
Carrín and Crapiste (2008) described a De Smet type extractorin which two media are involved: (1) a porous medium of
pretreated (mechanically crushed and pelletized) oleaginous mate-rial with two porosity types (bed porosity and collet porosity),which moves horizontally on a perforated band; and (2) an oil–sol-vent miscella that moves in countercurrent cross-flow (Fig. 1). Inthe extractor inlet (tube 2), the miscella has a very low oil concen-tration, and it is called solvent or weak miscella. In contrast, in theoutlet (tube 3), it is called concentrated miscella. In the loadingarea (through tube 1), the bed is filled with the porous solid andmoves from N to I, until it reaches the drainage zone (6). The mis-cella passes from tube 2 to 3 in counter cross flow (relative to theraw material flow), and it is enriched with extracted oil. In theloading zone (5), the concentrated miscella fills out the spaces be-tween the collets and permeates the pore phase. In the drainagearea (6), weak miscella abandons the spaces between the collets,but it still remains in the pore phase. The extraction area is dividedin sections, each section or stage being determined by the qualityof the sprayed miscella.
The general assumptions made in the proposed model (Carrínand Crapiste, 2008), and which were maintained in this work, aresummarized as follows: (a) constant temperature, (b) constantporosities and velocities (bed and bulk phase miscella), (c) isotro-pic porous particles, (d) diffusion (in solid) and convection (in bulkfluid phase) as mass transfer processes, (e) oil and solvent contra-diffusion maintaining constant volumes, and (f) the main oil com-ponent (triacylglycerols) is regarded as a single component. In thepresent work, minor components were also considered and addedto the solvent extraction modeling. Thus, the model equationswere extended to minor compounds in their two categories: thecomponent contained in the undamaged cells, and the componentthat comes from ruptured cells and migrates more easily.

Fig. 1. Scheme of the process in the extractor: (1) porous media inlet; (2) solvent inlet; (3) miscella exit; (4) porous media exit; (5) loading zone; (6) drainage zone; (7) tray;(8) transporter; (9) miscella distributor; (I–N) extraction stages (the tray numbering is the same as the extraction stage numbering). A descriptive illustration of the masstransfer phenomena considered in the mathematical model is at the top of this figure. Source: Carrín and Crapiste (2008)
188 E.R. Baümler et al. / Journal of Food Engineering 107 (2011) 186–194
2.1. Transfer equation for oil and minor compounds
As mentioned above, the components inside the solid particlesare assumed to be composed of elements of two categories: (C1)a free component that is easily extracted, and (C2) a bounded com-ponent that is hardly extracted (Fan et al., 1948). Ccscr is the criticalcomponent content and it corresponds to the maximum concen-tration of C2 in particles. The components are extracted by paralleldiffusion of both component categories. By applying mass balanceto solid-porous particles at stationary state when convective masstransport occurs between the matrix surface and the bulk phase(Wakao and Kaguei, 1982), diffusive flux leaving the porous matrixfor each component (c) in its i-category can be obtained as:
nci ¼dp
6q
dp
6kLþ 1
KxEf
� � ðKcCsci � CciÞ ð1Þ
with
Ef ¼3u
cothu� 1u
� �u ¼ dp
2Kx
Doh
� �0:5
Kx ¼Dcin
qKc dip=2� �
n ¼ 4qs
dpoep
where Kc is the equilibrium constant of each component, Ef is thediffusion effectiveness factor, and u is the Jüttner modulus, whichrelates particle (Dci) and liquid (Doh) diffusion.
2.2. Mass balances
The mathematical model includes the extraction, drainage andloading zones and the trays. In the drainage zone, only the liquidbulk phase is drained, and this miscella is collected in the sametray as the miscella from the first extraction section. Oil transferbetween pore and bulk phases occurs while there is bulk phasesurrounding the collets. The solid-porous material enters the load-ing zone with a known mass concentration and at a known massflow rate, and without any solvent. As the miscella is sprayed inthis zone, the porous bed is occupied by miscella and the oil trans-fer between collets and miscella begins. At the bottom of this sec-tion, a part of the solid-porous material is without miscella becauseof the bed movement and residence time. Therefore, the flow of themiscella collected in the loading zone is lower than that of the mis-cella sprayed over it. For each component (oil, tocopherols, phos-pholipids and waxes) and for each category (free and bounded),the mass balances in bulk miscella and solid-porous material(including occluded miscella) in a bed portion (Fig. 1) led to the fol-lowing equations expressed in a dimensionless form:

E.R. Baümler et al. / Journal of Food Engineering 107 (2011) 186–194 189
2.2.1. Bulk phase
@ðqCciÞ@t�
¼ � @ðv�zCciqÞ@z�
� LW
� � @ v�yCciq� �@y�
þ dp
L
� �@
@z�v�zqPe
@Cci
@z�
� �� �
þ dp
L
� �L
W
� �2@
@y�v�yqPe
@Cci
@y�
� �� �
þ 1� eb
eb
� �ap
Lvm
� �nci ð2Þ
In Eq. (2) the miscella density (q) was only considered as a functionof the oil concentration. This simplification was based on thehypothesis that the minor compounds have a low incidence onthese properties due to their low concentrations. Following thisassumption, the equations used for oil or for the minor compoundsare different.
2.2.2. Solid-porous (collet) and occluded miscella
@Csci
@t�¼ � ap
qs
Lvm
nci �ms
qsdz�XWLð1� ebÞL
vm
� �@ðCsciÞ@y�
ð3Þ
where the first term on the right represents the mass transfer be-tween the bulk and collet phases, and the second term correspondsto the horizontal movement.
2.2.3. TraysThe miscella flow pours into a tray with non-uniform i-category
component concentration distribution, CciL. Considering a rapidmixture of the miscella inside the tray, it can be assumed thatthe concentration in the tray is uniform, but time-dependent forthe transient regime. By applying the conservation law to the trayvolume Vt, the equation to account for the changes in the miscellafor i-category component concentration in the intermediate trays(Cmcis) becomes:
dðCmcisqmsÞdt�
¼ �bLX=Vtð Þ WZ y�
Ids
y�fds
ðCciLqLÞdy� �WeCmcisqms
!ð4Þ
The first tray (1) not only receives the miscella that flows out fromthe first stage, but also the drained miscella. Thus, the correspond-ing equation to account for the changes in the miscella for i-cate-gory component concentration in the first tray (Cmci1) is:
dðCmci1qm1Þdt�
¼ �bLX=Vtð Þ WZ y�
1dd
y�fd1
ðCciLqLÞdy� � ðWe þWdÞCmci1qm1
!
ð5Þ
For the last tray (PN), the outlet miscella mass concentration is notestablished by the accumulation in a tray, but by the integrationover the drainage zone of this tray. The following expression resultsfor i-category component concentration in this miscella (CmciPN):
CmciPNqmPN ¼
R y�ldPN
y�fdPNðCciLqLÞdy�R y�
ldPNy�
fdPNdy�
ð6Þ
Average concentration in solid-occluded miscella phase at a fixedhorizontal position of the bed ðCa
sciÞ is evaluated by:
Casci ¼
Z 1
0Cscidz� ð7Þ
2.3. Physical properties and transport coefficients
As mentioned before, minor compounds have a low incidenceon the physical and transport properties of the miscella becauseof their low concentrations. Therefore, these properties were onlyconsidered as a function of the oil concentration.
Convective mass transfer coefficient, kL, was obtained fromdimensionless correlations in terms of the Sherwood number,Sh = kLdp/Dho, by (Treybal, 1981).
Sh ¼ 2:4ebRe0:34Sc0:42 for 0:08 � Re � 125Sh ¼ 0:442ebRe0:69Sc0:42 for 125 � Re � 5000
ð8Þ
Reynolds, Re, and Schmidt, Sc, numbers were recalculated by meansof the following equations:
Re ¼ qvmdp
l¼ Re0 q
q0
� �l0
l
� �ð9Þ
Sc ¼ lqDoh
¼ Sc0 D0oh
Doh
!q0
q
� �ll0
� �ð10Þ
where l: is the bulk phase viscosity, subscripts h and o refer to hex-ane and oil, respectively, and superscript 0 indicates the initialstate.
Peclet number was obtained by (Butt, 1980):
ebPe ¼ 0:2þ 0:011ðebReÞ0:48 ð11Þ
Physical and transport properties of miscella as functions of oil con-centration were evaluated by means of (Perry and Green, 1984; Riceand Hamm, 2002):
q ¼ MhMo
VhMo þ ðVoMh � VhMoÞCð12Þ
l ¼ l1�wh � lw
0 ð13Þ
Doh
D0oh
¼V2=3
h þ ð3V0Þ2=3� �
lhVo
V2=3o þ ð3VhÞ2=3
� �loVh
24
35
x�x0
ð14Þ
Diffusivity values of the diffusion stage (D2c) and equilibrium con-stant values (Kc) of oil, tocopherols and phospholipids were ob-tained from Baümler et al. (2010), while the same parametersrelated to waxes were obtained from original data in a similarway. Data of each component concentration in particles as a func-tion of time were used to determine the washing stage diffusivityvalues (D1c) and critical concentrations (Csccr) by applying Eq. (15)(Carrín and Crapiste, 2008).
Csc0 � Csc
Csc0 � Cscinf¼ 1� 1� Csccr
Csc0 � Cscinf
� �exp �4D1cp2t
d2ip
!
� Csccr
Csc0 � Cscinf
� �exp �4D2cp2t
d2ip
!ð15Þ
The wax equilibrium ratio between its concentration in miscellaand in solid, Kc, was evaluated under the same experimental condi-tions when stationary state was reached.
2.4. Initial and boundary conditions
As the bed is not filled with miscella at the beginning of theextraction process, initial conditions were not evaluated at timezero. This situation was represented by setting initial conditionsas a function of dimensionless residence time for each section ofthe bed ðt�r Þ, as follows:

190 E.R. Baümler et al. / Journal of Food Engineering 107 (2011) 186–194
t� � t�rCciðy�; z�; t�Þ ¼ 0 Csciðy�; z�; t�Þ ¼ C0
sci
y� ¼ 0; . . . ;1 z� ¼ 0; . . . ;1
(
t� ¼ t�r
@Cciðy� ;z� ;t�Þ@z� ¼ 0 Csciðy�; z�; t�r Þ ¼ C0
sci
y� ¼ 0; � � �;1 z� > 0Cciðy�;0; t�Þ ¼ C0
ci Csciðy�; z�; t�Þ ¼ C0sci y� ¼ 0; � � �;1
8><>:
When the bed is filled with miscella, the boundary conditions forthe bulk and solid-porous phases are:� for the right and left hand of the extraction field
t� P 0 @Ccið0;z� ;t�Þ@y� ¼ 0 @Ccið1;z� ;t�Þ
@y� ¼ 0 z� ¼ 0; . . . ;1n
t� P 0 Cscið0; z�; t�Þ ¼ C0sci z� ¼ 0; . . . ;1
�
� for the top and bottom boundaries of the field
� � � y� ¼ 0; . . . ; y�8
t� P t�rCciðy ;0; t Þ ¼ Cmci;s�1ðt Þ fd1
Cciðy�;0; t�Þ ¼ C0ci
y� ¼ y�fd1; . . . ; y�ld1
@Cciðy� ;0;t�Þ@z� ¼ 0 y� ¼ y�ld1; . . . ;1
@Cciðy� ;1;t�Þ@z� ¼ 0 y� ¼ 0; . . . ;1
>>>><>>>>:
where
y�fdl ¼ 1� 1=PNð Þ 1�Wd=Wð Þ; y�ldl ¼ 1�Wd=Wð Þ
Table 1Wax extraction behavior at different temperatures, expressed as the ratio betweenwax mass extracted at a given time and the equilibrium state (Mt/Minf).
Waxes (number of carbon atoms) Time (s)
120 300 420 5400 57,600
40 �C36 0.716 0.768 0.880 0.962 1.0038 0.653 0.703 0.767 0.871 1.0040 0.570 0.624 0.659 0.998 1.0042 0.757 0.778 0.768 0.831 1.0044 0.825 0.774 0.738 0.888 1.0046 0.893 0.782 0.728 0.993 1.0048 0.844 0.661 0.641 0.920 1.00Soluble 0.741 0.712 0.790 0.892 1.00Partially soluble 0.651 0.692 0.725 0.942 1.00Crystallized 0.839 0.710 0.691 0.938 1.00
Total 0.791 0.707 0.714 0.931 1.00
50 �C36 0.642 0.733 0.753 0.929 1.0038 0.607 0.703 0.743 0.903 1.0040 0.602 0.699 0.733 0.979 1.0042 0.762 0.763 0.754 0.948 1.0044 0.737 0.773 0.803 0.872 1.0046 0.807 0.728 0.728 0.794 1.0048 0.720 0.646 0.642 0.700 1.00Soluble 0.621 0.735 0.759 0.934 1.00Partially soluble 0.649 0.703 0.718 0.935 1.00Crystallized 0.791 0.736 0.735 0.807 1.00
Total 0.740 0.730 0.736 0.849 1.00
60 �C36 0.540 0.655 0.666 0.778 1.0038 0.620 0.728 0.757 0.932 1.0040 0.592 0.676 0.691 1.001 1.0042 0.694 0.701 0.710 0.817 1.0044 0.768 0.816 0.856 0.887 1.0046 0.832 0.753 0.750 0.747 1.0048 0.585 0.588 0.551 0.647 1.00Soluble 0.557 0.650 0.712 0.808 1.00Partially soluble 0.651 0.677 0.752 0.930 1.00Crystallized 0.690 0.694 0.705 0.729 1.00
Total 0.663 0.685 0.713 0.772 1.00
2.5. Resolution procedure
The set of Eqs. (1)–(14), together with the initial and boundaryconditions listed above, constitutes the expanded model from thatproposed by Carrín and Crapiste (2008), with the considerationsmade regarding the minor compounds. These equations were usedto describe simultaneously the extraction of both the oil and one ofthe minor compounds in a De Smet-type extractor. The model wassolved numerically using a finite-difference method (Davis, 1984)to discretize the spatial derivatives, and finite sums to replacethe integral terms. The ordinary differential equations thus ob-tained were solved by the fourth-order Runge–Kutta numericalmethod, with Matlab 7.5�.
Fig. 2. Wax extraction kinetics of sunflower collets at different temperatures.Points represent average values of three experiments, and bars represent standarddeviations.
Table 2Diffusivities (D1c and D2c), critical concentrations (Csccr) and equilibrium constant (Kc)of oil and minor compounds.
D1c (m2/s) D2c (m2/s) Csccr (kg/inert solid kg) Kc (C/Cs)
Oil – CSc0 = 0.307 (kg/inert solid kg)40 �C 1.880 � 10�6 1.356 � 10�8 0.2016 1.62250 �C 6.549 � 10�6 1.683 � 10�8 0.1934 2.10960 �C 9.463 � 10�6 2.247 � 10�8 0.1853 4.207
Phospholipids – CSc0 = 2.548 � 10�3 (kg/inert solid kg)40 �C – 1.323 � 10�9 2.548 � 10�3 0.41250 �C – 1.498 � 10�9 2.548 � 10�3 0.72160 �C 2.903 � 10�5 4.229 � 10�9 1.841 � 10�3 0.848
Tocopherols – CSc0 = 2.072 � 10�4 (kg/inert solid kg)40 �C 1.360 � 10�7 7.006 � 10�9 1.822 � 10�4 0.45050 �C 1.218 � 10�7 3.066 � 10�8 1.880 � 10�4 0.45660 �C 2.981 � 10�6 1.324 � 10�7 1.777 � 10�4 1.305
Waxes – CSc0 = 1.529 � 10�4 (kg/inert solid kg)40 �C 3.832 � 10�7 4.989 � 10�9 7.671 � 10�5 0.64950 �C 2.944 � 10�7 1.040 � 10�9 4.076 � 10�5 1.22860 �C 5.724 � 10�6 6.975 � 10�10 5.068 � 10�5 1.738
E.R. Baümler et al. / Journal of Food Engineering 107 (2011) 186–194 191
3. Materials and methods
The experimental determinations were performed with sun-flower collets (porous cylinders obtained from the pressed cakeby expanding), which were kindly provided by a local factory.The collets were stored in the dark at 5 �C under nitrogen atmo-sphere until used in extraction experiments. The moisture contentwas measured by the vacuum oven technique according to AOCSmethod Ba 2b-82 (AOCS, 1993), and the oil content was deter-mined by an exhaustive extraction with n-hexane (bp 68–72 �C)in a Soxhlet apparatus according to AOCS method Ac 3–44. Analy-ses were performed in triplicate.
All reagents were of analytical-reagent grade, except for n-hex-ane, n-heptane and ethyl ether used in wax analyses, which wereof chromatographic grade (J.T. Baker Inc., Phillipsburg, NJ). Silicagel 60, particle size 0.063–0.200 mm, 70–230 mesh (Merck,Darmstadt, Germany), was dried at 500 �C for 4 h, hydrated with2% of water and stabilized for 12 h, prior to its use in column chro-matography. The following wax standards of almost 99% purity(Sigma Chemical Co., St. Louis, MO) were used for chromatographicanalysis: C32 = lauric acid arachidyl ester (C32H64O2), C36 = stearicacid stearyl ester (C36H72O2), C38 = arachidic acid oleoyl ester(C38H74O2), C40 = arachidic acid arachidyl ester (C40H80O2),C42 = arachidic acid behenyl ester (C42H84O2), and C44 = behenicacid behenyl ester (C44H88O2).
A sample of 20 collets was randomly selected to determine theaverage size and density of the collets. Collet dimensions weremeasured using a gauge with 0.01 mm accuracy. Collet densitywas determined with a pycnometer according to AOCS methodCc 10a-25 with modifications. The collet was weighed, introducedinto a pycnometer of known volume and covered with glycerin.
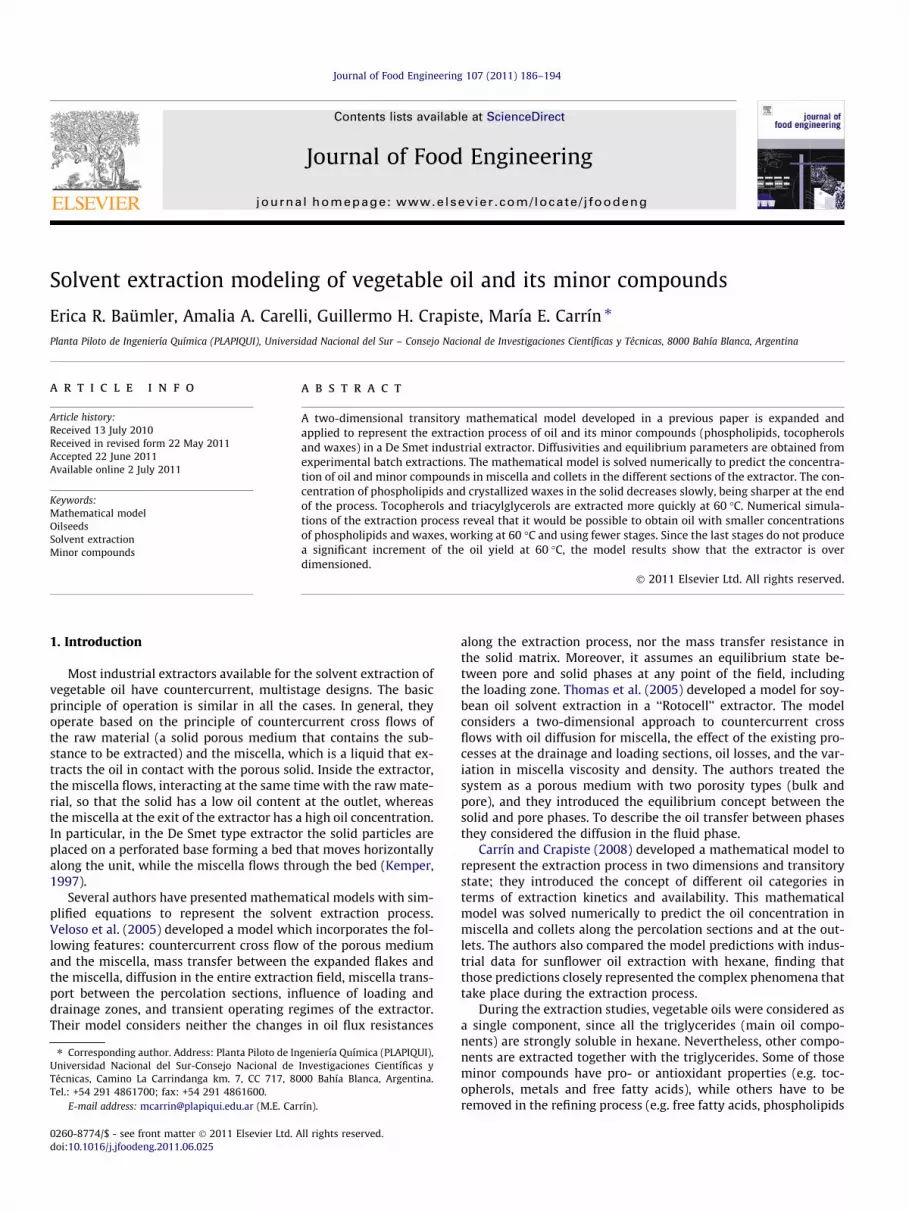
Table 3Simulation results and average values of the experimental data of oil concentration inmiscella (Cmo [kg/kg miscella]) along the extractor.
Stage Simulation model Experimental*
40 �C 50 �C 60 �CCmo Cmo Cmo Cmo
1 0.023 0.014 0.0005 0.002 ± 8 � 10�4
2 0.094 0.071 0.002 0.005 ± 7 � 10�5
3 0.137 0.118 0.006 0.009 ± 2 � 10�4
4 0.162 0.159 0.014 0.015 ± 2 � 10�4
5 0.180 0.196 0.033 0.025 ± 6 � 10�4
6 0.201 0.229 0.077 0.045 ± 6 � 10�3
7 0.230 0.261 0.178 0.099 ± 0.018 0.255 0.295 0.325 0.224 ± 8 � 10�3
* Experimental data determined by Carrín and Crapiste (2008), average values andstandard deviations of four replicates.
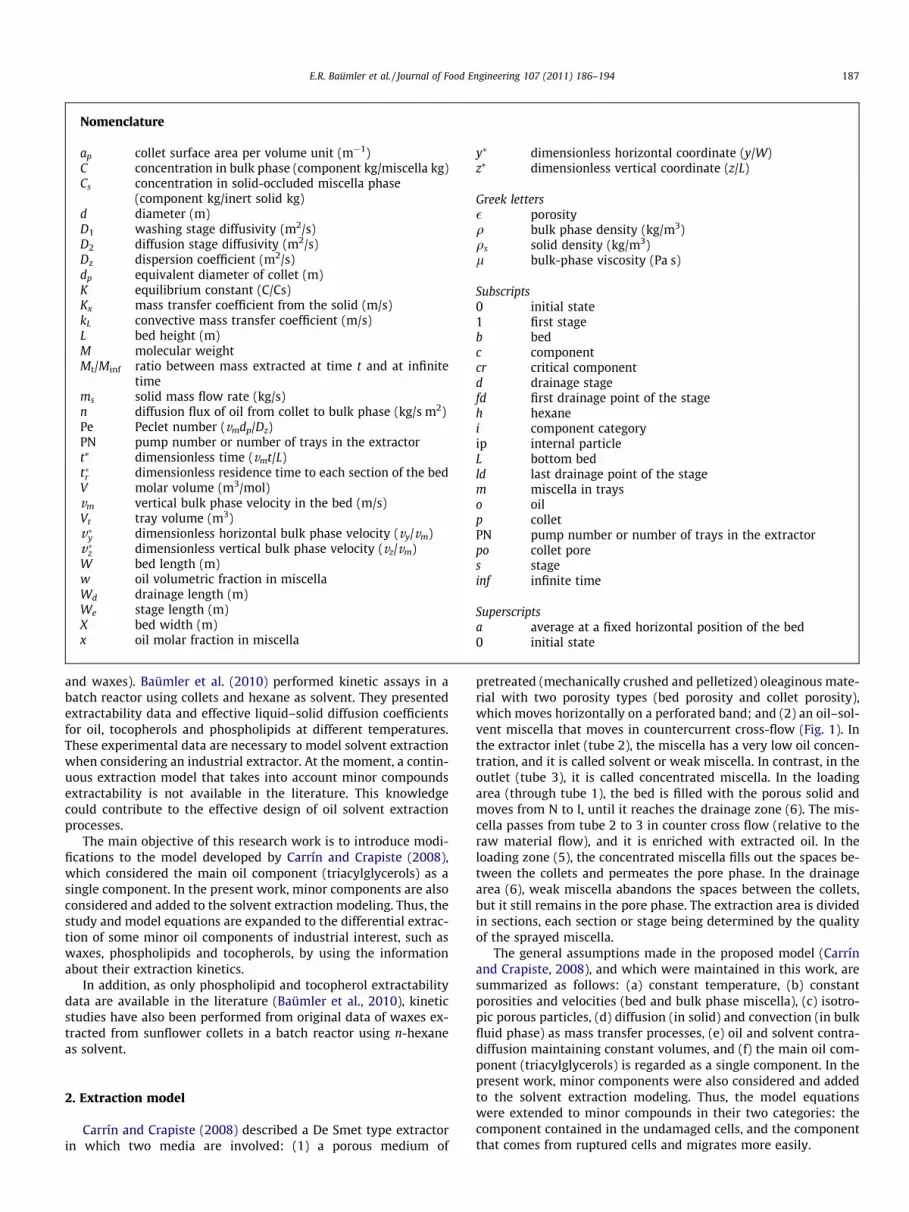
Table 4Simulation results of concentration of minor compounds in miscella trays (Cmc [kg/kg mis
Trays
1 2 3 4
PLSa
40 �C Cmc 1.24 � 10�4 4.02 � 10�4 5.91 � 10�4 7.25 �50 �C Cmc 1.28 � 10�4 4.60 � 10�4 7.28 � 10�4 9.51 �60 �C Cmc 2.25 � 10�4 6.28 � 10�4 8.22 � 10�4 9.85 �
TOCb
40 �C Cmc 1.39 � 10�5 4.24 � 10�5 5.83 � 10�5 6.77 �50 �C Cmc 1.74 � 10�5 5.29 � 10�5 6.86 � 10�5 7.63 �60 �C Cmc 1.13 � 10�5 4.00 � 10�5 5.93 � 10�5 8.06 �
Waxes40 �C Cmc 1.55 � 10�5 4.04 � 10�5 4.66 � 10�5 4.83 �50 �C Cmc 8.16 � 10�6 3.08 � 10�5 4.51 � 10�5 5.73 �60 �C Cmc 5.99 � 10�6 2.75 � 10�5 4.43 � 10�5 5.78 �
a PLS: phospholipids.b TOC: tocopherols.
Then, its volume was calculated as the difference between the vol-umes of the pycnometer and glycerin.
Physical and chemical properties of the raw material were ex-pressed as the mean of four determinations with 95% confidenceintervals.
4. Wax solvent-extraction experiments
In order to determine kinetic parameters of wax extraction (D1c,D2c, and Csccr), experiments were performed using a similar proce-dure to Baümler et al. (2010), working at 40, 50 and 60 �C, withextraction times from 0 to 90 min. In addition, equilibrium testsat the three selected temperatures were completed at 960 min(considered as infinite time) to obtain Kc. All the extractions werecarried out in triplicate.
Wax composition of extracted oils was determined by separa-tion with silicagel chromatographic column and analysis by GLC(Carelli et al., 2002). Briefly, it consists of: (i) heating the oil to80 �C, adding an internal standard (C32), and fractionating by chro-matography on hydrated (2% water content) silica gel column; (ii)recovering the first fraction eluted with n-hexane:ethyl ether(98.5:1.5 v/v) at a flowrate of 3 mL/min, whose polarity is lowerthan that of the triglycerides, evaporating the solvent, and addingn-heptane; (iii) performing an analysis by capillary GLC with anon-column injection system and FID. A Varian 3700 gas chromato-graph, equipped with FID and a temperature-programmable on-column injector (Varian Associates Inc., Palo Alto, CA), was usedfor the final analysis. The capillary column was a HP5 fused-silicacolumn of 11 m length x 0.32 mm i.d., 0.52 mm film thickness(Hewlett Packard, Palo Alto, CA). The operating conditions werethe following: (a) hydrogen as carrier gas at 3 mL/min and a pres-sure of 55.2 kPa; (b) oven temperature programming: initial tem-perature at 80 �C, increased at 30 �C/min to 200 �C, maintainedfor 1 min, increased at 3 �C/min to 340 �C, maintained for 20 min;(c) on-column injector programmed from 80 to 320 �C at 40 �C/min and injection volume of 3 lL; (d) FID at 350 �C and attenuation2x10�12. A recorder-integrator Millenium 2010 (Millipore Corpora-tion, Milford, MA) was used for quantification.
5. Results and discussion
5.1. Extraction of waxes
Experimental data (n = 3) of the extracted fraction Mt/Minf at40, 50 and 60 �C from simple batch extraction experiments areshown in Table 1. The wax fraction in sunflower oil was foundto range between 36 and 48 carbon atoms (C36–C48), which is
cella]) along the extractor.
5 6 7 8
10�4 8.23 � 10�4 8.92 � 10�4 9.41 � 10�4 1.00 � 10�3
10�4 1.14 � 10�3 1.30 � 10�3 1.44 � 10�3 1.60 � 10�3
10�4 1.12 � 10�3 1.23 � 10�3 1.31 � 10�3 1.50 � 10�3
10�5 7.33 � 10�5 7.67 � 10�5 7.86 � 10�5 8.51 � 10�5
10�5 8.02 � 10�5 8.24 � 10�5 8.37 � 10�5 9.12 � 10�5
10�5 1.04 � 10�4 1.31 � 10�4 1.60 � 10�4 2.011 � 10�4
10�5 4.88 � 10�5 4.90 � 10�5 4.91 � 10�5 5.27 � 10�5
10�5 7.08 � 10�5 8.60 � 10�5 1.03 � 10�4 1.40 � 10�4
10�5 6.92 � 10�5 8.12 � 10�5 1.01 � 10�4 1.40 � 10�4

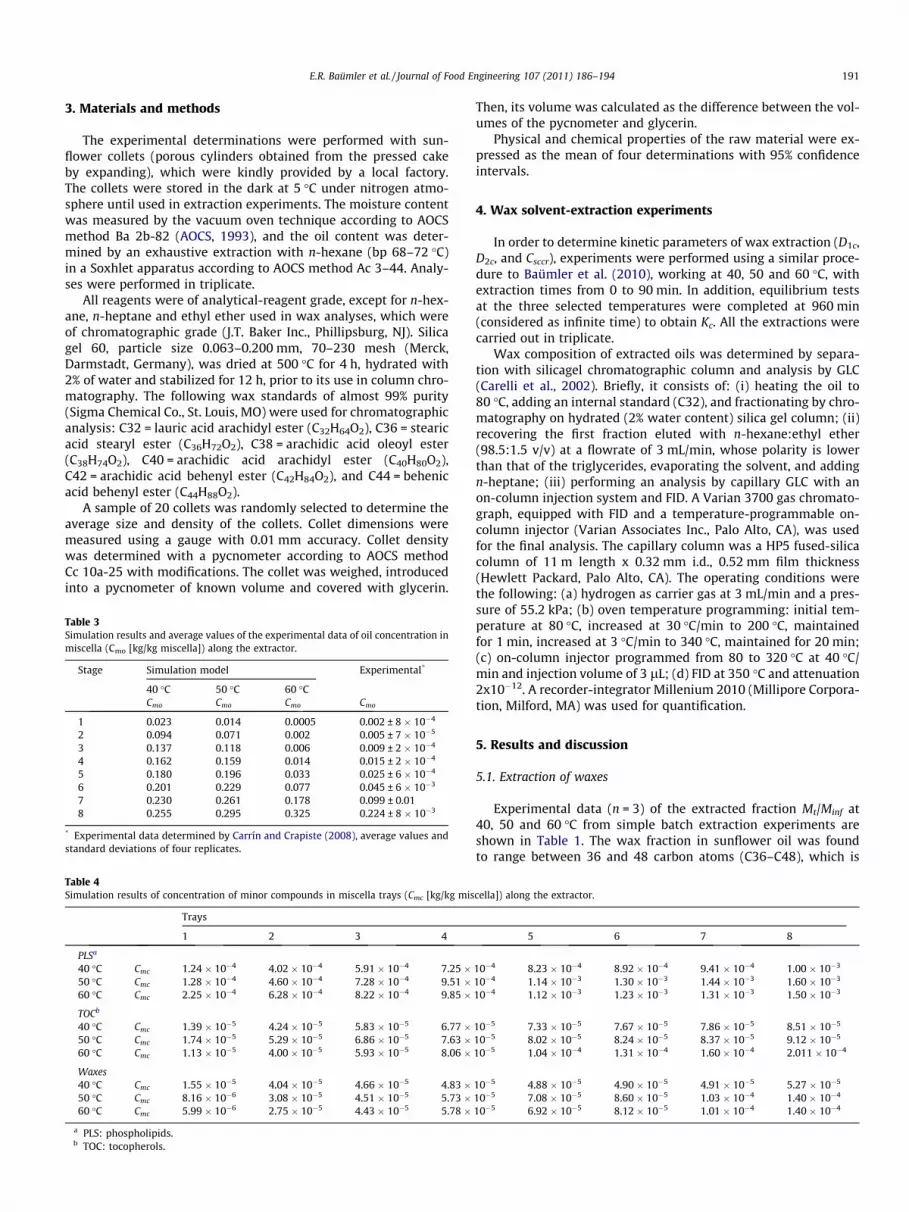
Fig. 3. Average concentrations of oil and minor compounds in the solid phase as a function of the extraction temperature. Stage-9 belongs to the solid inlet of the extractor.
Fig. 4. Miscella/oil concentration profiles along the extractor for steady-state operation.
192 E.R. Baümler et al. / Journal of Food Engineering 107 (2011) 186–194
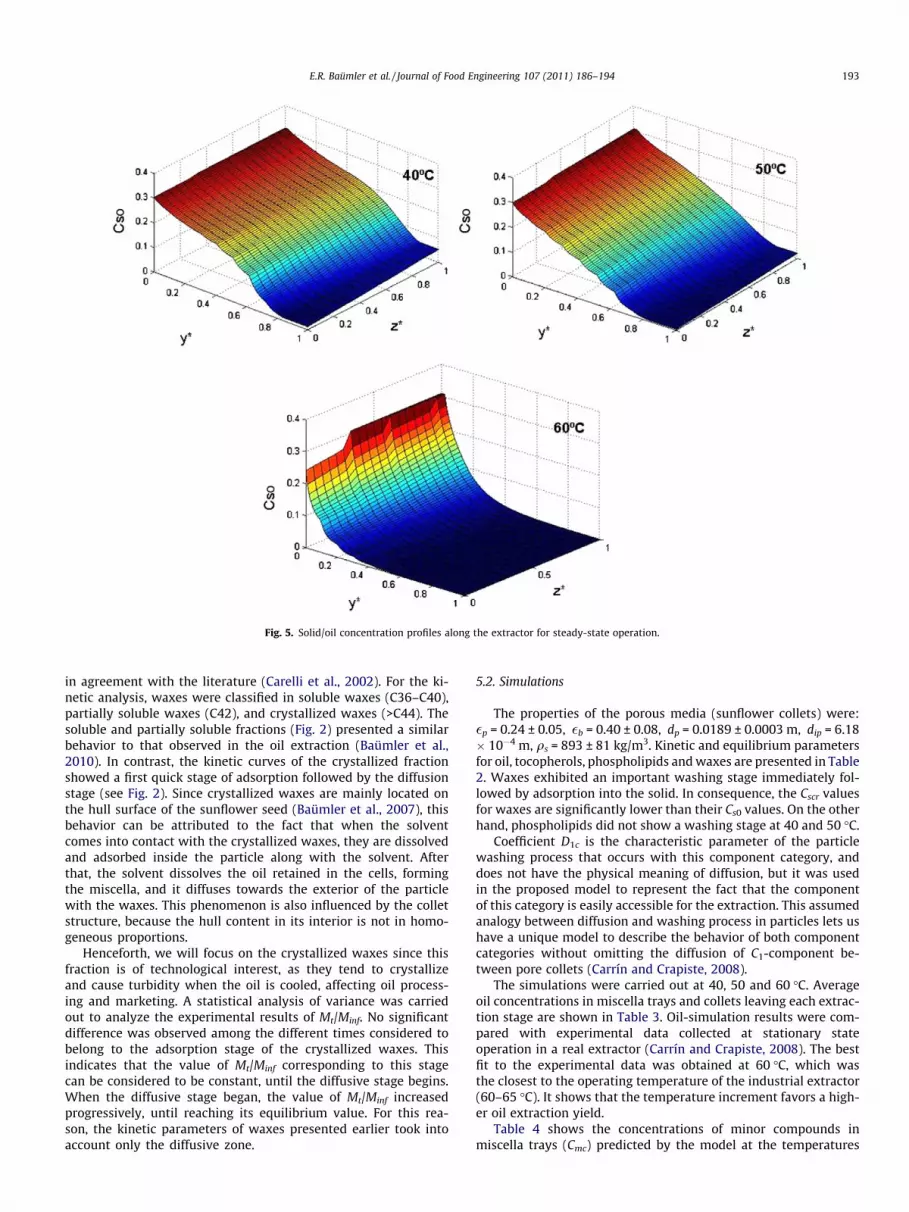
Fig. 5. Solid/oil concentration profiles along the extractor for steady-state operation.
E.R. Baümler et al. / Journal of Food Engineering 107 (2011) 186–194 193
in agreement with the literature (Carelli et al., 2002). For the ki-netic analysis, waxes were classified in soluble waxes (C36–C40),partially soluble waxes (C42), and crystallized waxes (>C44). Thesoluble and partially soluble fractions (Fig. 2) presented a similarbehavior to that observed in the oil extraction (Baümler et al.,2010). In contrast, the kinetic curves of the crystallized fractionshowed a first quick stage of adsorption followed by the diffusionstage (see Fig. 2). Since crystallized waxes are mainly located onthe hull surface of the sunflower seed (Baümler et al., 2007), thisbehavior can be attributed to the fact that when the solventcomes into contact with the crystallized waxes, they are dissolvedand adsorbed inside the particle along with the solvent. Afterthat, the solvent dissolves the oil retained in the cells, formingthe miscella, and it diffuses towards the exterior of the particlewith the waxes. This phenomenon is also influenced by the colletstructure, because the hull content in its interior is not in homo-geneous proportions.
Henceforth, we will focus on the crystallized waxes since thisfraction is of technological interest, as they tend to crystallizeand cause turbidity when the oil is cooled, affecting oil process-ing and marketing. A statistical analysis of variance was carriedout to analyze the experimental results of Mt/Minf. No significantdifference was observed among the different times considered tobelong to the adsorption stage of the crystallized waxes. Thisindicates that the value of Mt/Minf corresponding to this stagecan be considered to be constant, until the diffusive stage begins.When the diffusive stage began, the value of Mt/Minf increasedprogressively, until reaching its equilibrium value. For this rea-son, the kinetic parameters of waxes presented earlier took intoaccount only the diffusive zone.
5.2. Simulations
The properties of the porous media (sunflower collets) were:�p = 0.24 ± 0.05, �b = 0.40 ± 0.08, dp = 0.0189 ± 0.0003 m, dip = 6.18� 10�4 m, qs = 893 ± 81 kg/m3. Kinetic and equilibrium parametersfor oil, tocopherols, phospholipids and waxes are presented in Table2. Waxes exhibited an important washing stage immediately fol-lowed by adsorption into the solid. In consequence, the Cscr valuesfor waxes are significantly lower than their Cs0 values. On the otherhand, phospholipids did not show a washing stage at 40 and 50 �C.
Coefficient D1c is the characteristic parameter of the particlewashing process that occurs with this component category, anddoes not have the physical meaning of diffusion, but it was usedin the proposed model to represent the fact that the componentof this category is easily accessible for the extraction. This assumedanalogy between diffusion and washing process in particles lets ushave a unique model to describe the behavior of both componentcategories without omitting the diffusion of C1-component be-tween pore collets (Carrín and Crapiste, 2008).
The simulations were carried out at 40, 50 and 60 �C. Averageoil concentrations in miscella trays and collets leaving each extrac-tion stage are shown in Table 3. Oil-simulation results were com-pared with experimental data collected at stationary stateoperation in a real extractor (Carrín and Crapiste, 2008). The bestfit to the experimental data was obtained at 60 �C, which wasthe closest to the operating temperature of the industrial extractor(60–65 �C). It shows that the temperature increment favors a high-er oil extraction yield.
Table 4 shows the concentrations of minor compounds inmiscella trays (Cmc) predicted by the model at the temperatures

194 E.R. Baümler et al. / Journal of Food Engineering 107 (2011) 186–194
considered. In general, minor compound concentrations at stage 8,which is the drainage zone of oil-concentrated miscella, increasedwith temperature. This trend can be associated with the incrementof the oil concentration in miscella and changes in the solubility ofthe components in the solvent. Numerical results for phospholipidsat 50 and 60 �C did not show significant differences (F = 1.280, Fc
= 5.591, significance level 0.95), but the difference was noticeablewith respect to the numerical results obtained at 40 �C betweenstages 3 and 8 (F > Fc, Fc = 5.591, significance level 0.95). The modeloutputs for the tocopherol concentrations in miscella at 40 and50 �C were similar. On the other hand, at 60 �C these compoundswere easier to extract, showing a similar trend to that of oil. At50 and 60 �C, wax concentrations in miscella showed a first fastextraction stage corresponding to their washing stage.
In Fig. 3 the concentrations of oil and minor compounds in thesolid are illustrated. At 60 �C the solid contains almost no oil(Cso < 0.0005) from stage 4 to 1, while at lower temperatures thesolid exited the extractor (stage 1) with a residual concentrationof oil (Cso = 0.031 and Cso = 0.012 at 40 and 50 �C, respectively).Phospholipid concentrations in the solid had a slow decrease asthe collets advanced through the extractor. This fact allows us tostate that the extraction of phospholipids increased at the end ofthe extraction process (stage 1–3).
The tocopherols in the solid matrix showed the same behavioras the oil, being extracted faster at 60 �C (see Fig. 3). The concentra-tion of waxes in the solid decreased slowly from the inlet of the so-lid to the area near its drainage zone, where the extraction becamefaster, being this trend more intensive at 60 �C. At this tempera-ture, a first zone belonging to the washing stage was observed (be-tween stages 9 and 7), followed by a slighter decrease of the waxconcentrations in the solid. This behavior is in agreement with thatobserved in miscella.
The evolution of oil concentrations in miscella and collets alongthe extractor showed a wave behavior at the top of the bed (z⁄ = 0)during the stationary state because of the change in miscella qual-ity between two stages (Figs. 4 and 5). This behavior disappeared atthe bottom of the bed (z⁄ = 1), where a monotonous decrease of theoil concentrations was observed. At steady state and at 40 and50 �C, this behavior was detected in almost every tray, whereasat 60 �C it was noticed only in the trays close to the solid porousinlet zone, where free oil extraction (C1 category) occurred(Fig. 4). From the middle of the bed to drainage zone (y⁄ = 0.5–1),a plateau was obtained due to the slow transfer of the boundedoil (C2 category).
6. Conclusion
The extended model presented in this work has proved to beuseful to predict oil and minor-compound concentration profiles,
and to represent the complex phenomena that take place duringthe extraction process under different operating conditions. Thismodel can be employed to design and manage extractors byusing several types of solvents and porous solids. However,experimental data obtained under laboratory conditions are re-quired to use this model. Particularly, the model predictions indi-cate that it would be possible to obtain sunflower oil at 60 �Cusing fewer stages in a De Smet extractor with hexane as solvent.Under these conditions, the phospholipid and wax concentrationsin the produced oil would result in a less-demanding refiningprocess.
Acknowledgments
The authors acknowledge the financial support from CONICET(Consejo Nacional de Investigaciones Científicas y Técnicas) andUniversidad Nacional del Sur, Argentina.
References
AOCS, 1993. Official Methods and Recommended Practices of the American OilChemist’s Society, fourth ed. AOCS Press, Champaign.
Baümler, E., Crapiste, G., Carelli, A., 2007. Sunflower-oil wax reduction by seedsolvent washing. Journal of the American Oil Chemists Society 84, 603–608.
Baümler, E., Crapiste, G., Carelli, A., 2010. Oil solvent extraction: kinetic study ofmajor and minor compounds. Journal of the American Oil Chemists Society 87,1489–1495.
Butt, J., 1980. Reaction Kinetics and Reactor Design. Prentice Hall, New Jersey.Carelli, A., Frizzera, L., Forbito, P., Crapiste, G., 2002. Wax composition of
sunflower seed oils. Journal of the American Oil Chemists Society 79, 763–768.
Carrín, M., Crapiste, G., 2008. Mathematical modeling of vegetable oil solventextraction in a multistage horizontal extractor. Journal of Food Engineering 85,418–425.
Davis, M., 1984. Numerical Methods and Modeling for Chemical Engineers. JohnWiley and Sons Inc., New York.
Fan, H., Morris, J., Wakeham, H., 1948. Diffusion phenomena in solvent extraction ofpeanut oil. Industrial and Engineering Chemistry 40, 195–199.
Kemper, T., 1997. Extraction principles and extractor design. In: Wan, P., Wakelyn,P. (Eds.), Technology and Solvents for Extracting Oilseeds and NonpetroleumOils. AOCS Press, Champaign, pp. 137–141.
Perry, R., Green, D., 1984. Perry’s Chemical Engineers’ Handbook. McGraw-Hill Inc.,New York.
Rice, P., Hamm, W., 2002. Densities of soybean oil–solvent mixtures. Oils and Fats47, 227–230.
Thomas, G., Krioukov, V., Vielmo, H., 2005. Simulation of vegetable oil extraction incounter-current crossed flows using the artificial neuronal network. ChemicalEngineering Processes 44, 581–592.
Treybal, R., 1981. Mass Transfer Operations. McGraw-Hill Kogakusha Ltd.,Singapore.
Veloso, G., Krioukov, V., Vielmo, H., 2005. Mathematical modeling of vegetable oilextraction in a countercurrent crossed flow horizontal extractor. Journal of FoodEngineering 66 (4), 477–486.
Wakao, N., Kaguei, S., 1982. Heat and Mass Transfer in Packed Beds. Gordon andBreach Science Publishers, London.