vegetable market assessment - us agency for
TRANSCRIPT
VEGETABLE MARKET ASSESSMENT REPORT
FINAL
Wednesday, September 07, 2011
This publication was produced for review by the United States Agency for International Development. It was prepared by Deloitte Consulting LLP.
VEGETABLE MARKET ASSESSMENT REPORT
FINAL
USAID ECONOMIC PROSPERITY INITIATIVE (EPI)
CONTRACT NUMBER: AID-114-C-10-00004
DELOITTE CONSULTING LLP
USAID/CAUCASUS
WEDNESDAY, SEPTEMBER 07, 2011
DISCLAIMER:
The author‟s views expressed in this publication do not necessarily reflect the views of the United States Agency for International Development or the United States Government.
ECONOMIC PROSPERITY INITIATIVE (EPI) i
DATA
Author(s): Lucas B. Caltrider
Name of Component: Agriculture Sectors Component (ASC)
Practice Area: Vegetables
Key Words: Georgia, vegetables, potatoes, imports, exports, Farm Service Centers, Machinery Service Centers, seeds, seedlings, fertilizers, pesticides, food processing, cold storage, access to capital, access to financing, loans, Microfinance Institution, commercial banking, capacity building, education and training, associations, government agency, and credit.
Reviewed by:
Zurab Chekurashvili, Deputy Agriculture Sectors Component Lead
Dennis Zeedyk, Agriculture Sectors Component Lead
ECONOMIC PROSPERITY INITIATIVE (EPI) ii
CONTENTS I. EXECUTIVE SUMMARY ..................................................................................................................... 1
II. APPENDICES ..................................................................................................................................... 4
A. BACKGROUND……… ............................................................................................................ 5
B. METHODOLOGY…….. ........................................................................................................... 6
C. FINDINGS…………… .............................................................................................................. 7
D. RECOMMENDATIONS . ……………………………………………………………………………40
E. ADDITIONAL INFORMATION ............................................................................................... 44
LIST OF FIGURES
FIGURE 1: ANNUAL VEGETABLE PRODUCTION OUTPUTS (GEL MILLION) ............................ 9
FIGURE 2: VEGETABLE AND POTATO PRODUCTION IN GEORGIA ('000 MT) ...................... 10
FIGURE 3: PRODUCTION THROUGH TRANSITIONS – 1980-2009 („000 MT) .......................... 10
FIGURE 4: AVERAGE ANNUAL YIELDS (MT PER HECTARE) – 2006-2010 ............................. 11
FIGURE 5: ANNUAL CONSUMPTION VOLUMES ....................................................................... 12
FIGURE 6: IMPORTS AS A PERCENTAGE OF DOMESTIC CONSUMPTION ........................... 13
FIGURE 7: IMPORT AND EXPORT VOLUMES FOR VEGETABLES AND POTATOES - 2010 .............................................................................................................. 13
FIGURE 8: KEY VEGETABLE IMPORTS ('000 USD) – 2000-2010 ............................................. 14
FIGURE 9: KEY VEGETABLE EXPORTS ('000 USD) – 2000-2010 ............................................ 14
FIGURE 10: MAP OF FSC AND MSC NETWORK ....................................................................... 16
FIGURE 11: FOOD PROCESSORS AND CANNERIES PRODUCTION OUTPUT (GEL '000) ............................................................................................................................ 18
FIGURE 12: INDIVIDUAL VEGETABLE PRODUCTION VOLUME ('000 MT) .............................. 21
FIGURE 13: PRICE ANALYSIS FOR 4 MAJOR VEGETABLES (IN GEL) ................................... 21
ECONOMIC PROSPERITY INITIATIVE (EPI) iii
FIGURE 14: VEGETABLE IMPORTS TO GEORGIA BY VOLUME, VALUE AND ORIGIN ................................................................................................................................. 21
FIGURE 15: VEGETABLE EXPORTS FROM GEORGIA BY VOLUME, VALUE AND ORIGIN ........................................................................................................................ 22
FIGURE 16: VEGETABLE PRODUCTION ZONES ...................................................................... 23
FIGURE 17: NUMBER OF VEGETABLE FARMS BY REGION – 2010 ....................................... 24
FIGURE 18: NUMBER OF POTATO FARMS BY REGION – 2010 .............................................. 24
FIGURE 19: SOWN AREAS IN HECTARES – 2010 ..................................................................... 26
FIGURE 20: NUMBER OF VEGETABLE FARMS BY SIZE CATEGORIES ................................. 26
FIGURE 21: NUMBER OF POTATO FARMS BY SIZE CATEGORIES ........................................ 27
FIGURE 22: BREAKDOWN OF FARMS BY REGION AND SIZE (CUMULATIVE)...................... 28
FIGURE 23: ANNUAL OUTPUT GROWTH RATES ..................................................................... 33
FIGURE 24: VEGETABLE MARKET VALUE CHAIN .................................................................... 36
VEGETABLE MARKET ASSESSMENT FINAL
ECONOMIC PROSPERITY INITIATIVE (EPI) 1
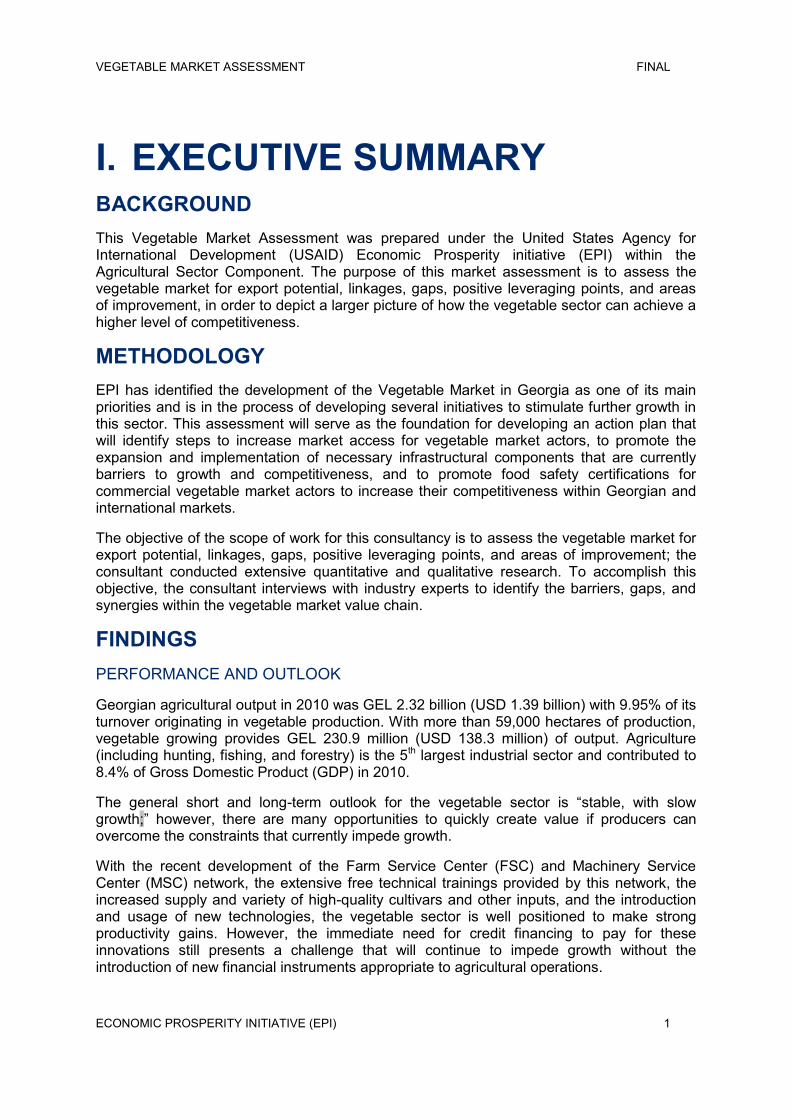
I. EXECUTIVE SUMMARY BACKGROUND This Vegetable Market Assessment was prepared under the United States Agency for International Development (USAID) Economic Prosperity initiative (EPI) within the Agricultural Sector Component. The purpose of this market assessment is to assess the vegetable market for export potential, linkages, gaps, positive leveraging points, and areas of improvement, in order to depict a larger picture of how the vegetable sector can achieve a higher level of competitiveness.
METHODOLOGY EPI has identified the development of the Vegetable Market in Georgia as one of its main priorities and is in the process of developing several initiatives to stimulate further growth in this sector. This assessment will serve as the foundation for developing an action plan that will identify steps to increase market access for vegetable market actors, to promote the expansion and implementation of necessary infrastructural components that are currently barriers to growth and competitiveness, and to promote food safety certifications for commercial vegetable market actors to increase their competitiveness within Georgian and international markets.
The objective of the scope of work for this consultancy is to assess the vegetable market for export potential, linkages, gaps, positive leveraging points, and areas of improvement; the consultant conducted extensive quantitative and qualitative research. To accomplish this objective, the consultant interviews with industry experts to identify the barriers, gaps, and synergies within the vegetable market value chain.
FINDINGS PERFORMANCE AND OUTLOOK
Georgian agricultural output in 2010 was GEL 2.32 billion (USD 1.39 billion) with 9.95% of its turnover originating in vegetable production. With more than 59,000 hectares of production, vegetable growing provides GEL 230.9 million (USD 138.3 million) of output. Agriculture (including hunting, fishing, and forestry) is the 5th largest industrial sector and contributed to 8.4% of Gross Domestic Product (GDP) in 2010.
The general short and long-term outlook for the vegetable sector is “stable, with slow growth;” however, there are many opportunities to quickly create value if producers can overcome the constraints that currently impede growth.
With the recent development of the Farm Service Center (FSC) and Machinery Service Center (MSC) network, the extensive free technical trainings provided by this network, the increased supply and variety of high-quality cultivars and other inputs, and the introduction and usage of new technologies, the vegetable sector is well positioned to make strong productivity gains. However, the immediate need for credit financing to pay for these innovations still presents a challenge that will continue to impede growth without the introduction of new financial instruments appropriate to agricultural operations.
VEGETABLE MARKET ASSESSMENT FINAL
ECONOMIC PROSPERITY INITIATIVE (EPI) 2
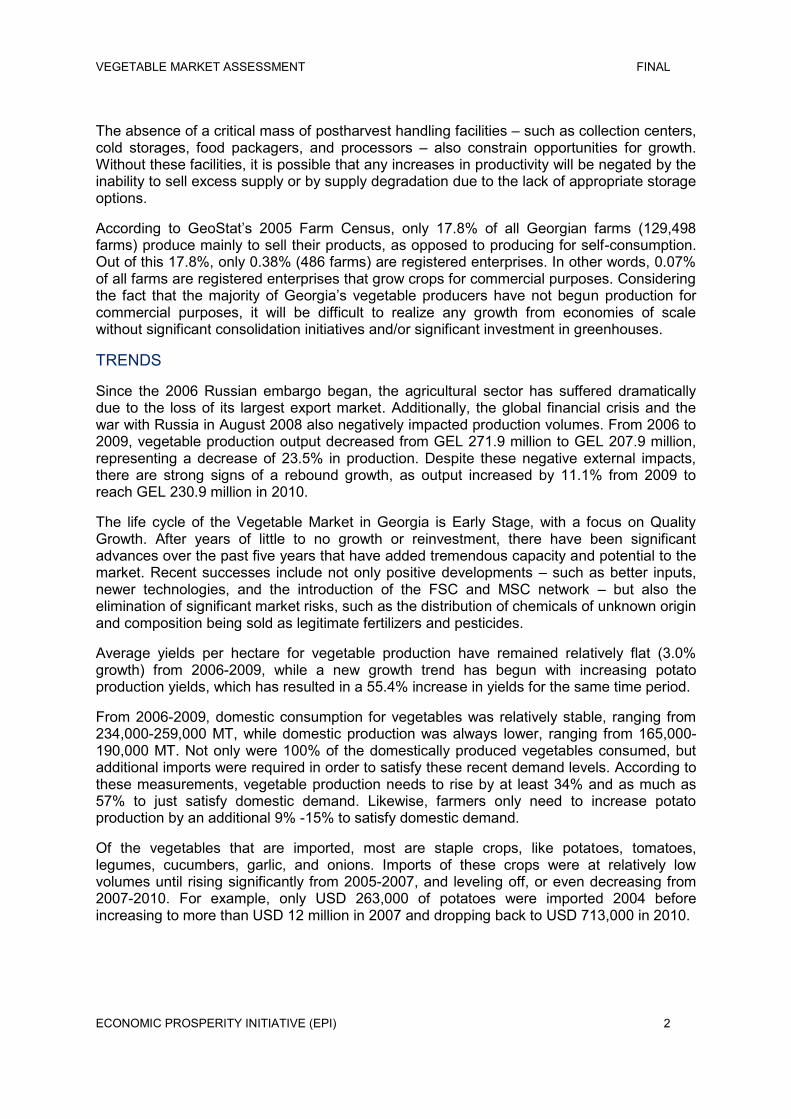
The absence of a critical mass of postharvest handling facilities – such as collection centers, cold storages, food packagers, and processors – also constrain opportunities for growth. Without these facilities, it is possible that any increases in productivity will be negated by the inability to sell excess supply or by supply degradation due to the lack of appropriate storage options.
According to GeoStat‟s 2005 Farm Census, only 17.8% of all Georgian farms (129,498 farms) produce mainly to sell their products, as opposed to producing for self-consumption. Out of this 17.8%, only 0.38% (486 farms) are registered enterprises. In other words, 0.07% of all farms are registered enterprises that grow crops for commercial purposes. Considering the fact that the majority of Georgia‟s vegetable producers have not begun production for commercial purposes, it will be difficult to realize any growth from economies of scale without significant consolidation initiatives and/or significant investment in greenhouses.
TRENDS
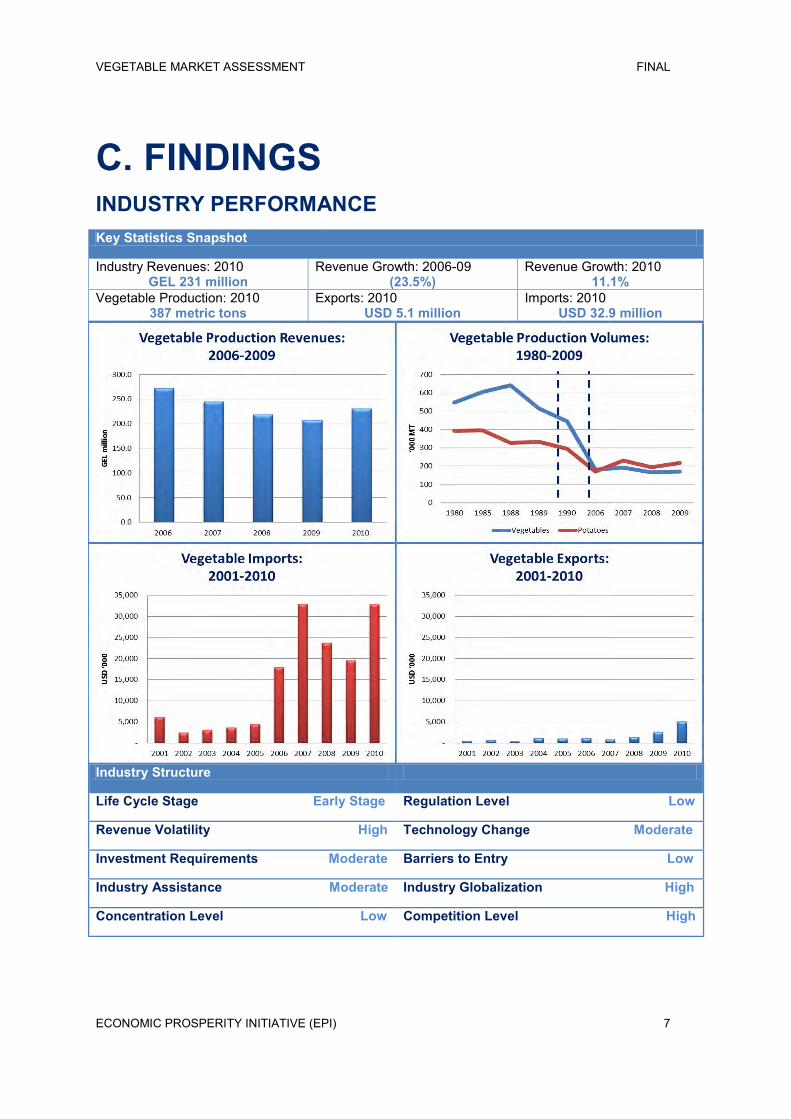
Since the 2006 Russian embargo began, the agricultural sector has suffered dramatically due to the loss of its largest export market. Additionally, the global financial crisis and the war with Russia in August 2008 also negatively impacted production volumes. From 2006 to 2009, vegetable production output decreased from GEL 271.9 million to GEL 207.9 million, representing a decrease of 23.5% in production. Despite these negative external impacts, there are strong signs of a rebound growth, as output increased by 11.1% from 2009 to reach GEL 230.9 million in 2010.
The life cycle of the Vegetable Market in Georgia is Early Stage, with a focus on Quality Growth. After years of little to no growth or reinvestment, there have been significant advances over the past five years that have added tremendous capacity and potential to the market. Recent successes include not only positive developments – such as better inputs, newer technologies, and the introduction of the FSC and MSC network – but also the elimination of significant market risks, such as the distribution of chemicals of unknown origin and composition being sold as legitimate fertilizers and pesticides.
Average yields per hectare for vegetable production have remained relatively flat (3.0% growth) from 2006-2009, while a new growth trend has begun with increasing potato production yields, which has resulted in a 55.4% increase in yields for the same time period.
From 2006-2009, domestic consumption for vegetables was relatively stable, ranging from 234,000-259,000 MT, while domestic production was always lower, ranging from 165,000-190,000 MT. Not only were 100% of the domestically produced vegetables consumed, but additional imports were required in order to satisfy these recent demand levels. According to these measurements, vegetable production needs to rise by at least 34% and as much as 57% to just satisfy domestic demand. Likewise, farmers only need to increase potato production by an additional 9% -15% to satisfy domestic demand.
Of the vegetables that are imported, most are staple crops, like potatoes, tomatoes, legumes, cucumbers, garlic, and onions. Imports of these crops were at relatively low volumes until rising significantly from 2005-2007, and leveling off, or even decreasing from 2007-2010. For example, only USD 263,000 of potatoes were imported 2004 before increasing to more than USD 12 million in 2007 and dropping back to USD 713,000 in 2010.
VEGETABLE MARKET ASSESSMENT FINAL
ECONOMIC PROSPERITY INITIATIVE (EPI) 3
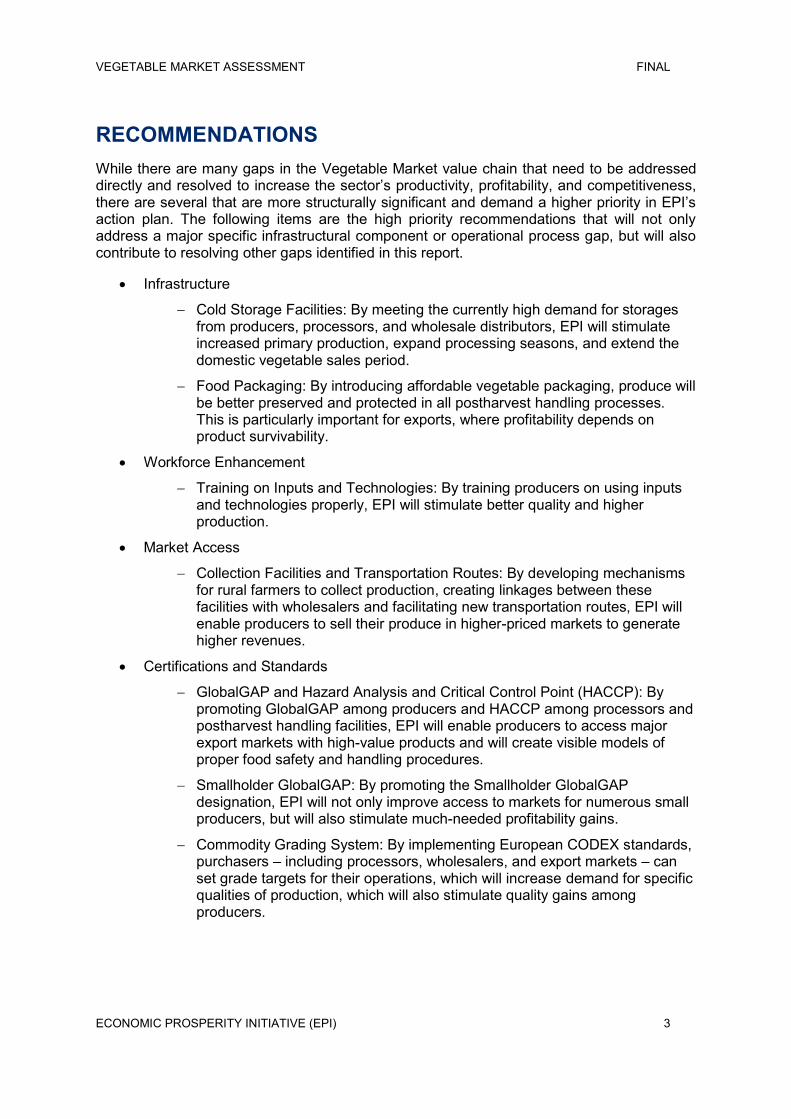
RECOMMENDATIONS While there are many gaps in the Vegetable Market value chain that need to be addressed directly and resolved to increase the sector‟s productivity, profitability, and competitiveness, there are several that are more structurally significant and demand a higher priority in EPI‟s action plan. The following items are the high priority recommendations that will not only address a major specific infrastructural component or operational process gap, but will also contribute to resolving other gaps identified in this report.
Infrastructure
Cold Storage Facilities: By meeting the currently high demand for storages from producers, processors, and wholesale distributors, EPI will stimulate increased primary production, expand processing seasons, and extend the domestic vegetable sales period.
Food Packaging: By introducing affordable vegetable packaging, produce will be better preserved and protected in all postharvest handling processes. This is particularly important for exports, where profitability depends on product survivability.
Workforce Enhancement
Training on Inputs and Technologies: By training producers on using inputs and technologies properly, EPI will stimulate better quality and higher production.
Market Access
Collection Facilities and Transportation Routes: By developing mechanisms for rural farmers to collect production, creating linkages between these facilities with wholesalers and facilitating new transportation routes, EPI will enable producers to sell their produce in higher-priced markets to generate higher revenues.
Certifications and Standards
GlobalGAP and Hazard Analysis and Critical Control Point (HACCP): By promoting GlobalGAP among producers and HACCP among processors and postharvest handling facilities, EPI will enable producers to access major export markets with high-value products and will create visible models of proper food safety and handling procedures.
Smallholder GlobalGAP: By promoting the Smallholder GlobalGAP designation, EPI will not only improve access to markets for numerous small producers, but will also stimulate much-needed profitability gains.
Commodity Grading System: By implementing European CODEX standards, purchasers – including processors, wholesalers, and export markets – can set grade targets for their operations, which will increase demand for specific qualities of production, which will also stimulate quality gains among producers.
VEGETABLE MARKET ASSESSMENT FINAL
ECONOMIC PROSPERITY INITIATIVE (EPI) 4
II. APPENDICES A. BACKGROUND
B. METHODOLOGY
C. FINDINGS
D. RECOMMENDATIONS
E. ADDITIONAL INFORMATION
VEGETABLE MARKET ASSESSMENT FINAL
ECONOMIC PROSPERITY INITIATIVE (EPI) 5
A. BACKGROUND DEFINITIONS
For the purpose of this assessment, “Vegetable Market” refers to the primary production of vegetables (including potatoes), and includes both open field producers as well as greenhouse producers. This assessment refers to vegetables and potatoes collectively as “vegetables,” but potatoes are broken out from vegetables for statistical purposes. Furthermore, this definition does not include other annual crops, such as wheat, maize, melons, and gourds or crops used for fodder purposes. All references to performance of the “Vegetable Industry” focus on actual vegetable sector production and exclude all other market actors. Support services provided to the Vegetable Market by input providers, processors, storages, distributors, etc., are outlined in a separate section.
MAIN ACTIVITIES
The main activities of the Vegetable Industry include:
PreProduction
Soil testing and ground preparation
Seedling production
Equipment and machinery rental services
Research and development
Technical training
Production (including planting)
Equipment and machinery rental services
Planting of seeds or seedlings
Irrigation systems
Application of fertilizers, herbicides, and pesticides
Postharvest
Sorting produce according to size and quality
Cleaning and packaging
Drying and processing
Storing produce in cold storages and other facilities
Distribution
Delivering produce to local fresh markets
Wholesalers purchasing and transporting produce to consumer markets
Export preparation and shipment
Retail market outlet sales
VEGETABLE MARKET ASSESSMENT FINAL
ECONOMIC PROSPERITY INITIATIVE (EPI) 6
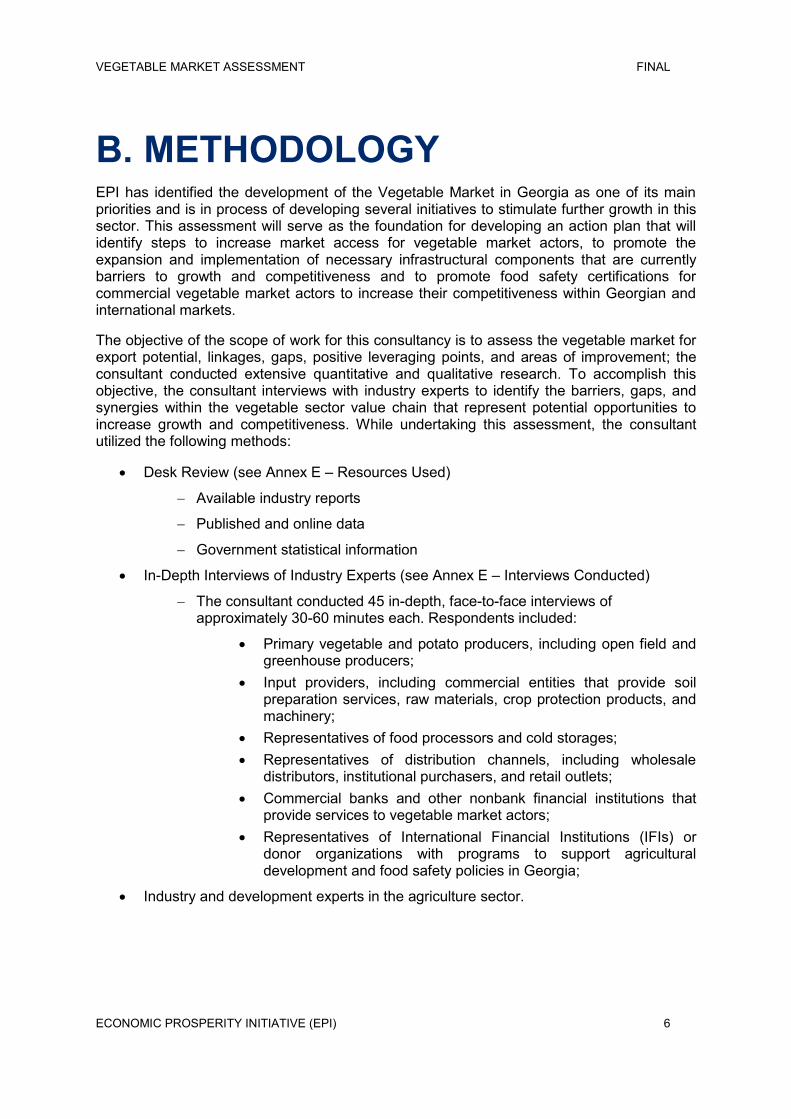
B. METHODOLOGY EPI has identified the development of the Vegetable Market in Georgia as one of its main priorities and is in process of developing several initiatives to stimulate further growth in this sector. This assessment will serve as the foundation for developing an action plan that will identify steps to increase market access for vegetable market actors, to promote the expansion and implementation of necessary infrastructural components that are currently barriers to growth and competitiveness and to promote food safety certifications for commercial vegetable market actors to increase their competitiveness within Georgian and international markets.
The objective of the scope of work for this consultancy is to assess the vegetable market for export potential, linkages, gaps, positive leveraging points, and areas of improvement; the consultant conducted extensive quantitative and qualitative research. To accomplish this objective, the consultant interviews with industry experts to identify the barriers, gaps, and synergies within the vegetable sector value chain that represent potential opportunities to increase growth and competitiveness. While undertaking this assessment, the consultant utilized the following methods:
Desk Review (see Annex E – Resources Used)
Available industry reports
Published and online data
Government statistical information
In-Depth Interviews of Industry Experts (see Annex E – Interviews Conducted)
The consultant conducted 45 in-depth, face-to-face interviews of approximately 30-60 minutes each. Respondents included:
Primary vegetable and potato producers, including open field and greenhouse producers;
Input providers, including commercial entities that provide soil preparation services, raw materials, crop protection products, and machinery;
Representatives of food processors and cold storages; Representatives of distribution channels, including wholesale
distributors, institutional purchasers, and retail outlets; Commercial banks and other nonbank financial institutions that
provide services to vegetable market actors; Representatives of International Financial Institutions (IFIs) or
donor organizations with programs to support agricultural development and food safety policies in Georgia;
Industry and development experts in the agriculture sector.
VEGETABLE MARKET ASSESSMENT FINAL
ECONOMIC PROSPERITY INITIATIVE (EPI) 7
C. FINDINGS INDUSTRY PERFORMANCE Key Statistics Snapshot
Industry Revenues: 2010 GEL 231 million
Revenue Growth: 2006-09 (23.5%)
Revenue Growth: 2010 11.1%
Vegetable Production: 2010 387 metric tons
Exports: 2010 USD 5.1 million
Imports: 2010 USD 32.9 million
Industry Structure
Life Cycle Stage Early Stage Regulation Level Low
Revenue Volatility High Technology Change Moderate
Investment Requirements Moderate Barriers to Entry Low
Industry Assistance Moderate Industry Globalization High
Concentration Level Low Competition Level High
VEGETABLE MARKET ASSESSMENT FINAL
ECONOMIC PROSPERITY INITIATIVE (EPI) 8
LIFE CYCLE STAGE
The life cycle of the Vegetable Market in Georgia is Early Stage, with a focus on Quality Growth. After years of little to no growth or reinvestment, there have been significant advances over the past five years that have added tremendous capacity and potential to the market. Recent successes include not only positive developments – such as better inputs, newer technologies, and the introduction of the FSC and MSC network – but also the elimination of significant market risks, such as the distribution of chemicals of unknown origin and composition being sold as legitimate fertilizers and pesticides.
Despite these gains, vegetable producers and processors face many significant challenges, including:
General lack of market and price information;
No economies of scale to increase competitiveness with regional competitors;
Poor primary production practices;
Low-quality postharvest handling systems;
Limited access to credit for operations and capital investments;
Limited access to production inputs and technical training services;
Poor harvest and postharvest infrastructure;
Limited access to major domestic and export markets.
Gains in production and competitiveness will be realized over the next few years by these successes, but the specific challenge that will impede this industry is that growth will be limited by the current absence of any significant economies of scale among vegetable producers. With more than 99% of all producers farming plots smaller than two hectares, it is impossible to realize cost-efficiency measures and profitability potential unless some form of consolidation occurs, despite the implementation of new technologies and better inputs.
CURRENT PERFORMANCE
Financial Performance
Georgian agricultural output in 2010 was GEL 2.32 billion (USD 1.39 billion) with 9.95% of its turnover originating in vegetable production. With more than 59,000 hectares of production, vegetable growing provides GEL 230.9 million (USD 138.3 million) of output. Agriculture (including hunting, fishing, and forestry) is the 5th largest industrial sector and contributed to 8.4% of GDP in 2010.
Since the 2006 Russian embargo began, the agricultural sector has suffered dramatically due to the loss of its largest export market, but the market is showing signs of recovery. Additionally, the global financial crisis and the war with Russia in August 2008 also negatively impacted production volumes.
From 2006 to 2009, vegetable production output decreased from GEL 271.9 million to GEL 207.9 million, representing a decrease of 23.5% in production. Despite these negative
VEGETABLE MARKET ASSESSMENT FINAL
ECONOMIC PROSPERITY INITIATIVE (EPI) 9
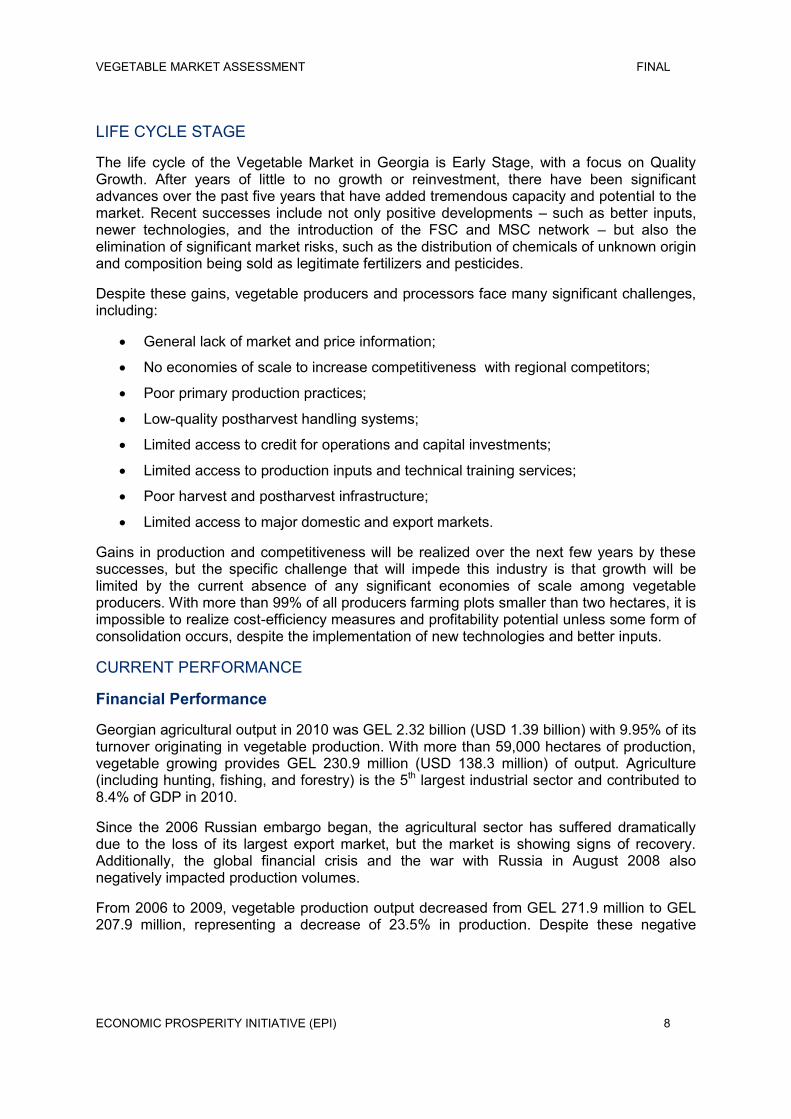
external impacts, there are potential signs of a growth, as output increased by 11.1% from 2009 to reach GEL 230.9 million in 2010.1
Figure 1: Annual Vegetable Production Outputs (GEL million)
Source: GeoStat, 2011
Supply Analysis
Historically, Georgia‟s economy has been, to a great extent, based on agricultural production, especially in fresh and processed vegetables. During the Soviet period, farms and greenhouses were very productive. Greenhouse vegetable production for off-season produce was a well-developed sector during the second half of the twentieth century. In fact, there are still thousands of small greenhouses throughout the country; however, most are unheated, need rehabilitation, and cannot currently contribute meaningfully to off-season production.
After the dissolution of the Soviet Union, the central market economy collapsed, large Soviet kolhoz and sovhoz (large Soviet state-owned farms) were broken up into small farm plots, input drivers became increasingly more expensive, and supply lines to international demand markets were broken. Combining these factors with the energy crisis in the early 2000s and the degradation of irrigation systems throughout the country in the mid-2000s led to a significant decrease in domestic production. This made it necessary to rely heavily upon imported products from the international markets.
As can be seen in Figure 2, production volumes during the Soviet period were very high, as much as 2.95 times larger than current production volumes, as can be seen in Figure 3.
1 GeoStat, National Statistics Office of Georgia. “Gross Domestic Product of Georgia in 2010”. www.geostat.ge.
271.9
245.4
218.7207.9
230.9
0.0
50.0
100.0
150.0
200.0
250.0
300.0
2006 2007 2008 2009 2010
GEL
mill
ion
VEGETABLE MARKET ASSESSMENT FINAL
ECONOMIC PROSPERITY INITIATIVE (EPI) 10
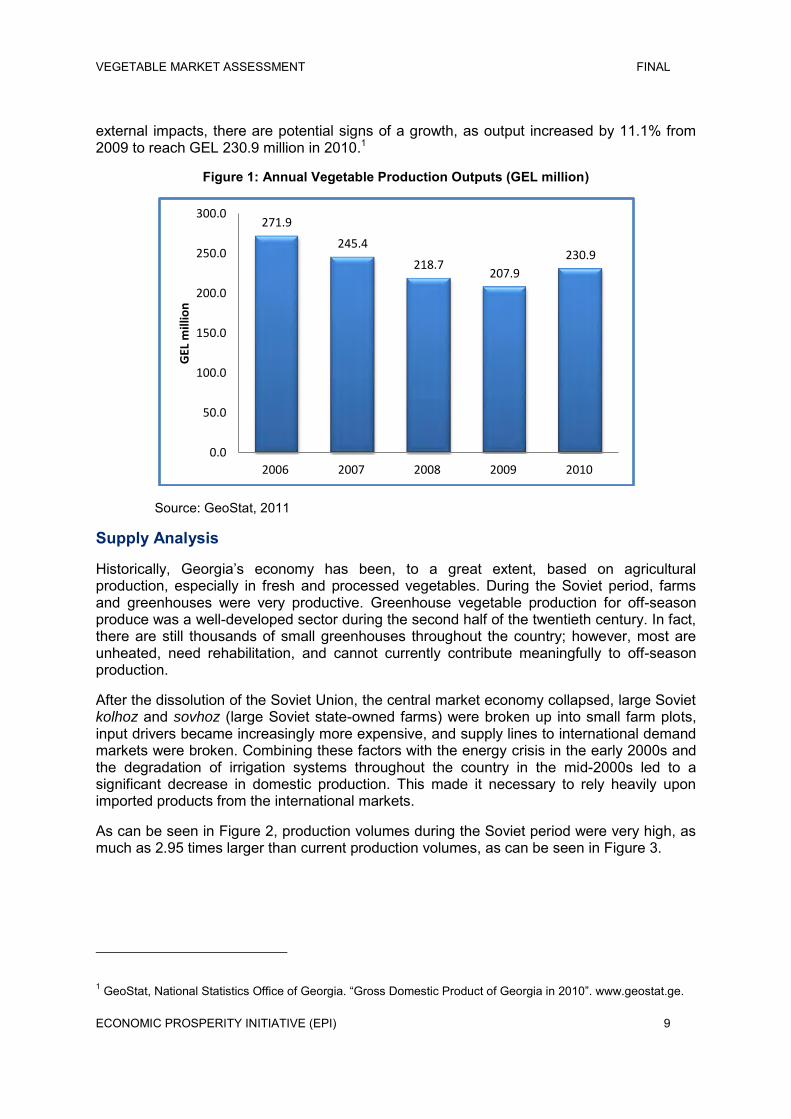
Figure 2: Vegetable and Potato Production in Georgia ('000 MT)
1980 1985 1988 1989 1990 Vegetables 546 604 641 515 443 Potatoes 393 394 326 332 294
Source: Народное Хозяйство СССР, 1991.
Although a major food exporter during the Soviet era, production trends decrease sharply in 1985-1990. In this period, vegetable and potato production had already decreased by 26.7% and 25.4%, respectively.
From 1990 to 2006, there was a prolonged period of contraction, followed by stagnation, in the agriculture industry, characterized by significant decreases in production volumes across all agricultural sectors. As can be seen in Figure 2 below, vegetable and potato production volumes decreased by an additional 59.4% and 42.5%, respectively.
In 2006, production volumes stabilized and a new growth trend is beginning to emerge, with an 11% growth in total production volumes from 2006-2009. However, price strength is still a major issue, since total production output (in GEL) decreased by 23.5% for the same time period.
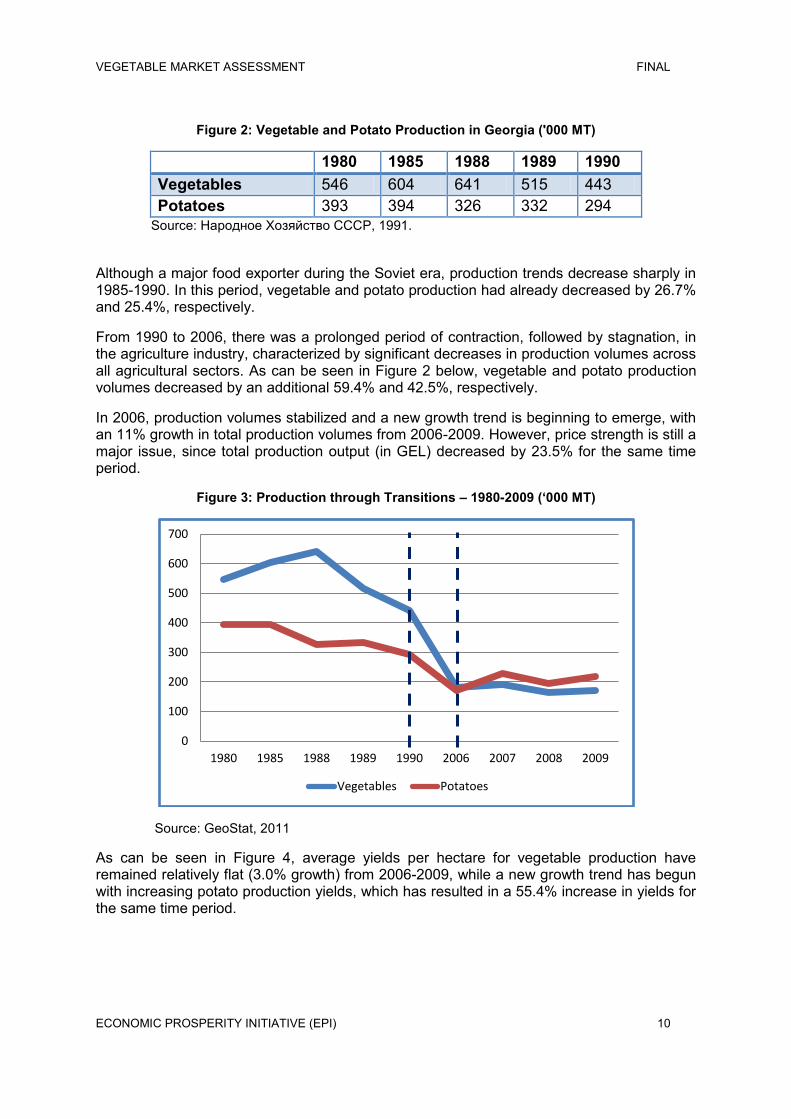
Figure 3: Production through Transitions – 1980-2009 (‘000 MT)
Source: GeoStat, 2011
As can be seen in Figure 4, average yields per hectare for vegetable production have remained relatively flat (3.0% growth) from 2006-2009, while a new growth trend has begun with increasing potato production yields, which has resulted in a 55.4% increase in yields for the same time period.
0
100
200
300
400
500
600
700
1980 1985 1988 1989 1990 2006 2007 2008 2009
Vegetables Potatoes
VEGETABLE MARKET ASSESSMENT FINAL
ECONOMIC PROSPERITY INITIATIVE (EPI) 11
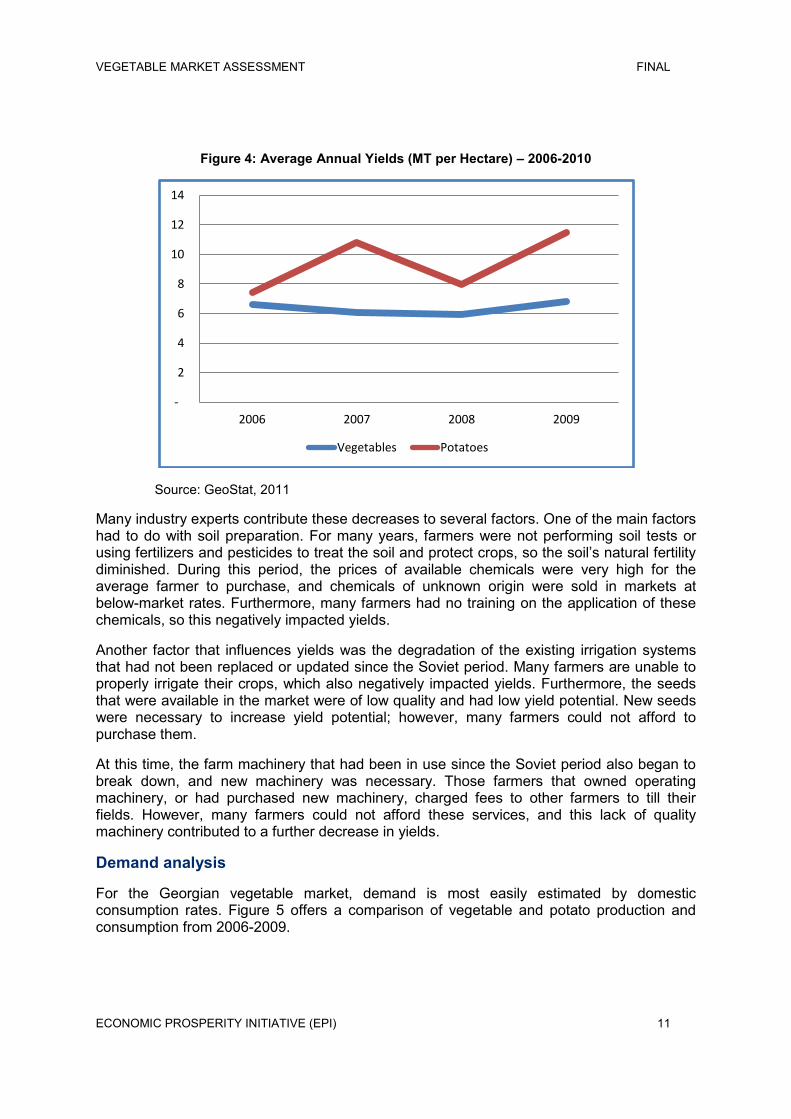
Figure 4: Average Annual Yields (MT per Hectare) – 2006-2010
Source: GeoStat, 2011
Many industry experts contribute these decreases to several factors. One of the main factors had to do with soil preparation. For many years, farmers were not performing soil tests or using fertilizers and pesticides to treat the soil and protect crops, so the soil‟s natural fertility diminished. During this period, the prices of available chemicals were very high for the average farmer to purchase, and chemicals of unknown origin were sold in markets at below-market rates. Furthermore, many farmers had no training on the application of these chemicals, so this negatively impacted yields.
Another factor that influences yields was the degradation of the existing irrigation systems that had not been replaced or updated since the Soviet period. Many farmers are unable to properly irrigate their crops, which also negatively impacted yields. Furthermore, the seeds that were available in the market were of low quality and had low yield potential. New seeds were necessary to increase yield potential; however, many farmers could not afford to purchase them.
At this time, the farm machinery that had been in use since the Soviet period also began to break down, and new machinery was necessary. Those farmers that owned operating machinery, or had purchased new machinery, charged fees to other farmers to till their fields. However, many farmers could not afford these services, and this lack of quality machinery contributed to a further decrease in yields.
Demand analysis
For the Georgian vegetable market, demand is most easily estimated by domestic consumption rates. Figure 5 offers a comparison of vegetable and potato production and consumption from 2006-2009.
-
2
4
6
8
10
12
14
2006 2007 2008 2009
Vegetables Potatoes
VEGETABLE MARKET ASSESSMENT FINAL
ECONOMIC PROSPERITY INITIATIVE (EPI) 12
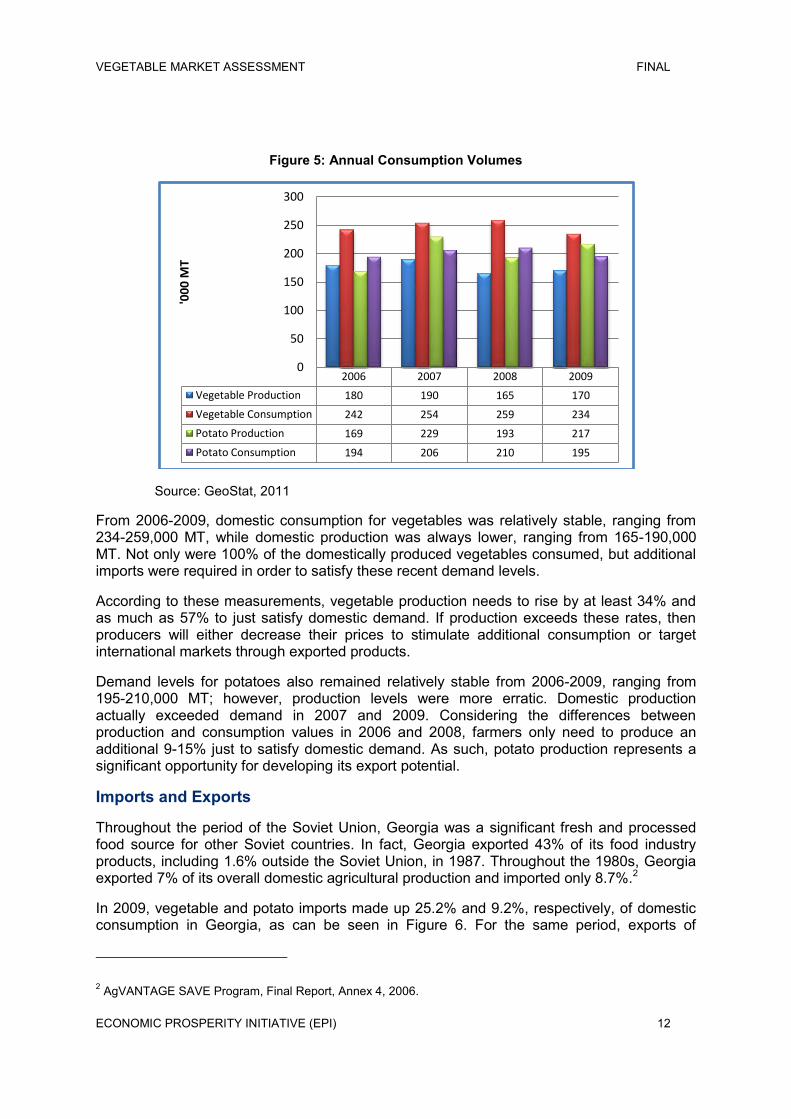
Figure 5: Annual Consumption Volumes
Source: GeoStat, 2011
From 2006-2009, domestic consumption for vegetables was relatively stable, ranging from 234-259,000 MT, while domestic production was always lower, ranging from 165-190,000 MT. Not only were 100% of the domestically produced vegetables consumed, but additional imports were required in order to satisfy these recent demand levels.
According to these measurements, vegetable production needs to rise by at least 34% and as much as 57% to just satisfy domestic demand. If production exceeds these rates, then producers will either decrease their prices to stimulate additional consumption or target international markets through exported products.
Demand levels for potatoes also remained relatively stable from 2006-2009, ranging from 195-210,000 MT; however, production levels were more erratic. Domestic production actually exceeded demand in 2007 and 2009. Considering the differences between production and consumption values in 2006 and 2008, farmers only need to produce an additional 9-15% just to satisfy domestic demand. As such, potato production represents a significant opportunity for developing its export potential.
Imports and Exports
Throughout the period of the Soviet Union, Georgia was a significant fresh and processed food source for other Soviet countries. In fact, Georgia exported 43% of its food industry products, including 1.6% outside the Soviet Union, in 1987. Throughout the 1980s, Georgia exported 7% of its overall domestic agricultural production and imported only 8.7%.2
In 2009, vegetable and potato imports made up 25.2% and 9.2%, respectively, of domestic consumption in Georgia, as can be seen in Figure 6. For the same period, exports of
2 AgVANTAGE SAVE Program, Final Report, Annex 4, 2006.
2006 2007 2008 2009
Vegetable Production 180 190 165 170
Vegetable Consumption 242 254 259 234
Potato Production 169 229 193 217
Potato Consumption 194 206 210 195
0
50
100
150
200
250
300'0
00
MT
VEGETABLE MARKET ASSESSMENT FINAL
ECONOMIC PROSPERITY INITIATIVE (EPI) 13
vegetables and potatoes were 2.1% and 0.5%, respectively, of domestic consumption. Compared to import and export volumes during the period of the Soviet Union, Georgia‟s balance between imported and exported products has evolved into a form of dependence on imports with very little export activity.
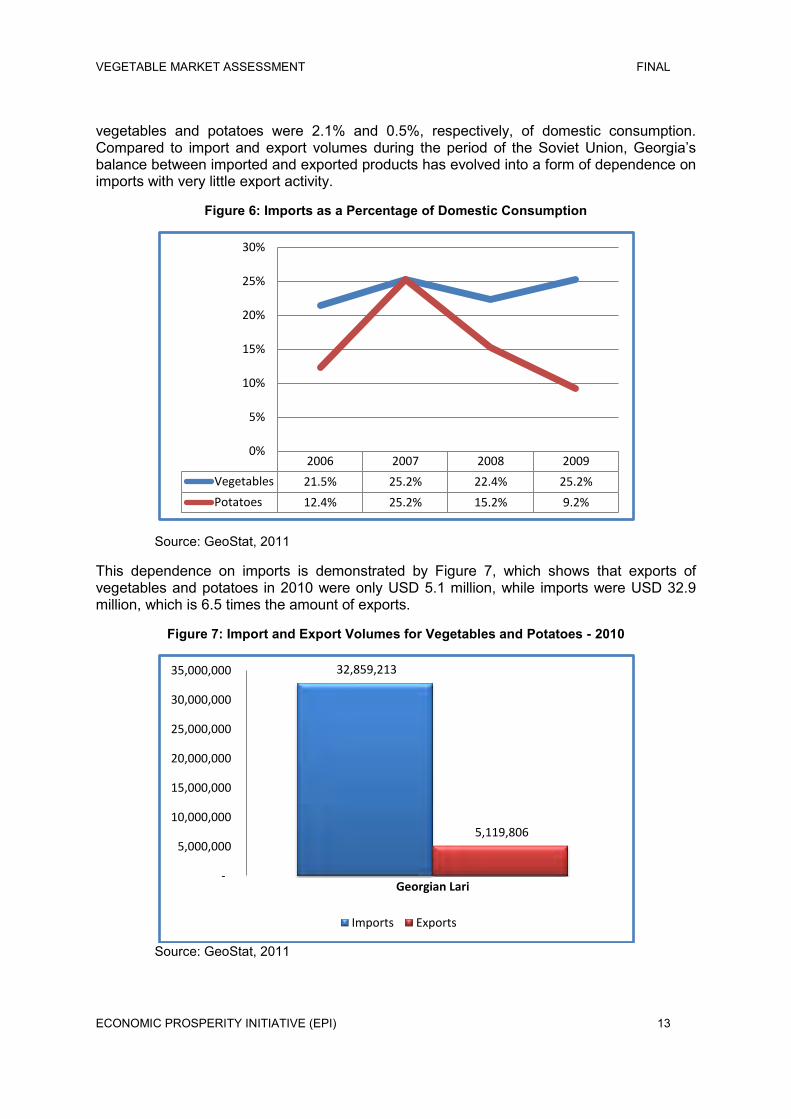
Figure 6: Imports as a Percentage of Domestic Consumption
Source: GeoStat, 2011
This dependence on imports is demonstrated by Figure 7, which shows that exports of vegetables and potatoes in 2010 were only USD 5.1 million, while imports were USD 32.9 million, which is 6.5 times the amount of exports.
Figure 7: Import and Export Volumes for Vegetables and Potatoes - 2010
Source: GeoStat, 2011
2006 2007 2008 2009
Vegetables 21.5% 25.2% 22.4% 25.2%
Potatoes 12.4% 25.2% 15.2% 9.2%
0%
5%
10%
15%
20%
25%
30%
32,859,213
5,119,806
-
5,000,000
10,000,000
15,000,000
20,000,000
25,000,000
30,000,000
35,000,000
Georgian Lari
Imports Exports
VEGETABLE MARKET ASSESSMENT FINAL
ECONOMIC PROSPERITY INITIATIVE (EPI) 14
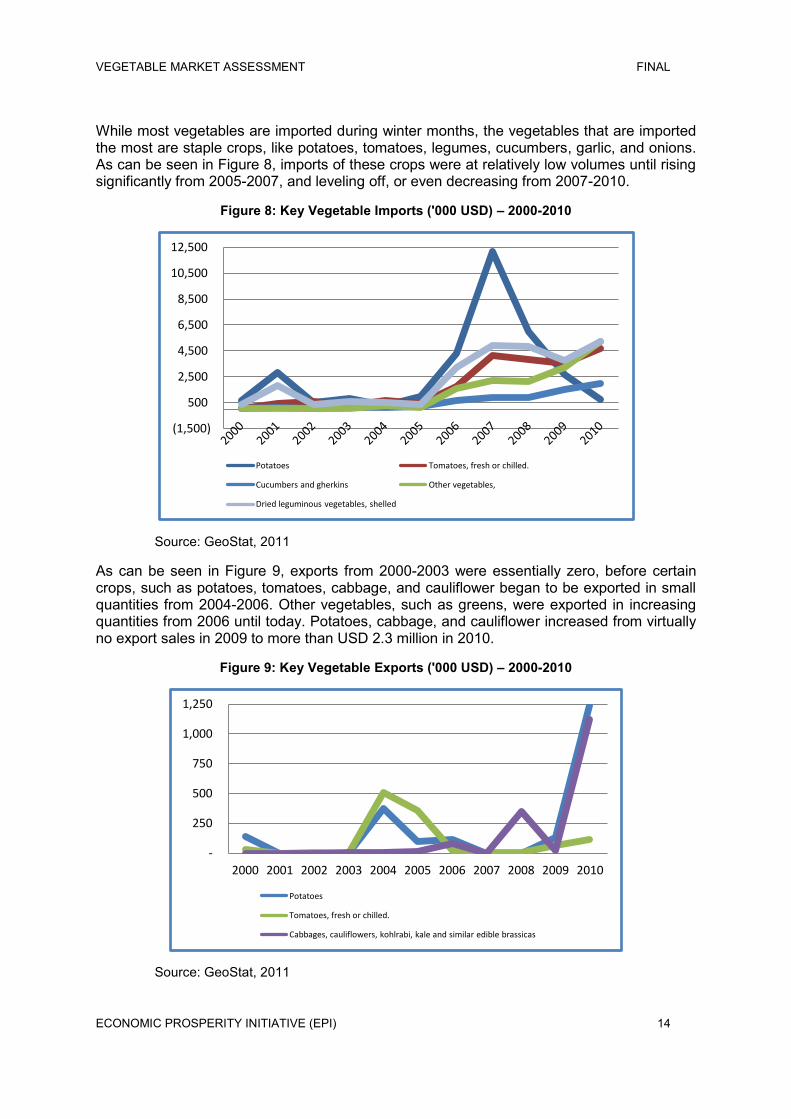
While most vegetables are imported during winter months, the vegetables that are imported the most are staple crops, like potatoes, tomatoes, legumes, cucumbers, garlic, and onions. As can be seen in Figure 8, imports of these crops were at relatively low volumes until rising significantly from 2005-2007, and leveling off, or even decreasing from 2007-2010.
Figure 8: Key Vegetable Imports ('000 USD) – 2000-2010
Source: GeoStat, 2011
As can be seen in Figure 9, exports from 2000-2003 were essentially zero, before certain crops, such as potatoes, tomatoes, cabbage, and cauliflower began to be exported in small quantities from 2004-2006. Other vegetables, such as greens, were exported in increasing quantities from 2006 until today. Potatoes, cabbage, and cauliflower increased from virtually no export sales in 2009 to more than USD 2.3 million in 2010.
Figure 9: Key Vegetable Exports ('000 USD) – 2000-2010
Source: GeoStat, 2011
(1,500)
500
2,500
4,500
6,500
8,500
10,500
12,500
Potatoes Tomatoes, fresh or chilled.
Cucumbers and gherkins Other vegetables,
Dried leguminous vegetables, shelled
-
250
500
750
1,000
1,250
2000 2001 2002 2003 2004 2005 2006 2007 2008 2009 2010
Potatoes
Tomatoes, fresh or chilled.
Cabbages, cauliflowers, kohlrabi, kale and similar edible brassicas
VEGETABLE MARKET ASSESSMENT FINAL
ECONOMIC PROSPERITY INITIATIVE (EPI) 15
Despite its long history exporting products during the Soviet period, Georgian farmers are just beginning to realize the potential of exporting to international markets. This presents not only an opportunity to expand production, increase product quality, and access new markets, but also a challenge to identify which products and quantities that international markets demand. Furthermore, in order to export to most international markets, farmers, and processors alike will need to increase their product certifications to satisfy food safety standards in the importing country. This challenge will not only make their products more competitive in Georgia, but internationally as well.
SUPPORT SERVICES TO VEGETABLE SECTOR
Inputs
Farmers at most levels of production understand that better inputs result in higher yields and profitability. Specifically, by using high-quality cultivars – such as hybrid seeds – and by introducing drip irrigation, greenhouse management systems, regular fertilizer and pesticide schedules, and proper harvest and postharvest techniques, yields have begun to increase among the large and medium-sized farms. As long as there is support from the government and donor agencies to promote these practices and to provide technical skills training, small farms will emulate these techniques, and vegetable production should expand quickly in the next three to five years.
The speed at which Georgian farmers will implement these technologies depends on several factors, including:
Improved access to markets
Very few farms and greenhouses are producing high-value crops for export markets because most do not satisfy the requisite food safety certifications or adhere to internationally recognized production standards like GlobalGAP.
Major wholesalers do not purchase vegetables from small farms because they require a stable supply of quality produce, which is not available from individual farmers. Developing supply line infrastructural components to consolidate, sort, and channel small farm productions will offer wholesalers an alternative supply line to exclusively purchasing from larger farms.
Obtaining export-related certifications
As production increases among small farmers, the medium and large farms will face increased competition and oversupply domestically and will look for ways to access export markets to sell their products. To do so, these farms (and food processors as well) will need to obtain food safety certifications, such as GlobalGAP and HACCP, to satisfy export market standards.
Increased access to credit
Most small and medium farms operate have little to no short-term cash reserves for purchasing inputs. This problem is compounded by the fact that they will not receive revenues from their production until after harvest. By increasing the number of credit programs and by introducing forward contracting, farmers can access the credit they need for working capital and to make input purchases.
VEGETABLE MARKET ASSESSMENT FINAL
ECONOMIC PROSPERITY INITIATIVE (EPI) 16
New cold storage facilities
With 170,000 MT of vegetables and 217,000 MT of potatoes currently produced, there is only 12,005 MT of vegetable storage capacity across the country.
Many farmers have the ability to produce more; however, they do not simply because there is no financial incentive to do so. Most regions have no cold storage for fresh vegetables, and any excess produce would be liquidated at a fraction of the price at the end of the harvest or would simply spoil. By introducing new cold storages, farmers will have the financial incentive to produce more, since they will be able to store crops throughout the off-season and sell at premium prices.
Sources of Inputs
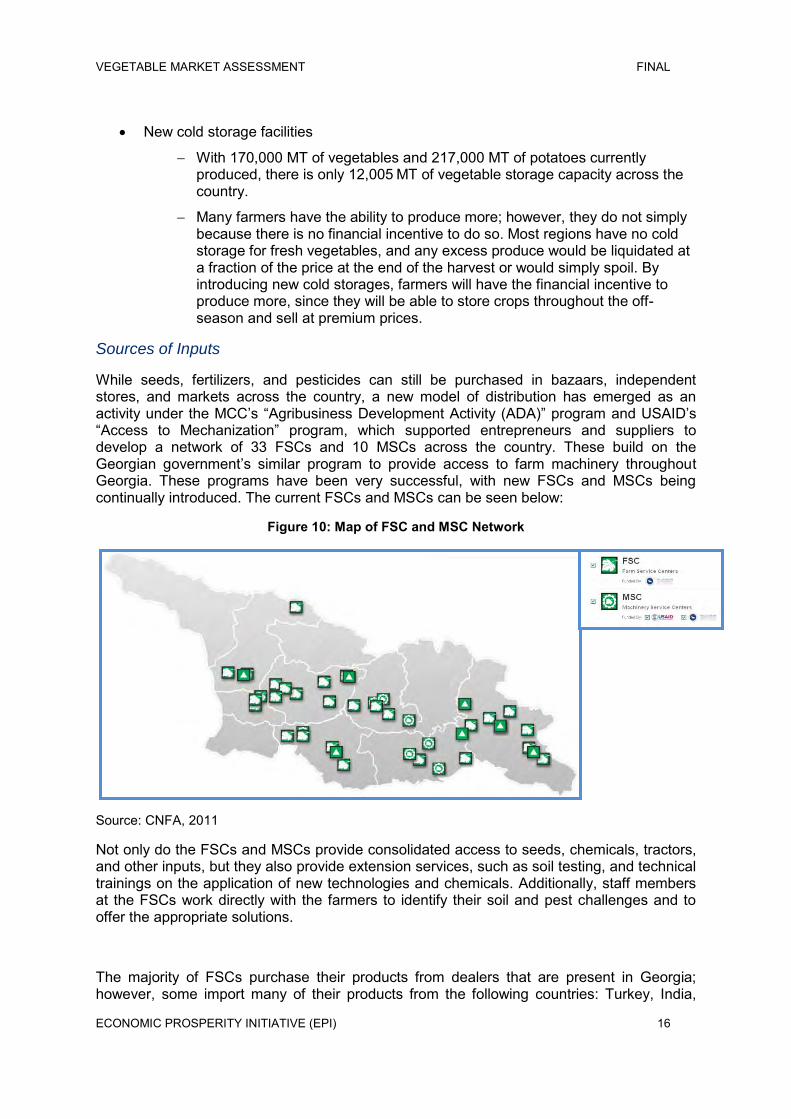
While seeds, fertilizers, and pesticides can still be purchased in bazaars, independent stores, and markets across the country, a new model of distribution has emerged as an activity under the MCC‟s “Agribusiness Development Activity (ADA)” program and USAID‟s “Access to Mechanization” program, which supported entrepreneurs and suppliers to develop a network of 33 FSCs and 10 MSCs across the country. These build on the Georgian government‟s similar program to provide access to farm machinery throughout Georgia. These programs have been very successful, with new FSCs and MSCs being continually introduced. The current FSCs and MSCs can be seen below:
Figure 10: Map of FSC and MSC Network
Source: CNFA, 2011
Not only do the FSCs and MSCs provide consolidated access to seeds, chemicals, tractors, and other inputs, but they also provide extension services, such as soil testing, and technical trainings on the application of new technologies and chemicals. Additionally, staff members at the FSCs work directly with the farmers to identify their soil and pest challenges and to offer the appropriate solutions.
The majority of FSCs purchase their products from dealers that are present in Georgia; however, some import many of their products from the following countries: Turkey, India,
VEGETABLE MARKET ASSESSMENT FINAL
ECONOMIC PROSPERITY INITIATIVE (EPI) 17
America, Germany, Belarus, Ukraine, China, Kazakhstan, Bulgaria, Switzerland, Moldova, Belarus, Italy, Netherlands, Belgium, China, Czech Republic, France, Spain, and Slovenia.
According to a survey of FSC and MSC managers, conducted in February 2011:
Three FSCs work with both vegetable and fruit producers in exporting their products.
20 FSCs have demonstration plots, while 19 FSCs do not but are interested in establishing them.
18 FSCs have some type of cold storage facilities available to producers, while 21 additional FSCs are interested in establishing them.
No FSC or MSC has a greenhouse, but 35 FSCs are interested in creating them, while four only have no interest in establishing a greenhouse.
The FSC/MSC network is a valuable infrastructural component to the agricultural sector, as well as a sustainable system in its own right. Annual sales revenues for the FSCs were GEL 23.7 million and they have more than 134,000 customers.
Many international seed and chemical distributors sell their products exclusively through the FSCs and have abandoned selling through proprietary distribution centers or in the markets. These distributors regularly host free training seminars at the FSCs for farmers on the benefits of their products and how to properly apply them to crops. Additionally, they offer farmers advice on when to fertilize their crops and how often they should apply pesticides.
One input that is completely underserved that is necessary for both domestic and export distribution is proper vegetable-specific packaging. In Georgia, there is only one vegetable packaging manufacture, Georgia Plastic in Adjara. This lack of capacity makes it very difficult for producers to protect their produce during postharvest handling processes. For example, instead of delivering tomatoes to wholesalers in single-layer boxes, farmers use large bulk banana boxes that allow the tomatoes to touch and weigh down on each other, which decreases overall shelf-life and damage the middle and bottom tomatoes. When comparing the proper single-layer packaging provided by distributors of imported tomatoes, retail stores and wholesalers report that they would prefer to pay extra for vegetables that are properly sorted and packaged.
Outputs
Food Processors
In 1990, Georgia‟s 58 canneries produced approximately 760 million cans of food every year. Most of these canneries are outdated, pose significant health hazards, and have been abandoned. With little to no investment or updating of machinery, this sector quickly decreased in production outputs. By 2003, total output had dropped to only 1 million cans.3Currently, there are only three significant commercial food processors (canneries) operating in Georgia today: Marneuli, Bazi, and Kula. Although they are growing rapidly, their ability to expand is limited.
3Elizabeth Cullen Dunn, "Post-Socialist Spores: Disease, Bodies, and the State in the Republic of Georgia", American Ethnologist, Vol. 35/2, pp. 246, 249.
VEGETABLE MARKET ASSESSMENT FINAL
ECONOMIC PROSPERITY INITIATIVE (EPI) 18
For example, Kula processed 20,000 MT during the 2010 harvest season and plans to process 27,000 MT in 2011 (35% growth). Although Kula is currently exporting to 18 countries, its ability to expand will quickly plateau, limited mainly by insufficient vegetable supplies and scarce cold storage facilities. Because Georgian farmers do not produce vegetables year-round, processors operate for only four months per year (June to October), which results an asset utilization rate of 33%.
If farmers could provide a stable supply of vegetables in the off-season, processors could extend production into the winter and spring. Likewise, if cold storages were available, processors could purchase vegetables during harvest, store them until November, and process them in the off-season.4 Each of these structural improvements could allow processors to increase their production time and volumes, increase their asset utilization rates, expand their markets, and increase turnovers. Additionally, if processors can optimize their delivery schedules to coordinate between the harvesting and process schedules, they could increase the overall process efficiency of their operations.
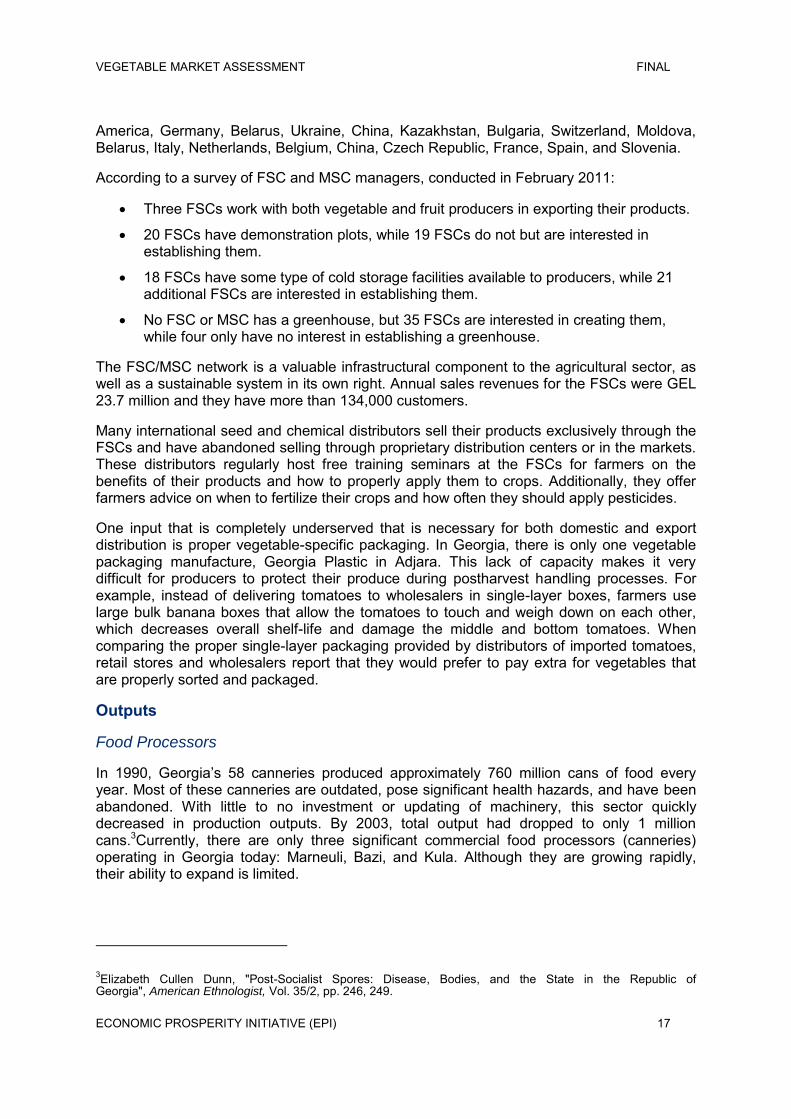
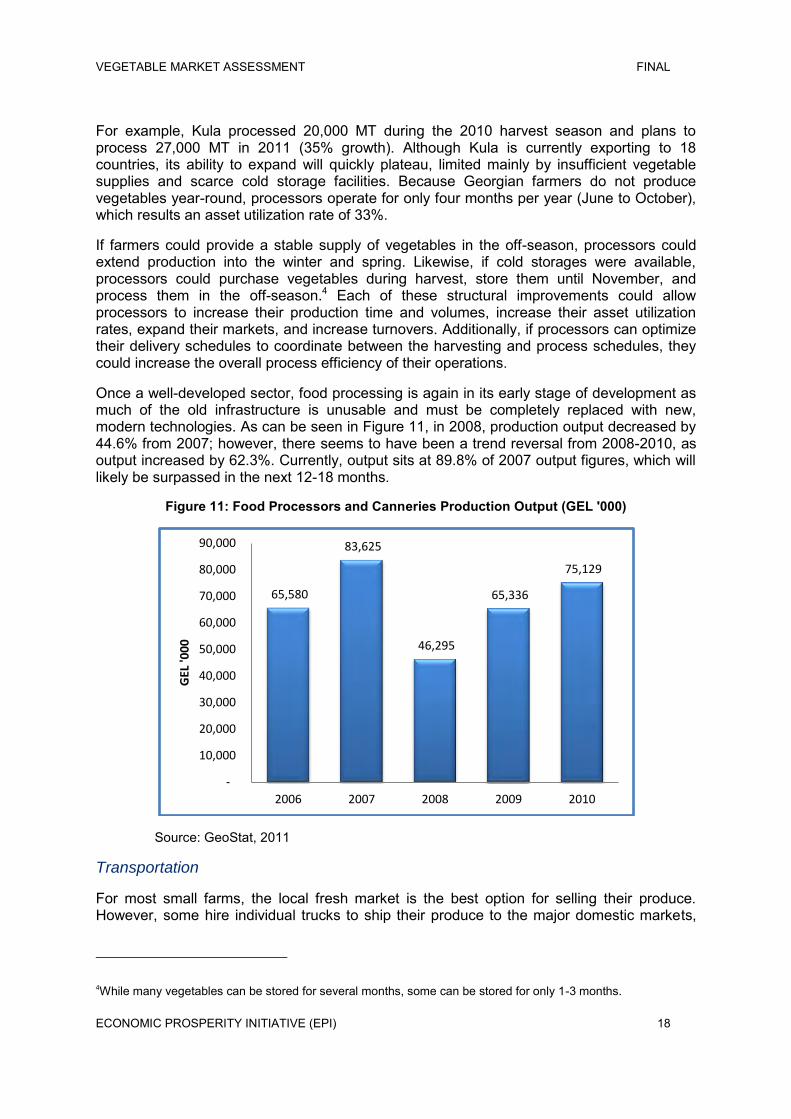
Once a well-developed sector, food processing is again in its early stage of development as much of the old infrastructure is unusable and must be completely replaced with new, modern technologies. As can be seen in Figure 11, in 2008, production output decreased by 44.6% from 2007; however, there seems to have been a trend reversal from 2008-2010, as output increased by 62.3%. Currently, output sits at 89.8% of 2007 output figures, which will likely be surpassed in the next 12-18 months.
Figure 11: Food Processors and Canneries Production Output (GEL '000)
Source: GeoStat, 2011
Transportation
For most small farms, the local fresh market is the best option for selling their produce. However, some hire individual trucks to ship their produce to the major domestic markets,
4While many vegetables can be stored for several months, some can be stored for only 1-3 months.
65,580
83,625
46,295
65,336
75,129
-
10,000
20,000
30,000
40,000
50,000
60,000
70,000
80,000
90,000
2006 2007 2008 2009 2010
GEL
'00
0
VEGETABLE MARKET ASSESSMENT FINAL
ECONOMIC PROSPERITY INITIATIVE (EPI) 19
which increases costs dramatically and reduces farm profitability. Wholesalers often include transportation services when they make purchases from medium and large farms; however, these farms generally have their own trucks to ship their produce to market.
One currently available option that many producers do not utilize is shipment by Georgian Railways‟ refrigerated containers. Shipping by railway is a significantly cheaper option than shipping by truck throughout Georgia and to neighboring countries For example, to ship a 40-foot container (up to 34 tons) from Poti to Tbilisi by train would cost approximately GEL 400 for the entire container, while shipment by truck (including loading and unloading) can cost up to GEL 1,700 to ship the same amount. Over the last two years, Georgian Railways has begun to offer both 40-foot and 20-foot refrigerated containers; however, these are not highly utilized but do present significant opportunities for cost savings and creation of synergies among producers.
Export Preparation
Currently, there are very few exporters shipping vegetables to international markets, with the majority of these being either wholesale distributors or primary producers. However, they do not offer a standard service of cleaning, sorting, grading, and packaging other farmer‟s produce to prepare it for export. Furthermore, due to the small sizes of farmers, most small farms will not pursue food safety certifications because of the costs involved and will, therefore, not export.
According to a survey of FSC and MSC managers, conducted in February 2011, three FSCs work with both vegetable and fruit producers in exporting their products.
INDUSTRY OUTLOOK
The general short and long-term outlook for the vegetable sector is “stable, with slow growth;” however, there are many opportunities to quickly create value if producers can overcome the constraints that currently impede growth.
With the recent development of the FSC and MSC network, the extensive free technical trainings provided by this network, the increased supply and variety of high-quality cultivars and other inputs, and the introduction and usage of new technologies, the vegetable sector is well positioned to make strong productivity gains; however, the immediate need for credit financing to pay for these innovations still presents a challenge that will continue to impede growth without the introduction of new financial instruments appropriate to agricultural operations.
The absence of a critical mass of postharvest handling facilities – such as collection centers, cold storages, food packagers, and processors – also constrain opportunities for growth. Without these facilities, it is possible that any increases in productivity will be negated by the inability to sell excess supply or by supply degradation due to the lack of appropriate storage options.
Furthermore, without the necessary GlobalGAP certifications, it will be very difficult for Georgian producers to break into high-value markets as exports. This is due to the current requirement from international wholesalers to purchase only produce that has been certified according to GlobalGAP.
According to GeoStat‟s 2005 Farm Census, only 17.8% of all Georgian farms (129,498 farms) produce mainly to sell their products, as opposed to producing for self-consumption. Out of this 17.8%, only 0.38% (486 farms) are registered enterprises.
VEGETABLE MARKET ASSESSMENT FINAL
ECONOMIC PROSPERITY INITIATIVE (EPI) 20
Considering the facts that the majority of Georgia‟s vegetable producers have only begun to consider production for commercial purposes and that only 0.07% of all vegetable farms are more than two hectares, it will be difficult to realize any growth from economies of scale without significant consolidation initiatives.
The vegetable sector is extremely limited by a general lack of an economy of scale – 99.93% of all vegetable farms are less than two hectares. Without massive consolidation, any growth from this sector will only be realized through increased productivity gains. These gains could be achieved through several factors, including:
Increased yields per hectare through the usage of higher quality inputs and modern technologies;
Additional hectares sown through the increased availability of machinery to farmers;
More producers becoming active in off-season production in heated and unheated greenhouses;
Shift to high-value crops from low-value crops.
With the recently established – and currently expanding – FSC and MSC network, the probability of increasing production yields through usage of better inputs and newer technologies is very high for most commercial producers. While the average family holding still operates at a subsistence level and cannot afford these inputs, many should be able to increase their production levels to begin distributing some produce commercially by using higher quality inputs and through modern technology implementation.
Due to the increased availability of farm machinery at the MSCs, there is a high probability that farmers will increase the number of hectares sown, although this growth in land sown will increase slowly as the majority of farmers cannot yet afford to rent the machinery and, instead, still opt for manual labor. With increased productivity gains from higher yields, larger producers will quickly see the value in increasing their production capacity through more land sown and will therefore expand operations accordingly.
Despite the presence of a few large commercial greenhouses and several clusters of many greenhouses across the country, there are still very few heated greenhouses. While unheated greenhouses in western Georgia can grow cold-resistant crops in the off-season, their ability to grow other high-value crops that are not cold-resistant is extremely limited. Any new investments in heated greenhouses will mostly likely result in immediate productivity gains and growth. Georgia‟s potential for heated (and unheated as well) greenhouses is barely utilized and there is room for dramatic growth.
Since smaller producers tend to plant according to which crops sold well and at higher prices in the previous season, there is a slight probability that some gains will be seen through shifting to high-value instead of low-value crops. However, if this results in oversupply, the expected high prices will not be realized unless the excess can be exported to the international markets. Generally, due to the currently low levels of production, there is very little potential for productivity gains through shifting crops.
PRODUCTS AND MARKETS PRODUCTS
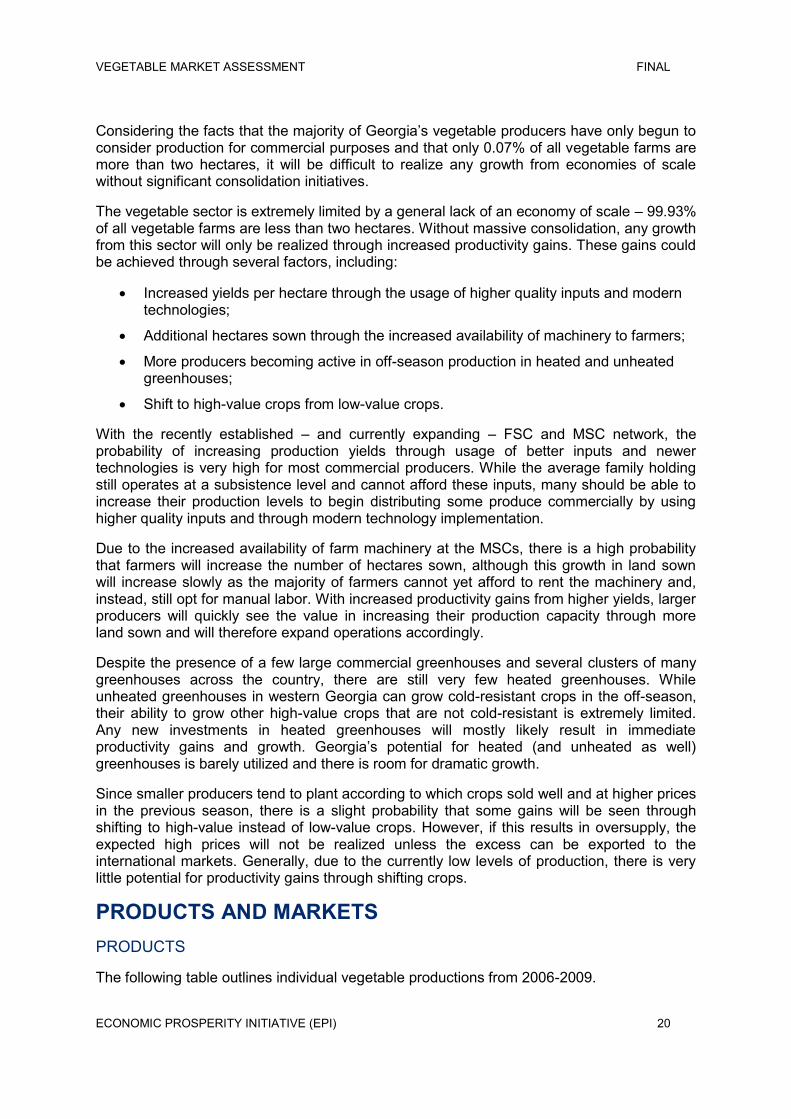
The following table outlines individual vegetable productions from 2006-2009.
VEGETABLE MARKET ASSESSMENT FINAL
ECONOMIC PROSPERITY INITIATIVE (EPI) 21
Figure 12: Individual Vegetable Production Volume ('000 MT)
2006 2007 2008 2009 Tomatoes 70 80 63 51 Cabbages 36 34 42 40 Cucumbers 19 20 19 31 Onions 16 12 11 10 Eggplants 12 13 5 10 Greens 8 7 5 8 Other Vegetables 7 2 4 6 Peppers 5 4 6 3 Red Beets 4 11 3 4 Garlic 3 3 2 2 Carrots 1 3 6 4 Potatoes 169 229 193 217
Source: GeoStat, 2011
One important trend to note is that many small farmers will adjust crop selections according to the previous season‟s prices. For example, because the prices of cucumbers were high in 2008, many additional farmers planted cucumbers in 2009 instead of tomatoes and pepper, resulting in capacity gaps in other crops. Production increases need to be implemented across the range of vegetables produced with particular emphasis on high-value crops over low-value alternatives.
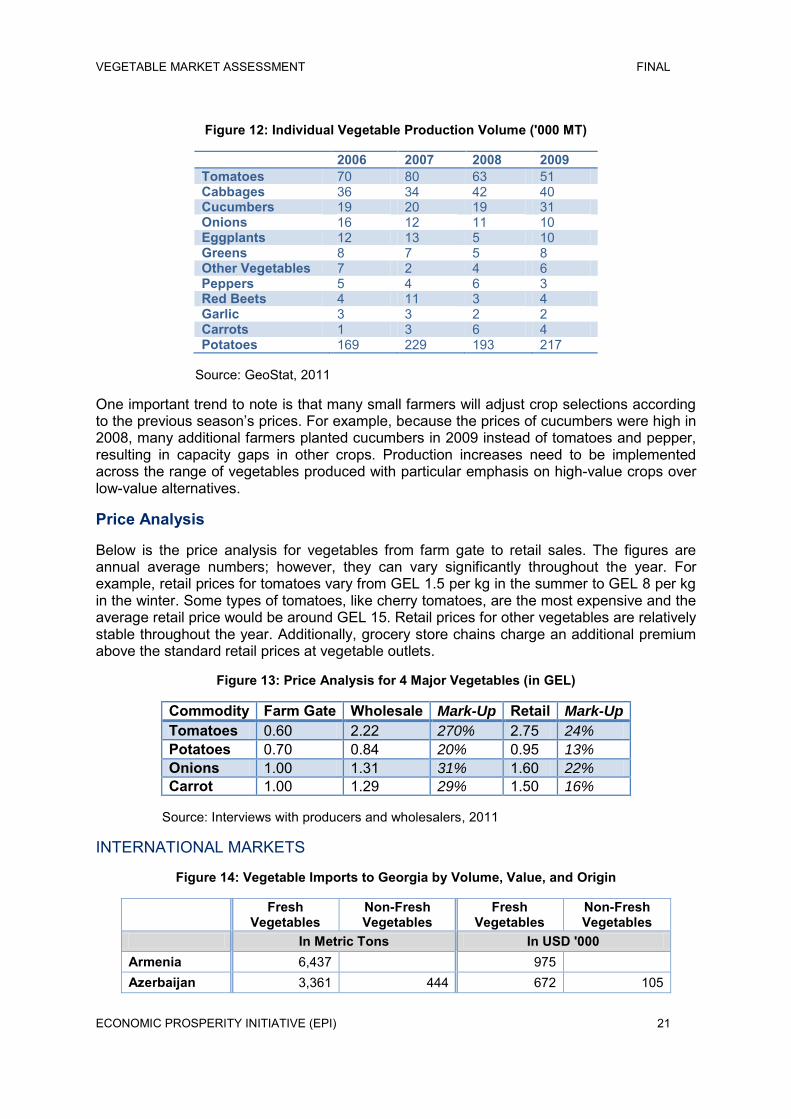
Price Analysis
Below is the price analysis for vegetables from farm gate to retail sales. The figures are annual average numbers; however, they can vary significantly throughout the year. For example, retail prices for tomatoes vary from GEL 1.5 per kg in the summer to GEL 8 per kg in the winter. Some types of tomatoes, like cherry tomatoes, are the most expensive and the average retail price would be around GEL 15. Retail prices for other vegetables are relatively stable throughout the year. Additionally, grocery store chains charge an additional premium above the standard retail prices at vegetable outlets.
Figure 13: Price Analysis for 4 Major Vegetables (in GEL)
Commodity Farm Gate Wholesale Mark-Up Retail Mark-Up
Tomatoes 0.60 2.22 270% 2.75 24%
Potatoes 0.70 0.84 20% 0.95 13%
Onions 1.00 1.31 31% 1.60 22%
Carrot 1.00 1.29 29% 1.50 16%
Source: Interviews with producers and wholesalers, 2011
INTERNATIONAL MARKETS
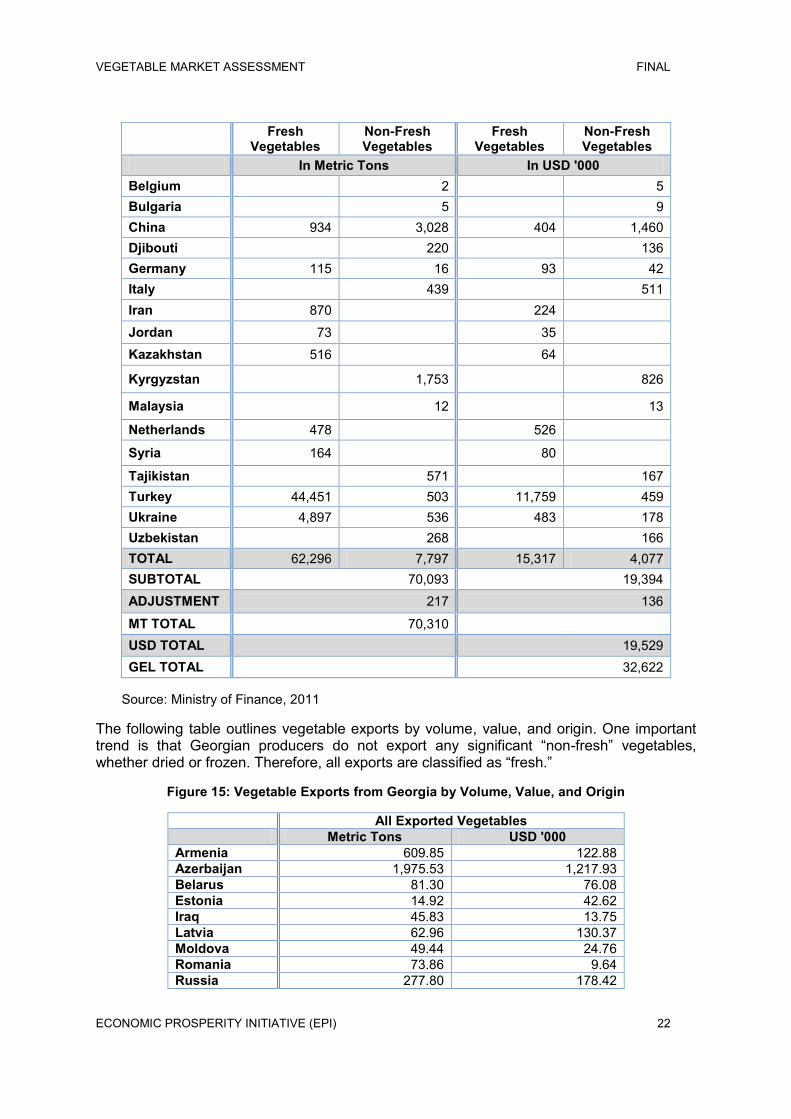
Figure 14: Vegetable Imports to Georgia by Volume, Value, and Origin
Fresh Vegetables
Non-Fresh Vegetables
Fresh Vegetables
Non-Fresh Vegetables
In Metric Tons In USD '000 Armenia 6,437 975 Azerbaijan 3,361 444 672 105
VEGETABLE MARKET ASSESSMENT FINAL
ECONOMIC PROSPERITY INITIATIVE (EPI) 22
Fresh Vegetables
Non-Fresh Vegetables
Fresh Vegetables
Non-Fresh Vegetables
In Metric Tons In USD '000 Belgium 2 5 Bulgaria 5 9 China 934 3,028 404 1,460 Djibouti 220 136 Germany 115 16 93 42 Italy 439 511 Iran 870 224 Jordan 73 35 Kazakhstan 516 64
Kyrgyzstan 1,753 826
Malaysia 12 13
Netherlands 478 526
Syria 164 80
Tajikistan 571 167 Turkey 44,451 503 11,759 459 Ukraine 4,897 536 483 178 Uzbekistan 268 166 TOTAL 62,296 7,797 15,317 4,077 SUBTOTAL 70,093 19,394 ADJUSTMENT 217 136
MT TOTAL 70,310 USD TOTAL 19,529 GEL TOTAL 32,622
Source: Ministry of Finance, 2011
The following table outlines vegetable exports by volume, value, and origin. One important trend is that Georgian producers do not export any significant “non-fresh” vegetables, whether dried or frozen. Therefore, all exports are classified as “fresh.”
Figure 15: Vegetable Exports from Georgia by Volume, Value, and Origin
All Exported Vegetables Metric Tons USD '000
Armenia 609.85 122.88 Azerbaijan 1,975.53 1,217.93 Belarus 81.30 76.08 Estonia 14.92 42.62 Iraq 45.83 13.75 Latvia 62.96 130.37 Moldova 49.44 24.76 Romania 73.86 9.64 Russia 277.80 178.42
VEGETABLE MARKET ASSESSMENT FINAL
ECONOMIC PROSPERITY INITIATIVE (EPI) 23
All Exported Vegetables Metric Tons USD '000
Turkey 18.20 2.37 Ukraine 1,903.63 778.71 SUBTOTAL 5,113.32 2,597.52 ADJUSTMENT 8.74 1.62 MT TOTAL 5,122.05 USD TOTAL 2,599.14 GEL TOTAL 4,341.68
Source: Ministry of Finance, 2011
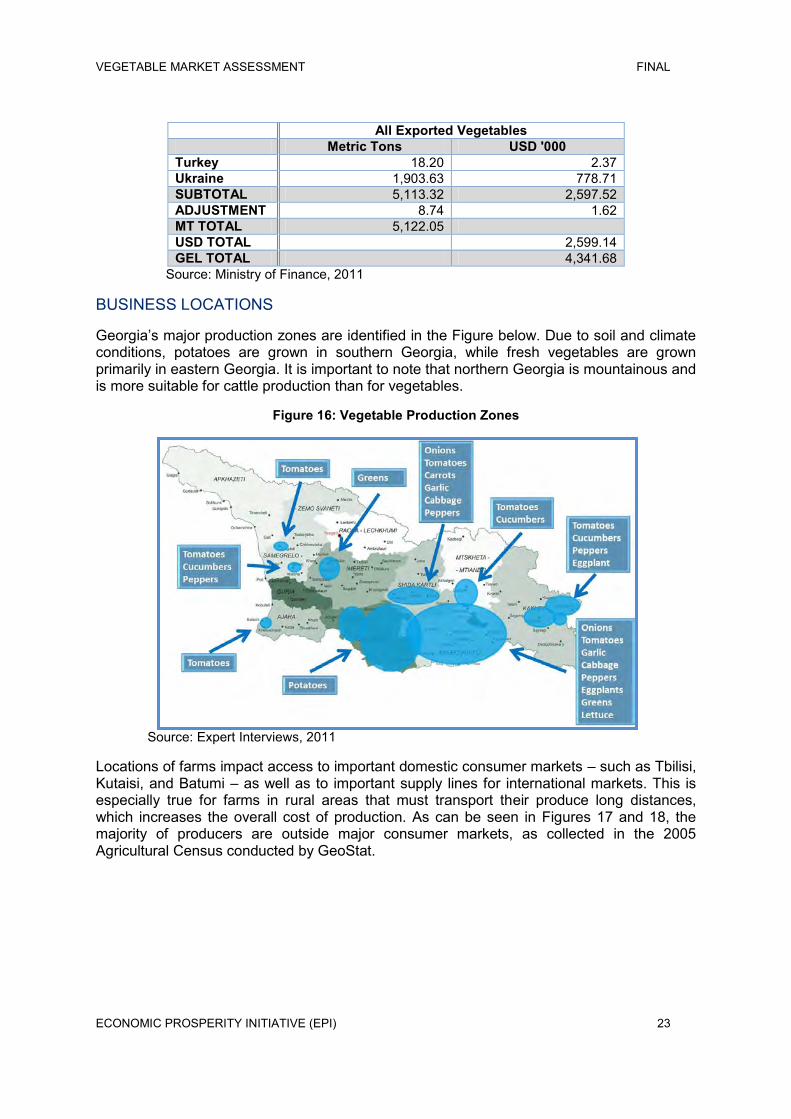
BUSINESS LOCATIONS
Georgia‟s major production zones are identified in the Figure below. Due to soil and climate conditions, potatoes are grown in southern Georgia, while fresh vegetables are grown primarily in eastern Georgia. It is important to note that northern Georgia is mountainous and is more suitable for cattle production than for vegetables.
Figure 16: Vegetable Production Zones
Source: Expert Interviews, 2011
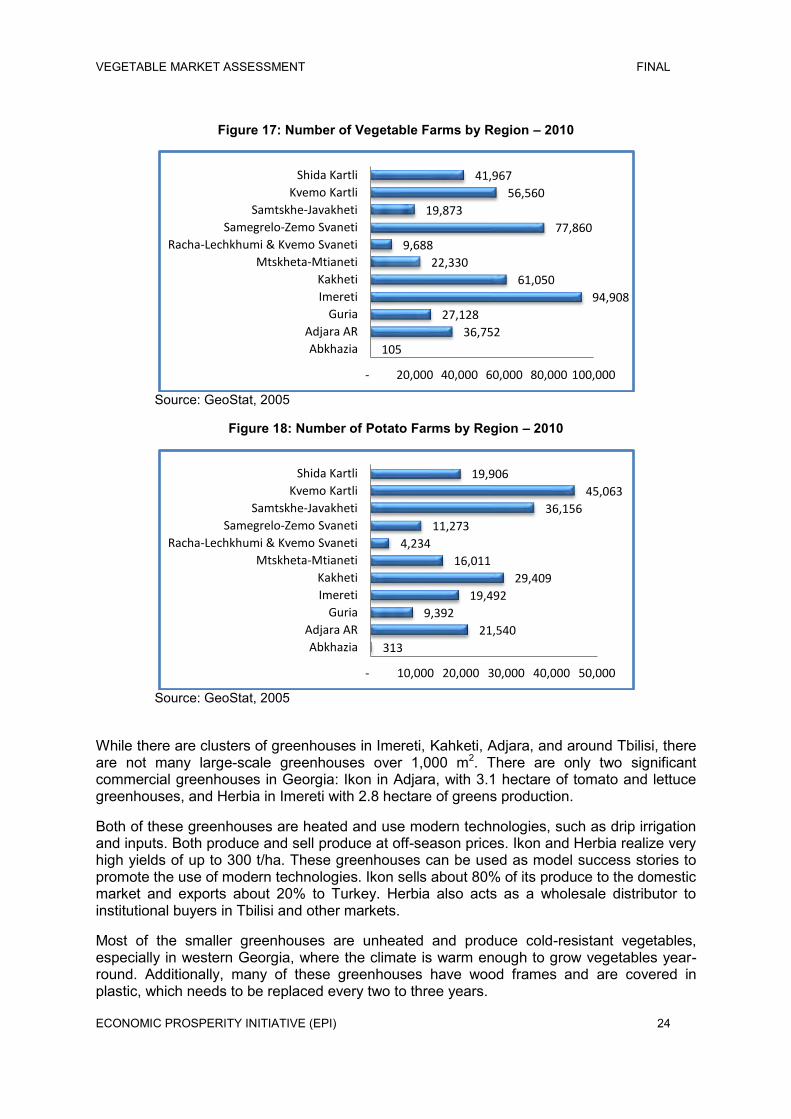
Locations of farms impact access to important domestic consumer markets – such as Tbilisi, Kutaisi, and Batumi – as well as to important supply lines for international markets. This is especially true for farms in rural areas that must transport their produce long distances, which increases the overall cost of production. As can be seen in Figures 17 and 18, the majority of producers are outside major consumer markets, as collected in the 2005 Agricultural Census conducted by GeoStat.
VEGETABLE MARKET ASSESSMENT FINAL
ECONOMIC PROSPERITY INITIATIVE (EPI) 24
Figure 17: Number of Vegetable Farms by Region – 2010
Source: GeoStat, 2005
Figure 18: Number of Potato Farms by Region – 2010
Source: GeoStat, 2005
While there are clusters of greenhouses in Imereti, Kahketi, Adjara, and around Tbilisi, there are not many large-scale greenhouses over 1,000 m2. There are only two significant commercial greenhouses in Georgia: Ikon in Adjara, with 3.1 hectare of tomato and lettuce greenhouses, and Herbia in Imereti with 2.8 hectare of greens production.
Both of these greenhouses are heated and use modern technologies, such as drip irrigation and inputs. Both produce and sell produce at off-season prices. Ikon and Herbia realize very high yields of up to 300 t/ha. These greenhouses can be used as model success stories to promote the use of modern technologies. Ikon sells about 80% of its produce to the domestic market and exports about 20% to Turkey. Herbia also acts as a wholesale distributor to institutional buyers in Tbilisi and other markets.
Most of the smaller greenhouses are unheated and produce cold-resistant vegetables, especially in western Georgia, where the climate is warm enough to grow vegetables year-round. Additionally, many of these greenhouses have wood frames and are covered in plastic, which needs to be replaced every two to three years.
105
36,752
27,128
94,908
61,050
22,330
9,688
77,860
19,873
56,560
41,967
- 20,000 40,000 60,000 80,000 100,000
Abkhazia
Adjara AR
Guria
Imereti
Kakheti
Mtskheta-Mtianeti
Racha-Lechkhumi & Kvemo Svaneti
Samegrelo-Zemo Svaneti
Samtskhe-Javakheti
Kvemo Kartli
Shida Kartli
313
21,540
9,392
19,492
29,409
16,011
4,234
11,273
36,156
45,063
19,906
- 10,000 20,000 30,000 40,000 50,000
Abkhazia
Adjara AR
Guria
Imereti
Kakheti
Mtskheta-Mtianeti
Racha-Lechkhumi & Kvemo Svaneti
Samegrelo-Zemo Svaneti
Samtskhe-Javakheti
Kvemo Kartli
Shida Kartli
VEGETABLE MARKET ASSESSMENT FINAL
ECONOMIC PROSPERITY INITIATIVE (EPI) 25
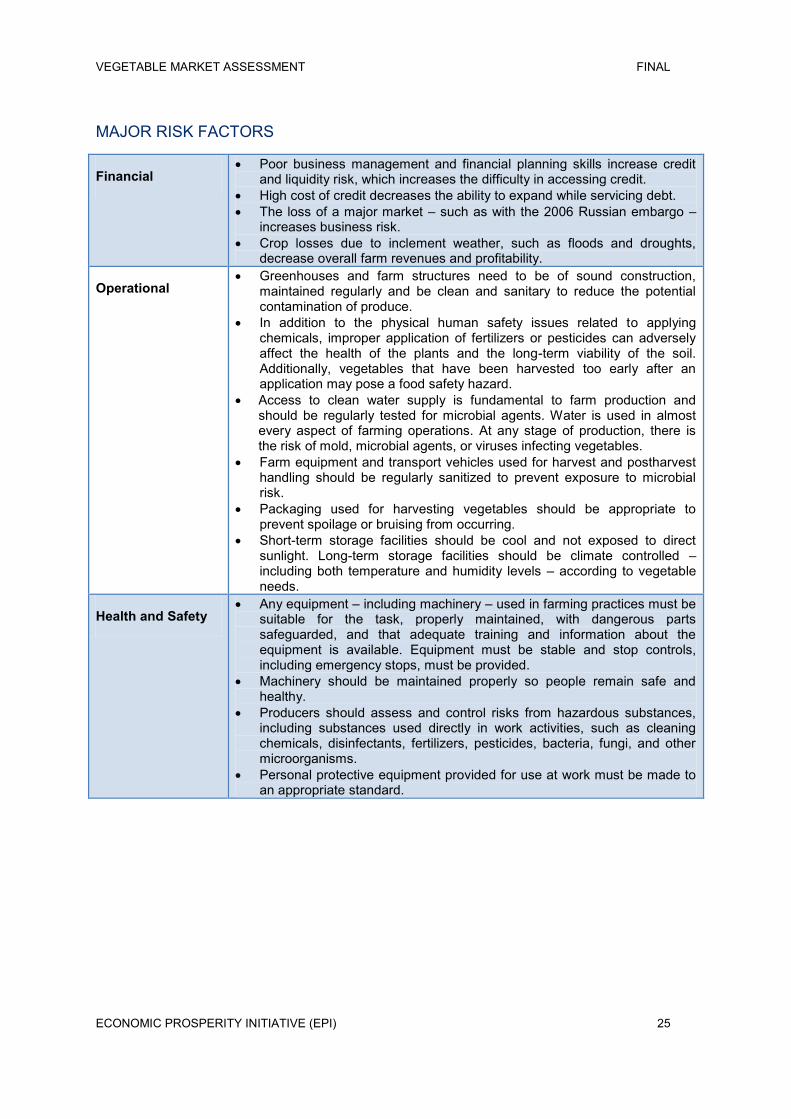
MAJOR RISK FACTORS
Financial Poor business management and financial planning skills increase credit
and liquidity risk, which increases the difficulty in accessing credit. High cost of credit decreases the ability to expand while servicing debt. The loss of a major market – such as with the 2006 Russian embargo –
increases business risk. Crop losses due to inclement weather, such as floods and droughts,
decrease overall farm revenues and profitability.
Operational Greenhouses and farm structures need to be of sound construction,
maintained regularly and be clean and sanitary to reduce the potential contamination of produce.
In addition to the physical human safety issues related to applying chemicals, improper application of fertilizers or pesticides can adversely affect the health of the plants and the long-term viability of the soil. Additionally, vegetables that have been harvested too early after an application may pose a food safety hazard.
Access to clean water supply is fundamental to farm production and should be regularly tested for microbial agents. Water is used in almost every aspect of farming operations. At any stage of production, there is the risk of mold, microbial agents, or viruses infecting vegetables.
Farm equipment and transport vehicles used for harvest and postharvest handling should be regularly sanitized to prevent exposure to microbial risk.
Packaging used for harvesting vegetables should be appropriate to prevent spoilage or bruising from occurring.
Short-term storage facilities should be cool and not exposed to direct sunlight. Long-term storage facilities should be climate controlled – including both temperature and humidity levels – according to vegetable needs.
Health and Safety Any equipment – including machinery – used in farming practices must be
suitable for the task, properly maintained, with dangerous parts safeguarded, and that adequate training and information about the equipment is available. Equipment must be stable and stop controls, including emergency stops, must be provided.
Machinery should be maintained properly so people remain safe and healthy.
Producers should assess and control risks from hazardous substances, including substances used directly in work activities, such as cleaning chemicals, disinfectants, fertilizers, pesticides, bacteria, fungi, and other microorganisms.
Personal protective equipment provided for use at work must be made to an appropriate standard.
VEGETABLE MARKET ASSESSMENT FINAL
ECONOMIC PROSPERITY INITIATIVE (EPI) 26
COMPETITIVE LANDSCAPE MARKET SHARE CONCENTRATION
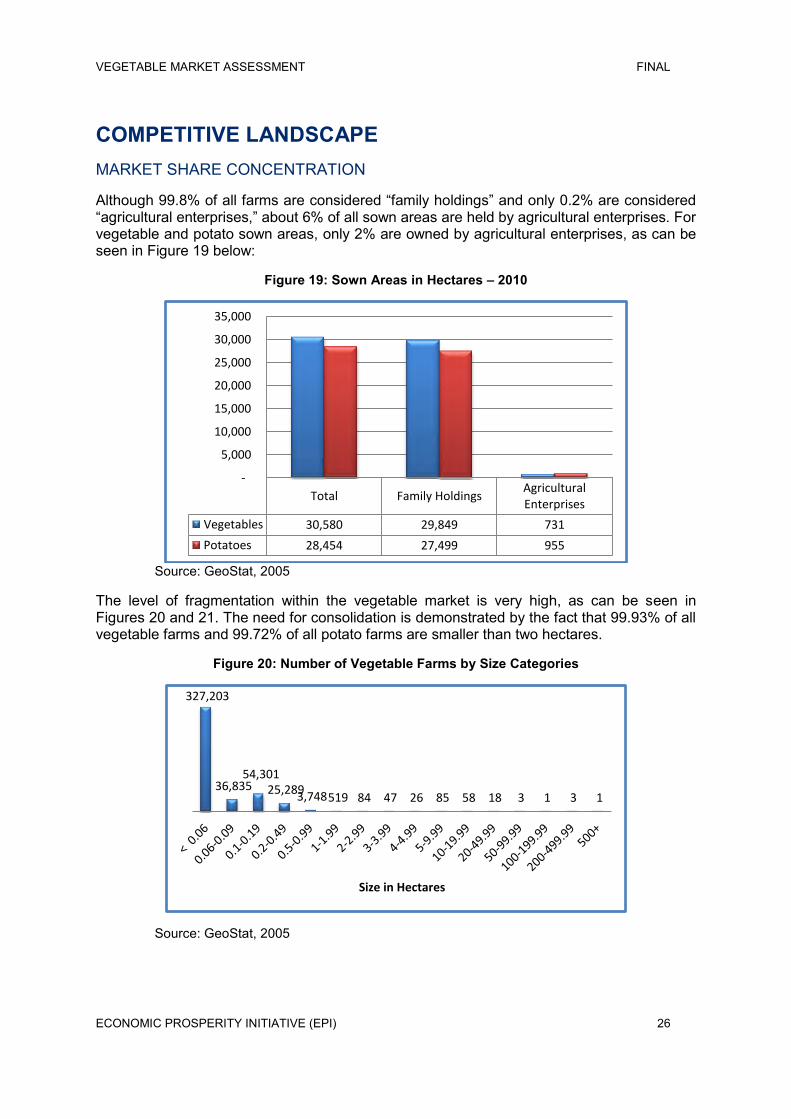
Although 99.8% of all farms are considered “family holdings” and only 0.2% are considered “agricultural enterprises,” about 6% of all sown areas are held by agricultural enterprises. For vegetable and potato sown areas, only 2% are owned by agricultural enterprises, as can be seen in Figure 19 below:
Figure 19: Sown Areas in Hectares – 2010
Source: GeoStat, 2005
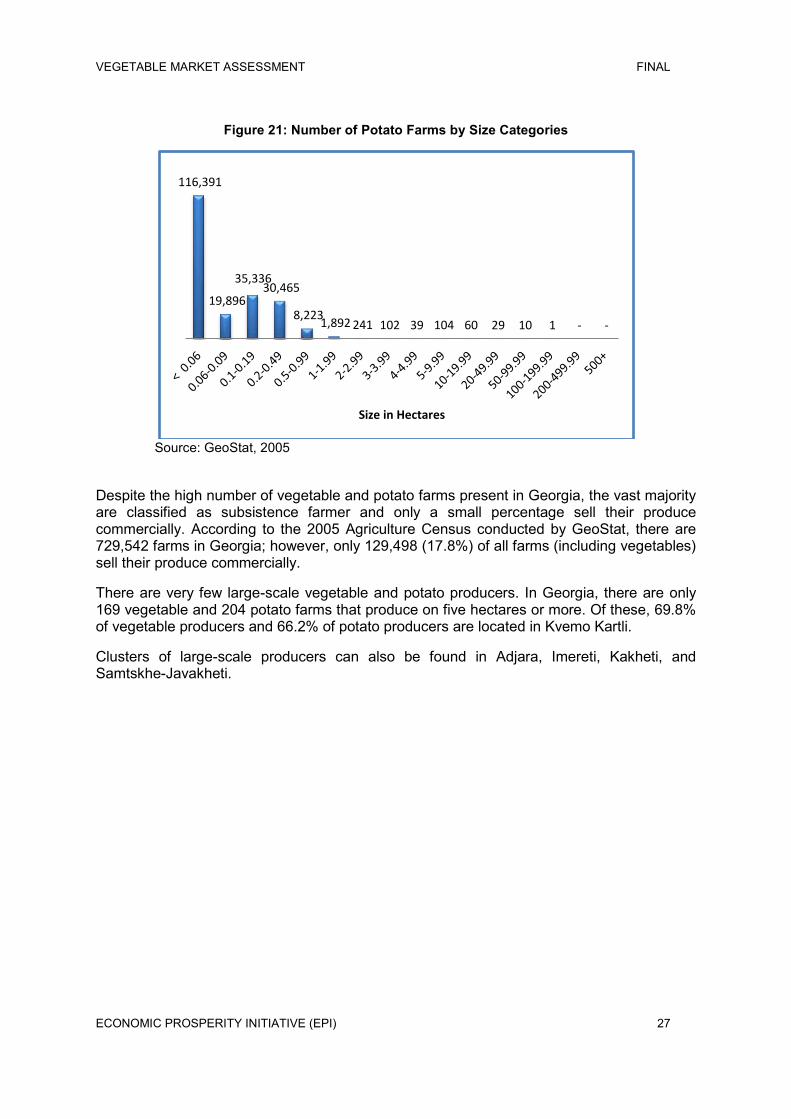
The level of fragmentation within the vegetable market is very high, as can be seen in Figures 20 and 21. The need for consolidation is demonstrated by the fact that 99.93% of all vegetable farms and 99.72% of all potato farms are smaller than two hectares.
Figure 20: Number of Vegetable Farms by Size Categories
Source: GeoStat, 2005
Total Family HoldingsAgricultural Enterprises
Vegetables 30,580 29,849 731
Potatoes 28,454 27,499 955
-
5,000
10,000
15,000
20,000
25,000
30,000
35,000
327,203
36,835 54,301
25,289 3,748 519 84 47 26 85 58 18 3 1 3 1
Size in Hectares
VEGETABLE MARKET ASSESSMENT FINAL
ECONOMIC PROSPERITY INITIATIVE (EPI) 27
Figure 21: Number of Potato Farms by Size Categories
Source: GeoStat, 2005
Despite the high number of vegetable and potato farms present in Georgia, the vast majority are classified as subsistence farmer and only a small percentage sell their produce commercially. According to the 2005 Agriculture Census conducted by GeoStat, there are 729,542 farms in Georgia; however, only 129,498 (17.8%) of all farms (including vegetables) sell their produce commercially.
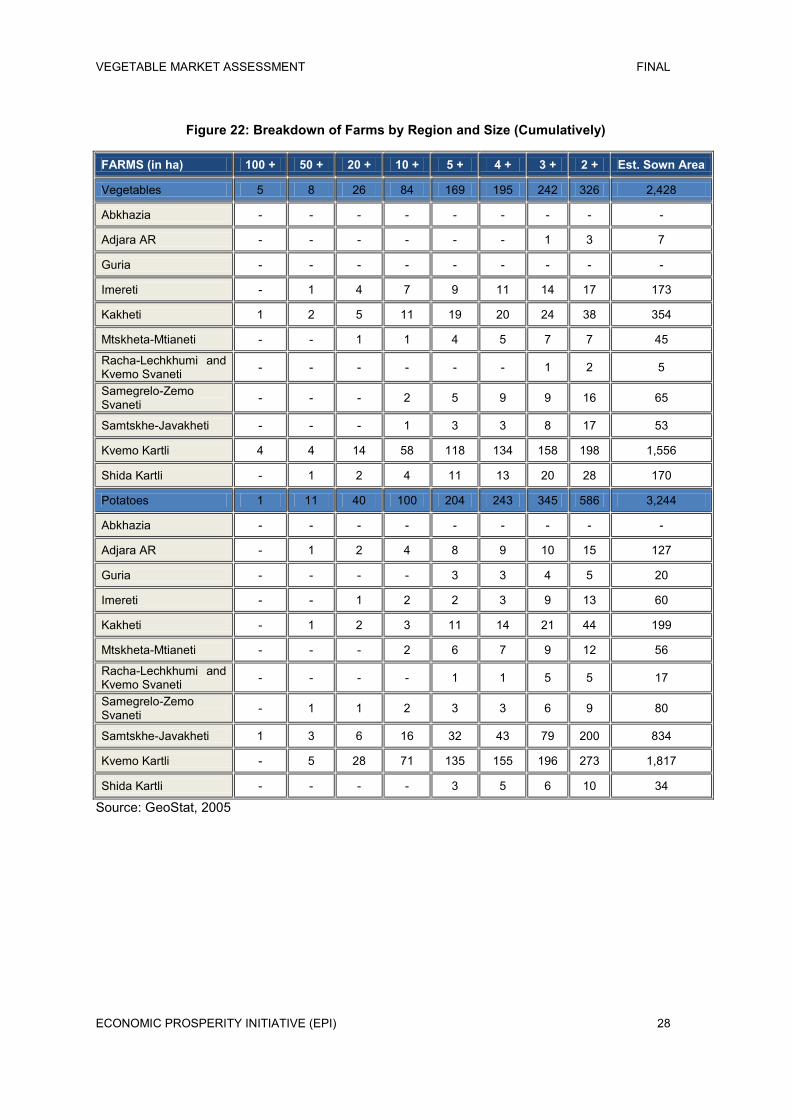
There are very few large-scale vegetable and potato producers. In Georgia, there are only 169 vegetable and 204 potato farms that produce on five hectares or more. Of these, 69.8% of vegetable producers and 66.2% of potato producers are located in Kvemo Kartli.
Clusters of large-scale producers can also be found in Adjara, Imereti, Kakheti, and Samtskhe-Javakheti.
116,391
19,896
35,336 30,465
8,223 1,892 241 102 39 104 60 29 10 1 - -
Size in Hectares
VEGETABLE MARKET ASSESSMENT FINAL
ECONOMIC PROSPERITY INITIATIVE (EPI) 28
Figure 22: Breakdown of Farms by Region and Size (Cumulatively)
FARMS (in ha) 100 + 50 + 20 + 10 + 5 + 4 + 3 + 2 + Est. Sown Area
Vegetables 5 8 26 84 169 195 242 326 2,428
Abkhazia - - - - - - - - -
Adjara AR - - - - - - 1 3 7
Guria - - - - - - - - -
Imereti - 1 4 7 9 11 14 17 173
Kakheti 1 2 5 11 19 20 24 38 354
Mtskheta-Mtianeti - - 1 1 4 5 7 7 45
Racha-Lechkhumi and Kvemo Svaneti - - - - - - 1 2 5
Samegrelo-Zemo Svaneti - - - 2 5 9 9 16 65
Samtskhe-Javakheti - - - 1 3 3 8 17 53
Kvemo Kartli 4 4 14 58 118 134 158 198 1,556
Shida Kartli - 1 2 4 11 13 20 28 170
Potatoes 1 11 40 100 204 243 345 586 3,244
Abkhazia - - - - - - - - -
Adjara AR - 1 2 4 8 9 10 15 127
Guria - - - - 3 3 4 5 20
Imereti - - 1 2 2 3 9 13 60
Kakheti - 1 2 3 11 14 21 44 199
Mtskheta-Mtianeti - - - 2 6 7 9 12 56
Racha-Lechkhumi and Kvemo Svaneti - - - - 1 1 5 5 17
Samegrelo-Zemo Svaneti - 1 1 2 3 3 6 9 80
Samtskhe-Javakheti 1 3 6 16 32 43 79 200 834
Kvemo Kartli - 5 28 71 135 155 196 273 1,817
Shida Kartli - - - - 3 5 6 10 34
Source: GeoStat, 2005
VEGETABLE MARKET ASSESSMENT FINAL
ECONOMIC PROSPERITY INITIATIVE (EPI) 29
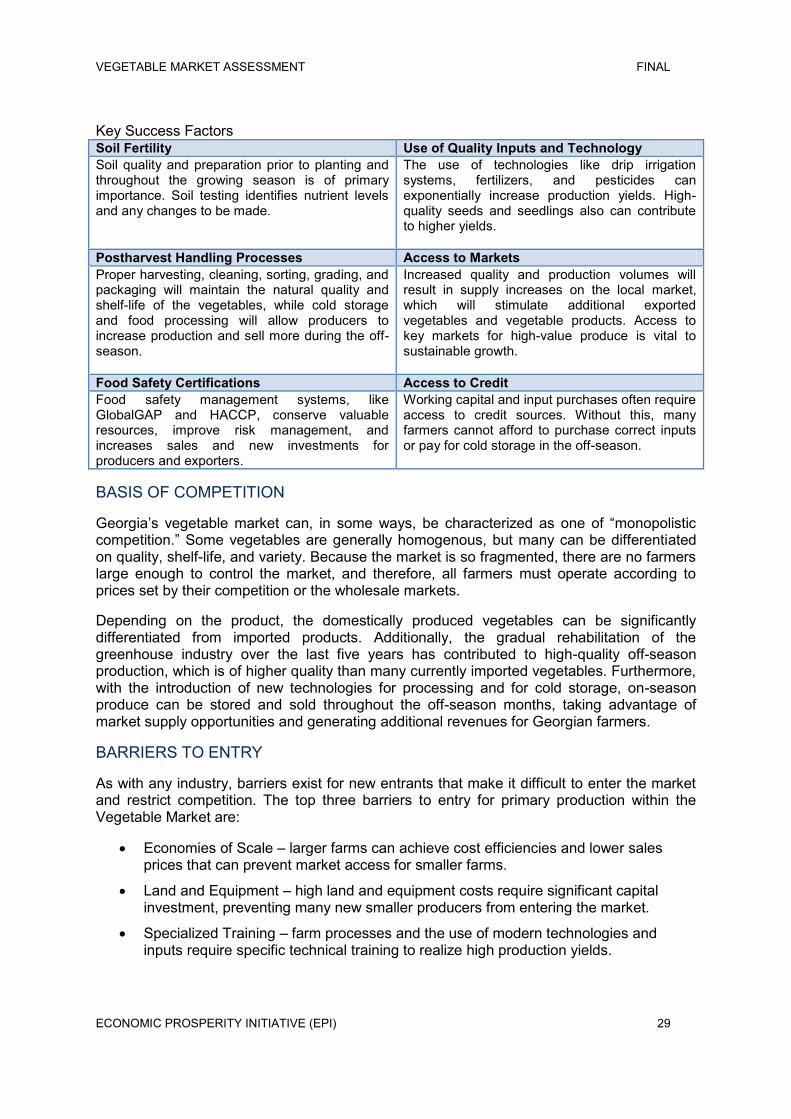
Key Success Factors Soil Fertility Use of Quality Inputs and Technology Soil quality and preparation prior to planting and throughout the growing season is of primary importance. Soil testing identifies nutrient levels and any changes to be made.
The use of technologies like drip irrigation systems, fertilizers, and pesticides can exponentially increase production yields. High-quality seeds and seedlings also can contribute to higher yields.
Postharvest Handling Processes Access to Markets Proper harvesting, cleaning, sorting, grading, and packaging will maintain the natural quality and shelf-life of the vegetables, while cold storage and food processing will allow producers to increase production and sell more during the off-season.
Increased quality and production volumes will result in supply increases on the local market, which will stimulate additional exported vegetables and vegetable products. Access to key markets for high-value produce is vital to sustainable growth.
Food Safety Certifications Access to Credit Food safety management systems, like GlobalGAP and HACCP, conserve valuable resources, improve risk management, and increases sales and new investments for producers and exporters.
Working capital and input purchases often require access to credit sources. Without this, many farmers cannot afford to purchase correct inputs or pay for cold storage in the off-season.
BASIS OF COMPETITION
Georgia‟s vegetable market can, in some ways, be characterized as one of “monopolistic competition.” Some vegetables are generally homogenous, but many can be differentiated on quality, shelf-life, and variety. Because the market is so fragmented, there are no farmers large enough to control the market, and therefore, all farmers must operate according to prices set by their competition or the wholesale markets.
Depending on the product, the domestically produced vegetables can be significantly differentiated from imported products. Additionally, the gradual rehabilitation of the greenhouse industry over the last five years has contributed to high-quality off-season production, which is of higher quality than many currently imported vegetables. Furthermore, with the introduction of new technologies for processing and for cold storage, on-season produce can be stored and sold throughout the off-season months, taking advantage of market supply opportunities and generating additional revenues for Georgian farmers.
BARRIERS TO ENTRY
As with any industry, barriers exist for new entrants that make it difficult to enter the market and restrict competition. The top three barriers to entry for primary production within the Vegetable Market are:
Economies of Scale – larger farms can achieve cost efficiencies and lower sales prices that can prevent market access for smaller farms.
Land and Equipment – high land and equipment costs require significant capital investment, preventing many new smaller producers from entering the market.
Specialized Training – farm processes and the use of modern technologies and inputs require specific technical training to realize high production yields.
VEGETABLE MARKET ASSESSMENT FINAL
ECONOMIC PROSPERITY INITIATIVE (EPI) 30
INDUSTRY GLOBALIZATION
With an ever growing global population, the importance of maintaining an adequate food supply is becoming increasingly more important. As global agriculture demand grows, there is an increasing need to expand production within the Vegetable Market in Georgia. Export markets represent a stable flow of inbound revenues that directly benefit farmers and the economy as a whole.
Due to Georgia‟s strategic location as a transport corridor of the Southern Caucasus and a strategic transit center on the Silk Road route from Asia to Europe, the Vegetable Market is well positioned to take advantage of these export opportunities and begin exporting to Europe, Central Asia, and the Middle East.
VEGETABLE MARKET ASSESSMENT FINAL
ECONOMIC PROSPERITY INITIATIVE (EPI) 31
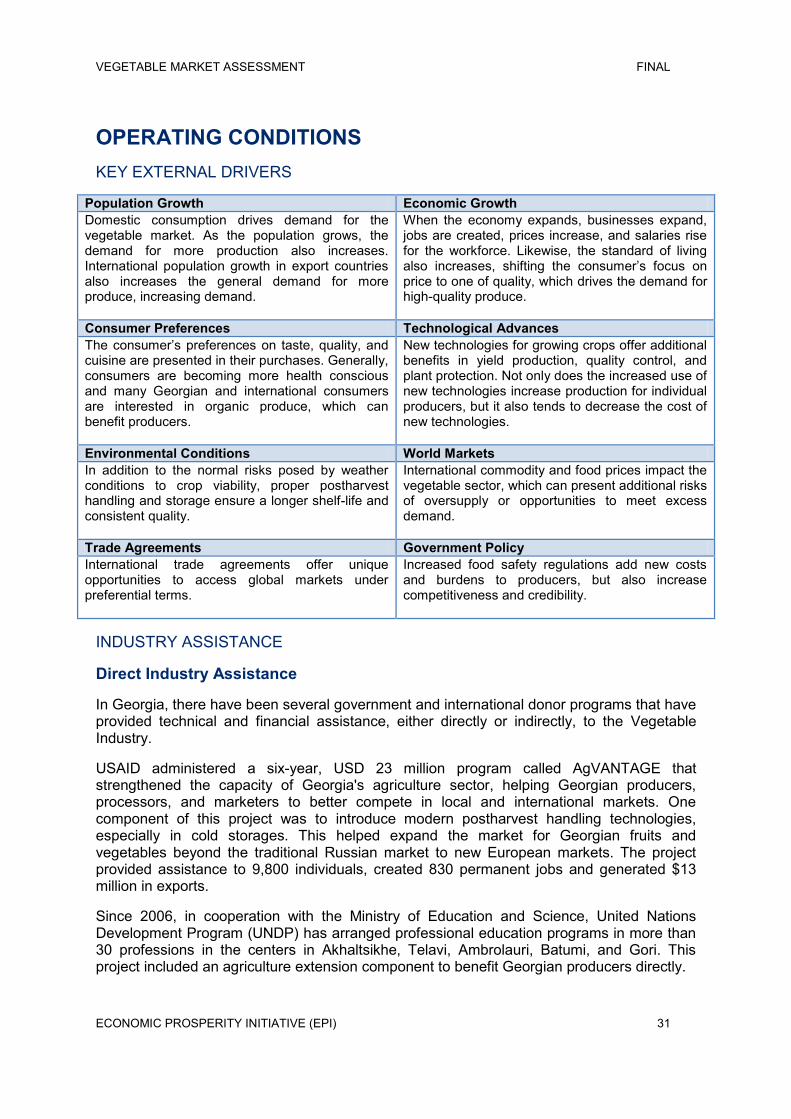
OPERATING CONDITIONS KEY EXTERNAL DRIVERS
Population Growth Economic Growth Domestic consumption drives demand for the vegetable market. As the population grows, the demand for more production also increases. International population growth in export countries also increases the general demand for more produce, increasing demand.
When the economy expands, businesses expand, jobs are created, prices increase, and salaries rise for the workforce. Likewise, the standard of living also increases, shifting the consumer‟s focus on price to one of quality, which drives the demand for high-quality produce.
Consumer Preferences Technological Advances The consumer‟s preferences on taste, quality, and cuisine are presented in their purchases. Generally, consumers are becoming more health conscious and many Georgian and international consumers are interested in organic produce, which can benefit producers.
New technologies for growing crops offer additional benefits in yield production, quality control, and plant protection. Not only does the increased use of new technologies increase production for individual producers, but it also tends to decrease the cost of new technologies.
Environmental Conditions World Markets In addition to the normal risks posed by weather conditions to crop viability, proper postharvest handling and storage ensure a longer shelf-life and consistent quality.
International commodity and food prices impact the vegetable sector, which can present additional risks of oversupply or opportunities to meet excess demand.
Trade Agreements Government Policy International trade agreements offer unique opportunities to access global markets under preferential terms.
Increased food safety regulations add new costs and burdens to producers, but also increase competitiveness and credibility.
INDUSTRY ASSISTANCE
Direct Industry Assistance
In Georgia, there have been several government and international donor programs that have provided technical and financial assistance, either directly or indirectly, to the Vegetable Industry.
USAID administered a six-year, USD 23 million program called AgVANTAGE that strengthened the capacity of Georgia's agriculture sector, helping Georgian producers, processors, and marketers to better compete in local and international markets. One component of this project was to introduce modern postharvest handling technologies, especially in cold storages. This helped expand the market for Georgian fruits and vegetables beyond the traditional Russian market to new European markets. The project provided assistance to 9,800 individuals, created 830 permanent jobs and generated $13 million in exports.
Since 2006, in cooperation with the Ministry of Education and Science, United Nations Development Program (UNDP) has arranged professional education programs in more than 30 professions in the centers in Akhaltsikhe, Telavi, Ambrolauri, Batumi, and Gori. This project included an agriculture extension component to benefit Georgian producers directly.
VEGETABLE MARKET ASSESSMENT FINAL
ECONOMIC PROSPERITY INITIATIVE (EPI) 32
Many international agencies provide assistance to the Vegetable Industry, especially in the fields of economic development, agriculture, and aquaculture. Their programs work to increase the productivity and value of domestic production, as well as to implement new technologies and operational models.
Agencies involved in general agricultural industry assistance include:
FAO - Food and Agriculture Organization
UNEP - United Nations Environment Programme
UNDP - United Nations Development Programme
WB - World Bank
CGIAR - Consultative Group on Agriculture Development
IFAD - International Fund for Agricultural Development
EBRD - European Bank for Reconstruction and Development
DFID - Department for International Development
ICARDA - International Center Agricultural Research in the Dry Area
JICA - Japan International Cooperation Agency
GTZ - German Technical Cooperation
IFC - International Finance Corporation
USAID – U.S. Agency for International Development
SIDA - Swedish International Development Cooperation Agency
DEFRA - Britain's Department for the Environment, Food, and Rural Affairs
SECO - State Secretariat for Economic Affairs
KfW - KfW Development Bank
CARE - CARE Georgia and CARE International
UNHCR - United Nations High Commissioner for Refugees
Indirect Industry Assistance
In 2008, the Ministry of Agriculture introduced a program to provide credit at low interest rates for cold storage facilities.
In 2010, through USAID funding, CHF International Georgia worked with investors to establish a cold storage facility in Rustavi, giving farmers an extended selling season and the opportunity to sell products to the local supermarket chains, Vegini and Populi. The cold storage facility and quality control programs introduced by USAID and CHF International Georgia will significantly increase the value and quality of the vegetables and fruits received by farmers, increasing their profits.
CNFA administered a USD 20.2 million Agribusiness Development Activity (ADA), which is funded by the Millennium Challenge Georgia Fund, supports sustainable, long-term agricultural growth by strengthening commercial linkages. ADA awarded farmers and
VEGETABLE MARKET ASSESSMENT FINAL
ECONOMIC PROSPERITY INITIATIVE (EPI) 33
agribusinesses matching grants to develop farm service centers, value-adding enterprises, value chain initiatives, and primary production practices.
In 2010, two cold storage facilities were established in the Kakheti region and have created a total of 72 jobs and will benefit more than 200 farmers. Supported by a grant of $150,000 from CNFA‟s ADA, each company also made a matching investment to establish modern cold storage facilities for fruits in Sagarejo and Gurjaani, respectively.
CNFA‟s grants were used to purchase modern storage and cooling equipment. Environmental mitigation and marketing concerns were incorporated in the design processes to ensure sustainable and eco-friendly enterprises.
A recently opened cold storage in Kachreti provides small farmers with effective technology for storing perishable fruits and vegetables before sale. The cold storage had been launched by the United Nations Development Programme (UNDP) with funding from Swiss Agency for Development and Cooperation. At a cost of USD 19,000, it is part of UNDP‟s larger initiative to promote vocational education and training in Georgia. The facility can store up to 18 tons of fruit and up to 20 tons of vegetables a day with the storage cycle from 5 to 10 days, which is enough for serving around 160 small farmer families.
In Kachreti, UNDP combines vocational education programs with the assistance to local agriculture development. Last year, with funds from the Romanian government, UNDP set up a small-scale processing plant, which helps local farmers to process fruits and vegetables and to get their product ready for sale in attractive packing. Finally, several international organizations, including the IFC, the EU, the FAO, and USDA have introduced significant projects focused on improving food safety in Georgia.
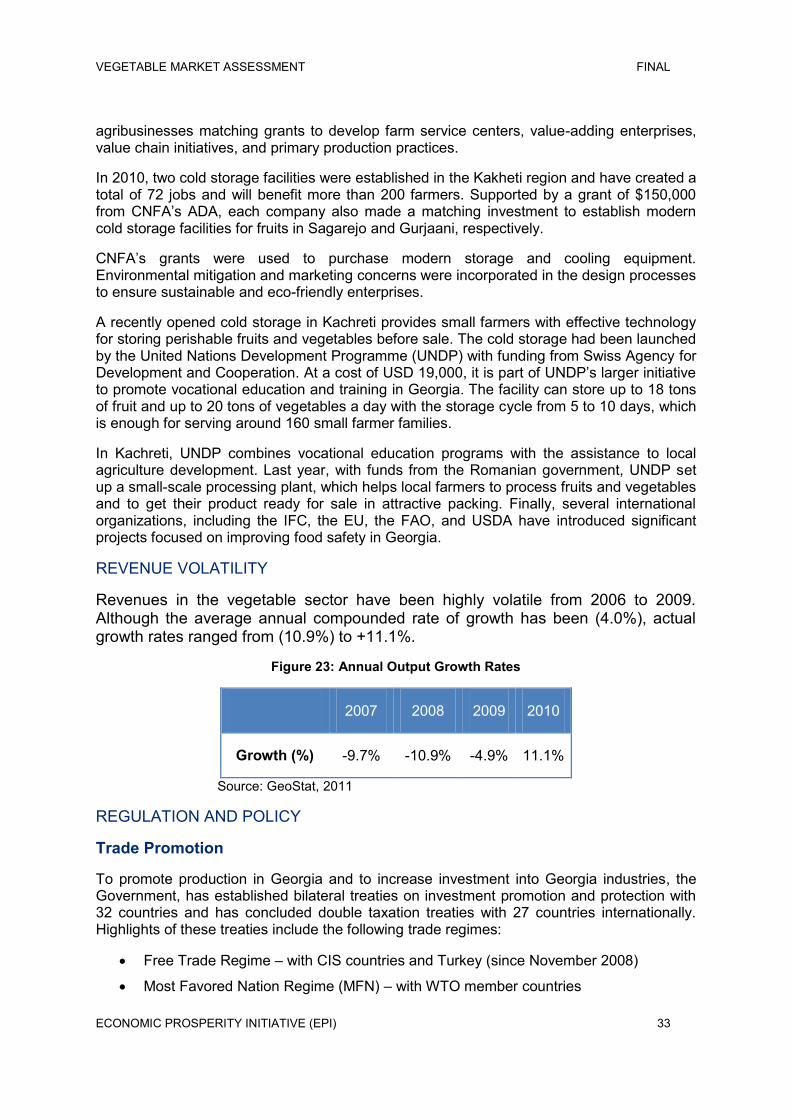
REVENUE VOLATILITY
Revenues in the vegetable sector have been highly volatile from 2006 to 2009. Although the average annual compounded rate of growth has been (4.0%), actual growth rates ranged from (10.9%) to +11.1%.
Figure 23: Annual Output Growth Rates
2007 2008 2009 2010
Growth (%) -9.7% -10.9% -4.9% 11.1%
Source: GeoStat, 2011
REGULATION AND POLICY
Trade Promotion
To promote production in Georgia and to increase investment into Georgia industries, the Government, has established bilateral treaties on investment promotion and protection with 32 countries and has concluded double taxation treaties with 27 countries internationally. Highlights of these treaties include the following trade regimes:
Free Trade Regime – with CIS countries and Turkey (since November 2008)
Most Favored Nation Regime (MFN) – with WTO member countries
VEGETABLE MARKET ASSESSMENT FINAL
ECONOMIC PROSPERITY INITIATIVE (EPI) 34
Preferential Regime (GSP) – with USA, Canada, Japan, Switzerland, and Norway
Preferential Regime (GSP+) – with EU (> 7,200 items) since 2005
Possibility of FTA with EU in nearest future5
Georgia‟s customs code is on par with European standards and has streamlined its customs procedures to simplify the import and export process. The key features that benefit Georgian farms include:
Low import tariffs
Few export/import licenses and permits
No quantitative restrictions on import and export
No customs tariff on export and re-export
No value added tax on export
Simplified export and import procedures6
Food Safety
The 2005 Law on Food Safety and Quality was amended in June 2010 and is the foundation of Georgia‟s Food Safety Strategy, a key component of European Neighborhood Policy Action Plan and one of the integral parts of the upcoming “Deep and Comprehensive Free Trade Agreement” with the EU. This strategy focuses on consumer protection and on harmonization of Georgia‟s food safety policies with EU legislation.7
Under this strategy, the National Service for Food Safety, Veterinary and Plant Protection will be reorganized into the Food Safety Service, which will operate within the Ministry of Agriculture. More than 3,000 companies exporting food products have already been registered with the National Service for inspection and food safety control issues. The National Service plans to inspect high-risk enterprises annually and low-risk enterprises every two years. Enterprises that have obtained ISO or HACCP certifications will be inspected less frequently.8
The first steps will be to establish a set of registration rules and establish state control over producers and all distributors of food. Accordingly, the National Service shall exercise its authority for control and inspections in accordance with these regulations. Producers and processors – as well as distributors and exporters – will have to maintain these Food Safety and Quality Control standards for their products.
Recent developments in Food Safety Reform include:
Institutional and legal reform spurred by the forthcoming FTA with EU.
5 National Investment Agency of Georgia website: www.investingeorgia.org. 6 Ministry of Finance website: www.mof.gov.ge. 7 LEPL National Food Agency website: www.fvp.ge. 8 Ministry of Agriculture of Georgia website: www.moa.gov.ge.
VEGETABLE MARKET ASSESSMENT FINAL
ECONOMIC PROSPERITY INITIATIVE (EPI) 35
Renewed food safety control provisions for all product groups from 2011.
Required to have HACCP (few exceptions for small, primary producers).
Traceability on all stages of production, processing, and distribution.
Recently enacted secondary legislation: General Hygiene Regulation (and Simplified Hygiene Rule), Regulation on Official Controls in food safety.
Responsibility to ensure food safety lies with the private sector.9
9 Tevzadze, Maia. “Role of Food Safety Standards in Improving Agricultural Producers‟ Access to Markets”. IFC presentation, March 2011.
VEGETABLE MARKET ASSESSMENT FINAL
ECONOMIC PROSPERITY INITIATIVE (EPI) 36
VALUE CHAIN GAP ANALYSIS INTRODUCTION
The vegetable industry is composed of businesses that provide physical, advisory and financial input services to primary producers of vegetables (including potatoes); postharvest facilities that provide storage and processing; wholesale and retail distributors; and outlets and trading companies that provide import and export services.
The Vegetable Market Value Chain is mapped out in the organizational chart on the following page, demonstrating not only the relationships between the various market actors, but also charting the flow of inputs and outputs from pre-production to consumption.
Figure 24: Vegetable Market Value Chain
GAP ANALYSIS
Inputsand Technologies
Most small farmers purchase low-quality, low-yielding seeds from bazaars because they cannot afford to purchase high-quality seeds, with significantly higher yield potential, and cannot access agricultural credit.
Pesticides and fertilizers are expensive for most small farmers who cannot afford to use these regularly.
While almost all medium and large farms use pesticides regularly, only about 60% regularly use chemical fertilizers.
VEGETABLE MARKET ASSESSMENT FINAL
ECONOMIC PROSPERITY INITIATIVE (EPI) 37
Manure fertilizer management systems have become obsolete and there are no incentives to rebuild. Manure fertilizers are used rarely.
Most farmers still use flood irrigation techniques as opposed to the more efficient, though more expensive, technique of drip irrigation. The main reason for this is that the irrigation systems are broken and dilapidated, and farmers must replace these systems completely. The secondary reason is because farmers cannot afford to purchase the necessary equipment for drip irrigation.
Many farmers still apply chemicals inappropriately. One grocery store fruit and vegetable buyer reported that she rejected 25 MT of melons in the fall of 2010 because, upon testing at the grocery store‟s food laboratory, the melons contained extremely high levels of nitrites.
Primary Production
According to the 2005 Agriculture Census conducted by GeoStat, there are 729,542 farms in Georgia; however, only 129,498 (17.8%) sell their produce commercially. Most of these farms are too small to have the economies of scale to achieve cost efficiencies or maximize profitability.
There are only two significant commercial greenhouses in Georgia: Ikon in Adjara, with 3.1 hectare of tomato and lettuce greenhouses, and Herbia in Imereti with 2.8 hectare of greens production. Both of these greenhouses are heated and use modern technologies, such as drip irrigation and inputs. Both produce and sell produce at off-season prices. Ikon and Herbia realize very high yields of up to 300 t/ha. These greenhouses can be used as model success stories to promote the use of modern technologies. Ikon sells about 80% of its produce to the domestic market and exports about 20% to Turkey. Herbia also acts as a wholesale distributor to institutional buyers in Tbilisi and other major markets.
Additionally, there are clusters of greenhouses in the regions that produce several vegetables, mainly greens and tomatoes. These greenhouses are usually individually owned and too small to achieve economies of scale for production.
There is only one greenhouse that has a GlobalGAP certification: Herbia in Imereti.
There are no vegetable or potato farms with food safety certifications.
Food Packaging Facilities
There is currently only one supplier of vegetable packaging in Georgia. This supplier, Georgia Plastic, is in Adjara. Most boxes that are in use were previously used to ship imported products and are continually reused until they are damaged.
Stand-alone food packaging services are non-existent.
Grocery stores, like Goodwill and Populi, report that many of the vegetables delivered by farmers arrive in plastic grocery bags or packed in large banana boxes. Imported vegetables arrive in vegetable-specific packaging and are much more desirable than current Georgian practices.
Cold Storage Facilities
Total Vegetable Production volumes for 2009 were 404,000 MT, while there are only 12,005 MT of space available for vegetable storage in Georgia.
VEGETABLE MARKET ASSESSMENT FINAL
ECONOMIC PROSPERITY INITIATIVE (EPI) 38
Cold storage facilities in regions are virtually non-existent. Some farmers claim that they have no financial incentive to produce more vegetables, because the market cannot absorb additional production volumes at normal market rates. Any extra would be sold at a fraction of market rates or it would be discarded. However, if these farmers had access to cold storage facilities, then they would immediately increase production.
Currently, many large farms have their own ad hoc storage facilities, while many medium and small farms store their produce in basements and cellars, using standard residential air conditioners for climate control. These techniques usually result in a significant loss of both quality and quantity of the produce.
Processors are growing rapidly and need more storage. Kula has 2,000 MT of short-term storage on its premises, but currently needs an additional 500 MT. Because Kula is expanding its production from 20,000 MT of vegetables in 2010 to 27,000 MT in 2011 (35%), it needs additional storage to accommodate the overflow.
Wholesalers cannot grow without access to cold storage. Wholesalers report that they have limited storage space, but it is used for daily purchases. There is significant interest to develop cold storages and expand wholesale activities of Georgian produce during off-season months; however, wholesalers claim that the banks will not finance them due to their generally low levels of fixed assets.
Food Processing
There are only three significant commercial food processors in Georgia: Marneuli, Bazi, and Kula. Their ability to process vegetables is limited by their capacity; for example, Kula can only process 20,000 MT per season without additional storage capacity.
There are no processors that have food safety certifications; however, Kula is exporting to 18 countries (including Germany and EU country) because their products have been tested extensively in EU and Israeli food laboratories.
Consumption Gaps
From 2006-2009, domestic consumption for vegetables was relatively stable, ranging from 234-259,000 MT, while domestic production was always lower, ranging from 165-190,000 MT. Not only were 100% of the domestically produced vegetables consumed, but also additional imports were required in order to satisfy these recent demand levels.
Demand levels for potatoes also remained relatively stable from 2006-2009, ranging from 195-210,000 MT; however, production levels were more erratic. Domestic production actually exceeded demand in 2007 and 2009.
Access to Markets
Wholesalers to the major domestic markets need a stable supply of vegetables, so they purchase only from large producers.
Wholesalers will include transportation services from rural locations; however, many medium and large farms have their own transport vehicles to ship the produce to major markets.
VEGETABLE MARKET ASSESSMENT FINAL
ECONOMIC PROSPERITY INITIATIVE (EPI) 39
Small producers in regions either sell to local markets at depressed prices, barter, or higher independent trucks to transport their produce to the major markets.
Most farms are not GlobalGAP or HACCP certified and can export products to only a limited number of export markets, such as to CIS countries.
Access to Credit
Agricultural loans make up only 0.8% of national commercial loan portfolio, because it is seen as a risky activity despite the fact that it is the most profitable portion of the loan portfolio for several banks.
Because small farmers do not qualify for loans at commercial banks, they must access credit from micro finance institutions that charge approximately 35% interest per annum.
Most small farmers take “personal” loans to use for farm from MFIs, so it is impossible to quantify the total amount of loans used for vegetable farms.
One commercial bank started a new lending program in April 2011 that allowed farmers to take an installment loan to pay for seeds, fertilizers, and pesticides in the spring and to have a grace period of six to seven months to begin repayment, with an interest rate 15% per annum. However, this is limited in its scope because the program is only available in Kakheti and inputs must be purchased through Bank Constanta‟s partner, Boran Distribution. One MFI, Credo, has a similar product; however, interest rates start at 35% per annum.
Only one commercial bank (Procredit Bank) has a team dedicated to agriculture lending. Its agricultural (primary production) loan portfolio amounts to GEL 13 million, which is almost half of the national agricultural loan portfolio. The average loan size is approximately $2,000, and the average interest rate is 22-24%.
VEGETABLE MARKET ASSESSMENT FINAL
ECONOMIC PROSPERITY INITIATIVE (EPI) 40
D. RECOMMENDATIONS INPUTS AND TECHNOLOGIES
EPI consultants should promote the use of cultivars that are appropriate to the Georgian climate, taste, and culture that are available at a competitive price.
FSCs introduce new technology, seeds, and chemicals and provide limited training upon purchase; however, there still needs to be consistent training and seminars on new technologies and their application. Distributors also provide similar seminars for farmers. EPI consultants should work with these organizations, possibly through the FSCs or AgroService Associations, to create a master calendar of training schedules and topics, so EPI consultants can identify where gaps are in the training topics.
Very few farms and greenhouses are using advanced technologies to produce higher yields. EPI consultants should develop a promotional campaign or subsidy program to encourage usage, specifically identifying potential production yield increases that will generate additional revenues.
EPI consultants should assist FSCs and input providers in establishing more “demonstration plots” for small farmers. Despite the fact that the FSCs are very successful, they currently serve a little more than 100,000 farmers. With approximately 730,000 farms in Georgia, many farmers still need access to this knowledge and training.
EPI consultants should identify where the bottlenecks are for replacing irrigation systems and develop a strategy, if possible, to decrease their costs.
EPI consultants should provide assistance to farmers who desire to raise seeds or seedlings domestically, especially through greenhouse production.
EPI consultants should work with commercial training organizations or educational institutions to train a new generation of Georgian vegetable experts, possibly through an industry advisory body, who will be able to continue training producers and their employees in soil, input, and crop management techniques.
PRIMARY PRODUCTION Because there are very few large-scale, heated greenhouses in Georgia, EPI
consultants should work with potential investors, or current greenhouse operators, to develop business plans and financing strategies to increase investment within the heated greenhouse sector.
Production increases need to be implemented across the range of vegetables produced with particular emphasis on high-value crops over low-value alternatives. EPI consultants should promote import substitution activities by promoting additional production in the four largest imports: potatoes, tomatoes, cucumbers, and legumes. More importantly, for export production, EPI consultants should promote high value, crops that can be produced efficiently and cheaply in Georgia to maximize profitability.
EPI consultants prepare the larger commercial producers for export readiness by promoting GlobalGAP among producers and HACCP among the exporters. This
VEGETABLE MARKET ASSESSMENT FINAL
ECONOMIC PROSPERITY INITIATIVE (EPI) 41
should be done while also introducing domestic producers to international wholesale distributors.
EPI consultants should work with Vegetable Market actors to fix the gaps in the production and infrastructure chain for producers to access international markets. For example, if there are no cold storage facilities close enough to the producers, EPI consultants should work with market actors to establish a facility in the area.
EPI consultants should also promote Smallholder GlobalGAP certifications for groups of farmers or greenhouses that can qualify under a GlobalGAP umbrella certification for individual smallholder farms.
EPI consultants should promote increased production across the board, in conjunction with export demand surveys for local produce and export markets to identify what products will sell.
EPI consultants should recommend and promote the implementation of the European CODEX product standards.
EPI consultants should promote investment in vertically integrated ventures, specifically within greenhouses, cold storage, processing, and wholesaling. Any combination of these would result in substantial returns.
FOOD PACKAGING FACILITIES EPI consultants should identify production facilities that can produce cardboard or
plastic boxes that are appropriate for vegetables and mediate prices for farmers.
EPI consultants should determine appropriate short-term, cost-efficient alternatives to cold storages, such as Modified Gas Packaging, which extends the shelf-life of produce.
COLD STORAGE FACILITIES EPI consultants should undertake a survey of the major producer regions to identify
where the major demand for cold storage will be and how many MT of storage could be utilized by the private sector at normal commercial rates.
EPI consultants should identify what exactly are the financial and/or psychological barriers for farmers to use cold storages in lieu of basements and cellars, and develop an action plan to overcome these barriers.
EPI consultants should consider financial solutions to stimulate new investment in cold storages from both domestic and foreign investors.
EPI consultants should promote vertical integration between the cold storage sector and primary producers, the FSCs, wholesale distributors, or exporters.
FOOD PROCESSING EPI consultants should work with current food processors to assist in developing
additional capacity.
EPI consultants should promote new investment in food processing sector.
VEGETABLE MARKET ASSESSMENT FINAL
ECONOMIC PROSPERITY INITIATIVE (EPI) 42
CONSUMPTION GAPS Vegetable production needs to rise by at least 34% and as much as 57% to just
satisfy domestic demand.
Considering the differences between production and consumption values in 2006 and 2008, farmers only need to produce an additional 9-15% just to satisfy domestic demand. As such, potato production represents a significant opportunity for developing its export potential.
ACCESS TO MARKETS EPI consultants should work with the FSCs and collection centers to improve
consolidation mechanisms for small farmers.
EPI consultants should promote the development of additional transportation routes from rural Georgia to major domestic markets.
EPI consultants should work with organic farming producers to identify which farms and producers are certified organic, as these could be exported to EU markets and sold at a premium.
ACCESS TO CREDIT EPI consultants should work with MFIs banks to develop customized lending
solutions for producers to access credit schemes, similar to Bank Constanta and Credo‟s products, throughout Georgia at commercial banking rates.
EPI consultants should identify working capital solutions to finance cold storage services for vegetables.
Because the commercial banks‟ credit committees have a low level of understanding of general agricultural processes, EPI consultants should provide trainings in agricultural lending practices and standards.
SUMMARY While there are many gaps in the Vegetable Market value chain that need to be addressed directly and resolved to increase the sector‟s productivity, profitability, and competitiveness, there are several that are more structurally significant and demand a higher priority in EPI‟s action plan. The following items are the high priority recommendations that will not only address a major specific infrastructural component or operational process gap, but will also contribute to alleviating pressure, or even resolving, other lower priority gaps identified in this report:
Infrastructure
Cold Storage Facilities: By meeting the currently high demand for storages from producers, processors, and wholesale distributors, EPI will stimulate increased primary production, expand processing seasons, and extend the domestic vegetable sales period.
Food Packaging: By introducing affordable vegetable packaging, produce will be better preserved and protected in all postharvest handling processes.
VEGETABLE MARKET ASSESSMENT FINAL
ECONOMIC PROSPERITY INITIATIVE (EPI) 43
This is particularly important for exports, where profitability depends on product survivability.
Workforce Enhancement
Training on Inputs and Technologies: By training producers on using inputs and technologies properly, EPI will stimulate better quality and higher production.
Market Access
Collection Facilities and Transportation Routes: By developing a mechanism for rural farmers to collect production, creating linkages between these facilities with wholesalers, and facilitating new transportation routes, EPI will enable producers to sell their produce in higher-priced markets.
Certifications and Standards
GlobalGAP and HACCP: By promoting GlobalGAP among producers and HACCP among processors and postharvest handling facilities, EPI will enable producers to access major export markets with high-value products and will create visible models of proper food safety and handling procedures.
Smallholder GlobalGAP: By promoting the Smallholder GlobalGAP designation, EPI will not only improve access to markets for numerous small producers, but will also stimulate much-needed profitability gains.
Commodity Grading System: By implementing European CODEX standards, purchasers – including processors, wholesalers, and export markets – can set grade targets for their operations, which will increase demand for specific qualities of production, which will also stimulate gains among producers.
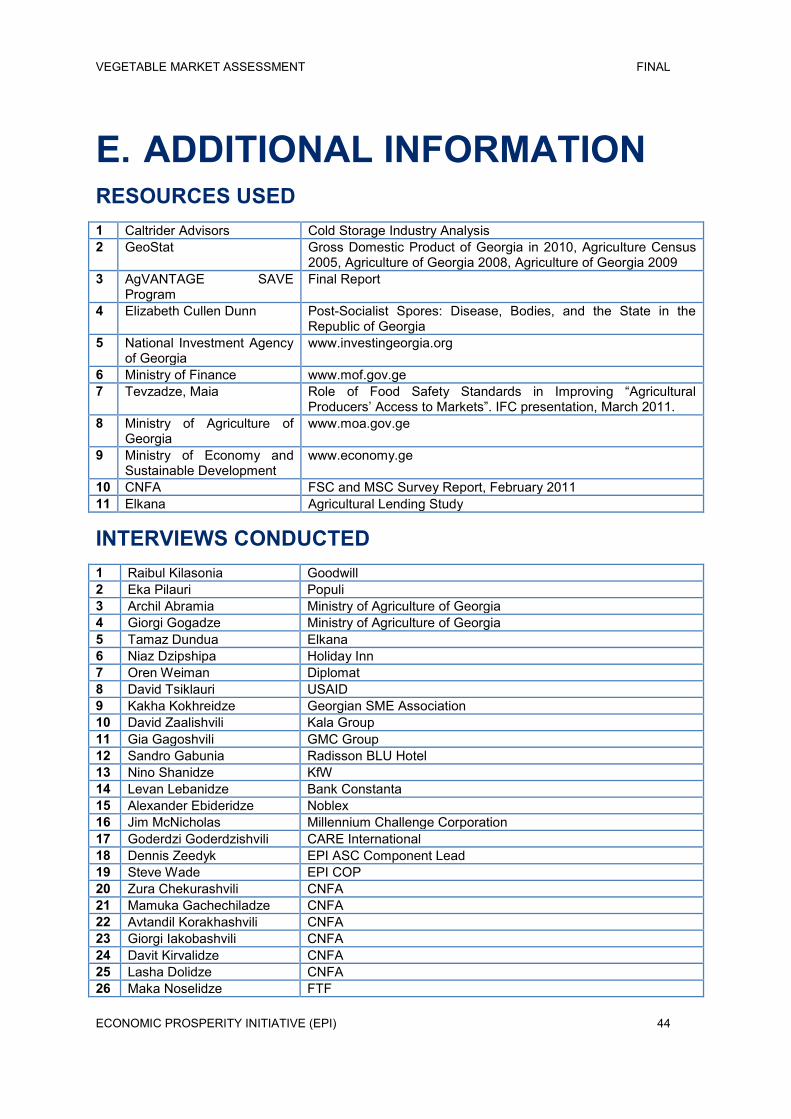
VEGETABLE MARKET ASSESSMENT FINAL
ECONOMIC PROSPERITY INITIATIVE (EPI) 44
E. ADDITIONAL INFORMATION RESOURCES USED 1 Caltrider Advisors Cold Storage Industry Analysis 2 GeoStat Gross Domestic Product of Georgia in 2010, Agriculture Census
2005, Agriculture of Georgia 2008, Agriculture of Georgia 2009 3 AgVANTAGE SAVE
Program Final Report
4 Elizabeth Cullen Dunn Post-Socialist Spores: Disease, Bodies, and the State in the Republic of Georgia
5 National Investment Agency of Georgia
www.investingeorgia.org
6 Ministry of Finance www.mof.gov.ge 7 Tevzadze, Maia Role of Food Safety Standards in Improving “Agricultural
Producers‟ Access to Markets”. IFC presentation, March 2011. 8 Ministry of Agriculture of
Georgia www.moa.gov.ge
9 Ministry of Economy and Sustainable Development
www.economy.ge
10 CNFA FSC and MSC Survey Report, February 2011 11 Elkana Agricultural Lending Study
INTERVIEWS CONDUCTED 1 Raibul Kilasonia Goodwill 2 Eka Pilauri Populi 3 Archil Abramia Ministry of Agriculture of Georgia 4 Giorgi Gogadze Ministry of Agriculture of Georgia 5 Tamaz Dundua Elkana 6 Niaz Dzipshipa Holiday Inn 7 Oren Weiman Diplomat 8 David Tsiklauri USAID 9 Kakha Kokhreidze Georgian SME Association 10 David Zaalishvili Kala Group 11 Gia Gagoshvili GMC Group 12 Sandro Gabunia Radisson BLU Hotel 13 Nino Shanidze KfW 14 Levan Lebanidze Bank Constanta 15 Alexander Ebideridze Noblex 16 Jim McNicholas Millennium Challenge Corporation 17 Goderdzi Goderdzishvili CARE International 18 Dennis Zeedyk EPI ASC Component Lead 19 Steve Wade EPI COP 20 Zura Chekurashvili CNFA 21 Mamuka Gachechiladze CNFA 22 Avtandil Korakhashvili CNFA 23 Giorgi Iakobashvili CNFA 24 Davit Kirvalidze CNFA 25 Lasha Dolidze CNFA 26 Maka Noselidze FTF
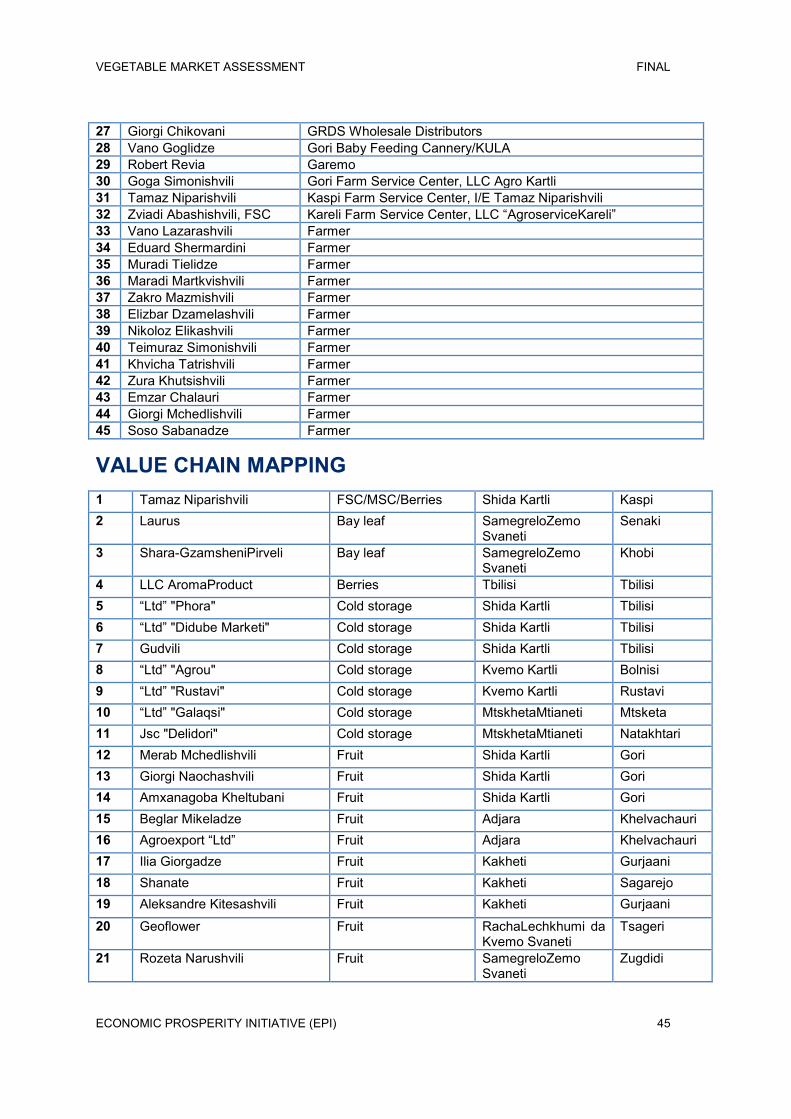
VEGETABLE MARKET ASSESSMENT FINAL
ECONOMIC PROSPERITY INITIATIVE (EPI) 45
27 Giorgi Chikovani GRDS Wholesale Distributors 28 Vano Goglidze Gori Baby Feeding Cannery/KULA 29 Robert Revia Garemo 30 Goga Simonishvili Gori Farm Service Center, LLC Agro Kartli 31 Tamaz Niparishvili Kaspi Farm Service Center, I/E Tamaz Niparishvili 32 Zviadi Abashishvili, FSC Kareli Farm Service Center, LLC “AgroserviceKareli” 33 Vano Lazarashvili Farmer 34 Eduard Shermardini Farmer 35 Muradi Tielidze Farmer 36 Maradi Martkvishvili Farmer 37 Zakro Mazmishvili Farmer 38 Elizbar Dzamelashvili Farmer 39 Nikoloz Elikashvili Farmer 40 Teimuraz Simonishvili Farmer 41 Khvicha Tatrishvili Farmer 42 Zura Khutsishvili Farmer 43 Emzar Chalauri Farmer 44 Giorgi Mchedlishvili Farmer 45 Soso Sabanadze Farmer
VALUE CHAIN MAPPING 1 Tamaz Niparishvili FSC/MSC/Berries Shida Kartli Kaspi 2 Laurus Bay leaf SamegreloZemo
Svaneti Senaki
3 Shara-GzamsheniPirveli Bay leaf SamegreloZemo Svaneti
Khobi
4 LLC AromaProduct Berries Tbilisi Tbilisi 5 “Ltd” "Phora" Cold storage Shida Kartli Tbilisi 6 “Ltd” "Didube Marketi" Cold storage Shida Kartli Tbilisi 7 Gudvili Cold storage Shida Kartli Tbilisi 8 “Ltd” "Agrou" Cold storage Kvemo Kartli Bolnisi 9 “Ltd” "Rustavi" Cold storage Kvemo Kartli Rustavi 10 “Ltd” "Galaqsi" Cold storage MtskhetaMtianeti Mtsketa 11 Jsc "Delidori" Cold storage MtskhetaMtianeti Natakhtari 12 Merab Mchedlishvili Fruit Shida Kartli Gori 13 Giorgi Naochashvili Fruit Shida Kartli Gori 14 Amxanagoba Kheltubani Fruit Shida Kartli Gori 15 Beglar Mikeladze Fruit Adjara Khelvachauri 16 Agroexport “Ltd” Fruit Adjara Khelvachauri 17 Ilia Giorgadze Fruit Kakheti Gurjaani 18 Shanate Fruit Kakheti Sagarejo 19 Aleksandre Kitesashvili Fruit Kakheti Gurjaani
20 Geoflower Fruit RachaLechkhumi da Kvemo Svaneti
Tsageri
21 Rozeta Narushvili Fruit SamegreloZemo Svaneti
Zugdidi
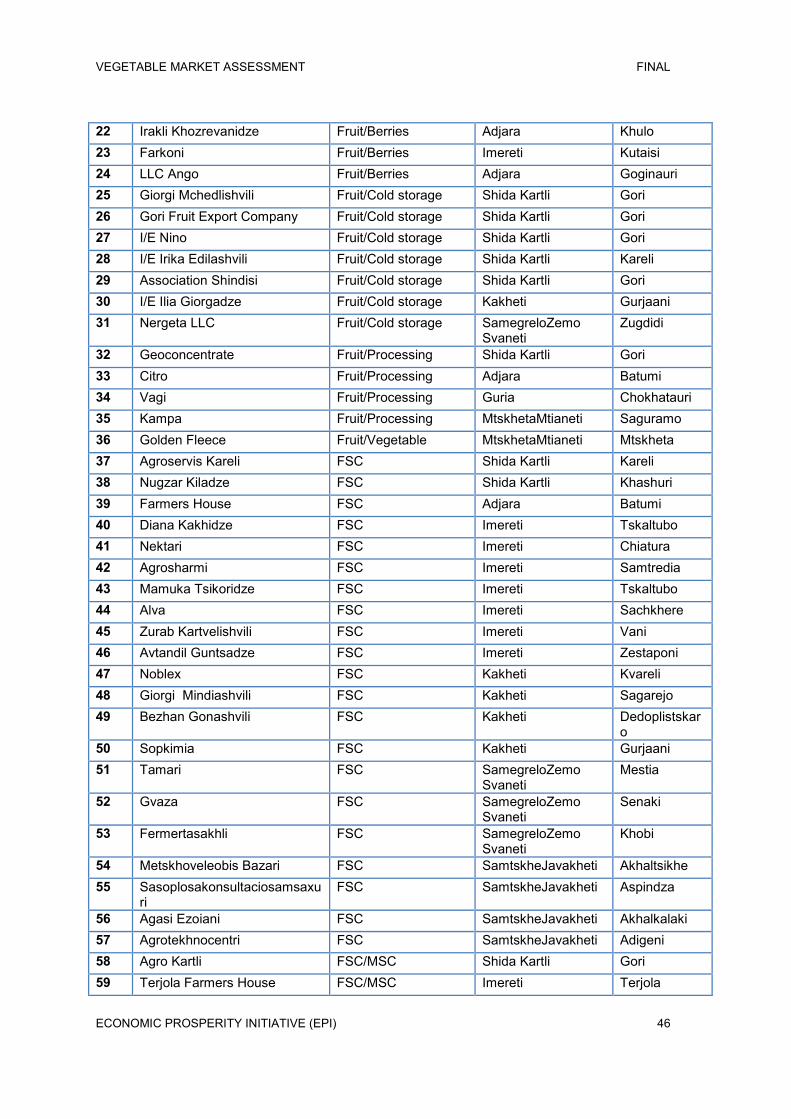
VEGETABLE MARKET ASSESSMENT FINAL
ECONOMIC PROSPERITY INITIATIVE (EPI) 46
22 Irakli Khozrevanidze Fruit/Berries Adjara Khulo 23 Farkoni Fruit/Berries Imereti Kutaisi 24 LLC Ango Fruit/Berries Adjara Goginauri 25 Giorgi Mchedlishvili Fruit/Cold storage Shida Kartli Gori 26 Gori Fruit Export Company Fruit/Cold storage Shida Kartli Gori 27 I/E Nino Fruit/Cold storage Shida Kartli Gori 28 I/E Irika Edilashvili Fruit/Cold storage Shida Kartli Kareli 29 Association Shindisi Fruit/Cold storage Shida Kartli Gori 30 I/E Ilia Giorgadze Fruit/Cold storage Kakheti Gurjaani 31 Nergeta LLC Fruit/Cold storage SamegreloZemo
Svaneti Zugdidi
32 Geoconcentrate Fruit/Processing Shida Kartli Gori 33 Citro Fruit/Processing Adjara Batumi 34 Vagi Fruit/Processing Guria Chokhatauri 35 Kampa Fruit/Processing MtskhetaMtianeti Saguramo 36 Golden Fleece Fruit/Vegetable MtskhetaMtianeti Mtskheta 37 Agroservis Kareli FSC Shida Kartli Kareli 38 Nugzar Kiladze FSC Shida Kartli Khashuri 39 Farmers House FSC Adjara Batumi 40 Diana Kakhidze FSC Imereti Tskaltubo 41 Nektari FSC Imereti Chiatura 42 Agrosharmi FSC Imereti Samtredia 43 Mamuka Tsikoridze FSC Imereti Tskaltubo 44 Alva FSC Imereti Sachkhere 45 Zurab Kartvelishvili FSC Imereti Vani 46 Avtandil Guntsadze FSC Imereti Zestaponi 47 Noblex FSC Kakheti Kvareli 48 Giorgi Mindiashvili FSC Kakheti Sagarejo 49 Bezhan Gonashvili FSC Kakheti Dedoplistskar
o 50 Sopkimia FSC Kakheti Gurjaani 51 Tamari FSC SamegreloZemo
Svaneti Mestia
52 Gvaza FSC SamegreloZemo Svaneti
Senaki
53 Fermertasakhli FSC SamegreloZemo Svaneti
Khobi
54 Metskhoveleobis Bazari FSC SamtskheJavakheti Akhaltsikhe 55 Sasoplosakonsultaciosamsaxu
ri FSC SamtskheJavakheti Aspindza
56 Agasi Ezoiani FSC SamtskheJavakheti Akhalkalaki 57 Agrotekhnocentri FSC SamtskheJavakheti Adigeni 58 Agro Kartli FSC/MSC Shida Kartli Gori 59 Terjola Farmers House FSC/MSC Imereti Terjola
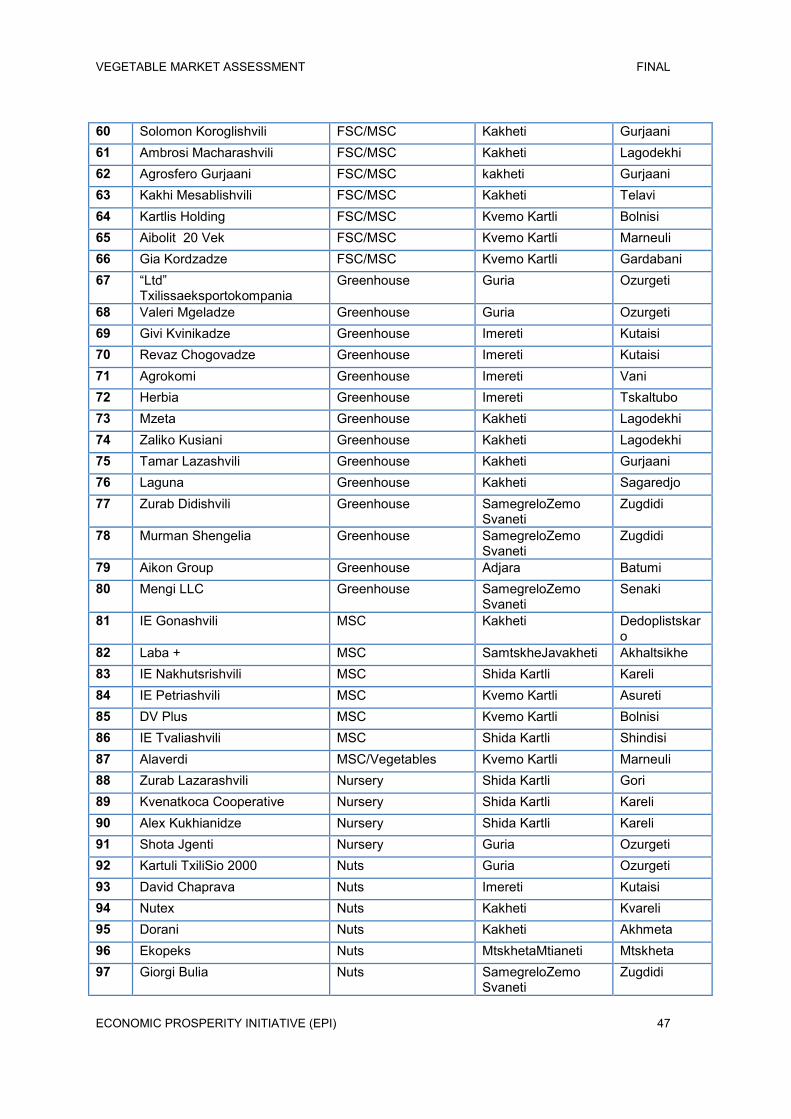
VEGETABLE MARKET ASSESSMENT FINAL
ECONOMIC PROSPERITY INITIATIVE (EPI) 47
60 Solomon Koroglishvili FSC/MSC Kakheti Gurjaani 61 Ambrosi Macharashvili FSC/MSC Kakheti Lagodekhi 62 Agrosfero Gurjaani FSC/MSC kakheti Gurjaani 63 Kakhi Mesablishvili FSC/MSC Kakheti Telavi 64 Kartlis Holding FSC/MSC Kvemo Kartli Bolnisi 65 Aibolit 20 Vek FSC/MSC Kvemo Kartli Marneuli 66 Gia Kordzadze FSC/MSC Kvemo Kartli Gardabani 67 “Ltd”
Txilissaeksportokompania Greenhouse Guria Ozurgeti
68 Valeri Mgeladze Greenhouse Guria Ozurgeti 69 Givi Kvinikadze Greenhouse Imereti Kutaisi 70 Revaz Chogovadze Greenhouse Imereti Kutaisi 71 Agrokomi Greenhouse Imereti Vani 72 Herbia Greenhouse Imereti Tskaltubo 73 Mzeta Greenhouse Kakheti Lagodekhi 74 Zaliko Kusiani Greenhouse Kakheti Lagodekhi 75 Tamar Lazashvili Greenhouse Kakheti Gurjaani 76 Laguna Greenhouse Kakheti Sagaredjo 77 Zurab Didishvili Greenhouse SamegreloZemo
Svaneti Zugdidi
78 Murman Shengelia Greenhouse SamegreloZemo Svaneti
Zugdidi
79 Aikon Group Greenhouse Adjara Batumi 80 Mengi LLC Greenhouse SamegreloZemo
Svaneti Senaki
81 IE Gonashvili MSC Kakheti Dedoplistskaro
82 Laba + MSC SamtskheJavakheti Akhaltsikhe 83 IE Nakhutsrishvili MSC Shida Kartli Kareli 84 IE Petriashvili MSC Kvemo Kartli Asureti 85 DV Plus MSC Kvemo Kartli Bolnisi 86 IE Tvaliashvili MSC Shida Kartli Shindisi 87 Alaverdi MSC/Vegetables Kvemo Kartli Marneuli 88 Zurab Lazarashvili Nursery Shida Kartli Gori 89 Kvenatkoca Cooperative Nursery Shida Kartli Kareli 90 Alex Kukhianidze Nursery Shida Kartli Kareli 91 Shota Jgenti Nursery Guria Ozurgeti 92 Kartuli TxiliSio 2000 Nuts Guria Ozurgeti 93 David Chaprava Nuts Imereti Kutaisi 94 Nutex Nuts Kakheti Kvareli 95 Dorani Nuts Kakheti Akhmeta 96 Ekopeks Nuts MtskhetaMtianeti Mtskheta 97 Giorgi Bulia Nuts SamegreloZemo
Svaneti Zugdidi
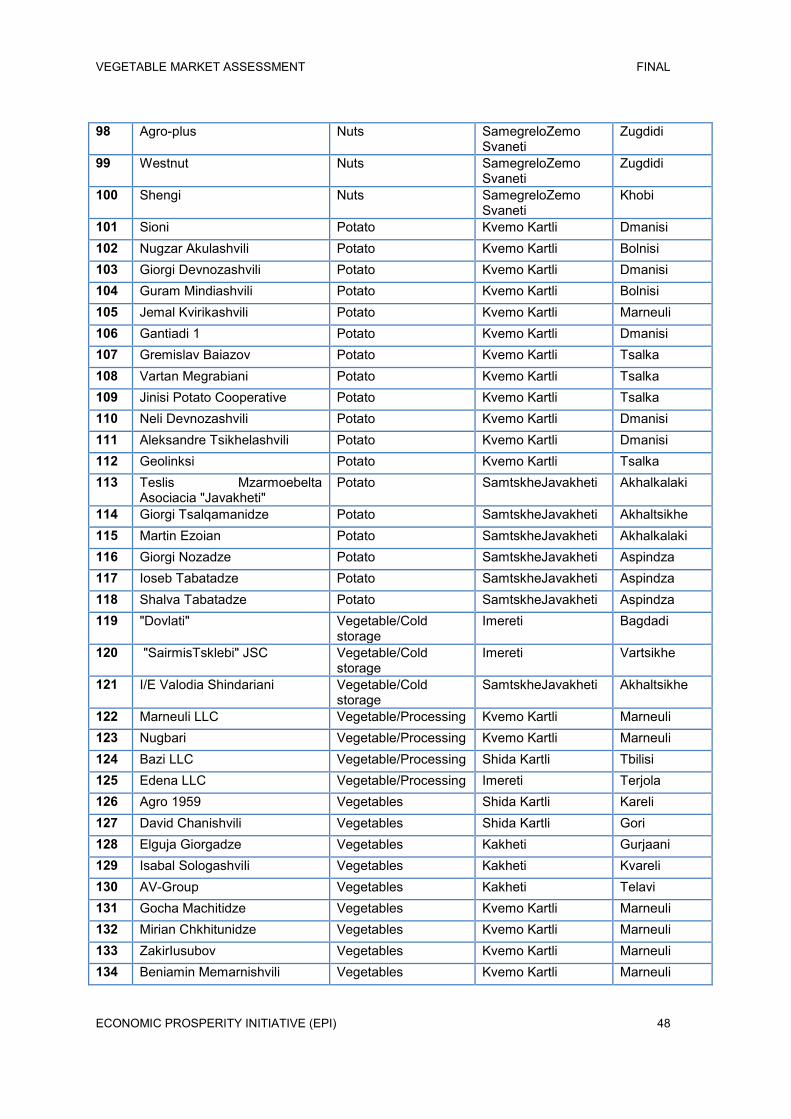
VEGETABLE MARKET ASSESSMENT FINAL
ECONOMIC PROSPERITY INITIATIVE (EPI) 48
98 Agro-plus Nuts SamegreloZemo Svaneti
Zugdidi
99 Westnut Nuts SamegreloZemo Svaneti
Zugdidi
100 Shengi Nuts SamegreloZemo Svaneti
Khobi
101 Sioni Potato Kvemo Kartli Dmanisi 102 Nugzar Akulashvili Potato Kvemo Kartli Bolnisi 103 Giorgi Devnozashvili Potato Kvemo Kartli Dmanisi 104 Guram Mindiashvili Potato Kvemo Kartli Bolnisi 105 Jemal Kvirikashvili Potato Kvemo Kartli Marneuli 106 Gantiadi 1 Potato Kvemo Kartli Dmanisi 107 Gremislav Baiazov Potato Kvemo Kartli Tsalka 108 Vartan Megrabiani Potato Kvemo Kartli Tsalka 109 Jinisi Potato Cooperative Potato Kvemo Kartli Tsalka 110 Neli Devnozashvili Potato Kvemo Kartli Dmanisi 111 Aleksandre Tsikhelashvili Potato Kvemo Kartli Dmanisi 112 Geolinksi Potato Kvemo Kartli Tsalka 113 Teslis Mzarmoebelta
Asociacia "Javakheti" Potato SamtskheJavakheti Akhalkalaki
114 Giorgi Tsalqamanidze Potato SamtskheJavakheti Akhaltsikhe 115 Martin Ezoian Potato SamtskheJavakheti Akhalkalaki 116 Giorgi Nozadze Potato SamtskheJavakheti Aspindza 117 Ioseb Tabatadze Potato SamtskheJavakheti Aspindza 118 Shalva Tabatadze Potato SamtskheJavakheti Aspindza 119 "Dovlati" Vegetable/Cold
storage Imereti Bagdadi
120 "SairmisTsklebi" JSC Vegetable/Cold storage
Imereti Vartsikhe
121 I/E Valodia Shindariani Vegetable/Cold storage
SamtskheJavakheti Akhaltsikhe
122 Marneuli LLC Vegetable/Processing Kvemo Kartli Marneuli 123 Nugbari Vegetable/Processing Kvemo Kartli Marneuli 124 Bazi LLC Vegetable/Processing Shida Kartli Tbilisi 125 Edena LLC Vegetable/Processing Imereti Terjola 126 Agro 1959 Vegetables Shida Kartli Kareli 127 David Chanishvili Vegetables Shida Kartli Gori 128 Elguja Giorgadze Vegetables Kakheti Gurjaani 129 Isabal Sologashvili Vegetables Kakheti Kvareli 130 AV-Group Vegetables Kakheti Telavi 131 Gocha Machitidze Vegetables Kvemo Kartli Marneuli 132 Mirian Chkhitunidze Vegetables Kvemo Kartli Marneuli 133 ZakirIusubov Vegetables Kvemo Kartli Marneuli 134 Beniamin Memarnishvili Vegetables Kvemo Kartli Marneuli
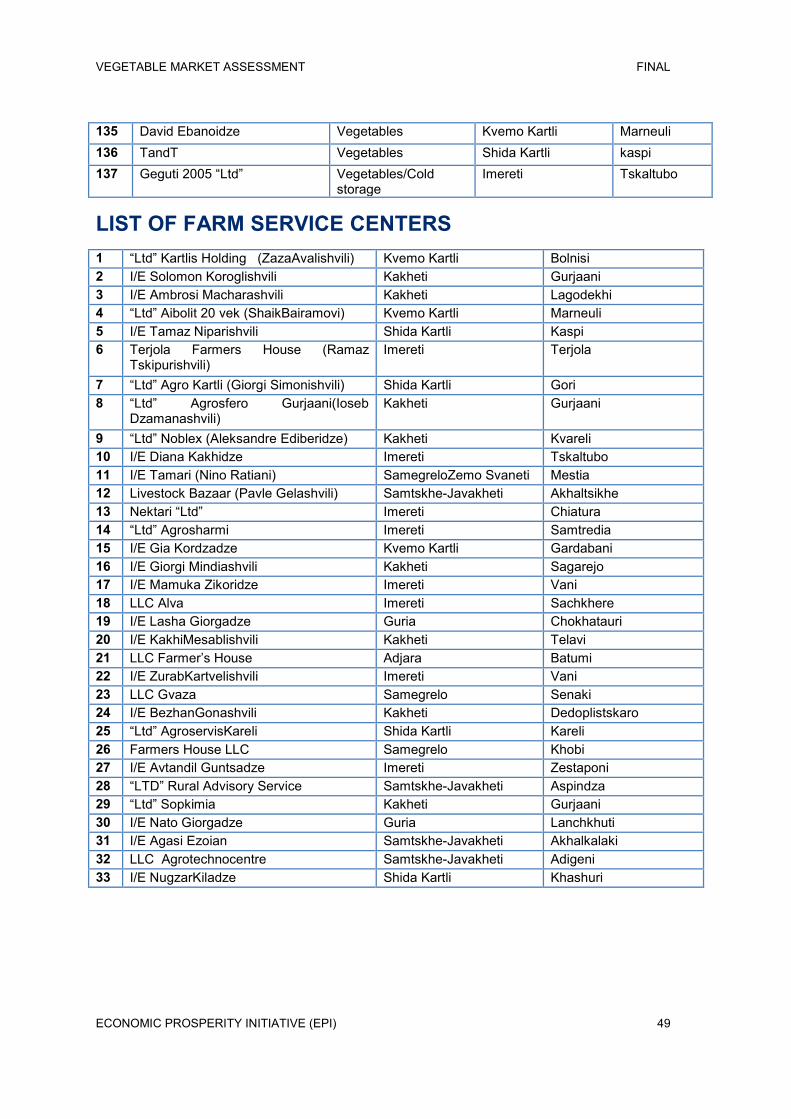
VEGETABLE MARKET ASSESSMENT FINAL
ECONOMIC PROSPERITY INITIATIVE (EPI) 49
135 David Ebanoidze Vegetables Kvemo Kartli Marneuli 136 TandT Vegetables Shida Kartli kaspi 137 Geguti 2005 “Ltd” Vegetables/Cold
storage Imereti Tskaltubo
LIST OF FARM SERVICE CENTERS 1 “Ltd” Kartlis Holding (ZazaAvalishvili) Kvemo Kartli Bolnisi 2 I/E Solomon Koroglishvili Kakheti Gurjaani 3 I/E Ambrosi Macharashvili Kakheti Lagodekhi 4 “Ltd” Aibolit 20 vek (ShaikBairamovi) Kvemo Kartli Marneuli 5 I/E Tamaz Niparishvili Shida Kartli Kaspi 6 Terjola Farmers House (Ramaz
Tskipurishvili) Imereti Terjola
7 “Ltd” Agro Kartli (Giorgi Simonishvili) Shida Kartli Gori 8 “Ltd” Agrosfero Gurjaani(Ioseb
Dzamanashvili) Kakheti Gurjaani
9 “Ltd” Noblex (Aleksandre Ediberidze) Kakheti Kvareli 10 I/E Diana Kakhidze Imereti Tskaltubo 11 I/E Tamari (Nino Ratiani) SamegreloZemo Svaneti Mestia 12 Livestock Bazaar (Pavle Gelashvili) Samtskhe-Javakheti Akhaltsikhe 13 Nektari “Ltd” Imereti Chiatura 14 “Ltd” Agrosharmi Imereti Samtredia 15 I/E Gia Kordzadze Kvemo Kartli Gardabani 16 I/E Giorgi Mindiashvili Kakheti Sagarejo 17 I/E Mamuka Zikoridze Imereti Vani 18 LLC Alva Imereti Sachkhere 19 I/E Lasha Giorgadze Guria Chokhatauri 20 I/E KakhiMesablishvili Kakheti Telavi 21 LLC Farmer‟s House Adjara Batumi 22 I/E ZurabKartvelishvili Imereti Vani 23 LLC Gvaza Samegrelo Senaki 24 I/E BezhanGonashvili Kakheti Dedoplistskaro 25 “Ltd” AgroservisKareli Shida Kartli Kareli 26 Farmers House LLC Samegrelo Khobi 27 I/E Avtandil Guntsadze Imereti Zestaponi 28 “LTD” Rural Advisory Service Samtskhe-Javakheti Aspindza 29 “Ltd” Sopkimia Kakheti Gurjaani 30 I/E Nato Giorgadze Guria Lanchkhuti 31 I/E Agasi Ezoian Samtskhe-Javakheti Akhalkalaki 32 LLC Agrotechnocentre Samtskhe-Javakheti Adigeni 33 I/E NugzarKiladze Shida Kartli Khashuri

VEGETABLE MARKET ASSESSMENT FINAL
USAID Economic Prosperity Initiative (EPI) 6 Samgebro St.
Tbilisi, Georgia
Phone: +995 32 43 89 24/25/26
Fax: +995 32 43 89 27