f~ pt0 .p$b- 2~.3 - us agency for international development
TRANSCRIPT
f~Pt0 .P$B- 2~.3
q t.stS3Republic of Mali
FINAL EVALUATION REPORT
Knowledge, Attitudes, Reported Practicesand
Anthropometric Indicators of Children's Nutritional Status
Dr. Claudia FishmanDr. Anne GolazOandara KanteKaty Dolo
NUTRITION COMMUNICATION PROJECT
Emory University, Rollins School ofPublic HealthAcademy for Educational Development
Centers for Disease Control and Prevention
January 1996
\)~ \\) S I \ 3- Z-- 00 - 10 3' - c) 0
TABLE OF CONTENTS
I. Executive Summary 1
Background 1
The Evaluation 2
Key Results 6
Conclusions 9
II. Introduction 7
A. Key Elements of the NCP Intervention in Mali 7
B. Schedule 9
m. Evaluation Methods and Materials 10
A. Evaluation Design 10
B. Field Survey Methods 16
IV. Results: Analysis 1- Pre (1990) & Post (1994) 22
A. Analytical Features 22
B. Findings 23
V. Results: Cross-Sectional Comparison ofVillages and Individuals by Strength ofNCP ExposureAssessed in December 1994 - January 1995 36A. Analytical Features 36
B. Findings 38
VI. Final Conclusions 65
TABLES AND FIGURES
Tables
1. Chronology ofKey Events in NCP Intervention
2. Reclassification of Villages by 1990 and 1994 Designation
3. Contribution of Sites to Pre-Post and Cross-Sectional Analysis Schemes
4. NCP Individual Media Exposure Scoring
5. Child Survival Program Input Variables in 1994 Survey
6. Villages Included in Pre-Post Analysis
7. Pre-Post Analysis Sample
8. Ownership ofHousehold Items and Livestock by NCP Designation, 1994
9. Individual Exposure to NCP Interventions
10. Reported Breastfeeding and Timely Introduction of Complementary Foods
11. Mean Z-Scores for Anthropometric Indicators
12. Changes in Prevalence of Malnutrition Using Village as Unit of Analysis, Pre-Post
13. Own Bike or Radio: Impact on WAZ in 1990/1994
14. MANOVA ofWAZ by NCP status within Wealth groupings over Time
15. Selection of Villages in Cross-Sectional Assessment
16. Cross-Sectional Sample, 1994
17. Household Characteristics of Cross-Sectional Sample
18. Children's Sickness Two Weeks Prior/During Survey by NCP Category
19. Child Survival Program Inputs by NCP Classification
20. Percent ofMen Reporting Ownership of Household Items and Livestock,
by NCP Exposure Categories, 1994
21. Relative Wealth Classification
22. NCP Exposure Scores for Target Audience Groups in HighlMedium NCP Villages
23. Average Exposure Scores by Gender and NCP Classification
24. Percent recalling 1 or more NCP Intervention by Gender and NCP Classification
11
9
15
15
20
21
22
23
25
25
27
28
32
33
34
36
38
38
40
40
41
41
42
42
43
25. Recall Hearing/Seeing "Liver" Messages contained in NCP Flip Chart by
Village Exposure Level 44
26. Recall Hearing/Seeing Feeding Skill Messages in NCP Counseling Cards by
Village Exposure Level 47
27. Analysis ofLiver Purchasing by NCP Message Recall Within Wealth Categories 52
28. Percent of Sample Performing Optimal Infant Feeding Behaviors by NCP Category 54
29. What Mothers Learned from Counseling Card No. 10 55
30. Use ofFeeding Bowl for Weaning Age Child and Recall ofNCP Card No.5 56
31. Descriptive Statistics for Anthropometric Indicators ofNutritional Status for Children
in Cross-Sectional Sample, 1994 57
32. Stratified Analysis ofWAZ Exposure and Wealth Categories 62
33. Prevalence ofLow Weight/ Age by Site Classification 63
34. Logistic Regression Model for Weight for Age 64
35. Logistic Regression Model for Height for Age and Child Survival 64
Figures
1. Percent of Children with Low Weight-for-Age
2. Children's Age Distribution in 1990, 1994
3a. Weight for Age, Trial Villages
3b. Weight for Age, Comparison Villages
4a. Height for Age, Trial 1990-1994
4b. Height for Age, Comparison 1990-1994
5. Percent of Stunted Children
6. Percent of Wasted Children
7. NCP Project Design
8. Age Distribution, 1994
9. Man Brought Food Home for Family
10. Money Spent on Healthy Foods
11. Reported Liver Purchasing by Men
12. How Many Times Liver Purchased in past 2 months by Message Recall
111
5
24
29
29
30
30
31
32
37
39
48
49
49
50
13. Among Men, Meat Purchasing by Radio Spot Recall 51
14. Mom Also Eats What She Buys 53
15. Height/ Age Distribution 58
16. Weight/ Age Distribution 58
17. Percent ofMalnourished Children Based on Weight-for-Age less than -2 S.D. 59
18. Percent ofMalnourished Children based on Height-for-Age less than -2 S.D. 59
19. Percent ofMalnourished Children Based on Weight-for-Height less than -2 S.D. 60
20. Weight for Age and NCP Counseling Cards 61
21. Recalled Recuperative Feeding Message and Children's WAZ 61
IV
EVALUATION TEAM
Survey DesignClaudia Fishman, Ph.D., Assistant Professor, Rollins School ofPublic Health, Emory University, AtlantaAnne Golaz, :rvID, MPH, Epidemiological Intelligence Service, Centers for Disease Control andPrevention (CDC), Nutrition Division, Maternal and Child Health Branch, AtlantaLaurence Grummer-Strawn, PhD, Epidemiologist, Centers for Disease Control and Prevention (CDC),Nutrition Division, Maternal and Child Health Branch, AtlantaNutrition Communication Project Staff: Margaret Parlato, Director; Peter Gottert, Sr. Program Officer,and Robin Anthony, Program Officer and former NCP Coordinator/Mali, Academy for EducationalDevelopment,Washington, D.C.
Questionnaire: Bambara Supervision and Pre-testingKante Dandara Toure, M.S., Group Pivot Survie de l'enfant
Survey ImplementationAnne Golaz,:rvID, MPH (CDC), Team LeaderSite Supervisors:Dorothy Stevens, MPH, Technical Advisor for AIDS and Child Survival, USAIDlMaliDandara Kante, MS, Nutritionist, Group Pivot Survie de l'enfantKaty Dolo, Nurse and State Certified Mid-Wife (formerly with World Vision, Koutiala)Interviewers:Saba Soumbounou, State Certified Nurse, CNIECSFatimata Tony, State Certified Nurse, DSFCAlima Simaga, Researcher, ISHNana Toure, LinguistFanta Ba, EconomistOuassa Sanogo, Medical StudentBoubacar Diarra, :rvID (Internal medicine and nutrition)Noumouke Diarra, lEC Director, National AIDS Elimination Program
Data Base PreparationBakary Doumbia, Statistician and Demographer, INFO-STAT, Bamako
Statistical AnalysisKaren Sagatelianl, B.S., Primary data analysis and graphicsClaudia Fishman, Additional analyses and graphicsLaurence Grummer-Strawn, Anne Golaz, CDC, Consultants
Report PreparationClaudia Fishman and Anne GolazKaren Sagatelian (graphics)
'Mr. Sagatelian is a 2nd year student in the biostatistics MPH program at the Rollins School ofPublic Health, Emory University.He is a Freedom Support Act Fellow.
v
AEDA.I.D.ANOVACDCCNIECS
DHSDSFC
EPIFAOGOMISHKAPMSSPA
NCPNCHSNGOSPSSIPCTACSWHOUNICEFUSAID
ABBREVIATIONS
Academy for Educational DevelopmentAgency for International Development (U.S.)Analysis of VarianceNational Centers for Disease Control and Prevention (D. S.)Centre national d'Information, d'Education et de la Communication pour la sante (NationalCenter for Health Information, Education and Communication)Demographic and Health SurveyDivision de la Sante de la Famille et de la Communaute (Division ofFamily andCommunity Health)Expanded Program on ImmunizationFood and Agricultural OrganizationGovernment ofMaliInstitut des Sciences humaines (Institute ofHuman Sciences)Knowledge, Attitudes and Practices (survey)Ministere de la Sante, de la Solidarite et des Personnes Agees (Ministry ofHealth,Solidarity and the Elderly)Nutrition Communication ProjectNational Center for Health Statistics (U.S.)Non-governmental OrganizationStatistical Package for the Social Sciences, Personal Computer versionTechnical Advisor for Child SurvivalWorld Health OrganizationUnited Nations Children's FundUnited States Agency for International Development
VI
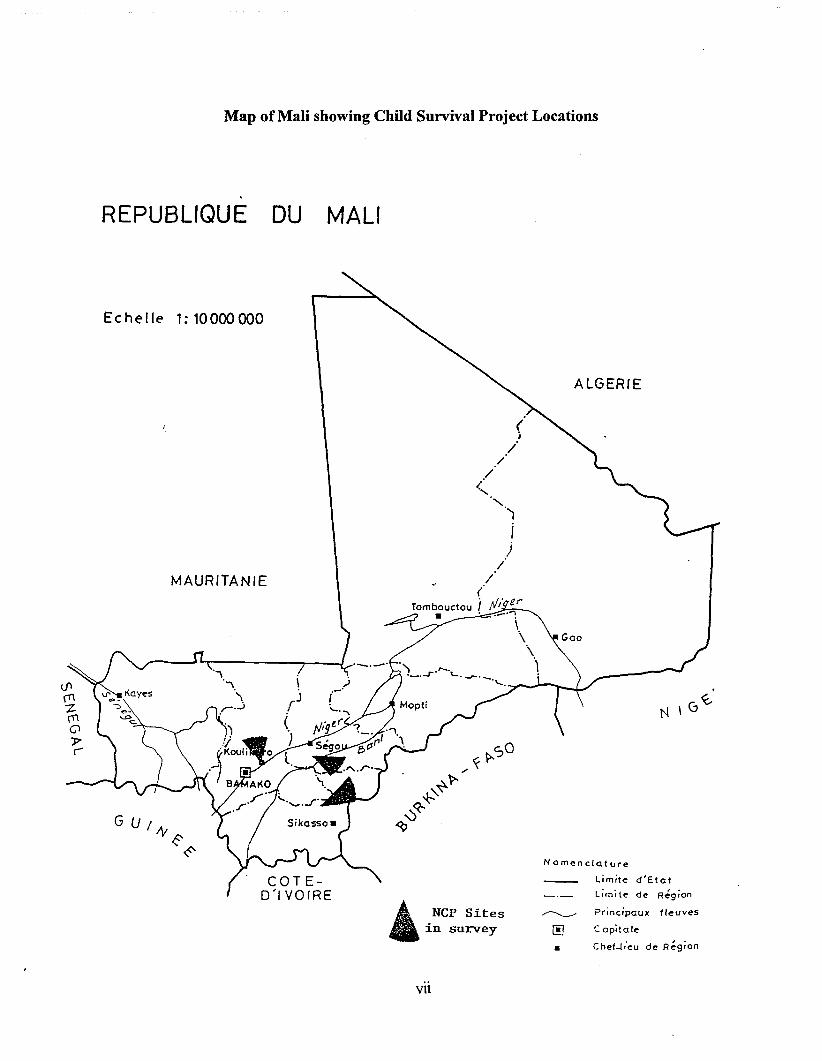
Map of Mali showing Child Survival Project Locations
REPUBLIQUE DU MALI
.N\G~
Chef...l'·eu de R~9ion
ALGERIE
•
NomenclatlJre
Limite d'Etat
Limite de Region
~ Princ;paux fleuves
~ Capitale
NCP Sitesin survey
{i
//
/(
"-.')
i)
//
(Tombouctou i tit" er. .. .-"~
\\ Gao
\·1
MAURITANIE
Echelle 1: 10000000
vii
I. EXECUTIVE SUMMARY
Background
Between October, 1990 and March, 1995, the United States Agency for International Development(USAID) assisted the Government of Mali and 10 non-governmental organizations (NGOs) inmounting a community-based nutrition education program, consisting of health worker and primaryschool teacher training, as well as broadcast ofa radio drama and spots. This cluster of activities wasknown, and continues as, the "Mali Nutrition Communication Project." The name was derived fromthe USAID Office of Health and Nutrition's centrally-funded "Nutrition Communication Project"(NCP) managed by the Academy for Educational Development, between 1989 and 1995.
At the projeds start, national data indicated that 25% ofMali's children suffered from malnutrition,which contributed to a rural under-5 mortality rate close to 300/1000. Women's diets were poorduring pregnancy and nursing, and children's diets were missing critical vitamins and minerals (suchas Vitamin A and iron), as well as the energy required to support adequate growth and development.A close examination ofdietary practices indicated that mothers delayed feeding most solid foods untilchildren were nearly 1 year old, and knew of few measures to help sick children regain their strengthfollowing bouts ofdiarrhea and illness. At the community level, men were fairly unaware of women'sor children's dietary needs, and the "norm" for child feeding was that it did not require muchattention.
The NCP communication strategy addressed these knowledge gaps, and attempted to create newcommunity norms. Messages on food selection and feeding skills were largely directed to women,while men were sensitized to women's and children's nutritional needs, and encouraged to purchasespecific foods for family consumption, such as green leafy vegetables and liver. NCP developed andprovided flip charts, counseling cards, games, and role-play guides to support health worker-ledcommunication activities, as well as motivational buttons, stickers and newsletters for the communityagents. Towards the end of the project, regular broadcast ofa radio drama began, accompanied byspot announcements of key nutrition and health messages.
The Evaluation
The evaluation component measured outcome indicators relevant to NCP's community-basedprograms: knowledge, attitudes, reported dietary/feeding practices, children's height and weight.Upon agreeing to participate in the evaluation component ofNCP, each NGO selected 8 villages toparticipate intensively in NCP and child survival activities--these are referred to as NCP Trials-- and8 villages, matched for socioeconomic and other factors, to act as "comparisons." In the comparisonvillages, the evaluation design called for all other Child Survival actjyjtjes2 to occur, but NCPapproaches and materials to be withheld. This research protocol was applied, with varying degrees •of fidelity, in 4 NGOs3 between 1991 and 1995. The primary intervention examined by this evaluation
2E.g. immunization, water hygiene. oral rehydration therapy, safe motherhood, family planning.
>AfricarelDioro, 1990-1995; CARElMacina. 1990-1993; Save the ChildrenlKolondieba, 1991-1995; World VisionlKoutiala,1990-1995.
is the community media strategy, largely in place in most villages before the 4th training (October,1993), although some villages were exposed to parts of the strategy as early as January, 1991.
The final survey, conducted between December, 1994 and January, 1995, provides the best pictureofhow well NCP performed in the NGO setting. Analysis ofdata from this survey contrasts outcomeindicators from individuals who recalled NCP materials against those who did not; and comparesvillage level indicators by length of time enrolled in NCP. Villages consistently participating in NCPfor more than 1 year (before the October 1993 training) are called "High" exposure villages; villagesparticipating for less than one year are called "Intermediate" exposure villages; villages notintentionally exposed to NCP, and where NCP was not systematically applied, are called "LowlNo"exposure villages.
Results from the cross-sectional analysis of the final survey data provide strong evidence to suggestthat NCP had a marked impact on the nutrition knowledge and behaviors ofvillagers consistentlyexposed to the intervention; and that parents who learned information from NCP had children withbetter height and weight measurements than those who did not. While attempts have been made tocontrol for confounding factors, unless a different design had been applied from the beginning (e.g.measuring food intake; using a longitudinal design; collecting data more frequently, etc.), we can notbe totally free of doubt that NCP is the sole reason for this improvement. However, the amount ofdoubt that remains must be balanced against what can be reasonably controlled when attempting todo fairly participatory research in one ofthe most difficult regions in the world to improve children'snutrition.
An additional pre-intervention, post-intervention analysis is made for data from the 2 NGOs thatparticipated in both the baseline and final survey4. Because ofdeviations from the original researchdesign (e.g. CARE dropped out; World Vision began applying NCP in all of its Child Survivalvillages by the 3rd year), and an error made in selecting villages for inclusion in the final survey (themajority of"trial" villages come from World Vision/Koutiala, the majority of"comparison" villagescome from Africare/Dioro), the pre-post analysis results, while quite striking, are difficult to defend.However, they are consistent with both the retrospective results, as well as NCP's pre-post evaluationconducted for the CARE/Macina project in 1993. These pre-post data make a case for theplausibility that improvements in nutritional status are related to NCP alone and not other time- orregionally-affected factors (such as wealth, food availability, etc.).
Key Results
1. Reach
Where NCP was meant to be seen (TriallHigh-Intermediate villages), approximately 50% of thewomen and 300/0 of the men sampled in the 1994 survey remembered at least one interventionof five tested. Among women, 10% could recall two different counseling media, and anadditional 6% saw these interventions as well as remembered the radio program.
4AfricarelDioro, World VisionlKoutiala. CARElMacina also took part in the baseline survey. For administrative reasons, CAREhad to close the Macina Child Survival Project in 1993. A rapid assessment was made at that time, comparing results in 1993 to thosecollected at the baseline.
2
Where NCP was not jntentjonally deployed (Comparison villages), 18% ofthe women and 6%of the men reported seeing an NCP flip chart or counseling card. As the Child Survivalcoordinators could attest, NCP materials were well-liked and spread around the region --as didthe people. This weakens, but does not entirely nullify, the validity of "exposure categories" usedto assess NCP's impact.
2. Purchasing Behavior
NCP was a better predictor of whether a man gave money to his wife to purchase food, orbrought recommended foods home for his family to eat, than being in the upper 50th percentileofwealth as measured in the survey. For example, men who learned that "liver can prevent orcure night blindness" purchased liver, on average 3 times during the 2 month period precedingthe survey in contrast to a one time purchase by those who had not learned this concept. OtherNCP messages concerning women's and children's need for liver, or the man's role in providingfor this need, were also associated with increases in purchasing (1.7 times and 1.5 times,respectively). This combined analysis was significant (p=.OOO).
While NCP radio spots had only been on the air for a short period, 63% ofthose who heard thespots purchased meat for their families in the 2 weeks prior to the survey, compared to 47% whohad not heard the spots. (Chi sq. P=.003).
3. Maternal Diet
Where NCP was systematically applied, against where it was not, women were more likely tohave porridge, leaf sauce, tomatoes, bananas and green beans (item by item, all chi sq. analysesp< .01) in their 24 hour dietary recall, which was used to assess dietary intake. And amongpregnant and breastfeeding women, 26% percent of those in NCP villages reported consumingliver in the past 24 hours compared to 9% in non-NCP villages (N=245, p=.005). Women incomparison villages did report greater consumption of milk and peanuts than women in NCPvillages. Other maternal dietary practices were not assessed.
4. Child feeding and care skills
Women who remembered the first NCP counseling card assessed (No. 10) were more likely to learnto be patient and use small portions when feeding sick children (36% said they did, n=172)compared to those who did not see cards (2% said they did, n=540). 60% of 147 women whorecalled the second NCP counseling card (No.5) knew that a small bowl could be used to checkon a child's portion size. Of the 546 women who had not seen the card, 59% had learned aboutusing a bowl from a community agent, a health worker, a village volunteer or the radio, indicatingthe spread ofNCP messages from their original media. Women who actually saw the card weremore likely to use a bowlfor this purpose, suggesting that the visually-supported counseling wasmore effective.
On a pre-post basis, giving children colostrum (first breast milk) more than doubled in Trialvillages (from 25% to 58%) compared to a 12 point change (30% to 42%) in Comparison
3
5
villages. The number of mothers in Trial villages not giving infants water until after 4 monthsdoubled over the baseline level (from 10% to 21 %) compared to a 6 point change (11 % to 17%)in Comparison villages. Mothers in Trial villages were far more likely to introduce porridge,fruit, green leafy vegetables, cow's milk and meat or liver into their child's diets -- in a timelyfashion~-than mothers in Comparison villagess.
5 Growth
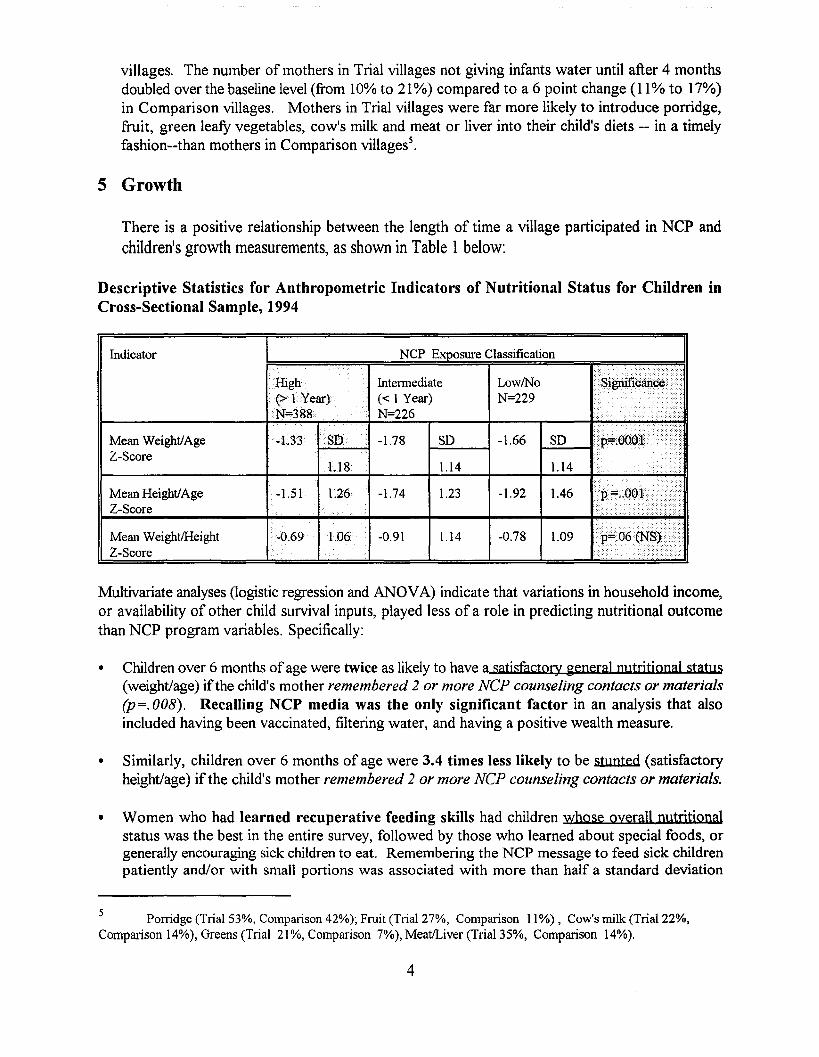
There is a positive relationship between the length of time a village participated in NCP andchildren's growth measurements, as shown in Table 1below:
Descriptive Statistics for Anthropometric Indicators of Nutritional Status for Children inCross-Sectional Sample, 1994
Indicator NCP Exposure Classification
High Intennediate LowlNo •• 8······· ··ificarid~ •••••••••••(>FYear) « I Year) N=229 ,... 1N=388.
....N=226 •• • •
...
•••••• • •••••••••••••••••••••••Mean Weight/Age -1.33 SD -1.78 SD -1.66 SDZ-Score ••
l.18 1.14 1.14•••••••
Mean Height/Age ~1.51 1.26 -1.74 1.23 -1.92 1.46 •••.... ~.. .,:.
~ .. yZ-Score
..... ...:....Mean Weight/Height -0.69 1.06 -0.91 1.14 -0.78 1.09Z-Score ... ..... <
Multivariate analyses (logistic regression and ANOVA) indicate that variations in household income,or availability of other child survival inputs, played less of a role in predicting nutritional outcomethan NCP program variables. Specifically:
• Children over 6 months ofage were twice as likely to have a satisfactory general nutritional status(weight/age) ifthe child's mother remembered 2 or more NCP counseling contacts or materials(p=.008). Recalling NCP media was the only significant factor in an analysis that alsoincluded having been vaccinated, filtering water, and having a positive wealth measure.
• Similarly, children over 6 months of age were 3.4 times less likely to be stunted (satisfactoryheight/age) if the child's mother remembered 2 or more NCP counseling contacts or materials.
• Women who had learned recuperative feeding skills had children whose overall nutritjonalstatus was the best in the entire survey, followed by those who learned about special foods, orgenerally encouraging sick children to eat. Remembering the NCP message to feed sick childrenpatiently and/or with small portions was associated with more than half a standard deviation
Porridge (Trial 53%, Compalison 42%); Fruit (Trial 27%, Comparison II %), Cow's milk (Trial 22%,Comparison 14%), Greens (Trial 21 %, Comparison 7%), MeatILiver (Trial 35%, Comparison 14%).
4
difference (.6 SD change, p=.0056). These children were likely to have a normal nutritional
status (compared to international reference data) in contrast to other children who weremalnourished.
• Neither the presence of child survival activities alone, nor socioeconomic factors alone(particularly wealth indices), or a combination ofthese factors without NCP, were associated withimproved nutritional status. This was tested in a multitude of ways.
• Sickness 2 weeks prior to/during the survey was the only variable associated with wasting (lowweight/age).
6. Pre-Post Analysis of Growth
Percent of Children with Low Weight-for-Age
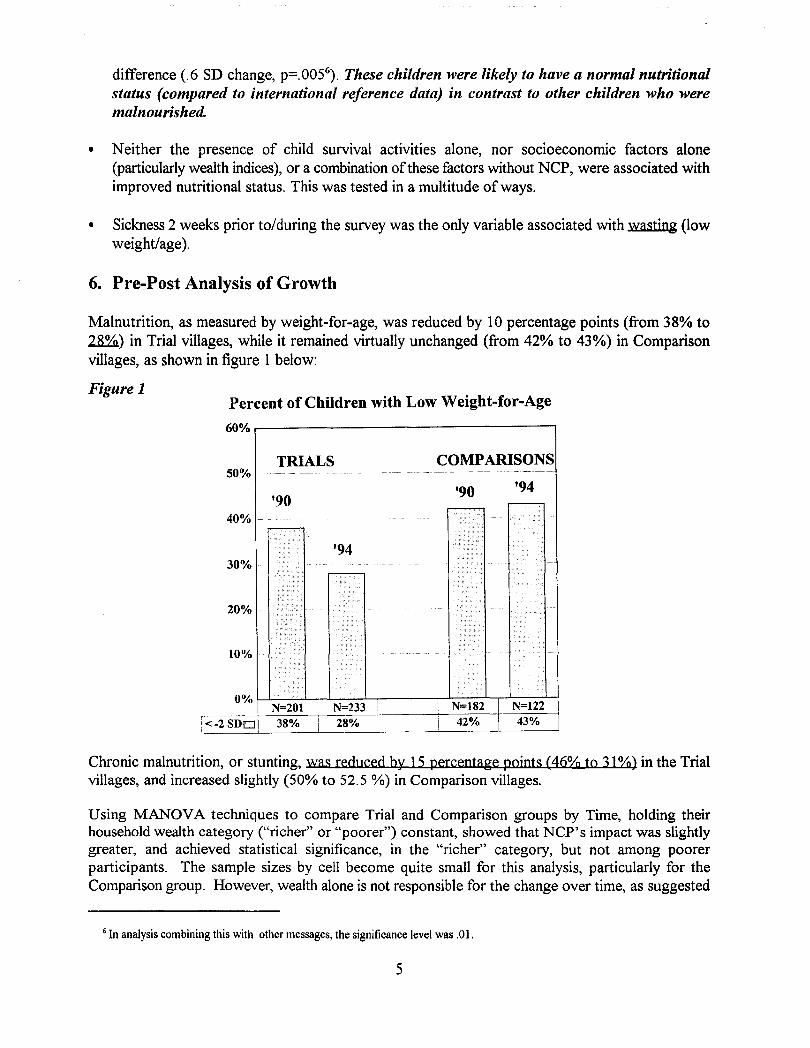
Malnutrition, as measured by weight-for-age, was reduced by 10 percentage points (from 38% to~) in Trial villages, while it remained virtually unchanged (from 42% to 43%) in Comparisonvillages, as shown in figure 1 below:
Figure 1
60% ,.-------------------,
'94'90
COMPARISONS
'94
TRIALS
'90
20%
10%
40%
30%
50%
0% \-L-------.......l-...l..----..L-,....---~..L:_:__:_::_:::'_r':::__:::::'_~
I N=201 I-----.:N-.:...-=..=2=..::33=------ii ---lI_ N-,-:=:-::-18-:-2-t_-=-::-::-_;___
[<-2 SDO! 38% I 28% I 42%
Chronic malnutrition, or stunting, was reduced by ] 5 percentage pojnts (46% to 3] %) in the Trialvillages, and increased slightly (50% to 52.5 %) in Comparison villages.
Using MANOVA techniques to compare Trial and Comparison groups by Time, holding theirhousehold wealth category ("richer" or "poorer") constant, showed that NCP's impact was slightlygreater, and achieved statistical significance, in the "richer" category, but not among poorerparticipants. The sample sizes by cell become quite small for this analysis, particularly for theComparison group. However, wealth alone is not responsible for the change over time, as suggested
6 In analysis combining this with other messages, the significance level was .01.
5
by contrasting the mean Z-score ofchildren in the "richer" comparison group (-2.0) to children in the"poorer" trial group (-1.5). It does suggest that families with marginally better incomes, (whichcharacterizes the region ofKoutiala), if given nutrition education, make more effective use of thisinput than poorer families are able to do. In the cross-sectional analysis described above, the survey'swealth indicator is not significantly associated with growth when NCP program inputs are enteredin the analysis.
Conclusions
The combined analysis suggests that NCP was associated with improvements in nutrition knowledge,practices and children's growth. These improvements:
• were achieved in combination with other child survival interventions, although theseinterventions alone ,were not responsible for the change;
• were not associated with indicators of more household income, although communities withmore wealth appeared to have applied some information more readily;
• were achieved on a community-wide basis; boding well for sustainability of the behaviorchange;
• were obtained through the additional costs of staff training, flip charts, and counseling cards(and possibly radio). Compared to supplemental feeding, these costs are minimal.
The Child Survival literature indicates that nutritional status is responsible for up to 56% of a child'slikelihood ofliving or dying in the first 5 years7
. On this basis, the reduction in child malnutritionalone, achieved through NCP activities, is estimated to have prevented the deaths of approximately850 children per year by the end of the project8
. The long term impact ofNCP on the approximately750,000 persons taking part in the community-based component, or on those listening to the radiobroadcasts (which potentially reach any Barnbara speaker in the country of9 million people), remainsto be seen. While funding for USAID's project ended in March, 1995, in Mali, NCP continues underthe direction of its lead government agency, the National Center for Health Information, Educationand Communication (CNIECS), the Group pivot for Child Survival (an NGO coordinating group,partially supported by USAID), and the network ofNGOs, and additional support from UNICEF.
'Pelletier, D.L., Frongillo, E., J-P. Habicht, 1993. Epidemiologic evidence for a potentiatingeffect of malnutrition on child mortality. AJPH 83: 1130-33.
8J.Ross, PROFILES analyst, p.c.
6
II. INTRODUCTION
Between June, 1989 and March, 1995, the "Nutrition Communication Project" (NCP)9, managed bythe Academy for Educational Development (AED) for the U.S. Agency for InternationalDevelopment (USAID), implemented a rural communication program for Child Survival projects runcollaboratively by the Government ofMali and its non-governmental (NGO) partners. In addition,NCP worked at the central level to integrate nutrition into primary health care, develop a primaryschool curriculum and conduct teacher training, and broadcast a radio soap opera nationally as avehicle for nutrition information. The population ofMali is approximately 9 million people, and allmight eventually benefit from these interventions. NCP activities for Child Survival projects coveredapproximately 760,000 people.
While USAID funding for NCP stopped in March, 1995, NCP continues to be implemented by theGovernment ofMali's Center for Health Information, Education and Communications (CNIECS), theMinistry of Education, and the NGO "Pivot Group" for Child Survival, with support fromUNICEFlMali.
A. Key Elements of the NCP Intervention in MaJi1°
The primary goal ofNCP in Mali was to mount communication activities enabling rural populationsto improve the nutritional status ofwomen and young children. At the project's start, national dataindicated that 25% of children suffered from moderate to severe malnutrition, and this contributedto a rural under-5 mortality rate close to 300/100011
. National surveys indicated that women andchildren consumed inadequate levels of certain micronutrients and protein12
. Pregnant and nursingwomen, as well as children being weaned from breastmilk (18 months-3 years), also consumed toofew calories for their nutritional needs. To address these problems, the Government ofMali soughta communication strategy to motivate the population to direct critical dietary resources to womenand children, and to modifY child feeding practices (breastfeeding, complementary feeding) linked tochild survival. With funding from USAID/Mali, the Office ofNutrition and the Africa Bureau, NCPapproached this challenge with a series ofcommunity-based and mass media interventions developedusing a "social marketing II framework.
Social marketing is used in communication to focus on individuals, their social contexts and thedecisions they make relevant to a behavioral domain, such as child feeding. Formative research onspecific behaviors, (in this case, eating, food purchasing, child-feeding as well as media habits), isused to develop a strategy to communicate nutrition messages, direct parents towards healthservices or products, or affect community norms and attitudes.
9The formal name ofthe project is: The Nutrition Education and Social Marketing Field Support Project.IOSee Nutrition Communication Project Final Report Mali, 1995, for a detailed description of the program.llMali DHS, 1987.12See Parlato & Fishman, 1988 Assessment and Project Planning Trip Report, NCP, for compilation of nutrition data available at
project start. Sundberg, S. An Ovel,'iew ofthe Food Consumption and Nutrition Situation in Mali, Final Report to USAIDlBamako,March, 1988, was consulted extensively. See also recent update by Government ofMali, Country Situation Report, InternationalConference on Nutrition, Rome, 1992.
7
The NCP communication strategy was developed following a rapid ethnographic study of the targetpopulation directed by an anthropologist well-known for her work in Mali. 13 The strategy usedvillage-based stories and drama to introduce new nutrition concepts and model appropriatebehavior.14 Five village story books (flip charts) were designed for use by village health committeesor health workers: (1) The Nutrition of Awa and (2) Awa Finds the Solution emphasize theconnection between vitamin A- rich foods, night blindness and health; (3) Why SUa is Vigorous andin GoodHealth emphasizes appropriate child feeding practices, such as using a small feeding bowl,supervising older children's meals and feeding sick children patiently and persistently; (4 & 5) TwoFamilies on the Road to Health (Part 1 and Part 2) stress pre-natal health and nutrition as well asimmediate follow-up care ofboth the mother and infant.
NCP trained community agents in interpersonal counseling and small group animation. A step-bystep approach was taught to negotiate small behavior changes with mothers, fathers, and communityleaders. Communities in Good Health, a manual featuring realistic dialogues and drawings toillustrate behavioral negotiation, was distributed at the training. In addition, several items wereproduced to motivate and reinforce the community agents' confidence, while improving their nutritioncounseling skills. These included an idea bulletin, On the Road to Health, a professional follow-upnote-book The Village Companion, motivational buttons for use with mothers who complied withrecommendations, as well as stickers.
In addition to community-based interventions, Mali NCP also launched a weekly radio program, aswell as a series of spot announcements. These had been on the air approximately 3 weeks at the timeof the first wave of the final evaluation, and 6 weeks by its conclusion1s
. As the Child SurvivalProject staff took part in research and strategy formation steps, this is also considered part of their"training." Table 1 below summarizes the critical research, strategy formation and training events thataffected these project sites.
13 See K. Dettwyler and C. Fishman. 1989, Communication for Vitamin A, NCP, Academy for Educational Development,Washington, D.C.
14These stories, featuring role models perfonning the desired behaviors, incorporate many of the principles ofBandura's "Social Cognitive Theory," one cornerstone of public health communications this decade. A secondcornerstone theory, "Stages of Change," was applied in NCP's step-by-step counseling approach. The Academy forEducational Development pioneered use of an "Applied Behavior Change (ABC)" framework, founded on these twotheories, in developing health communications (see, e.g. Smith W.A. and Elder 1. Applied Behavior Change: AFrameworkfor Behavior Change Interventions and Research, NAE, USAID, 1992). The Nutrition CommunicationProject was influenced by this approach, although it was not designed, as were other AED projects, to explicitly usebehavioral psychological theories.
15A prototype version was broadcast for about 10 weeks in 1993. No one mentioned hearing this broadcast when asked aboutradio.
8
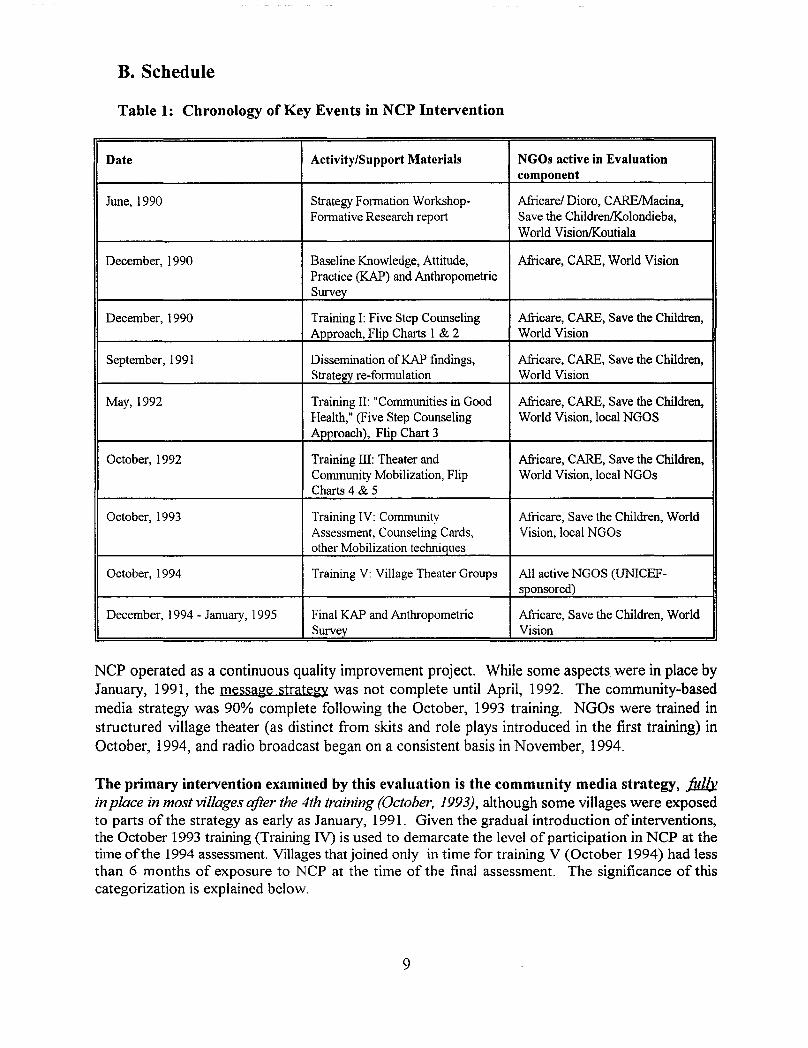
B. Schedule
Table 1: Chronology of Key Events in NCP Intervention
Date Activity/Support Materials NGOs active in Evaluationcomponent
June, 1990 Strategy Fonnation Workshop- Africare/ Dioro, CARElMacina,Fonnative Research report Save the ChildrenIKolondieba,
World VisionIKoutiala
December, 1990 Baseline Knowledge, Attitude, Africare, CARE, World VisionPractice (KAP) and AnthropometricSurvey
December, 1990 Training I: Five Step Counseling Africare, CARE, Save the Children,Approach, Flip Charts 1 & 2 World Vision
September, 1991 Dissemination of KAP findings, Africare, CARE, Save the Children,Strategy re-fonnulation World Vision
May, 1992 Training II: "Communities in Good Africare, CARE, Save the Children,Health," (Five Step Counseling World Vision, local NGOSApproach), Flip Chart 3
October, 1992 Training III: Theater and Africare, CARE, Save the Children,Community Mobilization, Flip World Vision, local NGOsCharts 4 & 5
October, 1993 Training IV: Community Africare, Save the Children, WorldAssessment, Counseling Cards, Vision, local NGOsother Mobilization techniques
October, 1994 Training V: Village Theater Groups All active NGOS (UNICEF-sponsored)
December, 1994 - January, 1995 Final KAP and Anthropometric Africare, Save the Children, WorldSurvey Vision
NCP operated as a continuous quality improvement project. While some aspects were in place byJanuary, 1991, the messa~e strate~y was not complete until April, 1992. The community-basedmedia strategy was 90% complete following the October, 1993 training. NGOs were trained instructured village theater (as distinct from skits and role plays introduced in the first training) inOctober, 1994, and radio broadcast began on a consistent basis in November, 1994.
The primary intervention examined by this evaluation is the community media strategy, ./iJ1b!in place in most villages after the 4th training (October. 1993), although some villages were exposedto parts of the strategy as early as January, 1991. Given the gradual introduction of interventions,the October 1993 training (Training IV) is used to demarcate the level of participation in NCP at thetime ofthe 1994 assessment. Villages that joined only in time for training V (October 1994) had lessthan 6 months of exposure to NCP at the time of the final assessment. The significance of thiscategorization is explained below.
9
III. EVALUATION METHODS AND MATERIALS
A. Evaluation Design
1. Study Protocol
a. Original Design
Beginning in October, 1990, the Child Survival projects of AfricarelDioro, CARElMacina,and World Vision/Koutiala agreed to participate in a longitudinal evaluation of NCP.Agreed-to activities consisted of (1) a pre-intervention (Baseline) survey of villagers'nutrition knowledge, attitudes and practices (KAP) coupled with measurements of children'snutritional status; (2) staff participation in NCP training; (3) use ofNCP approaches andmaterials according to a study protocol that required the NGO to withhold the interventionfrom 8 of their project villages16
; (4) participation in NCP supervisory visits; and (5) a postintervention (Impact) survey. Save the Children/Kolondieba signed a letter of agreementshortly after this time, but was not able to participate in the baseline survey for administrativereasons.
The project's evaluation protocol was designed to allow NCP to use a quasi-experimentaldesign, in which some villages are exposed to the intervention ("trials"), while others matchedfor environmental and socioeconomic conditions are purposefully not exposed to theintervention to serve as a "comparison" group. Measurements from the pre-intervention andthe post-intervention surveys are compared to see whether the presence of the interventionis associated with any change in the outcome variables of interest: knowledge, attitudes,behaviors (practices) and children's growth measurements. The comparison villages areneeded to help rule out non-project factors that might confound knowledge, attitudes,practices and children's growth.
b. Events Necessitating Change in Evaluation Design
Since the NCP evaluation depends upon NGO programs, and took place over 5 years,circumstances, as well as project-based decisions, forced changes in the original researchdesign. These include the following:
1. NCP in Mali was extended (from 1993 to 1995), in part due to fielding delays causedby the Gulf War as well as political turbulence in Mali. The final evaluation wasrescheduled for December, 1994. CARE/Macina was not able to participate in theNCP program after January, 1993, and an evaluation was made in this site alone inFebruary of that yearl7
. This left only two of the original sites (Africare/Dioro andWorld Vision/Koutiala) with pre-intervention data.
16As explained below, each project selected 8 villages to serve as comparison sites for a prospective trialofNCP impact.
17Please see Fishman, C. et aI, Mid-Term Assessment report, February, 1995.
10
2. Within AfiicarelDioro and World Vision/Koutiala, some villages originally designatedas "comparison sites" were exposed to the NCP intervention beginning in 1993.Other villages enrolled as "trials" in 1990 withdrew from the NGO's Child Survivalproject, and hence, were no longer exposed to NCP. The validity of the trialcomparison/pre-post design was threatened by these project "drop-outs" and "dropins".
3. NCP introduced a number ofprogram innovations developed after the 1990 baseline.The knowledge and attitude questions from the baseline instrument were not adequateto measure impact in these areas.
4. Both Africare and World Vision had expanded their projects (e.g. from 40 to 80villages in the case of Africare), and felt that their work with NCP over the past twoyears in the new villages should be reflected in the final evaluation.
c. Final Eyaluation plan
As a result ofthese factors, NCP planned to use two analytical designs in evaluating projectimpact:
1. The original quasi-experimental design: Pre-Post Intervention/Trial- Comparison
For the Pre-Post Comparison, any village randomized to be a "trial" in 1990 wouldmaintain this classification in 1994 even ifactivities were discontinued prior to the endof the project. Similarly, villages randomized as "comparisons" in 1990 would maintainthis designation even ifthey were exposed to the intervention. The entire baseline sampleof trial and comparison villages in Dioro and Koutiala would be used to compare toresults in 1994, acknowledging that some of the villages are lost to follow-up (due tovillage drop-out/drop-in). This is necessitated by the original design which pools datafrom trial villages v. comparison villages -- in contrast to a village-by-village design(which may also be used to answer different questions about the program).
2. A new cross-sectional design to assess the relationship of outcome variables to villagelevel "involvement" to NCP measured retrospectively from 1994. Both villagesparticipating in the baseline as well as those joining later are included in this analysis,as explained below:
Retrospective Village Level Involvement
Participation in NCP was determined at the village level by records kept by NGOpartners, checked against the NCP Field Coordinator's records. The terms "High,""Intermediate" and "Low/No" are used to distinguish the length of time a villagecollectively participated in NCP, as follows:
High High Involvement villages participated in NCP for a minimum of1 full year, and were actively engaged at the time of the finalevaluation.
11
Intermediate
Low/No
Intermediate villages participated in NCP for more than 6 monthsbut less than 1 year, or, participated in NCP for more than 1year, but had not been active in the project (nor possibly the ChildSurvival Project) for the past two years.
NCP was not systematically applied in these villages, althoughindividuals might have seen a material outside of the village, ormaterials might have been sent to a health center in the village justprior to the survey.
For the sake ofhaving sufficient numbers to analyze in the intermediate category, villagesthat once participated in NCP but discontinued are combined with those beginning lessthan 1 year ago. Villages falling in this category are difficult to analyze due to theimprecision oftheir actual exposure. High involvement villages have the strongest/clearestexposure to NCP, and Low/No villages have no deliberate exposure to NCP.
2. Sampling
a. Sample size
(1) 1990
At baseline, the sample for children was calculated based on the 25% prevalence ofmoderate and severe malnutrition (children having less than -2 standard deviations ofweight/age) reported in the DHS 1987 survey for Mali. In order to assess the impact ofNCP interventions on this estimated rate of malnutrition with a 95% confidence interval(5% allowable error), the total sample of children for a simple random sample wascalculated18 as 300 children. With the 2 group (trial-comparison) design, approximately300 children in each group were sought -- or 600 total children. As there were 3 NGOs,200 were selected from each of the 3 NGO sites. The evaluation was designed tocombine individual data from 24 (3 sets of 8) trial villages as one group in comparison tothe 24 comparison villages as another group. For some analyses, data would be groupedby child's age: newborn-6 months; 7 months-12 months; 13-36 months. Because oftheemphasis in the project on "weaningll
, children 7-24 months were over-sampled. An equalnumber of boys and girls were desired, although children were selected randomly forgender. Parents were sampled in relation to their children's status. The completedbaseline sample included 835 women, 524 men and 657 children, who represented,respectively, 1% of the women of procreational age; 1% of the men, and 3% of thechildren under 3 in each Child Survival Project's catchment area.
(2) 1994
In order to allow for multi-variate analyses of the cross-sectional data, a larger samplewas desired. The 1990 sampling plan for children was approximately doubled for the two
18 Standard equation for estimating sample size is N = 4pqlU, where p=the proportion with conditionin the population, q = 1-p, L = error:. The sample was 4 (25)(75)125 =300.
12
sites remaining from the baseline survey (Dioro and Koutiala), and a comparable samplewas drawn for Kolondieba. Approximately 1400 children were sought, breaking downas 30 children/village x 48 villages. A total of 851 children were actually sampled in thefinal evaluation, which included virtually all children who fell within the age range in eachvillage. A subset ofmothers and fathers, selected randomly from the list of children, wasinterviewed. The 1994 sample used for the pre-post analyses is much smaller, as onlythose villages with both baseline and final data are included.
b. Vj1Jage Selectjon
(1) Assignment o/villages to the study - 1990
As part of the baseline protocol in December, 1990, Africare/Dioro, CarelMacina andWorld VisionIKoutiala19 were each asked to select 16 villages randomly from their ChildSurvival project rosters according to the following criteria:
1. Equal length of time participating in the Child Survival program.
2. Presence of improved wells, roads, vaccination, and gardening projects.
3. Presence ofa maternity center or other health post nearby (w/in 10 kilometers).
4. Similar ethnic, demographic and economic make-up (study villages were limited to75% Bambara and 25% Bozo or other ethnic groups).
Half of the villages (8) would receive NCP interventions, and the remaining 8 villageswould not during the course of the research period. However, all other child survivalprogram activities (e.g. immunization, water and sanitation, oral rehydration therapy andlimited breastfeeding promotion and nutritional screening) would take place. Thepurpose ofthe matching was to eliminate as many confounding variables as possible in therural village situation, including the improvements made by the child survival interventionin its own right. The NGOs were asked to implement the NCP intervention accordingto their own schedule, but more or less uniformly.
(2) Selection o/villages - 1994
Village sampling instructions were forwarded to NCP's resident coordinator well aheadofthe scheduled survey (See Appendix B). For the pre-post analysis, NCP attempted toinclude 6 original "trial" and 6 original "comparison" villages each from Dioro andKoutiala, for a total of 24 villages from which there were pre-post data. For the crosssectional survey, NCP requested that 2 villages each from World Vision's and Africare'snew Child Survival projects be included, as well as 2 new comparison villages from the
19 Save the ChildrenIKolondieba wished to participate in the project, but was unable to take part in thebaseline study for administrative reasons.
13
Child Survival expansion projects. Kolondieba was asked to select villages according tothe original criteria for baseline selection.
The survey field supervisors had difficulty meeting these requirements. In KoutiaJa, it wasyirtually impossible to find a yjlJage - among 70 - that had not been exposed, howeverminimally to NCP. The field team decided it was pointless to include the originalcomparison villages in the sample from Koutiala.
In addition, because participant recruitment was not complete by the time the field teamarrived in each village (see Field Survey Methods below), and a greater number ofparticipants were interviewed per village, only one village could be completed in a day.As the budget allocated for the survey did not allow for extending the time in the fieldnecessary to visit all 16 villages, the total number was reduced to 10 per site, for a totalono instead of48. The total number of individuals included in the survey remained closeto the baseline, as more children were recruited on a per village basis. The combinationof the budgetary restrictions and decisions made by the field team in the course ofimplementing the impact survey resulted in the following sample ofvillages:
In Koutiala, the 8 original trial villages were included.
Two new "comparison" villages were selected from the expansion project using theoriginal criteria above.
Having over-selected "trials" in Koutiala, the field team decided to over-select"comparison" villages in Dior020
, and only two original trials were included togetherwith four original comparisons. In addition, two participating and one comparisonvillage were selected from Africare's expansion site.
Save-the-Children in Kolondieba was asked to select villages according to high andlow involvement categories matching villages according to the original health serviceand economic criteria given in 1990 (see above).
Tables 2 and 3 below show the final disposition of villages for the two analytical designs.Appendix C, Tables C-l to C-3 shows.al1 villages included in the 1990 and 1994 surveys byname and level of exposure. This makes clear which villages from 1990 are effectively "10stto follow-up" in 1994 for the Pre-Post analysis, and how each village is classified for theretrospective, cross-sectional analysis performed on 1994 data only.
2°This was a serious mistake, the ramifications of which are explained below.
14
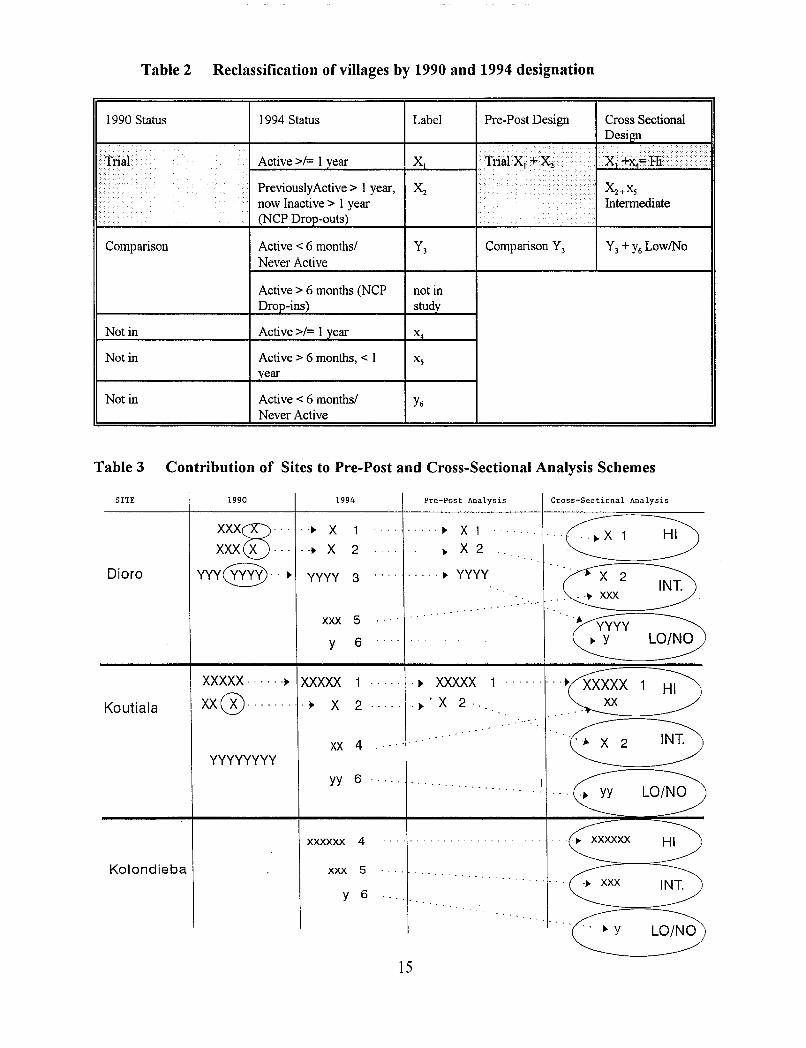
Table 2 Reclassification of villages by 1990 and 1994 designation
1990 Status 1994 Status Label Pre-Post Design Cross SectionalDesign
, ,{1 ... ,.;,,1········ / .. i I .. > •... .
Ina! Active>! 1 year X I· A,'~1"'2 /..
•••••
... PreviouslyActive> 1 year, X2........
•••••• X2 +XS
now Inactive> I year.....
••••• Intennediatei ..... i
(NCP Drop-outs) .'.
Comparison Active < 6 months! Y3 Comparison Y3 Y3+ Y6 LowlNoNever Active
Active> 6 months (NCP not inDrop-ins) study
Not in Active >!= 1 year X4
Not in Active> 6 months, < I Xsyear
Not in Active < 6 months! Y6Never Active
Table 3 Contribution of Sites to Pre-Post and Cross-Sectional Analysis Schemes
SITE 1990 1994 Pre-Post Analysis Cross-Sectional Analysis
Dioro
Koutiala
Kolondieba
XXX0 ··· ..~ X 1 ..... ~ X 1 ......... (0' 3)XXX X ... ..~ X 2 ... ~ X 2
yyy@...~ YYYY 3 ..... ~ YYYY ··c;2 3. "
.. , ..• XXX
xxx 5 •• yyyyy 6 .. .. -- .. j> Y La/NO
XXXXX····· .j> XXXXX 1 j> XXXXX 1 ..... .~x Vxx@........ . ., X 2 . j>' X 2 '... '
~2 3)XX 4yyyyyyyy
yy 6.., YY La/NO
xxxxxx 4 - - -. - ... .... ~ xxxxxx HI
xxx 5. .~ xxx INT.
y 6' ..
C ~15
c. Impact of Samp1ing on Eyaluation Design
Village sampling decisions made once the survey was in the field, and the resulting number ofvillages contributed from each region, sharply constrain NCP's ability to use the original Pre-Postdesign. Where the 1990 and 1994 survey instruments are comparable, limited comparativeanalyses of anthropometric variables, women's reported feeding behaviors and wealthclassifications are performed.
B. Field Survey Methods
1. Recruitment of survey participants
At the baseline, Child Survival project staff recruited villagers to participate in the survey severaldays in advance. Due to changes in project management and location, current project staffhadnot been informed ofthis need ahead ofthe 1994 field team's arrival on location. As a result, thefield team (which included the former Coordinator for the World Vision Child Survival project)asked village-level traditional birth attendants and volunteer health workers to recruit villagersfor the survey on the morning that the team arrived in each village. Individuals were picked "asrandomly as possible" from lists maintained by health posts or according to village birth records.In the case of non-project villages, the village Chiefwas asked to provide the list ofnames andidentifY volunteers to assist with recruitment. Eligible families (with pregnant women or childrenunder age three) were categorized into the following interview classifications: Pregnant woman,mother of infant through 6 months, mother of child 7 to 36 months, father of child. In everyvillage, virtually .all pregnant women and mothers of children less than two years of age wereinterviewed. There was slightly more choice for mothers ofolder children, and either a "random"enumeration technique (see Appendix B), or, simply "rounding up anyone available," was usedto select the remaining participants. The Team leader stressed that recruitment was time andlabor-intensive, and as "random as possible" under the circumstances. However, the end resultis an exhaustive sample ofpregnant and breastfeeding women as well as children under age 2, anda convenience, (rather than a strictly random), sample ofolder children and men.
2. Organization of Evaluation and Preparation of Interview Teams
Prior to the arrival ofthe field team leader, Dr. Anne Golaz, NCP Local Coordinator EnkaterinaSissoko and NCP resident consultant, Dandara Kante, recruited field interviewers21 and mademost logistical arrangements. Dr. Golaz and Ms. Kante reviewed the questionnaires and itswritten Bambara translation, instructed the interviewers in its use, and trained the interviewersin anthropometric measurement. The team practiced both interviewing and measuring for oneday in Bamako. Two field teams were created. These were as follows:
21Please refer to page i. for personnel titles.
16
Team 1Dandara Kante, SupervisorOuessa Sanogo, MeasurerSaba Soumbounou, Team LeaderNana Toure, Women's questionsBoubacar Diarra, Men's questions
Responsibilities were divided as follows:
Team 2Katy Dolo, SupervisorFanta Ba, MeasurerFatimata Tony, Team LeaderAlima Simaga, Women's questionsNoumouke Diarra, Men's questions
The Supervisor and Team leader worked with local staff to recruit participants in the village forthe survey, handled village introductions and hospitality, checked children's records, whereavailable. The IIMeasurer" performed all anthropometric measurements. As indicated above, twoofthe team members specialized in either the woman's or the man's questionnaire, by their owngender. The Team leader specialized in questions asked to women, after recruitment and otherduties were completed. The supervisors checked all data for quality and completeness and helpedcomplete interviews, as needed.
USAID/Mali's Technical Advisor for Child Survival (TACS), Dorothy Stevens, accompanied theteam to Koutiala, where Dr. Golaz oversaw the entire study, assisted by Ms. Kante and Ms.Dolo. Dr. Golaz left after the Koutiala portion was fielded, leaving the study to Ms. Kante andMs. Dolo for completion (as had been done for the baseline).
3. Data Collection Instruments, methods and key variables
The final evaluation instrument incorporated as much of the original baseline instrument asconsidered useful, and new items were added to capture NCP interventions introduced after the1990 baseline.
a. Anthropometry and Nutritional Stat1ls
Children were weighed using Salter suspension scales borrowed from the CDC in Atlanta.Length was measured using locally constructed length measuring boards, belonging to theNGOs. Mid-Upper Arm Circumference (MUAC) was also collected using a red-yellow-green"Zerfas" insertion tape manufactured by TALe, London. The research team was trained tofollow the anthropometric procedures described in United Nations, How to Weigh andMeasure Children, 198622
. The following information was collected:
• Child's age - calculated by Epi Info from:Date of birth (from health post or village records)Date of interview
• Child's weight measured in kilograms to the nearest 0.1 kg• Child's length (all children measured supine) in centimeters to the nearest 0.lcm23
• Child's sex (male or female)
2~ational Household Survey Capability Programme. DPIUN/INT-81-041/6E23Children were measured supine in 1990 and 1994. The CDC recommends a corrective factor (-.35 cm) to adjust for supine measurement of
children over 24 months ofage, however. this step was considered non essential for this analysis. Approximately 20% of the children were over 24months in each survey.
17
(1) Anthropometric Indicators
Three anthropometric indicators of nutritional status can be derived from height and weightmeasurements: height-for-age, weight-for-height and weight-for-age. Low hcight-for-ageindicates growth stunting, which reflects a long term deficit of nutrition and a greaterexperience ofdisease such as diarrhea and acute respiratory infection. In a healthy referencepopulation, the expected prevalence ofgrowth stunting is 2.3%. In developing countries, thisranges from 10 to 60% nationally.
Low weiiht-for-height indicates acute, wasting malnutrition. It is often the consequence ofsevere food shortages and/or prolonged severe illness. Even in poor countries, the prevalenceofwasting at the natjooallevel stays below 5% except under disaster conditions.
Low weiabt-for-aie indicates that a child is malnourished, but does not distinguish betweena child who is wasted, and one who is stunted, but proportioned.
In this report, height-for-age, weight-for-height and weight-for-age data are interpreted usingliZ-scores" which are standard deviation units from the reference mean for eachanthropometric indicator based on the international growth reference data approved byNCHS, CDC and WHO. The Z score allows for comparison across ages and sex, and permitscomputations of summary statistics. A score of "0" indicates that a child's measurementsmatch the reference mean. Positive numbers indicate that the child is taller or heavier thanthe mean; negative numbers indicate the child is shorter or lighter. In a normal distributionof scores, 99% of the variation within a population will be found between 6 standarddeviations around the mean (Normally 3 up and 3 down from 024
). The Epi Info programautomatically "flags" records which are missing data or fall outside of an accepted range (LE2s
-5 or GE 5 standard deviations), indicating a high likelihood of measurement/data entry error.Flagged records are excluded from the analysis. USAID, CDC, WHO and others recommendthat a Z-score cut-offpoint of-2 be used to classify low height-for-age, low weight-for-heightand low weight-for-age for the purpose of estimating the prevalence of malnutrition. (Othercut points might be indicated for other purposes).
(2) Dietary Assessment
Interviewers asked a series of open-ended questions concerning individual and familycharacteristics, food choices and food-related behavior. Dietary intake for adult pregnant andnursing women and for children over 6 months of age was assessed using a "24 hour recall"following the methodology of Gibson, R. Principles ofNutrition Assessmenf6
• In addition,mothers were asked at what age various foods were given for the first time to their child, suchas fruit juice, millet, meat, etc.
24See Diagram, Appendix D, which displays relationship ofZ-scores to NCHS percentiles.
25LE=Less than or equal to, GE=Greater than or equal to.
26Gibson, R. 1990 Oxford University press. N. Y. :37-39. See also Christakis, G. 1972 Nutrition assessment in health programs. APHA: 11-18and Appendix C. For discussion see Block, G. A review of validations of dietary assessment methods. A.J. Epid. JJ5:492-505 and National ResearchCouncil, Diet and Health, National Academy Press. 1989. Washington. D.C .. Chp. 2, Methodological Considerations:23-40; Chp. 3, Dietary Intake
and Nutritional Status:41-84.
18
Women were asked either about their own experience during pregnancy or the first threemonths ofbreastfeeding, or they were asked questions concerning their youngest child. Menwere asked to comment on their wife's pregnancy or about their youngest child. A series ofquestions on target food purchasing, provision of money, and intra-household distribution ofpurchased foods was added27.
b. Demographics, Knowledge, Attitudes and Practices
(1) Instruments andMethods
Adult participants were interviewed individually. The instrument is reproduced inAppendix A. The instrument consisted of a verbal and illustrated section.
The illustrated section was totally revised from the baseline to account for the innovationsin NCP that occurred after 1990. The questions related to the Awa series flip charts,introduced in 1990; the 5-Step counseling approach and Communities in Good Healthmanual, introduced in 1992; the counseling cards, introduced in 1993; and radio program,launched only 2 weeks before the start of the survey. Pre-coded answer choices wereprovided for many ofthe questions to facilitate collecting data. While the new questionswere not pre-tested for the purpose ofthe final evaluation, the illustrations themselves hadbeen pre-tested (and were in use) with rural villagers, and the questions used in the finalevaluation were originally developed for the material pre-testing or NGO staff trainingsupervision visit assessments. Illustrations used in the survey appear in Appendix A.
(2) Key Variables
(a) NCP Individual Exposure Indices
Participants were shown samples ofNCP media and asked if they had seen the materialbefore, and under what circumstances. A scoring system was developed, which is shownin Table 4 below.
27These questions were developed and tested in NCP's final evaluation in Niger which preceded the Maliand Burkina evaluations.
19
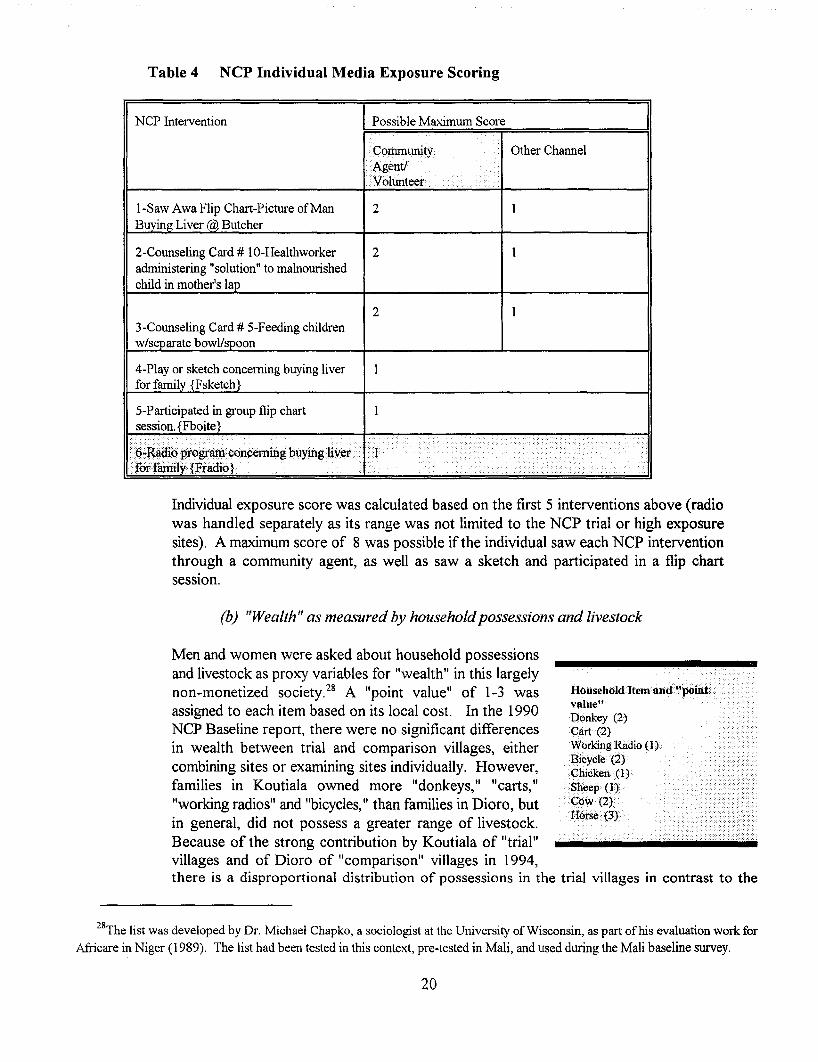
Table 4 NCP Individual Media Exposure Scoring
NCP Intervention Possible Maximum Score
Community.Agent!
.Volunteer
Other Channel
I-Saw Awa Flip Chart-Picture of Man 2Buying Liver @, Butcher
2-Counse1ing Card # IO-Healthworker 2administering "solution" to malnourishedchild in mother's lap
23-Counseling Card # 5-Feeding childrenw/separate bowl/spoon
4-Play or sketch concerning buying liverfor familv {Fsketch}
5-Participated in group flip chartsession. {Fboite}
6.:.Radi6programconceming buyingiiver . 11.forfamilv· {Fradio}
.. ..
.
HouseholdItem and "poiiit, •.value"Donkey (2)Cart (2)Working Radio (1).Bicycle (2)
. Chicken (1)Sheep (1)COw(2}
.:Horse (3)
Individual exposure score was calculated based on the first 5 interventions above (radiowas handled separately as its range was not limited to the NCP trial or high exposuresites). A maximum score of 8 was possible if the individual saw each NCP interventionthrough a community agent, as well as saw a sketch and participated in a flip chartsession.
(b) "Wealth" as measured by householdpossessions and livestock
Men and women were asked about household possessionsand livestock as proxy variables for "wealth" in this largelynon-monetized society.28 A "point value" of 1-3 wasassigned to each item based on its local cost. In the 1990NCP Baseline report, there were no significant differencesin wealth between trial and comparison villages, eithercombining sites or examining sites individually. However,families in Koutiala owned more "donkeys, II IIcarts, II
"working radios" and "bicycles," than families in Dioro, butin general, did not possess a greater range of livestock.Because of the strong contribution by Koutiala of "trial"villages and of Dioro of "comparison" villages in 1994,there is a disproportional distribution of possessions in the trial villages in contrast to the
28The list was developed by Dr. Michael Chapko, a sociologist at the University of Wisconsin, as part of his evaluation work for
Africare in Niger (1989). The list had been tested in this context, pre-tested in Mali, and used during the Mali baseline survey.
20
comparisons. The effects of wealth are discussed in each analysis (Pre-Post and CrossSectional) under IIconfounding factors ll
•
(c) Child Survival Program Variables
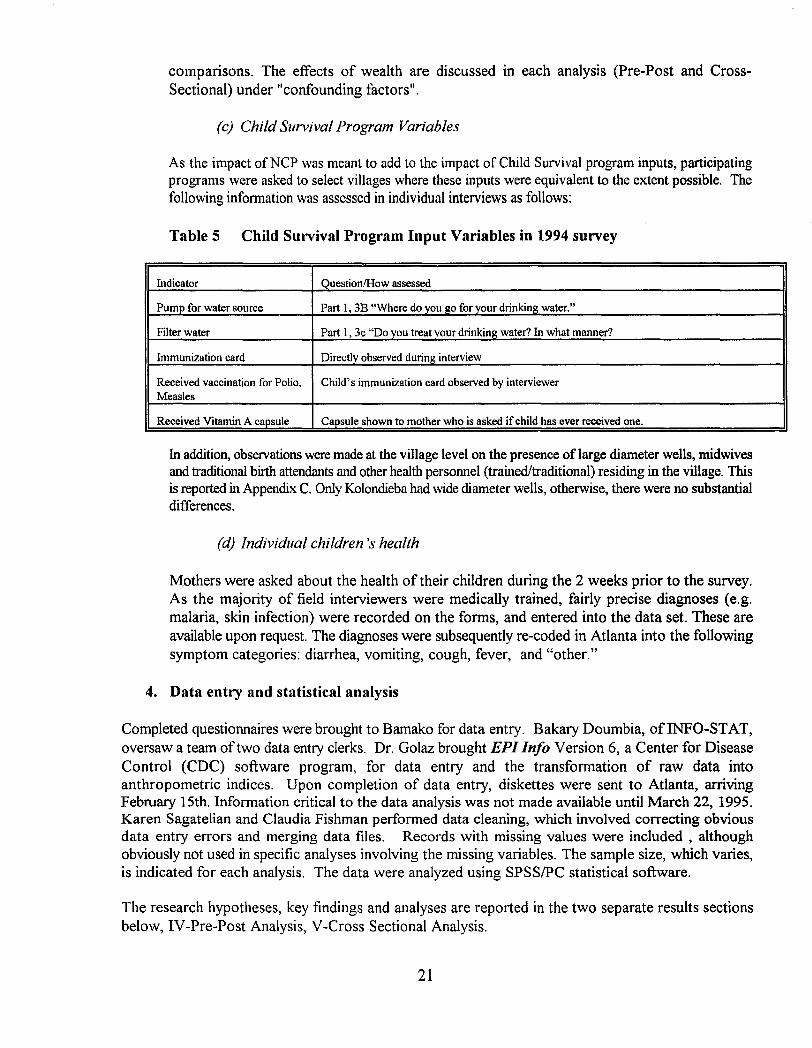
As the impact ofNCP was meant to add to the impact of Child Survival program inputs, participatingprograms were asked to select villages where these inputs were equivalent to the extent possible. Thefollowing information was assessed in individual interviews as follows:
Table 5 Child Survival Program Input Variables in 1994 survey
Indicator QuestionIHow assessed
Pump for water source Part 1, 3B "Where do you p;o for your drinking water."
Filter water Part 1, 3c "Do you treat your drinkinp; water? In what manner?
Immunization card Directly observed during interview
Received vaccination for Polio, Child's immunization card observed by interviewerMeasles
Received Vitamin A capsule Capsule shown to mother who is asked if child has ever received one.
In addition, observations were made at the village level on the presence of large diameter wells, midwivesand traditional birth attendants and other health personnel (trained/traditional) residing in the village. Thisis reported in Appendix C. Only Kolondieba had wide diameter wells, otherwise, there were no substantialdifferences.
(d) Individual children's health
Mothers were asked about the health of their children during the 2 weeks prior to the survey.As the majority of field interviewers were medically trained, fairly precise diagnoses (e.g.malaria, skin infection) were recorded on the forms, and entered into the data set. These areavailable upon request. The diagnoses were subsequently re-coded in Atlanta into the followingsymptom categories: diarrhea, vomiting, cough, fever, and "other."
4. Data entry and statistical analysis
Completed questionnaires were brought to Bamako for data entry. Bakary Doumbia, of INFO-STAT,oversaw a team oftwo data entry clerks. Dr. Golaz brought EPI Info Version 6, a Center for DiseaseControl (CDC) software program, for data entry and the transformation of raw data intoanthropometric indices. Upon completion of data entry, diskettes were sent to Atlanta, arrivingFebruary 15th. Information critical to the data analysis was not made available until March 22, 1995.Karen Sagatelian and Claudia Fishman performed data cleaning, which involved correcting obviousdata entry errors and merging data files. Records with missing values were included , althoughobviously not used in specific analyses involving the missing variables. The sample size, which varies,is indicated for each analysis. The data were analyzed using SPSSIPC statistical software.
The research hypotheses, key findings and analyses are reported in the two separate results sectionsbelow, IV-Pre-Post Analysis, V-Cross Sectional Analysis.
21
IV. RESULTS: ANALYSIS 1- PRE (1990) & POST (1994)
A. Analytical Features
1. Design
This analysis makes use ofthe original quasi-experimental protocol in which cooperating NGO ChildSurvival projects selected villages to receive the NCP intervention (designated as "trials") and villagesto not receive the interventions (designated as "comparisons") throughout the duration of the project.Only AfiicarelDioro and World Vision/Koutiala satisfy minimum requirements to be included in thisanalysis, which are: (1) Anthropometric, KAP and economic data were collected at both surveys(1990, 1994), (2) The NCP intervention was carried out in the trial villages for more than 1 full yearbetween March, 1991 and June, 1994.
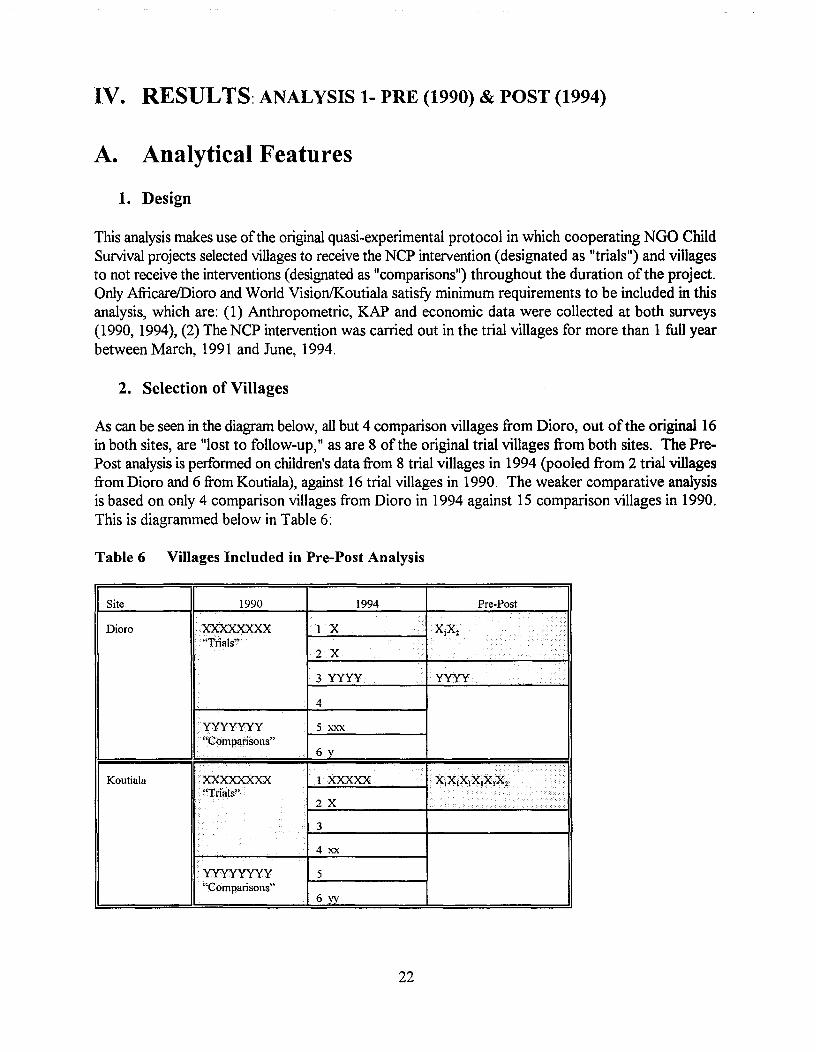
2. Selection of Villages
As can be seen in the diagram below, all but 4 comparison villages from Dioro, out of the original 16in both sites, are "lost to follow-up," as are 8 of the original trial villages from both sites. The PrePost analysis is performed on children's data from 8 trial villages in 1994 (pooled from 2 trial villagesfrom Dioro and 6 from Koutiala), against 16 trial villages in 1990. The weaker comparative analysisis based on only 4 comparison villages from Dioro in 1994 against 15 comparison villages in 1990.This is diagrammed below in Table 6:
Table 6 Villages Included in Pre-Post Analysis
I
Site
Dioro
1990
·XXXXXXXX.·.·"Tnals"
1994
1--=-1....;;.X,;;,.....;.......;.......;.... 4. X1Xz
2X
Pre-Post
.
..
I .. .
Koutiala
yyyyyyy"Comparisons"
XXXXXXXX. "Trials"
.• yyyyyyyy
. "Comparisons"
3 yyyy
4
5 xxx
6 y
1.XXXXX
2X
3
4xx
5
6yy
22
•• Iyyyy
x: . ..
••••
As there were still over 100 children remaining in each group (Trial and Comparison), the data areworth analyzing at this level. Analyses requiring subclassifications produced weak results, which havelargely not been included.
3. Hypotheses to be tested in Analysis 1
a. Pregnant women and mothers of children less than 3 years of age living in trial villageswill report better nutrition behavior (consumption/feeding of more foods recommendedby the intervention) in 1994 than pregnant women and mothers of children ofthe sameage range residing in NCP trial villages prior to the intervention (1990).
b. Children less than 3 years of age living in trial villages will have better nutritional status(measured by anthropometric indices ofweight-for-age, height-for-age and weight-forheight) in 1994 than children ofthe same age range residing in NCP trial villages prior tothe intervention (1990).
c. Comparably significant changes will not be seen in the comparison villages.
B. Findings
1. Sample Characteristics
a. Sample Sjze by category
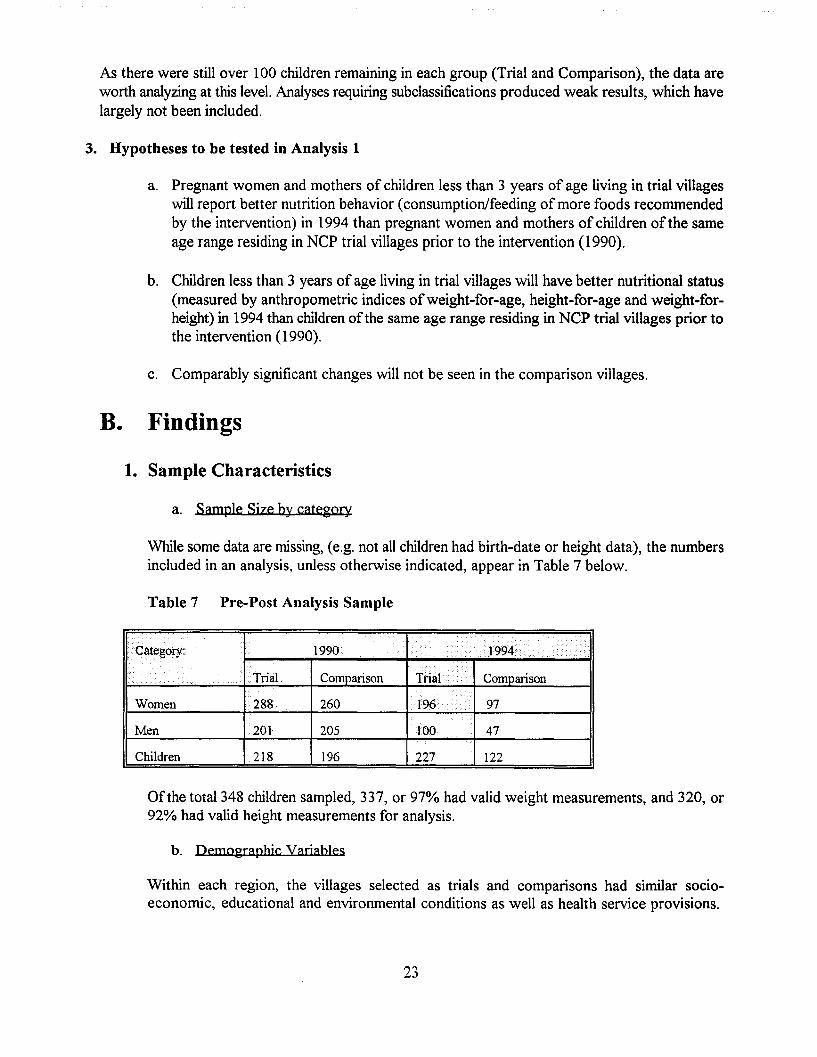
While some data are missing, (e.g. not all children had birth-date or height data), the numbersincluded in an analysis, unless otherwise indicated, appear in Table 7 below.
Table 7 Pre-Post Analysis Sample
).~..
1990 .>.·1994 .....>............
•••••
... '"'.».
.. Trial Comparison Trial Comparison. ..
Women 288 260 196 ..•...• 97
Men 201 205 100 47
Children 218 196 227 122
Ofthe total 348 children sampled, 337, or 97% had valid weight measurements, and 320, or92% had valid height measurements for analysis.
b. Demographic Variables
Within each region, the villages selected as trials and comparisons had similar socioeconomic, educational and environmental conditions as well as health service provisions.
23
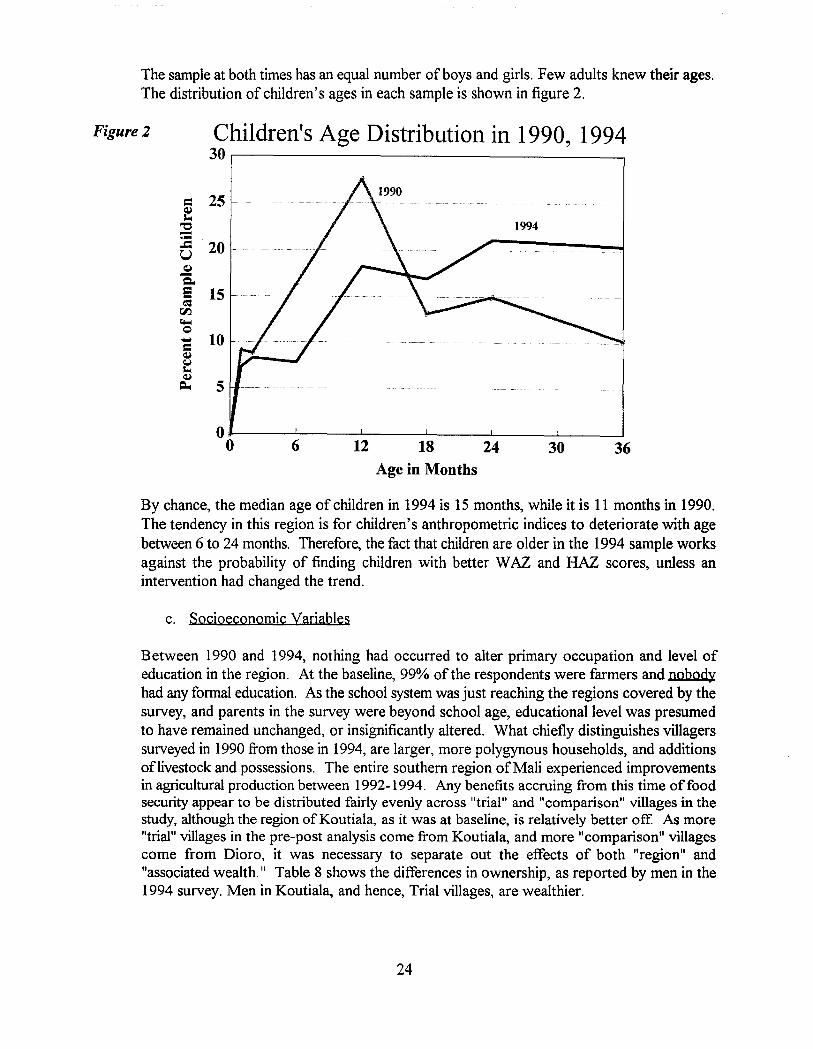
The sample at both times has an equal number of boys and girls. Few adults knew their ages.The distribution of children's ages in each sample is shown in figure 2.
Figure 2 Children's Age Distribution in 1990, 199430,--------------------,
= 25Q,ll-o
"0-.--= 20UQ,l-Q"e 15c:=
rIJ.~Q- 10=Q,l
t::Q,l
~ 5
00 6 12 18 24 30 36
Age in Months
By chance, the median age of children in 1994 is 15 months, while it is 11 months in 1990.The tendency in this region is for children's anthropometric indices to deteriorate with agebetween 6 to 24 months. Therefore, the fact that children are older in the 1994 sample worksagainst the probability of finding children with better WAZ and HAZ scores, unless anintervention had changed the trend.
c. Socioeconomic variables
Between 1990 and 1994, nothing had occurred to alter primary occupation and level ofeducation in the region. At the baseline, 99% ofthe respondents were farmers and nobodyhad any formal education. As the school system was just reaching the regions covered by thesurvey, and parents in the survey were beyond school age, educational level was presumedto have remained unchanged, or insignificantly altered. What chiefly distinguishes villagerssurveyed in 1990 from those in 1994, are larger, more polygynous households, and additionsoflivestock and possessions. The entire southern region ofMali experienced improvementsin agricultural production between 1992-1994. Any benefits accruing from this time of foodsecurity appear to be distributed fairly evenly across "trial" and "comparison" villages in thestudy, although the region of Koutiala, as it was at baseline, is relatively better off. As more"trial" villages in the pre-post analysis come from Koutiala, and more "comparison" villagescome from Dioro, it was necessary to separate out the effects of both "region" and"associated wealth." Table 8 shows the differences in ownership, as reported by men in the1994 survey. Men in Koutiala, and hence, Trial villages, are wealthier.
24
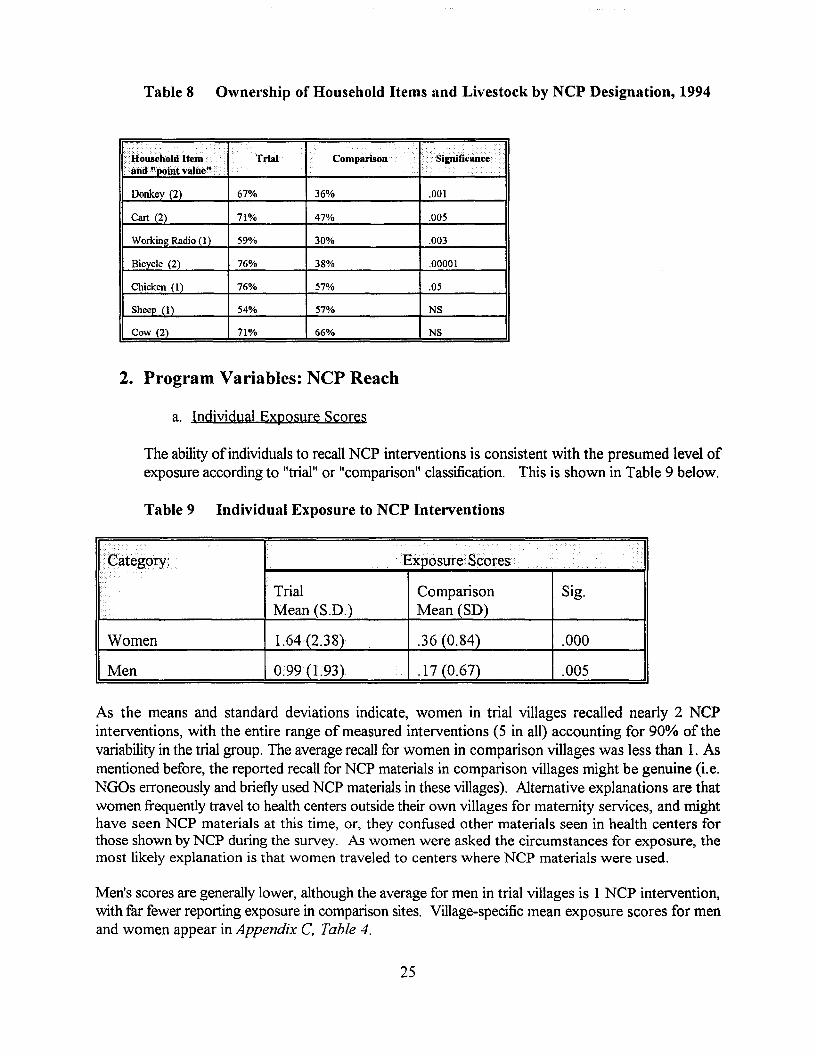
Table 8 Ownership of Household Items and Livestock by NCP Designation, 1994
Household Item . •••••••••••••> . ........
Trial•••
Comparison
• •••••••••
.iand"Doln.tvalue"··
Donkey (2) 67% 36% .001
Cart (2) 71% 47% .005
Working Radio (I) 59% 30% .003
Bicycle (2) 76% 38% .00001
Chicken (I) 76% 57% .05
Sheep (1) 54% 57% NS
Cow (2) 71% 66% NS
2. Program Variables: NCP Reach
a. Indiyidual Exposure Scores
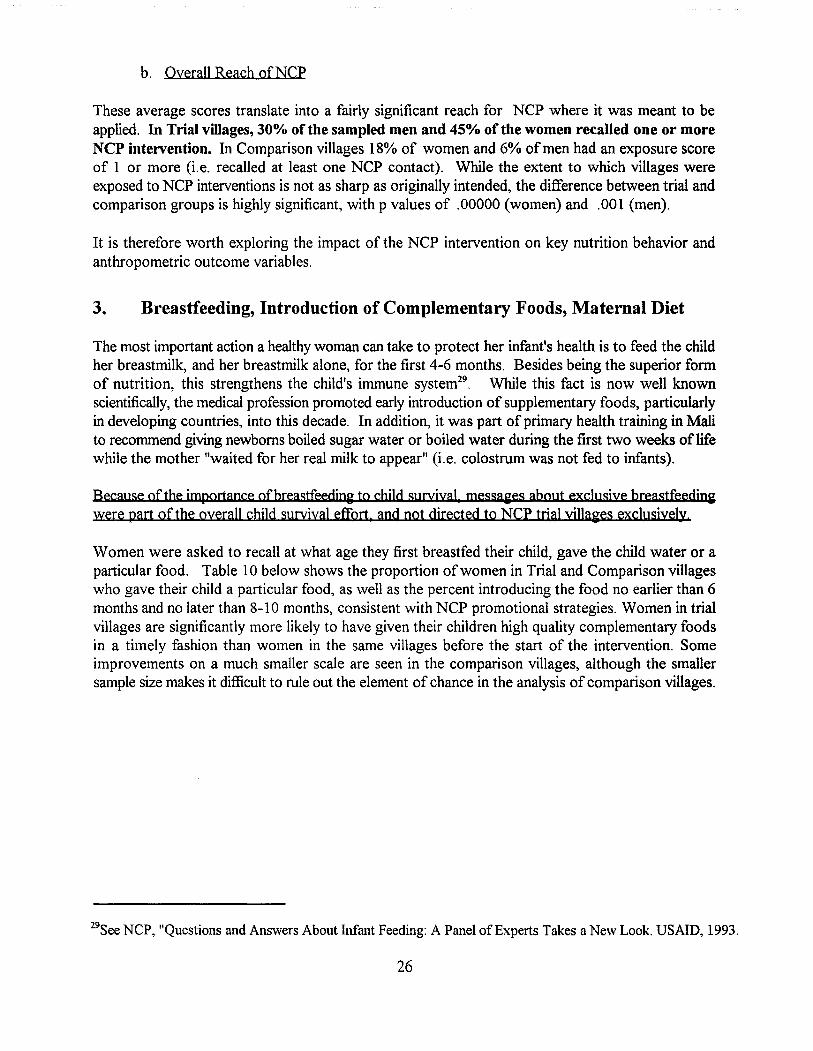
The ability ofindividuals to recall NCP interventions is consistent with the presumed level ofexposure according to "trial" or "comparison" classification. This is shown in Table 9 below.
Table 9 Individual Exposure to NCP Interventions
..... <Exposure Scores.v-.
Trial Comparison Sig.Mean (S.D.) Mean (SD)
Women 1.64 (2.38) .36 (0.84) .000
Men 0.99(1.93) .17 (0.67) .005
As the means and standard deviations indicate, women in trial villages recalled nearly 2 NCPinterventions, with the entire range of measured interventions (5 in all) accounting for 90% of thevariability in the trial group. The average recall for women in comparison villages was less than 1. Asmentioned before, the reported recall for NCP materials in comparison villages might be genuine (i.e.NGOs erroneously and briefly used NCP materials in these villages). Alternative explanations are thatwomen frequently travel to health centers outside their own villages for maternity services, and mighthave seen NCP materials at this time, or, they confused other materials seen in health centers forthose shown by NCP during the survey. As women were asked the circumstances for exposure, themost likely explanation is that women traveled to centers where NCP materials were used.
Men's scores are generally lower, although the average for men in trial villages is 1 NCP intervention,with far fewer reporting exposure in comparison sites. Village-specific mean exposure scores for menand women appear in Appendix C. Table 4.
25
b. OveraJl Reach ofNCP
These average scores translate into a fairly significant reach for NCP where it was meant to beapplied. In Trial villages, 30% of the sampled men and 45% of the women recalled one or moreNCP intervention. In Comparison villages 18% of women and 6% of men had an exposure scoreof 1 or more (i.e. recalled at least one NCP contact). While the extent to which villages wereexposed to NCP interventions is not as sharp as originally intended, the difference between trial andcomparison groups is highly significant, with p values of .00000 (women) and .001 (men).
It is therefore worth exploring the impact of the NCP intervention on key nutrition behavior andanthropometric outcome variables.
3. Breastfeeding, Introduction of Complementary Foods, Maternal Diet
The most important action a healthy woman can take to protect her infant's health is to feed the childher breastmilk, and her breastmilk alone, for the first 4-6 months. Besides being the superior formof nutrition, this strengthens the child's immune system29 . While this fact is now well knownscientifically, the medical profession promoted early introduction of supplementary foods, particularlyin developing countries, into this decade. In addition, it was part of primary health training in Malito recommend giving newborns boiled sugar water or boiled water during the first two weeks oflifewhile the mother "waited for her real milk to appear" (i.e. colostrum was not fed to infants).
Because of the jmportance ofbreastfeeding to chUd survival, messages about exclusive breastfeedjnawere part of the overall child survival effort. and not directed to NCP trial villa~es exclusively.
Women were asked to recall at what age they first breastfed their child, gave the child water or aparticular food. Table 10 below shows the proportion ofwomen in Trial and Comparison villageswho gave their child a particular food, as well as the percent introducing the food no earlier than 6months and no later than 8-10 months, consistent with NCP promotional strategies. Women in trialvillages are significantly more likely to have given their children high quality complementary foodsin a timely fashion than women in the same villages before the start of the intervention. Someimprovements on a much smaller scale are seen in the comparison villages, although the smallersample size makes it difficult to rule out the element of chance in the analysis of comparison villages.
29See NCP, "Questions and Answers About Infant Feeding: A Panel of Experts Takes a New Look. USAID, 1993.
26
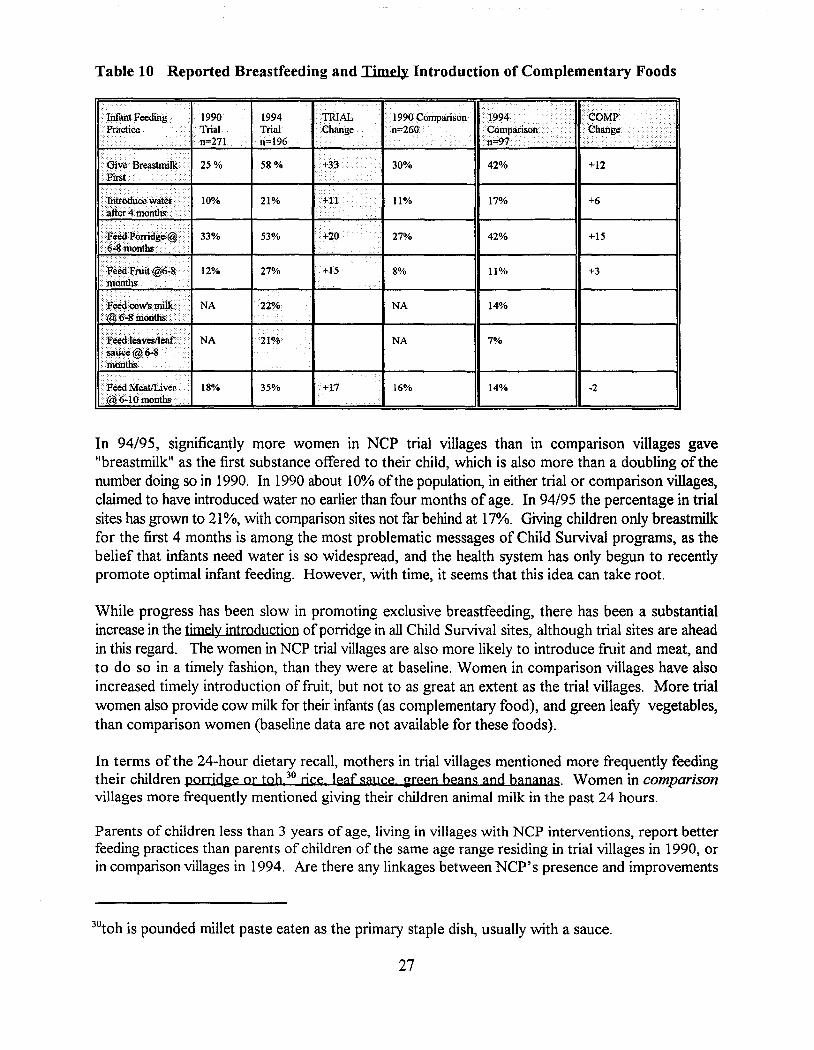
Table 10 Reported Breastfeeding and Timely Introduction of Complementary Foods
.>.. 1990 Comparison ;''''''' . . '::.vlVlr
.n=260 . . .. Change...........n=:fl ..
30% 42% +12
•·lnfant Feeding.Practice .
.. . .•..P'W; .....
• Introduce water .·.after4moilths.. '.. ,.,., , .. - - .
··te¥Poniclge@ •.6>;8 monthS
•.Feoo Fruit@6"8 .••·inonths
Feedteavestleaf.·· ...·Satlce@6~ .·inotiths... ..... ...
.... Feed MeatlLiver··@J();.10months .
1990 1994 .TRIALTrial Trilll .Changen=271 n=196
25% 58% )+:
•••••••••••••••
10% 21% +11...
33% 53% +20
12% 27%....
NA 22%
NA
18% 35% +17
11% 17%
••••••••
27% 42%
>8% 11%
NA 14%
NA 7%
16% 14%
+6
+15
+3
·2
In 94/95, significantly more women in NCP trial villages than in comparison villages gave"breastmilk" as the first substance offered to their child, which is also more than a doubling of thenumber doing so in 1990. In 1990 about 10% ofthe population, in either trial or comparison villages)claimed to have introduced water no earlier than four months of age. In 94/95 the percentage in trialsites has grown to 21%, with comparison sites not far behind at 17%. Giving children only breastmilkfor the first 4 months is among the most problematic messages of Child Survival programs, as thebelief that infants need water is so widespread, and the health system has only begun to recentlypromote optimal infant feeding. However, with time, it seems that this idea can take root.
While progress has been slow in promoting exclusive breastfeeding, there has been a substantialincrease in the timely introduction ofporridge in all Child Survival sites, although trial sites are aheadin this regard. The women in NCP trial villages are also more likely to introduce fruit and meat, andto do so in a timely fashion, than they were at baseline. Women in comparison villages have alsoincreased timely introduction of fruit, but not to as great an extent as the trial villages. More trialwomen also provide cow milk for their infants (as complementary food), and green leafY vegetables,than comparison women (baseline data are not available for these foods).
In terms of the 24-hour dietary recall, mothers in trial villages mentioned more frequently feedingtheir children porridge or toh 30 rjce, leaf sauce green beans and bananas. Women in comparisonvillages more frequently mentioned giving their children animal milk in the past 24 hours.
Parents of children less than 3 years of age, living in villages with NCP interventions, report betterfeeding practices than parents of children of the same age range residing in trial villages in 1990, orin comparison villages in 1994. Are there any linkages between NCP's presence and improvements
30toh is pounded millet paste eaten as the primary staple dish, usually with a sauce.
27
in children's nutritional status, or are these changes due to confounding variables? This is exploredin the next section.
4. Nutritional Status
a. Weight and Height Z-Scores among Trial and Comparison Children
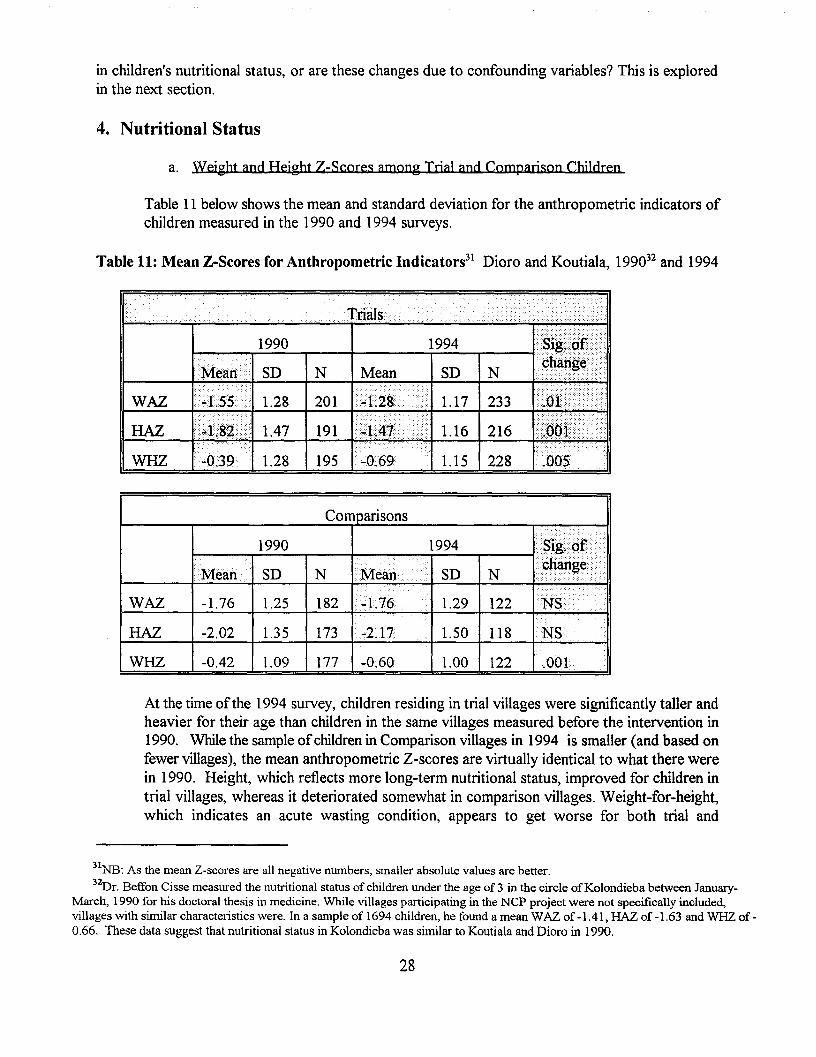
Table 11 below shows the mean and standard deviation for the anthropometric indicators ofchildren measured in the 1990 and 1994 surveys.
Table 11: Mean Z-Scores for Anthropometric Indicators31 Dioro and Koutiala, 199032 and 1994
WAZ
HAZ
WHZ
1990
SD
1.28
1.47
1.28
N
201
191
195 1.15 228
Comparisons
1990 1994 t"'I!E2:t'
Mean SD N 1\,1..<>"•••••••••
SD N » r, .
... ...."N"i
~> ,....••••••WAZ -1.76 1.25 182 14.76 1.29 122 :t
HAZ -2.02 1.35 173 -2.17 1.50 118 NS
WHZ -0.42 1.09 177 -0.60 1.00 122 .001
At the time ofthe 1994 survey, children residing in trial villages were significantly taller andheavier for their age than children in the same villages measured before the intervention in1990. While the sample ofchildren in Comparison villages in 1994 is smaller (and based onfewer villages), the mean anthropometric Z-scores are virtually identical to what there werein 1990. Height, which reflects more long-term nutritional status, improved for children intrial villages, whereas it deteriorated somewhat in comparison villages. Weight-far-height,which indicates an acute wasting condition, appears to get worse for both trial and
31NB: As the mean Z-scores are all negative numbers, smaller absolute values are better.32Dr. Beffon Cisse measured the nutritional status of children under the age of 3 in the circle ofKolondieba between January
March, 1990 for his doctoral thesis in medicine. While villages participating in the NCP project were not specifically included,villages with similar characteristics were. In a sample of 1694 children, he found a mean WAZ of -1.41, HAZ of -1.63 and WHZ of 0.66. These data suggest that nutritional status in Kolondieba was similar to Koutiala and Dioro in 1990.
28
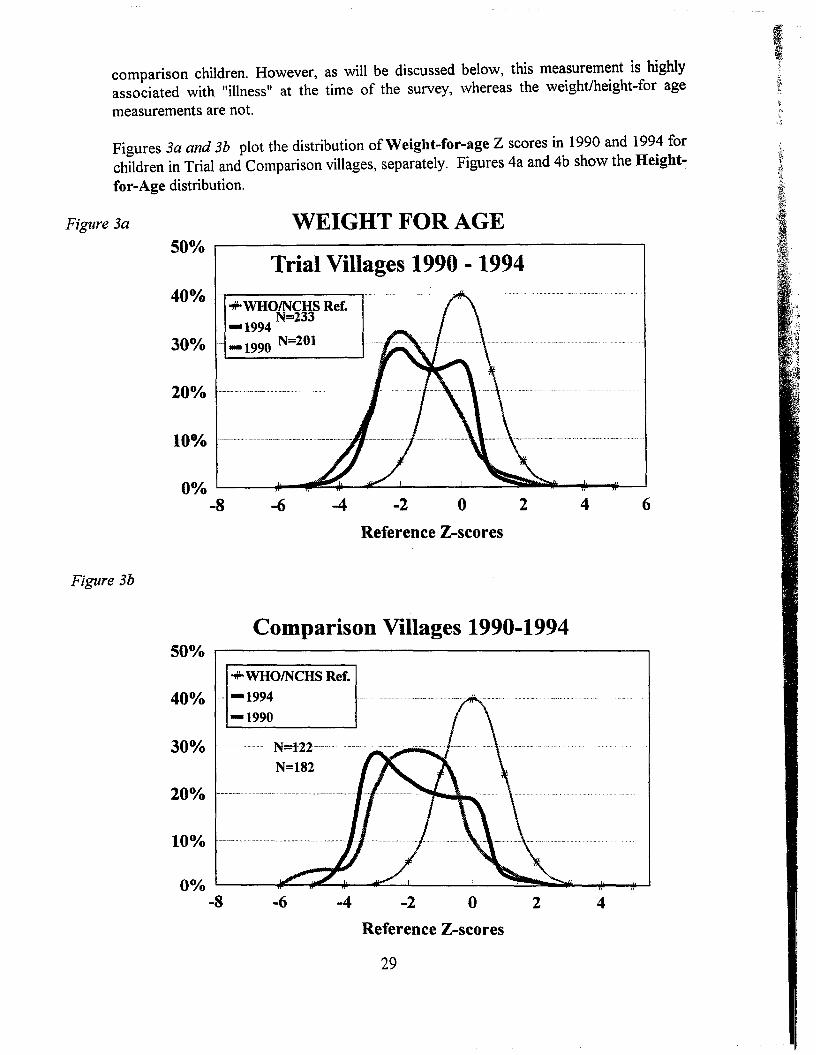
comparison children. However, as will be discussed below, this measurement is highlyassociated with Itillnesslt at the time of the survey, whereas the weight/height-for age
measurements are not.
Figures 3a and 3b plot the distribution ofWeight-for-age Z scores in 1990 and 1994 forchildren in Trial and Comparison villages, separately. Figures 4a and 4b show the Heightfor-Age distribution.
Figure 3a WEIGHT FOR AGE
Trial Villages 1990 - 1994
642o-2-4-6
Comparison Villages 1990-1994
Reference Z-scores
0°./0 L.-_~_"'fIII!!~_,;I:C..:......L __-..L_~~~I&-"""lIi-...-...I~
-8
20%
40°./0..,..WHOINCHS Ref.-1994 N=233
30°./0 - -1990 N=201
Figure 3b
500/0 r------------------------.
N=122----
N=182
..,..WHOINCHS Ref.
400/0 -- -1994-1990
200/0
-6 -4 -2 o 2 4
Reference Z-scores
29
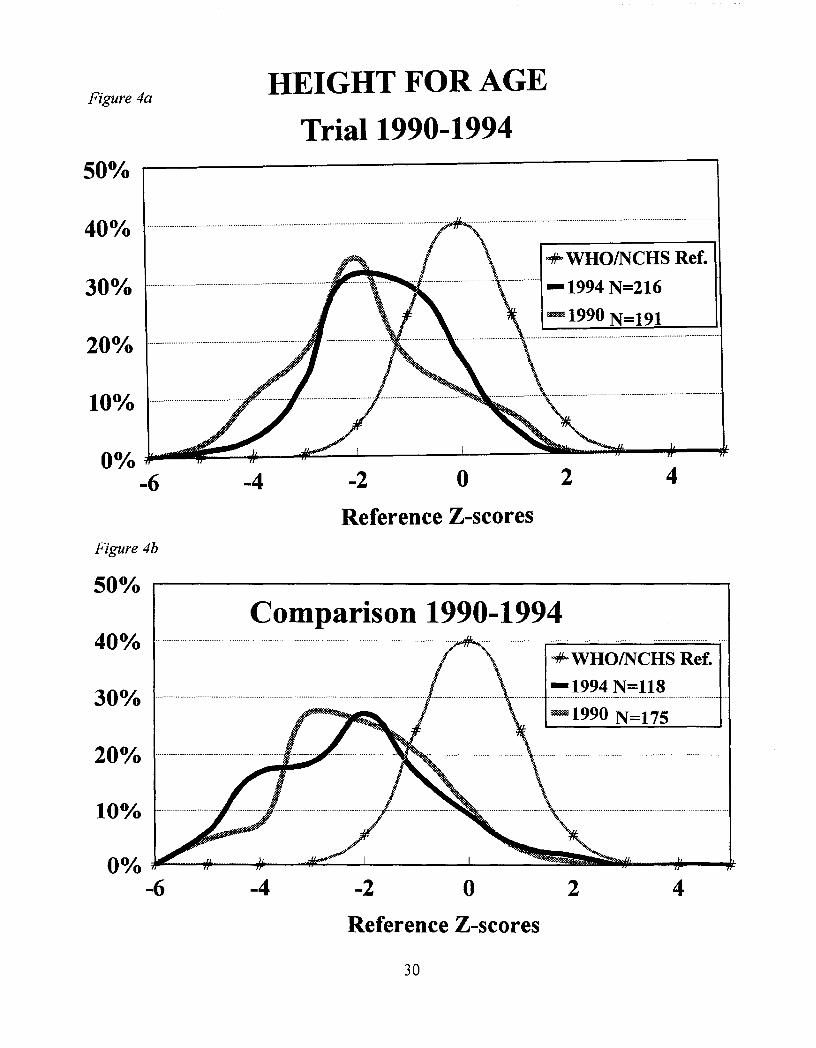
Figure 4aHEIGHT FOR AGE
Trial 1990-199450°A. .----------------------------,
42
+-WHO/NCHS Ref.
-1994 N=216
-1990 N=191
o-2-4
00/0 ~. ===--Ji---4~___l.. _L__ _..:~........~-...--dl:
-6
200/0
400/0
Reference Z-scoresFigure 4b
50% r----------------------,
Comparison 1990-1994-+WHO/NCHS Ref.
-1994 N=118- _ _-_ _-_............. ----_ _ -..
-1990 N=175
40%
200/0
10%
-4 -2 o 2 4
Reference Z-scores
30
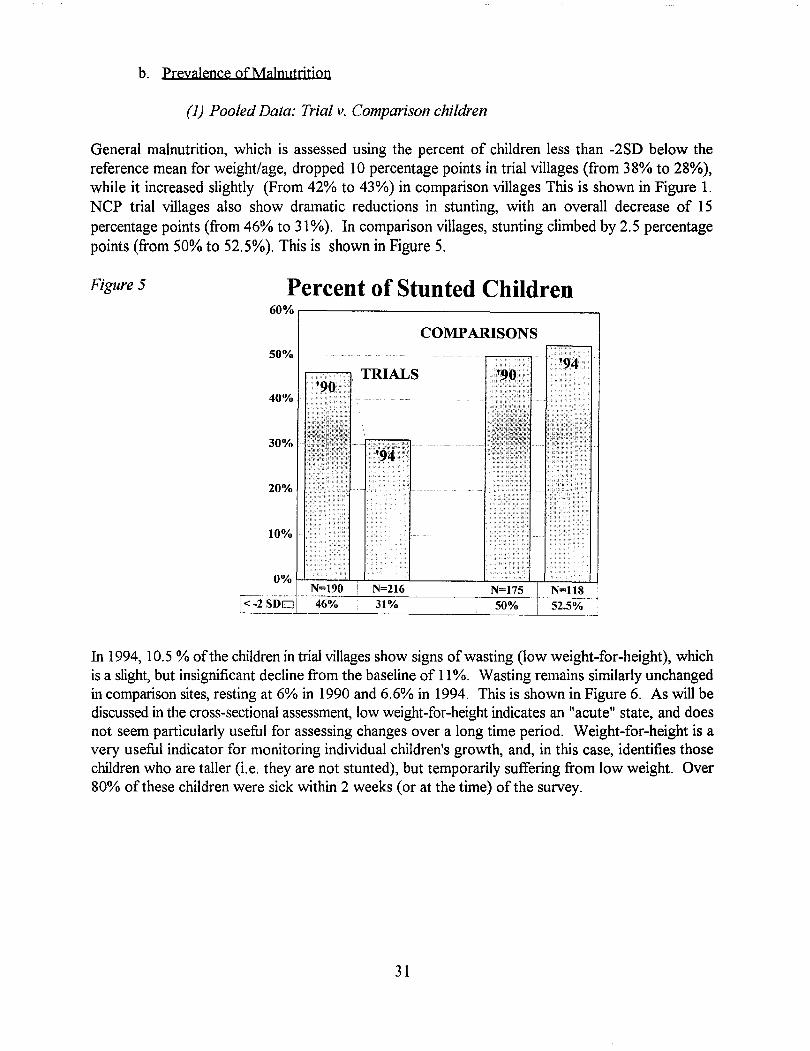
b. prevalence ofMalnutrjtjon
(1) Pooled Data: Trial v. Comparison children
General malnutrition, which is assessed using the percent of children less than -2SD below thereference mean for weight/age, dropped 10 percentage points in trial villages (from 38% to 28%),while it increased slightly (From 42% to 43%) in comparison villages This is shown in Figure 1.NCP trial villages also show dramatic reductions in stunting, with an overall decrease of 15percentage points (from 46% to 31%). In comparison villages, stunting climbed by 2.5 percentagepoints (from 50% to 52.5%). This is shown in Figure 5.
Figure 5 Percent of Stunted Children60% ,----------------_--.
COMPARISONS50%
40%
30%
20%
10%
<-2 SDo'------'-----------'----- ---l.--__.--.L__._
In 1994, 10.5 % ofthe children in trial villages show signs of wasting (low weight-for-height), whichis a slight, but insignificant decline from the baseline of 11%. Wasting remains similarly unchangedin comparison sites, resting at 6% in 1990 and 6.6% in 1994. This is shown in Figure 6. As will bediscussed in the cross-sectional assessment, low weight-far-height indicates an "acute" state, and doesnot seem particularly useful for assessing changes over a long time period. Weight-for-height is avery useful indicator for monitoring individual children's growth, and, in this case, identifies thosechildren who are taller (i.e. they are not stunted), but temporarily suffering from low weight. Over80% of these children were sick within 2 weeks (or at the time) of the survey.
31
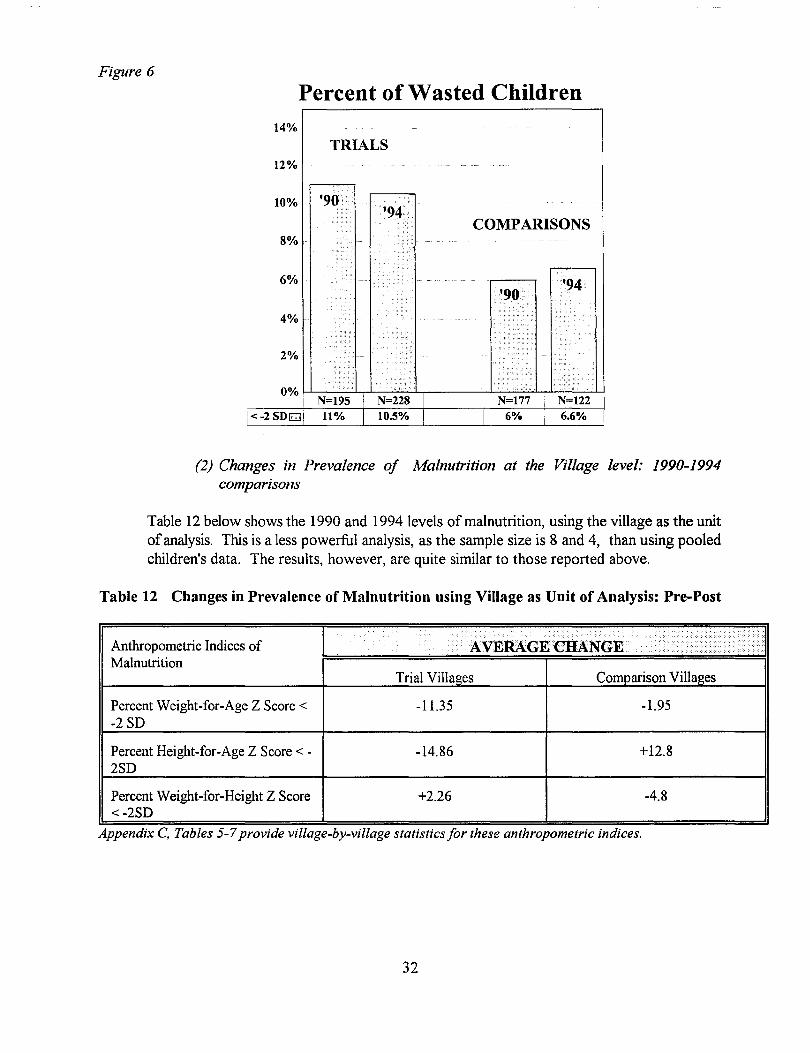
Figure 6
Percent of Wasted Children14%
TRIALS12%
10%
8%
6%
4%
2%
COMPARISONS
(2) Changes in Prevalence of Malnutrition at the Village level: 1990-1994comparisons
Table 12 below shows the 1990 and 1994 levels of malnutrition, using the village as the unitofanalysis. This is a less powerful analysis, as the sample size is 8 and 4, than using pooledchildren's data. The results, however, are quite similar to those reported above.
Table 12 Changes in Prevalence of Malnutrition using Village as Unit of Analysis: Pre-Post
•••••••••••••••••••
?..... .........Anthropometric Indices of ·AV . / ......./)]Malnutrition
Trial Villages Comparison Villages
Percent Weight-far-Age Z Score < -11.35 -1.95-2 SD
Percent Height-far-Age Z Score < - -14.86 +12.82SD
Percent Weight-far-Height Z Score +2.26 -4.8<-2SD
Appendix C, Tables 5-7provide village-by-village statistics for these anthropometric indices.
32
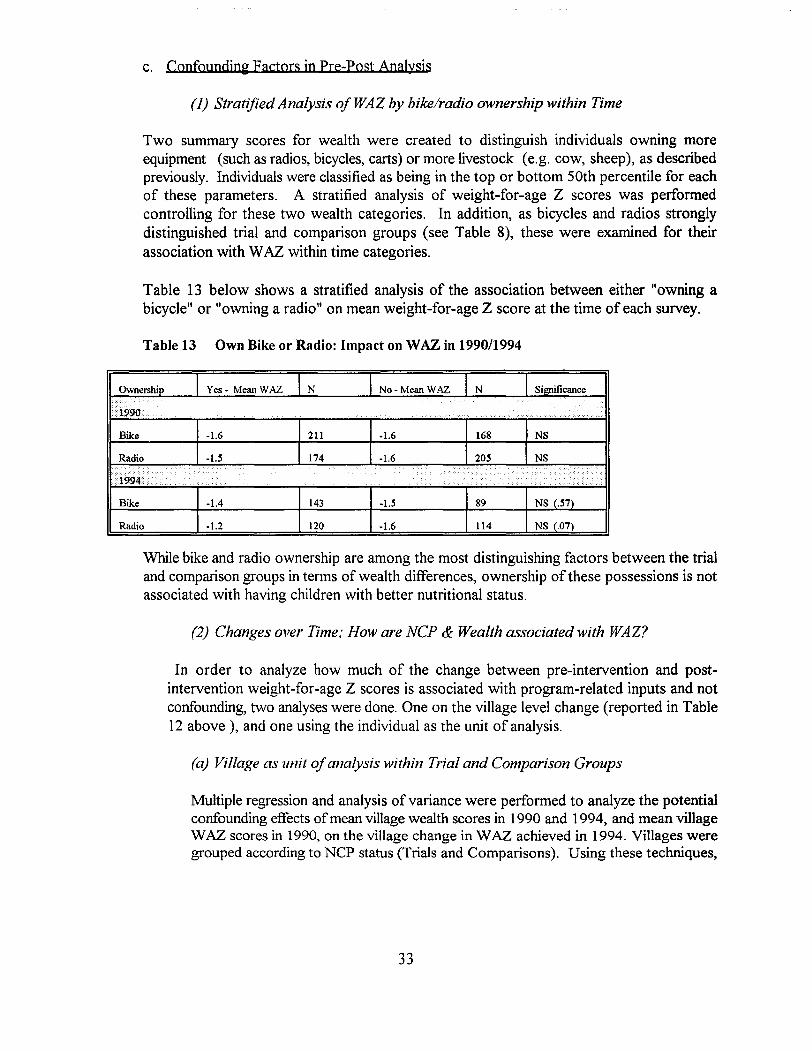
c. Confounding Factors in Pre-post Analysis
(1) Stratified Analysis ofWAZ by bike/radio ownership within Time
Two summary scores for wealth were created to distinguish individuals owning moreequipment (such as radios, bicycles, carts) or more livestock (e.g. cow, sheep), as describedpreviously. Individuals were classified as being in the top or bottom 50th percentile for eachof these parameters. A stratified analysis of weight-for-age Z scores was performedcontrolling for these two wealth categories. In addition, as bicycles and radios stronglydistinguished trial and comparison groups (see Table 8), these were examined for theirassociation with WAZ within time categories.
Table 13 below shows a stratified analysis of the association between either "owning abicycle" or "owning a radio" on mean weight-for-age Z score at the time of each survey.
Table 13 Own Bike or Radio: Impact on WAZ in 199011994
Ownership Yes- Mean WAZ N No-Mean WAZ N Significance
Ir t99G
...
..'.
Bike -1.6 211 -1.6 168 NS
Radio -1.5 174 -1.6 205 NS
Idid "." " ......', ,...
•••••••" ............ d <> • <. '.......
..... '.
Bike -1.4 143 -1.5 89 NS (.57)
Radio -1.2 120 -1.6 114 NS (.07)
While bike and radio ownership are among the most distinguishing factors between the trialand comparison groups in terms of wealth differences, ownership of these possessions is notassociated with having children with better nutritional status.
(2) Changes over Time; How are NCP & Wealth associated with WAZ?
In order to analyze how much of the change between pre-intervention and postintervention weight-for-age Z scores is associated with program-related inputs and notconfounding, two analyses were done. One on the village level change (reported in Table12 above ), and one using the individual as the unit of analysis.
(a) Village as unit ofanalysis within Trial and Comparison Groups
Multiple regression and analysis of variance were performed to analyze the potentialconfounding effects ofmean village wealth scores in 1990 and 1994, and mean villageWAZ scores in 1990, on the village change in W AZ achieved in 1994. Villages weregrouped according to NCP status (Trials and Comparisons). Using these techniques,
33
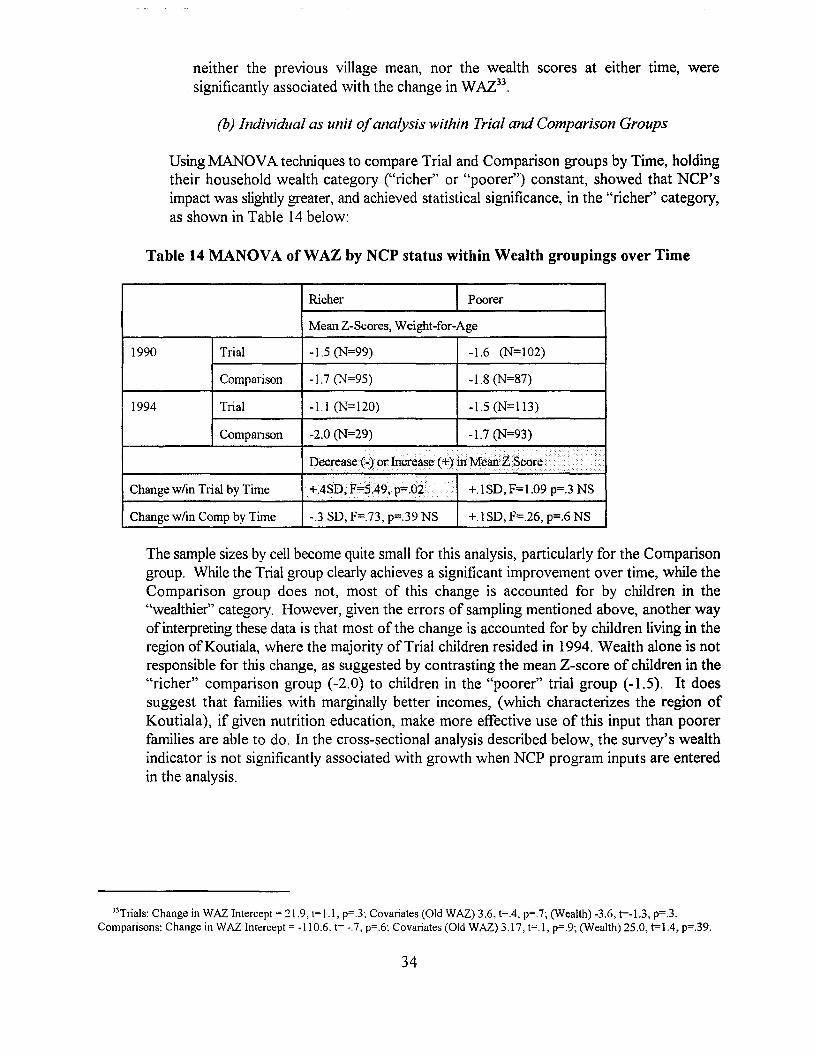
neither the previous village mean, nor the wealth scores at either time, weresignificantly associated with the change in WAZ33
.
(b) Individual as unit ofanalysis within Trial and Comparison Groups
Using MANDYA techniques to compare Trial and Comparison groups by Time, holdingtheir household wealth category ("richer" or "poorer") constant, showed that NCP'simpact was slightly greater, and achieved statistical significance, in the "richer" category,as shown in Table 14 below:
Table 14 MANOVA ofWAZ by NCP status within Wealth groupings over Time
Richer Poorer
Mean Z-Scores, Weight-far-Age
1990
1994
Trial
Compmison
Trial
Compmison
-1.5 (N=99)
-1.7 (N=95)
-1.1 (N=120)
-2.0 (N=29)
-1.6 (N=102)
-1.8 (N=87)
-1.5 (N=I13)
-1.7 (N=93)
Change w/in Trial by Time
Decrease (-) or Increase (+) inMeiinZ Scare.. .
+.4SD,F=$,49,p=.02 Y +.1 SD, F=1.09 p=.3 NS
Change w/in Camp by Time -.3 SD, F=.73, p=.39 NS +.1 SD, F=.26, p=.6 NS
The sample sizes by cell become quite small for this analysis, particularly for the Comparisongroup. While the Trial group clearly achieves a significant improvement over time, while theComparison group does not, most of this change is accounted for by children in the"wealthier" category. However, given the errors of sampling mentioned above, another wayofinterpreting these data is that most of the change is accounted for by children living in theregion ofKoutiala, where the majority ofTrial children resided in 1994. Wealth alone is notresponsible for this change, as suggested by contrasting the mean Z-score of children in the"richer" comparison group (-2.0) to children in the "poorer" trial group (-1.5). It doessuggest that families with marginally better incomes, (which characterizes the region ofKoutiala), if given nutrition education, make more effective use of this input than poorerfamilies are able to do. In the cross-sectional analysis described below, the survey's wealthindicator is not significantly associated with growth when NCP program inputs are enteredin the analysis.
33Trials: Change in WAZ Intercept = 21.9, t= 1.1, p=.3: Covariates (Old WAZ) 3.6, t=.4, p=.7; (Wealth) -3.6, t=-I.3, p=.3.Comparisons: Change in WAZ Intercept = -110.6. t= -.7. p=.6; Covariates (Old WAZ) 3.17, t=.I, p=.9; (Wealth) 25.0, t=1.4, p=.39.
34
5. Conclusion, Part IV
Because of deviations from the original research design (e.g. CARE dropped out; World Visionbegan applying NCP in all of its Child Survival villages by the 3rd year), and an error made inselecting villages for inclusion in the final survey (the majority of"trial" villages come from WorldVisionIKoutiala, the majority of "comparison" villages come from Africare/Dioro), the pre-postanalysis results, while quite striking, are difficult to defend. However, they are consistent with boththe retrospective results, as well as NCP's pre-post evaluation conducted for the CARE/Macinaproject in 1993. These pre-post data make a case for the plausihility that improvements in nutritionalstatus are related to NCP alone and not other time- or regionally-affected factors (such as wealth,food availability, etc.)
35
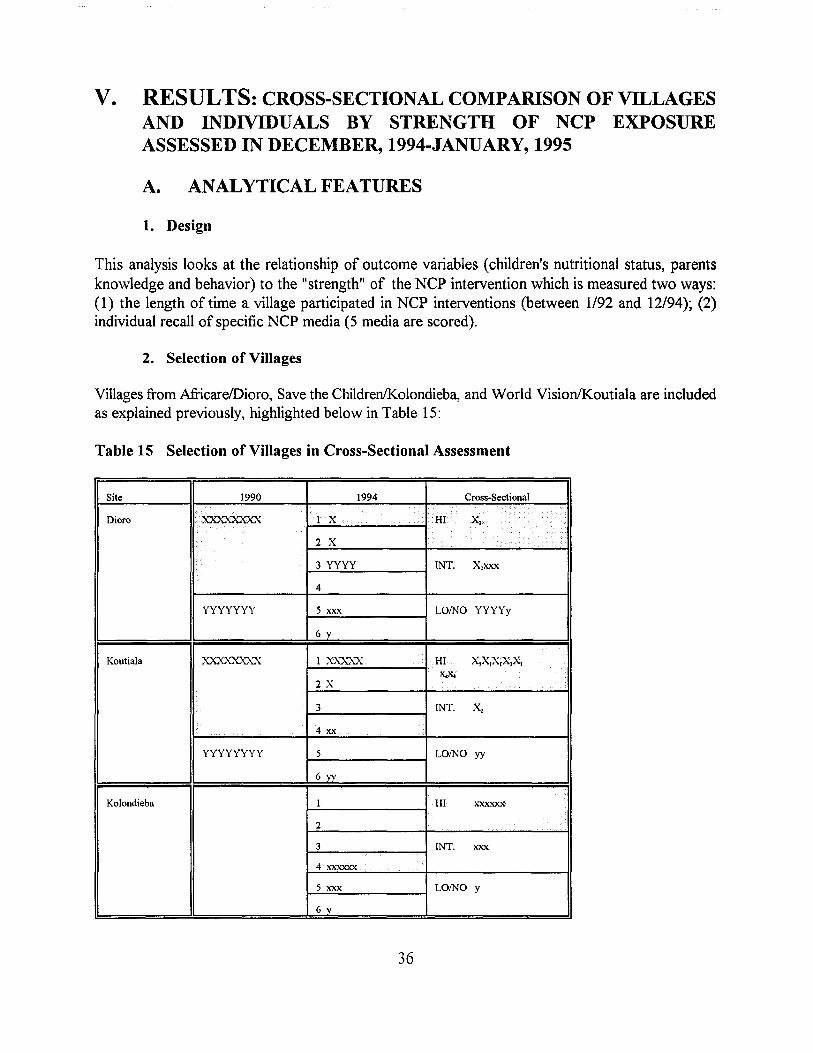
V. RESULTS: CROSS-SECTIONAL COMPARISON OF VILLAGESAND INDIVIDUALS BY STRENGTH OF NCP EXPOSUREASSESSED IN DECEMBER, 1994-JANUARY, 1995
A. ANALYTICAL FEATURES
1. Design
This analysis looks at the relationship of outcome variables (children's nutritional status, parentsknowledge and behavior) to the "strength" of the NCP intervention which is measured two ways:(1) the length of time a village participated in NCP interventions (between 1/92 and 12/94); (2)individual recall of specific NCP media (5 media are scored).
2. Selection of Villages
Villages from AfricarelDioro, Save the Children/Kolondieba, and World Vision/Koutiala are includedas explained previously, highlighted below in Table 15:
Table 15 Selection of Villages in Cross-Sectional Assessment
Site 1990 1994 Cross-Sectional
1.......
Dioro ,'XXXXXXXX X i2 X
3 YYYY INT. X,xxx
4
YYYYYYY 5 xxx LOINO YYYYy
6 y
Koutiala XXX)..."'{){A.'X 1 xx:x..'XX HI X,X,X,X,X,x.-x.-
2 X
3 INT. X,
4 xx
YYYYYYYY 5 LOINO yy
6yy
Kolondieba 1 HI xxxxxx
2
3 INT. xxx
4 xxxxxx
5 xxx LOINO Y
6 y
36
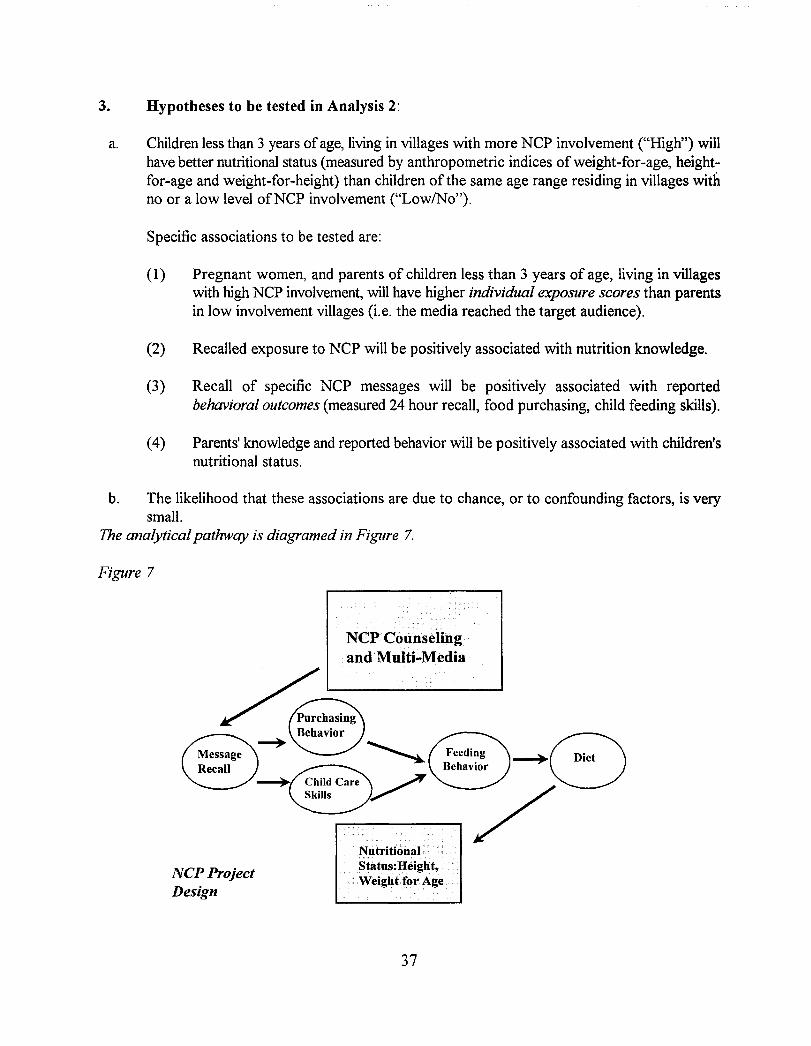
3. Hypotheses to be tested in Analysis 2:
a. Children less than 3 years ofage, living in villages with more NCP involvement ("High") willhave better nutritional status (measured by anthropometric indices of weight-for-age, heightfor-age and weight-for-height) than children of the same age range residing in villages withno or a low level ofNCP involvement ("Low/No").
Specific associations to be tested are:
(1) Pregnant women, and parents of children less than 3 years of age, living in villageswith high NCP involvement, will have higher individual exposure scores than parentsin low involvement villages (i.e. the media reached the target audience).
(2) Recalled exposure to NCP will be positively associated with nutrition knowledge.
(3) Recall of specific NCP messages will be positively associated with reportedbehavioral outcomes (measured 24 hour recall, food purchasing, child feeding skills).
(4) Parents' knowledge and reported behavior will be positively associated with children'snutritional status.
b. The likelihood that these associations are due to chance, or to confounding factors, is verysmall.
The analytical pathway is diagramed in Figure 7.
Figure 7
NCPCou.nselillgandMulti~Media
NCP ProjectDesign
NutritionalStatus:Height,Weight for Age
37
B. FINDINGS
1. Sample Characteristics
a. Sample ofMen Women and Chjldren by Exposure Group
Table 16 Cross-Sectional Sample, 1994
c;ategory:
Women
Men
Children
Total
712
354
.. ..... . i.· ..
HighNCP IntermediateHoi
337 187 188
169 92 93.......
388 227 230
Ofthe 845 children in the total sample, 823 (97%) had sufficient data to analyze weight/ageand 796 (94%) had sufficient data to analyze height/age.
b. Demographic Variables
Few adults knew their age, and there was no schooling in the region. Numbers of children perhousehold were distributed without any significant differences in the entire sample population.Table 17 reports this and other household information. These characteristics were unrelatedto any outcome variables.
Table 17 Household characteristics Cross Sectional Sample
Monogamous 49%
Polygynous: Woman interviewed 51%by "marriage" order:
1st 48%2nd 41%3rd 10%
Boys in sample 444Girls 412
Mean age of children in sample 16.0months
Mean Number of children per 4.3household
38
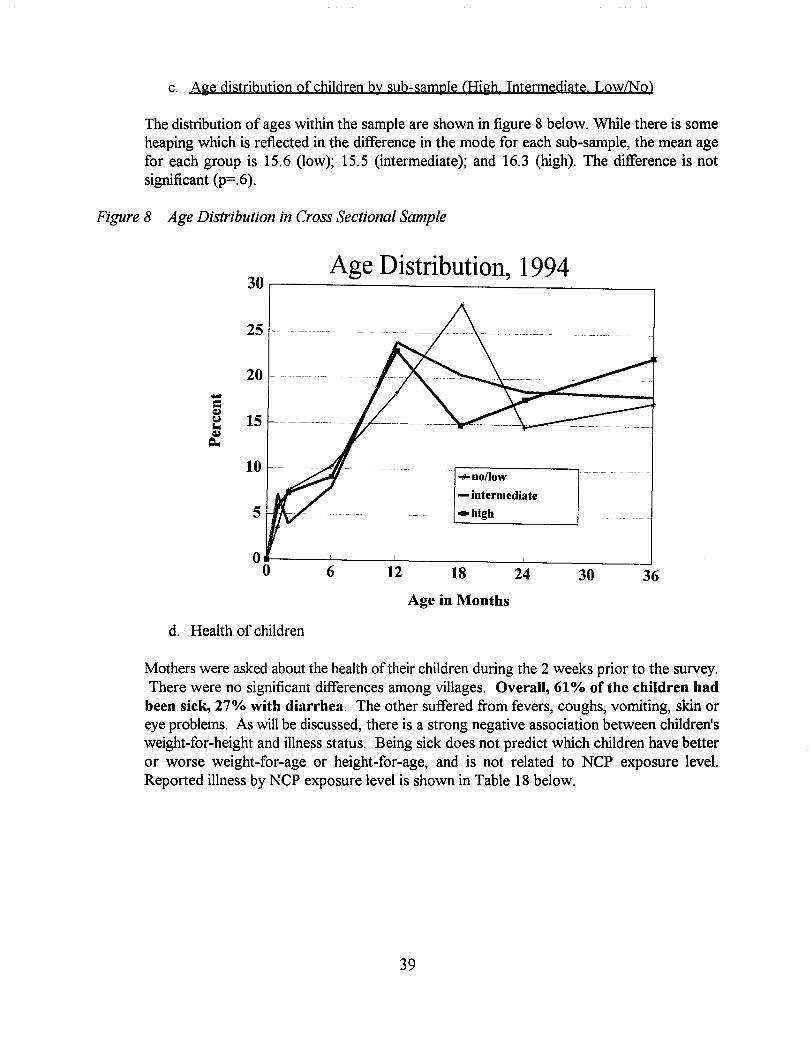
c. Aie distribution of children by sub-sample (Hiih, Intermediate LowlNo)
The distribution of ages within the sample are shown in figure 8 below. While there is someheaping which is reflected in the difference in the mode for each sub-sample, the mean agefor each group is 15.6 (low); 15.5 (intermediate); and 16.3 (high). The difference is notsignificant (p=.6).
Figure 8 Age Distribution in Cross Sectional Sample
Age Distribution, 1994
+no/low
- intermediate
-high
30
25
20-=~15~
~
~
10
5
00
d. Health of children
6 12 18
Age in Months
24 30 36
Mothers were asked about the health oftheir children during the 2 weeks prior to the survey.There were no significant differences among villages. Overall, 61 % of the children had
been sick, 27% with diarrhea. The other suffered from fevers, coughs, vomiting, skin oreye problems. As will be discussed, there is a strong negative association between children'sweight-for-height and illness status. Being sick does not predict which children have betteror worse weight-far-age or height-for-age, and is not related to NCP exposure level.Reported illness by NCP exposure level is shown in Table 18 below.
39
Table 18 Children's Sickness Two Weeks Prior/During Survey by NCP Category
Total HighNCP Intermediate No/Low Signif.NCP NCP (Chi Sq.)
••••••••,. ••• % 64%
)is::lO/n ·····~~ot. ./ ) .• > •.•..
N:'\
11< .......
Diarrhea lI'rIU/" . 29% 21% 30% .16 (NS).
Vomiting ·1#1'0 13% 14% 16% .58 (NS)
Fever...........
27% 23% 28% .56 (NS)
Cough··0
27% 22% 22% .36 (NS).·~"t'/(F
(NB: All percentages are from total N. More than one symptom may have been reported).
e. Child Survjyal variables
Table 19 shows the indicators of child survival program inputs collected in the survey.
Table 19 Child Survival Program Inputs by NCP Classification
HighNCP Intermediate NCP NolLowNCP
Pump for water source 30% 30% 40%
Filter water 47% 31% 22%
Vaccination card 58% 67% 66%
Measles vaccine 40% 44% 43%
Received Vitamin A 12% 10% 15%capsule
Apart from filtering water, no other child survival program in-put was found to besignificantly associated with exposure to NCP. The impact of this one distinguishing factoris discussed in the analysis ofconfounding section (see p. 62). As one of the NCP flip chartsdiscussed filtering water, and it may weJl have been the topic of role plays developed by NCPtrained animators, it is difficult to say this was not also influenced by NCP.
f Wealth indjcators
Wealth indicators as distribution by NCP exposure classification are shown in Table 20.
40
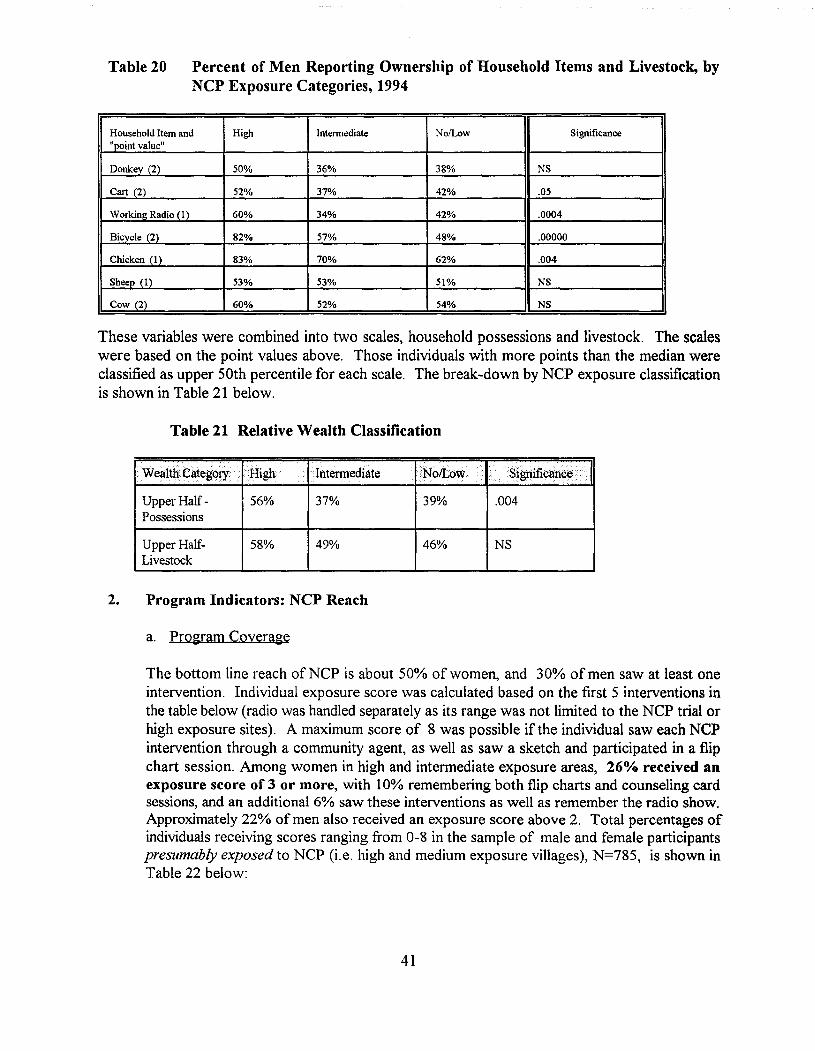
Table 20 Percent of Men Reporting Ownership of Household Items and Livestock, byNCP Exposure Categories, 1994
Household Item and High Intennediate NofLow Significance"point value"
Donkey (2) 50% 36% 38% NS
Cart (2) 52% 37% 42% .05
Working Radio (1 ) 60% 34% 42% .0004
Bicycle (2) 82% 57% 48% .00000
Chicken (1) 83% 70% 62% .004
Sheep (1) 53% 53% 51% NS
Cow (2) 60% 52% 54% NS
These variables were combined into two scales, household possessions and livestock. The scaleswere based on the point values above. Those individuals with more points than the median wereclassified as upper 50th percentile for each scale. The break-down by NCP exposure classificationis shown in Table 21 below.
Table 21 Relative Wealth Classification
. WealthCategOly .High ··lntennediate
Upper Half Possessions
Upper HalfLivestock
56%
58%
37%
49%
39%
46%
.004
NS
2. Program Indicators: NCP Reach
a. Program Coverage
The bottom line reach ofNCP is about 50% of women, and 30% of men saw at least oneintervention. Individual exposure score was calculated based on the first 5 interventions inthe table below (radio was handled separately as its range was not limited to the NCP trial orhigh exposure sites). A maximum score of 8 was possible if the individual saw each NCPintervention through a community agent, as well as saw a sketch and participated in a flipchart session. Among women in high and intermediate exposure areas, 26% received anexposure score of 3 or more, with 10% remembering both flip charts and counseling cardsessions, and an additional 6% saw these interventions as well as remember the radio show.Approximately 22% of men also received an exposure score above 2. Total percentages ofindividuals receiving scores ranging from 0-8 in the sample of male and female participantspresumably exposed to NCP (i.e. high and medium exposure villages), N=785, is shown inTable 22 below:
41
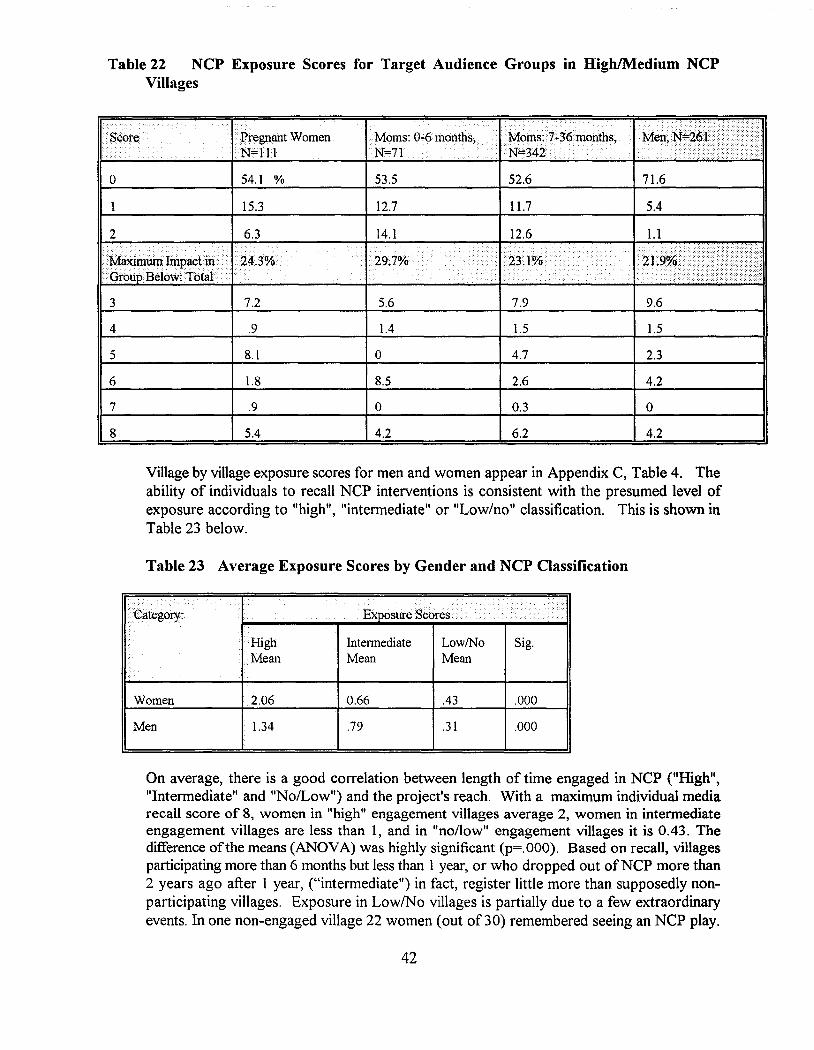
Table 22 NCP Exposure Scores for Target Audience Groups in High/Medium NCPVillages
. PregnantWomenW=lll
o 54.1 %
15.3
53.5
12.7
52.6
11.7
71.6
5.4
2
•• MaXiIillJffi Inlpact ill •. ···· I.' "''''.J ,tU
Grou Below: Tbtal.
3
4
5
6
7
8
7.2
.9
8.1
1.8
.9
5.4
5.6 7.9 9.6
1.4 1.5 1.5
0 4.7 2.3
8.5 2.6 4.2
0 0.3 0
4.2 6.2 4.2
Village by village exposure scores for men and women appear in Appendix C, Table 4. Theability of individuals to recall NCP interventions is consistent with the presumed level ofexposure according to "high", "intermediate" or "Low/no" classification. This is shown inTable 23 below.
Table 23 Average Exposure Scores by Gender and NCP Classification
••. ..
Expu:sun;·"'· ····>i...... ...... ............
.High Intermediate LowlNo Sig.Mean Mean Mean
Women 2.06 0.66 .43 .000
Men 1.34 .79 .31 .000
On average, there is a good correlation between length of time engaged in NCP ("High","Intermediate" and "No/Low") and the project's reach. With a maximum individual mediarecall score of 8, women in "high" engagement villages average 2, women in intermediateengagement villages are less than 1, and in "no/low" engagement villages it is 0.43. Thedifference ofthe means (ANOVA) was highly significant (p=.OOO). Based on recall, villagesparticipating more than 6 months but less than 1 year, or who dropped out ofNCP more than2 years ago after I year, ("intermediate") in fact, register little more than supposedly nonparticipating villages. Exposure in LowlNo villages is partially due to a few extraordinaryevents. In one non-engaged village 22 women (out of30) remembered seeing an NCP play.
42
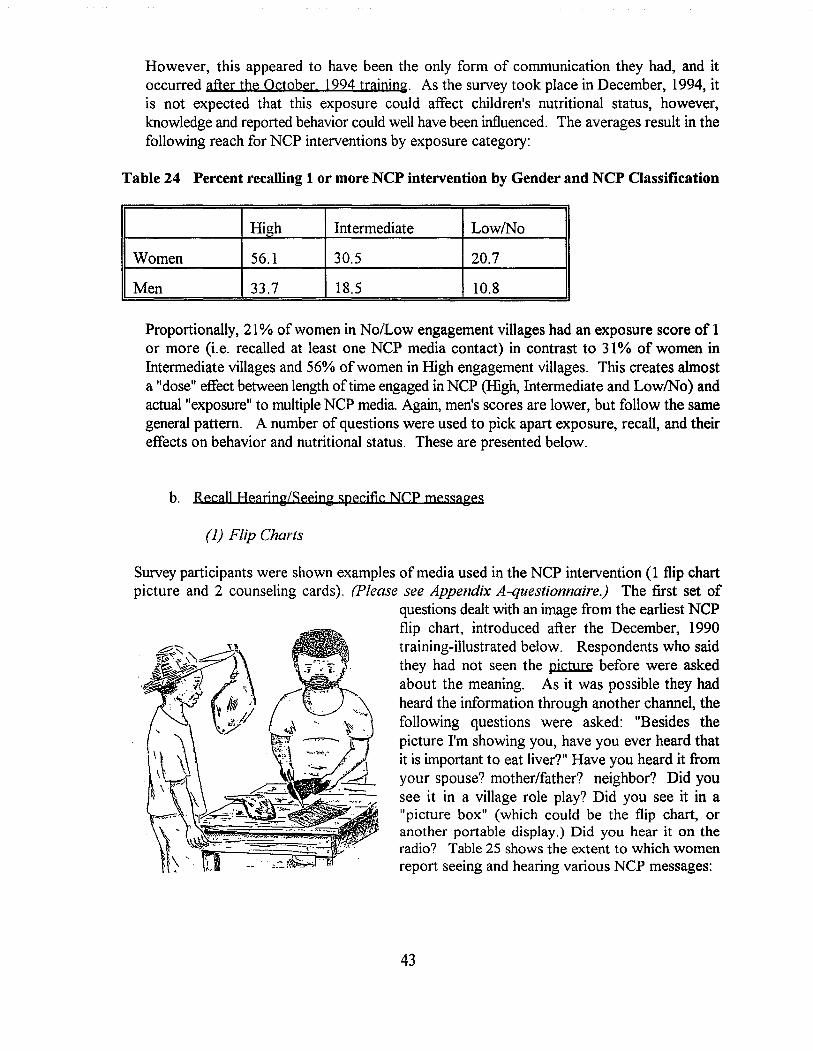
However, this appeared to have been the only form of communication they had, and itoccurred after the October 1994 training. As the survey took place in December, 1994, itis not expected that this exposure could affect children's nutritional status, however,knowledge and reported behavior could well have been influenced. The averages result in thefollowing reach for NCP interventions by exposure category:
Table 24 Percent recalling 1 or more NCP intervention by Gender and NCP Oassification
High Intermediate Low/No
Women 56.1 30.5 20.7
Men 33.7 18.5 10.8
Proportionally, 21% of women in NolLow engagement villages had an exposure score of 1or more (i.e. recalled at least one NCP media contact) in contrast to 31% of women inIntermediate villages and 56% ofwomen in High engagement villages. This creates almosta "dose" effect between length oftime engaged in NCP (High, Intermediate and Low/No) andactual "exposure" to multiple NCP media. Again, men's scores are lower, but follow the samegeneral pattern. A number of questions were used to pick apart exposure, recall, and theireffects on behavior and nutritional status. These are presented below.
b. Recall Hearing/Seeing specific NCr messages
(1) Flip Charts
Survey participants were shown examples ofmedia used in the NCP intervention (1 flip chartpicture and 2 counseling cards). (Please see Appendix A-questionnaire.) The first set of
questions dealt with an image from the earliest NCPflip chart, introduced after the December, 1990training-illustrated below. Respondents who saidthey had not seen the picture before were askedabout the meaning. As it was possible they hadheard the information through another channel, thefollowing questions were asked: "Besides thepicture I'm showing you, have you ever heard thatit is important to eat liver?" Have you heard it fromyour spouse? mother/father? neighbor? Did yousee it in a village role play? Did you see it in a"picture box" (which could be the flip chart, oranother portable display.) Did you hear it on theradio? Table 25 shows the extent to which womenreport seeing and hearing various NCP messages:
43
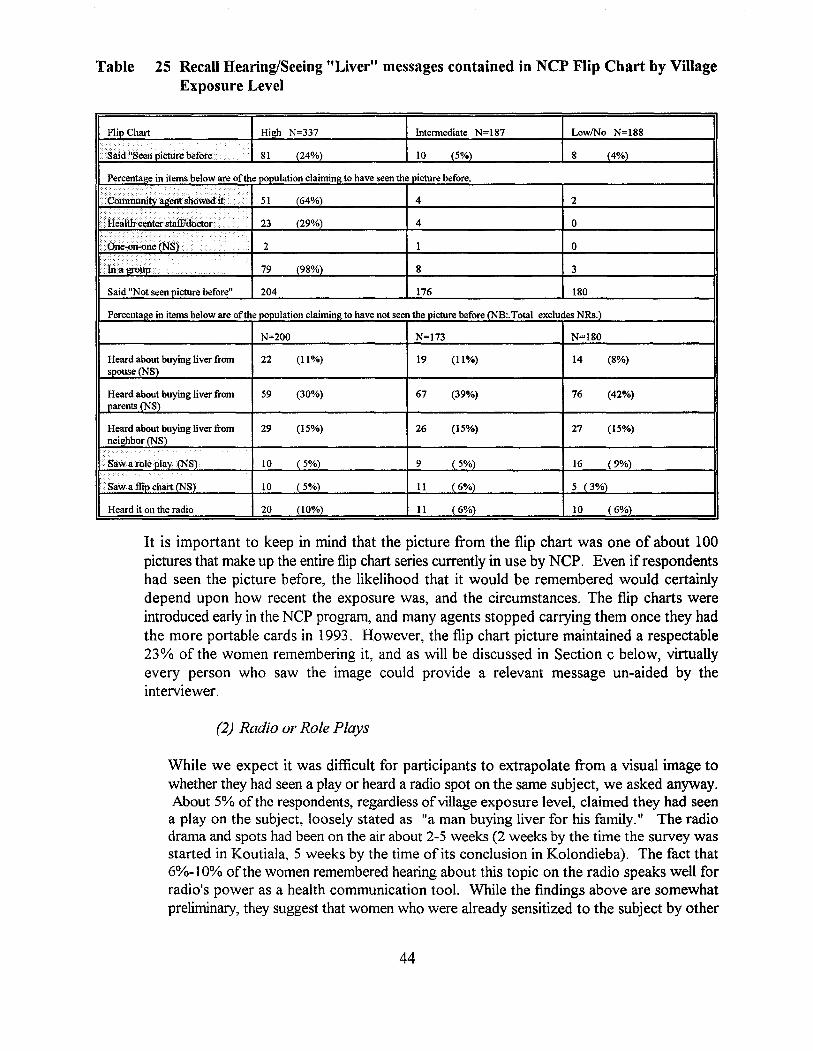
Table 25 Recall Hearing/Seeing "Liver" messages contained in NCP Flip Chart by VillageExposure Level
Flip Chart High N=337 Intennediate N=187 LowlNo N=188
said "Seel1 picture before . 81 (24%) 10 (5%) 8 (4%)
Percentage in items below are ofthe population claimine to have seen the picture before.
1<....··.·... ··· .... ..... ..........•••• 51 (64%) 4 2
...... ..c..,•••••• > (29%)23 4 0
...•••••••••••••
....
2 1 0. ....
79 (98%) 8 3
Said "Not seen picture before" 204 176 180
Percenta~e in items below are ofthe population claimin~ to have not seen the picture before (NB:.Total excludes NRs.)
N=200 N=173 N=180
Heard about buying liver from 22 (11%) 19 (11%) 14 (8%)spouse (NS)
Heard about buying liver from 59 (30%) 67 (39%) 76 (42%)parents (NS)
Heard about buying liver from 29 (15%) 26 (15%) 27 (15%)neighbor (NS)
.•..• Saw a roleplay (NS). 10 ( 5%) 9 ( 5%) 16 (9%)
··Sawaflit>chart eNS) 10 ( 5%) II (6%) 5 (3%)
Heard it on the radio 20 (10%) 11 (6%) 10 (6%)
It is important to keep in mind that the picture from the flip chart was one of about 100pictures that make up the entire flip chart series currently in use by NCP. Even if respondentshad seen the picture before, the likelihood that it would be remembered would certainlydepend upon how recent the exposure was, and the circumstances. The flip charts wereintroduced early in the NCP program, and many agents stopped carrying them once they hadthe more portable cards in 1993. However, the flip chart picture maintained a respectable23% of the women remembering it, and as will be discussed in Section c below, virtuallyevery person who saw the image could provide a relevant message un-aided by theinterviewer.
(2) Radio or Role Plays
While we expect it was difficult for participants to extrapolate from a visual image towhether they had seen a play or heard a radio spot on the same subject, we asked anyway.About 5% ofthe respondents, regardless ofvillage exposure level, claimed they had seena play on the subject, loosely stated as "a man buying liver for his family." The radiodrama and spots had been on the air about 2-5 weeks (2 weeks by the time the survey wasstarted in Koutiala, 5 weeks by the time of its conclusion in Kolondieba). The fact that6%-10% ofthe women remembered hearing about this topic on the radio speaks well forradio's power as a health communication tool. While the findings above are somewhatpreliminary, they suggest that women who were already sensitized to the subject by other
44
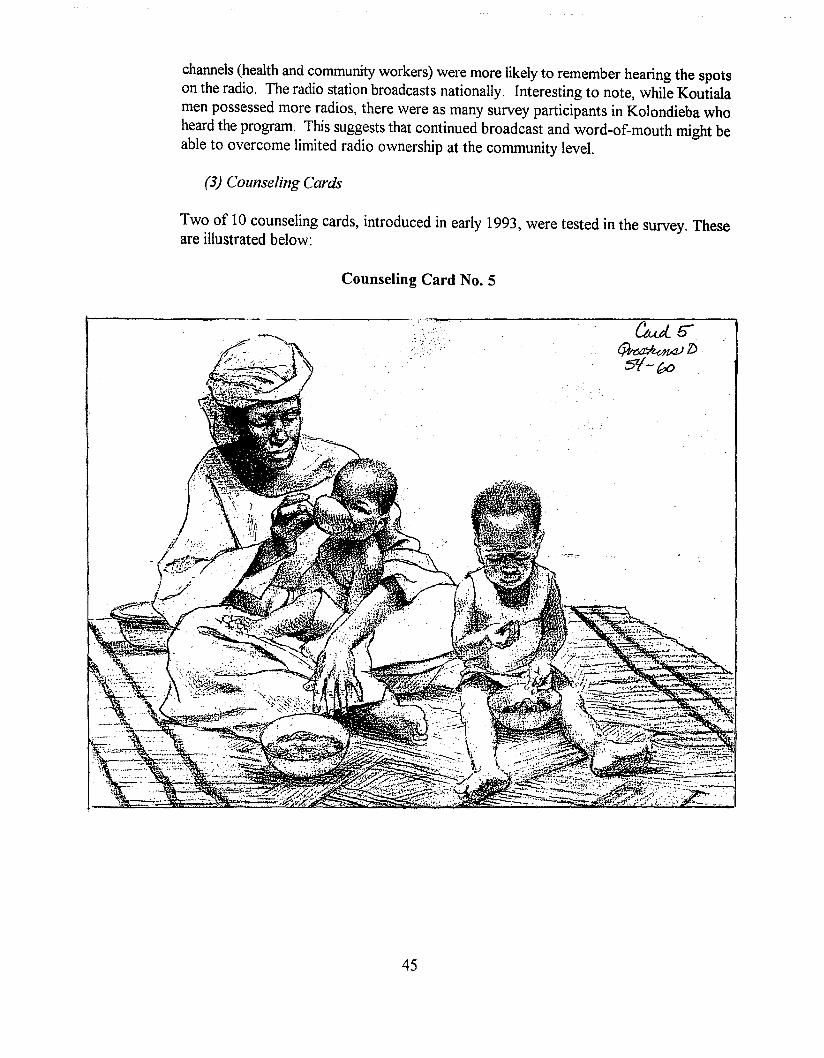
channels (health and community workers) were more likely to remember hearing the spotson the radio. The radio station broadcasts nationally. Interesting to note, while Koutialamen possessed more radios, there were as many survey participants in Kolondieba whoheard the program. This suggests that continued broadcast and word-of-mouth might beable to overcome limited radio ownership at the community level.
(3) Counseling Cards
Two of 10 counseling cards, introduced in early 1993, were tested in the survey. Theseare illustrated below:
Counseling Card No.5
45
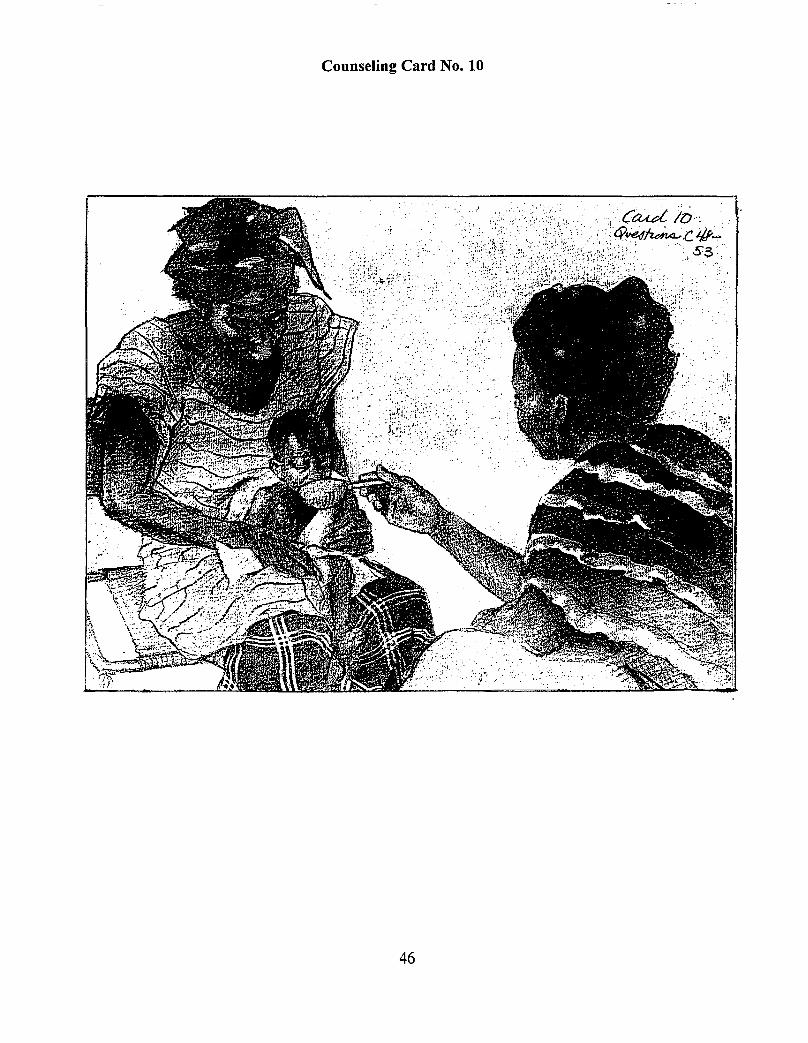
Counseling Card No. 10
46
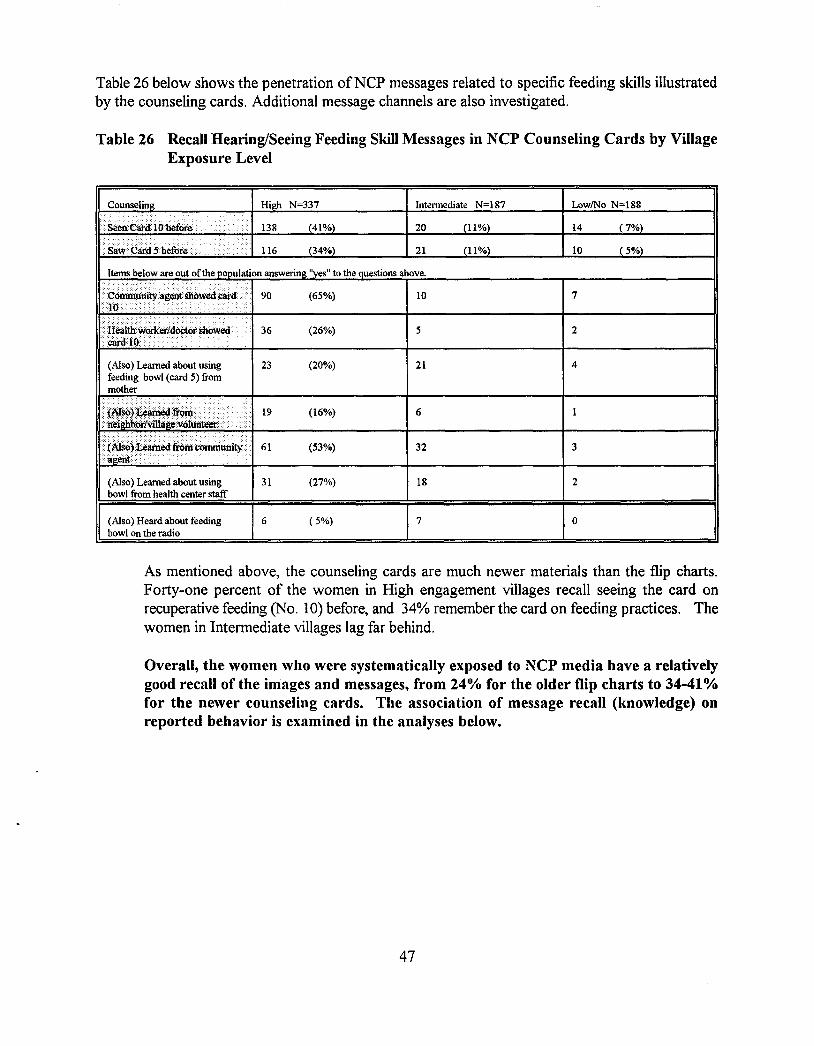
Table 26 below shows the penetration ofNCP messages related to specific feeding skills illustratedby the counseling cards. Additional message channels are also investigated.
Table 26 Recall Hearing/Seeing Feeding Skill Messages in NCP Counseling Cards by VillageExposure Level
23 (20%)
19 (16%)
61 (53%)
(Also) Learned about using 31 (27%)bowl from health center staff
(Also) Heard about feeding 6 ( 5%)bowl on the radio
Intennediate N=187
20
21
10
5
21
6
32
18
7
LowiNo N=188
14
10
7
2
4
3
2
o
As mentioned above, the counseling cards are much newer materials than the flip charts.Forty-one percent of the women in High engagement villages recall seeing the card onrecuperative feeding (No. 10) before, and 34% remember the card on feeding practices. Thewomen in Intermediate villages lag far behind.
Overall, the women who were systematically exposed to NCP media have a relativelygood recall of the images and messages, from 24% for the older flip charts to 34-41%for the newer counseling cards. The association of message recall (knowledge) onreported behavior is examined in the analyses below.
47
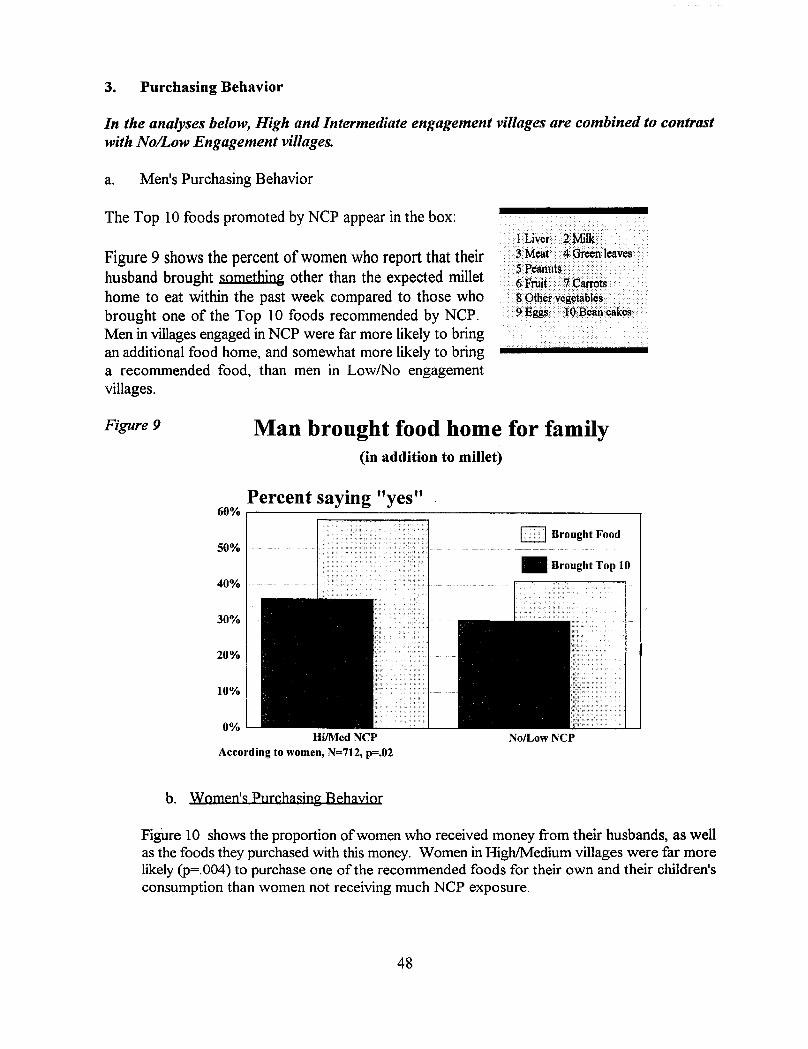
3. Purchasing Behavior
In the analyses below, High and Intermediate engagement villages are combined to contrastwith NolLow Engagement villages.
a. Men's Purchasing Behavior
The Top 10 foods promoted by NCP appear in the box:
Figure 9 shows the percent of women who report that theirhusband brought something other than the expected millethome to eat within the past week compared to those whobrought one of the Top 10 foods recommended by NCP.Men in villages engaged in NCP were far more likely to bringan additional food home, and somewhat more likely to bringa recommended food, than men in LowlNo engagementvillages.
.,." ".' ,.,.- ,.
• lLiver2Milk ... . .....3M~t •• 4 GfCCDteaves. .5Peanllts ••..•.•...•.•.•..
... 6Fniit. ··7 carrOts> .S()thervegetables ....9 Eggs· ··lQBeancakes·.
Figure 9 Man brought food home for family(in addition to millet)
Percent saying "yes"60% 1----;=::::::::::===:::;------------1
50%
40%
30%
20%
10%
0%Hi/MedNCP
According to women, N=712, p=.02
b. Women's purchasing Behayjor
1<>·1 Brought Food
NolLowNCP
FigUre 10 shows the proportion ofwomen who received money from their husbands, as wellas the foods they purchased with this money. Women in High/Medium villages were far morelikely (p=.004) to purchase one of the recommended foods for their own and their children'sconsumption than women not receiving much NCP exposure.
48
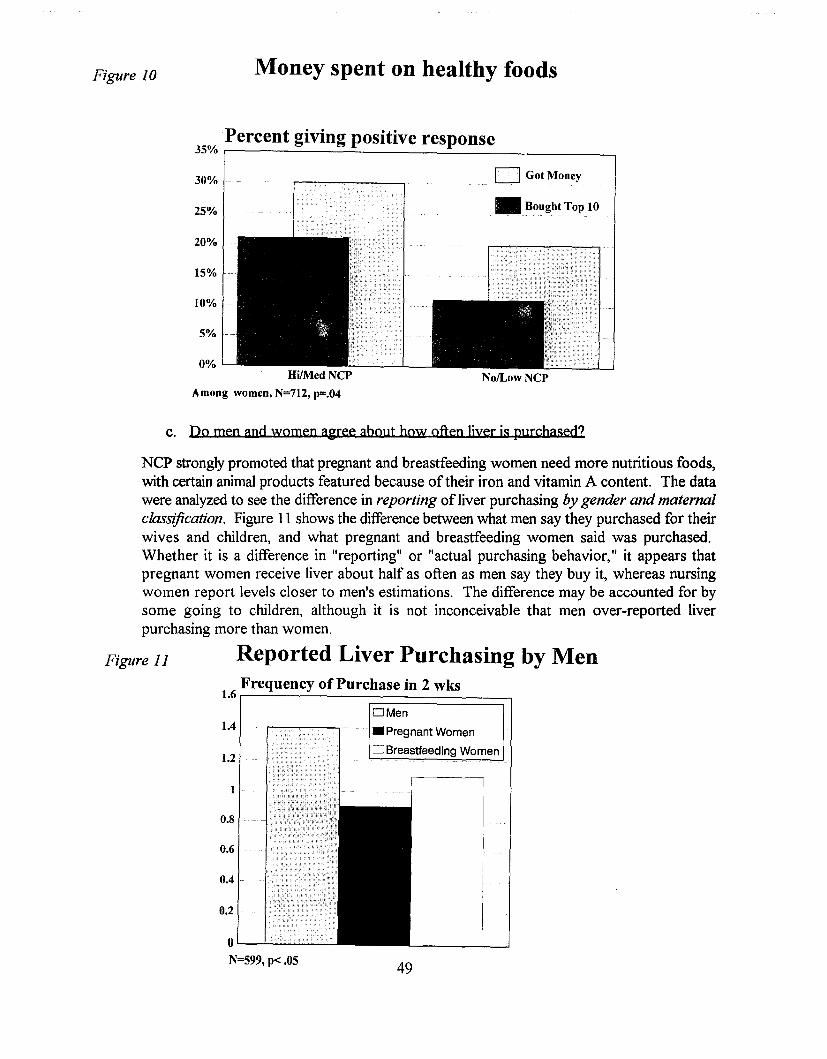
Figure 10 Money spent on healthy foods
Percent giving positive response35% ,------ ---.:=-- --,30%
25%
20%
15%
10%
5%
0%
o Got Money
• Bought Top 10
NolLowNCPAmong women, N=712, p=.04
c. Do men and women agree about how often liver is purchased?
49
0'----'-.........................................
N=599, p< .05
1.4
1.2
0.2
0.6
0.8
0.4
NCP strongly promoted that pregnant and breastfeeding women need more nutritious foods,with certain animal products featured because of their iron and vitamin A content. The datawere analyzed to see the difference in reporting ofliver purchasing by gender and maternalclassification. Figure 11 shows the difference between what men say they purchased for theirwives and children, and what pregnant and breastfeeding women said was purchased.Whether it is a difference in "reporting" or "actual purchasing behavior," it appears thatpregnant women receive liver about half as often as men say they buy it, whereas nursingwomen report levels closer to men's estimations. The difference may be accounted for bysome going to children, although it is not inconceivable that men over-reported liverpurchasing more than women.
Figure 11 Reported Liver Purchasing by MenFrequency of Purchase in 2 wks
1.61---'------~==========::;lOMen
• Pregnant Women
o Breastfeeding Women
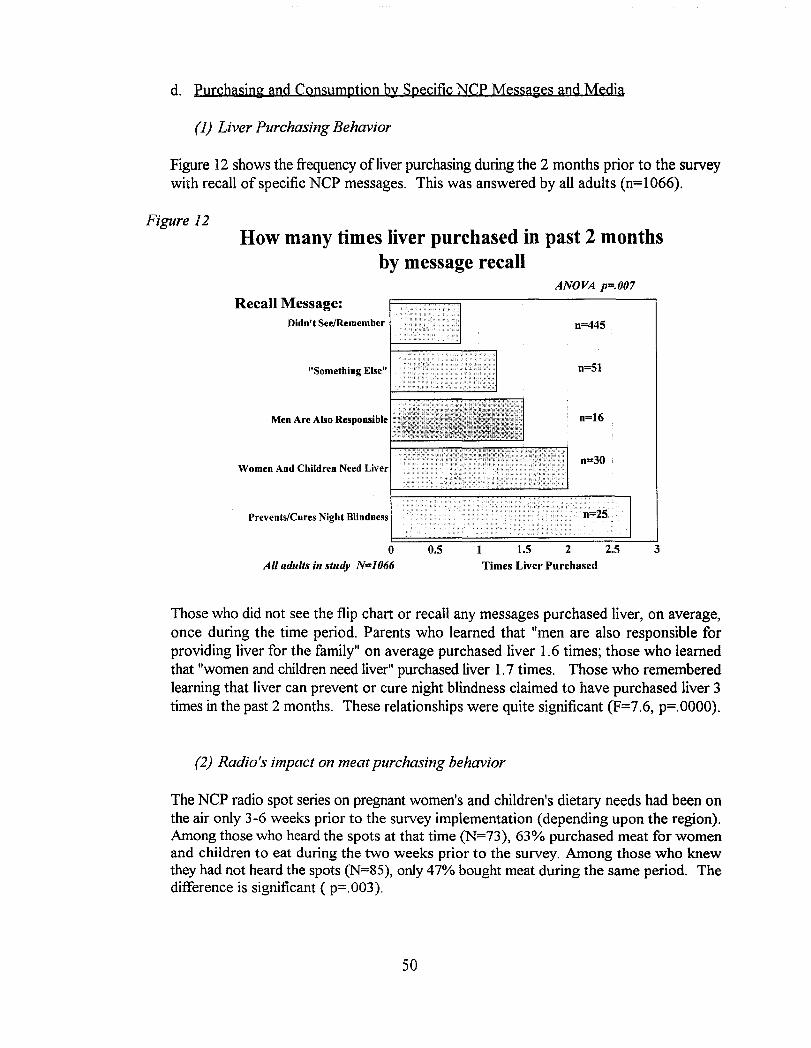
d. Purchasing and Consumption by Specific NCP Messages and Media
(1) Liver Purchasing Behavior
Figure 12 shows the frequency ofliver purchasing during the 2 months prior to the surveywith recall of specific NCP messages. This was answered by all adults (n=1066).
Figure 12How many times liver purchased in past 2 months
by message recallANOVA p=.007
0=30
0=445
Times Liver Purchased32.5
0=16
0=51
1.5 210.5
Didn't SeelRemember
"Something Else"
Men Are Also Responsible
oAll adults in study N=1066
Prevents/Cures Night Blindness
Women And Children Need Liver
Recall Message:
Those who did not see the flip chart or recall any messages purchased liver, on average,once during the time period. Parents who learned that "men are also responsible forproviding liver for the family" on average purchased liver 1.6 times; those who learnedthat "women and children need liver" purchased liver 1.7 times. Those who rememberedlearning that liver can prevent or cure night blindness claimed to have purchased liver 3times in the past 2 months. These relationships were quite significant (F=7.6, p=.OOOO).
(2) Radio's impact on meat purchasing behavior
The NCP radio spot series on pregnant women's and children's dietary needs had been onthe air only 3-6 weeks prior to the survey implementation (depending upon the region).Among those who heard the spots at that time (N=73), 63% purchased meat for womenand children to eat during the two weeks prior to the survey. Among those who knewthey had not heard the spots (N=85), only 47% bought meat during the same period. Thedifference is significant ( p=.003).
50
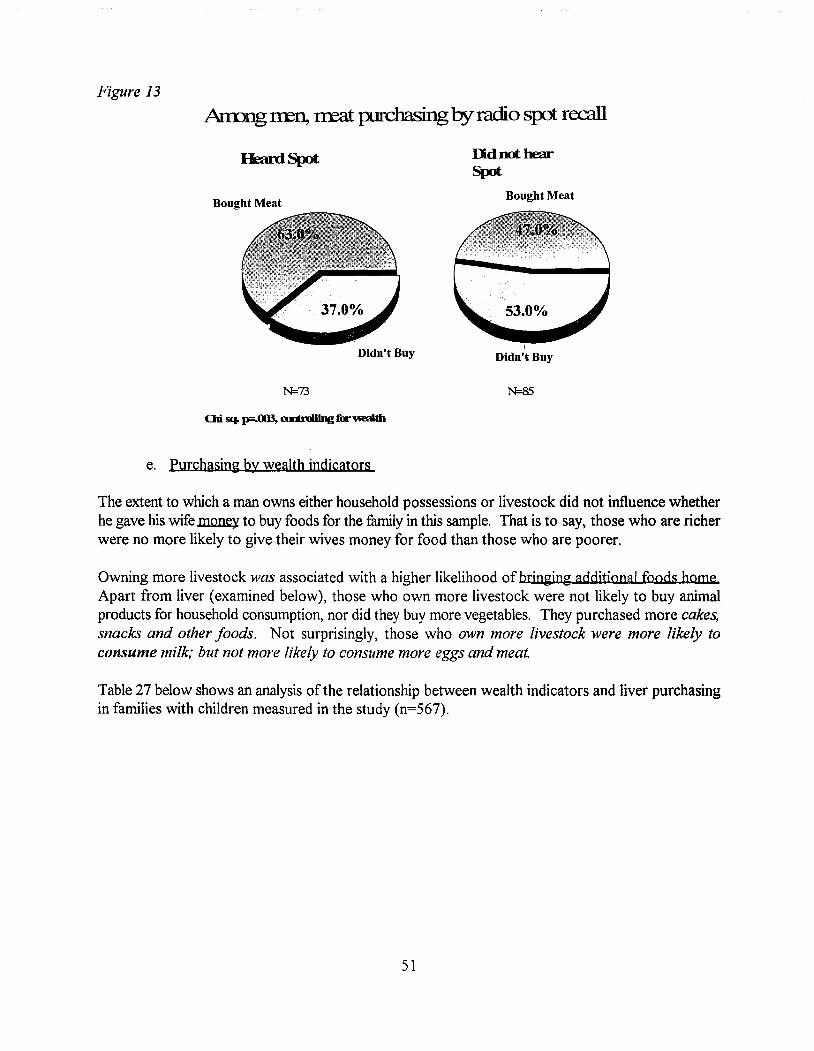
Figure 13
Anung rren, treat purchasingby radio srct recall
UdnothearSpot
Bought MeatBought Meat
IDidn't BuyDidn't Buy
N=73 N=85
e. Purchasin~ by wealth indicators
The extent to which a man owns either household possessions or livestock did not influence whetherhe gave his wife money to buy foods for the family in this sample. That is to say, those who are richerwere no more likely to give their wives money for food than those who are poorer.
Owning more livestock was associated with a higher likelihood ofbringing additional foods homeApart from liver (examined below), those who own more livestock were not likely to buy animalproducts for household consumption, nor did they buy more vegetables. They purchased more cakes,snacks and other foods. Not surprisingly, those who own more livestock were more likely toconsume milk; but not more likely to consume more eggs and meat.
Table 27 below shows an analysis of the relationship between wealth indicators and liver purchasingin families with children measured in the study (n=567).
51
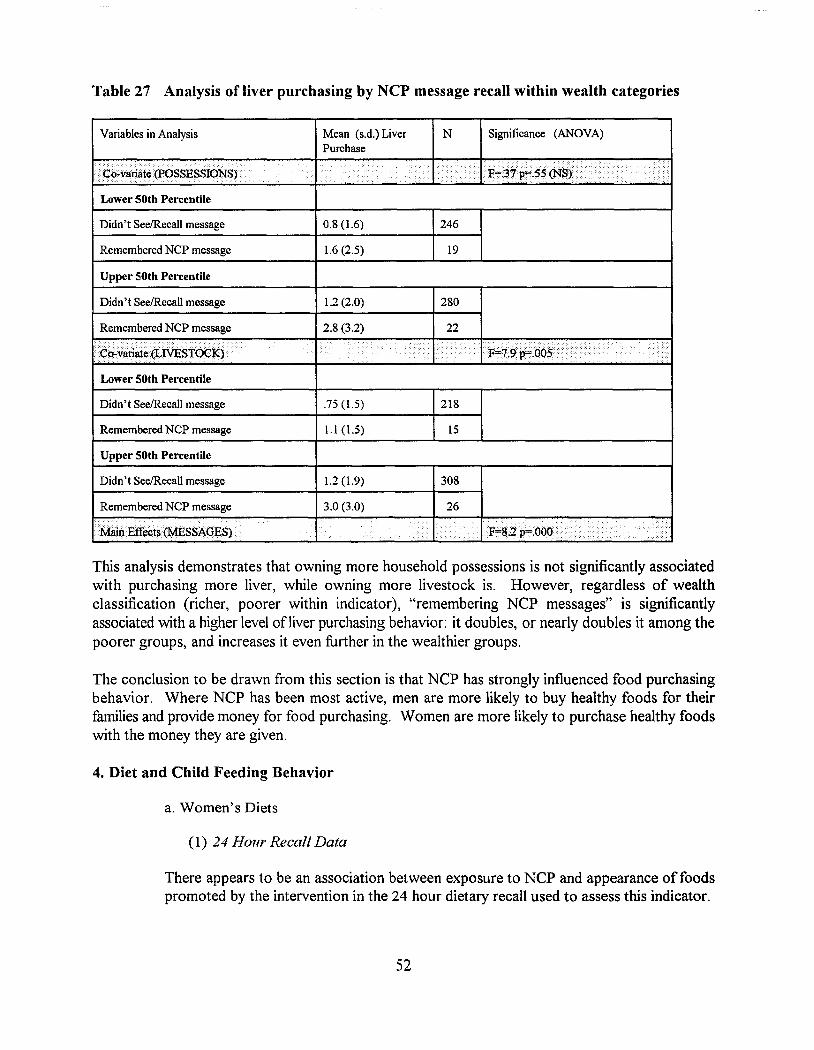
Table 27 Analysis of liver purchasing by NCP message recall within wealth categories
Yariables in Analysis
··Co-variate(1'OSSESSIONS).
Lower 50th Percentile
Didn't SeelRecall message
Remembered NCP message
Upper 50th Percentile
Mean (s.d.) Liver N Significance (ANOYA)Purchase
i••••••••
I» ... ..: ... >••• > > .....• >(..
•••••••••••...~.. ''"'·r .. ,<.
0.8 (1.6) 246
1.6 (2.5) 19
Didn't SeelRecall message
Remembered NCP message.. ., > • ..•.• ..
Lower 50th Percentile
Didn't SeelRecall message
Remembered NCP message
Upper 50th Percentile
Didn't SeelRecall message
1.2 (2.0)
2.8 (3.2)
••• •••••
.75 (1.5)
1.1 (1.5)
1.2 (1.9)
280
218
15
308
Remembered NCP message
.Main Effects (MESSAGES)
3.0 (3.0) 26
...... . ....•••••••••
This analysis demonstrates that owning more household possessions is not significantly associatedwith purchasing more liver, while owning more livestock is. However, regardless of wealthclassification (richer, poorer within indicator), "remembering NCP messages" is significantlyassociated with a higher level ofliver purchasing behavior: it doubles, or nearly doubles it among thepoorer groups, and increases it even further in the wealthier groups.
The conclusion to be drawn from this section is that NCP has strongly influenced food purchasingbehavior. Where NCP has been most active, men are more likely to buy healthy foods for theirfamilies and provide money for food purchasing. Women are more likely to purchase healthy foodswith the money they are given.
4. Diet and Child Feeding Behavior
a. Women's Diets
(1) 24 Hour Recall Data
There appears to be an association between exposure to NCP and appearance offoodspromoted by the intervention in the 24 hour dietary recall used to assess this indicator.
52
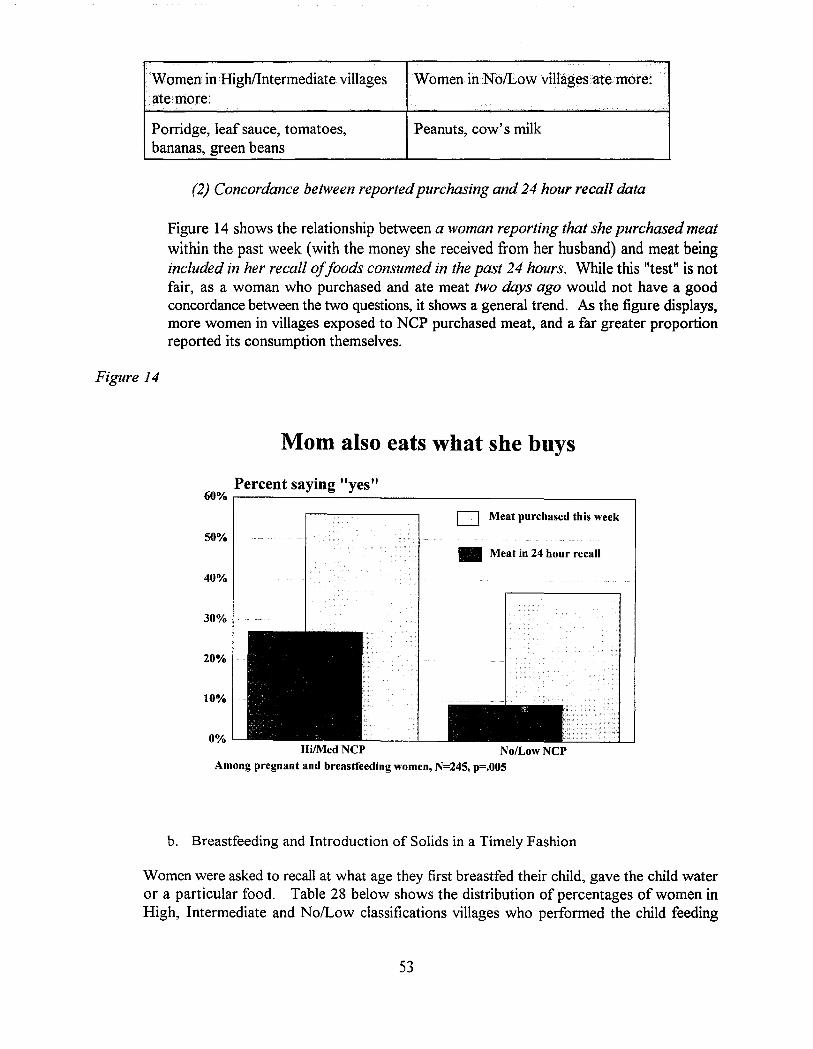
WomeninHigh/Intermediate villagesate more:
Porridge, leaf sauce, tomatoes,bananas, green beans
WomeninNb/Low viUagesatemore:
Peanuts, cow's milk
(2) Concordance between reportedpurchasing and 24 hour recall data
Figure 14 shows the relationship between a woman reporting that she purchased meatwithin the past week (with the money she received from her husband) and meat beingincluded in her recall ojjoods consumed in the past 24 hours. While this "test" is notfair, as a woman who purchased and ate meat two days ago would not have a goodconcordance between the two questions, it shows a general trend. As the figure displays,more women in villages exposed to NCP purchased meat, and a far greater proportionreported its consumption themselves.
Figure 14
Mom also eats what she buys
Percent saying "yes"60% r--------------------------,
[J Meat purchased this week
50%• Meat in 24 hour recall
40%
30%
20%
10%
0%Hi/Med NCP NolLow NCP
Among pregnant and breastfeeding women, N=245, p=.005
b. Breastfeeding and Introduction of Solids in a Timely Fashion
Women were asked to recall at what age they first breastfed their child, gave the child wateror a particular food. Table 28 below shows the distribution of percentages of women inHigh, Intermediate and No/Low classifications villages who performed the child feeding
53
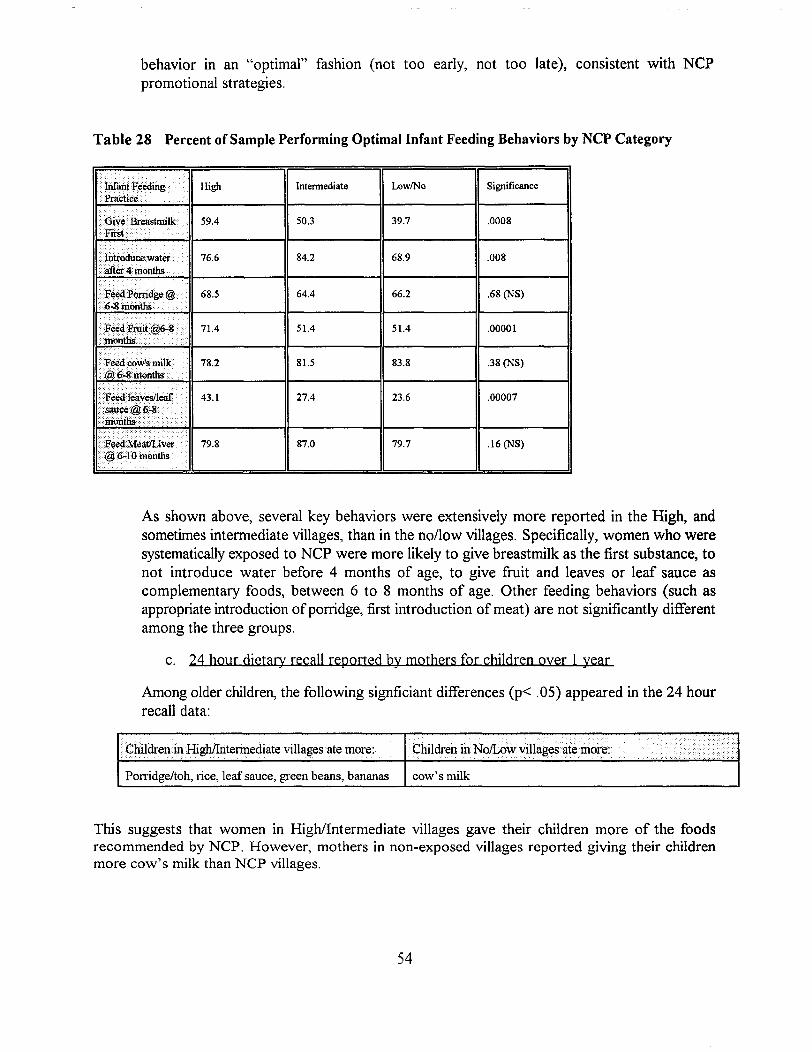
behavior in an "optimal" fashion (not too early, not too late), consistent with NCPpromotional strategies.
Table 28 Percent of Sample Performing Optimal Infant Feeding Behaviors by NCP Category
•• lnfuiltF¢eding ..·Praetice.
.••. lntfoduce water>after·4 months ...••Feed Porridge @···6·8~6nths
~~ .
·.Fliedcows milk@J6·8rnonths .
High
59.4
76.6
68.5
71.4
78.2
79.8
Intennediate LowINo Significance
50.3 39.7 .0008
84.2 68.9 .008
64.4 66.2 .68 (NS)
51.4 51.4 .00001
81.5 83.8 .38 (NS)
27.4 23.6 .00007
87.0 79.7 .16 (NS)
As shown above, several key behaviors were extensively more reported in the High, andsometimes intermediate villages, than in the no/low villages. Specifically, women who weresystematically exposed to NCP were more likely to give breastmilk as the first substance, tonot introduce water before 4 months of age, to give fruit and leaves or leaf sauce ascomplementary foods, between 6 to 8 months of age. Other feeding behaviors (such asappropriate introduction ofporridge, first introduction of meat) are not significantly differentamong the three groups.
c. 24 hour djetary recall reported by mothers for chjldren oyer 1 year
Among older children, the following signficiant differences (p< .05) appeared in the 24 hourrecall data:
Children in High/llitermediate villages ate more: Children in NolLow villages ate more:.
Porridge/toh, rice, leaf sauce, green beans, bananas cow's milk
This suggests that women in High/Intermediate villages gave their children more of the foodsrecommended by NCP. However, mothers in non-exposed villages reported giving their childrenmore cow's milk than NCP villages.
54
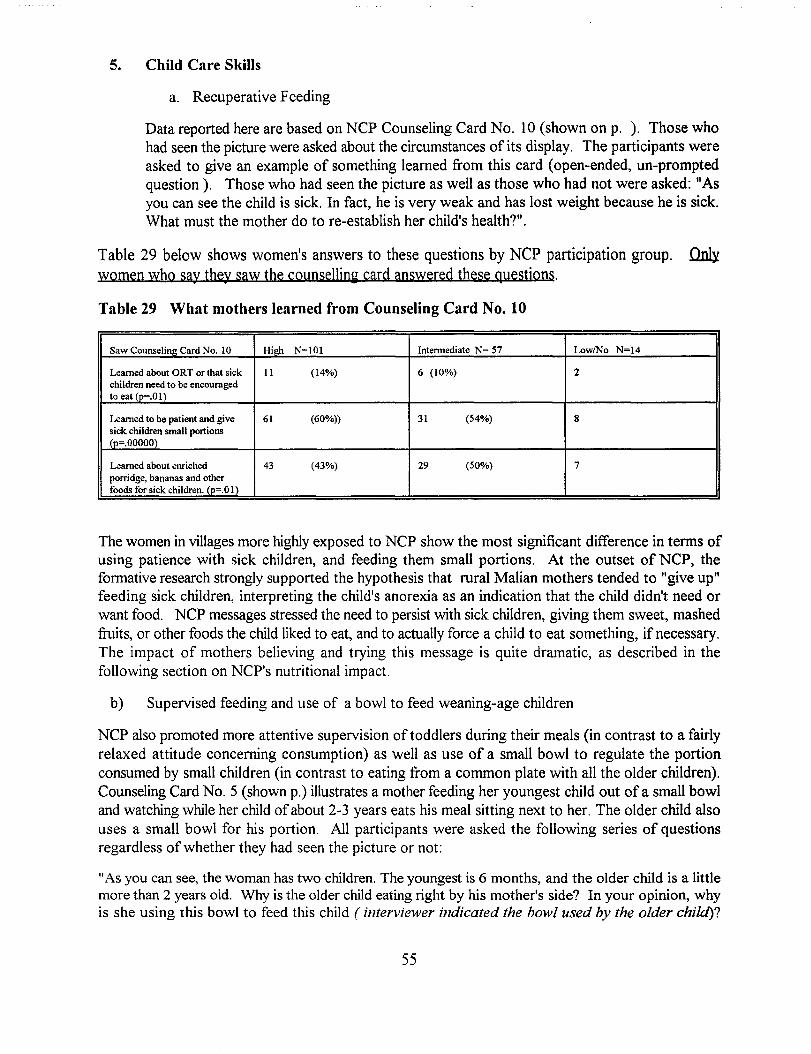
5. Child Care Skills
a. Recuperative Feeding
Data reported here are based on NCP Counseling Card No. 10 (shown on p. ). Those whohad seen the picture were asked about the circumstances of its display. The participants wereasked to give an example of something learned from this card (open-ended, un-promptedquestion). Those who had seen the picture as well as those who had not were asked: liAsyou can see the child is sick. In fact, he is very weak and has lost weight because he is sick.What must the mother do to re-establish her child's health?".
Table 29 below shows women's answers to these questions by NCP participation group. ~women who say they saw the cQunselling card answered these questions.
Table 29 What mothers learned from Counseling Card No. 10
Saw Counseling Card No. 10 Hieh N=101 Intermediate N= 57 LowlNo N=14
Learned about aRT or that sick 11 (14%) 6 (10%) 2children need to be encouragedto eat (p=.OI)
Learned to be patient and give 61 (60%)) 31 (54%) 8sick children small portions(p=.OOOOO)
Learned about enriched 43 (43%) 29 (50%) 7porridge, bananas and otherfoods for sick children. (p=.O 1)
The women in villages more highly exposed to NCP show the most significant difference in terms ofusing patience with sick children, and feeding them small portions. At the outset of NCP, theformative research strongly supported the hypothesis that rural Malian mothers tended to "give up"feeding sick children, interpreting the child's anorexia as an indication that the child didn't need orwant food. NCP messages stressed the need to persist with sick children, giving them sweet, mashedfruits, or other foods the child liked to eat, and to actually force a child to eat something, if necessary.The impact of mothers believing and trying this message is quite dramatic, as described in thefollowing section on NCP's nutritional impact.
b) Supervised feeding and use of a bowl to feed weaning-age children
NCP also promoted more attentive supervision of toddlers during their meals (in contrast to a fairlyrelaxed attitude concerning consumption) as well as use of a small bowl to regulate the portionconsumed by small children (in contrast to eating from a common plate with all the older children).Counseling Card NO.5 (shown p.) illustrates a mother feeding her youngest child out of a small bowland watching while her child ofabout 2-3 years eats his meal sitting next to her. The older child alsouses a small bowl for his portion. All participants were asked the following series of questionsregardless of whether they had seen the picture or not:
liAs you can see, the woman has two children. The youngest is 6 months, and the older child is a littlemore than 2 years old. Why is the older child eating right by his mother's side? In your opinion, whyis she using this bowl to feed this child (interviewer indicated the bowl used by the older chi/d)?
55
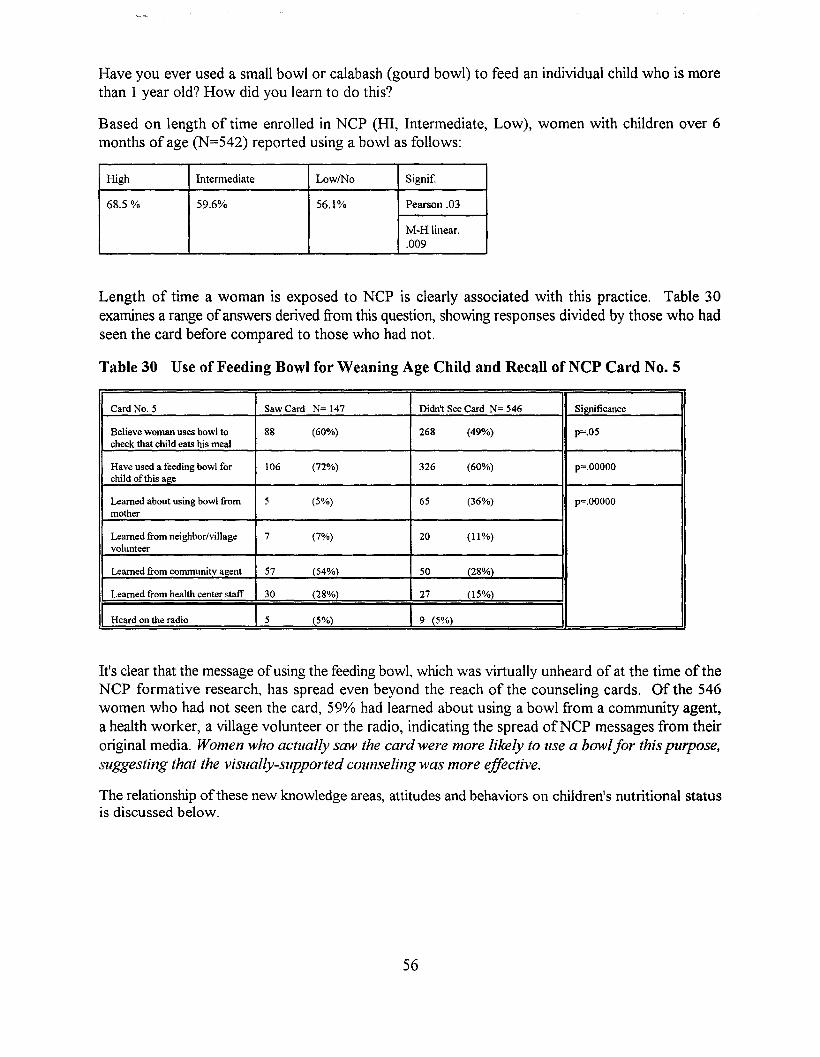
Have you ever used a small bowl or calabash (gourd bowl) to feed an individual child who is morethan 1 year old? How did you learn to do this?
Based on length of time enrolled in NCP (HI, Intermediate, Low), women with children over 6months of age (N=542) reported using a bowl as follows:
High Intennediate LowlNo Signif.
68.5 % 59.6% 56.1% Pearson .03
M-Hlinear..009
Length of time a woman is exposed to NCP is clearly associated with this practice. Table 30examines a range ofanswers derived from this question, showing responses divided by those who hadseen the card before compared to those who had not.
Table 30 Use of Feeding Bowl for Weaning Age Child and Recall ofNCP Card No.5
Card No. 5 Saw Card N= 147 Didn't See Card N= 546 Si~ficance
Believe woman uses bowl to 88 (60%) 268 (49%) p=.05check that child eats his meal
Have used a feeding bowl for 106 (72%) 326 (60%) p=.OOOOOchild ofthis age
Learned about using bowl from 5 (5%) 65 (36%) p=.OOOOOmother
Learned from neighbor/village 7 (7%) 20 (11%)volunteer
Learned from communitv agent 57 (54%) 50 (28%)
Learned from health center staff 30 (28%) 27 (15%)
IHeard on the radio I 5 (5%) I 9 (5%) I
It's clear that the message ofusing the feeding bowl, which was virtually unheard of at the time of theNCP formative research, has spread even beyond the reach of the counseling cards. Of the 546women who had not seen the card, 59% had learned about using a bowl from a community agent,a health worker, a village volunteer or the radio, indicating the spread ofNCP messages from theiroriginal media. Women who actually saw the card were more likely to use a bowlfor this purpose,suggesting that the visually-supported counseling was more effective.
The relationship ofthese new knowledge areas, attitudes and behaviors on children's nutritional statusis discussed below.
56
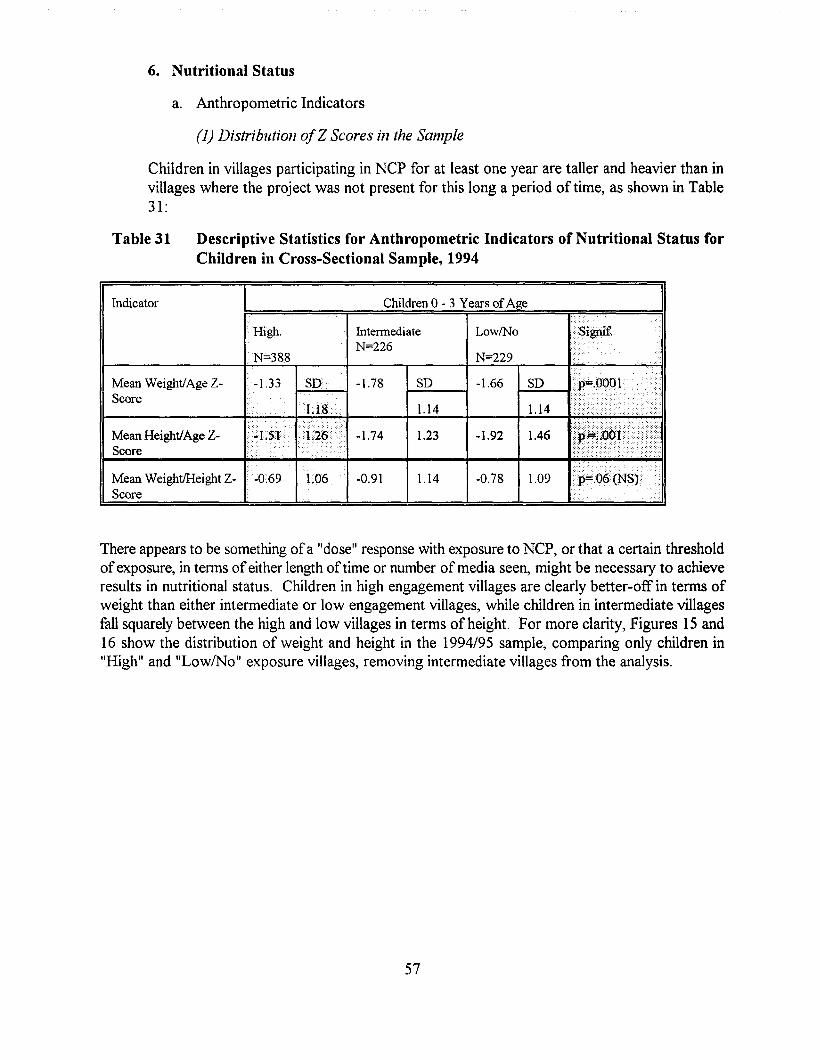
6. Nutritional Status
a. Anthropometric Indicators
(1) Distribution ofZ Scores in the Sample
Children in villages participating in NCP for at least one year are taller and heavier than invillages where the project was not present for this long a period oftime, as shown in Table31:
Table 31 Descriptive Statistics for Anthropometric Indicators of Nutritional Status forChildren in Cross-Sectional Sample, 1994
Indicator Children 0 - 3 Years of Age
..
..
LowlNoIntennediateN=226
High.
. N=388 N=229
Mean Weight!Age ZScore
-1.33 SO -1.78 I--SO__-I -1.66 /--SO_-t/} .. .v ,-11
1.18 1.14 1.14<>.ii
1.09-0.781.14-0.91-0.69 1.06Mean WeightlHeight ZScore
•...•.•..••.... /i/ I ;:;);.1)<[Mean Height!Age Z- ...r 'H<.,,,,,, -1.74 1 23 -1.92 1 46 j~y-J
II-S_co_l'_e -+- -11......« __..-.+ +-_.---l~--+-'--+ ••.•..••••.•<> •..•.•••.••..•y ,--,
There appears to be something ofa "dose" response with exposure to NCP, or that a certain thresholdofexposure, in terms ofeither length of time or number of media seen, might be necessary to achieveresults in nutritional status. Children in high engagement villages are clearly better-off in terms ofweight than either intermediate or low engagement villages,while children in intermediate villagesfall squarely between the high and low villages in terms of height. For more clarity, Figures 15 and16 show the distribution of weight and height in the 1994/95 sample, comparing only children in"High" and "Low/No" exposure villages, removing intermediate villages from the analysis.
57
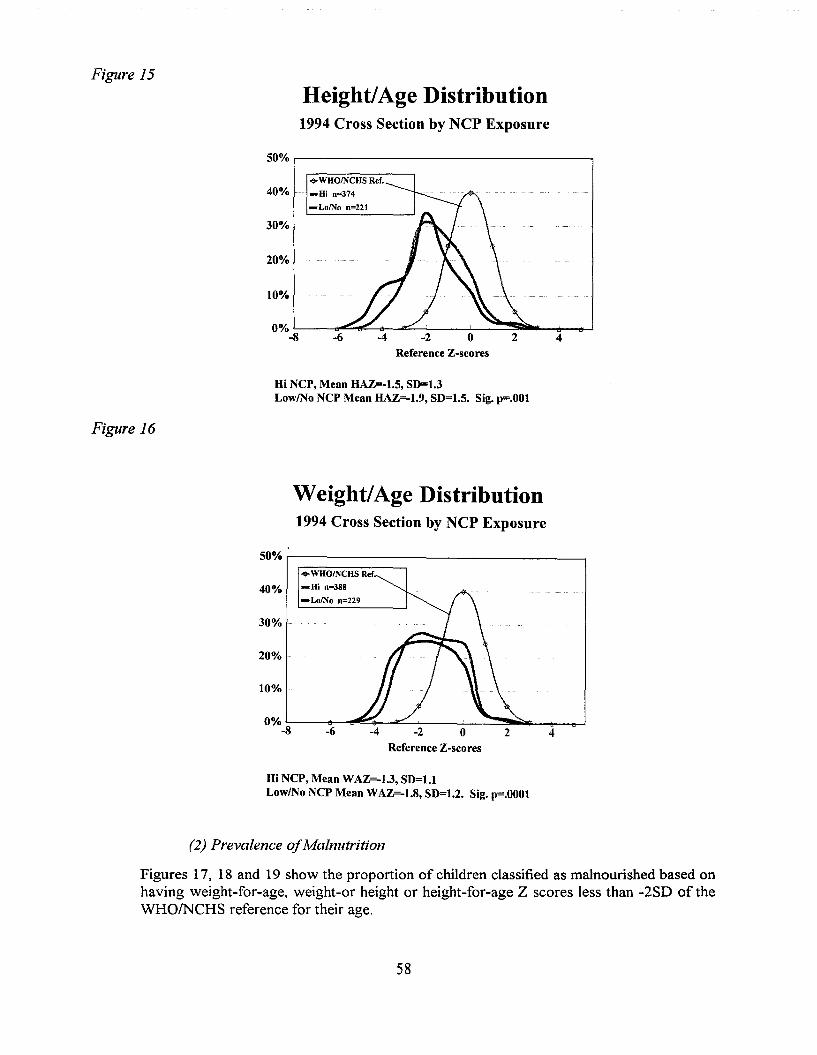
Figure 15
Height/Age Distribution1994 Cross Section by NCP Exposure
50% ,------------------..,
42o-2-4-6
10%
20%
....WHOINCHS Ref.
40% -Hi 0=374
- LolNo 0=221
30%
Reference Z-scores
Hi NCP, Mean HAZ=-1.5, SD=1.3LowlNo NCP Mean HAZ=-1.9, SD=1.5. Sig. p=.OOI
Figure 16
weight/Age Distribution1994 Cross Section by NCP Exposure
50% r----------------------,....WHOINCHS Ref
40% -Hi 0=388
-LolNo 0=229
30%
20%
10%
Reference Z-scores
Hi NCP, Mean WAZ=-1.3, SD=l.lLowlNo NCP Mean WAZ=-1.8, SD=1.2. Sig. p=.OOOI
(2) Prevalence ofMalnutrition
Figures 17, 18 and 19 show the proportion of children classified as malnourished based onhaving weight-for-age, weight-or height or height-for-age Z scores less than -2SD of theWHO/NCHS reference for their age.
58
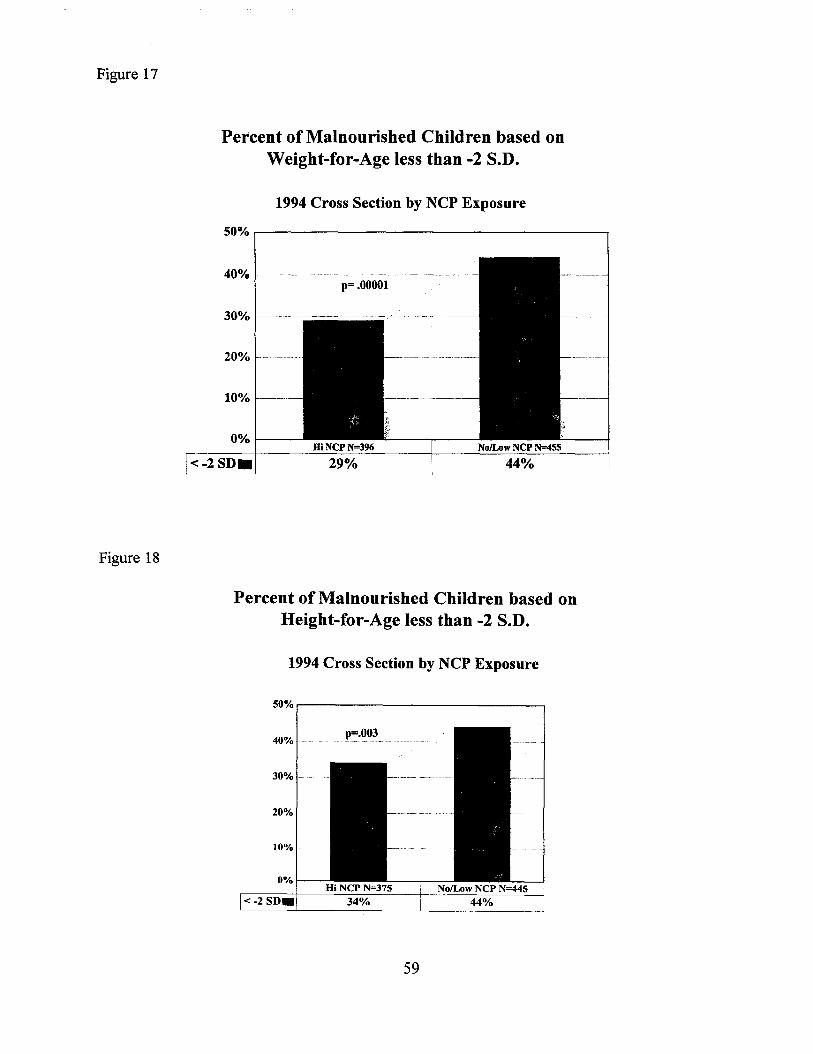
Figure 17
Figure 18
Percent of Malnourished Children based onWeight-for-Age less than -2 S.D.
1994 Cross Section by NCP Exposure
50% ,.-----------------------,
40% 1---·----·· .-.---.-- .. - .-- -- --- ---- .. -~.--.-.--- ..--.... -- -.--- .-------
p=.OOOOl
30% -
20%
10% -----
0%1----
Percent of Malnourished Children based onHeight-for-Age less than -2 S.D.
1994 Cross Section by NCP Exposure
50%,.----------------,
40%
30% -------
20%
10%
0%
p=.003
59
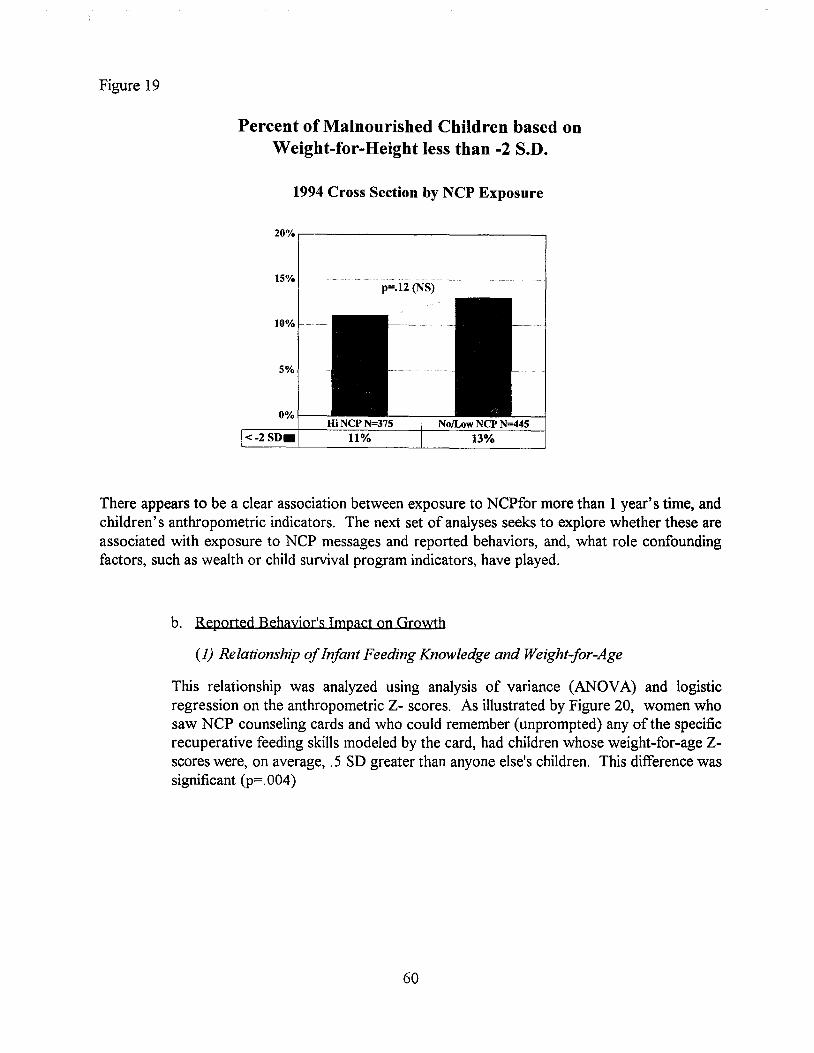
Figure 19
Percent of Malnourished Children based onWeight-for-Height less than -2 S.D.
1994 Cross Section by NCP Exposure
20%,----------------.
15%p=.12 (NS)
There appears to be a clear association between exposure to NCPfor more than 1 year's time, andchildren's anthropometric indicators. The next set of analyses seeks to explore whether these areassociated with exposure to NCP messages and reported behaviors, and, what role confoundingfactors, such as wealth or child survival program indicators, have played.
b. Reported Behayjor's Impact on Growth
(1) Relationship ofInfant Feeding Knowledge and Weight-jor-Age
This relationship was analyzed using analysis of variance (ANOVA) and logisticregression on the anthropometric Z- scores. As illustrated by Figure 20, women whosaw NCP counseling cards and who could remember (unprompted) any of the specificrecuperative feeding skills modeled by the card, had children whose weight-for-age Zscores were, on average, .5 SD greater than anyone else's children. This difference wassignificant (p=. 004)
60
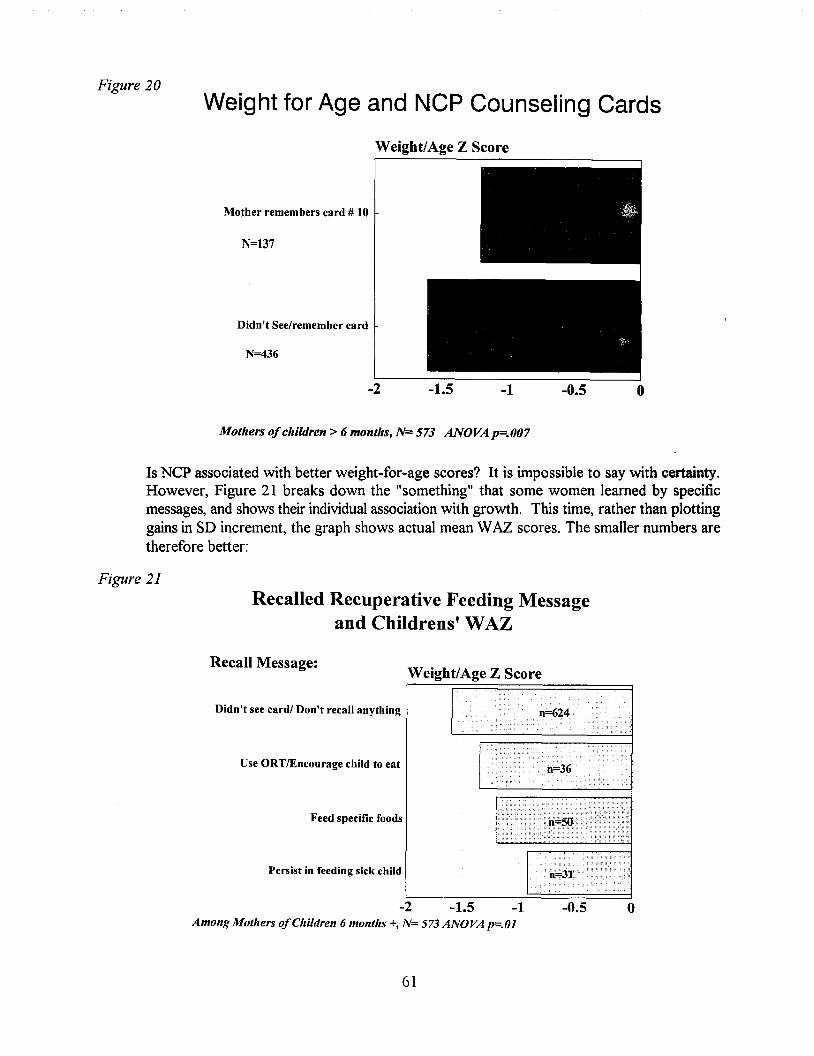
Figure 20Weight for Age and NCP Counseling Cards
Weight/Age Z Score
Mother remembers card # 10
N=137
Didn't See/remember card
N=436
-2 -1 -0.5 o
Mothers ofchildren> 6 months, N= 573 ANOVA p=.007
Is NCP associated with better weight-for-age scores? It is impossible to say with certainty.However, Figure 21 breaks down the "something" that some women learned by specificmessages, and shows their individual association with growth. This time, rather than plottinggains in SD increment, the graph shows actual mean WAZ scores. The smaller numbers aretherefore better:
Figure 21
Recalled Recuperative Feeding Messageand Childrens' WAZ
-2 -1.5 -1Among Mothers ofChildren 6 months +, N= 573 ANOVA p=.Ol
Recall Message:
Didn't see card/ Don't recall anything
Use ORTlEncourage child to eat
Feed specific foods
Persist in feeding sick child
Weight/Age Z Score
-0.5 o
61
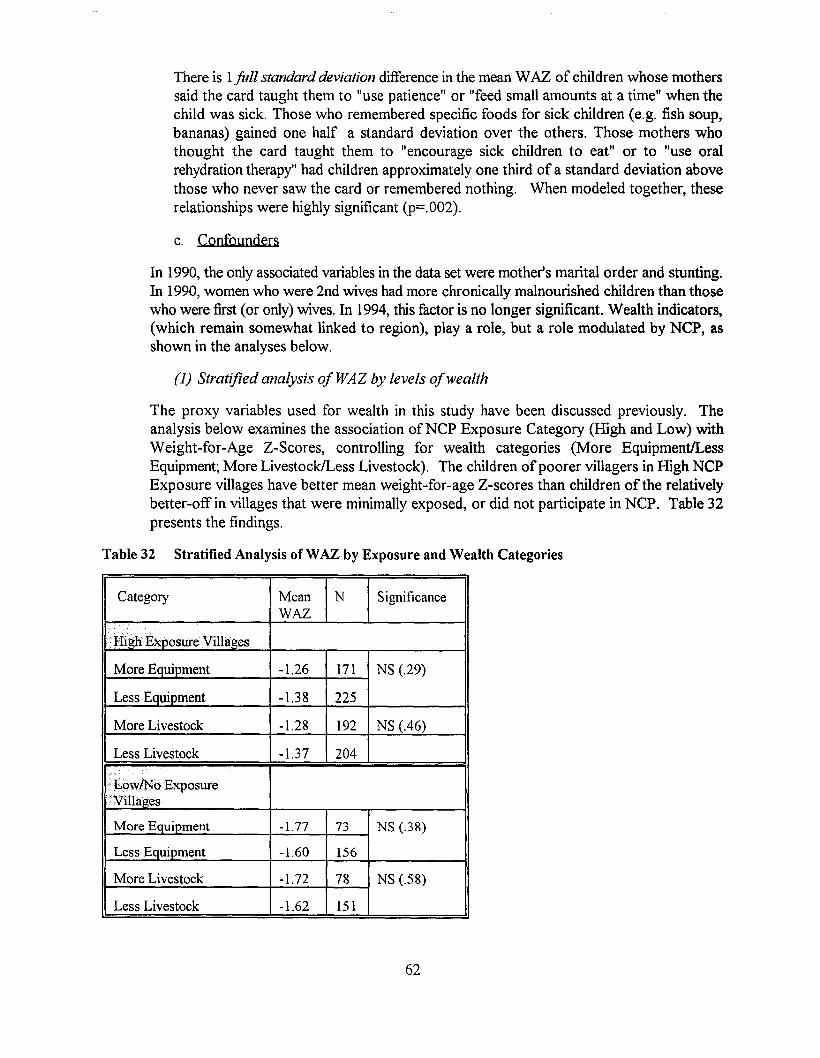
There is 1full standard deviation difference in the mean WAZ of children whose motherssaid the card taught them to "use patience" or "feed small amounts at a time" when thechild was sick. Those who remembered specific foods for sick children (e.g. fish soup,bananas) gained one half a standard deviation over the others. Those mothers whothought the card taught them to "encourage sick children to eat" or to "use oralrehydration therapy" had children approximately one third of a standard deviation abovethose who never saw the card or remembered nothing. When modeled together, theserelationships were highly significant (p=.002).
c. Confounders
In 1990, the only associated variables in the data set were mother's marital order and stunting.In 1990, women who were 2nd wives had more chronically malnourished children than thosewho were first (or only) wives. In 1994, this factor is no longer significant. Wealth indicators,(which remain somewhat linked to region), playa role, but a role modulated by NCP, asshown in the analyses below.
(1) Stratified analysis of WAZ by levels ofwealth
The proxy variables used for wealth in this study have been discussed previously. Theanalysis below examines the association ofNCP Exposure Category (High and Low) withWeight-far-Age Z-Scores, controlling for wealth categories (More EquipmentlLessEquipment; More LivestocklLess Livestock). The children of poorer villagers in High NCPExposure villages have better mean weight-for-age Z-scores than children of the relativelybetter-off in villages that were minimally exposed, or did not participate in NCP. Table 32presents the findings.
Table 32 Stratified Analysis ofWAZ by Exposure and Wealth Categories
Category Mean N SignificanceWAZ
IT";' .......... osureVilhtges
More Equipment -1.26 171 NS (.29)
Less Equipment -1.38 225
More Livestock -1.28 192 NS (.46)
Less Livestock -1.37 204
l ..ow!No••ExposureVillages
More Equipment -1.77 73 NS (.38)
Less Equipment -1.60 156
More Livestock -1.72 78 NS (.58)
Less Livestock -1.62 151
62
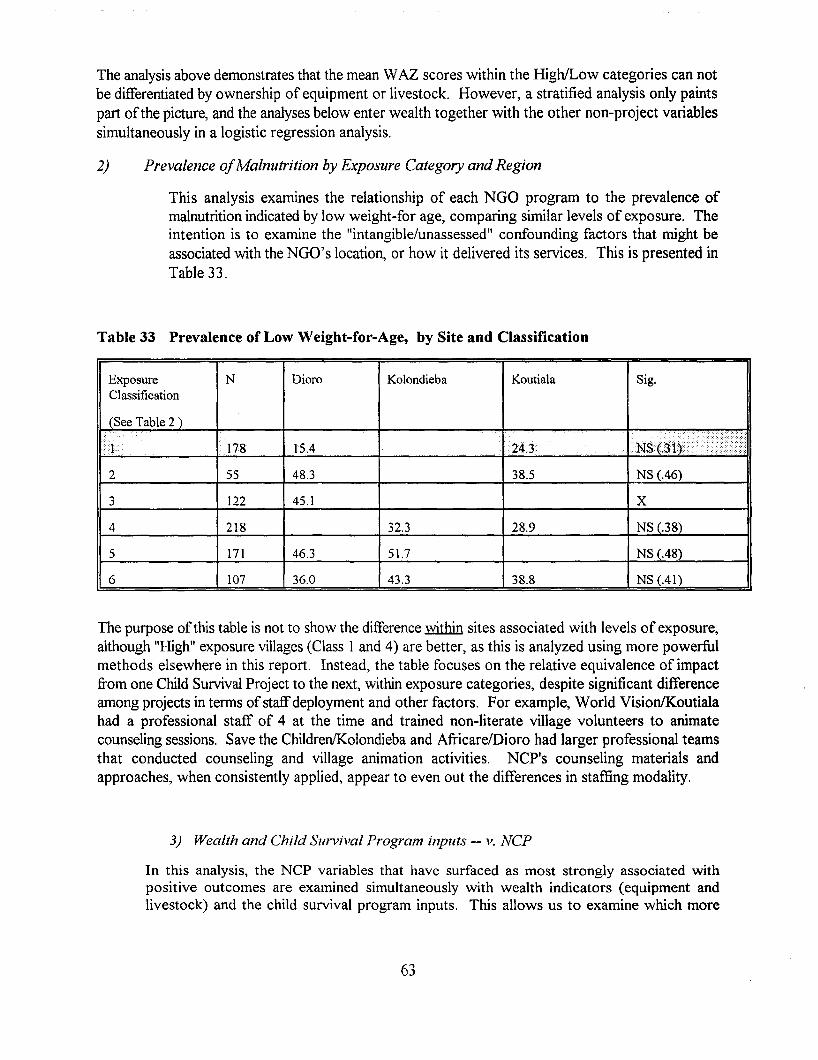
The analysis above demonstrates that the mean WAZ scores within the HighILow categories can notbe differentiated by ownership of equipment or livestock. However, a stratified analysis only paintspart ofthe picture, and the analyses below enter wealth together with the other non-project variablessimultaneously in a logistic regression analysis.
2) Prevalence ofMalnutrition by Exposure Category and Region
This analysis examines the relationship of each NGO program to the prevalence ofmalnutrition indicated by low weight-for age, comparing similar levels of exposure. Theintention is to examine the "intangible/unassessed" confounding factors that might beassociated with the NGO's location, or how it delivered its services. This is presented inTable 33.
Table 33 Prevalence of Low Weight-for-Age, by Site and Classification
Exposure N Dioro Kolondieba Koutiala Sig.Classification
(See Table 2 )
IJ •.. :.
178 1504 24.3 .,
2 55 48.3 38.5 NS (046)
3 122 45.1 X
4 218 32.3 28.9 NS (.38)
5 171 46.3 51.7 NS (.48)
6 107 36.0 43.3 38.8 NS (AI)
The purpose ofthis table is not to show the difference within sites associated with levels of exposure,although "High" exposure villages (Class 1 and 4) are better, as this is analyzed using more powerfulmethods elsewhere in this report. Instead, the table focuses on the relative equivalence of impactfrom one Child Survival Project to the next, within exposure categories, despite significant differenceamong projects in terms ofstaffdeployment and other factors. For example, World Vision/Koutialahad a professional staff of 4 at the time and trained non-literate village volunteers to animatecounseling sessions. Save the Children/Kolondieba and Africare/Dioro had larger professional teamsthat conducted counseling and village animation activities. NCP's counseling materials andapproaches, when consistently applied, appear to even out the differences in staffing modality.
3) Wealth and Child Survival Program inputs -- v. NCP
In this analysis, the NCP variables that have surfaced as most strongly associated withpositive outcomes are examined simultaneously with wealth indicators (equipment andlivestock) and the child survival program inputs. This allows us to examine which more
63
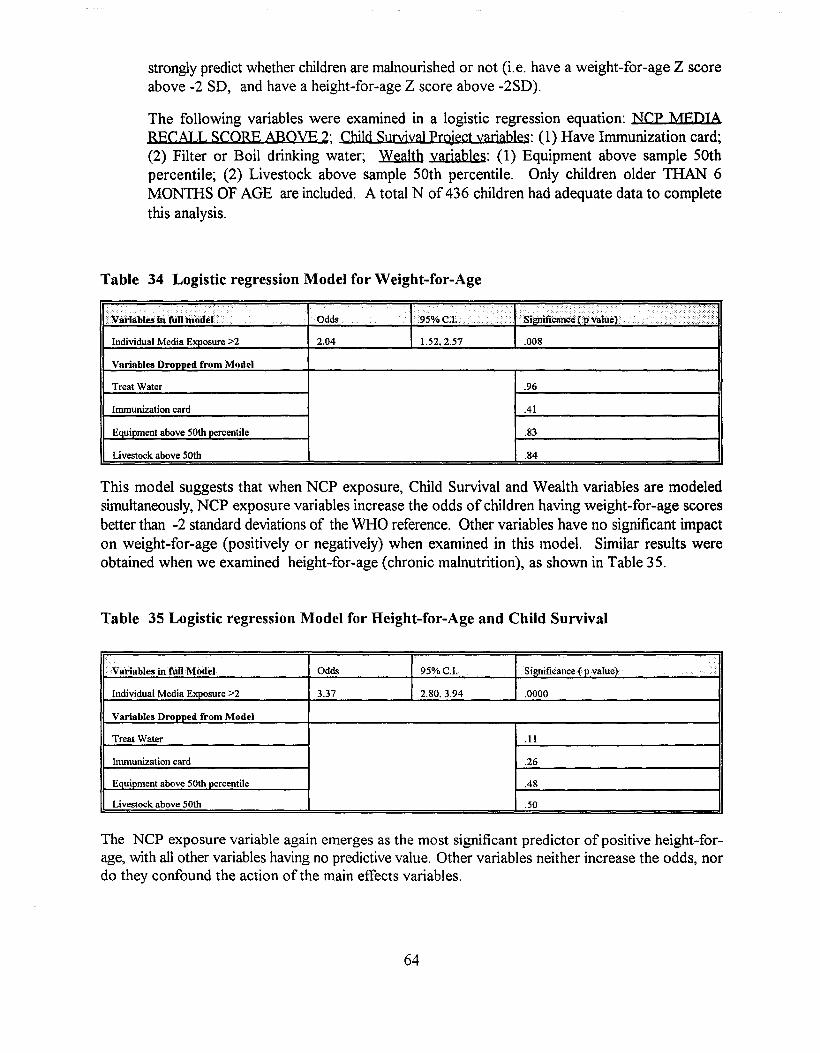
strongly predict whether children are malnourished or not (i.e. have a weight-for-age Z scoreabove -2 SD, and have a height-for-age Z score above -2SD).
The following variables were examined in a logistic regression equation: NCP MEDIARECALL SCORE ABOVE 2; Child SunrivaJ project variables: (1) Have Immunization card;(2) Filter or Boil drinking water; Wealth variables: (1) Equipment above sample 50thpercentile; (2) Livestock above sample 50th percentile. Only children older THAN 6MONTHS OF AGE are included. A total N of 436 children had adequate data to completethis analysis.
Table 34 Logistic regression Model for Weight-for-Age
. . .....
Variables in fulhnodel·
Individual Media Exposure >2
Variables Dropped from Model
Treat Water
Immunization card
Equipment above 50th percentile
Livestock above 50th
Odds
2.04
95%"'1
1.52,2.57 .008
.96
Al
.83
.84
This model suggests that when NCP exposure, Child Survival and Wealth variables are modeledsimultaneously, NCP exposure variables increase the odds of children having weight-for-age scoresbetter than -2 standard deviations of the WHO reference. Other variables have no significant impacton weight-far-age (positively or negatively) when examined in this model. Similar results wereobtained when we examined height-far-age (chronic malnutrition), as shown in Table 35.
Table 35 Logistic regression Model for Height-for-Age and Child Survival
Vitriablesblfull Model Odds 95%C.1. Significance{p value) iIndividual Media Exposure >2 3.37 2.80.3.94 .0000
Variables Dropped from Model
Treat Water .11
Immunization card .26
Equipment above 50th percentile 048
Livestock above 50th .50
The NCP exposure variable again emerges as the most significant predictor of positive height-forage, with all other variables having no predictive value. Other variables neither increase the odds, nordo they confound the action of the main effects variables.
64
VI. FINAL CONCLUSIONS
There is sufficient evidence to see a strong, statistically significant association betweenexposure to NCP approaches and materials and:
••••
more parental nutrition knowledge;more parental purchasing of recommended foods;more consumption of recommended foods by women and children;better children's nutritional status
This has been demonstrated in relationship to the level of exposure to the project's inputs, and issuggested by a before-and-after examination of the data. The Nutrition Communication Projectshould be judged to have had "an impact" as can be best determined using the methods and analysesin this survey.
In order to reach the World Summit Goal of halving Protein-Energy Malnutrition, most Africancountries need to make what appears to be an impossibly large reduction in the number ofchildrenwith low weight for age (the index used by the ACC/SCN to track progress against the Year 2000goals), on the order of 3-4 percentage points/year. Countries reducing malnutrition by even onepercentage point/year are considered to be making progress towards the goal, as few are eventouching their problem34. Over the 4 year period measured by this survey, Malian villages engagedin NCP reduced protein-energy malnutrition at an average rate of 2.8 percentage points per year.Where NCP was not applied, despite other Child Survival interventions, there was no progressagainst malnutrition.
• The impact of wealth on nutritional status, when all other factors are controlled, is...no.tsignificant. And, the impact of being in an NCP "trial" or "high exposure" villages,when wealth is controlled, remains statistically significant.
This finding suggests that within a poor, rural environment, money spent on purchasing livestock orequipment.i£...nQ1 ncecessarily associated with improvements in children's nutritional status. Andconversely, among the poorer households, where other child survival services are offered,improvements in nutrition practices and growth can be obtained with simple educational inputs, evenwhen wealth does not significantly improve.
• NCP approaches resulted in fairly standard improvements regardless of the ChildSurvival Project's mode of interaction with the target population.
The quality of communication with villagers concerning nutrition was determined by the individualagents themselves, and by their NGO supervisors. This varied by agent within Child Survivalprojects, and from one Child Survival project to another. However, one of the key contributions ofNCP was to create materials adaptable to almost any community-based setting. As the evaluationindicates, regardless of whether the Child Survival project relied on village volunteers, or paid
34ACC/SCNNutrition News, 1995.
65
professional nurses, the positive impact on nutritional status was similar where NGOs used NCPapproaches and materials consistently.
The child survival literature now indicates that nutritional status is responsible for 56% of a child'slikelihood ofliving or dying in the first 5 years3S
. The children of women who saw 2 or more NCPmedia were twice as likely to have better nutritional status than children whose mothers did not seeor remember these intervention. On this basis, the reduction in child malnutrition alone, achievedthrough NCP activities, is estimated to have prevented the deaths of approximately 850 children peryear by the end of the project36
. The long term impact ofNCP on the population of approximately750,000 persons taking part in the community-based component, or those listening to the radiobroadcasts (which potentially reach any Bambara speaker in the country of9 million people), remainsto be seen. While funding for USAID's project ended in March, 1995, in Mali, NCP continues underthe direction of its lead government agency, the National Center for Health Information, Educationand Communication (CNIECS), the Group pivot for Child Survival (an NGO coordinating group,partially supported by USAID), and the network ofNGOs, and additional support from UNICEF.
See Pelletier, D.L., Frongillo, E. I.-P. Habicht, 1993. Epidemiologic evidence for a potentiating effect of malnutrition on childmortality. AJPH 83:1130-33.
36J.Ross, PROFILES analyst, p.c.
66
Appendix A - Questionnaire and illustrations

1
CAT:MERE D'ENFANT DE 7 MOIS A 36 MOIS Famille No. -------Enqueteur: _Reg: 0 Dioro 0 Koutiala 0 Kolondieba Village: _"'0 Femme aussi interviewee en tante que femme enceinte (Repetez Partie IT seulement)"'0 Fiche de l'enfant"'0 Mari est incIu aussi"'0 Autre enfant est incIu aussi
Partie I: Nous commencons par!aire connaissance:
1. Etes vous dans un foyer monogame ou po1ygame?1=monogame (sautez a 3) 2=po1ygame
2. Etes vous 1a 1er, 2ieme ou 3ieme femme?
3. Vous ou votre mari, possedez-vous du betail ou des objets suivants:
a. velo OUl non e. ane OUl nonb. vache(s) OUl non f. volailIe/pintade OUl nonc. mouton(s) OUl non g. radio qui marche OUl nond. charette om non h. table/boutique om non
3b. Ou alIez vous actuellement chercher de l'eau potable? 1 = puits du village 2 = pompe3 = riviere ou source 4=autre
3c:
4.
Traitez-vous 1'eau de boissonet de queUe maniere? _
Quel age avez-vous?(Aidez fa femme a etablir son age)
1 = non, rien2 = fiItrer/faire passer en tissu3 = bouillir 4 = j aveI 5 = autres__ (Ne Sait Pas = 99)
5. Combien d'enfants avez vous? (nombre en vie) __
6. Au cour de 1a semaine demiere, est-ce que votre marivous a amene des aliments ou friandises, autre que Ie mil,pour manger? __ Oui Non (Sautez a 9)
7. Qu'est-ce qu'iI vous a amene comme aliment? (ne pas lire la liste)
1=foie 2=lait 3=viande 4=gateau de haricots S=arachides 6=fruit 7=carotes 8=autreslegumes 9 = oeufs 10=feuilles 11=pate de tomates/tomates12=autres ( Si fa reponse ne figure pas ici, posez encore "Riend'autre pour vous ou vos enfants?"~~ Cochez fa boite a droiteO)
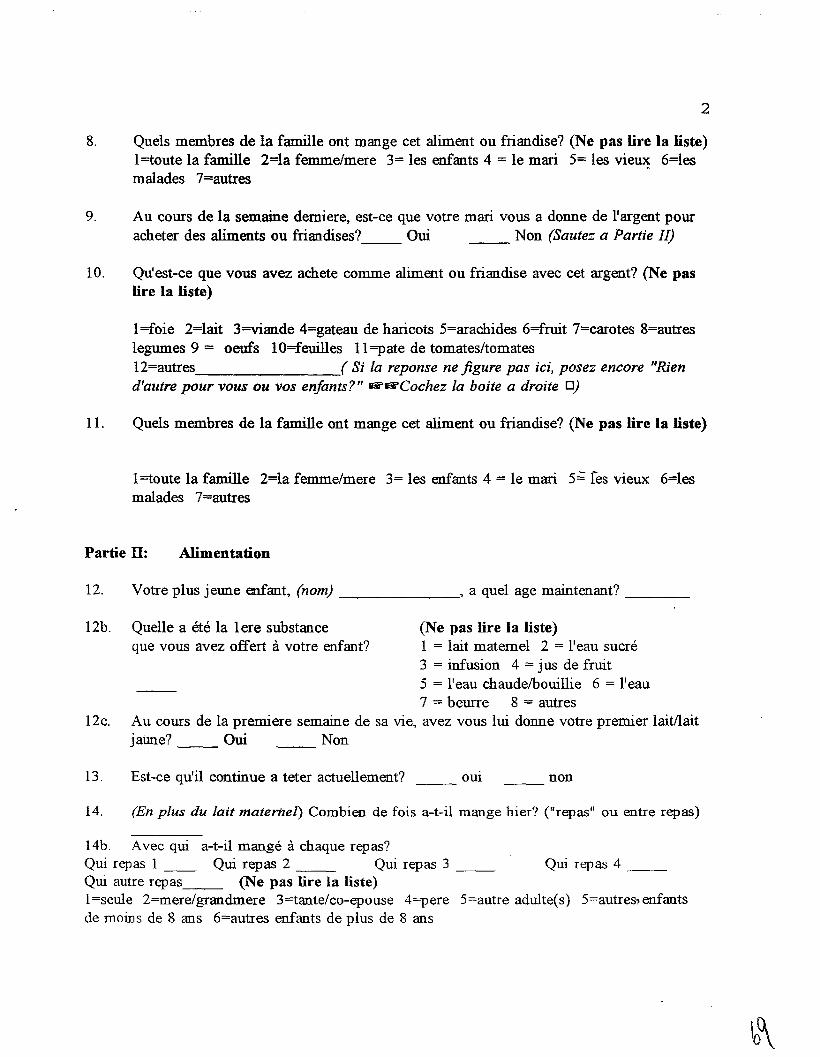
2
8. Quels membres de la famille ont mange cet aliment ou friandise? (Ne pas lire la liste)1=toute la famille 2=la femme/mere 3= les enfants 4 = Ie mari 5= les vie~ 6=lesmalades 7=autres
9. Au cours de la semaine demiere, est-ce que votre mari vous a donne de l'argent pouracheter des aliments ou friandises?__ Oui __ Non (Sautez a Partie II)
10. Qu'est-ce que vous avez achete comme aliment ou friandise avec cet argent? (Ne paslire la liste)
1=foie 2=lait 3=viande 4=gateau de haricots 5=arachides 6=fruit 7=carotes 8=autreslegumes 9 = oeufs 10=feuilles 11=pate de tomates/tomates12=autres ( Si la reponse ne figure pas ici, posez encore "Riend'autre pour vous ou vos enfants?" ~&i'Cochez la boite a droite 0)
11. Queis membres de la famille ont mange cet aliment ou friandise? (Ne pas lire fa liste)
1=toute la famille 2=la femme/mere 3= les enfants 4 = Ie mari 5;; res vieux: 6=lesmalades 7=autres
Partie II: Alimentation
12. Votre plus jeune enfant, (nom) , a quel age maintenant? _
12b. Quelle a ete la Iere substance (Ne pas lire fa liste)que vous avez offert avotre enfant? 1 = lait matemel 2 = l'eau sucre
3 = infusion 4 = jus de fruit5 = lleau chaude/bouillie 6 = lleau7 = beurre 8 = autres
12c. Au cours de la premiere semaine de sa vie, avez vous lui donne votre premier laitl1aitjatme? Oui Non
13. Est-ce qu'il continue a teter actuellement? OUI non
14. (En plus du Jait materneJ) Combien de fois a-t-il mange hier? ("repas" ou entre repas)
14b. Avee qui a-t-il mange a chaque repas?Qui repas 1 __ Qui repas 2 __ Qui repas 3 __ Qui repas 4 __Qui autre repas__ (Ne pas lire la liste)1=seule 2=mere/grandmere 3=tante/co-epouse 4=pere 5=autre adulte(s) 5=autres.-enfautsde moms de 8 aus 6=autres enfauts de plus de 8 aus
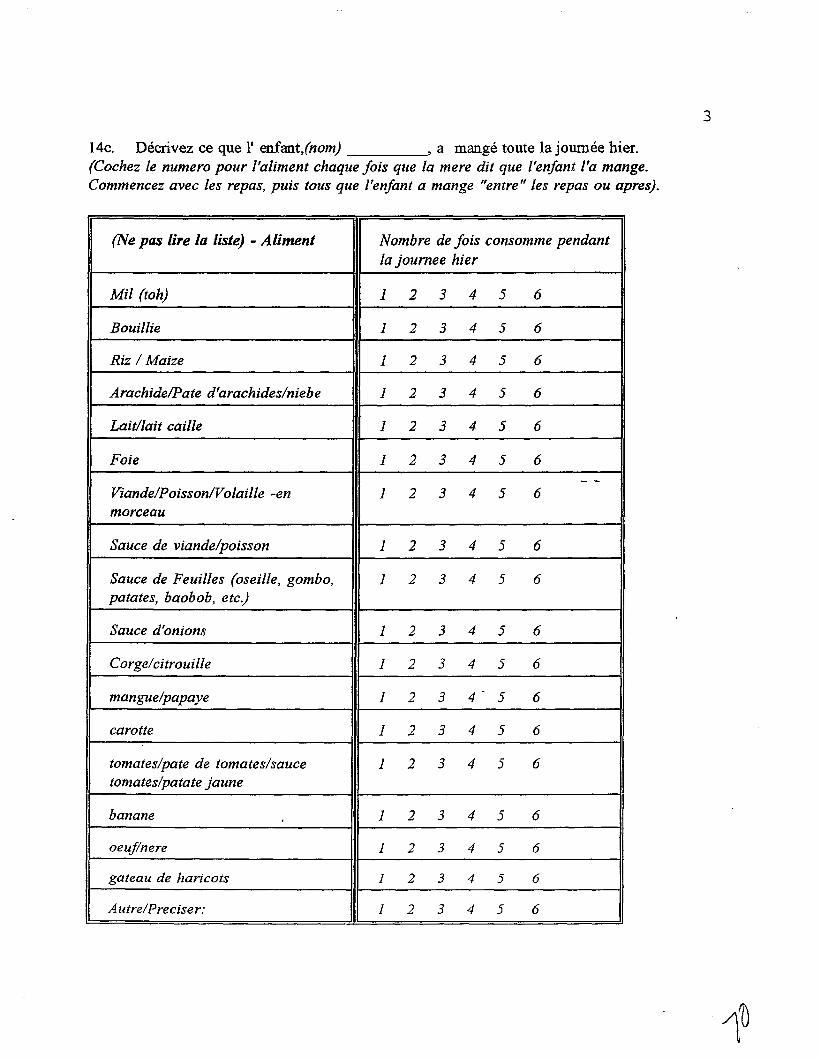
14c. Decrivez ce que l' enfant,(nom) , a mange toute la joumee hier.(Cochez /e numero pour /'aliment chaque fois que /a mere dil que l'enfant ['a mange.Commencez avec /es repas, puis tous que ['enfant a mange "entre" /es repas ou apres).
(Ne pas lire La liste) - Aliment Nombre de fois consomme pendant/a joumee hier
Mil (toh) 1 2 3 4 5 6
Bouillie 1 2 3 4 5 6
Riz / Maize 1 2 3 4 5 6
Arachide/Pate d'arachides/niebe 1 2 3 4 5 6
Lait//ail caille 1 2 3 4 5 6
Foie 1 2 3 4 5 6
- -Viande/Poisson/Vo/aille -en 1 2 3 4 5 6morceau
Sauce de viande/poisson 1 2 3 4 5 6
Sauce de Feuilles (oseille, gombo, 1 2 3 4 5 6patates, baobob, etc.)
Sauce d'onions 1 2 3 4 5 6
Corge/cilrouille 1 2 3 4 5 6
mangue/papaye 1 2 3 4- 5 6
carotte 1 2 3 4 5 6
tomates/pate de tomates/sauce 1 2 3 4 5 6tomates/patate jaune
banane 1 2 3 4 5 6
oeuf/nere 1 2 3 4 5 6
gateau de haricots 1 2 3 4 5 6
Autre/Preciser: 1 2 3 4 5 6
3
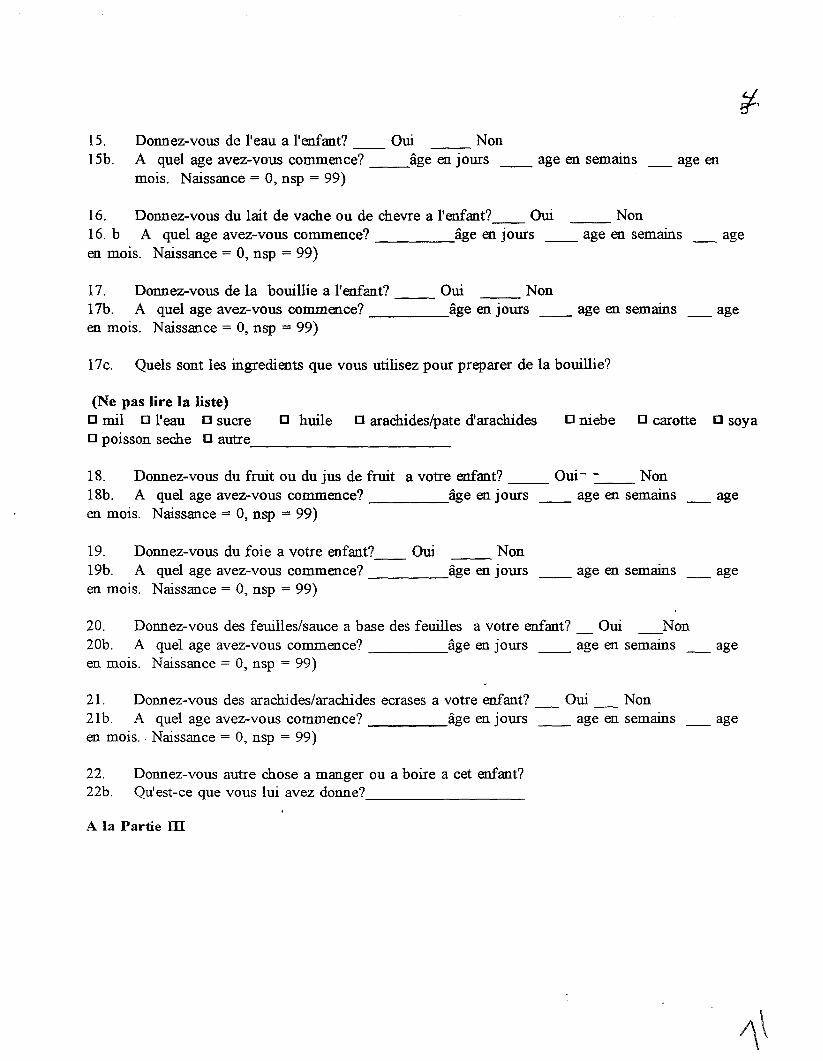
15. Donnez-vous de l'eau a l'enfant? Oui NonISb. A quel age avez-vous commence? __age en jours __ age en semams __ age en
mois. Naissance = 0, nsp = 99)
16. Donnez-vous du lait de vache ou de chevre a l'enfant?__ Oui Non16. b A quel age avez-vous commence? age en jours __ age en semains _ ageen mois. Naissance = 0, nsp = 99)
17. Donnez-vous de la bouillie a l'enfant? Oui __ Non17b. A quel age avez-vous commence? age en joms __ age en semains __ ageen mois. Naissance = 0, nsp = 99)
17c. Quels sont les ingredients que vous utilisez pour preparer de la boui1lie?
o huile 0 arachides/pate d'arachides(Ne pas lire la liste)o mil 0 reau 0 sucreo poisson seche 0 autre, _
o niebe 0 carotte 0 soya
18. Donnez-vous du fruit ou du jus de fruit a votre enfant? Oui- -__ Non18b. A quel age avez-vous commence? age en joms __ age en semams _ ageen mois. Naissance = 0, nsp = 99)
19. Donnez-vous du foie a votre enfant?__ Oui Non19b. A quel age avez-vous commence? age en jours __ age en semams _ ageen mois. Naissance = 0, nsp = 99)
20. Donnez-vous des feuilles/sauce a base des feuilles a votre enfant? Oui Non20b. A quel age avez-vous commence? age en joms __ age en semams _ ageen mois. Naissance = 0, nsp = 99)
21. Donnez-vous des arachides/arachides ecrases a votre enfant? Oui Non21b. A quel age avez-vous commence? age en joms __ age en semains __ ageen mois.. Naissance = 0, nsp = 99)
22. Donnez-vous autre chose a manger ou a boire a cet enfant?22b. Qu'est-ce que vous lui avez donne?----------A la Partie ill
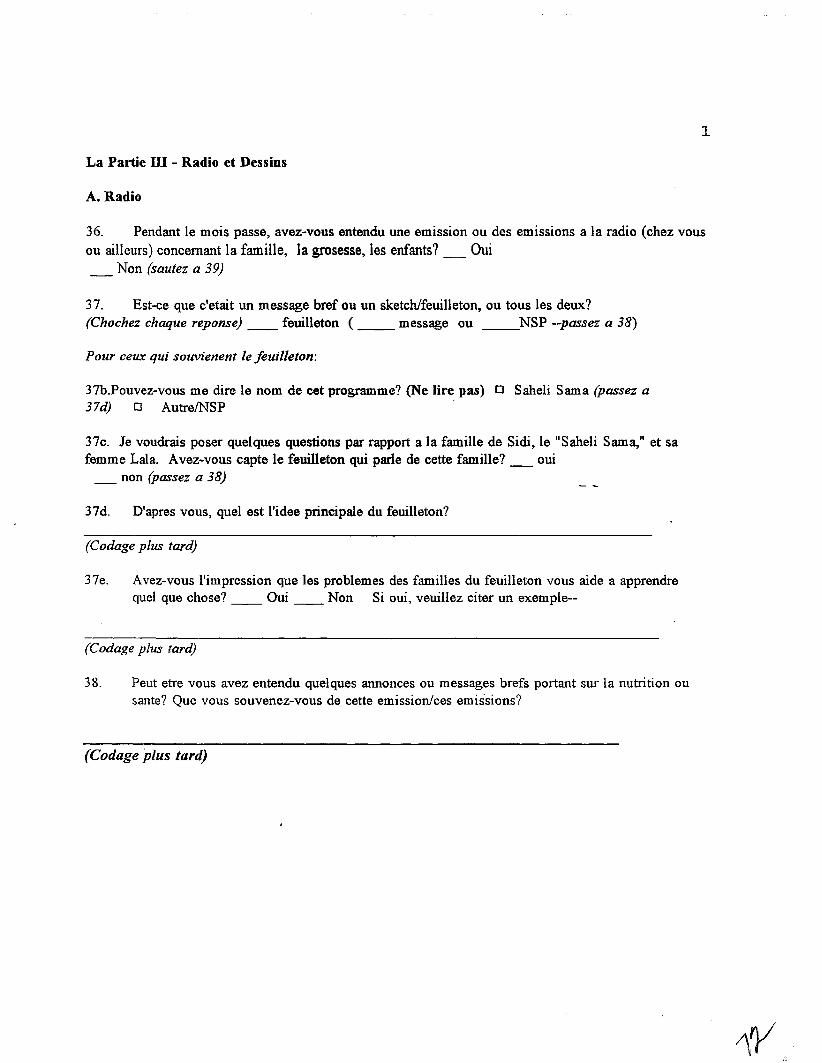
1
La Partie ill - Radio et Dessins
A. Radio
36. Pendant Ie mois passe, avez-vous entendu une emission ou des emissions a la radio (chez vousou ailleurs) concernant la familie, la grosesse, les enfants? _ Qui_ Non (sautez a 39)
37. Est-ce que c'etait un message bref au un sketchifeuilleton, au taus les deux?(Chochez chaque reponse) __ feuilleton ( __ message ou __NSP --passez a 38)
Pour ceux qui souvienent Ie jeuil/eton:
37b.Pouvez-vous me dire Ie nom de eet programme? (Ne lire pas) 0 Saheli Sama (passez a37d) 0 AutrelNSP
37c. Je voudrais poser quelques questions par rapport a la famille de Sidi, Ie "Saheli Sama," et safemme Lala. Avez-vous capte Ie feuilleton qui parle de cette familIe? _ oui
_ non (passez a 38)
37d. D'apres vous, quel est l'idee principale du feuilleton?
(Codage plus tardY
37e. Avez-vous l'impression que les problemes des familles du feuilleton vous aide a apprendrequel que chose? __ Qui __ Non Si oui, veuillez citer un exemple--
(Codage plus tardY
38. Peut etre vous avez entendu quelques annonces ou messages brefs portant sur la nutrition ousante? Que vous souvenez-vous de cette emission/ces emissions?
(Codage plus tardy
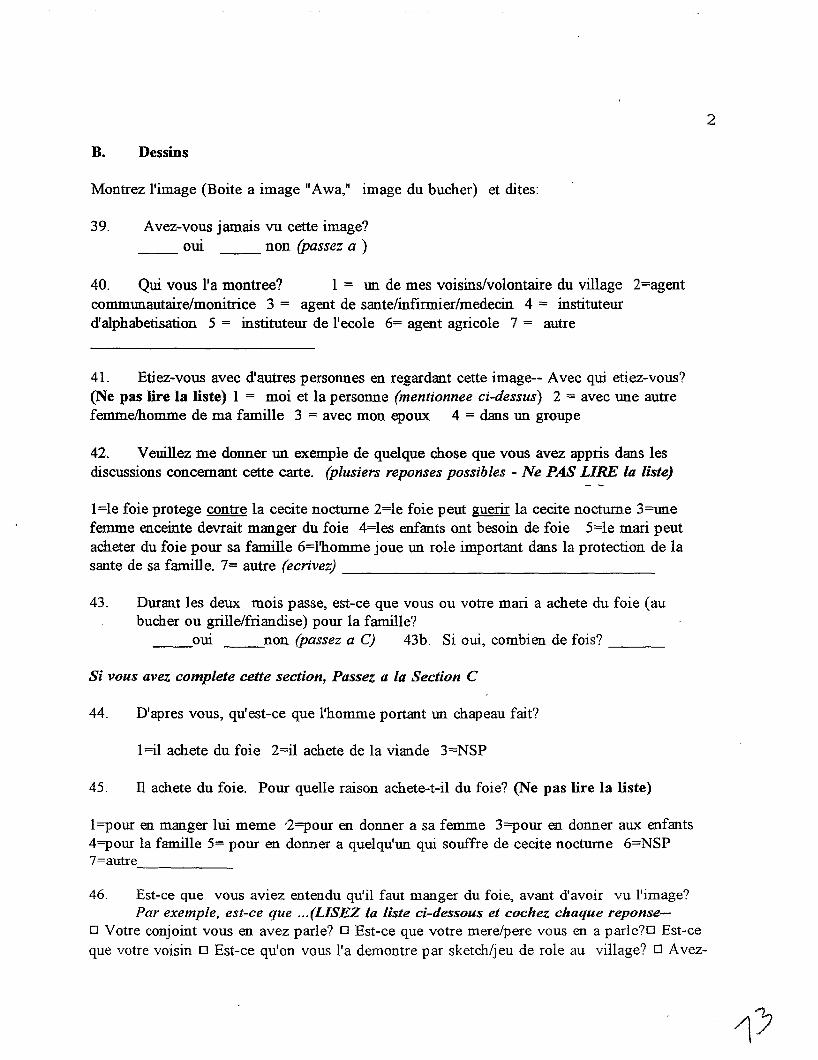
B. Dessins
Montrez l'image (Boite a image lIAwa,lI image du bucher) et dites:
39. Avez-vous jamais vu cette image?oui non (passez a )
40. Qui vous l'a montree? 1 = un de mes voisins/volontaire du village 2=agentcommlDlautaire/monitrice 3 = agent de sante/infirmier/medecin 4 = instituteurdlalphabetisation 5 = instituteur de l'ecole 6= agent agricole 7 = autre
41. Etiez-vous avec d'autres personnes en regardant cette image-- Avec qui etiez-vous?(Ne pas lire la liste) 1 = moi et la personne (mentionnee ci-dessus) 2 = avec une autrefemme/homme de ma famille 3 = avec man epoux 4 = dans un groupe
42. Veuillez me donner un exemple de quelque chose que vous avez appris dans lesdiscussions concernant cette carte. (plusiers reponses possibles - Ne PAS LIRE la liste)
1=le foie protege contre la cecite nocturne 2=le foie peut guerir la cecite nocturne 3=unefemme enceinte devrait manger du foie 4=les enfants ont besoin de foie 5=le mari peutacheter du foie pour sa famille 6=1'homme joue lDl role important dans la protection de lasante de sa famille. 7= autre (ecrivez) _
43. Durant les deux mois passe, est-ce que vous ou votre mari a achete du foie (aubucher au grille/friandise) pour la famille?__oui non (passez a C) 43b. Si oui, combien de fois? _
Si vous avez complete cette section, Passez a La Section C
44. D'apres vous, qu'est-ce que l'homme portant lDl chapeau fait?
1=i1 achete du foie 2=i1 achete de la viande 3=NSP
45. II achete du foie. Pour queUe raison achete-t-il du foie? (Ne pas lire la liste)
1=pour en manger lui meme '2=pour en donner a sa femme 3=pour en donner aux enfants4=pour la famille 5= pour en donner a quelqu'un qui souffre de cecite nocturne 6=NSP7=autre------
2
46. Est-ce que vous aviez entendu qu'il faut manger du foie, avant d'avoir vu l'image?Par exemple, est-ce que ... (LISEZ La liste ci-dessous et cochez chaque reponse-
o Votre conjoint vous en avez parle? 0 Est-ce que votre mere/pere vous en a parle?D Est-ceque votre voisin 0 Est-ce qu'on VallS lla demontre par sketch/jeu de role au village? 0 Avez-
3
vous vu une boite a image qui represente plus ou moins de la meme idee? 0 A-t-on parle decette idee a la radio?
47. Durant les deux mois passe, est-ce que vous ou votre mari a achete du foie (au bucher ougrille/friandise) pour la famille?
__oui non (passez a C)
47b. Si oui, combien de fois? _
C. Montrez l'image (Carte de Conseils No. 10) et dites:
48. Avez-vous jamais vu cette image?oui non (sautez a 55)
49. Qui vous l'a montre? 1 = un de mes voisins/volontaire du village 2=agentcommunautaire/monitrice 3 = agent de sante/infumier/medecin 4 = instituteurd'alphabetisation 5 = instituteur de l'ecole 6= agent agricole 7 = autre __
50. Etiez-vous avec d'autres personnes en regardant cette image-- Avec qui etiez-vous?(Ne pas lire la Iiste) 1 = moi et la personne (mentionnee ci-dessus) 2 = avec une autrefemme/homme de rna famille 3 = avec mon epoux 4 = dans un groupe
51. Veuillez me donner un exemple de quelque chose que VOllS avez appris par cette carte.(Ne pas lire la liste) l=donner de l'eau/kene a ji/ORS 2=donner a manger aux enfants .malades avec patience 3=encourager les enfants malades a manger 4=la bouillie enrichie, lasoupe de poisson est bonne pour l'enfant malade. 5. La banane ecrasee ou un fruit sucre etbonne pour les enfants malades. 6=autres --,- _
52. Comme vous voyez, cet enfant est malade. En effet, il est tres faible et perd du poidsparce qu'il est malade. Que doit faire la mere pour que son enfant se retablisse?(Ne pas lire la liste) (Cochez ta premiere reponse qui s'applique):o Donner beaucoup a boire 0 Continuer avec keneaji/ORS 0 Donner plus a mangerDDonner a manger avec patience 0 Donner a manger en petites quantites a la foiso Preparer la bouillie, la banane, de la soupe de poisson, ou un fruit pour encourager enfant a
manger. 0 Je ne sais pas 'DAutre: _
53. Quai d'autre (Coche= fa deuxieme reponse a partir de la liste ci-dessus.)
4
D. Montrez /'image (Carte No.5) et dUes:
54. Avez-vous jamais vu cette image?om non
55. Comme vous Ie voyez, la dame a deux enfants. Le plus jeune a 6 mois, l'ainee a unpeu plus de 2 ans. Pourquoi est-ce que l'ainee mange a cote de sa mere? (Ne pas lire la liste)I =pour que la mere puisse controler qu'il mange bien 2 = pour qu'elle puisse verifier sil'enfant fini son repas 3 =par habitude, comment faire autrem.ent 4 = autre reponse
56. D'apres vous, pourquoi utilise-t-elle ce bol pour cet enfant (indiquez l'ainee)(Ne pas lire la liste)
1=elle a ete recomande par l'agent/monitrice 2=c'est plus simple/c'est pratique 3=c'est plusnet/agreable 4=c'est plus facile de veiller sur l'alimentation de l'enfant 5=11enfant est fragile6=c'est son habitude 7=NSP 8=autre------------57. Avez-vous deja utilise un petit bol/une petite calebasse pour donner-.a..manger
individullement a un seule enfant de plus d'un an? Oui Non
58. Aviez-vous deja entendu qu'il fallait donner a manger comme ca?__ oui __ non (Si non, passez a 60 )
59. Comment l'avez vous entendu? I =belle mere/autre parente 2=co-epouse 3=00 demes voisins/volontaire de village 4=agent commooautaire/monitrice 5 = agent desante/infirmier/medecin 6 = instituteur d'alphabetisation 7 = instituteur de l'ecole 8= agentagricole 9 = radio 10=autre
60. Que pensez-vous de cette idee? LISEZ LA LISTE __ je pense que c'est unemauvaise idee __ je pense que c'est une bonne idee, mais je ne veux pas l'essayer__ je pense que dest une bonne idee, mais je ne peux pas l'essayer~e pense que c'estooe bonne idee, et je voudrais l'essayer.
FIN. MEReI.
AVEZ VOUS LA FICHE DE L 'ENFANT ET LE QUESTIONNAIRE DU MARl, SINECESSAlRE?
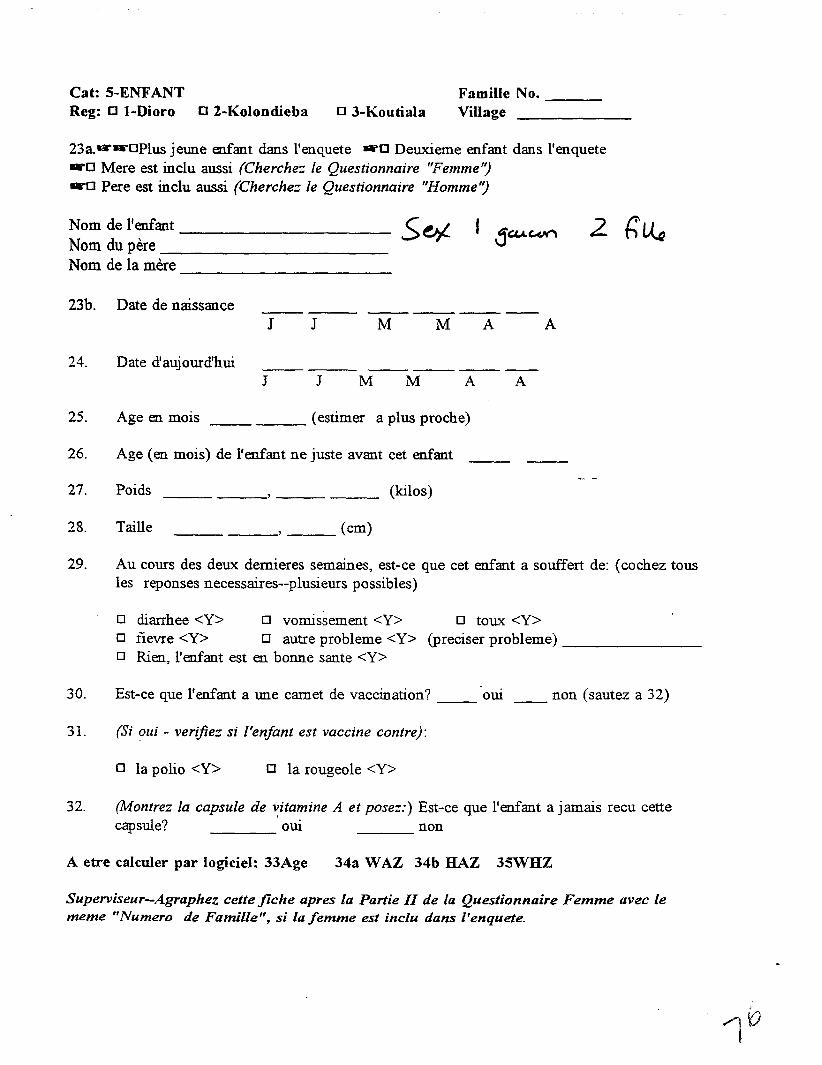
Cat: 5-ENFANTReg: 0 I-Dioro 02-Kolondieba o 3-Koutiala
Famille No. ---Village
23a.d'IIIIi"OPlus jeune enfant dans l'enquete "0 Deuxieme enfant dans l'enquete.-0 Mere est inclu aussi (Cherchez Ie Questionnaire "Femme'').-0 Pere est inclu aussi (Cherchez Ie Questionnaire "Homme'')
Nom de Itenfant ------------Nom du pere _Nom de la mere ------------23b. Date de naissance
24. Date d'aujourd'hui
J
J
J
J M
M
M
M
A
A
A
A
25. Age en mois _____ (estimer a plus proche)
26. Age (en mois) de l'enfant ne juste avant cet enfant
27.
28.
Poids
Taille _________ (em)
(kilos)
29. Au COUTS des deux demieres semaines, est-ee que eet enfant a souffert de: (coehez tousles reponses necessaires--plusieurs possibles)
o diarrhee <V> 0 vomissement <V> 0 toux <V>o fievre <V> 0 autre probleme <V> (preciser probleme) _o Rien, l'enfant est en bonne sante <V>
30. Est-ce que l'enfant a une camet de vaccination? __-oui __ non (sautez a 32)
31. (Si oui - verifiez si l'enfant est vaccine contre):
o la polio <V> o la rougeole <V>
32. (Montrez la capsule de ,,:itamine A et posez:) Est-ee que l'en.fant a jamais recu cettecapsule? oui non
A etre caleuler par logicieI: 33Age 34a W AZ 34b HAZ 35WHZ
Superviseur-Agraphez cette fiche apres la Partie II de la Questionnaire Femme avec Iememe "Numero de Famille", si lafemme est inclu dans l'enquete.
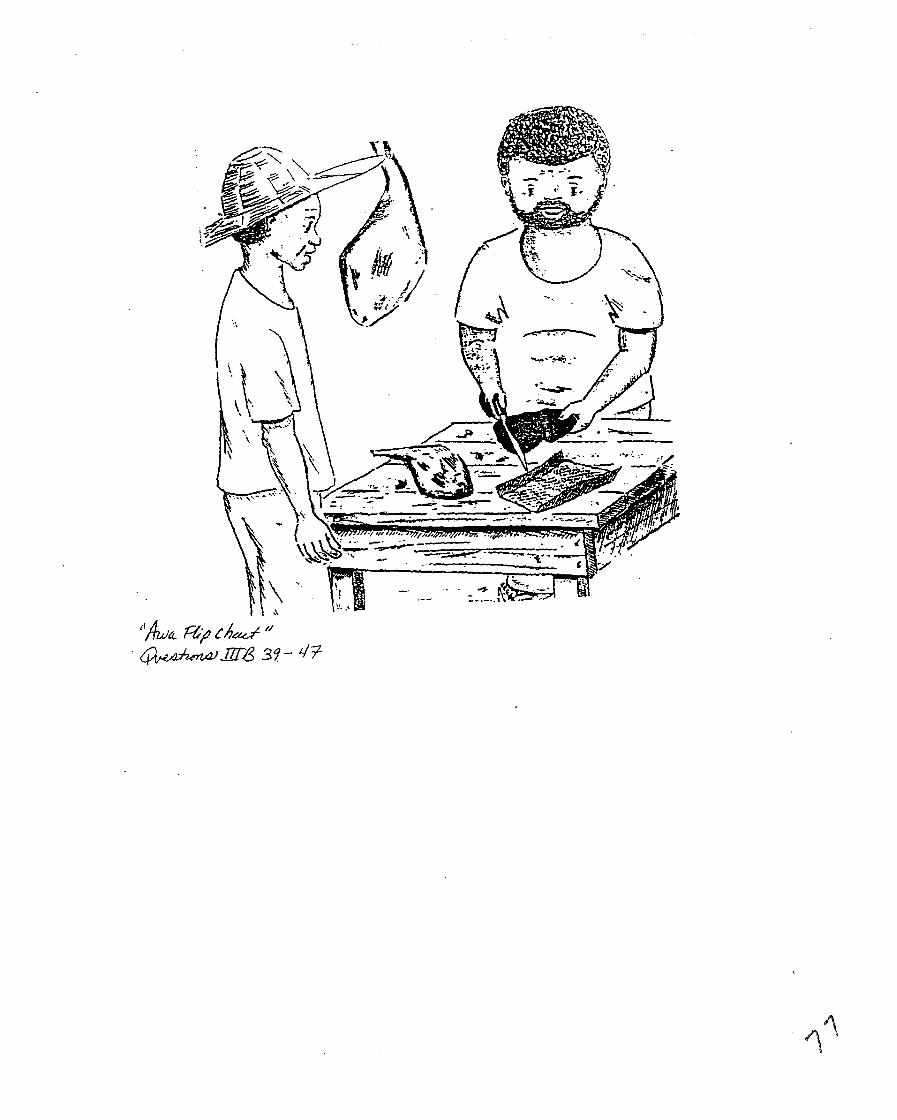
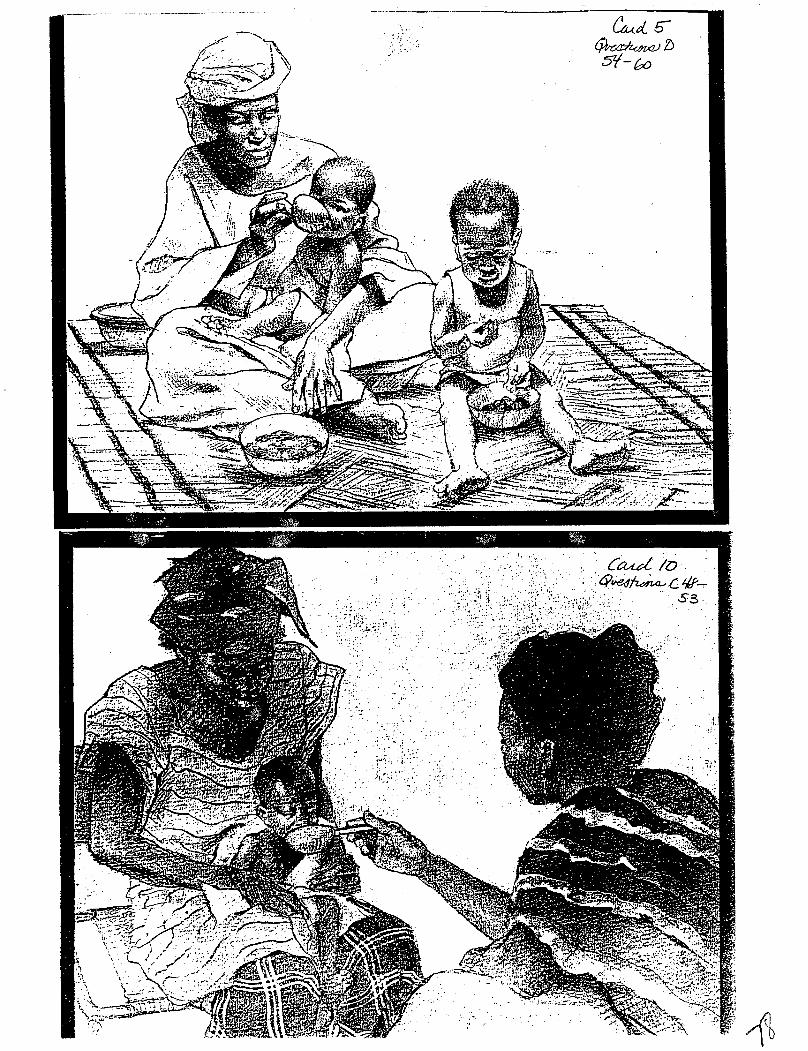
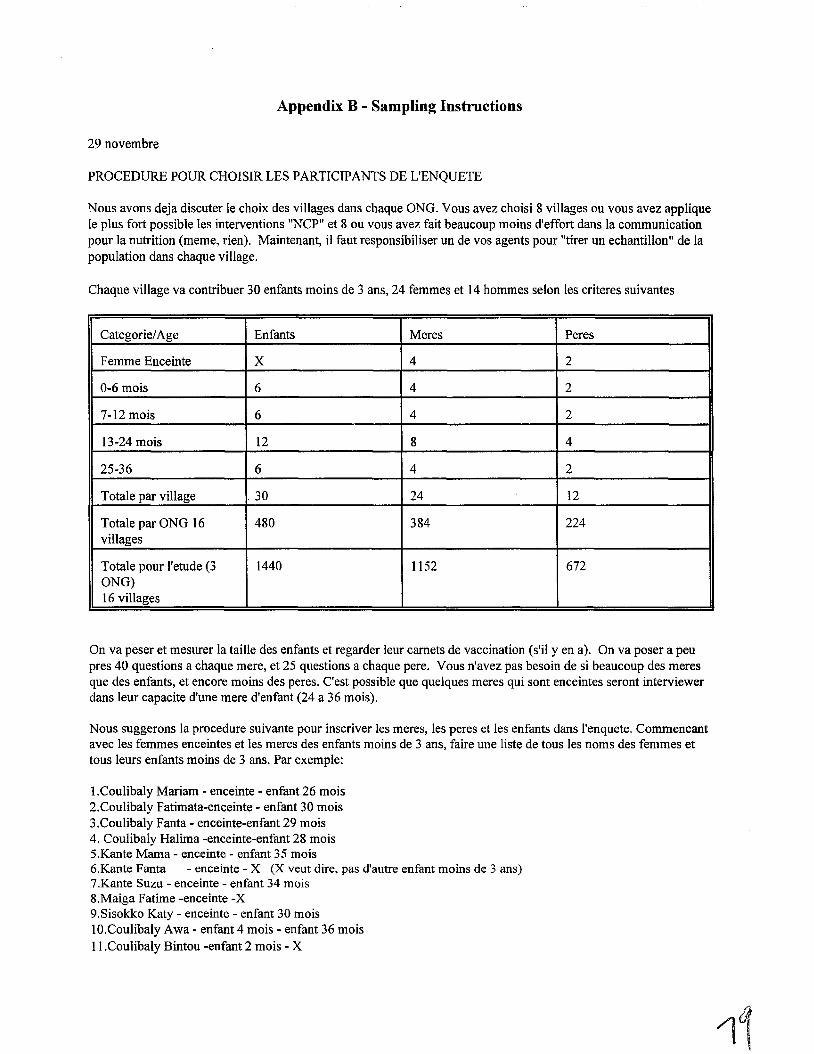
Appendix B - Sampling Instructions
29 novembre
PROCEDURE POUR CHOISIR LES PARTICIPANTS DE L'ENQUETE
Nous avons deja discuter Ie choix des villages dans chaque ONG. Vous avez choisi 8 villages ou vous avez appliqueIe plus fort possible les interventions "NCP" et 8 ou vous avez fait beaucoup moins d'effort dans la communicationpour la nutrition (meme, rien). Maintenant, il faut responsibiliser un de vos agents pour "tirer un echantillon" de lapopulation dans chaque village.
Chaque village va contribuer 30 enfants moins de 3 ans, 24 femmes et 14 hommes selon les criteres suivantes
Categorie/Age Enfants Meres Peres
Femme Enceinte X 4 2
0-6 mois 6 4 2
7-12 mois 6 4 2
13-24 mois 12 8 4
25-36 6 4 2
Totale par village .30 24 12
Totale par ONG 16 480 384 224villages
Totale pour I'etude (3 1440 1152 672ONG)16 villages
On va peser et mesurer la taille des enfants et regarder leur camets de vaccination (s'i! y en a). On va poser a peupres 40 questions a chaque mere, et 25 questions a chaque pere. Vous n'avez pas besoin de si beaucoup des meresque des enfants, et encore moins des peres. C'est possible que quelques meres qui sont enceintes seront interviewerdans leur capacite d'une mere d'enfant (24 a 36 mois).
Nous suggerons la procedure suivante pour inscriver les meres, les peres et les enfants dans l'enquete. Commencantavec les femmes enceintes et les meres des enfants moins de 3 ans, faire une liste de tous les noms des femmes ettous leurs enfants moins de 3 ans. Par exemple:
I.Coulibaly Mariam - enceinte - enfant 26 mois2.Coulibaly Fatimata-enceinte - enfant 30 mois3.Coulibaly Fanta - enceinte-enfant 29 mois4. Coulibaly Halima -enceinte-enfant 28 mois5.Kante Mama - enceinte - enfant 35 mois6.Kante Fanta - enceinte - X (X veut dire, pas d'autre enfant moins de 3 ans)7.Kante Suzu - enceinte - enfant 34 mois8.Maiga Fatime -enceinte-X9.Sisokko Katy - enceinte - enfant 30 mois1O.Coulibaly Awa - enfant 4 mois - enfant 36 moisII.Coulibaly Bintou -enfant 2 mois - X
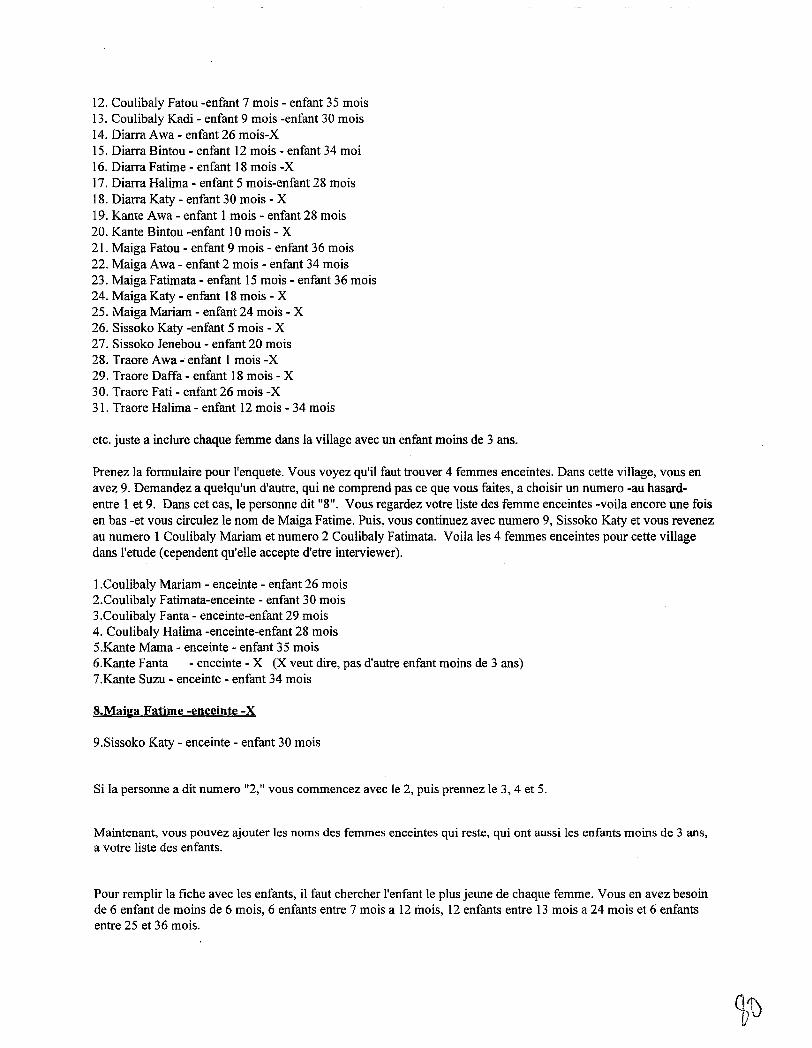
12. Coulibaly Fatou -enfant 7 mois - enfant 35 mois13. Coulibaly Kadi - enfant 9 mois -enfant 30 mois14. Diarra Awa - enfant 26 mois-X15. Diarra Bintou - enfant 12 mois - enfant 34 moi16. Diarra Fatime - enfant 18 mois -x17. Diarra Halima - enfant 5 mois-enfant 28 mois18. Diarra Katy - enfant 30 mois - X19. Kante Awa - enfant 1 mois - enfant 28 mois20. Kante Bintou -enfant 10 mois - X21. Maiga Fatou - enfant 9 mois - enfant 36 mois22. Maiga Awa - enfant 2 mois - enfant 34 mois23. Maiga Fatimata - enfant 15 mois - enfant 36 mois24. Maiga Katy - enfant 18 mois - X25. Maiga Mariam - enfant 24 mois - X26. Sissoko Katy -enfant 5 mois - X27. Sissoko Jenebou - enfant 20 mois28. Traore Awa..; enfant 1 mois-X29. Traore Daffa - enfant 18 mois - X30. Traore Fati - enfant 26 mois-X31. Traore Halima - enfant 12 mois - 34 mois
etc. juste a inclure chaque femme dans la village avec un enfant moins de 3 ans.
Prenez la formulaire pour l'enquete. Vous voyez qu'il faut trouver 4 femmes enceintes. Dans cette village, vous enavez 9. Demandez a quelqu'un d'autre, qui ne comprend pas ce que vous faites, a choisir un numero -au hasardentre 1 et 9. Dans cet cas, Ie personne dit "8". Vous regardez votre liste des femme enceintes -voila encore une foisen bas -et vous circulez Ie nom de Maiga Fatime. Puis, vous continuez avec numero 9, Sissoko Katy et vous revenezau numero 1 Coulibaly Mariam et numero 2 Coulibaly Fatimata. Voila les 4 femmes enceintes pour cette villagedans l'etude (cependent qu'elle accepte d'etre interviewer).
I.Coulibaly Mariam - enceinte - enfant 26 mois2.Coulibaly Fatimata-enceinte - enfant 30 mois3.Coulibaly Fanta - enceinte-enfant 29 mois4. Coulibaly Halima -enceinte-enfant 28 mois5.Kante Mama - enceinte - enfant 35 mois6.Kante Fanta - enceinte - X (X veut dire, pas d'autre enfant moins de 3 ans)7.Kante Suzu - enceinte - enfant 34 mois
8.Maiga Fatime -enceinte -X
9.Sissoko Katy - enceinte - enfant 30 mois
Si la personne a dit numero "2," vous commencez avec Ie 2, puis prennez Ie 3, 4 et 5.
Maintenant, vous pouvez ajouter les noms des femmes enceintes qui reste, qui ont aussi les enfants moins de 3 ans,a votre liste des enfants.
Pour remplir la fiche avec les enfants, il faut chercher I'enfant Ie plus jeune de chaque femme. Vous en avez besoinde 6 enfant de moins de 6 mois, 6 enfants entre 7 mois a 12 mois, 12 enfants entre 13 mois a 24 mois et 6 enfantsentre 25 et 36 mois.
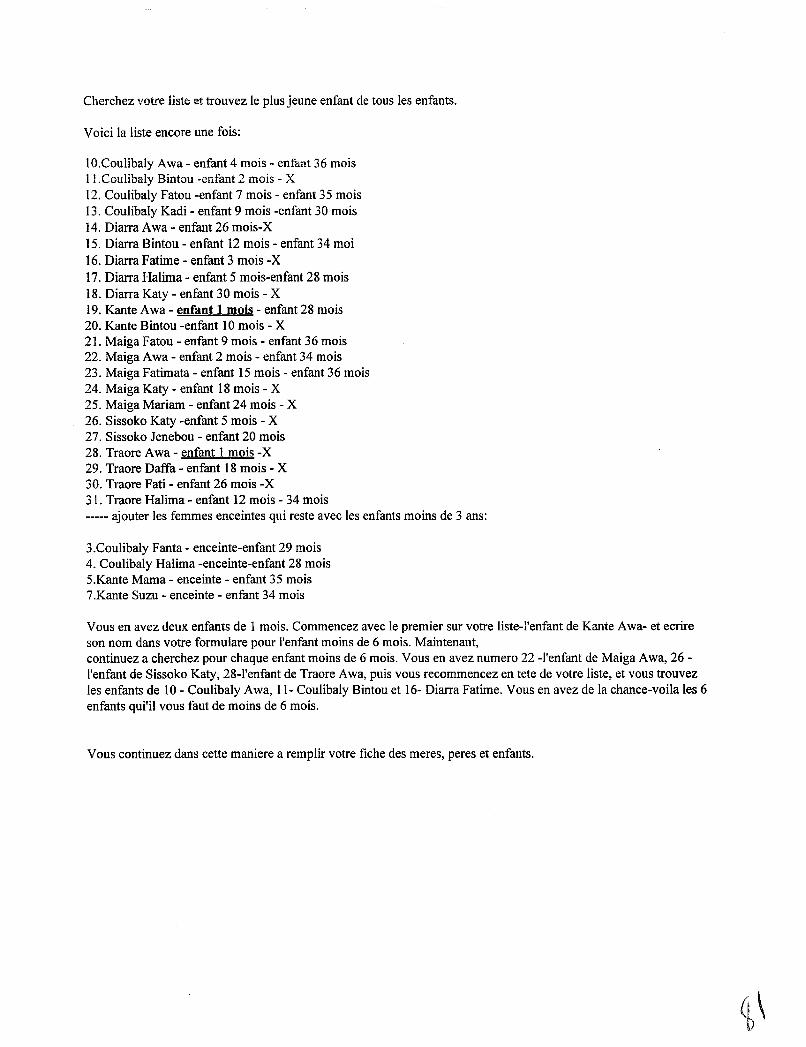
Cherchez votre liste et trouvez Ie plus jeune enfant de tous les enfants.
Voici la liste encore une fois:
1O.Coulibaly Awa - enfant 4 mois - enfa..'1t 36 moisII.Coulibaly Bintou -enfant 2 mois - X12. Coulibaly Fatou -enfant 7 mois - enfant 35 mois13. Coulibaly Kadi - enfant 9 mois -enfant 30 mois14. Diarra Awa - enfant 26 mois-X15. Diarra Bintou - enfant 12 mois - enfant 34 moi16. Diarra Fatime - enfant 3 mois-X17. Diarra Halima - enfant 5 mois-enfant 28 mois18. Diarra Katy - enfant 30 mois - X19. Kante Awa - enfant 1 mois - enfant 28 mois20. Kante Bintou -enfant 10 mois - X21. Maiga Fatou - enfant 9 mois - enfant 36 mois22. Maiga Awa - enfant 2 mois - enfant 34 mois23. Maiga Fatimata - enfant 15 mois - enfant 36 mois24. Maiga Katy - enfant 18 mois - X25. Maiga Mariam - enfant 24 mois - X26. Sissoko Katy -enfant 5 mois - X27. Sissoko Jenebou - enfant 20 mois28. Traore Awa - enfant 1 mois-X29. Traore Daffa - enfant 18 mois - X30. Traore Fati - enfant 26 mois -X31. Traore Halima - enfant 12 mois - 34 mois----- ajouter les femmes enceintes qui reste avec les enfants moins de 3 ans:
3.Coulibaly Fanta - enceinte-enfant 29 mois4. Coulibaly Halima -enceinte-enfant 28 mois5.Kante Mama - enceinte - enfant 35 mois7.Kante Suzu - enceinte - enfant 34 mois
Vous en avez deux enfants de 1 mois. Commencez avec Ie premier sur votre liste-l'enfant de Kante Awa- et ecrireson nom dans votre formulare pour l'enfant moins de 6 mois. Maintenant,continuez a cherchez pour chaque enfant moins de 6 mois. Vous en avez numero 22 -l'enfant de Maiga Awa, 26l'enfant de Sissoko Katy, 28-I'enfant de Traore Awa, puis vous recommencez en tete de votre liste, et vous trouvezles enfants de 10 - Coulibaly Awa, 11- Coulibaly Bintou et 16- Diarra Fatime. Vous en avez de la chance-voila les 6enfants qui'il vous faut de moins de 6 mois.
Vous continuez dans cette maniere a remplir votre fiche des meres, peres et enfants.
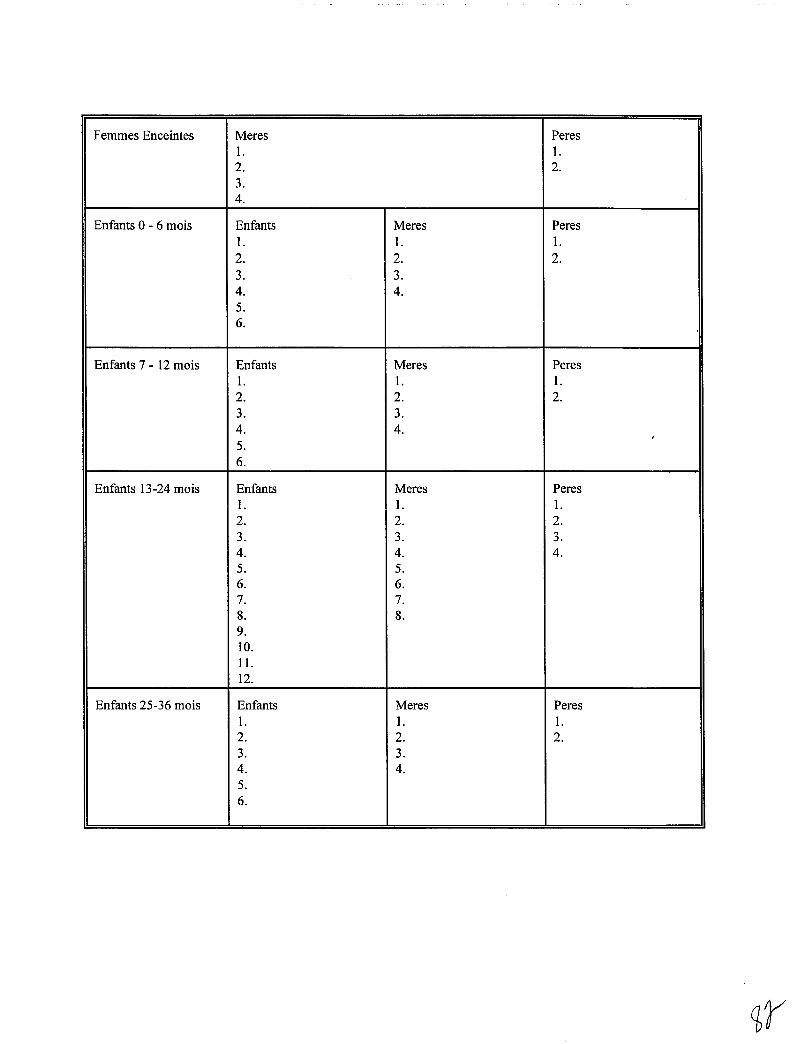
Femmes Enceintes Meres PeresI. I.2. 2.3.4.
Enfants 0 - 6 mois Enfants Meres PeresI. I. I.2. 2. 2.3. 3.4. 4.5.6.
Enfants 7 - 12 mois Enfants Meres PeresI. I. I.2. 2. 2.3. 3.4. 4.5.6.
Enfants 13-24 mois Enfants Meres PeresI. I. I.2. 2. 2.3. 3. 3.4. 4. 4.5. 5.6. 6.7. 7.8. 8.9.10.II.12.
Enfants 25-36 mois Enfants Meres PeresI. I. I.2. 2. 2.3. 3.4. 4.5.6.
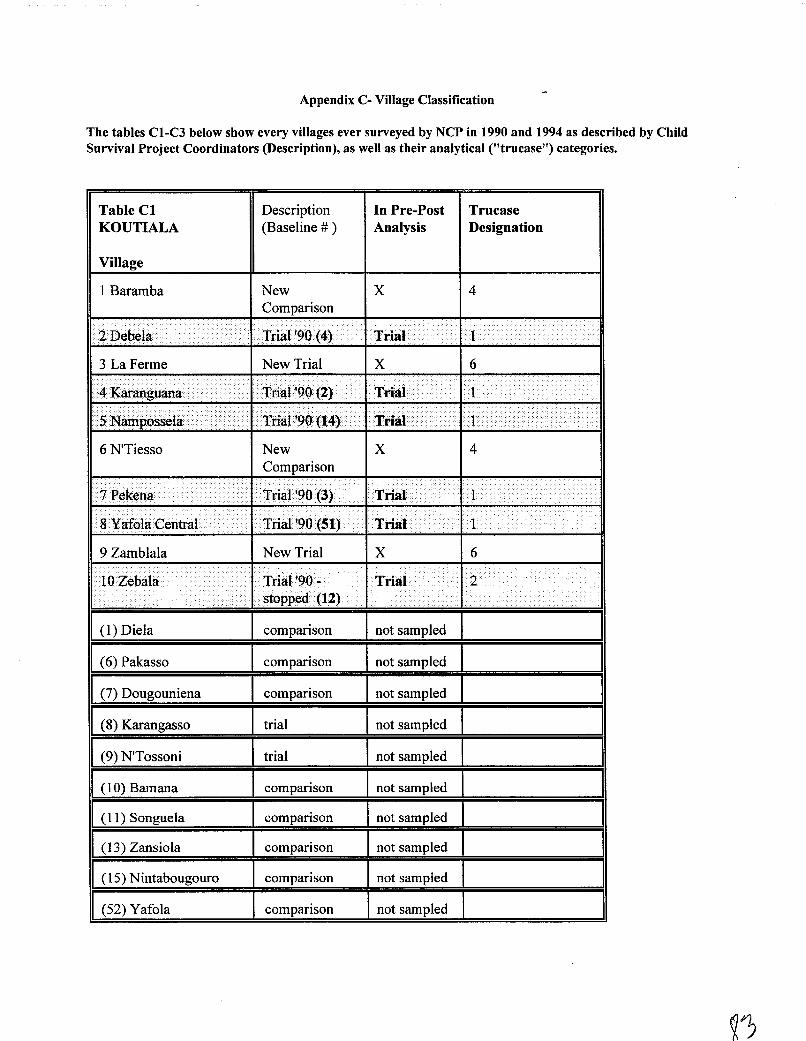
Appendix C- Village Classification
The tables CI-C3 below show every villages ever surveyed by NCP in 1990 and 1994 as described by ChildSurvival Project Coordinators (Description), as well as their analytical ("trucase") categories.
Table ClKOUTIALA
Village
Description(Baseline # )
In Pre-PostAnalysis
TrucaseDesignation
1 Baramba NewComparison
x 4
'- .. '. .. • ••"" fA\....... . T ..~ol· ·1
3 La Ferme New Trial X 6
6 N'Tiesso NewComparison
X 4
" ~. ~ .... . .
.
-_.... ....
/ .. .
Trial '90 -..... ... . .stopped· (12)
9 Zamblala
- ...i
.
(1) Diela
(6) Pakasso
U) Vougouniena
(8) Karangasso
(9) N'Tossoni
(10) Bamana
(11) Songuela
(13) Zansiola
(15) Nintabougouro
(52) Yafola
New Trial
comparison
comparison
comparison
trial
trial
comparison
comparison
comparison
comparison
comparison
'~ .. .1 ....· •••AIl··' . .
~. .1
.
.inal·
X 6
~....nal. 2
I
not sampled
not sampled
not sampled
not sampled
not sampled
not sampled
not sampled
not sampled
not sampled
not sampled
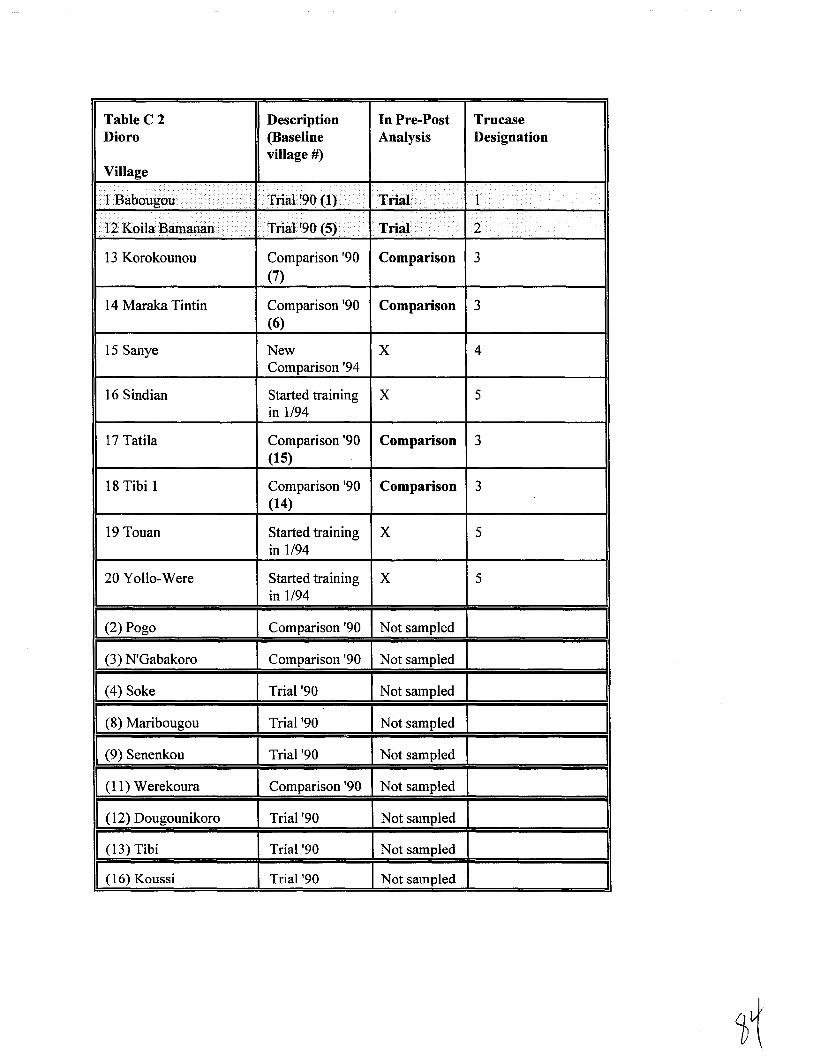
Table C 2 Description In Pre-Post TrucaseDioro (Baseline Analysis Designation
village #)Village
I.r n ···.·i ... i ••...... ,.
'1\ \ ,..., ...........··1 • ••••.,. ._. ...
• ••
>••..••.•.•... • • •••••....
. ...
112.,..., ......... 2< Tnal >,u \;)J •.•• ·.lnal .•.•··
13 Korokounou Comparison '90 Comparison 3(7)
14 Maraka Tintin Comparison '90 Comparison 3(6)
15 Sanye New X 4Comparison '94
16 Sindian Started training X 5in 1/94
17 Tatila Comparison '90 Comparison 3(15)
18 Tibi 1 Comparison '90 Comparison 3(14)
19 Touan Started training X 5in 1/94
20 Yollo-Were Started training X 5in 1/94
II (2) Pogo Comparison '90 Not sampled
(3) N'Gabakoro Comparison '90 Not sampled
(4) Soke Trial '90 Not sampled
(8) Maribougou Trial '90 Not sampled
an co enenkou Trial '90 Not sampled
(11) Werekoura Comparison '90 Not sampled
(12) Dougounikoro Trial '90 Not sampled
(13) Tibi Trial '90 Not sampled
(16) Koussi Trial '90 Not sampled
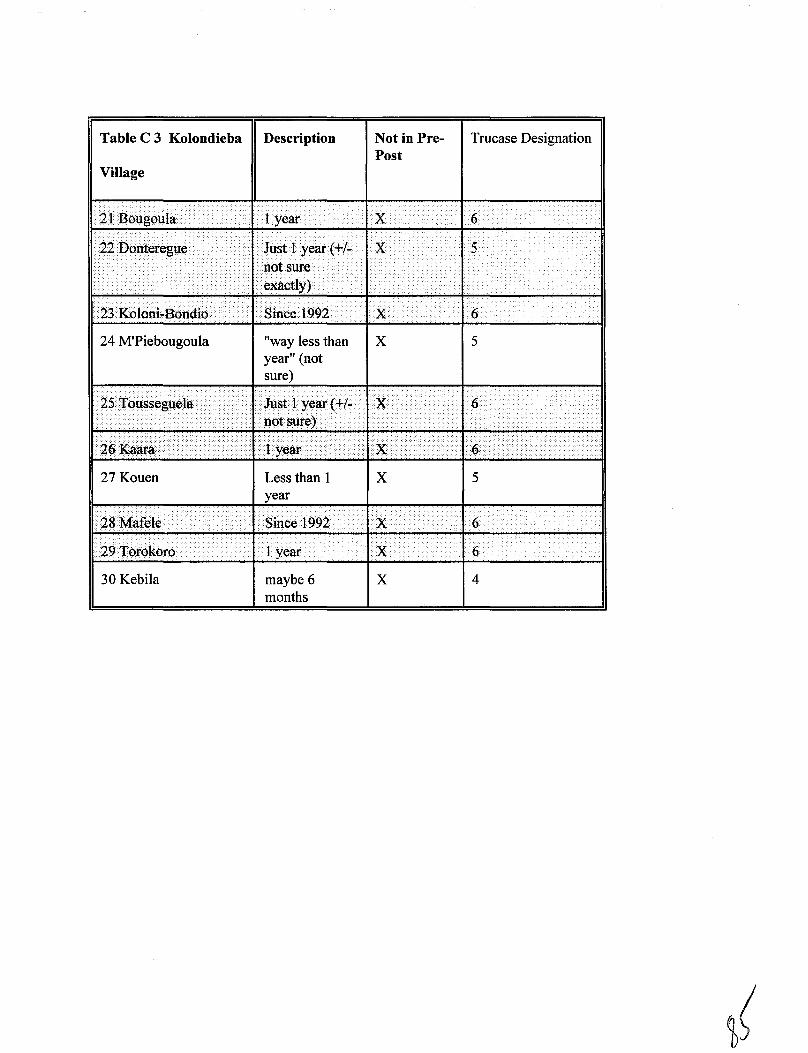
Table C 3 Kolondieba Description
Village
Not in PrePost
Trucase Designation
.' . .··..1...... ···~vear IX 6
:c._.~.. . .... ' .• 1 /.[ I' x .II 22D~ntere:gue' ." ~. )'''',.. \ .,-'. .... .... - .... ..
.. . . ". .,:
.'. . ". " .....
. , ., .•..:..... --' ·lQQ? X 6
24 M'Piebougoula
. '. .' ".
.
"way less thanyear" (notsure)
X 5
I.: .... . .' ..::... . •. .' 6. '.' ..
. '.' .
27 Kouen Less than 1 X 5year
-.: ~. • . 1 year . I X 6
30 Kebila maybe 6months
x 4
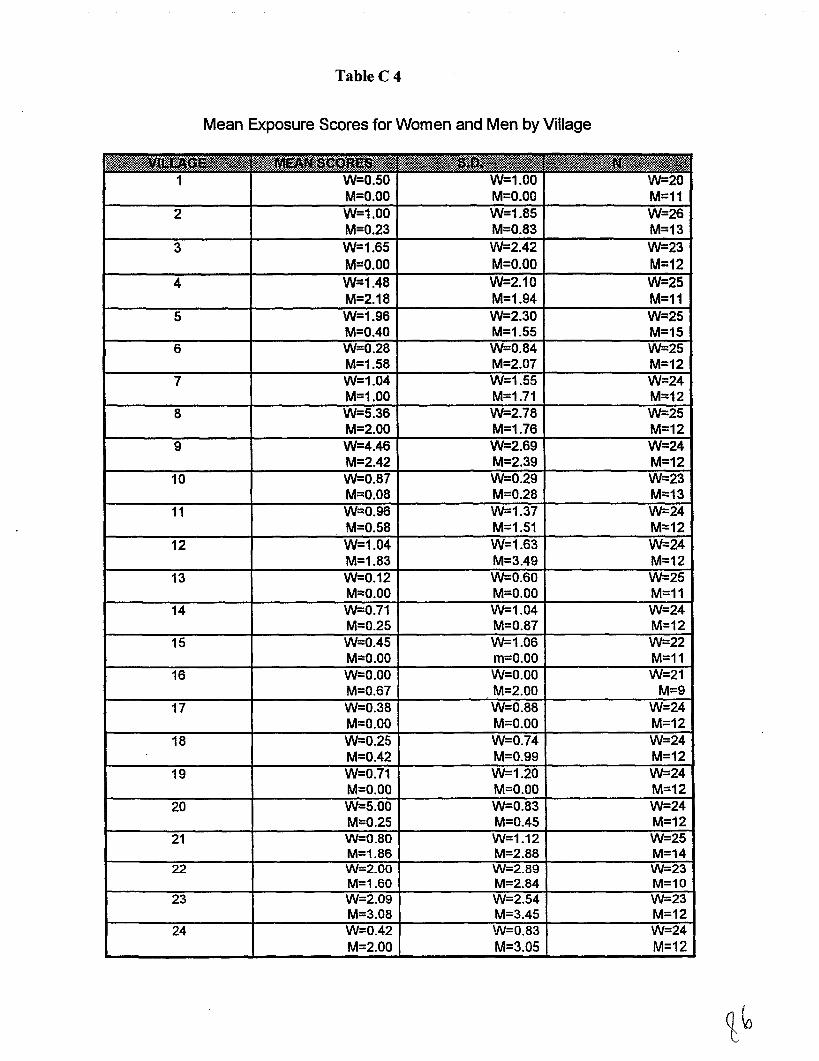
TableC 4
Mean Exposure Scores for Women and Men by Village
_tie•• " , " ,'.itt, , ,
II.!;' ;:::: •• •••• .... •.••• •• • ,!S:-.................:••.•-:•••• : .......... " ...:-.. '"
1 W=O.50 W=1.00 W=20M=O.OO M=O.OO M=11
2 W=1.00 W=1.85 W=26M=O.23 M=O.83 M=13
3 W=1.65 W=2.42 W=23M=O.OO M=O.OO M=12
4 W=1.48 W=2.10 W=25M=2.18 M=1.94 M=11
5 W=1.96 W=2.30 W=25M=0.40 M=1.55 M=15
6 W=0.28 W=0.84 W=25M=1.58 M=2.07 M=12
7 W=1.04 W=1.55 W=24M=1.00 M=1.71 M=12
8 W=5.36 W=2.78 W=25M=2.00 M=1.76 M=12
9 W=4.46 W=2.69 W=24M=2.42 M=2.39 M=12
10 W=0.87 W=0.29 W=23M=0.08 M=0.28 M=13
11 W=0.96 W=1.37 W=24M=0.58 M=1.51 M=12
12 W=1.04 W=1.63 W=24M=1.83 M=3.49 M=12
13 W=0.12 W=0.60 W=25M=O.OO M=O.OO M=11
14 W=0.71 W-1.04 W=24M=O.25 M=0.87 M=12
15 W=0.45 W-1.06 W=22M=O.OO m=O.OO M=11
16 W=O.OO W=O.OO W=21M=O.67 M=2.00 M=9
17 W=0.38 W=0.88 W=24M=O.OO M=O.OO M=12
18 W=0.25 W-0.74 W=24M=0.42 M=0.99 M=12
19 W=O.71 W=1.20 W=24M=O.OO M=O.OO M=12
20 W=5.00 W=0.83 W=24M=0.25 M=0.45 M=12
21 W=0.80 W-1.12 W-25M=1.86 M=2.88 M=14
22 W=2.00 W-2.89 W-23M=1.60 M=2.84 M=10
23 W=2.09 W-2.54 W=23M=3.08 M=3.45 M=12
24 W=0.42 W=0.83 W=24M=2.00 M=3.05 M=12
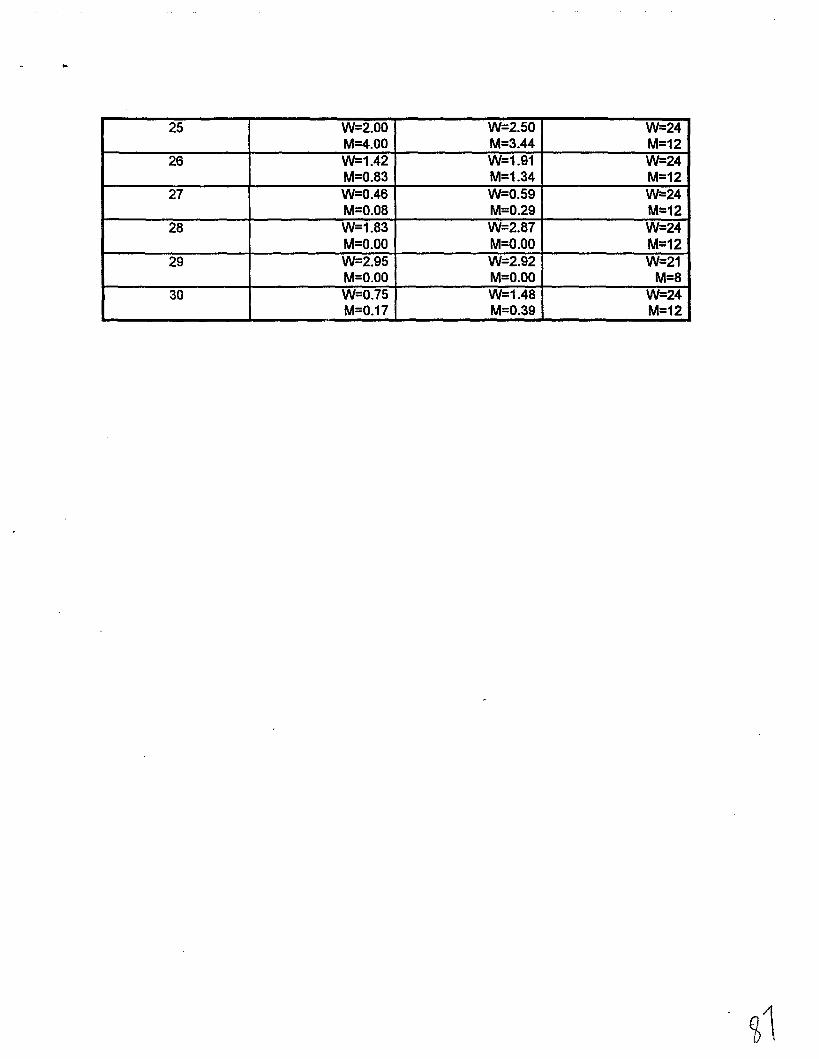
25 W=2.00 W=2.50 W=24M=4.00 M=3.44 M=12
26 W=1.42 W=1.91 W=24M=0.83 M=1.34 M=12
27 W=0.46 W=0.59 W=24M=0.08 M=0.29 M=12
28 W=1.83 W=2.87 W=24M=O.OO M=O.OO M=12
29 W=2.95 W=2.92 W=21M=O.OO M=O.OO M=8
30 W=0.75 W=1.48 W=24M=0.17 M=0.39 M=12
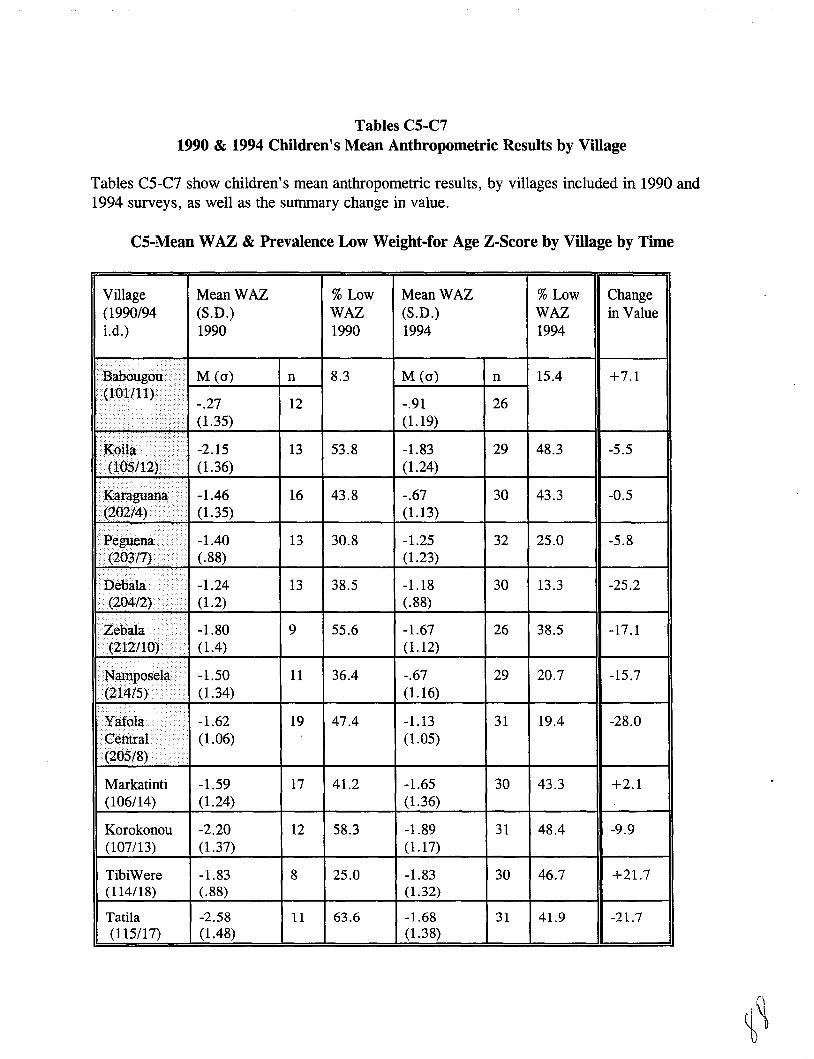
Tables C5-C71990 & 1994 Children's Mean Anthropometric Results by Village
Tables C5-C7 show children's mean anthropometric results, by villages included in 1990 and1994 surveys, as well as the summary change in value.
CS-Mean WAZ & Prevalence Low Weight-for Age Z-Score by Village by Time
Village(1990/94Ld.)
..
~
"ill..... . -, .....
. .
MeanWAZ(S.D.)1990
M (0)
-.27(1.35)
%LowWAZ1990
n 8.3
12
MeanWAZ(S.D.)1994
M (0)
-.91(1.19)
%LowWAZ1994
n 15.4
26
Changein Value
+7.1
••••••••
III<:gil:ii »1 -2.15"Ll) (1. 36)
(1.35)
11- -1.40- .
f).. . (.88)
•. "n<>l~ •. •.•• -1.24./7.\ ..... ... (1.2)
- . ........ -1.80II '\-,,'l,"ul ".I'"1IlltlU}IY· ( 1.4)
L -1.50L I) .. (1.34)
T • -1.62I
(1.06)I.\,,",v 'oj ...•
13 53.8
16 43.8
13 30.8
13 38.5
9 55.6
11 36.4
19 47.4
-1.83(1.24)
-.67(1.13)
-1.25(1.23)
-1.18(.88)
-1.67(1.12)
-.67(1.16)
-1.13(1.05)
29 48.3
30 43.3
32 25.0
30 13.3
26 38.5
29 20.7
31 19.4
-5.5
-0.5
-5.8
-25.2
-17.1
-15.7
-28.0
Markatinti(106/14)
Korokonou(107/13)
TibiWere(114/18)
Tatila(115/17)
-1.59(1.24)
-2.20(1.37)
-1.83(.88)
-2.58(1.48)
17
12
8
11
41.2
58.3
25.0
63.6
-1.65(1.36)
-1.89(1.17)
-1.83(1.32)
-1.68(1.38)
30
31
30
31
43.3
48.4
46.7
41.9
+2.1
-9.9
+21.7
-21.7
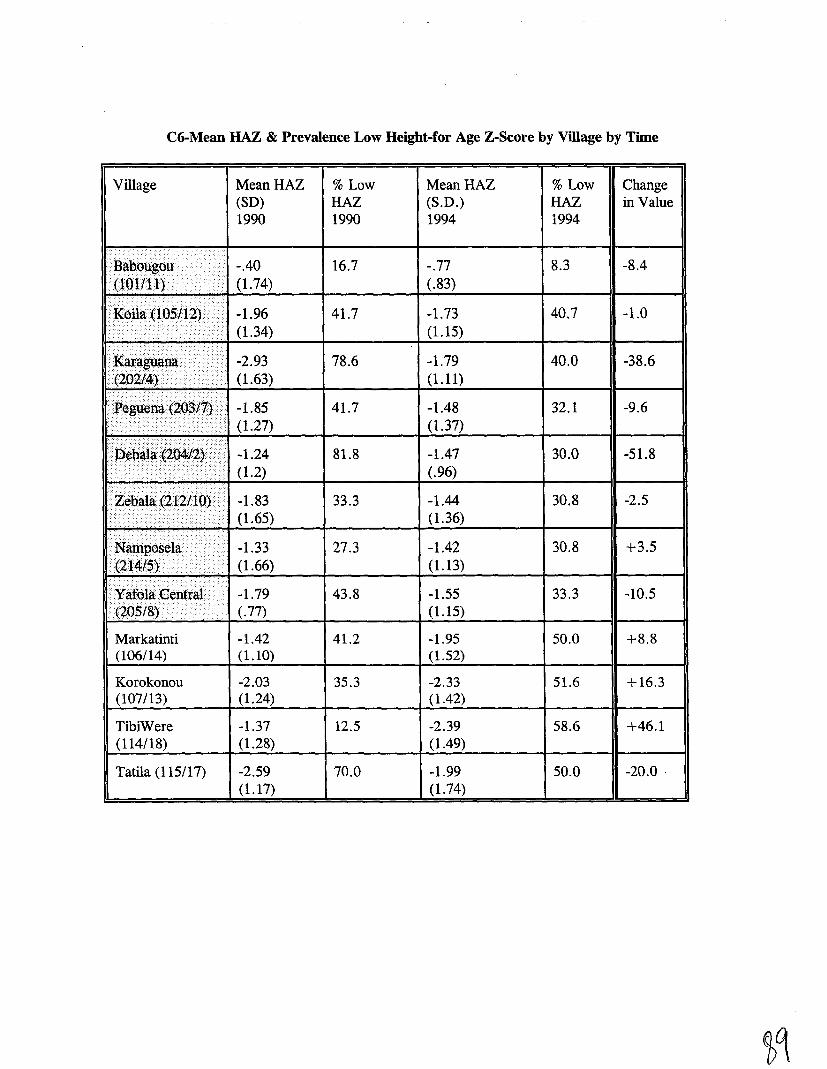
C6-Mean HAZ & Prevalence Low Height-for Age Z-Score by Village by Time
Village MeanHAZ(SO)1990
% LowHAZ1990
MeanHAZ(S.D.)1994
% LowHAZ1994
Changein Value
. ' ..
i; .•.... ..... '.
..... ,.. ..... .....
.
-.40 16.7 -.77(1.74) (.83)
-1.96 41.7 -1.73(1.34) (1.15)
-2.93 78.6 -1.79(1.63) (1.11)
8.3
40.7
40.0
-8.4
-1.0
-38.6
.... ....IItZ,ebaJ.a(2c12/:'lOy i l -1.83 33.3 -1.44
i'\ (1.65) (1.36)....... ...... /
IIN'a.tllIlOselaii •. />il -1.33 27.3 -1.42i ....>< (1.66) (1.13)
....i -1.79 43.8 -1.55............ / •.•.•.• (.77) (1.15)
30.8
30.8
33.3
-2.5
+3.5
-10.5
Markatinti(106/14)
Korokonou(107/13)
TibiWere(114/18)
Tatila (115/17)
-1.42 41.2 -1.95(1.10) (1.52)
-2.03 35.3 -2.33(1.24) (1.42)
-1.37 12.5 -2.39(1.28) (1.49)
-2.59 70.0 -1.99(1.17) (1.74)
50.0
51.6
58.6
50.0
+8.8
+16.3
+46.1
-20.0 .
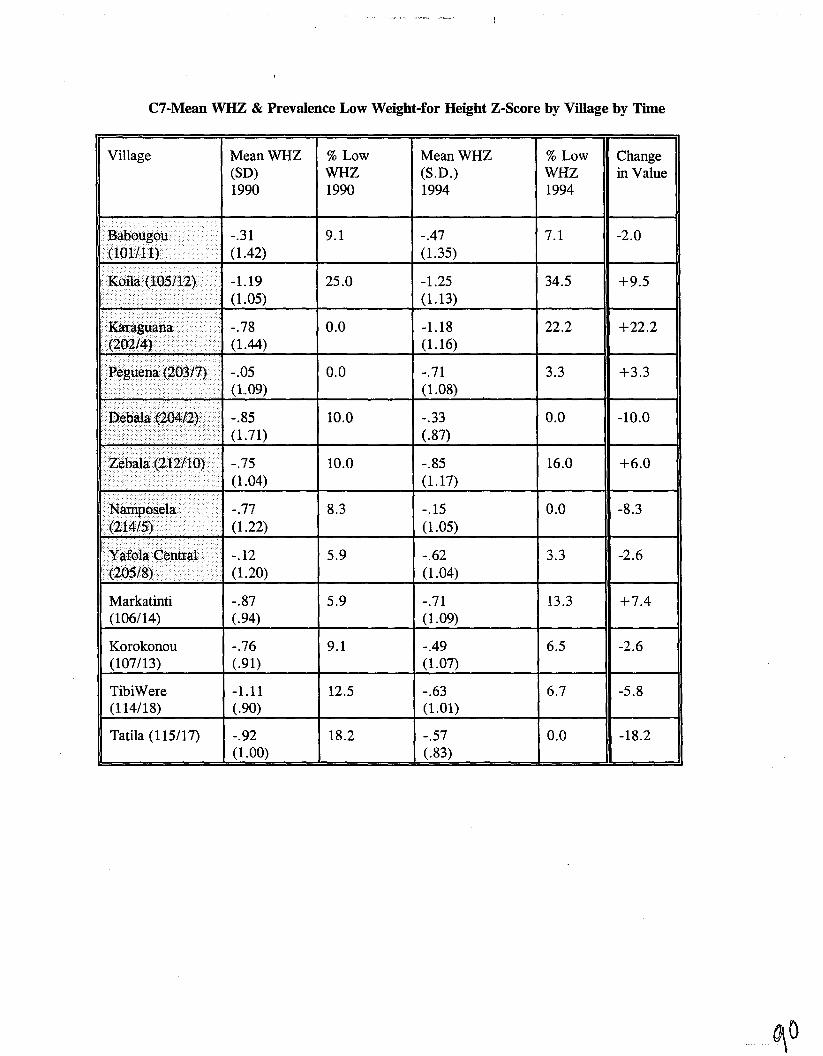
C7-Mean WHZ & Prevalence Low Weight-for Height Z-Score by Village by Time
Village MeanWHZ(SO)1990
% LowWHZ1990
MeanWHZ(S.D.)1994
% LowWHZ1994
Changein Value
_..nBiaboll1go111. -.31
- . (1.42).'
-1.19." ..... (1.05).... ."
. .... -.78. (1.44)
9.1
25.0
0.0
0.0
-.47(1.35)
-1.25(1.13)
-1.18(1.16)
-.71(1.08)
7.1
34.5
22.2
3.3
-2.0
+9.5
+22.2
+3.3
.... .
'1 ••.'< -.85 10.0
10.0
-.33(.87)
-.85(1.17)
0.0
16.0
-10.0
+6.0
.......... . .'.
NamIlpm;ela '.. -.77. (1.22)
IIY'afo,la<:;ellit!',lll"... -.12'. .' (1.20)
8.3
5.9
-.15(1.05)
-.62(1.04)
0.0
3.3
-8.3
-2.6
Markatinti(106/14)
Korokonou(107/13)
TibiWere(114/18)
Tatila (115/17)
-.87(.94)
-.76(.91)
-1.11(.90)
-.92(1.00)
5.9
9.1
12.5
18.2
-.71(1.09)
-.49(1.07)
-.63(1.01)
-.57(.83)
13.3
6.5
6.7
0.0
+7.4
-2.6
-5.8
-18.2
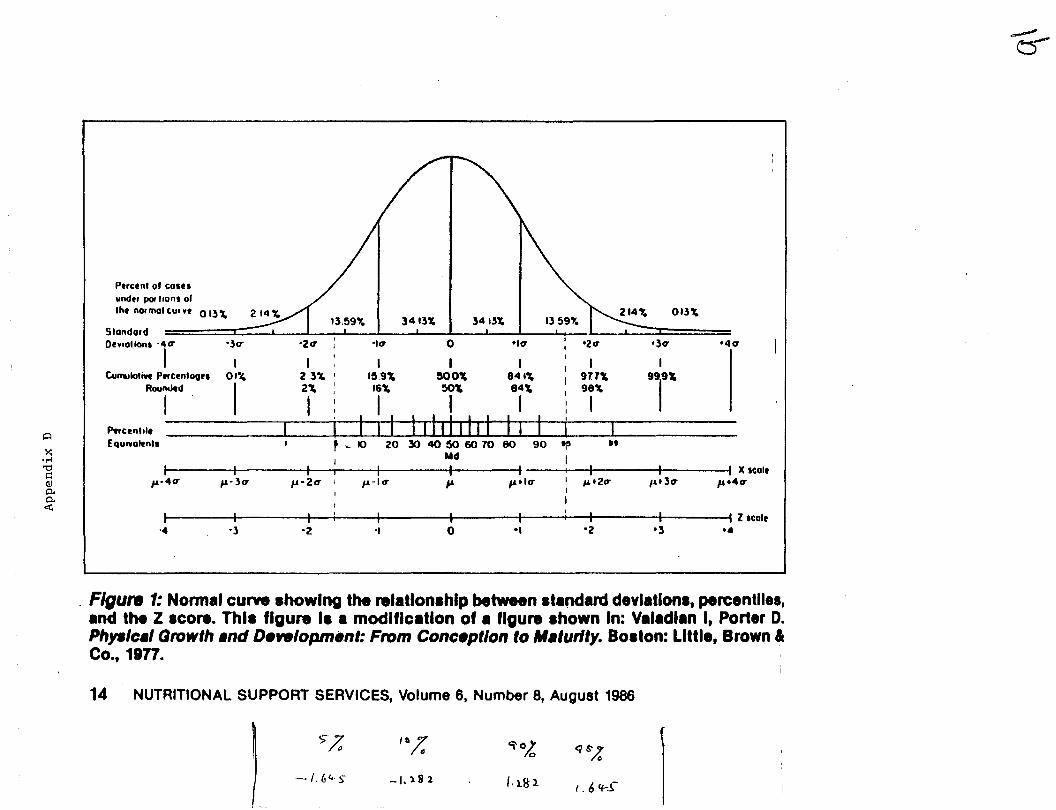
~
'4CT
013\
'3er
..
'ZCT'ICTo-ICT-2CT-3CT
Ptrcent 0' COIU
under pol "ons 01Iht normal CU. _t 0 I~ \
I I I I I I I IC4ll!alloti'lt PtrCtnlaQu Ol~ 2 3\ I 1~.9\ ~OO\ 841'4 I 977," 99
1
9'"
ROUjd 1 Y ~ Ii'" i'" 8t: 9j'"~
F'wCtnltle I ~======:I===============:Equ''Iolenll I ~ .. 10 20,X) 40 l)() 60 70 80 90 apI Md I
I I I I I I I I I I I )( scaltf&-4 CT f&-3O' f&-2CT I fi-1er f& fitlCT I #4 t 2CT 14.3CT f& t 4CT
I I
I I
I I I I I I I: I I I Z Icale-4 -3 -2 -I 0 '1 '2 '3 ••
SlondardOt'l'ollonl . 4 CT
I
~
~•.-1'0r::
Q)p..p..<
Figure 1: Norm.1 curve showing the rel.tlonlhlp between Itand.reI devl.tlonl, percentile.,and the Z .co.... Thll figure II a modlflc.tlon of a figure Ihown In: Valadlan I, Porter D.Php/c.l Growth .nd Development: From Conception to M.'urlty. Boston: Little, Brown &Co., 1977.
14 NUTRITIONAL SUPPORT SERVICES, Volume 6, Number 8, August 1986
'.>7/"
It.;:9'O~ q $',lc
-{,64-~ -1."82 /.ll!l I. 6 If-S"