imaging techniques applied to characterize bitumen and bituminous emulsions
TRANSCRIPT
ce Science 136 (2008) 93–108www.elsevier.com/locate/cis
Advances in Colloid and Interfa
Imaging techniques applied to characterize bitumenand bituminous emulsions
M.A. Rodríguez-Valverde a, P. Ramón-Torregrosa a, A. Páez-Dueñas b,M.A. Cabrerizo-Vílchez a, R. Hidalgo-Álvarez a,⁎
a Biocolloid and Fluid Physics Group, Department of Applied Physics, Faculty of Sciences, University of Granada, Fuentenueva Campus; E-18071 Granada, Spainb Headquarters of Technology, RepsolYPF, Extremadura Highway, km 18, E-28931 Móstoles, Madrid, Spain
Available online 7 August 2007
Abstract
The purpose of this article is to present some important advances in the imaging techniques currently used in the characterization of bitumenand bituminous emulsions. Bitumen exhibits some properties, such as a black colour and a reflecting surface at rest, which permit the use ofoptical techniques to study the macroscopic behaviour of asphalt mixes in the cold mix technology based on emulsion use. Imaging techniquesallow monitoring in situ the bitumen thermal sensitivity as well as the complex phenomenon of emulsion breaking. Evaporation-driven breakingwas evaluated from the shape of evaporating emulsion drops deposited onto non-porous and hydrophobic substrates. To describe the breakingkinetics, top-view images of a drying emulsion drop placed on an aggregate sheet were acquired and processed properly. We can conclude thatcomputer-aided image analysis in road pavement engineering can elucidate the mechanism of breaking and curing of bituminous emulsion.© 2007 Elsevier B.V. All rights reserved.
Keywords: Bitumen; Bituminous emulsion; Thermal sensitivity; Breaking kinetics; Image analysis
Contents
1. Introduction . . . . . . . . . . . . . . . . . . . . . . . . . . . . . . . . . . . . . . . . . . . . . . . . . . . . . . . . . . . . . . 942. Materials and methods . . . . . . . . . . . . . . . . . . . . . . . . . . . . . . . . . . . . . . . . . . . . . . . . . . . . . . . . . 95
2.1. Bitumen films . . . . . . . . . . . . . . . . . . . . . . . . . . . . . . . . . . . . . . . . . . . . . . . . . . . . . . . . . . 952.2. Bitumen emulsions . . . . . . . . . . . . . . . . . . . . . . . . . . . . . . . . . . . . . . . . . . . . . . . . . . . . . . . 952.3. Polytetrafluoroethylene substrates . . . . . . . . . . . . . . . . . . . . . . . . . . . . . . . . . . . . . . . . . . . . . . . . 952.4. Mineral aggregate sheets . . . . . . . . . . . . . . . . . . . . . . . . . . . . . . . . . . . . . . . . . . . . . . . . . . . . 952.5. Measurement of optical reflectance . . . . . . . . . . . . . . . . . . . . . . . . . . . . . . . . . . . . . . . . . . . . . . . 952.6. Optical microscopy of side-view drop images . . . . . . . . . . . . . . . . . . . . . . . . . . . . . . . . . . . . . . . . . 962.7. Histogram analysis of top-view drop images . . . . . . . . . . . . . . . . . . . . . . . . . . . . . . . . . . . . . . . . . . 96
3. Thermal sensitivity of bitumen by image histogram analysis . . . . . . . . . . . . . . . . . . . . . . . . . . . . . . . . . . . . . . . 964. Bituminous emulsion breaking by optical microscopy . . . . . . . . . . . . . . . . . . . . . . . . . . . . . . . . . . . . . . . . . 98
4.1. Emulsion breaking controlled by evaporation . . . . . . . . . . . . . . . . . . . . . . . . . . . . . . . . . . . . . . . . . . 984.2. Emulsion breaking controlled by emulsion–aggregate interaction . . . . . . . . . . . . . . . . . . . . . . . . . . . . . . 101
4.2.1. Water retention of aggregate sheets . . . . . . . . . . . . . . . . . . . . . . . . . . . . . . . . . . . . . . . . . 1014.2.2. Emulsion drop–aggregate sheet interaction . . . . . . . . . . . . . . . . . . . . . . . . . . . . . . . . . . . . . 102
⁎ Corresponding author. Tel.: +34 958 243 213; fax: +34 958 243 214.E-mail address: [email protected] (R. Hidalgo-Álvarez).URL's: http://biocol.ugr.es (M.A. Rodríguez-Valverde), http://biocol.ugr.es (P. Ramón-Torregrosa), http://biocol.ugr.es (M.A. Cabrerizo-Vílchez),
http://biocol.ugr.es (R. Hidalgo-Álvarez).
0001-8686/$ - see front matter © 2007 Elsevier B.V. All rights reserved.doi:10.1016/j.cis.2007.07.008
94 M.A. Rodríguez-Valverde et al. / Advances in Colloid and Interface Science 136 (2008) 93–108
5. Kinetics of emulsion breaking by image histogram analysis . . . . . . . . . . . . . . . . . . . . . . . . . . . . . . . . . . . . . . . 1036. Conclusions . . . . . . . . . . . . . . . . . . . . . . . . . . . . . . . . . . . . . . . . . . . . . . . . . . . . . . . . . . . . . . 105Acknowledgments . . . . . . . . . . . . . . . . . . . . . . . . . . . . . . . . . . . . . . . . . . . . . . . . . . . . . . . . . . . . . 106References . . . . . . . . . . . . . . . . . . . . . . . . . . . . . . . . . . . . . . . . . . . . . . . . . . . . . . . . . . . . . . . . . 106
1. Introduction
Bitumen, more commonly referred to as asphalt in the USA, isa generic term applied to native as well pyrogeneous substances,produced by the non-destructive distillation of crude oil duringpetroleum refining [1]. Due to its thermoplastic nature, its waterresistance and its adhesion towardmost other substances, bitumenis a primary engineering material, often employed as binder inroad construction. Mixing of stones (mineral aggregate) andbitumen produces asphalt mix, also referred to as asphalticconcrete or bituminous mix. Usually, in order to dry the sand-gravel and obtain adequate fluidity (handling) of the bitumen,both must be heated prior to mixing. This is the origin of the term“hot asphalt mix” [2,3]. This methodology involves the potentialhazards of burning and fumes emission. Instead, “cold asphaltmixes” are mixtures, at room temperature, of aggregates andbitumen-in-water emulsions, i.e. aqueous dispersions of finelydivided bitumen [4]. Indeed, emulsification [5] is the most cost-effective and environmental/user-friendly way of converting bi-tumen into a workable and effective binder for road maintenanceproducts.
Even though the road paving technology known as “coldasphalt mix” [3,6] still requires further efforts to improve thefinal mechanical response of pavements, it appears as solidalternative to hot asphalt mixes. Actually, policies related tosustainable development, the recent coming into effect of theKyoto protocol (16 February 2005) and the resulting nationalregulations, draw a suitable scenario to consolidate this pavingtechnology.
After mixing the bitumen emulsion with the aggregates, aphase separation (by flocculation and coalescence) shouldquickly occur: emulsion breaking or rupturing. Next, after the(partial) loss of water in emulsion, an apparently continuousfilm of bituminous binder is formed on and between theaggregates. The overall process finishes with the build-up of theasphaltic mix strength: setting or curing. The initiator breakingprocess is deliberately delayed or speeded up in accordancewith the traffic solicitations. In spite of the current vastknowledge in this field, traditionally acquired by the know-howof asphalt technologists, a better understanding of the be-haviour, relations and performance of bituminous binders mustbe reached.
During the last decades, the technical community of roadpaving has been looking for new bituminous binder specifica-tions based on arguments that are more rational. The StrategicHighway Research Program in the United States at thebeginning of the 1990s [7] and the two generations of Europeanstandards issued by the European Standardization Committee in1999 and 2005 [8] are examples of institutional standardisationof measuring procedures for binder tests.
Asphalt pavement design is mainly based on mechanistic-empirical approaches [9] to describe dynamic mechanicalbehaviour of asphalt mastics. Consequently, the usual charac-terization of the products for road paving is based on thermo-mechanical tests performed upon realistic conditions [10,11].These methods are relatively inexpensive and simple to carryout in industrial laboratories. However, this phenomenologicalapproach permits to explain partly the binder rheologicalbehaviour and hardly the precursor mechanisms of emulsionbreaking [12,13]. Because of the ever-continuing process ofdeveloping new products or improving the production process-es, there emerges a need for achieving complementary researchstudies.
Currently, results from the standardized procedures are beingcorrelated to experiments accomplished with analytical techni-ques [14,15]. Equally, numerous references can be foundconcerning the analysis of the microstructure/morphology of thebituminous binders using confocal laser microscopy [16–18],atomic force microscopy [19–22] and other techniques [23–26].Recently, there is a growing interest in the application of advancedmesoscopic techniques capable of measuring directly thecolloidal forces between bitumen particles in water [27–29] andthe bitumen–mineral interactions [30–35]. Although many ofthese studies are aimed to oil sands recovery (e.g. Athabascabitumen), this technology and road paving based on cold mixesshare the same underlying physical chemistry. Furthermore, theevaluation of the stability of bitumen/water dispersions hasevolved [36], so that the bulk elemental analyses are beingsubstituted by techniques that focused on the interfacial behaviour[37,38]. In addition, to produce high-grade asphaltic mixtureswith high values of compactness, an optimal emulsion coating onthe mineral aggregates and a good bitumen–aggregate adhesionmust be achieved [39]. Even though adhesion in bitumen–mineralsystems can be studied by Calorimetric [40–43], the backgroundon early fundamental research reveals that surface energy has longbeen considered an important parameter to elucidate adhesion inbituminous mixtures [39]. Since coating and adhesion areconcepts closely related to wetting, wettability experiments arevery useful for quantifying the realistic emulsion–aggregateinteraction [6,44–46].
Bitumen seems to be a highly unattractive system to studyfrom the basic research point of view, nevertheless this materialcan be considered surprisingly as amodel system in some aspects.For example, the presence of ionisable surface groups on thebitumen surface in aqueous media results in particles with a veryhigh surface charge [47]. Owing to this peculiar electrostaticproperty, its amphoteric behaviour and the barely spherical shapeof the particles, bitumen dispersions can be used as a testingsystem in Electrokinetics [48,49] and for Colloidal Stabilitytheories [50–52]. The hydrophobic–thermoplastic nature of
95M.A. Rodríguez-Valverde et al. / Advances in Colloid and Interface Science 136 (2008) 93–108
bitumen allows preparing smooth films with an excellentinterfacial response for contact angle measurements [53,54]. Onthesemodel surfaces, the typical adsorption isotherms on bitumen[55–58] can be obtained at room temperature using simply sessiledrops of surfactant solutions [59].
Thanks to its most widely known feature, i.e. the dark colour,bitumen might be proposed as a model substance in imagingtechniques. For instance, optical imaging is used for quantifyingthe internal structure of asphalt mixes in terms of air voiddistribution and aggregate packing. This serves to characterize thedifferences among mixes prepared with different materials andcompaction methods (mechanical performance). Images oftransversal/longitudinal cross sections of compacted asphaltmixes allow access to the internal organization of the bitumen-coated aggregates and to quantify the mix density (compactness)[60–65]. Recently, X-ray computed tomography has been used asalternative to the optical approach [66]. Coating of aggregateswith a bituminous emulsion, which is a quality indicator of a coldmix, is simulated using standard mixing conditions at laboratoryscale. In these tests, the coverage degree is visually evaluated. Thelighting conditions, the native colour of the aggregates, theparticle sizing (causing a heterogeneous colour), the subjectiveappreciation of the operator, the viewing angle, etc.., are many ofthe uncontrolled factors affecting the result. Instead, computer-aided image analysis overcomes the effect of these factorsbecause it permits objectively quantifying the coverage degree ofa bitumen emulsion on aggregates [67].
In civil engineering, computer vision and digital imageprocessing have become additional suitable tools that can beemployed for the above-mentioned conventional studies and otherones [68], without almost operator intervention. Additionally,these devices might readily be installed in industrial laboratories.
2. Materials and methods
2.1. Bitumen films
Two paving-grade bitumens from Mexican Maya and SaudiArabian light crudes with equal consistency (150/200, penetra-tion index [69]) were supplied by RepsolYPF. The higher thepenetration value, the softer the binder. Penetration bitumen hasno additives and is primarily used by the coated roadstonematerial industry. Six films of each bitumen were prepared. Thedetails of the production of bitumen films can be foundelsewhere [54,59]. The film samples were transported in closedopaque recipients in order to avoid an eventual photo-oxidation.
2.2. Bitumen emulsions
Two bituminous emulsions (∼ 65% w/w bitumen content)were manufactured by RepsolYPF in a laboratory colloidal mill,using 150/200 penetration asphaltic bitumen (Mexico) anddifferent emulsifier concentrations (0.1% and 0.5% w/w). Theemulsifier, used without further purification, was a commerciallyavailable cationic surfactant. This is a blend of several components(N-alkyl propylendiamines, alkylamidoamines) derived fromtallow [70], with average molecular and equivalent weights of
340 and 202, respectively. No commercial name was reportedbecause of confidential reasons. The emulsifier chosen in thisstudy is accordingly aimed for the manufacturing of rapid- andmedium-setting cationic bituminous emulsions for surfacedressing (0.5% w/w) and for the manufacturing of bituminousmixtures (0.1% w/w), respectively. The average particle sizes ofthe emulsionswere 3180±140 nm (0.1%w/w) and 2100±200 nm(0.5% w/w). They were measured with a High PerformanceParticle Sizer based on Non-Invasive Back Scattering.
2.3. Polytetrafluoroethylene substrates
Polytetrafluoroethylene smooth strips (PTFE, plumbing sealer)were used as inert hydrophobic substrates (pure water contact angle∼ 110°) for drop drying of bitumen emulsions. These low-surfaceenergy substrates cause drop bending, avoid any electrostaticinteraction with the charged bitumen particles and just as well, theseparation of the polar and apolar components of bitumen.
2.4. Mineral aggregate sheets
RepsolYPF supplied the mineral aggregates, as receivedfrom quarries. Siliceous aggregates were boulders from the riverJarama (Madrid) whereas silica-calcareous aggregates werecrushed stones supplied by the quarry of Arganda del Rey(Madrid). The preparation protocol of aggregate sheets isdescribed in the literature [71]. After polishing, the values ofarithmetic roughness of the sheets of siliceous and silica-calcareous aggregates were 1.05±0.17 μm and 1.59±0.13 μm,respectively. These values were measured with a stylusprofilemeter (Mitutoyo). The values of specific area obtainedby BET isotherm (N2, Quantasorb) were 2.69±0.06 m
2 g− 1 and3.83±0.13 m2 g− 1, for the finest-size fraction (filler) ofsiliceous and silica-calcareous aggregates, respectively. Roadstone aggregates have been generally classified according totheir acid/basic nature [72]. However, most minerals containboth acidic and basic surface groups. Hence, even thoughsiliceous aggregates were mainly composed of quartz (94%),the crystallographic composition of silica-calcareous aggregateswas: lime (40%) and silicates (55%) [73].
2.5. Measurement of optical reflectance
Since the reflectance (the ratio of reflected light power toincident power) of a smooth solid surface is mainly specular andintrinsic to the solid material (reflectivity) [74], opticalreflectance variations can inform about the material evolution.Visible reflectance spectroscopy [75] is used routinely tomeasure the colour of opaque objects such as textile fabrics,paint films and plastics for purposes such as colour matching anddye and pigment recipe prediction. However, a simplest methodis based on white light optical imaging.
From a top-view colour image of a levelled, smooth surface,exposed to uniform lighting, the optical reflectance for a givenwavelength can be expressed as the ratio of the image meanlevel to the maximum level (image depth), for the respectivechannel. Both levels can be obtained from image histogram
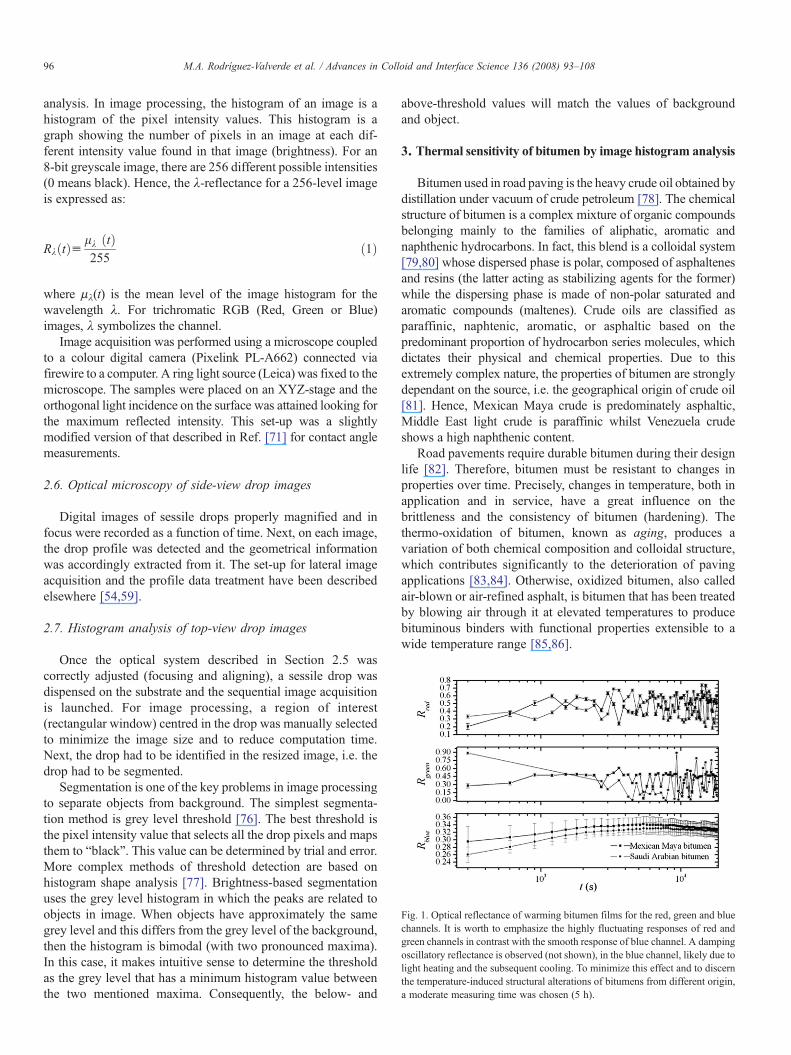
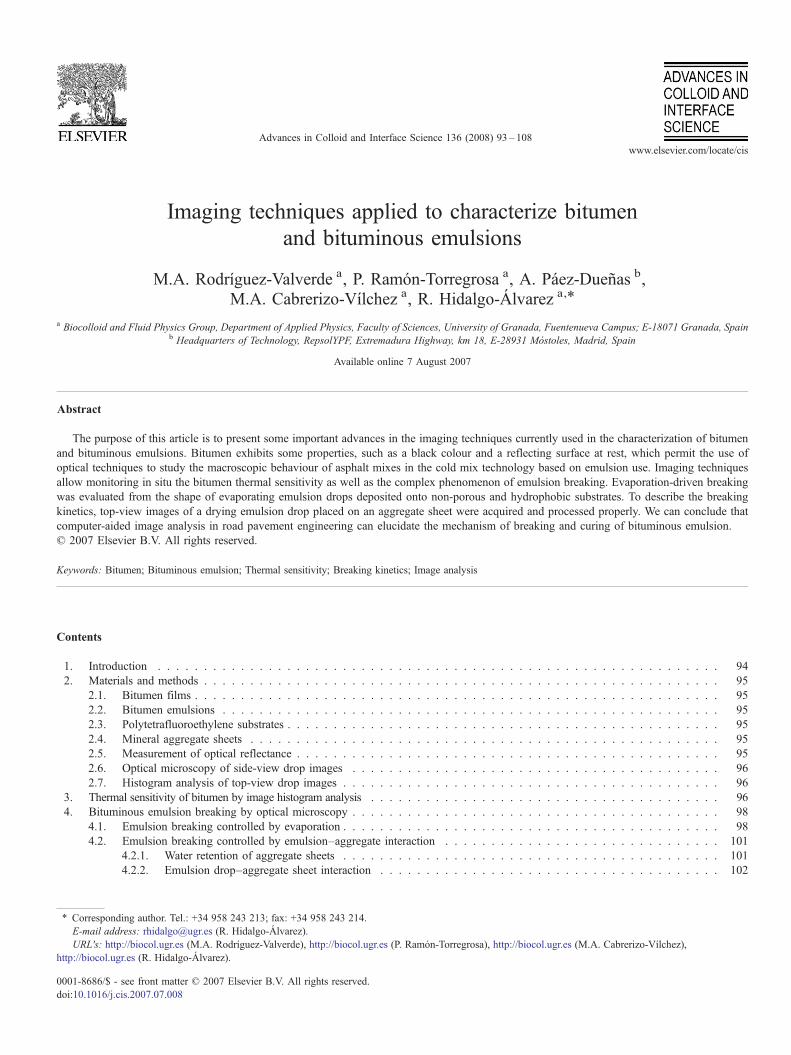
Fig. 1. Optical reflectance of warming bitumen films for the red, green and bluechannels. It is worth to emphasize the highly fluctuating responses of red andgreen channels in contrast with the smooth response of blue channel. A dampingoscillatory reflectance is observed (not shown), in the blue channel, likely due tolight heating and the subsequent cooling. To minimize this effect and to discernthe temperature-induced structural alterations of bitumens from different origin,a moderate measuring time was chosen (5 h).
96 M.A. Rodríguez-Valverde et al. / Advances in Colloid and Interface Science 136 (2008) 93–108
analysis. In image processing, the histogram of an image is ahistogram of the pixel intensity values. This histogram is agraph showing the number of pixels in an image at each dif-ferent intensity value found in that image (brightness). For an8-bit greyscale image, there are 256 different possible intensities(0 means black). Hence, the λ-reflectance for a 256-level imageis expressed as:
RkðtÞu lk ðtÞ255
ð1Þ
where μλ(t) is the mean level of the image histogram for thewavelength λ. For trichromatic RGB (Red, Green or Blue)images, λ symbolizes the channel.
Image acquisition was performed using a microscope coupledto a colour digital camera (Pixelink PL-A662) connected viafirewire to a computer. A ring light source (Leica) was fixed to themicroscope. The samples were placed on an XYZ-stage and theorthogonal light incidence on the surface was attained looking forthe maximum reflected intensity. This set-up was a slightlymodified version of that described in Ref. [71] for contact anglemeasurements.
2.6. Optical microscopy of side-view drop images
Digital images of sessile drops properly magnified and infocus were recorded as a function of time. Next, on each image,the drop profile was detected and the geometrical informationwas accordingly extracted from it. The set-up for lateral imageacquisition and the profile data treatment have been describedelsewhere [54,59].
2.7. Histogram analysis of top-view drop images
Once the optical system described in Section 2.5 wascorrectly adjusted (focusing and aligning), a sessile drop wasdispensed on the substrate and the sequential image acquisitionis launched. For image processing, a region of interest(rectangular window) centred in the drop was manually selectedto minimize the image size and to reduce computation time.Next, the drop had to be identified in the resized image, i.e. thedrop had to be segmented.
Segmentation is one of the key problems in image processingto separate objects from background. The simplest segmenta-tion method is grey level threshold [76]. The best threshold isthe pixel intensity value that selects all the drop pixels and mapsthem to “black”. This value can be determined by trial and error.More complex methods of threshold detection are based onhistogram shape analysis [77]. Brightness-based segmentationuses the grey level histogram in which the peaks are related toobjects in image. When objects have approximately the samegrey level and this differs from the grey level of the background,then the histogram is bimodal (with two pronounced maxima).In this case, it makes intuitive sense to determine the thresholdas the grey level that has a minimum histogram value betweenthe two mentioned maxima. Consequently, the below- and
above-threshold values will match the values of backgroundand object.
3. Thermal sensitivity of bitumen by image histogram analysis
Bitumen used in road paving is the heavy crude oil obtained bydistillation under vacuum of crude petroleum [78]. The chemicalstructure of bitumen is a complex mixture of organic compoundsbelonging mainly to the families of aliphatic, aromatic andnaphthenic hydrocarbons. In fact, this blend is a colloidal system[79,80] whose dispersed phase is polar, composed of asphaltenesand resins (the latter acting as stabilizing agents for the former)while the dispersing phase is made of non-polar saturated andaromatic compounds (maltenes). Crude oils are classified asparaffinic, naphtenic, aromatic, or asphaltic based on thepredominant proportion of hydrocarbon series molecules, whichdictates their physical and chemical properties. Due to thisextremely complex nature, the properties of bitumen are stronglydependant on the source, i.e. the geographical origin of crude oil[81]. Hence, Mexican Maya crude is predominately asphaltic,Middle East light crude is paraffinic whilst Venezuela crudeshows a high naphthenic content.
Road pavements require durable bitumen during their designlife [82]. Therefore, bitumen must be resistant to changes inproperties over time. Precisely, changes in temperature, both inapplication and in service, have a great influence on thebrittleness and the consistency of bitumen (hardening). Thethermo-oxidation of bitumen, known as aging, produces avariation of both chemical composition and colloidal structure,which contributes significantly to the deterioration of pavingapplications [83,84]. Otherwise, oxidized bitumen, also calledair-blown or air-refined asphalt, is bitumen that has been treatedby blowing air through it at elevated temperatures to producebituminous binders with functional properties extensible to awide temperature range [85,86].
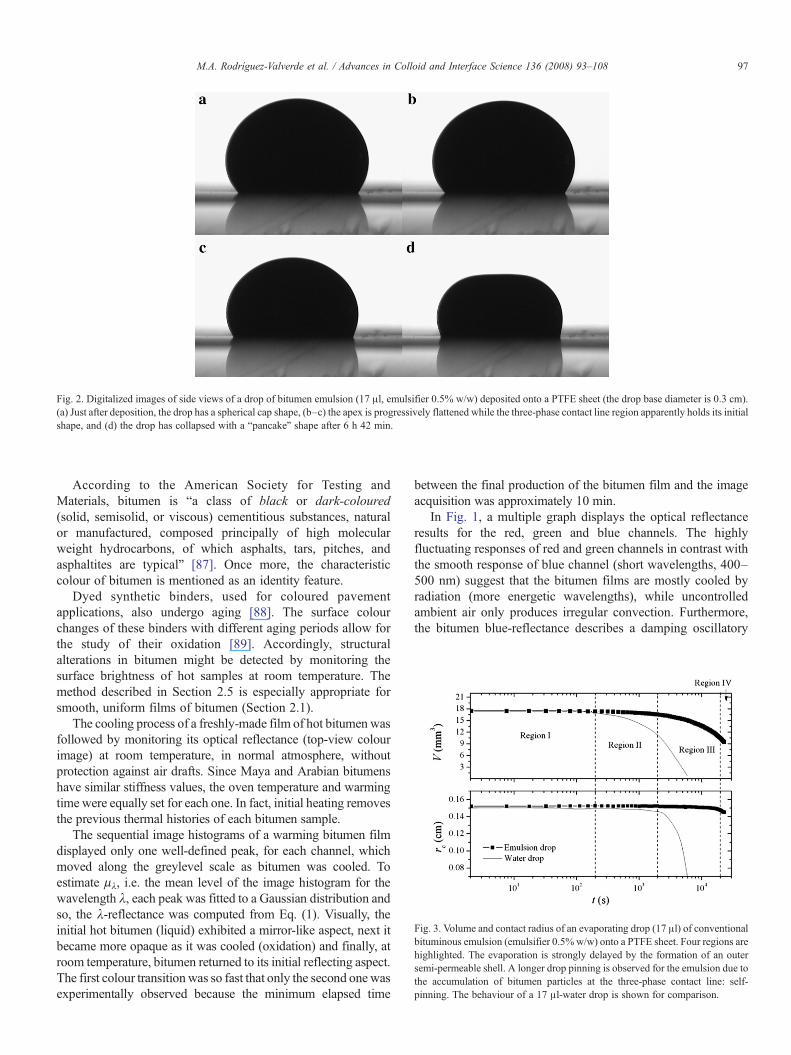
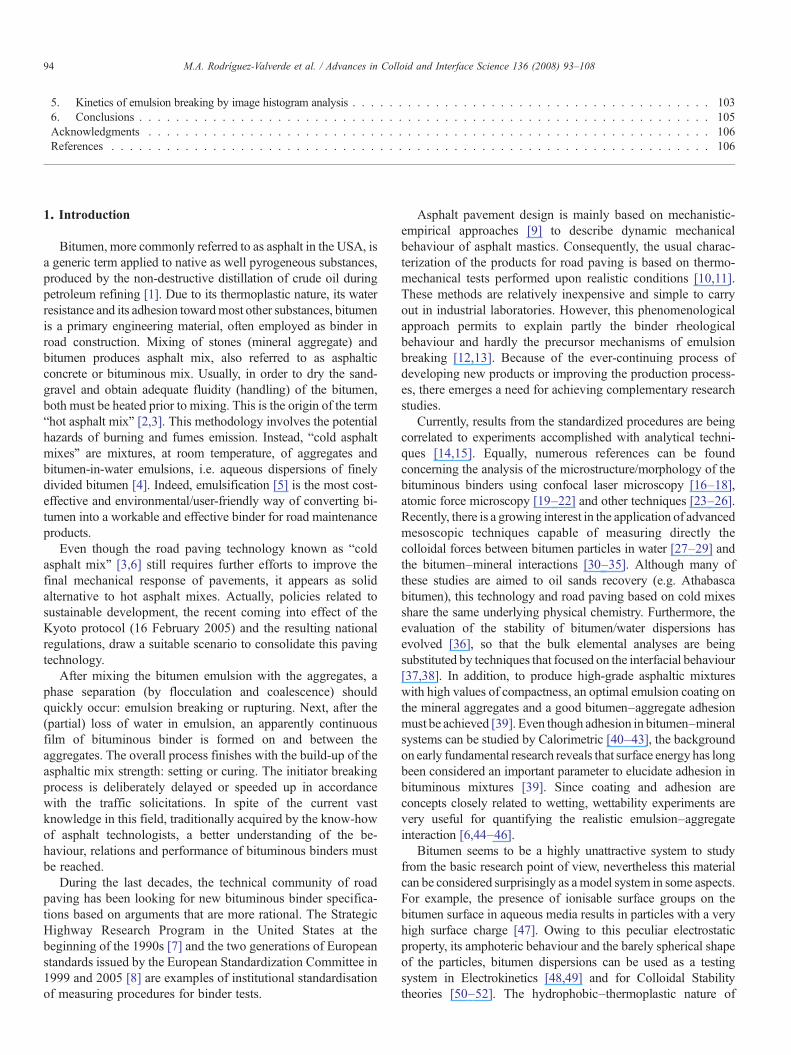
Fig. 2. Digitalized images of side views of a drop of bitumen emulsion (17 μl, emulsifier 0.5% w/w) deposited onto a PTFE sheet (the drop base diameter is 0.3 cm).(a) Just after deposition, the drop has a spherical cap shape, (b–c) the apex is progressively flattened while the three-phase contact line region apparently holds its initialshape, and (d) the drop has collapsed with a “pancake” shape after 6 h 42 min.
Fig. 3. Volume and contact radius of an evaporating drop (17 μl) of conventionalbituminous emulsion (emulsifier 0.5% w/w) onto a PTFE sheet. Four regions arehighlighted. The evaporation is strongly delayed by the formation of an outersemi-permeable shell. A longer drop pinning is observed for the emulsion due tothe accumulation of bitumen particles at the three-phase contact line: self-pinning. The behaviour of a 17 μl-water drop is shown for comparison.
97M.A. Rodríguez-Valverde et al. / Advances in Colloid and Interface Science 136 (2008) 93–108
According to the American Society for Testing andMaterials, bitumen is “a class of black or dark-coloured(solid, semisolid, or viscous) cementitious substances, naturalor manufactured, composed principally of high molecularweight hydrocarbons, of which asphalts, tars, pitches, andasphaltites are typical” [87]. Once more, the characteristiccolour of bitumen is mentioned as an identity feature.
Dyed synthetic binders, used for coloured pavementapplications, also undergo aging [88]. The surface colourchanges of these binders with different aging periods allow forthe study of their oxidation [89]. Accordingly, structuralalterations in bitumen might be detected by monitoring thesurface brightness of hot samples at room temperature. Themethod described in Section 2.5 is especially appropriate forsmooth, uniform films of bitumen (Section 2.1).
The cooling process of a freshly-made film of hot bitumenwasfollowed by monitoring its optical reflectance (top-view colourimage) at room temperature, in normal atmosphere, withoutprotection against air drafts. Since Maya and Arabian bitumenshave similar stiffness values, the oven temperature and warmingtime were equally set for each one. In fact, initial heating removesthe previous thermal histories of each bitumen sample.
The sequential image histograms of a warming bitumen filmdisplayed only one well-defined peak, for each channel, whichmoved along the greylevel scale as bitumen was cooled. Toestimate μλ, i.e. the mean level of the image histogram for thewavelength λ, each peak was fitted to a Gaussian distribution andso, the λ-reflectance was computed from Eq. (1). Visually, theinitial hot bitumen (liquid) exhibited a mirror-like aspect, next itbecame more opaque as it was cooled (oxidation) and finally, atroom temperature, bitumen returned to its initial reflecting aspect.The first colour transitionwas so fast that only the second onewasexperimentally observed because the minimum elapsed time
between the final production of the bitumen film and the imageacquisition was approximately 10 min.
In Fig. 1, a multiple graph displays the optical reflectanceresults for the red, green and blue channels. The highlyfluctuating responses of red and green channels in contrast withthe smooth response of blue channel (short wavelengths, 400–500 nm) suggest that the bitumen films are mostly cooled byradiation (more energetic wavelengths), while uncontrolledambient air only produces irregular convection. Furthermore,the bitumen blue-reflectance describes a damping oscillatory
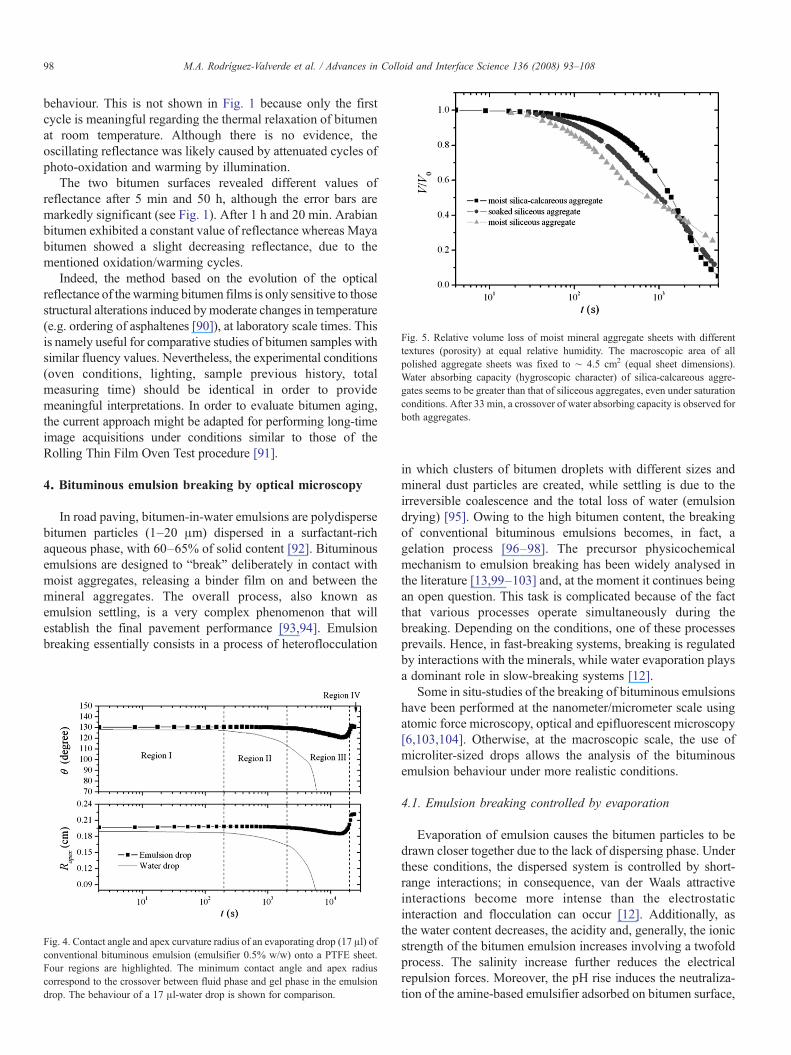
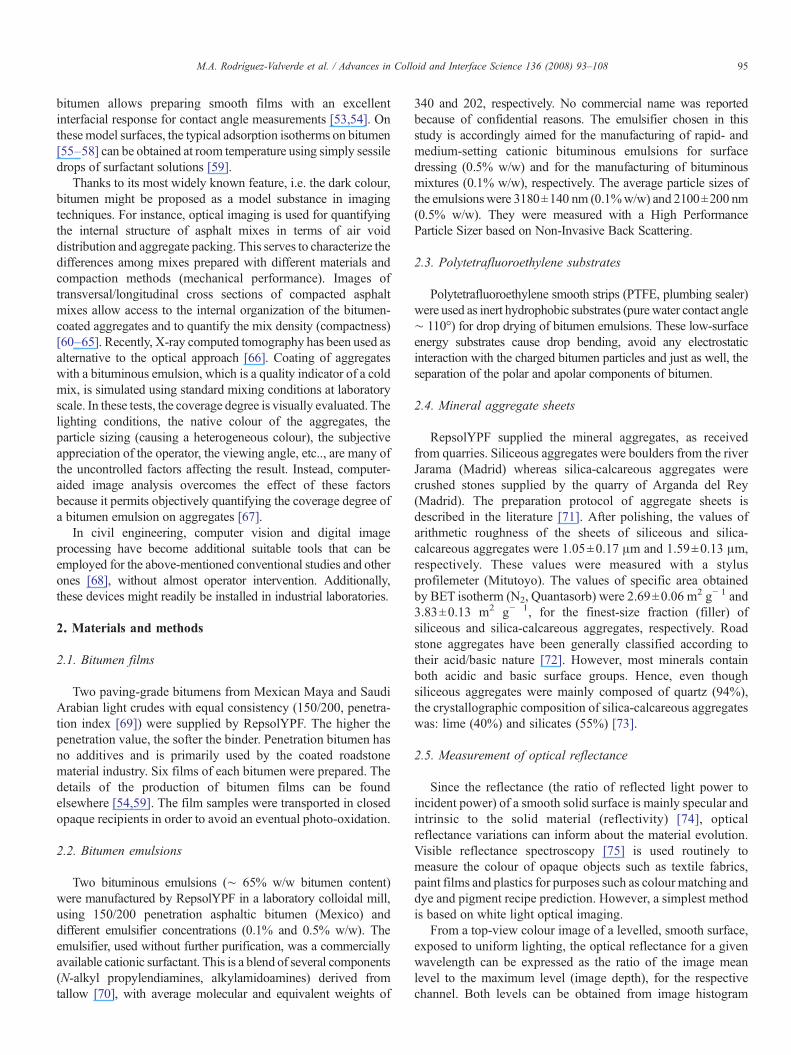
Fig. 5. Relative volume loss of moist mineral aggregate sheets with differenttextures (porosity) at equal relative humidity. The macroscopic area of allpolished aggregate sheets was fixed to ∼ 4.5 cm2 (equal sheet dimensions).Water absorbing capacity (hygroscopic character) of silica-calcareous aggre-gates seems to be greater than that of siliceous aggregates, even under saturationconditions. After 33 min, a crossover of water absorbing capacity is observed forboth aggregates.
98 M.A. Rodríguez-Valverde et al. / Advances in Colloid and Interface Science 136 (2008) 93–108
behaviour. This is not shown in Fig. 1 because only the firstcycle is meaningful regarding the thermal relaxation of bitumenat room temperature. Although there is no evidence, theoscillating reflectance was likely caused by attenuated cycles ofphoto-oxidation and warming by illumination.
The two bitumen surfaces revealed different values ofreflectance after 5 min and 50 h, although the error bars aremarkedly significant (see Fig. 1). After 1 h and 20 min. Arabianbitumen exhibited a constant value of reflectance whereas Mayabitumen showed a slight decreasing reflectance, due to thementioned oxidation/warming cycles.
Indeed, the method based on the evolution of the opticalreflectance of the warming bitumen films is only sensitive to thosestructural alterations induced bymoderate changes in temperature(e.g. ordering of asphaltenes [90]), at laboratory scale times. Thisis namely useful for comparative studies of bitumen samples withsimilar fluency values. Nevertheless, the experimental conditions(oven conditions, lighting, sample previous history, totalmeasuring time) should be identical in order to providemeaningful interpretations. In order to evaluate bitumen aging,the current approach might be adapted for performing long-timeimage acquisitions under conditions similar to those of theRolling Thin Film Oven Test procedure [91].
4. Bituminous emulsion breaking by optical microscopy
In road paving, bitumen-in-water emulsions are polydispersebitumen particles (1–20 μm) dispersed in a surfactant-richaqueous phase, with 60–65% of solid content [92]. Bituminousemulsions are designed to “break” deliberately in contact withmoist aggregates, releasing a binder film on and between themineral aggregates. The overall process, also known asemulsion settling, is a very complex phenomenon that willestablish the final pavement performance [93,94]. Emulsionbreaking essentially consists in a process of heteroflocculation
Fig. 4. Contact angle and apex curvature radius of an evaporating drop (17 μl) ofconventional bituminous emulsion (emulsifier 0.5% w/w) onto a PTFE sheet.Four regions are highlighted. The minimum contact angle and apex radiuscorrespond to the crossover between fluid phase and gel phase in the emulsiondrop. The behaviour of a 17 μl-water drop is shown for comparison.
in which clusters of bitumen droplets with different sizes andmineral dust particles are created, while settling is due to theirreversible coalescence and the total loss of water (emulsiondrying) [95]. Owing to the high bitumen content, the breakingof conventional bituminous emulsions becomes, in fact, agelation process [96–98]. The precursor physicochemicalmechanism to emulsion breaking has been widely analysed inthe literature [13,99–103] and, at the moment it continues beingan open question. This task is complicated because of the factthat various processes operate simultaneously during thebreaking. Depending on the conditions, one of these processesprevails. Hence, in fast-breaking systems, breaking is regulatedby interactions with the minerals, while water evaporation playsa dominant role in slow-breaking systems [12].
Some in situ-studies of the breaking of bituminous emulsionshave been performed at the nanometer/micrometer scale usingatomic force microscopy, optical and epifluorescent microscopy[6,103,104]. Otherwise, at the macroscopic scale, the use ofmicroliter-sized drops allows the analysis of the bituminousemulsion behaviour under more realistic conditions.
4.1. Emulsion breaking controlled by evaporation
Evaporation of emulsion causes the bitumen particles to bedrawn closer together due to the lack of dispersing phase. Underthese conditions, the dispersed system is controlled by short-range interactions; in consequence, van der Waals attractiveinteractions become more intense than the electrostaticinteraction and flocculation can occur [12]. Additionally, asthe water content decreases, the acidity and, generally, the ionicstrength of the bitumen emulsion increases involving a twofoldprocess. The salinity increase further reduces the electricalrepulsion forces. Moreover, the pH rise induces the neutraliza-tion of the amine-based emulsifier adsorbed on bitumen surface,
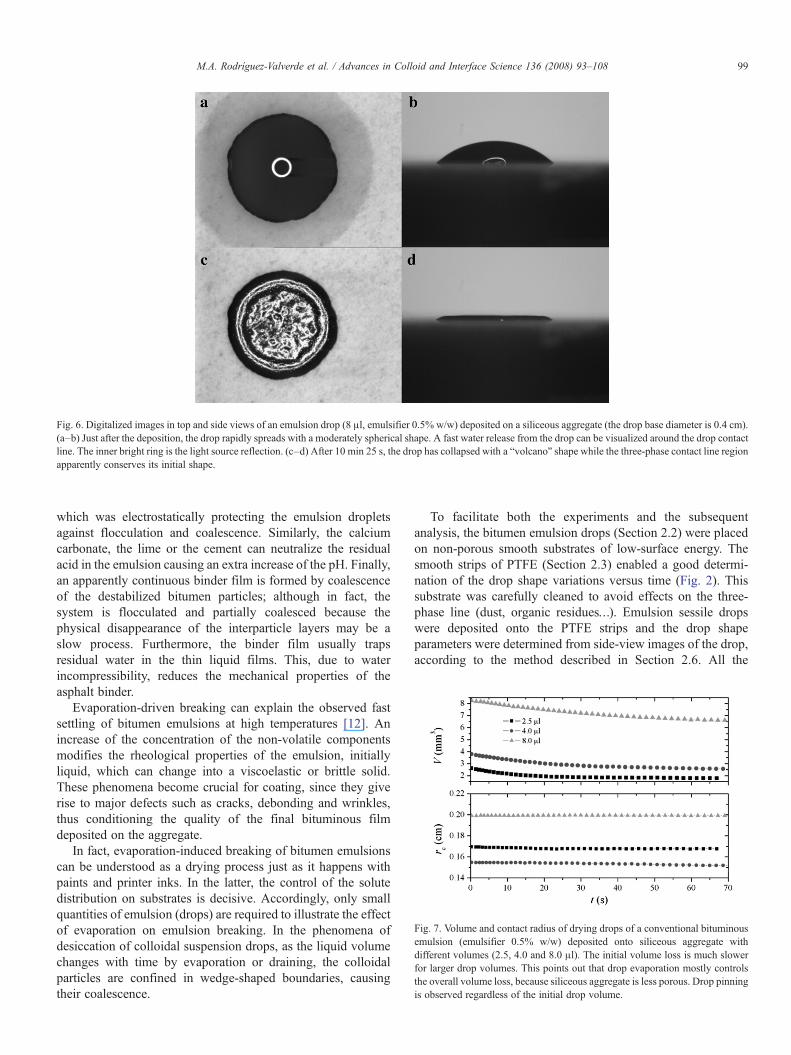
Fig. 6. Digitalized images in top and side views of an emulsion drop (8 μl, emulsifier 0.5% w/w) deposited on a siliceous aggregate (the drop base diameter is 0.4 cm).(a–b) Just after the deposition, the drop rapidly spreads with a moderately spherical shape. A fast water release from the drop can be visualized around the drop contactline. The inner bright ring is the light source reflection. (c–d) After 10 min 25 s, the drop has collapsed with a “volcano” shape while the three-phase contact line regionapparently conserves its initial shape.
Fig. 7. Volume and contact radius of drying drops of a conventional bituminousemulsion (emulsifier 0.5% w/w) deposited onto siliceous aggregate withdifferent volumes (2.5, 4.0 and 8.0 μl). The initial volume loss is much slowerfor larger drop volumes. This points out that drop evaporation mostly controlsthe overall volume loss, because siliceous aggregate is less porous. Drop pinningis observed regardless of the initial drop volume.
99M.A. Rodríguez-Valverde et al. / Advances in Colloid and Interface Science 136 (2008) 93–108
which was electrostatically protecting the emulsion dropletsagainst flocculation and coalescence. Similarly, the calciumcarbonate, the lime or the cement can neutralize the residualacid in the emulsion causing an extra increase of the pH. Finally,an apparently continuous binder film is formed by coalescenceof the destabilized bitumen particles; although in fact, thesystem is flocculated and partially coalesced because thephysical disappearance of the interparticle layers may be aslow process. Furthermore, the binder film usually trapsresidual water in the thin liquid films. This, due to waterincompressibility, reduces the mechanical properties of theasphalt binder.
Evaporation-driven breaking can explain the observed fastsettling of bitumen emulsions at high temperatures [12]. Anincrease of the concentration of the non-volatile componentsmodifies the rheological properties of the emulsion, initiallyliquid, which can change into a viscoelastic or brittle solid.These phenomena become crucial for coating, since they giverise to major defects such as cracks, debonding and wrinkles,thus conditioning the quality of the final bituminous filmdeposited on the aggregate.
In fact, evaporation-induced breaking of bitumen emulsionscan be understood as a drying process just as it happens withpaints and printer inks. In the latter, the control of the solutedistribution on substrates is decisive. Accordingly, only smallquantities of emulsion (drops) are required to illustrate the effectof evaporation on emulsion breaking. In the phenomena ofdesiccation of colloidal suspension drops, as the liquid volumechanges with time by evaporation or draining, the colloidalparticles are confined in wedge-shaped boundaries, causingtheir coalescence.
To facilitate both the experiments and the subsequentanalysis, the bitumen emulsion drops (Section 2.2) were placedon non-porous smooth substrates of low-surface energy. Thesmooth strips of PTFE (Section 2.3) enabled a good determi-nation of the drop shape variations versus time (Fig. 2). Thissubstrate was carefully cleaned to avoid effects on the three-phase line (dust, organic residues…). Emulsion sessile dropswere deposited onto the PTFE strips and the drop shapeparameters were determined from side-view images of the drop,according to the method described in Section 2.6. All the
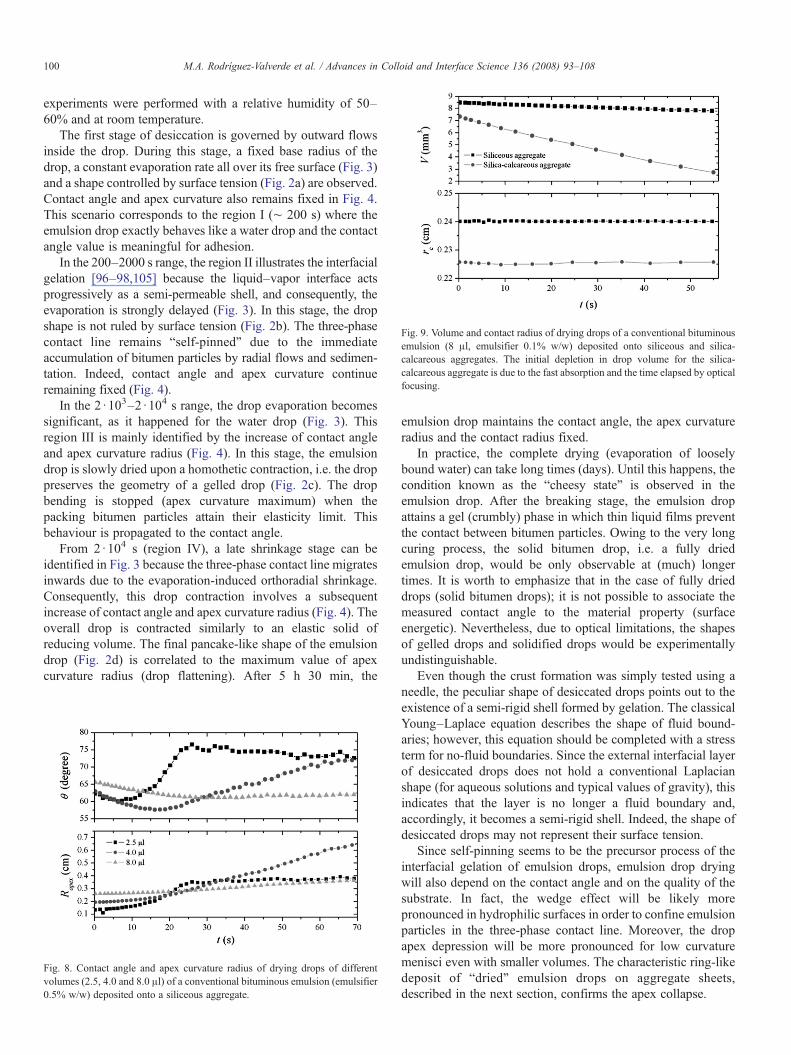
Fig. 9. Volume and contact radius of drying drops of a conventional bituminousemulsion (8 μl, emulsifier 0.1% w/w) deposited onto siliceous and silica-calcareous aggregates. The initial depletion in drop volume for the silica-calcareous aggregate is due to the fast absorption and the time elapsed by opticalfocusing.
100 M.A. Rodríguez-Valverde et al. / Advances in Colloid and Interface Science 136 (2008) 93–108
experiments were performed with a relative humidity of 50–60% and at room temperature.
The first stage of desiccation is governed by outward flowsinside the drop. During this stage, a fixed base radius of thedrop, a constant evaporation rate all over its free surface (Fig. 3)and a shape controlled by surface tension (Fig. 2a) are observed.Contact angle and apex curvature also remains fixed in Fig. 4.This scenario corresponds to the region I (∼ 200 s) where theemulsion drop exactly behaves like a water drop and the contactangle value is meaningful for adhesion.
In the 200–2000 s range, the region II illustrates the interfacialgelation [96–98,105] because the liquid–vapor interface actsprogressively as a semi-permeable shell, and consequently, theevaporation is strongly delayed (Fig. 3). In this stage, the dropshape is not ruled by surface tension (Fig. 2b). The three-phasecontact line remains “self-pinned” due to the immediateaccumulation of bitumen particles by radial flows and sedimen-tation. Indeed, contact angle and apex curvature continueremaining fixed (Fig. 4).
In the 2 ·103–2 ·104 s range, the drop evaporation becomessignificant, as it happened for the water drop (Fig. 3). Thisregion III is mainly identified by the increase of contact angleand apex curvature radius (Fig. 4). In this stage, the emulsiondrop is slowly dried upon a homothetic contraction, i.e. the droppreserves the geometry of a gelled drop (Fig. 2c). The dropbending is stopped (apex curvature maximum) when thepacking bitumen particles attain their elasticity limit. Thisbehaviour is propagated to the contact angle.
From 2·104 s (region IV), a late shrinkage stage can beidentified in Fig. 3 because the three-phase contact line migratesinwards due to the evaporation-induced orthoradial shrinkage.Consequently, this drop contraction involves a subsequentincrease of contact angle and apex curvature radius (Fig. 4). Theoverall drop is contracted similarly to an elastic solid ofreducing volume. The final pancake-like shape of the emulsiondrop (Fig. 2d) is correlated to the maximum value of apexcurvature radius (drop flattening). After 5 h 30 min, the
Fig. 8. Contact angle and apex curvature radius of drying drops of differentvolumes (2.5, 4.0 and 8.0 μl) of a conventional bituminous emulsion (emulsifier0.5% w/w) deposited onto a siliceous aggregate.
emulsion drop maintains the contact angle, the apex curvatureradius and the contact radius fixed.
In practice, the complete drying (evaporation of looselybound water) can take long times (days). Until this happens, thecondition known as the “cheesy state” is observed in theemulsion drop. After the breaking stage, the emulsion dropattains a gel (crumbly) phase in which thin liquid films preventthe contact between bitumen particles. Owing to the very longcuring process, the solid bitumen drop, i.e. a fully driedemulsion drop, would be only observable at (much) longertimes. It is worth to emphasize that in the case of fully drieddrops (solid bitumen drops); it is not possible to associate themeasured contact angle to the material property (surfaceenergetic). Nevertheless, due to optical limitations, the shapesof gelled drops and solidified drops would be experimentallyundistinguishable.
Even though the crust formation was simply tested using aneedle, the peculiar shape of desiccated drops points out to theexistence of a semi-rigid shell formed by gelation. The classicalYoung–Laplace equation describes the shape of fluid bound-aries; however, this equation should be completed with a stressterm for no-fluid boundaries. Since the external interfacial layerof desiccated drops does not hold a conventional Laplacianshape (for aqueous solutions and typical values of gravity), thisindicates that the layer is no longer a fluid boundary and,accordingly, it becomes a semi-rigid shell. Indeed, the shape ofdesiccated drops may not represent their surface tension.
Since self-pinning seems to be the precursor process of theinterfacial gelation of emulsion drops, emulsion drop dryingwill also depend on the contact angle and on the quality of thesubstrate. In fact, the wedge effect will be likely morepronounced in hydrophilic surfaces in order to confine emulsionparticles in the three-phase contact line. Moreover, the dropapex depression will be more pronounced for low curvaturemenisci even with smaller volumes. The characteristic ring-likedeposit of “dried” emulsion drops on aggregate sheets,described in the next section, confirms the apex collapse.
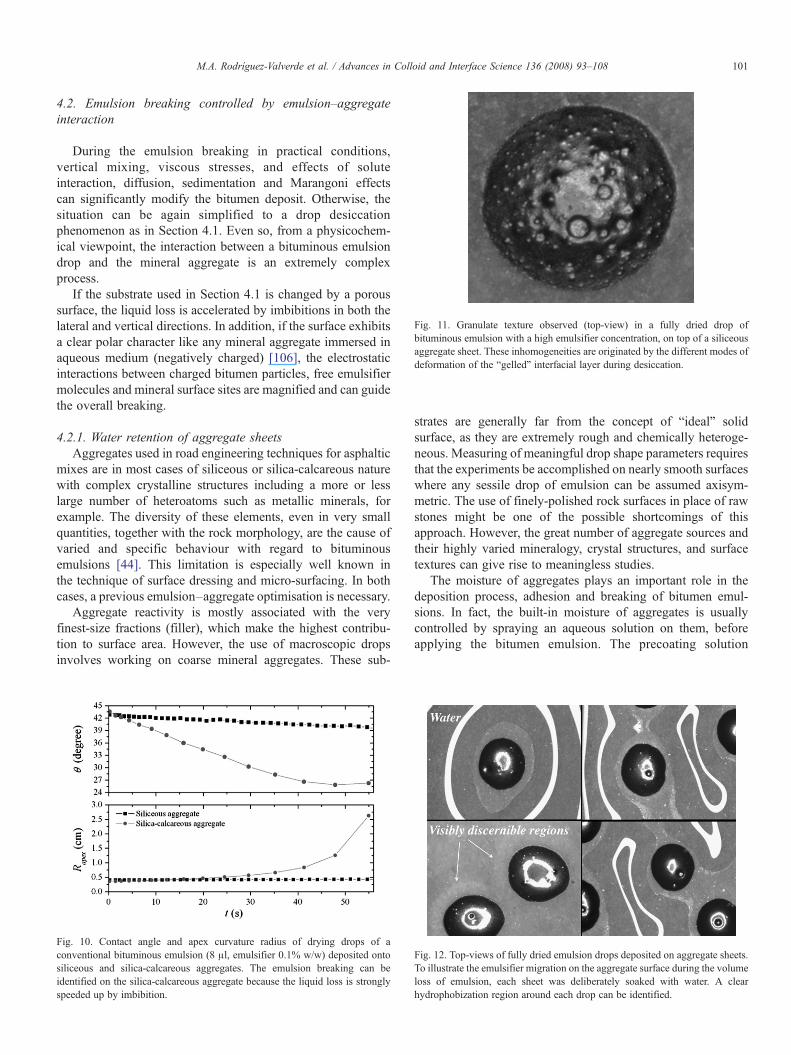
Fig. 11. Granulate texture observed (top-view) in a fully dried drop ofbituminous emulsion with a high emulsifier concentration, on top of a siliceousaggregate sheet. These inhomogeneities are originated by the different modes ofdeformation of the “gelled” interfacial layer during desiccation.
101M.A. Rodríguez-Valverde et al. / Advances in Colloid and Interface Science 136 (2008) 93–108
4.2. Emulsion breaking controlled by emulsion–aggregateinteraction
During the emulsion breaking in practical conditions,vertical mixing, viscous stresses, and effects of soluteinteraction, diffusion, sedimentation and Marangoni effectscan significantly modify the bitumen deposit. Otherwise, thesituation can be again simplified to a drop desiccationphenomenon as in Section 4.1. Even so, from a physicochem-ical viewpoint, the interaction between a bituminous emulsiondrop and the mineral aggregate is an extremely complexprocess.
If the substrate used in Section 4.1 is changed by a poroussurface, the liquid loss is accelerated by imbibitions in both thelateral and vertical directions. In addition, if the surface exhibitsa clear polar character like any mineral aggregate immersed inaqueous medium (negatively charged) [106], the electrostaticinteractions between charged bitumen particles, free emulsifiermolecules and mineral surface sites are magnified and can guidethe overall breaking.
4.2.1. Water retention of aggregate sheetsAggregates used in road engineering techniques for asphaltic
mixes are in most cases of siliceous or silica-calcareous naturewith complex crystalline structures including a more or lesslarge number of heteroatoms such as metallic minerals, forexample. The diversity of these elements, even in very smallquantities, together with the rock morphology, are the cause ofvaried and specific behaviour with regard to bituminousemulsions [44]. This limitation is especially well known inthe technique of surface dressing and micro-surfacing. In bothcases, a previous emulsion–aggregate optimisation is necessary.
Aggregate reactivity is mostly associated with the veryfinest-size fractions (filler), which make the highest contribu-tion to surface area. However, the use of macroscopic dropsinvolves working on coarse mineral aggregates. These sub-
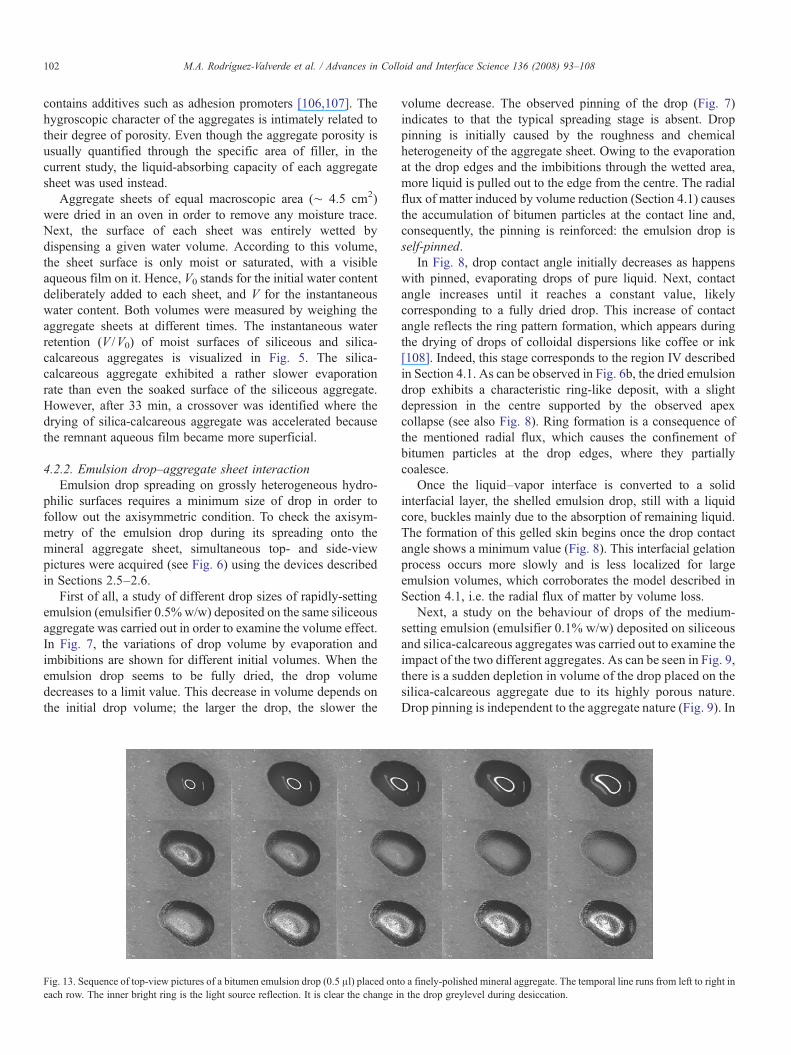
Fig. 10. Contact angle and apex curvature radius of drying drops of aconventional bituminous emulsion (8 μl, emulsifier 0.1% w/w) deposited ontosiliceous and silica-calcareous aggregates. The emulsion breaking can beidentified on the silica-calcareous aggregate because the liquid loss is stronglyspeeded up by imbibition.
strates are generally far from the concept of “ideal” solidsurface, as they are extremely rough and chemically heteroge-neous. Measuring of meaningful drop shape parameters requiresthat the experiments be accomplished on nearly smooth surfaceswhere any sessile drop of emulsion can be assumed axisym-metric. The use of finely-polished rock surfaces in place of rawstones might be one of the possible shortcomings of thisapproach. However, the great number of aggregate sources andtheir highly varied mineralogy, crystal structures, and surfacetextures can give rise to meaningless studies.
The moisture of aggregates plays an important role in thedeposition process, adhesion and breaking of bitumen emul-sions. In fact, the built-in moisture of aggregates is usuallycontrolled by spraying an aqueous solution on them, beforeapplying the bitumen emulsion. The precoating solution
Fig. 12. Top-views of fully dried emulsion drops deposited on aggregate sheets.To illustrate the emulsifier migration on the aggregate surface during the volumeloss of emulsion, each sheet was deliberately soaked with water. A clearhydrophobization region around each drop can be identified.
102 M.A. Rodríguez-Valverde et al. / Advances in Colloid and Interface Science 136 (2008) 93–108
contains additives such as adhesion promoters [106,107]. Thehygroscopic character of the aggregates is intimately related totheir degree of porosity. Even though the aggregate porosity isusually quantified through the specific area of filler, in thecurrent study, the liquid-absorbing capacity of each aggregatesheet was used instead.
Aggregate sheets of equal macroscopic area (∼ 4.5 cm2)were dried in an oven in order to remove any moisture trace.Next, the surface of each sheet was entirely wetted bydispensing a given water volume. According to this volume,the sheet surface is only moist or saturated, with a visibleaqueous film on it. Hence, V0 stands for the initial water contentdeliberately added to each sheet, and V for the instantaneouswater content. Both volumes were measured by weighing theaggregate sheets at different times. The instantaneous waterretention (V /V0) of moist surfaces of siliceous and silica-calcareous aggregates is visualized in Fig. 5. The silica-calcareous aggregate exhibited a rather slower evaporationrate than even the soaked surface of the siliceous aggregate.However, after 33 min, a crossover was identified where thedrying of silica-calcareous aggregate was accelerated becausethe remnant aqueous film became more superficial.
4.2.2. Emulsion drop–aggregate sheet interactionEmulsion drop spreading on grossly heterogeneous hydro-
philic surfaces requires a minimum size of drop in order tofollow out the axisymmetric condition. To check the axisym-metry of the emulsion drop during its spreading onto themineral aggregate sheet, simultaneous top- and side-viewpictures were acquired (see Fig. 6) using the devices describedin Sections 2.5–2.6.
First of all, a study of different drop sizes of rapidly-settingemulsion (emulsifier 0.5% w/w) deposited on the same siliceousaggregate was carried out in order to examine the volume effect.In Fig. 7, the variations of drop volume by evaporation andimbibitions are shown for different initial volumes. When theemulsion drop seems to be fully dried, the drop volumedecreases to a limit value. This decrease in volume depends onthe initial drop volume; the larger the drop, the slower the
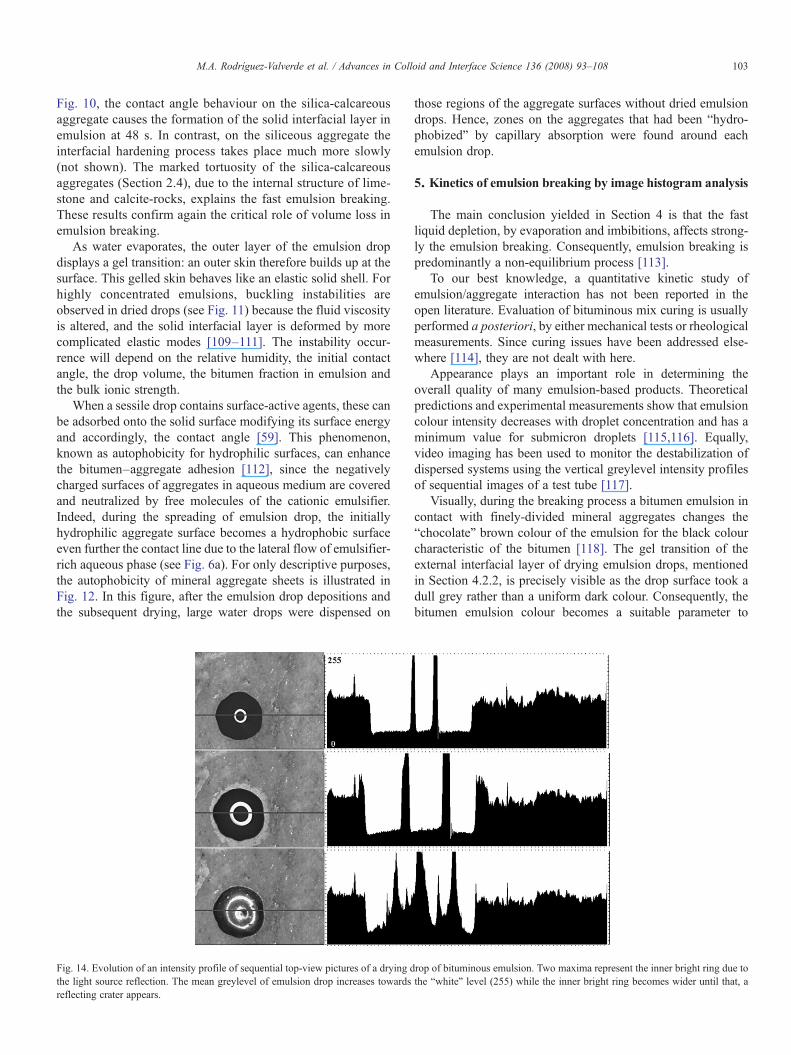
Fig. 13. Sequence of top-view pictures of a bitumen emulsion drop (0.5 μl) placed onteach row. The inner bright ring is the light source reflection. It is clear the change i
volume decrease. The observed pinning of the drop (Fig. 7)indicates to that the typical spreading stage is absent. Droppinning is initially caused by the roughness and chemicalheterogeneity of the aggregate sheet. Owing to the evaporationat the drop edges and the imbibitions through the wetted area,more liquid is pulled out to the edge from the centre. The radialflux of matter induced by volume reduction (Section 4.1) causesthe accumulation of bitumen particles at the contact line and,consequently, the pinning is reinforced: the emulsion drop isself-pinned.
In Fig. 8, drop contact angle initially decreases as happenswith pinned, evaporating drops of pure liquid. Next, contactangle increases until it reaches a constant value, likelycorresponding to a fully dried drop. This increase of contactangle reflects the ring pattern formation, which appears duringthe drying of drops of colloidal dispersions like coffee or ink[108]. Indeed, this stage corresponds to the region IV describedin Section 4.1. As can be observed in Fig. 6b, the dried emulsiondrop exhibits a characteristic ring-like deposit, with a slightdepression in the centre supported by the observed apexcollapse (see also Fig. 8). Ring formation is a consequence ofthe mentioned radial flux, which causes the confinement ofbitumen particles at the drop edges, where they partiallycoalesce.
Once the liquid–vapor interface is converted to a solidinterfacial layer, the shelled emulsion drop, still with a liquidcore, buckles mainly due to the absorption of remaining liquid.The formation of this gelled skin begins once the drop contactangle shows a minimum value (Fig. 8). This interfacial gelationprocess occurs more slowly and is less localized for largeemulsion volumes, which corroborates the model described inSection 4.1, i.e. the radial flux of matter by volume loss.
Next, a study on the behaviour of drops of the medium-setting emulsion (emulsifier 0.1% w/w) deposited on siliceousand silica-calcareous aggregates was carried out to examine theimpact of the two different aggregates. As can be seen in Fig. 9,there is a sudden depletion in volume of the drop placed on thesilica-calcareous aggregate due to its highly porous nature.Drop pinning is independent to the aggregate nature (Fig. 9). In
o a finely-polished mineral aggregate. The temporal line runs from left to right inn the drop greylevel during desiccation.
103M.A. Rodríguez-Valverde et al. / Advances in Colloid and Interface Science 136 (2008) 93–108
Fig. 10, the contact angle behaviour on the silica-calcareousaggregate causes the formation of the solid interfacial layer inemulsion at 48 s. In contrast, on the siliceous aggregate theinterfacial hardening process takes place much more slowly(not shown). The marked tortuosity of the silica-calcareousaggregates (Section 2.4), due to the internal structure of lime-stone and calcite-rocks, explains the fast emulsion breaking.These results confirm again the critical role of volume loss inemulsion breaking.
As water evaporates, the outer layer of the emulsion dropdisplays a gel transition: an outer skin therefore builds up at thesurface. This gelled skin behaves like an elastic solid shell. Forhighly concentrated emulsions, buckling instabilities areobserved in dried drops (see Fig. 11) because the fluid viscosityis altered, and the solid interfacial layer is deformed by morecomplicated elastic modes [109–111]. The instability occur-rence will depend on the relative humidity, the initial contactangle, the drop volume, the bitumen fraction in emulsion andthe bulk ionic strength.
When a sessile drop contains surface-active agents, these canbe adsorbed onto the solid surface modifying its surface energyand accordingly, the contact angle [59]. This phenomenon,known as autophobicity for hydrophilic surfaces, can enhancethe bitumen–aggregate adhesion [112], since the negativelycharged surfaces of aggregates in aqueous medium are coveredand neutralized by free molecules of the cationic emulsifier.Indeed, during the spreading of emulsion drop, the initiallyhydrophilic aggregate surface becomes a hydrophobic surfaceeven further the contact line due to the lateral flow of emulsifier-rich aqueous phase (see Fig. 6a). For only descriptive purposes,the autophobicity of mineral aggregate sheets is illustrated inFig. 12. In this figure, after the emulsion drop depositions andthe subsequent drying, large water drops were dispensed on
Fig. 14. Evolution of an intensity profile of sequential top-view pictures of a drying dthe light source reflection. The mean greylevel of emulsion drop increases towardsreflecting crater appears.
those regions of the aggregate surfaces without dried emulsiondrops. Hence, zones on the aggregates that had been “hydro-phobized” by capillary absorption were found around eachemulsion drop.
5. Kinetics of emulsion breaking by image histogram analysis
The main conclusion yielded in Section 4 is that the fastliquid depletion, by evaporation and imbibitions, affects strong-ly the emulsion breaking. Consequently, emulsion breaking ispredominantly a non-equilibrium process [113].
To our best knowledge, a quantitative kinetic study ofemulsion/aggregate interaction has not been reported in theopen literature. Evaluation of bituminous mix curing is usuallyperformed a posteriori, by either mechanical tests or rheologicalmeasurements. Since curing issues have been addressed else-where [114], they are not dealt with here.
Appearance plays an important role in determining theoverall quality of many emulsion-based products. Theoreticalpredictions and experimental measurements show that emulsioncolour intensity decreases with droplet concentration and has aminimum value for submicron droplets [115,116]. Equally,video imaging has been used to monitor the destabilization ofdispersed systems using the vertical greylevel intensity profilesof sequential images of a test tube [117].
Visually, during the breaking process a bitumen emulsion incontact with finely-divided mineral aggregates changes the“chocolate” brown colour of the emulsion for the black colourcharacteristic of the bitumen [118]. The gel transition of theexternal interfacial layer of drying emulsion drops, mentionedin Section 4.2.2, is precisely visible as the drop surface took adull grey rather than a uniform dark colour. Consequently, thebitumen emulsion colour becomes a suitable parameter to
rop of bituminous emulsion. Two maxima represent the inner bright ring due tothe “white” level (255) while the inner bright ring becomes wider until that, a
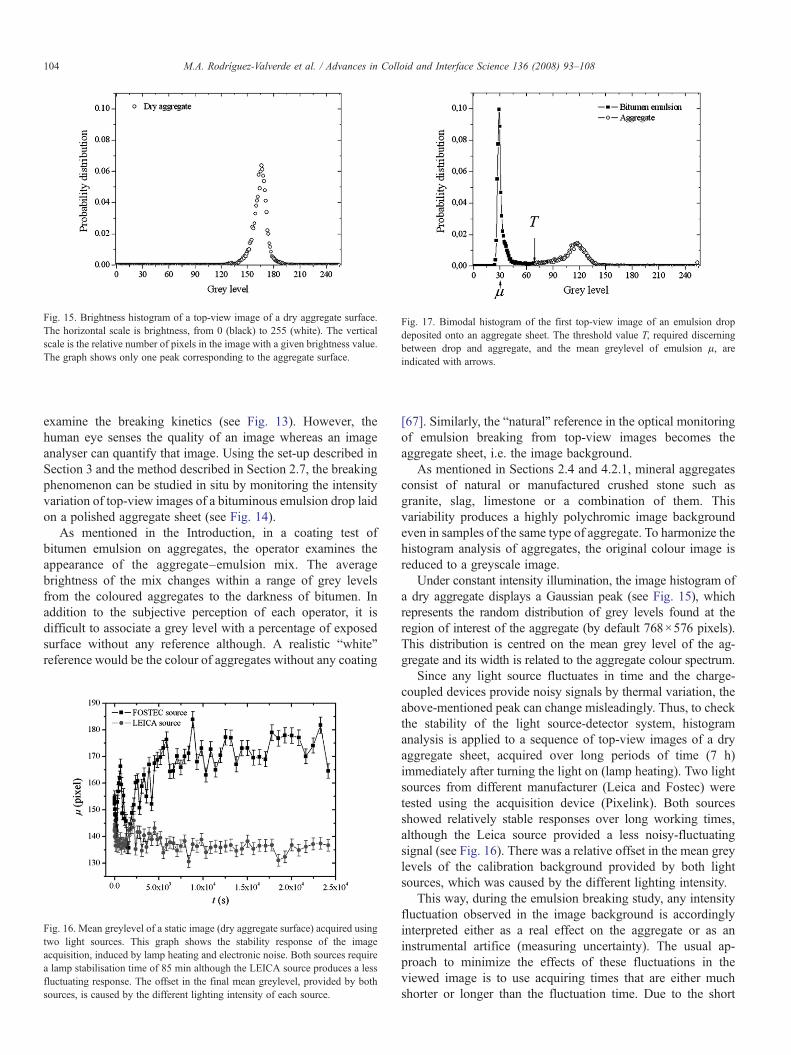
Fig. 17. Bimodal histogram of the first top-view image of an emulsion dropdeposited onto an aggregate sheet. The threshold value T, required discerningbetween drop and aggregate, and the mean greylevel of emulsion μ, areindicated with arrows.
Fig. 15. Brightness histogram of a top-view image of a dry aggregate surface.The horizontal scale is brightness, from 0 (black) to 255 (white). The verticalscale is the relative number of pixels in the image with a given brightness value.The graph shows only one peak corresponding to the aggregate surface.
104 M.A. Rodríguez-Valverde et al. / Advances in Colloid and Interface Science 136 (2008) 93–108
examine the breaking kinetics (see Fig. 13). However, thehuman eye senses the quality of an image whereas an imageanalyser can quantify that image. Using the set-up described inSection 3 and the method described in Section 2.7, the breakingphenomenon can be studied in situ by monitoring the intensityvariation of top-view images of a bituminous emulsion drop laidon a polished aggregate sheet (see Fig. 14).
As mentioned in the Introduction, in a coating test ofbitumen emulsion on aggregates, the operator examines theappearance of the aggregate–emulsion mix. The averagebrightness of the mix changes within a range of grey levelsfrom the coloured aggregates to the darkness of bitumen. Inaddition to the subjective perception of each operator, it isdifficult to associate a grey level with a percentage of exposedsurface without any reference although. A realistic “white”reference would be the colour of aggregates without any coating
Fig. 16. Mean greylevel of a static image (dry aggregate surface) acquired usingtwo light sources. This graph shows the stability response of the imageacquisition, induced by lamp heating and electronic noise. Both sources requirea lamp stabilisation time of 85 min although the LEICA source produces a lessfluctuating response. The offset in the final mean greylevel, provided by bothsources, is caused by the different lighting intensity of each source.
[67]. Similarly, the “natural” reference in the optical monitoringof emulsion breaking from top-view images becomes theaggregate sheet, i.e. the image background.
As mentioned in Sections 2.4 and 4.2.1, mineral aggregatesconsist of natural or manufactured crushed stone such asgranite, slag, limestone or a combination of them. Thisvariability produces a highly polychromic image backgroundeven in samples of the same type of aggregate. To harmonize thehistogram analysis of aggregates, the original colour image isreduced to a greyscale image.
Under constant intensity illumination, the image histogram ofa dry aggregate displays a Gaussian peak (see Fig. 15), whichrepresents the random distribution of grey levels found at theregion of interest of the aggregate (by default 768×576 pixels).This distribution is centred on the mean grey level of the ag-gregate and its width is related to the aggregate colour spectrum.
Since any light source fluctuates in time and the charge-coupled devices provide noisy signals by thermal variation, theabove-mentioned peak can change misleadingly. Thus, to checkthe stability of the light source-detector system, histogramanalysis is applied to a sequence of top-view images of a dryaggregate sheet, acquired over long periods of time (7 h)immediately after turning the light on (lamp heating). Two lightsources from different manufacturer (Leica and Fostec) weretested using the acquisition device (Pixelink). Both sourcesshowed relatively stable responses over long working times,although the Leica source provided a less noisy-fluctuatingsignal (see Fig. 16). There was a relative offset in the mean greylevels of the calibration background provided by both lightsources, which was caused by the different lighting intensity.
This way, during the emulsion breaking study, any intensityfluctuation observed in the image background is accordinglyinterpreted either as a real effect on the aggregate or as aninstrumental artifice (measuring uncertainty). The usual ap-proach to minimize the effects of these fluctuations in theviewed image is to use acquiring times that are either muchshorter or longer than the fluctuation time. Due to the short
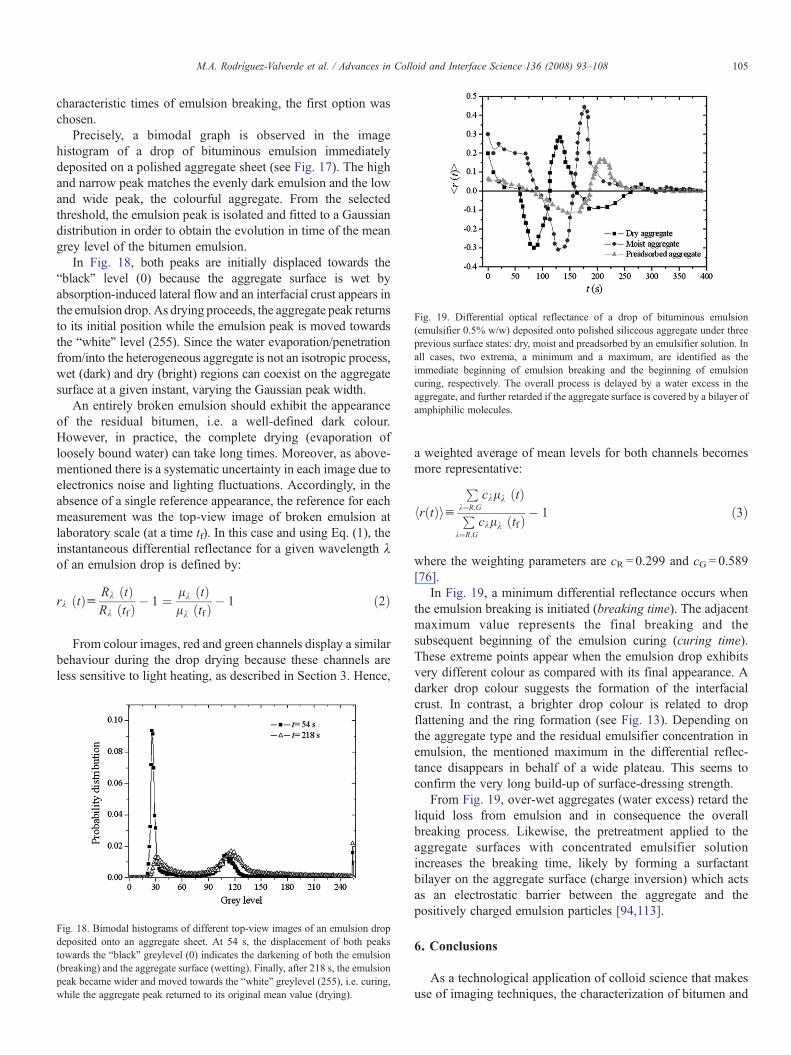
Fig. 19. Differential optical reflectance of a drop of bituminous emulsion(emulsifier 0.5% w/w) deposited onto polished siliceous aggregate under threeprevious surface states: dry, moist and preadsorbed by an emulsifier solution. Inall cases, two extrema, a minimum and a maximum, are identified as theimmediate beginning of emulsion breaking and the beginning of emulsioncuring, respectively. The overall process is delayed by a water excess in theaggregate, and further retarded if the aggregate surface is covered by a bilayer ofamphiphilic molecules.
105M.A. Rodríguez-Valverde et al. / Advances in Colloid and Interface Science 136 (2008) 93–108
characteristic times of emulsion breaking, the first option waschosen.
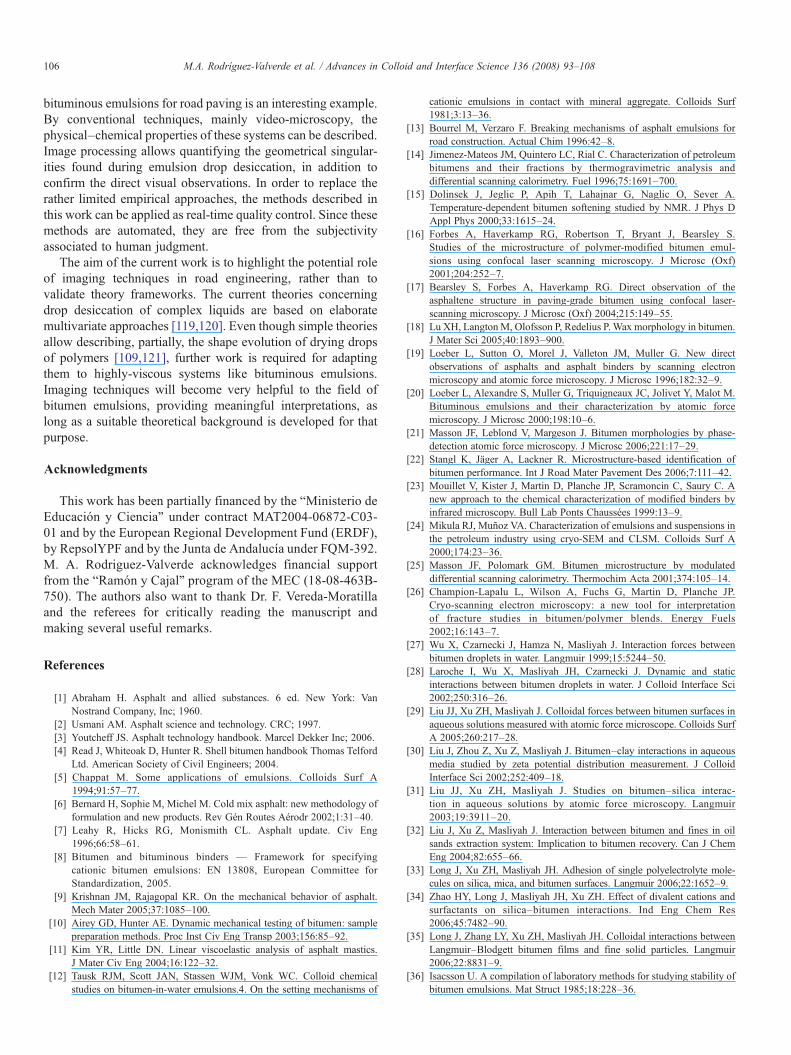
Precisely, a bimodal graph is observed in the imagehistogram of a drop of bituminous emulsion immediatelydeposited on a polished aggregate sheet (see Fig. 17). The highand narrow peak matches the evenly dark emulsion and the lowand wide peak, the colourful aggregate. From the selectedthreshold, the emulsion peak is isolated and fitted to a Gaussiandistribution in order to obtain the evolution in time of the meangrey level of the bitumen emulsion.
In Fig. 18, both peaks are initially displaced towards the“black” level (0) because the aggregate surface is wet byabsorption-induced lateral flow and an interfacial crust appears inthe emulsion drop. As drying proceeds, the aggregate peak returnsto its initial position while the emulsion peak is moved towardsthe “white” level (255). Since the water evaporation/penetrationfrom/into the heterogeneous aggregate is not an isotropic process,wet (dark) and dry (bright) regions can coexist on the aggregatesurface at a given instant, varying the Gaussian peak width.
An entirely broken emulsion should exhibit the appearanceof the residual bitumen, i.e. a well-defined dark colour.However, in practice, the complete drying (evaporation ofloosely bound water) can take long times. Moreover, as above-mentioned there is a systematic uncertainty in each image due toelectronics noise and lighting fluctuations. Accordingly, in theabsence of a single reference appearance, the reference for eachmeasurement was the top-view image of broken emulsion atlaboratory scale (at a time tf). In this case and using Eq. (1), theinstantaneous differential reflectance for a given wavelength λof an emulsion drop is defined by:
rk ðtÞu Rk ðtÞRk ðtf Þ � 1 ¼ lk ðtÞ
lk ðtf Þ � 1 ð2Þ
From colour images, red and green channels display a similarbehaviour during the drop drying because these channels areless sensitive to light heating, as described in Section 3. Hence,
Fig. 18. Bimodal histograms of different top-view images of an emulsion dropdeposited onto an aggregate sheet. At 54 s, the displacement of both peakstowards the “black” greylevel (0) indicates the darkening of both the emulsion(breaking) and the aggregate surface (wetting). Finally, after 218 s, the emulsionpeak became wider and moved towards the “white” greylevel (255), i.e. curing,while the aggregate peak returned to its original mean value (drying).
a weighted average of mean levels for both channels becomesmore representative:
hrðtÞiuP
k¼R;G
cklk ðtÞP
k¼R;G
cklk ðtf Þ � 1 ð3Þ
where the weighting parameters are cR=0.299 and cG=0.589[76].
In Fig. 19, a minimum differential reflectance occurs whenthe emulsion breaking is initiated (breaking time). The adjacentmaximum value represents the final breaking and thesubsequent beginning of the emulsion curing (curing time).These extreme points appear when the emulsion drop exhibitsvery different colour as compared with its final appearance. Adarker drop colour suggests the formation of the interfacialcrust. In contrast, a brighter drop colour is related to dropflattening and the ring formation (see Fig. 13). Depending onthe aggregate type and the residual emulsifier concentration inemulsion, the mentioned maximum in the differential reflec-tance disappears in behalf of a wide plateau. This seems toconfirm the very long build-up of surface-dressing strength.
From Fig. 19, over-wet aggregates (water excess) retard theliquid loss from emulsion and in consequence the overallbreaking process. Likewise, the pretreatment applied to theaggregate surfaces with concentrated emulsifier solutionincreases the breaking time, likely by forming a surfactantbilayer on the aggregate surface (charge inversion) which actsas an electrostatic barrier between the aggregate and thepositively charged emulsion particles [94,113].
6. Conclusions
As a technological application of colloid science that makesuse of imaging techniques, the characterization of bitumen and
106 M.A. Rodríguez-Valverde et al. / Advances in Colloid and Interface Science 136 (2008) 93–108
bituminous emulsions for road paving is an interesting example.By conventional techniques, mainly video-microscopy, thephysical–chemical properties of these systems can be described.Image processing allows quantifying the geometrical singular-ities found during emulsion drop desiccation, in addition toconfirm the direct visual observations. In order to replace therather limited empirical approaches, the methods described inthis work can be applied as real-time quality control. Since thesemethods are automated, they are free from the subjectivityassociated to human judgment.
The aim of the current work is to highlight the potential roleof imaging techniques in road engineering, rather than tovalidate theory frameworks. The current theories concerningdrop desiccation of complex liquids are based on elaboratemultivariate approaches [119,120]. Even though simple theoriesallow describing, partially, the shape evolution of drying dropsof polymers [109,121], further work is required for adaptingthem to highly-viscous systems like bituminous emulsions.Imaging techniques will become very helpful to the field ofbitumen emulsions, providing meaningful interpretations, aslong as a suitable theoretical background is developed for thatpurpose.
Acknowledgments
This work has been partially financed by the “Ministerio deEducación y Ciencia” under contract MAT2004-06872-C03-01 and by the European Regional Development Fund (ERDF),by RepsolYPF and by the Junta de Andalucía under FQM-392.M. A. Rodriguez-Valverde acknowledges financial supportfrom the “Ramón y Cajal” program of the MEC (18-08-463B-750). The authors also want to thank Dr. F. Vereda-Moratillaand the referees for critically reading the manuscript andmaking several useful remarks.
References
[1] Abraham H. Asphalt and allied substances. 6 ed. New York: VanNostrand Company, Inc; 1960.
[2] Usmani AM. Asphalt science and technology. CRC; 1997.[3] Youtcheff JS. Asphalt technology handbook. Marcel Dekker Inc; 2006.[4] Read J, Whiteoak D, Hunter R. Shell bitumen handbook Thomas Telford
Ltd. American Society of Civil Engineers; 2004.[5] Chappat M. Some applications of emulsions. Colloids Surf A
1994;91:57–77.[6] Bernard H, Sophie M, Michel M. Cold mix asphalt: new methodology of
formulation and new products. Rev Gén Routes Aérodr 2002;1:31–40.[7] Leahy R, Hicks RG, Monismith CL. Asphalt update. Civ Eng
1996;66:58–61.[8] Bitumen and bituminous binders — Framework for specifying
cationic bitumen emulsions: EN 13808, European Committee forStandardization, 2005.
[9] Krishnan JM, Rajagopal KR. On the mechanical behavior of asphalt.Mech Mater 2005;37:1085–100.
[10] Airey GD, Hunter AE. Dynamic mechanical testing of bitumen: samplepreparation methods. Proc Inst Civ Eng Transp 2003;156:85–92.
[11] Kim YR, Little DN. Linear viscoelastic analysis of asphalt mastics.J Mater Civ Eng 2004;16:122–32.
[12] Tausk RJM, Scott JAN, Stassen WJM, Vonk WC. Colloid chemicalstudies on bitumen-in-water emulsions.4. On the setting mechanisms of
cationic emulsions in contact with mineral aggregate. Colloids Surf1981;3:13–36.
[13] Bourrel M, Verzaro F. Breaking mechanisms of asphalt emulsions forroad construction. Actual Chim 1996:42–8.
[14] Jimenez-Mateos JM, Quintero LC, Rial C. Characterization of petroleumbitumens and their fractions by thermogravimetric analysis anddifferential scanning calorimetry. Fuel 1996;75:1691–700.
[15] Dolinsek J, Jeglic P, Apih T, Lahajnar G, Naglic O, Sever A.Temperature-dependent bitumen softening studied by NMR. J Phys DAppl Phys 2000;33:1615–24.
[16] Forbes A, Haverkamp RG, Robertson T, Bryant J, Bearsley S.Studies of the microstructure of polymer-modified bitumen emul-sions using confocal laser scanning microscopy. J Microsc (Oxf)2001;204:252–7.
[17] Bearsley S, Forbes A, Haverkamp RG. Direct observation of theasphaltene structure in paving-grade bitumen using confocal laser-scanning microscopy. J Microsc (Oxf) 2004;215:149–55.
[18] Lu XH, LangtonM, Olofsson P, Redelius P. Wax morphology in bitumen.J Mater Sci 2005;40:1893–900.
[19] Loeber L, Sutton O, Morel J, Valleton JM, Muller G. New directobservations of asphalts and asphalt binders by scanning electronmicroscopy and atomic force microscopy. J Microsc 1996;182:32–9.
[20] Loeber L, Alexandre S, Muller G, Triquigneaux JC, Jolivet Y, Malot M.Bituminous emulsions and their characterization by atomic forcemicroscopy. J Microsc 2000;198:10–6.
[21] Masson JF, Leblond V, Margeson J. Bitumen morphologies by phase-detection atomic force microscopy. J Microsc 2006;221:17–29.
[22] Stangl K, Jäger A, Lackner R. Microstructure-based identification ofbitumen performance. Int J Road Mater Pavement Des 2006;7:111–42.
[23] Mouillet V, Kister J, Martin D, Planche JP, Scramoncin C, Saury C. Anew approach to the chemical characterization of modified binders byinfrared microscopy. Bull Lab Ponts Chaussées 1999:13–9.
[24] Mikula RJ, Muñoz VA. Characterization of emulsions and suspensions inthe petroleum industry using cryo-SEM and CLSM. Colloids Surf A2000;174:23–36.
[25] Masson JF, Polomark GM. Bitumen microstructure by modulateddifferential scanning calorimetry. Thermochim Acta 2001;374:105–14.
[26] Champion-Lapalu L, Wilson A, Fuchs G, Martin D, Planche JP.Cryo-scanning electron microscopy: a new tool for interpretationof fracture studies in bitumen/polymer blends. Energy Fuels2002;16:143–7.
[27] Wu X, Czarnecki J, Hamza N, Masliyah J. Interaction forces betweenbitumen droplets in water. Langmuir 1999;15:5244–50.
[28] Laroche I, Wu X, Masliyah JH, Czarnecki J. Dynamic and staticinteractions between bitumen droplets in water. J Colloid Interface Sci2002;250:316–26.
[29] Liu JJ, Xu ZH, Masliyah J. Colloidal forces between bitumen surfaces inaqueous solutions measured with atomic force microscope. Colloids SurfA 2005;260:217–28.
[30] Liu J, Zhou Z, Xu Z, Masliyah J. Bitumen–clay interactions in aqueousmedia studied by zeta potential distribution measurement. J ColloidInterface Sci 2002;252:409–18.
[31] Liu JJ, Xu ZH, Masliyah J. Studies on bitumen–silica interac-tion in aqueous solutions by atomic force microscopy. Langmuir2003;19:3911–20.
[32] Liu J, Xu Z, Masliyah J. Interaction between bitumen and fines in oilsands extraction system: Implication to bitumen recovery. Can J ChemEng 2004;82:655–66.
[33] Long J, Xu ZH, Masliyah JH. Adhesion of single polyelectrolyte mole-cules on silica, mica, and bitumen surfaces. Langmuir 2006;22:1652–9.
[34] Zhao HY, Long J, Masliyah JH, Xu ZH. Effect of divalent cations andsurfactants on silica–bitumen interactions. Ind Eng Chem Res2006;45:7482–90.
[35] Long J, Zhang LY, Xu ZH, Masliyah JH. Colloidal interactions betweenLangmuir–Blodgett bitumen films and fine solid particles. Langmuir2006;22:8831–9.
[36] Isacsson U. A compilation of laboratory methods for studying stability ofbitumen emulsions. Mat Struct 1985;18:228–36.
107M.A. Rodríguez-Valverde et al. / Advances in Colloid and Interface Science 136 (2008) 93–108
[37] Salou M, Siffert B, Jada A. Interfacial characteristics of petroleumbitumens in contact with acid water. Fuel 1998;77:343–6.
[38] Jada A, Salou A. Effects of the asphaltene and resin contents of thebitumens on the water-bitumen interface properties. J Pet Sci Eng2002;33:185–93.
[39] Hefer A, Little D. Adhesion in bitumen–aggregate systems andquantification of the effects of water on the adhesive bond. InternationalCenter for Aggregates Research; 2005.
[40] Ensley EK, Petersen JC, Robertson RE. Asphalt–aggregate bondingenergy measurements by microcalorimetric methods. Thermochim Acta1984;77:95–107.
[41] Nowell DV, Powell MW. Determination of adhesion in bitumen–mineralsystems by heat-of-immersion calorimetry.1. The effect of crude-oil sourceon adhesive performance. J Therm Anal 1991;37:2109–24.
[42] Letoffe JM, Claudy P, Planche JP, Germanaud L. Characterization ofbitumen–aggregate interaction by isothermal microcalorimetry. Thermo-chim Acta 1992;210:27–40.
[43] Evans MB, Nowell DV, Powell MW. Determination of adhesion inbitumen mineral systems by heat-of-immersion calorimetry.2. Correlationof chemical-properties with adhesion. J Therm Anal 1993;40:121–31.
[44] Gorman JL, Crawford RJ, Stannard P, Harding IH. Harding, the role ofaggregate surface chemistry in bitumen emulsion–aggregate interactions.Road & Transport Research; 1998.
[45] Rodríguez-Valverde MA, Cabrerizo-Vílchez MA, Hidalgo-Álvarez R,Páez-Dueñas A, Unzueta–Etxeita E. Novel technique for mineralaggregates and bitumen wetting studies based on ADSA. 2nd Eurasphalt& Eurobitume Congress, Barcelona, Spain; 2000. p. 743–9.
[46] Cheng DX, Little DN, Lytton RL, Holste JC. Surface energymeasurement of asphalt and its application to predicting fatigue andhealing in asphalt mixtures. Bituminous Binders 2002; 2002. p. 44–53.
[47] Takamura K, Chow RS, Tse DL. Prediction of electrophoretic mobilitiesand the coagulation behaviour of bitumen-in-water emulsions in aqueousNaCl and CaCl_2 solutions using the ionizable surface-group model. In:Attia YA, editor. International Symposium on Flocculation in Biotech-nology and Separation Systems: Flocculation in Biotechnology andSeparation SystemsElsevier; 1987. p. 565–78.
[48] Jada A, Florentin C, Robin M, Louis C, Colin JM, Mariotti S. Electricalproperties of cationic bitumen emulsions as investigated by zeta potentialmeasurements. 3rd World Congress on Emulsions. Lyon, France: CME;2002.
[49] Jada A, Florentin C, Mariotti S. Study of the electrical properties ofcationic bitumen emulsions by microelectrophoresis. Adv ColloidInterface Sci 2004;108–09:127–32.
[50] Salou M, Siffert B, Jada A. Study of the stability of bitumen emulsions byapplication of DLVO theory. Colloids Surf A 1998;142:9–16.
[51] Urbina-Villalba G, Garcia-Sucre M. A simple computational techniquefor the systematic study of adsorption effects in emulsified systems.Influence of inhomogeneous surfactant distributions on the coalescencerate of a bitumen-in-water emulsion. Mol Simul 2001;27:75–97.
[52] Rodríguez-Valverde MA, Cabrerizo-Vílchez MA, Paez-Dueñas A,Hidalgo-Álvarez R. Stability of highly charged particles: bitumen-in-water dispersions. Colloids Surf A 2003;222:233–51.
[53] Varghabutler EI, Zubovits TK, Budziak CJ, Neumann AW, Potoczny ZM.Surface-tension of bitumen from contact-angle measurements on films ofbitumen. Energy Fuels 1988;2:653–6.
[54] Wege HA, Holgado-Terriza JA, Rosales-Leal JI, Osorio R, Toledano M,Cabrerizo-Vílchez MA. Contact angle hysteresis on dentin surfacesmeasured with ADSA on drops and bubbles. Colloids Surf A2002;206:469–83.
[55] Poirier JE, Bourrel M, Castillo P, Chambu C, Kbala M. Asphaltemulsions: experimental study of the cationic surfactant adsorption at theasphalt–water interface. Prog Colloid Polym Sci 1989;79:106–11.
[56] Mohammed RA, Lorenzo MD, Marino J, Cohen J. Adsorption isothermsof bitumen/aqueous solutions of Intan-100. J Colloid Interface Sci1997;191:517–20.
[57] Di Lorenzo M, Vinagre HTM, Joseph DD. Adsorption of Intan-100 at thebitumen/aqueous solution interface studied by spinning drop tensiometry.Colloids Surf A 2001;180:121–30.
[58] Verlhac P, Nieuwenhuyze Kv, Verzaro F, Cagna A. Interfacial tensionmeasurements of bitumen at high temperature using a drop tensiometer.Bull Lab Ponts Chaussées 2002;235:3–16.
[59] Rodríguez-Valverde MA, Páez-Dueñas A, Cabrerizo-Vílchez MA,Hidalgo-Álvarez R. Adsorption isotherms of cationic surfactants onbitumen films studied using axisymmetric drop shape analysis. In: MittalKL, editor. Contact Angle, Wettability and AdhesionThe Netherlands:VSP; 2003. p. 441–62.
[60] Ghaly AM. Digital image processing for aggregate orientation in asphaltconcrete mixtures: discussion. Can J Civ Eng 1997;24:333–4.
[61] Obaidat MT, Al-Masaeid HR, Gharaybeh F, Khedaywi TS. An innovativedigital image analysis approach to quantify the percentage of voids inmineral aggregates of bituminous mixtures. Can J Civ Eng 1998;25:1041–9.
[62] Masad E, Muhunthan B, Shashidhar N, Harman T. Internal structurecharacterization of asphalt concrete using image analysis. J Comput CivEng 1999;13:88–95.
[63] Seo Y, Kim YR, Witczak MW, Bonaquist R. Application of digital imagecorrelation method to mechanical testing of asphalt–aggregate mixtures.Bituminous Paving Mixtures 2002; 2002. p. 162–72.
[64] Hunter AE, Airey GD, Collop AC. Aggregate orientation and segregationin laboratory-compacted asphalt samples. Transp Res Rec 2004:8–15.
[65] Obaidat MT, Abo-Qudais S, Obaidat AF. Evaluation of stripping inbituminous mixtures using conventional and image processing techni-ques. J Test Eval 2005;33:418–32.
[66] Masad E. X-ray computed tomography of aggregates and asphalt mixes.Mater Eval 2004;62:775–83.
[67] Deneuvilliers C, Cornet E. Image analysis: a tool to assist in fomur-lating asphalt cold mixes. International Symposium on AsphaltEmulsion Technology: Manufacturing, Application and Performance;1999. p. 310–6.
[68] Al-Rousan T, Masad E, Tutumluer E, Pan T. Evaluation of image analysistechniques for quantifying aggregate shape characteristics. Constr BuildMater 2007;21:978–90.
[69] Bitumen and bituminous binders— Determination of needle penetration:EN 1426, European Committee for Standardization, 1999.
[70] Gutierrez X, Silva F, Morles A, Pazos D, Rivas H. The use of amines inthe stabilization of acidic hydrocarbons in water emulsions. Pet SciTechnol 2003;21:1219–40.
[71] Rodríguez-Valverde MA, Cabrerizo-Vílchez MA, Rosales-López P,Páez-Dueñas A, Hidalgo-Álvarez R. Contact angle measurementson two (wood and stone) non-ideal surfaces. Colloids Surf A2002;206:485–95.
[72] Ardebrant H, Pugh RJ. Surface acidity/basicity of road stone aggre-gates by adsorption from non-aqueous solutions. Colloids Surf1991;53:101–16.
[73] Páez A, Unzueta E, Sánchez J. Adsorption of cationic surfactants onaggregates related to the behavior of bituminous emulsions. InternationalSymposium on Asphalt Emulsion Technology: Manufacturing Applica-tion and Performance; 1999. p. 247–53.
[74] Forsyth DA, Ponce J. Radiometry — measuring light. Computer Vision:A Modern Approach. Prentice Hall; 2003.
[75] Moroz LV, Arnold G, Korochantsev AV, Wasch R. Natural solid bitumensas possible analogs for cometary and asteroid organics: 1. Reflectancespectroscopy of pure bitumens. Icarus 1998;134:253–68.
[76] Russ JC. The image processing handbook. 3rd ed. CRC press; 1998.[77] Kindratenko V. Development and application of image analysis
techniques for identification and classification of microscopic particles.University of Antwerp, Antwerp: University Institute of Antwerp; 1997.p. 182.
[78] Singh H, Jain PK. Bitumen quality and manufacturing processes — pastand present technological status. Indian J Chem Technol 1997;4:259–76.
[79] Pfeiffer JP, Saal RNJ. Asphaltic bitumen as colloid system. J Phys Chem1939;44:139–49.
[80] Loeber L, Muller G, Morel J, Sutton O. Bitumen in colloid science: achemical, structural and rheological approach. Fuel 1998;77:1443–50.
[81] Baginska K, Gawel I. Effect of origin and technology on the chemicalcomposition and colloidal stability of bitumens. Fuel Process Technol2004;85:1453–62.
108 M.A. Rodríguez-Valverde et al. / Advances in Colloid and Interface Science 136 (2008) 93–108
[82] Abo-Qudais S. The effects of damage evaluation techniques on theprediction of environmental damage in asphalt mixtures. Build Environ2007;42:288–96.
[83] Lu X, Isacsson U. Effect of ageing on bitumen chemistry and rheology.Constr Build Mater 2002;16:15–22.
[84] Said SF. Aging effect on mechanical characteristics of bituminousmixtures. Bituminous Binders 2005; 2005. p. 1–9.
[85] Patwardhan SR, Khade SB. Kinetics of air-blowing of petroleumbitumen. Ind Eng Chem Process Des Dev 1982;21:154–7.
[86] Gawel I, Katarzyna B. Effect of bitumen blowing on its chemicalcomposition and colloidal type. 2nd Eurasphalt & Eurobitume Congress;2000. p. 157–60.
[87] Terminology Relating to Materials for Roads and Pavements: D0008-02,American Society for Testing and Materials, 2006.
[88] Gao M, Xiao B, Liao KH, Cong YF, Dai YL. Aging behavior of coloredpaving asphalt. Pet Sci Technol 2006;24:689–98.
[89] Lin DF, Luo HL. Fading and color changes in colored asphalt quantifiedby the image analysis method. Constr Build Mater 2004;18:255–61.
[90] Masson JF, Collins P, Polomark G. Steric hardening and the ordering ofasphaltenes in bitumen. Energy Fuels 2005;19:120–2.
[91] Bitumen and bituminous binders — Determination of the resistance tohardening under the influence of heat and air — Part 1: RTFOT method:EN 12607-1, European Committee for Standardization, 1999.
[92] Gorman JL, Crawford RJ, Harding IH. Bitumen emulsions in roadconstruction - A review. Road Transp Res 2004:25–38.
[93] Lesueur D, Potti JJ. Cold mix design: a rational approach based on thecurrent understanding of the breaking of bituminous emulsions. RoadMater Pavement Des 2004;5:65–87.
[94] Glet W. Five stages model for the bitumen emulsion setting andits importance for the performance of such emulsions in roadconstruction. International Symposium on Asphalt Emulsion Technolo-gy: Manufacturing, Application and Performance; 1999. p. 318–44.
[95] Scott JAN. A general description of the breaking process of cationicbitumen emulsions in contact with mineral aggregate. In: Smith AL,editor. Symposium on Theory and Practice of Emulsion TechnologyAca-demic Press; 1974. p. 179–201.
[96] Philip J, Bonakdar L, Poulin P, Bibette J, Leal-Calderon F. Viscoussintering phenomena in liquid–liquid dispersions. Phys Rev Lett2000;84:2018–21.
[97] Philip J, Poirier JE, Bibette J, Leal-Calderon F. Gelation and coarseningin dispersions of highly viscous droplets. Langmuir 2001;17:3545–52.
[98] Bonakdar L, Philip J, Bardusco P, Petkov J, Potti JJ, Meleard P, et al.Rupturing of bitumen-in-water emulsions: experimental evidence forviscous sintering phenomena. Colloids Surf A 2001;176:185–94.
[99] Gaestel C. Breaking mechanism of cationic bitumen emulsions. ChemInd 1967:221.
[100] Zizi Z, Oulahna D, Benhassaine A, Sainton A, Bourdrel D, Pelon M. Lesystème “émulsion-solides divisés siliceux”. La rupture physique del'emulsion. Bull Lab Ponts Chaussées 1997;207:5–12.
[101] Babak VG. Principles physico-chimiques de la maîtrise de la rupture desémulsions. Rev Gén Routes Aérodr 1997:17–21.
[102] Bourrel M, Verzaro F. Contrôle de la rupture des émulsions de bitumedans les applications routières. Rev Gén Routes Aérodr 1998:58–63.
[103] Loeber L, Héritier B, Jolivet T, Malot M. Rupture des émulsions. Unenouvelle voie pour contrôler la formation du film de liant. Rev GénRoutes Aérodr 2000:18–21.
[104] Chamerois M. The various breaking mechanisms of bitumen emulsions.4th World Congress on Emulsions. Lyon, France: CME; 2006.
[105] Lesueur D, Coupé C, Ezzarouguiwas M. Skin formation during the dryingof an asphalt emulsion. Int J Road Mater Pavement Des 2001;2:161–79.
[106] Ernstsson M, Larsson A. A multianalytical approach to characterize acidicadsorption sites on a quartz powder. Colloids Surf A 2000;168:215–30.
[107] Guru M. Improvement of adhesion of bitumen — aggregate coatings byadditives. Cellul Chem Technol 2004;38:129–40.
[108] Deegan RD, Bakajin O, Dupont TF, Huber G, Nagel SR, Witten TA.Capillary flow as the cause of ring stains from dried liquid drops. Nature1997;389:827–9.
[109] Pauchard L, Allain C. Stable and unstable surface evolution during thedrying of a polymer solution drop. Phys Rev E 2003;68:052801–4.
[110] Pauchard L, Allain C. Mechanical instability induced by complex liquiddesiccation. C R Phys 2003;4:231–9.
[111] Pauchard L, Allain C. Buckling instability induced by polymer solutiondrying. Europhys Lett 2003;62:897–903.
[112] Peltonen PV. Road aggregate choice based on silicate quality and bitumenadhesion. J Transp Eng (Asce) 1992;118:50–61.
[113] Rodríguez-Valverde MÁ, Cabrerizo-Vílchez MÁ, Páez-Dueñas A,Hidalgo-Álvarez R. Kinetic model of bitumen emulsion breaking. 3rdWorld Congress on Emulsions. France: Lyon; 2002.
[114] Serfass JP, Poirier JE, Henrat JP, Carbonneau X. Influence of curing oncold mix mechanical performance. Mat Struct 2004;37:365–8.
[115] McClements DJ. Theoretical prediction of emulsion color. Adv ColloidInterface Sci 2002;97:63–89.
[116] McClements DJ. Colloidal basis of emulsion color. Curr Opin ColloidInterface Sci 2002;7:451–5.
[117] Novales B, Papineau P, Sire A, Axelos MAV. Characterization of emulsionsand suspensions by video image analysis. Colloids Surf A 2003;221:81–9.
[118] Bitumen and bituminous binders—Determination of breaking behaviour—Part 1: Determination of breaking value of cationic bitumen emulsions;Mineral filler method: EN 13075-1, European Committee for Standardiza-tion, 2002.
[119] Head DA. Volume-controlled buckling of thin elastic shells: applicationto crusts formed on evaporating partially wetted droplets. J Phys CondensMatter 2006;18:L485–91.
[120] Head DA. Modeling the elastic deformation of polymer crusts formed bysessile droplet evaporation. Phys Rev E 2006;74:021601–8.
[121] Kajiya T, Nishitani E, Yamaue T, Doi M. Piling-to-buckling transition inthe drying process of polymer solution drop on substrate having a largecontact angle. Phys Rev E 2006;73:011601–5.