an empirical model for modified bituminous binder master curves
TRANSCRIPT

1 23
Materials and Structures ISSN 1359-5997 Mater StructDOI 10.1617/s11527-012-9988-x
An empirical model for modifiedbituminous binder master curves
Seyed Mohammad Asgharzadeh, NaderTabatabaee, Koorosh Naderi & ManfredPartl

1 23
Your article is protected by copyright and all
rights are held exclusively by RILEM. This e-
offprint is for personal use only and shall not
be self-archived in electronic repositories.
If you wish to self-archive your work, please
use the accepted author’s version for posting
to your own website or your institution’s
repository. You may further deposit the
accepted author’s version on a funder’s
repository at a funder’s request, provided it is
not made publicly available until 12 months
after publication.

ORIGINAL ARTICLE
An empirical model for modified bituminous binder mastercurves
Seyed Mohammad Asgharzadeh •
Nader Tabatabaee • Koorosh Naderi •
Manfred Partl
Received: 17 July 2012 / Accepted: 19 November 2012
� RILEM 2012
Abstract Modeling the mechanical behavior of
asphalt binders and mixtures has been the subject of
intensified research in recent decades. Master curves
of the norm of the complex modulus |G*| in the linear
viscoelastic domain are frequently used for modeling,
while phase angle master curves are less frequently
considered for this purpose. Therefore in this research,
an empirical model is introduced for phase angle
master curves of modified and neat bituminous
binders. The model is based on a general form of a
double-logistic (DL) mathematical function. The |G*|
master curve was then modeled using a mutual
relationship between the phase angle and |G*|. Master
curves of three neat and seven modified binders were
generated and used to validate the DL model. The
results showed that the model is capable of properly
predicting the plateau region of phase angle master
curves. In particular, the asymptotic behavior of the
master curves at high frequencies can be modeled
correctly. The model also describes irregularities in
the high temperature range of the phase angle master
curve. In general, model outputs such as the phase
angle value at the plateau, glassy modulus, rheological
index and crossover frequency correctly predict the
behavior of the neat and modified binders.
Keywords Master curve � Modified binders �Phase angle � Modeling � Double logistic � Plateau
1 Introduction
The master curves of neat and modified binders have
been widely generated and interpreted over the years
to characterize the rheological properties of bitumi-
nous binders. In a master curve of dynamic mechan-
ical data, any viscoelastic function, such as the
complex shear modulus |G*| or the phase angle, are
plotted against frequency on a log–log (or semi-log)
scale [4]. Using the master curve of dynamic mechan-
ical data, the three-dimensional characterization of
modulus, time and temperature can be reduced to a
two-dimensional format (modulus, reduced fre-
quency) using the time–temperature superposition
principle [17].
Quantifying the linear viscoelastic rheological
properties of bituminous binders can be performed
by finding predictive models or equations for the
master curves of any rheological parameter in terms of
reduced frequency. Modeling the master curves is
useful because testing is generally laborious, time
consuming, expensive and requires skilled operators
S. M. Asgharzadeh (&) � N. Tabatabaee
Sharif University of Technology, Tehran, Iran
e-mail: [email protected]
K. Naderi
Amirkabir University of Technology, Tehran, Iran
M. Partl
EMPA Swiss Federal Laboratories for Materials Science
and Technology, Duebendorf, Switzerland
Materials and Structures
DOI 10.1617/s11527-012-9988-x
Author's personal copy

[27]. Also, modeling rheological master curves usually
provides a fundamental understanding of the materials
since it allows an estimation of mechanical properties
for a wide range of temperature and loading times or
frequencies that may be experienced in the field but is
not practical to directly simulate in the laboratory [28].
Mathematical models allow such calculations to be
made directly and quickly in a repeatable fashion.
Furthermore, prediction of the stress–strain response of
the binder to model pavement response or predict
pavement performance can only be done realistically
with the use of reasonably accurate mathematical
models of a binder’s viscoelastic behavior [4].
Modeling the mechanical behavior of asphalt
binders and mixtures has been studied since the
1950s. Master curves of binder stiffness modulus were
first introduced by Van der Poel [25]; however, that
modeling was not done mathematically. Improve-
ments in dynamic testing techniques led to the
construction of master curves for dynamic parameters
such as the norm of complex modulus |G*| or the loss
and storage moduli [10, 11, 15]. Modeling and the use
of phase angle master curves have received less
attention, since their construction, interpretation and
application are not as straight forward.
Unlike |G*| master curves, the phase angle d master
curves of polymer modified binders (PMB) substan-
tially differ from those of neat binders. The formation
of entanglements in the bitumen-polymer network in
elastomer modified binders and the presence of a rigid,
tough network in plastomer modified binders lead to
the formation of a plateau zone in phase angle master
curves [1, 2]. The mathematical models available for
neat binders are not capable of describing this
behavior and there is a need to correctly model the
plateau zone.
The mechanical model of the generalized Maxwell
model [6, 12] and the fractional model [23] can predict
the plateau zone and other irregularities in phase angle
master curves, but both models require a compara-
tively large number of parameters than mathematical
models. In these models, the required number of
parameters varies in an arbitrary manner and is
determined for each case by selecting one of the
approaches available for this purpose. The variable
number of parameters and the difficulty of determin-
ing them can affect the uniqueness of the results.
The 2S2P1D model [20] with seven parameters
(including static and glassy modulus) can partially
predict irregularities such as a plateau zone in the PMB
and its corresponding asphalt mixture. One shortcom-
ing of this model is that, for some binders, a third
parabolic parameter must be added to get a good fit at
high temperature ranges. This may increase the
complexity of the model and its parameter estimation
method [20]. A visual inspection of the master curves
may also be needed for parameter estimation, making
the results user-dependent.
Mathematical equations like the Christensen–
Anderson (CA) model [9] developed in the Strategic
Highway Research Program (SHRP) [4] and Chris-
tensen–Anderson–Marasteanu (CAM) model (Maras-
teanu and Anderson [16] cannot predict plateaus or
irregularities in phase angle master curves because
they essentially assume an S-shaped curve. The
equations in the modified CAM model presented by
Zeng et al. [28], however, can be used to fit a simple
form of phase angle master curves for a PMB at low
frequencies. The sigmoidal (or standard logistic)
model presented in the mechanistic empirical pave-
ment design guide (MEPDG) [19] and the generalized
logistic sigmoidal model presented by Rowe et al. [21,
22]) also do not present explicit models for phase
angle diagrams. Yusoff et al. [26, 27] have presented a
thorough discussion of available models for asphalt
master curves and shifting techniques.
Most available models for the mechanical behavior
of bitumen are based on |G*| master curves. The |G*|
master curves follow a similar S-shaped trend for
different binders. However, phase angle master curves
assume various shapes and trends for different mod-
ified binders that can be used to interpret binder
characteristics. Given the lack of an appropriate
mathematical model for the phase angle master curves
of PMBs, it is the objective of this research to focus on
the development of a mathematical model for phase
angle master curves using parameters that have
physical significance. It is hypothesized that a math-
ematical model based on the general shape of a
double-logistic function can be developed to describe
the phase angle master curves of neat and modified
bitumen in its general form. The model will be capable
of predicting the plateau region and other irregularities
in PMB phase angle master curves that cannot be
thoroughly modeled by other available models. This
model can then be used to develop a |G*| model for
that binder as well. In this study, several types of neat
and modified binders are used to validate the newly
Materials and Structures
Author's personal copy

introduced model, through its ability to fit various
patterns of phase angle master curves.
2 Modeling approach
The complex modulus G* = |G*|eid comprises an
absolute value |G*| and a phase lag d (phase angle).
The phase angle master curves of most unmodified
binders follow a simple S-shaped diagram in the range
of 0�–90� (Fig. 1a) when tested over a wide range of
temperatures and plotted on a semi-logarithmic scale.
The main scheme for the phase angle master curves of
a large number of PMBs is depicted in Fig. 1b. This
figure represents a group of double logistics (DL)
curves. No algebraic equation has been presented for
asphaltic materials that directly follow such a scheme.
The DL function is described as:
fDL ¼ sgn x� dð Þ � e�x�d
sð Þ2
� �� 1
� �ð1aÞ
where the first term represents a signum function
defined as
sgn x� dð Þ ¼�1 if x\d0 if x ¼ dþ1 if x [ d
8<
:
9=
;ð1bÞ
and the second term is a simplified bell-shaped
Gaussian function [13] with two constants (d and s).
The signum operator converts the bell-shaped Gauss-
ian function to a DL form as shown in Fig. 1c by
flipping the bell-shaped function at its peak point. The
peak point will then form the plateau region in the DL
function.
A double logistic diagram consists of two identical
logistic-shaped curves joined together at point x = d.
It should be noted that, the algebraic equation of the
DL function is entirely different from the logistic
sigmoid function [19, 21, 22] commonly used in
asphalt technology.
In order to use the mathematical DL function for
phase angle master curve data from a modified binder,
appropriate constants must be inserted into Eq. (1a) to
change it to the new function in Eq. (2)
d ¼ dP þ dS � sgn(fred � fPÞ � e�log fred�log fP
Sð Þ2� �
� 1
� �;
ð2Þ
where the phase angle d (in degrees) has been modeled
using four parameters; dP, fP, dS, and S as a function of
the reduced frequency fred. Equation (2) defines a
symmetrical function over point fred = fP (the fre-
quency at the plateau) where the value of the phase
angle is dP (plateau phase angle) as shown in Fig. 1c.
The phase angle master curve rises or falls by the
amount of dS toward two horizontal asymptotes where
the reduced frequency decreases or increases toward
infinity. These values equal d = dP - dS on the right
side and d = dP ? dS on the left side (Fig. 1c). S also
shows how rapidly the rise and fall occurs on both
sides.
Equation (2) only presents a symmetrical form of
the phase angle master curve where the plateau zone
always lies in the middle of the range and the rise and
fall are equal on both sides; however, the general form
of a phase angle master curves is not symmetrical. In
order to define a more general equation, different
coefficients for the left and right side of the plateau
should be applied. However it is not possible to apply
different coefficients at the left and right side of the
plateau when using the signum function, since the
signum function yields equal values at both sides.
Thus, the signum function should be replaced by two
Heaviside step functions as defined in Eq. (3a):
HðuÞ ¼ 0 if u\0
1 if u� 0
� �: ð3aÞ
The replacement is
sgn(x� dÞ ¼ Hðx� dÞ � Hðd � xÞ ð3bÞ
or in the terms of a phase angle master curve, it is
dS � sgn(fred� fPÞ ¼ dS �Hðfred� fPÞ � dS �HðfP� fredÞð3cÞ
which with different coefficients on the left and right
sides of fP, it becomes
dS � sgn(fred� fPÞ! dR �Hðfred� fPÞ�dL �HðfP� fredÞ;ð3dÞ
where dR stands for the rise (or fall) on the right side
and dL for the left side of plateau dP. It is then
suggested to preset the value of dR to dP to ensure that
the phase angle always approaches zero at high
frequencies. Similarly to dS, S can vary in the left
and right sides of the plateau (SL and SR) to accom-
modate non-symmetry in the shape of the master
Materials and Structures
Author's personal copy

curve. These can also change from denominator to
numerator for simplicity without affecting the con-
cept. All these features can be incorporated into Eq. (2)
to get a final form for the DL model that estimates the
phase angle of unmodified and modified binders as
d ¼ dP � dP �Hðf red � f PÞ � 1� e� SR�log
fredfP
� � 20
@
1
A
þ dL �Hðf P � f redÞ � 1� e� SL�log
fPfred
� � 20
@
1
A;
ð4aÞ0\dP� 90; ð4bÞ0\dP þ dL� 90; ð4cÞ0\SL; SR; ð4dÞ
where d (in degrees) is modeled as a function of fred
using the previously defined parameters dP, dL, fP, SL
and SR. The Heaviside step functions are written in
bold to make the equation more clear. For fred values
larger than fP, the first Heaviside step function is
activated to reduce the phase angle, whereas for fred
values less than fP, the second Heaviside step function
comes into play. Figure 2 shows the scheme of this
model. Parameters dP, fP and SR are referred to as
‘‘base parameters’’ since they generate the general
form of the function at the right side of the plateau.
Equation (4b) keeps the value of dP below 90� to
prevent the model from incorrectly predicting the
phase angle. The parameter dP can be used to
distinguish between different PMBs because it refers
to the phase angle plateau value of the master curves.
The parameter fP determines the horizontal displace-
ment of the master curve over the frequency axis. Its
value depends on the selected reference temperature
for the master curve. Parameter SR indicates how
sharply the master curve approaches zero at high
frequencies. Smaller SR values cause the master curve
to approach the phase angle of zero in a smoother way,
as shown in Fig. 2. This may happen for a PMB with
lower temperature susceptibility at medium and low
temperature ranges.
Parameters dL and SL accommodate the changes in
the shape of the phase angle master curve at the left
side of the plateau compared to the right side. The
horizontal asymptote of the master curve at low
frequencies can be determined by d = dP ? dL. If dL
is positive, the expression yields the maximum value
of the phase angle that should be less than 90� to
produce the correct phase angle values. Equation (4c)
in the model defines this condition. It should be noted
that the model does not necessarily lead to an
asymptotic value of 90� for the phase angle at low
Fig. 1 a S-shaped diagram (common in unmodified binders phase angle master curves), b plateau zone (common in PMB phase angle
master curves), c converting bell-shape function to DL form
Materials and Structures
Author's personal copy

frequencies. This is desirable when modeling modified
binders because some PMBs may not show entirely
viscous behavior at high temperatures under testing
conditions. Negative values of dL also make the maxi-
mum value of the model equal to dP at the peak, which is
less than 90� based on Eq. (4b). A larger absolute value of
dL (positive or negative) yield greater rise or fall in the
master curve at the left side of the plateau. Parameter SL
also determines how fast the phase angle approaches its
asymptotic value at low frequencies.
For unmodified binders, the phase angle usually
approaches 90� at high temperatures (low frequencies)
without an intermediate plateau region. The whole
range of phase angle values from 0� to 90� can be
modeled using the base parameters of Eq. (4a). This
happens when dP approaches 90�. In this case, dL and
SL are not needed and it is recommended to preset dL to
zero and SL to SR.
The model in Eq. (4a) estimates the phase angle
master curve of unmodified and modified binders.
Furthermore, the same parameters in Eq. (4) are used
to generate a model for a |G*| master curve. To do this,
the Kramers–Kronig equation as modified by Booij
and Thoone [7] was used as follows:
d xð Þ ffi 90� d log G� xð Þð Þd log x
ð5aÞ
or after integration as
log G� xð Þð Þ ffi 1
90
Zd xð Þd log xþ C ð5bÞ
Equation (5a) relates the phase angle and |G*|. This
has been investigated by Dickinson and Witt [10] and
validated for a wide variety of materials by Ferry [12].
Chailleux et al. [8] also used the above relationship to
produce a new method for master curve shifting.
By integrating the phase angle function of Eq. (4a)
in terms of fred instead of x, a direct function for the
|G*| master curve is obtained:
log G�j j ¼ log G�0 � dP
90�H f red ¼ f p
� �
log fredð Þ � p1=2
2 � SR
erf SR logfred
fP
� �� ��
� logðfPÞ �dP þ dL
dP
�þ dL
90�Hðf p � f redÞ
�log fredð Þ þ p1=2
2 � SL
erf SL logfP
fred
� �� ��
þ dP
90log fred;
ð6Þ
where erf(x) (error function) is defined as
erfðxÞ ¼ 2
Zx
0
e�t2
dt
0
@
1
A=p1=2 ð7Þ
The parameters in Eq. (6) are the same as those in
Eq. (4a) and the conditions in Eq. (4b) and (4c) hold.
Also, as described for Eq. (4a), only one Heaviside
step function is called in depending on the value of fred.
The parameter G0* is an integration constant that
accommodates the required vertical shift for the |G*|
curve.
It is possible to calculate rheological parameters for
the model to evaluate the binder characteristics. These
parameters include the glassy modulus |Gg*|, crossover
frequency and rheological index (R) as defined by
Anderson et al. [3]. The glassy modulus indicates the
hardness of the binder at extremely low temperatures.
The lower the glassy modulus, the softer the binder,
and an improved cracking behavior of the binder at
low temperatures is expected. R is directly propor-
tional to the width of the relaxation spectrum. When
R increases, the master curve flattens and the binder
becomes less temperature susceptible [3, 9]. The
frequency at which R is calculated is called the
crossover frequency (fC) and can be regarded as a
hardness parameter [9]. It frequently correlates with
the gel point [18], but its value changes with the
reference temperature. A further description of these
parameters and the formulation needed to calculate
them from the DL model is explained in Appendix A.
The DL model presented above can also be used to
model asphalt mixture master curves. However, the
Fig. 2 DL model parameters for two PMBs phase angle master
curves
Materials and Structures
Author's personal copy

data used for model evaluation in this research is
limited to asphalt binders. An explanation of how to
apply this model to asphalt mixture master curves is
presented in Appendix B.
3 Model validation
Combining Eqs. (4) and (6) yields a new model for the
master curves of the phase angle and |G*| for neat and
modified binders. Note that, despite the complex
appearance of the equations, fitting these functions to
master curve data simply yields the parameters of the
model. Three neat and seven modified binders are used
to generate master curves using the DL model in this
research. The neat binders consist of two Pen.85/100
bitumen samples from different sources (Neat-1 and
Neat-3) and an aged Pen.40/50 bitumen (Neat-2). The
modified binders comprise one commercial (Styrelf
13-80) and six laboratory-made unaged PMBs. These
PMBs were produced using the Neat-1 binder with
different types and amounts of modifiers in the lab.
These modifiers and their concentrations, by the
weight of the neat bitumen, are polyphosphoric acid
(PPA) at 0.5 and 2.5 %, crumb rubber (CR) at 9 and
18 %, styrene–butadiene–styrene (SBS) at 7 %, and
ethylene vinyl acetate (EVA) at 6 %. Table 1 shows
the properties of these modified binders. The detailed
description of the preparation of the PMBs was
presented elsewhere [24].
The data required to generate master curves was
gathered using a dynamic shear rheometer (DSR)
MCR301 Anton Paar at several temperatures from
-30 to 88 �C, depending on the binders. For the EVA
modified binder, high temperature testing was lim-
ited to 64 �C because the melting of different
crystalline structures [1] in the EVA polymer causes
discontinuities in the master curve, making the
time–temperature superposition principle (TTSP)
inapplicable [12]. Frequency sweep data in the
frequency range of 0.1–10 Hz in a strain-controlled
mode was used. Strain amplitudes of 0.1 % or lower
was used at low temperatures to assure linear
viscoelastic response.
Shifting the isotherms to generate the master curves
was done for G0 and G00 using US200/32 V2.3
commercial software. The reference temperature of
40 �C was chosen. Then, the nonlinear least square
method was used to estimate the model parameters
using Microsoft Excel 2010 solver tools. Model fitting
can be applied to any viscoelastic parameter, including
|G*|, phase angle d, G0 or G00 or a combination of them.
By fitting the d master curve, dP, dL, fP, SL and SR can
be estimated and the best fit of |G*| then used to
determine |G0*,| as done by other researchers for other
models [23]. However, the approach used in this
research is the simultaneous fitting of the models over
G0 and G00 [5, 14] where the target is to minimize the
summation of the square of relative errors (SSRE) as
shown in Eq. (8):
Table 1 Physical properties of binders
Continuous PG
ASTM D7643
Pen. @ 25 �C
ASTM D5
TR&B
ASTM D36
PIa Stiffness @ -30 �C,
60 s, unaged
ASTM D6648
m-value @ -30 �C,
60 s, unaged
ASTM D6648
Binder (�C) (dmm) (�C) – (MPa) –
Styrelf 13–80 – 65 58 1.31 – –
’SBS7 75.8–22.3 54 82 4.74 516 0.186
EVA6 74.9–20.5 46 71 2.78 746 0.190
PPA2.5 91.9–23.8 40 79 3.61 729 0.214
CR18 75.0–31.6 60 56 0.66 451 0.209
CR9 66.8–27.7 66 52 -0.14 603 0.208
Neat-1 (85/100) 60.7–26.2 86 48 -0.35 781 0.196
Neat-2 (40/50) – – – – – –
Neat-3 (85/100) – – – – – –
PPA0.5 67.3–26.3 61 52 -0.23 688 0.249
a PI = 1952–500 9 Log(Pen.)-20 9 TR&B/50 9 Log(Pen.)-TR&B-120
Materials and Structures
Author's personal copy
SSREG0 þ SSREG00ð Þ ¼Xn
i¼1
1� G0model fið ÞG0measured fið Þ
� �2
þ 1� G00model fið ÞG00measured fið Þ
� �2 !
ð8Þ
where G0model and G00model are the real and imaginary
parts of |G*|model, respectively. These components are
calculated using the DL model at frequency fi. G0mea-
sured and G00measured are the laboratory measured coun-
terparts of the above components and n is the number of
data points. Equation (8) provides elative errors instead
of absolute errors. This is preferred because G0 and G00
values vary over several orders of magnitude. The use
of logarithmic errors for the above parameters is
another option for modeling. The selection of method
is a user preference. Further evaluation and refinement
of these methods is a subject for future research.
4 Results and discussion
The results of applying the DL model to three neat and
seven modified binders are shown in Table 2. The six
parameters of the model, as well as Gg*, rheological
index (R) and fc, are the main outcomes of the model.
Table 2 also presents the SSRE values as calculated
from Eq. (8), the Pearson coefficient of R2 for |G*| and
d, as well as the number of data points used for master
curve generation. The model generates high R2 values
for |G*| and the phase angle for all binders. This shows
the general goodness of fit for the model with the small
amount of scatter in the experimental results. Using R2
to compare a model is not recommended under these
conditions because all R2 values were very high and
close to one another. A visual comparison of the model
is recommended in this case. Figure 3 shows d and
|G*| master curves for the binders as well as the fit of
the DL model. It is clear in the figure that the phase
angle master curves of different modified binders
cover comparatively diverse patterns and features,
which makes the set of the selected binders an
appropriate choice for validating the model.
Styrelf 13–80 is the first binder shown in Fig. 3. It
corresponds exactly to the concept for which the DL
model has been generated. Its phase angle master
curve consists of an intermediate plateau region at
about 70�, a rise toward 90� at low frequencies, and a
decline toward zero at high frequencies. The DL
model precisely fits the master curves as shown in
Fig. 3. Table 2 also confirms the phase angle plateau
at about 70�. Furthermore, it can be seen in the figure
that the |G*| master curve shows a nearly constant
slope in the same frequency range (about
0.01–100 Hz) where the phase angle plateau occurs.
These observations confirm the fundamental assump-
tions used in the modeling (Eq. 5).
Two PMBs modified with 7 % SBS (SBS7) and
6 % EVA (EVA6) follow similar phase angle master
curve patterns as shown in Fig. 3. They both show a
peak at intermediate frequencies followed by a decline
toward lower frequencies (high temperatures). The
model captures the general pattern of the master
curves for both binders. Table 2 shows that both
models result in negative values for dL which means
that these two binders do not exhibit further viscous
behavior at higher temperatures. In Fig. 3, the |G*|
master curve shows a smaller slope at low frequencies
followed by an inflexion point that corresponds to the
peak point of its phase angle master curve. The model
also captures this behavior.
The binder modified with 2.5 % PPA (PPA2.5)
shows a phase angle master curve with low frequency
dependency as shown in Fig. 3. It is difficult to
visually determine an exact region at which the
plateau occurs. The model reveals a plateau phase
angle value of about 47�. Visual inspection confirms
this selection. A high PI value of 3.6 for PPA2.5
(Table 1) confirms the low frequency dependency, or
temperature susceptibility, of the binder. The rheo-
logical index, R calculated using the DL model, shows
the highest value (3.1) for PPA2.5 in Table 2,
indicating low temperature susceptibility as well [3,
9]. Parameter dP for PPA2.5 has the lowest value
among the binders. This shows that the phase angle
increased only slightly from zero to the point where
the plateau occurs, which, again, indicates the low
temperature susceptibility of the binder. The low
crossover frequency of this binder indicates a hard and
consistent binder with a low penetration value
(40 dmm). This is expected from a binder modified
with a high dose of PPA. The parameters of the model
correctly predict the above-mentioned behavior.
The phase angle master curve for binders modified
with 9 and 18 % crumb rubber (CR9 and CR18,
respectively) are different from the others. At the left
side of the plateau, which is about 53� for CR18 (59�
Materials and Structures
Author's personal copy

Ta
ble
2R
esu
lts
of
fitt
edD
Lm
od
els
for
thre
en
eat
and
sev
enm
od
ified
bin
der
s
Par
amet
ers
Un
its
Bin
der
s
Sty
relf
13
–8
0S
BS
7%
EV
A6
%P
PA
2.5
%C
R1
8%
CR
9%
Nea
t-1
85
/10
0N
eat-
24
0/5
0N
eat-
38
5/1
00
PP
A0
.5%
d Pd
egre
es6
8.4
06
3.9
55
6.5
44
7.6
75
3.0
65
9.1
39
09
09
09
0.0
0
f PH
z1
.E-1
9.E
-31
.E-1
3.E
-14
.E-1
1.E
?0
5.E
-41
.E-5
1.E
-34
.E-5
SR
–0
.14
30
.11
80
.12
00
.11
10
.12
60
.14
20
.11
40
.10
50
.12
20
.10
5
d LD
egre
es3
7.8
-2
2.2
-5
6.5
24
.31
9.4
24
.70
00
0.0
0
SL
–0
.25
70
.98
50
.23
70
.27
31
.55
30
.89
80
.11
40
.10
50
.12
20
.10
5
|G0*|
GP
a1
.7E
-4
2.2
E-
52
.1E
-5
1.7
E-
47
.0E
-5
3.3
E-
52
.7E
-5
2.4
E-
43
.5E
-5
8.2
E-
5
|Gg*|
GP
a0
.74
0.5
60
.94
1.1
40
.47
0.5
40
.83
0.7
70
.99
0.8
7
f cH
z4
.E?
03
1.E
?0
31
.E?
03
5.E
?0
16
.E?
02
6.E
?0
31
.E?
04
1.E
?0
31
.E?
04
3.E
?0
3
R–
1.6
92
.15
2.3
23
.10
2.3
61
.89
1.8
52
.01
1.7
42
.02
SS
RE
G0
?S
SR
EG00
–0
.95
0.5
51
.07
0.9
53
.35
4.0
35
.40
8.8
31
0.2
11
.26
(R2)d
–0
.99
78
0.9
95
50
.97
66
0.9
87
70
.97
58
0.9
91
80
.99
80
0.9
97
40
.99
57
0.9
99
1
(R2)G
*–
0.9
99
30
.99
99
0.9
99
90
.99
98
0.9
98
90
.99
83
0.9
99
90
.99
65
0.9
95
30
.99
95
n–
14
31
43
12
31
58
14
21
43
12
11
43
12
71
31
Materials and Structures
Author's personal copy
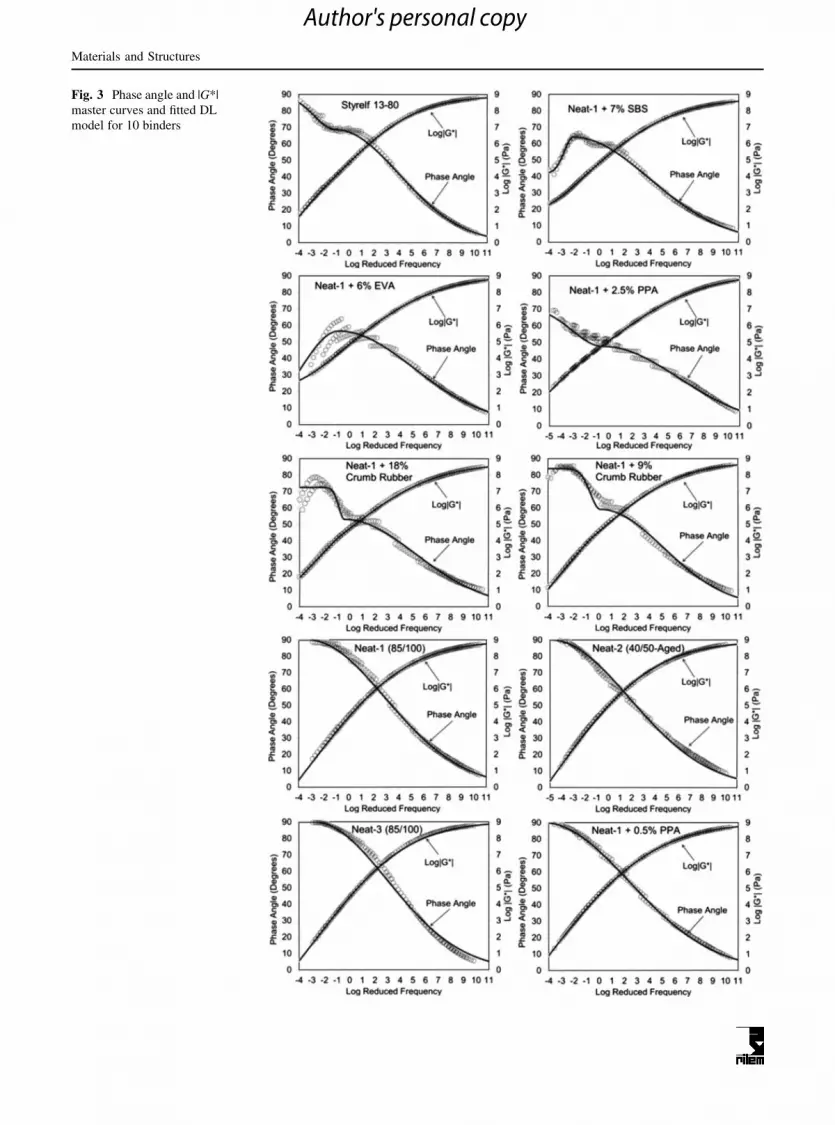
Fig. 3 Phase angle and |G*|
master curves and fitted DL
model for 10 binders
Materials and Structures
Author's personal copy

for CR9), a rise toward 80� (85� for CR9), and then a
decline at temperatures up to 88 �C occurs. This
differs from all other binders in this study although in
general SBS modified binders show a similar pattern.
The DL model follows the phase angle master curve at
high frequencies down to the plateau region at lower
frequency ranges, but not for the last decline at very
high temperatures (extremely low frequencies) as
shown in Fig. 3. This is especially the case for CR18.
However, this is not a major concern for the model
because, at very high temperatures (low frequency
regions in the master curve), complications such as
distortion of sample geometry may occur, making the
high temperature test results unreliable. Furthermore,
these temperatures are well above common high
pavement service temperatures. Therefore, generating
master curves for these temperatures does not have
practical significance and is mostly for the sake of
completeness over the entire temperature range.
CR18, in comparison with CR9, shows a smaller dP
and a higher R. It was expected that CR18 would show
more elastic behavior and lower temperature suscep-
tibility because of its higher modification level. The
higher softening point temperature and higher PI value
(Table 1) also confirm these findings.
If the phase angle plateau value approaches 90 in
the model estimation, the model is applied to a binder
having no intermediate temperature plateau region.
This is especially the case for neat binders, where the
entire range of phase angle master curve can be
modeled using only the base parameters. As shown in
Fig. 3, the three neat binders follow the general form
of a simple logistic function. Hence, the model is able
to fit these binder master curves using a reduced
number of parameters (dP, fP, SR and G0*). This may
result in higher SSRE values for neat binders com-
pared to PMBs, as shown in Table 2. Although using
all six parameters can improve the goodness of fit for
neat binders, the authors believe that it is not
reasonable to model a relatively simple behavior with
a more complicated model, especially when the simple
model goodness is sufficiently high, as shown in
Fig. 3.
The binder modified with 0.5 % PPA (PPA0.5) is a
binder with little modification that does not show
irregularities in the master curve, as shown in Fig. 3.
The generated master curve by the DL model for this
binder is like a neat binder with dP = 90� and dL = 0�,
as presented in Table 2.
Comparison of the glassy modulus in Table 2
demonstrates the capability of the model in predicting
binder low temperature properties. As it was expected,
the |Gg*| for binder Neat-1 reduced from 0.83 to
0.54 GPa, 0.47 and 0.56 GPa for CR9, CR18, and
SBS7, respectively. This shows the softening effects
of crumb rubber and SBS. The results of the bending
beam rheometer (BBR) in Table 1 show similar
stiffness reduction trends for the same binders.
Table 2 shows increased glassy modulus of 0.87 and
1.14 GPa for PPA0.5 and PPA2.5, respectively.
However, the BBR stiffness values in Table 1 do not
show increase for these two binders. The increased
glassy modulus of these binders can be attributed to
the increased slope of the stiffness curve (indicated by
the m value in Table 2). This implies that the stiffness
has not yet reached its asymptotic value at -30 �C.
5 Summary and conclusion
A simple model with six parameters based on the
general shape of a double logistic function has been
introduced to estimate the phase angle and |G*| master
curves of neat and modified binders in their linear
viscoelastic domains. The model was applied to
master curves of selected binders covering tempera-
tures from -30 �C to about 88 �C and more than 15
decades of reduced frequency values, which is a large
domain for validating a model.
Key parameters from the master curves such as the
phase angle plateau, glassy modulus, rheological
index, and crossover frequency were extracted from
the model for all binders. Their results were in good
agreement with the expectations from the modified
binders and other tests.
It is shown that the model can properly predict the
plateau region, a common PMB characteristic, at the
intermediate or high temperature ranges of phase
angle master curves. Furthermore, this model appro-
priately estimates the master curves at low tempera-
tures (high frequencies) and extrapolates below this
temperature range because it yields an asymptotic
value of zero at extremely high frequencies. This
model is also applicable at high temperatures for a
large variety of PMBs, especially those with low
variations in that range. This includes all binders in
this research except CR18. The phase angle master
curves for the neat binders and the SBS, EVA, and
Materials and Structures
Author's personal copy

PPA modified binders were all well described by the
DL model. A good fit of the |G*| master curve for all
binders at all frequency ranges was also achieved by
the model. The reduced slope of the |G*| master curves
of SBS and EVA modified binders at their low
frequency ranges were also properly predicted.
For neat binders, this model requires only about
half as many parameters as for the modified binders to
provide an acceptable fit, even though the point of
strength of the DL model is its ability to closely model
different modified binders.
This investigation clearly demonstrates that |G*|
master curves alone, for modeling purposes, do not
sufficiently characterize binder properties because
they mask some of the characteristic differences
among the binders, whereas phase angle master curves
clearly reveal them.
Phase angle master curves of modified binders vary
significantly from binder to binder. Therefore, vali-
dating the DL model using a large amount of master
curve data from other laboratories could be beneficial.
The DL function generated in this research identified
parameters that are expected to have physical signif-
icance. The correctness of this assumption was briefly
evaluated in the current research, but it is also
suggested as a topic of further research to calibrate
the model parameters with other tests results.
Appendix A
The glassy modulus of the binders is calculated using
Eq. (6) when simplified as:
Rheological index R, as defined by Anderson et al.
[3], can be calculated using the glassy modulus. This
parameter shows how rapidly the behavior of asphalt
cement changes overtime and thus indicates the time-
dependency of the asphalt binder [3]. R can be
calculated as the difference between the glassy
modulus and the modulus of the binder at a point
where the loss and storage moduli are equal (or the
phase angle is 45�). The crossover frequency fC can be
calculated by setting Eq. (4a) to 45� and extracting the
logarithm of the reduced frequency as a function of the
model parameters:
LogfC ¼ LogfP þH f C � f Pð Þ �
ffiffiffiffiffiffiffiffiffiffiffiffiffiffiffiffiffiffiffiffi�LN 45
dP
� r
SR
�H f P � f Cð Þ �
ffiffiffiffiffiffiffiffiffiffiffiffiffiffiffiffiffiffiffiffiffiffiffiffiffiffiffiffiffiffiffi�LN dPþdL�45
dL
� r
SL
ðA:2Þ
The above equation denotes that Log(fC) is located
on either side of the frequency at the plateau (fP) and
can be calculated using either of the Napierian
logarithms.
The complex modulus at crossover frequency Gfc*
can then be calculated by substituting Log(fC) from
Eq. (A.2) into Eq. (6). Finally, R can be calculated as:
R ¼ LogG�gG�fc
ðA:3Þ
Appendix B
The DL model is also capable of modeling asphalt
mixture master curves using the same parameters
log G�g
¼ lim
log fred!1log G�j j ¼ log G�0
þ limlog fred!1
1
90
� dP �H f red � f Pð Þ
logðfredÞ �p1=2
2 � SRerf SR log
fred
fP
� �� �� log fPð Þ �
dP þ dL
dP
� �þ dP � log fred
!
¼ 1
90�dP � lim
log fred!1log fredð Þ � p1=2
2 � SRlim
log fred!1erf SR log
fred
fP
� �� �� log fPð Þ �
dP þ dL
dP
� ��
þ limlog fred!1
dP � log fred
�þ log G�0
¼ 1
90dP
p1=2
2 � SR� log fPð Þ � dP
dP þ dL
dP
� �
þ log G�0 ¼ 1
90dP
p1=2
2 � SRþ dP þ dLð Þ � log fPð Þ
� �þ log G�0
ðA:1Þ
Materials and Structures
Author's personal copy

presented above. The high frequency asymptotes of
the master curves of asphalt mixtures can be obtained
using the same method as for asphalt binders. Here, the
phase angle approaches zero and |E*| approaches the
glassy modulus. For low frequency ranges (fred B fP),
the phase angle approaches dP ? dL. The phase angle
master curve of an asphalt mixture usually shows an
intermediate peak and declines on both sides at higher
and lower frequencies. Based on Eq. (6), the |G*| low
frequency asymptote will be zero except fordL =
-dP, where it approaches a fixed value of |G0*|-10^
(p0.5dP/180SL). It is generally believed that asphalt
mixtures show the behavior of a viscoelastic solid.
These materials approach an equilibrium modulus of
|Ge*| at very low frequencies [28], which happens only
when dL = -dP. This is not a limitation, but an
advantage, and the number of parameters will reduce
to five. The phase angle for extremely low frequencies
will also be zero for dL = -dP. This is a commonly
used assumption for asphalt mixtures [28].
References
1. Airey GD (2002) Rheological evaluation of ethylene vinyl
acetate polymer modified bitumens. Const Build Mater
16(8):473–487
2. Airey GD (2003) Rheological properties of styrene butadi-
ene styrene polymer modified road bitumens. Fuel
82(14):1709–1719. doi:10.1016/s0016-2361(03)00146-7
3. Anderson DA, Christensen DW, Bahia H (1991) Physical
properties of asphalt cement and the development of per-
formance-related specifications. J Assoc Asphalt Paving
Technol 60:437–475
4. Anderson DA, Christensen DW, Bahia HU, Dongre R,
Sharma M, Antle CE, Button J (1994) Binder character-
ization and evaluation, vol 3: physical characterization,
SHRP-A-369. Strategic Highway Research Program,
National Research Council, Washington DC
5. Baumgaertel M, Winter H (1989) Determination of discrete
relaxation and retardation time spectra from dynamic
mechanical data. Rheol Acta 28(6):511–519
6. Bird RB, Armstrong RC, Hassager O (1987) Dynamics of
polymeric liquids, vol 1, fluid mechanics, 2nd edn. Wiley,
New York
7. Booij H, Thoone G (1982) Generalization of Kramers–
Kronig transforms and some approximations of relations
between viscoelastic quantities. Rheol Acta 21(1):15–24
8. Chailleux E, Ramond G, Such C, de La Roche C (2006)
A mathematical-based master-curve construction method
applied to complex modulus of bituminous materials. Road
Mater Pavement Des 7(1):75–92
9. Christensen D, Anderson DA (1992) Interpretation of
dynamic mechanical test data for paving grade asphalt
cements. J Assoc Asphalt Paving Technol 61:67–116
10. Dickinson EJ, Witt HP (1974) The dynamic shear modulus
of paving asphalts as a function of frequency. Trans Soc
Rheol 18(4):591–606
11. Dobson G, Jongepier RD, Monismith C, Puzinauskas V,
Busching H, Warden WD (1969) The dynamic mechanical
properties of bitumen. J Assoc Asphalt Paving Technol
38:123–139
12. Ferry JD (1980) Viscoelastic properties of polymers, 1st
edn. Wiley, New York
13. Guo H (2011) A simple algorithm for fitting a gaussian
function [DSP tips and tricks]. Signal Process Mag IEEE
28(5):134–137
14. Jensen EA (2002) Determination of discrete relaxation
spectra using simulated annealing. J Non Newtonian Fluid
Mech 107(1–3):1–11
15. Jongepier R, Kuilman B, Schmidt R, Puzinauskas V, Rostler
F (1969) Characteristics of the rheology of bitumens.
J Assoc Asphalt Paving Technol 38:98–122
16. Marasteanu O, Anderson DA (1999) Improved model for
bitumen rheological characterization. In: Eurobitume work-
shop on performance related properties for bitumens binder,
Luxembourg
17. Marateanu M, Anderson D (1996) Time-temperature
dependency of asphalt binders—an improved model. J As-
soc Asphalt Paving Technol 65:408–448
18. Menard KP (1998) Dynamic mechanical analysis. Wiley
Online Library
19. NCHRP (2004) Guide for mechanistic–empirical design of
new and rehabilitated pavement structures. NCHRP Report
01-37A. National Cooperative Highway Research Program,
Transportation Research Board, National Research Council,
Washington DC
20. Olard F, Di Benedetto H (2003) General 2S2P1D model and
relation between the linear viscoelastic behaviours of bitu-
minous binders and mixes. Road Mater Pavement Des
4(2):185–224
21. Rowe GM, Baumgardner G, Sharrock MJ (2008) A gen-
eralized logistic function to describe the master curve
stiffness properties of binder mastics and mixtures. In:
45th Petersen Asphalt Research Conference. Laramie,
Wyoming, July 14–16
22. Rowe GM, Baumgardner G, Sharrock MJ (2009) Functional
forms for master curve analysis of bituminous materials. In:
Loizos A, Partl MN, Scarpas T, Al-Qadi IL (eds) Advanced
testing and characterization of bituminous materials. CRC
Press, Boca Raton, pp 81–91
23. Stastna J, Zanzotto L, Ho K (1994) Fractional complex
modulus manifested in asphalts. Rheol Acta 33(4):344–
354
24. Tabatabaee N, Teymourpour P (2010) Rut resistance
evaluation of mixtures made with modified asphalt
binders. Paper presented at the 11th International Con-
ference on Asphalt Pavements, ISAP, Japan, August
2010
25. Van der Poel C (1954) A general system describing the
visco elastic properties of bitumens and its relation to rou-
tine test data. J Appl Chem 4(5):221–236
26. Yusoff NIM, Chailleux E, Airey GD (2011a) A comparative
study of the influence of shift factor equations on master
curve construction. Int J Pavement Res Technol 4(6):324–
336
Materials and Structures
Author's personal copy

27. Yusoff NIM, Shaw MT, Airey GD (2011) Modelling the
linear viscoelastic rheological properties of bituminous
binders. Const Build Mater 25:2171–2189
28. Zeng M, Bahia H, Zhai H, Turner P (2001) Rheological
modeling of modified asphalt binders and mixtures. J Assoc
Asphalt Paving Technol 70:403–441
Materials and Structures
Author's personal copy