acid – base titration curves
TRANSCRIPT
Objectives
ACID – BASE TITRATION CURVES
After completing this unit , the student should be able to :
1- realize the importance of the titration curves in acid – base titration .
2- Construct the various types of titration curves, their applications and
requirements .
3- understand that the most important characteristics of a neutralization
titration can be summarized in the titration curve .
4- Differentiate between the three important regions of the curve i.e. before , at
and after the equivalent point .
5- find the values of Ka and Kb for weak acids and bases respectively from the
titration curve .
Subjects Unit 7
Last update : 1/1/2014 Page.No
Introduction
ACID – BASE TITRATION CURVES
Acid – base titration , which is sometimes called neutralization titration is used to
titrate any species having an acidic characteristic enough (Ka> 1x10⁻⁸) where it can
be titrated with a standard solution of a strong base . Like wise any species that has
basic property enough ((Kb> 1x10⁻⁸ ) can be titrated with a standard solution of a
strong acid. The most important characteristics of a neutralization titration can be
summarized in the titration curve (usually pH as a function of volume of the titrant).
The titration curve can be calculated theoretically, whereupon conclusion can be
drawn from it for the feasibility and the expected accuracy of a titration, and the
selection of the proper indicator. The most common approach for the calculation of
titration curves is based on approximations depending on the relative strength of the
acid and base, the concentration levels, and the actual region of the titration curve
relatively to the equivalence point.
Subjects Unit 7
Last update : 1/1/2014 Page.No
Titration Curves
ACID – BASE TITRATION CURVES
Recall that titration is the quantitative measurement of an analyte in solution
by reacting it completely with a standardized reagent. Acids and bases react
until the analyte is consumed completely. A solution of base of known
concentration can therefore be used to titrate an acid solution of unknown
concentration. Likewise, an acid solution of known concentration can be used to titrate a base solution of unknown concentration.
This unit describes how pH changes during various acid-base titrations , therefore ,
before discussing the derivation of the titration curves you should go back to unit 4
and review the relevant equations of the pH calculations particularly those of strong
and weak acids and bases and their salts and buffer solutions and also check out unit
3 ( stoichiometry ) .
Subjects Unit 7
Last update : 1/1/2014 Page.No
Titration Curve
ACID – BASE TITRATION CURVES
An acid – base titration curve can be derived by drawing a relationship between the pH
of the titration solution ( conical flask solution ) on the y- axis and the volume of the
titrant ( standard solution ) which is read from the burette on the x-axis .
The importance of the titration curve lies in determining the appropriate
conditions for the titration , such as the selection of the appropriate indicator and
the appropriate titrant( reagent ) .
Subjects Unit 7
Last update : 1/1/2014 Page.No
Strong Base By Strong Acid Titration Curve
ACID – BASE TITRATION CURVES
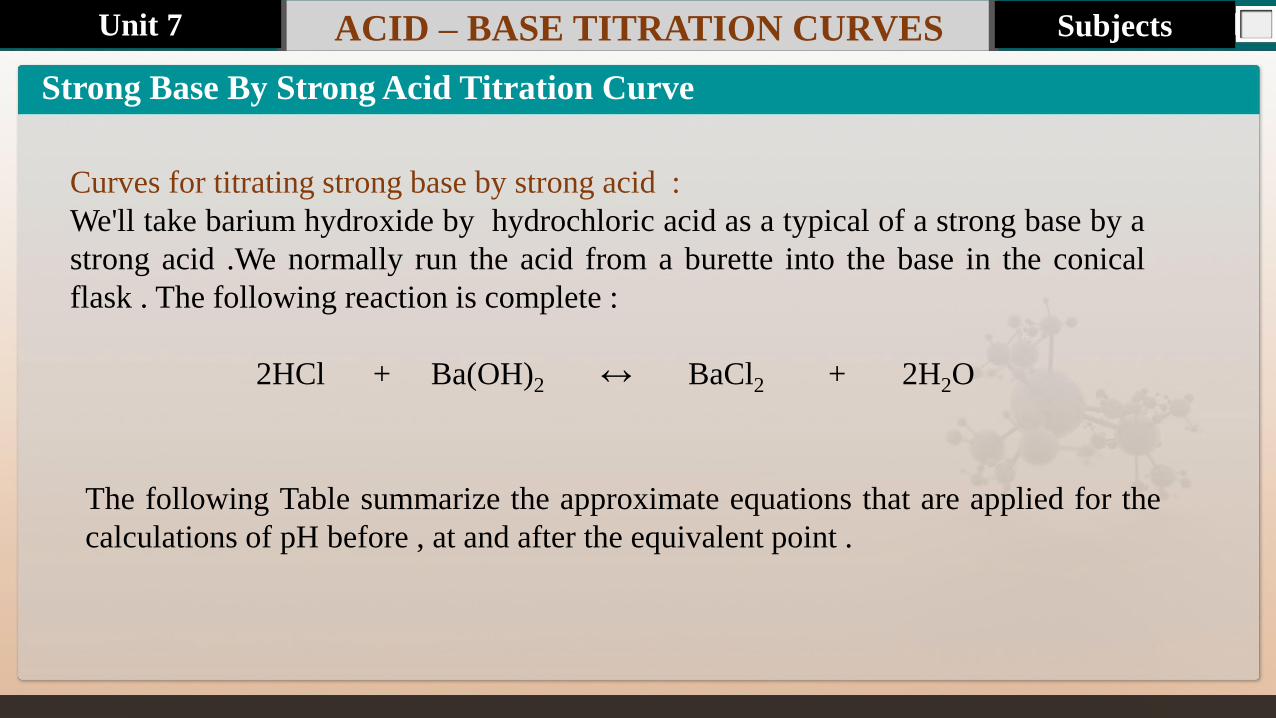
Curves for titrating strong base by strong acid :
We'll take barium hydroxide by hydrochloric acid as a typical of a strong base by a
strong acid .We normally run the acid from a burette into the base in the conical
flask . The following reaction is complete :
2HCl + Ba(OH)2 ↔ BaCl2 + 2H2O
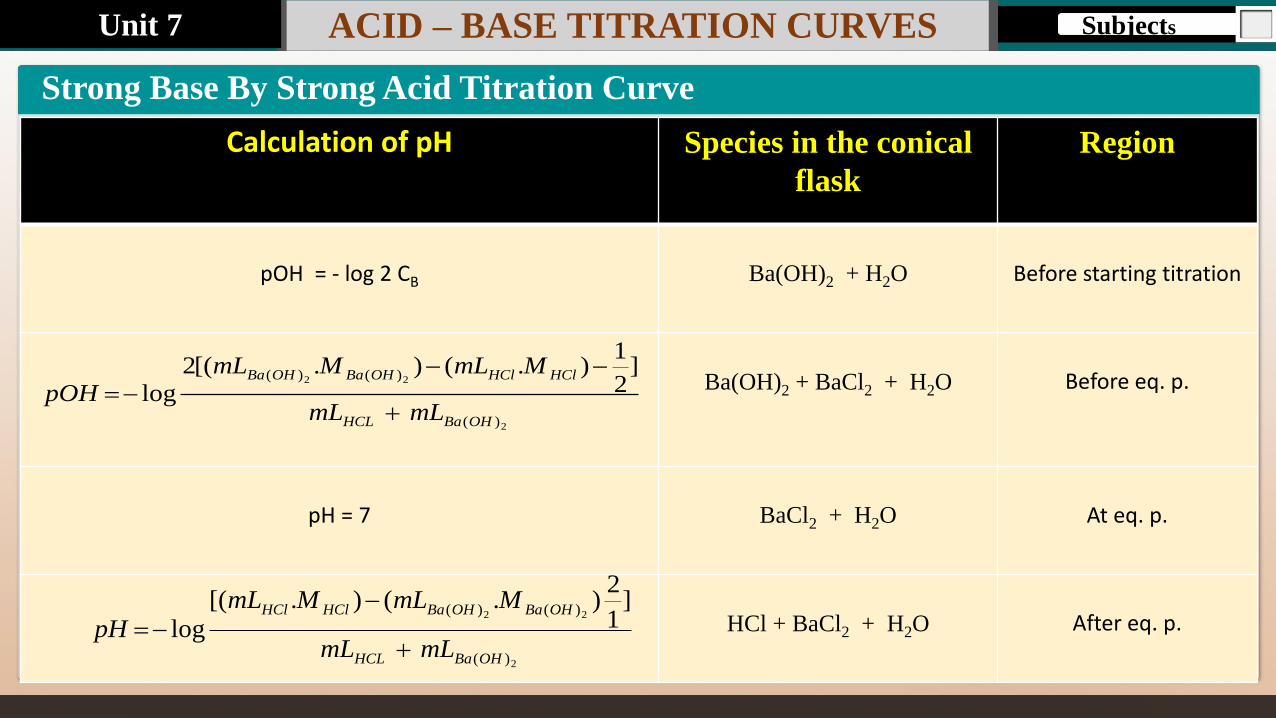
The following Table summarize the approximate equations that are applied for the
calculations of pH before , at and after the equivalent point .
Subjects Unit 7
Last update : 1/1/2014 Subjects
Calculation of pH
Species in the conical
flask
Region
pOH = - log 2 CB
Ba(OH)2 + H2O
Before starting titration
Ba(OH)2 + BaCl2 + H2O
Before eq. p.
pH = 7
BaCl2 + H2O
At eq. p.
HCl + BaCl2 + H2O
After eq. p.
2
22
)(
)()( ]1
2).().[(
logOHBaHCL
OHBaOHBaHClHCl
mLmL
MmLMmL
pH
2
22
)(
)()( ]2
1).().[(2
logOHBaHCL
HClHClOHBaOHBa
mLmL
MmLMmL
pOH
ACID – BASE TITRATION CURVES
Strong Base By Strong Acid Titration Curve
Unit 7
Last update : 1/1/2014 Page.No
Strong Base By Strong Acid Titration Curve
ACID – BASE TITRATION CURVES
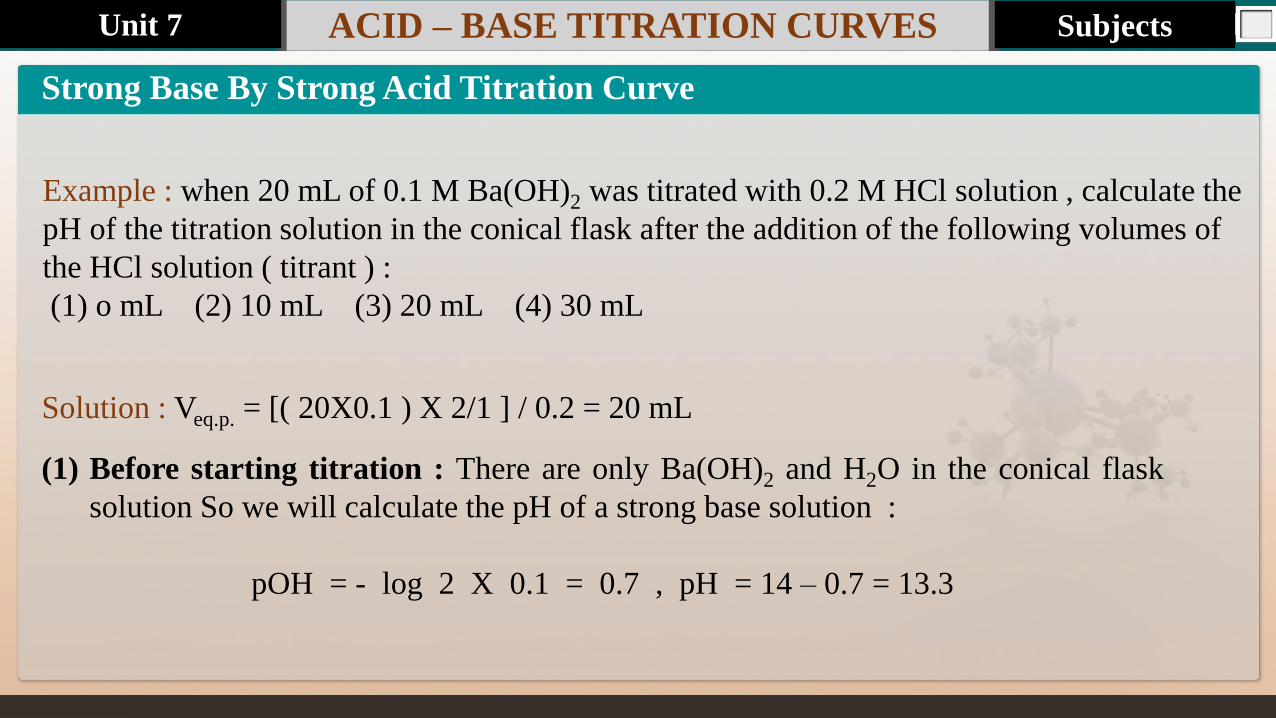
Example : when 20 mL of 0.1 M Ba(OH)2 was titrated with 0.2 M HCl solution , calculate the
pH of the titration solution in the conical flask after the addition of the following volumes of
the HCl solution ( titrant ) :
(1) o mL (2) 10 mL (3) 20 mL (4) 30 mL
Solution : Veq.p. = [( 20X0.1 ) X 2/1 ] / 0.2 = 20 mL
(1) Before starting titration : There are only Ba(OH)2 and H2O in the conical flask
solution So we will calculate the pH of a strong base solution :
pOH = - log 2 X 0.1 = 0.7 , pH = 14 – 0.7 = 13.3
Subjects Unit 7
Last update : 1/1/2014 Page.No
Strong Base By Strong Acid Titration Curve
ACID – BASE TITRATION CURVES
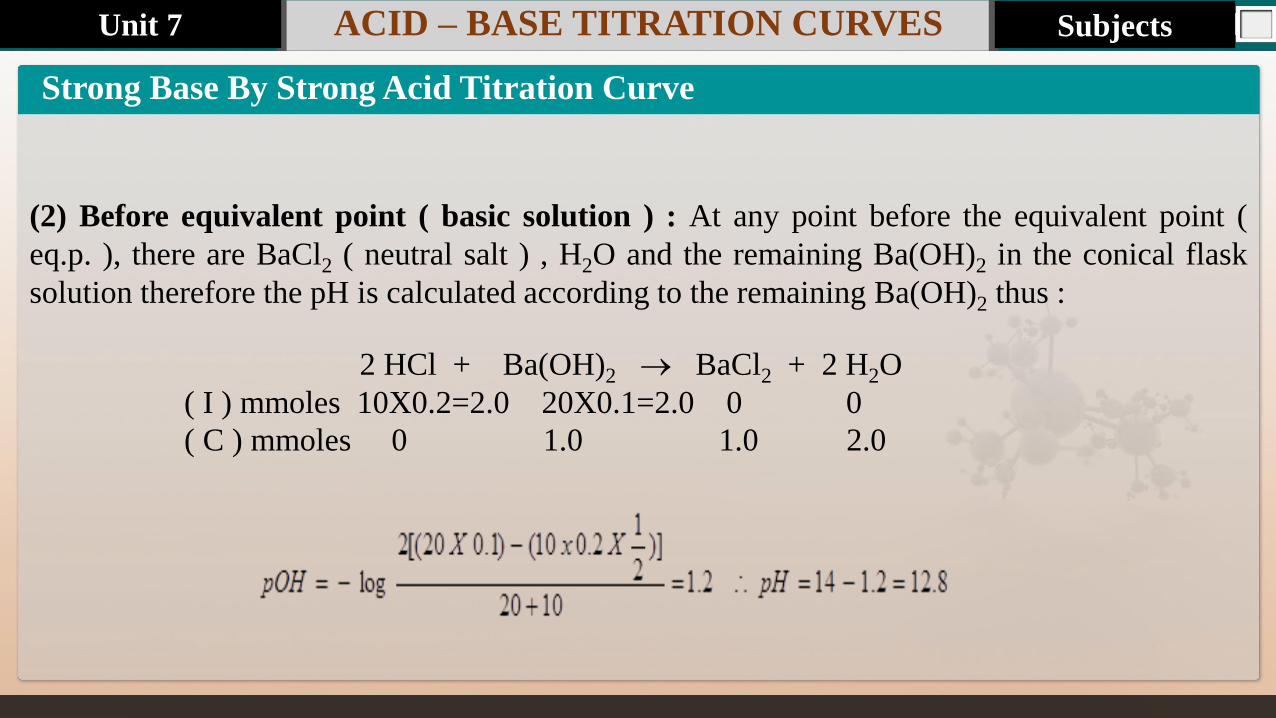
(2) Before equivalent point ( basic solution ) : At any point before the equivalent point (
eq.p. ), there are BaCl2 ( neutral salt ) , H2O and the remaining Ba(OH)2 in the conical flask
solution therefore the pH is calculated according to the remaining Ba(OH)2 thus :
2 HCl + Ba(OH)2 BaCl2 + 2 H2O
( I ) mmoles 10X0.2=2.0 20X0.1=2.0 0 0
( C ) mmoles 0 1.0 1.0 2.0
Subjects Unit 7
Last update : 1/1/2014 Page.No
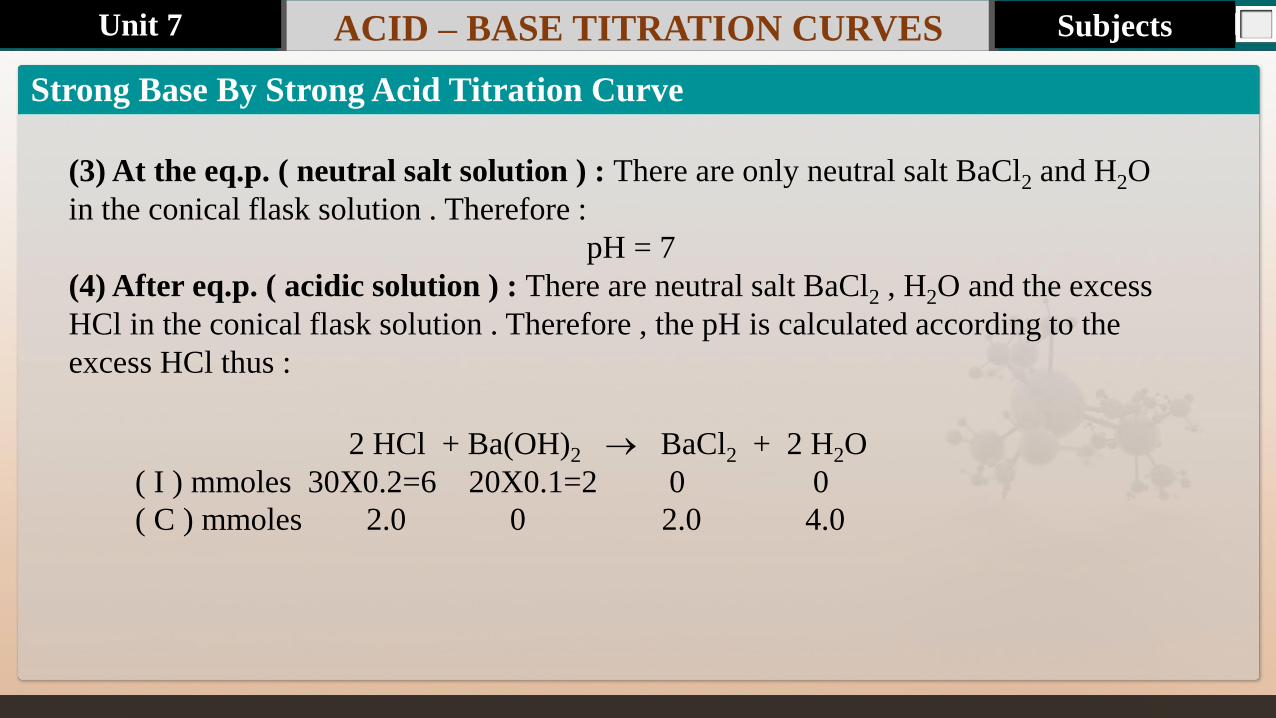
(3) At the eq.p. ( neutral salt solution ) : There are only neutral salt BaCl2 and H2O
in the conical flask solution . Therefore :
pH = 7
(4) After eq.p. ( acidic solution ) : There are neutral salt BaCl2 , H2O and the excess
HCl in the conical flask solution . Therefore , the pH is calculated according to the
excess HCl thus :
Strong Base By Strong Acid Titration Curve
ACID – BASE TITRATION CURVES
2 HCl + Ba(OH)2 BaCl2 + 2 H2O
( I ) mmoles 30X0.2=6 20X0.1=2 0 0
( C ) mmoles 2.0 0 2.0 4.0
Subjects Unit 7
Last update : 1/1/2014 Page.No
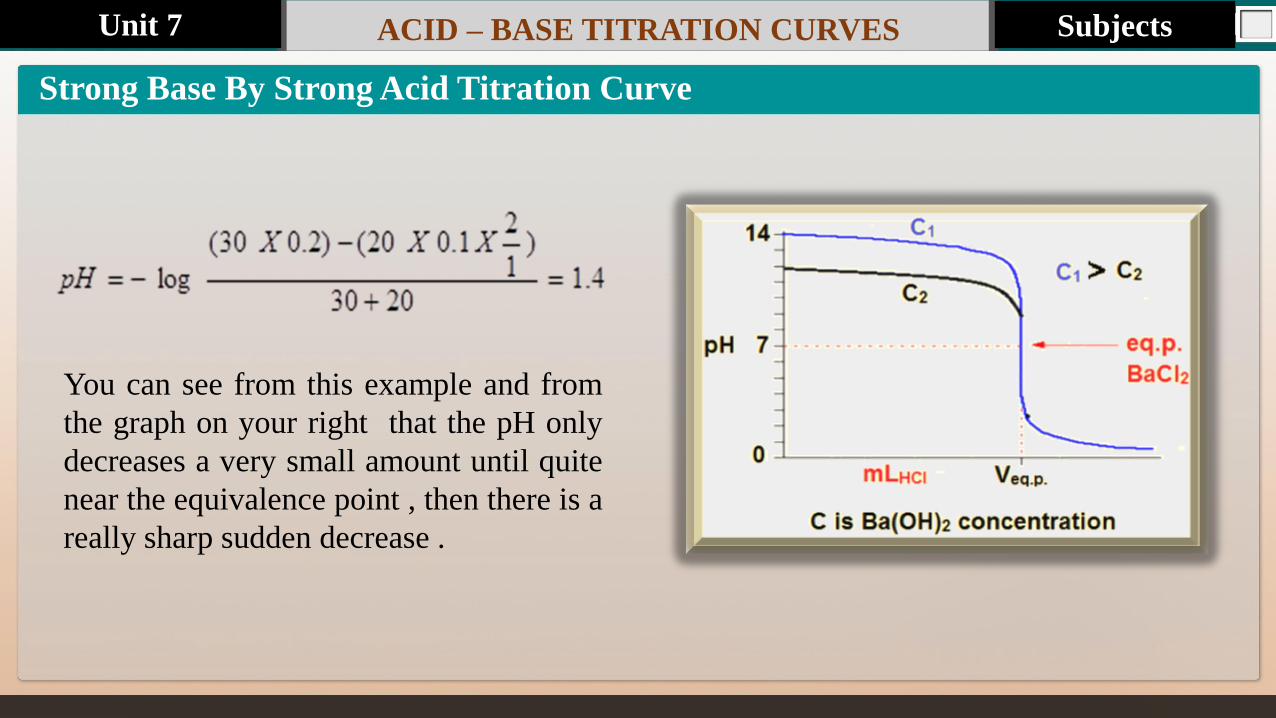
You can see from this example and from
the graph on your right that the pH only
decreases a very small amount until quite
near the equivalence point , then there is a
really sharp sudden decrease .
ACID – BASE TITRATION CURVES
Strong Base By Strong Acid Titration Curve
Subjects Unit 7
Last update : 1/1/2014 Page.No
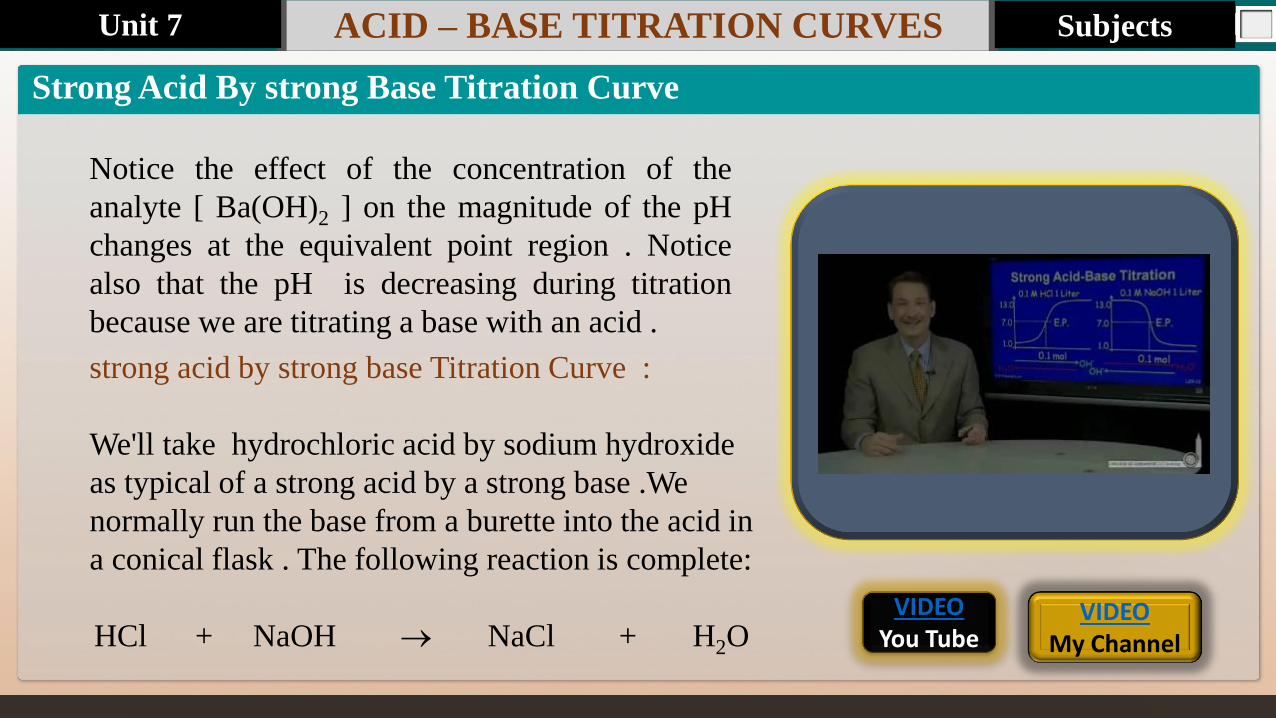
Notice the effect of the concentration of the
analyte [ Ba(OH)2 ] on the magnitude of the pH
changes at the equivalent point region . Notice
also that the pH is decreasing during titration
because we are titrating a base with an acid .
ACID – BASE TITRATION CURVES
strong acid by strong base Titration Curve :
We'll take hydrochloric acid by sodium hydroxide
as typical of a strong acid by a strong base .We
normally run the base from a burette into the acid in
a conical flask . The following reaction is complete:
HCl + NaOH NaCl + H2O
Strong Acid By strong Base Titration Curve
VIDEO You Tube
VIDEO My Channel
Subjects Unit 7
Last update : 1/1/2014 Page.No ACID – BASE TITRATION CURVES
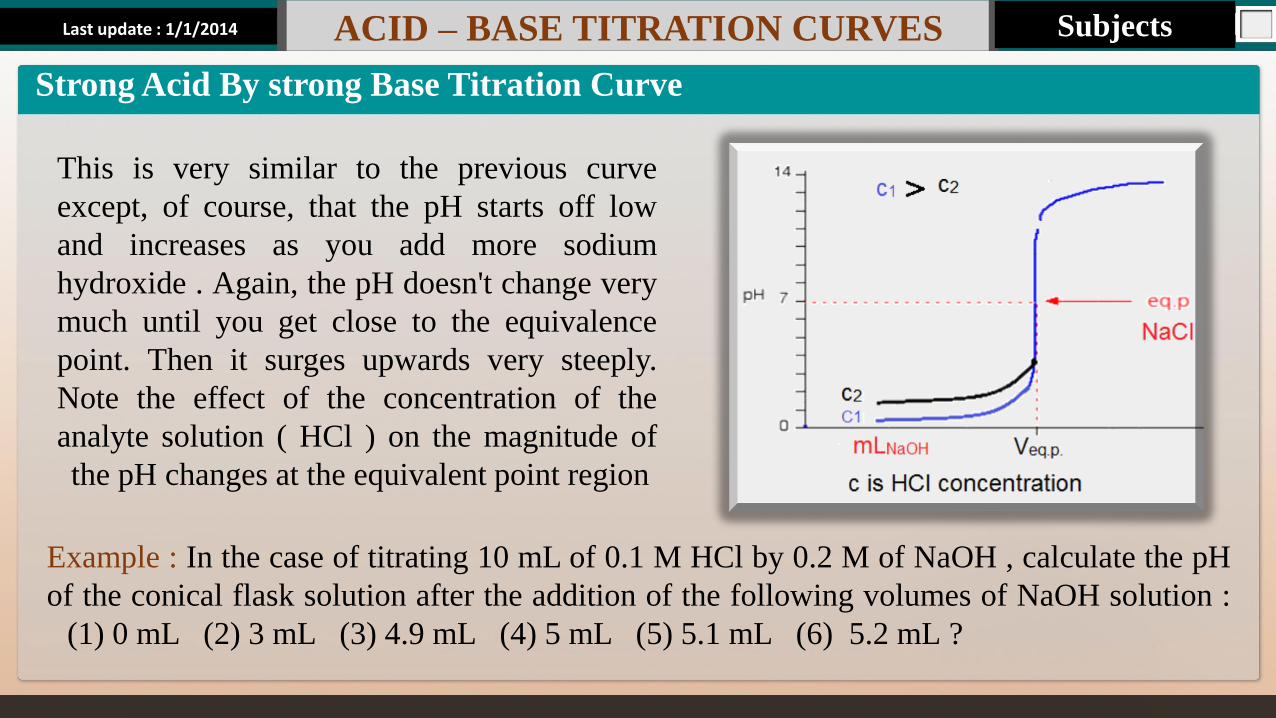
This is very similar to the previous curve
except, of course, that the pH starts off low
and increases as you add more sodium
hydroxide . Again, the pH doesn't change very
much until you get close to the equivalence
point. Then it surges upwards very steeply.
Note the effect of the concentration of the
analyte solution ( HCl ) on the magnitude of
the pH changes at the equivalent point region
Strong Acid By strong Base Titration Curve
Example : In the case of titrating 10 mL of 0.1 M HCl by 0.2 M of NaOH , calculate the pH
of the conical flask solution after the addition of the following volumes of NaOH solution :
(1) 0 mL (2) 3 mL (3) 4.9 mL (4) 5 mL (5) 5.1 mL (6) 5.2 mL ?
Subjects
Last update : 1/1/2014 Page.No ACID – BASE TITRATION CURVES
Strong Acid By strong Base Titration Curve
Solution :
(1) : Before starting the titration , the conical flask
solution contains only HCl and H2O , therefore ,
the pH of a strong acid solution is calculated as we
all know :
pH = - log 0.1 = 1
(2) : At any point before the equivalent point , the
conical flask solution contains the neutral salt NaCl
, H2O and the remaining HCl , therefore the pH is
calculated according to the remaining HCl thus :
mLX
V peq 5)2.0(
)1.010(..
VIDEO You Tube
VIDEO My Channel
Subjects Unit 7
Last update : 1/1/2014 Page.No ACID – BASE TITRATION CURVES
Strong Acid By strong Base Titration Curve
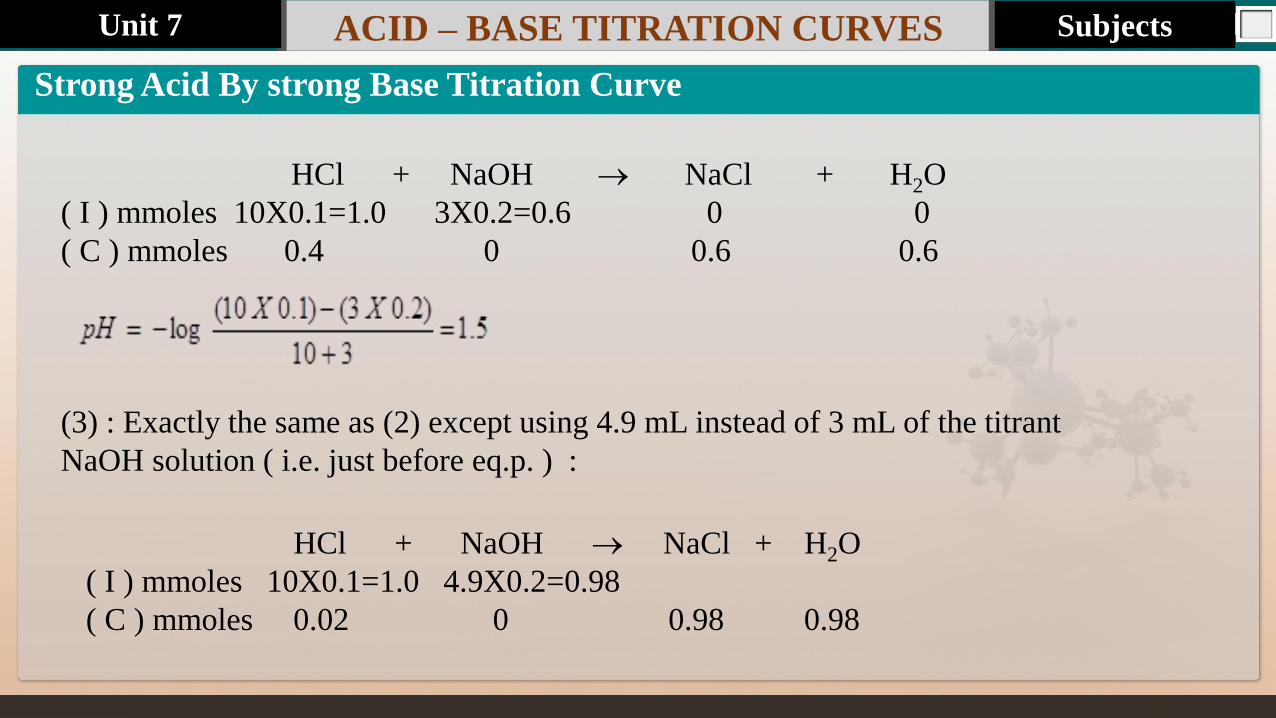
HCl + NaOH NaCl + H2O
( I ) mmoles 10X0.1=1.0 3X0.2=0.6 0 0
( C ) mmoles 0.4 0 0.6 0.6
HCl + NaOH NaCl + H2O
( I ) mmoles 10X0.1=1.0 4.9X0.2=0.98
( C ) mmoles 0.02 0 0.98 0.98
(3) : Exactly the same as (2) except using 4.9 mL instead of 3 mL of the titrant
NaOH solution ( i.e. just before eq.p. ) :
Subjects Unit 7
Last update : 1/1/2014 Page.No ACID – BASE TITRATION CURVES
Strong Acid By strong Base Titration Curve
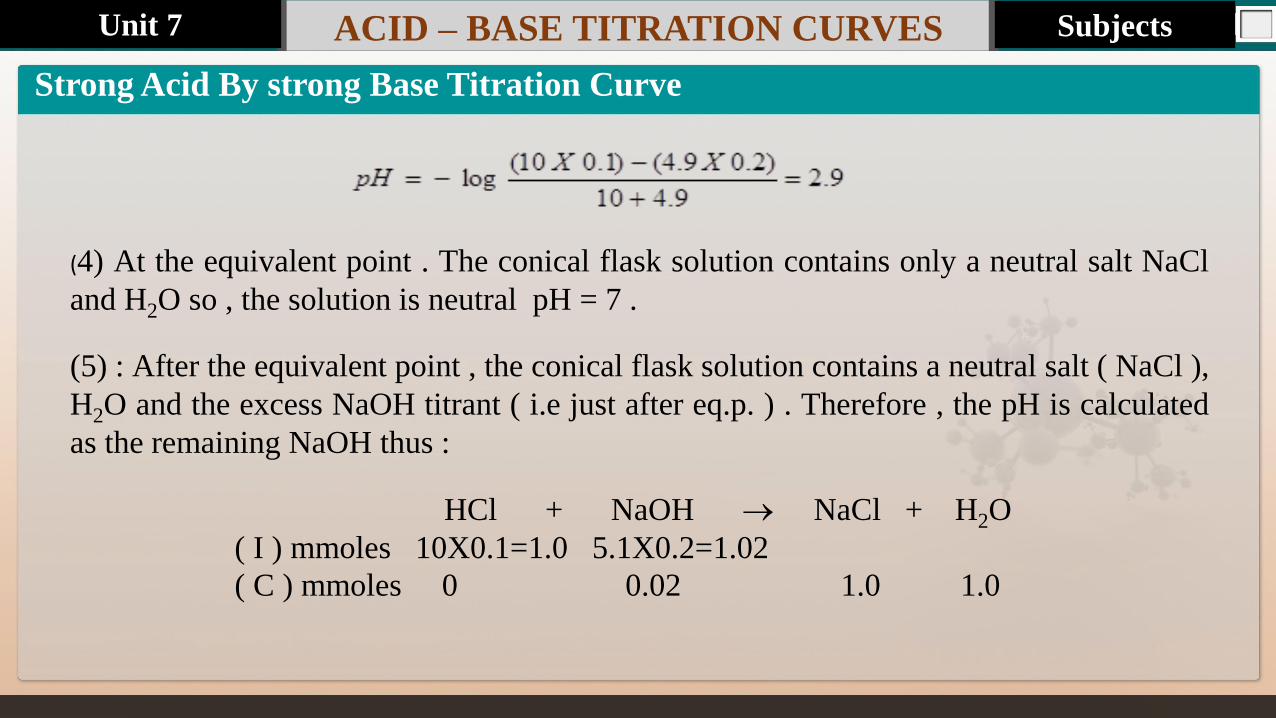
(4) At the equivalent point . The conical flask solution contains only a neutral salt NaCl
and H2O so , the solution is neutral pH = 7 .
(5) : After the equivalent point , the conical flask solution contains a neutral salt ( NaCl ),
H2O and the excess NaOH titrant ( i.e just after eq.p. ) . Therefore , the pH is calculated
as the remaining NaOH thus :
HCl + NaOH NaCl + H2O
( I ) mmoles 10X0.1=1.0 5.1X0.2=1.02
( C ) mmoles 0 0.02 1.0 1.0
Subjects Unit 7
Last update : 1/1/2014 Page.No ACID – BASE TITRATION CURVES
Strong Acid By strong Base Titration Curve
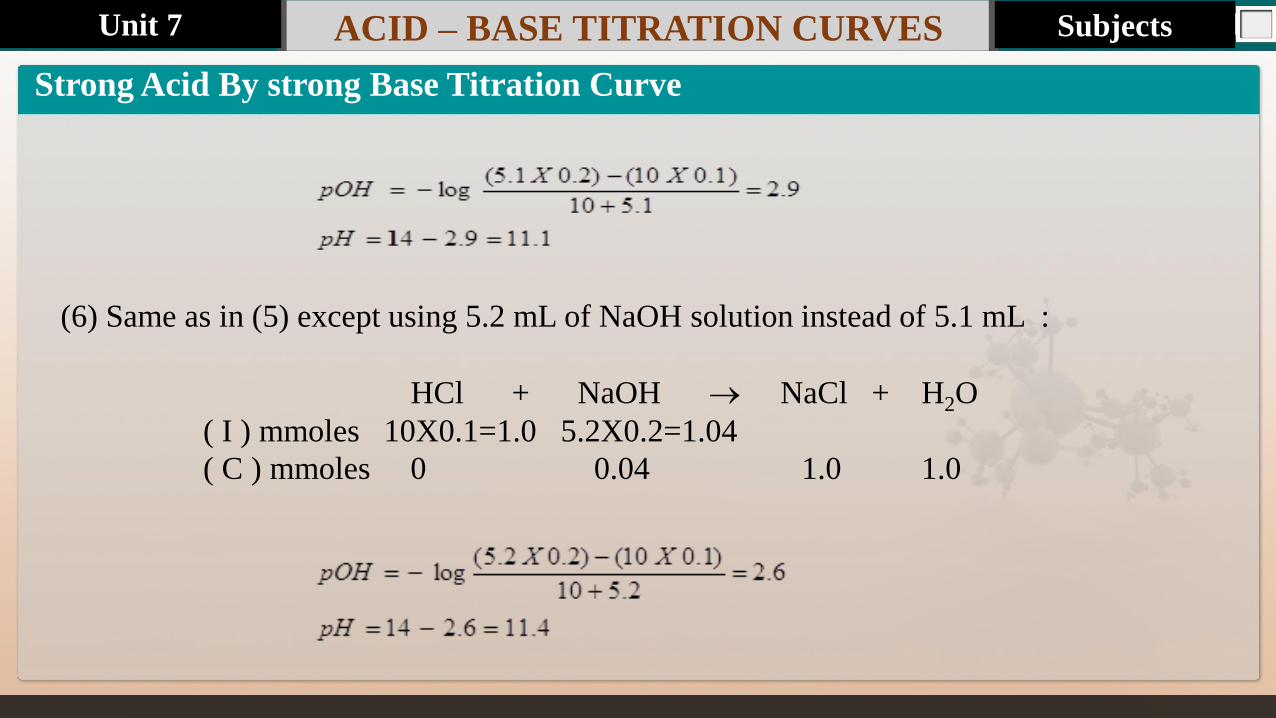
(6) Same as in (5) except using 5.2 mL of NaOH solution instead of 5.1 mL :
HCl + NaOH NaCl + H2O
( I ) mmoles 10X0.1=1.0 5.2X0.2=1.04
( C ) mmoles 0 0.04 1.0 1.0
Subjects Unit 7
Last update : 1/1/2014 Page.No ACID – BASE TITRATION CURVES
You can see that the pH only rises a very small
amount until quite near the equivalent point , then
there is a really sharp and sudden raise . The
previous graph shows the shape of the curve of this
kind of titration. .
Weak Acid By Strong Base Titration Curve
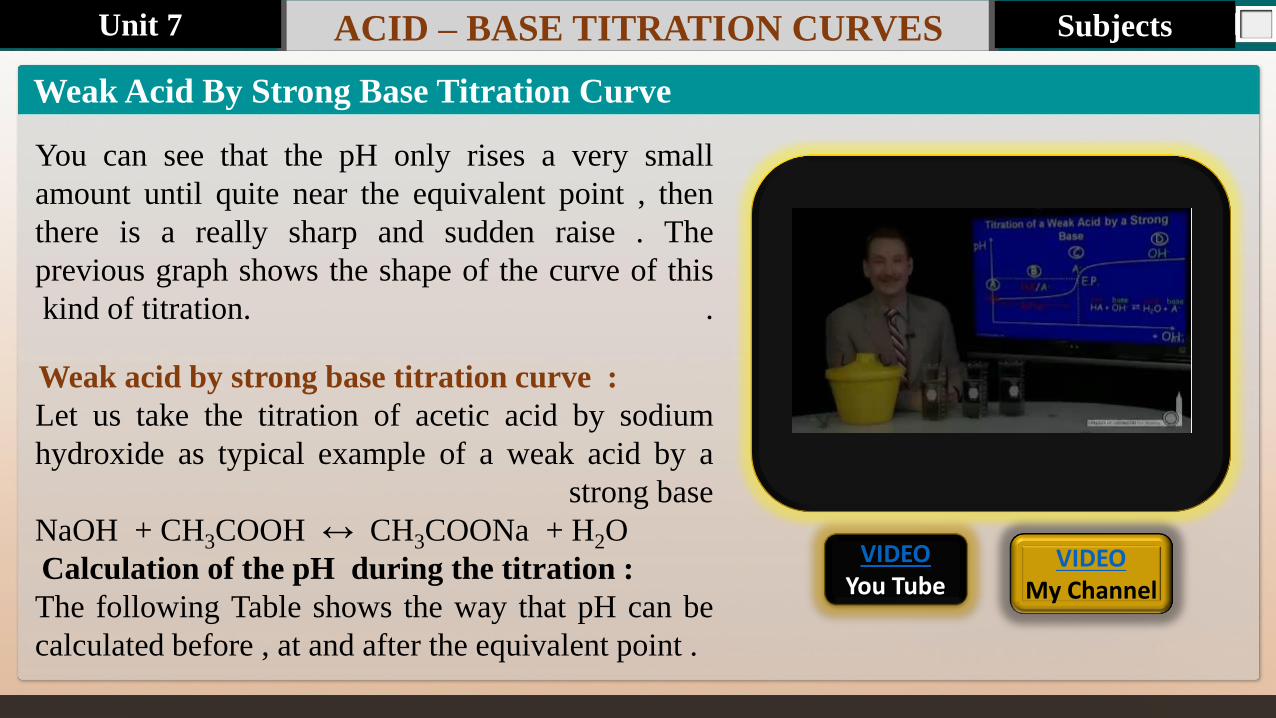
Weak acid by strong base titration curve :
Let us take the titration of acetic acid by sodium
hydroxide as typical example of a weak acid by a
strong base
NaOH + CH3COOH ↔ CH3COONa + H2O
Calculation of the pH during the titration :
The following Table shows the way that pH can be
calculated before , at and after the equivalent point .
VIDEO You Tube
VIDEO My Channel
Subjects Unit 7
Last update : 1/1/2014 Page.No ACID – BASE TITRATION CURVES
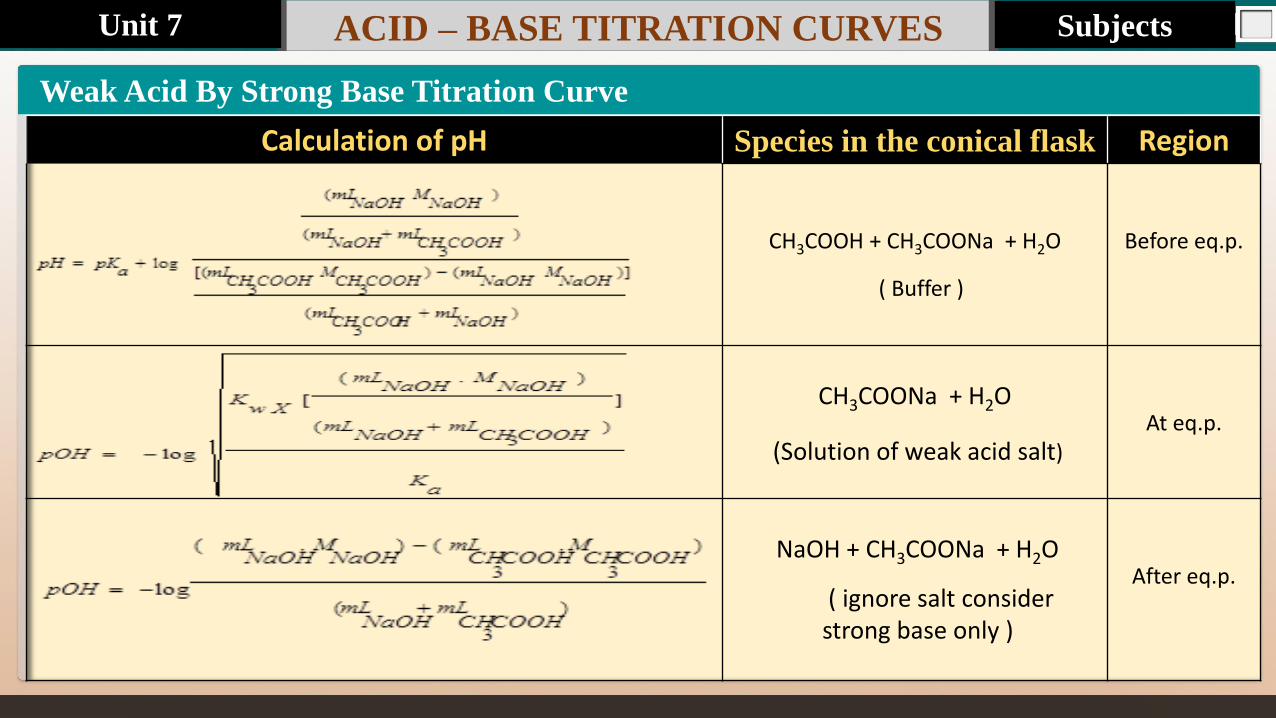
Calculation of pH Species in the conical flask Region
CH3COOH + CH3COONa + H2O
Before eq.p.
CH3COONa + H2O
At eq.p.
NaOH + CH3COONa + H2O
After eq.p.
( Buffer )
(Solution of weak acid salt)
( ignore salt consider strong base only )
Weak Acid By Strong Base Titration Curve
Subjects Unit 7
Last update : 1/1/2014 Page.No ACID – BASE TITRATION CURVES
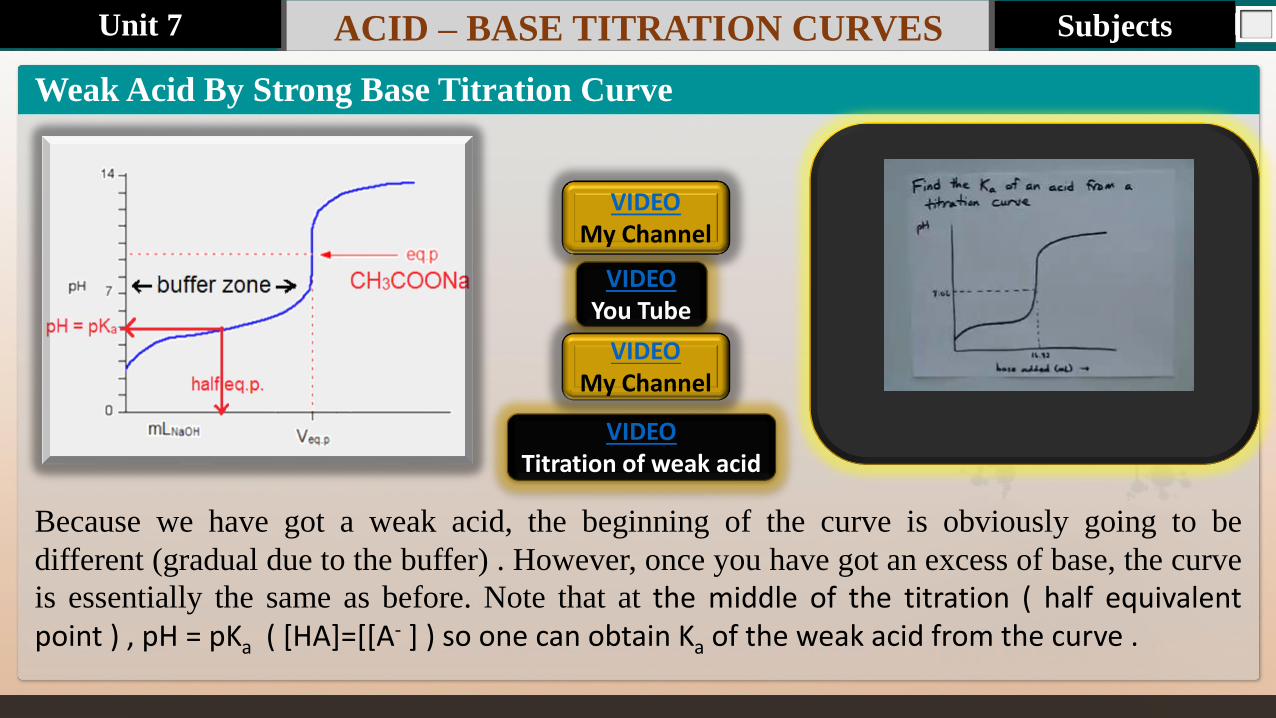
Because we have got a weak acid, the beginning of the curve is obviously going to be
different (gradual due to the buffer) . However, once you have got an excess of base, the curve
is essentially the same as before. Note that at the middle of the titration ( half equivalent point ) , pH = pKa ( [HA]=[[A- ] ) so one can obtain Ka of the weak acid from the curve .
Weak Acid By Strong Base Titration Curve
VIDEO Titration of weak acid
VIDEO You Tube
VIDEO My Channel
Subjects Unit 7
VIDEO My Channel
Last update : 1/1/2014 Page.No ACID – BASE TITRATION CURVES
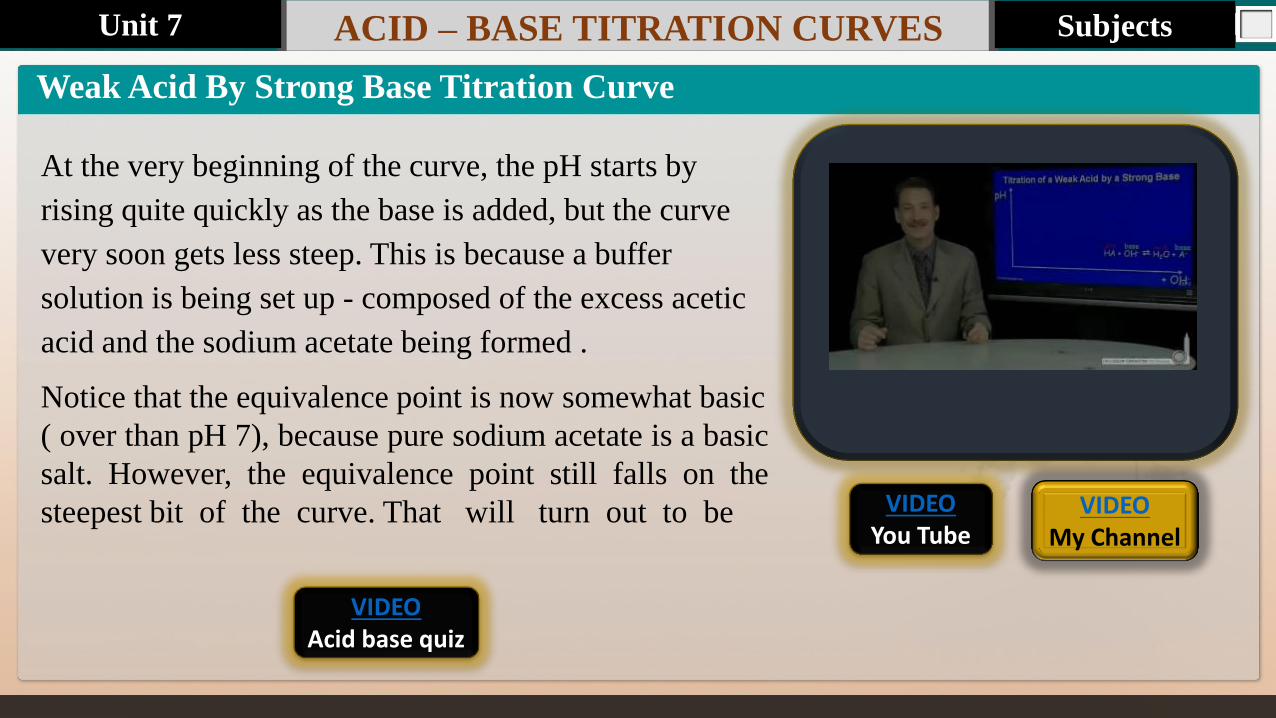
At the very beginning of the curve, the pH starts by
rising quite quickly as the base is added, but the curve
very soon gets less steep. This is because a buffer
solution is being set up - composed of the excess acetic
acid and the sodium acetate being formed .
Notice that the equivalence point is now somewhat basic
( over than pH 7), because pure sodium acetate is a basic
salt. However, the equivalence point still falls on the
steepest bit of the curve. That will turn out to be
Weak Acid By Strong Base Titration Curve
VIDEO You Tube
VIDEO Acid base quiz
Subjects Unit 7
VIDEO My Channel
Last update : 1/1/2014 Page.No ACID – BASE TITRATION CURVES
important in choosing a suitable indicator for
the titration. Beyond the equivalence point
(when the sodium hydroxide is in excess) the
curve is just the same as that end of the HCl -
NaOH graph.
Example : If 10 mL of 0.1 M CH3COOH ((Ka =
1.8 x 10⁻⁵ ) is titrated with 0.2 M NaOH
solution , calculate the pH of the titration
solution in the conical flask after the addition of
the following volumes of NaOH solution :
(1) 3 mL (2) 5 mL (3) 10 mL ?
Weak Acid By Strong Base Titration Curve
VIDEO You Tube
VIDEO My Channel
Subjects Unit 7
Last update : 1/1/2014 Page.No ACID – BASE TITRATION CURVES
Solution :
(1) Before equivalent point : the remaining CH3COOH and its
produced salt CH3COONa form buffer :
NaOH + CH3COOH ↔ CH3COONa + H2O
( I ) mmoles 3X0.2=0.6 10X0.1=1.0 0 0
( C ) mmoles 0 0.4 0.6 0.6
(2) : At equivalent point (solution of weak acid salt ) :
mLX
V peq 52.0
1.010..
Weak Acid By Strong Base Titration Curve
VIDEO You Tube
VIDEO My Channel
Subjects Unit 7
Last update : 1/1/2014 Page.No ACID – BASE TITRATION CURVES
(3) : After equivalent point ( to simplify the calculation ignore salt and consider strong base only ) :
NaOH + CH3COOH ↔ CH3COONa + H2O
( I ) mmoles 10X0.2=2.0 10X0.1=1.0 0 0
( C ) mmoles 1.0 0 1.0 1.0
Weak Acid By Strong Base Titration Curve
NaOH + CH3COOH ↔ CH3COONa + H2O
( I ) mmoles 5X0.2=1.0 10X0.1=1.0 0 0
( C ) mmoles 0 0 1.0 1.0
Subjects Unit 7
Last update : 1/1/2014 Page.No ACID – BASE TITRATION CURVES
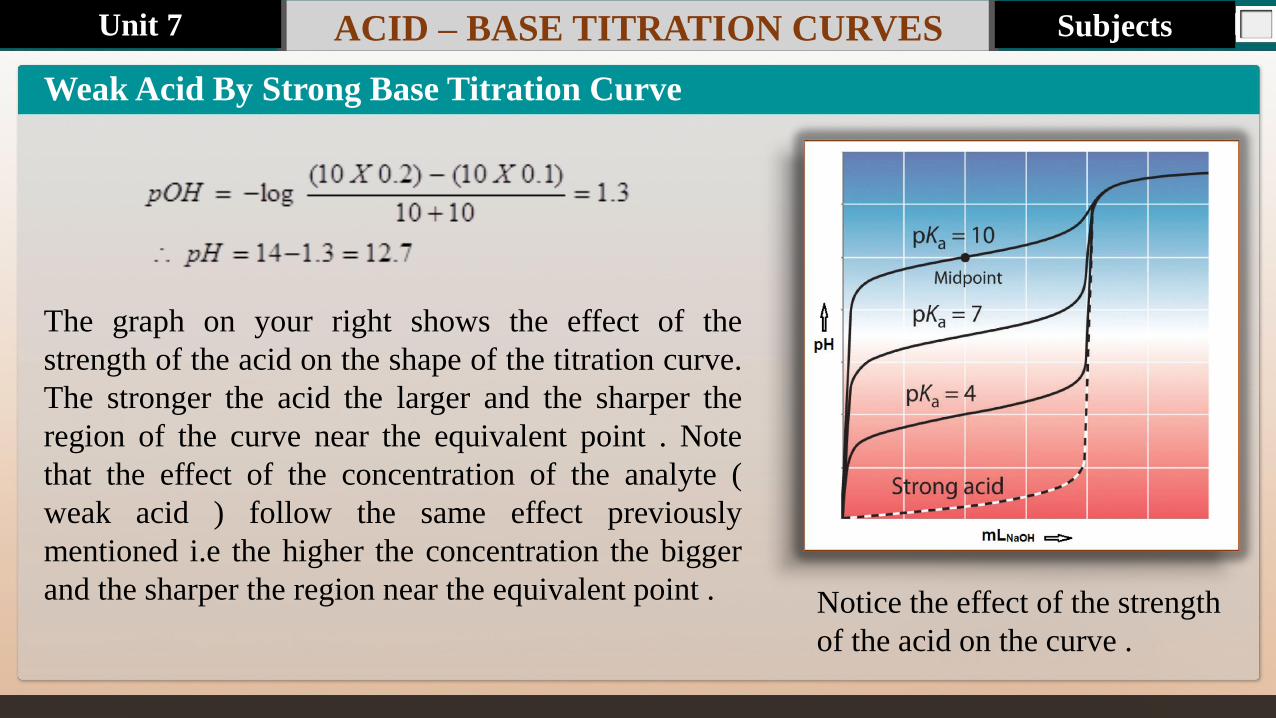
The graph on your right shows the effect of the
strength of the acid on the shape of the titration curve.
The stronger the acid the larger and the sharper the
region of the curve near the equivalent point . Note
that the effect of the concentration of the analyte (
weak acid ) follow the same effect previously
mentioned i.e the higher the concentration the bigger
and the sharper the region near the equivalent point .
Weak Acid By Strong Base Titration Curve
Notice the effect of the strength
of the acid on the curve .
Subjects Unit 7
Last update : 1/1/2014 Page.No ACID – BASE TITRATION CURVES
Weak Base By Strong Acid Titration Curve
Weak base by strong acid titration curve :
This time we are going to use hydrochloric acid as the strong acid and ammonia solution as the weak base . Because you have got a weak base, the beginning of the curve is obviously going to be different (gradual due to
the buffer ) . However, once you have got an excess of acid, the curve is essentially the same as before. At the very beginning of the curve, the pH starts by falling quite quickly as the acid is added, but the curve very soon gets less steep. This is because a buffer solution is being set up - composed of the excess ammonia and the ammonium chloride being formed .
Subjects Unit 7
Last update : 1/1/2014 Page.No ACID – BASE TITRATION CURVES
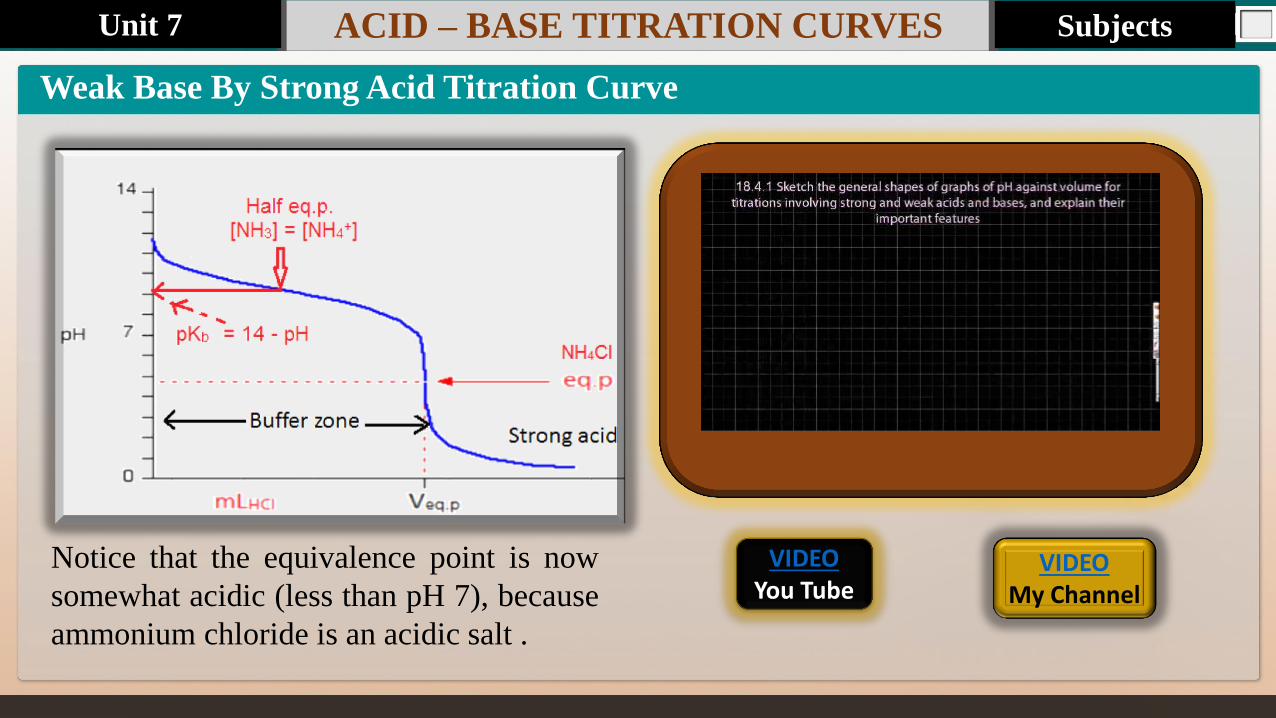
Weak Base By Strong Acid Titration Curve
Notice that the equivalence point is now
somewhat acidic (less than pH 7), because
ammonium chloride is an acidic salt .
VIDEO You Tube
VIDEO My Channel
Subjects Unit 7
Last update : 1/1/2014 Page.No ACID – BASE TITRATION CURVES
Weak Base By Strong Acid Titration Curve
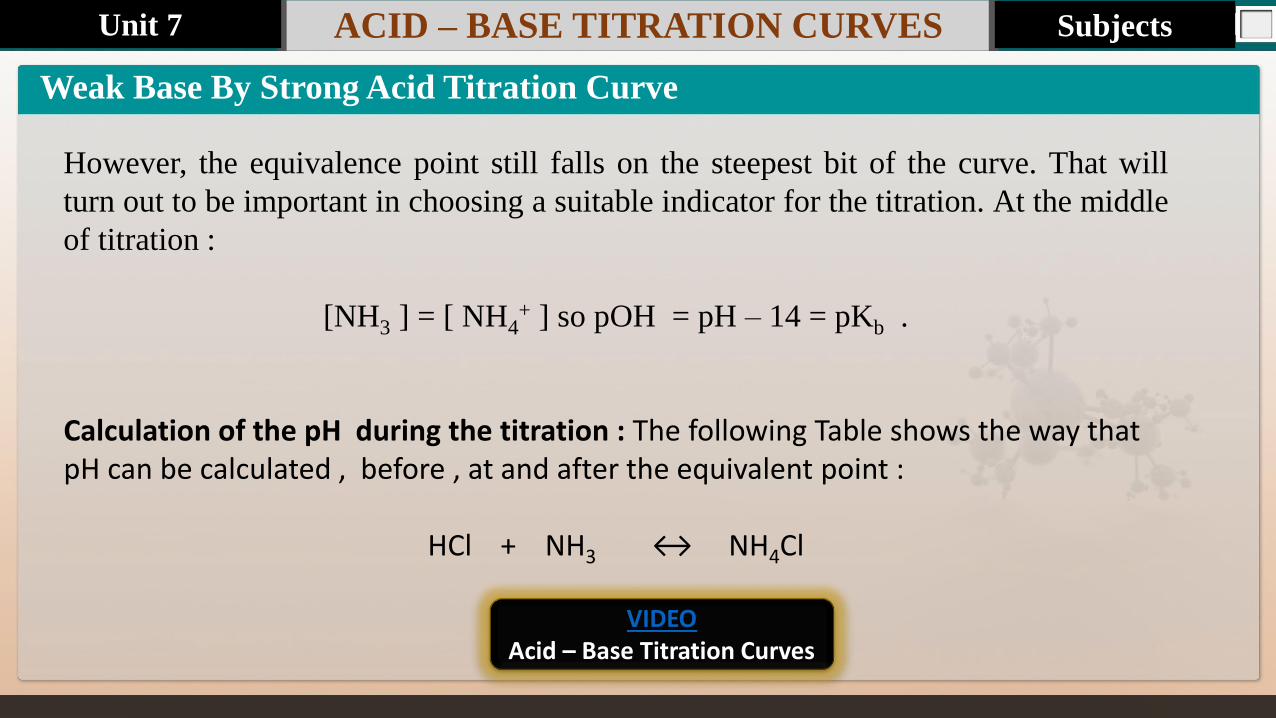
However, the equivalence point still falls on the steepest bit of the curve. That will
turn out to be important in choosing a suitable indicator for the titration. At the middle
of titration :
[NH3 ] = [ NH4+ ] so pOH = pH – 14 = pKb .
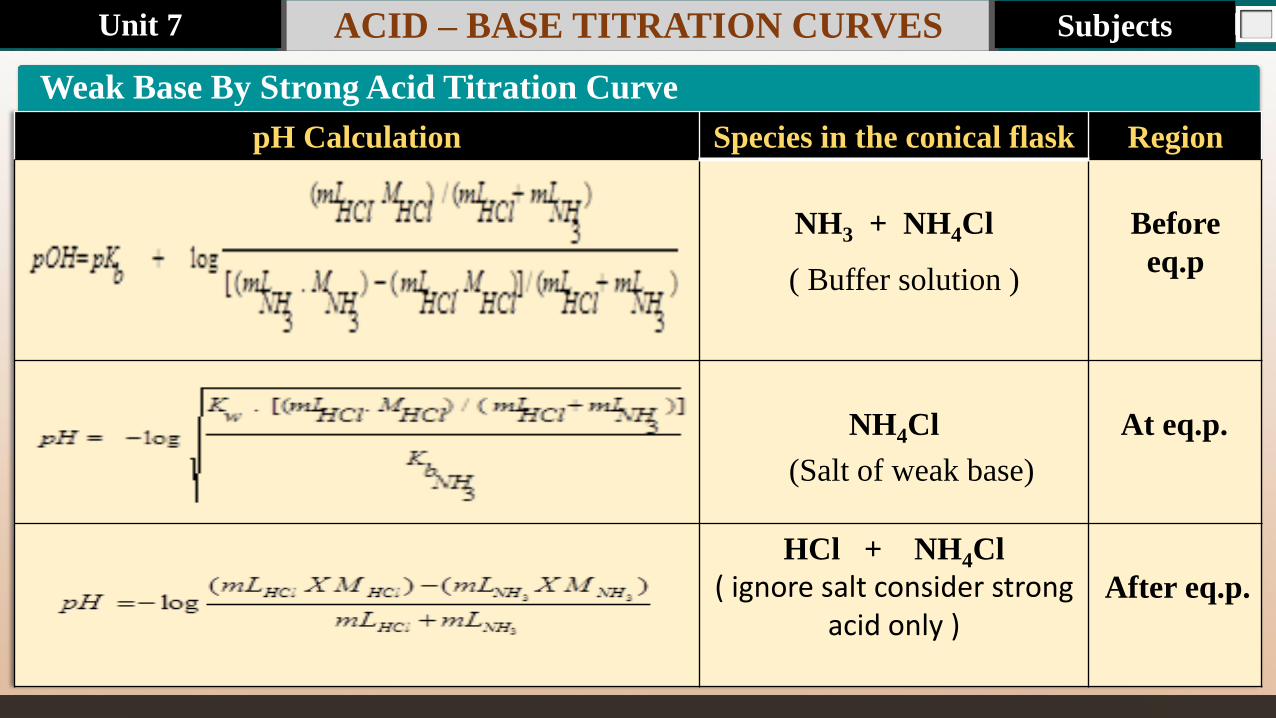
Calculation of the pH during the titration : The following Table shows the way that pH can be calculated , before , at and after the equivalent point :
HCl + NH3 ↔ NH4Cl
VIDEO Acid – Base Titration Curves
Subjects Unit 7
Last update : 1/1/2014 Page.No ACID – BASE TITRATION CURVES
Weak Base By Strong Acid Titration Curve
pH Calculation Species in the conical flask Region
NH3 + NH4Cl
Before
eq.p
NH4Cl
At eq.p.
HCl + NH4Cl
( ignore salt consider strong acid only )
After eq.p.
( Buffer solution )
(Salt of weak base)
Subjects Unit 7

Last update : 1/1/2014 Page.No ACID – BASE TITRATION CURVES
Weak Base By Strong Acid Titration Curve
The graph on your right shows the
effect of the strength of the base on the
shape of the titration curve. The
stronger the base the larger and the
sharper the region of the curve near the
equivalent point . Note that the effect of
the concentration of the analyte ( weak
base ) follow the same effect previously
mentioned i.e the higher the
concentration the bigger and the sharper
the region near equivalent point
Buffer zone
Notice the effect of the strength
of the base on the curve .
Subjects Unit 7
Last update : 1/1/2014 Page.No ACID – BASE TITRATION CURVES
Weak Base By Strong Acid Titration Curve
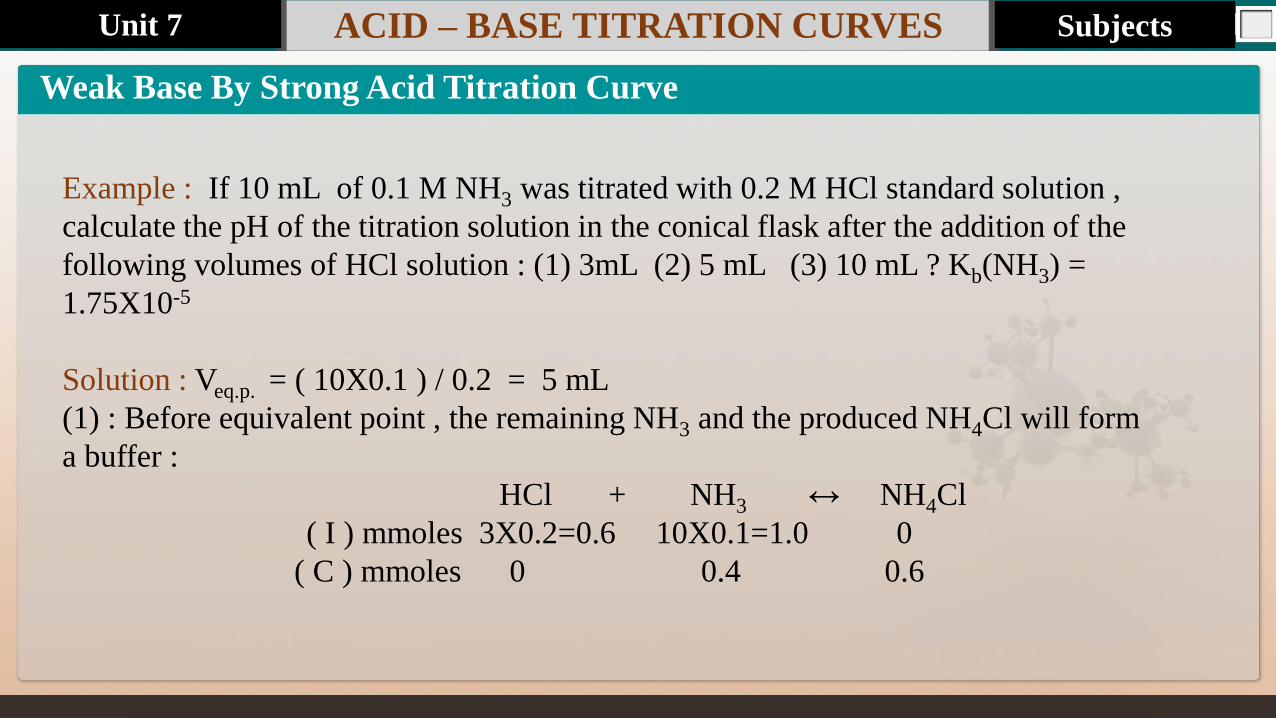
Example : If 10 mL of 0.1 M NH3 was titrated with 0.2 M HCl standard solution ,
calculate the pH of the titration solution in the conical flask after the addition of the
following volumes of HCl solution : (1) 3mL (2) 5 mL (3) 10 mL ? Kb(NH3) =
1.75X10⁻⁵
Solution : Veq.p. = ( 10X0.1 ) / 0.2 = 5 mL
(1) : Before equivalent point , the remaining NH3 and the produced NH4Cl will form
a buffer :
HCl + NH3 ↔ NH4Cl
( I ) mmoles 3X0.2=0.6 10X0.1=1.0 0
( C ) mmoles 0 0.4 0.6
Subjects Unit 7
Last update : 1/1/2014 Page.No ACID – BASE TITRATION CURVES
Weak Base By Strong Acid Titration Curve
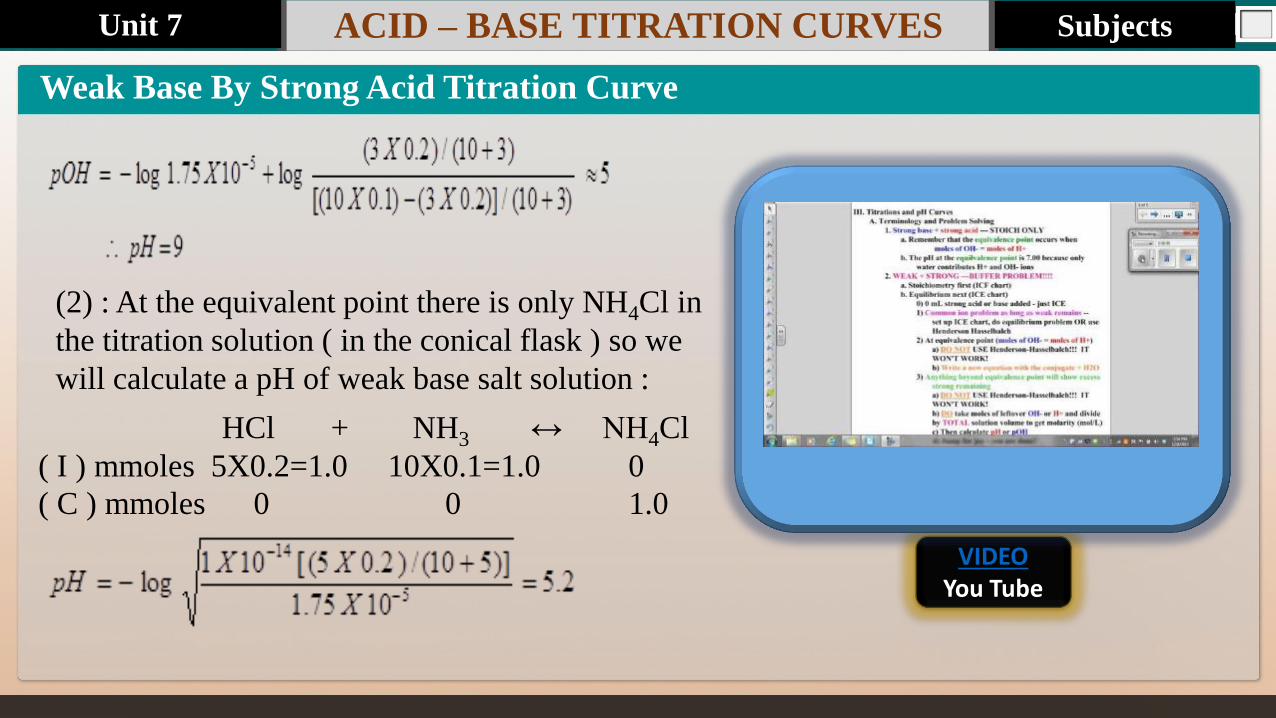
(2) : At the equivalent point there is only NH4Cl in
the titration solution ( in the conical flask ) so we
will calculate a pH of weak base salt solution :
HCl + NH3 ↔ NH4Cl
( I ) mmoles 5X0.2=1.0 10X0.1=1.0 0
( C ) mmoles 0 0 1.0
VIDEO You Tube
Subjects Unit 7
Last update : 1/1/2014 Page.No ACID – BASE TITRATION CURVES
Weak Base By Strong Acid Titration Curve
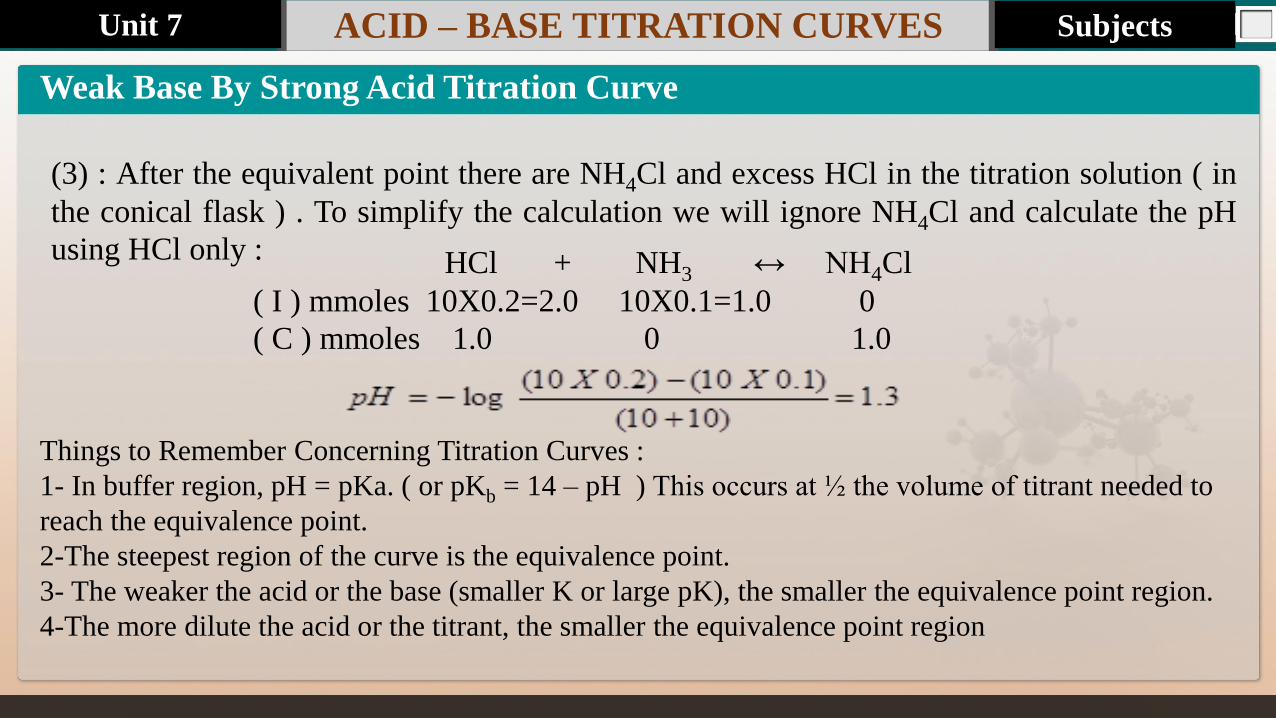
(3) : After the equivalent point there are NH4Cl and excess HCl in the titration solution ( in
the conical flask ) . To simplify the calculation we will ignore NH4Cl and calculate the pH
using HCl only : HCl + NH3 ↔ NH4Cl
( I ) mmoles 10X0.2=2.0 10X0.1=1.0 0
( C ) mmoles 1.0 0 1.0
Things to Remember Concerning Titration Curves :
1- In buffer region, pH = pKa. ( or pKb = 14 – pH ) This occurs at ½ the volume of titrant needed to
reach the equivalence point.
2-The steepest region of the curve is the equivalence point.
3- The weaker the acid or the base (smaller K or large pK), the smaller the equivalence point region.
4-The more dilute the acid or the titrant, the smaller the equivalence point region
Subjects Unit 7
Last update : 1/1/2014 Page.No ACID – BASE TITRATION CURVES
Weak Base By Weak Acid Titration Curve
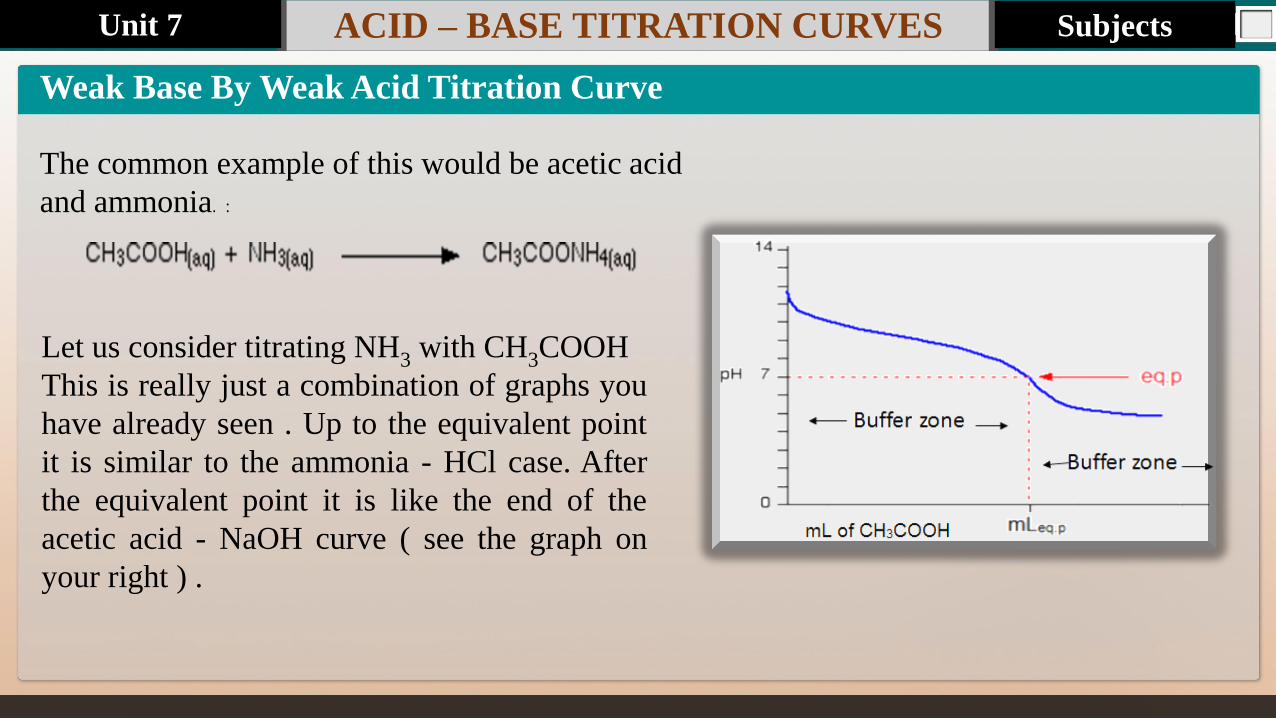
The common example of this would be acetic acid
and ammonia. :
Let us consider titrating NH3 with CH3COOH
This is really just a combination of graphs you
have already seen . Up to the equivalent point
it is similar to the ammonia - HCl case. After
the equivalent point it is like the end of the
acetic acid - NaOH curve ( see the graph on
your right ) .
Subjects Unit 7
Last update : 1/1/2014 Page.No ACID – BASE TITRATION CURVES
Weak Base By Weak Acid Titration Curve
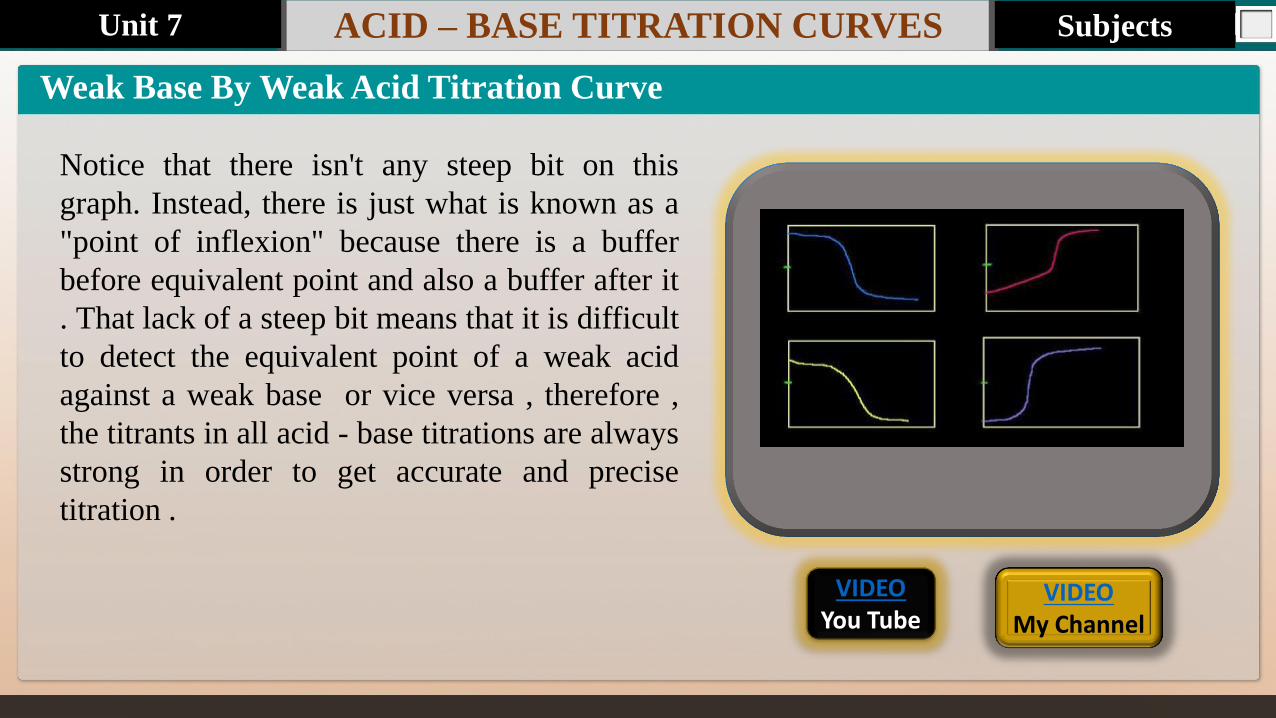
Notice that there isn't any steep bit on this
graph. Instead, there is just what is known as a
"point of inflexion" because there is a buffer
before equivalent point and also a buffer after it
. That lack of a steep bit means that it is difficult
to detect the equivalent point of a weak acid
against a weak base or vice versa , therefore ,
the titrants in all acid - base titrations are always
strong in order to get accurate and precise
titration .
VIDEO You Tube
VIDEO My Channel
Subjects Unit 7
Last update : 1/1/2014 Page.No ACID – BASE TITRATION CURVES
Mixture Of Two Acids Or Two Bases
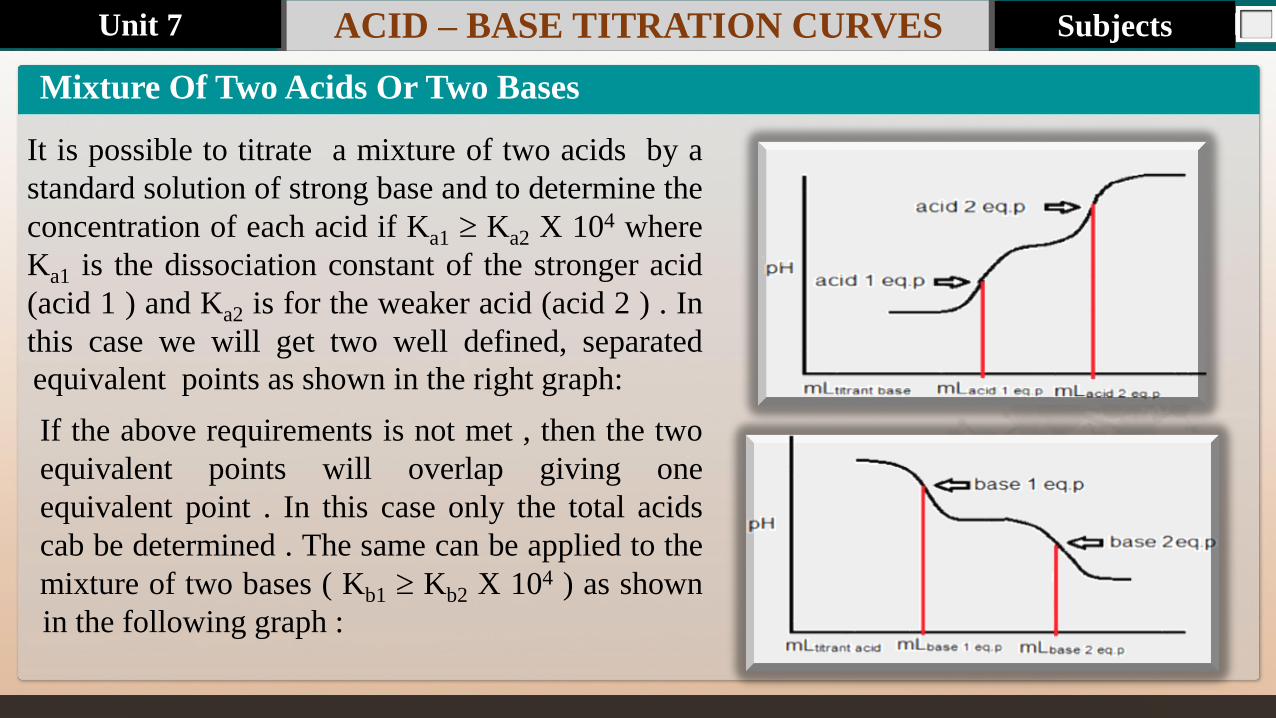
It is possible to titrate a mixture of two acids by a
standard solution of strong base and to determine the
concentration of each acid if Ka1 Ka2 X 104 where
Ka1 is the dissociation constant of the stronger acid
(acid 1 ) and Ka2 is for the weaker acid (acid 2 ) . In
this case we will get two well defined, separated
equivalent points as shown in the right graph:
If the above requirements is not met , then the two
equivalent points will overlap giving one
equivalent point . In this case only the total acids
cab be determined . The same can be applied to the
mixture of two bases ( Kb1 Kb2 X 104 ) as shown
in the following graph :
Subjects Unit 7
Last update : 1/1/2014 Page.No ACID – BASE TITRATION CURVES
Curves For Weak Acid Or Weak Base Salts
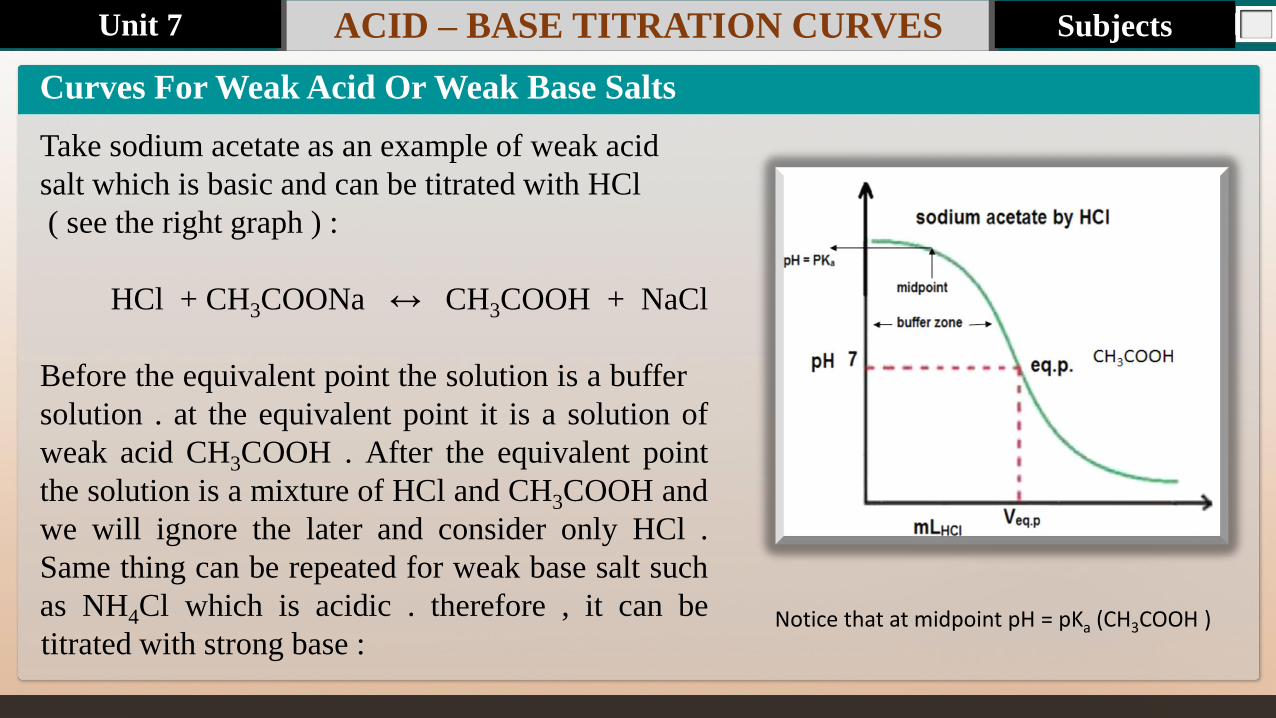
Take sodium acetate as an example of weak acid
salt which is basic and can be titrated with HCl
( see the right graph ) :
HCl + CH3COONa ↔ CH3COOH + NaCl
Before the equivalent point the solution is a buffer
solution . at the equivalent point it is a solution of
weak acid CH3COOH . After the equivalent point
the solution is a mixture of HCl and CH3COOH and
we will ignore the later and consider only HCl .
Same thing can be repeated for weak base salt such
as NH4Cl which is acidic . therefore , it can be
titrated with strong base : Notice that at midpoint pH = pKa (CH3COOH )
Subjects Unit 7
Last update : 1/1/2014 Page.No ACID – BASE TITRATION CURVES
Curves For Weak Acid Or Weak Base Salts
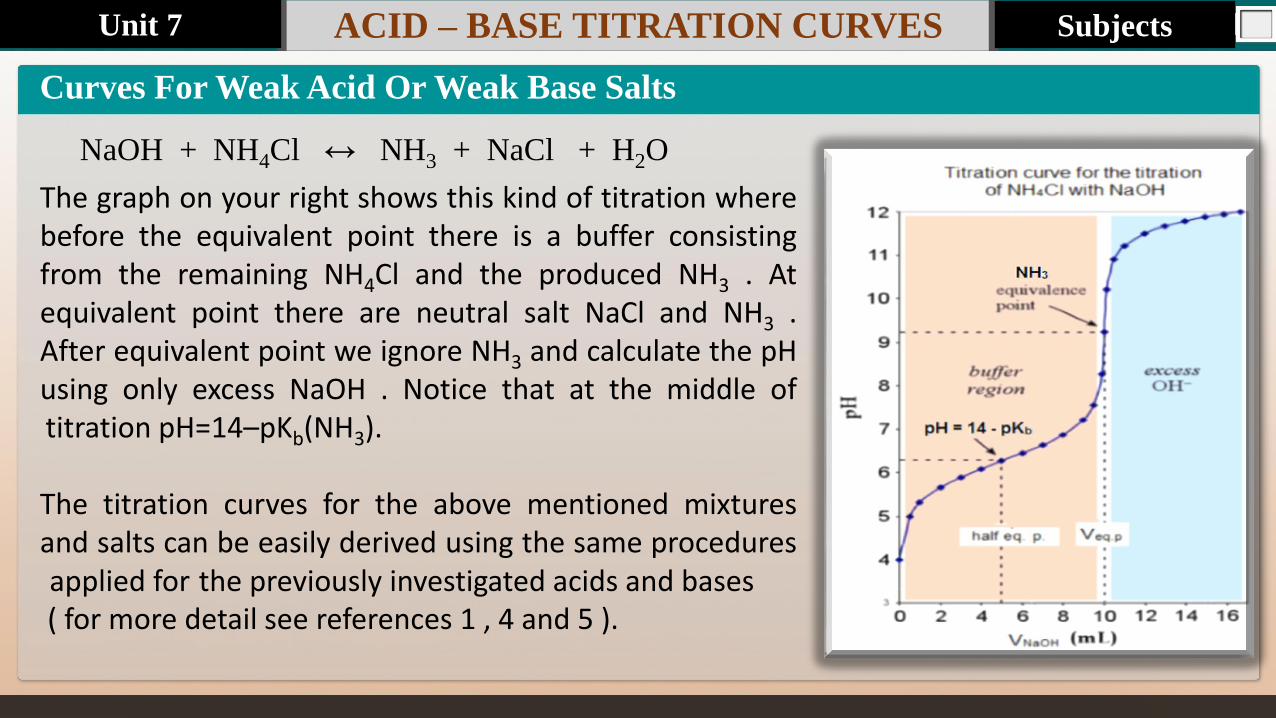
NaOH + NH4Cl ↔ NH3 + NaCl + H2O
The graph on your right shows this kind of titration where before the equivalent point there is a buffer consisting from the remaining NH4Cl and the produced NH3 . At equivalent point there are neutral salt NaCl and NH3 . After equivalent point we ignore NH3 and calculate the pH using only excess NaOH . Notice that at the middle of titration pH=14–pKb(NH3).
The titration curves for the above mentioned mixtures and salts can be easily derived using the same procedures applied for the previously investigated acids and bases
( for more detail see references 1 , 4 and 5 ).
Subjects Unit 7
Last update : 1/1/2014 Page.No ACID – BASE TITRATION CURVES
Curves for polyprotic acids titration
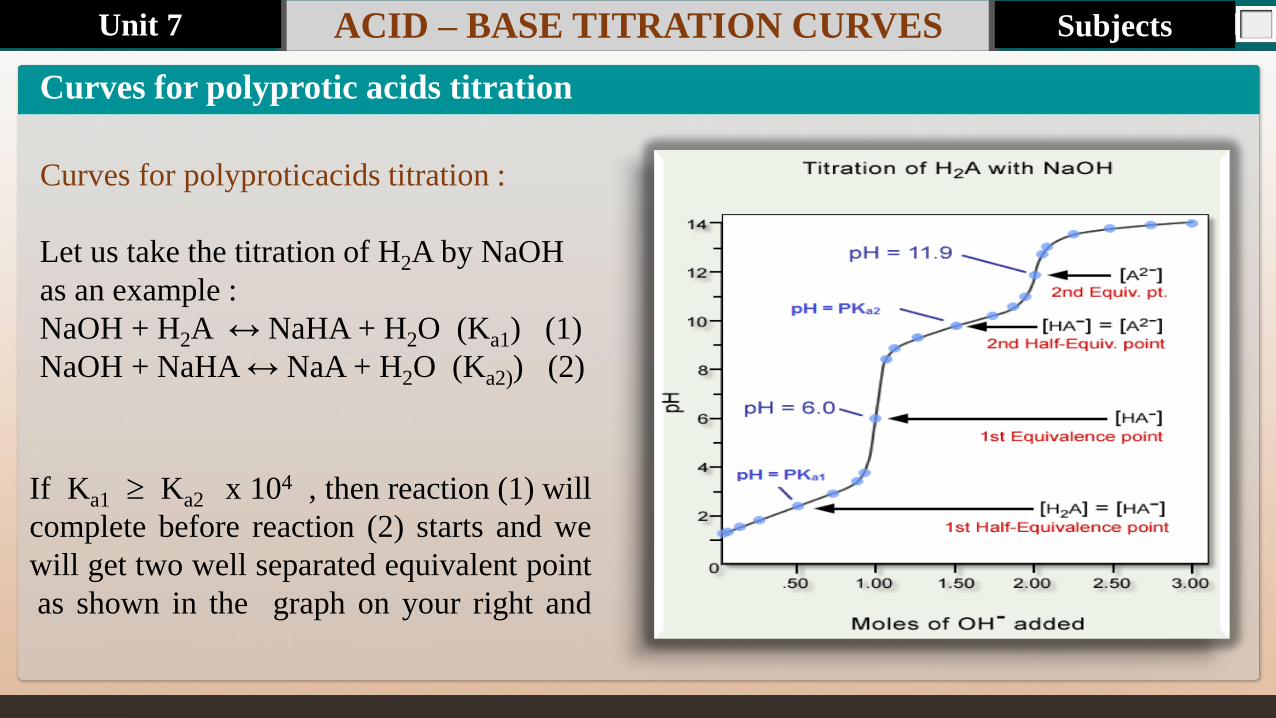
Curves for polyproticacids titration :
Let us take the titration of H2A by NaOH
as an example :
NaOH + H2A ↔ NaHA + H2O (Ka1) (1)
NaOH + NaHA ↔ NaA + H2O (Ka2)) (2)
If Ka1 Ka2 x 104 , then reaction (1) will
complete before reaction (2) starts and we
will get two well separated equivalent point
as shown in the graph on your right and
Subjects Unit 7
Last update : 1/1/2014 Page.No ACID – BASE TITRATION CURVES
Curves for polyprotic acids titration
and the curve can easily be derived as previously mentioned . If this condition is not met , then
the two point will overlap giving only one point ( for more details see references 1 , 2 and 5 ).
VIDEO You Tube
VIDEO Diprotic acid titration curves
VIDEO My Channel
Subjects Unit 7
VIDEO My Channel
Last update : 1/1/2014 Page.No ACID – BASE TITRATION CURVES
Summary
In this unit , the importance of titration curves together with the theoretical
calculations of the curves of all sorts of acid – base titrations have been fully
investigated . We have focused on three main regions of the curve i.e. before , at and after the equivalent point . The way of finding Ka or Kb for weak acid and weak base respectively from
the titration curve has been clarified .
The concepts of this units have been clarified with the help of some pictures ,
graphs and videos .
In the following unit ( acid – base indicators ) we will realize the important of
the acid – base titration curves .
Subjects Unit 7
Last update : 1/1/2016 ACID – BASE TITRATION CURVES
Tutorial
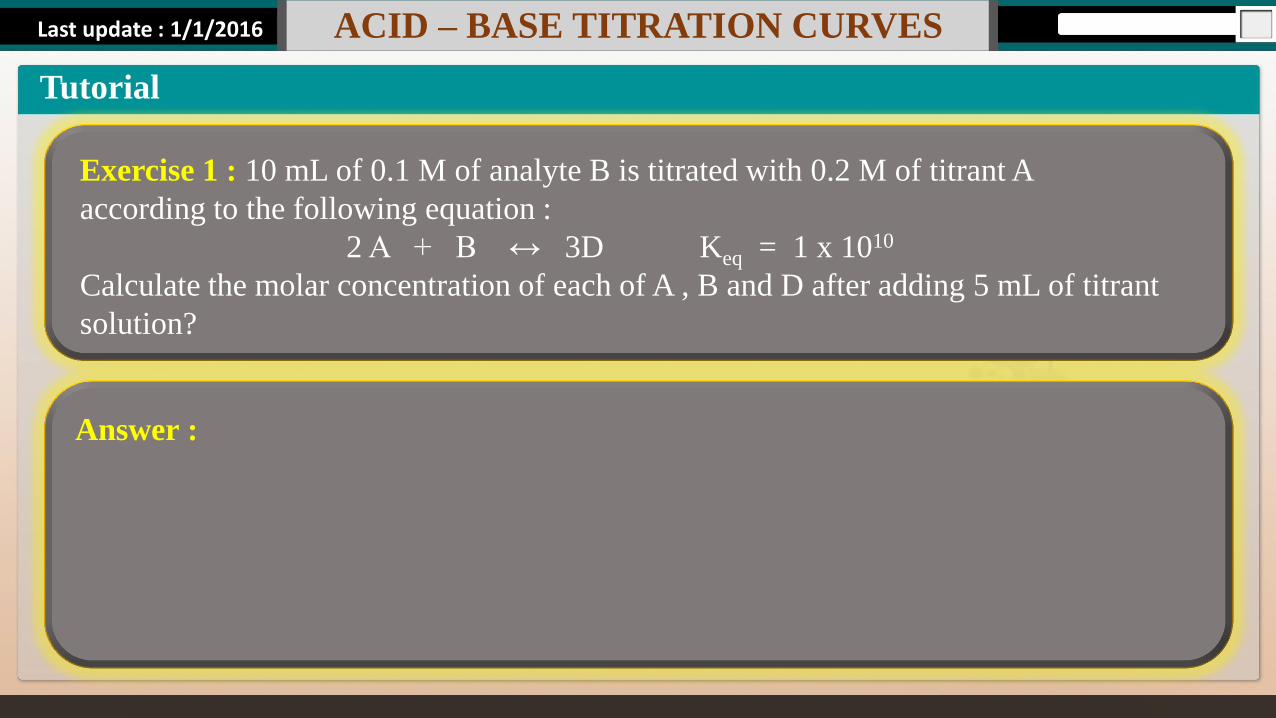
Exercise 1 : 10 mL of 0.1 M of analyte B is titrated with 0.2 M of titrant A
according to the following equation :
2 A + B ↔ 3D Keq = 1 x 10¹⁰
Calculate the molar concentration of each of A , B and D after adding 5 mL of titrant
solution?
Answer :
ACID – BASE TITRATION CURVES
Tutorial
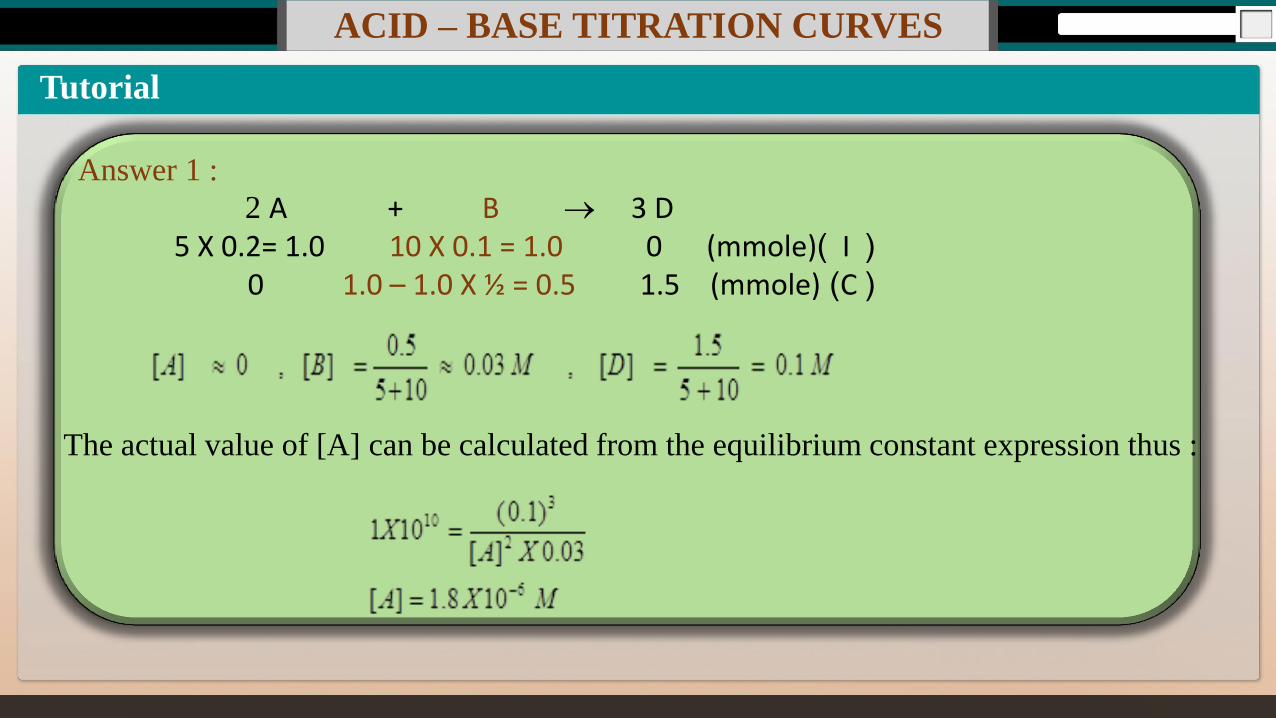
Answer 1 :
2 A + B 3 D ( I )(mmole) 0 5 X 0.2= 1.0 10 X 0.1 = 1.0 (C )(mmole) 1.5 0 1.0 – 1.0 X ½ = 0.5
The actual value of [A] can be calculated from the equilibrium constant expression thus :
ACID – BASE TITRATION CURVES
Tutorial
Exercise 2 : 1O mL of 0.1 M of CH3COOH is titrated with 0.2 M NaOH.
Calculate the pH of the titration solution in the conical flask after the additions of
2 mL of NaOH solution ?
Answer :
ACID – BASE TITRATION CURVES
Tutorial
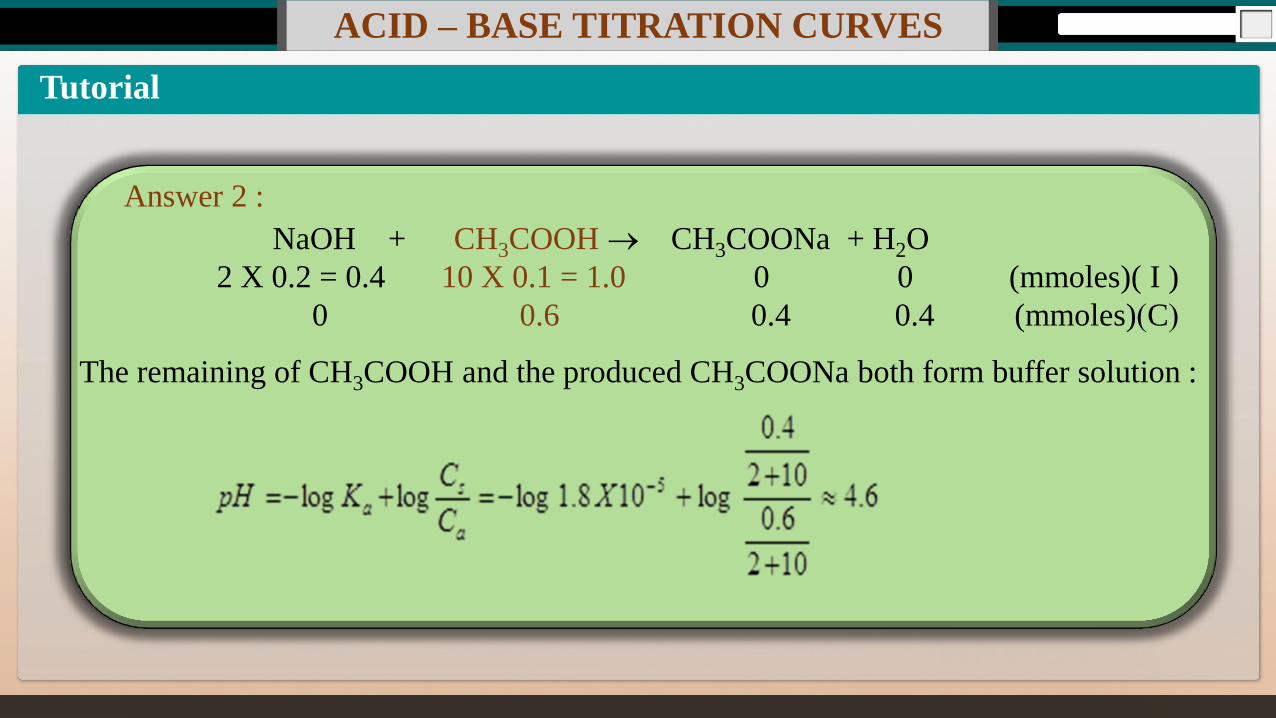
NaOH + CH3COOH CH3COONa + H2O
(mmoles)( I ) 0 0 2 X 0.2 = 0.4 10 X 0.1 = 1.0
(C) (mmoles) 0.4 0.4 0.6 0
The remaining of CH3COOH and the produced CH3COONa both form buffer solution :
Answer 2 :
ACID – BASE TITRATION CURVES
Tutorial
Exercise 3 : 1O mL of 0.1 M of CH3COOH is titrated with 0.2 M NaOH. Calculate the pH
of the titration solution in the conical flask after the additions of 5 mL of NaOH solution ?
Answer :
ACID – BASE TITRATION CURVES
Tutorial
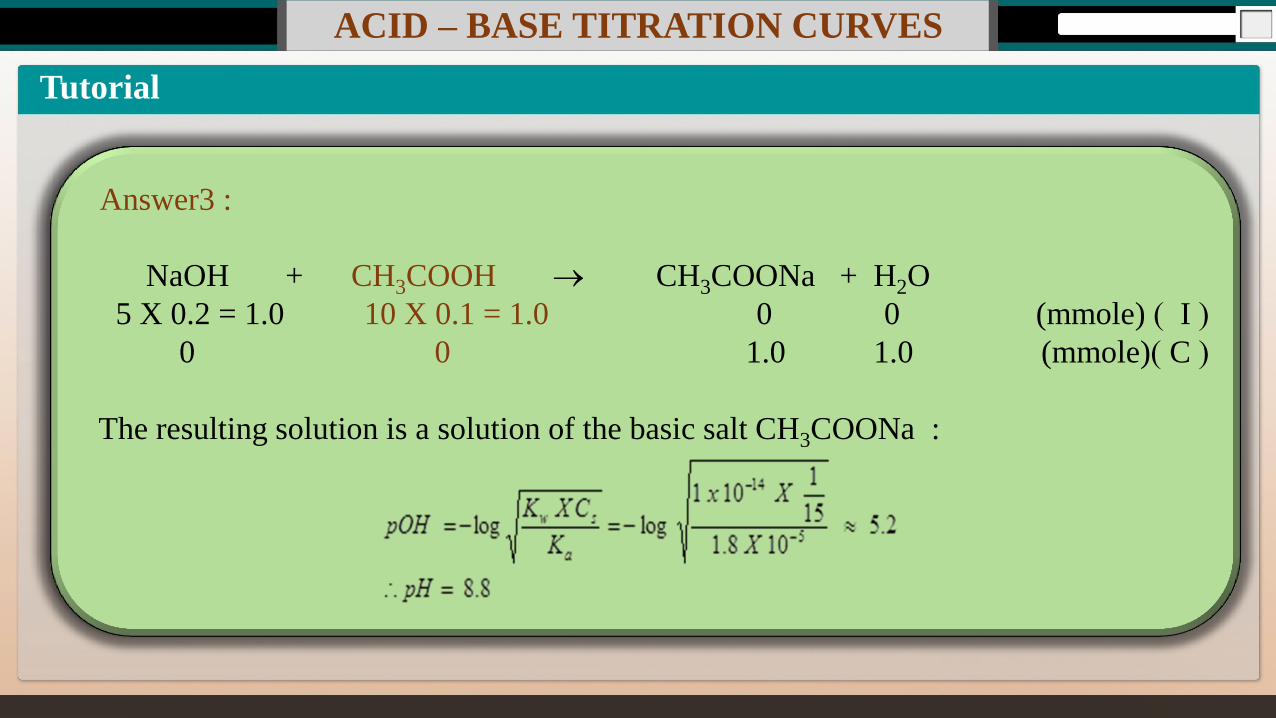
Answer3 :
NaOH + CH3COOH CH3COONa + H2O
( I )(mmole) 0 0 5 X 0.2 = 1.0 10 X 0.1 = 1.0
( C ) (mmole) 1.0 1.0 0 0
The resulting solution is a solution of the basic salt CH3COONa :
ACID – BASE TITRATION CURVES
Tutorial
Exercise 4 : 1O mL of 0.1 M of CH3COOH is titrated with 0.2 M NaOH. Calculate the pH
of the titration solution in the conical flask after the additions of 7 mL of NaOH solution ?
Answer :
ACID – BASE TITRATION CURVES
Tutorial
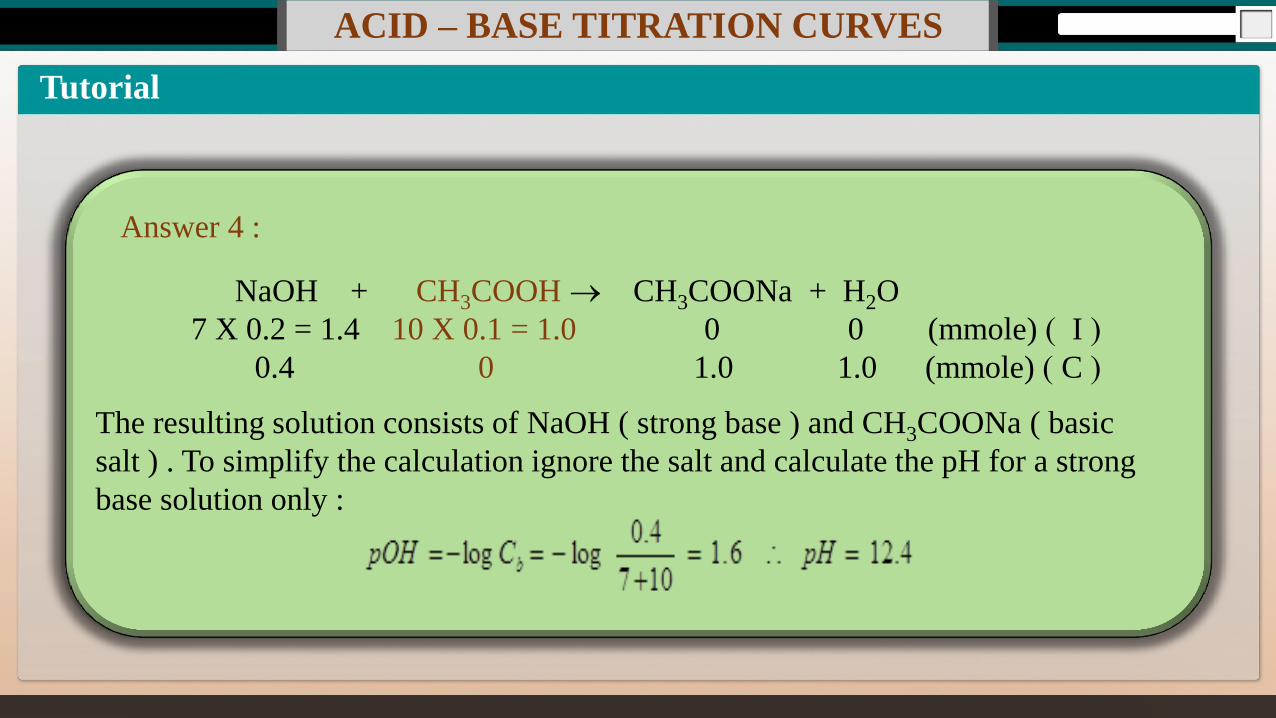
Answer 4 :
NaOH + CH3COOH CH3COONa + H2O
( I )(mmole) 0 0 7 X 0.2 = 1.4 10 X 0.1 = 1.0
( C ) (mmole) 1.0 1.0 0 0.4
The resulting solution consists of NaOH ( strong base ) and CH3COONa ( basic
salt ) . To simplify the calculation ignore the salt and calculate the pH for a strong
base solution only :
ACID – BASE TITRATION CURVES
Tutorial
Exercise 5 : 1O mL of 0.1 M of CH3COONa solution is titrated with 0.2 M
HCl. Calculate the pH of the titration solution in the conical flask after the
additions of 2 mL of HCl solution ?
Answer :
ACID – BASE TITRATION CURVES
Tutorial
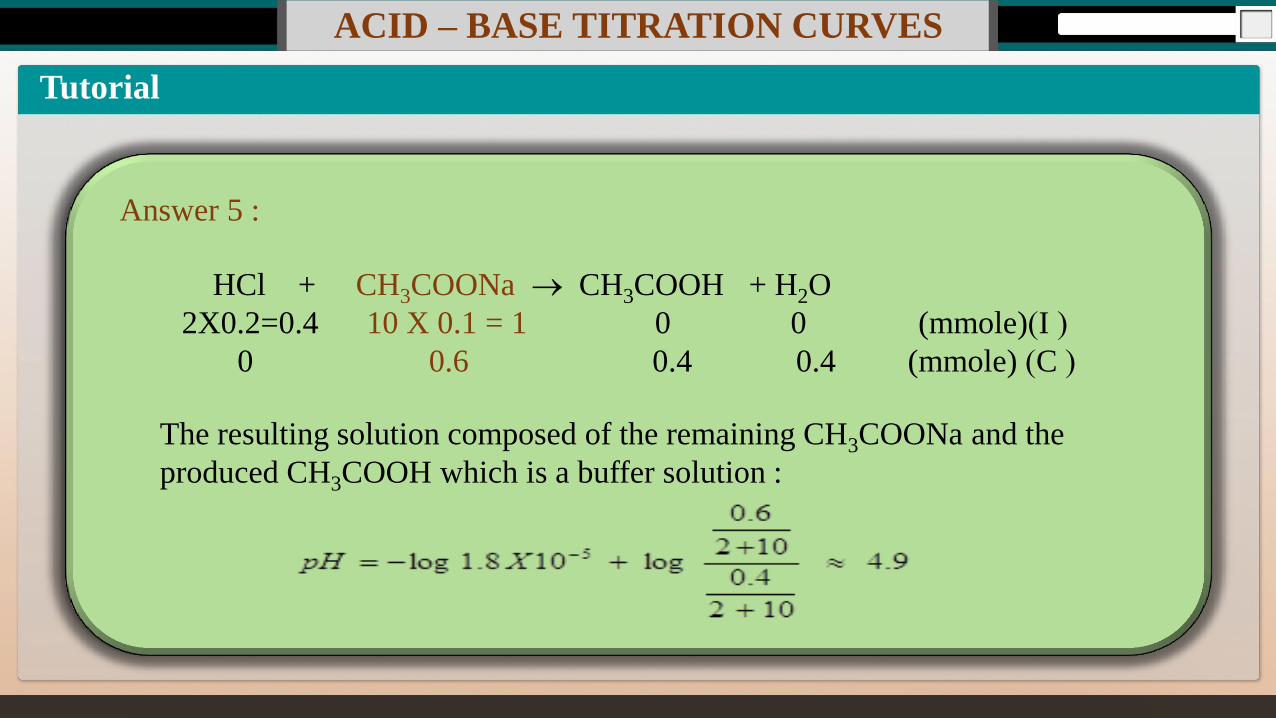
+ H2O HCl + CH3COONa CH3COOH
(I)(mmole) 0 0 10 X 0.1 = 1 2X0.2=0.4
(C )(mmole) 0.4 0.4 0.6 0
Answer 5 :
The resulting solution composed of the remaining CH3COONa and the
produced CH3COOH which is a buffer solution :
ACID – BASE TITRATION CURVES
Tutorial
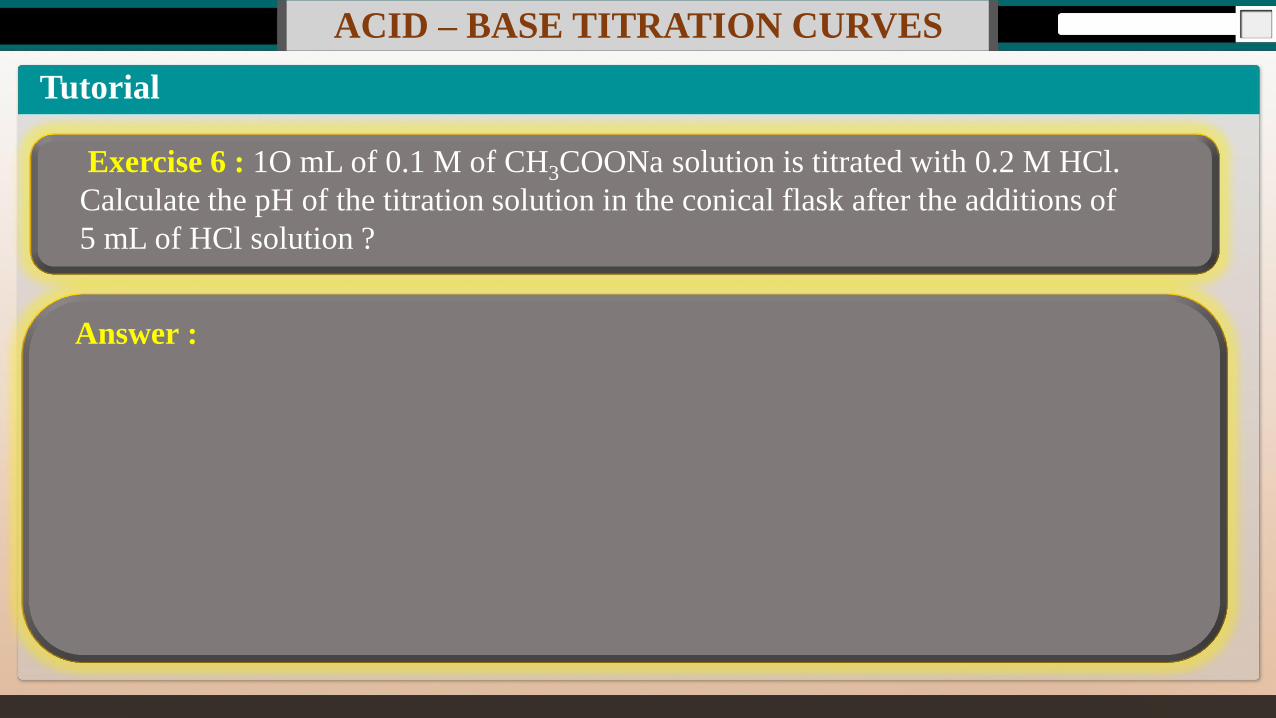
Exercise 6 : 1O mL of 0.1 M of CH3COONa solution is titrated with 0.2 M HCl.
Calculate the pH of the titration solution in the conical flask after the additions of
5 mL of HCl solution ?
Answer :
ACID – BASE TITRATION CURVES
Tutorial
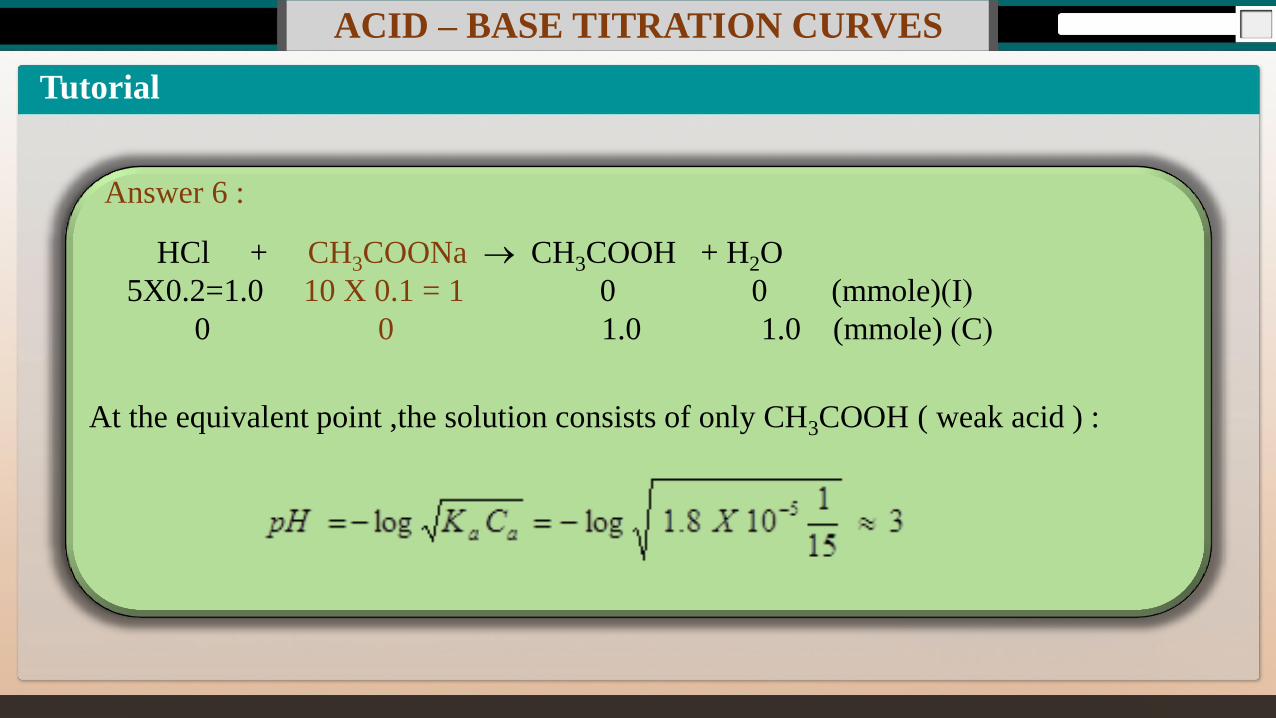
+ H2O HCl + CH3COONa CH3COOH
(I)(mmole) 0 0 10 X 0.1 = 1 5X0.2=1.0
(C )(mmole) 1.0 1.0 0 0
Answer 6 :
At the equivalent point ,the solution consists of only CH3COOH ( weak acid ) :
ACID – BASE TITRATION CURVES
Tutorial
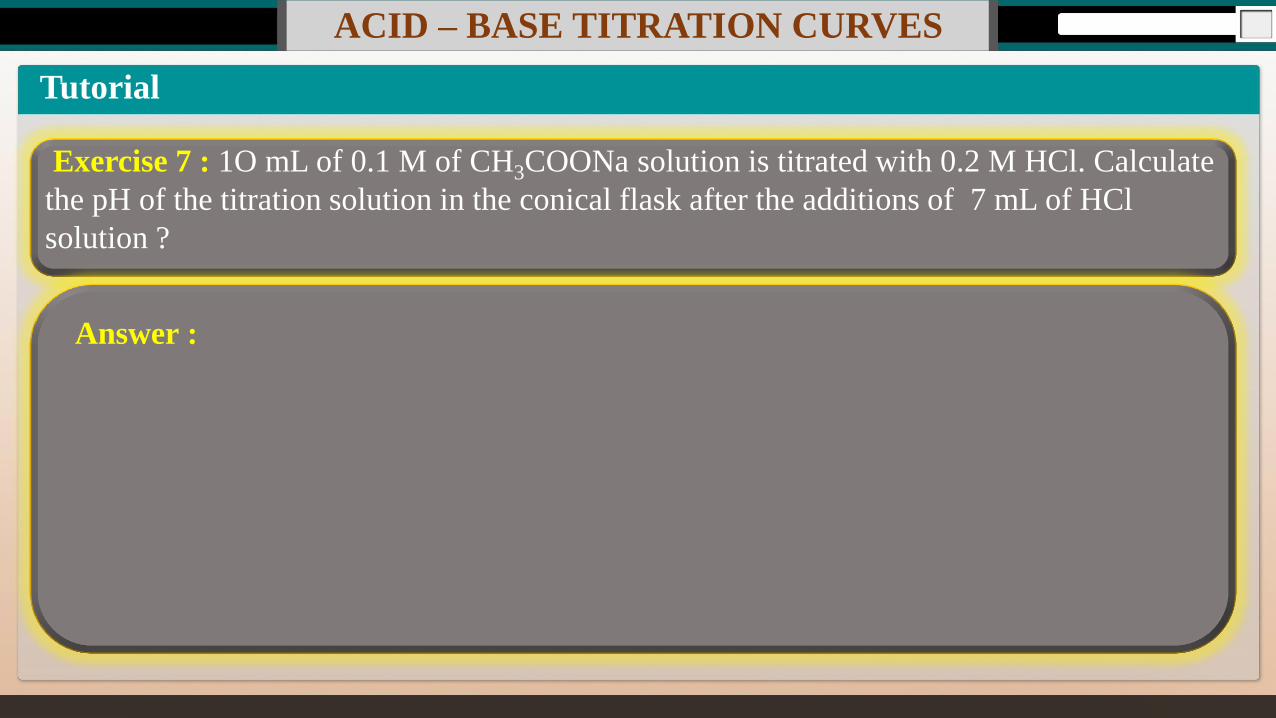
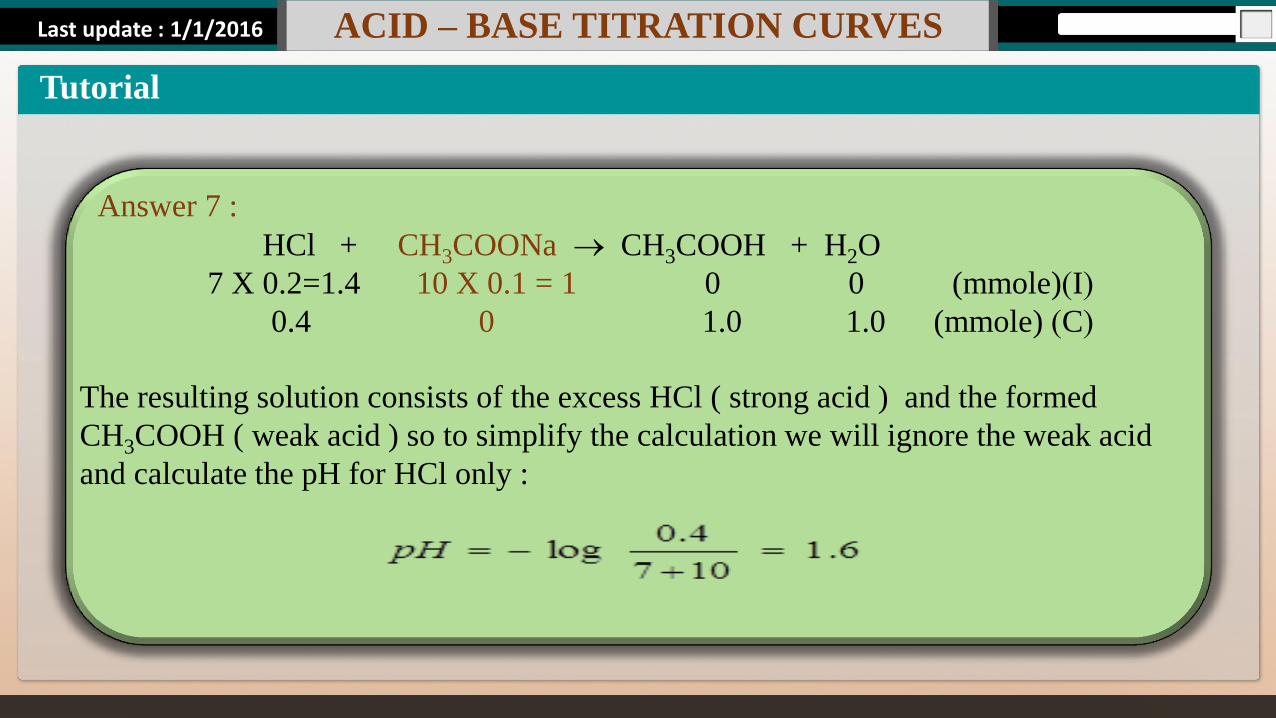
Exercise 7 : 1O mL of 0.1 M of CH3COONa solution is titrated with 0.2 M HCl. Calculate
the pH of the titration solution in the conical flask after the additions of 7 mL of HCl
solution ?
Answer :
Last update : 1/1/2016 ACID – BASE TITRATION CURVES
Tutorial
+ H2O HCl + CH3COONa CH3COOH
(I)(mmole) 0 0 10 X 0.1 = 1 7 X 0.2=1.4
(C )(mmole) 1.0 1.0 0 0.4
Answer 7 :
The resulting solution consists of the excess HCl ( strong acid ) and the formed
CH3COOH ( weak acid ) so to simplify the calculation we will ignore the weak acid
and calculate the pH for HCl only :

Last update : 1/1/2014 Page.No
ابراهيم زامل الزامل باللغة العربية عن هذا / على الراغبين االستماع الى محاضرات االستاذ الدكتور
: الموضوع الرجوع الى الروابط التالية
منحنيات معايرات الحموض و القواعد
منحنيات معايرات الحموض و القواعد 2