wettability determination of solids isolated from oil sands
TRANSCRIPT
W
Ta
b
a
ARRAA
KOSSW
1
riCbcafTceawai[a
drmobb
0d
Colloids and Surfaces A: Physicochem. Eng. Aspects 337 (2009) 80–90
Contents lists available at ScienceDirect
Colloids and Surfaces A: Physicochemical andEngineering Aspects
journa l homepage: www.e lsev ier .com/ locate /co lsur fa
ettability determination of solids isolated from oil sands
rong Dang-Vua, Rahul Jhaa,b, Shiau-Yin Wua, Dwayne D. Tannantb, Jacob Masliyaha, Zhenghe Xua,∗
Department of Chemical and Materials Engineering, University of Alberta, 7th Floor, ECERF, Edmonton, Alberta, Canada T6G 2V4School of Mining and Petroleum Engineering, 3-133 Markin/CNRL Natural Resources Engineering Facility, University of Alberta, Edmonton, Alberta, Canada T6G 2W2
r t i c l e i n f o
rticle history:eceived 24 July 2008eceived in revised form 9 November 2008ccepted 28 November 2008
a b s t r a c t
The purpose of this study is to determine the wettability of solids isolated from oil sands. The fine(−45 �m) and coarse (+106 �m −250 �m) fractions of the mineral solids were extracted from differ-ent Athabasca oil sands ores using water-based extraction in a Denver flotation cell. Four different
vailable online 6 December 2008
eywords:il sandsolids wettabilityolvent washing
methods were used to characterize the wettability of solids, i.e., contact angle, critical surface tension,hydrophilic/hydrophobic partitioning, and water drop penetration time (WDPT). Advantages and limi-tations of these methods were discussed. WDPT measurements were found to be the most sensitive fordetermining wettability of the solids extracted from oil sands. The effect of the protocol for isolating thesolids from oil sands on solids surface properties was investigated. Solvent washing and solids dryingwere found to affect the wettability of the solids. Solids wettability measurements were corroborated
of th
ater drop penetration time with surface composition. Introduction
Oil sands in Alberta cover 141,000 square kilometres in threeegions: Athabasca, Peace River, and Cold Lake with total bitumenn place being estimated to be 1.7–2.5 trillion barrels [1]. It makesanada one of the world largest sources of bitumen. Commercially,itumen is extracted from oil sands by water-based extraction pro-esses which involve two essential stages: bitumen liberation anderation [2]. In order to recover bitumen, the bitumen must releaserom sand grains (liberation) and attach to air bubbles (aeration).he air bubbles provide the liberated bitumen drops with suffi-ient buoyancy to float to the top of the pulp where the bitumen isnriched and recovered as a bitumen froth. Bitumen liberation anderation are controlled by interactions between bitumen, solids,ater and air. These interactions are affected by many factors such
s process temperature, mechanical energy input and water chem-stry including pH, surfactants, divalent cations (Ca2+, Mg2+), etc.2,3]. In conjunction with these factors, the wettability of the solidslso affects bitumen recovery.
The release of bitumen from hydrophobic sand grains is moreifficult than from hydrophilic grains. This leads to a low bitumenecovery coupled with poor quality of bitumen froth. Further-
ore, hydrophobic fine solids can also attach to bitumen dropsr/and bubbles, thereby further lowering bitumen recovery anditumen froth quality. For hydrophilic solids, on the other hand,itumen is easily liberated from the sand grains, leading to a
∗ Corresponding author. Tel.: +1 780 492 7667; fax: +1 780 492 2881.E-mail address: [email protected] (Z. Xu).
927-7757/$ – see front matter © 2008 Elsevier B.V. All rights reserved.oi:10.1016/j.colsurfa.2008.11.055
e solids as determined by X-ray photoelectron spectroscopy.© 2008 Elsevier B.V. All rights reserved.
high bitumen recovery. However, under unfavourable slurry chem-istry, hydrophilic fine solids can attach to bitumen drops, therebycreating a layer of fine solids on the bitumen drops. Such finesolids coating is referred to in the literature as slime coating[4–7]. Depending on the degree of slime coating, the slime coatingcould hinder bubble–bitumen attachment, leading to lower bitu-men recovery, or cause the fine solids to float with the bitumen,reducing bitumen froth quality. Different mechanisms control theattachment between the hydrophilic fine solids and bitumen drops[4,6,8].
Despite the important role of solids wettability in bitumenrecovery, only few studies on the wettability of solids isolated fromoil sands were conducted. Darcovich et al. [9] measured critical sur-face tension of toluene-washed solids from a bitumen froth andtailings obtained from a cold water digestion test, and reportedsurface tension values of 42.7, 48.6, and 47.4 mN/m for the solidsfrom the froth, top layer and bottom layer of the tailings, respec-tively. Chen et al. [10] measured water contact angles in heptane onsurface of the solids extracted from bitumen and reported contactangle values of 25◦ and 150◦ for wet and dry solids, respectively. Fur-thermore, water contact angles on toluene- and heptane-washedfine solids measured in toluene were 83◦ and 151◦, respectively.The authors stated that the observed difference was due to differ-ent solubilities of the surface organic compounds in the washingsolvents. Toluene, with good dissolving power for surfactants and
asphaltenes, removed more organic species from the solids thanheptane, leading to less hydrophobic solids (smaller contact angle)for the toluene-washed solids.Limited knowledge on the wettability of solids isolated from oilsands can be attributed to the difficulties in determination of the
: Phys
wtw
sosci
smrssicdoi
toasd
2
wwcTamfbmiliscAlii
2
ppd
2
lbs[
pcm
T. Dang-Vu et al. / Colloids and Surfaces A
ettability of the solid particles [11,12] and on the sensitivity ofhe solids wettability to the methods used for solids isolation andashing [12–14].
The present study fills a knowledge gap by characterizing theolids isolated from different types of naturally occurring oil sandsres. The wettability characteristics of both the fine and coarseolids fractions were measured with different techniques and theseharacteristics were linked to the oil sands processability measuredn terms of bitumen recovery and froth quality.
The research results are presented in two papers. Part 1 of thetudy (this paper) focuses on selection of the best method for deter-ining wettability of solids isolated from oil sands. A literature
eview of the methods for determining wettability of particulateolids and application of these methods to solids isolated from oilands are presented. Advantages and limitations of the methodsn the context of characterizing solids from oil sands ores are dis-ussed. Furthermore, the influence of solvent washing and solidsrying on wettability was investigated. The chemical compositionf the surface of the solids was determined to understand the vary-ng hydrophobicity of the different solids.
Part 2 of the study [15] focuses on measuring the wettability ofhe solids from different oil sands ores using the selected meth-ds from Part 1. Part 2 deals with processability of oil sands oresnd its correlation to solids wettability for both the fine and coarseolids fractions. The wettability of bitumen is also presented andiscussed in Part 2.
. Determination of wettability of particulate solids
Wettability describes the ability of a surface to be wetted byater and it can be characterized by different parameters. The mostidely used parameter to describe the wettability of solids is the
ontact angle of the probing liquid (often water) on solid surfaces.he contact angle approach is conceptually easy to understand forflat smooth, surface. There are several well-known methods foreasuring the contact angle of probing liquids on flat smooth sur-
aces [16–18]. For particles, however, the concept of contact angleecomes difficult to envision, although a number of sophisticatedethods, such as capillary pressure compensation [19], liquid wick-
ng [20] and atomic force microscope [21], have been used for aimited number of systems. In addition to contact angle, wettabil-ty of the particulate solids is also often characterized by criticalurface tension [22,23]. Many formulae have been developed toalculate contact angle from surface tension and vice versa [18].nother measure of wettability is through penetration time of a
iquid drop into a bed of solid particles [24–26] or by partition-ng of solids between oil and aqueous phases or between air/waternterface and aqueous phase [27,28].
.1. Contact angle measurements
A solid–liquid contact angle is the angle formed at the three-hase contact of a liquid drop on a solid surface. Contact angle ofarticles can be measured using a single particle, on a compressedisc of particles or for a bed of particles.
.1.1. Contact angle measurements for single particleIn this technique contact angle is determined by directly ana-
yzing a profile of a liquid drop in contact with a particle [29] ory calculating interfacial interaction (liquid/solid or solid/air) mea-ured using appropriate equipment, e.g. atomic force microscope
21,30] or Langmuir trough [31,32].A major limitation of contact angle measurements for singlearticle is the requirement of a perfectly spherical particle, whichannot be found in real systems such as soil or oil sands. Further-ore, due to heterogeneity of the solids, the results obtained for
icochem. Eng. Aspects 337 (2009) 80–90 81
single particles do not represent all the solids unless an excessivelylarge number of measurements are performed with a statisticallysignificant number of particles.
2.1.2. Contact angle measurement on a flattened surfaceThe concept of this method is to form a flat surface of solid par-
ticles and measure the contact angle on the flattened surface usingtechniques developed for measuring contact angle on a flat smoothsurface. Two main approaches for preparation of a flat surface areby compaction or deposition. In the first approach, the particles arecompressed into a disc by pressing [33–36] or centrifugation [10].In the second method, the particles are deposited on a flat substrateby evaporating a liquid suspension or pressing the dry solids onto aflat substrate [26,37]. Compressed discs have been widely used andthe effect of disc preparation procedure on the measured contactangle has been also broadly discussed [38–41].
Compared with the deposition method, a major advantage of thecompressed disc approach is its ability to produce a sufficiently ‘flat’surface of relatively small surface roughness. A surface obtained bydeposition method can be very rough and heterogeneous due tolack of control during the deposition on the substrate.
Contact angle of liquid on flattened surfaces can be easily mea-sured using well-known methods, such as: sessile drop (bubble),captive bubble (drop) [38–42] or Wilhelm plate method [43–45].
2.1.3. Contact angle measurements of particles bedCapillary rise is one of the earliest and most commonly used
methods for determining the wettability of solid particles. As thename indicates, this method is based on the measurement of com-pensating capillary pressure (Bartell method) or penetration rate(Washburn method) of a probing liquid penetrating (capillary rise)into a particles bed.
Bartell method measures a pressure difference required to stopa liquid penetrating into a particles bed and the contact angle is cal-culated based on the characteristics of the particles bed [19,46–49].
Washburn method, on the other hand, allows for calculation ofnot only contact angle but also a mean pore radius of particles[49–51]. In general, a penetration height [52–54] or weight gain[49,55] of the penetrating liquid into capillaries of particles bed isdetermined. The contact angle of particles is then evaluated usingWashburn’s equation [55,56]. The challenge for both Bartell andWashburn method is to obtain a uniform and reproducible packingof particles beds.
The thin layer wicking method proposed by Van Oss [20] is amodification of the capillary rise method. In this modified method,the mass gain of the liquid penetrating vertically into a thin layerof particles deposited on a glass surface is measured with time. Thecontact angle of the particles is then calculated using a modifiedWashburn’s equation.
It is worth to note that a condition, which is also a limitationof the capillary rise method is that the probing liquid must be ableto rise into the particles bed. Therefore, it cannot be applied to thesolids of strong hydrophobicity with contact angle approaching orgreater than 90◦.
In addition to the capillary rise methods, contact angles of pow-ders can also be estimated from immersion enthalpy determinedby calorimeter [57,58] or from an entry pressure [59].
2.2. Solids surface tension measurements
As mentioned above, many theories have been developed forcalculating solids surface tension from the contact angle valuesand vice versa. Therefore, many methods for contact angle mea-surement, for example, capillary rise method, have been applied tosurface tension measurements.
8 : Physicochem. Eng. Aspects 337 (2009) 80–90
smisamltssmftc
�
wtids
et
2
asetfftptw
si[bamt
2
wieflaoaodticm
Table 1Composition (wt.%) of oils sands ores and corresponding bitumen recovery.
Oil sands Composition [wt.%] Bitumenrecovery [%]
Source
Bitumen Water Solids Finesa
G 14.6 3.9 81.5 10.4 94.2 Syncrude
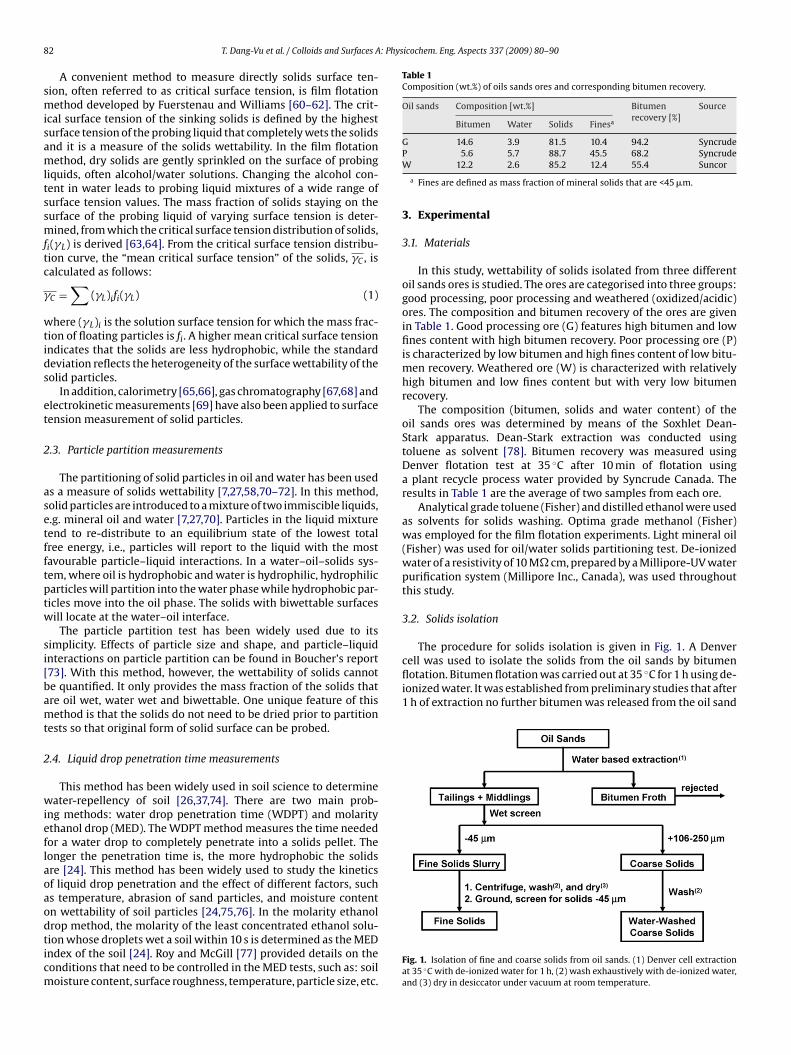
The procedure for solids isolation is given in Fig. 1. A Denvercell was used to isolate the solids from the oil sands by bitumenflotation. Bitumen flotation was carried out at 35 ◦C for 1 h using de-ionized water. It was established from preliminary studies that after1 h of extraction no further bitumen was released from the oil sand
2 T. Dang-Vu et al. / Colloids and Surfaces A
A convenient method to measure directly solids surface ten-ion, often referred to as critical surface tension, is film flotationethod developed by Fuerstenau and Williams [60–62]. The crit-
cal surface tension of the sinking solids is defined by the highesturface tension of the probing liquid that completely wets the solidsnd it is a measure of the solids wettability. In the film flotationethod, dry solids are gently sprinkled on the surface of probing
iquids, often alcohol/water solutions. Changing the alcohol con-ent in water leads to probing liquid mixtures of a wide range ofurface tension values. The mass fraction of solids staying on theurface of the probing liquid of varying surface tension is deter-ined, from which the critical surface tension distribution of solids,
i(�L) is derived [63,64]. From the critical surface tension distribu-ion curve, the “mean critical surface tension” of the solids, �C , isalculated as follows:
C =∑
(�L)ifi(�L) (1)
here (�L)i is the solution surface tension for which the mass frac-ion of floating particles is fi. A higher mean critical surface tensionndicates that the solids are less hydrophobic, while the standardeviation reflects the heterogeneity of the surface wettability of theolid particles.
In addition, calorimetry [65,66], gas chromatography [67,68] andlectrokinetic measurements [69] have also been applied to surfaceension measurement of solid particles.
.3. Particle partition measurements
The partitioning of solid particles in oil and water has been useds a measure of solids wettability [7,27,58,70–72]. In this method,olid particles are introduced to a mixture of two immiscible liquids,.g. mineral oil and water [7,27,70]. Particles in the liquid mixtureend to re-distribute to an equilibrium state of the lowest totalree energy, i.e., particles will report to the liquid with the mostavourable particle–liquid interactions. In a water–oil–solids sys-em, where oil is hydrophobic and water is hydrophilic, hydrophilicarticles will partition into the water phase while hydrophobic par-icles move into the oil phase. The solids with biwettable surfacesill locate at the water–oil interface.
The particle partition test has been widely used due to itsimplicity. Effects of particle size and shape, and particle–liquidnteractions on particle partition can be found in Boucher’s report73]. With this method, however, the wettability of solids cannote quantified. It only provides the mass fraction of the solids thatre oil wet, water wet and biwettable. One unique feature of thisethod is that the solids do not need to be dried prior to partition
ests so that original form of solid surface can be probed.
.4. Liquid drop penetration time measurements
This method has been widely used in soil science to determineater-repellency of soil [26,37,74]. There are two main prob-
ng methods: water drop penetration time (WDPT) and molaritythanol drop (MED). The WDPT method measures the time neededor a water drop to completely penetrate into a solids pellet. Theonger the penetration time is, the more hydrophobic the solidsre [24]. This method has been widely used to study the kineticsf liquid drop penetration and the effect of different factors, suchs temperature, abrasion of sand particles, and moisture content
n wettability of soil particles [24,75,76]. In the molarity ethanolrop method, the molarity of the least concentrated ethanol solu-ion whose droplets wet a soil within 10 s is determined as the MEDndex of the soil [24]. Roy and McGill [77] provided details on theonditions that need to be controlled in the MED tests, such as: soiloisture content, surface roughness, temperature, particle size, etc.P 5.6 5.7 88.7 45.5 68.2 SyncrudeW 12.2 2.6 85.2 12.4 55.4 Suncor
a Fines are defined as mass fraction of mineral solids that are <45 �m.
3. Experimental
3.1. Materials
In this study, wettability of solids isolated from three differentoil sands ores is studied. The ores are categorised into three groups:good processing, poor processing and weathered (oxidized/acidic)ores. The composition and bitumen recovery of the ores are givenin Table 1. Good processing ore (G) features high bitumen and lowfines content with high bitumen recovery. Poor processing ore (P)is characterized by low bitumen and high fines content of low bitu-men recovery. Weathered ore (W) is characterized with relativelyhigh bitumen and low fines content but with very low bitumenrecovery.
The composition (bitumen, solids and water content) of theoil sands ores was determined by means of the Soxhlet Dean-Stark apparatus. Dean-Stark extraction was conducted usingtoluene as solvent [78]. Bitumen recovery was measured usingDenver flotation test at 35 ◦C after 10 min of flotation usinga plant recycle process water provided by Syncrude Canada. Theresults in Table 1 are the average of two samples from each ore.
Analytical grade toluene (Fisher) and distilled ethanol were usedas solvents for solids washing. Optima grade methanol (Fisher)was employed for the film flotation experiments. Light mineral oil(Fisher) was used for oil/water solids partitioning test. De-ionizedwater of a resistivity of 10 M� cm, prepared by a Millipore-UV waterpurification system (Millipore Inc., Canada), was used throughoutthis study.
3.2. Solids isolation
Fig. 1. Isolation of fine and coarse solids from oil sands. (1) Denver cell extractionat 35 ◦C with de-ionized water for 1 h, (2) wash exhaustively with de-ionized water,and (3) dry in desiccator under vacuum at room temperature.
: Physicochem. Eng. Aspects 337 (2009) 80–90 83
soafocaw2riwst
wwathFtc
3
taar2rw
3
oeivawbcctrd
twcdw
3
sNw1at
T. Dang-Vu et al. / Colloids and Surfaces A
ample. After extraction, the obtained tailings were wet-screened tobtain coarse fraction of solids in particle size range of 106–250 �mnd fine size fraction of solids less than 45 �m. The coarse solidsraction was then washed exhaustively with de-ionized water. Thebtained solids were referred to as water-washed coarse solids (oroarse solids). The fine solids fraction in suspension was centrifugedt 20,000 g for 20 min to remove the water. The obtained solidsere washed with de-ionized water, followed by centrifugation at0,000 g to remove the washing water. The washing process wasepeated two times. The washed solids were then dried in a des-ccator under vacuum at room temperature. The dried solids cakeas broken manually to individual particles and screened again for
olids less than 45 �m. The solids obtained as such were referredo as the fine solids (or fines).
In the present study, two significantly different fractions of solidsere chosen. The first fraction (fines, less than 45 �m) has beenidely studied in oil sands research and its amount has been used
s an indicator of oil sands processability [2]. The fines fraction con-ains different types and amounts of clay minerals. On the otherand, the coarse size fraction (106–250 �m) contains mainly silica.or many wettability tests, such as film flotation or water/oil par-itioning, this size fraction has been proven the most suitable andommonly used.
.3. Preparation of compressed disc of fine solids
Compressed discs were prepared at room temperature fromhe fine solids in a manual hydraulic press (Enerpac JH-5) using25.4 mm diameter die. Precisely weighed 2 g of fine solids were
dded to the die and the applied force was increased slowly. Aftereaching a value of 26.7 kN, the sample was left undisturbed formin. The discs of compressed fines were immediately used after
emoval from the die. The surface roughness of the obtained discas analyzed using an Alpha-Step 200 (Tencor) profilometer.
.4. Washing of the coarse solids with solvents
The effect of coarse solids washing with different solventsn solids wettability was examined. Two solvents, toluene andthanol, were chosen due to their water miscibility, i.e., toluenes water immiscible while ethanol is water miscible. Prior to sol-ent washing the water-washed coarse solids were first dried indesiccator under vacuum at room temperature. The dry solidsere washed exhaustively with a solvent until the supernatantecame colourless. After washing, the solids were dried in a desic-ator under vacuum at room temperature. The washed solids wereoded as toluene-washed or ethanol-washed solids, depending onhe solvent used for washing. The ethanol-washed solids were alsoeferred to as ethanol-dry-washed solids because the solids wereried before being washed with ethanol.
To investigate the effect of drying on coarse solids wettability,he water-washed coarse solids without drying (see Fig. 1) were alsoashed exhaustively with ethanol until the supernatant became
olourless. Then the washed solids were dried under vacuum in aesiccator at room temperature. These solids were called ethanol-et-washed solids.
.5. Contact angle measurements
Contact angle of water on pressed fine solid discs was mea-ured using a Drop Shape Analyser DSA 10 (KRUSS USA, Charlotte,
C, US) equipped with a CCD camera. The sessile drop techniqueas used to determine the contact angle of the water drop. A0-�L de-ionized water drop was placed on the compressed discnd a real-time video of the drop was recorded. The image ofhe water drop was then analyzed using vendor-provided soft-
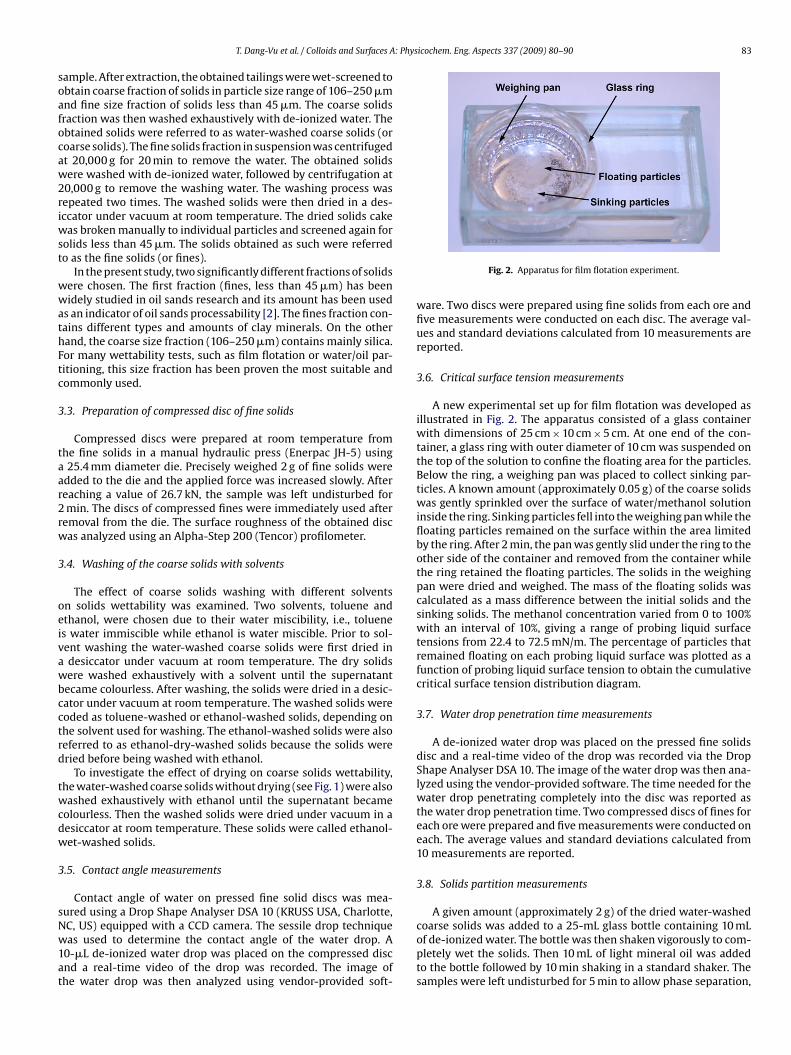
Fig. 2. Apparatus for film flotation experiment.
ware. Two discs were prepared using fine solids from each ore andfive measurements were conducted on each disc. The average val-ues and standard deviations calculated from 10 measurements arereported.
3.6. Critical surface tension measurements
A new experimental set up for film flotation was developed asillustrated in Fig. 2. The apparatus consisted of a glass containerwith dimensions of 25 cm × 10 cm × 5 cm. At one end of the con-tainer, a glass ring with outer diameter of 10 cm was suspended onthe top of the solution to confine the floating area for the particles.Below the ring, a weighing pan was placed to collect sinking par-ticles. A known amount (approximately 0.05 g) of the coarse solidswas gently sprinkled over the surface of water/methanol solutioninside the ring. Sinking particles fell into the weighing pan while thefloating particles remained on the surface within the area limitedby the ring. After 2 min, the pan was gently slid under the ring to theother side of the container and removed from the container whilethe ring retained the floating particles. The solids in the weighingpan were dried and weighed. The mass of the floating solids wascalculated as a mass difference between the initial solids and thesinking solids. The methanol concentration varied from 0 to 100%with an interval of 10%, giving a range of probing liquid surfacetensions from 22.4 to 72.5 mN/m. The percentage of particles thatremained floating on each probing liquid surface was plotted as afunction of probing liquid surface tension to obtain the cumulativecritical surface tension distribution diagram.
3.7. Water drop penetration time measurements
A de-ionized water drop was placed on the pressed fine solidsdisc and a real-time video of the drop was recorded via the DropShape Analyser DSA 10. The image of the water drop was then ana-lyzed using the vendor-provided software. The time needed for thewater drop penetrating completely into the disc was reported asthe water drop penetration time. Two compressed discs of fines foreach ore were prepared and five measurements were conducted oneach. The average values and standard deviations calculated from10 measurements are reported.
3.8. Solids partition measurements
A given amount (approximately 2 g) of the dried water-washed
coarse solids was added to a 25-mL glass bottle containing 10 mLof de-ionized water. The bottle was then shaken vigorously to com-pletely wet the solids. Then 10 mL of light mineral oil was addedto the bottle followed by 10 min shaking in a standard shaker. Thesamples were left undisturbed for 5 min to allow phase separation,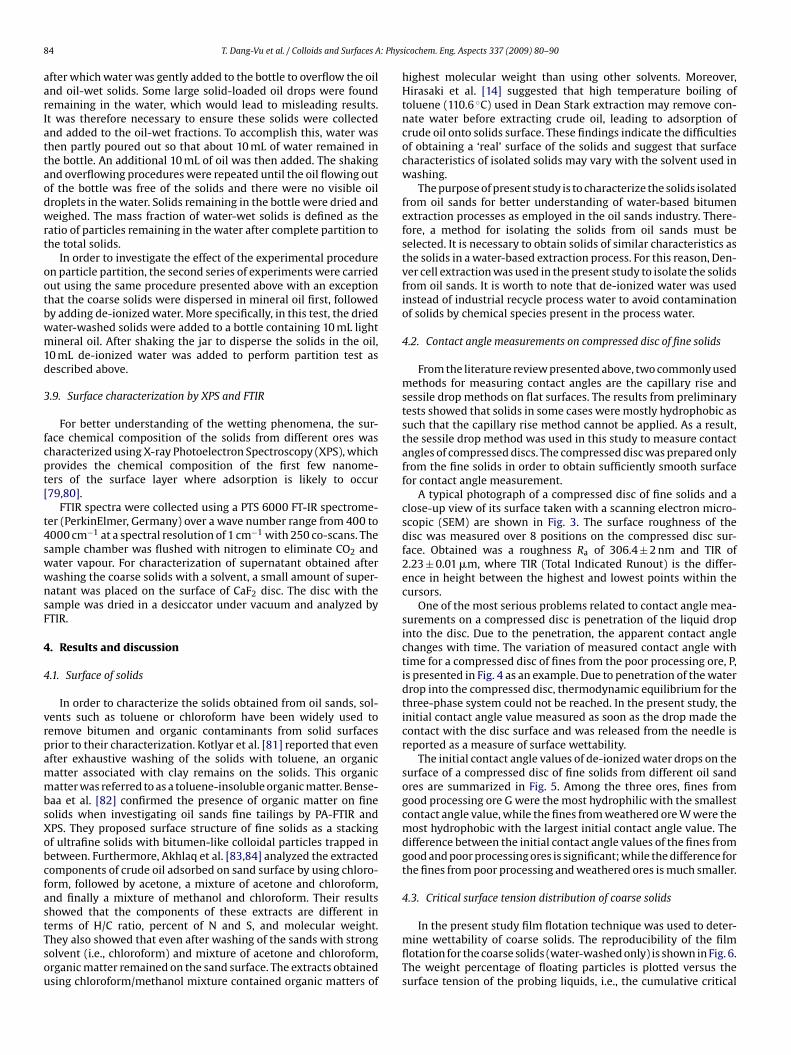
8 : Phys
aarIattaodwrt
ootbwm1d
3
fcpt[
t4swwnsF
4
4
vrpammbsXobcfastTsou
4 T. Dang-Vu et al. / Colloids and Surfaces A
fter which water was gently added to the bottle to overflow the oilnd oil-wet solids. Some large solid-loaded oil drops were foundemaining in the water, which would lead to misleading results.t was therefore necessary to ensure these solids were collectednd added to the oil-wet fractions. To accomplish this, water washen partly poured out so that about 10 mL of water remained inhe bottle. An additional 10 mL of oil was then added. The shakingnd overflowing procedures were repeated until the oil flowing outf the bottle was free of the solids and there were no visible oilroplets in the water. Solids remaining in the bottle were dried andeighed. The mass fraction of water-wet solids is defined as the
atio of particles remaining in the water after complete partition tohe total solids.
In order to investigate the effect of the experimental proceduren particle partition, the second series of experiments were carriedut using the same procedure presented above with an exceptionhat the coarse solids were dispersed in mineral oil first, followedy adding de-ionized water. More specifically, in this test, the driedater-washed solids were added to a bottle containing 10 mL lightineral oil. After shaking the jar to disperse the solids in the oil,
0 mL de-ionized water was added to perform partition test asescribed above.
.9. Surface characterization by XPS and FTIR
For better understanding of the wetting phenomena, the sur-ace chemical composition of the solids from different ores washaracterized using X-ray Photoelectron Spectroscopy (XPS), whichrovides the chemical composition of the first few nanome-ers of the surface layer where adsorption is likely to occur79,80].
FTIR spectra were collected using a PTS 6000 FT-IR spectrome-er (PerkinElmer, Germany) over a wave number range from 400 to000 cm−1 at a spectral resolution of 1 cm−1 with 250 co-scans. Theample chamber was flushed with nitrogen to eliminate CO2 andater vapour. For characterization of supernatant obtained afterashing the coarse solids with a solvent, a small amount of super-atant was placed on the surface of CaF2 disc. The disc with theample was dried in a desiccator under vacuum and analyzed byTIR.
. Results and discussion
.1. Surface of solids
In order to characterize the solids obtained from oil sands, sol-ents such as toluene or chloroform have been widely used toemove bitumen and organic contaminants from solid surfacesrior to their characterization. Kotlyar et al. [81] reported that evenfter exhaustive washing of the solids with toluene, an organicatter associated with clay remains on the solids. This organicatter was referred to as a toluene-insoluble organic matter. Bense-
aa et al. [82] confirmed the presence of organic matter on fineolids when investigating oil sands fine tailings by PA-FTIR andPS. They proposed surface structure of fine solids as a stackingf ultrafine solids with bitumen-like colloidal particles trapped inetween. Furthermore, Akhlaq et al. [83,84] analyzed the extractedomponents of crude oil adsorbed on sand surface by using chloro-orm, followed by acetone, a mixture of acetone and chloroform,nd finally a mixture of methanol and chloroform. Their resultshowed that the components of these extracts are different in
erms of H/C ratio, percent of N and S, and molecular weight.hey also showed that even after washing of the sands with strongolvent (i.e., chloroform) and mixture of acetone and chloroform,rganic matter remained on the sand surface. The extracts obtainedsing chloroform/methanol mixture contained organic matters oficochem. Eng. Aspects 337 (2009) 80–90
highest molecular weight than using other solvents. Moreover,Hirasaki et al. [14] suggested that high temperature boiling oftoluene (110.6 ◦C) used in Dean Stark extraction may remove con-nate water before extracting crude oil, leading to adsorption ofcrude oil onto solids surface. These findings indicate the difficultiesof obtaining a ‘real’ surface of the solids and suggest that surfacecharacteristics of isolated solids may vary with the solvent used inwashing.
The purpose of present study is to characterize the solids isolatedfrom oil sands for better understanding of water-based bitumenextraction processes as employed in the oil sands industry. There-fore, a method for isolating the solids from oil sands must beselected. It is necessary to obtain solids of similar characteristics asthe solids in a water-based extraction process. For this reason, Den-ver cell extraction was used in the present study to isolate the solidsfrom oil sands. It is worth to note that de-ionized water was usedinstead of industrial recycle process water to avoid contaminationof solids by chemical species present in the process water.
4.2. Contact angle measurements on compressed disc of fine solids
From the literature review presented above, two commonly usedmethods for measuring contact angles are the capillary rise andsessile drop methods on flat surfaces. The results from preliminarytests showed that solids in some cases were mostly hydrophobic assuch that the capillary rise method cannot be applied. As a result,the sessile drop method was used in this study to measure contactangles of compressed discs. The compressed disc was prepared onlyfrom the fine solids in order to obtain sufficiently smooth surfacefor contact angle measurement.
A typical photograph of a compressed disc of fine solids and aclose-up view of its surface taken with a scanning electron micro-scopic (SEM) are shown in Fig. 3. The surface roughness of thedisc was measured over 8 positions on the compressed disc sur-face. Obtained was a roughness Ra of 306.4 ± 2 nm and TIR of2.23 ± 0.01 �m, where TIR (Total Indicated Runout) is the differ-ence in height between the highest and lowest points within thecursors.
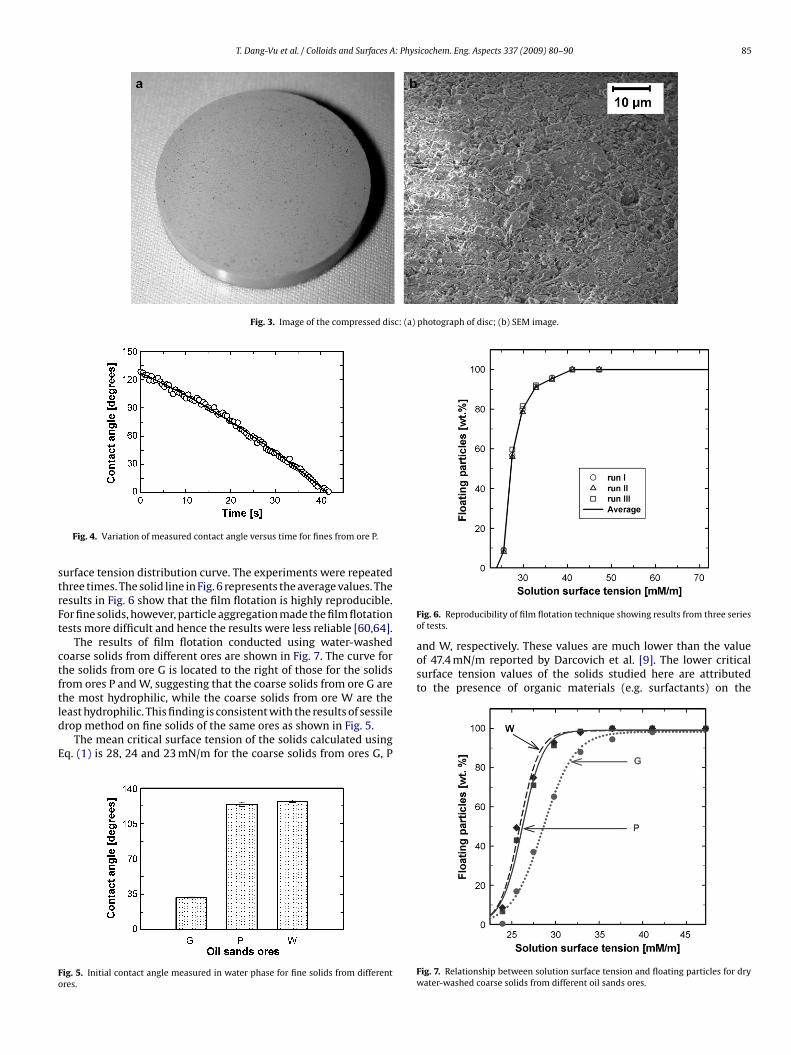
One of the most serious problems related to contact angle mea-surements on a compressed disc is penetration of the liquid dropinto the disc. Due to the penetration, the apparent contact anglechanges with time. The variation of measured contact angle withtime for a compressed disc of fines from the poor processing ore, P,is presented in Fig. 4 as an example. Due to penetration of the waterdrop into the compressed disc, thermodynamic equilibrium for thethree-phase system could not be reached. In the present study, theinitial contact angle value measured as soon as the drop made thecontact with the disc surface and was released from the needle isreported as a measure of surface wettability.
The initial contact angle values of de-ionized water drops on thesurface of a compressed disc of fine solids from different oil sandores are summarized in Fig. 5. Among the three ores, fines fromgood processing ore G were the most hydrophilic with the smallestcontact angle value, while the fines from weathered ore W were themost hydrophobic with the largest initial contact angle value. Thedifference between the initial contact angle values of the fines fromgood and poor processing ores is significant; while the difference forthe fines from poor processing and weathered ores is much smaller.
4.3. Critical surface tension distribution of coarse solids
In the present study film flotation technique was used to deter-mine wettability of coarse solids. The reproducibility of the filmflotation for the coarse solids (water-washed only) is shown in Fig. 6.The weight percentage of floating particles is plotted versus thesurface tension of the probing liquids, i.e., the cumulative critical
T. Dang-Vu et al. / Colloids and Surfaces A: Physicochem. Eng. Aspects 337 (2009) 80–90 85
Fig. 3. Image of the compressed disc: (a) photograph of disc; (b) SEM image.
strFt
ctftld
E
Fo
and W, respectively. These values are much lower than the valueof 47.4 mN/m reported by Darcovich et al. [9]. The lower criticalsurface tension values of the solids studied here are attributedto the presence of organic materials (e.g. surfactants) on the
Fig. 4. Variation of measured contact angle versus time for fines from ore P.
urface tension distribution curve. The experiments were repeatedhree times. The solid line in Fig. 6 represents the average values. Theesults in Fig. 6 show that the film flotation is highly reproducible.or fine solids, however, particle aggregation made the film flotationests more difficult and hence the results were less reliable [60,64].
The results of film flotation conducted using water-washedoarse solids from different ores are shown in Fig. 7. The curve forhe solids from ore G is located to the right of those for the solidsrom ores P and W, suggesting that the coarse solids from ore G arehe most hydrophilic, while the coarse solids from ore W are the
east hydrophilic. This finding is consistent with the results of sessilerop method on fine solids of the same ores as shown in Fig. 5.The mean critical surface tension of the solids calculated usingq. (1) is 28, 24 and 23 mN/m for the coarse solids from ores G, P
ig. 5. Initial contact angle measured in water phase for fine solids from differentres.
Fig. 6. Reproducibility of film flotation technique showing results from three seriesof tests.
Fig. 7. Relationship between solution surface tension and floating particles for drywater-washed coarse solids from different oil sands ores.
86 T. Dang-Vu et al. / Colloids and Surfaces A: Physicochem. Eng. Aspects 337 (2009) 80–90
sd[t(h
4
owitrsosae
ocptw
ditwbmsg
TS
FCW
CMW
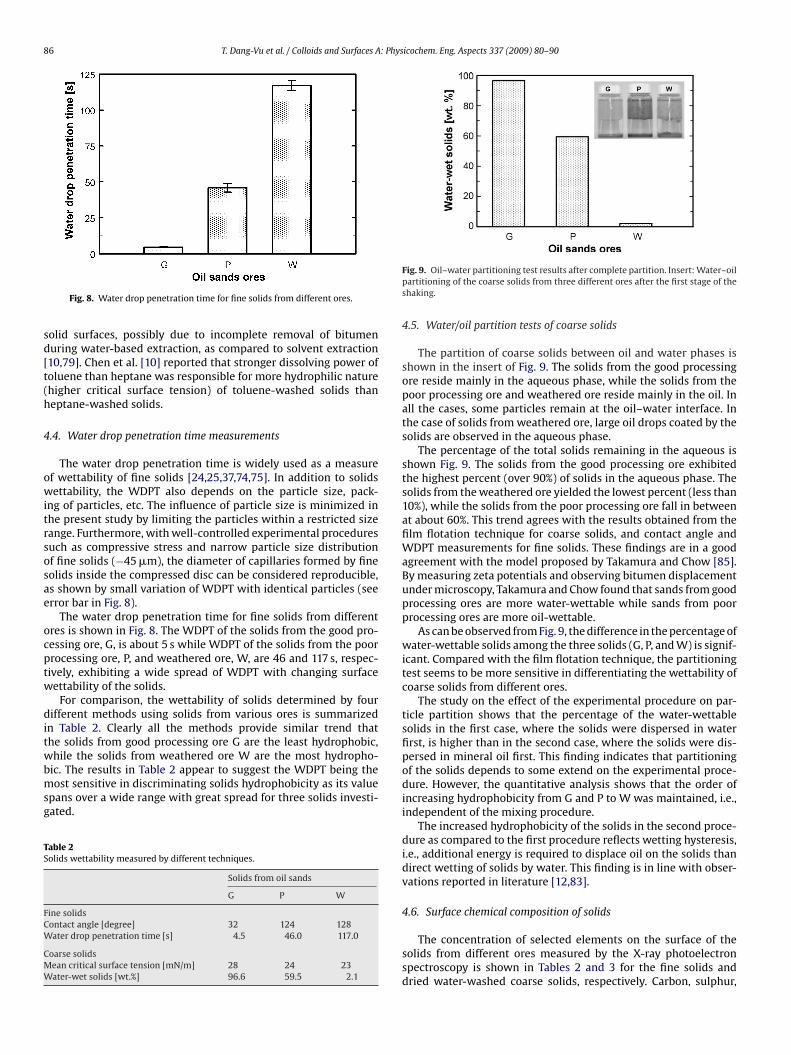
Fig. 8. Water drop penetration time for fine solids from different ores.
olid surfaces, possibly due to incomplete removal of bitumenuring water-based extraction, as compared to solvent extraction10,79]. Chen et al. [10] reported that stronger dissolving power ofoluene than heptane was responsible for more hydrophilic naturehigher critical surface tension) of toluene-washed solids thaneptane-washed solids.
.4. Water drop penetration time measurements
The water drop penetration time is widely used as a measuref wettability of fine solids [24,25,37,74,75]. In addition to solidsettability, the WDPT also depends on the particle size, pack-
ng of particles, etc. The influence of particle size is minimized inhe present study by limiting the particles within a restricted sizeange. Furthermore, with well-controlled experimental proceduresuch as compressive stress and narrow particle size distributionf fine solids (−45 �m), the diameter of capillaries formed by fineolids inside the compressed disc can be considered reproducible,s shown by small variation of WDPT with identical particles (seerror bar in Fig. 8).
The water drop penetration time for fine solids from differentres is shown in Fig. 8. The WDPT of the solids from the good pro-essing ore, G, is about 5 s while WDPT of the solids from the poorrocessing ore, P, and weathered ore, W, are 46 and 117 s, respec-ively, exhibiting a wide spread of WDPT with changing surfaceettability of the solids.
For comparison, the wettability of solids determined by fourifferent methods using solids from various ores is summarized
n Table 2. Clearly all the methods provide similar trend thathe solids from good processing ore G are the least hydrophobic,hile the solids from weathered ore W are the most hydropho-
ic. The results in Table 2 appear to suggest the WDPT being theost sensitive in discriminating solids hydrophobicity as its value
pans over a wide range with great spread for three solids investi-ated.
able 2olids wettability measured by different techniques.
Solids from oil sands
G P W
ine solidsontact angle [degree] 32 124 128ater drop penetration time [s] 4.5 46.0 117.0
oarse solidsean critical surface tension [mN/m] 28 24 23ater-wet solids [wt.%] 96.6 59.5 2.1
Fig. 9. Oil–water partitioning test results after complete partition. Insert: Water–oilpartitioning of the coarse solids from three different ores after the first stage of theshaking.
4.5. Water/oil partition tests of coarse solids
The partition of coarse solids between oil and water phases isshown in the insert of Fig. 9. The solids from the good processingore reside mainly in the aqueous phase, while the solids from thepoor processing ore and weathered ore reside mainly in the oil. Inall the cases, some particles remain at the oil–water interface. Inthe case of solids from weathered ore, large oil drops coated by thesolids are observed in the aqueous phase.
The percentage of the total solids remaining in the aqueous isshown Fig. 9. The solids from the good processing ore exhibitedthe highest percent (over 90%) of solids in the aqueous phase. Thesolids from the weathered ore yielded the lowest percent (less than10%), while the solids from the poor processing ore fall in betweenat about 60%. This trend agrees with the results obtained from thefilm flotation technique for coarse solids, and contact angle andWDPT measurements for fine solids. These findings are in a goodagreement with the model proposed by Takamura and Chow [85].By measuring zeta potentials and observing bitumen displacementunder microscopy, Takamura and Chow found that sands from goodprocessing ores are more water-wettable while sands from poorprocessing ores are more oil-wettable.
As can be observed from Fig. 9, the difference in the percentage ofwater-wettable solids among the three solids (G, P, and W) is signif-icant. Compared with the film flotation technique, the partitioningtest seems to be more sensitive in differentiating the wettability ofcoarse solids from different ores.
The study on the effect of the experimental procedure on par-ticle partition shows that the percentage of the water-wettablesolids in the first case, where the solids were dispersed in waterfirst, is higher than in the second case, where the solids were dis-persed in mineral oil first. This finding indicates that partitioningof the solids depends to some extend on the experimental proce-dure. However, the quantitative analysis shows that the order ofincreasing hydrophobicity from G and P to W was maintained, i.e.,independent of the mixing procedure.
The increased hydrophobicity of the solids in the second proce-dure as compared to the first procedure reflects wetting hysteresis,i.e., additional energy is required to displace oil on the solids thandirect wetting of solids by water. This finding is in line with obser-vations reported in literature [12,83].
4.6. Surface chemical composition of solids
The concentration of selected elements on the surface of thesolids from different ores measured by the X-ray photoelectronspectroscopy is shown in Tables 2 and 3 for the fine solids anddried water-washed coarse solids, respectively. Carbon, sulphur,
T. Dang-Vu et al. / Colloids and Surfaces A: Phys
Table 3Results of XPS analysis on fine solids (<45 �m) from different oil sands ores.
Ore Mass concentration [%]
C S C + S Si Al Si + Al
G 35.5 1.8 37.3 38.6 24.1 62.7P 49.6 1.4 51.0 30.6 18.5 49.1W 64.6 2.3 66.9 23.8 9.3 33.1
Table 4Results of XPS analysis on coarse solids (+106 �m −250 �m) from different ores.
Ore Mass concentration [%]
C S C + S Si Al Si + Al
GPW
amtttt[
CWTlaoGm(awa
4
pff
Fs
42.0 3.0 45.0 50.6 4.4 55.069.8 2.6 72.3 23.9 3.8 27.778.8 3.7 82.5 17.2 0.4 17.5
luminium, and silica were chosen for comparison as they are theajor components determining solids wettability. A high concen-
ration of Si and Al reflects lower coverage of organic matter onhe surface, leading to more hydrophilic solids. A high concen-ration of C and S would suggest a high coverage of organics onhe solids and hence less hydrophilic (more hydrophobic) solids79].
As summarized in Table 3, the fines from ore G have the lowestand S and the highest Si and Al concentration. The fines from orehave the highest C and S and the lowest Si and Al concentration.
he concentration of C and S of fines from ore G is almost two timesower than that of fines from ore W and the concentration of Sind Al of fines from ore G is almost two times higher than thatf fines from ore W. These results suggest that the solids from oreare the least hydrophobic, while the solids from ore W are theost hydrophobic. A similar trend was observed for coarse solids
see Table 4). These findings are in good agreement with the WDPTnd contact angle measurements for the fine solids, and with theettability determination of the coarse solids using film flotation
nd water–oil partitioning tests, as shown in Table 2.
.7. Effect of solvent washing on wettability of coarse solids
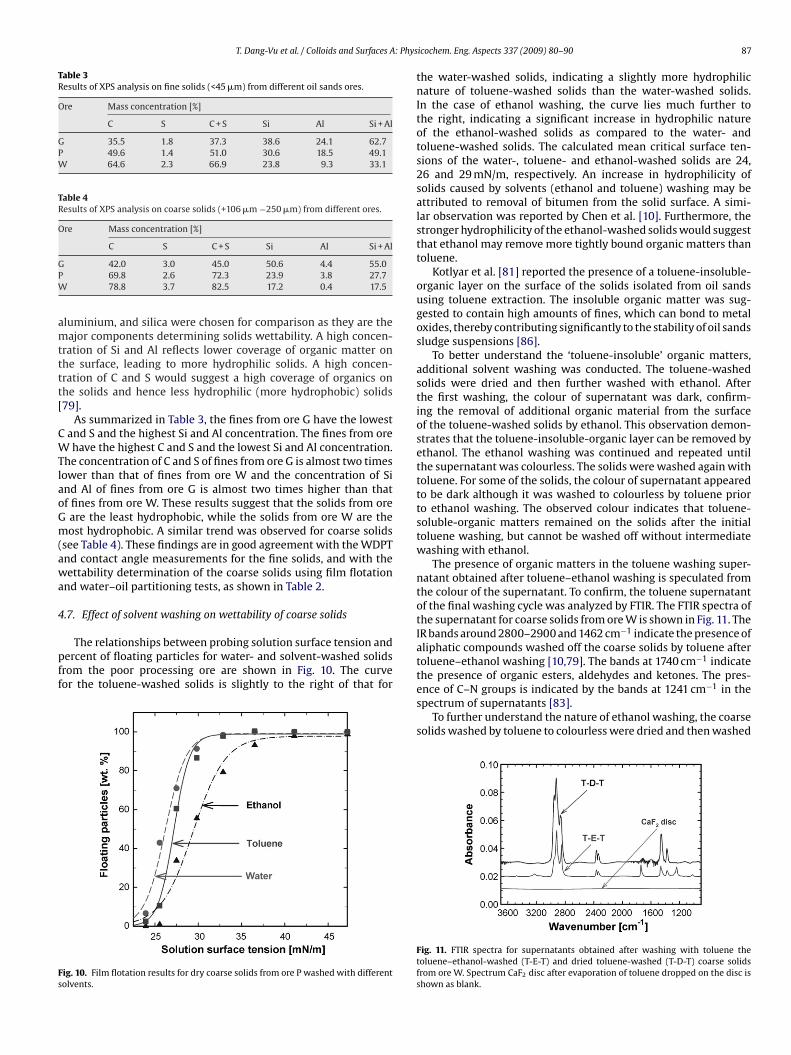
The relationships between probing solution surface tension andercent of floating particles for water- and solvent-washed solidsrom the poor processing ore are shown in Fig. 10. The curveor the toluene-washed solids is slightly to the right of that for
ig. 10. Film flotation results for dry coarse solids from ore P washed with differentolvents.
icochem. Eng. Aspects 337 (2009) 80–90 87
the water-washed solids, indicating a slightly more hydrophilicnature of toluene-washed solids than the water-washed solids.In the case of ethanol washing, the curve lies much further tothe right, indicating a significant increase in hydrophilic natureof the ethanol-washed solids as compared to the water- andtoluene-washed solids. The calculated mean critical surface ten-sions of the water-, toluene- and ethanol-washed solids are 24,26 and 29 mN/m, respectively. An increase in hydrophilicity ofsolids caused by solvents (ethanol and toluene) washing may beattributed to removal of bitumen from the solid surface. A simi-lar observation was reported by Chen et al. [10]. Furthermore, thestronger hydrophilicity of the ethanol-washed solids would suggestthat ethanol may remove more tightly bound organic matters thantoluene.
Kotlyar et al. [81] reported the presence of a toluene-insoluble-organic layer on the surface of the solids isolated from oil sandsusing toluene extraction. The insoluble organic matter was sug-gested to contain high amounts of fines, which can bond to metaloxides, thereby contributing significantly to the stability of oil sandssludge suspensions [86].
To better understand the ‘toluene-insoluble’ organic matters,additional solvent washing was conducted. The toluene-washedsolids were dried and then further washed with ethanol. Afterthe first washing, the colour of supernatant was dark, confirm-ing the removal of additional organic material from the surfaceof the toluene-washed solids by ethanol. This observation demon-strates that the toluene-insoluble-organic layer can be removed byethanol. The ethanol washing was continued and repeated untilthe supernatant was colourless. The solids were washed again withtoluene. For some of the solids, the colour of supernatant appearedto be dark although it was washed to colourless by toluene priorto ethanol washing. The observed colour indicates that toluene-soluble-organic matters remained on the solids after the initialtoluene washing, but cannot be washed off without intermediatewashing with ethanol.
The presence of organic matters in the toluene washing super-natant obtained after toluene–ethanol washing is speculated fromthe colour of the supernatant. To confirm, the toluene supernatantof the final washing cycle was analyzed by FTIR. The FTIR spectra ofthe supernatant for coarse solids from ore W is shown in Fig. 11. TheIR bands around 2800–2900 and 1462 cm−1 indicate the presence ofaliphatic compounds washed off the coarse solids by toluene aftertoluene–ethanol washing [10,79]. The bands at 1740 cm−1 indicate
the presence of organic esters, aldehydes and ketones. The pres-ence of C–N groups is indicated by the bands at 1241 cm−1 in thespectrum of supernatants [83].To further understand the nature of ethanol washing, the coarsesolids washed by toluene to colourless were dried and then washed
Fig. 11. FTIR spectra for supernatants obtained after washing with toluene thetoluene–ethanol-washed (T-E-T) and dried toluene-washed (T-D-T) coarse solidsfrom ore W. Spectrum CaF2 disc after evaporation of toluene dropped on the disc isshown as blank.
88 T. Dang-Vu et al. / Colloids and Surfaces A: Phys
Fs
aTswr
biaisomoo
4
fldftswaw(
fmiwtch
4o
sewa
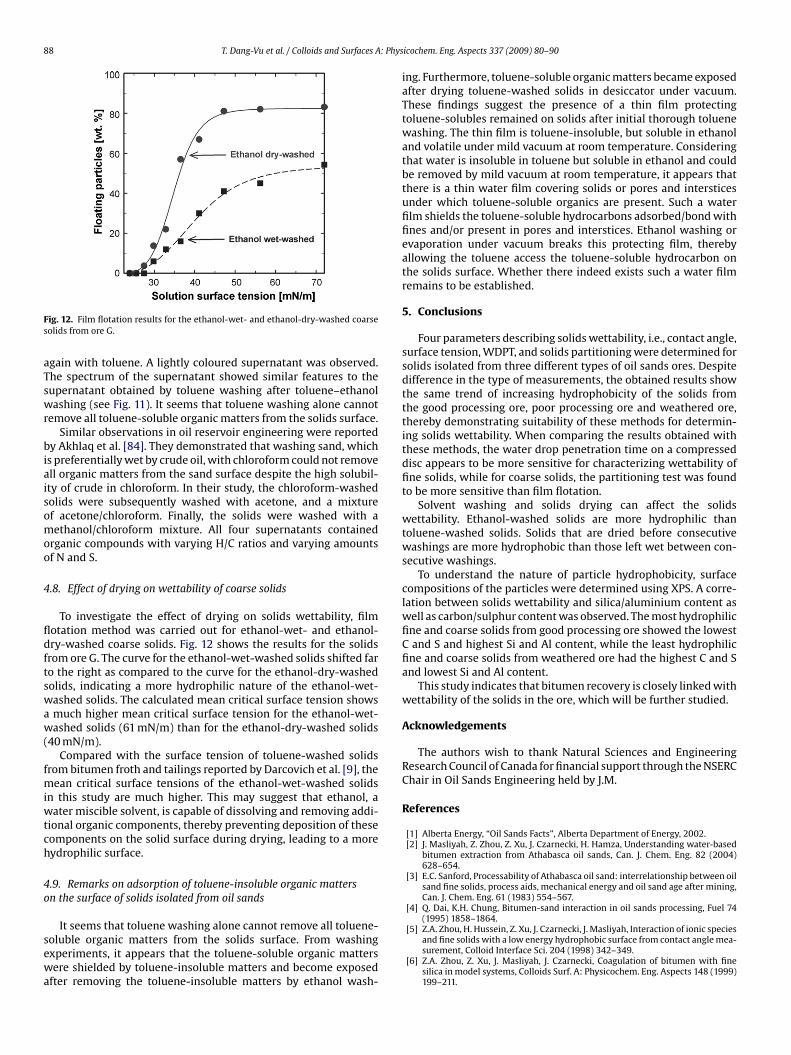
ig. 12. Film flotation results for the ethanol-wet- and ethanol-dry-washed coarseolids from ore G.
gain with toluene. A lightly coloured supernatant was observed.he spectrum of the supernatant showed similar features to theupernatant obtained by toluene washing after toluene–ethanolashing (see Fig. 11). It seems that toluene washing alone cannot
emove all toluene-soluble organic matters from the solids surface.Similar observations in oil reservoir engineering were reported
y Akhlaq et al. [84]. They demonstrated that washing sand, whichs preferentially wet by crude oil, with chloroform could not removell organic matters from the sand surface despite the high solubil-ty of crude in chloroform. In their study, the chloroform-washedolids were subsequently washed with acetone, and a mixturef acetone/chloroform. Finally, the solids were washed with aethanol/chloroform mixture. All four supernatants contained
rganic compounds with varying H/C ratios and varying amountsf N and S.
.8. Effect of drying on wettability of coarse solids
To investigate the effect of drying on solids wettability, filmotation method was carried out for ethanol-wet- and ethanol-ry-washed coarse solids. Fig. 12 shows the results for the solidsrom ore G. The curve for the ethanol-wet-washed solids shifted faro the right as compared to the curve for the ethanol-dry-washedolids, indicating a more hydrophilic nature of the ethanol-wet-ashed solids. The calculated mean critical surface tension showsmuch higher mean critical surface tension for the ethanol-wet-ashed solids (61 mN/m) than for the ethanol-dry-washed solids
40 mN/m).Compared with the surface tension of toluene-washed solids
rom bitumen froth and tailings reported by Darcovich et al. [9], theean critical surface tensions of the ethanol-wet-washed solids
n this study are much higher. This may suggest that ethanol, aater miscible solvent, is capable of dissolving and removing addi-
ional organic components, thereby preventing deposition of theseomponents on the solid surface during drying, leading to a moreydrophilic surface.
.9. Remarks on adsorption of toluene-insoluble organic mattersn the surface of solids isolated from oil sands
It seems that toluene washing alone cannot remove all toluene-oluble organic matters from the solids surface. From washingxperiments, it appears that the toluene-soluble organic mattersere shielded by toluene-insoluble matters and become exposed
fter removing the toluene-insoluble matters by ethanol wash-
icochem. Eng. Aspects 337 (2009) 80–90
ing. Furthermore, toluene-soluble organic matters became exposedafter drying toluene-washed solids in desiccator under vacuum.These findings suggest the presence of a thin film protectingtoluene-solubles remained on solids after initial thorough toluenewashing. The thin film is toluene-insoluble, but soluble in ethanoland volatile under mild vacuum at room temperature. Consideringthat water is insoluble in toluene but soluble in ethanol and couldbe removed by mild vacuum at room temperature, it appears thatthere is a thin water film covering solids or pores and intersticesunder which toluene-soluble organics are present. Such a waterfilm shields the toluene-soluble hydrocarbons adsorbed/bond withfines and/or present in pores and interstices. Ethanol washing orevaporation under vacuum breaks this protecting film, therebyallowing the toluene access the toluene-soluble hydrocarbon onthe solids surface. Whether there indeed exists such a water filmremains to be established.
5. Conclusions
Four parameters describing solids wettability, i.e., contact angle,surface tension, WDPT, and solids partitioning were determined forsolids isolated from three different types of oil sands ores. Despitedifference in the type of measurements, the obtained results showthe same trend of increasing hydrophobicity of the solids fromthe good processing ore, poor processing ore and weathered ore,thereby demonstrating suitability of these methods for determin-ing solids wettability. When comparing the results obtained withthese methods, the water drop penetration time on a compresseddisc appears to be more sensitive for characterizing wettability offine solids, while for coarse solids, the partitioning test was foundto be more sensitive than film flotation.
Solvent washing and solids drying can affect the solidswettability. Ethanol-washed solids are more hydrophilic thantoluene-washed solids. Solids that are dried before consecutivewashings are more hydrophobic than those left wet between con-secutive washings.
To understand the nature of particle hydrophobicity, surfacecompositions of the particles were determined using XPS. A corre-lation between solids wettability and silica/aluminium content aswell as carbon/sulphur content was observed. The most hydrophilicfine and coarse solids from good processing ore showed the lowestC and S and highest Si and Al content, while the least hydrophilicfine and coarse solids from weathered ore had the highest C and Sand lowest Si and Al content.
This study indicates that bitumen recovery is closely linked withwettability of the solids in the ore, which will be further studied.
Acknowledgements
The authors wish to thank Natural Sciences and EngineeringResearch Council of Canada for financial support through the NSERCChair in Oil Sands Engineering held by J.M.
References
[1] Alberta Energy, “Oil Sands Facts”, Alberta Department of Energy, 2002.[2] J. Masliyah, Z. Zhou, Z. Xu, J. Czarnecki, H. Hamza, Understanding water-based
bitumen extraction from Athabasca oil sands, Can. J. Chem. Eng. 82 (2004)628–654.
[3] E.C. Sanford, Processability of Athabasca oil sand: interrelationship between oilsand fine solids, process aids, mechanical energy and oil sand age after mining,Can. J. Chem. Eng. 61 (1983) 554–567.
[4] Q. Dai, K.H. Chung, Bitumen-sand interaction in oil sands processing, Fuel 74(1995) 1858–1864.
[5] Z.A. Zhou, H. Hussein, Z. Xu, J. Czarnecki, J. Masliyah, Interaction of ionic speciesand fine solids with a low energy hydrophobic surface from contact angle mea-surement, Colloid Interface Sci. 204 (1998) 342–349.
[6] Z.A. Zhou, Z. Xu, J. Masliyah, J. Czarnecki, Coagulation of bitumen with finesilica in model systems, Colloids Surf. A: Physicochem. Eng. Aspects 148 (1999)199–211.
: Phys
[
[
[
[
[
[
[
[
[
[
[
[
[[
[
[
[
[
[
[
[
[
[
[
[
[
[
[
[
[
[
[
[
[
[
[
[
[
[
[
[
[
[
[
[
[
[[
[
[
[
[
[
[
[
[
[
[
[
[
[
[
[
T. Dang-Vu et al. / Colloids and Surfaces A
[7] J. Liu, Z. Xu, J. Masliyah, Processability of oil sand ores in Alberta, Energy Fuels19 (2005) 2056–2063.
[8] S. Wik, B.D. Sparks, S. Ng, Y. Tu, Z. Li, K.H. Chung, L.S. Kotlyar, Effect of processwater chemistry and particulate mineralogy on model oil sands using a warmslurry extraction process simulation, Fuel 87 (2008) 1394–1412.
[9] K. Darcovich, L.S. Kotlyar, W.C. Tse, J.A. Ripmeester, C.E. Capes, B.D. Sparks, Wet-tability study of organic-rich solids separated from Athabasca oil sands, EnergyFuels 3 (1989) 386–391.
10] F. Chen, J.A. Finch, Z. Xu, J. Czarnecki, Wettability of fine solids extracted frombitumen froth, J. Adhes. Sci. Technol. 13 (1999) 1209–1224.
11] W.G. Anderson, Wettability literature survey—part 1: rock/oil/brine interac-tions and the effects of core handling on wettability, J. Petrol. Technol. 38 (1986)1125–1144.
12] J.S. Buckley, Effective wettability of minerals exposed to crude oil, Curr. Opin.Colloid Interface Sci. 6 (2001) 191–196.
13] Y. Liu, J.S. Buckley, Evolution of wetting alternation by adsorption from crudeoil, SPE Form. Eval. (1997) 5–11.
14] G.J. Hirasaki, J.A. Rohan, S.T. Dubey, H. Niko, Wettability evaluation duringrestored state core analysis, Paper SPE 20506 presented at the 1990 ATCE, NewOrleans, Sept. 23–26.
15] T. Dang-Vu, S.Y. Wu, R. Jha, T.D. Dwayne, J. Masliyah, Z. Xu, Role of wettabilityof solids in oil sands ore processability, Energy Fuels, in preparation.
16] J.S. Buckley, D.L. Lord, Wettability and morphology of mica surfaces after expo-sure to crude oil, J. Petrol. Sci. Eng. 39 (2003) 261–273.
17] Z. Xu, J. Masliyah, Contact angle measurements on oxide and related surfaces,in: Encyclopedia of Surface and Colloid Science, Marcel Dekker, New York, 2002,pp. 1228–1241.
18] E. Chibowski, R. Perea-Carpio, Problems of contact angle and solid surface freeenergy determination, Adv. Colloid Interface Sci. 98 (2002) 245–264.
19] F.E. Bartell, C.E. Whitney, Adhesion tension. III, J. Phys. Chem. 36 (1932)3115–3126.
20] C.J. van Oss, R.F. Giese, Z. Li, K. Murphy, J. Norris, M.K. Chaudhury, R.J. Good,Determination of contact angles and pore sizes of porous media by column andthin layer wicking, J. Adhes. Sci. Technol. 6 (1992) 413–428.
21] M. Preuss, H.J. Butt, Measuring the contact angle of individual colloidal particles,Colloid Interface Sci. 208 (1998) 468–477.
22] F.M. Fowkes, Attractive forces at interfaces, Ind. Eng. Chem. 56 (1964) 40–52.23] D.W. Fuerstenau, J. Diao, J.S. Hanson, Estimation of distribution of surface sites
and contact angles on coal particles from film floatation data, Energy Fuels 4(1990) 34–37.
24] M.P. King, Comparison of methods for measuring severity of water repellence ofsandy soils and assessment of some factors that affect its measurement, Aust.J. Soil Res. 19 (1981) 275–285.
25] L.W. Dekker, C.J. Ritsema, How water moves in a water repellent sandy soil, 1.Potential and actual water repellent, Water Resour. Res. 30 (1994) 2507–2517.
26] J. Bachmann, R. Horton, R.R. van der Ploeg, S. Woche, Modified sessile dropmethod for assessing initial soil–water contact angle of sandy soil, Soil Sci. Soc.Am. J. 64 (2000) 564–567.
27] S. Levine, B.D. Bowen, S.J. Partridge, Stabilization of emulsions by fine particlesI. Partitioning of particles between continuous phase and oil/water interface,Colloids Surf. 38 (1989) 325–343.
28] S. Ren, T. Dang-Vu, J. Long, H. Zhao, Z. Xu, J.H. Masliyah, Effect of weatheringon surface characteristics of solids and bitumen from oil sands, Energy Fuels(2008), doi:10.1021/ef800635t.
29] R. Aveyard, B.D. Beake, J.H. Clint, Wettability of spherical particles at liquidsurfaces, J. Chem. Soc., Faraday Trans. 92 (1996) 4271–4277.
30] V.A. Nguyen, J. Nalaskowski, J.D. Miller, The dynamic nature of contact anglesas measured by atomic force microscopy, Colloid Interface Sci. 262 (2003)303–306.
31] J.H. Clint, S.E. Taylor, Particle size and interparticle forces of overbased deter-gents: a Langmuir trough study, Colloid Surf. A: Physicochem. Eng. Aspects 65(1992) 61–67.
32] R. Aveyard, B.P. Binks, P.D.I. Fletcher, C.E. Rutherford, Measurement of contactangles of spherical monodisperse particles with surfactant solutions, ColloidsSurf. 83 (1994) 89–98.
33] Y.B. He, J.S. Laskowski, Contact angle measurements on discs compressed fromfine coal, Coal Prep. 10 (1992) 19–36.
34] Y. Yan, J.H. Masliyah, Solids-stabilized oil-in-water emulsions: scavenging ofemulsion droplets by fresh oil addition, Colloids Surf. A. Physicochem. Eng.Aspects 75 (1993) 123–132.
35] N. Yan, M.R. Gray, J.H. Masliyah, On water-in-oil emulsions stabilized by finesolids, Colloids Surf. A: Physicochem. Eng. Aspects 193 (2001) 97–107.
36] A. Hannisdal, M.H. Ese, P.V. Hemmingsen, J. Sjoblom, Particle-stabilized emul-sions: effect of heavy crude oil components pre-adsorbed onto stabilizingsolids, Colloids Surf. A: Physicochem. Eng. Aspects 276 (2006) 45–58.
37] U. Buczko, O. Bens, Assessing soil hydrophobicity and its variability throughthe soil profile using two different methods, Soil Sci. Soc. Am. J. 70 (2006)718–727.
38] G. Bucton, J.M. Newton, Assessment of the wettability of powders by use ofcompressed powder discs, Powder Technol. 46 (1986) 201–208.
39] C. Jouany, P. Chassin, Determination of the surface energy of clay-organic com-plexes by contact angle measurements, Colloid Surf. 27 (1987) 289–303.
40] W. Duncan-Hewitt, R. Nisman, Investigation of the surface free energy ofpharmaceutical materials from contact angle, sedimentation, and adhesionmeasurements, in: K. Mittal (Ed.), Contact angle, Wettability and Adhesion, VPS1993, pp. 791–811.
[
icochem. Eng. Aspects 337 (2009) 80–90 89
41] N.W.F. Kossen, P.M. Heertjes, The determination of the contact angle for systemwith a powder, Chem. Eng. Sci. 20 (1965) 593–599.
42] P.M. Herrtjes, N.W.F. Kossen, Measuring the contact angles of powder-liquidsystems, Powder Technol. 1 (1967) 33–42.
43] L. Kvitek, P. Pikal, L. Kovarikova, J. Hrbac, The study of the wettability of pow-der inorganic pigments based on dynamic contact angle measurement usingWilhelmy method, Chemica 41 (2002) 27–35.
44] A. Chawla, G. Buckton, K.M.G. Taylor, J.M. Newton, M.C.R. Johnson, Wilhelmyplate contact angle data on powder compacts: considerations of plate perime-ter, Eur. J. Pharm. Sci. 2 (1994) 253–258.
45] S.A. Young, G. Buckton, Particle growth in aqueous suspensions: the influenceof surface energy and polarity, Int. J. Pharm. 60 (1990) 235–241.
46] D. Dunstan, L.R. White, A capillary pressure method for measurement of contactangles in powders and porous media, Colloid Interface Sci. 111 (1986) 60–64.
47] D. Diggins, L.G.S. Fokkink, J. Ralston, The wetting of angular quartz particle: cap-illary pressure and contact angles, Colloid Surf. A: Physicochem. Eng. Aspects44 (1990) 299–313.
48] C.A. Prestidge, J. Ralston, Contact angle studies of particulate sulphide minerals,Miner. Eng. 9 (1996) 85–102.
49] T.V. Subrahmanyam, C.A. Prestidge, J. Ralston, Contact angle and surface analysisstudies of sphalerite particles, Miner. Eng. 9 (1996) 727–741.
50] A. Siebold, M. Nardin, J. Schultz, A. Walliser, M. Oppliger, Effect of dynamiccontact angles on capillary rise phenomena, Colloid Surf. A: Physicochem. Eng.Aspects 161 (2000) 81–87.
51] E.P. Kalogianni, T. Savopoulos, T.D. Karapantsios, S.N. Raphaelides, A dynamicwicking technique for determining the effective pore radius of pregelatinizedstarch sheets, Colloid Surf. B: Biointerfaces 35 (2004) 159–167.
52] H.G. Bruil, J.J. van Aartsen, The determination of contact angles of aqueoussurfactant solutions on powders, Colloid Polym. Sci. 252 (1974) 32–38.
53] T.V. Subrahmanyam, M.B. Monte, A. Middea, E. Valdiviezo, F.F. Lins, Contactangles of quarts by capillary penetration of liquids and captive bubble tech-niques, Miner. Eng. 12 (1999) 1347–1357.
54] C.A. Prestidge, G. Tsatouhas, Wettability studies of morphine sulfate powders,Int. J. Pharm. 198 (2000) 201–212.
55] A. Siebold, A. Walliser, M. Nardin, M. Oppliger, J. Schultz, Capillary rise for ther-modynamic characterization of solid particle surface, Colloid Interface Sci. 186(1997) 60–70.
56] E.W. Washburn, The dynamics of capillary flow, Phys. Rev. 17 (1921) 273–283.57] D.A. Spagnolo, Y. Maham, K.T. Chuang, Calculation of contact angle for
hydrophobic powders using heat of immersion data, Phys. Chem. 100 (1996)6626–6630.
58] N. Yan, Y. Maham, J.H. Masliyah, M.R. Gray, A.E. Mather, Measurement of con-tact angles for fumed silica nanospheres using heat of immersion data, ColloidInterface Sci. 228 (2000) 1–6.
59] C. Hosten, O.D. Eratak, A novel method for contact angle determination of par-ticulate solids, in: Proceedings of the XXIII International Mineral ProcessingCongress, vol. 1, 2006, pp. 604–608.
60] D.W. Fuerstenau, M.C. Williams, A new method for characterization of the sur-face energy of the hydrophobic particles, Part. Charact. 4 (1987) 7–13.
61] D.W. Fuerstenau, M.C. Williams, Characterization of the lyophobicity of parti-cles by film flotation, Colloids Surf. 22 (1987) 87–91.
62] M.C. Williams, D.W. Fuerstenau, A simple floatation method for rapidly assess-ing the hydrophobicity of coal particles, Int. J. Miner. Process. 20 (1987) 153–157.
63] D.W. Fuerstenau, J. Diao, M.C. Williams, Characterization of the wettability ofsolid particles by film flotation. 1. Experimental investigation, Colloids Surf. 60(1991) 127–144.
64] J. Diao, D.W. Fuerstenau, Characterization of the wettability of solid parti-cles by film flotation. 2. Theoretical analysis, Colloids Surf. 60 (1991) 145–160.
65] J.M. Douillard, T. Zoungrana, S. Partyka, Surface Gibbs free energy of minerals:some values, Petrol. Sci. Eng. 14 (1995) 51–57.
66] V. Médout-Marère, H. Malandrini, T. Zoungrana, J.M. Douillard, S. Partyka, Ther-modynamic investigation of surface of minerals, Petrol. Sci. Eng. 20 (1998)223–231.
67] B. Bilinski, E. Chibowski, The determination of the dispersion and polar freesurface energy of quartz by the elution gas chromatography method, PowderTechnol. 35 (1983) 39–45.
68] B. Bilinski, L. Holysz, Some theoretical and experimental limitations in the deter-mination of surface free energy of siliceous solids, Powder Technol. 102 (1999)120–126.
69] E. Chibowski, Zeta potential and surface free energy changes: quartz/n-heptane-water system, Colloids Interface Sci. 69 (1979) 326–329.
70] M.A. Hoeben, R.G.J.M. van der Lans, L.A.M. van der Wielen, Kinetic model forseparation of particle mixtures by interfacial partitioning, AIChE J. 50 (2005)1156–1168.
71] B.P. Binks, S.O. Lumsdon, Effects of oil type and aqueous phase composition onoil–water mixtures containing particles of intermediate hydrophobicity, Phys.Chem. Chem. Phys. 2 (2000) 2959–2967.
72] V. Medout-Marere, A.E. Ghzaoui, C. Charnay, J.M. Douillard, G. Chauveteau,
S. Partyka, Surface heterogeneity of passively oxidized silicon carbide parti-cles: hydrophobic–hydrophilic partition, Colloid Interface Sci. 223 (2000) 205–214.73] E.A. Boucher, Separation of small-particle dispersions by the preferential accu-mulation in one of two liquid phases, or by static flotation at their interface,Chem Soc. Faraday Trans. 1 85 (1989) 2963–2972.

9 : Phys
[
[
[
[
[
[
[
[
[
[
[
0 T. Dang-Vu et al. / Colloids and Surfaces A
74] C. Chenu, Y.L. Bissonnais, D. Arrouays, Organic matter influence on clay wetta-bility and soil aggregate stability, Soil Sci. Soc. Am. 64 (2000) 1479–1486.
75] K.P. Hapgood, J.D. Litster, S.R. Biggs, T. Howes, Drop penetration into porouspowder beds, Colloid Interface Sci. 253 (2002) 353–366.
76] G. McHale, M.I. Newton, N.J. Shirtcliffe, Water-repellent soil and its relationshipto granularity, surface roughness and hydrophobicity: a materials science view,Eur. J. Soil Sci. 56 (2005) 445–452.
77] J.L. Roy, W.B. McGill, Assessing soil water repellence using the molarity ofethanol droplet (MED) test, Soil Sci. 167 (2002) 83–97.
78] J. Bulmer, J. Starr, Syncrude Analytical Methods for Oil Sand and Bitumen Pro-
cessing, AOSTRA, Edmonton, 1979.79] B.D. Sparks, L.S. Kotlyar, J.B. O’Carroll, K.H. Chung, Athabasca oil sands: effectof organic coated solids on bitumen recovery and quality, Petrol. Sci. Eng. 39(2003) 417–430.
80] C. Duran, P. Beccat, Use of XPS for reservoir sandstone wettability evaluation.Application to kaolinite and illite, Petrol. Sci. Eng. 20 (1998) 259–265.
[
[
icochem. Eng. Aspects 337 (2009) 80–90
81] L.S. Kotlyar, B.D. Sparks, H. Kodama, Isolation of inorganic matter-humic complexes from Athabasca oil sands, AOSTRA J. Res. 2 (1985)103–111.
82] F. Bensebaa, A. Majid, Y. Deslandes, Step-scan photoacoustic Fourier transformand X-ray photoelectron spectroscopy of oil sands fine tailings: new structuralinsights, Spectrochim. Acta, Part A 57 (2001) 2695–2702.
83] M.S. Akhlaq, Characterization of the isolated wetting crude oil components withinfrared spectroscopy, Petrol. Sci. Eng. 22 (1999) 229–235.
84] M.S. Akhlaq, D. Kessel, W. Dornow, Separation and chemical characteri-zation of wetting crude oil compounds, Colloid Interface Sci. 180 (1996)
309–314.85] K. Takamura, R.S. Chow, A mechanism for initiation of bitumen displacementfrom oil sand, J. Can. Pet. Tech. 22 (1983) 22–30.
86] L.S. Kotlyar, H. Kodama, B.D. Sparks, P.E. Grattan-Bellew, Non-crystalline inor-ganic matter-humic complexes in Athabasca oil sand and their relationship tobitumen recovery, Applied Clay Sci. 2 (1987) 253–271.